Exhibit 13
POTASHCORP 2004 ANNUAL REPORT
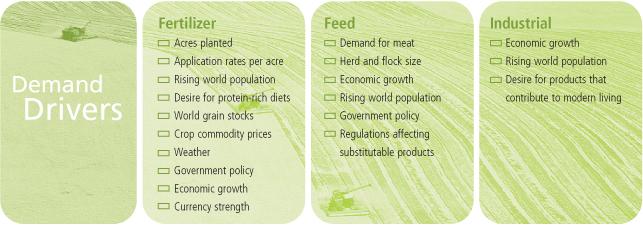
Several factors are driving a wave of demand for
fertilizer nutrients, especially potash.
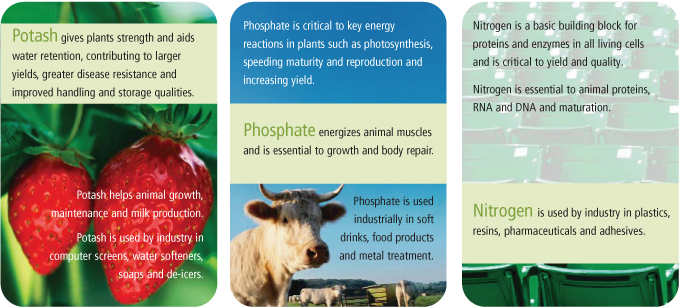
| o | An expanding world population wants more and better food that must be grown on less land. |
| |
| o | Farmers recognize that replenishing potash, phosphate and nitrogen in their soils helps produce larger crops. |
| |
| o | Asian and Latin American nations with growing economies have more purchasing power and are increasing the ratio of potash, “the quality nutrient”, in their fertilizer applications. |
This represents the beginning of a period of substantial growth for the potash industry.
...and the
Pieces Are
Aligned
The growth in demand has pushed other producers close to their maximum output. Meaningful new production would require the development of additional reserves, as well as significant time and money.
With demand growing, supply tightening and prices rising, we are ready to show our unique strength – responding to the need for potash when others cannot.
This offers triple leverage: greater volumes, lower costs and better prices.
Our benefit from the upside in potash will be amplified by our investments in other potash companies.
| | | |
With
86 percent
of the world’s
excess capacity | | | PotashCorp has
the unique ability
to capitalize
on growing
demand for
potash. |
2
POTASHCORP 2004 ANNUAL REPORT | WHO WE ARE
A Global Company
for a Global
Industry
At PotashCorp, our goal is to be the global low-cost supplier of potash into all key world markets,
enhanced by a focused nitrogen and phosphate business that leverages our strengths of lower-cost gas in Trinidad and specialty phosphate products in North Carolina.
To achieve this, we have built an extended enterprise that includes facilities and investments in seven countries on three continents. This allows us optimal participation in a growing business.
We strive for transparency and open dialogue with our stakeholders, including investors, customers, employees and the communities where we work and live. Each year, we report on our financial, social and environmental performance, with the goal of continuous improvement.
Size and Market Prominence
| PotashCorp is not only the world’s largest fertilizer company by market capitalization, it has the greatest production capacity. We can produce more potash, the most desirable business of the three nutrients, than any other company or any country. | |
3
POTASHCORP 2004 ANNUAL REPORT | BUSINESS & FINANCIAL HIGHLIGHTS
2004 Business Highlights
| o | Produced and sold record potash volumes |
| |
| o | Achieved record potash prices |
| |
| o | Increased potash market share |
| |
| o | Generated record gross margin |
| |
| o | Reached record gross margin in potash and nitrogen |
| |
| o | Sold record purified acid volumes |
| |
| o | More than tripled 2003 adjusted earnings* |
| |
| o | Implemented a two-for-one stock split and increased dividend by 20 percent |
| |
| o | Outperformed sector in total shareholder return, with stock price almost doubling |
| |
| o | Reduced recordable injury frequency rate to record low for third consecutive year |
| |
| o | Received the Overall Award of Excellence for Corporate Reporting in Canada |
Financial Highlights
All financial data in this report are stated in US dollars
$ millions except per-share amounts
| | | | | | | | | | | | | |
| | | 2004 | | | 2003 | | | 2002 | |
Financial Results | | | | | | | | | | | | |
| Sales | | $ | 3,244.4 | | | $ | 2,799.0 | | | $ | 2,224.4 | |
| |
Net sales* | | $ | 2,901.4 | | | $ | 2,465.8 | | | $ | 1,928.7 | |
| |
| Gross margin | | $ | 681.4 | | | $ | 380.4 | | | $ | 307.3 | |
| |
| Net income (loss) | | $ | 298.6 | | | $ | (126.3 | ) | | $ | 53.6 | |
| |
Adjusted net income* | | $ | 267.8 | | | $ | 76.9 | | | $ | 53.6 | |
| |
| Net income (loss) per diluted share | | $ | 2.70 | | | $ | (1.21 | ) | | $ | 0.51 | |
| |
Adjusted net income per diluted share* | | $ | 2.42 | | | $ | 0.73 | | | $ | 0.51 | |
| |
EBITDA* | | $ | 754.3 | | | $ | 171.8 | | | $ | 386.0 | |
| |
Adjusted EBITDA* | | $ | 723.5 | | | $ | 417.7 | | | $ | 386.0 | |
| |
| Additions to property, plant and equipment | | $ | 220.5 | | | $ | 150.7 | | | $ | 212.2 | |
| |
| | | | | | | | | | | | | |
Financial Position | | | | | | | | | | | | |
| Total assets | | $ | 5,126.8 | | | $ | 4,567.3 | | | $ | 4,685.6 | |
| |
Net debt* | | $ | 903.5 | | | $ | 1,441.4 | | | $ | 1,471.8 | |
| |
Cash flow prior to working capital changes* | | $ | 529.6 | | | $ | 364.5 | | | $ | 289.2 | |
| |
| Cash provided by operating activities | | $ | 649.6 | | | $ | 381.5 | | | $ | 316.4 | |
| |
* See reconciliation and description of certain non-GAAP measures in Financial Performance Indicators on Pages 52 to 54.
4
POTASHCORP 2004 ANNUAL REPORT | LETTER TO SHAREHOLDERS

William J. Doyle
President and Chief Executive Officer
By any measure, 2004 was a rewarding year for your company.
PotashCorp sold 8.3 million tonnes of potash, setting North American and offshore sales records. Demand continued to grow and prices reached new highs by the end of the year, driving gross margin to an unprecedented level.
Our success was also reflected in areas beyond the income statement. We achieved growth while reducing our recordable injury frequency rate to the lowest ever. We earned recognition and awards for governance and corporate reporting. Our share price nearly doubled as our investors enjoyed the benefits of a stock split and a higher dividend.
It was an amazing year filled with remarkable successes. But for those who know our company and the determination of our people, it was not surprising. We have a talented, well-trained and committed team that has been building toward this time for almost two decades. We have assembled tremendous assets and managed them with a long-term view.
Now, the factors that impact our business – and our potential – are falling into place like dominos, each one triggering the next for PotashCorp.
Rewarding Investors
Our company holds a distinct advantage in potash. This was demonstrated in 2004 as higher volumes and prices resulted in a considerable increase in earnings. Our potash gross margin of $422.8 million was more than twice that of 2003 and represented 47 percent of potash net sales.
This was supplemented by a strong year in nitrogen as tight supply/demand fundamentals kept prices up and pushed our nitrogen gross margin to a record high of $242.8 million, 26 percent more than the previous year. The significance of this improvement should not be overlooked, as our 2003 nitrogen margin was aided by the sale of our natural gas hedges at the peak of the market.
Phosphate remained a challenging business, with continued excess supply in DAP, one of our four main product lines. Although higher input costs negatively impacted results,
5
POTASHCORP 2004 ANNUAL REPORT | LETTER TO SHAREHOLDERS
gross margin in this nutrient did recover from a loss of $16.5 million in 2003 to contribute $15.8 million in 2004. More importantly, our fourth-quarter gross margin of $10.4 million bodes well for 2005.
As a result, PotashCorp’s total gross margin grew to $681.4 million, operating income to $514.3 million and net income to $298.6 million. This led to earnings of $2.70 per diluted share. We generated $649.6 million in cash from operating activities, showing that strong cash flow remains a hallmark of PotashCorp.
This was accomplished despite the continued strengthening of the Canadian dollar, which began 2004 at 1.29 against the US dollar and closed at 1.20. Record potash production reduced our cost per tonne by 5 percent on a real basis, but the higher value of the Canadian dollar against its US counterpart hurt translated costs. While this had a negative effect on gross margin, the biggest earnings impact was primarily non-cash, due to the translation of certain items on our balance sheet. In total, the strong Canadian dollar reduced annual earnings by $0.16 per share.
In July, our Board of Directors approved a two-for-one stock split and raised our dividend by 20 percent. Our shares increased by 92.1 percent on the New York Stock Exchange in 2004. This compares to an increase of 10.5 percent for the Dow Jones Basic Materials Index and an average of 66.5 percent for other companies in our sector. Once again we achieved our goal of outperforming our industry peers and other basic materials companies.
Potash Triggers Growth
This was the third consecutive year of above-average growth for potash in offshore markets. We have emerged from a period of significant oversupply that began in the early 1980s and was exacerbated by the collapse of the Soviet Union. For nearly two decades, PotashCorp stuck to a strategy of matching production to demand, confident that the continued need for our products would drive world growth and eventually absorb the capacity overhang. Our patience was rewarded as we sold 17 percent more potash at prices 29 percent higher than in 2003.
A key driver is the rapid GDP growth in many Asian and Latin American nations. Among our major customers, China’s economy grew 9 percent in 2004, India’s 6 percent and Brazil’s 4 percent. Several foreign currencies rose against the US dollar, giving customers in those countries greater buying power and the ability to purchase more potash.
In the past, farmers in many agricultural economies applied nitrogen and phosphate at higher levels than potash. Now those countries are trying to catch up, especially in Southeast Asia where Indonesia, India, Malaysia, Vietnam, Thailand and Taiwan are becoming bigger customers.
This accelerating demand has pushed the rest of our industry to its production limits. Excluding PotashCorp, producers operated at approximately 98 percent of capacity in 2004. We operated at 65 percent of our maximum production rate. With 86 percent of the world’s unused capacity, we are in the enviable position of being the only producer able to bring on significant additional capacity in a timely manner.
In the second half of 2004, we took steps to utilize this strength. We added fourth shifts at Lanigan and Allan, which enables them to operate around the clock and will increase annual production by 1.2 million tonnes. We continued work on an $80-million expansion
6
POTASHCORP 2004 ANNUAL REPORT | LETTER TO SHAREHOLDERS
at Rocanville, which began producing in the first quarter of 2005. This raises our annual production capacity by 400,000 tonnes. Further projects in Saskatchewan and New Brunswick are being assessed with a view to being able to operate at full capacity – now 12.5 million tonnes – within three years.
Playing to Our Strengths
We also worked to leverage our unique strengths in nitrogen and phosphate, focusing on areas that offer the greatest returns.
North American gas costs continued to rise in 2004, leading to further reductions in domestic nitrogen production and more imports to the United States. Fertilizer and industrial demand remained strong and capacity additions did not keep pace with consumption growth. The resulting tight supply/demand drove our ammonia prices up by 23 percent, urea 18 percent and nitrogen solutions 29 percent.
These conditions demonstrated the value of our facility in Trinidad, where we have long-term, advantageous gas contracts that give PotashCorp a significant edge. We are building on that advantage with expansions at our four plants that together will add
270,000 tonnes of ammonia capacity for $71 million, less than half the cost of new capacity. This will give us the most low-cost offshore production capability of any producer in the Western Hemisphere. All expansions will be completed by the third quarter of 2006.
In phosphate, we are focused on specialty products to offset the cyclicality of the fertilizer business. However, start-up problems at our new DFP (poultry feed) plant at Aurora cost $9 million. We have worked to resolve them, and the facility should operate at capacity in 2005. We did demonstrate our unique strength in purified acid, a high-margin industrial product. PotashCorp is the only company with local access to the quality rock preferred for low-cost purified acid production. The lack of high-quality ore is a barrier for other phosphate producers.
We have increased our focus on industrial production, the area of phosphate furthest removed from commodity cycles. Industrial volumes rose 13 percent and prices 4 percent. We are pursuing a greater share of this high-margin market, investing $73 million at Aurora to add 82,000 tonnes of purified acid production per year. This expansion should be operational by 2006.
7
POTASHCORP 2004 ANNUAL REPORT | LETTER TO SHAREHOLDERS
The Chain Continues
As we look forward to 2005, it is clear that potash will be the value driver in the fertilizer industry as offshore markets continue to grow. With our global position, we expect to be the main beneficiary. That was certainly the case in 2004, when we brought on an additional 0.8 million tonnes of production. We plan to do more in 2005.
Our anticipation of further volume growth at higher prices was validated when Sinochem in China signed a 2005 contract with Canpotex. This agreement is expected to increase China’s Canadian potash imports from 1.8 million tonnes to 2.3 million tonnes at prices at least $40 per tonne higher than in 2004. China’s total consumption in 2005 will rival that of the United States, historically the world’s largest potash consumer.
In nitrogen, anticipated high natural gas prices in the United States and Europe are expected to keep some production shuttered. Limited new capacity is projected and this, combined with strong demand, should maintain high prices for nitrogen products and enhance the value of our Trinidad asset.
In phosphate, better supply/demand fundamentals in feed and purified acid should translate into higher prices and better returns. Still, the phosphate fertilizer industry suffers from oversupply, although a mid-term DAP recovery is possible with industry consolidation.
Over the longer term, all three nutrients – but especially potash – will benefit from the chain of events unfolding in Asia and Latin America. Brazil, an agricultural powerhouse and our largest offshore potash customer, continues to bring acres into production in the cerrado region, where soils are naturally low in potassium and the climate is ideal for growing soybeans.
That is important given China’s rapidly increasing demand for soybeans – a crop that provides an important protein source for livestock as well as oil for cooking. China’s population now expects a healthier, protein-rich diet and will not return to starch as its food staple. More soybeans and other grains will be needed for animal consumption.
This happens as world grain stocks are precariously low. Farmers around the world produced a huge crop in 2004, but it did little to raise grain inventories since consumption rose as well. The need for increased crop production is kickstarting the fertilizer industry.
Of the three nutrients, potash has the greatest growth potential as farmers have not applied enough of it compared to nitrogen and phosphate. For example, China would need to double its ratio of potash to other nutrients just to catch up to the US and could go even further to meet its scientifically recommended needs. India would need to more than triple potash applications to meet its recommended ratio, which translates to an additional 7.5 million tonnes. Brazil could increase consumption by as much as 50 percent. These regions have little or no indigenous production and must rely on imports from an industry that, exclusive of PotashCorp, is running full out.
Tight fundamentals and our historical practice of matching supply to demand have enabled potash to decouple from the grain cycle and position it best among the three nutrients. While we expect continuing vigorous competition as other producers strive to generate additional capacity by debottlenecking, we don’t anticipate any significant new greenfield production in the short- to mid-term.
8
POTASHCORP 2004 ANNUAL REPORT | LETTER TO SHAREHOLDERS
Available reserves are restricted to a few locations and the high cost and long lead time for a new mine prevent the volatile swings of a typical commodity cycle. We know there will be some fluctuations in our outward growth line, with either temporarily reduced consumption or competitive debottlenecking. However, we believe demand will continue to rise, taking our earnings with it. We will remain faithful to our strategy of matching production to demand, which served us well in the past and will do so in the future.
PotashCorp spent years preparing for today’s conditions. We have added to our Saskatchewan base with strategic investments in New Brunswick, Chile, Jordan and Israel that expand our global potash presence. Late in 2004, we increased our ownership in SQM in Chile from 20 percent to 25 percent. We are well placed to capitalize on our own potash position as well as on these investments. They have performed well and their value will become more evident in the years to come.
Now, more than ever, the world is looking to PotashCorp. We have the people, production facilities and excess capacity to answer the call.
Excellence in All Areas
One of our core values is to seek continuous improvement and in 2004 we pursued that in all areas of our business, with the objective of becoming a stronger company for our stakeholders.
The first priority is safety, as our people are at the heart of our success. We have a goal of no harm to people, no accidents and no damage to the environment. PotashCorp’s employees have embraced this and moved us closer to our goal by reducing our recordable injury frequency rate for the third year in a row. In addition, our potash operations in New Brunswick earned the John T. Ryan trophy, the Canadian mining industry’s most prestigious safety honor. Our environmental efforts were also recognized, as Aurora was honored with North Carolina’s Mining Stewardship Award for reclamation.
Cognizant of our company’s global responsibilities, we quickly donated $1 million to the relief effort after a tsunami struck Southeast Asia in December. Of that total, $250,000 was set aside to match donations
from our employees – yet another example of how our people rise to a challenge and step forward whenever and wherever they are needed.
Those values drive the ongoing advancement of our business. In 2004, we issued our second annual sustainability report, detailing our economic, social and environmental performance. This is part of a corporate reporting program designed to increase transparency and ensure we are responsible and accountable. These efforts led the Canadian Institute of Chartered Accountants to recognize PotashCorp as having the best corporate reporting program in Canada. The CICA selected our 2003 annual report as the best in Canada’s mining industry and one of the top two in all sectors. It also presented us with top honors for sustainability reporting and for our website, www.potashcorp.com.
All of these accomplishments are made possible by a Board of Directors focused on making PotashCorp not only the best company in our industry but a shining example for the corporate world. We have a dynamic board that sets high standards, demonstrates its stated commitment to best practices and leads with a vision of greater success for PotashCorp. In January 2005, it approved a plan to repurchase up to 5 percent of our outstanding common shares, which will allow us to reinvest in our potash business.
Our approach is opening new doors, such as increased opportunities for our people who have assumed management responsibilities with APC in Jordan. We are extending our reach and knowledge around the world – and that will bring benefits to all our stakeholders.
We continue to put in place more pieces that will lead to ongoing success for our company. In 2004, we enjoyed a tremendous year, but we believe it was only the beginning. At PotashCorp, our time has come.

William J. Doyle
President and Chief Executive Officer
February 28, 2005
9
POTASHCORP 2004 ANNUAL REPORT | GOALS AND TARGETS
| | | | | | | | |
| | | | | | |
| |
To continue to outperform our sector and other basic materials companies in total shareholder return.
| |
| | | | | | |
| | 2004 Targets | | 2004 Results | | | 2005 Targets | |
| |
| | | | |
| | Exceed total shareholder return performance of the companies on the Dow Jones Basic Materials Index (DJBMI). | |  PotashCorp provided total shareholder return of 93.4 percent, compared to 13.1 percent for the DJBMI. | | | 1Exceed total shareholder return performance for our sector and companies on the DJBMI for 2005 and three-year average. | |
| |
| | | | |
| | Be at the top of our earnings guidance range. | | Achieved adjusted earnings per diluted share* of $2.42, exceeding initial guidance of $1.35 to $1.75 (adjusted for stock split). | | | 2Be the preferred fertilizer investment as measured by surveys. | |
| |
| | | | |
| | Work with the management and board of APC to improve its shareholder return. | | APC increased its shareholder return by 137 percent. | | | 3Non-cash operating working capital to be less than 10 percent of net sales.
4Total cash flow return to exceed cost of capital by 500 basis points. | |
| |
| | | | |
| | Maintain non-cash operating working capital* at year-end rates. | | More than achieved as non-cash operating working capital declined by 47 percent to $185 million. | | | 5Carry higher multiple than average of other fertilizer companies on both earnings and cash flow. | |
| |
| | | | |
| | Total cash flow return* to exceed cost of capital by 200 basis points. | | Cash flow return exceeded cost of capital by 400 basis points. | | | 6Exceed five-year average of historical gross margin as a percentage of net sales. | |
| |
| | | | |
| | Exceed five-year average of historical gross margin as a percentage of net sales*.
| | Achieved 23.5 percent compared to five-year average of 18.6 percent. | | | 7Be at the top of our earnings guidance range. | |
| | | | | | |
| | | | | | | | |
| | | | | | |
| |
To remain the leader and preferred supplier of potash, phosphate and nitrogen products worldwide.
| |
| | | | | | |
| | 2004 Targets | | 2004 Results | | | 2005 Targets | |
| |
| | | | |
| | Continue to be the preferred supplier, as measured by customer surveys. | | Customers evaluated PotashCorp as No. 1 on a series of sales criteria, and we outperformed the competition. | | | 1Increase potash sales volumes by 5 percent at 25 percent higher realized prices. | |
| |
| | | | |
| | Reduce the number of customer complaints by 5 percent. | | PotashCorp reduced customer complaints by 10 percent. | | | 2Industrial nitrogen net sales from US plants to comprise 70 percent of the total from those plants. | |
| |
| | | | |
| | Increase total potash sales volumes by 5 percent at 5 percent higher realized prices. | | Sales volumes increased by 17 percent and realized prices by 29 percent. | | | 3Increase North American feed realized prices by 15 percent.
4Increase purified acid price realizations by 5 percent. | |
| |
| | | | |
| | Increase purified acid sales by 12 percent. | | Purified acid sales volumes increased 25 percent; net sales* up 24 percent. | | | 5Implement enterprise-wide customer complaint system to facilitate tracking and resolution. | |
| |
| | | | |
| | Increase North American industrial nitrogen sales volumes to 60 percent of total nitrogen sales. | | North American industrial nitrogen sales represented 67 percent of total North American nitrogen sales volumes. | | | 6Outperform competitors on quality and service as measured by customer surveys.
7Expand computer applications’ e-mail capabilities to improve communications with customers and vendors. |
| |
| | | | |
| | Increase DFP volumes by 18 percent at 16 percent higher realized prices. | | DFP volumes increased 31 percent at 16 percent higher realized prices. | | | | |
| | | | | | |
* See reconciliation and description of certain non-GAAP measures on Pages 52 to 54.
10
POTASHCORP 2004 ANNUAL REPORT | GOALS AND TARGETS
| | | | | | | | |
| | | | | | |
| |
To be the low-cost supplier in our industry.
| |
| | | | | | |
| | 2004 Targets | | 2004 Results | | | 2005 Targets | |
| |
| | | | |
| | Reduce per-tonne conversion costs in each of our three nutrients by 5 percent. | |  Costs were reduced in potash by 3 percent (on a Canadian dollar basis); in nitrogen by 3 percent; and in phosphate by 1 percent. | | | 1Achieve rock costs at Aurora and White Springs 5 percent below 2004. | |
| |
| | | | |
| | Reduce phosphate rock costs by 5 percent. | |  Phosphate rock costs were reduced by 1 percent. | | | 2Achieve conversion costs for P2O5 production 4 percent better than 2004. | |
| |
| | | | |
| | Achieve average natural gas input costs in North America 10 percent below the average NYMEX spot price. | | Achieved savings of 13 percent relative to NYMEX. | | | 3Achieve 5-percent reduction in per-tonne potash conversion costs on a Canadian dollar basis.
4Achieve energy efficiency in nitrogen 2 percent better than 2004. | |
| |
| | | | |
| | Implement supply-chain management process. | | Nitrogen implementation was completed in 2004; potash and phosphate implementations are scheduled for 2005. | | | 5Operate the Aurora DFP plant at design capacity. | |
| |
| | | | |
| | Reduce North American transportation and distribution expenses by 5 percent. | | Reduced North American transportation and distribution expenses by 4.2 percent. | | | 6Yield a 3-percent saving in transportation and distribution from industry benchmark. | |
| |
| | | | |
| | Realize expected saving from negotiated medical plan design. | | Changes in the medical plan were implemented, resulting in savings that exceeded expectations. Annual savings are projected to be $800,000. | | | | |
| | | | | | |
| | | | | | | | |
| | | | | | |
| |
To move closer to our goal of no harm to people, no accidents, no damage to the environment.
| |
| | | | | | |
| | 2004 Targets | | 2004 Results | | | 2005 Targets | |
| |
| | | | |
| | Reduce recordable and lost-time injury frequency rates by 10 percent. | | PotashCorp’s recordable injury frequency rate dropped by more than 13 percent and the lost-time injury rate fell 21 percent. | | | 1Reduce recordable and lost-time injury rates by 10 percent. | |
| |
| | | | |
| | Reduce the number of environmental releases and permit excursions by 10 percent. | | Total environmental releases (18) and permit excursions (31) were 25 percent higher due to issues at our Lima nitrogen plant. | | | 2Reduce reported releases and permit excursions by 25 percent. | |
| |
| | | | |
| | Implement proactive facility security plans addressing current and anticipated security regulations. | | All high-risk facilities (US and Trinidad nitrogen) have security plans in place. | | | 3Achieve 100-percent compliance on all environmental and safety audit action items. | |
| |
| | | | |
| | Through the use of effective management processes, continue to avoid major adverse incidents.
| | By designing, implementing and auditing safety processes and action plans, PotashCorp avoided major adverse incidents. | | | | |
| | | | | | |
11
POTASHCORP 2004 ANNUAL REPORT | GOALS AND TARGETS
| | | | | | | | |
| | | | | | |
| |
To have motivated and productive employees committed to our long-term goals.
| |
| | | | | | |
| | 2004 Targets | | 2004 Results | | | 2005 Targets | |
| |
| | | | |
| | Implement key corporate performance metrics. | | Senior management utilized a balanced scorecard approach to develop a system for tracking and reporting on key performance indicators in operations, sales, finance, investor relations and human resources. This system will be rolled out in 2005. | | | 1Integrate key corporate performance metrics into regular employee reviews, providing managers with greater discretion to reward individual achievement. | |
| |
| | | | |
| | Implement employee incentives that tie compensation more directly to the achievement of key corporate financial performance measures. | | A performance-related contribution to savings plans for non-union employees was introduced, based on cash flow return* exceeding weighted average cost of capital*. A redesigned stock-option program focusing on long-term achievement will be presented to shareholders for approval. | | | 2Proactively improve orientation programs for new employees and career development processes for existing employees. | |
| |
| | | | |
| | Complete implementation of succession management and employee development processes to improve focus on key talent and critical shortages. | | Succession management continued at the board level. Identification of key talent, critical positions and development is now an ongoing component of senior management discussions. | | | 3Complete implementation of a human resources administration system enabled by information technology. | |
| |
| | | | |
| | Complete implementation of a human resources administration system enabled by information technology. | | By January 2005, half of US payrolls had been shifted to the new system and all other components were in place for US administration. Implementation of the remaining components for Canada will be completed in 2005. | | | 4Maintain personnel turnover improvements achieved in 2004 in Trinidad. | |
| |
| | | | |
| | Reduce employee turnover in the Trinidad segment. | | Turnover at Trinidad was successfully reduced by 40 percent. | | | | |
| | | | | | |
| | | | | | | | |
| | | | | | |
| |
To have a positive impact on the communities in which we operate.
| |
| | | | | | |
| | 2004 Targets | | 2004 Results | | | 2005 Targets | |
| |
| | | | |
| | Be engaged with community support projects at each of our plants and offices. | | Each of our plants and offices completed many community support volunteer projects. | | | 1Be in the top quartile of responses in a survey of community leaders. | |
| |
| | | | |
| | Develop emergency management and crisis communication plans for Saskatoon and Northbrook offices. | | The emergency management plans for Saskatoon and Northbrook offices are in draft form. The crisis communication plan is complete. Emergency management and crisis communication plans are in place at all plant facilities. | | | 2Be engaged with community support projects at each of our plants and offices.
3Achieve a 10-percent increase in individual participation in the matching gift program and a 20-percent increase in total donations. | |
| |
| | | | |
| | Conduct a review of governance policies and principles to identify and implement most recent best practices. | | PotashCorp’s governance policies and practices were recognized as among the top 7 percent of companies by Governance Metrics International. | | | 4Remain in the top quartile of governance practices as measured by external reviews. | |
| | | | | | | | |
| | | | | | |
* See reconciliation and description of certain non-GAAP measures on Pages 52 to 54.
| | | |
| In January 2005, PotashCorp’s phosphate operation at Aurora won the North Carolina Mining Stewardship Award for its reclamation efforts at Whitehurst Creek. The restoration included enhancements to the aquatic culture and stream system, and the area is once again home to fish, birds and wildlife. | | achieved 
partially achieved 
did not achieve 
|
12
POTASHCORP 2004 ANNUAL REPORT | SUSTAINABILITY
Sustainability
and
Success
At PotashCorp, we recognize that business success and sustainability are intertwined. We are building sustainable business practices into our management systems as we weave the policies and principles of sustainability into our company culture. This requires well-defined expectations that take into account the concerns of our stakeholders, and goals that move us forward as a sustainable enterprise.
Governance
To be sustainable, a company must clearly define the roles and responsibilities of its board and management as well as its relationships with stakeholders. Our Board of Directors follows a charter that sets out its responsibilities and the limits to management’s responsibilities, and adheres to a comprehensive statement of governance principles that addresses key issues, including: board independence and integrity; functions of the board; selection and composition of the board; and board committees. PotashCorp’s board is specifically charged with:
| |
| o | oversight and approval on an ongoing basis of the corporation’s business strategy; |
| |
| o | appointment of the Chief Executive Officer and monitoring his or her performance; |
| |
| o | approving the appointment of all corporate officers; |
| |
| o | establishing standards for management and monitoring performance; and |
| |
| o | approving procedures for strategy implementation, for identifying and managing risks and for ensuring the integrity of internal control and management information systems. |
Management Systems
At the management level, we continue to advance management systems designed to support continuous improvement. Our corporate disclosure policy, which was adopted before it was required, ensures

all shareholders have equal access to information. We have a comprehensive purchasing policy that links procurement, in part, to considerations of community development. Our Safety, Health and Environment Management System outlines our requirements and expectations in areas such as safety and accident prevention, pollution, energy conservation and product stewardship. This has contributed to improved safety performance and a reduction in the recordable injury frequency rate for three consecutive years.
Code of Conduct
Our statement of core values and code of business conduct make clear that honesty, transparency, integrity and respect for the law are fundamental to the way our company and our people operate. This has been communicated to all employees through meetings and ongoing dialogue. Employees sign off on having a thorough understanding of how PotashCorp’s values and code of conduct affect the way they do their jobs, fostering a culture of responsibility and accountability.
13
POTASHCORP 2004 ANNUAL REPORT | SUSTAINABILITY
| | | | | | |
| | | | | | |
| |
CONNECTING WITH STAKEHOLDERS: Sustainability does not live inside a company; it acknowledges the needs and interests of all stakeholders. PotashCorp maintains a dialogue with people affected by our operations, providing forums to share our strategies and the resulting benefits. This is also an important risk-management tool that can identify areas of concern before problems arise. We rely on independent research to gather feedback and insight into stakeholder perceptions and interests.
| |
| | | | | | |
| | | | | | |
| | | | | | |
| | Customers | | | Employees | |
| | | | | | |
| | o say product quality is the key factor in buying decisions, after price
o those surveyed ranked PotashCorp No. 1 in product quality in each of our four major product areas | | | o list PotashCorp’s integrity as an important factor in their continuous improvement efforts and positive view of the company
o those surveyed reported a high level of overall engagement | |
| | | | | | |
| | | | | | |
| | | | | | |
| | Investors | | | Communities | |
| | | | | | |
| | o believe PotashCorp has the attributes of a growth company
o those surveyed valued our Potash First strategy, which is well-matched to these attributes | | | o respect our long-term approach to business, strong safety and environmental performance and the work we do in the community
o those surveyed supported the expansion of our business | |
| | | | | | |
| | | | | | |
| | | | | | | | | |
| | | | | | | | | |
| |
LEADING BY EXAMPLE: Actions speak louder than words – and PotashCorp demonstrates social responsibility in areas that are important to our stakeholders. Through financial support, volunteerism and corporate leadership, we are actively involved in the communities where we live and work.
| |
| | | | | | | | | |
| | | | | | | | | |
| | | | | | | | | |
| | Financial
Less than one week after a tsunami devastated regions of Southeast Asia in December 2004, PotashCorp announced a $1-million donation to the relief effort, including $250,000 to match donations from our employees.
The practice of matching donations brings a sense of partnership to our giving practices, as our financial support goes to causes our stakeholders consider important. For example, in Saskatchewan we pledged $1.5 million to match community donations to a health-care initiative. | | | Volunteerism
Volunteerism connects PotashCorp to our communities. At Aurora, our people answered telephones and recorded pledges at the Children’s Miracle Network telethon, contributing to a record-breaking effort that raised more than $1.25 million.
At Joplin, PotashCorp employees read to elementary school students on a regular basis, while Saskatoon and Northbrook employees teamed up on the construction of a house as part of Habitat for Humanity’s “Women Build” day. | | | Leadership
Our people rise to the occasion when assistance is needed. After Hurricane Ivan destroyed more than 90 percent of the homes in Grenada, employees in Trinidad gathered food, clothing and water, and collected money to purchase tarps for temporary shelters.
PotashCorp sponsored a series of anti-drug talks by D.D. Lewis, an employee and former NFL star, that reached more than 17,000 students in 2004. Our people also led the creation of a Saskatchewan chapter of the Institute of Corporate Directors to enhance governance. | |
| | | | | | | | | |
| | | | | | | | | |
| | | | |  | | |  | |
| | | | | | | | | |
14
POTASHCORP 2004 ANNUAL REPORT | MD&A
Management’s
Discussion &
Analysis
of Financial Condition and Results of Operations (in US Dollars)
The following discussion and analysis is the responsibility of management and is as of February 28, 2005. The Board of Directors carries out its responsibility for review of this disclosure principally through its audit committee, comprised exclusively of independent directors. The audit committee reviews this disclosure and recommends its approval by the Board of Directors. Additional information relating to us (which is not incorporated by reference herein) can be found on SEDAR at www.sedar.com and on EDGAR at www.sec.gov.
| Special things to watch for: |
| |
| 26 | Factors that shaped 2004 business conditions |
| |
| | World economic growth and specific conditions that affected the entire fertilizer industry last year. |
| |
| 28 | Earnings review |
| |
| | Our 2004 earnings exceeded our guidance and 2003 results. This section explains the variances in detail on a per-share basis. |
| |
| 44 | Risk management |
| |
| | A more integrated risk-management framework was introduced, and here are the details. |
| |
| 50 | Key earnings sensitivities |
| |
| | Key factors and their effect on earnings per share. |
| |
| 50 | Indicators to watch in 2005 |
| |
| | These are our best estimates of factors that could affect our industry and our performance in the year to come. |
15
POTASHCORP 2004 ANNUAL REPORT | MD&A•N, P & K and PotashCorp Facts
BUSINESS
Different nutrients, different attributes
Different nutrients, different business environments
| | | | | | | |
 | | Potash(K) | | Phosphate(P) | | Nitrogen(N) |
| | | |
| Base Product | | Potassium chloride | | Phosphate rock
– phosphoric acid | | Ammonia |
| | | |
Geographic Availability
of Raw Materials1 | | Very limited | | Limited | | Readily available in numerous
locations (natural gas) |
| | | |
Cost of New Capacity2 | | Approximately $500 million
for 1 million tonnes KCl | | Approximately $1 billion
for 1 million tonnes P2O5 | | Approximately $500 million
for 1 million tonnes ammonia |
| | | |
Greenfield3
Development Time4 | | 5 years | | 3 years | | 2 years |
| | | |
Producing Countries5 | | 12 | | 41 (based on phosphoric acid) | | Approximately 60 |
| | | |
State- or Subsidy-
Controlled Production6 | | 14% | | 44% | | 50% |
| | | |
Industry Operating Rate7 | | 91% | | 74% | | 82% |
| | | |
PotashCorp Capacity8 | | 12.5 million tonnes potash*
23% of world capacity | | 2.5 million tonnes
phosphoric acid | | 3.9 million tonnes ammonia
2% of world capacity |
| | | | | 6% of world capacity | | |
| | | |
PotashCorp World Position
by Capacity9 | | # 1 | | # 3 | | # 4 |
| | | |
| | |
| * Increased from 12.1 million tonnes by expansion completed in first quarter of 2005. | | 1-9, See Appendix Page 51 |
16
POTASHCORP 2004 ANNUAL REPORT | MD&A•Our Business Environment
BUSINESS
Our Business Environment
As the world’s largest producer, by capacity, of the three primary plant nutrients – potash, phosphate and nitrogen – PotashCorp has built a global business on these natural nutrients. Our products serve three different markets: fertilizer, feed and industrial. All three nutrients are important in fertilizer, with phosphate the biggest player in the feed market. In the industrial market, phosphate and nitrogen products play the major role.

We sell fertilizer to North American retailers, cooperatives and distributors that provide storage and application services to farmers, the end users. Our offshore customers are governments and private importers that tend to buy under contract, while spot sales are more prevalent in North America. Key offshore customers include Brazil, China, Japan, Malaysia and Indonesia. Fertilizers are sold primarily for spring and fall application in both northern and southern hemispheres. In North America, all three nutrients are used on
corn, wheat, cotton and rice, while nitrogen-producing soybeans require potash and phosphate. This is also true offshore, although potash is used extensively on a broader range of crops there, including oil palm, sugarcane and coffee.
Transportation is an important part of the final purchase price for fertilizer so producers usually sell to the closest customers. In North America, we sell mainly on a delivered basis via rail, barge, truck and pipeline. Offshore customers purchase product either at the port where it is loaded or with freight included. Approximately 60 percent of our potash customers buy it freight included (CFR) and the remainder are responsible for ocean freight (FOB). In phosphate, the majority of offshore sales are FOB. Our nitrogen is sold primarily in North America.
Our feed customers are mainly US bulk feed producers, with Brazil and Mexico the biggest offshore customers. Our industrial customers are primarily based in the US, and include industrial intermediate and product manufacturers such as Astaris and Innophos in phosphate and BASF and DSM in nitrogen. Most feed and industrial sales are by contract and are more evenly distributed throughout the year than fertilizer sales.
In all product categories (fertilizer, feed and industrial products), price is the most important variable in the buying decision. North American customer surveys indicate that product quality is the next most important factor when a supplier is being chosen. Customers’ specific needs also affect their buying decisions. For example, in Japan, where our potash products are commonly used in industrial applications, quality is a significant factor. In Brazil, granular potash to blend with the other nutrients is key.
17
POTASHCORP 2004 ANNUAL REPORT | MD&A•Vision/ Strategy
BUSINESS
Vision
We envision PotashCorp as a long-term business enterprise providing superior value to all our stakeholders. To achieve this, we believe we need to be the sustainable gross margin leader in the products we sell and the markets we serve.
Through our strategy, we attempt to minimize the natural volatility of our business. Risk rises with volatility and we believe the capital markets will assign a better earnings multiple to a growth company with lower risk. We also strive for increased earnings, and to outperform our peer group and other basic materials companies in total shareholder return, a key measure of any company’s value.
We link our financial performance with areas of extended responsibility: the environment, our social and economic stakeholders. We focus on increased transparency to improve our relationships with all our stakeholders, believing this gives us a competitive advantage.
Strategy
Our strategy is based on our commitment to seek earnings growth and quality. We strive to build value with reduced volatility and we reduce volatility by doing all we can to strengthen our potash business, hence our Potash First strategy. Our goal is to be the low-cost global potash supplier on a delivered basis into all key world markets. We supplement this potash strategy by leveraging our strengths in nitrogen with our lower-cost gas in Trinidad, and our specialty phosphate products, particularly the industrial product, purified acid, produced in North Carolina.
In our day-to-day actions, we seek to maximize gross margin by focusing on the right blend of price, volumes and asset utilization. Our highest-margin products – potash, purified phosphoric acid and Trinidad nitrogen products – drive our strategy, and we strive to grow the business by enhancing our position as supplier of choice. We aim to build on our strengths by acquiring and maintaining low-cost, high-quality capacity that complements our existing assets and adds strategic value. Our decisions are based on our cash flow return materially exceeding cost of capital.
18
POTASHCORP 2004 ANNUAL REPORT | MD&A•Potash
BUSINESS
PotashCorp in the World Potash Scene
Around the world, potash deposits that can be mined economically are limited to a few countries. There are only 12 producing countries, more than 150 consuming countries, and over 80 percent of the product crosses borders. The primary producing areas – Canada, Russia and Belarus – account for two-thirds of world production. The US, a mature market, is the largest potash importer. The greatest growth markets are nations with limited or no indigenous production, such as Brazil, China and India. PotashCorp is a prominent supplier to these markets.
Our major competitors in North America are Agrium and Mosaic, which have more exposure to North American sales than we do. Globally, we compete with producers in Belarus, Russia, Germany and Israel in the key growing markets of Asia and Latin America.
STRATEGY:
Using excess capacity to build on global leadership
Our strategy in potash is designed to capture the benefits of our excess capacity. We match supply to demand to minimize inventory overhang and we believe price and margin are more important than volumes. We focus on maintaining our low-cost position both in production and on a delivered basis. We expect to use our excess capacity and make capital investments as necessary to seamlessly provide the world with the appropriate amount of potash as consumption grows.
Growth in demand over the last three years (4.0 percent in 2002, 7.6 percent in 2003 and 9.9 percent in 2004) has absorbed nearly all of

the world’s excess capacity exclusive of PotashCorp. The threat of major new capacity in the form of a new mine is somewhat constrained, as we believe there are few geographic opportunities. According to industry consultants, a 2-million tonne greenfield operation would require approximately $1 billion in capital and a five-year lead time. We believe current potash margins do not support such investments.
Our competitors are debottlenecking and doing incremental expansions where possible, but none can bring up significant capacity as quickly and economically as we can. What’s more, their announced
| | STRENGTHS: |
| |
| o | 86 percent of world excess capacity to respond to growing world consumption |
| |
| o | Excess capacity can be brought on stream quickly with modest capital outlay |
| |
| o | Low-cost, flexible production with smaller percentage of fixed costs |
| |
| o | Long-term reserves from existing shafts |
| |
| o | Greater sales exposure in growing offshore market |
| |
| o | Few world producers, reduced government control |
| |
| o | Stable pricing historically with current upward trend |
| |
| o | High cost and long lead time to build greenfield capacity |
| |
| o | No greenfield operations initiated, providing us with a multi-year window |
| |
| o | No substitutable products for potash |
| |
| | WEAKNESSES: |
| |
| o | Competitors will continue with low-cost incremental expansions |
| |
| o | High provincial resource taxes (Saskatchewan) and federal income taxes relative to global competitors |
| |
| o | High freight costs to ship Saskatchewan potash to port |
| |
| o | Exposure to Canadian dollar volatility |
| |
| o | Currently high ocean freight costs |
| |
| o | Water inflow continues to hurt New Brunswick margins |
| |
| o | Potential for rail transportation bottlenecks |
| |
| | OPPORTUNITIES: |
| |
| o | Ability to optimize excess capacity quickly and competitively |
| |
| o | Our competitors are operating at capacity, which should allow us to benefit from a significant portion of accelerated growth |
| |
| o | New deposit found in New Brunswick could resolve water inflow problem and allow expansion in a lower-tax environment |
| |
| o | Strategic acquisitions of other low-cost production in the world, including adding to our existing investments in APC, SQM and ICL |
| |
| | THREATS: |
| |
| o | Current upward trend in pricing could encourage new greenfield operations
|
| |
| o | Competitors’ debottlenecking of existing plants with a simultaneous drop in demand could offset potential market growth for us |
19
POTASHCORP 2004 ANNUAL REPORT | MD&A•Potash
BUSINESS
debottlenecking plans amount to approximately 2 million tonnes in the next six years, while the historical growth rate of 2 percent suggests 7 million tonnes will be required. We expect customers to turn to us to meet the majority of continuing growth in world consumption. As we increase our operating rate, we expect to be able to capitalize on our three leverage points of increased sales volumes, lower per-unit costs and higher sales prices. This leverage is further enhanced by our investments in other potassium-based companies: SQM, APC and ICL.
Transportation costs are increasingly important and our sales strategy is built with customer proximity in mind. We are advantaged supplying Asia and the US from our Saskatchewan operations and South and Central America from New Brunswick. This allows for quicker and more cost-efficient delivery to some key markets – an important factor as ocean freight rates climbed to unprecedented levels in 2003 and stayed high throughout 2004.
Offshore sales of our Saskatchewan potash are handled through our membership in Canpotex, which minimizes transportation and marketing costs. Approximately 60 percent of Canpotex sales are made on a delivered basis, meaning it pays the freight. Domestically, our strategy relies on a distribution network in the US and Canada that allows timely delivery to high-demand spring and fall markets. We optimize these systems, attempting to get the lowest freight rates possible.
Shifts in foreign currencies can affect our margins. As currencies, including the Canadian dollar, strengthen against the US dollar, translated production costs rise. With higher freight rates, this could
impact margins. Investments in companies such as APC have the advantage of providing a natural hedge against rising freight costs and currency fluctuations, as the Jordanian dinar is pegged to the US dollar.
PotashCorp will continue to review investment opportunities that offer freight advantages, provide economic hedges and expand our enterprise. We will also explore opportunities in upgraded potash (which offers higher returns and less volatility), consistent with our investment in SQM, the world’s largest producer of specialty upgraded potash products. We believe the strategic positioning of our existing potash operations and investments places us in the targeted top right quadrant.
CAPABILITY TO DELIVER
In potash, the ability to bring on excess capacity in a timely manner is key to our growing profitability. Tight global supply is increasing the need for potash production. In 2004, we went to four shifts at our Lanigan and Allan mines and reduced inventory shutdown weeks by nearly one-third, to 28 weeks. This increased our production to almost 8 million tonnes from 7.1 million tonnes in 2003. In 2005, we will have the capability to produce 9.6 million tonnes. This would reflect a full year of four shifts at Lanigan and Allan and, if demand warrants, further reduction in inventory shutdown weeks and vacation/maintenance shutdowns. It also reflects the 400,000-tonne, $80-million expansion at Rocanville. Our ability to bring this capacity on quickly is unmatched in our industry – especially with virtually no capital costs other than the Rocanville expansion.
As markets continue to grow, we can add another 2.9 million tonnes of capacity at a current estimated cost of $300 million. This represents one-fifth of the cost of developing the same amount of new greenfield capacity. Engineering design work is being conducted to evaluate a number of projects in Saskatchewan and New Brunswick to determine the optimum mix, with a view to being able to operate at full stated capacity of 12.5 million tonnes within three years, if the market requires.
We have also recognized the growing demand for granular product by customers in areas such as Brazil. With the expansion at Rocanville on stream, we are able to produce 1.5 million tonnes of granular product there to help meet the needs of these key customers. A further expansion to the compaction capability at Rocanville is currently under way. It will facilitate the production of an additional 0.5 million tonnes per year and is scheduled for completion in August 2005.
20
POTASHCORP 2004 ANNUAL REPORT | MD&A•Phosphate
BUSINESS
PotashCorp in the World Phosphate Scene
Phosphate is produced in 41 countries, with the United States the biggest producer, followed by China, Morocco and Russia. World capacity of the major phosphate fertilizer product, diammonium phosphate (DAP), has surged in recent years, and approximately 42 percent is traded across borders. US DAP production was built predicated on exports and historically much of it went to India and China, which are now developing their domestic production behind protective trade barriers. The current excess capacity for DAP production relative to consumption is depressing prices. Governments influence a significant proportion of world capacity through subsidy control or ownership, or by overproducing and accepting negligible to negative returns to support employment.
In North America, our major competitor for both fertilizer and feed products is Mosaic (formerly IMC Global and Cargill Crop Nutrition, which merged in October 2004), while imports from Morocco and Israel compete for industrial sales. In offshore markets, competition for fertilizer sales comes from indigenous producers in India and China and from other global producers. In China, indigenous producers compete for feed sales.
STRATEGY:Strength through diversification
In phosphate, we work to maximize the benefits of our long-term rock position, multi-year mining permits and high-quality rock that enables low-cost production and product diversity. The quality of our rock at Aurora and its integrated production facility place that plant in a more desirable position on our strategic profile than
| | STRENGTHS: |
| |
| o | Most diversified producer, making the entire range of phosphate products – solid and liquid fertilizers, feed and industrial
|
| |
| o | High-quality rock makes it possible to upgrade economically to more stable, higher-margin products |
| |
| o | Strong competitive cost position and tight global supply in purified acid |
| |
| o | Long-term deposits close to low-cost processing facilities |
| |
| o | Approximately 75 years of reserves in North Carolina at current operating rates |
| |
| o | Existing mining permits at Aurora for seven years and covering estimated life of mine at White Springs (17 years) |
| |
| | WEAKNESSES: |
| |
| o | US producer dependency on declining world DAP trade has led to lower sales volumes and operating rates |
| |
| o | High percentage of fixed costs means plants do not perform profitably at lower operating rates |
| |
| o | Current high raw material input costs for ammonia and sulfur |
| |
| o | Product diversity creates production requirements that increase costs |
| |
| o | Too much government intervention globally, either in constructing capacity or in restricting imports
|
| |
| o | Offshore sales heavily exposed to China and India, which seek self-sufficiency |
| |
| | OPPORTUNITIES: |
| |
| o | Our high-quality rock and proven technology allow us to expand production of the industrial product purified acid |
| |
| o | Production flexibility will allow us to streamline production at three operations to reduce costs |
| |
| o | Our strong competitive cost position in purified acid makes us less susceptible to offshore competition |
| |
| o | Resolution of DFP start-up problems should improve feed profitability |
| |
| o | Potential for industry shutdowns |
| |
| | THREATS: |
| |
| o | Excess world DAP capacity in many hands can easily be brought back on stream |
| |
| o | Depressed fertilizer prices could encourage others to expand into the feed business, hurting margins |
| |
| o | Competitors with liquidity issues are selling at lower prices to accelerate cash flow |
| |
| o | Higher barriers to exit because environmental costs force some companies to continue production at uneconomic levels, impacting supply/demand fundamentals |
21
POTASHCORP 2004 ANNUAL REPORT | MD&A•Phosphate
BUSINESS

White Springs. One of Aurora’s upgraded products is purified acid, which has higher, more stable margins and lessens the impact of the volatility of phosphate fertilizer.
Industry demand for purified acid continues to grow globally in response to demand for products that require it. Our position strengthened in 2004 when imports from China to the US were down 10 percent from 2003 and there was consolidation among US competitors. Barriers to entry – the need for high-quality rock as well as capital considerations – keep this product in our most desirable strategic positioning quadrant.
We continue to expand the purified acid business at Aurora, where we have proven technology and a strong, competitive cost position. Prices are favorable, and we will continue to look for opportunities to further diversify in purified acid.
Feed phosphates, our other diversification effort in phosphate, have suffered recently. Declining demand due to increased use of substitutes, and the fallout from DAP as competitors switched their phosphoric acid into feed, hurt supply/demand fundamentals. However, recent consolidation in the US feed industry may improve its strategic positioning.
CAPABILITY TO DELIVER
Keys to profitability in phosphate include diversification away from fertilizer products, high operating rates and minimizing the impact of high costs for inputs such as ammonia, sulfur and rock. Therefore, we are reallocating P2O5 away from the more competitive fertilizers to higher-margin products. In March 2003, we increased our
purified acid capacity at Aurora to 251,000 tonnes P2O5, and that production capacity is sold out. We are now installing an additional 82,000 tonnes of P2O5 capacity, to be complete in June 2006, and all output is already in demand by various companies. Together, these expansions have allowed us to divert 165,000 tonnes P2O5 away from fertilizer production.
We have announced three projects that will allow us to run at higher operating rates, decreasing costs without increasing solid fertilizer production tonnes: At Aurora’s DAP/acid facility, we will debottleneck the #2 plant and close the less efficient #1 plant; also at Aurora, the gypsum blend process will be streamlined to use more gypsum from direct blend filters; and, at White Springs, we will convert production of all phosphoric acid to the superior hemihydrate process, which will lower energy costs, increase production flexibility and produce a higher quality P2O5.
At approximately 30 percent of total production costs, rock is the largest controllable cost of producing P2O5. Rock inventory was allowed to build in two previous years as a safety cushion during the transition to another mining area at Aurora, and reduction of that inventory last year increased rock costs by 10 percent. Constant inventory levels of wet phosphate rock concentrate year over year and higher operating rates should reduce costs moving forward.
The new design of the DFP plant brought on stream at Aurora in 2003 created complications, which have prevented it from achieving full operating rates. We are working at resolving the problems with the anticipation of operating it at design capacity in 2005.

22
POTASHCORP 2004 ANNUAL REPORT | MD&A•Nitrogen
BUSINESS
PotashCorp in the World Nitrogen Scene
Nitrogen, the most widely produced nutrient, is a regional business. Ammonia, the feedstock for all downstream nitrogen products, can be manufactured in any country with adequate natural gas supplies, and approximately 60 countries do so. Ownership is widely dispersed around the globe, so only 13 percent of ammonia is traded. Several developing countries with large gas reserves and low production costs use little of their gas domestically, and monetize it by producing ammonia cheaply for the export market. China is the largest producer, followed by India, Russia and the US. Half of the industry is under government ownership so decisions are not necessarily based on economic considerations.
Rising natural gas costs in North America and Europe have led to plant closures, since gas is at least 70 percent of the cost of producing ammonia. The resulting tight supply has increased prices, attracting imports from areas of low-cost gas such as Trinidad, Venezuela, Russia and the Middle East. Increasingly, the US is supplied from offshore. Since 1999, approximately 4.5 million tonnes of US ammonia capacity has been permanently shut down, with a corresponding increase in imports of 55 percent.
Nitrogen is an input in industrial production of a wide range of products that enhance modern living. Manufacturers want consistent quality and just-in-time delivery to keep their plants running efficiently. Many are attached to their suppliers by pipeline.
GDP improvements in developing nations have historically supported growth in demand for these lifestyle products.
Within North America, sales are regionalized due to transportation costs. This limits competition from Agrium and other Canadian sources which serve a different geographic market. CF Industries, a cooperative, Koch, a private company, and Terra, a publicly traded company, are our main competitors, along with imports.

STRATEGY: Trinidad is key
Our nitrogen strategy is designed to benefit from favorable gas contracts in Trinidad. In North America, we employ natural gas hedges with the goal of minimizing risk from gas price swings and protecting US margins. We believe our nitrogen position is spread along the bottom two quadrants of our strategic positioning profile, with our Trinidad operations in the superior right corner.
In nitrogen, North America is our primary market. We supply it through a combination of tonnes produced in Trinidad, US production and purchased tonnes which we re-sell, always seeking to source the highest-margin method of supply. Our multiple port facilities, warehouse and distribution network, dedicated sales and customer service teams and associated infrastructure make it possible to supply customers from this flexible production base.
Trinidad is home to more than 60 percent of our ammonia production. It has a stable government and is ideally situated to service the sizeable US market. Thus we are expanding this lower-cost facility.
23
POTASHCORP 2004 ANNUAL REPORT | MD&A•Nitrogen
BUSINESS
| | STRENGTHS: |
| |
| o | Long-term, lower-cost gas contracts in Trinidad |
| |
| o | Our gas hedging program in the US helps stabilize costs there |
| |
| o | Serve both fertilizer and industrial customers |
| |
| o | Some of our US plants are linked by pipeline to industrial customers willing to pay a premium for secure, high-quality supply |
| |
| o | We own/operate deepwater import terminals |
| |
| | WEAKNESSES: |
| |
| o | US plants depend on high-cost natural gas |
| |
| o | Plant ownership spread over many companies |
| |
| o | Contractual commitments to industrial customers may force us to operate unprofitably in a high-cost gas environment |
| |
| o | Small volume changes can significantly impact prices |
| |
| | OPPORTUNITIES: |
| |
| o | High volume demand in the US |
| |
| o | Plants in Trinidad being expanded to provide more cost-advantageous production |
| |
| o | Our US distribution system allows us to import and sell purchased tonnes |
| |
| o | Consolidation of US industry |
| |
| o | High cost of construction materials such as steel could delay new capacity, extending the current cycle |
| |
| | THREATS: |
| |
| o | Abundance of lower-cost natural gas in developing countries leads to new ammonia capacity as they attempt to monetize their gas resources
|
| |
| o | Competitors need only a short lead time to bring on new capacity when the supply/demand ratio is tight |
Our US plants, located in different regions, focus on industrial sales in which quality and security of supply are key. With varied production rates at these operations, we plan to maximize sales to industrial customers, supplemented by fertilizer sales, to run our plants at the highest possible operating rate to help control costs.
We currently operate three plants in the US: Augusta and Lima, producing a range of nitrogen products, and Geismar, the world’s largest nitric acid producer. Augusta is a highly competitive, economical plant with a strong industrial customer base. Lima is also a strong industrial supplier with a good inland location that is insulated from imports. We curtailed all production at Memphis and ammonia and nitrogen solutions production at Geismar in June 2003.
Our strategy moving forward also considers leveraging our marketing and operations expertise without significant capital
outlay through asset-light/fee-heavy arrangements. Our goal is to find investments where we provide the operating, management and marketing knowledge along with distribution resources, while our partner provides the assets. This has the potential to deliver stable returns for minimum investment.
CAPABILITY TO DELIVER
We have announced four debottlenecking expansions in Trinidad to capitalize on our lower-cost gas position there. The first two expansions are for approximately 138,000 tonnes of ammonia for $30 million; 69,000 tonnes will be available in the first quarter of 2005 and the rest in the third quarter. Subsequent expansions will increase capacity by a further 132,000 tonnes for $41 million. Half is expected to be available in the first quarter of 2006 and the remainder in the third quarter. US natural gas is expected to remain above $4.50 per MMBtu, which sets the floor price for US ammonia above $195 per tonne. Ammonia prices would have to fall below $140 per tonne before these expansions would provide a return of less than 15 percent.
In the US, we continue to utilize our gas hedging program to mitigate the risk of price volatility. Natural gas prices will determine the profitability of our hedging program and our ability to buy more cheaply, on average, than the market going forward. By using our distribution system for purchased tonnes, we can source product with the best margins.
24
POTASHCORP 2004 ANNUAL REPORT | MD&A•Sales
BUSINESS
PotashCorp Sales
STRATEGY: Be the supplier of choice
In our business, where products are similar and price is the most important influence on buying decisions, our goal is to move our customer base to the top right strategic position of highest volumes and highest margins. We want to be the supplier of choice to our customers, always getting the final opportunity to win their business. We seek to become the preferred supplier to high-volume, high-margin customers with the lowest credit risk.
CAPABILITY TO DELIVER
Customers’ perceptions of our ability to create value for them based on the price they pay for our products are fundamental to our ability to maintain and grow their business. Our dedicated sales teams for each product (fertilizer, feed and industrial) focus on increasing their specific knowledge to provide maximum value for customers. We follow up our sales with customer service that is available 24/7, and have strong technical support. We also do annual customer surveys. In our most recent survey, price was listed as the top purchasing criterion. However, beyond price, customers named “product quality” as the single most important factor influencing their buying decisions. The same research indicates that PotashCorp is rated by survey respondents from each customer group as having the highest product quality. In addition, at least three-quarters of those surveyed indicated that sustainability performance affected buying decisions, especially as it related to economic and safety, health and environmental performance. Recognizing its importance, PotashCorp focuses on this in customer communications and sets targets for improvement in these areas.
In North America, continued engagement with our customers, along with strategic alliances with dealers who warehouse our products, will influence our success in maintaining fertilizer market share. For feed, the proximity of our plants to customers is an advantage, as are our long-term relationships with purified acid customers. Additionally, our extensive North American distribution network gives us a logistical advantage in supplying the growing needs of all customers.
Our participation in the fertilizer sales organizations Canpotex and PhosChem, where we share marketing costs and volumes with other producers, is important to our offshore margins. These organizations maintain a network of agents in offshore markets, aimed at ensuring our products benefit from market growth.
As a producer of large volumes which are sold around the world, our success requires an efficient transportation system. This is achieved by operating our own transportation department, with a distribution
network of approximately 175 terminal and warehouse facilities and a fleet of approximately 6,600 railcars.
Rising sales of North American grain and other commodities have affected the availability of railcars for potash. CN Rail handles our North American rail shipments. In response to the growing demand and potential increase in rates, we signed a long-term agreement with CN through 2010, which will deliver annual savings. CN has committed to meeting our North American growth and has therefore added 60 locomotives and 500 covered hopper cars.
Rail from Saskatchewan to west coast ports is handled by CP Rail, Canpotex’s primary carrier. CP has committed to meet Canpotex’s offshore growth by investing approximately $1 billion in improvements that will include 24 more locomotives and 600 more covered hopper cars, for a total of 1,500. Canpotex’s private hopper car fleet will increase from 1,960 cars to 3,260 by mid-2005 to meet the growing demand.
The relationship between costs and return on our investment in the system is key. Recent increases in ocean freight rates are raising our cost to deliver to offshore customers that purchase potash on contracts with freight included. In response to the volatile and rising ocean freight rates, Canpotex plans to increase its fixed freight agreements from 15 percent in 2003 to a target of over 50 percent in 2005. For our sales out of New Brunswick, we negotiated a three-year freight contract for 60 percent of sales from there to Brazil.
25
POTASHCORP 2004 ANNUAL REPORT | MD&A•Key Performance Drivers
BUSINESS
Key Performance Drivers
Each year we set targets to advance our goals and drive results. In 2004 we further developed key performance indicators to monitor our progress and measure success. As we drill down the organization with these metrics, we believe:
| • | management will focus on the most important things, which will be reinforced by having the relevant results readily accessible; |
| |
| • | employees will understand and be able to effectively monitor their contribution to the achievement of corporate goals; and |
| |
| • | we will be even more effective in meeting our targets. |
Recognizing that this is an evolving process, we began by examining the company’s long-term goals and developing metrics to measure progress.
We achieve our goal of outperforming comparable companies by maximizing shareholder wealth through increasing sales of our products with more stable and higher margins. At the corporate level, the key performance metric for maximizing shareholder wealth is total shareholder return, on both an annual basis and a sustaining basis. Supporting metrics which contribute to this are cash flow return versus our weighted average cost of capital, EBITDA multiple relative to our peers, and sales and gross margin growth.
In our sales and production divisions, the metrics are cash flow return at the divisional gross margin level and associated working capital. We measure our success at increasing sales of products with stable, desirable margins by analyzing volumes, revenue and gross margin for all sales within each nutrient. The question we ask ourselves is, “Have we optimized our gross margin on a product and customer mix basis?”
The metrics for achieving our goal of being the preferred supplier are the number of complaints we receive and order fill rate categories. We also do annual customer surveys to measure our effectiveness at every stage of the sales transaction and how we compare with our competitors. Our goal is to outperform and be in the top quartile. We are establishing monthly surveys to monitor customer attitudes about our quality and service.
We recognize that being a low-cost supplier is essential to sustaining profitability. We achieve this goal by reducing cash costs and spending appropriate sustaining capital to maintain low costs and productivity. The metrics for success at the corporate level are total cost per tonne of each nutrient or primary product and supporting selling and administrative expense. In sales, we measure percentage of customer shipments by preferred carrier and route, associated transportation and distribution expense, freight cost, sales expense and number of tonnes per sales representative. For all nutrients, performance reliability relative to maintenance cost is measured.
Reducing injury rates and environmental impact will help us achieve our goal of no harm to people, no accidents and no damage to the environment. Lost-time and recordable injury rates and environmental events such as reportable releases and permit excursions measure the components of this goal.
To reach our goal of having motivated, productive employees, we encourage and reward performance that supports PotashCorp’s strategy. We have initiated a process to survey employee engagement with the company’s goals and objectives. Over time we will be able to compare year-over-year results to provide a guideline for activities we might introduce or improve to increase employee productivity and emotional buy-in to our objectives.
We achieve our goal of having a positive impact on communities in which we operate by contributing to socio-economic well-being. Part of this is having good governance principles, and our board continues to assess this area. We contribute to our communities by being a competitive employer on a compensation and benefit basis, and we support local causes in areas where we operate. We measure our success by reviewing tone of media coverage, number of events the company sponsors and total charitable donations and volunteer hours. We also do community surveys and aim for top-quartile performance.
26 POTASHCORP 2004 ANNUAL REPORT | MD&A • Factors That Shaped 2004 Business Conditions 2004 RESULTS Factors That Shaped 2004 Business Conditions |
| 1 | Economic Growth Strong, China and India Lead |
| |
| | The global economy grew in 2004 by an estimated 5 percent, spurred by booms in two countries with the largest populations, China – almost one-third of total global economic growth with 9 percent – and India, 6 percent. Despite some difficulty, the US economy averaged over 4 percent growth. The strong GDP growth gave world farmers a solid basis for boosting their fertilizer application rates, and consumption of all three nutrients was above trend. |
| |
| |  |
| |
| 2 | Ideal Growing Conditions Produced Record Crop |
| |
| | With highly favorable weather in most of the important crop-producing countries, world grain production reached an all-time high in 2004. The ideal growing conditions allowed global production to exceed consumption for the first time in six years, though the surplus was only 2.8 percent more than the escalating consumption. The stocks-to-use ratio for crop year 2004/05 is still expected to be the second lowest in 30 years, at 19.4 percent. |
| |
| 3 | Record Income for US Farmers |
| |
| | US farmers, buoyed by favorable pricing opportunities in the spring of 2004 and excellent planting weather, enjoyed record net cash farm income totalling $77.5 billion, including farm program payments. These conditions, following record income in 2003, resulted in corn plantings being increased by 2.5 million acres. Corn requires more fertilizer than any other crop, which boosted US fertilizer consumption. |
| 4 | Ocean Freight Rates Remained High |
| |
| | Demand by Asia’s growing economies for industrial and agricultural commodities continued to support elevated ocean freight rates in 2004. China’s construction and infrastructure boom relies heavily on ocean transport, and when its government tapped the brakes on its overheating economy by tightening credit at mid-year, the Baltic Panamax Ocean Freight Index dipped. It rose again when China decided no further tightening was necessary, and freight rates reached record levels in December. |
| |
| |  |
| |
| 5 | Foreign Currencies Appreciate as US Dollar Struggles |
| |
| | The US dollar fell significantly in 2004, influenced in part by the country’s large negative trade balance, with the value of imports almost twice its annual exports. The currencies of several countries continued to strengthen against the dollar, giving them increased buying power. In the last two years, when Brazil’s real appreciated about 25 percent, it increased its potash and phosphate purchases significantly. |
| |
| |  |
27 POTASHCORP 2004 ANNUAL REPORT | MD&A •Factors That Shaped 2004 Business Conditions 2004 RESULTS |
| | | | | | | | | | | | | | | | | | | | | | | | | |
| | | Potash | | | Phosphate | | | Nitrogen | |
| | | 2004 | | | 2003 | | | 2004 | | | 2003 | | | 2004 | | | 2003 | |
| | | | | | | | | | | | | | | | | | | | | | | | | |
Total World |
Demand10 | | | 49.9 | | | | 45.4 | | | | 59.8 | | | | 56.6 | | | | 137.6 | | | | 133.8 | |
| (product tonnes |
| – millions) | | | | | | | | | | | | | | | | | | | | | | | | |
| |
PotashCorp |
Share of | | | 16% | | | | 16% | | | | 6% | | | | 6% | | | | 2% | | | | 2% | |
World |
Production11 | | | | | | | | | | | | | | | | | | | | | | | | |
| |
10-11, See Appendix Page 51
| 6 | High US Natural Gas Prices Affect Ammonia Production, Imports |
| |
| | Natural gas prices on NYMEX remained high throughout the year, with the closing monthly price averaging $6.14 per MMBtu, 75 cents higher than in 2003. In spite of the tight supply/demand situation in 2004, US ammonia producers operated at only 75 percent of capacity. Imports held on to the position they had gained in the US market in the last few years, with the bulk coming from Trinidad. |
| |
| 7 | Ammonia and Urea Prices Higher |
| |
| | Bolstered by increased global nitrogen consumption of 4.3 percent, the international ammonia price was substantially stronger in 2004. Urea also benefited from tight supply/demand fundamentals, which included production disruptions. Average prices were up, and peaked at their highest level since 1996, underpinned by high US natural gas costs. |
| |
| 8 | US DAP Exports Decline |
| |
| | World consumption of DAP grew by 8.6 percent in 2004 but the steady decline in US DAP exports continued, falling by 0.5 million tonnes. Increased demand from Latin America, Africa and Turkey did not offset lower imports by China and India, where production was increased by 1.3 million and 0.8 million tonnes, respectively, resulting in lower world DAP trade. |
| |
| |  |
| 9 | Record Demand for Potash |
| |
| | Potash demand grew 9.9 percent in 2004, absorbing world production and depleting inventories. Global sales totalled 49.9 million tonnes, a new record. Asia and Latin America were in the forefront of demand, with China importing a record 7.2 million tonnes and Brazil 6.4 million tonnes. India, Indonesia, Malaysia, Vietnam and Thailand all had record imports, and Canpotex set a new sales record of almost 8 million tonnes. |
| |
| |  |
| |
| 10 | Potash Production Jumps, Prices Follow |
| |
| | In response to this unprecedented demand, world potash production also jumped by over 9 percent, with all producers except PotashCorp operating at or near capacity. Nonetheless, sales exceeded production for the second straight year. Prices January 1, 2004 to January 1, 2005 rose 40 to 60 percent in major offshore markets and by approximately 40 percent in the North American market, where further increases announced for 2005 should bring the total increase to over 60 percent. |
| |
| |  |
28
POTASHCORP 2004 ANNUAL REPORT | MD&A•2004 Financial Overview
2004 RESULTS
2004 Financial Overview
This section provides an overview of our financial performance based on our consolidated financial statements on Pages 58 to 86. All references to per-share amounts pertain to diluted net income or loss per share (EPS). All share and per-share data have been retroactively adjusted to reflect our two-for-one stock split effected by way of stock dividend in 2004. Certain of the prior years’ figures have been reclassified to conform with the current year’s presentation.
| | | | | | | | | | | | | | | | | | | | | |
| | | | Dollars (millions) | | | | % Increase (Decrease) | |
| | | 2004 | | | 2003 | | | 2002 | | | 2004 | | | 2003 | |
| Sales | | $ | 3,244.4 | | | $ | 2,799.0 | | | $ | 2,224.4 | | | | 16 | | | | 26 | |
| |
| Gross Margin | | $ | 681.4 | | | $ | 380.4 | | | $ | 307.3 | | | | 79 | | | | 24 | |
| |
| Operating Income (Loss) | | $ | 514.3 | | | $ | (55.6 | ) | | $ | 166.9 | | | | n/m | | | | (133 | ) |
| |
| Net Income (Loss) | | $ | 298.6 | | | $ | (126.3 | ) | | $ | 53.6 | | | | n/m | | | | (336 | ) |
| |
| Net Income (Loss) Per Share – Diluted | | $ | 2.70 | | | $ | (1.21 | ) | | $ | 0.51 | | | | n/m | | | | (337 | ) |
| |
| | | | | | | | | | | | | | | | | | | n/m = not meaningful
| |
2004 Earnings Compared to Guidance
The company’s initial estimate for 2004 EPS was approximately $1.55 per share. The final result was $2.70 per share. The primary causes of this variance from guidance were:
| | | | | |
| | | Effect | |
| Cause | | on EPS | |
| |
| |
| Potash offshore realized prices higher | | | 0.49 | |
|
| Potash domestic realized prices increased | | | 0.26 | |
|
| Potash sales volumes higher | | | 0.22 | |
|
Decreased potash costs partially offset
by lower nitrate margin | | | 0.03 | |
|
| Higher provincial mining taxes | | | (0.27 | ) |
| |
Subtotal potash | | | 0.73 | |
| | | | | |
| Phosphate realized prices higher | | | 0.24 | |
|
| Increased input costs for ammonia and sulfur | | | (0.10 | ) |
|
| Start-up problems with DFP expansion at Aurora | | | (0.05 | ) |
| |
Subtotal phosphate | | | 0.09 | |
| | | | | |
| Increased nitrogen realized prices (exclusive of purchased product) | | | 0.69 | |
|
| Cost of natural gas higher | | | (0.38 | ) |
|
| Nitrogen costs higher (exclusive of cost of natural gas) combined with lower manufactured volumes | | | (0.29 | ) |
|
| Gain on natural gas hedges and purchased product margin | | | 0.10 | |
| |
Subtotal nitrogen | | | 0.12 | |
| | | | | |
| Foreign exchange variance | | | (0.05 | ) |
|
| Increase in selling and administrative | | | (0.13 | ) |
|
| Increase in other income (excluding gain on sale of SQM shares) and decrease in interest expense | | | 0.11 | |
| |
| |
Subtotal of the above | | | 0.87 | |
| | | | | |
| Provision for PCS Yumbes | | | (0.03 | ) |
|
| Gain from the sale of SQM shares | | | 0.31 | |
| |
Total variance from EPS guidance | | | 1.15 | |
| |
| | | | | |
2004 Earnings Compared to 2003
The company’s EPS for 2003 was a loss of $1.21 per share. The final EPS for 2004 was $2.70 per share. The primary causes of this increase from last year’s actuals were:
| | | | | |
| | | Effect | |
| Cause | | on EPS | |
| |
| |
| Potash offshore realized prices higher | | | 0.85 | |
|
| Potash domestic realized prices increased | | | 0.62 | |
|
| Potash sales volumes higher | | | 0.25 | |
|
| Increased potash costs due to foreign exchange and other, partially offset by higher nitrate margin | | | (0.33 | ) |
|
| Higher provincial mining taxes | | | (0.24 | ) |
| |
Subtotal potash | | | 1.15 | |
| | | | | |
| Phosphate realized prices higher | | | 0.65 | |
|
| Increased input costs for ammonia and sulfur | | | (0.25 | ) |
|
| Phosphate sales volumes higher | | | (0.21 | ) |
| |
Subtotal phosphate | | | 0.19 | |
| | | | | |
| Increased nitrogen realized prices (exclusive of purchased product) | | | 1.25 | |
|
| Cost of natural gas higher | | | (0.62 | ) |
|
| Nitrogen costs higher (exclusive of cost of natural gas) | | | (0.08 | ) |
|
| Nitrogen volumes lower (exclusive of purchased product) | | | 0.09 | |
|
| Smaller gain on natural gas hedges and purchased product margin | | | (0.27 | ) |
| |
Subtotal nitrogen | | | 0.37 | |
| | | | | |
| Foreign exchange variance | | | 0.18 | |
|
| Increase in selling and administrative | | | (0.24 | ) |
|
| Increase in other income (excluding gain on sale of SQM shares) and decrease in interest expense | | | 0.10 | |
| |
| |
Subtotal of the above | | | 1.75 | |
| | | | | |
| Future income tax reversal from 2003 | | | (0.06 | ) |
|
| Provision for PCS Yumbes and plant shutdowns | | | 1.91 | |
|
| Gain from the sale of SQM shares | | | 0.31 | |
| |
Total variance from 2003 EPS | | | 3.91 | |
| |
| | | | | |
29
POTASHCORP 2004 ANNUAL REPORT | MD&A• Business Segment Review/ Potash Results
2004 RESULTS
Business Segment Review
Management includes net sales in segment disclosures in the consolidated financial statements pursuant to Canadian GAAP, which requires segmentation based upon our internal organization and reporting of revenue and profit measures derived from internal accounting methods. Net sales (and the related per-tonne amounts) are primary revenue measures we use and review in making decisions about operating matters on a business segment basis. These decisions include assessments about potash, phosphate and nitrogen performance and the resources to be allocated to these segments. We also use net sales (and the related per-tonne amounts) for business planning and monthly forecasting. Net sales are calculated as sales revenues less freight, transportation and distribution expenses. The following is based on these segment measures as used and reviewed by management.
Potash Results
| | | | | | | | | | | | | | | | | | | | | | | | | | | | | | | | | | | | | | | | | | | | | | | | | | | | | | | | | | | | | | | | | | |
| | | | | | | | | | | | | | | | | % Increase | | | | | | | | | | | | | | | | | | % Increase | | | | | | | | | | | | | | | | | | % Increase | |
| | | | Dollars (millions) | | | | | (Decrease) | | | | | Tonnes (thousands) | | | | | (Decrease) | | | | | Average Price per Tonne | | | | | (Decrease) | |
| | | 2004 | | | | 2003 | | | | 2002 | | | | | 2004 | | | | 2003 | | | | | 2004 | | | | 2003 | | | | 2002 | | | | | 2004 | | | | 2003 | | | | | 2004 | | | | 2003 | | | | 2002 | | | | | 2004 | | | | 2003 | |
| Sales | | $ | 1,056.1 | | | $ | 758.7 | | | $ | 669.0 | | | | | 39 | | | | 13 | | | | | | | | | | | | | | | | | | | | | | | | | | | | | | | | | | | | | | | | | | | | | |
| | | | | | | | | | | | | | | | |
| Freight | | | 128.7 | | | | 109.9 | | | | 99.9 | | | | | 17 | | | | 10 | | | | | | | | | | | | | | | | | | | | | | | | | | | | | | | | | | | | | | | | | | | | | |
| | | | | | | | | | | | | | | | |
| Transportation and distribution | | | 32.6 | | | | 29.7 | | | | 24.6 | | | | | 10 | | | | 21 | | | | | | | | | | | | | | | | | | | | | | | | | | | | | | | | | | | | | | | | | | | | | |
| | | | | | | | | | | | | | | | |
| | | $ | 894.8 | | | $ | 619.1 | | | $ | 544.5 | | | | | 45 | | | | 14 | | | | | | | | | | | | | | | | | | | | | | | | | | | | | | | | | | | | | | | | | | | | | |
| | | | | | | | | | | | | | | | |
| Net sales | | | | | | | | | | | | | | | | | | | | | | | | | | | | | | | | | | | | | | | | | | | | | | | | | | | | | | | | | | | | | | | | | |
| | | | | | | | | | | | | | | | |
| North American | | $ | 347.5 | | | $ | 230.6 | | | $ | 215.3 | | | | | 51 | | | | 7 | | | | | 3,246 | | | | 2,870 | | | | 2,780 | | | | | 13 | | | | 3 | | | | $ | 107.06 | | | $ | 80.33 | | | $ | 77.45 | | | | | 33 | | | | 4 | |
| Offshore | | | 504.6 | | | | 336.2 | | | | 300.7 | | | | | 50 | | | | 12 | | | | | 5,030 | | | | 4,213 | | | | 3,547 | | | | | 19 | | | | 19 | | | | $ | 100.33 | | | $ | 79.80 | | | $ | 84.76 | | | | | 26 | | | | (6 | ) |
| | | | | | | | | | | | | | | | |
| | | | 852.1 | | | | 566.8 | | | | 516.0 | | | | | 50 | | | | 10 | | | | | 8,276 | | | | 7,083 | | | | 6,327 | | | | | 17 | | | | 12 | | | | $ | 102.97 | | | $ | 80.01 | | | $ | 81.55 | | | | | 29 | | | | (2 | ) |
| | | | | | | | | | | | | | | | |
| Miscellaneous | | | 42.7 | | | | 52.3 | | | | 28.5 | | | | | (18 | ) | | | 84 | | | | | – | | | | – | | | | – | | | | | – | | | | – | | | | | – | | | | – | | | | – | | | | | – | | | | – | |
| | | | | | | | | | | | | | | | |
| | | | 894.8 | | | | 619.1 | | | | 544.5 | | | | | 45 | | | | 14 | | | | | 8,276 | | | | 7,083 | | | | 6,327 | | | | | 17 | | | | 12 | | | | $ | 108.12 | | | $ | 87.41 | | | $ | 86.06 | | | | | 24 | | | | 2 | |
| | | | | | | | | | | | | | | | |
| Cost of goods sold | | | 472.0 | | | | 415.4 | | | | 326.5 | | | | | 14 | | | | 27 | | | | | | | | | | | | | | | | | | | | | | | | | | $ | 57.03 | | | $ | 58.65 | | | $ | 51.60 | | | | | (3 | ) | | | 14 | |
| | | | | | | | | | | | | | | | |
| Gross Margin | | $ | 422.8 | | | $ | 203.7 | | | $ | 218.0 | | | | | 108 | | | | (7 | ) | | | | | | | | | | | | | | | | | | | | | | | | | $ | 51.09 | | | $ | 28.76 | | | $ | 34.46 | | | | | 78 | | | | (17 | ) |
| | | | | | | | | | | | | | | | |
| Note 18 to the consolidated financial statements provides information pertaining to our business segments. |
2004 VS 2003
Total potash sales increased by $297.4 million from 2003 and net sales by $275.7 million, driven by higher average realized prices and record volumes. This led potash to provide $422.8 million (62 percent) of our total gross margin for the year and increase its gross margin percentage from 33 percent of net sales in 2003 to 47 percent.
Canpotex sold a record 7.8 million tonnes for the year and our Saskatchewan-sourced offshore volumes rose 28 percent, favorably impacting net sales by $72.6 million. Brazil remained our largest customer with 23 percent of volumes. China was second with 20 percent. Indonesia, Oceania, China, India, Malaysia and Korea all had double-digit growth, leading to a 19-percent rise in offshore volumes.
Offshore prices climbed 26 percent despite a 46-percent rise in Canpotex’s ocean freight costs. As new contracts were negotiated with many customers, tight market conditions enabled us to more than cover the increases in ocean freight rates. Year over year, our gains in offshore prices on Saskatchewan-sourced tonnes favorably impacted net sales by $88.6 million, despite China being supplied with potash under a contract negotiated last year at old prices. Average price increases realized on the sale of our New Brunswick product contributed $29.3 million to the increase in offshore net sales.
In the North American market, our average realized prices climbed 33 percent. Over the course of 2004, we announced increases that amounted to $66 per tonne, with the most recent of these to be implemented by the end of the second quarter of 2005. North American volumes rose overall by 13 percent. With competitors operating near capacity, we were able to increase market share as the year progressed.
30
POTASHCORP 2004 ANNUAL REPORT | MD&A•Potash Results/ Phosphate Results
2004 RESULTS
POTASH PRODUCTION(million tonnes KCl)
| | | | | | | | | | | | | | | | | | | | | |
| | | | | | | | | | | Production | | | | | | Mine Site |
| | | Capacity | | 2004 | | 2003 | | 2002 | | | Employees |
| | | | | | | | | | | | (active) |
| Lanigan SK | | | 3.828 | | | | 2.025 | | | | 1.488 | | | | 1.424 | | | | 364 | |
| |
Rocanville SK1 | | | 2.695 | | | | 1.833 | | | | 1.989 | | | | 1.700 | | | | 328 | |
| |
| Allan SK | | | 1.885 | | | | 1.344 | | | | .934 | | | | .864 | | | | 285 | |
| |
| Cory SK | | | 1.361 | | | | .738 | | | | .730 | | | | .677 | | | | 196 | |
| |
| Patience Lake SK | | | 1.033 | | | | .239 | | | | .251 | | | | .230 | | | | 67 | |
| |
Esterhazy SK2 | | | .953 | | | | .953 | | | | .953 | | | | .953 | | | | 0 | |
| |
| New Brunswick NB | | | .785 | | | | .782 | | | | .749 | | | | .599 | | | | 330 | |
| |
TOTAL1 | | | 12.540 | | | | 7.914 | | | | 7.094 | | | | 6.447 | | | | 1,570 | |
| |
| 1 | A 400,000-tonne expansion at Rocanville came on stream in first-quarter 2005, raising total capacity from 12.140 million tonnes to 12.540 million tonnes. |
| 2 | PotashCorp’s mineral rights at Esterhazy are mined by Mosaic Potash Esterhazy Limited Partnership under a long-term agreement. For calendar year 2005, our production allocation is 0.953 million tonnes. |
PotashCorp continued to increase production to meet growing demand, adding shifts at Lanigan and Allan in 2004 and producing a record 7.9 million tonnes. The growth in volumes allowed us to lower our Canadian dollar cost of goods sold per tonne by 5 percent, and capitalize on economies of scale. This was partially offset by a stronger Canadian dollar, resulting in our cost of goods sold decreasing by $1.62 per tonne from 2003.
2003 VS 2002
Sales volumes from our potash segment rose 12 percent in 2003, led by offshore sales that were 19 percent above 2002. Brazil bought 36 percent more from us than in 2002, making it our largest customer for the second straight year and a key market. Sales to India, Indonesia, Vietnam and Malaysia were up significantly; China sales were flat.
Lower realized offshore prices reflected the year-long escalation in freight rates. A tight supply/demand balance in North America raised sales volumes by 3 percent and prices by 4 percent.
Higher volumes and increased North American prices did not offset higher unit cost of sales, which was pushed up by the stronger Canadian dollar. Otherwise, unit cost of sales would have been lower than in 2002, even with higher natural gas costs, because volumes were up significantly.
The gross margin dropped from 2002 in our potash segment despite record sales, due to escalating offshore freight rates and higher unit cost of sales. The increase in costs was due primarily to the strengthening Canadian dollar, which raised costs by approximately $4.50 per tonne over 2002. These increased costs were partially offset by higher operating rates.
Phosphate Results
| | | | | | | | | | | | | | | | | | | | | | | | | | | | | | | | | | | | | | | | | | | | | | | | | | | | | | | | | | | | | | | | | | |
| | | | | | | | | | | | | | | | % Increase | | | | | | | | | | | | | | | | | % Increase | | | | | | | | | | | | | | | | | % Increase | |
| | | Dollars (millions) | | | | (Decrease) | | | | Tonnes (thousands) | | | | (Decrease) | | | | Average Price per Tonne | | | | (Decrease) | |
| | | 2004 | | | | 2003 | | | | 2002 | | | | | 2004 | | | | 2003 | | | | | 2004 | | | | 2003 | | | | 2002 | | | | | 2004 | | | | 2003 | | | | | 2004 | | | | 2003 | | | | 2002 | | | | | 2004 | | | | 2003 | |
| Sales | | $ | 977.9 | | | $ | 883.9 | | | $ | 714.0 | | | | | 11 | | | | 24 | | | | | | | | | | | | | | | | | | | | | | | | | | | | | | | | | | | | | | | | | | | | | |
| | | | | | | | | | | | | | | | |
| Freight | | | 71.9 | | | | 75.8 | | | | 58.8 | | | | | (5 | ) | | | 29 | | | | | | | | | | | | | | | | | | | | | | | | | | | | | | | | | | | | | | | | | | | | | |
| | | | | | | | | | | | | | | | |
| Transportation and distribution | | | 29.4 | | | | 26.2 | | | | 18.4 | | | | | 12 | | | | 42 | | | | | | | | | | | | | | | | | | | | | | | | | | | | | | | | | | | | | | | | | | | | | |
| | | | | | | | | | | | | | | | |
| | | $ | 876.6 | | | $ | 781.9 | | | $ | 636.8 | | | | | 12 | | | | 23 | | | | | | | | | | | | | | | | | | | | | | | | | | | | | | | | | | | | | | | | | | | | | |
| | | | | | | | | | | | | | | | |
| Net sales | | | | | | | | | | | | | | | | | | | | | | | | | | | | | | | | | | | | | | | | | | | | | | | | | | | | | | | | | | | | | | | | | |
| | | | | | | | | | | | | | | | |
| Fertilizer – liquids | | $ | 147.3 | | | $ | 167.7 | | | $ | 144.9 | | | | | (12 | ) | | | 16 | | | | | 704 | | | | 751 | | | | 675 | | | | | (6 | ) | | | 11 | | | | $ | 209.17 | | | $ | 223.17 | | | $ | 214.55 | | | | | (6 | ) | | | 4 | |
| | | | | | | | | | | | | | | | |
| Fertilizer – solids | | | 324.7 | | | | 249.2 | | | | 113.4 | | | | | 30 | | | | 120 | | | | | 1,590 | | | | 1,494 | | | | 745 | | | | | 6 | | | | 101 | | | | $ | 204.16 | | | $ | 166.78 | | | $ | 152.26 | | | | | 22 | | | | 10 | |
| | | | | | | | | | | | | | | | |
| Feed | | | 190.6 | | | | 182.6 | | | | 216.8 | | | | | 4 | | | | (16 | ) | | | | 888 | | | | 861 | | | | 961 | | | | | 3 | | | | (10 | ) | | | $ | 214.78 | | | $ | 212.25 | | | $ | 225.55 | | | | | 1 | | | | (6 | ) |
| | | | | | | | | | | | | | | | |
| Industrial | | | 204.1 | | | | 174.5 | | | | 155.1 | | | | | 17 | | | | 13 | | | | | 611 | | | | 541 | | | | 482 | | | | | 13 | | | | 12 | | | | $ | 334.09 | | | $ | 322.72 | | | $ | 321.93 | | | | | 4 | | | | – | |
| | | | | | | | | | | | | | | | |
| | | | 866.7 | | | | 774.0 | | | | 630.2 | | | | | 12 | | | | 23 | | | | | 3,793 | | | | 3,647 | | | | 2,863 | | | | | 4 | | | | 27 | | | | $ | 228.50 | | | $ | 212.23 | | | $ | 220.12 | | | | | 8 | | | | (4 | ) |
| | | | | | | | | | | | | | | | |
| Miscellaneous | | | 9.9 | | | | 7.9 | | | | 6.6 | | | | | 25 | | | | 20 | | | | | – | | | | – | | | | – | | | | | – | | | | – | | | | | – | | | | – | | | | – | | | | | – | | | | – | |
| | | | | | | | | | | | | | | | |
| | | $ | 876.6 | | | $ | 781.9 | | | $ | 636.8 | | | | | 12 | | | | 23 | | | | | 3,793 | | | | 3,647 | | | | 2,863 | | | | | 4 | | | | 27 | | | | $ | 231.11 | | | $ | 214.40 | | | $ | 222.43 | | | | | 8 | | | | (4 | ) |
| | | | | | | | | | | | | | | | |
| North American | | $ | 690.3 | | | $ | 654.8 | | | $ | 542.5 | | | | | 5 | | | | 21 | | | | | 2,797 | | | | 2,886 | | | | 2,310 | | | | | (3 | ) | | | 25 | | | | $ | 246.84 | | | $ | 226.91 | | | $ | 234.88 | | | | | 9 | | | | (3 | ) |
| | | | | | | | | | | | | | | | |
| Offshore | | | 186.3 | | | | 127.1 | | | | 94.3 | | | | | 47 | | | | 35 | | | | | 996 | | | | 761 | | | | 553 | | | | | 31 | | | | 38 | | | | $ | 186.99 | | | $ | 167.04 | | | $ | 170.37 | | | | | 12 | | | | (2 | ) |
| | | | | | | | | | | | | | | | |
| | | | 876.6 | | | | 781.9 | | | | 636.8 | | | | | 12 | | | | 23 | | | | | 3,793 | | | | 3,647 | | | | 2,863 | | | | | 4 | | | | 27 | | | | $ | 231.11 | | | $ | 214.40 | | | $ | 222.43 | | | | | 8 | | | | (4 | ) |
| | | | | | | | | | | | | | | | |
| Cost of goods sold | | | 860.8 | | | | 798.4 | | | | 594.9 | | | | | 8 | | | | 34 | | | | | | | | | | | | | | | | | | | | | | | | | | $ | 226.94 | | | $ | 218.92 | | | $ | 207.79 | | | | | 4 | | | | 5 | |
| | | | | | | | | | | | | | | | |
| Gross Margin | | $ | 15.8 | | | $ | (16.5 | ) | | $ | 41.9 | | | | | n/m | | | | (139 | ) | | | | | | | | | | | | | | | | | | | | | | | | | $ | 4.17 | | | $ | (4.52 | ) | | $ | 14.64 | | | | | n/m | | | | (131 | ) |
| | | | | | | | | | | | | | | | |
| Note 18 to the consolidated financial statements provides information pertaining to our business segments. | | | | | | | | | | | n/m = not meaningful
|
31
POTASHCORP 2004 ANNUAL REPORT | MD&A•Phosphate Results
2004 RESULTS
2004 VS 2003
Our total phosphate gross margin improved to $15.8 million in 2004 from a loss of $16.5 million in 2003. Total phosphate sales increased by $94.0 million and net sales by $94.7 million, with freight, transportation and distribution costs remaining flat, in aggregate, compared to 2003.
Solid fertilizer net sales increased by $75.5 million over 2003, driven by 16 percent higher offshore volumes. Volumes were lower in 2003 as they were impacted by the shutdown of DAP capacity at the White Springs Suwannee River plant. Prices for DAP and MAP were higher due to hurricanes during the third quarter that decreased North American inventory and tightened supply. The higher prices had a positive impact on net sales of $55.0 million.
Net sales of liquid fertilizers declined by $20.4 million from last year. Sales volumes dropped 6 percent, largely due to a 23-percent decline in North American tonnages, as PotashCorp chose to sell less there when strong competition kept prices under pressure. The overall decline in sales volumes negatively impacted net sales by $23.6 million. Prices for liquid fertilizers were also below 2003 levels, primarily as a result of product mix.
Net sales of feed improved by $8.0 million as we benefited from higher DFP prices and extra volumes due to a plant closure by a competitor. Industrial net sales rose by $29.6 million compared with 2003. Volumes increased by 13 percent, favorably impacting net sales by $28.7 million. The volume increase was largely a result of lower imports from China, and more product being available from our purified acid plant expansion at Aurora.
While overall phosphate prices and volumes increased, product costs continued to be a challenge. Cost of goods sold increased by $8 per tonne. Average sulfur and ammonia input costs per tonne rose 4 percent and 31 percent, respectively, increasing cost of goods sold by a total of $29.4 million. In addition to these higher input costs, continuing start-up problems with our DFP plant at Aurora impacted cost of goods sold by approximately $9.0 million.
2003 VS 2002
Higher fertilizer prices and increased sales volumes of liquid and solid fertilizers and industrial products in 2003 were more than offset by rising input costs, resulting in negative gross margin in our phosphate segment.

ROCK AND ACID PRODUCTION
| | | | | | | | | | | | | | | | | | | | | | | | | | | | | | | | | | | | | |
| | | Phosphate Rock (million tonnes) | | | Phosphoric Acid (million tonnes P2O5) | |
| | | Annual | | | Production | | | Annual | | | Production | | | Employees |
| | | Capacity | | | 2004 | | | | 2003 | | | | 2002 | | | Capacity | | | 2004 | | | | 2003 | | | | 2002 | | | (active) |
| Aurora NC | | | 6.0 | | | | 3.964 | | | | 3.078 | | | | 3.444 | | | | 1.202 | | | | 1.018 | | | | .919 | | | | .852 | | | | 1,015 | |
| |
| White Springs FL | | | 3.6 | | | | 2.745 | | | | 2.686 | | | | 1.547 | | | | 1.093 | | | | .773 | | | | .777 | | | | .480 | | | | 898 | |
| |
| Geismar LA | | | – | | | | – | | | | – | | | | – | | | | .202 | | | | .171 | | | | .165 | | | | .180 | | | | 77 | |
| |
| TOTAL | | | 9.6 | | | | 6.709 | | | | 5.764 | | | | 4.991 | | | | 2.497 | | | | 1.962 | | | | 1.861 | | | | 1.512 | | | | 1,990 | |
| |
PHOSPHATE PRODUCTION(million tonnes product)
| | | | | | | | | | | | | | | | | | | | | | | | | | | | | | | | | | | | | | | | | | | | | | | | | | | | | | | | | | | | | |
| | | Aurora | | | White Springs | | | Geismar | |
| | | Annual | | | | | | | Production | | | Annual | | | | | | Production | | | Annual | | | | | | Production | |
| | | Capacity | | | | | | | 2004 | | | | 2003 | | | | 2002 | | | Capacity | | | | | | | 2004 | | | | 2003 | | | | 2002 | | | Capacity | | | | | | | 2004 | | | | 2003 | | | | 2002 | |
Liquids: MGA1 | | | 1.835 | | | | | | | | 1.687 | | | | 1.522 | | | | 1.336 | | | | 1.908 | | | | | | | | 1.004 | | | | .966 | | | | .828 | | | | .337 | | | | | | | | .282 | | | | .272 | | | | .324 | |
| |
| SPA | | | .676 | | | | | | | | .224 | | | | .285 | | | | .200 | | | | 1.138 | | | | | | | | .569 | | | | .748 | | | | .639 | | | | .196 | | | | | | | | .086 | | | | .091 | | | | .117 | |
| |
| Solids (total) | | | 1.247 | | | DAP | | | .472 | | | | .377 | | | | .495 | | | | .710 | | | DAP | | | .575 | | | | .625 | | | | .028 | | | | | | | DAP | | | – | | | | – | | | | – | |
| |
| | | | | | | MAP | | | .525 | | | | .469 | | | | .255 | | | | | | | MAP | | | .091 | | | | – | | | | – | | | | | | | MAP | | | – | | | | – | | | | – | |
| |
| 1 | A substantial portion is consumed internally in the production of downstream products. The balance is exported to phosphate fertilizer producers and sold domestically to dealers who custom-mix liquid fertilizer. |
32
POTASHCORP 2004 ANNUAL REPORT | MD&A•Phosphate Results/ Nitrogen Results
2004 RESULTS
| | | | | | | | | | | | | | | | | |
| PURIFIED ACID PRODUCTION(million tonnes P2O5) |
| | | Annual | | Production |
| | | Capacity | | 2004 | | 2003 | | 2002 |
| Aurora NC | | | .251 | | | | .246 | | | | .204 | | | | .165 | |
Purified acid is a feedstock for production of downstream industrial products such as metal brighteners, cola drinks and pharmaceuticals.
PHOSPHATE FEED PRODUCTION(million tonnes)
| | | | | | | | | | | | | | | | | | | | | |
| | | Annual | | | | | | Production | | | | | | Employees |
| | | Capacity | | 2004 | | 2003 | | 2002 | | (active) |
| Marseilles IL | | | .278 | | | | .138 | | | | .151 | | | | .177 | | | | 33 | |
| |
| White Springs FL (monocal) | | | .272 | | | | .126 | | | | .060 | | | | .137 | | | | 26 | |
| |
| Weeping Water NE | | | .209 | | | | .122 | | | | .147 | | | | .166 | | | | 43 | |
| |
Joplin MO1 | | | .163 | | | | .087 | | | | .088 | | | | .104 | | | | 33 | |
| |
| Aurora NC (DFP) | | | .159 | | | | .079 | | | | .050 | | | | .004 | | | | 30 | |
| |
Kinston NC2 | | | – | | | | – | | | | .008 | | | | .054 | | | | 0 | |
| |
| White Springs FL (DFP) | | | .100 | | | | .086 | | | | .059 | | | | .096 | | | | 34 | |
| |
| Fosfatos do Brasil | | | .110 | | | | .075 | | | | .051 | | | | .047 | | | | 79 | |
| |
| TOTAL | | | 1.291 | | | | .713 | | | | .614 | | | | .785 | | | | 278 | |
| |
| 1 | Purchased March 1, 2002. |
| 2 | Ceased production February 19, 2003. |
Solid fertilizer sales volumes more than doubled in 2003 with the restart of White Springs’ DAP capacity, and sales were up significantly in both North American and offshore markets. Sales of liquid fertilizers rose by 11 percent, with more than 90 percent of our sales in the US where PotashCorp is the largest supplier. Feed margins were under pressure as overall demand was down, and competitive pressures from new capacity domestically and in Asia and Latin America affected sales in both markets. Industrial volumes increased with completion of the expansion of the purified acid plant at Aurora in the first quarter.
Higher fertilizer prices reflect a somewhat improving market demand and tighter supply. US ending inventories of both DAP and MAP were well below the five-year average. Feed prices were kept down by new
competitive capacity, and flat prices for industrial products reflect competitive pressure of imports from China, Israel and Africa.
Phosphate production costs were positively affected by 11 percent lower rock costs, but this was more than offset by rising prices for the key inputs of sulfur and ammonia, up 54 percent and 47 percent, respectively, for a total of $73 million. DAP start-up costs at White Springs also increased total costs by $7 million. Start-up issues at the new DFP plant in Aurora increased costs by $15 million in 2003. Inventories for our finished feed products were significantly reduced over the year as feed operating rates were reduced to draw down this inventory. This raised unit costs of production as proportionately higher fixed costs were spread over fewer tonnes, further impacting feed margins.
Nitrogen Results
2004 VS 2003
Nitrogen sales increased by $54.0 million and net sales by $65.2 million as compared to 2003. Tight supply/demand contributed to higher average realized prices, and all products had double-digit percentage price increases in 2004.
Nitrogen gross margin grew by $49.6 million. Our operation in Trinidad provided 60 percent of our total nitrogen gross margin while our US operations contributed 22 percent. The remainder was achieved from our US gas hedging program.
Overall sales volumes were down 12 percent due to the production shutdowns at Memphis and Geismar. Nitrogen solutions sales volumes were down 54 percent and US urea volumes were down 28 percent, negatively impacting net sales by $46.0 million and $45.1 million, respectively. These volume reductions were partially offset by a rise in average realized prices that increased net sales of these products by
a total of $33.8 million. Despite a 6-percent increase from our Trinidad operations, total manufactured ammonia sales volumes were flat, due in part to the shutdown of ammonia production at Geismar. Urea volumes at our Trinidad plant were down 12 percent as a result of a turnaround and other tonnage outages, leading to a reduction in net sales of $13.3 million.
The high natural gas price environment supported an 18-percent increase in US ammonia prices, resulting in $17.3 million additional net sales. At our Trinidad facility, average ammonia and urea prices climbed 28 percent and 18 percent, respectively, favorably impacting net sales by $85.8 million. Higher average realized prices for nitric acid and ammonium nitrate were the primary reason for the $23.1 million increase in net sales compared to 2003.
Our average unit cost of natural gas, including our hedge, was $3.71 per MMBtu in 2004, compared to $2.96 per MMBtu in 2003. Since
33
POTASHCORP 2004 ANNUAL REPORT | MD&A •Nitrogen Results
2004 RESULTS
NITROGEN RESULTS
| | | | | | | | | | | | | | | | | | | | | | | | | | | | | | | | | | | | | | | | | | | | | | | | | | | | | | | | | | | | | | | | | | |
| | | | | | | | | | | | | | | | % Increase | | | | | | | | | | | | | | | | % Increase | | | | | | | | | | | | | | | | | % Increase | |
| | | Dollars (millions) | | | | (Decrease) | | | | Tonnes (thousands) | | | (Decrease) | | | Average Price per Tonne | | | | (Decrease) | |
| | | 2004 | | | 2003 | | | 2002 | | | | 2004 | | | 2003 | | | | 2004 | | | 2003 | | | 2002 | | | 2004 | | | | 2003 | | | 2004 | | | | 2003 | | | 2002 | | | | 2004 | | | 2003 | |
| Sales | | $ | 1,210.4 | | | $ | 1,156.4 | | | $ | 841.4 | | | | | 5 | | | | 37 | | | | | | | | | | | | | | | | | | | | | | | | | | | | | | | | | | | | | | | | | | | | | |
| | | | | | | | | | | | | | | | |
| Freight | | | 38.1 | | | | 48.8 | | | | 56.5 | | | | | (22 | ) | | | (14 | ) | | | | | | | | | | | | | | | | | | | | | | | | | | | | | | | | | | | | | | | | | | | | |
| | | | | | | | | | | | | | | | |
| Transportation and distribution | | | 42.3 | | | | 42.8 | | | | 37.5 | | | | | (1 | ) | | | 14 | | | | | | | | | | | | | | | | | | | | | | | | | | | | | | | | | | | | | | | | | | | | | |
| | | | | | | | | | | | | | | | |
| | | $ | 1,130.0 | | | $ | 1,064.8 | | | $ | 747.4 | | | | | 6 | | | | 42 | | | | | | | | | | | | | | | | | | | | | | | | | | | | | | | | | | | | | | | | | | | | | |
| | | | | | | | | | | | | | | | |
| Net sales | | | | | | | | | | | | | | | | | | | | | | | | | | | | | | | | | | | | | | | | | | | | | | | | | | | | | | | | | | | | | | | | | |
| | | | | | | | | | | | | | | | |
| Ammonia | | $ | 458.0 | | | $ | 368.0 | | | $ | 232.7 | | | | | 24 | | | | 58 | | | | | 1,776 | | | | 1,755 | | | | 1,867 | | | | 1 | | | | | (6 | ) | | $ | 257.85 | | | | $ | 209.63 | | | $ | 124.66 | | | | | 23 | | | | 68 | |
| | | | | | | | | | | | | | | | |
| Urea | | | 259.1 | | | | 276.9 | | | | 212.0 | | | | | (6 | ) | | | 31 | | | | | 1,165 | | | | 1,470 | | | | 1,592 | | | | (21 | ) | | | | (8 | ) | | $ | 222.44 | | | | $ | 188.33 | | | $ | 133.16 | | | | | 18 | | | | 41 | |
| | | | | | | | | | | | | | | | |
| Nitrogen solutions | | | 51.1 | | | | 85.8 | | | | 93.3 | | | | | (40 | ) | | | (8 | ) | | | | 337 | | | | 730 | | | | 1,097 | | | | (54 | ) | | | | (33 | ) | | $ | 151.83 | | | | $ | 117.52 | | | $ | 85.04 | | | | | 29 | | | | 38 | |
| | | | | | | | | | | | | | | | |
| Nitric acid and ammonium nitrate | | | 188.1 | | | | 165.0 | | | | 127.5 | | | | | 14 | | | | 29 | | | | | 1,460 | | | | 1,414 | | | | 1,361 | | | | 3 | | | | | 4 | | | $ | 128.82 | | | | $ | 116.70 | | | $ | 93.65 | | | | | 10 | | | | 25 | |
| | | | | | | | | | | | | | | | |
| Purchased | | | 151.5 | | | | 149.6 | | | | 61.1 | | | | | 1 | | | | 145 | | | | | 612 | | | | 711 | | | | 474 | | | | (14 | ) | | | | 50 | | | $ | 247.66 | | | | $ | 210.53 | | | $ | 128.89 | | | | | 18 | | | | 63 | |
| | | | | | | | | | | | | | | | |
| | | | 1,107.8 | | | | 1,045.3 | | | | 726.6 | | | | | 6 | | | | 44 | | | | | 5,350 | | | | 6,080 | | | | 6,391 | | | | (12 | ) | | | | (5 | ) | | $ | 207.07 | | | | $ | 171.92 | | | $ | 113.69 | | | | | 20 | | | | 51 | |
| | | | | | | | | | | | | | | | |
| Miscellaneous | | | 22.2 | | | | 19.5 | | | | 20.8 | | | | | 14 | | | | (6 | ) | | | | – | | | | – | | | | – | | | | – | | | | | – | | | | – | | | | | – | | | | – | | | | | – | | | | – | |
| | | | | | | | | | | | | | | | |
| | | $ | 1,130.0 | | | $ | 1,064.8 | | | $ | 747.4 | | | | | 6 | | | | 42 | | | | | 5,350 | | | | 6,080 | | | | 6,391 | | | | (12 | ) | | | | (5 | ) | | $ | 211.23 | | | | $ | 175.13 | | | $ | 116.95 | | | | | 21 | | | | 50 | |
| | | | | | | | | | | | | | | | |
| Fertilizer | | $ | 438.7 | | | $ | 480.0 | | | $ | 317.4 | | | | | (9 | ) | | | 51 | | | | | 2,063 | | | | 2,810 | | | | 2,976 | | | | (27 | ) | | | | (6 | ) | | $ | 212.73 | | | | $ | 170.82 | | | $ | 106.64 | | | | | 25 | | | | 60 | |
| | | | | | | | | | | | | | | | |
| Feed and industrial | | | 691.3 | | | | 584.8 | | | | 430.0 | | | | | 18 | | | | 36 | | | | | 3,287 | | | | 3,270 | | | | 3,415 | | | | 1 | | | | | (4 | ) | | $ | 210.28 | | | | $ | 178.83 | | | $ | 125.92 | | | | | 18 | | | | 42 | |
| | | | | | | | | | | | | | | | |
| | | | 1,130.0 | | | | 1,064.8 | | | | 747.4 | | | | | 6 | | | | 42 | | | | | 5,350 | | | | 6,080 | | | | 6,391 | | | | (12 | ) | | | | (5 | ) | | $ | 211.23 | | | | $ | 175.13 | | | $ | 116.95 | | | | | 21 | | | | 50 | |
| | | | | | | | | | | | | | | | |
| Cost of goods sold | | | 887.2 | | | | 871.6 | | | | 700.0 | | | | | 2 | | | | 25 | | | | | | | | | | | | | | | | | | | | | | | | | $ | 165.84 | | | | $ | 143.35 | | | $ | 109.53 | | | | | 16 | | | | 31 | |
| | | | | | | | | | | | | | | | |
| Gross Margin | | $ | 242.8 | | | $ | 193.2 | | | $ | 47.4 | | | | | 26 | | | | 308 | | | | | | | | | | | | | | | | | | | | | | | | | $ | 45.39 | | | | $ | 31.78 | | | $ | 7.42 | | | | | 43 | | | | 328 | |
| |
Note 18 to the consolidated financial statements provides information pertaining to our business segments.
natural gas represents the major component of our cost of goods sold in nitrogen, this increase was a key factor in the 16-percent rise in per-tonne costs. Within the US, our natural gas hedging activities contributed $43.0 million to gross margin in 2004, compared to $89.9 million in 2003.
2003 VS 2002
Nitrogen gross margin more than quadrupled in 2003, reflecting sharply increased prices that benefited PotashCorp’s Trinidad production, and liquidation of certain natural gas hedge contracts in February.
Poor margins at our US plants due to high natural gas costs led to the shutdown of the Memphis plant and of Geismar’s ammonia and nitrogen solutions production. The reduced production of ammonia, urea and nitrogen solutions was more than offset by considerably higher prices. Nitric acid and ammonium nitrate volumes increased to meet demand, as did purchased sales volumes. The company’s warehouse and distribution network was used effectively for these imports.
As more shutdowns in the US industry tightened supply, prices increased significantly. Product prices, which had previously reflected the cost premium on natural gas, began trading off the supply/demand fundamentals during the fourth quarter, providing unhedged margin to our US plants.
Nitrogen production costs reflected the higher natural gas prices. PotashCorp’s average gas costs in the US and
Trinidad were up 33 percent over 2002. However, since the Trinidad facility operates with favorable natural gas contracts which mitigate the impact of volatility, the company is a net beneficiary of high-priced US natural gas. Trinidad provided 52 percent of nitrogen gross margin. The remainder came from our 2003 natural gas hedges in the US, which provided a gross margin contribution of $89.9 million.
High ocean freight rates – detrimental for potash – worked in the company’s favor for nitrogen as they made imports from the Middle East less competitive in North America and helped tighten market supply.

34
POTASHCORP 2004 ANNUAL REPORT | MD&A •Nitrogen Results/Expenses and Other Income
2004 RESULTS
NITROGEN PRODUCTION (million tonnes)
| | | | | | | | | | | | | | | | | | | | | | | | | | | | | | | | | | | | | | | | | | | | | | | | | |
| | | Ammonia1 | | | Urea Solids | | | Nitrogen Solutions2 | |
| | | Annual | | Production | | | Annual | | Production | | | Annual | | Production | |
| | | Capacity | | 2004 | | 2003 | | 2002 | | Capacity | | 2004 | | 2003 | | 2002 | | Capacity | | 2004 | | 2003 | | 2002 |
| Trinidad | | | 1.851 | | | | 1.837 | | | | 1.759 | | | | 1.768 | | | | .631 | | | | .619 | | | | .647 | | | | .674 | | | | – | | | | – | | | | – | | | | – | |
| |
| Augusta GA | | | .688 | | | | .665 | | | | .655 | | | | .689 | | | | .381 | | | | .368 | | | | .334 | | | | .363 | | | | .581 | | | | .225 | | | | .223 | | | | .220 | |
| |
| Lima OH | | | .542 | | | | .460 | | | | .510 | | | | .496 | | | | .329 | | | | .238 | | | | .280 | | | | .208 | | | | .227 | | | | .104 | | | | .120 | | | | .124 | |
| |
Geismar LA4 | | | .483 | | | | – | | | | .116 | | | | .369 | | | | – | | | | – | | | | – | | | | – | | | | 1.028 | | | | – | | | | .250 | | | | .721 | |
| |
Memphis TN5 | | | .371 | | | | – | | | | .154 | | | | .324 | | | | .409 | | | | – | | | | .178 | | | | .374 | | | | – | | | | – | | | | – | | | | – | |
| |
| TOTAL | | | 3.935 | | | | 2.962 | | | | 3.194 | | | | 3.646 | | | | 1.750 | | | | 1.225 | | | | 1.439 | | | | 1.619 | | | | 1.836 | | | | .329 | | | | .593 | | | | 1.065 | |
| |
| | | | | | | | | | | | | | | | | | | | | | | | | | | | | | | | | | | | | |
| | | Nitric Acid1,3 | | | Ammonium Nitrate Solids | | | | |
| | | Annual | | Production | | | Annual | | Production | | | Employees |
| | | Capacity | | 2004 | | 2003 | | 2002 | | Capacity | | 2004 | | 2003 | | 2002 | | (active) |
| Trinidad | | | – | | | | – | | | | – | | | | – | | | | – | | | | – | | | | – | | | | – | | | | 395 | |
| |
| Augusta GA | | | .541 | | | | .544 | | | | .534 | | | | .539 | | | | .512 | | | | .544 | | | | .539 | | | | .512 | | | | 111 | |
| |
| Lima OH | | | .100 | | | | .103 | | | | .097 | | | | .098 | | | | – | | | | – | | | | – | | | | – | | | | 5 | 6 |
| |
Geismar LA4 | | | .844 | | | | .521 | | | | .589 | | | | .731 | | | | – | | | | – | | | | – | | | | – | | | | 51 | |
| |
Memphis TN5 | | | – | | | | – | | | | – | | | | – | | | | – | | | | – | | | | – | | | | – | | | | 1 | |
| |
| TOTAL | | | 1.485 | | | | 1.168 | | | | 1.220 | | | | 1.368 | | | | .512 | | | | .544 | | | | .539 | | | | .512 | | | | 563 | 7 |
| |
| 1 | A substantial portion is upgraded to value-added products. |
| 2 | Based on 32% N content. |
| 3 | As 100% HNO3 tonnes. |
| 4 | Indefinitely shut down production of ammonia and nitrogen solutions June 4, 2003. |
| 5 | Indefinitely shut down production June 4, 2003. |
| 6 | BP Chemicals operates the Lima facility under an operational agreement with PCS Nitrogen. |
| 7 | 360 contract employees work at the nitrogen plants, for a total active workforce of 923. |
Expenses and Other Income
| | | | | | | | | | | | | | | | | | | | | |
| | | Dollars (millions) | | | % Increase (Decrease) | |
| | | 2004 | | | 2003 | | | 2002 | | | 2004 | | | 2003 | |
| Selling and administrative | | $ | 130.6 | | | $ | 96.1 | | | $ | 91.7 | | | | 36 | | | | 5 | |
| |
| Provincial mining and other taxes | | | 92.6 | | | | 57.0 | | | | 68.0 | | | | 62 | | | | (16 | ) |
| |
| Provision for plant shutdowns | | | – | | | | 123.7 | | | | – | | | | (100 | ) | | | – | |
| |
| Provision for PCS Yumbes S.C.M. | | | 3.6 | | | | 140.5 | | | | – | | | | (97 | ) | | | – | |
| |
| Foreign exchange loss | | | 19.7 | | | | 51.9 | | | | 5.5 | | | | (62 | ) | | | 844 | |
| |
| Other income | | | 79.4 | | | | 33.2 | | | | 24.8 | | | | 139 | | | | 34 | |
| |
| Interest expense | | | 84.0 | | | | 91.3 | | | | 83.1 | | | | (8 | ) | | | 10 | |
| |
| Income tax expense (recovery) | | | 131.7 | | | | (20.6 | ) | | | 30.2 | | | | n/m | | | | (168 | ) |
| |
n/m = not meaningful
2004 VS 2003
Selling and administrative expenses increased by $34.5 million, primarily due to compensation programs tied to our share price performance and our cash flow return. Our share price nearly doubled over the course of the year, requiring higher accruals in respect of these programs. Additionally, $11.1 million in compensation related to stock options was expensed during 2004. This non-cash expense arose on the prospective adoption of a new provision of Canadian GAAP in December 2003. Only $1.0 million relating to stock option expense was recorded in 2003.
Provincial mining and other taxes increased by $35.6 million year over year as a direct result of significant increases in profits per tonne, sales volumes and prices in our Canadian potash operations.
The company experienced a net foreign exchange loss of $19.7 million in 2004 (2003 – $51.9 million loss). The decline in foreign exchange loss reflects the Canadian to US dollar exchange rate changes, year over year. The Canadian dollar closed the year $0.09 stronger than at December 31, 2003, which compares with an appreciation of $0.29 from December 31, 2002 to December 31, 2003. The net foreign exchange loss was also reduced in part by $8.0 million in gains realized from foreign currency forward contracts.
Other income rose by $46.2 million, chiefly as a result of: a $34.4-million gain on sale of approximately 9.8 million shares of SQM in December; increases in our share of earnings of equity investees; and growth in dividends from our portfolio investments.
35
POTASHCORP 2004 ANNUAL REPORT | MD&A •Expenses and Other Income
2004 RESULTS
Interest expense decreased by $7.3 million, due to lower total debt balances outstanding, interest rate hedging activities and a substantial build-up of cash and cash equivalents. Weighted average long-term debt outstanding in the year was $1,269.5 million (2003 – $1,230.9 million) with a weighted average interest rate of 6.9 percent (2003 – 7.0 percent). The weighted average interest rate on short-term debt outstanding in the year was 1.4 percent (2003 – 1.4 percent).
The company’s effective consolidated income tax rate in 2004 approximated 33 percent of income before income taxes when adjusted to reflect the non-taxable gain on the sale of SQM shares and the provision for PCS Yumbes. This compares with a rate of approximately 40 percent (exclusive of the provision for PCS Yumbes and a future income tax reversal of $6.5 million) for 2003. The decrease in rate is due primarily to the impact of Saskatchewan resource tax incentives, changes to the Canadian federal resource allowance and the scheduled Canadian federal statutory rate reduction. Income tax expense increased, driven by the rise in operating income levels. For the year, 80 percent of the effective rate pertained to current income taxes and 20 percent to future income taxes. The increase in the current tax provision from zero percent in 2003 was principally due to the substantial rise in potash operating income in Canada.
STATUS OF 2003 RESTRUCTURING ACTIVITIES
Nitrogen and Phosphate Plant Shutdowns
In 2003, we indefinitely shut down our Memphis, Tennessee plant and suspended production of ammonia and nitrogen solutions at Geismar, Louisiana due to high US natural gas costs and low product margins. The operations have not been restarted. We recorded $4.8 million in employee special termination costs, $101.6 million in long-lived asset impairment charges and $12.4 million in parts inventory writedowns. To date, we have made payments relating to the employee terminations totalling $4.4 million and expect to pay the remainder in 2005. We also expect to incur other shutdown-related costs of approximately $12.1 million, the timing of which is not yet determinable, and nominal annual expenditures for site security and other maintenance costs.
The phosphate feed plant at Kinston, North Carolina ceased operations in 2003. In that year, the company recorded $0.6 million for costs of special termination benefits, $0.3 million for parts inventory writedowns and $4.0 million for long-lived asset impairment charges. The Kinston property was sold in 2004 for nominal proceeds. No additional significant costs were incurred in connection with the nitrogen or phosphate plant shutdowns in 2004.
Provision for PCS Yumbes S.C.M.
In December 2004, we concluded the sale of 100 percent of our shares of PCS Yumbes to SQM. The total gain on the sale was $3.5 million, of which $2.6 million was recognized in 2004. During the year, we also recorded an additional writedown of $6.2 million, relating primarily to certain mining machinery and equipment not transferred to SQM.
In 2003, in connection with entering into the share purchase (and related) agreement with SQM, we had recorded long-lived asset impairment charges of $77.4 million, non-parts inventory writedowns of $50.2 million, employee contractual termination benefit costs of $1.8 million and $11.1 million for early termination penalties relating to other contractual arrangements.
2003 VS 2002
Selling and administrative expenses increased by $4.4 million, primarily due to the stronger Canadian dollar. Other contributing factors were increases in amortization expense, consulting and professional fees, fringe benefits and stock-based compensation expense. These were substantially offset by company-wide cost restraints, including pay reductions for the executive management team, a salary freeze for middle management and reduction in company contributions to employee savings plans.
A revised tax structure for potash producers in Saskatchewan contributed $5.6 million to earnings, the equivalent of $0.06 per share.
The company’s foreign exchange loss increased significantly over 2002 due to the strengthening of the Canadian dollar relative to the US dollar. At December 31, 2003, the Canadian dollar was $0.29 higher than at December 31, 2002, compared with a $0.01 increase the preceding year. This was the equivalent of $0.60 per share, compared with $0.02 in 2002. Exposure to the Brazilian real had a nominal impact on the company in 2003 but contributed a loss of nearly $0.05 per share in 2002.
For the year, other income was up $8.4 million, primarily due to APC equity earnings, nitrogen insurance proceeds, the excess of 2003 equity earnings from SQM over 2002 equity earnings and dividends, and higher ICL dividends.
Interest expense increased, primarily due to the issuance of $250.0 million of 4.875-percent 10-year notes in March 2003 under the company’s shelf registration. These notes replaced lower-cost commercial paper. Weighted average long-term debt outstanding for the year was $1,230.9 million, compared with $1,023.3 million in 2002, with a weighted average interest rate of 7.0 percent
36
POTASHCORP 2004 ANNUAL REPORT | MD&A•Cash Requirements
LIQUIDITY AND CAPITAL RESOURCES
(2002 – 7.4 percent). The weighted average interest rate on short-term debt for 2003 was 1.4 percent (2002 – 1.7 percent).
The effective consolidated income tax rate in 2003 was approximately 40 percent (exclusive of the charges relating to PCS Yumbes described previously and a future income tax reversal of $6.5 million). This compares with a rate of approximately 36 percent for 2002. The increase was primarily due to the expiration of the last tax holiday in Trinidad. The 2003 tax provision was all future income taxes, compared with a current/future split of 80/20 for 2002. The decrease in the current portion was primarily due to utilization of tax losses in the US as well as certain reclassifications from current to future income taxes.
Liquidity and Capital Resources
Liquidity risk arises from our general funding needs and in the management of our assets, liabilities and optimal capital structure. We manage liquidity risk to maintain sufficient liquid financial resources to fund our balance sheet and meet our obligations in the most cost-effective manner possible.
CASH REQUIREMENTS
The following aggregated information about our contractual obligations and other commitments aims to provide insight into our short- and long-term liquidity and capital resource requirements. The information presented in the table below does not include obligations that have original maturities of less than one year, planned capital expenditures or potential share repurchases.
Long-Term Debt
Long-term debt consists of $1,250.0 million of notes payable that were issued under our US shelf registration statements, $9.0 million of Industrial Revenue and Pollution Control Obligations, a net of $5.9 million under a back-to-back loan arrangement (described in Note 12 to the consolidated financial statements) and other commitments of $4.0 million payable over the next five years. The notes payable are unsecured. Of the notes outstanding,
$400.0 million bear interest at 7.125 percent and mature in 2007, $600.0 million bear interest at 7.750 percent and mature in 2011 and $250.0 million bear interest at 4.875 percent and mature in 2013. There are no sinking fund requirements. The Industrial Revenue and Pollution Control Obligations bear interest at varying rates, are secured by bank letters of credit and have no sinking fund requirements. The notes payable are not subject to any financial test covenants but are subject to certain customary covenants (including limitations on liens and sale and leaseback transactions) and events of default, including an event of default for acceleration of other debt in excess of $50.0 million. Neither the Industrial Revenue and Pollution Control Obligations nor the other long-term debt instruments are subject to any financial test covenants but each is subject to certain customary covenants and events of default, including, for other long-term debt, an event of default for non-payment of other debt in excess of $25.0 million. Non-compliance with such covenants could result in accelerated payment of the related debt. The company was in compliance with all covenants as at December 31, 2004.
The commitments in the table below include our cumulative scheduled interest payments on fixed and variable rate long-term debt, totalling $479.7 million. Interest on variable rate debt is based on interest rates prevailing at December 31, 2004.
Operating Leases
We have long-term operating lease agreements for buildings, port facilities, equipment, ocean-going transportation vessels, mineral leases and railcars, the latest of which expires in 2025. The most significant operating leases consist of three items. The first is our lease of railcars, which extends to approximately 2020. The second is the lease of port facilities at the Port of Saint John for shipping New Brunswick potash offshore. This lease runs until 2018. The third is the lease of three vessels for transporting ammonia from Trinidad. One vessel agreement runs until 2011; the others terminate in 2016.
CONTRACTUAL OBLIGATIONS AND OTHER COMMITMENTSPayments Due By Period – Dollars (millions)
| | | | | | | | | | | | | | | | | | | | | |
| | | Total | | | Within 1 year | | | 1 to 3 years | | | 3 to 5 years | | | Over 5 years | |
| Long-term debt (including interest) | | $ | 1,748.6 | | | $ | 97.9 | | | $ | 562.6 | | | $ | 118.7 | | | $ | 969.4 | |
| |
| Operating leases | | | 567.0 | | | | 78.9 | | | | 132.7 | | | | 98.1 | | | | 257.3 | |
| |
| Purchase obligations | | | 907.2 | | | | 104.5 | | | | 190.9 | | | | 159.8 | | | | 452.0 | |
| |
| Other commitments | | | 54.3 | | | | 13.4 | | | | 19.9 | | | | 16.8 | | | | 4.2 | |
| |
| Other long-term liabilities | | | 317.9 | | | | 43.3 | | | | 67.5 | | | | 47.4 | | | | 159.7 | |
| |
| Total | | $ | 3,595.0 | | | $ | 338.0 | | | $ | 973.6 | | | $ | 440.8 | | | $ | 1,842.6 | |
| |
37
POTASHCORP 2004 ANNUAL REPORT | MD&A•Sources and Uses of Cash
LIQUIDITY AND CAPITAL RESOURCES
Purchase Obligations
We have long-term agreements for the purchase of sulfur for use in the production of phosphoric acid. These agreements provide for minimum purchase quantities, and certain prices are based on market rates at the time of delivery. The commitments included in the table on Page 36 are based on contract prices.
We have entered into long-term natural gas contracts with the National Gas Company of Trinidad. The contracts provide for prices that vary with ammonia market prices, escalating floor prices and minimum purchase quantities. The commitments included in the table on Page 36 are based on floor prices and minimum purchase quantities.
We also have a long-term agreement for the purchase of phosphate rock used at our Geismar facility. The commitments included in the table on Page 36 are based on the expected purchase quantity and current net base prices.
Other Commitments
Other operating commitments consist principally of amounts relating to our contracts to purchase limestone that run through 2007 and various rail freight contracts, the latest of which expire in 2010.
Other Long-Term Liabilities
Other long-term liabilities consist primarily of accrued post-retirement/ post-employment benefits, environmental costs and asset retirement obligations.
Capital Expenditures
During 2005, we expect to incur capital expenditures of approximately $225.0 million for opportunity capital and approximately $125.0 million to sustain operations at existing levels.
Share Repurchase Program
In January 2005, our Board of Directors authorized a share repurchase program of up to 5.5 million common shares (approximately 5 percent of the company’s issued and outstanding common shares) through a normal course issuer bid. If considered advisable, shares may be repurchased from time to time on the open market through February 14, 2006 at prevailing market prices. The timing and amount of purchases, if any, will be dependent upon the availability and alternative uses of capital, market conditions and other factors.
SOURCES AND USES OF CASH
| | | | | | | | | | | | | |
| Dollars (millions) | | | | | | | | | | | |
| | | | | | | | | | | % Increase | |
| | | 2004 | | | 2003 | | | (Decrease) | |
| Cash provided by operating activities | | $ | 649.6 | | | $ | 381.5 | | | | 70 | |
| |
| Cash used in investing activities | | $ | (216.8 | ) | | $ | (357.7 | ) | | | (39 | ) |
| |
| Cash provided by (used in) financing activities | | $ | 21.4 | | | $ | (43.6 | ) | | | n/m | |
| |
n/m – not meaningful
| | | | | | | | | | | | | |
| Dollars (millions) except ratio amounts | |
| | | December 31 | | | December 31 | | | % Increase | |
| | | 2004 | | | 2003 | | | (Decrease) | |
| Current assets | | $ | 1,243.6 | | | $ | 733.9 | | | | 69 | |
| |
| Current liabilities | | $ | (703.7 | ) | | $ | (557.8 | ) | | | 26 | |
| |
| Working capital | | $ | 539.9 | | | $ | 176.1 | | | | 207 | |
| |
| Current ratio | | | 1.77 | | | | 1.32 | | | | 34 | |
| |
Our liquidity needs can be met through a variety of sources, including: cash generated from operations, short-term borrowings against our line of credit and commercial paper program, and long-term debt issued under our US shelf registration statement and drawn down under our syndicated credit facility. Our primary uses of funds are operational expenses, sustaining and opportunity capital spending, dividends, and interest and principal payments on our debt securities.
Cash provided by operating activities increased in 2004 by 70 percent, or $268.1 million. Higher gross margin in potash ($422.8 million as compared to $203.7 million) contributed significantly to the improvement. Working capital requirements were down by $103.0 million, primarily due to income taxes and provincial mining taxes payable on substantially higher profits in our Canadian potash operations, increases in margin deposits due to fluctuations in natural gas prices and increases in short- and long-term incentive program accruals that are directly correlated with the company’s performance. The changes in these working capital items were partially offset by a rise in accounts receivable due to fourth-quarter sales being 21 percent higher than in the same period last year. Our customer credit policies have remained substantially consistent with 2003.
Cash used in investing activities declined by $140.9 million. However, there were several key sources and uses of funds:
| • | We increased our investment in SQM by acquiring all the outstanding shares of an indirect subsidiary of ICL for a net cash outlay of $97.2 million. Prior to this transaction, to be in a position to comply with certain Chilean securities ownership thresholds, we sold certain of our shares in SQM for $66.3 million. |
38
POTASHCORP 2004 ANNUAL REPORT | MD&A•Debt Instruments /Off-Balance Sheet Arrangements
LIQUIDITY AND CAPITAL RESOURCES
| • | We concluded the sale of 100 percent of our shares of PCS Yumbes to SQM. Proceeds totalled $42.3 million, including certain working capital adjustments of $6.2 million and contingent consideration of $1.1 million. We received $34.5 million of the sale price prior to the end of the year. |
| • | We increased our investment in APC by $8.3 million, supplementing our initial $178.3 million investment in 2003. |
| • | We invested $220.5 million (2003 – $150.7 million) in capital projects. The increase related primarily to our expansion and compactor upgrade project at Rocanville. |
Cash provided by financing activities during the year was $21.4 million, an increase of $65.0 million over 2003. This was mainly due to the receipt of $102.3 million more proceeds from the issuance of common shares (mostly arising from the exercise of stock options as our share price appreciated substantially during the year). The proceeds were offset by a $33.5-million net increase in short- and long-term debt payments during the year. In 2003, we had issued $250.0 million of notes under our US shelf registration statement, and the net proceeds from that issue were put toward short-term debt repayments of $296.8 million in that year. In 2004, we used our cash generated from operations to reduce commercial paper balances by $82.7 million.
We have historically paid quarterly dividends to shareholders at a rate of $0.125 per share on a post-split basis. In July 2004, we announced that our quarterly cash dividend payment would be increasing to $0.15 per share, commencing in November 2004. As a result, total dividend payments to shareholders increased by $3.8 million.
We believe that internally generated cash flow, supplemented by borrowing from existing financing sources, will be sufficient to meet our anticipated capital expenditures and other cash requirements in 2005, exclusive of any possible acquisitions. At this time, we do not reasonably expect any presently known trend or uncertainty to affect our ability to access our historical sources of cash.
DEBT INSTRUMENTS
| | | | | | | | | | | | | |
| Dollars (millions) | | | | | | | |
| | | | | | | Amount | | | Amount | |
| | | | | | | Outstanding at | | | Available at | |
| | | Total | | | December 31 | | | December 31 | |
| | | Amount | | | 2004 | | | 2004 | |
| Syndicated credit facility | | $ | 750.0 | | | $ | – | | | $ | 656.5 | |
| |
| Line of credit | | | 75.0 | | | | 15.1 | | | | 59.9 | |
| |
| Commercial paper | | | 500.0 | | | | 93.5 | | | | 406.5 | |
| |
| US shelf registration | | | 2,000.0 | | | | 1,250.0 | | | | 750.0 | |
| |
We have a $750.0 million syndicated credit facility, renewable annually, which provides for unsecured advances. In September 2004, we renewed the facility for one year. The amount available to us is the total committed amount less direct borrowings and commercial paper outstanding. No funds were borrowed under the facility as of December 31, 2004. The line of credit is also renewable annually, and outstanding letters of credit and direct borrowings reduce the amount available. Both the line of credit and the syndicated credit facility have financial tests and other covenants with which we must comply at each quarter-end. Principal covenants and events of default under the credit facility and line of credit require debt to capital of less than or equal to 0.55:1, long-term debt to EBITDA (defined in the respective agreements as earnings before interest, income taxes, provincial mining and other taxes, depreciation, amortization and other non-cash expenses) of less than or equal to 3.5:1, tangible net worth greater than or equal to $1,250.0 million and debt of subsidiaries less than $590.0 million. The syndicated credit facility and line of credit are also subject to other customary covenants and events of default, including an event of default for non-payment of other debt in excess of Cdn $40.0 million. Non-compliance with any of the above covenants could result in accelerated payment of the related debt and termination of the line of credit. We were in compliance with all covenants as at December 31, 2004.
The commercial paper market is a source of “same day” cash for the company, and we have a commercial paper program of up to $500.0 million. Access to this source of short-term financing depends primarily on maintaining our R1 low credit rating by Dominion Bond Rating Service (DBRS) and conditions in the money markets. Our credit rating, as measured by Standard & Poor’s senior debt ratings, remained unchanged at BBB+ with a stable outlook, and our Moody’s rating was unchanged at Baa2 with a positive outlook.
We also have a US shelf registration statement under which we may issue up to an additional $750.0 million in unsecured debt securities.
For 2004, our weighted average cost of capital was 8.4 percent (2003 – 7.3 percent), of which 90 percent represented equity. The increase was principally due to a shift in mix to equity – which carries a higher cost than debt – as the average stock price for the year rose 55 percent compared to 2003 and closed 92 percent higher.
OFF-BALANCE SHEET ARRANGEMENTS
We enter into off-balance sheet arrangements in the normal course of our business, including guarantee contracts, certain derivative instruments and long-term fixed price contracts. We do not reasonably
39
POTASHCORP 2004 ANNUAL REPORT | MD&A•Off-Balance Sheet Arrangements
LIQUIDITY AND CAPITAL RESOURCES
expect any presently known trend or uncertainty to affect our ability to continue using these arrangements. These types of arrangements are discussed below.
Guarantee Contracts
In the normal course of operations, we provide indemnifications that are often standard contractual terms to counterparties in transactions such as purchase and sale contracts, service agreements, director/officer contracts and leasing transactions. These indemnification agreements may require us to compensate the counterparties for costs incurred as a result of various events. The terms of these indemnification agreements will vary based upon the contract, the nature of which prevents us from making a reasonable estimate of the maximum potential amount that could be required to pay to counterparties. Historically, we have not made any significant payments under such indemnifications and no amounts have been accrued in our consolidated financial statements with respect to these guarantees.
We have guaranteed various debt obligations (such as overdrafts, lines of credit with counterparties for derivatives, and back-to-back loan arrangements) and other commitments (such as railcar leases) for certain subsidiaries. We would be required to perform on these guarantees in the event of default by the guaranteed parties. No material loss is anticipated by reason of such agreements and guarantees. At December 31, 2004, the maximum potential amount of future (undiscounted) payments under significant guarantees provided to third parties approximated $159.9 million, representing the maximum risk of loss if there were a total default by the guaranteed parties, without consideration of possible recoveries under recourse provisions or from collateral held or pledged. At December 31, 2004, no subsidiary balances subject to guarantees were outstanding in connection with the company’s cash management facilities, and we had no liabilities recorded for other obligations other than subsidiary bank borrowings of approximately $5.9 million and cash margin requirements of $28.5 million to maintain derivatives.
We have also guaranteed the gypsum stack capping, closure and post-closure obligations of White Springs and PCS Nitrogen, in Florida and Louisiana, respectively, pursuant to the financial assurance regulatory requirements in those states. The State of Florida is presently reviewing, and is expected to revise, its financial assurance requirements to ensure that responsible parties have sufficient resources to cover all closure and post-closure costs and liabilities associated with gypsum stacks. This review may result in the imposition of more stringent requirements to demonstrate financial responsibility and/or inclusion of a greater scope of closure and post-closure costs than under current law. All amounts subject to guarantee are included in the accrued costs reflected in Note 15 to the consolidated financial statements.
The environmental regulations of the Province of Saskatchewan require each potash mine to have decommissioning and reclamation (D&R) plans. In 2001, agreement was reached with the provincial government on the financial assurances for the D&R plan to cover an interim period to July 1, 2005. In October 2004, this interim period was extended to July 1, 2006. A government/industry task force has been established to assess decommissioning options for all Saskatchewan potash producers and to produce mutually acceptable revisions to the plan schedules. We have posted a Cdn $2.0 million letter of credit as collateral that will remain in effect until the revised plans are accepted.
Derivative Instruments
We use derivative financial instruments to manage exposure to commodity price, interest rate and foreign exchange rate fluctuations. Only our hedging activities represent off-balance sheet items.
We employ derivative instruments to hedge the future cost of committed and anticipated natural gas purchases primarily for our US nitrogen plants. By policy, the maximum period for these hedges cannot exceed five years. Exceptions to policy may be made with the specific approval of our Gas Policy Advisory Committee. The fair value of our gas hedging contracts at December 31, 2004 was $66.5 million (2003 – $59.8 million).
We primarily use interest rate swaps to manage the interest rate mix of our total debt portfolio and related overall cost of borrowing. In January and February 2004, we entered into interest rate swap agreements with total notional amounts of $300.0 million, whereby we, over the remaining terms of the underlying notes, would receive a fixed rate payment equivalent to the fixed interest rate of the underlying note and pay a floating rate of interest based on six-month US dollar LIBOR. In October 2004, we terminated the interest rate swap contracts.
Note 29 to our consolidated financial statements provides more detail on our accounting for and types of derivatives.
Long-Term Fixed Price Contracts
Certain of our long-term raw materials agreements contain fixed price components. Our significant agreements, and the related obligations under such agreements, are discussed in Cash Requirements.
40
POTASHCORP 2004 ANNUAL REPORT | MD&A•Market Risks / Related Party Transactions / Critical Accounting Estimates
LIQUIDITY AND CAPITAL RESOURCES
Market Risks Associated with Financial Instruments
Market risk is the potential for loss from changes in the value of financial instruments. The following discussion provides additional detail regarding our exposure to the risks of changing commodity prices, interest rates and foreign exchange rates. A discussion of enterprise-wide risk management can be found on Pages 44 and 45.
COMMODITY RISK
Our US nitrogen results are significantly affected by the price of natural gas. As discussed on Page 39, we employ derivative commodity instruments related to a portion of our natural gas requirements (primarily futures, swaps and options) for the purpose of managing our exposure to commodity price risk in the purchase of natural gas, not for speculative or trading purposes. Changes in the market value of these derivative instruments have a high correlation to changes in the spot price of natural gas.
A sensitivity analysis has been prepared to estimate our market risk exposure arising from derivative commodity instruments. The fair value of such instruments is calculated by valuing each position using quoted market prices. Market risk is estimated as the potential loss in fair value resulting from a hypothetical 10-percent adverse change in such prices. The results of this analysis indicate that as of December 31, 2004, our estimated derivative commodity instruments’ market risk exposure was $46.2 million (2003 – $27.5 million). Actual results may differ from this estimate. Changes in the fair value of such derivative instruments, with maturities in 2005 through 2014, will generally relate to changes in the spot price of natural gas purchases.
INTEREST RATE RISK
We address interest rate risk by using a diversified portfolio of fixed and floating rate instruments. This exposure is also managed by aligning current and long-term assets with demand and fixed-term debt and by monitoring the effects of market changes in interest rates.
As at December 31, 2004, our short-term debt (comprised of commercial paper) was $93.5 million, our current portion of long-term debt was $10.3 million and our long-term portion was $1,258.6 million. Long-term debt is comprised primarily of $1,250.0 million of notes payable that were issued under our US shelf registration statements. Since most of our outstanding borrowings have fixed interest rates, the primary market risk exposure is to changes in fair value. It is estimated that, all else constant, a hypothetical 10-percent change in interest rates would not materially impact our results of operations or financial position. If interest rates changed significantly, management
would likely take actions to manage our exposure to the change. However, due to the uncertainty of the specific actions that would be taken and their possible effects, the sensitivity analysis assumes no changes in our financial structure.
FOREIGN EXCHANGE RISK
We also enter into foreign currency forward contracts for the sole purpose of limiting exposure to exchange rate fluctuations relating to Canadian dollar operating and capital expenditures. These contracts are not designated as hedging instruments for accounting purposes. Gains or losses resulting from foreign exchange contracts are recognized in earnings in the period in which changes in fair value occur.
As at December 31, 2004, we had entered into foreign currency forward contracts to sell US dollars and receive Canadian dollars in the notional amount of $54.1 million (2003 – $46.0 million) at an average exchange rate of 1.2306 (2003 – 1.3315). We also had small forward contracts outstanding as at December 31, 2004 to reduce exposure to the euro and Swiss franc. Maturity dates for all forward contracts are within 2005.
Related Party Transactions
The company sells potash from our Saskatchewan mines for use outside of North America exclusively to Canpotex Limited. Sales for the year ended December 31, 2004 were $421.9 million (2003 –$260.6 million; 2002 – $241.2 million). Sales to Canpotex are at prevailing market prices and are settled on normal trade terms.
In connection with entering into the share transfer agreement with SQM, PCS Yumbes agreed to purchase potash from SQM and sell to SQM all of its potassium nitrate production at a negotiated price that approximated market value. Both agreements were in effect until closing of the PCS Yumbes sale agreement in December 2004. Potash purchases from SQM for the year were $7.0 million (2003 – $13.1 million; 2002 – $17.9 million). Potassium nitrate sales to SQM for the year were $25.1 million (2003 – $25.8 million; 2002 – $2.1 million). All transactions with SQM are settled on normal trade terms.
Critical Accounting Estimates
Our discussion and analysis of our financial condition and results of operations are based upon our consolidated financial statements, which have been prepared in accordance with Canadian GAAP. These principles differ in certain significant respects from US GAAP, and these differences are described and quantified in Note 36 to the consolidated financial statements.
41
POTASHCORP 2004 ANNUAL REPORT | MD&A •Critical Accounting Estimates
CRITICAL ACCOUNTING ESTIMATES
Our significant accounting policies are contained in Note 2 to the consolidated financial statements. Certain of these policies involve critical accounting estimates because they require us to make particularly subjective or complex judgments about matters that are inherently uncertain and because of the likelihood that materially different amounts could be reported under different conditions or using different assumptions. We have discussed the development, selection and application of our key accounting policies, and the critical accounting estimates and assumptions they involve, with the audit committee of the Board of Directors, and it has reviewed the disclosures described in this section.
The following section discusses the critical accounting estimates and assumptions that management has made and how they affect the amounts reported in the consolidated financial statements.
ASSET IMPAIRMENT
We review long-lived assets and intangible assets with finite lives whenever events or changes in circumstances indicate that the carrying amount of such assets may not be fully recoverable. Determination of recoverability is based on an estimate of undiscounted future cash flows, and measurement of an impairment loss is based on the fair value of the assets. We believe that the accounting estimate related to asset impairment is a critical accounting estimate because: (1) it is highly susceptible to change from period to period as it requires management to make assumptions about future sales, margins and market conditions over the long-term life of the assets; and (2) the impact that recognizing an impairment would have on our financial position and results of operations may be material. During 2003, we indefinitely shut down certain nitrogen operations, ceased operations at a phosphate feed plant and entered into an agreement to sell our shares of PCS Yumbes. In connection with these activities, we recognized various impairment charges, as more fully described in Notes 22 and 23 to the consolidated financial statements. As at December 31, 2004, we determined that there were no other triggering events requiring additional impairment analysis.
Goodwill is not amortized, but is assessed for impairment at the reporting unit level annually, or sooner if events or changes in circumstances indicate that the carrying amount could exceed fair value. Goodwill is assessed for impairment using a two-step approach, with the first step being to assess whether the fair value of the reporting unit to which the goodwill is associated is less than its carrying value. If this is the case, a second impairment test is performed which requires a comparison of the fair value of goodwill to its carrying amount. If fair value is less than carrying value, goodwill is considered impaired and an impairment charge must
be recognized immediately. The fair value of our reporting units is determined from internally developed valuation models that consider various factors such as normalized and projected earnings, present value of future cash flows and discount rates. In each of the last two years we tested goodwill for impairment, and in each year we determined that, based on our assumptions, the fair value of our reporting units exceeded their carrying amounts and therefore we did not recognize impairment.
Long-term investments that are carried at cost or accounted for using the equity method are also reviewed to determine whether fair value is below carrying value. An investment is considered impaired if any such decline is considered other than temporary. Factors we consider in determining whether a loss is temporary include the length of time and extent to which fair value has been below cost; financial condition and near-term prospects of the investee; and our ability and intent to hold the investment for a period of time sufficient to allow for any anticipated recovery. For actively traded securities, we typically consider quoted market value to be fair value. For thinly traded securities where market quotes are either not available or not representative of fair value, we use estimation techniques such as market or income valuation approaches to determine fair value.
Although we believe our estimates are reasonable and consistent with current conditions, internal planning and expected future operations, such estimates are subject to significant uncertainties and judgments. As a result, it is reasonably possible that the amounts reported for asset impairments could be different if we were to use different assumptions or if market and other conditions were to change. The changes could result in non-cash charges that could materially affect our consolidated financial statements.
RESTRUCTURING CHARGES
We approved plans to restructure various operations in 2003 which required us to make critical estimates regarding exit costs. Because such activities are complex processes that take several months to complete, they involve periodically reassessing the estimates made when the original decision to exit the activities was made. As a result, we may have to change originally reported estimates as actual payments are made or the related activities are completed.
POST-RETIREMENT AND POST-EMPLOYMENT COSTS
We sponsor plans that provide pensions and other retirement and post-employment benefits for most of our employees. We believe the accounting estimates related to our employee benefit plan costs are critical accounting estimates because: (1) the amounts are based on complex actuarial calculations using several assumptions; and
42
POTASHCORP 2004 ANNUAL REPORT | MD&A•Critical Accounting Estimates
CRITICAL ACCOUNTING ESTIMATES
(2) given the magnitude of our estimated costs, differences in actual results or changes in assumptions could materially affect our consolidated financial statements.
Due to the long-term nature of these plans, the calculation of expenses and obligations depends on various assumptions such as discount rates, expected rates of return on assets, health care cost trend rates, projected salary increases, retirement age, mortality and termination rates. These assumptions are determined by management and are reviewed annually by our actuaries. The discount rate assumptions used in determining obligations and expense reflect market yields on high-quality debt instruments with cash flows that match expected benefit payments. The expected rate of return on plan assets assumption is based on expected returns for the various asset classes. Other assumptions are based on actual experience and our best estimates. Actual results that differ from the assumptions are accumulated and amortized over future periods and, therefore, generally affect recognized expense and the recorded obligation in future periods.
The following table provides the sensitivity of benefit obligations and expense for our US plans (which represent 90 percent of our benefit obligations) to changes in the discount rate, expected long-term return on plan assets assumption and rate of compensation increase. The sensitivity analysis should be used with caution as the changes are hypothetical and the impact of changes in each key assumption may not be linear. For further details on our annual expense and obligation, see Note 14 to the consolidated financial statements.
| | | | | | | | | | | | | | | | | |
| IMPACT OF A 0.5% CHANGE IN KEY ASSUMPTIONS |
| Dollars (millions) |
| | Pension Plans | Other Plans |
| | | Obligation | | | Expense | | | Obligation | | | Expense | |
| Discount rate | | | | | | | | | | | | | | | | |
| |
| Decrease in assumption | | $ | 34.0 | | | $ | 3.1 | | | $ | 16.9 | | | $ | 1.7 | |
| |
| Increase in assumption | | | (32.7 | ) | | | (3.2 | ) | | | (16.2 | ) | | | (1.8 | ) |
| |
| Expected long-term rate of return | | | | | | | | | | | | | | | | |
| |
| Decrease in assumption | | | n/a | | | | 1.6 | | | | n/a | | | | n/a | |
| |
| Increase in assumption | | | n/a | | | | (1.6 | ) | | | n/a | | | | n/a | |
| |
| Rate of compensation increase | | | | | | | | | | | | | | | | |
| |
| Decrease in assumption | | | (7.7 | ) | | | (1.3 | ) | | | n/a | | | | n/a | |
| |
| Increase in assumption | | | 7.5 | | | | 1.3 | | | | n/a | | | | n/a | |
| |
ASSET RETIREMENT OBLIGATIONS AND OTHER ENVIRONMENTAL COSTS
We have significant liabilities relating to asset retirement obligations and other environmental matters. The major categories of our asset retirement obligations include reclamation and restoration costs at
our potash and phosphate mining operations (most particularly phosphate mining). Other environmental liabilities typically relate to regulatory compliance, environmental management associated with ongoing operations other than mining, and site assessment and remediation of contamination related to the activities of the company and its predecessors.
We believe the accounting estimates related to asset retirement obligations and other environmental costs are critical accounting estimates because: (1) we will not incur most of these costs for a number of years, requiring us to make estimates over a long period; (2) environmental laws and regulations and interpretations by regulatory authorities could change in the future or circumstances affecting our operations could change, either of which could result in significant changes to our current plans; and (3) given the magnitude of our estimated costs, changes in any or all of these estimates could have a material impact on our consolidated financial statements.
Accruals for asset retirement obligations and other environmental matters totalled $100.7 million at December 31, 2004. In arriving at this amount we considered the nature, extent and timing of current and proposed reclamation and closure techniques in view of present environmental laws and regulations. It is reasonably possible the ultimate costs could change in the future and that changes to these estimates could have a material effect on our consolidated financial statements.
DEPRECIATION AND AMORTIZATION
We depreciate certain mining and milling assets using the units of production method based on the shorter of estimates of reserve or service lives. We have other assets that we depreciate on a straight-line basis over their estimated useful lives.
We perform assessments of our existing assets and depreciable lives in connection with the review of mine operating plans. When we determine that assigned asset lives do not reflect the expected remaining period of benefit, we make prospective changes to their depreciable lives. There are a number of uncertainties inherent in estimating reserve quantities, particularly as they relate to assumptions regarding future prices, the geology of our mines, the mining methods we use and the related costs we incur to develop and mine our reserves. Changes in these assumptions could result in material adjustments to our reserve estimates, which could result in changes to units of production depreciation expense in future periods. Although some degree of variability is expected, we believe the extent of our technical data and operating experience mitigates the potential for significant changes in reserve estimates.
43
POTASHCORP 2004 ANNUAL REPORT | MD&A•Recent Accounting Changes
RECENT ACCOUNTING CHANGES
As discussed on Page 41, we review and evaluate our long-lived assets for impairment when events or changes in circumstances indicate that the related carrying amounts may not be recoverable. We believe it is unlikely that revisions to our estimates of reserves would give rise to an impairment of our assets because of their significant size in relation to our asset carrying values.
INCOME TAXES
We operate in a specialized industry and in several tax jurisdictions. As such, our income is subject to various rates of taxation. The breadth of the company’s operations and the global complexity of tax regulations require assessments of uncertainties and judgments in estimating the ultimate taxes the company will pay. The final taxes paid are dependent upon many factors, including negotiations with taxing authorities in various jurisdictions, outcomes of tax litigation and resolution of disputes arising from federal, provincial, state and local tax audits. The resolution of these uncertainties and the associated final taxes may result in adjustments to our tax assets and tax liabilities.
We estimate future income taxes based upon temporary differences between the income and losses that we report in our consolidated financial statements and our taxable income and losses as determined under applicable tax laws. We record a valuation allowance against our future income tax assets when we believe, based on all available evidence, that it is not “more likely than not” that all of our future income tax assets recognized will be realized prior to their expiration. The amount of the future income tax asset recognized and considered realizable could, however, be reduced if projected income is not achieved.
Recent Accounting Changes
2004
Effective January 1, 2004, we changed certain of our accounting policies in response to new accounting standards. We now report sales, freight costs and transportation and distribution expenses separately on our Consolidated Statements of Operations and Retained Earnings, rather than on a net basis. This had no effect on gross margin or net income, and all comparative information has been appropriately reclassified. Other changes related to our accounting for asset retirement obligations and hedging relationships. Neither of these changes had a significant effect on our results of operations or financial position. For further information, see Note 3 to our consolidated financial statements.
2005
The US accounting standard for variable interest entities (VIEs) was effective for the company in the first quarter of 2004, and there was no material impact on our consolidated financial statements from adoption. The standard provided direction for applying consolidation principles to certain entities that are subject to control on a basis other than ownership of voting interests. The CICA’s guideline on VIEs is similar to US GAAP and is effective in fiscal 2005. We do not expect its application to have a material impact on our consolidated financial statements.
In November 2004, the US accounting standards for inventory were amended, requiring abnormal amounts of idle facility expense, freight, handling costs and spoilage to be recognized as current-period charges. The guidance is effective for our 2006 fiscal year, and we are currently assessing the potential impact, if any, on our consolidated financial statements.
In December 2004, US accounting requirements relating to share-based payments were revised. With limited exceptions, compensation cost will now be measured based on the grant-date fair value of the equity or liability instruments issued. In addition, liability awards will be remeasured each reporting period. Compensation cost will be recognized over the period that an employee provides service in exchange for the award. The new guidance is effective in the third quarter of 2005. We are currently assessing the potential impact, if any, on our consolidated financial statements.
In January 2005, the CICA issued Section 1530, “Comprehensive Income”, Section 3251, “Equity”, Section 3855, “Financial Instruments – Recognition and Measurement” and Section 3865, “Hedges”. Under the new standards: a new location for recognizing certain gains and losses – other comprehensive income – has been introduced, providing for certain gains and losses arising from changes in fair value to be temporarily recorded outside the income statement, but in a transparent manner; existing requirements for hedge accounting are extended; and all financial instruments, including derivatives, are to be included on a company’s balance sheet and measured (in most cases) at fair value. The guidance will apply for interim and annual financial statements relating to fiscal years beginning on or after October 1, 2006. Earlier adoption will be permitted only as of the beginning of a fiscal year. We are currently assessing the potential impact of these new standards on our consolidated financial statements.
For further information, see Notes 2 and 36 to our consolidated financial statements.
44
POTASHCORP 2004 ANNUAL REPORT | MD&A • Risk Management
RISK MANAGEMENT
Risk Management
Understanding and managing risk are important parts of PotashCorp’s strategic planning. In previous years, we identified and analyzed the risks facing the company, ranked them by likelihood of occurrence and significance of consequences, and determined the most effective ways to manage this risk universe.
In 2004, we introduced a new integrated risk-management framework that allowed for a comprehensive evaluation of the interdependence of the risks across all segments of the company. We reviewed historical risks, identified new risks and delineated all risks into categories that could interfere with successful implementation of our strategy. We saw those risk categories as markets/business, distribution, operational, financial/information technology, regulatory and integrity/empowerment. Together and separately, these risks affect our ability to take advantage of opportunities. The greatest consequence of all risks is a loss of reputation, for it can threaten our earnings, access to capital or our brand by creating negative opinions of the company in the minds of employees, customers, investors or our communities. As the risk globe turns, a risk to reputation affects our ability to execute our strategies.
All risks were plotted on a matrix which recognized that the inherent risks to the company can be reduced by lowering either the expected frequency or the consequences. These mitigation activities result in lower residual risk levels. Management focused on the most significant residual risks to our strategy, as follows, and reported to the board on plans to manage them.
RISK TO POTASH PRODUCTION
As potash is the cornerstone of our success, our ability to bring on our excess capacity in a timely manner is key to the credibility of our strategy. Higher-than-trend growth rates in the last three years have absorbed the excess production of our global competitors, putting expectations on PotashCorp to deliver our excess capacity moving forward.
In Saskatchewan, we have increased production at Rocanville, added fourth shifts at Lanigan and Allan and reduced the number of shutdown weeks taken. In addition, we have the ability to bring on another 2.9 million tonnes. We could get 1.5 million tonnes from the Lanigan phase I mill, 400,000 tonnes from debottlenecking at Allan and another 1 million tonnes, total, at Cory and Patience Lake. All these projects can be brought on stream within three years at a current estimate of $300 million. At New Brunswick we are exploring a potential adjacent deposit that could be developed.
NEW SUPPLY CREATES STRUCTURAL MARKET IMBALANCE
An increase in competitive supply in potash or nitrogen that outpaced the growth in world consumption could upset the supply/demand balance of those nutrients and depress prices for a prolonged period.
We partially mitigate the risk in potash by ensuring additional supply is available from our excess capacity only as required by the market. In nitrogen, capacity growth has generally matched consumption, but abundant low-cost natural gas has encouraged many developing countries to exploit their gas by producing ammonia for the US market. Closure of high-cost US facilities has cushioned the effect of these imports and is expected to continue to do so. Our nutrient diversity mitigates this risk through strong potash profits and specialty phosphate sales. We are examining nitrogen expansions in lower-cost gas regions which would have a low capital investment and stable returns, consistent with our asset-light/fee-heavy strategy.
RISK OF CYCLICALITY
The risk of short-term cyclicality in product prices is most significant in phosphate and nitrogen.
Competitive costs, availability of supply and world demand affect short-term nitrogen and phosphate pricing. This results in supply/demand imbalances, pressure on prices and margins, unprofitable operations and, eventually, shutdown costs.
To help mitigate this cyclicality in phosphate, we work through PhosChem to export excess DAP, MAP and phosphoric acid so our plants operate at cost-effective utilization rates. We continue to diversify our products by growing offshore feed sales and expanding
45
POTASHCORP 2004 ANNUAL REPORT | MD&A • Risk Management
RISK MANAGEMENT
purified acid production. In nitrogen, we target markets offering price premiums and grow our more stable industrial markets, including those requiring a physical link to our plant or specialized manufacturing. We are expanding our low-cost Trinidad production and have indefinitely shut down our Memphis facility and production of ammonia and nitrogen solutions at Geismar. We continue to hedge a portion of our US gas costs.
SUPPRESSED DEMAND CREATES STRUCTURAL MARKET IMBALANCE
A risk to our potash business would arise if growth in demand fell below expectations, reducing world trade and affecting our sales volumes and price realizations. This risk is mitigated by our long-held strategy of matching supply to demand. We see a fall in global consumption as less likely than a softening in demand that results in negligible growth.
POLITICAL RISK
PotashCorp’s board has approved strategic acquisition of interests in other low-cost potash producers with logistical advantages to offshore markets. The goal is to achieve sustained returns without threat of forced divestiture, political violence, selective discrimination or inconvertibility of funds. Outside of Canada, viable low-cost production is in areas which have elements of political risk.
A diversity of sources mitigates this risk. Interruptions in business elsewhere allow us to produce more in Canada. Political risk insurance is expensive, but we try to ensure that companies we invest in carry business interruption insurance.
RAILCAR SHORTAGES
A shortage of railcars for carrying potash and increased transit time in North America would result in customer dissatisfaction, loss of sales and higher equipment costs. Strong demand for grain and other exports affects railcar availability.
We seek to manage these risks through timely and accurate forecasting to the railroads, balanced shipping patterns and by adding domestic storage capacity that reduces seasonal shipping. We continue to increase our private fleet of hopper cars and to work closely with Canadian National and Canadian Pacific railroads.
OCEAN FREIGHT VOLATILITY
A strong world economy is fueling higher dry bulk freight rates. The shortage of bulk ships reflects the rise in exports encouraged by a weaker US dollar, resurgent North American grain exports, China’s demand for bulk commodities and the long lead time required to build new ships. As a result, vessel utilization is at an all-time high.
The consequences for PotashCorp are higher distribution costs, reduced price realizations and delayed or missed shipments.
We seek to mitigate this through long-term charters, joint ventures, vessel pools and contracts of affreightment. We are proactive in the ocean freight market to minimize cost fluctuations and coordinate potash shipments with other products to obtain more favorable freight economics.
SECURITY RISKS
Such risks include a deliberate, malicious act involving product or facilities that may expose employees, contractors or the public to extensive injury, cause property damage or affect the company’s reputation. Theft of product for use in criminal acts or terrorism is included.
We seek to mitigate this risk by maintaining strict controls, standards and operating procedures, while increasing security and intrusion measures. We introduced a proof-of-delivery process and adopted stricter identification requirements, and we cooperate with the US Department of Transportation program to upgrade ammonia railcars.
RISK TO REPUTATION
Its reputation should be a company’s most valuable corporate asset, loss of that reputation its greatest risk. In any of the circumstances outlined, PotashCorp’s reputation could be damaged. Diminished investor confidence can make raising capital difficult. Poor community relations can result in loss of license to operate or public boycott of products. Lack of customer confidence can result in irreversible loss of market share. Employee apathy makes recruitment and retention of the best people difficult. Negligence claims could be laid against officers and directors.
We mitigate risk to our reputation by building goodwill, using best practices, ensuring transparency and communicating with stakeholders. Our commitment to sustainability helps reduce environmental and social risks, which could affect economic performance. We regularly survey all our key stakeholder groups to ensure we are enhancing our brand and reducing any concerns they have about our business. We maintain good relations with customers by focusing on service and our customer complaint system. We encourage our employees to be engaged with the company by fostering a culture of fair treatment and providing training and opportunities for development. We aim for leading-edge corporate governance and have timely and complete disclosure. We have a code of conduct and a crisis communications program, and introduced Fertile Minds to inform the public about the science of fertilizer. With all stakeholders, we strive to have “no surprises” to support our good reputation, which is key to achieving our strategies.
46
POTASHCORP 2004 ANNUAL REPORT | MD&A • 2005 Outlook
OUTLOOK
2005 Outlook
ECONOMY: The global economic outlook remains very optimistic. Factors affecting world economic growth include US interest rates, China’s foreign exchange policy and global inflation. The IMF forecast for 4.3-percent growth for 2005 compares with 5 percent in 2004, the highest in nearly 30 years. This is projected to support expenditures on fertilizer and industrial products based on N, P & K.
AGRICULTURE: The outlook for agriculture is highly favorable. Demand for grain is expected to continue to expand. Several commodity prices, including those for rubber, tea, rice, coffee and sugar, have improved. Grain stocks are historically low and a second consecutive year of the ideal growing conditions that produced record crops in 2004 is unlikely. The USDA recently estimated that at the end of the current crop year, there will be only 2.3 months’ worth of grain in world bins. China is expected to look again to the US and Brazil to make up its shortfall in grain and oilseed production, driving agricultural output in those countries.
After harvesting the best crop in years in 2004, the world’s farmers have an improved financial position entering 2005. This will support increased fertilizer consumption to replace nutrients drawn from the soil by the large crop, and help farmers achieve their production goals.
World nutrient consumption is expected to rise by 3 to 4 percent in 2005, with projected US nutrient use up by 1 to 2 percent.
OCEAN FREIGHT RATES: Record ocean freight rates were established in February 2004 and subsequently topped in December. The market is
expected to decline in 2005 from the December highs, with moderation of China’s industry boom and more new bulk vessels providing a moderate decrease in global fleet utilization. However, average ocean freight rates are expected to remain historically high in 2005.
NATURAL GAS: Futures price projections for US natural gas over the period 2005-2008 are in the range of $5.00 to $7.00 per MMBtu. Barring a major find, future drilling will be into smaller potential gas pools which are expected to provide a lower average success rate and a shorter production life. These factors are increasing the cost of bringing natural gas to the marketplace and are expected to put a floor under NYMEX futures prices.
NITROGEN: Tight supply/demand is expected to continue through 2005, as historically high US gas prices will likely keep some North American production shuttered. We are proceeding with capacity additions at our Trinidad operation, based on long-term, lower-cost natural gas contracts. This should increase output capability by 15 percent by mid-2006. We will continue to evaluate our plant shutdowns at Geismar and Memphis, basing any potential restart decisions on a combination of market conditions and the right balance of prices versus volumes.
Approximately 60 percent of our 2005 gas needs are hedged through our indexed gas contracts in Trinidad. For our US gas needs, the hedge gain in 2005 is currently expected to approximate 2004 levels. However, the ultimate gain is difficult to predict as the nitrogen market and gas prices are highly volatile.
PHOSPHATE: The supply/demand balance tightened in late 2004 as a series of hurricanes forced production outages in Florida. However, the phosphate industry continues to face issues of oversupply.
China and India, large potential markets for US phosphate exports, are expected to continue to support their domestic industries in 2005. New DAP capacity is expected to exceed demand growth in the next six years, with the result that US DAP exports will continue near current levels or decline slightly.
High input costs are expected to continue. US natural gas prices should provide a floor price for ammonia, and sulfur prices are projected to remain high due to China’s increasing need for sulfur to grow its domestic phosphate production.
A $33-per-tonne price increase for feed products and the expected resolution of our DFP operating problems at Aurora should improve our feed margins. The outlook for industrial phosphate remains positive, especially for purified acid which we are expanding.
47
POTASHCORP 2004 ANNUAL REPORT | MD&A • 2005 Outlook
OUTLOOK
POTASH: The outlook for potash is bright. World demand is expected to continue to trend upward in 2005, following three years of spectacular growth totalling more than 20 percent. Soil nutrients depleted by the record crops of 2004 must be replaced.
Canpotex is forecasting another record in 2005, with the expectation of 8.7 million tonnes in sales as China and other nations in Southeast Asia continue to increase consumption. Sinochem, a purchasing agent for China, signed a 2005 contract with Canpotex for a minimum 17-percent increase in volumes with a $40-per-tonne increase in price. Since China purchases its own freight, this increase in price will directly impact our realized prices.
In North America, our company expects to maintain the growth we achieved in 2004 market share as other competitors operate at capacity. Price increases announced in 2004 should be fully realized during the second quarter of 2005.
Global producers other than PotashCorp ended 2004 with little remaining excess capacity. Some debottlenecking projects have been announced to increase future output, but most producers have already exhausted such opportunities. PotashCorp is doing engineering studies to define the work required to bring excess capacity into production, and to establish priorities for proceeding at our different production locations. As required by the marketplace, we will operate the fourth production shifts at Lanigan and Allan and the 2005 Rocanville expansion.
POTASHCORP FINANCIAL OUTLOOK
Capital expenditures are expected to approximate $350.0 million, of which approximately $125.0 million will be for sustaining capital. Total expenditures are up from the $220.5 million in 2004, primarily due to opportunity capital set aside for ramping up potash production and the expansions of purified acid at Aurora and ammonia at Trinidad.
Selling and administrative expenses are expected to be similar to 2004 levels while other income should exceed 2004, excluding the impact of the gain on sale of SQM shares. The increase is expected to result from higher equity earnings from our potash investments in SQM and APC and dividends from ICL.
The effective consolidated tax rate is expected to remain at approximately 33 percent, with 90 percent expected to be current and 10 percent future. Provincial mining and other taxes should continue to approximate 21 percent of total potash gross margin.
Given the positive industry fundamentals, we anticipate another record year in 2005 and expect net income to be in the range of $400 million to $485 million or $3.50 to $4.25 per diluted share, assuming a flat Canadian dollar from the end of 2004 at 1.20. Capital expenditures of approximately $350 million will exceed our expected non-cash charges of $250 million, which primarily consist of depreciation and amortization.
48
POTASHCORP 2004 ANNUAL REPORT | MD&A•Quarterly Data
FOURTH QUARTER 2004
Quarterly Results and Review of Fourth-Quarter Performance(in millions of US dollars except per-share amounts)
| | | | | | | | | | | | | | | | | | | | | | | | | | | | | | | | | | | | | | | | | |
| | | 2004 | | | 2003 | |
| | | Q1 | | | Q2 | | | Q3 | | | Q4 | | | Total | | | Q1 | | | Q2 | | | Q3 | | | Q4 | | | Total | |
| Sales | | | 728.4 | | | | 833.7 | | | | 815.7 | | | | 866.6 | | | | 3,244.4 | | | | 661.8 | | | | 745.0 | | | | 674.6 | | | | 717.6 | | | | 2,799.0 | |
| |
| Gross margin | | | 124.0 | | | | 170.7 | | | | 189.4 | | | | 197.3 | | | | 681.4 | | | | 81.1 | | | | 122.3 | | | | 84.5 | | | | 92.5 | | | | 380.4 | |
| |
| Operating income (loss) | | | 97.8 | | | | 129.2 | | | | 133.1 | | | | 154.2 | | | | 514.3 | | | | 24.7 | | | | 73.1 | | | | (210.9 | ) | | | 57.5 | | | | (55.6 | ) |
| |
| Net income (loss) | | | 50.7 | | | | 72.6 | | | | 75.2 | | | | 100.1 | | | | 298.6 | | | | 3.2 | | | | 29.9 | | | | (185.9 | ) | | | 26.5 | | | | (126.3 | ) |
| |
| Net income (loss) per diluted share | | | 0.47 | | | | 0.67 | | | | 0.68 | | | | 0.88 | | | | 2.70 | | | | 0.03 | | | | 0.29 | | | | (1.78 | ) | | | 0.25 | | | | (1.21 | ) |
| |
| Potash gross margin | | | 66.7 | | | | 121.4 | | | | 120.8 | | | | 113.9 | | | | 422.8 | | | | 49.3 | | | | 60.7 | | | | 52.3 | | | | 41.4 | | | | 203.7 | |
| |
| Phosphate gross margin | | | (0.9 | ) | | | 5.7 | | | | 0.6 | | | | 10.4 | | | | 15.8 | | | | 2.0 | | | | (1.0 | ) | | | (9.7 | ) | | | (7.8 | ) | | | (16.5 | ) |
| |
| Nitrogen gross margin | | | 58.2 | | | | 43.6 | | | | 68.0 | | | | 73.0 | | | | 242.8 | | | | 29.8 | | | | 62.6 | | | | 41.9 | | | | 58.9 | | | | 193.2 | |
Net income (loss) per share for each quarter has been computed based on the weighted average number of shares issued and outstanding during the respective quarter; therefore, quarterly amounts may not add to the annual total. All share and per-share data have been retroactively adjusted to reflect the stock dividend of one common share for each share owned by shareholders of record at the close of business on August 11, 2004. The stock dividend had the same effect as a two-for-one stock split.
Our results in each quarter of 2004 were well above the prior year. The most significant contributing factor to the trend of increasing earnings was tight supply/demand fundamentals leading to greater volumes, lower costs and better prices in potash. Our 2003 results also reflect our decision to restructure various operations.
Certain aspects of our business can be impacted by seasonal factors. Fertilizers are sold primarily for spring and fall application in both northern and southern hemispheres. However, planting conditions and the timing of customer purchases will vary each year and fertilizer sales can be expected to shift from one quarter to another. Most feed and industrial sales are by contract and are more evenly distributed throughout the year.
Highlights of our 2004 fourth quarter include:
| • | Growing world potash consumption led to record sales volumes and a positive pricing environment. North American and offshore prices were up 33 percent and 52 percent respectively over last |
| | year’s fourth quarter, resulting in a 175-percent quarter-over-quarter increase in gross margin. |
| |
| • | Phosphate, led by industrial products, had its best quarter of the year. |
| |
| • | Nitrogen gross margin improved by 24 percent quarter over quarter due to the high price environment. Our Trinidad operations were responsible for 70 percent of fourth-quarter margin, with our US operations and hedging programs accounting for the remainder. |
| |
| • | Earnings were negatively affected by the continued appreciation of the Canadian dollar. |
| |
| • | Selling and administrative expenses rose compared to the same quarter of 2003, primarily due to performance-based compensation accruals. |
| |
| • | We concluded the sale of our shares of PCS Yumbes to SQM and sold certain SQM shares for a non-taxable gain of $34.4 million. |
49
POTASHCORP 2004 ANNUAL REPORT | MD&A•11 Year Report
11 YEAR REPORT
| | |
| 11 Year Report | | for the years ended December 31 |
| | | | | | | | | | | | | | | | | | | | | | | | | | | | | | | | | | | | | | | | | | | | | |
| | | 2004 | | | 2003 | | | 2002 | | | 2001 | | | 2000 | | | 1999 | | | 1998 | | | 1997(3) | | | 1996 | | | 1995(2) | | | 1994(1) | |
| | | | | | | | | | | | | | | | | | | | | | | | | | | | | | | | | | | | | | | | | | | | | |
| Financial Data(in millions of US dollars except share and per-share amounts) |
| Sales | | | | | | | | | | | | | | | | | | | | | | | | | | | | | | | | | | | | | | | | | | | | |
| Potash | | | 1,056.1 | | | | 758.7 | | | | 669.0 | | | | 655.2 | | | | 710.3 | | | | 688.6 | | | | 663.3 | | | | 644.0 | | | | 521.1 | | | | 530.2 | | | | 465.1 | |
| Phosphate | | | 977.9 | | | | 883.9 | | | | 714.0 | | | | 732.1 | | | | 868.1 | | | | 922.3 | | | | 1,099.5 | | | | 1,036.7 | | | | 972.5 | | | | 448.8 | | | | – | |
| Nitrogen | | | 1,210.4 | | | | 1,156.4 | | | | 841.4 | | | | 993.5 | | | | 964.5 | | | | 744.7 | | | | 844.2 | | | | 939.3 | | | | 111.3 | | | | 23.8 | | | | – | |
| Total sales | | | 3,244.4 | | | | 2,799.0 | | | | 2,224.4 | | | | 2,380.8 | | | | 2,542.9 | | | | 2,355.6 | | | | 2,607.0 | | | | 2,620.0 | | | | 1,604.9 | | | | 1,002.8 | | | | 465.1 | |
| Gross margin | | | | | | | | | | | | | | | | | | | | | | | | | | | | | | | | | | | | | | | | | | | | |
| Potash | | | 422.8 | | | | 203.7 | | | | 218.0 | | | | 248.1 | | | | 307.4 | | | | 304.2 | | | | 319.2 | | | | 261.4 | | | | 193.0 | | | | 217.9 | | | | 161.2 | |
| Phosphate | | | 15.8 | | | | (16.5 | ) | | | 41.9 | | | | 64.5 | | | | 76.8 | | | | 130.5 | | | | 230.1 | | | | 196.6 | | | | 196.2 | | | | 87.1 | | | | – | |
| Nitrogen | | | 242.8 | | | | 193.2 | | | | 47.4 | | | | 94.7 | | | | 104.7 | | | | (21.4 | ) | | | 64.8 | | | | 133.0 | | | | 2.1 | | | | 2.3 | | | | – | |
| Total gross margin | | | 681.4 | | | | 380.4 | | | | 307.3 | | | | 407.3 | | | | 488.9 | | | | 413.3 | | | | 614.1 | | | | 591.0 | | | | 391.3 | | | | 307.3 | | | | 161.2 | |
| Depreciation and amortization | | | | | | | | | | | | | | | | | | | | | | | | | | | | | | | | | | | | | | | | | | | | |
| Potash | | | 66.4 | | | | 52.4 | | | | 46.3 | | | | 34.1 | | | | 40.9 | | | | 37.2 | | | | 36.2 | | | | 39.6 | | | | 38.5 | | | | 42.1 | | | | 39.3 | |
| Phosphate | | | 84.4 | | | | 75.7 | | | | 76.8 | | | | 72.0 | | | | 68.1 | | | | 61.8 | | | | 59.1 | | | | 55.1 | | | | 51.6 | | | | 28.9 | | | | – | |
| Nitrogen | | | 79.7 | | | | 89.6 | | | | 88.0 | | | | 72.8 | | | | 66.1 | | | | 83.5 | | | | 86.7 | | | | 69.0 | | | | – | | | | – | | | | – | |
| Other | | | 9.5 | | | | 9.7 | | | | 8.0 | | | | 6.8 | | | | 11.9 | | | | 8.6 | | | | 8.9 | | | | 6.3 | | | | – | | | | – | | | | – | |
| Total depreciation and amortization | | | 240.0 | | | | 227.4 | | | | 219.1 | | | | 185.7 | | | | 187.0 | | | | 191.1 | | | | 190.9 | | | | 170.0 | | | | 90.1 | | | | 71.0 | | | | 39.3 | |
| Operating income (loss) | | | 514.3 | | | | (55.6 | ) | | | 166.9 | | | | 269.7 | | | | 326.8 | | | | (353.0 | ) | | | 442.3 | | | | 442.0 | | | | 297.4 | | | | 219.6 | | | | 97.5 | |
| |
Net income (loss)*(4) | | | 298.6 | | | | (126.3 | ) | | | 53.6 | | | | 121.2 | | | | 198.0 | | | | (412.0 | ) | | | 261.0 | | | | 297.1 | | | | 209.0 | | | | 159.5 | | | | 91.2 | |
| |
Net income (loss) per share – basic(5) | | | 2.77 | | | | (1.21 | ) | | | 0.52 | | | | 1.17 | | | | 1.89 | | | | (3.80 | ) | | | 2.41 | | | | 2.84 | | | | 2.29 | | | | 1.84 | | | | 1.06 | |
| |
Net income (loss) per share – diluted(5) | | | 2.70 | | | | (1.21 | ) | | | 0.51 | | | | 1.16 | | | | 1.88 | | | | (3.80 | ) | | | 2.39 | | | | 2.81 | | | | 2.27 | | | | 1.82 | | | | 1.06 | |
| |
Dividends per share(5) | | | 0.55 | | | | 0.50 | | | | 0.50 | | | | 0.50 | | | | 0.50 | | | | 0.50 | | | | 0.48 | | | | 0.52 | | | | 0.53 | | | | 0.53 | | | | 0.39 | |
| |
| Cash provided by operating activities | | | 649.6 | | | | 381.5 | | | | 316.4 | | | | 75.7 | | | | 480.4 | | | | 343.6 | | | | 578.0 | | | | 467.8 | | | | 296.2 | | | | 233.5 | | | | 150.7 | |
| |
| Working capital | | | 539.9 | | | | 176.1 | | | | 8.6 | | | | 47.1 | | | | (148.7 | ) | | | (104.8 | ) | | | 329.2 | | | | 281.7 | | | | 278.8 | | | | 136.1 | | | | 103.3 | |
| |
| Total assets | | | 5,126.8 | | | | 4,567.3 | | | | 4,685.6 | | | | 4,597.3 | | | | 4,145.7 | | | | 3,916.8 | | | | 4,534.3 | | | | 4,427.6 | | | | 2,494.4 | | | | 2,581.8 | | | | 1,027.8 | |
| |
| Long-term debt | | | 1,258.6 | | | | 1,268.6 | | | | 1,019.9 | | | | 1,013.7 | | | | 413.7 | | | | 437.0 | | | | 933.3 | | | | 1,130.0 | | | | 620.0 | | | | 714.5 | | | | 2.0 | |
| |
| Shareholders’ equity | | | 2,385.6 | | | | 1,973.8 | | | | 2,092.5 | | | | 2,086.5 | | | | 2,012.1 | | | | 1,962.4 | | | | 2,453.8 | | | | 2,227.9 | | | | 1,405.5 | | | | 1,241.9 | | | | 964.3 | |
| |
Shares outstanding at the end
of the year (in 000’s)(5) | | | 110,631 | | | | 106,224 | | | | 104,156 | | | | 103,904 | | | | 103,682 | | | | 107,388 | | | | 108,488 | | | | 107,792 | | | | 91,164 | | | | 90,880 | | | | 85,976 | |
| |
| | | | | | | | | | | | | | | | | | | | | | | | | | | | | | | | | | | | | | | | | | | | | |
Operating Data(thousands) | | | | | | | | | | | | | | | | | | | | | | | | | | | | | | | | | | | | | | | | | | | | |
| Employees at year-end (actual #) | | | 4,906 | | | | 4,904 | | | | 5,199 | | | | 4,997 | | | | 5,338 | | | | 5,498 | | | | 5,744 | | | | 5,751 | | | | 4,490 | | | | 4,579 | | | | 1,781 | |
| |
| Potash production (KCI) tonnage | | | 7,914 | | | | 7,094 | | | | 6,447 | | | | 6,128 | | | | 7,149 | | | | 6,388 | | | | 6,995 | | | | 6,483 | | | | 5,782 | | | | 6,071 | | | | 5,298 | |
| |
Phosphate production (P205) tonnage | | | 1,962 | | | | 1,861 | | | | 1,512 | | | | 1,573 | | | | 2,042 | | | | 2,124 | | | | 2,363 | | | | 2,282 | | | | 2,096 | | | | 1,008 | | | | – | |
| |
| Nitrogen production (N) tonnage | | | 2,558 | | | | 2,619 | | | | 2,990 | | | | 3,032 | | | | 2,706 | | | | 3,138 | | | | 3,121 | | | | 2,349 | | | | – | | | | – | | | | – | |
| |
| Potash sales – KCI tonnes | | | 8,276 | | | | 7,083 | | | | 6,327 | | | | 6,243 | | | | 6,912 | | | | 6,474 | | | | 6,283 | | | | 6,640 | | | | 5,612 | | | | 5,848 | | | | 5,569 | |
| |
| Phosphate sales – product tonnes | | | 3,793 | | | | 3,647 | | | | 2,863 | | | | 3,045 | | | | 3,893 | | | | 4,016 | | | | 4,627 | | | | 4,434 | | | | 4,305 | | | | 2,206 | | | | – | |
| |
| Nitrogen sales – product tonnes | | | 5,350 | | | | 6,080 | | | | 6,391 | | | | 6,381 | | | | 6,760 | | | | 6,705 | | | | 6,596 | | | | 5,851 | | | | 535 | | | | 115 | | | | – | |
| |
| (1) | The consolidated financial statements of the company for 1994 have been restated to US dollars using the translation of convenience method. The Canadian dollar amounts for this period have been converted to US dollars at the exchange rate of US $1.00 = Cdn $1.4028. |
| (2) | Data for 1995 and thereafter reflect the acquisition of Texasgulf Inc. on April 10, 1995 and the acquisition of White Springs Agricultural Chemicals, Inc. on October 31, 1995. |
| (3) | Data for 1997 and thereafter reflect the acquisition of Arcadian Corporation on March 6,1997. |
| (4) | There were no extraordinary items nor were there any discontinued operations in any of the accounting periods. |
| (5) | All share and per-share data have been retroactively adjusted to reflect the stock dividend of one common share for each share owned by shareholders of record at the close of business on August 11, 2004. The stock dividend had the same effect as a two-for-one stock split. |
The consolidated financial statements of the company have been prepared in accordance with Canadian generally accepted accounting principles. These principles differ in some respects from those applicable in the United States. (See Note 36 to the company’s consolidated financial statements.) Certain of the prior years’ figures have been reclassified to conform with the current year’s presentation.
Additional Information
| * | The after-tax effects of asset impairment, plant shutdown, plant closure and office consolidation charges and the gain on sale of long-term investments and Moab Inc. are included (as applicable) in the data for 2004, 2003, 2000 and 1999 in the amounts of $(30.8) million, $203.2 million, $1.5 million and $547.1 million, respectively. |
50
POTASHCORP 2004 ANNUAL REPORT | MD&A•Key Earnings Sensitivities /Indicators to Watch /Forward-Looking Statements
SENSITIVITIES / INDICATORS / FORWARD-LOOKING STATEMENTS
Key Earnings Sensitivities
A number of factors affect the earnings of the company’s three nutrient segments. The table below shows the key factors and their approximate effect on EPS based on the assumptions used in the 2005 earnings guidance of $3.50 to $4.25 per diluted share.
| | | | | | | | | | | | |
| | | | | Effect | | | | | | | Effect |
| Input Cost Sensitivities | | | | on EPS | | | Price and Volume Sensitivities | | on EPS |
| | | | | | | | | | | |
| NYMEX gas price increases by $1/MMBtu | | Nitrogen | | + 0.13 | | | Price | | Potash changes by $5/tonne | | ± 0.19 |
| | | | | | | | | | | |
| | Potash | | – 0.04 | | | | | DAP/MAP changes by $5/tonne | | ± 0.05 |
| | | | | | | | | | | |
| Sulfur changes by $5/long ton | | Phosphate | | ± 0.06 | | | | | Ammonia increases by $10/tonne • Nitrogen | | + 0.05 |
| | | | | | | | | • Phosphate | | – 0.02 |
| | | | | | | | | Urea changes by $10/tonne | | ± 0.08 |
| | | | | | | | | | | | |
| Canadian to US dollar changes by $0.01 | | Canadian operating expenses net of provincial taxes | | ± 0.02 | | | Volume | | Potash changes by 100,000 tonnes | | ± 0.05 |
| | | | | | | | | Phosphate changes by 50,000 P2O5tonnes | | ± 0.04 |
| | | | | | | | | | | |
| | Translation gain/loss | | ± 0.02 | | | | | Nitrogen changes by 50,000 N tonnes | | ± 0.04 |
The above sensitivities affect cash flow as well, except the translation gain/loss which is primarily non-cash.
| | | | | | | | |
Indicators to Watch in 2005 |
| | | | |
| | | | | | | |
Fertilizer | | | Feed and Industrial |
| o | | Weather and global acreage planted | | | o | | Health of US and world economies |
| o | | China’s grain stocks and corn exports | | | o | | Effect of livestock disease-based restrictions on world trade |
o
o
o
o
o
o
o
o | | US dollar exchange rates with global currencies
Global crop prices
Impact of Asian rust on the soybean market
Ocean freight rates
Prices for natural gas, sulfur and ammonia
Russia’s energy policy as a condition for its WTO entry
India’s reform of fertilizer subsidy policy
Impact of EU policy on fertilizer imports from Russia | | | o
o
o
| | Potential tightening of restrictions on the use of meat and bone meal in animal feeds
Impact of residual grain from ethanol production on US feed phosphate consumption
Consumer spending, housing starts, household improvements and vehicle production and sales |
Forward-Looking Statements
Certain statements in this annual report and this Management’s Discussion & Analysis of Financial Condition and Results of Operations, including those in the “Outlook” section relating to the period after December 31, 2004, are forward-looking statements subject to risks and uncertainties. A number of factors could cause actual results to differ materially from those expressed in the forward-looking statements, including, but not limited to: fluctuation in supply and demand in fertilizer, sulfur, petrochemical and transportation markets; changes in competitive pressures, including pricing pressures; risks associated with natural gas and other hedging activities; changes in capital markets; changes in currency and exchange rates; fluctuation in costs of distribution and transportation; unexpected geological or environmental conditions; imprecision in
resource estimates; the outcome of legal proceedings; changes in government policy and regulation including those with respect to environmental matters; worldwide political conditions; acquisitions the company may undertake in the future; and the Fertilizer and Feed and Industrial Indicators to Watch and other matters under Risk Management as described previously. The company sells to a diverse group of customers both by geography and by end product. Market conditions will vary on a year-over-year basis and sales can be expected to shift from one period to another. The company disclaims any intention or obligation to update or revise any forward-looking statements, whether as a result of new information, future events or otherwise, other than as required by applicable law.
51
POTASHCORP 2004 ANNUAL REPORT | MD&A•Appendix
APPENDIX
Market and Industry Data
Some of the market and industry data contained in this annual report and this Management’s Discussion & Analysis of Financial Condition and Results of Operations are based on internal surveys, market research, independent industry publications or other publicly available information. Although we believe that the independent sources used by us are reliable, we have not independently verified and cannot guarantee the accuracy or completeness of this information. Similarly, we believe our internal research is reliable, but such research has not been verified by any independent sources.
Information in the preparation of this annual report is based on statistical data and other material available at February 28, 2005.
Sources and Glossary of Terms*
SOURCES
| | | | | |
| Page 15 Footnotes |
| |
Fact | | | | Reference** |
| 1 | | Geographic Availability of Raw Materials | | Source: Fertecon, EIA |
| 2 | | Cost of New Capacity | | Source: Fertecon |
| 3 | | Greenfield | | Definition: New operation built on
undeveloped site |
| 4 | | Greenfield Development Time | | Source: Fertecon |
| 5 | | Producing Countries | | Source: Fertecon |
| 6 | | State- or Subsidy-Controlled
Production | | Definitions:
State-controlled: Operational control in the hands of the state
Subsidy-controlled: The state provides subsidies which control the economic viability of the operation |
| 7 | | Industry Operating Rate | | Source: Fertecon, PotashCorp |
| 8 | | PotashCorp Capacity | | Source: Fertecon, PotashCorp |
| 9 | | PotashCorp World Position
by Capacity | | Source: Fertecon, PotashCorp |
| |
| Page 27 Footnotes |
| |
Fact | | | | Reference |
| 10 | | Total World Demand | | Source: Fertecon |
| 11 | | PotashCorp Share of World Production | | Source: Fertecon, PotashCorp |
| |
| Footnotes to the Appendix |
| |
| * | | Where PotashCorp is listed as a source in conjunction with external sources, we have supplemented the external data with internal analysis. |
| ** | | Abbreviated Source Name | | Complete Source Name and Location |
| | Blue, Johnson | | Blue, Johnson & Associates
Albuquerque, NM, USA |
| | British Sulphur | | British Sulphur Consultants
London, England |
| | Canpotex | | Canpotex Limited
Saskatoon, SK, Canada |
| | EIA | | Energy Information Administration
Washington, DC, USA |
| | Fertecon | | Fertecon Limited
Tunbridge Wells, Kent, England |
| | IFA | | International Fertilizer Industry Association
Paris, France |
| | IMF World Economic Outlook | | International Monetary Fund
Washington, DC, USA |
| | NRCan | | Natural Resources Canada
Ottawa, ON, Canada |
| | NYMEX | | New York Mercantile Exchange
New York, NY, USA |
| | OANDA | | OANDA Corporation
New York, NY USA; Toronto, ON Canada |
| | Overseas Marine Services | | Overseas Marine Services
New York, NY, USA |
| | USDA | | US Department of Agriculture
Washington, DC, USA |
GLOSSARY OF TERMS
| | | | | |
| Canpotex | | An export company owned by all Saskatchewan producers (PotashCorp, Mosaic and Agrium). Sales through Canpotex are generally allocated pro rata to each producer on the basis of productive capacity. PotashCorp provides approximately 54% of Canpotex product. |
Consumption
vs Demand | | End use vs product purchased |
| North America | | The North American market includes Canada and the United States. |
| Offshore | | Offshore markets include all markets except Canada and the United States. |
| PhosChem | | An association formed under the Webb-Pomerene Act for US exports of phosphate fertilizer products. Members are PotashCorp, Mosaic and Mississippi Phosphates Corporation. PCS Sales is responsible for export sales of liquid fertilizers for all PhosChem members while Mosaic is responsible for sales of solid fertilizers for members. |
| |
| Abbreviated | | |
| Company | | Complete Company |
| Name | | Name and Country |
| |
| Agrium | | Agrium Inc. (TSX and NYSE: AGU), Canada |
| APC | | Arab Potash Company Ltd. (Amman: ARPT), Jordan |
| Astaris LLC | | Astaris LLC, USA |
| BASF | | BASF Group (Xetra: BAS, NYSE: BF), USA |
| Belaruskali | | PA Belaruskali, Belarus |
| CF Industries | | CF Industries, Inc., USA |
| CNC | | Caribbean Nitrogen Company, Trinidad |
| CVRD | | Companhia Vale do Rio Doce, Brazil |
| DSM | | DSM Chemicals North America Inc. (XAMS: DSMA, NYSE: DSMKY), USA |
| Emaphos | | Euro-Maroc-Phosphore, Morocco |
| ICL | | Israel Chemicals Ltd. (Tel Aviv: CHIM), Israel |
| Innophos | | Innophos, Inc., USA |
| Kali & Salz (K&S) | | Kali und Salz GmbH (Xetra: SDF), Germany |
| Koch | | Koch Industries, Inc., USA |
| Mosaic | | The Mosaic Company (NYSE: MOS), USA |
| OCP | | Office Cherifien des Phosphates, Morocco |
| Prayon | | Societe Chimique Prayon-Rupel SA, Belgium |
| Rotem | | Rotem Amfert Negev Limited (Tel Aviv: ROTM), Israel |
| Silvinit | | JSC Silvinit, Russia |
| SQM | | Sociedad Quimica y Minera de Chile S.A. (Santiago Bolsa de Comercio Exchange, NYSE: SQM), Chile |
| Terra | | Terra Industries, Inc. (NYSE: TRA), USA |
| Tringen | | Trinidad Nitrogen Co., Limited, Trinidad |
| Uralkali | | JSC Uralkali, Russia |
| Yara | | Yara International (Formerly Hydro Agri and Hydro Gas and Chemicals) (Oslo: YAR), Norway |
| |
| Scientific Terms | | |
| |
Nitrogen | | HNO3 | | nitric acid (liquid) |
| | UAN | | nitrogen solutions, 28-32% N (liquid) |
Phosphate | | P2O5 | | phosphoric acid |
| | MGA | | merchant grade acid, 54% P2O5(liquid) |
| | DAP | | diammonium phosphate, 46% P2O5(solid) |
| | MAP | | monoammonium phosphate, 52% P2O5(solid) |
| | SPA | | superphosphoric acid, 70% P2O5(liquid) |
Potash | | KCl | | potassium chloride |
| |
| Fertilizer Measures |
| |
P2O5tonne | | | | Measures the phosphorus content of fertilizers having different chemical analyses |
N tonne | | | | Measures the nitrogen content of fertilizers having different chemical analyses |
Product tonne | | | | Standard measure of the weights of all types of potash, phosphate and nitrogen products |
52
POTASHCORP 2004 ANNUAL REPORT | FINANCIAL PERFORMANCE INDICATORS
Financial Performance Indicators(in millions of US dollars except share and per-share amounts)
| | | | | | | | | | | | | | | | | | | | | | | | | | | | | | | | | | | | | | | | | | | | | | | |
| | | | 2004 | | | 2003 | | | 2002 | | | 2001 | | | 2000 | | | 1999 | | | 1998 | | | 1997 | | | 1996 | | | 1995 | | | 1994 | | |
| | | |
| | Summary | | | | | | | | | | | | | | | | | | | | | | | | | | | | | | | | | | | | | | | | | | | | | |
| | Net income (loss) | | | 298.6 | | | | (126.3 | ) | | | 53.6 | | | | 121.2 | | | | 198.0 | | | | (412.0 | ) | | | 261.0 | | | | 297.1 | | | | 209.0 | | | | 159.5 | | | | 91.2 | | |
| | | |
| | Adjusted net income(1) | | | 267.8 | | | | 76.9 | | | | 53.6 | | | | 121.2 | | | | 199.5 | | | | 135.1 | | | | 261.0 | | | | 297.1 | | | | 209.0 | | | | 159.5 | | | | 91.2 | | |
| | | |
| | Net income (loss) per diluted share | | | 2.70 | | | | (1.21 | ) | | | 0.51 | | | | 1.16 | | | | 1.88 | | | | (3.80 | ) | | | 2.39 | | | | 2.81 | | | | 2.27 | | | | 1.82 | | | | 1.06 | | |
| | | |
| | Adjusted net income per diluted share(1) | | | 2.42 | | | | 0.73 | | | | 0.51 | | | | 1.16 | | | | 1.89 | | | | 1.23 | | | | 2.39 | | | | 2.81 | | | | 2.27 | | | | 1.82 | | | | 1.06 | | |
| | | |
| | EBITDA(2) | | | 754.3 | | | | 171.8 | | | | 386.0 | | | | 455.4 | | | | 513.8 | | | | (161.9 | ) | | | 633.2 | | | | 612.0 | | | | 387.5 | | | | 290.6 | | | | 136.8 | | |
| | | |
| | Adjusted EBITDA(2) | | | 723.5 | | | | 417.7 | | | | 386.0 | | | | 455.4 | | | | 508.2 | | | | 401.8 | | | | 633.2 | | | | 612.0 | | | | 387.5 | | | | 290.6 | | | | 136.8 | | |
| | | |
| | Cash flow prior to working capital changes(3) | | | 529.6 | | | | 364.5 | | | | 289.2 | | | | 345.8 | | | | 405.1 | | | | 319.6 | | | | 556.2 | | | | 489.3 | | | | 321.7 | | | | 242.1 | | | | 130.9 | | |
| | | |
| | Cash provided by operating activities | | | 649.6 | | | | 381.5 | | | | 316.4 | | | | 75.7 | | | | 480.4 | | | | 343.6 | | | | 578.0 | | | | 467.8 | | | | 296.2 | | | | 233.5 | | | | 150.7 | | |
| | | |
| | Return on assets | | | 5.8% | | | | (2.8% | ) | | | 1.1% | | | | 2.6% | | | | 4.8% | | | | (10.5% | ) | | | 5.8% | | | | 6.7% | | | | 8.4% | | | | 6.2% | | | | 8.9% | | |
| | | |
| | Cash flow return(4) | | | 12.4% | | | | 2.6% | | | | 6.7% | | | | 8.1% | | | | 11.0% | | | | (3.6% | ) | | | 12.7% | | | | 12.9% | | | | 12.6% | | | | 13.8% | | | | 10.1% | | |
| | | |
| | Weighted average cost of capital | | | 8.4% | | | | 7.3% | | | | 7.3% | | | | 7.7% | | | | 8.7% | | | | 8.7% | | | | 8.3% | | | | 8.8% | | | | 9.7% | | | | 8.5% | | | | n/a | | |
| | | |
| | Total shareholder return | | | 93.4% | | | | 37.5% | | | | 5.2% | | | | (20.4% | ) | | | 64.6% | | | | (23.0% | ) | | | (21.9% | ) | | | (1.1% | ) | | | 21.4% | | | | 111.6% | | | | 35.6% | | |
| | | |
| | Total debt to capital | | | 36.4% | | | | 42.3% | | | | 41.7% | | | | 42.1% | | | | 31.1% | | | | 31.9% | | | | 29.5% | | | | 35.7% | | | | 30.9% | | | | 41.5% | | | | – | | |
| | | |
| | Net debt to capital(5) | | | 27.5% | | | | 42.2% | | | | 41.3% | | | | 41.3% | | | | 28.7% | | | | 30.8% | | | | 28.1% | | | | 35.5% | | | | 30.9% | | | | 40.3% | | | | – | | |
| | | |
| |
| | Reconciliations and Calculations | | | | | | | | | | | | | | | | | | | | | | | | | | | | | | | | | | | | | | | | | | | | | |
| | Net income (loss) | | | 298.6 | | | | (126.3 | ) | | | 53.6 | | | | 121.2 | | | | 198.0 | | | | (412.0 | ) | | | 261.0 | | | | 297.1 | | | | 209.0 | | | | 159.5 | | | | 91.2 | | |
| | Provision for plant shutdowns | | | – | | | | 123.7 | | | | – | | | | – | | | | – | | | | – | | | | – | | | | – | | | | – | | | | – | | | | – | | |
| | Provision for PCS Yumbes | | | 3.6 | | | | 140.5 | | | | – | | | | – | | | | – | | | | – | | | | – | | | | – | | | | – | | | | – | | | | – | | |
| | Other provisions for plant closures, office consolidation and asset impairment | | | – | | | | – | | | | – | | | | – | | | | 24.3 | | | | 591.6 | | | | – | | | | – | | | | – | | | | – | | | | – | | |
| | Gain on sale of long-term investments and Moab Inc. | | | (34.4 | ) | | | – | | | | – | | | | – | | | | (16.3 | ) | | | – | | | | – | | | | – | | | | – | | | | – | | | | – | | |
| | Tax effect | | | – | | | | (61.0 | ) | | | – | | | | – | | | | (6.5 | ) | | | (44.5 | ) | | | – | | | | – | | | | – | | | | – | | | | – | | |
| | | |
| | Adjusted net income(1) | | | 267.8 | | | | 76.9 | | | | 53.6 | | | | 121.2 | | | | 199.5 | | | | 135.1 | | | | 261.0 | | | | 297.1 | | | | 209.0 | | | | 159.5 | | | | 91.2 | | |
| | | |
| |
| | Net income (loss) per diluted share | | | 2.70 | | | | (1.21 | ) | | | 0.51 | | | | 1.16 | | | | 1.88 | | | | (3.80 | ) | | | 2.39 | | | | 2.81 | | | | 2.27 | | | | 1.82 | | | | 1.06 | | |
| | After-tax effect per diluted share for above provisions | | | (0.28 | ) | | | 1.94 | | | | – | | | | – | | | | 0.01 | | | | 5.03 | | | | – | | | | – | | | | – | | | | – | | | | – | | |
| | | |
| | Adjusted net income per diluted share(1) | | | 2.42 | | | | 0.73 | | | | 0.51 | | | | 1.16 | | | | 1.89 | | | | 1.23 | | | | 2.39 | | | | 2.81 | | | | 2.27 | | | | 1.82 | | | | 1.06 | | |
| | | |
| |
| | Net income (loss) | | | 298.6 | | | | (126.3 | ) | | | 53.6 | | | | 121.2 | | | | 198.0 | | | | (412.0 | ) | | | 261.0 | | | | 297.1 | | | | 209.0 | | | | 159.5 | | | | 91.2 | | |
| | Income taxes | | | 131.7 | | | | (20.6 | ) | | | 30.2 | | | | 68.2 | | | | 67.2 | | | | 7.5 | | | | 117.5 | | | | 69.1 | | | | 43.7 | | | | 22.9 | | | | 3.5 | | |
| | Interest expense | | | 84.0 | | | | 91.3 | | | | 83.1 | | | | 80.3 | | | | 61.6 | | | | 51.5 | | | | 63.8 | | | | 75.8 | | | | 44.7 | | | | 37.2 | | | | 2.8 | | |
| | Depreciation and amortization | | | 240.0 | | | | 227.4 | | | | 219.1 | | | | 185.7 | | | | 187.0 | | | | 191.1 | | | | 190.9 | | | | 170.0 | | | | 90.1 | | | | 71.0 | | | | 39.3 | | |
| | | |
| | EBITDA(2) | | | 754.3 | | | | 171.8 | | | | 386.0 | | | | 455.4 | | | | 513.8 | | | | (161.9 | ) | | | 633.2 | | | | 612.0 | | | | 387.5 | | | | 290.6 | | | | 136.8 | | |
| | Impairment charges and non-cash shutdown/closure-related costs, office consolidation costs and the gain on sale of long-term investments and Moab Inc. | | | (30.8 | ) | | | 245.9 | | | | – | | | | – | | | | (5.6 | ) | | | 563.7 | | | | – | | | | – | | | | – | | | | – | | | | – | | |
| | | |
| | Adjusted EBITDA(2) | | | 723.5 | | | | 417.7 | | | | 386.0 | | | | 455.4 | | | | 508.2 | | | | 401.8 | | | | 633.2 | | | | 612.0 | | | | 387.5 | | | | 290.6 | | | | 136.8 | | |
| | | |
| |
| | Cash flow prior to working capital changes(3) | | | 529.6 | | | | 364.5 | | | | 289.2 | | | | 345.8 | | | | 405.1 | | | | 319.6 | | | | 556.2 | | | | 489.3 | | | | 321.7 | | | | 242.1 | | | | 130.9 | | |
| | | |
| | Accounts receivable | | | (51.9 | ) | | | (39.5 | ) | | | (11.1 | ) | | | 69.9 | | | | (52.2 | ) | | | 33.8 | | | | 48.8 | | | | 23.5 | | | | (7.4 | ) | | | (48.8 | ) | | | (14.4 | ) | |
| | Inventories | | | (10.5 | ) | | | 11.8 | | | | (18.2 | ) | | | (76.1 | ) | | | (27.4 | ) | | | (16.1 | ) | | | (7.9 | ) | | | 19.9 | | | | 2.5 | | | | 9.3 | | | | 14.6 | | |
| | Prepaid expenses and other current assets | | | (6.3 | ) | | | 11.4 | | | | (3.9 | ) | | | 2.3 | | | | (3.1 | ) | | | 3.2 | | | | (16.6 | ) | | | 3.7 | | | | (1.9 | ) | | | 2.5 | | | | 0.5 | | |
| | Accounts payable and accrued charges | | | 102.2 | | | | 51.6 | | | | 37.0 | | | | (244.6 | ) | | | 137.4 | | | | (5.0 | ) | | | 1.3 | | | | (72.0 | ) | | | 0.5 | | | | 1.8 | | | | – | | |
| | Current income taxes | | | 86.5 | | | | (18.3 | ) | | | 23.4 | | | | (21.6 | ) | | | 20.6 | | | | 8.1 | | | | (3.8 | ) | | | 3.4 | | | | (19.2 | ) | | | 26.6 | | | | 19.1 | | |
| | | |
| | Changes in non-cash operating working capital | | | 120.0 | | | | 17.0 | | | | 27.2 | | | | (270.1 | ) | | | 75.3 | | | | 24.0 | | | | 21.8 | | | | (21.5 | ) | | | (25.5 | ) | | | (8.6 | ) | | | 19.8 | | |
| | | |
| | Cash provided by operating activities | | | 649.6 | | | | 381.5 | | | | 316.4 | | | | 75.7 | | | | 480.4 | | | | 343.6 | | | | 578.0 | | | | 467.8 | | | | 296.2 | | | | 233.5 | | | | 150.7 | | |
| | | |
| |
| | Net income (loss) | | | 298.6 | | | | (126.3 | ) | | | 53.6 | | | | 121.2 | | | | 198.0 | | | | (412.0 | ) | | | 261.0 | | | | 297.1 | | | | 209.0 | | | | 159.5 | | | | 91.2 | | |
| | Total assets | | | 5,126.8 | | | | 4,567.3 | | | | 4,685.6 | | | | 4,597.3 | | | | 4,145.7 | | | | 3,916.8 | | | | 4,534.3 | | | | 4,427.6 | | | | 2,494.4 | | | | 2,581.8 | | | | 1,027.8 | | |
| | | |
| | Return on assets | | | 5.8% | | | | (2.8% | ) | | | 1.1% | | | | 2.6% | | | | 4.8% | | | | (10.5% | ) | | | 5.8% | | | | 6.7% | | | | 8.4% | | | | 6.2% | | | | 8.9% | | |
| | | |
53
POTASHCORP 2004 ANNUAL REPORT | FINANCIAL PERFORMANCE INDICATORS
Financial Performance Indicators(in millions of US dollars except share and per-share amounts)
Reconciliations and Calculations (continued)
| | | | | | | | | | | | | | | | | | | | | | | | | | | | | | | | | | | | | | | | | | | | | |
| | | 2004 | | | 2003 | | | 2002 | | | 2001 | | | 2000 | | | 1999 | | | 1998 | | | 1997 | | | 1996 | | | 1995 | | | 1994 | |
| |
| Net income (loss) | | | 298.6 | | | | (126.3 | ) | | | 53.6 | | | | 121.2 | | | | 198.0 | | | | (412.0 | ) | | | 261.0 | | | | 297.1 | | | | 209.0 | | | | 159.5 | | | | 91.2 | |
| Income taxes | | | 131.7 | | | | (20.6 | ) | | | 30.2 | | | | 68.2 | | | | 67.2 | | | | 7.5 | | | | 117.5 | | | | 69.1 | | | | 43.7 | | | | 22.9 | | | | 3.5 | |
| Interest expense | | | 84.0 | | | | 91.3 | | | | 83.1 | | | | 80.3 | | | | 61.6 | | | | 51.5 | | | | 63.8 | | | | 75.8 | | | | 44.7 | | | | 37.2 | | | | 2.8 | |
| Cash taxes paid | | | (33.5 | ) | | | (22.8 | ) | | | (4.4 | ) | | | (41.5 | ) | | | (13.4 | ) | | | (5.8 | ) | | | (19.2 | ) | | | (41.3 | ) | | | (32.9 | ) | | | (6.2 | ) | | | (1.2 | ) |
| Depreciation and amortization | | | 240.0 | | | | 227.4 | | | | 219.1 | | | | 185.7 | | | | 187.0 | | | | 191.1 | | | | 190.9 | | | | 170.0 | | | | 90.1 | | | | 71.0 | | | | 39.3 | |
| |
Cash flow(4) | | | 720.8 | | | | 149.0 | | | | 381.6 | | | | 413.9 | | | | 500.4 | | | | (167.7 | ) | | | 614.0 | | | | 570.7 | | | | 354.6 | | | | 284.4 | | | | 135.6 | |
| |
| | | | | | | | | | | | | | | | | | | | | | | | | | | | | | | | | | | | | | | | | | | | | |
| Total assets | | | 5,126.8 | | | | 4,567.3 | | | | 4,685.6 | | | | 4,597.3 | | | | 4,145.7 | | | | 3,916.8 | | | | 4,534.3 | | | | 4,427.6 | | | | 2,494.4 | | | | 2,581.8 | | | | 1,027.8 | |
| Cash and cash equivalents | | | (458.9 | ) | | | (4.7 | ) | | | (24.5 | ) | | | (45.3 | ) | | | (100.0 | ) | | | (44.0 | ) | | | (68.0 | ) | | | (8.8 | ) | | | – | | | | (40.5 | ) | | | (16.6 | ) |
| Accumulated depreciation of property, plant and equipment | | | 1,754.9 | | | | 1,576.2 | | | | 1,454.7 | | | | 1,274.3 | | | | 1,111.8 | | | | 951.0 | | | | 812.4 | | | | 662.0 | | | | 528.7 | | | | 454.1 | | | | 388.4 | |
| Accumulated amortization of goodwill | | | 7.3 | | | | 7.3 | | | | 7.3 | | | | 7.3 | | | | 4.3 | | | | 1.4 | | | | 27.4 | | | | 12.7 | | | | 0.3 | | | | – | | | | – | |
| Accounts payable and accrued charges | | | (599.9 | ) | | | (380.3 | ) | | | (347.0 | ) | | | (271.4 | ) | | | (525.9 | ) | | | (349.1 | ) | | | (349.7 | ) | | | (348.1 | ) | | | (180.0 | ) | | | (199.2 | ) | | | (60.9 | ) |
| |
| Adjusted assets | | | 5,830.2 | | | | 5,765.8 | | | | 5,776.1 | | | | 5,562.2 | | | | 4,635.9 | | | | 4,476.1 | | | | 4,956.4 | | | | 4,745.4 | | | | 2,843.4 | | | | 2,796.2 | | | | 1,338.7 | |
| |
| Average adjusted assets | | | 5,798.0 | | | | 5,771.0 | | | | 5,669.2 | | | | 5,099.1 | | | | 4,556.0 | | | | 4,716.3 | | | | 4,850.9 | | | | 4,432.2 | | | | 2,819.8 | | | | 2,067.5 | | | | 1,348.2 | |
| |
Cash flow return(4) | | | 12.4% | | | | 2.6% | | | | 6.7% | | | | 8.1% | | | | 11.0% | | | | (3.6% | ) | | | 12.7% | | | | 12.9% | | | | 12.6% | | | | 13.8% | | | | 10.1% | |
| |
| | | | | | | | | | | | | | | | | | | | | | | | | | | | | | | | | | | | | | | | | | | | | |
| Weighted average cost of capital | | | 8.4% | | | | 7.3% | | | | 7.3% | | | | 7.7% | | | | 8.7% | | | | 8.7% | | | | 8.3% | | | | 8.8% | | | | 9.7% | | | | 8.5% | | | | n/a | |
| |
| | | | | | | | | | | | | | | | | | | | | | | | | | | | | | | | | | | | | | | | | | | | | |
| End of year closing price (dollars) | | | 83.06 | | | | 43.24 | | | | 31.80 | | | | 30.69 | | | | 39.16 | | | | 24.10 | | | | 31.94 | | | | 41.50 | | | | 42.50 | | | | 35.44 | | | | 17.00 | |
| Beginning of year opening price (dollars) | | | 43.24 | | | | 31.80 | | | | 30.69 | | | | 39.16 | | | | 24.10 | | | | 31.94 | | | | 41.50 | | | | 42.50 | | | | 35.44 | | | | 17.00 | | | | 12.82 | |
| |
| Change in share price (dollars) | | | 39.82 | | | | 11.44 | | | | 1.11 | | | | (8.47 | ) | | | 15.06 | | | | (7.84 | ) | | | (9.56 | ) | | | (1.00 | ) | | | 7.06 | | | | 18.44 | | | | 4.18 | |
| |
| Dividends per share (dollars) | | | 0.55 | | | | 0.50 | | | | 0.50 | | | | 0.50 | | | | 0.50 | | | | 0.50 | | | | 0.48 | | | | 0.52 | | | | 0.53 | | | | 0.53 | | | | 0.39 | |
| |
| Total shareholder return | | | 93.4% | | | | 37.5% | | | | 5.2% | | | | (20.4% | ) | | | 64.6% | | | | (23.0% | ) | | | (21.9% | ) | | | (1.1% | ) | | | 21.4% | | | | 111.6% | | | | 35.6% | |
| |
| | | | | | | | | | | | | | | | | | | | | | | | | | | | | | | | | | | | | | | | | | | | | |
| Short-term debt | | | 93.5 | | | | 176.2 | | | | 473.0 | | | | 501.1 | | | | 488.8 | | | | 474.5 | | | | 94.9 | | | | 101.9 | | | | 6.3 | | | | – | | | | – | |
| Current portion of long-term debt | | | 10.3 | | | | 1.3 | | | | 3.4 | | | | – | | | | 5.7 | | | | 7.4 | | | | 0.4 | | | | 2.7 | | | | 1.8 | | | | 165.9 | | | | 0.6 | |
| Long-term debt | | | 1,258.6 | | | | 1,268.6 | | | | 1,019.9 | | | | 1,013.7 | | | | 413.7 | | | | 437.0 | | | | 933.3 | | | | 1,130.0 | | | | 620.0 | | | | 714.5 | | | | 2.0 | |
| |
| Total debt | | | 1,362.4 | | | | 1,446.1 | | | | 1,496.3 | | | | 1,514.8 | | | | 908.2 | | | | 918.9 | | | | 1,028.6 | | | | 1,234.6 | | | | 628.1 | | | | 880.4 | | | | 2.6 | |
| Cash and cash equivalents | | | (458.9 | ) | | | (4.7 | ) | | | (24.5 | ) | | | (45.3 | ) | | | (100.0 | ) | | | (44.0 | ) | | | (68.0 | ) | | | (8.8 | ) | | | – | | | | (40.5 | ) | | | (16.6 | ) |
| |
Net debt(5) | | | 903.5 | | | | 1,441.4 | | | | 1,471.8 | | | | 1,469.5 | | | | 808.2 | | | | 874.9 | | | | 960.6 | | | | 1,225.8 | | | | 628.1 | | | | 839.9 | | | | (14.0 | ) |
| |
| Shareholders’ equity | | | 2,385.6 | | | | 1,973.8 | | | | 2,092.5 | | | | 2,086.5 | | | | 2,012.1 | | | | 1,962.4 | �� | | | 2,453.8 | | | | 2,227.9 | | | | 1,405.5 | | | | 1,241.9 | | | | 964.3 | |
| |
| Total debt to capital | | | 36.4% | | | | 42.3% | | | | 41.7% | | | | 42.1% | | | | 31.1% | | | | 31.9% | | | | 29.5% | | | | 35.7% | | | | 30.9% | | | | 41.5% | | | | – | |
| |
Net debt to capital(5) | | | 27.5% | | | | 42.2% | | | | 41.3% | | | | 41.3% | | | | 28.7% | | | | 30.8% | | | | 28.1% | | | | 35.5% | | | | 30.9% | | | | 40.3% | | | | – | |
| |
| | | | | | | | | | | | | | | | | | | | | | | | | | | | | | | | | | | | | | | | | | | | | |
| Current assets | | | 1,243.6 | | | | 733.9 | | | | 832.0 | | | | 819.6 | | | | 871.7 | | | | 726.2 | | | | 774.2 | | | | 734.5 | | | | 467.0 | | | | 501.1 | | | | 164.7 | |
| Current liabilities | | | (703.7 | ) | | | (557.8 | ) | | | (823.4 | ) | | | (772.5 | ) | | | (1,020.4 | ) | | | (831.0 | ) | | | (445.0 | ) | | | (452.8 | ) | | | (188.2 | ) | | | (365.0 | ) | | | (61.4 | ) |
| |
| Working capital | | | 539.9 | | | | 176.1 | | | | 8.6 | | | | 47.1 | | | | (148.7 | ) | | | (104.8 | ) | | | 329.2 | | | | 281.7 | | | | 278.8 | | | | 136.1 | | | | 103.3 | |
| Cash and cash equivalents | | | (458.9 | ) | | | (4.7 | ) | | | (24.5 | ) | | | (45.3 | ) | | | (100.0 | ) | | | (44.0 | ) | | | (68.0 | ) | | | (8.8 | ) | | | – | | | | (40.5 | ) | | | (16.6 | ) |
| Short-term debt | | | 93.5 | | | | 176.2 | | | | 473.0 | | | | 501.1 | | | | 488.8 | | | | 474.5 | | | | 94.9 | | | | 101.9 | | | | 6.3 | | | | – | | | | – | |
| Current portion of long-term debt | | | 10.3 | | | | 1.3 | | | | 3.4 | | | | – | | | | 5.7 | | | | 7.4 | | | | 0.4 | | | | 2.7 | | | | 1.8 | | | | 165.9 | | | | 0.6 | |
| |
| Non-cash operating working capital | | | 184.8 | | | | 348.9 | | | | 460.5 | | | | 502.9 | | | | 245.8 | | | | 333.1 | | | | 356.5 | | | | 377.5 | | | | 286.9 | | | | 261.5 | | | | 87.3 | |
| |
| | | | | | | | | | | | | | | | | | | | | | | | | | | | | | | | | | | | | | | | | | | | | |
| Sales | | | 3,244.4 | | | | 2,799.0 | | | | 2,224.4 | | | | 2,380.8 | | | | 2,542.9 | | | | 2,355.6 | | | | 2,607.0 | | | | 2,620.0 | | | | 1,604.9 | | | | 1,002.8 | | | | 465.1 | |
| Freight | | | 238.7 | | | | 234.5 | | | | 215.2 | | | | 216.7 | | | | 222.1 | | | | 212.5 | | | | 216.5 | | | | 226.6 | | | | 144.6 | | | | 92.8 | | | | 85.2 | |
| Transportation and distribution | | | 104.3 | | | | 98.7 | | | | 80.5 | | | | 83.3 | | | | 83.1 | | | | 77.0 | | | | 77.9 | | | | 61.7 | | | | 49.1 | | | | 53.5 | | | | 14.8 | |
| |
Net sales(6) | | | 2,901.4 | | | | 2,465.8 | | | | 1,928.7 | | | | 2,080.8 | | | | 2,237.7 | | | | 2,066.1 | | | | 2,312.6 | | | | 2,331.7 | | | | 1,411.2 | | | | 856.5 | | | | 365.1 | |
| |
| | | | | | | | | | | | | | | | | | | | | | | | | | | | | | | | | | | | | | | | | | | | | |
| Weighted average shares outstanding | | | | | | | | | | | | | | | | | | | | | | | | | | | | | | | | | | | | | | | | | | | | |
| Basic (in 000’s) | | | 107,967 | | | | 104,460 | | | | 104,042 | | | | 103,758 | | | | 104,820 | | | | 108,460 | | | | 108,354 | | | | 104,550 | | | | 91,074 | | | | 86,704 | | | | 85,744 | |
| |
| Diluted (in 000’s) | | | 110,739 | | | | 104,460 | | | | 104,632 | | | | 104,372 | | | | 105,406 | | | | 108,460 | | | | 109,003 | | | | 105,642 | | | | 92,119 | | | | 87,729 | | | | 86,305 | |
| |
All share and per-share data have been retroactively adjusted to reflect the stock dividend of one common share for each share owned by shareholders of record at the close of business on August 11, 2004. The stock dividend had the same effect as a two-for-one stock split.
n/a – not available
Certain of the prior years’ figures have been reclassified to conform with the current year’s presentation.
54
POTASHCORP 2004 ANNUAL REPORT | FINANCIAL PERFORMANCE INDICATORS
Financial Performance Indicators (in millions of US dollars except share and per-share amounts)
Non-GAAP Financial Measures and Footnotes to Reconciliations and Calculations
The following information is included for convenience only. Generally, a non-GAAP financial measure is a numerical measure of a company’s performance, financial position or cash flows that either excludes or includes amounts that are not normally excluded or included in the most directly comparable measure calculated and presented in accordance with generally accepted accounting principles (“GAAP”). Adjusted net income, adjusted net income per diluted share, EBITDA, adjusted EBITDA, cash flow prior to working capital changes, cash flow, cash flow return, net debt, net debt to capital and consolidated net sales are not measures of financial performance (nor do they have standardized meanings) under either Canadian GAAP or US GAAP. In evaluating these measures, investors should consider that the methodology applied in calculating such measures may differ among companies and analysts.
The company uses both GAAP and certain non-GAAP measures to assess performance. The company’s management believes these non-GAAP measures provide useful supplemental information to investors in order that they may evaluate PotashCorp’s financial performance using the same measures as management. PotashCorp’s management believes that, as a result, the investor is afforded greater transparency in assessing the financial performance of the company. These non-GAAP financial measures should not be considered as a substitute for, nor superior to, measures of financial performance prepared in accordance with GAAP.
| (1) | The company’s management uses net income (loss) adjusted to exclude impairment charges and shutdown/closure-related costs, office consolidation costs and the gain on sale of long-term investments and Moab Inc., and diluted net income per share excluding such items as supplemental financial measures. These measures are used to evaluate PotashCorp’s operating performance and to compare such performance with the company’s historical operating results and the operating results of other companies. The company’s management believes that these measures allow management to consider the ongoing financial performance of the company with respect to short-term patterns and long-term trends without the potentially obscuring effects of the above-noted items. |
| |
| | As compared to net income (loss) according to GAAP, these measures are limited by the exclusion of items that have been identified by the company’s impairment, shutdown and other analyses. PotashCorp’s management compensates for these limitations by applying the specific recognition, measurement, presentation and disclosure provisions for such items as required under GAAP. Management also evaluates such charges, costs and gains through other financial measures such as cash flow provided by operating activities. |
| |
| | For periods in which there was a net loss applicable to common shareholders, any outstanding stock options to purchase the company’s common shares with underlying exercise prices less than the average market prices were excluded from the calculation of diluted net loss per share, as inclusion of these securities would have been anti-dilutive to the net loss per share. |
| |
| | The weighted average number of shares used for calculating adjusted net income in 2004, 2003, 2000 and 1999 was 110,739,000, 105,266,000, 105,406,000 and 109,954,000, respectively. |
| |
| (2) | PotashCorp uses EBITDA and adjusted EBITDA as supplemental financial measures of its operational performance. Management believes EBITDA and adjusted EBITDA to be important measures as they exclude the effects of items which primarily reflect the impact of long-term investment decisions, rather than the performance of the company’s day-to-day operations. As compared to net income (loss) according to GAAP, these measures are limited in that they do not reflect the periodic costs of certain capitalized tangible and intangible assets used in generating revenues in the company’s business, or the non-cash charges associated with impairments and shutdown-related costs, or gain on sale of long-term investments. Management evaluates such items through other financial measures such as capital expenditures and cash flow provided by operating activities. The company believes that these measurements are useful to measure a company’s ability to service debt and to meet other payment obligations or as a valuation measurement. |
| |
| (3) | Cash flow prior to working capital changes is defined as the cash provided by operating activities, exclusive of changes in non-cash operating working capital. PotashCorp uses cash flow prior to working capital changes as a supplemental financial measure in its evaluation of liquidity. Management believes that adjusting principally for the swings in non-cash working capital items due to seasonality assists management in making long-term liquidity assessments. The company also believes that this measurement is useful as a measure of liquidity or as a valuation measurement. |
| |
| (4) | PotashCorp uses cash flow and cash flow return as supplemental measures to evaluate the performance of the company’s assets in terms of the cash flow they |
| | have generated. Calculated on the total cost basis of the company’s assets rather than on the depreciated value, these measures reflect cash returned on the total investment outlay. The company believes these measures are one of the best predictors of shareholder value. As such, management believes this information to be useful to investors. |
| |
| (5) | Management believes that net debt and net debt to capital ratio are useful to investors because they are helpful in determining the company’s leverage. It also believes that since the company has the ability to and may elect to use a portion of cash and cash equivalents to retire debt or to incur additional expenditures without increasing debt, it is appropriate to apply cash and cash equivalents to debt in calculating net debt and net debt to capital. PotashCorp believes that this measurement is useful as a financial leverage measure. |
| |
| (6) | Management includes net sales in its segment disclosures in the consolidated financial statements pursuant to Canadian GAAP, which requires segmentation based upon the company’s internal organization and reporting of revenue and profit measures derived from internal accounting methods. Net sales (and related per-tonne amounts and other ratios) are primary revenue measures it uses and reviews in making decisions about operating matters on a business segment basis. These decisions include assessments about potash, phosphate and nitrogen performance and the resources to be allocated to these segments. It also uses net sales (and related per-tonne amounts and other ratios) for business segment planning and monthly forecasting. Net sales are calculated as sales revenues less freight, transportation and distribution expenses. Net sales presented on a consolidated basis rather than by business segment is considered a non-GAAP financial measure. |
Financial Terms
Total shareholder return= (change in market price per common share + dividends per share) / beginning market price per common share
Debt to capital= total debt / (total debt + total shareholders’ equity)
Net debt to capital= (total debt – cash and cash equivalents) / (total debt – cash and cash equivalents + total shareholders’ equity)
Cash flow= net income or loss + income taxes + interest – cash taxes paid + depreciation and amortization
Cash flow return= cash flow / average (total assets – cash and cash equivalents + accumulated depreciation and amortization – accounts payable and accrued charges)
EBITDA= earnings (net income or loss) before interest, taxes, depreciation and amortization
Adjusted EBITDA= EBITDA + impairment charges + non-cash shutdown / closure-related costs and office consolidation costs – gain on sale of long-term investments and Moab Inc.
Return on assets= net income or loss / total assets
Market value of total capital= market value of total debt – cash and cash equivalents + market value of equity
Weighted average cost of capital= simple quarterly average of ((market value of total debt – cash and cash equivalents) / market value of total capital x after-tax cost of debt + market value of equity / market value of total capital x cost of equity)
Average adjusted assets= simple average of the current year’s adjusted assets and the previous year’s adjusted assets, except when a material acquisition occurred, in which case the weighted average rather than the simple average is calculated; the last material acquisition was in 1997.
55
POTASHCORP 2004 ANNUAL REPORT | MANAGEMENT’S RESPONSIBILITY
Management’s Responsibility for Financial Reporting
MANAGEMENT’S REPORT ON FINANCIAL STATEMENTS
The accompanying consolidated financial statements and related financial information are the responsibility of PotashCorp management and have been prepared in accordance with accounting principles generally accepted in Canada and include amounts based on estimates and judgments. Financial information included elsewhere in this report is consistent with the consolidated financial statements.
Our independent auditors, Deloitte & Touche LLP, provide an audit of the consolidated financial statements, as reflected in their report for 2004 included on Page 56.
The consolidated financial statements are approved by the Board of Directors on the recommendation of the audit committee.
The audit committee of the Board of Directors is composed of directors who are not officers or employees of PotashCorp. PotashCorp’s interim consolidated financial statements and MD&A are discussed and reviewed by the audit committee with management and the independent auditors before such information is approved by the committee and submitted to securities commissions or other regulatory authorities. The annual consolidated financial statements and MD&A are also reviewed by the audit committee together with management and the independent auditors and are approved by the board.
In addition, the audit committee has the duty to review critical accounting policies and significant estimates and judgments underlying the consolidated financial statements as presented by management; and to approve the fees of the independent auditors.
Deloitte & Touche LLP, the independent auditors, obtain an understanding of PotashCorp’s internal controls and procedures for financial reporting to plan and conduct such tests and other audit procedures as they consider necessary in the circumstances. The independent auditors have full and independent access to the audit committee to discuss their audit and related matters.
MANAGEMENT’S REPORT ON INTERNAL CONTROL OVER FINANCIAL REPORTING
Management is responsible for establishing and maintaining an adequate system of internal control over financial reporting. During the past year, we have directed efforts to improve and document our internal control over financial reporting. Internal control over financial reporting is a process designed to provide reasonable assurance regarding the reliability of financial reporting and the preparation of consolidated financial statements for external reporting purposes in accordance with generally accepted accounting principles. Because of its inherent limitations, internal control over financial reporting may not prevent or detect misstatements. Management has assessed the effectiveness of the company’s internal control over financial reporting based on the framework inInternal Control – Integrated Frameworkissued by the Committee of Sponsoring Organizations of the Treadway Commission (COSO) and concluded that the company’s internal control over financial reporting was effective as of December 31, 2004. Management’s assessment of the effectiveness of the company’s internal control over financial reporting as of December 31, 2004 has been audited by Deloitte & Touche LLP, as reflected in their report for 2004 included on Page 57.

W. Doyle
President and
Chief Executive Officer
February 17, 2005

W. Brownlee
Senior Vice President and
Chief Financial Officer
56
POTASHCORP 2004 ANNUAL REPORT | AUDITORS’ REPORTS
Report of Independent Registered Chartered Accountants
TO THE SHAREHOLDERS OF POTASH CORPORATION OF SASKATCHEWAN INC.
We have audited the consolidated statements of financial position of Potash Corporation of Saskatchewan Inc. (the Company) as at December 31, 2004 and 2003 and the consolidated statements of operations and retained earnings and cash flow for each of the years in the three-year period ended December 31, 2004. These financial statements are the responsibility of the Company’s management. Our responsibility is to express an opinion on these financial statements based on our audits.
We conducted our audits in accordance with Canadian generally accepted auditing standards and the standards of the Public Company Accounting Oversight Board (United States). These standards require that we plan and perform an audit to obtain reasonable assurance whether the financial statements are free of material misstatement. An audit includes examining, on a test basis, evidence supporting the amounts and disclosures in the financial statements. An audit also includes assessing the accounting principles used and significant estimates made by management, as well as evaluating the overall financial statement presentation. We believe that our audits provide a reasonable basis for our opinion.
In our opinion, these consolidated financial statements present fairly, in all material respects, the financial position of Potash Corporation of Saskatchewan Inc. as at December 31, 2004 and 2003 and the results of its operations and its cash flows for each of the years in the three-year period ended December 31, 2004, in accordance with Canadian generally accepted accounting principles.
We have also audited, in accordance with the standards of the Public Company Accounting Oversight Board (United States), the effectiveness of the Company’s internal control over financial reporting as of December 31, 2004, based on the criteria established inInternal Control – Integrated Frameworkissued by the Committee of Sponsoring Organizations of the Treadway Commission (COSO) and our report dated February 17, 2005 expressed an unqualified opinion on management’s assessment of the effectiveness of the Company’s internal control over financial reporting and an unqualified opinion on the effectiveness of the Company’s internal control over financial reporting.
Independent Registered Chartered Accountants
Saskatoon, Saskatchewan, Canada
February 17, 2005
COMMENTS BY AUDITORS ON CANADA-UNITED STATES OF AMERICA REPORTING DIFFERENCES
The standards of the Public Company Accounting Oversight Board (United States) require the addition of an explanatory paragraph (following the opinion paragraph) when there are changes that have an effect on the comparability of the consolidated financial statements or changes that have been implemented in the financial statements, such as the changes described in Note 3, Note 14, Note 28 and Note 36 to Potash Corporation of Saskatchewan Inc.’s consolidated financial statements. Our report to the shareholders dated February 17, 2005 is expressed in accordance with Canadian reporting standards, which do not require a reference to such changes in accounting principles in the auditors’ report when the changes are properly accounted for and adequately disclosed in the consolidated financial statements.

Independent Registered Chartered Accountants
Saskatoon, Saskatchewan, Canada
February 17, 2005
57
POTASHCORP 2004 ANNUAL REPORT | AUDITORS’ REPORTS
Report of Independent Registered Chartered Accountants
TO THE SHAREHOLDERS OF POTASH CORPORATION OF SASKATCHEWAN INC.
We have audited management’s assessment, included in the accompanying Management’s Report on Internal Control Over Financial Reporting, that Potash Corporation of Saskatchewan Inc. (the Company) maintained effective internal control over financial reporting as of December 31, 2004, based on the criteria established inInternal Control – Integrated Frameworkissued by the Committee of Sponsoring Organizations of the Treadway Commission (COSO). The Company’s management is responsible for maintaining effective internal control over financial reporting and for its assessment of the effectiveness of internal control over financial reporting. Our responsibility is to express an opinion on management’s assessment and an opinion on the effectiveness of the Company’s internal control over financial reporting based on our audit.
We conducted our audit in accordance with the standards of the Public Company Accounting Oversight Board (United States). Those standards require that we plan and perform the audit to obtain reasonable assurance about whether effective internal control over financial reporting was maintained in all material respects. Our audit included obtaining an understanding of internal control over financial reporting, evaluating management’s assessment, testing and evaluating the design and operating effectiveness of internal control, and performing such other procedures as we considered necessary in the circumstances. We believe that our audit provides a reasonable basis for our opinions.
A company’s internal control over financial reporting is a process designed by, or under the supervision of, the company’s principal executive and principal financial officers, or persons performing similar functions, and effected by the company’s board of directors, management and other personnel to provide reasonable assurance regarding the reliability of financial reporting and the preparation of financial statements for external purposes in accordance with generally accepted accounting principles. A company’s internal control over financial reporting includes those policies and procedures that (1) pertain to the maintenance of records that, in reasonable detail, accurately and fairly reflect the transactions and dispositions of the assets of the company; (2) provide reasonable assurance that transactions are recorded as necessary to permit preparation of financial statements in accordance with generally accepted accounting principles, and that receipts and expenditures of the company are being made only in accordance with authorizations of management and directors of the company; and (3) provide reasonable assurance regarding prevention or timely detection of unauthorized acquisition, use or disposition of the company’s assets that could have a material effect on the financial statements.
Because of the inherent limitations of internal control over financial reporting, including the possibility of collusion or improper management override of controls, material misstatements due to error or fraud may not be prevented or detected on a timely basis. Also, projections of any evaluation of the effectiveness of the internal control over financial reporting to future periods are subject to the risk that the controls may become inadequate because of changes in conditions, or that the degree of compliance with the policies or procedures may deteriorate.
In our opinion, management’s assessment that Potash Corporation of Saskatchewan Inc. maintained effective internal control over financial reporting as of December 31, 2004, is fairly stated, in all material respects, based on the criteria established inInternal Control – Integrated Framework issued by the Committee of Sponsoring Organizations of the Treadway Commission (COSO). Also in our opinion, Potash Corporation of Saskatchewan Inc. maintained, in all material respects, effective internal control over financial reporting as of December 31, 2004, based on the criteria established inInternal Control – Integrated Frameworkissued by the Committee of Sponsoring Organizations of the Treadway Commission (COSO).
We have also audited, in accordance with Canadian generally accepted auditing standards and the standards of the Public Company Accounting Oversight Board (United States), the consolidated statements of financial position of Potash Corporation of Saskatchewan Inc. as at December 31, 2004 and the consolidated statements of operations and retained earnings and cash flow for the year ended December 31, 2004 and our report dated February 17, 2005 expressed an unqualified opinion on these financial statements and included comments on Canada-United States of America Reporting Differences.

Independent Registered Chartered Accountants
Saskatoon, Saskatchewan, Canada
February 17, 2005
58
POTASHCORP 2004 ANNUAL REPORT | CONSOLIDATED FINANCIAL STATEMENTS
CONSOLIDATED STATEMENTS OF FINANCIAL POSITION
| | | | | | | | | |
| as at December 31 | | in millions of US dollars except share amounts | |
| | | 2004 | | | 2003 | |
| |
Assets | | | | | | | | |
| Current assets | | | | | | | | |
| Cash and cash equivalents | | $ | 458.9 | | | $ | 4.7 | |
Accounts receivable (Note 5) | | | 352.6 | | | | 305.0 | |
Inventories (Note 6) | | | 396.8 | | | | 395.2 | |
| Prepaid expenses and other current assets | | | 35.3 | | | | 29.0 | |
| |
| | | | 1,243.6 | | | | 733.9 | |
Property, plant and equipment (Note 7) | | | 3,098.9 | | | | 3,108.1 | |
Other assets (Note 8) | | | 650.2 | | | | 595.4 | |
Intangible assets (Note 8) | | | 37.1 | | | | 32.9 | |
Goodwill (Note 9) | | | 97.0 | | | | 97.0 | |
| |
| | | $ | 5,126.8 | | | $ | 4,567.3 | |
| |
Liabilities | | | | | | | | |
| Current liabilities | | | | | | | | |
Short-term debt (Note 10) | | $ | 93.5 | | | $ | 176.2 | |
Accounts payable and accrued charges(Note 11) | | | 599.9 | | | | 380.3 | |
Current portion of long-term debt (Note 12) | | | 10.3 | | | | 1.3 | |
| |
| | | | 703.7 | | | | 557.8 | |
Long-term debt (Note 12) | | | 1,258.6 | | | | 1,268.6 | |
Future income tax liability (Note 26) | | | 499.4 | | | | 484.2 | |
Accrued post-retirement/post-employment benefits (Note 14) | | | 193.4 | | | | 194.5 | |
Accrued environmental costs and asset retirement obligations(Note 15) | | | 81.2 | | | | 81.3 | |
| Other non-current liabilities and deferred credits | | | 4.9 | | | | 7.1 | |
| |
| | | | 2,741.2 | | | | 2,593.5 | |
| |
Commitments,Contingencies and Guarantees (Notes 13,30 and 31, respectively) | | | | | | | | |
Shareholders’ Equity | | | | | | | | |
Share capital (Note 16) | | | 1,408.4 | | | | 1,245.8 | |
| Unlimited authorization of common shares without par value; issued and outstanding 110,630,503 and 106,224,432 shares in 2004 and 2003, respectively | | | | | | | | |
Unlimited authorization of first preferred shares;none outstanding Contributed surplus (Note 17) | | | 275.7 | | | | 265.2 | |
| Retained earnings | | | 701.5 | | | | 462.8 | |
| |
| | | | 2,385.6 | | | | 1,973.8 | |
| |
| | | $ | 5,126.8 | | | $ | 4,567.3 | |
| |
(See Notes to the Consolidated Financial Statements) |
Approved by the Board,
| | | |
| |  |
| Director | | Director |
59
POTASHCORP 2004 ANNUAL REPORT | CONSOLIDATED FINANCIAL STATEMENTS
CONSOLIDATED STATEMENTS OF OPERATIONS AND RETAINED EARNINGS
| | | | | | | | | | | | | |
| for the years ended December 31 | | in millions of US dollars except per-share amounts | |
| | | 2004 | | | 2003 | | | 2002 | |
| |
Sales(Note 18) | | $ | 3,244.4 | | | $ | 2,799.0 | | | $ | 2,224.4 | |
| Less: Freight | | | 238.7 | | | | 234.5 | | | | 215.2 | |
| Transportation and distribution | | | 104.3 | | | | 98.7 | | | | 80.5 | |
Cost of goods sold(Note 19) | | | 2,220.0 | | | | 2,085.4 | | | | 1,621.4 | |
| |
Gross Margin | | | 681.4 | | | | 380.4 | | | | 307.3 | |
| |
| | | | | | | | | | | | | |
Selling and administrative(Note 20) | | | 130.6 | | | | 96.1 | | | | 91.7 | |
Provincial mining and other taxes(Note 21) | | | 92.6 | | | | 57.0 | | | | 68.0 | |
Provision for plant shutdowns(Note 22) | | | – | | | | 123.7 | | | | – | |
Provision for PCS Yumbes S.C.M.(Note 23) | | | 3.6 | | | | 140.5 | | | | – | |
| Foreign exchange loss | | | 19.7 | | | | 51.9 | | | | 5.5 | |
Other income(Note 24) | | | (79.4 | ) | | | (33.2 | ) | | | (24.8 | ) |
| |
| | | | 167.1 | | | | 436.0 | | | | 140.4 | |
| |
| | | | | | | | | | | | | |
Operating Income (Loss) | | | 514.3 | | | | (55.6 | ) | | | 166.9 | |
| | | | | | | | | | | | | |
Interest Expense(Note 25) | | | 84.0 | | | | 91.3 | | | | 83.1 | |
| |
| | | | | | | | | | | | | |
Income (Loss) Before Income Taxes | | | 430.3 | | | | (146.9 | ) | | | 83.8 | |
| | | | | | | | | | | | | |
Income Taxes(Note 26) | | | 131.7 | | | | (20.6 | ) | | | 30.2 | |
| |
| | | | | | | | | | | | | |
Net Income (Loss) | | | 298.6 | | | | (126.3 | ) | | | 53.6 | |
| | | | | | | | | | | | | |
Retained Earnings, Beginning of Year | | | 462.8 | | | | 641.4 | | | | 639.8 | |
| | | | | | | | | | | | | |
Dividends | | | (59.9 | ) | | | (52.3 | ) | | | (52.0 | ) |
| |
| | | | | | | | | | | | | |
Retained Earnings, End of Year | | $ | 701.5 | | | $ | 462.8 | | | $ | 641.4 | |
| |
| | | | | | | | | | | | | |
Net Income (Loss) per Share – Basic(Note 27) | | $ | 2.77 | | | $ | (1.21 | ) | | $ | 0.52 | |
| |
| | | | | | | | | | | | | |
Net Income (Loss) per Share – Diluted(Note 27) | | $ | 2.70 | | | $ | (1.21 | ) | | $ | 0.51 | |
| |
| | | | | | | | | | | | | |
Dividends per Share | | $ | 0.55 | | | $ | 0.50 | | | $ | 0.50 | |
| |
| |
| (See Notes to the Consolidated Financial Statements) |
60
POTASHCORP 2004 ANNUAL REPORT | CONSOLIDATED FINANCIAL STATEMENTS
CONSOLIDATED STATEMENTS OF CASH FLOW
| | | | | | | | | | | | | | | | | | | | | | | | | |
| for the years ended December 31 | | in millions of US dollars | |
| | | | | | | 2004 | | | | | | | 2003 | | | | | | | 2002 | |
| |
Operating Activities | | | | | | | | | | | | | | | | | | | | | | | | |
Net income (loss) | | | | | | $ | 298.6 | | | | | | | $ | (126.3 | ) | | | | | | $ | 53.6 | |
Items not affecting cash
Depreciation and amortization | | | 240.0 | | | | | | | | 227.4 | | | | | | | | 219.1 | | | | | |
| Stock-based compensation | | | 11.1 | | | | | | | | 1.0 | | | | | | | | – | | | | | |
| (Gain) loss on disposal of property, plant and equipment | | | (0.7 | ) | | | | | | | 1.0 | | | | | | | | 1.0 | | | | | |
Gain on sale of long-term investments (Note 4) | | | (34.4 | ) | | | | | | | – | | | | | | | | – | | | | | |
| Provision for plant shutdowns | | | – | | | | | | | | 118.3 | | | | | | | | – | | | | | |
| Provision for PCS Yumbes S.C.M. | | | 3.6 | | | | | | | | 127.6 | | | | | | | | – | | | | | |
| Foreign exchange on future income tax | | | 17.2 | | | | | | | | 35.9 | | | | | | | | 1.0 | | | | | |
| Provision for (recovery of) future income tax | | | 26.3 | | | | | | | | (20.6 | ) | | | | | | | 6.0 | | | | | |
| Share of earnings of equity investees | | | (30.9 | ) | | | | | | | (12.4 | ) | | | | | | | (5.3 | ) | | | | |
| (Recovery of) provision for post-retirement/post-employment benefits | | | (1.1 | ) | | | | | | | 9.7 | | | | | | | | 18.2 | | | | | |
| Accrued environmental costs and asset retirement obligations | | | (0.1 | ) | | | | | | | 1.3 | | | | | | | | (3.0 | ) | | | | |
| Other non-current liabilities and deferred credits | | | – | | | | | | | | 1.6 | | | | | | | | (1.4 | ) | | | | |
| | | | | | | | | | | | | | | | | | | | | | |
Subtotal of items not affecting cash | | | | | | | 231.0 | | | | | | | | 490.8 | | | | | | | | 235.6 | |
| | | | | | | | | | | | | | | | | | | | | | | | | |
Changes in non-cash operating working capital | | | | | | | | | | | | | | | | | | | | | | | | |
| Accounts receivable | | | (51.9 | ) | | | | | | | (39.5 | ) | | | | | | | (11.1 | ) | | | | |
| Inventories | | | (10.5 | ) | | | | | | | 11.8 | | | | | | | | (18.2 | ) | | | | |
| Prepaid expenses and other current assets | | | (6.3 | ) | | | | | | | 11.4 | | | | | | | | (3.9 | ) | | | | |
| Accounts payable and accrued charges | | | 102.2 | | | | | | | | 51.6 | | | | | | | | 37.0 | | | | | |
| Current income taxes | | | 86.5 | | | | | | | | (18.3 | ) | | | | | | | 23.4 | | | | | |
| | | | | | | | | | | | | | | | | | | | | | |
Subtotal of changes in non-cash operating working capital | | | | | | | 120.0 | | | | | | | | 17.0 | | | | | | | | 27.2 | |
| |
Cash provided by operating activities | | | | | | | 649.6 | | | | | | | | 381.5 | | | | | | | | 316.4 | |
| |
| | | | | | | | | | | | | | | | | | | | | | | | | |
Investing Activities | | | | | | | | | | | | | | | | | | | | | | | | |
| Additions to property, plant and equipment | | | | | | | (220.5 | ) | | | | | | | (150.7 | ) | | | | | | | (212.2 | ) |
| Proceeds from disposal of property, plant and equipment | | | | | | | 2.5 | | | | | | | | – | | | | | | | | – | |
Investment in Sociedad Quimica y Minera de Chile S.A.(“SQM”) (Note 4) | | | | | | | (97.2 | ) | | | | | | | – | | | | | | | | (23.2 | ) |
| Investment in Arab Potash Company (“APC”) | | | | | | | (8.3 | ) | | | | | | | (178.3 | ) | | | | | | | – | |
Proceeds from sale of long-term investments (Note 4) | | | | | | | 66.3 | | | | | | | | – | | | | | | | | – | |
Proceeds from sale of shares of PCS Yumbes S.C.M. (Note 23) | | | | | | | 34.5 | | | | | | | | – | | | | | | | | – | |
| Dividends received from equity investees | | | | | | | 8.7 | | | | | | | | 4.0 | | | | | | | | – | |
| Other assets and intangibles | | | | | | | (2.8 | ) | | | | | | | (32.7 | ) | | | | | | | (36.0 | ) |
| |
Cash used in investing activities | | | | | | | (216.8 | ) | | | | | | | (357.7 | ) | | | | | | | (271.4 | ) |
| |
Cash before financing activities | | | | | | | 432.8 | | | | | | | | 23.8 | | | | | | | | 45.0 | |
| |
| | | | | | | | | | | | | | | | | | | | | | | | | |
Financing Activities | | | | | | | | | | | | | | | | | | | | | | | | |
| Proceeds from long-term debt obligations | | | | | | | – | | | | | | | | 250.0 | | | | | | | | 11.2 | |
| Repayment of long-term debt obligations | | | | | | | (1.0 | ) | | | | | | | (3.4 | ) | | | | | | | (1.3 | ) |
| Repayment of short-term debt obligations | | | | | | | (82.7 | ) | | | | | | | (296.8 | ) | | | | | | | (28.1 | ) |
| Dividends | | | | | | | (56.1 | ) | | | | | | | (52.3 | ) | | | | | | | (52.0 | ) |
| Issuance of shares | | | | | | | 161.2 | | | | | | | | 58.9 | | | | | | | | 4.4 | |
| |
Cash provided by (used in) financing activities | | | | | | | 21.4 | | | | | | | | (43.6 | ) | | | | | | | (65.8 | ) |
| |
Increase (Decrease) in Cash and Cash Equivalents | | | | | | | 454.2 | | | | | | | | (19.8 | ) | | | | | | | (20.8 | ) |
Cash and Cash Equivalents, Beginning of Year | | | | | | | 4.7 | | | | | | | | 24.5 | | | | | | | | 45.3 | |
| |
Cash and Cash Equivalents, End of Year | | | | | | $ | 458.9 | | | | | | | $ | 4.7 | | | | | | | $ | 24.5 | |
| |
| Supplemental cash flow disclosure | | | | | | | | | | | | | | | | | | | | | | | | |
| Interest paid | | | | | | $ | 83.3 | | | | | | | $ | 83.8 | | | | | | | $ | 81.2 | |
| Income taxes paid | | | | | | $ | 33.5 | | | | | | | $ | 22.8 | | | | | | | $ | 4.4 | |
| |
| (See Notes to the Consolidated Financial Statements) |
61
NOTES TO THE CONSOLIDATED FINANCIAL STATEMENTS | in millions of US dollars except share and per-share amounts
NOTES TO THE CONSOLIDATED FINANCIAL STATEMENTS
in millions of US dollars except share and per-share amounts
| 1. | DESCRIPTION OF BUSINESS |
With its subsidiaries, Potash Corporation of Saskatchewan Inc. (“PCS”) – together known as “PotashCorp” or “the company” except to the extent the context otherwise requires – forms an integrated fertilizer and related industrial and feed products company. The company has producing assets in the following locations:
| • | Potash |
| |
| – | five mines and mills and mining rights to potash reserves at a sixth location, all in the province of Saskatchewan |
| – | one mine and two mills in the province of New Brunswick |
| |
| • | Phosphate |
| |
| – | a mine and processing plant in the state of North Carolina |
| – | a mine and two processing plants in the state of Florida |
| – | a processing plant in the state of Louisiana |
| – | phosphate feed plants in five states and one in Brazil |
| – | two industrial phosphoric acid plants, in the states of North Carolina and Ohio |
| |
| • | Nitrogen |
| |
| – | four plants in the states of Georgia, Louisiana, Ohio and Tennessee |
| – | large-scale operations in Trinidad |
The company owns or leases approximately 175 terminal and warehouse facilities strategically located in Canada and the United States, and services customers with a fleet of approximately 6,600 railcars.
PotashCorp sells potash from its Saskatchewan mines for use outside North America exclusively to Canpotex Limited (“Canpotex”). Canpotex, a potash export, sales and marketing company owned in equal shares by the three potash producers in the Province of Saskatchewan (including the company), resells potash to offshore customers. PCS Sales (Canada) Inc. and PCS Sales (USA), Inc., wholly owned subsidiaries of PotashCorp, execute marketing and sales for the company’s potash, phosphate and nitrogen products in North America. PCS Sales (Canada) Inc. executes offshore marketing and sales for the company’s New Brunswick potash. PCS Sales (USA), Inc. generally executes offshore marketing and sales for the company’s nitrogen products. Phosphate Chemicals Export Association, Inc. (“PhosChem”), an unrelated phosphate export association established under United States law, is the principal vehicle through which the company executes offshore marketing and sales for its phosphate fertilizers.
| 2. | SIGNIFICANT ACCOUNTING POLICIES |
BASIS OF PRESENTATION
The company’s accounting policies are in accordance with Canadian generally accepted accounting principles (“Canadian GAAP”). These policies are consistent with accounting principles generally accepted in the United States (“US GAAP”) in all material respects except as outlined in Note 36. The preparation of consolidated financial statements in accordance with generally accepted accounting principles requires management to make estimates and assumptions that affect the reported amounts of assets and liabilities and disclosure of contingent assets and liabilities at the date of the consolidated
financial statements and the reported amounts of revenues and expenses during the reporting period. Actual results could differ from those estimates.
As described in Notes 22 and 23, during 2003 the company approved plans to restructure certain operations. Those plans required significant estimates to be made of: (i) the recoverability of the carrying value of certain assets based on their capacity to generate future cash flows; and (ii) employee termination, contract termination and other exit costs. Because restructuring activities are complex processes that can take several months to complete, they involve periodically reassessing estimates. As a result, the company may have to change originally reported estimates when actual payments are made or the activities are completed.
As described in Note 16, on July 21, 2004, the Board of Directors of PCS approved a split of the company’s outstanding common shares on a two-for-one basis. The stock split was effected in the form of a stock dividend. All equity-based benefit plans, share and per-share data have been retroactively adjusted to reflect the stock split.
The following accounting policies are considered to be significant:
PRINCIPLES OF CONSOLIDATION
The consolidated financial statements include the accounts of PotashCorp and its principal operating subsidiaries:
| • | PCS Sales (Canada) Inc. |
| | – | PCS Joint Venture, L. P. |
| • | PCS Sales (USA), Inc. |
| • | PCS Phosphate Company, Inc. |
| | – | PCS Purified Phosphates |
| • | White Springs Agricultural Chemicals, Inc. (“White Springs”) |
| • | PCS Nitrogen, Inc. (“PCS Nitrogen”) |
| | – | PCS Nitrogen Fertilizer, L. P. |
| | – | PCS Nitrogen Ohio, L. P. |
| | – | PCS Nitrogen Trinidad Limited |
| • | PCS Cassidy Lake Company (“PCS Cassidy Lake”) |
| • | PCS Yumbes S. C. M. (“PCS Yumbes”) – sold in 2004 (see Note 23) |
| • | PCS Fosfatos do Brasil Ltda. |
All significant intercompany balances and transactions have been eliminated.
CASH EQUIVALENTS
Highly liquid investments with an original maturity of three months or less are considered to be cash equivalents.
INVENTORIES
Inventories of finished product, raw materials and work in process are valued at the lower of cost and market. Cost for substantially all raw materials and work in process inventories is determined using the first in, first out (FIFO) method. Certain inventories of materials and supplies are valued at the lower of average cost and replacement cost and certain inventories of materials and supplies are valued at the lower of cost and market. Cost for substantially all finished product is determined using the weighted average cost method.
62
NOTES TO THE CONSOLIDATED FINANCIAL STATEMENTS | in millions of US Dollars except share and per-share mounts
| 2. | SIGNIFICANT ACCOUNTING POLICIES (CONTINUED) |
PREPAID EXPENSES
Prepaid expenses include prepaid freight relating to product inventory stored at warehouse and terminal facilities.
PROPERTY, PLANT AND EQUIPMENT
Property, plant and equipment (which includes mine development costs) are carried at cost. Costs of additions, betterments, renewals and interest during construction are capitalized.
Maintenance and repair expenditures, which do not improve or extend productive life, are expensed as incurred.
DEPRECIATION AND AMORTIZATION
Certain mining and milling assets are depreciated using the units of production method based on the shorter of estimates of reserves or service lives. Other asset classes are depreciated or amortized on a straight-line basis as follows: land improvements 5 to 30 years, buildings and improvements 6 to 30 years and machinery and equipment (comprised primarily of plant equipment) 20 to 25 years.
GOODWILL
All business combinations are accounted for using the purchase method. Goodwill is carried at cost, is not amortized and represents the excess of the purchase price and related costs over the fair value assigned to the net tangible assets of businesses acquired.
OTHER ASSETS AND INTANGIBLES
Issue costs of long-term obligations are capitalized to deferred charges and are amortized to expense over the term of the related liability.
Preproduction costs are capitalized to deferred charges and represent costs incurred prior to obtaining commercial production at new facilities, net of revenue earned, and are amortized on either a straight-line or units of production basis over a maximum of 10 years.
The costs of constructing bases for gypsum stacks and settling ponds are capitalized to deferred charges and are amortized on a straight-line basis over their estimated useful lives of 3 to 5 years.
Investments in which the company exercises significant influence (but does not control) are accounted for using the equity method. Other investments are stated at cost. An investment is considered impaired if its fair value falls below its cost, and the decline is considered other than temporary.
Rotational plant maintenance costs, which consist primarily of planned major maintenance projects (also known as “turnarounds”), are capitalized when incurred and are amortized over a period that generally does not exceed 1 year.
Finite-lived intangible assets are amortized over their estimated useful lives as follows: production and technology rights 25 to 30 years and computer software 5 years.
ASSET IMPAIRMENT
The company reviews both long-lived assets to be held and used and identifiable intangible assets with finite lives whenever events or changes in circumstances indicate that the carrying amount of such assets may not be fully recoverable. Determination of recoverability is based on an estimate of undiscounted future cash flows resulting from the use of the asset and its eventual disposition. Measurement of an impairment loss for long-lived assets and certain identifiable intangible
assets that management expects to hold and use is based on the fair value of the assets, whereas such assets to be disposed of are reported at the lower of carrying amount or fair value less costs to sell. During 2004 and 2003, the company recognized asset impairment charges as described in Notes 22 and 23. As at December 31, 2004, the company determined that there were no other triggering events requiring impairment analysis.
Goodwill impairment is assessed at the reporting unit level at least annually, in April. Reporting units comprise business operations with similar economic characteristics and strategies and may represent either a business segment or a business unit within a business segment. Potential impairment is identified when the carrying value of a reporting unit, including the allocated goodwill, exceeds its fair value. Goodwill impairment is measured as the excess of the carrying amount of the reporting unit’s allocated goodwill over the implied fair value of the goodwill, based on the fair value of the assets and liabilities of the reporting unit.
The fair values are estimated using accepted valuation methodologies such as discounted future net cash flows, earnings multiples or prices for similar assets, whichever is most appropriate under the circumstances.
LEASES
Leases entered into are classified as either capital or operating leases. Leases that transfer substantially all of the benefits and risks of ownership of property to the company are accounted for as capital leases. Equipment acquired under capital leases is depreciated on the same basis as other property, plant and equipment. Gains or losses resulting from sale/leaseback transactions are deferred and amortized in proportion to the amortization of the leased asset. Rental payments under operating leases are expensed as incurred.
POST-EMPLOYMENT AND POST-RETIREMENT BENEFITS
The company offers a number of benefit plans that provide pension and other benefits to qualified employees. These plans include defined benefit pension plans, supplemental pension plans, defined contribution plans and health, disability, dental and life insurance plans.
The company accrues its obligations under employee benefit plans and the related costs, net of plan assets. The cost of pensions and other retirement benefits earned by employees is generally actuarially determined using the projected benefit method prorated on service and management’s best estimate of expected plan investment performance, salary escalation, retirement ages of employees and expected health-care costs. For the purpose of calculating the expected return on plan assets, those assets are valued at fair value. Prior service costs from plan amendments are deferred and amortized on a straight-line basis over the average remaining service period of employees active at the date of amendment. Actuarial gains (losses) arise from the difference between actual long-term rate of return on plan assets for a period and the expected long-term rate of return on plan assets for that period, or from changes in actuarial assumptions used to determine the accrued benefit obligation. The excess of the net accumulated actuarial gain (loss) over 10 percent of the greater of the benefit obligation and the fair value of plan assets is amortized over the average remaining service period of active employees. The average remaining service period of the active employees covered by the company’s pension plans is 16.3 years (2003 – 15.3). The average remaining service period of the active employees covered by the
63
NOTES TO THE CONSOLIDATED FINANCIAL STATEMENTS | in millions of US Dollars except share and per-share amounts
| 2. | SIGNIFICANT ACCOUNTING POLICIES (CONTINUED) |
company’s other benefits plans is 13. 7 years (2003 – 13.5). When the restructuring of a benefit plan gives rise to both a curtailment and a settlement of obligations, the curtailment is accounted for prior to the settlement. Actuaries perform valuations on a regular basis to determine the actuarial present value of the accrued pension and other retirement benefits.
Pension expense includes the net of management’s best estimate of the cost of benefits provided, interest cost of projected benefits, return on plan assets, amortization of experience gains or losses and plan amendments, and changes in the valuation allowance.
Defined contribution plan costs are recognized in earnings for services rendered by employees during the period.
ENVIRONMENTAL COSTS AND ASSET RETIREMENT OBLIGATIONS
Environmental costs that relate to current operations are expensed or capitalized as appropriate. Environmental costs are capitalized if the costs extend the life of the property, increase its capacity, mitigate or prevent contamination from future operations, or relate to legal asset retirement obligations. Costs that relate to existing conditions caused by past operations and that do not contribute to current or future revenue generation are expensed. Provisions for estimated costs are recorded when environmental remedial efforts are likely and the costs can be reasonably estimated. In determining the provisions, the company uses the most current information available, including similar past experiences, available technology, regulations in effect, the timing of remediation and cost-sharing arrangements.
The company recognizes its obligations to retire certain tangible long-lived assets in accordance with Canadian Institute of Chartered Accountants (“CICA”) Section 3110, “Accounting for Asset Retirement Obligations” (see Note 3). Under Section 3110, the fair value of a liability for an asset retirement obligation is recognized in the period in which it is incurred if a reasonable estimate of fair value can be made. The associated asset retirement costs are capitalized as part of the carrying amount of the long-lived asset and then amortized over its estimated useful life. In subsequent periods, the asset retirement obligation is adjusted for the passage of time and any changes in the amount or timing of the underlying future cash flows through charges to earnings. A gain or loss may be incurred upon settlement of the liability.
STOCK-BASED COMPENSATION PLANS
The company has four stock-based compensation plans, which are described in Note 28. The company accounts for its grants under those plans in accordance with the fair value based method of accounting for stock-based compensation. For stock option plans, the fair value of stock options is determined on their grant date and recorded as compensation expense over the period that the stock options vest, with a corresponding increase to contributed surplus. When stock options are exercised, the proceeds, together with the amount recorded in contributed surplus, are recorded in share capital.
FOREIGN EXCHANGE TRANSACTIONS
The company’s functional currency is the US dollar.
Canadian dollar operating transactions are translated to US dollars at the average exchange rate for the previous month. Trinidad dollar operating transactions are translated to US dollars at the average
exchange rate for the period. Monetary assets and liabilities are translated at period-end exchange rates. Non-monetary assets owned at December 31, 1994 have been translated under the translation of convenience method at the December 31, 1994 year-end exchange rate of US $1.00 = Cdn $1.4028. Additions subsequent to December 31, 1994 are translated at the exchange rate prevailing at the time of the transaction. Translation exchange gains and losses of integrated foreign operations are reflected in earnings.
DERIVATIVE FINANCIAL INSTRUMENTS
Derivative financial instruments are used by the company to manage its exposure to exchange rate, interest rate and commodity price fluctuations. The company’s policy is not to utilize derivative financial instruments for trading or speculative purposes. The company formally documents all relationships between hedging instruments and hedged items, as well as its risk-management objective and strategy for undertaking the hedge transaction. This process includes linking derivatives to specific assets and liabilities or to specific firm commitments or forecasted transactions. The company also assesses, both at the hedge’s inception and on an ongoing basis, whether the derivatives that are used in hedging transactions are highly effective in offsetting changes in fair values of hedged items. When derivative instruments have been designated within a hedge relationship and are highly effective in offsetting the identified risk characteristics of specific financial assets and liabilities, or groups of financial assets and liabilities, hedge accounting is applied to these derivative instruments. Hedge accounting requires that gains, losses, revenue and expenses of a hedging item be recognized in the same period that the associated gains, losses, revenue and expenses of the hedged item are recognized. A hedging relationship is terminated if the hedge ceases to be effective; if the underlying asset or liability being hedged is derecognized or if it is no longer probable that the anticipated transaction will occur and the derivative instrument is still outstanding; or if the derivative instrument is no longer designated as a hedging instrument. If a hedging relationship is terminated, the difference between the fair value and the accrued value of the hedging derivatives upon termination is deferred and recognized into earnings on the same basis as gains, losses, revenue and expenses of the previously hedged item are recognized.
The company enters into natural gas futures, swaps and option agreements to manage the cost of natural gas. Gains or losses resulting from changes in the fair value of natural gas hedging transactions which have not yet been settled are not recognized, as they generally relate to changes in the spot price of anticipated natural gas purchases. Gains or losses arising from gas hedging transactions that have been settled, terminated or cease to be effective prior to maturity are deferred as a component of inventory until the product containing the hedged item is sold, at which time both the natural gas purchase cost and the related hedging deferral are recorded as cost of sales. The company regularly evaluates its unrecognized or deferred gains and losses on these derivatives from a net realizable value of inventory perspective and establishes appropriate provisions, if necessary.
The company periodically uses interest rate swaps to manage the interest rate mix of the total debt portfolio and related overall cost of borrowing. Hedge accounting treatment for interest rate swaps results in interest expense on the related debt being reflected at hedged rates rather than original contractual interest rates.
64
NOTES TO THE CONSOLIDATED FINANCIAL STATEMENTS | in millions of US Dollars except share and per-share amounts
| 2. | SIGNIFICANT ACCOUNTING POLICIES (CONTINUED) |
The company enters into foreign currency forward contracts in respect of its Canadian dollar requirements for operating and capital expenditures. These contracts are not designated as hedging instruments for accounting purposes. Accordingly, they are marked-to-market and carried at fair value as assets or liabilities, as appropriate, with changes in fair value recognized in earnings.
REVENUE RECOGNITION
Sales revenue is recognized when the product is shipped, the sales price is determinable and collectability is reasonably assured. Revenue is recorded based on the FOB mine, plant, warehouse or terminal price, except for certain vessel sales which are shipped on a delivered basis. Transportation costs are recovered from the customer through sales pricing.
RECENT ACCOUNTING PRONOUNCEMENTS
In June 2003, the CICA issued Accounting Guideline 15 (“AcG-15”), “Consolidation of Variable Interest Entities”. In August 2004, a revised guideline (“AcG-15(R)”) was issued to ensure that AcG-15 was harmonized with FIN 46(R), its US GAAP equivalent. AcG-15(R) provides guidance for applying consolidation principles to certain entities that are subject to control on a basis other than ownership of voting interests. AcG-15(R) is effective for annual and interim periods, beginning on or after November 1, 2004. The company does not expect application of the guideline to have a material impact on its consolidated financial statements.
In January 2005, the CICA issued Section 1530, “Comprehensive Income”, Section 3251, “Equity”, Section 3855, “Financial Instruments – Recognition and Measurement” and Section 3865, “Hedges”. Under the new standards: a new location for recognizing certain gains and losses – other comprehensive income – has been introduced providing an ability for certain gains and losses arising from changes in fair value to be temporarily recorded outside the income statement, but in a transparent manner; all financial instruments, including derivatives, are to be included on a company’s balance sheet and measured in most cases at their fair values; and existing requirements for hedge accounting are extended. The guidance will apply for interim and annual financial statements relating to fiscal years beginning on or after October 1, 2006. Earlier adoption will be permitted only as of the beginning of a fiscal year. The company is in the process of evaluating the impact of these recently issued standards on its consolidated financial statements.
| 3. | CHANGES IN ACCOUNTING POLICY |
SOURCES OF GAAP
Effective January 1, 2004, the company prospectively adopted new accounting requirements of the CICA as issued in Section 1100, “Generally Accepted Accounting Principles”. This section establishes standards for financial reporting in accordance with Canadian GAAP and provides guidance on sources to consult when selecting accounting policies and determining appropriate disclosures when a matter is not dealt with explicitly in the primary sources of Canadian GAAP. In light of the new Section 1100 provisions, the company reviewed the application of its accounting policies and changed the consolidated financial statement presentation of sales revenue, freight costs and transportation and distribution expenses, which were previously reported on a net basis, to now reporting as separate line items on the Consolidated Statements of Operations and Retained
Earnings. There was no effect on gross margin or net income. All comparative information has been appropriately reclassified.
ASSET RETIREMENT OBLIGATIONS
As described in Note 2, on January 1, 2004, the company retroactively adopted CICA Section 3110, “Accounting for Asset Retirement Obligations”, which requires the company to record an asset and related liability for the costs associated with the retirement of long-lived tangible assets when a legal liability to retire such assets exists. This includes obligations incurred as a result of acquisition, construction or normal operation of a long-lived asset. The company has recorded asset retirement obligations primarily associated with certain closure, reclamation and restoration costs for its potash and phosphate operations (see Note 15).
The adoption of Section 3110 did not have a significant effect on the results of operations or financial position of the company. Had the provisions of Section 3110 been applied as of January 1, 2003, the pro forma effects on net loss would not have been material for the year ended December 31, 2003.
HEDGING RELATIONSHIPS
Effective January 1, 2004, the company adopted CICA Accounting Guideline 13 (“AcG-13”), “Hedging Relationships”. This guideline sets out the criteria that must be met in order to apply hedge accounting for derivatives. The guideline provides detailed guidance on the identification, designation, documentation and effectiveness of hedging relationships for purposes of applying hedge accounting, and the discontinuance of hedge accounting. Income and expenses on derivative instruments designated and qualifying as hedges under this guideline are recognized in earnings in the same period as the related hedged item. Ineffective hedging relationships and hedges not designated in a hedging relationship are carried at fair value on the Consolidated Statement of Financial Position, and subsequent changes in their fair value are recorded in earnings. The adoption of this accounting guideline did not have a material impact on the consolidated financial statements.
On December 21, 2004, the company acquired all the outstanding shares of RAC Investments Ltd. (“RAC Investments”), an indirect subsidiary of Israel Chemicals Ltd. (“ICL”), for $100.7, including acquisition costs. RAC Investments is an investment holding company which indirectly owns 19,200,242 Series A shares and 2,699,773 Series B shares in SQM, a Chilean specialty fertilizer, iodine and lithium company. RAC Investments’ earnings have been included in the consolidated financial statements since the acquisition date.
The following table summarizes the fair value of the assets acquired and liabilities assumed at the date of acquisition.
| | | | | |
| Cash | | $ | 3.5 | |
| Investment in SQM | | | 97.2 | |
| |
| Total assets acquired | | | 100.7 | |
| |
| Future income taxes | | | – | |
| |
| Total liabilities assumed | | | – | |
| |
| Net assets acquired | | | 100.7 | |
| Less: cash acquired | | | (3.5 | ) |
| |
| Cash consideration | | $ | 97.2 | |
| |
65
NOTES TO THE CONSOLIDATED FINANCIAL STATEMENTS | in millions of US Dollars except share and per-share amounts
4. BUSINESS ACQUISITION (CONTINUED)
Prior to execution of the above noted transaction, the company (through a subsidiary) sold 8,500,000 Series A shares of SQM via public auction on the Santiago Stock Exchange (the “Exchange”) and 1,301,724 Series A shares in other Exchange transactions. Proceeds on sale were $66.3, resulting in a non-taxable gain recorded in Other Income of $34.4, net of selling costs (see Note 24).The company now indirectly holds 63,062,037 Series A shares and 2,699,773 Series B shares of SQM.
5. ACCOUNTS RECEIVABLE
| | | | | | | | | |
| | | 2004 | | | 2003 | |
| |
| Trade accounts – Canpotex | | $ | 55.7 | | | $ | 28.3 | |
| – Other | | | 260.0 | | | | 244.8 | |
| Non-trade accounts | | | 41.5 | | | | 36.8 | |
| |
| | | | 357.2 | | | | 309.9 | |
| Less allowance for doubtful accounts | | | (4.6 | ) | | | (4.9 | ) |
| |
| | | $ | 352.6 | | | $ | 305.0 | |
| |
6. INVENTORIES
| | | | | | | | | |
| | | 2004 | | | 2003 | |
| |
| Finished product | | $ | 181.8 | | | $ | 160.7 | |
| Materials and supplies | | | 97.7 | | | | 108.0 | |
| Raw materials | | | 50.3 | | | | 54.1 | |
| Work in process | | | 67.0 | | | | 72.4 | |
| |
| | | $ | 396.8 | | | $ | 395.2 | |
| |
7. PROPERTY, PLANT AND EQUIPMENT
| | | | | | | | | | | | | |
| | | 2004 | |
| | | | | | | Accumulated | | |
| | | | | | | Depreciation and | | Net Book |
| | | Cost | | Amortization | | Value |
| |
| Land and improvements | | $ | 223.7 | | | $ | 42.5 | | | $ | 181.2 | |
| Buildings and improvements | | | 481.0 | | | | 177.6 | | | | 303.4 | |
| Machinery and equipment | | | 4,011.1 | | | | 1,474.9 | | | | 2,536.2 | |
| Mine development costs | | | 138.0 | | | | 59.9 | | | | 78.1 | |
| |
| | | $ | 4,853.8 | | | $ | 1,754.9 | | | $ | 3,098.9 | |
| |
| | | | | | | | | | | | | |
| | | 2003 | |
| | | | | | | Accumulated | | |
| | | | | | | Depreciation and | | Net Book |
| | | Cost | | Amortization | | Value |
| |
| Land and improvements | | $ | 225.7 | | | $ | 38.6 | | | $ | 187.1 | |
| Buildings and improvements | | | 469.0 | | | | 164.9 | | | | 304.1 | |
| Machinery and equipment | | | 3,856.4 | | | | 1,317.2 | | | | 2,539.2 | |
| Mine development costs | | | 133.2 | | | | 55.5 | | | | 77.7 | |
| |
| | | $ | 4,684.3 | | | $ | 1,576.2 | | | $ | 3,108.1 | |
| |
Depreciation and amortization of property, plant and equipment included in cost of goods sold and in selling and administrative was $210.9 (2003 – $193.9; 2002 – $188.2).The net carrying amount of property, plant and equipment not being amortized at December 31, 2004 because it was under construction or development was $234.9 (2003 – $170.8).
During the year, the company recorded an impairment charge of $6.2 (2003 – $117.6; 2002 – $NIL) relating to certain assets (see Notes 22 and 23). Interest capitalized to property, plant and equipment during the year was $2.5 (2003 – $1.5; 2002 – $4.2).
8. OTHER ASSETS AND INTANGIBLE ASSETS
| | | | | | | | | |
| | | 2004 | | | 2003 | |
| |
| Other assets | | | | | | | | |
| Investments at equity | | | | | | | | |
| APC – 27 percent ownership; quoted market value of $346.2 | | $ | 202.0 | | | $ | 181.5 | |
| SQM – 25 percent ownership; quoted market value of $445.5 | | | 240.2 | | | | 164.7 | |
| Other | | | 20.4 | | | | 17.0 | |
| Investments at cost | | | | | | | | |
| ICL – 9 percent ownership; quoted market value of $254.5 | | | 92.8 | | | | 92.8 | |
| Deferred charges – net of accumulated amortization of $35.0 (2003 – $26.1) | | | 34.8 | | | | 44.1 | |
| Accrued pension benefit asset | | | 25.6 | | | | 22.2 | |
| Rotational plant maintenance costs | | | | | | | | |
| – net of accumulated amortization of $48.0 (2003 – $33.2) | | | – | | | | 14.8 | |
| Other | | | 34.4 | | | | 58.3 | |
| |
| | | $ | 650.2 | | | $ | 595.4 | |
| |
Intangible assets– net of accumulated amortization of $11.4 (2003 – $7.9) | | $ | 37.1 | | | $ | 32.9 | |
| |
The company’s share of earnings of equity investees of $30.9 (2003 – $12.4; 2002 – $5.3) is included in other income (see Note 24).
During the year, the company recorded an impairment charge of $NIL (2003 – $65.4; 2002 – $NIL) relating to certain deferred charges. Amortization of deferred charges and rotational plant maintenance costs included in cost of goods sold and in selling and administrative was $25.6 (2003 – $28.5; 2002 – $30.2).
Intangible assets relate primarily to production and technology rights and computer software. Other than goodwill (see Note 9), the company has not recognized any intangible assets with indefinite useful lives. Total amortization expense relating to finite-lived intangible assets for 2004 was $3.5 (2003 – $5.0; 2002 – $0.7). Amortization expense in each of the next five years is estimated to be $5.3 for 2005, $6.0 for 2006, $5.2 for 2007, $3.9 for 2008 and $3.1 for 2009.
9. GOODWILL
| | | | | | | | | |
| | | 2004 | | | 2003 | |
| |
| Cost | | $ | 104.3 | | | $ | 104.3 | |
| Accumulated amortization | | | 7.3 | | | | 7.3 | |
| |
| | | $ | 97.0 | | | $ | 97.0 | |
| |
10. SHORT-TERM DEBT
Short-term debt was $93.5 at December 31, 2004 (2003 – $176.2). The weighted average interest rate on this debt was 1.42 percent (2003 – 1.43 percent; 2002 – 1.70 percent). The company had an unsecured line of credit available for short-term financing (net of letters of credit of $15.1 and direct borrowings of $NIL) in the amount of $59.9 at December 31, 2004 (2003 – $45.3). In addition, the company is authorized to borrow a further $406.5 under its commercial paper program.
The line of credit is subject to financial tests and other covenants. The principal covenants require a debt to capital ratio of less than or equal to 0.55:1, a long-term debt to EBITDA (defined in the agreement as earnings before interest, income taxes, provincial mining and other taxes, depreciation, amortization and other non-cash expenses) ratio of
66
NOTES TO THE CONSOLIDATED FINANCIAL STATEMENTS | in millions of US Dollars except share and per-share amounts
10. SHORT-TERM DEBT (CONTINUED)
less than or equal to 3.5:1, tangible net worth in an amount greater than or equal to $1,250.0 and debt of subsidiaries not to exceed $590.0. The line of credit is subject to other customary covenants and events of default, including an event of default for non-payment of other debt in excess of Cdn $40.0. Non-compliance with such covenants could result in accelerated payment of amounts due under the line of credit, and its termination. The company was in compliance with the above-mentioned covenants at December 31, 2004.
11. ACCOUNTS PAYABLE AND ACCRUED CHARGES
| | | | | | | | | |
| | | 2004 | | | 2003 | |
| |
| Trade accounts | | $ | 193.0 | | | $ | 161.6 | |
| Other payables | | | 127.7 | | | | 93.1 | |
| Current portion accrued environmental costs and asset retirement obligations | | | 19.5 | | | | 18.7 | |
| Accrued interest | | | 16.8 | | | | 16.1 | |
| Accrued compensation | | | 58.8 | | | | 32.8 | |
Current portion post-retirement/
post-employment benefits | | | 23.8 | | | | 15.3 | |
| Income taxes | | | 143.6 | | | | 29.4 | |
| Dividends | | | 16.7 | | | | 13.3 | |
| |
| | | $ | 599.9 | | | $ | 380.3 | |
| |
12. LONG-TERM DEBT
| | | | | | | | | |
| | | 2004 | | | 2003 | |
| |
Industrial Revenue and Pollution
Control Obligations | | $ | 9.0 | | | $ | 9.0 | |
Adjustable Rate Industrial Revenue and Pollution Control Obligations bearing interest at an average rate of 1.307% (2003 – 1.166%; 2002 – 1.725%)
and maturing in 2005. There are no sinking fund requirements prior to maturity. Bank letters of
credit are pledged as collateral for these loans. | | | | | | | | |
Notes Payable | | | | | | | | |
| 7.125% notes payable June 15, 2007 | | | 400.0 | | | | 400.0 | |
| 7.750% notes payable May 31, 2011 | | | 600.0 | | | | 600.0 | |
| 4.875% notes payable March 1, 2013 | | | 250.0 | | | | 250.0 | |
There are no sinking fund requirements prior to maturity. These notes were issued under US shelf registration statements covering up to $2,000.0
of debt securities. The notes are unsecured. The 2011 and 2013 notes are redeemable, in whole or in part, at the company’s option at any time prior to maturity for a price at least equal to the principal amount of the notes to be redeemed, plus accrued interest. | | | | | | | | |
| Other | | | 9.9 | | | | 10.9 | |
| |
| | | | 1,268.9 | | | | 1,269.9 | |
| Less current maturities | | | 10.3 | | | | 1.3 | |
| |
| | | $ | 1,258.6 | | | $ | 1,268.6 | |
| |
The company has entered into back-to-back loan arrangements involving certain financial assets and financial liabilities. The company has presented financial assets of $310.1 and financial liabilities of $316.0 on a net basis because a legal right to set-off exists, and intends to settle on a net basis. Other long-term debt in the above table includes a net financial liability of $5.9 (2003 – $5.9) pursuant to these arrangements.
The company has a syndicated credit facility, renewable annually, which provides for unsecured advances of up to $750.0 (less the amount of direct borrowings and commercial paper outstanding). As at December 31, 2004, no amounts were outstanding and $656.5 was available under the facility. Principal covenants and events of default under the credit facility requirements are the same as the line of credit as described in Note 10. The notes payable are not subject to any financial test covenants but are subject to certain customary covenants (including limitations on liens and sale and leaseback transactions) and events of default, including an event of default for acceleration of other debt in excess of $50.0. Neither the Industrial Revenue and Pollution Control Obligations nor the other long-term debt instruments are subject to any financial test covenants but each is subject to certain customary covenants and events of default, including, for other long-term debt, an event of default for non-payment of other debt in excess of $25.0. Non-compliance with such covenants could result in accelerated payment of the related debt. The company was in compliance with the above-mentioned covenants at December 31, 2004.
Long-term debt at December 31, 2004 will mature as follows:
| | | | | |
| 2005 | | $ | 10.3 | |
| 2006 | | | 1.3 | |
| 2007 | | | 400.6 | |
| 2008 | | | 0.3 | |
| 2009 | | | 0.3 | |
| Subsequent years | | | 856.1 | |
| |
| | | $ | 1,268.9 | |
| |
13. COMMITMENTS
LEASE COMMITMENTS
The company has various long-term operating lease agreements for buildings, port facilities, equipment, ocean-going transportation vessels, mineral leases and railcars, the latest of which expires in 2025. Rental expense for operating leases for the years ended December 31, 2004, 2003 and 2002 was $69.6,$39.9 and $41.2, respectively.
PURCHASE COMMITMENTS
The company has long-term agreements for the purchase of sulfur for use in the production of phosphoric acid. These agreements provide for minimum purchase quantities, and certain prices are based on market rates at the time of delivery. The commitments included in the table below are based on contract prices as at December 31, 2004.
The company has entered into long-term natural gas contracts with the National Gas Company of Trinidad. The contracts provide for prices that vary with ammonia market prices, escalating floor prices and minimum purchase quantities. The commitments included in the table below are based on floor prices and minimum purchase quantities.
The company also has a long-term agreement for the purchase of phosphate rock used at the Geismar facility. The commitments included in the table below are based on the expected purchase quantity and current base prices (less applicable discounts).
67
NOTES TO THE CONSOLIDATED FINANCIAL STATEMENTS | in millions of US Dollars except share and per-share amounts
| 13. | COMMITMENTS (CONTINUED) |
OTHER COMMITMENTS
Other operating commitments consist principally of amounts relating to the company’s contracts to purchase limestone that run through 2007 and various rail freight contracts, the latest of which expire in 2010.
Minimum future commitments under these contractual arrangements for the next five years and thereafter are shown below.
| | | | | | | | | | | | | |
| | | Operating | | Purchase | | Other |
| | | Leases | | Commitments | | Commitments |
| |
| 2005 | | $ | 78.9 | | | $ | 104.5 | | | $ | 13.4 | |
| 2006 | | | 69.8 | | | | 99.7 | | | | 10.8 | |
| 2007 | | | 62.9 | | | | 91.2 | | | | 9.1 | |
| 2008 | | | 50.9 | | | | 79.9 | | | | 8.4 | |
| 2009 | | | 47.2 | | | | 79.9 | | | | 8.4 | |
| Thereafter | | | 257.3 | | | | 452.0 | | | | 4.2 | |
| |
| Total | | $ | 567.0 | | | $ | 907.2 | | | $ | 54.3 | |
| |
| 14. | POST-RETIREMENT/POST-EMPLOYMENT BENEFITS |
PENSION PLANS
Canada
Substantially all employees of the company are participants in either a defined contribution or a defined benefit pension plan.
The company has established a supplemental retirement income plan for senior management which is unfunded, non-contributory and provides a supplementary pension benefit. The plan is provided for by charges to earnings sufficient to meet the projected benefit obligation.
United States
The company has defined benefit pension plans that cover a substantial majority of its employees. Benefits are based on a combination of years of service and compensation levels, depending on the plan. Generally, contributions to the US plans are made to meet or exceed minimum funding requirements of the Employee Retirement Income Security Act of 1974 (“ERISA”).
Trinidad
The company has contributory defined benefit pension plans that cover a substantial majority of its employees. Benefits are based on service. The plans’ assets consist mainly of local government and other bonds, local mortgage and mortgage-backed securities, fixed income deposits and cash.
OTHER POST-RETIREMENT PLANS
The company provides certain contributory health-care plans and non-contributory life insurance benefits for retired employees. These plans contain certain cost-sharing features such as deductibles and coinsurance, and are unfunded, with benefits subject to change.
DEFINED BENEFIT PENSION AND OTHER POST-RETIREMENT/POST-EMPLOYMENT BENEFIT PLANS
The components of net expense for the company’s pension and other post-retirement/post-employment benefit plans, computed actuarially, were as follows:
| | | | | | | | | | | | | | | | | | | | | | | | | |
| | | Pension | | | Other | |
| |
| | | 2004 | | | 2003 | | | 2002 | | | 2004 | | | 2003 | | | 2002 | |
| |
| Costs arising in the period | | | | | | | | | | | | | | | | | | | | | | | | |
| Service cost for benefits earned during the year | | $ | 12.9 | | | $ | 12.2 | | | $ | 12.0 | | | $ | 5.2 | | | $ | 5.5 | | | $ | 4.1 | |
| Interest cost on projected benefit obligations | | | 30.2 | | | | 29.6 | | | | 28.1 | | | | 13.2 | | | | 12.9 | | | | 13.9 | |
| Actual return on plan assets | | | (47.1 | ) | | | (73.3 | ) | | | 18.1 | | | | – | | | | – | | | | – | |
| Actuarial loss (gain) | | | 23.3 | | | | 27.3 | | | | 37.1 | | | | (6.8 | ) | | | 25.7 | | | | 7.4 | |
| Plan amendments | | | – | | | | 2.3 | | | | 1.9 | | | | – | | | | (12.6 | ) | | | – | |
| Change in valuation allowance | | | (2.2 | ) | | | 2.0 | | | | – | | | | – | | | | – | | | | – | |
| |
| Costs arising in the period | | | 17.1 | | | | 0.1 | | | | 97.2 | | | | 11.6 | | | | 31.5 | | | | 25.4 | |
| Difference between costs arising in the period and costs recognized in the period in respect of: | | | | | | | | | | | | | | | | | | | | | | | | |
| Return on plan assets | | | 13.6 | | | | 42.9 | | | | (50.0 | ) | | | – | | | | – | | | | – | |
| Actuarial (gain) loss | | | (20.2 | ) | | | (27.4 | ) | | | (36.5 | ) | | | 9.5 | | | | (13.6 | ) | | | 3.5 | |
| Plan amendments | | | 0.4 | | | | (2.2 | ) | | | (1.8 | ) | | | (1.9 | ) | | | 2.5 | | | | (9.7 | ) |
| Transitional obligation | | | 1.5 | | | | 5.1 | | | | – | | | | – | | | | – | | | | – | |
| |
| Net expense | | $ | 12.4 | | | $ | 18.5 | | | $ | 8.9 | | | $ | 19.2 | | | $ | 20.4 | | | $ | 19.2 | |
| |
The assumptions used to determine the benefit obligation and expense for the company’s significant plans were as follows (weighted average as of December 31):
| | | | | | | | | | | | | | | | | | | | | | | | | |
| | | Pension | | | Other | |
| |
| | | 2004 | | | 2003 | | | 2002 | | | 2004 | | | 2003 | | | 2002 | |
| |
| Discount rate – obligation | | | 5.75% | | | | 6.10% | | | | 6.50% | | | | 5.75% | | | | 6.10% | | | | 6.50% | |
| Discount rate – expense | | | 6.10% | | | | 6.50% | | | | 7.25% | | | | 6.10% | (1) | | | 6.50% | | | | 7.25% | |
| Long-term rate of return on assets | | | 8.50% | | | | 8.50% | | | | 9.00% | | | | n/a | | | | n/a | | | | n/a | |
| Rate of increase in compensation levels | | | 4.00% | | | | 4.00% | | | | 4.00% | | | | n/a | | | | n/a | | | | n/a | |
| (1) | Discount rate changed to 6. 25% effective July 1, 2004, upon recognition of Medicare Part D. |
68
NOTES TO THE CONSOLIDATED FINANCIAL STATEMENTS | in millions of US Dollars except share and per-share amounts
| 14. | POST-RETIREMENT/POST-EMPLOYMENT BENEFITS (CONTINUED) |
The assumed health-care cost trend rates are as follows:
| | | | | | | | | | | | | |
| | | 2004 | | | 2003 | | | 2002 | |
| |
| Health-care cost trend rates assumed for next year | | | 6.00% | | | | 6.00% | | | | 10.00% | |
| Ultimate health-care cost trend rate assumed | | | 6.00% | | | | 6.00% | | | | 6.00% | |
| Year that the rate reaches the ultimate trend rate | | | 2004 | | | | 2003 | | | | 2006 | |
Effective January 1, 2004, the company’s largest retiree medical plan limits the company’s share of annual medical cost increases to 4.5 percent for recent and future retirees. Any cost increases in excess of this amount are funded by increased retiree contributions.
The company employs a building block approach in determining the long-term rate of return for pension plan assets. Historical markets are studied and long-term historical relationships between equities and fixed-income are preserved consistent with the widely accepted capital market principle that assets with higher volatility generate a greater return over the long run. Current market factors such as inflation and interest rates are evaluated before long-term capital market assumptions are determined. The long-term rate of return is established with proper consideration of diversification and rebalancing. Peer data and historical returns are considered to check for reasonability and appropriateness.
The company is a sponsor of certain US post-retirement health-care plans that were impacted by the US Medicare Prescription Drug, Improvement and Modernization Act of 2003. This legislation expanded Medicare to include (for the first time) coverage for prescription drugs and introduced a prescription drug benefit and federal subsidy to sponsors of retiree health-care benefit plans that provide benefits at least “actuarially equivalent” to Medicare Part D. The company has accounted for the impact of the legislation prospectively as of July 1, 2004. The federal subsidy had the effect of reducing the company’s accumulated post-retirement benefit obligation by $23.2 and reducing the net periodic post-retirement benefit cost for the period by $1.7.
The company uses a December 31 measurement date for the majority of its plans. The most recent actuarial valuations of the majority of the pension plans for funding purposes were as of January 1, 2004, and the next required valuations will be as of January 1, 2005. The change in benefit obligations and change in plan assets for the above pension and other post-retirement/post-employment plans were as follows:
| | | | | | | | | | | | | | | | | |
| | | Pension | | | Other | |
| |
| | | 2004 | | | 2003 | | | 2004 | | | 2003 | |
| |
| Change in Benefit Obligations | | | | | | | | | | | | | | | | |
| Balance, beginning of year | | $ | 502.4 | | | $ | 449.2 | | | $ | 230.7 | | | $ | 208.3 | |
| Service cost | | | 12.9 | | | | 12.2 | | | | 5.2 | | | | 5.5 | |
| Interest cost | | | 30.2 | | | | 29.6 | | | | 13.2 | | | | 12.9 | |
| Participants’ contributions | | | 0.2 | | | | 0.3 | | | | 2.8 | | | | 1.8 | |
| Actuarial loss (gain) | | | 23.9 | | | | 27.3 | | | | (6.8 | ) | | | 25.7 | |
| Foreign exchange rate changes | | | 3.1 | | | | 6.4 | | | | 1.1 | | | | – | |
| Amendments | | | – | | | | 2.3 | | | | – | | | | (14.0 | ) |
| Benefits paid | | | (24.1 | ) | | | (24.9 | ) | | | (10.8 | ) | | | (9.5 | ) |
| |
| Balance, end of year | | | 548.6 | | | | 502.4 | | | | 235.4 | | | | 230.7 | |
| |
| Change in Plan Assets | | | | | | | | | | | | | | | | |
| Fair value, beginning of year | | | 406.1 | | | | 330.4 | | | | – | | | | – | |
| Actual return on plan assets | | | 47.1 | | | | 73.6 | | | | – | | | | – | |
| Employer contributions | | | 20.5 | | | | 23.3 | | | | 8.0 | | | | 7.7 | |
| Participants’ contributions | | | 0.2 | | | | 0.3 | | | | 2.8 | | | | 1.8 | |
| Foreign exchange rate changes | | | 3.1 | | | | 3.4 | | | | – | | | | – | |
| Benefits paid | | | (24.1 | ) | | | (24.9 | ) | | | (10.8 | ) | | | (9.5 | ) |
| |
| Fair value, end of year | | | 452.9 | | | | 406.1 | | | | – | | | | – | |
| |
| Funded Status | | | (95.7 | ) | | | (96.3 | ) | | | (235.4 | ) | | | (230.7 | ) |
| Valuation allowance | | | (11.7 | ) | | | (13.9 | ) | | | – | | | | – | |
| Unamortized net actuarial loss | | | 93.1 | | | | 86.1 | | | | 55.3 | | | | 70.5 | |
| Unamortized prior service cost | | | 3.8 | | | | 4.4 | | | | (9.1 | ) | | | (15.3 | ) |
| Unamortized transitional obligation | | | 6.7 | | | | 7.6 | | | | 1.4 | | | | – | |
| |
| Accrued post-retirement/post-employment benefits | | $ | (3.8 | ) | | $ | (12.1 | ) | | $ | (187.8 | ) | | $ | (175.5 | ) |
| |
| Amounts included in: | | | | | | | | | | | | | | | | |
| Liabilities | | | | | | | | | | | | | | | | |
Current(Note 11) | | $ | (16.0 | ) | | $ | (7.7 | ) | | $ | (7.8 | ) | | $ | (7.6 | ) |
| Long-term | | | (4.6 | ) | | | (17.7 | ) | | | (188.8 | ) | | | (176.8 | ) |
Other assets(Note 8) | | | 16.8 | | | | 13.3 | | | | 8.8 | | | | 8.9 | |
| |
| | | $ | (3.8 | ) | | $ | (12.1 | ) | | $ | (187.8 | ) | | $ | (175.5 | ) |
| |
69
NOTES TO THE CONSOLIDATED FINANCIAL STATEMENTS | in millions of US Dollars except share and per-share amounts
| 14. | POST-RETIREMENT/POST-EMPLOYMENT BENEFITS (CONTINUED) |
The accumulated benefit obligation for all defined benefit pension plans was $484.7 and $439.6 at December 31, 2004 and 2003, respectively. The aggregate projected benefit obligation, accumulated benefit obligation and aggregate fair value of plan assets for pension plans with accumulated benefit obligations in excess of plan assets were as follows:
| | | | | | | | | |
| | | 2004 | | | 2003 | |
| |
| Projected benefit obligation | | $ | 520.4 | | | $ | 460.1 | |
| Accumulated benefit obligation | | | 467.9 | | | | 411.4 | |
| Fair value of plan assets | | | 391.1 | | | | 355.0 | |
SENSITIVITY OF ASSUMPTIONS
The effect of a change in the health-care cost trend rate on the other post-retirement/post-employment benefit obligation and the aggregate of service and interest cost would have been as follows:
| | | | | | | | | | | | | |
| | | 2004 | | | 2003 | | | 2002 | |
| |
| As reported: | | | | | | | | | | | | |
| Benefit obligation | | $ | 235.4 | | | $ | 230.7 | | | $ | 208.3 | |
| Aggregate of service and interest cost | | | 18.4 | | | | 18.4 | | | | 18.0 | |
| Increase of 1.0 percentage point: | | | | | | | | | | |
| Benefit obligation | | | 34.4 | | | | 36.3 | | | | 35.0 | |
| Aggregate of service and interest cost | | | 3.3 | | | | 3.8 | | | | 3.3 | |
| Decrease of 1.0 percentage point: | | | | | | | | | |
| Benefit obligation | | | (35.3 | ) | | | (31.7 | ) | | | (28.7 | ) |
| Aggregate of service and interest cost | | | (3.4 | ) | | | (3.1 | ) | | | (2.7 | ) |
The above sensitivities should be used with caution. Changes in amounts based on a 1.0 percentage point variation in assumptions generally cannot be extrapolated because the relationship of the change in assumption to the change in amounts may not be linear. The sensitivities have been calculated independently of changes in other key variables. Changes in one factor may result in changes in another, which could amplify or reduce certain sensitivities.
PLAN ASSETS
Approximate asset allocations, by asset category, of the company’s significant pension plans were as follows at December 31:
| | | | | | | | | | | | | |
| Asset Category | | Target | | | 2004 | | | 2003 | |
| |
| Equity securities | | | 65% | | | | 67% | | | | 67% | |
| Debt securities | | | 35% | | | | 32% | | | | 32% | |
| Real estate | | | – | | | | – | | | | – | |
| Other | | | – | | | | 1% | | | | 1% | |
| |
| Total | | | 100% | | | | 100% | | | | 100% | |
| |
The company employs a total return investment approach whereby a mix of equities and fixed income investments is used to maximize the long-term return of plan assets for a prudent level of risk. Risk tolerance is established through careful consideration of plan liabilities, plan funded status and corporate financial condition. The investment portfolio contains a diversified blend of equity and fixed income investments.
Furthermore, equity investments are diversified across US and non-US stocks, as well as growth, value and small and large capitalizations. US equities also are diversified across actively managed and passively invested portfolios. Other assets such as private equity and hedge funds are not used at this time. Derivatives may be used to gain market exposure in an efficient and timely manner; however, derivatives may not be used to leverage the portfolio beyond the market value of the underlying investments. Investment risk is measured and monitored on an ongoing basis through quarterly investment portfolio reviews, annual liability measurements and periodic asset/liability studies. Investment strategy in Trinidad is largely dictated by local investment restrictions (maximum of 50 percent in equities and 20 percent foreign) and asset availability since the local equity market is small and there is little secondary market activity in debt securities.
DEFINED CONTRIBUTION SAVINGS PLANS
All of the company’s US employees may participate in defined contribution savings plans. These plans are subject to US federal tax limitations and provide for voluntary employee salary deduction contributions. The company suspended its contributions of up to 5 percent of salary in July 2003. Contributions were reinstated in August 2004, providing a minimum of 3 percent (to a maximum of 6 percent) of salary based on company performance. The company’s 2004 contributions were $2.9 (2003 – $3.4; 2002 – $5.0). All of the company’s Canadian salaried employees and certain hourly employees participate in the PCS Inc. Savings Plan and may make voluntary contributions. The company suspended its contributions to this plan in July 2003. Contributions were reinstated in August 2004, providing a minimum of 3 percent (to a maximum of 6 percent) of salary based on company performance. The company’s contributions in 2004 were $0.7 (2003 – $0.9; 2002 – $1.5).
CASH PAYMENTS
Total cash payments for pensions and other post-retirement/ post-employment benefits for 2004, consisting of cash contributed by the company to its funded pension plans, cash payments directly to beneficiaries for its unfunded other benefit plans and cash contributed to its defined contribution plans, were $32.4 (2003 – $35.5).
Approximately $35.1 is expected to be contributed by the company to all plans during 2005.
ESTIMATED FUTURE BENEFIT PAYMENTS
The following benefit payments, which reflect expected future service, as appropriate, are expected to be paid from either corporate assets or the qualified pension trusts:
| | | | | | | | | | | | | | | | | |
| | | | | | | Other | |
| | | | | | | |
| | | | | | | | | | | Reduction due | | | |
| | | | | | | | | | | to Medicare | | | |
| | | Pension | | | Gross | | | Part D Subsidy | | Net | |
| |
| 2005 | | $ | 23.5 | | | $ | 9.0 | | | $ | – | | | $ | 9.0 | |
| 2006 | | | 24.0 | | | | 9.4 | | | | 0.6 | | | | 8.8 | |
| 2007 | | | 24.8 | | | | 10.0 | | | | 0.6 | | | | 9.4 | |
| 2008 | | | 25.9 | | | | 10.5 | | | | 0.6 | | | | 9.9 | |
| 2009 | | | 27.4 | | | | 11.0 | | | | 0.7 | | | | 10.3 | |
| 2010-2014 | | | 162.9 | | | | 65.8 | | | | 4.3 | | | | 61.5 | |
70
NOTES TO THE CONSOLIDATED FINANCIAL STATEMENTS | in millions of US Dollars except share and per-share amounts
| 15. | ENVIRONMENTAL COSTS AND ASSET RETIREMENT OBLIGATIONS |
The company records an asset and related retirement obligation for the costs associated with the retirement of long-lived tangible assets when a legal liability to retire such assets exists. The major categories of asset retirement obligations include reclamation and restoration costs at the company’s potash and phosphate mining operations (most particularly phosphate mining), including management of mining byproducts such as gypsum and various mine tailings, land reclamation and revegetation programs, decommissioning of underground and surface operating facilities, general clean-up activities aimed at returning the areas to an environmentally acceptable condition, and post-closure care and maintenance. The asset retirement obligations are generally incurred over an extended period of time.
The estimation of asset retirement obligation costs depends on the development of environmentally acceptable closure and post-closure plans. In some cases, this may require significant research and development to identify preferred methods for such plans which are economically sound and which, in most cases, may not be implemented for several decades. The company has continued to utilize appropriate technical resources, including outside consultants, to develop specific site closure and post-closure plans in accordance with the requirements of the various jurisdictions in which it operates. The company estimates that the undiscounted cash flows required to settle the asset retirement obligations approximate $2,040.0. The estimated cash flows have been discounted at credit-adjusted risk-free rates ranging from 5.00 percent to 6.75 percent. Other than certain land reclamation programs, settlement of the obligations is typically correlated with mine life estimates. Cash flow payments are expected to occur principally over the next 75 years for the company’s phosphate operations. Payments relating to most potash operations are not expected to occur until after that time. The present value of the company’s asset retirement obligations at December 31, 2004 totalled $85.0 (2003 – $81.6), as set out in the table below. The current portion totalled $4.8 (2003 – $3.5).
Other environmental liabilities typically relate to regulatory compliance, environmental management associated with ongoing operations other than mining, site assessment and remediation of environmental contamination related to the activities of the company and its predecessors, including waste disposal practices and ownership and operations of real property and facilities.
SITE ASSESSMENT AND REMEDIATION COSTS
The company has accrued assessment costs, including legal and consulting fees, and remediation costs related to the clean-up of contaminated sites currently or formerly associated with the company or its predecessors’ business in the amount of $14.4 (2003 – $14.9) for certain PCS Joint Venture facilities, $0.3 (2003 – $0.3) for various sulfur facilities and $1.0 (2003 – $2.0) for other matters in the phosphate and nitrogen businesses. The current portion of these costs totalled $14.7 (2003 – $15.2).
ENVIRONMENTAL OPERATING COSTS AND CAPITAL EXPENDITURES
The company’s operating expenses, other than costs associated with asset retirement obligations, relating to compliance with environmental laws and regulations governing ongoing operations
were approximately $68.9 (2003 – $59.0; 2002 – $52.7). These amounts include environmental operating expenses related primarily to the production of phosphoric acid, fertilizer, feed and other products.
The company routinely undertakes environmental capital projects. In 2004, capital expenditures of $7.6 (2003 – $12.1) were incurred to meet pollution prevention and control objectives and $0.3 (2003 – $0.3) were incurred to meet other environmental objectives.
Following is a reconciliation of asset retirement and other environmental obligations as at December 31:
| | | | | | | | | |
| | | 2004 | | | 2003 | |
| |
| Asset retirement obligations, beginning of year | | $ | 81.6 | | | $ | 83.0 | |
| Liabilities incurred | | | 15.7 | | | | 14.4 | |
| Liabilities settled | | | (16.0 | ) | | | (14.4 | ) |
| Accretion expense | | | 5.2 | | | | 3.3 | |
| Revisions in estimated cash flows | | | (1.5 | ) | | | (4.7 | ) |
| |
| Asset retirement obligations, end of year | | | 85.0 | | | | 81.6 | |
| Other environmental liabilities | | | 15.7 | | | | 18.4 | |
Less current portion (Note 11) | | | (19.5 | ) | | | (18.7 | ) |
| |
| | | $ | 81.2 | | | $ | 81.3 | |
| |
AUTHORIZED:
The company is authorized to issue an unlimited number of common shares without par value and an unlimited number of first preferred shares. The first preferred shares may be issued in one or more series with rights and conditions to be determined by the Board of Directors.
| | | | | | | | | | | | | |
| Issued: | | 2004 | | | 2003 | | | 2002 | |
| | | Consideration | | | Consideration | | | Consideration | |
| |
| Issued, beginning of year | | $ | 1,245.8 | | | $ | 1,186.9 | | | $ | 1,182.5 | |
| Shares issued under option | | | 162.1 | | | | 58.7 | | | | 4.3 | |
| Shares issued for dividend reinvestment plan | | | 0.5 | | | | 0.2 | | | | 0.1 | |
| |
| Issued, end of year | | $ | 1,408.4 | | | $ | 1,245.8 | | | $ | 1,186.9 | |
| |
| | | | | | | | | | | | | |
| Issued: | | 2004 | | | 2003 | | | 2002 | |
| | | Number of | | | Number of | | | Number of | |
| | | Common Shares | | | Common Shares | | | Common Shares | |
| |
| Issued, beginning of year | | | 106,224,432 | | | | 104,155,296 | | | | 103,904,964 | |
| Shares issued under option | | | 4,397,324 | | | | 2,061,700 | | | | 243,800 | |
| Shares issued for dividend reinvestment plan | | | 8,747 | | | | 7,436 | | | | 6,532 | |
| |
| Issued, end of year | | | 110,630,503 | | | | 106,224,432 | | | | 104,155,296 | |
| |
On July 21, 2004, the Board of Directors of PCS approved a split of the company’s outstanding common shares on a two-for-one basis. The stock split was effected in the form of a stock dividend of one additional common share for each share owned by shareholders of record at the close of business on August 11, 2004. All equity-based benefit plans and share data have been retroactively adjusted to reflect the stock split.
| | | | | | | | | | | | | |
| | | 2004 | | | 2003 | | | 2002 | |
| |
| Balance, beginning of year | | $ | 265.2 | | | $ | 264.2 | | | $ | 264.2 | |
| Stock-based compensation | | | 10.5 | | | | 1.0 | | | | – | |
| |
| Balance, end of year | | $ | 275.7 | | | $ | 265.2 | | | $ | 264.2 | |
| |
71
NOTES TO THE CONSOLIDATED FINANCIAL STATEMENTS | in millions of US Dollars except share and per-share amounts
The company has three reportable business segments: potash, phosphate and nitrogen. These business segments are differentiated by the chemical nutrient contained in the product that each produces. Inter-segment sales are made under terms that approximate market value. The accounting policies of the segments are the same as those described in Note 2.
| | | | | | | | | | | | | | | | | | | | | |
| |
| 2004 | | | | | | | | | | | | | | | | | | | | |
| |
| | | Potash | | | Phosphate | | | Nitrogen | | | All others | | | Consolidated | |
| |
| Sales | | $ | 1,056.1 | | | $ | 977.9 | | | $ | 1,210.4 | | | $ | – | | | $ | 3,244.4 | |
| Freight | | | 128.7 | | | | 71.9 | | | | 38.1 | | | | – | | | | 238.7 | |
| Transportation and distribution | | | 32.6 | | | | 29.4 | | | | 42.3 | | | | – | | | | 104.3 | |
| Net sales – third party | | | 894.8 | | | | 876.6 | | | | 1,130.0 | | | | – | | | | | |
| Cost of goods sold | | | 472.0 | | | | 860.8 | | | | 887.2 | | | | – | | | | 2,220.0 | |
| Gross Margin | | | 422.8 | | | | 15.8 | | | | 242.8 | | | | – | | | | 681.4 | |
| Inter-segment sales | | | 5.9 | | | | 12.1 | | | | 92.9 | | | | – | | | | – | |
| Depreciation and amortization | | | 66.4 | | | | 84.4 | | | | 79.7 | | | | 9.5 | | | | 240.0 | |
| Provision for PCS Yumbes | | | 3.6 | | | | – | | | | – | | | | – | | | | 3.6 | |
| Goodwill | | | – | | | | – | | | | 96.6 | | | | 0.4 | | | | 97.0 | |
| Assets | | | 1,576.9 | | | | 1,532.9 | | | | 1,511.1 | | | | 505.9 | | | | 5,126.8 | |
| Additions to property, plant and equipment | | | 92.2 | | | | 55.9 | | | | 63.0 | | | | 9.4 | | | | 220.5 | |
| |
| |
| 2003 | | | | | | | | | | | | | | | | | | | | |
| |
| | | Potash | | | Phosphate | | | Nitrogen | | | All others | | | Consolidated | |
| |
| Sales | | $ | 758.7 | | | $ | 883.9 | | | $ | 1,156.4 | | | $ | – | | | $ | 2,799.0 | |
| Freight | | | 109.9 | | | | 75.8 | | | | 48.8 | | | | – | | | | 234.5 | |
| Transportation and distribution | | | 29.7 | | | | 26.2 | | | | 42.8 | | | | – | | | | 98.7 | |
| Net sales – third party | | | 619.1 | | | | 781.9 | | | | 1,064.8 | | | | – | | | | | |
| Cost of goods sold | | | 415.4 | | | | 798.4 | | | | 871.6 | | | | – | | | | 2,085.4 | |
| Gross Margin | | | 203.7 | | | | (16.5 | ) | | | 193.2 | | | | – | | | | 380.4 | |
| Inter-segment sales | | | 6.0 | | | | 9.4 | | | | 67.8 | | | | – | | | | – | |
| Depreciation and amortization | | | 52.4 | | | | 75.7 | | | | 89.6 | | | | 9.7 | | | | 227.4 | |
| Provision for plant shutdowns | | | – | | | | 4.9 | | | | 118.8 | | | | – | | | | 123.7 | |
| Provision for PCS Yumbes | | | 140.5 | | | | – | | | | – | | | | – | | | | 140.5 | |
| Goodwill | | | – | | | | – | | | | 96.6 | | | | 0.4 | | | | 97.0 | |
| Assets | | | 1,240.1 | | | | 1,541.3 | | | | 1,479.1 | | | | 306.8 | | | | 4,567.3 | |
| Additions to property, plant and equipment | | | 50.9 | | | | 51.0 | | | | 44.1 | | | | 4.7 | | | | 150.7 | |
| |
| |
| 2002 | | | | | | | | | | | | | | | | | | | | |
| |
| | | Potash | | | Phosphate | | | Nitrogen | | | All others | | | Consolidated | |
| |
| Sales | | $ | 669.0 | | | $ | 714.0 | | | $ | 841.4 | | | $ | – | | | $ | 2,224.4 | |
| Freight | | | 99.9 | | | | 58.8 | | | | 56.5 | | | | – | | | | 215.2 | |
| Transportation and distribution | | | 24.6 | | | | 18.4 | | | | 37.5 | | | | – | | | | 80.5 | |
| Net sales – third party | | | 544.5 | | | | 636.8 | | | | 747.4 | | | | – | | | | | |
| Cost of goods sold | | | 326.5 | | | | 594.9 | | | | 700.0 | | | | – | | | | 1,621.4 | |
| Gross Margin | | | 218.0 | | | | 41.9 | | | | 47.4 | | | | – | | | | 307.3 | |
| Inter-segment sales | | | 6.4 | | | | 6.4 | | | | 24.6 | | | | – | | | | – | |
| Depreciation and amortization | | | 46.3 | | | | 76.8 | | | | 88.0 | | | | 8.0 | | | | 219.1 | |
| Goodwill | | | – | | | | – | | | | 96.6 | | | | 0.4 | | | | 97.0 | |
| Assets | | | 1,198.4 | | | | 1,577.0 | | | | 1,602.4 | | | | 307.8 | | | | 4,685.6 | |
| Additions to property, plant and equipment | | | 35.5 | | | | 126.3 | | | | 47.0 | | | | 3.4 | | | | 212.2 | |
72
NOTES TO THE CONSOLIDATED FINANCIAL STATEMENTS | in millions of US Dollars except share and per-share amounts
| 18. | SEGMENT INFORMATION (CONTINUED) |
As described in Note 1, PhosChem and Canpotex execute marketing and sales for certain of the company’s offshore sales. Financial information by geographic area is summarized in the following table:
| | | | | | | | | | | | | | | | | | | | | |
| | | Country of Origin | |
| |
| | | Canada | | | United States | | | Trinidad | | | Other | | | Consolidated | |
| |
2004 | | | | | | | | | | | | | | | | | | | | |
| Sales to customers outside the company | | | | | | | | | | | | | | | | | | | | |
| Canada | | $ | 48.3 | | | $ | 87.5 | | | $ | – | | | $ | – | | | $ | 135.8 | |
| United States | | | 443.0 | | | | 1,383.7 | | | | 413.1 | | | | 2.8 | | | | 2,242.6 | |
| PhosChem | | | – | | | | 140.4 | | | | – | | | | – | | | | 140.4 | |
| Canpotex | | | 421.9 | | | | – | | | | – | | | | – | | | | 421.9 | |
| Other | | | 114.9 | | | | 57.3 | | | | 86.1 | | | | 45.4 | | | | 303.7 | |
| |
| | | $ | 1,028.1 | | | $ | 1,668.9 | | | $ | 499.2 | | | $ | 48.2 | | | $ | 3,244.4 | |
| |
| Operating income | | $ | 250.0 | | | $ | 67.8 | | | $ | 139.8 | | | $ | 56.7 | | | $ | 514.3 | |
| |
| Capital assets and goodwill | | $ | 831.2 | | | $ | 1,722.6 | | | $ | 601.4 | | | $ | 40.7 | | | $ | 3,195.9 | |
| |
| |
| | | Country of Origin | |
| |
| | | Canada | | | United States | | | Trinidad | | | Other | | | Consolidated | |
| |
2003 | | | | | | | | | | | | | | | | | | | | |
| Sales to customers outside the company | | | | | | | | | | | | | | | | | | | | |
| Canada | | $ | 41.1 | | | $ | 91.4 | | | $ | – | | | $ | – | | | $ | 132.5 | |
| United States | | | 314.9 | | | | 1,392.4 | | | | 350.6 | | | | 11.7 | | | | 2,069.6 | |
| PhosChem | | | – | | | | 87.0 | | | | – | | | | – | | | | 87.0 | |
| Canpotex | | | 260.6 | | | | – | | | | – | | | | – | | | | 260.6 | |
| Other | | | 96.8 | | | | 58.9 | | | | 49.0 | | | | 44.6 | | | | 249.3 | |
| |
| | | $ | 713.4 | | | $ | 1,629.7 | | | $ | 399.6 | | | $ | 56.3 | | | $ | 2,799.0 | |
| |
| Operating income (loss) | | $ | 97.8 | | | $ | (82.7 | ) | | $ | 91.4 | | | $ | (162.1 | ) | | $ | (55.6 | ) |
| |
| Capital assets and goodwill | | $ | 786.2 | | | $ | 1,745.6 | | | $ | 604.7 | | | $ | 68.6 | | | $ | 3,205.1 | |
| |
| |
| | | Country of Origin | |
| |
| | | Canada | | | United States | | | Trinidad | | | Other | | | Consolidated | |
| |
2002 | | | | | | | | | | | | | | | | | | | | |
| Sales to customers outside the company | | | | | | | | | | | | | | | | | | | | |
| Canada | | $ | 27.8 | | | $ | 79.1 | | | $ | – | | | $ | – | | | $ | 106.9 | |
| United States | | | 301.8 | | | | 1,099.5 | | | | 209.6 | | | | 9.0 | | | | 1,619.9 | |
| PhosChem | | | – | | | | 37.6 | | | | – | | | | – | | | | 37.6 | |
| Canpotex | | | 241.2 | | | | – | | | | – | | | | – | | | | 241.2 | |
| Other | | | 73.0 | | | | 67.4 | | | | 49.4 | | | | 29.0 | | | | 218.8 | |
| |
| | | $ | 643.8 | | | $ | 1,283.6 | | | $ | 259.0 | | | $ | 38.0 | | | $ | 2,224.4 | |
| |
| Operating income (loss) | | $ | 145.6 | | | $ | 17.8 | | | $ | 20.5 | | | $ | (17.0 | ) | | $ | 166.9 | |
| |
| Capital assets and goodwill | | $ | 778.0 | | | $ | 1,875.3 | | | $ | 627.9 | | | $ | 85.7 | | | $ | 3,366.9 | |
| |
The primary components of cost of goods sold are labor, employee benefits, services, raw materials (including inbound freight and purchasing and receiving costs), operating supplies, energy costs, property and miscellaneous taxes, and depreciation and amortization.
| 20. | SELLING AND ADMINISTRATIVE |
The primary components of selling and administrative are compensation, employee benefits, supplies, communications, travel, professional services and depreciation and amortization.
| 21. | PROVINCIAL MINING AND OTHER TAXES |
Provincial mining and other taxes consist of:
| | | | | | | | | | | | | |
| | | 2004 | | | 2003 | | | 2002 | |
| |
| Potash Production Tax | | $ | 63.7 | | | $ | 35.8 | | | $ | 47.7 | |
| Saskatchewan corporate capital taxes and other | | | 28.9 | | | | 21.2 | | | | 20.3 | |
| |
| | | $ | 92.6 | | | $ | 57.0 | | | $ | 68.0 | |
| |
73
NOTES TO THE CONSOLIDATED FINANCIAL STATEMENTS | in millions of US Dollars except share and per-share amounts
| 22. | PROVISION FOR PLANT SHUTDOWNS |
MEMPHIS AND GEISMAR NITROGEN OPERATIONS – 2003
In June 2003, the company indefinitely shut down its Memphis, Tennessee plant and suspended production of ammonia and nitrogen solutions at its Geismar, Louisiana facilities due to high US natural gas costs and low product margins. The operations have not been restarted.
The company determined that all employee positions pertaining to the affected operations would be eliminated, and recorded $4.8 in connection with costs of special termination benefits in 2003. The number of employees terminated as a result of the shutdowns was 187, of whom 186 had left the company as of December 31, 2004. The company has made payments relating to the terminations totalling $4.4 and expects to pay the remainder in 2005.
In connection with the shutdowns, management had determined that the carrying amounts of the long-lived assets at the Memphis and Geismar nitrogen facilities were not fully recoverable, and an impairment loss of $101.6, equal to the amount by which the carrying amount of the facilities’ asset groups exceeded their respective fair values, was recognized. Of the total impairment charge, $100.6 related to property, plant and equipment and $1.0 related to other assets. As part of its review, management also wrote down certain parts inventories at these plants in the amount of $12.4.
In addition to the costs described above, management expects to incur other shutdown-related costs of approximately $12.1 and nominal annual expenditures for site security and other maintenance costs. The other shutdown-related costs have not been recorded in the consolidated financial statements as of December 31, 2004. Such costs will be recognized and recorded in the period in which they are incurred.
KINSTON PHOSPHATE FEED PLANT – 2003
The phosphate feed plant at Kinston, North Carolina ceased operations in 2003. In that year, the company recorded $0.6 for costs of special termination benefits, $0.3 for parts inventory writedowns and $4.0 for long-lived asset impairment charges.
The Kinston property was sold in 2004 for nominal proceeds. There was no significant gain or loss on sale.
No additional significant costs were incurred in connection with the plant shutdowns in 2004. The following table summarizes, by reportable segment, the total costs incurred to date and the total costs expected to be incurred in connection with the plant shutdowns described above:
| | | | | | | | | |
| | | Costs | | | Total Costs | |
| | | Incurred | | | Expected to | |
| | | to Date | | | Be Incurred | |
| |
Nitrogen Segment | | | | | | | | |
| Employee termination and related benefits | | $ | 4.8 | | | $ | 4.8 | |
| Writedown of parts inventory | | | 12.4 | | | | 12.4 | |
| Asset impairment charges | | | 101.6 | | | | 101.6 | |
| Other related exit costs | | | – | | | | 12.1 | |
| |
| | | | 118.8 | | | | 130.9 | |
| |
Phosphate Segment | | | | | | | | |
| Employee termination and related benefits | | | 0.6 | | | | 0.6 | |
| Writedown of parts inventory | | | 0.3 | | | | 0.3 | |
| Asset impairment charges | | | 4.0 | | | | 4.0 | |
| |
| | | | 4.9 | | | | 4.9 | |
| |
| | | $ | 123.7 | | | $ | 135.8 | |
| |
Fair value for purposes of all impairment measurements was determined based on discounted expected future net cash flows.
The following table summarizes, by reportable segment, the costs accrued as of December 31, 2004 in connection with the plant shutdowns described above:
| | | | | | | | | | | | | |
| | | Accrued Balance | | | Cash Payments | | | Accrued Balance | |
| | | December 31, 2003 | | | and Adjustments | | | December 31, 2004 | |
| |
| Nitrogen Segment | | | | | | | | | | | | |
| Employee termination and related benefits | | $ | 2.1 | | | $ | (1.7 | ) | | $ | 0.4 | |
| |
Phosphate Segment | | | | | | | | | | | | |
| Employee termination and related benefits | | | 0.5 | | | | (0.5 | ) | | | – | |
| |
| | | $ | 2.6 | | | $ | (2.2 | ) | | $ | 0.4 | |
| |
The accrued balance is included in accounts payable and accrued charges in the Consolidated Statement of Financial Position as of December 31, 2004.
| 23. | PROVISION FOR PCS YUMBES S.C.M. |
2004
In December 2004, the company concluded the sale of 100 percent of its shares of PCS Yumbes to SQM. Acquired by the company in 1999, PCS Yumbes holds mining concessions on certain sodium nitrate deposits in the Atacama Desert in northern Chile and is a producer of potassium nitrate, sodium nitrate and iodine. Proceeds pursuant to the agreement totalled $42.3, including certain working capital adjustments of $6.2 and contingent consideration of $1.1. The company received $34.5 of the sale price prior to the end of the year. The total gain on sale was $3.5, of which $2.6 has been recognized in 2004. The deferred portion of the gain will be recognized in earnings in proportion to any future dilution or sale of part or all of the company’s interest in SQM.
During the year, the company recorded an additional writedown of $6.2, relating primarily to certain mining machinery and equipment that was not transferred to SQM under the terms of the agreement and that management plans to sell prior to the end of 2005. As of December 31, 2004, the fair value and carrying amount of the machinery and equipment that remained to be sold was $0.5. For measurement purposes, fair value was determined in reference to market prices for similar assets.
74
NOTES TO THE CONSOLIDATED FINANCIAL STATEMENTS | in millions of US Dollars except share and per-share amounts
| 23. | PROVISION FOR PCS YUMBES S.C.M. (CONTINUED) |
2003
In 2003, in connection with entering into the share purchase (and related) agreement with SQM, management conducted an assessment of the recoverability of the long-lived assets of the PCS Yumbes operations. As a result of its review, management determined that the carrying amounts of PCS Yumbes’ long-lived assets were not recoverable and recorded an impairment charge of $77.4, equal to the amount by which the carrying amount of the asset group exceeded fair value. Of the total impairment charge, $13.0 related to property, plant and equipment, $63.9 related to deferred pre-production costs and $0.5 related to deferred acquisition costs. For purposes of the impairment measurement, fair value was determined in reference to the commercial agreement referred to above. As part of the review, management also wrote down certain non-parts inventory by $50.2 due to the need to liquidate all inventories that would not be transferred to SQM under the agreement.
The company recorded a provision of $1.8 in 2003 pertaining to contractual termination benefits to be paid to employees, primarily under Chilean law. The company had also incurred early termination penalties in respect of certain PCS Yumbes contractual arrangements and recorded a provision of $11.1 in 2003 for these contract termination costs.
The following table summarizes the amounts recognized during 2004 and 2003 in connection with PCS Yumbes:
| | | | | | | | | | | | | |
| | | | | | | Amounts | | | | |
| | | Cumulative to | | | Recognized | | | | |
| | | December 31, 2003 | | | in 2004 | | | Total | |
| |
Potash Segment | | | | | | | | | | | | |
| Contract termination costs | | $ | 11.1 | | | $ | – | | | $ | 11.1 | |
| Employee termination and related benefits | | | 1.8 | | | | – | | | | 1.8 | |
| Writedown of non-parts inventory | | | 50.2 | | | | – | | | | 50.2 | |
| Asset impairment charges | | | 77.4 | | | | 6.2 | | | | 83.6 | |
| Gain on sale | | | – | | | | (2.6 | ) | | | (2.6 | ) |
| |
| | | $ | 140.5 | | | $ | 3.6 | | | $ | 144.1 | |
| |
The following table summarizes the costs accrued as of December 31, 2004 in connection with PCS Yumbes as described above:
| | | | | | | | | | | | | | | | | | | | | |
| | | Accrued Balance | | | Costs Incurred | | | Cash Payments | | | Non-cash | | | Accrued Balance | |
| | | December 31, 2003 | | | During 2004 | | | and Adjustments | | | Settlements | | | December 31, 2004 | |
| |
Potash Segment | | | | | | | | | | | | | | | | | | | | |
| Contract termination costs | | $ | 0.6 | | | $ | – | | | $ | (0.6 | ) | | $ | – | | | $ | – | |
| Employee termination and related benefits | | | 1.2 | | | | – | | | | (1.2 | ) | | | – | | | | – | |
| Asset impairment charges | | | – | | | | 6.2 | | | | – | | | | (6.2 | ) | | | – | |
| |
| | | $ | 1.8 | | | $ | 6.2 | | | $ | (1.8 | ) | | $ | (6.2 | ) | | $ | – | |
| |
| | | | | | | | | | | | | |
| | | 2004 | | | 2003 | | | 2002 | |
| |
| Share of earnings of equity investees | | $ | 30.9 | | | $ | 12.4 | | | $ | 5.3 | |
| Dividend income | | | 8.2 | | | | 5.6 | | | | 7.7 | |
Gain on sale of long-term investments(Note 4) | | | 34.4 | | | | – | | | | – | |
| Other | | | 5.9 | | | | 15.2 | | | | 11.8 | |
| |
| | | $ | 79.4 | | | $ | 33.2 | | | $ | 24.8 | |
| |
| | | | | | | | | | | | | |
| | | 2004 | | | 2003 | | | 2002 | |
| |
| Interest (income) expense on | | | | | | | | | | | | |
| Short-term debt and cash and cash equivalents | | $ | (1.8 | ) | | $ | 3.6 | | | $ | 8.0 | |
| Long-term debt | | | 85.8 | | | | 87.7 | | | | 75.1 | |
| |
| | | $ | 84.0 | | | $ | 91.3 | | | $ | 83.1 | |
| |
75
NOTES TO THE CONSOLIDATED FINANCIAL STATEMENTS | in millions of US Dollars except share and per-share amounts
As the company operates in a specialized industry and in several tax jurisdictions, its income is subject to various rates of taxation.
The provision for income taxes differs from the amount that would have resulted from applying the Canadian statutory income tax rates to income (loss) before income taxes as follows:
| | | | | | | | | | | | | |
| | | 2004 | | | 2003 | | | 2002 | |
| |
| Income (loss) before income taxes |
| Canada | | $ | 175.0 | | | $ | 16.3 | | | $ | 56.8 | |
| United States | | | 69.1 | | | | (86.3 | ) | | | 21.5 | |
| Trinidad | | | 118.5 | | | | 80.6 | | | | 20.5 | |
| Other | | | 67.7 | | | | (157.5 | ) | | | (15.0 | ) |
| |
| | | $ | 430.3 | | | $ | (146.9 | ) | | $ | 83.8 | |
| |
| Federal and provincial statutory tax rates | | | 43.36% | | | | 44.36% | | | | 46.12% | |
| |
| Tax at statutory rates | | $ | 186.6 | | | $ | (65.2 | ) | | $ | 38.7 | |
| Adjusted for the effect of: | | | | | | | | | | | | |
| Writedown of PCS Yumbes | | | 1.4 | | | | 50.8 | | | | – | |
| Gain on sale of long-term investments | | | (14.9 | ) | | | – | | | | – | |
| Net non-deductible provincial taxes and royalties and resource allowances | | | 8.1 | | | | 7.5 | | | | 10.2 | |
| Stock-based compensation deduction | | | (17.1 | ) | | | (5.4 | ) | | | – | |
| Additional tax deductions | | | (11.0 | ) | | | (11.8 | ) | | | (18.6 | ) |
| Difference between Canadian rate and rates applicable to subsidiaries in other countries | | | (26.7 | ) | | | 4.4 | | | | 0.8 | |
| Other | | | 5.3 | | | | (0.9 | ) | | | (0.9 | ) |
| |
| Income tax expense (recovery) | | $ | 131.7 | | | $ | (20.6 | ) | | $ | 30.2 | |
| |
Details of income tax expense (recovery) are as follows:
| | | | | | | | | | | | | |
| | | 2004 | | | 2003 | | | 2002 | |
| |
| Canada | | | | | | | | | | | | |
| Current | | $ | 69.4 | | | $ | 14.9 | | | $ | 46.2 | |
| Future | | | 11.5 | | | | 20.6 | | | | (10.1 | ) |
| United States – Federal | | | | | | | | | | | | |
| Current | | | 14.7 | | | | (16.4 | ) | | | (27.5 | ) |
| Future | | | (19.4 | ) | | | (40.7 | ) | | | 19.2 | |
| United States – State | | | | | | | | | | | | |
| Current | | | 2.2 | | | | (0.6 | ) | | | 1.6 | |
| Future | | | 12.5 | | | | (8.5 | ) | | | (1.5 | ) |
| Trinidad and other | | | | | | | | | | | | |
| Current | | | 19.1 | | | | 2.1 | | | | 3.9 | |
| Future | | | 21.7 | | | | 8.0 | | | | (1.6 | ) |
| |
| Income tax expense (recovery) | | $ | 131.7 | | | $ | (20.6 | ) | | $ | 30.2 | |
| |
The tax effects of temporary differences that give rise to significant portions of the net future income tax liability are:
| | | | | | | | | |
| | | 2004 | | | 2003 | |
| |
| Future income tax assets: | | | | | | | | |
| Loss and credit carryforwards | | $ | 294.2 | | | $ | 271.3 | |
| Post-retirement/post-employment benefits | | | 78.3 | | | | 55.2 | |
Accrued environmental costs and asset
retirement obligations | | | 0.9 | | | | 4.0 | |
| Other | | | 31.8 | | | | 29.5 | |
| |
| Total future income tax assets | | | 405.2 | | | | 360.0 | |
| |
| Future income tax liabilities: | | | | | | | | |
| Basis difference in fixed assets | | | 814.3 | | | | 806.1 | |
| Basis difference in investments | | | 27.6 | | | | – | |
| Other | | | 62.7 | | | | 38.1 | |
| |
| Total future income tax liabilities | | | 904.6 | | | | 844.2 | |
| |
| Net future income tax liability | | $ | 499.4 | | | $ | 484.2 | |
| |
Earnings of certain international subsidiaries would be taxed upon their repatriation. The company has not recognized a future income tax liability for these undistributed earnings as it does not currently expect them to be repatriated. Taxes that would be payable, at existing tax rates, if all foreign subsidiaries’ accumulated unremitted earnings were repatriated as at December 31, 2004 are estimated to be $30.3.
At December 31, 2004, the company has income tax losses carried forward of approximately $644.9 which will begin to expire in 2010. In addition, the company has alternative minimum tax credits of approximately $0.2 which carry forward indefinitely. The benefit relating to these amounts has been recognized by reducing future income tax liabilities.
| 27. | NET INCOME (LOSS) PER SHARE |
| | | | | | | | | | | | | | | | | |
| | | 2004 | | | 2003 | | | 2002 | | | | | |
| |
Basic net income (loss) per share | | | | | | | | | | | | | | | | |
| Net income (loss) available to common shareholders | | $ | 298.6 | | | $ | (126.3 | ) | | $ | 53.6 | | | | | |
| |
| Weighted average number of common shares | | 107,967,000 | | | 104,460,000 | | | 104,042,000 | | | | | |
| |
| Basic net income (loss) per share | | $ | 2.77 | | | $ | (1.21 | ) | | $ | 0.52 | | | | | |
| |
Diluted net income (loss) per share | | | | | | | | | | | | | | | | |
| Net income (loss) available to common shareholders | | $ | 298.6 | | | $ | (126.3 | ) | | $ | 53.6 | | | | | |
| |
| Weighted average number of common shares | | 107,967,000 | | | 104,460,000 | | | 104,042,000 | | | | | |
| Dilutive effect of stock options | | 2,772,000 | | | – | | | 590,000 | | | | | |
| |
| Weighted average number of diluted common shares | | 110,739,000 | | | 104,460,000 | | | 104,632,000 | | | | | |
| |
| Diluted net income (loss) per share | | $ | 2.70 | | | $ | (1.21 | ) | | $ | 0.51 | | | | | |
| |
76
NOTES TO THE CONSOLIDATED FINANCIAL STATEMENTS | in millions of US Dollars except share and per-share amounts
| 27. | NET INCOME (LOSS) PER SHARE (CONTINUED) |
Diluted net income (loss) per share is calculated based on the weighted average number of shares issued and outstanding during the year. The denominator is: (i) increased by the total of the additional common shares that would have been issued assuming exercise of all stock options with exercise prices at or below the average market price for the year; and (ii) decreased by the number of shares that the company could have repurchased if it had used the proceeds from the exercise of stock options to repurchase them on the open market at the average share price for the year. For years in which there was a loss applicable to common shares, stock options with exercise prices at or below the average market price for the year were excluded from the calculations of diluted net loss per share, as inclusion of these securities would have been anti-dilutive to the net loss per share.
Excluded from the calculation of diluted net income (loss) per share were average options outstanding of NIL (2003 – 2,239,861; 2002 – 4,230,525) as the options’ exercise price was greater than the average market price of the common shares for the year.
All per-share data have been retroactively adjusted to reflect the stock split described in Note 16.
| 28. | STOCK-BASED COMPENSATION |
The company has four stock-based compensation plans, which are described below. The company accounts for its grants under those plans in accordance with the fair value based method of accounting for stock-based compensation. The compensation cost that has been charged against income for those plans was $35.3 (2003 – $6.6; 2002 – $5.7).
STOCK OPTION PLANS
The company has two option plans. Under the Officers and Employees Plan, the company may, after February 3, 1998, issue up to 13,852,250 common shares pursuant to the exercise of options.
Under the Directors Plan, the company may, after January 24, 1995, issue up to 912,000 common shares pursuant to the exercise of options. Under both plans, the exercise price is the quoted market closing price of the company’s common shares on the last trading day immediately preceding the date of the grant, and an option’s maximum term is 10 years. All options granted to date have provided that one-half of the options granted in a year will vest one year from the date of the grant, with the other half of the options vesting the following year.
The company did not grant any stock options in 2004. A summary of the status of the plans as of December 31, 2004, 2003 and 2002 and changes during the years ending on those dates is presented as follows:
Number of Shares Subject to Option
| | | | | | | | | | | | | |
| | | 2004 | | | 2003 | | | 2002 | |
| |
| Outstanding, beginning of year | | | 10,876,022 | | | | 11,638,750 | | | | 10,088,550 | |
| Granted | | | – | | | | 1,399,072 | | | | 1,815,200 | |
| Exercised | | | (4,397,324 | ) | | | (2,061,700 | ) | | | (243,800 | ) |
| Cancelled | | | (77,968 | ) | | | (100,100 | ) | | | (21,200 | ) |
| |
| Outstanding, end of year | | | 6,400,730 | | | | 10,876,022 | | | | 11,638,750 | |
| |
Weighted Average Exercise Price
| | | | | | | | | | | | | |
| | | 2004 | | | 2003 | | | 2002 | |
| |
| Outstanding, beginning of year | | $ | 34.70 | | | $ | 32.99 | | | $ | 32.61 | |
| Granted | | | – | | | | 39.50 | | | | 33.25 | |
| Exercised | | | 34.34 | | | | 28.28 | | | | 17.47 | |
| Cancelled | | | 38.78 | | | | 35.41 | | | | 39.20 | |
| Outstanding, end of year | | | 34.97 | | | | 34.70 | | | | 32.99 | |
The weighted average grant-date fair value of options granted during the year was $NIL (2003 – $15.7; 2002 – $20.1).
The following table summarizes information about stock options outstanding at December 31, 2004:
| | | | | | | | | | | | | | | | | | | | | |
| | | Options Outstanding | | | Options Exercisable | |
| |
| Range of | | Number | | | Weighted Average | | | Weighted Average | | | | | | | Weighted Average | |
| Exercise Prices | | Outstanding | | | Remaining Life | | | Exercise Price | | | Number | | | Exercise Price | |
| |
| $21.84 | | | 287,500 | | | | 5 years | | | $ | 21.84 | | | | 287,500 | | | $ | 21.84 | |
| $30.64 | | | 698,200 | | | | 6 years | | | | 30.64 | | | | 698,200 | | | | 30.64 | |
| $29.04 to $32.69 | | | 855,500 | | | | 7 years | | | | 31.45 | | | | 855,500 | | | | 31.45 | |
| $33.25 | | | 1,208,350 | | | | 8 years | | | | 33.25 | | | | 1,208,350 | | | | 33.25 | |
| $33.94 | | | 733,600 | | | | 4 years | | | | 33.94 | | | | 733,600 | | | | 33.94 | |
| $35.19 to $37.38 | | | 626,400 | | | | 1.5 years | | | | 36.18 | | | | 626,400 | | | | 36.18 | |
| $39.50 | | | 1,250,320 | | | | 9 years | | | | 39.50 | | | | 574,400 | | | | 39.50 | |
| $40.88 to $43.38 | | | 740,860 | | | | 3 years | | | | 43.33 | | | | 740,860 | | | | 43.33 | |
| |
| | | | 6,400,730 | | | | 6 years | | | $ | 34.97 | | | | 5,724,810 | | | $ | 34.43 | |
| |
The foregoing options have expiry dates ranging from November 7, 2005 to November 20, 2013.
Prior to 2003, the company applied the intrinsic value based method of accounting for the plans. Effective December 15, 2003, the company adopted the fair value based method of accounting for stock options prospectively to all employee awards granted, modified or settled after January 1, 2003. Since the company’s stock option awards vest over two years, the compensation cost included in the determination of net income (loss) for years ended December 31, 2004 and 2003 is less than that which would have been recognized if the fair value based method had been applied to all awards since the original effective date of CICA Section 3870, “Stock-based Compensation and Other Stock-based Payments”. The following table illustrates the effect on net income (loss) and the related per-share amount if the fair value based method had been applied to all outstanding and unvested awards in each period.
77
NOTES TO THE CONSOLIDATED FINANCIAL STATEMENTS | in millions of US Dollars except share and per-share amounts
| 28. | STOCK-BASED COMPENSATION (CONTINUED) |
| | | | | | | | | | | | | |
| | | 2004 | | | 2003 | | | 2002 | |
| |
| Net income (loss) – as reported | | $ | 298.6 | | | $ | (126.3 | ) | | $ | 53.6 | |
| Add: Stock-based employee compensation expense included in reported net income |
| (loss), net of related tax effects | | | 8.8 | | | | 0.8 | | | | – | |
| Deduct: Total stock-based employee compensation expense determined under fair value | | | (12.8 | ) | | | (14.8 | ) | | | (14.3 | ) |
| based method for all option awards, net of related | | | | | | | | | | | | |
| tax effects | | | | | | | | | | | | |
| |
Net income (loss) – pro forma(1) | | $ | 294.6 | | | $ | (140.3 | ) | | $ | 39.3 | |
| |
(1)Compensation expense under the fair value based method is recognized over the vesting period of the related stock options. Accordingly, the pro forma results of applying this method may not be indicative of future results.
| | | | | | | | | | | | | |
| | | 2004 | | | 2003 | | | 2002 | |
| |
| Basic net income (loss) per share | | | | | | | | | | | | |
| As reported | | $ | 2.77 | | | $ | (1.21 | ) | | $ | 0.52 | |
| Pro forma | | | 2.73 | | | | (1.34 | ) | | | 0.38 | |
| Diluted net income (loss) per share | | | | | | | | | | | | |
| As reported | | $ | 2.70 | | | $ | (1.21 | ) | | $ | 0.51 | |
| Pro forma | | | 2.66 | | | | (1.34 | ) | | | 0.38 | |
In calculating the foregoing pro forma amounts, the fair value of each option grant was estimated as of the date of grant using the modified Black-Scholes option-pricing model with the following weighted-average assumptions:
| | | | | | | | | | | | | |
| | | Year of Grant | |
| |
| | | 2003 | | | 2002 | | | 2001 | |
| |
| Expected dividend | | | $0.50 | | | | $0.50 | | | | $0.50 | |
| Expected volatility | | | 27% | | | | 32% | | | | 32% | |
| Risk-free interest rate | | | 4.06% | | | | 4.13% | | | | 4.54% | |
| Expected life of options | | 8 years | | | 8 years | | | 8 years | |
| Expected forfeitures | | | 16% | | | | 10% | | | | 10% | |
DEFERRED SHARE UNIT AND OTHER PLANS
The company offers a deferred share unit plan to non-employee directors, which entitles those directors to receive discretionary grants of deferred share units (DSUs), each of which has a value equal to the market value of a common share at the time of its grant. The plan also allows each director to choose to receive, in the form of DSUs, all or a percentage of the director’s fee, which would otherwise be payable in cash. Each DSU fully vests upon award, but is distributed only when the director has ceased to be a member of the Board of Directors of the company. Vested units are settled in cash based on the common share price at that time. As of December 31, 2004, the total DSUs held by participating directors was 50,999 (2003 – 35,906; 2002 – 20,526).
The company offers a long-term incentive plan to senior executives and other key employees. The performance objectives under the plan are designed to further align the interests of executives and key employees with those of shareholders by linking the vesting of awards to the total return to shareholders over the three-year performance period ending December 31, 2005. Total shareholder return measures the capital appreciation in the company’s common shares, including dividends paid over the performance period. Vesting of one-half of the awards is based on increases in the total shareholder return over the three-year performance period. Vesting of the remaining one-half of the awards is based on the extent to which the total shareholder return matches or exceeds the total shareholder return of the common shares of a pre-defined peer group. Vested units are settled in cash based on the common share price generally at the end of the performance period.
Compensation expense for this program is recorded over the three-year performance cycle of the program. The amount of compensation expense is adjusted over the three-year performance cycle to reflect the current market value of common shares and the number of shares vested in accordance with the vesting schedule based upon total shareholder return and such return compared to the company’s peer group.
| 29. | FINANCIAL INSTRUMENTS AND RISK MANAGEMENT |
The company uses financial instruments, including foreign currency forward contracts, futures, swaps and option agreements, to manage foreign exchange, interest rate and commodity price risk. These hedging derivatives represent off-balance sheet items, since these derivatives are not recorded at fair value on the Consolidated Statements of Financial Position.
The company manages interest rate exposures by using a diversified portfolio of fixed and floating rate instruments. The company’s sensitivity to fluctuations in interest rates is substantially limited to certain of its cash and cash equivalents, short-term debt and long-term debt. In January and February 2004, the company entered into interest rate swap contracts designated as fair value hedges that effectively converted a notional amount of $300.0 of fixed rate debt (due 2011) into floating rate debt based on six-month US dollar LIBOR rates. Net settlements on the swap instruments have been recorded as adjustments to interest expense. In October 2004, the company terminated the interest rate swap contracts for cash proceeds of $3.0 and a gain of $0.8. Hedge accounting was discontinued prospectively and the associated gain is being amortized over the remaining term of the debt as a reduction to interest expense. The company did not enter into any interest rate swap contracts in 2003.
In addition to physical spot and term purchases, the company at times employs futures, swaps and option agreements to establish the cost on a portion of its natural gas requirements. These instruments are intended to hedge the future cost of the committed and anticipated natural gas purchases for its US nitrogen and phosphate plants. Under these arrangements, the company receives or makes payments based on the differential between a specified price and the actual spot price of natural gas. The company has certain available lines of credit which are utilized to reduce cash margin requirements to maintain the derivatives. At
78
NOTES TO THE CONSOLIDATED FINANCIAL STATEMENTS | in millions of US Dollars except share and per-share amounts
| 29. | FINANCIAL INSTRUMENTS AND RISK MANAGEMENT (CONTINUED) |
December 31, 2004, the company had collected cash margin requirements of $28.5 (2003 – $4.3) which were included in accounts payable.
As at December 31, 2004, the company had derivatives qualifying for deferral in the form of futures and swaps. The futures represented a notional amount of 2.8 MMBtu of natural gas with maturities in 2005. The swaps represented a notional amount of 91.4 MMBtu with maturities in 2005 through 2014. As at December 31, 2004, deferred losses from settled hedging transactions were $3.0 (2003 – $2.7).
As at December 31, 2004, the company had entered into foreign currency forward contracts to sell US dollars and receive Canadian dollars in the notional amount of $54.1 (2003 – $46.0) at an average exchange rate of 1.2306 (2003 – 1.3315). The company also had small forward contracts outstanding as at December 31, 2004 to reduce exposure to the euro and Swiss franc. The notional amounts of the company’s derivatives do not represent assets or liabilities and therefore are not reflected in the Consolidated Statements of Financial Position. Maturity dates for all forward contracts are within 2005.
The company is exposed to credit-related losses in the event of non-performance by counterparties to derivative financial instruments. The company anticipates, however, that counterparties will be able to fully satisfy their obligations under the contracts.
The major concentration of credit risk arises from the company’s receivables. A majority of its sales are in North America and are primarily for use in the agricultural industry. The company seeks to manage the credit risk relating to these sales through a credit management program. Internationally, the company’s products are sold primarily through two export associations whose accounts receivable are substantially insured or secured by letters of credit.
FAIR VALUE
Fair value represents point-in-time estimates that may change in subsequent reporting periods due to market conditions or other factors. The estimated fair values disclosed below are designed to approximate amounts at which the financial instruments could be exchanged in a current transaction between willing parties. However, some financial instruments lack an available trading market and therefore certain fair values are based on estimates using net present value and other valuation techniques, which are significantly affected by assumptions as to the amount and timing of estimated future cash flows and discount rates, all of which reflect varying degrees of risk.
Due to their short-term nature, the fair value of cash and cash equivalents, accounts receivable, short-term debt, and accounts payable and accrued charges is assumed to approximate carrying value. The fair value of the company’s gas hedging contracts at December 31, 2004 approximated $66.5 (2003 – $59.8). Futures contracts are exchange-traded and fair value was determined based on exchange prices. Swaps and option agreements are traded in the over-the-counter market and fair value was calculated based on a price that was converted to an exchange-equivalent price. The fair value of the company’s notes payable at December 31, 2004 approximated $1,383.2 (2003 – $1,417.8) and reflects a current yield valuation based on observed market prices. The fair value of the company’s other long-term debt instruments approximated carrying value.
CANPOTEX
PotashCorp is a shareholder in Canpotex which markets potash offshore. Should any operating losses or other liabilities be incurred by Canpotex, the shareholders have contractually agreed to reimburse Canpotex for such losses or liabilities in proportion to their productive capacity. There were no such operating losses or other liabilities in 2004, 2003 or 2002.
MINING RISK
In common with other companies in the industry, the company is unable to acquire insurance for underground assets.
INVESTMENT IN APC
The terms of a shareholders agreement with Jordan Investment Company (“JIC”) provide that, from October 17, 2006 to October 16, 2009, JIC may seek to exercise a put option (the “Put”) to require the company to purchase JIC’s remaining common shares in APC. If the Put were exercised, the company’s purchase price would be calculated in accordance with a specified formula based, in part, on future earnings of APC. The amount, if any, which the company may have to pay for JIC’s remaining common shares if there was to be a valid exercise of the Put is not presently determinable.
LEGAL AND OTHER MATTERS
In 1998, the company, along with other parties, was notified by the US Environmental Protection Agency (“EPA”) of potential liability under the US federal Comprehensive Environmental Response, Compensation and Liability Act of 1980 (“CERCLA”) with respect to certain soil and groundwater conditions at a PCS Joint Venture blending facility in Lakeland, Florida and certain adjoining property. In 1999, PCS Joint Venture signed an Administrative Order on Consent with EPA pursuant to which PCS Joint Venture agreed to conduct a Remedial Investigation and Feasibility Study (“RI/FS”) of these conditions. PCS Joint Venture and another party are sharing the costs of the RI/FS. The draft feasibility study has been submitted for review and approval, and selection of a remedy is projected to occur some time in 2005. No final determination has yet been made of the nature, timing or cost of remedial action that may be needed, nor to what extent costs incurred may be recoverable from third parties.
In 1994, PCS Joint Venture responded to information requests from the EPA and the Georgia Department of Natural Resources, Environmental Protection Division (“GEPD”), regarding conditions at its Moultrie, Georgia location. PCS Joint Venture believes that the lead-contaminated soil and groundwater found at the site is attributable to former operations at the site prior to PCS Joint Venture’s ownership. PCS Joint Venture initially submitted a proposed Corrective Action Plan to GEPD in 1999, which has now been revised several times in response to GEPD comments. PCS Joint Venture has also conducted and submitted an assessment of the site. Based on its review of the assessment and the Corrective Action Plan, GEPD has expressed its opinion that remediation of the site will require some excavation and off-site disposal of impacted soil and installation of a groundwater recovery and treatment system. The company has continued discussions with GEPD regarding a remedial plan for the site.
In 2003, EPA notified PCS Nitrogen that it considered PCS Nitrogen to be a potentially responsible party with respect to a former fertilizer
79
NOTES TO THE CONSOLIDATED FINANCIAL STATEMENTS | in millions of US Dollars except share and per-share amounts
| 30. | CONTINGENCIES (CONTINUED) |
blending operation in South Carolina formerly owned by a company from which PCS Nitrogen acquired certain other assets. It is the company’s understanding that EPA is conducting an assessment of conditions at the site and intends to propose a remedial plan for the site in the coming year. The company intends to continue to assert its position that it is not a responsible party. The company is also engaged in ongoing site assessment and/or remediation activities at a number of other facilities and sites. Based on current information, it believes that its future obligations with respect to these facilities and sites will not have a material adverse effect on the company’s consolidated financial position or results of operations.
The breadth of the company’s operations and the global complexity of tax regulations require assessments of uncertainties and judgments in estimating the ultimate taxes the company will pay. The final taxes paid are dependent upon many factors, including negotiations with taxing authorities in various jurisdictions, outcomes of tax litigation and resolution of disputes arising from federal, provincial, state and local tax audits. The resolution of these uncertainties and the associated final taxes may result in adjustments to the company’s tax assets and tax liabilities.
Various other claims and lawsuits are pending against the company in the ordinary course of business. While it is not possible to determine the ultimate outcome of such actions at this time, and there exist inherent uncertainties in predicting such outcomes, it is management’s belief that the ultimate resolution of such actions will not have a material adverse effect on the company’s consolidated financial position or results of operations.
31.GUARANTEES
In the normal course of operations, the company provides indemnifications that are often standard contractual terms to counterparties in transactions such as purchase and sale contracts, service agreements, director/officer contracts and leasing transactions. These indemnification agreements may require the company to compensate the counterparties for costs incurred as a result of various events, including environmental liabilities and changes in (or in the interpretation of) laws and regulations, or as a result of litigation claims or statutory sanctions that may be suffered by the counterparty as a consequence of the transaction. The terms of these indemnification agreements will vary based upon the contract, the nature of which prevents the company from making a reasonable estimate of the maximum potential amount that it could be required to pay to counterparties. Historically, the company has not made any significant payments under such indemnifications and no amounts have been accrued in the accompanying consolidated financial statements with respect to these indemnification guarantees.
The company enters into agreements in the normal course of business that may contain features which meet the definition of a guarantee. Various debt obligations (such as overdrafts, lines of credit with counterparties for derivatives, and back-to-back loan arrangements) and other commitments (such as railcar leases) related to certain subsidiaries have been directly guaranteed by the company under such agreements with third parties. The company would be required to perform on these guarantees in the event of default by the guaranteed parties. No material loss is anticipated by reason of such agreements and guarantees. At December 31, 2004, the maximum potential
amount of future (undiscounted) payments under significant guarantees provided to third parties approximated $159.9, representing the maximum risk of loss if there were a total default by the guaranteed parties, without consideration of possible recoveries under recourse provisions or from collateral held or pledged. At December 31, 2004, no subsidiary balances subject to guarantees were outstanding in connection with the company’s cash management facilities, and the company had no liabilities recorded for other obligations other than subsidiary bank borrowings of approximately $5.9, which are reflected in other long-term debt in Note 12, and the cash margin requirements to maintain derivatives as disclosed in Note 29.
The company has guaranteed the gypsum stack capping, closure and post-closure obligations of White Springs and PCS Nitrogen, in Florida and Louisiana, respectively, pursuant to the financial assurance regulatory requirements in those states. The State of Florida is presently reviewing, and is expected to revise, its financial assurance requirements to ensure that responsible parties have sufficient resources to cover all closure and post-closure costs and liabilities associated with gypsum stacks. This review may result in the imposition of more stringent requirements to demonstrate financial responsibility and/or inclusion of a greater scope of closure and post-closure costs than under current law.
The environmental regulations of the Province of Saskatchewan require each potash mine to have decommissioning and reclamation (“D&R”) plans. In 2001, agreement was reached with the provincial government on the financial assurances for the D&R plan to cover an interim period to July 1, 2005. In October 2004, this interim period was extended to July 1, 2006. A government/industry task force has been established to assess decommissioning options for all Saskatchewan potash producers and to produce mutually acceptable revisions to the plan schedules. The company has posted a Cdn $2.0 letter of credit as collateral that will remain in effect until the revised plans are accepted.
During the year, the company entered into various other commercial letters of credit in the normal course of operations.
The company expects that it will be able to satisfy all applicable credit support requirements without disrupting normal business operations.
| 32. | RELATED PARTY TRANSACTIONS |
Sales to Canpotex are at prevailing market prices. Sales for the year ended December 31, 2004 were $421.9 (2003 – $260.6; 2002 – $241.2). Account balances resulting from the Canpotex transactions are included in the Consolidated Statements of Financial Position and settled on normal trade terms (see Note 5).
In connection with entering into the agreement with SQM as described in Note 23, PCS Yumbes agreed to purchase potash from SQM at a negotiated price that approximated market value. In addition, PCS Yumbes agreed to sell to SQM all of its potassium nitrate production at a negotiated price that approximated market value. Both agreements were in effect until closing of the PCS Yumbes sale agreement in December 2004. Potash purchases from SQM for the year were $7.0 (2003 – $13.1; 2002 – $17.9). Potassium nitrate sales to SQM for the year were $25.1 (2003 – $25.8; 2002 – $2.1). All transactions with SQM are settled on normal trade terms.
80
NOTES TO THE CONSOLIDATED FINANCIAL STATEMENTS | in millions of US Dollars except share and per-share amounts
| 33. | QUARTERLY RESULTS (UNAUDITED) |
The following quarterly information in management’s opinion includes all adjustments (consisting solely of normal recurring adjustments) necessary for fair presentation. All per-share data have been retroactively adjusted to reflect the stock split described in Note 16.
| | | | | | | | | | | | | | | | | |
| | | First Quarter | | | Second Quarter | | | Third Quarter | | | Fourth Quarter | |
2004 | | | | | | | | | | | | | | | | |
| Sales | | $ | 728.4 | | | $ | 833.7 | | | $ | 815.7 | | | $ | 866.6 | |
| Less: Freight | | | 58.1 | | | | 68.9 | | | | 51.2 | | | | 60.5 | |
| Transportation and distribution | | | 23.0 | | | | 31.3 | | | | 23.6 | | | | 26.4 | |
| Cost of goods sold | | | 523.3 | | | | 562.8 | | | | 551.5 | | | | 582.4 | |
| |
| Gross Margin | | $ | 124.0 | | | $ | 170.7 | | | $ | 189.4 | | | $ | 197.3 | |
| |
| Operating Income | | $ | 97.8 | | | $ | 129.2 | | | $ | 133.1 | | | $ | 154.2 | |
| |
| Net Income | | $ | 50.7 | | | $ | 72.6 | | | $ | 75.2 | | | $ | 100.1 | |
| |
| Net Income per Share – Basic | | $ | 0.48 | | | $ | 0.68 | | | $ | 0.69 | | | $ | 0.91 | |
| |
| Net Income per Share – Diluted | | $ | 0.47 | | | $ | 0.67 | | | $ | 0.68 | | | $ | 0.88 | |
| |
| |
| | | First Quarter | | | Second Quarter | | | Third Quarter | | | Fourth Quarter | |
2003 | | | | | | | | | | | | | | | | |
| Sales | | $ | 661.8 | | | $ | 745.0 | | | $ | 674.6 | | | $ | 717.6 | |
| Less: Freight | | | 64.4 | | | | 60.5 | | | | 55.9 | | | | 53.7 | |
| Transportation and distribution | | | 23.0 | | | | 27.5 | | | | 28.3 | | | | 19.9 | |
| Cost of goods sold | | | 493.3 | | | | 534.7 | | | | 505.9 | | | | 551.5 | |
| |
| Gross Margin | | $ | 81.1 | | | $ | 122.3 | | | $ | 84.5 | | | $ | 92.5 | |
| |
| Operating Income (Loss) | | $ | 24.7 | | | $ | 73.1 | | | $ | (210.9 | ) | | $ | 57.5 | |
| |
| Net Income (Loss) | | $ | 3.2 | | | $ | 29.9 | | | $ | (185.9 | ) | | $ | 26.5 | |
| |
| Net Income (Loss) per Share – Basic | | $ | 0.03 | | | $ | 0.29 | | | $ | (1.78 | ) | | $ | 0.25 | |
| |
| Net Income (Loss) per Share – Diluted | | $ | 0.03 | | | $ | 0.29 | | | $ | (1.78 | ) | | $ | 0.25 | |
| |
Net income (loss) per share for each quarter has been computed based on the weighted average number of shares issued and outstanding during the respective quarter; therefore, quarterly amounts may not add to the annual total.
The company’s sales of fertilizer can be seasonal. Typically, the second quarter of the year is when fertilizer sales will be highest, due to the North American spring planting season. However, planting conditions and the timing of customer purchases will vary each year and sales can be expected to shift from one quarter to another.
Certain of the prior years’ figures have been reclassified to conform with the current year’s presentation.
| 36. | RECONCILIATION OF CANADIAN AND UNITED STATES GENERALLY ACCEPTED ACCOUNTING PRINCIPLES |
Canadian GAAP varies in certain significant respects from US GAAP. As required by the United States Securities and Exchange Commission, the effect of these principal differences on the company’s consolidated financial statements is described and quantified below:
Long-term investments:The company’s investment in ICL is stated at cost. US GAAP requires that this investment be classified as available-for-sale and be stated at market value with the difference between market value and cost reported as a component of Other Comprehensive Income (“OCI”). Under US GAAP, when an investment previously accounted for using the cost method qualifies for use of the equity method, the investor should adopt the equity method of accounting. The investment, results of operations (current and prior periods presented), and retained earnings of the investor should be adjusted retroactively.
Under Canadian GAAP, equity accounting is generally not applied retroactively. In 2002, the company acquired additional shares in SQM and adopted the equity method of accounting, though not on a retroactive basis. In 2004, the company corrected this omission in its US GAAP reconciliation to reflect a reduction in 2002 opening accumulated other comprehensive income, deferred income taxes payable and long-term investments of $6.8, $3.9 and $10.7, respectively, and an increase in other comprehensive income of $23.2. The revision had no effect on 2002 opening retained earnings, net income or net income per share.
Property, plant and equipment and goodwill:The net book value of property, plant and equipment and goodwill under Canadian GAAP is higher than under US GAAP, as past provisions for asset impairment under Canadian GAAP were measured based on the undiscounted cash flow from use together with the residual value of the assets. Under US GAAP they were measured based on fair value, which was lower than the undiscounted cash flow from use together with the residual value of the assets. Fair value for this purpose was determined based on discounted expected future net cash flows.
Depreciation and amortization:Depreciation and amortization under Canadian GAAP is higher than under US GAAP, as a result of differences in the carrying amounts of property, plant and equipment under Canadian and US GAAP.
Pre-operating costs:Operating costs incurred during the start-up phase of new projects are deferred under Canadian GAAP until commercial production levels are reached, at which time they are amortized over the estimated life of the project. US GAAP requires that these costs be expensed as incurred.
81
NOTES TO THE CONSOLIDATED FINANCIAL STATEMENTS | in millions of US Dollars except share and per-share amounts
| 36. | RECONCILIATION OF CANADIAN AND UNITED STATES GENERALLY ACCEPTED ACCOUNTING PRINCIPLES (CONTINUED) |
Asset retirement obligations:The company adopted SFAS No. 143, “Accounting for Asset Retirement Obligations”, for US GAAP purposes effective January 1, 2003. As described in Note 3, the equivalent Canadian standard was not adopted until January 1, 2004.
Post-retirement and post-employment benefits:Under Canadian GAAP, when a defined benefit plan gives rise to an accrued benefit asset, a company must recognize a valuation allowance for the excess of the adjusted benefit asset over the expected future benefit to be realized from the plan asset. Changes in the pension valuation allowance are recognized in income. US GAAP does not specifically address pension valuation allowances, and the US regulators have interpreted this to be a difference between Canadian and US GAAP. In light of this, a difference between Canadian and US GAAP has been recorded for the effects of recognizing a pension valuation allowance and the changes therein under Canadian GAAP.
The company’s accumulated benefit obligation for its US pension plans exceeds the fair value of plan assets. US GAAP requires the recognition of an additional minimum pension liability in the amount of the excess of the unfunded accumulated benefit obligation over the recorded pension benefits liability. An offsetting intangible asset is recorded equal to the unrecognized prior service costs, with any difference recorded as a reduction of accumulated OCI. No similar requirement exists under Canadian GAAP.
Foreign currency translation adjustment:The company adopted the US dollar as its functional and reporting currency on January 1, 1995. At that time, the consolidated financial statements were translated into US dollars at the December 31, 1994 year-end exchange rate using the translation of convenience method under Canadian GAAP. This translation method was not permitted under US GAAP. US GAAP required the comparative Consolidated Statements of Operations and Consolidated Statements of Cash Flow to be translated at applicable weighted-average exchange rates; whereas the Consolidated Statements of Financial Position were permitted to be translated at the December 31, 1994 year-end exchange rate. The use of disparate exchange rates under US GAAP gave rise to a foreign currency translation adjustment. Under US GAAP, this adjustment is reported as a component of accumulated OCI.
Derivative instruments and hedging activities:Under Canadian GAAP, effective January 1, 2004, derivatives used for non-trading purposes that do not qualify for hedge accounting are carried at fair value on the Consolidated Statements of Financial Position, with changes in fair value reflected in earnings. Derivatives embedded within hybrid instruments are generally not separately accounted for except for those related to equity-linked deposit contracts, which are not applicable to the company. Gains and losses on derivative instruments held within an effective hedge relationship are recognized in earnings on the same basis and in the same period as the underlying hedged items. There is no difference in accounting between Canadian and US GAAP in respect of derivatives that do not qualify for hedge accounting. Unlike Canadian GAAP, however, the company recognizes all of its derivative instruments (whether designated in hedging relationships or not, or embedded within hybrid instruments) at fair value on the Consolidated Statements of
Financial Position for US GAAP purposes. Under US GAAP, the accounting for changes in the fair value (i.e. gains or losses) of a derivative instrument depends on whether it has been designated and qualifies as part of a hedging relationship. For strategies designated as fair value hedges, the effective portion of the change in the fair value of the derivative is offset in income against the change in fair value, attributed to the risk being hedged, of the underlying hedged asset, liability or firm commitment. For cash flow hedges, the effective portion of the changes in the fair value of the derivative is accumulated in OCI until the variability in cash flows being hedged is recognized in earnings in future accounting periods. For both fair value and cash flow hedges, if a derivative instrument is designated as a hedge and meets the criteria for hedge effectiveness, earnings offset is available, but only to the extent that the hedge is effective. Ineffective portions of fair value or cash flow hedges are recorded in earnings in the current period.
Freight, transportation and distribution:The company has changed its accounting policy regarding consolidated financial statement presentation of freight costs and transportation and distribution expenses under US GAAP. In prior years, the company included freight costs in cost of goods sold and transportation and distribution expenses in operating expenses under US GAAP. Effective January 1, 2004, the company discloses freight costs and transportation and distribution expenses under US GAAP as separate line items within gross margin on the Consolidated Statements of Operations and Retained Earnings. This presentation is consistent with the new Canadian GAAP presentation described in Note 3. All comparative information has been appropriately reclassified.
Provision for plant shutdowns:The 2003 provision for plant shutdowns under Canadian GAAP includes $12.7 for writedowns of parts inventory. US GAAP requires that these writedowns be presented as a component of cost of goods sold.
Provision for PCS Yumbes S.C.M.:The 2003 provision for PCS Yumbes under Canadian GAAP includes $50.2 for writedowns of non-parts inventory. US GAAP requires that these writedowns be presented as a component of cost of goods sold.
Comprehensive income:Comprehensive income is recognized and measured under US GAAP pursuant to SFAS No. 130, “Reporting Comprehensive Income”. This standard defines comprehensive income as all changes in equity other than those resulting from investments by owners and distributions to owners. Comprehensive income is comprised of two components, net income and OCI. OCI refers to amounts that are recorded as an element of shareholders’ equity but are excluded from net income because these transactions or events were attributed to changes from non-owner sources. As described in Note 2, Canadian standards relating to comprehensive income are not effective until fiscal years beginning on or after October 1, 2006.
Income taxes:The income tax adjustment reflects the impact on income taxes of the US GAAP adjustments described above. Accounting for income taxes under Canadian and US GAAP is similar, except that income tax rates of enacted or substantively enacted tax law must be used to calculate future income tax assets and liabilities under Canadian GAAP, whereas only income tax rates of enacted tax law can be used under US GAAP.
82
NOTES TO THE CONSOLIDATED FINANCIAL STATEMENTS | in millions of US Dollars except share and per-share amounts
| 36. | RECONCILIATION OF CANADIAN AND UNITED STATES GENERALLY ACCEPTED ACCOUNTING PRINCIPLES (CONTINUED) |
The application of US GAAP, as described above, would have had the following effects on net income (loss), net income (loss) per share, total assets and shareholders’ equity. All share and per-share data have been retroactively adjusted to reflect the stock split described in Note 16.
| | | | | | | | | | | | | |
| | | 2004 | | | 2003 | | | 2002(1) | |
| |
| Net income (loss) as reported – Canadian GAAP | | $ | 298.6 | | | $ | (126.3 | ) | | $ | 53.6 | |
| Items increasing or decreasing reported net income (loss) | | | | | | | | | | | | |
| Cash flow hedge ineffectiveness | | | 2.6 | | | | – | | | | – | |
| Pre-operating costs | | | – | | | | 63.0 | | | | 2.6 | |
| Depreciation and amortization | | | 8.4 | | | | 8.5 | | | | 8.4 | |
| Accretion of asset retirement obligations | | | 3.3 | | | | (3.3 | ) | | | – | |
| Post-retirement and post-employment benefits | | | (2.2 | ) | | | 2.0 | | | | – | |
| Deferred income taxes relating to the above adjustments | | | (4.3 | ) | | | (23.7 | ) | | | (4.0 | ) |
| |
| Net income (loss) – US GAAP | | $ | 306.4 | | | $ | (79.8 | ) | | $ | 60.6 | |
| |
| Weighted average shares outstanding – US GAAP | 107,967,000 | | 104,460,000 | | 104,042,000 | |
| |
| Basic net income per share – US GAAP | | $ | 2.84 | | | $ | (0.76 | ) | | $ | 0.58 | |
| |
| | | | | | | | | | | | | |
| Total assets as reported – Canadian GAAP | | $ | 5,126.8 | | | $ | 4,567.3 | | | $ | 4,685.6 | |
| Items increasing (decreasing) reported total assets | | | | | | | | | | | | |
| Inventory | | | (3.0 | ) | | | (2.7 | ) | | | (4.0 | ) |
| Other current assets | | | 2.6 | | | | – | | | | – | |
| Available-for-sale securities (unrealized holding gain) | | | 161.7 | | | | 60.6 | | | | 17.9 | |
| Fair value of derivative instruments | | | 66.5 | | | | 59.8 | | | | 52.7 | |
| Property, plant and equipment | | | (126.5 | ) | | | (134.9 | ) | | | (143.4 | ) |
| Pre-operating costs | | | – | | | | – | | | | (63.0 | ) |
| Post-retirement and post-employment benefits | | | 11.7 | | | | 13.9 | | | | 11.9 | |
| Intangible asset relating to additional minimum pension liability | | | 9.6 | | | | 2.7 | | | | – | |
| Goodwill | | | (46.7 | ) | | | (46.7 | ) | | | (46.7 | ) |
| |
| Total assets – US GAAP | | $ | 5,202.7 | | | $ | 4,520.0 | | | $ | 4,511.0 | |
| |
| | | | | | | | | | | | | |
| Total shareholders’ equity as reported – Canadian GAAP | | $ | 2,385.6 | | | $ | 1,973.8 | | | $ | 2,092.5 | |
| Items increasing (decreasing) reported shareholders’ equity | | | | | | | | | | | | |
| Accumulated other comprehensive income (loss), net of related income taxes | | | 96.8 | | | | 31.2 | | | | (13.6 | ) |
| Foreign currency translation adjustment | | | 20.9 | | | | 20.9 | | | | 20.9 | |
| Accretion of asset retirement obligations | | | – | | | | (3.3 | ) | | | – | |
| Provision for asset impairment | | | (218.0 | ) | | | (218.0 | ) | | | (218.0 | ) |
| Depreciation and amortization | | | 44.8 | | | | 36.4 | | | | 27.9 | |
| Pre-operating costs | | | – | | | | – | | | | (63.0 | ) |
| Cash flow hedge ineffectiveness | | | 2.6 | | | | – | | | | – | |
| Post-retirement and post-employment benefits | | | 11.7 | | | | 13.9 | | | | 11.9 | |
| Deferred income taxes relating to the above adjustments | | | 30.4 | | | | 34.7 | | | | 58.4 | |
| |
| Shareholders’ equity – US GAAP | | $ | 2,374.8 | | | $ | 1,889.6 | | | $ | 1,917.0 | |
| |
| | | | | | | | | | | | | |
(1)Previously reported figures for 2002 have been adjusted for the US GAAP accounting for long-term investments as described on Page 80.
SUPPLEMENTAL US GAAP DISCLOSURE
Recent Accounting Pronouncements
In December 2003, the Financial Accounting Standards Board (“FASB”) revised FIN No. 46, “Consolidation of Variable Interest Entities”, which clarifies the application of Accounting Research Bulletin No. 51 “Consolidated Financial Statements” to those entities (defined as VIEs) in which either the equity at risk is not sufficient to permit that entity to finance its activities without additional subordinated financial support from other parties, or equity investors lack voting control, an obligation to absorb expected losses or the right to receive expected residual returns. FIN No. 46(R) requires consolidation by a business of VIEs in which it is the primary beneficiary. The primary beneficiary is defined as the party that has
exposure to the majority of the expected losses and/or expected residual returns of the VIE. FIN No. 46(R) was effective for the company in the first quarter, and there was no material impact on its financial position, results of operations or cash flows from adoption.
In July 2004, the Emerging Issues Task Force (“EITF”) discussed Issue No. 04-6, “Accounting for Post-Production Stripping Costs in the Mining Industry”. At its September meeting, the EITF generally supported an approach that stripping costs incurred during production are mine-development costs that should be capitalized as an investment in the mine, and these capitalized costs should be attributed to reserves in a systematic and rational manner. The EITF did not make this a final consensus because it wanted to explore the impact of any consensus on mines with differing physical patterns of ore location (which affects the overall timing of attribution). Further discussion of this issue is expected at a future EITF meeting.
83
NOTES TO THE CONSOLIDATED FINANCIAL STATEMENTS | in millions of US Dollars except share and per-share amounts
| 36. | RECONCILIATION OF CANADIAN AND UNITED STATES GENERALLY ACCEPTED ACCOUNTING PRINCIPLES (CONTINUED) |
In November 2004, the EITF ratified Issue No. 03-13, “Applying the Conditions in Paragraph 42 of FASB Statement No.144, Accounting for the Impairment or Disposal of Long-Lived Assets, in Determining Whether to Report Discontinued Operations”. The EITF reached a consensus that classification of a disposed of or held-for-sale component as a discontinued operation is only appropriate if the ongoing entity (i) expects to have no continuing “direct” cash flows, and (ii) does not retain or expect to retain an interest, contract or other arrangement sufficient to enable it to exert significant influence over the disposed component’s operating and financial policies after the disposal transaction. Application of this consensus did not have a material impact on the company’s consolidated financial statements.
In November 2004, the FASB issued SFAS No. 151, “Inventory Costs”, to clarify that abnormal amounts of idle facility expense, freight, handling costs and wasted materials (spoilage) should be recognized as current-period charges, and to require the allocation of fixed production overheads to inventory based on the normal capacity of the production facilities. The guidance is effective for inventory costs incurred during fiscal years beginning after June 15, 2005. Earlier application is permitted. The company is reviewing the guidance to determine the potential impact, if any, on its consolidated financial statements.
In December 2004, the FASB issued SFAS No. 123 (revised 2004), “Share-Based Payment”, that will require compensation costs related to share-based payment transactions to be recognized in financial statements. With limited exceptions, the amount of compensation cost will be measured based on the grant-date fair value of the equity or liability instruments issued. In addition, liability awards will be remeasured each reporting period. Compensation cost will be recognized over the period that an employee provides service in exchange for the award. The standard replaces SFAS No. 123, “Accounting for Stock-Based Compensation”, and supersedes APB Opinion No. 25, “Accounting for Stock Issued to Employees”. It is effective for the first interim or annual reporting period beginning after
June 15, 2005, meaning that the company will apply the guidance to all employee awards of share-based payment granted, modified or settled in the third quarter of 2005. The company is reviewing the standard to determine the potential impact, if any, on its consolidated financial statements.
Available-for-Sale Security
The company’s investment in ICL is classified as available-for-sale. The fair market value of this investment at December 31, 2004 was $254.5 and the unrealized holding gain was $161.7.
Deferred Income Taxes
The total valuation allowance recognized for deferred income tax assets in 2004 was $29.4 (2003 – $11.4). The company has determined that it is more likely than not that the deferred income tax asset net of the valuation allowance will be realized through a combination of future reversals of temporary differences and taxable income.
Stock-Based Compensation
Prior to 2003, the company applied the intrinsic value based method of accounting for its stock option plans under US GAAP. No stock-based employee compensation cost is reflected in 2002 net income, as all options granted under the plans had an exercise price equal to the market value of the underlying common stock on the date of grant. Effective December 15, 2003, the company adopted the fair value based method of accounting for stock options prospectively to all employee awards granted, modified or settled after January 1, 2003 pursuant to the transitional provisions of SFAS No. 148, “Accounting for Stock-Based Compensation – Transition and Disclosure”. Since the company’s stock option awards vest over two years, the compensation cost included in the determination of net income (loss) for years ended December 31, 2004 and 2003 is less than that which would have been recognized if the fair value based method had been applied to all awards since the original effective date of SFAS No.123, “Accounting for Stock-Based Compensation”. The following table illustrates the effect on net income (loss) and net income (loss) per share under US GAAP if the fair value based method had been applied to all outstanding and unvested awards in each period.
| | | | | | | | | | | | | |
| | | 2004 | | | 2003 | | | 2002 | |
| |
| Net income (loss) – as reported under US GAAP | | $ | 306.4 | | | $ | (79.8 | ) | | $ | 60.6 | |
| Add: Stock-based employee compensation expense included in reported net income |
| (loss), net of related tax effects | | | 8.8 | | | | 0.8 | | | | – | |
| Less: Total stock-based employee compensation expense determined under fair value |
| based method for all option |
| awards, net of related tax effects | | | (12.8 | ) | | | (14.8 | ) | | | (14.3 | ) |
| |
Net income (loss) – pro forma under US GAAP (1) | | $ | 302.4 | | | $ | (93.8 | ) | | $ | 46.3 | |
| |
| |
(1) Compensation expense under the fair value based method is recognized over the vesting period of the related stock options. Accordingly, the pro forma results of applying this method may not be indicative of future results. |
| | | | | | | | | | | | | |
| | | 2004 | | | 2003 | | | 2002 | |
| |
| Basic net income (loss) per share | | | | | | | | | | | | |
| As reported | | $ | 2.84 | | | $ | (0.76 | ) | | $ | 0.58 | |
| Pro forma | | | 2.80 | | | | (0.90 | ) | | | 0.45 | |
| Diluted net income (loss) per share | | | | | | | | | | | | |
| As reported | | $ | 2.77 | | | $ | (0.76 | ) | | $ | 0.58 | |
| Pro forma | | | 2.73 | | | | (0.90 | ) | | | 0.44 | |
84
NOTES TO THE CONSOLIDATED FINANCIAL STATEMENTS | in millions of US Dollars except share and per-share amounts
| 36. | RECONCILIATION OF CANADIAN AND UNITED STATES GENERALLY ACCEPTED ACCOUNTING PRINCIPLES (CONTINUED) |
Derivative Instruments and Hedging Activities
The company has designated its natural gas derivative instruments as cash flow hedges.
The portion of gain or loss on derivative instruments designated as cash flow hedges that are effective at offsetting changes in the hedged item is reported as a component of accumulated OCI and then is reclassified into cost of goods sold when the product containing the hedged item is sold. Any hedge ineffectiveness is recorded in cost of goods sold in the current period. During the year, a gain of $43.0 was recognized in cost of goods sold (2003 – $89.9; 2002 – $15.5). Of the deferred gains at year-end, approximately $36.7 will be reclassified to cost of goods sold within the next 12 months.
Related Party Transactions
During the year, sales to a company associated with the immediate family of a member of the Board of Directors of PCS totalled $16.2 (2003 – $9.1). These transactions were conducted in the normal course of business at the prevailing market prices and on normal trade terms.
SUPPLEMENTAL SCHEDULES
The following supplemental schedules present the consolidated Financial Position, Operations and Retained Earnings, Comprehensive Income (Loss), Accumulated Other Comprehensive Income (Loss), and Cash Flow in accordance with US GAAP as adjusted for the GAAP differences described in this note.
SUPPLEMENTAL SCHEDULE OF CONSOLIDATED FINANCIAL POSITION
As at December 31
| | | | | | | | | |
| | | 2004 | | | 2003 | |
| |
Assets | | | | | | | | |
| Current assets | | | | | | | | |
| Cash and cash equivalents | | $ | 458.9 | | | $ | 4.7 | |
| Accounts receivable | | | 352.6 | | | | 305.0 | |
| Inventories | | | 393.8 | | | | 392.5 | |
| Prepaid expenses and other current assets | | | 37.9 | | | | 29.0 | |
| Current portion of derivative instruments | | | 38.2 | | | | 37.5 | |
| |
| | | | 1,281.4 | | | | 768.7 | |
| Derivative instruments | | | 28.3 | | | | 22.3 | |
| Property, plant and equipment | | | 2,972.4 | | | | 2,973.2 | |
| Other assets | | | 833.2 | | | | 672.6 | |
| Intangible assets | | | 37.1 | | | | 32.9 | |
| Goodwill | | | 50.3 | | | | 50.3 | |
| |
| | | $ | 5,202.7 | | | $ | 4,520.0 | |
| |
Liabilities | | | | | | | | |
| Current liabilities | | | | | | | | |
| Short-term debt | | $ | 93.5 | | | $ | 176.2 | |
| Accounts payable and accrued charges | | | 599.9 | | | | 380.3 | |
| Current portion of long-term debt | | | 10.3 | | | | 1.3 | |
| |
| | | | 703.7 | | | | 557.8 | |
| Long-term debt | | | 1,258.6 | | | | 1,268.6 | |
| Deferred income tax liability | | | 521.6 | | | | 469.8 | |
| Accrued post-retirement/post-employment benefits | | | 257.9 | | | | 242.5 | |
| Accrued environmental costs and asset retirement obligations | | | 81.2 | | | | 84.6 | |
| Other non-current liabilities and deferred credits | | | 4.9 | | | | 7.1 | |
| |
| | | | 2,827.9 | | | | 2,630.4 | |
| |
Shareholders’ Equity | | | | | | | | |
| Share capital | | | 1,408.4 | | | | 1,245.8 | |
| Additional paid-in capital | | | 275.7 | | | | 265.2 | |
| Retained earnings | | | 593.9 | | | | 347.4 | |
| Accumulated other comprehensive income | | | 96.8 | | | | 31.2 | |
| |
| | | | 2,374.8 | | | | 1,889.6 | |
| |
| | | $ | 5,202.7 | | | $ | 4,520.0 | |
| |
85
NOTES TO THE CONSOLIDATED FINANCIAL STATEMENTS | in millions of US Dollars except share and per-share amounts
| 36. | RECONCILIATION OF CANADIAN AND UNITED STATES GENERALLY ACCEPTED ACCOUNTING PRINCIPLES (CONTINUED) |
SUPPLEMENTAL SCHEDULE OF CONSOLIDATED OPERATIONS AND RETAINED EARNINGS
For the Years Ended December 31
| | | | | | | | | | | | | |
| | | 2004 | | | 2003 | | | 2002 | |
| |
| Sales | | $ | 3,244.4 | | | $ | 2,799.0 | | | $ | 2,222.4 | |
| Less: Freight | | | 238.7 | | | | 234.5 | | | | 215.2 | |
| Transportation and distribution | | | 104.3 | | | | 98.7 | | | | 80.5 | |
| Cost of goods sold | | | 2,207.9 | | | | 2,141.2 | | | | 1,610.4 | |
| |
Gross Margin | | | 693.5 | | | | 324.6 | | | | 318.3 | |
| |
| Selling and administrative | | | 130.6 | | | | 96.1 | | | | 91.7 | |
| Provincial mining and other taxes | | | 92.6 | | | | 57.0 | | | | 68.0 | |
| Provision for plant shutdowns | | | – | | | | 111.0 | | | | – | |
| Provision for PCS Yumbes S.C.M. | | | 3.6 | | | | 27.3 | | | | – | |
| Foreign exchange loss | | | 19.7 | | | | 51.9 | | | | 5.5 | |
| Share of earnings of equity investees | �� | | (30.9 | ) | | | (12.4 | ) | | | (5.3 | ) |
| Other income | | | (48.5 | ) | | | (20.8 | ) | | | (19.5 | ) |
| |
| | | | 167.1 | | | | 310.1 | | | | 140.4 | |
| |
Operating Income | | | 526.4 | | | | 14.5 | | | | 177.9 | |
Interest Expense | | | 84.0 | | | | 91.3 | | | | 83.1 | |
| |
Income (Loss) Before Income Taxes | | | 442.4 | | | | (76.8 | ) | | | 94.8 | |
Income Taxes | | | 136.0 | | | | 3.0 | | | | 34.2 | |
| |
Net Income (Loss) | | | 306.4 | | | | (79.8 | ) | | | 60.6 | |
Retained Earnings, Beginning of Year | | | 347.4 | | | | 479.5 | | | | 470.9 | |
Dividends | | | (59.9 | ) | | | (52.3 | ) | | | (52.0 | ) |
| |
Retained Earnings, End of Year | | $ | 593.9 | | | $ | 347.4 | | | $ | 479.5 | |
| |
Net Income (Loss) Per Share – Basic | | $ | 2.84 | | | $ | (0.76 | ) | | $ | 0.58 | |
| |
Net Income (Loss) Per Share – Diluted | | $ | 2.77 | | | $ | (0.76 | ) | | $ | 0.58 | |
| |
Dividends Per Share | | $ | 0.55 | | | $ | 0.50 | | | $ | 0.50 | |
| |
SUPPLEMENTAL SCHEDULE OF CONSOLIDATED COMPREHENSIVE INCOME (LOSS)
For the Years Ended December 31
| | | | | | | | | | | | | |
| | | 2004 | | | 2003 | | | 2002 | (1) |
| |
| Net income (loss) | | $ | 306.4 | | | $ | (79.8 | ) | | $ | 60.6 | |
| |
| Other comprehensive income (loss) | | | | | | | | | | | | |
| Change in unrealized holding gains and losses on available-for-sale securities | | | 101.2 | | | | 42.7 | | | | (6.3 | ) |
| Change in gains and losses on derivatives designated as cash flow hedges | | | 49.3 | | | | 98.3 | | | | 66.0 | |
| Reclassification to income of gains and losses on cash flow hedges | | | (43.0 | ) | | | (89.9 | ) | | | (15.5 | ) |
| Adjustment to additional minimum pension liability | | | (9.6 | ) | | | 23.4 | | | | (68.7 | ) |
| Deferred income taxes related to other comprehensive income | | | (32.3 | ) | | | (29.7 | ) | | | 8.8 | |
| |
| Other comprehensive income (loss), net of related income taxes | | | 65.6 | | | | 44.8 | | | | (15.7 | ) |
| |
| Comprehensive income (loss) | | $ | 372.0 | | | $ | (35.0 | ) | | $ | 44.9 | |
| |
SUPPLEMENTAL SCHEDULE OF CONSOLIDATED ACCUMULATED OTHER COMPREHENSIVE INCOME (LOSS)
For the Years Ended December 31
| | | | | | | | | | | | | |
| | | 2004 | | | 2003 | | | 2002 | (1) |
| |
| Accumulated other comprehensive income (loss), beginning of year | | $ | 31.2 | | | $ | (13.6 | ) | | $ | 2.1 | |
| Other comprehensive income (loss), net of related income taxes | | | 65.6 | | | | 44.8 | | | | (15.7 | ) |
| |
| Accumulated other comprehensive income (loss), end of year | | $ | 96.8 | | | $ | 31.2 | | | $ | (13.6 | ) |
| |
The balances related to each component of accumulated other comprehensive income (loss), net of related income taxes, are as follows:
| | | | | | | | | | | | | |
| | | 2004 | | | 2003 | | | 2002 | (1) |
| |
| Unrealized gains and losses on available-for-sale securities | | $ | 106.7 | | | $ | 39.0 | | | $ | 13.3 | |
| Gains and losses on derivatives designated as cash flow hedges | | | 47.4 | | | | 43.1 | | | | 38.0 | |
| Additional minimum pension liability | | | (36.4 | ) | | | (30.0 | ) | | | (44.0 | ) |
| Foreign currency translation adjustment | | | (20.9 | ) | | | (20.9 | ) | | | (20.9 | ) |
| |
| Accumulated other comprehensive income (loss), end of year | | $ | 96.8 | | | $ | 31.2 | | | $ | (13.6 | ) |
| |
| |
(1) Previously reported figures for 2002 have been adjusted for the US GAAP accounting for long-term investments as described on Page 80. |
86
NOTES TO THE CONSOLIDATED FINANCIAL STATEMENTS | in millions of US Dollars except share and per-share amounts
| 36. | RECONCILIATION OF CANADIAN AND UNITED STATES GENERALLY ACCEPTED ACCOUNTING PRINCIPLES (CONTINUED) |
SUPPLEMENTAL SCHEDULE OF CONSOLIDATED CASH FLOW
For the Years Ended December 31
| | | | | | | | | | | | | |
| | | 2004 | | | 2003 | | | 2002 | |
| |
Operating Activities | | | | | | | | | | | | |
| Net income (loss) | | $ | 306.4 | | | $ | (79.8 | ) | | $ | 60.6 | |
| Items not affecting cash | | | | | | | | | | | | |
| Depreciation and amortization | | | 231.6 | | | | 218.9 | | | | 208.1 | |
| Stock-based compensation | | | 11.1 | | | | 1.0 | | | | – | |
| (Gain) loss on disposal of property, plant and equipment | | | (0.7 | ) | | | 1.0 | | | | 1.0 | |
| Gain on sale of long-term investments | | | (34.4 | ) | | | – | | | | – | |
| Provision for plant shutdowns | | | – | | | | 105.6 | | | | – | |
| Provision for PCS Yumbes S.C.M. | | | 3.6 | | | | 14.5 | | | | – | |
| Writedown of inventories | | | – | | | | 62.9 | | | | – | |
| Foreign exchange on deferred income tax | | | 17.2 | | | | 35.9 | | | | 1.0 | |
| Provision for deferred income tax | | | 30.6 | | | | 3.0 | | | | 10.0 | |
| Share of earnings of equity investees | | | (30.9 | ) | | | (12.4 | ) | | | (5.3 | ) |
| Provision for post-retirement/post-employment benefits | | | 1.1 | | | | 9.7 | | | | 18.2 | |
| Accrued environmental costs and asset retirement obligations | | | (3.4 | ) | | | 4.6 | | | | (3.0 | ) |
| Other non-current liabilities and deferred credits | | | – | | | | 1.6 | | | | (1.4 | ) |
Changes in non-cash operating working capital | | | | | | | | | | | | |
| Accounts receivable | | | (51.9 | ) | | | (39.5 | ) | | | (11.1 | ) |
| Inventories | | | (10.5 | ) | | | 14.5 | | | | (14.2 | ) |
| Prepaid expenses and other current assets | | | (8.9 | ) | | | 9.4 | | | | (3.9 | ) |
| Accounts payable and accrued charges | | | 102.2 | | | | 48.9 | | | | 33.0 | |
| Current income taxes | | | 86.5 | | | | (18.3 | ) | | | 23.4 | |
| |
Cash provided by operating activities | | | 649.6 | | | | 381.5 | | | | 316.4 | |
| |
| |
Investing Activities | | | | | | | | | | | | |
| Additions to property, plant and equipment | | | (220.5 | ) | | | (150.7 | ) | | | (212.2 | ) |
| Proceeds from disposal of property, plant and equipment | | | 2.5 | | | | – | | | | – | |
| Investment in Sociedad Quimica y Minera de Chile S.A. | | | (97.2 | ) | | | – | | | | (23.2 | ) |
| Investment in Arab Potash Company | | | (8.3 | ) | | | (178.3 | ) | | | – | |
| Proceeds from sale of long-term investments | | | 66.3 | | | | – | | | | – | |
| Proceeds from sale of shares of PCS Yumbes S.C.M. | | | 34.5 | | | | – | | | | – | |
| Dividends received from equity investees | | | 8.7 | | | | 4.0 | | | | – | |
| Other assets and intangibles | | | (2.8 | ) | | | (32.7 | ) | | | (36.0 | ) |
| |
Cash used in investing activities | | | (216.8 | ) | | | (357.7 | ) | | | (271.4 | ) |
| |
| |
Financing Activities | | | | | | | | | | | | |
| Proceeds from long-term debt obligations | | | – | | | | 250.0 | | | | 11.2 | |
| Repayment of long-term debt obligations | | | (1.0 | ) | | | (3.4 | ) | | | (1.3 | ) |
| Repayment of short-term debt obligations | | | (82.7 | ) | | | (296.8 | ) | | | (28.1 | ) |
| Dividends | | | (56.1 | ) | | | (52.3 | ) | | | (52.0 | ) |
| Issuance of shares | | | 161.2 | | | | 58.9 | | | | 4.4 | |
| |
Cash provided by (used in) financing activities | | | 21.4 | | | | (43.6 | ) | | | (65.8 | ) |
| |
Increase (Decrease) in Cash and Cash Equivalents | | | 454.2 | | | | (19.8 | ) | | | (20.8 | ) |
Cash and Cash Equivalents, Beginning of Period | | | 4.7 | | | | 24.5 | | | | 45.3 | |
| |
Cash and Cash Equivalents, End of Period | | $ | 458.9 | | | $ | 4.7 | | | $ | 24.5 | |
| |
On January 25, 2005, the Board of Directors of PCS authorized a share repurchase program of up to 5.5 million common shares (approximately 5 percent of the company’s issued and outstanding common shares) through a normal course issuer bid. If considered advisable, shares may be repurchased from time to time on the open market through February 14, 2006 at prevailing market prices. The timing and amount of purchases, if any, under the program will be dependent upon the availability and alternative uses of capital, market conditions and other factors.
87
POTASHCORP 2004 ANNUAL REPORT | BOARD OF DIRECTORS

Committees:
| (1) | Executive committee |
| (2) | Corporate governance and nominating committee |
| (3) | Compensation committee |
| (4) | Safety, health and environment committee |
| (5) | Audit committee |
Frederick J. Blesi,of Glenview, Illinois, is a retired Chairman and CEO of the Phosphate Chemicals Export Association Inc. (PhosChem), principal exporter of US phosphate chemicals. Before joining PhosChem, he was Vice President, International with International Minerals and Chemical Corporation. He is a director of the Evans Scholars Foundation and The Western Golf Association. He joined the PCS Inc. Board in 2001. (2,5)
William J. Doyle,of Saskatoon, Saskatchewan, is President and CEO of Potash Corporation of Saskatchewan Inc. He became President of PCS Sales in 1987, after a career with International Minerals and Chemical Corporation. He is Chairman of the Potash & Phosphate Institute and the International Fertilizer Industry Association’s Production and International Trade Committee, and Vice-Chairman of Canpotex Limited and The Fertilizer Institute. Mr. Doyle is on the College Board of Advisors at Georgetown University. He joined the PCS Inc. Board in 1989. (1)
John W. Estey,of Glenview, Illinois, is President and CEO of S&C Electric Company. He is a director of the Institute of Electrical and Electronics Engineers and a member of the Board of Governors of the National Electrical Manufacturers Association. A director of the Executives’ Club of Chicago, he is also a member of the Dean’s Advisory Board at the Kellogg School of Management at Northwestern University. He joined the PCS Inc. Board in 2003. (3,4)
Wade Fetzer III,of Glencoe, Illinois, is Retired Partner with the investment banking firm Goldman Sachs. He sits on the boards of Serologicals Corporation, Sphere Communications, Northern Star Broadcasting, University of Wisconsin Foundation and Rush-Presbyterian St. Luke’s Medical Center. He is also on the Kellogg Alumni Advisory Board. He joined the PCS Inc. Board in 2002. (2,3)
Dallas J. Howe,of Calgary, Alberta, serves in a management role with GE Medical Systems Information Technology, which now includes the company he formerly owned, BDM Information Systems. He is owner and CEO of DSTC Ltd., a technology investment company, and a director of Advanced Data Systems Ltd., as well as Chair of the University of Saskatchewan Board of Governors. A director of the PCS Crown corporation from 1982 to 1989, he joined the PCS Inc. Board in 1991 and was elected Chair in 2003. (1,2)
Alice D. Laberge,of Vancouver, British Columbia, is President and CEO of Fincentric Corporation, a global provider of software solutions to financial institutions. She was formerly Senior Vice President and Chief Financial Officer of MacMillan Bloedel Limited, and is a director of BC Hydro, the United Way of the Lower Mainland and St. Paul’s Hospital Foundation. She joined the PCS Inc. Board in 2003. (4,5)
Jeffrey J. McCaig,of Houston, Texas, is Chairman, CEO and a director of Trimac Holdings, a bulk trucking and third-party logistics company. He is also a director of Orbus Pharma Inc. and The Standard Life Assurance Company of Canada. He joined the PCS Inc. Board in 2001. (3,5)
Mary Mogford,of Newcastle, Ontario, a Corporate Director, is a former Ontario Deputy Finance Minister and Deputy Minister of Natural Resources. She is a director of Falconbridge Ltd., MDS Inc., Sears Canada Inc. and Sears Canada Bank, and a member of the Altamira Advisory Council. A Fellow of the Institute of Corporate Directors (ICD), in 2004 she was accredited through the ICD/Rotman School of Business Directors’ Training Program. She joined the PCS Inc. Board in 2001. (2,5)
Paul J. Schoenhals,of Calgary, Alberta, is President of Petroleum Industry Training Service. He is a former Member of the Legislative Assembly and Cabinet Minister in Saskatchewan and was Chairman of Potash Corporation of Saskatchewan, the Crown corporation, from 1987 to 1989. He joined the PCS Inc. Board in 1992. (3,4)
E. Robert Stromberg,QC, of Saskatoon, Saskatchewan, is associated with the Saskatchewan law firm Robertson Stromberg Pedersen. He is a director of NorSask Forest Products Inc. and Hitachi Canadian Industries Ltd. and Chairman of the Saskatoon Airport Authority. He joined the PCS Inc. Board in 1991. (1,2,4)
Jack G. Vicq,of Saskatoon, Saskatchewan, is Professor Emeritus of Accounting, University of Saskatchewan. He is a past Associate Dean of Commerce at the university and was responsible for the Centre for International Business Studies. Formerly holder of the A.W. Johnson Distinguished Chair in Public Policy in the Saskatchewan Department of Finance, he is currently Chairman of the Provincial Court Commission. He joined the PCS Inc. Board in 1989. (1,5)
Elena Viyella de Paliza,of the Dominican Republic, is President of Inter-Quimica, S.A., a chemicals importer and distributor, Monte Rio Power Corp and Indescorp, S.A. She is president of the Dominican Business Council, a member of the board of the Inter-American Dialogue and past president of the Dominican Stock Exchange, Dominican Manufacturers Association and the National Agribusiness Board. She joined the PCS Inc. Board in 2003. (1,4)
88
POTASHCORP 2004 ANNUAL REPORT | CORPORATE INFORMATION
Corporate Officers and Key Management
William J. Doyle
President and Chief Executive Officer
He joined the company in 1987 as President of PCS Sales, and has more than 30 years in the fertilizer industry. He was named CEO in 1999.
James F. Dietz
Executive Vice President and Chief Operating Officer
A chemical engineer with more than 30 years in the fertilizer industry, he joined the company in 1997 and became COO in 2000.
Wayne R. Brownlee
Senior Vice President, Treasurer and Chief Financial Officer
An MBA with responsibility for corporate business development, he joined the company in 1988 and was appointed CFO in 1999.
Betty-Ann L. Heggie
Senior Vice President, Corporate Relations
An educator with a marketing background, she joined the company in 1981 and rose to her current post in 1995, with responsibility for PotashCorp’s reputation.
Barbara Jane Irwin
Senior Vice President, Administration
A lawyer by training with more than 20 years in human resources, she joined the company in 2000 with responsibility for recruitment, benefits and compensation.
Robert A. Jaspar
Senior Vice President, Information Technology
A chartered accountant, he came to PotashCorp in 1997 as an internal auditor and moved to his current position in 2003, managing the systems that meet company information needs.
G. David Delaney
President, PCS Sales
With a BSc in Agriculture, he has worked in the fertilizer industry since 1983 and joined PotashCorp in 1997, rising to his current position in 2000.
Garth W. Moore
President, PCS Potash
A mining engineer, he has spent more than 30 years in the potash industry and joined PotashCorp in 1982, rising to his current position in 1997.
Thomas J. Regan, Jr.
President, PCS Phosphate
A chemical engineer and MBA, he has spent 30 years in industrial operations, joining PotashCorp in 1995 and becoming president of its phosphate division in 1999.
Daphne J. Arnason
Vice President, Internal Audit
A chartered accountant, she joined the company in 1988 and rose to her current position in 2003, with responsibility for auditing policies and programs.
Karen G. Chasez
Vice President, Procurement
A social worker with 19 years in fertilizer industry publishing and administration, she has overseen company purchasing, inventory and supplier negotiations since joining PotashCorp in 2000.
John R. Hunt
Vice President, Safety, Health and Environment
After studying agricultural business, he has spent 24 years in the fertilizer industry, joining PotashCorp in 1997 and moving to his present position in 2005.
Joseph A. Podwika
Vice President, General Counsel and Secretary
A lawyer, he joined PotashCorp in 1997 and took on his current post in 2005, with responsibility for the delivery of legal services and oversight of corporate governance.
Denis A. Sirois
Vice President and Corporate Controller
A certified management accountant, he joined the company in 1978 and has held his current position since 1997, with wide responsibilities in financial reporting.
89
POTASHCORP 2004 ANNUAL REPORT | SHAREHOLDER INFORMATION
Shareholder Information
ANNUAL MEETING
The Annual Shareholders meeting will be held at 10:30 a.m. Central Standard Time May 5, 2005 in the Adam Ballroom, Delta Bessborough Hotel, 601 Spadina Crescent East, Saskatoon, Saskatchewan.
It will be carried live on the company’s website,www.potashcorp.com.
Holders of common shares as of March 17, 2005 are entitled to vote at the meeting and are encouraged to participate.
DIVIDENDS
Dividend amounts paid to shareholders resident in Canada are adjusted by the exchange rate applicable on the dividend record date. Dividends are normally paid in February, May, August and November, with record dates normally set approximately three weeks earlier. Future cash dividends will be paid out of, and are conditioned upon, the company’s available earnings. Shareholders who wish to have their dividends deposited directly in their bank accounts should contact the transfer agent and registrar, CIBC Mellon Trust Company.
Registered shareholders can have dividends reinvested in newly issued common shares of PotashCorp at prevailing market rates.
INFORMATION FOR SHAREHOLDERS OUTSIDE CANADA
Dividends paid to residents in countries with which Canada has bilateral tax treaties are generally subject to the 15-percent Canadian non-resident withholding tax. There is no Canadian tax on gains from the sale of shares (assuming ownership of less than 25 percent) or debt instruments of the company owned by non-residents not carrying on business in Canada. No government in Canada levies estate taxes or succession duties.
OWNERSHIP
On February 28, 2005, there were 1,901 holders of record of the company’s common shares.
SHARES LISTED
Toronto Stock Exchange
New York Stock Exchange
Ticker Symbol: POT
COMMON SHARE TRANSFER AGENT
| | | |
In Canada: | | In the United States: |
CIBC Mellon Trust Company
Suite 750 – One Lombard Place
Winnipeg, Manitoba R3B 0X3
Phone: (204) 987-2490
(800) 387-0825 | | Mellon Investor Services, L.L.C.
85 Challenger Road, Overpeck Center
Ridgefield Park, New Jersey 07660
Phone: (800) 526-0801 |
Website:www.cibcmellon.com | | Website:www.melloninvestor.com |
Shareholders with address changes or those with inquiries concerning their Potash Corporation of Saskatchewan Inc. stock are invited to contact:
CIBC Mellon Trust (address above), or
Joseph A. Podwika, Corporate Secretary
PotashCorp
Suite 500, 122 - 1st Avenue South
Saskatoon, Saskatchewan S7K 7G3
INVESTOR INQUIRIES
Betty-Ann Heggie, Senior Vice President, Corporate Relations
Canada: (800) 667-0403 US: (800) 667-3930
e-mail: corporate.relations@potashcorp.com
Visit us atwww.potashcorp.com
INTERIM REPORTS, NEWS RELEASES AND FORM 10-K
Non-registered shareholders who wish to receive quarterly reports should contact the Corporate Relations department. News releases are available via fax and e-mail.
Copies of the company’s most recent Form 10-K are available upon request and on our website.
NYSE CORPORATE GOVERNANCE
Disclosure contemplated by 303A.11 of the NYSE’s listed company manual is available on our website atwww.potashcorp.com. The company has filed appropriate certifications pursuant to the NYSE listing standards. The certifications required by Section 302 of the Sarbanes-Oxley Act of 2002 are filed as exhibits to our 2004 Annual Report on Form 10-K.
| | | | |
| | | | |
| | Canada: | | Suite 500, 122 - 1st Avenue South, Saskatoon, SK S7K 7G3 Phone: (306) 933-8500 |
| | | | |
| | US: | | Suite 400, 1101 Skokie Boulevard, Northbrook, IL 60062 Phone: (847) 849-4200 |
| | | | |
| |
| Common Share Prices and Volumes |
The adjacent table sets forth the high and low prices, as well as the volumes, for the company’s common shares as traded on the Toronto Stock Exchange and the New York Stock Exchange (composite transactions) on a quarterly basis. Potash Corporation of Saskatchewan Inc. is on the S&P/TSX 60 and the S&P/TSX Composite indices.
(Note: Data are adjusted for stock split effective August 9, 2004 on the TSX and August 16, 2004 on the NYSE.)
1Trading prices are in Cdn$ |
| | | | | | | | | | | | | | | | | | | | | | | | | | |
| | | | Toronto Stock Exchange1 | | | New York Stock Exchange | |
| | | | High | | | Low | | | Volume | | | High | | | Low | | | Volume | |
| |
| | 2004 | | | | | | | | | | | | | | | | | | | | | | | | |
| |
| | First Quarter | | | 57.93 | | | | 50.96 | | | | 12,670,142 | | | | 44.75 | | | | 38.13 | | | | 15,905,400 | |
| |
| | Second Quarter | | | 64.87 | | | | 54.58 | | | | 12,009,046 | | | | 48.50 | | | | 39.46 | | | | 23,604,000 | |
| |
| | Third Quarter | | | 81.00 | | | | 60.75 | | | | 13,237,872 | | | | 64.25 | | | | 45.78 | | | | 30,366,000 | |
| |
| | Fourth Quarter | | | 104.06 | | | | 76.05 | | | | 16,211,631 | | | | 84.00 | | | | 60.65 | | | | 29,245,700 | |
| |
| | Year 2004 | | | 104.06 | | | | 50.96 | | | | 54,128,691 | | | | 84.00 | | | | 38.13 | | | | 99,121,100 | |
| |
| | 2003 | | | | | | | | | | | | | | | | | | | | | | | | |
| |
| | First Quarter | | | 51.40 | | | | 41.28 | | | | 15,018,768 | | | | 33.18 | | | | 27.48 | | | | 25,139,800 | |
| |
| | Second Quarter | | | 47.21 | | | | 40.75 | | | | 12,704,274 | | | | 32.75 | | | | 29.82 | | | | 21,213,000 | |
| |
| | Third Quarter | | | 50.52 | | | | 42.40 | | | | 8,477,440 | | | | 36.78 | | | | 30.95 | | | | 14,140,200 | |
| |
| | Fourth Quarter | | | 57.75 | | | | 46.88 | | | | 14,428,736 | | | | 43.63 | | | | 35.24 | | | | 24,381,780 | |
| |
| | Year 2003 | | | 57.75 | | | | 40.75 | | | | 50,629,218 | | | | 43.63 | | | | 27.48 | | | | 84,874,780 | |
| |