ABOUT POTASHCORP
PotashCorp is an integrated producer of fertilizer, industrial and animal feed products. We are the world’s largest fertilizer enterprise by capacity, producing the three primary plant nutrients – potash, nitrogen and phosphate. Among these, potash – the namesake of our company – delivers the highest quality earnings in the fertilizer universe.
With a majority of the world’s excess potash capacity, large low-cost operations and strategic global investments, we have an unmatched ability to serve both North American and growing offshore markets.
| | |
| | Our Goal Our goal is to be the partner of choice, providing superior value to all our stakeholders. We strive to be the highest quality low-cost producer and sustainable gross margin leader in the products we sell and the markets we serve. We link our financial performance with areas of extended responsibility that include safety, the environment and all those who have a social or economic interest in our business. Our Strategy Committed to seeking earnings growth and to minimizing volatility, we employ a Potash First strategy, focusing our capital – internally and through investments – to build on our unmatched potash assets and meet the growing global demand for this vital nutrient. By investing in potash capacity while producing to meet market demand, we create the opportunity for significant growth while limiting downside risk. We complement our potash operations with focused nitrogen and phosphate businesses that emphasize the production of high-margin products with stable and sustainable earnings potential. |
BUILDING A PLATFORM FOR LONG-TERM GROWTH
Many factors make us the leader in the fertilizer industry:
| | | | | |
| |
| 1 | | Unparalleled potash position
With unrivaled potash resources and the majority of the world’s excess capacity, we have the unique ability to increase production to quickly and cost-effectively meet rising demand. | | |
| | | |
| 2 | | Access to key global markets
With large low-cost potash operations in Canada, an extensive global distribution network and strategic investments in Jordan, Israel, Chile and China, we benefit from growth in all key world markets. | | |
| | | |
| 3 | | Targeted strengths in nitrogen and phosphate
Long-term, lower-cost natural gas contracts in Trinidad and geographic proximity provide unique advantages in serving the US, the world’s largest nitrogen importer. Superior-quality phosphate rock enables us to produce higher-margin feed and industrial products, including purified acid. | | |
| | | |
| 4 | | Clear vision and skilled management
Our management team’s ability to develop and execute focused, long-term strategies – proven in changing market conditions over nearly two decades – helps us capitalize on our unique strengths. | | |
| | | |
| 5 | | Commitment to sustainability and core values
We promote the long-term viability and value of our company by monitoring our economic, environmental and social performance, and by living by our core values of safety, integrity, listening, sharing, accountability and continuous improvement. | | |
| | | |
| 6 | | Strong cash flow
Our strong cash flow enables us to grow our business, choosing from options that include bringing back idled capacity, plant expansions and extending our global enterprise via investments. | | |
| | | |
| 7 | | High-quality earnings
Our emphasis on potash, Trinidad nitrogen and industrial phosphates – almost 80 percent of our gross margin – delivers earnings growth with less dependence on volatile agricultural cycles. | | |
| | | |
UNLOCK MORE WITH KEYWORDS
The » symbol indicates that more information
is available online atwww.PotashCorp2006AR.com All financial data in this report are stated in US dollars.
2 OVERVIEW/ POTASHCORP 2006 SUMMARY ANNUAL REPORT WHY POTASH?
Potash is known as the quality nutrient because it significantly enhances the taste, texture, health and yield of crops. Among investors, it is also recognized as the quality nutrient because of its potential for greater growth, higher margins and stability.
█ Demand for potash is increasing
| | – | | Growing offshore economies are improving diets. |
| |
| | – | | Rising global populations and expanding urbanization are shrinking the per-capita agricultural land base. |
| |
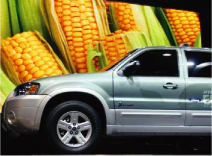
| | – | | The need for alternative energy sources is creating new markets for crops. |
█ Potash supply is tightening
| | – | | Most producers are operating at or near capacity. |
█ Crop prices are rising, encouraging maximum production
| | – | | Prices for corn, wheat and other crops are reaching levels not experienced in the past decade. |
█ The environment is favorable
| | – | | The potash industry has relatively few competitors, minimal government involvement and high barriers to entry. |
| |
| | – | | Significant new competitive production appears unlikely in the next five years due to the rarity of deposits and the high cost and long lead time to develop a greenfield mine. |
Our Business Segments
WORLD POSITION BY CAPACITY
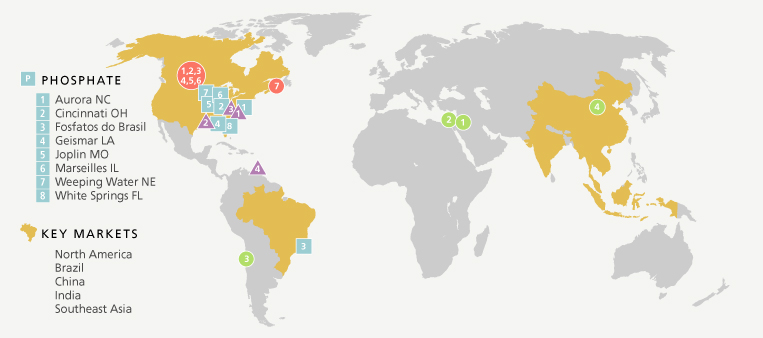
Facilities, Investments and Key Markets
FACILITIES
| | | |
KPOTASH | | NNITROGEN |
1 Allan SK | | 1 Augusta GA |
2 Cory SK | | 2 Geismar LA |
3 Esterhazy SK1 | | 3 Lima OH |
4 Lanigan SK | | 4 Point Lisas, Trinidad |
5 Patience Lake SK | | |
6 Rocanville SK | | |
7 Sussex NB | | |
| |
invINVESTMENTS
1 Arab Potash Company (APC), Jordan (28%)
2 Israel Chemicals Ltd. (ICL), Israel (10%)
3 Sociedad Quimica y Minera de Chile S.A. (SQM), Chile (32%)
4 Sinofert Holdings Limited (Sinofert), China (20%)
POTASHCORP 2006 SUMMARY ANNUAL REPORT /OVERVIEW 3
| | | | | | | | | |
POTASH | | NITROGEN | | PHOSPHATE |
| |
13.5million | | 58% | | 27% |
Tonnes of potash capacity
by the end of 2010 | | Percentage of nitrogen
gross margin from Trinidad | | Increase in phosphate
gross margin year-over-year |
1st | | 4th | | 3rd |
• Low-cost producer with 22 percent of world capacity and majority of world excess capacity
• Access to key markets through Canadian operations, a global distribution network and strategic offshore investments
• High barriers to entry | | • Majority of ammonia produced in Trinidad with long-term access to lower-cost natural gas
• Proximity of Trinidad production to the US, the world’s largest nitrogen importer
• US-produced ammonia sold primarily to stable industrial customer base | | • Unique, high-quality phosphate rock can be processed into diversified higher-margin products
• Long-term competitive cost advantage for phosphate rock in North America given proximity of mines to processing facilities
• Significant reserves |
• Use low-cost excess capacity to respond to growing world demand
• Produce only what the market needs
• Seek internal and global opportunities to add low-cost, high-quality capacity | | • Maximize Trinidad ammonia production under existing natural gas contracts
• Focus on less-cyclical industrial products at US-based plants | | • Maximize benefits of superior rock to produce diverse phosphate products that are less cyclical and more profitable |
1 PotashCorp’s mineral rights at Esterhazy are mined by Mosaic Potash Esterhazy Limited Partnership under a mining and processing agreement.
| | | |
4
| | OVERVIEW/ POTASHCORP 2006 SUMMARY ANNUAL REPORT |
2006 KEY FIGURES
| | | | | |
| | | | | |
$632million | | $941million | | 20% |
2006 Earnings
(third consecutive record year) | | 2006 Cash flow
prior to working capital changes1 | | 5 Year EBITDA1CAGR2 |
| | | | | |
2006 Financial Highlights
| • | | Delivered earnings of $632 million – a record for the third straight year – even as annual potash shipments to China and India declined by 40 percent because of extended price negotiations |
| |
| • | | Achieved record cash flow prior to working capital changes1of $941 million |
| |
| • | | Realized a year-over-year share price increase of 79 percent, and a 368-percent increase since the beginning of 2002 |
| |
| • | | Reached potash gross margin of $561 million, second only to the 2005 record of $707 million |
| |
| • | | Generated more than $300 million in nitrogen gross margin for a second straight year |
| |
| • | | Increased phosphate gross margin 27 percent year-over-year despite a reduction in solid fertilizer margins |
2006 Operating Highlights
| • | | Advanced projects to bring back 400,000 tonnes of idled potash capacity at Allan in 2007 and 1.5 million tonnes at Lanigan in 2008 |
| |
| • | | Concluded a two-year, 294,000-tonne expansion of ammonia capacity at Trinidad and an expansion of 82,000 tonnes P2O5 in purified acid capacity at Aurora |
| |
| • | | Purchased an additional 10 percent of Sinofert, bringing our ownership in China’s largest fertilizer importer and distributor to 20 percent |
| |
| • | | Acquired additional interest in SQM in Chile, a producer of specialty fertilizers, and APC in Jordan, one of the two lowest-cost potash suppliers to Mediterranean and Asian markets |
| |
| • | | Received recognition as Canada’s best corporate reporter, earning the Overall Award of Excellence in Corporate Reporting from the Canadian Institute of Chartered Accountants for an unprecedented third consecutive year |
| | | | | | | |
NET INCOME | | GROSS MARGIN
 | | EBITDA1
 | | CASH FLOW RETURN1
 |
| Despite constrained potash shipments for seven months of 2006, we achieved our highest net income ever and earned a record $5.95 per share (diluted). | | Record second-half potash sales and strong contributions from nitrogen and phosphate produced the second highest gross margin in our history. | | 2006 EBITDA was consistent with record 2005 despite a temporary disruption in potash demand, verifying the effectiveness of our business strategy. | | An indicator of shareholder value created, our cash flow return exceeded weighted average cost of capital by more than 5 percent. |
POTASHCORP 2006 SUMMARY ANNUAL REPORT /OVERVIEW 5
| | | | | |
$15billion | |
$2.8billion | |
79% |
Total market capitalization
at year-end
| | Market value of equity investments
(book value of $1.1 billion) | | Share price increase
year-over-year |
2006 Financial Highlights
| | | | | | | | | | | | | | | | | | | | | | | | | | | | | |
| ($ millions, except per-share data and percentages) | | 2006 | | | Change | | 2005 | | | Change | | 2004 | | | 5-Year | | 10-Year |
| | | | | | YOY3 | | | | | YOY3 | | | | | CAGR2 | | CAGR2 |
| |
Financial Results | | | | | | | | | | | | | | | | | | | | | | | | | | | | |
| |
| Sales | | $ | 3,766.7 | | | | -2 | % | | $ | 3,847.2 | | | | 19 | % | | $ | 3,244.4 | | | | 10 | % | | | 9 | % |
| |
Net sales1 | | $ | 3,376.8 | | | | -3 | % | | $ | 3,475.6 | | | | 20 | % | | $ | 2,901.4 | | | | 10 | % | | | 9 | % |
| |
| Gross margin | | $ | 1,002.0 | | | | -11 | % | | $ | 1,125.0 | | | | 65 | % | | $ | 681.4 | | | | 20 | % | | | 10 | % |
| |
| Net income | | $ | 631.8 | | | | 16 | % | | $ | 542.9 | | | | 82 | % | | $ | 298.6 | | | | 39 | % | | | 12 | % |
| |
| Net income per share – diluted | | $ | 5.95 | | | | 22 | % | | $ | 4.89 | | | | 81 | % | | $ | 2.70 | | | | 39 | % | | | 10 | % |
| |
EBITDA1 | | $ | 1,117.9 | | | | -2 | % | | $ | 1,135.0 | | | | 50 | % | | $ | 754.3 | | | | 20 | % | | | 11 | % |
| |
| Additions to property, plant and equipment | | $ | 508.6 | | | | 33 | % | | $ | 382.7 | | | | 74 | % | | $ | 220.5 | | | | | | | | | |
| |
| Dividends per share | | $ | 0.60 | | | | – | | | $ | 0.60 | | | | 9 | % | | $ | 0.55 | | | | | | | | | |
| |
| | | | | | | | | | | | | | | | | | | | | | | | | | | | | |
| |
Financial Position | | | | | | | | | | | | | | | | | | | | | | | | | | | | |
| |
| Total Assets | | $ | 6,217.0 | | | | 16 | % | | $ | 5,357.9 | | | | 5 | % | | $ | 5,126.8 | | | | | | | | | |
| |
Net debt1 | | $ | 1,589.7 | | | | 12 | % | | $ | 1,417.1 | | | | 57 | % | | $ | 903.5 | | | | | | | | | |
| |
Cash flow prior to working capital changes1 | | $ | 940.8 | | | | 9 | % | | $ | 860.3 | | | | 60 | % | | $ | 538.3 | | | | | | | | | |
| |
| Cash provided by operating activities | | $ | 696.8 | | | | -19 | % | | $ | 865.1 | | | | 31 | % | | $ | 658.3 | | | | | | | | | |
| |
| 1 | | See reconciliation and description of certain non-GAAP measures on Page 33 |
| |
| 2 | | Compound annual growth rate expressed as a percentage |
| |
| 3 | | Year-over-year |
For a complete list of financial
performance indicators, see our online
Annual Report, Keyword »
LETTER TO SHAREHOLDERS
| | | In 2006, PotashCorp achieved record earnings despite disruptions in potash demand. |
| |
| | | This provided an opportunity to demonstrate our ability to deliver growth with reduced volatility. |
| |
| | | We entered 2007 with the factors that drive our success aligned better than ever before. |
William J. Doyle
President and Chief Executive Officer
The success of PotashCorp in 2006 is a testament to the power of focused long-term strategies that your company has patiently and consistently executed over nearly two decades.
The most visible measure of their effectiveness is a third consecutive year of record earnings. We also achieved an all-time low recordable injury rate and had significant positive impacts on our communities, while our investors benefited from a 79-percent increase in our share price.
This was achieved despite some very challenging conditions. We entered 2006 with potash shipments to China and, shortly afterward, India at a virtual standstill, as fertilizer buyers in those countries deferred purchases and drew down their inventories while negotiating new price contracts with global suppliers. This continued into the third quarter. Potash demand was further constrained as North America and other markets delayed purchasing and relied on inventories in the face of high fuel costs and low crop prices.
While this created short-term challenges for producers, it allowed our company to demonstrate how our diverse, high-quality assets and long-term strategies – including our long-employed practice of matching production to market demand – keep us highly profitable even with a disruption in the potash market. Further, it proved the complementary benefit of our Trinidad nitrogen and industrial phosphate businesses, showing the importance of having world-class capabilities in all three nutrients.
By year-end, our optimism was growing as the factors that fuel our success began to align in ways that suggest unprecedented opportunity. These include:
| – | | growth in offshore economies where people have higher expectations for better diets; |
| |
| – | | rising world population (primarily in these offshore markets) and a limited agricultural land base, making fertilizer use more important to farmers working to increase yields and improve food quality; |
| |
| – | | a quest for alternative energy sources, such as ethanol and biodiesel, that is creating a growing market for key crops; |
| |
| – | | historically low global grain inventories; and |
| |
| – | | strong farm economics, including higher prices for many crop commodities, that encourage farmers to maximize production. |
These conditions ultimately raise demand for fertilizers – especially potash, the nutrient with the greatest impact on food quality. Our company holds most of the world’s unused potash capacity, giving us an unmatched ability to meet growing demand and reap the benefit of this expanding market.
Our success is the product of an exceptionally motivated and talented workforce that is fully committed to maximizing the benefits of a resource base that we believe is the best in our industry.
Even after a third year of record performance, our real opportunity is still in front of us.
POTASHCORP 2006 SUMMARY ANNUAL REPORT /LETTER TO SHAREHOLDERS 7
Growing Markets for Food, Feed, Fuel and Fiber
We view 2006 as a transition toward even greater success as our offshore customers continued to gain economic strength. China’s GDP grew by more than 10 percent, while India’s was up more than 8 percent. As a whole, global GDP was up about 5 percent.
With higher incomes, the first priority for many people is more nutritious, protein-rich food. China’s meat consumption, for example, has more than tripled in less than two decades. Producing more animals takes a greater supply of grain and feed supplements.
A rising global population with more money leads to spreading urbanization. The agricultural land base per capita is less than half the 1950 level and is expected to fall a further 13 percent by 2020, making higher crop yields a necessity.
Added to this, uncertainty over the world’s oil supply and desire for cleaner fuels have resulted in a surge of demand for alternative energy sources such as biofuels. The production of ethanol creates a new market for crops like corn and sugar cane, while biodiesel drives up demand for oil from crops like oil palm, soybeans and canola. In the US, ethanol used 6 percent of corn production in 2000 and is projected to take 20 percent of that crop in 2007.
At the same time, the world grain stocks-to-use ratio is expected to fall to its lowest level on record in the 2006/2007 crop year, with less than two months’ supply.
As a result, crop prices are rising. This gives farmers the motivation and resources to increase acres planted and responsibly intensify fertilizer application rates on all acres.
Meeting Growing Potash Demand
Of the three nutrients, potash has the greatest growth potential.
In the short term, many countries need to rebuild inventories that were drained in 2006. This is a lengthy process that will require significant increases in import volumes in 2007. Industry consultants are projecting the global potash market of almost 50 million tonnes will grow by 10 percent in 2007 and 3 percent per year to 2011. Demand for biofuels has the potential to raise this to 4 percent. This growth represents between 11 million and 14 million tonnes of additional annual demand within five years.
The longer-term picture could be even more dramatic. To meet scientifically recommended application rates, China would need to raise its annual consumption from approximately 10 million tonnes to 26 million tonnes, India from 4 million tonnes to 10.5 million tonnes and Brazil from 5.5 million tonnes to 11.5 million tonnes.
Supply, however, is expected to remain tight. Anticipated expansions by competitors would bring only 2.6 million tonnes of new production on stream by 2011. No greenfield projects have been announced and it is estimated that it would take five to seven years and more than $1.6 billion to bring a 2-million-tonne conventional mine into production in Canada. Given the high cost and long lead time, we do not expect any significant greenfield production to come on stream in the next five years. Supply was further tightened by the unfortunate flooding that closed a Russian competitor’s mine in October 2006, removing 1.2 million tonnes of annual production from the market.
PotashCorp’s excess capacity can be brought on more quickly and at a significant discount to the cost of a greenfield mine, giving us a competitive advantage. We expect to have 13.5 million tonnes available by the end of 2010. Beyond this, we are reviewing additional projects that could increase our production capabilities to 15.7 million tonnes by 2015, or earlier if the market warrants, before we rely on greenfield opportunities. We have plenty of low-cost spare capacity to stay ahead of the market and will continue to be disciplined in its use.
As we increase production, we reduce our per-tonne fixed costs. With greater volumes, lower costs and higher prices produced by tight fundamentals, we have triple leverage to improve performance for our shareholders.
Growing global demand for food and biofuels is adding to the pressure on farmers to grow more grain, driving up the need for fertilizers.
Potash demand is expected to grow 10 percent in 2007 and 3-4 percent per year through 2011.
PotashCorp can bring back unused capacity more quickly and at a lower cost than greenfield production.
Greater volumes, lower costs and higher prices give us triple leverage in potash.
8 LETTER TO SHAREHOLDERS/ POTASHCORP 2006 SUMMARY ANNUAL REPORT
| | | Nitrogen and phosphate generated record combined gross margin in 2006. |
| |
| | | Strategic offshore investments extend our global potash enterprise. |
Playing to Our Strengths
The value of our nitrogen and phosphate operations was evident in 2006, as their combined gross margin reached a record level. While potash remains our foundation, focused nitrogen and phosphate businesses are essential components of our strategy and have served us exceptionally well.
In nitrogen, higher natural gas prices in Europe led to curtailments, driving up ammonia prices in many regions. With higher ocean freight also a factor, less nitrogen found its way to the United States, reducing competitive import pressures. This was especially beneficial to our Trinidad operation, which is built on long-term, lower-cost gas contracts and has logistical advantages for shipping to the US. During 2005 and 2006, we completed debottlenecking projects that added 294,000 tonnes of ammonia production at Trinidad, further leveraging our advantage.
In phosphate, where we use our superior quality rock to focus on higher-margin feed and industrial products, we generated our highest gross margin since 1999. These specialty products will remain our priority, as they provide stable and solid returns that shelter us from the volatility of the solid phosphate fertilizer market. We completed an expansion of 82,000 tonnes of P2O5 in purified acid capacity at Aurora in the second quarter of 2006, further increasing our gross margin potential.
Broadening Our Global Reach
In addition to our internal growth strategies, we use our strong cash flow to invest in areas that will further enhance our long-term value and international advantages in potash. Our investments in Arab Potash Company (APC) in Jordan, Israel Chemicals Ltd. (ICL) in Israel, Sociedad Quimica y Minera de Chile S.A. (SQM) in Chile and Sinofert Holdings Limited (Sinofert) in China are natural and strategic extensions of our global potash enterprise. These investments were important contributors to PotashCorp’s bottom line in 2006.
During the year, we spent $353 million to increase our ownership interest in APC and SQM and to exercise an option to raise our stake in Sinofert, expanding our position in a company with state-of-the-art distribution capabilities in the world’s largest fertilizer market. At the end of 2006, our investments in these publicly traded companies and in ICL had a total market value of $2.8 billion – exceeding book value by $1.7 billion.
█ Increasing Capacity to Meet Long-Term Potash Demand Growth
With the growth picture for potash becoming clear, we are preparing to further capitalize on our advantages in this nutrient.
Continuing work at Allan and Lanigan, along with a minor increase gained through our share of Mosaic’s Esterhazy expansion, will provide an additional 2 million tonnes of operational capacity by 2008. Projects planned for Cory and Patience Lake will build our capacity to 13.5 million tonnes by the end of 2010.
Although our access to 1 million tonnes from Esterhazy will end in approximately 2013, additional debottlenecking and technological improvements in Saskatchewan and New Brunswick could raise our capacity to 15.7 million tonnes by 2015. This would give us a substantial increase in capacity at a significant discount to the cost of greenfield development.
POTASHCORP 2006 SUMMARY ANNUAL REPORT /LETTER TO SHAREHOLDERS 9
Performing at All Levels
Our financial success grows from a commitment to excellence across our company. This vision extends to all areas that impact our relationships with investors, customers, employees, suppliers and the communities and environments where we do business.
Safety is the top priority for our company and the most important measure of our success. One of our most significant accomplishments in 2006 was reducing our recordable injury rate to a record low. In addition, our New Brunswick operation was awarded the John T. Ryan Award, the highest safety honor in the Canadian mining industry.
We continued to take a leadership role in our communities. This included our title sponsorship of the 2006 PotashCorp Vanier Cup in Saskatoon, as we helped bring the Canadian university football championship to Western Canada for the first time. According to organizers, it generated more than Cdn $14 million in game-related spending, facility development and tourism. More than that, it became a rallying point in our hometown, pulling people together in support of a common interest.
The desire to contribute to community has been embraced by our company and our employees. Our offices and operations have been recognized by their local United Way chapters and many of our facilities earned praise for their volunteerism and donations. We are proud of their efforts.
Once again, our commitment to clearly communicating our performance to stakeholders was recognized as we received the Overall Award of Excellence from the Canadian Institute of Chartered Accountants for a third consecutive year, a first for any company. Our sustainability reporting was also rated No. 1 in Canada and among the world’s top 50 in a review led by SustainAbility, in partnership with the United Nations Environment Programme and Standard & Poor’s.
Built for Long-Term Success
In 2006, we proved our ability to be responsive and adaptable, capitalizing on PotashCorp’s unique strengths to achieve earnings growth while minimizing volatility.
In the coming years, growth from our offshore potash customers will continue to drive our business. Although we anticipate periods of short-term volatility, as we saw in 2006, the long-term growth trend is evident.
For almost two decades, we have been building toward this time. We have assembled tremendous assets and carefully managed them with a long-term view. Now we are prepared to capitalize on them in an exceptionally favorable global environment for our products.
Our role is to execute our strategies for maximum results over the long term. We will exercise our advantage in potash, using only as much of our capacity as required to meet market demand while building a company with an ongoing ability to generate larger margins and higher earnings. We will remain committed to serving all of our stakeholders.
We do so with strong direction from our Board of Directors and exceptional efforts from our people.
Your company is in an excellent and unmatched position to capitalize on the opportunities that lie ahead. Our ability to enrich the land, the food that grows on it and the lives of people who depend on it is more important than ever and we are ready to deliver.
By making this our mission, we look forward to rewarding the PotashCorp shareholders who make it possible.
William J. Doyle, President and Chief Executive Officer
February 20, 2007
Our financial success is tied to our commitment to all stakeholder groups.
We report on our performance in all areas of our business.
For almost two decades, we’ve been preparing for the conditions we see today.
By enriching the land and the food grown on it, we will enrich our shareholders.
| | | |
10
| | BUSINESS ENVIRONMENT/ POTASHCORP 2006 SUMMARY ANNUAL REPORT |
BUSINESS ENVIRONMENT
The fundamental premise that drives the fertilizer industry is as elementary as the basic human need for nutrition:
| | With more people to feed, the world’s farmers must produce more food. |
| |
| | Our products help farmers increase yields by replenishing essential nutrients in their soil. |
Although the need for fertilizer products is undeniable, success in the fertilizer industry requires a clear sense of evolving markets, a solid asset base, strategies designed to capture value in changing global conditions and an ability to execute those strategies for maximum results.
Six Keys to Understanding Our Business
| | | |
| |
| 1 | | The world needs more fertilizer |
| |
| 2 | | Potash is the core of our business |
| |
| 3 | | Our strategies emphasize earnings growth and quality |
| |
| 4 | | We are uniquely prepared to meet growing potash demand |
| |
| 5 | | The factors that drive our success are aligning |
| |
| 6 | | We are transparent and accountable |
| |
| | |
For a complete analysis of our business
environment, see our online Annual |
| Report, Keyword » |  |
Offshore Markets Are Driving
Rising Demand for Food
As recently as 1950, only 2.5 billion people shared the planet and its resources. By 1980, that number had grown to 4.4 billion. In 2007, it is expected to be 50 percent greater at 6.6 billion.
World Population Rising
The areas experiencing the most significant increases in population are now also benefiting from rapidly growing economies. Foremost among these are China and India, which enjoyed 2006 economic growth of more than 10 and 8 percent, respectively.
Offshore Economies Growing
As incomes rise, access to more nutritious food is often the first priority. Many of these nations are moving from low-cost, starch-based food to protein-rich diets with more meat. In the past two decades, meat consumption in China more than tripled to 70 million tonnes and is expected to reach 120 million tonnes by 2030.
The need to feed more people – and produce more animals for food – is driving up the demand for grain, oilseed meal and phosphate and nitrogen feed supplements. All these increase demand for our products.
Fertilizer Application Rates
Are Growing
In the past, many of these nations also under-applied fertilizer, particularly potash. Nitrogen has the most immediately visible impact on yield enhancement and was applied first, followed by phosphate. Potash, which has the greatest impact on food quality, was often the last nutrient in the chain. Now farmers around the world are recognizing the need to apply more of all three nutrients and are beginning to respond accordingly.
Fertilizer Growth Potential
China and India could achieve recommended nutrient levels by each applying about 30 million more tonnes of KCl, N and P2O5annually. Soybeans, Brazil’s major crop, draw nitrogen from the air but are hungry for potash.
Production of Biofuels Is Increasing
Biofuels Creating New Demand
In addition to this food-driven demand, many countries are expanding their production of biofuels to alleviate reliance on non-renewable oil supplies. Global ethanol production, for example, has doubled in the last four years to 14 billion gallons. This is creating a new market for crops like corn, soybeans, sugar cane, oil palm and canola, placing even greater pressure on agricultural production.
Global Potash Supply Is Tightening
The growing demand for potash must be filled by a few global producers, as production can only occur in regions with economically viable deposits.
Except for PotashCorp, this producer base has been pushed to its production limits. Significant new sources of supply are unlikely within the next five years given barriers to entry: a greenfield mine would require a good ore deposit, a substantial investment (approximately $1.6 billion for a 2-million-tonne mine in Canada) and a development period of five to seven years.
Global Grain Stocks Falling
Wheat and Coarse Grains
More grain has been consumed than produced in most recent years, reducing the stocks-to-use ratio to the lowest level ever recorded.
Crop Prices Are Rising
These tightening market conditions are leading to higher prices for many crop commodities. Early in 2007, US corn prices reached a 10-year high and, like those for wheat and soybeans, are expected to remain elevated. World sugar prices climbed to record levels and palm oil prices have strengthened.
Higher Crop Prices
None of this is lost on farmers, who recognize the role of fertilizer in increasing yields and protecting the fertility of their soil. In the US, fertilizer typically represents only 4-14 percent of production costs for major crops, while the return can be as much as three times this amount.
These attractive economics, made even more pronounced by low global inventories and high commodity prices, set the stage for more acres to be planted and fertilizer applications to increase.
12 BUSINESS ENVIRONMENT/ POTASHCORP 2006 SUMMARY ANNUAL REPORT
PotashCorp produces potash, nitrogen and phosphate for use in fertilizer, feed and industrial markets. We have operations and strategic investments in eight countries and our products are sold in more than 50 countries.
Among major crops, rice, corn, wheat and cotton require all three nutrients while soybeans need mainly potash and phosphate. The amount of each nutrient required depends on crop and soil conditions.
Fertilizer generated 60 percent of our net sales and 70 percent of gross margin in the past three years. Offshore customers took 50 percent of total fertilizer sales volumes in 2006, primarily potash and phosphate. Our nitrogen fertilizers are sold mainly in North America.
PotashCorp Gross Margin by Nutrient
2006
“Potash First” Maximizes Growth Potential and Gross Margin
As our name suggests, potash is the foundation of our business. We are the world’s largest potash company, with 22 percent of global capacity. This includes a majority of the world’s excess capacity, giving us the ability to meet rising demand for potash when others cannot.
With the rest of our industry operating at or near its maximum capability, we have an unparalleled ability to deploy our excess capacity and capture a significant share of market growth.
In 2006, potash generated $561 million and 56 percent of our total gross margin.
Over 60 percent of our potash goes offshore for use mainly in the production of rice, soybeans, palm oil, sugar, rubber, bananas, oranges and coffee. In North America, potash is used on corn, wheat, cotton, rice and soybeans, and the market has historically been stable.
Our potash operations include five large, low-cost mining and milling facilities in Saskatchewan and one in New Brunswick.
Largest Potash Company
2006
We also have mineral rights for ore included under a mining and processing agreement at a sixth location in Saskatchewan.
Our potash business is enhanced by increasingly significant offshore investments that extend our global reach, including:
█ 20% of Sinofert in China
█ 28% of APC in Jordan
█ 10% of ICL in Israel
█ 32% of SQM in Chile
Nitrogen and Phosphate Provide Balance and Stability
While potash is our core business, we also focus on our unique advantages in nitrogen and phosphate, which enhance our ability to serve a global customer base.
Trinidad Advantage in Nitrogen
PotashCorp is the world’s fourth largest producer of nitrogen, a business that requires abundant access to natural gas to make ammonia, the feedstock for other downstream products.
The core of our nitrogen operations is our facility in Trinidad, where we have advantages that include long-term lower-cost natural gas contracts and proximity to the United States, the world’s largest nitrogen importer. Approximately two-thirds of our ammonia is produced in Trinidad, a country with extensive natural gas reserves and a stable, low-risk government.
Stability and Diversity in Phosphate
PotashCorp is the world’s third largest phosphate producer, with the most diversified product line. While traditional phosphate businesses have been built around the solid fertilizer diammonium phosphate (DAP), we can produce higher margin industrial and feed products from our superior quality phosphate rock. This minimizes our exposure to the volatility in the phosphate fertilizer market.
PotashCorp is the largest and one of only three North American producers of industrial purified phosphoric acid, giving us a strong position in this business.
POTASHCORP 2006 SUMMARY ANNUAL REPORT /BUSINESS ENVIRONMENT 13
Peers in Our Industry
To achieve the highest sustainable results for our shareholders, management evaluates our performance against basic materials indices and our peers in the fertilizer sector. Some of the key metrics tracked are set out below.
Peer Performance Summary
Comparability of Peer Information
This information is included for convenience only. All peer group financial information included in the performance summary was obtained from publicly available reports published by the respective companies. We have not independently verified and cannot guarantee the accuracy or completeness of such information.
Readers are cautioned that, other than PotashCorp and Agrium, none of the companies identified in this group prepare their financial statements (and accompanying notes) in accordance with accounting principles generally accepted in Canada (Canadian GAAP). Accounting principles generally accepted in the foreign jurisdictions in which these peers operate may vary in certain material respects from Canadian GAAP, and such differences (if and as applicable) have not been identified or quantified for this purpose. For those companies with fiscal year-ends other than December 31, all financial information was based on the 12-month period comprising the most recent four fiscal quarters reported upon by such companies.
Sources:Company financial reports
| 1 | | Capital expenditures = additions to property, plant and equipment |
| |
| 2 | | Year ended December 31, 2006 |
| |
| 3 | | Last four quarters ended November 30, 2006 |
| |
| 4 | | Last four quarters ended September 30, 2006 |
| |
| 5 | | Mosaic’s last four-quarter net income includes $287.6 million (pre-tax) and $285.6 million (after-tax), respectively, in phosphate division writedowns. |
| |
| 6 | | Agrium’s year-ended December 31, 2006 net income includes $136.0 million (pre-tax) and $95.0 million (after-tax), respectively, in phosphate division writedowns. As Agrium’s year-ended December 31, 2006 statement of cash flows was not provided by time of print, last four quarters ended September 30, 2006 were used in determining cash flow from operations and capital expenditures. |
| |
| 7 | | Yara net income, cash flow from operations and capital expenditures translated at 1 USD = NOK 6.3826, average exchange rate for 2006 as provided from company reports. |
| |
| 8 | | K+S net income, cash flow from operations and capital expenditures translated by quarter at: Q4 2005 1 USD = EUR 0.8408; Q1 2006 1 USD = EUR 0.8310; Q2 2006 1 USD = EUR 0.7951; and Q3 2006 1 USD = EUR 0.7846; average exchange rate in each quarter per Bloomberg. |
14 BUSINESS ENVIRONMENT/ POTASHCORP 2006 SUMMARY ANNUAL REPORT
PotashCorp’s goal is to achieve superior value for our stakeholders by generating long-term growth and minimizing the volatility inherent in the fertilizer business.
To achieve this goal, we implement strategies for our business as a whole and for all three nutrient segments individually that emphasize products which leverage our competitive strengths to deliver higher margins on a sustainable basis.
This dictates our Potash First approach, along with the following strategies for each nutrient:
| █ | | Potash – Meet rising world demand |
| |
| █ | | Nitrogen – Reduce volatility by focusing on our Trinidad asset |
| |
| █ | | Phosphate – Enhance stability with industrial and feed production |
As we plan our future, we choose from among several options how best to use our cash flow, including investing in our own potash capacity, offshore opportunities, share repurchase and increased dividends. Our 2005 share repurchase represented over $510 million in shareholder value as of December 31, 2006.
We base our investment decisions on cash flow return materially exceeding cost of capital.
Our Highest Margin Businesses
Year Ended December 31, 2006
RISK MITIGATION SUPPORTS STRATEGIES
Successful execution of our strategies requires us to examine all potential risks and manage them to lessen their ability to impact performance.
We examine risk in six key categories:
| █ | | Markets/Business Risk |
| |
| █ | | Distribution Risk |
| |
| █ | | Operational Risk |
| |
| █ | | Financial/Information Technology Risk |
| |
| █ | | Regulatory Risk |
| |
| █ | | Integrity/Empowerment Risk |
Each year, management re-evaluates previously identified risks and examines changes in our business environment that hold the potential to create new risks. We develop mitigation strategies and present these to PotashCorp’s Board of Directors for approval.
We make it a priority to protect our reputation, as any risk that damages PotashCorp’s reputation could harm our ability to perform.
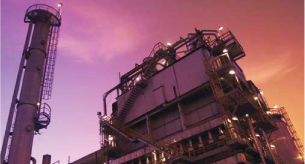
Pursuing the Best Position
| | | |
PotashCorp’s Trinidad nitrogen facility | | We focus on areas of our business where we have cost advantages and lower competitive pressures, which allows us to maximize gross margin. We strive to build on the parts of our business that fit in the top right quadrant of our strategic positioning profile. |
We recognize that some business segments are more competitive, but nonetheless contribute to stability in our earnings. Our Trinidad nitrogen operation, for example, faces higher competitive pressures but maintains significant margin potential because of its cost advantages.
1 See reconciliation and description of certain non-GAAP measures on Page 33
POTASHCORP 2006 SUMMARY ANNUAL REPORT /BUSINESS ENVIRONMENT 15
POTASH:
Meet Rising World Demand
To capitalize on our potash advantage and remain the preferred low-cost supplier into all key world markets, we follow these primary strategies:
| █ | | Use our excess capacity to fill rising world demand. |
| | | With our competitors operating at or near their maximum capabilities, we are uniquely able to meet demand increases and capture a disproportionate share of market growth. Further, as we bring on this excess capacity, we have triple leverage – higher sales volumes at higher prices, with lower fixed costs per tonne. |
PotashCorp Production
Driven by Demand
| █ | | Produce only what the market requires.If demand does not materialize, we will not use our excess capacity. For almost two decades, we have matched production to market demand, minimizing inventory overhang. This has enabled us to maximize the value of our potash, preserving our unused capacity for periods with rising demand and higher prices. |
| |
| █ | | Maximize our internal capacity.Although we have opportunities for the development of a greenfield mine when growth in global demand makes that necessary, our shareholders benefit most from our ability to debottleneck or expand our capacity at our existing facilities. We can do this more quickly and at less cost than the five to seven years and approximately $1.6 billion needed for a greenfield mine. By reducing the time and cost of achieving more capacity, we reduce risk to our shareholders. |
| |
| █ | | Extend our global potash enterprise through strategic investments.In addition to investing in our internal potash assets, we focus our capital on strategic global investments. Our investments in profitable and growing companies like SQM, APC, ICL and Sinofert add to our bottom line and, more importantly, provide strategic value by extending our global reach. |
NITROGEN:
Reduce Volatility by Focusing on Our Trinidad Asset
To achieve long-term growth with minimal volatility, we operate our nitrogen business according to the following key strategies:
| █ | | Leverage our proximity and long-term natural gas contracts in Trinidad to supply nitrogen to the US.Close access to the United States, combined with lower-cost gas contracts indexed to ammonia prices, provides a distinct advantage and more stable margins in a high-cost US gas environment. |
| |
| █ | | Concentrate our US production on industrial sales that provide gross margin stability.Industrial products shelter us from the volatility of agricultural cycles. We use our US nitrogen production, with direct pipeline links from our production facilities, to supply this stable customer base. In a high-cost US gas environment, we rely on our hedge program to stabilize costs and, if necessary, reduce operating rates to minimize margin volatility. |
PHOSPHATE:
Enhance Stability with Industrial and Feed Production
Our high-quality phosphate rock gives us distinct advantages over producers that make mostly fertilizers. We operate this business according to the following strategy:
| █ | | Leverage our high-quality, low-impurity phosphate rock to maintain a diversified and higher margin product line.High-quality rock enables us to economically produce diversified industrial and feed products that are less affected by cyclicality and deliver better margins than phosphate fertilizers. |
| | | |
| | For a complete overview of our business
strategies, see our online Annual Report, |
| | Keyword » |  |
16 BUSINESS ENVIRONMENT/ POTASHCORP 2006 SUMMARY ANNUAL REPORT
As market demand for potash grows, PotashCorp will be prepared to deliver.
We are:
| █ | | Maximizing capacity to have potash available when needed |
| |
| | | Primarily by bringing back idled capacity, we expect to have 13.5 million tonnes of operational capacity by the end of 2010. |
| |
| | | We believe other expansions in Saskatchewan and New Brunswick could raise our capacity to 15.7 million tonnes by 2015. Only then would we need to rely on a greenfield project. |
| |
| █ | | Adding compaction capability to improve the flexibility of our product mix |
| |
| | | Compaction allows us to produce premium granular product, which is in demand in North American markets and increasingly in offshore markets. It commands $10 to $20 per tonne more than standard-grade potash. We are adding an additional 1.25 million tonnes of compaction capability at Allan and Lanigan which will enable us to move toward the product mix that tomorrow’s potash markets will demand. |
| █ | | Broadening our offshore investments |
| |
| | | We are continuing to strengthen our global enterprise by increasing ownership interests in key offshore potash businesses. This gives us greater reach to markets that are experiencing accelerating growth. |
| | | In 2006 we raised our ownership in: |
| | – | | Sinofert, from 10 percent to 20 percent. This gives us a strategic foothold in China, the world’s largest fertilizer market. Sinofert distributes 60 percent of imported fertilizers in China and generates more than half its total gross margin through potash sales; |
| |
| | – | | SQM, a specialty potash, iodine and lithium producer in Chile, from 25 percent to 32 percent; and |
| |
| | – | | APC, a leading potash producer and key supplier to Mediterranean and Asian markets. |
| █ | | Investing in our distribution chain |
| |
| | | To capitalize on the growth opportunity in potash markets, it is important that our transportation and distribution system is prepared for increased volumes. |
| |
| | | In 2006, we: |
| | – | | participated in the development of two terminals in Brazil; and |
| |
| | – | | added terminals in the US on a variable-cost basis where we pay only when we use them. |
| | | Canpotex, the offshore marketing company for all Saskatchewan potash producers, is strengthening its capabilities by: |
| | – | | evaluating the addition of approximately 500 railcars per year over the next few years to transport product from Saskatchewan to West Coast ports; |
| |
| | – | | increasing capacity at its Portland, Oregon terminal by 1 million tonnes; and |
| |
| | – | | exploring alternatives for expansion or construction at West Coast port facilities that serve offshore markets. |
Expanding Our Trinidad Advantage
| █ | | Over the past two years, we expanded our Trinidad ammonia production. This gives us greater ability to meet rising US demand for ammonia while using our lowest-cost nitrogen facility. |
Building on Phosphate Strengths
| █ | | In 2006, we completed another purified phosphoric acid expansion at Aurora that will enable us to better serve higher-margin industrial markets. |
POTASHCORP 2006 SUMMARY ANNUAL REPORT /BUSINESS ENVIRONMENT 17
UNDERSTANDING POTASH For more information about potash, see our online Annual Report, Keyword »

| | | | | | | |
| STRATEGIES | | RISKS | | MITIGATION | | CAPABILITY TO DELIVER |
| Use excess capacity to fill rising demand | | • Insufficient capacity available in time to meet growing demand | | • Pace internal growth to ensure production is available when needed | | • ~ 75 percent of global excess capacity in 2007 and 13.5 million tonnes capacity by end of decade |
| | | | | | | |
| | | • Inadequate distribution capability to supply markets | | • Invest in distribution chain | | • Capacity at terminals in North America and Brazil is being raised |
| |
| Produce only what the market requires | | • Short-term reduction in demand | | • Limit production in periods of lower demand | | • Production curtailed historically, including 2006, to prevent inventory overhang |
| |
| Extend global potash enterprise | | • Competitor greenfield developments change market fundamentals | | • Restore and expand capacity at a fraction of the cost and time of greenfield projects | | • Lower-cost capacity up to 15.7 million tonnes before a greenfield mine is required |
| | | | | | | |
18 BUSINESS ENVIRONMENT/ POTASHCORP 2006 SUMMARY ANNUAL REPORT
| | |
UNDERSTANDING NITROGEN | | More nitrogen information is at our online Annual Report, Keyword »  |
| | | | |
| STRATEGIES | RISKS | MITIGATION | CAPABILITY TO DELIVER |
| Leverage benefits of lower-cost Trinidad production | • Abundant low-cost gas supply in developing countries can lead to oversupply | • Protect Trinidad’s cost advantage and ability to deliver through gas contracts and vessel leases | • Multi-year, lower-cost gas contracts provide cost advantage and long-term vessel leases secure delivery
|
| |
| Concentrate US production on industrial sales | • Nitrogen fertilizers subject to volume and price volatility | • Emphasize sales to stable industrial customer base | • About 85 percent of US manufactured ammonia is sold to industrial customers, some linked directly by pipeline
|
POTASHCORP 2006 SUMMARY ANNUAL REPORT /BUSINESS ENVIRONMENT 19
UNDERSTANDING PHOSPHATE For more on phosphate, see our online Annual Report, Keyword »
| | | | |
 |
| STRATEGIES | RISKS | MITIGATION | CAPABILITY TO DELIVER |
| Leverage high-quality phosphate rock to supply higher-margin product lines | • Changes in environmental
or permitting requirements | • Engage with local communities and stakeholders to better understand and address their needs | • 2006 survey of community leaders affirmed strong support for operations |
| | | | |
| | • Less competitive in solid fertilizers given higher delivered ammonia costs, coupled with potential long-term oversupply of DAP | • Develop long-term plans to reduce exposure or rationalize production away from solid phosphate fertilizers | • Long-term solid phosphate fertilizer alternatives are under evaluation |
| | | | |
| | | | |
| | | | |
| | | | |
| | | | |
 |
20 BUSINESS ENVIRONMENT/ POTASHCORP 2006 SUMMARY ANNUAL REPORT

Growing Demand + Tight Supply = Promising Outlook
For almost two decades, we have worked toward our long-term goal of being the highest quality low-cost producer and sustainable gross margin leader in the products we sell and markets we serve. We have faithfully executed the long-term strategies necessary to achieve this position.
This has allowed us to deliver superior value to stakeholders, even when short-term demand decreased or when the collapse of the Soviet Union led to a global oversupply of potash.
For the first time in our history, however, all the factors that drive our growth are now converging in our favor:
| █ | | Long-term demand for fertilizer, especially potash, is growing as: |
| | – | | More of the world’s growing population
wants – and can afford – nutritious food |
| |
| | – | | Renewable alternative energy sources are creating new demand for many crops |
| █ | | Potash supply is tight, with competitors operating at or near their capacities |
| |
| █ | | Prices for crop commodities are rising |
| |
| █ | | Our excess potash capacity will be available, as needed, to support this growing market. |
These conditions represent a long-term change in the fundamentals of our industry. More than that, they create an ideal environment for PotashCorp’s strengths, giving us an opportunity to generate greater value for our shareholders.
| | |
For a more detailed outlook,
see our online Annual Report, |
| Keyword » |  |
POTASHCORP 2006 SUMMARY ANNUAL REPORT /BUSINESS ENVIRONMENT 21
The Fertilizer Outlook for 2007 Is Promising
The need for fertilizer is clear and the economics of agriculture are encouraging its use. With PotashCorp’s strong position in all three nutrients, especially potash, the outlook is bright.
External industry consultants project 2007 demand growth of 10 percent for potash, 5.8 percent for phosphate (phosphoric acid) and 3.4 percent for nitrogen.
Potash
A surge in global potash sales is expected in 2007 as farmers maximize acres planted to take advantage of higher crop prices and offshore markets rebuild inventories depleted during extended 2006 price negotiations with China and India. In addition to the 10-percent demand growth forecast for 2007, industry consultants anticipate growth of 3 percent per year through 2011. With oil projected to be between $45 and $65 per barrel during this period, demand for biofuels could bring this closer to 4 percent per year.
In a market of almost 50 million tonnes annually, 3-4 percent growth represents new production roughly equivalent to opening a greenfield mine every year.
Greenfield mines have a high cost and a long development time, and no such projects are currently underway. PotashCorp’s excess capacity, which can be accessed at a fraction of the cost of a greenfield development, stands as the best source of new supply for the next five years. With competitors at or near capacity, we should realize a significant share of this growth in demand.
Nitrogen
Higher crop prices are expected to drive up nitrogen demand more quickly than scheduled new capacity will become available over the course of 2007, further tightening fundamentals and underpinning global nitrogen prices. While strong prices have historically encouraged greenfield development, construction costs have risen approximately 40 percent and several projects have been deferred or scrapped. This gives our nitrogen facilities the potential to realize more significant gross margin.
Phosphate
Demand for higher-margin industrial and feed products is expected to remain steady in 2007, adding stability to this segment. The same is true of liquid fertilizer products. Low inventories for solid phosphate fertilizers are creating a positive pricing environment as we enter what is expected to be a strong fertilizer season.
While recent shutdowns in the US are expected to keep the solid fertilizer market relatively strong over the next two years, new capacity in China and Saudi Arabia near the end of the decade may affect the long-term fundamentals. US producers of the solid fertilizer DAP, which is the foundation of the phosphate fertilizer business, could face future challenges as the US share of the global DAP market is expected to fall from over half in 2005 to roughly one-third by the end of the decade.
World N, P and K Sales Growth Forecast
World Potash Sales Growth Forecast
US DAP Exports
22 BUSINESS ENVIRONMENT/ POTASHCORP 2006 SUMMARY ANNUAL REPORT
| | | |
Goals & Targets
Our business goals are linked to the vision and strategy guiding the company. | | l ACHIEVED
¤ PARTIALLY ACHIEVED
¦ DID NOT ACHIEVE |
| Each year we set targets linked to our goals, holding ourselves publicly accountable for our performance. |
Shareholder Value
| | | | |
█ To continue to outperform our sector and other basic materials companies in total shareholder return. |
| | | | |
| | | | |
2006 Targets | 2006 Results | | 2007 Targets |
| | | | |
| | �� | | |
Exceed total shareholder return performance for our sector and companies on the DJUSBM1for 2006. | l Total shareholder return of 79.6 percent surpassed our sector at53.5 percent and the DJUSBM at 17.6 percent. | | 1Exceed total shareholder return performance for our sector and companies on the DJUSBM for 2007. |
| | | | |
Non-cash operating working capital to be less than 10 percent of net sales.2 | ¦ PotashCorp’s non-cash operating working capital was approximately 13 percent of net sales. | | 2Cash flow return to exceed weighted average cost of capital by 600 basis points. |
| | | | |
Cash flow return2to exceed weighted average cost of capital by 800 basis points. | ¤ Cash flow return exceeded weighted average cost of capital by more than 500 basis points. | | 3Carry a higher multiple than the average of other fertilizer companies on both earnings and cash flow. |
| | | | |
| Carry a higher multiple than the average of other fertilizer companies on both earnings and cash flow. | l PotashCorp multiples were higher than the average of other fertilizer companies based on earnings and cash flow. | | 4Gross margin compound annual growth rate (CAGR) of 15 percent over next five years. |
| | | | |
| Exceed 2005 gross margin by 20 percent. | ¦ Gross margin was 11 percent lower than in 2005. | | |
| | | | |
| | |
Cost Management
| | | | |
█ To be the low-cost supplier on a delivered basis in our industry through ongoing cost reduction management. |
| | | | |
| | | | |
2006 Targets | 2006 Results | | 2007 Targets |
| | | | |
| | | | |
| Achieve 5-percent reduction in per-tonne potash conversion costs on a Canadian dollar basis. | ¦ Canadian dollar potash conversion costs rose by 27 percent due to production curtailment. | | 1Achieve 3-percent reduction in per-tonne potash conversion costs on a Canadian dollar basis. |
| | | | |
| Improve energy efficiency in Trinidad by 10 percent from 2005. | ¤ Energy efficiency in Trinidad was improved by 3 percent from 2005. | | 2Improve energy efficiency in Trinidad by 3 percent from 2006. |
| | | | |
| Achieve rock costs at Aurora and White Springs 3 percent below 2005. | ¦ Rock costs were 5 percent above 2005, with power and reagent cost increases well above expectations. | | 3Achieve rock costs at Aurora and White Springs 1 percent below 2006. |
| | | | |
Achieve conversion costs for P2O5 production 9 percent better than 2005. | ¤ P2O5 conversion costs were 3 percent better than 2005. | | 4Maintain cash conversion costs for P2O5 at 2006 levels. |
| | | | |
| Reduce/avoid transportation and distribution expenses to achieve a level 3 percent below market rates. | l Transportation and distribution costs were 7 percent below market rates. | | 5Reduce/avoid transportation and distribution expenses to achieve a level 3 percent below market rates. |
| | | | |
| | |
| | |
| 1Dow Jones US Basic Materials index | | 2See reconciliation and description of certain non-GAAP measures on Page 33 |
POTASHCORP 2006 SUMMARY ANNUAL REPORT /BUSINESS ENVIRONMENT 23
Sales and Marketing
| | | | |
█ To remain the leader and preferred supplier of potash, nitrogen and phosphate products worldwide. |
| | | | |
| | | | |
2006 Targets | 2006 Results | | 2007 Targets |
| | | | |
| | | | |
| Increase North American realized prices for potash by 10 percent. | ¤ North American realized potash prices increased by 7 percent. | | 1Potash gross margin to exceed $800 million, more than 40 percent above 2006. |
| | | | |
| Increase offshore potash sales volumes by 5 percent. | ¦ Offshore potash volumes declined by 12 percent due to extended price negotiations. | | 2Phosphate gross margin to be up by 50 percent from 2006. |
| | | | |
| Increase North American realized feed prices by 20 percent. | l North American realized feed prices increased by 25 percent. | | 3Nitrogen gross margin to exceed $325 million. |
| | | | |
| Increase realized nitric acid prices by 5 percent. | l Realized prices for nitric acid increased by 6 percent. | | 4Outperform competitors on quality and service as measured by customer surveys. |
| | | | |
| | |
Sustainability
| | | | |
█ To move closer to our goal of no harm to people, no accidents, no damage to the environment. |
| | | | |
█ To have motivated and productive employees committed to our long-term goals. |
| | | | |
█ To improve the socio-economic well-being of our communities. |
| | | | |
█ To be a leader in corporate governance. |
| | | | |
| | | | |
2006 Targets | 2006 Results | | 2007 Targets |
| | | | |
| | | | |
| Reduce recordable injury rate by 30 percent from 2005. | ¤ Achieved a record low recordable injury rate, representing a 23-percent reduction from 2005. | | 1Reduce recordable injury rate by 15 percent from 2006. |
| | | | |
| Reduce lost-time injury rate by 30 percent from 2005. | ¦ Lost-time injury rate was 8 percent above 2005. | | 2Reduce lost-time injury rate by 40 percent from 2006. |
| | | | |
| Reduce reportable releases and permit excursions by 30 percent from 2005. | l Releases and permit excursions were reduced by 45 percent. | | 3Reduce reportable releases and permit excursions by 10 percent from 2006. |
| | | | |
| Achieve total compliance on environmental, safety and security audit action items. | l 100-percent compliance was achieved. | | 4Fill at least 75 percent of senior staff openings with internal candidates. |
| | | | |
| Fill at least 75 percent of senior staff openings internally. | ¤ Filled 72 percent of senior staff openings with internal candidates. | | 5Improve employee engagement, as measured by surveys, by 10 percent from 2006. |
| | | | |
| Maintain or improve employee engagement as measured by surveys. | N/A A new survey format used in 2006 made prior survey results incomparable. The new survey will serve as a baseline for future engagement surveys. | | 6Achieve a 10-percent increase in individual participation in the matching gift program and a 20-percent increase in total donations. |
| | | | |
| Stabilize employee turnover at Trinidad operations. | l Employee turnover at Trinidad was reduced from 2005. | | 7Remain in the top quartile of governance practices as measured by predetermined external reviews. |
| | | | |
| Continue to be engaged with community support projects at our plants and offices. | l Our company and people were engaged in volunteer efforts, cash donations and relationship-building activities. | | |
| | | | |
| Achieve a 10-percent increase in individual participation in the matching gift program and a 20-percent increase in total donations. | ¦ Not achieved due to significant 2005 donations directed to Asian tsunami and Hurricane Katrina relief efforts. Excluding these two events, participation and donations exceeded 2005. | | |
| | | | |
| Remain in the top quartile of governance practices as measured by external reviews. | l Governance practices placed ninth among 204 S&P/TSX companies evaluated byReport on Business. | | |
| | | | |
| | |
CONNECTING SUSTAINABILITY WITH LONG-TERM SHAREHOLDER VALUE
| | | | | | |
| PotashCorp’s commitment to sustainability does more than measure financial, social and environmental performance. It brings our vision and values to the forefront when decisions are made. Ultimately, it improves the way we operate for all stakeholders, giving us greater strength for the future and building long-term shareholder value. | | To hear audio interviews with senior management on key sustainability topics, see our online annual report, |
| Our sustainability committee has identified five key platforms that are important to our ongoing operational and financial success: | | Keyword » |  |
| | | | | |
| SAFETY | | DIVERSITY | | |
A safety-driven culture reduces the likelihood of accidents, injuries and death. While the well-being of employees and contractors is our main goal, the company also realizes operating efficiencies from fewer disruptions to work flow and lower insurance premiums. In 2006, our focus on safety led to a record low recordable injury rate. | | Employees identified workplace diversity as an important factor in their engagement with PotashCorp. Diversity also gives us ideas and insights that are important for a company with global operations, investments and customers. To maximize the contribution of our broad workforce and focus on the strength we gain through diversity, we completed in-person and online diversity training with all our employees in 2006. | |
| | | | | |
| STAKEHOLDER ENGAGEMENT | | ENVIRONMENT | | PHILANTHROPY |
| | | | | |
Our long-term performance is directly related to our ability to understand stakeholder expectations and make decisions that position us to meet the needs of the people who depend on us. In 2006, we completed surveys with key customer groups, our investor base and community leaders at five locations. The results help shape decisions made by our Board of Directors and senior management team. | | By restoring fertility to the world’s agricultural land, PotashCorp’s products are inherently beneficial to the environment. We strive to minimize the environmental impact of our operations and improve our energy efficiency. Over the past five years, our energy efficiency per tonne has improved by over 10 percent, resulting in significant savings. | | A strong company can help build a healthy community. We contribute to organizations and events that improve the quality of life in the areas where we work and live. During the year, we continued to deliver significant support – in cash and through volunteer efforts – to various groups that improve our communities. By partnering with our employees through the matching gift program, we maximize the total value of our donations to a range of community partners. |
| | | | | |
 | | n CEO DOYLE HEADS IFA SUSTAINABILITY INITIATIVE |
| | PotashCorp has taken a leadership role in our industry and has stepped to the forefront on issues of sustainability and transparency. In 2006, President and CEO Bill Doyle was elected by members of the International Fertilizer Industry Association (IFA) to be the organization’s first-ever Vice President for Sustainable Development. This position was created to strengthen the industry’s ability to address environmental issues and to promote the widespread adoption of sustainable business practices among the Association’s members. |
POTASHCORP 2006 SUMMARY ANNUAL REPORT /SUSTAINABILITY 25
| | PROVIDING LEADERSHIP
AT THE BOARD LEVEL |
| | | |
| | Dallas Howe
Chair, PotashCorp Board of Directors |
The evolution of PotashCorp’s corporate governance and sustainability practices is a priority for the company’s Board of Directors.
While our Board and its committees have historically been responsible for overseeing numerous aspects of sustainability – even before it became mainstream – we have expanded our role to better align with the company’s reporting practices. Each committee reviews sustainability performance in the areas within its particular mandate, using criteria utilized for the Dow Jones Sustainability Index. The corporate governance committee is responsible for sustainability issues that are not specifically addressed by other committees, such as philanthropy, human rights and economic issues involving relationships with customers and investors.
During the year, our Board continued to explore the areas of strategy, risk management and director education. At our March 2006 meeting, these areas converged as directors and management participated in a simulated crisis led by an outside facilitator. By looking ahead and developing practical, progressive plans for potential issues, we reduce risk for shareholders.
We also revised PotashCorp’sCore Values and Code of Conduct, giving employees greater direction about how to raise ethical or compliance concerns. Our people take pride in PotashCorp’s reputation and diligently protect it. Our Board and the audit committee receive regular reports on the company’s ethics and compliance activities and we review quantitative and qualitative accounts of compliance matters that are reported.
This commitment to the interests of stakeholders also shapes our philosophy on compensation. Company executives have a significant percentage of their compensation package tied to specific performance measures and we have expanded the number of employees with a percentage of their compensation connected to corporate performance. This ensures the focus of our people is closely aligned with the best interests of our stakeholders.
Our approach helps maintain a Board and management team that is focused on the expectations of PotashCorp’s stakeholders – not only for today but for generations to come.
| | | | |
| | | SETTING A
NEW STANDARD
FOR SAFETY |
Safety is our No. 1 priority at PotashCorp and our emphasis on continuous improvement in this area led to a record low recordable injury rate in 2006.
Under the direction of the Senior Safety Leadership Team, each facility implemented a site safety action plan in 2006. These plans, which required the approval of division presidents, established goals and targets and examined safety from four key perspectives:
Accident Prevention– Each site looked for ways to eliminate actions with the potential to cause accidents.
Tracking Compliance– Each site completed a key procedures audit that quantified and analyzed compliance with our safety procedures.
Safety Attitudes– The Organizational Culture Diagnostic Instrument survey measured current attitudes toward safety and identified ways to further embed it into our culture.
Contractor Safety– PotashCorp implemented safety action plans that ensure contractors understand and live up to the same safety standards as our employees.
These plans remain integral to our safety strategy as we pursue further improvements.
Reducing Our Recordable Injury Rate
26 SUSTAINABILITY/ POTASHCORP 2006 SUMMARY ANNUAL REPORT
| LISTENING TO POTASHCORP STAKEHOLDERS |
At the heart of sustainability is a desire to communicate with people outside the company who are affected by our performance. To encourage feedback, we use external consultants who annually survey key customer groups, investors and community leaders in the areas where we operate.
Here’s what they told us in 2006:
Fertilizer
Reliability of Long-Term Supply
Feed
PotashCorp’s Product Quality
Industrial Nitrogen
Most Important Factor After Price
Purified Phosphate
PotashCorp’s Product Quality
Customers
Each year, we ask fertilizer, feed, industrial nitrogen and purified phosphate customers to rate the performance of PotashCorp and our North American competitors. In 2006, these surveys reached customers who represented more than $1.3 billion in sales.
The findings both confirmed our beliefs and shed light on areas that can create opportunities for our company.
Our goal is to be a preferred supplier to our customers. By listening to their feedback, we strengthen our ability to achieve this goal.
Fertilizer
| – | | PotashCorp received the industry’s highest ranking for reliability of supply, one of the most important criteria for customers. |
| |
| – | | Our sales representatives were recognized as the most knowledgeable in the industry, which provides a significant advantage in maintaining strong relationships with customers. |
| |
| – | | Ratings of our delivery and truck-loading capabilities suggest improvement is needed. |
Feed
| – | | Product quality issues are important to feed customers. PotashCorp earned the highest marks in this category. |
| |
| – | | Phytase enzymes and alternative products are gaining traction with customers and are areas to be watched. |
Industrial Nitrogen
| – | | Availability of supply, quality and on-time delivery are important for industrial nitrogen customers. PotashCorp earned 93 of a possible 100 points for reliability of long-term supply and 95 for product quality. Customers were not asked to rate companies for on-time delivery. |
| |
| – | | We earned the highest ratings for product quality, with customers’ most important measure of quality being the ability to meet product specifications. |
| |
| – | | Rising costs for energy, raw materials and transportation are of importance to industrial nitrogen customers. |
Purified Phosphate
| – | | Product quality is the key criterion for purified phosphate customers. PotashCorp is consistently ranked as the industry leader in this category. |
| |
| – | | Our scores on order entry and invoicing suggest these are areas where we can improve. |
POTASHCORP 2006 SUMMARY ANNUAL REPORT /SUSTAINABILITY 27
Investors
Our investor survey, conducted in June/July 2006, included 19 buy-side (▲) analysts, some of whom held PotashCorp shares, and six sell-side (l) analysts.
Key Findings
| – | | Potash is considered the biggest value driver for our company, with emerging markets’ desire for food as the key factor of influence. |
| |
| – | | Many investors believe the agriculture environment will be even more positive within three years. |
| |
| – | | Over three-quarters of investors view the potash sector as a long-term investment while nitrogen and phosphate are seen as more short-term and cyclical. |
| |
| – | | Most investors place priority on growth and advocate strategic investment in assets. |
Community Leaders
In 2006, surveys were completed with community leaders at our operations in Rocanville, Augusta, Lanigan, White Springs and Trinidad.
The surveys measured perceptions of:
| – | | our community involvement; |
| |
| – | | our business practices, specifically in the areas of safety, health and environment; and |
| |
| – | | our impact on local economies. |
Using the combined average scores from these five surveys, PotashCorp earned the following ratings on a scale from 1 (Not Performing Well) to 5 (Performing Very Well):
| | | | |
Community Involvement | | | 4.3/5 |
Business Practices | | | 4.3/5 |
Economic Value | | | 4.4/5 |
Overall Rating | | | 4.3/5 |
The surveys consistently showed high respect for our business practices. The impact on the local environment was commonly stressed, reminding us that focusing on sustainability and environmental initiatives will continue to be important to our long-term community support.
| █ | | IMPROVING OUR COMMUNITIES |
Engaging with local communities improves the quality of life where we operate. It can also strengthen relationships by giving us insight into stakeholders’ expectations and building support for our operations. This is critical as we pursue potential expansions and mining permits.
In 2006, PotashCorp:
| – | | took an active role in sponsoring community events,including the PotashCorp Vanier Cup in Saskatoon (Canada’s university football championship) and the Cricket World Cup in Trinidad; |
| |
| – | | increased awareness of our matching gift programand made improvements that reduced the minimum and increased the maximum contribution levels; and |
| |
| – | | was named the Top Corporate Citizenby the North Suburban United Way, a chapter of the Metropolitan United Way of Chicago. We also received the Campaign Chair’s Choice Award from the United Way of Saskatoon and Area for the best overall performance by a workplace campaign, which reflected record employee contributions at the local minesites and the corporate office. |
| █ | | INVOLVING BUSINESS PARTNERS IN SUSTAINABILITY |
In 2006, we encouraged business partners to embrace sustainability, knowing that more can be achieved if we act together.
Suppliers– To date, we have received documentation confirming human rights policies from approximately 97 percent of our key vendors and no companies have been removed from our supplier list for their human rights performance. We continue to obtain documentation from remaining companies.
Customers– PotashCorp’s new “Enriching” program (www.enriching.com) recognizes agricultural retailers and dealers who are promoting sustainable business practices in their communities. Our goal is to share customers’ sustainability efforts, encouraging more business partners to adopt practices that support sustainable development.
| | | |
28
| | FINANCIAL OVERVIEW/ POTASHCORP 2006 SUMMARY ANNUAL REPORT |
FINANCIAL OVERVIEW
| | | |
| | Get inside the numbers |
| | | |
| | The condensed consolidated financial
statements in this Summary Annual Report
provide an overview of PotashCorp’s
performance. For complete consolidated
financial statements, notes and our
Management’s Discussion & Analysis, | |
| | go to Keyword » |  |
| | | |
| █ | | MANAGEMENT’S RESPONSIBILITY
FOR FINANCIAL REPORTING |
PotashCorp management is responsible for the condensed consolidated financial statements and related financial information, which have been prepared in accordance with accounting principles generally accepted in Canada and include amounts based on estimates and judgments. Financial information included elsewhere in this report is consistent with the consolidated financial statements. Management is also responsible for establishing and maintaining an adequate system of internal control over financial reporting.
In order to meet its responsibility and ensure integrity of financial reporting, management has established a code of business ethics, and maintains appropriate internal controls and accounting systems.
The condensed consolidated financial statements and all other information in this Summary Annual Report should be read in conjunction with the audited consolidated financial statements and Management’s Discussion & Analysis of Financial Condition and Results of Operations.
Our independent registered chartered accountants, Deloitte & Touche LLP, have completed their audit and submitted their report.
 W. Doyle
President and Chief Executive Officer
 W. Brownlee
Executive Vice President
and Chief Financial Officer
February 14, 2007
| █ | | REPORT OF INDEPENDENT REGISTERED CHARTERED ACCOUNTANTS
TO THE SHAREHOLDERS OF POTASH CORPORATION OF SASKATCHEWAN INC. |
We have audited the consolidated statements of financial position of Potash Corporation of Saskatchewan Inc. and subsidiaries (the “Company”) as of December 31, 2006 and 2005, and the related consolidated statements of operations and retained earnings and cash flows for each of the three years in the period ended December 31, 2006. We also have audited management’s assessment of the effectiveness of the Company’s internal control over financial reporting and the effectiveness of the Company’s internal control over financial reporting as of December 31, 2006. Such consolidated financial statements, management’s assessment of the effectiveness of the Company’s internal control over financial reporting and our reports thereon (which audit report on the consolidated financial statements includes a separate report titled Comments by Independent Registered Chartered Accountants on Canada – United States of America Reporting Differences referring to changes in accounting principles) dated February 14, 2007, expressing unqualified opinions (which are not included herein) appear in the Company’s 2006 Financial Review. The accompanying condensed consolidated financial statements are the responsibility of the Company’s management. Our responsibility, in accordance with the applicable Assurance Guideline of The Canadian Institute of Chartered Accountants, is to express an opinion on such condensed consolidated financial statements in relation to the complete consolidated financial statements.
In our opinion, the accompanying condensed consolidated statements of financial position as of December 31, 2006 and 2005, and the related condensed consolidated statements of operations and retained earnings and cash flows for each of the two years in the period ended December 31, 2006 fairly summarize, in all material respects, the related complete consolidated financial statements in accordance with the criteria described in the Guideline referred to above.
These summarized financial statements do not contain all the disclosures required by Canadian generally accepted accounting principles. Readers are cautioned that these statements may not be appropriate for their purposes. For more information on the Company’s financial position, results of operations and cash flow, reference should be made to the related complete consolidated financial statements.
 Independent Registered Chartered Accountants
Saskatoon, Canada
February 14, 2007
POTASHCORP 2006 SUMMARY ANNUAL REPORT /FINANCIAL OVERVIEW 29
CONDENSED CONSOLIDATED STATEMENTS OF FINANCIAL POSITION
| | | | | | | | | | | |
| as at December 31 | in millions of US dollars except share amounts | | | |
| | | 2006 | | | 2005 | | | |
Assets | | | | | | | | | | Management’s Discussion (unaudited) |
| |
| Current assets | | | | | | | | | | Property, plant and equipment Additions of $508.6 million in 2006 include $216.7 million to bring back idled potash capacity at our Allan and Lanigan operations. |
| Cash and cash equivalents | | $ | 325.7 | | | $ | 93.9 | | |
| Accounts receivable | | | 442.3 | | | | 453.3 | | |
| Inventories | | | 501.3 | | | | 522.5 | | |
| Prepaid expenses and other current assets | | | 40.9 | | | | 41.1 | | |
| | |
| | | | 1,310.2 | | | | 1,110.8 | | |
| Property, plant and equipment | | | 3,525.8 | | | | 3,262.8 | | |
| |
| Other assets | | | 1,254.7 | | | | 852.8 | | | Other assets With further investments in Sinofert ($126.3 million), APC ($3.7 million) and SQM ($235.0 million), the market value of our offshore investments exceeded book value by $1,653.2 million at year-end. |
| Intangible assets | | | 29.3 | | | | 34.5 | | |
| Goodwill | | | 97.0 | | | | 97.0 | | |
| |
| | | $ | 6,217.0 | | | $ | 5,357.9 | | |
| |
Liabilities | | | | | | | | | |
| Current liabilities | | | | | | | | | |
| Short-term debt | | $ | 157.9 | | | $ | 252.2 | | |
| |
| Accounts payable and accrued charges | | | 545.2 | | | | 842.7 | | | Accounts payable and accrued charges Current income taxes payable declined by $160.4 million as a result of Canadian installments for 2006 based on expectations higher than actual results, while the 2005 required installments were significantly lower than taxes accrued for that year. A reclassification of amounts between current and future income tax liabilities and lower Canadian income tax rates also contributed to the decrease. Hedging margin deposits were down $150.9 million with lower natural gas prices and reduced volumes of derivative contracts outstanding. |
| |
| Current portion of long-term debt | | | 400.4 | | | | 1.2 | | |
| | | |
| | | | 1,103.5 | | | | 1,096.1 | | |
| Long-term debt | | | 1,357.1 | | | | 1,257.6 | | |
| Future income tax liability | | | 632.1 | | | | 543.3 | | |
| Accrued pension and other post-retirement benefits | 219.6 | | | | 213.9 | | |
| Accrued environmental costs and asset retirement obligations | 110.3 | | | | 97.3 | | |
| Other non-current liabilities and deferred credits | | | 14.1 | | | | 17.2 | | |
| | | |
| | | | 3,436.7 | | | | 3,225.4 | | |
| | | |
| | |
| | |
| | |
| | |
Shareholders’ Equity | | | | | | | | | |
| | | | |
| Share capital | | | 1,431.6 | | | | 1,379.3 | | | Long-term debt The issue of $500.0 million in 30-year notes, with an interest rate of 5.875 percent, will provide capital to repay $400.0 million of notes, with an interest rate of 7.125 percent, maturing in 2007 and for general corporate purposes. |
| Unlimited authorization of common shares without par value; issued and outstanding 104,801,049 and 103,593,792 at December 31, 2006 and 2005, respectively | | | | | | | | | |
| Contributed surplus | | | 62.3 | | | | 36.3 | | |
| Retained earnings | | | 1,286.4 | | | | 716.9 | | |
| | |
| | | | 2,780.3 | | | | 2,132.5 | | |
| | |
| | | $ | 6,217.0 | | | $ | 5,357.9 | | |
| | |
Approved by the Board of Directors,
| | | |
|  | |
| Director | Director | |
30 FINANCIAL OVERVIEW/ POTASHCORP 2006 SUMMARY ANNUAL REPORT
CONDENSED CONSOLIDATED STATEMENTS OF OPERATIONS AND RETAINED EARNINGS
| | | | | | | | | | | | | | | | | | |
| for the years ended December 31 | in millions of US dollars except per-share amounts | | | | | | | | |
| | | | | 2006 | | | 2005 | | | | | | | | |
| Sales | | $ | 3,766.7 | | | $ | 3,847.2 | | | | | | | | Management’s Discussion (unaudited) |
| | | | |
| Less: | | Freight | | | 255.8 | | | | 249.7 | | | | | | | | Gross margin Although potash shipments were severely constrained for the first seven months of 2006, the decline in gross margin was not substantial. Nitrogen gross margin benefited from a strong pricing environment, while phosphate gross margin was the highest since 1999. |
| | | Transportation and distribution | | | 134.1 | | | | 121.9 | | | | | | | |
| | | Cost of goods sold | | | 2,374.8 | | | | 2,350.6 | | | | | | | |
| | | | | | | |
| Gross Margin | | | 1,002.0 | | | | 1,125.0 | | | | | | | |
| | | | | | | |
| | | | | | | |
| Selling and administrative | | | 158.4 | | | | 144.5 | | | | | | | |
| Provincial mining and other taxes | | | 66.5 | | | | 137.2 | | | | | | | |
| Foreign exchange (gain) loss | | | (4.4 | ) | | | 12.5 | | | | | | | |
| Other income | | | (94.0 | ) | | | (61.8 | ) | | | | | | |
| | | | | | | | |
| | | | | | 126.5 | | | | 232.4 | | | | | | | | Provincial mining and other taxes Saskatchewan Potash Production Tax declined as a result of lower potash gross margin and the deductibility of capital expenditures on potash, most of it to bring back idled capacity. |
| | | | | | | |
| | | | | | | |
| Operating Income | | | 875.5 | | | | 892.6 | | | | | | | |
| | | | | | | |
| Interest Expense | | | 85.6 | | | | 82.3 | | | | | | | |
| | | | | | | |
| | | | | | | |
| Income Before Income Taxes | | | 789.9 | | | | 810.3 | | | | | | | |
| | | | | | |
| | | | | | | |
| Income Taxes | | | 158.1 | | | | 267.4 | | | | | | | | Other income Dividend income and earnings from equity investments comprised $75.5 million of 2006 other income (2005 – $61.3). The increase was primarily attributable to higher dividend income from ICL and a $3.0-million dividend from Sinofert received in 2006. |
| | | | | | | | |
| | | | | | | |
| Net Income | | | 631.8 | | | | 542.9 | | | | | | | |
| | | | | | | |
| Retained Earnings, Beginning of Year | | | 716.9 | | | | 701.5 | | | | | | | |
| | | | | | | |
| Repurchase of Common Shares | | | – | | | | (462.5 | ) | | | | | | |
| | | | | | | | |
| | | | | | | |
| Dividends | | | (62.3 | ) | | | (65.0 | ) | | | | | | | Income taxes The combination of income tax refunds received, changes in tax rates and lower operating income led to a reported tax rate of approximately 20 percent in 2006 compared to 33 percent in 2005. Exclusive of income tax refunds and the effect of rate changes on our future income tax liability, our effective tax rate was 30 percent in 2006. |
| | | | | | | |
| | | | | | | |
| Retained Earnings, End of Year | | $ | 1,286.4 | | | $ | 716.9 | | | | | | | |
| | | | | | | |
| | | | | | | |
| Net Income per Share – Basic | | $ | 6.08 | | | $ | 5.00 | | | | | | | |
| | | | | | | |
| | | | | | | |
| Net Income per Share – Diluted | | $ | 5.95 | | | $ | 4.89 | | | | | | | |
| | | | | | | |
| | | | | | | |
| Dividends per Share | | $ | 0.60 | | | $ | 0.60 | | | | | | | |
| | | | | | | |
POTASHCORP 2006 SUMMARY ANNUAL REPORT /FINANCIAL OVERVIEW 31
CONDENSED CONSOLIDATED STATEMENTS OF CASH FLOW
| | | | | | | | | | | | | | | | | | | |
| for the years ended December 31 | | | | | | in millions of US dollars | | | |
| | | | | | | 2006 | | | | | | | 2005 | | | |
Operating Activities | | | | | | | | | | | | | | | | | | Management’s Discussion (unaudited) |
| | |
Net income | | | | | | $ | 631.8 | | | | | | | $ | 542.9 | | | Cash provided by operating activities Changes provided by operating working capital negatively impacted cash provided by operating activities. Operating cash flow due to changes in accounts payable and accrued charges reduced cash flow from operations during 2006 due to:
(1) reductions in income tax payable because of paying 2005 Canadian income taxes due in first-quarter 2006 and making Canadian installments for 2006 based on more optimistic expectations than actual results;
(2) a decline in hedging margin deposits due to falling gas prices and reduced volumes of derivative contracts outstanding; and
(3) payments of performance-based compensation accruals that were outstanding at December 31, 2005. |
| Adjustments to reconcile net income to cash provided by operating activities | | | | | | | | | | | | | | | | | |
| Depreciation and amortization | | | 242.4 | | | | | | | | 242.4 | | | | | | |
| Other | | | 66.6 | | | | | | | | 75.0 | | | | | | |
Subtotal of adjustments | | | | | | | 309.0 | | | | | | | | 317.4 | | |
| | | | | | | | | | | | | | | | | | |
Changes in non-cash operating
working capital | | | | | | | | | | | | | | | | | |
| Accounts receivable | | | 11.0 | | | | | | | | (107.6 | ) | | | | | |
| Inventories | | | 13.9 | | | | | | | | (119.9 | ) | | | | | |
| Prepaid expenses and other current assets | | | 0.2 | | | | | | | | (5.8 | ) | | | | | |
| Accounts payable and accrued charges | | | (269.1) | | | | | | | | 238.1 | | | | | | |
Subtotal of changes in non-cash operating working capital | | | | | | | (244.0 | ) | | | | | | | 4.8 | | |
| | |
Cash provided by operating activities | | | | | | | 696.8 | | | | | | | | 865.1 | | |
| | |
Investing Activities | | | | | | | | | | | | | | | | | |
| Additions to property, plant and equipment | | | | | | | (508.6 | ) | | | | | | | (382.7 | ) | |
| Purchase of long-term investments | | | | | | | (352.5 | ) | | | | | | | (190.9 | ) | |
| Proceeds from disposal of property, plant and equipment and long-term investments | | | | | | | 22.0 | | | | | | | | 12.4 | | |
| Other assets and intangible assets | | | | | | | (0.6 | ) | | | | | | | 5.9 | | |
| | |
Cash used in investing activities | | | | | | | (839.7 | ) | | | | | | | (555.3 | ) | |
| | |
Cash before financing activities | | | | | | | (142.9 | ) | | | | | | | 309.8 | | |
| | | |
| | | | | | | | | | | | | | | | | | | Repurchase of common shares We repurchased 9,500,000 common shares – at an average price of less than $90 per share – during 2005 under our normal course issuer bid. We completed the repurchase program by December 31, 2005 and did not initiate a new program in 2006. |
Financing Activities | | | | | | | | | | | | | | | | | |
| Proceeds from (repayment of) long-term debt obligations | | | | | | | 482.6 | | | | | | | | (10.1 | ) | |
| (Repayment of) proceeds from short-term debt obligations | | | | | | | (94.3 | ) | | | | | | | 158.7 | | |
| Dividends | | | | | | | (60.9 | ) | | | | | | | (65.4 | ) | |
| Repurchase of common shares | | | | | | | – | | | | | | | | (851.9 | ) | |
| Issuance of common shares | | | | | | | 47.3 | | | | | | | | 93.9 | | |
| | |
Cash provided by (used in) financing activities | | | | | | | 374.7 | | | | | | | | (674.8 | ) | |
| | |
Increase (Decrease) in Cash and Cash Equivalents | | | | | | | 231.8 | | | | | | | | (365.0 | ) | |
Cash and Cash Equivalents, Beginning of Year | | | | | | | 93.9 | | | | | | | | 458.9 | | | |
| | | |
Cash and Cash Equivalents, End of Year | | | | | | $ | 325.7 | | | | | | | $ | 93.9 | | | |
| | | |
| Supplemental cash flow disclosure | | | | | | | | | | | | | | | | | | |
| Interest paid | | | | | | $ | 106.8 | | | | | | | $ | 86.3 | | | |
| Income taxes paid | | | | | | $ | 226.8 | | | | | | | $ | 141.6 | | | |
| | | |
32 FINANCIAL OVERVIEW/ POTASHCORP 2006 SUMMARY ANNUAL REPORT
5 YEAR FINANCIAL AND OPERATING DATA
FINANCIAL DATA(in millions of US dollars except per-share amounts)
| | | | | | | | | | | | | | | | | | | | | |
| | | 2006 | | | 2005 | | | 2004 | | | 2003 | | | 2002 | |
| | | | | | | | | | | | | | | | | | | | | |
| Sales | | | | | | | | | | | | | | | | | | | | |
| Potash | | | 1,227.5 | | | | 1,341.1 | | | | 1,056.1 | | | | 758.7 | | | | 669.0 | |
| Nitrogen | | | 1,284.1 | | | | 1,368.8 | | | | 1,210.4 | | | | 1,156.4 | | | | 841.4 | |
| Phosphate | | | 1,255.1 | | | | 1,137.3 | | | | 977.9 | | | | 883.9 | | | | 714.0 | |
| Total sales | | | 3,766.7 | | | | 3,847.2 | | | | 3,244.4 | | | | 2,799.0 | | | | 2,224.4 | |
| |
| Gross margin | | | | | | | | | | | | | | | | | | | | |
| Potash | | | 561.1 | | | | 707.4 | | | | 422.8 | | | | 203.7 | | | | 218.0 | |
| Nitrogen | | | 315.6 | | | | 318.7 | | | | 242.8 | | | | 193.2 | | | | 47.4 | |
| Phosphate | | | 125.3 | | | | 98.9 | | | | 15.8 | | | | (16.5 | ) | | | 41.9 | |
| Total gross margin | | | 1,002.0 | | | | 1,125.0 | | | | 681.4 | | | | 380.4 | | | | 307.3 | |
| |
| Capital expenditures | | | | | | | | | | | | | | | | | | | | |
| Potash | | | 293.2 | | | | 165.5 | | | | 92.2 | | | | 50.9 | | | | 35.5 | |
| Nitrogen | | | 75.5 | | | | 99.3 | | | | 62.1 | | | | 39.8 | | | | 47.0 | |
| Phosphate | | | 119.7 | | | | 109.5 | | | | 56.8 | | | | 55.3 | | | | 126.3 | |
| Corporate/Sales | | | 20.2 | | | | 8.4 | | | | 9.4 | | | | 4.7 | | | | 3.4 | |
| Total capital expenditures | | | 508.6 | | | | 382.7 | | | | 220.5 | | | | 150.7 | | | | 212.2 | |
| |
| EBITDA* | | | 1,117.9 | | | | 1,135.0 | | | | 754.3 | | | | 171.8 | | | | 386.0 | |
| Net income (loss) | | | 631.8 | | | | 542.9 | | | | 298.6 | | | | (126.3 | ) | | | 53.6 | |
Net income (loss)
per share – diluted | | | 5.95 | | | | 4.89 | | | | 2.70 | | | | (1.21 | ) | | | 0.51 | |
| |
| Cash flow provided by operating activities | | | 696.8 | | | | 865.1 | | | | 658.3 | | | | 385.5 | | | | 316.4 | |
| Cash flow prior to working capital changes* | | | 940.8 | | | | 860.3 | | | | 538.3 | | | | 368.5 | | | | 289.2 | |
| |
| Total assets | | | 6,217.0 | | | | 5,357.9 | | | | 5,126.8 | | | | 4,567.3 | | | | 4,685.6 | |
| Long-term debt | | | 1,357.1 | | | | 1,257.6 | | | | 1,258.6 | | | | 1,268.6 | | | | 1,019.9 | |
| Shareholders’ equity | | | 2,780.3 | | | | 2,132.5 | | | | 2,385.6 | | | | 1,973.8 | | | | 2,092.5 | |
| | | | | | | | | | | | | | | | | | | | | |
OPERATING DATA(in thousands of tonnes except employee numbers)
| | | | | | | | | | | | | | | | | | | | | |
| | | 2006 | | | 2005 | | | 2004 | | | 2003 | | | 2002 | |
| Employees at year-end | | | 4,871 | | | | 4,879 | | | | 4,906 | | | | 4,904 | | | | 5,199 | |
| |
| Potash production (KCl) tonnage | | | 7,018 | | | | 8,816 | | | | 7,914 | | | | 7,094 | | | | 6,447 | |
| Nitrogen production (N) tonnage | | | 2,579 | | | | 2,600 | | | | 2,558 | | | | 2,619 | | | | 2,990 | |
Phosphate production (P2O5) tonnage | | | 2,108 | | | | 2,097 | | | | 1,962 | | | | 1,861 | | | | 1,512 | |
| |
| Potash sales – KCl tonnes | | | 7,196 | | | | 8,164 | | | | 8,276 | | | | 7,083 | | | | 6,327 | |
| Nitrogen sales – product tonnes | | | 4,820 | | | | 5,220 | | | | 5,350 | | | | 6,080 | | | | 6,391 | |
| Phosphate sales – product tonnes | | | 4,078 | | | | 3,971 | | | | 3,793 | | | | 3,647 | | | | 2,863 | |
| | | | | | | | | | | | | | | | | | | | | |
| * | | See reconciliation and description of certain non-GAAP measures on Page 33 |
FINANCIAL TERMS
Debt to capital
| = | total debt / (total debt + total shareholders’ equity) |
Net debt to capital
| = | (total debt – cash and cash equivalents) / (total debt – cash and cash equivalents + total shareholders’ equity) |
Current income taxes
| = | income tax expense (recovery) – provision for (recovery of) future income tax |
Cash flow
| = | net income or loss + income taxes + interest – current income + depreciation and amortization |
Cash flow return
| = | cash flow / average (total assets) – cash and cash equivalents + accumulated depreciation and amortization – accounts payable and accrued charges) |
EBITDA
| = | earnings (net income or loss) before interest, taxes, depreciation and amortization |
Return on assets
| = | net income or loss / total assets |
POTASHCORP 2006 SUMMARY ANNUAL REPORT /FINANCIAL OVERVIEW 33
FINANCIAL PERFORMANCE INDICATORS(in millions of US dollars)
NON-GAAP FINANCIAL MEASURES AND FOOTNOTES TO RECONCILIATIONS AND CALCULATIONS
The following information is included for convenience only. Generally, a non-GAAP financial measure is a numerical measure of a company’s performance, financial position or cash flows that either excludes or includes amounts that are not normally excluded or included in the most directly comparable measure calculated and presented in accordance with generally accepted accounting principles (“GAAP”). EBITDA, cash flow prior to working capital changes, cash flow, cash flow return, net debt, net debt to capital and consolidated net sales are not measures of financial performance (nor do they have standardized meanings) under either Canadian GAAP or US GAAP. In evaluating these measures, investors should consider that the methodology applied in calculating such measures may differ among companies and analysts.
The company uses both GAAP and certain non-GAAP measures to assess performance. Management believes these non-GAAP measures provide useful supplemental information to investors in order that they may evaluate PotashCorp’s financial performance using the same measures as management. Management believes that, as a result, the investor is afforded greater transparency in assessing the financial performance of the company. These non-GAAP financial measures should not be considered as a substitute for, nor superior to, measures of financial performance prepared in accordance with GAAP.
RECONCILIATIONS AND CALCULATIONS
| | | | | | | | | | | | | | | | | | | | | | | | | | | | | |
| | | 2006 | | | 2005 | | | 2004 | | | 2003 | | | 2002 | | | 2001 | | | 1996 | |
| | | | | | | | | | | | | | | | | | | | | | | | | | | | | |
| Net income (loss) | | | 631.8 | | | | 542.9 | | | | 298.6 | | | | (126.3 | ) | | | 53.6 | | | | 121.2 | | | | 209.0 | |
| Income taxes | | | 158.1 | | | | 267.4 | | | | 131.7 | | | | (20.6 | ) | | | 30.2 | | | | 68.2 | | | | 43.7 | |
| Interest expense | | | 85.6 | | | | 82.3 | | | | 84.0 | | | | 91.3 | | | | 83.1 | | | | 80.3 | | | | 44.7 | |
| Depreciation and amortization | | | 242.4 | | | | 242.4 | | | | 240.0 | | | | 227.4 | | | | 219.1 | | | | 185.7 | | | | 90.1 | |
| |
EBITDA1 | | | 1,117.9 | | | | 1,135.0 | | | | 754.3 | | | | 171.8 | | | | 386.0 | | | | 455.4 | | | | 387.5 | |
| | | | | | | | | | | | | | | | | | | | | | | | | | | | | |
Cash flow prior to working capital changes2 | | | 940.8 | | | | 860.3 | | | | 538.3 | | | | 368.5 | | | | 289.2 | | | | | | | | | |
| | | | | | | | | |
| Accounts receivable | | | 11.0 | | | | (107.6 | ) | | | (51.9 | ) | | | (39.5 | ) | | | (11.1 | ) | | | | | | | | |
| Inventories | | | 13.9 | | | | (119.9 | ) | | | (10.5 | ) | | | 11.8 | | | | (18.2 | ) | | | | | | | | |
| Prepaid expenses and other current assets | | | 0.2 | | | | (5.8 | ) | | | (6.3 | ) | | | 11.4 | | | | (3.9 | ) | | | | | | | | |
| Accounts payable and accrued charges | | | (269.1 | ) | | | 238.1 | | | | 188.7 | | | | 33.3 | | | | 60.4 | | | | | | | | | |
| | | | | | | | | |
| Changes in non-cash operating working capital | | | (244.0 | ) | | | 4.8 | | | | 120.0 | | | | 17.0 | | | | 27.2 | | | | | | | | | |
| | | | | | | | | |
| Cash provided by operating activities | | | 696.8 | | | | 865.1 | | | | 658.3 | | | | 385.5 | | | | 316.4 | | | | | | | | | |
| | | | | | | | | |
| Net income (loss) | | | 631.8 | | | | 542.9 | | | | 298.6 | | | | (126.3 | ) | | | 53.6 | | | | | | | | | |
| Total assets | | | 6,217.0 | | | | 5,357.9 | | | | 5,126.8 | | | | 4,567.3 | | | | 4,685.6 | | | | | | | | | |
| | | | | | | | | |
| Return on assets | | | 10.2 | % | | | 10.1 | % | | | 5.8 | % | | | (2.8 | %) | | | 1.1 | % | | | | | | | | |
| | | | | | | | | |
| Net income (loss) | | | 631.8 | | | | 542.9 | | | | 298.6 | | | | (126.3 | ) | | | 53.6 | | | | | | | | | |
| Income taxes | | | 158.1 | | | | 267.4 | | | | 131.7 | | | | (20.6 | ) | | | 30.2 | | | | | | | | | |
| Interest expense | | | 85.6 | | | | 82.3 | | | | 84.0 | | | | 91.3 | | | | 83.1 | | | | | | | | | |
| Current income taxes | | | (108.1 | ) | | | (227.3 | ) | | | (105.4 | ) | | | – | | | | (24.2 | ) | | | | | | | | |
| Depreciation and amortization | | | 242.4 | | | | 242.4 | | | | 240.0 | | | | 227.4 | | | | 219.1 | | | | | | | | | |
| | | | | | | | | |
Cash flow3 | | | 1,009.8 | | | | 907.7 | | | | 648.9 | | | | 171.8 | | | | 361.8 | | | | | | | | | |
| | | | | | | | | |
| Total assets | | | 6,217.0 | | | | 5,357.9 | | | | 5,126.8 | | | | 4,567.3 | | | | 4,685.6 | | | | | | | | | |
| Cash and cash equivalents | | | (325.7 | ) | | | (93.9 | ) | | | (458.9 | ) | | | (4.7 | ) | | | (24.5 | ) | | | | | | | | |
| Accumulated depreciation of property, plant and equipment | | | 2,073.8 | | | | 1,927.7 | | | | 1,754.9 | | | | 1,576.2 | | | | 1,454.7 | | | | | | | | | |
| Accumulated amortization of other assets and intangible assets | | | 72.6 | | | | 66.4 | | | | 65.1 | | | | 70.1 | | | | 59.1 | | | | | | | | | |
| Accumulated amortization of goodwill | | | 7.3 | | | | 7.3 | | | | 7.3 | | | | 7.3 | | | | 7.3 | | | | | | | | | |
| Accounts payable and accrued charges | | | (545.2 | ) | | | (842.7 | ) | | | (599.9 | ) | | | (380.3 | ) | | | (347.0 | ) | | | | | | | | |
| | | | | | | | | |
| Adjusted assets | | | 7,499.8 | | | | 6,422.7 | | | | 5,895.3 | | | | 5,835.9 | | | | 5,835.2 | | | | | | | | | |
| | | | | | | | | |
| Average adjusted assets | | | 6,961.3 | | | | 6,159.0 | | | | 5,865.6 | | | | 5,835.6 | | | | 5,719.7 | | | | | | | | | |
| | | | | | | | | |
Cash flow return3 | | | 14.5 | % | | | 14.7 | % | | | 11.1 | % | | | 2.9 | % | | | 6.3 | % | | | | | | | | |
| | | | | | | | | |
| Short-term debt | | | 157.9 | | | | 252.2 | | | | 93.5 | | | | 176.2 | | | | 473.0 | | | | | | | | | |
| Current portion of long-term debt | | | 400.4 | | | | 1.2 | | | | 10.3 | | | | 1.3 | | | | 3.4 | | | | | | | | | |
| Long-term debt | | | 1,357.1 | | | | 1,257.6 | | | | 1,258.6 | | | | 1,268.6 | | | | 1,019.9 | | | | | | | | | |
| | | | | | | | | |
| Total debt | | | 1,915.4 | | | | 1,511.0 | | | | 1,362.4 | | | | 1,446.1 | | | | 1,496.3 | | | | | | | | | |
| Cash and cash equivalents | | | (325.7 | ) | | | (93.9 | ) | | | (458.9 | ) | | | (4.7 | ) | | | (24.5 | ) | | | | | | | | |
| | | | | | | | | |
Net debt4 | | | 1,589.7 | | | | 1,417.1 | | | | 903.5 | | | | 1,441.4 | | | | 1,471.8 | | | | | | | | | |
| | | | | | | | | |
| Shareholders’ equity | | | 2,780.3 | | | | 2,132.5 | | | | 2,385.6 | | | | 1,973.8 | | | | 2,092.5 | | | | | | | | | |
| | | | | | | | | |
| Total debt to capital | | | 40.8 | % | | | 41.5 | % | | | 36.4 | % | | | 42.3 | % | | | 41.7 | % | | | | | | | | |
| | | | | | | | | |
Net debt to capital4 | | | 36.4 | % | | | 39.9 | % | | | 27.5 | % | | | 42.2 | % | | | 41.3 | % | | | | | | | | |
| | | | | | | | | |
| Sales | | | 3,766.7 | | | | 3,847.2 | | | | 3,244.4 | | | | 2,799.0 | | | | 2,224.4 | | | | 2,380.8 | | | | 1,604.9 | |
| Freight | | | 255.8 | | | | 249.7 | | | | 238.7 | | | | 234.5 | | | | 215.2 | | | | 216.7 | | | | 144.6 | |
| Transportation and distribution | | | 134.1 | | | | 121.9 | | | | 104.3 | | | | 98.7 | | | | 80.5 | | | | 83.3 | | | | 49.1 | |
| |
Net sales5 | | | 3,376.8 | | | | 3,475.6 | | | | 2,901.4 | | | | 2,465.8 | | | | 1,928.7 | | | | 2,080.8 | | | | 1,411.2 | |
| |
Certain of the prior years’ figures have been reclassified to conform with the current year’s presentation.
FOOTNOTES
| 1 | | PotashCorp uses EBITDA as a supplemental financial measure of its operational performance. Management believes EBITDA to be an important measure as it excludes the effects of items which primarily reflect the impact of long-term investment decisions, rather than the performance of the company’s day-to-day operations. As compared to net income (loss) according to GAAP, this measure is limited in that it does not reflect the periodic costs of certain capitalized tangible and intangible assets used in generating revenues in the company’s business. Management evaluates such items through other financial measures such as capital expenditures and cash flow provided by operating activities. The company believes that this measurement is useful to measure a company’s ability to service debt and to meet other payment obligations or as a valuation measurement. |
| |
| 2 | | Cash flow prior to working capital changes is defined as the cash provided by operating activities, exclusive of changes in non-cash operating working capital. PotashCorp uses cash flow prior to working capital changes as a supplemental financial measure in its evaluation of liquidity. Management believes that adjusting principally for the swings in non-cash working capital items due to seasonality assists management in making long-term liquidity assessments. The company also believes that this measurement is useful as a measure of liquidity or as a valuation measurement. |
| |
| 3 | | PotashCorp uses cash flow and cash flow return as supplemental measures to evaluate the performance of the company’s assets in terms of the cash flow they have generated. Calculated on the total cost basis of the company’s assets rather than on the depreciated value, these measures reflect cash returned on the total investment outlay. The company believes these measures are one of the best predictors of shareholder value. As such, management believes this information to be useful to investors. |
| |
| 4 | | Management believes that net debt and net-debt-to-capital ratio are useful to investors because they are helpful in determining the company’s leverage. It also believes that, since the company has the ability to and may elect to use a portion of cash and cash equivalents to retire debt or to incur additional expenditures without increasing debt, it is appropriate to apply cash and cash equivalents to debt in calculating net debt and net debt to capital. PotashCorp believes that this measurement is useful as a financial leverage measure. |
| |
| 5 | | Management includes net sales in its segment disclosures in the consolidated financial statements pursuant to Canadian GAAP, which requires segmentation based upon the company’s internal organization and reporting of revenue and profit measures derived from internal accounting methods. Net sales (and related per-tonne amounts and other ratios) are primary revenue measures it uses and reviews in making decisions about operating matters on a business segment basis. These decisions include assessments about potash, nitrogen and phosphate performance and the resources to be allocated to these segments. It also uses net sales (and related per-tonne amounts and other ratios) for business segment planning and monthly forecasting. Net sales are calculated as sales revenues less freight, transportation and distribution expenses. Net sales presented on a consolidated basis rather than by business segment is considered a non-GAAP financial measure. |
| | | |
34
| | BOARD AND SENIOR MANAGEMENT/ POTASHCORP 2006 SUMMARY ANNUAL REPORT |
POTASHCORP BOARD OF DIRECTORS
COMMITTEES
| 1 | | Executive |
| |
| 2 | | Corporate governance and nominating |
| |
| 3 | | Compensation |
| |
| 4 | | Safety, health and environment |
| |
| 5 | | Audit |
Learn more about the PotashCorp Board of Directors
in our online Annual Report, Keyword »
POTASHCORP 2006 SUMMARY ANNUAL REPORT /BOARD AND SENIOR MANAGEMENT 35
CORPORATE OFFICERS AND KEY MANAGEMENT
SHAREHOLDER INFORMATION
█ ANNUAL MEETING
The Annual Shareholders Meeting will be held at 10:30 a.m. Central Standard Time May 3, 2007 in the Adam Ballroom, Delta Bessborough Hotel, 601 Spadina Crescent East, Saskatoon, Saskatchewan.
It will be carried live on the company’s website, www.potashcorp.com.
Holders of common shares as of March 12, 2007 are entitled to vote at the meeting and are encouraged to participate.
█ DIVIDENDS
Dividend amounts paid to shareholders resident in Canada are adjusted by the exchange rate applicable on the dividend record date. Dividends are normally paid in February, May, August and November, with record dates normally set approximately three weeks earlier. Future cash dividends will be paid out of, and are conditioned upon, the company’s available earnings. Shareholders who wish to have their dividends deposited directly to their bank accounts should contact the transfer agent and registrar, CIBC Mellon Trust Company.
Registered shareholders can have dividends reinvested in newly issued common shares of PotashCorp at prevailing market rates.
█ INFORMATION FOR SHAREHOLDERS OUTSIDE CANADA
Dividends paid to residents in countries with which Canada has bilateral tax treaties are generally subject to the 15-percent Canadian non-resident withholding tax. There is no Canadian tax on gains from the sale of shares (assuming ownership of less than 25 percent) or debt instruments of the company owned by non-residents not carrying on business in Canada. No government in Canada levies estate taxes or succession duties.
█ INVESTOR INQUIRIES
Denita Stann, Director, Investor Relations
Canada: (800) 667-0403 US: (800) 667-3930
e-mail: ir@potashcorp.com
Visit us at www.potashcorp.com
█ COMMON SHARE TRANSFER AGENT
| | | | | |
| In Canada: | | In the United States: |
| CIBC Mellon Trust Company | | Mellon Investor Services, L.L.C. |
| P.O. Box 7010 | | 480 Washington Boulevard |
| Adelaide Street Postal Station | | Jersey City NJ 07310-1900 |
| Toronto ON M5C 2W9 | | |
| Phone: | | (416) 643-5500
(800) 387-0825 | | Phone: (800) 526-0801 |
| Website: www.cibcmellon.com | | Website: www.mellon.com |
Shareholders with address changes or inquiries concerning their Potash Corporation of Saskatchewan Inc. stock are invited to contact:
CIBC Mellon Trust (address above), or
Joseph A. Podwika, Corporate Secretary
PotashCorp
Suite 500, 122 – 1st Avenue South
Saskatoon SK S7K 7G3
█ OWNERSHIP
On February 20, 2007, there were 1,762 holders of record of the company’s common shares.
█ SHARES LISTED
Toronto Stock Exchange
New York Stock Exchange
Ticker Symbol: POT
█ FINANCIAL REPORTS AND NEWS RELEASES
Annual reports, interim reports and news releases are available on our website or by contacting the Investor Relations department.
█ NYSE CORPORATE GOVERNANCE
Disclosure contemplated by 303A.11 of the NYSE’s listed company manual is available on our website at www.potashcorp.com. The company has filed annual written affirmations/certifications pursuant to the NYSE listing company manual. The certifications required by Section 302 of the Sarbanes-Oxley Act of 2002 are filed as exhibits to our 2006 Annual Report on Form 10-K.
| | | |
| █ CORPORATE OFFICES |
Canada: | | US: |
| Suite 500 | | Suite 400 |
122 – 1st Avenue South
Saskatoon SK S7K 7G3
Phone: (306) 933-8500 | | 1101 Skokie Boulevard
Northbrook IL 60062
Phone: (847) 849-4200 |
POTASHCORP 2006 SUMMARY ANNUAL REPORT /SHAREHOLDER INFORMATION 37
SHAREHOLDER INFORMATION
█COMMON SHARE PRICES AND VOLUMES
This table sets forth the high and low prices, as well as the volumes, for the company’s common shares as traded on the Toronto Stock Exchange and the New York Stock Exchange (composite transactions) on a quarterly basis. Potash Corporation of Saskatchewan Inc. is on the S&P/TSX 60 and the S&P/TSX Composite indices.
(Note: Data are adjusted for a stock split effective August 9, 2004 on the TSX and August 16, 2004 on the NYSE.)
| | | | | | | | | | | | | | | | | | | | | | | | | |
| | | Toronto Stock Exchange1 | | | | New York Stock Exchange | |
| | | | High | | | | Low | | | | Volume | | | | High | | | | Low | | | | Volume | |
2006 | | | | | | | | | | | | | | | | | | | | | | | | |
| | | | |
| First Quarter | | | 113.88 | | | | 91.50 | | | | 21,008,219 | | | | 99.24 | | | | 78.15 | | | | 55,217,500 | |
| | | | |
| Second Quarter | | | 117.00 | | | | 86.79 | | | | 18,686,817 | | | | 106.40 | | | | 78.84 | | | | 54,130,300 | |
| | | | |
| Third Quarter | | | 118.46 | | | | 92.01 | | | | 14,141,380 | | | | 106.48 | | | | 82.03 | | | | 41,196,600 | |
| | | | |
| Fourth Quarter | | | 170.89 | | | | 113.25 | | | | 19,487,859 | | | | 147.19 | | | | 101.50 | | | | 61,695,700 | |
| | | | |
Year 2006 | | | 170.89 | | | | 86.79 | | | | 73,324,275 | | | | 147.19 | | | | 78.15 | | | | 212,240,100 | |
| | | | | | | | | | | | | | | | | | | | | | | | | |
2005 | | | | | | | | | | | | | | | | | | | | | | | | |
| | | | |
| First Quarter | | | 113.92 | | | | 89.11 | | | | 18,297,446 | | | | 92.00 | | | | 72.91 | | | | 32,012,000 | |
| | | | |
| Second Quarter | | | 132.11 | | | | 98.39 | | | | 13,432,009 | | | | 106.67 | | | | 79.27 | | | | 29,833,400 | |
| | | | |
| Third Quarter | | | 137.99 | | | | 108.23 | | | | 14,451,392 | | | | 115.15 | | | | 92.85 | | | | 24,526,600 | |
| | | | |
| Fourth Quarter | | | 108.89 | | | | 84.76 | | | | 22,180,812 | | | | 93.32 | | | | 72.77 | | | | 46,103,900 | |
| | | | |
Year 2005 | | | 137.99 | | | | 84.76 | | | | 68,361,659 | | | | 115.15 | | | | 72.77 | | | | 132,475,900 | |
| | | | | | | | | | | | | | | | | | | | | | | | | |
2004 | | | | | | | | | | | | | | | | | | | | | | | | |
| | | | |
| First Quarter | | | 57.93 | | | | 50.96 | | | | 12,670,142 | | | | 44.75 | | | | 38.13 | | | | 15,905,400 | |
| | | | |
| Second Quarter | | | 64.87 | | | | 54.58 | | | | 12,009,046 | | | | 48.50 | | | | 39.46 | | | | 23,604,000 | |
| | | | |
| Third Quarter | | | 81.00 | | | | 60.75 | | | | 13,237,872 | | | | 64.25 | | | | 45.78 | | | | 30,366,000 | |
| | | | |
| Fourth Quarter | | | 104.06 | | | | 76.05 | | | | 16,211,631 | | | | 84.00 | | | | 60.65 | | | | 29,245,700 | |
| | | | |
Year 2004 | | | 104.06 | | | | 50.96 | | | | 54,128,691 | | | | 84.00 | | | | 38.13 | | | | 99,121,100 | |
| | 1Trading prices are in Cdn$ | | | Source: Thomson Financial |
Yearly POT Stock Price Since Inception – NYSE Composite
| | |
POT Share Ownership – Geographic Distribution | | 2006 Monthly POT Stock Price – NYSE Composite |
| | | |
38
| | GLOSSARY/ POTASHCORP 2006 SUMMARY ANNUAL REPORT |
| █ | | FORWARD-LOOKING STATEMENTS |
This 2006 Summary Annual Report contains forward-looking statements. These statements can be identified by expressions of belief, expectation or intention, as well as those statements that are not historical fact. These statements are based on certain factors and assumptions as set forth in this Summary Annual Report including expected growth, results of operations, performance and business prospects and opportunities. While the company considers these factors and assumptions to be reasonable based on information currently available, they may prove to be incorrect. A number of factors could cause actual results to differ materially from those in the forward-looking statements, including, but not limited to: fluctuations in supply and demand in fertilizer, sulfur, transportation and petrochemical markets; changes in competitive pressures, including pricing pressures; risks associated with natural gas and other hedging activities; changes in capital markets; changes in currency and exchange rates; unexpected geological or environmental conditions, including water inflow; and government policy changes. Additional risks and uncertainties can be found in our Form 10-K for the fiscal year ended December 31, 2006 under the captions “Forward-Looking Statements” and “Item 1A – Risk Factors” and in our filings with the US Securities and Exchange Commission and the Canadian provincial securities commissions. Forward-looking statements are given only as at the date of this report and the company disclaims any obligation to update or revise the forward-looking statements, whether as a result of new information, future events or otherwise. In the case of guidance, should subsequent events show that the forward-looking statements released herein may be materially off-target, the company will evaluate whether to issue and, if appropriate following such review, issue a news release updating guidance or explaining reasons for the difference.
| █ | | MARKET AND INDUSTRY DATA STATEMENT |
Some of the market and industry data contained in this Summary Annual Report are based on internal surveys, market research, independent industry publications or other publicly available information. Although we believe that the independent sources used by us are reliable, we have not independently verified and cannot guarantee the accuracy or completeness of this information. Similarly, we believe our internal research is reliable, but such research has not been verified by any independent sources.
Information in the preparation of this Summary Annual Report is based on statistical data and other material available at February 20, 2007.
| █ | | SOURCES, ABBREVIATIONS, TERMS AND MEASURES |
| | | | | |
| ABBREVIATED COMPANY NAMES AND SOURCES* |
| |
| Agrium | | Agrium Inc. (TSX and NYSE: AGU), Canada |
| APC | | Arab Potash Company Ltd. (Amman: ARPT), Jordan |
| Belaruskali | | PA Belaruskali, Belarus |
| Canpotex | | Canpotex Limited, Canada |
| CVRD | | Companhia Vale do Rio Doce, Brazil |
| Doane | | Doane Agricultural Services, USA |
| Fergus/Peters | | Fergus/Peters Group Inc., USA |
| Fertecon | | Fertecon Limited and Fertecon Research Centre Limited, UK |
| Israel Chemicals (ICL) | | Israel Chemicals Ltd. (Tel Aviv: ICL), Israel |
| IFA | | International Fertilizer Industry Association, France |
| IMF | | International Monetary Fund, USA |
| Intrepid | | Intrepid Potash, USA |
| IPNI | | International Plant Nutrition Institute, USA |
| Kali & Salz (K+S) | | Kali und Salz GmbH (Xetra: SDF), Germany |
| Mosaic | | The Mosaic Company (NYSE: MOS), USA |
| NYMEX | | New York Mercantile Exchange, USA |
| PIRA | | PIRA Energy Group, USA |
| Silvinit | | JSC Silvinit, Russia |
| Sinofert | | Sinofert Holdings Limited (HKSE, 0297.HK), China |
| SQM | | Sociedad Quimica y Minera de Chile S.A. (Santiago Bolsa de Comercio Exchange, NYSE: SQM), Chile |
| Thomson Financial | | Thomson Financial Inc., USA |
| TSX | | Toronto Stock Exchange, Canada |
| Uralkali | | JSC Uralkali, Russia |
| USDA | | US Department of Agriculture, USA |
| Yara | | Yara International (Formerly Hydro Agri and Hydro Gas and Chemicals) (Oslo: YAR), Norway |
| | | | | |
| GLOSSARY OF TERMS |
| |
| 2006E | | 2006 Estimated |
| 2007F | | 2007 Forecast |
| Canpotex | | An export company owned by all Saskatchewan producers of potash (PotashCorp, Mosaic and Agrium) |
| | | | | |
| GLOSSARY OF TERMS |
| |
| Consumption vs Demand | | Product applied vs product purchased |
| Greenfield | | New operation built on undeveloped site |
| North America | | The North American market includes Canada and the United States |
| Offshore | | Offshore markets include all markets except Canada and the United States |
| PotashCorp | | Potash Corporation of Saskatchewan Inc. (PCS) and its direct or indirect subsidiaries, individually or in any combination, as applicable |
| | | | | |
| SCIENTIFIC TERMS |
| |
| Nitrogen | | NH3 | | ammonia (anhydrous), 82.2% N |
| | | HNO3 | | nitric acid, 22% N (liquid) |
| | | UAN | | nitrogen solutions, 28-32% N (liquid) |
| Phosphate | | P2O5 | | phosphoric acid (liquid) |
| | | MGA | | merchant grade acid, 54% P2O5(liquid) |
| | | DAP | | diammonium phosphate, 46% P2O5(solid) |
| | | MAP | | monoammonium phosphate, 52% P2O5(solid) |
| | | SPA | | superphosphoric acid, 70% P2O5(liquid) |
| | | MCP | | monocalcium phosphate, 48.1% P2O5(solid) |
| | | DCP | | dicalcium phosphate, 42.4% P2O5(solid) |
| | | DFP | | defluorinated phosphate, 41.2% P2O5(solid) |
| Potash | | KCl | | potassium chloride, 60-63.2% (solid) |
| | | | | |
| FERTILIZER MEASURES |
| |
| P2O5 tonne | | Measures the phosphorus content of fertilizers having different chemical analyses |
| N tonne | | Measures the nitrogen content of fertilizers having different chemical analyses |
| Product tonne | | Standard measure of the weights of all types of potash, phosphate and nitrogen products |
| |
* Where PotashCorp is listed as a source in conjunction with external sources, we have supplemented the external data with internal analysis.
POTASHCORP 2006 SUMMARY ANNUAL REPORT /POTASHCORP AT A GLANCE
WE HAVE A STRONG FOUNDATION...
With consistent strong performance and three consecutive years of record earnings, PotashCorp has built a strong and diverse enterprise with increasing value.
Our market capitalization has grown from $9 billion to $15 billion in two years and total assets now exceed $6 billion.
...FOR BUILDING FUTURE PERFORMANCE
From this foundation, we plan for even stronger performance as we move forward. For 2007, we are targeting earnings per share in the range of $6.25-$7.25 per share, with gross margin approximating $1.3 billion.
Source: PotashCorp
| * | | See reconciliation and description of certain non-GAAP measures on Page 33 |