Exhibit 99(b)
SOLUTIONS FOR A GROWING WORLD
2012 Summary Integrated Report

TABLE OF CONTENTS
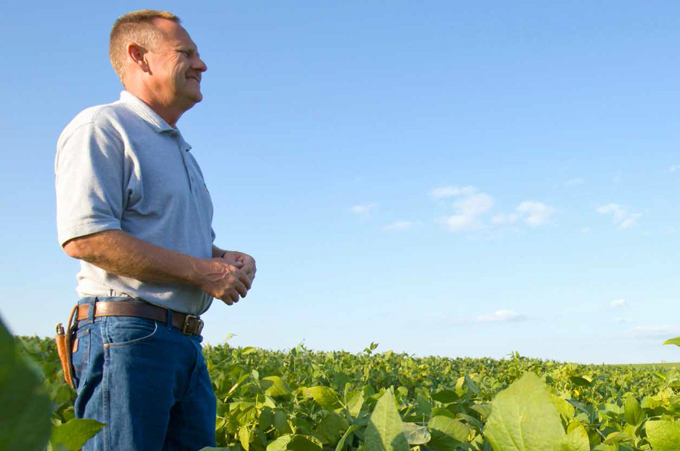
In a world that needs to feed a growing population with improving diets, fertilizer plays a significant role in the global food solution. With little additional land available for crops, these essential nutrients are a critical tool for improving yields to help keep pace with the demand on food production today and in the years ahead.
This situation provides an opportunity for companies that can be part of the solution – and PotashCorp has a unique ability to respond to the growing need for crop nutrients.
We believe this potential offers an exciting future for our stakeholders – investors who can benefit from increasing returns, customers who can grow their businesses with confidence that their supplier can meet their needs,
employees, communities and suppliers who can thrive alongside our success.
As we strive to create long-lasting value, we understand that it can only be done by ensuring that our strategies, risk management and performance work together in an integrated way that goes beyond traditional measures. That is what you will find in this report.

Financial data in this report are stated in US dollars unless otherwise noted.
FINDING SOLUTIONS THAT MATTER
HELPING TO GROW FOOD FOR A CHANGING WORLD
Dear Shareholders,
The success of any business can be measured by its impact on those it touches – the way it benefits the people responsible for its success, serves the needs of customers, improves lives in its communities – and by the future it leaves in the hands of the next generation.
Understanding how to preserve and grow that impact – to make the most of opportunity – is a matter of having both a vision and a plan to carry it out.
Our vision is simple – to be part of the world’s food solution. As the largest global producer of essential crop nutrients, we have a tremendous opportunity to help mankind meet one of its greatest challenges. It is a privilege that carries with it both great promise and great responsibility.
Experience has shown us that the best way to fulfill our mission is to create long-term value for all of our stakeholders. We build this value by listening, by understanding what impacts our business and by devising strategies and setting goals that reflect the integrated perspective with which we view our world, our industry and our company. Our value-building process – and our progress as we implement it – is detailed in these pages.
Guided by our Core Values and led by our dedicated people, we work every day to seize the opportunities before us as we strive to find solutions for the nutritional requirements of a growing world.

William J. Doyle
President and CEO
February 19, 2013

VALUE REPORTING
ENSURING OUR SOLUTIONS – AND REPORTING – ARE DELIVERING VALUE
Our emphasis is on identifying the factors that matter most in long-term value creation and using them to manage our business and shape our reporting.
| | |
While this has always been at the heart of everything we do, this year we took another step to better define and report on the factors most important to our long-term success – not just from our perspective but also from the viewpoint of our stakeholders. The idea is rather simple. Through ourPriority Matrixtool, we have worked to capture the relative importance of the factors most likely to impact the long-term value of our company. It is a process that we believe can help ensure our efforts are focused on driving value throughout the organization – from the goals we pursue to the performance targets we set – and a tool that informs our reporting. Developing a priority matrix involved interviews and surveys within PotashCorp as well as input from customers, investors, community leaders and the public. Then we considered broader societal views, market factors and recognized best practices. The closer a factor is to the top right corner of our matrix, the more important it is to PotashCorp and our stakeholders. This process helps determine what information is included in this Summary Integrated Report, our Annual Integrated Report and our online reporting. While some items may end up lower in our priority matrix, that does not mean they are ignored, but that their potential to impact our value, positively or negatively, is not as significant. The pages that follow outline our approach to integrated reporting, with a discussion of our strategies and their interconnectedness and an examination of how we manage the factors that matter most to our business. | | 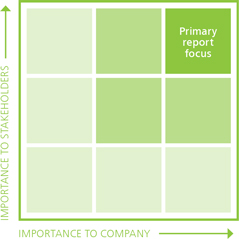 |
Summary Integrated Report
Discusses the most influential factors affecting how we build and sustain value for our company and the people and places impacted by our business
Annual Integrated Report
Examines in greater depth the factors that influence long-term value creation, including our strategies, performance, outlook and the risks inherent to our business
Online Reporting
Enhances our print reports with special features and tools, leveraging a deeper discussion around the sustainability of our business, including performance against Global Reporting Initiative (GRI) measures
POTASHCORP 2012 SUMMARY INTEGRATED REPORT 3
OUR COMPANY AND OPERATIONS
OUR VISION
To play a key role in the global food solution while building long-term value for our stakeholders
WHO WE ARE
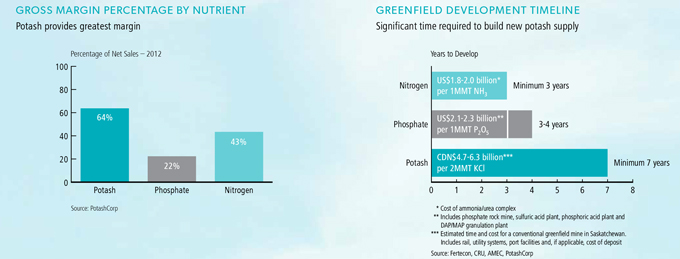
PotashCorp is the world’s largest fertilizer company by capacity, producing the three primary crop nutrients: potash (K), phosphate (P) and nitrogen (N).
As the world’s leading potash producer, we are responsible for approximately 20 percent of global capacity through our Canadian operations.1To enhance our global footprint, we also have investments in other key global potash-related businesses in South America, the Middle East and Asia.
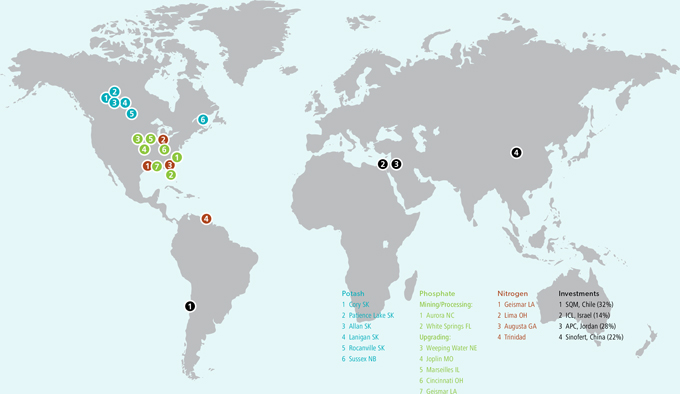
With operations and business interests in seven countries, PotashCorp is an international enterprise and a key player in the growing challenge to feed the world.
OUR OPERATIONS AND COMMUNITIES
4 POTASHCORP 2012 SUMMARY INTEGRATED REPORT
OUR BUSINESS SEGMENTS (2012)
| | | | | | | | |
| | | Global Position1 | | Share of Gross Margin | | Sales Volumes by Product Category | | Sales Volumes by Region |
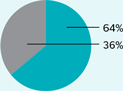
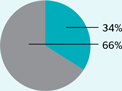
POTASH | | 20% of Global Capacity (#1 in the world) | | 57% | | 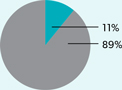
| | 
|
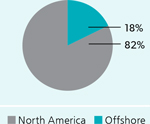
PHOSPHATE | | 5% of Global Capacity (#3 in the world) | | 14% | | 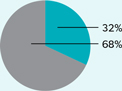
| | 
|
NITROGEN | | 2% of Global Capacity (#3 in the world) | | 29% | | 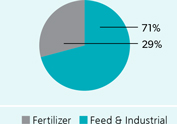
| | 
|
OUR IMPACT (2012) |
| | | Number of Employees2 | | Safety (total site3 severity injury rate4) | | Number of Reportable Environmental Incidents5 | | Community Investment6 ($ millions) |
POTASH | | 2,759 | | 0.94 | | 8 | | 17 |
PHOSPHATE | | 1,792 | | 0.41 | | 5 | | 3 |
NITROGEN | | 788 | | 0.12 | | 6 | | 5 |
| 1 | Based on nameplate capacity at year-end 2012, which may exceed operational capability (estimated annual achievable production level) |
| 2 | Does not include employees not allocated to individual nutrient segments |
| 3 | Total site includes PotashCorp employees, contractors and others on site. |
| 4 | Site severity injury rate is the total of lost-time injuries and modified work injuries for every 200,000 hours worked. |
| 5 | Includes reportable quantity releases, permit excursions and provincial reportable spills |
| 6 | Excludes corporate contributions not allocated to nutrient segments |
POTASHCORP 2012 SUMMARY INTEGRATED REPORT 5
SIX COMPETITIVE STRENGTHS
THAT DRIVE OUR VALUE POTENTIAL
1
INDUSTRY-LEADING POTASH POSITION
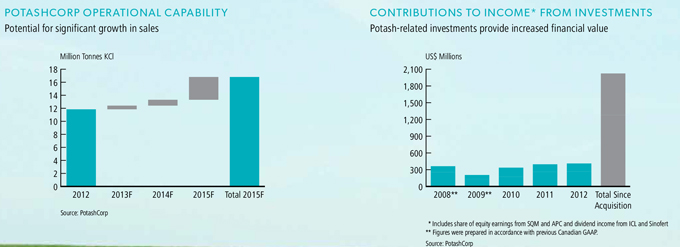
PotashCorp is the world’s largest potash producer by capacity, with unmatched brownfield expansions being completed at lower cost and more quickly than potential greenfield projects. We enhance our potash position with strategic investments in four global potash-focused companies that give us greater exposure to key growth markets and increase our company’s long-term financial value.
How we enhance our advantage:
| • | | Invest in expansions to prepare for anticipated demand growth. |
| • | | Build on our potash position when value-adding opportunities arise. |
2
ACCESS TO LONG-LIVED, HIGH-QUALITY POTASH RESERVES
We have access to decades of high-quality reserves in Canada and our production facilities are among the lowest-cost potash operations in the world, with well-established infrastructure in a politically stable region. As stewards of a unique and valuable resource, we recognize the importance of managing our reserves with a long-term view.
How we enhance our advantage:
| • | | Develop long-term plans with the goal of ensuring that our reserves are mined in a sustainable manner. |
| • | | Manage mining risks such as ground collapses and flooding through the development and use of world-class monitoring tools and mining techniques. |
3
FOCUSED POSITIONS IN PHOSPHATE AND NITROGEN
Access to high-quality, long-lived phosphate rock reserves allows us to vary our product mix to maximize gross margin and reduce volatility. In nitrogen, access to lower-cost natural gas for our US production facilities and proximity of our plants to key markets provide a delivered-cost advantage.
How we enhance our advantage:
| • | | Deploy capital to maintain and expand existing assets, focusing on projects that reduce costs, improve efficiencies and provide quick financial paybacks. |
| • | | Develop long-term relationships with key customers for specialized products. |
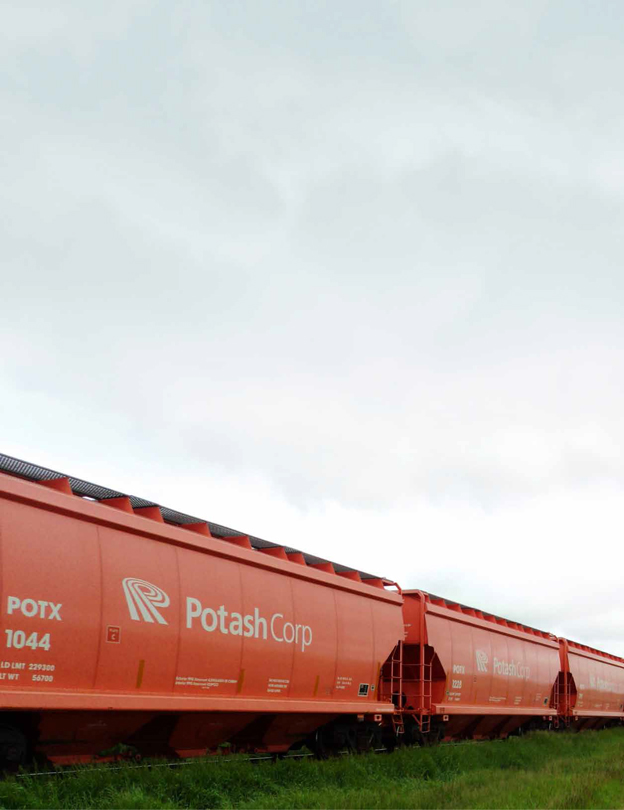
This potash train near Roblin, Manitoba is headed to the US Midwest, where the fertilizer is especially important to corn and soybean crops.
6 POTASHCORP 2012 SUMMARY INTEGRATED REPORT
We develop and enhance the advantages that make us unique in our industry. This enables us to capture opportunities as they arise,better positioning us to deliver long-term solutions that benefit all our stakeholders.
4
STRONG CASH FLOW AND FINANCIAL STRENGTH
Our business model has consistently generated positive cash flow even in periods of fluctuating market demand. As our potash expansion program nears completion, our potential to generate free cash flow rises. This gives us a unique opportunity to enhance shareholder returns by investing in our competitive advantages, increasing dividends or executing share repurchase programs.
How we enhance our advantage:
| • | | Measure potential uses of cash against a high internal required rate of return to ensure only the most promising opportunities are funded. |
| • | | Focus on maintaining an investment-grade debt rating to ensure access to credit in order to operate and grow our business. |
5
EXPERIENCED, ENGAGED MANAGEMENT TEAM AND WORKFORCE
With a long track record of success in conceiving, developing and executing value-enhancing strategies, our leadership team is among the most experienced in the industry. Our workforce is also world-class, with a deep-rooted knowledge in all aspects of our operations that has led to strong performance in efficiency, safety and innovation.
How we enhance our advantage:
| • | | Attract, retain and engage our workforce by providing an environment of growth and opportunity. |
| • | | Focus on succession planning across all key positions. |
| • | | Structure our compensation and benefit programs so they are highly competitive relative to peers. |
6
STRONG SUPPLY CHAIN AND CUSTOMER RELATIONSHIPS
In North America, our experienced sales team and extensive distribution network help us be the supplier of choice to our customers. Offshore, our partnerships with marketing organizations Canpotex and PhosChem and our internal expertise in PCS Sales enable us to reliably meet the growing needs of a global customer base.
How we enhance our advantage:
| • | | Develop relationships with suppliers, and with customers whose unique needs we seek to understand and meet. |
| • | | Invest in our distribution network, focusing on opportunities to optimize our warehousing and distribution capabilities. |

POTASHCORP 2012 SUMMARY INTEGRATED REPORT 7
AN OPPORTUNITY TO GROW
FOOD SOLUTIONS: THE CRITICAL ROLE OF FERTILIZER
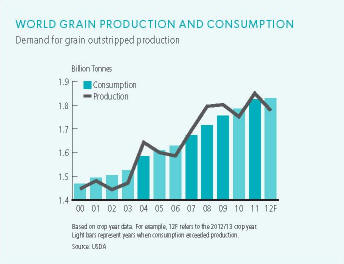
As global population pushes toward 9 billion by 2050 and diets improve in developing countries, the world faces an unprecedented challenge to keep pace with the rapidly rising demand for food.
Fertilizer is responsible for about half of global crop production today*, and we expect it to become even more important in the years ahead. With demand for food already stressing the world’s available farmland, the need to improve crop yields is clear.
This is especially true in developing countries, where yields are considerably lower than those of the developed world. Improving their productivity requires more fertilizer and better balance among the essential nutrients necessary to produce healthy and abundant crops.
The drive to improve crop yields is expected to create opportunity not only for farmers, but also for the companies that can supply nutrients quickly as need arises.
We believe the expanding operational capability of our company – particularly in potash – positions us to play a key role in helping the world’s farmers meet the rising need for food both today and in the years ahead.
| * | Source: Agronomy Journal (January-February 2005), IPNI |
8 POTASHCORP 2012 SUMMARY INTEGRATED REPORT

Soybean crops like this are a large consumer of the potash we ship to the US market.
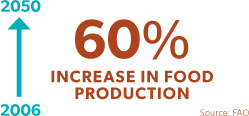
To keep pace with rising food demand, it is estimated that more food must be produced in the next half-century than in the previous 10,000 years.
POTASH: A VITAL NUTRIENT
Commonly mined from underground deposits left behind by ancient evaporated seas, potash is one of the three primary nutrients used to help grow healthy and abundant crops.
Working in synergy with nitrogen and phosphate to improve crop yields, potash is often called the “quality nutrient,” because it enhances the taste, texture and nutritional value of food. Potash also strengthens plant roots, improves water retention and increases a crop’s resistance to pests and diseases.
A Limited Resource, a Global Need
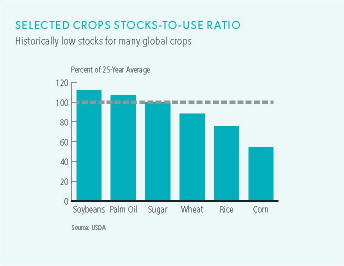
Economically mineable potash deposits are rare and geographically concentrated, and according to the US Geological Survey, Saskatchewan holds almost half of known global reserves. High capital costs and long lead times associated with developing new capacity limit the number of global producers.
Historically Under-Applied in Many Regions
In many growing regions, potash application remains well below scientifically recommended levels, resulting in yields that lag behind those of more developed agricultural areas. With this significant agronomic incentive, along with strong crop economics expected to support farmers’ efforts to improve yields, we believe long-term demand for potash will outpace demand for other crop nutrients.
POTASHCORP 2012 SUMMARY INTEGRATED REPORT 9

AN OPPORTUNITY TO EFFECT CHANGE
FOOD SECURITY: OUR ROLE IN MEETING A GLOBAL CHALLENGE
While the primary purpose of our business is to produce the nutrients that help the world grow more and better food, our role in providing food solutions extends beyond the products we make.
Each year we invest at least 1 percent of our before-tax earnings* in community and philanthropic programs, including food security. Our commitment involves projects such as education, training and provision of resources to help farmers in developing regions grow more food, supporting new research into global food solutions and assisting local food banks.
Driven by the belief that we have a unique opportunity as a key player in food production, we will continue to focus our efforts – and the collective strength of our people and partnerships – to help find sustainable solutions in both the communities where we operate and regions in need elsewhere in the world.
| * | On a five-year historical rolling average |
10 POTASHCORP 2012 SUMMARY INTEGRATED REPORT

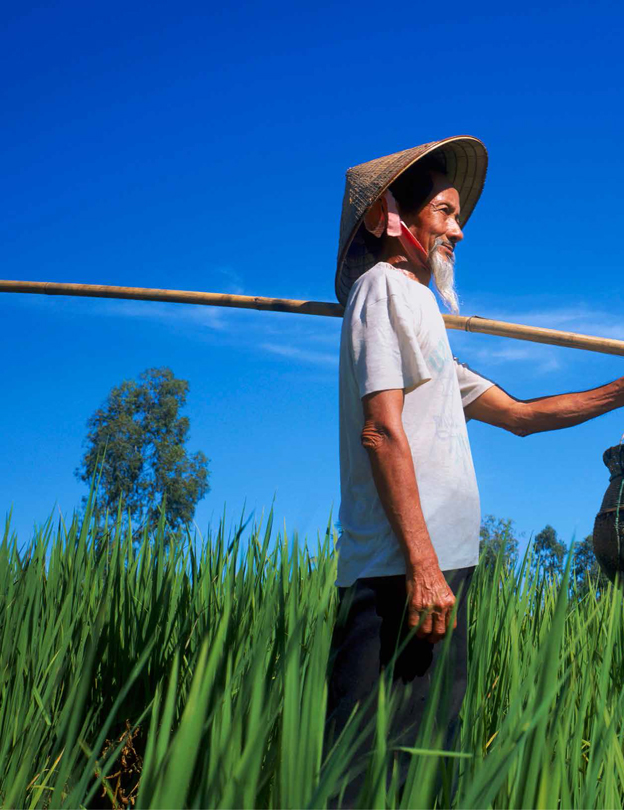
Potash improves taste, color and texture of vegetables like these in a Vietnamese market.
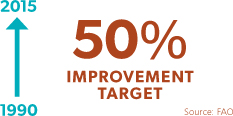
The Food and Agriculture Organization of the United Nations set a Millennium Development Goal: By 2015, reduce by half the proportion of people suffering from hunger around the world.
EXPANDING OUR IMPACT THROUGH PARTNERSHIP AND INVESTMENT
In 2012, PotashCorp committed up to $45 million to partnerships that enhance our support for global food security issues. Key programs include:
The Global Institute for Food Security – Announced in December 2012, the Institute aims to discover, develop and deliver solutions that optimize the global food supply system. By partnering with the University of Saskatchewan and the Government of Saskatchewan, PotashCorp will play a greater role in the technological, economic and policy issues that impact food security worldwide.
Free The Children – Our multi-year partnership adds an Agriculture and Food Security pillar to Free The Children’s successful Adopt a Village development model. This pillar will use PotashCorp’s agricultural expertise to make an immediate, tangible impact on international communities in need. It will also, importantly, educate Canadian youth on global food challenges and provide opportunities for PotashCorp employees, families and communities to engage with this worthwhile organization.
The Trinidad Model Farm – Spearheaded and funded by PotashCorp, this 75-acre demonstration facility provides free training and expert analysis for local farmers, increasing their productivity and helping to build food security in Trinidad.
POTASHCORP 2012 SUMMARY INTEGRATED REPORT 11
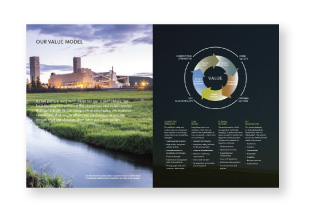
OUR VALUE MODEL
As we pursue long-term value for our stakeholders, we look for ways to enhance the resources and relationships that contribute to our competitive strengths, we monitor conditions that might affect our performance and we ensure that our choices align with our Core Values.
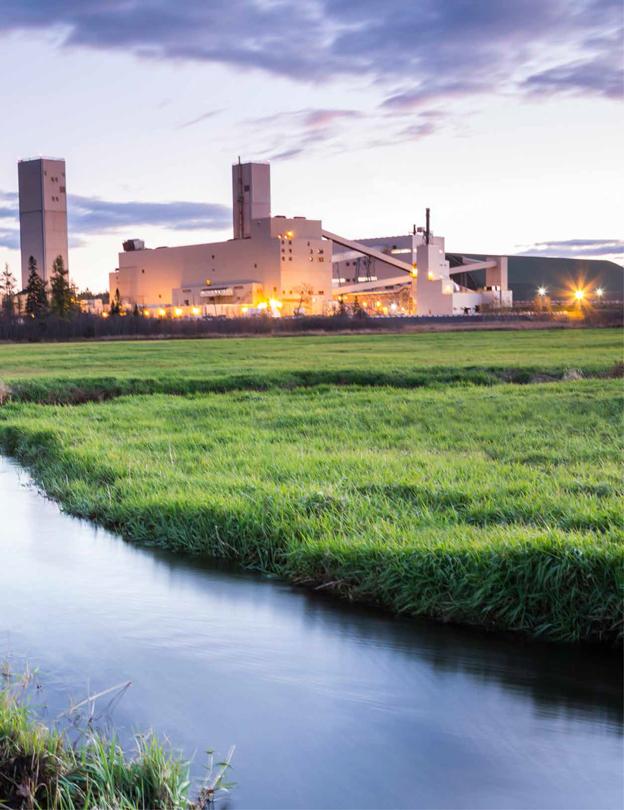
Our New Brunswick potash facility is expected to have 1.8 million tonnes of operational capability when its expansion and ramp-up are complete.

Through our integrated value model, we set, evaluate and refine our goals and priorities to drive improvements that benefit all those impacted by our business.
POTASHCORP 2012 SUMMARY INTEGRATED REPORT 13

FINANCIAL HEALTH
GOAL
Create superior long-term shareholder value
Our Strategic Approach
| • | | Devise and execute strategies that prioritize future earnings growth and reduce volatility across all business segments |
| • | | Strategically use capital to enhance shareholder returns through dividends, share repurchases and building competitive advantages especially in potash |
| • | | Develop and implement governance practices that mitigate risk, maximize management performance and ensure we operate with integrity and transparency |
What We Measure
| 22 | Total shareholder return |
| 22 | Governance practice rankings |
SUPPLIER OF CHOICE
GOAL
Be the supplier of choice to the markets we serve
Our Strategic Approach
| • | | Build our potash operational capability to meet expected growth in demand |
| • | | Invest in our transportation and distribution system to efficiently meet our customers’ needs |
| • | | Establish standards for customer service and product quality that set us apart from our competitors |
What We Measure
| 26 | Product quality and service ranking |
| 26 | Number of quality-related customer complaints |

COMMUNITY ENGAGEMENT
GOAL
Build strong relationships with and improve the socioeconomic well-being of our communities
Our Strategic Approach
| • | | Contribute to economic growth by creating direct and indirect jobs, purchasing locally, attracting investment and paying taxes |
| • | | Invest in organizations and projects that bring sustainable value in the communities where we operate, through corporate and site contributions and employee volunteerism |
| • | | Participate in outreach projects and partnerships to address global food security and share information about best farming practices, environmental matters and safety |
What We Measure
| 28 | Community leader perception scores |
| 28 | Employee matching gift donations and participation |

ENGAGED EMPLOYEES
GOAL
Attract and retain talented, motivated and productive employees who are committed to our long-term goals
Our Strategic Approach
| • | | Offer competitive compensation and provide opportunities for employee development and advancement |
| • | | Provide equal, merit-based opportunity in hiring, promotions, wages, benefits, and terms and conditions of employment |
| • | | Communicate our goals and expectations clearly, particularly in matters regarding ethics and workplace behavior |
What We Measure
| 30 | Employee engagement cores |
| 30 | Senior staff internal promotion levels |
| 30 | External employment offer acceptance rate |
NO HARM TO PEOPLE OR ENVIRONMENT
GOAL
Achieve no harm to people and no damage to the environment
Our Strategic Approach
| • | | Use peer-to-peer behavioral-based process to improve safety and environmental performance |
| • | | Meet or exceed all federal, state, provincial and local safety and environmental requirements |
| • | | Use our best practices program to pilot and refine innovative processes that improve safety and efficiency and minimize water, waste and emissions |
| • | | Actively preserve habitat and promote natural biodiversity in areas where we operate |
What We Measure
| 32 | Site injury rates and life-altering injuries |
| 32 | Greenhouse gas emissions |
| 32 | Reportable environmental incidents |
| 32 | Water usage per product tonne |
POTASHCORP 2012 SUMMARY INTEGRATED REPORT 16
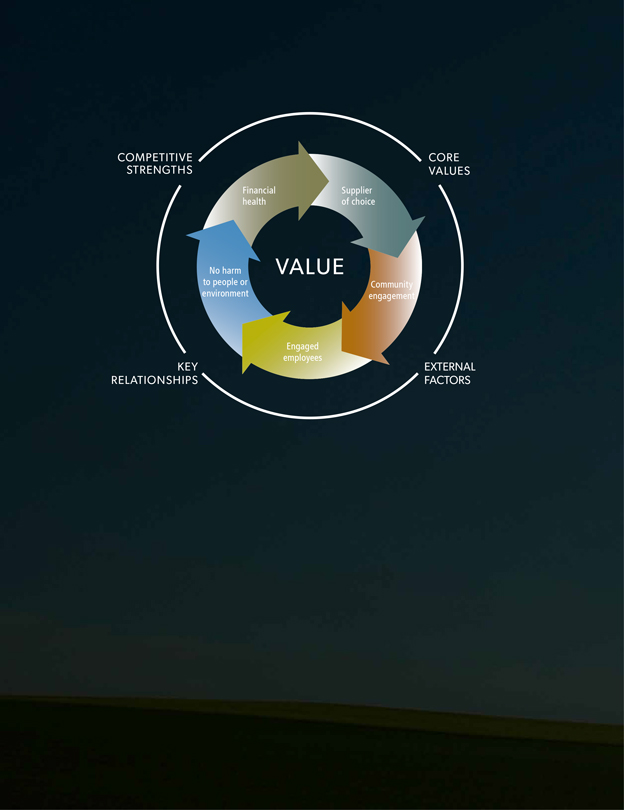
COMPETITIVE STRENGTHS
Our ability to create and sustain value on a long-term basis requires us to manage and enhance our competitive strengths.
| • | | Leading potash position |
| • | | High-quality, long-lived potash reserves |
| • | | Focused positions in phosphate and nitrogen |
| • | | Experienced management team and workforce |
| • | | Strong supply chain and customer relationships |
CORE VALUES
Everything we do as a company – from how we interact with stakeholders to how we operate – stems from our Core Values.
| • | | Emphasize safety and care for the environment |
| • | | Listen to all stakeholders |
| • | | Strive for continuing improvement |
| • | | Be accessible, accountable and transparent |
EXTERNAL FACTORS
The environment in which we operate is continually changing. To protect and build value, we need to monitor and respond to external factors that have the potential to impact our business.
| • | | Supply/demand fundamentals |
| • | | Tax environment and government policies |
KEY RELATIONSHIPS
Our success depends on mutually beneficial relationships with our stakeholders. We need to ensure we understand their needs and concerns.
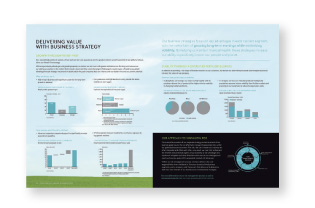
DELIVERING VALUE WITH BUSINESS STRATEGY
GROWTH THROUGH POTASH FIRST
Our unparalleled position in potash, where we have low-cost operations and the greatest volume growth potential of any global producer, drives our Potash First strategy.
With unique industry advantages and growth prospects, we believe we can invest with greater confidence over the long term because we can add to our position in this nutrient faster and at a lower cost than conventional greenfield projects would require. We add to our potash advantage through strategic investments in global potash-focused companies that can enhance both our bottom line and our growth potential.
Why we focus on it:
| • | | High-margin business with significant potential for long-term growth in demand |
| • | | Few producers and high barriers to entry provide for better visibility on new supply |
How we are positioned to deliver:
| • | | Advanced expansion program designed to significantly increase operational capability |
| • | | Offshore potash-focused investments to enhance exposure to key growth markets |
18 POTASHCORP 2012 SUMMARY INTEGRATED REPORT
Our business strategies focus on key advantages in each nutrient segment, with the overall aim ofgrowing long-term earnings while minimizing volatility. By helping us maintain financial health, these strategies increase our ability to positively impact our people and planet.
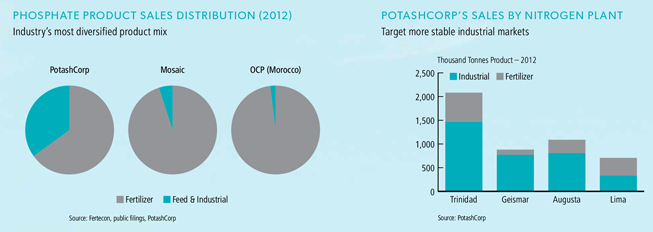
STABILITY THROUGH A DIVERSIFIED FERTILIZER BUSINESS
In addition to providing a full range of fertilizer nutrients to our customers, we believe our diversified phosphate and nitrogen businesses enhance the value of our company.
How we are positioned to deliver:
| • | | In phosphate, we leverage our access to high-quality rock to produce a diverse line of products that helps minimize volatility in changing market conditions. |
| • | | In nitrogen, we focus on industrial products that typically provide less seasonal volume volatility than fertilizer markets and proximity to our customers to reduce transportation costs. |
| | |
OUR APPROACH TO MANAGING RISK | | 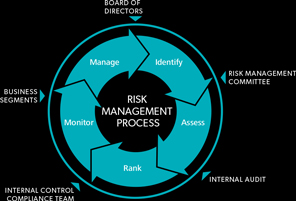
|
The successful execution of our corporate strategy and achievement of our business goals require that we effectively manage the associated risks within our global business environment. The risks that can threaten our business are often integrated and affect each other. As a result, we must fully understand the inherent risks within all aspects of our business so we can design and implement mitigation activities that allow us to execute our strategies and meet our business goals within acceptable residual risk tolerances. Within our risk management process, we have defined roles and responsibilities from the Board of Directors to each of the business segments, and a company-wide framework that allows us to determine best how risks inherent in our business are monitored and managed. For more information on our risk management process as well as discussion of specific risks, visit www.potashcorp2012AR.com/risks | |
PERFORMANCE
HIGHLIGHTS
| | | | | | | | | | | | | | | | | | | | |
| | | 2012 | | | 2011 | | | 2010 | | | 2009 | | | 2008 | |
FINANCIAL RESULTS 1 | | | | | | | | | | | | | | | | | | | | |
| (in millions of US dollars except per-share amounts) | | | | | | | | | | | | | | | |
Sales | | | 7,927 | | | | 8,715 | | | | 6,539 | | | | 3,977 | | | | 9,447 | |
Gross margin | | | 3,410 | | | | 4,286 | | | | 2,690 | | | | 1,015 | | | | 4,861 | |
Net income | | | 2,079 | | | | 3,081 | | | | 1,775 | | | | 981 | | | | 3,466 | |
Net income per share – diluted | | | 2.37 | | | | 3.51 | | | | 1.95 | | | | 1.08 | | | | 3.64 | |
Cash provided by operating activities | | | 3,225 | | | | 3,485 | | | | 3,131 | | | | 924 | | | | 3,013 | |
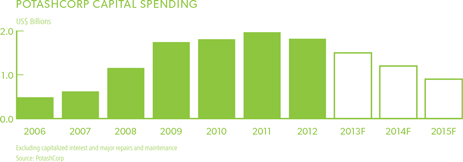
Cash additions to property, plant and equipment | | | 2,133 | | | | 2,176 | | | | 2,079 | | | | 1,764 | | | | 1,198 | |
| | | | | |
NON-FINANCIAL RESULTS | | | | | | | | | | | | | | | | | | | | |
Customers | | | | | | | | | | | | | | | | | | | | |
Average customer survey score 2 | | | 92% | | | | 90% | | | | 90% | | | | 89% | | | | 91% | |
Community | | | | | | | | | | | | | | | | | | | | |
Average community survey score (out of five) 3 | | | 4.5 | | | | 4.4 | | | | 4.2 | | | | 4.1 | | | | 4.0 | |
Employees | | | | | | | | | | | | | | | | | | | | |
Average employee engagement score 4 | | | 79% | | | | 73% | | | | 73% | | | | 76% | | | | 79% | |
Safety | | | | | | | | | | | | | | | | | | | | |
Total site 5severity injury rate 6 | | | 0.55 | | | | 0.54 | | | | 0.38 | | | | 0.74 | | | | 0.97 | |
Environment | | | | | | | | | | | | | | | | | | | | |
Environmental incidents 7 | | | 19 | | | | 14 | | | | 20 | | | | 22 | | | | 19 | |
| 1 | As we adopted International Financial Reporting Standards, as issued by the International Accounting Standards Board (IFRS), with effect from January 1, 2010, our 2008 and 2009 information is presented on a previous Canadian generally accepted accounting principles (GAAP) basis. Accordingly, information for those years may not be comparable to 2010, 2011 and 2012. |
| 2 | The annual customer satisfaction survey is conducted online by an independent third party and includes a select group of top customers from each sales segment and region. |
| 3 | The PotashCorp Survey of Community Opinion is conducted annually by an independent third party in the communities where we have significant operations; each community is generally surveyed every three years. Score is rated on a scale of 1 (low) to 5 (high). |
| 4 | A confidential external survey is generally administered to every employee every second year. |
| 5 | Total site includes PotashCorp employees, contractors and others on site. |
| 6 | Total of lost-time injuries and modified work injuries for every 200,000 hours worked |
| 7 | Includes reportable quantity releases, permit excursions and provincial reportable spills |
20 POTASHCORP 2012 SUMMARY INTEGRATED REPORT
SEGMENT HIGHLIGHTS
Potash
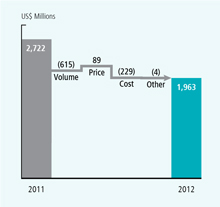
Reduced global demand – the result of inventory destocking and weaker sales to India – weighed on world potash markets in 2012. This resulted in lower sales volumes and cost variances for our potash segment. However, despite weaker performance than in 2011, our potash results were the third highest on record.
$1,963
MILLION
2012 Gross Margin
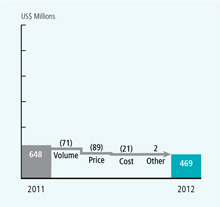
Phosphate
Despite stronger sales volumes in North America, temporary supply challenges and reduced offshore demand lowered our 2012 total phosphate sales volumes. This decline – along with slightly lower realized prices and higher per-tonne cost of goods sold – reduced gross margin compared to 2011.
$469
MILLION
2012 Gross Margin
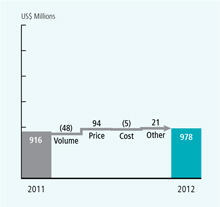
Nitrogen
Strong industrial and agricultural demand, plus tight global supplies, supported a robust nitrogen market throughout 2012. Despite slightly lower sales volumes, higher realized prices – most significantly in ammonia – pushed gross margin to a company record. Lower natural gas costs at our US facilities resulted in a decline in our overall cost of goods sold.
$978
MILLION
2012 Gross Margin
POTASHCORP 2012 SUMMARY INTEGRATED REPORT 21
PERFORMANCE
GOAL
CREATE SUPERIOR LONG-TERM
SHAREHOLDER VALUE
WHY THIS GOAL MATTERS
Strong financial performance enables us to generate superior returns for our shareholders and gives us access to capital to grow our business. Good financial health increases our ability to make a positive impact on our stakeholders.
KEY 2012 DEVELOPMENTS
We took further steps to better position the company to generate superior long-term shareholder return by:
| • | | Advancing our potash expansions – We have now completed more than 80 percent of anticipated CDN $8.3 billion spending on our multi-year potash expansion program. Construction continues at New Brunswick and Rocanville, where projects are well advanced and on schedule. |
| • | | Maximizing our Canpotex allocation – At the end of 2012, our long-term tolling agreement with Mosaic at Esterhazy ended, reducing our 2013 Canpotex sales entitlement. We expect this temporary loss to be offset by successful completion of our Canpotex allocation runs at our Cory, Allan and Rocanville facilities through 2016. We believe we will be able to respond to rising demand, and expect to benefit by replacing higher-cost Esterhazy tonnes with product from our lower-cost mines. |
| • | | Implementing phosphate cost improvements – We took steps to increase the global competitiveness of our phosphate business, implementing efficiencies and process initiatives to improve productivity and reduce controllable costs. |
| • | | Expanding nitrogen capabilities – We were able to take advantage of our lower-cost US natural gas position by completing an ammonia capacity expansion project at Augusta and planning to resume ammonia production at Geismar in early 2013. |
| • | | Increasing dividends – We increased our quarterly dividend twice in 2012, raising it by 200 percent from the beginning of the year, and declared a further increase of 33 percent in early 2013. |
| | | | | | | | | | | | | | | | | | | | | | | | |
| | | Target
Achieved | | | 2012 | | | 2011 | | | 2010 | | | 2009 | | | 2008 | |
Performance | | | | | | | | | | | | | | | | | | | | | | | | |
Total shareholder return | | |  | | | | (0.1 | )% | | | (19.5 | )% | | | 43.1 | % | | | 48.7 | % | | | (48.9 | )% |
Cash flow return* | | | | | | | 19.2 | % | | | 25.7 | % | | | 18.8 | % | | | 13.5 | % | | | 43.2 | % |
Top quartile corporate governance ranking | | |  | | | | | | | | | | | | | | | | | | | | | |
Potash expansion program execution | | | | | | | —————————— on schedule —————————— | |
| | | | |
* See reconciliation and description of certain non-IFRS measures on Page 94 of the 2012 Annual Integrated Report. | |  Achieved Not achieved Achieved Not achieved |
For more information on our specific targets and performance discussion
Visit our online annual report at www.potashcorp2012AR.com/goal1
22 POTASHCORP 2012 SUMMARY INTEGRATED REPORT
Mill Operations Technician Clinton Key near the service headframe being converted to a second production shaft as part of the almost CDN $3 billion expansion that will make Rocanville PotashCorp’s largest potash mine
We believe our assets, strategies and planning have positioned us well to deliver on our long-term financial goal: to generate superior value for our shareholders. Our business model has consistently produced positive cash flow – in 2012, despite lower year-over-year potash sales volumes, we achieved our second-highest cash flow from operating activities. We expect to improve our ability to deliver in the coming years as we utilize more of our potash operational capability to meet increased demand.
As we complete our potash expansions and reduce our capital expenditures, we believe we will be in a unique
position in our industry. While many of our competitors must invest to grow the capacity needed to capitalize on anticipated rising potash demand, we expect to have the operational capability in place to give us greater potential to generate significant free cash flow.
We will continue to deploy cash in ways that we believe achieve the best return for our investors, such as enhancing dividends, repurchasing shares and growing our potash business as value-adding opportunities arise. Through this constant focus, we will build on a record of success.
740%
INCREASE*
in quarterly dividend since beginning of 2011
* As at February 19, 2013
PERFORMANCE
FACTORS AFFECTING OUR 2012 FINANCIAL PERFORMANCE
Crop Returns Supportive but Farmers and Dealers Remained Cautious
Although early indicators supported prospects for record crop production in 2012, severe drought in the US and adverse weather in Russia, Ukraine, Australia and other growing regions diminished that potential, further tightening global grain supply.
Tight supply resulted in higher prices for corn, soybeans, wheat and other crops, making agronomics favorable to farmers. However, global economic uncertainty drove fertilizer buyers to maintain a cautious approach as they attempted to minimize inventory.
Potash Market Impacted by Dealer Destocking and Reduced Indian Demand
After a slow start to the year as buyers worked through previously built inventories, key spot markets purchased aggressively to secure potash to meet strong farmer demands – including increased second-half purchases by North American customers and record demand from Brazil through the last nine months of 2012.
Contrasting these markets was limited engagement by contract buyers in China and India. The absence of second-half contract settlements with China resulted in lower annual Canpotex shipments in 2012 compared to 2011. India’s imports continued to be subdued – impacting total Canpotex shipments to this market – as reduced potash subsidies and a weakened rupee led to a sharp increase in retail potash prices and low consumption.
We believe significant destocking occurred at the distributor level in most major markets. We estimate that global inventories were down more than 4 million tonnes from the end of 2011.
Relatively Balanced Phosphate Market due to Lower Exports From China and the US
Restrictive export tax policies in China and constrained US solid fertilizer production due to tight rock supply limited product available for offshore markets and helped offset lower demand from India. In the US, solid phosphate fertilizer demand improved as buyers secured product for fall applications after depleting inventories built early in the year. Although slower offshore deliveries in the fourth quarter led to lower phosphate fertilizer prices compared to early 2011 highs, they remained well above historical levels.
Strong Demand and Supply Issues Supported Nitrogen Markets
North American ammonia markets remained strong for much of the year, supported by gas supply challenges in Trinidad and reduced Iranian supply due to shipping restrictions. US urea prices rose sharply in the first half as buyers responded to limited product availability during a strong spring application season, but fell in the second half when more product became available and seasonal demand declined. Favorable natural gas prices continued to provide North American producers with a delivered-cost advantage to domestic markets over most offshore suppliers, prompting the announcement of several regional expansion and potential greenfield nitrogen projects.
| | |
 | | 
|
|
| 24 POTASHCORP 2012 SUMMARY INTEGRATED REPORT |
2013 BUSINESS OUTLOOK
Agricultural Fundamentals Expected to Support Strong Demand for Fertilizer
After a year marked by challenging conditions in key growing regions, crop production will need to increase substantially to meet demand for grain and oilseeds in 2013/14.
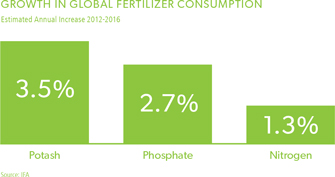
Although increased production could ease pressure on global crop commodities – even while volatility is expected to remain high – we anticipate prices will remain at supportive levels for the medium term. We expect that favorable economics, and agronomic needs, will result in strong global fertilizer consumption.
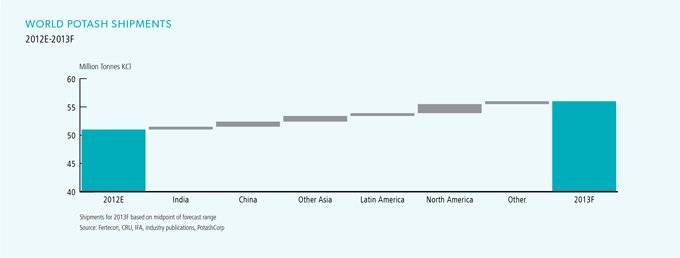
Offshore Market Growth Expected to Drive Potash Demand to Record Levels
We estimate that global potash demand will rebound significantly in 2013, rising to 55-57 million tonnes.
Improved demand is anticipated in China, a forecast supported by the settlement of new contracts by early 2013 – including Canpotex’s largest first-half commitment ever. Demand in Latin America is expected to remain strong as farmers replenish nutrients in their potassium-dependent soils. India had limited inventories on hand as 2013 opened but began settling new contracts with suppliers in early February, and we anticipate that its imports will surpass the low 2012 level but remain well below the record set in 2010. Strong demand and record growth in consumption are anticipated in other countries in Asia, while limited inventory and supportive economics in North America should push shipments slightly above historical trends.
Relatively Balanced Markets Anticipated for Phosphate
With phosphate fertilizer consumption forecast to improve and little new capacity due to come on stream, we anticipate relatively balanced phosphate markets in 2013.
While global demand is likely to rise in most regions, uncertainty about requirements in India – the largest importer of phosphate products – could lead to periods of weakness offshore. In North America, demand is forecast to be robust as farmers ensure nutrient levels in their soils can help them achieve higher yields and profitability.
US Nitrogen Producers Expected to Benefit From Lower Gas Prices
Global nitrogen consumption is forecast to rise by approximately 2 percent in 2013, driven by strong agricultural fundamentals and relatively stable industrial consumption. We anticipate markets will remain relatively tight, but they could ease modestly as production challenges in key exporting regions and delays in new export capacity experienced in 2012 are likely to abate.
For more information
Visit our online annual report at
www.potashcorp2012AR.com/outlook
POTASHCORP 2012 SUMMARY INTEGRATED REPORT 25
PERFORMANCE
GOAL
BE THE SUPPLIER OF CHOICE
TO THE MARKETS WE SERVE
WHY THIS GOAL MATTERS
We are expanding to be better able to serve our growing customer base. By helping improve customers’ opportunities for success, we strengthen our own ability to grow, to remain profitable and to serve the interests of all our stakeholders.
KEY 2012 DEVELOPMENTS
We work with our customers to make sure we can deliver product when and where they need it. During 2012, we improved our capability to deliver by:
| • | | Increasing potash and nitrogen capability – Our expansion efforts, most notably in potash, are expected to allow us to produce more product to meet the anticipated needs of both our offshore and North American customers. |
| • | | Adding new, high-efficiency potash railcars – Higher-capacity railcars increase product volumes per trainload. Since 2010, we have added almost 1,700 of these cars, including approximately 700 during 2012; we expect this to help us improve the effectiveness of our rail fleet. |
| • | | Commissioning a new regional distribution center – We began operating the first phase of our new regional distribution center in Hammond, Indiana – an investment that allows us to bypass US transit bottlenecks while cutting average delivery times, improving railcar use and reducing fleet expenses. |
| • | | Investing in the capabilities of Canpotex – We anticipate that railcar repair and storage will be expedited and improved at a new maintenance facility commissioned in Saskatchewan in 2012. Canpotex added five new ships to its ocean fleet, and it continues to advance plans to build a new ocean freight terminal on Canada’s West Coast. |
| | | | | | | | | | | | | | | | | | | | | | | | |
| | | Target
Achieved | | | | 2012 | | | 2011 | | | 2010 | | | 2009 | | | 2008 | |
Performance | | | | | | | | | | | | | | | | | | | | | | | | |
Average customer survey score | |  | | | | | 92% | | | | 90% | | | | 90% | | | | 89% | | | | 91% | |
Number of product tonnes involved in customer complaints (000 tonnes)* | | | | | | | 64 | | | | 59 | | | | 97 | | | | 190 | | | | 191 | |
Net rail cycle time improvement | | | | | | | ——— on track ——— | |
| | | | | | |
* A complaint occurs when our product does not meet our product specification sheet requirements, our chemical analysis requirements or our physical size specifications. | | | |  Achieved Achieved  Not achieved Not achieved |
For more information on our specific targets and performance discussion
Visit our online annual report at www.potashcorp2012AR.com/goal2
26 POTASHCORP 2012 SUMMARY INTEGRATED REPORT
Our New Brunswick potash operation used the nearby Port of Saint John to ship most of its 2012 production to South America.
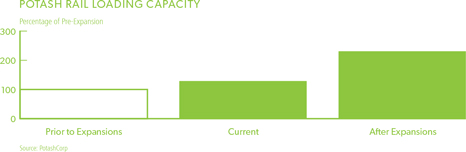
As we invest in potash capacity, we are also investing in logistical enhancements to better serve the evolving needs of our customers.
The logistics investment includes nearly CDN $300 million for improving mine load-out capability. We expect this will more than double our mine site rail loading capacity and better position us to deliver product safely and reliably to
customers worldwide. We believe improved loading capacity will enable us to be more responsive to seasonal fluctuations in demand, helping us meet the just-in-time delivery needs of our customers.
We expect to also continue benefiting from Canpotex’s well-established distribution system and customer relations that help us meet the needs of our offshore potash buyers.
$300
MILLION
Approximate capital allocated
since 2003 to improve mine
load-out capability
PERFORMANCE
GOAL
BUILD STRONG RELATIONSHIPS WITH
AND IMPROVE THE SOCIOECONOMIC
WELL-BEING OF OUR COMMUNITIES
WHY THIS GOAL MATTERS
To grow our company, we strive to create long-term, mutually beneficial relationships with the communities where we operate. By building trust and goodwill, we are more likely to receive support for our operating and development plans and attract talent. By being a good neighbor, we can invest with confidence in PotashCorp’s future.
KEY 2012 DEVELOPMENTS
Building trust and support for our operations continued to drive our community initiatives in 2012, as we made progress in the following areas:
| • | | Improving communication with communities – Responding to feedback that cited communication as an area in need of improvement, we developed a resource to help our facilities produce clear and more informative communications materials. We also established a consistent, company-wide issues management framework, which helps each facility identify and prioritize community engagement and other issues that need to be addressed. |
| • | | Improving our community survey scores – Company perception scores rose in all five communities surveyed (Augusta, Aurora, |
| | Joplin, Rocanville, Weeping Water), compared to previous results at these locations. Safety performance received particularly high scores. Survey results are shared each year with site managers and our senior management team to identify areas for improvement. |
| • | | Enhancing our community initiatives and employee matching gift program – We continued to promote our matching gift program to employees, making it more accessible to new hires by removing the one-year waiting period previously required to participate. We also held company-wide campaigns to promote our work with the United Way and Nutrients For Life. Through our involvement with Free The Children, we will make it possible for youth in our communities and across Canada to participate in exciting opportunities to make a difference locally and abroad. |
| | | | | | | | | | | | | | | | | | | | | | | | |
| | | Target
Achieved | | | | 2012 | | | 2011 | | | 2010 | | | 2009 | | | 2008 | |
Performance | | | | | | | | | | | | | | | | | | | | | | | | |
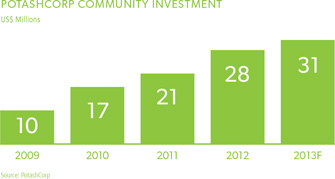
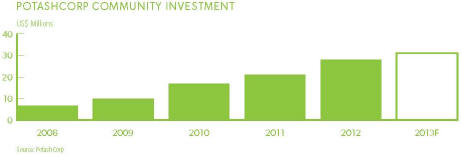
Community investment ($ millions) | |  | | | | | 28 | | | | 21 | | | | 17 | | | | 10 | | | | 7 | |
Average community survey score (out of five) | | | | | | | 4.5 | | | | 4.4 | | | | 4.2 | | | | 4.1 | | | | 4.0 | |
Matching Gift Program | |  | | | | | | | | | | | | | | | | | | | | | | |
Participation increase | | | | | | | 11% | | | | 12% | | | | 9% | | | | 10% | | | | 2% | |
Total contributions ($ millions) | | | | | | | 3.2 | | | | 2.9 | | | | 2.4 | | | | 2.0 | | | | 1.6 | |
| | |
| | Achieved Partially achieved  Not achieved Not achieved |
For more information on our specific targets and performance discussion
Visit our online annual report at www.potashcorp2012AR.com/goal3
28 POTASHCORP 2012 SUMMARY INTEGRATED REPORT
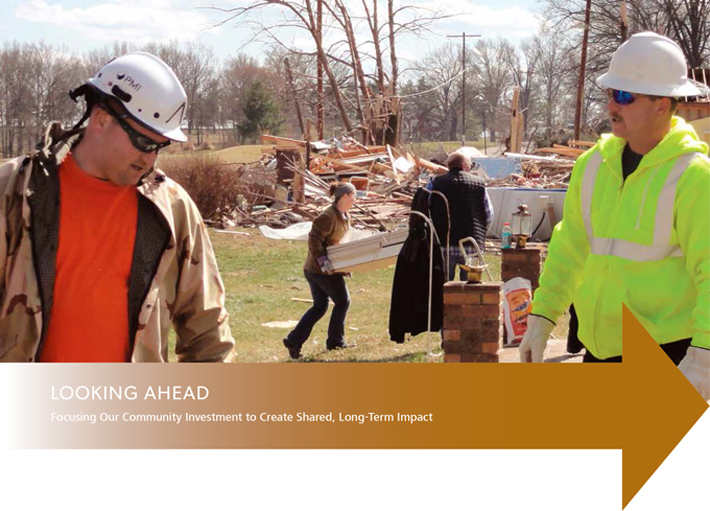
PotashCorp and our people helped the city of Joplin, Missouri, where we have a phosphate feed plant, after it was hit by a tornado in 2011. Doug Engel Jr. (l) from our feed plant at Marseilles and Curtis Black (r) from Joplin were among those who pitched in.
We refined our giving focus substantially in 2012 as we pursued more strategic ways to support our efforts to be a key player in global food solutions and our goal of benefiting our communities.
This focus to our community investment program maximizes PotashCorp’s positive impact at home and abroad. Food security, education and training, community
building, health and recreation, environmental stewardship,
and arts and culture are the priorities for community investment initiatives.
With a record amount spent in 2012 – including partnerships with Free The Children and the Global Institute for Food Security in Saskatchewan – we will continue to strengthen our community relationships, enrich the lives of our neighbors and improve quality of life for people who need it most.
$28
MILLION
Record community investment in 2012
PERFORMANCE
GOAL
ATTRACT AND RETAIN TALENTED, MOTIVATED AND PRODUCTIVE EMPLOYEES WHO ARE COMMITTED TO OUR LONG-TERM GOALS
WHY THIS GOAL MATTERS
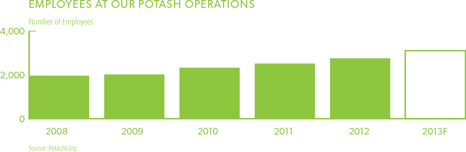
We require a talented and motivated workforce that can help us maintain our competitive advantages and reach our goals. Securing expertise is even more critical now as our potash expansions continue, as competition for qualified candidates rises and as more-experienced employees approach retirement.
KEY 2012 DEVELOPMENTS
We continue to look for ways to find, engage and motivate the people responsible for our success. We took steps to improve our performance in these areas by:
| • | | Empowering employees to make a difference – We have expanded our practice of offering employees paid time off to volunteer with charitable organizations to give them and their families the opportunity to participate in Free The Children’s Adopt a Village development model. These two-week projects in Kenya, China or India let employees help improve the lives of people there. |
| • | | Continuing to support innovative programs to find talent – Our co-op, engineer-in-training and internship programs help us find the young talent we need to keep our workforce among the best in the industry. In 2012, 145 co-op and intern students gained real-world experience on projects at our locations. In |
| | Saskatchewan, our efforts to attract First Nations and Métis employees produced more than 750 self-identified applicants, resulting in 12 percent of new employees in entry level and trades positions. |
| • | | Working to improve supervisor/employee relations – We took steps to enhance skills training for supervisors and other leaders in 2012. Our leadership development committees continue to integrate core competency training into recruitment and performance evaluation models. |
| • | | Succession planning – We look for better ways to select and develop employees who can step into key management roles, and provide them with appropriate training and leadership opportunities. In 2012, we filled several key senior management positions through internal promotions. |
| | | | | | | | | | | | | | | | | | | | | | |
| | | Target
Achieved | | 2012 | | | 2011 | | | 2010 | | | 2009 | | | 2008 | |
Performance | | | | | | | | | | | | | | | | | | | | | | |
Average employee engagement score | |  | | | 79 | % | | | 73 | % | | | 73 | % | | | 76 | % | | | 79 | % |
Percentage of senior staff positions filled internally | | | | | 80 | % | | | 92 | % | | | 94 | % | | | 89 | % | | | 73 | % |
Average external acceptance rate1 | | | | | 93 | % | | | 93 | % | | | 86 | % | | | n/a | 3 | | | n/a | 3 |
Annual Employee turnover rate2 | | | | | 4.6 | % | | | 3.8 | % | | | 3.3 | % | | | 5.8 | % | | | 5.7 | % |
| | | | |
| 1 | | Rate excludes hourly employees for 2010 and 2011 but includes hourly employees for 2012. | | Achieved  Not achieved Not achieved |
| 2 | | The number of permanent employees who left the company as a percentage of average total employees during the year. Retirements and terminations of temporary employees are excluded. | | |
| 3 | | Not available as data had not been previously compiled consistent with current methodology. | | |
For more information on our specific targets and performance discussion
Visit our online annual report at www.potashcorp2012AR.com/goal4
30 POTASHCORP 2012 SUMMARY INTEGRATED REPORT

James Whitford (l), Light Keeper Facilitator, and Prestripping Operator Warren Bonner discuss a Light Keeper observation for the behavioral-based safety program at our Aurora phosphate operation.
As our company grows and more of our workforce becomes eligible for retirement, we must continue to explore innovative ways to attract, motivate and retain talent.
To help achieve this, we plan to add a Manager of Organizational Development to lead our succession planning and leadership development, guide our performance evaluation process and develop best practices for training throughout our operations.
Most of our hiring is taking place in our Saskatchewan potash operations and we see a tremendous opportunity to add
talent from within the currently under-represented pool of Aboriginal people, the province’s fastest-growing demographic. We are engaging with Aboriginal leaders and community members to understand how best to bridge the education gaps that pose barriers to men and women who want to join our skilled workforce. We believe our investments in scholarships and training that emphasizes practical workplace skills such as equipment operation and safety procedures can help bridge this gap and grow a larger base of skilled workers.

Recognized as one of Canada’s Top 100 Employers by The Globe and Mail
PERFORMANCE
GOAL
ACHIEVE NO HARM TO PEOPLE AND NO DAMAGE TO THE ENVIRONMENT
WHY THIS GOAL MATTERS
Creating safe and environmentally sound operations is so vital to our company that it is embedded in our goals and our Core Values. Rooted in respect for people and the planet, this goal reflects our priority of doing the right thing – and doing it well.
KEY 2012 DEVELOPMENTS
The drive to achieve no harm to people and no damage to the environment motivates our management and employees every day to find better ways to operate safely and to minimize the impact of our operations. In 2012, we took steps to improve our safety and environmental performance by:
| • | | Sharing knowledge and best practices – Ongoing safety training focused on reducing injury rates by improving work procedures and eliminating hazards and exposures. Senior management and site safety leaders continued to engage workers to improve work processes, with site managers performing reviews at all facilities to identify areas for improving safety, health and environmental performance. |
| • | | Adding safety performance to all employee incentive programs – Our employee short-term incentive program (STIP) was amended in 2012 to include a safety component for all corporate office employees. Previously, only corporate office senior managers’ and facilities’ STIP incentives included a safety component. |
| • | | Holding annual environmental meetings – Annual environmental manager meetings are critical as they provide a forum to discuss opportunities to improve our performance. Key discussion focused on progress toward our 2012 targets, opportunities for improvement and areas where new targets could be developed. |
| | | | | | | | | | | | | | | | | | | | | | | | |
| | | Target
Achieved | | | 2012 | | | 2011 | | | 2010 | | | 2009 | | | 2008 | |
Safety Performance | | | | | | | | | | | | | | | | | | | | | | | | |
Life-altering injuries at our sites | | | | | | | 1 | | | | 1 | | | | 0 | | | | 1 | | | | 1 | |
Total site severity injury rate | | | | | | | 0.55 | | | | 0.54 | | | | 0.38 | | | | 0.74 | | | | 0.97 | |
Total siterecordable injury rate1 | | | | | | | 1.29 | | | | 1.42 | | | | 1.29 | | | | 1.54 | | | | 2.21 | |
Environmental Performance | | | | | | | | | | | | | | | | | | | | | | | | |
Greenhouse gas emissions (tonnes2/tonne of product) | | | | | | | 2.0 | | | | 2.3 | | | | 2.3 | | | | 2.3 | | | | 2.2 | |
Environmental incidents | | | | | | | 19 | | | | 14 | | | | 20 | | | | 22 | | | | 19 | |
Fresh water used for operations (M3/product tonne) | | | | | | | 25 | | | | 25 | 3 | | | 20 | | | | 26 | | | | 22 | |
| | | | |
| 1 | | Total recordable injuries multiplied by 200,000 hours worked divided by the actual number of hours worked | | Achieved Not Achieved |
| 2 | | CO2 equivalent | | |
| 3 | | Number restated due to error in previously reported water usage data | | |
For more information on our specific targets and performance discussion
Visit our online annual report at www.potashcorp2012AR.com/goal5
32 POTASHCORP 2012 SUMMARY INTEGRATED REPORT
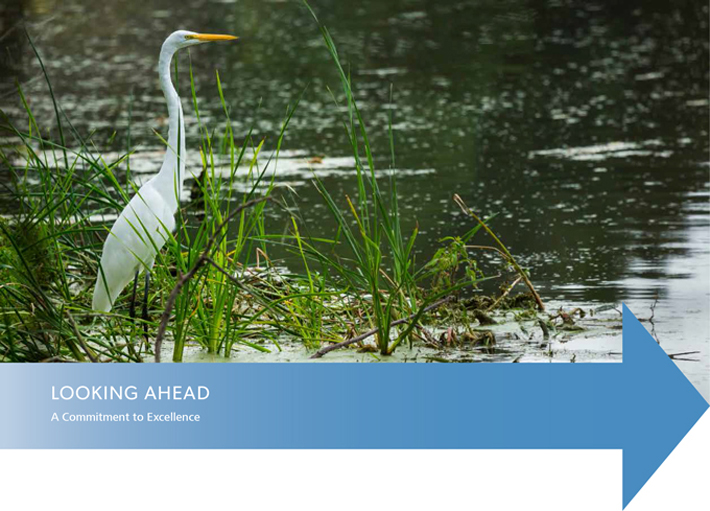
A great egret, a bird that was close to extinction a century ago, looks for food in one of the thriving wetlands restored at our White Springs phosphate operation in Florida.
Safety is our number one priority, and we remain committed to engage and educate our employees, contractors and suppliers about the critical importance of safety in the workplace.
Chief among the topics discussed at our company-wide safety summit in 2012 was a challenge set by senior
management: to be a global leader in safety performance. We have begun the process of developing a five-year safety plan to ensure we are doing the right thing and are able to track our performance against the best in class as we pursue this safety vision.
In environmental performance, we focus on complying with all permit and regulatory provisions while looking for opportunities to reduce the environmental footprint of our operations. In 2012, we began to explore ways to reduce waste throughout the company and are currently evaluating internal performance targets. We continue to look for ways to improve our reporting and data collection to be more timely and consistent in our company-wide reporting.
CHARTER
MEMBER
CAMPBELL INSTITUTE
Invited by the US National Safety Council to join this new institute, thus allowing us to share best practices with other high-performing workplaces
BUILDING AND PROTECTING VALUE WITH GOVERNANCE
GOVERNANCE
Role of the Board
The Board of Directors is responsible for the oversight of PotashCorp management and the stewardship of the company and our global business. It has the statutory authority and obligation to protect and enhance the company’s assets. In pursuing the best interests of the company, the Board considers customers, employees, suppliers and the communities and environments where we do business, recognizing that all are vital to our success and sustainability.
Board’s View on Directors
Each director must possess and exhibit the highest degree of integrity, professionalism and independent judgment. Directors and senior officers are bound by the PotashCorp Governance Principles and PotashCorp Core Values and Code of Conduct. We believe boards function most effectively when individual directors are free from conflicts of interest and exercise independent judgment in discharging their responsibilities. We comply with the independence requirements of all applicable regulators.
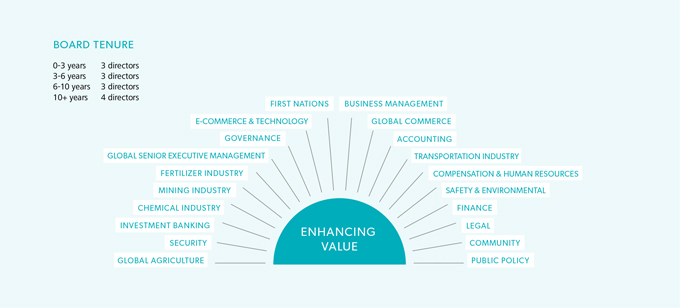
Directors’ Skills and Expertise
To enhance value for the company, the Board draws on the following specific attributes, qualifications and areas of expertise, represented by one or multiple directors, when looking at issues being faced by PotashCorp.
To learn more about our approach to governance and compensation
See our 2013 Proxy Circular at www.potashcorp.com/2013proxy
34 POTASHCORP 2012 SUMMARY INTEGRATED REPORT
EXECUTIVE COMPENSATION
Our Philosophy
The Board is responsible for executive compensation and committed to getting it right, both for shareholders and for the company’s long-term success. We believe our executive compensation philosophy is straightforward:
| • | | We set corporate goals aligned with shareholder interests. |
| • | | We design pay packages to incent and reward performance aligned with our corporate goals. |
| • | | We test the outcomes of our compensation packages to measure their reasonableness and our success in aligning pay and performance. |
Our Compensation Structure
At PotashCorp, accountability is a core value. To that end, we annually set targets that reflect the interests of our stakeholders and measure our performance against these targets. We design our compensation plans to help drive achievement of our goals and objectives.
The program’s key elements are base salary, short-term incentives (STIP), performance units granted under a medium-term incentive plan (MTIP), performance stock options under a long-term incentive plan, retirement benefits and severance benefits.
Alignment With Company Goals
| | |
| GOAL | | DISCUSSION |
| |
| Create superior shareholder value | | At-risk incentive compensation plans include short-term, medium-term and long-term cycles and are based on total shareholder return, share appreciation or a related measure. |
| Be the supplier of choice to the markets we serve | | The STIP is based on annual Board-approved goals for sales, productivity and profitability. Achieving them requires us to meet the needs of our customers throughout the year. |
| Build strong relationships with and improve the socioeconomic well-being of our communities | | Our target is to invest 1 percent of consolidated income before income taxes on a five-year rolling average in the communities in which we work and in other philanthropic programs. We actively encourage all employees, particularly executives, to participate in these programs. |
| Attract and retain talented, motivated and productive employees who are committed to our long-term goals | | Target compensation is competitive with the industry average. Executives are motivated to achieve strong results through opportunities to earn above target based on company and individual performance. |
| Achieve no harm to people and no damage to the environment | | At all plant locations, one-half of the annual STIP payout is based on performance in relation to local metrics, a significant portion of which relates to safety and environmental performance. At corporate offices, 5 percent of the annual STIP payout depends on the company’s overall safety performance. |
POTASHCORP 2012 SUMMARY INTEGRATED REPORT 35
BOARD OF DIRECTORS
| | | | | | | | |
| 1 Christopher M. BurleyA,D | | 4 William J. Doyle | | 7 C. Steven HoffmanB,C | | 10 Keith G. MartellB,D | | 12Mary MogfordA,B |
| Calgary AB | | Saskatoon SK | | Lincolnshire IL | | Saskatoon SK | | Newcastle ON |
| | | | |
| 2 Donald G. ChynowethC,D | | 5 John W. EsteyA,B | | 8 Dallas J. Howe (Chair)A | | 11 Jeffrey J. McCaigB,C | | 13 Elena Viyella De PalizaC |
| Calgary AB | | Glenview IL | | Calgary AB | | Calgary AB | | Dominican Republic |
| | | | |
| 3 Daniel Clauw C,D | | 6 Gerald W. Grandey B,C | | 9 Alice D. Laberge A,D | | | | |
| Fourqueux, France | | Saskatoon SK | | Vancouver BC | | | | |
Committees:
(A) Corporate Governance and Nominating (B) Compensation (C) Safety, Health and Environment (D) Audit
SENIOR MANAGEMENT
| | | | | | | | |
| 1 William J. Doyle | | 4 Stephen F. Dowdle | | 7 Joseph A. Podwika | | 10 Daphne J. Arnason | | 13 Denita C. Stann |
President and Chief Executive Officer | | President, PCS Sales | | Senior Vice President, General Counsel and Secretary | | Vice President, Internal Audit | | Vice President, Investor and Public Relations |
| | | | |
| 2 Wayne R. Brownlee | | 5 Brent E. Heimann | | 8 Robert A. Jaspar | | 11 Darryl S. Stann | | 14 Lee M. Knafelc |
Executive Vice President and Chief Financial Officer | | President, PCS Phosphate and PCS Nitrogen | | Senior Vice President, Information Technology | | Vice President, Procurement | | Vice President, Human Resources and Administration |
| | | | |
| 3 G. David Delaney | | 6 Michael T. Hogan | | 9 Denis A. Sirois | | 12 Mark F. Fracchia | | |
Executive Vice President and Chief Operating Officer | | President, PCS Potash | | Vice President and Corporate Controller | | Vice President, Safety, Health and Environment | | |
Learn more at www.potashcorp2012AR.com/bios
36 POTASHCORP 2012 SUMMARY INTEGRATED REPORT
COMPANY INFORMATION AND DISCLOSURE
Investor Inquiries
Denita Stann, Vice President, Investor and Public Relations
Canada: (800) 667-0403
US: (800) 667-3930
email: ir@potashcorp.com
Visit us at www.potashcorp.com
Corporate Headquarters
Suite 500, 122 – 1st Ave S
Saskatoon SK S7K 7G3
Canada
Phone: (306) 933-8500
Forward-Looking Statements
This 2012 Summary Integrated Report contains forward-looking statements or forward-looking information (“forward-looking statements”). These statements can be identified by expressions of belief, expectation or intention, as well as those statements that are not historical fact. These statements often contain words such as “should,” “could,” “expect,” “may,” “anticipate,” “believe,” “intend,” “estimates,” “plans” and similar expressions. These statements are based on certain factors and assumptions as set forth in this 2012 report, including with respect to: foreign exchange rates, expected growth, results of operations, performance, business prospects and opportunities, and effective tax rates. While the company considers these factors and assumptions to be reasonable based on information currently available, they may prove to be incorrect. Forward-looking statements are subject to risks and uncertainties that are difficult to predict. The results or events set forth in forward-looking statements may differ materially from actual results or events. Several factors could cause actual results or events to differ materially from those expressed in the forward-looking statements, including, but not limited to the following: variations from our assumptions with respect to foreign exchange rates, expected growth, results of operations, performance, business prospects and opportunities, and effective tax rates; fluctuations in supply and demand in the fertilizer, sulfur, transportation and petrochemical markets; costs and availability of transportation and distribution for our raw materials and products, including railcars and ocean freight; changes in competitive pressures, including pricing pressures; adverse or uncertain economic conditions and changes in credit and financial markets; the results of sales contract negotiations within major markets; economic and political uncertainty around the world, timing and impact of capital expenditures; risks associated with natural gas and other hedging activities; changes in capital markets; unexpected or adverse weather conditions; changes in currency and exchange rates; unexpected geological or environmental conditions, including water inflows; imprecision in reserve estimates; adverse developments in new and pending legal proceedings or government investigations; acquisitions we may undertake; strikes or other forms of work stoppage or slowdowns; rates of return on and the risks associated with our investments; changes in, and the effects of, government policies and regulations; security risks related to our information technology systems; and earnings, exchange rates and the decisions of taxing authorities, all of which could affect our effective tax rates. Additional risks and uncertainties can be found in our Form 10-K for the fiscal year ended December 31, 2012 under the captions “Forward-Looking Statements” and “Item 1A – Risk Factors” and in our filings with the US Securities and Exchange Commission and the Canadian provincial securities commissions. Forward-looking statements are given only as at the date of this report and the company disclaims any obligation to update or revise any forward-looking statements, whether as a result of new information, future events or otherwise, except as required by law.
Market and Industry Data Statement
Some of the market and industry data contained in this Summary Integrated Report are based on internal surveys, market research, independent industry publications or other publicly available information. Although we believe that the independent sources used by us are reliable, we have not independently verified and cannot guarantee the accuracy or completeness of this information. Similarly, we believe our internal research is reliable, but such research has not been verified by any independent sources.
Information in the preparation of this Summary Integrated Report is based on statistical data and other material available at February 19, 2013.
Sources, Abbreviations and Terms
| | |
| APC | | Arab Potash Company (Amman: ARPT), Jordan |
| |
| Canpotex | | Canpotex Limited, Canada |
| |
| ICL | | Israel Chemicals Ltd. (Tel Aviv: ICL), Israel |
| |
| MT | | Metric tonne |
| |
| MMT | | Million metric tonnes |
| |
| NYSE | | New York Stock Exchange, USA |
| |
| Sinofert | | Sinofert Holdings Limited (HKSE, 0297.HK), China |
| |
| SQM | | Sociedad Quimica y Minera de Chile S.A. (Santiago Bolsa de Comercio Exchange, NYSE: SQM), Chile |
POTASHCORP 2012 SUMMARY INTEGRATED REPORT 37

PotashCorp2012AR.com
| | |
 | | PotashCorp.com Visit us online |
| |
 | | Facebook.com/PotashCorp Find us on Facebook |
| |
 | | Twitter.com/PotashCorp Follow us on Twitter |