UNITED STATES SECURITIES AND EXCHANGE COMMISSION
Washington, D.C. 20549
Form 10-Q
| þ | QUARTERLY REPORT PURSUANT TO SECTION 13 OR 15(d) OF THE SECURITIES EXCHANGE ACT OF 1934 |
For the Quarterly Period Ended March 31, 2013
OR
| ¨ | TRANSITION REPORT PURSUANT TO SECTION 13 OR 15(d) OF THE SECURITIES EXCHANGE ACT OF 1934 |
Commission File Number 1-10351
Potash Corporation of Saskatchewan Inc.
(Exact name of registrant as specified in its charter)
| | |
| Canada | | N/A |
(State or other jurisdiction of
incorporation or organization) | | (I.R.S. Employer
Identification No.) |
| |
122 — 1st Avenue South Saskatoon, Saskatchewan, Canada (Address of principal executive offices) | | S7K 7G3 (Zip Code) |
306-933-8500
(Registrant’s telephone number, including area code)
Indicate by check mark whether the registrant (1) has filed all reports required to be filed by Sections 13 or 15(d) of the Securities Exchange Act of 1934 during the preceding 12 months (or for such shorter period that the registrant was required to file such reports), and (2) has been subject to such filing requirements for the past 90 days.
Yes þ No ¨
Indicate by check mark whether the registrant has submitted electronically and posted on its corporate Web site, if any, every Interactive Data File required to be submitted and posted pursuant to Rule 405 of Regulation S-T during the preceding 12 months (or for such shorter period that the registrant was required to submit and post such files).
Yes ¨ No ¨
Indicate by check mark whether the registrant is a large accelerated filer, an accelerated filer, a non-accelerated filer, or a smaller reporting company. See the definitions of “large accelerated filer,” “accelerated filer” and “smaller reporting company” in Rule 12b-2 of the Exchange Act. (Check one):
| | | | | | |
| Large accelerated filer þ | | Accelerated filer ¨ | | Non-accelerated filer ¨ | | Smaller reporting company ¨ |
| | | | (Do not check if a smaller reporting company) | | |
Indicate by check mark whether the registrant is a shell company (as defined in Exchange Act Rule 12b-2).
Yes ¨ No þ
As at March 31, 2013, Potash Corporation of Saskatchewan Inc. had 865,135,124 Common Shares outstanding.
Part I. Financial Information
Item 1. Financial Statements
Potash Corporation of Saskatchewan Inc.
Condensed Consolidated Statements of Financial Position
(in millions of US dollars)
(unaudited)
| | | | | | | | |
| As at | | March 31,
2013 | | | December 31,
2012 | |
Assets | | | | | | | | |
Current assets | | | | | | | | |
Cash and cash equivalents | | $ | 585 | | | $ | 562 | |
Receivables | | | 1,120 | | | | 1,089 | |
Inventories (Note 2) | | | 715 | | | | 762 | |
Prepaid expenses and other current assets | | | 86 | | | | 83 | |
| | | 2,506 | | | | 2,496 | |
Non-current assets | | | | | | | | |
Property, plant and equipment | | | 11,692 | | | | 11,505 | |
Investments in equity-accounted investees | | | 1,332 | | | | 1,254 | |
Available-for-sale investments | | | 2,667 | | | | 2,481 | |
Other assets | | | 338 | | | | 344 | |
Intangible assets | | | 128 | | | | 126 | |
Total Assets | | $ | 18,663 | | | $ | 18,206 | |
Liabilities | | | | | | | | |
Current liabilities | | | | | | | | |
Short-term debt and current portion of long-term debt (Note 3) | | $ | 581 | | | $ | 615 | |
Payables and accrued charges | | | 1,104 | | | | 1,188 | |
Current portion of derivative instrument liabilities | | | 48 | | | | 51 | |
| | | 1,733 | | | | 1,854 | |
Non-current liabilities | | | | | | | | |
Long-term debt (Note 3) | | | 3,467 | | | | 3,466 | |
Derivative instrument liabilities | | | 157 | | | | 167 | |
Deferred income tax liabilities | | | 1,592 | | | | 1,482 | |
Pension and other post-retirement benefit liabilities | | | 538 | | | | 569 | |
Asset retirement obligations and accrued environmental costs | | | 619 | | | | 645 | |
Other non-current liabilities and deferred credits | | | 115 | | | | 111 | |
Total Liabilities | | | 8,221 | | | | 8,294 | |
Shareholders’ Equity | | | | | | | | |
Share capital (Note 4) | | | 1,550 | | | | 1,543 | |
Contributed surplus | | | 311 | | | | 299 | |
Accumulated other comprehensive income | | | 1,596 | | | | 1,399 | |
Retained earnings | | | 6,985 | | | | 6,671 | |
Total Shareholders’ Equity | | | 10,442 | | | | 9,912 | |
Total Liabilities and Shareholders’ Equity | | $ | 18,663 | | | $ | 18,206 | |
(See Notes to the Condensed Consolidated Financial Statements)
| | |
| 1 | | PotashCorp 2013 First Quarter Quarterly Report on Form 10-Q |
Potash Corporation of Saskatchewan Inc.
Condensed Consolidated Statements of Income
(in millions of US dollars except per-share amounts)
(unaudited)
| | | | | | | | |
| | | Three Months Ended
March 31 | |
| | | 2013 | | | 2012 | |
Sales (Note 5) | | $ | 2,100 | | | $ | 1,746 | |
Freight, transportation and distribution | | | (149 | ) | | | (104 | ) |
Cost of goods sold | | | (1,084 | ) | | | (944 | ) |
Gross Margin | | | 867 | | | | 698 | |
Selling and administrative expenses | | | (66 | ) | | | (57 | ) |
Provincial mining and other taxes | | | (63 | ) | | | (28 | ) |
Share of earnings of equity-accounted investees | | | 80 | | | | 75 | |
Other expenses | | | (1 | ) | | | (3 | ) |
Operating Income | | | 817 | | | | 685 | |
Finance costs | | | (35 | ) | | | (34 | ) |
Income Before Income Taxes | | | 782 | | | | 651 | |
Income taxes (Note 6) | | | (226 | ) | | | (160 | ) |
Net Income | | $ | 556 | | | $ | 491 | |
Net Income per Share(Note 7) | | | | | | | | |
Basic | | $ | 0.64 | | | $ | 0.57 | |
Diluted | | $ | 0.63 | | | $ | 0.56 | |
Dividends Declared per Share | | $ | 0.28 | | | $ | 0.14 | |
(See Notes to the Condensed Consolidated Financial Statements)
| | |
| PotashCorp 2013 First Quarter Quarterly Report on Form 10-Q | | 2 |
Potash Corporation of Saskatchewan Inc.
Condensed Consolidated Statements of Comprehensive Income
(in millions of US dollars)
(unaudited)
| | | | | | | | |
| | | Three Months Ended
March 31 | |
| (Net of related income taxes) | | 2013 | | | 2012 | |
Net Income | | $ | 556 | | | $ | 491 | |
Other comprehensive income | | | | | | | | |
Items that will not be reclassified to net income: | | | | | | | | |
Net actuarial loss on defined benefit plans(1) | | | — | | | | (11 | ) |
Items that may be reclassified subsequently to net income: | | | | | | | | |
Available-for-sale investments | | | | | | | | |
Net fair value gain during the period(2) | | | 186 | | | | 122 | |
Cash flow hedges | | | | | | | | |
Net fair value loss during the period(3) | | | — | | | | (13 | ) |
Reclassification to income of net loss(4) | | | 11 | | | | 12 | |
Other Comprehensive Income | | | 197 | | | | 110 | |
Comprehensive Income | | $ | 753 | | | $ | 601 | |
| (1) | Net of income taxes of $NIL (2012 — $4). |
| (2) | Available-for-sale investments are comprised of shares in Israel Chemicals Ltd. and Sinofert Holdings Limited. |
| (3) | Cash flow hedges are comprised of natural gas derivative instruments and are net of income taxes of $NIL (2012 — $8). |
| (4) | Net of income taxes of $(6) (2012 — $(8)). |
(See Notes to the Condensed Consolidated Financial Statements)
| | |
| 3 | | PotashCorp 2013 First Quarter Quarterly Report on Form 10-Q |
Potash Corporation of Saskatchewan Inc.
Condensed Consolidated Statements of Cash Flow
(in millions of US dollars)
(unaudited)
| | | | | | | | |
| | | Three Months Ended
March 31 | |
| | | 2013 | | | 2012 | |
Operating Activities | | | | | | | | |
Net income | | $ | 556 | | | $ | 491 | |
Adjustments to reconcile net income to cash provided by operating activities | | | | | | | | |
Depreciation and amortization | | | 154 | | | | 128 | |
Share-based compensation | | | 16 | | | | 16 | |
Provision for deferred income tax | | | 102 | | | | 52 | |
Net undistributed earnings of equity-accounted investees | | | (77 | ) | | | (73 | ) |
Pension and other post-retirement benefits | | | (31 | ) | | | 9 | |
Other long-term liabilities and miscellaneous | | | 16 | | | | 2 | |
Subtotal of adjustments | | | 180 | | | | 134 | |
Changes in non-cash operating working capital | | | | | | | | |
Receivables | | | (104 | ) | | | 49 | |
Inventories | | | 47 | | | | 26 | |
Prepaid expenses and other current assets | | | 1 | | | | (14 | ) |
Payables and accrued charges | | | 58 | | | | (314 | ) |
Subtotal of changes in non-cash operating working capital | | | 2 | | | | (253 | ) |
Cash provided by operating activities | | | 738 | | | | 372 | |
Investing Activities | | | | | | | | |
Additions to property, plant and equipment | | | (496 | ) | | | (476 | ) |
Other assets and intangible assets | | | (5 | ) | | | (20 | ) |
Cash used in investing activities | | | (501 | ) | | | (496 | ) |
Financing Activities | | | | | | | | |
Repayment of long-term debt obligations | | | (250 | ) | | | — | |
Proceeds from short-term debt obligations | | | 211 | | | | 168 | |
Dividends | | | (177 | ) | | | (59 | ) |
Issuance of common shares | | | 2 | | | | 2 | |
Cash (used in) provided by financing activities | | | (214 | ) | | | 111 | |
Increase (Decrease) in Cash and Cash Equivalents | | | 23 | | | | (13 | ) |
Cash and Cash Equivalents, Beginning of Period | | | 562 | | | | 430 | |
Cash and Cash Equivalents, End of Period | | $ | 585 | | | $ | 417 | |
Cash and cash equivalents comprised of: | | | | | | | | |
Cash | | $ | 103 | | | $ | 37 | |
Short-term investments | | | 482 | | | | 380 | |
| | | $ | 585 | | | $ | 417 | |
Supplemental cash flow disclosure | | | | | | | | |
Interest paid | | $ | 9 | | | $ | 38 | |
Income taxes paid | | $ | 55 | | | $ | 316 | |
(See Notes to the Condensed Consolidated Financial Statements)
| | |
| PotashCorp 2013 First Quarter Quarterly Report on Form 10-Q | | 4 |
Potash Corporation of Saskatchewan Inc.
Condensed Consolidated Statements of Changes in Equity
(in millions of US dollars)
(unaudited)
| | | | | | | | | | | | | | | | | | | | | | | | | | | | | | | | | | | | |
| | | | | | | | | Accumulated Other Comprehensive Income | | | | | | | |
| | | Share
Capital | | | Contributed
Surplus | | | Net
unrealized
gain on
available-for-
sale
investments | | | Net loss on
derivatives
designated as
cash flow
hedges | | | Net
actuarial
loss on
defined
benefit
plans | | | Other | | | Total
Accumulated
Other
Comprehensive
Income | | | Retained
Earnings | | | Total
Equity(1) | |
Balance — December 31, 2012 | | $ | 1,543 | | | $ | 299 | | | $ | 1,539 | | | $ | (138 | ) | | $ | — | (2) | | $ | (2 | ) | | $ | 1,399 | | | $ | 6,671 | | | $ | 9,912 | |
Net income | | | — | | | | — | | | | — | | | | — | | | | — | | | | — | | | | — | | | | 556 | | | | 556 | |
Other comprehensive income | | | — | | | | — | | | | 186 | | | | 11 | | | | — | | | | — | | | | 197 | | | | — | | | | 197 | |
Dividends declared | | | — | | | | — | | | | — | | | | — | | | | — | | | | — | | | | — | | | | (242 | ) | | | (242 | ) |
Effect of share-based compensation including issuance of common shares | | | 3 | | | | 12 | | | | — | | | | — | | | | — | | | | — | | | | — | | | | — | | | | 15 | |
Shares issued for dividend reinvestment plan | | | 4 | | | | — | | | | — | | | | — | | | | — | | | | — | | | | — | | | | — | | | | 4 | |
Balance — March 31, 2013 | | $ | 1,550 | | | $ | 311 | | | $ | 1,725 | | | $ | (127 | ) | | $ | — | (2) | | $ | (2 | ) | | $ | 1,596 | | | $ | 6,985 | | | $ | 10,442 | |
| (1) | All equity transactions were attributable to common shareholders. |
| (2) | Any amounts incurred during a period are closed out to retained earnings at each period-end. Therefore, no balance exists at the beginning or end of period. |
| | | | | | | | | | | | | | | | | | | | | | | | | | | | | | | | | | | | |
| | | | | | | | | Accumulated Other Comprehensive Income | | | | | | | |
| | | Share
Capital | | | Contributed
Surplus | | | Net
unrealized
gain on
available-for-
sale
investments | | | Net loss on
derivatives
designated as
cash flow
hedges | | | Net
actuarial
loss on
defined
benefit
plans | | | Other | | | Total
Accumulated
Other
Comprehensive
Income | | | Retained
Earnings | | | Total
Equity(1) | |
Balance — December 31, 2011 | | $ | 1,483 | | | $ | 291 | | | $ | 982 | | | $ | (168 | ) | | $ | — | (2) | | $ | 2 | | | $ | 816 | | | $ | 5,257 | | | $ | 7,847 | |
Net income | | | — | | | | — | | | | — | | | | — | | | | — | | | | — | | | | — | | | | 491 | | | | 491 | |
Other comprehensive income (loss) | | | — | | | | — | | | | 122 | | | | (1 | ) | | | (11 | ) | | | — | | | | 110 | | | | — | | | | 110 | |
Dividends declared | | | — | | | | — | | | | — | | | | — | | | | — | | | | — | | | | — | | | | (120 | ) | | | (120 | ) |
Effect of share-based compensation including issuance of common shares | | | 2 | | | | 29 | | | | — | | | | — | | | | — | | | | — | | | | — | | | | — | | | | 31 | |
Shares issued for dividend reinvestment plan | | | 1 | | | | — | | | | — | | | | — | | | | — | | | | — | | | | — | | | | — | | | | 1 | |
Transfer of net actuarial loss on defined benefit plans | | | — | | | | — | | | | — | | | | — | | | | 11 | | | | — | | | | 11 | | | | (11 | ) | | | — | |
Balance — March 31, 2012 | | $ | 1,486 | | | $ | 320 | | | $ | 1,104 | | | $ | (169 | ) | | $ | — | (2) | | $ | 2 | | | $ | 937 | | | $ | 5,617 | | | $ | 8,360 | |
| (1) | All equity transactions were attributable to common shareholders. |
| (2) | Any amounts incurred during a period are closed out to retained earnings at each period-end. Therefore, no balance exists at the beginning or end of period. |
(See Notes to the Condensed Consolidated Financial Statements)
| | |
| 5 | | PotashCorp 2013 First Quarter Quarterly Report on Form 10-Q |
Potash Corporation of Saskatchewan Inc.
Notes to the Condensed Consolidated Financial Statements
For the Three Months Ended March 31, 2013
(in millions of US dollars except as otherwise noted)
(unaudited)
1. Significant Accounting Policies
Basis of Presentation
With its subsidiaries, Potash Corporation of Saskatchewan Inc. (“PCS”) — together known as “PotashCorp” or “the company” except to the extent the context otherwise requires — forms an integrated fertilizer and related industrial and feed products company. These unaudited interim condensed consolidated financial statements are based on International Financial Reporting Standards, as issued by the International Accounting Standards Board (“IFRS”), and have been prepared in accordance with International Accounting Standard (“IAS”) 34, “Interim Financial Reporting.” The accounting policies used in preparing these unaudited interim condensed consolidated financial statements are consistent with those used in the preparation of the company’s 2012 annual consolidated financial statements, except as described below.
These unaudited interim condensed consolidated financial statements include the accounts of PCS and its subsidiaries; however, they do not include all disclosures normally provided in annual consolidated financial statements and should be read in conjunction with the company’s 2012 annual consolidated financial statements. In management’s opinion, the unaudited interim condensed consolidated financial statements include all adjustments necessary to fairly present such information. Interim results are not necessarily indicative of the results expected for the fiscal year.
These unaudited interim condensed consolidated financial statements were authorized by the audit committee of the Board of Directors for issue on April 30, 2013.
Standards, amendments and interpretations effective and applied
The International Accounting Standards Board (“IASB”) and International Financial Reporting Interpretations Committee (“IFRIC”) have issued the following standards and amendments or interpretations to existing standards that are effective and applied.
| | | | |
| Standard | | Description | | Impact |
| Amendments to IAS 1, Presentation of Financial Statements | | Amendments require items within other comprehensive income (“OCI”) that may be reclassified to the profit or loss section of the income statement to be grouped together. | | Adopted retrospectively effective January 1, 2013. The format of the company’s consolidated statements of comprehensive income has changed. Prior periods’ figures have been reclassified to conform with the current period’s presentation. |
| Amendments to IFRS 7, Financial Instruments: Disclosures | | Issued as part of its offsetting project, addresses common disclosure requirements related to financial instruments. | | Adopted retrospectively effective January 1, 2013. Applicable disclosures included in Note 8 to these unaudited interim condensed consolidated financial statements, and will be included in the company’s 2013 annual consolidated financial statements. |
| IFRS 10, Consolidated Financial Statements | | Builds on existing principles by identifying the concept of control as the determining factor in whether an entity should be included within the consolidated financial statements of the parent company. | | Adopted retrospectively effective January 1, 2013 with no change to the company’s consolidated financial statements. |
| IFRS 11, Joint Arrangements | | Removes a choice in accounting method and requires equity accounting for participants in joint ventures. Also focuses on the rights and obligations of an arrangement rather than its legal form. | | Adopted prospectively effective January 1, 2013 with no change to the company’s consolidated financial statements. |
| IFRS 12, Disclosure of Interests in Other Entities | | Establishes a new and comprehensive standard on disclosure requirements for all forms of interest in other entities, including subsidiaries, joint arrangements, associates and unconsolidated structured entities. | | Adopted prospectively effective January 1, 2013. Applicable disclosures will be included in the company’s 2013 annual consolidated financial statements. |
| IFRS 13, Fair Value Measurement | | Establishes a single framework for measuring fair value and introduces consistent disclosure requirements on fair value measurements. | | Adopted prospectively effective January 1, 2013. Applicable disclosures included in Note 8 to these unaudited interim condensed consolidated financial statements, and will be included in the company’s 2013 annual consolidated financial statements. |
| | |
| PotashCorp 2013 First Quarter Quarterly Report on Form 10-Q | | 6 |
| | | | |
| Standard | | Description | | Impact |
| Amendments to IAS 19, Employee Benefits | | Changes relating to the recognition, measurement, presentation and disclosure of post-employment benefits. The amendment also changes the accounting for termination benefits and short-term employment benefits, along with other minor clarifications. | | Adopted prospectively effective January 1, 2013. The amendments resulted in changes in accounting policy but did not result in any material adjustments to the company’s consolidated financial statements. Previously, the company calculated interest costs on the defined benefit obligation and the expected return on plan assets, and included such amounts within employee costs in cost of goods sold and selling and administrative expenses, as applicable. The net interest cost will now be calculated on the net funded status, and included in finance costs. Previously, vested past service costs were recognized immediately and unvested past service costs were amortized on a straight-line basis over the average period until the benefits became vested. All past service costs will now be recognized immediately. Actuarial gains and losses will continue to be recognized in OCI, and closed out to retained earnings each period. Required additional disclosures will be included in the company’s 2013 annual consolidated financial statements. |
| IFRIC 20, Stripping Costs in the Production Phase of a Surface Mine | | Clarifies the requirements for accounting for stripping costs in the production phase of a surface mine. | | Adopted effective January 1, 2013 with no change to the company’s consolidated financial statements. |
Standards, amendments and interpretations not yet effective and not applied
The IASB and IFRIC issued the following standards and amendments or interpretations to existing standards that are not yet effective and not applied. The company does not anticipate early adoption of these standards at this time.
| | | | | | |
| Standard | | Description | | Impact | | Effective Date(1) |
| Amendments to IAS 32, Offsetting Financial Assets and Financial Liabilities | | Issued as part of the IASB’s offsetting project, amendments clarify certain items regarding offsetting financial assets and financial liabilities. | | The company is reviewing the standard to determine the potential impact, if any; however, no significant impact is anticipated. | | January 1, 2014, applied retrospectively. |
| IFRS 9, Financial Instruments | | Initially issued guidance on the classification and measurement of financial assets. Additional guidance was issued on the classification and measurement of financial liabilities. Further, amendments were issued that will modify the requirements for transition from IAS 39 to IFRS 9. | | The company is reviewing the standard to determine the potential impact, if any. | | January 1, 2015, applied prospectively. |
| (1) | Effective date for annual periods beginning on or after the stated date. |
2. Inventories
| | | | | | | | |
| | | March 31,
2013 | | | December 31,
2012 | |
Finished products | | $ | 364 | | | $ | 417 | |
Intermediate products | | | 89 | | | | 82 | |
Raw materials | | | 85 | | | | 91 | |
Materials and supplies | | | 177 | | | | 172 | |
| | | $ | 715 | | | $ | 762 | |
| | |
| 7 | | PotashCorp 2013 First Quarter Quarterly Report on Form 10-Q |
3. Long-Term Debt
On March 1, 2013, the company fully repaid $250 of 4.875 percent 10-year senior notes at maturity.
4. Share Capital
Authorized
The company is authorized to issue an unlimited number of common shares without par value and an unlimited number of first preferred shares. The common shares are not redeemable or convertible. No first preferred shares have been issued.
Issued
| | | | | | | | |
| | | Number of
Common Shares | | | Consideration | |
Balance — December 31, 2012 | | | 864,900,513 | | | $ | 1,543 | |
Issued under option plans | | | 140,456 | | | | 3 | |
Issued for dividend reinvestment plan | | | 94,155 | | | | 4 | |
Balance — March 31, 2013 | | | 865,135,124 | | | $ | 1,550 | |
5. Segment Information
The company’s operating segments have been determined based on reports reviewed by the Chief Executive Officer, its chief operating decision-maker, that are used to make strategic decisions. The company has three reportable operating segments: potash, nitrogen and phosphate. These operating segments are differentiated by the chemical nutrient contained in the product that each produces. Inter-segment sales are made under terms that approximate market value. The accounting policies of the segments are the same as those described in Note 1.
| | | | | | | | | | | | | | | | | | | | |
| | | Three Months Ended March 31, 2013 | |
| | | Potash | | | Nitrogen | | | Phosphate | | | All Others | | | Consolidated | |
Sales | | $ | 885 | | | $ | 659 | | | $ | 556 | | | $ | — | | | $ | 2,100 | |
Freight, transportation and distribution | | | (71 | ) | | | (25 | ) | | | (53 | ) | | | — | | | | (149 | ) |
Net sales — third party | | | 814 | | | | 634 | | | | 503 | | | | — | | | | | |
Cost of goods sold | | | (310 | ) | | | (363 | ) | | | (411 | ) | | | — | | | | (1,084 | ) |
Gross margin | | | 504 | | | | 271 | | | | 92 | | | | — | | | | 867 | |
Depreciation and amortization | | | (41 | ) | | | (38 | ) | | | (71 | ) | | | (4 | ) | | | (154 | ) |
Inter-segment sales | | | — | | | | 71 | | | | — | | | | — | | | | — | |
Assets | | | 8,826 | | | | 2,256 | | | | 2,546 | | | | 5,035 | | | | 18,663 | |
Cash flows for additions to property, plant and equipment | | | 349 | | | | 45 | | | | 65 | | | | 37 | | | | 496 | |
| | | | | | | | | | | | | | | | | | | | |
| | | Three Months Ended March 31, 2012 | |
| | | Potash | | | Nitrogen | | | Phosphate | | | All Others | | | Consolidated | |
Sales | | $ | 583 | | | $ | 550 | | | $ | 613 | | | | $— | | | $ | 1,746 | |
Freight, transportation and distribution | | | (34 | ) | | | (29 | ) | | | (41 | ) | | | — | | | | (104 | ) |
Net sales — third party | | | 549 | | | | 521 | | | | 572 | | | | — | | | | | |
Cost of goods sold | | | (222 | ) | | | (302 | ) | | | (420 | ) | | | — | | | | (944 | ) |
Gross margin | | | 327 | | | | 219 | | | | 152 | | | | — | | | | 698 | |
Depreciation and amortization | | | (30 | ) | | | (35 | ) | | | (60 | ) | | | (3 | ) | | | (128 | ) |
Inter-segment sales | | | — | | | | 42 | | | | — | | | | — | | | | — | |
Assets | | | 7,689 | | | | 2,050 | | | | 2,659 | | | | 4,244 | | | | 16,642 | |
Cash flows for additions to property, plant and equipment | | | 343 | | | | 73 | | | | 50 | | | | 10 | | | | 476 | |
| | |
| PotashCorp 2013 First Quarter Quarterly Report on Form 10-Q | | 8 |
6. Income Taxes
A separate estimated average annual effective tax rate is determined for each taxing jurisdiction and applied individually to the interim period pre-tax income of each jurisdiction.
| | | | | | | | |
| | | Three Months Ended March 31 | |
| | | 2013 | | | 2012 | |
Income tax expense | | $ | 226 | | | $ | 160 | |
Actual effective tax rate on ordinary earnings | | | 27% | | | | 25% | |
Actual effective tax rate including discrete items | | | 29% | | | | 25% | |
Discrete tax adjustments that impacted the tax rate | | $ | 19 | | | $ | (2 | ) |
Significant items to note include the following:
| Ÿ | | The actual effective tax rate on ordinary earnings for the first quarter of 2013 increased compared to the same period last year due to a different income weighting between jurisdictions. |
| Ÿ | | In first-quarter 2013, a tax expense of $15 was recorded to adjust the 2012 income tax provision. |
Income tax balances within the consolidated statements of financial position were comprised of the following:
| | | | | | | | | | |
| Income Tax Assets (Liabilities) | | Statements of Financial Position Location | | March 31,
2013 | | | December 31,
2012 | |
Current income tax assets: | | | | | | | | | | |
Current | | Receivables | | $ | 75 | | | $ | 124 | |
Non-current | | Other assets | | | 126 | | | | 130 | |
Deferred income tax assets | | Other assets | | | 29 | | | | 30 | |
Total income tax assets | | | | $ | 230 | | | $ | 284 | |
Current income tax liabilities: | | | | | | | | | | |
Current | | Payables and accrued charges | | $ | (7 | ) | | $ | (2 | ) |
Non-current | | Other non-current liabilities and deferred credits | | | (112 | ) | | | (110 | ) |
Deferred income tax liabilities | | Deferred income tax liabilities | | | (1,592 | ) | | | (1,482 | ) |
Total income tax liabilities | | | | $ | (1,711 | ) | | $ | (1,594 | ) |
7. Net Income per Share
Net income per share was calculated on the following weighted average number of shares:
| | | | | | | | |
| | | Three Months Ended
March 31 | |
| | | 2013 | | | 2012 | |
Basic | | | 865,056,000 | | | | 858,788,000 | |
Diluted | | | 876,672,000 | | | | 876,098,000 | |
Diluted net income per share was calculated based on the weighted average number of shares issued and outstanding during the period, incorporating the following adjustments. The denominator was: (1) increased by the total of the additional common shares that would have been issued assuming exercise of all stock options with exercise prices at or below the average market price for the period; and (2) decreased by the number of shares that the company could have repurchased if it had used the assumed proceeds from the exercise of stock options to repurchase them on the open market at the average share price for the period. For performance-based stock option plans, the
number of contingently issuable common shares included in the calculation was based on the number of shares, if any, that would be issuable if the end of the reporting period were the end of the performance period and the effect were dilutive.
Excluded from the calculation of diluted net income per share for the three months ended March 31, 2013 were weighted average options outstanding of 2,456,300 relating to the 2011 and 2008 Performance Option Plans, as the options’ exercise prices were greater than the average market price of common shares for the period.
| | |
| 9 | | PotashCorp 2013 First Quarter Quarterly Report on Form 10-Q |
8. Financial Instruments
Fair Value
Estimated fair values for financial instruments are designed to approximate amounts at which the instruments could be exchanged in a current arm’s-length transaction between knowledgeable willing parties. The valuation policies and procedures for financial reporting purposes are determined by the company’s finance department.
Presented below is a comparison of the fair value of certain financial instruments to their carrying values.
| | | | | | | | | | | | | | | | |
| | | March 31, 2013 | | | December 31, 2012 | |
| | | Carrying Amount of
Liability | | | Fair Value of
Liability | | | Carrying Amount of
Liability | | | Fair Value of
Liability | |
Long-term debt senior notes | | $ | 3,500 | | | $ | 3,993 | | | $ | 3,750 | | | $ | 4,284 | |
Due to their short-term nature, the fair value of cash and cash equivalents, receivables, short-term debt, and payables and accrued charges was assumed to approximate carrying value. The company’s derivative instruments and investments in Israel Chemicals Ltd. (“ICL”) and Sinofert Holdings Limited (“Sinofert”) were carried at fair value. The fair value of the company’s other long-term debt instruments approximated carrying value.
The fair value of the company’s senior notes at March 31, 2013 reflected the yield valuation based on observed market prices (Level 1), which ranged from 0.77 percent to 4.50 percent (December 31, 2012 — 0.40 percent to 4.35 percent).
The fair value of derivative instruments that are not traded in an active market (such as natural gas swaps and foreign currency derivatives) was determined using valuation techniques. The company used a variety of methods and made assumptions that were based on market conditions existing at each reporting date. Natural gas swap valuations were based on a discounted cash flow model. The inputs used in the model included contractual cash flows based on prices for natural gas futures contracts, fixed prices and notional volumes specified by the swap contracts, the time value of money, liquidity risk, the company’s own credit risk (related to instruments in a liability position) and counterparty credit risk (related to instruments in an asset position). Certain of the futures contract prices used as inputs in the model were
supported by prices quoted in an active market and others were not based on observable market data.
For valuations that included both observable and unobservable data, if the unobservable input was determined to be significant to the overall inputs, the entire valuation was categorized in Level 3. For natural gas swaps, the primary input into the valuation model was natural gas futures prices, which were based on delivery at the Henry Hub and were observable only for up to three years in the future. The unobservable futures price range at March 31, 2013 was $4.20 to $5.22 per MMBtu (December 31, 2012 — $4.58 to $5.48 per MMBtu). Changes in the unobservable natural gas futures prices would not result in significantly higher or lower fair values as any price change would be counterbalanced by offsetting derivative positions. Interest rates used to discount estimated cash flows at March 31, 2013 were between 0.20 percent and 3.10 percent (December 31, 2012 — between 0.21 percent and 3.26 percent) depending on the settlement date.
The fair value of foreign currency derivatives was determined using quoted forward exchange rates (Level 2) at the statements of financial position dates.
Fair value of investments designated as available-for-sale was based on the closing bid price of the common shares (Level 1) as of the statements of financial position dates.
| | |
| PotashCorp 2013 First Quarter Quarterly Report on Form 10-Q | | 10 |
The following table presents the company’s fair value hierarchy for financial assets and financial liabilities carried at fair value on a recurring basis.
| | | | | | | | | | | | | | | | |
| | | | | | Fair Value Measurements at Reporting Date Using: | |
| | | Carrying Amount
of Asset
(Liability) | | | Quoted Prices in
Active Markets for
Identical Assets
(Level 1)(1) | | | Significant Other
Observable
Inputs (Level 2)(1,2) | | | Significant
Unobservable
Inputs (Level 3)(2) | |
March 31, 2013 | | | | | | | | | | | | | | | | |
Derivative instrument assets | | | | | | | | | | | | | | | | |
Natural gas derivatives | | $ | 8 | | | $ | — | | | $ | — | | | $ | 8 | |
Investments in ICL and Sinofert | | | 2,667 | | | | 2,667 | | | | — | | | | — | |
Derivative instrument liabilities | | | | | | | | | | | | | | | | |
Natural gas derivatives | | | (203 | ) | | | — | | | | (13 | ) | | | (190 | ) |
Foreign currency derivatives | | | (2 | ) | | | — | | | | (2 | ) | | | — | |
| | | | | | | | | | | | | | | | |
December 31, 2012 | | | | | | | | | | | | | | | | |
Derivative instrument assets | | | | | | | | | | | | | | | | |
Natural gas derivatives | | $ | 9 | | | $ | — | | | $ | — | | | $ | 9 | |
Foreign currency derivatives | | | 1 | | | | — | | | | 1 | | | | — | |
Investments in ICL and Sinofert | | | 2,481 | | | | 2,481 | | | | — | | | | — | |
Derivative instrument liabilities | | | | | | | | | | | | | | | | |
Natural gas derivatives | | | (218 | ) | | | — | | | | (18 | ) | | | (200 | ) |
| (1) | During the three months ended March 31, 2013 and twelve months ended December 31, 2012, there were no transfers between Level 1 and Level 2. |
| (2) | During the three months ended March 31, 2013, there were no transfers into Level 3 and $(1) of gains was transferred out of Level 3 into Level 2 as (due to the passage of time) the terms of certain natural gas derivatives now matured within 36 months. During the twelve months ended December 31, 2012, there were no transfers into Level 3 and $10 of losses was transferred out of Level 3 into Level 2 as (due to the passage of time) the terms of certain natural gas derivatives now matured within 36 months. Our policy is to recognize transfers at the end of the reporting period. |
The following table presents the company’s fair value measurements using significant unobservable inputs (Level 3):
| | | | | | | | |
| | | Natural Gas Derivatives | |
| | | Three Months Ended
March 31, 2013 | | | Twelve Months Ended
December 31, 2012 | |
Balance, beginning of period | | $ | (191 | ) | | $ | (229 | ) |
Total (losses) gains (realized and unrealized) before income taxes | | | | | | | | |
Included in net income (cost of goods sold) | | | (7 | ) | | | (27 | ) |
Included in other comprehensive income | | | 8 | | | | 16 | |
Purchases | | | — | | | | — | |
Sales | | | — | | | | — | |
Issues | | | — | | | | — | |
Settlements | | | 9 | | | | 39 | |
Transfers of (gains) losses out of Level 3 | | | (1 | ) | | | 10 | |
Balance, end of period | | $ | (182 | ) | | $ | (191 | ) |
Gains (losses) for the period included in net income (cost of goods sold) were: | | | | | | | | |
Change in unrealized gains (losses) relating to instruments still held at the reporting date | | $ | — | | | $ | — | |
Total losses (realized and unrealized) | | | (7 | ) | | | (27 | ) |
9. Seasonality
The company’s sales of fertilizer can be seasonal. Typically, fertilizer sales are highest in the second quarter of the year, due to the North American spring planting season. However, planting conditions and the timing of customer purchases will vary each year and sales can be expected to shift from one quarter to another.
10. Contingencies and Other Matters
Canpotex
PCS is a shareholder in Canpotex Limited (“Canpotex”), which markets Saskatchewan potash offshore. Should any operating losses or other liabilities be incurred by Canpotex, the shareholders have contractually agreed to reimburse it for such losses or liabilities in proportion to each shareholder’s productive capacity.
| | |
| 11 | | PotashCorp 2013 First Quarter Quarterly Report on Form 10-Q |
Through March 31, 2013, there were no such operating losses or other liabilities.
Mining Risk
As is typical with other companies in the industry, the company is unable to acquire insurance for underground assets.
Legal and Other Matters
Significant environmental site assessment and/or remediation matters include the following:
| Ÿ | | The company, along with other parties, has been notified by the US Environmental Protection Agency (“USEPA”) of potential liability under the US Comprehensive Environmental Response, Compensation and Liability Act of 1980 (“CERCLA”) with respect to certain soil and groundwater conditions at a site in Lakeland, Florida that includes a former PCS Joint Venture fertilizer blending facility and certain surrounding properties. A Record of Decision (“ROD”) issued in September 2007 provides for a remedy that requires excavation of impacted soils and interim treatment of groundwater at a total estimated cost of $9. The soil remediation has been performed and approved by the USEPA. A Remedial Design Work Plan for the interim remedy for groundwater has been submitted to the USEPA for approval and work is expected to commence in the fourth quarter of 2013. Although PCS Joint Venture sold the Lakeland property in July 2006, PCS Joint Venture has retained the above-described remediation responsibilities and has indemnified the third-party purchaser for the costs of remediation and certain related items. |
| Ÿ | | The USEPA has identified PCS Nitrogen, Inc. (“PCS Nitrogen”) as a potentially responsible party at the Planters Property or Columbia Nitrogen site in Charleston, South Carolina. The site includes a former fertilizer blending operation, formerly owned by a company from which PCS Nitrogen acquired certain other assets. The USEPA has requested reimbursement of $3 of previously incurred response costs and the performance or financing of future site investigation and response activities from PCS Nitrogen and other named potentially responsible parties. The current owner of the Planters Property filed a complaint against PCS Nitrogen in the United States District Court for the District of South Carolina seeking environmental response costs. The district court allocated 30 percent of the liability for response costs at the site to PCS Nitrogen, as well as a proportional share of any costs that cannot be recovered from another responsible party. PCS Nitrogen appealed the decision to the United States Court of Appeals for the Fourth Circuit (“Fourth Circuit”). The Fourth Circuit affirmed the district court’s judgment on April 4, 2013. PCS Nitrogen is considering what actions are appropriate to take in response to the Fourth Circuit’s opinion. The ultimate amount of liability for PCS Nitrogen, if any, depends upon the final outcome of the litigation, the amount needed for remedial activities, the ability of other parties to pay and the availability of insurance. |
| Ÿ | | PCS Phosphate has agreed to participate, on a non-joint and several basis, with parties to an Administrative Settlement Agreement with the USEPA (“Settling Parties”) in a removal action and the payment of certain other costs associated with PCB soil contamination at the Ward Superfund Site in Raleigh, North Carolina (“Site”), including reimbursement of past USEPA costs. The removal activities commenced in August 2007 and are estimated to cost $75. PCS Phosphate is a party to ongoing CERCLA contribution and cost recovery litigation for the recovery of costs of the removal activities, and the USEPA is seeking additional investigation and remediation work at the site. At this time, the company is unable to evaluate the extent of any exposure that it may have for the matters addressed in the CERCLA contribution litigation or as a result of the requests by the USEPA for additional work at the site. |
| Ÿ | | In 1996, PCS Nitrogen Fertilizer, L.P. (“PCS Nitrogen Fertilizer”), then known as Arcadian Fertilizer, L.P., entered into a Consent Order (the “Order”) with the Georgia Environmental Protection Division (“GEPD”) in conjunction with PCS Nitrogen Fertilizer’s acquisition of real property in Augusta, Georgia. Under the Order, PCS Nitrogen Fertilizer is required to perform certain activities to investigate and, if necessary, implement corrective measures for substances in soil and groundwater. The investigation has proceeded and the results have been presented to GEPD. Two interim corrective measures for substances in groundwater have been proposed by PCS Nitrogen Fertilizer and approved by GEPD. PCS Nitrogen Fertilizer is implementing the approved interim corrective measures but it is unable to estimate with reasonable certainty the total cost of its corrective action obligations under the Order at this time. |
| Ÿ | | In December 2009, during a routine inspection of a gypsum stack at the White Springs, Florida facility, a sinkhole was discovered that resulted in the loss of approximately 82 million gallons of water from the stack. The company incurred costs of $17 to address the sinkhole between the time of discovery and completion of remediation in July 2011. The company submitted, and the Florida Department of Environmental Protection is reviewing, the Remedial Summary Report for the sinkhole remediation. The company also entered into an order on consent with the USEPA. In May 2011, the USEPA and the company’s Board of Directors approved the company’s proposal to implement certain mitigation measures to meet the goals of the USEPA order on consent. |
The company is also engaged in ongoing site assessment and/or remediation activities at a number of other facilities and sites, and anticipated costs associated with these matters are added to accrued environmental costs in the manner previously described in Note 14 to the company’s 2012 annual consolidated financial statements. This includes matters related to investigation of potential brine migration at certain of the potash sites. Based on current information, the company does not believe that its future obligations with respect to these facilities and sites are reasonably
| | |
| PotashCorp 2013 First Quarter Quarterly Report on Form 10-Q | | 12 |
likely to have a material adverse effect on its consolidated financial position or results of operations.
Other significant legal matters include the following:
| Ÿ | | The USEPA has an ongoing initiative to evaluate implementation within the phosphate industry of a particular exemption for mineral processing wastes under the hazardous waste program. In connection with this industry-wide initiative, the USEPA conducted inspections at numerous phosphate operations and notified the company of alleged violations of the US Resource Conservation and Recovery Act (“RCRA”) at its plants in Aurora, North Carolina; Geismar, Louisiana; and White Springs, Florida; and one alleged Clean Air Act (“CAA”) violation at its Geismar, Louisiana plant. The company has entered into RCRA 3013 Administrative Orders on Consent and has performed certain site assessment activities at all three plants. At this time, it does not know the scope of corrective action, if any, that may be required. As to the alleged RCRA violations, the company continues to participate in settlement discussions with the USEPA but is uncertain if any resolution will be possible without litigation, or, if litigation occurs, what the outcome would be. At this time, it is unable to evaluate the extent of any exposure it may have in these matters. As to the alleged CAA violation, the company and the USEPA have negotiated a consent decree, pursuant to which PCS has agreed to pay a penalty of $0.2 to resolve this matter. The consent decree remains subject to public comment. |
| Ÿ | | The USEPA has begun an initiative to evaluate compliance with the CAA at sulfuric acid and nitric acid plants. In connection with this industry-wide initiative, it has sent requests for information to numerous facilities, including the company’s plants in Augusta, Georgia; Aurora, North Carolina; Geismar, Louisiana; Lima, Ohio; and White Springs, Florida. The USEPA and the Louisiana Department of Environmental Quality have notified the company of various alleged violations of the CAA at its Geismar, Louisiana plant. The governments have demanded process changes and penalties that would cost approximately $46, but the company denies that it has any liability for the Geismar, Louisiana matter. The company is uncertain if any resolution will be possible without litigation, or, if litigation occurs, what the outcome would be. In May 2012, the USEPA issued to the company’s White Springs, Florida plant a Notice of Violation alleging that certain specified projects at the sulfuric acid plants were undertaken in violation of the CAA. The company has met with the USEPA to discuss these allegations but, at this time, is uncertain if any resolution will be possible without litigation, or, if litigation occurs, what the outcome would be. |
| Ÿ | | Significant portions of the company’s phosphate reserves in Aurora, North Carolina are located in wetlands. Under the Clean Water Act, the company must obtain a permit from the US Army Corps of Engineers (the “Corps”) before mining in the |
| | | wetlands. In January 2009, the Division of Water Quality of the North Carolina Department of Natural Resources issued a certification under Section 401 of the Clean Water Act that mining of phosphate in excess of 30 years from lands owned or controlled by the company, including some wetlands, would not degrade water quality. Thereafter, in June 2009, the Corps issued the company a permit that will allow it to mine the phosphate deposits identified in the Section 401 certification. Four environmental organizations (Pamlico-Tar River Foundation, North Carolina Coastal Federation, Environmental Defense Fund and Sierra Club, collectively, the “petitioners”), have exhausted their administrative appeals of this decision without success and are now pursuing an appeal in a North Carolina Superior Court. |
| Ÿ | | There is no certainty as to the scope or timing of any final, effective requirements to control greenhouse gas emissions in the US or Canada. Canada has withdrawn from participation in the Kyoto Protocol, and the Canadian government has announced its intention to coordinate greenhouse gas policies with the US. Although the US Congress has not passed any greenhouse gas emission control laws, the USEPA has adopted several rules to control such emissions using authority under existing environmental laws. Some Canadian provinces and US states are considering the adoption of greenhouse gas emission control requirements. In Saskatchewan, provincial regulations pursuant to the Management and Reduction of Greenhouse Gases Act, which impose a type of carbon tax to achieve a goal of a 20 percent reduction in greenhouse gas emissions by 2020 compared to 2006 levels, may become effective in 2013. None of these regulations has resulted in material limitations on greenhouse gas emissions at the company’s facilities. The company is monitoring these developments and their future effect on its operations cannot be determined with certainty at this time. |
| Ÿ | | In December 2010, the USEPA issued a final rule to restrict nutrient concentrations in surface waters in Florida to levels below those currently permitted to be discharged from the company’s White Springs, Florida plant. Projected capital costs resulting from the USEPA rule, if it becomes effective, could be in excess of $100 for White Springs, and there is no guarantee that controls can be implemented which are capable of achieving compliance with the revised nutrient standards under all flow conditions. Various judicial challenges to the federal rules have been filed, including one lawsuit against the federal rule by The Fertilizer Institute (“TFI”) and White Springs. In February 2012, the United States District Court for the Northern District of Florida (“District Court”) ruled on summary judgment motions filed by the parties seeking to either vacate or uphold the USEPA rule. The District Court upheld the USEPA numeric nutrient criteria for Florida’s lakes and springs but rejected the criteria for Florida’s streams and rivers as arbitrary and capricious. In November 2012, the USEPA approved numeric nutrient criteria rules in their entirety which had been adopted |
| | |
| 13 | | PotashCorp 2013 First Quarter Quarterly Report on Form 10-Q |
| | | by the State of Florida and filed with the USEPA in June 2012. These state rules, which have been upheld on appeal, could substitute for the federal rules. In addition, the District Court recently granted the USEPA a further stay (to November 15, 2013) of protection values for certain inland waters but upheld the current effective date (January 6, 2013) of numeric nutrient criteria for Florida lakes and springs. The Florida Legislature is also considering proposed legislation that, if enacted, would facilitate the USEPA’s withdrawal of its federal rules, thereby allowing the State of Florida to fully implement the adopted state rules. In the meantime, the company continues to monitor and evaluate actions related to both the federal and state rules. The prospects for implementation of either the federal or the state rule and the availability of the site-specific relief mechanisms under either rule are uncertain. |
| Ÿ | | Between September and October 2008, the company and PCS Sales (USA), Inc. were named as defendants in eight similar antitrust complaints filed in US federal courts. Other potash producers were also defendants in these cases. Each of the separate complaints alleges conspiracy to fix potash prices, to divide markets, to restrict supply and to fraudulently conceal the conspiracy, all in violation of Section 1 of the Sherman Act and/or certain states’ laws. In January 2013, the company and PCS Sales (USA), Inc. settled the eight private antitrust lawsuits for a total of $44. The settlements are subject to final approval of the US District Court for the Northern District of Illinois. The court has scheduled a final approval hearing on the settlement for June 12, 2013. The company and PCS Sales (USA), Inc. expressly deny any wrongdoing but decided to settle after weighing the multi-year financial cost and resources that would be required to defend these meritless allegations. The other potash producers who were defendants in these cases also have settled with the plaintiffs. |
In addition, various other claims and lawsuits are pending against the company in the ordinary course of business. While it is not possible to determine the ultimate outcome of such actions at this time, and inherent uncertainties exist in predicting such outcomes, it is the company’s belief that the ultimate resolution of such actions is not reasonably likely to have a material adverse effect on its consolidated financial position or results of operations.
The breadth of the company’s operations and the global complexity of tax regulations require assessments of uncertainties and judgments in estimating the taxes it will ultimately pay. The final taxes paid are dependent upon many factors, including negotiations with taxing authorities in various jurisdictions, outcomes of tax litigation and resolution of disputes arising from federal, provincial, state and local tax audits. The resolution of these uncertainties and the associated final taxes may result in adjustments to the company’s tax assets and tax liabilities.
The company owns facilities that have been either permanently or indefinitely shut down. It expects to incur nominal annual
expenditures for site security and other maintenance costs at certain of these facilities. Should the facilities be dismantled, certain other shutdown-related costs may be incurred. Such costs are not expected to have a material adverse effect on the company’s consolidated financial position or results of operations and would be recognized and recorded in the period in which they are incurred.
11. Guarantees
The environmental regulations of the Province of Saskatchewan require each potash mine to have decommissioning and reclamation plans, and financial assurances for these plans, approved by the responsible provincial minister. The Minister of the Environment for Saskatchewan (“MOE”) has approved the plans previously submitted by the company, which had provided a CDN $2 irrevocable letter of credit and a payment of CDN $3 into the agreed-upon trust fund. Under the regulations, the decommissioning and reclamation plans and financial assurances are to be reviewed at least once every five years, or as required by the MOE. The most recent scheduled review was to be completed by June 30, 2011. The company submitted its decommissioning and reclamation plans and its financial assurances proposal in May 2011. The MOE has previously advised that it considers the company in compliance with the regulations until the review is finalized. In April 2013, the company received a counter proposal from the MOE that includes a proposed increase to the amount of required funding to a trust fund. The company is currently reviewing the MOE counter proposal. The company does not believe that the funding amounts proposed by the MOE with respect to this matter are reasonably likely to have a material impact on its consolidated financial position or results of operations.
12. Related Party Transactions
The company sells potash from its Saskatchewan mines for use outside Canada and the US exclusively to Canpotex, a potash export, sales and marketing company owned in equal shares by the three producers in Saskatchewan. Sales are at prevailing market prices and are settled on normal trade terms. Sales to Canpotex for the three months ended March 31, 2013 were $375 (2012 — $292). At March 31, 2013, $229 (December 31, 2012 — $251) was owing from Canpotex.
13. Comparative Figures
As described in Note 1, as a result of the retrospective adoption of amendments to IAS 1 effective January 1, 2013, prior periods’ figures within the Condensed Consolidated Statements of Comprehensive Income have been reclassified to conform with the current period’s presentation.
Additionally, certain prior periods’ figures within the Condensed Consolidated Statements of Changes in Equity have been reclassified to conform with the current period’s presentation which the company believes provides more succinct information.
| | |
| PotashCorp 2013 First Quarter Quarterly Report on Form 10-Q | | 14 |
Item 2. Management’s Discussion and Analysis of Financial Condition and Results of Operations
The following discussion and analysis is the responsibility of management and is as of April 30, 2013. The Board of Directors carries out its responsibility for review of this disclosure principally through its audit committee, comprised exclusively of independent directors. The audit committee reviews and, prior to its publication, approves this disclosure, pursuant to the authority delegated to it by the Board of Directors. The term “PCS” refers to Potash Corporation of Saskatchewan Inc. and the terms “we,” “us,” “our,” “PotashCorp” and “the company” refer to PCS and, as applicable, PCS and its direct and indirect subsidiaries as a group. Additional information relating to PotashCorp, including our Annual Report on Form 10-K for the year ended December 31, 2012 (Form 10-K), can be found on SEDAR at www.sedar.com and on EDGAR at www.sec.gov/edgar.shtml. The company is a foreign private issuer under the rules and regulations of the US Securities and Exchange Commission (the SEC); however, it currently files voluntarily on the SEC’s domestic forms.
PotashCorp and Our Business Environment
PotashCorp is an integrated producer of fertilizer, industrial and animal feed products. We are the world’s largest fertilizer company by capacity, producing the three primary crop nutrients: potash (K), nitrogen (N) and phosphate (P). As the world’s leading potash producer, we are responsible for approximately 20 percent of global potash capacity through our Canadian operations. To enhance our global footprint, we also have investments in other key global potash-related businesses in South America, the Middle East and Asia. We complement our potash assets with focused positions in nitrogen and phosphate.
We sell fertilizer to North American retailers, cooperatives and distributors that provide storage and application services to farmers, the end users. Our offshore customers are government agencies and private importers that buy under contract and on the spot market; while spot market sales are more prevalent in North America, South America and Southeast Asia. Fertilizers are sold primarily for spring and fall application in both Northern and Southern hemispheres.
Transportation is an important part of the final purchase price for fertilizer so producers usually sell to the closest customers. In North America, we sell mainly on a delivered basis via rail, barge, truck and pipeline. Offshore customers purchase product either at the port where it is loaded or delivered with freight included directly to a specified location.
Potash, nitrogen and phosphate are also used as inputs for the production of animal feed and industrial products. Most feed and industrial sales are by contract and are more evenly distributed throughout the year than fertilizer sales.
PotashCorp Strategy
We believe that our ability to deliver superior long-term financial returns is the cornerstone of establishing enduring value for all stakeholders. Strong financial performance rewards our shareholders and, at the same time, allows us to focus on our broader social and environmental responsibilities and contribute to the long-term success of our customers, employees, suppliers and communities.
In each nutrient segment, we develop strategies and set priorities that align with our broad goals. Each nutrient plays an important part in our success, but we believe our unique leverage in potash offers the greatest opportunity for future growth.
Our strategic approach in potash is to build on our world-class position whenever opportunities arise that can enhance our value, and to focus on matching our production to market demand (to reduce downside risk and conserve the long-term value of our resource, while still striving to grow our volumes as capacity rises). Our strategic approach in nitrogen is to enhance gross margin and earnings stability by being a lower delivered-cost supplier to the large US market, emphasizing ammonia sales to industrial customers that value long-term secure supply, and to focus on initiatives that can reduce our environmental impact. Our strategic approach in phosphate is to leverage our high-quality rock and produce the industry’s most diversified mix of products in an attempt to maximize returns and provide earnings stability, with a focus on reducing our environmental footprint to support the long-term viability of our operations.
We seek to be the supplier of choice to the markets we serve. It is critical to our success that our customers recognize our ability to create value for them based on the price they pay for our products.
As we plan for our future, we carefully weigh our choices for use of our cash flow. We will continue to deploy cash in ways that we believe achieve the best return for our investors, such as enhancing dividends, repurchasing shares and growing our potash business as value-adding opportunities arise.
| | |
| 15 | | PotashCorp 2013 First Quarter Quarterly Report on Form 10-Q |
Key Performance Drivers — Performance Compared to Targets
Through our integrated value model, we set, evaluate and refine our goals and priorities to drive improvements that benefit all those impacted by our business. We demonstrate our accountability by tracking and reporting our progress against targets related to each goal. Our long-term goals and 2013 targets are set out on pages 42 to 52 of our 2012 Annual Integrated Report. A summary of our progress against selected goals and representative annual targets is set out below.
| | | | |
| Goal | | Representative 2013 Annual Target | | Performance to March 31, 2013 |
| Create superior long-term shareholder value. | | Exceed total shareholder return performance for our sector and the DAXglobal Agribusiness Index. | | PotashCorp’s total shareholder return was -3 percent in the first three months of 2013 compared to our sector’s weighted average return (based on market capitalization) of -1 percent and the DAXglobal Agribusiness Index weighted average return (based on market capitalization) of 4 percent. |
| Be the supplier of choice to the markets we serve. | | Reduce domestic potash net rail cycle time through the Chicago corridor by 10 percent in 2014, compared to 2011 levels. | | The domestic potash net rail cycle time through the Chicago corridor during the first quarter of 2013 was higher than the comparable quarter in both 2011 and 2012. Rail performance was impacted by severe and prolonged winter weather in the Canadian prairies increasing transit times and yard dwell during the quarter. We view this as a single quarter impact to the business and anticipate improved performance for the balance of the year. Improved net rail cycle times during subsequent quarters should allow us to achieve our targeted performance on an annual basis in 2013. |
| Attract and retain talented, motivated and productive employees who are committed to our long-term goals. | | Maintain an annual employee turnover rate (excluding retirements) of 5 percent or less. | | Employee turnover rate (excluding retirements) on an annualized basis for the first three months of 2013 was 4.5 percent. |
Achieve no harm to people. | | Become one of the safest companies in the world within five years by achieving a recordable injury rate in the lowest quartile of a best-in-class peer group. | | A five-year strategic plan and a benchmark group of best-in-class peer companies are expected to be developed by the second quarter of 2013. |
| | | | | |
| | | Reduce total site recordable injury rate to 1.25 (per 200,000 hours worked) or lower. | | During the first three months of 2013, total site recordable injury rate was 0.90. |
| Achieve no damage to the environment. | | Reduce total reportable incidents (releases, permit excursions and spills) by 15 percent from 2012 levels. | | Annualized total reportable incidents were up 47 percent during the first three months of 2013 compared to 2012 annual levels. Compared to the first three months of 2012, total reportable incidents were flat. |
Performance Overview
This discussion and analysis are based on the company’s unaudited interim condensed consolidated financial statements included in Item 1 of this Quarterly Report on Form 10-Q (financial statements in this Form 10-Q) based on International Financial Reporting Standards, as issued by the International Accounting Standards
Board (IFRS), unless otherwise stated. All references to per-share amounts pertain to diluted net income per share.
For an understanding of trends, events, uncertainties and the effect of critical accounting estimates on our results and financial condition, the entire document should be read carefully, together with our 2012 Annual Integrated Report.
Earnings Guidance — First Quarter 2013
| | | | | | | | |
| | | Company Guidance | | | Actual Results | |
Earnings per share | | $ | 0.50 – $0.65 | | | $ | 0.63 | |
| | |
| PotashCorp 2013 First Quarter Quarterly Report on Form 10-Q | | 16 |
Overview of Actual Results
| | | | | | | | | | | | | | | | |
| | | Three Months Ended March 31 | |
| Dollars (millions) — except per-share amounts | | 2013 | | | 2012 | | | Change | | | % Change | |
Sales | | $ | 2,100 | | | $ | 1,746 | | | $ | 354 | | | | 20 | |
Gross margin | | | 867 | | | | 698 | | | | 169 | | | | 24 | |
Operating income | | | 817 | | | | 685 | | | | 132 | | | | 19 | |
Net income | | | 556 | | | | 491 | | | | 65 | | | | 13 | |
Net income per share — diluted | | | 0.63 | | | | 0.56 | | | | 0.07 | | | | 13 | |
Other comprehensive income | | | 197 | | | | 110 | | | | 87 | | | | 79 | |
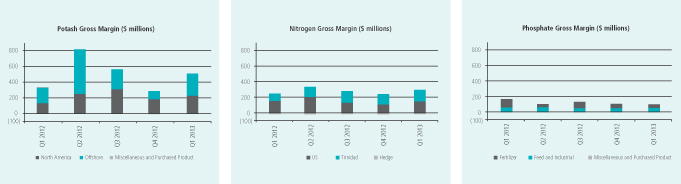
Earnings in the first quarter of 2013 were higher than the first quarter of 2012 due mostly to higher potash sales volumes, partially offset by lower potash prices. Record first-quarter nitrogen gross margin improved primarily due to increased sales prices while phosphate gross margin fell mainly due to lower fertilizer prices and volumes.
Potash shipments to all major markets accelerated during the first quarter. In North America, dealers began positioning product to meet farmers’ significant spring requirements. First-quarter domestic shipments from North American potash producers rose 56 percent above those of the same period last year and dealers’ need to secure additional product remained high as the quarter closed. Buyers in key offshore markets also turned their attention to securing new supply after limited activity in the final quarter of 2012. As a result, offshore shipments from North American producers were 74 percent above last year’s first quarter. With China’s early settlement of potash supply contracts and strong demand in Brazil, shipments accelerated during the quarter, culminating in a monthly export record in March. Indian customers returned to the potash market, although movement was limited as new contracts with major suppliers were not settled until mid-quarter. Following a weak market to close 2012, prices in all key regions reset late in the year, resulting in lower realizations during the first quarter of 2013.
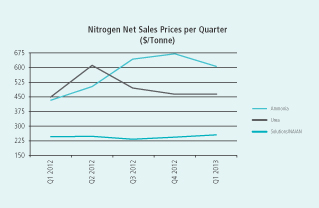
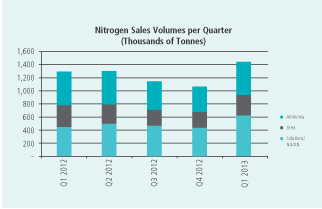
In nitrogen, the slow start to the spring season in North America delayed demand during the quarter. While prices for nitrogen products – especially ammonia – remained at historically high levels, a significant rise in urea imports to the US ahead of the spring season led to weaker urea prices relative to other nitrogen products.
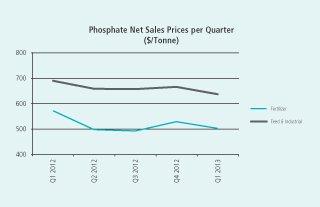
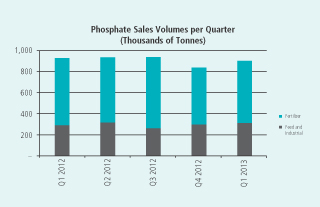
Phosphate markets continued to face challenges due to uncertainty surrounding the timing and extent of a return in demand from India, which in recent years accounted for more than 30 percent of global trade in solid phosphate fertilizers. While a rebound in North American demand and strong US producer exports to Latin America partially offset the absence of significant Indian demand, total US shipments trailed those of the previous year. This resulted in lower prices for phosphate fertilizer products compared to the first quarter of 2012.
Other significant factors that affected earnings in the first quarter of 2013 compared to the same period in 2012 were higher income taxes due to increased earnings before taxes and higher provincial mining and other taxes on increased potash sales. Other comprehensive income for the first quarter of 2013 was mainly the result of an increase in the fair value of our investments in Israel Chemicals Ltd. (ICL) and Sinofert Holdings Limited (Sinofert). Other comprehensive income for the first quarter of 2012 was primarily impacted by a rise in the fair value of our investment in ICL and was partially offset by a decline in the fair value of our investment in Sinofert.
| | |
| 17 | | PotashCorp 2013 First Quarter Quarterly Report on Form 10-Q |
Balance Sheet
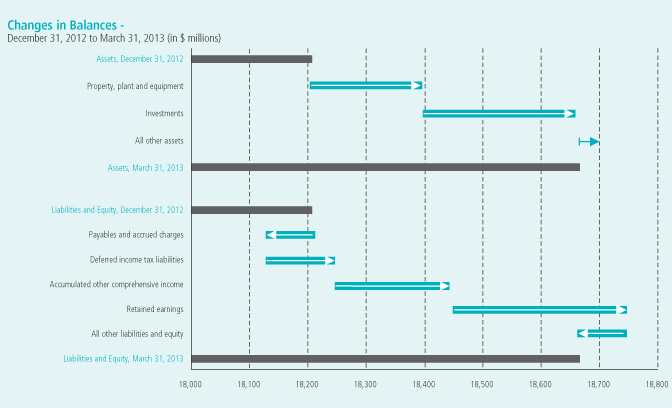
Property, plant and equipment increased primarily (70 percent) due to our previously announced potash capacity expansions and other potash projects. Available-for-sale investments rose due to the higher fair value of our investments in ICL and Sinofert. As at March 31, 2013, $476 million (December 31, 2012 — $481 million) of our cash and cash equivalents were held in certain foreign subsidiaries. There are no current plans to repatriate these funds in a taxable manner.
Payables and accrued charges were impacted by (1) lower trade payables; (2) higher dividends payable due to announced increases in dividends per share; and (3) increased interest payable due to timing of routine interest payments. Deferred income tax liabilities increased primarily due to tax depreciation exceeding accounting depreciation.
Equity was impacted by net income, other comprehensive income (both discussed in more detail above) and dividends declared during the first three months of 2013.
Operating Segment Review
We report our results (including gross margin) in three business segments: potash, nitrogen and phosphate as described in Note 5 to the financial statements in this Form 10-Q. Our reporting structure reflects how we manage our business and how we classify our operations for planning and measuring performance. Management includes net sales in segment disclosures in the unaudited interim condensed consolidated financial statements pursuant to IFRS, which require segmentation based upon our internal organization and reporting of revenue and profit measures derived from internal accounting methods. As a component of gross margin, net sales (and the related per-tonne amounts) are the primary revenue measures we use and review in making decisions about operating matters on a business segment basis. These decisions include assessments about potash, nitrogen and phosphate performance and the resources to be allocated to these segments. We also use net sales (and the related per-tonne amounts) for business planning and monthly forecasting. Net sales are calculated as sales revenues less freight, transportation and distribution expenses. Realized prices refer to net sales prices.
Our discussion of segment operating performance is set out below and includes nutrient product and/or market performance results, where applicable, to give further insight into these results.
| | |
| PotashCorp 2013 First Quarter Quarterly Report on Form 10-Q | | 18 |
Potash
Potash Financial Performance
| | | | | | | | | | | | | | | | | | | | | | | | | | | | | | | | | | | | |
| | | Three Months Ended March 31 | |
| | | Dollars (millions) | | | Tonnes (thousands) | | | Average per Tonne(1) | |
| | | 2013 | | | 2012 | | | % Change | | | 2013 | | | 2012 | | | % Change | | | 2013 | | | 2012 | | | % Change | |
Manufactured product | | | | | | | | | | | | | | | | | | | | | | | | | | | | | | | | | | | | |
Net sales | | | | | | | | | | | | | | | | | | | | | | | | | | | | | | | | | | | | |
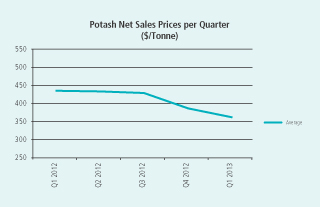
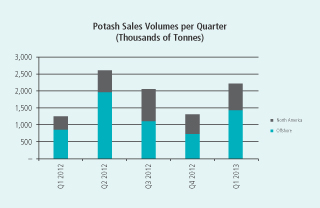
North America | | $ | 331 | | | $ | 199 | | | | 66 | | | | 794 | | | | 400 | | | | 99 | | | $ | 417 | | | $ | 497 | | | | (16 | ) |
Offshore | | | 477 | | | | 344 | | | | 39 | | | | 1,432 | | | | 849 | | | | 69 | | | $ | 333 | | | $ | 406 | | | | (18 | ) |
| | | 808 | | | | 543 | | | | 49 | | | | 2,226 | | | | 1,249 | | | | 78 | | | $ | 363 | | | $ | 435 | | | | (17 | ) |
Cost of goods sold | | | (304 | ) | | | (218 | ) | | | 39 | | | | | | | | | | | | | | | $ | (136 | ) | | $ | (175 | ) | | | (22 | ) |
Gross margin | | | 504 | | | | 325 | | | | 55 | | | | | | | | | | | | | | | $ | 227 | | | $ | 260 | | | | (13 | ) |
Other miscellaneous and purchased product gross margin(2) | | | — | | | | 2 | | | | (100 | ) | | | | | | | | | | | | | | | | | | | | | | | | |
Gross Margin | | $ | 504 | | | $ | 327 | | | | 54 | | | | | | | | | | | | | | | $ | 227 | | | $ | 262 | | | | (13 | ) |
| (1) | Rounding differences may occur due to the use of whole dollars in per-tonne calculations. |
| (2) | Comprised of net sales of $6 million (2012 — $6 million) less cost of goods sold of $6 million (2012 — $4 million). |
Potash gross margin variance attributable to:
| | | | | | | | | | | | | | | | |
| | | Three Months Ended March 31 2013 vs. 2012 | |
| | | | | | Change in
Prices/Costs | | | | |
| Dollars (millions) | | Change in Sales Volumes | | | Net Sales | | | Cost of Goods Sold | | | Total | |
Manufactured product | | | | | | | | | | | | | | | | |
North America | | $ | 158 | | | $ | (63 | ) | | $ | 4 | | | $ | 99 | |
Offshore | | | 182 | | | | (105 | ) | | | 3 | | | | 80 | |
Change in market mix | | | (7 | ) | | | 8 | | | | (1 | ) | | | — | |
Total manufactured product | | $ | 333 | | | $ | (160 | ) | | $ | 6 | | | | 179 | |
Other miscellaneous and purchased product | | | | | | | | | | | | | | | (2 | ) |
Total | | | | | | | | | | | | | | $ | 177 | |
| | |
| 19 | | PotashCorp 2013 First Quarter Quarterly Report on Form 10-Q |
Canpotex Limited (Canpotex) sales to major markets, by percentage of sales volumes, were as follows:
| | | | | | | | | | | | | | | | |
| | | Three Months Ended March 31 | |
| | | 2013 | | | 2012 | | | Change | | | % Change | |
Asia (excluding China and India) | | | 39 | | | | 70 | | | | (31 | ) | | | (44 | ) |
Latin America | | | 27 | | | | 12 | | | | 15 | | | | 125 | |
China | | | 25 | | | | 7 | | | | 18 | | | | 257 | |
India | | | 3 | | | | 4 | | | | (1 | ) | | | (25 | ) |
Oceania, Europe and Other | | | 6 | | | | 7 | | | | (1 | ) | | | (14 | ) |
| | | | 100 | | | | 100 | | | | | | | | | |
| | |
| PotashCorp 2013 First Quarter Quarterly Report on Form 10-Q | | 20 |
The most significant contributors to the change in total gross margin quarter over quarter were as follows(1):
| (1) | Direction of arrows refers to impact on gross margin. |
| | | | |
| Net Sales Prices | | Sales Volumes | | Cost of Goods Sold |
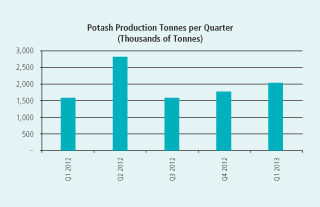
i Our average realized potash price trailed the first quarter of 2012, reflecting lower pricing that took hold late in that year. | | h Strong engagement in key markets pushed sales volumes significantly above first-quarter 2012. With limited dealer inventory carried into 2013 and strong agricultural fundamentals, North American sales volumes nearly doubled the volumes sold in the same period last year. h Offshore demand accelerated during the quarter. Our New Brunswick facility sold record first-quarter volumes to Latin America and Canpotex shipped, in March, its highest one-month total ever to this market. China resumed seaborne deliveries in the quarter. | | h Brine management costs fell as our tolling agreement at Esterhazy expired at the end of 2012. h 16 shutdown weeks were taken in 2013 mainly as a result of our strategy to match production with market demand and for expansion-related activities (29 shutdown weeks were taken in 2012 to match supply to demand; during this downtime, we opted to allocate resources to non-production activities rather than lay off employees, which resulted in higher shutdown costs). |
| | | | |
Potash Non-Financial Performance
| | | | | | | | | | | | |
| | | Three Months Ended March 31 | |
| | | 2013 | | | 2012 | | | % Change | |
KCl tonnes produced (thousands) | | | 2,025 | | | | 1,575 | | | | 29 | |
Total site recordable injury rate | | | 1.43 | | | | 2.16 | | | | (34 | ) |
Employee turnover percentage | | | 4.8 | | | | 4.7 | | | | 2 | |
Environmental incidents | | | 6 | | | | 2 | | | | 200 | |
Potash production increased due to the reduction in shutdown weeks as discussed above.
Total site recordable injury rate declined because of the effort by the site teams and an external consultant on targeted safety improvement projects at Allan, Cory and Rocanville.
The increase in environmental incidents in potash is due largely to several failures of refrigerant lines in new HVAC units installed at Picadilly.
| | |
| 21 | | PotashCorp 2013 First Quarter Quarterly Report on Form 10-Q |
Nitrogen
Nitrogen Financial Performance
| | | | | | | | | | | | | | | | | | | | | | | | | | | | | | | | | | | | |
| | | Three Months Ended March 31 | |
| | | Dollars (millions) | | | Tonnes (thousands) | | | Average per Tonne(1) | |
| | | 2013 | | | 2012 | | | % Change | | | 2013 | | | 2012 | | | % Change | | | 2013 | | | 2012 | | | % Change | |
Manufactured product | | | | | | | | | | | | | | | | | | | | | | | | | | | | | | | | | | | | |
Net sales | | | | | | | | | | | | | | | | | | | | | | | | | | | | | | | | | | | | |
Ammonia | | $ | 311 | | | $ | 230 | | | | 35 | | | | 513 | | | | 516 | | | | (1 | ) | | $ | 606 | | | $ | 447 | | | | 36 | |
Urea | | | 145 | | | | 154 | | | | (6 | ) | | | 305 | | | | 334 | | | | (9 | ) | | $ | 476 | | | $ | 462 | | | | 3 | |
Solutions/Nitric acid/Ammonium nitrate | | | 161 | | | | 110 | | | | 46 | | | | 622 | | | | 440 | | | | 41 | | | $ | 259 | | | $ | 249 | | | | 4 | |
| | | 617 | | | | 494 | | | | 25 | | | | 1,440 | | | | 1,290 | | | | 12 | | | $ | 429 | | | $ | 383 | | | | 12 | |
Cost of goods sold | | | (349 | ) | | | (288 | ) | | | 21 | | | | | | | | | | | | | | | $ | (242 | ) | | $ | (223 | ) | | | 9 | |
Gross margin | | | 268 | | | | 206 | | | | 30 | | | | | | | | | | | | | | | $ | 187 | | | $ | 160 | | | | 17 | |
Other miscellaneous and purchased product gross margin(2) | | | 3 | | | | 13 | | | | (77 | ) | | | | | | | | | | | | | | | | | | | | | | | | |
Gross Margin | | $ | 271 | | | $ | 219 | | | | 24 | | | | | | | | | | | | | | | $ | 188 | | | $ | 170 | | | | 11 | |
| (1) | Rounding differences may occur due to the use of whole dollars in per-tonne calculations. |
| (2) | Comprised of net sales of $17 million (2012 — $27 million) less cost of goods sold of $14 million (2012 — $14 million). |
Nitrogen gross margin variance attributable to:
| | | | | | | | | | | | | | | | |
| | | Three Months Ended March 31
2013 vs. 2012 | |
| | | | | | Change in
Prices/Costs | | | | |
| Dollars (millions) | | Change in Sales Volumes | | | Net Sales | | | Cost of Goods Sold | | | Total | |
Manufactured product | | | | | | | | | | | | | | | | |
Ammonia | | $ | (2 | ) | | $ | 82 | | | $ | (22 | ) | | $ | 58 | |
Urea | | | (9 | ) | | | 4 | | | | (9 | ) | | | (14 | ) |
Solutions, NA, AN | | | 32 | | | | 6 | | | | (23 | ) | | | 15 | |
Hedge | | | — | | | | — | | | | 3 | | | | 3 | |
Change in market mix | | | 27 | | | | (27 | ) | | | — | | | | — | |
Total manufactured product | | $ | 48 | | | $ | 65 | | | $ | (51 | ) | | | 62 | |
Other miscellaneous and purchased product | | | | | | | | | | | | | | | (10 | ) |
Total | | | | | | | | | | | | | | $ | 52 | |
| | |
| PotashCorp 2013 First Quarter Quarterly Report on Form 10-Q | | 22 |
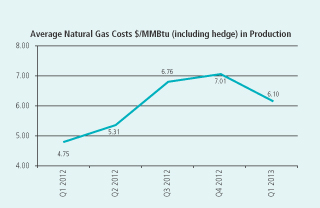
| | | | | | | | | | | | | | | | |
| | | Three Months Ended March 31 | |
| | | Sales Tonnes
(thousands) | | | Price per Tonne | |
| | | 2013 | | | 2012 | | | 2013 | | | 2012 | |
Fertilizer | | | 364 | | | | 375 | | | $ | 423 | | | $ | 413 | |
Industrial and Feed | | | 1,076 | | | | 915 | | | $ | 430 | | | $ | 371 | |
| | | | 1,440 | | | | 1,290 | | | $ | 429 | | | $ | 383 | |
The most significant contributors to the change in total gross margin quarter over quarter were as follows(1):
| (1) | Direction of arrows refers to impact on gross margin. |
| | | | | | | | | | |
| | | Net Sales Prices | | | | Sales Volumes | | | | Cost of Goods Sold |
h | | Ammonia increased as a result of strong demand coupled with supply challenges in key producing regions. | | h | | Additional ammonia capacity at Geismar and Augusta, as well as reduced impact from natural gas curtailments in Trinidad led to an increase in saleable tonnes of downstream products. This resulted in first-quarter nitrogen sales volumes higher than the same period last year. | | i | | Average natural gas costs in production, including hedge, increased 28 percent. Natural gas costs in Trinidad production rose 46 percent (contract price indexed, in part, to Tampa ammonia prices) while our US spot costs for natural gas used in production increased 21 percent. Including losses on our hedge position, US gas prices increased 3 percent. |
| | | | | | | �� | | | |
| The change in market mix produced a favorable variance of $27 million related to sales volumes and an unfavorable variance of $27 million in sales prices due to more lower-priced products being sold. | | i | | Increased costs, due to the restart of a plant at Geismar, caused the cost of goods sold variance for solutions/nitric acid/ammonium nitrate to be higher. |
| | |
| 23 | | PotashCorp 2013 First Quarter Quarterly Report on Form 10-Q |
Nitrogen Non-Financial Performance
| | | | | | | | | | | | |
| | | Three Months Ended March 31 | |
| | | 2013 | | | 2012 | | | % Change | |
N tonnes produced (thousands) | | | 723 | | | | 681 | | | | 6 | |
Total site recordable injury rate | | | 0.50 | | | | 0.21 | | | | 138 | |
Employee turnover percentage | | | 5.6 | | | | 4.4 | | | | 27 | |
Environmental incidents | | | 1 | | | | 2 | | | | (50 | ) |
There were four recordable injuries in the first quarter of 2013 compared to two in the same period in 2012, resulting in an increase in the nitrogen total site recordable injury rate.
Phosphate
Phosphate Financial Performance
| | | | | | | | | | | | | | | | | | | | | | | | | | | | | | | | | | | | |
| | | Three Months Ended March 31 | |
| | | Dollars (millions) | | | Tonnes (thousands) | | | Average per Tonne(1) | |
| | | 2013 | | | 2012 | | | % Change | | | 2013 | | | 2012 | | | % Change | | | 2013 | | | 2012 | | | % Change | |
Manufactured product | | | | | | | | | | | | | | | | | | | | | | | | | | | | | | | | | | | | |
Net sales | | | | | | | | | | | | | | | | | | | | | | | | | | | | | | | | | | | | |
Fertilizer | | $ | 297 | | | $ | 363 | | | | (18 | ) | | | 590 | | | | 637 | | | | (7 | ) | | $ | 503 | | | $ | 570 | | | | (12 | ) |
Feed and Industrial | | | 199 | | | | 201 | | | | (1 | ) | | | 313 | | | | 293 | | | | 7 | | | $ | 635 | | | $ | 686 | | | | (7 | ) |
| | | 496 | | | | 564 | | | | (12 | ) | | | 903 | | | | 930 | | | | (3 | ) | | $ | 549 | | | $ | 607 | | | | (10 | ) |
Cost of goods sold | | | (407 | ) | | | (416 | ) | | | (2 | ) | | | | | | | | | | | | | | $ | (451 | ) | | $ | (447 | ) | | | 1 | |
Gross margin | | | 89 | | | | 148 | | | | (40 | ) | | | | | | | | | | | | | | $ | 98 | | | $ | 160 | | | | (39 | ) |
Other miscellaneous and purchased product gross margin(2) | | | 3 | | | | 4 | | | | (25 | ) | | | | | | | | | | | | | | | | | | | | | | | | |
Gross Margin | | $ | 92 | | | $ | 152 | | | | (39 | ) | | | | | | | | | | | | | | $ | 102 | | | $ | 163 | | | | (37 | ) |
| (1) | Rounding differences may occur due to the use of whole dollars in per-tonne calculations. |
| (2) | Comprised of net sales of $7 million (2012 — $8 million) less cost of goods sold of $4 million (2012 — $4 million). |
Phosphate gross margin variance attributable to:
| | | | | | | | | | | | | | | | |
| | | Three Months Ended March 31
2013 vs. 2012 | |
| | | | | | Change in
Prices/Costs | | | | |
| Dollars (millions) | | Change in Sales Volumes | | | Net Sales | | | Cost of Goods Sold | | | Total | |
Manufactured product | | | | | | | | | | | | | | | | |
Fertilizer | | $ | (14 | ) | | $ | (39 | ) | | $ | — | | | $ | (53 | ) |
Feed and Industrial | | | 7 | | | | (14 | ) | | | 1 | | | | (6 | ) |
Change in market mix | | | — | | | | 1 | | | | (1 | ) | | | — | |
Total manufactured product | | $ | (7 | ) | | $ | (52 | ) | | $ | — | | | | (59 | ) |
Other miscellaneous and purchased product | | | | | | | | | | | | | | | (1 | ) |
Total | | | | | | | | | | | | | | $ | (60 | ) |
| | |
| PotashCorp 2013 First Quarter Quarterly Report on Form 10-Q | | 24 |
The most significant contributors to the change in total gross margin quarter over quarter were as follows(1):
| (1) | Direction of arrows refers to impact on gross margin. |
| | | | | | | | | | |
| | | Net Sales Prices | | | | Sales Volumes | | | | Cost of Goods Sold |
i | | Our average realized phosphate price was down from the same period last year, with fertilizer products experiencing the largest decline. | | i | | Sales volumes were relatively flat compared to the first quarter of 2012. | | h | | Costs were impacted by lower sulfur costs (down 21 percent). |
| | | | | | i | | Ammonia and rock input costs were higher. |
Phosphate Non-Financial Performance
| | | | | | | | | | | | |
| | | Three Months Ended March 31 | |
| | | 2013 | | | 2012 | | | % Change | |
P2O5 tonnes produced (thousands) | | | 499 | | | | 486 | | | | 3 | |
P2O5 operating rate percentage | | | 84% | | | | 82% | | | | 2 | |
Total site recordable injury rate | | | 0.47 | | | | 0.79 | | | | (41 | ) |
Employee turnover percentage | | | 3.6 | | | | 3.1 | | | | 16 | |
Water usage (million m3) per million tonnes of product | | | 31 | | | | 38 | | | | (18 | ) |
Environmental incidents | | | — | | | | 3 | | | | (100 | ) |
The phosphate recordable injury rate fell largely due to continued efforts by contract personnel to prevent injuries.
Water usage in our phosphate operations decreased primarily due to changes in practices at our White Springs location in the way storm water is generally handled.
| | |
| 25 | | PotashCorp 2013 First Quarter Quarterly Report on Form 10-Q |
Other Expenses and Income
| | | | | | | | | | | | | | | | |
| | | Three Months Ended March 31 | |
| Dollars (millions) | | 2013 | | | 2012 | | | Change | | | % Change | |
Selling and administrative expenses | | $ | (66 | ) | | $ | (57 | ) | | $ | (9 | ) | | | 16 | |
Provincial mining and other taxes | | | (63 | ) | | | (28 | ) | | | (35 | ) | | | 125 | |
Share of earnings of equity-accounted investees | | | 80 | | | | 75 | | | | 5 | | | | 7 | |
Other expenses | | | (1 | ) | | | (3 | ) | | | 2 | | | | (67 | ) |
Finance costs | | | (35 | ) | | | (34 | ) | | | (1 | ) | | | 3 | |
Income taxes | | | (226 | ) | | | (160 | ) | | | (66 | ) | | | 41 | |
Provincial mining and other taxes are comprised mainly of the Saskatchewan potash production tax (PPT) and a resource surcharge. The PPT is comprised of a base tax per tonne of product sold and an additional tax based on mine profit, which is reduced by an amount based on potash capital expenditures. The resource surcharge is 3 percent of the value of the company’s Saskatchewan resource sales. The PPT expense in the first quarter of 2013 was higher than in the same period in 2012 as a result of a higher proportion of forecasted annual gross margin earned in
the first quarter of 2013 as compared to the proportion of forecasted annual gross margin earned in the first quarter of 2012. The resource surcharge increased as a result of higher potash sales revenues in the first three months of 2013 compared to the same period in 2012.
Share of earnings of equity-accounted investees pertains primarily to Sociedad Quimica y Minera de Chile S.A. (SQM) and Arab Potash Company (APC).
Weighted average debt obligations outstanding and the associated interest rates were as follows:
| | | | | | | | | | | | | | | | | | |
| Dollars (millions) — except percentage amounts | | | | Three Months Ended March 31 | |
Obligations | | Weighted Average | | 2013 | | | 2012 | | | Change | | | % Change | |
Long-term debt(1) | | Outstanding | | $ | 3,714 | | | $ | 3,757 | | | $ | (43 | ) | | | (1 | ) |
| | Effective interest rate | | | 5.2% | | | | 5.2% | | | | — | | | | — | |
Short-term debt | | Outstanding | | $ | 440 | | | $ | 837 | | | $ | (397 | ) | | | (47 | ) |
| | | Effective interest rate | | | 0.3% | | | | 0.4% | | | | (0.1)% | | | | (25 | ) |
| (1) | Includes current portion |
Income taxes increased due to higher income before income taxes. Effective tax rates and discrete items were as follows:
| | | | | | | | |
| | | Three Months Ended
March 31 | |
| Dollars (millions) — except percentage amounts | | 2013 | | | 2012 | |
Actual effective tax rate on ordinary earnings | | | 27% | | | | 25% | |
Actual effective tax rate including discrete items | | | 29% | | | | 25% | |
Discrete tax adjustments that impacted the rate | | $ | 19 | | | $ | (2 | ) |
Significant items to note include the following:
| | • | | The actual effective rate on ordinary earnings for the first quarter of 2013 increased compared to the same period last year due to a different income weighting between jurisdictions. |
| | • | | In first-quarter 2013, a tax expense of $15 million was recorded to adjust the 2012 income tax provision. |
For the first three months of 2013, 54 percent of the effective tax rate on the current year’s ordinary earnings pertained to current income taxes and 46 percent related to deferred income taxes. For the first three months of 2012, 74 percent of the effective tax rate on the year’s ordinary earnings pertained to current income taxes
and 26 percent related to deferred income taxes. The decrease in the current portion was largely due to increased tax depreciation in Canada and the US.
Liquidity and Capital Resources
Cash Requirements
Contractual Obligations and Other Commitments
Our contractual obligations and other commitments detailed on pages 81 and 82 of our 2012 Annual Integrated Report summarize certain of our liquidity and capital resource requirements, excluding obligations that have original maturities of less than one year, planned (but not legally committed) capital expenditures or potential share repurchases.
| | |
| PotashCorp 2013 First Quarter Quarterly Report on Form 10-Q | | 26 |
Capital Expenditures
Based on anticipated exchange rates, during 2013 we expect to incur capital expenditures, including capitalized interest, of approximately $1,020 million for opportunity capital, approximately $580 million to sustain operations at existing levels and approximately $140 million for major repairs and maintenance (including plant turnarounds).
Page 58 of our 2012 Annual Integrated Report outlines key potash construction projects and their expected total cost, as well as the impact of these projects on capacity expansion/debottlenecking and any expected remaining spending on each project still in progress. The most significant of these potash projects(1) on which funds are expected to be spent in 2013, excluding capitalized interest, are outlined in the table below:
| | | | | | | | | | | | | | | | | | |
| CDN Dollars (millions) | | 2013 Forecast | | | Total Forecast(2) | | | Started | | | Expected Completion(3) (Description) | | Forecasted Remaining Spending (after 2013)(2) | |
Allan, Saskatchewan | | $ | 50 | | | $ | 770 | | | | 2008 | | | 2012 (general expansion) | | $ | — | |
New Brunswick | | $ | 190 | | | $ | 2,180 | | | | 2007 | | | 2013 (mine shaft and mill) | | $ | 340 | |
Rocanville, Saskatchewan | | $ | 540 | | | $ | 2,810 | | | | 2008 | | | 2014 (mine shaft and mill) | | $ | 220 | |
| (1) | The expansion at each of these projects is discussed in the technical report for such project filed on SEDAR in accordance with National Instrument 43-101 Standards of Disclosure for Mineral Projects. |
| (2) | Amounts are based on the most recent forecast amounts approved by the Board of Directors, and are subject to change based on project timelines, cost changes and ongoing project reviews. |
| (3) | Excludes ramp-up time. We expect these projects will be fully ramped up by the end of 2015, provided market conditions warrant. |
In 2011, we began the process to restart our anhydrous ammonia plant in Geismar, Louisiana. We are investing an aggregate of approximately $260 million ($20 million in 2013, of which $10 million was spent through the end of March 2013) to increase ammonia production by an estimated 500,000 tonnes. We started production in the first quarter of 2013.
We anticipate starting an expansion of ammonia production at our Lima, Ohio plant in 2013. We are investing approximately $190 million through the fourth quarter of 2015 ($40 million in 2013) to increase our capacity in ammonia (88,000 tons) and urea (80,000 tons).
We anticipate that all capital spending will be financed by internally generated cash flows supplemented, if and as necessary, by borrowing from existing financing sources.
Sources and Uses of Cash
Cash flows from operating, investing and financing activities, as reflected in the unaudited interim Condensed Consolidated Statements of Cash Flow, are summarized in the following table:
| | | | | | | | | | | | | | | | |
| | | Three Months Ended March 31 | |
| Dollars (millions) | | 2013 | | | 2012 | | | Change | | | % Change | |
Cash provided by operating activities | | $ | 738 | | | $ | 372 | | | $ | 366 | | | | 98 | |
Cash used in investing activities | | | (501 | ) | | | (496 | ) | | | (5 | ) | | | 1 | |
Cash (used in) provided by financing activities | | | (214 | ) | | | 111 | | | | (325 | ) | | | n/m | |
The following table presents summarized working capital information:
| | | | | | | | | | | | | | | | |
| Dollars (millions) — except ratio amounts | | March 31, 2013 | | | December 31, 2012 | | | Change | | | % Change | |
Current assets | | $ | 2,506 | | | $ | 2,496 | | | $ | 10 | | | | — | |
Current liabilities | | | (1,733 | ) | | | (1,854 | ) | | | 121 | | | | (7 | ) |
Working capital | | | 773 | | | | 642 | | | | 131 | | | | 20 | |
Working capital ratio | | | 1.45 | | | | 1.35 | | | | 0.10 | | | | 7 | |
Liquidity needs can be met through a variety of sources, including: cash generated from operations, drawdowns under our revolving credit facilities, issuances of commercial paper and short-term borrowings under our line of credit. Our primary uses of funds are operational expenses, sustaining and opportunity capital spending, intercorporate investments, dividends, and interest and principal payments on our debt securities.
Cash provided by operating activities rose quarter over quarter due to higher net income and was impacted by higher receivables in
first-quarter 2013 compared to the decrease in the first quarter of 2012 and lower payables and accrued charges in first-quarter 2013 compared to the increase in the first quarter of 2012.
Cash used in investing activities was primarily for additions to property, plant and equipment, of which approximately 70 percent in the first quarter of 2013 (2012 — 72 percent) related to the potash segment.
| | |
| 27 | | PotashCorp 2013 First Quarter Quarterly Report on Form 10-Q |
Cash used in financing activities in the first quarter of 2013 primarily reflected the repayment of 10-year senior notes at maturity, net increase in outstanding commercial paper and higher dividends paid. In the same period of 2012, cash provided by financing activities primarily reflected the net increase in outstanding commercial paper.
We believe that internally generated cash flow, supplemented by borrowing from existing financing sources, if necessary, will be sufficient to meet our anticipated capital expenditures and other cash requirements for at least the next 12 months, exclusive of any acquisitions or other significant expenditures the company may consider from time to time. At this time, we do not reasonably expect any presently known trend or uncertainty to affect our ability to access our historical sources of liquidity.
Principal Debt Instruments
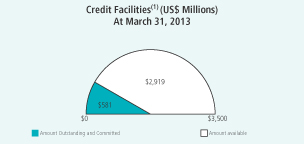

| (1) | Included in the amount outstanding and committed is $581 million of commercial paper. The authorized aggregate amount under the company’s commercial paper programs in Canada and the US was $2,500 million. The amounts available under the commercial paper programs are limited to the availability of funds under the credit facilities. |
| (2) | Letters of credit committed. We also have an uncommitted $32 million letter of credit facility against which $30 million was issued at March 31, 2013. |
We use a combination of short-term and long-term debt to finance our operations. We typically pay floating rates of interest on our short-term debt and credit facilities, and fixed rates on our senior notes. As at March 31, 2013, interest rates were 0.3 percent on outstanding commercial paper denominated in US dollars.
Our two syndicated credit facilities provide for unsecured advances up to the total facilities amount less direct borrowings and
amounts committed in respect of commercial paper outstanding. Our $2,750 million credit facility matures December 11, 2016 and our $750 million credit facility matures May 31, 2013. We also have a $75 million short-term line of credit that is available through August 2013 and an uncommitted $32 million letter of credit facility that is due on demand. Direct borrowings, outstanding commercial paper and outstanding letters of credit reduce the amounts available under the line of credit and the credit facilities. The line of credit and credit facilities have financial tests and other covenants (detailed in Notes 9 and 12 to the 2012 audited annual consolidated financial statements) with which we must comply at each quarter-end. Non-compliance with any such covenants could result in accelerated payment of amounts borrowed and termination of lenders’ further funding obligations under the credit facilities and line of credit. We were in compliance with all covenants as of March 31, 2013, and at this time anticipate being in compliance with such covenants in 2013. The accompanying table summarizes the limits and results of certain covenants:
| | | | | | | | |
| Debt covenants at March 31 | | | | | | |
| Dollars (millions), except ratio amounts | | Limit | | | 2013 | |
Debt-to-capital ratio(1) | | £ | 0.60 | | | | 0.28 | |
Long-term debt-to-EBITDA ratio(2) | | £ | 3.5 | | | | 0.80 | |
Debt of subsidiaries ($2,750 credit facility and line of credit) | | <$ | 1,000 | | | $ | 6 | |
Debt of subsidiaries ($750 credit facility) | | <$ | 650 | | | $ | 6 | |
Minimum tangible net worth ($750 credit facility)(3) | | ³$ | 1,250 | | | $ | 10,292 | |
The following non-IFRS financial measures are requirements of our debt covenants and should not be considered as a substitute for, nor superior to, measures of financial performance prepared in accordance with IFRS:
| (1) | Debt-to-capital ratio = debt (short-term debt and current portion of long-term debt + long-term debt) / (debt + shareholders’ equity). |
| (2) | Long-term debt-to-EBITDA ratio = long-term debt / EBITDA. EBITDA is calculated according to the definition in Notes 9 and 12 to the 2012 audited annual consolidated financial statements for the trailing 12 months. As compared to net income according to IFRS, EBITDA is limited in that periodic costs of certain capitalized tangible and intangible assets used in generating revenues are excluded. Long-term debt to net income for the trailing 12 months was 1.6. |
| (3) | Defined as shareholders’ equity – goodwill – intangible assets – deferred expenses. As compared to shareholders’ equity according to IFRS ($10,442 million at March 31, 2013), this measure is limited in that certain assets required to be recognized are excluded. |
Our ability to access reasonably priced debt in the capital markets is dependent, in part, on the quality of our credit ratings. We continue to maintain investment grade credit ratings for our long-term debt. A downgrade of the credit rating of our long-term debt by Standard & Poor’s would increase the interest rates applicable to borrowings under our syndicated credit facilities and our line of credit.
Commercial paper markets are normally a source of same-day cash for the company. Our access to the Canadian and US commercial paper markets primarily depends on maintaining our current short-term credit ratings as well as general conditions in the money markets.
| | |
| PotashCorp 2013 First Quarter Quarterly Report on Form 10-Q | | 28 |
| | | | | | | | |
| | | Long-Term Debt | | Short-Term Debt |
| Rating (outlook) | | Mar 31,
2013 | | Dec 31, 2012 | | Mar 31,
2013 | | Dec 31,
2012 |
Moody’s | | Baa1 (positive) | | Baa1 (positive) | | P-2 | | P-2 |
Standard & Poor’s | | A-(stable) | | A-(stable) | | A-2(1) | | A-2(1) |
DBRS | | n/a | | n/a | | R-1 (low) | | R-1 (low) |
| (1) | S&P assigned a global commercial paper rating of A-2, but rated our commercial paper A-1 (low) on a Canadian scale. |
A security rating is not a recommendation to buy, sell or hold securities. Such rating may be subject to revision or withdrawal at any time by the respective credit rating agency and each rating should be evaluated independently of any other rating.
Our $3,500 million of outstanding senior notes were issued under US shelf registration statements.
For the first three months of 2013, our weighted average cost of capital was 9.4 percent (2012 — 9.3 percent), of which 90 percent represented the cost of equity (2012 — 89 percent).
Outstanding Share Data
We had 865,135,124 common shares issued and outstanding at March 31, 2013, compared to 864,900,513 at
December 31, 2012. At March 31, 2013, 23,012,738 options to purchase common shares were outstanding under the company’s nine stock option plans, as compared to 23,164,444 under nine stock option plans at December 31, 2012.
Off-Balance Sheet Arrangements
In the normal course of operations, PotashCorp engages in a variety of transactions that, under IFRS, are either not recorded on our consolidated statements of financial position or are recorded at amounts that differ from the full contract amounts. Principal off-balance sheet activities include operating leases, agreement to reimburse losses of Canpotex, issuance of guarantee contracts, certain derivative instruments and long-term contracts. We do not reasonably expect any presently known trend or uncertainty to affect our ability to continue using these arrangements. Refer to Note 10 to the financial statements in this Form 10-Q for a contingency related to Canpotex. Refer to pages 84 and 85 of our 2012 Annual Integrated Report for information pertaining to our guarantees and derivative instruments. Note 11 to the financial statements in this Form 10-Q contains an update to a certain guarantee. See “Cash Requirements” above and our 2012 Annual Integrated Report for obligations related to operating leases and certain of our long-term raw materials agreements which contain fixed price and/or volume components.
Quarterly Financial Highlights
| | | | | | | | | | | | | | | | | | | | | | | | | | | | | | | | |
Dollars (millions) — except
per-share amounts | | March 31,
2013 | | | December 31,
2012 | | | September 30,
2012 | | | June 30,
2012 | | | March 31,
2012 | | | December 31,
2011 | | | September 30,
2011 | | | June 30,
2011 | |
Sales | | $ | 2,100 | | | $ | 1,642 | | | $ | 2,143 | | | $ | 2,396 | | | $ | 1,746 | | | $ | 1,865 | | | $ | 2,321 | | | $ | 2,325 | |
Gross margin | | | 867 | | | | 586 | | | | 927 | | | | 1,199 | | | | 698 | | | | 890 | | | | 1,132 | | | | 1,168 | |
Net income | | | 556 | | | | 421 | | | | 645 | | | | 522 | | | | 491 | | | | 683 | | | | 826 | | | | 840 | |
Net income per share — basic | | | 0.64 | | | | 0.49 | | | | 0.75 | | | | 0.61 | | | | 0.57 | | | | 0.80 | | | | 0.96 | | | | 0.98 | |
Net income per share — diluted | | | 0.63 | | | | 0.48 | | | | 0.74 | | | | 0.60 | | | | 0.56 | | | | 0.78 | | | | 0.94 | | | | 0.96 | |
Net income per share for each quarter has been computed based on the weighted average number of shares issued and outstanding during the respective quarter, including the dilutive number of shares assumed for the diluted earnings per share computation; therefore, as the number of shares varies each period, quarterly amounts may not add to the annual total.
Certain aspects of our business can be impacted by seasonal factors. Fertilizers are sold primarily for spring and fall application in both Northern and Southern hemispheres. However, planting conditions and the timing of customer purchases will vary each year and fertilizer sales can be expected to shift from one quarter to another. Most feed and industrial sales are by contract and are more evenly distributed throughout the year.
In the second quarter of 2012, earnings were impacted by a $341 million non-tax deductible impairment loss on our available-for-sale investment in Sinofert due to the significance by which fair value was below cost.
Related Party Transactions
Refer to Note 12 to the financial statements in this Form 10-Q for information pertaining to transactions with related parties.
Critical Accounting Estimates
Our discussion and analysis of our financial condition and results of operations are based upon the financial statements in this Form 10-Q, which comply with IFRS.
The accounting policies used in preparing the financial statements in this Form 10-Q are consistent with those used in the preparation of the 2012 audited annual consolidated financial statements, except as described in Note 1 to the financial statements in this Form 10-Q. Certain of these policies involve critical accounting estimates because they require us to make particularly subjective or complex judgments about matters that are inherently uncertain and because of the likelihood that materially different amounts could be reported under different
| | |
| 29 | | PotashCorp 2013 First Quarter Quarterly Report on Form 10-Q |
conditions or using different assumptions. There have been no material changes to our critical accounting estimate policies in the first three months of 2013.
We have discussed the development, selection and application of our key accounting policies, and the critical accounting estimates and assumptions they involve, with the audit committee of the Board of Directors, and the committee reviewed the disclosures described in this section.
Recent Accounting Changes
Refer to Note 1 to the financial statements in this Form 10-Q for information pertaining to accounting changes effective in 2013 and for information on issued accounting pronouncements that will be effective in future periods.
Risk Management
Execution of our corporate strategy requires an effective program to manage the associated risks. The PotashCorp Risk Management Framework (the Framework) is applied to identify and manage such risks. The Framework consists of a comprehensive risk universe, with six corporate risk categories, and corresponding identification of risk events. The major corporate categories of risks are: markets/business, distribution, operational, financial, compliance and organizational. Separately and in combination, these risks potentially threaten our strategies and could affect our ability to deliver long-term shareholder value.
The Framework establishes an entity-wide risk ranking methodology. Risk events are evaluated against the criteria of likelihood or frequency of occurrence and the consequential magnitude or severity of the event. Mitigation activities are identified that will reduce the likelihood and/or severity of the occurrence of a risk event. The residual risk that results from identified mitigation activities is also evaluated using the same criteria. Management identifies the most significant risks to our strategy and reports to the Board of Directors on the mitigation plans.
The company’s Risk Management Process of identification, management and reporting of risk is continuous and dynamic. Changes to corporate risk that result from changing internal and external factors are evaluated on a quarterly basis and significant changes in risks and corresponding mitigation activities are reported quarterly to the audit committee. Detailed discussion of the PotashCorp Risk Management Process can be found on pages 29 and 30 of our 2012 Annual Integrated Report as well as in our 2012 Annual Report on Form 10-K. Risk management discussions specific to potash, nitrogen and phosphate operations can be found on pages 31 and 32 of the 2012 Annual Integrated Report.
The company recognizes damage to reputation as one of its most severe risk consequences, which is mitigated by ongoing and transparent communication with stakeholders, commitment to sustainability, and best practices in corporate governance. Moreover, significant investments and operations in a number of
countries subject the company to business risks which could be exaggerated by differences in domestic culture, political and economic conditions, policies, laws and regulations. In addition, the company may be adversely affected by changing anti-trust laws in its jurisdictions of operation worldwide. The company may also be adversely affected by unauthorized access to our confidential information, which could result from a security breach of our information technology systems.
The greatest potential risks to potash reported in the 2012 Annual Integrated Report include market supply imbalances which may result from fluctuations in global demand for product or from new competitor supply in the form of greenfield mines, global potash demand insufficient to consume PotashCorp capacity, inadequacy of the transportation and distribution infrastructure to timely accommodate volume delivery demands, physical risks particular to underground mines (such as unexpected underground rock falls and water inflow from underground water-bearing strata), inability to execute and deliver in respect of capital expansions, and safety related risks.
We mitigate the market imbalance and insufficient demand risks by managing production to meet market demand. The company mitigates transportation and distribution risks both directly and through Canpotex by working with carriers and undertaking sufficient capital investment in transportation infrastructure. Underground mine risk mitigation activities include the use of advanced geophysical surveys, microseismic monitoring, rock mechanics modelling, ground penetrating radar, training and procedures and protective structures. We ensure resources are in place for safe and efficient execution of capital plans to mitigate our capital expansions risk. We mitigate the risk of unsafe actions or conditions by enhancing safety systems at all sites. Similar risks of cyclicality and market imbalance exist in phosphate and nitrogen, largely due to competitive costs, availability of supply and government involvement. The company mitigates these risks by focusing on less cyclical markets, maintaining a diversified sulfur supply portfolio and employing natural gas price risk hedging strategies where appropriate.
Outlook
Potash Market Update
Global agricultural markets are providing the necessary economic incentive for farmers to maximize yields and, ultimately, their financial returns. As they focus on soil fertility and crop nutrition, farmers’ demand for fertilizer is increasing. We anticipate that this will continue in 2013 and the years ahead, driven by the need to increase food production around the world.
Based on first-quarter shipments and the expectation of continuing strong demand, 2013 is shaping up as a recovery year for potash. Even as solid phosphate fertilizer and urea markets reflect uncertainty related to Chinese exports and the absence of significant Indian demand, potash fundamentals have shown
| | |
| PotashCorp 2013 First Quarter Quarterly Report on Form 10-Q | | 30 |
improved strength. We expect the engagement and confidence we see in key potash markets to continue, and maintain our previous estimate for 2013 global demand in the range of 55-57 million tonnes.
In North America, customer engagement is expected to remain high as the planting season progresses and dealers respond to the needs of farmers. We anticipate that buyers will seek to limit inventories as they exit the spring season and farmers’ increased commitment to replenish nutrients in the soil will result in historically strong sales through the second half. For the full year, we forecast total shipments to this market of approximately 9.5 million tonnes.
The Latin American market, particularly Brazil, started the year at a record pace and we have a strong order book well into the second quarter. Buyers remain optimistic about strong global demand for crops grown in this region and are striving to spread large import volumes more evenly through the calendar year to help alleviate pressure on port and distribution infrastructure. For 2013, we forecast demand at or above record levels, with total shipments to Latin America anticipated to exceed 10 million tonnes.
While many global commodities have been affected by concerns about slower economic growth in China, food production is essential and demand for agricultural products remains robust. First-quarter potash shipments to China were strong and Canpotex’s existing contract commitments to this market are expected to be completed by the end of the second quarter. Discussions for the second half of the year are expected to begin in May and we anticipate a smooth transition to a new contract. China’s demand is expected to grow to approximately 11.5 million tonnes for the year, with total imports forecast between 6.5 million and 7 million tonnes.
Although India’s potash market continues to face uncertainty around subsidy levels, new contracts settled during the quarter — including those by Canpotex — are expected to provide an improved demand environment through the remaining three quarters of the year, relative to the same period in 2012. We now forecast 2013 shipments to this market of approximately 4 million tonnes.
In other Asian countries (outside of China and India), the first quarter brought a re-emergence of demand and we anticipate increased shipments in the coming quarters resulting from the strength of grower incentives and low inventory positions. We continue to forecast demand for 2013 to outpace the previous year and anticipate total shipments to this region could approach 8.5 million tonnes.
Financial Outlook
In this environment, we maintain our previous full-year 2013 estimates of potash gross margin in the range of $1.9-$2.4 billion and shipments between 8.5 million and 9.2 million tonnes.
While additional market-related downtime will be likely during 2013, improved operating rates and our ability to replace higher-cost tonnes from Esterhazy with our own production are expected to reduce our cost of goods sold on a per-tonne basis compared to 2012.
In nitrogen, sales volumes are expected to surpass 2012 levels as we increase our production of downstream products following the restart of ammonia capacity at our Geismar facility and expect fewer gas-related curtailments at our Trinidad plants. A decline in prices for nitrogen-based products — primarily urea — is expected to result in lower margins than previously estimated, but the potential remains for record nitrogen gross margin in 2013.
In phosphate, global markets continue to be adversely impacted by uncertainty related to the timing and extent of India’s engagement. Improved demand in North America and Latin America is expected to partially offset a weaker Indian market, but we anticipate that pricing may lag that of 2012. Demand for feed and industrial products is forecast to remain relatively strong and we anticipate gross margins in these product categories to be near those of 2012.
Given these conditions, we now forecast full-year 2013 combined nitrogen and phosphate gross margin of between $1.4 billion and $1.7 billion, but near-term uncertainty could produce results toward the low end of our range.
With the exception of our guidance for income from offshore investments, which we now expect to be in the range of $370-$400 million, all other previously released guidance estimates for 2013 are unchanged: selling and administrative expenses ($240-$260 million), finance costs ($100-$130 million), capital expenditures ($1.5 billion), annual effective tax rate (25-27 percent) and provincial mining and other taxes (11-13 percent of total potash gross margin).
Based on these factors, PotashCorp maintains its full-year 2013 net income guidance at $2.75-$3.25 per share, including second-quarter earnings in the range of $0.70-$0.85 per share.
At PotashCorp, we always take a long-term approach to managing our business and exercise patience in the execution of our strategy. This approach has led to strong financial performance that enables us to build enduring value for our shareholders, customers, employees, communities and business partners. Over recent months, we have been exploring the possibility of expanding our ownership interests in ICL. While we continue to believe that such a transaction would be of tremendous benefit to stakeholders of both companies and the State of Israel, there must be receptivity to foreign investment and certainty in the rules that govern such investment. We have therefore concluded that now is not the time to pursue this opportunity and will focus our energies on other options to maximize shareholder value.
| | |
| 31 | | PotashCorp 2013 First Quarter Quarterly Report on Form 10-Q |
-
Forward-Looking Statements
Certain statements in this Quarterly Report on Form 10-Q, including those in the “Outlook” section of Management’s Discussion and Analysis of Financial Condition and Results of Operations, are forward-looking statements or forward-looking information (forward-looking statements). These statements can be identified by expressions of belief, expectation or intention, as well as those statements that are not historical fact. These statements often contain words such as “should,” “could,” “expect,” “may,” “anticipate,” “believe,” “intend,” “estimates,” “plans” and similar expressions. These statements are based on certain factors and assumptions as set forth in this Form 10-Q, including with respect to: foreign exchange rates, expected growth, results of operations, performance, business prospects and opportunities, and effective tax rates. While the company considers these factors and assumptions to be reasonable based on information currently available, they may prove to be incorrect. Forward-looking statements are subject to risks and uncertainties that are difficult to predict. The results or events set forth in forward-looking statements may differ materially from actual results or events. Several factors could cause actual results or events to differ materially from those expressed in the forward-looking statements, including, but not limited to the following: variations from our assumptions with respect to foreign exchange rates, expected growth, results of operations, performance, business prospects and opportunities, and effective tax rates; fluctuations in supply and demand in the fertilizer, sulfur, transportation and petrochemical markets; costs and availability of transportation and distribution for our raw materials and products, including railcars and ocean freight; changes in competitive pressures, including pricing pressures; adverse or uncertain economic conditions and changes in credit and financial markets; the results of sales contract negotiations within major markets; economic and political uncertainty around the world; timing and impact of capital expenditures; risks associated with natural gas and other hedging activities; changes in capital markets; unexpected or adverse weather conditions; changes in currency and exchange rates; unexpected geological or environmental conditions, including water inflows; imprecision in reserve estimates; adverse developments in new and pending legal proceedings or government investigations; acquisitions we may undertake; strikes or other forms of work stoppage or slowdowns; rates of return on and the risks associated with our investments; changes in, and the effects of, government policies and regulations; security risks related to our information technology systems; and earnings, exchange rates and the decisions of taxing authorities, all of which could affect our effective tax rates. Additional risks and uncertainties can be found in our Form 10-K for the fiscal year ended December 31, 2012 under the captions “Forward-Looking Statements” and “Item 1A — Risk Factors” and in our filings with the SEC and the Canadian provincial securities commissions. Forward-looking statements are given only as at the
date of this report and the company disclaims any obligation to update or revise the forward-looking statements, whether as a result of new information, future events or otherwise, except as required by law.
Item 3. Quantitative and Qualitative Disclosures About Market Risk
Market risk is the potential for loss from adverse changes in the market value of financial instruments. The level of market risk to which we are exposed varies depending on the composition of our derivative instrument portfolio, as well as current and expected market conditions. A discussion of enterprise-wide risk management can be found in our 2012 Annual Integrated Report, pages 29 to 32.
Price, foreign exchange and interest rate risks faced by the company and how we manage those risks are outlined in Notes 11 and 24 to the 2012 audited annual consolidated financial statements and there were no significant changes as at March 31, 2013, except as noted below.
Price Risk
The carrying amount of our investments in ICL and Sinofert was $2,667 million at March 31, 2013 (December 31, 2012 — $2,481 million). There were no substantial changes to the price sensitivities reported in Note 24 to the 2012 audited annual consolidated financial statements.
The company’s net exposure to natural gas derivatives in the form of swaps qualifying for hedge accounting was NIL at March 31, 2013 and December 31, 2012.
Foreign Exchange Risk
As at March 31, 2013, the company had entered into foreign currency forward contracts to sell US dollars and receive Canadian dollars in the notional amount of $243 million (December 31, 2012 — $300 million) at an average exchange rate of 1.0079 (December 31, 2012 — 0.9982) per US dollar with maturities in 2013. There were no substantial changes to the US dollar sensitivities reported in Note 24 to the 2012 audited annual consolidated financial statements.
Interest Rate Risk
As at March 31, 2013, the company had no significant exposure to interest rate risk.
Item 4. Controls and Procedures
As of March 31, 2013, we carried out an evaluation under the supervision and with the participation of our management, including our Chief Executive Officer and Chief Financial Officer, of the effectiveness of the design and operation of our disclosure controls and procedures. There are inherent limitations to the effectiveness of any system of disclosure controls and procedures,
| | |
| PotashCorp 2013 First Quarter Quarterly Report on Form 10-Q | | 32 |
including the possibility of human error and the circumvention or overriding of the controls and procedures. Accordingly, even effective disclosure controls and procedures can only provide reasonable assurance of achieving their control objectives. Based upon that evaluation and as of March 31, 2013, the Chief Executive Officer and Chief Financial Officer concluded that the disclosure controls and procedures were effective to provide reasonable assurance that information required to be disclosed in the reports the company files and submits under the Securities Exchange Act of 1934 is recorded, processed, summarized and
reported as and when required and that such information is accumulated and communicated to our management, including our Chief Executive Officer and Chief Financial Officer, as appropriate to allow timely decisions regarding required disclosure.
There has been no change in our internal control over financial reporting during the quarter ended March 31, 2013 that has materially affected, or is reasonably likely to materially affect, our internal control over financial reporting.
| | |
| 33 | | PotashCorp 2013 First Quarter Quarterly Report on Form 10-Q |
Part II. Other Information
Item 1. Legal Proceedings
For a description of certain other legal and environmental proceedings, see Note 10 to the unaudited interim condensed consolidated financial statements included in Part I of this Quarterly Report on Form 10-Q.
Item 4. Other Information
Mine Safety Disclosures
Safety is the company’s top priority and we are committed to providing a healthy and safe work environment for our employees, contractors and all others at our sites to help meet our company-wide goal of achieving no harm to people.
The operations at the company’s Aurora, Weeping Water and White Springs facilities are subject to theFederal Mine Safety and Health Act of 1977, as amended by theMine Improvement and
New Emergency Response Act of 2006, and the implementing regulations, which impose stringent health and safety standards on numerous aspects of mineral extraction and processing operations, including the training of personnel, operating procedures, operating equipment and other matters. Our Senior Safety Leadership Team is responsible for managing compliance with applicable government regulations, as well as implementing and overseeing the elements of our safety program as outlined in our Safety, Health and Environment Manual.
Section 1503(a) of theDodd-Frank Wall Street Reform and Consumer Protection Act (Section 1503(a)) requires us to include certain safety information in the periodic reports we file with the United States Securities and Exchange Commission. The information concerning mine safety violations and other regulatory matters required by Section 1503(a) and Item 104 of Regulation S-K is included in Exhibit 95 to this Quarterly Report on Form 10-Q.
Item 6. Exhibits
(a) Exhibits
| | | | | | | | | | | | |
| | | | | Incorporated by Reference | |
Exhibit
Number | | Description of Document | | Form | | Filing Date/Period
End Date | | | Exhibit Number
(if different) | |
3(a) | | Articles of Continuance of the registrant dated May 15, 2002. | | 10-Q | | | 6/30/2002 | | | | | |
3(b) | | Bylaws of the registrant effective May 15, 2002. | | 10-Q | | | 6/30/2002 | | | | | |
4(a) | | Term Credit Agreement between The Bank of Nova Scotia and other financial institutions and the registrant dated September 25, 2001. | | 10-Q | | | 9/30/2001 | | | | | |
4(b) | | Syndicated Term Credit Facility Amending Agreement between The Bank of Nova Scotia and other financial institutions and the registrant dated as of September 23, 2003. | | 10-Q | | | 9/30/2003 | | | | | |
4(c) | | Syndicated Term Credit Facility Second Amending Agreement between The Bank of Nova Scotia and other financial institutions and the registrant dated as of September 21, 2004. | | 8-K | | | 9/24/2004 | | | | | |
4(d) | | Syndicated Term Credit Facility Third Amending Agreement between The Bank of Nova Scotia and other financial institutions and the registrant dated as of September 20, 2005. | | 8-K | | | 9/22/2005 | | | | 4 | (a) |
4(e) | | Syndicated Term Credit Facility Fourth Amending Agreement between The Bank of Nova Scotia and other financial institutions and the registrant dated as of September 27, 2006. | | 10-Q | | | 9/30/2006 | | | | | |
4(f) | | Syndicated Term Credit Facility Fifth Amending Agreement between the Bank of Nova Scotia and other financial institutions and the registrant dated as of October 19, 2007. | | 8-K | | | 10/22/2007 | | | | 4 | (a) |
4(g) | | Indenture dated as of February 27, 2003, between the registrant and The Bank of Nova Scotia Trust Company of New York. | | 10-K | | | 12/31/2002 | | | | 4 | (c) |
4(h) | | Form of Note relating to the registrant’s offering of $500,000,000 principal amount of 5.875% Notes due December 1, 2036. | | 8-K | | | 11/30/2006 | | | | 4 | (a) |
| | |
| PotashCorp 2013 First Quarter Quarterly Report on Form 10-Q | | 34 |
| | | | | | | | | | | | |
| | | | | Incorporated by Reference | |
Exhibit
Number | | Description of Document | | Form | | Filing Date/Period
End Date | | | Exhibit Number
(if different) | |
4(i) | | Form of Note relating to the registrant’s offering of $500,000,000 principal amount of 5.25% Notes due May 15, 2014. | | 8-K | | | 5/1/2009 | | | | 4 | (a) |
4(j) | | Form of Note relating to the registrant’s offering of $500,000,000 principal amount of 6.50% Notes due May 15, 2019. | | 8-K | | | 5/1/2009 | | | | 4 | (b) |
4(k) | | Form of Note relating to the registrant’s offering of $500,000,000 principal amount of 3.75% Notes due September 30, 2015. | | 8-K | | | 9/25/2009 | | | | 4 | (a) |
4(l) | | Form of Note relating to the registrant’s offering of $500,000,000 principal amount of 4.875% Notes due March 30, 2020. | | 8-K | | | 9/25/2009 | | | | 4 | (b) |
4(m) | | Revolving Term Credit Facility Agreement between The Bank of Nova Scotia and other financial institutions and the registrant dated as of December 11, 2009. | | 8-K | | | 12/15/2009 | | | | 4 | (a) |
4(n) | | Revolving Term Credit Facility First Amending Agreement between The Bank of Nova Scotia and other financial institutions and the registrant dated as of September 23, 2011. | | 8-K | | | 9/26/2011 | | | | 4 | (a) |
4(o) | | Form of Note relating to the registrant’s offering of $500,000,000 principal amount of 3.25% Notes due December 1, 2017. | | 8-K | | | 11/29/2010 | | | | 4 | (a) |
4(p) | | Form of Note relating to the registrant’s offering of $500,000,000 principal amount of 5.625% Notes due December 1, 2040. | | 8-K | | | 11/29/2010 | | | | 4 | (b) |
The registrant hereby undertakes to file with the Securities and Exchange Commission, upon request, copies of any constituent instruments defining the rights of holders of long-term debt of the registrant or its subsidiaries that have not been filed herewith because the amounts represented thereby are less than 10% of the total assets of the registrant and its subsidiaries on a consolidated basis.
| | | | | | | | | | | | |
| | | | | Incorporated by Reference | |
Exhibit
Number | | Description of Document | | Form | | Filing Date/Period
End Date | | | Exhibit Number
(if different) | |
10(a) | | Sixth Voting Agreement dated April 22, 1978, between Central Canada Potash, Division of Noranda, Inc., Cominco Ltd., International Minerals and Chemical Corporation (Canada) Limited, PCS Sales and Texasgulf Inc. | | F-1
(File No.
33-31303) | | | 9/28/1989 | | | | 10 | (f) |
10(b) | | Canpotex Limited Shareholders Seventh Memorandum of Agreement effective April 21, 1978, between Central Canada Potash, Division of Noranda Inc., Cominco Ltd., International Minerals and Chemical Corporation (Canada) Limited, PCS Sales, Texasgulf Inc. and Canpotex Limited as amended by Canpotex S&P amending agreement dated November 4, 1987. | | F-1
(File No.
33-31303) | | | 9/28/1989 | | | | 10 | (g) |
10(c) | | Producer Agreement dated April 21, 1978, between Canpotex Limited and PCS Sales. | | F-1
(File No.
33-31303) | | | 9/28/1989 | | | | 10 | (h) |
10(d) | | Canpotex/PCS Amending Agreement, dated as of October 1, 1992. | | 10-K | | | 12/31/1995 | | | | 10 | (f) |
10(e) | | Canpotex PCA Collateral Withdrawing/PCS Amending Agreement, dated as of October 7, 1993. | | 10-K | | | 12/31/1995 | | | | 10 | (g) |
10(f) | | Canpotex Producer Agreement amending agreement dated as of July 1, 2002. | | 10-Q | | | 6/30/2004 | | | | 10 | (g) |
10(g) | | Esterhazy Restated Mining and Processing Agreement dated January 31, 1978, between International Minerals & Chemical Corporation (Canada) Limited and the registrant’s predecessor. | | F-1
(File No.
33-31303) | | | 9/28/1989 | | | | 10 | (e) |
10(h) | | Agreement dated December 21, 1990, between International Minerals & Chemical Corporation (Canada) Limited and the registrant, amending the Esterhazy Restated Mining and Processing Agreement dated January 31, 1978. | | 10-K | | | 12/31/1990 | | | | 10 | (p) |
10(i) | | Agreement effective August 27, 1998, between International Minerals & Chemical (Canada) Global Limited and the registrant, amending the Esterhazy Restated Mining and Processing Agreement dated January 31, 1978 (as amended). | | 10-K | | | 12/31/1998 | | | | 10 | (l) |
| | |
| 35 | | PotashCorp 2013 First Quarter Quarterly Report on Form 10-Q |
| | | | | | | | | | | | |
| | | | | Incorporated by Reference | |
Exhibit
Number | | Description of Document | | Form | | Filing Date/Period
End Date | | | Exhibit Number
(if different) | |
10(j) | | Agreement effective August 31, 1998, among International Minerals & Chemical (Canada) Global Limited, International Minerals & Chemical (Canada) Limited Partnership and the registrant assigning the interest in the Esterhazy Restated Mining and Processing Agreement dated January 31, 1978 (as amended) held by International Minerals & Chemical (Canada) Global Limited to International Minerals & Chemical (Canada) Limited Partnership. | | 10-K
| | | 12/31/1998 | | | | 10 | (m) |
10(k) | | Potash Corporation of Saskatchewan Inc. Stock Option Plan — Directors, as amended. | | 10-K | | | 12/31/2006 | | | | 10 | (l) |
10(l) | | Potash Corporation of Saskatchewan Inc. Stock Option Plan — Officers and Employees, as amended. | | 10-K | | | 12/31/2006 | | | | 10 | (m) |
10(m) | | Short-Term Incentive Plan of the registrant effective January 1, 2000, as amended. | | 8-K | | | 3/13/2012 | | | | 10 | (a) |
10(n) | | Resolution and Forms of Agreement for Supplemental Executive Retirement Income Plan, for officers and key employees of the registrant. | | 10-K | | | 12/31/1995 | | | | 10 | (o) |
10(o) | | Amending Resolution and revised forms of agreement regarding Supplemental Retirement Income Plan of the registrant. | | 10-Q | | | 6/30/1996 | | | | 10 | (x) |
10(p) | | Amended and restated Supplemental Executive Retirement Income Plan of the registrant and text of amendment to existing supplemental income plan agreements. | | 10-Q | | | 9/30/2000 | | | | 10 | (mm) |
10(q) | | Amendment, dated February 23, 2009, to the amended and restated Supplemental Executive Retirement Income Plan. | | 10-K | | | 12/31/2008 | | | | 10 | (r) |
10(r) | | Amendment, dated December 29, 2010, to the amended and restated Supplemental Executive Retirement Income Plan. | | 10-K | | | 12/31/2010 | | | | | |
10(s) | | Form of Letter of amendment to existing supplemental income plan agreements of the registrant. | | 10-K | | | 12/31/2002 | | | | 10 | (cc) |
10(t) | | Amended and restated agreement dated February 20, 2007, between the registrant and William J. Doyle concerning the Supplemental Executive Retirement Income Plan. | | 10-K | | | 12/31/2006 | | | | 10 | (s) |
10(u) | | Amendment, dated December 24, 2008, to the amended and restated agreement, dated February 20, 2007, between the registrant and William J. Doyle concerning the Supplemental Executive Retirement Income Plan. | | 10-K | | | 12/31/2008 | | | | 10 | (u) |
10(v) | | Amendment, dated February 23, 2009, to the amended and restated agreement, dated February 20, 2007, between the registrant and William J. Doyle concerning the Supplemental Executive Retirement Income Plan. | | 10-K | | | 12/31/2008 | | | | 10 | (v) |
10(w) | | Amendment, dated February 23, 2009, to the amended and restated agreement, dated August 2, 1996, between the registrant and Wayne R. Brownlee concerning the Supplemental Executive Retirement Income Plan. | | 10-K | | | 12/31/2008 | | | | 10 | (w) |
10(x) | | Amendment, dated December 29, 2010, to the amended and restated agreement, dated February 20, 2007, between the registrant and William J. Doyle concerning the Supplemental Executive Retirement Income Plan. | | 10-K | | | 12/31/2010 | | | | 10 | (y) |
10(y) | | Amendment, dated December 29, 2010, to the amended and restated agreement, dated August 2, 1996, between the registrant and Wayne R. Brownlee concerning the Supplemental Executive Retirement Income Plan. | | 10-K | | | 12/31/2010 | | | | 10 | (z) |
10(z) | | Supplemental Retirement Agreement dated December 24, 2008, between the registrant and Stephen F. Dowdle. | | 10-K | | | 12/31/2011 | | | | 10 | (bb) |
10(aa) | | Supplemental Retirement Benefits Plan for U.S. Executives dated effective January 1, 1999. | | 10-Q | | | 6/30/2002 | | | | 10 | (aa) |
10(bb) | | Amendment No. 1, dated December 24, 2008, to the Supplemental Retirement Plan for U.S. Executives. | | 10-K | | | 12/31/2008 | | | | 10 | (z) |
| | |
| PotashCorp 2013 First Quarter Quarterly Report on Form 10-Q | | 36 |
| | | | | | | | | | |
| | | | | Incorporated by Reference |
Exhibit
Number | | Description of Document | | Form | | Filing Date/Period
End Date | | | Exhibit Number
(if different) |
10(cc) | | Amendment No. 2, dated February 23, 2009, to the Supplemental Retirement Plan for U.S. Executives. | | 10-K | | | 12/31/2008 | | | 10(aa) |
10(dd) | | Forms of Agreement dated December 30, 1994, between the registrant and certain officers of the registrant. | | 10-K | | | 12/31/1995 | | | 10(p) |
10(ee) | | Amendment, dated December 31, 2010, to the Agreement, dated December 30, 1994 between the registrant and William J. Doyle. | | 10-K | | | 12/31/2010 | | | 10(ff) |
10(ff) | | Form of Agreement of Indemnification dated August 8, 1995, between the registrant and certain officers and directors of the registrant. | | 10-K | | | 12/31/1995 | | | 10(q) |
10(gg) | | Resolution and Form of Agreement of Indemnification dated January 24, 2001. | | 10-K | | | 12/31/2000 | | | 10(ii) |
10(hh) | | Resolution and Form of Agreement of Indemnification — July 21, 2004. | | 10-Q | | | 6/30/2004 | | | 10(ii) |
10(ii) | | Chief Executive Officer Medical and Dental Benefits. | | 10-K | | | 12/31/2010 | | | 10(jj) |
10(jj) | | Potash Corporation of Saskatchewan Inc. Deferred Share Unit Plan for Non-Employee Directors. | | 10-Q | | | 3/31/2012 | | | 10(ll) |
10(kk) | | Potash Corporation of Saskatchewan Inc. 2005 Performance Option Plan and Form of Option Agreement, as amended. | | 10-K | | | 12/31/2006 | | | 10(cc) |
10(ll) | | Potash Corporation of Saskatchewan Inc. 2006 Performance Option Plan and Form of Option Agreement, as amended. | | 10-K | | | 12/31/2006 | | | 10(dd) |
10(mm) | | Potash Corporation of Saskatchewan Inc. 2007 Performance Option Plan and Form of Option Agreement. | | 10-Q | | | 3/31/2007 | | | 10(ee) |
10(nn) | | Potash Corporation of Saskatchewan Inc. 2008 Performance Option Plan and Form of Option Agreement. | | 10-Q | | | 3/31/2008 | | | 10(ff) |
10(oo) | | Potash Corporation of Saskatchewan Inc. 2009 Performance Option Plan and Form of Option Agreement. | | 10-Q | | | 3/31/2009 | | | 10(mm) |
10(pp) | | Potash Corporation of Saskatchewan Inc. 2010 Performance Option Plan and Form of Option Agreement. | | 8-K | | | 5/7/2010 | | | 10.1 |
10(qq) | | Potash Corporation of Saskatchewan Inc. 2011 Performance Option Plan and Form of Option Agreement. | | 8-K | | | 5/13/2011 | | | 10(a) |
10(rr) | | Potash Corporation of Saskatchewan Inc. 2012 Performance Option Plan and Form of Option Agreement. | | 8-K | | | 5/18/2012 | | | 10(a) |
10(ss) | | Medium-Term Incentive Plan of the registrant effective January 1, 2012. | | 10-K | | | 12/31/2011 | | | 10(uu) |
31(a) | | Certification pursuant to Section 302 of theSarbanes-Oxley Act of 2002. | | | | | | | | |
31(b) | | Certification pursuant to Section 302 of theSarbanes-Oxley Act of 2002. | | | | | | | | |
32 | | Certification pursuant to Section 906 of theSarbanes-Oxley Act of 2002. | | | | | | | | |
95 | | Information concerning mine safety violations or other regulatory matters required by Section 1503(a) of the Dodd-Frank Wall Street Reform and Consumer Protection Act. | | | | | | | | |
| | |
| 37 | | PotashCorp 2013 First Quarter Quarterly Report on Form 10-Q |
Signatures
Pursuant to the requirements of the Securities Exchange Act of 1934, the registrant has duly caused this report to be signed on its behalf by the undersigned, thereunto duly authorized.
| | | | |
| | POTASH CORPORATION OF SASKATCHEWAN INC. |
| | |
| April 30, 2013 | | By: | | /s/ JOSEPH PODWIKA |
| | | | Joseph Podwika |
| | | | Senior Vice President, General Counsel and Secretary |
| | |
| April 30, 2013 | | By: | | /s/ WAYNE R. BROWNLEE |
| | | | Wayne R. Brownlee |
| | | | Executive Vice President, Treasurer and Chief Financial Officer (Principal Financial and Accounting Officer) |
| | |
| PotashCorp 2013 First Quarter Quarterly Report on Form 10-Q | | 38 |
EXHIBIT INDEX
| | | | | | | | | | | | |
| | | | | Incorporated by Reference | |
Exhibit
Number | | Description of Document | | Form | | Filing Date/Period
End Date | | | Exhibit Number
(if different) | |
3(a) | | Articles of Continuance of the registrant dated May 15, 2002. | | 10-Q | | | 6/30/2002 | | | | | |
3(b) | | Bylaws of the registrant effective May 15, 2002. | | 10-Q | | | 6/30/2002 | | | | | |
4(a) | | Term Credit Agreement between The Bank of Nova Scotia and other financial institutions and the registrant dated September 25, 2001. | | 10-Q | | | 9/30/2001 | | | | | |
4(b) | | Syndicated Term Credit Facility Amending Agreement between The Bank of Nova Scotia and other financial institutions and the registrant dated as of September 23, 2003. | | 10-Q | | | 9/30/2003 | | | | | |
4(c) | | Syndicated Term Credit Facility Second Amending Agreement between The Bank of Nova Scotia and other financial institutions and the registrant dated as of September 21, 2004. | | 8-K | | | 9/24/2004 | | | | | |
4(d) | | Syndicated Term Credit Facility Third Amending Agreement between The Bank of Nova Scotia and other financial institutions and the registrant dated as of September 20, 2005. | | 8-K | | | 9/22/2005 | | | | 4 | (a) |
4(e) | | Syndicated Term Credit Facility Fourth Amending Agreement between The Bank of Nova Scotia and other financial institutions and the registrant dated as of September 27, 2006. | | 10-Q | | | 9/30/2006 | | | | | |
4(f) | | Syndicated Term Credit Facility Fifth Amending Agreement between the Bank of Nova Scotia and other financial institutions and the registrant dated as of October 19, 2007. | | 8-K | | | 10/22/2007 | | | | 4 | (a) |
4(g) | | Indenture dated as of February 27, 2003, between the registrant and The Bank of Nova Scotia Trust Company of New York. | | 10-K | | | 12/31/2002 | | | | 4 | (c) |
4(h) | | Form of Note relating to the registrant’s offering of $500,000,000 principal amount of 5.875% Notes due December 1, 2036. | | 8-K | | | 11/30/2006 | | | | 4 | (a) |
| | | | | | | | | | | | |
| | | | | Incorporated by Reference | |
Exhibit
Number | | Description of Document | | Form | | Filing Date/Period
End Date | | | Exhibit Number
(if different) | |
4(i) | | Form of Note relating to the registrant’s offering of $500,000,000 principal amount of 5.25% Notes due May 15, 2014. | | 8-K | | | 5/1/2009 | | | | 4 | (a) |
4(j) | | Form of Note relating to the registrant’s offering of $500,000,000 principal amount of 6.50% Notes due May 15, 2019. | | 8-K | | | 5/1/2009 | | | | 4 | (b) |
4(k) | | Form of Note relating to the registrant’s offering of $500,000,000 principal amount of 3.75% Notes due September 30, 2015. | | 8-K | | | 9/25/2009 | | | | 4 | (a) |
4(l) | | Form of Note relating to the registrant’s offering of $500,000,000 principal amount of 4.875% Notes due March 30, 2020. | | 8-K | | | 9/25/2009 | | | | 4 | (b) |
4(m) | | Revolving Term Credit Facility Agreement between The Bank of Nova Scotia and other financial institutions and the registrant dated as of December 11, 2009. | | 8-K | | | 12/15/2009 | | | | 4 | (a) |
4(n) | | Revolving Term Credit Facility First Amending Agreement between The Bank of Nova Scotia and other financial institutions and the registrant dated as of September 23, 2011. | | 8-K | | | 9/26/2011 | | | | 4 | (a) |
4(o) | | Form of Note relating to the registrant’s offering of $500,000,000 principal amount of 3.25% Notes due December 1, 2017. | | 8-K | | | 11/29/2010 | | | | 4 | (a) |
4(p) | | Form of Note relating to the registrant’s offering of $500,000,000 principal amount of 5.625% Notes due December 1, 2040. | | 8-K | | | 11/29/2010 | | | | 4 | (b) |
The registrant hereby undertakes to file with the Securities and Exchange Commission, upon request, copies of any constituent instruments defining the rights of holders of long-term debt of the registrant or its subsidiaries that have not been filed herewith because the amounts represented thereby are less than 10% of the total assets of the registrant and its subsidiaries on a consolidated basis.
| | | | | | | | | | | | |
| | | | | Incorporated by Reference | |
Exhibit
Number | | Description of Document | | Form | | Filing Date/Period
End Date | | | Exhibit Number
(if different) | |
10(a) | | Sixth Voting Agreement dated April 22, 1978, between Central Canada Potash, Division of Noranda, Inc., Cominco Ltd., International Minerals and Chemical Corporation (Canada) Limited, PCS Sales and Texasgulf Inc. | | F-1
(File No.
33-31303) | | | 9/28/1989 | | | | 10 | (f) |
10(b) | | Canpotex Limited Shareholders Seventh Memorandum of Agreement effective April 21, 1978, between Central Canada Potash, Division of Noranda Inc., Cominco Ltd., International Minerals and Chemical Corporation (Canada) Limited, PCS Sales, Texasgulf Inc. and Canpotex Limited as amended by Canpotex S&P amending agreement dated November 4, 1987. | | F-1
(File No.
33-31303) | | | 9/28/1989 | | | | 10 | (g) |
10(c) | | Producer Agreement dated April 21, 1978, between Canpotex Limited and PCS Sales. | | F-1
(File No.
33-31303) | | | 9/28/1989 | | | | 10 | (h) |
10(d) | | Canpotex/PCS Amending Agreement, dated as of October 1, 1992. | | 10-K | | | 12/31/1995 | | | | 10 | (f) |
10(e) | | Canpotex PCA Collateral Withdrawing/PCS Amending Agreement, dated as of October 7, 1993. | | 10-K | | | 12/31/1995 | | | | 10 | (g) |
10(f) | | Canpotex Producer Agreement amending agreement dated as of July 1, 2002. | | 10-Q | | | 6/30/2004 | | | | 10 | (g) |
10(g) | | Esterhazy Restated Mining and Processing Agreement dated January 31, 1978, between International Minerals & Chemical Corporation (Canada) Limited and the registrant’s predecessor. | | F-1
(File No.
33-31303) | | | 9/28/1989 | | | | 10 | (e) |
10(h) | | Agreement dated December 21, 1990, between International Minerals & Chemical Corporation (Canada) Limited and the registrant, amending the Esterhazy Restated Mining and Processing Agreement dated January 31, 1978. | | 10-K | | | 12/31/1990 | | | | 10 | (p) |
10(i) | | Agreement effective August 27, 1998, between International Minerals & Chemical (Canada) Global Limited and the registrant, amending the Esterhazy Restated Mining and Processing Agreement dated January 31, 1978 (as amended). | | 10-K | | | 12/31/1998 | | | | 10 | (l) |
| | | | | | | | | | | | |
| | | | | Incorporated by Reference | |
Exhibit
Number | | Description of Document | | Form | | Filing Date/Period
End Date | | | Exhibit Number
(if different) | |
10(j) | | Agreement effective August 31, 1998, among International Minerals & Chemical (Canada) Global Limited, International Minerals & Chemical (Canada) Limited Partnership and the registrant assigning the interest in the Esterhazy Restated Mining and Processing Agreement dated January 31, 1978 (as amended) held by International Minerals & Chemical (Canada) Global Limited to International Minerals & Chemical (Canada) Limited Partnership. | | 10-K
| | | 12/31/1998 | | | | 10 | (m) |
10(k) | | Potash Corporation of Saskatchewan Inc. Stock Option Plan — Directors, as amended. | | 10-K | | | 12/31/2006 | | | | 10 | (l) |
10(l) | | Potash Corporation of Saskatchewan Inc. Stock Option Plan — Officers and Employees, as amended. | | 10-K | | | 12/31/2006 | | | | 10 | (m) |
10(m) | | Short-Term Incentive Plan of the registrant effective January 1, 2000, as amended. | | 8-K | | | 3/13/2012 | | | | 10 | (a) |
10(n) | | Resolution and Forms of Agreement for Supplemental Executive Retirement Income Plan, for officers and key employees of the registrant. | | 10-K | | | 12/31/1995 | | | | 10 | (o) |
10(o) | | Amending Resolution and revised forms of agreement regarding Supplemental Retirement Income Plan of the registrant. | | 10-Q | | | 6/30/1996 | | | | 10 | (x) |
10(p) | | Amended and restated Supplemental Executive Retirement Income Plan of the registrant and text of amendment to existing supplemental income plan agreements. | | 10-Q | | | 9/30/2000 | | | | 10 | (mm) |
10(q) | | Amendment, dated February 23, 2009, to the amended and restated Supplemental Executive Retirement Income Plan. | | 10-K | | | 12/31/2008 | | | | 10 | (r) |
10(r) | | Amendment, dated December 29, 2010, to the amended and restated Supplemental Executive Retirement Income Plan. | | 10-K | | | 12/31/2010 | | | | | |
10(s) | | Form of Letter of amendment to existing supplemental income plan agreements of the registrant. | | 10-K | | | 12/31/2002 | | | | 10 | (cc) |
10(t) | | Amended and restated agreement dated February 20, 2007, between the registrant and William J. Doyle concerning the Supplemental Executive Retirement Income Plan. | | 10-K | | | 12/31/2006 | | | | 10 | (s) |
10(u) | | Amendment, dated December 24, 2008, to the amended and restated agreement, dated February 20, 2007, between the registrant and William J. Doyle concerning the Supplemental Executive Retirement Income Plan. | | 10-K | | | 12/31/2008 | | | | 10 | (u) |
10(v) | | Amendment, dated February 23, 2009, to the amended and restated agreement, dated February 20, 2007, between the registrant and William J. Doyle concerning the Supplemental Executive Retirement Income Plan. | | 10-K | | | 12/31/2008 | | | | 10 | (v) |
10(w) | | Amendment, dated February 23, 2009, to the amended and restated agreement, dated August 2, 1996, between the registrant and Wayne R. Brownlee concerning the Supplemental Executive Retirement Income Plan. | | 10-K | | | 12/31/2008 | | | | 10 | (w) |
10(x) | | Amendment, dated December 29, 2010, to the amended and restated agreement, dated February 20, 2007, between the registrant and William J. Doyle concerning the Supplemental Executive Retirement Income Plan. | | 10-K | | | 12/31/2010 | | | | 10 | (y) |
10(y) | | Amendment, dated December 29, 2010, to the amended and restated agreement, dated August 2, 1996, between the registrant and Wayne R. Brownlee concerning the Supplemental Executive Retirement Income Plan. | | 10-K | | | 12/31/2010 | | | | 10 | (z) |
10(z) | | Supplemental Retirement Agreement dated December 24, 2008, between the registrant and Stephen F. Dowdle. | | 10-K | | | 12/31/2011 | | | | 10 | (bb) |
10(aa) | | Supplemental Retirement Benefits Plan for U.S. Executives dated effective January 1, 1999. | | 10-Q | | | 6/30/2002 | | | | 10 | (aa) |
10(bb) | | Amendment No. 1, dated December 24, 2008, to the Supplemental Retirement Plan for U.S. Executives. | | 10-K | | | 12/31/2008 | | | | 10 | (z) |
| | | | | | | | | | |
| | | | | Incorporated by Reference |
Exhibit
Number | | Description of Document | | Form | | Filing Date/Period
End Date | | | Exhibit Number
(if different) |
10(cc) | | Amendment No. 2, dated February 23, 2009, to the Supplemental Retirement Plan for U.S. Executives. | | 10-K | | | 12/31/2008 | | | 10(aa) |
10(dd) | | Forms of Agreement dated December 30, 1994, between the registrant and certain officers of the registrant. | | 10-K | | | 12/31/1995 | | | 10(p) |
10(ee) | | Amendment, dated December 31, 2010, to the Agreement, dated December 30, 1994 between the registrant and William J. Doyle. | | 10-K | | | 12/31/2010 | | | 10(ff) |
10(ff) | | Form of Agreement of Indemnification dated August 8, 1995, between the registrant and certain officers and directors of the registrant. | | 10-K | | | 12/31/1995 | | | 10(q) |
10(gg) | | Resolution and Form of Agreement of Indemnification dated January 24, 2001. | | 10-K | | | 12/31/2000 | | | 10(ii) |
10(hh) | | Resolution and Form of Agreement of Indemnification — July 21, 2004. | | 10-Q | | | 6/30/2004 | | | 10(ii) |
10(ii) | | Chief Executive Officer Medical and Dental Benefits. | | 10-K | | | 12/31/2010 | | | 10(jj) |
10(jj) | | Potash Corporation of Saskatchewan Inc. Deferred Share Unit Plan for Non-Employee Directors. | | 10-Q | | | 3/31/2012 | | | 10(ll) |
10(kk) | | Potash Corporation of Saskatchewan Inc. 2005 Performance Option Plan and Form of Option Agreement, as amended. | | 10-K | | | 12/31/2006 | | | 10(cc) |
10(ll) | | Potash Corporation of Saskatchewan Inc. 2006 Performance Option Plan and Form of Option Agreement, as amended. | | 10-K | | | 12/31/2006 | | | 10(dd) |
10(mm) | | Potash Corporation of Saskatchewan Inc. 2007 Performance Option Plan and Form of Option Agreement. | | 10-Q | | | 3/31/2007 | | | 10(ee) |
10(nn) | | Potash Corporation of Saskatchewan Inc. 2008 Performance Option Plan and Form of Option Agreement. | | 10-Q | | | 3/31/2008 | | | 10(ff) |
10(oo) | | Potash Corporation of Saskatchewan Inc. 2009 Performance Option Plan and Form of Option Agreement. | | 10-Q | | | 3/31/2009 | | | 10(mm) |
10(pp) | | Potash Corporation of Saskatchewan Inc. 2010 Performance Option Plan and Form of Option Agreement. | | 8-K | | | 5/7/2010 | | | 10.1 |
10(qq) | | Potash Corporation of Saskatchewan Inc. 2011 Performance Option Plan and Form of Option Agreement. | | 8-K | | | 5/13/2011 | | | 10(a) |
10(rr) | | Potash Corporation of Saskatchewan Inc. 2012 Performance Option Plan and Form of Option Agreement. | | 8-K | | | 5/18/2012 | | | 10(a) |
10(ss) | | Medium-Term Incentive Plan of the registrant effective January 1, 2012. | | 10-K | | | 12/31/2011 | | | 10(uu) |
31(a) | | Certification pursuant to Section 302 of theSarbanes-Oxley Act of 2002. | | | | | | | | |
31(b) | | Certification pursuant to Section 302 of theSarbanes-Oxley Act of 2002. | | | | | | | | |
32 | | Certification pursuant to Section 906 of theSarbanes-Oxley Act of 2002. | | | | | | | | |
95 | | Information concerning mine safety violations or other regulatory matters required by Section 1503(a) of the Dodd-Frank Wall Street Reform and Consumer Protection Act. | | | | | | | | |