UNITED STATES
SECURITIES AND EXCHANGE COMMISSION
Washington, D.C. 20549
FORM N-CSR
CERTIFIED SHAREHOLDER REPORT OF
REGISTERED MANAGEMENT INVESTMENT COMPANIES
Investment Company Act file number 811-05931
Nuveen New York Performance Plus Municipal Fund, Inc.
(Exact name of registrant as specified in charter)
Nuveen Investments
333 West Wacker Drive
Chicago, IL 60606
(Address of principal executive offices) (Zip code)
Kevin J. McCarthy
Nuveen Investments
333 West Wacker Drive
Chicago, IL 60606
(Name and address of agent for service)
Registrant's telephone number, including area code: (312) 917-7700
Date of fiscal year end: September 30
Date of reporting period: September 30, 2014
Form N-CSR is to be used by management investment companies to file reports with the Commission not later than 10 days after the transmission to stockholders of any report that is required to be transmitted to stockholders under Rule 30e-1 under the Investment Company Act of 1940 (17 CFR 270.30e-1). The Commission may use the information provided on Form N-CSR in its regulatory, disclosure review, inspection, and policymaking roles.
A registrant is required to disclose the information specified by Form N-CSR, and the Commission will make this information public. A registrant is not required to respond to the collection of information contained in Form N-CSR unless the Form displays a currently valid Office of Management and Budget (“OMB”) control number. Please direct comments concerning the accuracy of the information collection burden estimate and any suggestions for reducing the burden to Secretary, Securities and Exchange Commission, 450 Fifth Street, NW, Washington, DC 20549-0609. The OMB has reviewed this collection of information under the clearance requirements of 44 U.S.C. ss. 3507.
ITEM 1. REPORTS TO STOCKHOLDERS.
NUVEEN INVESTMENTS ACQUIRED BY TIAA-CREF
On October 1, 2014, TIAA-CREF completed its previously announced acquisition of Nuveen Investments, Inc., the parent company of your fund’s investment adviser, Nuveen Fund Advisors, LLC (“NFAL”) and the Nuveen affiliates that act as sub-advisers to the majority of the Nuveen Funds. TIAA-CREF is a national financial services organization with approximately $840 billion in assets under management as of October 1, 2014 and is a leading provider of retirement services in the academic, research, medical and cultural fields. Nuveen expects to operate as a separate subsidiary within TIAA-CREF’s asset management business. Nuveen’s existing leadership and key investment teams have remained in place following the transaction.
NFAL and your fund’s sub-adviser(s) continue to manage your fund according to the same objectives and policies as before, and there have been no changes to your fund’s operations.
Table of Contents
| Chairman’s Letter to Shareholders | | | 4 |
| | | | |
| Portfolio Manager’s Comments | | | 5 |
| | | | |
| Fund Leverage | | | 11 |
| | | | |
| Common Share Information | | | 13 |
| | | | |
| Risk Considerations | | | 15 |
| | | | |
| Performance Overview and Holding Summaries | | | 16 |
| | | | |
| Shareholder Meeting Report | | | 22 |
| | | | |
| Report of Independent Registered Public Accounting Firm | | | 25 |
| | | | |
| Portfolios of Investments | | | 26 |
| | | | |
| Statement of Assets and Liabilities | | | 69 |
| | | | |
| Statement of Operations | | | 71 |
| | | | |
| Statement of Changes in Net Assets | | | 72 |
| | | | |
| Statement of Cash Flows | | | 74 |
| | | | |
| Financial Highlights | | | 76 |
| | | | |
| Notes to Financial Statements | | | 84 |
| | | | |
| Additional Fund Information | | | 99 |
| | | | |
| Glossary of Terms Used in this Report | | | 100 |
| | | | |
| Reinvest Automatically, Easily and Conveniently | | | 102 |
| | | | |
| Board Members & Officers | | | 103 |
| | | | |
| Annual Investment Management Agreement Approval Process | | | 108 |
Chairman’s Letter to Shareholders
Dear Shareholders,
Over the past year, global financial markets were generally strong as stocks of many countries rose due to strengthening economies and abundant central bank support. A low and stable interest rate environment allowed the bond market to generate modest but positive returns.
More recently, markets have been less certain as economic growth is strengthening in some parts of the world, but in other areas recovery has been slow or uneven at best. Despite increasing market volatility, geopolitical turmoil and concerns over rising rates, better-than-expected earnings results and economic data have supported U.S. stocks. Europe continues to face challenges as disappointing growth and inflation measures led the European Central Bank to further cut interest rates. Japan is suffering from the burden of the recent consumption tax as the government’s structural reforms continue to steadily progress. Flare-ups in hotspots, such as the ongoing Russia-Ukraine conflict and Middle East, have not yet been able to derail the markets, though that remains a possibility. With all the challenges facing the markets, accommodative monetary policy around the world has helped lessen the impact of these events.
It is in such changeable markets that professional investment management is most important. Investment teams who have experienced challenging markets in the past understand how their asset class can behave in rapidly changing times. Remaining committed to their investment disciplines during these times is a critical component to achieving long-term success. In fact, many strong investment track records are established during challenging periods because experienced investment teams understand that volatile markets place a premium on companies and investment ideas that can weather the short-term volatility. By maintaining appropriate time horizons, diversification and relying on practiced investment teams, we believe that investors can achieve their long-term investment objectives.
As always, I encourage you to communicate with your financial consultant if you have any questions about your investment in a Nuveen Fund. On behalf of the other members of the Nuveen Fund Board, we look forward to continuing to earn your trust in the months and years ahead.
William J. Schneider
Chairman of the Board
November 21, 2014
Portfolio Manager’s Comments
Nuveen New York Municipal Value Fund, Inc. (NNY)
Nuveen New York Municipal Value Fund 2 (NYV)
Nuveen New York Performance Plus Municipal Fund, Inc. (NNP)
Nuveen New York Dividend Advantage Municipal Fund (NAN)
Nuveen New York Dividend Advantage Municipal Fund 2 (NXK)
Nuveen New York AMT-Free Municipal Income Fund (NRK)
These Funds feature portfolio management by Nuveen Asset Management, LLC, an affiliate of Nuveen Investments, Inc. Portfolio manager Scott R. Romans, PhD, discusses economic and municipal market conditions at the national and state levels, key investment strategies and the twelve-month performance of the Nuveen New York Funds. Scott assumed portfolio management responsibility for these six Funds in 2011.
What factors affected the U.S. economy and the national municipal market during the twelve-month reporting period ended September 30, 2014?
During this reporting period, the U.S. economy continued its growth at a moderate pace. The Federal Reserve (Fed) maintained efforts to bolster growth and promote progress toward its mandates of maximum employment and price stability by holding the benchmark fed funds rate at the record low level of zero to 0.25% that it established in December 2008. At its October 2014 meeting (following the end of this reporting period), the Fed announced that it would end its bond-buying stimulus program as of November 1, 2014, after tapering its monthly asset purchases of mortgage-backed and longer-term Treasury securities from the original $85 billion per month to $15 billion per month over the course of seven consecutive meetings (December 2013 through September 2014). In making the announcement, the Fed cited substantial improvement in the outlook for the labor market since the inception of the current asset purchase program as well as sufficient underlying strength in the broader economy to support ongoing progress toward maximum employment in a context of price stability. The Fed also reiterated that it would continue to look at a wide range of factors, including labor market conditions, indicators of inflationary pressures and readings on financial developments, in determining future actions, saying that it would likely maintain the current target range for the fed funds rate for a considerable time after the end of the asset purchase program, especially if projected inflation continues to run below the Fed’s 2% longer-run goal. However, if economic data shows faster progress toward the Fed’s employment and inflation objectives than currently anticipated, the Fed indicated that the first increase in the target range since 2006 could occur sooner than expected.
In the third quarter of 2014, the U.S. economy, as measured by the U.S. gross domestic product (GDP), grew at a 3.5% annual rate, compared with -2.1% in the first quarter of 2014 and 4.6% in the second quarter. Third-quarter growth was attributed in part
| Certain statements in this report are forward-looking statements. Discussions of specific investments are for illustration only and are not intended as recommendations of individual investments. The forward-looking statements and other views expressed herein are those of the portfolio manager as of the date of this report. Actual future results or occurrences may differ significantly from those anticipated in any forward-looking statements, and the views expressed herein are subject to change at any time, due to numerous market and other factors. The Funds disclaim any obligation to update publicly or revise any forward-looking statements or views expressed herein. |
Ratings shown are the highest rating given by one of the following national rating agencies: Standard & Poor’s (S&P), Moody’s Investors Service, Inc. (Moody’s) or Fitch, Inc. (Fitch) Credit ratings are subject to change. AAA, AA, A and BBB are investment grade ratings; BB, B, CCC, CC, C and D are below investment grade ratings. Certain bonds backed by U.S. government or agency securities are regarded as having an implied rating equal to the rating of such securities. Holdings designated N/R are not rated by these national rating agencies.
Bond insurance guarantees only the payment of principal and interest on the bond when due, and not the value of the bonds themselves, which will fluctuate with the bond market and the financial success of the issuer and the insurer. Insurance relates specifically to the bonds in the portfolio and not to the share prices of a Fund. No representation is made as to the insurers’ ability to meet their commitments.
Portfolio Manager’s Comments (continued)
to a surge in exports and a major increase in military spending. The Consumer Price Index (CPI) rose 1.7% year-over-year as of September 2014, while the core CPI (which excludes food and energy) also increased 1.7% during the same period, below the Fed’s unofficial longer term inflation objective of 2.0%. As of September 2014, the national unemployment rate was 5.9%, the lowest level since July 2008, down from the 7.2% reported in September 2013, but still above levels that would provide consistent support for optimal GDP growth. The housing market continued to post gains, although price growth showed some signs of deceleration. The average home price in the S&P/Case-Shiller Index of 20 major metropolitan areas rose 5.6% for the twelve months ended August 2014 (most recent data available at the time this report was prepared), raising home prices to fall 2004 levels, although they continued to be down 16%-17% from their mid-2006 peak.
During the early part of this reporting period, widespread uncertainty about the future of the Fed’s quantitative easing program and Congress’s failure to reach an agreement on the Fiscal 2014 federal budget contributed to increased volatility in the financial markets. On October 1, 2013, the start date for Fiscal 2014, the lack of a resolution on spending cuts intended to address the federal budget deficit triggered sequestration, or a program of automatic spending cuts, and the federal government shut down for 16 days until an interim appropriations bill was signed into law. (Consensus on a $1.1 trillion federal spending bill was ultimately reached in January 2014 and in February 2014, members of Congress agreed to suspend the $16.7 trillion debt ceiling until March 2015.) In this unsettled environment, the Treasury market traded off, the municipal market followed suit, and spreads widened as investor concern grew, prompting selling by bondholders across the fixed income markets.
As we turned the page to calendar year 2014, the market environment stabilized, as the Fed’s policies continued to be accommodative and some degree of political consensus was reached. The Treasury market rallied and municipal bonds rebounded, with flows into municipal bond funds increasing, while supply continued to drop. This supply/demand dynamic served as a key driver of municipal market performance for the reporting period. The resultant rally in municipal bonds generally produced positive total returns for the reporting period as a whole. Overall, municipal credit fundamentals continued to improve, as state governments made good progress in dealing with budget issues. Due to strong growth in personal tax and sales tax collections, year-over-year totals for state tax revenues had increased for 16 consecutive quarters as of the second quarter of 2014, while on the expense side, many states made headway in cutting and controlling costs, with more than 40 states implementing some type of pension reform. The current level of municipal issuance reflects the more conservative approach to state budgeting. For the twelve months ended September 30, 2014, municipal bond issuance nationwide totaled $302.7 billion, down 13% from the issuance for the twelve-month reporting period ended September 30, 2013.
How were economic and market conditions in New York during the twelve-month reporting period ended September 30, 2014?
During this reporting period, New York continued to post improving economic numbers. As of September 2014, unemployment in the state stood at 6.2%, the lowest level since October 2008, compared with the current national rate of 5.9%. This marked a substantial improvement from New York’s 7.5% jobless rate in September 2013. The unemployment rate was slightly lower in New York City, which stood at 6.1% and the 52 counties of upstate New York averaged 5.5% than in the state as a whole as of September 2014. New York added 120,500 private sector jobs, bringing the number of these jobs to an all-time high. In September 2014, the Empire State manufacturing survey for New York hit a nearly five-year high of 27.5, in a gauge where readings above zero indicate improving conditions. The survey’s new-orders index was 16.9 in September, while the shipments index was 27.1. New York’s housing market continued to post gains, although improvement lagged the national average. According to the S&P/Case-Shiller Index of 20 major metropolitan areas, housing prices in New York City rose 3.1% over the twelve months ended August 2014 (most recent data available at the time this report was prepared), compared with an average increase of 5.6% nationally.
The state’s budget picture has improved considerably over the past few years, as revenues have been increased through higher taxes and expenditures have been more tightly controlled. New York’s $142.6 billion state budget for Fiscal 2015 contained no new
taxes and continued the state’s recent movement toward structural budget balance by holding spending growth below 2% for the fourth consecutive year. The budget also provided for $1.5 billion in property tax cuts aimed at aiding New York’s homeowners and encouraging local governments to increase efficiencies as well as a 5% increase in state education aid. According to Moody’s, New York ranked fifth in the nation in debt per capita, at three times the national average. Although New York is a heavily indebted state, the state pension system remained well funded compared with those of other states and its unfunded liability was modest, placing the state’s fixed costs at the 50-state median relative to total revenues. In June and July 2014, ratings on New York GOs were upgraded by all three agencies, with Moody’s citing New York’s sustained improvements in fiscal governance, the strength of the recent economic recovery, a strong financial position reflected in improved reserves and reduced spending growth in line with growth in the state’s economic capacity. As of September 2014, New York GO debt was rated Aa1/AA+/AA+ with stable outlooks from Moody’s, S&P and Fitch, respectively. Municipal bond supply in New York totaled $41.2 billion for the twelve-month reporting period ended September 30, 2014, a 19% increase from the twelve months ended September 30, 2013. This ranked New York second among state issuers for the reporting period, behind California.
What key strategies were used to manage the New York Funds during the twelve-month reporting period ended September 30, 2014?
During this reporting period, we saw the municipal market environment shift from volatility to a rally driven by strong demand and tight supply and reinforced by an environment of improving fundamentals. For the reporting period, municipal bond prices generally rose, while interest rates declined. In general, New York municipal paper slightly underperformed the national market. During this time, we continued to take a bottom-up approach to discovering sectors that appeared undervalued as well as individual credits that we believed had the potential to perform well and helped us keep our Funds fully invested.
During the first three months of this reporting period, we primarily focused on strategies that enabled us to take advantage of the higher coupons and attractive prices resulting from a pattern of outflows, predominately from high yield funds. This presented us with opportunities to add lower rated credits to the New York Funds in the secondary market, both in positions already held and in issues new to the Funds. In general, the majority of our purchases focused on health care bonds, education credits, continuing care retirement communities (CCRCs) issues and tobacco bonds.
While new municipal supply declined nationally, the New York market saw a 19% increase in issuance, due in part to a $2.1 billion new issue of AAA-rated Debt Securitization bonds for the Long Island Power Authority (LIPA), which were used to restructure a portion of LIPA’s lower rated debt. In the aftermath of Hurricane Sandy in 2012, the New York state legislature decided to restructure the utility’s finances in an effort to reduce debt service costs and reinvest in improved customer service. The bond deal, which came to market in December 2013, marked the first time that a U.S. municipal utility issued tax-exempt bonds through a special purpose entity, the Utility Debt Securitization Authority, which was created by the state legislature in June 2013 to handle the borrowing. The bonds are backed by charges on LIPA’s 1.1 million customers in the New York suburbs of Nassau and Suffolk counties that cannot be revoked or altered. However, we should note that much of the increase in New York issuance during this reporting period can be attributed to a sharp increase in refinancings, especially when interest rates began to decline in early 2014, as bond issuers sought to lower debt service costs by retiring older bonds and replacing them with bonds issued at lower rates. During the third quarter of 2014, for example, this current refunding activity increased by more than 64% nationwide. These refinanced bonds do not represent an actual increase in issuance because they are issued to replace bonds already existing in the market. As a result, it remained challenging to source appropriate bonds that would help us meet our goals for the Funds.
Despite this, we continued to find opportunities to purchase bonds in both the primary and secondary markets that helped us keep the Funds fully invested. In the primary market, our purchases included the LIPA bonds discussed above. As the municipal
Portfolio Manager’s Comments (continued)
market improved, we tried to position our portfolios somewhat more defensively and enhance the Funds’ total return performance prospects. As part of this, we implemented relative value bond swaps as we found attractive opportunities that would enable us to improve book yields while maintaining similar credit profiles. In the current rate environment, we believe it is advantageous to think of purchases as short term holdings that can be exchanged for credit positions with better embedded yields when interest rates start to rise. We successfully used this strategy when rates rose in 2013 to replace bonds with 5% coupons with higher coupon bonds. Many of those existing holdings also had been purchased at significant premiums. Because premiums must be amortized, that cut into the amount of income available for distribution from the coupon. By executing a bond swap in a rising interest rate environment, the amortization expense was basically converted into a loss, so that more of the income from the coupon could be distributed to shareholders. An additional benefit of this strategy was the generation of tax loss carry-forwards that could be used to offset future capital gains.
When we found appropriate opportunities, we also carried out curve trades, in some cases selling longer maturity bonds with shorter calls and buying shorter maturity bonds with longer calls. By moving the Funds’ positioning in on the yield curve, we enhanced their convexity, which measures the relationship between bond prices and bond yields. Convexity helps to gauge performance potential regardless of the movement of interest rates. As the result of these curve trades, the Funds hold bonds priced to a longer call that we believe should perform well if rates decline and if rates rise, they hold bonds with shorter maturities that offer a better downside profile.
Overall, our emphasis in purchase activity during the latter part of this reporting period was on relative value and credit quality, rather than sector. That is, when considering the purchase of a lower rated bond or a slightly less liquid issue, we looked carefully at the compensation offered by the bond in question relative to its credit quality or liquidity to determine that, if the bond were held for the long term rather than used in a bond swap when interest rates rise, the Funds would be well compensated for that. All of the additions to our portfolios during this reporting period consisted of New York paper. Cash for purchases during this reporting period was generated primarily by proceeds from called and matured bonds, which we worked to redeploy to keep the Funds fully invested and support their income streams. In addition, as previously mentioned, the decline in municipal yields and the flattening of the municipal yield curve relative to the Treasury curve helped to make refunding deals more attractive. The increase in this activity provided ample cash for purchases and drove much of our trading for the reporting period.
As of September 30, 2014, all six of these Funds continued to use inverse floating rate securities. We employ inverse floaters for a variety of reasons, including duration management, income enhancement and total return enhancement. As part of our duration management strategies, NYV also used a forward interest rate swap to manage duration and reduce price volatility risk to movements in U.S. interest rates relative to the Fund’s benchmark. During this reporting period, the swap made a slight negative contribution to performance as interest rates decreased at the long end of the yield curve, which affected the value of the swap. We removed the swaps at the end of April 2014, as NYV no longer needed them to reach its preferred duration range.
How did the Funds perform during the twelve-month reporting period ended September 30, 2014?
The tables in each Fund’s Performance Overview and Holding Summaries section of this report provide the Fund’s total returns for the one-year, five-year and ten-year periods ended September 30, 2014. Each Fund’s returns at net asset value (NAV) are compared with the performance of corresponding market indexes and Lipper classification average.
For the twelve months ended September 30, 2014, the total returns on common share NAV for all six of these Funds exceeded the return for the S&P Municipal Bond New York Index as well as that for the national S&P Municipal Bond Index. For the same period, these six Funds underperformed the average return for the Lipper New York Municipal Debt Funds Classification Average.
Key management factors that influenced the Funds’ returns included duration and yield curve positioning, credit exposure and sector allocation. The use of regulatory leverage also was a positive factor in the performance of NNP, NAN, NXK and NRK during
this reporting period; NNY and NYV do not use regulatory leverage. Leverage is discussed in more detail in the Fund leverage section of this report.
Given the combination of declining interest rates and a flattening yield curve during this reporting period, municipal bonds with longer maturities generally outperformed those with shorter maturities. Overall, credits with maturities of 15 years or more, especially those at the longest end of the municipal yield curve, outperformed the general municipal market, while bonds at the shortest end of the curve produced the weakest results. Consistent with our long term strategy, all of these Funds tended to be overweighted in the longer parts of the yield curve that performed best and underweighted in the underperforming shorter end of the curve. This positioning was the key positive contributor to their performance. Among the four Funds, with regulatory leverage, the positioning of NXK was slightly less advantageous than that of the other three Funds and it received less benefit from duration. In NNY and NYV, the two Funds that do not use regulatory leverage, the performance differential can be ascribed to NYV having the longer duration of the two.
During this reporting period, lower rated bonds, including sub-investment grade credits, generally outperformed higher quality bonds, as the municipal market rally continued and investors became increasingly willing to accept risk in their search for yield in the current low rate environment. While their longer average durations provided an advantage for lower rated bonds, they also generally had stronger duration-adjusted results. Because these Funds typically tended to be overweighted in the lower quality categories relative to the market, credit exposure was positive for their performance.
Among the municipal market sectors, health care and industrial development revenue (IDR) bonds generally were the top performers, with water and sewer and education credits also outperforming the general municipal market. The outperformance of the health care sector can be attributed in part to the current scarcity of these bonds, with issuance in this sector declining 31% during the first nine months of 2014. As of September 30, 2014, NYV had the heaviest weighting in health care among these Funds. During this reporting period, lower rated tobacco credits backed by the 1998 master tobacco settlement agreement experienced some volatility, but finished the reporting period well ahead of the national municipal market as a whole as well as the New York municipal market. The performance of these bonds was helped by their longer effective durations, lower credit quality and the broader demand for higher yields. In addition, several tobacco bond issues were strengthened following the favorable resolution of a dispute over payments by tobacco companies. All of these Funds had allocations of tobacco bonds issued by various state and territorial agencies, with NNP having the heaviest weighting in these credits.
In contrast, pre-refunded bonds, which are often backed by U.S. Treasury securities, were among the poorest performing market segments. The underperformance of these bonds relative to the market can be attributed primarily to their shorter effective maturities and higher credit quality. As of September 30, 2014, all of these Funds except NYV had holdings of pre-refunded bonds, with NNP having the heaviest allocation of these bonds and NAN the smallest. In addition, general obligation (GO) credits generally trailed the revenue sectors as well as the municipal market as a whole for the reporting period, although by a substantially smaller margin than the pre-refunded category. This included New York State GOs, which underperformed despite the credit upgrades in June and July 2014 mentioned earlier in this report, as well as local GOs. Some of the GOs’ underperformance can be attributed to their higher quality.
Portfolio Manager’s Comments (continued)
We continued to monitor the ongoing economic problems of Puerto Rico for any impact on the Funds’ holdings and performance. Shareholders should note that, as of the end of this reporting period, NYV and NXK had no exposure to Puerto Rico debt, while the other four Funds had allocations of 2.5% or less, all of which was insured. These territorial bonds were originally added to our portfolios to keep assets fully invested and working for the Funds as well as to enhance diversity, duration and credit. The Puerto Rico credits offered higher yields, added diversification and triple exemption (i.e., exemption from most federal, state and local taxes). However, Puerto Rico’s continued economic weakening, escalating debt service obligations and longstanding inability to deliver a balanced budget led to multiple downgrades on its debt over the past two years. Following the latest rating reduction by Moody’s in July 2014, Puerto Rico general obligation debt was rated B2/BB+/BB (below investment grade) by Moody’s, S&P and Fitch, respectively, with negative outlooks. In late June 2014, Puerto Rico approved new legislation creating a judicial framework and formal process that would allow several of the commonwealth’s public corporations to restructure their public debt. As of September 2014, the Nuveen complex held $70.9 million in bonds backed by public corporations in Puerto Rico that could be restructured under this legislation, representing less than 0.1% of our municipal assets under management. In light of the evolving economic situation in Puerto Rico, Nuveen’s credit analysis of the commonwealth had previously considered the possibility of a default and the restructuring of public corporations and we had adjusted our portfolios to prepare for such an outcome, although no such default or restructuring has occurred to date. The Nuveen complex’s entire exposure to obligations of the government of Puerto Rico and other Puerto Rico issuers totals 0.35% of assets under management as of September 30, 2014. For the reporting period ended September 30, 2014, Puerto Rico paper underperformed the municipal market as a whole as well as the New York market. The effect on performance from their Puerto Rico holdings differed from Fund to Fund in line with the type and amount of its position, but on the whole, the small nature of our exposure helped to limit the negative impact of the underperformance.
Fund Leverage
IMPACT OF THE FUNDS’ LEVERAGE STRATEGIES ON PERFORMANCE
One important factor impacting the returns of the Funds relative to their comparative benchmarks was the Funds’ use of leverage through their issuance of preferred shares and/or investments in inverse floating rate securities, which represent leveraged investments in underlying bonds. As mentioned previously, NNY and NYV do not use regulatory leverage. The Funds use leverage because our research has shown that, over time, leveraging provides opportunities for additional income, particularly in the recent market environment where short-term market rates are at or near historical lows, meaning that the short-term rates the Fund has been paying on its leveraging instruments have been much lower than the interest the Fund has been earning on its portfolio of long-term bonds that it has bought with the proceeds of that leverage. However, use of leverage also can expose the Fund to additional price volatility. When a Fund uses leverage, the Fund will experience a greater increase in its net asset value if the municipal bonds acquired through the use of leverage increase in value, but it will also experience a correspondingly larger decline in its net asset value if the bonds acquired through leverage decline in value, which will make the Fund’s net asset value more volatile, and its total return performance more variable over time. In addition, income in levered funds will typically decrease in comparison to unlevered funds when short-term interest rates increase and increase when short-term interest rates decrease. Leverage had a positive impact on the performance of the Funds over this reporting period.
As of September 30, 2014, the Funds’ percentages of leverage are as shown in the accompanying table:
| | | | NNY | | NYV | | NNP | | NAN | | NXK | | NRK | |
| Effective Leverage* | | | 2.69 | % | | 5.07 | % | | 35.76 | % | | 35.62 | % | | 33.37 | % | | 35.57 | % | |
| Regulatory Leverage* | | | 0.00 | % | | 0.00 | % | | 27.16 | % | | 28.24 | % | | 27.94 | % | | 31.06 | % | |
| * | Effective leverage is a Fund’s effective economic leverage, and includes both regulatory leverage and the leverage effects of certain derivative and other investments in a Fund’s portfolio that increase the Fund’s investment exposure. Currently, the leverage effects of Tender Option Bond (TOB) inverse floater holdings are included in effective leverage values, in addition to any regulatory leverage. Regulatory leverage consists of preferred shares issued or borrowings of a Fund. Both of these are part of a Fund’s capital structure. Regulatory leverage is subject to asset coverage limits set forth in the Investment Company Act of 1940. |
Fund Leverage (continued)
THE FUNDS’ REGULATORY LEVERAGE
As of September 30, 2014, the following Funds have issued and outstanding Institutional MuniFund Term Preferred (iMTP) Shares, Variable Rate MuniFund Term Preferred (VMTP) Shares and/or Variable Rate Demand Preferred (VRDP) Shares as shown in the accompanying table. As mentioned previously, NNY and NYV do not use regulatory leverage.
| | | | iMTP Shares | | | VMTP Shares | | | VRDP Shares | | | | |
| | | | | | | Shares | | | | | | Shares | | | | | | Shares | | | | |
| | | | | | | Issued at | | | | | | Issued at | | | | | | Issued at | | | | |
| | | | Series | | | Liquidation Value | | | Series | | | Liquidation Value | | | Series | | | Liquidation Value | | | Total | |
| NNP | | | | | $ | — | | | — | | $ | — | | | 1 | | $ | 89,000,000 | | $ | 89,000,000 | |
| NAN | | | | | $ | — | | | 2017 | | $ | 56,000,000 | | | — | | $ | — | | $ | 56,000,000 | |
| NXK | | | | | $ | — | | | 2017 | | $ | 38,000,000 | | | — | | $ | — | | $ | 38,000,000 | |
| NRK | | | 2017 | | $ | 79,000,000 | | | — | | $ | — | | | 1 | | $ | 112,300,000 | | | | |
| | | | | | | — | | | — | | | — | | | 2 | | | 164,800,000 | | | | |
| | | | | | | — | | | — | | | — | | | 3 | | | 161,700,000 | | | | |
| | | | | | | — | | | — | | | — | | | 4 | | | 50,000,000 | | | | |
| | | | | | $ | 79,000,000 | | | | | $ | — | | | | | $ | 488,800,000 | | $ | 567,800,000 | |
During the current reporting period, NAN and NXK redeemed their MTP Shares with the issuance of VMTP Shares and NRK redeemed its MTP and VMTP Shares with the issuance of iMTP Shares. Refer to the Notes to Financial Statements, Note 1 – General Information and Significant Accounting Policies for further details on iMTP, MTP, VMTP and VRDP Shares and each Fund’s respective transactions.
Common Share Information
COMMON SHARE DISTRIBUTION INFORMATION
The following information regarding the Funds’ distributions is current as of September 30, 2014. Each Fund’s distribution levels may vary over time based on each Fund’s investment activity and portfolio investments value changes.
During the current reporting period, each Fund’s monthly distributions to common shareholders were as shown in the accompanying table.
| | | Per Common Share Amounts | |
| Ex-Dividend Date | | | NNY | | | NYV | | | NNP | | | NAN | | | NXK | | | NRK | |
| October 2013 | | $ | 0.0310 | | $ | 0.0560 | | $ | 0.0710 | | $ | 0.0630 | | $ | 0.0550 | | $ | 0.0690 | |
| November | | | 0.0310 | | | 0.0560 | | | 0.0710 | | | 0.0630 | | | 0.0550 | | | 0.0690 | |
| December | | | 0.0310 | | | 0.0560 | | | 0.0710 | | | 0.0630 | | | 0.0550 | | | 0.0690 | |
| January | | | 0.0325 | | | 0.0560 | | | 0.0710 | | | 0.0630 | | | 0.0550 | | | 0.0690 | |
| February | | | 0.0325 | | | 0.0560 | | | 0.0710 | | | 0.0630 | | | 0.0550 | | | 0.0690 | |
| March | | | 0.0325 | | | 0.0545 | | | 0.0710 | | | 0.0630 | | | 0.0550 | | | 0.0690 | |
| April | | | 0.0325 | | | 0.0545 | | | 0.0710 | | | 0.0630 | | | 0.0550 | | | 0.0690 | |
| May | | | 0.0325 | | | 0.0545 | | | 0.0710 | | | 0.0630 | | | 0.0550 | | | 0.0690 | |
| June | | | 0.0325 | | | 0.0545 | | | 0.0710 | | | 0.0630 | | | 0.0550 | | | 0.0690 | |
| July | | | 0.0325 | | | 0.0545 | | | 0.0710 | | | 0.0630 | | | 0.0550 | | | 0.0690 | |
| August | | | 0.0325 | | | 0.0545 | | | 0.0710 | | | 0.0630 | | | 0.0550 | | | 0.0690 | |
| September 2014 | | | 0.0325 | | | 0.0525 | | | 0.0710 | | | 0.0630 | | | 0.0550 | | | 0.0650 | |
| | | | | | | | | | | | | | | | | | | | |
| Ordinary Income Distribution* | | $ | 0.0011 | | $ | 0.0008 | | $ | — | | $ | 0.0003 | | $ | 0.0022 | | $ | — | |
| | | | | | | | | | | | | | | | | | | | |
| Market Yield** | | | 4.02 | % | | 4.36 | % | | 6.12 | % | | 5.67 | % | | 5.01 | % | | 6.09 | % |
| Taxable-Equivalent Yield** | | | 5.98 | % | | 6.49 | % | | 9.11 | % | | 8.44 | % | | 7.46 | % | | 9.06 | % |
| * | Distribution paid in December 2013. |
| | |
| ** | Market Yield is based on the Fund’s current annualized monthly dividend divided by the Fund’s current market price as of the end of the reporting period. Taxable-Equivalent Yield represents the yield that must be earned on a fully taxable investment in order to equal the yield of the Fund on an after-tax basis. It is based on a combined federal and state income tax rate of 32.8%. When comparing a Fund to investments that generate qualified dividend income, the Taxable-Equivalent Yield is lower. |
Each Fund in this report seeks to pay regular monthly dividends out of its net investment income at a rate that reflects its past and projected net income performance. To permit each Fund to maintain a more stable monthly dividend, the Fund may pay dividends at a rate that may be more or less than the amount of net income actually earned by the Fund during the period. If a Fund has cumulatively earned more than it has paid in dividends, it will hold the excess in reserve as undistributed net investment income (UNII) as part of the Fund’s net asset value. Conversely, if a Fund has cumulatively paid in dividends more than it has earned, the excess will constitute a negative UNII that will likewise be reflected in the Fund’s net asset value. Each Fund will, over time, pay all its net investment income as dividends to shareholders.
As of September 30, 2014, all the Funds in this report had positive UNII balances for both financial reporting and tax purposes.
Common Share Information (continued)
All monthly dividends paid by the Funds during the fiscal year ended September 30, 2014 were paid from net investment income. If a portion of a Fund’s monthly distributions was sourced from or comprised of elements other than net investment income, including capital gains and/or a return of capital, the Funds’ shareholders would have received a notice to that effect. The composition and per share amounts of each Fund’s monthly dividends for the reporting period are presented in the Statement of Changes in Net Assets and Financial Highlights, respectively (for reporting purposes) and in Note 6 — Income Tax Information within the accompany Notes to Financial Statements (for income tax purposes), later in this report.
COMMON SHARE REPURCHASES
As of September 30, 2014, and since the inception of the Funds’ repurchase programs, the Funds have cumulatively repurchased and retired their common shares as shown in the accompanying table.
| | | | NNY | | | NYV | | | NNP | | | NAN | | | NXK | | | NRK | |
| Common Shares Cumulatively Repurchased and Retired | | | — | | | — | | | 27,800 | | | — | | | 12,500 | | | 6,800 | |
| Common Shares Authorized for Repurchase | | | 1,520,000 | | | 235,000 | | | 1,505,000 | | | 925,000 | | | 650,000 | | | 8,760,000 | |
During the current reporting period, NXK repurchased and retired its common shares at a weighted average price per common share and a weighted average discount per common share as shown in the accompanying table.
| | | | NXK | |
| Common Shares Repurchased and Retired | | | 5,300 | |
| Weighted Average Price per Common Share Repurchased and Retired | | $ | 12.22 | |
| Weighted Average Discount per Common Share Repurchased and Retired | | | 13.40 | % |
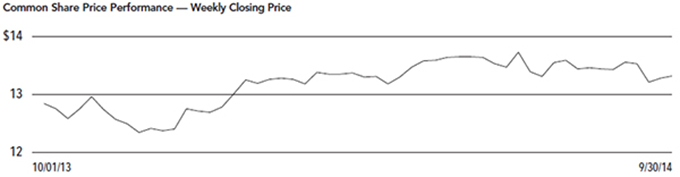
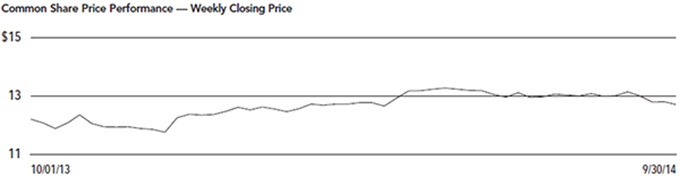
OTHER COMMON SHARE INFORMATION
As of September 30, 2014, and during the current reporting period, the Funds’ common share prices were trading at a premium/(discount) to their common share NAVs as shown in the accompanying table.
| | | | NNY | | | NYV | | | NNP | | | NAN | | | NXK | | | NRK | |
| Common Share NAV | | $ | 10.08 | | $ | 15.94 | | $ | 15.85 | | $ | 15.36 | | $ | 15.12 | | $ | 14.39 | |
| Common Share Price | | $ | 9.71 | | $ | 14.44 | | $ | 13.93 | | $ | 13.33 | | $ | 13.17 | | $ | 12.80 | |
| Premium/(Discount) to NAV | | | (3.67 | )% | | (9.41 | )% | | (12.11 | )% | | (13.22 | )% | | (12.90 | )% | | (11.05 | )% |
| 12-Month Average Premium/(Discount) to NAV | | | (4.51 | )% | | (8.88 | )% | | (9.53 | )% | | (10.58 | )% | | (10.87 | )% | | (8.83 | )% |
Risk Considerations
Fund shares are not guaranteed or endorsed by any bank or other insured depository institution, and are not federally insured by the Federal Deposit Insurance Corporation. Past performance is no guarantee of future results. Fund common shares are subject to a variety of risks, including:
Investment, Price and Market Risk. An investment in common shares is subject to investment risk, including the possible loss of the entire principal amount that you invest. Your investment in common shares represents an indirect investment in the municipal securities owned by the Fund, which generally trade in the over-the-counter markets. Shares of closed-end investment companies like these Funds frequently trade at a discount to their net asset value (NAV). Your common shares at any point in time may be worth less than your original investment, even after taking into account the reinvestment of Fund dividends and distributions.
Leverage Risk. Each Fund’s use of leverage creates the possibility of higher volatility for the Fund’s per share NAV, market price, distributions and returns. There is no assurance that a Fund’s leveraging strategy will be successful. Certain aspects of the recently adopted Volcker Rule may limit the availability of tender option bonds, which are used by the Funds for leveraging and duration management purposes. The effects of this new Rule, expected to take effect in mid-2015, may make it more difficult for a Fund to maintain current or desired levels of leverage and may cause the Fund to incur additional expenses to maintain its leverage.
Tax Risk. The tax treatment of Fund distributions may be affected by new IRS interpretations of the Internal Revenue Code and future changes in tax laws and regulations.
Issuer Credit Risk. This is the risk that a security in a Fund’s portfolio will fail to make dividend or interest payments when due.
Interest Rate Risk. Fixed-income securities such as bonds, preferred, convertible and other debt securities will decline in value if market interest rates rise.
Reinvestment Risk. If market interest rates decline, income earned from a Fund’s portfolio may be reinvested at rates below that of the original bond that generated the income.
Call Risk or Prepayment Risk. Issuers may exercise their option to prepay principal earlier than scheduled, forcing a Fund to reinvest in lower-yielding securities.
Inverse Floater Risk. The Funds invest in inverse floaters. Due to their leveraged nature, these investments can greatly increase a Fund’s exposure to interest rate risk and credit risk. In addition, investments in inverse floaters involve the risk that the Fund could lose more than its original principal investment.
Municipal Bond Market Liquidity Risk. Inventories of municipal bonds held by brokers and dealers have decreased in recent years, lessening their ability to make a market in these securities. This reduction in market making capacity has the potential to decrease a Fund’s ability to buy or sell bonds, and increase bond price volatility and trading costs, particularly during periods of economic or market stress. In addition, recent federal banking regulations may cause certain dealers to reduce their inventories of municipal bonds, which may further decrease a Fund’s ability to buy or sell bonds. As a result, the Fund may be forced to accept a lower price to sell a security, to sell other securities to raise cash, or to give up an investment opportunity, any of which could have a negative effect on performance. If the Fund needed to sell large blocks of bonds, those sales could further reduce the bonds’ prices and hurt performance.
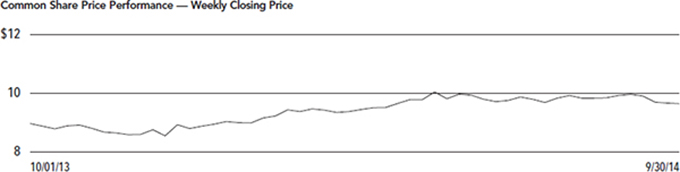
| NNY | |
| | Nuveen New York Municipal Value Fund, Inc. |
| | Performance Overview and Holding Summaries as of September 30, 2014 |
Refer to the Glossary of Terms Used in this Report for further definition of the terms used within this section.
Average Annual Total Returns as of September 30, 2014
| | | Average Annual |
| | | | 1-Year | | 5-Year | | 10-Year |
| NNY at Common Share NAV | | | 8.63 | % | | 4.65 | % | | 4.56 | % |
| NNY at Common Share Price | | | 12.76 | % | | 4.84 | % | | 5.27 | % |
| S&P Municipal Bond New York Index | | | 7.75 | % | | 4.57 | % | | 4.73 | % |
| S&P Municipal Bond Index | | | 8.30 | % | | 4.84 | % | | 4.77 | % |
| Lipper New York Municipal Debt Funds Classification Average | | | 14.68 | % | | 6.43 | % | | 5.32 | % |
Past performance is not predictive of future results. Current performance may be higher or lower than the data shown. Returns do not reflect the deduction of taxes that shareholders may have to pay on Fund distributions or upon the sale of Fund shares. Returns at NAV are net of Fund expenses, and assume reinvestment of distributions. Comparative index and Lipper return information is provided for the Fund’s shares at NAV only. Indexes and Lipper averages are not available for direct investment.
This data relates to the securities held in the Fund’s portfolio of investments as of the end of the reporting period. It should not be construed as a measure of performance for the Fund itself. Holdings are subject to change.
Ratings shown are the highest rating given by one of the following national rating agencies: Standard & Poor’s Group, Moody’s Investors Service, Inc. or Fitch, Inc. Credit ratings are subject to change. AAA, AA, A and BBB are investment grade ratings; BB, B, CCC, CC, C and D are below-investment grade ratings. Certain bonds backed by U.S. Government or agency securities are regarded as having an implied rating equal to the rating of such securities. Holdings designated N/R are not rated by these national rating agencies.
| Fund Allocation | | | |
| (% of net assets) | | | |
| Municipal Bonds | | 100.0 | % |
| Floating Rate Obligations | | (2.1) | % |
| Other Assets Less Liabilities | | 2.1 | % |
| Portfolio Composition | | | |
| (% of total investments) | | | |
| Tax Obligation/Limited | | 20.9 | % |
| Transportation | | 18.2 | % |
| Education and Civic Organizations | | 15.5 | % |
| Utilities | | 11.1 | % |
| Health Care | | 9.5 | % |
| Tax Obligation/General | | 7.8 | % |
| U.S. Guaranteed | | 5.6 | % |
| Other Industries | | 11.4 | % |
| Credit Quality | | | |
| (% of total investment exposure) | | | |
| AAA/U.S. Guaranteed | | 21.5 | % |
| AA | | 44.1 | % |
| A | | 10.0 | % |
| BBB | | 7.3 | % |
| BB or Lower | | 12.9 | % |
| N/R (not rated) | | 4.2 | % |
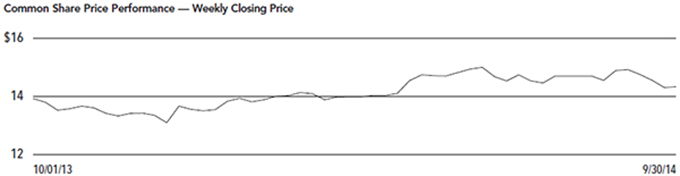
| NYV | |
| | Nuveen New York Municipal Value Fund 2 |
| | Performance Overview and Holding Summaries as of September 30, 2014 |
Refer to the Glossary of Terms Used in this Report for further definition of the terms used within this section.
Average Annual Total Returns as of September 30, 2014
| | | Average Annual | |
| | | | | | | | | | Since |
| | | | 1-Year | | 5-Year | | Inception1 |
| NYV at Common Share NAV | | | 9.69 | % | | 4.65 | % | | 6.65 | % |
| NYV at Common Share Price | | | 8.12 | % | | 4.32 | % | | 4.11 | % |
| S&P Municipal Bond New York Index | | | 7.75 | % | | 4.57 | % | | 5.64 | % |
| S&P Municipal Bond Index | | | 8.30 | % | | 4.84 | % | | 5.99 | % |
| Lipper New York Municipal Debt Funds Classification Average | | | 14.68 | % | | 6.43 | % | | 6.67 | % |
Past performance is not predictive of future results. Current performance may be higher or lower than the data shown. Returns do not reflect the deduction of taxes that shareholders may have to pay on Fund distributions or upon the sale of Fund shares. Returns at NAV are net of Fund expenses, and assume reinvestment of distributions. Comparative index and Lipper return information is provided for the Fund’s shares at NAV only. Indexes and Lipper averages are not available for direct investment.
This data relates to the securities held in the Fund’s portfolio of investments as of the end of the reporting period. It should not be construed as a measure of performance for the Fund itself. Holdings are subject to change.
Ratings shown are the highest rating given by one of the following national rating agencies: Standard & Poor’s Group, Moody’s Investors Service, Inc. or Fitch, Inc. Credit ratings are subject to change. AAA, AA, A and BBB are investment grade ratings; BB, B, CCC, CC, C and D are below-investment grade ratings. Certain bonds backed by U.S. Government or agency securities are regarded as having an implied rating equal to the rating of such securities. Holdings designated N/R are not rated by these national rating agencies.
| Fund Allocation | | | |
| (% of net assets) | | | |
| Municipal Bonds | | 100.6 | % |
| Other Assets Less Liabilities | | (0.6) | % |
| Portfolio Composition | | | |
| (% of total investments) | | | |
| Tax Obligation/Limited | | 24.4 | % |
| Health Care | | 18.9 | % |
| Education and Civic Organizations | | 14.7 | % |
| Housing/Multifamily | | 12.9 | % |
| Transportation | | 12.2 | % |
| Other Industries | | 16.9 | % |
| Credit Quality | | | |
| (% of total investment exposure) | | | |
| AAA/U.S. Guaranteed | | 18.7 | % |
| AA | | 39.0 | % |
| A | | 22.2 | % |
| BBB | | 8.2 | % |
| BB or Lower | | 7.8 | % |
| N/R (not rated) | | 4.1 | % |
1 Since inception returns are from 4/28/09.
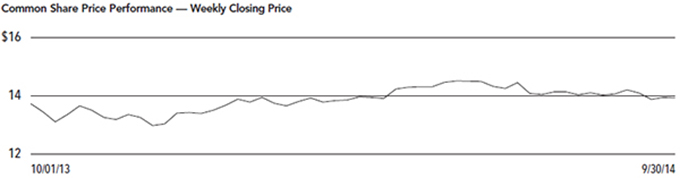
| NNP | |
| | Nuveen New York Performance Plus Municipal Fund, Inc. |
| | Performance Overview and Holding Summaries as of September 30, 2014 |
Refer to the Glossary of Terms Used in this Report for further definition of the terms used within this section.
Average Annual Total Returns as of September 30, 2014
| | Average Annual | |
| | 1-Year | 5-Year | 10-Year | |
| NNP at Common Share NAV | 12.57% | 6.02% | 5.56% | |
| NNP at Common Share Price | 8.22% | 4.81% | 5.09% | |
| S&P Municipal Bond New York Index | 7.75% | 4.57% | 4.73% | |
| S&P Municipal Bond Index | 8.30% | 4.84% | 4.77% | |
| Lipper New York Municipal Debt Funds Classification Average | 14.68% | 6.43% | 5.32% | |
Past performance is not predictive of future results. Current performance may be higher or lower than the data shown. Returns do not reflect the deduction of taxes that shareholders may have to pay on Fund distributions or upon the sale of Fund shares. Returns at NAV are net of Fund expenses, and assume reinvestment of distributions. Comparative index and Lipper return information is provided for the Fund’s shares at NAV only. Indexes and Lipper averages are not available for direct investment.
This data relates to the securities held in the Fund’s portfolio of investments as of the end of the reporting period. It should not be construed as a measure of performance for the Fund itself. Holdings are subject to change.
Ratings shown are the highest rating given by one of the following national rating agencies: Standard & Poor’s Group, Moody’s Investors Service, Inc. or Fitch, Inc. Credit ratings are subject to change. AAA, AA, A and BBB are investment grade ratings; BB, B, CCC, CC, C and D are below-investment grade ratings. Certain bonds backed by U.S. Government or agency securities are regarded as having an implied rating equal to the rating of such securities. Holdings designated N/R are not rated by these national rating agencies.
| Fund Allocation | | | |
| (% of net assets) | | | |
| Municipal Bonds | | 146.4 | % |
| Common Stocks | | 1.2 | % |
| Floating Rate Obligations | | (10.7) | % |
| VRDP Shares, at Liquidation Value | | (37.3) | % |
| Other Assets Less Liabilities | | 0.4 | % |
| Portfolio Composition | | | |
| (% of total investments) | | | |
| Tax Obligation/Limited | | 21.3 | % |
| Education and Civic Organizations | | 17.7 | % |
| U.S. Guaranteed | | 12.7 | % |
| Utilities | | 9.5 | % |
| Health Care | | 8.5 | % |
| Transportation | | 8.1 | % |
| Tax Obligation/General | | 8.1 | % |
| Other Industries | | 14.1 | % |
| Credit Quality | | | |
| (% of total investment exposure) | | | |
| AAA/U.S. Guaranteed | | 28.2 | % |
| AA | | 40.2 | % |
| A | | 11.3 | % |
| BBB | | 6.3 | % |
| BB or Lower | | 9.5 | % |
| N/R (not rated) | | 3.8 | % |
| N/A (not applicable) | | 0.7 | % |
| NAN | |
| | Nuveen New York Dividend Advantage Municipal Fund |
| | Performance Overview and Holding Summaries as of September 30, 2014 |
Refer to the Glossary of Terms Used in this Report for further definition of the terms used within this section.
Average Annual Total Returns as of September 30, 2014
| | Average Annual | |
| | 1-Year | 5-Year | 10-Year | |
| NAN at Common Share NAV | 12.79% | 6.23% | 5.54% | |
| NAN at Common Share Price | 9.29% | 5.83% | 4.95% | |
| S&P Municipal Bond New York Index | 7.75% | 4.57% | 4.73% | |
| S&P Municipal Bond Index | 8.30% | 4.84% | 4.77% | |
| Lipper New York Municipal Debt Funds Classification Average | 14.68% | 6.43% | 5.32% | |
Past performance is not predictive of future results. Current performance may be higher or lower than the data shown. Returns do not reflect the deduction of taxes that shareholders may have to pay on Fund distributions or upon the sale of Fund shares. Returns at NAV are net of Fund expenses, and assume reinvestment of distributions. Comparative index and Lipper return information is provided for the Fund’s shares at NAV only. Indexes and Lipper averages are not available for direct investment.
This data relates to the securities held in the Fund’s portfolio of investments as of the end of the reporting period. It should not be construed as a measure of performance for the Fund itself. Holdings are subject to change.
Ratings shown are the highest rating given by one of the following national rating agencies: Standard & Poor’s Group, Moody’s Investors Service, Inc. or Fitch, Inc. Credit ratings are subject to change. AAA, AA, A and BBB are investment grade ratings; BB, B, CCC, CC, C and D are below-investment grade ratings. Certain bonds backed by U.S. Government or agency securities are regarded as having an implied rating equal to the rating of such securities. Holdings designated N/R are not rated by these national rating agencies.
| Fund Allocation | | | |
| (% of net assets) | | | |
| Municipal Bonds | | 147.1 | % |
| Floating Rate Obligations | | (9.2) | % |
| VMTP Shares, at Liquidation Value | | (39.4) | % |
| Other Assets Less Liabilities | | 1.5 | % |
| Portfolio Composition | | | |
| (% of total investments) | | | |
| Tax Obligation/Limited | | 20.8 | % |
| Transportation | | 15.2 | % |
| Education and Civic Organizations | | 13.0 | % |
| Tax Obligation/General | | 12.1 | % |
| Health Care | | 9.2 | % |
| Utilities | | 8.5 | % |
| Water and Sewer | | 4.3 | % |
| Other Industries | | 16.9 | % |
| Credit Quality | | | |
| (% of total investment exposure) | | | |
| AAA/U.S. Guaranteed | | 17.9 | % |
| AA | | 46.4 | % |
| A | | 12.2 | % |
| BBB | | 5.7 | % |
| BB or Lower | | 12.2 | % |
| N/R (not rated) | | 5.6 | % |
| NXK | |
| | Nuveen New York Dividend Advantage Municipal Fund 2 |
| | Performance Overview and Holding Summaries as of September 30, 2014 |
Refer to the Glossary of Terms Used in this Report for further definition of the terms used within this section.
Average Annual Total Returns as of September 30, 2014
| | Average Annual | |
| | 1-Year | 5-Year | 10-Year | |
| NXK at Common Share NAV | 11.49% | 5.75% | 5.46% | |
| NXK at Common Share Price | 9.18% | 5.28% | 4.92% | |
| S&P Municipal Bond New York Index | 7.75% | 4.57% | 4.73% | |
| S&P Municipal Bond Index | 8.30% | 4.84% | 4.77% | |
| Lipper New York Municipal Debt Funds Classification Average | 14.68% | 6.43% | 5.32% | |
Past performance is not predictive of future results. Current performance may be higher or lower than the data shown. Returns do not reflect the deduction of taxes that shareholders may have to pay on Fund distributions or upon the sale of Fund shares. Returns at NAV are net of Fund expenses, and assume reinvestment of distributions. Comparative index and Lipper return information is provided for the Fund’s shares at NAV only. Indexes and Lipper averages are not available for direct investment.
This data relates to the securities held in the Fund’s portfolio of investments as of the end of the reporting period. It should not be construed as a measure of performance for the Fund itself. Holdings are subject to change.
Ratings shown are the highest rating given by one of the following national rating agencies: Standard & Poor’s Group, Moody’s Investors Service, Inc. or Fitch, Inc. Credit ratings are subject to change. AAA, AA, A and BBB are investment grade ratings; BB, B, CCC, CC, C and D are below-investment grade ratings. Certain bonds backed by U.S. Government or agency securities are regarded as having an implied rating equal to the rating of such securities. Holdings designated N/R are not rated by these national rating agencies.
| Fund Allocation | | | |
| (% of net assets) | | | |
| Municipal Bonds | | 147.1 | % |
| Floating Rate Obligations | | (9.6) | % |
| VMTP Shares, at Liquidation Value | | (38.8) | % |
| Other Assets Less Liabilities | | 1.3 | % |
| Portfolio Composition | | | |
| (% of total investments) | | | |
| Tax Obligation/Limited | | 26.5 | % |
| Education and Civic Organizations | | 18.4 | % |
| Transportation | | 15.7 | % |
| Utilities | | 9.6 | % |
| Health Care | | 7.8 | % |
| Tax Obligation/General | | 5.0 | % |
| Other Industries | | 17.0 | % |
| Credit Quality | | | |
| (% of total investment exposure) | | | |
| AAA/U.S. Guaranteed | | 26.1 | % |
| AA | | 34.8 | % |
| A | | 15.0 | % |
| BBB | | 6.4 | % |
| BB or Lower | | 12.4 | % |
| N/R (not rated) | | 5.3 | % |
| NRK | |
| | Nuveen New York AMT-Free Municipal Income Fund |
| | Performance Overview and Holding Summaries as of September 30, 2014 |
Refer to the Glossary of Terms Used in this Report for further definition of the terms used within this section.
Average Annual Total Returns as of September 30, 2014
| | Average Annual | |
| | 1-Year | 5-Year | 10-Year | |
| NRK at Common Share NAV | 12.48% | 4.24% | 4.86% | |
| NRK at Common Share Price | 11.53% | 4.30% | 4.84% | |
| S&P Municipal Bond New York Index | 7.75% | 4.57% | 4.73% | |
| S&P Municipal Bond Index | 8.30% | 4.84% | 4.77% | |
| Lipper New York Municipal Debt Funds Classification Average | 14.68% | 6.43% | 5.32% | |
Past performance is not predictive of future results. Current performance may be higher or lower than the data shown. Returns do not reflect the deduction of taxes that shareholders may have to pay on Fund distributions or upon the sale of Fund shares. Returns at NAV are net of Fund expenses, and assume reinvestment of distributions. Comparative index and Lipper return information is provided for the Fund’s shares at NAV only. Indexes and Lipper averages are not available for direct investment.
This data relates to the securities held in the Fund’s portfolio of investments as of the end of the reporting period. It should not be construed as a measure of performance for the Fund itself. Holdings are subject to change.
Ratings shown are the highest rating given by one of the following national rating agencies: Standard & Poor’s Group, Moody’s Investors Service, Inc. or Fitch, Inc. Credit ratings are subject to change. AAA, AA, A and BBB are investment grade ratings; BB, B, CCC, CC, C and D are below-investment grade ratings. Certain bonds backed by U.S. Government or agency securities are regarded as having an implied rating equal to the rating of such securities. Holdings designated N/R are not rated by these national rating agencies.
| Fund Allocation | | | |
| (% of net assets) | | | |
| Municipal Bonds | | 150.6 | % |
| Floating Rate Obligations | | (6.7) | % |
| iMTP Shares, at Liquidation Value | | (6.3) | % |
| VRDP Shares, at Liquidation Value | | (38.8) | % |
| Other Assets Less Liabilities | | 1.2 | % |
| Portfolio Composition | | | |
| (% of total investments) | | | |
| Tax Obligation/Limited | | 35.0 | % |
| Education and Civic Organizations | | 18.6 | % |
| Transportation | | 9.7 | % |
| Utilities | | 9.0 | % |
| Health Care | | 6.9 | % |
| Tax Obligation/General | | 6.4 | % |
| U.S. Guaranteed | | 5.3 | % |
| Water and Sewer | | 5.3 | % |
| Other Industries | | 3.8 | % |
| Credit Quality | | | |
| (% of total investment exposure) | | | |
| AAA/U.S. Guaranteed | | 25.8 | % |
| AA | | 52.8 | % |
| A | | 10.9 | % |
| BBB | | 3.8 | % |
| BB or Lower | | 6.1 | % |
| N/R (not rated) | | 0.6 | % |
Shareholder Meeting Report
The annual meeting of shareholders was held in the offices of Nuveen Investments on January 10, 2014, for NAN, NNP and NXK; at this meeting the shareholders were asked to vote on the election of Board Members, the approval of an Agreement and Plan of Reorganization and the Issuance of Additional Common Shares. The meeting was subsequently adjourned to February 7, 2014 and March 7, 2014 and again for NNP and NAN to April 4, 2014 and again for NAN to May 9, 2014.
The annual meeting of shareholders was held in the offices of Nuveen Investments on August 5, 2014, for NNY, NYV, NAN, NXK and NRK; at this meeting the shareholders were asked to vote to approve a new investment management agreement, to approve a new sub-advisory agreement and to elect Board Members. The meeting was subsequently adjourned for NNY, NRK, NYV and NXK to August 15, 2014 and then again for NXK to September 15, 2014.
A special meeting of shareholders was held for NNP along with several other Nuveen funds in the offices of Nuveen Investments on August 5, 2014; at this meeting the shareholders were asked to vote to approve a new investment management agreement and to approve a new sub-advisory agreement.
| | | | NNY | | | NYV | | | NNP | | | NAN | |
| | | | | | | | | | Common and | | | | | | | | | Common and | | | | |
| | | | | | | | | | Preferred | | | | | | | | | Preferred | | | | |
| | | | | | | | | | shares | | | | | | | | | shares | | | | |
| | | | Common | | | Common | | | voting together | | | Preferred | | | Common | | | voting together | | | Preferred | |
| | | | shares | | | shares | | | as a class | | | Shares | | | Shares | | | as a class | | | Shares | |
| To approve an Agreement and | | | | | | | | | | | | | | | | | | | | | | |
| Plan of Reorganization | | | | | | | | | | | | | | | | | | | | | | |
| For | | | — | | | — | | | 7,690,274 | | | 890 | | | — | | | 2,495,284 | | | 2,495,284 | |
| Against | | | — | | | — | | | 408,642 | | | — | | | — | | | 107,679 | | | 107,679 | |
| Abstain | | | — | | | — | | | 493,446 | | | — | | | — | | | 79,078 | | | 79,078 | |
| Broker Non-Votes | | | — | | | — | | | 5,384,246 | | | — | | | — | | | 2,588,784 | | | 2,588,784 | |
| Total | | | — | | | — | | | 13,976,608 | | | 890 | | | — | | | 5,270,825 | | | 5,270,825 | |
To approve the issuance of additional common shares in connection with each Reorganization. | | | | | | | | | | | | | | | | | | | | | | |
| For | | | — | | | — | | | — | | | — | | | 4,438,183 | | | 6,921,755 | | | 2,483,572 | |
| Against | | | — | | | — | | | — | | | — | | | 307,461 | | | 421,557 | | | 114,096 | |
| Abstain | | | — | | | — | | | — | | | — | | | 179,704 | | | 264,077 | | | 84,373 | |
| Total | | | — | | | — | | | — | | | — | | | 4,925,348 | | | 7,607,389 | | | 2,682,041 | |
To approve a new investment management agreement | | | | | | | | | | | | | | | | | | | | | | |
| For | | | 6,681,108 | | | 952,039 | | | 7,125,718 | | | — | | | — | | | 4,085,121 | | | — | |
| Against | | | 318,522 | | | 52,576 | | | 215,659 | | | — | | | — | | | 150,589 | | | — | |
| Abstain | | | 198,410 | | | 47,511 | | | 349,995 | | | — | | | — | | | 159,657 | | | — | |
| Broker Non-Votes | | | 2,591,497 | | | 359,009 | | | — | | | — | | | — | | | 1,625,035 | | | — | |
| Total | | | 9,789,537 | | | 1,411,135 | | | 7,691,372 | | | — | | | — | | | 6,020,402 | | | — | |
To approve a new sub-advisory agreement | | | | | | | | | | | | | | | | | | | | | | |
| For | | | 6,653,725 | | | 951,631 | | | 7,114,463 | | | — | | | — | | | 4,068,639 | | | — | |
| Against | | | 316,121 | | | 54,940 | | | 225,488 | | | — | | | — | | | 156,031 | | | — | |
| Abstain | | | 228,194 | | | 45,555 | | | 351,421 | | | — | | | — | | | 170,697 | | | — | |
| Broker Non-Votes | | | 2,591,497 | | | 359,009 | | | — | | | — | | | — | | | 1,625,035 | | | — | |
| Total | | | 9,789,537 | | | 1,411,135 | | | 7,691,372 | | | — | | | — | | | 6,020,402 | | | — | |
| | | | NNY | | | NYV | | | NNP | | | NAN | |
| | | | | | | | | | Common and | | | | | | | | | Common and | | | | |
| | | | | | | | | | Preferred | | | | | | | | | Preferred | | | | |
| | | | | | | | | | shares | | | | | | | | | shares | | | | |
| | | | Common | | | Common | | | voting together | | | Preferred | | | Common | | | voting together | | | Preferred | |
| | | | shares | | | shares | | | as a class | | | Shares | | | Shares | | | as a class | | | Shares | |
Approval of the Board Members was reached as follows: | | | | | | | | | | | | | | | | | | | | | | |
| William Adams IV | | | | | | | | | | | | | | | | | | | | | | |
| For | | | 9,337,629 | | | 1,322,076 | | | — | | | — | | | — | | | — | | | — | |
| Withhold | | | 302,812 | | | 66,406 | | | — | | | — | | | — | | | — | | | — | |
| Total | | | 9,640,441 | | | 1,388,482 | | | — | | | — | | | — | | | — | | | — | |
| William C. Hunter | | | | | | | | | | | | | | | | | | | | | | |
| For | | | — | | | — | | | — | | | — | | | — | | | — | | | — | |
| Withhold | | | — | | | — | | | — | | | — | | | — | | | — | | | — | |
| Total | | | — | | | — | | | — | | | — | | | — | | | — | | | — | |
| David J. Kundert | | | | | | | | | | | | | | | | | | | | | | |
| For | | | 9,327,529 | | | 1,306,860 | | | — | | | — | | | — | | | — | | | — | |
| Withhold | | | 312,912 | | | 81,622 | | | — | | | — | | | — | | | — | | | — | |
| Total | | | 9,640,441 | | | 1,388,482 | | | — | | | — | | | — | | | — | | | — | |
| John K. Nelson | | | | | | | | | | | | | | | | | | | | | | |
| For | | | 9,325,583 | | | 1,320,888 | | | — | | | — | | | — | | | — | | | — | |
| Withhold | | | 314,858 | | | 67,594 | | | — | | | — | | | — | | | — | | | — | |
| Total | | | 9,640,441 | | | 1,388,482 | | | — | | | — | | | — | | | — | | | — | |
| William J. Schneider | | | | | | | | | | | | | | | | | | | | | | |
| For | | | — | | | — | | | — | | | — | | | — | | | — | | | — | |
| Withhold | | | — | | | — | | | — | | | — | | | — | | | — | | | — | |
| Total | | | — | | | — | | | — | | | — | | | — | | | — | | | — | |
| Thomas S. Schreier, Jr. | | | | | | | | | | | | | | | | | | | | | | |
| For | | | — | | | — | | | — | | | — | | | — | | | 5,757,129 | | | — | |
| Withhold | | | — | | | — | | | — | | | — | | | — | | | 263,273 | | | — | |
| Total | | | — | | | — | | | — | | | — | | | — | | | 6,020,402 | | | — | |
| Terence J. Toth | | | | | | | | | | | | | | | | | | | | | | |
| For | | | 9,324,854 | | | 1,308,050 | | | — | | | — | | | — | | | — | | | — | |
| Withhold | | | 315,587 | | | 80,432 | | | — | | | — | | | — | | | — | | | — | |
| Total | | | 9,640,441 | | | 1,388,482 | | | — | | | — | | | — | | | — | | | — | |
Shareholder Meeting Report (continued)
| | | | NXK | | | NRK | |
| | | | Common and | | | Common and | | | | |
| | | | Preferred | | | Preferred | | | Preferred | |
| | | | shares | | | shares | | | shares | |
| | | | voting together | | | voting together | | | voting together | |
| | | | as a class | | | as a class | | | as a class | |
| To approve an Agreement and Plan of Reorganization | | | | | | | | | | |
| For | | | — | | | — | | | — | |
| Against | | | — | | | — | | | — | |
| Abstain | | | — | | | — | | | — | |
| Broker Non-Votes | | | — | | | — | | | — | |
| Total | | | — | | | — | | | — | |
| To approve the issuance of additional common shares in connection with each Reorganization. | | | | | | | | | | |
| For | | | — | | | — | | | — | |
| Against | | | — | | | — | | | — | |
| Abstain | | | — | | | — | | | — | |
| Total | | | — | | | — | | | — | |
| To approve a new investment management agreement | | | | | | | | | | |
| For | | | 3,305,437 | | | 36,855,955 | | | — | |
| Against | | | 211,298 | | | 1,784,108 | | | — | |
| Abstain | | | 188,357 | | | 1,908,085 | | | — | |
| Broker Non-Votes | | | 1,240,476 | | | 12,419,161 | | | — | |
| Total | | | 4,945,568 | | | 52,967,309 | | | — | |
| To approve a new sub-advisory agreement | | | | | | | | | | |
| For | | | 3,281,813 | | | 36,757,111 | | | — | |
| Against | | | 220,127 | | | 1,800,312 | | | — | |
| Abstain | | | 203,152 | | | 1,990,725 | | | — | |
| Broker Non-Votes | | | 1,240,476 | | | 12,419,161 | | | — | |
| Total | | | 4,945,568 | | | 52,967,309 | | | — | |
| Approval of the Board Members was reached as follows: | | | | | | | | | | |
| William Adams IV | | | | | | | | | | |
| For | | | — | | | 48,626,442 | | | — | |
| Withhold | | | — | | | 2,633,254 | | | — | |
| Total | | | — | | | 51,259,696 | | | — | |
| William C. Hunter | | | | | | | | | | |
| For | | | — | | | — | | | 6,383 | |
| Withhold | | | — | | | — | | | 1,030 | |
| Total | | | — | | | — | | | 7,413 | |
| David J. Kundert | | | | | | | | | | |
| For | | | — | | | 48,586,174 | | | — | |
| Withhold | | | — | | | 2,673,522 | | | — | |
| Total | | | — | | | 51,259,696 | | | — | |
| John K. Nelson | | | | | | | | | | |
| For | | | — | | | 48,610,210 | | | — | |
| Withhold | | | — | | | 2,649,486 | | | — | |
| Total | | | — | | | 51,259,696 | | | — | |
| William J. Schneider | | | | | | | | | | |
| For | | | — | | | — | | | 6,383 | |
| Withhold | | | — | | | — | | | 1,030 | |
| Total | | | — | | | — | | | 7,413 | |
| Thomas S. Schreier, Jr. | | | | | | | | | | |
| For | | | 4,144,338 | | | — | | | — | |
| Withhold | | | 283,546 | | | — | | | — | |
| Total | | | 4,427,884 | | | — | | | — | |
| Terence J. Toth | | | | | | | | | | |
| For | | | — | | | 48,602,159 | | | — | |
| Withhold | | | — | | | 2,657,527 | | | — | |
| Total | | | — | | | 51,259,686 | | | — | |
Report of Independent Registered Public Accounting Firm
To the Board of Directors/Trustees and Shareholders of
Nuveen New York Municipal Value Fund, Inc.
Nuveen New York Municipal Value Fund 2
Nuveen New York Performance Plus Municipal Fund, Inc.
Nuveen New York Dividend Advantage Municipal Fund
Nuveen New York Dividend Advantage Municipal Fund 2
Nuveen New York AMT-Free Municipal Income Fund:
We have audited the accompanying statement of assets and liabilities, including the portfolios of investments, of Nuveen New York Municipal Value Fund, Inc., Nuveen New York Municipal Value Fund 2, Nuveen New York Performance Plus Municipal Fund, Inc., Nuveen New York Dividend Advantage Municipal Fund, Nuveen New York Dividend Advantage Municipal Fund 2 and Nuveen New York AMT-Free Municipal Income Fund (the “Funds”) as of September 30, 2014, and the related statements of operations, changes in net assets, and cash flows (Nuveen New York Performance Plus Municipal Fund, Inc., Nuveen New York Dividend Advantage Municipal Fund, Nuveen New York Dividend Advantage Municipal Fund 2 and Nuveen New York AMT-Free Municipal Income Fund only) and the financial highlights for the year then ended. The statements of changes in net assets and the financial highlights for the periods presented through September 30, 2013 were audited by other auditors whose report dated November 26, 2013 expressed an unqualified opinion on those statements and those financial highlights. These financial statements and financial highlights are the responsibility of the Funds’ management. Our responsibility is to express an opinion on these financial statements and financial highlights based on our audits.
We conducted our audits in accordance with the standards of the Public Company Accounting Oversight Board (United States). Those standards require that we plan and perform the audit to obtain reasonable assurance about whether the financial statements and financial highlights are free of material misstatement. An audit includes examining, on a test basis, evidence supporting the amounts and disclosures in the financial statements. Our procedures included confirmation of securities owned as of September 30, 2014, by correspondence with the custodian and brokers or other appropriate auditing procedures. An audit also includes assessing the accounting principles used and significant estimates made by management, as well as evaluating the overall financial statement presentation. We believe that our audits provide a reasonable basis for our opinion.
In our opinion, the financial statements and financial highlights referred to above present fairly, in all material respects, the financial position of the Funds as of September 30, 2014, the results of their operations, the changes in their net assets, their cash flows (Nuveen New York Performance Plus Municipal Fund, Inc., Nuveen New York Dividend Advantage Municipal Fund, Nuveen New York Dividend Advantage Municipal Fund 2 and Nuveen New York AMT-Free Municipal Income Fund only) and the financial highlights for the year then ended, in conformity with U.S. generally accepted accounting principles.
/s/ KPMG LLP
Chicago, Illinois
November 26, 2014
| NNY | | |
| | Nuveen New York Municipal Value Fund, Inc. | |
| | Portfolio of Investments | September 30, 2014 |
| | Principal | | | Optional Call | | | | | |
| | Amount (000) | | Description (1) | Provisions (2) | | Ratings (3) | | Value | |
| | | | LONG-TERM INVESTMENTS 100.0% (100.0% of Total Investments) | | | | | | |
| | | | MUNICIPAL BONDS 100.0% (100.0% of Total Investments) | | | | | | |
| | | | Consumer Discretionary – 1.5% (1.5% of Total Investments) | | | | | | |
| $ | 275 | | New York City Industrial Development Agency, New York, Liberty Revenue Bonds, IAC/InterActiveCorp, Series 2005, 5.000%, 9/01/35 | 9/15 at 100.00 | | BBB | $ | 280,605 | |
| | 1,950 | | Seneca Nation of Indians Capital Improvements Authority, New York, Special Obligation Bonds, Series 2007A, 5.000%, 12/01/23 | 6/17 at 100.00 | | BB | | 2,045,160 | |
| | 2,225 | | Total Consumer Discretionary | | | | | 2,325,765 | |
| | | | Consumer Staples – 2.1% (2.1% of Total Investments) | | | | | | |
| | 500 | | Nassau County Tobacco Settlement Corporation, New York, Tobacco Settlement Asset-Backed Bonds, Refunding Series 2006A-2, 5.250%, 6/01/26 | 6/16 at 100.00 | | B | | 485,905 | |
| | 875 | | Nassau County Tobacco Settlement Corporation, New York, Tobacco Settlement Asset-Backed Bonds, Series 2006A-3, 5.000%, 6/01/35 | 6/16 at 100.00 | | B | | 729,785 | |
| | 85 | | New York Counties Tobacco Trust II, Tobacco Settlement Pass-Through Bonds, Series 2001, 5.250%, 6/01/25 | 12/14 at 100.00 | | A1 | | 84,992 | |
| | 705 | | New York Counties Tobacco Trust III, Tobacco Settlement Pass-Through Bonds, Series 2003, 5.750%, 6/01/33 | 12/14 at 100.00 | | A1 | | 704,937 | |
| | 35 | | Rensselaer Tobacco Asset Securitization Corporation, New York, Tobacco Settlement Asset-Backed Bonds, Series 2001A, 5.200%, 6/01/25 | 12/14 at 100.00 | | A1 | | 33,958 | |
| | | | TSASC Inc., New York, Tobacco Asset-Backed Bonds, Series 2006: | | | | | | |
| | 705 | | 4.750%, 6/01/22 | 6/16 at 100.00 | | BBB– | | 700,396 | |
| | 345 | | 5.000%, 6/01/26 | 6/16 at 100.00 | | BB– | | 338,169 | |
| | 240 | | 5.125%, 6/01/42 | 6/16 at 100.00 | | B | | 195,082 | |
| | 3,490 | | Total Consumer Staples | | | | | 3,273,224 | |
| | | | Education and Civic Organizations – 15.5% (15.5% of Total Investments) | | | | | | |
| | 275 | | Albany Industrial Development Agency, New York, Revenue Bonds, Albany Law School, Series 2007A, 5.000%, 7/01/31 | 7/17 at 100.00 | | BBB | | 284,441 | |
| | 415 | | Albany Industrial Development Agency, New York, Revenue Bonds, Brighter Choice Charter Schools, Series 2007A, 5.000%, 4/01/37 | 4/17 at 100.00 | | BB+ | | 411,128 | |
| | 1,350 | | Brooklyn Arena Local Development Corporation, New York, Payment in Lieu of Taxes Revenue Bonds, Barclays Center Project, Series 2009, 6.250%, 7/15/40 | 1/20 at 100.00 | | BBB– | | 1,528,187 | |
| | 750 | | Buffalo and Erie County Industrial Land Development Corporation, New York, Revenue Bonds, Enterprise Charter School Project, Series 2011A, 7.500%, 12/01/40 | 12/20 at 100.00 | | B | | 777,960 | |
| | 90 | | Cattaraugus County Industrial Development Agency, New York, Revenue Bonds, St. Bonaventure University, Series 2006, 5.000%, 5/01/23 | 5/16 at 100.00 | | BBB– | | 93,476 | |
| | 1,175 | | Dormitory Authority of the State of New York, General Revenue Bonds, Manhattan College, Series 2007A, 5.000%, 7/01/41 – RAAI Insured | 7/17 at 100.00 | | N/R | | 1,208,053 | |
| | 415 | | Dormitory Authority of the State of New York, General Revenue Bonds, Saint Johns University, Series 2013A, 5.000%, 7/01/44 | 7/23 at 100.00 | | A– | | 457,123 | |
| | 1,000 | | Dormitory Authority of the State of New York, Housing Revenue Bonds, Fashion Institute of Technology, Series 2007, 5.250%, 7/01/34 – FGIC Insured | No Opt. Call | | AA– | | 1,170,270 | |
| | 505 | | Dormitory Authority of the State of New York, Lease Revenue Bonds, State University Dormitory Facilities, Series 2004A, 5.000%, 7/01/29 – NPFG Insured | 7/15 at 100.00 | | Aa2 | | 520,049 | |
| | 525 | | Dormitory Authority of the State of New York, Revenue Bonds, New School University, Series 2010, 5.250%, 7/01/30 | 7/20 at 100.00 | | A– | | 583,301 | |
| | 280 | | Dormitory Authority of the State of New York, Revenue Bonds, St. Joseph’s College, Series 2010, 5.250%, 7/01/35 | 7/20 at 100.00 | | Baa3 | | 297,441 | |
| | Principal | | | Optional Call | | | | | |
| | Amount (000) | | Description (1) | Provisions (2) | | Ratings (3) | | Value | |
| | | | Education and Civic Organizations (continued) | | | | | | |
| $ | 2,170 | | Dutchess County Industrial Development Agency, New York, Civic Facility Revenue Bonds, Bard College Refunding, Series 2007-A1, 5.000%, 8/01/46 | 8/17 at 100.00 | | Ba1 | $ | 2,183,042 | |
| | 300 | | Hempstead Town Local Development Corporation, New York, Revenue Bonds, Adelphi University Project, Series 2013, 5.000%, 9/01/43 | 9/23 at 100.00 | | A | | 328,554 | |
| | 880 | | Hempstead Town Local Development Corporation, New York, Revenue Bonds, Molloy College Project, Series 2009, 5.750%, 7/01/39 | 7/19 at 100.00 | | BBB+ | | 954,114 | |
| | | | Monroe County Industrial Development Corporation, New York, Revenue Bonds, St. John Fisher College, Series 2011: | | | | | | |
| | 1,000 | | 6.000%, 6/01/30 | 6/21 at 100.00 | | BBB+ | | 1,134,460 | |
| | 1,000 | | 6.000%, 6/01/34 | 6/21 at 100.00 | | BBB+ | | 1,118,430 | |
| | 3,000 | | Monroe County Industrial Development Corporation, New York, Revenue Bonds, University of Rochester Project, Series 2011B, 5.000%, 7/01/41 | 7/21 at 100.00 | | AA– | | 3,303,450 | |
| | 245 | | New York City Industrial Development Agency, New York, Civic Facility Revenue Bonds, St. Francis College, Series 2004, 5.000%, 10/01/34 | 10/14 at 100.00 | | A– | | 245,292 | |
| | | | New York City Industrial Development Agency, New York, PILOT Revenue Bonds, Queens Baseball Stadium Project, Series 2006: | | | | | | |
| | 1,500 | | 5.000%, 1/01/39 – AMBAC Insured | 1/17 at 100.00 | | Ba1 | | 1,538,265 | |
| | 1,175 | | 4.750%, 1/01/42 – AMBAC Insured | 1/17 at 100.00 | | Ba1 | | 1,197,678 | |
| | | | New York City Industrial Development Authority, New York, PILOT Revenue Bonds, Yankee Stadium Project, Series 2006: | | | | | | |
| | 1,610 | | 4.500%, 3/01/39 – FGIC Insured | 9/16 at 100.00 | | BBB | | 1,628,692 | |
| | 800 | | 4.750%, 3/01/46 – NPFG Insured | 9/16 at 100.00 | | AA– | | 812,648 | |
| | 170 | | Seneca County Industrial Development Authority, New York, Revenue Bonds, New York Chiropractic College, Series 2007, 5.000%, 10/01/27 | 10/17 at 100.00 | | BBB | | 177,405 | |
| | 1,345 | | Tompkins County Development Corporation, New York, Revenue Bonds, Ithaca College, Series 2011, 5.375%, 7/01/41 – AGM Insured | 1/21 at 100.00 | | A2 | | 1,483,858 | |
| | 300 | | Troy Capital Resource Corporation, New York, Revenue Bonds, Rensselaer Polytechnic Institute, Series 2010A, 5.125%, 9/01/40 | 9/20 at 100.00 | | A– | | 326,103 | |
| | 22,275 | | Total Education and Civic Organizations | | | | | 23,763,420 | |
| | | | Financials – 1.4% (1.4% of Total Investments) | | | | | | |
| | 1,705 | | New York Liberty Development Corporation, Revenue Bonds, Goldman Sachs Headquarters Issue, Series 2007, 5.500%, 10/01/37 | No Opt. Call | | A | | 2,091,660 | |
| | | | Health Care – 9.5% (9.5% of Total Investments) | | | | | | |
| | 990 | | Albany Industrial Development Agency, New York, Revenue Bonds, Saint Peter’s Hospital, Series 2008D, 5.750%, 11/15/27 | 11/17 at 100.00 | | A+ | | 1,108,127 | |
| | 1,005 | | Dormitory Authority of the State of New York, FHA-Insured Mortgage Revenue Bonds, Montefiore Hospital, Series 2004, 5.000%, 8/01/29 – FGIC Insured | 2/15 at 100.00 | | AA– | | 1,018,155 | |
| | 995 | | Dormitory Authority of the State of New York, FHA-Insured Mortgage Revenue Bonds, New York Hospital Medical Center of Queens, Series 2007, 4.650%, 8/15/27 | 2/17 at 100.00 | | N/R | | 1,060,869 | |
| | 700 | | Dormitory Authority of the State of New York, FHA-Insured Revenue Bonds, Montefiore Medical Center, Series 2005, 5.000%, 2/01/22 – FGIC Insured | 2/15 at 100.00 | | AA– | | 710,458 | |
| | 350 | | Dormitory Authority of the State of New York, Highland Hospital of Rochester Revenue Bonds, Series 2010, 5.000%, 7/01/26 | 7/20 at 100.00 | | A2 | | 392,021 | |
| | | | Dormitory Authority of the State of New York, Orange Regional Medical Center Obligated Group Revenue Bonds, Series 2008: | | | | | | |
| | 1,060 | | 6.500%, 12/01/21 | 12/18 at 100.00 | | Ba1 | | 1,183,840 | |
| | 565 | | 6.125%, 12/01/29 | 12/18 at 100.00 | | Ba1 | | 601,386 | |
| | 1,155 | | 6.250%, 12/01/37 | 12/18 at 100.00 | | Ba1 | | 1,219,079 | |
| | 2,350 | | Dormitory Authority of the State of New York, Revenue Bonds, Memorial Sloan Kettering Cancer Center, Series 2006-1, 5.000%, 7/01/35 | 7/16 at 100.00 | | AA | | 2,486,864 | |
| | 510 | | Dormitory Authority of the State of New York, Revenue Bonds, New York and Presbyterian Hospital, Series 2004A, 5.250%, 8/15/15 – AGM Insured | 2/15 at 100.00 | | AA | | 515,738 | |
| NNY | Nuveen New York Municipal Value Fund, Inc. | |
| | Portfolio of Investments (continued) | September 30, 2014 |
| | Principal | | | Optional Call | | | | | |
| | Amount (000) | | Description (1) | Provisions (2) | | Ratings (3) | | Value | |
| | | | Health Care (continued) | | | | | | |
| $ | 2,100 | | Dormitory Authority of the State of New York, Revenue Bonds, NYU Hospitals Center, Series 2011A, 6.000%, 7/01/40 | 7/20 at 100.00 | | A– | $ | 2,368,947 | |
| | 290 | | Livingston County Industrial Development Agency, New York, Civic Facility Revenue Bonds, Nicholas H. Noyes Hospital, Series 2005, 6.000%, 7/01/30 | 1/15 at 100.00 | | BB | | 290,229 | |
| | | | Madison County Industrial Development Agency, New York, Civic Facility Revenue Bonds, Oneida Health System, Series 2007A: | | | | | | |
| | 280 | | 5.250%, 2/01/27 | 2/17 at 100.00 | | BB+ | | 283,850 | |
| | 260 | | 5.500%, 2/01/32 | 2/17 at 100.00 | | BB+ | | 263,957 | |
| | 295 | | Suffolk County Economic Development Corporation, New York, Revenue Bonds, Catholic Health Services of Long Island Obligated Group Project, Refunding Series 2011, 5.000%, 7/01/28 | 7/21 at 100.00 | | BBB+ | | 323,249 | |
| | 500 | | Yonkers Industrial Development Agency, New York, Revenue Bonds, St. John’s Riverside Hospital, Series 2001A, 7.125%, 7/01/31 | 1/15 at 100.00 | | B+ | | 500,780 | |
| | 155 | | Yonkers Industrial Development Agency, New York, Revenue Bonds, St. John’s Riverside Hospital, Series 2001B, 7.125%, 7/01/31 | 1/15 at 100.00 | | B+ | | 155,242 | |
| | 13,560 | | Total Health Care | | | | | 14,482,791 | |
| | | | Housing/Multifamily – 1.7% (1.7% of Total Investments) | | | | | | |
| | 270 | | East Syracuse Housing Authority, New York, FHA-Insured Section 8 Assisted Revenue Refunding Bonds, Bennett Project, Series 2001A, 6.700%, 4/01/21 | 10/14 at 100.00 | | AA | | 270,842 | |
| | 1,000 | | New York City Housing Development Corporation, New York, Multifamily Housing Revenue Bonds, Series 2009C-1, 5.500%, 11/01/34 | 5/19 at 100.00 | | AA+ | | 1,072,850 | |
| | 1,250 | | New York City Housing Development Corporation, New York, Multifamily Housing Revenue Bonds, Series 2009M, 5.150%, 11/01/45 | 5/19 at 100.00 | | AA+ | | 1,315,800 | |
| | 2,520 | | Total Housing/Multifamily | | | | | 2,659,492 | |
| | | | Housing/Single Family – 0.6% (0.6% of Total Investments) | | | | | | |
| | 925 | | New York State Mortgage Agency, Homeowner Mortgage Revenue Bonds, Series 130, 4.650%, 4/01/27 (Alternative Minimum Tax) | 4/15 at 100.00 | | Aa1 | | 929,773 | |
| | | | Long-Term Care – 1.9% (1.9% of Total Investments) | | | | | | |
| | 435 | | Dormitory Authority of the State of New York, GNMA Collateralized Revenue Bonds, Cabrini of Westchester Project, Series 2006, 5.200%, 2/15/41 | 2/17 at 103.00 | | AA+ | | 460,674 | |
| | 270 | | Dormitory Authority of the State of New York, Non-State Supported Debt, Ozanam Hall of Queens Nursing Home Revenue Bonds, Series 2006, 5.000%, 11/01/31 | 11/16 at 100.00 | | B1 | | 260,369 | |
| | 135 | | Dormitory Authority of the State of New York, Revenue Bonds, Providence Rest, Series 2005, 5.000%, 7/01/35 – ACA Insured | 7/15 at 100.00 | | N/R | | 134,816 | |
| | 610 | | Erie County Industrial Development Agency, New York, Revenue Bonds, Orchard Park CCRC Inc. Project, Series 2006A, 6.000%, 11/15/36 | 11/16 at 100.00 | | N/R | | 620,449 | |
| | 100 | | New York City Industrial Development Agency, New York, Civic Facility Revenue Bonds, Special Needs Facilities Pooled Program, Series 2000, 8.125%, 7/01/19 | 1/15 at 100.00 | | N/R | | 100,197 | |
| | 195 | | New York City Industrial Development Agency, New York, Civic Facility Revenue Bonds, Special Needs Facilities Pooled Program, Series 2001A-1, 7.250%, 7/01/16 | 1/15 at 100.00 | | N/R | | 195,786 | |
| | 640 | | New York City Industrial Development Agency, New York, Civic Facility Revenue Bonds, Special Needs Facilities Pooled Program, Series 2008A-1, 5.500%, 7/01/18 | 7/16 at 101.00 | | N/R | | 628,774 | |
| | 235 | | Suffolk County Industrial Development Agency, New York, Civic Facility Revenue Bonds, Special Needs Facilities Pooled Program, Series 2008-B1, 5.800%, 7/01/23 | 7/16 at 101.00 | | N/R | | 236,194 | |
| | 225 | | Yonkers Industrial Development Agency, New York, Civic Facilities Revenue Bonds, Special Needs Facilities Pooled Program Bonds, Series 2008-C1, 5.800%, 7/01/23 | 7/16 at 101.00 | | N/R | | 218,833 | |
| | 2,845 | | Total Long-Term Care | | | | | 2,856,092 | |
| | | | Tax Obligation/General – 7.8% (7.8% of Total Investments) | | | | | | |
| | 4,760 | | New York City, New York, General Obligation Bonds, Fiscal 2008 Series D, 5.125%, 12/01/25 | 12/17 at 100.00 | | AA | | 5,344,766 | |
| | 1,000 | | New York City, New York, General Obligation Bonds, Fiscal 2014 Series A-1, 5.000%, 8/01/26 | 8/23 at 100.00 | | AA | | 1,180,350 | |
| | 2,000 | | New York City, New York, General Obligation Bonds, Fiscal 2015 Series A, 5.000%, 8/01/31 | 8/24 at 100.00 | | AA | | 2,337,520 | |
| | Principal | | | Optional Call | | | | | |
| | Amount (000) | | Description (1) | Provisions (2) | | Ratings (3) | | Value | |
| | | | Tax Obligation/General (continued) | | | | | | |
| $ | 35 | | New York City, New York, General Obligation Bonds, Fiscal Series 2005F-1, 5.000%, 9/01/19 – SYNCORA GTY Insured | 9/15 at 100.00 | | AA | $ | 36,540 | |
| | 2,795 | | New York City, New York, General Obligation Bonds, Fiscal Series 2007A, 5.000%, 8/01/25 | 8/16 at 100.00 | | AA | | 3,011,501 | |
| | 10,590 | | Total Tax Obligation/General | | | | | 11,910,677 | |
| | | | Tax Obligation/Limited – 20.9% (20.9% of Total Investments) | | | | | | |
| | 395 | | Dormitory Authority of the State of New York, Department of Health Revenue Bonds, Series 2005A, 5.250%, 7/01/24 – CIFG Insured | 7/15 at 100.00 | | AA | | 409,354 | |
| | | | Dormitory Authority of the State of New York, Second General Resolution Consolidated Revenue Bonds, City University System, Series 1993A: | | | | | | |
| | 820 | | 5.750%, 7/01/18 | No Opt. Call | | AA | | 892,800 | |
| | 1,400 | | 6.000%, 7/01/20 | No Opt. Call | | AA | | 1,669,584 | |
| | 6,290 | | Dormitory Authority of the State of New York, State Personal Income Tax Revenue Bonds, General Purpose Series 2012D, 5.000%, 2/15/37 | No Opt. Call | | AAA | | 7,039,263 | |
| | 1,500 | | Metropolitan Transportation Authority, New York, Dedicated Tax Fund Bonds, Series 2009B, 5.000%, 11/15/34 | 11/19 at 100.00 | | AA | | 1,703,400 | |
| | 560 | | Monroe Newpower Corporation, New York, Power Facilities Revenue Bonds, Series 2003, 5.500%, 1/01/34 | 1/15 at 100.00 | | A– | | 561,288 | |
| | 1,200 | | New York City Transitional Finance Authority, New York, Building Aid Revenue Bonds, Fiscal Series 2007S-2, 5.000%, 1/15/28 – FGIC Insured | 1/17 at 100.00 | | Aa2 | | 1,297,908 | |
| | 1,500 | | New York City Transitional Finance Authority, New York, Building Aid Revenue Bonds, Fiscal Series 2009-S5, 5.250%, 1/15/39 | 1/19 at 100.00 | | Aa2 | | 1,694,205 | |
| | 1,680 | | New York City Transitional Finance Authority, New York, Future Tax Secured Bonds, Subordinate Fiscal 2013 Series I, 5.000%, 5/01/38 | 5/23 at 100.00 | | AAA | | 1,898,014 | |
| | 1,225 | | New York City Transitional Finance Authority, New York, Future Tax Secured Bonds, Subordinate Fiscal 2014 Series D-1, 5.000%, 2/01/35 | 2/24 at 100.00 | | AAA | | 1,405,418 | |
| | 2,100 | | New York State Environmental Facilities Corporation, State Personal Income Tax Revenue Bonds, Series 2008A, 5.000%, 12/15/27 (UB) | 12/17 at 100.00 | | AAA | | 2,336,460 | |
| | 765 | | New York State Housing Finance Agency, State Personal Income Tax Revenue Bonds, Economic Development and Housing, Series 2006A, 5.000%, 3/15/36 | 9/15 at 100.00 | | AAA | | 795,860 | |
| | 865 | | New York State Thruway Authority, Highway and Bridge Trust Fund Bonds, Second General, Series 2005B, 5.000%, 4/01/21 – AMBAC Insured | 10/15 at 100.00 | | AA+ | | 906,373 | |
| | 1,175 | | New York State Thruway Authority, Highway and Bridge Trust Fund Bonds, Series 2007, 5.000%, 4/01/27 | 10/17 at 100.00 | | AA+ | | 1,295,790 | |
| | 2,450 | | New York State Thruway Authority, Highway and Bridge Trust Fund Bonds, Series 2005B, 5.500%,4/01/20 – AMBAC Insured (UB) (4) | No Opt. Call | | AA+ | | 2,970,846 | |
| | 600 | | New York State Urban Development Corporation, Special Project Revenue Bonds, University Facilities Grants, Series 1995, 5.875%, 1/01/21 | No Opt. Call | | AA | | 731,028 | |
| | 20,000 | | Puerto Rico Sales Tax Financing Corporation, Sales Tax Revenue Bonds, Series 2007A, 0.000%,8/01/43 – NPFG Insured | No Opt. Call | | AA– | | 3,179,600 | |
| | 1,000 | | Sales Tax Asset Receivable Corporation of New York City, New York, Sales Tax Asset Revenue Bonds, Fiscal 2015 Series A, 5.000%, 10/15/29 (WI/DD, Settling 10/15/14) | 10/24 at 100.00 | | AAA | | 1,213,360 | |
| | 45,525 | | Total Tax Obligation/Limited | | | | | 32,000,551 | |
| | | | Transportation – 18.2% (18.2% of Total Investments) | | | | | | |
| | 3,000 | | Metropolitan Transportation Authority, New York, Transportation Revenue Bonds, Series 2008A, 5.250%, 11/15/36 | 11/17 at 100.00 | | AA– | | 3,308,760 | |
| | 3,500 | | Metropolitan Transportation Authority, New York, Transportation Revenue Bonds, Series 2012E, 5.000%, 11/15/42 | No Opt. Call | | AA– | | 3,851,470 | |
| | 1,100 | | Metropolitan Transportation Authority, New York, Transportation Revenue Bonds, Series 2013E, 5.000%, 11/15/31 | 11/23 at 100.00 | | AA– | | 1,253,241 | |
| | 2,000 | | Metropolitan Transportation Authority, New York, Transportation Revenue Bonds, Series 2014B, 5.250%, 11/15/38 | 5/24 at 100.00 | | AA– | | 2,298,820 | |
| NNY | Nuveen New York Municipal Value Fund, Inc. | |
| | Portfolio of Investments (continued) | September 30, 2014 |
| | Principal | | | Optional Call | | | | | |
| | Amount (000) | | Description (1) | Provisions (2) | | Ratings (3) | | Value | |
| | | | Transportation (continued) | | | | | | |
| $ | 1,500 | | New York City Industrial Development Agency, New York, Civic Facility Revenue Bonds, Bronx Parking Development Company, LLC Project, Series 2007, 5.875%, 10/01/46 (5) | 10/17 at 102.00 | | N/R | $ | 555,000 | |
| | 1,600 | | New York City Industrial Development Agency, New York, Special Facilities Revenue Bonds, British Airways PLC, Series 1998, 5.250%, 12/01/32 (Alternative Minimum Tax) | 12/14 at 100.00 | | BB | | 1,599,984 | |
| | 1,000 | | New York City Industrial Development Agency, New York, Special Facilities Revenue Bonds, JFK Airport – American Airlines Inc., Series 2002B, 8.500%, 8/01/28 (Alternative Minimum Tax) | 2/16 at 100.00 | | N/R | | 1,043,420 | |
| | 700 | | New York City Industrial Development Agency, New York, Special Facilities Revenue Bonds, Terminal One Group JFK Project, Series 2005, 5.500%, 1/01/24 (Alternative Minimum Tax) | 1/16 at 100.00 | | A3 | | 737,800 | |
| | 1,000 | | New York City Industrial Development Agency, New York, Special Facility Revenue Bonds, JetBlue Airways Corporation Project, Series 2006, 5.125%, 5/15/30 (Alternative Minimum Tax) | 11/14 at 100.00 | | B | | 1,000,120 | |
| | 660 | | New York Liberty Development Corporation, Liberty Revenue Bonds, 4 World Trade Center Project, Series 2011, 5.000%, 11/15/44 | 11/21 at 100.00 | | A+ | | 725,201 | |
| | 55 | | New York State Thruway Authority, General Revenue Bonds, Series 2005F, 5.000%, 1/01/30 – AMBAC Insured | 1/15 at 100.00 | | A | | 55,551 | |
| | 400 | | New York State Thruway Authority, General Revenue Bonds, Series 2005G, 5.000%, 1/01/30 – AGM Insured | 7/15 at 100.00 | | AA | | 412,520 | |
| | 4,000 | | Port Authority of New York and New Jersey, Consolidated Revenue Bonds, One Hundred Eighty-Forth Series 2014, 5.000%, 9/01/35 | 9/24 at 100.00 | | AA– | | 4,657,638 | |
| | | | Port Authority of New York and New Jersey, Consolidated Revenue Bonds, One Hundred Fortieth Series 2005: | | | | | | |
| | 1,000 | | 5.000%, 12/01/28 – SYNCORA GTY Insured | 6/15 at 101.00 | | AA– | | 1,037,528 | |
| | 435 | | 5.000%, 12/01/31 – SYNCORA GTY Insured | 6/15 at 101.00 | | AA– | | 451,286 | |
| | 325 | | Port Authority of New York and New Jersey, Consolidated Revenue Bonds, One Hundred Forty Eighth Series 2008, Trust 2920, 17.814%, 8/15/32 – AGM Insured (IF) | 8/17 at 100.00 | | AA | | 459,329 | |
| | 1,575 | | Port Authority of New York and New Jersey, Consolidated Revenue Bonds, One Hundred Seventy Ninth Series 2013, 5.000%, 12/01/43 | 12/23 at 100.00 | | AA– | | 1,784,633 | |
| | | | Port Authority of New York and New Jersey, Special Project Bonds, JFK International Air Terminal LLC Project, Eighth Series 2010: | | | | | | |
| | 225 | | 6.500%, 12/01/28 | 12/15 at 100.00 | | BBB | | 238,658 | |
| | 1,160 | | 6.000%, 12/01/36 | 12/20 at 100.00 | | BBB | | 1,351,771 | |
| | 780 | | Triborough Bridge and Tunnel Authority, New York, General Purpose Revenue Bonds, Refunding Subordinate Lien Series 2002E, 5.500%, 11/15/20 – NPFG Insured | No Opt. Call | | AA– | | 958,090 | |
| | 26,015 | | Total Transportation | | | | | 27,780,820 | |
| | | | U.S. Guaranteed – 5.6% (5.6% of Total Investments) (6) | | | | | | |
| | 1,825 | | Dormitory Authority of the State of New York, FHA-Insured Revenue Bonds, St. Luke’s Roosevelt Hospital, Series 2005, 4.900%, 8/15/31 (Pre-refunded 8/15/15) | 8/15 at 100.00 | | N/R (6) | | 1,901,358 | |
| | 870 | | Dormitory Authority of the State of New York, Judicial Facilities Lease Revenue Bonds, Suffolk County Issue, Series 1986, 7.375%, 7/01/16 (ETM) | No Opt. Call | | Aaa | | 942,341 | |
| | | | Dormitory Authority of the State of New York, State Personal Income Tax Revenue Bonds, Series 2005F: | | | | | | |
| | 260 | | 5.000%, 3/15/21 (Pre-refunded 3/15/15) – AGM Insured | 3/15 at 100.00 | | Aa1 (6) | | 265,845 | |
| | 15 | | 5.000%, 3/15/21 (Pre-refunded 3/15/15) – AGM Insured | 3/15 at 100.00 | | AAA | | 15,337 | |
| | 265 | | Hempstead Town Industrial Development Agency, New York, Revenue Bonds, Adelphi University, Civic Facility Project, Series 2005, 5.000%, 10/01/35 (Pre-refunded 10/01/15) | 10/15 at 100.00 | | A (6) | | 277,943 | |
| | Principal | | | Optional Call | | | | | |
| | Amount (000) | | Description (1) | Provisions (2) | | Ratings (3) | | Value | |
| | | | U.S. Guaranteed (6) (continued) | | | | | | |
| $ | 1,690 | | New York City Housing Development Corporation, New York, Capital Fund Program Revenue Bonds, New York Housing Authority Program, Series 2005A, 5.000%, 7/01/25 (Pre-refunded 7/01/15) – FGIC Insured | 7/15 at 100.00 | | AA+ (6) | $ | 1,752,226 | |
| | | | New York City, New York, General Obligation Bonds, Fiscal Series 2004E: | | | | | | |
| | 375 | | 5.000%, 11/01/19 (Pre-refunded 11/01/14) – AGM Insured | 11/14 at 100.00 | | AA (6) | | 376,575 | |
| | 625 | | 5.000%, 11/01/19 (Pre-refunded 11/01/14) – AGM Insured | 11/14 at 100.00 | | AA (6) | | 627,569 | |
| | 1,965 | | New York City, New York, General Obligation Bonds, Fiscal Series 2005F-1, 5.000%, 9/01/19 (Pre-refunded 9/01/15) – SYNCORA GTY Insured | 9/15 at 100.00 | | Aa2 (6) | | 2,053,111 | |
| | 75 | | New York State Housing Finance Agency, State Personal Income Tax Revenue Bonds, Economic Development and Housing, Series 2006A, 5.000%, 3/15/36 (Pre-refunded 9/15/15) | 9/15 at 100.00 | | N/R (6) | | 78,503 | |
| | 110 | | New York State Thruway Authority, General Revenue Bonds, Series 2005F, 5.000%, 1/01/30 (Pre-refunded 1/01/15) – AMBAC Insured | 1/15 at 100.00 | | A2 (6) | | 111,366 | |
| | 135 | | New York State Thruway Authority, Highway and Bridge Trust Fund Bonds, Second General, Series 2005B, 5.000%, 4/01/21 (Pre-refunded 10/01/15) – AMBAC Insured | 10/15 at 100.00 | | N/R (6) | | 141,593 | |
| | 8,210 | | Total U.S. Guaranteed | | | | | 8,543,767 | |
| | | | Utilities – 11.1% (11.1% of Total Investments) | | | | | | |
| | 1,000 | | Chautauqua County Industrial Development Agency, New York, Exempt Facility Revenue Bonds, NRG Dunkirk Power Project, Series 2009, 5.875%, 4/01/42 | 2/20 at 100.00 | | Baa3 | | 1,093,700 | |
| | 90 | | Guam Power Authority, Revenue Bonds, Series 2012A, 5.000%, 10/01/34 | 10/22 at 100.00 | | BBB | | 99,385 | |
| | | | Long Island Power Authority, New York, Electric System General Revenue Bonds, Series 2006A: | | | | | | |
| | 1,500 | | 5.000%, 12/01/23 – FGIC Insured | 6/16 at 100.00 | | AA– | | 1,603,395 | |
| | 1,500 | | 5.000%, 12/01/24 – FGIC Insured | 6/16 at 100.00 | | AA– | | 1,601,580 | |
| | 250 | | Long Island Power Authority, New York, Electric System General Revenue Bonds, Series 2006B, 5.000%, 12/01/35 – CIFG Insured | 6/16 at 100.00 | | A– | | 263,878 | |
| | 400 | | Long Island Power Authority, New York, Electric System Revenue Bonds, Series 2011A, 5.000%, 5/01/38 | 5/21 at 100.00 | | A– | | 437,348 | |
| | 1,250 | | Long Island Power Authority, New York, Electric System Revenue Bonds, Series 2012A, 5.000%, 9/01/37 | No Opt. Call | | A– | | 1,363,775 | |
| | 1,000 | | Nassau County Industrial Development Authority, New York, Keyspan Glenwood Energy Project, Series 2003, 5.250%, 6/01/27 (Alternative Minimum Tax) | 12/14 at 100.00 | | A– | | 1,003,840 | |
| | 2,490 | | Niagara Area Development Corporation, New York, Solid Waste Disposal Facility Revenue Refunding Bonds, Covanta Energy Project, Series 2012A, 5.250%, 11/01/42 | No Opt. Call | | BB+ | | 2,549,984 | |
| | 25 | | Power Authority of the State of New York, General Revenue Bonds, Series 2006A, 5.000%,11/15/19 – FGIC Insured | 11/15 at 100.00 | | Aa2 | | 26,354 | |
| | 535 | | Suffolk County Industrial Development Agency, New York, Revenue Bonds, Nissequogue Cogeneration Partners Facility, Series 1998, 5.500%, 1/01/23 (Alternative Minimum Tax) | 1/15 at 100.00 | | N/R | | 535,005 | |
| | | | Utility Debt Securitization Authority, New York, Restructuring Bonds, Series 2013TE: | | | | | | |
| | 4,440 | | 5.000%, 12/15/34 | 12/23 at 100.00 | | AAA | | 5,186,630 | |
| | 1,100 | | 5.000%, 12/15/41 | 12/23 at 100.00 | | AAA | | 1,261,040 | |
| | 15,580 | | Total Utilities | | | | | 17,025,914 | |
| NNY | Nuveen New York Municipal Value Fund, Inc. | |
| | Portfolio of Investments (continued) | September 30, 2014 |
| | Principal | | | Optional Call | | | | | |
| | Amount (000) | | Description (1) | Provisions (2) | | Ratings (3) | | Value | |
| | | | Water and Sewer – 2.2% (2.2% of Total Investments) | | | | | | |
| $ | 2,000 | | New York City Municipal Water Finance Authority, New York, Water and Sewer System Revenue Bonds, Fiscal 2009 Series 2008A, 5.750%, 6/15/40 | No Opt. Call | | AAA | $ | 2,302,280 | |
| | 1,000 | | New York State Environmental Facilities Corporation, Revenue Bonds, State Revolving Funds Master Financing, Series 2012B, 5.000%, 2/15/42 | 2/22 at 100.00 | | AAA | | 1,123,320 | |
| | 3,000 | | Total Water and Sewer | | | | | 3,425,600 | |
| $ | 158,465 | | Total Long-Term Investments (cost $143,505,026) | | | | | 153,069,546 | |
| | | | Floating Rate Obligations – (2.1)% | | | | | (3,255,000 | ) |
| | | | Other Assets Less Liabilities – 2.1% | | | | | 3,272,275 | |
| | | | Net Assets Applicable to Common Shares – 100% | | | | $ | 153,086,821 | |
| (1) | All percentages shown in the Portfolio of Investments are based on net assets applicable to common shares unless otherwise noted. |
| (2) | Optional Call Provisions (not covered by the report of independent registered public accounting firm): Dates (month and year) and prices of the earliest optional call or redemption. There may be other call provisions at varying prices at later dates. Certain mortgage-backed securities may be subject to periodic principal paydowns. |
| (3) | Ratings (not covered by the report of independent registered public accounting firm): Using the highest of Standard & Poor’s Group (“Standard & Poor’s”), Moody’s Investors Service, Inc. (“Moody’s”) or Fitch, Inc. (“Fitch”) rating. Ratings below BBB by Standard & Poor’s, Baa by Moody’s or BBB by Fitch are considered to be below investment grade. Holdings designated N/R are not rated by any of these national rating agencies. |
| (4) | Investment, or portion of investment, has been pledged to collateralize the net payment obligations for investments in inverse floating rate transactions. |
| (5) | On April 1, 2013, the Fund’s Adviser determined it was unlikely that this borrower would fulfill its entire obligation on this security, and therefore reduced the security’s interest rate of accrual from 5.875% to 2.350%. |
| (6) | Backed by an escrow or trust containing sufficient U.S. Government or U.S. Government agency securities, which ensure the timely payment of principal and interest. Certain bonds backed by U.S. Government or agency securities are regarded as having an implied rating equal to the rating of such securities. |
| (ETM) | Escrowed to maturity. |
| WI/DD | Investment, or portion of investment, purchased on a when-issued or delayed delivery basis. |
| (IF) | Inverse floating rate investment. |
| (UB) | Underlying bond of an inverse floating rate trust reflected as a financing transaction. See Notes to Financial Statements, Note 3 – Portfolio Securities and Investments in Derivatives, Inverse Floating Rate Securities for more information. |
See accompanying notes to financial statements.
| NYV | | |
| | Nuveen New York Municipal Value Fund 2 | |
| | Portfolio of Investments | September 30, 2014 |
| | Principal | | | Optional Call | | | | | |
| | Amount (000) | | Description (1) | Provisions (2) | | Ratings (3) | | Value | |
| | | | LONG-TERM INVESTMENTS 100.6% (100.0% of Total Investments) | | | | | | |
| | | | MUNICIPAL BONDS 100.6% (100.0% of Total Investments) | | | | | | |
| | | | Consumer Staples – 4.2% (4.1% of Total Investments) | | | | | | |
| $ | 1,350 | | District of Columbia Tobacco Settlement Corporation, Tobacco Settlement Asset-Backed Bonds, Series 2001, 6.500%, 5/15/33 | No Opt. Call | | Baa1 | $ | 1,561,545 | |
| | | | Education and Civic Organizations – 14.7% (14.7% of Total Investments) | | | | | | |
| | 1,200 | | Albany Industrial Development Agency, New York, Revenue Bonds, Brighter Choice Charter Schools, Series 2007A, 5.000%, 4/01/37 | 4/17 at 100.00 | | BB+ | | 1,188,804 | |
| | 380 | | Buffalo and Erie County Industrial Land Development Corporation, New York, Revenue Bonds, Enterprise Charter School Project, Series 2011A, 6.000%, 12/01/19 | No Opt. Call | | B | | 393,323 | |
| | 100 | | Dormitory Authority of the State of New York, General Revenue Bonds, Saint Johns University, Series 2013A, 5.000%, 7/01/44 | 7/23 at 100.00 | | A– | | 110,150 | |
| | 1,000 | | Dormitory Authority of the State of New York, Lease Revenue Bonds, State University Dormitory Facilities, Series 2007, 5.000%, 7/01/37 | 7/17 at 100.00 | | Aa2 | | 1,098,150 | |
| | 1,000 | | Dormitory Authority of the State of New York, Revenue Bonds, Non State Supported Debt, Cornell University, Series 2010A, 5.000%, 7/01/40 | 7/20 at 100.00 | | Aa1 | | 1,133,370 | |
| | 100 | | Hempstead Town Local Development Corporation, New York, Revenue Bonds, Adelphi University Project, Series 2013, 5.000%, 9/01/38 | 9/23 at 100.00 | | A | | 110,879 | |
| | 4,895 | | New York City Industrial Development Agency, New York, Revenue Bonds, Yankee Stadium Project PILOT, Series 2009A, 0.000%, 3/01/40 – AGC Insured | No Opt. Call | | AA | | 1,490,381 | |
| | 8,675 | | Total Education and Civic Organizations | | | | | 5,525,057 | |
| | | | Financials – 1.0% (1.0% of Total Investments) | | | | | | |
| | 300 | | New York Liberty Development Corporation, Revenue Bonds, Goldman Sachs Headquarters Issue, Series 2007, 5.500%, 10/01/37 | No Opt. Call | | A | | 368,034 | |
| | | | Health Care – 19.1% (18.9% of Total Investments) | | | | | | |
| | 290 | | Albany Capital Resource Corporation, New York, St. Peter’s Hospital Project, Series 2011, 6.000%, 11/15/25 | 11/20 at 100.00 | | A+ | | 337,589 | |
| | 700 | | Delaware County Hospital Authority, Indiana, Hospital Revenue Bonds, Cardinal Health System, Series 2006, 5.000%, 8/01/24 | 8/16 at 100.00 | | A3 | | 744,716 | |
| | 50 | | Dormitory Authority of the State of New York, Highland Hospital of Rochester Revenue Bonds, Series 2010, 5.000%, 7/01/26 | 7/20 at 100.00 | | A2 | | 56,003 | |
| | | | Dormitory Authority of the State of New York, Orange Regional Medical Center Obligated Group Revenue Bonds, Series 2008: | | | | | | |
| | 285 | | 6.500%, 12/01/21 | 12/18 at 100.00 | | Ba1 | | 318,297 | |
| | 140 | | 6.125%, 12/01/29 | 12/18 at 100.00 | | Ba1 | | 149,016 | |
| | 245 | | 6.250%, 12/01/37 | 12/18 at 100.00 | | Ba1 | | 258,593 | |
| | 1,500 | | Dormitory Authority of the State of New York, Revenue Bonds, North Shore Long Island Jewish Obligated Group, Series 2006B, 5.000%, 11/01/34 | 11/16 at 100.00 | | A3 | | 1,559,415 | |
| | 1,500 | | Dormitory Authority of the State of New York, Revenue Bonds, North Shore Long Island Jewish Obligated Group, Series 2009A, 5.500%, 5/01/37 | 5/19 at 100.00 | | A | | 1,663,920 | |
| | 1,010 | | Dormitory Authority of the State of New York, Revenue Bonds, NYU Hospitals Center, Series 2007B, 5.625%, 7/01/37 | 7/17 at 100.00 | | A– | | 1,104,284 | |
| | 725 | | Illinois Finance Authority, Revenue Bonds, OSF Healthcare System, Series 2007A, 5.750%, 11/15/37 | 11/17 at 100.00 | | A | | 784,138 | |
| | 160 | | Yonkers Industrial Development Agency, New York, Revenue Bonds, St. John’s Riverside Hospital, Series 2001B, 7.125%, 7/01/31 | 1/15 at 100.00 | | B+ | | 160,250 | |
| | 6,605 | | Total Health Care | | | | | 7,136,221 | |
| NYV | Nuveen New York Municipal Value Fund 2 | |
| | Portfolio of Investments (continued) | September 30, 2014 |
| | Principal | | | Optional Call | | | | | |
| | Amount (000) | | Description (1) | Provisions (2) | | Ratings (3) | | Value | |
| | | | Housing/Multifamily – 12.9% (12.9% of Total Investments) | | | | | | |
| $ | 1,500 | | New York City Housing Development Corporation, New York, FNMA Backed Progress of Peoples Development Multifamily Rental Housing Revenue Bonds, Series 2005B, 4.950%, 5/15/36 (Alternative Minimum Tax) | 11/15 at 100.00 | | AA+ | $ | 1,512,525 | |
| | 1,800 | | New York City Housing Development Corporation, New York, Multifamily Housing Revenue Bonds, Series 2004-H2, 5.125%, 11/01/34 (Alternative Minimum Tax) | 11/14 at 100.00 | | AA+ | | 1,801,440 | |
| | 1,000 | | New York State Housing Finance Agency, Affordable Housing Revenue Bonds, Series 2009A, 5.250%, 11/01/41 | 5/19 at 100.00 | | Aa2 | | 1,060,250 | |
| | 450 | | New York State Housing Finance Agency, Affordable Housing Revenue Bonds, Series 2009B, 4.500%, 11/01/29 | 5/19 at 100.00 | | Aa2 | | 472,896 | |
| | 4,750 | | Total Housing/Multifamily | | | | | 4,847,111 | |
| | | | Long-Term Care – 0.4% (0.4% of Total Investments) | | | | | | |
| | 150 | | Erie County Industrial Development Agency, New York, Revenue Bonds, Orchard Park CCRC Inc. Project, Series 2006A, 6.000%, 11/15/36 | 11/16 at 100.00 | | N/R | | 152,570 | |
| | | | Tax Obligation/General – 4.3% (4.3% of Total Investments) | | | | | | |
| | 1,000 | | New York City, New York, General Obligation Bonds, Fiscal 2015 Series A, 5.000%, 8/01/32 | 8/24 at 100.00 | | AA | | 1,162,280 | |
| | 400 | | Yonkers, New York, General Obligation Bonds, Series 2011A, 5.000%, 10/01/24 – AGM Insured | 10/21 at 100.00 | | AA | | 449,652 | |
| | 1,400 | | Total Tax Obligation/General | | | | | 1,611,932 | |
| | | | Tax Obligation/Limited – 24.6% (24.4% of Total Investments) | | | | | | |
| | 1,200 | | Dormitory Authority of the State of New York, State Personal Income Tax Revenue Bonds, Education Series 2009A, 5.000%, 3/15/38 | 3/19 at 100.00 | | AAA | | 1,354,944 | |
| | 560 | | Dormitory Authority of the State of New York, State Personal Income Tax Revenue Bonds, General Purpose Series 2013A, 5.000%, 2/15/43 | 2/23 at 100.00 | | AAA | | 627,189 | |
| | 1,200 | | Guam Government, Limited Obligation Section 30 Revenue Bonds, Series 2009A, 5.750%, 12/01/34 | 12/19 at 100.00 | | BBB+ | | 1,325,112 | |
| | 1,710 | | Hudson Yards Infrastructure Corporation, New York, Revenue Bonds, Series 2006A, 5.000%, 2/15/47 | 2/17 at 100.00 | | A | | 1,811,878 | |
| | 1,500 | | New York City Transitional Finance Authority, New York, Building Aid Revenue Bonds, Fiscal Series 2009-S5, 5.250%, 1/15/39 | 1/19 at 100.00 | | Aa2 | | 1,694,205 | |
| | 300 | | New York City Transitional Finance Authority, New York, Future Tax Secured Bonds, Subordinate Fiscal 2014 Series D-1, 5.000%, 2/01/35 | 2/24 at 100.00 | | AAA | | 344,184 | |
| | 25 | | New York City Transitional Finance Authority, New York, Future Tax Secured Revenue Bonds, Subordinate Lien Series 2011C, 5.500%, 11/01/35 | 11/20 at 100.00 | | AAA | | 29,761 | |
| | 1,000 | | New York State Urban Development Corporation, State Personal Income Tax Revenue Bonds, Tender Option Bond Trust 09-6W, 13.241%, 3/15/37 (IF) (4) | 3/17 at 100.00 | | AAA | | 1,262,320 | |
| | 750 | | Sales Tax Asset Receivable Corporation of New York City, New York, Sales Tax Asset Revenue Bonds, Fiscal 2005 Series A, 5.000%, 10/15/26 – AGM Insured | 10/14 at 100.00 | | AAA | | 753,068 | |
| | 8,245 | | Total Tax Obligation/Limited | | | | | 9,202,661 | |
| | | | Transportation – 12.3% (12.2% of Total Investments) | | | | | | |
| | 1,000 | | Foothill/Eastern Transportation Corridor Agency, California, Toll Road Revenue Refunding Bonds, Series 2013A, 5.000%, 1/15/42 – AGM Insured | 1/24 at 100.00 | | AA | | 1,084,830 | |
| | | | New York City Industrial Development Agency, New York, American Airlines-JFK International Airport Special Facility Revenue Bonds, Series 2005: | | | | | | |
| | 185 | | 7.500%, 8/01/16 (Alternative Minimum Tax) | No Opt. Call | | N/R | | 194,663 | |
| | 500 | | 7.750%, 8/01/31 (Alternative Minimum Tax) | 8/16 at 101.00 | | N/R | | 550,495 | |
| | 2,000 | | New York City Industrial Development Agency, New York, Civic Facility Revenue Bonds, Bronx Parking Development Company, LLC Project, Series 2007, 5.750%, 10/01/37 (5) | 10/17 at 100.00 | | N/R | | 740,000 | |
| | 155 | | New York Liberty Development Corporation, Liberty Revenue Bonds, 4 World Trade Center Project, Series 2011, 5.000%, 11/15/44 | 11/21 at 100.00 | | A+ | | 170,312 | |
| | | | Port Authority of New York and New Jersey, Special Project Bonds, JFK International Air Terminal LLC Project, Eighth Series 2010: | | | | | | |
| | 180 | | 6.500%, 12/01/28 | 12/15 at 100.00 | | BBB | | 190,926 | |
| | 140 | | 6.000%, 12/01/36 | 12/20 at 100.00 | | BBB | | 163,145 | |
| | Principal | | | Optional Call | | | | | |
| | Amount (000) | | Description (1) | Provisions (2) | | Ratings (3) | | Value | |
| | | | Transportation (continued) | | | | | | |
| $ | 1,325 | | Triborough Bridge and Tunnel Authority, New York, General Purpose Revenue Bonds, Refunding Series 2008A, 5.000%, 11/15/33 | 5/18 at 100.00 | | AA– | $ | 1,495,925 | |
| | 5,485 | | Total Transportation | | | | | 4,590,296 | |
| | | | Utilities – 4.5% (4.5% of Total Investments) | | | | | | |
| | 25 | | Guam Power Authority, Revenue Bonds, Series 2012A, 5.000%, 10/01/34 | 10/22 at 100.00 | | BBB | | 27,607 | |
| | 605 | | Niagara Area Development Corporation, New York, Solid Waste Disposal Facility Revenue Refunding Bonds, Covanta Energy Project, Series 2012A, 5.250%, 11/01/42 | No Opt. Call | | BB+ | | 619,574 | |
| | 905 | | Utility Debt Securitization Authority, New York, Restructuring Bonds, Series 2013TE, 5.000%, 12/15/41 | 12/23 at 100.00 | | AAA | | 1,037,492 | |
| | 1,535 | | Total Utilities | | | | | 1,684,673 | |
| | | | Water and Sewer – 2.6% (2.6% of Total Investments) | | | | | | |
| | 900 | | New York City Municipal Water Finance Authority, New York, Water and Sewer System Revenue Bonds, Second Generation Resolution, Fiscal 2012 Series BB, 5.000%, 6/15/44 | 12/21 at 100.00 | | AA+ | | 992,232 | |
| $ | 39,395 | | Total Long-Term Investments (cost $33,282,310) | | | | | 37,672,332 | |
| | | | Other Assets Less Liabilities – (0.6)% | | | | | (217,025 | ) |
| | | | Net Assets Applicable to Common Shares – 100% | | | | $ | 37,455,307 | |
| (1) | All percentages shown in the Portfolio of Investments are based on net assets applicable to common shares unless otherwise noted. |
| (2) | Optional Call Provisions (not covered by the report of independent registered public accounting firm): Dates (month and year) and prices of the earliest optional call or redemption. There may be other call provisions at varying prices at later dates. Certain mortgage-backed securities may be subject to periodic principal paydowns. |
| (3) | Ratings (not covered by the report of independent registered public accounting firm): Using the highest of Standard & Poor’s Group (“Standard & Poor’s”), Moody’s Investors Service, Inc. (“Moody’s”) or Fitch, Inc. (“Fitch”) rating. Ratings below BBB by Standard & Poor’s, Baa by Moody’s or BBB by Fitch are considered to be below investment grade. Holdings designated N/R are not rated by any of these national rating agencies. |
| (4) | Investment, or portion of investment, has been pledged to collateralize the net payment obligations for investments in inverse floating rate transactions. |
| (5) | On April 1, 2013, the Fund’s Adviser determined it was unlikely that this borrower would fulfill its entire obligation on this security, and therefore reduced the security’s interest rate of accrual from 5.750% to 2.300%. |
| (IF) | Inverse floating rate investment. |
See accompanying notes to financial statements.
| NNP | | |
| | Nuveen New York Performance Plus Municipal Fund, Inc. |
| | Portfolio of Investments | September 30, 2014 |
| | Principal | | | Optional Call | | | | | |
| | Amount (000) | | Description (1) | Provisions (2) | | Ratings (3) | | Value | |
| | | | LONG-TERM INVESTMENTS 147.6% (100.0% of Total Investments) | | | | | | |
| | | | MUNICIPAL BONDS – 146.4% (99.2% of Total Investments) | | | | | | |
| | | | Consumer Discretionary – 0.3% (0.2% of Total Investments) | | | | | | |
| $ | 685 | | New York City Industrial Development Agency, New York, Liberty Revenue Bonds, IAC/InterActiveCorp, Series 2005, 5.000%, 9/01/35 | 9/15 at 100.00 | | BBB | $ | 698,960 | |
| | | | Consumer Staples – 3.1% (2.1% of Total Investments) | | | | | | |
| | 1,000 | | Nassau County Tobacco Settlement Corporation, New York, Tobacco Settlement Asset-Backed Bonds, Refunding Series 2006A-2, 5.250%, 6/01/26 | 6/16 at 100.00 | | B | | 971,810 | |
| | 1,450 | | Nassau County Tobacco Settlement Corporation, New York, Tobacco Settlement Asset-Backed Bonds, Series 2006A-3, 5.000%, 6/01/35 | 6/16 at 100.00 | | B | | 1,209,358 | |
| | 175 | | New York Counties Tobacco Trust II, Tobacco Settlement Pass-Through Bonds, Series 2001, 5.250%, 6/01/25 | 12/14 at 100.00 | | A1 | | 174,984 | |
| | 470 | | New York Counties Tobacco Trust III, Tobacco Settlement Pass-Through Bonds, Series 2003, 5.750%, 6/01/33 | 12/14 at 100.00 | | A1 | | 469,958 | |
| | 90 | | Rensselaer Tobacco Asset Securitization Corporation, New York, Tobacco Settlement Asset-Backed Bonds, Series 2001A, 5.200%, 6/01/25 | 12/14 at 100.00 | | A1 | | 87,320 | |
| | | | TSASC Inc., New York, Tobacco Asset-Backed Bonds, Series 2006: | | | | | | |
| | 1,855 | | 4.750%, 6/01/22 | 6/16 at 100.00 | | BBB– | | 1,842,887 | |
| | 930 | | 5.000%, 6/01/26 | 6/16 at 100.00 | | BB– | | 911,586 | |
| | 500 | | 5.000%, 6/01/34 | 6/16 at 100.00 | | B | | 414,455 | |
| | 1,580 | | 5.125%, 6/01/42 | 6/16 at 100.00 | | B | | 1,284,287 | |
| | 8,050 | | Total Consumer Staples | | | | | 7,366,645 | |
| | | | Education and Civic Organizations – 26.2% (17.7% of Total Investments) | | | | | | |
| | 655 | | Albany Industrial Development Agency, New York, Revenue Bonds, Albany Law School, Series 2007A, 5.000%, 7/01/31 | 7/17 at 100.00 | | BBB | | 677,486 | |
| | 925 | | Albany Industrial Development Agency, New York, Revenue Bonds, Brighter Choice Charter Schools, Series 2007A, 5.000%, 4/01/37 | 4/17 at 100.00 | | BB+ | | 916,370 | |
| | 1,000 | | Brooklyn Arena Local Development Corporation, New York, Payment in Lieu of Taxes Revenue Bonds, Barclays Center Project, Series 2009, 6.375%, 7/15/43 | 1/20 at 100.00 | | BBB– | | 1,133,430 | |
| | 1,630 | | Buffalo and Erie County Industrial Land Development Corporation, New York, Revenue Bonds, Enterprise Charter School Project, Series 2011A, 7.500%, 12/01/40 | 12/20 at 100.00 | | B | | 1,690,766 | |
| | 90 | | Cattaraugus County Industrial Development Agency, New York, Revenue Bonds, St. Bonaventure University, Series 2006, 5.000%, 5/01/23 | 5/16 at 100.00 | | BBB– | | 93,476 | |
| | 2,815 | | Dormitory Authority of the State of New York, General Revenue Bonds, Manhattan College, Series 2007A, 5.000%, 7/01/41 – RAAI Insured | 7/17 at 100.00 | | N/R | | 2,894,186 | |
| | 2,120 | | Dormitory Authority of the State of New York, General Revenue Bonds, New York University, Series 2001-1, 5.500%, 7/01/20 – AMBAC Insured | No Opt. Call | | AA– | | 2,556,487 | |
| | 870 | | Dormitory Authority of the State of New York, General Revenue Bonds, Saint Johns University, Series 2013A, 5.000%, 7/01/44 | 7/23 at 100.00 | | A– | | 958,305 | |
| | 1,000 | | Dormitory Authority of the State of New York, Housing Revenue Bonds, Fashion Institute of Technology, Series 2007, 5.250%, 7/01/29 – FGIC Insured | No Opt. Call | | AA– | | 1,166,860 | |
| | 1,215 | | Dormitory Authority of the State of New York, Lease Revenue Bonds, State University Dormitory Facilities, Series 2004A, 5.000%, 7/01/29 – NPFG Insured | 7/15 at 100.00 | | Aa2 | | 1,251,207 | |
| | 1,000 | | Dormitory Authority of the State of New York, Lease Revenue Bonds, State University Dormitory Facilities, Series 2012A, 5.000%, 7/01/37 | 7/22 at 100.00 | | Aa2 | | 1,123,770 | |
| | 2,615 | | Dormitory Authority of the State of New York, Lease Revenue Bonds, State University Dormitory Facilities, Series 2013A, 5.000%, 7/01/27 | 7/23 at 100.00 | | Aa3 | | 3,092,185 | |
| | Principal | | | Optional Call | | | | | |
| | Amount (000) | | Description (1) | Provisions (2) | | Ratings (3) | | Value | |
| | | | Education and Civic Organizations (continued) | | | | | | |
| $ | 2,500 | | Dormitory Authority of the State of New York, Revenue Bonds, Columbia University, Series 2011A, 5.000%, 10/01/41 | 4/21 at 100.00 | | AAA | $ | 2,864,900 | |
| | 2,100 | | Dormitory Authority of the State of New York, Revenue Bonds, Marymount Manhattan College, Series 2009, 5.250%, 7/01/29 | 7/19 at 100.00 | | Baa2 | | 2,209,221 | |
| | 875 | | Dormitory Authority of the State of New York, Revenue Bonds, New School University, Series 2010, 5.250%, 7/01/30 | 7/20 at 100.00 | | A– | | 972,169 | |
| | 5,000 | | Dormitory Authority of the State of New York, Revenue Bonds, New York University, Series 2007, 5.000%, 7/01/32 – AMBAC Insured | 7/17 at 100.00 | | AA– | | 5,510,750 | |
| | 290 | | Dormitory Authority of the State of New York, Revenue Bonds, New York University, Series 2009A, 5.000%, 7/01/39 | 7/19 at 100.00 | | AA– | | 330,101 | |
| | 7,000 | | Dormitory Authority of the State of New York, Revenue Bonds, Non State Supported Debt, Cornell University, Series 2010A, 5.000%, 7/01/40 | 7/20 at 100.00 | | Aa1 | | 7,933,590 | |
| | 640 | | Dormitory Authority of the State of New York, Revenue Bonds, St. Joseph’s College, Series 2010, 5.250%, 7/01/35 | 7/20 at 100.00 | | Baa3 | | 679,866 | |
| | 925 | | Dutchess County Industrial Development Agency, New York, Civic Facility Revenue Bonds, Bard College Project, Series 2007-A2, 4.500%, 8/01/36 | 8/17 at 100.00 | | Ba1 | | 901,089 | |
| | 3,880 | | Dutchess County Industrial Development Agency, New York, Civic Facility Revenue Bonds, Bard College Refunding, Series 2007-A1, 5.000%, 8/01/46 | 8/17 at 100.00 | | Ba1 | | 3,903,319 | |
| | 630 | | Hempstead Town Local Development Corporation, New York, Revenue Bonds, Adelphi University Project, Series 2013, 5.000%, 9/01/38 | 9/23 at 100.00 | | A | | 698,538 | |
| | 1,885 | | Hempstead Town Local Development Corporation, New York, Revenue Bonds, Molloy College Project, Series 2009, 5.750%, 7/01/39 | 7/19 at 100.00 | | BBB+ | | 2,043,755 | |
| | 1,260 | | Madison County Capital Resource Corporation, New York, Revenue Bonds, Colgate University Project, Series 2010A, 5.000%, 7/01/40 | 7/20 at 100.00 | | AA | | 1,402,393 | |
| | 580 | | New York City Industrial Development Agency, New York, Civic Facility Revenue Bonds, St. Francis College, Series 2004, 5.000%, 10/01/34 | 10/14 at 100.00 | | A– | | 580,690 | |
| | | | New York City Industrial Development Agency, New York, PILOT Revenue Bonds, Queens Baseball Stadium Project, Series 2006: | | | | | | |
| | 2,515 | | 5.000%, 1/01/39 – AMBAC Insured | 1/17 at 100.00 | | Ba1 | | 2,579,158 | |
| | 2,300 | | 4.750%, 1/01/42 – AMBAC Insured | 1/17 at 100.00 | | Ba1 | | 2,344,390 | |
| | 400 | | 5.000%, 1/01/46 – AMBAC Insured | 1/17 at 100.00 | | Ba1 | | 409,508 | |
| | | | New York City Industrial Development Authority, New York, PILOT Revenue Bonds, Yankee Stadium Project, Series 2006: | | | | | | |
| | 3,855 | | 4.500%, 3/01/39 – FGIC Insured | 9/16 at 100.00 | | BBB | | 3,899,757 | |
| | 1,000 | | 4.750%, 3/01/46 – NPFG Insured | 9/16 at 100.00 | | AA– | | 1,015,810 | |
| | 420 | | Seneca County Industrial Development Authority, New York, Revenue Bonds, New York Chiropractic College, Series 2007, 5.000%, 10/01/27 | 10/17 at 100.00 | | BBB | | 438,295 | |
| | 1,750 | | St. Lawrence County Industrial Development Agency Civic Development Corporation, New York, Revenue Bonds, Clarkson University Project, Series 2012A, 5.000%, 9/01/41 | 3/22 at 100.00 | | A3 | | 1,920,783 | |
| | 1,425 | | Troy Capital Resource Corporation, New York, Revenue Bonds, Rensselaer Polytechnic Institute, Series 2010A, 5.125%, 9/01/40 | 9/20 at 100.00 | | A– | | 1,548,989 | |
| | 660 | | Yonkers Industrial Development Agency, New York, Civic Facility Revenue Bonds, Sarah Lawrence College Project, Series 2001A Remarketed, 6.000%, 6/01/41 | 6/19 at 100.00 | | BBB | | 727,934 | |
| | 57,825 | | Total Education and Civic Organizations | | | | | 62,469,533 | |
| | | | Financials – 3.1% (2.1% of Total Investments) | | | | | | |
| | 3,380 | | New York Liberty Development Corporation, Revenue Bonds, Goldman Sachs Headquarters Issue, Series 2005, 5.250%, 10/01/35 | No Opt. Call | | A | | 4,011,249 | |
| | 2,740 | | New York Liberty Development Corporation, Revenue Bonds, Goldman Sachs Headquarters Issue, Series 2007, 5.500%, 10/01/37 | No Opt. Call | | A | | 3,361,377 | |
| | 6,120 | | Total Financials | | | | | 7,372,626 | |
| NNP | Nuveen New York Performance Plus Municipal Fund, Inc. | |
| | Portfolio of Investments (continued) | September 30, 2014 |
| | Principal | | | Optional Call | | | | | |
| | Amount (000) | | Description (1) | Provisions (2) | | Ratings (3) | | Value | |
| | | | Health Care – 12.6% (8.5% of Total Investments) | | | | | | |
| $ | 1,000 | | Dormitory Authority of the State of New York , Revenue Bonds, NYU Hospitals Center, Refunding Series 2007A, 5.000%, 7/01/36 | 7/17 at 100.00 | | A– | $ | 1,044,070 | |
| | 1,235 | | Dormitory Authority of the State of New York, FHA-Insured Mortgage Revenue Bonds, Montefiore Hospital, Series 2004, 5.000%, 8/01/29 – FGIC Insured | 2/15 at 100.00 | | AA– | | 1,251,166 | |
| | 1,700 | | Dormitory Authority of the State of New York, FHA-Insured Revenue Bonds, Montefiore Medical Center, Series 2005, 5.000%, 2/01/22 – FGIC Insured | 2/15 at 100.00 | | AA– | | 1,725,398 | |
| | 350 | | Dormitory Authority of the State of New York, Highland Hospital of Rochester Revenue Bonds, Series 2010, 5.000%, 7/01/26 | 7/20 at 100.00 | | A2 | | 392,021 | |
| | | | Dormitory Authority of the State of New York, Orange Regional Medical Center Obligated Group Revenue Bonds, Series 2008: | | | | | | |
| | 2,210 | | 6.500%, 12/01/21 | 12/18 at 100.00 | | Ba1 | | 2,468,194 | |
| | 1,205 | | 6.125%, 12/01/29 | 12/18 at 100.00 | | Ba1 | | 1,282,602 | |
| | 2,495 | | 6.250%, 12/01/37 | 12/18 at 100.00 | | Ba1 | | 2,633,423 | |
| | 5,590 | | Dormitory Authority of the State of New York, Revenue Bonds, Memorial Sloan Kettering Cancer Center, Series 2006, 5.000%, 7/01/35 (UB) | 7/16 at 100.00 | | AA | | 5,915,562 | |
| | 935 | | Dormitory Authority of the State of New York, Revenue Bonds, New York and Presbyterian Hospital, Series 2004A, 5.250%, 8/15/15 – AGM Insured | 2/15 at 100.00 | | AA | | 945,519 | |
| | 1,800 | | Dormitory Authority of the State of New York, Revenue Bonds, North Shore Long Island Jewish Obligated Group, Series 2005A, 5.000%, 11/01/34 | 11/16 at 100.00 | | A | | 1,872,414 | |
| | 3,750 | | Dormitory Authority of the State of New York, Revenue Bonds, NYU Hospitals Center, Series 2011A, 6.000%, 7/01/40 | 7/20 at 100.00 | | A– | | 4,230,263 | |
| | 500 | | Dutchess County Local Development Corporation, New York, Revenue Bonds, Health Quest System Inc, Series 2010A, 5.750%, 7/01/30 | 7/20 at 100.00 | | A– | | 566,200 | |
| | | | Madison County Industrial Development Agency, New York, Civic Facility Revenue Bonds, Oneida Health System, Series 2007A: | | | | | | |
| | 710 | | 5.250%, 2/01/27 | 2/17 at 100.00 | | BB+ | | 719,763 | |
| | 625 | | 5.500%, 2/01/32 | 2/17 at 100.00 | | BB+ | | 634,513 | |
| | 2,730 | | Suffolk County Economic Development Corporation, New York, Revenue Bonds, Catholic Health Services of Long Island Obligated Group Project, Refunding Series 2011, 5.000%, 7/01/28 | 7/21 at 100.00 | | BBB+ | | 2,991,425 | |
| | 1,100 | | Yonkers Industrial Development Agency, New York, Revenue Bonds, St. John’s Riverside Hospital, Series 2001A, 7.125%, 7/01/31 | 1/15 at 100.00 | | B+ | | 1,101,716 | |
| | 290 | | Yonkers Industrial Development Agency, New York, Revenue Bonds, St. John’s Riverside Hospital, Series 2001B, 7.125%, 7/01/31 | 1/15 at 100.00 | | B+ | | 290,452 | |
| | 28,225 | | Total Health Care | | | | | 30,064,701 | |
| | | | Housing/Multifamily – 2.6% (1.8% of Total Investments) | | | | | | |
| | 5 | | New York City Housing Development Corporation, New York, Multifamily Housing Revenue Bonds, Series 2002A, 5.500%, 11/01/34 (Alternative Minimum Tax) | 11/14 at 100.00 | | AA+ | | 5,018 | |
| | 345 | | New York City Housing Development Corporation, New York, Multifamily Housing Revenue Bonds, Series 2010D-1A, 5.000%, 11/01/42 | 5/20 at 100.00 | | AA+ | | 363,606 | |
| | 2,000 | | New York State Housing Finance Agency, Affordable Housing Revenue Bonds, Series 2007B, 5.300%,11/01/37 (Alternative Minimum Tax) | 11/17 at 100.00 | | Aa2 | | 2,063,560 | |
| | 2,000 | | New York State Housing Finance Agency, Affordable Housing Revenue Bonds, Series 2010A, 5.000%, 11/01/42 | 5/20 at 100.00 | | Aa2 | | 2,119,200 | |
| | 690 | | New York State Housing Finance Agency, Affordable Housing Revenue, Series 2007A, 5.250%,11/01/38 (Alternative Minimum Tax) | 11/17 at 100.00 | | Aa2 | | 708,326 | |
| | 970 | | New York State Housing Finance Agency, Secured Mortgage Program Multifamily Housing Revenue Bonds, Series 1999I, 6.200%, 2/15/20 (Alternative Minimum Tax) | 2/15 at 100.00 | | Aa1 | | 972,406 | |
| | 6,010 | | Total Housing/Multifamily | | | | | 6,232,116 | |
| | | | Housing/Single Family – 0.9% (0.6% of Total Investments) | | | | | | |
| | 2,230 | | New York State Mortgage Agency, Homeowner Mortgage Revenue Bonds, Series 130, 4.650%, 4/01/27 (Alternative Minimum Tax) | 4/15 at 100.00 | | Aa1 | | 2,241,507 | |
| | Principal | | | Optional Call | | | | | |
| | Amount (000) | | Description (1) | Provisions (2) | | Ratings (3) | | Value | |
| | | | Long-Term Care – 3.5% (2.4% of Total Investments) | | | | | | |
| $ | 1,070 | | Dormitory Authority of the State of New York, GNMA Collateralized Revenue Bonds, Cabrini of Westchester Project, Series 2006, 5.200%, 2/15/41 | 2/17 at 103.00 | | AA+ | $ | 1,133,151 | |
| | 645 | | Dormitory Authority of the State of New York, Non-State Supported Debt, Ozanam Hall of Queens Nursing Home Revenue Bonds, Series 2006, 5.000%, 11/01/31 | 11/16 at 100.00 | | B1 | | 621,993 | |
| | | | Dormitory Authority of the State of New York, Revenue Bonds, Providence Rest, Series 2005: | | | | | | |
| | 50 | | 5.125%, 7/01/30 – ACA Insured | 7/15 at 100.00 | | N/R | | 50,108 | |
| | 425 | | 5.000%, 7/01/35 – ACA Insured | 7/15 at 100.00 | | N/R | | 424,422 | |
| | 1,615 | | East Rochester Housing Authority, New York, Senior Living Revenue Bonds, Woodland Village Project, Series 2006, 5.500%, 8/01/33 | 8/16 at 101.00 | | N/R | | 1,630,972 | |
| | 1,295 | | Erie County Industrial Development Agency, New York, Revenue Bonds, Orchard Park CCRC Inc. Project, Series 2006A, 6.000%, 11/15/36 | 11/16 at 100.00 | | N/R | | 1,317,183 | |
| | 140 | | New York City Industrial Development Agency, New York, Civic Facility Revenue Bonds, Special Needs Facilities Pooled Program, Series 2000, 8.125%, 7/01/19 | 1/15 at 100.00 | | N/R | | 140,276 | |
| | 495 | | New York City Industrial Development Agency, New York, Civic Facility Revenue Bonds, Special Needs Facilities Pooled Program, Series 2001A-1, 7.250%, 7/01/16 | 1/15 at 100.00 | | N/R | | 496,995 | |
| | | | New York City Industrial Development Agency, New York, Civic Facility Revenue Bonds, Special Needs Facilities Pooled Program, Series 2008A-1: | | | | | | |
| | 1,525 | | 5.500%, 7/01/18 | 7/16 at 101.00 | | N/R | | 1,498,252 | |
| | 755 | | 5.800%, 7/01/23 | 7/16 at 101.00 | | N/R | | 734,305 | |
| | 340 | | Suffolk County Industrial Development Agency, New York, Civic Facility Revenue Bonds, Special Needs Facilities Pooled Program, Series 2008-B1, 5.800%, 7/01/23 | 7/16 at 101.00 | | N/R | | 341,727 | |
| | 8,355 | | Total Long-Term Care | | | | | 8,389,384 | |
| | | | Tax Obligation/General – 11.9% (8.1% of Total Investments) | | | | | | |
| | 10,000 | | New York City, New York, General Obligation Bonds, Fiscal 2007 Series D-1, 5.125%,12/01/26 (UB) | 12/17 at 100.00 | | AA | | 11,211,900 | |
| | 400 | | New York City, New York, General Obligation Bonds, Fiscal 2009 Series E, 5.000%, 8/01/28 | 8/19 at 100.00 | | AA | | 460,592 | |
| | 3,000 | | New York City, New York, General Obligation Bonds, Fiscal 2014 Series A-1, 5.000%, 8/01/26 | 8/23 at 100.00 | | AA | | 3,541,050 | |
| | 5,000 | | New York City, New York, General Obligation Bonds, Fiscal 2015 Series B, 5.000%, 8/01/30 | 8/24 at 100.00 | | AA | | 5,871,700 | |
| | 5 | | New York City, New York, General Obligation Bonds, Fiscal Series 2004C, 5.250%, 8/15/16 | 2/15 at 100.00 | | AA | | 5,021 | |
| | 50 | | New York City, New York, General Obligation Bonds, Fiscal Series 2005F-1, 5.000%, 9/01/19 – SYNCORA GTY Insured | 9/15 at 100.00 | | AA | | 52,200 | |
| | 20 | | New York City, New York, General Obligation Bonds, Fiscal Series 2006J-1, 5.000%, 6/01/25 (UB) | 6/16 at 100.00 | | AA | | 21,436 | |
| | 1,915 | | New York City, New York, General Obligation Bonds, Subseries G-1 Fiscal Series 2012, 5.000%, 4/01/28 | No Opt. Call | | AA | | 2,229,998 | |
| | 3,125 | | New York City, New York, General Obligation Bonds, Tender Option Bond Trust 3324, 18.395%, 3/01/21 (IF) (4) | No Opt. Call | | AA | | 4,967,625 | |
| | 23,515 | | Total Tax Obligation/General | | | | | 28,361,522 | |
| | | | Tax Obligation/Limited – 31.4% (21.3% of Total Investments) | | | | | | |
| | 1,000 | | Dormitory Authority of the State of New York, Revenue Bonds, Mental Health Services Facilities Improvements, Series 2005D-1, 5.000%, 8/15/23 – NPFG Insured | 2/15 at 100.00 | | AA | | 1,017,500 | |
| | 2,500 | | Dormitory Authority of the State of New York, Revenue Bonds, State University Educational Facilities, Series 1993A, 5.875%, 5/15/17 – FGIC Insured | No Opt. Call | | AA | | 2,745,400 | |
| | 980 | | Dormitory Authority of the State of New York, State Personal Income Tax Revenue Bonds, General Purpose Series 2011C, 5.000%, 3/15/41 | 3/21 at 100.00 | | AAA | | 1,082,479 | |
| | 1,000 | | Dormitory Authority of the State of New York, State Personal Income Tax Revenue Bonds, General Purpose Series 2012D, 5.000%, 2/15/33 | No Opt. Call | | AAA | | 1,133,180 | |
| | 2,580 | | Dormitory Authority of the State of New York, State Personal Income Tax Revenue Bonds, General Purpose Series 2014C. Group C, 5.000%, 3/15/44 | 3/24 at 100.00 | | AAA | | 2,912,562 | |
| | 4,700 | | Hudson Yards Infrastructure Corporation, New York, Revenue Bonds, Senior Fiscal 2012 Series 2011A, 5.750%, 2/15/47 | 2/21 at 100.00 | | A | | 5,430,709 | |
| NNP | Nuveen New York Performance Plus Municipal Fund, Inc. | |
| | Portfolio of Investments (continued) | September 30, 2014 |
| | Principal | | | Optional Call | | | | | |
| | Amount (000) | | Description (1) | Provisions (2) | | Ratings (3) | | Value | |
| | | | Tax Obligation/Limited (continued) | | | | | | |
| $ | 500 | | Hudson Yards Infrastructure Corporation, New York, Revenue Bonds, Series 2006A, 5.000%, 2/15/47 | 2/17 at 100.00 | | A | $ | 529,790 | |
| | 2,175 | | Metropolitan Transportation Authority, New York, State Service Contract Refunding Bonds, Series 2002A, 5.750%, 7/01/18 | No Opt. Call | | AA | | 2,554,994 | |
| | 1,680 | | Monroe Newpower Corporation, New York, Power Facilities Revenue Bonds, Series 2003, 5.500%, 1/01/34 | 1/15 at 100.00 | | A– | | 1,683,864 | |
| | 3,100 | | New York City Transitional Finance Authority, New York, Building Aid Revenue Bonds, Fiscal Series 2007S-2, 5.000%, 1/15/28 – FGIC Insured | 1/17 at 100.00 | | Aa2 | | 3,352,929 | |
| | 1,870 | | New York City Transitional Finance Authority, New York, Building Aid Revenue Bonds, Fiscal Series 2013S-1, 5.000%, 7/15/31 | No Opt. Call | | Aa2 | | 2,148,368 | |
| | 1,915 | | New York City Transitional Finance Authority, New York, Future Tax Secured Bonds, Subordinate Fiscal 2012 Series E-1, 5.000%, 2/01/37 | 2/22 at 100.00 | | AAA | | 2,160,752 | |
| | 1,570 | | New York City Transitional Finance Authority, New York, Future Tax Secured Bonds, Subordinate Fiscal 2013 Series F-1, 5.000%, 2/01/29 | No Opt. Call | | AAA | | 1,823,257 | |
| | 3,900 | | New York City Transitional Finance Authority, New York, Future Tax Secured Bonds, Subordinate Fiscal 2013 Series I, 5.000%, 5/01/38 | 5/23 at 100.00 | | AAA | | 4,406,103 | |
| | 2,600 | | New York City Transitional Finance Authority, New York, Future Tax Secured Bonds, Subordinate Fiscal 2014 Series D-1, 5.000%, 2/01/35 | 2/24 at 100.00 | | AAA | | 2,982,928 | |
| | 2,400 | | New York City Transitional Finance Authority, New York, Future Tax Secured Bonds, Tender Option Bond Trust 3545, 13.963%, 5/01/32 (IF) | 5/19 at 100.00 | | AAA | | 3,331,992 | |
| | 2,500 | | New York City Transitional Finance Authority, New York, Future Tax Secured Revenue Bonds, Subordinate Lien Series 2011C, 5.500%, 11/01/35 | 11/20 at 100.00 | | AAA | | 2,976,050 | |
| | 2,800 | | New York City Transitional Finance Authority, New York, Future Tax Secured Revenue Bonds, Subordinate Series 2011-D1, 5.000%, 2/01/28 | No Opt. Call | | AAA | | 3,265,192 | |
| | 1,000 | | New York City, New York, Educational Construction Fund, Revenue Bonds, Series 2011A, 5.750%, 4/01/41 | 4/21 at 100.00 | | AA– | | 1,195,800 | |
| | 5,000 | | New York State Environmental Facilities Corporation, State Personal Income Tax Revenue Bonds, Series 2008A, 5.000%, 12/15/27 (UB) | 12/17 at 100.00 | | AAA | | 5,563,000 | |
| | 1,855 | | New York State Housing Finance Agency, State Personal Income Tax Revenue Bonds, Economic Development and Housing, Series 2006A, 5.000%, 3/15/36 | 9/15 at 100.00 | | AAA | | 1,929,831 | |
| | 865 | | New York State Thruway Authority, Highway and Bridge Trust Fund Bonds, Second General, Series 2005B, 5.000%, 4/01/21 – AMBAC Insured | 10/15 at 100.00 | | AA+ | | 906,373 | |
| | 2,800 | | New York State Thruway Authority, Highway and Bridge Trust Fund Bonds, Series 2007, 5.000%, 4/01/27 | 10/17 at 100.00 | | AA+ | | 3,087,840 | |
| | 5,600 | | New York State Thruway Authority, Highway and Bridge Trust Fund Bonds, Series 2005B, 5.500%,4/01/20 – AMBAC Insured (UB) (4) | No Opt. Call | | AA+ | | 6,790,504 | |
| | 1,600 | | New York State Thruway Authority, State Personal Income Tax Revenue Bonds, Series 2010A, 5.000%, 3/15/29 | 9/20 at 100.00 | | AAA | | 1,870,992 | |
| | 1,045 | | New York State Urban Development Corporation, State Personal Income Tax Revenue Bonds, Series 2005B, 5.000%, 3/15/30 – AGM Insured | 3/15 at 100.00 | | AAA | | 1,066,569 | |
| | | | Puerto Rico Sales Tax Financing Corporation, Sales Tax Revenue Bonds, Series 2007A: | | | | | | |
| | 16,000 | | 0.000%, 8/01/43 – NPFG Insured | No Opt. Call | | AA– | | 2,543,680 | |
| | 11,250 | | 0.000%, 8/01/45 – NPFG Insured | No Opt. Call | | AA– | | 1,574,438 | |
| | 2,505 | | Sales Tax Asset Receivable Corporation of New York City, New York, Sales Tax Asset Revenue Bonds, Fiscal 2015 Series A, 5.000%, 10/15/29 (WI/DD, Settling 10/15/14) | 10/24 at 100.00 | | AAA | | 3,039,467 | |
| | 89,290 | | Total Tax Obligation/Limited | | | | | 75,106,543 | |
| | | | Transportation – 11.9% (8.1% of Total Investments) | | | | | | |
| | 2,000 | | Metropolitan Transportation Authority, New York, Transportation Revenue Bonds, Series 2010D, 5.000%, 11/15/34 | 11/20 at 100.00 | | AA– | | 2,205,160 | |
| | 2,000 | | New York City Industrial Development Agency, New York, Civic Facility Revenue Bonds, Bronx Parking Development Company, LLC Project, Series 2007, 5.875%, 10/01/46 (5) | 10/17 at 102.00 | | N/R | | 740,000 | |
| | Principal | | | Optional Call | | | | | |
| | Amount (000) | | Description (1) | Provisions (2) | | Ratings (3) | | Value | |
| | | | Transportation (continued) | | | | | | |
| $ | 2,585 | | New York City Industrial Development Agency, New York, Special Facilities Revenue Bonds, British Airways PLC, Series 1998, 5.250%, 12/01/32 (Alternative Minimum Tax) | 12/14 at 100.00 | | BB | $ | 2,584,974 | |
| | 1,550 | | New York City Industrial Development Agency, New York, Special Facilities Revenue Bonds, Terminal One Group JFK Project, Series 2005, 5.500%, 1/01/24 (Alternative Minimum Tax) | 1/16 at 100.00 | | A3 | | 1,633,700 | |
| | 1,420 | | New York Liberty Development Corporation, Liberty Revenue Bonds, 4 World Trade Center Project, Series 2011, 5.000%, 11/15/44 | 11/21 at 100.00 | | A+ | | 1,560,282 | |
| | 70 | | New York State Thruway Authority, General Revenue Bonds, Series 2005F, 5.000%, 1/01/30 – AMBAC Insured | 1/15 at 100.00 | | A | | 70,701 | |
| | 1,100 | | New York State Thruway Authority, General Revenue Bonds, Series 2005G, 5.000%, 1/01/30 – AGM Insured | 7/15 at 100.00 | | AA | | 1,134,430 | |
| | 6,000 | | Port Authority of New York and New Jersey, Consolidated Revenue Bonds, One Hundred Eighty-Forth Series 2014, 5.000%, 9/01/33 | 9/24 at 100.00 | | AA– | | 7,042,500 | |
| | | | Port Authority of New York and New Jersey, Consolidated Revenue Bonds, One Hundred Fortieth Series 2005: | | | | | | |
| | 2,300 | | 5.000%, 12/01/28 – SYNCORA GTY Insured | 6/15 at 101.00 | | AA– | | 2,386,319 | |
| | 1,080 | | 5.000%, 12/01/31 – SYNCORA GTY Insured | 6/15 at 101.00 | | AA– | | 1,120,435 | |
| | 770 | | Port Authority of New York and New Jersey, Consolidated Revenue Bonds, One Hundred Forty Eighth Series 2008, Trust 2920, 17.814%, 8/15/32 – AGM Insured (IF) | 8/17 at 100.00 | | AA | | 1,088,256 | |
| | 1,000 | | Port Authority of New York and New Jersey, Consolidated Revenue Bonds, One Hundred Sixty Sixth Series 2011, 5.000%, 1/15/41 | 1/21 at 100.00 | | AA– | | 1,119,630 | |
| | | | Port Authority of New York and New Jersey, Special Project Bonds, JFK International Air Terminal LLC Project, Eighth Series 2010: | | | | | | |
| | 520 | | 6.500%, 12/01/28 | 12/15 at 100.00 | | BBB | | 551,564 | |
| | 2,500 | | 6.000%, 12/01/36 | 12/20 at 100.00 | | BBB | | 2,913,300 | |
| | 1,750 | | Triborough Bridge and Tunnel Authority, New York, Subordinate Lien General Purpose Revenue Refunding Bonds, Tender Option Bond Trust 1184, 9.241%, 5/15/16 (IF) | No Opt. Call | | AA– | | 2,254,420 | |
| | 26,645 | | Total Transportation | | | | | 28,405,671 | |
| | | | U.S. Guaranteed – 18.7% (12.7% of Total Investments) (6) | | | | | | |
| | 8,500 | | Dormitory Authority of the State of New York, FHA-Insured Revenue Bonds, St. Luke’s Roosevelt Hospital, Series 2005, 4.900%, 8/15/31 (Pre-refunded 8/15/15) | 8/15 at 100.00 | | N/R (6) | | 8,855,639 | |
| | | | Dormitory Authority of the State of New York, State Personal Income Tax Revenue Bonds, Series 2005F: | | | | | | |
| | 655 | | 5.000%, 3/15/21 (Pre-refunded 3/15/15) – AGM Insured | 3/15 at 100.00 | | Aa1 (6) | | 669,724 | |
| | 35 | | 5.000%, 3/15/21 (Pre-refunded 3/15/15) – AGM Insured | 3/15 at 100.00 | | AAA | | 35,787 | |
| | 635 | | Hempstead Town Industrial Development Agency, New York, Revenue Bonds, Adelphi University, Civic Facility Project, Series 2005, 5.000%, 10/01/35 (Pre-refunded 10/01/15) | 10/15 at 100.00 | | A (6) | | 666,013 | |
| | 5,000 | | Metropolitan Transportation Authority, New York, Dedicated Tax Fund Bonds, Series 1998A, 4.500%, 4/01/18 (Pre-refunded 10/01/15) – FGIC Insured | 10/15 at 100.00 | | AA+ (6) | | 5,219,150 | |
| | 4,530 | | New York City Housing Development Corporation, New York, Capital Fund Program Revenue Bonds, New York Housing Authority Program, Series 2005A, 5.000%, 7/01/25 (Pre-refunded 7/01/15) – NPFG Insured (UB) (4) | 7/15 at 100.00 | | AA+ (6) | | 4,696,795 | |
| | | | New York City, New York, General Obligation Bonds, Fiscal Series 2004E: | | | | | | |
| | 925 | | 5.000%, 11/01/19 (Pre-refunded 11/01/14) – AGM Insured | 11/14 at 100.00 | | AA (6) | | 928,885 | |
| | 1,575 | | 5.000%, 11/01/19 (Pre-refunded 11/01/14) – AGM Insured | 11/14 at 100.00 | | AA (6) | | 1,581,473 | |
| | 2,950 | | New York City, New York, General Obligation Bonds, Fiscal Series 2005F-1, 5.000%, 9/01/19 (Pre-refunded 9/01/15) – SYNCORA GTY Insured | 9/15 at 100.00 | | Aa2 (6) | | 3,082,278 | |
| | 6,380 | | New York City, New York, General Obligation Bonds, Fiscal Series 2006J-1, 5.000%, 6/01/25 (Pre-refunded 6/01/16) (UB) | 6/16 at 100.00 | | N/R (6) | | 6,881,532 | |
| | 175 | | New York State Housing Finance Agency, State Personal Income Tax Revenue Bonds, Economic Development and Housing, Series 2006A, 5.000%, 3/15/36 (Pre-refunded 9/15/15) | 9/15 at 100.00 | | N/R (6) | | 183,174 | |
| | 145 | | New York State Thruway Authority, General Revenue Bonds, Series 2005F, 5.000%, 1/01/30 (Pre-refunded 1/01/15) – AMBAC Insured | 1/15 at 100.00 | | A2 (6) | | 146,801 | |
| NNP | Nuveen New York Performance Plus Municipal Fund, Inc. | |
| | Portfolio of Investments (continued) | September 30, 2014 |
| | Principal | | | Optional Call | | | | | |
| | Amount (000) | | Description (1) | Provisions (2) | | Ratings (3) | | Value | |
| | | | U.S. Guaranteed (6) (continued) | | | | | | |
| $ | 135 | | New York State Thruway Authority, Highway and Bridge Trust Fund Bonds, Second General, Series 2005B, 5.000%, 4/01/21 (Pre-refunded 10/01/15) – AMBAC Insured | 10/15 at 100.00 | | N/R (6) | $ | 141,593 | |
| | 255 | | New York State Urban Development Corporation, State Personal Income Tax Revenue Bonds, Series 2005B, 5.000%, 3/15/30 (Pre-refunded 3/15/15) – AGM Insured | 3/15 at 100.00 | | Aa1 (6) | | 260,732 | |
| | 1,600 | | Triborough Bridge and Tunnel Authority, New York, General Purpose Revenue Bonds, Series 1993B, 5.000%, 1/01/20 (ETM) | No Opt. Call | | AA+ (6) | | 1,849,056 | |
| | 7,500 | | Triborough Bridge and Tunnel Authority, New York, General Purpose Revenue Bonds, Series 1999B, 5.500%, 1/01/30 (Pre-refunded 1/01/22) | 1/22 at 100.00 | | AA+ (6) | | 9,393,150 | |
| | 40,995 | | Total U.S. Guaranteed | | | | | 44,591,782 | |
| | | | Utilities – 14.1% (9.5% of Total Investments) | | | | | | |
| | 2,200 | | Chautauqua County Industrial Development Agency, New York, Exempt Facility Revenue Bonds, NRG Dunkirk Power Project, Series 2009, 5.875%, 4/01/42 | 2/20 at 100.00 | | Baa3 | | 2,406,140 | |
| | 185 | | Guam Power Authority, Revenue Bonds, Series 2012A, 5.000%, 10/01/34 | 10/22 at 100.00 | | BBB | | 204,292 | |
| | | | Long Island Power Authority, New York, Electric System General Revenue Bonds, Series 2006A: | | | | | | |
| | 3,100 | | 5.000%, 12/01/23 – FGIC Insured | 6/16 at 100.00 | | AA– | | 3,313,681 | |
| | 3,100 | | 5.000%, 12/01/24 – FGIC Insured | 6/16 at 100.00 | | AA– | | 3,309,931 | |
| | 3,380 | | Long Island Power Authority, New York, Electric System Revenue Bonds, Series 2011A, 5.000%, 5/01/38 | 5/21 at 100.00 | | A– | | 3,695,591 | |
| | 2,300 | | Nassau County Industrial Development Authority, New York, Keyspan Glenwood Energy Project, Series 2003, 5.250%, 6/01/27 (Alternative Minimum Tax) | 12/14 at 100.00 | | A– | | 2,308,832 | |
| | 5,325 | | Niagara Area Development Corporation, New York, Solid Waste Disposal Facility Revenue Refunding Bonds, Covanta Energy Project, Series 2012A, 5.250%, 11/01/42 | No Opt. Call | | BB+ | | 5,453,279 | |
| | 820 | | Power Authority of the State of New York, General Revenue Bonds, Series 2006A, 5.000%,11/15/19 – FGIC Insured | 11/15 at 100.00 | | Aa2 | | 864,395 | |
| | 3,720 | | Suffolk County Industrial Development Agency, New York, Revenue Bonds, Nissequogue Cogeneration Partners Facility, Series 1998, 5.500%, 1/01/23 (Alternative Minimum Tax) | 1/15 at 100.00 | | N/R | | 3,720,037 | |
| | | | Utility Debt Securitization Authority, New York, Restructuring Bonds, Series 2013TE: | | | | | | |
| | 3,800 | | 5.000%, 12/15/33 | 12/23 at 100.00 | | AAA | | 4,452,422 | |
| | 1,060 | | 5.000%, 12/15/34 | 12/23 at 100.00 | | AAA | | 1,238,250 | |
| | 2,335 | | 5.000%, 12/15/41 | 12/23 at 100.00 | | AAA | | 2,676,844 | |
| | 31,325 | | Total Utilities | | | | | 33,643,694 | |
| | | | Water and Sewer – 6.1% (4.1% of Total Investments) | | | | | | |
| | 1,995 | | Guam Government Waterworks Authority, Water and Wastewater System Revenue Bonds, Series 2010, 5.625%, 7/01/40 | 7/20 at 100.00 | | A– | | 2,183,049 | |
| | 4,140 | | New York City Municipal Water Finance Authority, New York, Water and Sewer System Revenue Bonds, Second Generation Resolution, Fiscal 2012 Series BB, 5.000%, 6/15/44 | 12/21 at 100.00 | | AA+ | | 4,564,267 | |
| | 3,000 | | New York City Municipal Water Finance Authority, New York, Water and Sewer System Second General Resolution Revenue Bonds, Fiscal Series 2014DD, 5.000%, 6/15/35 | 6/24 at 100.00 | | AA+ | | 3,470,490 | |
| | 3,840 | | New York State Environmental Facilities Corporation, Revenue Bonds, State Revolving Funds Master Financing, Series 2010C, 5.000%, 10/15/35 | 4/20 at 100.00 | | AAA | | 4,368,653 | |
| | 12,975 | | Total Water and Sewer | | | | | 14,586,459 | |
| $ | 342,245 | | Total Municipal Bonds (cost $326,544,564) | | | | | 349,531,143 | |
| Shares | | Description (1) | | Value | |
| | | COMMON STOCKS – 1.2% (0.8% of Total Investments) | | | |
| | | Airlines – 1.2% (0.8% of Total Investments) | | | |
| 78,264 | | American Airlines Group Inc., (7) | $ | 2,776,807 | |
| | | Total Common Stocks (cost $2,431,776) | | 2,776,807 | |
| | | Total Long-Term Investments (cost $328,976,340) | | 352,307,950 | |
| | | Floating Rate Obligations – (10.7)% | | (25,625,000 | ) |
| | | Variable Rate Demand Preferred Shares, at Liquidation Value – (37.3)% (8) | | (89,000,000 | ) |
| | | Other Assets Less Liabilities – 0.4% | | 1,039,154 | |
| | | Net Assets Applicable to Common Shares – 100% | $ | 238,722,104 | |
| (1) | All percentages shown in the Portfolio of Investments are based on net assets applicable to common shares unless otherwise noted. |
| (2) | Optional Call Provisions (not covered by the report of independent registered public accounting firm): Dates (month and year) and prices of the earliest optional call or redemption. There may be other call provisions at varying prices at later dates. Certain mortgage-backed securities may be subject to periodic principal paydowns. |
| (3) | Ratings (not covered by the report of independent registered public accounting firm): Using the highest of Standard & Poor’s Group (“Standard & Poor’s”), Moody’s Investors Service, Inc. (“Moody’s”) or Fitch, Inc. (“Fitch”) rating. Ratings below BBB by Standard & Poor’s, Baa by Moody’s or BBB by Fitch are considered to be below investment grade. Holdings designated N/R are not rated by any of these national rating agencies. |
| (4) | Investment, or portion of investment, has been pledged to collateralize the net payment obligations for investments in inverse floating rate transactions. |
| (5) | On April 1, 2013, the Fund’s Adviser determined it was unlikely that this borrower would fulfill its entire obligation on this security, and therefore reduced the security’s interest rate of accrual from 5.875% to 2.350%. |
| (6) | Backed by an escrow or trust containing sufficient U.S. Government or U.S. Government agency securities, which ensure the timely payment of principal and interest. Certain bonds backed by U.S. Government or agency securities are regarded as having an implied rating equal to the rating of such securities. |
| (7) | On November 28, 2011, AMR Corp. (“AMR”), the parent company of American Airlines Group, Inc. (“AAL”) filed for federal bankruptcy protection. On December 9, 2013, AMR emerged from federal bankruptcy with the acceptance of its reorganization plan by the bankruptcy court. Under the settlement agreement established to meet AMR’s unsecured bond obligations, the bondholders, including the Fund, received a distribution of AAL preferred stock which was converted to AAL common stock over a 120- day period. Every 30 days, a quarter of the preferred stock was converted to AAL common stock based on the 5-day volume-weighted average price and the amount of preferred shares tendered during the optional preferred conversion period. |
| (8) | Variable Rate Demand Preferred Shares, at Liquidation Value, as a percentage of Total Investments is 25.3%. |
| (ETM) | Escrowed to maturity. |
| WI/DD | Investment, or portion of investment, purchased on a when-issued or delayed delivery basis. |
| (IF) | Inverse floating rate investment. |
| (UB) | Underlying bond of an inverse floating rate trust reflected as a financing transaction. See Notes to Financial Statements, Note 3 – Portfolio Securities and Investments in Derivatives, Inverse Floating Rate Securities for more information. |
See accompanying notes to financial statements.
| NAN | | |
| | Nuveen New York Dividend Advantage Municipal Fund |
| | Portfolio of Investments | September 30, 2014 |
| | Principal | | | Optional Call | | | | | |
| | Amount (000) | | Description (1) | Provisions (2) | | Ratings (3) | | Value | |
| | | | LONG-TERM INVESTMENTS 147.1% (100.0% of Total Investments) | | | | | | |
| | | | MUNICIPAL BONDS – 147.1% (100.0% of Total Investments) | | | | | | |
| | | | Consumer Discretionary – 3.2% (2.1% of Total Investments) | | | | | | |
| $ | 950 | | New York City Industrial Development Agency, New York, Liberty Revenue Bonds, IAC/InterActiveCorp, Series 2005, 5.000%, 9/01/35 | 9/15 at 100.00 | | BBB | $ | 969,361 | |
| | 3,350 | | Seneca Nation of Indians Capital Improvements Authority, New York, Special Obligation Bonds, Series 2007A, 5.000%, 12/01/23 | 6/17 at 100.00 | | BB | | 3,513,480 | |
| | 4,300 | | Total Consumer Discretionary | | | | | 4,482,841 | |
| | | | Consumer Staples – 3.0% (2.0% of Total Investments) | | | | | | |
| | 700 | | Nassau County Tobacco Settlement Corporation, New York, Tobacco Settlement Asset-Backed Bonds, Series 2006A-3, 5.000%, 6/01/35 | 6/16 at 100.00 | | B | | 583,828 | |
| | 120 | | New York Counties Tobacco Trust II, Tobacco Settlement Pass-Through Bonds, Series 2001, 5.250%, 6/01/25 | 12/14 at 100.00 | | A1 | | 119,989 | |
| | 50 | | Rensselaer Tobacco Asset Securitization Corporation, New York, Tobacco Settlement Asset-Backed Bonds, Series 2001A, 5.200%, 6/01/25 | 12/14 at 100.00 | | A1 | | 48,511 | |
| | | | TSASC Inc., New York, Tobacco Asset-Backed Bonds, Series 2006: | | | | | | |
| | 625 | | 4.750%, 6/01/22 | 6/16 at 100.00 | | BBB– | | 620,919 | |
| | 2,625 | | 5.000%, 6/01/26 | 6/16 at 100.00 | | BB– | | 2,573,025 | |
| | 315 | | 5.125%, 6/01/42 | 6/16 at 100.00 | | B | | 256,045 | |
| | 4,435 | | Total Consumer Staples | | | | | 4,202,317 | |
| | | | Education and Civic Organizations – 19.1% (13.0% of Total Investments) | | | | | | |
| | 380 | | Albany Industrial Development Agency, New York, Revenue Bonds, Albany Law School, Series 2007A, 5.000%, 7/01/31 | 7/17 at 100.00 | | BBB | | 393,045 | |
| | 550 | | Albany Industrial Development Agency, New York, Revenue Bonds, Brighter Choice Charter Schools, Series 2007A, 5.000%, 4/01/37 | 4/17 at 100.00 | | BB+ | | 544,869 | |
| | 1,725 | | Brooklyn Arena Local Development Corporation, New York, Payment in Lieu of Taxes Revenue Bonds, Barclays Center Project, Series 2009, 6.250%, 7/15/40 | 1/20 at 100.00 | | BBB– | | 1,952,683 | |
| | 965 | | Buffalo and Erie County Industrial Land Development Corporation, New York, Revenue Bonds, Enterprise Charter School Project, Series 2011A, 7.500%, 12/01/40 | 12/20 at 100.00 | | B | | 1,000,975 | |
| | 120 | | Cattaraugus County Industrial Development Agency, New York, Revenue Bonds, St. Bonaventure University, Series 2006, 5.000%, 5/01/23 | 5/16 at 100.00 | | BBB– | | 124,634 | |
| | 1,635 | | Dormitory Authority of the State of New York, General Revenue Bonds, Manhattan College, Series 2007A, 5.000%, 7/01/41 – RAAI Insured | 7/17 at 100.00 | | N/R | | 1,680,993 | |
| | 525 | | Dormitory Authority of the State of New York, General Revenue Bonds, Saint Johns University, Series 2013A, 5.000%, 7/01/44 | 7/23 at 100.00 | | A– | | 578,288 | |
| | 705 | | Dormitory Authority of the State of New York, Lease Revenue Bonds, State University Dormitory Facilities, Series 2004A, 5.000%, 7/01/29 – NPFG Insured | 7/15 at 100.00 | | Aa2 | | 726,009 | |
| | 1,300 | | Dormitory Authority of the State of New York, Lease Revenue Bonds, State University Dormitory Facilities, Series 2013A, 5.000%, 7/01/27 | 7/23 at 100.00 | | Aa3 | | 1,537,224 | |
| | 700 | | Dormitory Authority of the State of New York, Revenue Bonds, New School University, Series 2010, 5.250%, 7/01/30 | 7/20 at 100.00 | | A– | | 777,735 | |
| | 1,000 | | Dormitory Authority of the State of New York, Revenue Bonds, Non State Supported Debt, Cornell University, Series 2010A, 5.000%, 7/01/40 | 7/20 at 100.00 | | Aa1 | | 1,133,370 | |
| | 680 | | Dormitory Authority of the State of New York, Revenue Bonds, St. Joseph’s College, Series 2010, 5.250%, 7/01/35 | 7/20 at 100.00 | | Baa3 | | 722,357 | |
| | 1,630 | | Dutchess County Industrial Development Agency, New York, Civic Facility Revenue Bonds, Bard College Project, Series 2007-A2, 4.500%, 8/01/36 | 8/17 at 100.00 | | Ba1 | | 1,587,865 | |
| | 1,300 | | Dutchess County Industrial Development Agency, New York, Civic Facility Revenue Bonds, Bard College Refunding, Series 2007-A1, 5.000%, 8/01/46 | 8/17 at 100.00 | | Ba1 | | 1,307,813 | |
| | Principal | | | Optional Call | | | | | |
| | Amount (000) | | Description (1) | Provisions (2) | | Ratings (3) | | Value | |
| | | | Education and Civic Organizations (continued) | | | | | | |
| $ | 250 | | Hempstead Town Local Development Corporation, New York, Revenue Bonds, Adelphi University Project, Series 2009B, 5.250%, 2/01/39 | 2/19 at 100.00 | | A | $ | 268,123 | |
| | 375 | | Hempstead Town Local Development Corporation, New York, Revenue Bonds, Adelphi University Project, Series 2013, 5.000%, 9/01/38 | 9/23 at 100.00 | | A | | 415,796 | |
| | 1,085 | | Hempstead Town Local Development Corporation, New York, Revenue Bonds, Molloy College Project, Series 2009, 5.750%, 7/01/39 | 7/19 at 100.00 | | BBB+ | | 1,176,379 | |
| | 330 | | New York City Industrial Development Agency, New York, Civic Facility Revenue Bonds, St. Francis College, Series 2004, 5.000%, 10/01/34 | 10/14 at 100.00 | | A– | | 330,393 | |
| | | | New York City Industrial Development Agency, New York, PILOT Revenue Bonds, Queens Baseball Stadium Project, Series 2006: | | | | | | |
| | 160 | | 5.000%, 1/01/36 – AMBAC Insured | 1/17 at 100.00 | | Ba1 | | 164,221 | |
| | 1,000 | | 5.000%, 1/01/39 – AMBAC Insured | 1/17 at 100.00 | | Ba1 | | 1,025,510 | |
| | 1,630 | | 4.750%, 1/01/42 – AMBAC Insured | 1/17 at 100.00 | | Ba1 | | 1,661,459 | |
| | | | New York City Industrial Development Authority, New York, PILOT Revenue Bonds, Yankee Stadium Project, Series 2006: | | | | | | |
| | 2,240 | | 4.500%, 3/01/39 – FGIC Insured | 9/16 at 100.00 | | BBB | | 2,266,006 | |
| | 1,000 | | 4.750%, 3/01/46 – NPFG Insured | 9/16 at 100.00 | | AA– | | 1,015,810 | |
| | 1,000 | | New York City Trust for Cultural Resources, New York, Revenue Bonds, Whitney Museum of American Art, Series 2011, 5.000%, 7/01/31 | 1/21 at 100.00 | | A | | 1,117,140 | |
| | 1,500 | | New York City Trust for Cultural Resources, New York, Revenue Bonds, Wildlife Conservation Society, Series 2013A, 5.000%, 8/01/33 | 8/23 at 100.00 | | AA– | | 1,711,905 | |
| | 245 | | Seneca County Industrial Development Authority, New York, Revenue Bonds, New York Chiropractic College, Series 2007, 5.000%, 10/01/27 | 10/17 at 100.00 | | BBB | | 255,672 | |
| | 1,050 | | St. Lawrence County Industrial Development Agency Civic Development Corporation, New York, Revenue Bonds, Clarkson University Project, Series 2012A, 5.250%, 9/01/33 | 3/22 at 100.00 | | A3 | | 1,184,117 | |
| | 535 | | Troy Capital Resource Corporation, New York, Revenue Bonds, Rensselaer Polytechnic Institute, Series 2010A, 5.125%, 9/01/40 | 9/20 at 100.00 | | A– | | 581,550 | |
| | 25,615 | | Total Education and Civic Organizations | | | | | 27,241,941 | |
| | | | Financials – 3.1% (2.1% of Total Investments) | | | | | | |
| | 1,345 | | New York Liberty Development Corporation, Revenue Bonds, Goldman Sachs Headquarters Issue, Series 2005, 5.250%, 10/01/35 | No Opt. Call | | A | | 1,596,192 | |
| | 2,340 | | New York Liberty Development Corporation, Revenue Bonds, Goldman Sachs Headquarters Issue, Series 2007, 5.500%, 10/01/37 | No Opt. Call | | A | | 2,870,665 | |
| | 3,685 | | Total Financials | | | | | 4,466,857 | |
| | | | Health Care – 13.5% (9.2% of Total Investments) | | | | | | |
| | 625 | | Dormitory Authority of the State of New York, FHA-Insured Mortgage Revenue Bonds, Montefiore Hospital, Series 2004, 5.000%, 8/01/29 – FGIC Insured | 2/15 at 100.00 | | AA– | | 633,181 | |
| | 200 | | Dormitory Authority of the State of New York, Highland Hospital of Rochester Revenue Bonds, Series 2010, 5.200%, 7/01/32 | 7/20 at 100.00 | | A2 | | 217,262 | |
| | 1,000 | | Dormitory Authority of the State of New York, North Shore Long Island Jewish Obligated Group Revenue Bonds, Series 2011A, 5.000%, 5/01/41 | 5/21 at 100.00 | | A | | 1,081,410 | |
| | | | Dormitory Authority of the State of New York, Orange Regional Medical Center Obligated Group Revenue Bonds, Series 2008: | | | | | | |
| | 1,480 | | 6.500%, 12/01/21 | 12/18 at 100.00 | | Ba1 | | 1,652,908 | |
| | 710 | | 6.125%, 12/01/29 | 12/18 at 100.00 | | Ba1 | | 755,724 | |
| | 1,320 | | 6.250%, 12/01/37 | 12/18 at 100.00 | | Ba1 | | 1,393,234 | |
| | 3,160 | | Dormitory Authority of the State of New York, Revenue Bonds, Memorial Sloan Kettering Cancer Center, Series 2006, 5.000%, 7/01/35 (UB) | 7/16 at 100.00 | | AA | | 3,344,038 | |
| | 455 | | Dormitory Authority of the State of New York, Revenue Bonds, New York and Presbyterian Hospital, Series 2004A, 5.250%, 8/15/15 – AGM Insured | 2/15 at 100.00 | | AA | | 460,119 | |
| | 1,000 | | Dormitory Authority of the State of New York, Revenue Bonds, North Shore Long Island Jewish Obligated Group, Series 2005A, 5.000%, 11/01/34 | 11/16 at 100.00 | | A | | 1,040,230 | |
| | 2,000 | | Dormitory Authority of the State of New York, Revenue Bonds, NYU Hospitals Center, Series 2007B, 5.625%, 7/01/37 | 7/17 at 100.00 | | A– | | 2,186,700 | |
| NAN | Nuveen New York Dividend Advantage Municipal Fund | |
| | Portfolio of Investments (continued) | September 30, 2014 |
| | Principal | | | Optional Call | | | | | |
| | Amount (000) | | Description (1) | Provisions (2) | | Ratings (3) | | Value | |
| | | | Health Care (continued) | | | | | | |
| $ | 750 | | Dormitory Authority of the State of New York, Revenue Bonds, NYU Hospitals Center, Series 2011A, 6.000%, 7/01/40 | 7/20 at 100.00 | | A– | $ | 846,053 | |
| | 420 | | Livingston County Industrial Development Agency, New York, Civic Facility Revenue Bonds, Nicholas H. Noyes Hospital, Series 2005, 6.000%, 7/01/30 | 1/15 at 100.00 | | BB | | 420,332 | |
| | | | Madison County Industrial Development Agency, New York, Civic Facility Revenue Bonds, Oneida Health System, Series 2007A: | | | | | | |
| | 410 | | 5.250%, 2/01/27 | 2/17 at 100.00 | | BB+ | | 415,638 | |
| | 360 | | 5.500%, 2/01/32 | 2/17 at 100.00 | | BB+ | | 365,479 | |
| | 715 | | Monroe County Industrial Development Corporation, New York, FHA Insured Mortgage Revenue Bonds, Unity Hospital of Rochester Project, Series 2010, 5.750%, 8/15/35 | 2/21 at 100.00 | | Aa2 | | 858,829 | |
| | 470 | | Suffolk County Economic Development Corporation, New York, Revenue Bonds, Catholic Health Services of Long Island Obligated Group Project, Refunding Series 2011, 5.000%, 7/01/28 | 7/21 at 100.00 | | BBB+ | | 515,007 | |
| | 2,115 | | Yates County Industrial Development Agency, New York, FHA-Insured Civic Facility Mortgage Revenue Bonds, Soldiers and Sailors Memorial Hospital, Series 1999A, 5.650%, 2/01/39 | 2/15 at 100.00 | | N/R | | 2,118,342 | |
| | 950 | | Yonkers Industrial Development Agency, New York, Revenue Bonds, St. John’s Riverside Hospital, Series 2001A, 7.125%, 7/01/31 | 1/15 at 100.00 | | B+ | | 951,482 | |
| | 18,140 | | Total Health Care | | | | | 19,255,968 | |
| | | | Housing/Multifamily – 4.2% (2.9% of Total Investments) | | | | | | |
| | 400 | | Canton Capital Resource Corporation, New York, Student Housing Facility Revenue Bonds, Grasse River LLC at SUNY Canton Project Series 2010A, 5.000%, 5/01/40 | 5/20 at 100.00 | | AA | | 430,928 | |
| | 4,000 | | New York City Housing Development Corporation, New York, Multifamily Housing Revenue Bonds, Series 2009J, 4.800%, 5/01/36 | 5/19 at 100.00 | | AA+ | | 4,183,040 | |
| | 290 | | New York City Housing Development Corporation, New York, Multifamily Housing Revenue Bonds, Series 2010D-1A, 5.000%, 11/01/42 | 5/20 at 100.00 | | AA+ | | 305,640 | |
| | 600 | | New York State Housing Finance Agency, Affordable Housing Revenue Bonds, Series 2009B, 4.500%, 11/01/29 | 5/19 at 100.00 | | Aa2 | | 630,528 | |
| | 405 | | New York State Housing Finance Agency, Affordable Housing Revenue, Series 2007A, 5.250%,11/01/38 (Alternative Minimum Tax) | 11/17 at 100.00 | | Aa2 | | 415,757 | |
| | 5,695 | | Total Housing/Multifamily | | | | | 5,965,893 | |
| | | | Housing/Single Family – 1.4% (1.0% of Total Investments) | | | | | | |
| | 645 | | Guam Housing Corporation, Mortgage-Backed Securities Program Single Family Mortgage Revenue Bonds, Series 1998A, 5.750%, 9/01/31 (Alternative Minimum Tax) | No Opt. Call | | N/R | | 731,443 | |
| | 1,310 | | New York State Mortgage Agency, Homeowner Mortgage Revenue Bonds, Series 130, 4.650%, 4/01/27 (Alternative Minimum Tax) | 4/15 at 100.00 | | Aa1 | | 1,316,760 | |
| | 1,955 | | Total Housing/Single Family | | | | | 2,048,203 | |
| | | | Long-Term Care – 4.8% (3.3% of Total Investments) | | | | | | |
| | 2,000 | | Dormitory Authority of the State of New York, FHA-Insured Nursing Home Mortgage Revenue Bonds, Gurwin Jewish Geriatric Center of Long Island, Series 2005A, 4.900%, 2/15/41 | 2/15 at 100.00 | | AA | | 2,008,040 | |
| | 585 | | Dormitory Authority of the State of New York, GNMA Collateralized Revenue Bonds, Cabrini of Westchester Project, Series 2006, 5.200%, 2/15/41 | 2/17 at 103.00 | | AA+ | | 619,527 | |
| | 375 | | Dormitory Authority of the State of New York, Non-State Supported Debt, Ozanam Hall of Queens Nursing Home Revenue Bonds, Series 2006, 5.000%, 11/01/31 | 11/16 at 100.00 | | B1 | | 361,624 | |
| | 250 | | Dormitory Authority of the State of New York, Revenue Bonds, Providence Rest, Series 2005, 5.000%, 7/01/35 – ACA Insured | 7/15 at 100.00 | | N/R | | 249,660 | |
| | 960 | | East Rochester Housing Authority, New York, Senior Living Revenue Bonds, Woodland Village Project, Series 2006, 5.500%, 8/01/33 | 8/16 at 101.00 | | N/R | | 969,494 | |
| | 770 | | Erie County Industrial Development Agency, New York, Revenue Bonds, Orchard Park CCRC Inc. Project, Series 2006A, 6.000%, 11/15/36 | 11/16 at 100.00 | | N/R | | 783,190 | |
| | 100 | | New York City Industrial Development Agency, New York, Civic Facility Revenue Bonds, Special Needs Facilities Pooled Program, Series 2000, 8.125%, 7/01/19 | 1/15 at 100.00 | | N/R | | 100,197 | |
| | 275 | | New York City Industrial Development Agency, New York, Civic Facility Revenue Bonds, Special Needs Facilities Pooled Program, Series 2001A-1, 7.250%, 7/01/16 | 1/15 at 100.00 | | N/R | | 276,108 | |
| | Principal | | | Optional Call | | | | | |
| | Amount (000) | | Description (1) | Provisions (2) | | Ratings (3) | | Value | |
| | | | Long-Term Care (continued) | | | | | | |
| | | | New York City Industrial Development Agency, New York, Civic Facility Revenue Bonds, Special Needs Facilities Pooled Program, Series 2008A-1: | | | | | | |
| $ | 885 | | 5.500%, 7/01/18 | 7/16 at 101.00 | | N/R | $ | 869,477 | |
| | 635 | | 5.800%, 7/01/23 | 7/16 at 101.00 | | N/R | | 617,595 | |
| | 6,835 | | Total Long-Term Care | | | | | 6,854,912 | |
| | | | Tax Obligation/General – 17.8% (12.1% of Total Investments) | | | | | | |
| | 6,590 | | New York City, New York, General Obligation Bonds, Fiscal 2007 Series D-1, 5.125%,12/01/25 (UB) | 12/17 at 100.00 | | AA | | 7,399,582 | |
| | 980 | | New York City, New York, General Obligation Bonds, Fiscal 2012 Series I, 5.000%, 8/01/32 | 8/22 at 100.00 | | AA | | 1,114,093 | |
| | 2,000 | | New York City, New York, General Obligation Bonds, Fiscal 2014 Series A-1, 5.000%, 8/01/26 | 8/23 at 100.00 | | AA | | 2,360,700 | |
| | 4,365 | | New York City, New York, General Obligation Bonds, Fiscal 2015 Series B, 5.000%, 8/01/30 | 8/24 at 100.00 | | AA | | 5,125,994 | |
| | 3,700 | | New York City, New York, General Obligation Bonds, Fiscal Series 2007A, 5.000%, 8/01/25 | 8/16 at 100.00 | | AA | | 3,986,602 | |
| | 1,025 | | New York City, New York, General Obligation Bonds, Subseries G-1 Fiscal Series 2012, 5.000%, 4/01/28 | No Opt. Call | | AA | | 1,193,602 | |
| | 1,525 | | New York City, New York, General Obligation Bonds, Tender Option Bond Trust 3324, 18.395%,3/01/21 (IF) (4) | No Opt. Call | | AA | | 2,424,201 | |
| | | | Rochester, New York, General Obligation Bonds, Series 1999: | | | | | | |
| | 720 | | 5.250%, 10/01/18 – NPFG Insured | No Opt. Call | | AA– | | 834,847 | |
| | 720 | | 5.250%, 10/01/19 – NPFG Insured | No Opt. Call | | AA– | | 850,795 | |
| | 21,625 | | Total Tax Obligation/General | | | | | 25,290,416 | |
| | | | Tax Obligation/Limited – 30.5% (20.8% of Total Investments) | | | | | | |
| | 590 | | Dormitory Authority of the State of New York, Department of Health Revenue Bonds, Series 2005A, 5.250%, 7/01/24 – CIFG Insured | 7/15 at 100.00 | | AA | | 611,441 | |
| | 1,850 | | Dormitory Authority of the State of New York, Secured Hospital Revenue Refunding Bonds, Wyckoff Heights Medical Center, Series 1998H, 5.300%, 8/15/21 – NPFG Insured | 2/15 at 100.00 | | AA | | 1,857,881 | |
| | 1,000 | | Dormitory Authority of the State of New York, State Personal Income Tax Revenue Bonds, General Purpose Series 2013A, 5.000%, 2/15/43 | 2/23 at 100.00 | | AAA | | 1,119,980 | |
| | | | Metropolitan Transportation Authority, New York, Dedicated Tax Fund Bonds, Refunding Series 2012A: | | | | | | |
| | 1,815 | | 5.000%, 11/15/27 | No Opt. Call | | AA | | 2,167,709 | |
| | 2,250 | | 5.000%, 11/15/29 | 11/22 at 100.00 | | AA | | 2,636,505 | |
| | 1,130 | | Monroe Newpower Corporation, New York, Power Facilities Revenue Bonds, Series 2003, 5.500%, 1/01/34 | 1/15 at 100.00 | | A– | | 1,132,599 | |
| | 2,100 | | New York City Transitional Finance Authority, New York, Building Aid Revenue Bonds, Fiscal Series 2007S-2, 5.000%, 1/15/28 – FGIC Insured | 1/17 at 100.00 | | Aa2 | | 2,271,339 | |
| | 1,025 | | New York City Transitional Finance Authority, New York, Future Tax Secured Bonds, Subordinate Fiscal 2012 Series E-1, 5.000%, 2/01/37 | 2/22 at 100.00 | | AAA | | 1,156,538 | |
| | 840 | | New York City Transitional Finance Authority, New York, Future Tax Secured Bonds, Subordinate Fiscal 2013 Series F-1, 5.000%, 2/01/29 | No Opt. Call | | AAA | | 975,500 | |
| | 2,350 | | New York City Transitional Finance Authority, New York, Future Tax Secured Bonds, Subordinate Fiscal 2013 Series I, 5.000%, 5/01/38 | 5/23 at 100.00 | | AAA | | 2,654,960 | |
| | 1,570 | | New York City Transitional Finance Authority, New York, Future Tax Secured Bonds, Subordinate Fiscal 2014 Series D-1, 5.000%, 2/01/35 | 2/24 at 100.00 | | AAA | | 1,801,230 | |
| | 2,500 | | New York City Transitional Finance Authority, New York, Future Tax Secured Revenue Bonds, Subordinate Lien Series 2011C, 5.500%, 11/01/35 | 11/20 at 100.00 | | AAA | | 2,976,050 | |
| | | | New York City Transitional Finance Authority, New York, Future Tax Secured Revenue Bonds, Subordinate Series 2011-D1: | | | | | | |
| | 1,000 | | 5.250%, 2/01/30 | 2/21 at 100.00 | | AAA | | 1,170,150 | |
| | 2,000 | | 5.000%, 2/01/35 | 2/21 at 100.00 | | AAA | | 2,261,580 | |
| | 4,000 | | New York City, New York, Educational Construction Fund, Revenue Bonds, Series 2011A, 5.750%, 4/01/41 | 4/21 at 100.00 | | AA– | | 4,783,200 | |
| | 2,920 | | New York State Environmental Facilities Corporation, State Personal Income Tax Revenue Bonds, Series 2008A, 5.000%, 12/15/26 (UB) | 12/17 at 100.00 | | AAA | | 3,262,166 | |
| NAN | Nuveen New York Dividend Advantage Municipal Fund | |
| | Portfolio of Investments (continued) | September 30, 2014 |
| | Principal | | | Optional Call | | | | | |
| | Amount (000) | | Description (1) | Provisions (2) | | Ratings (3) | | Value | |
| | | | Tax Obligation/Limited (continued) | | | | | | |
| $ | 1,090 | | New York State Housing Finance Agency, State Personal Income Tax Revenue Bonds, Economic Development and Housing, Series 2006A, 5.000%, 3/15/36 | 9/15 at 100.00 | | AAA | $ | 1,133,971 | |
| | 865 | | New York State Thruway Authority, Highway and Bridge Trust Fund Bonds, Second General, Series 2005B, 5.000%, 4/01/21 – AMBAC Insured | 10/15 at 100.00 | | AA+ | | 906,373 | |
| | 1,625 | | New York State Thruway Authority, Highway and Bridge Trust Fund Bonds, Series 2007, 5.000%, 4/01/27 | 10/17 at 100.00 | | AA+ | | 1,792,050 | |
| | 3,400 | | New York State Thruway Authority, Highway and Bridge Trust Fund Bonds, Series 2005B, 5.500%,4/01/20 – AMBAC Insured (UB) (4) | No Opt. Call | | AA+ | | 4,122,806 | |
| | 510 | | New York State Thruway Authority, State Personal Income Tax Revenue Bonds, Series 2010A, 5.000%, 3/15/29 | 9/20 at 100.00 | | AAA | | 596,379 | |
| | 1,330 | | New York State Urban Development Corporation, State Personal Income Tax Revenue Bonds, Tender Option Bond Trust 09-6W, 13.241%, 3/15/37 (IF) (4) | 3/17 at 100.00 | | AAA | | 1,678,886 | |
| | 1,250 | | Puerto Rico Sales Tax Financing Corporation, Sales Tax Revenue Bonds, Series 2007A, 0.000%,8/01/45 – NPFG Insured | No Opt. Call | | AA– | | 174,938 | |
| | 170 | | Sales Tax Asset Receivable Corporation of New York City, New York, Sales Tax Asset Revenue Bonds, Fiscal 2015 Series A, 5.000%, 10/15/29 (WI/DD, Settling 10/15/14) | 10/24 at 100.00 | | AAA | | 206,271 | |
| | 39,180 | | Total Tax Obligation/Limited | | | | | 43,450,502 | |
| | | | Transportation – 22.4% (15.2% of Total Investments) | | | | | | |
| | | | Metropolitan Transportation Authority, New York, Transportation Revenue Bonds, Series 2010D: | | | | | | |
| | 1,000 | | 5.000%, 11/15/34 | 11/20 at 100.00 | | AA– | | 1,102,580 | |
| | 1,560 | | 5.250%, 11/15/40 | 11/20 at 100.00 | | AA– | | 1,732,411 | |
| | 4,140 | | Metropolitan Transportation Authority, New York, Transportation Revenue Bonds, Series 2012E, 5.000%, 11/15/42 | No Opt. Call | | AA– | | 4,555,739 | |
| | 2,000 | | Metropolitan Transportation Authority, New York, Transportation Revenue Bonds, Series 2013E, 5.000%, 11/15/31 | 11/23 at 100.00 | | AA– | | 2,278,620 | |
| | 1,750 | | New York City Industrial Development Agency, New York, American Airlines-JFK International Airport Special Facility Revenue Bonds, Series 2005, 7.750%, 8/01/31 (Alternative Minimum Tax) | 8/16 at 101.00 | | N/R | | 1,926,733 | |
| | | | New York City Industrial Development Agency, New York, Civic Facility Revenue Bonds, Bronx Parking Development Company, LLC Project, Series 2007: | | | | | | |
| | 200 | | 5.750%, 10/01/37 (5) | 10/17 at 100.00 | | N/R | | 74,000 | |
| | 2,000 | | 5.875%, 10/01/46 (6) | 10/17 at 102.00 | | N/R | | 740,000 | |
| | 1,575 | | New York City Industrial Development Agency, New York, Special Facilities Revenue Bonds, British Airways PLC, Series 1998, 5.250%, 12/01/32 (Alternative Minimum Tax) | 12/14 at 100.00 | | BB | | 1,574,984 | |
| | 1,000 | | New York City Industrial Development Agency, New York, Special Facilities Revenue Bonds, JFK Airport – American Airlines Inc., Series 2002B, 8.500%, 8/01/28 (Alternative Minimum Tax) | 8/15 at 100.50 | | N/R | | 1,043,420 | |
| | 900 | | New York City Industrial Development Agency, New York, Special Facilities Revenue Bonds, Terminal One Group JFK Project, Series 2005, 5.500%, 1/01/24 (Alternative Minimum Tax) | 1/16 at 100.00 | | A3 | | 948,600 | |
| | | | New York City Industrial Development Agency, New York, Special Facility Revenue Bonds, JetBlue Airways Corporation Project, Series 2006: | | | | | | |
| | 320 | | 5.000%, 5/15/20 (Alternative Minimum Tax) | 11/14 at 100.00 | | B | | 320,099 | |
| | 1,000 | | 5.125%, 5/15/30 (Alternative Minimum Tax) | 11/14 at 100.00 | | B | | 1,000,120 | |
| | 845 | | New York Liberty Development Corporation, Liberty Revenue Bonds, 4 World Trade Center Project, Series 2011, 5.000%, 11/15/44 | 11/21 at 100.00 | | A+ | | 928,478 | |
| | 50 | | New York State Thruway Authority, General Revenue Bonds, Series 2005F, 5.000%, 1/01/30 – AMBAC Insured | 1/15 at 100.00 | | A | | 50,501 | |
| | 700 | | New York State Thruway Authority, General Revenue Bonds, Series 2005G, 5.000%, 1/01/30 – AGM Insured | 7/15 at 100.00 | | AA | | 721,910 | |
| | 4,000 | | Port Authority of New York and New Jersey, Consolidated Revenue Bonds, One Hundred Eighty-Forth Series 2014, 5.000%, 9/01/34 | 9/24 at 100.00 | | AA– | | 4,676,278 | |
| | | | Port Authority of New York and New Jersey, Consolidated Revenue Bonds, One Hundred Fortieth Series 2005: | | | | | | |
| | 1,300 | | 5.000%, 12/01/28 – SYNCORA GTY Insured | 6/15 at 101.00 | | AA– | | 1,348,789 | |
| | 615 | | 5.000%, 12/01/31 – SYNCORA GTY Insured | 6/15 at 101.00 | | AA– | | 638,026 | |
| | Principal | | | Optional Call | | | | | |
| | Amount (000) | | Description (1) | Provisions (2) | | Ratings (3) | | Value | |
| | | | Transportation (continued) | | | | | | |
| $ | 440 | | Port Authority of New York and New Jersey, Consolidated Revenue Bonds, One Hundred Forty Eighth Series 2008, Trust 2920, 17.814%, 8/15/32 – AGM Insured (IF) | 8/17 at 100.00 | | AA | $ | 621,861 | |
| | 2,000 | | Port Authority of New York and New Jersey, Consolidated Revenue Bonds, One Hundred Sixty Sixth Series 2011, 5.000%, 1/15/41 | 1/21 at 100.00 | | AA– | | 2,239,260 | |
| | | | Port Authority of New York and New Jersey, Special Project Bonds, JFK International Air Terminal LLC Project, Eighth Series 2010: | | | | | | |
| | 290 | | 6.500%, 12/01/28 | 12/15 at 100.00 | | BBB | | 307,603 | |
| | 1,470 | | 6.000%, 12/01/36 | 12/20 at 100.00 | | BBB | | 1,713,020 | |
| | 1,000 | | Triborough Bridge and Tunnel Authority, New York, Subordinate Lien General Purpose Revenue Refunding Bonds, Tender Option Bond Trust 1184, 9.241%, 5/15/16 (IF) | No Opt. Call | | AA– | | 1,288,240 | |
| | 30,155 | | Total Transportation | | | | | 31,831,272 | |
| | | | U.S. Guaranteed – 5.2% (3.5% of Total Investments) (7) | | | | | | |
| | 3,600 | | Dormitory Authority of the State of New York, FHA-Insured Revenue Bonds, St. Luke’s Roosevelt Hospital, Series 2005, 4.900%, 8/15/31 (Pre-refunded 8/15/15) | 8/15 at 100.00 | | N/R (7) | | 3,750,624 | |
| | | | Dormitory Authority of the State of New York, State Personal Income Tax Revenue Bonds, Series 2005F: | | | | | | |
| | 175 | | 5.000%, 3/15/21 (Pre-refunded 3/15/15) – AGM Insured | 3/15 at 100.00 | | Aa1 (7) | | 178,934 | |
| | 10 | | 5.000%, 3/15/21 (Pre-refunded 3/15/15) – AGM Insured | 3/15 at 100.00 | | AAA | | 10,225 | |
| | 370 | | Hempstead Town Industrial Development Agency, New York, Revenue Bonds, Adelphi University, Civic Facility Project, Series 2005, 5.000%, 10/01/35 (Pre-refunded 10/01/15) | 10/15 at 100.00 | | A (7) | | 388,071 | |
| | 2,585 | | New York City Housing Development Corporation, New York, Capital Fund Program Revenue Bonds, New York Housing Authority Program, Series 2005A, 5.000%, 7/01/25 (Pre-refunded 7/01/15) – NPFG Insured (UB) (4) | 7/15 at 100.00 | | AA+ (7) | | 2,680,180 | |
| | 100 | | New York State Housing Finance Agency, State Personal Income Tax Revenue Bonds, Economic Development and Housing, Series 2006A, 5.000%, 3/15/36 (Pre-refunded 9/15/15) | 9/15 at 100.00 | | N/R (7) | | 104,671 | |
| | 110 | | New York State Thruway Authority, General Revenue Bonds, Series 2005F, 5.000%, 1/01/30 (Pre-refunded 1/01/15) – AMBAC Insured | 1/15 at 100.00 | | A2 (7) | | 111,366 | |
| | 135 | | New York State Thruway Authority, Highway and Bridge Trust Fund Bonds, Second General, Series 2005B, 5.000%, 4/01/21 (Pre-refunded 10/01/15) – AMBAC Insured | 10/15 at 100.00 | | N/R (7) | | 141,593 | |
| | 7,085 | | Total U.S. Guaranteed | | | | | 7,365,664 | |
| | | | Utilities – 12.5% (8.5% of Total Investments) | | | | | | |
| | 1,300 | | Chautauqua County Industrial Development Agency, New York, Exempt Facility Revenue Bonds, NRG Dunkirk Power Project, Series 2009, 5.875%, 4/01/42 | 2/20 at 100.00 | | Baa3 | | 1,421,810 | |
| | 110 | | Guam Power Authority, Revenue Bonds, Series 2012A, 5.000%, 10/01/34 | 10/22 at 100.00 | | BBB | | 121,471 | |
| | | | Long Island Power Authority, New York, Electric System General Revenue Bonds, Series 2006A: | | | | | | |
| | 2,500 | | 5.000%, 12/01/23 – FGIC Insured | 6/16 at 100.00 | | AA– | | 2,672,323 | |
| | 500 | | 5.000%, 12/01/24 – FGIC Insured | 6/16 at 100.00 | | AA– | | 533,860 | |
| | 3,885 | | Long Island Power Authority, New York, Electric System Revenue Bonds, Series 2011A, 5.000%, 5/01/38 | 5/21 at 100.00 | | A– | | 4,247,742 | |
| | 1,250 | | Long Island Power Authority, New York, Electric System Revenue Bonds, Series 2012A, 5.000%, 9/01/37 | No Opt. Call | | A– | | 1,363,775 | |
| | 1,400 | | Nassau County Industrial Development Authority, New York, Keyspan Glenwood Energy Project, Series 2003, 5.250%, 6/01/27 (Alternative Minimum Tax) | 12/14 at 100.00 | | A– | | 1,405,376 | |
| | 3,210 | | Niagara Area Development Corporation, New York, Solid Waste Disposal Facility Revenue Refunding Bonds, Covanta Energy Project, Series 2012A, 5.250%, 11/01/42 | No Opt. Call | | BB+ | | 3,287,329 | |
| | 2,410 | | Utility Debt Securitization Authority, New York, Restructuring Bonds, Series 2013TE, 5.000%, 12/15/41 | 12/23 at 100.00 | | AAA | | 2,762,824 | |
| | 16,565 | | Total Utilities | | | | | 17,816,510 | |
| NAN | Nuveen New York Dividend Advantage Municipal Fund | |
| | Portfolio of Investments (continued) | September 30, 2014 |
| | Principal | | | Optional Call | | | | | |
| | Amount (000) | | Description (1) | Provisions (2) | | Ratings (3) | | Value | |
| | | | Water and Sewer – 6.4% (4.3% of Total Investments) | | | | | | |
| $ | 1,185 | | Guam Government Waterworks Authority, Water and Wastewater System Revenue Bonds, Series 2010, 5.625%, 7/01/40 | 7/20 at 100.00 | | A– | $ | 1,296,698 | |
| | 2,000 | | New York City Municipal Water Finance Authority, New York, Water and Sewer System Second General Resolution Revenue Bonds, Fiscal Series 2014DD, 5.000%, 6/15/35 | 6/24 at 100.00 | | AA+ | | 2,313,660 | |
| | 4,875 | | New York State Environmental Facilities Corporation, State Clean Water and Drinking Water Revolving Funds Revenue Bonds, New York City Municipal Water Finance Authority Projects, Second Resolution Series 2011B, 5.000%, 6/15/41 | 6/21 at 100.00 | | AAA | | 5,464,825 | |
| | 8,060 | | Total Water and Sewer | | | | | 9,075,183 | |
| $ | 193,330 | | Total Long-Term Investments (cost $196,013,376) | | | | | 209,348,479 | |
| | | | Floating Rate Obligations – (9.2)% | | | | | (13,155,000 | ) |
| | | | Variable Rate MuniFund Term Preferred Shares, at Liquidation Value – (39.4)% (8) | | | | | (56,000,000 | ) |
| | | | Other Assets Less Liabilities – 1.5% | | | | | 2,085,839 | |
| | | | Net Assets Applicable to Common Shares – 100% | | | | $ | 142,279,318 | |
| (1) | All percentages shown in the Portfolio of Investments are based on net assets applicable to common shares unless otherwise noted. |
| (2) | Optional Call Provisions (not covered by the report of independent registered public accounting firm): Dates (month and year) and prices of the earliest optional call or redemption. There may be other call provisions at varying prices at later dates. Certain mortgage-backed securities may be subject to periodic principal paydowns. |
| (3) | Ratings (not covered by the report of independent registered public accounting firm): Using the highest of Standard & Poor’s Group (“Standard & Poor’s”), Moody’s Investors Service, Inc. (“Moody’s”) or Fitch, Inc. (“Fitch”) rating. Ratings below BBB by Standard & Poor’s, Baa by Moody’s or BBB by Fitch are considered to be below investment grade. Holdings designated N/R are not rated by any of these national rating agencies. |
| (4) | Investment, or portion of investment, has been pledged to collateralize the net payment obligations for investments in inverse floating rate transactions. |
| (5) | On April 1, 2013, the Fund’s Adviser determined it was unlikely that this borrower would fulfill its entire obligation on this security, and therefore reduced the security’s interest rate of accrual from 5.750% to 2.300%. |
| (6) | On April 1, 2013, the Fund’s Adviser determined it was unlikely that this borrower would fulfill its entire obligation on this security, and therefore reduced the security’s interest rate of accrual from 5.875% to 2.350%. |
| (7) | Backed by an escrow or trust containing sufficient U.S. Government or U.S. Government agency securities, which ensure the timely payment of principal and interest. Certain bonds backed by U.S. Government or agency securities are regarded as having an implied rating equal to the rating of such securities. |
| (8) | Variable Rate MuniFund Term Preferred Shares, at Liquidation Value as a percentage of Total Investments is 26.7%. |
| WI/DD | Investment, or portion of investment, purchased on a when-issued or delayed delivery basis. |
| (IF) | Inverse floating rate investment. |
| (UB) | Underlying bond of an inverse floating rate trust reflected as a financing transaction. See Notes to Financial Statements, Note 3 – Portfolio Securities and Investments in Derivatives, Inverse Floating Rate Securities for more information. |
See accompanying notes to financial statements.
| NXK | | |
| | Nuveen New York Dividend Advantage Municipal Fund 2 |
| | Portfolio of Investments | September 30, 2014 |
| | Principal | | | Optional Call | | | | | |
| | Amount (000) | | Description (1) | Provisions (2) | | Ratings (3) | | Value | |
| | | | LONG-TERM INVESTMENTS 147.1% (100.0% of Total Investments) | | | | | | |
| | | | MUNICIPAL BONDS – 147.1% (100.0% of Total Investments) | | | | | | |
| | | | Consumer Discretionary – 2.8% (1.9% of Total Investments) | | | | | | |
| $ | 700 | | New York City Industrial Development Agency, New York, Liberty Revenue Bonds, IAC/InterActiveCorp, Series 2005, 5.000%, 9/01/35 | 9/15 at 100.00 | | BBB | $ | 714,266 | |
| | 1,950 | | Seneca Nation of Indians Capital Improvements Authority, New York, Special Obligation Bonds, Series 2007A, 5.000%, 12/01/23 | 6/17 at 100.00 | | BB | | 2,045,160 | |
| | 2,650 | | Total Consumer Discretionary | | | | | 2,759,426 | |
| | | | Consumer Staples – 3.1% (2.1% of Total Investments) | | | | | | |
| | 350 | | Nassau County Tobacco Settlement Corporation, New York, Tobacco Settlement Asset-Backed Bonds, Refunding Series 2006A-2, 5.250%, 6/01/26 | 6/16 at 100.00 | | B | | 340,134 | |
| | 500 | | Nassau County Tobacco Settlement Corporation, New York, Tobacco Settlement Asset-Backed Bonds, Series 2006A-3, 5.000%, 6/01/35 | 6/16 at 100.00 | | B | | 417,020 | |
| | 115 | | New York Counties Tobacco Trust II, Tobacco Settlement Pass-Through Bonds, Series 2001, 5.250%, 6/01/25 | 12/14 at 100.00 | | A1 | | 114,990 | |
| | 230 | | New York Counties Tobacco Trust III, Tobacco Settlement Pass-Through Bonds, Series 2003, 5.750%, 6/01/33 | 12/14 at 100.00 | | A1 | | 229,979 | |
| | 35 | | Rensselaer Tobacco Asset Securitization Corporation, New York, Tobacco Settlement Asset-Backed Bonds, Series 2001A, 5.200%, 6/01/25 | 12/14 at 100.00 | | A1 | | 33,958 | |
| | | | TSASC Inc., New York, Tobacco Asset-Backed Bonds, Series 2006: | | | | | | |
| | 470 | | 4.750%, 6/01/22 | 6/16 at 100.00 | | BBB– | | 466,931 | |
| | 835 | | 5.000%, 6/01/26 | 6/16 at 100.00 | | BB– | | 818,467 | |
| | 500 | | 5.000%, 6/01/34 | 6/16 at 100.00 | | B | | 414,455 | |
| | 215 | | 5.125%, 6/01/42 | 6/16 at 100.00 | | B | | 174,761 | |
| | 3,250 | | Total Consumer Staples | | | | | 3,010,695 | |
| | | | Education and Civic Organizations – 27.1% (18.4% of Total Investments) | | | | | | |
| | 260 | | Albany Industrial Development Agency, New York, Revenue Bonds, Albany Law School, Series 2007A, 5.000%, 7/01/31 | 7/17 at 100.00 | | BBB | | 268,926 | |
| | 380 | | Albany Industrial Development Agency, New York, Revenue Bonds, Brighter Choice Charter Schools, Series 2007A, 5.000%, 4/01/37 | 4/17 at 100.00 | | BB+ | | 376,455 | |
| | 1,225 | | Brooklyn Arena Local Development Corporation, New York, Payment in Lieu of Taxes Revenue Bonds, Barclays Center Project, Series 2009, 6.250%, 7/15/40 | 1/20 at 100.00 | | BBB– | | 1,386,686 | |
| | 670 | | Buffalo and Erie County Industrial Land Development Corporation, New York, Revenue Bonds, Enterprise Charter School Project, Series 2011A, 7.500%, 12/01/40 | 12/20 at 100.00 | | B | | 694,978 | |
| | 2,070 | | Build NYC Resource Corp, New York, Revenue Bonds, City University of NY-Queens College, Q Student Residences, LLC Project, Refunding Series 2014, 5.000%, 6/01/43 | 6/24 at 100.00 | | Aa2 | | 2,330,903 | |
| | 90 | | Cattaraugus County Industrial Development Agency, New York, Revenue Bonds, St. Bonaventure University, Series 2006, 5.000%, 5/01/23 | 5/16 at 100.00 | | BBB– | | 93,476 | |
| | 1,125 | | Dormitory Authority of the State of New York, General Revenue Bonds, Manhattan College, Series 2007A, 5.000%, 7/01/41 – RAAI Insured | 7/17 at 100.00 | | N/R | | 1,156,646 | |
| | 365 | | Dormitory Authority of the State of New York, General Revenue Bonds, Saint Johns University, Series 2013A, 5.000%, 7/01/44 | 7/23 at 100.00 | | A– | | 402,048 | |
| | 1,000 | | Dormitory Authority of the State of New York, Housing Revenue Bonds, Fashion Institute of Technology, Series 2007, 5.250%, 7/01/29 – FGIC Insured | No Opt. Call | | AA– | | 1,166,860 | |
| | 485 | | Dormitory Authority of the State of New York, Lease Revenue Bonds, State University Dormitory Facilities, Series 2004A, 5.000%, 7/01/29 – NPFG Insured | 7/15 at 100.00 | | Aa2 | | 499,453 | |
| | 2,500 | | Dormitory Authority of the State of New York, Lease Revenue Bonds, State University Dormitory Facilities, Series 2012A, 5.000%, 7/01/37 | 7/22 at 100.00 | | Aa2 | | 2,809,423 | |
| | 2,000 | | Dormitory Authority of the State of New York, Revenue Bonds, Columbia University, Series 2011A, 5.000%, 10/01/41 | 4/21 at 100.00 | | AAA | | 2,291,918 | |
| NXK | Nuveen New York Dividend Advantage Municipal Fund 2 | |
| | Portfolio of Investments (continued) | September 30, 2014 |
| | Principal | | | Optional Call | | | | | |
| | Amount (000) | | Description (1) | Provisions (2) | | Ratings (3) | | Value | |
| | | | Education and Civic Organizations (continued) | | | | | | |
| $ | 175 | | Dormitory Authority of the State of New York, Revenue Bonds, New School University, Series 2010, 5.250%, 7/01/30 | 7/20 at 100.00 | | A– | $ | 194,434 | |
| | 2,000 | | Dormitory Authority of the State of New York, Revenue Bonds, Non State Supported Debt, Cornell University, Series 2010A, 5.000%, 7/01/40 | 7/20 at 100.00 | | Aa1 | | 2,266,740 | |
| | 280 | | Dormitory Authority of the State of New York, Revenue Bonds, St. Joseph’s College, Series 2010, 5.250%, 7/01/35 | 7/20 at 100.00 | | Baa3 | | 297,441 | |
| | 1,835 | | Dutchess County Industrial Development Agency, New York, Civic Facility Revenue Bonds, Bard College Refunding, Series 2007-A1, 5.000%, 8/01/46 | 8/17 at 100.00 | | Ba1 | | 1,846,028 | |
| | 265 | | Hempstead Town Local Development Corporation, New York, Revenue Bonds, Adelphi University Project, Series 2013, 5.000%, 9/01/43 | 9/23 at 100.00 | | A | | 290,223 | |
| | 1,475 | | Hempstead Town Local Development Corporation, New York, Revenue Bonds, Molloy College Project, Series 2009, 5.750%, 7/01/39 | 7/19 at 100.00 | | BBB+ | | 1,599,225 | |
| | 890 | | Monroe County Industrial Development Corporation, New York, Revenue Bonds, St. John Fisher College, Series 2011, 6.000%, 6/01/30 | 6/21 at 100.00 | | BBB+ | | 1,009,669 | |
| | 245 | | New York City Industrial Development Agency, New York, Civic Facility Revenue Bonds, St. Francis College, Series 2004, 5.000%, 10/01/34 | 10/14 at 100.00 | | A– | | 245,292 | |
| | | | New York City Industrial Development Agency, New York, PILOT Revenue Bonds, Queens Baseball Stadium Project, Series 2006: | | | | | | |
| | 1,000 | | 5.000%, 1/01/31 – AMBAC Insured | 1/17 at 100.00 | | Ba1 | | 1,028,450 | |
| | 1,120 | | 4.750%, 1/01/42 – AMBAC Insured | 1/17 at 100.00 | | Ba1 | | 1,141,616 | |
| | | | New York City Industrial Development Authority, New York, PILOT Revenue Bonds, Yankee Stadium Project, Series 2006: | | | | | | |
| | 1,460 | | 4.500%, 3/01/39 – FGIC Insured | 9/16 at 100.00 | | BBB | | 1,476,951 | |
| | 750 | | 4.750%, 3/01/46 – NPFG Insured | 9/16 at 100.00 | | AA– | | 761,858 | |
| | 170 | | Seneca County Industrial Development Authority, New York, Revenue Bonds, New York Chiropractic College, Series 2007, 5.000%, 10/01/27 | 10/17 at 100.00 | | BBB | | 177,405 | |
| | 300 | | Troy Capital Resource Corporation, New York, Revenue Bonds, Rensselaer Polytechnic Institute, Series 2010A, 5.125%, 9/01/40 | 9/20 at 100.00 | | A– | | 326,103 | |
| | 340 | | Yonkers Industrial Development Agency, New York, Civic Facility Revenue Bonds, Sarah Lawrence College Project, Series 2001A Remarketed, 6.000%, 6/01/41 | 6/19 at 100.00 | | BBB | | 374,996 | |
| | 24,475 | | Total Education and Civic Organizations | | | | | 26,514,203 | |
| | | | Financials – 2.3% (1.5% of Total Investments) | | | | | | |
| | 1,805 | | New York Liberty Development Corporation, Revenue Bonds, Goldman Sachs Headquarters Issue, Series 2007, 5.500%, 10/01/37 | No Opt. Call | | A | | 2,214,338 | |
| | | | Health Care – 11.5% (7.8% of Total Investments) | | | | | | |
| | 1,620 | | Dormitory Authority of the State of New York, FHA-Insured Revenue Bonds, Montefiore Medical Center, Series 2005, 5.000%, 2/01/22 – FGIC Insured | 2/15 at 100.00 | | AA– | | 1,644,203 | |
| | 150 | | Dormitory Authority of the State of New York, Highland Hospital of Rochester Revenue Bonds, Series 2010, 5.200%, 7/01/32 | 7/20 at 100.00 | | A2 | | 162,947 | |
| | | | Dormitory Authority of the State of New York, Orange Regional Medical Center Obligated Group Revenue Bonds, Series 2008: | | | | | | |
| | 975 | | 6.500%, 12/01/21 | 12/18 at 100.00 | | Ba1 | | 1,088,909 | |
| | 505 | | 6.125%, 12/01/29 | 12/18 at 100.00 | | Ba1 | | 537,522 | |
| | 985 | | 6.250%, 12/01/37 | 12/18 at 100.00 | | Ba1 | | 1,039,648 | |
| | 2,300 | | Dormitory Authority of the State of New York, Revenue Bonds, Memorial Sloan Kettering Cancer Center, Series 2006, 5.000%, 7/01/35 (UB) | 7/16 at 100.00 | | AA | | 2,433,952 | |
| | 170 | | Dormitory Authority of the State of New York, Revenue Bonds, New York and Presbyterian Hospital, Series 2004A, 5.250%, 8/15/15 – AGM Insured | 2/15 at 100.00 | | AA | | 171,913 | |
| | 1,500 | | Dormitory Authority of the State of New York, Revenue Bonds, NYU Hospitals Center, Series 2007B, 5.625%, 7/01/37 | 7/17 at 100.00 | | A– | | 1,640,025 | |
| | 1,000 | | Dormitory Authority of the State of New York, Revenue Bonds, NYU Hospitals Center, Series 2011A, 6.000%, 7/01/40 | 7/20 at 100.00 | | A– | | 1,128,070 | |
| | 290 | | Livingston County Industrial Development Agency, New York, Civic Facility Revenue Bonds, Nicholas H. Noyes Hospital, Series 2005, 6.000%, 7/01/30 | 1/15 at 100.00 | | BB | | 290,229 | |
| | Principal | | | Optional Call | | | | | |
| | Amount (000) | | Description (1) | Provisions (2) | | Ratings (3) | | Value | |
| | | | Health Care (continued) | | | | | | |
| | | | Madison County Industrial Development Agency, New York, Civic Facility Revenue Bonds, Oneida Health System, Series 2007A: | | | | | | |
| $ | 275 | | 5.250%, 2/01/27 | 2/17 at 100.00 | | BB+ | $ | 278,781 | |
| | 250 | | 5.500%, 2/01/32 | 2/17 at 100.00 | | BB+ | | 253,805 | |
| | 215 | | Yonkers Industrial Development Agency, New York, Revenue Bonds, St. John’s Riverside Hospital, Series 2001A, 7.125%, 7/01/31 | 1/15 at 100.00 | | B+ | | 215,335 | |
| | 360 | | Yonkers Industrial Development Agency, New York, Revenue Bonds, St. John’s Riverside Hospital, Series 2001B, 7.125%, 7/01/31 | 1/15 at 100.00 | | B+ | | 360,562 | |
| | 10,595 | | Total Health Care | | | | | 11,245,901 | |
| | | | Housing/Multifamily – 0.4% (0.3% of Total Investments) | | | | | | |
| | 70 | | New York City Housing Development Corporation, New York, Multifamily Housing Revenue Bonds, Series 2010D-1A, 5.000%, 11/01/42 | 5/20 at 100.00 | | AA+ | | 73,775 | |
| | 290 | | New York State Housing Finance Agency, Affordable Housing Revenue, Series 2007A, 5.250%,11/01/38 (Alternative Minimum Tax) | 11/17 at 100.00 | | Aa2 | | 297,702 | |
| | 360 | | Total Housing/Multifamily | | | | | 371,477 | |
| | | | Housing/Single Family – 0.9% (0.6% of Total Investments) | | | | | | |
| | 925 | | New York State Mortgage Agency, Homeowner Mortgage Revenue Bonds, Series 130, 4.650%, 4/01/27 (Alternative Minimum Tax) | 4/15 at 100.00 | | Aa1 | | 929,773 | |
| | | | Long-Term Care – 3.6% (2.5% of Total Investments) | | | | | | |
| | 440 | | Dormitory Authority of the State of New York, GNMA Collateralized Revenue Bonds, Cabrini of Westchester Project, Series 2006, 5.200%, 2/15/41 | 2/17 at 103.00 | | AA+ | | 465,969 | |
| | 255 | | Dormitory Authority of the State of New York, Non-State Supported Debt, Ozanam Hall of Queens Nursing Home Revenue Bonds, Series 2006, 5.000%, 11/01/31 | 11/16 at 100.00 | | B1 | | 245,904 | |
| | | | Dormitory Authority of the State of New York, Revenue Bonds, Providence Rest, Series 2005: | | | | | | |
| | 50 | | 5.125%, 7/01/30 – ACA Insured | 7/15 at 100.00 | | N/R | | 50,108 | |
| | 175 | | 5.000%, 7/01/35 – ACA Insured | 7/15 at 100.00 | | N/R | | 174,762 | |
| | 665 | | East Rochester Housing Authority, New York, Senior Living Revenue Bonds, Woodland Village Project, Series 2006, 5.500%, 8/01/33 | 8/16 at 101.00 | | N/R | | 671,577 | |
| | 530 | | Erie County Industrial Development Agency, New York, Revenue Bonds, Orchard Park CCRC Inc. Project, Series 2006A, 6.000%, 11/15/36 | 11/16 at 100.00 | | N/R | | 539,079 | |
| | 190 | | New York City Industrial Development Agency, New York, Civic Facility Revenue Bonds, Special Needs Facilities Pooled Program, Series 2001A-1, 7.250%, 7/01/16 | 1/15 at 100.00 | | N/R | | 190,766 | |
| | | | New York City Industrial Development Agency, New York, Civic Facility Revenue Bonds, Special Needs Facilities Pooled Program, Series 2008A-1: | | | | | | |
| | 275 | | 5.500%, 7/01/18 | 7/16 at 101.00 | | N/R | | 270,177 | |
| | 440 | | 5.800%, 7/01/23 | 7/16 at 101.00 | | N/R | | 427,940 | |
| | 340 | | Suffolk County Industrial Development Agency, New York, Civic Facility Revenue Bonds, Special Needs Facilities Pooled Program, Series 2008-B1, 5.500%, 7/01/18 | 7/16 at 100.00 | | N/R | | 342,890 | |
| | 170 | | Yonkers Industrial Development Agency, New York, Civic Facilities Revenue Bonds, Special Needs Facilities Pooled Program Bonds, Series 2008-C1, 5.800%, 7/01/23 | 7/16 at 101.00 | | N/R | | 165,340 | |
| | 3,530 | | Total Long-Term Care | | | | | 3,544,512 | |
| | | | Tax Obligation/General – 7.4% (5.0% of Total Investments) | | | | | | |
| | 4,540 | | New York City, New York, General Obligation Bonds, Fiscal 2007 Series D-1, 5.125%,12/01/25 (UB) | 12/17 at 100.00 | | AA | | 5,097,739 | |
| | 1,000 | | New York City, New York, General Obligation Bonds, Fiscal 2012 Series B, 5.000%, 8/01/30 | No Opt. Call | | AA | | 1,151,140 | |
| | 35 | | New York City, New York, General Obligation Bonds, Fiscal Series 2005F-1, 5.000%, 9/01/19 – SYNCORA GTY Insured | 9/15 at 100.00 | | AA | | 36,540 | |
| | 5 | | New York City, New York, General Obligation Bonds, Fiscal Series 2006J-1, 5.000%, 6/01/25 (UB) | 6/16 at 100.00 | | AA | | 5,359 | |
| | 835 | | New York City, New York, General Obligation Bonds, Subseries G-1 Fiscal Series 2012, 5.000%, 4/01/28 | No Opt. Call | | AA | | 972,349 | |
| | 6,415 | | Total Tax Obligation/General | | | | | 7,263,127 | |
| NXK | Nuveen New York Dividend Advantage Municipal Fund 2 | |
| | Portfolio of Investments (continued) | September 30, 2014 |
| | Principal | | | Optional Call | | | | | |
| | Amount (000) | | Description (1) | Provisions (2) | | Ratings (3) | | Value | |
| | | | Tax Obligation/Limited – 38.9% (26.5% of Total Investments) | | | | | | |
| $ | 4,000 | | Dormitory Authority of the State of New York, State Personal Income Tax Revenue Bonds, General Purpose Series 2013A, 5.000%, 2/15/43 | 2/23 at 100.00 | | AAA | $ | 4,479,920 | |
| | | | Hudson Yards Infrastructure Corporation, New York, Revenue Bonds, Senior Fiscal 2012 Series 2011A: | | | | | | |
| | 2,000 | | 5.750%, 2/15/47 | 2/21 at 100.00 | | A | | 2,310,940 | |
| | 2,000 | | 5.250%, 2/15/47 | 2/21 at 100.00 | | A | | 2,207,900 | |
| | 5,000 | | Hudson Yards Infrastructure Corporation, New York, Revenue Bonds, Series 2006A, 5.000%, 2/15/47 | 2/17 at 100.00 | | A | | 5,297,900 | |
| | 560 | | Monroe Newpower Corporation, New York, Power Facilities Revenue Bonds, Series 2003, 5.500%, 1/01/34 | 1/15 at 100.00 | | A– | | 561,288 | |
| | 1,300 | | New York City Transitional Finance Authority, New York, Building Aid Revenue Bonds, Fiscal Series 2007S-2, 5.000%, 1/15/28 – FGIC Insured | 1/17 at 100.00 | | Aa2 | | 1,406,067 | |
| | 1,200 | | New York City Transitional Finance Authority, New York, Future Tax Secured Bonds, Fiscal Series 2007B, 5.000%, 11/01/30 | 5/17 at 100.00 | | AAA | | 1,308,972 | |
| | | | New York City Transitional Finance Authority, New York, Future Tax Secured Bonds, Subordinate Fiscal 2012 Series E-1: | | | | | | |
| | 835 | | 5.000%, 2/01/37 | 2/22 at 100.00 | | AAA | | 942,156 | |
| | 3,950 | | 5.000%, 2/01/42 | 2/22 at 100.00 | | AAA | | 4,377,388 | |
| | 680 | | New York City Transitional Finance Authority, New York, Future Tax Secured Bonds, Subordinate Fiscal 2013 Series F-1, 5.000%, 2/01/29 | No Opt. Call | | AAA | | 789,691 | |
| | 1,610 | | New York City Transitional Finance Authority, New York, Future Tax Secured Bonds, Subordinate Fiscal 2013 Series I, 5.000%, 5/01/38 | 5/23 at 100.00 | | AAA | | 1,818,930 | |
| | 1,060 | | New York City Transitional Finance Authority, New York, Future Tax Secured Bonds, Subordinate Fiscal 2014 Series D-1, 5.000%, 2/01/35 | 2/24 at 100.00 | | AAA | | 1,216,117 | |
| | 1,000 | | New York City, New York, Educational Construction Fund, Revenue Bonds, Series 2011A, 5.750%, 4/01/41 | 4/21 at 100.00 | | AA– | | 1,195,800 | |
| | 2,020 | | New York State Environmental Facilities Corporation, State Personal Income Tax Revenue Bonds, Series 2008A, 5.000%, 12/15/27 (UB) | 12/17 at 100.00 | | AAA | | 2,247,452 | |
| | 770 | | New York State Housing Finance Agency, State Personal Income Tax Revenue Bonds, Economic Development and Housing, Series 2006A, 5.000%, 3/15/36 | 9/15 at 100.00 | | AAA | | 801,062 | |
| | 1,125 | | New York State Thruway Authority, Highway and Bridge Trust Fund Bonds, Series 2007, 5.000%, 4/01/27 | 10/17 at 100.00 | | AA+ | | 1,240,650 | |
| | 2,300 | | New York State Thruway Authority, Highway and Bridge Trust Fund Bonds, Series 2005B, 5.500% ,4/01/20 – AMBAC Insured (UB) (4) | No Opt. Call | | AA+ | | 2,788,957 | |
| | 1,425 | | Sales Tax Asset Receivable Corporation of New York City, New York, Sales Tax Asset Revenue Bonds, Fiscal 2005 Series A, 5.000%, 10/15/26 – AGM Insured | 10/14 at 100.00 | | AAA | | 1,430,828 | |
| | 1,435 | | Sales Tax Asset Receivable Corporation of New York City, New York, Sales Tax Asset Revenue Bonds, Fiscal 2015 Series A, 5.000%, 10/15/29 (WI/DD, Settling 10/15/14) | 10/24 at 100.00 | | AAA | | 1,741,172 | |
| | 34,270 | | Total Tax Obligation/Limited | | | | | 38,163,190 | |
| | | | Transportation – 23.1% (15.7% of Total Investments) | | | | | | |
| | 1,000 | | Metropolitan Transportation Authority, New York, Transportation Revenue Bonds, Series 2010D, 5.000%, 11/15/34 | 11/20 at 100.00 | | AA– | | 1,102,580 | |
| | 2,500 | | Metropolitan Transportation Authority, New York, Transportation Revenue Bonds, Series 2012E, 5.000%, 11/15/42 | No Opt. Call | | AA– | | 2,751,050 | |
| | 1,250 | | New York City Industrial Development Agency, New York, American Airlines-JFK International Airport Special Facility Revenue Bonds, Series 2005, 7.750%, 8/01/31 (Alternative Minimum Tax) | 8/16 at 101.00 | | N/R | | 1,376,238 | |
| | 1,500 | | New York City Industrial Development Agency, New York, Civic Facility Revenue Bonds, Bronx Parking Development Company, LLC Project, Series 2007, 5.875%, 10/01/46 (5) | 10/17 at 102.00 | | N/R | | 555,000 | |
| | 1,425 | | New York City Industrial Development Agency, New York, Special Facilities Revenue Bonds, British Airways PLC, Series 1998, 5.250%, 12/01/32 (Alternative Minimum Tax) | 12/14 at 100.00 | | BB | | 1,424,986 | |
| | 1,000 | | New York City Industrial Development Agency, New York, Special Facilities Revenue Bonds, JFK Airport – American Airlines Inc., Series 2002B, 8.500%, 8/01/28 (Alternative Minimum Tax) | 8/15 at 100.50 | | N/R | | 1,043,420 | |
| | 650 | | New York City Industrial Development Agency, New York, Special Facilities Revenue Bonds, Terminal One Group JFK Project, Series 2005, 5.500%, 1/01/24 (Alternative Minimum Tax) | 1/16 at 100.00 | | A3 | | 685,100 | |
| | Principal | | | | Optional Call | | | | | |
| | Amount (000) | | Description (1) | | Provisions (2) | | Ratings (3) | | Value | |
| | | | Transportation (continued) | | | | | | | |
| | | | New York City Industrial Development Agency, New York, Special Facility Revenue Bonds, JetBlue Airways Corporation Project, Series 2006: | | | | | | | |
| $ | 35 | | 5.000%, 5/15/20 (Alternative Minimum Tax) | | 11/14 at 100.00 | | B | $ | 35,011 | |
| | 750 | | 5.125%, 5/15/30 (Alternative Minimum Tax) | | 11/14 at 100.00 | | B | | 750,090 | |
| | 585 | | New York Liberty Development Corporation, New York, Liberty Revenue Bonds, 4 World Trade Center Project, Series 2011, 5.000%, 11/15/44 | | 11/21 at 100.00 | | A+ | | 642,792 | |
| | 300 | | New York State Thruway Authority, General Revenue Bonds, Series 2005G, 5.000%, 1/01/30 – AGM Insured | | 7/15 at 100.00 | | AA | | 309,390 | |
| | | | Port Authority of New York and New Jersey, Consolidated Revenue Bonds, One Hundred Eighty-Forth Series 2014: | | | | | | | |
| | 1,000 | | 5.000%, 9/01/35 | | 9/24 at 100.00 | | AA– | | 1,164,410 | |
| | 3,000 | | 5.000%, 9/01/36 | | 9/24 at 100.00 | | AA– | | 3,479,308 | |
| | | | Port Authority of New York and New Jersey, Consolidated Revenue Bonds, One Hundred Fortieth Series 2005: | | | | | | | |
| | 1,000 | | 5.000%, 12/01/28 – SYNCORA GTY Insured | | 6/15 at 101.00 | | AA– | | 1,037,530 | |
| | 280 | | 5.000%, 12/01/31 – SYNCORA GTY Insured | | 6/15 at 101.00 | | AA– | | 290,483 | |
| | 310 | | Port Authority of New York and New Jersey, Consolidated Revenue Bonds, One Hundred Forty Eighth Series 2008, Trust 2920, 17.814%, 8/15/32 – AGM Insured (IF) | | 8/17 at 100.00 | | AA | | 438,129 | |
| | 2,000 | | Port Authority of New York and New Jersey, Consolidated Revenue Bonds, One Hundred Sixty Sixth Series 2011, 5.000%, 1/15/41 | | 1/21 at 100.00 | | AA– | | 2,239,260 | |
| | | | Port Authority of New York and New Jersey, Special Project Bonds, JFK International Air Terminal LLC Project, Eighth Series 2010: | | | | | | | |
| | 210 | | 6.500%, 12/01/28 | | 12/15 at 100.00 | | BBB | | 222,747 | |
| | 1,030 | | 6.000%, 12/01/36 | | 12/20 at 100.00 | | BBB | | 1,200,280 | |
| | 780 | | Triborough Bridge and Tunnel Authority, New York, General Purpose Revenue Bonds, Refunding Subordinate Lien Series 2002E, 5.500%, 11/15/20 – NPFG Insured | | No Opt. Call | | AA– | | 958,090 | |
| | 750 | | Triborough Bridge and Tunnel Authority, New York, Subordinate Lien General Purpose Revenue Refunding Bonds, Tender Option Bond Trust 1184, 9.241%, 5/15/16 (IF) | | No Opt. Call | | AA– | | 966,180 | |
| | 21,355 | | Total Transportation | | | | | | 22,672,074 | |
| | | | U.S. Guaranteed – 5.4% (3.7% of Total Investments) (6) | | | | | | | |
| | | | Dormitory Authority of the State of New York, State Personal Income Tax Revenue Bonds, Series 2005F: | | | | | | | |
| | 120 | | 5.000%, 3/15/21 (Pre-refunded 3/15/15) – AGM Insured | | 3/15 at 100.00 | | Aa1 (6) | | 122,698 | |
| | 5 | | 5.000%, 3/15/21 (Pre-refunded 3/15/15) – AGM Insured | | 3/15 at 100.00 | | AAA | | 5,112 | |
| | 265 | | Hempstead Town Industrial Development Agency, New York, Revenue Bonds, Adelphi University, Civic Facility Project, Series 2005, 5.000%, 10/01/35 (Pre-refunded 10/01/15) | | 10/15 at 100.00 | | A (6) | | 277,943 | |
| | 1,965 | | New York City, New York, General Obligation Bonds, Fiscal Series 2005F-1, 5.000%, 9/01/19 (Pre-refunded 9/01/15) – SYNCORA GTY Insured | | 9/15 at 100.00 | | Aa2 (6) | | 2,053,111 | |
| | 2,595 | | New York City, New York, General Obligation Bonds, Fiscal Series 2006J-1, 5.000%, 6/01/25 (Pre-refunded 6/01/16) (UB) | | 6/16 at 100.00 | | N/R (6) | | 2,798,993 | |
| | 70 | | New York State Housing Finance Agency, State Personal Income Tax Revenue Bonds, Economic Development and Housing, Series 2006A, 5.000%, 3/15/36 (Pre-refunded 9/15/15) | | 9/15 at 100.00 | | N/R (6) | | 73,270 | |
| | 5,020 | | Total U.S. Guaranteed | | | | | | 5,331,127 | |
| | | | Utilities – 14.1% (9.6% of Total Investments) | | | | | | | |
| | 75 | | Guam Power Authority, Revenue Bonds, Series 2012A, 5.000%, 10/01/34 | | 10/22 at 100.00 | | BBB | | 82,821 | |
| | | | Long Island Power Authority, New York, Electric System General Revenue Bonds, Series 2006A: | | | | | | | |
| | 1,700 | | 5.000%, 12/01/23 – FGIC Insured | | 6/16 at 100.00 | | AA– | | 1,817,181 | |
| | 1,700 | | 5.000%, 12/01/24 – FGIC Insured | | 6/16 at 100.00 | | AA– | | 1,815,124 | |
| | 250 | | Long Island Power Authority, New York, Electric System General Revenue Bonds, Series 2006B, 5.000%, 12/01/35 – CIFG Insured | | 6/16 at 100.00 | | A– | | 263,878 | |
| | | | Long Island Power Authority, New York, Electric System Revenue Bonds, Series 2011A: | | | | | | | |
| | 1,000 | | 5.000%, 5/01/36 – AGM Insured | | 5/21 at 100.00 | | AA | | 1,102,040 | |
| | 1,000 | | 5.000%, 5/01/38 | | 5/21 at 100.00 | | A– | | 1,093,370 | |
| NXK | Nuveen New York Dividend Advantage Municipal Fund 2 | |
| | Portfolio of Investments (continued) | September 30, 2014 |
| | Principal | | | | Optional Call | | | | | |
| | Amount (000) | | Description (1) | | Provisions (2) | | Ratings (3) | | Value | |
| | | | Utilities (continued) | | | | | | | |
| $ | 900 | | Nassau County Industrial Development Authority, New York, Keyspan Glenwood Energy Project, Series 2003, 5.250%, 6/01/27 (Alternative Minimum Tax) | | 12/14 at 100.00 | | A– | $ | 903,456 | |
| | 2,225 | | Niagara Area Development Corporation, New York, Solid Waste Disposal Facility Revenue Refunding Bonds, Covanta Energy Project, Series 2012A, 5.250%, 11/01/42 | | No Opt. Call | | BB+ | | 2,278,600 | |
| | 695 | | Suffolk County Industrial Development Agency, New York, Revenue Bonds, Nissequogue Cogeneration Partners Facility, Series 1998, 5.500%, 1/01/23 (Alternative Minimum Tax) | | 1/15 at 100.00 | | N/R | | 695,007 | |
| | 3,285 | | Utility Debt Securitization Authority, New York, Restructuring Bonds, Series 2013TE, 5.000%, 12/15/41 | | 12/23 at 100.00 | | AAA | | 3,765,924 | |
| | 12,830 | | Total Utilities | | | | | | 13,817,401 | |
| | | | Water and Sewer – 6.5% (4.4% of Total Investments) | | | | | | | |
| | 820 | | Guam Government Waterworks Authority, Water and Wastewater System Revenue Bonds, Series 2010, 5.625%, 7/01/40 | | 7/20 at 100.00 | | A– | | 897,293 | |
| | 4,875 | | New York State Environmental Facilities Corporation, State Clean Water and Drinking Water Revolving Funds Revenue Bonds, New York City Municipal Water Finance Authority Projects, Second Resolution Series 2011B, 5.000%, 6/15/41 | | 6/21 at 100.00 | | AAA | | 5,464,826 | |
| | 5,695 | | Total Water and Sewer | | | | | | 6,362,119 | |
| $ | 133,175 | | Total Long-Term Investments (cost $135,682,853) | | | | | | 144,199,363 | |
| | | | Floating Rate Obligations – (9.6)% | | | | | | (9,400,000 | ) |
| | | | Variable Rate MuniFund Term Preferred Shares, at Liquidation Value – (38.8)% (7) | | | | | | (38,000,000 | ) |
| | | | Other Assets Less Liabilities – 1.3% | | | | | | 1,212,651 | |
| | | | Net Assets Applicable to Common Shares – 100% | | | | | $ | 98,012,014 | |
| (1) | All percentages shown in the Portfolio of Investments are based on net assets applicable to common shares unless otherwise noted. |
| (2) | Optional Call Provisions (not covered by the report of independent registered public accounting firm): Dates (month and year) and prices of the earliest optional call or redemption. There may be other call provisions at varying prices at later dates. Certain mortgage-backed securities may be subject to periodic principal paydowns. |
| (3) | Ratings (not covered by the report of independent registered public accounting firm): Using the highest of Standard & Poor’s Group (“Standard & Poor’s”), Moody’s Investors Service, Inc. (“Moody’s”) or Fitch, Inc. (“Fitch”) rating. Ratings below BBB by Standard & Poor’s, Baa by Moody’s or BBB by Fitch are considered to be below investment grade. Holdings designated N/R are not rated by any of these national rating agencies. |
| (4) | Investment, or portion of investment, has been pledged to collateralize the net payment obligations for investments in inverse floating rate transactions. |
| (5) | On April 1, 2013, the Fund’s Adviser determined it was unlikely that this borrower would fulfill its entire obligation on this security, and therefore reduced the security’s interest rate of accrual from 5.875% to 2.350%. |
| (6) | Backed by an escrow or trust containing sufficient U.S. Government or U.S. Government agency securities, which ensure the timely payment of principal and interest. Certain bonds backed by U.S. Government or agency securities are regarded as having an implied rating equal to the rating of such securities. |
| (7) | Variable Rate MuniFund Term Preferred Shares, at Liquidation Value as a percentage of Total Investments is 26.4%. |
| WI/DD | Investment, or portion of investment, purchased on a when-issued or delayed delivery basis. |
| (IF) | Inverse floating rate investment. |
| (UB) | Underlying bond of an inverse floating rate trust reflected as a financing transaction. See Notes to Financial Statements, Note 3 – Portfolio Securities and Investments in Derivatives, Inverse Floating Rate Securities for more information. |
See accompanying notes to financial statements.
| NRK | | |
| | Nuveen New York AMT-Free Municipal Income Fund |
| | Portfolio of Investments | September 30, 2014 |
| | Principal | | | | Optional Call | | | | | |
| | Amount (000) | | Description (1) | | Provisions (2) | | Ratings (3) | | Value | |
| | | | LONG-TERM INVESTMENTS 150.6% (100.0% of Total Investments) | | | | | | | |
| | | | MUNICIPAL BONDS – 150.6% (100.0% of Total Investments) | | | | | | | |
| | | | Consumer Staples – 3.1% (2.1% of Total Investments) | | | | | | | |
| $ | 6,350 | | Nassau County Tobacco Settlement Corporation, New York, Tobacco Settlement Asset-Backed Bonds, Series 2006A-3, 5.000%, 6/01/35 | | 6/16 at 100.00 | | B | $ | 5,296,154 | |
| | 680 | | New York Counties Tobacco Trust II, Tobacco Settlement Pass-Through Bonds, Series 2001, 5.250%, 6/01/25 | | 12/14 at 100.00 | | A1 | | 679,939 | |
| | 1,165 | | New York Counties Tobacco Trust III, Tobacco Settlement Pass-Through Bonds, Series 2003, 5.750%, 6/01/33 | | 12/14 at 100.00 | | A1 | | 1,164,895 | |
| | 40,120 | | TSASC Inc., New York, Tobacco Asset-Backed Bonds, Series 2006, 5.125%, 6/01/42 | | 6/16 at 100.00 | | B | | 32,611,141 | |
| | 48,315 | | Total Consumer Staples | | | | | | 39,752,129 | |
| | | | Education and Civic Organizations – 28.0% (18.6% of Total Investments) | | | | | | | |
| | | | Brooklyn Arena Local Development Corporation, New York, Payment in Lieu of Taxes Revenue Bonds, Barclays Center Project, Series 2009: | | | | | | | |
| | 9,995 | | 0.000%, 7/15/45 | | No Opt. Call | | BBB– | | 2,107,946 | |
| | 29,145 | | 0.000%, 7/15/47 | | No Opt. Call | | BBB– | | 5,518,314 | |
| | | | Build NYC Resource Corporation, New York, Revenue Bonds, Bronx Charter School for Excellence, Series 2013A: | | | | | | | |
| | 250 | | 5.000%, 4/01/33 | | 4/23 at 100.00 | | BBB– | | 261,528 | |
| | 2,535 | | 5.500%, 4/01/43 | | 4/23 at 100.00 | | BBB– | | 2,715,137 | |
| | 1,030 | | Dormitory Authority of the State of New York, 853 Schools Program Insured Revenue Bonds, St. Anne Institute, Issue 2, Series 1998E, 5.000%, 7/01/18 – AMBAC Insured | | 1/15 at 100.00 | | N/R | | 1,034,161 | |
| | | | Dormitory Authority of the State of New York, General Revenue Bonds, New York University, Series 2001-1: | | | | | | | |
| | 1,500 | | 5.500%, 7/01/24 – AMBAC Insured | | No Opt. Call | | AA– | | 1,905,150 | |
| | 4,000 | | 5.500%, 7/01/40 – AMBAC Insured | | No Opt. Call | | AA– | | 5,185,520 | |
| | 9,400 | | Dormitory Authority of the State of New York, General Revenue Bonds, Saint Johns University, Series 2007A, 5.250%, 7/01/32 – NPFG Insured | | 7/17 at 100.00 | | AA– | | 9,889,458 | |
| | 4,990 | | Dormitory Authority of the State of New York, General Revenue Bonds, Saint Johns University, Series 2013A, 5.000%, 7/01/44 | | 7/23 at 100.00 | | A– | | 5,496,485 | |
| | 4,265 | | Dormitory Authority of the State of New York, Housing Revenue Bonds, Fashion Institute of Technology, Series 2007, 5.250%, 7/01/34 – FGIC Insured | | No Opt. Call | | AA– | | 4,991,202 | |
| | 6,000 | | Dormitory Authority of the State of New York, Insured Revenue Bonds, Mount Sinai School of Medicine, Series 1994A, 5.150%, 7/01/24 – NPFG Insured | | No Opt. Call | | AA– | | 6,927,000 | |
| | | | Dormitory Authority of the State of New York, Insured Revenue Bonds, Touro College and University System, Series 2014A: | | | | | | | |
| | 1,685 | | 5.250%, 1/01/34 | | 7/24 at 100.00 | | BBB– | | 1,865,801 | |
| | 2,185 | | 5.500%, 1/01/39 | | 7/24 at 100.00 | | BBB– | | 2,437,105 | |
| | 2,820 | | 5.500%, 1/01/44 | | 7/24 at 100.00 | | BBB– | | 3,109,501 | |
| | 6,660 | | Dormitory Authority of the State of New York, Lease Revenue Bonds, State University Dormitory Facilities, Series 2004A, 5.000%, 7/01/29 – NPFG Insured | | 7/15 at 100.00 | | Aa2 | | 6,858,468 | |
| | 10,000 | | Dormitory Authority of the State of New York, Lease Revenue Bonds, State University Dormitory Facilities, Series 2006A, 5.000%, 7/01/31 – NPFG Insured | | 7/16 at 100.00 | | Aa2 | | 10,603,000 | |
| | 6,215 | | Dormitory Authority of the State of New York, Lease Revenue Bonds, State University Dormitory Facilities, Series 2009A, 5.000%, 7/01/39 | | 7/19 at 100.00 | | Aa2 | | 6,800,391 | |
| | 4,750 | | Dormitory Authority of the State of New York, Lease Revenue Bonds, State University Dormitory Facilities, Series 2011A, 5.000%, 7/01/41 | | 7/21 at 100.00 | | Aa2 | | 5,323,515 | |
| | 3,750 | | Dormitory Authority of the State of New York, Lease Revenue Bonds, State University Dormitory Facilities, Series 2012A, 5.000%, 7/01/37 | | 7/22 at 100.00 | | Aa2 | | 4,214,138 | |
| NRK | Nuveen New York AMT-Free Municipal Income Fund | |
| | Portfolio of Investments (continued) | September 30, 2014 |
| | Principal | | | | Optional Call | | | | | |
| | Amount (000) | | Description (1) | | Provisions (2) | | Ratings (3) | | Value | |
| | | | Education and Civic Organizations (continued) | | | | | | | |
| $ | 14,585 | | Dormitory Authority of the State of New York, Lease Revenue Bonds, State University Dormitory Facilities, Series 2013A, 5.000%, 7/01/27 | | 7/23 at 100.00 | | Aa3 | $ | 17,246,471 | |
| | | | Dormitory Authority of the State of New York, Revenue Bonds, Barnard College, Series 2007A: | | | | | | | |
| | 2,000 | | 5.000%, 7/01/25 – FGIC Insured | | 7/17 at 100.00 | | AA– | | 2,181,860 | |
| | 6,525 | | 5.000%, 7/01/37 – FGIC Insured | | 7/17 at 100.00 | | AA– | | 7,049,088 | |
| | 1,150 | | Dormitory Authority of the State of New York, Revenue Bonds, Canisius College, Series 2005, 5.000%, 7/01/21 – NPFG Insured | | 7/15 at 100.00 | | A3 | | 1,165,100 | |
| | 9,180 | | Dormitory Authority of the State of New York, Revenue Bonds, Columbia University, Series 2011A, 5.000%, 10/01/41 | | 4/21 at 100.00 | | AAA | | 10,519,913 | |
| | | | Dormitory Authority of the State of New York, Revenue Bonds, Convent of the Sacred Heart, Series 2011: | | | | | | | |
| | 1,000 | | 5.625%, 11/01/35 – AGM Insured | | 5/21 at 100.00 | | AA | | 1,164,410 | |
| | 5,980 | | 5.750%, 11/01/40 – AGM Insured | | 5/21 at 100.00 | | AA | | 6,942,302 | |
| | 3,000 | | Dormitory Authority of the State of New York, Revenue Bonds, Fordham University, Series 2008B, 5.000%, 7/01/38 – AGC Insured | | 7/18 at 100.00 | | A2 | | 3,341,610 | |
| | 1,000 | | Dormitory Authority of the State of New York, Revenue Bonds, Marymount Manhattan College, Series 2009, 5.250%, 7/01/29 | | 7/19 at 100.00 | | Baa2 | | 1,052,010 | |
| | 875 | | Dormitory Authority of the State of New York, Revenue Bonds, New School University, Series 2010, 5.250%, 7/01/30 | | 7/20 at 100.00 | | A– | | 972,169 | |
| | 3,250 | | Dormitory Authority of the State of New York, Revenue Bonds, New York University, Series 1998A, 6.000%, 7/01/18 – NPFG Insured | | No Opt. Call | | AA– | | 3,855,605 | |
| | 3,415 | | Dormitory Authority of the State of New York, Revenue Bonds, New York University, Series 2007, 5.000%, 7/01/32 – AMBAC Insured | | 7/17 at 100.00 | | AA– | | 3,763,842 | |
| | | | Dormitory Authority of the State of New York, Revenue Bonds, New York University, Series 2009A: | | | | | | | |
| | 10,000 | | 5.250%, 7/01/34 | | 7/19 at 100.00 | | AA– | | 11,574,600 | |
| | 3,890 | | 5.000%, 7/01/39 | | 7/19 at 100.00 | | AA– | | 4,427,909 | |
| | 13,500 | | Dormitory Authority of the State of New York, Revenue Bonds, New York University, Series 2009B, 5.000%, 7/01/39 | | 7/19 at 100.00 | | AA– | | 15,399,720 | |
| | 3,115 | | Dormitory Authority of the State of New York, Revenue Bonds, New York University, Series 2012A, 5.000%, 7/01/32 | | 7/22 at 100.00 | | AA– | | 3,530,292 | |
| | 2,800 | | Dormitory Authority of the State of New York, Revenue Bonds, Non State Supported Debt, Cornell University, Series 2008C, 5.000%, 7/01/37 | | 7/20 at 100.00 | | Aa1 | | 3,196,200 | |
| | | | Dormitory Authority of the State of New York, Revenue Bonds, Non State Supported Debt, Cornell University, Series 2010A: | | | | | | | |
| | 5,000 | | 5.000%, 7/01/35 | | 7/20 at 100.00 | | Aa1 | | 5,722,000 | |
| | 11,560 | | 5.000%, 7/01/40 | | 7/20 at 100.00 | | Aa1 | | 13,101,757 | |
| | | | Dormitory Authority of the State of New York, Revenue Bonds, Rochester Institute of Technology, Series 2006A: | | | | | | | |
| | 2,500 | | 5.250%, 7/01/20 – AMBAC Insured | | No Opt. Call | | A1 | | 2,958,075 | |
| | 2,000 | | 5.250%, 7/01/21 – AMBAC Insured | | No Opt. Call | | A1 | | 2,380,160 | |
| | 1,250 | | Dormitory Authority of the State of New York, Revenue Bonds, University of Rochester, Refunding Series 2009A, 5.125%, 7/01/39 | | No Opt. Call | | AA– | | 1,423,813 | |
| | 1,000 | | Dutchess County Local Development Corporation, New York, Revenue Bonds, Marist College Project, Series 2013A, 5.000%, 7/01/39 | | 7/23 at 100.00 | | A2 | | 1,108,620 | |
| | | | Hempstead Town Local Development Corporation, New York, Revenue Bonds, Adelphi University Project, Series 2013: | | | | | | | |
| | 1,785 | | 5.000%, 9/01/38 | | 9/23 at 100.00 | | A | | 1,979,190 | |
| | 1,785 | | 5.000%, 9/01/43 | | 9/23 at 100.00 | | A | | 1,954,896 | |
| | 15,650 | | Madison County Industrial Development Agency, New York, Civic Facility Revenue Bonds, Colgate University, Series 2005A, 5.000%, 7/01/40 – AMBAC Insured | | 7/15 at 100.00 | | AA+ | | 16,093,521 | |
| | 1,400 | | Monroe County Industrial Development Corporation, New York, Revenue Bonds, Saint John Fisher College, Series 2014A, 5.500%, 6/01/39 | | 6/24 at 100.00 | | BBB+ | | 1,560,412 | |
| | Principal | | | | Optional Call | | | | | |
| | Amount (000) | | Description (1) | | Provisions (2) | | Ratings (3) | | Value | |
| | | | Education and Civic Organizations (continued) | | | | | | | |
| $ | 7,250 | | New York City Industrial Development Agency, New York, Civic Facility Revenue Bonds, Horace Mann School, Series 1998, 5.000%, 7/01/28 – NPFG Insured | | 1/15 at 100.00 | | AA– | $ | 7,274,578 | |
| | | | New York City Industrial Development Agency, New York, Payment in Lieu of Taxes Revenue Bonds, Queens Baseball Stadium Project, Series 2009: | | | | | | | |
| | 1,000 | | 6.125%, 1/01/29 – AGC Insured | | 1/19 at 100.00 | | AA | | 1,159,580 | |
| | 1,000 | | 6.375%, 1/01/39 – AGC Insured | | 1/19 at 100.00 | | AA | | 1,167,910 | |
| | | | New York City Industrial Development Agency, New York, PILOT Revenue Bonds, Queens Baseball Stadium Project, Series 2006: | | | | | | | |
| | 6,815 | | 5.000%, 1/01/31 – AMBAC Insured | | 1/17 at 100.00 | | Ba1 | | 7,008,887 | |
| | 5,000 | | 5.000%, 1/01/36 – AMBAC Insured | | 1/17 at 100.00 | | Ba1 | | 5,131,900 | |
| | 1,030 | | 4.750%, 1/01/42 – AMBAC Insured | | 1/17 at 100.00 | | Ba1 | | 1,049,879 | |
| | 14,500 | | 5.000%, 1/01/46 – AMBAC Insured | | 1/17 at 100.00 | | Ba1 | | 14,844,665 | |
| | 4,730 | | New York City Industrial Development Agency, New York, Revenue Bonds, Yankee Stadium Project PILOT, Series 2009A, 7.000%, 3/01/49 – AGC Insured | | 3/19 at 100.00 | | AA | | 5,775,708 | |
| | | �� | New York City Industrial Development Authority, New York, PILOT Revenue Bonds, Yankee Stadium Project, Series 2006: | | | | | | | |
| | 4,280 | | 5.000%, 3/01/31 – FGIC Insured | | 9/16 at 100.00 | | BBB | | 4,380,066 | |
| | 31,650 | | 5.000%, 3/01/36 – NPFG Insured | | 9/16 at 100.00 | | AA– | | 32,366,240 | |
| | 20,210 | | 4.500%, 3/01/39 – FGIC Insured | | 9/16 at 100.00 | | BBB | | 20,444,638 | |
| | 3,400 | | New York City Trust for Cultural Resources, New York, Revenue Bonds, Whitney Museum of American Art, Series 2011, 5.000%, 7/01/31 | | 1/21 at 100.00 | | A | | 3,798,276 | |
| | | | Niagara Area Development Corporation, New York, Niagara University Project, Series 2012A: | | | | | | | |
| | 600 | | 5.000%, 5/01/35 | | 5/22 at 100.00 | | BBB+ | | 639,108 | |
| | 1,000 | | 5.000%, 5/01/42 | | 5/22 at 100.00 | | BBB+ | | 1,061,820 | |
| | 1,450 | | Onondaga Civic Development Corporation, New York, Revenue Bonds, Le Moyne College Project, Series 2012, 5.000%, 7/01/42 | | 7/22 at 100.00 | | Baa2 | | 1,537,319 | |
| | 1,000 | | Onondaga County Trust For Cultural Resources, New York, Revenue Bonds, Syracuse University Project, Series 2011, 5.000%, 12/01/36 | | 12/21 at 100.00 | | AA– | | 1,112,090 | |
| | | | Tompkins County Development Corporation, New York, Revenue Bonds, Ithaca College, Series 2011: | | | | | | | |
| | 1,390 | | 5.500%, 7/01/33 – AGM Insured | | 1/21 at 100.00 | | A2 | | 1,556,842 | |
| | 1,000 | | 5.250%, 7/01/36 – AGM Insured | | 1/21 at 100.00 | | A2 | | 1,096,580 | |
| | 4,000 | | 5.375%, 7/01/41 – AGM Insured | | 1/21 at 100.00 | | A2 | | 4,412,960 | |
| | 3,700 | | Troy Capital Resource Corporation, New York, Revenue Bonds, Rensselaer Polytechnic Institute, Series 2010A, 5.125%, 9/01/40 | | 9/20 at 100.00 | | A– | | 4,021,937 | |
| | 355,375 | | Total Education and Civic Organizations | | | | | | 352,750,348 | |
| | | | Financials – 1.5% (1.0% of Total Investments) | | | | | | | |
| | 1,615 | | New York Liberty Development Corporation, Revenue Bonds, Goldman Sachs Headquarters Issue, Series 2005, 5.250%, 10/01/35 | | No Opt. Call | | A | | 1,916,617 | |
| | 13,835 | | New York Liberty Development Corporation, Revenue Bonds, Goldman Sachs Headquarters Issue, Series 2007, 5.500%, 10/01/37 | | No Opt. Call | | A | | 16,972,501 | |
| | 15,450 | | Total Financials | | | | | | 18,889,118 | |
| | | | Health Care – 10.4% (6.9% of Total Investments) | | | | | | | |
| | 5,315 | | Albany Capital Resource Corporation, New York, St. Peter’s Hospital Project, Series 2011, 6.125%, 11/15/30 | | 11/20 at 100.00 | | A+ | | 6,112,675 | |
| | 5,935 | | Albany Industrial Development Agency, New York, Revenue Bonds, Saint Peter’s Hospital, Series 2008A, 5.250%, 11/15/32 | | 11/17 at 100.00 | | A+ | | 6,466,657 | |
| | 4,205 | | Albany Industrial Development Agency, New York, Revenue Bonds, Saint Peter’s Hospital, Series 2008D, 5.375%, 11/15/32 | | 11/17 at 100.00 | | A+ | | 4,597,453 | |
| | 1,000 | | Albany Industrial Development Agency, New York, Revenue Bonds, Saint Peter’s Hospital, Series 2008E, 5.250%, 11/15/32 | | 11/17 at 100.00 | | A+ | | 1,089,580 | |
| | 1,250 | | Build NYC Resource Corporation, New York, Revenue Bonds, New York Methodist Hospital Project, Series 2014, 5.000%, 7/01/27 (WI/DD, Settling 10/15/14) | | 7/24 at 100.00 | | A– | | 1,422,563 | |
| NRK | Nuveen New York AMT-Free Municipal Income Fund | |
| | Portfolio of Investments (continued) | September 30, 2014 |
| | Principal | | | | Optional Call | | | | | |
| | Amount (000) | | Description (1) | | Provisions (2) | | Ratings (3) | | Value | |
| | | | Health Care (continued) | | | | | | | |
| $ | 2,495 | | Dormitory Authority of the State of New York, FHA-Insured Mortgage Hospital Revenue Bonds, Hospital for Special Surgery, Series 2009, 6.250%, 8/15/34 | | 8/19 at 100.00 | | AA+ | $ | 2,961,415 | |
| | 7,620 | | Dormitory Authority of the State of New York, FHA-Insured Mortgage Revenue Bonds, Hudson Valley Hospital Center, Series 2007, 5.000%, 8/15/27 – AGM Insured | | 8/17 at 100.00 | | AA | | 8,377,276 | |
| | | | Dormitory Authority of the State of New York, FHA-Insured Mortgage Revenue Bonds, Montefiore Hospital, Series 2004: | | | | | | | |
| | 9,330 | | 5.000%, 8/01/29 – FGIC Insured | | 2/15 at 100.00 | | AA– | | 9,452,130 | |
| | 425 | | 5.000%, 8/01/33 – FGIC Insured | | 2/15 at 100.00 | | AA– | | 429,535 | |
| | 8,035 | | Dormitory Authority of the State of New York, FHA-Insured Revenue Bonds, Montefiore Medical Center, Series 2005, 5.000%, 2/01/22 – FGIC Insured | | 2/15 at 100.00 | | AA– | | 8,155,043 | |
| | 4,000 | | Dormitory Authority of the State of New York, North Shore Long Island Jewish Obligated Group Revenue Bonds, Series 2011A, 5.000%, 5/01/41 | | 5/21 at 100.00 | | A | | 4,325,640 | |
| | | | Dormitory Authority of the State of New York, Orange Regional Medical Center Obligated Group Revenue Bonds, Series 2008: | | | | | | | |
| | 3,880 | | 6.000%, 12/01/15 | | No Opt. Call | | Ba1 | | 4,068,568 | |
| | 4,345 | | 6.000%, 12/01/16 | | No Opt. Call | | Ba1 | | 4,704,332 | |
| | 5,430 | | 6.500%, 12/01/21 | | 12/18 at 100.00 | | Ba1 | | 6,064,387 | |
| | 6,780 | | 6.125%, 12/01/29 | | 12/18 at 100.00 | | Ba1 | | 7,216,632 | |
| | 14,770 | | 6.250%, 12/01/37 | | 12/18 at 100.00 | | Ba1 | | 15,589,440 | |
| | | | Dormitory Authority of the State of New York, Revenue Bonds, Health Quest System Inc., Series 2007B: | | | | | | | |
| | 3,865 | | 5.250%, 7/01/27 – AGC Insured | | 7/17 at 100.00 | | AA | | 4,255,558 | |
| | 3,500 | | 5.125%, 7/01/37 – AGC Insured | | 7/17 at 100.00 | | AA | | 3,812,585 | |
| | 3,565 | | Dormitory Authority of the State of New York, Revenue Bonds, New York and Presbyterian Hospital, Series 2004A, 5.250%, 8/15/15 – AGM Insured | | 2/15 at 100.00 | | AA | | 3,605,106 | |
| | 900 | | Dutchess County Local Development Corporation, New York, Revenue Bonds, Health Quest System Inc, Series 2010A, 5.750%, 7/01/40 – AGM Insured | | 7/20 at 100.00 | | A– | | 1,002,159 | |
| | 1,875 | | Monroe County Industrial Development Corporation, New York, FHA Insured Mortgage Revenue Bonds, Unity Hospital of Rochester Project, Series 2010, 5.750%, 8/15/35 | | 2/21 at 100.00 | | Aa2 | | 2,252,175 | |
| | 3,900 | | Monroe County Industrial Development Corporation, New York, Revenue Bonds, Rochester General Hospital Project, Series 2013A, 5.000%, 12/01/42 | | 12/22 at 100.00 | | A– | | 4,169,295 | |
| | 6,540 | | Suffolk County Economic Development Corporation, New York, Revenue Bonds, Catholic Health Services of Long Island Obligated Group Project, Refunding Series 2011, 5.000%, 7/01/28 | | 7/21 at 100.00 | | BBB+ | | 7,166,270 | |
| | 5,050 | | Westchester County Health Care Corporation, New York, Senior Lien Revenue Bonds, Series 2010-C2, 6.125%, 11/01/37 | | 11/20 at 100.00 | | A3 | | 5,747,102 | |
| | 5,740 | | Yonkers Industrial Development Agency, New York, Revenue Bonds, St. John’s Riverside Hospital, Series 2001A, 7.125%, 7/01/31 | | 1/15 at 100.00 | | B+ | | 5,748,954 | |
| | 2,035 | | Yonkers Industrial Development Agency, New York, Revenue Bonds, St. John’s Riverside Hospital, Series 2001B, 7.125%, 7/01/31 | | 1/15 at 100.00 | | B+ | | 2,038,175 | |
| | 121,785 | | Total Health Care | | | | | | 130,830,705 | |
| | | | Housing/Multifamily – 0.3% (0.2% of Total Investments) | | | | | | | |
| | | | Canton Capital Resource Corporation, New York, Student Housing Facility Revenue Bonds, Grasse River LLC at SUNY Canton Project Series 2010A: | | | | | | | |
| | 1,000 | | 5.000%, 5/01/40 | | 5/20 at 100.00 | | AA | | 1,077,320 | |
| | 1,000 | | 5.000%, 5/01/45 – AGM Insured | | 5/20 at 100.00 | | AA | | 1,073,120 | |
| | 1,040 | | New York City Housing Development Corporation, New York, Multifamily Housing Revenue Bonds, Series 2010D-1A, 5.000%, 11/01/42 | | 5/20 at 100.00 | | AA+ | | 1,096,087 | |
| | 450 | | New York State Housing Finance Agency, Affordable Housing Revenue Bonds, Series 2009B, 4.500%, 11/01/29 | | 5/19 at 100.00 | | Aa2 | | 472,896 | |
| | | | New York State Housing Finance Agency, Mortgage Revenue Refunding Bonds, Housing Project, Series 1996A: | | | | | | | |
| | 20 | | 6.100%, 11/01/15 – AGM Insured | | 11/14 at 100.00 | | AA | | 20,099 | |
| | 390 | | 6.125%, 11/01/20 – AGM Insured | | 11/14 at 100.00 | | AA | | 391,030 | |
| | 3,900 | | Total Housing/Multifamily | | | | | | 4,130,552 | |
| | Principal | | | | Optional Call | | | | | |
| | Amount (000) | | Description (1) | | Provisions (2) | | Ratings (3) | | Value | |
| | | | Long-Term Care – 0.8% (0.5% of Total Investments) | | | | | | | |
| $ | 800 | | Dormitory Authority of the State of New York, GNMA Collateralized Revenue Bonds, Cabrini of Westchester Project, Series 2006, 5.200%, 2/15/41 | | 2/17 at 103.00 | | AA+ | $ | 847,216 | |
| | 7,310 | | Erie County Industrial Development Agency, New York, Revenue Bonds, Orchard Park CCRC Inc. Project, Series 2006A, 6.000%, 11/15/36 | | 11/16 at 100.00 | | N/R | | 7,435,220 | |
| | 1,225 | | Suffolk County Economic Development Corporation, New York, Revenue Bonds, Peconic Landing At Southold, Inc. Project, Refunding Series 2010, 6.000%, 12/01/40 | | 12/20 at 100.00 | | BBB– | | 1,349,252 | |
| | 9,335 | | Total Long-Term Care | | | | | | 9,631,688 | |
| | | | Tax Obligation/General – 9.6% (6.4% of Total Investments) | | | | | | | |
| | 1,000 | | Nassau County, New York, General Obligation Bonds, General Improvement Series 2009C, 5.000%,10/01/29 – AGC Insured | | 10/19 at 100.00 | | AA | | 1,093,480 | |
| | 210 | | Nassau County, New York, General Obligation Improvement Bonds, Series 1993H, 5.500%, 6/15/16 – NPFG Insured | | No Opt. Call | | AA– | | 227,365 | |
| | 1,200 | | New York City, New York, General Obligation Bonds, Fiscal 2009 Series E, 5.000%, 8/01/28 | | 8/19 at 100.00 | | AA | | 1,381,776 | |
| | | | New York City, New York, General Obligation Bonds, Fiscal 2012 Series A-1: | | | | | | | |
| | 6,085 | | 5.000%, 10/01/31 | | No Opt. Call | | AA | | 6,975,418 | |
| | 1,000 | | 5.000%, 10/01/33 | | 10/22 at 100.00 | | AA | | 1,134,130 | |
| | 1,570 | | 5.000%, 10/01/34 | | No Opt. Call | | AA | | 1,774,634 | |
| | 8,665 | | New York City, New York, General Obligation Bonds, Fiscal 2012 Series B, 5.000%, 8/01/30 | | No Opt. Call | | AA | | 9,974,628 | |
| | | | New York City, New York, General Obligation Bonds, Fiscal 2012 Series I: | | | | | | | |
| | 1,000 | | 5.000%, 8/01/30 | | 8/22 at 100.00 | | AA | | 1,151,140 | |
| | 2,000 | | 5.000%, 8/01/31 | | 8/22 at 100.00 | | AA | | 2,287,160 | |
| | | | New York City, New York, General Obligation Bonds, Fiscal 2013 Series F-1: | | | | | | | |
| | 5,000 | | 5.000%, 3/01/29 | | 3/23 at 100.00 | | AA | | 5,785,350 | |
| | 3,400 | | 5.000%, 3/01/31 | | 3/23 at 100.00 | | AA | | 3,901,194 | |
| | 2,190 | | 5.000%, 3/01/32 | | 3/23 at 100.00 | | AA | | 2,500,564 | |
| | 1,000 | | 5.000%, 3/01/33 | | 3/23 at 100.00 | | AA | | 1,136,250 | |
| | 3,735 | | New York City, New York, General Obligation Bonds, Fiscal 2014 Series A-1, 5.000%, 8/01/26 | | 8/23 at 100.00 | | AA | | 4,408,607 | |
| | 8,000 | | New York City, New York, General Obligation Bonds, Fiscal 2014 Series D-1, 5.000%, 8/01/30 | | 8/23 at 100.00 | | AA | | 9,270,560 | |
| | 7,665 | | New York City, New York, General Obligation Bonds, Fiscal 2015 Series A, 5.000%, 8/01/33 | | 8/24 at 100.00 | | AA | | 8,859,588 | |
| | | | New York City, New York, General Obligation Bonds, Fiscal Series 2001D: | | | | | | | |
| | 5 | | 5.250%, 8/01/15 – AGM Insured | | 2/15 at 100.00 | | AA | | 5,022 | |
| | 5 | | 5.000%, 8/01/16 – FGIC Insured | | 2/15 at 100.00 | | AA | | 5,020 | |
| | 6,910 | | New York City, New York, General Obligation Bonds, Fiscal Series 2004E, 5.000%, 11/01/20 – AGM Insured | | 11/14 at 100.00 | | AA | | 6,938,193 | |
| | 10,330 | | New York City, New York, General Obligation Bonds, Fiscal Series 2005J, 5.000%, 3/01/19 – FGIC Insured | | 3/15 at 100.00 | | AA | | 10,538,563 | |
| | 715 | | New York City, New York, General Obligation Bonds, Fiscal Series 2006C, 5.000%, 8/01/16 – AGM Insured | | No Opt. Call | | AA | | 743,915 | |
| | | | New York City, New York, General Obligation Bonds, Series 2011D-I: | | | | | | | |
| | 2,785 | | 5.000%, 10/01/30 | | 10/21 at 100.00 | | AA | | 3,231,491 | |
| | 2,880 | | 5.000%, 10/01/34 | | No Opt. Call | | AA | | 3,240,605 | |
| | 3,345 | | New York City, New York, General Obligation Bonds, Subseries G-1 Fiscal Series 2012, 5.000%, 4/01/28 | | No Opt. Call | | AA | | 3,895,219 | |
| | | | Pavilion Central School District, Genesee County, New York, General Obligation Bonds, Series 2005: | | | | | | | |
| | 1,650 | | 5.000%, 6/15/16 – AGM Insured | | 6/15 at 100.00 | | AA | | 1,697,075 | |
| | 1,815 | | 5.000%, 6/15/18 – AGM Insured | | 6/15 at 100.00 | | AA | | 1,876,329 | |
| | | | Rensselaer County, New York, General Obligation Bonds, Series 1991: | | | | | | | |
| | 960 | | 6.700%, 2/15/16 – AMBAC Insured | | No Opt. Call | | AA | | 1,041,888 | |
| | 960 | | 6.700%, 2/15/17 – AMBAC Insured | | No Opt. Call | | AA | | 1,094,736 | |
| | 960 | | 6.700%, 2/15/18 – AMBAC Insured | | No Opt. Call | | AA | | 1,140,336 | |
| | 960 | | 6.700%, 2/15/19 – AMBAC Insured | | No Opt. Call | | AA | | 1,182,643 | |
| | 960 | | 6.700%, 2/15/20 – AMBAC Insured | | No Opt. Call | | AA | | 1,216,013 | |
| | 747 | | 6.700%, 2/15/21 – AMBAC Insured | | No Opt. Call | | AA | | 967,559 | |
| NRK | Nuveen New York AMT-Free Municipal Income Fund | |
| | Portfolio of Investments (continued) | September 30, 2014 |
| | Principal | | | | Optional Call | | | | | |
| | Amount (000) | | Description (1) | | Provisions (2) | | Ratings (3) | | Value | |
| | | | Tax Obligation/General (continued) | | | | | | | |
| | | | Rochester, New York, General Obligation Bonds, Series 1999: | | | | | | | |
| $ | 735 | | 5.250%, 10/01/20 – NPFG Insured | | No Opt. Call | | AA– | $ | 878,891 | |
| | 735 | | 5.250%, 10/01/21 – NPFG Insured | | No Opt. Call | | AA– | | 885,572 | |
| | 730 | | 5.250%, 10/01/22 – NPFG Insured | | No Opt. Call | | AA– | | 884,658 | |
| | 730 | | 5.250%, 10/01/23 – NPFG Insured | | No Opt. Call | | AA– | | 891,761 | |
| | 730 | | 5.250%, 10/01/24 – NPFG Insured | | No Opt. Call | | AA– | | 898,156 | |
| | 730 | | 5.250%, 10/01/25 – NPFG Insured | | No Opt. Call | | AA– | | 909,325 | |
| | 725 | | 5.250%, 10/01/26 – NPFG Insured | | No Opt. Call | | AA– | | 909,012 | |
| | 1,145 | | Three Village Central School District, Brookhaven and Smithtown, Suffolk County, New York, General Obligation Bonds, Series 2005, 5.000%, 6/01/18 – FGIC Insured | | No Opt. Call | | Aa2 | | 1,311,598 | |
| | 1,620 | | West Islip Union Free School District, Suffolk County, New York, General Obligation Bonds, Series 2005, 5.000%, 10/01/16 – AGM Insured | | 10/15 at 100.00 | | Aa3 | | 1,694,245 | |
| | 7,635 | | Yonkers, New York, General Obligation Bonds, Series 2005A, 5.000%, 8/01/16 – NPFG Insured | | 8/15 at 100.00 | | AA– | | 7,924,517 | |
| | | | Yonkers, New York, General Obligation Bonds, Series 2005B: | | | | | | | |
| | 1,650 | | 5.000%, 8/01/19 | | 8/15 at 100.00 | | A3 | | 1,710,704 | |
| | 1,735 | | 5.000%, 8/01/20 | | 8/15 at 100.00 | | A3 | | 1,798,275 | |
| | 108,607 | | Total Tax Obligation/General | | | | | | 121,373,165 | |
| | | | Tax Obligation/Limited – 52.7% (35.0% of Total Investments) | | | | | | | |
| | 1,615 | | Dormitory Authority of the State of New York, 853 Schools Program Insured Revenue Bonds, Harmony Heights School, Issue 1, Series 1999C, 5.500%, 7/01/18 – AMBAC Insured | | 1/15 at 100.00 | | N/R | | 1,622,187 | |
| | 115 | | Dormitory Authority of the State of New York, 853 Schools Program Insured Revenue Bonds, Vanderheyden Hall Inc., Issue 2, Series 1998F, 5.250%, 7/01/18 – AMBAC Insured | | 1/15 at 100.00 | | N/R | | 115,489 | |
| | 825 | | Dormitory Authority of the State of New York, Insured Revenue Bonds, 853 Schools Program – Anderson School, Series 1999E, Issue 2, 5.750%, 7/01/19 – AMBAC Insured | | 1/15 at 100.00 | | N/R | | 828,836 | |
| | 7,825 | | Dormitory Authority of the State of New York, Insured Revenue Bonds, Special Act School District Program, Series 1999, 5.750%, 7/01/19 – NPFG Insured | | 1/15 at 100.00 | | AA– | | 7,858,961 | |
| | 1,000 | | Dormitory Authority of the State of New York, Master Lease Program Revenue Bonds, Nassau County Board of Cooperative Educational Services, Series 2009A, 5.000%, 8/15/28 – AGC Insured | | 8/19 at 100.00 | | AA | | 1,114,770 | |
| | 10,840 | | Dormitory Authority of the State of New York, Revenue Bonds, Department of Health, Series 2004-2, 5.000%, 7/01/20 – FGIC Insured | | 1/15 at 100.00 | | AA | | 10,882,601 | |
| | | | Dormitory Authority of the State of New York, Revenue Bonds, Mental Health Services Facilities Improvements, Series 2005D-1: | | | | | | | |
| | 5,285 | | 5.000%, 2/15/15 – NPFG Insured | | No Opt. Call | | AA | | 5,382,033 | |
| | 4,710 | | 5.000%, 8/15/23 – NPFG Insured | | 2/15 at 100.00 | | AA | | 4,792,425 | |
| | 1,000 | | Dormitory Authority of the State of New York, Revenue Bonds, School Districts Financing Program, Series 2009A, 5.625%, 10/01/29 – AGC Insured | | 10/19 at 100.00 | | AA | | 1,168,900 | |
| | 4,000 | | Dormitory Authority of the State of New York, Revenue Bonds, State University Educational Facilities, 1989 Resolution, Series 2000C, 5.750%, 5/15/16 – AGM Insured | | No Opt. Call | | AA | | 4,351,280 | |
| | 1,000 | | Dormitory Authority of the State of New York, Revenue Bonds, State University Educational Facilities, Series 1993A, 5.500%, 5/15/19 – AMBAC Insured | | No Opt. Call | | Aa2 | | 1,159,560 | |
| | 3,375 | | Dormitory Authority of the State of New York, Second General Resolution Consolidated Revenue Bonds, City University System, Series 1993A, 5.750%, 7/01/18 – AGM Insured | | No Opt. Call | | AA | | 3,674,633 | |
| | 6,435 | | Dormitory Authority of the State of New York, State and Local Appropriation Lease Bonds, Upstate Community Colleges, Series 2005A, 5.000%, 7/01/19 – FGIC Insured | | 7/15 at 100.00 | | AA | | 6,659,260 | |
| | | | Dormitory Authority of the State of New York, State Personal Income Tax Revenue Bonds, General Purpose Series 2011C: | | | | | | | |
| | 995 | | 5.000%, 3/15/34 | | No Opt. Call | | AAA | | 1,128,778 | |
| | 25,100 | | 5.000%, 3/15/41 | | 3/21 at 100.00 | | AAA | | 27,724,707 | |
| | | | Dormitory Authority of the State of New York, State Personal Income Tax Revenue Bonds, General Purpose Series 2012D: | | | | | | | |
| | 7,550 | | 5.000%, 2/15/33 | | No Opt. Call | | AAA | | 8,555,509 | |
| | 10,000 | | 5.000%, 2/15/40 | | No Opt. Call | | AAA | | 11,135,600 | |
| | Principal | | | | Optional Call | | | | | |
| | Amount (000) | | Description (1) | | Provisions (2) | | Ratings (3) | | Value | |
| | | | Tax Obligation/Limited (continued) | | | | | | | |
| | | | Dormitory Authority of the State of New York, State Personal Income Tax Revenue Bonds, General Purpose Series 2014A: | | | | | | | |
| $ | 2,500 | | 5.000%, 2/15/26 | | 2/24 at 100.00 | | AAA | $ | 3,016,500 | |
| | 5,000 | | 5.000%, 2/15/29 | | 2/24 at 100.00 | | AAA | | 5,894,550 | |
| | 10,000 | | 5.000%, 2/15/30 | | 2/24 at 100.00 | | AAA | | 11,744,100 | |
| | 7,000 | | Dormitory Authority of the State of New York, State Personal Income Tax Revenue Bonds, General Purpose Series 2014C. Group C, 5.000%, 3/15/44 | | 3/24 at 100.00 | | AAA | | 7,902,300 | |
| | 28,280 | | Dormitory Authority of the State of New York, State Sales Tax Revenue Bonds, Series 2013A, 5.000%, 3/15/43 | | 3/23 at 100.00 | | AAA | | 31,791,528 | |
| | 8,100 | | Erie County Industrial Development Agency, New York, School Facility Refunding Revenue Bonds, Buffalo City School District, Series 2013A, 5.000%, 5/01/28 | | 5/23 at 100.00 | | AA | | 9,401,184 | |
| | | | Erie County Industrial Development Agency, New York, School Facility Revenue Bonds, Buffalo City School District Project, Series 2007A: | | | | | | | |
| | 5,980 | | 5.750%, 5/01/27 – AGM Insured (UB) | | 5/17 at 100.00 | | AA | | 6,657,713 | |
| | 21,030 | | 5.750%, 5/01/28 – AGM Insured (UB) | | 5/17 at 100.00 | | AA | | 23,395,665 | |
| | | | Erie County Industrial Development Agency, New York, School Facility Revenue Bonds, Buffalo City School District Project, Series 2008A: | | | | | | | |
| | 3,540 | | 5.750%, 5/01/27 – AGM Insured (UB) | | 5/18 at 100.00 | | AA | | 4,073,302 | |
| | 5,000 | | 5.750%, 5/01/28 – AGM Insured (UB) | | 5/18 at 100.00 | | AA | | 5,757,849 | |
| | 10,125 | | Erie County Industrial Development Agency, New York, School Facility Revenue Bonds, Buffalo City School District Project, Series 2009A, 5.000%, 5/01/31 | | 5/19 at 100.00 | | AA | | 11,370,274 | |
| | | | Hudson Yards Infrastructure Corporation, New York, Revenue Bonds, Senior Fiscal 2012 Series 2011A: | | | | | | | |
| | 23,030 | | 5.750%, 2/15/47 | | 2/21 at 100.00 | | A | | 26,610,474 | |
| | 6,000 | | 5.250%, 2/15/47 | | 2/21 at 100.00 | | A | | 6,623,700 | |
| | 1,850 | | 5.000%, 2/15/47 – AGM Insured | | 2/21 at 100.00 | | AA | | 1,991,858 | |
| | | | Hudson Yards Infrastructure Corporation, New York, Revenue Bonds, Series 2006A: | | | | | | | |
| | 51,590 | | 5.000%, 2/15/47 – FGIC Insured | | 2/17 at 100.00 | | A | | 54,663,732 | |
| | 4,200 | | 5.000%, 2/15/47 – AGM Insured | | 2/17 at 100.00 | | AA | | 4,450,236 | |
| | | | Metropolitan Transportation Authority, New York, State Service Contract Refunding Bonds, Series 2002A: | | | | | | | |
| | 1,000 | | 5.750%, 7/01/18 – AGM Insured | | No Opt. Call | | AA | | 1,176,730 | |
| | 9,000 | | 5.750%, 7/01/18 – AGM Insured (UB) | | No Opt. Call | | AA | | 10,590,570 | |
| | 3,675 | | Monroe County Industrial Development Agency, New York, School Facility Revenue Bonds, Rochester Schools Modernization Project, Series 2013, 5.000%, 5/01/28 | | 5/23 at 100.00 | | AA | | 4,250,211 | |
| | 560 | | Monroe Newpower Corporation, New York, Power Facilities Revenue Bonds, Series 2003, 5.500%, 1/01/34 | | 1/15 at 100.00 | | A– | | 561,288 | |
| | 10,440 | | New York City Transitional Finance Authority, New York, Building Aid Revenue Bonds, Fiscal Series 2007S-2, 5.000%, 1/15/28 – FGIC Insured | | 1/17 at 100.00 | | Aa2 | | 11,291,800 | |
| | 5 | | New York City Transitional Finance Authority, New York, Future Tax Secured Bonds, Fiscal Series 2002B, 5.250%, 5/01/16 – NPFG Insured | | 11/14 at 100.00 | | AAA | | 5,021 | |
| | 3,795 | | New York City Transitional Finance Authority, New York, Future Tax Secured Bonds, Fiscal Series 2007B, 5.000%, 11/01/30 | | 5/17 at 100.00 | | AAA | | 4,139,624 | |
| | 5,000 | | New York City Transitional Finance Authority, New York, Future Tax Secured Bonds, Series 2009A-1, 5.000%, 5/01/36 | | 5/19 at 100.00 | | AAA | | 5,642,900 | |
| | | | New York City Transitional Finance Authority, New York, Future Tax Secured Bonds, Subordinate Fiscal 2012 Series E-1: | | | | | | | |
| | 6,225 | | 5.000%, 2/01/37 | | 2/22 at 100.00 | | AAA | | 7,023,854 | |
| | 24,155 | | 5.000%, 2/01/42 | | 2/22 at 100.00 | | AAA | | 26,768,571 | |
| | 32,500 | | New York City Transitional Finance Authority, New York, Future Tax Secured Bonds, Subordinate Fiscal 2012 Series F-1, 5.000%, 5/01/39 | | 5/22 at 100.00 | | AAA | | 36,284,300 | |
| | 5,100 | | New York City Transitional Finance Authority, New York, Future Tax Secured Bonds, Subordinate Fiscal 2013 Series F-1, 5.000%, 2/01/29 | | No Opt. Call | | AAA | | 5,922,681 | |
| NRK | Nuveen New York AMT-Free Municipal Income Fund | |
| | Portfolio of Investments (continued) | September 30, 2014 |
| | Principal | | | | Optional Call | | | | | |
| | Amount (000) | | Description (1) | | Provisions (2) | | Ratings (3) | | Value | |
| | | | Tax Obligation/Limited (continued) | | | | | | | |
| $ | 13,530 | | New York City Transitional Finance Authority, New York, Future Tax Secured Bonds, Subordinate Fiscal 2014 Series D-1, 5.000%, 2/01/37 | | 2/24 at 100.00 | | AAA | $ | 15,440,571 | |
| | | | New York City Transitional Finance Authority, New York, Future Tax Secured Revenue Bonds, Subordinate Lien Series 2011C: | | | | | | | |
| | 10,000 | | 5.500%, 11/01/35 | | 11/20 at 100.00 | | AAA | | 11,904,200 | |
| | 1,000 | | 5.000%, 11/01/39 | | 11/20 at 100.00 | | AAA | | 1,147,890 | |
| | | | New York City Transitional Finance Authority, New York, Future Tax Secured Revenue Bonds, Subordinate Series 2011-D1: | | | | | | | |
| | 2,000 | | 5.250%, 2/01/30 | | 2/21 at 100.00 | | AAA | | 2,340,300 | |
| | 8,490 | | 5.000%, 2/01/35 | | 2/21 at 100.00 | | AAA | | 9,600,407 | |
| | | | New York City, New York, Educational Construction Fund, Revenue Bonds, Series 2011A: | | | | | | | |
| | 18,575 | | 5.750%, 4/01/33 – AGM Insured | | 4/21 at 100.00 | | AA+ | | 22,150,502 | |
| | 4,000 | | 5.750%, 4/01/41 | | 4/21 at 100.00 | | AA– | | 4,783,200 | |
| | | | New York Convention Center Development Corporation, Hotel Fee Revenue Bonds, Tender Option Bonds Trust 3095: | | | | | | | |
| | 2,890 | | 13.553%, 11/15/30 – AMBAC Insured (IF) (4) | | 11/15 at 100.00 | | AA+ | | 3,229,662 | |
| | 12,940 | | 13.539%, 11/15/44 – AMBAC Insured (IF) (4) | | 11/15 at 100.00 | | AA+ | | 14,481,672 | |
| | | | New York State Thruway Authority, Highway and Bridge Trust Fund Bonds, Second General, Series 2005B: | | | | | | | |
| | 30,795 | | 5.500%, 4/01/20 – AMBAC Insured | | No Opt. Call | | AA+ | | 37,341,709 | |
| | 5,725 | | 5.000%, 4/01/21 – AMBAC Insured | | 10/15 at 100.00 | | AA+ | | 5,998,827 | |
| | | | New York State Thruway Authority, State Personal Income Tax Revenue Bonds, Series 2010A: | | | | | | | |
| | 1,600 | | 5.000%, 3/15/29 | | 9/20 at 100.00 | | AAA | | 1,870,992 | |
| | 1,945 | | 5.000%, 3/15/30 | | 9/20 at 100.00 | | AAA | | 2,266,100 | |
| | | | New York State Urban Development Corporation, Revenue Refunding Bonds, State Facilities, Series 1995: | | | | | | | |
| | 1,105 | | 5.600%, 4/01/15 – NPFG Insured | | No Opt. Call | | AA | | 1,130,514 | |
| | 8,600 | | 5.700%, 4/01/20 – AGM Insured (UB) | | No Opt. Call | | AA | | 9,887,850 | |
| | 12,070 | | New York State Urban Development Corporation, State Personal Income Tax Revenue Bonds, General Purpose Series 2013C, 5.000%, 3/15/32 | | 3/23 at 100.00 | | AAA | | 13,885,690 | |
| | 2,000 | | New York State Urban Development Corporation, State Personal Income Tax Revenue Bonds, Series 2005B, 5.000%, 3/15/30 – AGM Insured | | 3/15 at 100.00 | | AAA | | 2,041,280 | |
| | 3,325 | | Niagara Falls City School District, Niagara County, New York, Certificates of Participation, High School Facility, Series 2005, 5.000%, 6/15/28 – AGM Insured | | 6/15 at 100.00 | | AA | | 3,373,113 | |
| | | | Puerto Rico Sales Tax Financing Corporation, Sales Tax Revenue Bonds, Series 2007A: | | | | | | | |
| | 11,000 | | 0.000%, 8/01/41 – NPFG Insured | | No Opt. Call | | AA– | | 1,986,710 | |
| | 13,520 | | 0.000%, 8/01/42 – FGIC Insured | | No Opt. Call | | AA– | | 2,290,964 | |
| | 10,000 | | 0.000%, 8/01/44 – NPFG Insured | | No Opt. Call | | AA– | | 1,491,600 | |
| | 19,900 | | 0.000%, 8/01/45 – NPFG Insured | | No Opt. Call | | AA– | | 2,785,005 | |
| | 201,690 | | 0.000%, 8/01/46 – NPFG Insured | | No Opt. Call | | AA– | | 26,481,895 | |
| | 89,130 | | 0.000%, 8/01/47 – AMBAC Insured | | No Opt. Call | | BBB | | 10,807,013 | |
| | | | Sales Tax Asset Receivable Corporation of New York City, New York, Sales Tax Asset Revenue Bonds, Fiscal 2015 Series A: | | | | | | | |
| | 4,830 | | 5.000%, 10/15/28 (WI/DD, Settling 10/15/14) | | 10/24 at 100.00 | | AAA | | 5,898,782 | |
| | 2,775 | | 5.000%, 10/15/29 (WI/DD, Settling 10/15/14) | | 10/24 at 100.00 | | AAA | | 3,367,074 | |
| | 5,000 | | 5.000%, 10/15/30 (WI/DD, Settling 10/15/14) | | 10/24 at 100.00 | | AAA | | 6,032,400 | |
| | 10,000 | | 5.000%, 10/15/31 (WI/DD, Settling 10/15/14) | | 10/24 at 100.00 | | AAA | | 12,015,900 | |
| | 825 | | Suffolk County Industrial Development Agency, New York, Revenue Bonds, Hampton Bays Public Library, Series 1999A, 6.000%, 10/01/19 – NPFG Insured | | 10/14 at 100.00 | | A3 | | 828,077 | |
| | 895,610 | | Total Tax Obligation/Limited | | | | | | 664,017,943 | |
| | Principal | | | | Optional Call | | | | | |
| | Amount (000) | | Description (1) | | Provisions (2) | | Ratings (3) | | Value | |
| | | | Transportation – 14.7% (9.7% of Total Investments) | | | | | | | |
| $ | 13,950 | | Metropolitan Transportation Authority, New York, Transportation Revenue Bonds, Refunding Series 2012F, 5.000%, 11/15/30 | | No Opt. Call | | AA– | $ | 15,931,877 | |
| | 8,800 | | Metropolitan Transportation Authority, New York, Transportation Revenue Bonds, Series 2008A, 5.250%, 11/15/36 | | 11/17 at 100.00 | | AA– | | 9,705,696 | |
| | 27,285 | | Metropolitan Transportation Authority, New York, Transportation Revenue Bonds, Series 2010D, 5.250%, 11/15/40 | | 11/20 at 100.00 | | AA– | | 30,300,535 | |
| | 6,090 | | Metropolitan Transportation Authority, New York, Transportation Revenue Bonds, Series 2013B, 5.000%, 11/15/30 | | 5/23 at 100.00 | | AA– | | 6,947,289 | |
| | 480 | | Metropolitan Transportation Authority, New York, Transportation Revenue Bonds, Series 2013C, 5.000%, 11/15/32 | | 5/23 at 100.00 | | AA– | | 542,146 | |
| | 1,900 | | Metropolitan Transportation Authority, New York, Transportation Revenue Bonds, Series 2013D, 5.250%, 11/15/30 | | 11/23 at 100.00 | | AA– | | 2,254,825 | |
| | | | Metropolitan Transportation Authority, New York, Transportation Revenue Bonds, Series 2013E: | | | | | | | |
| | 14,000 | | 5.000%, 11/15/31 | | 11/23 at 100.00 | | AA– | | 15,950,340 | |
| | 1,785 | | 5.000%, 11/15/32 | | 11/23 at 100.00 | | AA– | | 2,027,617 | |
| | 10,000 | | 5.000%, 11/15/38 | | 11/23 at 100.00 | | AA– | | 11,175,100 | |
| | 9,370 | | Metropolitan Transportation Authority, New York, Transportation Revenue Bonds, Series 2014B, 5.250%, 11/15/35 | | 5/24 at 100.00 | | AA– | | 10,853,271 | |
| | 8,055 | | New York Liberty Development Corporation, Liberty Revenue Bonds, 4 World Trade Center Project, Series 2011, 5.000%, 11/15/44 | | 11/21 at 100.00 | | A+ | | 8,850,753 | |
| | 3,420 | | New York State Thruway Authority, General Revenue Bonds, Refunding Series 2007H, 5.000%,1/01/25 – FGIC Insured | | 1/18 at 100.00 | | AA– | | 3,801,433 | |
| | 3,910 | | New York State Thruway Authority, General Revenue Bonds, Series 2005F, 5.000%, 1/01/30 – AMBAC Insured | | 1/15 at 100.00 | | A | | 3,949,178 | |
| | | | New York State Thruway Authority, General Revenue Bonds, Series 2005G: | | | | | | | |
| | 5,800 | | 5.000%, 1/01/30 – AGM Insured | | 7/15 at 100.00 | | AA | | 5,981,540 | |
| | 3,000 | | 5.000%, 1/01/32 – AGM Insured | | 7/15 at 100.00 | | AA | | 3,096,540 | |
| | | | Port Authority of New York and New Jersey, Consolidated Revenue Bonds, One Hundred Eighty-Forth Series 2014: | | | | | | | |
| | 2,100 | | 5.000%, 9/01/33 | | 9/24 at 100.00 | | AA– | | 2,464,875 | |
| | 3,950 | | 5.000%, 9/01/34 | | 9/24 at 100.00 | | AA– | | 4,617,827 | |
| | 1,000 | | 5.000%, 9/01/35 | | 9/24 at 100.00 | | AA– | | 1,164,410 | |
| | 5,155 | | 5.000%, 9/01/36 | | 9/24 at 100.00 | | AA– | | 5,978,614 | |
| | 9,755 | | 5.000%, 9/01/39 | | 9/24 at 100.00 | | AA– | | 11,232,590 | |
| | | | Port Authority of New York and New Jersey, Consolidated Revenue Bonds, One Hundred Fortieth Series 2005: | | | | | | | |
| | 4,625 | | 5.000%, 12/01/28 – SYNCORA GTY Insured | | 6/15 at 101.00 | | AA– | | 4,798,576 | |
| | 5,760 | | 5.000%, 12/01/31 – SYNCORA GTY Insured | | 6/15 at 101.00 | | AA– | | 5,975,654 | |
| | 4,185 | | Port Authority of New York and New Jersey, Consolidated Revenue Bonds, One Hundred Forty Eighth Series 2008, Trust 2920, 17.814%, 8/15/32 – AGM Insured (IF) | | 8/17 at 100.00 | | AA | | 5,914,744 | |
| | 2,000 | | Port Authority of New York and New Jersey, Consolidated Revenue Bonds, One Hundred Seventy Ninth Series 2013, 5.000%, 12/01/43 | | 12/23 at 100.00 | | AA– | | 2,266,200 | |
| | 2,500 | | Port Authority of New York and New Jersey, Special Project Bonds, JFK International Air Terminal LLC Project, Eighth Series 2010, 6.500%, 12/01/28 | | 12/15 at 100.00 | | BBB | | 2,651,750 | |
| | 5,480 | | Triborough Bridge and Tunnel Authority, New York, General Purpose Revenue Bonds, Refunding Subordinate Lien Series 2002E, 5.500%, 11/15/20 – NPFG Insured | | No Opt. Call | | AA– | | 6,731,194 | |
| | 164,355 | | Total Transportation | | | | | | 185,164,574 | |
| NRK | Nuveen New York AMT-Free Municipal Income Fund | |
| | Portfolio of Investments (continued) | September 30, 2014 |
| | Principal | | | | Optional Call | | | | | |
| | Amount (000) | | Description (1) | | Provisions (2) | | Ratings (3) | | Value | |
| | | | U.S. Guaranteed – 8.0% (5.3% of Total Investments) (5) | | | | | | | |
| $ | 950 | | Dormitory Authority of the State of New York, FHA-Insured Revenue Bonds, St. Luke’s Roosevelt Hospital, Series 2005, 4.900%, 8/15/31 (Pre-refunded 8/15/15) | | 8/15 at 100.00 | | N/R (5) | $ | 989,748 | |
| | | | Dormitory Authority of the State of New York, Judicial Facilities Lease Revenue Bonds, Suffolk County Issue, Series 1986: | | | | | | | |
| | 815 | | 7.375%, 7/01/16 (ETM) | | No Opt. Call | | Aaa | | 882,767 | |
| | 245 | | 7.375%, 7/01/16 – BIGI Insured (ETM) | | No Opt. Call | | Aaa | | 265,372 | |
| | 30 | | Dormitory Authority of the State of New York, Revenue Bonds, Mental Health Services Facilities Improvements, Series 2005D-1, 5.000%, 2/15/15 – NPFG Insured (ETM) | | No Opt. Call | | AA– (5) | | 30,552 | |
| | 5 | | Dormitory Authority of the State of New York, Revenue Bonds, Mental Health Services Facilities Improvements, Series 2005D-1, 5.000%, 8/15/23 (Pre-refunded 2/15/15) – NPFG Insured | | 2/15 at 100.00 | | AA– (5) | | 5,092 | |
| | 3,000 | | Dormitory Authority of the State of New York, School Districts Revenue Bond Financing Program, Peekskill City School District, Series 2005D, 5.000%, 10/01/33 (Pre-refunded 10/01/15) – NPFG Insured | | 10/15 at 100.00 | | AA– (5) | | 3,145,590 | |
| | | | Dormitory Authority of the State of New York, State Personal Income Tax Revenue Bonds, Series 2005F: | | | | | | | |
| | 2,885 | | 5.000%, 3/15/21 (Pre-refunded 3/15/15) – AGM Insured | | 3/15 at 100.00 | | Aa1 (5) | | 2,949,855 | |
| | 155 | | 5.000%, 3/15/21 (Pre-refunded 3/15/15) – AGM Insured | | 3/15 at 100.00 | | AAA | | 158,484 | |
| | 15 | | Erie County Water Authority, New York, Water Revenue Bonds, Series 1990B, 6.750%, 12/01/14 – AMBAC Insured (ETM) | | No Opt. Call | | N/R (5) | | 15,170 | |
| | 2,000 | | Erie County, New York, General Obligation Bonds, Series 2005A, 5.000%, 12/01/18 (Pre-refunded 12/01/15) – NPFG Insured | | 12/15 at 100.00 | | AA– (5) | | 2,113,580 | |
| | | | Metropolitan Transportation Authority, New York, Dedicated Tax Fund Bonds, Series 1998A: | | | | | | | |
| | 5,090 | | 5.000%, 4/01/23 (Pre-refunded 10/01/15) – FGIC Insured | | 10/15 at 100.00 | | AA+ (5) | | 5,338,596 | |
| | 11,000 | | 4.750%, 4/01/28 (Pre-refunded 10/01/15) – FGIC Insured | | 10/15 at 100.00 | | AA+ (5) | | 11,509,630 | |
| | | | New York City Housing Development Corporation, New York, Capital Fund Program Revenue Bonds, New York Housing Authority Program, Series 2005A: | | | | | | | |
| | 4,600 | | 5.000%, 7/01/16 (Pre-refunded 7/01/15) – FGIC Insured | | 7/15 at 100.00 | | AA+ (5) | | 4,769,372 | |
| | 18,865 | | 5.000%, 7/01/25 (Pre-refunded 7/01/15) – NPFG Insured (UB) (4) | | 7/15 at 100.00 | | AA+ (5) | | 19,559,609 | |
| | 5 | | New York City Transitional Finance Authority, New York, Future Tax Secured Bonds, Fiscal Series 2007B, 5.000%, 11/01/30 (Pre-refunded 5/01/17) | | 5/17 at 100.00 | | N/R (5) | | 5,574 | |
| | | | New York City, New York, General Obligation Bonds, Fiscal Series 2004E: | | | | | | | |
| | 4,705 | | 5.000%, 11/01/19 (Pre-refunded 11/01/14) – AGM Insured | | 11/14 at 100.00 | | AA (5) | | 4,724,761 | |
| | 7,845 | | 5.000%, 11/01/19 (Pre-refunded 11/01/14) – AGM Insured | | 11/14 at 100.00 | | AA (5) | | 7,877,243 | |
| | 940 | | 5.000%, 11/01/20 (Pre-refunded 11/01/14) – AGM Insured | | 11/14 at 100.00 | | AA (5) | | 943,967 | |
| | 35 | | New York City, New York, General Obligation Bonds, Fiscal Series 2006C, 5.000%, 8/01/16 (Pre-refunded 8/01/15) – AGM Insured | | 8/15 at 100.00 | | AA (5) | | 36,429 | |
| | 8,190 | | New York State Thruway Authority, General Revenue Bonds, Series 2005F, 5.000%, 1/01/30 (Pre-refunded 1/01/15) – AMBAC Insured | | 1/15 at 100.00 | | A2 (5) | | 8,291,720 | |
| | 875 | | New York State Thruway Authority, Highway and Bridge Trust Fund Bonds, Second General, Series 2005B, 5.000%, 4/01/21 (Pre-refunded 10/01/15) – AMBAC Insured | | 10/15 at 100.00 | | N/R (5) | | 917,735 | |
| | 500 | | New York State Urban Development Corporation, State Personal Income Tax Revenue Bonds, Series 2005B, 5.000%, 3/15/30 (Pre-refunded 3/15/15) – AGM Insured | | 3/15 at 100.00 | | Aa1 (5) | | 511,240 | |
| | | | Suffolk County Water Authority, New York, Waterworks Revenue Bonds, Series 2005C: | | | | | | | |
| | 9,395 | | 5.000%, 6/01/28 (Pre-refunded 6/01/15) – NPFG Insured | | 6/15 at 100.00 | | AAA | | 9,699,680 | |
| | 14,700 | | 5.000%, 6/01/28 (Pre-refunded 6/01/15) – NPFG Insured (UB) | | 6/15 at 100.00 | | AA+ (5) | | 15,176,721 | |
| | | | Yonkers, New York, General Obligation Bonds, Series 2005B: | | | | | | | |
| | 540 | | 5.000%, 8/01/19 (Pre-refunded 8/01/15) | | 8/15 at 100.00 | | A3 (5) | | 562,054 | |
| | 570 | | 5.000%, 8/01/20 (Pre-refunded 8/01/15) | | 8/15 at 100.00 | | A3 (5) | | 593,279 | |
| | 97,955 | | Total U.S. Guaranteed | | | | | | 101,073,820 | |
| | Principal | | | | Optional Call | | | | | |
| | Amount (000) | | Description (1) | | Provisions (2) | | Ratings (3) | | Value | |
| | | | Utilities – 13.6% (9.0% of Total Investments) | | | | | | | |
| $ | 2,450 | | Chautauqua County Industrial Development Agency, New York, Exempt Facility Revenue Bonds, NRG Dunkirk Power Project, Series 2009, 5.875%, 4/01/42 | | 2/20 at 100.00 | | Baa3 | $ | 2,679,565 | |
| | 3,000 | | Guam Power Authority, Revenue Bonds, Series 2010A, 5.000%, 10/01/37 – AGM Insured | | 10/20 at 100.00 | | AA | | 3,279,930 | |
| | 1,045 | | Guam Power Authority, Revenue Bonds, Series 2012A, 5.000%, 10/01/34 | | 10/22 at 100.00 | | BBB | | 1,153,973 | |
| | | | Long Island Power Authority, New York, Electric System General Revenue Bonds, Series 2000A: | | | | | | | |
| | 8,000 | | 0.000%, 6/01/24 – AGM Insured | | No Opt. Call | | AA | | 6,184,880 | |
| | 8,000 | | 0.000%, 6/01/25 – AGM Insured | | No Opt. Call | | AA | | 5,898,560 | |
| | 20,000 | | 0.000%, 6/01/26 – AGM Insured | | No Opt. Call | | AA | | 14,130,800 | |
| | 10,000 | | 0.000%, 6/01/27 – AGM Insured | | No Opt. Call | | AA | | 6,707,900 | |
| | 15,000 | | 0.000%, 6/01/28 – AGM Insured | | No Opt. Call | | AA | | 9,602,100 | |
| | 10,000 | | 0.000%, 6/01/29 – AGM Insured | | No Opt. Call | | AA | | 6,089,500 | |
| | | | Long Island Power Authority, New York, Electric System General Revenue Bonds, Series 2006A: | | | | | | | |
| | 21,830 | | 5.000%, 12/01/23 – FGIC Insured | | 6/16 at 100.00 | | AA– | | 23,334,740 | |
| | 27,015 | | 5.000%, 12/01/25 – FGIC Insured | | 6/16 at 100.00 | | AA– | | 28,821,223 | |
| | 2,750 | | Long Island Power Authority, New York, Electric System General Revenue Bonds, Series 2006B, 5.000%, 12/01/35 – CIFG Insured | | 6/16 at 100.00 | | A– | | 2,902,653 | |
| | 3,310 | | Long Island Power Authority, New York, Electric System Revenue Bonds, Series 2008A, 5.500%, 5/01/33 – BHAC Insured | | 5/19 at 100.00 | | AA+ | | 3,880,512 | |
| | 5,000 | | Long Island Power Authority, New York, Electric System Revenue Bonds, Series 2011A, 5.000%, 5/01/38 | | 5/21 at 100.00 | | A– | | 5,466,850 | |
| | 5,000 | | New York State Energy Research and Development Authority, Pollution Control Revenue Refunding Bonds, Niagara Mohawk Power Corporation, Series 1998A, 5.150%, 11/01/25 – AMBAC Insured | | 11/14 at 100.00 | | A | | 5,009,000 | |
| | 6,500 | | Niagara Area Development Corporation, New York, Solid Waste Disposal Facility Revenue Refunding Bonds, Covanta Energy Project, Series 2012B, 4.000%, 11/01/24 | | No Opt. Call | | BB+ | | 6,593,210 | |
| | 2,635 | | Power Authority of the State of New York, General Revenue Bonds, Series 2006A, 5.000%, 11/15/19 – FGIC Insured | | 11/15 at 100.00 | | Aa2 | | 2,777,659 | |
| | | | Utility Debt Securitization Authority, New York, Restructuring Bonds, Series 2013TE: | | | | | | | |
| | 9,500 | | 5.000%, 12/15/32 | | 12/23 at 100.00 | | AAA | | 11,173,045 | |
| | 22,290 | | 5.000%, 12/15/41 | | 12/23 at 100.00 | | AAA | | 25,553,256 | |
| | 183,325 | | Total Utilities | | | | | | 171,239,356 | |
| | | | Water and Sewer – 7.9% (5.3% of Total Investments) | | | | | | | |
| | 800 | | New York City Municipal Water Finance Authority, New York, Water and Sewer System Revenue Bonds, Fiscal 2009 Series 2008A, 5.750%, 6/15/40 | | No Opt. Call | | AAA | | 920,912 | |
| | 5,160 | | New York City Municipal Water Finance Authority, New York, Water and Sewer System Revenue Bonds, Second Generation Resolution, Fiscal 2012 Series BB, 5.000%, 6/15/44 | | 12/21 at 100.00 | | AA+ | | 5,688,797 | |
| | 5,000 | | New York City Municipal Water Finance Authority, New York, Water and Sewer System Revenue Bonds, Second Generation Resolution, Series 2007AA, 5.000%, 6/15/37 | | 6/17 at 100.00 | | AA+ | | 5,455,500 | |
| | 19,455 | | New York City Municipal Water Finance Authority, New York, Water and Sewer System Revenue Bonds, Series 2005C, 5.000%, 6/15/27 – NPFG Insured (UB) | | 6/15 at 100.00 | | AAA | | 20,098,961 | |
| | 12,365 | | New York City Municipal Water Finance Authority, New York, Water and Sewer System Revenue Bonds, Series 2006B, 5.000%, 6/15/36 – NPFG Insured (UB) | | 6/16 at 100.00 | | AAA | | 13,113,700 | |
| | 4,085 | | New York City Municipal Water Finance Authority, New York, Water and Sewer System Second General Resolution Revenue Bonds, Fiscal 2013 Series DD, 5.000%, 6/15/35 | | 6/23 at 100.00 | | AA+ | | 4,668,175 | |
| | 10,000 | | New York City Municipal Water Finance Authority, New York, Water and Sewer System Second General Resolution Revenue Bonds, Fiscal Series 2014DD, 5.000%, 6/15/35 | | 6/24 at 100.00 | | AA+ | | 11,568,300 | |
| | 3,845 | | New York State Environmental Facilities Corporation, Revenue Bonds, State Revolving Funds Master Financing, Series 2010C, 5.000%, 10/15/35 | | 4/20 at 100.00 | | AAA | | 4,374,341 | |
| | 3,095 | | New York State Environmental Facilities Corporation, Revenue Bonds, State Revolving Funds Master Financing, Series 2012B, 5.000%, 2/15/42 | | 2/22 at 100.00 | | AAA | | 3,476,675 | |
| NRK | Nuveen New York AMT-Free Municipal Income Fund | |
| | Portfolio of Investments (continued) | September 30, 2014 |
| | Principal | | | | Optional Call | | | | | |
| | Amount (000) | | Description (1) | | Provisions (2) | | Ratings (3) | | Value | |
| | | | Water and Sewer (continued) | | | | | | | |
| $ | 2,580 | | New York State Environmental Facilities Corporation, State Clean Water and Drinking Water Revolving Funds Revenue Bonds, New York City Municipal Water Finance Authority Projects, Second Resolution Subordinated Series 2014A, 5.000%, 6/15/30 | | 6/24 at 100.00 | | AAA | $ | 3,092,233 | |
| | 22,340 | | New York State Environmental Facilities Corporation, State Revolving Funds Revenue Bonds, Master Financing Program, Green Bonds Series 2014B, 5.000%, 5/15/44 | | 5/24 at 100.00 | | AAA | | 25,677,594 | |
| | 2,230 | | Upper Mohawk Valley Regional Water Finance Authority, New York, Water System Revenue Bonds, Series 2000, 0.000%, 4/01/23 – AMBAC Insured | | No Opt. Call | | A1 | | 1,777,934 | |
| | 90,955 | | Total Water and Sewer | | | | | | 99,913,122 | |
| $ | 2,094,967 | | Total Long-Term Investments (cost $1,786,674,057) | | | | | | 1,898,766,520 | |
| | | | Floating Rate Obligations – (6.7)% | | | | | | (83,985,000 | ) |
| | | | Institutional MuniFund Term Preferred Shares, at Liquidation Value – (6.3)% (6) | | | | | | (79,000,000 | ) |
| | | | Variable Rate Demand Preferred Shares, at Liquidation Value – (38.8)% (7) | | | | | | (488,800,000 | ) |
| | | | Other Assets Less Liabilities – 1.2% | | | | | | 13,515,986 | |
| | | | Net Assets Applicable to Common Shares – 100% | | | | | $ | 1,260,497,506 | |
| (1) | All percentages shown in the Portfolio of Investments are based on net assets applicable to common shares unless otherwise noted. |
| (2) | Optional Call Provisions (not covered by the report of independent registered public accounting firm): Dates (month and year) and prices of the earliest optional call or redemption. There may be other call provisions at varying prices at later dates. Certain mortgage-backed securities may be subject to periodic principal paydowns. |
| (3) | Ratings (not covered by the report of independent registered public accounting firm): Using the highest of Standard & Poor’s Group (“Standard & Poor’s”), Moody’s Investors Service, Inc. (“Moody’s”) or Fitch, Inc. (“Fitch”) rating. Ratings below BBB by Standard & Poor’s, Baa by Moody’s or BBB by Fitch are considered to be below investment grade. Holdings designated N/R are not rated by any of these national rating agencies. |
| (4) | Investment, or portion of investment, has been pledged to collateralize the net payment obligations for investments in inverse floating rate transactions. |
| (5) | Backed by an escrow or trust containing sufficient U.S. Government or U.S. Government agency securities, which ensure the timely payment of principal and interest. Certain bonds backed by U.S. Government or agency securities are regarded as having an implied rating equal to the rating of such securities. |
| (6) | Institutional MuniFund Term Preferred Shares, at Liquidation Value as a percentage of Total Investments is 4.2%. |
| (7) | Variable Rate Demand Preferred Shares, at Liquidation Value as a percentage of Total Investments is 25.7%. |
| (ETM) | Escrowed to maturity. |
| WI/DD | Investment, or portion of investment, purchased on a when-issued or delayed delivery basis. |
| (IF) | Inverse floating rate investment. |
| (UB) | Underlying bond of an inverse floating rate trust reflected as a financing transaction. See Notes to Financial Statements, Note 3 – Portfolio Securities and Investments in Derivatives, Inverse Floating Rate Securities for more information. |
See accompanying notes to financial statements.
| Statement of | |
| | Assets and Liabilities | September 30, 2014 |
| | | | | | | New York | |
| | | New York | | New York | | Performance | |
| | | Value | | Value 2 | | Plus | |
| | | (NNY | ) | (NYV | ) | (NNP | ) |
| Assets | | | | | | | | | | |
| Long-term investments, at value (cost $143,505,026, $33,282,310, and $328,976,340, respectively) | | $ | 153,069,546 | | $ | 37,672,332 | | $ | 352,307,950 | |
| Cash | | | 968,380 | | | — | | | — | |
| Receivable for: | | | | | | | | | | |
| Interest | | | 2,165,466 | | | 561,243 | | | 4,774,112 | |
| Investments sold | | | 1,905,000 | | | — | | | — | |
| Deferred offering costs | | | — | | | — | | | 1,154,782 | |
| Other assets | | | 3,766 | | | 1,163 | | | 127,000 | |
| Total assets | | $ | 158,112,158 | | | 38,234,738 | | | 358,363,844 | |
| Liabilities | | | | | | | | | | |
| Cash overdraft | | | — | | | 613,210 | | | 754,501 | |
| Floating rate obligations | | | 3,255,000 | | | — | | | 25,625,000 | |
| Payable for: | | | | | | | | | | |
| Common share dividends | | | 444,462 | | | 116,962 | | | 915,608 | |
| Interest | | | — | | | — | | | — | |
| Investments purchased | | | 1,197,480 | | | — | | | 2,999,687 | |
| Offering costs | | | — | | | — | | | — | |
| Institutional MuniFund Term Preferred (“iMTP”) Shares, at liquidation value | | | — | | | — | | | — | |
| Variable Rate MuniFund Term Preferred (“VMTP”) Shares, at liquidation value | | | — | | | — | | | — | |
| Variable Rate Demand Preferred (“VRDP”) Shares, at liquidation value | | | — | | | — | | | 89,000,000 | |
| Accrued expenses: | | | | | | | | | | |
| Management fees | | | 63,737 | | | 18,244 | | | 183,577 | |
| Directors/Trustees fees | | | 934 | | | 229 | | | 43,483 | |
| Reorganization | | | — | | | — | | | 25,000 | |
| Other | | | 63,724 | | | 30,786 | | | 94,884 | |
| Total liabilities | | | 5,025,337 | | | 779,431 | | | 119,641,740 | |
| Net assets applicable to common shares | | $ | 153,086,821 | | $ | 37,455,307 | | $ | 238,722,104 | |
| Common shares outstanding | | | 15,191,165 | | | 2,349,612 | | | 15,063,511 | |
| Net asset value (“NAV”) per common share outstanding | | $ | 10.08 | | $ | 15.94 | | $ | 15.85 | |
| Net assets applicable to common shares consist of: | | | | | | | | | | |
| Common shares, $.01 par value per share | | $ | 151,912 | | $ | 23,496 | | $ | 150,635 | |
| Paid-in surplus | | | 144,979,430 | | | 33,599,476 | | | 219,945,033 | |
| Undistributed (Over-distribution of) net investment income | | | 733,827 | | | 249,418 | | | 2,232,184 | |
| Accumulated net realized gain (loss) | | | (2,342,868 | ) | | (807,105 | ) | | (6,937,358 | ) |
| Net unrealized appreciation (depreciation) | | | 9,564,520 | | | 4,390,022 | | | 23,331,610 | |
| Net assets applicable to common shares | | $ | 153,086,821 | | $ | 37,455,307 | | $ | 238,722,104 | |
| Authorized shares: | | | | | | | | | | |
| Common | | | 250,000,000 | | | Unlimited | | | 200,000,000 | |
| Preferred | | | N/A | | | N/A | | | 950,000 | |
N/A – Fund is not authorized to issue preferred shares.
See accompanying notes to financial statements.
Statement of Assets and Liabilities (continued)
| | | New York | | New York | | New York | |
| | | Dividend | | Dividend | | AMT-Free | |
| | | Advantage | | Advantage 2 | | Income | |
| | | (NAN | ) | (NXK | ) | (NRK | ) |
| Assets | | | | | | | | | | |
| Long-term investments, at value (cost $196,013,376, $135,682,853 and $1,786,674,057, respectively) | | $ | 209,348,479 | | $ | 144,199,363 | | $ | 1,898,766,520 | |
| Cash | | | — | | | 1,770,444 | | | 973,623 | |
| Receivable for: | | | | | | | | | | |
| Interest | | | 2,877,915 | | | 1,935,594 | | | 24,570,932 | |
| Investments sold | | | — | | | — | | | 19,624,503 | |
| Deferred offering costs | | | 82,186 | | | 82,186 | | | 3,299,258 | |
| Other assets | | | 451,569 | | | 5,353 | | | 548,808 | |
| Total assets | | | 212,760,149 | | | 147,992,940 | | | 1,947,783,644 | |
| Liabilities | | | | | | | | | | |
| Cash overdraft | | | 317,658 | | | — | | | — | |
| Floating rate obligations | | | 13,155,000 | | | 9,400,000 | | | 83,985,000 | |
| Payable for: | | | | | | | | | | |
| Common share dividends | | | 555,859 | | | 342,806 | | | 5,313,594 | |
| Interest | | | 45,613 | | | 30,952 | | | — | |
| Investments purchased | | | 203,572 | | | 1,718,384 | | | 28,430,041 | |
| Offering costs | | | 25,728 | | | 32,011 | | | 92,248 | |
| Institutional MuniFund Term Preferred (“iMTP”) Shares, at liquidation value | | | — | | | — | | | 79,000,000 | |
| Variable Rate MuniFund Term Preferred (“VMTP”) Shares, at liquidation value | | | 56,000,000 | | | 38,000,000 | | | — | |
| Variable Rate Demand Preferred (“VRDP”) Shares, at liquidation value | | | — | | | — | | | 488,800,000 | |
| Accrued expenses: | | | | | | | | | | |
| Management fees | | | 110,081 | | | 73,886 | | | 924,391 | |
| Directors/Trustees fees | | | 1,205 | | | 828 | | | 193,886 | |
| Reorganization | | | — | | | 330,000 | | | 113,907 | |
| Other | | | 66,115 | | | 52,059 | | | 433,071 | |
| Total liabilities | | | 70,480,831 | | | 49,980,926 | | | 687,286,138 | |
| Net assets applicable to common shares | | $ | 142,279,318 | | $ | 98,012,014 | | $ | 1,260,497,506 | |
| Common shares outstanding | | | 9,265,330 | | | 6,483,216 | | | 87,618,504 | |
| Net asset value (“NAV”) per common share outstanding | | $ | 15.36 | | $ | 15.12 | | $ | 14.39 | |
| Net assets applicable to common shares consist of: | | | | | | | | | | |
| Common shares, $.01 par value per share | | $ | 92,653 | | $ | 64,832 | | $ | 876,185 | |
| Paid-in surplus | | | 130,308,114 | | | 91,183,806 | | | 1,192,153,431 | |
| Undistributed (Over-distribution of) net investment income | | | 868,604 | | | 468,722 | | | 2,073,373 | |
| Accumulated net realized gain (loss) | | | (2,325,156 | ) | | (2,221,856 | ) | | (46,697,946 | ) |
| Net unrealized appreciation (depreciation) | | | 13,335,103 | | | 8,516,510 | | | 112,092,463 | |
| Net assets applicable to common shares | | $ | 142,279,318 | | $ | 98,012,014 | | $ | 1,260,497,506 | |
| Authorized shares: | | | | | | | | | | |
| Common | | | Unlimited | | | Unlimited | | | Unlimited | |
| Preferred | | | Unlimited | | | Unlimited | | | Unlimited | |
See accompanying notes to financial statements.
| Statement of | |
| | Operations |
| | Year Ended September 30, 2014 |
| | | | | | | New York | | New York | | New York | | New York | |
| | | New York | | New York | | Performance | | Dividend | | Dividend | | AMT-Free | |
| | | Value | | Value 2 | | Plus | | Advantage | | Advantage 2 | | Income | |
| | | (NNY | ) | (NYV | ) | (NNP | ) | (NAN | ) | (NXK | ) | (NRK | ) |
| Investment Income | | $ | 7,097,312 | | $ | 1,873,987 | | $ | 16,249,723 | | $ | 9,690,523 | | $ | 6,457,982 | | $ | 86,026,595 | |
| Expenses | | | | | | | | | | | | | | | | | | | |
| Management fees | | | 761,879 | | | 218,046 | | | 2,206,661 | | | 1,310,930 | | | 889,037 | | | 11,088,248 | |
| Shareholder servicing agent fees and expenses | | | 26,082 | | | 237 | | | 25,459 | | | 28,280 | | | 21,003 | | | 89,361 | |
| Interest expense and amortization of offering costs | | | 11,398 | | | — | | | 317,667 | | | 1,643,061 | | | 1,132,457 | | | 2,613,506 | |
| Liquidity fees | | | — | | | — | | | 919,055 | | | — | | | — | | | 3,912,497 | |
| Remarketing fees | | | — | | | — | | | 90,235 | | | — | | | — | | | 495,590 | |
| Custodian fees and expenses | | | 33,349 | | | 13,861 | | | 56,925 | | | 42,682 | | | 31,038 | | | 271,277 | |
| Directors/Trustees fees and expenses | | | 4,525 | | | 1,105 | | | 9,738 | | | 16,513 | | | 11,354 | | | 54,462 | |
| Professional fees | | | 26,632 | | | 22,890 | | | 42,177 | | | 30,961 | | | 29,512 | | | 149,342 | |
| Shareholder reporting expenses | | | 28,264 | | | 10,063 | | | 56,194 | | | 44,319 | | | 32,141 | | | 77,294 | |
| Stock exchange listing fees | | | 8,791 | | | 265 | | | 8,765 | | | 38,766 | | | 15,732 | | | 21,882 | |
| Investor relations expenses | | | 19,173 | | | 4,856 | | | 36,440 | | | 23,003 | | | 16,065 | | | 195,037 | |
| Reorganization expenses | | | — | | | — | | | 25,000 | | | 270,000 | | | 330,000 | | | — | |
| Other expenses | | | 13,419 | | | 7,455 | | | 52,545 | | | 31,829 | | | 37,925 | | | 159,079 | |
| Total expenses | | | 933,512 | | | 278,778 | | | 3,846,861 | | | 3,480,344 | | | 2,546,264 | | | 19,127,575 | |
| Net investment income (loss) | | $ | 6,163,800 | | $ | 1,595,209 | | $ | 12,402,862 | | $ | 6,210,179 | | $ | 3,911,718 | | $ | 66,899,020 | |
| Realized and Unrealized Gain (Loss) | | | | | | | | | | | | | | | | | | | |
| Net realized gain (loss) from: | | | | | | | | | | | | | | | | | | | |
| Investments | | | (1,535,232 | ) | | (281,701 | ) | | (5,598,937 | ) | | (1,338,553 | ) | | (1,593,407 | ) | | (19,256,151 | ) |
| Swaps | | | — | | | 64,300 | | | — | | | — | | | — | | | — | |
| Change in net unrealized appreciation (depreciation) of: | | | | | | | | | | | | | | | | | | | |
| Investments | | | 7,808,893 | | | 2,182,124 | | | 20,585,674 | | | 11,647,643 | | | 7,978,079 | | | 95,855,590 | |
| Swaps | | | — | | | (182,941 | ) | | — | | | — | | | — | | | — | |
| Net realized and unrealized gain (loss) | | | 6,273,661 | | | 1,781,782 | | | 14,986,737 | | | 10,309,090 | | | 6,384,672 | | | 76,599,439 | |
| Net increase (decrease) in net assets applicable to common shares from operations | | $ | 12,437,461 | | $ | 3,376,991 | | $ | 27,389,599 | | $ | 16,519,269 | | $ | 10,296,390 | | $ | 143,498,459 | |
See accompanying notes to financial statements.
| Statement of | |
| | Changes in Net Assets |
| | | New York Value (NNY) | | New York Value 2 (NYV) | | New York Performance Plus (NNP) | |
| | | Year Ended | | Year Ended | | Year Ended | | Year Ended | | Year Ended | | Year Ended | |
| | | 9/30/14 | | 9/30/13 | | 9/30/14 | | 9/30/13 | | 9/30/14 | | 9/30/13 | |
| Operations | | | | | | | | | | | | | | | | | | | |
| Net investment income (loss) | | $ | 6,163,800 | | $ | 6,111,531 | | $ | 1,595,209 | | $ | 1,695,660 | | $ | 12,402,862 | | $ | 12,469,968 | |
| Net realized gain (loss) from: | | | | | | | | | | | | | | | | | | | |
| Investments | | | (1,535,232 | ) | | (880,642 | ) | | (281,701 | ) | | 11,111 | | | (5,598,937 | ) | | (920,503 | ) |
| Swaps | | | — | | | — | | | 64,300 | | | — | | | — | | | — | |
| Change in net unrealized appreciation (depreciation) of: | | | | | | | | | | | | | | | | | | | |
| Investments | | | 7,808,893 | | | (10,658,504 | ) | | 2,182,124 | | | (3,355,084 | ) | | 20,585,674 | | | (27,575,761 | ) |
| Swaps | | | — | | | — | | | (182,941 | ) | | 409,098 | | | — | | | — | |
| Net increase (decrease) in net assets applicable to common shares from operations | | | 12,437,461 | | | (5,427,615 | ) | | 3,376,991 | | | (1,239,215 | ) | | 27,389,599 | | | (16,026,296 | ) |
| Distributions to Common Shareholders | | | | | | | | | | | | | | | | | | | |
| From net investment income | | | (5,872,906 | ) | | (5,954,061 | ) | | (1,551,449 | ) | | (1,578,939 | ) | | (12,834,114 | ) | | (12,948,803 | ) |
| From accumulated net realized gains | | | — | | | (229,332 | ) | | — | | | — | | | — | | | (587,477 | ) |
| Decrease in net assets applicable to common shares from distributions to common shareholders | | | (5,872,906 | ) | | (6,183,393 | ) | | (1,551,449 | ) | | (1,578,939 | ) | | (12,834,114 | ) | | (13,536,280 | ) |
| Capital Share Transactions | | | | | | | | | | | | | | | | | | | |
| Common shares: | | | | | | | | | | | | | | | | | | | |
| Issued in reorganizations | | | — | | | — | | | — | | | — | | | — | | | — | |
| Net proceeds from shares issued to shareholders due to reinvestment of distributions | | | — | | | 154,748 | | | — | | | 13,897 | | | — | | | 303,049 | |
| Repurchased and retired | | | — | | | — | �� | | — | | | — | | | — | | | — | |
| Net increase (decrease) in net assets applicable to common shares from capital share transactions | | | — | | | 154,748 | | | — | | | 13,897 | | | — | | | 303,049 | |
| Net increase (decrease) in net assets applicable to common shares | | | 6,564,555 | | | (11,456,260 | ) | | 1,825,542 | | | (2,804,257 | ) | | 14,555,485 | | | (29,259,527 | ) |
| Net assets applicable to common shares at the beginning of period | | | 146,522,266 | | | 157,978,526 | | | 35,629,765 | | | 38,434,022 | | | 224,166,619 | | | 253,426,146 | |
| Net assets applicable to common shares at the end of period | | $ | 153,086,821 | | $ | 146,522,266 | | $ | 37,455,307 | | $ | 35,629,765 | | $ | 238,722,104 | | $ | 224,166,619 | |
| Undistributed (Over-distribution of) net investment income at the end of period | | $ | 733,827 | | $ | 502,627 | | $ | 249,418 | | $ | 205,995 | | $ | 2,232,184 | | $ | 2,605,453 | |
See accompanying notes to financial statements.
| | | New York | | New York | | New York | |
| | | Dividend Advantage (NAN) | | Dividend Advantage 2 (NXK) | | AMT-Free Income (NRK) | |
| | | Year Ended | | Year Ended | | Year Ended | | Year Ended | | Year Ended | | Year Ended | |
| | | 9/30/14 | | 9/30/13 | | 9/30/14 | | 9/30/13 | | 9/30/14 | | 9/30/13 | |
| Operations | | | | | | | | | | | | | | | | | | | |
| Net investment income (loss) | | $ | 6,210,179 | | $ | 6,478,387 | | $ | 3,911,718 | | $ | 4,271,991 | | $ | 66,899,020 | | $ | 37,688,512 | |
| Net realized gain (loss) from: | | | | | | | | | | | | | | | | | | | |
| Investments | | | (1,338,553 | ) | | (801,059 | ) | | (1,593,407 | ) | | (533,765 | ) | | (19,256,151 | ) | | (13,911,765 | ) |
| Swaps | | | — | | | — | | | — | | | — | | | — | | | — | |
| Change in net unrealized appreciation (depreciation) of: | | | | | | | | | | | | | | | | | | | |
| Investments | | | 11,647,643 | | | (14,980,656 | ) | | 7,978,079 | | | (10,364,770 | ) | | 95,855,590 | | | (127,408,711 | ) |
| Swaps | | | — | | | — | | | — | | | — | | | — | | | — | |
| Net increase (decrease) in net assets applicable to common shares from operations | | | 16,519,269 | | | (9,303,328 | ) | | 10,296,390 | | | (6,626,544 | ) | | 143,498,459 | | | (103,631,964 | ) |
| Distributions to Common Shareholders | | | | | | | | | | | | | | | | | | | |
| From net investment income | | | (7,007,369 | ) | | (7,061,108 | ) | | (4,293,769 | ) | | (4,677,571 | ) | | (72,197,648 | ) | | (31,617,133 | ) |
| From accumulated net realized gains | | | — | | | (285,372 | ) | | — | | | (148,587 | ) | | — | | | (74,697 | ) |
| Decrease in net assets applicable to common shares from distributions to common shareholders | | | (7,007,369 | ) | | (7,346,480 | ) | | (4,293,769 | ) | | (4,826,158 | ) | | (72,197,648 | ) | | (31,691,830 | ) |
| Capital Share Transactions | | | | | | | | | | | | | | | | | | | |
| Common shares: | | | | | | | | | | | | | | | | | | | |
| Issued in reorganizations | | | — | | | — | | | — | | | — | | | — | | | 1,270,370,280 | |
| Net proceeds from shares issued to shareholders due to reinvestment of distributions | | | — | | | — | | | — | | | — | | | — | | | 10,707 | |
| Repurchased and retired | | | — | | | — | | | (64,887 | ) | | — | | | — | | | — | |
| Net increase (decrease) in net assets applicable to common shares from capital share transactions | | | — | | | — | | | (64,887 | ) | | — | | | — | | | 1,270,380,987 | |
| Net increase (decrease) in net assets applicable to common shares | | | 9,511,900 | | | (16,649,808 | ) | | 5,937,734 | | | (11,452,702 | ) | | 71,300,811 | | | 1,135,057,193 | |
| Net assets applicable to common shares at the beginning of period | | | 132,767,418 | | | 149,417,226 | | | 92,074,280 | | | 103,526,982 | | | 1,189,196,695 | | | 54,139,502 | |
| Net assets applicable to common shares at the end of period | | $ | 142,279,318 | | $ | 132,767,418 | | $ | 98,012,014 | | $ | 92,074,280 | | $ | 1,260,497,506 | | $ | 1,189,196,695 | |
| Undistributed (Over-distribution of) net investment income at the end of period | | $ | 868,604 | | $ | 1,083,630 | | $ | 468,722 | | $ | 240,029 | | $ | 2,073,373 | | $ | 8,167,274 | |
See accompanying notes to financial statements.
| Statement of | |
| | Cash Flows |
| | Year Ended September 30, 2014 |
| | | New York | | New York | |
| | | Performance | | Dividend | |
| | | Plus | | Advantage | |
| | | (NNP | ) | (NAN | ) |
| Cash Flows from Operating Activities: | | | | | | | |
| Net Increase (Decrease) in Net Assets Applicable to Common Shares from Operations | | $ | 27,389,599 | | $ | 16,519,269 | |
| Adjustments to reconcile the net increase (decrease) in net assets applicable to common shares from operations to net cash provided by (used in) operating activities: | | | | | | | |
| Purchases of investments | | | (66,488,697 | ) | | (40,894,875 | ) |
| Proceeds from sales and maturities of investments | | | 70,310,038 | | | 46,362,232 | |
| Amortization (Accretion) of premiums and discounts, net | | | 165,782 | | | 536,617 | |
| Amortization of deferred offering costs | | | 39,498 | | | 380,309 | |
| (Increase) Decrease in: | | | | | | | |
| Receivable for interest | | | 90,289 | | | 133,856 | |
| Receivable for investments sold | | | 30,000 | | | 15,000 | |
| Other assets | | | 108 | | | (441,621 | ) |
| Increase (Decrease) in: | | | | | | | |
| Payable for interest | | | — | | | (74,726 | ) |
| Payable for investments purchased | | | 2,999,687 | | | 203,572 | |
| Accrued management fees | | | 6,704 | | | 5,374 | |
| Accrued Directors/Trustees fees | | | (1,879 | ) | | 15 | |
| Accrued reorganization expenses | | | 25,000 | | | — | |
| Accrued other expenses | | | 9,630 | | | 6,305 | |
| Net realized (gain) loss from investments | | | 5,598,937 | | | 1,338,553 | |
| Change in net unrealized (appreciation) depreciation of investments | | | (20,585,674 | ) | | (11,647,643 | ) |
| Taxes paid on undistributed capital gains | | | — | | | (688 | ) |
| Net cash provided by (used in) operating activities | | | 19,589,022 | | | 12,441,549 | |
| Cash Flows from Financing Activities: | | | | | | | |
| (Payments for) deferred offering costs | | | — | | | (92,000 | ) |
| Increase (Decrease) in: | | | | | | | |
| Cash overdraft | | | 754,501 | | | (1,697,451 | ) |
| Floating rate obligations | | | (9,020,000 | ) | | (4,310,000 | ) |
| Payable for offering costs | | | — | | | 25,728 | |
| iMTP Shares, at liquidation value | | | — | | | — | |
| MTP Shares, at liquidation value | | | — | | | (55,360,000 | ) |
| VMTP Shares, at liquidation value | | | — | | | 56,000,000 | |
| Cash distributions paid to common shareholders | | | (12,821,000 | ) | | (7,007,826 | ) |
| Cost of shares repurchased and retired | | | — | | | — | |
| Net cash provided by (used in) financing activities | | | (21,086,499 | ) | | (12,441,549 | ) |
| Net Increase (Decrease) in Cash | | | (1,497,477 | ) | | — | |
| Cash at the beginning of period | | | 1,497,477 | | | — | |
| Cash at the end of period | | $ | — | | $ | — | |
Supplemental Disclosure of Cash Flow Information
| | | New York | | New York | |
| | | Performance | | Dividend | |
| | | Plus | | Advantage | |
| | | (NNP | ) | (NAN | ) |
| Cash paid for interest (excluding amortization of offering costs) | | $ | 272,376 | | $ | 1,337,479 | |
See accompanying notes to financial statements.
| | | New York | | New York | |
| | | Dividend | | AMT-Free | |
| | | Advantage 2 | | Income | |
| | | (NXK | ) | (NRK | ) |
| Cash Flows from Operating Activities: | | | | | | | |
| Net Increase (Decrease) in Net Assets Applicable to Common Shares from Operations | | $ | 10,296,390 | | $ | 143,498,459 | |
| Adjustments to reconcile the net increase (decrease) in net assets applicable to common shares from operations to net cash provided by (used in) operating activities: | | | | | | | |
| Purchases of investments | | | (32,090,887 | ) | | (464,563,638 | ) |
| Proceeds from sales and maturities of investments | | | 33,692,739 | | | 516,104,247 | |
| Amortization (Accretion) of premiums and discounts, net | | | 445,634 | | | 1,470,279 | |
| Amortization of deferred offering costs | | | 284,019 | | | 503,740 | |
| (Increase) Decrease in: | | | | | | | |
| Receivable for interest | | | 154,270 | | | 1,141,833 | |
| Receivable for investments sold | | | — | | | (10,009,191 | ) |
| Other assets | | | (1,041 | ) | | (4,647 | ) |
| Increase (Decrease) in: | | | | | | | |
| Payable for interest | | | (49,565 | ) | | (46,325 | ) |
| Payable for investments purchased | | | (340,816 | ) | | 13,603,321 | |
| Accrued management fees | | | 2,291 | | | 35,050 | |
| Accrued Directors/Trustees fees | | | 6 | | | (3,538 | ) |
| Accrued reorganization expenses | | | 330,000 | | | (81,404 | ) |
| Accrued other expenses | | | 6,761 | | | (12,726 | ) |
| Net realized (gain) loss from investments | | | 1,593,407 | | | 19,256,151 | |
| Change in net unrealized (appreciation) depreciation of investments | | | (7,978,079 | ) | | (95,855,590 | ) |
| Taxes paid on undistributed capital gains | | | (521 | ) | | (3,657 | ) |
| Net cash provided by (used in) operating activities | | | 6,344,608 | | | 125,032,364 | |
| Cash Flows from Financing Activities: | | | | | | | |
| (Payments for) deferred offering costs | | | (92,000 | ) | | (590,000 | ) |
| Increase (Decrease) in: | | | | | | | |
| Cash overdraft | | | — | | | (2,875,394 | ) |
| Floating rate obligations | | | (2,750,000 | ) | | (48,735,000 | ) |
| Payable for offering costs | | | 32,011 | | | 33,427 | |
| iMTP Shares, at liquidation value | | | — | | | 79,000,000 | |
| MTP Shares, at liquidation value | | | (37,890,000 | ) | | (27,680,000 | ) |
| VMTP Shares, at liquidation value | | | 38,000,000 | | | (50,700,000 | ) |
| Cash distributions paid to common shareholders | | | (4,294,226 | ) | | (72,511,774 | ) |
| Cost of shares repurchased and retired | | | (64,887 | ) | | — | |
| Net cash provided by (used in) financing activities | | | (7,059,102 | ) | | (124,058,741 | ) |
| Net Increase (Decrease) in Cash | | | (714,494 | ) | | 973,623 | |
| Cash at the beginning of period | | | 2,484,938 | | | — | |
| Cash at the end of period | | $ | 1,770,444 | | $ | 973,623 | |
Supplemental Disclosure of Cash Flow Information
| | | New York | | New York | |
| | | Dividend | | AMT-Free | |
| | | Advantage 2 | | Income | |
| | | (NXK | ) | (NRK | ) |
| Cash paid for interest (excluding amortization of offering costs) | | $ | 898,003 | | $ | 2,138,812 | |
See accompanying notes to financial statements.
Selected data for a common share outstanding throughout each period:
| | | | | Investment Operations | | Less Distributions | | | | | |
| | | Beginning Common Share NAV | | Net Investment Income (Loss) | | Net Realized/ Unrealized Gain (Loss) | | Total | | From Net Investment Income to Common Share- holders | | From Accumu- lated Net Realized Gains to Common Share- holders | | Total | | Ending Common Share NAV | | Ending Market Value | |
| New York Value (NNY) | | | | | | | | | | | | | | | | | | | | | | | | | |
| Year Ended 9/30: | | | | | | | | | | | | | | | | | | | | | | | | | | | | |
| 2014 | | $ | 9.65 | | $ | .41 | | $ | .41 | | $ | .82 | | $ | (.39 | ) | $ | — | | $ | (.39 | ) | $ | 10.08 | | $ | 9.71 | |
| 2013 | | | 10.41 | | | .40 | | | (.75 | ) | | (.35 | ) | | (.39 | ) | | (.02 | ) | | (.41 | ) | | 9.65 | | | 8.97 | |
| 2012 | | | 9.93 | | | .42 | | | .48 | | | .90 | | | (.42 | ) | | — | | | (.42 | ) | | 10.41 | | | 10.55 | |
| 2011 | | | 10.02 | | | .43 | | | (.08 | ) | | .35 | | | (.43 | ) | | (.01 | ) | | (.44 | ) | | 9.93 | | | 9.47 | |
| 2010 | | | 9.91 | | | .42 | | | .14 | | | .56 | | | (.43 | ) | | (.02 | ) | | (.45 | ) | | 10.02 | | | 9.88 | |
| | | | | | | | | | | | | | | | | | | | | | | | | | |
| New York Value 2 (NYV) | | | | | | | | | | | | | | | | | | | | | | | | | |
| Year Ended 9/30: | | | | | | | | | | | | | | | | | | | | | | | | | | | | |
| 2014 | | | 15.16 | | | .68 | | | .76 | | | 1.44 | | | (.66 | ) | | — | | | (.66 | ) | | 15.94 | | | 14.44 | |
| 2013 | | | 16.36 | | | .72 | | | (1.25 | ) | | (.53 | ) | | (.67 | ) | | — | | | (.67 | ) | | 15.16 | | | 13.99 | |
| 2012 | | | 15.36 | | | .72 | | | .95 | | | 1.67 | | | (.67 | ) | | — | | | (.67 | ) | | 16.36 | | | 16.33 | |
| 2011 | | | 16.10 | | | .75 | | | (.74 | ) | | .01 | | | (.75 | ) | | — | | | (.75 | ) | | 15.36 | | | 14.13 | |
| 2010 | | | 15.91 | | | .79 | | | .17 | | | .96 | | | (.77 | ) | | — | | | (.77 | ) | | 16.10 | | | 15.38 | |
| (a) | Total Return Based on Market Value is the combination of changes in the market price per share and the effect of reinvested dividend income and reinvested capital gains distributions, if any, at the average price paid per share at the time of reinvestment. The last dividend declared in the period, which is typically paid on the first business day of the following month, is assumed to be reinvested at the ending market price. The actual reinvestment for the last dividend declared in the period may take place over several days, and in some instances may not be based on the market price, so the actual reinvestment price may be different from the price used in the calculation. Total returns are not annualized. |
| | |
| | Total Return Based on Common share NAV is the combination of changes in common share NAV, reinvested dividend income at NAV and reinvested capital gains distributions at NAV, if any. The last dividend declared in the period, which is typically paid on the first business day of the following month, is assumed to be reinvested at the ending NAV. The actual reinvest price for the last dividend declared in the period may often be based on the Fund’s market price (and not its NAV), and therefore may be different from the price used in the calculation. Total returns are not annualized. |
| | | | Ratios/Supplemental Data | |
| | Total Returns | | | | Ratios to Average Net Assets Applicable to Common Shares | | | |
| | | | | | | | | | | | | |
| | Based on Common Share NAV | (a) | Based on Market Value | (a) | Ending Net Assets Applicable to Common Shares (000) | | Expenses | (b) | Net Investment Income (Loss) | | Portfolio Turnover Rate | (c) |
| | | | | | | | | | | | | | | | | | | |
| | | | | | | | | | | | | | | | | | | |
| | | 8.63 | % | | 12.76 | % | $ | 153,087 | | | .63 | % | | 4.13 | % | | 23 | % |
| | | (3.51 | ) | | (11.41 | ) | | 146,522 | | | .61 | | | 3.97 | | | 21 | |
| | | 9.23 | | | 16.11 | | | 157,979 | | | .65 | | | 4.14 | | | 10 | |
| | | 3.62 | | | .39 | | | 150,555 | | | .65 | | | 4.40 | | | 10 | |
| | | 5.82 | | | 8.78 | | | 152,031 | | | .67 | | | 4.30 | | | 5 | |
| | | | | | | | | | | | | | | | | | | |
| | | | | | | | | | | | | | | | | | | |
| | | 9.69 | | | 8.12 | | | 37,455 | | | .76 | | | 4.37 | | | 19 | |
| | | (3.36 | ) | | (10.46 | ) | | 35,630 | | | .74 | | | 4.50 | | | 3 | |
| | | 11.12 | | | 20.74 | | | 38,434 | | | .75 | | | 4.55 | | | 10 | |
| | | .27 | | | (3.15 | ) | | 36,040 | | | .77 | | | 4.99 | | | 18 | |
| | | 6.26 | | | 9.12 | | | 37,796 | | | .74 | | | 5.04 | | | 2 | |
| (b) | The expense ratios reflect, among other things, the interest expense deemed to have been paid by the Fund on the floating rate certificates issued by the special purpose trusts for the self-deposited inverse floaters held by the Fund, where applicable, as described in Note 3 – Portfolio Securities and Investments in Derivatives, Inverse Floating Rate Securities, as follows: |
| New York Value (NNY) | | |
| Year Ended 9/30: | | |
| 2014 | .01 | % |
| 2013 | .01 | |
| 2012 | .01 | |
| 2011 | .01 | |
| 2010 | .01 | |
| New York Value 2 (NYV) | | |
| Year Ended 9/30: | | |
| 2014 | — | % |
| 2013 | — | |
| 2012 | — | |
| 2011 | — | |
| 2010 | — | |
| (c) | Portfolio Turnover Rate is calculated based on the lesser of long-term purchases or sales (as disclosed in Note 5 – Investment Transactions) divided by the average long-term market value during the period. |
See accompanying notes to financial statements.
Financial Highlights (continued)
Selected data for a common share outstanding throughout each period:
| | | | | Investment Operations | | Less Distributions | | | | | |
| | | Beginning Common Share NAV | | Net Investment Income (Loss) | | Net Realized/ Unrealized Gain (Loss) | | Distributions from Net Investment Income to Auction Rate Preferred Share- holders | (a) | Distributions from Accumu- lated Net Realized Gains to Auction Rate Preferred Share- holders | (a) | Total | | From Net Investment Income to Common Share- holders | | From Accumu- lated Net Realized Gains to Common Share- holders | | Total | | Ending Common Share NAV | | Ending Market Value | |
| New York Performance Plus (NNP) | | | | | | | | | | | | | | | | | | | | | | | | | |
| Year Ended 9/30: | | | | | | | | | | | | | | | | | | | | | | | | | | | | | | | |
| 2014 | | $ | 14.88 | | $ | .82 | | $ | 1.00 | | $ | — | | $ | — | | $ | 1.82 | | $ | (.85 | ) | $ | — | | $ | (.85 | ) | $ | 15.85 | | $ | 13.93 | |
| 2013 | | | 16.84 | | | .83 | | | (1.89 | ) | | — | | | — | | | (1.06 | ) | | (.86 | ) | | (.04 | ) | | (.90 | ) | | 14.88 | | | 13.68 | |
| 2012 | | | 15.86 | | | .86 | | | 1.00 | | | — | | | — | | | 1.86 | | | (.88 | ) | | — | | | (.88 | ) | | 16.84 | | | 17.18 | |
| 2011 | | | 16.05 | | | .88 | | | (.18 | ) | | — | | | — | | | .70 | | | (.88 | ) | | (.01 | ) | | (.89 | ) | | 15.86 | | | 14.93 | |
| 2010 | | | 15.63 | | | .91 | | | .38 | | | (.01 | ) | | — | * | | 1.28 | | | (.84 | ) | | (.02 | ) | | (.86 | ) | | 16.05 | | | 15.52 | |
| | | | | | | | | | | | | | | | | | | | | | | | | | | | | | | | | | | |
| New York Dividend Advantage (NAN) | | | | | | | | | | | | | | | | | | | | | | | | | |
| Year Ended 9/30: | | | | | | | | | | | | | | | | | | | | | | | | | | | | | | | |
| 2014 | | | 14.33 | | | .67 | | | 1.12 | | | — | | | — | | | 1.79 | | | (.76 | ) | | -— | | | (.76 | ) | | 15.36 | | | 13.33 | |
| 2013 | | | 16.13 | | | .70 | | | (1.71 | ) | | — | | | — | | | (1.01 | ) | | (.76 | ) | | (.03 | ) | | (.79 | ) | | 14.33 | | | 12.91 | |
| 2012 | | | 15.01 | | | .73 | | | 1.19 | | | — | | | — | | | 1.92 | | | (.79 | ) | | (.01 | ) | | (.80 | ) | | 16.13 | | | 16.00 | |
| 2011 | | | 15.17 | | | .76 | | | (.10 | ) | | — | * | | — | | | .66 | | | (.79 | ) | | (.03 | ) | | (.82 | ) | | 15.01 | | | 13.70 | |
| 2010 | | | 14.82 | | | .84 | �� | | .34 | | | (.01 | ) | | — | * | | 1.17 | | | (.78 | ) | | (.04 | ) | | (.82 | ) | | 15.17 | | | 14.43 | |
| (a) | The amounts shown are based on common share equivalents. |
| (b) | Total Return Based on Market Value is the combination of changes in the market price per share and the effect of reinvested dividend income and reinvested capital gains distributions, if any, at the average price paid per share at the time of reinvestment. The last dividend declared in the period, which is typically paid on the first business day of the following month, is assumed to be reinvested at the ending market price. The actual reinvestment for the last dividend declared in the period may take place over several days, and in some instances may not be based on the market price, so the actual reinvestment price may be different from the price used in the calculation. Total returns are not annualized. |
| | |
| | Total Return Based on Common Share NAV is the combination of changes in common share NAV, reinvested dividend income at NAV and reinvested capital gains distributions at NAV, if any. The last dividend declared in the period, which is typically paid on the first business day of the following month, is assumed to be reinvested at the ending NAV. The actual reinvest price for the last dividend declared in the period may often be based on the Fund’s market price (and not its NAV), and therefore may be different from the price used in the calculation. Total returns are not annualized. |
| * | Rounds to less than $.01 per share. |
| | | | Ratios/Supplemental Data | |
| | Total Returns | | | | Ratios to Average Net Assets Applicable to Common Shares(c) | | | |
| | | | | | | | | | | | | |
| | Based on Common Share NAV | (b) | Based on Market Value | (b) | Ending Net Assets Applicable to Common Shares (000) | | Expenses | (d) | Net Investment Income (Loss) | | Portfolio Turnover Rate | (e) |
| | | | | | | | | | | | | | | | | | | |
| | | | | | | | | | | | | | | | | | | |
| | | 12.57 | % | | 8.22 | % | $ | 238,722 | | | 1.67 | % | | 5.38 | % | | 19 | % |
| | | (6.57 | ) | | (15.66 | ) | | 224,167 | | | 1.63 | | | 5.12 | | | 16 | |
| | | 12.05 | | | 21.58 | | | 253,426 | | | 1.64 | | | 5.27 | | | 11 | |
| | | 4.78 | | | 2.30 | | | 238,572 | | | 1.77 | | | 5.77 | | | 6 | |
| | | 8.46 | | | 11.39 | | | 241,450 | | | 1.53 | | | 5.84 | | | 9 | |
| | | | | | | | | | | | | | | | | | | |
| | | | | | | | | | | | | | | | | | | |
| | | 12.79 | | | 9.29 | | | 142,279 | | | 2.55 | | | 4.54 | | | 20 | |
| | | (6.48 | ) | | (14.81 | ) | | 132,767 | | | 2.35 | | | 4.51 | | | 14 | |
| | | 13.05 | | | 23.20 | | | 149,417 | | | 2.37 | | | 4.71 | | | 9 | |
| | | 4.75 | | | .98 | | | 139,060 | | | 2.42 | | | 5.26 | | | 10 | |
| | | 8.28 | | | 14.63 | | | 140,525 | | | 1.74 | | | 5.74 | | | 10 | |
| (c) | Ratios do not reflect the effect of dividend payments to Auction Rate Preferred shareholders, where applicable; Net Investment Income (Loss) ratios reflect income earned and expenses incurred on assets attributable to Auction Rate Preferred Shares (“ARPS”), MTP Shares, VMTP Shares and/or VRDP Shares, where applicable. |
| (d) | The expense ratios reflect, among other things, all interest expense and other costs related to MTP Shares, VMTP Shares, VRDP Shares and/or the interest expense deemed to have been paid by the Fund on the floating rate certificates issued by the special purpose trusts for the self-deposited inverse floaters held by the Fund, where applicable, each as described in Note 1 – General Information and Significant Accounting Policies, MuniFund Term Preferred Shares, Variable Rate MuniFund Term Preferred Shares and Variable Rate Demand Preferred Shares and Note 3 – Portfolio Securities and Investments in Derivatives, Inverse Floating Rate Securities, respectively, as follows: |
| New York Performance Plus (NNP) | | |
| Year Ended 9/30: | | |
| 2014 | .58 | % |
| 2013 | .59 | |
| 2012 | .61 | |
| 2011 | .70 | |
| 2010 | .40 | |
| New York Dividend Advantage (NAN) | | |
| Year Ended 9/30: | | |
| 2014 | 1.20 | % |
| 2013 | 1.26 | |
| 2012 | 1.27 | |
| 2011 | 1.27 | |
| 2010 | .63 | |
| (e) | Portfolio Turnover Rate is calculated based on the lesser of long-term purchases or sales (as disclosed in Note 5 – Investment Transactions) divided by the average long-term market value during the period. |
See accompanying notes to financial statements.
Financial Highlights (continued)
Selected data for a common share outstanding throughout each period:
| | | | | Investment Operations | | Less Distributions | | | | | | | |
| | | Beginning Common Share NAV | | Net Investment Income (Loss) | | Net Realized/ Unrealized Gain (Loss) | | Distributions from Net Investment Income to Auction Rate Preferred Shareholders | (a) | Distributions from Accumu lated Net Realized Gains to Auction Rate Preferred Shareholders | (a) | Total | | From Net Investment Income to Common Share- holders | | From Accumulated Net Realized Gains to Common Shareholders | | Total | | Discount from Common Shares Repurchased and Retired | | Ending Common Share NAV | | Ending Market Value | |
| New York Dividend Advantage 2 (NXK) | | | | | | | | | | | | | | | | | | | | | | | | | | | | |
| Year Ended 9/30: | | | | | | | | | | | | | | | | | | | | | | | | | | | | | | | | | | |
| 2014 | | $ | 14.19 | | $ | .60 | | $ | .99 | | $ | — | | $ | — | | $ | 1.59 | | $ | (.66 | ) | $ | — | | $ | (.66 | ) | $ | — | * | $ | 15.12 | | $ | 13.17 | |
| 2013 | | | 15.96 | | | .66 | | | (1.69 | ) | | — | | | — | | | (1.03 | ) | | (.72 | ) | | (.02 | ) | | (.74 | ) | | — | | | 14.19 | | | 12.69 | |
| 2012 | | | 14.94 | | | .72 | | | 1.10 | | | — | | | — | | | 1.82 | | | (.80 | ) | | — | | | (.80 | ) | | — | | | 15.96 | | | 15.51 | |
| 2011 | | | 15.13 | | | .74 | | | (.13 | ) | | — | | | — | | | .61 | | | (.80 | ) | | — | | | (.80 | ) | | — | | | 14.94 | | | 13.60 | |
| 2010 | | | 14.76 | | | .83 | | | .36 | | | (.01 | ) | | — | * | | 1.18 | | | (.80 | ) | | (.01 | ) | | (.81 | ) | | — | | | 15.13 | | | 14.37 | |
| | | | | | | | | | | | | | | | | | | | | | | | | | | | | | | | | | | | | | |
| New York AMT-Free Income (NRK) | | | | | | | | | | | | | | | | | | | | | | | | | | | |
| Year Ended 9/30: | | | | | | | | | | | | | | | | | | | | | | | | | | | | | | | | | | |
| 2014 | | | 13.57 | | | .76 | | | .88 | | | — | | | — | | | 1.64 | | | (.82 | ) | | — | | | (.82 | ) | | — | | | 14.39 | | | 12.80 | |
| 2013 | | | 15.44 | | | .76 | | | (1.87 | ) | | — | | | — | | | (1.11 | ) | | (.74 | ) | | (.02 | ) | | (.76 | ) | | — | | | 13.57 | | | 12.24 | |
| 2012 | | | 15.03 | | | .66 | | | .46 | | | — | | | — | | | 1.12 | | | (.70 | ) | | (.01 | ) | | (.71 | ) | | — | | | 15.44 | | | 15.29 | |
| 2011 | | | 15.36 | | | .65 | | | (.24 | ) | | — | | | — | | | .41 | | | (.74 | ) | | — | | | (.74 | ) | | — | | | 15.03 | | | 13.86 | |
| 2010 | | | 15.18 | | | .77 | | | .23 | | | (.01 | ) | | (.01 | ) | | .98 | | | (.73 | ) | | (.07 | ) | | (.80 | ) | | — | | | 15.36 | | | 14.75 | |
| (a) | The amounts shown are based on common share equivalents. |
| (b) | Total Return Based on Market Value is the combination of changes in the market price per share and the effect of reinvested dividend income and reinvested capital gains distributions, if any, at the average price paid per share at the time of reinvestment. The last dividend declared in the period, which is typically paid on the first business day of the following month, is assumed to be reinvested at the ending market price. The actual reinvestment for the last dividend declared in the period may take place over several days, and in some instances may not be based on the market price, so the actual reinvestment price may be different from the price used in the calculation. Total returns are not annualized. |
| | |
| | Total Return Based on Common Share NAV is the combination of changes in common share NAV, reinvested dividend income at NAV and reinvested capital gains distributions at NAV, if any. The last dividend declared in the period, which is typically paid on the first business day of the following month, is assumed to be reinvested at the ending NAV. The actual reinvest price for the last dividend declared in the period may often be based on the Fund’s market price (and not its NAV), and therefore may be different from the price used in the calculation. Total returns are not annualized. |
| * | Rounds to less than $.01 per share. |
| | | | Ratios/Supplemental Data | |
| | Total Returns | | | | Ratios to Average Net Assets Applicable to Common Shares Before Reimbursement(c) | | Ratios to Average Net Assets Applicable to Common Shares After Reimbursement(c)(d) | | | |
| | | | | | | | | | | | | | | | | |
| | Based on Common Share NAV | (b) | Based on Market Value | (b) | Ending Net Assets Applicable to Common Shares (000) | | Expenses | (e) | Net Investment Income (Loss) | | Expenses | (e) | Net Investment Income (Loss) | | Portfolio Turnover Rate | (f) |
| | | | | | | | | | | | | | | | | | | | | | | | | |
| | | | | | | | | | | | | | | | | | | | | | | | | |
| | | 11.49 | % | | 9.18 | % | $ | 98,012 | | | 2.70 | % | | 4.15 | % | | N/A | | | N/A | | | 23 | % |
| | | (6.67 | ) | | (13.85 | ) | | 92,074 | | | 2.30 | | | 4.29 | | | N/A | | | N/A | | | 17 | |
| | | 12.47 | | | 20.38 | | | 103,527 | | | 2.32 | | | 4.66 | | | N/A | | | N/A | | | 10 | |
| | | 4.38 | | | .49 | | | 96,940 | | | 2.44 | | | 5.12 | | | 2.41 | % | | 5.16 | % | | 14 | |
| | | 8.27 | | | 13.65 | | | 98,156 | | | 1.74 | | | 5.54 | | | 1.63 | | | 5.65 | | | 6 | |
| | | | | | | | | | | | | | | | | | | | | | | | | |
| | | | | | | | | | | | | | | | | | | | | | | | | |
| | | 12.48 | | | 11.53 | | | 1,260,498 | | | 1.57 | | | 5.50 | | | N/A | | | N/A | | | 25 | |
| | | (7.40 | ) | | (15.46 | ) | | 1,189,197 | | | 1.77 | | | 5.26 | | | N/A | | | N/A | | | 27 | |
| | | 7.63 | | | 15.78 | | | 54,140 | | | 2.82 | | | 4.35 | | | N/A | | | N/A | | | 15 | |
| | | 2.91 | | | (.81 | ) | | 52,694 | | | 2.91 | | | 4.44 | | | 2.89 | | | 4.47 | | | 6 | |
| | | 6.70 | ** | | 13.97 | | | 53,866 | | | 1.95 | | | 5.01 | | | 1.81 | | | 5.15 | | | 4 | |
| (c) | Ratios do not reflect the effect of dividend payments to Auction Rate Preferred shareholders, where applicable; Net Investment Income (Loss) ratios reflect income earned and expenses incurred on assets attributable to ARPS, iMTP, MTP, VMTP and/or VRDP Shares, where applicable. |
| (d) | After expense reimbursement from the Adviser, where applicable. As of March 31, 2011 and November 30, 2010, the Adviser is no longer reimbursing New York Dividend Advantage 2 (NXK) and New York AMT-Free Income (NRK), respectively, for any fees or expenses. |
| (e) | The expense ratios reflect, among other things, all interest expense and other costs related to iMTP Shares, MTP Shares, VMTP Shares, VRDP Shares and/or the interest expense deemed to have been paid by the Fund on the floating rate certificates issued by the special purpose trusts for the self-deposited inverse floaters held by the Fund, where applicable, each as described in Note 1 – General Information and Significant Accounting Policies, Institutional MuniFund Term Preferred Shares, MuniFund Term Preferred Shares, Variable Rate MuniFund Term Preferred Shares and Variable Rate Demand Preferred Shares and Note 3 – Portfolio Securities and Investments in Derivatives, Inverse Floating Rate Securities, respectively, as follows: |
| New York Dividend Advantage 2 (NXK) | | |
| Year Ended 9/30: | | |
| 2014 | 1.20 | % |
| 2013 | 1.20 | |
| 2012 | 1.20 | |
| 2011 | 1.29 | |
| 2010 | .63 | |
| New York AMT-Free Income (NRK) | | |
| Year Ended 9/30: | | |
| 2014 | .58 | % |
| 2013 | .70 | |
| 2012 | 1.59 | |
| 2011 | 1.66 | |
| 2010 | .77 | |
| (f) | Portfolio Turnover Rate is calculated based on the lesser of long-term purchases or sales (as disclosed in Note 5 – Investment Transactions) divided by the average long-term market value during the period. |
| ** | During the fiscal year ended September 30, 2010, New York AMT-Free Income (NRK) received payments from the Adviser of $35,020 to offset losses realized on the disposal of investments purchased in violation of the Fund’s investment restrictions. This reimbursement did not have an impact on the Fund’s Total Return on Common Share NAV. |
| N/A | Fund no longer has a contractual reimbursement agreement with the Adviser. |
See accompanying notes to financial statements.
Financial Highlights (continued)
| | | ARPS at the End of Period | | MTP Shares at the End of Period (a) | | VMTP Shares at the End of Period | | VRDP Shares at the End of Period | | ARPS and MTP Shares at the End of Period | |
| | | Aggregate Amount Outstanding (000) | | Asset Coverage Per $25,000 Share | | Aggregate Amount Outstanding (000) | | Asset Coverage Per $10 Share | | Aggregate Amount Outstanding (000) | | Asset Coverage Per $100,000 Share | | Aggregate Amount Outstanding (000) | | Asset Coverage Per $100,000 Share | | Asset Coverage Per $1 Liquidation Preference | |
| New York Performance Plus (NNP) | | | | | | | | | | | | | | | | | | | | | | |
| Year Ended 9/30: | | | | | | | | | | | | | | | | | | | | | | | | | |
| 2014 | | $ | — | | $ | — | | $ | — | | $ | — | | $ | — | | $ | — | | $ | 89,000 | | $ | 368,227 | | $ | — | |
| 2013 | | | — | | | — | | | — | | | — | | | — | | | — | | | 89,000 | | | 351,873 | | | — | |
| 2012 | | | — | | | — | | | — | | | — | | | — | | | — | | | 89,000 | | | 384,748 | | | — | |
| 2011 | | | — | | | — | | | — | | | — | | | — | | | — | | | 89,000 | | | 368,059 | | | — | |
| 2010 | | | — | | | — | | | — | | | — | | | — | | | — | | | 89,000 | | | 371,292 | | | — | |
| | | | | | | | | | | | | | | | | | | | | | | | | | | | | |
| New York Dividend Advantage (NAN) | | | | | | | | | | | | | | | | | | | |
| Year Ended 9/30: | | | | | | | | | | | | | | | | | | | | | | | | | |
| 2014 | | | — | | | — | | | — | | | — | | | 56,000 | | | 354,070 | | | — | | | — | | | — | |
| 2013 | | | — | | | — | | | 55,360 | | | 33.98 | | | — | | | — | | | — | | | — | | | — | |
| 2012 | | | — | | | — | | | 55,360 | | | 36.99 | | | — | | | — | | | — | | | — | | | — | |
| 2011 | | | — | | | — | | | 55,360 | | | 35.12 | | | — | | | — | | | — | | | — | | | — | |
| 2010 | | | 21,900 | | | 92,690 | | | 30,000 | | | 37.08 | | | — | | | — | | | — | | | — | | | 3.71 | |
| (a) | The Ending and Average Market Value Per Share for each Series of the Fund’s MTP Shares were as follows: |
| | | | 2014 | | | 2013 | | | 2012 | | | 2011 | | | 2010 | |
| New York Dividend Advantage (NAN) | | | | | | | | | | | | | | | | |
| Series 2015 (NAN PRC) | | | | | | | | | | | | | | | | |
| Ending Market Value per Share | | $ | — | | $ | 10.09 | | $ | 10.08 | | $ | 10.09 | | $ | 10.16 | |
| Average Market Value per Share | | | 10.04 | ^^^ | | 10.09 | | | 10.11 | | | 10.08 | | | 10.09 | ^ |
| Series 2016 (NAN PRD) | | | | | | | | | | | | | | | | |
| Ending Market Value per Share | | | — | | | 10.02 | | | 10.09 | | | 10.06 | | | — | |
| Average Market Value per Share | | | 10.05 | ^^^ | | 10.10 | | | 10.11 | | | 9.95 | ^^ | | — | |
| ^ | For the period December 21, 2009 (first issuance date of shares) through September 30, 2010. |
| ^^ | For the period December 13, 2010 (first issuance date of shares) through September 30, 2011. |
| ^^^ | For the period October 1, 2013 through June 13, 2014. |
| | | iMTP Shares at the End of Period | | MTP Shares at the End of Period (a) | | VMTP Shares at the End of Period | | VRDP Shares at the End of Period | | iMTP, MTP, VMTP and/or VRDP Shares at the End of Period | |
| | | Aggregate Amount Outstanding (000) | | Asset Coverage Per $5,000 Share | | Aggregate Amount Outstanding (000) | | Asset Coverage Per $10 Share | | Aggregate Amount Outstanding (000) | | Asset Coverage Per $100,000 Share | | Aggregate Amount Outstanding (000) | | Asset Coverage Per $100,000 Share | | Asset Coverage Per $1 Liquidation Preference | |
| New York Dividend Advantage 2 (NXK) | | | | | | | | | | | | | | | | | | | |
| Year Ended 9/30: | | | | | | | | | | | | | | | | | | | | | | | | | |
| 2014 | | $ | — | | $ | — | | $ | — | | $ | — | | $ | 38,000 | | $ | 357,926 | | $ | — | | $ | — | | $ | — | |
| 2013 | | | — | | | — | | | 37,890 | | | 34.30 | | | — | | | — | | | — | | | — | | | — | |
| 2012 | | | — | | | — | | | 37,890 | | | 37.32 | | | — | | | — | | | — | | | — | | | — | |
| 2011 | | | — | | | — | | | 37,890 | | | 35.58 | | | — | | | — | | | — | | | — | | | — | |
| 2010 | | | — | | | — | | | 37,890 | | | 35.91 | | | — | | | — | | | — | | | — | | | — | |
| | | | | | | | | | | | | | | | | | | | | | | | | | | | | |
| New York AMT-Free Income (NRK) | | | | | | | | | | | | | | | | | | | | | | |
| Year Ended 9/30: | | | | | | | | | | | | | | | | | | | | | | | | | |
| 2014 | | | 79,000 | | | 16,100 | | | — | | | — | | | — | | | — | | | 488,800 | | | 321,997 | | | 3.22 | |
| 2013 | | | — | | | — | | | 27,680 | | | 30.97 | | | 50,700 | | | 309,668 | | | 488,800 | | | 309,668 | | | 3.10 | |
| 2012 | | | — | | | — | | | 27,680 | | | 29.56 | | | — | | | — | | | — | | | — | | | — | |
| 2011 | | | — | | | — | | | 27,680 | | | 29.04 | | | — | | | — | | | — | | | — | | | — | |
| 2010 | | | — | | | — | | | 27,680 | | | 29.46 | | | — | | | — | | | — | | | — | | | — | |
| (a) | The Ending and Average Market Value Per Share for each Series of the Fund’s MTP Shares were as follows: |
| | | | 2014 | | | 2013 | | | 2012 | | | 2011 | | | 2010 | |
| New York Dividend Advantage 2 (NXK) | | | | | | | | | | | | | | | | |
| Series 2015 (NXK PRC) | | | | | | | | | | | | | | | | |
| Ending Market Value per Share | | $ | — | | $ | 10.05 | | $ | 10.07 | | $ | 10.11 | | $ | 10.14 | |
| Average Market Value per Share | | | 10.03 | ΩΩ | | 10.06 | | | 10.09 | | | 10.05 | | | 10.05 | Ω |
| | | | | | | | | | | | | | | | | |
| New York AMT-Free Income (NRK) | | | | | | | | | | | | | | | | |
| Series 2015 (NRK PRC) | | | | | | | | | | | | | | | | |
| Ending Market Value per Share | | | — | | | 10.01 | | | 10.14 | | | 10.10 | | | 10.33 | |
| Average Market Value per Share | | | 10.04 | ΩΩ | | 10.07 | | | 10.10 | | | 10.06 | | | 10.09 | Ω |
| Ω | For the period April 14, 2010 (first issuance date of shares) through September 30, 2010. |
| ΩΩ | For the period October 1, 2013 through June 13, 2014. |
See accompanying notes to financial statements.
| Notes to | |
| | Financial Statements |
1. General Information and Significant Accounting Policies
General Information
Fund Information
The funds covered in this report and their corresponding New York Stock Exchange (“NYSE”) or NYSE MKT symbols are as follows (each a “Fund” and collectively, the “Funds”):
• Nuveen New York Municipal Value Fund, Inc. (NNY) (“New York Value (NNY)”)
• Nuveen New York Municipal Value Fund 2 (NYV) (“New York Value 2 (NYV)”)
• Nuveen New York Performance Plus Municipal Fund, Inc. (NNP) (“New York Performance Plus (NNP)”)
• Nuveen New York Dividend Advantage Municipal Fund (NAN) (“New York Dividend Advantage (NAN)”)
• Nuveen New York Dividend Advantage Municipal Fund 2 (NXK) (“New York Dividend Advantage 2 (NXK)”)
• Nuveen New York AMT-Free Municipal Income Fund (NRK) (“New York AMT-Free Income (NRK)”)
The Funds are registered under the Investment Company Act of 1940, as amended, as diversified (non-diversified for New York Municipal Value 2 (NYV)), closed-end registered investment companies. Common shares of New York Value (NNY), New York Performance Plus (NNP), New York Dividend Advantage (NAN), and New York AMT-Free Income (NRK) are traded on the NYSE (Common shares of New York AMT-Free Income (NRK) were formerly traded on the NYSE MKT.) Common shares of New York Value 2 (NYV) and New York Dividend Advantage 2 (NKX) are traded on the NYSE MKT. New York Value (NNY) and New York Performance Plus (NNP) were incorporated under the state laws of Minnesota on July 14, 1987 and October 6, 1989, respectively. New York Value 2 (NYV), New York Dividend Advantage (NAN), New York Dividend Advantage 2 (NXK) and New York AMT-Free Income (NRK) were organized as Massachusetts business trusts on January 26, 2009, December 1, 1998, June 1, 1999 and April 9, 2002, respectively.
Investment Adviser
The Funds’ investment adviser is Nuveen Fund Advisors, LLC (the “Adviser”), a wholly-owned subsidiary of Nuveen Investments, Inc. (“Nuveen”). The Adviser is responsible for each Fund’s overall investment strategy and asset allocation decisions. The Adviser has entered into sub-advisory agreements with Nuveen Asset Management, LLC (the “Sub-Adviser”), a subsidiary of the Adviser, under which the Sub-Adviser manages the investment portfolios of the Funds.
Purchase and Sale Agreement
On October 1, 2014, TIAA-CREF, a national financial services organization, completed its previously announced acquisition of Nuveen, the parent company of the Adviser. The transaction has not resulted in any change in the portfolio management of the Funds or in the Funds’ investment objectives or policies.
Because the consummation of the acquisition resulted in the “assignment” (as defined in the Investment Company Act of 1940) and automatic termination of the Funds’ investment management agreements and investment sub-advisory agreements, Fund shareholders were asked to approve new investment management agreements with the Adviser and new investment sub-advisory agreements with each Fund’s sub-adviser. These new agreements were approved by shareholders of each of the Funds, and went into effect on October 1, 2014. The terms of the new agreements, including the fees payable to each Fund’s Adviser and Sub-Adviser, are substantially identical to those of the investment management agreements and investment sub-advisory agreements in place immediately prior to the closing.
Investment Objectives and Principal Investment Strategies
Each Fund seeks to provide current income exempt from both regular federal and New York state income taxes, and in the case of New York AMT-Free Income (NRK) the alternative minimum tax applicable to individuals, by investing primarily in a portfolio of municipal obligations issued by state and local government authorities within the state of New York or certain U.S. territories.
Significant Accounting Policies
The following is a summary of significant accounting policies followed by the Funds in the preparation of their financial statements in accordance with U.S. generally accepted accounting principles (“U.S. GAAP”).
Investment Transactions
Investment transactions are recorded on a trade date basis. Realized gains and losses from investment transactions are determined on the specific identification method, which is the same basis used for federal income tax purposes. Investments purchased on a when-issued/delayed delivery basis may have extended settlement periods. Any investments so purchased are subject to market fluctuation during this period. The Funds have instructed the custodian to earmark securities in the Funds’ portfolios with a current value at least equal to the amount of the when-issued/delayed delivery purchase commitments.
As of September 30, 2014, the Funds’ outstanding when-issued/delayed delivery purchase commitments were as follows:
| | | | | | | New York | | New York | | New York | | New York | |
| | | New York | | New York | | Performance | | Dividend | | Dividend | | AMT-Free | |
| | | Value | | Value 2 | | Plus | | Advantage | | Advantage 2 | | Income | |
| | | (NNY | ) | (NYV | ) | (NNP | ) | (NAN | ) | (NXK | ) | (NRK | ) |
| Outstanding when-issued/delayed delivery purchase commitments | | $ | 1,197,480 | | $ | — | | $ | 2,999,687 | | $ | 203,572 | | $ | 1,718,384 | | $ | 28,430,041 | |
Investment Income
Investment income, which reflects the amortization of premiums and accretion of discounts for financial reporting purposes, is recorded on an accrual basis. Investment income also reflects paydown gains and losses, if any.
Professional Fees
Professional fees presented on the Statement of Operations consist of legal fees incurred in the normal course of operations, audit fees, tax consulting fees and, in some cases, workout expenditures. Workout expenditures are incurred in an attempt to protect or enhance an investment, or to pursue other claims or legal actions on behalf of Fund shareholders. If a refund is received for workout expenditures paid in a prior reporting period, such amounts will be recognized as “Legal fee refund” on the Statement of Operations.
Dividends and Distributions to Common Shareholders
Dividends from net investment income are declared monthly. Net realized capital gains and/or market discount from investment transactions, if any, are distributed to shareholders at least annually. Furthermore, capital gains are distributed only to the extent they exceed available capital loss carryforwards.
Distributions to common shareholders of net investment income, net realized capital gains and/or market discount, if any, are recorded on the ex-dividend date. The amount and timing of distributions are determined in accordance with federal income tax regulations, which may differ from U.S. GAAP.
Auction Rate Preferred Shares
Each Fund except New York Value (NNY) and New York Value 2 (NYV), is authorized to issue Auction Rate Preferred Shares (“ARPS”). During prior fiscal periods, the Funds redeemed all of their outstanding ARPS, at liquidation value.
Institutional MuniFund Term Preferred Shares
The following Fund has issued and outstanding Institutional MuniFund Term Preferred (“iMTP”) Shares, with a $5,000 liquidation value per share. iMTP Shares are issued via private placement and are not publicly available.
As of September 30, 2014, iMTP Shares outstanding, at liquidation value, for the following Fund was as follows:
| | | | | | | Shares | |
| | | | | | | Outstanding | |
| | | | | | | at $5,000 | |
| | | | | Shares | | Per Share | |
| | | Series | | Outstanding | | Liquidation Value | |
| New York AMT-Free Income (NRK) | | | 2017 | | | 15,800 | | $ | 79,000,000 | |
Notes to Financial Statements (continued)
The Fund is obligated to redeem its iMTP Shares by the date as specified in its offering document (“Term Redemption Date”), unless earlier redeemed or repurchased by the Fund. iMTP Shares are subject to optional and mandatory redemption in certain circumstances. The iMTP Shares are not subject to redemption at the option of the Fund for one year following the date of issuance (“Non-Call Expiration Date”), at which point the Fund may begin to redeem at its option (“Optional Redemption Date”). The Fund may be obligated to redeem certain of the iMTP Shares if the Fund fails to maintain certain asset coverage and leverage ratio requirements and such failures are not cured by the applicable cure date. The redemption price per share is equal to the sum of the liquidation value per share plus any accumulated but unpaid dividends. The Term Redemption Date, Optional Redemption Date and Premium Expiration Date for the Fund’s iMTP Shares are as follows:
| | | | | Term | | Optional | | Non-Call | |
| | | Series | | Redemption Date | | Redemption Date | | Expiration Date | |
| New York AMT-Free Income (NRK) | | 2017 | | October 1, 2017 | | April 1, 2015 | | March 31, 2015 | |
The average liquidation value of iMTP Shares outstanding and annualized dividend rate for the Fund during the fiscal year ended September 30, 2014, were as follows:
| | | | New York | |
| | | | AMT-Free | |
| | | | Income | |
| | | | (NRK | )* |
| Average liquidation value of iMTP Shares outstanding | | $ | 79,000,000 | |
| Annualized dividend rate | | | 0.68 | % |
* For the period April 1, 2014 (first issuance of shares) through September 30, 2014.
iMTP Shares generally do not trade, and market quotations are generally not available. iMTP Shares are short-term or short/intermediate-term instruments that pay a variable dividend rate tied to a short-term index, plus an additional fixed “spread” amount established at the time of issuance. The fair value of iMTP Shares is expected to be approximately their liquidation par value so long as the fixed “spread” on the iMTP Shares remains roughly in line with the “spread” rates being demanded by investors on instruments having similar terms in the current market environment. In present market conditions, the Fund’s Adviser has determined that the fair value of iMTP Shares is their liquidation value, but their fair value could vary if market conditions change materially. For financial reporting purposes, the liquidation value of iMTP Shares is recorded as a liability and recognized as “Institutional MuniFund Term Preferred (“iMTP”) Shares, at liquidation value” on the Statement of Assets and Liabilities.
Dividends on the iMTP Shares (which are treated as interest payments for financial reporting purposes) are set weekly. Unpaid dividends on iMTP Shares are recognized as a component of “Interest payable” on the Statement of Assets and Liabilities, when applicable. Dividends accrued on iMTP Shares are recognized as a component of “Interest expense and amortization of offering costs” on the Statement of Operations.
Offering costs of $590,000 were incurred in connection with the Fund’s offering of iMTP Shares, which were recorded as a deferred charge and are being amortized over the life of the shares. These offering costs are recognized as components of “Deferred offering costs” on the Statement of Assets and Liabilities and “Interest expense and amortization of offering costs” on the Statement of Operations.
MuniFund Term Preferred Shares
During the current fiscal period, New York Dividend Advantage (NAN), New York Dividend Advantage 2 (NXK) and New York AMT-Free Income (NRK) had issued and outstanding MuniFund Term Preferred (“MTP”) Shares, with a $10 liquidation value per share. Each Fund’s MTP Shares were issued in one or more Series and trade on the NYSE.
On June 13, 2014, New York Dividend Advantage (NAN) redeemed all of its outstanding Series 2015 and Series 2016 MTP Shares and New York Dividend Advantage 2 (NXK) redeemed all of its outstanding Series 2015 MTP Shares. New York AMT-Free Income (NRK) redeemed all of its outstanding Series 2015 MTP Shares on April 11, 2014.
New York Dividend Advantage (NAN) and New York Dividend Advantage 2’s (NXK) MTP Shares were redeemed at their $10.00 liquidation value per share, plus dividend amounts owed, using proceeds from its issuance of Variable Rate MuniFund Term Preferred (“VMTP”) Shares (as described below in Variable Rate MuniFund Term Preferred Shares). New York AMT-Free Income’s (NRK) MTP Shares were redeemed at their $10.00 liquidation value per share, plus dividend amounts owed, using a portion of the proceeds from its issuance of iMTP Shares (as described above in Institutional MuniFund Term Preferred Shares).
The average liquidation value of MTP Shares outstanding for each Fund during the fiscal year ended September 30, 2014, was as follows:
| | | New York | | New York | | New York | |
| | | Dividend | | Dividend | | AMT-Free | |
| | | Advantage | | Advantage 2 | | Income | |
| | | (NAN | )* | (NXK | )* | (NRK | )** |
| Average liquidation value of MTP Shares outstanding | | $ | 55,360,000 | | $ | 37,890,000 | | $ | 27,680,000 | |
* For the period October 1, 2013 through June 13, 2014.
** For the period October 1, 2013 through April 11, 2014.
For financial reporting purposes, the liquidation value of MTP Shares was recorded as a liability and recognized as “MuniFund Term Preferred (“MTP”) Shares, at liquidation value” on the Statement of Assets and Liabilities. Dividends on MTP Shares, which are recognized as interest expense for financial reporting purposes, are paid monthly at a fixed annual rate, subject to adjustments in certain circumstances. Unpaid dividends on MTP Shares were recognized as a component of “Interest payable” on the Statement of Assets and Liabilities. Dividends accrued on MTP Shares were recognized as a component of “Interest expense and amortization of offering costs” on the Statement of Operations. Costs incurred by the Funds in connection with their offerings of MTP Shares were recorded as a deferred charge, which were amortized over the life of the shares and are recognized as components of “Deferred offering costs” on the Statement of Assets and Liabilities and “Interest expense and amortization of offering costs” on the Statement of Operations.
In conjunction with New York Dividend Advantage (NAN), New York Dividend Advantage 2’s (NXK) and New York AMT-Free Income’s (NRK) redemption of MTP Shares, the remaining deferred offering costs of $218,534, $157,972 and $141,529, respectively, were fully expensed during the current fiscal period, as the redemptions were deemed extinguishments of debt.
Variable Rate MuniFund Term Preferred Shares
The following Funds have issued and outstanding VMTP Shares, with a $100,000 liquidation value per share. VMTP Shares are issued via private placement and are not publicly available.
As of September 30, 2014, VMTP Shares outstanding, at liquidation value, for each Fund was as follows:
| | | | | | | Shares | |
| | | | | | | Outstanding | |
| | | | | | | at $100,000 | |
| | | | | Shares | | Per Share | |
| Fund | | Series | | Outstanding | | Liquidation Value | |
| New York Dividend Advantage (NAN) | | | 2017 | | | 560 | | $ | 56,000,000 | |
| New York Dividend Advantage 2 (NXK) | | | 2017 | | | 380 | | $ | 38,000,000 | |
During the current fiscal period, New York Dividend Advantage (NAN) and New York Dividend Advantage 2 (NXK) issued their outstanding VMTP Shares through privately negotiated offerings.
New York AMT-Free Income (NRK) redeemed all of its 2014 Series VTMP Shares on April 11, 2014. New York AMT-Free Income’s (NRK) VMTP Shares were redeemed at their $100,000 liquidation value per share, plus dividend amounts owed, using a portion of the proceeds from its issuance of iMTP Shares (as described above in Institutional MuniFund Term Preferred Shares).
Each Fund is obligated to redeem its VMTP Shares by the date as specified in its offering document (“Term Redemption Date”), unless earlier redeemed or repurchased by the Fund. VMTP Shares are subject to optional and mandatory redemption in certain circumstances. The VMTP Shares are subject to redemption at the option of each Fund (“Optional Redemption Date”), subject to payment of premium for one year following the date of issuance (“Premium Expiration Date”), and at par thereafter. Each Fund may be obligated to redeem certain of the VMTP Shares if the Fund fails to maintain certain asset coverage and leverage ratio requirements and such failures are not cured by the applicable cure date. The redemption price per share is equal to the sum of the liquidation value per share plus any accumulated but unpaid dividends. The Term Redemption Date, Optional Redemption Date and Premium Expiration Date for each Fund’s series of VMTP Shares are as follows:
| | | | | Term | | Optional | | Premium | |
| Fund | | Series | | Redemption Date | | Redemption Date | | Expiration Date | |
| New York Dividend Advantage (NAN) | | 2017 | | July 1, 2017 | | July 1, 2015 | | June 30, 2015 | |
| New York Dividend Advantage 2 (NXK) | | 2017 | | July 1, 2017 | | July 1, 2015 | | June 30, 2015 | |
The average liquidation value of VMTP Shares outstanding and annualized dividend rate for each Fund during the fiscal year ended September 30, 2014, were as follows:
| | | New York | | New York | | New York | |
| | | Dividend | | Dividend | | AMT-Free | |
| | | Advantage | | Advantage 2 | | Income | |
| | | (NAN | )* | (NXK | )* | (NRK | )** |
| Average liquidation value of VMTP Shares outstanding | | $ | 56,000,000 | | $ | 38,000,000 | | $ | 50,700,000 | |
| Annualized dividend rate | | | 1.00 | % | | 1.00 | % | | 1.10 | % |
| * | For the period June 3, 2014 (first issuance of shares) through September 30, 2014. |
| ** | For the period October 1, 2013 through April 11, 2014. |
VMTP Shares generally do not trade, and market quotations are generally not available. VMTP Shares are short-term or short/intermediate-term instruments that pay a variable dividend rate tied to a short-term index, plus an additional fixed “spread” amount established at the time of issuance. The fair value of VMTP Shares is expected to be approximately their liquidation par value so long as the fixed “spread” on the VMTP Shares remains roughly in line with the “spread” rates being demanded by investors on instruments having similar terms in the current market environment. In present market conditions, the Funds’ Adviser has determined that fair value of VMTP Shares is their liquidation value, but their fair value could vary if market conditions change materially. For financial reporting purposes, the liquidation value of VMTP Shares is recorded as a liability and recognized as “Variable Rate MuniFund Term Preferred (“VMTP”) Shares, at liquidation value” on the Statement of Assets and Liabilities.
Notes to Financial Statements (continued)
Dividends on the VMTP shares (which are treated as interest payments for financial reporting purposes) are set weekly. Unpaid dividends on VMTP Shares are recognized as a component of “Interest payable” on the Statement of Assets and Liabilities, when applicable. Dividends accrued on VMTP Shares are recognized as a component of “Interest expense and amortization of offering costs” on the Statement of Operations.
Costs incurred by the Funds in connection with each Fund’s offering of VMTP Shares were recorded as a deferred charge, which are amortized over the life of the shares and are recognized as components of “Deferred offering costs” on the Statement of Assets and Liabilities and “Interest expense and amortization of offering costs” on the Statement of Operations.
In conjunction with New York AMT-Free Income’s (NRK) redemption of VMTP Shares, the remaining deferred offering costs of $61,675, were fully expensed during the current fiscal period, as the redemption was deemed an extinguishment of debt. New York Dividend Advantage (NAN) and New York Dividend Advantage 2 (NXK) each incurred offering costs of $92,000 in connection with the issuance of Series 2017 VMTP Shares.
Variable Rate Demand Preferred Shares
The following Funds have issued and outstanding Variable Rate Demand Preferred (“VRDP”) Shares, with a $100,000 liquidation value per share. VRDP Shares are issued via private placement and are not publicly available.
As of September 30, 2014, the details of the Funds’ VRDP Shares outstanding are as follows:
| | | | | | | Shares Outstanding at | | | |
| | | | | Shares | | $100,000 Per Share | | | |
| | | Series | | Outstanding | | Liquidation Value | | Maturity | |
| New York Performance Plus (NNP) | | | 1 | | | 890 | | $ | 89,000,000 | | | March 1, 2040 | |
| New York AMT-Free Income (NRK) | | | | | | | | | | | | | |
| | | | 1 | | | 1,123 | | $ | 112,300,000 | | | August 1, 2040 | |
| | | | 2 | | | 1,648 | | $ | 164,800,000 | | | August 1, 2040 | |
| | | | 3 | | | 1,617 | | $ | 161,700,000 | | | December 1, 2040 | |
| | | | 4 | | | 500 | | $ | 50,000,000 | | | June 1, 2040 | |
VRDP Shares include a liquidity feature that allows VRDP shareholders to have their shares purchased by a liquidity provider with whom each Fund has contracted in the event that purchase orders for VRDP Shares in a remarketing are not sufficient in number to be matched with the sale orders in that remarketing. Each Fund is required to redeem any VRDP Shares that are still owned by the liquidity provider after six months of continuous, unsuccessful remarketing. Each Fund pays an annual remarketing fee of .10% of the aggregate principal amount of all VRDP Shares outstanding. Each Fund’s VRDP Shares have successfully remarketed since issuance.
Dividends on the VRDP Shares (which are treated as interest payments for financial reporting purposes) are set weekly at a rate established by a remarketing agent; therefore, the market value of the VRDP Shares is expected to approximate its liquidation value. If remarketings for VRDP Shares are continuously unsuccessful for six months, the maximum rate is designed to escalate according to a specified schedule in order to enhance the remarketing agent’s ability to successfully remarket the VRDP Shares.
Subject to certain conditions, VRDP Shares may be redeemed, in whole or in part, at any time at the option of each Fund. Each Fund may also redeem certain of the VRDP Shares if the Fund fails to maintain certain asset coverage requirements and such failures are not cured by the applicable cure date. The redemption price per share is equal to the sum of the liquidation value per share plus any accumulated but unpaid dividends.
The average liquidation value of VRDP Shares outstanding and annualized dividend rate for each Fund during the fiscal year ended September 30, 2014, were as follows:
| | | New York | | New York | |
| | | Performance | | AMT-Free | |
| | | Plus | | Income | |
| | | (NNP | ) | (NRK | ) |
| Average liquidation value of VRDP Shares outstanding | | $ | 89,000,000 | | $ | 488,800,000 | |
| Annualized dividend rate | | | 0.15 | % | | 0.12 | % |
For financial reporting purposes, the liquidation value of VRDP Shares is a liability and is recognized as “Variable Rate Demand Preferred (“VRDP”) Shares, at liquidation value” on the Statement of Assets and Liabilities. Unpaid dividends on VRDP Shares are recognized as a component of “Interest payable” on the Statement of Assets and Liabilities, when applicable. Dividends accrued on the VRDP Shares are recognized as a component of “Interest expense and amortization of offering costs” on the Statement of Operations. Costs incurred by the Funds in connection with their offerings of VRDP Shares were recorded as a deferred charge, which are amortized over the life of the shares and are recognized as a component of “Deferred offering costs” on the Statement of Assets and Liabilities and “Interest expense and amortization of offerings costs” on the Statement of Operations. In addition to interest expense, each Fund also pays a per annum liquidity fee to the liquidity provider, as well as a remarketing fee, which are recognized as “Liquidity fees” and “Remarketing fees”, respectively, on the Statement of Operations.
Indemnifications
Under the Funds’ organizational documents, their officers and directors/trustees are indemnified against certain liabilities arising out of the performance of their duties to the Funds. In addition, in the normal course of business, the Funds enter into contracts that provide general indemnifications to other parties. The Funds’ maximum exposure under these arrangements is unknown as this would involve future claims that may be made against the Funds that have not yet occurred. However, the Funds have not had prior claims or losses pursuant to these contracts and expect the risk of loss to be remote.
Netting Agreements
In the ordinary course of business, the Funds may enter into transactions subject to enforceable International Swaps and Derivative Association, Inc. (“ISDA”) master agreements or other similar arrangements (“netting agreements”). Generally, the right to offset in netting agreements allows each Fund to offset any exposure to a specific counterparty with any collateral received or delivered to that counterparty based on the terms of the agreements. Generally, a Fund manages its cash collateral and securities collateral on a counterparty basis.
The Funds’ investments subject to netting agreements as of the end of the reporting period, if any, are further described in Note 3 – Portfolio Securities and Investments in Derivatives.
Use of Estimates
The preparation of financial statements in conformity with U.S. GAAP requires management to make estimates and assumptions that affect the reported amounts of assets and liabilities at the date of the financial statements and the reported amounts of increases and decreases in net assets applicable to common shares from operations during the reporting period. Actual results may differ from those estimates.
2. Investment Valuation and Fair Value Measurements
The fair valuation input levels as described below are for fair value measurement purposes.
Investment Valuation
Common stocks and other equity-type securities are valued at the last sales price on the securities exchange on which such securities are primarily traded and are generally classified as Level 1. Securities primarily traded on the NASDAQ National Market (“NASDAQ”) are valued at the NASDAQ Official Closing Price and are generally classified as Level 1. However, securities traded on a securities exchange or NASDAQ for which there were no transactions on a given day or securities not listed on a securities exchange or NASDAQ are valued at the quoted bid price and are generally classified as Level 2.
Prices of fixed income securities are provided by a pricing service approved by the Funds’ Board of Directors/Trustees (the “Board”). The pricing service establishes a security’s fair value using methods that may include consideration of the following: yields or prices of investments of comparable quality, type of issue, coupon, maturity and rating, market quotes or indications of value from security dealers, evaluations of anticipated cash flows or collateral, general market conditions and other information and analysis, including the obligor’s credit characteristics considered relevant. These securities are generally classified as Level 2. In pricing certain securities, particularly less liquid and lower quality securities, the pricing service may consider information about a security, its issuer or market activity provided by the Adviser. These securities are generally classified as Level 2 or Level 3 depending on the priority of the significant inputs.
Prices of swap contracts are also provided by a pricing service approved by the Board using the same methods as described above, and are generally classified as Level 2.
Certain securities may not be able to be priced by the pre-established pricing methods as described above. Such securities may be valued by the Board or its appointee at fair value. These securities generally include, but are not limited to, restricted securities (securities which may not be publicly sold without registration under the Securities Act of 1933, as amended) for which a pricing service is unable to provide a market price; securities whose trading has been formally suspended; debt securities that have gone into default and for which there is no current market quotation; a security whose market price is not available from a pre-established pricing source; a security with respect to which an event has occurred that is likely to materially affect the value of the security after the market has closed but before the calculation of a fund’s NAV (as may be the case in non-U.S. markets on which the security is primarily traded) or make it difficult or impossible to obtain a reliable market quotation; and a security whose price, as provided by the pricing service, is not deemed to reflect the security’s fair value. As a general principle, the fair value of a security would appear to be the amount that the owner might reasonably expect to receive for it in a current sale. A variety of factors may be considered in determining the fair value of such securities, which may include consideration of the following: yields or prices of investments of comparable quality, type of issue, coupon, maturity and rating, market quotes or indications of value from security dealers, evaluations of anticipated cash flows or collateral, general market conditions and other information and analysis, including the obligor’s credit characteristics considered relevant. These securities are generally classified as Level 2 or Level 3 depending on the priority of the significant inputs. Regardless of the method employed to value a particular security, all valuations are subject to review by the Board or its appointee.
Fair Value Measurements
Fair value is defined as the price that would be received upon selling an investment or transferring a liability in an orderly transaction to an independent buyer in the principal or most advantageous market for the investment. A three-tier hierarchy is used to maximize the use of observable market data and minimize the use of unobservable inputs and to establish classification of fair value measurements for disclosure purposes. Observable
Notes to Financial Statements (continued)
inputs reflect the assumptions market participants would use in pricing the asset or liability. Observable inputs are based on market data obtained from sources independent of the reporting entity. Unobservable inputs reflect the reporting entity’s own assumptions about the assumptions market participants would use in pricing the asset or liability. Unobservable inputs are based on the best information available in the circumstances. The following is a summary of the three-tiered hierarchy of valuation input levels.
| Level 1 – | Inputs are unadjusted and prices are determined using quoted prices in active markets for identical securities. |
| Level 2 – | Prices are determined using other significant observable inputs (including quoted prices for similar securities, interest rates, prepayment speeds, credit risk, etc.). |
| Level 3 – | Prices are determined using significant unobservable inputs (including management’s assumptions in determining the fair value of investments). |
The inputs or methodologies used for valuing securities are not an indication of the risks associated with investing in those securities. The following is a summary of each Fund’s fair value measurements as of the end of the reporting period:
| New York Value (NNY) | | | Level 1 | | | Level 2 | | | Level 3 | | | Total | |
| Long-Term Investments*: | | | | | | | | | | | | | |
| Municipal Bonds | | $ | — | | $ | 153,069,546 | | $ | — | | $ | 153,069,546 | |
| New York Value 2 (NYV) | | | | | | | | | | | | | |
| Long-Term Investments*: | | | | | | | | | | | | | |
| Municipal Bonds | | $ | — | | $ | 37,672,332 | | $ | — | | $ | 37,672,332 | |
| New York Performance Plus (NNP) | | | | | | | | | | | | | |
| Long-Term Investments*: | | | | | | | | | | | | | |
| Municipal Bonds | | $ | — | | $ | 349,531,143 | | $ | — | | $ | 349,531,143 | |
| Common Stocks | | | 2,776,807 | | | — | | | — | | | 2,776,807 | |
| Total | | $ | 2,776,807 | | $ | 349,531,143 | | $ | — | | $ | 352,307,950 | |
| New York Dividend Advantage (NAN) | | | | | | | | | | | | | |
| Long-Term Investments*: | | | | | | | | | | | | | |
| Municipal Bonds | | $ | — | | $ | 209,348,479 | | $ | — | | $ | 209,348,479 | |
| New York Dividend Advantage 2 (NXK) | | | | | | | | | | | | | |
| Long-Term Investments*: | | | | | | | | | | | | | |
| Municipal Bonds | | $ | — | | $ | 144,199,363 | | $ | — | | $ | 144,199,363 | |
| New York AMT-Free Income (NRK) | | | | | | | | | | | | | |
| Long-Term Investments*: | | | | | | | | | | | | | |
| Municipal Bonds | | $ | — | | $ | 1,898,766,520 | | $ | — | | $ | 1,898,766,520 | |
* Refer to the Fund’s Portfolio of Investments for industry classifications.
The Board is responsible for the valuation process and has appointed the oversight of the daily valuation process to the Adviser’s Valuation Committee. The Valuation Committee, pursuant to the valuation policies and procedures adopted by the Board is responsible for making fair value determinations, evaluating the effectiveness of the funds’ pricing policies and reporting to the Board. The Valuation Committee is aided in its efforts by the Adviser’s dedicated Securities Valuation Team, which is responsible for administering the daily valuation process and applying fair value methodologies as approved by the Valuation Committee. When determining the reliability of independent pricing services for investments owned by the funds, the Valuation Committee, among other things, conducts due diligence reviews of the pricing services and monitors the quality of security prices received through various testing reports conducted by the Securities Valuation Team.
The Valuation Committee will consider pricing methodologies it deems relevant and appropriate when making a fair value determination, based on the facts and circumstances specific to the portfolio instrument. Fair value determinations generally will be derived as follows, using public or private market information:
| | (i) | If available, fair value determinations shall be derived by extrapolating from recent transactions or quoted prices for identical or comparable securities. |
| | | |
| | (ii) | If such information is not available, an analytical valuation methodology may be used based on other available information including, but not limited to: analyst appraisals, research reports, corporate action information, issuer financial statements and shelf registration statements. Such analytical valuation methodologies may include, but are not limited to: multiple of earnings, discount from market value of a similar freely-traded security, discounted cash flow analysis, book value or a multiple thereof, risk premium/yield analysis, yield to maturity and/or fundamental investment analysis. |
The purchase price of a portfolio instrument will be used to fair value the instrument only if no other valuation methodology is available or deemed appropriate, and it is determined that the purchase price fairly reflects the instrument’s current value.
For each portfolio security that has been fair valued pursuant to the policies adopted by the Board, the fair value price is compared against the last available and next available market quotations. The Valuation Committee reviews the results of such testing and fair valuation occurrences are reported to the Board.
3. Portfolio Securities and Investments in Derivatives
Portfolio Securities
Inverse Floating Rate Securities
Each Fund is authorized to invest in inverse floating rate securities. An inverse floating rate security is created by depositing a municipal bond, typically with a fixed interest rate, into a special purpose trust created by a broker-dealer. In turn, this trust (a) issues floating rate certificates, in face amounts equal to some fraction of the deposited bond’s par amount or market value, that typically pay short-term tax-exempt interest rates to third parties, and (b) issues to a long-term investor (such as one of the Funds) an inverse floating rate certificate (sometimes referred to as an “inverse floater”) that represents all remaining or residual interest in the trust. The income received by the inverse floater holder varies inversely with the short-term rate paid to the floating rate certificates’ holders, and in most circumstances the inverse floater holder bears substantially all of the underlying bond’s downside investment risk and also benefits disproportionately from any potential appreciation of the underlying bond’s value. The price of an inverse floating rate security will be more volatile than that of the underlying bond because the interest rate is dependent on not only the fixed coupon rate of the underlying bond but also on the short-term interest paid on the floating rate certificates, and because the inverse floating rate security essentially bears the risk of loss of the greater face value of the underlying bond.
The inverse floater held by a Fund gives the Fund the right (a) to cause the holders of the floating rate certificates to tender their notes at par and (b) to have the broker transfer the fixed-rate bond held by the trust to the Fund, thereby collapsing the trust.
A Fund may purchase an inverse floating rate security in a secondary market transaction without first owning the underlying bond (referred to as an “externally-deposited inverse floater”), or instead by first selling a fixed-rate bond to a broker-dealer for deposit into the special purpose trust and receiving in turn the residual interest in the trust (referred to as a “self-deposited inverse floater”).
An investment in an externally-deposited inverse floater is identified in the Portfolio of Investments as “(IF) – Inverse floating rate investment.” The Fund’s Statement of Assets and Liabilities shows only the inverse floaters and not the underlying bonds as an asset and does not reflect the short-term floating rate certificates as liabilities. Also, the Fund reflects in “Investment Income” only the net amount of earnings on its inverse floater investment (net of the interest paid to the holders of the short-term floating rate certificates and the expenses of the trust), and does not show the amount of that interest paid as an interest expense on the Statement of Operations.
An investment in a self-deposited inverse floater is accounted for as a financing transaction. In such instances, a fixed-rate bond deposited into a special purpose trust is identified in the Portfolio of Investments as “(UB) – Underlying bond of an inverse floating rate trust reflected as a financing transaction,” with the Fund accounting for the short-term floating rate certificates issued by the trust, at their liquidation value, as “Floating rate obligations” on the Statement of Assets and Liabilities. In addition, the Fund reflects in “Investment Income” the entire earnings of the underlying bond and recognizes the related interest paid to the holders of the short-term floating rate certificates as a component of “Interest expense and amortization of offering costs” on the Statement of Operations.
The average floating rate obligations outstanding and average annual interest rate and fees related to self-deposited inverse floaters for the Funds during the fiscal year ended September 30, 2014, were as follows:
| | | | | | | New York | | New York | | New York | | New York | |
| | | New York | | New York | | Performance | | Dividend | | Dividend | | AMT-Free | |
| | | Value | | Value 2 | | Plus | | Advantage | | Advantage 2 | | Income | |
| | | (NNY | ) | (NYV | ) | (NNP | ) | (NAN | ) | (NXK | ) | (NRK | ) |
| Average floating rate obligations outstanding | | $ | 3,255,000 | | $ | — | | $ | 31,353,438 | | $ | 15,746,096 | | $ | 11,058,877 | | $ | 117,889,836 | |
| Average annual interest rate and fees | | | .35 | % | | — | % | | .44 | % | | .43 | % | | .43 | % | | .48 | % |
As of September 30, 2014, the total amount of floating rate obligations issued by each Fund’s self-deposited inverse floaters and externally-deposited inverse floaters was as follows:
| | | | | | | New York | | New York | | New York | | New York | |
| | | New York | | New York | | Performance | | Dividend | | Dividend | | AMT-Free | |
| | | Value | | Value 2 | | Plus | | Advantage | | Advantage 2 | | Income | |
| | | (NNY | ) | (NYV | ) | (NNP | ) | (NAN | ) | (NXK | ) | (NRK | ) |
| Floating rate obligations: self-deposited inverse floaters | | $ | 3,255,000 | | $ | — | | $ | 25,625,000 | | $ | 13,155,000 | | $ | 9,400,000 | | $ | 83,985,000 | |
| Floating rate obligations: externally-deposited inverse floaters | | | 975,000 | | | 2,000,000 | | | 18,235,000 | | | 9,565,000 | | | 1,680,000 | | | 44,220,000 | |
| Total | | $ | 4,230,000 | | $ | 2,000,000 | | $ | 43,860,000 | | $ | 22,720,000 | | $ | 11,080,000 | | $ | 128,205,000 | |
Each Fund may also enter into shortfall and forbearance agreements (sometimes referred to as a “recourse trust” or “credit recovery swap”) (such agreements referred to herein as “Recourse Trusts”) with a broker-dealer by which a Fund agrees to reimburse the broker-dealer, in certain
Notes to Financial Statements (continued)
circumstances, for the difference between the liquidation value of the fixed-rate bond held by the trust and the liquidation value of the floating rate certificates issued by the trust plus any shortfalls in interest cash flows. Under these agreements, a Fund’s potential exposure to losses related to or on inverse floaters may increase beyond the value of a Fund’s inverse floater investments as a Fund may potentially be liable to fulfill all amounts owed to holders of the floating rate certificates. At period end, any such shortfall is recognized as “Unrealized depreciation on Recourse Trusts” on the Statement of Assets and Liabilities.
As of September 30, 2014, each Fund’s maximum exposure to the floating rate obligations issued by externally-deposited Recourse Trusts, was as follows:
| | | | | | | New York | | New York | | New York | | New York | |
| | | New York | | New York | | Performance | | Dividend | | Dividend | | AMT-Free | |
| | | Value | | Value 2 | | Plus | | Advantage | | Advantage 2 | | Income | |
| | | (NNY | ) | (NYV | ) | (NNP | ) | (NAN | ) | (NXK | ) | (NRK | ) |
| Maximum exposure to Recourse Trusts | | $ | — | | $ | 2,000,000 | | $ | 9,375,000 | | $ | 7,245,000 | | $ | — | | $ | 31,665,000 | |
Zero Coupon Securities
A zero coupon security does not pay a regular interest coupon to its holders during the life of the security. Income to the holder of the security comes from accretion of the difference between the original purchase price of the security at issuance and the par value of the security at maturity and is effectively paid at maturity. The market prices of zero coupon securities generally are more volatile than the market prices of securities that pay interest periodically.
Investments in Derivatives
Each Fund is authorized to invest in certain derivative instruments such as futures, options and swap contracts. Each Fund limits its investments in futures, options on futures and swap contracts to the extent necessary for the Adviser to claim the exclusion from registration by the Commodity Futures Trading Commission as a commodity pool operator with respect to the Fund. The Funds record derivative instruments at fair value, with changes in fair value recognized on the Statement of Operations, when applicable. Even though the Funds’ investments in derivatives may represent economic hedges, they are not considered to be hedge transactions for financial reporting purposes.
Swap Contracts
Interest rate swap contracts involve a Fund’s agreement with the counterparty to pay or receive a fixed rate payment in exchange for the counterparty receiving or paying a variable rate payment. Forward interest rate swap contracts involve a Fund’s agreement with a counterparty to pay or receive, in the future, a fixed or variable rate payment in exchange for the counterparty receiving or paying the Fund a variable or fixed rate payment, the accruals for which would begin at a specified date in the future (the “effective date”). The amount of the payment obligation is based on the notional amount of the swap contract and the termination date of the swap (which is akin to a bond’s maturity). Swap contracts do not involve the delivery of securities or other underlying assets or principal. Accordingly, the risk of loss with respect to the swap counterparty on such transactions is limited to the net amount of interest payments that a Fund is to receive. Swap contracts are valued daily. Upon entering into an interest rate swap contract (and beginning on the effective date for a forward interest rate swap contract), a Fund accrues the fixed rate payment expected to be paid or received and the variable rate payment expected to be received or paid on a daily basis, and recognizes the daily change in the fair value of the Fund’s contractual rights and obligations under the contracts. The net amount recorded on these transactions for each counterparty is recognized on the Statement of Assets and Liabilities as a component of “Unrealized appreciation or depreciation on interest rate swaps (,net)” with the change during the fiscal period recognized on the Statement of Operations as a component of “Change in net unrealized appreciation (depreciation) of swaps.” Income received or paid by a Fund is recognized as a component of “Net realized gain (loss) from swaps” on the Statement of Operations, in addition to the net realized gains or losses recognized upon the termination of a swap contract and are equal to the difference between a Fund’s basis in the swap and the proceeds from (or cost of) the closing transaction. Payments received or made at the beginning of the measurement period are recognized as a component of “Interest rate swap premiums paid and/or received” on the Statement of Assets and Liabilities, when applicable. For tax purposes, periodic payments are treated as ordinary income or expense.
During the fiscal year ended September 30, 2014, New York Value 2 (NYV) used forward interest rate swaps to manage the duration of the Fund’s portfolio and to reduce its price volatility risk to movements in U.S. interest rates relative to the Fund’s benchmark.
The average notional amount of interest rate swap contracts outstanding during the fiscal year ended September 30, 2014, was as follows:
| | | | New York | |
| | | | Value 2 | |
| | | | (NYV | ) |
| Average notional amount of interest rate swap contracts outstanding* | | $ | 1,650,000 | |
| * | The average notional amount is calculated based on the outstanding notional at the beginning of the fiscal year and at the end of each fiscal quarter within the current fiscal year. |
The following table presents the amount of net realized gain (loss) and change in net unrealized appreciation (depreciation) recognized on swap contracts on the Statement of Operations during the fiscal year ended September 30, 2014, and the primary underlying risk exposure.
| | | | | | | Net Realized | | Change in Net Unrealized | |
| | | Underlying | | Derivative | | Gain (Loss from | ) | Appreciation (Depreciation of | ) |
| Fund | | Risk Exposure | | Instrument | | Swaps | | Swaps | |
| New York Value 2 (NYV) | | Interest rate | | Swaps | | $ | 64,300 | | $ | (182,941 | ) |
Market and Counterparty Credit Risk
In the normal course of business each Fund may invest in financial instruments and enter into financial transactions where risk of potential loss exists due to changes in the market (market risk) or failure of the other party to the transaction to perform (counterparty credit risk). The potential loss could exceed the value of the financial assets recorded on the financial statements. Financial assets, which potentially expose each Fund to counterparty credit risk, consist principally of cash due from counterparties on forward, option and swap transactions, when applicable. The extent of each Fund’s exposure to counterparty credit risk in respect to these financial assets approximates their carrying value as recorded on the Statement of Assets and Liabilities.
Each Fund helps manage counterparty credit risk by entering into agreements only with counterparties the Adviser believes have the financial resources to honor their obligations and by having the Adviser monitor the financial stability of the counterparties. Additionally, counterparties may be required to pledge collateral daily (based on the daily valuation of the financial asset) on behalf of each Fund with a value approximately equal to the amount of any unrealized gain above a pre-determined threshold. Reciprocally, when each Fund has an unrealized loss, the Funds have instructed the custodian to pledge assets of the Funds as collateral with a value approximately equal to the amount of the unrealized loss above a pre-determined threshold. Collateral pledges are monitored and subsequently adjusted if and when the valuations fluctuate, either up or down, by at least the pre-determined threshold amount.
4. Fund Shares
Common Shares
Transactions in common shares were as follows:
| | | | | | | New York | |
| | | New York Value (NNY) | | New York Value 2 (NYV) | | Performance Plus (NNP) | |
| | | Year Ended | | Year Ended | | Year Ended | | Year Ended | | Year Ended | | Year Ended | |
| | | 9/30/14 | | 9/30/13 | | 9/30/14 | | 9/30/13 | | 9/30/14 | | 9/30/13 | |
| Common shares: | | | | | | | | | | | | | | | | | | | |
| Issued to shareholders due to reinvestment of distributions | | | — | | | 14,833 | | | — | | | 849 | | | — | | | 17,886 | |
| | | New York | | New York | | New York | |
| | | Dividend Advantage (NAN) | | Dividend Advantage 2 (NXK) | | AMT-Free Income (NRK) | |
| | | Year Ended | | Year Ended | | Year Ended | | Year Ended | | Year Ended | | Year Ended | |
| | | 9/30/14 | | 9/30/13 | | 9/30/14 | | 9/30/13 | | 9/30/14 | | 9/30/13 | |
| Common shares: | | | | | | | | | | | | | | | | | | | |
| Issued in reorganizations | | | — | | | — | | | — | | | — | | | — | | | 84,111,257 | |
| Issued to shareholders due to reinvestment of distributions | | | — | | | — | | | — | | | — | | | — | | | 687 | |
| Repurchased and retired | | | — | | | — | | | (5,300 | ) | | — | | | — | | | — | |
| Weighted average common share: | | | | | | | | | | | | | | | | | | | |
| Price per share repurchased and retired | | | — | | | — | | $ | 12.22 | | | — | | | — | | | — | |
| Discount per share repurchased and retired | | | — | | | — | | | 13.40 | % | | — | | | — | | | — | |
Preferred Shares
Transactions in preferred shares for the Funds during the fiscal years ended September 30, 2014 and September 30, 2013, where applicable, are noted in the following tables.
Transactions in iMTP Shares for the Funds, where applicable, were as follows:
| | | Year Ended | |
| | | September 30, 2014 | |
| New York AMT-Free Income (NRK) | | | Series | | | Shares | | | Amount | |
| iMTP Shares issued | | | 2017 | | | 15,800 | | $ | 79,000,000 | |
Notes to Financial Statements (continued)
Transactions in MTP Shares for the Funds, where applicable, were as follows:
| | | Year Ended | |
| | | September 30, 2014 | |
| New York Dividend Advantage (NAN) | | Series | | NYSE Ticker | | Shares | | Amount | |
| MTP Shares redeemed | | | 2015 | | | NAN PRC | | | (3,000,000 | ) | $ | (30,000,000 | ) |
| | | | 2016 | | | NAN PRD | | | (2,536,000 | ) | | (25,360,000 | ) |
| Total | | | | | | | | | (5,536,000 | ) | $ | (55,360,000 | ) |
| New York Dividend Advantage 2 (NXK) | | | | | | | | | | | | | |
| MTP Shares redeemed | | | 2015 | | | NXK PRC | | | (3,789,000 | ) | $ | (37,890,000 | ) |
| New York AMT-Free Income (NRK) | | | | | | | | | | | | | |
| MTP Shares redeemed | | | 2015 | | | NRK PRC | | | (2,768,000 | ) | $ | (27,680,000 | ) |
Transactions in VMTP Shares for the Funds, where applicable, were as follows:
| | | Year Ended | |
| | | September 30, 2014 | |
| | | Series | | Shares | | Amount | |
| New York Dividend Advantage (NAN) | | | | | | | | | | |
| VMTP Shares issued | | | 2017 | | | 560 | | $ | 56,000,000 | |
| New York Dividend Advantage 2 (NXK) | | | | | | | | | | |
| VMTP Shares issued | | | 2017 | | | 380 | | $ | 38,000,000 | |
| New York AMT-Free Income (NRK) | | | | | | | | | | |
| VMTP Shares redeemed | | | 2014 | | | (507 | ) | $ | (50,700,000 | ) |
| | | Year Ended | |
| | | September 30, 2013 | |
| New York AMT-Free Income (NRK) | | | Series | | | Shares | | | Amount | |
| VMTP Shares issued in connection with the reorganizations | | | 2014 | | | 507 | | $ | 50,700,000 | |
Transactions in VRDP Shares for the Funds, where applicable, were as follows:
| | | Year Ended | |
| | | September 30, 2013 | |
| New York AMT-Free Income (NRK) | | Series | | Shares | | Amount | |
| VRDP Shares issued in connection with the reorganizations: | | | 1 | | | 1,123 | | $ | 112,300,000 | |
| | | | 2 | | | 1,648 | | | 164,800,000 | |
| | | | 3 | | | 1,617 | | | 161,700,000 | |
| | | | 4 | | | 500 | | | 50,000,000 | |
| Total | | | | | | 4,888 | | $ | 488,800,000 | |
5. Investment Transactions
Long-term purchases and sales (including maturities but excluding derivative transactions, where applicable) during the fiscal year ended September 30, 2014, were as follows:
| | | | | | | New York | | New York | | New York | | New York | |
| | | New York | | New York | | Performance | | Dividend | | Dividend | | AMT-Free | |
| | | Value | | Value 2 | | Plus | | Advantage | | Advantage 2 | | Income | |
| | | (NNY | ) | (NYV | ) | (NNP | ) | (NAN | ) | (NXK | ) | (NRK | ) |
| Purchases | | $ | 34,637,338 | | $ | 7,530,601 | | $ | 66,488,697 | | $ | 40,894,875 | | $ | 32,090,887 | | $ | 464,563,638 | |
| Sales and maturities | | | 37,389,313 | | | 6,752,976 | | | 70,310,038 | | | 46,362,232 | | | 33,692,739 | | | 516,104,247 | |
6. Income Tax Information
Each Fund is a separate taxpayer for federal income tax purposes. Each Fund intends to distribute substantially all of its net investment income and net capital gains to shareholders and to otherwise comply with the requirements of Subchapter M of the Internal Revenue Code applicable to regulated investment companies. Therefore, no federal income tax provision is required. Furthermore, each Fund intends to satisfy conditions that will enable interest from municipal securities, which is exempt from regular federal and New York state income taxes, and in the case of New York AMT-Free Income (NRK) the alternative minimum tax applicable to individuals, to retain such tax-exempt status when distributed to shareholders of the Funds. Net realized capital gains and ordinary income distributions paid by the Funds are subject to federal taxation.
For all open tax years and all major taxing jurisdictions, management of the Funds has concluded that there are no significant uncertain tax positions that would require recognition in the financial statements. Open tax years are those that are open for examination by taxing authorities (i.e., generally the last four tax year ends and the interim tax period since then). Furthermore, management of the Funds is also not aware of any tax positions for which it is reasonably possible that the total amounts of unrecognized tax benefits will significantly change in the next twelve months.
The following information is presented on an income tax basis. Differences between amounts for financial statement and federal income tax purposes are primarily due to the timing differences in recognizing taxable market discount, timing differences in recognizing certain gains and losses on investment transactions and the treatment of investments in inverse floating rate securities reflected as financing transactions, if any. To the extent that differences arise that are permanent in nature, such amounts are reclassified within the capital accounts as detailed below. Temporary differences do not require reclassification. Temporary and permanent differences do not impact the NAVs of the Funds.
As of September 30, 2014, the cost and unrealized appreciation (depreciation) of investments in securities (excluding investments in derivatives), as determined on a federal income tax basis, were as follows:
| | | | | | | New York | | New York | | New York | | New York | |
| | | New York | | New York | | Performance | | Dividend | | Dividend | | AMT-Free | |
| | | Value | | Value 2 | | Plus | | Advantage | | Advantage 2 | | Income | |
| | | (NNY | ) | (NYV | ) | (NNP | ) | (NAN | ) | (NXK | ) | (NRK | ) |
| Cost of investments | | $ | 139,889,870 | | $ | 33,026,253 | | $ | 302,222,481 | | $ | 182,638,185 | | $ | 125,939,725 | | $ | 1,701,707,381 | |
| Gross unrealized: | | | | | | | | | | | | | | | | | | | |
| Appreciation | | $ | 10,642,928 | | $ | 5,036,986 | | $ | 26,028,381 | | $ | 14,793,208 | | $ | 9,620,728 | | $ | 139,668,481 | |
| Depreciation | | | (720,424 | ) | | (390,907 | ) | | (1,570,240 | ) | | (1,240,043 | ) | | (761,420 | ) | | (26,594,617 | ) |
| Net unrealized appreciation (depreciation) of investments | | $ | 9,922,504 | | $ | 4,646,079 | | $ | 24,458,141 | | $ | 13,553,165 | | $ | 8,859,308 | | $ | 113,073,864 | |
Permanent differences, primarily due to federal taxes paid, taxable market discount, nondeductible offering costs, nondeductible reorganization expenses and reorganization adjustments resulted in reclassifications among the Funds’ components of common share net assets as of September 30, 2014, the Funds’ tax year end, as follows:
| | | | | | | New York | | New York | | New York | | New York | |
| | | New York | | New York | | Performance | | Dividend | | Dividend | | AMT-Free | |
| | | Value | | Value 2 | | Plus | | Advantage | | Advantage 2 | | Income | |
| | | (NNY | ) | (NYV | ) | (NNP | ) | (NAN | ) | (NXK | ) | (NRK | ) |
| Paid-in-surplus | | $ | — | | $ | — | | $ | (70,291 | ) | $ | (650,482 | ) | $ | (611,625 | ) | $ | 747,229 | |
| Undistributed (Over-distribution of) net investment income | | | (59,694 | ) | | (337 | ) | | 57,983 | | | 582,164 | | | 610,744 | | | (795,273 | ) |
| Accumulated net realized gain (loss) | | | 59,694 | | | 337 | | | 12,308 | | | 68,318 | | | 881 | | | 48,044 | |
The tax components of undistributed net tax-exempt income, net ordinary income and net long-term capital gains as of September 30, 2014, the Funds’ tax year end, were as follows:
| | | | | | | New York | | New York | | New York | | New York | |
| | | New York | | New York | | Performance | | Dividend | | Dividend | | AMT-Free | |
| | | Value | | Value 2 | | Plus | | Advantage | | Advantage 2 | | Income | |
| | | (NNY | ) | (NYV | ) | (NNP | ) | (NAN | ) | (NXK | ) | (NRK | ) |
Undistributed net tax-exempt income1 | | $ | 867,960 | | $ | 105,598 | | $ | 2,514,605 | | $ | 1,272,941 | | $ | 695,125 | | $ | 6,087,222 | |
Undistributed net ordinary income2 | | | 1,596 | | | 11,119 | | | 15,032 | | | 203 | | | 1,961 | | | 54,691 | |
| Undistributed net long-term capital gains | | | — | | | — | | | — | | | — | | | — | | | — | |
| 1 | Undistributed net tax-exempt income (on a tax basis) has not been reduced for the dividend declared on September 2, 2014, and paid on October 1, 2014. |
| 2 | Net ordinary income consists of taxable market discount income and net short-term capital gains, if any. |
Notes to Financial Statements (continued)
The tax character of distributions paid during the Funds’ tax years ended September 30, 2014 and September 30, 2013, was designated for purposes of the dividends paid deduction as follows:
| | | | | | | New York | | New York | | New York | | New York | |
| | | New York | | New York | | Performance | | Dividend | | Dividend | | AMT-Free | |
| | | Value | | Value 2 | | Plus | | Advantage | | Advantage 2 | | Income | |
| 2014 | | (NNY | ) | (NYV | ) | (NNP | ) | (NAN | ) | (NXK | ) | (NRK | ) |
Distributions from net tax-exempt income3 | | $ | 5,833,409 | | $ | 1,557,788 | | $ | 12,968,491 | | $ | 8,274,258 | | $ | 5,130,661 | | $ | 74,135,766 | |
Distributions from net ordinary income2 | | | 16,710 | | | 1,884 | | | — | | | 2,780 | | | 14,263 | | | — | |
| Distributions from net long-term capital gains | | | — | | | — | | | — | | | — | | | — | | | — | |
| | | | | | | New York | | New York | | New York | | New York | |
| | | New York | | New York | | Performance | | Dividend | | Dividend | | AMT-Free | |
| | | Value | | Value 2 | | Plus | | Advantage | | Advantage 2 | | Income | |
| 2013 | | (NNY | ) | (NYV | ) | (NNP | ) | (NAN | ) | (NXK | ) | (NRK | ) |
| Distributions from net tax-exempt income | | $ | 5,991,531 | | $ | 1,578,892 | | $ | 13,147,980 | | $ | 8,518,069 | | $ | 5,706,057 | | $ | 27,301,455 | |
Distributions from net ordinary income2 | | | 24,301 | | | — | | | 40,530 | | | 10,192 | | | 12,328 | | | 1 | |
| Distributions from net long-term capital gains | | | 220,219 | | | — | | | 587,618 | | | 285,372 | | | 148,587 | | | 74,697 | |
| 2 | Net ordinary income consists of taxable market discount income and net short-term capital gains, if any. |
| 3 | The Funds hereby designate these amounts paid during the fiscal year ended September 30, 2014, as Exempt Interest Dividends. |
As of September 30, 2014, the Funds’ tax year end, the Funds had unused capital loss carryforwards available for federal tax purposes to be applied against future capital gains, if any. The capital losses are not subject to expiration.
| | | | | | | New York | | New York | | New York | | New York | |
| | | New York | | New York | | Performance | | Dividend | | Dividend | | Dividend | |
| | | Value | | Value 2 | | Plus | | Advantage | | Advantage 2 | | Advantage 3 | |
| | | (NNY | ) | (NYV | ) | (NNP | ) | (NAN | ) | (NXK | ) | (NRK | ) |
| Capital losses to be carried forward – not subject to expiration | | $ | 955,802 | | $ | 590,041 | | $ | 1,366,806 | | $ | 1,152,216 | | $ | 468,386 | | $ | 16,049,781 | |
The Funds have elected to defer late-year losses in accordance with federal income tax rules. These losses are treated as having arisen on the first day of the following fiscal year. The Funds have elected to defer losses as follows:
| | | | | | | New York | | New York | | New York | | New York | |
| | | New York | | New York | | Performance | | Dividend | | Dividend | | AMT-Free | |
| | | Value | | Value 2 | | Plus | | Advantage | | Advantage 2 | | Income | |
| | | (NNY | ) | (NYV | ) | (NNP | ) | (NAN | ) | (NXK | ) | (NRK | ) |
Post-October capital losses4 | | $ | 1,387,067 | | $ | 217,064 | | $ | 5,515,444 | | $ | 964,636 | | $ | 1,790,115 | | $ | 17,517,224 | |
Late-year ordinary losses5 | | | — | | | — | | | — | | | — | | | — | | | — | |
| 4 | Capital losses incurred from November 1, 2013 through September 30, 2014, the Funds’ tax year end. |
| 5 | Ordinary losses incurred from January 1, 2014 through September 30, 2014, and specified losses incurred from November 1, 2013 through September 30, 2014. |
7. Management Fees and Other Transactions with Affiliates
Each Fund’s management fee compensates the Adviser for overall investment advisory and administrative services and general office facilities. The Sub-Adviser is compensated for its services to the Funds from the management fees paid to the Adviser.
Each Fund’s management fee consists of two components — a fund-level fee, based only on the amount of assets within the Fund, and a complex-level fee, based on the aggregate amount of all eligible fund assets managed by the Adviser and for New York Value (NNY) a gross interest income component. This pricing structure enables Fund shareholders to benefit from growth in the assets within their respective Fund as well as from growth in the amount of complex-wide assets managed by the Adviser.
New York Value (NNY) pays an annual fund-level fee, payable monthly, of .15% of the average daily net assets* of the Fund, as well as 4.125% of the gross interest income (excluding interest on bonds underlying a “self-deposited inverse floater” trust that is attributed to the Fund over and above the net interest earned on the inverse floater itself) of the Fund.
The annual fund-level fee for the following Funds, payable monthly, is calculated according to the following schedules:
| | New York Performance Plus (NNP) |
| Average Daily Managed Assets* | Fund-Level Fee Rate |
| For the first $125 million | .4500 | % |
| For the next $125 million | .4375 | |
| For the next $250 million | .4250 | |
| For the next $500 million | .4125 | |
| For the next $1 billion | .4000 | |
| For the next $3 billion | .3875 | |
| For managed assets over $5 billion | .3750 | |
| | New York Value 2 (NYV) |
| Average Daily Managed Assets* | Fund-Level Fee Rate |
| For the first $125 million | .4000 | % |
| For the next $125 million | .3875 | |
| For the next $250 million | .3750 | |
| For the next $500 million | .3625 | |
| For the next $1 billion | .3500 | |
| For managed assets over $2 billion | .3375 | |
| | New York Dividend Advantage (NAN) |
| | New York Dividend Advantage 2 (NXK) |
| | New York AMT-Free Income (NRK) |
| Average Daily Managed Assets* | Fund-Level Fee Rate |
| For the first $125 million | .4500 | % |
| For the next $125 million | .4375 | |
| For the next $250 million | .4250 | |
| For the next $500 million | .4125 | |
| For the next $1 billion | .4000 | |
| For managed assets over $2 billion | .3750 | |
The annual complex-level fee for each Fund, payable monthly, is calculated according to the following schedule:
| Complex-Level Managed Asset Breakpoint Level* | Effective Rate at Breakpoint Level |
| $55 billion | .2000 | % |
| $56 billion | .1996 | |
| $57 billion | .1989 | |
| $60 billion | .1961 | |
| $63 billion | .1931 | |
| $66 billion | .1900 | |
| $71 billion | .1851 | |
| $76 billion | .1806 | |
| $80 billion | .1773 | |
| $91 billion | .1691 | |
| $125 billion | .1599 | |
| $200 billion | .1505 | |
| $250 billion | .1469 | |
| $300 billion | .1445 | |
| * | For the fund-level and complex-level fees, managed assets include closed-end fund assets managed by the Adviser that are attributable to certain types of leverage. For these purposes, leverage includes the funds’ use of preferred stock and borrowings and certain investments in the residual interest certificates (also called inverse floating rate securities) in tender option bond (TOB) trusts, including the portion of assets held by a TOB trust that has been effectively financed by the trust’s issuance of floating rate securities, subject to an agreement by the Adviser as to certain funds to limit the amount of such assets for determining managed assets in certain circumstances. The complex-level fee is calculated based upon the aggregate daily managed assets of all Nuveen Funds that constitute “eligible assets.” Eligible assets do not include assets attributable to investments in other Nuveen Funds or assets in excess of $2 billion added to the Nuveen Fund complex in connection with the Adviser’s assumption of the management of the former First American Funds effective January 1, 2011. As of September 30, 2014, the complex-level fee rate for each of these Funds was .1646%. |
Notes to Financial Statements (continued)
The Funds pay no compensation directly to those of its directors/trustees who are affiliated with the Adviser or to its officers, all of whom receive remuneration for their services to the Funds from the Adviser or its affiliates. The Board has adopted a deferred compensation plan for independent directors/trustees that enables directors/trustees to elect to defer receipt of all or a portion of the annual compensation they are entitled to receive from certain Nuveen-advised funds. Under the plan, deferred amounts are treated as though equal dollar amounts had been invested in shares of select Nuveen-advised funds.
8. New Accounting Pronouncement
Financial Accounting Standards Board (“FASB”) Financial Services – Investment Companies (Topic 946): Amendments to the Scope, Measurement, and Disclosure Requirements
During 2013, the FASB issued Accounting Standards Update (“ASU”) 2013-08, “Financial Services – Investment Companies (Topic 946): Amendments to the Scope, Measurement, and Disclosure Requirements,” which amends the criteria that define an investment company and clarifies the measurement guidance and requires new disclosures for investment companies. ASU 2013-08 is effective for fiscal years beginning on or after December 15, 2013. Management has evaluated the implications of ASU 2013-08 and determined that each Fund’s current disclosures already followed this guidance and therefore it does not have an impact on the Funds’ financial statements or footnote disclosures.
9. Subsequent Events
Purchase and Sale Agreement
As previously described in Note 1 – General Information and Significant Accounting Policies, Purchase and Sale Agreement, on October 1, 2014, TIAA-CREF completed its previously announced acquisition of Nuveen and new investment management agreements and new sub-advisory agreements have been approved by shareholders of the Funds and went into effect on October 1, 2014.
Additional Fund Information
| Board of Directors/Trustees | | | | | | | | | | |
| William Adams IV* | | Robert P. Bremner | | Jack B. Evans | | William C. Hunter | | David J. Kundert | | John K. Nelson |
| William J. Schneider | | Thomas S. Schreier, Jr.* | | Judith M. Stockdale | | Carole E. Stone | | Virginia L. Stringer | | Terence J. Toth |
| | | | | | | | | | | |
| * Interested Board Member. | | | | | | | | | | |
| Fund Manager | | Custodian | | Legal Counsel | | Independent Registered | | Transfer Agent and |
| Nuveen Fund Advisors, LLC | | State Street Bank | | Chapman and Cutler LLP | | Public Accounting Firm** | | Shareholder Services |
| 333 West Wacker Drive | | & Trust Company | | Chicago, IL 60603 | | KPMG LLP | | State Street Bank |
| Chicago, IL 60606 | | Boston, MA 02111 | | | | Chicago, IL 60601 | | & Trust Company |
| | | | | | | | | Nuveen Funds |
| | | | | | | | | P.O. Box 43071 |
| | | | | | | | | Providence, RI 02940-3071 |
| | | | | | | | | (800) 257-8787 |
| ** | During the fiscal period ended September 30, 2014, the Board of Trustees of the Funds, upon recommendation of the Audit Committee, engaged KPMG LLP (“KPMG”) as the independent registered public accounting firm to the Funds replacing Ernst & Young LLP (“Ernst & Young”), which resigned as the independent registered public accounting firm effective August 11, 2014 as a result of the pending acquisition of Nuveen Investments by TIAA-CREF. |
| | |
| | Ernst & Young’s report on the Funds for the two most recent fiscal periods ended September 30, 2013 and September 30, 2012, contained no adverse opinion or disclaimer of opinion, and were not qualified or modified as to uncertainty, audit scope or accounting principles. For the fiscal periods ended September 30, 2013 and September 30, 2012 for the Funds and for the period October 1, 2014 through August 11, 2014, there were no disagreements with Ernst & Young on any matter of accounting principles or practices, financial statement disclosure or auditing scope or procedures, which disagreements, if not resolved to the satisfaction of Ernst & Young, would have caused it to make reference to the subject matter of the disagreements in connection with its reports on the Funds’ financial statements. |
Quarterly Form N-Q Portfolio of Investments Information
Each Fund is required to file its complete schedule of portfolio holdings with the Securities and Exchange Commission (SEC) for the first and third quarters of each fiscal year on Form N-Q. You may obtain this information directly from the SEC. Visit the SEC on-line at http://www.sec.gov or in person at the SEC’s Public Reference Room in Washington, D.C. Call the SEC toll-free at (800) SEC -0330 for room hours and operation.
Nuveen Funds’ Proxy Voting Information
You may obtain (i) information regarding how each fund voted proxies relating to portfolio securities held during the most recent twelve-month period ended June 30, without charge, upon request, by calling Nuveen Investments toll-free at (800) 257-8787 or on Nuveen’s website at www.nuveen.com and (ii) a description of the policies and procedures that each fund used to determine how to vote proxies relating to portfolio securities without charge, upon request, by calling Nuveen Investments toll free at (800) 257-8787. You may also obtain this information directly from the SEC. Visit the SEC on-line at http://www.sec.gov.
CEO Certification Disclosure
Each Fund’s Chief Executive Officer (CEO) has submitted to the New York Stock Exchange (NYSE) the annual CEO certification as required by Section 303A.12(a) of the NYSE Listed Company Manual. Each Fund has filed with the SEC the certification of its CEO and Chief Financial Officer required by Section 302 of the Sarbanes-Oxley Act.
Common Share Information
Each Fund intends to repurchase shares of its own common stock at such times and in such amounts as is deemed advisable. During the period covered by this report, each Fund repurchased shares of its common stock as shown in the accompanying table. Any future repurchases will be reported to shareholders in the next annual or semi-annual report.
| | NNY | NYV | NNP | NAN | NXK | NRK |
| Common shares repurchased | — | — | — | — | 5,300 | — |
FINRA BrokerCheck
The Financial Industry Regulatory Authority (FINRA) provides information regarding the disciplinary history of FINRA member firms and associated investment professionals. This information as well as an investor brochure describing FINRA BrokerCheck is available to the public by calling the FINRA BrokerCheck Hotline number at (800) 289-9999 or by visiting www.FINRA.org.
Glossary of Terms Used in this Report
| ■ | Auction Rate Bond: An auction rate bond is a security whose interest payments are adjusted periodically through an auction process, which process typically also serves as a means for buying and selling the bond. Auctions that fail to attract enough buyers for all the shares offered for sale are deemed to have “failed,” with current holders receiving a formula-based interest rate until the next scheduled auction. |
| | |
| ■ | Average Annual Total Return: This is a commonly used method to express an investment’s performance over a particular, usually multi-year time period. It expresses the return that would have been necessary each year to equal the investment’s actual cumulative performance (including change in NAV or market price and reinvested dividends and capital gains distributions, if any) over the time period being considered. |
| | |
| ■ | Duration: Duration is a measure of the expected period over which a bond’s principal and interest will be paid, and consequently is a measure of the sensitivity of a bond’s or bond fund’s value to changes when market interest rates change. Generally, the longer a bond’s or fund’s duration, the more the price of the bond or fund will change as interest rates change. |
| | |
| ■ | Effective Leverage: Effective leverage is a fund’s effective economic leverage, and includes both regulatory leverage (see leverage) and the leverage effects of certain derivative investments in the fund’s portfolio. Currently, the leverage effects of Tender Option Bond (TOB) inverse floater holdings are included in effective leverage values, in addition to any regulatory leverage. |
| | |
| ■ | Forward Interest Rate Swap: A contractual agreement between two counterparties under which one party agrees to make periodic payments to the other for an agreed period of time based on a fixed rate, while the other party agrees to make periodic payments based on a floating rate of interest based on an underlying index. Alternatively, both series of cashflows to be exchanged could be calculated using floating rates of interest but floating rates that are based upon different underlying indexes. |
| | |
| ■ | Gross Domestic Product (GDP): The total market value of all final goods and services produced in a country/region in a given year, equal to total consumer, investment and government spending, plus the value of exports, minus the value of imports. |
| | |
| ■ | Inverse Floating Rate Securities: Inverse floating rate securities, also known as inverse floaters or tender option bonds (TOBs), are created by depositing a municipal bond, typically with a fixed interest rate, into a special purpose trust created by a broker-dealer. This trust, in turn, (a) issues floating rate certificates typically paying short-term tax-exempt interest rates to third parties in amounts equal to some fraction of the deposited bond’s par amount or market value, and (b) issues an inverse floating rate certificate (sometimes referred to as an “inverse floater”) to an investor (such as a fund) interested in gaining investment exposure to a long-term municipal bond. The income received by the holder of the inverse floater varies inversely with the short-term rate paid to the floating rate certificates’ holders, and in most circumstances the holder of the inverse floater bears substantially all of the underlying bond’s downside investment risk. The holder of the inverse floater typically also benefits disproportionately from any potential appreciation of the underlying bond’s value. Hence, an inverse floater essentially represents an investment in the underlying bond on a leveraged basis. |
| | |
| ■ | Leverage: Leverage is created whenever a fund has investment exposure (both reward and/or risk) equivalent to more than 100% of the investment capital. |
| | |
| ■ | Lipper New York Municipal Debt Funds Classification Average: Calculated using the returns of all closed-end funds in this category. Lipper returns account for the effects of management fees and assume reinvestment of distributions, but do not reflect any applicable sales charges. |
| | |
| ■ | Net Asset Value (NAV) Per Share: A fund’s Net Assets is equal to its total assets (securities, cash, accrued earnings and receivables) less its total liabilities. NAV per share is equal to the fund’s Net Assets divided by its number of shares outstanding. |
| ■ | Pre-Refunding: Pre-Refunding, also known as advanced refundings or refinancings, is a procedure used by state and local governments to refinance municipal bonds to lower interest expenses. The issuer sells new bonds with a lower yield and uses the proceeds to buy U.S. Treasury securities, the interest from which is used to make payments on the higher-yielding bonds. Because of this collateral, pre-refunding generally raises a bond’s credit rating and thus its value. |
| | |
| ■ | Regulatory Leverage: Regulatory leverage consists of preferred shares issued by or borrowings of a fund. Both of these are part of a fund’s capital structure. Regulatory leverage is subject to asset coverage limits set in the Investment Company Act of 1940. |
| | |
| ■ | S&P Municipal Bond Index: An unleveraged, market value-weighted index designed to measure the performance of the tax-exempt, investment-grade U.S. municipal bond market. Index returns assume reinvestment of distributions but do not reflect any applicable sales charges or management fees. |
| | |
| ■ | S&P Municipal Bond New York Index: An unleveraged, market value-weighted index designed to measure the performance of the tax-exempt, investment-grade New York municipal bond market. Index returns assume reinvestment of distributions but do not reflect any applicable sales charges or management fees. |
| | |
| ■ | Total Investment Exposure: Total investment exposure is a fund’s assets managed by the Adviser that are attributable to financial leverage. For these purposes, financial leverage includes a fund’s use of preferred stock and borrowings and investments in the residual interest certificates (also called inverse floating rate securities) in tender option bond (TOB) trusts, including the portion of assets held by a TOB trust that has been effectively financed by the trust’s issuance of floating rate securities. |
| | |
| ■ | Zero Coupon Bond: A zero coupon bond does not pay a regular interest coupon to its holders during the life of the bond. Tax-exempt income to the holder of the bond comes from accretion of the difference between the original purchase price of the bond at issuance and the par value of the bond at maturity and is effectively paid at maturity. The market prices of zero coupon bonds generally are more volatile than the market prices of bonds that pay interest periodically. |
Reinvest Automatically, Easily and Conveniently |
Nuveen makes reinvesting easy. A phone call is all it takes to set up your reinvestment account.
Nuveen Closed-End Funds Automatic Reinvestment Plan
Nuveen Closed-End Fund allows you to conveniently reinvest distributions in additional Fund shares. By choosing to reinvest, you’ll be able to invest money regularly and automatically, and watch your investment grow through the power of compounding. Just like distributions in cash, there may be times when income or capital gains taxes may be payable on distributions that are reinvested. It is important to note that an automatic reinvestment plan does not ensure a profit, nor does it protect you against loss in a declining market.
Easy and convenient
To make recordkeeping easy and convenient, each month you’ll receive a statement showing your total distributions, the date of investment, the shares acquired and the price per share, and the total number of shares you own.
How shares are purchased
The shares you acquire by reinvesting will either be purchased on the open market or newly issued by the Fund. If the shares are trading at or above net asset value at the time of valuation, the Fund will issue new shares at the greater of the net asset value or 95% of the then-current market price. If the shares are trading at less than net as -set value, shares for your account will be purchased on the open market. If the Plan Agent begins purchasing Fund shares on the open market while shares are trading below net asset value, but the Fund’s shares subsequently trade at or above their net asset value before the Plan Agent is able to complete its purchases, the Plan Agent may cease open-market purchases and may invest the uninvested portion of the distribution in newly-issued Fund shares at a price equal to the greater of the shares’ net asset value or 95% of the shares’ market value on the last business day imme -diately prior to the purchase date. Distributions received to purchase shares in the open market will normally be invested shortly after the distribution payment date. No interest will be paid on distributions awaiting reinvestment. Because the market price of the shares may increase before purchases are completed, the average purchase price per share may exceed the market price at the time of valuation, resulting in the acquisition of fewer shares than if the distribution had been paid in shares issued by the Fund. A pro rata portion of any applicable brokerage commissions on open market purchases will be paid by Plan participants. These commissions usually will be lower than those charged on individual transactions.
Flexible
You may change your distribution option or withdraw from the Plan at any time, should your needs or situation change. You can reinvest whether your shares are registered in your name, or in the name of a brokerage firm, bank, or other nominee. Ask your investment advisor if his or her firm will participate on your behalf. Participants whose shares are registered in the name of one firm may not be able to transfer the shares to another firm and continue to participate in the Plan. The Fund reserves the right to amend or terminate the Plan at any time. Although the Fund reserves the right to amend the Plan to include a service charge payable by the participants, there is no direct service charge to participants in the Plan at this time.
Call today to start reinvesting distributions
For more information on the Nuveen Automatic Reinvestment Plan or to enroll in or withdraw from the Plan, speak with your financial advisor or call us at (800) 257-8787.
The management of the Funds, including general supervision of the duties performed for the Funds by the Adviser, is the responsibility of the Board of Trustees of the Funds. The number of trustees of the Funds is currently set at twelve. None of the trustees who are not “interested” persons of the Funds (referred to herein as “independent trustees”) has ever been a director or employee of, or consultant to, Nuveen or its affiliates. The names and business addresses of the trustees and officers of the Funds, their principal occupations and other affiliations during the past five years, the number of portfolios each oversees and other directorships they hold are set forth below.
| | Name, Year of Birth & Address | | Position(s) Held with the Funds | | Year First Elected or Appointed and Term(1) | | Principal Occupation(s) Including other Directorships During Past 5 Years | | Number of Portfolios in Fund Complex Overseen by Board Member |
| | | | | | | | | | |
| Independent Board Members: | | | | | | | | |
| | | | | | | | | | |
| ■ | WILLIAM J. SCHNEIDER 1944 333 W. Wacker Drive Chicago, IL 60606 | | Chairman and Board Member | | 1996 Class III | | Chairman of Miller-Valentine Partners, a real estate investment company; formerly, Senior Partner and Chief Operating Officer (retired (2004) of Miller-Valentine Group; an owner in several other Miller Valentine entities; Board Member of Med-America Health System, Tech Town, Inc., a not-for-profit community development company, Board Member of WDPR Public Radio station; formerly, member, Business Advisory Council, Cleveland Federal Reserve Bank and University of Dayton Business School Advisory Council. | | 199 |
| | | | | | | | | | |
| ■ | ROBERT P. BREMNER 1940 333 W. Wacker Drive Chicago, IL 60606 | | Board Member | | 1996 Class III | | Private Investor and Management Consultant; Treasurer and Director, Humanities Council of Washington, D.C.; Board Member, Independent Directors Council affiliated with the Investment Company Institute. | | 199 |
| | | | | | | | | | |
| ■ | JACK B. EVANS 1948 333 W. Wacker Drive Chicago, IL 60606 | | Board Member | | 1999 Class III | | President, The Hall-Perrine Foundation, a private philanthropic corporation (since 1996); Chairman, United Fire Group, a publicly held company; formerly, President Pro-Tem of the Board of Regents for the State of Iowa University System; Director, Source Media Group; Life Trustee of Coe College; formerly, Director, Alliant Energy; formerly, Director, Federal Reserve Bank of Chicago; formerly, President and Chief Operating Officer, SCI Financial Group, Inc., a regional financial services firm. | | 199 |
| | | | | | | | | | |
| ■ | WILLIAM C. HUNTER 1948 333 W. Wacker Drive Chicago, IL 60606 | | Board Member | | 2004 Class I | | Dean Emeritus (since June 30, 2012), formerly, Dean, Tippie College of Business, University of Iowa (2006-2012); Director (since 2004) of Xerox Corporation; Director (since 2005), and President (since July 2012) Beta Gamma Sigma, Inc., The International Honor Society; Director of Wellmark, Inc. (since 2009); formerly, Dean and Distinguished Professor of Finance, School of Business at the University of Connecticut (2003-2006); previously, Senior Vice President and Director of Research at the Federal Reserve Bank of Chicago (1995-2003); formerly, Director (1997-2007), Credit Research Center at Georgetown University. | | 199 |
| | | | | | | | | | |
| ■ | DAVID J. KUNDERT 1942 333 W. Wacker Drive Chicago, IL 60606 | | Board Member | | 2005 Class II | | Formerly, Director, Northwestern Mutual Wealth Management Company (2006-2013), retired (since 2004) as Chairman, JPMorgan Fleming Asset Management, President and CEO, Banc One Investment Advisors Corporation, and President, One Group Mutual Funds; prior thereto, Executive Vice President, Banc One Corporation and Chairman and CEO, Banc One Investment Management Group; Regent Emeritus, Member of Investment Committee, Luther College; member of the Wisconsin Bar Association; member of Board of Directors, Friends of Boerner Botanical Gardens; member of Board of Directors and Chair of Investment Committee, Greater Milwaukee Foundation; member of the Board of Directors (Milwaukee), College Possible. | | 199 |
Board Members & Officers (continued)
| | Name, Year of Birth & Address | | Position(s) Held with the Funds | | Year First Elected or Appointed and Term(1) | | Principal Occupation(s) Including other Directorships During Past 5 Years | | Number of Portfolios in Fund Complex Overseen by Board Member |
| | | | | | | | | | |
| Independent Board Members (continued): | | | | | | |
| | | | | | | | | | |
| ■ | JOHN K. NELSON 1962 333 West Wacker Drive Chicago, IL 60606 | | Board Member | | 2013 Class II | | Senior external advisor to the financial services practice of Deloitte Consulting LLP (since 2012); Member of Board of Directors of Core12 LLC since 2008), a private firm which develops branding, marketing and communications strategies for clients; Director of The Curran Center for Catholic American Studies (since 2009) and The President’s Council, Fordham University (since 2010); formerly, Chairman of the Board of Trustees of Marian University (2010 as trustee, 2011-2014 as Chairman); formerly, Chief Executive Officer of ABN AMRO N.V. North America, and Global Head of its Financial Markets Division (2007-2008); prior senior positions held at ABN AMRO include Corporate Executive Vice President and Head of Global Markets-the Americas (2006-2007), CEO of Wholesale Banking North America and Global Head of Foreign Exchange and Futures Markets (2001-2006), and Regional Commercial Treasurer and Senior Vice President Trading-North America (1996-2001); formerly, Trustee at St. Edmund Preparatory School in New York City. | | 199 |
| | | | | | | | | | |
| ■ | JUDITH M. STOCKDALE 1947 333 W. Wacker Drive Chicago, IL 60606 | | Board Member | | 1997 Class I | | Board Member, Land Trust Alliance (since June 2013) and U.S. Endowment for Forestry and Communities (since November 2013); formerly, Executive Director (1994-2012), Gaylord and Dorothy Donnelley Foundation; prior thereto, Executive Director, Great Lakes Protection Fund (1990-1994). | | 199 |
| | | | | | | | | | |
| ■ | CAROLE E. STONE 1947 333 W. Wacker Drive Chicago, IL 60606 | | Board Member | | 2007 Class I | | Director, Chicago Board Options Exchange (since 2006); Director, C2 Options Exchange, Incorporated (since 2009); Director, CBOE Holdings, Inc. (since 2010); formerly, Commissioner, New York State Commission on Public Authority Reform (2005-2010). | | 199 |
| | | | | | | | | | |
| ■ | VIRGINIA L. STRINGER 1944 333 W. Wacker Drive Chicago, IL 60606 | | Board Member | | 2011 Class I | | Board Member, Mutual Fund Directors Forum; former governance consultant and non-profit board member; former Owner and President, Strategic Management Resources, Inc., a management consulting firm; former Member, Governing Board, Investment Company Institute’s Independent Directors Council; previously, held several executive positions in general management, marketing and human resources at IBM and The Pillsbury Company; Independent Director, First American Fund Complex (1987-2010) and Chair (1997-2010). | | 199 |
| | | | | | | | | | |
| ■ | TERENCE J. TOTH 1959 333 W. Wacker Drive Chicago, IL 60606 | | Board Member | | 2008 Class II | | Managing Partner, Promus Capital (since 2008); Director, Fulcrum IT Service LLC (since 2010), Quality Control Corporation (since 2012) and LogicMark LLC (since 2012); formerly, Director, Legal & General Investment Management America, Inc. (2008-2013); formerly, CEO and President, Northern Trust Global Investments (2004-2007); Executive Vice President, Quantitative Management & Securities Lending (2000-2004); prior thereto, various positions with Northern Trust Company (since 1994); member: Chicago Fellowship Board (since 2005), Catalyst Schools of Chicago Board (since 2008) and Chairman, and Mather Foundation Board (since 2012), and a member of its investment committee; formerly, Member, Northern Trust Mutual Funds Board (2005-2007), Northern Trust Global Investments Board (2004-2007), Northern Trust Japan Board (2004-2007), Northern Trust Securities Inc. Board (2003-2007) and Northern Trust Hong Kong Board (1997-2004). | | 199 |
| | Name, Year of Birth & Address | | Position(s) Held with the Funds | | Year First Elected or Appointed and Term(1) | | Principal Occupation(s) Including other Directorships During Past 5 Years | | Number of Portfolios in Fund Complex Overseen by Board Member |
| | | | | | | | | | |
| Interested Board Members: | | | | | | | | |
| | | | | | | | | | |
| ■ | WILLIAM ADAMS IV(2) 1955 333 W. Wacker Drive Chicago, IL 60606 | | Board Member | | 2013 Class II | | Senior Executive Vice President, Global Structured Products (since 2010); formerly, Executive Vice President, U.S. Structured Products, of Nuveen Investments, Inc. (1999-2010); Co-President of Nuveen Fund Advisors, LLC (since 2011); President (since 2011), formerly, Managing Director (2010-2011) of Nuveen Commodities Asset Management, LLC; Board Member of the Chicago Symphony Orchestra and of Gilda’s Club Chicago. | | 199 |
| | | | | | | | | | |
| ■ | THOMAS S. SCHREIER, JR.(2) 1962 333 W. Wacker Drive Chicago, IL 60606 | | Board Member | | 2013 Class III | | Vice Chairman, Wealth Management of Nuveen Investments, Inc. (since 2011); Co-President of Nuveen Fund Advisors, LLC; Chairman of Nuveen Asset Management, LLC (since 2011); Co-Chief Executive Officer of Nuveen Securities, LLC (since 2011); Member of Board of Governors and Chairman’s Council of the Investment Company Institute; formerly, Chief Executive Officer (2000-2010) and Chief Investment Officer (2007-2010) of FAF Advisors, Inc.; formerly, President of First American Funds (2001-2010). | | 199 |
| | Name, Year of Birth & Address | | Position(s) Held with the Funds | | Year First Elected or Appointed(3) | | Principal Occupation(s) During Past 5 Years | | Number of Portfolios in Fund Complex Overseen by Officer |
| | | | | | | | | | |
| Officers of the Funds: | | | | | | | | |
| | | | | | | | | | |
| ■ | GIFFORD R. ZIMMERMAN 1956 333 W. Wacker Drive Chicago, IL 60606 | | Chief Administrative Officer | | 1988 | | Managing Director (since 2002), and Assistant Secretary of Nuveen Securities, LLC; Managing Director (since 2004) and Assistant Secretary (since 1994) of Nuveen Investments, Inc.; Managing Director (since 2002), Assistant Secretary (since 1997) and Co-General Counsel (since 2011) of Nuveen Fund Advisors, LLC; Managing Director, Assistant Secretary and Associate General Counsel of Nuveen Asset Management, LLC (since 2011); Managing Director, Associate General Counsel and Assistant Secretary, of Symphony Asset Management LLC (since 2003); Vice President and Assistant Secretary of NWQ Investment Management Company, LLC (since 2002), Nuveen Investments Advisers Inc. (since 2002), Santa Barbara Asset Management, LLC (since 2006), and of Winslow Capital Management, LLC, (since 2010); Vice President and Assistant Secretary (since 2013), formerly, Chief Administrative Officer and Chief Compliance Officer (2006-2013) of Nuveen Commodities Asset Management, LLC; Chartered Financial Analyst. | | 200 |
| | | | | | | | | | |
| ■ | CEDRIC H. ANTOSIEWICZ 1962 333 W. Wacker Drive Chicago, IL 60606 | | Vice President | | 2007 | | Managing Director of Nuveen Securities, LLC. | | 93 |
| | | | | | | | | | |
| ■ | MARGO L. COOK 1964 333 W. Wacker Drive Chicago, IL 60606 | | Vice President | | 2009 | | Executive Vice President (since 2008) of Nuveen Investments, Inc. and of Nuveen Fund Advisors, LLC (since 2011); Managing Director-Investment Services of Nuveen Commodities Asset Management, LLC (since August 2011), previously, Head of Institutional Asset Management (2007-2008) of Bear Stearns Asset Management; Head of Institutional Asset Management (1986-2007) of Bank of NY Mellon; Chartered Financial Analyst. | | 200 |
Board Members & Officers (continued)
| | Name, Year of Birth & Address | | Position(s) Held with the Funds | | Year First Elected or Appointed(3) | | Principal Occupation(s) During Past 5 Years | | Number of Portfolios in Fund Complex Overseen by Officer |
| | | | | | | | | | |
| Officers of the Funds (continued): | | | | | | |
| | | | | | | | | | |
| ■ | LORNA C. FERGUSON 1945 333 W. Wacker Drive Chicago, IL 60606 | | Vice President | | 1998 | | Managing Director (since 2005) of Nuveen Fund Advisors, LLC and Nuveen Securities, LLC (since 2004). | | 200 |
| | | | | | | | | | |
| ■ | STEPHEN D. FOY 1954 333 W. Wacker Drive Chicago, IL 60606 | | Vice President and Controller | | 1998 | | Managing Director (since 2014), formerly, Senior Vice President (2013-2014), and Vice President of Nuveen Fund Advisors, LLC; Chief Financial Officer of Nuveen Commodities Asset Management, LLC (since 2010); Senior Vice President (2010-2011), Formerly Vice President (2005-2010) and Funds Controller of Nuveen Securities, LLC; Certified Public Accountant. | | 200 |
| | | | | | | | | | |
| ■ | SCOTT S. GRACE 1970 333 W. Wacker Drive Chicago, IL 60606 | | Vice President and Treasurer | | 2009 | | Managing Director, Corporate Finance & Development, Treasurer (since 2009) of Nuveen Securities, LLC; Managing Director and Treasurer (since 2009) of Nuveen Fund Advisors, LLC, Nuveen Investments Advisers, Inc., Nuveen Investments Holdings Inc. and (since 2011) Nuveen Asset Management, LLC; Vice President and Treasurer of NWQ Investment Management Company, LLC, Tradewinds Global Investors, LLC, Symphony Asset Management LLC and Winslow Capital Management, LLC.; Vice President of Santa Barbara Asset Management, LLC; formerly, Treasurer (2006-2009), Senior Vice President (2008-2009), previously, Vice President (2006-2008) of Janus Capital Group, Inc.; formerly, Senior Associate in Morgan Stanley’s Global Financial Services Group (2000-2003); Chartered Accountant Designation. | | 200 |
| | | | | | | | | | |
| ■ | WALTER M. KELLY 1970 333 W. Wacker Drive Chicago, IL 60606 | | Chief Compliance Officer and Vice President | | 2003 | | Senior Vice President (since 2008) of Nuveen Investment Holdings, Inc. | | 200 |
| | | | | | | | | | |
| ■ | TINA M. LAZAR 1961 333 W. Wacker Drive Chicago, IL 60606 | | Vice President | | 2002 | | Senior Vice President of Nuveen Investment Holdings, Inc. | | 200 |
| | | | | | | | | | |
| ■ | KEVIN J. MCCARTHY 1966 333 W. Wacker Drive Chicago, IL 60606 | | Vice President and Secretary | | 2007 | | Managing Director and Assistant Secretary (since 2008), Nuveen Securities, LLC; Managing Director (since 2008), Assistant Secretary since 2007) and Co-General Counsel (since 2011) of Nuveen Fund Advisors, LLC; Managing Director, Assistant Secretary and Associate General Counsel (since 2011) of Nuveen Asset Management, LLC; Managing Director (since 2008), and Assistant Secretary, Nuveen Investment Holdings, Inc.; Vice President (since 2007) and Assistant Secretary of Nuveen Investments Advisers Inc., NWQ Investment Management Company, LLC, NWQ Holdings, LLC, Symphony Asset Management LLC, Santa Barbara Asset Management, LLC, and of Winslow Capital Management, LLC. (since 2010); Vice President and Secretary (since 2010) of Nuveen Commodities Asset Management, LLC. | | 200 |
| | Name, Year of Birth & Address | | Position(s) Held with the Funds | | Year First Elected or Appointed(3) | | Principal Occupation(s) During Past 5 Years | | Number of Portfolios in Fund Complex Overseen by Officer |
| | | | | | | | | | |
| Officers of the Funds (continued): | | | | | |
| | | | | | | | | | |
| ■ | KATHLEEN L. PRUDHOMME 1953 901 Marquette Avenue Minneapolis, MN 55402 | | Vice President and Assistant Secretary | | 2011 | | Managing Director, Assistant Secretary and Co-General Counsel (since 2011) of Nuveen Fund Advisors, LLC; Managing Director, Assistant Secretary and Associate General Counsel (since 2011) of Nuveen Asset Management, LLC; Managing Director and Assistant Secretary (since 2011) of Nuveen Securities, LLC; formerly, Deputy General Counsel, FAF Advisors, Inc. (2004-2010). | | 200 |
| | | | | | | | | | |
| ■ | JOEL T. SLAGER 1978 333 West Wacker Drive Chicago, IL 60606 | | Vice President and Assistant Secretary | | 2013 | | Fund Tax Director for Nuveen Funds (since May, 2013); previously, Vice President of Morgan Stanley Investment Management, Inc., Assistant Treasurer of the Morgan Stanley Funds (from 2010 to 2013); Tax Director at PricewaterhouseCoopers LLP (from 2008 to 2010). | | 200 |
| (1) | For New York Municipal Value Fund, Inc. (NNY), New York Municipal Value Fund 2 (NYV), New York Dividend Advantage Municipal Fund (NAN) New York Dividend Advantage 2 (NXK) and New York AMT-Free Municipal Income (NRK), the Board of Trustees is divided into three classes, Class I, Class II, and Class III, with each being elected to serve until the third succeeding annual shareholders’ meeting subsequent to its election or thereafter in each case when its respective successors are duly elected or appointed, except two board members are elected by the holders of Preferred Shares to serve until the next annual shareholders’ meeting subsequent to its election or thereafter in each case when its respective successors are duly elected or appointed. For New York Performance Plus Fund (NNP), the Board Members serve a one year term to serve until the next annual meeting or until their successors shall have been duly elected and qualified. The year first elected or appointed represents the year in which the board member was first elected or appointed to any fund in the Nuveen Complex. |
| (2) | “Interested person” as defined in the 1940 Act, by reason of his position with Nuveen Investments, Inc. and certain of its subsidiaries, which are affiliates of the Nuveen Funds. |
| (3) | Officers serve one year terms through August of each year. The year first elected or appointed represents the year in which the Officer was first elected or appointed to any fund in the Nuveen Complex. |
Annual Investment Management Agreement Approval Process (Unaudited)
I. The Approval Process
The Board of Trustees or Directors (as the case may be) of each Fund (each, a “Board” and each Trustee or Director, a “Board Member”), including the Board Members who are not parties to the Funds’ advisory or sub-advisory agreements or “interested persons” of any such parties (the “Independent Board Members”), is responsible for overseeing the performance of the investment adviser and the sub-adviser to the respective Fund and determining whether to approve or continue such Fund’s advisory agreement (each, an “Original Investment Management Agreement”) between the Fund and Nuveen Fund Advisors, LLC (the “Adviser”) and sub-advisory agreement (each, an “Original Sub-Advisory Agreement” and, together with the Original Investment Management Agreement, the “Original Advisory Agreements”) between the Adviser and Nuveen Asset Management, LLC (the “Sub-Adviser”). Pursuant to the Investment Company Act of 1940, as amended (the “1940 Act”), each Board is required to consider the continuation of the respective Original Advisory Agreements on an annual basis. In addition, prior to its annual review, the Board Members were advised of the potential acquisition of Nuveen Investments, Inc. (“Nuveen”) by TIAA-CREF (the “Transaction”). For purposes of this section, references to “Nuveen” herein include all affiliates of Nuveen Investments, Inc. providing advisory, sub-advisory, distribution or other services to the Funds and references to the “Board” refer to the Board of each Fund. In accordance with the 1940 Act and the terms of the Original Advisory Agreements, the completion of the Transaction would terminate each of the Original Investment Management Agreements and the Original Sub-Advisory Agreements. Accordingly, at an in-person meeting held on April 30, 2014 (the “April Meeting”), the Board, including all of the Independent Board Members, performed its annual review of the Original Advisory Agreements and approved the continuation of the Original Advisory Agreements for the Funds. Furthermore, in anticipation of the termination of the Original Advisory Agreements that would occur upon the consummation of the Transaction, the Board also approved for each Fund a new advisory agreement (each, a “New Investment Management Agreement”) between the Fund and the Adviser and a new sub-advisory agreement (each, a “New Sub-Advisory Agreement” and, together with the New Investment Management Agreement, the “New Advisory Agreements”) between the Adviser and the Sub-Adviser, each on behalf of the respective Fund to be effective following the completion of the Transaction and the receipt of the requisite shareholder approval.
Leading up to the April Meeting, the Independent Board Members had several meetings and deliberations, with and without management from Nuveen present and with the advice of legal counsel, regarding the Original Advisory Agreements, the Transaction and its impact and the New Advisory Agreements. At its meeting held on February 25-27, 2014 (the “February Meeting”), the Board Members met with a senior executive representative of TIAA-CREF to discuss the proposed Transaction. At the February Meeting, the Independent Board Members also established an ad hoc committee comprised solely of the Independent Board Members to monitor and evaluate the Transaction and to keep the Independent Board Members updated with developments regarding the Transaction. On March 20, 2014, the ad hoc committee met telephonically to discuss with management of Nuveen, and separately with independent legal counsel, the terms of the proposed Transaction and its impact on, among other things: the governance structure of Nuveen; the strategic plans for Nuveen; the operations of the Nuveen funds (which include the Funds); the quality or level of services provided to the Nuveen funds; key personnel that service the Nuveen funds and/or the Board and the compensation or incentive arrangements to retain such personnel; Nuveen’s capital structure; the regulatory requirements applicable to Nuveen or fund operations; and the Nuveen funds’ fees and expenses, including the funds’ complex-wide fee arrangement. Following the meeting of the ad hoc committee, the Board met in person (two Independent Board Members participating telephonically) in an executive session on March 26, 2014 to further discuss the proposed Transaction. At the executive session, the Board met privately with independent legal counsel to review its duties with respect to reviewing advisory agreements, particularly in the context of a change of control, and to evaluate further the Transaction and its impact on the Nuveen funds, the Adviser and the Sub-Adviser (collectively, the “Fund Advisers” and each, a “Fund Adviser”) and the services provided. Representatives of Nuveen also met with the Board to update the Board Members on developments regarding the Transaction, to respond to questions and to
discuss, among other things: the governance of the Fund Advisers following the Transaction; the background, culture (including with respect to regulatory and compliance matters) and resources of TIAA-CREF; the general plans and intentions of TIAA-CREF for Nuveen; the terms and conditions of the Transaction (including financing terms); any benefits or detriments the Transaction may impose on the Nuveen funds, TIAA-CREF or the Fund Advisers; the reaction from the Fund Advisers’ employees knowledgeable of the Transaction; the incentive and retention plans for key personnel of the Fund Advisers; the potential access to additional distribution platforms and economies of scale; and the impact of any additional regulatory schemes that may be applicable to the Nuveen funds given the banking and insurance businesses operated in the TIAA-CREF enterprise. As part of its review, the Board also held a separate meeting on April 15-16, 2014 to review the Nuveen funds’ investment performance and consider an analysis provided by the Adviser of each sub-adviser of the Nuveen funds (including the Sub-Adviser) and the Transaction and its implications to the Nuveen funds. During their review of the materials and discussions, the Independent Board Members presented the Adviser with questions and the Adviser responded. Further, the Independent Board Members met in an executive session with independent legal counsel on April 29, 2014 and April 30, 2014.
In connection with their review of the Original Advisory Agreements and the New Advisory Agreements, the Independent Board Members received extensive information regarding the Funds and the Fund Advisers including, among other things: the nature, extent and quality of services provided by each Fund Adviser; the organization and operations of any Fund Adviser; the expertise and background of relevant personnel of each Fund Adviser; a review of each Fund’s performance (including performance comparisons against the performance of peer groups and appropriate benchmarks); a comparison of Fund fees and expenses relative to peers; a description and assessment of shareholder service levels for the Funds; a summary of the performance of certain service providers; a review of fund initiatives and shareholder communications; and an analysis of the Adviser’s profitability with comparisons to peers in the managed fund business. In light of the proposed Transaction, the Independent Board Members, through their independent legal counsel, also requested in writing and received additional information regarding the proposed Transaction and its impact on the provision of services by the Fund Advisers.
The Independent Board Members received, well in advance of the April Meeting, materials which responded to the request for information regarding the Transaction and its impact on Nuveen and the Nuveen funds including, among other things: the structure and terms of the Transaction; the impact of the Transaction on Nuveen, its operations and the nature, quality and level of services provided to the Nuveen funds, including, in particular, any changes to those services that the Nuveen funds may experience following the Transaction; the strategic plan for Nuveen, including any financing arrangements following the Transaction and any cost-cutting efforts that may impact services; the organizational structure of TIAA-CREF, including the governance structure of Nuveen following the Transaction; any anticipated effect on each Nuveen fund’s expense ratios (including changes to advisory and sub-advisory fees) and economies of scale that may be expected; any benefits or conflicts of interest that TIAA-CREF, Nuveen or their affiliates can expect from the Transaction; any benefits or undue burdens or other negative implications that may be imposed on the Nuveen funds as a result of the Transaction; the impact on Nuveen or the Nuveen funds as a result of being subject to additional regulatory schemes that TIAA-CREF must comply with in operating its various businesses; and the costs associated with obtaining necessary shareholder approvals and the bearer of such costs. The Independent Board Members also received a memorandum describing the applicable laws, regulations and duties in approving advisory contracts, including in conjunction with a change of control, from their independent legal counsel.
The materials and information prepared in connection with the review of the Original Advisory Agreements and New Advisory Agreements supplemented the information and analysis provided to the Board during the year. In this regard, throughout the year, the Board, acting directly or through its committees, regularly reviewed the performance and various services provided by the Adviser and Sub-Adviser. The Board met at least quarterly as well as at other times as the need arose. At its quarterly meetings, the Board reviewed reports by the Adviser regarding, among other things, fund performance, fund expenses, premium and discount levels of closed-end funds, the performance of the investment teams and compliance, regulatory and risk management matters. In addition to regular reports, the Adviser provided special reports to the Board or a committee thereof from time to time to enhance
Annual Investment Management Agreement Approval Process (Unaudited) (continued)
the Board’s understanding of various topics that impact some or all the Nuveen funds (such as distribution channels, oversight of omnibus accounts and leverage management topics), to update the Board on regulatory developments impacting the investment company industry or to update the Board on the business plans or other matters impacting the Adviser. The Board also met with key investment personnel managing certain Nuveen fund portfolios during the year.
In addition, the Board has created several standing committees (the Executive Committee; the Dividend Committee; the Audit Committee; the Compliance, Risk Management and Regulatory Oversight Committee; the Nominating and Governance Committee; the Open-End Funds Committee; and the Closed-End Funds Committee). The Open-End Funds Committee and Closed-End Funds Committee are intended to assist the full Board in monitoring and gaining a deeper insight into the distinctive business practices of closed-end and open-end funds. These two Committees have met prior to each quarterly Board meeting, and the Adviser provided presentations to these Committees permitting them to delve further into specific matters or initiatives impacting the respective product line.
Further, the Board continued its program of seeking to have the Board Members or a subset thereof visit each sub-adviser to the Nuveen funds and meet key investment and business personnel at least once over a multiple year rotation. In this regard, the Independent Board Members made site visits to certain equity and fixed income teams of the Sub-Adviser in September 2013 and met with the Sub-Adviser’s municipal team at the August and November 2013 quarterly meetings.
The Board considered the information provided and knowledge gained at these meetings and visits during the year when performing its annual review of the Original Advisory Agreements and its review of the New Advisory Agreements. The Independent Board Members also were assisted throughout the process by independent legal counsel. During the course of the year and during their deliberations regarding the review of advisory contracts, the Independent Board Members met with independent legal counsel in executive sessions without management present. In addition, it is important to recognize that the management arrangements for the funds are the result of many years of review and discussion between the Independent Board Members and Nuveen fund management and that the Board Members’ conclusions may be based, in part, on their consideration of fee arrangements and other factors developed in previous years.
The Board considered all factors it believed relevant with respect to each Fund, including, among other things: (a) the nature, extent and quality of the services provided by the Fund Advisers, (b) the investment performance of the Fund and the Fund Advisers, (c) the advisory fees and costs of the services to be provided to the Fund and the profitability of the Fund Advisers, (d) the extent of any economies of scale, (e) any benefits derived by the Fund Advisers from the relationship with the Fund and (f) other factors. With respect to the New Advisory Agreements, the Board also considered the Transaction and its impact on the foregoing factors. Each Board Member may have accorded different weight to the various factors in reaching his or her conclusions with respect to a Fund’s Original Advisory Agreements and New Advisory Agreements. The Independent Board Members did not identify any single factor as all-important or controlling. The Independent Board Members’ considerations were instead based on a comprehensive consideration of all the information presented. The principal factors considered by the Board and its conclusions are described below.
A. Nature, Extent and Quality of Services
1. The Original Advisory Agreements
In considering renewal of each Original Advisory Agreement, the Independent Board Members considered the nature, extent and quality of the respective Fund Adviser’s services, including portfolio management services (and the resulting Fund performance) and administrative services. The Independent Board Members further considered the overall reputation and capabilities of the Adviser and its affiliates, the commitment of the Adviser to provide high quality service to the Funds, their overall confidence in the capability and integrity of the Adviser and its staff and the Adviser’s responsiveness to questions and concerns raised by them. The Independent Board Members reviewed materials outlining, among other things: each Fund Adviser’s organization and business; the types of services that each Fund Adviser or its affiliates provide to each Fund; the performance record of each Fund (as described in further detail below); and any initiatives Nuveen had taken for the closed-end fund product line.
In considering the services provided by the Fund Advisers, the Board recognized that the Adviser provides a myriad of investment management, administrative, compliance, oversight and other services for the Funds, and the Sub-Adviser generally provides the portfolio advisory services to the Funds under the oversight of the Adviser. The Board considered the wide range of services provided by the Adviser to the Nuveen funds beginning with developing the fund and monitoring and analyzing its performance to providing or overseeing the services necessary to support a fund’s daily operations. The Board recognized the Adviser, among other things, provides: (a) product management (such as analyzing ways to better position a fund in the marketplace, maintaining relationships to gain access to distribution platforms and setting dividends); (b) fund administration (such as preparing a fund’s tax returns, regulatory filings and shareholder communications; managing fund budgets and expenses; overseeing a fund’s various service providers; and supporting and analyzing new and existing funds); (c) Board administration (such as supporting the Board and its committees, in relevant part, by organizing and administering the Board and committee meetings and preparing the necessary reports to assist the Board in its duties); (d) compliance (such as monitoring adherence to a fund’s investment policies and procedures and applicable law; reviewing the compliance program periodically and developing new policies or updating existing compliance policies and procedures as considered necessary or appropriate; responding to regulatory requests; and overseeing compliance testing of sub-advisers); (e) legal support (such as preparing or reviewing fund registration statements, proxy statements and other necessary materials; interpreting regulatory requirements and compliance thereof; and maintaining applicable registrations); and (f) investment services (such as overseeing and reviewing sub-advisers and their investment teams; analyzing performance of the funds; overseeing investment and risk management; overseeing the daily valuation process for portfolio securities and developing and recommending valuation policies and methodologies and changes thereto; and participating in fund development, leverage management and the development of investment policies and parameters). With respect to closed-end funds, the Adviser also monitors asset coverage levels on leveraged funds, manages leverage, negotiates the terms of leverage, evaluates alternative forms and types of leverage, promotes an orderly secondary market for common shares and maintains an asset maintenance system for compliance with certain rating agency criteria.
In its review, the Board also considered the new services, initiatives or other changes adopted since the last advisory contract review that were designed to enhance the services and support the Adviser provides to the Nuveen funds. The Board recognized that some initiatives are a multi-year process. In reviewing the activities of 2013, the Board recognized that the year reflected the Adviser’s continued focus on fund rationalization for both closed-end and open-end funds, consolidating certain funds through mergers that were designed to improve efficiencies and economies of scale for shareholders, repositioning various funds through updates in their investment policies and guidelines with the expectation of bringing greater value to shareholders, and liquidating certain funds. As in the past, the Board recognized the Adviser’s significant investment in its technology initiatives, including the continued progress toward a central repository for fund and other Nuveen product data and implementing a data system to support the risk oversight group enabling it to provide more detailed risk analysis for the Nuveen funds. The Board noted the new data system has permitted more in-depth analysis of the investment risks of the Funds and across the complex providing additional feedback and insights to the investment teams and more comprehensive risk reporting to the Board. The Adviser also conducted several workshops for the Board regarding the new data system, including explaining the risk measures being applied and their purpose. The Board also recognized the enhancements in the valuation group within the Adviser, including centralizing the fund pricing process within the valuation group, trending to more automated and expedient reviews and continuing to expand its valuation team. The Board further considered the expansion of personnel in the compliance department enhancing the collective expertise of the group, investments in additional compliance systems and the updates of various compliance policies.
In addition to the foregoing actions, the Board also considered other initiatives related to the closed-end funds, including the continued investment of considerable resources and personnel dedicated to managing and overseeing the various forms of leverage utilized by certain funds. The Board recognized the results of these efforts included the development of less expensive forms of leverage, expansion of leverage providers, the negotiation of more favorable terms for existing leverage, the enhanced ability to respond to market and regulatory developments and the enhancements to technology systems to manage and track the various forms of leverage. The Board also noted Nuveen’s continued capital management services, including executing share
Annual Investment Management Agreement Approval Process (Unaudited) (continued)
repurchase programs, its implementation of data systems that permit more targeted solicitation strategies for fund mergers and more targeted marketing and promotional efforts and its continued focus and efforts to address the discounts of various funds. The Board further noted Nuveen’s continued commitment to supporting the secondary market for the common shares of its closed-end funds through a comprehensive communication program designed to further educate the investor and analyst about closed-end funds. Nuveen’s support services included, among other things, maintaining and enhancing a closed-end fund website, creating marketing campaigns and educational materials, communicating with financial advisers, sponsoring and participating in conferences, providing educational seminars and programs and evaluating the results of these marketing efforts.
As noted, the Adviser also oversees the Sub-Adviser who provides the portfolio advisory services to the Funds. In reviewing the portfolio advisory services provided to each Fund, the Nuveen Investment Services Oversight Team of the Adviser analyzes the performance of the Sub-Adviser and may recommend changes to the investment team or investment strategies as appropriate. In assisting the Board’s review of the Sub-Adviser, the Adviser provides a report analyzing, among other things, the Sub-Adviser’s investment team and changes thereto, organization and history, assets under management, the investment team’s philosophy and strategies in managing each Fund, developments affecting the Sub-Adviser or the Funds and their performance. In their review of the Sub-Adviser, the Independent Board Members considered, among other things, the experience and qualifications of the relevant investment personnel, their investment philosophy and strategies, the Sub-Adviser’s organization and stability, its capabilities and any initiatives taken or planned to enhance its current capabilities or support potential growth of business and, as outlined in further detail below, the performance of the Funds. The Independent Board Members also reviewed portfolio manager compensation arrangements to evaluate each Fund Adviser’s ability to attract and retain high quality investment personnel, preserve stability, and reward performance while not providing an inappropriate incentive to take undue risks.
Given the importance of compliance, the Independent Board Members also considered Nuveen’s compliance program, including the report of the chief compliance officer regarding the Nuveen funds’ compliance policies and procedures; the resources dedicated to compliance; the record of compliance with the policies and procedures; and Nuveen’s supervision of the Funds’ service providers. The Board recognized Nuveen’s commitment to compliance and strong commitment to a culture of compliance. Given the Adviser’s emphasis on monitoring investment risk, the Board has also appointed two Independent Board Members as point persons to review and keep the Board apprised of developments in this area and work with applicable Fund Adviser personnel.
Based on their review, the Independent Board Members found that, overall, the nature, extent and quality of services provided to each Fund under the respective Original Advisory Agreement were satisfactory.
2. The New Advisory Agreements
In evaluating the nature, quality and extent of the services expected to be provided by the Fund Advisers under the New Investment Management Agreements and the New Sub-Advisory Agreements, the Board Members concluded that no diminution in the nature, quality and extent of services provided to each Fund and its shareholders by the respective Fund Advisers is expected as a result of the Transaction. In making their determination, the Independent Board Members considered, among other things: the expected impact, if any, of the Transaction on the operations, facilities, organization and personnel of each Fund Adviser; the ability of each Fund Adviser to perform its duties after the Transaction, including any changes to the level or quality of services provided to the Funds; the potential implications of any additional regulatory requirements imposed on the Fund Advisers or the Nuveen funds following the Transaction; and any anticipated changes to the investment and other practices of the Nuveen funds.
The Board noted that the terms of each New Investment Management Agreement, including the fees payable thereunder, are substantially identical to those of the Original Investment Management Agreement relating to the same Fund. Similarly, the
terms of each New Sub-Advisory Agreement, including fees payable thereunder, are substantially identical to those of the Original Sub-Advisory Agreement relating to the same Fund. The Board considered that the services to be provided and the standard of care under the New Investment Management Agreements and the New Sub-Advisory Agreements are the same as the corresponding original agreements. The Board Members noted the Transaction also does not alter the allocation of responsibilities between the Adviser and the Sub-Adviser. The Sub-Adviser will continue to furnish an investment program, make investment decisions and place all orders for the purchase and sale of securities, all on behalf of each Fund and subject to oversight of the Board and the Adviser. The Board noted that TIAA-CREF did not anticipate any material changes to the advisory, sub-advisory or other services provided to the Nuveen funds as a result of the Transaction. The Independent Board Members recognized that there were not any planned “cost cutting” measures that could be expected to reduce the nature, extent or quality of services. The Independent Board Members further noted that there were currently no plans for material changes to senior personnel at Nuveen or key personnel who provide services to the Nuveen funds and the Board following the Transaction. The key personnel who have responsibility for the Nuveen funds in each area, including portfolio management, investment oversight, fund management, fund operations, product management, legal/compliance and board support functions, are expected to be the same following the Transaction, although such personnel may have additional reporting requirements to TIAA-CREF. The Board also considered the anticipated incentive plans designed to retain such key personnel. Notwithstanding the foregoing, the Board Members recognized that personnel changes may occur in the future as a result of normal business developments or personal career decisions.
The Board Members also considered Nuveen’s proposed governance structure following the Transaction and noted that Nuveen was expected to remain a stand-alone business within the TIAA-CREF enterprise and operate relatively autonomously from the other TIAA-CREF businesses, but would receive the general support and oversight from certain TIAA-CREF functional groups (such as legal, finance, internal audit, compliance, and risk management groups). The Board recognized, however, that Nuveen may be subject to additional reporting requirements as it keeps TIAA-CREF abreast of developments affecting the Nuveen business, may be required to modify certain of its reports, policies and procedures as necessary to conform to the practices followed in the TIAA-CREF enterprise and may need to collaborate with TIAA-CREF with respect to strategic planning for its business.
In considering the implications of the Transaction, the Board Members also recognized the reputation and size of TIAA-CREF and the benefits that the Transaction may bring to the Nuveen funds and Nuveen. In this regard, the Board recognized, among other things, that the increased resources and support that may be available to Nuveen from TIAA-CREF and the improved capital structure of Nuveen Investments, Inc. (the parent of the Adviser) that would result from the significant reduction in its debt level may reinforce and enhance Nuveen’s ability to provide quality services to the Nuveen funds and to invest further into its infrastructure.
Further, with the consummation of the Transaction, the Board recognized the enhanced distribution capabilities for the Nuveen funds as the funds may gain access to TIAA-CREF’s distribution network, particularly through TIAA-CREF’s retirement platform and institutional client base. The Board also considered that investors in TIAA-CREF’s retirement platform may choose to roll their investments as they exit their retirement plans into the Nuveen funds. The Independent Board Members recognized the potential cost savings to the benefit of all shareholders of the Nuveen funds from reduced expenses as assets in the Nuveen fund complex rise pursuant to the complex-wide fee arrangement described in further detail below.
Based on their review, the Independent Board Members found that the expected nature, extent and quality of services to be provided to each Fund under its New Advisory Agreements were satisfactory and supported approval of the New Advisory Agreements.
Annual Investment Management Agreement Approval Process (Unaudited) (continued)
B. The Investment Performance of the Funds and Fund Advisers
1. The Original Advisory Agreements
The Board, including the Independent Board Members, considered the performance history of each Fund over various time periods. The Board reviewed reports, including an analysis of each Fund’s performance and the applicable investment team. In considering each Fund’s performance, the Board recognized that a fund’s performance can be reviewed through various measures including the fund’s absolute return, the fund’s return compared to the performance of other peer funds and the fund’s performance compared to its respective benchmark. Accordingly, the Board reviewed, among other things, each Fund’s historic investment performance as well as information comparing the Fund’s performance information with that of other funds (the “Performance Peer Group”) and with recognized and/or customized benchmarks (i.e., generally benchmarks derived from multiple recognized benchmarks) for the quarter, one-, three- and five-year periods ending December 31, 2013, as well as performance information reflecting the first quarter of 2014 (or for such shorter periods available for Nuveen New York Municipal Value Fund 2 (the “Municipal Value Fund 2”), which did not exist for part of the foregoing time frame). With respect to closed-end funds, the Independent Board Members also reviewed historic premium and discount levels, including a summary of actions taken to address or discuss other developments affecting the secondary market discounts of various funds. This information supplemented the Nuveen fund performance information provided to the Board at each of its quarterly meetings.
In evaluating performance, the Board recognized several factors that may impact the performance data as well as the consideration given to particular performance data.
• The performance data reflects a snapshot in time, in this case as of the end of the most recent calendar year or quarter. A different performance period, however, could generate significantly different results.
• Long-term performance can be adversely affected by even one period of significant underperformance so that a single investment decision or theme has the ability to disproportionately affect long-term performance.
• The investment experience of a particular shareholder in a fund will vary depending on when such shareholder invests in such fund, the class held (if multiple classes offered in the fund) and the performance of the fund (or respective class) during that shareholder’s investment period.
• The usefulness of comparative performance data as a frame of reference to measure a fund’s performance may be limited because the Performance Peer Group, among other things, does not adequately reflect the objectives and strategies of the fund, has a different investable universe, or the composition of the peer set may be limited in size or number as well as other factors. In this regard, the Board noted that the Adviser classified the Performance Peer Groups of the Nuveen funds from highly relevant to less relevant. For funds classified with less relevant Performance Peer Groups, which include Nuveen New York Municipal Value Fund, Inc. (the “Municipal Value Fund”), the Municipal Value Fund 2 and Nuveen New York AMT-Free Municipal Income Fund (the “AMT-Free Fund”), the Board considered each fund’s performance compared to its benchmark to help assess the fund’s comparative performance. A fund was generally considered to have performed comparably to its benchmark if the fund’s performance was within certain thresholds compared to the performance of its benchmark and was considered to have outperformed or underperformed its benchmark if the fund’s performance was beyond these thresholds for the one- and three-year periods, subject to certain exceptions.i While the Board is cognizant of the relative performance of a fund’s peer set and/or benchmark(s), the Board evaluated fund performance in light of the respective fund’s investment objectives, investment parameters and guidelines and considered that the variations between the objectives and investment parameters or guidelines of the fund with its peers and/or benchmarks result in differences in performance results. Further, for funds that utilize leverage, the Board understands that leverage during different periods can provide both benefits and risks to a portfolio as compared to an unlevered benchmark.
With respect to any Nuveen funds for which the Board has identified performance concerns, the Board monitors such funds closely until performance improves, discusses with the Adviser the reasons for such results, considers those steps necessary or appropriate to address such issues and reviews the results of any efforts undertaken. The Board is aware, however, that shareholders chose to invest or remain invested in a fund knowing that the Adviser manages the fund and knowing the fund’s fee structure.
In considering the performance data, the Independent Board Members noted that Nuveen New York Dividend Advantage Municipal Fund (the “Dividend Advantage Fund”), Nuveen New York Dividend Advantage Municipal Fund 2 (the “Dividend Advantage Fund 2”) and Nuveen New York Performance Plus Municipal Fund, Inc. (the “Performance Plus Fund”) had satisfactory performance compared to their peers, performing in the second and third quartiles over various periods.
With respect to the Funds with Performance Peer Groups classified as less relevant as noted above, the Board considered the Funds’ performance compared to their respective benchmarks and noted that certain Funds’ performance over time was satisfactory compared to the performance of their benchmarks. In this regard, although the Municipal Value Fund underperformed its benchmark in the one-year period, it provided generally comparable performance in the three- and five-year periods; and, although the Municipal Value Fund 2 underperformed its benchmark in the one-year period, it provided generally comparable performance in the three-year period.
With respect to the AMT-Free Fund, the Board noted that the Fund underperformed its benchmark over the one- and three-year periods, although it provided generally comparable performance to its benchmark in the five-year period. The Board noted that the Fund’s underperformance compared to its benchmark in 2013 was a result of, among other things, an overweight in longer duration bonds and Fund-level leverage. Although the exposure to longer duration bonds was a contributor to the Fund’s underperformance compared to its benchmark in the one-year period, the Board noted that longer duration bonds had been additive to performance in the three-year period. The Board considered the market conditions, the objectives of the Fund and the investment philosophy underlying the emphasis of longer duration bonds and determined that the performance of the Fund over time was satisfactory.
Based on their review, the Independent Board Members determined that each Fund’s investment performance had been satisfactory.
2. The New Advisory Agreements
With respect to the performance of each Fund, the Board considered that the portfolio investment personnel responsible for the management of the respective Fund portfolios were expected to continue to manage such portfolios following the completion of the Transaction and the investment strategies of the Funds were not expected to change as a result of the Transaction (subject to changes unrelated to the Transaction that are approved by the Board and/or shareholders). Accordingly, the findings regarding performance outlined above for the Original Advisory Agreements are applicable to the review of the New Advisory Agreements.
C. Fees, Expenses and Profitability
1. Fees and Expenses
The Board evaluated the management fees and expenses of each Fund, reviewing, among other things, such Fund’s gross management fees, net management fees and net expense ratios in absolute terms as well as compared to the fees and expenses of a comparable universe of funds provided by an independent fund data provider (the “Peer Universe”) and any expense limitations.
Annual Investment Management Agreement Approval Process (Unaudited) (continued)
The Independent Board Members further reviewed the methodology regarding the construction of the applicable Peer Universe. In reviewing the comparisons of fee and expense information, the Independent Board Members took into account that in certain instances various factors such as the limited size and particular composition of the Peer Universe (including the inclusion of other Nuveen funds in the peer set); expense anomalies; changes in the funds comprising the Peer Universe from year to year; levels of reimbursement or fee waivers; the timing of information used; the differences in the type and use of leverage; and the differences in the states reflected in the Peer Universe (with respect to state municipal funds) may impact the comparative data thereby limiting somewhat the ability to make a meaningful comparison with peers.
In reviewing the fee schedule for a fund, the Independent Board Members also considered the fund-level and complex-wide breakpoint schedules (described in further detail below) and any fee waivers and reimbursements provided by Nuveen. In reviewing fees and expenses (excluding leverage costs and leveraged assets for the closed-end funds), the Board considered the expenses and fees to be higher if they were over 10 basis points higher, slightly higher if they were approximately 6 to 10 basis points higher, in line if they were within approximately 5 basis points higher than the peer average and below if they were below the peer average of the Peer Universe. In reviewing the reports, the Board noted that the majority of the Nuveen funds were at, close to or below their peer average based on the net total expense ratio. The Independent Board Members observed that the Funds had net management fees and net expense ratios (including fee waivers and expense reimbursements) below or in line with their respective peer averages, except as noted below.
The Board considered that the Dividend Advantage Fund, the Dividend Advantage Fund 2 and the Performance Plus Fund had net management fees slightly higher than the peer average, but net expense ratios below or in line with the peer average.
Based on their review of the fee and expense information provided, the Independent Board Members determined that each Fund’s management fees (as applicable) to a Fund Adviser were reasonable in light of the nature, extent and quality of services provided to the Fund.
2. Comparisons with the Fees of Other Clients
The Board recognized that all Nuveen funds have a sub-adviser, either affiliated or non-affiliated, and therefore the overall fund management fee can be divided into two components, the fee retained by the Adviser and the fee paid to the sub-adviser. In general terms, the fee to the Adviser reflects the administrative and other services it provides to support the Nuveen fund (as described above) and, while some administrative services may occur at the sub-adviser level, the fee to the sub-adviser generally reflects the portfolio management services provided by the sub-adviser. The Independent Board Members considered the fees a Fund Adviser assesses to the Funds compared to that of other clients. With respect to municipal funds, such other clients of a Fund Adviser may include: municipal separately managed accounts and passively managed exchange traded funds (ETFs) sub-advised by the Adviser.
The Independent Board Members reviewed the nature of services provided by the Adviser, including through its affiliated sub-advisers and the average fee the affiliated sub-advisers assessed such clients as well as the range of fees assessed to the different types of separately managed accounts (such as retail, institutional or wrap accounts) to the extent applicable to the respective sub-adviser. In their review, the Independent Board Members considered the differences in the product types, including, but not limited to: the services provided, the structure and operations, product distribution and costs thereof, portfolio investment policies, investor profiles, account sizes and regulatory requirements. In evaluating the comparisons of fees, the Independent Board Members noted that the fee rates charged to the Nuveen funds and other clients vary, among other things, because of the different services involved and the additional regulatory and compliance requirements associated with registered investment companies, such as the Funds. The Independent Board Members noted that, as a general matter, higher fee levels reflect higher levels of service, increased investment management complexity, greater product management requirements and higher levels of risk or a combination of the foregoing. The Independent Board Members further noted, in particular, that the range of services provided to the Funds (as discussed above) is generally much more extensive than that provided to separately managed
accounts. Many of the additional administrative services provided by the Adviser are not required for institutional clients. The Independent Board Members also recognized that the management fee rates of the foreign funds advised by the Adviser may vary due to, among other things, differences in the client base, governing bodies, operational complexities and services covered by the management fee. Given the inherent differences in the various products, particularly the extensive services provided to the Funds, the Independent Board Members believe such facts justify the different levels of fees.
3. Profitability of Fund Advisers
In conjunction with their review of fees, the Independent Board Members also considered the profitability of Nuveen for its advisory activities and its financial condition. The Independent Board Members reviewed the revenues and expenses of Nuveen’s advisory activities for the last two calendar years, the allocation methodology used in preparing the profitability data, an analysis of the key drivers behind the changes in revenues and expenses that impacted profitability in 2013 and Nuveen’s consolidated financial statements for 2013. The Independent Board Members noted this information supplemented the profitability information requested and received during the year to help keep them apprised of developments affecting profitability (such as changes in fee waivers and expense reimbursement commitments). In this regard, the Independent Board Members noted that two Independent Board Members served as point persons to review the profitability analysis and methodologies employed, and any changes thereto, and to keep the Board apprised of such changes. The Independent Board Members also considered Nuveen’s revenues for advisory activities, expenses and profit margin compared to that of various unaffiliated management firms.
In reviewing profitability, the Independent Board Members noted the Adviser’s continued investment in its business with expenditures to, among other things, upgrade its investment technology and compliance systems and provide for additional personnel and other resources. The Independent Board Members recognized the Adviser’s continued commitment to its business should enhance the Adviser’s capacity and capabilities in providing the services necessary to meet the needs of the Nuveen funds as they grow or change over time. In addition, in evaluating profitability, the Independent Board Members also noted the subjective nature of determining profitability which may be affected by numerous factors including the allocation of expenses and that various allocation methodologies may each be reasonable but yield different results. Further, the Independent Board Members recognized the difficulties in making comparisons as the profitability of other advisers generally is not publicly available, and the profitability information that is available for certain advisers or management firms may not be representative of the industry and may be affected by, among other things, an adviser’s particular business mix, capital costs, size, types of funds managed and expense allocations. Notwithstanding the foregoing, the Independent Board Members noted the Adviser’s adjusted operating margin appears to be reasonable in relation to other investment advisers and sufficient to operate as a viable investment management firm meeting its obligations to the Nuveen funds. Based on their review, the Independent Board Members concluded that the Adviser’s level of profitability for its advisory activities was reasonable in light of the services provided.
With respect to sub-advisers affiliated with Nuveen, including the Sub-Adviser, the Independent Board Members reviewed such sub-advisers’ revenues, expenses and profitability margins (pre- and post-tax) for their advisory activities and the methodology used for allocating expenses among the internal sub-advisers. Based on their review, the Independent Board Members were satisfied that the Sub-Adviser’s level of profitability was reasonable in light of the services provided.
In evaluating the reasonableness of the compensation, the Independent Board Members also considered other amounts paid to a Fund Adviser by the funds as well as indirect benefits (such as soft dollar arrangements), if any, the Fund Adviser and its affiliates receive or are expected to receive that are directly attributable to the management of a Nuveen fund. See Section E below for additional information on indirect benefits the Fund Advisers may receive as a result of its relationship with a Nuveen fund. Based on their review of the overall fee arrangements of each Fund, the Independent Board Members determined that the advisory fees and expenses of the Funds were reasonable.
Annual Investment Management Agreement Approval Process (Unaudited) (continued)
4. The New Advisory Agreements
As noted above, the terms of the New Advisory Agreements are substantially identical to their corresponding Original Advisory Agreements. The fee schedule, including the breakpoint schedule and complex-wide fee schedule, in each New Advisory Agreement is identical to that under the corresponding Original Advisory Agreement. The Board Members also noted that Nuveen has committed for a period of two years from the date of closing the Transaction not to increase contractual management fee rates for any Nuveen fund. This commitment shall not limit or otherwise affect mergers or liquidations of any funds in the ordinary course. Based on the information provided, the Board Members did not believe that the overall expenses would increase as a result of the Transaction. In addition, the Board Members recognized that the Nuveen funds may gain access to the retirement platform and institutional client base of TIAA-CREF, and the investors in the retirement platforms may roll their investments into one or more Nuveen funds as they exit their retirement plans. The enhanced distribution access may result in additional sales of the Nuveen funds resulting in an increase in total assets under management in the complex and a corresponding decrease in overall management fees if additional breakpoints at the fund-level or complex-wide level are met. Based on its review, the Board determined that the management fees and expenses under each New Advisory Agreement were reasonable.
Further, other than from a potential reduction in the debt level of Nuveen Investments, Inc., the Board recognized that it is difficult to predict with any degree of certainty the impact of the Transaction on Nuveen’s profitability. Given the fee schedule was not expected to change under the New Advisory Agreements, however, the Independent Board Members concluded that each Fund Adviser’s level of profitability for its advisory activities under the respective New Advisory Agreements would continue to be reasonable in light of the services provided.
D. Economies of Scale and Whether Fee Levels Reflect These Economies of Scale
1. The Original Advisory Agreements
With respect to economies of scale, the Independent Board Members have recognized the potential benefits resulting from the costs of a fund being spread over a larger asset base, although economies of scale are difficult to measure and predict with precision, particularly on a fund-by-fund basis. One method to help ensure the shareholders share in these benefits is to include breakpoints in the advisory fee schedule. Generally, management fees for funds in the Nuveen complex are comprised of a fund-level component and a complex-level component, subject to certain exceptions. Accordingly, the Independent Board Members reviewed and considered the applicable fund-level breakpoints in the advisory fee schedules that reduce advisory fees as asset levels increase. Further, the Independent Board Members noted that, although closed-end funds may from time-to-time make additional share offerings, the growth of their assets would occur primarily through the appreciation of such funds’ investment portfolios.
In addition to fund-level advisory fee breakpoints, the Board also considered the Nuveen funds’ complex-wide fee arrangement. Pursuant to the complex-wide fee arrangement, the fees of the funds in the Nuveen complex are reduced as the assets in the fund complex reach certain levels. The complex-wide fee arrangement seeks to provide the benefits of economies of scale to fund shareholders when total fund complex assets increase, even if assets of a particular fund are unchanged or have decreased. The approach reflects the notion that some of Nuveen’s costs are attributable to services provided to all its funds in the complex and therefore all funds benefit if these costs are spread over a larger asset base.
Based on their review, the Independent Board Members concluded that the breakpoint schedules and complex-wide fee arrangement (as applicable) were acceptable and reflect economies of scale to be shared with shareholders when assets under management increase.
2. The New Advisory Agreements
As noted, the Independent Board Members recognized that the fund-level and complex-wide schedules will not change under the New Advisory Agreements. Assets in the funds advised by TIAA-CREF or its current affiliates will not be included in the complex-wide fee calculation. Nevertheless, the Nuveen funds may have access to TIAA-CREF’s retirement platform and institutional client base. The access to this distribution network may enhance the distribution of the Nuveen funds which, in turn, may lead to reductions in management and sub-advisory fees if the Nuveen funds reach additional fund-level and complex-wide breakpoint levels. Based on their review, including the considerations in the annual review of the Original Advisory Agreements, the Independent Board Members determined that the fund-level breakpoint schedules and complex-wide fee schedule continue to be appropriate and desirable in ensuring that shareholders participate in the benefits derived from economies of scale under the New Advisory Agreements.
E. Indirect Benefits
1. The Original Advisory Agreements
In evaluating fees, the Independent Board Members received and considered information regarding potential “fall out” or ancillary benefits the respective Fund Adviser or its affiliates may receive as a result of its relationship with each Fund. In this regard, with respect to closed-end funds, the Independent Board Members considered any revenues received by affiliates of the Adviser for serving as co-manager in initial public offerings of new closed-end funds as well as revenues received in connection with secondary offerings.
In addition to the above, the Independent Board Members considered whether the Fund Advisers received any benefits from soft dollar arrangements whereby a portion of the commissions paid by a fund for brokerage may be used to acquire research that may be useful to a Fund Adviser in managing the assets of the fund and other clients. Each Fund’s portfolio transactions are allocated by the Sub-Adviser. Accordingly, the Independent Board Members considered that the Sub-Adviser may benefit from its soft dollar arrangements pursuant to which it receives research from brokers that execute the applicable Fund’s portfolio transactions. With respect to any fixed income securities, however, the Board recognized that such securities generally trade on a principal basis that does not generate soft dollar credits. Similarly, the Board recognized that the research received pursuant to soft dollar arrangements by the Sub-Adviser may also benefit the Funds and their shareholders to the extent the research enhances the ability of the Sub-Adviser to manage the Funds. The Independent Board Members noted that the Sub-Adviser’s profitability may be somewhat lower if it did not receive the research services pursuant to the soft dollar arrangements and had to acquire such services directly.
Based on their review, the Independent Board Members concluded that any indirect benefits received by a Fund Adviser as a result of its relationship with the Funds were reasonable and within acceptable parameters.
2. The New Advisory Agreements
The Independent Board Members noted that, as the applicable policies and operations of the Fund Advisers with respect to the Nuveen funds were not anticipated to change significantly after the Transaction, such indirect benefits should remain after the Transaction. The Independent Board Members further noted the benefits the Transaction would provide to TIAA-CREF and Nuveen, including a larger-scale fund complex, certain shared services (noted above) and a broader range of investment capabilities, distribution capabilities and product line. Further, the Independent Board Members noted that Nuveen Investments, Inc. (the parent of the Adviser) would benefit from an improved capital structure through a reduction in its debt level.
Annual Investment Management Agreement Approval Process (Unaudited) (continued)
F. Other Considerations for the New Advisory Agreements
In addition to the factors above, the Board Members also considered the following with respect to the Nuveen funds:
• Nuveen would rely on the provisions of Section 15(f) of the 1940 Act. In this regard, to help ensure that an unfair burden is not imposed on the Nuveen funds, Nuveen has committed for a period of two years from the date of the closing of the Transaction not to increase contractual management fee rates for any fund. This commitment shall not limit or otherwise affect mergers or liquidations of any funds in the ordinary course.
• The Nuveen funds would not incur any costs in seeking the necessary shareholder approvals for the New Investment Management Agreements or the New Sub-Advisory Agreements (except for any costs attributed to seeking shareholder approvals of fund specific matters unrelated to the Transaction, such as election of Board Members or changes to investment policies, in which case a portion of such costs will be borne by the applicable funds).
• The reputation, financial strength and resources of TIAA-CREF.
• The long-term investment philosophy of TIAA-CREF and anticipated plans to grow Nuveen’s business to the benefit of the Nuveen funds.
• The benefits to the Nuveen funds as a result of the Transaction including: (i) increased resources and support available to Nuveen as well as an improved capital structure that may reinforce and enhance the quality and level of services it provides to the funds; (ii) potential additional distribution capabilities for the funds to access new markets and customer segments through TIAA-CREF’s distribution network, including, in particular, its retirement platforms and institutional client base; and (iii) access to TIAA-CREF’s expertise and investment capabilities in additional asset classes.
G. Other Considerations
The Independent Board Members did not identify any single factor discussed previously as all-important or controlling. The Board Members, including the Independent Board Members, unanimously concluded that the terms of each Original Advisory Agreement and New Advisory Agreement are fair and reasonable, that the respective Fund Adviser’s fees are reasonable in light of the services provided to each Fund and that the Original Advisory Agreements be renewed and the New Advisory Agreements be approved.
II. Approval of Interim Advisory Agreements
At the April Meeting, the Board Members, including the Independent Board Members, unanimously approved for each Fund an interim advisory agreement (the “Interim Investment Management Agreement”) between the respective Fund and the Adviser and an interim sub-advisory agreement (the “Interim Sub-Advisory Agreement”) between the Adviser and the Sub-Adviser. If necessary to assure continuity of advisory services, each respective Interim Investment Management Agreement and Interim Sub-Advisory Agreement will take effect upon the closing of the Transaction if shareholders have not yet approved the corresponding New Investment Management Agreement or New Sub-Advisory Agreement. The terms of each Interim Investment Management Agreement and Interim Sub-Advisory Agreement are substantially identical to those of the corresponding Original Investment Management Agreement and New Investment Management Agreement and the corresponding Original Sub-Advisory Agreement and New Sub-Advisory Agreement, respectively, except for certain term and fee escrow provisions. In light of the foregoing, the Board Members, including the Independent Board Members, unanimously determined that the scope and quality of services to be provided to the Funds under the respective Interim Investment Management Agreements and Interim Sub-Advisory Agreements are at least equivalent to the scope and quality of services provided under the applicable Original Investment Management Agreements and Original Sub-Advisory Agreements.
i The Board recognized that the Adviser considered a fund to have outperformed or underperformed its benchmark if the fund’s performance was higher or lower than the performance of the benchmark by the following thresholds: for open-end funds (+/- 100 basis points for equity funds excluding index funds; +/- 30 basis points for tax exempt fixed income funds; +/- 40 basis points for taxable fixed income funds) and for closed-end funds (assuming 30% leverage) (+/- 130 basis points for equity funds excluding index funds; +/- 39 basis points for tax exempt funds and +/- 52 basis points for taxable fixed income funds).
Notes
Notes
Notes
| Nuveen Investments: |
| | Serving Investors for Generations |
Since 1898, financial advisors and their clients have relied on Nuveen Investments to provide dependable investment solutions through continued adherence to proven, long-term investing principles. Today, we offer a range of high quality equity and fixed-income solutions designed to be integral components of a well-diversified core portfolio.
Focused on meeting investor needs.
Nuveen Investments provides high-quality investment services designed to help secure the long-term goals of institutional and individual investors as well as the consultants and financial advisors who serve them. Nuveen Investments markets a wide range of specialized investment solutions which provide investors access to capabilities of its high-quality boutique investment affiliates—Nuveen Asset Management, Symphony Asset Management, NWQ Investment Management Company, Santa Barbara Asset Management, Tradewinds Global Investors, Winslow Capital Management and Gresham Investment Management. In total, Nuveen Investments managed approximately $229 billion as of September 30, 2014.
Find out how we can help you.
To learn more about how the products and services of Nuveen Investments may be able to help you meet your financial goals, talk to your financial advisor, or call us at (800) 257-8787. Please read the information provided carefully before you invest. Investors should consider the investment objective and policies, risk considerations, charges and expenses of any investment carefully. Where applicable, be sure to obtain a prospectus, which contains this and other relevant information. To obtain a prospectus, please contact your securities representative or Nuveen Investments, 333 W. Wacker Dr., Chicago, IL 60606. Please read the prospectus carefully before you invest or send money.
Learn more about Nuveen Funds at: www.nuveen.com/cef
| Distributed by Nuveen Investments, LLC | 333 West Wacker Drive | Chicago, IL 60606 | www.nuveen.com |  |
EAN-A-0914D 4523-INV-Y11/15
ITEM 2. CODE OF ETHICS.
As of the end of the period covered by this report, the registrant has adopted a code of ethics that applies to the registrant's principal executive officer, principal financial officer, principal accounting officer or controller, or persons performing similar functions. There were no amendments to or waivers from the Code during the period covered by this report. The registrant has posted the code of ethics on its website at www.nuveen.com/CEF/Shareholder/FundGovernance.aspx. (To view the code, click on Code of Conduct.)
ITEM 3. AUDIT COMMITTEE FINANCIAL EXPERT.
The registrant's Board of Directors or Trustees (“Board”) determined that the registrant has at least one “audit committee financial expert” (as defined in Item 3 of Form N-CSR) serving on its Audit Committee. The registrant's audit committee financial expert is Carole E. Stone, who is “independent” for purposes of Item 3 of Form N-CSR.
Ms. Stone served for five years as Director of the New York State Division of the Budget. As part of her role as Director, Ms. Stone was actively involved in overseeing the development of the State's operating, local assistance and capital budgets, its financial plan and related documents; overseeing the development of the State's bond-related disclosure documents and certifying that they fairly presented the State's financial position; reviewing audits of various State and local agencies and programs; and coordinating the State's system of internal audit and control. Prior to serving as Director, Ms. Stone worked as a budget analyst/examiner with increasing levels of responsibility over a 30 year period, including approximately five years as Deputy Budget Director. Ms. Stone has also served as Chair of the New York State Racing Association Oversight Board, as Chair of the Public Authorities Control Board, as a Commissioner on the New York State Commission on Public Authority Reform and as a member of the Boards of Directors of several New York State public authorities. These positions have involved overseeing operations and finances of certain entities and assessing the adequacy of project/entity financing and financial reporting. Currently, Ms. Stone is on the Board of Directors of CBOE Holdings, Inc., of the Chicago Board Options Exchange, and of C2 Options Exchange. Ms. Stone's position on the boards of these entities and as a member of both CBOE Holdings' Audit Committee and its Finance Committee has involved, among other things, the oversight of audits, audit plans and preparation of financial statements.
ITEM 4. PRINCIPAL ACCOUNTANT FEES AND SERVICES.
Nuveen New York Performance Plus Municipal Fund, Inc.
The following tables show the amount of fees billed to the Fund during the Fund’s last two fiscal years by KPMG LLP, the Fund’s current auditor (engaged on August 7, 2014), and Ernst & Young LLP, the Fund’s former auditor. The audit fees billed to the Fund for the fiscal year 2014 are the only fees that have been billed to the Fund by KPMG LLP. All other fees listed in the tables below were billed to the Fund by Ernst & Young. For engagements with KPMG LLP and Ernst & Young LLP, the Audit Committee approved in advance all audit services and non-audit services that KPMG LLP and Ernst & Young LLP provided to the Fund, except for those non-audit services that were subject to the pre-approval exception under Rule 2-01 of Regulation S-X (the “pre-approval exception”). The pre-approval exception for services provided directly to the Fund waives the pre-approval requirement for services other than audit, review or attest services if: (A) the aggregate amount of all such services provided constitutes no more than 5% of the total amount of revenues paid by the Fund to its accountant during the fiscal year in which the services are provided; (B) the Fund did not recognize the services as non-audit services at the time of the engagement; and (C) the services are promptly brought to the Audit Committee's attention, and the Committee (or its delegate) approves the services before the audit is completed.
The Audit Committee has delegated certain pre-approval responsibilities to its Chairman (or, in his absence, any other member of the Audit Committee).
SERVICES THAT THE FUND'S AUDITOR BILLED TO THE FUND
| | | Audit Fees Billed | | | Audit-Related Fees | | | Tax Fees | | | All Other Fees | |
| Fiscal Year Ended | | to Fund 1 | | | Billed to Fund 2 | | | Billed to Fund 3 | | | Billed to Fund 4 | |
| September 30, 2014 | | $ | 22,500 | | | $ | 0 | | | $ | 0 | | | $ | 0 | |
| | | | | | | | | | | | | | | | | |
| Percentage approved | | | 0 | % | | | 0 | % | | | 0 | % | | | 0 | % |
| pursuant to | | | | | | | | | | | | | | | | |
| pre-approval | | | | | | | | | | | | | | | | |
| exception | | | | | | | | | | | | | | | | |
| | | | | | | | | | | | | | | | | |
| September 30, 2013 | | $ | 22,250 | | | $ | 0 | | | $ | 0 | | | $ | 0 | |
| | | | | | | | | | | | | | | | | |
| Percentage approved | | | 0 | % | | | 0 | % | | | 0 | % | | | 0 | % |
| pursuant to | | | | | | | | | | | | | | | | |
| pre-approval | | | | | | | | | | | | | | | | |
| exception | | | | | | | | | | | | | | | | |
| | | | | | | | | | | | | | | | | |
1 "Audit Fees" are the aggregate fees billed for professional services for the audit of the Fund's annual financial statements and services provided in | |
| connection with statutory and regulatory filings or engagements. | | | | | | | | | | | | | |
| | | | | | | | | | | | | | | | | |
2 "Audit Related Fees" are the aggregate fees billed for assurance and related services reasonably related to the performance of the audit or review of | | | | | |
| financial statements that are not reported under "Audit Fees". These fees include offerings related to the Fund's common shares and leverage. | | | | | |
| | | | | | | | | | | | | | | | | |
3 "Tax Fees" are the aggregate fees billed for professional services for tax advice, tax compliance, and tax planning. These fees include: all global | | | | | |
| withholding tax services; excise and state tax reviews; capital gain, tax equalization and taxable basis calculation performed by the principal accountant. | | | | | |
| | | | | | | | | | | | | | | | | |
4 "All Other Fees" are the aggregate fees billed for products and services other than "Audit Fees", "Audit-Related Fees" and "Tax Fees". These fees | | | | | |
| represent all "Agreed-Upon Procedures" engagements pertaining to the Fund's use of leverage. | | | | | | | | | |
SERVICES THAT THE FUND'S AUDITOR BILLED TO THE ADVISER AND AFFILIATED FUND SERVICE PROVIDERS
The following tables show the amount of fees billed by KPMG LLP and Ernst & Young LLP to Nuveen Fund Advisors, LLC (formerly Nuveen Fund Advisors, Inc.) (the “Adviser”), and any entity controlling, controlled by or under common control with the Adviser that provides ongoing services to the Fund (“Affiliated Fund Service Provider”), for engagements directly related to the Fund's operations and financial reporting, during the Fund's last two full fiscal years.
The tables also show the percentage of fees subject to the pre-approval exception. The pre-approval exception for services provided to the Adviser and any Affiliated Fund Service Provider (other than audit, review or attest services) waives the pre-approval requirement if: (A) the aggregate amount of all such services provided constitutes no more than 5% of the total amount of revenues paid to KPMG LLP and Ernst & Young LLP by the Fund, the Adviser and Affiliated Fund Service Providers during the fiscal year in which the services are provided that would have to be pre-approved by the Audit Committee; (B) the Fund did not recognize the services as non-audit services at the time of the engagement; and (C) the services are promptly brought to the Audit Committee's attention, and the Committee (or its delegate) approves the services before the Fund's audit is completed.
| | Audit-Related Fees | Tax Fees Billed to | All Other Fees |
| | Billed to Adviser and | Adviser and | Billed to Adviser |
| | Affiliated Fund | Affiliated Fund | and Affiliated Fund |
| Fiscal Year Ended | Service Providers | Service Providers | Service Providers |
| September 30, 2014 | $ 0 | $ 0 | $ 0 |
| | | | |
| Percentage approved | 0% | 0% | 0% |
| pursuant to | | | |
| pre-approval | | | |
| exception | | | |
| September 30, 2013 | $ 0 | $ 0 | $ 0 |
| | | | |
| Percentage approved | 0% | 0% | 0% |
| pursuant to | | | |
| pre-approval | | | |
| exception | | | |
NON-AUDIT SERVICES
The following table shows the amount of fees that KPMG LLP and Ernst & Young LLP billed during the Fund's last two full fiscal years for non-audit services. The Audit Committee is required to pre-approve non-audit services that KPMG LLP and Ernst & Young LLP provides to the Adviser and any Affiliated Fund Services Provider, if the engagement related directly to the Fund's operations and financial reporting (except for those subject to the pre-approval exception described above). The Audit Committee requested and received information from KPMG LLP and Ernst & Young LLP about any non-audit services that KPMG LLP and Ernst & Young LLP rendered during the Fund's last fiscal year to the Adviser and any Affiliated Fund Service Provider. The Committee considered this information in evaluating KPMG LLP and Ernsts & Young LLP’s independence.
| | | Total Non-Audit Fees | | |
| | | billed to Adviser and | | |
| | | Affiliated Fund Service | Total Non-Audit Fees | |
| | | Providers (engagements | billed to Adviser and | |
| | | related directly to the | Affiliated Fund Service | |
| | Total Non-Audit Fees | operations and financial | Providers (all other | |
| Fiscal Year Ended | Billed to Fund | reporting of the Fund) | engagements) | Total |
| September 30, 2014 | $ 0 | $ 0 | $ 0 | $ 0 |
| September 30, 2013 | $ 0 | $ 0 | $ 0 | $ 0 |
| | | | | |
| | | | | |
| "Non-Audit Fees billed to Fund" for both fiscal year ends represent "Tax Fees" and "All Other Fees" billed to Fund in their respective | |
| amounts from the previous table. | | | | |
| | | | | |
| Less than 50 percent of the hours expended on the principal accountant's engagement to audit the registrant's financial statements for the most recent |
| fiscal year were attributed to work performed by persons other than the principal accountant's full-time, permanent employees. | |
Audit Committee Pre-Approval Policies and Procedures. Generally, the Audit Committee must approve (i) all non-audit services to be performed for the Fund by the Fund's independent accountants and (ii) all audit and non-audit services to be performed by the Fund's independent accountants for the Affiliated Fund Service Providers with respect to operations and financial reporting of the Fund. Regarding tax and research projects conducted by the independent accountants for the Fund and Affiliated Fund Service Providers (with respect to operations and financial reports of the Fund) such engagements will be (i) pre-approved by the Audit Committee if they are expected to be for amounts greater than $10,000; (ii) reported to the Audit Committee chairman for his verbal approval prior to engagement if they are expected to be for amounts under $10,000 but greater than $5,000; and (iii) reported to the Audit Committee at the next Audit Committee meeting if they are expected to be for an amount under $5,000.
ITEM 5. AUDIT COMMITTEE OF LISTED REGISTRANTS.
The registrant's Board has a separately designated Audit Committee established in accordance with Section 3(a)(58)(A) of the Securities Exchange Act of 1934, as amended (15 U.S.C. 78c(a)(58)(A)). The members of the audit committee are Robert P. Bremner, Terence J. Toth, Jack B. Evans, Carole E. Stone and David J. Kundert.
ITEM 6. SCHEDULE OF INVESTMENTS.
a) See Portfolio of Investments in Item 1.
b) Not applicable.
ITEM 7. DISCLOSURE OF PROXY VOTING POLICIES AND PROCEDURES FOR CLOSED-END MANAGEMENT INVESTMENT COMPANIES.
Nuveen Fund Advisors, LLC, formerly known as Nuveen Fund Advisors, Inc., is the registrant’s investment adviser (also referred to as the “Adviser”). The Adviser is responsible for the on-going monitoring of the Fund’s investment portfolio, managing the Fund’s business affairs and providing certain clerical, bookkeeping and administrative services. The Adviser has engaged Nuveen Asset Management, LLC (“Sub-Adviser”) as Sub-Adviser to provide discretionary investment advisory services. As part of these services, the Adviser has delegated to the Sub-Adviser the full responsibility for proxy voting on securities held in the registrant’s portfolio and related duties in accordance with the Sub-Adviser's policies and procedures. The Adviser periodically monitors the Sub-Adviser's voting to ensure that it is carrying out its duties. The Sub-Adviser’s proxy voting policies and procedures are attached to this filing as an exhibit and incorporated herein by reference.
ITEM 8. PORTFOLIO MANAGERS OF CLOSED-END MANAGEMENT INVESTMENT COMPANIES.
Nuveen Fund Advisors, LLC, formerly known as Nuveen Fund Advisors, Inc., is the registrant’s investment adviser (also referred to as the “Adviser”). The Adviser is responsible for the selection and on-going monitoring of the Fund’s investment portfolio, managing the Fund’s business affairs and providing certain clerical, bookkeeping and administrative services. The Adviser has engaged Nuveen Asset Management, LLC (“Nuveen Asset Management” or “Sub-Adviser”) as Sub-Adviser to provide discretionary investment advisory services. The following section provides information on the portfolio manager at the Sub-Adviser:
The Portfolio Manager
The following individual has primary responsibility for the day-to-day implementation of the registrant’s investment strategies:
| Name | Fund |
| Scott R. Romans | Nuveen New York Performance Plus Municipal Fund, Inc. |
Other Accounts Managed. In addition to managing the registrant, the portfolio manager is also primarily responsible for the day-to-day portfolio management of the following accounts:
| Portfolio Manager | Type of Account Managed | Number of Accounts | Assets* |
| Scott R. Romans | Registered Investment Company | 15 | $8.62 billion |
| | Other Pooled Investment Vehicles | 0 | $0 |
| | Other Accounts | 2 | $1.63 million |
| * | Assets are as of September 30, 2014. None of the assets in these accounts are subject to an advisory fee based on performance. |
POTENTIAL MATERIAL CONFLICTS OF INTEREST
Actual or apparent conflicts of interest may arise when a portfolio manager has day-to-day management responsibilities with respect to more than one account. More specifically, portfolio managers who manage multiple accounts are presented a number of potential conflicts, including, among others, those discussed below.
The management of multiple accounts may result in a portfolio manager devoting unequal time and attention to the management of each account. Nuveen Asset Management seeks to manage such competing interests for the time and attention of portfolio managers by having portfolio managers focus on a particular investment discipline. Most accounts managed by a portfolio manager in a particular investment strategy are managed using the same investment models.
If a portfolio manager identifies a limited investment opportunity which may be suitable for more than one account, an account may not be able to take full advantage of that opportunity due to an allocation of filled purchase or sale orders across all eligible accounts. To deal with these situations, Nuveen Asset Management has adopted procedures for allocating limited opportunities across multiple accounts.
With respect to many of its clients’ accounts, Nuveen Asset Management determines which broker to use to execute transaction orders, consistent with its duty to seek best execution of the transaction. However, with respect to certain other accounts, Nuveen Asset Management may be limited by the client with respect to the selection of brokers or may be instructed to direct trades through a particular broker. In these cases, Nuveen Asset Management may place separate, non-simultaneous, transactions for a Fund and other accounts which may temporarily affect the market price of the security or the execution of the transaction, or both, to the detriment of the Fund or the other accounts.
Some clients are subject to different regulations. As a consequence of this difference in regulatory requirements, some clients may not be permitted to engage in all the investment techniques or transactions or to engage in these transactions to the same extent as the other accounts managed by the portfolio manager. Finally, the appearance of a conflict of interest may arise where Nuveen Asset Management has an incentive, such as a performance-based management fee, which relates to the management of some accounts, with respect to which a portfolio manager has day-to-day management responsibilities.
Nuveen Asset Management has adopted certain compliance procedures which are designed to address these types of conflicts common among investment managers. However, there is no guarantee that such procedures will detect each and every situation in which a conflict arises.
Item 8(a)(3). FUND MANAGER COMPENSATION
Portfolio manager compensation consists primarily of base pay, an annual cash bonus and long term incentive payments.
Base pay. Base pay is determined based upon an analysis of the portfolio manager’s general performance, experience, and market levels of base pay for such position.
Annual cash bonus. The Fund’s portfolio managers are eligible for an annual cash bonus based on investment performance, qualitative evaluation and financial performance of Nuveen Asset Management.
A portion of each portfolio manager’s annual cash bonus is based on the Fund’s investment performance, generally measured over the past one- and three or five-year periods unless the portfolio manager’s tenure is shorter. Investment performance for the Fund generally is determined by evaluating the Fund’s performance relative to its benchmark(s) and/or Lipper industry peer group.
A portion of the cash bonus is based on a qualitative evaluation made by each portfolio manager’s supervisor taking into consideration a number of factors, including the portfolio manager’s team collaboration, expense management, support of personnel responsible for asset growth, and his or her compliance with Nuveen Asset Management’s policies and procedures.
The final factor influencing a portfolio manager’s cash bonus is the financial performance of Nuveen Asset Management based on its operating earnings.
Long-term incentive compensation. Certain key employees of Nuveen Investments and its affiliates, including certain portfolio managers, have received equity interests in the parent company of Nuveen Investments. In addition, certain key employees of Nuveen Asset Management, including certain portfolio managers, have received profits interests in Nuveen Asset Management which entitle their holders to participate in the firm’s growth over time.
There are generally no differences between the methods used to determine compensation with respect to the Fund and the Other Accounts shown in the table above.
Beneficial Ownership of Securities. As of September 30, 2014, the portfolio manager beneficially owned the following dollar range of equity securities issued by the Fund and other Nuveen Funds managed by Nuveen Asset Management’s municipal investment team.
| Name of Portfolio Manager | Fund | Dollar range of equity securities beneficially owned in Fund | Dollar range of equity securities beneficially owned in the remainder of Nuveen funds managed by Nuveen Asset Management’s municipal investment team |
| Scott R. Romans | Nuveen New York Performance Plus Municipal Fund, Inc. | $0 | $0 |
PORTFOLIO MANAGER BIO:
Scott R. Romans, PhD, Senior Vice President of Nuveen Asset Management, joined Nuveen Investments in 2000 as a senior analyst in the education sector. In 2003, he was assigned management responsibility for several closed- and open-ended municipal bond funds. Currently, he manages investments for 16 Nuveen-sponsored investment companies.
ITEM 9. PURCHASES OF EQUITY SECURITIES BY CLOSED-END MANAGEMENT INVESTMENT COMPANY AND AFFILIATED PURCHASERS.
Not applicable.
ITEM 10. SUBMISSION OF MATTERS TO A VOTE OF SECURITY HOLDERS.
There have been no material changes to the procedures by which shareholders may recommend nominees to the registrant's Board implemented after the registrant last provided disclosure in response to this Item.
ITEM 11. CONTROLS AND PROCEDURES.
| (a) | The registrant's principal executive and principal financial officers, or persons performing similar functions, have concluded that the registrant's disclosure controls and procedures (as defined in Rule 30a-3(c) under the Investment Company Act of 1940, as amended (the “1940 Act”) (17 CFR 270.30a-3(c))) are effective, as of a date within 90 days of the filing date of this report that includes the disclosure required by this paragraph, based on their evaluation of the controls and procedures required by Rule 30a-3(b) under the 1940 Act (17 CFR 270.30a-3(b)) and Rules 13a-15(b) or 15d-15(b) under the Securities Exchange Act of 1934, as amended (the “Exchange Act”) (17 CFR 240.13a-15(b) or 240.15d-15(b)). |
| (b) | There were no changes in the registrant's internal control over financial reporting (as defined in Rule 30a-3(d) under the 1940 Act (17 CFR 270.30a-3(d)) that occurred during the second fiscal quarter of the period covered by this report that has materially affected, or is reasonably likely to materially affect, the registrant's internal control over financial reporting. |
ITEM 12. EXHIBITS.
File the exhibits listed below as part of this Form.
| (a)(1) | Any code of ethics, or amendment thereto, that is the subject of the disclosure required by Item 2, to the extent that the registrant intends to satisfy the Item 2 requirements through filing of an exhibit: Not applicable because the code is posted on registrant's website at www.nuveen.com/CEF/Shareholder/FundGovernance.aspx and there were no amendments during the period covered by this report. (To view the code, click on Code of Conduct.) |
| (a)(2) | A separate certification for each principal executive officer and principal financial officer of the registrant as required by Rule 30a-2(a) under the 1940 Act (17 CFR 270.30a-2(a)) in the exact form set forth below: Ex-99.CERT Attached hereto. |
| (a)(3) | Any written solicitation to purchase securities under Rule 23c-1 under the 1940 Act (17 CFR 270.23c-1) sent or given during the period covered by the report by or on behalf of the registrant to 10 or more persons. Not applicable. |
| (b) | If the report is filed under Section 13(a) or 15(d) of the Exchange Act, provide the certifications required by Rule 30a-2(b) under the 1940 Act (17 CFR 270.30a-2(b)); Rule 13a-14(b) or Rule 15d-14(b) under the Exchange Act (17 CFR 240.13a-14(b) or 240.15d-14(b)), and Section 1350 of Chapter 63 of Title 18 of the United States Code (18 U.S.C. 1350) as an exhibit. A certification furnished pursuant to this paragraph will not be deemed “filed” for purposes of Section 18 of the Exchange Act (15 U.S.C. 78r), or otherwise subject to the liability of that section. Such certification will not be deemed to be incorporated by reference into any filing under the Securities Act of 1933 or the Exchange Act, except to the extent that the registrant specifically incorporates it by reference. Ex-99.906 CERT attached hereto. |
SIGNATURES
Pursuant to the requirements of the Securities Exchange Act of 1934 and the Investment Company Act of 1940, the registrant has duly caused this report to be signed on its behalf by the undersigned, thereunto duly authorized.
(Registrant) Nuveen New York Performance Plus Municipal Fund, Inc.
By (Signature and Title) /s/ Kevin J. McCarthy
Kevin J. McCarthy
Vice President and Secretary
Date: December 5, 2014
Pursuant to the requirements of the Securities Exchange Act of 1934 and the Investment Company Act of 1940, this report has been signed below by the following persons on behalf of the registrant and in the capacities and on the dates indicated.
By (Signature and Title) /s/ Gifford R. Zimmerman
Gifford R. Zimmerman
Chief Administrative Officer
(principal executive officer)
By (Signature and Title) /s/ Stephen D. Foy
Stephen D. Foy
Vice President and Controller
(principal financial officer)