Exhibit (c)(4)
DRAFT
Project TENEDOR
Preliminary Valuation Summary
4 April 2007
SOCIETE GENERALE
Corporate & Investment Banking
CONFIDENTIAL
This presentation has been prepared for information purposes only and does not constitute an offer, or the solicitation of an offer, to buy or sell any securities, to participate in any transaction or to provide any investment banking or other services. Nothing contained herein should be construed as a direct or indirect offer of favorable research or a specific rating or a specific price target in exchange for investment banking business. Nothing contained herein shall be deemed a commitment or undertaking of any kind on the part of SG Americas Securities, LLC (“SGAS”) or any of its affiliates to underwrite, place or purchase any securities, to provide any debt or equity financing or to participate in any transaction, or a recommendation to buy or sell any securities. This presentation does not constitute investment, legal, tax or accounting advice. Prior to participating in any of the transactions described herein, you should consult, to the extent necessary, your own independent, competent, legal, tax, accounting and other professional advisors. This presentation is confidential. Any reproduction of this presentation, in whole or in part, is prohibited and you may not release these materials to any other person, except to your advisors and professionals who will be assisting you in evaluating these materials. Notwithstanding anything to the contrary contained herein, all persons may disclose to any and all persons, without limitation of any kind, the US tax treatment of the transactions discussed herein, any fact that may be relevant to understanding the US tax treatment of such transaction, and all materials of any kind (including opinions or other tax analyses) relating to such US federal tax treatment and that may be relevant to understanding such US tax treatment.
Circular 230 Waiver: Société Générale and its affiliates do not provide tax advice. Accordingly, any discussion of US tax matters contained herein (including any attachments) is not intended or written to be used, and cannot be used, in connection with the promotion, marketing or recommendation by anyone unaffiliated with Société Générale of any of the matters addressed herein or for the purpose of avoiding US tax-related penalties.
SOCIETE GENERALE
Corporate & Investment Banking 2
Stock Price Performance
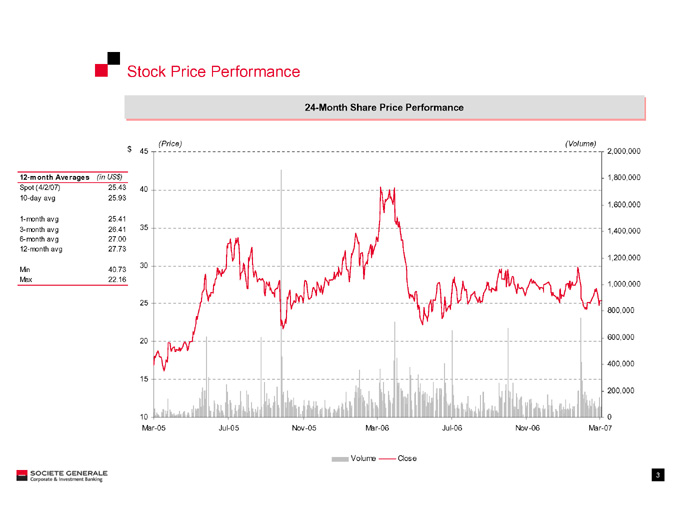
24-Month Share Price Performance
12-month Averages (in US$)
Spot (4/2/07) 25.43
10-day avg 25.93
1-month avg 25.41
3-month avg 26.41
6-month avg 27.00
12-month avg 27.73
Min 40.73
Max 22.16
(Price) (Volume)
$ 45 2,000,000
1,800,000 40 1,600,000
35
1,400,000
1,200,000 30
1,000,000
25
800,000
600,000 20
400,000 15 200,000
10 0 Mar-05 Jul-05 Nov-05 Mar-06 Jul-06 Nov-06 Mar-07
Volume Close
SOCIETE GENERALE
Corporate & Investment Banking 3

Tiger Case and Market “Consensus “ Forecasts
Tiger Case Market “Consensus” Forecasts
2007 forecasts
(in $m) Tiger case Brokers Diff.
Sales 403.8 483.1 -16%
EBITDA 32.5 50.3 -35%
EBIT 27.6 44.3 -38%
Net inc. 16.0 27.1 -41%
(US$ in m)
700 12.0% 700 (US$ in m) 12.0%
622.7 620.7 593.2
600 600
10.0% 553.8 10.0%
528.6
484.4 484.4 498.1 500 500 483.1
441.3 8.0% 8.0% 403.8 400.7 400 400 6.0% 6.0% 300 300 4.0% 4.0% 200 200
2.0% 2.0% 100 100
0 0.0% 0 0.0% 2006 2007 2008 2009 2010 2011 2006 2007 2008 2009 2010 2011 Revenue EBIT margin Revenue EBIT margin
Tiger case assuming: Based on broker forecasts for 2007 and 2008:
20% decline of the NA skid steer market 2007 in line with guidance of $2.0-2.3 EPS
25% decline of the NA telehandler market Pick up in 2008 followed by strong growth in 2009 and
Further decline in 2008 and strong catch up in 2010 and deceleration in 2010-2011
2011 EBIT 2011 35% lower than Leopard strategic plan
Both cases display similar level of profitability in 2011
SOCIETE GENERALE
Corporate & Investment Banking 4
Comparable Companies Analysis
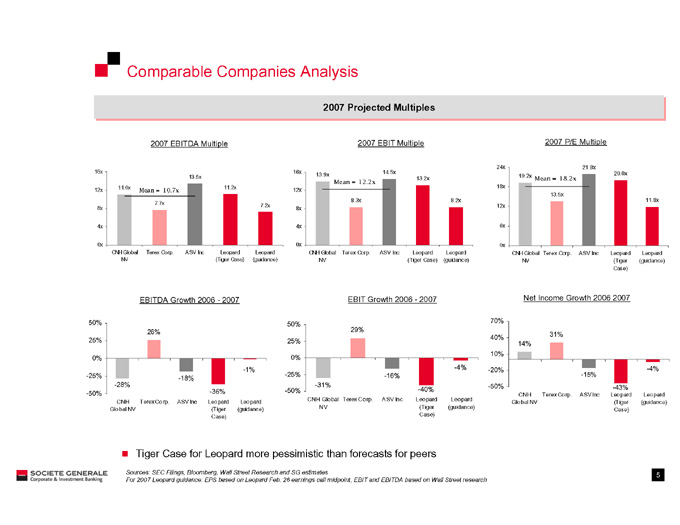
2007 Projected Multiples
2007 EBITDA Multiple 2007 EBIT Multiple 2007 P/E Multiple
24x 21.8x
16x 16x 14.5x 20.0x 13.5x 13.9x 19.2x
Mean = 12.2x 13.2x Mean = 18.2x
11.0x 11.2x 18x 12x Mean = 10.7x 12x
13.5x
8.3x 8.2x 11.8x 7.7x 7.2x
8x 8x 12x
4x 4x 6x
0x 0x 0x
CNH Global Terex Corp. ASV Inc Leopard Leopard CNH Global Terex Corp. ASV Inc Leopard Leopard CNH Global Terex Corp. ASV Inc Leopard Leopard NV (Tiger Case) (guidance) NV (Tiger Case) (guidance) NV (Tiger (guidance) Case)
EBITDA Growth 2006 - 2007 EBIT Growth 2006 - 2007 Net Income Growth 2006 2007
50% 70%
50%
26% 29%
40% 31% 25% 25% 14% 10%
0% 0%
-1% -4% -20% -4% -25% -25% -16% -15% -18% -28% -31% -50% -43% -36% - -50% -40%
-50% CNH Terex Corp. ASV Inc Leopard Leopard CNH Terex Corp. ASV Inc Leopard Leopard CNH Global Terex Corp. ASV Inc Leopard Leopard
Global NV (Tiger (guidance) Global NV (Tiger (guidance) NV (Tiger (guidance) Case) Case) Case)
Tiger Case for Leopard more pessimistic than forecasts for peers
Sources: SEC Filings, Bloomberg, Wall Street Research and SG estimates
For 2007 Leopard guidance: EPS based on Leopard Feb. 26 earnings call midpoint, EBIT and EBITDA based on Wall Street research
SOCIETE GENERALE
Corporate & Investment Banking 5
US Premiums Analysis
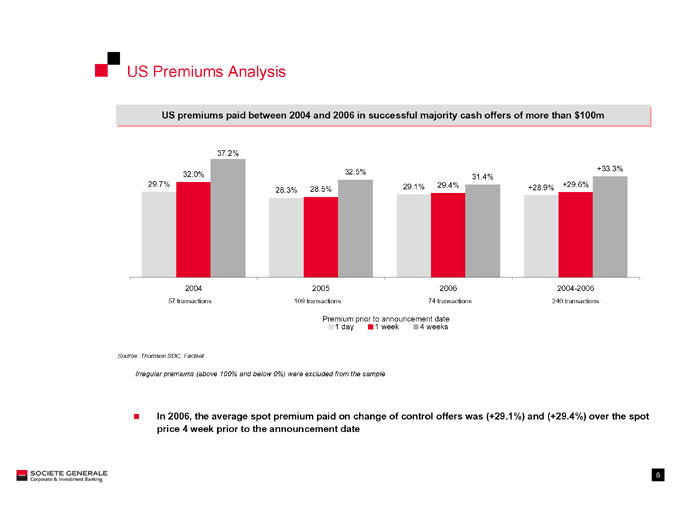
US premiums paid between 2004 and 2006 in successful majority cash offers of more than $100m
37.2%
32.5% +33.3% 32.0% 31.4% 29.7% 29.1% 29.4% +29.6% 28.3% 28.5% +28.9%
2004 2005 2006 2004-2006
57 transactions 109 transactions 74 transactions 240 transactions .
Premium prior to announcement date 1 day 1 week 4 weeks
Source: Thomson SDC, Factset
Irregular premiums (above 100% and below 0%) were excluded from the sample
In 2006, the average spot premium paid on change of control offers was (+29.1%) and (+29.4%) over the spot price 4 week prior to the announcement date
SOCIETE GENERALE
Corporate & Investment Banking 6
Selected Comparable Transactions
Enterprise Value vs. EBITDA
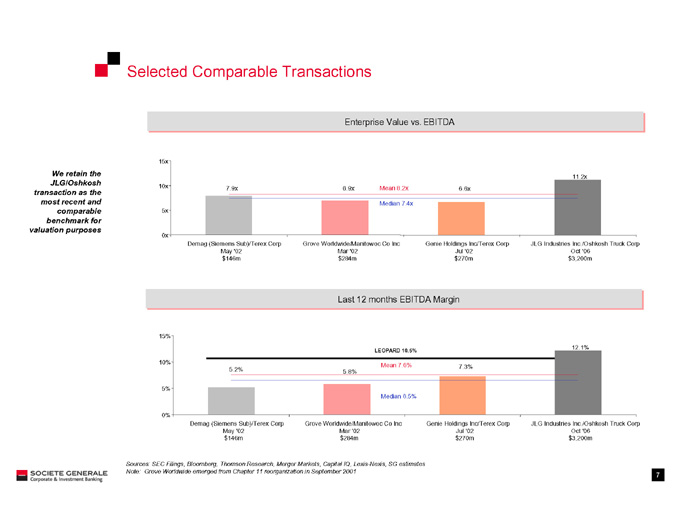
We retain the JLG/Oshkosh transaction as the most recent and comparable benchmark for valuation purposes
15x
11.2x 10x 7.9x 6.9x Mean 8.2x 6.6x Median 7.4x 5x
0x
Demag (Siemens Sub)/Terex Corp Grove Worldwide/Manitowoc Co Inc Genie Holdings Inc/Terex Corp JLG Industries Inc./Oshkosh Truck Corp May ‘02 Mar ‘02 Jul ‘02 Oct ‘06 $146m $284m $270m $3,200m
Last 12 months EBITDA Margin
15%
12.1%
LEOPARD 10.5%
10% Mean 7.6%
5.2% 7.3% 5.8%
5%
Median 6.5%
0%
Demag (Siemens Sub)/Terex Corp Grove Worldwide/Manitowoc Co Inc Genie Holdings Inc/Terex Corp JLG Industries Inc./Oshkosh Truck Corp May ‘02 Mar ‘02 Jul ‘02 Oct ‘06 $146m $284m $270m $3,200m
Sources: SEC Filings, Bloomberg, Thomson Research, Merger Markets, Capital IQ, Lexis-Nexis, SG estimates Note: Grove Worldwide emerged from Chapter 11 reorganization in September 2001
SOCIETE GENERALE
Corporate & Investment Banking 7
DCF and Transaction Synergies
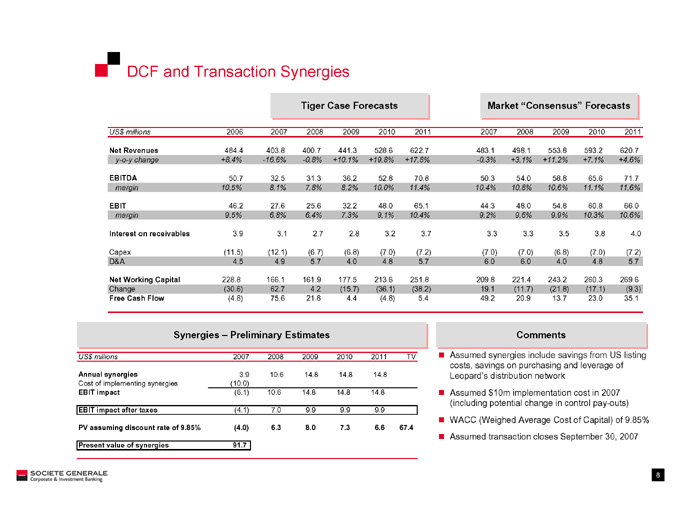
Tiger Case Forecasts Market “Consensus” Forecasts
US$ millions 2006 2007 2008 2009 2010 2011 2007 2008 2009 2010 2011
Net Revenues 484.4 403.8 400.7 441.3 528.6 622.7 483.1 498.1 553.8 593.2 620.7
y-o-y change +8.4% -16.6% -0.8% +10.1% +19.8% +17.8% -0.3% +3.1% +11.2% +7.1% +4.6%
EBITDA 50.7 32.5 31.3 36.2 52.8 70.8 50.3 54.0 58.8 65.6 71.7
margin 10.5% 8.1% 7.8% 8.2% 10.0% 11.4% 10.4% 10.8% 10.6% 11.1% 11.6%
EBIT 46.2 27.6 25.6 32.2 48.0 65.1 44.3 48.0 54.8 60.8 66.0
margin 9.5% 6.8% 6.4% 7.3% 9.1% 10.4% 9.2% 9.6% 9.9% 10.3% 10.6%
Interest on receivables 3.9 3.1 2.7 2.8 3.2 3.7 3.3 3.3 3.5 3.8 4.0
Capex (11.5)(12.1)(6.7)(6.8)(7.0)(7.2)(7.0)(7.0)(6.8)(7.0)(7.2)
D&A 4.5 4.9 5.7 4.0 4.8 5.7 6.0 6.0 4.0 4.8 5.7
Net Working Capital 228.8 166.1 161.9 177.5 213.6 251.8 209.8 221.4 243.2 260.3 269.6
Change (30.6) 62.7 4.2(15.7)(36.1)(38.2) 19.1(11.7)(21.8)(17.1)(9.3)
Free Cash Flow (4.8) 75.6 21.8 4.4(4.8) 5.4 49.2 20.9 13.7 23.0 35.1
DCF and Transaction Synergies
Tiger Case Forecasts Market “Consensus” Forecasts
US$ millions 2006 2007 2008 2009 2010 2011 2007 2008 2009 2010 2011
Net Revenues 484.4 403.8 400.7 441.3 528.6 622.7 483.1 498.1 553.8 593.2 620.7
y-o-y change +8.4% -16.6% -0.8% +10.1% +19.8% +17.8% -0.3% +3.1% +11.2% +7.1% +4.6%
EBITDA 50.7 32.5 31.3 36.2 52.8 70.8 50.3 54.0 58.8 65.6 71.7
margin 10.5% 8.1% 7.8% 8.2% 10.0% 11.4% 10.4% 10.8% 10.6% 11.1% 11.6%
EBIT 46.2 27.6 25.6 32.2 48.0 65.1 44.3 48.0 54.8 60.8 66.0
margin 9.5% 6.8% 6.4% 7.3% 9.1% 10.4% 9.2% 9.6% 9.9% 10.3% 10.6%
Interest on receivables 3.9 3.1 2.7 2.8 3.2 3.7 3.3 3.3 3.5 3.8 4.0
Capex 11.5)(12.1)(6.7)(6.8)(7.0)(7.2)(7.0)(7.0)(6.8)(7.0)(7.2)
D&A 4.5 4.9 5.7 4.0 4.8 5.7 6.0 6.0 4.0 4.8 5.7
Net Working Capital 228.8 166.1 161.9 177.5 213.6 251.8 209.8 221.4 243.2 260.3 269.6
Change (30.6) 62.7 4.2(15.7)(36.1)(38.2) 19.1(11.7)(21.8)(17.1)(9.3)
Free Cash Flow (4.8) 75.6 21.8 4.4(4.8) 5.4 49.2 20.9 13.7 23.0 35.1
Synergies – Preliminary Estimates
US$ millions 2007 2008 2009 2010 2011 TV
Annual synergies 3.9 10.6 14.8 14.8 14.8 Cost of implementing synergies (10.0) EBIT impact (6.1) 10.6 14.8 14.8 14.8
EBIT impact after taxes (4.1) 7.0 9.9 9.9 9.9
PV assuming discount rate of 9.85% (4.0) 6.3 8.0 7.3 6.6 67.4
Present value of synergies 91.7
Comments
Assumed synergies include savings from US listing costs, savings on purchasing and leverage of Leopard’s distribution network
Assumed $10m implementation cost in 2007 (including potential change in control pay-outs)
WACC (Weighed Average Cost of Capital) of 9.85%
Assumed transaction closes September 30, 2007
SOCIETE GENERALE
Corporate & Investment Banking 8
Preliminary Valuation Summary
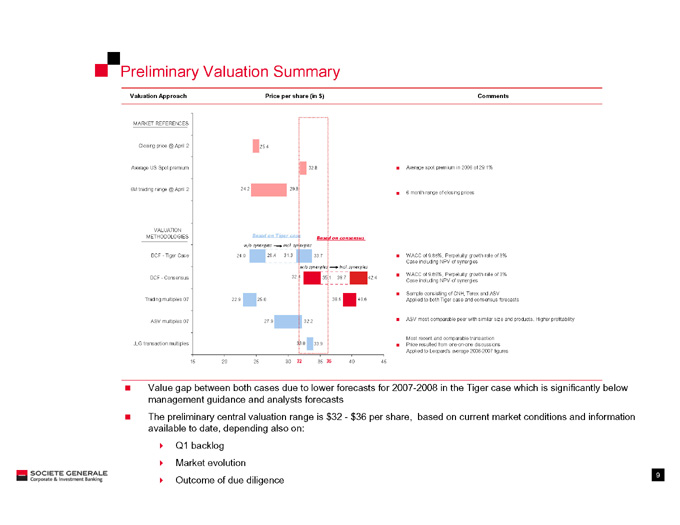
Valuation Approach Price per share (in $) Comments
MARKET REFERENCES
Closing price @ April 2 25.4
Average US Spot premium 32.8 Average spot premium in 2006 of 29.1%
6M trading range @ April 2 24.2 29.8
6 month range of closing prices
VALUATION
METHODOLOGIES Based on Tiger case
Based on consensus w/o synergies incl. synergies
DCF - Tiger Case 24.0 26.4 31.3 33.7 WACC of 9.85%, Perpetuity growth rate of 3% Case including NPV of synergies w/o synergies incl. synergies
WACC of 9.85%, Perpetuity growth rate of 3% DCF - Consensus 32.4 35.1 39.7 42.4
Case including NPV of synergies
Sample consisting of CNH, Terex and ASV
Trading multiples 07 22.9 25.0 38.6 40.6 Applied to both Tiger case and consensus forecasts
27.9 32.2 ASV most comparable peer with similar size and products. Higher profitability ASV multiples 07
Most recent and comparable transaction JLG transaction multiples 33.0 33.9 Price resulted from one-on-one discussions Applied to Leopard’s average 2006-2007 figures
15 20 25 30 32 35 36 40 45
Value gap between both cases due to lower forecasts for 2007-2008 in the Tiger case which is significantly below management guidance and analysts forecasts
The preliminary central valuation range is $32 - $36 per share, based on current market conditions and information available to date, depending also on:
Q1 backlog
Market evolution
Outcome of due diligence
SOCIETE GENERALE
Corporate & Investment Banking 9
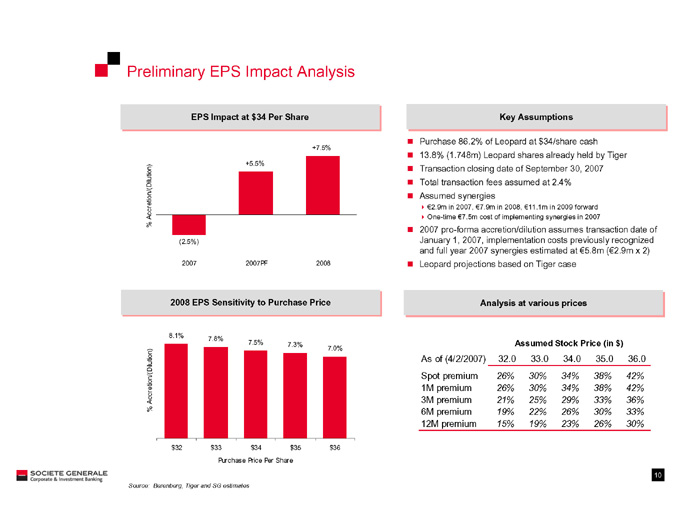
Preliminary EPS Impact Analysis
EPS Impact at $34 Per Share
+7.5%
+5.5% Accretion/(Dilution)
%
(2.5%)
2007 2007PF 2008
Key Assumptions
Purchase 86.2% of Leopard at $34/share cash
13.8% (1.748m) Leopard shares already held by Tiger
Transaction closing date of September 30, 2007
Total transaction fees assumed at 2.4%
Assumed synergies
€2.9m in 2007, €7.9m in 2008, €11.1m in 2009 forward
One-time €7.5m cost of implementing synergies in 2007
2007 pro-forma accretion/dilution assumes transaction date of January 1, 2007, implementation costs previously recognized and full year 2007 synergies estimated at €5.8m (€2.9m x 2)
Leopard projections based on Tiger case
2008 EPS Sensitivity to Purchase Price
8.1%
7.8%
7.5% 7.3%
7.0% Accretion/(Dilution)
%
$32$ 33 $34 $35 $36 Purchase Price Per Share
Analysis at various prices
Assumed Stock Price (in $)
As of (4/2/2007) 32.0 33.0 34.0 35.0 36.0
Spot premium 26% 30% 34% 38% 42%
1M premium 26% 30% 34% 38% 42%
3M premium 21% 25% 29% 33% 36%
6M premium 19% 22% 26% 30% 33%
12M premium 15% 19% 23% 26% 30%
Source: Berenberg, Tiger and SG estimates
SOCIETE GENERALE
Corporate & Investment Banking 10