Exhibit 99.(c) (8)
DRAFT BAIRD
PROJECT GIANT
Preliminary Discussion Materials
May 14, 2008
Preliminary Discussion Materials DRAFT BAIRD
Table of Contents
Review of M-Co Proposal 1
GIANT Financial Overview 2
Business Cycle Discussion 3
Preliminary Valuation Analysis 4
Selected Potential Strategic Partners 5
Appendix 6
A. Supplemental Information
For Confidential Use Of Board Of Directors Only And Not For Public Disclosure
PROJECT GIANT
1
Introduction DRAFT BAIRD
As discussed at the GIANT April Board meeting, and as prompted by the indicative offer letter sent by M-Co on May 5th (the “Proposal”), Baird has performed preliminary analyses regarding certain strategic and financial alternatives available to the Company, including:
Examined the summary terms and conditions of the Proposal
Conducted preliminary GIANT due diligence and reviewed certain historical and projected performance / plan information
Reviewed business cycle trends and valuation implications
Performed preliminary valuation analyses:
Selected company analysis
Discounted cash flow analysis
Selected transaction analysis
Other supplemental analyses as we deemed appropriate
Additionally, Baird identified other selected potential strategic partners that may have an interest in a transaction (if a decision were made to pursue that alternative) to assess their:
Recent merger and acquisition history
Likely rationale for a potential transaction with GIANT
Ability to finance / consummate an acquisition of GIANT
PROJECT GIANT
2
DRAFT BAIRD
Review of M-Co Proposal
Review of M-Co Proposal DRAFT BAIRD
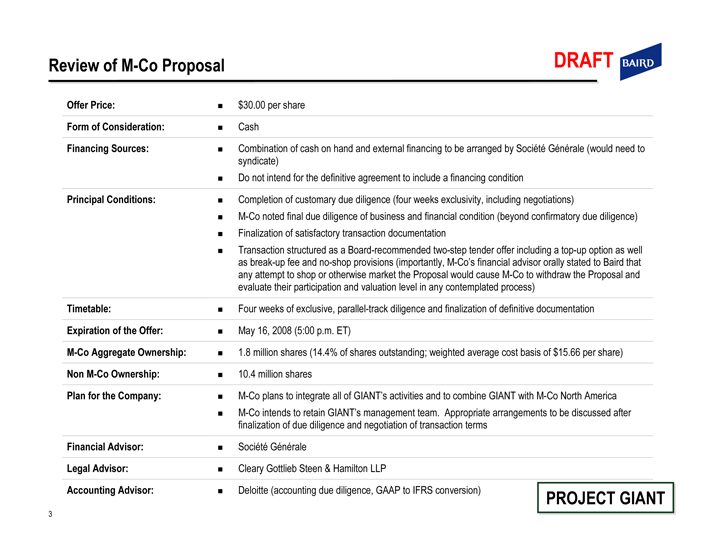
Offer Price: $30.00 per share
Form of Consideration: Cash
Financing Sources: Combination of cash on hand and external financing to be arranged by Société Générale (would need to syndicate)
Do not intend for the definitive agreement to include a financing condition
Principal Conditions: Completion of customary due diligence (four weeks exclusivity, including negotiations)
M-Co noted final due diligence of business and financial condition (beyond confirmatory due diligence)
Finalization of satisfactory transaction documentation
Transaction structured as a Board-recommended two-step tender offer including a top-up option as well as break-up fee and no-shop provisions (importantly, M-Co’s financial advisor orally stated to Baird that any attempt to shop or otherwise market the Proposal would cause M-Co to withdraw the Proposal and evaluate their participation and valuation level in any contemplated process) Timetable: Four weeks of exclusive, parallel-track diligence and finalization of definitive documentation
Expiration of the Offer: May 16, 2008 (5:00 p.m. ET)
M-Co Aggregate Ownership: 1.8 million shares (14.4% of shares outstanding; weighted average cost basis of $15.66 per share)
Non M-Co Ownership: 10.4 million shares
Plan for the Company: M-Co plans to integrate all of GIANT’s activities and to combine GIANT with M-Co North America
M-Co intends to retain GIANT’s management team. Appropriate arrangements to be discussed after finalization of due diligence and negotiation of transaction terms
Financial Advisor: Société Générale
Legal Advisor: Cleary Gottlieb Steen & Hamilton LLP
Accounting Advisor: Deloitte (accounting due diligence, GAAP to IFRS conversion)
PROJECT GIANT
3
Review of M-Co Proposal DRAFT BAIRD
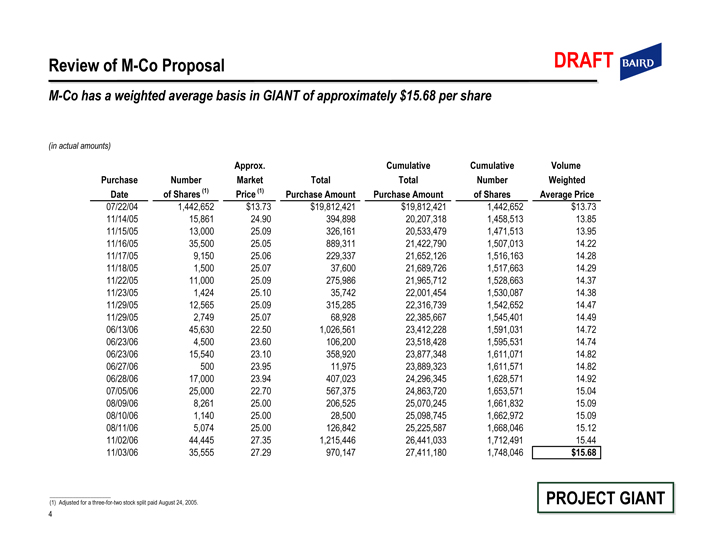
M-Co has a weighted average basis in GIANT of approximately $15.68 per share
(in actual amounts)
Approx. Cumulative Cumulative Volume
Purchase Number Market Total Total Number Weighted
Date of Shares (1) Price (1) Purchase Amount Purchase Amount of Shares Average Price
07/22/04 1,442,652 $13.73 $19,812,421 $19,812,421 1,442,652 $13.73
11/14/05 15,861 24.90 394,898 20,207,318 1,458,513 13.85
11/15/05 13,000 25.09 326,161 20,533,479 1,471,513 13.95
11/16/05 35,500 25.05 889,311 21,422,790 1,507,013 14.22
11/17/05 9,150 25.06 229,337 21,652,126 1,516,163 14.28
11/18/05 1,500 25.07 37,600 21,689,726 1,517,663 14.29
11/22/05 11,000 25.09 275,986 21,965,712 1,528,663 14.37
11/23/05 1,424 25.10 35,742 22,001,454 1,530,087 14.38
11/29/05 12,565 25.09 315,285 22,316,739 1,542,652 14.47
11/29/05 2,749 25.07 68,928 22,385,667 1,545,401 14.49
06/13/06 45,630 22.50 1,026,561 23,412,228 1,591,031 14.72
06/23/06 4,500 23.60 106,200 23,518,428 1,595,531 14.74
06/23/06 15,540 23.10 358,920 23,877,348 1,611,071 14.82
06/27/06 500 23.95 11,975 23,889,323 1,611,571 14.82
06/28/06 17,000 23.94 407,023 24,296,345 1,628,571 14.92
07/05/06 25,000 22.70 567,375 24,863,720 1,653,571 15.04
08/09/06 8,261 25.00 206,525 25,070,245 1,661,832 15.09
08/10/06 1,140 25.00 28,500 25,098,745 1,662,972 15.09
08/11/06 5,074 25.00 126,842 25,225,587 1,668,046 15.12
11/02/06 44,445 27.35 1,215,446 26,441,033 1,712,491 15.44
11/03/06 35,555 27.29 970,147 27,411,180 1,748,046 $15.68
(1) Adjusted for a three-for-two stock split paid August 24, 2005.
PROJECT GIANT
4
Preliminary Implied Purchase Price and Transaction Multiples DRAFT BAIRD
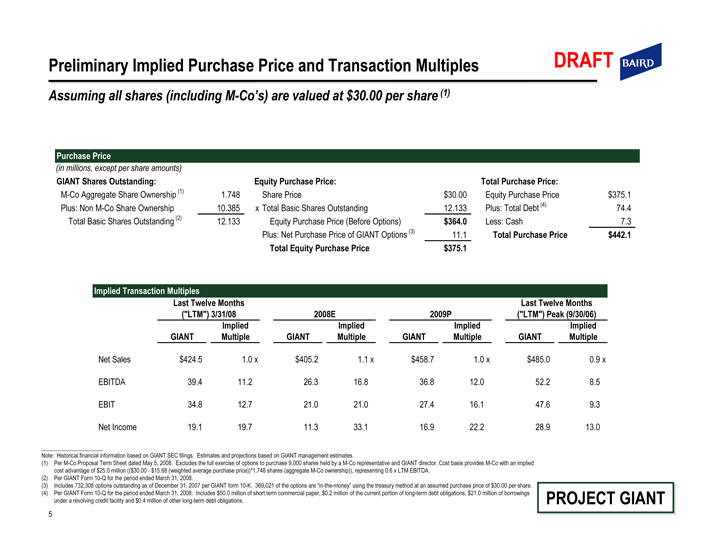
Assuming all shares (including M-Co’s) are valued at $30.00 per share (1)
Purchase Price
(in millions, except per share amounts)
GIANT Shares Outstanding:
M-Co Aggregate Share Ownership (1) 1.748
Plus: Non M-Co Share Ownership 10.385
Total Basic Shares Outstanding (2) 12.133
Equity Purchase Price:
Share Price $30.00
x Total Basic Shares Outstanding 12.133
Equity Purchase Price (Before Options) $364.0
Plus: Net Purchase Price of GIANT Options (3) 11.1
Total Equity Purchase Price $375.1
Total Purchase Price:
Equity Purchase Price $375.1
Plus: Total Debt (4) 74.4
Less: Cash 7.3
Total Purchase Price $442.1
Implied Transaction Multiples
Last Twelve Months (“LTM”) 3/31/08 2008E 2009P Last Twelve Months (“LTM”) Peak (9/30/06)
GIANT Implied Multiple GIANT Implied Multiple GIANT Implied Multiple GIANT Implied Multiple
Net Sales $424.5 1.0 x $405.2 1.1 x $458.7 1.0 x $485.0 0.9 x
EBITDA 39.4 11.2 26.3 16.8 36.8 12.0 52.2 8.5
EBIT 34.8 12.7 21.0 21.0 27.4 16.1 47.6 9.3
Net Income 19.1 19.7 11.3 33.1 16.9 22.2 28.9 13.0
Note: Historical financial information based on GIANT SEC filings. Estimates and projections based on GIANT management estimates.
(1) Per M-Co Proposal Term Sheet dated May 5, 2008. Excludes the full exercise of options to purchase 9,000 shares held by a M-Co representative and GIANT director. Cost basis provides M-Co with an implied cost advantage of $25.0 million (($30.00 - $15.68 (weighted average purchase price))*1.748 shares (aggregate M-Co ownership)), representing 0.6 x LTM EBITDA.
(2) Per GIANT Form 10-Q for the period ended March 31, 2008.
(3) Includes 732,308 options outstanding as of December 31, 2007 per GIANT form 10-K. 369,021 of the options are “in-the-money” using the treasury method at an assumed purchase price of $30.00 per share.
(4) Per GIANT Form 10-Q for the period ended March 31, 2008. Includes $50.0 million of short term commercial paper, $0.2 million of the current portion of long-term debt obligations, $21.0 million of borrowings under a revolving credit facility and $0.4 million of other long-term debt obligations.
PROJECT GIANT
5

DRAFT BAIRD
GIANT Financial Overview
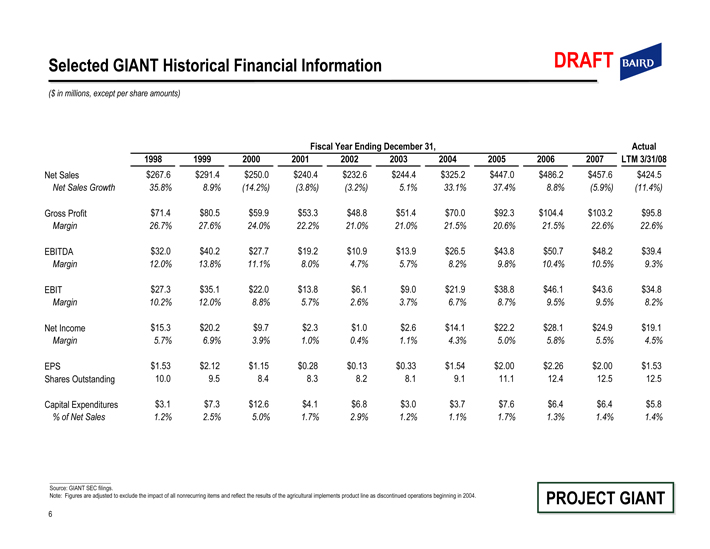
Selected GIANT Historical Financial Information
DRAFT BAIRD
($ in millions, except per share amounts)
Fiscal Year Ending December 31, Actual
1998 1999 2000 2001 2002 2003 2004 2005 2006 2007 LTM 3/31/08
Net Sales $267.6 $291.4 $250.0 $240.4 $232.6 $244.4 $325.2 $447.0 $486.2 $457.6 $424.5
Net Sales Growth 35.8% 8.9%(14.2%)(3.8%)(3.2%) 5.1% 33.1% 37.4% 8.8%(5.9%)(11.4%)
Gross Profit $71.4 $80.5 $59.9 $53.3 $48.8 $51.4 $70.0 $92.3 $104.4 $103.2 $95.8
Margin 26.7% 27.6% 24.0% 22.2% 21.0% 21.0% 21.5% 20.6% 21.5% 22.6% 22.6%
EBITDA $32.0 $40.2 $27.7 $19.2 $10.9 $13.9 $26.5 $43.8 $50.7 $48.2 $39.4
Margin 12.0% 13.8% 11.1% 8.0% 4.7% 5.7% 8.2% 9.8% 10.4% 10.5% 9.3%
EBIT $27.3 $35.1 $22.0 $13.8 $6.1 $9.0 $21.9 $38.8 $46.1 $43.6 $34.8
Margin 10.2% 12.0% 8.8% 5.7% 2.6% 3.7% 6.7% 8.7% 9.5% 9.5% 8.2%
Net Income $15.3 $20.2 $9.7 $2.3 $1.0 $2.6 $14.1 $22.2 $28.1 $24.9 $19.1
Margin 5.7% 6.9% 3.9% 1.0% 0.4% 1.1% 4.3% 5.0% 5.8% 5.5% 4.5%
EPS $1.53 $2.12 $1.15 $0.28 $0.13 $0.33 $1.54 $2.00 $2.26 $2.00 $1.53
Shares Outstanding 10.0 9.5 8.4 8.3 8.2 8.1 9.1 11.1 12.4 12.5 12.5
Capital Expenditures $3.1 $7.3 $12.6 $4.1 $6.8 $3.0 $3.7 $7.6 $6.4 $6.4 $5.8
% of Net Sales 1.2% 2.5% 5.0% 1.7% 2.9% 1.2% 1.1% 1.7% 1.3% 1.4% 1.4%
Source: GIANT SEC filings.
Note: Figures are adjusted to exclude the impact of all nonrecurring items and reflect the results of the agricultural implements product line as discontinued operations beginning in 2004.
PROJECT GIANT
6
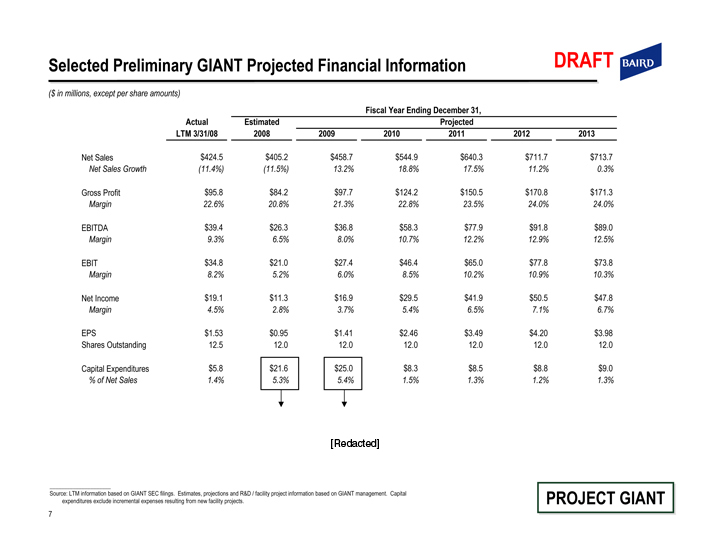
Selected Preliminary GIANT Projected Financial Information DRAFT BAIRD
($ in millions, except per share amounts)
Fiscal Year Ending December 31, Actual Estimated Projected
LTM 3/31/08 2008 2009 2010 2011 2012 2013
Net Sales $424.5 $405.2 $458.7 $544.9 $640.3 $711.7 $713.7
Net Sales Growth(11.4%)(11.5%) 13.2% 18.8% 17.5% 11.2% 0.3%
Gross Profit $95.8 $84.2 $97.7 $124.2 $150.5 $170.8 $171.3
Margin 22.6% 20.8% 21.3% 22.8% 23.5% 24.0% 24.0%
EBITDA $39.4 $26.3 $36.8 $58.3 $77.9 $91.8 $89.0
Margin 9.3% 6.5% 8.0% 10.7% 12.2% 12.9% 12.5%
EBIT $34.8 $21.0 $27.4 $46.4 $65.0 $77.8 $73.8
Margin 8.2% 5.2% 6.0% 8.5% 10.2% 10.9% 10.3%
Net Income $19.1 $11.3 $16.9 $29.5 $41.9 $50.5 $47.8
Margin 4.5% 2.8% 3.7% 5.4% 6.5% 7.1% 6.7%
EPS $1.53 $0.95 $1.41 $2.46 $3.49 $4.20 $3.98
Shares Outstanding 12.5 12.0 12.0 12.0 12.0 12.0 12.0
Capital Expenditures $5.8 $21.6 $25.0 $8.3 $8.5 $8.8 $9.0
% of Net Sales 1.4% 5.3% 5.4% 1.5% 1.3% 1.2% 1.3% [Redacted]
Source: LTM information based on GIANT SEC filings. Estimates, projections and R&D / facility project information based on GIANT management. Capital expenditures exclude incremental expenses resulting from new facility projects.
PROJECT GIANT
7
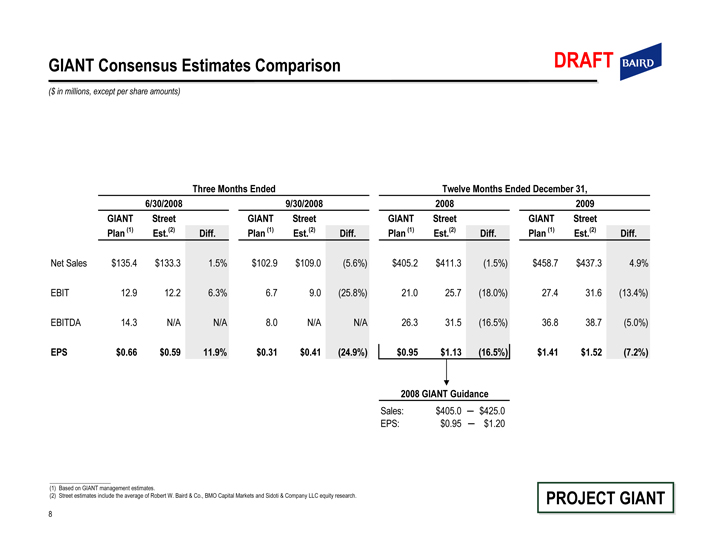
GIANT Consensus Estimates Comparison DRAFT BAIRD
($ in millions, except per share amounts)
Three Months Ended Twelve Months Ended December 31,
6/30/2008 9/30/2008 2008 2009
GIANT Plan(1) Street Est.(2) Diff. GIANT Plan(1) Street Est.(2) Diff. GIANT Plan(1) Street Est.(2) Diff. GIANT Plan(1) Street Est.(2) Diff.
Net Sales $135.4 $133.3 1.5% $102.9 $109.0 (5.6%) $405.2 $411.3 (1.5%) $458.7 $437.3 4.9%
EBIT 12.9 12.2 6.3% 6.7 9.0 (25.8%) 21.0 25.7 (18.0%) 27.4 31.6 (13.4%)
EBITDA 14.3 N/A N/A 8.0 N/A N/A 26.3 31.5 (16.5%) 36.8 38.7 (5.0%)
EPS $0.66 $0.59 11.9% $0.31 $0.41 (24.9%) $0.95 $1.13 (16.5%) $1.41 $1.52 (7.2%)
2008 GIANT Guidance
Sales: $405.0 - $425.0
EPS: $0.95 - $1.20
(1) Based on GIANT management estimates.
(2) Street estimates include the average of Robert W. Baird & Co., BMO Capital Markets and Sidoti & Company LLC equity research.
PROJECT GIANT
8
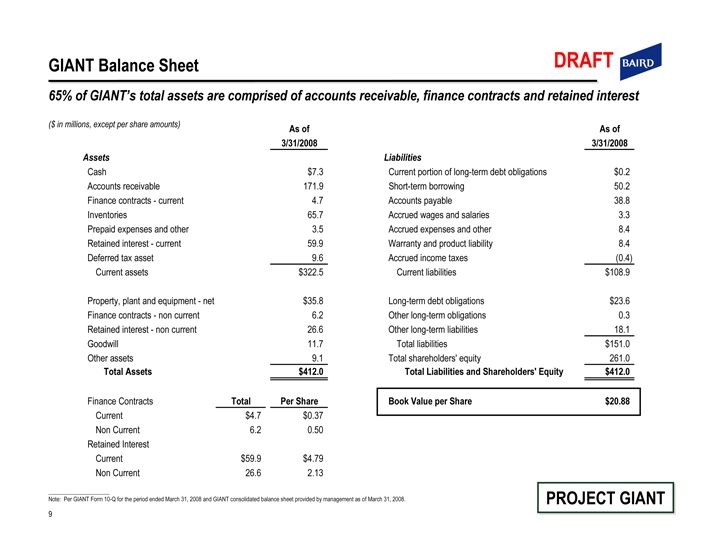
GIANT Balance Sheet DRAFT BAIRD
65% of GIANT’s total assets are comprised of accounts receivable, finance contracts and retained interest
($ in millions, except per share amounts)
As of 3/31/2008
Assets
Cash $7.3
Accounts receivable 171.9
Finance contracts - current 4.7
Inventories 65.7
Prepaid expenses and other 3.5
Retained interest - current 59.9
Deferred tax asset 9.6
Current assets $322.5
Property, plant and equipment - net $35.8
Finance contracts - non current 6.2
Retained interest - non current 26.6
Goodwill 11.7
Other assets 9.1
Total Assets $412.0
Finance Contracts Total Per Share
Current $4.7 $0.37
Non Current 6.2 0.50
Retained Interest
Current $59.9 $4.79
Non Current 26.6 2.13
As of 3/31/2008
Liabilities
Current portion of long-term debt obligations $0.2
Short-term borrowing 50.2
Accounts payable 38.8
Accrued wages and salaries 3.3
Accrued expenses and other 8.4
Warranty and product liability 8.4
Accrued income taxes (0.4)
Current liabilities $108.9
Long-term debt obligations $23.6
Other long-term obligations 0.3
Other long-term liabilities 18.1
Total liabilities $151.0
Total shareholders’ equity 261.0
Total Liabilities and Shareholders’ Equity $412.0
Book Value per Share $20.88
Note: Per GIANT Form 10-Q for the period ended March 31, 2008 and GIANT consolidated balance sheet provided by management as of March 31, 2008.
PROJECT GIANT
9

DRAFT BAIRD
Business Cycle Discussion
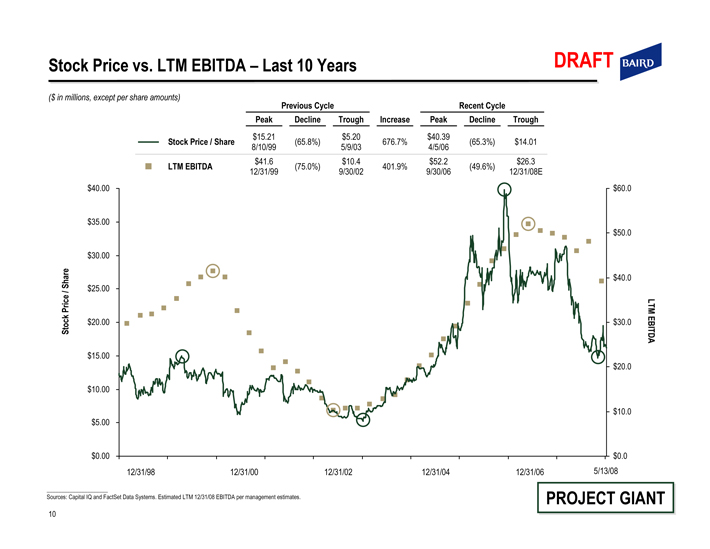
Stock Price vs. LTM EBITDA – Last 10 Years DRAFT BAIRD
($ in millions, except per share amounts)
Previous Cycle Recent Cycle
Peak Decline Trough Increase Peak Decline Trough
$15.21 $5.20 $40.39
Stock Price / Share (65.8%) 676.7%(65.3%) $14.01
8/10/99 5/9/03 4/5/06
$41.6 $10.4 $52.2 $26.3
LTM EBITDA (75.0%) 401.9%(49.6%)
12/31/99 9/30/02 9/30/06 12/31/08E
$40.00 $60.0
$35.00
$50.0
$30.00
Stock Price / Share $40.0
$25.00
LTM EBITDA
$20.00
$30.0
$15.00
$20.0
$10.00
$10.0
$5.00
$0.00 $0.0
12/31/98 12/31/00 12/31/02 12/31/04 12/31/06 5/13/08
Sources: Capital IQ and FactSet Data Systems. Estimated LTM 12/31/08 EBITDA per management estimates.
PROJECT GIANT
10
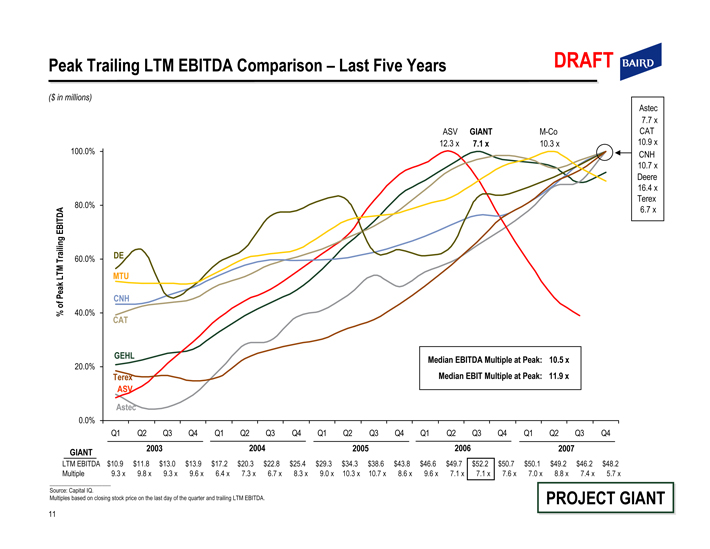
Peak Trailing LTM EBITDA Comparison – Last Five Years
DRAFT BAIRD
($ in millions)
% of Peak LTM Trailing EBITDA
100.0%
80.0%
60.0%
40.0%
20.0%
0.0%
DE
MTU
CNH
CAT
GEHL
Terex
ASV
Astec
ASV
12.3 x
GIANT
7.1 x
M-Co
10.3 x
Median EBITDA Multiple at Peak: 10.5 x
Median EBIT Multiple at Peak: 11.9 x
Astec
7.7 x
CAT
10.9 x
CNH
10.7 x
Deere
16.4 x
Terex
6.7 x
Q1 Q2 Q3 Q4 Q1 Q2 Q3 Q4 Q1 Q2 Q3 Q4 Q1 Q2 Q3 Q4 Q1 Q2 Q3 Q4
2003 2004 2005 2006 2007
GIANT
LTM EBITDA $10.9 $11.8 $13.0 $13.9 $17.2 $20.3 $22.8 $25.4 $29.3 $34.3 $38.6 $43.8 $46.6 $49.7 $52.2 $50.7 $50.1 $49.2 $46.2 $48.2
Multiple 9.3 x 9.8 x 9.3 x 9.6 x 6.4 x 7.3 x 6.7 x 8.3 x 9.0 x 10.3 x 10.7 x 8.6 x 9.6 x 7.1 x 7.1 x 7.6 x 7.0 x 8.8 x 7.4 x 5.7 x
Source: Capital IQ.
Multiples based on closing stock price on the last day of the quarter and trailing LTM EBITDA.
PROJECT GIANT
11
DRAFT BAIRD
Preliminary Valuation Analysis
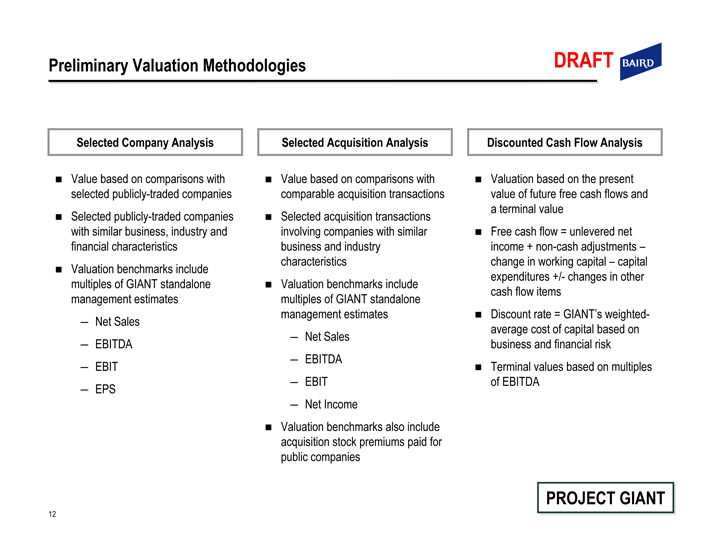
Preliminary Valuation Methodologies
DRAFT BAIRD
Selected Company Analysis
Value based on comparisons with selected publicly-traded companies
Selected publicly-traded companies with similar business, industry and financial characteristics
Valuation benchmarks include multiples of GIANT standalone management estimates
Net Sales
EBITDA
EBIT
EPS
Selected Acquisition Analysis
Value based on comparisons with comparable acquisition transactions
Selected acquisition transactions involving companies with similar business and industry characteristics
Valuation benchmarks include multiples of GIANT standalone management estimates
Net Sales
EBITDA
EBIT
Net Income
Valuation benchmarks also include acquisition stock premiums paid for public companies
Discounted Cash Flow Analysis
Valuation based on the present value of future free cash flows and a terminal value
Free cash flow = unlevered net income + non-cash adjustments – change in working capital – capital expenditures +/- changes in other cash flow items
Discount rate = GIANT’s weighted-average cost of capital based on business and financial risk
Terminal values based on multiples of EBITDA
PROJECT GIANT
12
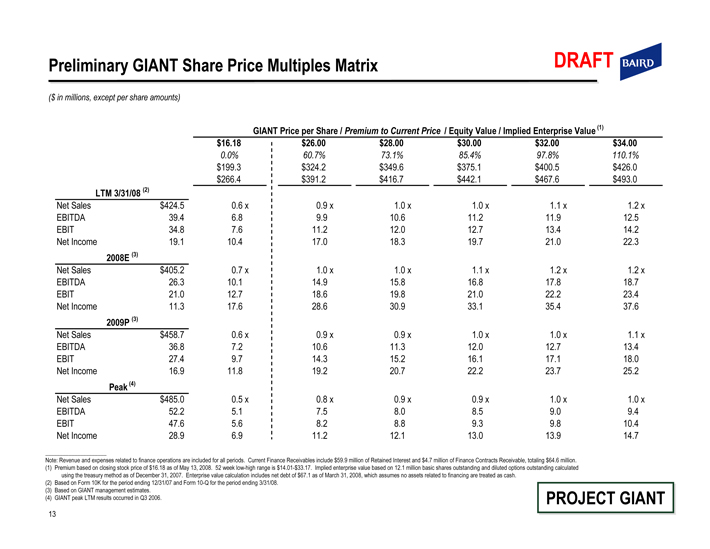
Preliminary GIANT Share Price Multiples Matrix DRAFT BAIRD
($ in millions, except per share amounts)
GIANT Price per Share / Premium to Current Price / Equity Value / Implied Enterprise Value (1)
$16.18 $26.00 $28.00 $30.00 $32.00 $34.00
0.0% 60.7% 73.1% 85.4% 97.8% 110.1%
$199.3 $324.2 $349.6 $375.1 $400.5 $426.0
$266.4 $391.2 $416.7 $442.1 $467.6 $493.0
LTM 3/31/08 (2)
Net Sales $424.5 0.6 x 0.9 x 1.0 x 1.0 x 1.1 x 1.2 x
EBITDA 39.4 6.8 9.9 10.6 11.2 11.9 12.5
EBIT 34.8 7.6 11.2 12.0 12.7 13.4 14.2
Net Income 19.1 10.4 17.0 18.3 19.7 21.0 22.3
2008E (3)
Net Sales $405.2 0.7 x 1.0 x 1.0 x 1.1 x 1.2 x 1.2 x
EBITDA 26.3 10.1 14.9 15.8 16.8 17.8 18.7
EBIT 21.0 12.7 18.6 19.8 21.0 22.2 23.4
Net Income 11.3 17.6 28.6 30.9 33.1 35.4 37.6
2009P (3)
Net Sales $458.7 0.6 x 0.9 x 0.9 x 1.0 x 1.0 x 1.1 x
EBITDA 36.8 7.2 10.6 11.3 12.0 12.7 13.4
EBIT 27.4 9.7 14.3 15.2 16.1 17.1 18.0
Net Income 16.9 11.8 19.2 20.7 22.2 23.7 25.2
Peak (4)
Net Sales $485.0 0.5 x 0.8 x 0.9 x 0.9 x 1.0 x 1.0 x
EBITDA 52.2 5.1 7.5 8.0 8.5 9.0 9.4
EBIT 47.6 5.6 8.2 8.8 9.3 9.8 10.4
Net Income 28.9 6.9 11.2 12.1 13.0 13.9 14.7
Note: Revenue and expenses related to finance operations are included for all periods. Current Finance Receivables include $59.9 million of Retained Interest and $4.7 million of Finance Contracts Receivable, totaling $64.6 million.
(1) Premium based on closing stock price of $16.18 as of May 13, 2008. 52 week low-high range is $14.01-$33.17. Implied enterprise value based on 12.1 million basic shares outstanding and diluted options outstanding calculated using the treasury method as of December 31, 2007. Enterprise value calculation includes net debt of $67.1 as of March 31, 2008, which assumes no assets related to financing are treated as cash.
(2) Based on Form 10K for the period ending 12/31/07 and Form 10-Q for the period ending 3/31/08.
(3) Based on GIANT management estimates.
(4) GIANT peak LTM results occurred in Q3 2006.
PROJECT GIANT
13
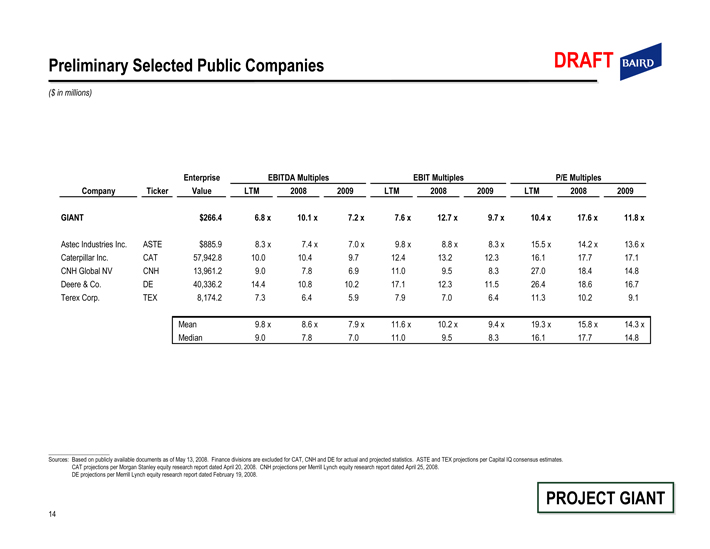
Preliminary Selected Public Companies DRAFT BAIRD
($ in millions)
EBITDA Multiples EBIT Multiples P/E Multiples
Company Ticker Enterprise Value LTM 2008 2009 LTM 2008 2009 LTM 2008 2009
GIANT $266.4 6.8 x 10.1 x 7.2 x 7.6 x 12.7 x 9.7 x 10.4 x 17.6 x 11.8 x
Astec Industries Inc. ASTE $885.9 8.3 x 7.4 x 7.0 x 9.8 x 8.8 x 8.3 x 15.5 x 14.2 x 13.6 x
Caterpillar Inc. CAT 57,942.8 10.0 10.4 9.7 12.4 13.2 12.3 16.1 17.7 17.1
CNH Global NV CNH 13,961.2 9.0 7.8 6.9 11.0 9.5 8.3 27.0 18.4 14.8
Deere & Co. DE 40,336.2 14.4 10.8 10.2 17.1 12.3 11.5 26.4 18.6 16.7
Terex Corp. TEX 8,174.2 7.3 6.4 5.9 7.9 7.0 6.4 11.3 10.2 9.1
Mean 9.8 x 8.6 x 7.9 x 11.6 x 10.2 x 9.4 x 19.3 x 15.8 x 14.3 x
Median 9.0 7.8 7.0 11.0 9.5 8.3 16.1 17.7 14.8
Sources: Based on publicly available documents as of May 13, 2008. Finance divisions are excluded for CAT, CNH and DE for actual and projected statistics. ASTE and TEX projections per Capital IQ consensus estimates.
CAT projections per Morgan Stanley equity research report dated April 20, 2008. CNH projections per Merrill Lynch equity research report dated April 25, 2008.
DE projections per Merrill Lynch equity research report dated February 19, 2008.
PROJECT GIANT
14
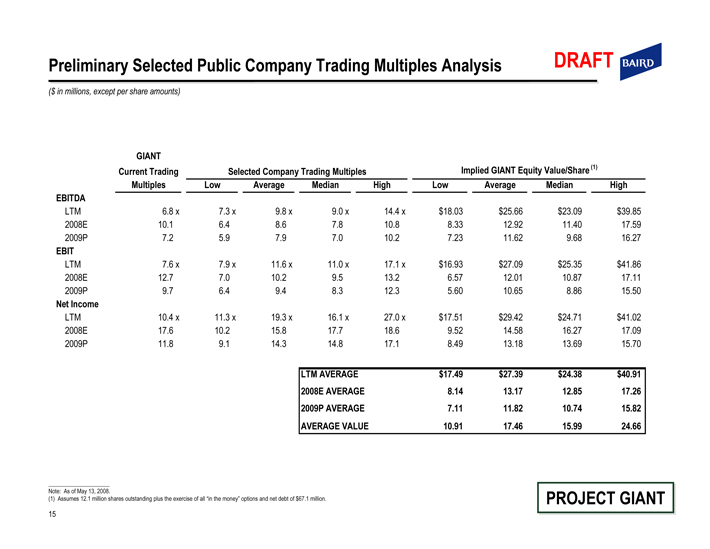
Preliminary Selected Public Company Trading Multiples Analysis DRAFT BAIRD
($ in millions, except per share amounts)
GIANT Current Trading Multiples Selected Company Trading Multiples Implied GIANT Equity Value/Share (1)
Low Average Median High Low Average Median High
EBITDA
LTM 6.8 x 7.3 x 9.8 x 9.0 x 14.4 x $18.03 $25.66 $23.09 $39.85
2008E 10.1 6.4 8.6 7.8 10.8 8.33 12.92 11.40 17.59
2009P 7.2 5.9 7.9 7.0 10.2 7.23 11.62 9.68 16.27
EBIT
LTM 7.6 x 7.9 x 11.6 x 11.0 x 17.1 x $16.93 $27.09 $25.35 $41.86
2008E 12.7 7.0 10.2 9.5 13.2 6.57 12.01 10.87 17.11
2009P 9.7 6.4 9.4 8.3 12.3 5.60 10.65 8.86 15.50
Net Income
LTM 10.4 x 11.3 x 19.3 x 16.1 x 27.0 x $17.51 $29.42 $24.71 $41.02
2008E 17.6 10.2 15.8 17.7 18.6 9.52 14.58 16.27 17.09
2009P 11.8 9.1 14.3 14.8 17.1 8.49 13.18 13.69 15.70
LTM AVERAGE $17.49 $27.39 $24.38 $40.91
2008E AVERAGE 8.14 13.17 12.85 17.26
2009P AVERAGE 7.11 11.82 10.74 15.82
AVERAGE VALUE 10.91 17.46 15.99 24.66
Note: As of May 13, 2008.
(1) Assumes 12.1 million shares outstanding plus the exercise of all “in the money” options and net debt of $67.1 million.
PROJECT GIANT
15
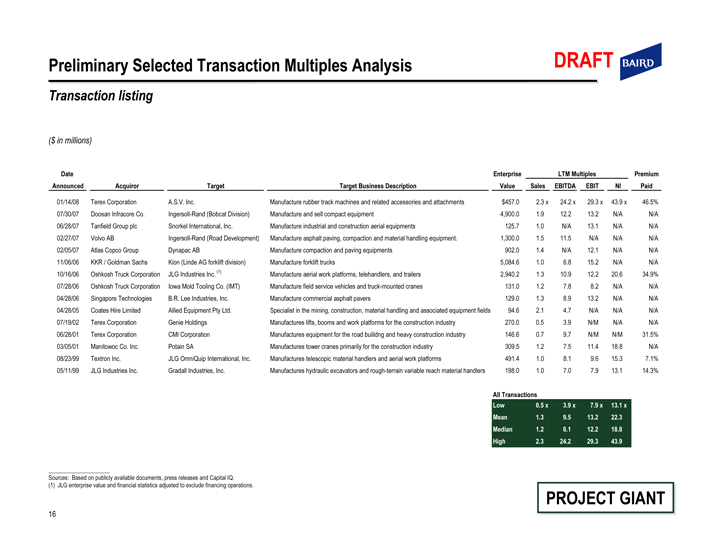
Preliminary Selected Transaction Multiples Analysis DRAFT BAIRD
Transaction listing
($ in millions)
Date Announced Acquiror Target Target Business Description Enterprise Value LTM Multiples Premium Sales EBITDA EBIT NI Paid
01/14/08 Terex Corporation A.S.V. Inc. Manufacture rubber track machines and related accessories and attachments $457.0 2.3 x 24.2 x 29.3 x 43.9 x 46.5%
07/30/07 Doosan Infracore Co. Ingersoll-Rand (Bobcat Division) Manufacture and sell compact equipment 4,900.0 1.9 12.2 13.2 N/A N/A
06/28/07 Tanfield Group plc Snorkel International, Inc. Manufacture industrial and construction aerial equipments 125.7 1.0 N/A 13.1 N/A N/A
02/27/07 Volvo AB Ingersoll-Rand (Road Development) Manufacture asphalt paving, compaction and material handling equipment. 1,300.0 1.5 11.5 N/A N/A N/A
02/05/07 Atlas Copco Group Dynapac AB Manufacture compaction and paving equipments 902.0 1.4 N/A 12.1 N/A N/A
11/06/06 KKR / Goldman Sachs Kion (Linde AG forklift division) Manufacture forklift trucks 5,084.6 1.0 6.8 15.2 N/A N/A
10/16/06 Oshkosh Truck Corporation JLG Industries Inc. (1) Manufacture aerial work platforms, telehandlers, and trailers 2,940.2 1.3 10.9 12.2 20.6 34.9%
07/28/06 Oshkosh Truck Corporation Iowa Mold Tooling Co. (IMT) Manufacture field service vehicles and truck-mounted cranes 131.0 1.2 7.8 8.2 N/A N/A
04/28/06 Singapore Technologies B.R. Lee Industries, Inc. Manufacture commercial asphalt pavers 129.0 1.3 8.9 13.2 N/A N/A
04/28/05 Coates Hire Limited Allied Equipment Pty Ltd. Specialist in the mining, construction, material handling and associated equipment fields 94.6 2.1 4.7 N/A N/A N/A
07/19/02 Terex Corporation Genie Holdings Manufactures lifts, booms and work platforms for the construction industry 270.0 0.5 3.9 N/M N/A N/A
06/28/01 Terex Corporation CMI Corporation Manufactures equipment for the road building and heavy construction industry 146.6 0.7 9.7 N/M N/M 31.5%
03/05/01 Manitowoc Co. Inc. Potain SA Manufactures tower cranes primarily for the construction industry 309.5 1.2 7.5 11.4 18.8 N/A
08/23/99 Textron Inc. JLG OmniQuip International, Inc. Manufactures telescopic material handlers and aerial work platforms 491.4 1.0 8.1 9.6 15.3 7.1%
05/11/99 JLG Industries Inc. Gradall Industries, Inc. Manufactures hydraulic excavators and rough-terrain variable reach material handlers 198.0 1.0 7.0 7.9 13.1 14.3%
All Transactions
Low 0.5 x 3.9 x 7.9 x 13.1 x
Mean 1.3 9.5 13.2 22.3
Median 1.2 8.1 12.2 18.8
High 2.3 24.2 29.3 43.9
Sources: Based on publicly available documents, press releases and Capital IQ.
(1) JLG enterprise value and financial statistics adjusted to exclude financing operations.
PROJECT GIANT
16
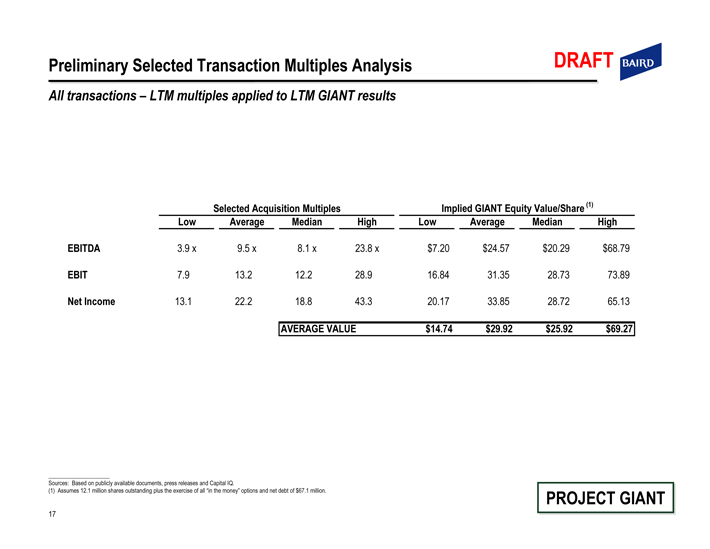
Preliminary Selected Transaction Multiples Analysis DRAFT BAIRD
All transactions – LTM multiples applied to LTM GIANT results
Selected Acquisition Multiples Implied GIANT Equity Value/Share (1)
Low Average Median High Low Average Median High
EBITDA 3.9 x 9.5 x 8.1 x 23.8 x $7.20 $24.57 $20.29 $68.79
EBIT 7.9 13.2 12.2 28.9 16.84 31.35 28.73 73.89
Net Income 13.1 22.2 18.8 43.3 20.17 33.85 28.72 65.13
AVERAGE VALUE $14.74 $29.92 $25.92 $69.27
Sources: Based on publicly available documents, press releases and Capital IQ.
(1) Assumes 12.1 million shares outstanding plus the exercise of all “in the money” options and net debt of $67.1 million. PROJECT GIANT
17
Preliminary Selected Transaction Multiples Analysis DRAFT BAIRD
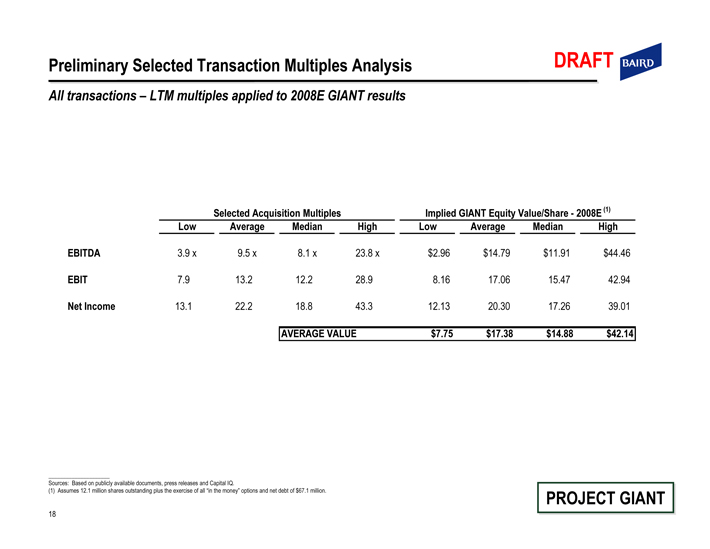
All transactions – LTM multiples applied to 2008E GIANT results
Selected Acquisition Multiples Implied GIANT Equity Value/Share - 2008E (1)
Low Average Median High Low Average Median High
EBITDA 3.9 x 9.5 x 8.1 x 23.8 x $2.96 $14.79 $11.91 $44.46
EBIT 7.9 13.2 12.2 28.9 8.16 17.06 15.47 42.94
Net Income 13.1 22.2 18.8 43.3 12.13 20.30 17.26 39.01
AVERAGE VALUE $7.75 $17.38 $14.88 $42.14
Sources: Based on publicly available documents, press releases and Capital IQ.
(1) Assumes 12.1 million shares outstanding plus the exercise of all “in the money” options and net debt of $67.1 million. PROJECT GIANT
18
Terex / A.S.V. Transaction Overview DRAFT BAIRD
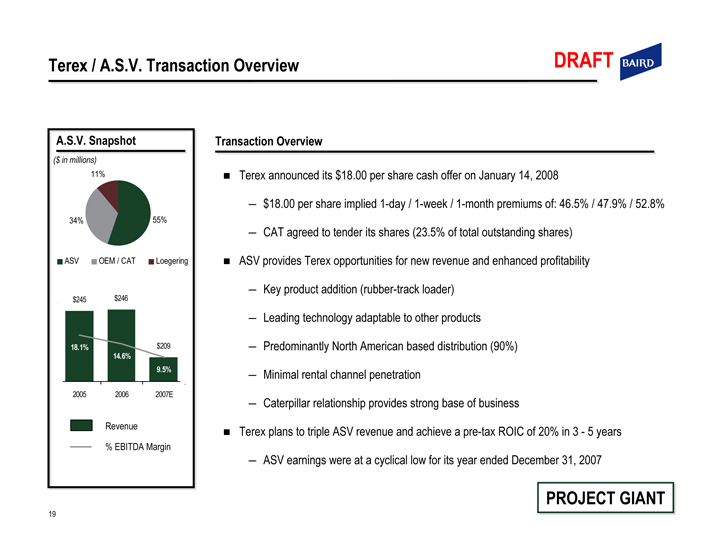
A.S.V. Snapshot
($ in millions)
11%
34% 55%
• ASV • OEM / CAT • Loegering
$245 $246
18.1% $209
14.6%
9.5%
2005 2006 2007E
Revenue
% EBITDA Margin
Transaction Overview
• Terex announced its $18.00 per share cash offer on January 14, 2008
– $18.00 per share implied 1-day / 1-week / 1-month premiums of: 46.5% / 47.9% / 52.8%
– CAT agreed to tender its shares (23.5% of total outstanding shares)
• ASV provides Terex opportunities for new revenue and enhanced profitability
– Key product addition (rubber-track loader)
– Leading technology adaptable to other products
– Predominantly North American based distribution (90%)
– Minimal rental channel penetration
– Caterpillar relationship provides strong base of business
• Terex plans to triple ASV revenue and achieve a pre-tax ROIC of 20% in 3 - 5 years
– ASV earnings were at a cyclical low for its year ended December 31, 2007
PROJECT GIANT
19
Preliminary Terex/A.S.V. Acquisition Analysis DRAFT BAIRD
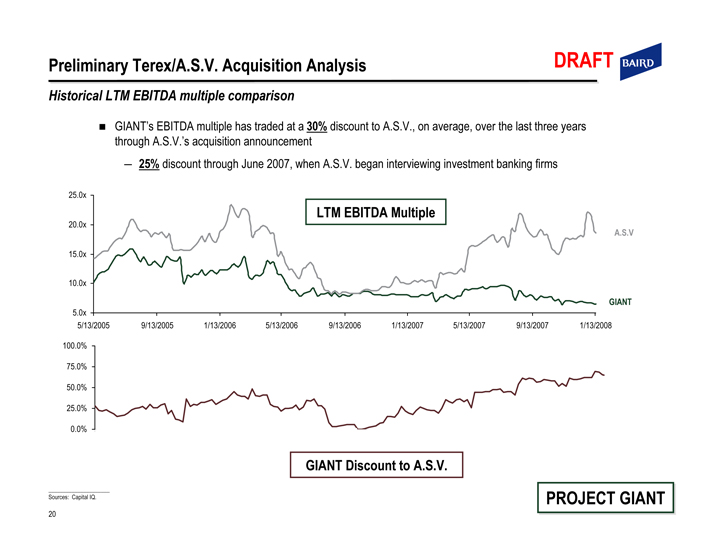
Historical LTM EBITDA multiple comparison
• GIANT’s EBITDA multiple has traded at a 30% discount to A.S.V., on average, over the last three years through A.S.V.’s acquisition announcement
– 25% discount through June 2007, when A.S.V. began interviewing investment banking firms
25.0x
20.0x
15.0x
10.0x
5.0x
LTM EBITDA Multiple
A.S.V
GIANT
5/13/2005 9/13/2005 1/13/2006 5/13/2006 9/13/2006 1/13/2007 5/13/2007 9/13/2007 1/13/2008
100.0% 75.0% 50.0% 25.0% 0.0%
GIANT Discount to A.S.V.
Sources: Capital IQ. PROJECT GIANT
20

Preliminary Terex/A.S.V. Acquisition Analysis DRAFT BAIRD
Multiples analysis
($ in millions, except per share amounts)
LTM and 2008E Multiples
A.S.V. GIANT Statistics Implied Equity Value / Share (1)
LTM Multiples LTM 3/31/08 2008E LTM 3/31/08 2008E
EBITDA 24.2 x $39.4 $26.3 $69.82 $45.14
EBIT 29.3 34.8 21.0 74.89 43.54
Net Income 43.9 19.1 11.3 65.94 39.49
A.S.V. GIANT Statistics Implied Equity Value / Share (1)
2008E Multiples (2) LTM 3/31/08 2008E LTM 3/31/08 2008E
EBITDA 14.9 x $39.4 $26.3 $41.47 $26.14
EBIT 16.7 34.8 21.0 41.01 22.95
Net Income 26.9 19.1 11.3 40.73 24.43
(1) Assumes 12.1 million shares outstanding plus the exercise of all “in the money” options and net debt of $67.1 million.
(2) Based on A.S.V. estimated 2008 figures as of November 11, 2007 (Net Sales of $259.3 million, EBITDA of $30.6 million, EBIT of $27.3 million and Net Income of $18.4 million). Based on confidential numbers provided by A.S.V. management, subject to confidentiality agreement . Subsequent disclosures in A.S.V. SEC filings dated January 28, 2008 were consistent
(Net Sales of $243.8 million and EBIT of $26.7 million).
PROJECT GIANT
21
Preliminary Terex/A.S.V. Acquisition Analysis DRAFT BAIRD
Multiples analysis
($ in millions, except per share amounts)
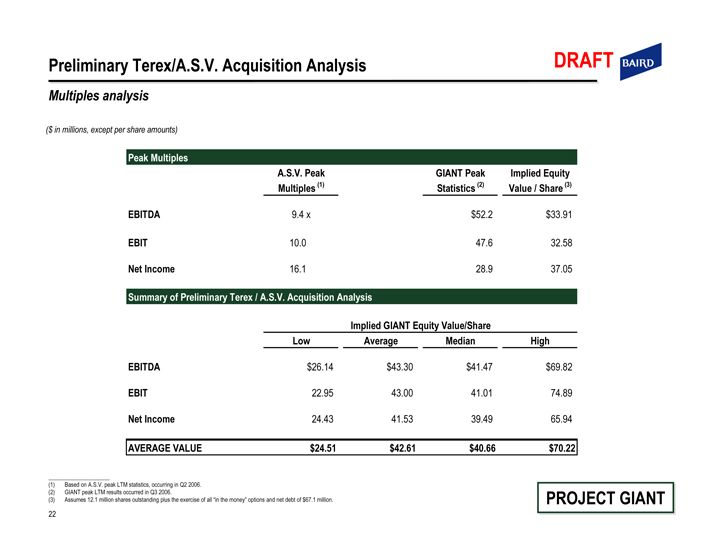
Peak Multiples
A.S.V. Peak GIANT Peak Implied Equity
Multiples (1) Statistics (2) Value / Share (3)
EBITDA 9.4 x $52.2 $33.91
EBIT 10.0 47.6 32.58
Net Income 16.1 28.9 37.05
Summary of Preliminary Terex / A.S.V. Acquisition Analysis
Implied GIANT Equity Value/Share
Low Average Median High
EBITDA $26.14 $43.30 $41.47 $69.82
EBIT 22.95 43.00 41.01 74.89
Net Income 24.43 41.53 39.49 65.94
AVERAGE VALUE $24.51 $42.61 $40.66 $70.22
(1) Based on A.S.V. peak LTM statistics, occurring in Q2 2006.
(2) GIANT peak LTM results occurred in Q3 2006.
(3) Assumes 12.1 million shares outstanding plus the exercise of all “in the money” options and net debt of $67.1 million. PROJECT GIANT
22
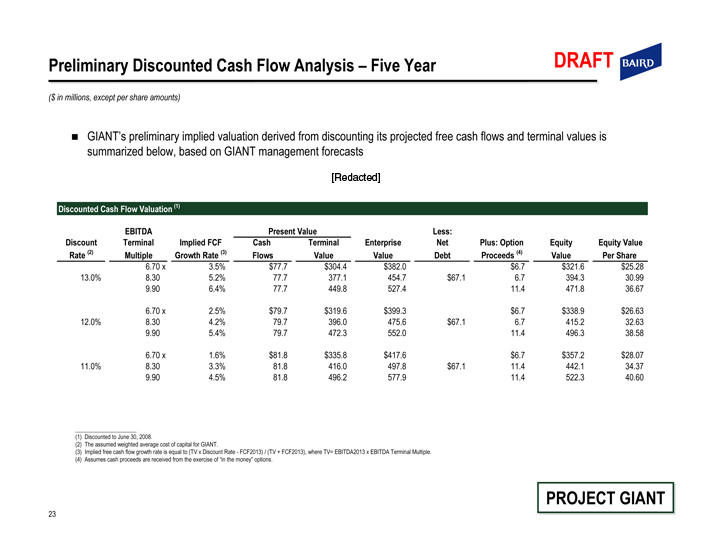
Preliminary Discounted Cash Flow Analysis – Five Year DRAFT BAIRD
($ in millions, except per share amounts)
• GIANT’s preliminary implied valuation derived from discounting its projected free cash flows and terminal values is
summarized below, based on GIANT management forecasts [Redacted]
Discounted Cash Flow Valuation (1) EBITDA Present Value Less:
Discount Terminal Implied FCF Cash Terminal Enterprise Net Plus: Option Equity Equity Value
Rate (2) Multiple Growth Rate (3) Flows Value Value Debt Proceeds (4) Value Per Share
6.70 x 3.5% $77.7 $304.4 $382.0 $6.7 $321.6 $25.28
13.0% 8.30 5.2% 77.7 377.1 454.7 $67.1 6.7 394.3 30.99
9.90 6.4% 77.7 449.8 527.4 11.4 471.8 36.67
6.70 x 2.5% $79.7 $319.6 $399.3 $6.7 $338.9 $26.63
12.0% 8.30 4.2% 79.7 396.0 475.6 $67.1 6.7 415.2 32.63
9.90 5.4% 79.7 472.3 552.0 11.4 496.3 38.58
6.70 x 1.6% $81.8 $335.8 $417.6 $6.7 $357.2 $28.07
11.0% 8.30 3.3% 81.8 416.0 497.8 $67.1 11.4 442.1 34.37
9.90 4.5% 81.8 496.2 577.9 11.4 522.3 40.60
(1) Discounted to June 30, 2008.
(2) The assumed weighted average cost of capital for GIANT.
(3) Implied free cash flow growth rate is equal to (TV x Discount Rate - FCF2013) / (TV + FCF2013), where TV= EBITDA2013 x EBITDA Terminal Multiple.
(4) Assumes cash proceeds are received from the exercise of “in the money” options.
PROJECT GIANT
23
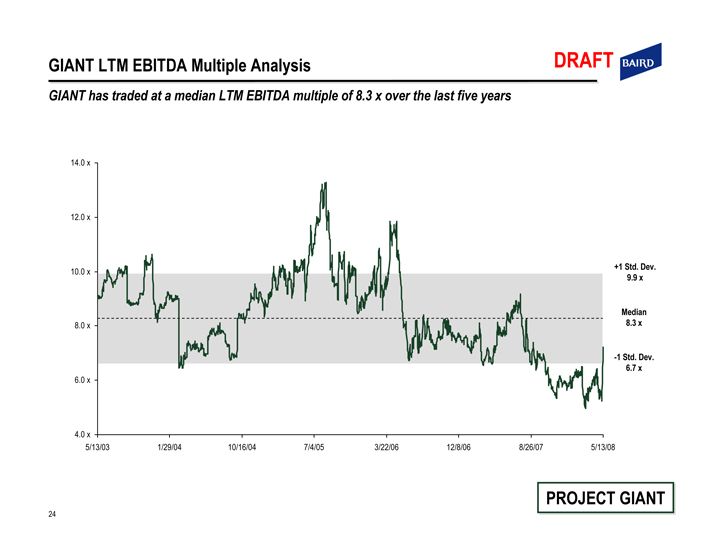
GIANT LTM EBITDA Multiple Analysis DRAFT BAIRD
GIANT has traded at a median LTM EBITDA multiple of 8.3 x over the last five years
14.0 x
12.0 x
10.0 x
8.0 x
6.0 x
4.0 x
+1 Std. Dev. 9.9 x
Median 8.3 x
-1 Std. Dev. 6.7 x
5/13/03 1/29/04 10/16/04 7/4/05 3/22/06 12/8/06 8/26/07 5/13/08
PROJECT GIANT
24
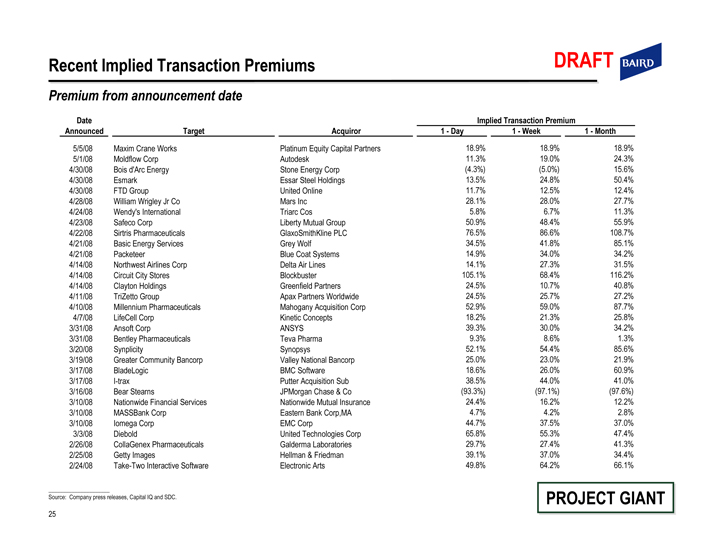
Recent Implied Transaction Premiums DRAFT BAIRD
Premium from announcement date
Date Implied Transaction Premium
Announced Target Acquiror 1 - Day 1 - Week 1 - Month
5/5/08 Maxim Crane Works Platinum Equity Capital Partners 18.9% 18.9% 18.9%
5/1/08 Moldflow Corp Autodesk 11.3% 19.0% 24.3%
4/30/08 Bois d’Arc Energy Stone Energy Corp (4.3%) (5.0%) 15.6%
4/30/08 Esmark Essar Steel Holdings 13.5% 24.8% 50.4%
4/30/08 FTD Group United Online 11.7% 12.5% 12.4%
4/28/08 William Wrigley Jr Co Mars Inc 28.1% 28.0% 27.7%
4/24/08 Wendy’s International Triarc Cos 5.8% 6.7% 11.3%
4/23/08 Safeco Corp Liberty Mutual Group 50.9% 48.4% 55.9%
4/22/08 Sirtris Pharmaceuticals GlaxoSmithKline PLC 76.5% 86.6% 108.7%
4/21/08 Basic Energy Services Grey Wolf 34.5% 41.8% 85.1%
4/21/08 Packeteer Blue Coat Systems 14.9% 34.0% 34.2%
4/14/08 Northwest Airlines Corp Delta Air Lines 14.1% 27.3% 31.5%
4/14/08 Circuit City Stores Blockbuster 105.1% 68.4% 116.2%
4/14/08 Clayton Holdings Greenfield Partners 24.5% 10.7% 40.8%
4/11/08 TriZetto Group Apax Partners Worldwide 24.5% 25.7% 27.2%
4/10/08 Millennium Pharmaceuticals Mahogany Acquisition Corp 52.9% 59.0% 87.7%
4/7/08 LifeCell Corp Kinetic Concepts 18.2% 21.3% 25.8%
3/31/08 Ansoft Corp ANSYS 39.3% 30.0% 34.2%
3/31/08 Bentley Pharmaceuticals Teva Pharma 9.3% 8.6% 1.3%
3/20/08 Synplicity Synopsys 52.1% 54.4% 85.6%
3/19/08 Greater Community Bancorp Valley National Bancorp 25.0% 23.0% 21.9%
3/17/08 BladeLogic BMC Software 18.6% 26.0% 60.9%
3/17/08 I-trax Putter Acquisition Sub 38.5% 44.0% 41.0%
3/16/08 Bear Stearns JPMorgan Chase & Co (93.3%) (97.1%) (97.6%)
3/10/08 Nationwide Financial Services Nationwide Mutual Insurance 24.4% 16.2% 12.2%
3/10/08 MASSBank Corp Eastern Bank Corp,MA 4.7% 4.2% 2.8%
3/10/08 Iomega Corp EMC Corp 44.7% 37.5% 37.0%
3/3/08 Diebold United Technologies Corp 65.8% 55.3% 47.4%
2/26/08 CollaGenex Pharmaceuticals Galderma Laboratories 29.7% 27.4% 41.3%
2/25/08 Getty Images Hellman & Friedman 39.1% 37.0% 34.4%
2/24/08 Take-Two Interactive Software Electronic Arts 49.8% 64.2% 66.1%
Source: Company press releases, Capital IQ and SDC. PROJECT GIANT
25
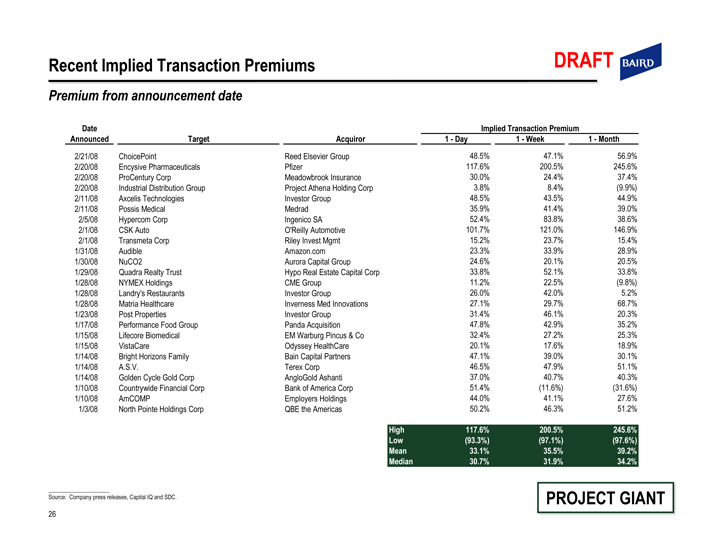
Recent Implied Transaction Premiums DRAFT BAIRD
Premium from announcement date
Date Implied Transaction Premium
Announced Target Acquiror 1-Day 1-Week 1-Month
2/21/08 ChoicePoint Reed Elsevier Group 48.5% 47.1% 56.9%
2/20/08 Encysive Pharmaceuticals Pfizer 117.6% 200.5% 245.6%
2/20/08 ProCentury Corp Meadowbrook Insurance 30.0% 24.4% 37.4%
2/20/08 Industrial Distribution Group Project Athena Holding Corp 3.8% 8.4%(9.9%)
2/11/08 Axcelis Technologies Investor Group 48.5% 43.5% 44.9%
2/11/08 Possis Medical Medrad 35.9% 41.4% 39.0%
2/5/08 Hypercom Corp Ingenico SA 52.4% 83.8% 38.6%
2/1/08 CSK Auto O’Reilly Automotive 101.7% 121.0% 146.9%
2/1/08 Transmeta Corp Riley Invest Mgmt 15.2% 23.7% 15.4%
1/31/08 Audible Amazon.com 23.3% 33.9% 28.9%
1/30/08 NuCO2 Aurora Capital Group 24.6% 20.1% 20.5%
1/29/08 Quadra Realty Trust Hypo Real Estate Capital Corp 33.8% 52.1% 33.8%
1/28/08 NYMEX Holdings CME Group 11.2% 22.5%(9.8%)
1/28/08 Landry’s Restaurants Investor Group 26.0% 42.0% 5.2%
1/28/08 Matria Healthcare Inverness Med Innovations 27.1% 29.7% 68.7%
1/23/08 Post Properties Investor Group 31.4% 46.1% 20.3%
1/17/08 Performance Food Group Panda Acquisition 47.8% 42.9% 35.2%
1/15/08 Lifecore Biomedical EM Warburg Pincus & Co 32.4% 27.2% 25.3%
1/15/08 VistaCare Odyssey HealthCare 20.1% 17.6% 18.9%
1/14/08 Bright Horizons Family Bain Capital Partners 47.1% 39.0% 30.1%
1/14/08 A.S.V. Terex Corp 46.5% 47.9% 51.1%
1/14/08 Golden Cycle Gold Corp AngloGold Ashanti 37.0% 40.7% 40.3%
1/10/08 Countrywide Financial Corp Bank of America Corp 51.4%(11.6%)(31.6%)
1/10/08 AmCOMP Employers Holdings 44.0% 41.1% 27.6%
1/3/08 North Pointe Holdings Corp QBE the Americas 50.2% 46.3% 51.2%
High 117.6% 200.5% 245.6%
Low(93.3%)(97.1%)(97.6%)
Mean 33.1% 35.5% 39.2%
Median 30.7% 31.9% 34.2%
Source: Company press releases, Capital IQ and SDC.
26 PROJECT GIANT
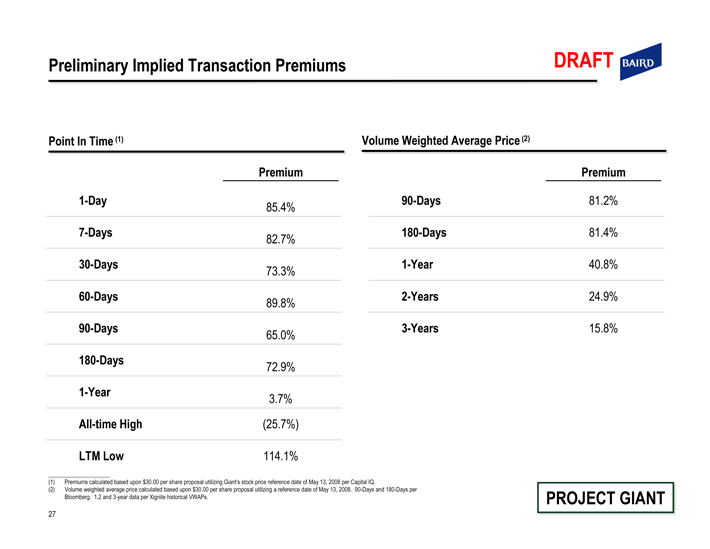
Preliminary Implied Transaction Premiums
DRAFT BAIRD
Point In Time (1) Volume Weighted Average Price (2)
Premium Premium
1-Day 85.4% 90-Days 81.2%
7-Days 82.7% 180-Days 81.4%
30-Days 73.3% 1-Year 40.8%
60-Days 89.8% 2-Years 24.9%
90-Days 65.0% 3-Years 15.8%
180-Days 72.9%
1-Year 3.7%
All-time High (25.7%)
LTM Low 114.1%
(1) Premiums calculated based upon $30.00 per share proposal utilizing Giant’s stock price reference date of May 13, 2008 per Capital IQ.
(2) Volume weighted average price calculated based upon $30.00 per share proposal utilizing a reference date of May 13, 2008. 90-Days and 180-Days per Bloomberg. 1,2 and 3-year data per Xignite historical VWAPs.
27 PROJECT GIANT
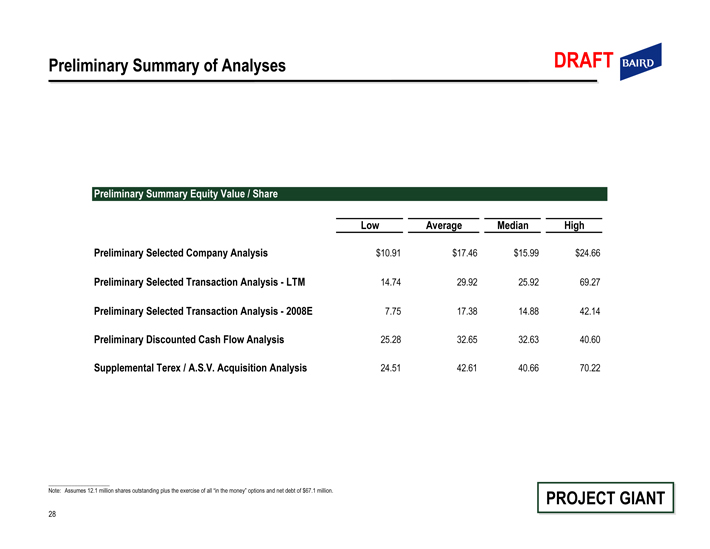
Preliminary Summary of Analyses
DRAFT BAIRD
Preliminary Summary Equity Value / Share
Low Average Median High
Preliminary Selected Company Analysis $10.91 $17.46 $15.99 $24.66
Preliminary Selected Transaction Analysis - LTM 14.74 29.92 25.92 69.27
Preliminary Selected Transaction Analysis - 2008E 7.75 17.38 14.88 42.14
Preliminary Discounted Cash Flow Analysis 25.28 32.65 32.63 40.60
Supplemental Terex / A.S.V. Acquisition Analysis 24.51 42.61 40.66 70.22
Note: Assumes 12.1 million shares outstanding plus the exercise of all “in the money” options and net debt of $67.1 million.
28 PROJECT GIANT
DRAFT BAIRD
Selected Potential Strategic Partners
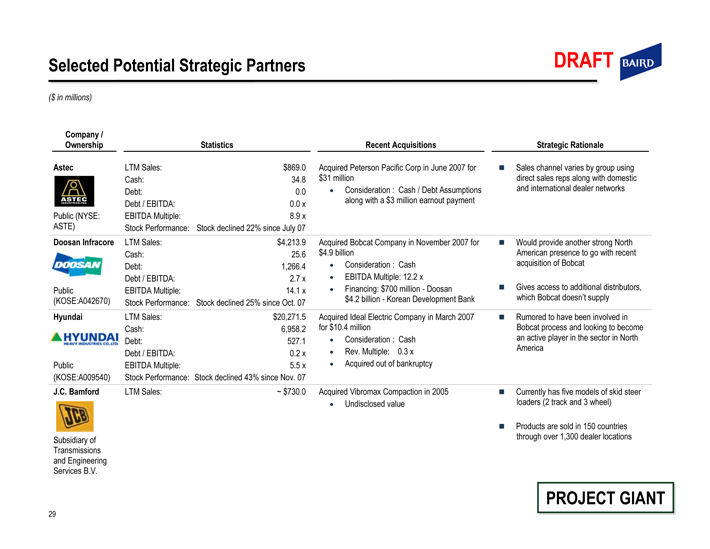
Selected Potential Strategic Partners
($ in millions)
DRAFT BAIRD
Company / Ownership
Astec
ASTEC
Public (NYSE: ASTE)
Doosan Infracore
DOOSAN
Public
(KOSE:A042670)
Hyundai
HYUNDAI
HEAVY INDUSTRIES CO., LTD.
Public
(KOSE:A009540)
J.C. Bamford
JCB
Subsidiary of Transmissions and Engineering Services B.V.
Statistics
LTM Sales: $869.0
Cash: 34.8
Debt: 0.0
Debt / EBITDA: 0.0 x
EBITDA Multiple: 8.9 x
Stock Performance: Stock declined 22% since July 07
LTM Sales: $4,213.9
Cash: 25.6
Debt: 1,266.4
Debt / EBITDA: 2.7 x
EBITDA Multiple: 14.1 x
Stock Performance: Stock declined 25% since Oct. 07
LTM Sales: $20,271.5
Cash: 6,958.2
Debt: 527.1
Debt / EBITDA: 0.2 x
EBITDA Multiple: 5.5 x
Stock Performance: Stock declined 43% since Nov. 07
LTM Sales: ~ $730.0
Recent Acquisitions
Acquired Peterson Pacific Corp in June 2007 for
$31 million
• Consideration : Cash / Debt Assumptions along with a $3 million earnout payment
Acquired Bobcat Company in November 2007 for $4.9 billion
• Consideration : Cash
• EBITDA Multiple: 12.2 x
• Financing: $700 million—Doosan
$4.2 billion—Korean Development Bank Acquired Ideal Electric Company in March 2007 for $10.4 million
• Consideration : Cash
• Rev. Multiple: 0.3 x
• Acquired out of bankruptcy Acquired Vibromax Compaction in 2005
• Undisclosed value
Strategic Rationale
• Sales channel varies by group using direct sales reps along with domestic and international dealer networks
• Would provide another strong North American presence to go with recent acquisition of Bobcat
• Gives access to additional distributors, which Bobcat doesn’t supply
• Rumored to have been involved in Bobcat process and looking to become an active player in the sector in North America
• Currently has five models of skid steer loaders (2 track and 3 wheel)
• Products are sold in 150 countries through over 1,300 dealer locations
29 PROJECT GIANT
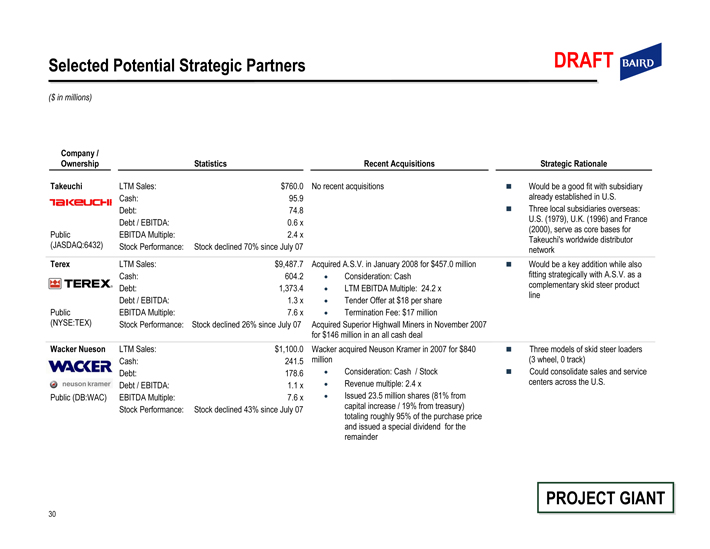
Selected Potential Strategic Partners DRAFT Baird
($ in millions)
Company / Ownership
Takeuchi
Public
(JASDAQ:6432)
Terex
Public (NYSE:TEX)
Wacker Nueson
Public (DB:WAC)
Statistics
LTM Sales: $760.0
Cash: 95.9
Debt: 74.8
Debt / EBITDA: 0.6 x
EBITDA Multiple: 2.4 x
Stock Performance: Stock declined 70% since July 07
LTM Sales: $9,487.7
Cash: 604.2
Debt: 1,373.4
Debt / EBITDA: 1.3 x
EBITDA Multiple: 7.6 x
Stock Performance: Stock declined 26% since July 07
LTM Sales: $1,100.0
Cash: 241.5
Debt: 178.6
Debt / EBITDA: 1.1 x
EBITDA Multiple: 7.6 x
Stock Performance: Stock declined 43% since July 07
Recent Acquisitions
No recent acquisitions
Acquired A.S.V. in January 2008 for $457.0 million
•Consideration: Cash
•LTM EBITDA Multiple: 24.2 x
•Tender Offer at $18 per share
•Termination Fee: $17 million
Acquired Superior Highwall Miners in November 2007 for $146 million in an all cash deal
Wacker acquired Neuson Kramer in 2007 for $840 million
•Consideration: Cash / Stock
•Revenue multiple: 2.4 x
•Issued 23.5 million shares (81% from capital increase / 19% from treasury) totaling roughly 95% of the purchase price and issued aspecial dividend for the remainder
Strategic Rationale
•Would be a good fit with subsidiary already established in U.S.
•Three local subsidiaries overseas: U.S. (1979), U.K. (1996) and France (2000), serve as core bases for Takeuchi’s worldwide distributor network
•Would be a key addition while also fitting strategically with A.S.V. as a complementary skid steer product line
•Three models of skid steer loaders (3 wheel, 0 track)
•Could consolidate sales and service centers across the U.S.
PROJECT GIANT
30
DRAFT Baird
Appendix
DRAFT Baird
Supplemental Information
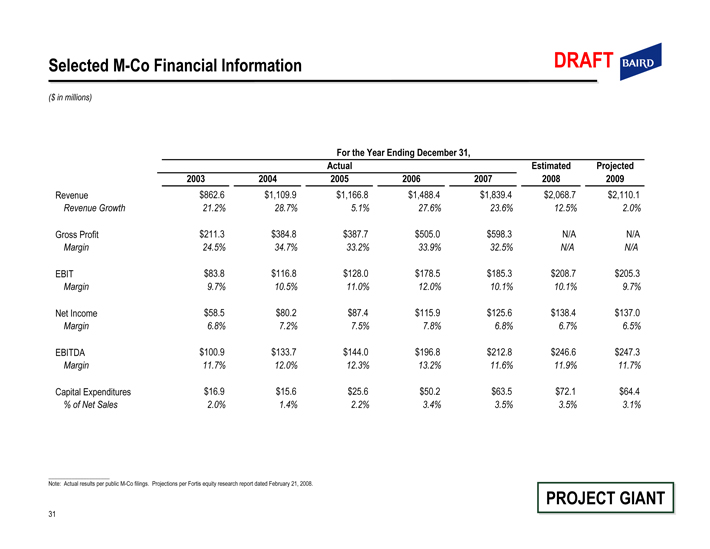
Selected M-Co Financial Information DRAFT Baird
($ in millions)
For the Year Ending December 31,
Actual Estimated Projected
2003 2004 2005 2006 2007 2008 2009
Revenue $862.6 $1,109.9 $1,166.8 $1,488.4 $1,839.4 $2,068.7 $2,110.1
Revenue Growth 21.2% 28.7% 5.1% 27.6% 23.6% 12.5% 2.0%
Gross Profit $211.3 $384.8 $387.7 $505.0 $598.3 N/A N/A
Margin 24.5% 34.7% 33.2% 33.9% 32.5% N/A N/A
EBIT $83.8 $116.8 $128.0 $178.5 $185.3 $208.7 $205.3
Margin 9.7% 10.5% 11.0% 12.0% 10.1% 10.1% 9.7%
Net Income $58.5 $80.2 $87.4 $115.9 $125.6 $138.4 $137.0
Margin 6.8% 7.2% 7.5% 7.8% 6.8% 6.7% 6.5%
EBITDA $100.9 $133.7 $144.0 $196.8 $212.8 $246.6 $247.3
Margin 11.7% 12.0% 12.3% 13.2% 11.6% 11.9% 11.7%
Capital Expenditures $16.9 $15.6 $25.6 $50.2 $63.5 $72.1 $64.4
% of Net Sales 2.0% 1.4% 2.2% 3.4% 3.5% 3.5% 3.1%
Note: Actual results per public M-Co filings. Projections per Fortis equity research report dated February 21, 2008.
PROJECT GIANT
31
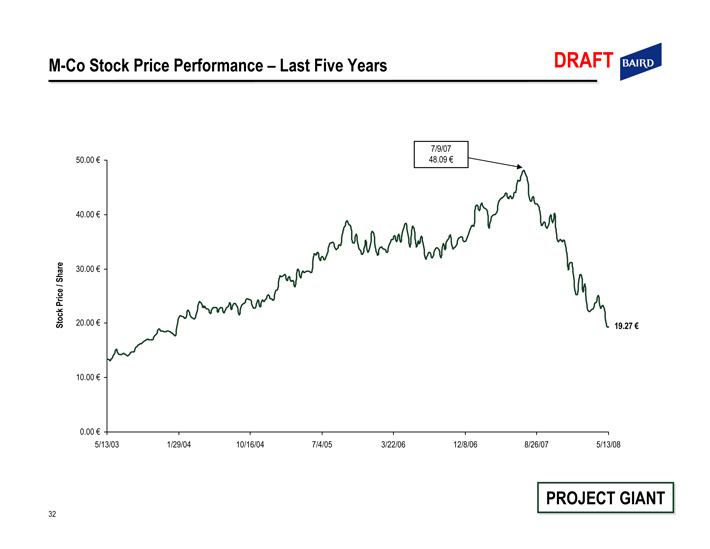
M-Co Stock Price Performance – Last Five Years DRAFT Baird
7/9/07
48.09 €
50.00 €
40.00 €
Stock Price / Share
30.00 €
20.00 €
19.27 €
10.00 €
0.00 €
5/13/03 1/29/04 10/16/04 7/4/05 3/22/06 12/8/06 8/26/07 5/13/08
PROJECT GIANT
32
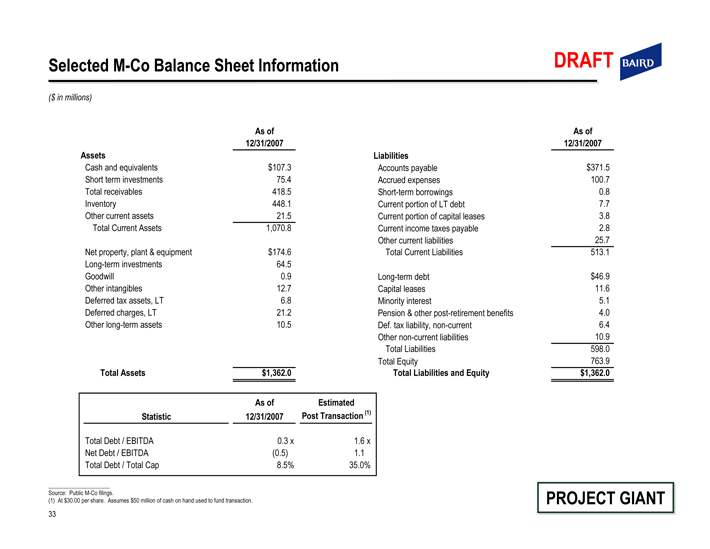
Selected M-Co Balance Sheet Information
($ in millions)
DRAFT Baird
As of
12/31/2007
Assets
Cash and equivalents $107.3
Short term investments 75.4
Total receivables 418.5
Inventory 448.1
Other current assets 21.5
Total Current Assets 1,070.8
Net property, plant & equipment $174.6
Long-term investments 64.5
Goodwill 0.9
Other intangibles 12.7
Deferred tax assets, LT 6.8
Deferred charges, LT 21.2
Other long-term assets 10.5
Total Assets $1,362.0
As of Estimated
Statistic 12/31/2007 Post Transaction (1)
Total Debt / EBITDA 0.3 x 1.6 x
Net Debt / EBITDA(0.5) 1.1
Total Debt / Total Cap 8.5% 35.0%
As of
12/31/2007
Liabilities
Accounts payable $371.5
Accrued expenses 100.7
Short-term borrowings 0.8
Current portion of LT debt 7.7
Current portion of capital leases 3.8
Current income taxes payable 2.8
Other current liabilities 25.7
Total Current Liabilities 513.1
Long-term debt $46.9
Capital leases 11.6
Minority interest 5.1
Pension & other post-retirement benefits 4.0
Def. tax liability, non-current 6.4
Other non-current liabilities 10.9
Total Liabilities 598.0
Total Equity 763.9
Total Liabilities and Equity $1,362.0
Source: Public M-Co filings.
(1) At $30.00 per share. Assumes $50 million of cash on hand used to fund transaction. PROJECT GIANT 33
Robert W. Baird Ltd. and Baird Capital Partners Europe are authorized and regulated in the UK by the Financial Services Authority.