UNITED STATES
SECURITIES AND EXCHANGE COMMISSION
Washington, D.C. 20549
FORM 6-K
REPORT OF FOREIGN PRIVATE ISSUER PURSUANT TO RULE 13a-16 or 15d-16
UNDER THE SECURITIES EXCHANGE ACT OF 1934
For the month of November 4, 2003
Commonwealth Bank of Australia-ACN 123 123 124
(Translation of registrant’s name into English)Level 2, 48 Martin Place
SYDNEY NSW 1155
AUSTRALIA
(Address of principal executive office)Indicate by check mark whether the registrant files or will fill annual reports under cover of Form 20-F or Form 40-F:
Form 20-F x Form 40-F o
Indicate by check mark whether the registrant by furnishing the information contained in this Form is also thereby furnishing the information to the Commission pursuant to Rule 12g-3-2(b) under the Securities and Exchange Act of 1934. Yes x Noo
TABLE OF CONTENTS
Documents Furnished By the Registrant
1. Press Release of the Registrant dated November 2003
SIGNATURES
Pursuant to the requirements of the Securities and Exchange Act of 1934, the registrant has duly caused this report to be signed on its behalf by the undersigned thereunto duly authorized.
| | | | | |
| | | Commonwealth Bank of Australia
|
|
|
|
|
| | | | | |
| Date: November 4, 2003 | | /s/ John Damien Hatton
|
| | | Name: | | John Damien Hatton
|
|
|
|
|
| | | Title: | | Company Secretary
|

This presentation is to be used as handouts for the offshore roadshore to the US and UK in the week commencing 3 November 2003.
The presentation contains similar content to the presentation released to the stock exchange on 13 October 2003 for the Merrill Lynch Australasian Investment Conference/roadshow presentation.
Copy of presentation available on Bank’s website.
Presentation also submitted to ASX.
| Roadshow Presentation David Murray Chief Executive Officer Michael Cameron Chief Financial Officer Commonwealth Bank of Australia November 2003 |

| The material that follows is a presentation of general background information about the Bank's activities current at the date of the presentation, 3 November 2003. It is information given in summary form and does not purport to be complete. It is not intended to be relied upon as advice to investors or potential investors and does not take into account the investment objectives, financial situation or needs of any particular investor. These should be considered, with or without professional advice when deciding if an investment is appropriate. Disclaimer |

| Speaker's Notes Speaker's notes for this presentation are attached below each slide. To access them, you may need to save the slides in PowerPoint and view/print in "notes view." |
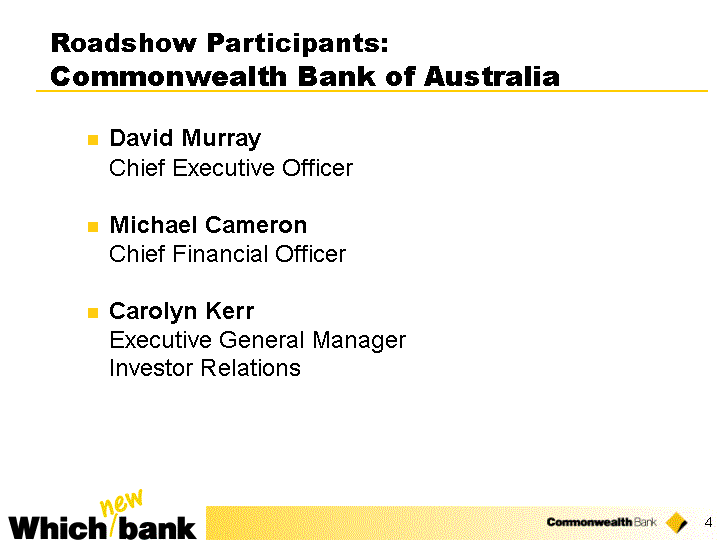
| Roadshow Participants: Commonwealth Bank of Australia David Murray Chief Executive Officer Michael Cameron Chief Financial Officer Carolyn Kerr Executive General Manager Investor Relations |
Agenda:
| • | | Review operating environment in Australia |
| |
| • | | Review Bank’s performance |
| |
| • | | Details of new transformation program. |
Happy to take questions at end of session.
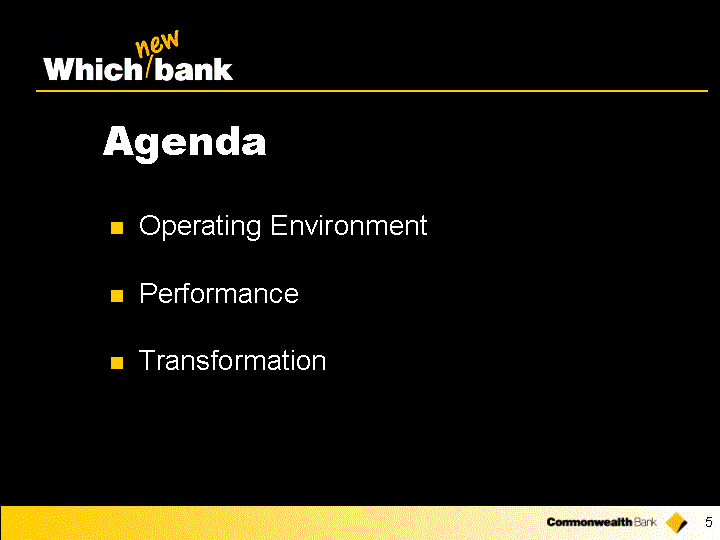
| Agenda Operating Environment Performance Transformation |

| The Operating Environment |
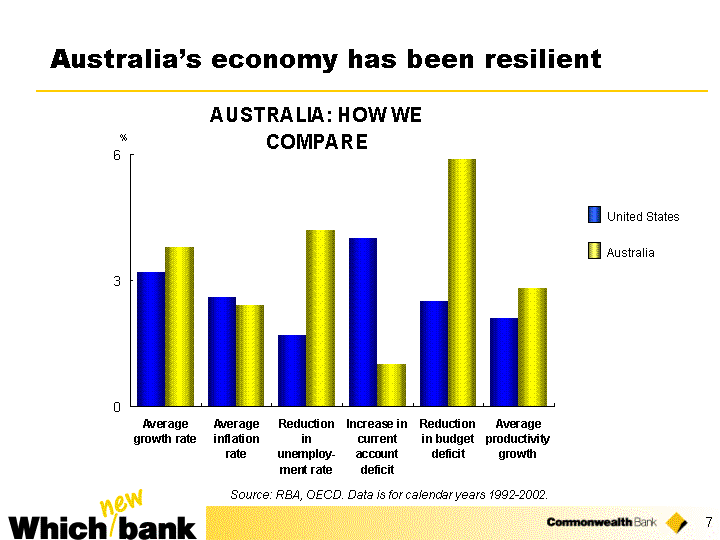
| • | | Australia’s economy resilient in global context |
| |
| • | | Aus vs US — outperformed on a number of measures over last decade. |
| |
| • | | However, downside risks remain as we are not immune from the impact of the global economy. |
| |
| • | | Economic growth FY30/06/03 was 2% (FY02: 3.8%, so some moderation but still travelling OK) |
| Australia's economy has been resilient Source: RBA, OECD. Data is for calendar years 1992-2002. Australia United States |
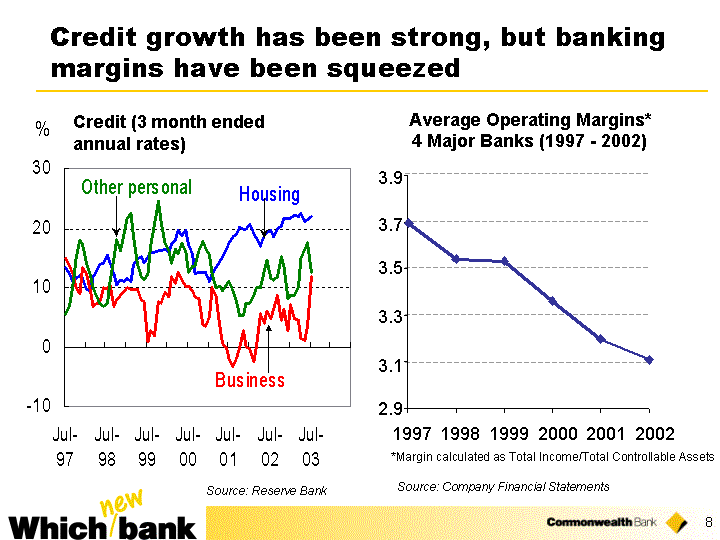
| • | | Economic growth and low interest rates underpinning strong credit growth, particularly housing. |
| |
| • | | Credit rose 13.7% over 12 months to August 2003. |
| |
| • | | Expect moderation back to 7-10% — timing uncertain. |
| |
| • | | Given competitive market, expect moderation to happen in environment of reducing operating margins, with NIM expected to reduce by 10bps per annum. |
| |
| • | | Of 15 AAA rated countries, Australia has highest interest rates: more flexibility in monetary policy. |
| |
| • | | In reducing NIM environment, efficiency becomes a major factor. |
Notes to Chart:
| • | | Total Controllable Assets refers to balance sheet assets + Funds under management and administration (excl. custody assets under administration) |
| Credit growth has been strong, but banking margins have been squeezed Source: Company Financial Statements Average Operating Margins* 4 Major Banks (1997 - 2002) *Margin calculated as Total Income/Total Controllable Assets 1997 1998 2001 2000 1999 2002 3.9 2.9 3.1 3.3 3.7 3.5 CBA NAB WBC ANZ Average 1997 3.24 4.01 3.78 3.76 3.7 1998 3.26 3.85 3.54 3.5 3.54 1999 3.18 3.87 3.51 3.54 3.53 2000 2.96 3.78 3.25 3.43 3.36 2001 2.97 3.36 3.18 3.3 3.2 2002 2.48 3.27 3.25 3.17 3.11 Credit (3 month ended annual rates) Source: Reserve Bank |
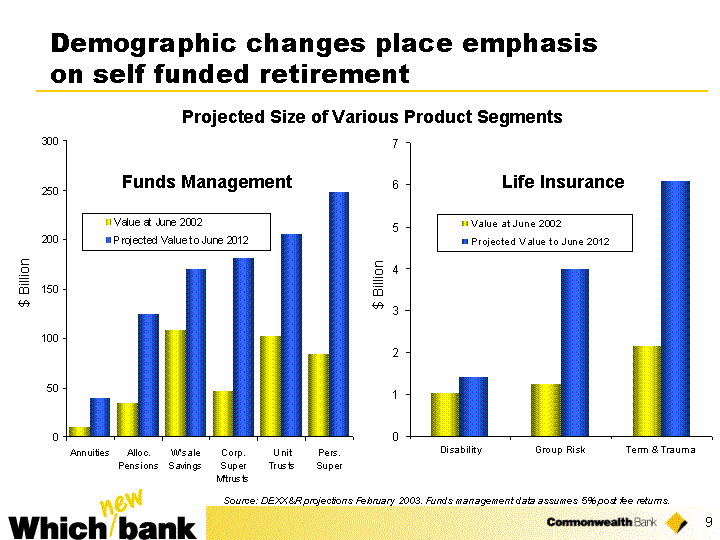
| • | | Demographic changes: Australia’s ageing population is living longer |
| |
| • | | That combined with 9% compulsory superannuation requirement puts emphasis on self funded retirement. |
| |
| • | | In the coming decade, we expect funds management to grow at 8% pa and life insurance at 10% pa. |
| |
| • | | Growth rates such as these emphasise the importance of being in wealth management. |
| Disability Group Risk Term & Trauma Value at June 2002 1.005 1.253 2.16 Projected Value to June 2012 1.404 3.977 6.071 $ Billion Source: DEXX&R projections February 2003. Funds management data assumes 5% post fee returns. Annuities Alloc. Pensions W'sale Savings Corp. Super M'trusts Unit Trusts Pers. Super Value at June 2002 9.661 33.763 107.598 46.299 101.867 83.599 Projected Value to June 2012 39.17 124.199 169.694 180.817 205.298 247.972 Projected Size of Various Product Segments $ Billion Funds Management Life Insurance Demographic changes place emphasis on self funded retirement |
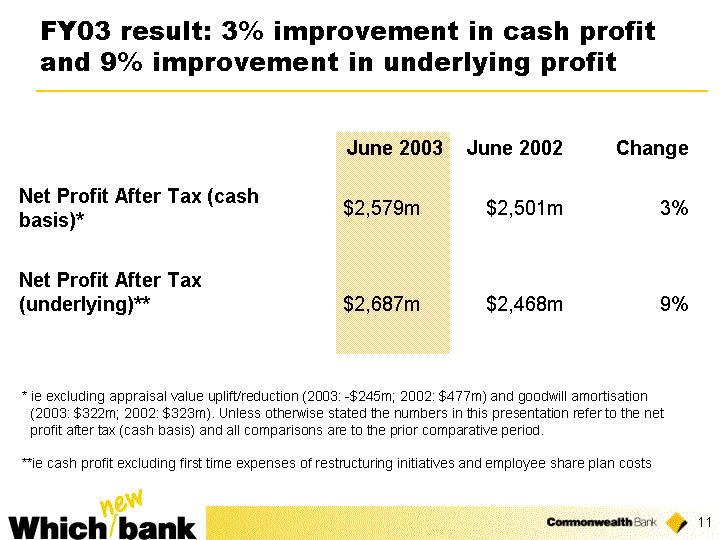
| • | | The Bank’s recent profit result 30/06/03: |
| |
| • | | Cash profit: 3% improvement to $2.6bn. |
| |
| • | | Excluding first time expenses and investment returns, underlying NPAT was $2.69bn, up 9%. |
| |
| • | | First time expenses: |
| | • | | $214m strategic initiatives |
| |
| | �� | | $45m: two years of ESAP costs |
| • | | Underlying profit growth slightly ahead of peers. |
| FY03 result: 3% improvement in cash profit and 9% improvement in underlying profit Net Profit After Tax (cash basis)* Net Profit After Tax (underlying)** June 2003 $2,579m $2,687m June 2002 $2,501m $2,468m Change 3% 9% * ie excluding appraisal value uplift/reduction (2003: -$245m; 2002: $477m) and goodwill amortisation (2003: $322m; 2002: $323m). Unless otherwise stated the numbers in this presentation refer to the net profit after tax (cash basis) and all comparisons are to the prior comparative period. **ie cash profit excluding first time expenses of restructuring initiatives and employee share plan costs |

| Banking performance drove underlying growth of 9% in FY03 |
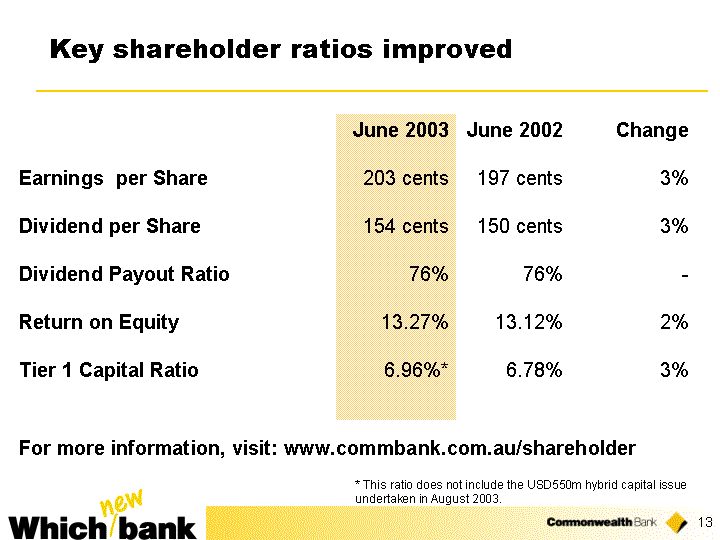
| • | | DPS and EPS up 3%. |
| |
| • | | Cash ROE up 15bps to 13.27%. Underlying ROE: 13.8%, up 68bps. |
| |
| • | | Tier 1 capital ratio further strengthened during the year to 6.96% — this is at the upper end of target. |
| |
| • | | Tier 1 ratio does not reflect USD550m hybrid (effect 56 basis points). |
| |
| • | | Ratings agencies have reaffirmed long term stable outlook. Unchanged since 1996. |
| Key shareholder ratios improved June 2003 203 cents 154 cents 76% 13.27% 6.96%* June 2002 197 cents 150 cents 76% 13.12% 6.78% Change 3% 3% - - 2% 3% Earnings per Share Dividend per Share Dividend Payout Ratio Return on Equity Tier 1 Capital Ratio * This ratio does not include the USD550m hybrid capital issue undertaken in August 2003. For more information, visit: www.commbank.com.au/shareholder |

| • | | The Bank’s final dividend: 85 cents fully franked. |
| |
| • | | Total full year dividend to 154 cents. |
| |
| • | | Dividend payout ratio of 76% remains high relative to peers. |
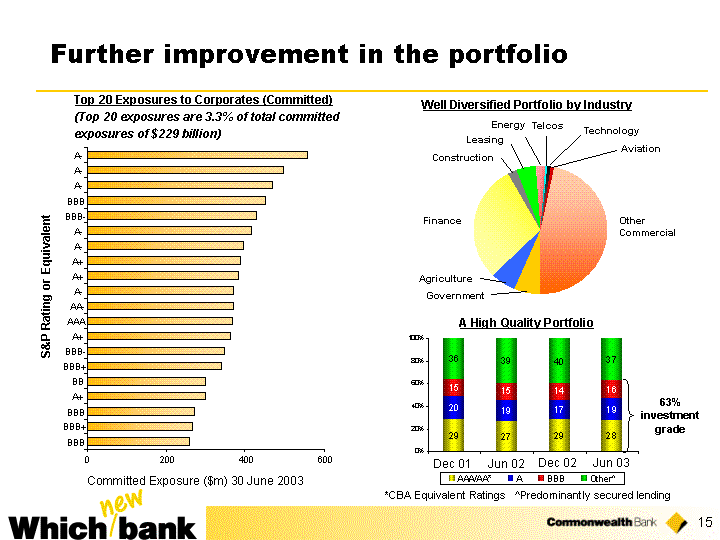
| • | | Quality of lending portfolio has further improved. |
| |
| • | | Our Top 20 committed exposures represent just 3.3% of total committed exposures. |
| |
| • | | Well diversified portfolio by industry, and 63% individual risk rated portfolio at investment grade or equivalent. |
| |
| • | | Home loans represent > 50% total lending assets. Home loan arrears are at historically low levels. |
| Further improvement in the portfolio 12/1/2001 6/1/2002 12/1/2002 6/1/2003 AAA/AA* 29 27 29 28 A 20 19 17 19 BBB 15 15 14 16 Other^ 36 39 40 37 Total 100 100 100 Dec 01 Dec 02 Jun 02 63% investment grade *CBA Equivalent Ratings ^Predominantly secured lending Jun 03 Government Agriculture Finance Construction Leasing Energy Telcos Technology Aviation Other Commercial 0.0634 0.0622 0.2927 0.0247 0.0461 0.0208 0.0075 0.0064 0.01 0.4661 Other Commercial Government Agriculture Finance Construction Leasing Energy Telcos Technology Aviation A High Quality Portfolio Well Diversified Portfolio by Industry Top 20 Exposures to Corporates (Committed) (Top 20 exposures are 3.3% of total committed exposures of $229 billion) Committed Exposure ($m) 30 June 2003 S&P Rating or Equivalent 0 200 400 600 BBB BBB+ BBB A+ BB BBB+ BBB- A+ AAA AA- A- A+ A+ A- A- BBB- BBB A- A- A- |
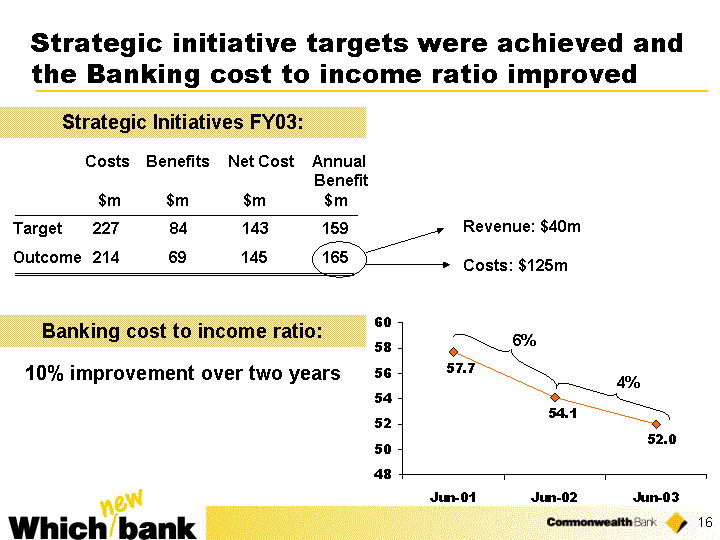
| • | | Have successfully implemented FY2003 strategic initiatives to improve productivity - |
| | • | | with program costs lower than target, and |
| |
| | • | | annualised benefits above target. Benefits are $40m revenue and $125m costs. |
| • | | Productivity improvement in banking cost to income ratio: 10% improvement over the last two years. |
| Strategic initiative targets were achieved and the Banking cost to income ratio improved Costs Benefits Net Cost Annual Benefit $m $m $m $m Target 227 84 143 159 Outcome 214 69 145 165 Revenue: $40m Strategic Initiatives FY03: 12/1/2000 3/1/2001 6/1/2001 9/1/2001 12/1/2001 3/1/2002 6/1/2002 9/1/2002 12/1/2002 3/1/2003 6/1/2003 Group Cost to Income 59 59 58.2 57.1 57.7 58.5 Adjusted Group Cost to Income* 57.7 56.5 Banking Cost to Income* 58.1 58.1 57.7 57.7 54.2 54.2 54.1 54.1 52.6 52.6 52 Adjusted Banking Cost to Income* 54 54 54.8 Average Cost to Income (Other Major Banks)^ Average Cost to Income (Other Major Banks)^ 49.6 49.6 48.3 48.3 47.8 47.8 48.2 48.2 6% 4% 10% improvement over two years Costs: $125m Banking cost to income ratio: |
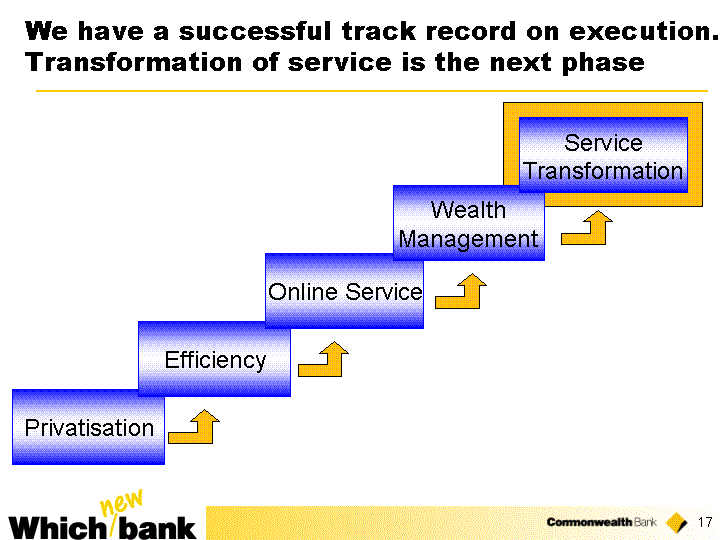
| We have a successful track record on execution. Transformation of service is the next phase Privatisation Efficiency Online Service Wealth Management Service Transformation |
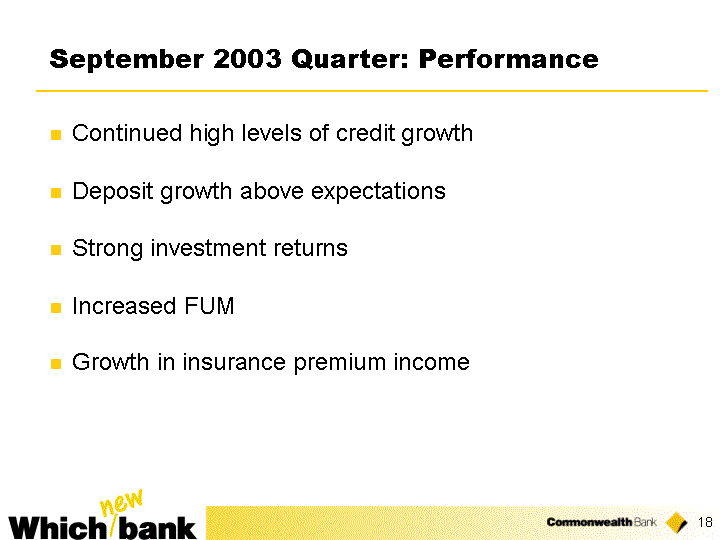
In relation to performance for the 1st quarter of 2004, we have experienced:
| • | | Continued high levels of credit growth, particularly in the housing sector |
| |
| • | | Deposit growth above expectations |
| |
| • | | Strong investment returns |
| |
| • | | Increased FUM |
| |
| • | | Growth in insurance premium income |
If current market conditions continue for the remainder of this half year, growth in underlying cash earnings could be sufficient to offset transformation costs incurred in the half year.
At this stage, there appears to be sufficient momentum in the economy to support solid underlying earnings growth for the full year, although the rate of growth may moderate in the second half.
| September 2003 Quarter: Performance Continued high levels of credit growth Deposit growth above expectations Strong investment returns Increased FUM Growth in insurance premium income |
Let’s now turn to the Bank’s transformation program, which was launched in September 2003.

Why is transformation necessary?
Look at from customer point of view:
| | • | | We have an ageing population who need to fund a longer timespan in retirement. |
| |
| | • | | The current low interest rate environment will eventually trend back towards a higher norm making many investment options more costly for them. |
This means customers will be seeking:
| | • | | Value creation through advice and investment. |
| |
| | • | | Greater value for money. |
That, combined with an outlook of lower industry margins, means that we need to ensure that CBA operates:
| | • | | as a true service organisation and |
| |
| | • | | in a way that provides competitive superiority. |
| Why service transformation is necessary Environment Customer need Demographic change Monetary cycle High value creation Through advice and investment Even better value Imperatives for the Bank Service transformation Competitive superiority |
Program called ‘Which new bank’
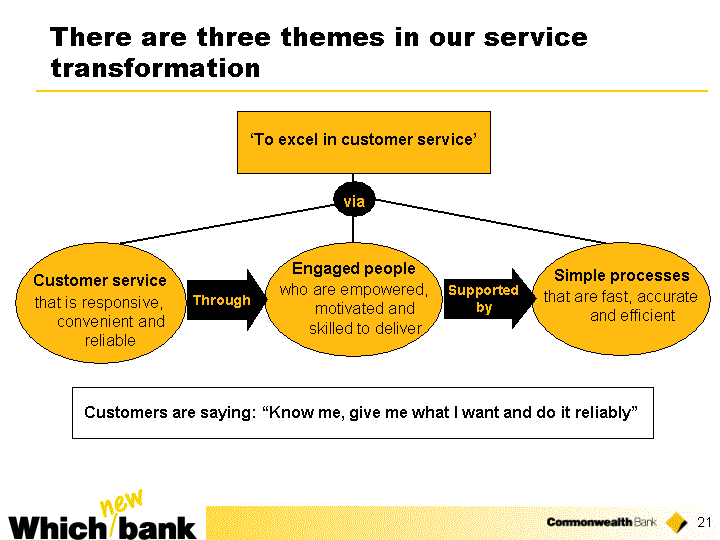
Three themes: customers, people and processes:
| • | | We wantcustomers to experience service that is responsive, convenient and reliable. Customers are saying, “know me, give me what I want and do it reliably”. |
| |
| • | | Served byengaged people who are empowered, motivated and skilled to deliver and |
| |
| • | | People supported bysimple processes that are fast, accurate and effective. Processes that are ‘simply better’. |
| Simple processes that are fast, accurate and efficient 'To excel in customer service' Customer service that is responsive, convenient and reliable via Engaged people who are empowered, motivated and skilled to deliver Supported by Through There are three themes in our service transformation Customers are saying: "Know me, give me what I want and do it reliably" |

| Simple processes 'To excel in customer service' Customer service via Engaged people Supported by Through There are over 100 initiatives ... grouped into 20 key workstreams Service/Sales 1. Segment and Advice Effectiveness Alignment 2. Advice Implementation 3. Service/Sales system 4. Divisional sales and service improvements IT Enablers 5. IT infrastructure 6. Single view Distribution 7. Distribution optimisation Efficiency 8. Branch use for IBS/PFS/RBS 9. Branch redesign Product 10. Product bundling and pricing 11. New product/service introductions Performance 12. Performance culture Culture diagnostic, management systems and actions Support 13. Support function redesign Process/product 14. End to end process redesign 15. Local site improvement 16. Product/system rationalisation IT Efficiency 17. IT efficiency 18. IT sourcing Purchasing 19. Purchasing improvements 20. Property rationalisation |
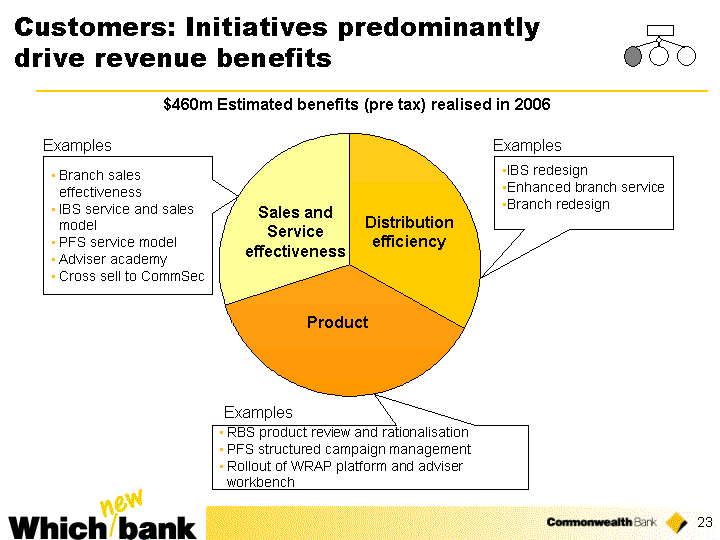
| • | | Customer initiatives cut across product offerings, sales and service and distribution, using a number of technology enablers. |
| |
| • | | Some examples of initiatives underway or about to be launched are on the slide. |
| |
| • | | Where these initiatives were already underway pre-transformation, we are accelerating their implementation. |
| |
| • | | Benefits expected in the region of $460m pre tax. |
Notes to Reader:
RBS: Retail Banking Services
IBS: Institutional & Business Services
PFS: Premium Financial Services
| Customers: Initiatives predominantly drive revenue benefits Distribution Efficiency Product Sales and Service Effectiveness East 33 37 30 Distribution efficiency Product Sales and Service effectiveness $460m Estimated benefits (pre tax) realised in 2006 IBS redesign Enhanced branch service Branch redesign Branch sales effectiveness IBS service and sales model PFS service model Adviser academy Cross sell to CommSec RBS product review and rationalisation PFS structured campaign management Rollout of WRAP platform and adviser workbench Examples Examples Examples |

| Initiative name Initiative description Size of prize Status > $100m $50m - $100m Estimated pre tax benefits realised in 2006 $30m - $49m $10m - $29m Branch sales effectiveness Reinvigoration of a world standard service and sales culture. Customer Service (CSO) roles redefined to increase customer contact time by 50%. Increase Branch Manager time with customers and time coaching staff. Pilot IBS service and sales models Grow revenue by increasing cross sell in business banking, growing market share in corporate banking and increasing penetration in institutional banking. Design PFS service model Complete rollout of the relationship management team (POD) structure. Improvement in productivity for relationship managers of around 50%. Rollout IIS Adviser Academy Establish the Commonwealth Adviser Academy to train financial planners. Design Cross sell to CommSec Offer over one million CommSec clients, with only a trading account, an integrated core banking and brokerage offering at a competitive price. Rollout Customers: Initiatives predominantly drive revenue benefits |
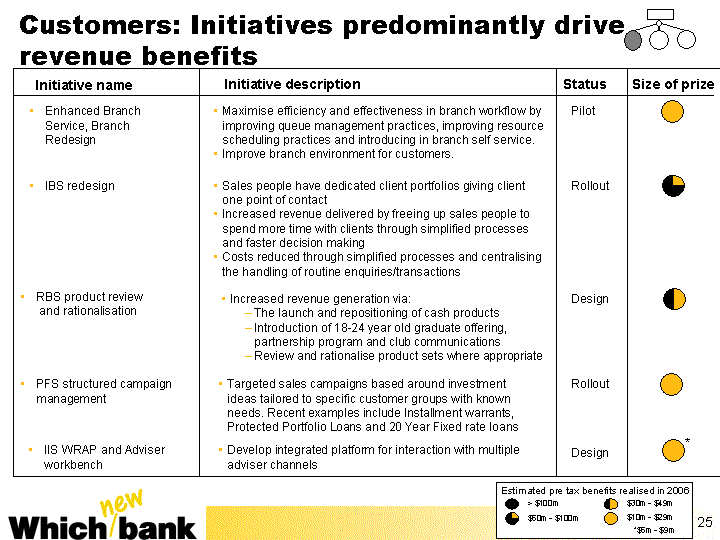
| Initiative name Initiative description Size of prize Status > $100m $50m - $100m Estimated pre tax benefits realised in 2006 $30m - $49m $10m - $29m Enhanced Branch Service, Branch Redesign Maximise efficiency and effectiveness in branch workflow by improving queue management practices, improving resource scheduling practices and introducing in branch self service. Improve branch environment for customers. Pilot IBS redesign Sales people have dedicated client portfolios giving client one point of contact Increased revenue delivered by freeing up sales people to spend more time with clients through simplified processes and faster decision making Costs reduced through simplified processes and centralising the handling of routine enquiries/transactions Rollout Increased revenue generation via: The launch and repositioning of cash products Introduction of 18-24 year old graduate offering, partnership program and club communications Review and rationalise product sets where appropriate Design RBS product review and rationalisation PFS structured campaign management Targeted sales campaigns based around investment ideas tailored to specific customer groups with known needs. Recent examples include Installment warrants, Protected Portfolio Loans and 20 Year Fixed rate loans Rollout IIS WRAP and Adviser workbench Develop integrated platform for interaction with multiple adviser channels Design Customers: Initiatives predominantly drive revenue benefits * *$5m - $9m |

| • | | These are just some of the service outcomes we expect our customers to notice once program is implemented. |
| |
| • | | To call out a couple of examples, our customers will benefit from: |
| | • | | More than 10% of branches will be modernised each year to better meet the needs of local communities |
| |
| | • | | Branch managers will have more time to deal directly with customers and for training staff. Customer service roles will be redefined to increase customer contact time by 50%. |
| |
| | • | | Customers will have greater access to financial planning services and advice, through the training of more than 200 additional financial planners. |
| Customers: Transformation Outcomes Improved customer experience, including: More modern branches better suited to community needs Average queue time reduction of 35% Increased branch manager visibility Innovative financial solutions better suited to customer needs More informed view of the customer Greater customer access to financial planning services and advice |
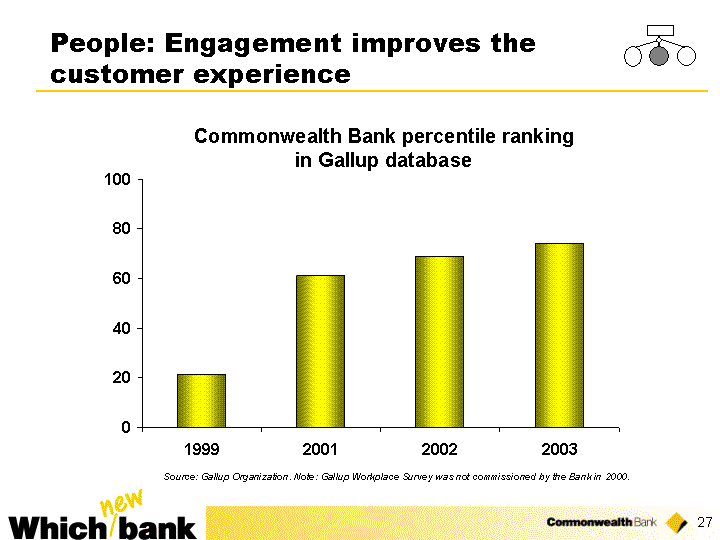
| People: Engagement improves the customer experience 1999 2001 2002 2003 Percentile scores 21 61 69 74 Source: Gallup Organization. Note: Gallup Workplace Survey was not commissioned by the Bank in 2000. Commonwealth Bank percentile ranking in Gallup database |

| • | | Focus of people workstream is to implement a cultural change program that is performance driven. |
| |
| • | | Quantification of benefits have not been assigned directly to this program. |
| |
| • | | However, increased levels of engagement are expected to have a tangible impact on branch performance and customer service. |
| |
| • | | The main outcome we want from this program is a better experience for our people. |
| |
| • | | An example of this in practice is that we will be doubling the investment in the training and development of our people over the next years, using facilities such as a new adviser academy. |
| People: Transformation Outcomes A better experience for our people, derived from: Taking direction from people that serve our customers Enabling frontline people to solve customer problems Investing in the development and training Measuring performance on customer outcomes Recognising and rewarding people for superior service |
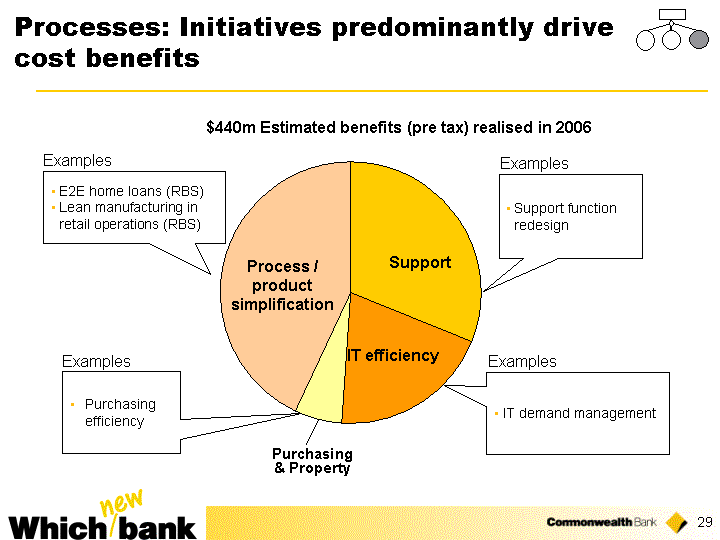
| • | | Process initiatives cut across process/product simplification, support, IT efficiency, purchasing and property. |
| |
| • | | Some examples of initiatives underway or about to be launched are on the slide. |
| |
| • | | Where these initiatives were already underway pre-transformation, we are accelerating their implementation. |
| |
| • | | Benefits expected in the region of $440m pre tax — predominantly cost, some revenue. |
| Processes: Initiatives predominantly drive cost benefits Support IT efficiency Purchasing and Property Process / Product simplification East 31 20 6 43 Support Purchasing & Property IT efficiency $440m Estimated benefits (pre tax) realised in 2006 Process / product simplification E2E home loans (RBS) Lean manufacturing in retail operations (RBS) Support function redesign Purchasing efficiency IT demand management Examples Examples Examples Examples |
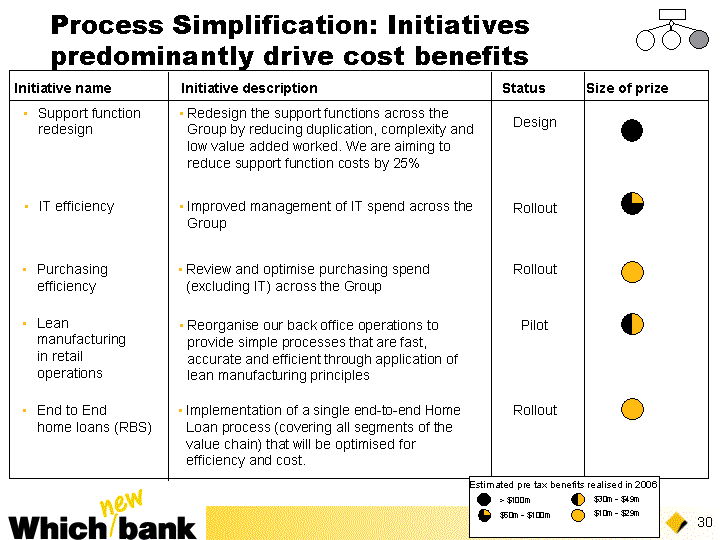
| Initiative name Initiative description Size of prize Support function redesign Redesign the support functions across the Group by reducing duplication, complexity and low value added worked. We are aiming to reduce support function costs by 25% Status Design IT efficiency Improved management of IT spend across the Group Rollout End to End home loans (RBS) Implementation of a single end-to-end Home Loan process (covering all segments of the value chain) that will be optimised for efficiency and cost. Rollout Purchasing efficiency Review and optimise purchasing spend (excluding IT) across the Group Rollout Lean manufacturing in retail operations Reorganise our back office operations to provide simple processes that are fast, accurate and efficient through application of lean manufacturing principles Pilot > $100m $50m - $100m Estimated pre tax benefits realised in 2006 $30m - $49m $10m - $29m Process Simplification: Initiatives predominantly drive cost benefits |
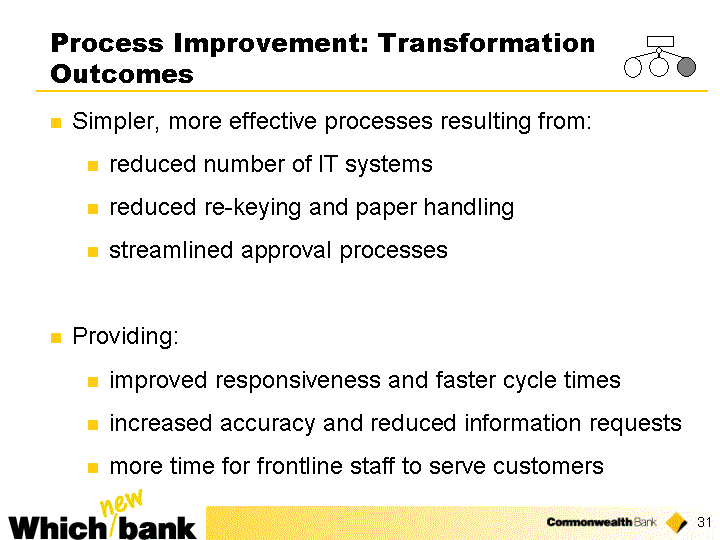
This slide sets out some of the process outcomes we expect to achieve from this program.
Underpinning all these outcomes is an aim of simpler, more effective processes that enable better customer service.
Just to give a couple of quick examples:
| | • | | The work we are doing around our home loan processes will help to improve cycle times and increase our responsiveness. Our aim is to have 100% of applications conditionally decisioned within 4 hours, with the majority being decisioned on the spot. |
| |
| | • | | The work we are doing around our business lending processes aims to cut business loans fulfilment time in half. |
| Process Improvement: Transformation Outcomes Simpler, more effective processes resulting from: reduced number of IT systems reduced re-keying and paper handling streamlined approval processes Providing: improved responsiveness and faster cycle times increased accuracy and reduced information requests more time for frontline staff to serve customers |
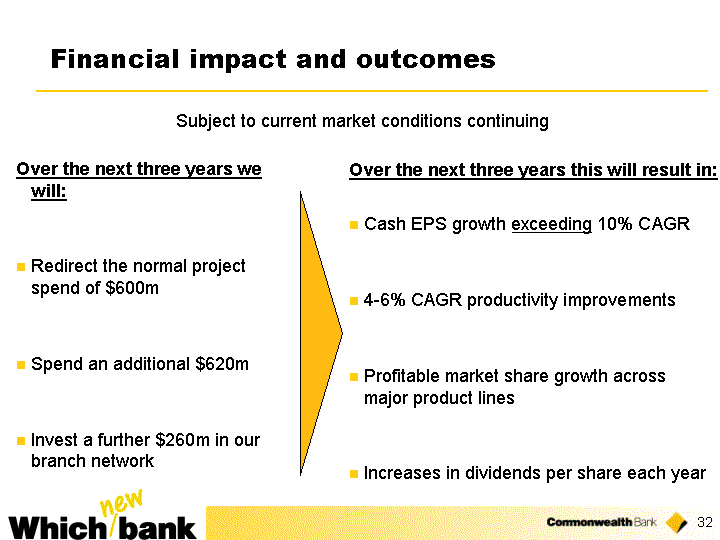
| • | | Over the next three years, the financial impact will be significant. |
| |
| • | | Normal project spend ($200m x 3) will be redirected, together with extra $620m over three years, to fund transformation activities. |
| |
| • | | In addition, the investment required to accelerate the branch refurbishment will total $260m. |
| |
| • | | The financial prize is large: EPS growth >10% CAGR subject to market conditions. |
| |
| • | | Committed to 4-6% pa productivity improvement and profitable market share improvement. |
| |
| • | | Expect that the costs of transformation will not stop us from increasing our dividend each year. |
| Financial impact and outcomes Over the next three years we will: Redirect the normal project spend of $600m Spend an additional $620m Invest a further $260m in our branch network Over the next three years this will result in: Cash EPS growth exceeding 10% CAGR 4-6% CAGR productivity improvements Profitable market share growth across major product lines Increases in dividends per share each year Subject to current market conditions continuing |
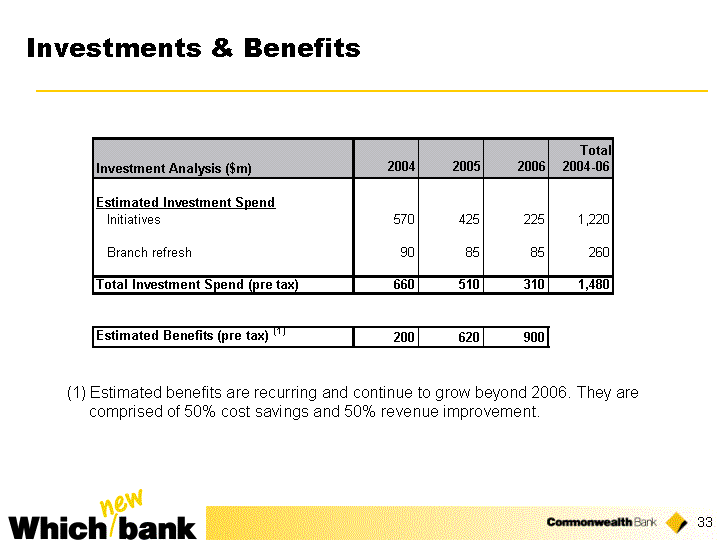
| • | | Slide sets out estimated spend and benefits for next three years. |
| |
| • | | The $1.2 billion of initiatives includes: |
| | • | | technology and project expenditure including redundancies: $210m |
| |
| | • | | additional $100m for training, making $200m for training in total. |
| • | | The investment spend on the branch refresh of $260m will be spread evenly over the three years. |
| |
| • | | Benefits broadly comprised 50% cost savings and 50% revenue improvement. |
| |
| • | | 2006 benefits of $900 million are recurring and will continue to grow into the future. |
| Investments & Benefits (1) Estimated benefits are recurring and continue to grow beyond 2006. They are comprised of 50% cost savings and 50% revenue improvement. Investment Analysis ($m) 2004 2005 2006 Total 2004-06 Estimated Investment Spend Initiatives 570 425 225 1,220 Branch refresh 90 85 85 260 Total Investment Spend (pre tax) 660 510 310 1,480 Estimated Benefits (pre tax) (1) 200 620 900 |

| Investment and Accounting Treatment $200m of software expenditure over the three years will be capitalised ($90m in 2004) and $260m over three years will be capitalised for branch refurbishment ($90m in 2004) In addition, $215m of the $248m capitalised software from previous years will be expensed in 2004 In 2004 we are required to provide for certain transformation costs in relation to future periods. This balance will be $210m at June 2004 reducing to $77m at June 2005 All other program costs which total $810m ($480m in 2004) will be expensed as incurred |

| • | | Transformation won’t stop us from increasing the dividend each year, subject to market conditions. |
| |
| • | | Costs of the transformation will be added back to 2004 cash earnings when determining the dividend. |
| Estimated Financial Impact of Transformation Costs Adjusted Cash EPS The following transformation costs will be added back to the 2004 cash earnings when considering the dividend payment: Total investment spend for 2004 660 Provision for future years (at June 2004) 210 Capitalised software and branch refurbishment (180) Normal annual spend (200) Expensing of previously capitalised software 215 total before tax 705 total after tax 500 $m |
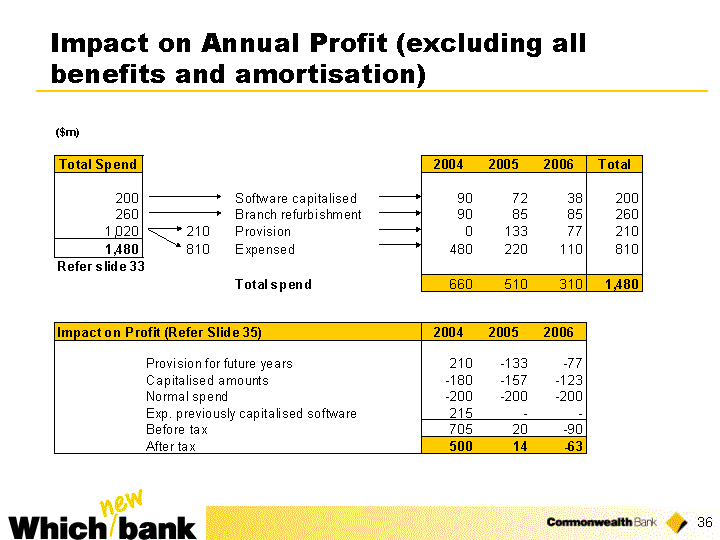
| Impact on Annual Profit (excluding all benefits and amortisation) |
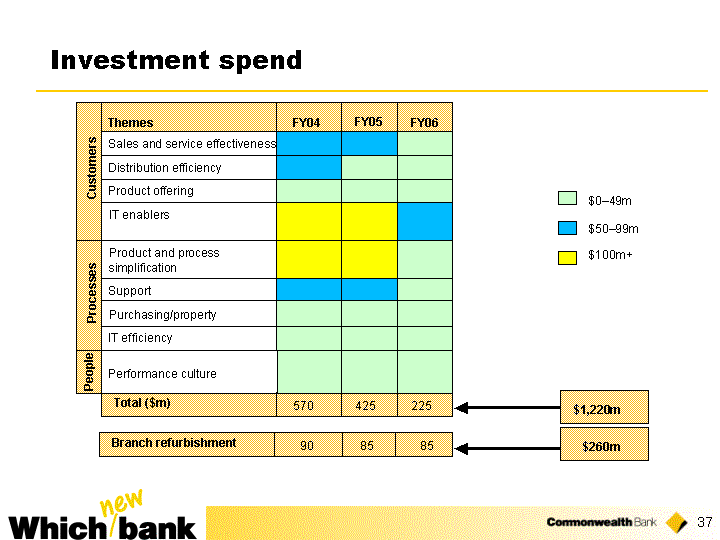
This heatmap provides a guide to the allocation of the investment spend and the expected timing of this spend.
| Investment spend $100m+ $0-49m $50-99m Investment spend Total ($m) FY04 FY05 FY06 Themes Sales and service effectiveness Product offering Distribution efficiency Customers IT enablers Product and process simplification Support Purchasing/property IT efficiency Performance culture Processes People 425 225 570 Branch refurbishment 85 85 90 $1,220m $260m |

This heatmap shows where the main benefits from the program are expected to be derived and the expected timing of these benefits.
Around 50% of all initiatives have a payback inside 2 years
| Total ($m) Benefit analysis Revenue Cost saving FY04 FY05 Themes Sales and service effectiveness Product offering Distribution efficiency Customers IT enablers Product and process simplification Support redesign Purchasing/property IT efficiency Performance culture Processes People FY06 $100m+ $0-49m $50-99m 200 620 900 $900m benefit realised in FY06 |

| • | | This slide sets out our target ratios by major businesses. |
| |
| • | | Expense component of these ratios includes broker commissions. |
| |
| • | | Target is 4-6% pa improvement over the next three years. |
| Productivity improvements of 4-6% pa CAGR over the next three years 52% Under 48% 0.85% Under 0.75% 57% Banking Cost to Income* Funds Management Cost* to Average FUM Life Cost* to Average Inforce Premiums Under 52% 2003 Actual 2006 Estimate * Includes commissions 2003 Actual 2006 Estimate 2003 Actual 2006 Estimate |
| • | | Expect dividends per share to be in line with EPS growth, after adding back transformation costs (subject to market conditions). |
| |
| • | | Consistent with our peers, will issue shares to satisfy DRP. |
| |
| • | | Subject to necessary approvals, this should enable structured buy back to proceed. |
| |
| • | | Expect capital position to be within our target range and to maintain current ratings. |
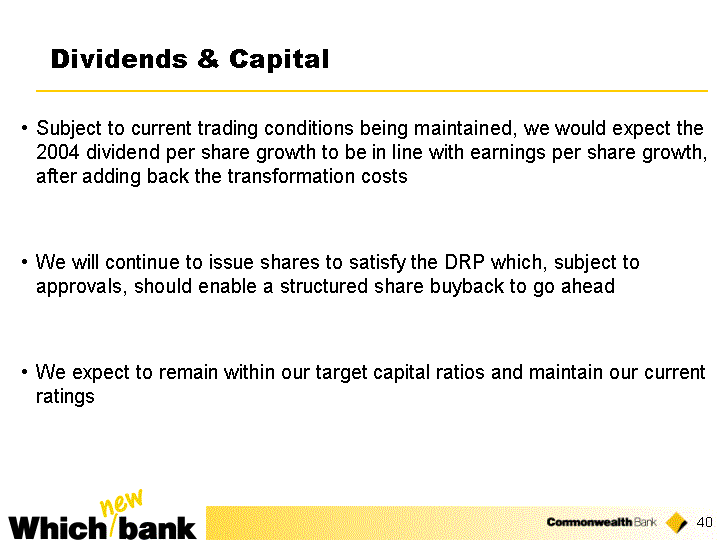
| Dividends & Capital Subject to current trading conditions being maintained, we would expect the 2004 dividend per share growth to be in line with earnings per share growth, after adding back the transformation costs We will continue to issue shares to satisfy the DRP which, subject to approvals, should enable a structured share buyback to go ahead We expect to remain within our target capital ratios and maintain our current ratings |
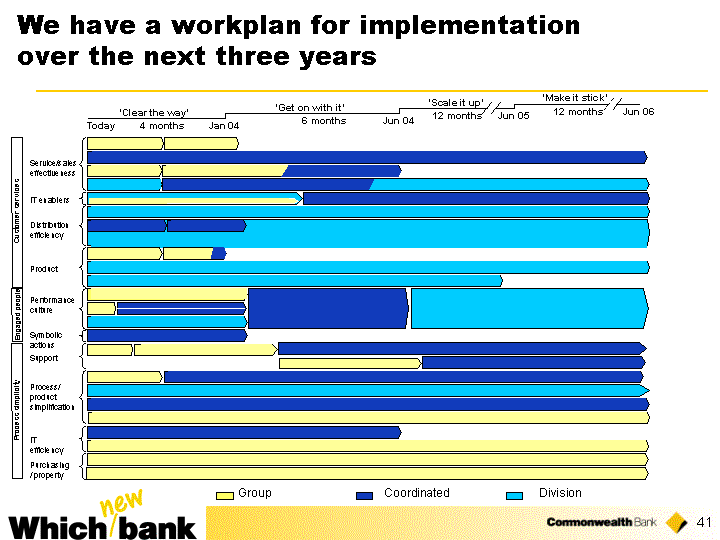
| We have a workplan for implementation over the next three years Group 'Clear the way' 'Get on with it' 'Scale it up' 'Make it stick' Jun 06 Jun 05 Jun 04 Jan 04 Today 4 months 6 months 12 months 12 months M m Service/sales effectiveness IT enablers Distribution efficiency Product Performance culture Symbolic actions Engaged people Support Process/ product simplification IT efficiency Purchasing / property Process simplicity Customer services Coordinated Division |
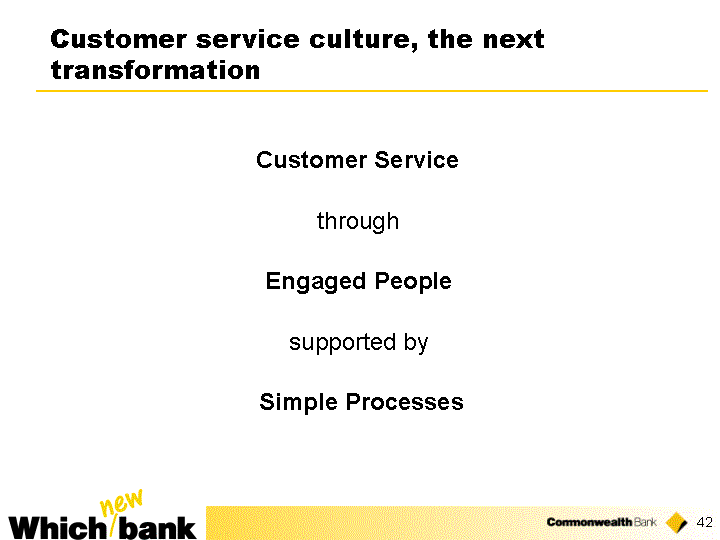
Just to reiterate:
Our transformation program is about:
• Customer Service
through
• Engaged People
supported by
• Simple Processes.
| Customer service culture, the next transformation Customer Service through Engaged People supported by Simple Processes |
In closing, the key points are:
| • | | In terms of the operating environment: |
| | • | | Australia’s economy has been resilient. |
| |
| | • | | This has underpinned continuing growth in the home loan market. |
| |
| | • | | The outlook for funds management and life insurance is also favourable. |
| • | | In this environment, CBA : |
| | • | | recorded a 9% improvement in underlying profit growth for FY2003 and |
| |
| | • | | improved its credit quality and strengthened its capital position |
| |
| | • | | We have also seen a good 1st quarter for FY2004. |
| • | | Finally the Bank’s transformation program launched September 2003: |
| | • | | represents a significant cultural transformation for the Bank and |
| |
| | • | | offers significant cost and revenue benefits over coming years. |
| • | | Thankyou — now take questions. |
| Summary Operating Environment: Economy resilient Home loan growth continues Favourable outlook for Funds Management and Life Insurance Performance: 9% underlying profit growth Strong credit quality and capital position Good September 2003 quarter Which new Bank: Launched September 2003 Significant cultural transformation Size of the prize is large |

| Roadshow Presentation David Murray Chief Executive Officer Michael Cameron Chief Financial Officer Commonwealth Bank of Australia November 2003 |

| Supplementary Pack Full Year Results Year Ended 30/06/03 www.commbank.com.au |


| Cash Profit Dec 2001 Interest Income Other Bank Income Expenses BDD Taxation Outside Equity Interest Underlying Dec 02 One off expense Cash Profit Dec 02 0 2067 2383 2443 2443 2401 2401 0 2249 0 2067 316 145 85 144 186 1 2401 152 2249 Banking result reflects the strong home loan market $m Interest Income 316 Other Bank Income 145 Expenses (85) BDD 144 Taxation (186) 2,249 2,067 One off expense (152) 2,401 16% increase from underlying business Underlying Profit Jun-02 Underlying Profit Jun-03 Cash Profit Jun-03 |
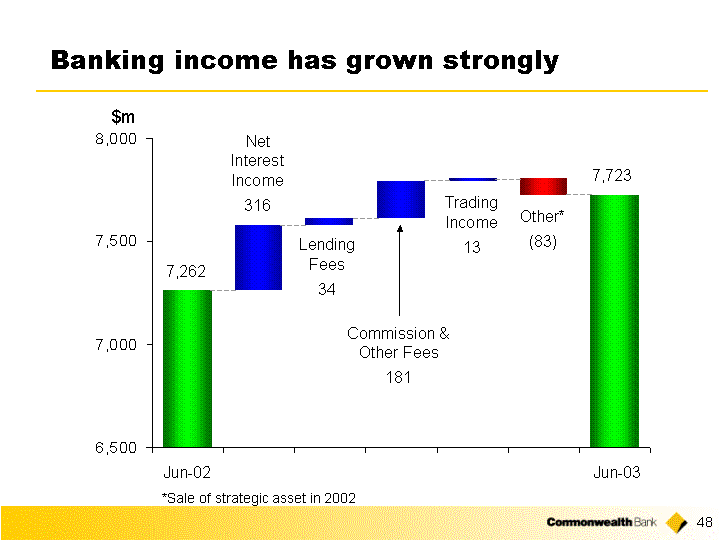
| Banking income has grown strongly NII Lending Fees Commissions Trading Income Other 0 7262 7578 7612 7793 7723 0 7262 316 34 181 13 83 7723 7,262 7,723 Jun-02 Jun-03 Net Interest Income 316 Commission & Other Fees 181 Lending Fees 34 Trading Income 13 Other* (83) $m *Sale of strategic asset in 2002 |

| 9% growth in lending assets Jun 2000* 12/1/2000 6/1/2001 12/1/2001 6/1/2002 12/1/2002 6/1/2003 Lending Assets - Housing** 71 72 74 80 86 94 100 Lending Assets - Personal 9 8 8 8 12 9 13 Lending Assets - Business & Corporate 32 32 32 55 51 54 49 Lending Assets - Corporate 22 24 24 24 24 25 Lending Assets - Bank acceptances 11 12 12 12 12 13 13 Retail 24 29 34 35 87 100 New Zealand 41 41 43 45 17 20 Institutional & Business 23 23 24 26 57 55 233 241 251 261 ** Excludes securitised housing loan balances $6.5b (Jun 03), $7.0b (Jun 02). $ billion 161 175 Lending Assets** Housing Personal Business & Corporate Bank Acceptances |

| Strong banking product market shares Source: RBA, APRA, East and Partners, AELA, Reserve Bank of NZ Banking Market Shares Merchant Acquiring1 Deposits2 Credit Cards Transaction Services3 Home Loans Business Lending New Zealand Lending New Zealand Deposits Asset Finance4 0% 10% 20% 30% 40% 33.9%5 24.8%6 22.7%7 19.5%8 14.3%9 15.1% 20.4%5 16.3%5 22.9%6 2003 2002 June 34.5% 24.7% 21.8%7 19.9%8 15.2% 16.5% 19.6% 15.5% 22.8% Notes: (1) - Includes both Credit and Debit Turnover (2) - Retail Only (3) - Mid-Corporates (turnover $20m-100m) (4) - Excludes consumer and commercial finance (5) - April Data (6) - May Data (7) - February Data (8) - March Data (9) - Eliminated effect of changes in data series |
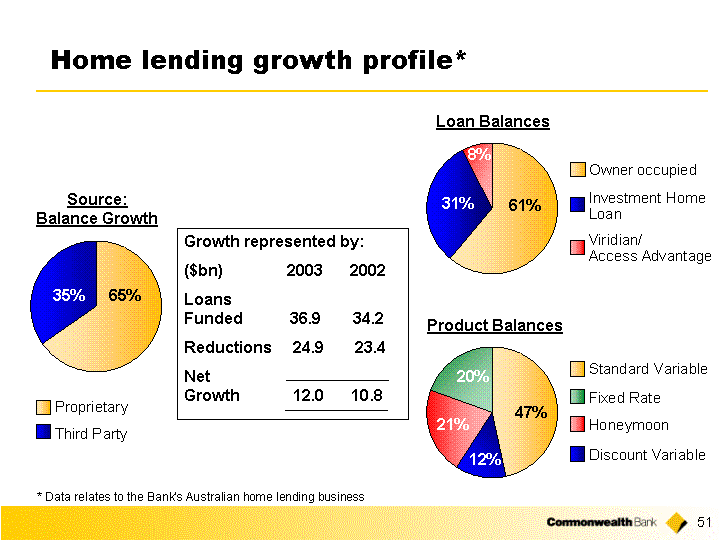
| Standard Variable Discount Variable Honeymoon Fixed Rate Jul 02-Jun 03 500565 130944 228740 209409 Home lending growth profile* Proprietary Third party Jul 02-jun 03 7815 4171 Source: Balance Growth Proprietary Third Party Growth represented by: ($bn) 2003 2002 Loans Funded 36.9 34.2 Reductions 24.9 23.4 Net Growth 12.0 10.8 Loan Balances Owner Occupied Investment Home Loan Viridian/Access Advantage Product Mix 57547 29610 7180 Product Balances Standard Variable Honeymoon Fixed Rate Discount Variable Owner occupied Viridian/ Access Advantage Investment Home Loan * Data relates to the Bank's Australian home lending business 65% 35% 61% 31% 8% 47% 20% 12% 21% |
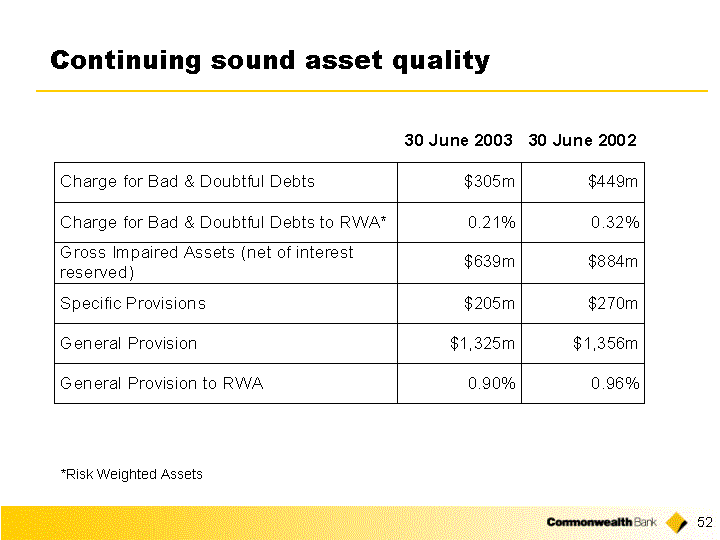
| Continuing sound asset quality *Risk Weighted Assets |

| 6/1/1994 12/1/1994 6/1/1995 12/1/1995 6/1/1996 12/1/1996 6/1/1997 12/1/1997 6/1/1998 12/1/1998 6/1/1999 12/1/1999 Jun 00* Dec 00* Jun 01* 12/1/2001 6/1/2002 12/1/2002 6/1/2003 Specific Provision 713 718 498 423 318 289 241 221 279 289 275 258 432 240 234 309 270 264 205 General Provision 396 396 476 565 613 643 690 716 1076 1059 1081 1117 1358 1412 1399 1334 1356 1327 1325 Total Provisions/Gross Impaired Assets (axis on right) 47.7 63.9 62 74.5 87.7 104 117 133.9 164.4 218.5 230.22 238.72 178.28 199.52 251.6 167.1 183.9 184.4 239.4 * Includes Colonial $millions The Bank remains well provisioned |

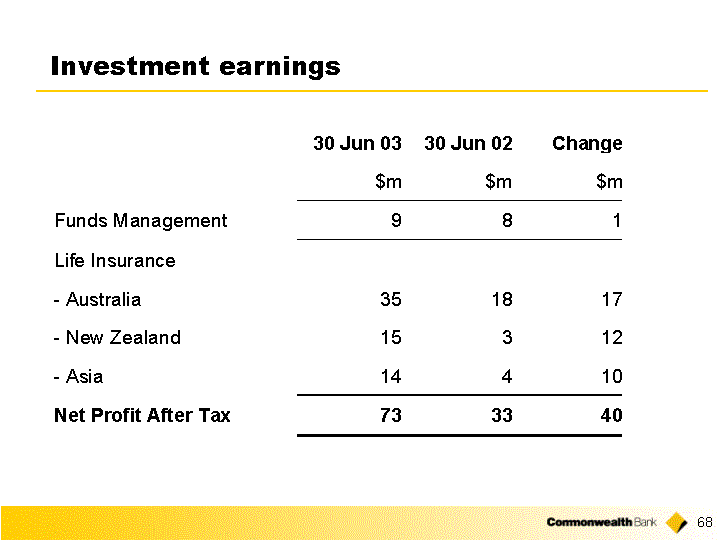
| Segment Results: Funds Management |

| Lower Funds Management profit Underlying Profit Net Operating Income Operating Expense OEI Tax Underlying Profit First Time Expenses S'holder Invest Returns Cash Profit Jun-03 0 251 205 199 199 0 199 199 360 109 46 6 29 228 29 9 208 360 208 (109) (6) $m (46) (29) 37% decrease from underlying business 228 9 29 Jun-02 Jun-03 |
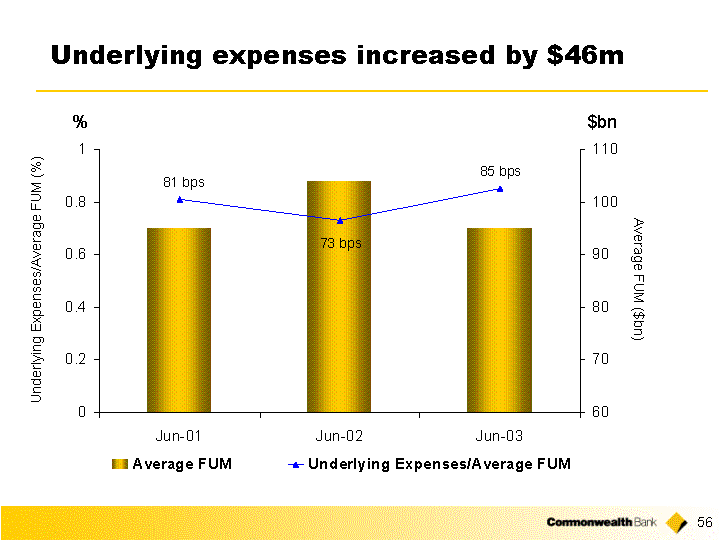
| Underlying expenses increased by $46m 12/1/2000 3/1/2001 6/1/2001 9/1/2001 12/1/2001 3/1/2002 6/1/2002 9/1/2002 12/1/2002 3/1/2003 6/1/2003 Group Cost to Income 59 59 58.2 57.1 57.7 58.5 Adjusted Group Cost to Income* 57.7 56.5 Underlying Expenses/Average FUM 0.81 0.81 0.81 0.81 0.73 0.73 0.73 0.73 0.85 Adjusted Banking Cost to Income* 54 54 54.8 Average Cost to Income (Other Major Banks)^ Average Cost to Income (Other Major Banks)^ 49.6 49.6 48.3 48.3 47.8 47.8 48.2 48.2 Average FUM 95 104 95 % $bn Underlying Expenses/Average FUM (%) Average FUM ($bn) |

| Movement in funds under management $bn 103 94 97 (1) (1) (4) 2 (4) (1) Underlying movement of $6bn One off net reduction of $3bn |
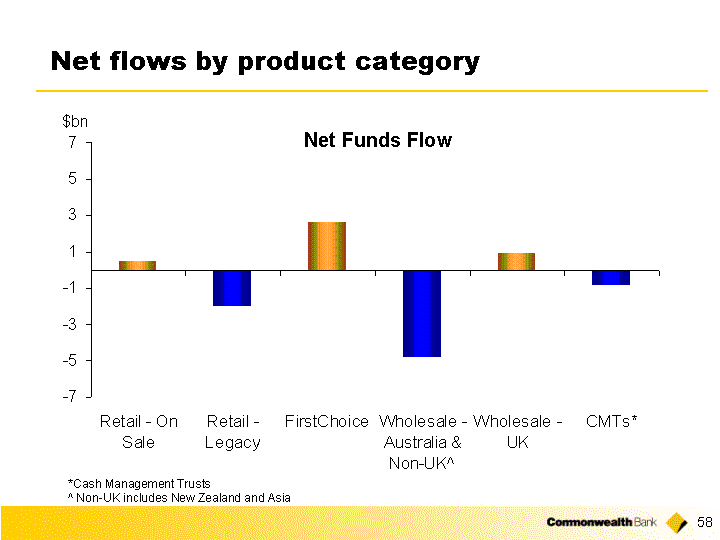
| Net flows by product category Retail - On Sale Retail - Legacy FirstChoice Wholesale - Australia & Non-UK^ Wholesale - UK CMTs* Inflows 9.732 1.32 3.206 1.92 10.66 1.121 Outflows -9.293 -3.337 -0.578 -6.713 -9.793 -1.97 Net Flows 0.439 -2.017 2.628 -4.793 0.867 -0.849 $bn *Cash Management Trusts ^ Non-UK includes New Zealand and Asia Net Funds Flow |

| Strong market share position Funds Management Market Shares Managed Investments1 0% 10% 20% Property Managed Funds2 New Zealand Managed Investments 6.3% 14.0%3 14.8% 2003 2002 June 5.2% 13.0% 15.5% Source: Plan for Life, Fund Source Research (1) Retail Only (2) Internally Calculated (3) March Data |
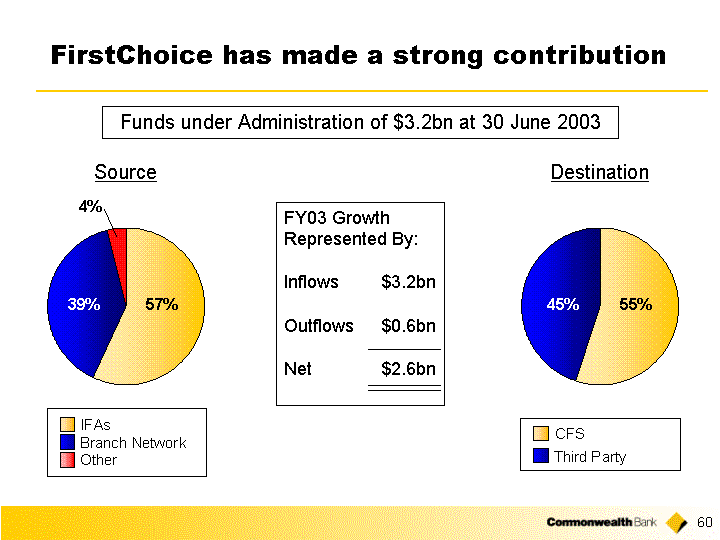
| CFS Third Party FirstChoice 0.55 0.45 IFA Branch Network Other FirstChoice 0.57 0.39 0.04 FirstChoice has made a strong contribution Source Destination Funds under Administration of $3.2bn at 30 June 2003 FY03 Growth Represented By: Inflows $3.2bn Outflows $0.6bn Net $2.6bn 57% 39% 4% 55% 45% IFAs Branch Network Other CFS Third Party |
| Segment Results: Life Insurance |
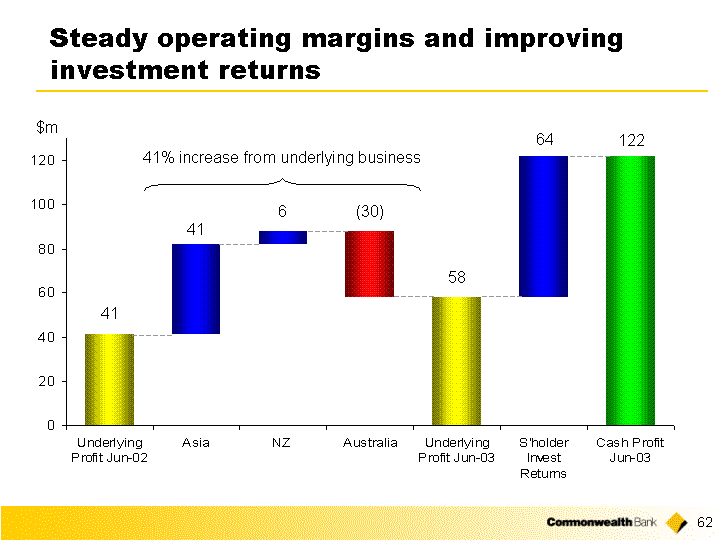
| Steady operating margins and improving investment returns Underlying Profit Jun-02 Asia NZ Australia Underlying Profit Jun-03 S'holder Invest Returns Cash Profit Jun-03 0 41 82 58 0 58 0 41 41 6 30 58 64 122 41 (30) 41 6 58 64 122 41% increase from underlying business $m |
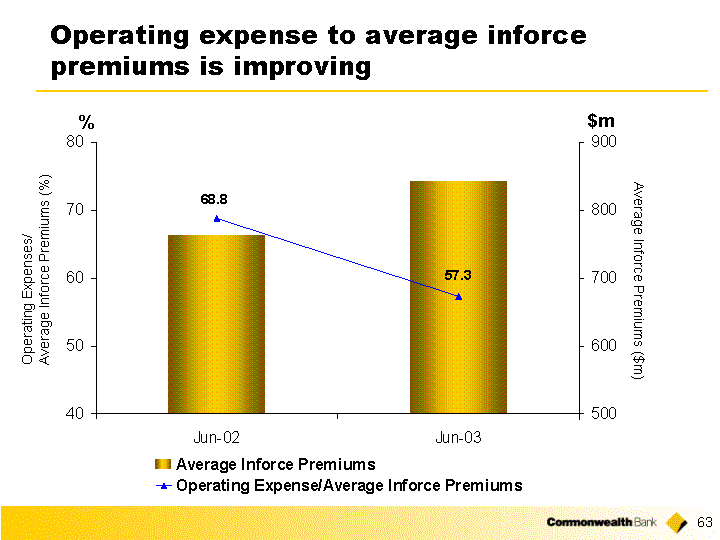
| Operating expense to average inforce premiums is improving % 12/1/2000 3/1/2001 6/1/2001 9/1/2001 12/1/2001 3/1/2002 6/1/2002 9/1/2002 12/1/2002 3/1/2003 6/1/2003 Group Cost to Income 59 59 58.2 57.1 57.7 58.5 Adjusted Group Cost to Income* 57.7 56.5 Operating Expense/Average Inforce Premiums 81 81 81 81 68.8 68.8 68.8 68.8 57.3 Adjusted Banking Cost to Income* 54 54 54.8 Average Cost to Income (Other Major Banks)^ Average Cost to Income (Other Major Banks)^ 49.6 49.6 48.3 48.3 47.8 47.8 48.2 48.2 Average Inforce Premiums 95 762 843 $m Operating Expenses/ Average Inforce Premiums (%) Average Inforce Premiums ($m) |
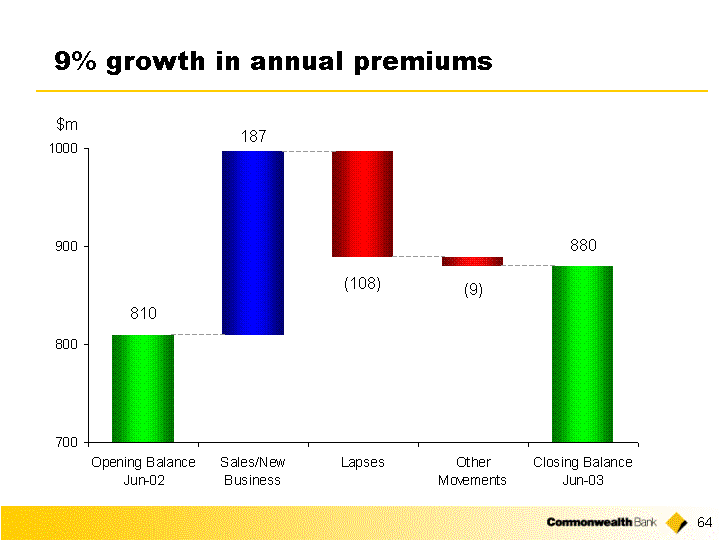
| 9% growth in annual premiums Opening Balance Jun-02 Sales/New Business Lapses Other Movements Closing Balance Jun-03 0 810 889 880 0 810 187 108 9 880 $m 810 187 (108) (9) 880 |

| Market shares growing Life Insurance Market Shares New Zealand1 0% 10% 20% 30% 40% Australia Hong Kong 2003 2002 June 26.2% 14.9% 2.1%4 Source: ISI Statistics, Plan for Life, HK Insurance Association (1) In-force Business (2) March Data (3) Single premium new business (Jan - Mar 2003) (4) Single premium new business (Jan - Jul 2002) 28.3%2 15.0%2 2.5%3 |
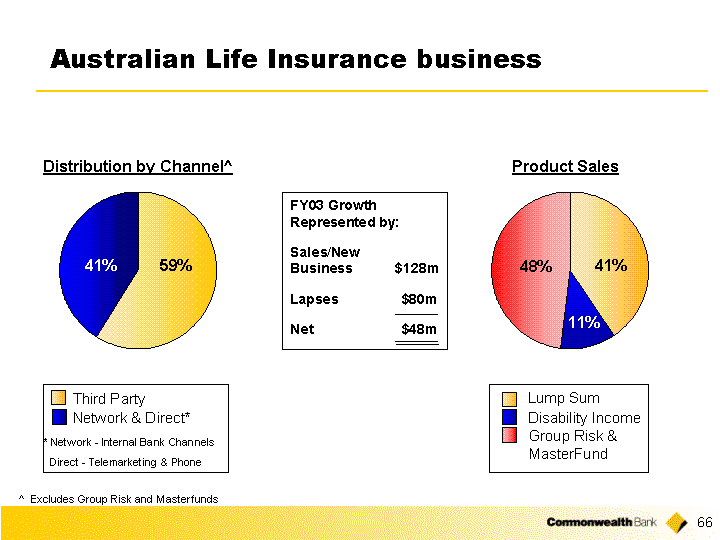
| Lump Sum Disability Income Group Risk Jul 02-Jun 03 39861000 11220000 47204000 Australian Life Insurance business External Proprietary Life Insurance Distribution by channel 30054 21026 Distribution by Channel^ Product Sales Lump Sum Disability Income Group Risk & MasterFund Network & Direct* Third Party FY03 Growth Represented by: Sales/New Business $128m Lapses $80m Net $48m * Network - Internal Bank Channels Direct - Telemarketing & Phone ^ Excludes Group Risk and Masterfunds 59% 41% 48% 41% 11% |
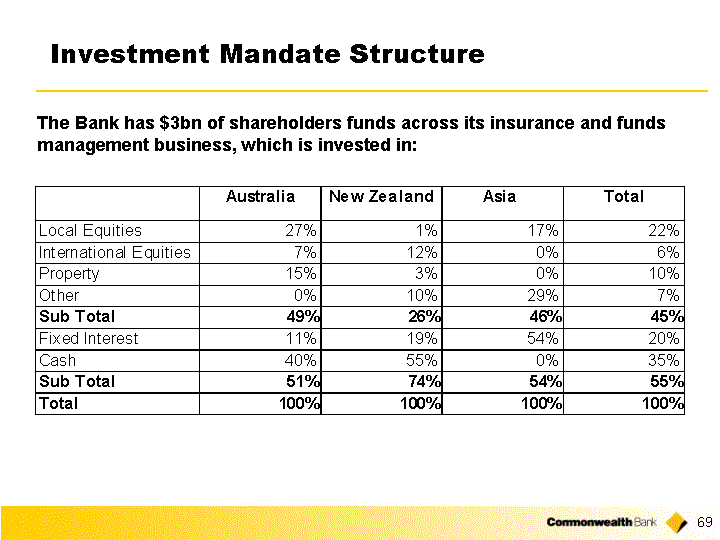
| Investment Mandate Structure The Bank has $3bn of shareholders funds across its insurance and funds management business, which is invested in: |

| Wealth Management Valuations |

| Wealth management valuations Jun-00 Dec-00 Jun-01 Dec-01 Jun-02 Dec-02 Jun-03 Jun-03 0 6736 7185 8003 8580 8358 8358 0 6736 449 818 625 48 222 188 8546 8,546 $m Increase in appraisal value since acquisition of 27% (222) (48) 625 818 449 6,736 188 |

| Wealth management valuations - movement analysis Directors' Valuation Jun-02 Directors' Valuation Jun-03 Reduction in Value (426) Profit 129 Other Capital Movements 75 8,580 8,546 $m Net appraisal value reduction of $222m Increase in Value 181 Other Capital Movements (194) Profit 201 8,358 Directors' Valuation Dec-02 Net appraisal value increase of $188m Total Profit 330 Capital (119) Value (245) Net (34) |


| Capital ratios remain strong 12/1/2001 6/1/2002 12/1/2002 6/1/2003 Tier 1 Capital 0.0675 0.0678 0.0706 0.0696 Tier 2 Capital 0.0256 0.0302 0.0275 0.0277 0.0931 0.098 0.0981 9.72 9.31% 9.80% 9.81% 6.75% 6.78% 7.06% Target Range 6.96% 9.73% Credit Ratings unchanged or improved since 1996... Short Term Long Term Fitch Moody's S&P F1+ AA (Stable) P1 Aa3 (Stable) A1+ AA- (Stable) |
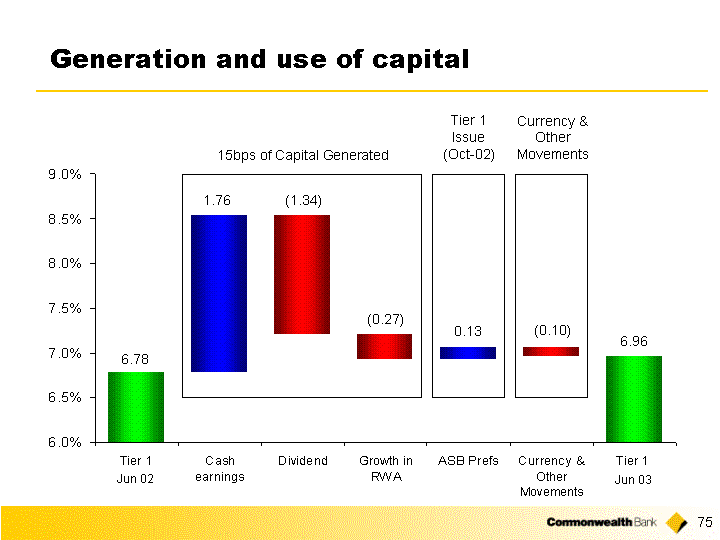
| Generation and use of capital 6.78 1.76 (1.34) (0.27) 0.13 (0.10) 6.96 15bps of Capital Generated Tier 1 Issue (Oct-02) Currency & Other Movements Jun 02 Jun 03 |

| Summary Cash profit up 3% with underlying Group profit growth of 9% 2003 strategic initiatives delivered Underlying bank cost/income improvement of 4% Further improvement in credit quality Continued strengthening of our Tier 1 capital position |

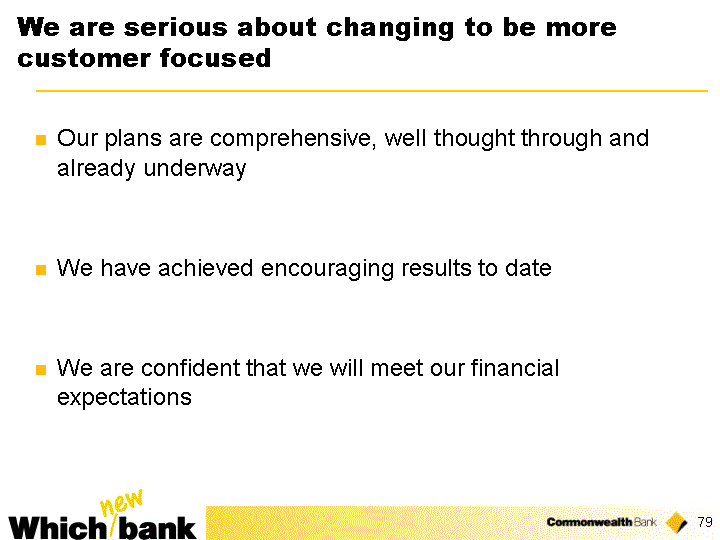
| We are serious about changing to be more customer focused Our plans are comprehensive, well thought through and already underway We have achieved encouraging results to date We are confident that we will meet our financial expectations |
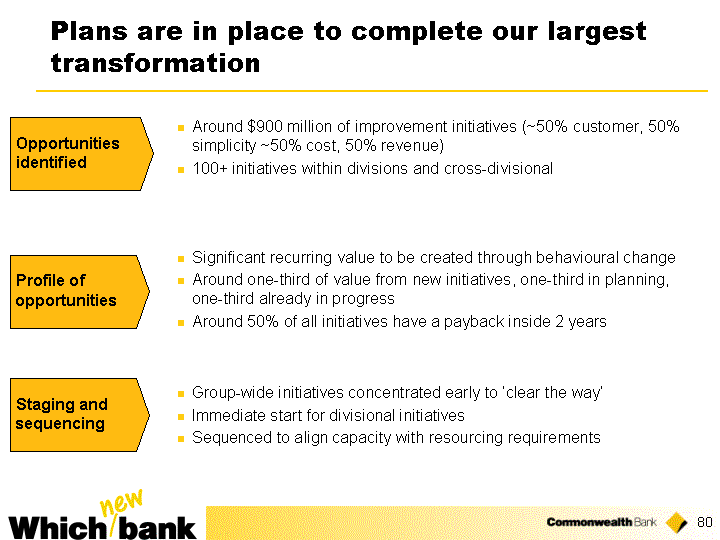
| Plans are in place to complete our largest transformation Around $900 million of improvement initiatives (~50% customer, 50% simplicity ~50% cost, 50% revenue) 100+ initiatives within divisions and cross-divisional Opportunities identified Significant recurring value to be created through behavioural change Around one-third of value from new initiatives, one-third in planning, one-third already in progress Around 50% of all initiatives have a payback inside 2 years Profile of opportunities Staging and sequencing Group-wide initiatives concentrated early to 'clear the way' Immediate start for divisional initiatives Sequenced to align capacity with resourcing requirements |
| Our vision 'To excel in customer service' |
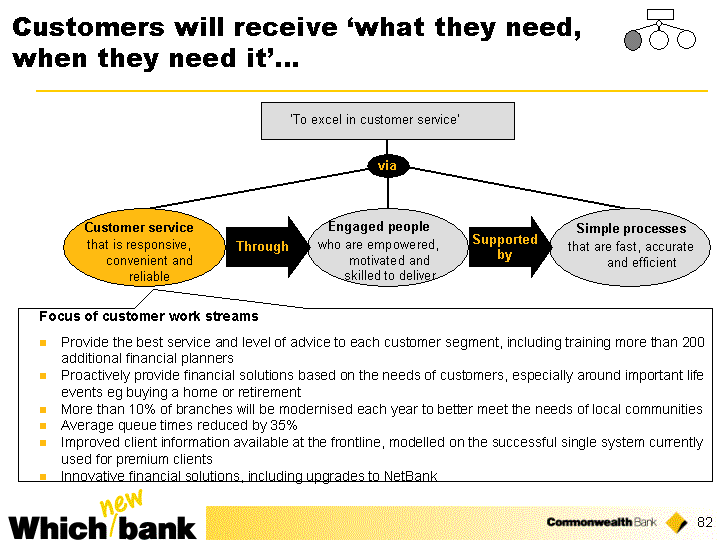
| Simple processes that are fast, accurate and efficient 'To excel in customer service' Customer service that is responsive, convenient and reliable Focus of customer work streams Provide the best service and level of advice to each customer segment, including training more than 200 additional financial planners Proactively provide financial solutions based on the needs of customers, especially around important life events eg buying a home or retirement More than 10% of branches will be modernised each year to better meet the needs of local communities Average queue times reduced by 35% Improved client information available at the frontline, modelled on the successful single system currently used for premium clients Innovative financial solutions, including upgrades to NetBank via Engaged people who are empowered, motivated and skilled to deliver Supported by Through Customers will receive 'what they need, when they need it'... |
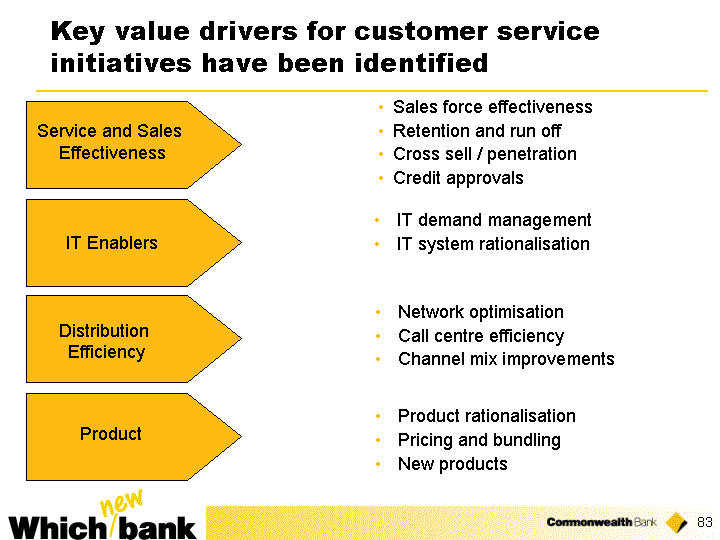
| Key value drivers for customer service initiatives have been identified Service and Sales Effectiveness IT Enablers Distribution Efficiency Product Sales force effectiveness Retention and run off Cross sell / penetration Credit approvals IT demand management IT system rationalisation Network optimisation Call centre efficiency Channel mix improvements Product rationalisation Pricing and bundling New products |

| ASB service and sales model - a proven success story Success has been widely recognised... 5th consecutive year rated NZ's No.1 Major Bank in terms of customer satisfaction1 3rd consecutive year rated No.1 Business Bank2 Best Bank in NZ3 Best Service Provider for any NZ company4 'Best in Class Status' Call Centre5 ....with service outcomes translating to the bottom line Operating profit has increased by more than 20% in each of the past four years Key market shares have increased every year over past decade 1, 2 University of Auckland survey of residential customers and business banking customers, 2002; 3 The Banker Country Awards, 2002 and 2003; 4 CGE&Y's Customer Service Survey, 2000; 5 TARPnz, 2001 and 2002 |

| Service & Sales Process Examples of Actions Weekly ExCo service & sales meetings Structured focus on behaviour Drives continuous improvement Align meeting processes across the Group Inter-divisional Referral Process Service & Sales Reporting & Meetings Rewards & Recognition Metrics & 'formal incentives' Application of ASB service and sales system in Commonwealth Bank Application in Commonwealth Bank Recent pilot in the retail bank resulted in 82% increase in average number of referrals per employee Planned Group-wide roll-out Refresh existing relevant processes via training and continuous coaching and roll out across the Group Establish and roll-out common non-negotiable minimum standards of behaviour Introduce CEO Awards for excellent customer service Embed a culture of day-to-day recognition behaviour within teams Implement metrics, targets, KPIs and incentive programs that are aligned to customer centricity and customer-oriented behaviours |

| Retail branch sales effectiveness is being trialled in 12 branches Focus on Customer Service Officers (CSOs); - redefine role to focus on identifying and satisfying customer needs - KPIs, targets & incentives clearly aligned to customer outcomes - emphasis on sales skills, role plays & coaching - Initial pilot completed - early results encouraging Branch Manager Role; - from back-office to front-line - move focus from administration to front-line staff coach - greater customer "visibility" - positive sales results and great feedback from staff & customers Also - Outbound Call Centre, Leads Generation & Tracking |
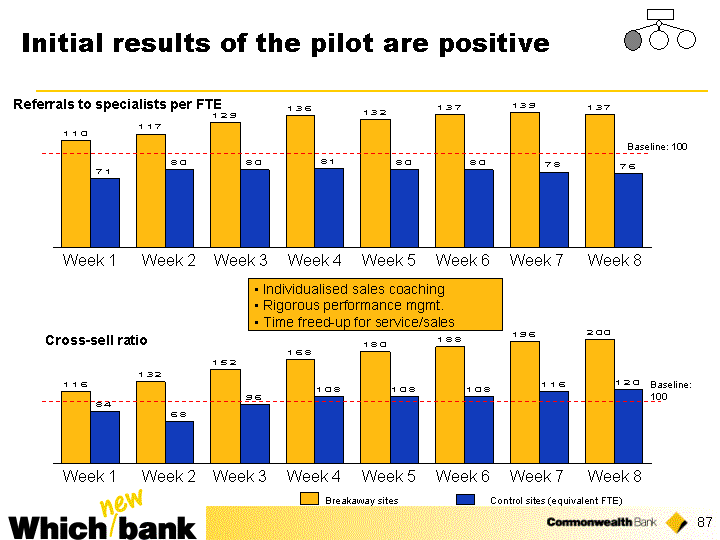
| Initial results of the pilot are positive Breakaway sites Control sites (equivalent FTE) Week 1 Week 2 Week 3 Week 4 Week 6 Referrals to specialists per FTE Week 5 Week 7 Week 8 Week 1 Week 2 Week 3 Week 4 Week 6 Cross-sell ratio Week 5 Week 7 Week 8 Baseline: 100 Baseline: 100 Individualised sales coaching Rigorous performance mgmt. Time freed-up for service/sales |
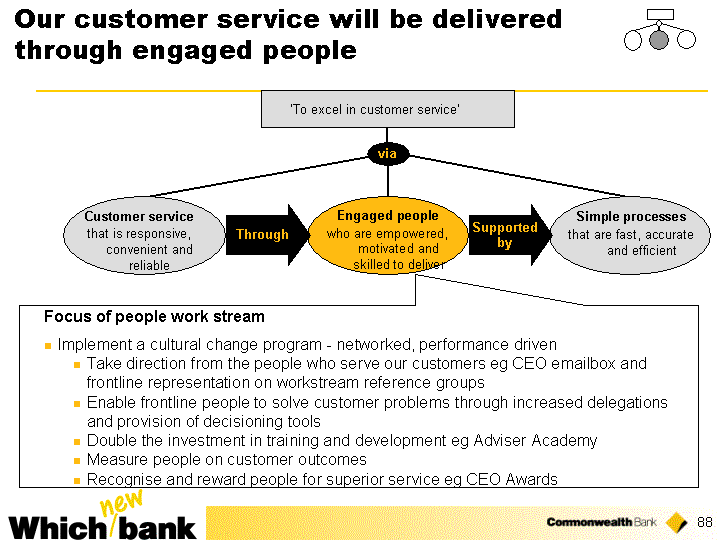
| Our customer service will be delivered through engaged people Simple processes that are fast, accurate and efficient 'To excel in customer service' Customer service that is responsive, convenient and reliable Focus of people work stream Implement a cultural change program - networked, performance driven Take direction from the people who serve our customers eg CEO emailbox and frontline representation on workstream reference groups Enable frontline people to solve customer problems through increased delegations and provision of decisioning tools Double the investment in training and development eg Adviser Academy Measure people on customer outcomes Recognise and reward people for superior service eg CEO Awards via Engaged people who are empowered, motivated and skilled to deliver Supported by Through |
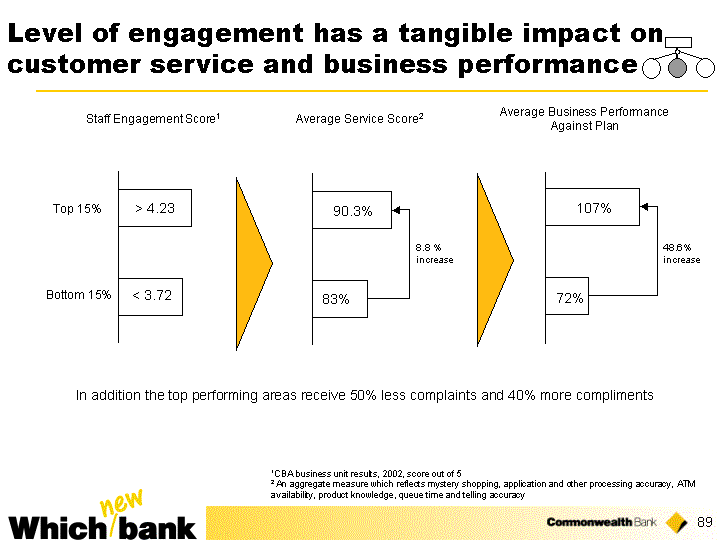
| Level of engagement has a tangible impact on customer service and business performance Bottom 15% Staff Engagement Score1 > 4.23 Top 15% < 3.72 Average Business Performance Against Plan 107% 72% Average Service Score2 90.3% 83% 1CBA business unit results, 2002, score out of 5 2 An aggregate measure which reflects mystery shopping, application and other processing accuracy, ATM availability, product knowledge, queue time and telling accuracy 8.8 % increase 48.6% increase In addition the top performing areas receive 50% less complaints and 40% more compliments |
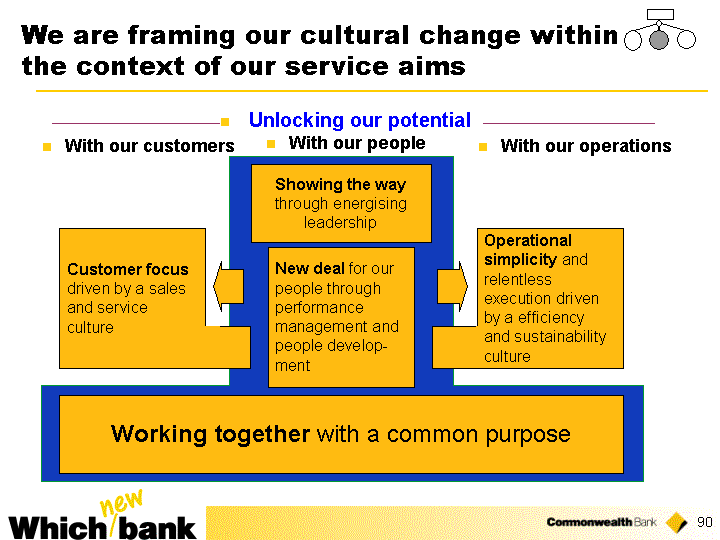
| We are framing our cultural change within the context of our service aims Customer focus driven by a sales and service culture Operational simplicity and relentless execution driven by a efficiency and sustainability culture New deal for our people through performance management and people develop- ment Showing the way through energising leadership Working together with a common purpose Unlocking our potential With our customers With our people With our operations |

| Simple processes that are fast, accurate and efficient 'To excel in customer service' Customer service that is responsive, convenient and reliable Focus of simplification work streams Provide faster service through improved cycle times eg aim to fund approved personal loans in less than 24 hours More frontline time spent serving customers through the removal and automation of procedures Increased accuracy and reduced information requests through pre-populated forms and single data entry Simpler processes which will improve response times eg aim to retrieve transaction information for business clients within 2 hours Reduce the number of IT systems via Engaged people who are empowered, motivated and skilled to deliver Supported by Through Our people will be supported by processes that are 'simply better' |

| Key value drivers for process simplification have been identified Support function redesign including purchasing & property Process / product IT Efficiency Activity Value Analysis Purchasing effectiveness & demand reduction Marketing spend effectiveness Collections effectiveness Property usage effectiveness Process improvement & consolidation with divisions Standardisation & rationalisation across divisions Consolidation across divisions Process/system rationalisation IT maintenance IT simplification & standardisation IT supple management IT overhead effectiveness |

| End to End Home Loan supported by service initiatives are already underway and will be extended to other product lines r New Origination Platform (CMP) + Workflow Technologies r "Straight-through" processing (network vanilla loans from application to document production) r Rollout CMP to Mobile Lenders r Online Application Portal for Brokers r New Branch Servicing Model r Common Back-Office Processes r Automated Credit Decisioning June 2003 July 2003 Single, modern sales platform Eliminate data re-keying + status tracking Nov 2003 Resolve customer enquiries on-the-spot Nov 2003 Jun 2004 Oct 2003 Brokers able to submit applications electronically Jun 2004 85% of loans conditionally approved "on-the-spot" (by Jun-06) Single, modern sales platform u u step completed u Replicate process for personal loans and credit cards r Completion of Programme Dec 2004 |
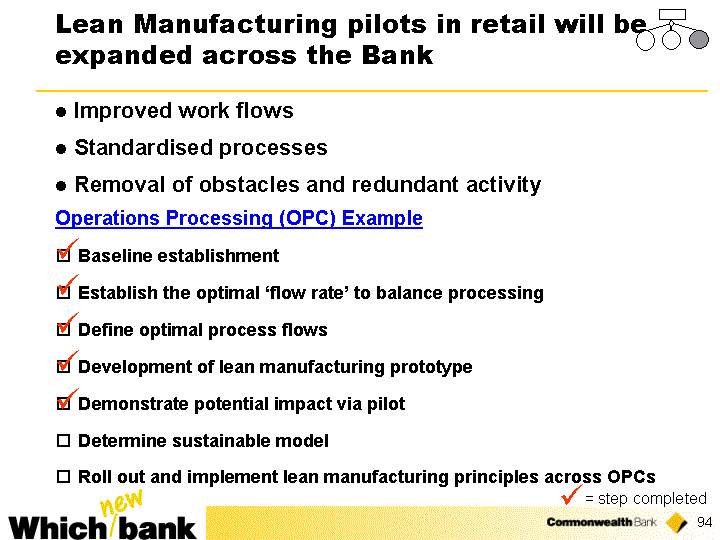
| Operations Processing (OPC) Example Improved work flows Standardised processes Removal of obstacles and redundant activity Lean Manufacturing pilots in retail will be expanded across the Bank Baseline establishment Establish the optimal 'flow rate' to balance processing Define optimal process flows Development of lean manufacturing prototype Demonstrate potential impact via pilot Determine sustainable model Roll out and implement lean manufacturing principles across OPCs ? ? ? ? ? ? = step completed |
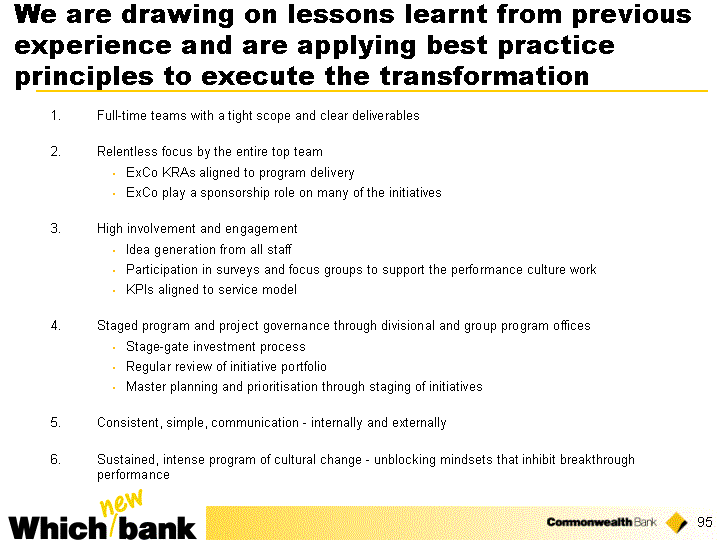
| We are drawing on lessons learnt from previous experience and are applying best practice principles to execute the transformation 1. Full-time teams with a tight scope and clear deliverables 2. Relentless focus by the entire top team ExCo KRAs aligned to program delivery ExCo play a sponsorship role on many of the initiatives 3. High involvement and engagement Idea generation from all staff Participation in surveys and focus groups to support the performance culture work KPIs aligned to service model 4. Staged program and project governance through divisional and group program offices Stage-gate investment process Regular review of initiative portfolio Master planning and prioritisation through staging of initiatives 5. Consistent, simple, communication - internally and externally 6. Sustained, intense program of cultural change - unblocking mindsets that inhibit breakthrough performance |

| A governance structure has been established to minimise execution risk CEO David Murray Group ExCo Group Strategic Delivery Divisional program office For each division Groupwide workstreams Sponsor from ExCo Leader Team Divisional initiatives Sponsor from line Leader Team Co-ordinated workstreams Divisional ExCo |