

| Profit Announcement For the half year ended 31 December 2003 |
| Results have been subject to an independent review by the external auditors. Released 11 February 2004 |
This Profit Announcement is available on the Internet at:
www.commbank.com.au
Table of Contents
Highlights | 3 | ||||
| Key Performance Indicators | 3 | ||||
| Financial Performance and Business Review | 4 | ||||
| Market share | 4 | ||||
| Which new Bank initiative | 5 | ||||
| Outlook | 5 | ||||
| Balance Sheet Summary | 7 | ||||
| Shareholder Summary | 7 | ||||
| Productivity and Efficiency | 7 | ||||
Banking Analysis | 8 | ||||
| Key Performance Indicators | 8 | ||||
| Financial Performance and Business Review | 9 | ||||
| Profit Summary | 10 | ||||
| Major Balance Sheet Items | 12 | ||||
Funds Management Analysis | 15 | ||||
| Key Performance Indicators | 15 | ||||
| Financial Performance and Business Review | 15 | ||||
| Profit Summary | 16 | ||||
| Funds Under Management | 17 | ||||
Insurance Analysis | 19 | ||||
| Key Performance Indicators | 19 | ||||
| Financial Performance and Business Review | 19 | ||||
| Profit Summary | 20 | ||||
| Inforce Premiums | 21 | ||||
Shareholder Investment Returns | 23 | ||||
Life Company Valuations | 24 | ||||
Statutory Financial Report | 25 | ||||
| Directors Report | 25 | ||||
| Consolidated Statement of Financial Performance | 26 | ||||
| Consolidated Statement of Financial Position | 27 | ||||
| Consolidated Statement of Cash Flows | 28 | ||||
Notes to the Financial Statements | 29 | ||||
Directors’ Declaration | 39 | ||||
Independent Review Report | 40 | ||||
Appendices | |||||
| 1. Net Interest Income | 42 | ||||
| 2. Net Interest Margin | 42 | ||||
| 3. Average Balances and Related Interest | 43 | ||||
| 4. Interest Rate and Volume Analysis | 46 | ||||
| 5. Other Banking Operating Income | 48 | ||||
| 6. Operating Expenses | 48 | ||||
| 7. Integrated Risk Management | 49 | ||||
| 8. Capital Adequacy | 51 | ||||
| 9. Share Capital | 53 | ||||
| 10. Life Company Valuations | 54 | ||||
| 11. Intangible Assets | 58 | ||||
| 12. Amortisation Schedule | 58 | ||||
| 13. Definitions | 59 | ||||
Terms used in the Profit Announcement are defined in Appendix 13.
| For further information contact: | ||
| Carolyn Kerr | - | Investor Relations |
| Ph:02 | 9378 5130 | |
| Fax: | 02 9378 2344 | |
| E-mail address: | ir@cba.com.au | |
Except where otherwise stated, all figures relate to the half year ended 31 December 2003 and comparatives for the profit and loss are to the half year ended 31 December 2002. The term “prior comparative period” refers to the six months ended 31 December 2002. Comparisons on balance sheet are to 30 June 2003 unless otherwise stated.
Highlights
| Half Year Ended | ||||||||||||||||
| 31/12/03 | ||||||||||||||||
| 31/12/03 | 30/06/03 | 31/12/02 | -v-31/12/02 | |||||||||||||
| Key Performance Indicators | $M | $M | $M | % | ||||||||||||
Profitability | ||||||||||||||||
| Underlying Segment Profit after Income Tax: | ||||||||||||||||
| Banking | 1,294 | 1,240 | 1,136 | 14 | ||||||||||||
| Funds Management | 126 | 108 | 125 | 1 | ||||||||||||
| Insurance | 67 | 52 | 13 | large | ||||||||||||
Underlying Profit after Income Tax | 1,487 | 1,400 | 1,274 | 17 | ||||||||||||
| Shareholder investment returns (after tax) | 99 | 81 | (8 | ) | large | |||||||||||
| Initiatives including Which new Bank (after tax) (1) | (346 | ) | (110 | ) | (58 | ) | large | |||||||||
Net Profit after Income Tax (“cash basis”) | 1,240 | 1,371 | 1,208 | 3 | ||||||||||||
| Goodwill amortisation | (162 | ) | (162 | ) | (160 | ) | 1 | |||||||||
| Appraisal value uplift/(reduction) | 165 | 181 | (426 | ) | large | |||||||||||
Net Profit after Income Tax (“statutory basis”) | 1,243 | 1,390 | 622 | 100 | ||||||||||||
Banking | ||||||||||||||||
| Net interest margin (%) | 2.60 | 2.69 | 2.65 | (2 | ) | |||||||||||
| Average interest earning assets | 204,323 | 192,942 | 183,675 | 11 | ||||||||||||
| Average interest bearing liabilities | 188,688 | 178,069 | 171,460 | 10 | ||||||||||||
Funds Management | ||||||||||||||||
| Funds under management | 100,383 | 94,207 | 95,266 | 5 | ||||||||||||
Insurance | ||||||||||||||||
| Inforce premiums | 1,102 | 1,076 | 1,040 | 6 | ||||||||||||
| Shareholder Investment Returns (before Tax) | 141 | 96 | (5 | ) | large | |||||||||||
Operating Expenses | ||||||||||||||||
| Operating expenses | 2,709 | 2,685 | 2,627 | 3 | ||||||||||||
| Initiatives including Which new Bank (1) | 494 | 156 | 83 | large | ||||||||||||
| Total | 3,203 | 2,841 | 2,710 | 18 | ||||||||||||
Underlying Productivity | ||||||||||||||||
| Banking expenses to income (%) | 50.7 | 51.9 | 52.2 | (3 | ) | |||||||||||
| Funds Management expenses to average funds under management (%) | 0.84 | 0.88 | 0.86 | (2 | ) | |||||||||||
| Insurance expenses to average inforce premiums (%) | 45.5 | 47.7 | 52.8 | (14 | ) | |||||||||||
Shareholder Measures | ||||||||||||||||
| Return on equity — cash basis | 12.33 | 13.95 | 12.39 | — | ||||||||||||
| EPS — cash basis — basic (cents) | 95.5 | 107.7 | 95.0 | 1 | ||||||||||||
| Dividend per share (cents) | 79 | 85 | 69 | 14 | ||||||||||||
| Dividend payout ratio (%) | 82.9 | 79.0 | 72.7 | 14 | ||||||||||||
Capital Adequacy | ||||||||||||||||
| Tier 1 (%) | 7.26 | 6.96 | 7.06 | 3 | ||||||||||||
| Total (%) | 9.46 | 9.73 | 9.81 | (4 | ) | |||||||||||
Full-time Staff Equivalent (FTE’s) | 34,956 | 35,845 | 36,421 | (4 | ) | |||||||||||
| (1) | December 2003 results include Which new Bank, while prior year includes strategic initiatives undertaken and June 2002 ESAP costs paid in October 2002. |
Underlying measures exclude shareholder investment returns and the cost of initiatives (including Which new Bank) along with their associated tax if relevant. This represents core operating performance, removing the volatility of shareholder earnings and the impact of strategic initiatives.
3
Highlights (cont’d)
Financial Performance and Business Review
The Bank’s net profit after tax (“statutory basis”) for the six months ended 31 December 2003 was $1,243 million. This is against a net profit after tax of $622 million for the six months ended 31 December 2002, which included a reduction in the appraisal value of controlled entities of $426 million, compared with an increase of $165 million in the appraisal value in the current period.
The net profit after tax (“cash basis”) for the period was $1,240 million, an increase of 3% over the prior comparative period. This result was achieved inclusive of $346 million (after tax) of incremental expenses in relation to the Which new Bank strategic initiative.
The Bank posted a strong core operating result for the six months ended 31 December 2003, with net profit after tax (“underlying basis”) up 17% to $1,487 million from $1,274 million at 31 December 2002.
This result reflects a strong performance in the Australian and New Zealand retail banking operations, driven primarily by strong growth in the housing market. Housing assets increased by 12% over the six months ending 31 December 2003 to $112 billion up from $100 billion as at 30 June 2003. The New Zealand performance represents above market growth across the portfolio.
Results for the Institutional and Business Services business has shown modest growth over the six months, reflecting improved market conditions combined with the more customer focussed business model implemented through the IBS redesign program during the second half of the last financial year and continuing in this financial year.
In Funds Management, stronger equity markets contributed to a rise in funds under management, an improvement in investor confidence and the levels of funds flow. Underlying net profit after tax of $126 million was up 1% on the prior comparative period, while the underlying net profit on a pre-tax basis was up 7% to $173 million. Funds under management levels have recovered significantly since June 2003.
Insurance results were strong, with underlying net profit after tax of $67 million, compared with $13 million in the prior comparable period. The increase was across all regions, particularly Australia and Asia. The Insurance result was restated for prior periods to include the General Insurance operations.
Underlying productivity across all three segments has improved since June 2003. Underlying operating expenses increased by 3% on the prior comparative period. This reflects growth in banking volumes, the full year effect of the establishment of the Premium Financial Services business, general Enterprise Bargaining Agreement (EBA) wage increases partly offset by benefits from prior period initiatives and reduced Asian expenses as a result of business disposals and cost management.
Credit quality in the lending portfolio has continued to improve with very low levels of corporate defaults. The bad debt charge as a percentage of risk weighted assets remained largely unchanged at 0.10% at 31 December 2003 compared with 0.11% at 31 December 2002.
Dividends
The interim dividend declared for the half year is another record at 79 cents per share, an increase of 10 cents or 14.5% on the prior comparative period. For the current half year, the dividend takes into acount the expense in relation to the Which new Bank initiative. As a result, the dividend payout ratio for the half year is 82.9% compared with a payout ratio of 72.7% in the prior comparative period.
This dividend payment is fully franked and will be paid on 30 March 2004 to owners of ordinary shares at the close of business on 20 February 2004 (record date). Shares become ex-dividend on 16 February 2004.
The Bank issued $201 million of shares to satisfy shareholder participation in the Dividend Reinvestment Plan (DRP) in respect of the final dividend for 2002/03. It expects to issue around $189 million of shares in respect to the DRP for the interim dividend for 2003/04.
Dividends are based on net profit after tax (“cash basis”) per share, having regard to the following:
| • | Rate of business growth; |
| • | Capital adequacy; |
| • | Investment requirements; |
| • | The cyclical nature of investment returns and expectations of long term investment returns; and |
| • | A range of other factors. |
Capital Management
The Bank maintains a strong capital position. This is recognised in its credit ratings. The Bank’s credit ratings remained unchanged during the period.
| Long- | Short- | |||||||||||
| term | term | Affirmed | ||||||||||
| Fitch Ratings | AA | F1+ | Feb 03 | |||||||||
| Moody’s Investor Services | Aa3 | P-1 | Dec 03 | |||||||||
| Standard & Poor’s | AA- | A-1+ | Sep 03 | |||||||||
Risk Weighted Capital Ratios
| 31/12/03 | 30/06/03 | 31/12/02 | ||||||||||
| % | % | % | ||||||||||
| Tier one | 7.26 | 6.96 | 7.06 | |||||||||
| Tier two | 3.56 | 4.21 | 4.08 | |||||||||
| Less deductions | (1.36 | ) | (1.44 | ) | (1.33 | ) | ||||||
| Total capital | 9.46 | 9.73 | 9.81 | |||||||||
| Adjusted Common Equity (ACE) (1) | 4.61 | |||||||||||
| (1) | The ACE ratio has been calculated in accordance with the Standard & Poor’s methodology. As this is the first time the Bank has disclosed this ratio, no comparatives are published. |
The Bank’s capital position remains strong. A more detailed explanation of the movements in the capital ratios are set out on page 51.
An off-market buy-back of $450 million to $550 million is planned for March 2004. This is expected to result in enhanced EPS and improved ROE. The ultimate size of the buy-back is at the discretion of Directors and will be dependent on market conditions at the time.
Market share
The table below sets out the latest available market shares for the current and prior period along key product lines.
| Line of Business | 31/12/03 | 30/06/03(1) | ||||||||||
Banking | ||||||||||||
| Retail and Business Deposits | 24.1 | %(2) | 24.2 | % | ||||||||
| Credit Cards | 22.7 | %(3) | 22.8 | % | ||||||||
| Home Loans | 19.3 | %(4) | 19.5 | %(6) | ||||||||
| New Zealand Lending | 21.6 | % | 20.6 | % | ||||||||
| New Zealand Retail Deposits | 17.2 | % | 16.4 | % | ||||||||
| Transaction Services | 23.1 | %(5) | 22.7 | % | ||||||||
| Business Lending | 14.2 | % | 14.0 | % | ||||||||
| Asset Finance | 15.5 | % | 15.1 | % | ||||||||
Funds Management | ||||||||||||
| Australia Retail | 14.7 | %(4) | 14.9 | % | ||||||||
| New Zealand | 14.7 | % | 14.5 | % | ||||||||
Insurance | ||||||||||||
| New Zealand | 28.1 | %(4) | 28.3 | % | ||||||||
| Australia | 15.1 | %(4) | 15.3 | % | ||||||||
| Hong Kong | 2.2 | %(4) | 2.2 | % | ||||||||
| (1) | Actual June 2003 Market Share number which was generally unavailable at the time of the previous profit announcement and includes an adjustment for any change in definitions on the part of regulatory authorities (2) reflects sale of Commonwealth Custodian Services in October 2003 (3) as at November 2003 (4) as at September 2003 (5) as at August 2003 (6) as at March 2003 |
4
Highlights (cont’d)
Which new Bank initiative
During September 2003, the Bank launched it’s Which new Bank initiative. The objective of this initiative is to excel in customer service through engaged people supported by simpler processes.
Outcomes will include faster service delivery and better quality advice, enhanced training for staff, simpler processes and less bureaucracy.
The Bank is pleased with the early stages of these initiatives where good progress has been made on several key workstreams. This has resulted in improved productivity across all businesses since June 2003. Over the life of the program, the improved customer service levels are expected to lead to growth in market share.
For the six months, total incremental spend on the Which new Bank initiative totalled $494 million pre-tax, ($346 million after-tax). The major categories of spend include the expensing of $210 million of previously capitalised software, $200 million of provisions for future spend and $134 million costs net of $45 million capitalisation. This incremental spend is after taking into consideration the normal level of project spend, which is $50 million pre-tax net of capitalisation. The $200 million provision covers expected retrenchment costs, consulting fees and other expenses.
The financial impact of Which new Bank for the half year is set out below:
| $m | Actual | |||
| 31/12/03 | ||||
| Initiative expenses incurred | 179 | |||
| Investment capitalised | (45 | ) | ||
| Provision for future costs | 200 | |||
| Expensing of previously capitalised software | 210 | |||
| Gross Which new Bank expense | 544 | |||
| Normal project spend (gross) | (70 | ) | ||
| Normal project spend capitalised | 20 | |||
Incremental Which new Bank expense | 494 | |||
Net benefits realised during the six months ended 31 December 2003 total $63m pre-tax. These benefits are mainly ongoing cost savings, and were realised across the following areas:
| • | Redesign of Business and Corporate Banking and associated risk support. |
| • | Several initiatives in the Retail Banking Services and Premium Financial Services business. |
The Bank remains on track to meet the targets for the Which new Bank initiative that were announced in September 2003.
Further details on the specific initiatives are included in the business overview sections.
Outlook
The global economy is expected to continue its strong growth in the short term. However, a number of medium-term structural issues remain, including the US current account deficit and the exchange rate re-alignment currently underway.
Factors influencing the Australian economy remain, on balance, positive and are expected to remain so for the first half of 2004. Beyond that, the interplay between household debt and interest rates, house prices and household wealth and the Australian Dollar could result in a slowing in credit growth.
Subject to market conditions being maintained, the Bank is targetting growth in cash EPS exceeding 10% compound annual growth rate (CAGR) over the three years to 30 June 2006, which is expected to be ahead of the industry growth for the period. The Bank also expects to improve productivity by between 4-6% CAGR over this period and aims to grow profitable market share across major product lines and increase the dividend per share every year.
Growth in cash earnings was sufficient to offset Which new Bank expenses in the first half. The Bank reiterates the views expressed at the AGM that:
“At this stage, there appears to be sufficient momentum in the economy to support solid underlying earnings growth for the full year, although the rate of growth may moderate in the second half.
The Bank will add back the non-recurring transformation charges, in considering the amount to be distributed as dividends to shareholders. Consequently, as indicated in the Which new Bank announcement, we expect to be able to continue the uninterrupted pattern of increased dividends that we have been able to deliver since privatisation.”
In respect of Which new Bank, early signs of the positive impact of some of our initiatives on the Bank’s culture, processes and performance confirm that the course we are taking is the right way forward.
The Bank remains extremely well positioned to meet the challenges ahead and will benefit from scale, breadth of services and strength of its proprietary distribution systems.
5
Highlights (cont’d)
| Half Year Ended | ||||||||||||||||
| 31/12/03 | ||||||||||||||||
| 31/12/03 | 30/06/03 | 31/12/02 | -v- 31/12/02 | |||||||||||||
| $M | $M | $M | % | |||||||||||||
Net Profit after Income Tax (“statutory basis”) | 1,243 | 1,390 | 622 | 100 | ||||||||||||
Net Profit after Income Tax (“cash basis”) | 1,240 | 1,371 | 1,208 | 3 | ||||||||||||
Net Profit after Income Tax (“underlying basis”) | 1,487 | 1,400 | 1,274 | 17 | ||||||||||||
| Net Interest Income | 2,671 | 2,572 | 2,454 | 9 | ||||||||||||
| Other banking income | 1,375 | 1,356 | 1,271 | 8 | ||||||||||||
| Funds management income | 582 | 540 | 575 | 1 | ||||||||||||
| Insurance income | 322 | 318 | 280 | 15 | ||||||||||||
Total Operating Income | 4,950 | 4,786 | 4,580 | 8 | ||||||||||||
| Shareholder investment returns | 141 | 96 | (5 | ) | large | |||||||||||
| Policyholder tax benefit/(expense) | 120 | 32 | (90 | ) | large | |||||||||||
Total Income | 5,211 | 4,914 | 4,485 | 16 | ||||||||||||
| Operating expenses | 2,709 | 2,685 | 2,627 | 3 | ||||||||||||
| Initiatives including Which new Bank(1) | 494 | 156 | 83 | large | ||||||||||||
Total Operating Expenses | 3,203 | 2,841 | 2,710 | 18 | ||||||||||||
| Charge for bad and doubtful debts | 150 | 154 | 151 | (1 | ) | |||||||||||
| Net Profit Before Income Tax | 1,858 | 1,919 | 1,624 | 14 | ||||||||||||
| Policyholder tax expense/(benefits) | 120 | 32 | (90 | ) | large | |||||||||||
| Corporate tax expense | 494 | 513 | 503 | (2 | ) | |||||||||||
| Outside equity interests | 4 | 3 | 3 | 33 | ||||||||||||
Net Profit after Income Tax (“cash basis”) | 1,240 | 1,371 | 1,208 | 3 | ||||||||||||
| Appraisal value uplift/(reduction) | 165 | 181 | (426 | ) | large | |||||||||||
| Goodwill amortisation | (162 | ) | (162 | ) | (160 | ) | 1 | |||||||||
Net Profit after Income Tax (“statutory basis”) | 1,243 | 1,390 | 622 | 100 | ||||||||||||
Contributions to Profit (after income tax) | ||||||||||||||||
| Banking | 1,294 | 1,240 | 1,136 | 14 | ||||||||||||
| Funds Management | 126 | 108 | 125 | 1 | ||||||||||||
| Insurance | 67 | 52 | 13 | large | ||||||||||||
Net Profit after Income Tax (“underlying basis”) | 1,487 | 1,400 | 1,274 | 17 | ||||||||||||
| Shareholder Investment Returns (after tax) | 99 | 81 | (8 | ) | large | |||||||||||
| Initiatives including Which new Bank (after tax)(1) | (346 | ) | (110 | ) | (58 | ) | large | |||||||||
Net Profit after Income Tax (“cash basis”) | 1,240 | 1,371 | 1,208 | 3 | ||||||||||||
| Appraisal value uplift/(reduction) | 165 | 181 | (426 | ) | large | |||||||||||
| Goodwill amortisation | (162 | ) | (162 | ) | (160 | ) | 1 | |||||||||
Net Profit after Income Tax (“statutory basis”) | 1,243 | 1,390 | 622 | 100 | ||||||||||||
| Half Year Ended | ||||||||||||||||
| Strategic Initiative Expenses and Shareholder | ||||||||||||||||
| Investment Returns(1) | Before Tax | After Tax | Before Tax | After Tax | ||||||||||||
| 31/12/03 | 31/12/03 | 31/12/02 | 31/12/02 | |||||||||||||
| "Underlying" measures exclude the following items: | $M | $M | $M | $M | ||||||||||||
Banking | ||||||||||||||||
| Initiatives | 463 | 324 | 56 | 39 | ||||||||||||
| ESAP | — | — | 27 | 19 | ||||||||||||
Funds Management | ||||||||||||||||
| Initiatives | 27 | 19 | — | — | ||||||||||||
| Investment returns | 14 | 10 | 5 | 4 | ||||||||||||
Insurance | ||||||||||||||||
| Initiatives | 4 | 3 | — | — | ||||||||||||
| Investment returns | 127 | 89 | (10 | ) | (12 | ) | ||||||||||
Total | ||||||||||||||||
| Initiatives | 494 | 346 | 56 | 39 | ||||||||||||
| ESAP | — | — | 27 | 19 | ||||||||||||
| Investment returns | 141 | 99 | (5 | ) | (8 | ) | ||||||||||
The current period benefits from initiatives of $63 million were reflected in operating expenses and operating income.
Throughout the report underlying measures exclude shareholder investment returns and incremental first time operating expenses, being strategic initiatives and the cost of the June 2002 ESAP paid in October 2002.
| (1) | December 2003 results reflects the Which new Bank initiative, while prior periods include strategic initiatives undertaken and the cost of the June 2002 ESAP paid in October 2002. |
6
Highlights (cont’d)
| 31/12/03 | ||||||||||||||||
| 31/12/03 | 30/06/03 | 31/12/02 | -v- 31/12/02 | |||||||||||||
| Balance Sheet Summary | $M | $M | $M | % | ||||||||||||
| Total assets | 285,879 | 265,110 | 262,017 | 9 | ||||||||||||
| Total liabilities | 262,678 | 242,958 | 239,571 | 10 | ||||||||||||
| Shareholders’ equity | 23,201 | 22,152 | 22,446 | 3 | ||||||||||||
Assets held and Funds under Management | ||||||||||||||||
| On Balance Sheet Banking assets | 250,594 | 229,289 | 226,729 | 11 | ||||||||||||
| Insurance funds under management | 22,145 | 22,800 | 23,969 | (8 | ) | |||||||||||
| Other insurance and internal funds management assets | 13,140 | 13,021 | 11,319 | 16 | ||||||||||||
| 285,879 | 265,110 | 262,017 | 9 | |||||||||||||
| Off Balance Sheet | ||||||||||||||||
| Funds under management | 78,238 | 71,407 | 71,297 | 10 | ||||||||||||
| 364,117 | 336,517 | 333,314 | 9 | |||||||||||||
| Half Year Ended | |||||||||||||||||
| 31/12/03 | |||||||||||||||||
| -v- 31/12/02 | |||||||||||||||||
| Shareholder Summary | 31/12/03 | 30/06/03 | 31/12/02 | % | |||||||||||||
| Dividends per share — fully franked (cents) | 79 | 85 | 69 | 14 | |||||||||||||
| Dividend cover — cash (times) | 1.2 | 1.3 | 1.4 | (14 | ) | ||||||||||||
| Earnings per share (cents) | |||||||||||||||||
| Statutory — basic | 95.8 | 109.2 | 48.2 | 99 | |||||||||||||
| Statutory — fully diluted | 95.7 | 109.1 | 48.2 | 99 | |||||||||||||
| Cash basis — basic | 95.5 | 107.7 | 95.0 | 1 | |||||||||||||
| Cash basis — fully diluted | 95.5 | 107.6 | 94.9 | 1 | |||||||||||||
| Dividend payout ratio (%) | |||||||||||||||||
| Statutory | 82.7 | 77.9 | 143.2 | (42 | ) | ||||||||||||
| Cash basis | 82.9 | 79.0 | 72.7 | 14 | |||||||||||||
| Weighted average number of shares — basic (number) | 1,257 | 1,254 | 1,253 | 0 | |||||||||||||
| Weighted average number of shares — fully diluted (number) | 1,258 | 1,254 | 1,254 | 0 | |||||||||||||
| Half Year Ended | ||||||||||||||||||||
| 31/12/03 | ||||||||||||||||||||
| -v- 31/12/02 | ||||||||||||||||||||
| Productivity and Efficiency | 31/12/03 | 30/06/03 | 31/12/02 | % | ||||||||||||||||
Banking | ||||||||||||||||||||
| Expense to income (%) | 62.1 | 54.9 | 54.4 | 14 | ||||||||||||||||
| Underlying expense to income (%) | 50.7 | 51.9 | 52.2 | (3 | ) | |||||||||||||||
Funds Management | ||||||||||||||||||||
| Expense to average funds under management (%) | 0.90 | 0.96 | 0.86 | 5 | ||||||||||||||||
| Underlying expenses to average funds under management (%) | 0.84 | 0.88 | 0.86 | (2 | ) | |||||||||||||||
Insurance | ||||||||||||||||||||
| Expense to average inforce premiums (%) | 46.2 | 47.7 | 52.8 | (13 | ) | |||||||||||||||
| Underlying expense to average inforce premiums (%) | 45.5 | 47.7 | 52.8 | (14 | ) | |||||||||||||||
| Underlying staff expense/total operating income (%) | 25.86 | 26.43 | 26.46 | (2 | ) | |||||||||||||||
| Total operating income per FTE ($) | 141,607 | 133,519 | 125,752 | 13 | ||||||||||||||||
| Full time staff equivalent (FTE’s) | 34,956 | 35,845 | 36,421 | (4 | ) | |||||||||||||||
7
Banking Analysis
| Half Year Ended | ||||||||||||||||
| 31/12/03 | ||||||||||||||||
| 31/12/03 | 30/06/03 | 31/12/02 | -v- 31/12/02 | |||||||||||||
| Key Performance Indicators | $M | $M | $M | % | ||||||||||||
Profitability | ||||||||||||||||
Underlying Profit after Income Tax | 1,294 | 1,240 | 1,136 | 14 | ||||||||||||
| Initiatives including Which new Bank (after tax)(1) | (324 | ) | (84 | ) | (58 | ) | large | |||||||||
Net Profit after Income Tax (“cash basis”) | 970 | 1,156 | 1,078 | (10 | ) | |||||||||||
Operating Income | ||||||||||||||||
| Net interest income ($m) | 2,671 | 2,572 | 2,454 | 9 | ||||||||||||
| Net interest margin (%) | 2.60 | 2.69 | 2.65 | (2 | ) | |||||||||||
| Other banking income ($m) | 1,375 | 1,356 | 1,271 | 8 | ||||||||||||
| Total banking income ($m) | 4,046 | 3,928 | 3,725 | 9 | ||||||||||||
| Other banking income/Total banking income (%) | 34.0 | 34.5 | 34.1 | — | ||||||||||||
Operating Expenses | ||||||||||||||||
| Operating expenses ($m) | 2,051 | 2,037 | 1,945 | 5 | ||||||||||||
| Initiatives including Which new Bank(1)($m) | 463 | 118 | 83 | large | ||||||||||||
Productivity and Other Measures | ||||||||||||||||
| Expense to income (%) | 62.1 | 54.9 | 54.4 | 14 | ||||||||||||
| Expense to income — underlying (%) | 50.7 | 51.9 | 52.2 | (3 | ) | |||||||||||
| Effective corporate tax rate (%) | 29.8 | 28.6 | 30.3 | (2 | ) | |||||||||||
Balance Sheet | ||||||||||||||||
| Lending assets ($m) | 191,272 | 175,074 | 169,084 | 13 | ||||||||||||
| Average interest earning assets ($m) | 204,323 | 192,942 | 183,675 | 11 | ||||||||||||
| Average interest bearing liabilities ($m) | 188,688 | 178,069 | 171,460 | 10 | ||||||||||||
Asset Quality | ||||||||||||||||
| Charge for bad and doubtful debts ($m) | 150 | 154 | 151 | (1 | ) | |||||||||||
| Risk weighted assets ($m) | 157,471 | 146,808 | 143,771 | 10 | ||||||||||||
| Net impaired assets ($m) | 375 | 434 | 599 | (37 | ) | |||||||||||
| General provision/Risk weighted assets (%) | 0.86 | 0.90 | 0.92 | (7 | ) | |||||||||||
| Total provisions/Gross impaired assets (net of interest reserved) (%) | 271.6 | 239.4 | 184.1 | 48 | ||||||||||||
| Bad debt expense/Risk weighted assets (%) | 0.10 | 0.10 | 0.11 | (9 | ) | |||||||||||
| (1) | December 2003 results reflects the Which new Bank initiative, while prior periods include strategic initiatives undertaken and the cost of the June 2002 ESAP paid in October 2002. |
8
Banking Analysis (cont’d)
Financial Performance and Business Review
Banking operations continued to post strong results, with underlying net profit after tax up 14% or $158 million to $1,294 million from $1,136 million for the prior comparative period. On a cash basis, after reflecting incremental expenses on the Which new Bank initiative totaling $324 million (after tax), net profit was down $108 million or 10% to $970 million.
The strong underlying result was driven by higher home loan balances, higher credit card and ATM volumes and an improvement in trading and business activity. The underlying cost to income ratio continued to reduce from 52.2% for the prior comparative period to 50.7% for the half year ended 31 December 2003.
Retail
In retail banking operations, the performance for the half-year to December was driven by continued growth in the residential housing market, with record new approval volumes underpinning strong growth in net interest income, which was up 9% on the prior corresponding period. The strong revenue result was further supported by strong credit card sales and new deposit growth.
Going forward, opportunities for further market-driven revenue growth are expected to come under pressure from a slowing housing market and the impact of Reserve Bank credit card reforms. In an environment of heightened competitive pressures, the Bank is pursuing a service transformation program designed to ensure a better service outcome for our customers. Across the retail bank, highlights to-date have included:
| • | Changes to our home loan process, which make applying for a new loan or changing details on an existing loan much simpler and easier. Through system and process improvements, the great majority of home loan applications are now either conditionally approved on the spot or within one business day. Around 70% of maintenance transactions (such as amending loan repayments) on existing loans can now be done immediately in the branch or over the telephone, compared with up to 10 days previously. |
| • | The refurbishment of 20 branches (at 31 December 2003) to a modern layout more conducive to effective customer service, with a further 105 branches to be completed by June 2004. This ongoing program will see more than 10% of branches modernised each year with a total investment of $260 million over the next three years. |
| • | A continued emphasis on reducing customer waiting times, with some branches showing up to a 50% improvement over the past six months. |
These actions represent the initial steps in a wide-ranging three year program that will transform the Bank’s service culture and results. Over the next twelve months, specific actions will include;
| • | Changes to frontline customer service roles from early 2004, designed to ensure a greater proportion of staff time is spent on servicing customers. Changes will be supported by additional skills training and new incentives for staff aligned to better customer service outcomes. Early trials of these changes in a selected number of branches have shown significant improvements in service and sales outcomes. |
| • | Changing the role of our branch managers so that up to 80% of their time is spent with their customers or coaching their staff. |
| • | Developing more efficient processes leading to faster approval times for credit cards and personal loans. |
| • | The introduction of a new, more efficient NetBank service with additional functionality by the end of 2004. |
Asia Pacific
Asia Pacific Banking incorporates the Bank’s retail and commercial banking operations in New Zealand, Fiji, and Indonesia. ASB Bank in New Zealand represents the majority of the Asia Pacific Banking business.
The New Zealand economy continued to grow strongly during the first half. Three successive interest rate reductions prior to August 2003 further boosted the housing sector. Total market lending as measured by Private Sector Credit (Residents only) grew by 8.2% in the year to November 2003. ASB Bank’s lending growth was 19.2%, more than double the market rate (source: Reserve Bank of New Zealand). The key drivers of the success were our first class sales and service performance, successful marketing campaigns and the continued momentum of the “One Team” referral program.
ASB Bank was recognised as the top major retail bank (for the sixth consecutive year) and business bank (for the fifth consecutive year) in the annual University of Auckland “Bank customer satisfaction survey”, resulting from the bank’s focus on customer service.
The banking operations in Indonesia and Fiji continued to achieve solid balance sheet growth.
Institutional & Business
The robust domestic economy, supported by improving global conditions, has sustained stronger momentum across all business segments. The environment has been conducive to maintaining good credit quality.
Significant transformation across all client segments and associated risk functions has improved client service standards, while achieving substantial productivity gains. While there was some slippage in lending market share during the implementation phase of this program, this has been recovered. Importantly, client satisfaction scores have continued to improve, providing positive feedback on the new service delivery models.
In Business Banking, we maintained our leading market share (source: Taylor Nelson Sofries). A range of successful marketing campaigns were conducted over the period. The support for regional and rural Australia, especially areas hard hit by the drought, was recognised at both State and Federal levels.
In Corporate Banking, we increased market share across a range of products while maintaining the leading market share for principal banker to mid-corporates and ranking first overall in client satisfaction for treasury services to mid-corporates (source: East & Partners).
A number of market leading transactions in commercial property and infrastructure finance were executed by the Institutional Banking teams. These included finance for the Chatswood Chase Shopping Centre acquisition, and acting as sponsor for the consortium that won the bid for the Sydney Basin airports.
The implementation for the Financial Services Reform Act (FSRA) has progressed well and our license is effective from 1 December 2003.
9
Banking Analysis (cont’d)
Profit Summary
| Half Year Ended | ||||||||||||||||
| 31/12/03 | ||||||||||||||||
| 31/12/03 | 30/06/03 | 31/12/02 | -v- 31/12/02 | |||||||||||||
| Key Performance Indicators | $M | $M | $M | % | ||||||||||||
| Net interest income | 2,671 | 2,572 | 2,454 | 9 | ||||||||||||
| Other operating income | 1,375 | 1,356 | 1,271 | 8 | ||||||||||||
Total Operating Income | 4,046 | 3,928 | 3,725 | 9 | ||||||||||||
| Operating expenses | 2,051 | 2,037 | 1,945 | 5 | ||||||||||||
| Initiatives including Which new Bank(1) | 463 | 118 | 83 | large | ||||||||||||
Total Operating Expenses | 2,514 | 2,155 | 2,028 | 24 | ||||||||||||
| Charge for bad and doubtful debts | 150 | 154 | 151 | (1 | ) | |||||||||||
Net Profit before Income Tax | 1,382 | 1,619 | 1,546 | (11 | ) | |||||||||||
| Income tax expense | 412 | 463 | 468 | (12 | ) | |||||||||||
Net Profit after Income Tax (“cash basis”) | 970 | 1,156 | 1,078 | (10 | ) | |||||||||||
| (1) | December 2003 results reflects the Which new Bank initiative, while prior periods include strategic initiatives undertaken and the cost of the June 2002 ESAP paid in October 2002. |
Net Interest Income
Net interest income increased by 9% or $217 million to $2,671 million for the six months ended 31 December 2003 while average interest earning assets increased by 11% or $20.6 billion to $204.3 billion over the same period. The average net interest margin (NIM) reduced by 5 basis points to 2.60%.
The increase in average interest earning assets comprises an increase of $16 billion in lending assets and $4 billion in investment and trading securities. The increase in average interest earning assets contributed $266 million to the increase in net interest income.
The largest contributor to the increase in average interest earning assets continued to be the strong residential lending market in Australia and New Zealand, with loan balances increasing by $12 billion or 12% since 30 June 2003, accounting for 75% of the total increase in lending assets.
The reduction of 5 basis points in the net interest margin from 2.65% for the six months to 31 December 2002 to 2.60% impacted net interest income by $49m. Factors impacting the margin reduction include:
| • | The strong growth in home loan balances was not matched by a similar increase in retail deposits, resulting in a higher reliance on wholesale funding. The net impact of the growth in home loans and higher reliance on wholesale funding reduced the net interest margin by 4 basis points. |
| • | Benefit from the two increases in the Australian cash rates contributed 1 basis point, although the impact of the second increase on 4 December was minimal for the period. |
| • | Margins in ASB Bank reduced as a result of three reductions in the cash rate in New Zealand prior to August and due to competitive pressures. This reduced the Bank’s overall net interest margin by 2 basis points. |
10
Banking Analysis (cont’d)
Other Banking Operating Income
Other Banking Operating Income
Other banking operating income increased by 8% or $104 million to $1,375 million for the half year compared with $1,271 million for the period ended 31 December 2002. Other banking operating income includes non-interest income earned on transaction accounts for the Bank’s personal, business and corporate customers.
The reasons for the increase in other operating income include:
| • | Fees and commissions increased by 12% or $80 million to $771 million. CommSec experienced record trading levels during the six months (exceeding 477,000 trades in October), resulting in an increase in commissions of $31 million or 84%. The acquisition and integration of TD Waterhouse effective 1 May 2003 also contributed to this increase. Credit card spend was up 15% while growth in transactional activity was also positive. Personal transaction fees are less than 5% of the Bank’s total income. |
| • | Lending fees increased by 9% or $28 million. Growth in retail lending fees was the result of the increased activity in home lending, margin lending and overdraft line fees, which was partly offset by increased mortgage brokerage and valuation fees. Institutional and Business fees increased, reflecting an improvement in market conditions relative to the prior comparative period. |
| • | Trading income was up 19% or $43 million, reflecting improved trading and market conditions in the reporting period compared with the half year ended 31 December 2002. |
| • | Other banking income decreased by $47 million to negative $7 million. The current period includes an equity accounted loss of an associate entity principally related to a change in its accounting policy. The prior period results included a loss on strategic investments. |
The income for General Insurance has been reallocated to the Insurance segment and prior period numbers and ratios have been restated. This reduced Banking other operating income by $24 million for the six months ended 31 December 2002 and $17 million for the year ended 30 June 2003, with a similar increase in the Insurance total operating income.
The income from tied financial planners was reallocated to Funds Management, reducing other banking operating income by $11 million for the six months ended 31 December 2002 and $18 million for the six months ended 30 June 2003.
Operating Expenses
Total operating expenses on a comparable business basis for the half year increased by 5% from $1,945 million in December 2002 to $2,051 million in December 2003. The increase was due to:
| • | Increases in volume related expenses including credit card loyalty. |
| • | The full year effect of establishing the Premium Financial Services business. |
| • | Salary increases of 4% awarded under the Enterprise Bargaining Agreement (EBA). |
| • | The net loss incurred as a result of a large fraud in Western Australia. |
These increases were partly offset by savings from prior period strategic initiatives.
Productivity Efficiency
The underlying banking expense to income ratio continued to improve from 51.9% for the six months ended 30 June 2003 to 50.7% at 31 December 2003, a productivity improvement of 4.6% annualised. The improvement is due to strong revenue growth in the Bank and the benefits from strategic initiatives implemented in current and prior years partially offset by the increase in costs.
Initiatives including Which new Bank
The key strategic activities carried out in the current period were the continued implementation of the IBS redesign program and process improvements relating to the home loan application process, as well as the branch refurbishment program in Retail Banking Services. More details on specific initiatives are outlined on page 9.
Bad and Doubtful Debts
The total charge of $150 million for bad and doubtful debts is at similar levels for the prior two six month periods ($151 million for the six months ended 31 December 2002 and $154 million for the six months ended 30 June 2003).
Low interest rates continued to contribute to a good credit environment, with personal and corporate arrears and default levels at historically low levels.
The Bank remains well provisioned, with total provisions for impairment as a percentage of gross impaired assets net of interest reserved of 271.6% (June 2003 : 239.4%) and a general provision as a percentage of risk weighted assets of 0.86%, compared against 0.90% at 30 June 2003.
Taxation Expense
The corporate tax charge of $412 million is 12% or $56 million lower than 31 December 2002 reflecting the lower profit inclusive of the incremental initiative expenses. The average effective tax rate has reduced slightly to 29.8%.
11
Banking Analysis (cont’d)
Major Balance Sheet Items
| 31/12/03 | ||||||||||||||||
| 31/12/03 | 30/06/03 | 31/12/02 | -v- 31/12/02 | |||||||||||||
| Major Balance Sheet Items (gross of impairment) - by Product | $M | $M | $M | % | ||||||||||||
| Gross housing | 117,530 | 106,683 | 99,456 | 18 | ||||||||||||
| Securitisation | (5,302 | ) | (6,480 | ) | (5,911 | ) | (10 | ) | ||||||||
| Housing (net of securitisation) | 112,228 | 100,203 | 93,545 | 20 | ||||||||||||
| Personal | 12,616 | 12,369 | 12,281 | 3 | ||||||||||||
| Institutional and Business | 52,694 | 49,305 | 50,427 | 4 | ||||||||||||
| Bank acceptances | 13,734 | 13,197 | 12,831 | 7 | ||||||||||||
Total Lending Assets | 191,272 | 175,074 | 169,084 | 13 | ||||||||||||
Trading & Investment Securities | 23,945 | 21,471 | 26,053 | (8 | ) | |||||||||||
Deposits and Other Public Borrowings | 158,914 | 140,974 | 139,348 | 14 | ||||||||||||
Debt Issues | 33,157 | 30,629 | 29,025 | 14 | ||||||||||||
| 31/12/03 | ||||||||||||||||
| 31/12/03 | 30/06/03 | 31/12/02 | -v- 31/12/02 | |||||||||||||
| Major Balance Sheet Items (gross of impairment) - by Business | $M | $M | $M | % | ||||||||||||
Retail: | ||||||||||||||||
| Lending assets | 110,604 | 100,134 | 94,094 | 18 | ||||||||||||
| Deposits | 71,932 | 68,702 | 68,024 | 6 | ||||||||||||
Asia Pacific: | ||||||||||||||||
| Lending assets | 22,685 | 19,880 | 19,468 | 17 | ||||||||||||
| Trading & investment securities | 3,008 | 2,953 | 2,983 | 1 | ||||||||||||
| Debt issues | 3,075 | 2,570 | 1,928 | 59 | ||||||||||||
| Deposits | 17,783 | 17,168 | 16,662 | 7 | ||||||||||||
Institutional and Business and Group Treasury: | ||||||||||||||||
| Lending assets | 57,983 | 55,060 | 55,522 | 4 | ||||||||||||
| Trading & investment securities | 20,937 | 18,518 | 23,070 | (9 | ) | |||||||||||
| Debt issues | 30,082 | 28,059 | 27,097 | 11 | ||||||||||||
| Deposits | 69,199 | 55,104 | 54,662 | 27 | ||||||||||||
 |  |
12
Banking Analysis (cont’d)
Retail
Lending Assets
Australian retail banking lending assets at 31 December 2003 were $111 billion, an increase of 11% or $11 billion over 30 June 2003 and up 18% over the 12 months since 31 December 2002. Lending assets comprise Australian Home Lending and Personal Lending.
Home Lending
Home loan balances net of securitisation increased by 12% since 30 June 2003 and 20% since 31 December 2002. The increase in home loans accounts for approximately 75% of the increase in total lending assets during the last six months. This reflects continued strong demand in both owner occupied and investment loans. Market share as at 30 September 2003 was 19.3%, compared with 19.5% as reported at June 2003, relating to March 2003 (source: APRA). The market for “low document” home loans experienced strong growth during the period. As most of these borrowers fall outside the Bank’s lending criteria, the Bank did not benefit from this growth. The Bank maintained its position as Australia’s leading home loan provider and has increased its share of broker originated loans which now account for 13% of the total Australian book compared with 10% at June 2003, while 25% of new home loans funded are originated by third party brokers. The Bank’s share of broker originated loans as at 30 September 2003 was 20.3% (source: Market Intelligence Strategy Centre), achieving its objective of at least 20% share of that market.
Approval levels remained strong up to December. It is likely that growth will moderate in the forthcoming half due to the increase in interest rates from historically low levels, and investors’ changing views on the relative merits of direct property investment.
Personal Lending
Personal lending includes Personal Loans, Credit Cards and Margin Loans. Balances increased by 2% over six months to $12.6 billion as at December 2003 reflecting growth in Credit Card balances and margin lending.
Retail Deposits
Retail deposits showed good growth, with total balances increasing by $3 billion from 30 June 2003 to $71.9 billion. Competition has intensified within the market as the improved investment market performance has started to attract customers back to equity based products.
Asia Pacific
Lending Assets
The New Zealand lending volumes remained strong during the first half across all sectors, particularly in housing and business lending. Credit demand was the major contributor to the strong growth. Housing activity remained buoyant and this has driven growth in housing mortgage balances.
ASB Bank’s share of the lending market continued to grow, with market share increasing to 21.6% as at December 2003 from 20.6% in June 2003 (source: Reserve Bank of New Zealand). Focused marketing activity and ASB Bank’s sales and service performance underpinned this result.
Deposits
Retail funding within ASB Bank increased from $12.3 billion at 30 June 2003 to $13 billion at 31 December 2003, an increase of 6%.
Institutional and Business and Group Treasury
Lending Assets
Institutional and Business Lending has increased $2.8 billion or 5% over the six months since 30 June 2003 to $58 billion. This growth reflected good transaction activity in Institutional Banking, a stronger performance in Corporate Banking and steady growth in Business Banking. Market share at 14.2% as at December 2003 has increased relative to 30 June 2003 of 14% (source: APRA).
Trading and Investment Securities
Trading and investment securities increased by $2.4 billion to $20.9 billion at 31 December 2003 from $18.5 billion as at 30 June 2003. This increase is primarily due to short term deposits as a result of funding operations.
Debt Issues
Debt issues were $30 billion at 31 December 2003, an increase of $2 billion since 30 June 2003. The increase reflects offshore funding raised to fund the growth in the Bank’s assets.
Deposits
Deposits were $69 billion at 31 December 2003, an increase of $14 billion from $55 billion at 30 June 2003. This primarily reflects an increase in business deposit market share as well as increased use of wholesale funding to fund the growth in the Bank’s assets.
13
Banking Analysis (cont’d)
| 31/12/03 | 30/06/03 | 31/12/02 | ||||||||||
| Provisions for Impairment | $M | $M | $M | |||||||||
| General provisions | 1,358 | 1,325 | 1,327 | |||||||||
| Specific provisions | 198 | 205 | 264 | |||||||||
Total Provisions | 1,556 | 1,530 | 1,591 | |||||||||
| Total provisions for impairment as a % of gross impaired assets net of interest reserved | 271.6 | 239.4 | 184.1 | |||||||||
| Specific provisions for impairment as a % of gross impaired assets net of interest reserved | 34.55 | 32.08 | 30.56 | |||||||||
| General provisions as a % of risk weighted assets | 0.86 | 0.90 | 0.92 | |||||||||
| Bad debt expense/Risk weighted assets | 0.10 | 0.10 | 0.11 | |||||||||
Total provisions for impairment for the Bank at 31 December 2003 were $1,556 million, up 1.7% from 30 June 2003. This level of provisioning is considered adequate to cover any bad debt write offs from the current lending portfolio having regard to the current outlook.
Specific provisions for impairment have decreased by 3.4% from $205 million at 30 June 2003 to $198 million at 31 December 2003, primarily as a result of continuing reductions in the level of impaired assets (Gross Impaired Assets net of interest reserved have reduced by $290 million since December 2002, a reduction of 34%).
The general provision for impairment has increased to $1,358 million at 31 December 2003 from $1,325 million at 30 June 2003, an increase of 2.5%. The general provision as a percentage of Risk Weighted Assets reduced to 0.86% from 0.90% in that period. This level is generally consistent with that of other major Australian banks. The general provision as a percentage of risk weighted assets has declined over the last 3 years reflecting the fact that the major growth in credit has been in home loans which have lower credit risk than other portfolios.
14
Funds Management Analysis
| Half Year Ended | ||||||||||||||||
| 31/12/03 | ||||||||||||||||
| 31/12/03 | 30/06/03 | 31/12/02 | -v- 31/12/02 | |||||||||||||
| Key Performance Indicators | $M | $M | $M | % | ||||||||||||
Profitability(2) | ||||||||||||||||
Underlying Profit after Income Tax | 126 | 108 | 125 | 1 | ||||||||||||
| Shareholder investment returns (after tax) | 10 | 6 | 4 | large | ||||||||||||
Initiatives including Which new Bank (after tax)(1) | (19 | ) | (27 | ) | — | — | ||||||||||
Net Profit after Income Tax (“cash basis”) | 117 | 87 | 129 | (9 | ) | |||||||||||
Operating Income | ||||||||||||||||
| Operating income | 589 | 548 | 580 | 2 | ||||||||||||
| Operating income to average funds under management (%) | 1.19 | 1.19 | 1.18 | 1 | ||||||||||||
Operating Expenses | ||||||||||||||||
| Operating expenses | 416 | 406 | 418 | — | ||||||||||||
Initiatives including Which new Bank(1) | 27 | 38 | — | — | ||||||||||||
Funds Under Management | ||||||||||||||||
| Funds under management — average | 98,357 | 93,202 | 97,465 | 1 | ||||||||||||
| Funds under management — spot | 100,383 | 94,207 | 95,266 | 5 | ||||||||||||
| Net flows | 1,080 | (1,493 | ) | (2,232 | ) | large | ||||||||||
Productivity and Other Measures | ||||||||||||||||
| Expenses to average funds under management — actual (%) | 0.90 | 0.96 | 0.86 | 5 | ||||||||||||
| Expenses to average funds under management — underlying (%) | 0.84 | 0.88 | 0.86 | (2 | ) | |||||||||||
| Effective corporate tax rate (%) | 24.4 | 19.6 | 21.4 | 14 | ||||||||||||
| (1) | December 2003 results reflects the Which new Bank initiative, while prior periods include strategic initiatives undertaken |
| (2) | Prior periods have been restated to include income from external advisors previously reported under Banking and some minor expense reallocations. |
Financial Performance and Business Review
Performance Highlights
Underlying net profit after tax of $126 million was up 1% on the prior comparative period and up a strong 17% on the six months ended 30 June 2003. On a pre-tax basis the underlying net profit was up 7% to $173 million on the prior comparative period. Spot funds under management for the six months ended 31 December 2003 was $100 billion, which is up 7% on 30 June 2003 levels ($94 billion).
Business Review
The business benefited from a recovery in global share markets which boosted funds under management. The more favourable market conditions also contributed to an improvement in investor confidence and funds flows. However, after the sustained period of poor equity returns in previous years, funds flow for the industry remains well down on historic levels.
A very tight focus was maintained on costs with business as usual expenses down $2 million period on period. The business, however, continued to incur significant costs in respect of regulatory and compliance spend in addition to initiative spend associated with Which new Bank.
Underpinning the financial results, the business highlights included:
| • | The FirstChoice mastertrust product continued to achieve very strong flows in the latest reported quarter (September 2003). Funds in this product, launched only 18 months ago now total $5 billion. |
| • | Funds flow in our UK business has been extremely strong. Net flows of $2.4 billion for the six months represent a record for the UK business. |
| • | Investment performance on the flagship Colonial First State Australian Equities fund continues to improve and is now back in the second quartile on a 12 month basis. |
Strategic Initiatives
The major strategic initiatives undertaken were focussed on process and system simplification, as well as continuing to build our position in the platform market. These included:
| • | Further progress was made on the product migration program, aimed at reducing the number of products and systems especially on the older closed products. The number of product systems supporting the older products has already been reduced from 17 to 14, and is targeted to reach five by 2006. |
| • | Continued development of the FirstChoice mastertrust platform, with a focus on enhancing the platform to provide additional services and reporting for financial planners. |
| • | A reorganisation of the various support functions, designed to reduce costs and better leverage the resources through the creation of common support functions across the various businesses. |
| • | Following a strategic review of our UK operations, the business has been refocussed as a manufacturer of specialist product, rather than a more generalised operation in all asset classes. |
Comparative Figures
The December 2003 result has been impacted by a different expense allocation between funds management and insurance.
If the comparatives were adjusted to reflect the December 2003 basis, $11 million of pre-tax expenses would have been included in the insurance business rather than the funds management business.
If done, this adjustment would have resulted in a 8% increase in underlying cash NPAT compared to the previous comparative period.
15
Funds Management Analysis (cont’d)
Profit Summary
| Half Year Ended | ||||||||||||||||
| 31/12/03 | ||||||||||||||||
| 31/12/03 | 30/06/03 | 31/12/02 | -v- 31/12/02 | |||||||||||||
| Key Performance Indicators | $M | $M | $M | % | ||||||||||||
Funds Management | ||||||||||||||||
| Operating income — external | 582 | 540 | 575 | 1 | ||||||||||||
| Operating income — internal | 7 | 8 | 5 | 40 | ||||||||||||
Total Operating Income | 589 | 548 | 580 | 2 | ||||||||||||
| Shareholder investment returns | 14 | 8 | 5 | large | ||||||||||||
| Policyholder tax expense/(benefits) | 82 | 4 | (66 | ) | large | |||||||||||
Funds Management Income | 685 | 560 | 519 | 32 | ||||||||||||
| Volume based expenses | 82 | 77 | 81 | 1 | ||||||||||||
| Other operating expenses | 334 | 329 | 337 | (1 | ) | |||||||||||
Operating expenses | 416 | 406 | 418 | — | ||||||||||||
Initiatives including Which new Bank(1) | 27 | 38 | — | — | ||||||||||||
Total Operating Expenses | 443 | 444 | 418 | 6 | ||||||||||||
| Net Profit before Income Tax | 242 | 116 | 101 | large | ||||||||||||
| Policyholder tax expense/(benefits) | 82 | 4 | (66 | ) | large | |||||||||||
| Corporate tax expense | 39 | 22 | 35 | 11 | ||||||||||||
| Outside equity interests | 4 | 3 | 3 | 33 | ||||||||||||
Net Profit after Income Tax (“cash basis”) | 117 | 87 | 129 | (9 | ) | |||||||||||
| (1) | December 2003 results reflects the Which new Bank initiative, while prior periods include strategic initiatives undertaken including the one off cost relating to the sale of the custody business. |
Operating Income
Operating income increased by 2% or $9 million to $589 million for the six months to 31 December 2003, compared with $580 million for the prior comparative period.
Improved domestic and global equity markets and strong inflows into the UK business resulted in an increase in total funds under management (spot balance) from $94.2 billion at 30 June 2003 to $100.4 billion. Average funds under management for the six months was $98.4 billion, which is 1% higher than levels at 31 December 2002 of $97.5 billion, although the closing funds under management at 31 December 2003 is much higher.
The operating income to average funds under management ratio remained steady at 1.19% which is consistent with the prior two six month periods.
Shareholder Investment Returns
Shareholder investment returns of $14 million reflected the impact of improved local and global equity markets compared with prior periods.
Operating Expenses
Volume related expenses (consisting mainly of commissions) increased slightly from $81 million for the six months ended 31 December 2002 to $82 million in the current reporting period.
A strong focus on expense control and the benefits from prior year strategic initiatives led to other expenses reducing slightly compared with the comparable period last year, with expenses totalling $334 million for the six months ended 31 December 2003 against $337 million for the prior comparative period.
Productivity Efficiency
Operating expenses as a percentage of average funds under management of 0.84% was down 4basis points compared with June 2003.
Initiatives including Which new Bank
Costs of $27 million relating to Which new Bank initiatives include the expenses of continued rationalisation of systems, development of FirstChoice mastertrust platform, reorganisation of support functions and the strategic review of the UK operations. In addition to strategic initiatives, the prior period also includes the one-off cost relating to the sale of the custody business.
Taxation
The corporate taxation charge for the period ending 31 December 2003 was $39 million, an increase of 11% compared wtih 31 December 2002. The tax charge reflects an increased effective tax rate of 24% compared with 21% at 31 December 2002. The low effective tax rate in this business is due to transitional tax relief on investment style funds management products within life insurance legal entities. The benefits derived from this relief are being phased out over a five year period ending in 2005, thereby progressively increasing the effective tax rate.
16
Funds Management Analysis (cont’d)
Funds Under Management
| Half Year Ended 31 December 2003 | ||||||||||||||||||||||||||||
| Opening | Other | Closing | ||||||||||||||||||||||||||
| Balance | Investment | Acquisitions & | Movements | Balance | ||||||||||||||||||||||||
| 30/06/03 | Inflows | Outflows | Income | Disposals | & Transfers(1) | 31/12/03 | ||||||||||||||||||||||
| $M | $M | $M | $M | $M | $M | $M | ||||||||||||||||||||||
| FirstChoice | 3,211 | 2,177 | (517 | ) | 157 | — | — | 5,028 | ||||||||||||||||||||
| Cash Management | 4,963 | 1,635 | (2,027 | ) | 93 | — | — | 4,664 | ||||||||||||||||||||
| Other Retail | 36,417 | 3,506 | (4,940 | ) | 1,720 | — | — | 36,703 | ||||||||||||||||||||
| Wholesale | 23,966 | 6,788 | (7,978 | ) | 1,717 | — | — | 24,493 | ||||||||||||||||||||
| Property | 11,790 | 1,418 | (1,490 | ) | 411 | — | — | 12,129 | ||||||||||||||||||||
Domestically Sourced | 80,347 | 15,524 | (16,952 | ) | 4,098 | — | — | 83,017 | ||||||||||||||||||||
| Internationally Sourced | 13,860 | 6,502 | (3,994 | ) | 1,678 | — | (680 | ) | 17,366 | |||||||||||||||||||
Total | 94,207 | 22,026 | (20,946 | ) | 5,776 | — | (680 | ) | 100,383 | |||||||||||||||||||
| Half Year Ended 30 June 2003 | ||||||||||||||||||||||||||||
| Opening | Other | Closing | ||||||||||||||||||||||||||
| Balance | Investment | Acquisitions & | Movements | Balance | ||||||||||||||||||||||||
| 31/12/02 | Inflows | Outflows | Income | Disposals | & Transfers(1) | 30/06/03 | ||||||||||||||||||||||
| $M | $M | $M | $M | $M | $M | $M | ||||||||||||||||||||||
| FirstChoice | 1,846 | 1,648 | (323 | ) | 40 | — | — | 3,211 | ||||||||||||||||||||
| Cash Management | 5,244 | 525 | (879 | ) | 73 | — | — | 4,963 | ||||||||||||||||||||
| Other Retail | 38,487 | 4,340 | (6,738 | ) | 328 | — | — | 36,417 | ||||||||||||||||||||
| Wholesale | 24,878 | 5,137 | (6,761 | ) | 712 | — | — | 23,966 | ||||||||||||||||||||
| Property | 11,250 | — | 348 | 192 | — | — | 11,790 | |||||||||||||||||||||
Domestically Sourced | 81,705 | 11,650 | (14,353 | ) | 1,345 | — | — | 80,347 | ||||||||||||||||||||
| Internationally Sourced | 13,561 | 1,311 | (101 | ) | 838 | — | (1,749 | ) | 13,860 | |||||||||||||||||||
Total | 95,266 | 12,961 | (14,454 | ) | 2,183 | — | (1,749 | ) | 94,207 | |||||||||||||||||||
| Half Year Ended 31 December 2002 | ||||||||||||||||||||||||||||
| Opening | Other | Closing | ||||||||||||||||||||||||||
| Balance | Investment | Acquisitions & | Movements | Balance | ||||||||||||||||||||||||
| 30/06/02 | Inflows | Outflows | Income | Disposals | & Transfers(1) | 31/12/02 | ||||||||||||||||||||||
| $M | $M | $M | $M | $M | $M | $M | ||||||||||||||||||||||
| FirstChoice | 561 | 1,558 | (255 | ) | (18 | ) | — | — | 1,846 | |||||||||||||||||||
| Cash Management | 5,634 | 596 | (1,091 | ) | 105 | — | — | 5,244 | ||||||||||||||||||||
| Other Retail | 40,909 | 3,111 | (4,404 | ) | (1,129 | ) | — | — | 38,487 | |||||||||||||||||||
| Wholesale | 27,766 | 4,460 | (6,062 | ) | (1,286 | ) | — | — | 24,878 | |||||||||||||||||||
| Property | 8,895 | — | (348 | ) | 545 | 2,158 | — | 11,250 | ||||||||||||||||||||
Domestically Sourced | 83,765 | 9,725 | (12,160 | ) | (1,783 | ) | 2,158 | — | 81,705 | |||||||||||||||||||
| Internationally Sourced | 19,073 | 5,273 | (5,070 | ) | (1,263 | ) | (5,000 | ) | 548 | 13,561 | ||||||||||||||||||
Total | 102,838 | 14,998 | (17,230 | ) | (3,046 | ) | (2,842 | ) | 548 | 95,266 | ||||||||||||||||||
| (1) | Includes foreign exchange gains and losses from translation of internationally sourced business. |
17
Funds Management Analysis (cont’d)
Funds under management
Funds under management increased by $6 billion or 7% from $94 billion at 30 June 2003 to $100 billion at 31 December 2003. Strong local and global equity markets contributed $6 billion, net inflows were $1 billion while the impact of a stronger Australian dollar had a negative impact of $680 million. Average funds under management of $98 billion at 31 December 2003 were 1% higher than 31 December 2002.
FirstChoice
FirstChoice continued its strong performance, with net inflows totalling $1.7 billion for the six months ended 31 December 2003. This took the total funds under management to over $5 billion since its launch in May 2002. FirstChoice topped the industry flows into platforms for the September 2003 quarter.
Cash Management
Cash management trusts saw further net outflows totalling $0.4 billion during the reporting period. The majority of these funds have moved into similar cash deposit products in Banking.
Other Retail
Other retail funds under management grew a modest $0.3 billion or 1% to $36.7 billion. The net outflows (excluding investment returns) on Colonial First State retail products reflects an industry move away from single manager retail products to masterfund products (like FirstChoice).
Wholesale
Despite relatively high levels of outflows, wholesale FUM has increased by $0.5 billion or 2.2% to $24.5 billion. These outflows were predominantly in the Australian equities asset class.
The level of FUM in the institutional market increased substantially with the cash, fixed interest and other debt products performing strongly.
Property
Property FUM comprises both listed and unlisted (wholesale) funds. Total property FUM grew $0.3 billion or 2.8%, benefiting from both asset revaluations and acquisitions of new properties.
Internationally sourced
International funds inflow was particularly strong at $6.5 billion for the half year due to some large mandate wins into the Global Emerging Markets product.
Due to the exceptional funds flow, FUM growth was 25% (or 30% in local currency).
18
Insurance Analysis
| Half Year Ended | ||||||||||||||||
| 31/12/03 | ||||||||||||||||
| 31/12/03 | 30/06/03 | 31/12/02 | -v- 31/12/02 | |||||||||||||
| Key Performance Indicators | $M | $M | $M | % | ||||||||||||
Profitability | ||||||||||||||||
| Underlying Profit after Income Tax | 67 | 52 | 13 | large | ||||||||||||
| Shareholder investment returns (after tax) | 89 | 76 | (12 | ) | large | |||||||||||
| Initiatives including Which new Bank (after tax) | (3 | ) | — | — | — | |||||||||||
| Net Profit after Income Tax (“cash basis”) | 153 | 128 | 1 | large | ||||||||||||
Regional Net Profit after Income Tax — (“cash basis”) | ||||||||||||||||
| Australia | 96 | 75 | 3 | large | ||||||||||||
| New Zealand | 30 | 33 | 13 | large | ||||||||||||
| Asia | 27 | 20 | (15 | ) | large | |||||||||||
Operating Income | ||||||||||||||||
| Operating income | 322 | 318 | 280 | 15 | ||||||||||||
Operating Expenses | ||||||||||||||||
| Operating expenses | 249 | 250 | 269 | (7 | ) | |||||||||||
| Initiatives including Which new Bank | 4 | — | — | — | ||||||||||||
Annual Inforce Premiums | ||||||||||||||||
| Australia | 800 | 771 | 746 | 7 | ||||||||||||
| New Zealand | 226 | 221 | 203 | 11 | ||||||||||||
| Asia | 76 | 84 | 91 | (16 | ) | |||||||||||
Productivity and Other Measures | ||||||||||||||||
| Expenses to average inforce premiums (actual %) | 46.2 | 47.7 | 52.8 | 12 | ||||||||||||
| Expenses to average inforce premiums (underlying %) | 45.5 | 47.7 | 52.8 | 13 | ||||||||||||
| Effective corporate tax rate (%) | 21.9 | 17.9 | — | |||||||||||||
Financial Performance and Business Review
Performance Highlights
The profit from the Insurance business was $153 million compared with a profit of $1 million for the prior comparative period. Excluding investment returns and incremental Which new Bank expenses, the underlying operating performance was $67 million, an increase of $54 million over the prior comparative period. This improvement was across all regions. The insurance results have been restated from those reported at 30 June 2003 and 31 December 2002 to include the general insurance business, which were previously reported under Banking.
Business Review
Australia
The profit in the Australian insurance business was up strongly on the prior comparative period, which was adversely impacted by a one off asset write down. Key drivers of the half year result were the positive investment returns, solid premium growth (4%) and tight expense control. General insurance claims were slightly above prior period mainly due to claims arising from the Melbourne and Sydney storms and flooding.
Other highlights for the period included:
| • | Maintained No. 1 market share (15.1%) of inforce life risk premiums. |
| • | Launch of a new Loan Protection product, designed to facilitate cross sell to bank customers taking out loans. |
A number of reengineering projects and technology investments were commenced, designed to streamline processes, improve customer service, improve productivity and reduce costs in servicing and administration areas.
New Zealand
The life insurance manufacturing operations in New Zealand trade predominantly under the Sovereign brand.
New business volumes across the market contracted by 3.4% in the year to September 2003. During the same period, Sovereign’s market share held steady at 25.4%. Sovereign had maintained its market leadership position with 28.1% share of the in-force premium income market in September 2003.
Repricing of products, new underwriting and claims management programmes produced significant profit margin expansion. In addition persistency experience showed continued improvement as the business maintained its focus on improving customer service. Product and system platform rationalisation continued to make substantial progress.
Asia
Asia includes life insurance and pension administration operations in Hong Kong, together with life businesses in China, Vietnam, Indonesia and Fiji. Hong Kong represents our largest operation in the region.
The relatively swift containment of the SARS epidemic, increasing economic co-operation with the Chinese mainland, and the rebound of international equity markets improved economic conditions and stabilised the life insurance industry in Hong Kong.
The Asian business continued to improve. Key initiatives during the period included:
| • | Alignment of policyholder dividends to investment returns in Hong Kong. |
| • | Launch of an innovative new multi-manager investment product in Hong Kong. |
| • | Expense reductions within Hong Kong operations. |
| • | Improvement in agent remuneration practice in China and Indonesia. |
19
Insurance Analysis (cont’d)
Profit Summary
| Half Year Ended | ||||||||||||||||
| 31/12/03 | ||||||||||||||||
| Summary Financial Performance | 31/12/03 | 30/06/03 | 31/12/02 | -v- 31/12/02 | ||||||||||||
| (excluding appraisal value (reduction)/uplift) | $M | $M | $M | % | ||||||||||||
Insurance | ||||||||||||||||
| Insurance Operating Income | 303 | 297 | 254 | 19 | ||||||||||||
| General Insurance Operating Income | 19 | 21 | 26 | (27 | ) | |||||||||||
Total Operating Income | 322 | 318 | 280 | 15 | ||||||||||||
| Shareholder investment returns | 127 | 88 | (10 | ) | large | |||||||||||
| Policyholder tax | 38 | 28 | (24 | ) | large | |||||||||||
Total Insurance Income | 487 | 434 | 246 | 98 | ||||||||||||
| Volume based expenses | 105 | 114 | 114 | (8 | ) | |||||||||||
| Other operating expenses — external | 137 | 128 | 150 | (9 | ) | |||||||||||
| Other operating expenses — internal | 7 | 8 | 5 | 40 | ||||||||||||
Operating expenses | 249 | 250 | 269 | (7 | ) | |||||||||||
| Initiatives including Which new Bank | 4 | — | — | — | ||||||||||||
Total operating expenses | 253 | 250 | 269 | (6 | ) | |||||||||||
| Net Profit before Income Tax | 234 | 184 | (23 | ) | large | |||||||||||
| Income tax expense attributable to: | ||||||||||||||||
| Policyholder | 38 | 28 | (24 | ) | large | |||||||||||
| Corporate | 43 | 28 | — | — | ||||||||||||
| Net Profit after Income Tax (“cash basis”) | 153 | 128 | 1 | large | ||||||||||||
Operating Income
Operating income of $322 million was 15% or $42 million higher than in the prior comparative period. Operating income in the prior period included a write-down of an asset in the Australian annuity fund of $23 million. Taking this item into account, operating income was up 6% on 31 December 2002 with a growth in life insurance income being partly offset by a decline in general insurance income as a result of adverse weather claims in Melbourne and Sydney.
Shareholder Investment Returns
Shareholder investment returns of $127 million for the period represent an increase of $137 million on the prior comparative period, reflecting the rebound in domestic and overseas equity markets.
Operating Expenses
Operating expenses of $249 million represent a decline of $20 million on the prior comparative period. This reflects a decline in expenses particularly within the Asian business, due to cost control initiatives in the Hong Kong life and CommServe businesses.
Corporate Taxation
The corporate tax charge for the period was $43 million compared with a nil charge in the prior year. This reflects the growth in profit. The effective tax rate for the business was 22%.
| Half Year Ended | ||||||||||||||||
| 31/12/03 | ||||||||||||||||
| 31/12/03 | 30/06/03 | 31/12/02 | -v- 31/12/02 | |||||||||||||
| Sources of Profit from Insurance Activities | $M | $M | $M | % | ||||||||||||
| The Margin on Services profit from ordinary activities after income tax is represented by: | ||||||||||||||||
| Planned profit margins | 52 | 52 | 52 | — | ||||||||||||
| Experience variations | 11 | 4 | (46 | ) | large | |||||||||||
| New business losses / reversal of capitalised losses | 2 | (8 | ) | — | n/a | |||||||||||
| General insurance operating margin | (1 | ) | 4 | 7 | large | |||||||||||
| Operating margins | 64 | 52 | 13 | large | ||||||||||||
| After tax shareholder investment returns | 89 | 76 | (12 | ) | large | |||||||||||
| Net profit after Income Tax (“cash basis”) | 153 | 128 | 1 | large | ||||||||||||
20
Insurance Analysis (cont’d)
Geographical Analysis of Business Performance
| Half Year Ended | ||||||||||||||||||||||||||||||||
| Australia | New Zealand | Asia | Total | |||||||||||||||||||||||||||||
| 31/12/03 | 31/12/02 | 31/12/03 | 31/12/02 | 31/12/03 | 31/12/02 | 31/12/03 | 31/12/02 | |||||||||||||||||||||||||
| Underlying Profit after Income Tax | $M | $M | $M | $M | $M | $M | $M | $M | ||||||||||||||||||||||||
| Operating margins | 42 | 10 | 20 | 12 | 2 | (9 | ) | 64 | 13 | |||||||||||||||||||||||
| Investment earnings on assets in excess of policyholder liabilities | 54 | (7 | ) | 10 | 1 | 25 | (6 | ) | 89 | (12 | ) | |||||||||||||||||||||
Net Profit after Income Tax | 96 | 3 | 30 | 13 | 27 | (15 | ) | 153 | 1 | |||||||||||||||||||||||
Australia
The Australian business generated $96 million in cash profit after tax. This reflects an increase of $93 million on the prior comparative period. This is attributable to:
| • | An increase in shareholder investment returns of $61 million. |
| • | An improvement in operating margins of $32 million, reflecting the inclusion in the prior periods of the write-down of an investment asset, together with better claims experience and improved investment returns. |
New Zealand
The New Zealand business generated $30 million in profit after tax. This represents an increase of $17 million over the same period last year. This is attributable to:
| • | Improved underwriting and claims management. |
| • | Rate increases. |
| • | Improved persistency. |
| • | Positive investment earnings. |
| • | Expenses containment. |
Asia
The Asian business produced $27 million in profit, compared with a loss of $15 million in the prior period. Disposal of the Philippine life company had adversely impacted the prior result by $10 million. The favourable current period result reflected strong investment markets performance and improved operating margins.
Operating margins (including regional and business start-up/development expenses) improved to a profit of $2 million, compared with a prior year loss of $9 million due to:
| • | Continuing improvement in persistency rates within the Hong Kong business. |
| • | Expense reductions. |
| • | Consolidation of the pension administration business in the first half of 2003. |
| Half Year Ended 31 December 2003 | ||||||||||||||||||||
| Opening | Closing | |||||||||||||||||||
| Balance | Sales/New | Other | Balance | |||||||||||||||||
| 30/06/03 | Business | Lapses | Movements(1) | 31/12/03 | ||||||||||||||||
| Annual Inforce Premiums | $M | $M | $M | $M | $M | |||||||||||||||
| General Insurance | 196 | 24 | (19 | ) | — | 201 | ||||||||||||||
| Personal Life | 626 | 56 | (41 | ) | (6 | ) | 635 | |||||||||||||
| Group Life | 254 | 39 | (24 | ) | (3 | ) | 266 | |||||||||||||
Total | 1,076 | 119 | (84 | ) | (9 | ) | 1,102 | |||||||||||||
| Australia | 771 | 91 | (64 | ) | 2 | 800 | ||||||||||||||
| New Zealand | 221 | 18 | (13 | ) | — | 226 | ||||||||||||||
| Asia | 84 | 10 | (7 | ) | (11 | ) | 76 | |||||||||||||
Total | 1,076 | 119 | (84 | ) | (9 | ) | 1,102 | |||||||||||||
| (1) | Consists mainly of foreign exchange movements. |
21
Insurance Analysis (cont’d)
| Half Year Ended 30 June 2003 | ||||||||||||||||||||
| Opening | Closing | |||||||||||||||||||
| Balance | Sales/New | Other | Balance | |||||||||||||||||
| 31/12/02 | Business | Lapses | Movements(2) | 30/06/03 | ||||||||||||||||
| Annual Inforce Premiums | $M | $M | $M | $M | $M | |||||||||||||||
| General Insurance | 187 | 24 | (15 | ) | — | 196 | ||||||||||||||
| Personal Life | 603 | 57 | (28 | ) | (6 | ) | 626 | |||||||||||||
| Group Life | 250 | 28 | (21 | ) | (3 | ) | 254 | |||||||||||||
Total | 1,040 | 109 | (64 | ) | (9 | ) | 1,076 | |||||||||||||
| Australia | 746 | 83 | (58 | ) | — | 771 | ||||||||||||||
| New Zealand | 203 | 16 | (5 | ) | 7 | 221 | ||||||||||||||
| Asia | 91 | 10 | (1 | ) | (16 | ) | 84 | |||||||||||||
Total | 1,040 | 109 | (64 | ) | (9 | ) | 1,076 | |||||||||||||
| Half Year Ended 31 December 2002 | ||||||||||||||||||||
| Opening | Closing | |||||||||||||||||||
| Balance | Sales/New | Other | Balance | |||||||||||||||||
| 30/06/02 | Business | Lapses | Movements(2) | 31/12/02 | ||||||||||||||||
| Annual Inforce Premiums | $M | $M | $M | $M | $M | |||||||||||||||
| General Insurance Personal Life Group Life | 172 580 229 | 27 72 30 | (12 (50 (9 | ) ) ) | - 1 - - | 187 603 250 | ||||||||||||||
| Total | 981 | 129 | (71 | ) | 1 | 1,040 | ||||||||||||||
| Australia New Zealand(1) Asia(1) | 698 187 96 | 97 27 5 | (49 (11 (11 | ) ) ) | - - - 1 | 746 203 91 | ||||||||||||||
| Total | 981 | 129 | (71 | ) | 1 | 1,040 | ||||||||||||||
| (1) | Life Insurance results for both New Zealand and Asia include savings products. Savings products are disclosed within Funds Management for the Australian business. Inforce premium relates to risk business only. |
| (2) | Consists mainly of foreign exchange movements. |
Annual inforce premiums increased by $62 million or 6% to $1,102 million at 31 December 2003. The premiums for the six months ended 31 December 2002 included the results of Asian operations since sold.
The Australian market share of inforce premiums reduced slightly from 15.3% at 30 June 2003 to 15.1% at 30 September 2003, and Sovereign maintained its leading position in New Zealand with a market share of 28.1%, slightly down from 28.3% at 30 June 2003.
22
| Half Year Ended | ||||||||||||||||
| 31/12/03 | ||||||||||||||||
| 31/12/03 | 30/06/03 | 31/12/02 | -v- 31/12/02 | |||||||||||||
| Shareholder Investment Returns | $M | $M | $M | % | ||||||||||||
| Funds Management Business | 14 | 8 | 5 | large | ||||||||||||
| Insurance Business | 127 | 88 | (10 | ) | large | |||||||||||
| Shareholder Investment Returns before Tax | 141 | 96 | (5 | ) | large | |||||||||||
| Taxation | 42 | 15 | 3 | large | ||||||||||||
| Shareholder Investment Returns after Tax | 99 | 81 | (8 | ) | large | |||||||||||
| Australia | New Zealand | Asia | Total | |||||||||||||
| 31/12/03 | 31/12/03 | 31/12/03 | 31/12/03 | |||||||||||||
| Shareholder Investments Asset Mix (%) | % | % | % | % | ||||||||||||
| Local equities | 13 | 1 | 5 | 10 | ||||||||||||
| International equities | 3 | 11 | 5 | 5 | ||||||||||||
| Property | 16 | 2 | — | 11 | ||||||||||||
Other(1) | — | 12 | 13 | 4 | ||||||||||||
Sub-total | 32 | 26 | 23 | 30 | ||||||||||||
| Fixed interest | 37 | 38 | 53 | 40 | ||||||||||||
| Cash | 31 | 32 | 11 | 27 | ||||||||||||
| Other | — | 4 | 13 | 3 | ||||||||||||
Sub-total | 68 | 74 | 77 | 70 | ||||||||||||
Total | 100 | 100 | 100 | 100 | ||||||||||||
| Australia | New Zealand | Asia | Total | |||||||||||||
| 31/12/03 | 31/12/03 | 31/12/03 | 31/12/03 | |||||||||||||
| Shareholder Investments Asset Mix ($M) | $M | $M | $M | $M | ||||||||||||
| Local equities | 258 | 3 | 28 | 289 | ||||||||||||
| International equities | 53 | 45 | 30 | 128 | ||||||||||||
| Property | 308 | 8 | — | 316 | ||||||||||||
Other(1) | — | 50 | 73 | 123 | ||||||||||||
Sub-total | 619 | 106 | 131 | 856 | ||||||||||||
| Fixed interest | 704 | 148 | 308 | 1,160 | ||||||||||||
| Cash | 597 | 130 | 63 | 790 | ||||||||||||
| Other | — | 18 | 76 | 94 | ||||||||||||
Sub-total | 1,301 | 296 | 447 | 2,044 | ||||||||||||
Total | 1,920 | 402 | 578 | 2,900 | ||||||||||||
| (1) Other assets include the excess of carrying value over net tangible assets. |
The Group revised its investment mandate during the period, reducing the weighting of growth assets to income assets from a benchmark 45:55 split to a 30:70 split. It is anticipated that this will reduce the volatility of shareholder investment earnings in future reporting periods.
23
Life Company Valuations
The following table sets out the components of the carrying values of the Bank’s life insurance and funds management businesses. These were Directors’ valuations, based on appraisal values using a range of economic and business assumptions determined by management, which were reviewed by independent actuaries, Trowbridge Deloitte.
In determining the carrying value, Directors have taken account of certain market based factors which result in the adoption of a more conservative valuation that is $450 million lower at 31 December 2003 (which is consistent with June 2003) than that determined by Trowbridge Deloitte. The key consideration by Directors in determining their value is the potential impact from subdued levels of industry funds flows.
| Life Insurance | ||||||||||||||||||||
| Managed | New | |||||||||||||||||||
| Products | Australia | Zealand | Asia(1) | Total | ||||||||||||||||
| Carrying Value at 31 December 2003 | $M | $M | $M | $M | $M | |||||||||||||||
| Shareholders net tangible assets | 620 | 1,300 | 402 | 578 | 2,900 | |||||||||||||||
| Value of inforce business | 1,217 | 233 | 226 | 4 | 1,680 | |||||||||||||||
Embedded Value | 1,837 | 1,533 | 628 | 582 | 4,580 | |||||||||||||||
| Value of future new business | 3,658 | 79 | 266 | 22 | 4,025 | |||||||||||||||
Carrying Value | 5,495 | 1,612 | 894 | 604 | 8,605 | |||||||||||||||
Increase/(Decrease) in carrying Value since 30 June 2003 | 22 | 24 | 45 | (32 | ) | 59 | ||||||||||||||
| Life Insurance | ||||||||||||||||||||
| Managed | ||||||||||||||||||||
| Products | Australia | New Zealand | Asia(1) | Total | ||||||||||||||||
| Analysis of Movement Since 30 June 2003 | $M | $M | $M | $M | $M | |||||||||||||||
| Profits | 117 | 96 | 30 | 27 | 270 | |||||||||||||||
Capital movements and dividends(2) | (241 | ) | (60 | ) | (9 | ) | — | (310 | ) | |||||||||||
| FX Movements | (10 | ) | — | 1 | (57 | ) | (66 | ) | ||||||||||||
Change in Shareholders NTA | (134 | ) | 36 | 22 | (30 | ) | (106 | ) | ||||||||||||
| Appraisal value uplift/(reduction) | 156 | (12 | ) | 23 | (2 | ) | 165 | |||||||||||||
Increase/(Decrease) to 31 December 2003 | 22 | 24 | 45 | (32 | ) | 59 | ||||||||||||||
| (1) | The Asian life businesses are not held in a market value environment and are carried at net assets plus any excess representing the difference between appraisal value and net assets at the time of acquisition. This excess, which effectively represents goodwill, is being amortised on a straight line basis over 20 years. |
| (2) | Includes capital injections, transfers and movements in intergroup loans. |
Change in valuations
The valuations adopted have resulted in a total value increase of $59 million since 30 June 2003.
The main components of the increase of $59 million comprised:
| • | A $106 million decrease in net tangible assets as detailed above. |
| • | An appraisal value uplift of $165 million, which is in line with expectations, reflecting steady business performance, some slight changes to risk discount rates and improved world equity markets and their effect on industry flows. |
The capital movements in the current period primarily represent inter-group transfers to fund dividend payments.
24
Directors Report
The Directors submit their report for the half year ended 31 December 2003.
Directors
The names of the Directors holding office during the half year ended 31 December 2003 and until the date of this report were:
| JT Ralph AC | Chairman | |
| J M Schubert | Deputy Chairman | |
| D V Murray | Chief Executive Officer | |
| N R Adler AO | Director | |
| R J Clairs AO | Director | |
| A B Daniels OAM | Director | |
| C R Galbraith AM | Director | |
| S C Kay | Director | |
| W G Kent AO | Director | |
| F D Ryan | Director | |
| F J Swan | Director | |
| B K Ward | Director |
Review and Results of Operations
Commonwealth Bank recorded a net profit after tax of $1,243 million for the half year ended 31 December 2003, compared with $622 million for the half year ended 31 December 2002, an increase of 100%. The increase was principally due to the appraisal value uplift in respect of the insurance and funds management businesses compared with a negative adjustment in the prior comparative period.
The net profit from Banking of $970 million (2002: $1,078 million) before goodwill amortisation includes $324 million (after tax) incremental Which new Bank expenses (2002: $39 million in strategic initiatives). The results reflected strong growth in net interest income primarily due to continued growth in the residential housing market, credit card sales and new deposits, and an improvement in trading and business activity.
The net profit from funds management of $117 million (2002: $129 million) before goodwill amortisation and appraisal value uplift reflects the phasing out of the transitional tax relief and expenses from the Which new Bank initiative. Insurance reported a net profit of $153 million (2002: $1 million) before amortisation and appraisal value uplift reflecting strong investment returns, solid premium growth, tight expense control and new business volumes.
The funds management and insurance businesses are recorded at a value of $8,605 million (funds management $5,495 million, insurance $3,110 million). For the half year ended 31 December 2003, there was a $59 million increase in value, represented by a $165 million appraisal value increase and ($106) million in net asset movements.
In accordance with the ASX Principles of Good Corporate Governance and Best Practice Recommendations, the Chief Executive Officer and the Group Executive Financial and Risk Management, have provided the Board with a written statement that the accompanying financial report represents a true and fair view, in all material respects, of the Bank’s financial position as at 31 December 2003 and performance for the six month period ended 31 December 2003, in accordance with relevant accounting standards.
Signed in accordance with a resolution of the Directors.
 |  | |
| JT Ralph AC | DV Murray | |
| Chairman | Managing Director and Chief Executive Officer |
11 February 2004
25
Consolidated Statement of Financial Performance
For the half year ended 31 December 2003
| 31/12/03 | 30/06/03 | 31/12/02 | ||||||||||||||
| Note | $M | $M | $M | |||||||||||||
| Interest income | 6,241 | 5,860 | 5,668 | |||||||||||||
| Interest expense | 3,570 | 3,288 | 3,214 | |||||||||||||
| Net interest income | 2,671 | 2,572 | 2,454 | |||||||||||||
| Other income: | ||||||||||||||||
| Revenue from sale of assets | 111 | 61 | 67 | |||||||||||||
| Written down value of assets sold | (114 | ) | (43 | ) | (63 | ) | ||||||||||
| Other | 1,378 | 1,338 | 1,267 | |||||||||||||
| Net banking operating income | 4,046 | 3,928 | 3,725 | |||||||||||||
| Funds management fee income including premiums | 597 | 627 | 522 | |||||||||||||
| Investment revenue | 941 | 276 | (268 | ) | ||||||||||||
| Claims and policyholder liability expense | (860 | ) | (351 | ) | 260 | |||||||||||
| Net funds management operating income | 678 | 552 | 514 | |||||||||||||
| Premiums and related revenue | 552 | 648 | 483 | |||||||||||||
| Investment revenue | 504 | 506 | 114 | |||||||||||||
| Claims and policyholder liability expense | (569 | ) | (720 | ) | (351 | ) | ||||||||||
| Insurance margin on services operating income | 487 | 434 | 246 | |||||||||||||
| Net insurance and funds management operating income before appraisal value uplift/(reduction) | 1,165 | 986 | 760 | |||||||||||||
| Total net operating income before appraisal value uplift/(reduction) | 5,211 | 4,914 | 4,485 | |||||||||||||
| Charge for bad and doubtful debts | 150 | 154 | 151 | |||||||||||||
| Operating expenses: | ||||||||||||||||
| Operating expenses | 3 | 2,709 | 2,685 | 2,627 | ||||||||||||
Initiatives including Which new Bank(1) | 3 | 494 | 156 | 83 | ||||||||||||
| 3,203 | 2,841 | 2,710 | ||||||||||||||
| Appraisal value uplift/(reduction) | 165 | 181 | (426 | ) | ||||||||||||
| Goodwill amortisation | (162 | ) | (162 | ) | (160 | ) | ||||||||||
Profit from ordinary activities before income tax | 1,861 | 1,938 | 1,038 | |||||||||||||
| Income tax expense | 4 | 614 | 545 | 413 | ||||||||||||
Profit from ordinary activities after income tax | 1,247 | 1,393 | 625 | |||||||||||||
| Outside equity interests in net profit | (4 | ) | (3 | ) | (3 | ) | ||||||||||
Net profit attributable to members of the Bank | 1,243 | 1,390 | 622 | |||||||||||||
| Foreign currency translation adjustment | (173 | ) | (285 | ) | 156 | |||||||||||
| Revaluation of properties | (2 | ) | 3 | — | ||||||||||||
| Total valuation adjustments | (175 | ) | (282 | ) | 156 | |||||||||||
| Total changes in equity other than those resulting from transactions with owners as owners | 1,068 | 1,108 | 778 | |||||||||||||
| Cents per Share | ||||||||||||||||||||
| Earnings per share based on net profit distributable to members of the Bank Basic | 95.8 | 109.2 | 48.2 | |||||||||||||||||
| Fully Diluted | 95.7 | 109.1 | 48.2 | |||||||||||||||||
| Dividends per share attributable to shareholders of the Bank: | ||||||||||||||||||||
| Ordinary shares | 79 | 85 | 69 | |||||||||||||||||
| Preference shares (issued 6 April 2001) | 509 | 500 | 519 | |||||||||||||||||
| Other equity instruments (issued 6 August 2003) | 3,096 | — | — | |||||||||||||||||
| $M | $M | $M | ||||||||||
| Net Profit after Income Tax comprises Net Profit after income tax (“cash basis”) | 1,240 | 1,371 | 1,208 | |||||||||
| Add Appraisal value uplift/(reduction) | 165 | 181 | (426 | ) | ||||||||
| Less Goodwill amortisation | (162 | ) | (162 | ) | (160 | ) | ||||||
| Net Profit after income tax (“statutory basis”) | 1,243 | 1,390 | 622 | |||||||||
| (1) | December 2003 results reflects the Which new Bank initiative, while prior periods include strategic initiatives undertaken and the cost of the June 2002 ESAP paid in October 2002. |
26
Consolidated Statement of Financial Position
As at 31 December 2003
| 31/12/03 | 30/06/03 | 31/12/02 | ||||||||||||||
| Note | $M | $M | $M | |||||||||||||
Assets | ||||||||||||||||
| Cash and liquid assets | 5,892 | 5,575 | 5,015 | |||||||||||||
| Receivables due from other financial institutions | 7,620 | 7,066 | 6,735 | |||||||||||||
| Trading securities | 12,134 | 10,435 | 13,462 | |||||||||||||
| Investment securities | 11,811 | 11,036 | 12,591 | |||||||||||||
| Loans, advances and other receivables | 5 | 175,982 | 160,347 | 154,663 | ||||||||||||
| Bank acceptances of customers | 13,734 | 13,197 | 12,831 | |||||||||||||
| Insurance investment assets | 27,955 | 27,835 | 28,847 | |||||||||||||
| Deposits with regulatory authorities | 95 | 23 | 21 | |||||||||||||
| Property, plant and equipment | 1,027 | 821 | 832 | |||||||||||||
| Investment in associates | 251 | 287 | 323 | |||||||||||||
| Intangible assets | 4,867 | 5,029 | 5,161 | |||||||||||||
| Other assets | 24,511 | 23,459 | 21,536 | |||||||||||||
Total assets | 285,879 | 265,110 | 262,017 | |||||||||||||
Liabilities | ||||||||||||||||
| Deposits and other public borrowings | 7 | 158,914 | 140,974 | 139,348 | ||||||||||||
| Payables due to other financial institutions | 5,846 | 7,538 | 8,458 | |||||||||||||
| Bank acceptances | 13,734 | 13,197 | 12,831 | |||||||||||||
| Provision for dividend | 12 | 12 | 13 | |||||||||||||
| Income tax liability | 999 | 876 | 774 | |||||||||||||
| Other provisions | 1,041 | 819 | 745 | |||||||||||||
| Insurance policyholder liabilities | 23,992 | 23,861 | 24,762 | |||||||||||||
| Debt issues | 33,157 | 30,629 | 29,025 | |||||||||||||
| Bills payable and other liabilities | 19,193 | 19,027 | 18,166 | |||||||||||||
| 256,888 | 236,933 | 234,122 | ||||||||||||||
| Loan Capital | 5,790 | 6,025 | 5,449 | |||||||||||||
Total liabilities | 262,678 | 242,958 | 239,571 | |||||||||||||
Net assets | 23,201 | 22,152 | 22,446 | |||||||||||||
Shareholders’ Equity | ||||||||||||||||
| Share Capital: | ||||||||||||||||
| Ordinary share capital | 12,885 | 12,678 | 12,678 | |||||||||||||
| Preference share capital | 687 | 687 | 687 | |||||||||||||
| Other equity instruments | 832 | — | — | |||||||||||||
| Reserves | 3,626 | 3,850 | 4,014 | |||||||||||||
| Retained profits | 2,996 | 2,809 | 2,424 | |||||||||||||
Shareholders’ equity attributable to members of the Bank | 21,026 | 20,024 | 19,803 | |||||||||||||
| Outside Equity Interests: | ||||||||||||||||
| Controlled entities | 304 | 304 | 300 | |||||||||||||
| Insurance statutory funds and other funds | 1,871 | 1,824 | 2,343 | |||||||||||||
| Total outside equity interests | 2,175 | 2,128 | 2,643 | |||||||||||||
Total shareholders’ equity | 23,201 | 22,152 | 22,446 | |||||||||||||
27
Consolidated Statement of Cash Flows
For the half year ended 31 December 2003
| 31/12/03 | 30/06/03 | 31/12/02 | |||||||||||||||
| Note | $M | $M | $M | ||||||||||||||
Cash Flows from Operating Activities | |||||||||||||||||
| Interest received | 6,276 | 5,942 | 5,510 | ||||||||||||||
| Dividends received | 3 | 1 | 3 | ||||||||||||||
| Interest paid | (3,551 | ) | (3,384 | ) | (3,071 | ) | |||||||||||
| Other operating income received | 1,934 | 1,194 | 1,941 | ||||||||||||||
| Expenses paid | (2,953 | ) | (2,710 | ) | (2,728 | ) | |||||||||||
| Income taxes paid | (740 | ) | (293 | ) | (965 | ) | |||||||||||
| Net decrease (increase) in trading securities | (1,258 | ) | 2,793 | (5,277 | ) | ||||||||||||
| Life insurance: | |||||||||||||||||
| Investment income | 418 | 429 | 215 | ||||||||||||||
Premiums received(1) | 1,894 | 1,719 | �� | 2,411 | |||||||||||||
Policy payments(1) | (2,501 | ) | (2,843 | ) | (3,012 | ) | |||||||||||
Net Cash provided by / (used in) operating activities | 9 | (478 | ) | 2,848 | (4,973 | ) | |||||||||||
Cash Flows from Investing Activities | |||||||||||||||||
| Payments for acquisition of entities and management rights | — | (59 | ) | (114 | ) | ||||||||||||
| Proceeds from disposal of entities and businesses | — | — | 33 | ||||||||||||||
| Net movement in investment securities: | |||||||||||||||||
| Purchases | (7,647 | ) | (4,694 | ) | (13,361 | ) | |||||||||||
| Proceeds from sale | 50 | — | 24 | ||||||||||||||
| Proceeds at or close to maturity | 6,755 | 6,213 | 11,505 | ||||||||||||||
| Withdrawal (lodgement) of deposits with regulatory authorities | (72 | ) | (2 | ) | 68 | ||||||||||||
| Net increase in loans, advances and other receivables | (15,785 | ) | (5,837 | ) | (7,740 | ) | |||||||||||
| Proceeds from sale of property, plant and equipment | 61 | 29 | 43 | ||||||||||||||
| Purchase of property, plant and equipment | (334 | ) | (75 | ) | (68 | ) | |||||||||||
| Net decrease (increase) in receivables due from other financial institutions not at call | (888 | ) | 450 | 63 | |||||||||||||
| Net decrease (increase) in securities purchased under agreements to resell | (207 | ) | (1,505 | ) | 1,555 | ||||||||||||
| Net decrease (increase) in other assets | (348 | ) | 1,331 | (1,030 | ) | ||||||||||||
| Life insurance: | |||||||||||||||||
| Purchases of investment securities | (4,829 | ) | (7,301 | ) | (5,790 | ) | |||||||||||
| Proceeds from sale/maturity of investment securities | 5,612 | 7,624 | 7,004 | ||||||||||||||
Net cash used in investing activities | (17,632 | ) | (3,826 | ) | (7,808 | ) | |||||||||||
Cash Flows from Financing Activities | |||||||||||||||||
| Proceeds from issue of shares (net of costs) | 6 | — | 13 | ||||||||||||||
| Proceeds from issue of preference shares for outside equity interests | — | — | 182 | ||||||||||||||
| Proceeds from issue of other equity instruments (net of costs) | 832 | — | — | ||||||||||||||
| Net increase (decrease) in deposits and other borrowings | 16,966 | (886 | ) | 6,015 | |||||||||||||
| Net movement in debt issues | 2,528 | 1,619 | 5,435 | ||||||||||||||
| Dividends paid (including DRP buy back of shares) | (904 | ) | (888 | ) | (1,045 | ) | |||||||||||
| Net movements in other liabilities | (851 | ) | (1,598 | ) | 672 | ||||||||||||
| Net increase (decrease) in payables due to other financial institutions not at call | (535 | ) | (1,722 | ) | 926 | ||||||||||||
| Net increase (decrease) in securities sold under agreements to repurchase | 974 | 2,514 | 532 | ||||||||||||||
| Issue of loan capital | — | 901 | — | ||||||||||||||
| Other | 27 | 41 | (22 | ) | |||||||||||||
Net cash provided by financing activities | 19,043 | (19 | ) | 12,708 | |||||||||||||
| Net Increase (decrease) in cash and cash equivalents | 933 | (997 | ) | (73 | ) | ||||||||||||
| Cash and cash equivalents at beginning of period | 1,428 | 2,425 | 2,498 | ||||||||||||||
Cash and cash equivalents at end of period | 9 | 2,361 | 1,428 | 2,425 | |||||||||||||
It should be noted that the Bank does not use this accounting Statement of Cash Flows in the internal management of its liquidity positions.
| (1) | These were gross premiums and policy payments before splitting between policyholders and shareholders. |
28
Notes to the Financial Statements
Note 1 Accounting Policies
The half year report should be read in conjunction with the annual consolidated financial statements of Commonwealth Bank of Australia (the Bank) as at 30 June 2003 and with any public announcements made by the Bank and its controlled entities during the half year ended 31 December 2003 in accordance with the continuous disclosure obligations under the Corporations Act 2001.
These half year consolidated financial statements are a general purpose financial report made out in accordance with the Corporations Act 2001, applicable Accounting Standards including AASB 1029: Interim Financial Reporting, Urgent Issues Group Consensus Views and other mandatory reporting requirements so far as the requirements are considered appropriate to a banking corporation. This half year report does not include all notes of the type normally included in the annual financial report.
The accounting policies followed in this half year report are the same as those applied in the 30 June 2003 annual financial report.
Software Capitalisation
The criteria for information technology software capitalisation has been amended, such that only computer software projects costing $10 million or more are being capitalised and capitalisation is limited to those investments that will deliver identifiable and sustainable customer value and an increase in returns, in a significant line of business.
This change has been applied retrospectively and has resulted in the expensing of $210 million of previously capitalised software.
This half year report has been prepared in accordance with the historical cost convention and, except for AASB 1038: Life Insurance Business requirements and Directors’ valuations of property holdings, does not reflect current valuations of non monetary assets. Trading securities and traded derivative financial instruments are brought to account at net fair value.
In accordance with the Australian Securities and Investments Commission Class Order No. 98/100 dated 10 July 1998, amounts in these financial statements have been rounded to the nearest million dollars unless otherwise stated.
For the purposes of preparing the half year financial statements, the half year has been treated as a discrete reporting period.
Note 2 Revenue from Ordinary Activities
| Half Year Ended | ||||||||||||
| 31/12/03 | 30/06/03 | 31/12/02 | ||||||||||
| Revenue from Ordinary Activities | $M | $M | $M | |||||||||
Banking | ||||||||||||
| Interest income | 6,241 | 5,860 | 5,668 | |||||||||
| Fee and commissions | 1,113 | 1,041 | 1,005 | |||||||||
| Trading income | 269 | 276 | 226 | |||||||||
| Dividends | 3 | 1 | 3 | |||||||||
| Sale of property, plant and equipment | 61 | 29 | 43 | |||||||||
| Sale of investment securities | 50 | 32 | 24 | |||||||||
Other(1) | (7 | ) | 20 | 34 | ||||||||
| 7,730 | 7,259 | 7,003 | ||||||||||
Funds Management and Insurance | ||||||||||||
| Insurance premium and related income | 552 | 648 | 483 | |||||||||
| Investment revenue | 1,445 | 782 | (154 | ) | ||||||||
| Funds management fee income | 597 | 627 | 522 | |||||||||
| 2,594 | 2,057 | 851 | ||||||||||
Appraisal value uplift(2) | 165 | 181 | — | |||||||||
Total revenue from ordinary activities | 10,489 | 9,497 | 7,854 | |||||||||
| (1) | Includes an equity accounted loss of $36 million for the half year ended 31 December 2003. Loss principally relates to a change in revenue recognition accounting policy by the associate entity. |
| (2) | Appraisal value reduction of $426 million for the half year ended 31 December 2002. |
29
Notes to the Financial Statements
Note 3 Operating Expenses
| Half Year Ended | ||||||||||||||
| 31/12/03 | 30/06/03 | 31/12/02 | ||||||||||||
| $M | $M | $M | ||||||||||||
Staff Expenses | ||||||||||||||
| Salaries and wages | 1,078 | 1,058 | 1,050 | |||||||||||
| Superannuation contributions | 3 | 8 | 5 | |||||||||||
| Provisions for employee entitlements | 22 | 7 | 4 | |||||||||||
| Payroll tax | 59 | 57 | 50 | |||||||||||
| Fringe benefits tax | 14 | 12 | 14 | |||||||||||
| Other staff expenses | 55 | 63 | 57 | |||||||||||
| 1,231 | 1,205 | 1,180 | ||||||||||||
Share Based Compensation | 49 | 60 | 32 | |||||||||||
Occupancy and Equipment Expenses | ||||||||||||||
| Operating lease rentals | 172 | 179 | 175 | |||||||||||
| Depreciation | ||||||||||||||
| Buildings | 11 | 11 | 13 | |||||||||||
| Leasehold improvements | 26 | 28 | 23 | |||||||||||
| Equipment | 24 | 28 | 25 | |||||||||||
| Repairs and maintenance | 29 | 31 | 27 | |||||||||||
| Other | 32 | 31 | 38 | |||||||||||
| 294 | 308 | 301 | ||||||||||||
Information Technology Services | ||||||||||||||
| Projects and development | 107 | 92 | 103 | |||||||||||
| Data processing | 127 | 123 | 132 | |||||||||||
| Desktop | 75 | 85 | 76 | |||||||||||
| Communications | 93 | 89 | 82 | |||||||||||
| Software amortisation | 4 | 41 | 37 | |||||||||||
| 406 | 430 | 430 | ||||||||||||
Other Expenses | ||||||||||||||
| Postage | 56 | 55 | 54 | |||||||||||
| Stationery | 52 | 52 | 66 | |||||||||||
| Fees and commissions | 289 | 269 | 282 | |||||||||||
| Advertising, marketing and loyalty rewards | 159 | 128 | 148 | |||||||||||
| Other | 173 | 178 | 134 | |||||||||||
| 729 | 682 | 684 | ||||||||||||
Operating Expenses | 2,709 | 2,685 | 2,627 | |||||||||||
Initiatives including Which new Bank | 494 | 156 | 83 | |||||||||||
Total | 3,203 | 2,841 | 2,710 | |||||||||||
Transformation Program
On 19 September 2003, the Group launched its Which new Bank customer service vision. This is a three year transformation program and involves the Bank in additional expenditure in the key areas of staff training and skilling, systems and process simplification, and technology. In the period to 31 December 2003 transformation expenses have totalled $494 million and principally comprise redundancies, expensing of capitalised software of $210 million and consulting costs. The outstanding provision for transformation at 31 December 2003 is $200 million.
Some prior period comparatives have been reclassified to reflect the current categorisation of expenses, while the cost of the June 2002 ESAP, paid in October 2002 is included under Initiatives.
30
Notes to the Financial Statements
Note 4 Income Tax Expense
Income tax expense shown in the financial statements differs from the prima facie tax charge calculated at current taxation rates on net profit.
| Half Year Ended | ||||||||||||
| 31/12/03 | 30/06/03 | 31/12/02 | ||||||||||
| $M | $M | $M | ||||||||||
Profit from Ordinary Activities before Income Tax | ||||||||||||
| Banking | 1,382 | 1,619 | 1,546 | |||||||||
| Funds management | 242 | 116 | 101 | |||||||||
| Insurance | 234 | 184 | (23 | ) | ||||||||
| Appraisal value uplift/(reduction) | 165 | 181 | (426 | ) | ||||||||
| Goodwill amortisation | (162 | ) | (162 | ) | (160 | ) | ||||||
| 1,861 | 1,938 | 1,038 | ||||||||||
Prima Facie Income Tax at 30% Banking | 415 | 486 | 464 | |||||||||
| Funds management | 73 | 35 | 30 | |||||||||
| Insurance | 70 | 55 | (7 | ) | ||||||||
| Appraisal value uplift/(reduction) | 50 | 55 | (128 | ) | ||||||||
| Goodwill amortisation | (49 | ) | (49 | ) | (48 | ) | ||||||
| 559 | 582 | 311 | ||||||||||
Add (or Deduct) Permanent Differences Expressed on a Tax Effect Basis | ||||||||||||
Current period | ||||||||||||
| Specific provisions for offshore bad and doubtful debts not tax effected | 2 | 15 | (2 | ) | ||||||||
| Taxation offsets (net of accruals) | (21 | ) | (31 | ) | (5 | ) | ||||||
| Tax adjustment referable to policyholder income | 84 | 22 | (63 | ) | ||||||||
| Non-assessable income — life insurance surplus | (10 | ) | 2 | (20 | ) | |||||||
| Change in excess of net market value over net assets of life insurance controlled entities | (50 | ) | (55 | ) | 128 | |||||||
| Non-deductible goodwill amortisation | 49 | 49 | 48 | |||||||||
| Tax losses recognised | — | (12 | ) | (6 | ) | |||||||
| Other items | 1 | (33 | ) | 28 | ||||||||
| 55 | (43 | ) | 108 | |||||||||
Prior periods | ||||||||||||
| Other | — | 6 | (6 | ) | ||||||||
Total income tax expense | 614 | 545 | 413 | |||||||||
Income Tax Attributable to Profit from Ordinary Activities | ||||||||||||
| Banking | 412 | 463 | 468 | |||||||||
| Funds management | 39 | 22 | 35 | |||||||||
| Insurance | 43 | 28 | — | |||||||||
| Corporate tax | 494 | 513 | 503 | |||||||||
| Policyholder tax | 120 | 32 | (90 | ) | ||||||||
Total income tax expense | 614 | 545 | 413 | |||||||||
Effective Tax Rate | ||||||||||||
| Group — corporate | 28 | % | 27 | % | 29 | % | ||||||
| Banking — corporate | 30 | % | 29 | % | 30 | % | ||||||
| Funds management — corporate | 24 | % | 20 | % | 21 | % | ||||||
| Insurance — corporate | 22 | % | 18 | % | - | |||||||
Tax Consolidation
Legislation has been enacted to allow Australian resident entities to elect to consolidate and be treated as a single entity for Australian tax purposes. At the date of this report, the directors of the Commonwealth Bank of Australia have made a decision to elect to be taxed as a single entity. Members of the group have entered into a tax sharing arrangement which provides for the allocation of income tax liabilities between the entities should the head entity (Commonwealth Bank of Australia) default on its tax payment obligations. At balance date, the possibility of default is remote. The Bank has not formally notified the Australian Taxation Office of its adoption of the tax consolidation regime.
Commonwealth Bank of Australia has agreed to reimburse its wholly-owned subsidiaries which form part of the consolidated tax group for the net deferred tax assets that remain at implementation date. Alternatively where there exists a net tax liability, wholly owned subsidiaries will compensate Commonwealth Bank of Australia.
Tax consolidation calculations at 31 December 2003 have been based on legislation enacted to that date. Legislation in respect of leasing and leasing partnerships has not yet been finalised. These calculations have resulted in no material adjustment to the consolidated tax expense for the half year ended 31 December 2003.
31
Notes to the Financial Statements
Note 5 Loans, Advances and Other Receivables
| Half Year Ended | |||||||||||||
| 31/12/03 | 30/06/03 | 31/12/02 | |||||||||||
| $M | $M | $M | |||||||||||
Australia | |||||||||||||
| Overdrafts | 2,013 | 2,452 | 2,034 | ||||||||||
| Housing loans | 97,729 | 87,592 | 81,713 | ||||||||||
| Credit card outstandings | 5,583 | 5,227 | 4,992 | ||||||||||
| Lease financing | 3,837 | 3,988 | 3,932 | ||||||||||
| Bills discounted | 2,957 | 2,303 | 2,431 | ||||||||||
| Term loans | 39,127 | 36,742 | 37,519 | ||||||||||
| Redeemable preference share financing | 37 | — | — | ||||||||||
| Equity participation in leveraged leases | 1,162 | 1,276 | 1,259 | ||||||||||
| Other lending | 668 | 604 | 637 | ||||||||||
Total Australia | 153,113 | 140,184 | 134,517 | ||||||||||
Overseas | |||||||||||||
| Overdrafts | 2,132 | 2,005 | 2,387 | ||||||||||
| Housing loans | 14,499 | 12,611 | 11,832 | ||||||||||
| Credit card outstandings | 336 | 296 | 323 | ||||||||||
| Lease financing | 173 | 197 | 238 | ||||||||||
| Term loans | 8,437 | 7,444 | 7,744 | ||||||||||
| Redeemable preference share financing | 237 | 511 | 585 | ||||||||||
| Other lending | 16 | 13 | 56 | ||||||||||
Total overseas | 25,830 | 23,077 | 23,165 | ||||||||||
Gross loans, advances and other receivables | 178,943 | 163,261 | 157,682 | ||||||||||
| Less: | |||||||||||||
| Provisions for impairment | |||||||||||||
| General provision | (1,358 | ) | (1,325 | ) | (1,327 | ) | |||||||
| Specific provision against loans and advances | (198 | ) | (205 | ) | (263 | ) | |||||||
| Unearned income | |||||||||||||
| Term loans | (678 | ) | (618 | ) | (628 | ) | |||||||
| Lease financing | (536 | ) | (549 | ) | (542 | ) | |||||||
| Leveraged leases | (127 | ) | (143 | ) | (146 | ) | |||||||
| Interest reserved | (24 | ) | (26 | ) | (56 | ) | |||||||
| Unearned tax remissions on leveraged leases | (40 | ) | (48 | ) | (57 | ) | |||||||
| (2,961 | ) | (2,914 | ) | (3,019 | ) | ||||||||
Net loans, advances and other receivables | 175,982 | 160,347 | 154,663 | ||||||||||
Note 6 Asset Quality
| 31/12/03 | 30/06/03 | 31/12/02 | ||||||||||
| Balances of Impaired Assets | $M | $M | $M | |||||||||
Total Impaired Assets | ||||||||||||
| Gross non-accruals | 597 | 665 | 919 | |||||||||
| Gross structured | — | — | — | |||||||||
| Other assets acquired through security enforcement | — | — | — | |||||||||
| Total gross impaired assets | 597 | 665 | 919 | |||||||||
| Less Interest reserved | (24 | ) | (26 | ) | (56 | ) | ||||||
| 573 | 639 | 863 | ||||||||||
| Less Specific provisions for impairment | (198 | ) | (205 | ) | (264 | ) | ||||||
Total net impaired assets | 375 | 434 | 599 | |||||||||
Net Impaired Assets by Geographical Segment | ||||||||||||
| Australia | 308 | 357 | 499 | |||||||||
| Overseas | 67 | 77 | 100 | |||||||||
Total | 375 | 434 | 599 | |||||||||
32
Notes to the Financial Statements
| Half Year Ended | |||||||||||||
| 31/12/03 | 30/06/03 | 31/12/02 | |||||||||||
| Provisions for Impairment | $M | $M | $M | ||||||||||
General Provisions | |||||||||||||
| Opening balance | 1,325 | 1,327 | 1,356 | ||||||||||
| Charge against profit and loss | 150 | 154 | 151 | ||||||||||
| Transfer to specific provisions | (118 | ) | (160 | ) | (190 | ) | |||||||
| Bad debts recovered | 37 | 41 | 33 | ||||||||||
| Adjustments for exchange rate fluctuations and other items | (2 | ) | (9 | ) | — | ||||||||
| 1,392 | 1,353 | 1,350 | |||||||||||
| Bad debts written off | (34 | ) | (28 | ) | (23 | ) | |||||||
| Closing balance | 1,358 | 1,325 | 1,327 | ||||||||||
Specific Provisions | |||||||||||||
| Opening balance | 205 | 264 | 270 | ||||||||||
| Transfer from general provision for: | |||||||||||||
| New and increased provisioning | 143 | 211 | 205 | ||||||||||
| Less write-back of provisions no longer required | (25 | ) | (51 | ) | (15 | ) | |||||||
| Net transfer | 118 | 160 | 190 | ||||||||||
| Adjustments for exchange rate fluctuations and other items | (1 | ) | (11 | ) | — | ||||||||
| 322 | 413 | 460 | |||||||||||
| Bad debts written off | (124 | ) | (208 | ) | (196 | ) | |||||||
| Closing balance | 198 | 205 | 264 | ||||||||||
Total provisions for impairment | 1,556 | 1,530 | 1,591 | ||||||||||
| Specific provisions for impairment comprise the following segments: | |||||||||||||
| Provisions against loans and advances | 198 | 205 | 263 | ||||||||||
| Provisions for diminution | — | — | 1 | ||||||||||
Total | 198 | 205 | 264 | ||||||||||
| % | % | % | |||||||||||
Provision Ratios | |||||||||||||
| Specific provisions for impairment as a % of gross impaired assets net of interest reserved | 34.55 | 32.08 | 30.56 | ||||||||||
| Total provisions for impairment as a % of gross impaired assets net of interest reserved | 271.55 | 239.44 | 184.10 | ||||||||||
| General provisions as a % of risk weighted assets | 0.86 | 0.90 | 0.92 | ||||||||||
Impaired Asset Ratios | |||||||||||||
| Gross impaired assets net of interest reserved as % of risk weighted assets | 0.36 | 0.44 | 0.60 | ||||||||||
| Net impaired assets as % of: | |||||||||||||
| Risk weighted assets | 0.24 | 0.30 | 0.42 | ||||||||||
| Total shareholders’ equity | 1.62 | 1.96 | 2.67 | ||||||||||
Accounting Policy
Provisions for impairment are maintained at an amount adequate to cover anticipated credit related losses.
Specific provisions are established where full recovery of principal is considered doubtful. Specific provisions are made against:
| • | Individual facilities in the credit risk rated managed segment where exposure aggregates to $250,000 or more. |
| • | Each statistically managed portfolio to cover facilities that are not well secured and past due 180 days or more. |
| • | Credit risk rated managed segment for exposures aggregating to less than $250,000 and 90 days past due or more. |
| • | Emerging credit risks identified in specific segments in the credit risk rated managed portfolio. |
Provisions against segments are determined primarily by reference to historical ratios of write offs to balances in default.
General provisions for bad and doubtful debts are maintained to cover non identified probable losses and latent risks inherent in the overall portfolio of advances and other credit transactions. The provisions are determined having regard to the general risk profile of the credit portfolio, historical loss experience, economic conditions and a range of other criteria.
The amounts required to bring the provisions for impairment to their assessed levels are charged to profit. Provisions for impairment and movements therein are set out above.
Income Received and Forgone on Impaired Assets
Interest is only taken to profit on non-accrual loans when received in cash. Interest entitlement on non-accrual loans that is not received represents income forgone.
33
Notes to the Financial Statements
| Half Year Ended | ||||||||||||
| 31/12/03 | 30/06/03 | 31/12/02 | ||||||||||
| $M | $M | $M | ||||||||||
Impaired Assets | ||||||||||||
| Income received: | ||||||||||||
| Current period | 4 | 14 | 6 | |||||||||
| Prior period | 4 | 3 | 7 | |||||||||
Total income received | 8 | 17 | 13 | |||||||||
Interest income forgone | 4 | 3 | 15 | |||||||||
Movement in Impaired Asset Balances | ||||||||||||
| Gross impaired assets at period beginning | 665 | 919 | 943 | |||||||||
| New and increased | 257 | 263 | 354 | |||||||||
| Balances written off | (129 | ) | (243 | ) | (213 | ) | ||||||
| Returned to performing or repaid | (196 | ) | (274 | ) | (165 | ) | ||||||
Gross impaired assets at period end | 597 | 665 | 919 | |||||||||
| 31/12/03 | 30/06/03 | 31/12/02 | ||||||||||
| Loans Accruing but Past Due 90 Days or More | $M | $M | $M | |||||||||
| Housing loans | 147 | 157 | 136 | |||||||||
| Other loans | 66 | 91 | 75 | |||||||||
| 213 | 248 | 211 | ||||||||||
Note 7 Deposits and Other Public Borrowings
| 31/12/03 | 30/06/03 | 31/12/02 | ||||||||||
| $M | $M | $M | ||||||||||
Australia | ||||||||||||
| Certificates of deposit | 19,636 | 11,228 | 13,535 | |||||||||
| Term deposits | 35,391 | 32,398 | 31,382 | |||||||||
| On demand and short term deposits | 71,055 | 68,507 | 66,772 | |||||||||
| Deposits not bearing interest | 5,659 | 5,001 | 5,267 | |||||||||
| Securities sold under agreements to repurchase and short sales | 4,479 | 3,231 | 689 | |||||||||
Total Australia | 136,220 | 120,365 | 117,645 | |||||||||
Overseas | ||||||||||||
| Certificates of deposit | 3,585 | 2,900 | 3,607 | |||||||||
| Term deposits | 11,413 | 10,326 | 10,725 | |||||||||
| On demand and short term deposits | 6,266 | 5,871 | 5,822 | |||||||||
| Deposits not bearing interest | 1,113 | 921 | 935 | |||||||||
| Securities sold under agreements to repurchase and short sales | 317 | 591 | 614 | |||||||||
Total overseas | 22,694 | 20,609 | 21,703 | |||||||||
Total deposits and other public borrowings | 158,914 | 140,974 | 139,348 | |||||||||
34
Notes to the Financial Statements
Note 8 Financial Reporting by Segments
This note sets out segment reporting in accordance with statutory reporting requirements. Refer to the business analysis at the front of this report for detailed profit and loss accounts by segment.
The general insurance business results have been aggregated with the previously reported life insurance segment results to comprise the insurance segment results. Prior period results have been reclassified accordingly. General insurance business was previously included in the banking segment.
| Half Year Ended | ||||||||||||||||
| 31 December 2003 | ||||||||||||||||
| Primary Segment | Funds | |||||||||||||||
| Business Segments | Banking | Management | Insurance | Total | ||||||||||||
| Financial Performance | $M | $M | $M | $M | ||||||||||||
| Interest income | 6,241 | — | — | 6,241 | ||||||||||||
| Premium and related revenue | — | — | 552 | 552 | ||||||||||||
| Other income | 1,489 | 1,538 | 504 | 3,531 | ||||||||||||
| Appraisal value uplift | — | 156 | 9 | 165 | ||||||||||||
| Total revenue | 7,730 | 1,694 | 1,065 | 10,489 | ||||||||||||
| Interest expense | 3,570 | — | — | 3,570 | ||||||||||||
| Segment result before income tax, goodwill amortisation and appraisal value uplift | 1,382 | 242 | 234 | 1,858 | ||||||||||||
| Income tax (expense)/credit | (412 | ) | (121 | ) | (81 | ) | (614 | ) | ||||||||
| Segment result after income tax and before goodwill amortization and appraisal value uplift | 970 | 121 | 153 | 1,244 | ||||||||||||
| Outside equity interest | — | (4 | ) | — | (4 | ) | ||||||||||
| Segment result after income tax and outside equity interest before goodwill amortisation and appraisal value uplift | 970 | 117 | 153 | 1,240 | ||||||||||||
| Goodwill amortisation | (151 | ) | (9 | ) | (2 | ) | (162 | ) | ||||||||
| Appraisal value uplift | — | 156 | 9 | 165 | ||||||||||||
Net profit attributable to shareholders of the Bank | 819 | 264 | 160 | 1,243 | ||||||||||||
Non-Cash Expenses | ||||||||||||||||
| Goodwill amortisation | (151 | ) | (9 | ) | (2 | ) | (162 | ) | ||||||||
| Charge for bad and doubtful debts | (150 | ) | — | — | (150 | ) | ||||||||||
| Depreciation | (56 | ) | (1 | ) | (4 | ) | (61 | ) | ||||||||
| Transformation | (399 | ) | (11 | ) | — | (410 | ) | |||||||||
| Other | (26 | ) | — | — | (26 | ) | ||||||||||
Financial Position | ||||||||||||||||
| Total assets | 250,594 | 18,980 | 16,305 | 285,879 | ||||||||||||
| Acquisition of property, plant & equipment, intangibles and other non-current assets | 329 | — | 5 | 334 | ||||||||||||
| Associate investments | 190 | 1 | 60 | 251 | ||||||||||||
| Total liabilities | 236,796 | 16,781 | 9,101 | 262,678 | ||||||||||||
35
Notes to the Financial Statements
| Half Year Ended | ||||||||||||||||
| 31 December 2002 | ||||||||||||||||
| Primary Segment | Funds | Group | ||||||||||||||
| Business Segments | Banking | Management | Insurance | Total | ||||||||||||
| Financial Performance | $M | $M | $M | $M | ||||||||||||
| Interest income | 5,668 | — | — | 5,668 | ||||||||||||
| Premium and related revenue | — | — | 483 | 483 | ||||||||||||
| Other income | 1,335 | 254 | 114 | 1,703 | ||||||||||||
| Total revenue | 7,003 | 254 | 597 | 7,854 | ||||||||||||
| Interest expense | 3,214 | — | — | 3,214 | ||||||||||||
| Segment result before income tax, goodwill amortisation and appraisal value reduction | 1,546 | 101 | (23 | ) | 1,624 | |||||||||||
| Income tax (expense)/credit | (468 | ) | 31 | 24 | (413 | ) | ||||||||||
| Segment result after income tax and before goodwill amortisation and appraisal value reduction | 1,078 | 132 | 1 | 1,211 | ||||||||||||
| Outside equity interest | — | (3 | ) | — | (3 | ) | ||||||||||
| Segment result after income tax and outside equity interest before goodwill amortisation and appraisal value reduction | 1,078 | 129 | 1 | 1,208 | ||||||||||||
Goodwill amortisation (1) | (149 | ) | (9 | ) | (2 | ) | (160 | ) | ||||||||
| Appraisal value reduction | — | (351 | ) | (75 | ) | (426 | ) | |||||||||
Net profit attributable to shareholders of the Bank | 929 | (231 | ) | (76 | ) | 622 | ||||||||||
Non-Cash Expenses | ||||||||||||||||
| Goodwill amortisation | (149 | ) | (9 | ) | (2 | ) | (160 | ) | ||||||||
| Charge for bad and doubtful debts | (151 | ) | — | — | (151 | ) | ||||||||||
| Depreciation | (49 | ) | (4 | ) | (7 | ) | (60 | ) | ||||||||
| Appraisal value reduction | — | (351 | ) | (75 | ) | (426 | ) | |||||||||
| Other | (3 | ) | (1 | ) | — | (4 | ) | |||||||||
Financial Position | ||||||||||||||||
| Total assets | 226,728 | 18,518 | 16,771 | 262,017 | ||||||||||||
| Acquisition of property, plant & equipment and intangibles and other non-current assets | 40 | 142 | — | 182 | ||||||||||||
| Associate investments | 229 | 36 | 58 | 323 | ||||||||||||
| Total liabilities | 212,781 | 17,523 | 9,267 | 239,571 | ||||||||||||
| (1) | Prior periods have been restated to reflect the allocation of goodwill amortisation across businesses. |
36
Notes to the Financial Statements
| Half Year Ended | ||||||||||||||||
| Secondary Segment | ||||||||||||||||
| Geographical Segment | 31/12/03 | 31/12/02 | ||||||||||||||
| Financial Performance | $M | % | $M | % | ||||||||||||
Revenue | ||||||||||||||||
| Australia | 8,572 | 81.7 | 6,523 | 83.1 | ||||||||||||
| New Zealand | 1,300 | 12.4 | 894 | 11.4 | ||||||||||||
Other Countries (1) | 617 | 5.9 | 437 | 5.5 | ||||||||||||
| 10,489 | 100.0 | 7,854 | 100.0 | |||||||||||||
Net Profit Attributable to Shareholders of the Bank | ||||||||||||||||
| Australia | 973 | 78.3 | 476 | 76.5 | ||||||||||||
| New Zealand | 163 | 13.1 | 130 | 20.9 | ||||||||||||
Other Countries (1) | 107 | 8.6 | 16 | 2.6 | ||||||||||||
| 1,243 | 100.0 | 622 | 100.0 | |||||||||||||
Assets | ||||||||||||||||
| Australia | 237,255 | 83.0 | 217,207 | 82.9 | ||||||||||||
| New Zealand | 30,825 | 10.8 | 27,879 | 10.6 | ||||||||||||
Other Countries (1) | 17,799 | 6.2 | 16,931 | 6.5 | ||||||||||||
| 285,879 | 100.0 | 262,017 | 100.0 | |||||||||||||
Acquisition of Property, Plant & Equipment and Intangibles and Other Non-current | ||||||||||||||||
Assets | ||||||||||||||||
| Australia | 313 | 93.7 | 165 | 90.7 | ||||||||||||
| New Zealand | 17 | 5.1 | 8 | 4.4 | ||||||||||||
Other Countries (1) | 4 | 1.2 | 9 | 4.9 | ||||||||||||
| 334 | 100.0 | 182 | 100.0 | |||||||||||||
| (1) | Other Countries were: United Kingdom, United States of America, Japan, Singapore, Hong Kong, Grand Cayman, the Philippines, Fiji, Indonesia, China and Vietnam. |
The geographical segment represents the location in which the transaction was booked.
Note 9 Statement of Cash Flows
| (a) | Reconciliation of Operating Profit after Income Tax to Net Cash Provided by Operating Activities |
| Half Year Ended | ||||||||||||
| 31/12/03 | 30/06/03 | 31/12/02 | ||||||||||
| $M | $M | $M | ||||||||||
| Profit from ordinary activities after income tax | 1,247 | 1,393 | 625 | |||||||||
| Decrease (increase) in interest receivable | (31 | ) | 85 | (163 | ) | |||||||
| Increase (decrease) in interest payable | 20 | (80 | ) | 142 | ||||||||
| Net (increase) decrease in trading securities | (1,258 | ) | 2,793 | (5,277 | ) | |||||||
| Net (gain)/loss on sale of investment securities | (1 | ) | 8 | 1 | ||||||||
| (Gain)/loss on sale of property plant and equipment | 3 | (16 | ) | (6 | ) | |||||||
| Charge for bad and doubtful debts | 150 | 154 | 151 | |||||||||
| Depreciation and amortisation | 227 | 270 | 259 | |||||||||
| Other provisions | 223 | 74 | (89 | ) | ||||||||
| Increase (decrease) in income taxes payable | 139 | 209 | (443 | ) | ||||||||
| (Decrease) increase in deferred income taxes payable | (15 | ) | (107 | ) | (59 | ) | ||||||
| (Increase) decrease in future income tax benefits | (250 | ) | 133 | (33 | ) | |||||||
| (Increase) decrease in accrued fees/reimbursements receivable | (3 | ) | (4 | ) | (90 | ) | ||||||
| (Decrease) increase in accrued fees and other items payable | (51 | ) | 1 | 5 | ||||||||
| Amortisation of premium on investment securities | 4 | (275 | ) | 6 | ||||||||
| Unrealised gain on revaluation of trading securities | 320 | (233 | ) | 239 | ||||||||
| Change in excess of net market value over net assets of life insurance controlled entities | (165 | ) | (181 | ) | 426 | |||||||
| Unrealised (gain)/loss on insurance investment assets | (947 | ) | 209 | 371 | ||||||||
| Change in policy liabilities | 131 | (901 | ) | (1,155 | ) | |||||||
| Unrealised (gain)/loss on loan capital | (231 | ) | (325 | ) | 22 | |||||||
| Other | 10 | (359 | ) | 95 | ||||||||
Net Cash provided by Operating Activities | (478 | ) | 2,848 | (4,973 | ) | |||||||
37
| (b) | Reconciliation of Cash |
| For the purposes of the Statement of Cash Flows, cash includes cash at bank, money at short call, at call deposits with other financial institutions and settlement account balances with other banks. |
| Half Year Ended | ||||||||||||
| 31/12/03 | 30/06/03 | 31/12/02 | ||||||||||
| $M | $M | $M | ||||||||||
| Notes, coins and cash at bankers | 1,852 | 1,492 | 2,387 | |||||||||
| Other short term liquid assets | 391 | 641 | 689 | |||||||||
| Receivables due from other financial institutions — at call | 2,194 | 2,528 | 1,779 | |||||||||
| Payables due to other financial institutions — at call | (2,076 | ) | (3,233 | ) | (2,430 | ) | ||||||
| Cash and Cash Equivalents at end of year | 2,361 | 1,428 | 2,425 | |||||||||
| (c) | Non Cash Financing and Investing Activities |
| The value of shares issued under the Dividend Reinvestment Plan was $201 million during the half year ended 31 December 2003 (31 December 2002: nil) |
Note 10 Events after the end of the Financial Period
Issue of PERLS II
On 6 January 2004 a wholly owned entity of the Bank (Commonwealth Managed Investments Limited as Responsible Entity of the PERLS II Trust) issued A$750 million Perpetual Exchangeable Resettable Listed Securities (PERLS II). These securities are units in a registered managed investments scheme, perpetual in nature, offering a non-cumulative floating rate distribution, payable quarterly.
Buy Back
On 11 February 2004, the Bank announced that an off-market buy-back of $450 million to $550 million is planned for March 2004. The ultimate size of the buy-back is at the discretion of Directors and will be dependent on market conditions at the time.
Dividends
The Directors have declared a fully franked dividend of 79 cents per share — amounting to $996 million for the half year ended 31 December 2003.
The Directors are not aware of any other matter or circumstance that has occurred since the end of the half year that has significantly affected or may significantly affect the operation of the Bank, the results of those operations or the state of affairs of the Bank in subsequent financial years.
Note 11 Contingent Liabilities
There have been no material changes in contingent liabilities since those disclosed in the financial statements for the year ended 30 June 2003, refer to note 38 of the 2003 Annual Report.
38
Directors’ Declaration
In accordance with a resolution of the Directors of the Commonwealth Bank of Australia we state that in the opinion of the Directors:
| (a) | the half year consolidated financial statements and notes as set out on pages 26 to 38: |
| (i) | give a true and fair view of the financial position as at 31 December 2003 and the performance for the half year ended on that date of the consolidated entity; and |
| (ii) | comply with Accounting Standard AASB1029: Interim Financial Reporting and the Corporations Regulations 2001; and |
| (b) | there are reasonable grounds to believe that the company will be able to pay its debts as and when they become due and payable. |
Signed in accordance with a resolution of the Directors.
| | |
| J T Ralph AC | D V Murray | |
| Chairman | Chief Executive Officer |
11 February 2004
39
Independent Review Report
To the Members of Commonwealth Bank of Australia
Matters relating to the Electronic Presentation of the Reviewed Financial Report
This review report relates to the financial report of Commonwealth Bank of Australia, for the period ended 31 December 2003 included on the company’s web site. The company’s directors are responsible for the integrity of the company’s web site. We have not been engaged to report on the integrity of the company’s web site. The review report refers only to the statements named below. It does not provide an opinion on any other information which may have been hyperlinked to/from these statements. If users of this report are concerned with the inherent risks arising from electronic data communications they are advised to refer to the hard copy of the reviewed financial report to confirm the information included in the reviewed financial report presented on this web site.
Scope
The financial report and directors’ responsibility
The financial report comprises the statement of financial position, statement of financial performance, statement of cash flows, accompanying notes to the financial statements, and the directors’ declaration for the consolidated entity, for the period ended 31 December 2003. The consolidated entity comprises both the Commonwealth Bank of Australia and the entities it controlled during that period.
The directors of the company are responsible for preparing a financial report that gives a true and fair view of the financial position and performance of the consolidated entity, and that complies with Accounting Standard AASB 1029 “Interim Financial Reporting”, in accordance with theCorporations Act 2001. This includes responsibility for the maintenance of adequate accounting records and internal controls that are designed to prevent and detect fraud and error, and for the accounting policies and accounting estimates inherent in the financial report.
Review approach
We conducted an independent review of the financial report in order to make a statement about it to the members of the company, and in order for the company to lodge the financial report with the Australian Stock Exchange and the Australian Securities and Investments Commission.
Our review was conducted in accordance with Australian Auditing Standards applicable to review engagements, in order to state whether, on the basis of the procedures described, anything has come to our attention that would indicate that the financial report is not presented fairly in accordance with theCorporations Act 2001, Accounting Standard AASB 1029 “Interim Financial Reporting” and other mandatory professional reporting requirements in Australia, so as to present a view which is consistent with our understanding of the consolidated entity’s financial position, and of their performance as represented by the results of their operations and cash flows.
A review is limited primarily to inquiries of company personnel and analytical procedures applied to the financial data. These procedures do not provide all the evidence that would be required in an audit, thus the level of assurance is less than given in an audit. We have not performed an audit and, accordingly, we do not express an audit opinion.
Independence
We are independent of the company, and have met the independence requirements of Australian professional ethical pronouncements and theCorporations Act 2001. In addition to our review of the financial report, we were engaged to undertake other non-audit services. The provision of these services has not impaired our independence.
Statement
Based on our review, which is not an audit, we have not become aware of any matter that makes us believe that the financial report of Commonwealth Bank of Australia is not in accordance with:
| (a) | theCorporations Act 2001, including: |
| (i) | giving a true and fair view of the financial position of the consolidated entity at 31 December 2003 and of its performance for the period ended on that date; and |
| (ii) | complying with Accounting Standard AASB 1029 “Interim Financial Reporting” and theCorporations Regulations 2001; and |
| (b) | other mandatory financial reporting requirements in Australia. |
 |  | |
| Ernst Young Sydney | S J Ferguson Partner |
11 February 2004
40
Appendices
| 1. | Net Interest Income | |||
| 2. | Net Interest Margin | |||
| 3. | Average Balances and Related Interest | |||
| 4. | Interest Rate and Volume Analysis | |||
| 5. | Other Banking Operating Income | |||
| 6. | Operating Expenses | |||
| 7. | Integrated Risk Management | |||
| 8. | Capital Adequacy | |||
| 9. | Share Capital | |||
| 10. | Insurance Business | |||
| 11. | Intangible Assets | |||
| 12. | Amortisation Schedule | |||
| 13. | Definitions |
41
1. Net Interest Income
| Half Year Ended | ||||||||||||||||
| 31/12/03 | ||||||||||||||||
| 31/12/03 | 30/06/03 | 31/12/02 | -v- 31/12/02 | |||||||||||||
| $M | $M | $M | % | |||||||||||||
Interest Income | ||||||||||||||||
| Loans | 5,496 | 5,154 | 4,972 | 11 | ||||||||||||
| Other financial institutions | 97 | 86 | 105 | (8 | ) | |||||||||||
| Cash and liquid assets | 92 | 73 | 77 | 19 | ||||||||||||
| Trading securities | 269 | 238 | 216 | 25 | ||||||||||||
| Investment securities | 270 | 291 | 275 | (2 | ) | |||||||||||
| Dividends on redeemable preference shares | 17 | 18 | 23 | (26 | ) | |||||||||||
Total interest income | 6,241 | 5,860 | 5,668 | 10 | ||||||||||||
Interest Expense | ||||||||||||||||
| Deposits | 2,670 | 2,360 | 2,372 | 13 | ||||||||||||
| Other financial institutions | 76 | 92 | 106 | (28 | ) | |||||||||||
| Debt issues | 700 | 727 | 625 | 12 | ||||||||||||
| Loan capital | 124 | 109 | 111 | 12 | ||||||||||||
Total interest expense | 3,570 | 3,288 | 3,214 | 11 | ||||||||||||
Net interest income | 2,671 | 2,572 | 2,454 | 9 | ||||||||||||
2. Net Interest Margin
| Half Year Ended | ||||||||||||
| 31/12/03 | 30/06/03 | 31/12/02 | ||||||||||
| % | % | % | ||||||||||
Australia | ||||||||||||
Interest spread (1) | 2.56 | 2.71 | 2.65 | |||||||||
Benefit of interest free liabilities, provisions and equity (2) | 0.23 | 0.19 | 0.21 | |||||||||
Net interest margin (3) | 2.79 | 2.90 | 2.86 | |||||||||
Overseas | ||||||||||||
Interest spread (1) | 1.22 | 1.08 | 1.36 | |||||||||
Benefit of interest free liabilities, provisions and equity (2) | 0.50 | 0.63 | 0.35 | |||||||||
Net interest margin (3) | 1.72 | 1.71 | 1.71 | |||||||||
Group | ||||||||||||
Interest spread (1) | 2.31 | 2.40 | 2.40 | |||||||||
Benefit of interest free liabilities, provisions and equity (2) | 0.29 | 0.29 | 0.25 | |||||||||
Net interest margin (3) | 2.60 | 2.69 | 2.65 | |||||||||
(1) Difference between the average interest rate earned and the average interest rate paid on funds.
| (2) | A portion of the Bank’s interest earning assets is funded by interest free liabilities and shareholders’ equity. The benefit to the Bank of these interest free funds is the amount it would cost to replace them at the average cost of funds. |
(3) Net interest income divided by average interest earning assets for the period.
42
3. Average Balances and Related Interest
The table lists the major categories of interest earning assets and interest bearing liabilities of the Bank together with the respective interest earned or paid and the average interest rates for each of the half years ending 31 December 2003, 30 June 2003 and 31 December 2002. Averages used were predominantly daily averages.
The overseas component comprises overseas branches of the Bank and overseas domiciled controlled entities. Overseas intragroup borrowing’s have been adjusted into the interest spread and margin calculations to more appropriately reflect the overseas cost of funds. Non-accrual loans were included in interest earning assets under loans, advances and other receivables.
| Half Year Ended | ||||||||||||||||||||||||||||||||||||||
| 31/12/03 | 30/06/03 | 31/12/02 | ||||||||||||||||||||||||||||||||||||
| Average | Interest | Average | Average | Interest | Average | Average | Interest | Average | ||||||||||||||||||||||||||||||
| Balance | Rate | Balance | Rate | Balance | Rate | |||||||||||||||||||||||||||||||||
| $M | $M | % | $M | $M | % | $M | $M | % | ||||||||||||||||||||||||||||||
Average Interest Earning | ||||||||||||||||||||||||||||||||||||||
Assets and Interest Income | ||||||||||||||||||||||||||||||||||||||
| Cash and liquid assets | ||||||||||||||||||||||||||||||||||||||
| Australia | 3,748 | 83 | 4.4 | 2,983 | 63 | 4.3 | 3,598 | 70 | 3.9 | |||||||||||||||||||||||||||||
| Overseas | 1,004 | 9 | 1.8 | 1,032 | 10 | 1.9 | 598 | 7 | 2.3 | |||||||||||||||||||||||||||||
| Receivables due from other financial institutions | ||||||||||||||||||||||||||||||||||||||
| Australia | 3,306 | 17 | 1.0 | 2,394 | 17 | 1.4 | 2,497 | 20 | 1.6 | |||||||||||||||||||||||||||||
| Overseas | 3,816 | 80 | 4.2 | 3,931 | 69 | 3.5 | 3,540 | 85 | 4.8 | |||||||||||||||||||||||||||||
| Deposits with regulatory authorities | ||||||||||||||||||||||||||||||||||||||
| Australia | — | — | — | — | — | — | — | — | — | |||||||||||||||||||||||||||||
| Overseas | 59 | — | n/a | 57 | — | n/a | 55 | — | n/a | |||||||||||||||||||||||||||||
| Trading securities | ||||||||||||||||||||||||||||||||||||||
| Australia | 8,192 | 191 | 4.6 | 8,293 | 169 | 4.1 | 6,443 | 157 | 4.8 | |||||||||||||||||||||||||||||
| Overseas | 3,551 | 78 | 4.4 | 3,910 | 69 | 3.6 | 2,888 | 59 | 4.1 | |||||||||||||||||||||||||||||
| Investment securities | ||||||||||||||||||||||||||||||||||||||
| Australia | 4,043 | 130 | 6.4 | 4,274 | 142 | 6.7 | 4,207 | 119 | 5.6 | |||||||||||||||||||||||||||||
| Overseas | 7,614 | 140 | 3.7 | 8,334 | 149 | 3.6 | 7,794 | 156 | 4.0 | |||||||||||||||||||||||||||||
| Loans, advances and other receivables | ||||||||||||||||||||||||||||||||||||||
| Australia | 144,104 | 4,681 | 6.5 | 134,021 | 4,296 | 6.5 | 129,508 | 4,242 | 6.5 | |||||||||||||||||||||||||||||
| Overseas | 24,886 | 832 | 6.7 | 23,713 | 876 | 7.4 | 22,547 | 753 | 6.6 | |||||||||||||||||||||||||||||
| Other interest earning assets | — | — | n/a | — | — | n/a | — | — | n/a | |||||||||||||||||||||||||||||
| Intragroup loans | ||||||||||||||||||||||||||||||||||||||
| Australia | — | — | n/a | — | — | n/a | — | — | n/a | |||||||||||||||||||||||||||||
| Overseas | 3,360 | 5 | 0.3 | 4,724 | 19 | 0.8 | 2,502 | 12 | 1.0 | |||||||||||||||||||||||||||||
| Average interest earning assets and interest income including intragroup | 207,683 | 6,246 | 6.0 | 197,666 | 5,879 | 6.0 | 186,177 | 5,680 | 6.1 | |||||||||||||||||||||||||||||
| Intragroup eliminations | (3,360 | ) | (5 | ) | 0.3 | (4,724 | ) | (19 | ) | 0.8 | (2,502 | ) | (12 | ) | 1.0 | |||||||||||||||||||||||
Total average interest earning assets and interest income | 204,323 | 6,241 | 6.1 | 192,942 | 5,860 | 6.1 | 183,675 | 5,668 | 6.1 | |||||||||||||||||||||||||||||
43
3. Average Balances and Related Interest (Cont’d)
| Half Year Ended | |||||||||||||
| 31/12/03 | 30/06/03 | 31/12/02 | |||||||||||
| $M | $M | $M | |||||||||||
Average Non-Interest Earning Assets | |||||||||||||
| Bank acceptances | |||||||||||||
| Australia | 13,560 | 13,050 | 13,237 | ||||||||||
| Overseas | 2 | 66 | 40 | ||||||||||
| Life insurance investment assets | |||||||||||||
| Australia | 24,565 | 25,076 | 27,569 | ||||||||||
| Overseas | 4,023 | 4,050 | 4,090 | ||||||||||
| Property, plant and equipment | |||||||||||||
| Australia | 677 | 619 | 635 | ||||||||||
| Overseas | 183 | 194 | 200 | ||||||||||
| Other assets | |||||||||||||
| Australia | 22,756 | 22,789 | 21,118 | ||||||||||
| Overseas | 6,787 | 6,450 | 4,459 | ||||||||||
| Provisions for impairment | |||||||||||||
| Australia | (1,391 | ) | (1,469 | ) | (1,525 | ) | |||||||
| Overseas | (148 | ) | (151 | ) | (149 | ) | |||||||
Total average non-interest earning assets | 71,014 | 70,674 | 69,674 | ||||||||||
Total average assets | 275,337 | 263,616 | 253,349 | ||||||||||
Percentage of total average assets applicable to overseas operations | 20.0 | % | 21.4 | % | 19.2 | % | |||||||
44
3. Average Balances and Related Interest (Cont’d)
| Half Year Ended | ||||||||||||||||||||||||||||||||||||||
| 30/12/03 | 30/06/03 | 31/12/02 | ||||||||||||||||||||||||||||||||||||
| Average | Interest | Average | Average | Interest | Average | Average | Interest | Average | ||||||||||||||||||||||||||||||
| Balance | Rate | Balance | Rate | Balance | Rate | |||||||||||||||||||||||||||||||||
| $M | $M | % | $M | $M | % | $M | $M | % | ||||||||||||||||||||||||||||||
Average Interest Bearing Liabilities and Loan Capital and Interest Expense | ||||||||||||||||||||||||||||||||||||||
| Time Deposits | ||||||||||||||||||||||||||||||||||||||
| Australia | 50,954 | 1,110 | 4.3 | 45,402 | 926 | 4.1 | 45,941 | 1,030 | 4.4 | |||||||||||||||||||||||||||||
| Overseas | 15,980 | 503 | 6.3 | 13,781 | 461 | 6.7 | 14,722 | 415 | 5.6 | |||||||||||||||||||||||||||||
| Savings Deposits | ||||||||||||||||||||||||||||||||||||||
| Australia | 31,711 | 249 | 1.6 | 32,496 | 243 | 1.5 | 33,059 | 249 | 1.5 | |||||||||||||||||||||||||||||
| Overseas | 2,991 | 51 | 3.4 | 2,885 | 53 | 3.7 | 2,693 | 47 | 3.5 | |||||||||||||||||||||||||||||
| Other demand deposits | ||||||||||||||||||||||||||||||||||||||
| Australia | 38,637 | 718 | 3.7 | 35,595 | 638 | 3.6 | 32,517 | 592 | 3.6 | |||||||||||||||||||||||||||||
| Overseas | 3,291 | 39 | 2.4 | 2,996 | 39 | 2.6 | 2,817 | 39 | 2.7 | |||||||||||||||||||||||||||||
| Payables due to other financial institutions | ||||||||||||||||||||||||||||||||||||||
| Australia | 2,019 | 17 | 1.7 | 1,634 | 12 | 1.5 | 1,868 | 22 | 2.3 | |||||||||||||||||||||||||||||
| Overseas | 4,802 | 59 | 2.4 | 6,692 | 80 | 2.4 | 6,732 | 84 | 2.5 | |||||||||||||||||||||||||||||
| Debt issues | ||||||||||||||||||||||||||||||||||||||
| Australia | 20,966 | 595 | 5.6 | 19,017 | 560 | 5.9 | 16,307 | 487 | 5.9 | |||||||||||||||||||||||||||||
| Overseas | 11,368 | 105 | 1.8 | 12,181 | 167 | 2.8 | 9,319 | 138 | 2.9 | |||||||||||||||||||||||||||||
| Loan capital | ||||||||||||||||||||||||||||||||||||||
| Australia | 5,761 | 120 | 4.1 | 5,127 | 105 | 4.1 | 5,339 | 107 | 4.0 | |||||||||||||||||||||||||||||
| Overseas | 208 | 4 | 3.8 | 263 | 4 | 3.1 | 146 | 4 | 5.4 | |||||||||||||||||||||||||||||
| Other interest bearing liabilities | — | — | n/a | — | — | n/a | — | — | n/a | |||||||||||||||||||||||||||||
| Intragroup borrowings | ||||||||||||||||||||||||||||||||||||||
| Australia | 3,360 | 5 | 0.3 | 4,724 | 19 | 0.8 | 2,502 | 12 | 1.0 | |||||||||||||||||||||||||||||
| Overseas | — | — | n/a | — | — | n/a | — | — | n/a | |||||||||||||||||||||||||||||
| Average interest bearing liabilities and loan capital and interest expense including intragroup | 192,048 | 3,575 | 3.7 | 182,793 | 3,307 | 3.6 | 173,962 | 3,226 | 3.7 | |||||||||||||||||||||||||||||
| Intragroup eliminations | (3,360 | ) | (5 | ) | 0.3 | (4,724 | ) | (19 | ) | 0.8 | (2,502 | ) | (12 | ) | 1.0 | |||||||||||||||||||||||
Total average interest bearing liabilities and loan capital and interest expense | 188,688 | 3,570 | 3.8 | 178,069 | 3,288 | 3.7 | 171,460 | 3,214 | 3.7 | |||||||||||||||||||||||||||||
| Half Year Ended | |||||||||||||
| 31/12/03 | 30/06/03 | 31/12/02 | |||||||||||
| Average Balance | Average Balance | Average Balance | |||||||||||
| $M | $M | $M | |||||||||||
Average Non-Interest Bearing Liabilities | |||||||||||||
| Deposits not bearing interest | |||||||||||||
| Australia | 4,996 | 4,849 | 4,720 | ||||||||||
| Overseas | 1,053 | 913 | 830 | ||||||||||
| Liability on acceptances | |||||||||||||
| Australia | 13,560 | 13,049 | 13,242 | ||||||||||
| Overseas | 2 | 66 | 40 | ||||||||||
| Life insurance policy liabilities | |||||||||||||
| Australia | 20,464 | 20,080 | 21,564 | ||||||||||
| Overseas | 3,491 | 3,495 | 3,695 | ||||||||||
| Other liabilities | |||||||||||||
| Australia | 17,620 | 18,136 | 13,303 | ||||||||||
| Overseas | 2,701 | 2,695 | 2,782 | ||||||||||
Total average non-interest bearing liabilities | 63,887 | 63,283 | 60,176 | ||||||||||
Total average liabilities and loan capital | 252,575 | 241,352 | 231,636 | ||||||||||
| Shareholders’ equity | 22,762 | 22,264 | 21,713 | ||||||||||
Total average liabilities, loan capital and shareholders’ equity | 275,337 | 263,616 | 253,349 | ||||||||||
Percentage of total average liabilities applicable to overseas operations | 18.2 | % | 19.0 | % | 18.9 | % | |||||||
45
4. Interest Rate and Volume Analysis
| Half Year Ended | ||||||||
| 31/12/03 vs 31/12/02 | 31/12/03 vs 30/06/03 | |||||||
| Increase/ | Increase/ | |||||||
| (Decrease) | (Decrease) | |||||||
| Change in Net Interest Income | % | % | ||||||
| Due to changes in average volume of interest earning assets and interest bearing liabilities | 266 | 152 | ||||||
| Due to changes in interest margin | (49 | ) | (88 | ) | ||||
| Due to variation in time period | — | 35 | ||||||
Change in net interest income | 217 | 99 | ||||||
46
4. Interest Rate and Volume Analysis (Cont’d)
| Half Year Ended | |||||||||||||||||||||||||
| 31/12/03 vs 31/12/02 | 31/12/03 vs 30/06/03 | ||||||||||||||||||||||||
| Changes due to | Changes due to | ||||||||||||||||||||||||
| Changes in Net Interest Income: | Volume | Rate | Total | Volume | Rate | Total | |||||||||||||||||||
| Volume and Rate Analysis | $M | $M | $M | $M | $M | $M | |||||||||||||||||||
Interest Earning Assets | |||||||||||||||||||||||||
| Cash and liquid assets | |||||||||||||||||||||||||
| Australia | 3 | 10 | 13 | 17 | 2 | 19 | |||||||||||||||||||
| Overseas | 4 | (2 | ) | 2 | — | (1 | ) | (1 | ) | ||||||||||||||||
| Receivables due from other financial institutions | |||||||||||||||||||||||||
| Australia | 5 | (8 | ) | (3 | ) | 6 | (6 | ) | — | ||||||||||||||||
| Overseas | 6 | (11 | ) | (5 | ) | (2 | ) | 12 | 10 | ||||||||||||||||
| Trading securities | |||||||||||||||||||||||||
| Australia | 41 | (7 | ) | 34 | (2 | ) | 22 | 20 | |||||||||||||||||
| Overseas | 14 | 5 | 19 | (7 | ) | 15 | 8 | ||||||||||||||||||
| Investment securities | |||||||||||||||||||||||||
| Australia | (5 | ) | 16 | 11 | (8 | ) | (6 | ) | (14 | ) | |||||||||||||||
| Overseas | (3 | ) | (13 | ) | (16 | ) | (13 | ) | 2 | (11 | ) | ||||||||||||||
| Loans, advances and other receivables | |||||||||||||||||||||||||
| Australia | 464 | (25 | ) | 439 | 328 | (2 | ) | 326 | |||||||||||||||||
| Overseas | 78 | 1 | 79 | 42 | (98 | ) | (56 | ) | |||||||||||||||||
| Other interest earning assets | — | — | — | — | — | — | |||||||||||||||||||
| Intragroup loans | |||||||||||||||||||||||||
| Australia | — | — | — | — | — | — | |||||||||||||||||||
| Overseas | 3 | (10 | ) | (7 | ) | (4 | ) | (10 | ) | (14 | ) | ||||||||||||||
| Change in interest income including intragroup | 639 | (73 | ) | 566 | 321 | (35 | ) | 286 | |||||||||||||||||
| Intragroup eliminations | (3 | ) | 10 | 7 | 4 | 10 | 14 | ||||||||||||||||||
Change in interest income | 618 | (45 | ) | 573 | 350 | (49 | ) | 301 | |||||||||||||||||
Interest Bearing Liabilities and Loan Capital | |||||||||||||||||||||||||
| Time Deposits | |||||||||||||||||||||||||
| Australia | 108 | (29 | ) | 79 | 118 | 52 | 170 | ||||||||||||||||||
| Overseas | 38 | 51 | 89 | 72 | (35 | ) | 37 | ||||||||||||||||||
| Savings Deposits | |||||||||||||||||||||||||
| Australia | (11 | ) | 11 | — | (6 | ) | 9 | 3 | |||||||||||||||||
| Overseas | 5 | (1 | ) | 4 | 2 | (5 | ) | (3 | ) | ||||||||||||||||
| Other demand deposits | |||||||||||||||||||||||||
| Australia | 111 | 15 | 126 | 56 | 15 | 71 | |||||||||||||||||||
| Overseas | 6 | (6 | ) | — | 3 | (4 | ) | (1 | ) | ||||||||||||||||
| Payables due to other financial institutions | |||||||||||||||||||||||||
| Australia | 1 | (6 | ) | (5 | ) | 3 | 2 | 5 | |||||||||||||||||
| Overseas | (24 | ) | (1 | ) | (25 | ) | (23 | ) | 1 | (22 | ) | ||||||||||||||
| Debt Issues | |||||||||||||||||||||||||
| Australia | 134 | (26 | ) | 108 | 56 | (29 | ) | 27 | |||||||||||||||||
| Overseas | 25 | (58 | ) | (33 | ) | (9 | ) | (55 | ) | (64 | ) | ||||||||||||||
| Loan Capital | |||||||||||||||||||||||||
| Australia | 8 | 5 | 13 | 14 | — | 14 | |||||||||||||||||||
| Overseas | 1 | (1 | ) | — | (1 | ) | 1 | — | |||||||||||||||||
| Other interest bearing liabilities | — | — | — | — | — | — | |||||||||||||||||||
| Intragroup borrowings | |||||||||||||||||||||||||
| Australia | 3 | (10 | ) | (7 | ) | (4 | ) | (10 | ) | (14 | ) | ||||||||||||||
| Overseas | — | — | — | — | — | — | |||||||||||||||||||
| Change in interest expense including intragroup | 327 | 22 | 349 | 166 | 56 | 222 | |||||||||||||||||||
| Intragroup eliminations | (3 | ) | 10 | 7 | 4 | 10 | 14 | ||||||||||||||||||
Change in interest expense | 315 | 41 | 356 | 200 | 37 | 237 | |||||||||||||||||||
Change in net interest income | 266 | (49 | ) | 217 | 152 | (88 | ) | 64 | |||||||||||||||||
Change due to variation in time periods | 35 | ||||||||||||||||||||||||
These volume and rate analyses were for half year periods. The calculations were based on balances over the half year.
The volumes and rate variances for total interest earning assets and liabilites have been calculated separately (rather than being the sum of the individual categories).
The variation in time periods allows for the different number of days in the half years.
47
5. Other Banking Operating Income
| Half Year Ended | ||||||||||||||||
| 31/12/03 | ||||||||||||||||
| 31/12/03 | 30/06/03 | 31/12/02 | -v- 31/12/02 | |||||||||||||
| $M | $M | $M | % | |||||||||||||
| Lending fees | 342 | 338 | 314 | 9 | ||||||||||||
| Commission and other fees | 771 | 703 | 691 | 12 | ||||||||||||
| Trading income | 269 | 276 | 226 | 19 | ||||||||||||
| Dividends | 3 | 1 | 3 | — | ||||||||||||
| Net gain on investments and loans | — | 3 | (12 | ) | large | |||||||||||
| Net (loss)/profit on sale of property, plant and equipment | (3 | ) | 16 | 6 | large | |||||||||||
| Other (1) | (7 | ) | 19 | 43 | large | |||||||||||
Total other banking operating income | 1,375 | 1,356 | 1,271 | 8 | ||||||||||||
| (1) | Includes an equity accounted loss of $36 million for the half year ended 31 December 2003. Loss principally relates to a change in revenue recognition accounting policy by the associate entity. |
6. Operating Expenses
| Half Year Ended | ||||||||||||||||
| 31/12/03 | ||||||||||||||||
| 31/12/03 | 30/06/03 | 31/12/02 | -v- 31/12/02 | |||||||||||||
| $M | $M | $M | % | |||||||||||||
| Operating expenses | 2,709 | 2,685 | 2,627 | 3 | ||||||||||||
| Initiatives including Which new Bank (1) | 494 | 156 | 83 | large | ||||||||||||
Total | 3,203 | 2,841 | 2,710 | 18 | ||||||||||||
| Half Year Ended | ||||||||||||||||
| 31/12/03 | ||||||||||||||||
| 31/12/03 | 30/06/03 | 31/12/02 | -v- 31/12/02 | |||||||||||||
| Expenses by Segment | $M | $M | $M | % | ||||||||||||
| Banking | 2,051 | 2,037 | 1,945 | 5 | ||||||||||||
| Funds management | 416 | 406 | 418 | — | ||||||||||||
| Insurance | 242 | 242 | 264 | (8 | ) | |||||||||||
Operating expenses | 2,709 | 2,685 | 2,627 | 3 | ||||||||||||
| Banking | 463 | 118 | 83 | large | ||||||||||||
| Funds management | 27 | 38 | — | — | ||||||||||||
| Insurance | 4 | — | — | — | ||||||||||||
| Initiatives including Which new Bank (1) | 494 | 156 | 83 | large | ||||||||||||
Total | 3,203 | 2,841 | 2,710 | 18 | ||||||||||||
| Half Year Ended | ||||||||||||||||
| 31/12/03 | ||||||||||||||||
| 31/12/03 | 30/06/03 | 31/12/02 | -v- 31/12/02 | |||||||||||||
| Expenses by Category | $M | $M | $M | % | ||||||||||||
| Staff | 1,231 | 1,205 | 1,180 | 4 | ||||||||||||
| Share based compensation | 49 | 60 | 32 | 53 | ||||||||||||
| Occupancy and equipment | 294 | 308 | 301 | (2 | ) | |||||||||||
| Information technology services | 406 | 430 | 430 | (6 | ) | |||||||||||
| Other expenses | 729 | 682 | 684 | 7 | ||||||||||||
Operating expenses | 2,709 | 2,685 | 2,627 | 3 | ||||||||||||
| Initiatives including Which new Bank (1) | 494 | 156 | 83 | large | ||||||||||||
Total | 3,203 | 2,841 | 2,710 | 18 | ||||||||||||
| (1) | December 2003 includes Which new Bank, while prior periods include strategic initiatives undertaken and the cost of the June 2002 ESAP paid in October 2002. |
48
7. Integrated Risk Management (Excludes Insurance and Funds Management)
The major categories of risk actively managed by the Bank include credit risk, liquidity and funding risk, market risk and other operational risks. The 2003 Annual Report pages 30 to 32, Integrated Risk Management, detail the major risks managed by a diversified financial institution.
Credit Risk
The Bank uses a portfolio approach for the m anagement of its credit risk. A key element is a well diversified portfolio. The Bank is using various portfolio management tools to assist in diversifying the credit portfolio. The 7.6% exposure to ‘Property and Business Services’ in the table below includes 0.8% of commercial property exposure for which the risk has effectively been transferred to third party investors by way of a synthetic securitisation transaction.
The commercial portfolio remains well rated and we experienced low actual bad debts during the period.
| 31/12/03 | 30/06/03 | 31/12/02 | ||||||||||
| Industry | % | % | % | |||||||||
| Accommodation, Cafes and Restaurants | 1.4 | 1.4 | 1.4 | |||||||||
| Agriculture, Forestry and Fishing | 2.8 | 2.9 | 2.9 | |||||||||
| Communication Services | 0.3 | 0.5 | 0.7 | |||||||||
| Construction | 1.5 | 1.7 | 1.7 | |||||||||
| Cultural and Recreational Services | 0.8 | 0.8 | 0.8 | |||||||||
| Electricity, Gas and Water Supply | 1.5 | 1.6 | 1.6 | |||||||||
| Finance and Insurance | 10.4 | 9.5 | 10.9 | |||||||||
| Government Administration and Defence | 4.6 | 4.3 | 4.3 | |||||||||
| Health and Community Services | 1.6 | 1.7 | 1.7 | |||||||||
| Manufacturing | 4.1 | 4.6 | 5.1 | |||||||||
| Mining | 0.8 | 1.0 | 1.3 | |||||||||
| Personal and Other Services | 0.4 | 0.5 | 0.6 | |||||||||
| Property and Business Services | 7.6 | 7.8 | 8.1 | |||||||||
| Retail Trade | 2.3 | 2.1 | 2.2 | |||||||||
| Transport and Storage | 2.5 | 2.6 | 2.5 | |||||||||
| Wholesale Trade | 1.2 | 1.5 | 1.6 | |||||||||
| Consumer | 56.2 | 55.5 | 52.6 | |||||||||
| 100.0 | 100.0 | 100.0 | ||||||||||
The Bank is traditionally a large home loan provider in both Australia and New Zealand (see “Consumer” above), where historically losses have been less than 0.03% of the portfolio in most years.
| 31/12/03 | 30/06/03 | 31/12/02 | ||||||||||
| Region | % | % | % | |||||||||
| Australia | 86.8 | 86.5 | 85.4 | |||||||||
| New Zealand | 9.9 | 9.9 | 10.2 | |||||||||
| Europe | 1.5 | 1.5 | 1.6 | |||||||||
| Americas | 1.1 | 1.3 | 1.5 | |||||||||
| Asia | 0.6 | 0.7 | 1.0 | |||||||||
| Other | 0.1 | 0.1 | 0.3 | |||||||||
| 100.0 | 100.0 | 100.0 | ||||||||||
The Bank has the bulk of committed exposures concentrated in Australia and New Zealand.
| 31/12/03 | 30/06/03 | 31/12/02 | ||||||||||
| Commercial Portfolio Quality | % | % | % | |||||||||
| AAA/AA | 30 | 28 | 29 | |||||||||
| A | 17 | 19 | 17 | |||||||||
| BBB | 17 | 16 | 14 | |||||||||
| Other | 36 | 37 | 40 | |||||||||
| 100 | 100 | 100 | ||||||||||
As percentage of commercial portfolio exposure (including finance and insurances) which has been individually risk rated, the Bank has 64% of commercial exposures at investment grade quality.
| Consumer Portfolio Quality | 31/12/03 | 30/06/03 | 31/12/02 | |||||||||
| Housing loans accruing but past 90 days or more $M | 147 | 157 | 136 | |||||||||
Housing loan balances ($m) (1) | 112,228 | 100,203 | 93,545 | |||||||||
| Arrears rate (%) | 0.13 | 0.16 | 0.15 | |||||||||
| (1) | Housing loan balances net of securitisation and includes home equity and similar facilities. |
49
7. Integrated Risk Management (Cont’d)
Interes Rate Risk
Interest rate risk in the balance sheet is discussed within Note 39 of the 2003 Annual Report
Next 12 months’ Earnings
Over the half year to 31 December 2003 the potential impact on net interest earnings of a 1% parallel rate shock and the expected change in price of assets and liabilities held for purposes other than trading is as follows:
| 31/12/03 | 30/06/03 | 31/12/02 | ||||||||||
| (expressed as a % of expected next 12 months' earnings) | % | % | % | |||||||||
| Average monthly exposure | 0.8 | 1.3 | 1.8 | |||||||||
| High month exposure | 1.1 | 2.1 | 2.1 | |||||||||
| Low month exposure | 0.3 | 0.4 | 1.6 | |||||||||
Foreign Exchange Risk
Foreign exchange risk in the balance sheet is discussed within Note 39 of the 2003 Annual Report.
An adverse movement of 10% in the applicable AUD foreign exchange rate would cause the Bank’s capital ratio to deteriorate by less than 0.3% (0.3% for the year to 30 June 2003).
Value at Risk (VaR)
VaR within Financial Markets Trading is discussed in the 2003 Annual Report.
| Average VaR | Average VaR | Average VaR | ||||||||||
| During | During | During | ||||||||||
| December 2003 | June 2003 | December 2002 | ||||||||||
| Half Year | Half Year | Half Year | ||||||||||
| VaR Expressed based on 97.5% confidence | $M | $M | $M | |||||||||
Group | ||||||||||||
| Interest rate risk | 3.02 | 3.43 | 3.37 | |||||||||
| Exchange rate risk | 1.24 | 1.31 | 1.47 | |||||||||
| Implied volatility risk | 0.92 | 0.62 | 0.59 | |||||||||
| Equities risk | 0.56 | 0.73 | 0.32 | |||||||||
| Commodities risk | 0.33 | 0.32 | 0.35 | |||||||||
| Prepayment risk | 0.36 | 0.38 | 0.30 | |||||||||
| ASB Bank | 0.20 | 0.15 | 0.19 | |||||||||
| Diversification benefit | (2.51 | ) | (2.32 | ) | (2.14 | ) | ||||||
Total | 4.12 | 4.62 | 4.45 | |||||||||
| Average VaR | Average VaR | Average VaR | ||||||||||
| During | During | During | ||||||||||
| December 2003 | June 2003 | December 2002 | ||||||||||
| Half Year | Half Year | Half Year | ||||||||||
| VaR Expressed based on 99.0% confidence | $M | $M | $M | |||||||||
Group | ||||||||||||
| Interest rate risk | 3.99 | 4.31 | 4.45 | |||||||||
| Exchange rate risk | 1.50 | 1.64 | 1.75 | |||||||||
| Implied volatility risk | 1.26 | 0.79 | 0.71 | |||||||||
| Equities risk | 0.70 | 0.93 | 0.39 | |||||||||
| Commodities risk | 0.40 | 0.41 | 0.42 | |||||||||
| Prepayment risk | 0.36 | 0.38 | 0.30 | |||||||||
| ASB Bank | 0.25 | 0.20 | 0.24 | |||||||||
| Diversification benefit | (3.26 | ) | (3.02 | ) | (2.70 | ) | ||||||
Total | 5.21 | 5.64 | 5.57 | |||||||||
In the half year ending 30 June 2004 a new risk type covering credit spreads will be added to the VaR model. To date that risk has been captured by way of a “Specific Risk” capital allocation charge. The change reflects growth in this particular market segment and the increasing availability of data for credit spreads on which to model.
50
8. Capital Adequacy
| 31/12/03 | 30/06/03 | 31/12/02 | ||||||||||
| Risk Weighted Capital Ratios | % | % | % | |||||||||
| Tier One | 7.26 | 6.96 | 7.06 | |||||||||
| Tier Two | 3.56 | 4.21 | 4.08 | |||||||||
| Less deductions | (1.36 | ) | (1.44 | ) | (1.33 | ) | ||||||
Total | 9.46 | 9.73 | 9.81 | |||||||||
Adjusted Common Equity (1) | 4.61 | |||||||||||
| 31/12/03 | 30/06/03 | 31/12/02 | |||||||||||
| $M | $M | $M | |||||||||||
Tier One capital | |||||||||||||
| Shareholders’ equity | 23,201 | 22,152 | 22,446 | ||||||||||
| Eligible loan capital | 311 | 351 | 414 | ||||||||||
Estimated reinvestment under Dividend Reinvestment Plan (2) | 189 | — | — | ||||||||||
| Foreign currency translation reserve related to non-consolidated subsidiaries | 246 | 147 | (3 | ) | |||||||||
| Deduct: | |||||||||||||
| Asset revaluation reserve | (5 | ) | (7 | ) | (4 | ) | |||||||
| Goodwill | (4,867 | ) | (5,029 | ) | (5,161 | ) | |||||||
| Expected dividend | (996 | ) | (1,066 | ) | (865 | ) | |||||||
| Intangible component of investment in non-consolidated subsidiaries | (4,644 | ) | (4,388 | ) | (4,191 | ) | |||||||
| Outside equity interest in entities controlled by non-consolidated subsidiaries | (123 | ) | (123 | ) | (110 | ) | |||||||
| Outside equity interest in life insurance statutory funds | (1,871 | ) | (1,824 | ) | (2,343 | ) | |||||||
| Other | (3 | ) | — | (35 | ) | ||||||||
Total Tier One capital | 11,438 | 10,213 | 10,148 | ||||||||||
Tier Two capital | |||||||||||||
| Asset revaluation reserve | 5 | 7 | 4 | ||||||||||
General provision for bad and doubtful debts (3) | 1,353 | 1,321 | 1,323 | ||||||||||
| FITB related to general provision | (388 | ) | (391 | ) | (384 | ) | |||||||
| Upper Tier Two note and bond issues | 249 | 250 | 298 | ||||||||||
| Lower Tier Two note and bond issues | 4,381 | 4,990 | 4,620 | ||||||||||
Total Tier Two capital | 5,600 | 6,177 | 5,861 | ||||||||||
Total Capital | 17,038 | 16,390 | 16,009 | ||||||||||
| Deduct: | |||||||||||||
| Investment in non-consolidated subsidiaries (net of intangible component deducted from Tier One capital) | (2,075 | ) | (2,072 | ) | (1,868 | ) | |||||||
| Other | (63 | ) | (42 | ) | (42 | ) | |||||||
Capital base | 14,900 | 14,276 | 14,099 | ||||||||||
| 31/12/03 | |||||
| Adjusted Common Equity (4) | $M | ||||
| Tier One capital | 11,438 | ||||
| Deduct: | |||||
| Eligible loan capital | (311 | ) | |||
| Preference share capital | (687 | ) | |||
| Other equity instruments | (832 | ) | |||
| Outside equity interest (net of outside equity interest component deducted from Tier One capital) | (181 | ) | |||
| Investment in non-consolidated subsidiaries (net of intangible component deducted from Tier One capital) | (2,075 | ) | |||
| Other | (86 | ) | |||
Total adjusted common equity | 7,266 | ||||
| (1) | The ACE ratio has been calculated in accordance with the Standard & Poor’s methodology. As this is the first time the Bank has disclosed this ratio, no comparatives are published. |
| (2) | Based on reinvestment experience related to the Bank’s Dividend Reinvestment Plan. |
| (3) | Excludes general provision for bad and doubtful debts in non-consolidated subsidiaries. |
| (4) | Adjusted Common Equity (ACE) is one measure considered by Standard & Poor’s in evaluating the Bank’s AA- credit rating. |
51
8. Capital Adequacy (Cont’d)
| Risk Weighted | ||||||||||||||||||||||||||||
| Face Value | Risk | Balance | ||||||||||||||||||||||||||
| Weights | ||||||||||||||||||||||||||||
| 31/12/03 | 30/06/03 | 31/12/02 | 31/12/03 | 30/06/03 | 31/12/02 | |||||||||||||||||||||||
| Risk-weighted Assets | $M | $M | $M | % | $M | $M | $M | |||||||||||||||||||||
On Balance Sheet Assets | ||||||||||||||||||||||||||||
| Cash, claims on Reserve Bank, short term claims on Australian Commonwealth and State Government and Territories, and other zero-weighted assets | 28,874 | 23,832 | 24,980 | 0 | % | — | — | — | ||||||||||||||||||||
| Claims on OECD banks and local governments | 13,351 | 12,427 | 14,329 | 20 | % | 2,670 | 2,485 | 2,866 | ||||||||||||||||||||
| Advances secured by residential property | 115,628 | 103,987 | 97,717 | 50 | % | 57,814 | 51,993 | 48,858 | ||||||||||||||||||||
| All other assets | 77,500 | 74,472 | 74,701 | 100 | % | 77,500 | 74,472 | 74,701 | ||||||||||||||||||||
Total on balance sheet assets — credit risk | 235,353 | 214,718 | 211,727 | 137,984 | 128,950 | 126,425 | ||||||||||||||||||||||
Total off balance sheet exposures — credit risk (1) | 17,278 | 16,533 | 16,088 | |||||||||||||||||||||||||
Risk weighted assets — market risk | 2,209 | 1,325 | 1,258 | |||||||||||||||||||||||||
Total risk weighted assets | 157,471 | 146,808 | 143,771 | |||||||||||||||||||||||||
| (1) | Off balance sheet exposures secured by residential property account for $10.6 billion of off balance sheet credit equivalent assets ($5.3 billion of off balance sheet risk weighted assets). |
The change in regulatory capital ratios since 30 June 2003 can be attributed to:
| • | An increase in Tier One capital of $1,225 million principally due to retained earnings, the issue of USD550 million (AUD832 million) of hybrid capital in August 2003, the issue of $201 million value of shares to satisfy the DRP in respect to the final dividend for 2002/03, and the estimated $189 million value of shares required to satisfy the DRP in respect to the interim dividend for 2003/04. |
| • | A decrease in Tier Two capital principally due to a reduction in lower Tier Two note and bond issues resulting from changes in foreign exchange rates. (Whilst these notes and bonds are hedged, the unhedged value is included in the calculation of regulatory capital). |
| • | An increase in risk weighted assets from $147 billion to $157 billion. This increase is largely related to the $12 billion increase in housing loans secured by residential mortgages, which attract a concessionary risk weighting of 50%. |
As required by APRA, the investment in life insurance and funds management is deducted from regulatory capital to arrive at the ratios shown above. This treatment does not recognise the $890 million of surplus capital above regulatory requirements held in the life insurance and funds management businesses, nor does it give credit for the risk diversification benefits provided by these businesses.
On 6 January 2004, a wholly owned entity of the Bank (Commonwealth Managed Investments Limited as Responsible Entity of the PERLS II Trust) issued $750 million of Perpetual Exchangeable Resettable Listed Securities (PERLS II). These securities are units in a registered managed investments scheme, perpetual in nature, offering a non-cumulative floating rate distribution payable quarterly. The issue of PERLS II forms part of the continual capital management strategy of the Bank and increases the diversity and flexibility of the Bank’s capital base.
On 27 January 2004, the Bank announced the issue of $500 million subordinated medium term notes for settlement on 10 February 2004. The notes mature in 2014 and are callable in 2009. The notes qualify as Lower Tier Two capital and will replace $300 million subordinated notes redeemed on 10 February 2004.
An off-market buy-back of $450 million to $550 million is planned for March 2004. This is expected to result in enhanced EPS and improved ROE. The ultimate size of the buy-back is at the discretion of Directors and will be dependent on market conditions at the time.
Shareholders in the Bank have previously been able to increase their shareholding directly through the DRP. The Bank intends to provide a further opportunity for shareholders to directly increase their shareholding through a Share Purchase Plan (SPP) to be introduced following completion of the buy-back. Shareholders participating in the SPP will have the opportunity to directly purchase shares in the Bank free of brokerage and other charges. It is anticipated that further offers under this SPP will be made in the future, subject to Director’s discretion.
The Bank intends to establish a Share Sale Facility (SSF) following completion of the buy-back. Under the SSF, eligible shareholders will be able to sell their shares free of brokerage and other charges.
On a proforma basis, at 31 December 2003, the issue of PERLS II, the increase in Lower Tier Two capital, an off-market buy-back of say, $500 million, and a SPP of say, $150 million would have increased Tier One capital from 7.26% to 7.51%, and total capital from 9.46% to 9.84%.
52
9. Share Capital
| Half Year Ended 31/12/03 | ||||||||
| Shares Issued | $M | |||||||
Ordinary Share Capital | ||||||||
| Opening balance 1 July 2003 | 1,253,581,363 | 12,678 | ||||||
| Exercise of executive options | 312,500 | 6 | ||||||
| 2002/2003 final dividend fully paid shares at $28.03 | 7,165,289 | 201 | ||||||
| Closing balance 31 December 2003 | 1,261,059,152 | 12,885 | ||||||
Preference Share Capital | ||||||||
| Opening balance 1 July 2003 | 3,500,000 | 687 | ||||||
| Closing balance 31 December 2003 | 3,500,000 | 687 | ||||||
Other Equity Instruments | ||||||||
| Issue during the half year | 550,000 | 832 | ||||||
| Closing balance 31 December 2003 | 550,000 | 832 | ||||||
Retained Profits | ||||||||
| Opening balance 1 July 2003 | 2,809 | |||||||
| Net profit for the half year | 1,243 | |||||||
| Payment of final dividend | (1,066 | ) | ||||||
| Appropriations from reserves (net) | 49 | |||||||
| Payment of other dividends | (39 | ) | ||||||
| Closing balance 31 December 2003 | 2,996 | |||||||
Reserves | ||||||||
| Opening balance 1 July 2003 | 3,850 | |||||||
| Appropriation to retained profits (net) | (49 | ) | ||||||
Movement in foreign currency translation reserve (1) | (173 | ) | ||||||
| Movement in asset revaluation reserve | (2 | ) | ||||||
| Closing balance 31 December 2003 | 3,626 | |||||||
Outside Equity Interests: Controlled Entities | ||||||||
| Opening balance 1 July 2003 | 304 | |||||||
| Closing balance 31 December 2003 | 304 | |||||||
| (1) | The movement in the foreign exchange translation reserve adjustment relates primarily to the revaluation of subsidiaries in Hong Kong, United Kingdom and United States of America as a result of foreign exchange rate movements. |
Issue of Other Equity Instruments
On 6 August 2003 the Bank, via a wholly owned entity of the Bank, issued USD 550 million (AUD 832 million) of trust preferred securities into the US Capital Markets. The securities qualify as Tier One capital of the Bank.
Issue of PERLS II
On 6 January 2004 a wholly owned entity of the Bank (Commonwealth Managed Investments Limited as Responsible Entity of the PERLS II Trust) issued $750 million Perpetual Exchangeable Resettable Listed Securities (PERLS II). The securities qualify as Tier One capital of the Bank. Refer Note 10 of Financial Statements for further details.
Buy Back
On 11 February 2004, the Bank announced that an off-market buy-back of $450 million to $550 million is planned for March 2004. The ultimate size of the buy-back is at the discretion of Directors and will be dependent on market conditions at the time.
Dividend Franking Account
After fully franking the interim dividend to be paid for the half year ended 31 December 2003, the amount of credits available as at 31 December 2003 to frank dividends for subsequent financial years is $337 million. This figure is based on the combined franking accounts of the Bank at 31 December 2003, which have been adjusted for franking credits that will arise from the payment of income tax payable on profits for the half year ended 31 December 2003, franking debits that will arise from the payment of dividends proposed for the half year and franking credits that the Bank may be prevented from distributing in subsequent financial periods. The available amount will be further reduced by an estimated $150 million resulting from the planned share buy-back. The Bank expects that future tax payments will generate sufficient franking credits for the Bank to be able to continue to fully frank future dividend payments. Dividend payments on or after 1 January 2004 will be franked at the 30% tax rate. These calculations have been based on the taxation law as at 11 February 2004.
Dividends
The Directors have declared a fully franked (at 30%) interim dividend of 79 cents per share (2002/03: 69 cents) amounting to $996 million (2002/03: $865 million). The dividend will be paid on 30 March 2004 to eligible shareholders. Additionally, distributions totalling $39 million for the half year were paid to preference shareholders and other equity instrument holders.
A fully franked final dividend of 85 cents per share amounting to $1,066 million was paid on 8 October 2003 in respect to the year ended 30 June 2003. The payment comprised cash disbursements of $865 million with $201 million being reinvested by participants through the Dividend Reinvestment Plan.
Dividend Reinvestment Plan
The Dividend Reinvestment Plan continues to be capped at 10,000 shares per shareholder.
Record Date
The register closes for determination of dividend entitlement and for participation in the dividend reinvestment plan at 5:00pm on 20 February 2004 at ASX Perpetual Registrars Limited, Locked Bag A14, Sydney South, 1235.
Ex Dividend Date
The ex dividend date is 16 February 2004.
53
10. Life Company Valuations
Carrying Values of Insurance and Funds Management Businesses
The following table sets out the components of the carrying values of the Bank’s life insurance and funds management businesses, together with the key actuarial assumptions that have been used. These were Directors’ valuations based on appraisal values using a range of economic and business assumptions determined by management which were reviewed by independent actuaries Trowbridge Deloitte.
| Life Insurance | ||||||||||||||||||||
| Managed | New | |||||||||||||||||||
| Products | Australia | Zealand | Asia(1) | Total | ||||||||||||||||
| Analysis of Movement since 30 June 2003 | $M | $M | $M | $M | $M | |||||||||||||||
| Profits | 117 | 96 | 30 | 27 | 270 | |||||||||||||||
Net capital movements and dividends(2) | (241 | ) | (60 | ) | (9 | ) | — | (310 | ) | |||||||||||
| Foreign exchange movements | (10 | ) | — | 1 | (57 | ) | (66 | ) | ||||||||||||
Change in shareholders net tangible assets | (134 | ) | 36 | 22 | (30 | ) | (106 | ) | ||||||||||||
Net appraisal value uplift/(reduction) | 156 | (12 | ) | 23 | (2 | ) | 165 | |||||||||||||
Increase/(Decrease) to 31 December 2003 | 22 | 24 | 45 | (32 | ) | 59 | ||||||||||||||
| Life Insurance | ||||||||||||||||||||
| Managed | New | |||||||||||||||||||
| Products | Australia | Zealand | Asia(1) | Total | ||||||||||||||||
| Shareholders' Net Tangible Assets | $M | $M | $M | $M | $M | |||||||||||||||
| 30 June 2003 balance | 754 | 1,264 | 380 | 608 | 3,006 | |||||||||||||||
| Profits | 117 | 96 | 30 | 27 | 270 | |||||||||||||||
| Net capital movements and dividends | (241 | ) | (60 | ) | (9 | ) | — | (310 | ) | |||||||||||
| Foreign exchange movements | (10 | ) | — | 1 | (57 | ) | (66 | ) | ||||||||||||
31 December 2003 balance | 620 | 1,300 | 402 | 578 | 2,900 | |||||||||||||||
| Life Insurance | ||||||||||||||||||||
| Managed | New | |||||||||||||||||||
| Products | Australia | Zealand | Asia(1) | Total | ||||||||||||||||
| Value Future New Business | $M | $M | $M | $M | $M | |||||||||||||||
| 30 June 2003 balance | 3,596 | 79 | 278 | 24 | 3,977 | |||||||||||||||
| Uplift/(reduction) | 62 | — | (12 | ) | (2 | ) | 48 | |||||||||||||
31 December 2003 balance | 3,658 | 79 | 266 | 22 | 4,025 | |||||||||||||||
| Life Insurance | ||||||||||||||||||||
| Managed | New | |||||||||||||||||||
| Products | Australia | Zealand | Asia(1) | Total | ||||||||||||||||
| Value in Force Business | $M | $M | $M | $M | $M | |||||||||||||||
| 30 June 2003 balance | 1,123 | 245 | 191 | 4 | 1,563 | |||||||||||||||
| Uplift/(reduction) | 94 | (12 | ) | 35 | — | 117 | ||||||||||||||
31 December 2003 balance | 1,217 | 233 | 226 | 4 | 1,680 | |||||||||||||||
| Life Insurance | ||||||||||||||||||||
| Managed | New | |||||||||||||||||||
| Products | Australia | Zealand | Asia(1) | Total | ||||||||||||||||
| Carrying Value at 31 December 2003 | $M | $M | $M | $M | $M | |||||||||||||||
| Shareholders’ net tangible assets | 620 | 1,300 | 402 | 578 | 2,900 | |||||||||||||||
| Value in force business | 1,217 | 233 | 226 | 4 | 1,680 | |||||||||||||||
Embedded value | 1,837 | 1,533 | 628 | 582 | 4,580 | |||||||||||||||
| Value future new business | 3,658 | 79 | 266 | 22 | 4,025 | |||||||||||||||
Carrying value | 5,495 | 1,612 | 894 | 604 | 8,605 | |||||||||||||||
| (1) | The Asian life insurance businesses are not held in a market value environment and are carried at net assets plus any excess representing the difference between appraisal value and net assets at the time of acquisition. This excess which effectively represents goodwill is being amortised on a straight line basis over 20 years. |
| (2) | Includes capital injections, transfers and movements in intergroup loans. |
54
10. Life Company Valuations (Cont’d)
The following table reconciles the carrying values of the life insurance and funds management businesses to the value of investments in non-consolidated subsidiaries as shown in the capital adequacy calculation in appendix 8.
Reconciliation of the Components of the Carrying Value to the Value of Investments in Non-Consolidated Subsidiaries
| 31/12/03 | 30/06/03 | 31/12/02 | ||||||||||
| $M | $M | $M | ||||||||||
Intangible component of investment in non-consolidated subsidiaries deducted from Tier one capital comprises: | ||||||||||||
| Value future new business | 4,025 | 3,977 | 3,765 | |||||||||
| Value of self-generated in force business | 528 | 411 | 426 | |||||||||
Other (1) | 91 | — | — | |||||||||
| 4,644 | 4,388 | 4,191 | ||||||||||
Investment in non-consolidated subsidiaries deducted from total capital comprises: | ||||||||||||
| Shareholders’ net tangible assets in life and funds management businesses | 2,900 | 3,006 | 3,015 | |||||||||
| Capital in other non-consolidated subsidiaries | 349 | 286 | 243 | |||||||||
| Value of acquired in force business | 1,152 | 1,152 | 1,152 | |||||||||
| Less non-recourse debt | (2,326 | ) | (2,372 | ) | (2,542 | ) | ||||||
| 2,075 | 2,072 | 1,868 | ||||||||||
| (1) | Relates to revised APRA Prudential Standards effective 1 July 2003 |
Key Assumptions Used in Appraisal Values
The following key assumptions have been used in determining the appraisal values. Other actuarial assumptions used in the valuation were described in the section Actuarial Methods and Assumptions.
| 31 December 2003 | ||||||||||||
| Risk | Value of | |||||||||||
| New | Discount | Franking | ||||||||||
| Business | Rate | Credits | ||||||||||
| Multiplier | % | % | ||||||||||
Life insurance entities | ||||||||||||
Australia | 8 | 10.8 | 70 | |||||||||
New Zealand | 8 | 11.7 | - | |||||||||
Asia | ||||||||||||
- Hong Kong | 8 | 12.0 | - | |||||||||
| - Other | various | various | - | |||||||||
Funds management entities | ||||||||||||
Australia | n/a | 12.4 | 70 | |||||||||
| 30 June 2003 | ||||||||||||
| Risk | Value of | |||||||||||
| New | Discount | Franking | ||||||||||
| Business | Rate | Credits | ||||||||||
| Multiplier | % | % | ||||||||||
Life insurance entities | ||||||||||||
Australia | 8 | 10.8 | 70 | |||||||||
New Zealand | 8 | 10.9 | — | |||||||||
Asia | ||||||||||||
- Hong Kong | 8 | 11.5 | — | |||||||||
| - Other | various | various | — | |||||||||
Funds management entities | ||||||||||||
Australia | n/a | 11.9 | 70 | |||||||||
The movement in the risk discount rate is based on the change in the underlying risk free rate using a capital asset pricing model framework. This framework utilises the local 10-year government bond yield as the proxy for the risk free rate.
The movement in risk discount rates have been accompanied by broadly equivalent movements in assumed future investment returns.
55
10. Life Company Valuations (Cont’d)
Policy Liabilities
Appropriately qualified actuaries have been appointed in respect of each life insurance business and they have reviewed and satisfied themselves as to the accuracy of the policy liabilities included in this financial report, including compliance with the regulations of the Insurance Act (Life Act) 1995 where appropriate. Details were set out in the various statutory returns of these life insurance businesses.
| 31/12/03 | 30/06/03 | 31/12/02 | ||||||||||
| Components of Policy Liabilities | $M | $M | $M | |||||||||
Future policy benefits (1) | 27,451 | 27,426 | 28,654 | |||||||||
| Future bonuses | 1,211 | 1,188 | 1,277 | |||||||||
| Future expenses | 1,689 | 1,637 | 2,318 | |||||||||
| Future profit margins | 1,392 | 1,420 | 1,352 | |||||||||
| Future charges for acquisition expenses | (971 | ) | (916 | ) | (741 | ) | ||||||
| Balance of future premiums | (6,829 | ) | (6,956 | ) | (8,147 | ) | ||||||
| Provisions for bonuses not allocated to participating policyholders | 49 | 62 | 49 | |||||||||
Total policy liabilities | 23,992 | 23,861 | 24,762 | |||||||||
| (1) | Including bonuses credited to policyholders in prior years. |
Taxation
Taxation has been allowed for in the determination of policy liabilities in accordance with the relevant legislation applicable in each territory.
Actuarial Methods and Assumptions
Policy liabilities have been calculated in accordance with the Margin on Services (MoS) methodology as set out in Actuarial Standard 1.03 — Valuation Standard (‘AS1.03’) issued by the Insurance Actuarial Standards Board (‘LIASB’). The principal methods and profit carriers used for particular product groups were as follows:
| Product Type | Method | Profit Carrier | ||
| Individual | ||||
| Conventional | Projection | Bonuses / dividends or expected claim payments | ||
| Investment account | Projection | Bonuses or asset charges | ||
| Investment linked | Accumulation | Not applicable | ||
| Lump sum risk | Projection | Premiums/claims | ||
| Income stream risk | Projection | Expected claim payments | ||
| Immediate annuities | Projection | Bonuses or annuity payments | ||
| Group | ||||
| Investment account | Projection | Bonuses or asset charges | ||
| Investment linked | Accumulation | Not applicable | ||
| Lump sum risk | Projection Accumulation | Claims Premiums (implied) | ||
| Income stream risk | Projection | Expected claim payments |
56
The ‘Projection Method’ measures the present values of estimated future policy cash flows to calculate policy liabilities. The policy cash flows incorporate investment income, premiums, expenses, redemptions and benefit payments.
The ‘Accumulation Method’ measures the accumulation of amounts invested by policyholders plus investment earnings less fees specified in the policy to calculate policy liabilities. Deferred acquisition costs were offset against this liability.
Bonuses were amounts added, at the discretion of the life insurer, to the benefits currently payable under Participating Business. Under the Life Act, bonuses were a distribution to policyholders of profits and may take a number of forms including reversionary bonuses, interest credits and capital growth bonuses (payable on the termination of the policy).
Actuarial assumptions
Set out below is a summary of the material assumptions used in the calculation of policy liabilities. These assumptions were also used in the determination of the appraisal values.
Discount rates
These were the rates used to discount future cash flows to determine their net present value in the policy liabilities. The discount rates were determined with reference to the expected earnings rate of the assets that support the policy liabilities adjusted for taxation where relevant. The following table shows the applicable rates for the major classes of business in Australia and New Zealand. The changes relate to changes in long term earnings rates, asset mix and reflect the new tax regime for Australian business.
| December 2003 | June 2003 | |||
| Class of Business | Rate Range % | Rate Range % | ||
| Traditional — ordinary business (after tax) | 5.87 — 6.62 | 5.44 — 6.19 | ||
| Traditional — superannuation business (after tax) | 7.17 — 8.11 | 6.65 — 7.58 | ||
| Annuity business (after tax) | 6.22 — 7.03 | 5.46 — 6.67 | ||
| Term insurance — ordinary business (after tax) | 3.57 — 3.92 | 3.16 — 3.85 | ||
| Term insurance — superannuation business (after tax) | 3.57 — 3.92 | 3.16 — 3.85 | ||
| Disability business (before tax) | 5.60 | 5.50 | ||
| Investment linked — ordinary business (after tax) | 5.42 — 5.86 | 4.88 — 5.68 | ||
| Investment linked — superannuation business (after tax) | 6.98 — 7.52 | 6.33 — 6.84 | ||
| Investment linked — exempt (after tax) | 7.92 — 8.49 | 7.20 — 8.27 | ||
| Investment account — ordinary business (after tax) | 4.08 | 3.67 | ||
| Investment account — superannuation business (after tax) | 4.97 | 4.46 | ||
| Investment account — exempt (after tax) | 5.80 | 5.21 |
Bonuses
The valuation assumes that the long-term supportable bonuses will be paid, which is in line with company bonus philosophy. There have been no significant changes to these assumptions.
Maintenance expenses
The maintenance expenses are based on an internal analysis of experience and are assumed to increase in line with inflation each year and to be sufficient to cover the cost of servicing the business in the coming year after adjusting for one off expenses. For Participating Business, expenses continue on the previous charging basis.
Investment management expenses
Investment management expense assumptions were based on the contractual fees (inclusive of an allowance for inflation) as set out in Fund Manager agreements. There have been no significant changes to these assumptions.
Inflation
The inflation assumption is consistent with the investment earning assumptions. The inflation assumption for maintenance expenses also include an allowance for higher per policy costs for some products. There have been no significant changes to these assumptions.
Benefit indexation
The indexation rates were based on an analysis of past experience and estimated long term inflation and vary by business and product type. There have been no significant changes to these assumptions.
Taxation
The taxation basis and rates assumed vary by territory and product type. For the Australian business it reflects the new regime for life insurance companies effective 1 July 2000.
Voluntary discontinuance
Discontinuance rates were based on recent company and industry experience and vary by territory, product, age and duration in force. There have been no significant changes to these assumptions.
Surrender values
Current surrender value bases were assumed to apply in the future. There have been no significant changes to these assumptions.
Unit price growth
Unit prices were assumed to grow in line with assumed investment earnings assumptions, net of asset charges as per current company practice. There have been no significant changes to these assumptions.
Mortality and morbidity
Rates vary by sex, age, product type and smoker status. Rates were based on standard mortality tables applicable to each territory e.g. IA90-92 in Australia for risk, IM/IF80 for annuities, adjusted for recent company and industry experience where appropriate.
Solvency
Australian life insurers
Australian life insurers were required to hold prudential reserves in excess of the amount of policy liabilities. These reserves were required to support capital adequacy requirements and provide protection against adverse experience. Actuarial Standard AS2.03 ‘Solvency Standard’ (‘AS2.03’) prescribes a minimum capital requirement and the minimum level of assets required to be held in each insurance fund. All controlled Australian insurance entities complied with the solvency requirements of AS2.03. Further information is available from the individual statutory returns of subsidiary life insurers.
Overseas life insurers
Overseas insurance subsidiaries were required to hold reserves in excess of policy liabilities in accordance with local Acts and prudential rules. Each of the overseas subsidiaries complied with local requirements. Further information is available from the individual statutory returns of subsidiary life insurers.
Managed assets & fiduciary activities
Arrangements were in place to ensure that asset management and other fiduciary activities of controlled
57
entities were independent of the insurance funds and other activities of the Bank.
Disaggregated information
Life Insurance business is conducted through a number of life insurance entities in Australia and overseas. Under the Australian Life Insurance Act 1995, life insurance business is conducted within one or more separate statutory funds that were distinguished from each other and from the shareholders’ fund. The financial statements of Australian life insurers prepared in accordance with AASB 1038, (and which were lodged with the relevant Australian regulators) show all major components of the financial statements disaggregated between the various insurance statutory funds and their shareholder funds.
11. Intangible Assets
| 31/12/03 | 30/06/03 | 31/12/02 | ||||||||||
| $M | $M | $M | ||||||||||
| Purchased goodwill — Colonial | 5,591 | 5,591 | 5,592 | |||||||||
| Purchased goodwill — other | 1,155 | 1,155 | 1,125 | |||||||||
| Accumulated amortisation | (1,879 | ) | (1,717 | ) | (1,556 | ) | ||||||
Total intangible assets | 4,867 | 5,029 | 5,161 | |||||||||
12. Amortisation Schedule
| Half Year Ended | ||||||||||||
| 31/12/03 | 30/06/03 | 31/12/02 | ||||||||||
| $M | $M | $M | ||||||||||
Goodwill | ||||||||||||
| Opening balance | 5,029 | 5,161 | 5,391 | |||||||||
| Purchased goodwill | — | 30 | — | |||||||||
| Amortisation for the half year | (162 | ) | (162 | ) | (160 | ) | ||||||
| Transfer of funds from Colonial Foundation Trust | — | — | (71 | ) | ||||||||
| Other adjustments | — | — | 1 | |||||||||
Closing balance | 4,867 | 5,029 | 5,161 | |||||||||
58
13. Definitions
| Term | Description | |||||
| Appraisal Value | The embedded value plus estimated value of profits from future business. | |||||
| Banking | Banking operations includes retail, institutional and business banking, Asia Pacific banking, treasury and centre support functions. Retail banking operations include banking services, which were distributed through the Premium and Retail distribution divisions. Institutional and business banking includes banking services which, were distributed to all business customers through the Institutional and Business Services division and the small business customers which were serviced through the Premium and Retail divisions and funding operations. Asia Pacific banking includes offshore banking subsidiaries, primarily ASB Bank operations in New Zealand. | |||||
| Dividend Payout Ratio | Dividends paid on ordinary shares divided by earnings (earnings are net of dividends on preference shares) | |||||
| DRP | Dividend reinvestment plan. | |||||
| DRP Participation Rate | The percentage of total issued capital participating in the dividend reinvestment plan. | |||||
| Earnings Per Share | Calculated in accordance with the revised AASB 1027: Earnings per Share. Dividends paid on preference shares and other equity instruments are deducted from earnings to arrive at earnings per share (31/12/03: $39 million) | |||||
| Embedded Value | The estimated value of future profits from existing business together with net tangible assets. | |||||
| Funds Management | Funds management business includes the Investment & Insurance division, International Financial Services division and custody business which resides in Institutional Banking Services. | |||||
| Insurance | Insurance business includes the life risk business within the Investment & Insurance division and the International Financial Services division and general insurance. | |||||
| Net Profit after Tax (“Cash Basis”) | Represents profit after tax and outside equity interest before appraisal value (reduction)/uplift and goodwill amortisation. | |||||
| Net Profit after Tax (“Statutory”) | Represents profit after tax and outside equity interests and after goodwill amortisation and appraisal value (reduction)/uplift. This is equivalent to the statutory item “Net Profit attributable to Members of the Bank”. | |||||
| Return on Average Shareholders’ Equity | Based on net profit after tax and outside equity interests applied to average shareholders equity, excluding outside equity interests. | |||||
| Return on Average Shareholders Equity Cash Basis | As per the return on average shareholder equity, excluding the effect of goodwill amortisation and appraisal value (reduction)/uplift from profit and equity. | |||||
| Return on Average Total Assets | Based on profit after tax and outside equity interests. Averages were based on beginning and end of period balances. | |||||
| Staff Numbers | Staff numbers include all permanent full time staff, part time staff equivalents and external contractors employed by 3rd party agencies. Prior period staff numbers have been restated to reflect this. | |||||
| Underlying Expense to Income Ratio | Represents operating expenses (excluding first time expenses) as a percentage of revenue. | |||||
| Underlying Profit | Represents net profit after tax (“cash basis”) excluding strategic initiatives and the cost of the June 2002 Employee Share Acquisition Plan (ESAP) paid in October 2002, and shareholder investment returns. |
59
RULE 4.3A
| APPENDIX 4E |
| Half yearly report |
Introduced 30/6/2002.
Name of entity
Commonwealth Bank of Australia
| ABN or equivalent company reference | Half yearly (tick) | Preliminary final(tick) | Financial half year ended (‘current period’) (Rule 4.3A Item No.1 ) | |||
| 123 123 124 | þ | o | 31 December 2003 |
Results for announcement to the market
| (Rule 4.3A Item No. 2) | $M |
| Revenues from ordinary activities | ||||
| (Rule 4.3A Item No. 2.1) | up | 33.5% to 10,489 | ||
| Profit (loss) from ordinary activities after tax attributable to members | ||||
| (Rule 4.3A Item No. 2.2 ) | up | 99.8% to 1,243 | ||
| Net profit (loss) for the period attributable to members | ||||
| (Rule 4.3A Item No. 2.3) | up | 99.8% to 1,243 |
| Dividends (distributions) | Amount per security | Franked amount per security | ||
| Final dividend | N/A | N/A | ||
| Interim dividend | 79¢ | 79¢ | ||
| Total | 79¢ | 79¢ | ||
| (Rule 4.3A Item No. 2.4) |
+Record date for determining entitlements to the dividend, 20th February 2004
(Rule 4.3A Item No. 2.5)
Brief explanation of any of the figures reported above(Rule 4.3A Item No. 2.6):
REFER TO PROFIT ANNOUNCEMENT.
Consolidated statement of financial performance
For the half year ended 31 December 2003
(Rule 4.3A Item No. 3)
| 31/12/03 | 31/12/02 | |||||||
| $M | $M | |||||||
| Interest income | 6,241 | 5,668 | ||||||
| Interest expense | 3,570 | 3,214 | ||||||
| Net interest income | 2,671 | 2,454 | ||||||
| Other income: | ||||||||
| Revenue from sale of assets | 111 | 67 | ||||||
| Written down value of assets sold | (114 | ) | (63 | ) | ||||
| Other | 1,378 | 1,267 | ||||||
| Net banking operating income | 4,046 | 3,725 | ||||||
| Funds management fee income including premiums | 597 | 522 | ||||||
| Investment revenue | 941 | (268 | ) | |||||
| Claims and policyholder liability expense | (860 | ) | 260 | |||||
| Net funds management operating income | 678 | 514 | ||||||
| Premiums and related revenue | 552 | 483 | ||||||
| Investment revenue | 504 | 114 | ||||||
| Claims and policyholder liability expense | (569 | ) | (351 | ) | ||||
| Insurance margin on services operating income | 487 | 246 | ||||||
| Net insurance and funds management operating income before appraisal value uplift/(reduction) | 1,165 | 760 | ||||||
| Total net operating income before appraisal value uplift/(reduction) | 5,211 | 4,485 | ||||||
| Charge for bad and doubtful debts | 150 | 151 | ||||||
| Operating expenses: | ||||||||
| Operating expenses | 2,709 | 2,627 | ||||||
Initiatives including Which new Bank(1) | 494 | 83 | ||||||
| 3,203 | 2,710 | |||||||
| Appraisal value uplift/(reduction) | 165 | (426 | ) | |||||
| Goodwill amortisation | (162 | ) | (160 | ) | ||||
Profit from ordinary activities before income tax | 1,861 | 1,038 | ||||||
| Income tax expense | 614 | 413 | ||||||
Profit from ordinary activities after income tax | 1,247 | 625 | ||||||
| Outside equity interests in net profit | (4 | ) | (3 | ) | ||||
Net profit attributable to members of the Bank | 1,243 | 622 | ||||||
| Foreign currency translation adjustment | (173 | ) | 156 | |||||
| Revaluation of properties | (2 | ) | — | |||||
| Total valuation adjustments | (175 | ) | 156 | |||||
| Total changes in equity other than those resulting from transactions with owners as owners | 1,068 | 778 | ||||||
| Cents per Share | ||||||||
| Earnings per share based on net profit distributable to members of the Bank | ||||||||
| Basic | 95.8 | 48.2 | ||||||
| Fully Diluted | 95.7 | 48.2 | ||||||
| Dividends per share attributtable to shareholders of the Bank: | ||||||||
| Ordinary shares | 79 | 69 | ||||||
| Preference shares (issued 6 April 2001) | 509 | 519 | ||||||
| Other equity instruments (issued 6 August 2003) | 3096 | 0 | ||||||
(1) December 2003 results reflects the Which new Bank initiative, while prior periods include strategic initiatives undertaken and the cost of the June 2002 ESAP paid in October 2002.
Consolidated statement of financial position
As at 31 December 2003
(Rule 4.3A Item No.4)
| 31/12/03 | 31/12/02 | |||||||
| $M | $M | |||||||
Assets | ||||||||
| Cash and liquid assets | 5,892 | 5,015 | ||||||
| Receivables due from other financial institutions | 7,620 | 6,735 | ||||||
| Trading securities | 12,134 | 13,462 | ||||||
| Investment securities | 11,811 | 12,591 | ||||||
| Loans, advances and other receivables | 175,982 | 154,663 | ||||||
| Bank acceptances of customers | 13,734 | 12,831 | ||||||
| Insurance investment assets | 27,955 | 28,847 | ||||||
| Deposits with regulatory authorities | 95 | 21 | ||||||
| Property, plant and equipment | 1,027 | 832 | ||||||
| Investment in associates | 251 | 323 | ||||||
| Intangible assets | 4,867 | 5,161 | ||||||
| Other assets | 24,511 | 21,536 | ||||||
Total assets | 285,879 | 262,017 | ||||||
Liabilities | ||||||||
| Deposits and other public borrowings | 158,914 | 139,348 | ||||||
| Payables due to other financial institutions | 5,846 | 8,458 | ||||||
| Bank acceptances | 13,734 | 12,831 | ||||||
| Provision for dividend | 12 | 13 | ||||||
| Income tax liability | 999 | 774 | ||||||
| Other provisions | 1,041 | 745 | ||||||
| Insurance policyholder liabilities | 23,992 | 24,762 | ||||||
| Debt issues | 33,157 | 29,025 | ||||||
| Bills payable and other liabilities | 19,193 | 18,166 | ||||||
| 256,888 | 234,122 | |||||||
| Loan Capital | 5,790 | 5,449 | ||||||
Total liabilities | 262,678 | 239,571 | ||||||
Net assets | 23,201 | 22,446 | ||||||
Shareholders’ Equity | ||||||||
| Share Capital: | ||||||||
| Ordinary share capital | 12,885 | 12,678 | ||||||
| Preference share capital | 687 | 687 | ||||||
| Other equity instruments | 832 | — | ||||||
| Reserves | 3,626 | 4,014 | ||||||
| Retained profits | 2,996 | 2,424 | ||||||
Shareholders’ equity attributable to members of the Bank | 21,026 | 19,803 | ||||||
| Outside Equity Interests: | ||||||||
| Controlled entities | 304 | 300 | ||||||
| Insurance statutory funds and other funds | 1,871 | 2,343 | ||||||
| Total outside equity interests | 2,175 | 2,643 | ||||||
Total shareholders’ equity | 23,201 | 22,446 | ||||||
Consolidated statement of cash flows
For the half year ended 31 December 2003
(Rule 4.3A Item No.5)
| 31/12/03 | 31/12/02 | ||||||||||||
| Note | $M | $M | |||||||||||
Cash Flows from Operating Activities | |||||||||||||
| Interest received | 6,276 | 5,510 | |||||||||||
| Dividends received | 3 | 3 | |||||||||||
| Interest paid | (3,551 | ) | (3,071 | ) | |||||||||
| Other operating income received | 1,934 | 1,941 | |||||||||||
| Expenses paid | (2,953 | ) | (2,728 | ) | |||||||||
| Income taxes paid | (740 | ) | (965 | ) | |||||||||
| Net decrease (increase) in trading securities | (1,258 | ) | (5,277 | ) | |||||||||
| Life insurance: | |||||||||||||
| Investment income | 418 | 215 | |||||||||||
Premiums received(1) | 1,894 | 2,411 | |||||||||||
Policy payments(1) | (2,501 | ) | (3,012 | ) | |||||||||
Net Cash provided by / (used in) operating activities | 1 | (c) | (478 | ) | (4,973 | ) | |||||||
Cash Flows from Investing Activities | |||||||||||||
| Payments for acquisition of entities and management rights | — | (114 | ) | ||||||||||
| Proceeds from disposal of entities and businesses | — | 33 | |||||||||||
| Net movement in investment securities: | |||||||||||||
| Purchases | (7,647 | ) | (13,361 | ) | |||||||||
| Proceeds from sale | 50 | 24 | |||||||||||
| Proceeds at or close to maturity | 6,755 | 11,505 | |||||||||||
| Withdrawal (lodgement) of deposits with regulatory authorities | (72 | ) | 68 | ||||||||||
| Net increase in loans, advances and other receivables | (15,785 | ) | (7,740 | ) | |||||||||
| Proceeds from sale of property, plant and equipment | 61 | 43 | |||||||||||
| Purchase of property, plant and equipment | (334 | ) | (68 | ) | |||||||||
| Net decrease (increase) in receivables due from other financial institutions not at call | (888 | ) | 63 | ||||||||||
| Net decrease (increase) in securities purchased under agreements to resell | (207 | ) | 1,555 | ||||||||||
| Net decrease (increase) in other assets | (348 | ) | (1,030 | ) | |||||||||
| Life insurance: | |||||||||||||
| Purchases of investment securities | (4,829 | ) | (5,790 | ) | |||||||||
| Proceeds from sale/maturity of investment securities | 5,612 | 7,004 | |||||||||||
Net cash used in investing activities | (17,632 | ) | (7,808 | ) | |||||||||
Cash Flows from Financing Activities | |||||||||||||
| Proceeds from issue of shares (net of costs) | 6 | 13 | |||||||||||
| Proceeds from issue of preference shares for outside equity interests | — | 182 | |||||||||||
| Proceeds from issue of other equity instruments (net of costs) | 832 | — | |||||||||||
| Net increase (decrease) in deposits and other borrowings | 16,966 | 6,015 | |||||||||||
| Net movement in debt issues | 2,528 | 5,435 | |||||||||||
| Dividends paid (including DRP buy back of shares) | (904 | ) | (1,045 | ) | |||||||||
| Net movements in other liabilities | (851 | ) | 672 | ||||||||||
| Net increase (decrease) in payables due to other financial institutions not at call | (535 | ) | 926 | ||||||||||
| Net increase (decrease) in securities sold under agreements to repurchase | 974 | 532 | |||||||||||
| Issue of loan capital | — | — | |||||||||||
| Other | 27 | (22 | ) | ||||||||||
Net cash provided by financing activities | 19,043 | 12,708 | |||||||||||
| Net Increase (decrease) in cash and cash equivalents | 933 | (73 | ) | ||||||||||
| Cash and cash equivalents at beginning of period | 1,428 | 2,498 | |||||||||||
Cash and cash equivalents at end of period | 1 | (a) | 2,361 | 2,425 | |||||||||
(1) These were gross premiums and policy payments before splitting between Policyholders and Shareholders.
Notes to the consolidated statement of cash flows are contained in Attachment 1
It should be noted that the Bank does not use this accounting Statement of Cash Flows in the internal management of its liquidity positions.
Dividend details
(Rule 4.3A Item Nos.6 & 7)
Dividends
The Directors have declared a fully franked (at 30%) interim dividend of 79 cents per share (2002/03: 69 cents) amounting to $996 million (2002/03: $865 million). The dividend will be paid on 30 March 2004 to eligible shareholders. Additionally, distributions totalling $39 million for the half year were paid to preference shareholders and other equity instrument holders.
A fully franked final dividend of 85 cents per share amounting to $1,066 million was paid on 8 October 2003 in respect to the year ended 30 June 2003. The payment comprised cash disbursements of $865 million with $201 million being reinvested by participants through the Dividend Reinvestment Plan.
Dividend Reinvestment Plan
The dividend reinvestment plan is capped at 10,000 shares per shareholder.
Record Date
The register closes for determination of dividend entitlement and for participation in the dividend reinvestment plan at 5:00pm on 20 February 2004 at ASX Perpetual Registrars Limited, Locked Bag A14, Sydney South, 1235.
Ex Dividend Date
The ex dividend date is 16 February 2004.
Consolidated retained earnings reconciliation
(Rule 4.3A Item No.8)
| Retained Profits | $M | |||
| Opening balance 30 June 2003 | 2,809 | |||
| Net profit for the year | 1,243 | |||
| Payment of final dividend | (1,066 | ) | ||
| Appropriations from reserves (net) | 49 | |||
| Payment of other dividends | (39 | ) | ||
| Closing balance 31 December 2003 | 2,996 | |||
Net tangible assets per security
(Rule 4.3A Item No.9)
| Half Year Ended | ||||||||
| As at | 31/12/03 | 31/12/02 | ||||||
| Net tangible assets per share ($) | 11.61 | 11.13 | ||||||
Details of entities over which control was gained during the year
(Rule 4.3A Item No.10)
| Ownership Interest Held | ||||||||
| Entity Name | Date control gained | (%) | ||||||
| N/a | ||||||||
Details of entities over which control was lost during the year
(Rule 4.3A Item No.10)
| Ownership Interest Held | ||||||||
| Entity Name | Date control lost | (%) | ||||||
| N/a | ||||||||
Details of associates and joint ventures
(Rule 4.3A Item No.11)
| Ownership Interest Held | ||||
| Entity Name | (%) | |||
| EDS (Australia) Pty Limited (EDSA) | 35 | |||
| Computer Fleet Management | 50 | |||
| Cyberlynx Procurement Services | 30 | |||
| PT Astra CMG Life | 50 | |||
| Allday Enterprises Ltd | 30 | |||
| China Life CMG Life Assurance Company Limited | 49 | |||
| Bao Minh CMG Life Insurance Company | 50 | |||
| CMG Mahon (China) Investment Management Limited | 50 | |||
| Mahon and Associates Limited | 50 | |||
| CMG CH China Funds Management Limited | 50 | |||
| Colonial First State Private Ltd | 50 | |||
The Group’s results include an equity accounted loss of $36m for the half year ended 31 December 2003. The loss principally relates to a change in revenue recognition accounting policy by an associate entity. The equity accounted result for the prior period was not material.
Any other significant information
(Rule 4.3A Item No.12)
Change in accounting policies
The accounting policies applied in the preparation of the financial statements of the group for the year ended 30 June 2003 are consistent with those applied in the 30 June Annual Financial Report.
Software Capitalisation
It should be noted however, that the criteria for information technology software capitalisation has been amended, such that only computer software projects costing $10 million or more are being capitalised and capitalisation will be limited to those investments that will deliver identifiable and sustainable customer value and an increase in returns, in a significant line of business.
This change has been applied retrospectively and has resulted in the write-off of $210 million of previously capitalised software.
Foreign entities
(Rule 4.3A Item No.13)
NOT APPLICABLE.
Commentary on results
(Rule 4.3A Item No.14)
REFER TO PROFIT ANNOUNCEMENT.
Statement in relation to accounts which have been reviewed
(Rule 4.3A Item Nos.15, 16 & 17)
THE INFORMATION INCLUDED WITHIN THIS REPORT AND THE ATTACHED PROFIT ANNOUNCEMENT HAVE BEEN SUBJECT TO AN INDEPENDENT REVIEW BY THE EXTERNAL AUDITORS, AND ARE NOT SUBJECT TO DISPUTE OR QUALIFICATION.
| Sign here: |  | Date: 11 February 2004 | ||
| (Director/Company Secretary) | ||||
Print name: JOHN DAMIEN HATTON
ATTACHMENT 1
Notes to Statement of Cash Flows
| Half Year Ended | ||||||||
| 31/12/03 | 31/12/02 | |||||||
| $M | $M | |||||||
| Note (a) Reconciliation of Cash | ||||||||
| For the purposes of the Statements of Cash Flows, cash includes cash at bankers, money at short call, at call deposits with other financial institutions and settlement account balances with other banks | ||||||||
| Notes, coins and cash at bankers | 1,852 | 2,387 | ||||||
| Other short term liquid assets | 391 | 689 | ||||||
| Receivables due from other financial institutions — at call | 2,194 | 1,779 | ||||||
| Payables due to other financial institutions — at call | (2,076 | ) | (2,430 | ) | ||||
| Cash and Cash Equivalents at end of year | 2,361 | 2,425 | ||||||
Note (b) Cash Flows presented on a Net Basis
Cash flows arising from the following activities are presented on a net basis in the Statement of Cash Flows:
| • | customer deposits to and withdrawals from deposit accounts; borrowings and repayments on loans, advances and other receivables; |
| • | sales and purchases of trading securities; and |
| • | proceeds from and repayment of short term debt issue |
| Half Year Ended | ||||||||
| Note (c) Reconciliation of Operating Profit After Income Tax to Net Cash | 31/12/03 | 31/12/02 | ||||||
| Provided by Operating Activities | $M | $M | ||||||
| Profit from ordinary activities after income tax | 1,247 | 625 | ||||||
| Decrease (increase) in interest receivable | (31 | ) | (163 | ) | ||||
| Increase (decrease) in interest payable | 20 | 142 | ||||||
| Net (increase) decrease in trading securities | (1,258 | ) | (5,277 | ) | ||||
| Net (gain)/loss on sale of investment securities | (1 | ) | 1 | |||||
| (Gain)/loss on sale of property plant and equipment | 3 | (6 | ) | |||||
| Charge for bad and doubtful debts | 150 | 151 | ||||||
| Depreciation and amortisation | 227 | 259 | ||||||
| Other provisions | 223 | (89 | ) | |||||
| Increase (decrease) in income taxes payable | 139 | (443 | ) | |||||
| (Decrease) increase in deferred income taxes payable | (15 | ) | (59 | ) | ||||
| (Increase) decrease in future income tax benefits | (250 | ) | (33 | ) | ||||
| (Increase) decrease in accrued fees/reimbursements receivable | (3 | ) | (90 | ) | ||||
| (Decrease) increase in accrued fees and other items payable | (51 | ) | 5 | |||||
| Amortisation of premium on investment securities | 4 | 6 | ||||||
| Unrealised gain on revaluation of trading securities | 320 | 239 | ||||||
| Change in excess of net market value over net assets of life insurance controlled entities | (165 | ) | 426 | |||||
| Unrealised (gain)/loss on insurance investment assets | (947 | ) | 371 | |||||
| Change in policy liabilities | 131 | (1,155 | ) | |||||
| Unrealised (gain)/loss on loan capital | (231 | ) | 22 | |||||
| Other | 10 | 95 | ||||||
Net Cash provided by Operating Activities | (478 | ) | (4,973 | ) | ||||

 |  |
| Group Corporate Relations GPO Box 2719 Sydney NSW 2001 Australia | Telephone: (02) 9378 2663 Telephone: (02) 9378 2662 Facsimile: (02) 9378 2395 www.commbank.com.au |
COMMONWEALTH BANK HALF YEAR RESULTS – 31 DECEMBER 2003
11 February 2004
Results Overview
The Commonwealth Bank announced a statutory net profit after tax of $1,243 million for the half year ended 31 December 2003. On a cash basis1, net profit was $1,240 million, an increase of 3% on the prior comparative period2. The result includes after tax expenses of $346 million related to the Which new Bank service transformation.
The underlying cash net profit after tax3 increased by 17% to $1,487 million compared with the prior comparative period.
The operating environment over the period has been by strong competition in the financial services sector, coupled with a relatively strong Australian economy.
Chief Executive Officer, David Murray said, “This is a very pleasing half year result. We have achieved growth in cash earnings sufficient to offset $346 million of after tax transformation costs incurred in the half year. The result reflects the strong performance of our Australian and New Zealand banking operations, significantly higher profit growth in the insurance business compared with the same time last year, and a rebound from funds management since June 2003 as global equity markets continue to recover.”
On a statutory basis, earnings per share was 96 cents. On a cash basis, earnings per share was 96 cents, an increase of 1% on the prior comparative period. Directors declared an interim dividend of 79 cents per share, fully franked. The interim dividend payout ratio on a cash basis is 82.9%. The dividend has been determined having regard to our previous commitment to add back the costs of Which new Bank in determining total dividends for the 2004 financial year.
Mr Murray said, “The interim dividend of 79 cents is 10 cents or 14% higher than for the same period last year. Importantly, the dividend maintains Commonwealth Bank’s impressive record of paying an increased dividend to shareholders at every interim and full year profit result since listing in 1991.”
| |
| Group Corporate Relations GPO Box 2719 Sydney NSW 2001 Australia | Telephone: (02) 9378 2663 Telephone: (02) 9378 2662 Facsimile: (02) 9378 2395 www.commbank.com.au |
Operations Performance
Banking
Banking operations performed strongly during the period, delivering a 14% increase in underlying net profit after tax, primarily the result of home loan growth and continued sound asset quality. The Bank’s total lending assets, excluding securitisation, increased 13% to $191 billion. This increase was primarily driven by the growth in home loan outstandings, and improved corporate lending. In New Zealand, ASB Bank performed well, increasing lending volumes, particularly in home loans and rural lending. ASB’s result was driven by the continuing success of its service and sales performance, successful marketing campaigns, and the continued momentum of the ‘One Team’ referral program.
Insurance
The underlying net profit after tax in the insurance business4 reflects a $54 million increase on the prior comparative period. Key drivers of this result included solid premium growth, improved persistency, and focused cost management.
Stronger performances were recorded in Australia and Asia. In Hong Kong, initiatives included the alignment of policyholder dividends to investment returns, the launch of an innovative new multi-manager investment product and expense reductions within operations.
Funds Management
The performance of the funds management business has rebounded since June, in line with a recovery in global equity markets and stronger funds flow, reflecting higher levels of investor confidence. Underlying net profit after tax increased by 1% compared with the prior comparative period. Funds under management rose by $6 billion or 7% to $100 billion since June 2003, through a combination of improving investment returns and stronger retail and wholesale inflows.
The Bank’s master trust offering, FirstChoice, continued to perform strongly with net inflows of $1.7 billion achieved in the half year. Total funds under administration now exceed $5 billion.
Which new Bank
The early stage of implementing the Which new Bank service transformation is progressing well. A major focus since September has been to ensure that staff understand, embrace and adopt the Bank’s vision to excel in customer service.
Mr Murray gave a comprehensive outline of all the work streams and activities. He highlighted the Bank’s progress on the following initiatives:
| |
| Group Corporate Relations GPO Box 2719 Sydney NSW 2001 Australia | Telephone: (02) 9378 2663 Telephone: (02) 9378 2662 Facsimile: (02) 9378 2395 www.commbank.com.au |
| • | In the Performance Culture Program, the Bank has completed all the diagnostic work and the leadership team has radically changed its day to day activities. |
| • | The Service and Sales Management System which will involve all staff across the Bank is already being applied by the leadership team. |
| • | The Bank-wide introduction of the CommSee customer management system has commenced in Tasmania providing customer-serving staff with an important tool to help them anticipate and respond to customer needs. |
| Capital Management The Bank’s capital position remains strong with the Tier 1 capital ratio at 7.26%, an increase from 6.96% at June 2003. |
| A $450-$550 million off-market share buy-back is planned for March 2004. The size of the buy back will be decided by Directors and will be dependent on various factors, including market conditions. |
| Following completion of the buy back, the Bank has announced that it will offer two further services for shareholders. A Share Sale Facility will enable shareholders to sell residual small holdings immediately after the buy-back. A Share Purchase Plan will give shareholders the opportunity to buy additional shares in the Bank. These services will be free of brokerage. |
| Outlook The global economy is expected to continue its strong growth in the short term. However, a number of medium-term structural issues remain, including the US current account deficit and the exchange rate re-alignment currently underway. |
| Factors influencing the Australian economy remain, on balance, positive and are expected to remain so for the first half of 2004. Beyond that, the interplay between household debt and interest rates, house prices and household wealth and the Australian Dollar could result in a slowing in credit growth. |
| Subject to market conditions being maintained, the Bank is targetting growth in cash EPS exceeding 10% compound annual growth rate (CAGR) over the three years to 30 June 2006, which is expected to be ahead of the industry growth for the period. The Bank also expects to improve productivity by between 4-6% CAGR over this period and aims to grow profitable market share across major product lines and increase the dividend per share every year. |
| Growth in cash earnings was sufficient to offset Which new Bank expenses in the first half. The Bank reiterates the views expressed by the Chairman at the AGM that: |
| |
| Group Corporate Relations GPO Box 2719 Sydney NSW 2001 Australia | Telephone: (02) 9378 2663 Telephone: (02) 9378 2662 Facsimile: (02) 9378 2395 www.commbank.com.au |
“At this stage, there appears to be sufficient momentum in the economy to support solid underlying earnings growth for the full year, although the rate of growth may moderate in the second half.
The Bank will add back the non-recurring transformation charges, in considering the amount to be distributed as dividends to shareholders. Consequently, as indicated in the Which new Bank announcement, we expect to be able to continue the uninterrupted pattern of increased dividends that we have been able to deliver since privatisation.”
In respect of Which new Bank, early signs of the positive impact of some of our initiatives on the Bank’s culture, processes and performance confirm that the course we are taking is the right way forward.
The Bank remains extremely well positioned to meet the challenges ahead and will benefit from scale, breadth of services and strength of its proprietary distribution systems.
Mr Murray said, “We are very encouraged by our early progress on Which new Bank. Whilst there is considerable work to be done over the next two and a half years, the size of the prize for the Bank and the first evidence that we are able to progressively implement our plans strengthens our resolve. Our commitment to maintain our policy of increasing shareholder dividends reflects that confidence in delivering on our Which new Bank service transformation vision.”
Performance Summary
Key aspects of the results:
| 31-Dec-2003 | 30-Jun-2003 | 31-Dec-2002 | ||||
| Net Profit After Tax attributable to shareholders (statutory) | $1,243 million | $1,390 million | $622 million | |||
| Net Profit After Tax (cash basis)1 Underlying Net | $1,240 million | $1,371 million | $1,208 million | |||
| Profit After Tax Banking | $1,294 million | $1,240 million | $1,136 million | |||
| Funds Management | $126 million | $108 million | $125 million | |||
| Insurance4 | $67 million | $52 million | $13 million | |||
| Underlying Net | ||||||
| Profit After Tax3 Total Assets Held and Funds Under Management | $1,487 million $364 billion | $1,400 million $337 billion | $1,274 million $333 billion | |||
| Final dividend (fully franked) | 79 cents | 85 cents | 69 cents |
| |
| Group Corporate Relations GPO Box 2719 Sydney NSW 2001 Australia | Telephone: (02) 9378 2663 Telephone: (02) 9378 2662 Facsimile: (02) 9378 2395 www.commbank.com.au |
Key Performance Measures and Comparison to prior comparative period2:
| Net Profit After Tax attributable to shareholders (statutory) | $1,243 million | Up from $622 million5 | ||
| Net Profit After Tax (cash basis) 1 | $1,240 million | Up 3% from $1,208 million | ||
| Return on Equity6 (cash basis) 1 | 12.33% | Down from 12.39% | ||
| Earnings per Share (cash basis) 1 | 95.5 cents | Up from 95 cents | ||
| Lending Assets net of securitisation | $191 billion | Up 13% from $169 billion | ||
| Underlying Banking Cost to Income Ratio7 | 50.7% | Down from 52.2% | ||
| Risk Weighted Capital Ratio | 9.46% | Down from 9.81% | ||
| Tier 1 Ratio | 7.26% | Up from 7.06% |
| 1 | “Cash basis” is defined as net profit after tax and before goodwill amortisation, life insurance and funds management appraisal value uplift/(reduction). The difference between the cash and statutory results for the half year reflects goodwill amortisation of $162 million and an appraisal value uplift of $165 million, both of which are non-cash items. | |
| 2 | “Prior comparative period” refers to the six month period ending 31 December 2002 | |
| 3 | Underlying cash profit excludes shareholder investment returns and the cost of initiatives (including Which new Bank) along with their associated tax if relevant. | |
| 4 | The insurance results have been restated from those reported at 30 June 2003 and 31 December 2002 to include the general insurance business, which were previously reported under Banking. | |
| 5 | The 31 December 2003 result included an uplift in the appraisal value of controlled entities of $165 million, whereas the prior comparative period included an appraisal value reduction of $426 million. | |
| 6 | Ratio based on profit from ordinary activities after tax and outside equity interest applied to average shareholders’ equity, excluding outside equity interests. | |
| 7 | “Underlying Banking Cost to Income Ratio” excludes expenses for strategic initiatives. |
| |
| Group Corporate Relations GPO Box 2719 Sydney NSW 2001 Australia | Telephone: (02) 9378 2663 Telephone: (02) 9378 2662 Facsimile: (02) 9378 2395 www.commbank.com.au |
COMMONWEALTH BANK LAUNCHES $450-550 MILLION OFF-MARKET BUY-BACK TENDER
SYDNEY, 11 February 2004: The Commonwealth Bank of Australia today announced that it will invite shareholders to participate in an off-market buy-back of the Bank’s ordinary shares. The buy-back will be implemented using a tender process, under which eligible shareholders will be able to tender any number of their shares to the Bank at specified prices in the tender range, which is $26.00 to $31.25, or as a Final Price Tender1.
The actual buy-back price will be the price in the tender range that enables the Bank to repurchase the targeted amount of capital. Only shares tendered at or below the buy-back price will be bought back. As shares tendered at the buy-back price may be subject to scale back, provisions have been adopted to ensure smaller shareholders are not disadvantaged. All successful tenders will receive the same buy-back price, even if they tendered their shares below the buy-back price.
The Bank’s Chief Executive Officer, David Murray, said the buy-back was the result of the Bank’s continued focus on active capital management.
“The Bank’s strong financial performance and risk profile provide an appropriate background for undertaking this buy-back. The buy-back will enable the Bank to maintain an efficient capital structure while optimising shareholder returns,” he said.
The Bank is targeting to buy back between $450 million and $550 million worth of shares through the buy-back tender. The amount of capital the Bank determines to buy back will depend on various factors including the tenders lodged by shareholders and market conditions around the time the buy-back is completed.
“We want to ensure our smaller shareholders have the best opportunity to participate in this buy-back. Accordingly, any shareholder who tenders all their shares at or below the buy-back price or as a Final Price Tender and who would be left with 200 or less shares as a result of any scale back will have all their shares bought back,” Mr Murray said. He added, “if the buy-back price is $26.00, the lowest price in the tender range, the Bank anticipates being able to buy back the first 200 shares of each successful tendering shareholder before any scale back is applied.”
Participation in the buy-back is completely optional. Shareholders who wish to retain their shares do not need to take any action. The implications of participating in the buy-back will depend on individual circumstances, and therefore shareholders should obtain their own professional advice (particularly on tax matters) before tendering their shares.
All shareholders with a registered holding on 20 February 2004 will be entitled to receive the 79 cent per share interim dividend, even if they sell their shares in the buy-back. Shareholders who wish to sell all their shares may consider withdrawing from the Bank’s dividend reinvestment
| 1 | A ‘Final Price Tender’ means the shareholder is willing to sell their shares at the buy-back price, whatever it is determined to be under the tender process. |
| |
| Group Corporate Relations GPO Box 2719 Sydney NSW 2001 Australia | Telephone: (02) 9378 2663 Telephone: (02) 9378 2662 Facsimile: (02) 9378 2395 www.commbank.com.au |
plan by 20 February 2004 to avoid the possibility of being left with a small parcel of shares after the buy-back.
The buy-back price will have two components – a cash capital component of $11.00 and a fully franked dividend component equal to the difference between the buy-back price and $11.00. Following the release of the Australian Tax Office’s draft Taxation Determination on off-market share buy-backs (TD 2004/D1), the Bank has received confirmation that the “market value” of the shares bought back for tax purposes is $29.16 adjusted for the movement in the S&P/ASX200 Index from the close of trading on 10 February 2004 to the close of trading on 26 March 2004 (“Tax Value”). If the buy-back price is less than this Tax Value, the difference will be added to the $11.00 capital component for the purposes of calculating the gain or loss arising on disposal of the shares for tax purposes. The Bank does not intend to buy back any shares at a price that exceeds the Tax Value.
For shareholders continuing to hold shares, the buy-back is expected to increase earnings per share and return on equity through the overall reduction in capital.
The timetable for the buy-back is outlined below. The full terms and conditions of the buy-back will be contained in a Buy-Back Tender Booklet, which will be sent to eligible shareholders by 5 March 2004.
| Event | Date | |
| Cut-off date for franking entitlement under 45 day rule (1) | 12 February 2004 | |
| Ex Date for determination of entitlements to the buy-back and interim dividend | 16 February 2004 | |
| Record Date for determination of entitlements to the Buy-Back and interim dividend | 20 February 2004 | |
| Tender Period opens | 8 March 2004 | |
| Tender Period closes (7.00pm Sydney time) | 26 March 2004 | |
| Announcement of the buy-back price and any scale back | 29 March 2004 | |
| Payment date for interim dividend | 30 March 2004 | |
| Proceeds sent to participating shareholders | 5 April 2004 |
| (1) | From discussions with the ATO, the Bank understands that if you purchase the Bank’s shares on or after 12 February 2004 and before the buy-back closes, you may not receive the franking credits and rebates that you would otherwise receive in relation to the dividend component of the buy-back price (final ATO Class Ruling pending). |
| |
| Group Corporate Relations GPO Box 2719 Sydney NSW 2001 Australia | Telephone: (02) 9378 2663 Telephone: (02) 9378 2662 Facsimile: (02) 9378 2395 www.commbank.com.au |
UBS AG (Australia Branch) is acting as Sole Financial Advisor and Commonwealth Securities Limited as Broker in relation to the buy-back tender.
For inquiries concerning the buy-back, shareholders should call 1800 022 440 or (+612) 8280 7110 if calling from outside Australia.
ENDS
For additional information, please contact:
Bryan Fitzgerald
General Manager, Media
Group Corporate Relations
Telephone (02) 9378 2663
Appendix 3C
Announcement of buy-back
Rule 3.8A
Appendix 3C
Announcement of buy-back
(except minimum holding buy-back)
Information and documents given to ASX become ASX’s property and may be made public.
Introduced 1/9/99. Origin: Appendix 7B. Amended 13/3/2000, 30/9/2001.
| Name of entity | ABN | |
| Commonwealth Bank of Australia | 48 123 123 124 |
We (the entity) give ASX the following information.
Information about buy-back
| 1 | Type of buy-back | Selective buy-back on equal access buy-back conditions (as modified) | ||
| 2 | +Class of shares which is the subject of the buy-back(eg, ordinary/preference) | Ordinary | ||
| 3 | Voting rights(eg, one for one) | One for one | ||
| 4 | Fully paid/partly paid(and if partly paid, details of how much has been paid and how much is outstanding) | Fully paid | ||
| 5 | Number of shares in the +class on issue | 1,261,059,152 | ||
| 6 | Whether shareholder approval is required for buy-back | No | ||
| 7 | Reason for buy-back | To allow the Company to maintain an efficient capital structure |
| + | See chapter 19 for defined terms. |
Appendix 3C
Announcement of buy-back
| 8 | Any other information material to a shareholder’s decision whether to accept the offer(eg, details of any proposed takeover bid) | See accompanying announcement |
On-market buy-back
| 9 | Name of broker who will act on the company’s behalf | |||
| 10 | Deleted 30/9/2001. | |||
| 11 | If the company intends to buy back a maximum number of shares — that number | |||
| Note: This requires a figure to be included, not a percentage. | ||||
| 12 | If the company intends to buy back shares within a period of time — that period of time; if the company intends that the buy-back be of unlimited duration — that intention | |||
| 13 | If the company intends to buy back shares if conditions are met — those conditions |
Employee share scheme buy-back
| 14 | Number of shares proposed to be bought back | |||
| 15 | Price to be offered for shares |
| + | See chapter 19 for defined terms. |
Appendix 3C
Announcement of buy-back
Selective buy-back
| 16 | Name of person or description of class of person whose shares are proposed to be bought back | |||
| 17 | Number of shares proposed to be bought back | |||
| 18 | Price to be offered for shares |
Equal access scheme
| 19 | Percentage of shares proposed to be bought back | Up to approximately 1.7% | ||
| 20 | Total number of shares proposed to be bought back if all offers are accepted | Up to 21.2 million | ||
| 21 | Price to be offered for shares | The price will be determined by a tender process (see accompanying announcement) | ||
| 22 | +Record date for participation in offer Cross reference: Appendix 7A, clause 9. | 20 February 2004 |
Compliance statement
| 1. | The company is in compliance with all Corporations Act requirements relevant to this buy-back. |
| 2. | There is no information that the listing rules require to be disclosed that has not already been disclosed, or is not contained in, or attached to, this form. |
| Sign here: | | Date: 11 February 2004 | ||
| (Director/Company secretary) | ||||
| Print name: | John Damien Hatton |
| + | See chapter 19 for defined terms. |

| Half Year Results Presentation to Media David Murray Chief Executive Officer 11 February 2004 www.commbank.com.au |
| Disclaimer The material that follows is a presentation of general background information about the Bank's activities current at the date of the presentation, 11 February 2004. It is information given in summary form and does not purport to be complete. It is not intended to be relied upon as advice to investors or potential investors and does not take into account the investment objectives, financial situation or needs of any particular investor. These should be considered, with or without professional advice when deciding if an investment is appropriate. |
| Agenda Half Year Results Which new Bank Outlook |

| A good result in line with 2003 outlook Statutory NPAT 1,243 622 100% Cash NPAT 1,240 1,208 3% Underlying cash NPAT 1,487 1,274 17% 31/12/03 31/12/02 change $m $m |
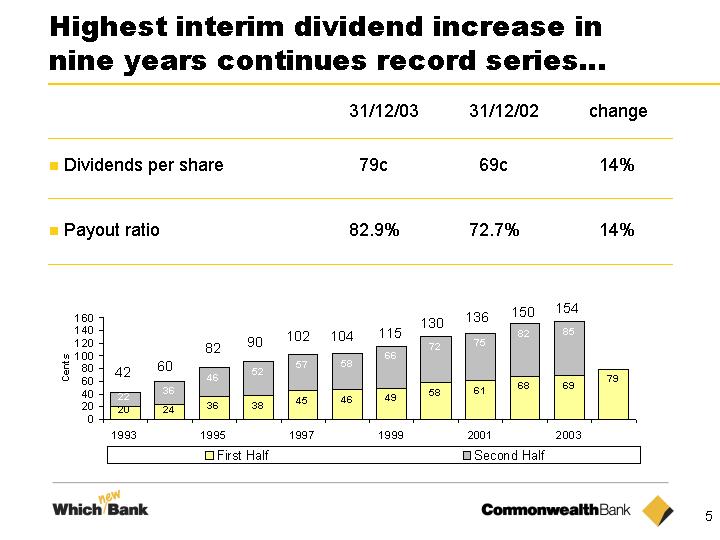
| Highest interim dividend increase in nine years continues record series... 31/12/03 31/12/02 change Dividends per share 79c 69c 14% Payout ratio 82.9% 72.7% 14% 42 60 82 90 102 104 115 130 136 150 154 |
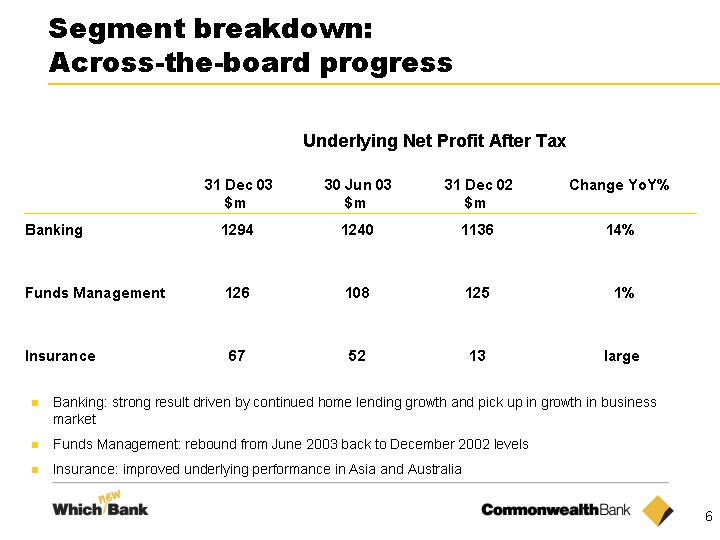
| 31 Dec 03 30 Jun 03 31 Dec 02 Change YoY% $m $m $m Banking 1294 1240 1136 14% Funds Management 126 108 125 1% Insurance 67 52 13 large Segment breakdown: Across-the-board progress Underlying Net Profit After Tax Banking: strong result driven by continued home lending growth and pick up in growth in business market Funds Management: rebound from June 2003 back to December 2002 levels Insurance: improved underlying performance in Asia and Australia |
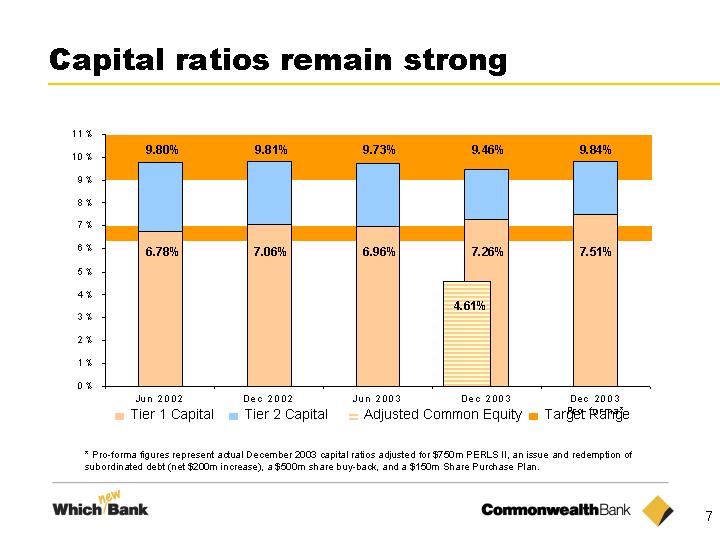
| Capital ratios remain strong * Pro-forma figures represent actual December 2003 capital ratios adjusted for $750m PERLS II, an issue and redemption of subordinated debt (net $200m increase), a $500m share buy-back, and a $150m Share Purchase Plan. Target Range Adjusted Common Equity Tier 2 Capital Tier 1 Capital |

| Off-market share buy-back Structure Offer to buy back approximately $450 to $550 million (up to 1.7%) of issued capital All shareholders eligible to participate via tender Shareholders can tender any number of their shares within the range $26.00 to $31.25 The buy back price will comprise: Cash capital component of $11.00 Fully franked dividend being difference between buy-back price and $11.00 New ATO approach to "market value" may increase the deemed capital component for tax purposes only Benefits Expected to enhance earnings per share and increase return on equity Efficiently distribute surplus capital and franking credits to shareholders Retain capital flexibility |


| Simple processes 'To excel in customer service' Customer service via Engaged people Supported by Through Service transformation Service/Sales Effectiveness IT Enablers Distribution Efficiency Product Performance Culture Support Process/product IT Efficiency Purchasing (4) (2) (3) (2) (1) (1) (3) (2) (2) ( ) = Number of workstreams |
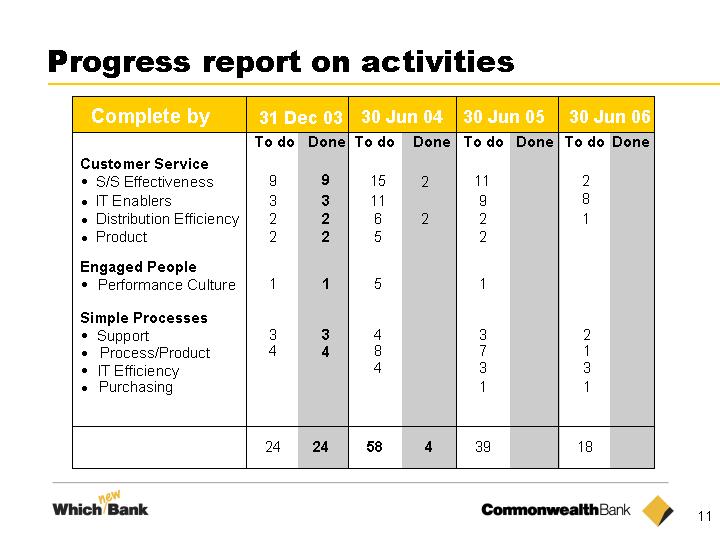
| Progress report on activities To do Done To do Done To do Done To do Done Customer Service · S/S Effectiveness · Distribution Efficiency · Product · IT Enablers 9 3 2 2 9 3 2 2 15 11 6 5 11 9 2 2 1 Engaged People · Performance Culture 1 1 5 1 Simple Processes · Support · Process/Product · IT Efficiency 3 4 4 4 8 4 3 7 3 2 1 3 Purchasing 1 1 3 2 2 2 Complete by 31 Dec 03 30 Jun 04 30 Jun 05 24 58 4 39 18 24 · 8 30 Jun 06 |
| Performance culture Cultural diagnostic completed Program implementation in next half Leading from the front Staff involvement |

| Staff feedback to CEO Strategy Improving service Staff Communication Executive visits Staff performance Personal Feedback category % Emails 8 13 6 43 14 16 0 5 10 15 20 25 30 35 40 45 50 |

| Service and Sales management Transforming the way we serve customers Realising full potential of customer serving staff Improving service & sales skills and effectiveness Applicable to everyone |
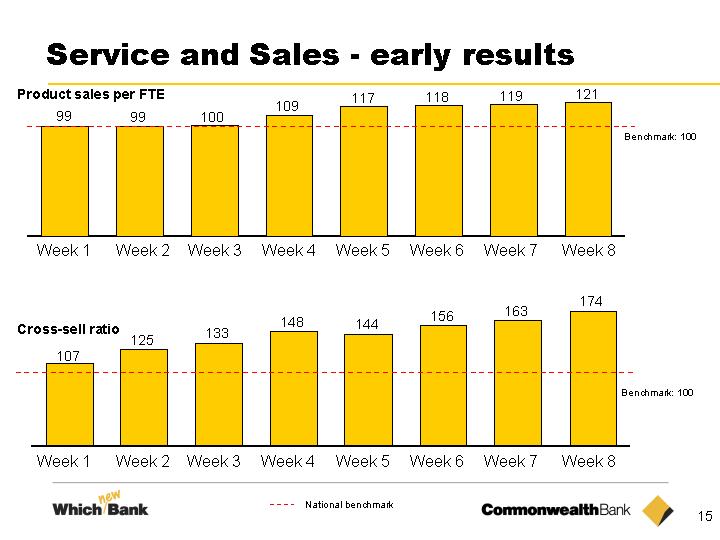
| Service and Sales - early results National benchmark Benchmark: 100 Benchmark: 100 99 99 100 109 117 118 119 121 Week 1 Week 2 Week 3 Week 4 Week 6 Product sales per FTE Week 5 Week 7 Week 8 Week 1 Week 2 Week 3 Week 4 Week 6 Cross-sell ratio Week 5 Week 7 Week 8 107 125 133 148 144 156 163 174 |

| CommSee - Service Excellence Everyday Bank-wide customer management system Provides single view of customer Starting in Tasmania Improving service for 250,000 customers |
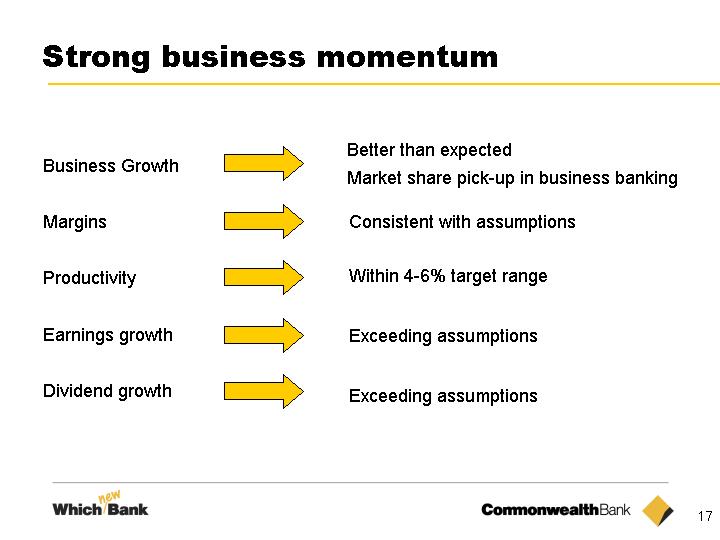
| Strong business momentum Business Growth Margins Productivity Earnings growth Dividend growth Better than expected Market share pick-up in business banking Exceeding assumptions Consistent with assumptions Within 4-6% target range Exceeding assumptions |
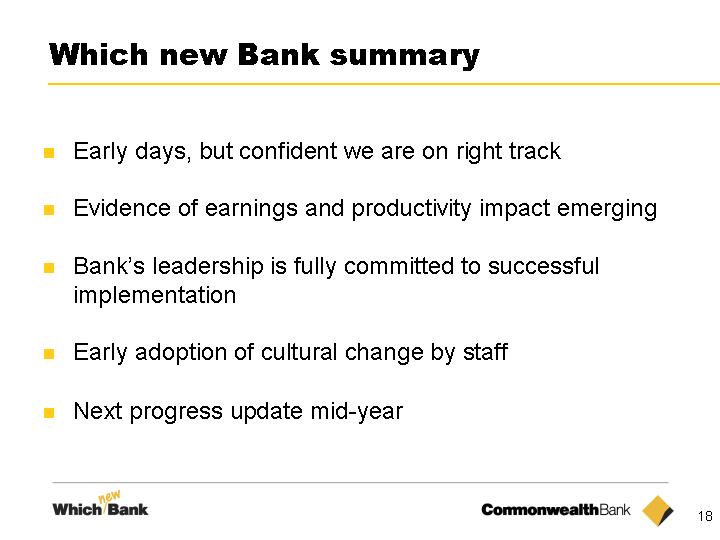
| Which new Bank summary Early days, but confident we are on right track Evidence of earnings and productivity impact emerging Bank's leadership is fully committed to successful implementation Early adoption of cultural change by staff Next progress update mid-year |
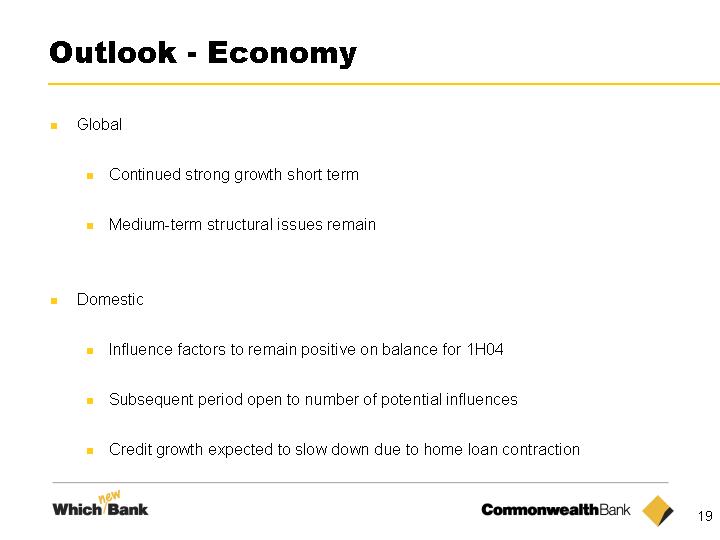
| Outlook - Economy Global Continued strong growth short term Medium-term structural issues remain Domestic Influence factors to remain positive on balance for 1H04 Subsequent period open to number of potential influences Credit growth expected to slow down due to home loan contraction |

| Outlook - Bank Earnings Economic momentum to support solid growth for full year Growth in cash EPS exceeding 10% CAGR over three years till 30 June 2006 Productivity Productivity improvement of 4-6% CAGR over a three years till 30 June 2006 Dividend Which new Bank initiative expenses added back to determine 2004 DPS Pattern of dividend increase continues uninterrupted |
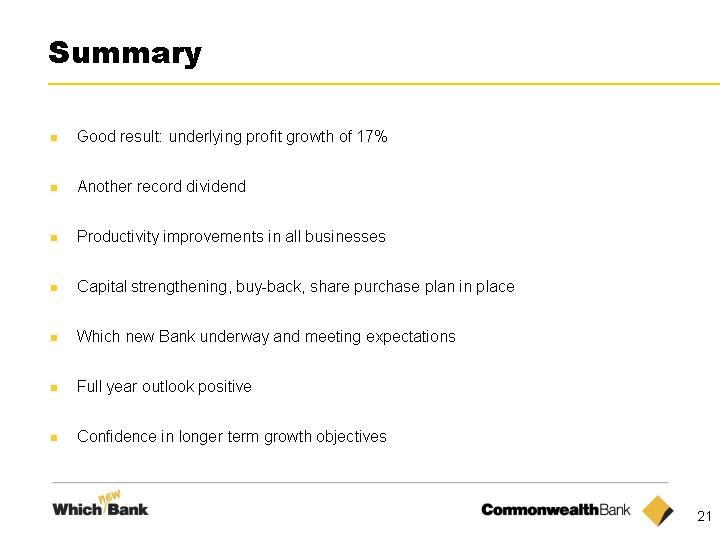
| Summary Good result: underlying profit growth of 17% Another record dividend Productivity improvements in all businesses Capital strengthening, buy-back, share purchase plan in place Which new Bank underway and meeting expectations Full year outlook positive Confidence in longer term growth objectives |

| Half Year Results Presentation to Media David Murray Chief Executive Officer 11 February 2004 www.commbank.com.au |

| Progress Update David Murray Chief Executive Officer 11 February 2004 www.commbank.com.au |

| The material that follows is a presentation of general background information about the Bank's activities current at the date of the presentation, 11 February 2004. It is information given in summary form and does not purport to be complete. It is not intended to be relied upon as advice to investors or potential investors and does not take into account the investment objectives, financial situation or needs of any particular investor. These should be considered, with or without professional advice when deciding if an investment is appropriate. Disclaimer |

| Speaker's Notes Speaker's notes for this presentation are attached below each slide. To access them, you may need to save the slides in PowerPoint and view/print in "notes view." |
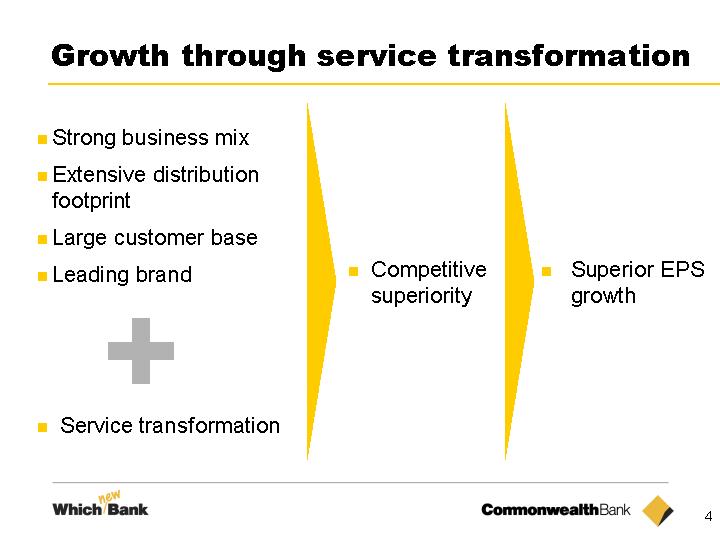
| Growth through service transformation Strong business mix Extensive distribution footprint Large customer base Leading brand Service transformation Superior EPS growth Competitive superiority |
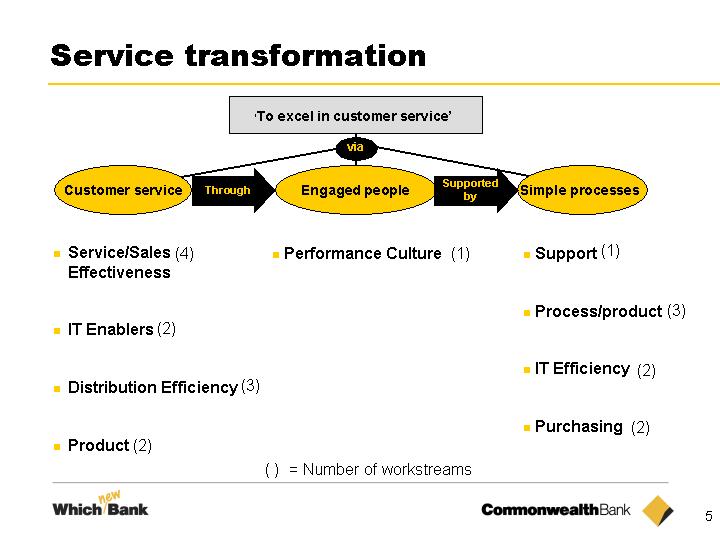
| Simple processes 'To excel in customer service' Customer service via Engaged people Supported by Through Service transformation Service/Sales Effectiveness IT Enablers Distribution Efficiency Product Performance Culture Support Process/product IT Efficiency Purchasing (4) (2) (3) (2) (1) (1) (3) (2) (2) ( ) = Number of workstreams |
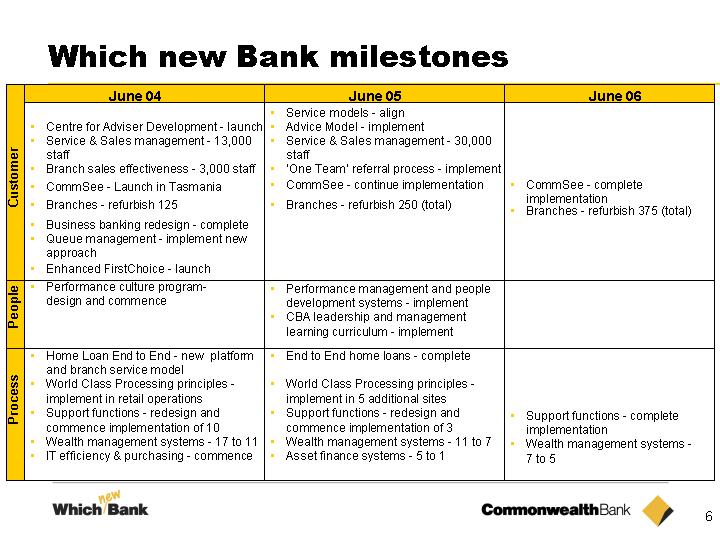
| Which new Bank milestones Service & Sales management - 30,000 staff 'One Team' referral process - implement Service & Sales management - 13,000 staff Branch sales effectiveness - 3,000 staff Centre for Adviser Development - launch Service models - align Advice Model - implement CommSee - Launch in Tasmania CommSee - continue implementation CommSee - complete implementation Branches - refurbish 125 Branches - refurbish 250 (total) Branches - refurbish 375 (total) Business banking redesign - complete Queue management - implement new approach Performance culture program- design and commence Enhanced FirstChoice - launch June 04 June 05 June 06 Process People Customer Home Loan End to End - new platform and branch service model World Class Processing principles - implement in retail operations Support functions - redesign and commence implementation of 10 Wealth management systems - 17 to 11 IT efficiency & purchasing - commence End to End home loans - complete World Class Processing principles - implement in 5 additional sites Support functions - redesign and commence implementation of 3 Wealth management systems - 11 to 7 Asset finance systems - 5 to 1 Support functions - complete implementation Wealth management systems - 7 to 5 Performance management and people development systems - implement CBA leadership and management learning curriculum - implement |

| Progress report on activities To do Done To do Done To do Done To do Done Customer Service · S/S Effectiveness · Distribution Efficiency · Product · IT Enablers 9 3 2 2 9 3 2 2 15 11 6 5 11 9 2 2 1 Engaged People · Performance Culture 1 1 5 1 Simple Processes · Support · Process/Product · IT Efficiency 3 4 4 4 8 4 3 7 3 2 1 3 Purchasing 1 1 3 2 2 2 Complete by 31 Dec 03 30 Jun 04 30 Jun 05 24 58 4 39 18 24 · 8 30 Jun 06 |

| Progress highlights Performance culture Service and sales management 'CommSee' in Tasmania Home Loan End to End Branch refurbishment |
| Performance culture Cultural diagnostic completed Program implementation next half Leading from the front Staff involvement |

| Staff feedback to CEO |

| Service and Sales management Transforming the way we serve customers Realising full potential of customer serving staff Improving service & sales skills and effectiveness Applicable to everyone |

| Service and Sales - early results National benchmark Product sales per FTE Cross-sell ratio Benchmark: 100 Benchmark: 100 |
| CommSee - Service Excellence Everyday Bank-wide customer management system Provides single view of customer Starting in Tasmania Improving service for 250,000 customers |

| Home Loan End to End Single home loan origination system Processing, turnaround and service improvements Efficiency gains |
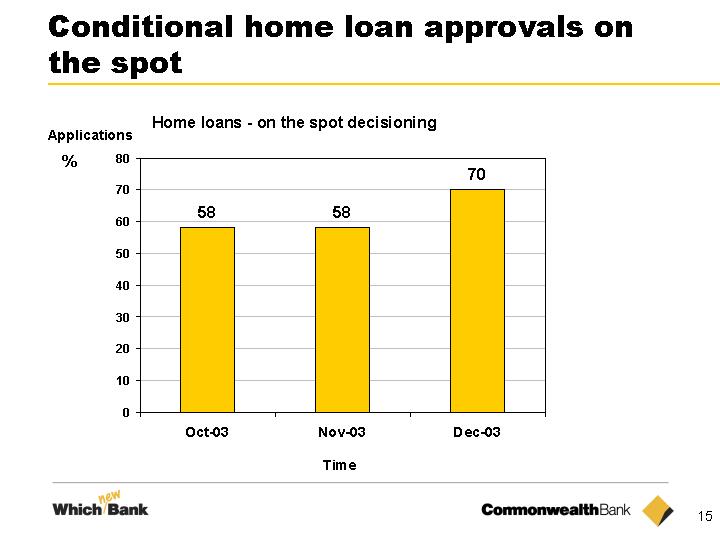
| Conditional home loan approvals on the spot Applications |

| Branch refurbishment A better experience for our customers |

| Customer service tracking |

| Strong market share position Source: RBA, APRA, East and Partners, AELA, Reserve Bank of NZ 24.1% 23.1%5 19.3%6 14.2% 15.5% 21.6% 17.2% 22.7%4 2003 2003 June 24.2% 22.7% 14.0% 15.1% 20.6% 16.4% 22.8% Notes: (1) - Note sale of Commonwealth Custodial Services during period (2) - Mid-Corporates (turnover $20m-100m) (3) - Excludes consumer and commercial finance (4) - November Data (5) - August Data (6) - September Data (7) - March Data (8) - Retail only Dec 19.5%7 14.7% 14.7%6 14.5% 14.9% Managed Investments8 New Zealand Managed Investments Retail and Business Deposits1 Credit Cards Transaction Services2 Home Loans Business Lending New Zealand Lending New Zealand Deposits1 Asset Finance3 |
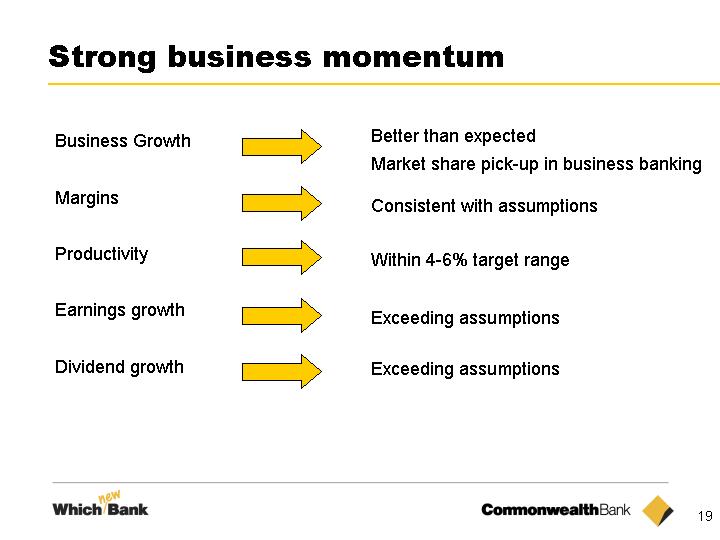
| Strong business momentum Business Growth Margins Productivity Earnings growth Dividend growth Better than expected Market share pick-up in business banking Exceeding assumptions Consistent with assumptions Within 4-6% target range Exceeding assumptions |

| Which new Bank summary Early days, but confident we are on right track Evidence of earnings and productivity impact emerging Bank's leadership is fully committed to successful implementation Early adoption of cultural change by staff Next progress update mid-year |
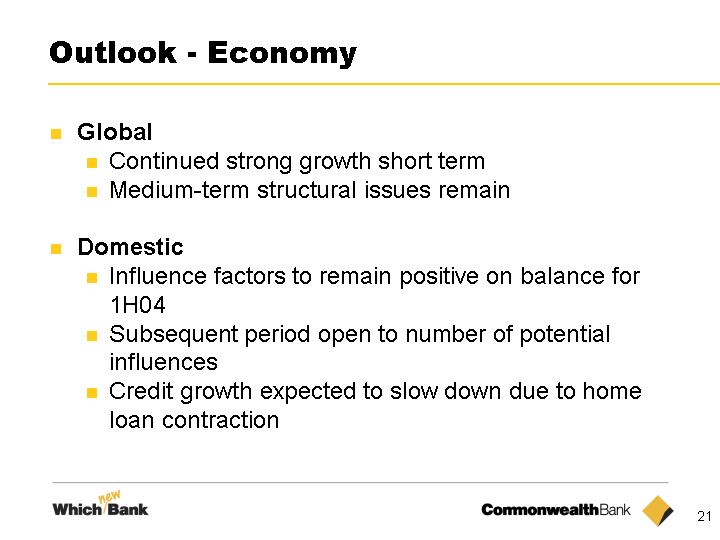
| Outlook - Economy Global Continued strong growth short term Medium-term structural issues remain Domestic Influence factors to remain positive on balance for 1H04 Subsequent period open to number of potential influences Credit growth expected to slow down due to home loan contraction |

| Outlook - Bank Earnings Economic momentum to support solid growth for full year Growth in cash EPS exceeding 10% CAGR over three years till 30 June 2006 Productivity Productivity improvement of 4-6% CAGR over a three years till 30 June 2006 Dividend Which new Bank initiative expenses added back to determine 2004 DPS Pattern of dividend increase continues uninterrupted |

| Summary Good result: underlying profit growth of 17% Another record dividend Productivity improvements in all businesses Capital strengthening, buy-back, share purchase plan in place Which new Bank underway and meeting expectations Full year outlook positive Confidence in longer term growth objectives |

| Progress Update David Murray Chief Executive Officer 11 February 2004 www.commbank.com.au |
| Presentation of Half Year Results for period ended 31 December 2003 David Murray Chief Executive Officer Michael Cameron Chief Financial Officer 11 February 2004 www.commbank.com.au |

| The material that follows is a presentation of general background information about the Bank's activities current at the date of the presentation, 11 February 2004. It is information given in summary form and does not purport to be complete. It is not intended to be relied upon as advice to investors or potential investors and does not take into account the investment objectives, financial situation or needs of any particular investor. These should be considered, with or without professional advice when deciding if an investment is appropriate. Disclaimer |

| Speaker's Notes Speaker's notes for this presentation are attached below each slide. To access them, you may need to save the slides in PowerPoint and view/print in "notes view." |
| Agenda Half Year Results - Michael Cameron (40 mins) Overview Segment Performance and key items Financial Update on Which new Bank Progress of Which new Bank - David Murray (20 mins) Questions |
| Half Year Results: Overview |
| Highlights Good result: underlying profit growth of 17% Another record dividend Productivity improvement in all businesses Further improvement in credit quality Continued strengthening of Tier 1 capital Which new Bank meeting early expectations Share Buy-Back announced |

| A good result: 17% growth in underlying cash profit |
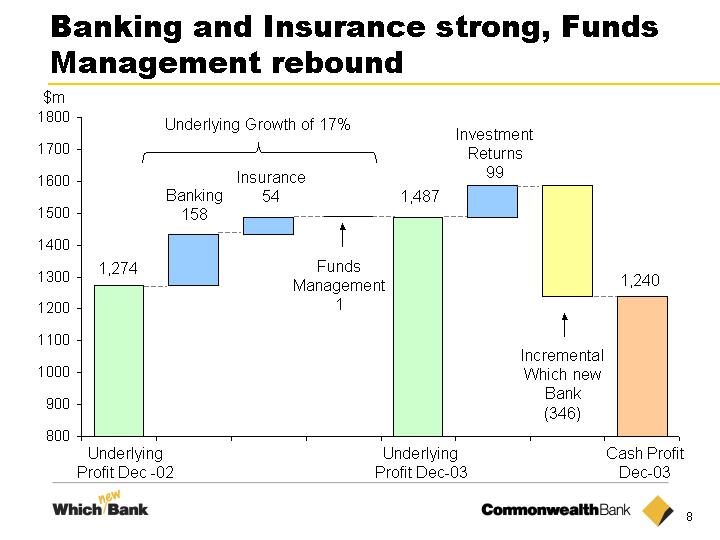
| Banking and Insurance strong, Funds Management rebound Cash Profit Dec-03 1,274 Banking 158 Funds Management 1 Insurance 54 Investment Returns 99 1,240 Underlying Profit Dec -02 Underlying Growth of 17% Incremental Which new Bank (346) Underlying Profit Dec-03 1,487 $m |
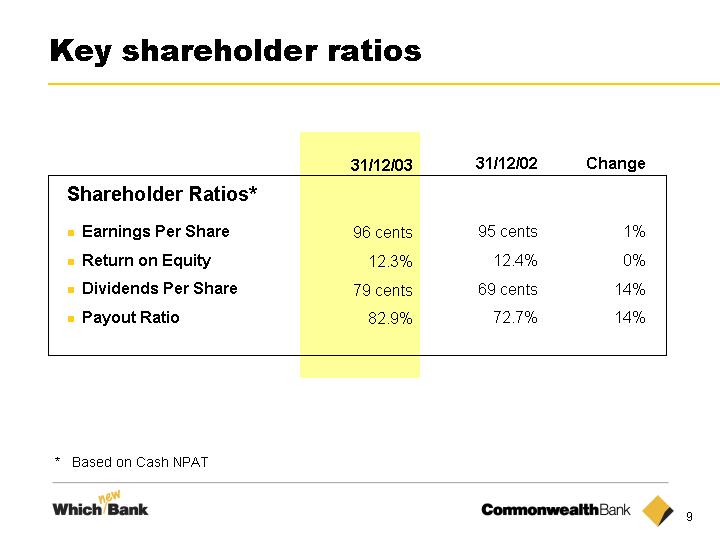
| Key shareholder ratios 31/12/03 96 cents 12.3% 79 cents 82.9% 31/12/02 95 cents 12.4% 69 cents 72.7% Change 1% 0% 14% 14% Earnings Per Share Return on Equity Dividends Per Share Payout Ratio Shareholder Ratios* * Based on Cash NPAT |
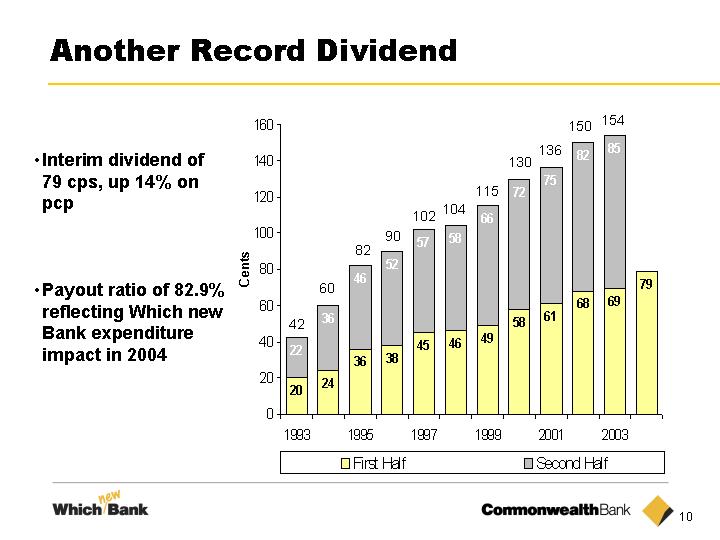
| Another Record Dividend Interim dividend of 79 cps, up 14% on pcp Payout ratio of 82.9% reflecting Which new Bank expenditure impact in 2004 42 60 82 90 102 104 115 130 136 150 154 |

| Segment Results: Banking |
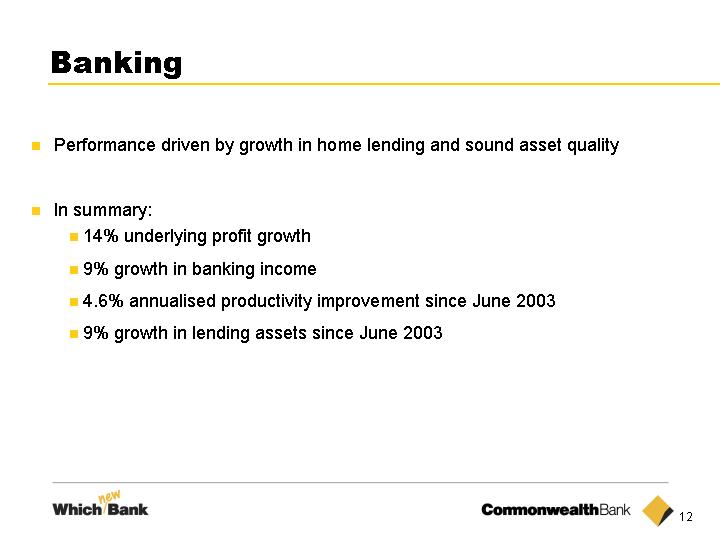
| Banking Performance driven by growth in home lending and sound asset quality In summary: 14% underlying profit growth 9% growth in banking income 4.6% annualised productivity improvement since June 2003 9% growth in lending assets since June 2003 |
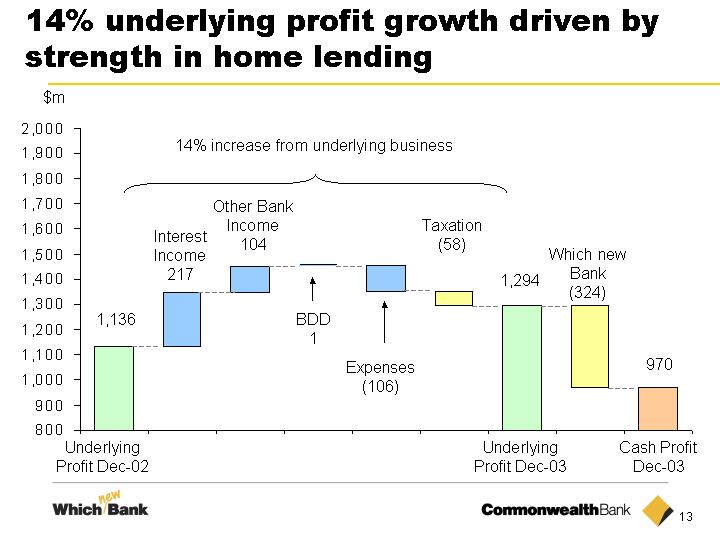
| 14% underlying profit growth driven by strength in home lending $m Interest Income 217 Other Bank Income 104 Expenses (106) BDD 1 Taxation (58) 970 1,136 Which new Bank (324) 1,294 14% increase from underlying business Underlying Profit Dec-02 Underlying Profit Dec-03 Cash Profit Dec-03 |
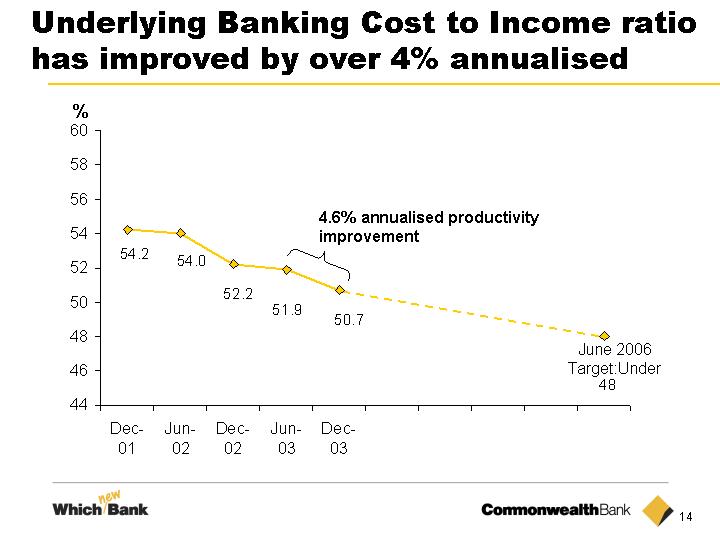
| Underlying Banking Cost to Income ratio has improved by over 4% annualised % June 2006 Target:Under 4.6% annualised productivity improvement |
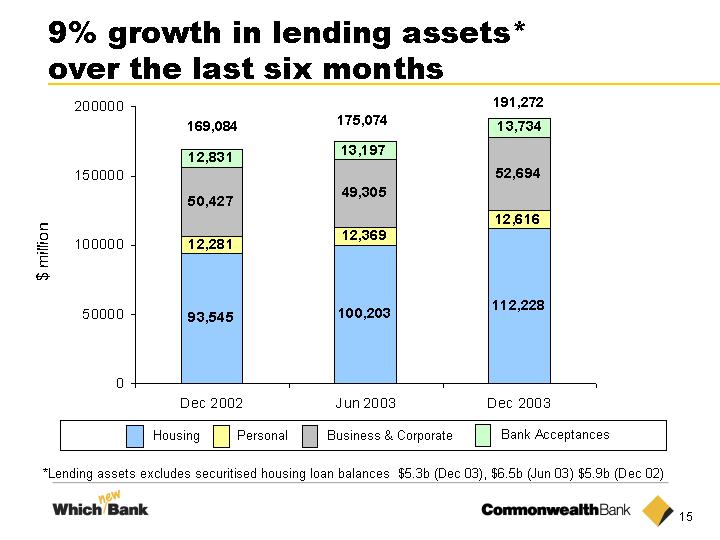
| 9% growth in lending assets* over the last six months *Lending assets excludes securitised housing loan balances $5.3b (Dec 03), $6.5b (Jun 03) $5.9b (Dec 02) $ million Housing Personal Business & Corporate Bank Acceptances 169,084 175,074 191,272 |
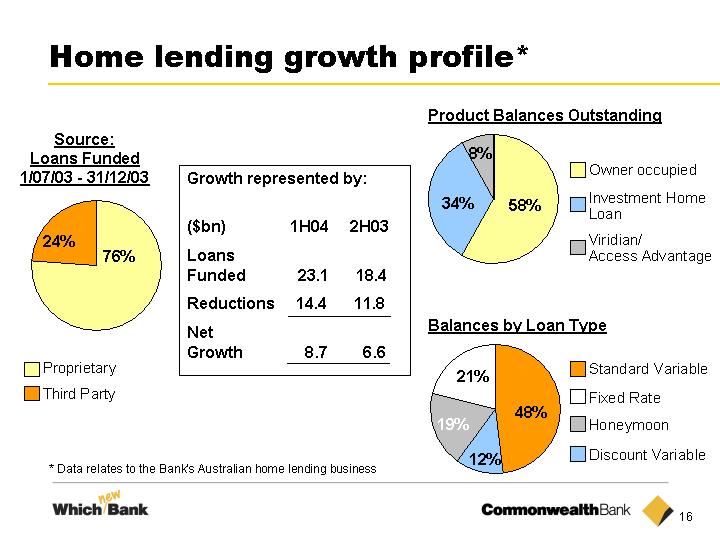
| Home lending growth profile* Source: Loans Funded 1/07/03 - 31/12/03 Proprietary Third Party Product Balances Outstanding Balances by Loan Type Standard Variable Honeymoon Fixed Rate Discount Variable Owner occupied Viridian/ Access Advantage Investment Home Loan * Data relates to the Bank's Australian home lending business 76% 24% 58% 34% 8% 48% 21% 12% 19% Growth represented by: ($bn) 1H04 2H03 Loans Funded 23.1 18.4 Reductions 14.4 11.8 Net Growth 8.7 6.6 |
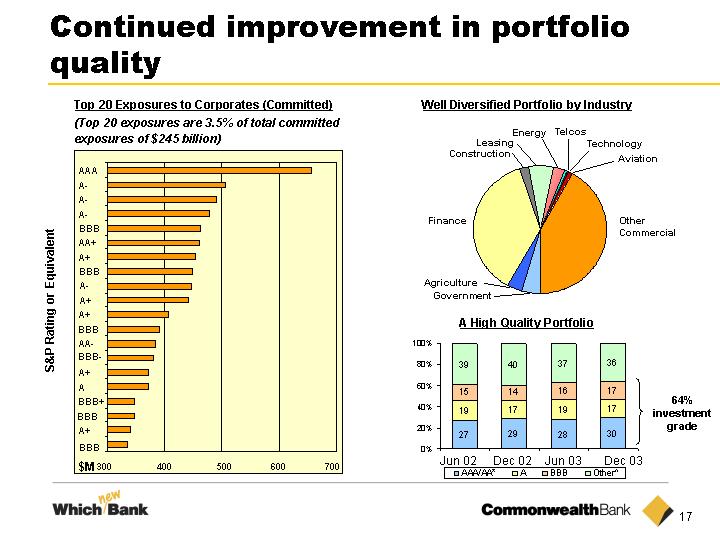
| Continued improvement in portfolio quality Dec 02 Dec 03 Jun 03 64% investment grade A High Quality Portfolio Well Diversified Portfolio by Industry Top 20 Exposures to Corporates (Committed) (Top 20 exposures are 3.5% of total committed exposures of $245 billion) Jun 02 BBB A+ BBB BBB+ A A+ BBB- AA- BBB A+ A+ A- BBB A+ AA+ BBB A- A- 300 400 500 600 700 A- Other Commercial Government Agriculture Finance Construction Leasing Energy Telcos Technology Aviation AAA S&P Rating or Equivalent $M |

| The Bank's asset quality remains sound *Risk Weighted Assets |
| Segment Results: Funds Management |
| Funds Management Since June 2003, underlying profit rebound of 17% to December 2002 levels Income to average FUM steady at 119 basis points 9.0% annualised productivity improvement since June 2003 FirstChoice continues to grow rapidly |

| Underlying profit rebounds to December 2002 levels 50 100 150 200 50 100 150 200 Dec-02 Jun-03 Dec-03 Underlying Profit Dec-02 $m $m Underlying Profit Dec-03 Cash Profit Dec-03 125 Net Operating Income 9 Operating Expense 2 OEI (1) Tax (9) S'holder Invest Returns 10 Incremental Which new Bank (19) After Tax Profit: 17% underlying growth in six months 126 117 125 108 126 |
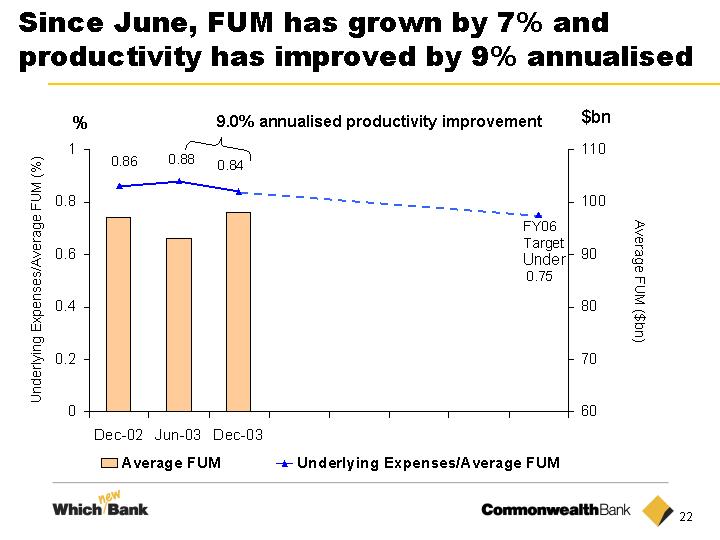
| Since June, FUM has grown by 7% and productivity has improved by 9% annualised % $bn Underlying Expenses/Average FUM (%) Average FUM ($bn) Under FY06 Target 9.0% annualised productivity improvement |
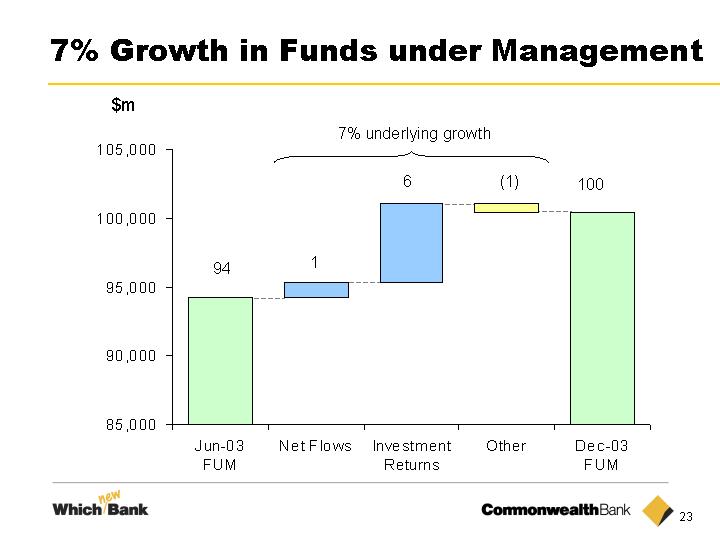
| 7% Growth in Funds under Management 94 100 6 1 $m (1) 7% underlying growth |
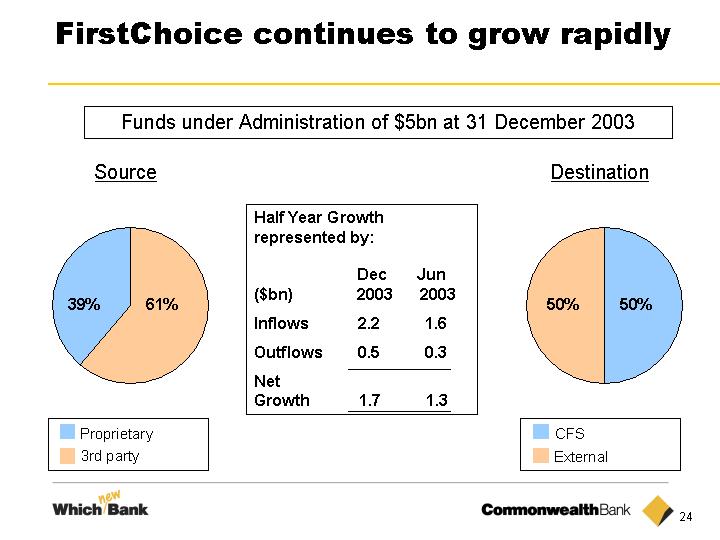
| FirstChoice continues to grow rapidly Source Destination Funds under Administration of $5bn at 31 December 2003 61% 39% 50% 50% 3rd party Proprietary CFS External Dec Half Year Growth represented by: ($bn) 2003 2003 Inflows 2.2 1.6 Outflows 0.5 0.3 Net Growth 1.7 1.3 Jun |
| Segment Results: Insurance |

| Insurance Fourfold increase in underlying net profit after tax to $67m Strong improvement in shareholder investment returns 9.2% annualised productivity improvement since June 2003 Continued growth in annual premiums Positive experience profit for two consecutive halves |
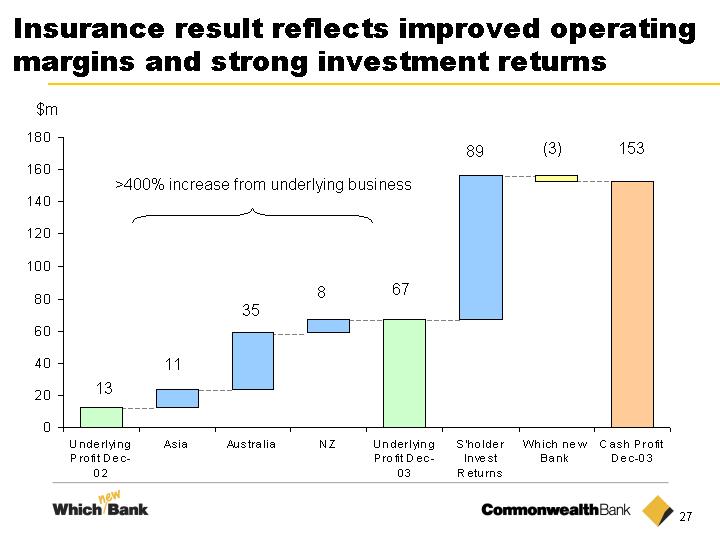
| Insurance result reflects improved operating margins and strong investment returns 13 8 11 35 67 89 153 >400% increase from underlying business $m (3) |

| % $m Operating Expenses/ Average Inforce Premiums (%) Average Inforce Premiums ($m) Under FY06 Target Since June, productivity has improved by 9.2% annualised 9.2% annualised productivity improvement |
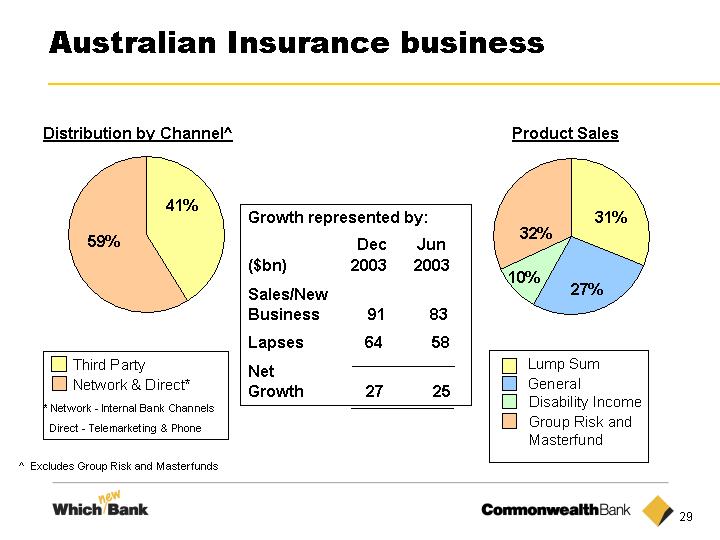
| Growth represented by: ($bn) 2003 2003 Sales/New Business 91 83 Lapses 64 58 Net Growth 27 25 Australian Insurance business Distribution by Channel^ Product Sales Lump Sum General Disability Income Network & Direct* Third Party * Network - Internal Bank Channels Direct - Telemarketing & Phone ^ Excludes Group Risk and Masterfunds 59% 41% 32% 31% 27% 10% Group Risk and Masterfund Dec Jun |
| Investment Earnings |
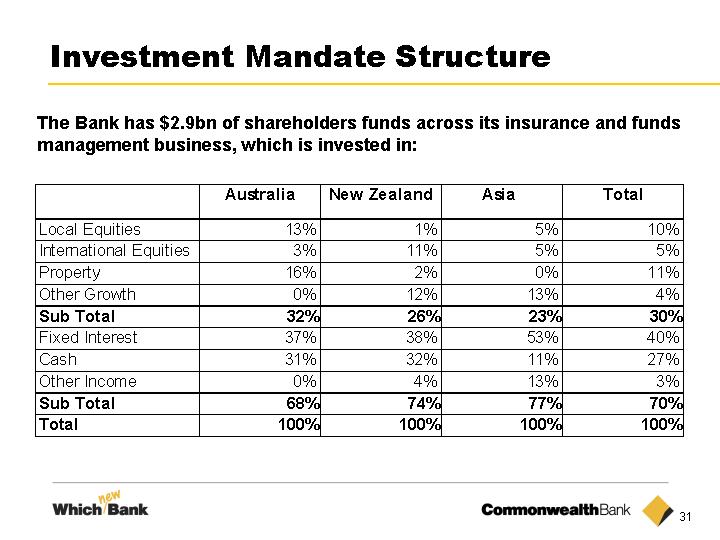
| Investment Mandate Structure The Bank has $2.9bn of shareholders funds across its insurance and funds management business, which is invested in: |
| Wealth Management Valuations |
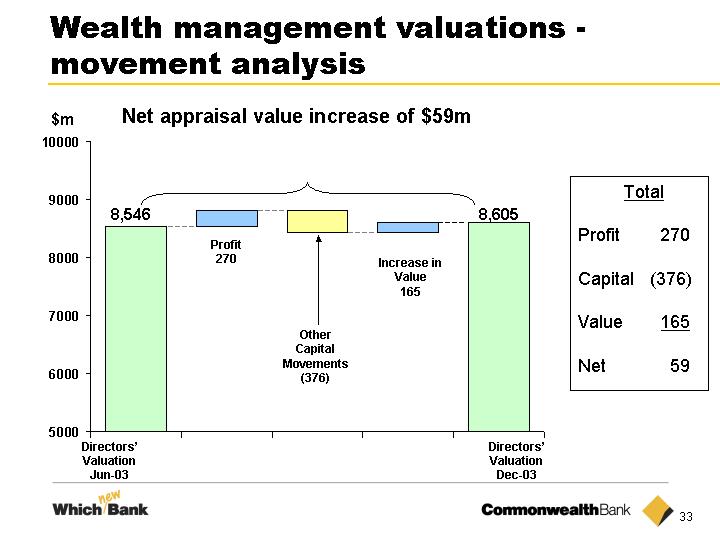
| Wealth management valuations - movement analysis Directors' Valuation Jun-03 Directors' Valuation Dec-03 Increase in Value 165 Profit 270 Other Capital Movements (376) 8,546 $m Net appraisal value increase of $59m Total Profit 270 Capital (376) Value 165 Net 59 8,605 |

| Capital |
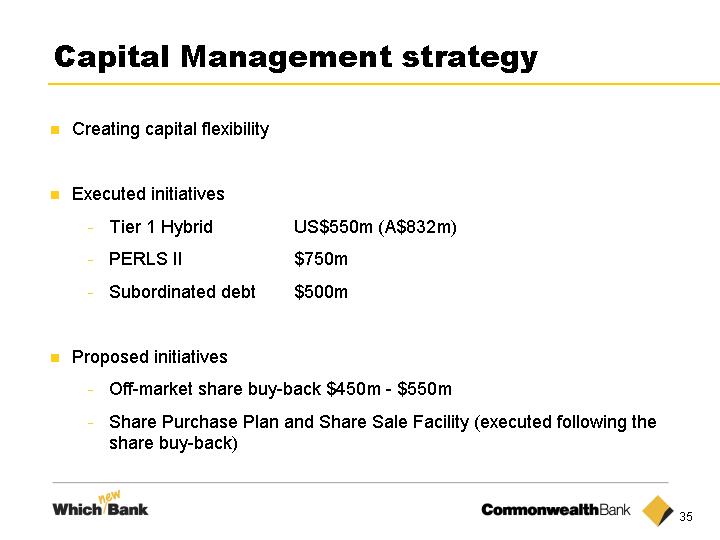
| Capital Management strategy Creating capital flexibility Executed initiatives Tier 1 Hybrid US$550m (A$832m) PERLS II $750m Subordinated debt $500m Proposed initiatives Off-market share buy-back $450m - $550m Share Purchase Plan and Share Sale Facility (executed following the share buy-back) |
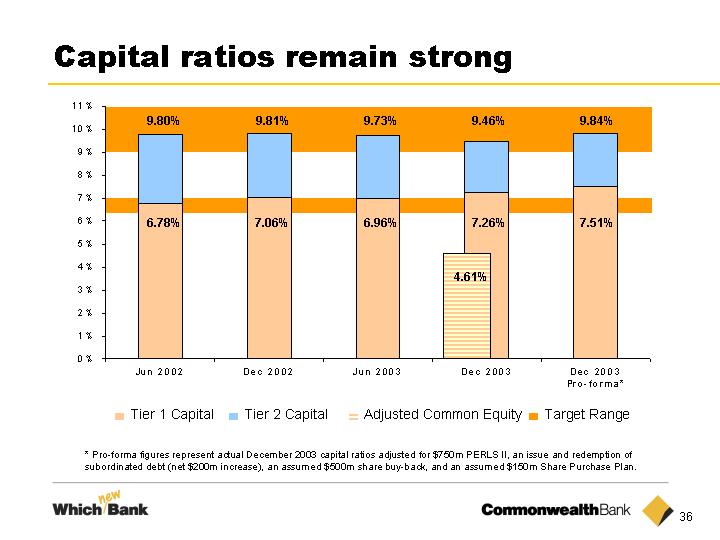
| Capital ratios remain strong * Pro-forma figures represent actual December 2003 capital ratios adjusted for $750m PERLS II, an issue and redemption of subordinated debt (net $200m increase), an assumed $500m share buy-back, and an assumed $150m Share Purchase Plan. Target Range Adjusted Common Equity Tier 2 Capital Tier 1 Capital 9.80% 9.81% 9.73% 9.46% 9.84% 4.61% 6.78% 7.06% 6.96% 7.26% 7.51% |

| Generation and use of tier 1 capital 6.96 0.79 (0.54) (0.47) 0.66 (0.14) 7.26 0.47 (0.32) 0.10 7.51 2 Principally comprises the issue of $201m of shares to satisfy the DRP in respect to the final dividend for 2002/03 and the issue of USD550m (AUD832m) of hybrid capital in August 2003. Tier 1 June 2003 $10,213m Cash Earnings $1,240m Dividend (net of estimated DRP $(846)m Currency & other movements $(208)m Tier 1 Dec 2003 $11,438m PERLS II (net of issue costs) $742m Buy-back $(500)m SPP $150m Tier 1 Dec 2003 (Proforma) $11,830m Growth in RWA 1 1 Growth in RWA = $10.7 bn New Issues $1,039m 2 |
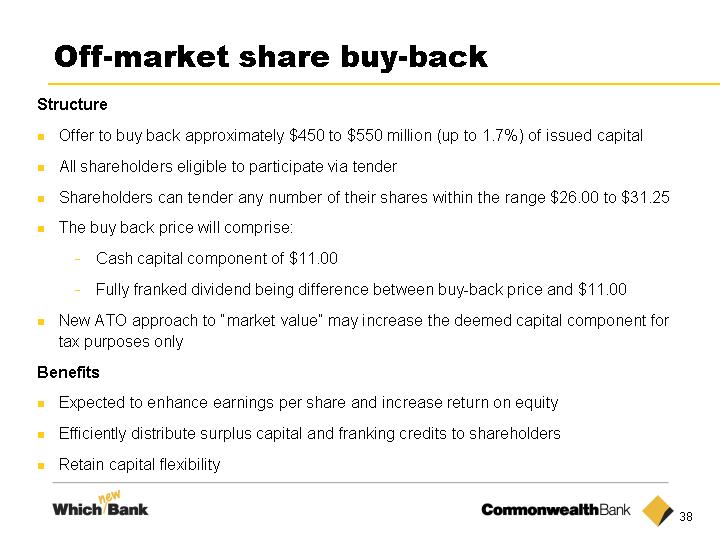
| Off-market share buy-back Structure Offer to buy back approximately $450 to $550 million (up to 1.7%) of issued capital All shareholders eligible to participate via tender Shareholders can tender any number of their shares within the range $26.00 to $31.25 The buy back price will comprise: Cash capital component of $11.00 Fully franked dividend being difference between buy-back price and $11.00 New ATO approach to "market value" may increase the deemed capital component for tax purposes only Benefits Expected to enhance earnings per share and increase return on equity Efficiently distribute surplus capital and franking credits to shareholders Retain capital flexibility |
| Which new Bank |
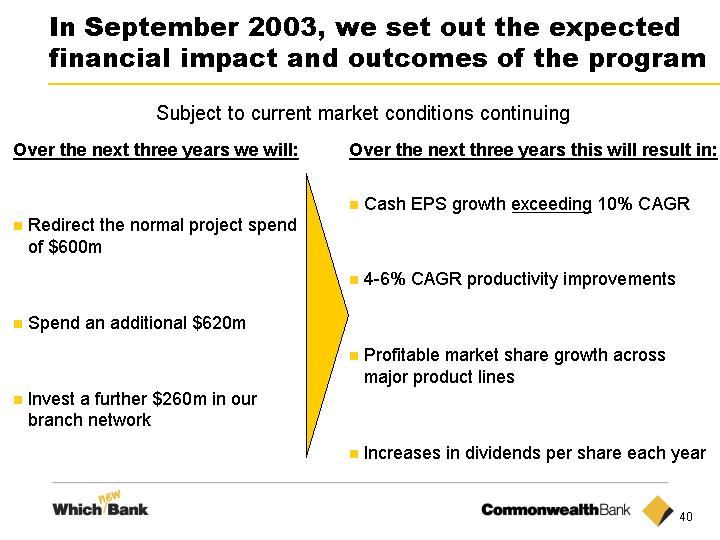
| In September 2003, we set out the expected financial impact and outcomes of the program Over the next three years we will: Redirect the normal project spend of $600m Spend an additional $620m Invest a further $260m in our branch network Over the next three years this will result in: Cash EPS growth exceeding 10% CAGR 4-6% CAGR productivity improvements Profitable market share growth across major product lines Increases in dividends per share each year Subject to current market conditions continuing |

| Which new Bank Expenditure to Date * *As per Which new Bank announcement, September 2003 |
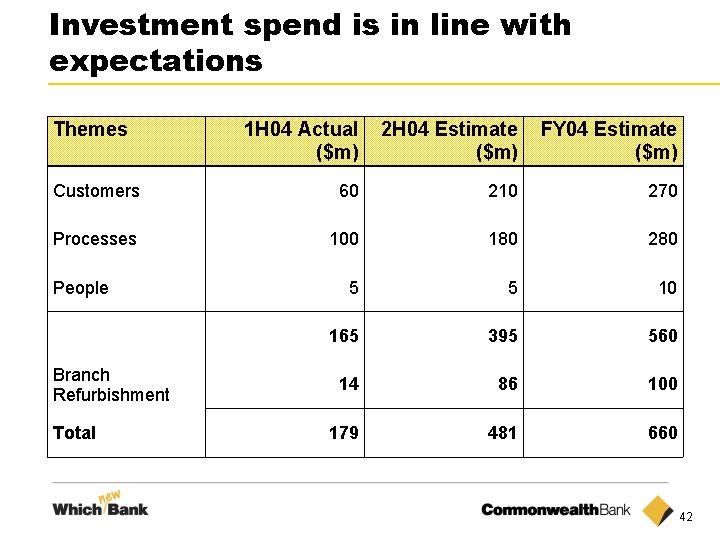
| Investment spend is in line with expectations |
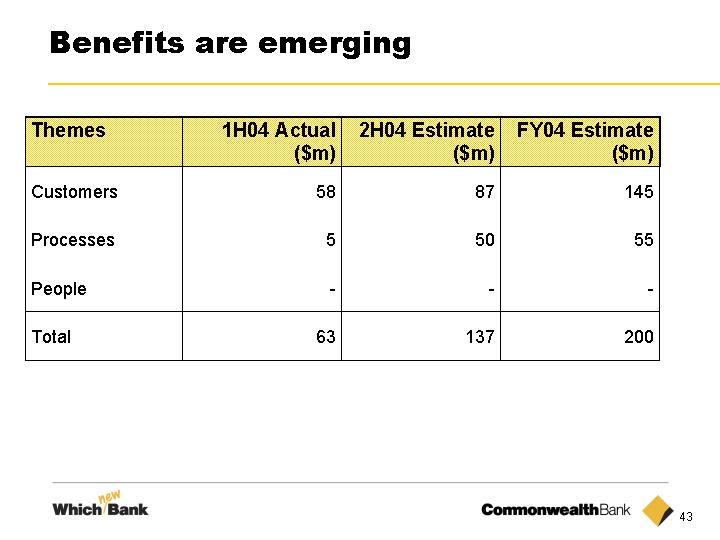
| Benefits are emerging |

| Highlights Good result: underlying profit growth of 17% Another record dividend Productivity improvement in all businesses Further improvement in credit quality Continued strengthening of Tier 1 capital Which new Bank is meeting early expectations Share Buy-Back announced |
| Presentation of Half Year Results for period ended 31 December 2003 David Murray Chief Executive Officer Michael Cameron Chief Financial Officer 11 February 2004 www.commbank.com.au |

| Supplementary Slides |
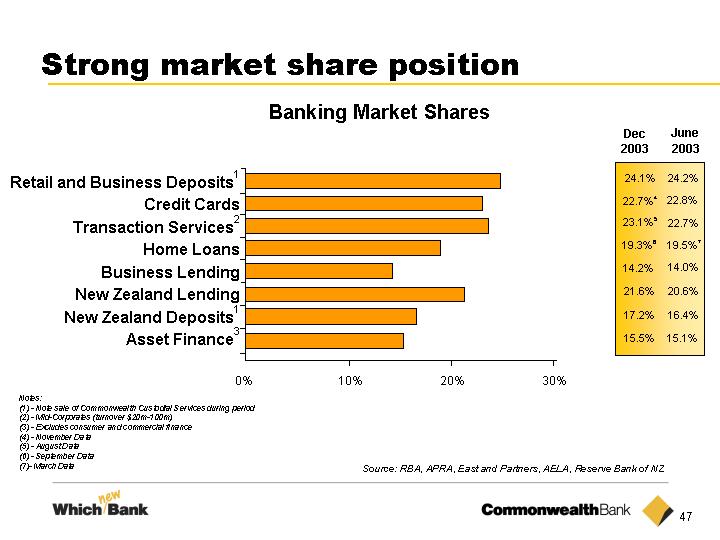
| Strong market share position Source: RBA, APRA, East and Partners, AELA, Reserve Bank of NZ Banking Market Shares Retail and Business Deposits1 Credit Cards Transaction Services2 Home Loans Business Lending New Zealand Lending New Zealand Deposits1 Asset Finance3 0% 10% 20% 30% 24.1% 23.1%5 19.3%6 14.2% 15.5% 21.6% 17.2% 22.7%4 2003 2003 June 24.2% 22.7% 14.0% 15.1% 20.6% 16.4% 22.8% Notes: (1) - Note sale of Commonwealth Custodial Services during period (2) - Mid-Corporates (turnover $20m-100m) (3) - Excludes consumer and commercial finance (4) - November Data (5) - August Data (6) - September Data (7)- March Data Dec 19.5%7 |
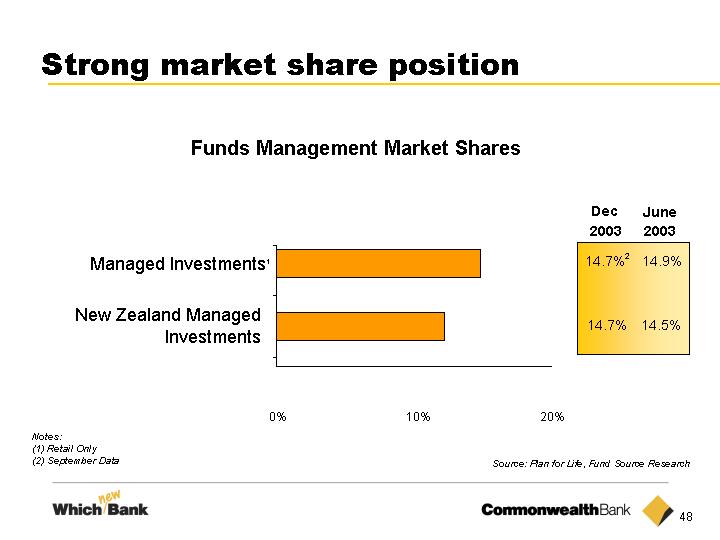
| Strong market share position Funds Management Market Shares Managed Investments1 0% 10% 20% New Zealand Managed Investments 14.7% 14.7%2 2003 2003 June 14.5% 14.9% Source: Plan for Life, Fund Source Research Notes: (1) Retail Only (2) September Data Dec |

| Strong market share position Life Insurance Market Shares New Zealand1 0% 10% 20% 30% 40% Australia Hong Kong 2003 2003 June 28.3% 15.3% 2.2% Source: ISI Statistics, Plan for Life, HK Insurance Association Notes: (1) In-force Business (2) September Data 28.1%2 15.1%2 2.2%2 Dec |

| Arrears in consumer book remain at low levels |

| CBA ANZ NAB WBC Credit ratios are in line with peers |
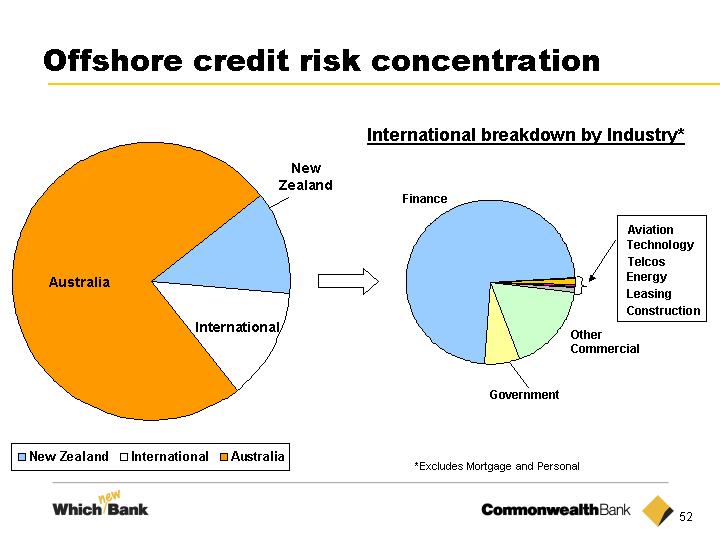
| Offshore credit risk concentration Other Commercial Government Finance International breakdown by Industry* Australia New Zealand International *Excludes Mortgage and Personal |
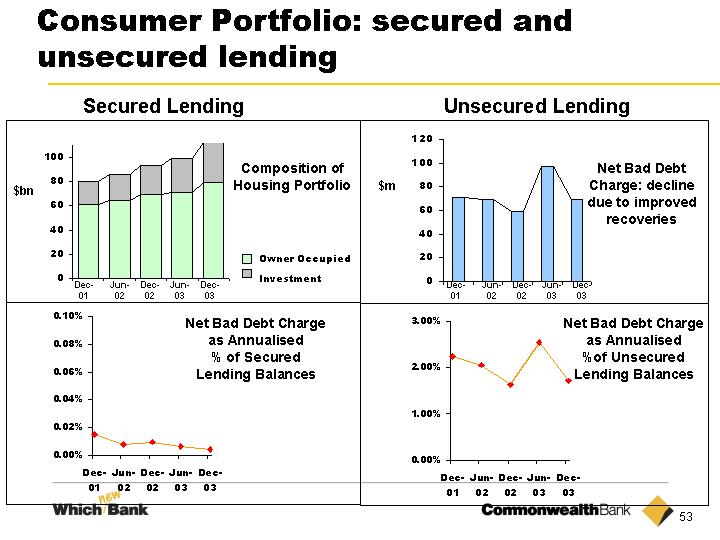
| Consumer Portfolio: secured and unsecured lending Net Bad Debt Charge as Annualised % of Secured Lending Balances Owner Occupied Investment $bn Composition of Housing Portfolio Secured Lending $m Net Bad Debt Charge: decline due to improved recoveries Unsecured Lending Net Bad Debt Charge as Annualised %of Unsecured Lending Balances Dec- 01 Jun- 02 Dec- 02 Jun- 03 Dec- 03 Dec- 01 Jun- 02 Dec- 02 Jun- 03 Dec- 03 |

| Credit Exposure - Energy Sector 81% 9% 5% 4% Australia (79% investment grade) $4,302 211 580 2,348 1,163 $m 1% New Zealand (100% investment grade) Asia (96% investment grade) Europe (100% investment grade) Americas (33% investment grade) Credit Exposure is measured as the higher of limit or credit equivalent balance for committed exposures and credit equivalent balance for uncommitted exposures |

| Credit Exposure - Telcos Sector 87% 14% Australia (75% investment grade) Europe (100% investment grade) $788 102 107 293 286 $m Credit Exposure is measured as the higher of limit or credit equivalent balance for committed exposures and credit equivalent balance for uncommitted exposures |

| Credit Exposure - Technology Sector 90% 7% 3% $1,108 276 125 661 45 $m Australia (76% investment grade) North America (100% investment grade) Other (19% investment grade) Credit Exposure is measured as the higher of limit or credit equivalent balance for committed exposures and credit equivalent balance for uncommitted exposures |
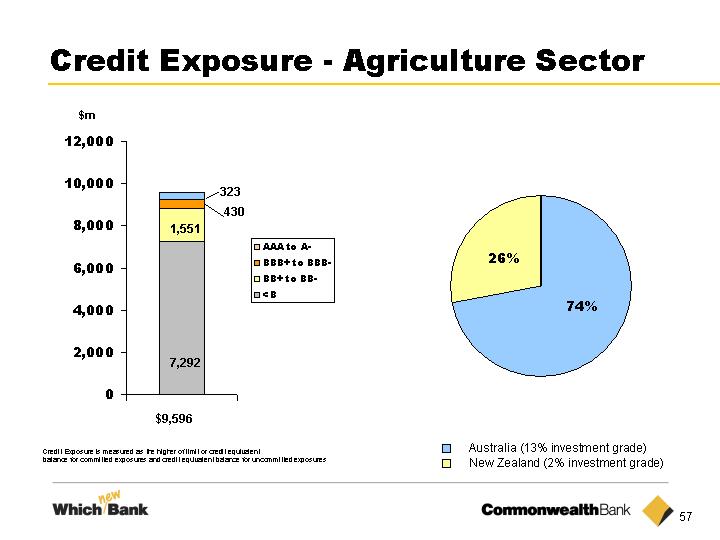
| Credit Exposure - Agriculture Sector 74% 26% $9,596 $m Australia (13% investment grade) New Zealand (2% investment grade) 1,551 7,292 430 323 Credit Exposure is measured as the higher of limit or credit equivalent balance for committed exposures and credit equivalent balance for uncommitted exposures |
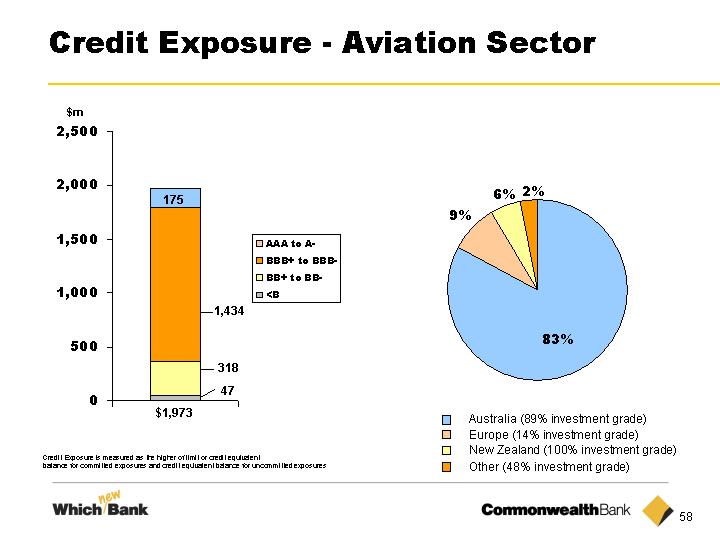
| Credit Exposure - Aviation Sector 83% 9% 6% New Zealand (100% investment grade) Australia (89% investment grade) Europe (14% investment grade) $1,973 47 318 1,434 175 $m Credit Exposure is measured as the higher of limit or credit equivalent balance for committed exposures and credit equivalent balance for uncommitted exposures 2% Other (48% investment grade) |
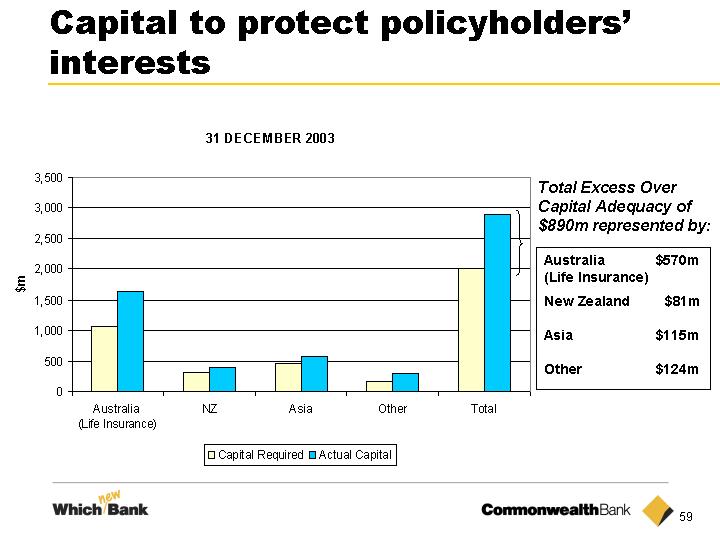
| Total Excess Over Capital Adequacy of $890m represented by: Australia $570m (Life Insurance) New Zealand $81m Asia $115m Other $124m Capital to protect policyholders' interests |
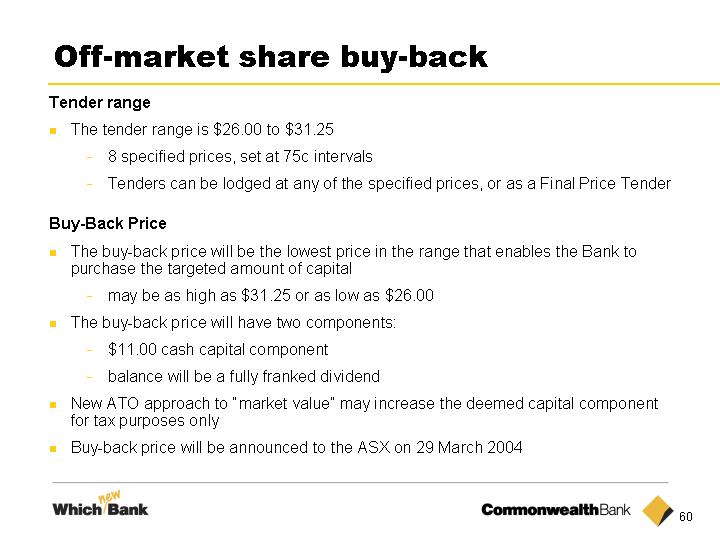
| Off-market share buy-back Tender range The tender range is $26.00 to $31.25 8 specified prices, set at 75c intervals Tenders can be lodged at any of the specified prices, or as a Final Price Tender Buy-Back Price The buy-back price will be the lowest price in the range that enables the Bank to purchase the targeted amount of capital may be as high as $31.25 or as low as $26.00 The buy-back price will have two components: $11.00 cash capital component balance will be a fully franked dividend New ATO approach to "market value" may increase the deemed capital component for tax purposes only Buy-back price will be announced to the ASX on 29 March 2004 |

| Off-market share buy-back Tender rules Only shares tendered at or below the buy-back price will be bought back Tenders at the buy-back price may be subject to scale back All successful tenderers will receive the same buy-back price Shares tendered above the buy-back price will not be bought back Scale back mechanism If more shares are tendered at and below the buy-back price than the Bank wishes to buy back, then shares tendered at the buy-back price will be subject to scale back Special rules to ensure small shareholders are not disadvantaged If the buy-back price is $26.00, the first 200 shares tendered at $26.00 or as a Final Price Tender will be bought back from each participant prior to any scale back |

| Off-market share buy-back The 45-day rule To qualify for franking credit benefits, shareholders must generally have held their shares at risk for at least 45 days From discussions with the ATO, the Bank understands that a shareholder who acquires shares on or after 12 February 2004 may fail the 45 day rule (final ATO Class Ruling pending) Details on how to participate Each shareholder eligible to participate in the buy-back will receive a personalised Tender Form Issuer Sponsored Holders need to complete and sign the Tender Form and forward it to the Bank's share registry CHESS Holders need to contact their controlling participant Shareholders intending to sell their entire holding through the buy-back may also consider withdrawing from the Bank's dividend reinvestment plan |
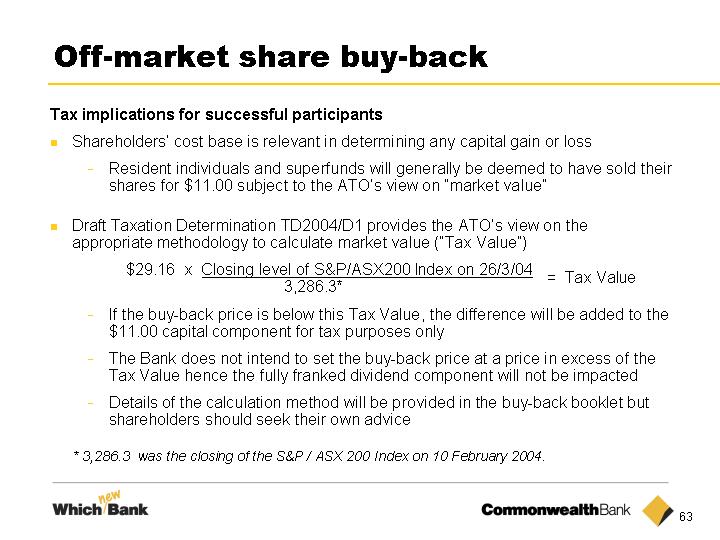
| Off-market share buy-back Tax implications for successful participants Shareholders' cost base is relevant in determining any capital gain or loss Resident individuals and superfunds will generally be deemed to have sold their shares for $11.00 subject to the ATO's view on "market value" Draft Taxation Determination TD2004/D1 provides the ATO's view on the appropriate methodology to calculate market value ("Tax Value") $29.16 x Closing level of S&P/ASX200 Index on 26/3/04 3,286.3* If the buy-back price is below this Tax Value, the difference will be added to the $11.00 capital component for tax purposes only The Bank does not intend to set the buy-back price at a price in excess of the Tax Value hence the fully franked dividend component will not be impacted Details of the calculation method will be provided in the buy-back booklet but shareholders should seek their own advice * 3,286.3 was the closing of the S&P / ASX 200 Index on 10 February 2004. = Tax Value |
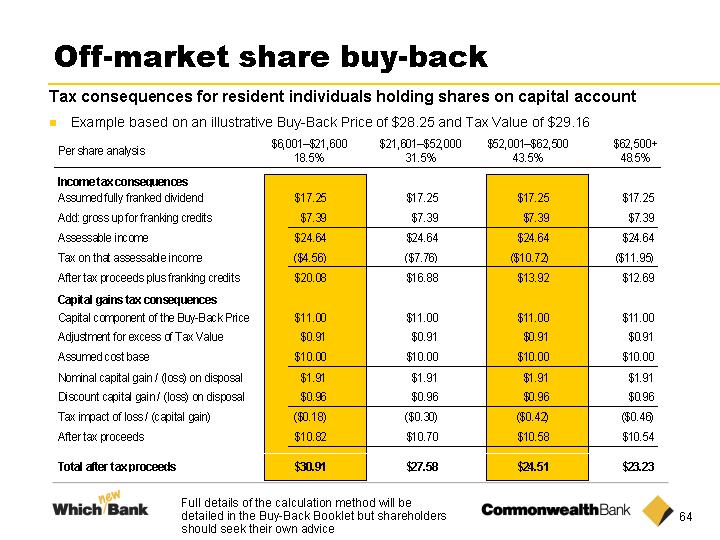
| Off-market share buy-back Tax consequences for resident individuals holding shares on capital account Example based on an illustrative Buy-Back Price of $28.25 and Tax Value of $29.16 Full details of the calculation method will be detailed in the Buy-Back Booklet but shareholders should seek their own advice |
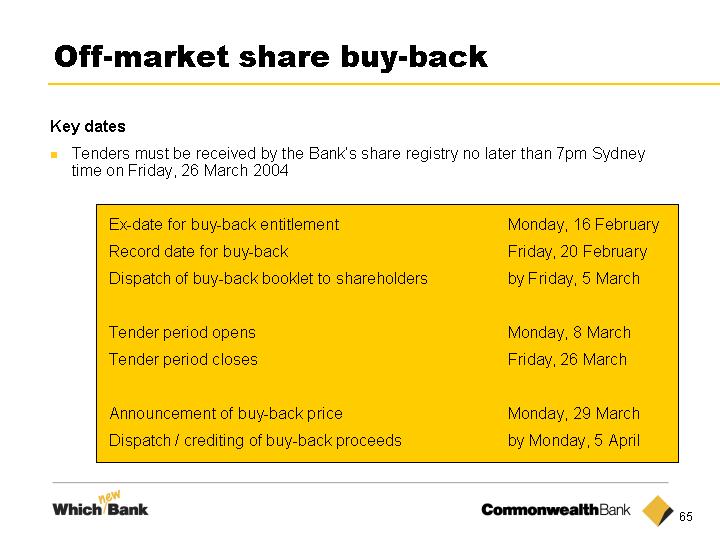
| Off-market share buy-back Key dates Tenders must be received by the Bank's share registry no later than 7pm Sydney time on Friday, 26 March 2004 Ex-date for buy-back entitlement Monday, 16 February Record date for buy-back Friday, 20 February Dispatch of buy-back booklet to shareholders by Friday, 5 March Tender period opens Monday, 8 March Tender period closes Friday, 26 March Announcement of buy-back price Monday, 29 March Dispatch / crediting of buy-back proceeds by Monday, 5 April |

| Total income segmentation at 31 December 2003 (1) (1) (2) (1) Excludes policyholder tax (2) Excludes internal funds management income |