INDEX TO EXHIBIT
| | | |
| Exhibit No. | | Description |
| 1) | | Profit Announcement Media Release |
| 2) | | Half Year Profit Announcement for 31 December 2005 |
| 3) | | Presentation Of Half Year Results for 31 December 2005. |
Media Release Media Release
Communication, Community & Reputation
GPO Box 2719
Sydney NSW 1155
www.commbank.com.au
COMMONWEALTH BANK DELIVERS STRONG RESULT
Another record Interim Dividend declared
Overview
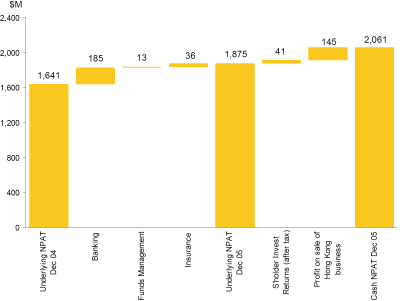
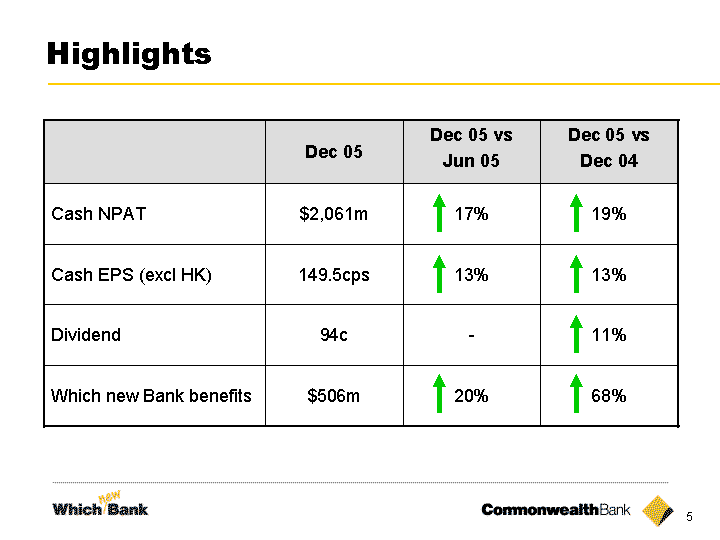
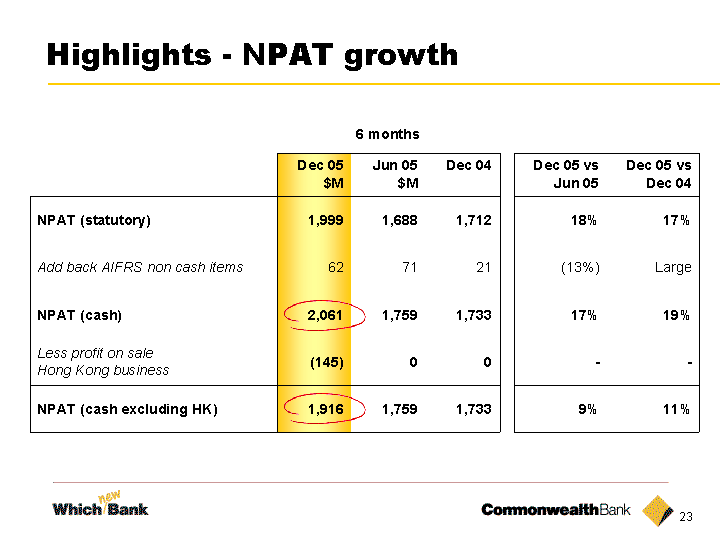
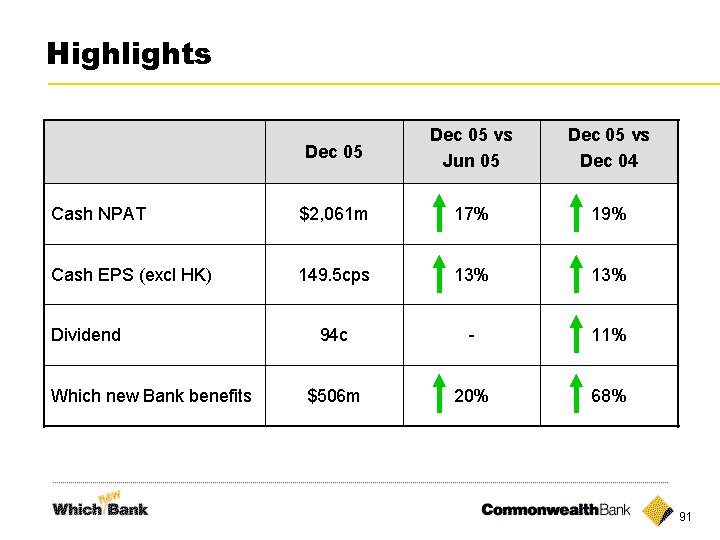
The Commonwealth Bank of Australia today announced a statutory net profit after tax (NPAT) for the six months to 31 December 2005 of $1,999 million, an increase of 18 percent on the prior six month period. Cash NPAT was up 17 percent, to $2,061 million.
Excluding the one-off impact from the $145 million profit on the sale of the Bank’s Hong Kong based insurance business, cash NPAT was up 9 percent on the prior period and 11 percent on the prior comparable period to $1,916 million. Cash earnings per share, again excluding the impact of the Hong Kong sale, increased 13 percent to 149.5 cents per share.
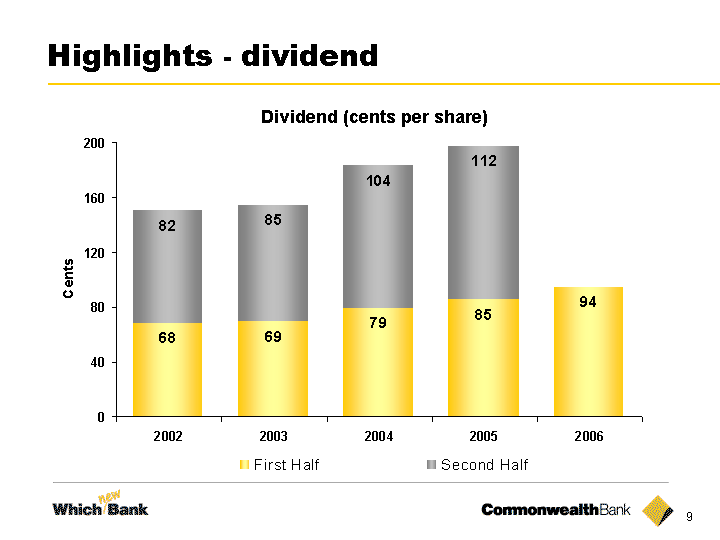
A fully franked dividend of 94 cents per share was declared, an increase of 11 percent on the 2005 interim dividend of 85 cents per share. The dividend will be paid on 5 April 2006.
Commonwealth Bank Chief Executive, Ralph Norris said: “This is a strong result. The earnings momentum from the prior fiscal year has been maintained despite some slowing in economic activity, particularly in consumer credit growth. We remain on track to deliver earnings per share growth for the 2006 fiscal year which equals or exceeds the average of our peers.”
“In a competitive market, we focused on profitable growth and all our businesses performed well. A combination of solid volume growth, effective margin management and tight cost control have all contributed to this excellent result. It is pleasing to note that in this very competitive environment, we have been able to maintain a high degree of margin stability for the last four halves.”
“We experienced good growth and stable margins in home lending, despite the slowing in retail system credit growth. In business banking, our volume growth was ahead of the market while our funds management business attracted strong inflows. ASB again outperformed in a competitive market.”
“Which new Bank is not only on track to deliver financial benefits ahead of our estimates but will also provide a solid platform for future profitable growth. If we are to meet our aspiration of being Australia’s finest financial services organisation, however, we must engage our people more effectively and demonstrate to our customers that we can provide them with the service they deserve. Our priority is to deliver these outcomes.”
“The Bank’s financial position is strong, we have positive earnings momentum and credit quality remains good. These factors leave us with a strong capital base which allowed us to increase the interim dividend by 11 percent. “
Media Release Media Release
Communication, Community & Reputation
GPO Box 2719
Sydney NSW 1155
www.commbank.com.au
The previously announced $500 million on market buy back, scheduled to complete on 28 April 2006, has been extended to complete on 28 October 2006.
Business Performance
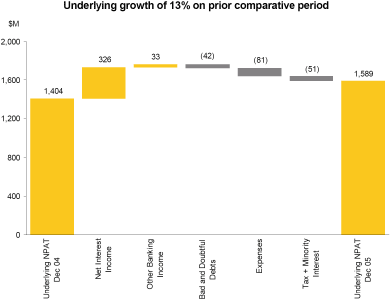
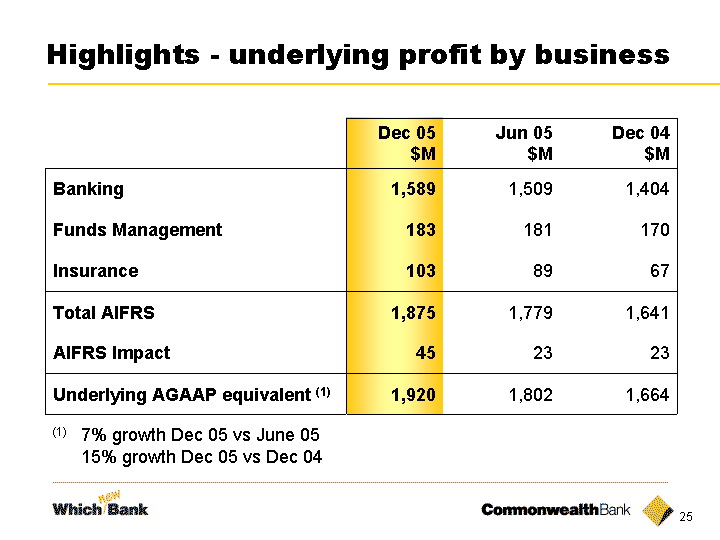
The underlying NPAT from the banking business was $1,589 million, up 5 percent on the prior half and 13 percent on the comparable period last year. This performance was underpinned by solid volume growth, a stable net interest margin and disciplined cost control programmes.
The retail banking operations performed well with strong revenue growth and further productivity gains. The increase in retail deposits growth was particularly pleasing, with the Bank responding to increased price-based competition through segmented product offers, including the launch of NetBank Saver in June.
Asset growth was lower over the half consistent with the general softening in system credit growth. Home loan market share was down slightly but margins were maintained, as the Bank elected not to match the aggressive discounting of some competitors. Unsecured credit growth was also lower, reflecting more subdued consumer demand and competition from low rate credit cards.
In Premium Business Services, the global markets business delivered a strong result, primarily due to good capital markets performance. The working capital services business maintained its leading position in transaction banking and merchant acquiring, despite increased competition. Business lending market share improved 27 bpts on June 2005.
ASB’s operating environment was impacted by the New Zealand Reserve Bank’s decision to increase the official cash rate twice during the period. Notwithstanding this monetary tightening, house sales and the lending market remained buoyant. ASB again achieved above market growth across its loan portfolio, despite intense competition.
During the half year, the Bank acquired a 19.9 percent interest in Hangzhou City Commercial Bank (HZB) for $102 million. HZB is one of China’s top five city commercial banks by assets. This investment further supports the Bank’s existing business strategy in China with both banks delivering performances which exceeded expectations.
In the Funds Management business, underlying profit before tax of $261 million represented an increase of 22 percent over the prior comparative period and was up 7 percent compared to the prior half year. After tax growth was adversely impacted by a significantly higher effective tax rate (due mainly to the loss of transitional tax relief). Funds under administration grew 11 percent to $137 billion, which outpaced underlying market growth. This was the result of favourable investment markets and continued improvements in net funds flow.
The insurance business delivered strong profit growth with underlying NPAT of $103 million, up 54 percent on the prior comparative period and 16 percent on the prior half year. This was achieved through solid income growth in both Australia and New Zealand.
Media Release Media Release
Communication, Community & Reputation
GPO Box 2719
Sydney NSW 1155
www.commbank.com.au
Outlook
The Australian economy performed well in the second half of the 2005 calendar year, despite some loss of momentum. Business credit growth has been solid, supported by infrastructure and capacity expansion while consumer credit growth has moderated.
The overall environment for financial services businesses is expected to remain highly competitive and as a result margin pressure will continue. Domestic credit quality, high employment levels and business confidence are strong and provide a positive outlook. Offshore, economic growth is likely to remain solid although oil prices and the rate of growth of the Chinese economy are two factors which are particularly likely to influence the domestic economy.
In February 2005, the Bank increased its expected compound annual growth rate in cash earnings per share for the period 2003 to 2006 from exceeding 10 percent per annum to exceeding 12 percent per annum. Subject to market conditions, the Bank is reconfirming that it remains committed to at least achieving this goal. Seven months into the 2006 fiscal year, the Bank remains confident that the momentum within the business will ensure that the Bank delivers EPS growth which equals or exceeds the average of its peers. As a consequence, the Bank expects dividend per share for the second half of the year to further increase, subject to the factors considered in its dividend policy.
ENDS
Media contact:
Bryan Fitzgerald
General Manager, Media and Issues Management
Communication, Community and Reputation
Commonwealth Bank of Australia
Ph: (02) 9378 2663
Mobile: 0414 789 649
Media Release Media Release
Communication, Community & Reputation
GPO Box 2719
Sydney NSW 1155
www.commbank.com.au
| | | | | | | | | | | | | | | | | | | | | |
| | | | | | | | | | | | | | | Dec 05 v | | | Dec 05 v | |
| | | 31/12/05 | | | 30/06/05 | | | 31/12/04 | | | Jun 05 | | | Dec 04 | |
| Highlights | | $m | | | $m | | | $m | | | % | | | % | |
| |
| Banking | | | 1,589 | | | | 1,509 | | | | 1,404 | | | | 5 | | | | 13 | |
| Funds Management | | | 183 | | | | 181 | | | | 170 | | | | 1 | | | | 8 | |
| Insurance | | | 103 | | | | 89 | | | | 67 | | | | 16 | | | | 54 | |
| | | |
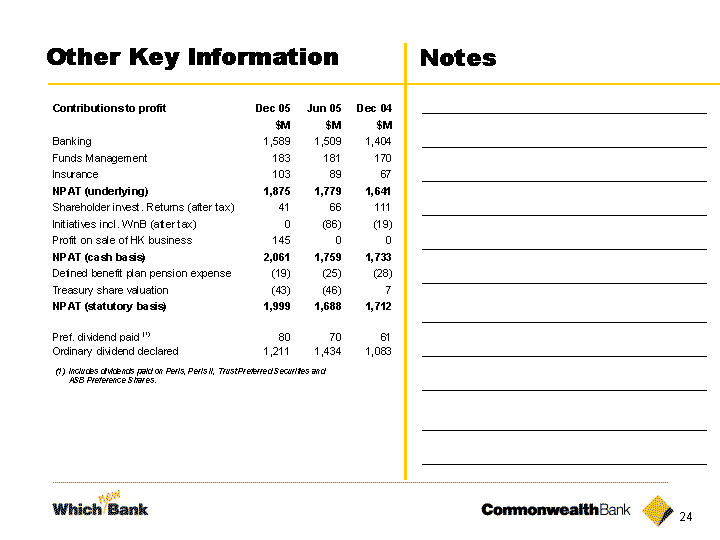
Net profit after tax (underlying basis) | | | 1,875 | | | | 1,779 | | | | 1,641 | | | | 5 | | | | 14 | |
| | | |
| Add profit on sale of the Hong Kong Business | | | 145 | | | | — | | | | — | | | | — | | | | — | |
| Add Shareholder Investment returns (after Tax) | | | 41 | | | | 66 | | | | 111 | | | | — | | | | — | |
| Less WnB expenses | | | — | | | | (86 | ) | | | (19 | ) | | | — | | | | — | |
| | | |
Net profit after tax (cash basis) | | | 2,061 | | | | 1,759 | | | | 1,733 | | | | 17 | | | | 19 | |
| | | |
| Less AIFRS non cash items | | | (62 | ) | | | (71 | ) | | | (21 | ) | | | — | | | | — | |
| | | |
Net profit after tax (statutory basis) | | | 1,999 | | | | 1,688 | | | | 1,712 | | | | 18 | | | | 17 | |
Key Shareholder Ratios | | | 31/12/05 | | | | 30/06/05 | | | | 31/12/04 | | | | | | | | | |
| Earnings per share (cash basis — basic) | | | 160.9 | | | | 132.7 | | | | 132.1 | | | | 21 | | | | 22 | |
| Return on equity (%) (cash basis) | | | 21.7 | | | | 18.8 | | | | 19.0 | | | 290bpts | | 270bpts |
| Dividend per share (fully franked) | | | 94 | | | | 112 | | | | 85 | | | | (16 | ) | | | 11 | |
| Dividend payout ratio (%) (cash basis) | | | 58.8 | | | | 84.9 | | | | 64.8 | | | | — | | | | — | |
Other Performance Indicators | | | 31/12/05 | | | | 30/06/05 | | | | 31/12/04 | | | | | | | | | |
| Total lending assets (net of securitisation) ($m) | | | 254,947 | | | | 235,862 | | | | 224,220 | | | | 8 | | | | 14 | |
| Total assets held and funds under administration ($m) | | | 466,950 | | | | 437,509 | | | | 419,578 | | | | 7 | | | | 11 | |
| Net interest margin (%) | | | 2.41 | | | | 2.44 | | | | 2.43 | | | (3)bpts | | (2)bpts |
| Banking expense to income (%) | | | 48.1 | | | | 50.7 | | | | 50.5 | | | | 5.1 | | | | 4.8 | |
| Funds management expense to average FUA (%) | | | 0.70 | | | | 0.71 | | | | 0.73 | | | | 1.4 | | | | 4.1 | |
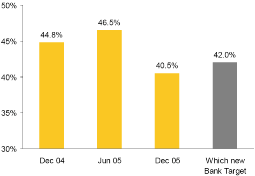
| Insurance expense to average in-force premiums (%) | | | 40.5 | | | | 46.6 | | | | 44.9 | | | | 13.1 | | | | 9.8 | |
Definitions:
NPAT (“Cash Basis”) — Represents profit after tax and minority interests before superannuation plan expenses and treasury shares valuation adjustment.
NPAT (“Underlying Basis”) — Represents NPAT (“Cash Basis”) excluding WnB initiatives, shareholder investment returns and profit on sale of the Hong Kong business.
NPAT (“Statutory Basis”) — Represents profit after tax, minority interests, defined benefit superannuation plan expenses and treasury shares. This is equivalent to the statutory item “Net Profit attributable to Members of the Group”.

| Presentation of Half Year Results for 31 December 2005 Ralph Norris Michael Cameron Chief Executive Officer Chief Financial Officer 15 February 2006 |
| The material that follows is a presentation of general background information about the Bank's activities current at the date of the presentation, 15 February 2006. It is information given in summary form and does not purport to be complete. It is not intended to be relied upon as advice to investors or potential investors and does not take into account the investment objectives, financial situation or needs of any particular investor. These should be considered, with or without professional advice when deciding if an investment is appropriate. Disclaimer |
| Agenda Half Year Results - Ralph Norris Highlights Outlook Half Year Results - Michael Cameron Questions |
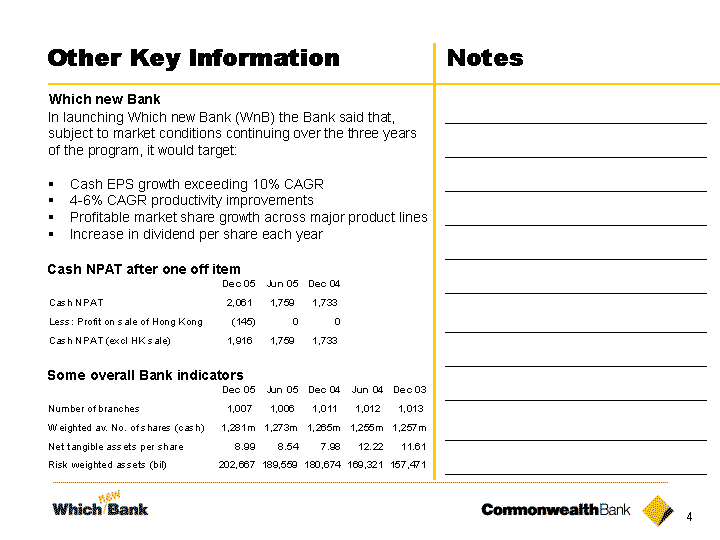
| Other Key Information Notes In launching Which new Bank (WnB) the Bank said that, subject to market conditions continuing over the three years of the program, it would target: Cash EPS growth exceeding 10% CAGR 4-6% CAGR productivity improvements Profitable market share growth across major product lines Increase in dividend per share each year Which new Bank Some overall Bank indicators Cash NPAT after one off item Cash NPAT after one off item |
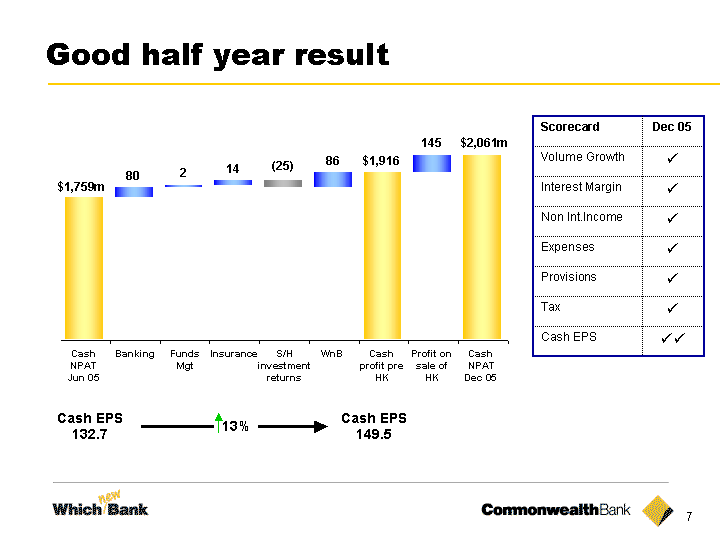
| Good half year result Cash EPS 132.7 Cash EPS 149.5 13% Scorecard Dec 05 Volume Growth ? Interest Margin ? Non Int.Income ? Expenses ? Provisions ? Tax ? Cash EPS ?? Cash NPAT Jun 05 Banking Funds Mgt Insurance S/H investment returns WnB Profit on sale of HK Cash NPAT Dec 05 $1,759m $2,061m 80 2 14 (25) 145 86 $1,916 Cash profit pre HK HK HK HK |
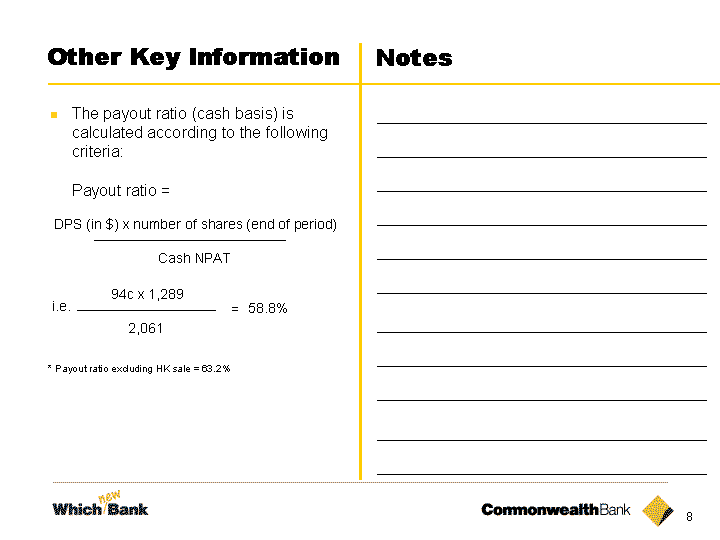
| Other Key Information The payout ratio (cash basis) is calculated according to the following criteria: Payout ratio = Notes DPS (in $) x number of shares (end of period) Cash NPAT 94c x 1,289 2,061 i.e. = 58.8% * Payout ratio excluding HK sale = 63.2% |
| Highlights - dividend Dividend (cents per share) Dividend (cents per share) |

| Other Key Information Notes APRA personal lending published data began in March 2004 APRA definition was restated in 2004 Note: Under the Administrator view, badged or white-labelled products are attributed to the underlying administrator of the product. The alternative Marketer view attributes such business to the marketer of the product of the product. The alternative Marketer view attributes such business to the marketer of the product of the product. The alternative Marketer view attributes such business to the marketer of the product of the product. The alternative Marketer view attributes such business to the marketer of the product of the product. The alternative Marketer view attributes such business to the marketer of the product |
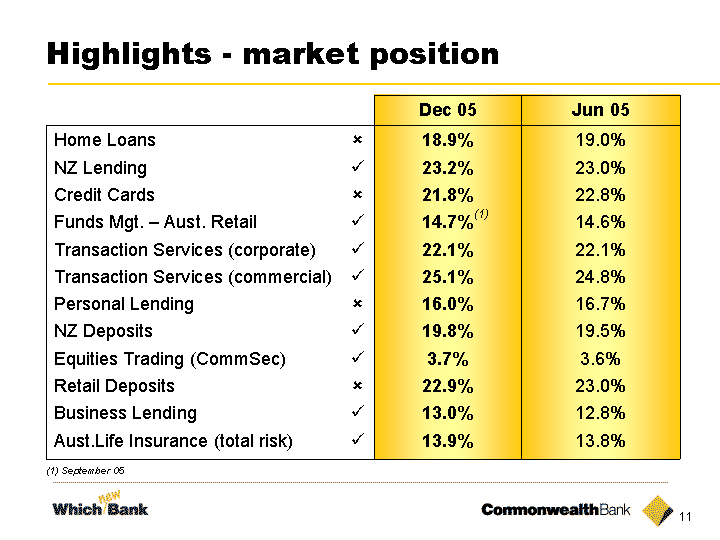
| Highlights - market position (1) September 05 (1) (1) (1) |
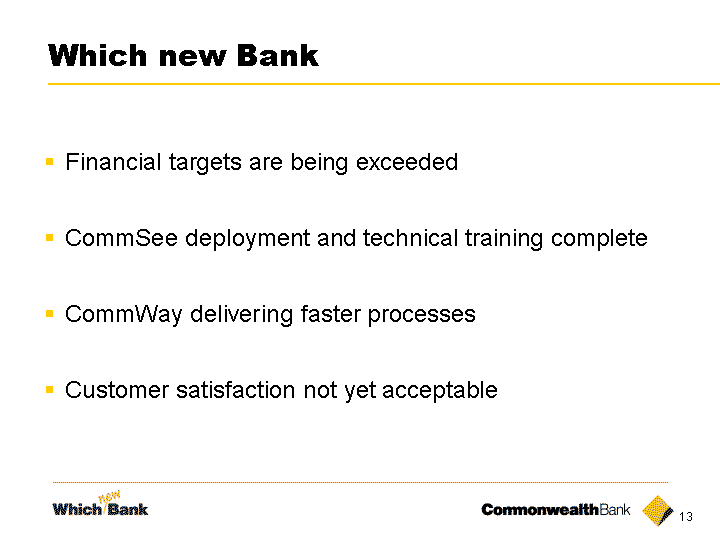
| Which new Bank Financial targets are being exceeded CommSee deployment and technical training complete CommWay delivering faster processes Customer satisfaction not yet acceptable |
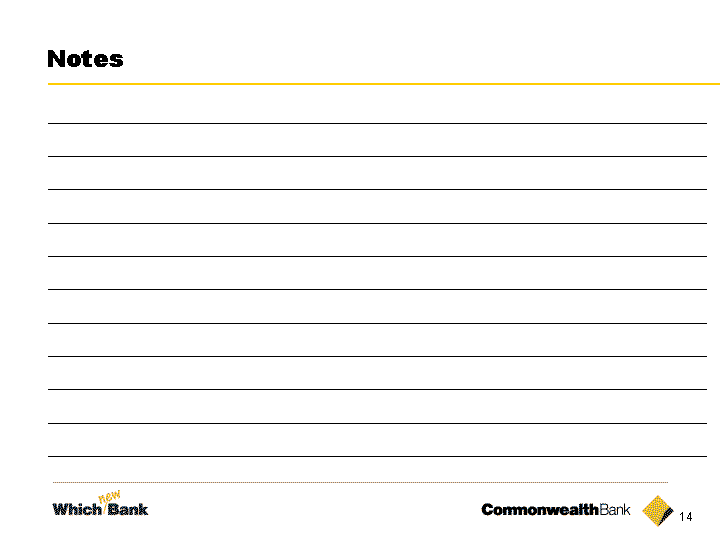
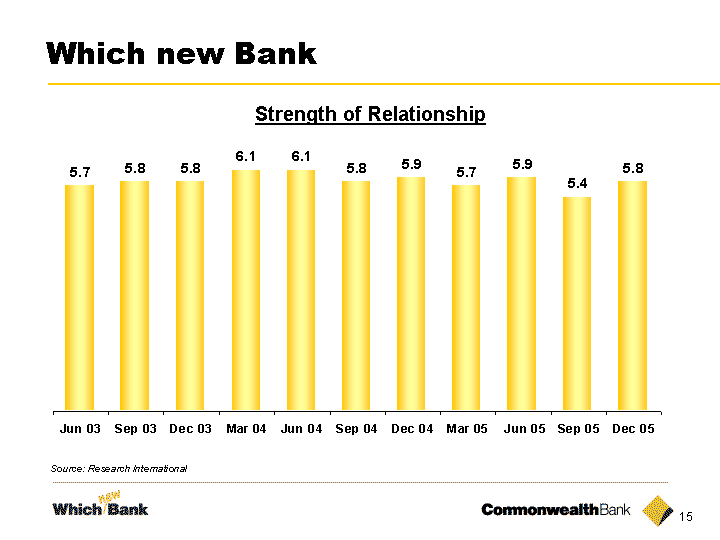
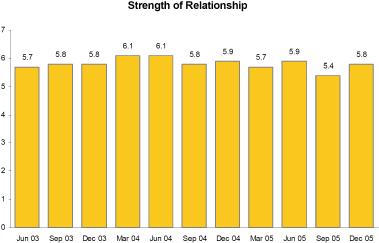
| Which new Bank Source: Research International Strength of Relationship Strength of Relationship |
| CEO Priorities Customer Service Business Banking Technology Trust & Team Spirit Superior operating and financial results |
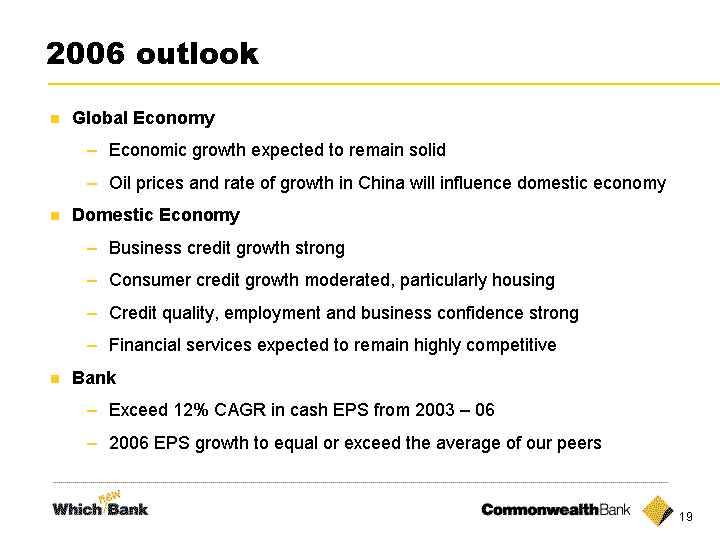
| 2006 outlook Global Economy Economic growth expected to remain solid Oil prices and rate of growth in China will influence domestic economy Domestic Economy Business credit growth strong Consumer credit growth moderated, particularly housing Credit quality, employment and business confidence strong Financial services expected to remain highly competitive Bank Exceed 12% CAGR in cash EPS from 2003 - 06 2006 EPS growth to equal or exceed the average of our peers |

| Michael Cameron Half Year Results |
| Highlights - NPAT growth Highlights - NPAT growth |
| Notes Other Key Information (1) Includes dividends paid on Perls, Perls II, Trust Preferred Securities and ASB Preference Shares. ASB Preference Shares. ASB Preference Shares. |
| Highlights - underlying profit by business (1) 7% growth Dec 05 vs June 05 15% growth Dec 05 vs Dec 04 15% growth Dec 05 vs Dec 04 15% growth Dec 05 vs Dec 04 |
| Other Key Information Notes Notes |
| Highlights - productivity (1) On a cash basis (3) Expense to income (4) Expense to average inforce premiums (5) Expense to average funds under administration (2) AGAAP equivalent basis (2) AGAAP equivalent basis |

| Other Key Information Notes Notes |
| Operating expenses by half year 15 21 20 Dec 04 Jun 05 Dec 05 Other $M Compliance Projects $M +1% +3% +3% |
| Other Key Information Notes Which New Bank estimates Benefits 2004 2005 2006 Est. 237 200 900 620 Actual Targets (1) (1) These were the original full year targets set out in the September 2003 presentation 724 Capitalised branch refurbishment costs are amortised over 10 years and capitalised IT costs are amortised over 2.5yrs. Investment spend Original 2004 Act. 2005 Act. 2006 Est. 660 510 310 634 601 245 Revised Total 1,480 1,480 |
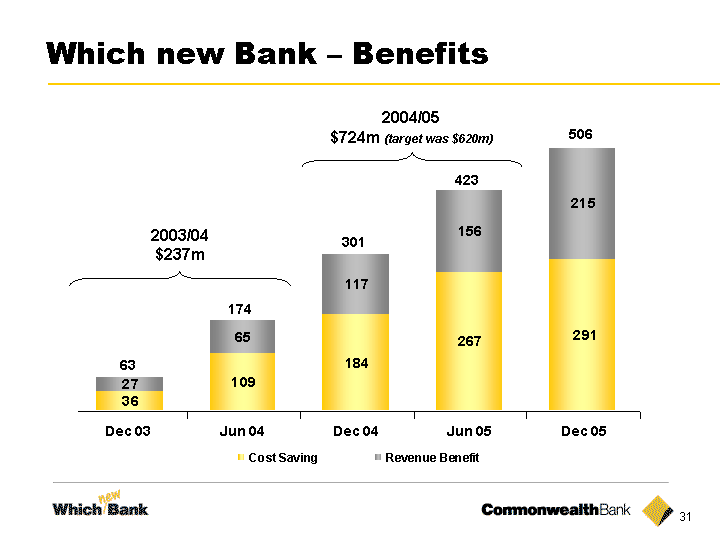
| Which new Bank - Benefits 63 174 301 Dec 03 Jun 04 Dec 04 Jun 05 2003/04 $237m 2004/05 $724m (target was $620m) 423 506 Dec 05 Dec 05 |
| Other Key Information Notes Notes |
| Which new Bank - Expenditure Which new Bank - Expenditure |
| Segment Results : Banking |
| Other Key Information Notes (1) Has been adjusted to remove effect of securitisation (1) Has been adjusted to remove effect of securitisation |
| Banking - underlying profit 13% underlying profit growth on pcp Margin maintained in competitive market Strong growth in net interest income Cost to income ratio continues to improve Underlying profit up 5% since June 05 Dec 04 Dec 05 NII Other income BDD Expenses Tax & OEI 1,589 216 (59) (12) (19) (46) 1,509 Jun 05 1,404 1,404 |
| Other Key Information Notes (1) Refer page 93 for a reconciliation of Net Interest Income (AIFRS to AGAAP equivalent) (1) Refer page 93 for a reconciliation of Net Interest Income (AIFRS to AGAAP equivalent) |
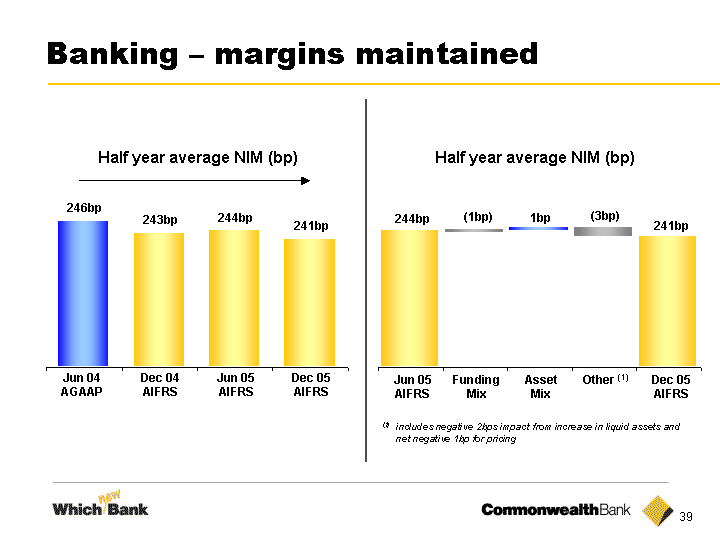
| Banking - margins maintained Half year average NIM (bp) Half year average NIM (bp) 244bp (1bp) Dec 05 AIFRS Funding Mix Asset Mix Other (1) Dec 04 AIFRS Jun 05 AIFRS Dec 05 AIFRS 1bp (3bp) 241bp 243bp 244bp 241bp Jun 05 AIFRS 246bp Jun 04 AGAAP (1) includes negative 2bps impact from increase in liquid assets and net negative 1bp for pricing net negative 1bp for pricing net negative 1bp for pricing |
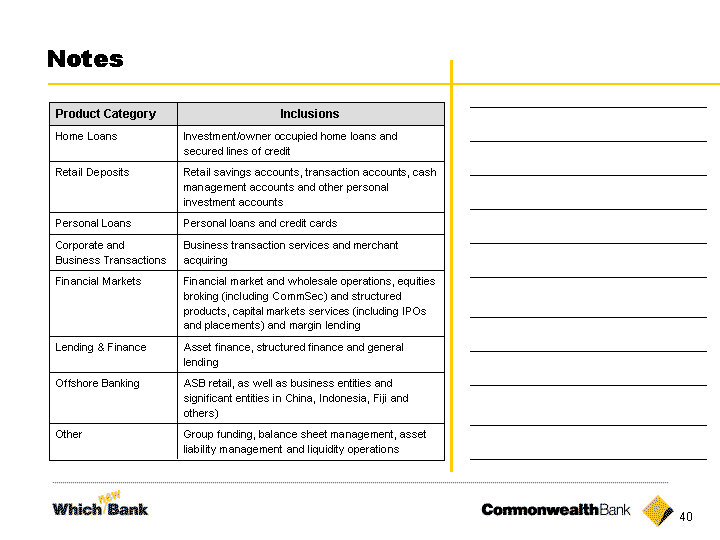
| Notes Product Category Inclusions Home Loans Investment/owner occupied home loans and secured lines of credit Retail Deposits Retail savings accounts, transaction accounts, cash management accounts and other personal investment accounts Personal Loans Personal loans and credit cards Corporate and Business Transactions Business transaction services and merchant acquiring Financial Markets Financial market and wholesale operations, equities broking (including CommSec) and structured products, capital markets services (including IPOs and placements) and margin lending Lending & Finance Asset finance, structured finance and general lending Offshore Banking ASB retail, as well as business entities and significant entities in China, Indonesia, Fiji and others) Other Group funding, balance sheet management, asset liability management and liquidity operations |
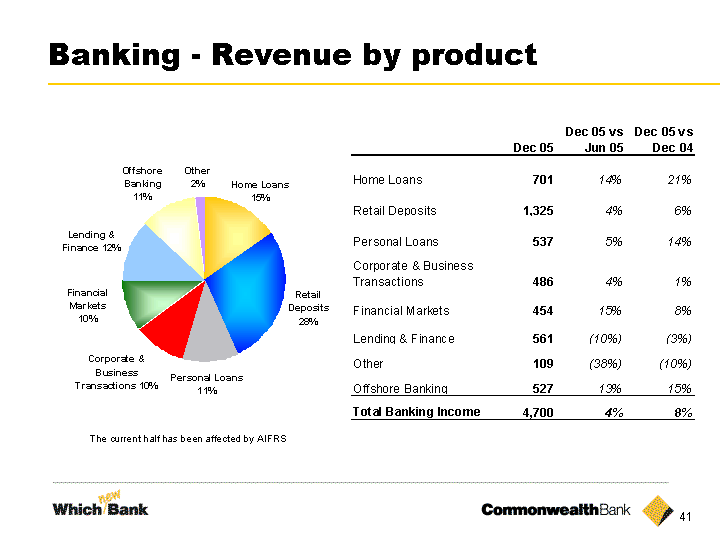
| Banking - Revenue by product The current half has been affected by AIFRS The current half has been affected by AIFRS The current half has been affected by AIFRS |
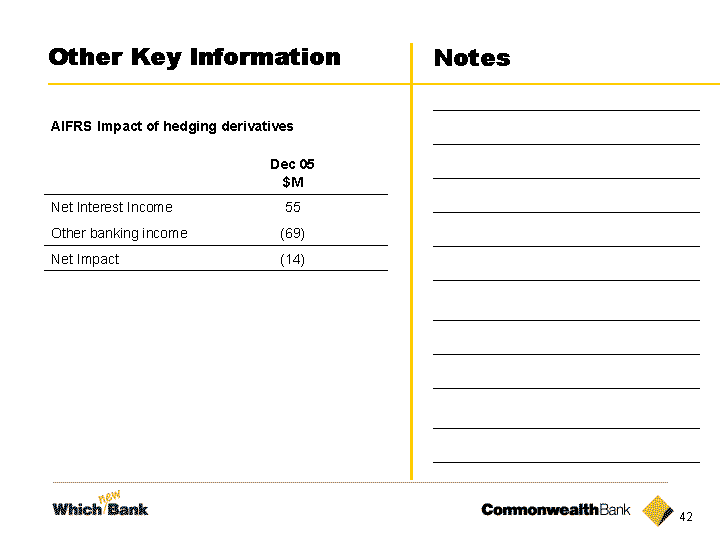
| Other Key Information Notes Notes |
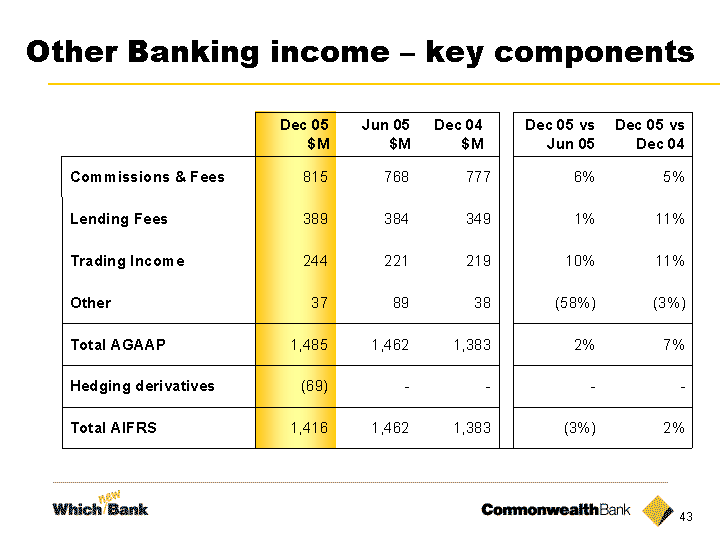
| Other Banking income - key components Other Banking income - key components |
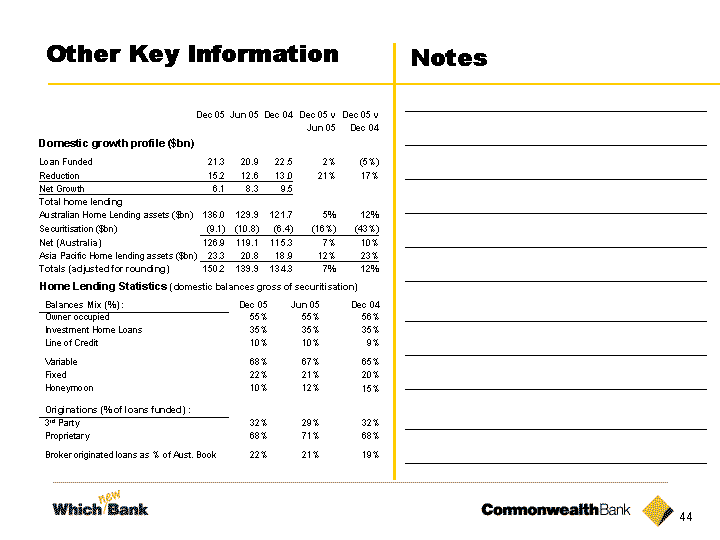
| Other Key Information Notes Notes |
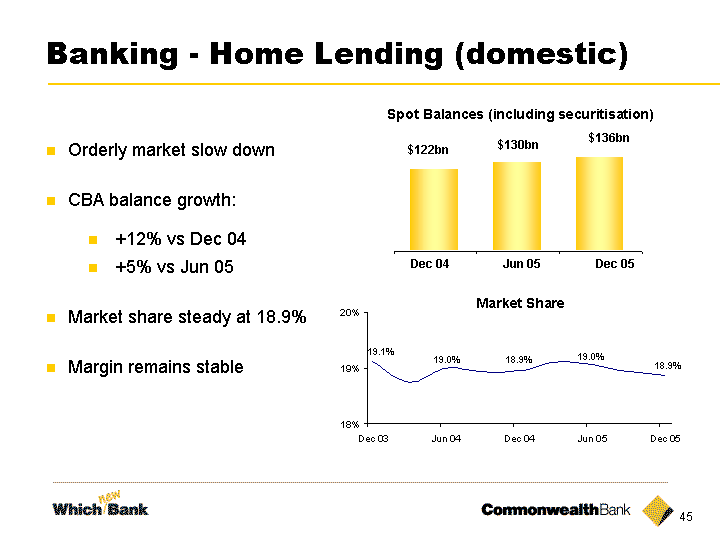
| Banking - Home Lending (domestic) Orderly market slow down CBA balance growth: +12% vs Dec 04 +5% vs Jun 05 Market share steady at 18.9% Margin remains stable Spot Balances (including securitisation) Market Share Dec 04 Jun 05 Dec 05 $122bn $130bn $136bn $136bn |
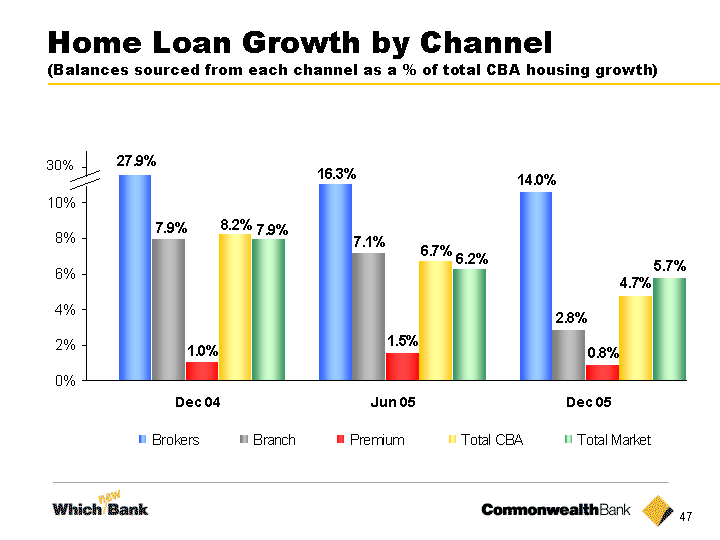
| Home Loan Growth by Channel (Balances sourced from each channel as a % of total CBA housing growth) (Balances sourced from each channel as a % of total CBA housing growth) (Balances sourced from each channel as a % of total CBA housing growth) Dec 04 Jun 05 Dec 05 |
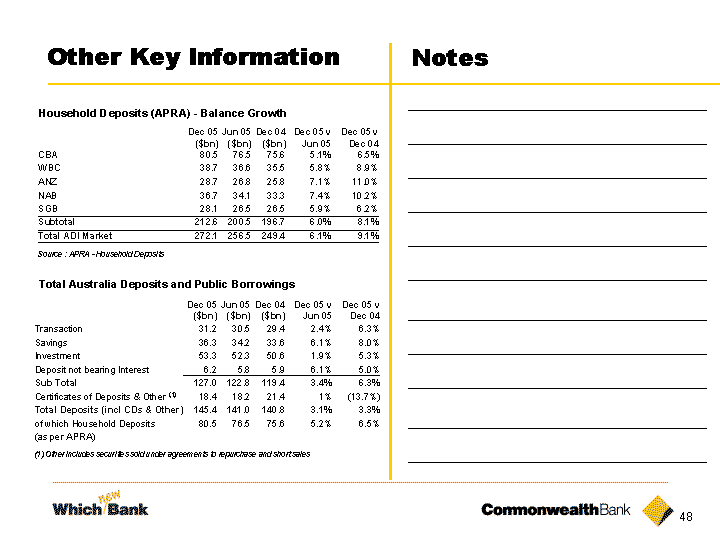
| Other Key Information Notes Notes |
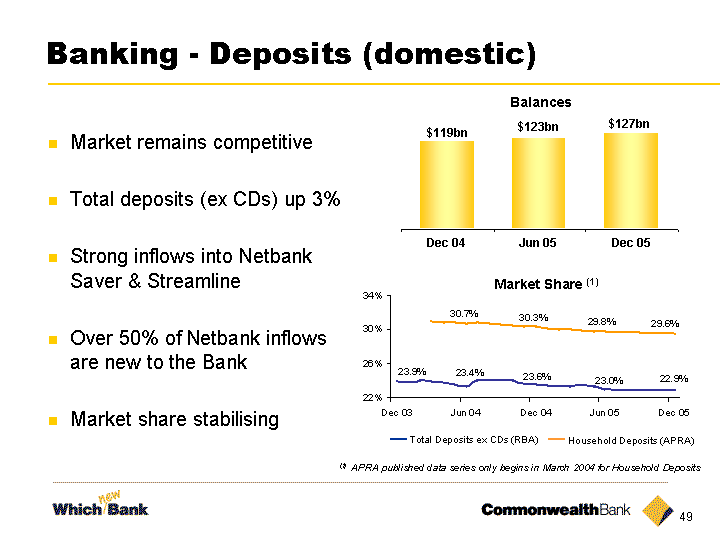
| Banking - Deposits (domestic) Market remains competitive Total deposits (ex CDs) up 3% Strong inflows into Netbank Saver & Streamline Over 50% of Netbank inflows are new to the Bank Market share stabilising Market Share (1) Balances Total Deposits ex CDs (RBA) Household Deposits (APRA) (1) APRA published data series only begins in March 2004 for Household Deposits East 119 123 128 Dec 04 Jun 05 Dec 05 $119bn $123bn $127bn $127bn |
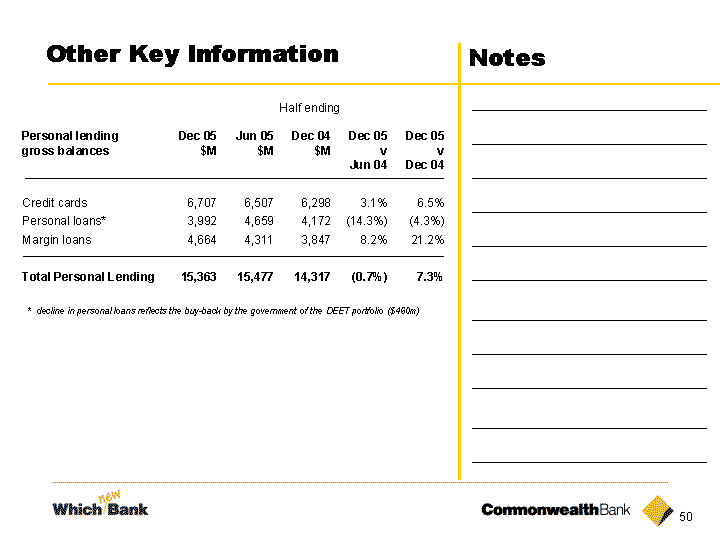
| Other Key Information Notes Half ending * decline in personal loans reflects the buy-back by the government of the DEET portfolio ($460m) * decline in personal loans reflects the buy-back by the government of the DEET portfolio ($460m) |
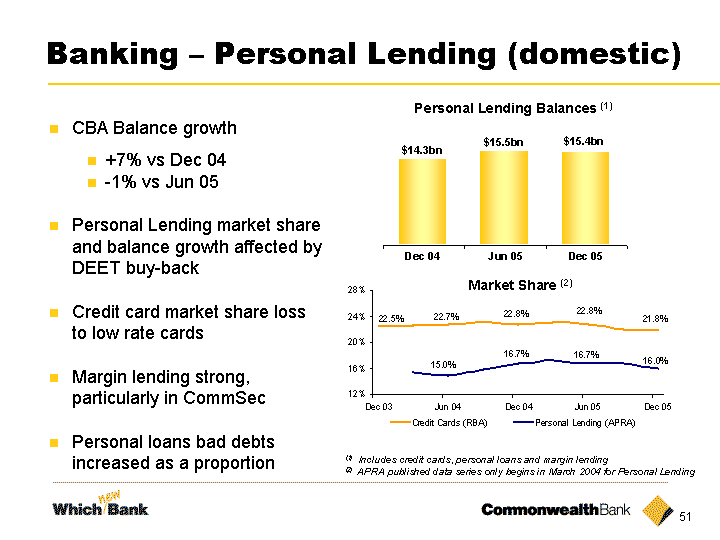
| Banking - Personal Lending (domestic) CBA Balance growth +7% vs Dec 04 - -1% vs Jun 05 Personal Lending market share and balance growth affected by DEET buy-back Credit card market share loss to low rate cards Margin lending strong, particularly in CommSec Personal loans bad debts increased as a proportion Personal Lending Balances (1) Market Share (2) (1) Includes credit cards, personal loans and margin lending (2) APRA published data series only begins in March 2004 for Personal Lending (2) APRA published data series only begins in March 2004 for Personal Lending (2) APRA published data series only begins in March 2004 for Personal Lending |
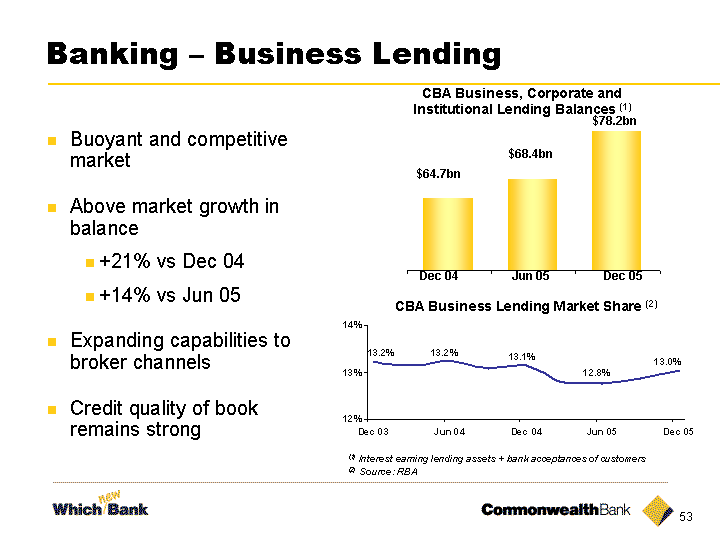
| Banking - Business Lending Buoyant and competitive market Above market growth in balance +21% vs Dec 04 +14% vs Jun 05 Expanding capabilities to broker channels Credit quality of book remains strong CBA Business, Corporate and Institutional Lending Balances (1) CBA Business Lending Market Share (2) (2) Source: RBA Dec 04 Jun 05 Dec 05 $68.4bn $64.7bn $78.2bn (1) Interest earning lending assets + bank acceptances of customers (1) Interest earning lending assets + bank acceptances of customers |
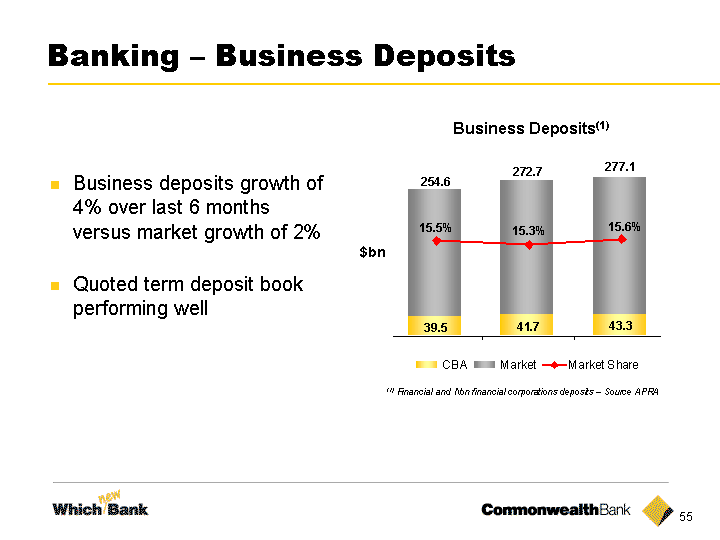
| Banking - Business Deposits Business deposits growth of 4% over last 6 months versus market growth of 2% Quoted term deposit book performing well Business Deposits(1) (1) Financial and Non financial corporations deposits - Source APRA $bn $bn |
| Other Key Information Notes Notes |
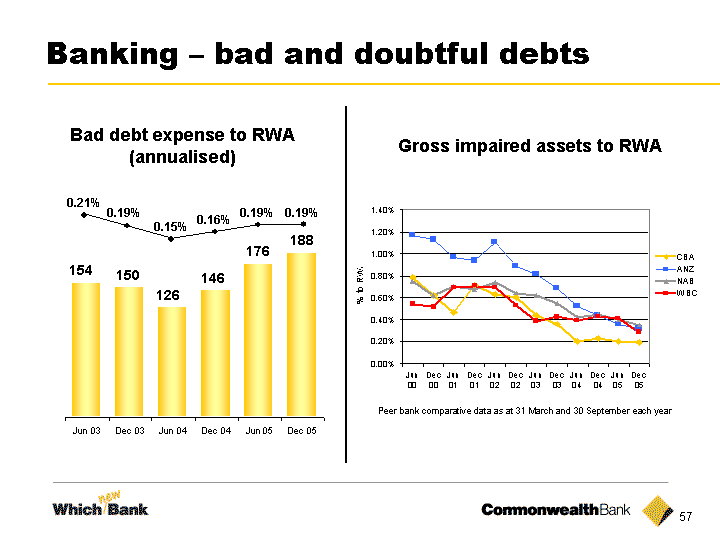
| Banking - bad and doubtful debts Bad debt expense to RWA (annualised) 0.15% 0.19% 0.21% 0.16% Gross impaired assets to RWA 0.19% Peer bank comparative data as at 31 March and 30 September each year 0.19% 146 126 150 154 176 188 188 |
| Other Key Information Notes For the half ending For the half ending |
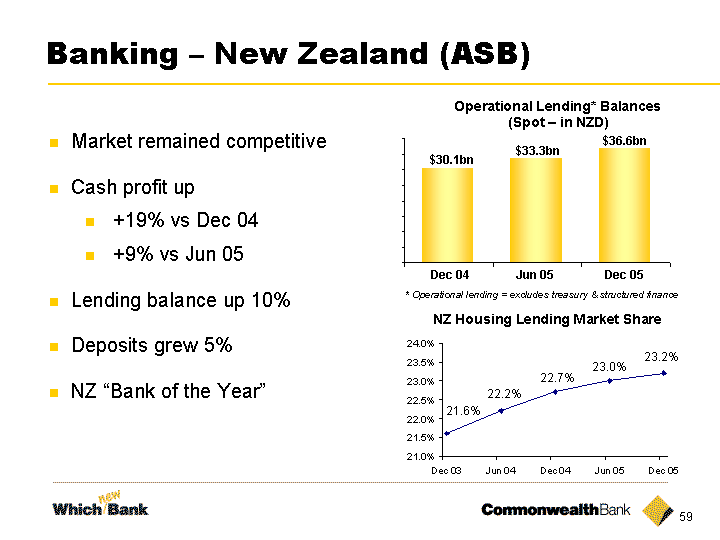
| Banking - New Zealand (ASB) Market remained competitive Cash profit up +19% vs Dec 04 +9% vs Jun 05 Lending balance up 10% Deposits grew 5% NZ "Bank of the Year" Operational Lending* Balances (Spot - in NZD) NZ Housing Lending Market Share 23.0% 22.7% 22.2% 21.6% * Operational lending = excludes treasury & structured finance $30.1bn $33.3bn $36.6bn Dec 04 Jun 05 Dec 05 23.2% 23.2% |
| Segment Results: Funds Management |
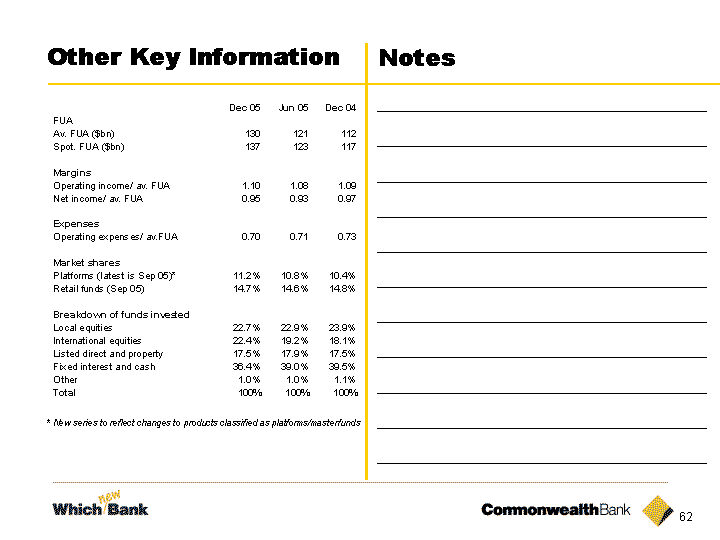
| Other Key Information Notes * New series to reflect changes to products classified as platforms/masterfunds * New series to reflect changes to products classified as platforms/masterfunds |
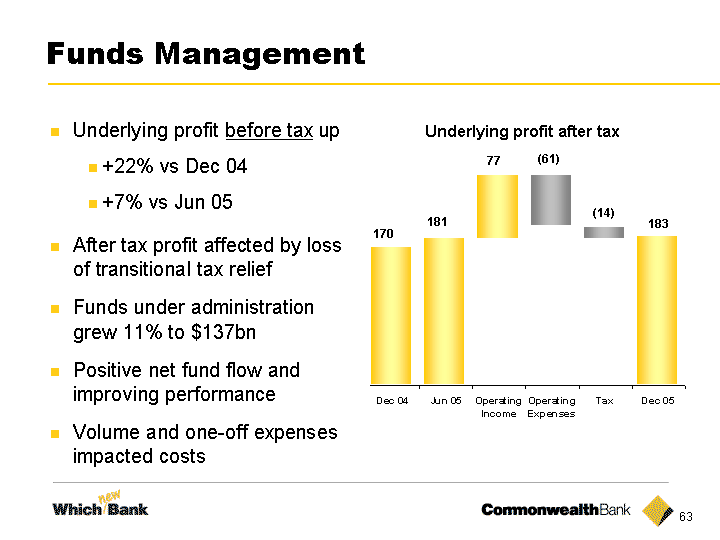
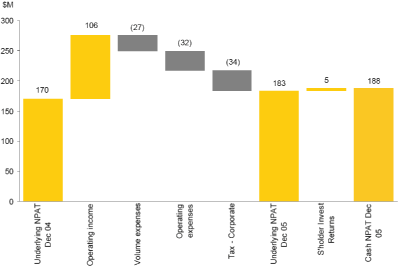
| Funds Management Underlying profit before tax up +22% vs Dec 04 +7% vs Jun 05 After tax profit affected by loss of transitional tax relief Funds under administration grew 11% to $137bn Positive net fund flow and improving performance Volume and one-off expenses impacted costs 170 77 (61) 183 Underlying profit after tax 181 (14) (14) |
| Other Key Information Notes Notes |
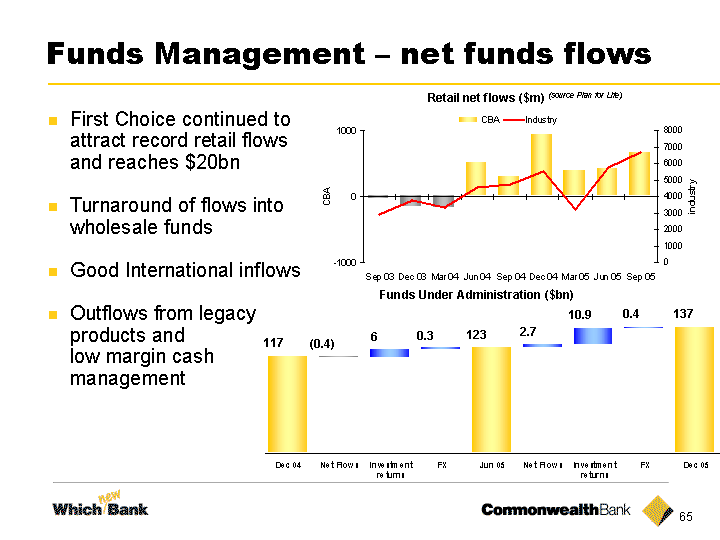
| Funds Management - net funds flows First Choice continued to attract record retail flows and reaches $20bn Turnaround of flows into wholesale funds Good International inflows Outflows from legacy products and low margin cash management Retail net flows ($m) (source Plan for Life) Funds Under Administration ($bn) 117 (0.4) 6 0.3 123 137 2.7 0.4 10.9 10.9 |
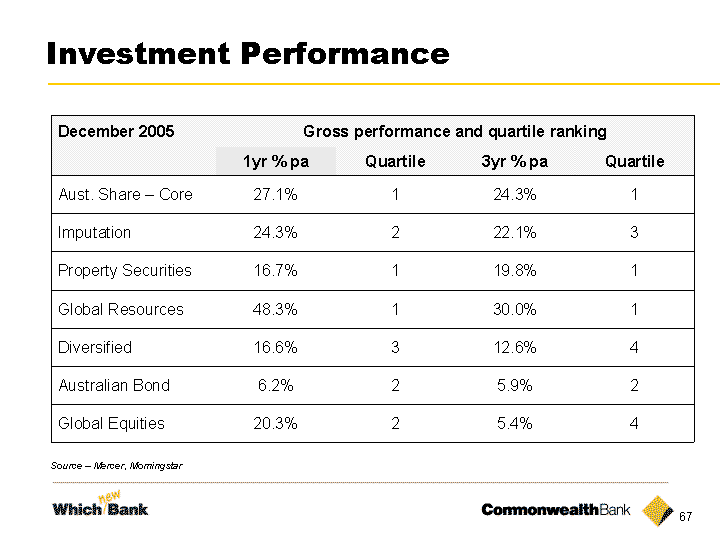
| Investment Performance Source - Mercer, Morningstar Source - Mercer, Morningstar |
| Segment Results: Insurance |
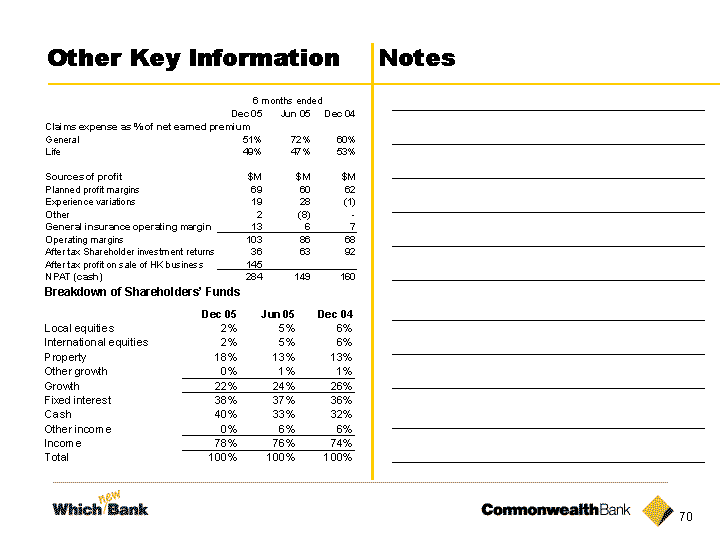
| Other Key Information Notes Notes |
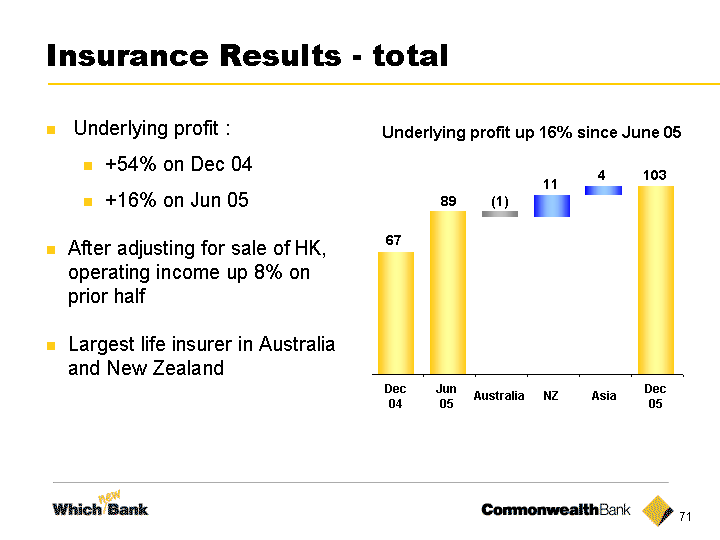
| Insurance Results - total Underlying profit : +54% on Dec 04 +16% on Jun 05 After adjusting for sale of HK, operating income up 8% on prior half Largest life insurer in Australia and New Zealand Dec 04 Dec 05 NZ 67 (1) 11 4 Underlying profit up 16% since June 05 Australia Asia 103 89 Jun 05 05 05 |
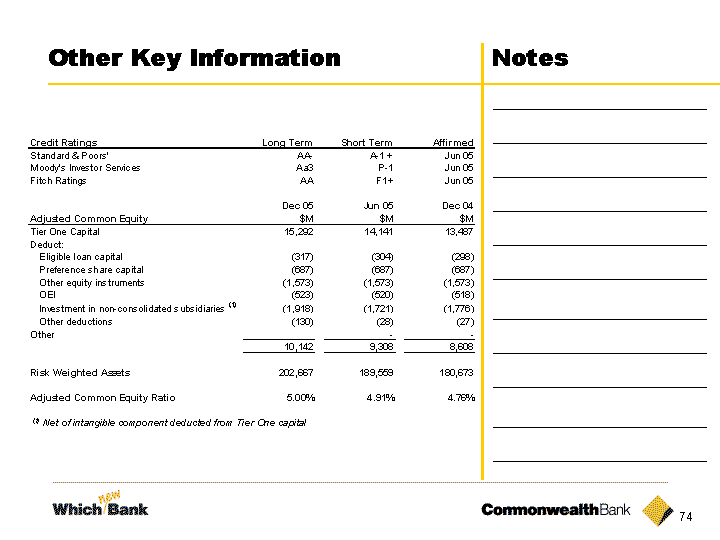
| Other Key Information Notes (1) Net of intangible component deducted from Tier One capital (1) Net of intangible component deducted from Tier One capital |
| East 0.0746 0.0746 0.0754 0.0214 0.0229 0.0227 East 0.0476 0.0491 0.05 Capital ratios Dec 2004 Jun 2005 Dec 2005 Adjusted Common Equity Tier one capital Tier two capital Target Range |
| Other Key Information Notes Notes |
| Generation and use of Tier 1 capital Tier 1 June 2005 $14,141 Cash NPAT $2,061m Ord. Dividends ($1,211m) Growth in RWA $13,108m DRP $221m Currency and Other Movements $78m Tier 1 Dec 2005 $15,290m 7.46% 1.02% (0.60%) (0.48%) 0.11% 0.03% 7.54% 7.54% |
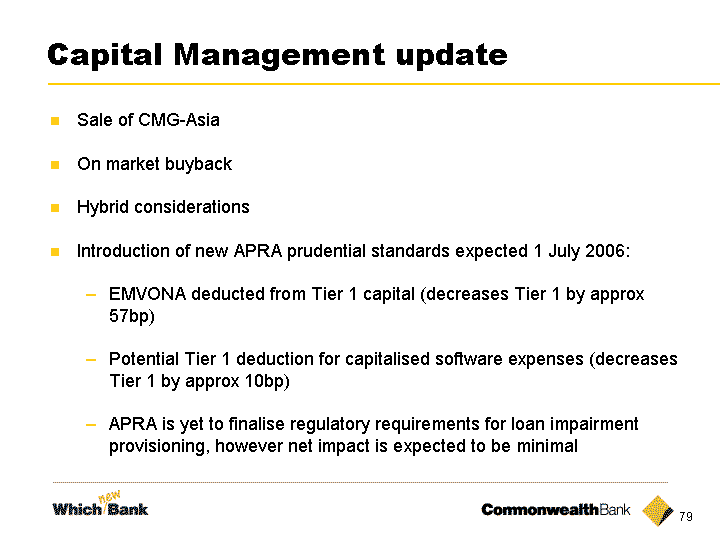
| Sale of CMG-Asia On market buyback Hybrid considerations Introduction of new APRA prudential standards expected 1 July 2006: EMVONA deducted from Tier 1 capital (decreases Tier 1 by approx 57bp) Potential Tier 1 deduction for capitalised software expenses (decreases Tier 1 by approx 10bp) APRA is yet to finalise regulatory requirements for loan impairment provisioning, however net impact is expected to be minimal Capital Management update |
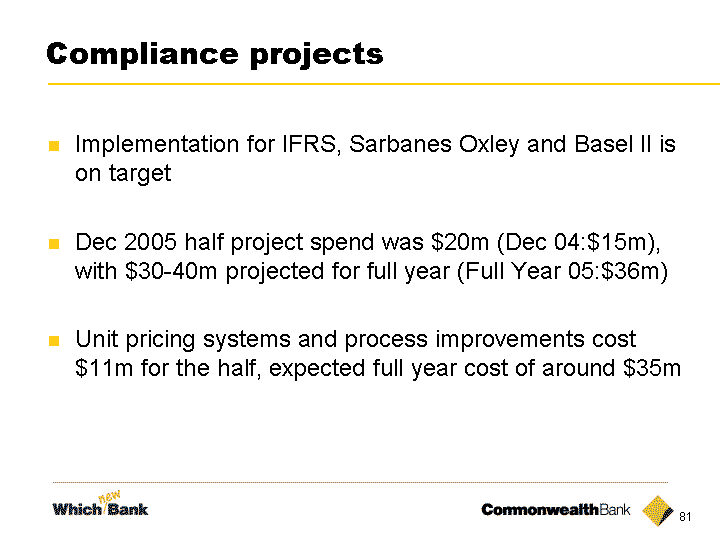
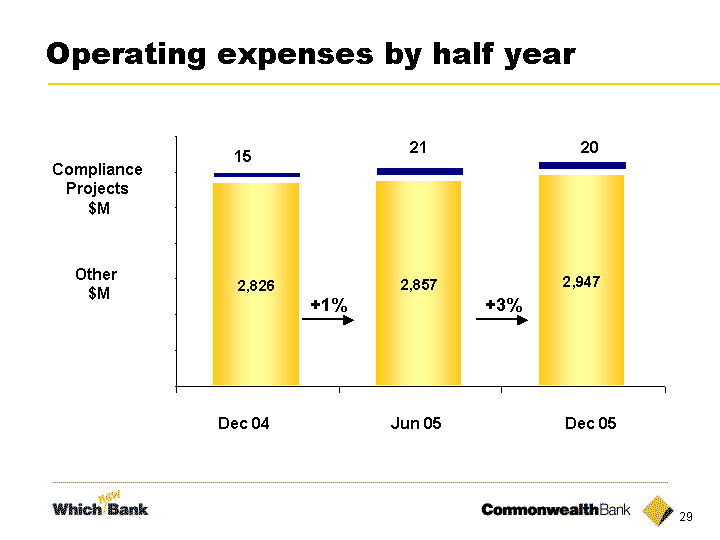
| Implementation for IFRS, Sarbanes Oxley and Basel II is on target Dec 2005 half project spend was $20m (Dec 04:$15m), with $30-40m projected for full year (Full Year 05:$36m) Unit pricing systems and process improvements cost $11m for the half, expected full year cost of around $35m Compliance projects |
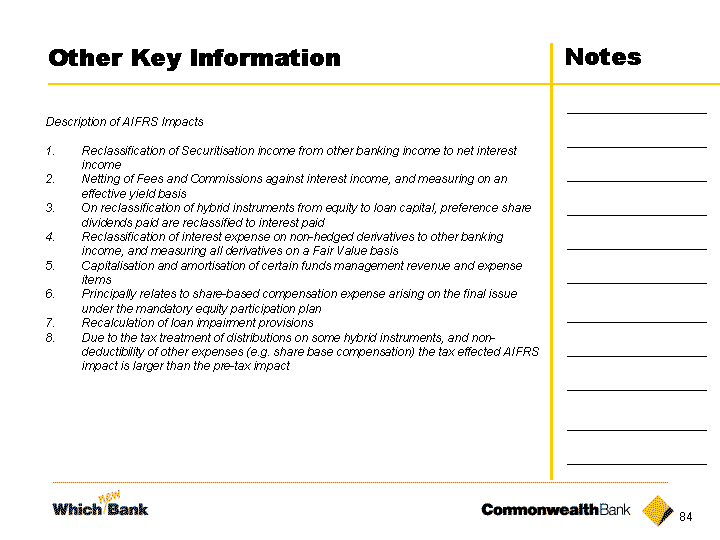
| Other Key Information Notes Description of AIFRS Impacts Reclassification of Securitisation income from other banking income to net interest income Netting of Fees and Commissions against interest income, and measuring on an effective yield basis On reclassification of hybrid instruments from equity to loan capital, preference share dividends paid are reclassified to interest paid Reclassification of interest expense on non-hedged derivatives to other banking income, and measuring all derivatives on a Fair Value basis Capitalisation and amortisation of certain funds management revenue and expense items Principally relates to share-based compensation expense arising on the final issue under the mandatory equity participation plan Recalculation of loan impairment provisions Due to the tax treatment of distributions on some hybrid instruments, and non- deductibility of other expenses (e.g. share base compensation) the tax effected AIFRS impact is larger than the pre-tax impact |
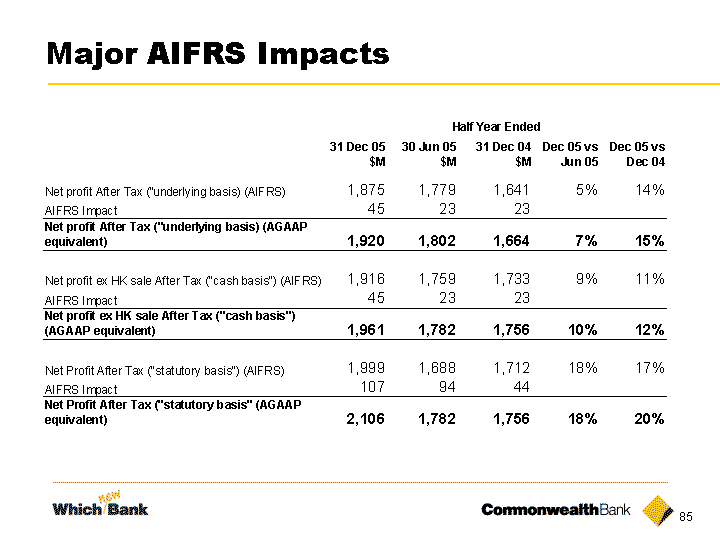
| Major AIFRS Impacts Major AIFRS Impacts |
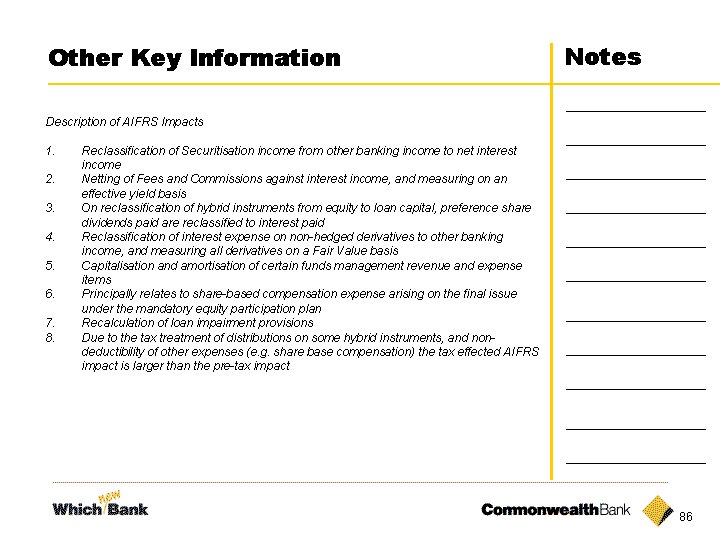
| Other Key Information Notes Description of AIFRS Impacts Reclassification of Securitisation income from other banking income to net interest income Netting of Fees and Commissions against interest income, and measuring on an effective yield basis On reclassification of hybrid instruments from equity to loan capital, preference share dividends paid are reclassified to interest paid Reclassification of interest expense on non-hedged derivatives to other banking income, and measuring all derivatives on a Fair Value basis Capitalisation and amortisation of certain funds management revenue and expense items Principally relates to share-based compensation expense arising on the final issue under the mandatory equity participation plan Recalculation of loan impairment provisions Due to the tax treatment of distributions on some hybrid instruments, and non- deductibility of other expenses (e.g. share base compensation) the tax effected AIFRS impact is larger than the pre-tax impact |
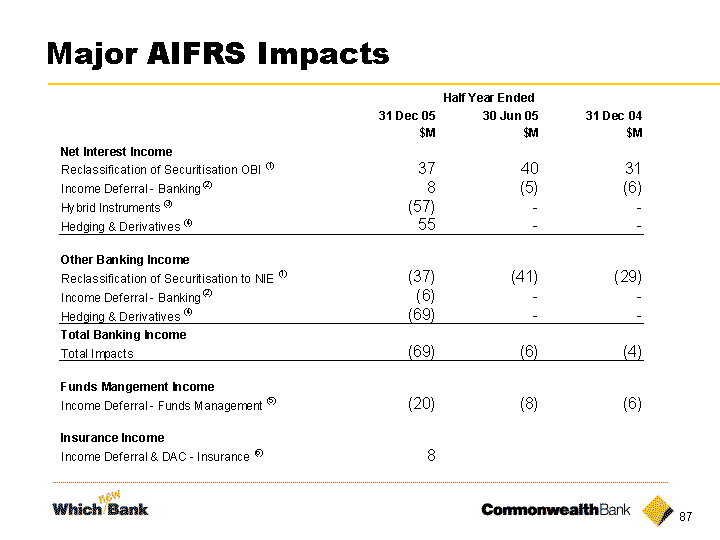
| Major AIFRS Impacts Major AIFRS Impacts |
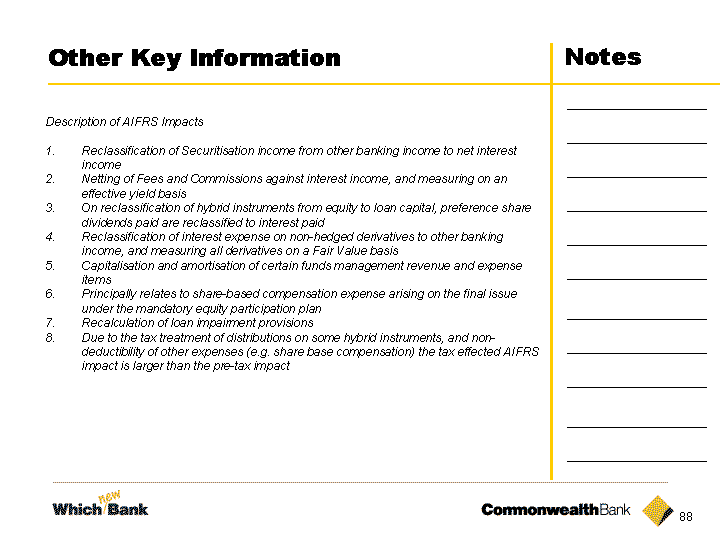
| Other Key Information Notes Description of AIFRS Impacts Reclassification of Securitisation income from other banking income to net interest income Netting of Fees and Commissions against interest income, and measuring on an effective yield basis On reclassification of hybrid instruments from equity to loan capital, preference share dividends paid are reclassified to interest paid Reclassification of interest expense on non-hedged derivatives to other banking income, and measuring all derivatives on a Fair Value basis Capitalisation and amortisation of certain funds management revenue and expense items Principally relates to share-based compensation expense arising on the final issue under the mandatory equity participation plan Recalculation of loan impairment provisions Due to the tax treatment of distributions on some hybrid instruments, and non- deductibility of other expenses (e.g. share base compensation) the tax effected AIFRS impact is larger than the pre-tax impact |
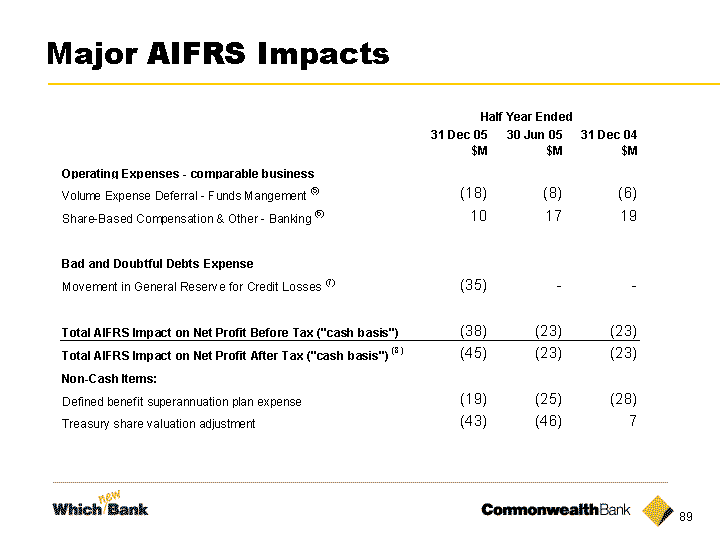
| Major AIFRS Impacts Major AIFRS Impacts |

| Presentation of Half Year Results for 31 December 2005 Ralph Norris Michael Cameron Chief Executive Officer Chief Financial Officer 15 February 2006 |
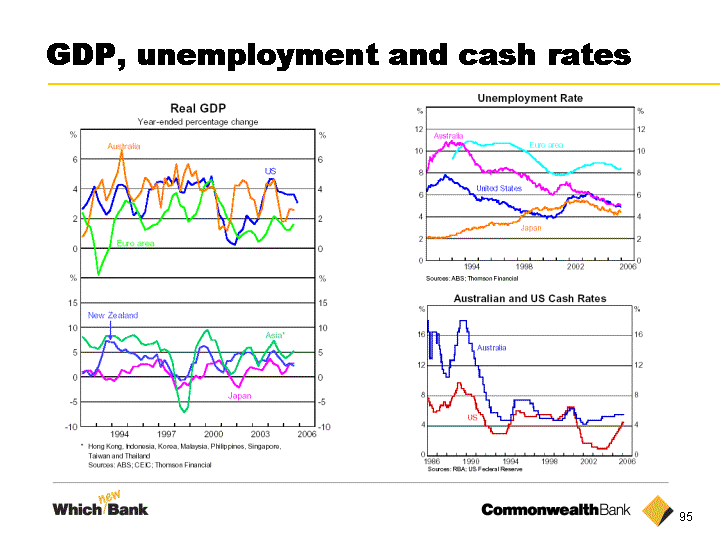
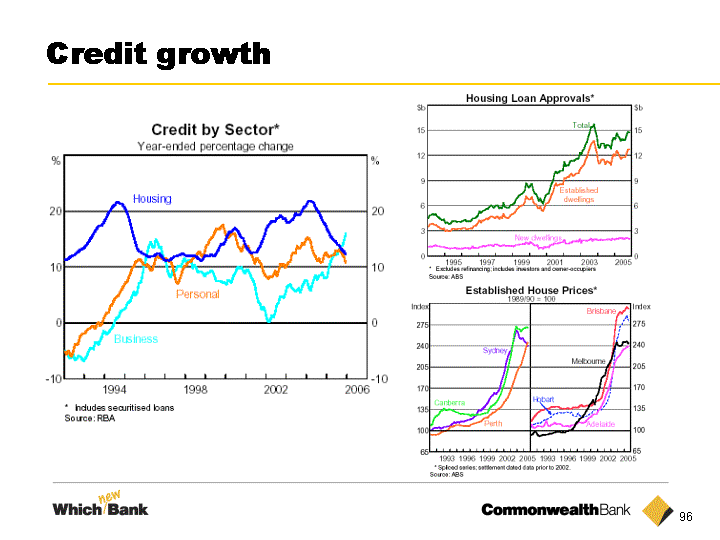
| GDP, unemployment and cash rates |
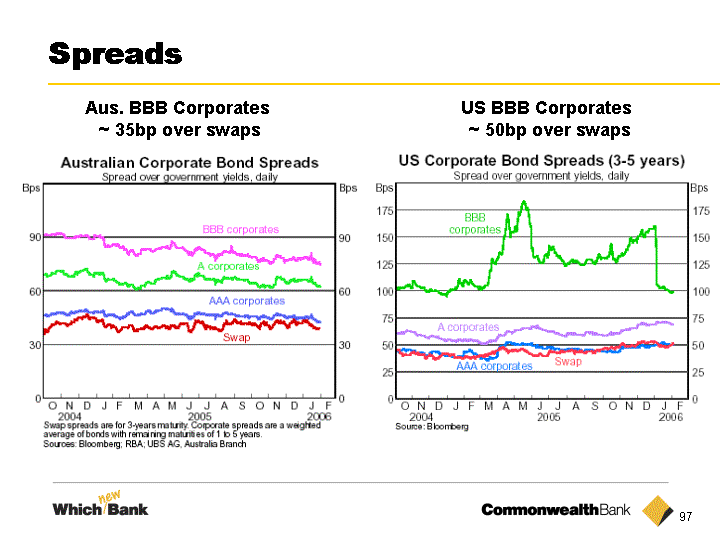
| Spreads Aus. BBB Corporates ~ 35bp over swaps US BBB Corporates ~ 50bp over swaps |
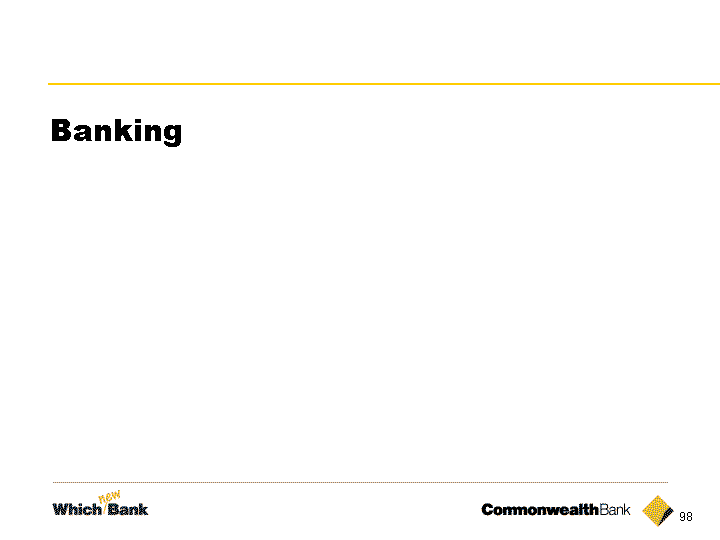
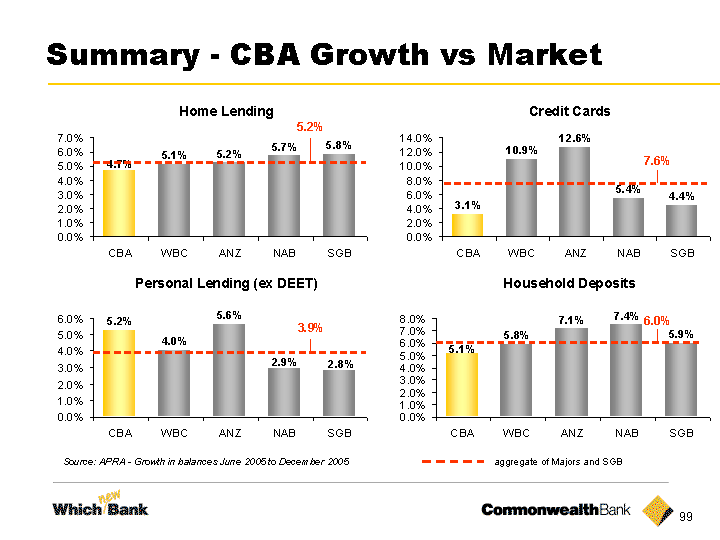
| Summary - CBA Growth vs Market Summary - CBA Growth vs Market |
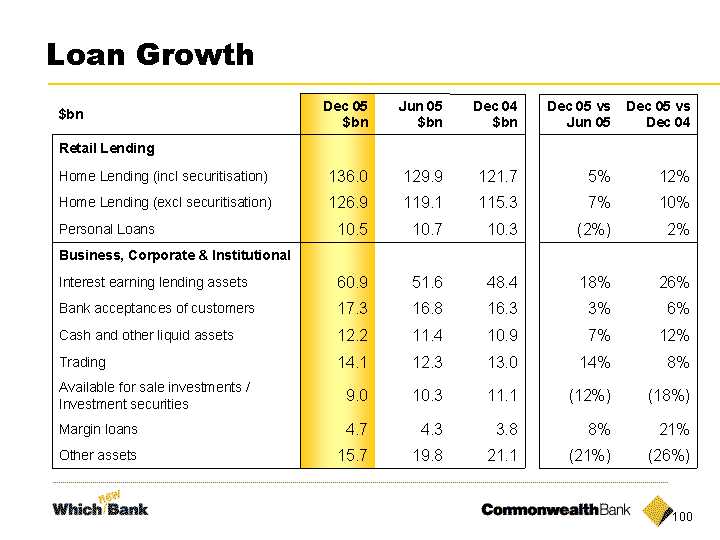
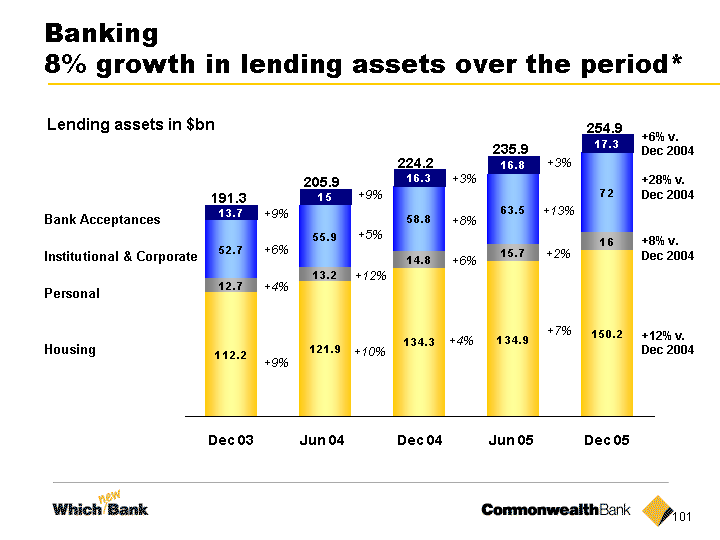
| Banking 8% growth in lending assets over the period* Housing Personal Institutional & Corporate Bank Acceptances Lending assets in $bn 191.3 205.9 Dec 03 Jun 04 +6% v. Dec 2004 +28% v. Dec 2004 +8% v. Dec 2004 +12% v. Dec 2004 Jun 05 +6% +4% +9% +9% +5% +12% +10% +9% 235.9 Dec 04 224.2 +8% +6% +4% +3% Dec 05 +13% +2% +7% +3% 254.9 254.9 |
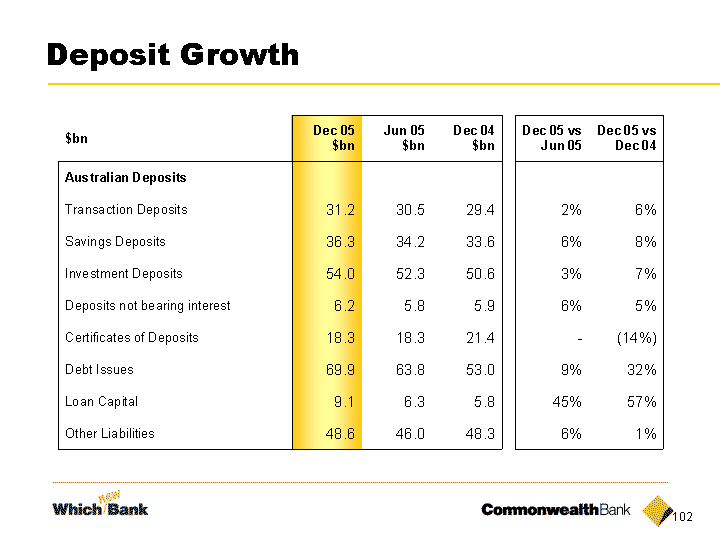
| Deposit Growth Deposit Growth |
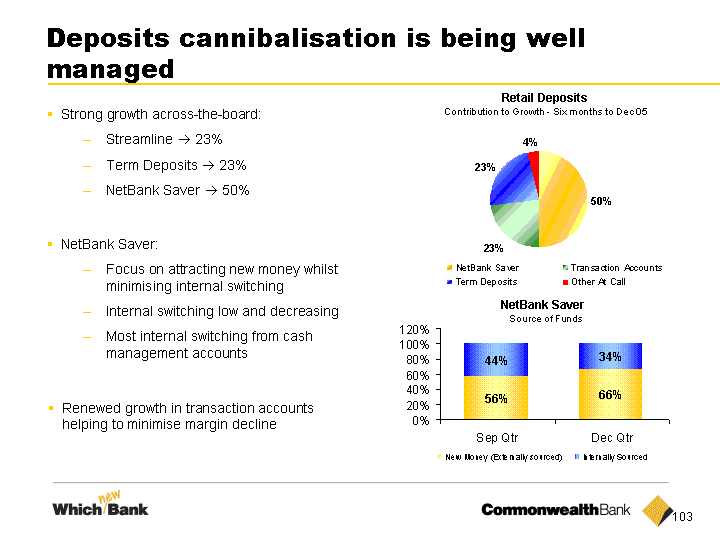
| Deposits cannibalisation is being well managed Retail Deposits Contribution to Growth - Six months to Dec 05 Strong growth across-the-board: Streamline ? 23% Term Deposits ? 23% NetBank Saver ? 50% NetBank Saver: Focus on attracting new money whilst minimising internal switching Internal switching low and decreasing Most internal switching from cash management accounts Renewed growth in transaction accounts helping to minimise margin decline NetBank Saver Source of Funds Source of Funds Source of Funds |
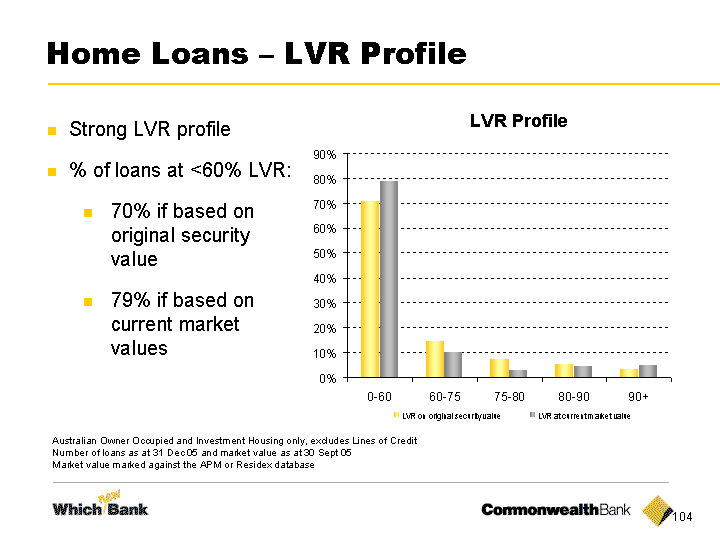
| Home Loans - LVR Profile LVR Profile Strong LVR profile % of loans at <60% LVR: 70% if based on original security value 79% if based on current market values Australian Owner Occupied and Investment Housing only, excludes Lines of Credit Number of loans as at 31 Dec 05 and market value as at 30 Sept 05 Market value marked against the APM or Residex database Market value marked against the APM or Residex database Market value marked against the APM or Residex database Market value marked against the APM or Residex database |
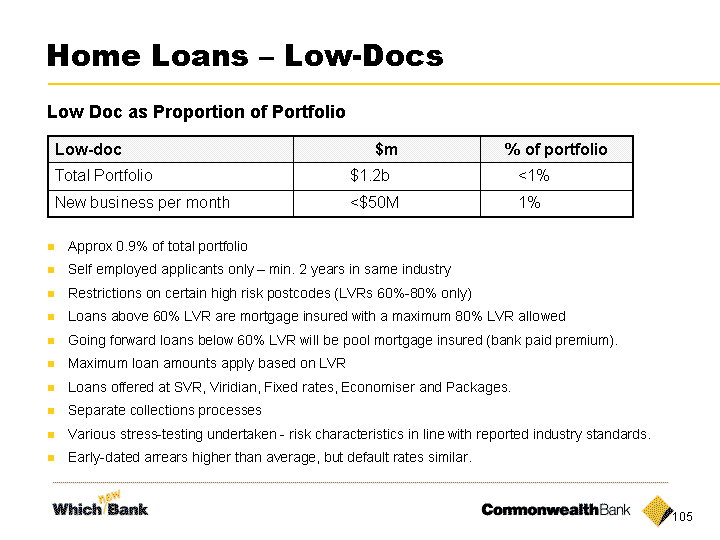
| Home Loans - Low-Docs Approx 0.9% of total portfolio Self employed applicants only - min. 2 years in same industry Restrictions on certain high risk postcodes (LVRs 60%-80% only) Loans above 60% LVR are mortgage insured with a maximum 80% LVR allowed Going forward loans below 60% LVR will be pool mortgage insured (bank paid premium). Maximum loan amounts apply based on LVR Loans offered at SVR, Viridian, Fixed rates, Economiser and Packages. Separate collections processes Various stress-testing undertaken - risk characteristics in line with reported industry standards. Early-dated arrears higher than average, but default rates similar. Low-doc $m % of portfolio Total Portfolio $1.2b <1% New business per month <$50M 1% Low Doc as Proportion of Portfolio |
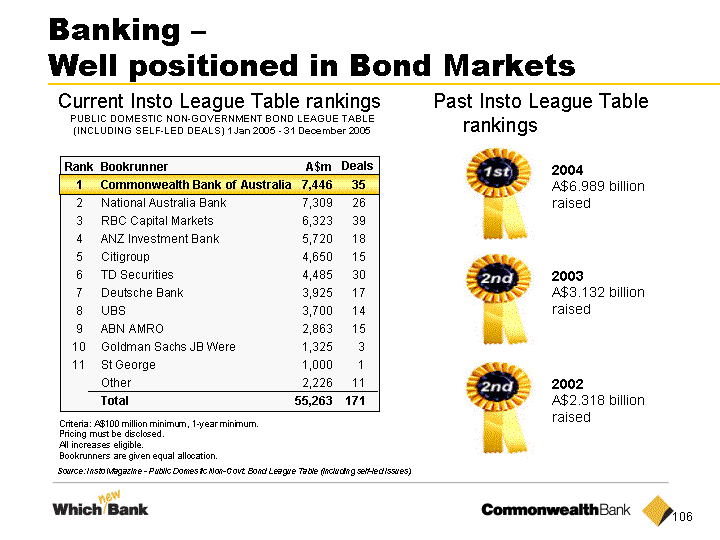
| Banking - Well positioned in Bond Markets Current Insto League Table rankings Past Insto League Table rankings 2003 A$3.132 billion raised 2004 A$6.989 billion raised Source: Insto Magazine - Public Domestic Non-Govt. Bond League Table (including self-led issues) Rank 1 2 3 4 5 6 7 8 9 10 11 Bookrunner Commonwealth Bank of Australia National Australia Bank RBC Capital Markets ANZ Investment Bank Citigroup TD Securities Deutsche Bank UBS ABN AMRO Goldman Sachs JB Were St George Other Total A$m 7,446 7,309 6,323 5,720 4,650 4,485 3,925 3,700 2,863 1,325 1,000 2,226 55,263 35 26 39 18 15 30 17 14 15 3 1 11 171 Deals Criteria: A$100 million minimum, 1-year minimum. Pricing must be disclosed. All increases eligible. Bookrunners are given equal allocation. PUBLIC DOMESTIC NON-GOVERNMENT BOND LEAGUE TABLE (INCLUDING SELF-LED DEALS) 1Jan 2005 - 31 December 2005 2002 A$2.318 billion raised |
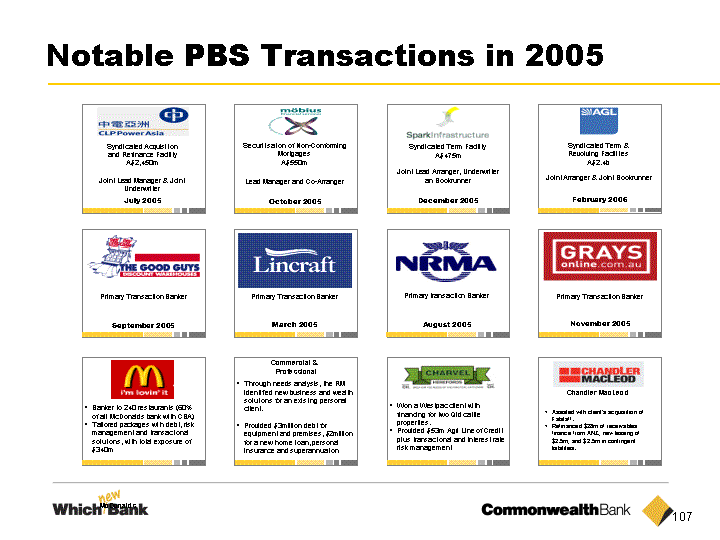
| Notable PBS Transactions in 2005 McDonalds Syndicated Acquisition and Refinance Facility A$2,450m Joint Lead Manager & Joint Underwriter July 2005 Securitisation of Non-Conforming Mortgages A$550m Lead Manager and Co-Arranger October 2005 Syndicated Term Facility A$475m Joint Lead Arranger, Underwriter an Bookrunner December 2005 Syndicated Term & Revolving Facilities A$2.4b February 2006 Joint Arranger & Joint Bookrunner Primary Transaction Banker September 2005 Primary Transaction Banker March 2005 Primary transaction Banker August 2005 Primary Transaction Banker November 2005 Banker to 240 restaurants (60% of all McDonalds bank with CBA) Tailored packages with debt, risk management and transactional solutions, with total exposure of $340m Commercial & Professional Through needs analysis, the RM identified new business and wealth solutions for an existing personal client. Provided $3million debt for equipment and premises, $2million for a new home loan, personal insurance and superannuation Won a Westpac client with financing for two Qld cattle properties. Provided $53m Agri Line of Credit plus transactional and interest rate risk management Chandler MacLeod Assisted with client's acquisition of Falstaff. Refinanced $28m of receivables finance from ANZ, new leasing of $2.5m, and $2.5m in contingent liabilities. |
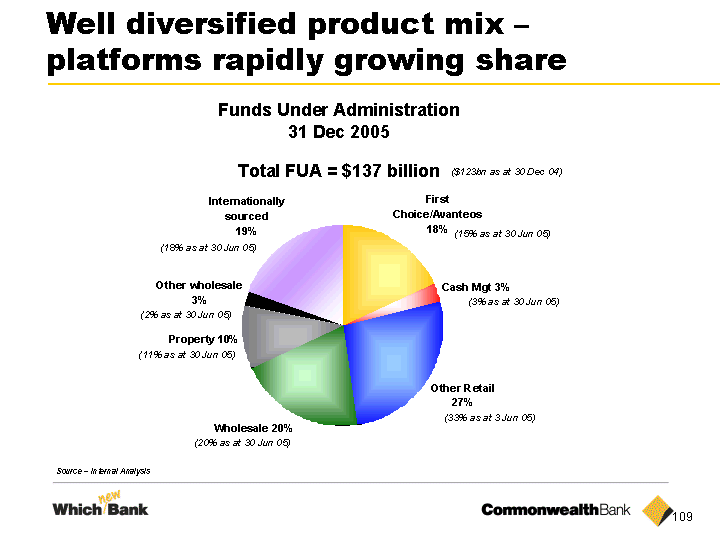
| Well diversified product mix - platforms rapidly growing share Source - Internal Analysis Source - Internal Analysis |
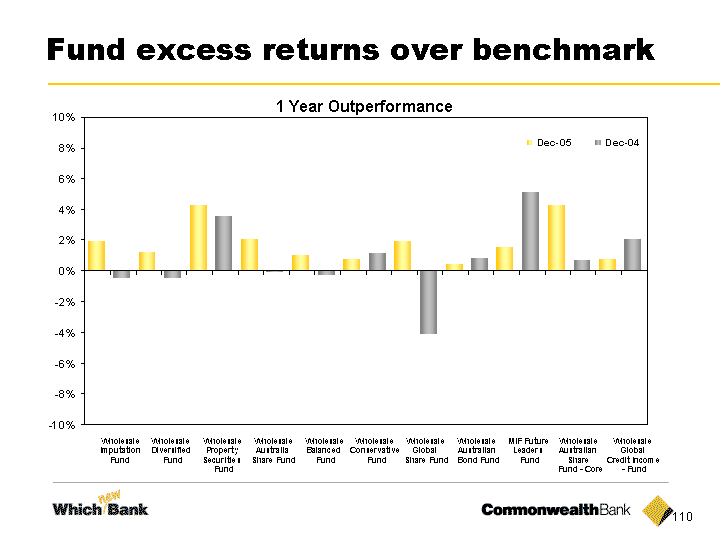
| Fund excess returns over benchmark Wholesale Imputation Fund Wholesale Diversified Fund Wholesale Property Securities Fund Wholesale Australia Share Fund Wholesale Balanced Fund Wholesale Conservative Fund Wholesale Global Share Fund Wholesale Australian Bond Fund MIF Future Leaders Fund Wholesale Australian Share Fund - Core Wholesale Global Credit Income - - Fund 1 Year Outperformance |
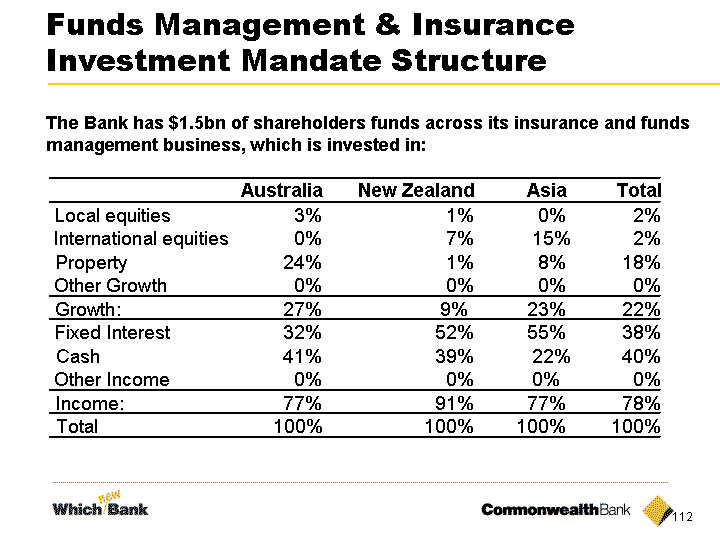
| Funds Management & Insurance Investment Mandate Structure The Bank has $1.5bn of shareholders funds across its insurance and funds management business, which is invested in: Australia New Zealand Asia Total Local equities 3% 1% 0% 2% International equities 0% 7% 15% 2% Property 24% 1% 8% 18% Other Growth 0% 0% 0% 0% Growth: 27% 9% 23% 22% Fixed Interest 32% 52% 55% 38% Cash 41% 39% 22% 40% Other Income 0% 0% 0% 0% Income: 77% 91% 77% 78% Total 100% 100% 100% 100% |
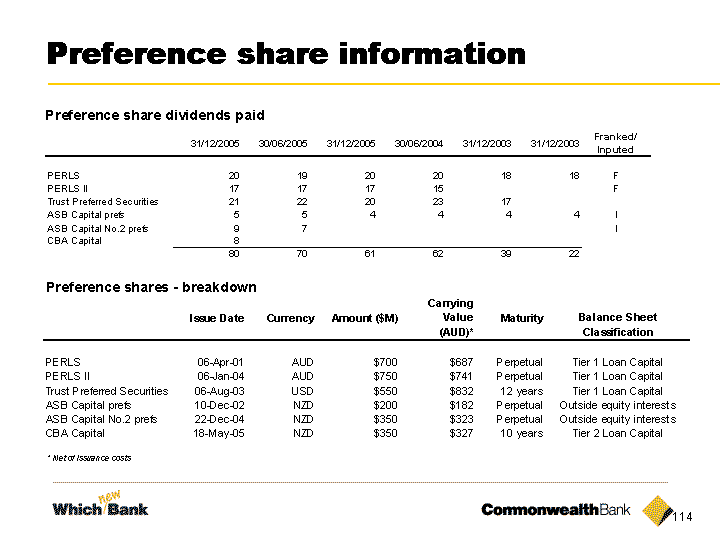
| Preference share information Preference share information |
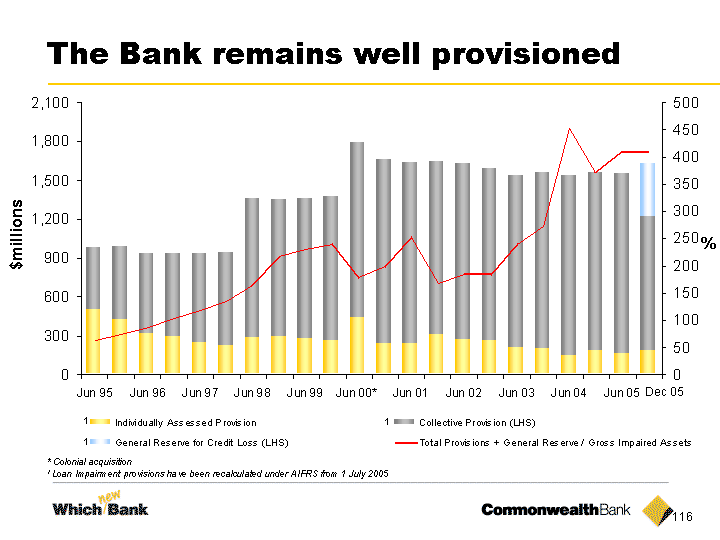
| The Bank remains well provisioned The Bank remains well provisioned |
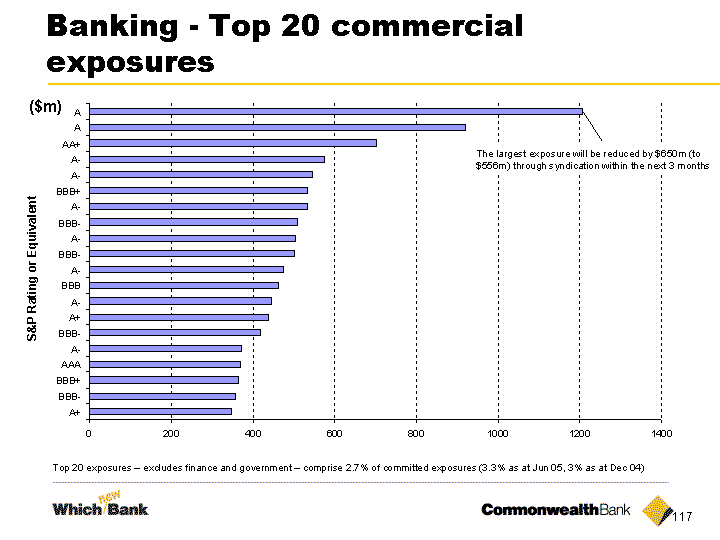
| Banking - Top 20 commercial exposures Top 20 exposures - excludes finance and government - comprise 2.7% of committed exposures (3.3% as at Jun 05, 3% as at Dec 04) Top 20 exposures - excludes finance and government - comprise 2.7% of committed exposures (3.3% as at Jun 05, 3% as at Dec 04) |
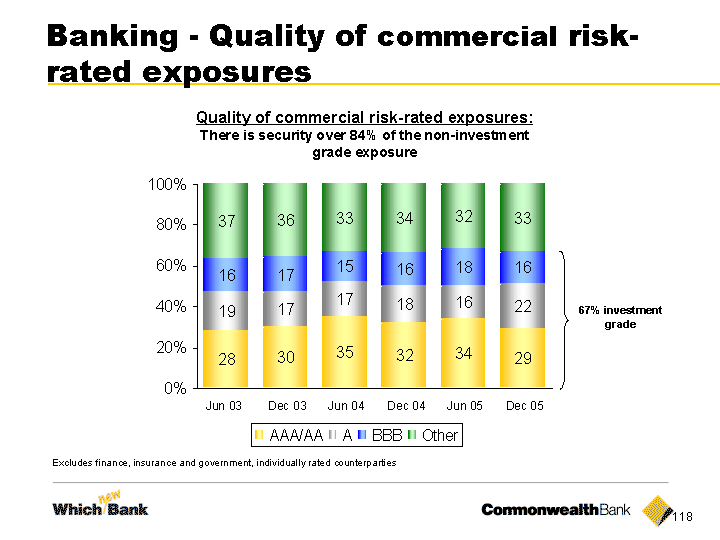
| Banking - Quality of commercial risk- rated exposures Excludes finance, insurance and government, individually rated counterparties Excludes finance, insurance and government, individually rated counterparties |
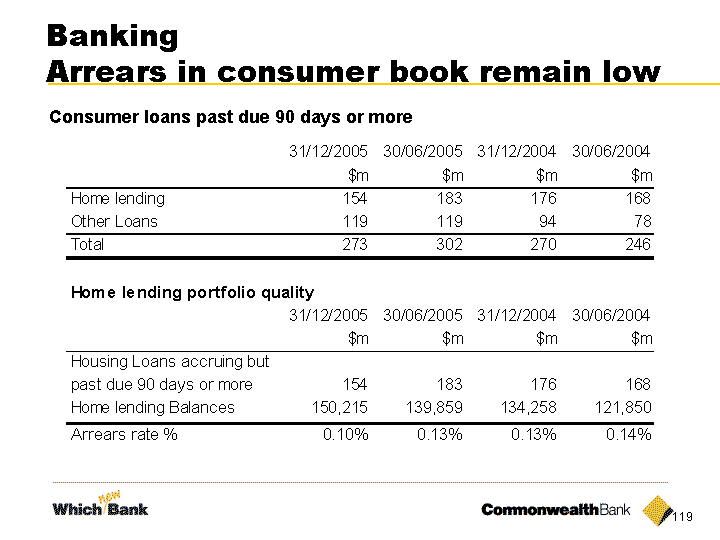
| Banking Arrears in consumer book remain low Consumer loans past due 90 days or more Consumer loans past due 90 days or more |
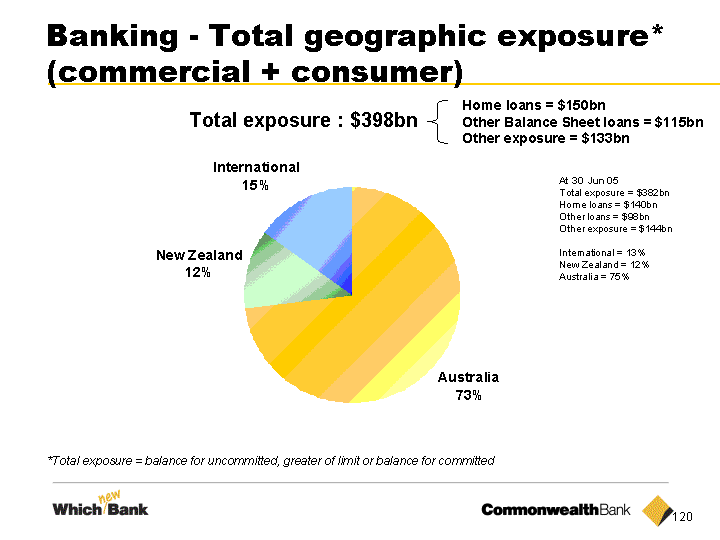
| Banking - Total geographic exposure* (commercial + consumer) Total exposure : $398bn *Total exposure = balance for uncommitted, greater of limit or balance for committed Home loans = $150bn Other Balance Sheet loans = $115bn Other exposure = $133bn At 30 Jun 05 Total exposure = $382bn Home loans = $140bn Other loans = $98bn Other exposure = $144bn International = 13% New Zealand = 12% Australia = 75% Australia = 75% Australia = 75% Australia = 75% Australia = 75% Australia = 75% Australia = 75% Australia = 75% Australia = 75% Australia = 75% |
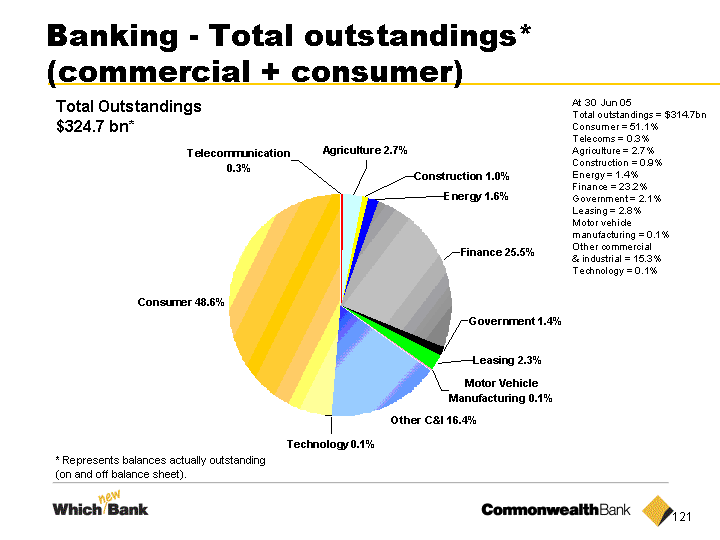
| Banking - Total outstandings* (commercial + consumer) Total Outstandings $324.7 bn* * Represents balances actually outstanding (on and off balance sheet). At 30 Jun 05 Total outstandings = $314.7bn Consumer = 51.1% Telecoms = 0.3% Agriculture = 2.7% Construction = 0.9% Energy = 1.4% Finance = 23.2% Government = 2.1% Leasing = 2.8% Motor vehicle manufacturing = 0.1% Other commercial & industrial = 15.3% Technology = 0.1% Technology = 0.1% Technology = 0.1% Technology = 0.1% Technology = 0.1% Technology = 0.1% Technology = 0.1% Technology = 0.1% Technology = 0.1% Technology = 0.1% Technology = 0.1% Technology = 0.1% Technology = 0.1% Technology = 0.1% Technology = 0.1% Technology = 0.1% |
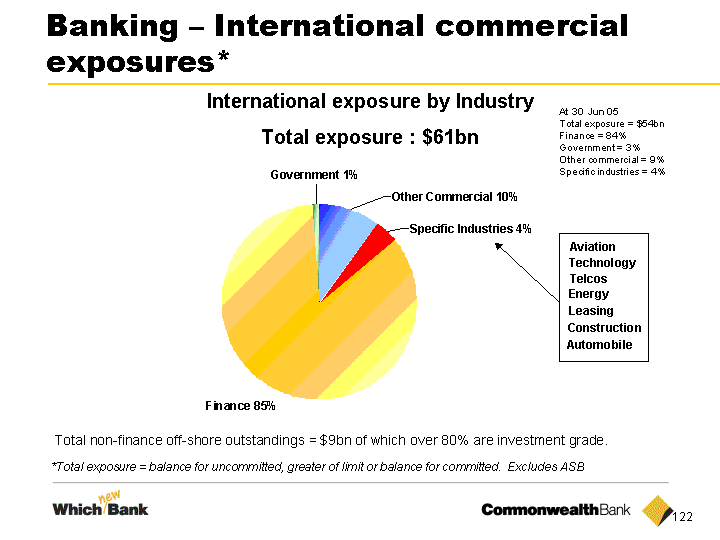
| Banking - International commercial exposures* International exposure by Industry Total exposure : $61bn *Total exposure = balance for uncommitted, greater of limit or balance for committed. Excludes ASB Total non-finance off-shore outstandings = $9bn of which over 80% are investment grade. Construction Leasing Energy Telcos Technology Aviation Automobile At 30 Jun 05 Total exposure = $54bn Finance = 84% Government = 3% Other commercial = 9% Specific industries = 4% Specific industries = 4% Specific industries = 4% Specific industries = 4% Specific industries = 4% Specific industries = 4% Specific industries = 4% |
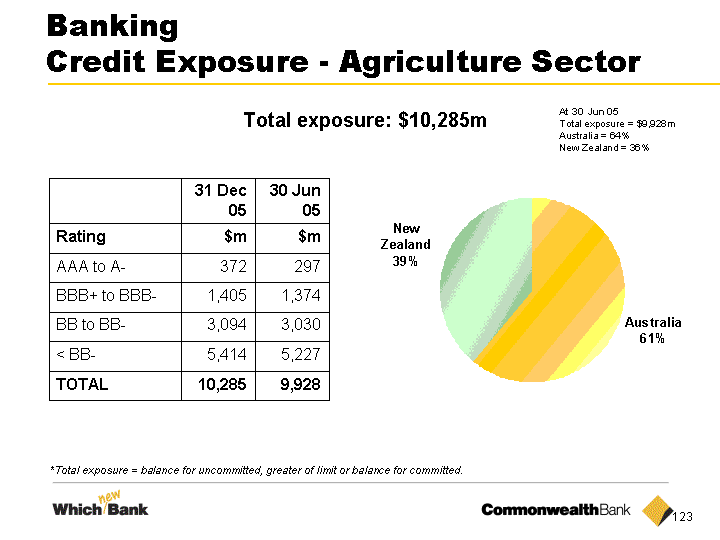
| Banking Credit Exposure - Agriculture Sector 31 Dec 05 30 Jun 05 Rating $m $m AAA to A- 372 297 BBB+ to BBB- 1,405 1,374 BB to BB- 3,094 3,030 < BB- 5,414 5,227 TOTAL 10,285 9,928 Total exposure: $10,285m *Total exposure = balance for uncommitted, greater of limit or balance for committed. At 30 Jun 05 Total exposure = $9,928m Australia = 64% New Zealand = 36% New Zealand = 36% New Zealand = 36% New Zealand = 36% New Zealand = 36% |
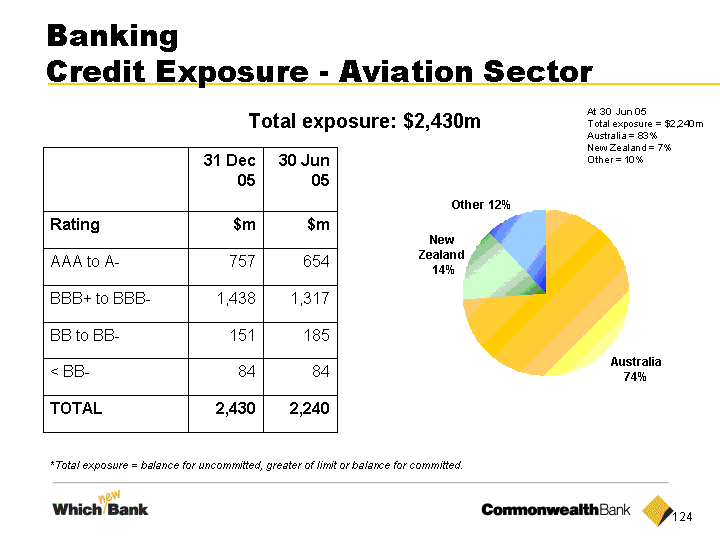
| Banking Credit Exposure - Aviation Sector 31 Dec 05 30 Jun 05 Rating $m $m AAA to A- 757 654 BBB+ to BBB- 1,438 1,317 BB to BB- 151 185 < BB- 84 84 TOTAL 2,430 2,240 Total exposure: $2,430m *Total exposure = balance for uncommitted, greater of limit or balance for committed. At 30 Jun 05 Total exposure = $2,240m Australia = 83% New Zealand = 7% Other = 10% Other = 10% Other = 10% Other = 10% Other = 10% Other = 10% |
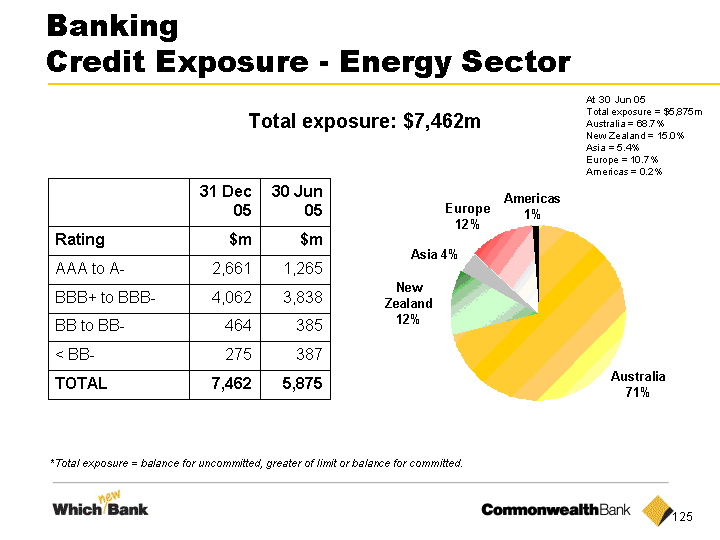
| Banking Credit Exposure - Energy Sector 31 Dec 05 30 Jun 05 Rating $m $m AAA to A- 2,661 1,265 BBB+ to BBB- 4,062 3,838 BB to BB- 464 385 < BB- 275 387 TOTAL 7,462 5,875 Total exposure: $7,462m *Total exposure = balance for uncommitted, greater of limit or balance for committed. At 30 Jun 05 Total exposure = $5,875m Australia = 68.7% New Zealand = 15.0% Asia = 5.4% Europe = 10.7% Americas = 0.2% Americas = 0.2% Americas = 0.2% Americas = 0.2% Americas = 0.2% Americas = 0.2% Americas = 0.2% Americas = 0.2% |
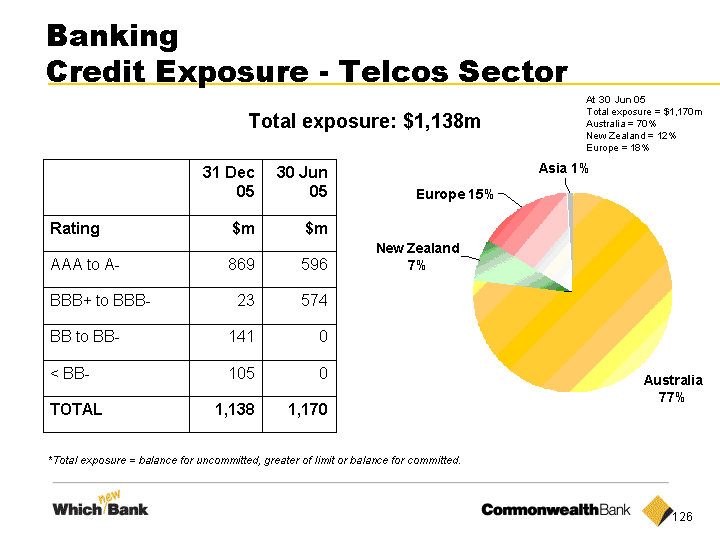
| Banking Credit Exposure - Telcos Sector 31 Dec 05 30 Jun 05 Rating $m $m AAA to A- 869 596 BBB+ to BBB- 23 574 BB to BB- 141 0 < BB- 105 0 TOTAL 1,138 1,170 Total exposure: $1,138m *Total exposure = balance for uncommitted, greater of limit or balance for committed. At 30 Jun 05 Total exposure = $1,170m Australia = 70% New Zealand = 12% Europe = 18% Europe = 18% Europe = 18% Europe = 18% Europe = 18% Europe = 18% |
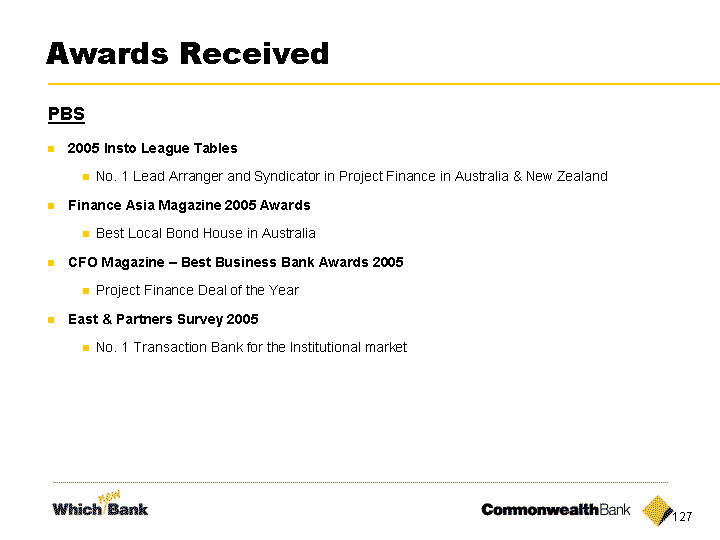
| PBS Awards Received 2005 Insto League Tables No. 1 Lead Arranger and Syndicator in Project Finance in Australia & New Zealand Finance Asia Magazine 2005 Awards Best Local Bond House in Australia CFO Magazine - Best Business Bank Awards 2005 Project Finance Deal of the Year East & Partners Survey 2005 No. 1 Transaction Bank for the Institutional market |
| Wealth Management Personal Investor Magazine Awards Fund Manager of the Year Term Life Product of the Year Trauma Product of the Year Money Magazine - Best of the Best Best Income Protection Insurance Winner Best Australian Shares Super Funds - CFS FirstChoice Personal Super Geared Shared Fund Aus & NZ Institute of Insurance and Finance Awards (July 2005) Life Insurance Company of the Year (CommInsure) Awards Received |
| RBS Money Magazine - 2005/06 Gold Winner of "Best of the Best Reverse Mortgage Award - Equity Unlock" Gold Winner of "Best of the Best Premium Banking Package" - Award for Wealth Package Gold Winner "Cheapest Home Loan" - Homepath - 2005 & 2006 Bronze Winner "best reverse Mortgage" - 2006 Personal Investor Magazine - 2005 SVR Home Loan of the Year - Homepath - 2005 Fixed rate Home Loan of the Year - Joint Winner - Homepath Cannex Ratings - 2005 VLOC - Superior Value (5 star rating (best)) 2yr & 5yr Fixed - Exceptional Value (4 star) Awards Received |
| ASB University of Auckland Customer Satisfaction Survey New Zealand's no.1 major bank for the 7th consecutive year UK Banker Magazine '2005 Bank of the Year' in New Zealand for the 4th consecutive year Business Finance Monitor Ranked no. 1 in overall performance by a business bank TUANZ Innovations Awards '2005 Financial Services Award' for continued innovation with its FastNet Classic online banking service CRM Contact Centre Awards '2005 Online (Web/Email) Award' Awards Received |

| Presentation of Half Year Results for 31 December 2005 Ralph Norris Michael Cameron Chief Executive Officer Chief Financial Officer 15 February 2006 |
Contents
| | | | | |
| | | 2 | |
| — |
| | | 2 | |
| | | 3 | |
| | | 4 | |
| | | 5 | |
| | | 5 | |
| | | 6 | |
| | | | | |
| | | 8 | |
| — |
| | | 8 | |
| | | 9 | |
| | | 12 | |
| | | 13 | |
| | | 16 | |
| | | | | |
| | | 18 | |
| — |
| | | 18 | |
| | | 19 | |
| | | 20 | |
| | | | | |
| | | 22 | |
| — |
| | | 22 | |
| | | 23 | |
| | | 24 | |
| | | 25 | |
| — |
| | | | | |
| | | 26 | |
| — |
| | | | | |
| | | 27 | |
| — |
| | | 28 | |
| | | 29 | |
| | | 30 | |
| | | 30 | |
| | | 31 | |
| | | | | |
| | | 33 | |
| — |
| | | | | |
Directors’ Declaration | | | 73 | |
| — |
| | | | | |
Independent Review Report | | | 74 | |
| — |
| | | | | |
Appendices | | | 75 | |
| — |
Highlights
Financial Performance and Business Review
Performance Highlights
| | | | | | | | | | | | | |
| | | Half year ended | |
| | | 31/12/05 | | | 30/06/05 | | | 31/12/04 | |
| Contributions to Profit | | $M | | | $M | | | $M | |
| |
NPAT (“statutory basis”) | | | 1,999 | | | | 1,688 | | | | 1,712 | |
| Add back AIFRS non cash items | | | 62 | | | | 71 | | | | 21 | |
| |
NPAT (“cash basis”) | | | 2,061 | | | | 1,759 | | | | 1,733 | |
| Less profit on sale of the Hong Kong business | | | (145 | ) | | | — | | | | — | |
| |
NPAT (cash basis ex HK sale) | | | 1,916 | | | | 1,759 | | | | 1,733 | |
| |
The Bank’s net profit after tax (“statutory basis”) for the half year ended 31 December 2005 was $1,999 million, an increase of 18% on the prior half. Another record interim dividend of 94 cents has been declared.
The Bank has achieved another strong result with continued growth and good momentum. Highlights of the half year include:
| • | | Strong growth in banking income, following profitable growth across all banking products and a stable net interest margin; |
| |
| • | | Positive growth in retail deposits with stable market share; |
| |
| • | | Growth in Funds under Administration of 11% to $137 billion supported by both strong inflows and continued strength in investment markets. First Choice has captured in excess of 24% of market net flows and greater than $20 billion funds under administration; |
| |
| • | | Further growth in insurance premiums and revenues together with favourable claims experience on general insurance; |
| |
| • | | The Bank has continued to meet or exceed it’s Which new Bank market commitments and has completed 84% of its critical project milestones. CommSee, the new customer management platform, was implemented four months ahead of schedule; |
| |
| • | | Sound expense management with continued productivity improvements; and |
| |
| • | | Further strengthening in the credit quality across the portfolio, and continuing moderate levels of bad debts. |
The Bank’s results include the full impact of the adoption of Australian equivalents to International Financial Reporting Standards (“AIFRS”) from 1 July 2005. Comparative figures have also been adjusted to an AIFRS basis, other than for the impact of those standards related to financial instruments and insurance. The introduction of the new standards has not had a material impact on net profit. Changes to the Bank’s accounting policies and explanations of the key changes are covered in Note 1 to the Financial Statements on pages 33-60, as well as Appendix 15.
The Bank’s net profit after tax (“statutory basis”) for the half year was $1,999 million. The statutory result includes the impact of two non-cash items:
| • | | Defined benefit superannuation plan expense which relates to the recognition of surplus superannuation fund assets ($19 million); and |
| |
| • | | “Treasury shares” valuation adjustment which is the appreciation of the Bank’s own shares held in the life insurance statutory funds ($43 million). |
Net profit after income tax (“cash basis”) increased by 17% to $2,061 million compared with $1,759 million for the prior half. During the half year the insurance business in Hong Kong was sold resulting in a profit on sale of $145 million.
Excluding this from the current period net profit after tax (“cash basis”), the result increased by 9% on the prior half and 11% on the prior comparative period. Earnings per share on the same basis increased by 13% to 149.5 cents.
Net profit after income tax (“cash basis”) includes:
| • | | Shareholder investment returns of $41 million compared with $66 million for the prior half and $111 million for the prior comparative period; and |
| |
| • | | Nil impact for Which new Bank expenses, compared with $86 million in the prior half. |
Dividends
The interim dividend declared for the half year is another record at 94 cents per share, an increase of 9 cents or 11% on the prior comparative period. The dividend has been determined based on NPAT (“cash basis”) excluding the sale of the Hong Kong business. On this basis the dividend payout ratio for the half year is 63.2%.
This dividend payment is fully franked and will be paid on 5 April 2006 to owners of ordinary shares at the close of business on 24 February 2006 (“record date”). Shares will be quoted ex–dividend on 20 February 2006.
The Bank issued $262 million of shares to satisfy shareholder participation in the Dividend Reinvestment Plan (“DRP”) in respect of the final dividend for 2004/05. The Bank expects to issue around $221 million of shares in respect of the DRP for the interim dividend for 2005/06.
Outlook
The Australian economy performed well in the second half of the 2005 calendar year, despite some loss of momentum. Business credit growth has been solid, supported by infrastructure and capacity expansion while consumer credit growth has moderated.
The overall environment for financial services businesses is expected to remain highly competitive and as a result margin pressure will continue to be experienced. Domestic credit quality, high employment levels and business confidence are strong and provide a positive outlook. Offshore, economic growth is likely to remain solid although the impact of oil prices and the rate of growth in China are two factors which are particularly likely to influence the domestic economy.
In February 2005, the Bank increased its expected compound annual growth rate in cash earnings per share for the period 2003 to 2006 from exceeding 10 percent per annum to exceeding 12 percent per annum. Subject to market conditions, the Bank is reconfirming that it remains committed to at least achieving this goal. Seven months into the 2006 fiscal year, the Bank remains confident that the momentum within the business will ensure that the Bank delivers EPS growth which equals or exceeds the average of its peers. As a consequence, the Bank expects dividend per share for the second half of the year to further increase, subject to the factors considered in its dividend policy.
2 Commonwealth Bank of Australia
Highlightscontinued
| | | | | | | | | | | | | | | | | | | | | |
| | | Half Year Ended | |
| | | 31/12/05 | | | 30/06/05 | | | 31/12/04 | | | Dec 05 vs | | | Dec 05 vs | |
| Contributions to Profit (after income tax) | | $M | | | $M | | | $M | | | Jun 05 % | | | Dec 04 % | |
| |
Net Profit after Income Tax (“statutory basis”) | | | 1,999 | | | | 1,688 | | | | 1,712 | | | | 18 | | | | 17 | |
Add back AIFRS non cash items(1) | | | 62 | | | | 71 | | | | 21 | | | | (13 | ) | | | large | |
| |
Net Profit after Income Tax (“cash basis”) | | | 2,061 | | | | 1,759 | | | | 1,733 | | | | 17 | | | | 19 | |
| Less profit on sale of the Hong Kong business | | | (145 | ) | | | — | | | | — | | | | — | | | | — | |
| |
Net Profit after Income Tax (“cash basis excl HK sale”) | | | 1,916 | | | | 1,759 | | | | 1,733 | | | | 9 | | | | 11 | |
| |
| | |
| (1) | | Includes “Treasury Shares” valuation adjustment $43 million (Dec 04: ($7) million and Jun 05: $46 million) and defined benefit superannuation plan expense $19 million (Dec 04: $28 million and Jun 05: $25 million). |
| | | | | | | | | | | | | | | | | | | | | |
| | | Half Year Ended | |
| | | 31/12/05 | | | 30/06/05 | | | 31/12/04 | | | Dec 05 vs | | | Dec 05 vs | |
| Contributions to Profit (after income tax) | | $M | | | $M | | | $M | | | Jun 05 % | | | Dec 04 % | |
| |
Net Profit after Income Tax (“cash basis”) | | | 2,061 | | | | 1,759 | | | | 1,733 | | | | 17 | | | | 19 | |
| Less profit on sale of the Hong Kong business | | | (145 | ) | | | — | | | | — | | | | — | | | | — | |
| Less Shareholder Investment Returns (after tax) | | | (41 | ) | | | (66 | ) | | | (111 | ) | | | (38 | ) | | | (63 | ) |
| Add back Which new Bank | | | — | | | | 86 | | | | 19 | | | | — | | | | — | |
| |
Net Profit after Income Tax (“underlying basis”) | | | 1,875 | | | | 1,779 | | | | 1,641 | | | | 5 | | | | 14 | |
| |
| Represented by: | | | | | | | | | | | | | | | | | | | | |
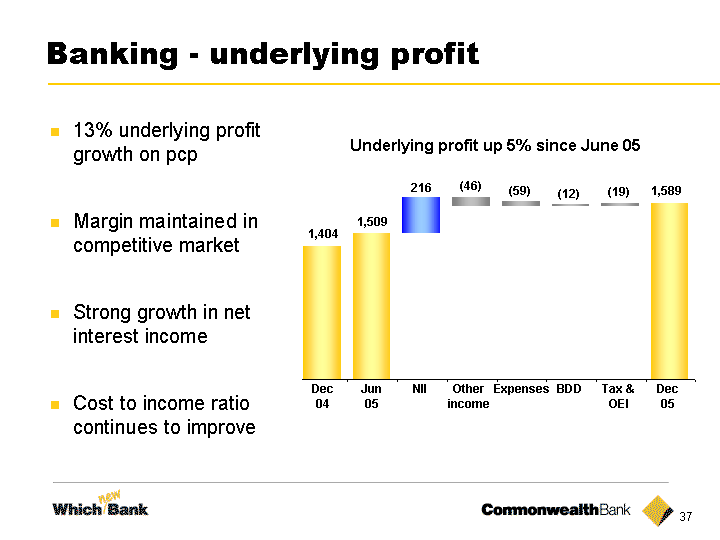
| Banking | | | 1,589 | | | | 1,509 | | | | 1,404 | | | | 5 | | | | 13 | |
| Funds Management | | | 183 | | | | 181 | | | | 170 | | | | 1 | | | | 8 | |
| Insurance | | | 103 | | | | 89 | | | | 67 | | | | 16 | | | | 54 | |
| |
| | | | | | | | | | | | | | | | | | | | | |
| | | Half Year Ended | |
| | | | | | | | | | | | | | | Dec 05 vs | | | Dec 05 vs | |
| Shareholder Summary | | 31/12/05 | | | 30/06/05 | | | 31/12/04 | | | Jun 05 % | | | Dec 04 % | |
| |
| Dividend per share — fully franked (cents) | | | 94 | | | | 112 | | | | 85 | | | | (16 | ) | | | 11 | |
| Dividend cover — cash (times) | | | 1.7 | | | | 1.2 | | | | 1.5 | | | | 41.7 | | | | 13.3 | |
| Dividend cover — underlying (times) | | | 1.5 | | | | 1.2 | | | | 1.5 | | | | 25.0 | | | | — | |
Earnings per share (cents) (2) | | | | | | | | | | | | | | | | | | | | |
| Statutory — basic | | | 157.1 | | | | 128.1 | | | | 131.4 | | | | 22.6 | | | | 19.6 | |
| Cash basis — basic | | | 160.9 | | | | 132.7 | | | | 132.1 | | | | 21.3 | | | | 21.8 | |
| Cash basis — basic excluding the sale of Hong Kong | | | 149.5 | | | | 132.7 | | | | 132.1 | | | | 12.7 | | | | 13.2 | |
| Underlying basis — basic | | | 146.4 | | | | 134.2 | | | | 124.9 | | | | 9.1 | | | | 17.2 | |
| Dividend payout ratio (%) | | | | | | | | | | | | | | | | | | | | |
| Statutory | | | 60.6 | | | | 88.6 | | | | 65.6 | | | | large | | | | large | |
| Cash basis | | | 58.8 | | | | 84.9 | | | | 64.8 | | | | large | | | | large | |
Weighted average number of shares — statutory basic (M)(1) (2) | | | 1,273 | | | | 1,264 | | | | 1,256 | | | | 1 | | | | 1 | |
Weighted average number of shares — cash basic (M)(1) | | | 1,281 | | | | 1,273 | | | | 1,265 | | | | 1 | | | | 1 | |
| Return on equity — cash (%) | | | 21.7 | | | | 18.8 | | | | 19.0 | | | 290bpts | | 270bpts |
| Return on equity — underlying (%) | | | 19.7 | | | | 19.0 | | | | 18.0 | | | | 70bpts | | | 170bpts |
| |
| | |
| (1) | | For definitions refer to appendix 18 page 100. |
| |
| (2) | | Fully diluted EPS and weighted average number of shares (fully diluted) are disclosed on page 97. |
Underlying growth of 14% on prior comparative period
Profit Announcement 3
Highlightscontinued
| | | | | | | | | | | | | | | | | | | | | |
| | | Half Year Ended | |
| | | 31/12/05 | | | 30/06/05 | | | 31/12/04 | | | Dec 05 vs | | | Dec 05 vs | |
| Group Performance Summary | | $M | | | $M | | | $M | | | Jun 05 % | | | Dec 04 % | |
| |
NPAT (“statutory basis”) | | | 1,999 | | | | 1,688 | | | | 1,712 | | | | 18 | | | | 17 | |
NPAT (“cash basis”) | | | 2,061 | | | | 1,759 | | | | 1,733 | | | | 17 | | | | 19 | |
NPAT (“underlying”)(1) | | | 1,875 | | | | 1,779 | | | | 1,641 | | | | 5 | | | | 14 | |
| |
| | | | | | | | | | | | | | | | | | | | | |
| Net interest income | | | 3,284 | | | | 3,068 | | | | 2,958 | | | | 7 | | | | 11 | |
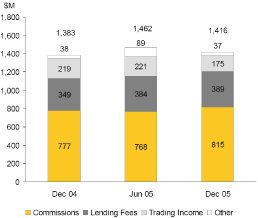
| Other banking income | | | 1,416 | | | | 1,462 | | | | 1,383 | | | | (3 | ) | | | 2 | |
| Funds management income | | | 715 | | | | 638 | | | | 609 | | | | 12 | | | | 17 | |
| Insurance income | | | 386 | | | | 387 | | | | 360 | | | | — | | | | 7 | |
| |
Total Operating Income | | | 5,801 | | | | 5,555 | | | | 5,310 | | | | 4 | | | | 9 | |
| Shareholder investment returns | | | 64 | | | | 92 | | | | 145 | | | | (30 | ) | | | (56 | ) |
| Profit on sale of the Hong Kong business | | | 145 | | | | — | | | | — | | | | — | | | | — | |
| |
Total Income | | | 6,010 | | | | 5,647 | | | | 5,455 | | | | 6 | | | | 10 | |
| | | | | | | | | | | | | | | | | | | | | |
| Operating expenses | | | 2,967 | | | | 2,878 | | | | 2,841 | | | | (3 | ) | | | (4 | ) |
| Which new Bank | | | — | | | | 122 | | | | 28 | | | | — | | | | — | |
| |
Total Operating Expenses | | | 2,967 | | | | 3,000 | | | | 2,869 | | | | 1 | | | | (3 | ) |
| | | | | | | | | | | | | | | | | | | | | |
| Bad and doubtful debts expense | | | 188 | | | | 176 | | | | 146 | | | | (7 | ) | | | (29 | ) |
| |
| Net profit before income tax | | | 2,855 | | | | 2,471 | | | | 2,440 | | | | 16 | | | | 17 | |
Corporate tax expense(2) | | | 776 | | | | 707 | | | | 702 | | | | (10 | ) | | | (11 | ) |
Minority interests(3) | | | 18 | | | | 5 | | | | 5 | | | | large | | | | large | |
| |
NPAT (“cash basis”) | | | 2,061 | | | | 1,759 | | | | 1,733 | | | | 17 | | | | 19 | |
| Defined benefit superannuation plan expense | | | (19 | ) | | | (25 | ) | | | (28 | ) | | | 24 | | | | 32 | |
| Treasury shares | | | (43 | ) | | | (46 | ) | | | 7 | | | | 7 | | | | large | |
| |
NPAT (“statutory basis”) | | | 1,999 | | | | 1,688 | | | | 1,712 | | | | 18 | | | | 17 | |
| |
| | |
| (1) | | Underlying basis excludes Which new Bank, Shareholder investment returns and the profit on sale of the Hong Kong business in the current half year. |
| |
| (2) | | For purposes of presentation, Policyholder tax benefit and Policyholder tax expense are shown on a net basis. |
| |
| (3) | | Minority interests for December 2005 includes preference dividends paid to holders of preference shares in ASB Capital. |
Key Performance Indicators
| | | | | | | | | | | | | | | | | | | | | |
| | | Half Year Ended | |
| | | | | | | | | | | | | | | Dec 05 vs | | | Dec 05 vs | |
| | | 31/12/05 | | | 30/06/05 | | | 31/12/04 | | | Jun 05 % | | | Dec 04 % | |
| |
Banking | | | | | | | | | | | | | | | | | | | | |
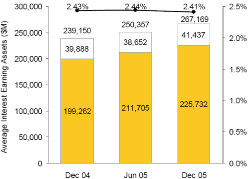
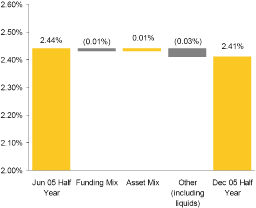
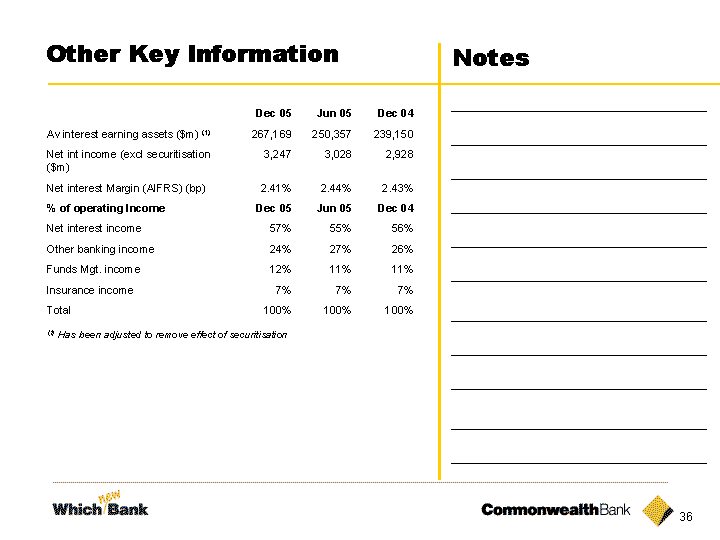
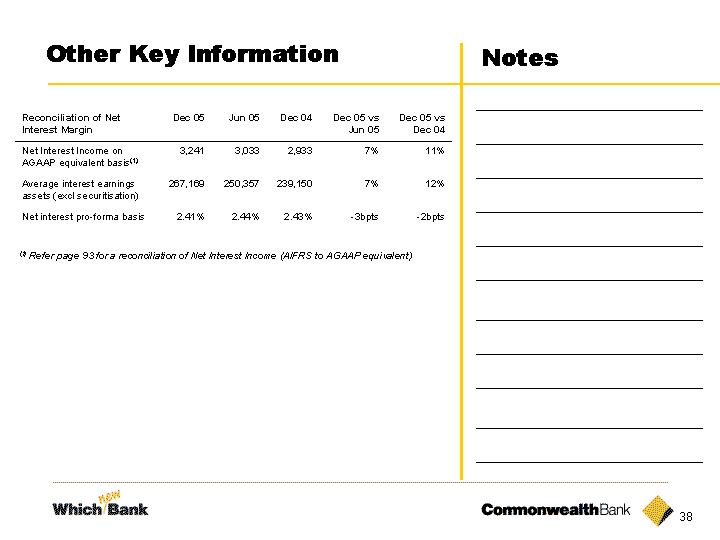
| Net interest margin (%) | | | 2.41 | | | | 2.44 | | | | 2. 43 | | | (3)bpts | | (2)bpts |
Average interest earning assets ($M)(1) | | | 267,169 | | | | 250,357 | | | | 239,150 | | | | 7 | | | | 12 | |
Average interest bearing liabilities ($M)(1) | | | 247,129 | | | | 230,352 | | | | 220,919 | | | | 7 | | | | 12 | |
| | | | | | | | | | | | | | | | | | | | | |
Funds Management | | | | | | | | | | | | | | | | | | | | |
| Operating income to average funds under administration (%) | | | 1.10 | | | | 1.08 | | | | 1. 09 | | | | 2bpts | | | | 1bpt | |
| Funds under administration — spot ($M) | | | 136,974 | | | | 123,064 | | | | 117,440 | | | | 11 | | | | 17 | |
| | | | | | | | | | | | | | | | | | | | | |
Insurance | | | | | | | | | | | | | | | | | | | | |
Inforce premiums ($M)(2) | | | 1,216 | | | | 1,265 | | | | 1,199 | | | | (4 | ) | | | 1 | |
| | | | | | | | | | | | | | | | | | | | | |
Capital Adequacy | | | | | | | | | | | | | | | | | | | | |
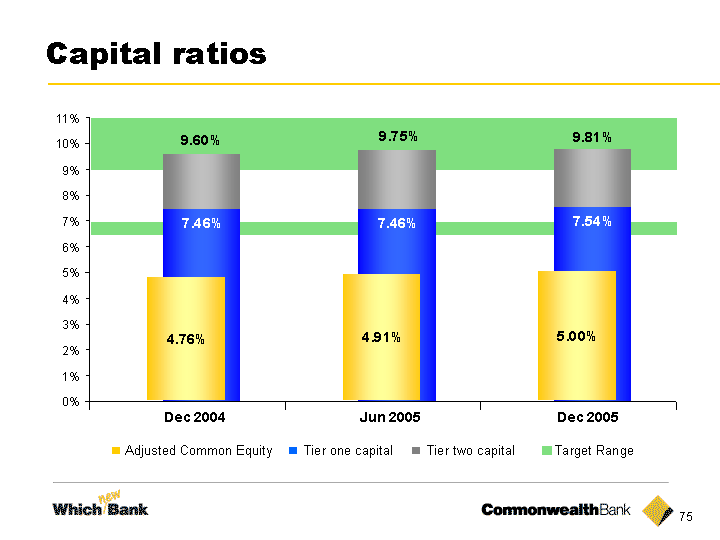
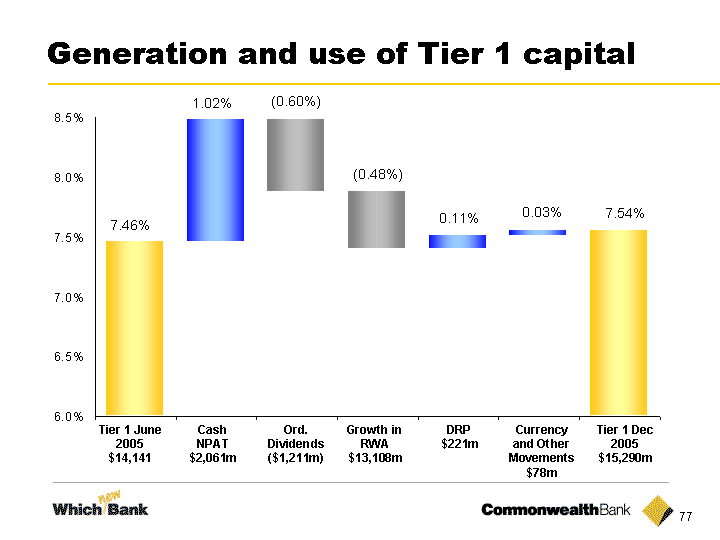
| Tier 1 (%) | | | 7.54 | | | | 7.46 | | | | 7. 46 | | | | 8bpts | | | | 8bpts | |
| Total (%) | | | 9.81 | | | | 9.75 | | | | 9. 60 | | | | 6bpts | | | | 21bpts | |
| Adjusted Common Equity (%) | | | 5.00 | | | | 4.91 | | | | 4. 76 | | | | 9bpts | | | | 24bpts | |
| |
| | |
| (1) | | Average interest earning assets and average interest bearing liabilities have been adjusted to remove the impact of securitisation. Refer to Average Balance Sheet Page 77. |
| |
| (2) | | Prior periods have been adjusted to reflect the impact of the sale of the Hong Kong Business. |
| | | | | | | | | | | | | |
| Credit Ratings | | Long–term | | | Short–term | | | Affirmed | |
| |
| Fitch Ratings | | AA | | | | F1+ | | | Jun 05 |
| Moody’s Investor Services | | Aa3 | | | | P-1 | | | Jun 05 |
| Standards & Poor’s | | AA- | | | | A-1+ | | | Jun 05 |
| |
The Bank continues to maintain a strong capital position which is reflected in its credit ratings which remained unchanged for the year. Additional information regarding the Bank’s capital is disclosed on pages 85 to 87.
4 Commonwealth Bank of Australia
Highlightscontinued
| | | | | | | | | | | | | | | | | | | | | |
| | | Half Year Ended | |
| | | 31/12/05 | | | 30/06/05 | | | 31/12/04 | | | Dec 05 vs | | | Dec 05 vs | |
| Balance Sheet Summary | | $M | | | $M | | | $M | | | Jun 05 % | | | Dec 04 % | |
| |
Lending assets(1) | | | 254,947 | | | | 235,862 | | | | 224,220 | | | | 8 | | | | 14 | |
| |
| Total assets | | | 351,193 | | | | 337,404 | | | | 325,359 | | | | 4 | | | | 8 | |
| Total liabilities | | | 331,343 | | | | 314,761 | | | | 303,258 | | | | 5 | | | | 9 | |
| |
| Shareholders’ equity | | | 19,850 | | | | 22,643 | | | | 22,101 | | | | n/a | | | | n/a | |
| |
| | | | | | | | | | | | | | | | | | | | | |
Assets held and FUA | | | | | | | | | | | | | | | | | | | | |
| On balance sheet Banking assets | | | 321,477 | | | | 304,620 | | | | 292,293 | | | | 6 | | | | 10 | |
| Insurance funds under administration | | | 21,217 | | | | 22,959 | | | | 23,221 | | | | (8 | ) | | | (9 | ) |
| Other insurance and internal funds management assets | | | 8,499 | | | | 9,825 | | | | 9,845 | | | | (13 | ) | | | (14 | ) |
| |
| | | | 351,193 | | | | 337,404 | | | | 325,359 | | | | 4 | | | | 8 | |
| |
| Off balance sheet Funds under administration | | | 115,757 | | | | 100,105 | | | | 94,219 | | | | 16 | | | | 23 | |
| |
| | | | 466,950 | | | | 437,509 | | | | 419,578 | | | | 7 | | | | 11 | |
| |
| | |
| (1) | | Lending assets comprise Loans, Advances, and Other Receivables (gross of provisions for impairment and excluding securitisation) and bank acceptances of customers. |
| | | | | | | | | | | | | | | | | | | | | |
| | | Half Year Ended | |
| | | | | | | | | | | | | | | Dec 05 vs | | | Dec 05 vs | |
| Productivity and Efficiency | | 31/12/05 | | | 30/06/05 | | | 31/12/04 | | | Jun 05 % | | | Dec 04 % |
| |
Banking | | | | | | | | | | | | | | | | | | | | |
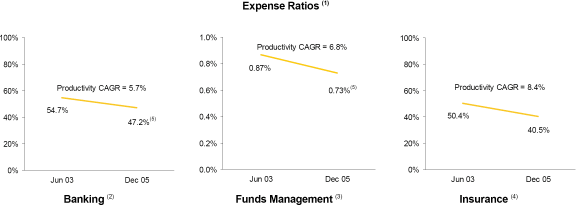
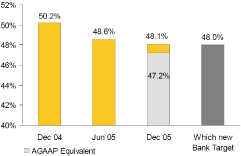
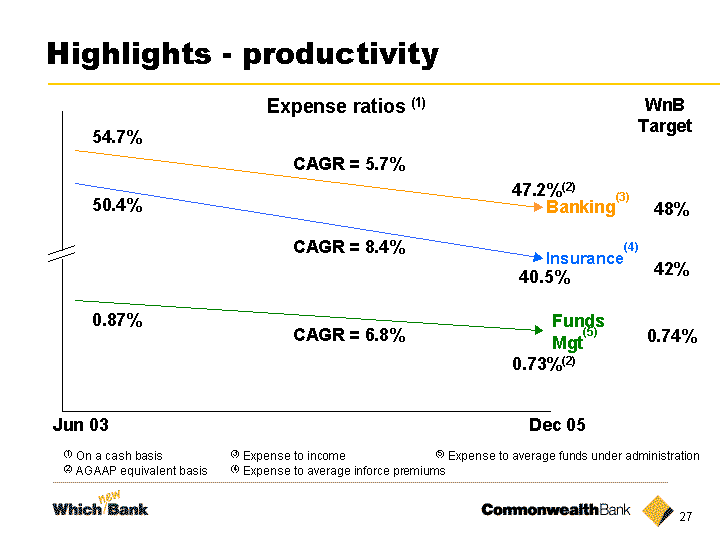
Expense to income (%)(5) | | | 47.2 | | | | 50.7 | | | | 50. 5 | | | 350bpts | | 330bpts |
Underlying expense to income (%)(5) | | | 47.2 | | | | 48.6 | | | | 50. 2 | | | 140bpts | | 300bpts |
| | | | | | | | | | | | | | | | | | | | | |
Funds Management | | | | | | | | | | | | | | | | | | | | |
Expense to average FUA (%)(5) | | | 0.73 | | | | 0.71 | | | | 0. 73 | | | 2bpt | | | | — | |
| | | | | | | | | | | | | | | | | | | | | |
Insurance | | | | | | | | | | | | | | | | | | | | |
| Expense to average inforce premiums (%) | | | 40.5 | | | | 46.6 | | | | 44. 9 | | | 610bpts | | 440bpts |
| Underlying expense to average inforce premiums (%) | | | 40.5 | | | | 46.5 | | | | 44. 8 | | | 600bpts | | 430bpts |
| |
| | |
| (1) | | On a cash basis. |
| |
| (2) | | Expense to income. |
| |
| (3) | | Expense to average funds under administration. |
| |
| (4) | | Expense to average inforce premiums. |
| |
| (5) | | On an AGAAP equivalent basis, as that was the accounting standard on which the targets were based. |
Profit Announcement 5
Which new Bank Summery
Which new Bank
Background
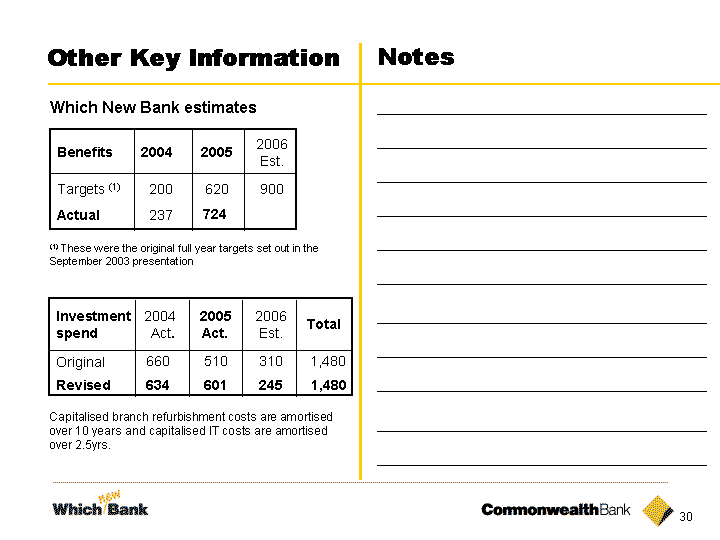
In September 2003, the Bank launched its Which new Bank customer service vision “To excel in customer service”. The service transformation consists of three themes;customer servicethroughengaged peoplesupported bysimple processes. The Bank estimated a spend of $1,480 million over the three years of the program to achieve this transformation.
Which new Bank has been a very successful undertaking by the Bank which has consistently exceeded its financial targets. Further improvements, especially in customer service and engaged people, are required as the Bank continues to strive to “excel in customer service”.
Progress in half year to December 2005
Progress within the major initiatives includes:
| • | | “CommLeader”, the Bank’s leadership program which provides a common understanding of leadership and the desired behaviours that underpin the Bank’s cultural change, has been completed by over 450 senior leaders; |
| |
| • | | “Service and Sales Training”, which will equip frontline people to provide higher quality service has been completed by over 30,000 staff; |
| |
| • | | “CommWay”, the Bank’s approach to process improvement, continues to deliver improvements in customer service and efficiency through reduced turnaround times for customers; |
| |
| • | | “CommSee”, the new customer management platform, is now providing all customer service staff with a single view of the customer. Training focused on integrating CommSee and Service and Sales behaviours and processes, is being delivered to frontline staff; |
| |
| • | | The CommSee Imaging project is saving customers time by providing staff online access to over 22 million customer documents; |
| |
| • | | The personal loan end-to-end process redesign provides customers with on-the-spot decisions for more applications, an expanded product offering, and access to funds and loan information via ATM, EFTPOS and NetBank; |
| |
| • | | Home loan end-to-end process redesign, provides customers with the option of paying interest in advance and allowing on-the-spot decisions for more applications, including customers of third party mortgage brokers; |
| |
| • | | A further 49 branches have been refurbished in the six months to December 2005. This brings the total number of branches modernised since 2003 to 301 which represents approximately one third of the Bank’s total branches; and |
| |
| • | | Implementation of a new advice platform and Centre for Adviser Development will assist financial advisers to provide more consistent higher quality advice to customers. |
Key metrics
Customer service
Referrals for the December 2005 quarter are 10% higher than for the December 2004 quarter with the quality of referrals also improving.
The Internal Service Quality Index, which tracks a number of service indicators, has improved by 10% since the start of the Which new Bank program; however, customer service is yet to improve sufficiently to result in improved satisfaction ratings.
Engaged People
The annual Gallup Survey showed the Bank increasing its percentile rating from 74th in May 2003 to 77th in May 2005.
The latest internal customer service survey, which surveys the Bank’s people on the quality of service they provide each other, has risen for a fourth successive quarter. The latest results show that 89% of internal customers agree that they receive excellent service.
The culture survey indicates an improving trend towards the Bank’s desired culture. This includes staff having a clearer understanding of the Bank’s vision and how they can be engaged and contribute towards achieving this vision.
Simple processes
CommWay which is based upon Six Sigma Principles, has completed 81 projects averaging a 49% reduction in process turnaround times for customers, as well as average efficiency gains of 35%. Projects were undertaken across all major operations and support areas. In addition, the program is building competencies across the Bank, with 800 people skilled in applying the tools and methodologies as part of their everyday roles.
Customers are being provided with quicker credit decisions for home loans and personal loans. The proportion of conditional on-the-spot approvals provided in branches has increased to 72% for home loans and 90% for personal loans, compared with 47% and 0% respectively at the start of the program.
Focus for 2006
The focus for the remainder of 2006 is to embed the changes to service behaviours, tools and processes to ensure continued improvements to service for customers. Embedding these changes will enable the delivery of further improvements in service delivery for customers.
6 Commonwealth Bank of Australia
Which Bank Summerycontinued
| | | | | | | | | | | | | | | | | | | | | |
| | | Half Year Ended | |
| | | 31/12/05 | | | 30/06/05 | | | 31/12/04 | | | Dec 05 vs | | | Dec 05 vs | |
| Which New Bank | | $M | | | $M | | | $M | | | Jun 05 % | | | Dec 04 % | |
| |
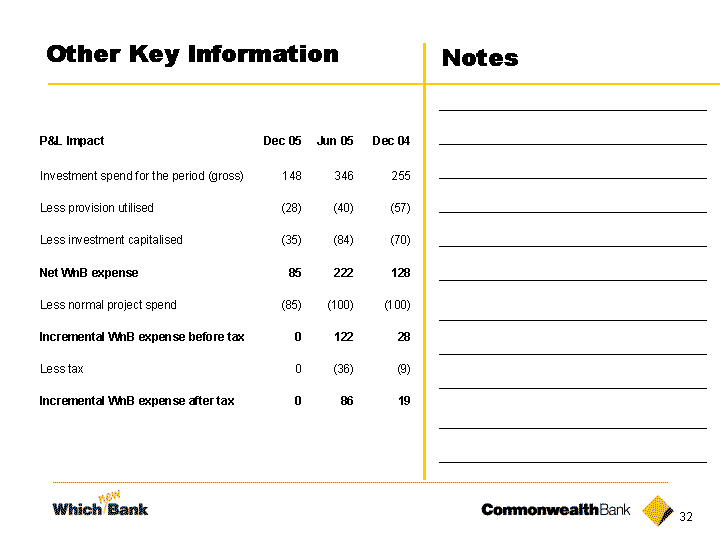
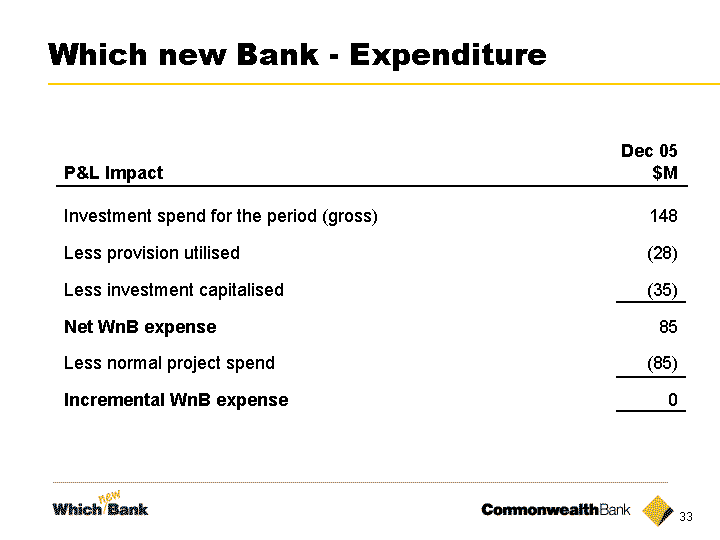
| Gross spend | | | 148 | | | | 346 | | | | 255 | | | | (57 | ) | | | (42 | ) |
| Change in provision for future costs | | | (28 | ) | | | (40 | ) | | | (57 | ) | | | (30 | ) | | | (51 | ) |
| Investments capitalised | | | (35 | ) | | | (84 | ) | | | (70 | ) | | | (58 | ) | | | (50 | ) |
| |
| Net Which new Bank expenses | | | 85 | | | | 222 | | | | 128 | | | | (62 | ) | | | (34 | ) |
| |
| Less: Normal project spend | | | (85 | ) | | | (100 | ) | | | (100 | ) | | | 15 | | | | 15 | |
| |
| Incremental WnB expense — before tax | | | — | | | | 122 | | | | 28 | | | large | | | large | |
| Incremental WnB expense — after tax | | | — | | | | 86 | | | | 19 | | | large | | | large | |
| |
| Which new Bank expense to date (gross investment) | | | 1,383 | | | | 1,235 | | | | 889 | | | | 12 | | | | 56 | |
| |
| | | | | | | | | | | | | | | | | | | | | |
| | | Half Year Ended | |
| | | 31/12/05 | | | 30/06/05 | | | 31/12/04 | | | Dec 05 vs | | | Dec 05 vs | |
| Incremental WnB expense by Segment | | $M | | | $M | | | $M | | | Jun 05 % | | | Dec 04 % | |
| |
| Banking | | | — | | | | 97 | | | | 15 | | | large | | large |
| Funds management | | | — | | | | 24 | | | | 12 | | | large | | large |
| Insurance | | | — | | | | 1 | | | | 1 | | | large | | large |
| |
| Incremental WnB expense — before tax | | | — | | | | 122 | | | | 28 | | | large | | large |
| |
| | | | | | | | | | | | | | | | | | | | | |
| | | Half Year Ended | |
| | | 31/12/05 | | | 30/06/05 | | | 31/12/04 | | | Dec 05 vs | | | Dec 05 vs | |
| Which new Bank benefits — total | | $M | | | $M | | | $M | | | Jun 05 % | | | Dec 04 % | |
| |
| Gross benefits — revenue | | | 254 | | | | 192 | | | | 148 | | | | 32 | | | | 72 | |
| Less: additional operating expenses | | | (39 | ) | | | (36 | ) | | | (31 | ) | | | 8 | | | | 26 | |
| |
| Net benefits — revenue | | | 215 | | | | 156 | | | | 117 | | | | 38 | | | | 84 | |
| Gross benefits — expenses | | | 291 | | | | 267 | | | | 184 | | | | 9 | | | | 58 | |
| |
| Net benefits pre tax | | | 506 | | | | 423 | | | | 301 | | | | 20 | | | | 68 | |
| |
The impact on current half year expenses represents $291 million expense benefits, less the impact of additional operating expenses of $39 million, totalling $252 million. The ratio of net benefits is: revenue 42%: expenses 58% (2005 was 38% and 62% respectively).
| | | | | | | | | | | | | | | | | | | | | |
| | | Half Year Ended | |
| | | 31/12/05 | | | 30/06/05 | | | 31/12/04 | | | Dec 05 vs | | | Dec 05 vs | |
| Investment capitalised under WnB | | $M | | | $M | | | $M | | | Jun 05 % | | | Dec 04 % | |
| |
| Branch refurbishment | | | 15 | | | | 45 | | | | 13 | | | | (67 | ) | | | 15 | |
| IT systems (hardware and software) | | | 20 | | | | 39 | | | | 57 | | | | (49 | ) | | | (65 | ) |
| |
| Total amount capitalised | | | 35 | | | | 84 | | | | 70 | | | | (58 | ) | | | (50 | ) |
| |
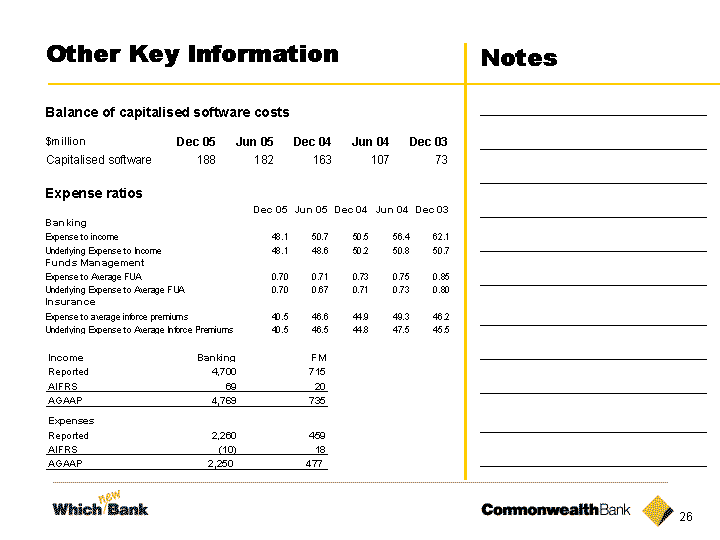
The balance of capitalised IT systems at 31 December 2005 was $188 million (June 2005: $182 million and December 2004: $163 million).
Profit Announcement 7
Banking Analysis
Performance Highlights
Financial Performance and Business Review
Underlying profit after tax of $1,589 million for the banking business for the half year increased 5% on the prior half and 13% on the prior comparative period.
The performance was underpinned by:
| • | | Strong volume growth in home loans, up 7% since June 2005 to $150 billion; |
| |
| • | | Domestic deposit volume growth of 3% since June 2005 to $145 billion including a 6% growth in savings accounts; |
| |
| • | | Continued improvement in business lending volumes, up 13% since June 2005 to $72 billion, and improved market share; |
| |
| • | | Net interest margin has been relatively flat for the last four half years; |
| |
| • | | Good cost control, with operating expenses increasing 3% compared with the prior half and 4% compared with prior comparative period; |
| |
| • | | Nil impact of Which new Bank expenses compared with $97 million in the prior half year; and |
| |
| • | | Sound credit quality leading to a flat Bad Debt expense. |
Australian Retail
The Australian retail banking operations continued to perform strongly over the half year, highlighted by strong revenue growth and further productivity gains.
The focus remains on profitable growth. The combination of volume growth and effective margin management resulted in strong revenue outcomes in the period.
Deposit growth was particularly strong, with the Bank responding to increased price-based competition through segmented product offers, including the launch of NetBank Saver in June 2005. Results to date have been in line with expectations, with nearly 60% of inflows being new money to the Bank. Together with growth in Term Deposits and Streamline Accounts, the Bank’s retail deposit balances grew strongly over the past six months, leading to an improved market share trend.
Asset growth was lower than the previous half consistent with the general softening in industry growth. Home loan market share remains in line with the position 12 months ago, with a slight reduction over the past six months due in part to aggressive price discounting by some competitors.
Personal lending growth was lower in the half, reflecting lower levels of consumer demand and strong competition in the low-rate credit card segment.
“Commsee”, the new customer management system has been deployed across the retail network. “Commserve”, a complementary learning program is being rolled out to assist staff in using this technology to improve customer service outcomes for customers.
Premium, Business & Corporate and Institutional
Premium Business Services provides financial services to a broad client base that incorporates the institutional, corporate and business banking segments as well as the Bank’s high-net-worth personal clients.
The Bank has increased market share in each of the key product areas of business lending, financial markets and transaction services during the half year. Activities undertaken to improve market share include the development of dedicated mobile lenders, strong servicing for third party brokers, the introduction of a dedicated acquisition sales force for corporate
clients and a dedicated foreign exchange sales force, which is remunerated on a commission basis.
Specialised client service teams have been developed that are now capable of supporting all business clients centrally for most servicing activities. The average number of work items processed by these teams per week has nearly doubled between June and December. This has also provided an opportunity to upskill staff in response to customers’ increasing demand for specialised knowledge.
The capital markets businesses delivered a strong half year result raising more than $50 billion of capital for clients, both domestic and international. The businesses participated in 67 separate capital markets transactions during the half year as book runner, co-manager, underwriter or participant.
CommSec continued to perform well during the period. October was a record trading month with the average number of trades per day of 28,900 compared with 25,700 in previous months. A record day was achieved on 6 October with 45,512 trades. Typically, CommSec touches one in three trades on the ASX.
Asia Pacific
Asia Pacific Banking incorporates the Bank’s retail, business/commercial and rural banking operations in New Zealand, Fiji, Indonesia and China. ASB Bank in New Zealand represents the majority of the Asia Pacific Banking business.
Notwithstanding the continued monetary policy tightening in New Zealand and increasing mortgage interest rates, both house sales activity and the lending market have remained buoyant and competition has remained intense. While the aggressive pricing in the market during the 2005 financial year has not been as evident, interest margins remain under pressure.
ASB Bank performance highlights include:
| • | | Lending growth at above market rates in the retail, business/ commercial and rural sectors continued. Home loan market share increased to 23.2% (December 2005) from 23.0% in June 2005; |
| |
| • | | ASB Bank underlying NPAT for the half year was $201 million, an increase of 9% over the prior half; |
| |
| • | | For the fourth consecutive year, ASB Bank was recognised as New Zealand’s “Bank of the Year” by the UK based Banker Magazine; and |
| |
| • | | ASB Bank continued its leadership position in Personal Banking customer satisfaction among the major banks. |
During the half year, the Bank acquired a 19.9% interest in Hangzhou City Commercial Bank (HZB) for A$102 million. HZB is one of the top five city commercial banks by assets in mainland China. Together with our 11% interest in Jinan City Commercial Bank (JNB), the Bank now holds minority investments in two of the top 10 city commercial banks in China by assets. The Capability Transfer Program with JNB has progressed to date with great success.
8 Commonwealth Bank of Australia
Bankung Analysiscontinued
| | | | | | | | | | | | | | | | | | | | | |
| | | Half Year Ended | |
| | | 31/12/05 | | | 30/06/05 | | | 31/12/04 | | | Dec 05 vs | | | Dec 05 vs | |
| Key Performance Indicators | | $M | | | $M | | | $M | | | Jun 05 % | | | Dec 04 % | |
| |
| Net interest income | | | 3,284 | | | | 3,068 | | | | 2,958 | | | | 7 | | | | 11 | |
| Other banking income | | | 1,416 | | | | 1,462 | | | | 1,383 | | | | (3 | ) | | | 2 | |
| |
Total operating income | | | 4,700 | | | | 4,530 | | | | 4,341 | | | | 4 | | | | 8 | |
| Operating expenses | | | 2,260 | | | | 2,201 | | | | 2,179 | | | | (3 | ) | | | (4 | ) |
| Which new Bank | | | — | | | | 97 | | | | 15 | | | | — | | | | — | |
| |
Total operating expenses | | | 2,260 | | | | 2,298 | | | | 2,194 | | | | 2 | | | | (3 | ) |
| Bad and Doubtful debts expense | | | 188 | | | | 176 | | | | 146 | | | | (7 | ) | | | (29 | ) |
| |
Net profit before income tax | | | 2,252 | | | | 2,056 | | | | 2,001 | | | | 10 | | | | 13 | |
| Income tax expense | | | 648 | | | | 615 | | | | 605 | | | | (5 | ) | | | (7 | ) |
| Minority interests | | | 15 | | | | 1 | | | | 2 | | | large | | | large | |
| |
NPAT (“cash basis”) | | | 1,589 | | | | 1,440 | | | | 1,394 | | | | 10 | | | | 14 | |
| |
NPAT(“underlying basis”)(1) | | | 1,589 | | | | 1,509 | | | | 1,404 | | | | 5 | | | | 13 | |
| |
| | | | | | | | | | | | | | | | | | | | | |
Productivity and other measures | | | | | | | | | | | | | | | | | | | | |
| |
| Net interest margin (%) | | | 2.41 | | | | 2.44 | | | | 2.43 | | | (3)bpts | | (2)bpts |
| Expense to income (%) | | | 48.1 | | | | 50.7 | | | | 50.5 | | | 260bpts | | 240bpts |
| Expense to income – underlying (%) | | | 48.1 | | | | 48.6 | | | | 50.2 | | | 50bpts | | 210bpts |
| Effective corporate tax rate (%) | | | 28.8 | | | | 29.9 | | | | 30.2 | | | (110)bpts | | | (140)bpts | |
| |
| | | | | | | | | | | | | | | | | | | | | |
Balance Sheet | | | | | | | | | | | | | | | | | | | | |
| |
Lending assets ($M)(2) | | | 254,947 | | | | 235,862 | | | | 224,220 | | | | 8 | | | | 14 | |
Average interest earning assets ($M)(3) | | | 267,169 | | | | 250,357 | | | | 239,150 | | | | 7 | | | | 12 | |
Average interest bearing liabilities ($M)(3) | | | 247,129 | | | | 230,352 | | | | 220,919 | | | | 7 | | | | 12 | |
| |
| | | | | | | | | | | | | | | | | | | | | |
Asset Quality(4) | | | | | | | | | | | | | | | | | | | | |
| |
Risk weighted assets ($M)(5) | | | 202,667 | | | | 189,559 | | | | 180,674 | | | | 7 | | | | 12 | |
| Net impaired assets ($M) | | | 217 | | | | 219 | | | | 238 | | | | (1 | ) | | | (9 | ) |
| General provision/Risk weighted assets (%) | | | — | | | | 0.73 | | | | 0.76 | | | | — | | | | — | |
| Collective provision plus general reserve for credit losses (pre-tax equivalent)/risk weighted assets (%) | | | 0.71 | | | | — | | | | — | | | | — | | | | — | |
Total provisions/Gross impaired assets (net of interest reserved) (%)(6) | | | 308.1 | | | | 411.4 | | | | 373.0 | | | large | | | large | |
| Total provisions plus general reserve for credit losses (pre-tax equivalent)/gross impaired assets (%) | | | 410.1 | | | | — | | | | — | | | | — | | | | — | |
| Bad debt expense as a % of risk weighted assets annualised (%) | | | 0.19 | | | | 0.19 | | | | 0.16 | | | | — | | | (3)bpts |
| |
| | |
| (1) | | Underlying basis excludes Which new Bank expenses. |
| |
| (2) | | Lending assets are comprised of Loans, Advances, Other Receivables (gross of provisions for impairment) and Bank Acceptances of Customers. |
| |
| (3) | | Average interest earning assets and average interest bearing liabilities have been adjusted to remove the impact of securitisation. Refer to Average Balance Sheet page 77. |
| |
| (4) | | Asset quality coverage ratios are not comparable to prior periods due to AIFRS. |
| |
| (5) | | No AIFRS adjustment is made to Risk Weighted Assets in the prior periods as the APRA prudential requirement is to apply previous Australian GAAP for regulatory capital purposes. |
| |
| (6) | | Interest/fees reserved are no longer recognised under AIFRS. |
Underlying growth of 13% on prior comparative period
Profit Announcement 9
Banking Analysiscontinued
Total Banking Income
Total banking income comprises income from the Australian Retail; Business & Corporate and Institutional; Group Treasury and Asia Pacific operations.
| | | | | | | | | | | | | |
| | | Half year | |
| | | 31/12/05 | | | 30/06/05 | | | 31/12/04 | |
| | | $M | | | $M | | | $M | |
| |
| Retail products | | | 2,563 | | | | 2,396 | | | | 2,297 | |
| Business, Corporate and Institutional | | | 1,501 | | | | 1,485 | | | | 1,478 | |
| Other | | | 636 | | | | 649 | | | | 566 | |
| |
Total Banking Income | | | 4,700 | | | | 4,530 | | | | 4,341 | |
| |
| | | | | | | | | | | | | |
| Net interest income | | | 3,284 | | | | 3,068 | | | | 2,958 | |
| Other banking income | | | 1,416 | | | | 1,462 | | | | 1,383 | |
| |
Total Banking Income | | | 4,700 | | | | 4,530 | | | | 4,341 | |
| |
| • | | Retail Products: Total income of $2,563 million increased by 7% compared with the prior half and 12% on the prior comparative period, reflecting growth in average interest earning assets; and |
| |
| • | | Business, Corporate and Institutional: Total income of $1,501 million in line with the prior half and 2% higher than the prior comparative period, reflecting continued improvement in lending asset growth. |
Additional disclosures are set out on pages 16 and 17.
Net Interest Income
Net interest income increased by 7% to $3,284 million compared with the prior half and 11% compared with the prior comparative period. The growth compared with the prior half was driven by a strong increase in average interest earning assets of 7% and a stable net interest margin. The introduction of AIFRS has not had an impact on the growth rates for the period (refer page 93 and 94 for a summary of the impacts of AIFRS).
Average Interest Earnings Assets and NIM Trends
Volume
Average interest earning assets increased by $17 billion over the prior half year to $267 billion, reflecting a $14 billion increase in average lending assets and a $3 billion increase in average liquid assets.
The largest contributor to the increase in average interest earning assets was the continued growth of home lending in Australia and New Zealand.
Average home loan balances increased by 6% since 30 June 2005 and 13% since 31 December 2004. Despite intense competition in both Australia and New Zealand market share in Australia has remained relatively stable while ASB Bank continues to grow ahead of the industry.
Personal lending average balances have increased by 3% since June 2005. This reflects lower levels of demand for consumer credit and strong competition in the low-rate credit card segment. Margin loans continue to experience strong growth.
Average balances for Business, Corporate and Institutional lending grew 8% since 30 June 2005. The result has delivered market share improvement during the half year.
Net Interest Margin
The net interest margin of 2.41% was down three basis points compared with the prior period. The key drivers of the margin reduction were:
Funding mix: lending asset growth continues to outpace retail deposit growth resulting in a greater reliance of wholesale funding which has moved from 41% in June 2005 to 43% in December 2005. The change in funding mix has resulted in a one basis point margin contraction;
Asset mix: the continued moderation in home loan growth has been offset by strength in business and corporate lending. This has increased margin by one basis point; and
Other: Average non-lending interest earning assets have increased by $3 billion resulting in margin reduction of two basis points. Other factors (including asset and deposit price margin) have contributed to a further reduction of one basis point.
NIM movement since June 2005
Additional information, including the average balance sheet and the impact of AIFRS, is set out on pages 77 to 80. The application of AIFRS did not have a significant impact on net interest margins. Page 93 contains further information on the impact of AIFRS.
10 Commonwealth Bank of Australia
Banking Analysiscontinued
Other Banking Income
| | | | | | | | | | | | | |
| | | Half year |
| | | 31/12/05 | | | 30/06/05 | | | 31/12/04 | |
| | | $M | | | $M | | | $M | |
| |
| Commissions | | | 815 | | | | 768 | | | | 777 | |
| Lending fees | | | 389 | | | | 384 | | | | 349 | |
| Trading income | | | 244 | | | | 221 | | | | 219 | |
| Non trading derivatives | | | (69 | ) | | | — | | | | — | |
| Other income | | | 37 | | | | 89 | | | | 38 | |
| |
Other banking income | | | 1,416 | | | | 1,462 | | | | 1,383 | |
| |
Other banking income decreased by 3% to $1,416 million compared with the prior half and increased by 2% compared with the prior comparative period. Excluding the impact of AIFRS and several one-off items in prior periods, other banking income increased by 5% on the prior half and increased 9% on the prior comparative period.
The introduction of AIFRS may result in increased volatility in future periods.
Other Banking Income
Factors impacting other banking income were:
| • | | Commissions: increased by 6% on the prior half to $815 million. The increase was driven by general volume increases together with various measures to improve fee collection rates; |
| |
| • | | Lending fees: increased by 1% compared with the prior period to $389 million. After adjusting for AIFRS, lending fee growth was up 7% compared with the prior half. The result was driven by an increase in fee volumes following strength in the business and corporate loan books together with higher volumes in overdraft facilities; |
| |
| • | | Trading income increased 10% on the prior period to $244 million reflecting favourable market conditions; |
| |
| • | | Non trading derivatives relates to volatility on the application on 1 July 2005 of AIFRS hedge accounting together with fair value adjustments on other non-trading derivatives; and |
| |
| • | | Other income, excluding one off items was flat compared with the prior half. The prior half included $52 million due to changes to tax consolidation legislation for leasing. |
Operating Expenses
Operating expenses within the Banking business increased by 3% from the prior half to $2,260 million.
Operating expenses were impacted by:
| • | | Average salary increases of 4% reflecting labour market movements and other inflation-related expense increases; |
| |
| • | | Continued volume growth particularly within the New Zealand operation; |
| |
| • | | Increased expenses supporting Asian expansion; |
| |
| • | | Further expenses related to compliance projects, which include Basel II and the implementation of AIFRS; |
| |
| • | | Commencing spend on a number of post Which new Bank strategic initiatives. |
Operating expenses benefited from continued savings arising from the implementation of Which new Bank initiatives.
Underlying Banking Expense to Income Ratio
The underlying Banking expense to income ratio improved from 48.6% as at June 2005 to 48.1% in December 2005. On an AGAAP basis, the Bank met its Which new Bank productivity target of 48%, with the expense to income ratio down to 47.2% for the six months to December 2005. The improvement reflects income growth (4%) and good expense control, including the ongoing realisation of Which new Bank savings.
Productivity
Bad and Doubtful Debts Expense
The total charge for bad and doubtful debts for the half year was $188 million, which is 19 basis points of Risk Weighted Assets. This is the first period where provisions are calculated in accordance with AIFRS.
Gross impaired assets were $396 million as at 31 December 2005, which is in line with June 2005 ($395 million) and down from $445 million at December 2004.
The Bank remains well provisioned, with total provisions for impairment as a percentage of gross impaired assets of 308%(1). Collective provision plus the general reserve for credit losses (pre-tax equivalent) is comparable to the prior period general provision. This total was 0.71% of risk weighted assets compared with 0.73% as at 30 June 2005 and 0.76% as at 31 December 2004 for the general provision.
Credit quality remains sound.
(1) Not comparable to prior periods due to AIFRS.
Taxation Expense
The corporate tax charge for the half year was $648 million, an effective tax rate of 28.8% compared with 29.9% in the prior half year and 30.2% in the prior comparative period.
Profit Announcement 11
Banking Analysiscontinued
Provisions for Impairment
| | | | | | | | | | | | | | | | | |
| | | 31/12/05 | | | 01/07/05 | | | 30/06/05 | | | 31/12/04 | |
| | | $M | | | $M | | | $M | | | $M | |
| |
| Collective provisions | | | 1,041 | | | | 1,021 | | | | 1,390 | | | | 1,379 | |
| Individually assessed provisions | | | 179 | | | | 191 | | | | 157 | | | | 180 | |
| |
| Total provisions | | | 1,220 | | | | 1,212 | | | | 1,547 | | | | 1,559 | |
| General reserve for credit losses (pre-tax equivalent) | | | 404 | | | | 369 | | | | — | | | | — | |
| |
Total provisions including general reserve for credit losses | | | 1,624 | | | | 1,581 | | | | 1,547 | | | | 1,559 | |
| |
| | | | | | | | | | | | | | | | | |
Total provisions for impairment as a % of gross impaired assets net of interest reserved(1) | | | 308.1 | | | | 306.8 | | | | 411.4 | | | | 373.0 | |
Individually assessed provisions for impairment as a % of gross impaired assets net of interest reserved(1) (2) | | | 45.2 | | | | 48.4 | | | | 41.8 | | | | 43.1 | |
Collective provisions as a % of risk weighted assets(1) | | | 0.51 | | | | 0.54 | | | | 0.73 | | | | 0.76 | |
| Collective provision plus general reserve for credit losses (pre-tax equivalent) as a % of risk weighted assets | | | 0.71 | | | | 0.73 | | | | — | | | | — | |
Bad debt expense as a % of risk weighted assets annualised(1) | | | 0.19 | | | | 0.19 | | | | 0.19 | | | | 0.16 | |
| |
| | |
| (1) | | Impairment provision ratios have changed because of the re-measurement under AIFRS. |
| |
| (2) | | Interest reserved no longer recognised under AIFRS. |
Impairment provisions as at 31 December 2005 have been assessed under AIFRS. The prior period provisions have not been restated for AIFRS, but have been assessed using the previous Australian GAAP methodology and are not comparable to the current half year period.
Total provisions for impairment at 31 December 2005 were $1,220 million excluding the pre-tax equivalent General Reserve for Credit Losses ($404 million). The addition of the collective provision and general reserve for credit losses approximates the level of the former general provision and is 0.71% expressed as a percentage of risk weighted assets. The current level continues to reflect:
| | | |
Growth in Assets (spot) | | Risk Weighted Assets on Balance Sheet |
| | |
| • | | A major portion of the credit portfolio is in home loans which have a lower risk weighting compared with other portfolios; |
| |
| • | | The continuing strong asset quality in the business lending book; and |
| |
| • | | A level of impaired assets which is at the lower level achieved over the past decade. |
12 Commonwealth Bank of Australia
Banking Analysiscontinued
Total Banking Assets & Liabilities
| | | | | | | | | | | | | | | | | | | | | |
| | | Half Year Ended |
| | | 31/12/05 | | | 30/06/05 | | | 31/12/04 | | | Dec 05 vs | | | Dec 05 vs | |
| | | $M | | | $M | | | $M | | | Jun 05 % | | | Dec 04 % | |
| |
Interest earning assets | | | | | | | | | | | | | | | | | | | | |
| Home loans including securitisation | | | 159,339 | | | | 150,677 | | | | 140,649 | | | | 6 | | | | 13 | |
| Less: securitisation | | | (9,124 | ) | | | (10,818 | ) | | | (6,391 | ) | | | (16 | ) | | | 43 | |
| |
| Home loans | | | 150,215 | | | | 139,859 | | | | 134,258 | | | | 7 | | | | 12 | |
| Personal | | | 15,967 | | | | 15,668 | | | | 14,806 | | | | 2 | | | | 8 | |
| Business and corporate | | | 71,502 | | | | 63,549 | | | | 58,859 | | | | 13 | | | | 21 | |
| |
Loans, advances and other receivables(1) | | | 237,684 | | | | 219,076 | | | | 207,923 | | | | 8 | | | | 14 | |
| |
Cash and other liquid assets(2) | | | 14,386 | | | | 10,804 | | | | 10,450 | | | | 33 | | | | 38 | |
| Assets at fair value through the Income Statement | | | 15,617 | | | | 14,631 | | | | 15,884 | | | | 7 | | | | (2 | ) |
| Available-for-sale investments/investment securities | | | 9,428 | | | | 10,838 | | | | 11,619 | | | | (13 | ) | | | (19 | ) |
| |
Non lending interest earning assets | | | 39,431 | | | | 36,273 | | | | 37,953 | | | | 9 | | | | 4 | |
| |
Total interest earning assets | | | 277,115 | | | | 255,349 | | | | 245,876 | | | | 9 | | | | 13 | |
Other assets(3) | | | 44,362 | | | | 49,271 | | | | 46,417 | | | | (10 | ) | | | (4 | ) |
| |
Total assets | | | 321,477 | | | | 304,620 | | | | 292,293 | | | | 6 | | | | 10 | |
| |
Interest bearing liabilities | | | | | | | | | | | | | | | | | | | | |
| Transaction deposits | | | 34,287 | | | | 34,694 | | | | 32,608 | | | | (1 | ) | | | 5 | |
| Savings deposits | | | 40,030 | | | | 38,461 | | | | 38,052 | | | | 4 | | | | 5 | |
| Investment deposits | | | 67,462 | | | | 66,087 | | | | 64,312 | | | | 2 | | | | 5 | |
| Other demand deposits | | | 19,573 | | | | 21,806 | | | | 25,438 | | | | (10 | ) | | | (23 | ) |
| |
Total interest bearing deposits | | | 161,352 | | | | 161,048 | | | | 160,410 | | | | — | | | | 1 | |
| Deposits not bearing interest | | | 7,371 | | | | 6,978 | | | | 7,013 | | | | 6 | | | | 5 | |
| |
Deposits and other public borrowings | | | 168,723 | | | | 168,026 | | | | 167,423 | | | | — | | | | 1 | |
| Due to other financial institutions | | | 9,900 | | | | 8,023 | | | | 9,512 | | | | 23 | | | | 4 | |
| Liabilities at fair value through the Income Statement | | | 16,322 | | | | — | | | | — | | | | — | | | | — | |
| Debt issues (excluding securitisation) | | | 60,187 | | | | 58,621 | | | | 51,346 | | | | 3 | | | | 17 | |
| Loan capital | | | 9,129 | | | | 6,291 | | | | 5,801 | | | | 45 | | | | 57 | |
| |
Total interest bearing liabilities | | | 264,261 | | | | 240,961 | | | | 234,082 | | | | 10 | | | | 13 | |
| |
| Securitisation debt issues | | | 9,849 | | | | 12,144 | | | | 7,504 | | | | (19 | ) | | | 31 | |
Non interest bearing liabilities | | | 32,945 | | | | 34,444 | | | | 34,419 | | | | (4 | ) | | | (4 | ) |
| |
Total liabilities | | | 307,055 | | | | 287,549 | | | | 276,005 | | | | 7 | | | | 11 | |
| |
| | |
| (1) | | Gross of provisions for impairment, which are included in Other Assets. |
| |
| (2) | | Includes interest earning portion only. Non interest earning portion is included under Other Assets. |
| |
| (3) | | Other assets include Bank acceptances of customers, provision for impairment and securitisation assets. |
| | | |
Australian Home Loan Balances by Product type | | Lending Assets |
| |
| | 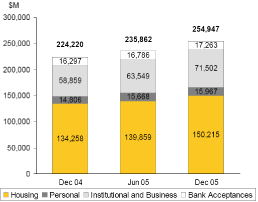 |
| | | |
Australian Home Loan Balances by Loan type | | Origination of Home Loans funded for the half year (Aust) |
| | |
Profit Announcement 13
Banking Analysiscontinued
Assets & Liabilities
Retail Lending Australia
| | | | | | | | | | | | | | | | | | | | | |
| | | Half Year Ended |
| | | 31/12/05 | | | 30/06/05 | | | 31/12/04 | | | Dec 05 vs | | | Dec 05 vs | |
| Major Balance Sheet Items (gross of impairment) | | $M | | | $M | | | $M | | | Jun 05% | | | Dec 04 % | |
| |
| Lending assets — home loans (including securitisation) | | | 135,990 | | | | 129,913 | | | | 121,704 | | | | 5 | | | | 12 | |
Lending assets — personal loans(1) | | | 10,507 | | | | 10,720 | | | | 10,316 | | | | (2 | ) | | | 2 | |
| |
Total assets — retail products | | | 146,497 | | | | 140,633 | | | | 132,020 | | | | 4 | | | | 11 | |
| |
| Lending assets — home loans (net of securitisation) | | | 126,866 | | | | 119,094 | | | | 115,313 | | | | 7 | | | | 10 | |
| |
| | | | | | | | | | | | | | | | | | | | | |
Market Share Percentage(2) | | | | | | | | | | | | | | | | | | | | |
| |
Home loans(3) | | | 18.9 | | | | 19.0 | | | | 18.9 | | | | | | | | | |
| Credit cards | | | 21.8 | | | | 22.8 | | | | 22.8 | | | | | | | | | |
Personal lending (APRA other households)(3) (4) | | | 16.0 | | | | 16.7 | | | | 16.7 | | | | | | | | | |
| |
| | |
| (1) | | Retail personal loans includes personal loans and credit cards. |
| |
| (2) | | For market share definitions refer to appendix 19 page 101. |
| |
| (3) | | Comparatives have been restated due to a reclassification between home loans and personal loans by another ADI. |
| |
| (4) | | Personal lending market share includes personal loans and margin loans (refer below). |
Home Loans
Home loan growth remains strong, albeit at lower levels consistent with the slowdown in system credit growth. Home loan balances (net of securitisation) increased by 7% in the half year to December 2005 to $127 billion. Growth over the prior comparative period was 12%, or 10% net of securitisation. Home lending market share has remained stable over the past twelve months, with a small reduction over the past six months due in part to aggressive price discounting by some competitors.
Business, Corporate and Institutional Lending Australia(1)
| | | | | | | | | | | | | | | | | | | | | |
| | | Half Year Ended |
| | | 31/12/05 | | | 30/06/05 | | | 31/12/04 | | | Dec 05 vs | | | Dec 05 vs | |
| Major Balance Sheet Items (gross of impairment) | | $M | | | $M | | | $M | | | Jun 05 % | | | Dec 04 % | |
| |
| Interest earning lending assets | | | 60,949 | | | | 51,584 | | | | 48,424 | | | | 18 | | | | 26 | |
| Bank acceptances of customers | | | 17,263 | | | | 16,786 | | | | 16,297 | | | | 3 | | | | 6 | |
| Cash and other liquid assets | | | 12,199 | | | | 11,366 | | | | 10,865 | | | | 7 | | | | 12 | |
| Assets at fair value through the Income Statement — trading | | | 14,087 | | | | 12,341 | | | | 13,044 | | | | 14 | | | | 8 | |
| Available-for-sale investments/investment securities | | | 9,034 | | | | 10,286 | | | | 11,081 | | | | (12 | ) | | | (18 | ) |
| Margin loans | | | 4,664 | | | | 4,311 | | | | 3,847 | | | | 8 | | | | 21 | |
Other assets(2) | | | 15,711 | | | | 19,773 | | | | 21,134 | | | | (21 | ) | | | (26 | ) |
| |
Total assets — Business, Corporate and Institutional products Australia | | | 133,907 | | | | 126,447 | | | | 124,692 | | | | 6 | | | | 7 | |
| |
| | | | | | | | | | | | | | | | | | | | | |
Market Share Percentage(3) | | | | | | | | | | | | | | | | | | | | |
| |
| Business lending | | | 13.0 | | | | 12.8 | | | | 13.1 | | | | | | | | | |
| Asset finance | | | 16.1 | | | | 16.3 | | | | 16.5 | | | | | | | | | |
| Transaction services (Commercial) | | | 25.1 | | | | 24.8 | | | | 24.4 | | | | | | | | | |
| Transaction services (Corporate) | | | 22.1 | | | | 22.1 | | | | 21.4 | | | | | | | | | |
| |
| | |
| (1) | | Includes Group Treasury. |
| |
| (2) | | Other assets include intangible assets and derivative assets. |
| |
| (3) | | For market share definitions refer to appendix 19 page 101. |
Lending Assets
Business, Corporate and Institutional assets have increased $7 billion or 6% compared with the prior half. The increase has been driven by continued growth in the Australian and New Zealand syndicated loan market. In addition the Bank has entered into several structured deals. Bank acceptances have increased by 3% since June 2005 (6% growth since December 2004) with Bill facilities continuing to be a valuable source of financing for our customers. Business lending market share (including bank acceptances) increased during the six months ended December 2005 to 13.0%.
Personal Loans
Personal loans balances have decreased by 2% compared with the last half and increased by 2% over the prior comparative period. This is due to the repayment of low margin, government funded student loans during the half. The current half year reflects lower levels of consumer credit demand as well as product and process changes. Credit card market share has come under pressure from strong competition, particularly in the low-rate segment of the market.
Margin Lending balances continued to grow strongly, assisted by strong equity markets.
Transaction Services
Transaction market share for medium corporations (commercial) continued to grow, increasing thirty basis points over the half, whilst transactions for large corporations (corporate) remained in line with June 2005.
14 Commonwealth Bank of Australia
Banking Analysiscontinued
Deposits and Liabilities Australia
| | | | | | | | | | | | | | | | | | | | | |
| | | Half Year Ended | |
| | | 31/12/05 | | | 30/06/05 | | | 31/12/04 | | | Dec 05 vs | | | Dec 05 vs | |
| Major Balance Sheet Items (gross of impairment) | | $M | | | $M | | | $M | | | Jun 05 % | | | Dec 04 % | |
| |
| Transaction deposits | | | 31,233 | | | | 30,501 | | | | 29,394 | | | | 2 | | | | 6 | |
| Savings deposits | | | 36,306 | | | | 34,205 | | | | 33,603 | | | | 6 | | | | 8 | |
| Other demand deposits | | | 53,322 | | | | 52,283 | | | | 50,564 | | | | 2 | | | | 5 | |
| Deposits not bearing interest | | | 6,149 | | | | 5,823 | | | | 5,885 | | | | 6 | | | | 4 | |
| |
| Sub total deposits (excluding CD’s and other) | | | 127,010 | | | | 122,812 | | | | 119,446 | | | | 3 | | | | 6 | |
Certificate of deposits and other(1) | | | 18,443 | | | | 18,299 | | | | 21,360 | | | | 1 | | | | (14 | ) |
| Debt issues | | | 69,854 | | | | 63,826 | | | | 52,969 | | | | 9 | | | | 32 | |
| Loan capital | | | 9,129 | | | | 6,291 | | | | 5,801 | | | | 45 | | | | 57 | |
Other liabilities(2) | | | 48,642 | | | | 45,950 | | | | 48,315 | | | | 6 | | | | 1 | |
| |
Total liabilities Australia | | | 273,078 | | | | 257,178 | | | | 247,891 | | | | 6 | | | | 10 | |
| |
Total liabilities Australia — retail products | | | 75,873 | | | | 72,056 | | | | 72,384 | | | | 5 | | | | 5 | |
Total liabilities Australia — Business, Corporate and Institutional products | | | 197,205 | | | | 185,122 | | | | 175,507 | | | | 7 | | | | 12 | |
| |
| | | | | | | | | | | | | | | | | | | | | |
Market Share Percentage(3) | | | | | | | | | | | | | | | | | | | | |
| |
| Household deposits | | | 29. 6 | | | | 29.8 | | | | 30.3 | | | | | | | | | |
| Retail deposits | | | 22. 9 | | | | 23.0 | | | | 23.6 | | | | | | | | | |
| |
| | |
| (1) | | Other includes securities sold under agreement to repurchase and short sales. |
| |
| (2) | | Other liabilities include liabilities at fair value through the Income Statement, bank acceptances, bills payable, due to other financial institutions and other derivative liabilities. |
| |
| (3) | | For market share definitions refer to appendix 19 page 101. |
Deposits
Total deposits excluding Certificates of Deposit (CD’s) increased by 3% in the half year (up 6% in the twelve months since 31 December 2004). Savings deposits grew strongly during the half year, rising by 6% underpinned by strong inflows into the Bank’s new NetBank Saver account as well as Term Deposits. The Bank’s main personal transaction account, Streamline, also recorded strong growth. NetBank Saver was launched in June 2005 to meet customer demand in the high interest online segment, with good results to date. Nearly 60% of NetBank Saver inflows represent new funds to the Bank. Strong deposit growth has helped stabilise the Bank’s market share of retail deposits at 22.9% (RBA). The combination of volume growth and effective margin management has underpinned strong revenue outcomes during the half year.
Asia Pacific
| | | | | | | | | | | | | | | | | | | | | |
| | | Half Year Ended | |
| | | 31/12/05 | | | 30/06/05 | | | 31/12/04 | | | Dec 05 vs | | | Dec 05 vs | |
| Major Balance Sheet Items (gross of impairment) | | $M | | | $M | | | $M | | | Jun 05 % | | | Dec 04 % | |
| |
| Home lending | | | 23,349 | | | | 20,765 | | | | 18,945 | | | | 12 | | | | 23 | |
| Other lending assets | | | 11,157 | | | | 12,132 | | | | 10,906 | | | | (8 | ) | | | 2 | |
| Assets at fair value through the Income Statement – trading | | | 1,530 | | | | 2,290 | | | | 2,840 | | | | (33 | ) | | | (46 | ) |
| Asset at fair value — other | | | 3,249 | | | | — | | | | — | | | | — | | | | — | |
| Available-for-sale investments/ Investment securities | | | 395 | | | | 553 | | | | 538 | | | | (29 | ) | | | (27 | ) |
| Cash and liquid assets | | | 349 | | | | 821 | | | | 1,469 | | | | (57 | ) | | | (76 | ) |
| Other assets | | | 1,044 | | | | 979 | | | | 883 | | | | 7 | | | | 18 | |
| |
| Total assets — offshore banking | | | 41,073 | | | | 37,540 | | | | 35,581 | | | | 9 | | | | 15 | |
| |
| Debt issues | | | 182 | | | | 6,939 | | | | 5,881 | | | | (97 | ) | | | (97 | ) |
Deposits(1) | | | 19,256 | | | | 23,006 | | | | 21,492 | | | | (16 | ) | | | (10 | ) |
| Liabilities at fair value through the Income Statement | | | 13,691 | | | | — | | | | — | | | | — | | | | — | |
| Other liabilities | | | 848 | | | | 426 | | | | 741 | | | | 99 | | | | 14 | |
| |
| Total liabilities — offshore banking | | | 33,977 | | | | 30,371 | | | | 28,114 | | | | 12 | | | | 21 | |
| |
| | | | | | | | | | | | | | | | | | | | | |
Market Share Percentage(2) | | | | | | | | | | | | | | | | | | | | |
| |
| NZ lending for housing | | | 23.2 | | | | 23.0 | | | | 22.7 | | | | | | | | | |
| NZ retail deposits | | | 19.8 | | | | 19.5 | | | | 17.5 | | | | | | | | | |
| |
| | |
| (1) | | Asia Pacific Deposits exclude deposits held in other overseas countries (31 December 2005: $4 billion). |
| |
| (2) | | For market share definitions refer to appendix 19 page 101. |
Lending Assets
New Zealand lending volumes were strong during the half year across all sectors, particularly in housing and business. Credit demand was strong and housing sales activity remained buoyant. ASB Bank achieved Personal lending growth of 11%, Rural lending growth of 6% and Business/Commercial lending growth of 8%.
Deposits
Retail funding within ASB Bank increased by 5% during the half year ended December 2005 ($16.8 billion). Growth in deposits has been ahead of the market with market share increasing to 19.8% at December 2005, up from 19.5% at June 2005. ASB Bank’s share of household deposits has continued to grow, with market share increasing to 23.2% by December 2005 from 23% at June 2005 (Source: Reserve Bank of New Zealand). Higher retail interest rates have helped deliver good funding growth.
Profit Announcement 15
Banking Analysiscontinued
Banking Segments
The following table summarises banking income by major product based category. Product categories shown, span the major banking businesses and are not directly aligned to the management structure. Product revenue is shown by category with full allocation of costs excluding some group costs and adjustments.
Product category definitions are as follows:
Home loansincludes investment/owner occupied home loans and secured lines of credit.
Personal loansincludes personal loans and credit cards.
Retail depositsincludes retail savings accounts, transaction accounts, cash management accounts and other personal investment accounts.
Corporate and Business transactionsincludes commercial and corporate transaction services and merchant acquiring.
Financial marketsincludes financial market and wholesale operations, equities broking (including CommSec) and structured products, capital markets services (including IPOs and placements) and margin lending.
Lending and financeincludes asset finance, structured finance and general lending
Offshore bankingincludes ASB retail and entities in China, Indonesia, Fiji and others.
Otherincludes Group Funding, Balance Sheet Management, and other support unit costs not directly attributable to the product based segments above.
Total banking income includes the impact of internal transfer pricing and other banking income. Transfer pricing is based on wholesale market rates and is adjusted to reflect liquidity and funding costs and other specific market risks. This transfer pricing methodology is not necessarily comparable with results reported by other banks.
The current half has been affected by AIFRS as follows:
| • | | Hedging and derivatives, and the reclassification of dividends paid on hybrid financial instruments reduce “Other” income by $71 million. |
| • | | Whilst the net deferral of Banking income under AIFRS is not significant overall (-$2 million), at product category level it increases Home Loan income and reduces Lending and Finance income in the current half year. |
Home loan income has increased 14% over the prior half, reflecting solid volume growth and continued stable margins. The lower balance growth profile is consistent with a general slowdown in the overall system credit growth.
Personal loan income has increased 5% in the half year to December 2005. Balances growth has been impacted by the repayment of low margin, government funded student loans during the current half. Lower levels of consumer credit demand and strong competition in the credit card market, have also affected the growth in balances.
Retail deposits income increased 4% over the prior half, with good volume growth partially offset by slight margin contraction. Balances grew strongly underpinned by strong inflows in both existing products (including Streamline and Term Deposits) as well as the Bank’s new NetBank Saver account.
Corporate and Business Transactions income growth of 4% compared with the prior half has been driven by higher deposit balances coupled with the benefit of the cash interest rate rise from March 2005. An improved merchant acquiring performance was supported by increased transaction volumes as well as higher merchant terminal rental income.
Financial Markets income has increased by 16% compared with the prior half due to improved trading conditions and increased customer flows experienced. In addition, the buoyant equity markets provided income growth opportunities in both CommSec and margin lending activities.
Lending and finance performance has been impacted by lower structured transaction income. Business lending volumes however have demonstrated strong growth during the period with market share improving. The prior period also included income recognised in relation to tax consolidation legislation changes impacting the leasing business of $52 million.
Offshore underlying net profit after tax is predominantly made up of ASB Bank. Income growth of 12% in a competitive environment is a strong result and reflects continued above market volume growth partly offset by margin contraction.
16 Commonwealth Bank of Australia
Banking Analysiscontinued
| | | | | | | | | | | | | | | | | | | | | | | | | |
| | | Half Year to December 2005 | |
| | | | | | | | | | | Total | | | | | | | | | | | Underlying | |
| | | | | | | | | | | Banking | | | | | | | | | | | after Profit | |
| Banking Segments $M | | Assets | | | Liabilities | | | Income | | | Expenses | | | Bad Debts | | | Tax | |
| |
| Home loans | | | 135,990 | | | | — | | | | 701 | | | | | | | | | | | | | |
| Personal loans | | | 10,507 | | | | — | | | | 537 | | | | | | | | | | | | | |
| Retail deposits | | | — | | | | 75,873 | | | | 1,325 | | | | | | | | | | | | | |
| |
Retail products | | | 146,497 | | | | 75,873 | | | | 2,563 | | | | 1,132 | | | | 156 | | | | 894 | |
| |
| Corporate and Business transactions | | | 2,982 | | | | 18,592 | | | | 486 | | | | | | | | | | | | | |
| Financial markets | | | 29,680 | | | | 70,098 | | | | 454 | | | | | | | | | | | | | |
| Lending and finance | | | 94,671 | | | | 25,145 | | | | 561 | | | | | | | | | | | | | |
| |
Business, Corporate and Institutional products(1) | | | 127,333 | | | | 113,835 | | | | 1,501 | | | | 779 | | | | 37 | | | | 501 | |
| |
| Offshore banking | | | 41,073 | | | | 33,977 | | | | 527 | | | | | | | | | | | | | |
Other(1) | | | 6,574 | | | | 83,370 | | | | 109 | | | | | | | | | | | | | |
| |
Other products | | | 47,647 | | | | 117,347 | | | | 636 | | | | 349 | | | | (5 | ) | | | 194 | |
| |
Total banking | | | 321,477 | | | | 307,055 | | | | 4,700 | | | | 2,260 | | | | 188 | | | | 1,589 | |
| |
| | | | | | | | | | | | | | | | | | | | | | | | | |
| | | Half Year to June 2005 | |
| | | | | | | | | | | Total | | | | | | | | | | | Underlying | |
| | | | | | | | | | | Banking | | | | | | | | | | | after Profit | |
| Banking Segments $M | | Assets | | | Liabilities | | | Income | | | Expenses | | | Bad Debts | | | Tax | |
| |
| Home loans | | | 129,913 | | | | — | | | | 615 | | | | | | | | | | | | | |
| Personal loans | | | 10,720 | | | | — | | | | 512 | | | | | | | | | | | | | |
| Retail deposits | | | — | | | | 72,056 | | | | 1,269 | | | | | | | | | | | | | |
| |
Retail products | | | 140,633 | | | | 72,056 | | | | 2,396 | | | | 1,101 | | | | 148 | | | | 817 | |
| |
| Corporate and Business transactions | | | 3,299 | | | | 18,659 | | | | 466 | | | | | | | | | | | | | |
| Financial markets | | | 34,104 | | | | 67,398 | | | | 393 | | | | | | | | | | | | | |
| Lending and finance | | | 85,935 | | | | 21,658 | | | | 626 | | | | | | | | | | | | | |
| |
Business, Corporate and Institutional products(1) | | | 123,338 | | | | 107,715 | | | | 1,485 | | | | 761 | | | | 19 | | | | 516 | |
| |
| Offshore banking | | | 37,540 | | | | 30,371 | | | | 472 | | | | | | | | | | | | | |
Other(1) | | | 3,109 | | | | 77,407 | | | | 177 | | | | | | | | | | | | | |
| |
Other products | | | 40,649 | | | | 107,778 | | | | 649 | | | | 339 | | | | 9 | | | | 176 | |
| |
Total banking | | | 304,620 | | | | 287,549 | | | | 4,530 | | | | 2,201 | | | | 176 | | | | 1,509 | |
| |
| | | | | | | | | | | | | | | | | | | | | | | | | |
| | | Half Year to December 2004 | |
| | | | | | | | | | | Total | | | | | | | | | | | Underlying | |
| | | | | | | | | | | Banking | | | | | | | | | | | after Profit | |
| Banking Segments $M | | Assets | | | Liabilities | | | Income | | | Expenses | | | Bad Debts | | | Tax | |
| |
| Home loans | | | 121,704 | | | | — | | | | 579 | | | | | | | | | | | | | |
| Personal loans | | | 10,316 | | | | — | | | | 473 | | | | | | | | | | | | | |
| Retail deposits | | | — | | | | 72,384 | | | | 1,245 | | | | | | | | | | | | | |
| |
Retail products | | | 132,020 | | | | 72,384 | | | | 2,297 | | | | 1,067 | | | | 118 | | | | 772 | |
| |
| Corporate and Business transactions | | | 2,944 | | | | 17,153 | | | | 479 | | | | | | | | | | | | | |
| Financial markets | | | 35,068 | | | | 68,183 | | | | 421 | | | | | | | | | | | | | |
| Lending and finance | | | 83,450 | | | | 21,401 | | | | 578 | | | | | | | | | | | | | |
| |
Business, Corporate and Institutional products(1) | | | 121,462 | | | | 106,737 | | | | 1,478 | | | | 775 | | | | (37 | ) | | | 533 | |
| |
| Offshore banking | | | 35,581 | | | | 28,114 | | | | 445 | | | | | | | | | | | | | |
Other(1) | | | 3,230 | | | | 68,770 | | | | 121 | | | | | | | | | | | | | |
| |
Other products | | | 38,811 | | | | 96,884 | | | | 566 | | | | 337 | | | | 65 | | | | 99 | |
| |
Total banking | | | 292,293 | | | | 276,005 | | | | 4,341 | | | | 2,179 | | | | 146 | | | | 1,404 | |
| |
| | |
| (1) | | Business, Corporate and Institutional balances on page 14 and 15 includes Business, Corporate and Institutional and other. |
Profit announcement 17
Funds Management Analysis
Financial Performance and Business Review
Performance Highlights
Underlying profit before tax of $261 million increased 7% over the prior half and 22% over the prior comparative period. The performance during the half year reflects strong growth across the business. The cash net profit after tax for the period increased by 11% to $188 million compared with the prior half and 5% on the prior comparative period.
Profit after tax has been impacted by a significantly higher effective tax rate due to the loss of the transitional tax relief on investment style products within life insurance entities, which ceased at the end of last financial year.
Funds under administration grew by 11% to $137 billion as at 31 December 2005. The growth in funds under administration was the result of favourable investment markets over the half and the continued improvement in the net funds flow position.
Business Review
The industry has again benefited in the six months to 31 December 2005 from favourable market conditions, with both the domestic and international investment markets providing significant positive returns. In addition, the continuing improvement in the net fund flows position has resulted in strong profit growth for the half year.
Funds flow performance for the half year was strong with $2.7 billion of net inflows (up $1.8 billion on prior comparative period) due to continuing success of FirstChoice, excellent sales results in our international businesses and good inflows in our domestic wholesale funds. An improvement in funds flow was achieved across most channels, including Independent Financial Advisors, Institutional Clients and the Bank Network.
Investment performance during the period was good, in both absolute returns and against benchmark, and this contributed to the improving funds flows.
Other key developments within the business during the period included:
| • | | Acquisition of the Gandel Group’s interests in the Colonial First State Property Retail Trust and Gandel Retail Management Trust, which provides funds management and property management services to a number of Colonial First State Retail Property trusts; |
| • | | Organisational changes to the asset management business, bringing together the domestic, international and property management businesses and establishing a strong team to manage the combined businesses; |
| • | | The continued rationalisation of legacy systems and products (17 administration systems reduced to 6) and significant improvement around the control environment; and |
| • | | Unit pricing control and process improvement program with $11 million spent in the half year. |
Investment Performance
Investment performance continues to improve with 16 out of 18 major funds exceeding benchmark on a one year basis.
Importantly, the investment performance of the two flagship Australian Equity funds were well ahead of benchmark on a one year basis with rankings in first and second quartiles.
Operating Income
Operating income for the half year to December 2005 increased by 12% on the prior half year and 17% over the prior comparative period. This growth was supported by an 11% increase in funds under administration to $137 billion as at 31 December 2005. The acquisition of Gandel’s Joint Venture interest in October 2005 has also contributed $15 million in revenue during the period and $9 million in expenses.
Margins improved by two basis points, against a background of increasing competition. This reflects good margins on FirstChoice, and strong flows into higher margin International products.
Operating Expenses
Operating expenses for the half year are up 15% over the prior half and 10% over the prior comparative period. Volume expenses, driven predominantly by stronger sales volumes and growth in FUA, have increased 18% on the prior half and 38% on the prior comparative period.
Key drivers of operating expenses (excluding volume) for the half year were:
| • | | Average salary increases of 4%; |
| • | | Significant regulatory and compliance spend, including the Unit pricing control and process improvement program ($11 million). This is expected to incur additional expenses of $35 million in the next 12 months; |
| • | | Acquisition of Gandel’s JV interest in October 2005, which added $9 million in expenses for the half year (3% contribution to expense growth); and |
| • | | Increase in performance based remuneration in line with continued growth of the business. |
Expenses to average funds under administration for the half year was 0.70%, an improvement on the prior half of one basis point and an improvement of three basis points on the prior comparative period.
Taxation
The corporate tax charge for the half year was $77 million, representing an effective tax rate of 28.7% compared with 24.3% for the prior half and 19.5% for the prior comparative period. The effective tax rate has been mainly impacted by the loss of transitional tax relief on investment style funds management products within life insurance legal entities (approximately $12 million) together with the utilisation of accumulated tax losses in offshore businesses in prior periods.
18 Commonwealth Bank of Australia
Funds Management Analysiscontinued
Key Performance Indicators
| | | | | | | | | | | | | | | | | | | | | |
| | | Half Year Ended | |
| | | 31/12/05 | | | 30/06/05 | | | 31/12/04 | | | Dec 05 vs | | | Dec 05 vs | |
| | | $M | | | $M | | | $M | | | Jun 05 % | | | Dec 04 % | |
| |
| Operating income — external | | | 715 | | | | 638 | | | | 609 | | | | 12 | | | | 17 | |
| Operating income — internal | | | 5 | | | | 5 | | | | 5 | | | | — | | | | — | |
| |
Total operating income | | | 720 | | | | 643 | | | | 614 | | | | 12 | | | | 17 | |
| Shareholder investment returns | | | 7 | | | | 9 | | | | 24 | | | | (22 | ) | | | (71 | ) |
| |
Funds management income | | | 727 | | | | 652 | | | | 638 | | | | 12 | | | | 14 | |
| Volume expense | | | 99 | | | | 84 | | | | 72 | | | | (18 | ) | | | (38 | ) |
| Operating expenses | | | 360 | | | | 314 | | | | 328 | | | | (15 | ) | | | (10 | ) |
| Which new Bank | | | — | | | | 24 | | | | 12 | | | | large | | | | large | |
| |
Total operating expenses | | | 459 | | | | 422 | | | | 412 | | | | (9 | ) | | | (11 | ) |
| |
Net profit before income tax (“cash basis”) | | | 268 | | | | 230 | | | | 226 | | | | 17 | | | | 19 | |
| |
Net profit before income tax (“underlying basis”)(1) | | | 261 | | | | 245 | | | | 214 | | | | 7 | | | | 22 | |
| |
Corporate tax expense(2) | | | 77 | | | | 56 | | | | 44 | | | | (38 | ) | | | (75 | ) |
| Minority interests | | | 3 | | | | 4 | | | | 3 | | | | (25 | ) | | | — | |
| |
Net profit after income tax (“cash basis”) | | | 188 | | | | 170 | | | | 179 | | | | 11 | | | | 5 | |
| |
Net profit after income tax (underlying basis)(1) | | | 183 | | | | 181 | | | | 170 | | | | 1 | | | | 8 | |
| |
| | |
| (1) | | Underlying basis excludes shareholder investment returns and Which new Bank expenses. |
| |
| (2) | | For purpose of presentation, Policyholder tax benefit and Policyholder tax expense are shown on a net basis. |
| | | | | | | | | | | | | | | | | | | | | |
| Funds under Administration | | | | | | | | | | | | | | | | | | | | |
| |
| Funds under administration — average | | | 130,179 | | | | 120,507 | | | | 112,185 | | | | 8 | | | | 16 | |
| Funds under administration — spot | | | 136,974 | | | | 123,064 | | | | 117,440 | | | | 11 | | | | 17 | |
| Net flows | | | 2,695 | | | | (394 | ) | | | 850 | | | | large | | | | large | |
| Total retail net flows | | | 1,365 | | | | 547 | | | | 1,643 | | | | large | | | | (17 | ) |
| |
| | | | | | | | | | | | | | | | | | | | | |
| Productivity and Other Measures | | | | | | | | | | | | | | | | | | | | |
| |
| Operating income to average funds under administration (%) | | | 1.10 | | | | 1.08 | | | | 1.09 | | | 2bpts | | 1bpt |
| Operating expenses to average funds under administration (%) | | | 0.70 | | | | 0.71 | | | | 0.73 | | | 1bpt | | 3bpts |
| Effective corporate tax rate (%) | | | 28.7 | | | | 24.3 | | | | 19.5 | | | large | | large |
| |
Underlying net Profit After Tax growth of 8% on prior comparative period
Profit Announcement 19
Funds Management Analysiscontinued
Funds under Administration
Funds under Administration (spot balances) have increased by 11% over the period to $137 billion. The growth in Funds under Administration was due to a combination of strong investment markets, investment performance which exceeded benchmark across many of our funds contributing $10.9 billion. Net inflows for the half year were $2.7 billion, showing a significant improvement on both prior half year periods.
Average Funds under Administration of $130 billion were 16% higher than the prior comparative period.
The key drivers of net funds flows were:
| • | | Continuation of market leading flows into FirstChoice capturing in excess of 24%(1) of the market net flows. FirstChoice has now reached $20 billion in funds under administration in less than four years; |
| • | | Reduced net outflows on Australian equity funds driven by improved investment performance; |
| • | | A turnaround in net flows into wholesale products, which achieved positive net flows of $1.2 billion for the half year; |
| • | | Good flows into higher margin equity products in the International business; |
| • | | Net outflows from the cash management product due to competition from attractively priced retail deposit products; and |
| • | | Net outflows in other retail products which include closed legacy products, which is consistent with prior periods. |
| | |
| (1) | | September quarter (source: Plan for Life). |
| | | | | | | | | | | | | |
| Market Share Percentage(1) | | 31/12/05 | | | 30/06/05 | | | 31/12/04 | |
| |
| Australian retail — administrator view | | | 14.7 | | | | 14.6 | | | | 14.8 | |
| New Zealand retail | | | 15.0 | | | | 15.2 | | | | 15.1 | |
| Platforms (Masterfunds) | | | 11.2 | | | | 10.8 | | | | 10.4 | |
| |
| | |
| (1) | | For market share definitions refer to appendix 19 page 101. |
Market Share
The Australian retail market share increased from 14.6% at 30 June 2005 to 14.7% at 30 September 2005 but decreased compared with 31 December 2004. The business has seen a significant turnaround in the net flow position of retail Funds under Administration in recent quarters.
The most recent Plan for Life survey (September 2005) showed the Bank ranking No. 4 for total retail net flows and No. 3 for retail flows excluding cash trusts. Improvement in investment performance has also aided market share gains.
2005 FirstChoice — Fund Manager Destination 2005 FirstChoice — Source of Funds
20 Commonwealth Bank of Australia
Funds Management Analysiscontinued
| | | | | | | | | | | | | | | | | | | | | | | | | |
| | | Half Year Ended 31 December 2005 | |
| | | Opening | | | | | | | | | | | | | | | | | | | Closing | |
| | | Balance | | | | | | | | | | | Investment | | | FX(3) & Other | | | Balance | |
| | | 30/06/05 | | | Inflows | | | Outflows | | | Income | | | Movements | | | 31/12/05 | |
| Funds under Administration | | $M | | | $M | | | $M | | | $M | | | $M | | | $M | |
| |
| FirstChoice & Avanteos | | | 19,069 | | | | 6,564 | | | | (2,628 | ) | | | 1,765 | | | | — | | | | 24,770 | |
| Cash management | | | 4,182 | | | | 1,258 | | | | (1,513 | ) | | | 39 | | | | — | | | | 3,966 | |
Other retail(1) | | | 36,069 | | | | 1,651 | | | | (3,967 | ) | | | 2,894 | | | | — | | | | 36,647 | |
| |
| Australian retail | | | 59,320 | | | | 9,473 | | | | (8,108 | ) | | | 4,698 | | | | — | | | | 65,383 | |
| Wholesale | | | 24,894 | | | | 7,098 | | | | (5,909 | ) | | | 1,929 | | | | — | | | | 28,012 | |
| Property | | | 13,456 | | | | 770 | | | | (1,136 | ) | | | 661 | | | | (1 | ) | | | 13,750 | |
Other(2) | | | 2,886 | | | | 97 | | | | (173 | ) | | | 539 | | | | — | | | | 3,349 | |
| |
Domestically sourced | | | 100,556 | | | | 17,438 | | | | (15,326 | ) | | | 7,827 | | | | (1 | ) | | | 110,494 | |
| |
| Internationally sourced | | | 22,508 | | | | 5,464 | | | | (4,881 | ) | | | 3,030 | | | | 359 | | | | 26,480 | |
| |
Total — Funds under Administration | | | 123,064 | | | | 22,902 | | | | (20,207 | ) | | | 10,857 | | | | 358 | | | | 136,974 | |
| |
| | | | | | | | | | | | | | | | | | | | | | | | | |
| | | Half Year Ended 30 June 2005 | |
| | | Opening | | | | | | | | | | | | | | | | | | | Closing | |
| | | Balance | | | | | | | | | | | Investment | | | FX(3) & Other | | | Balance | |
| | | 31/12/04 | | | Inflows | | | Outflows | | | Income | | | Movements | | | 30/06/05 | |
| Funds under Administration | | $M | | | $M | | | $M | | | $M | | | $M | | | $M | |
| |
FirstChoice & Avanteos(4) | | | 16,266 | | | | 5,287 | | | | (2,317 | ) | | | 104 | | | | (271 | ) | | | 19,069 | |
| Cash management | | | 4,460 | | | | 1,330 | | | | (1,788 | ) | | | 180 | | | | — | | | | 4,182 | |
Other retail(4) | | | 35,743 | | | | 1,822 | | | | (3,787 | ) | | | 1,420 | | | | 871 | | | | 36,069 | |
| |
| Australian retail | | | 56,469 | | | | 8,439 | | | | (7,892 | ) | | | 1,704 | | | | 600 | | | | 59,320 | |
Wholesale(4) | | | 24,274 | | | | 5,805 | | | | (6,445 | ) | | | 989 | | | | 271 | | | | 24,894 | |
Property(4) | | | 12,797 | | | | 740 | | | | (661 | ) | | | 1,451 | | | | (871 | ) | | | 13,456 | |
| Other | | | 2,887 | | | | — | | | | (674 | ) | | | 673 | | | | — | | | | 2,886 | |
| |
Domestically sourced | | | 96,427 | | | | 14,984 | | | | (15,672 | ) | | | 4,817 | | | | — | | | | 100,556 | |
| |
| Internationally sourced | | | 21,013 | | | | 3,600 | | | | (3,306 | ) | | | 912 | | | | 289 | | | | 22,508 | |
| |
Total — Funds under Administration | | | 117,440 | | | | 18,584 | | | | (18,978 | ) | | | 5,729 | | | | 289 | | | | 123,064 | |
| |
| | | | | | | | | | | | | | | | | | | | | | | | | |
| | | Half Year Ended 31 December 2004 | |
| | | Opening | | | | | | | | | | | | | | | | | | | Closing | |
| | | Balance | | | | | | | | | | | Investment | | | FX(3) & Other | | | Balance | |
| | | 30/06/04 | | | Inflows | | | Outflows | | | Income | | | Movements | | | 31/12/04 | |
| Funds under Administration | | $M | | | $M | | | $M | | | $M | | | $M | | | $M | |
| |
| FirstChoice & Avanteos | | | 12,075 | | | | 5,090 | | | | (1,948 | ) | | | 1,049 | | | | — | | | | 16,266 | |
| Cash management | | | 4,414 | | | | 1,631 | | | | (1,637 | ) | | | 52 | | | | — | | | | 4,460 | |
| Other retail | | | 34,705 | | | | 2,595 | | | | (4,088 | ) | | | 2,531 | | | | — | | | | 35,743 | |
| |
| Australian retail | | | 51,194 | | | | 9,316 | | | | (7,673 | ) | | | 3,632 | | | | — | | | | 56,469 | |
| Wholesale | | | 23,955 | | | | 5,036 | | | | (6,905 | ) | | | 2,188 | | | | — | | | | 24,274 | |
| Property | | | 12,624 | | | | 467 | | | | (511 | ) | | | 217 | | | | — | | | | 12,797 | |
| Other | | | 3,033 | | | | 248 | | | | (112 | ) | | | (282 | ) | | | — | | | | 2,887 | |
| |
Domestically sourced | | | 90,806 | | | | 15,067 | | | | (15,201 | ) | | | 5,755 | | | | — | | | | 96,427 | |
| |
| Internationally sourced | | | 19,077 | | | | 5,609 | | | | (4,625 | ) | | | 1,541 | | | | (589 | ) | | | 21,013 | |
| |
Total — Funds under Administration | | | 109,883 | | | | 20,676 | | | | (19,826 | ) | | | 7,296 | | | | (589 | ) | | | 117,440 | |
| |
| | |
| (1) | | Includes stand alone retail and legacy retail products. |
| |
| (2) | | Includes life company assets sourced from retail investors but not attributable to a funds management product (e.g. premiums from risk products). These amounts do not appear in retail market share data. |
| |
| (3) | | Includes foreign exchange gains and losses from translation of internationally sourced business. |
| |
| (4) | | Other movements represent the re-alignment of funds to correctly classify source of funds. |
Profit Announcement 21
Insurance Analysis
Financial Performance and Business Review
Performance Highlights
The Insurance business delivered good profit growth for the half year to December 2005, with underlying net profit after tax of $103 million increasing 16% on the prior half and 54% on the prior comparative period.
The underlying result reflects solid income growth in both Australia and New Zealand. After adjusting the operating results following the sale of the Hong Kong business, operating income increased 8% on the prior half and 15% on the prior comparative period. Appendix 13 on page 92 shows the full impact of the sale of the Hong Kong business on the operating results.
Operating expenses, after adjusting for the operating results of the Hong Kong business, were in line with the prior half but up 7% on the prior comparative period.
The net profit after tax (“cash basis”) of $284 million includes the profit on sale of the Hong Kong business of $145 million.
The Bank remained the largest life insurer in the Australian, New Zealand and Fiji markets.
Business Review
Australia
The Australian business delivered a good profit result for the half year. Underlying net profit before tax was up 18% on a very strong result in the prior half and up 27% on the prior comparative period.
Key drivers were:
| • | | Positive claims experience in General Insurance products, given the absence of significant weather related claims; |
| |
| • | | Focus on claims management processes within the business, improving efficiency of claims expense; |
| |
| • | | Life and General Insurance premium growth, with inforce premiums increasing by 5% for the half year; |
| |
| • | | Sales volume growth, particularly within General Insurance and Group Risk products; and |
| |
| • | | Focus on expense management, with expenses (excluding volume related) up only 2% on the prior half. |
The Bank maintained its number one market share position for Australian risk premiums with 13.9% of the life insurance risk market.
New Zealand
The life insurance operations in New Zealand operate predominantly under the Sovereign brand.
During the period, Sovereign has continued to focus on achieving above market business growth. Sovereign’s market position has been further enhanced, with in-force premium market share increasing to 30.7%, up from 30.3% at December 2004 (Source: ISI statistics).
Sovereign’s profit after tax was $48 million for the half year, an increase of 26% on the prior half and an increase of 33% on the prior comparative period. The main drivers of this result were:
| • | | Strong growth in new business sales of risk products resulting in market share growth; |
| |
| • | | Expense efficiencies from the legacy system consolidation project; and |
| |
| • | | Various customer service delivery business improvement initiatives. |
Asia
Asia includes the joint venture life insurance businesses in China, Vietnam and Indonesia. The Hong Kong based life insurance, pensions administration and financial planning businesses were sold to Sun Life Financial on 18 October 2005.
The profit after tax in the Asia business was $146 million, and includes the profit on sale of the Hong Kong business ($145 million). Operating margin for the half year was $10 million, an increase of $5 million from the prior comparative period. This primarily reflects final operating profits by the Hong Kong business, partially offset by lower investment returns due to negative returns from global equities prior to the sale date.
Operating Income
Operating income of $386 million was in line with the prior half and 7% higher than the prior comparative period.
General Insurance income was significantly higher due to improved claims experience. Life insurance income growth during the current half was solid following continued volume growth. After adjusting for the lower income in Asia following the sale, life insurance income increased 3% on the prior half and 13% on the prior comparative period.
Operating Expenses
Operating expenses of $253 million were 11% lower than the prior half and 6% lower than the prior comparative period.
After adjusting for the sale of the Hong Kong business, operating expenses were in line with the prior half and 7% higher than the prior comparative period.
Underlying expenses to average inforce premiums of 40.5% has exceeded the Which new Bank target of 42%.
Volume expenses have increased in Australia as a result of increased inforce premiums.
Productivity
Operating expenses to average inforce premiums (underlying) improved since June 2005 due to the impact of the sale of the Hong Kong business.
Corporate Taxation
The effective corporate tax rate (excluding the impact of the sale of the Hong Kong business) for the year was 26.8% compared with 19.5% in the prior half. The increase in the effective corporate tax rate is due to recognition of tax losses in prior periods.
22 Commonwealth Bank of Australia
Insurance Analysiscontinued
Key Performance Indicators
| | | | | | | | | | | | | | | | | | | | | |
| | | Half Year Ended | |
| | | 31/12/05 | | | 30/06/05 | | | 31/12/04 | | | Dec 05 vs | | | Dec 05 vs | |
| | | $M | | | $M | | | $M | | | Jun 05 % | | | Dec 04 % | |
| |
Insurance | | | | | | | | | | | | | | | | | | | | |
| Life insurance operating income | | | 347 | | | | 363 | | | | 330 | | | | (4 | ) | | | 5 | |
| General insurance operating income | | | 39 | | | | 24 | | | | 30 | | | | 63 | | | | 30 | |
| |
| Total operating income | | | 386 | | | | 387 | | | | 360 | | | | — | | | | 7 | |
| Shareholder investment returns | | | 57 | | | | 83 | | | | 121 | | | | (31 | ) | | | (53 | ) |
| Profit on sale of the Hong Kong business | | | 145 | | | | — | | | | — | | | | — | | | | — | |
| |
Total insurance income | | | 588 | | | | 470 | | | | 481 | | | | 25 | | | | 22 | |
| |
| Volume expense | | | 95 | | | | 106 | | | | 112 | | | | 10 | | | | 15 | |
Other operating expenses(1) | | | 158 | | | | 178 | | | | 155 | | | | 11 | | | | (2 | ) |
| Which new Bank | | | — | | | | 1 | | | | 1 | | | large | | large |
| |
Total operating expenses | | | 253 | | | | 285 | | | | 268 | | | | 11 | | | | 6 | |
| |
Net profit before income tax | | | 335 | | | | 185 | | | | 213 | | | | 81 | | | | 57 | |
| |
| Income tax expense attributable to: | | | | | | | | | | | | | | | | | | | | |
Corporate(3) | | | 51 | | | | 36 | | | | 53 | | | | (42 | ) | | | 4 | |
| |
Net profit after income tax (“cash basis”) | | | 284 | | | | 149 | | | | 160 | | | | 91 | | | | 78 | |
| |
Net profit after income tax (“underlying basis”)(2) | | | 103 | | | | 89 | | | | 67 | | | | 16 | | | | 54 | |
| |
| | | | | | | | | | | | | | | | | | | | | |
Productivity and Other Measures | | | | | | | | | | | | | | | | | | | | |
| |
| Expenses to average inforce premiums (%) | | | 40.5 | | | | 46.6 | | | | 44.9 | | | large | | large |
Expenses to average inforce premiums (underlying %)(2) | | | 40.5 | | | | 46.5 | | | | 44.8 | | | large | | large |
| Effective corporate tax rate including impact of profit on sale of Hong Kong business (%) | | | 15.2 | | | | 19.5 | | | | 24.9 | | | large | | large |
| |
| (1) | | Operating expenses include $5 million internal expenses relating to the asset management of shareholder funds (Jun 2005: $5 million and Dec 2004: $5 million). |
| |
| (2) | | Underlying basis excludes shareholder investment returns, the profit on the sale of the Hong Kong business and Which new Bank expenses. |
| |
| (3) | | For purpose of presentation, Policyholder tax benefit and Policyholder tax expense are shown on a net basis. |
| | | | | | | | | | | | | | | | | | | | | |
| | | Half Year Ended | |
| | | 31/12/05 | | | 30/06/05 | | | 31/12/04 | | | Dec 05 vs | | | Dec 05 vs | |
| Sources of Profit from Insurance Activities | | $M | | | $M | | | $M | | | Jun 05 % | | | Dec 04 % | |
| |
| The Margin on Services profit from ordinary activities after income tax is represented by: | | | | | | | | | | | | | | | | | | | | |
| Planned profit margins | | | 69 | | | | 60 | | | | 62 | | | | 15 | | | | 11 | |
| Experience variations | | | 19 | | | | 28 | | | | (1 | ) | | | (32 | ) | | large |
| Other | | | 2 | | | | (8 | ) | | | — | | | large | | | — | |
| General insurance operating margins | | | 13 | | | | 6 | | | | 7 | | | large | | | 86 | |
| |
| Operating margins | | | 103 | | | | 86 | | | | 68 | | | | 20 | | | | 51 | |
| After tax shareholder investment returns | | | 36 | | | | 63 | | | | 92 | | | | (43 | ) | | | (61 | ) |
| Profit on sale of the Hong Kong business | | | 145 | | | | — | | | | — | | | | — | | | | — | |
| |
Net profit after income tax (“cash basis”) | | | 284 | | | | 149 | | | | 160 | | | | 91 | | | | 78 | |
| |
Geographical Analysis of Business Performance
| | | | | | | | | | | | | | | | | | | | | | | | | | | | | | | | | |
| | | Half Year Ended | |
| | | Australia | | | New Zealand | | | Asia | | | Total | |
| Net Profit after Income Tax | | 31/12/05 | | | 30/06/05 | | | 31/12/05 | | | 30/06/05 | | | 31/12/05 | | | 30/06/05 | | | 31/12/05 | | | 30/06/05 | |
| (“cash basis”) | | $M | | | $M | | | $M | | | $M | | | $M | | | $M | | | $M | | | $M | |
| |
| Operating margins | | | 55 | | | | 55 | | | | 38 | | | | 26 | | | | 10 | | | | 5 | | | | 103 | | | | 86 | |
| After tax shareholder investment returns | | | 35 | | | | 44 | | | | 10 | | | | 12 | | | | (9 | ) | | | 7 | | | | 36 | | | | 63 | |
| Profit on sale of Hong Kong business | | | — | | | | — | | | | — | | | | — | | | | 145 | | | | — | | | | 145 | | | | — | |
| |
Net profit after income tax | | | 90 | | | | 99 | | | | 48 | | | | 38 | | | | 146 | | | | 12 | | | | 284 | | | | 149 | |
| |
Profit Announcement 23
Insurance Analysiscontinued
| | | | | | | | | | | | | | | | | | | | | |
| | | Half Year Ended 31 December 2005 | |
| | | Opening | | | | | | | | | | | | | | | Closing | |
| | | Balance | | | Sales/New | | | | | | | Other | | | Balance | |
| | | 30/06/05 | | | Balances | | | Lapses | | | Movements(1) | | | 31/12/05 | |
| Annual Inforce Premiums(2) | | $M | | | $M | | | $M | | | $M | | | $M | |
| |
General insurance(3) | | | 215 | | | | 35 | | | | (25 | ) | | | — | | | | 225 | |
| Personal life | | | 785 | | | | 72 | | | | (42 | ) | | | (75 | ) | | | 740 | |
| Group life | | | 265 | | | | 40 | | | | (24 | ) | | | (30 | ) | | | 251 | |
| |
Total | | | 1,265 | | | | 147 | | | | (91 | ) | | | (105 | ) | | | 1,216 | |
| | | | | | | | | | | | | | | | | | | | | |
| Australia | | | 856 | | | | 121 | | | | (83 | ) | | | 1 | | | | 895 | |
| New Zealand | | | 296 | | | | 26 | | | | (8 | ) | | | 7 | | | | 321 | |
Asia(4) | | | 113 | | | | — | | | | — | | | | (113 | ) | | | — | |
| |
Total | | | 1,265 | | | | 147 | | | | (91 | ) | | | (105 | ) | | | 1,216 | |
| |
| | | | | | | | | | | | | | | | | | | | | |
| | | Half Year Ended 30 June 2005 | |
| | | Opening | | | | | | | | | | | | | | | Closing | |
| | | Balance | | | Sales/New | | | | | | | Other | | | Balance | |
| | | 31/12/04 | | | Balances | | | Lapses | | | Movements(1) | | | 30/06/05 | |
| Annual Inforce Premiums(2) | | $M | | | $M | | | $M | | | $M | | | $M | |
| |
| General insurance | | | 205 | | | | 33 | | | | (23 | ) | | | — | | | | 215 | |
| Personal life | | | 750 | | | | 84 | | | | (47 | ) | | | (2 | ) | | | 785 | |
| Group life | | | 244 | | | | 42 | | | | (19 | ) | | | (2 | ) | | | 265 | |
| |
Total | | | 1,199 | | | | 159 | | | | (89 | ) | | | (4 | ) | | | 1,265 | |
| |
| Australia | | | 809 | | | | 123 | | | | (76 | ) | | | — | | | | 856 | |
| New Zealand | | | 281 | | | | 24 | | | | (6 | ) | | | (3 | ) | | | 296 | |
Asia(4) | | | 109 | | | | 12 | | | | (7 | ) | | | (1 | ) | | | 113 | |
| |
Total | | | 1,199 | | | | 159 | | | | (89 | ) | | | (4 | ) | | | 1,265 | |
| |
| | | | | | | | | | | | | | | | | | | | | |
| | | Half Year Ended 31 December 2004 | |
| | | Opening | | | | | | | | | | | | | | | Closing | |
| | | Balance | | | Sales/New | | | | | | | Other | | | Balance | |
| | | 30/06/04 | | | Balances | | | Lapses | | | Movements(1) | | | 31/12/04 | |
| Annual Inforce Premiums(2) | | $M | | | $M | | | $M | | | $M | | | $M | |
| |
| General insurance | | | 192 | | | | 29 | | | | (16 | ) | | | — | | | | 205 | |
| Personal life | | | 703 | | | | 80 | | | | (42 | ) | | | 9 | | | | 750 | |
| Group life | | | 272 | | | | 32 | | | | (68 | ) | | | 8 | | | | 244 | |
| |
Total | | | 1,167 | | | | 141 | | | | (126 | ) | | | 17 | | | | 1,199 | |
| | | | | | | | | | | | | | | | | | | | | |
| Australia | | | 815 | | | | 105 | | | | (111 | ) | | | — | | | | 809 | |
| New Zealand | | | 258 | | | | 24 | | | | (9 | ) | | | 8 | | | | 281 | |
| Asia | | | 94 | | | | 12 | | | | (6 | ) | | | 9 | | | | 109 | |
| |
Total | | | 1,167 | | | | 141 | | | | (126 | ) | | | 17 | | | | 1,199 | |
| |
| (1) | | Includes foreign exchange movements (refer also footnote 4). |
| |
| (2) | | Inforce premium relates to risk business. Savings products are disclosed within Funds Management. |
| |
| (3) | | General insurance inforce premiums includes approximately $40 million of badged premium. |
| |
| (4) | | Other movements represent the sale of the Hong Kong life insurance business. |
Inforce Premiums
Annual inforce premiums decreased by 4% for the half year to December 2005 to $1,216 million due to the sale of the Hong Kong business. Excluding the sale, inforce premiums increased by $64 million (6%) on the prior half and 12% on the prior comparative period. This was achieved through consistent growth in both Australia and New Zealand. General Insurance premiums increased by 5% for the half year.
Australia maintained its leading position of inforce premiums with 13.9% of market share in total life insurance at 30 September 2005.
Sovereign increased its leading market position in New Zealand with an increase to 30.9%, from 30.3% in December 2004.
| | | | | | | | | | | | | |
| Market Share Percentage — Annual Inforce Premiums(1) | | 31/12/05 | | | 30/06/05 | | | 31/12/04 | |
| |
Australia (total risk)(2) (3) | | | 13.9 | | | | 13.8 | | | | 13.8 | |
Australia (individual risk)(2) (3) | | | 12.8 | | | | 13.0 | | | | 13.0 | |
| New Zealand | | | 30.9 | | | | 30.7 | | | | 30.3 | |
| |
| (1) | | For market share definitions refer to appendix 19 page 101. |
| |
| (2) | | As at 30 September 2005. |
| |
| (3) | | Comparatives have been restated to include stamp duty in calculations. |
24 Commonwealth Bank of Australia
Shareholder Investment Returns
| | | | | | | | | | | | | | | | | | | | | |
| | | Half Year Ended | |
| | | 31/12/05 | | | 30/06/05 | | | 31/12/04 | | | Dec 05 vs | | | Dec 05 vs | |
| Shareholder Investment Returns | | $M | | | $M | | | $M | | | Jun 05 % | | | Dec 04 % | |
| |
| Funds management business | | | 7 | | | | 9 | | | | 24 | | | | (22 | ) | | | (71 | ) |
Insurance business(1) | | | 57 | | | | 83 | | | | 121 | | | | (31 | ) | | | (53 | ) |
| Profit on sale of Hong Kong business | | | 145 | | | | — | | | | — | | | | — | | | | — | |
| |
Shareholder investment returns before tax | | | 209 | | | | 92 | | | | 145 | | | large | | | 44 | |
| Taxation | | | 23 | | | | 26 | | | | 34 | | | | 12 | | | | 32 | |
| |
Shareholder investment returns after tax | | | 186 | | | | 66 | | | | 111 | | | large | | | 68 | |
| |
| (1) | | Excluding profit on sale of the Hong Kong business. |
| | | | | | | | | | | | | | | | | |
| | | As at 31 December 2005 | |
| | | Australia | | | New Zealand | | | Asia | | | Total | |
| Shareholder Investment Asset Mix (%) | | % | | | % | | | % | | | % | |
| |
| Local equities | | | 3 | | | | 1 | | | | — | | | | 2 | |
| International equities | | | — | | | | 7 | | | | 15 | | | | 2 | |
| Property | | | 24 | | | | 1 | | | | 8 | | | | 18 | |
| |
Growth | | | 27 | | | | 9 | | | | 23 | | | | 22 | |
| |
| Fixed interest | | | 32 | | | | 52 | | | | 55 | | | | 38 | |
| Cash | | | 41 | | | | 39 | | | | 22 | | | | 40 | |
| |
Income | | | 73 | | | | 91 | | | | 77 | | | | 78 | |
| |
Total | | | 100 | | | | 100 | | | | 100 | | | | 100 | |
| |
| | | | | | | | | | | | | | | | | |
| | | As at 31 December 2005 | |
| | | Australia | | | New Zealand | | | Asia | | | Total | |
| Shareholder Investment Asset Mix ($M) | | $M | | | $M | | | $M | | | $M | |
| |
| Local equities | | | 35 | | | | 2 | | | | — | | | | 37 | |
| International equities | | | — | | | | 25 | | | | 12 | | | | 37 | |
| Property | | | 267 | | | | 2 | | | | 6 | | | | 275 | |
| |
Growth | | | 302 | | | | 29 | | | | 18 | | | | 349 | |
| |
| Fixed interest | | | 348 | | | | 177 | | | | 42 | | | | 567 | |
| Cash | | | 451 | | | | 133 | | | | 17 | | | | 601 | |
| |
Income | | | 799 | | | | 310 | | | | 59 | | | | 1,168 | |
| |
Total | | | 1,101 | | | | 339 | | | | 77 | | | | 1,517 | |
| |
Shareholder investment returns of $209 million pre tax include a $145 million profit on the sale of the Bank’s Hong Kong life insurance business. More detail is contained in appendix 13 on page 92.
Domestic and international investment markets performed strongly for the half year to December 2005, with the benchmark S&P/ASX200 price index increasing by 11.4% and the MSCI World index by 9.5%. All other asset classes (fixed interest, property and cash) posted positive returns.
Excluding the profit on sale of the Hong Kong business, shareholder investment returns of $64 million pre tax for the half year represent a decrease of 30% over the prior half due to the relative strength of the indices in the prior comparative period. This reflected lower returns in Australia due to lower levels of capital held in the business, in addition to negative returns in global equities until the date of sale of the Hong Kong business. Fixed interest returns also fell due to increasing bond yields.
Profit Announcement 25
Director’s Report
The Directors submit their report for the half year ended 31 December 2005.
Directors
The names of the Directors holding office during the half year ended 31 December 2005 and until the date of this report were:
| | | |
| J M Schubert | | Chairman |
| R J Norris | | Managing Director and Chief Executive Officer (Appointed 22 September 2005) |
| D V Murray | | Managing Director and Chief Executive Officer (Retired 22 September 2005) |
| R J Clairs AO | | Director |
| A B Daniels OAM | | Director |
| C R Galbraith AM | | Director |
| S C Kay | | Director |
| W G Kent AO | | Director |
| F D Ryan | | Director |
| F J Swan | | Director |
| B K Ward | | Director |
Review and Results of Operations
Commonwealth Bank recorded a net profit after tax of $1,999 million for the half year ended 31 December 2005, compared with $1,712 million for the prior comparative period, an increase of 17%. The increase was principally due to an increase in net interest income resulting from strong lending growth, a reduction in Which new Bank expenses and a $145 million profit on the sale of the Hong Kong life insurance business.
The net profit from Banking of $1,589 million (December 2004: $1,394 million), reflects strong growth in net interest income primarily due to continued growth in home loans and other personal lending, together with a reduction in Which new Bank expenses.
The net profit from funds management of $188 million (December 2004: $179 million) reflects growth in revenues from a 17% increase in funds under administration over the period. Insurance reported a net profit of $284 million (December 2004: $160 million) including the profit of $145 million on the sale of the Hong Kong life insurance business, solid premium growth and new business volumes.
In accordance with the ASX Principles of Good Corporate Governance and Best Practice Recommendations, the Chief Executive Officer and the Group Executive Financial and Risk Management, have provided the Board with a written statement that the accompanying financial report represents a true and fair view, in all material respects, of the Bank’s financial position as at 31 December 2005 and performance for the six month period ended 31 December 2005, in accordance with relevant accounting standards.
We have obtained the following independence declaration from our auditors, Ernst and Young.
Signed in accordance with a resolution of the Directors.
| | | |
| |  |
| J M Schubert | | R J Norris |
| | | |
| Chairman | | Managing Director and Chief Executive Officer |
| | | |
| 15 February 2006 | | |
26 Commonwealth Bank of Australia
Financial Statements
This half year reporting period is the first under the Australian equivalent to International Financial Reporting Standards (“AIFRS”). For this reason, a full explanation of all AIFRS Accounting policies and differences from previous Australian GAAP is included in the Financial Statements. The financial impact of these changes is summarised in Note 1 (mm).
Profit Announcement 27
Financial Statements
Consolidated Income Statement
For the half year ended 31 December 2005
| | | | | | | | | | | | | | | | | |
| | | | | | | 31/12/05 | | | 30/06/05 | | | 31/12/04 | |
| | | Note | | | $M | | | $M | | | $M | |
| |
| Interest income | | | | | | | 9,638 | | | | 8,692 | | | | 8,089 | |
| Interest expense | | | | | | | 6,354 | | | | 5,624 | | | | 5,131 | |
| |
| Net interest income | | | | | | | 3,284 | | | | 3,068 | | | | 2,958 | |
| Other operating income | | | | | | | 1,416 | | | | 1,462 | | | | 1,383 | |
| |
| Net banking operating income | | | | | | | 4,700 | | | | 4,530 | | | | 4,341 | |
| | | | | | | | | | | | | | | | | |
| Funds management income including investment contract premiums | | | | | | | 737 | | | | 642 | | | | 605 | |
| Investment revenue | | | | | | | 1,379 | | | | 722 | | | | 1,234 | |
| Claims and policyholder liability expense | | | | | | | (1,343 | ) | | | (728 | ) | | | (1,143 | ) |
| |
| Net funds management and investment contract operating income | | | | | | | 773 | | | | 636 | | | | 696 | |
| | | | | | | | | | | | | | | | | |
| Premiums from insurance contracts | | | | | | | 573 | | | | 557 | | | | 575 | |
| Investment revenue | | | | | | | 693 | | | | 470 | | | | 716 | |
| Claims and policyholder liability expense from insurance contracts | | | | | | | (586 | ) | | | (492 | ) | | | (751 | ) |
| |
| Insurance contracts margin on services operating income | | | | | | | 680 | | | | 535 | | | | 540 | |
| | | | | | | | | | | | | | | | | |
| |
| Total net operating income | | | | | | | 6,153 | | | | 5,701 | | | | 5,577 | |
| | | | | | | | | | | | | | | | | |
| Bad and doubtful debts expense | | | | | | | 188 | | | | 176 | | | | 146 | |
| | | | | | | | | | | | | | | | | |
| Operating expenses: | | | | | | | | | | | | | | | | |
| Comparable business | | | 3 | | | | 2,967 | | | | 2,878 | | | | 2,841 | |
| Which new Bank | | | 3 | | | | — | | | | 122 | | | | 28 | |
| |
| Total operating expenses | | | | | | | 2,967 | | | | 3,000 | | | | 2,869 | |
| |
| | | | | | | | | | | | | | | | | |
| Defined benefit superannuation plan expense | | | | | | | (27 | ) | | | (35 | ) | | | (40 | ) |
| |
Profit before income tax | | | | | | | 2,971 | | | | 2,490 | | | | 2,522 | |
| Corporate tax expense | | | 4 | | | | 753 | | | | 680 | | | | 694 | |
| Policyholder tax expense | | | | | | | 201 | | | | 117 | | | | 111 | |
| |
Profit after income tax | | | | | | | 2,017 | | | | 1,693 | | | | 1,717 | |
| Minority interests | | | | | | | (18 | ) | | | (5 | ) | | | (5 | ) |
| |
Net profit attributable to members of the Bank | | | | | | | 1,999 | | | | 1,688 | | | | 1,712 | |
| |
| | | | | | | | | | | | | |
| | | Cents per share | |
| |
| Earnings per share based on net profit attributable to members of the Bank: | | | | | | | | | | | | |
| Basic | | | 157.1 | | | | 128.1 | | | | 131.4 | |
| Fully diluted | | | 154.4 | | | | 126.1 | | | | 128.2 | |
| Dividends per share attributable to shareholders of the Bank: | | | | | | | | | | | | |
| Ordinary shares | | | 94 | | | | 112 | | | | 85 | |
| PERLS | | | 571 | | | | 557 | | | | 558 | |
| Trust preferred securities (TPS) — issued 6 August 2003 | | | 3,879 | | | | 4,074 | | | | 3,721 | |
| PERLS II — issued 6 January 2004 | | | 465 | | | | 459 | | | | 449 | |
| |
| | | | | | | | | | | | | |
| | | $M | | | $M | | | $M | |
| |
| Net profit after income tax comprises: | | | | | | | | | | | | |
| Net Profit after income tax (“underlying basis”) | | | 1,875 | | | | 1,779 | | | | 1,641 | |
| Shareholders investment returns | | | 41 | | | | 66 | | | | 111 | |
| Which new Bank | | | — | | | | (86 | ) | | | (19 | ) |
| Profit on sale of the Hong Kong business | | | 145 | | | | — | | | | — | |
| |
| Net profit after income tax (“cash basis”) | | | 2,061 | | | | 1,759 | | | | 1,733 | |
| |
| Defined benefit superannuation plan expense | | | (19 | ) | | | (25 | ) | | | (28 | ) |
| Treasury share valuation adjustment | | | (43 | ) | | | (46 | ) | | | 7 | |
| |
| Net profit after income tax (“statutory basis”) | | | 1,999 | | | | 1,688 | | | | 1,712 | |
| |
28 Commonwealth Bank of Australia
Financial Statementscontinued
Consolidated Balance Sheet
As at 31 December 2005
| | | | | | | | | | | | | | | | | |
| | | | | | | 31/12/05 | | | 30/06/05 | | | 31/12/04 | |
| | | Note | | | $M | | | $M | | | $M | |
| |
Assets | | | | | | | | | | | | | | | | |
| Cash and liquid assets | | | | | | | 7,269 | | | | 6,055 | | | | 5,905 | |
| Receivables due from other financial institutions | | | | | | | 5,279 | | | | 6,087 | | | | 6,397 | |
| Assets as at fair value through the Income Statement: | | | | | | | | | | | | | | | | |
| Trading | | | | | | | 15,617 | | | | 14,631 | | | | 15,884 | |
| Insurance | | | | | | | 25,141 | | | | 27,484 | | | | 27,965 | |
| Other | | | | | | | 3,590 | | | | — | | | | — | |
| Derivative assets | | | | | | | 8,238 | | | | — | | | | — | |
| Investment securities | | | | | | | — | | | | 10,838 | | | | 11,619 | |
| Available for sale investments | | | | | | | 9,605 | | | | — | | | | — | |
| Loans, advances and other receivables | | | 5 | | | | 245,606 | | | | 228,346 | | | | 212,755 | |
| Bank acceptances of customers | | | | | | | 17,263 | | | | 16,786 | | | | 16,297 | |
| Investment property | | | | | | | 252 | | | | 252 | | | | 252 | |
| Property, plant and equipment | | | | | | | 1,143 | | | | 1,132 | | | | 1,063 | |
| Investment in associates | | | | | | | 191 | | | | 52 | | | | 233 | |
| Intangible assets | | | | | | | 7,740 | | | | 7,656 | | | | 7,638 | |
| Deferred tax assets | | | | | | | 891 | | | | 651 | | | | 606 | |
| Other assets | | | | | | | 3,368 | | | | 17,434 | | | | 18,745 | |
| |
Total assets | | | | | | | 351,193 | | | | 337,404 | | | | 325,359 | |
| |
| | | | | | | | | | | | | | | | | |
Liabilities | | | | | | | | | | | | | | | | |
| |
| Deposits and other public borrowings | | | 7 | | | | 168,723 | | | | 168,026 | | | | 167,423 | |
| Payables due to other financial institutions | | | | | | | 9,902 | | | | 8,023 | | | | 9,512 | |
| Liabilities at fair value through the Income Statement | | | | | | | 16,322 | | | | — | | | | — | |
| Derivative liabilities | | | | | | | 9,391 | | | | — | | | | — | |
| Bank acceptances | | | | | | | 17,263 | | | | 16,786 | | | | 16,297 | |
| Current tax liabilities | | | | | | | 575 | | | | 833 | | | | 424 | |
| Deferred tax liabilities | | | | | | | 1,153 | | | | 921 | | | | 982 | |
| Other provisions | | | | | | | 846 | | | | 871 | | | | 849 | |
| Insurance policy liabilities | | | | | | | 23,055 | | | | 24,694 | | | | 24,967 | |
| Debt issues | | | | | | | 70,036 | | | | 70,765 | | | | 58,850 | |
| Managed fund units on issue | | | | | | | 1,031 | | | | — | | | | — | |
| Bills payable and other liabilities | | | | | | | 3,917 | | | | 17,551 | | | | 18,153 | |
| |
| | | | | | | | 322,214 | | | | 308,470 | | | | 297,457 | |
| Loan capital | | | | | | | 9,129 | | | | 6,291 | | | | 5,801 | |
Total liabilities | | | | | | | 331,343 | | | | 314,761 | | | | 303,258 | |
| |
Net assets | | | | | | | 19,850 | | | | 22,643 | | | | 22,101 | |
| |
| | | | | | | | | | | | | | | | | |
Shareholders’ Equity | | | | | | | | | | | | | | | | |
| |
| Share capital: | | | | | | | | | | | | | | | | |
| Ordinary share capital | | | | | | | 13,801 | | | | 13,486 | | | | 13,344 | |
| Preference share capital | | | | | | | — | | | | 687 | | | | 687 | |
| Other equity instruments | | | | | | | — | | | | 1,573 | | | | 1,573 | |
| Reserves | | | | | | | 1,885 | | | | 1,265 | | | | 1,098 | |
| Retained profits | | | | | | | 3,641 | | | | 3,843 | | | | 3,357 | |
| |
Shareholders’ equity attributable to members of the Bank | | | | | | | 19,327 | | | | 20,854 | | | | 20,059 | |
| |
| Minority interests: | | | | | | | | | | | | | | | | |
| Controlled entities | | | | | | | 523 | | | | 631 | | | | 629 | |
| Insurance statutory funds and other funds | | | | | | | — | | | | 1,158 | | | | 1,413 | |
| |
Total shareholders’ equity | | | | | | | 19,850 | | | | 22,643 | | | | 22,101 | |
| |
Profit Announcement 29
Financial Statementscontinued
Consolidated Statement of Recognised Income and Expense
For the half year ended 31 December 2005
| | | | | | | | | | | | | | | | | |
| | | | | | | 31/12/05 | | | 30/06/05 | | | 31/12/04 | |
| | | Note | | | $M | | | $M | | | $M | |
| |
| Actuarial gains and losses from defined benefit superannuation plan | | | | | | | 68 | | | | 39 | | | | 71 | |
| Gains/(losses) on cash flow hedging instruments: | | | | | | | | | | | | | | | | |
| Recognised in equity | | | | | | | 23 | | | | — | | | | — | |
| Transferred to the income statement | | | | | | | 11 | | | | — | | | | — | |
| Gains/(losses) on available-for-sale investments: | | | | | | | | | | | | | | | | |
| Recognised in equity | | | | | | | (10 | ) | | | — | | | | — | |
| Transferred to the income statement on sale | | | | | | | 1 | | | | — | | | | — | |
| Transferred to the income statement on impairment | | | | | | | (3 | ) | | | — | | | | — | |
| Realised gains and dividend income on treasury shares held within the Bank’s life insurance statutory funds | | | | | | | 25 | | | | 21 | | | | — | |
| Revaluation of properties | | | | | | | — | | | | 29 | | | | — | |
| Transfer from FCTR to income statement on sale of entities | | | | | | | 41 | | | | — | | | | — | |
| Exchange differences on translation of foreign operations | | | | | | | 80 | | | | 10 | | | | (151 | ) |
| Income tax on items taken directly to or transferred directly from equity: | | | | | | | | | | | | | | | | |
| FCTR | | | | | | | (17 | ) | | | — | | | | — | |
| AFS investments revaluation reserve | | | | | | | (1 | ) | | | — | | | | — | |
| Cash flow hedge reserve | | | | | | | (11 | ) | | | — | | | | — | |
| |
| Net income recognised directly in equity | | | | | | | 207 | | | | 99 | | | | (80 | ) |
| Profit for the period | | | | | | | 2,017 | | | | 1,693 | | | | 1,717 | |
| |
Total net income recognised for the period | | | | | | | 2,224 | | | | 1,792 | | | | 1,637 | |
| |
| Attributable to: | | | | | | | | | | | | | | | | |
| Members of the parent | | | | | | | 2,206 | | | | 1,787 | | | | 1,632 | |
| Minority Interests | | | | | | | 18 | | | | 5 | | | | 5 | |
| |
| Total net income recognised for the period | | | | | | | 2,224 | | | | 1,792 | | | | 1,637 | |
| |
Consolidated Statement of Changes in Equity
For the half year ended 31 December 2005
| | | | | | | | | | | | | | | | | |
| | | | | | | 31/12/05 | | | 30/06/05 | | | 31/12/04 | |
| | | Note | | | $M | | | $M | | | $M | |
| |
| Total equity at the beginning of the period — AGAAP | | 1 (mm) | | | 26,060 | | | | 25,067 | | | | 24,885 | |
| — Under AIFRS | | 1 (mm) | | | 22,643 | | | | 22,101 | | | | 21,970 | |
| Net income recognised for the period | | | | | | | | | | | | | | | | |
| Net income recognised directly in equity | | | | | | | 207 | | | | 99 | | | | (80 | ) |
| Net profit attributable to members of the Bbank | | | | | | | 1,999 | | | | 1,688 | | | | 1,712 | |
| |
Total net income recognised for the period | | | | | | | 2,206 | | | | 1,787 | | | | 1,632 | |
| |
| Other movements in equity for the period | | | | | | | | | | | | | | | | |
| Share capital: | | | | | | | | | | | | | | | | |
| Ordinary share capital | | | | | | | 315 | | | | 142 | | | | (15 | ) |
| Preference share capital | | | | | | | (687 | ) | | | — | | | | — | |
| Other equity instruments | | | | | | | (1,573 | ) | | | — | | | | — | |
| Retained profits | | | | | | | (2,294 | ) | | | (1,262 | ) | | | (1,266 | ) |
| Reserves: | | | | | | | | | | | | | | | | |
| General reserve | | | | | | | 106 | | | | 109 | | | | (2,937 | ) |
| Capital reserve | | | | | | | 2 | | | | 2 | | | | — | |
| Asset revaluation reserve | | | | | | | (2 | ) | | | (2 | ) | | | 31 | |
| Foreign currency translation reserve | | | | | | | 27 | | | | — | | | | 205 | |
| Cash flow hedge reserve | | | | | | | 39 | | | | — | | | | — | |
| General reserve for credit loss | | | | | | | 283 | | | | — | | | | — | |
| AFS investments revaluation reserve | | | | | | | 56 | | | | — | | | | — | |
| Equity compensation reserve | | | | | | | (5 | ) | | | 19 | | | | 4 | |
| Minority interests (outside equity interest) movement | | | | | | | (1,266 | ) | | | (253 | ) | | | (438 | ) |
| |
| Total of other movements in equity for the period | | | | | | | (4,999 | ) | | | (1,245 | ) | | | (4,416 | ) |
| |
Total AIFRS-adjusted equity at the end of the period | | | 9 | | | | 19,850 | | | | 22,643 | | | | 22,101 | |
| |
| | | | | | | | | | | | | | | | | |
| Reconciliation to AGAAP closing equity: | | | | | | | | | | | | | | | | |
| Total adjusted equity at the end of the period | | | | | | | n/a | | | | 22,643 | | | | 22,101 | |
| AIFRS opening after tax adjustments | | | | | | | n/a | | | | 2,966 | | | | 2,915 | |
| AIFRS after tax adjustment to statutory profit for the year ended 30 June 2005 | | | | | | | n/a | | | | 444 | | | | 147 | |
| Other AIFRS reserve adjustments for the period | | | | | | | n/a | | | | 7 | | | | (96 | ) |
| |
AGAAP closing equity | | | | | | | n/a | | | | 26,060 | | | | 25,067 | |
| |
30 Commonwealth Bank of Australia
Financial Statementscontinued
Consolidated Statement of Cash Flows(1) (2)
For the half year ended 31 December 2005
| | | | | | | | | | | | | | | | | |
| | | | | | | 31/12/05 | | | 30/06/05 | | | 31/12/04 | |
| | | Note | | | $M | | | $M | | | $M | |
| |
Cash Flows from Operating Activities | | | | | | | | | | | | | | | | |
| Interest received | | | | | | | 9,521 | | | | 8,750 | | | | 8,031 | |
| Interest paid | | | | | | | (6,388 | ) | | | (5,642 | ) | | | (5,078 | ) |
| Other operating income received | | | | | | | 2,804 | | | | 2,830 | | | | 1,729 | |
| Expenses paid | | | | | | | (2,886 | ) | | | (2,931 | ) | | | (2,747 | ) |
| Income taxes paid | | | | | | | (1,290 | ) | | | (542 | ) | | | (443 | ) |
| Net increase in trading securities | | | | | | | — | | | | 1,727 | | | | (1,409 | ) |
| Assets at fair value through the Income Statement (excluding life insurance) | | | | | | | (790 | ) | | | — | | | | — | |
| Net decrease/(increase) in investment income related to life insurance assets at fair value through the Income Statement | | | | | | | | | | | | | | | | |
| Life contracts: | | | | | | | | | | | | | | | | |
| Investment income | | | | | | | 1,626 | | | | 1,138 | | | | 434 | |
Premiums received(3) | | | | | | | 1,224 | | | | 1,625 | | | | 1,558 | |
Policy payments(3) | | | | | | | (2,670 | ) | | | (2,228 | ) | | | (2,436 | ) |
| Liabilities at fair value through the Income Statement (excluding life insurance) | | | | | | | 2,499 | | | | — | | | | — | |
| |
Net Cash provided by/(used in) Operating Activities after taxation | | | 10 | (a) | | | 3,650 | | | | 4,727 | | | | (361 | ) |
| |
Cash Flows from Investing Activities | | | | | | | | | | | | | | | | |
| Payments for acquisition of entities and management rights | | | | | | | — | | | | (18 | ) | | | (64 | ) |
| Proceeds from disposal of entities and businesses (net of cash disposed) | | | 10 | (c) | | | 553 | | | | 173 | | | | — | |
| Dividend received | | | | | | | 1 | | | | 2 | | | | 1 | |
| Movement in investment securities: | | | | | | | | | | | | | | | | |
| Purchases | | | | | | | — | | | | (11,357 | ) | | | (11,251 | ) |
| Proceeds from sale | | | | | | | — | | | | 166 | | | | 230 | |
| Proceeds at or close to maturity | | | | | | | — | | | | 12,151 | | | | 10,648 | |
| Movement in available for sale investments: | | | | | | | | | | | | | | | | |
| Purchases | | | | | | | (11,502 | ) | | | — | | | | — | |
| Proceeds from sale | | | | | | | 416 | | | | — | | | | — | |
| Proceeds at or close to maturity | | | | | | | 10,994 | | | | — | | | | — | |
| (Lodgement)/withdrawal of deposits with regulatory authorities | | | | | | | — | | | | (13 | ) | | | 6 | |
| Net (increase)/decrease in loans, advances and other receivables | | | | | | | (17,884 | ) | | | (15,996 | ) | | | (15,725 | ) |
| Proceeds from sale of property, plant and equipment | | | | | | | 11 | | | | 21 | | | | 9 | |
| Purchase of property, plant and equipment | | | | | | | (119 | ) | | | (142 | ) | | | (144 | ) |
| Increase in investments in associates | | | | | | | (143 | ) | | | — | | | | — | |
| Purchase of intangible assets | | | | | | | (22 | ) | | | (32 | ) | | | (60 | ) |
| Net (increase)/decrease in receivables due from other financial institutions not at call | | | | | | | (1,013 | ) | | | (789 | ) | | | 1,886 | |
| Net (increase)/decrease in securities purchased under agreements to resell | | | | | | | (192 | ) | | | (275 | ) | | | 1,266 | |
| Net decrease/(increase) in other assets | | | | | | | 508 | | | | (848 | ) | | | 1,903 | |
| Life insurance business: | | | | | | | | | | | | | | | | |
| Purchase of insurance assets at fair value through the Income Statement | | | | | | | (5,714 | ) | | | (7,816 | ) | | | (6,349 | ) |
| Proceeds from sale/maturity of insurance assets at fair value through the Income Statement | | | | | | | 6,486 | | | | 7,487 | | | | 7,794 | |
| |
Net cash used in investing activities | | | | | | | (17,620 | ) | | | (17,286 | ) | | | (9,850 | ) |
| |
| | |
| (1) | | It should be noted that the Bank does not use this accounting Statement of Cash Flows in the internal management of its liquidity positions. |
| |
| (2) | | Adjusted for AIFRS gross-up. Refer note 1 (mm) (ii). |
| |
| (3) | | These were gross premiums and policy payments before splitting between policyholders and shareholders. |
Profit Announcement 31
Financial Statementscontinued
Consolidated Statement of Cash Flows(1)continued
For the half year ended 31 December 2005
| | | | | | | | | | | | | | | | | |
| | | | | | | 31/12/05 | | | 30/06/05 | | | 31/12/04 | |
| | | Note | | | $M | | | $M | | | $M | |
| |
Cash Flows from Financing Activities | | | | | | | | | | | | | | | | |
| Buy back of shares | | | | | | | (1 | ) | | | — | | | | — | |
| Proceeds from issue of shares (net of costs) | | | | | | | 35 | | | | 23 | | | | 43 | |
| Proceeds from issue of preference shares to minority interests | | | | | | | — | | | | — | | | | 323 | |
| Net increase in deposits and other borrowings | | | | | | | 8,797 | | | | 1,699 | | | | 4,633 | |
| Net proceeds from issuances of debt securities | | | | | | | 5,168 | | | | 11,965 | | | | 5,969 | |
| Dividends paid (excluding DRP buy back of shares) | | | | | | | (1,173 | ) | | | (953 | ) | | | (1,130 | ) |
| Net movements in other liabilities | | | | | | | (546 | ) | | | 734 | | | | (1,064 | ) |
| Net increase/(decrease) in payables due to other financial institutions not at call | | | | | | | 651 | | | | (554 | ) | | | 1,003 | |
| Net increase/(decrease) in securities sold under agreements to repurchase | | | | | | | 106 | | | | (1,095 | ) | | | (385 | ) |
| Net (purchase)/sale of treasury shares | | | | | | | 19 | | | | 48 | | | | (108 | ) |
| Issue of loan capital | | | | | | | 767 | | | | 912 | | | | 321 | |
| Redemption of loan capital | | | | | | | (402 | ) | | | (450 | ) | | | (942 | ) |
| Other | | | | | | | 5 | | | | (71 | ) | | | 126 | |
| |
Net cash provided by financing activities | | | | | | | 13,426 | | | | 12,258 | | | | 8,789 | |
| |
| Net (decrease)/increase in cash and cash equivalents | | | | | | | (544 | ) | | | (301 | ) | | | (1,422 | ) |
| Cash and cash equivalents at beginning of period | | | | | | | 1,276 | | | | 1,577 | | | | 2,999 | |
| |
Cash and cash equivalents at end of period | | | 10 | (b) | | | 732 | | | | 1,276 | | | | 1,577 | |
| |
| | |
| (1) | | It should be noted that the Bank does not use this accounting Statement of Cash Flows in the internal management of its liquidity positions. |
32 Commonwealth Bank of Australia
Notes to the Financial Statements
Note 1 Accounting Policies
General Information
This half year reporting period is the first under the Australian equivalent to International Financial Reporting Standards (“AIFRS”). For this reason, a full explanation of all AIFRS Accounting policies and differences from previous Australian GAAP is set out below. The financial impact of these changes is summarised in Note 1 (mm).
The financial statements of the Commonwealth Bank of Australia (the ‘Bank’) and the Bank and its subsidiaries (the ‘Group’) for the half year ended 31 December 2005, were approved and authorised for issue by the Board of Directors on 15 February 2006.
The Bank is incorporated and domiciled in Australia. It is a company limited by shares that are publicly traded on the Australian Stock Exchange. The address of its registered office is Level 7, 48 Martin Place, Sydney NSW 1155, Australia.
The Group is one of Australia’s leading providers of integrated financial services including retail, business and institutional banking, superannuation, life insurance, general insurance, funds management, broking services and finance company activities. The principal activities of the Commonwealth Bank Group during the financial period were:
(i) Banking
The Group provides retail banking services including housing loans, credit cards, personal loans, savings and cheque accounts, and demand and term deposits. The Group also offers commercial products including business loans, equipment and trade finance, and rural and agribusiness products. The Group also has full service banking operations in New Zealand, Fiji and the Philippines. The Group has wholesale banking operations in London, New York, Hong Kong, Singapore, Indonesia, China, Tokyo and Malta.
(ii) Funds Management
The Group’s funds management business comprises wholesale and retail investment, superannuation and retirement funds. Investments are across all major asset classes including Australian and International shares, property, fixed interest and cash. The Group also has funds management businesses in New Zealand, United Kingdom and Asia.
(iii) Insurance
The Group provides term insurance, disability insurance, annuities, master trusts, investment products and household general insurance. Life insurance operations are also conducted in New Zealand, where the Group has the leading market share, and in Asia and the Pacific.
There have been no significant changes in the nature of the principal activities of the Group during the financial half year.
(a) Bases of accounting
This general purpose financial report for the interim half-year reporting period ended 31 December 2005 has been prepared in accordance with the requirements of the Corporations Act 2001 and AASB 134 Interim Financial Reporting.
This half-year financial report does not include all notes of the type normally included within the annual financial report and therefore cannot be expected to provide as full an understanding of the financial position and financial performance of the consolidated entity as that given by the annual financial report.
As a result, this report should be read in conjunction with the 30 June 2005 Annual Financial Report of the Group and any public announcements made in the period by the Group in accordance with the continuous disclosure requirements of the Corporations Act 2001 and the ASX Listing Rules.
For the purpose of this half-year financial report, the half-year has been treated as a discrete reporting period.
The 30 June 2005 Annual Financial Report was prepared under the Australian Accounting Standards applicable to reporting periods beginning prior to 1 January 2005 (AGAAP). This half-year financial report, however, complies with current Australian Accounting Standards which consist of Australian equivalents to International Financial Reporting Standards (AIFRS).
Accounting policies for the Bank have changed significantly due to the adoption of AIFRS. These changes have been summarised by comparing prior periods accounting policy to the new AIFRS accounting policy. Differences in measurement, recognition and disclosure have been noted in the change in accounting policy section within each topic. The preparation of the financial report in conformity with generally accepted accounting principles requires management to make estimates and assumptions that affect the amounts reported in the financial statements and accompanying notes. Actual results could differ from these estimates although it is not anticipated that such differences would be material.
(b) Basis of preparation
The financial statements are prepared on the basis of historical cost except that the following assets and liabilities are stated at their fair value: derivative financial instruments, assets and liabilities at fair value through the Income Statement, available-for-sale investments, insurance policy liabilities, domestic bills discounted which are included in loans, advances and other receivables held by the Group, investment property and owner occupied property, defined benefit plans assets and liabilities, and employee share-based compensation liability. Recognised assets and liabilities that are hedged and are attributable to the hedged risk are stated at fair value.
The accounting policies which have changed as a result of the adoption of AIFRS, have been applied retrospectively and consistently by the Group to all periods presented in these financial statements and in preparing an opening AIFRS balance sheet at 1 July 2004, except for the following standards which were adopted and applied from 1 July 2005 onwards:-
i) AASB 132 Financial Instruments – Disclosure and Presentation;
ii) AASB 139 Financial Instruments – Recognition and Measurement;
iii) AASB 4 Insurance Contracts;
iv) AASB 1023 General Insurance Contracts; and
v) AASB 1038 Life Insurance Contracts
On this basis, comparison with prior period results should be read in conjunction with the following accounting policy notes.
AIFRS has been applied retrospectively subject to the following elections under AASB 1 First Time Adoption of AIFRS:
Profit Announcement 33
Notes to the Financial Statementscontinued
Note 1 Accounting Policies (continued)
i) not to restate any past business combinations that occurred prior to 1 July 2004 in preparing the Group’s opening AIFRS balance sheet at 30 June 2005.
ii) to transfer the Foreign Currency Translation Reserve as at 1 July 2004 to Retained Earnings.
The Group has applied its previous AGAAP in the comparative information to financial instruments and insurance contracts within the scope of the above standards.
(c) Consolidation
Additional entities have been consolidated within the Group due to the adoption of AASB 127 Consolidated and Separate Financial Statements and UIG 112 Consolidation – Special Purpose Entities. These changes do not have a material impact on net assets or net profit however they have resulted in material gross ups of individual asset and liability line items of the Group.
For further details, refer to the change in accounting policy below.
(i) Current accounting policy
The consolidated financial statements include the financial statements of the Bank and all entities where it is determined that there is a capacity to control as defined in AASB 127 and UIG 112. These also include Group’s share of the financial results of all entities where the Group holds an investment in and has significant influence over the financial and operating policies of entities as defined in AASB 128 Investments in Associates.
Associated companies are defined as those entities over which the Group has significant influence but there is no capacity to control. Investments in associates are carried at cost plus the Group’s share of post-acquisition profit or loss. The Group’s share of profit or loss of associates is included in the profit from ordinary activities.
All balances and transactions between Group entities, including unrealised gains and losses, have been eliminated on consolidation.
(ii) Change in accounting policy
With the adoption of AASB 127 and UIG 112, a number of additional entities have been included in the Group. This is due to a change in what constitutes control and the inclusion of potential voting rights when considering control. Some of these entities were formed by the Group for the purpose of asset securitisation transactions and structured debt issuance, and to accomplish certain narrow and well-defined objectives. Such entities may acquire assets directly or indirectly from the Bank or its affiliates. Additionally, some of these entities are bankruptcy-remote (i.e. their assets are not available to satisfy the claims of creditors of the Group or any other of its subsidiaries). However, these entities have been consolidated in the Group’s financial statements as the variability of return from the entity resides with the Group.
The adoption of AASB 127 and UIG 112 has been applied retrospectively from 1 July 2004.
(d) Revenue recognition
The adoption of AASB 118 Revenue and AASB 139 has had an impact on the recognition and measurement of revenue. For further details, refer to the change in accounting policy below.
(i) Current accounting policy
Revenue is recognised to the extent that it is probable that the economic benefits will flow to the entity and the revenue can be reliably measured. The principal sources of revenue are interest income and fees and commissions.
Interest income
Interest income is recognised on an accrual basis using the effective interest method. Further information is included in Note 1(j) Available-for-sale investments, Note 1(l) Loans, advances and other receivables, and Note 1(m) Leasing.
Lending fees
Fee income and direct costs relating to loan origination, financing or restructuring and to loan commitments are deferred and amortised to interest income over the life of the loan using the effective interest method. Fees received for commitments which are not expected to result in a loan are recognised in the profit and loss over the commitment period. Loan syndication fees where the Group does not retain a portion of the syndicated loan are recognised in income once the syndication has been completed. Where fees are received on an ongoing basis and represent the recoupment of the costs of maintaining and administering existing loans, these fees are taken to profit and loss on an accrual basis.
Fees and commission
When commission charges and fees relate to specific transactions or events, they are recognised in income in the period in which they are received. However, when they are charged for services provided over a period, they are recognised in income on an accrual basis.
Other income
Trading income is brought to account when earned based on changes in fair value of financial instruments and recorded from trade date. Further information is included in Notes 1(e) Foreign currency translations, 1(i) Assets at fair value through the Income Statement and Note 1(ff) Derivative financial instruments. Life insurance business income recognition is explained in Note 1(hh) below.
(iii) Change in accounting policy
Under AASB 118 and AASB 139, interest income now includes fees integral to the establishment of financial instruments using the effective interest method. Fee income and direct costs relating to loan origination are deferred and amortised to interest earned on loans, advances and other receivables over the life of the loan using the effective interest method.
There is no material change in the recognition and measurement of fees and commission and other income.
The changes have been applied from 1 July 2005.
(e) Foreign currency translations
The adoption of AASB 121 The Effects of Changes in Foreign Exchange Rates has not had a substantial impact on the reporting currency of the Group’s entities or the translation of foreign currency assets and liabilities. However, on transition under AASB 1 First-time Adoption of Australian Equivalents to IFRS, an option exists to transfer any amounts recorded within Foreign Currency Translation Reserve (FCTR) as at 1 July 2004 to retained earnings. For further details, refer to the change in accounting policy below.
34 Commonwealth Bank of Australia
Notes to the Financial Statementscontinued
Note 1 Accounting Policies (continued)
(i) Current accounting policy
The functional currency of the domestic operations of the Bank has been determined to be Australian Dollars (AUD) as this currency best reflects the economic substance of the underlying events and circumstances relevant to the Bank. Each entity and overseas branch within the Group has also determined their functional currency based on their own primary economic indicators.
All foreign currency monetary items are revalued at spot rates of exchange prevailing at balance sheet date and changes in the spot rate are recorded in the profit and loss. Foreign currency forward, futures, swaps and option positions are revalued at the appropriate market rates applying at balance sheet date.
Non-monetary assets and liabilities that are measured in terms of historical cost in a foreign currency are translated using the exchange rate at the date of transaction. Non-monetary assets and liabilities denominated in foreign currencies that are stated at fair value are translated to AUD at foreign exchange rates ruling at the dates the fair value was determined. With the exception of the revaluations classified in equity, unrealised foreign currency gains and losses arising from these revaluations and gains and losses arising from foreign exchange dealings are included in the profit and loss.
The foreign currency assets and liabilities of overseas branches and controlled entities with an overseas functional currency are converted to AUD at balance sheet date in accordance with the foreign exchange rates ruling at that date. Profit and loss items for overseas branches and controlled entities are converted to AUD progressively throughout the year at the spot exchange rate at the date of the transaction. All resulting exchange differences are recognised in the FCTR as a separate component of equity.
Translation differences arising from conversion of opening balances of shareholders’ funds of overseas branches and controlled entities at year end exchange rates are reflected in the FCTR. The Group maintains a substantially matched position in assets and liabilities in foreign currencies and the level of net foreign currency exposure does not have a material impact on its financial condition.
(ii) Change in accounting policy
Under the option available within AASB 1 the Bank transferred the FCTR as at 30 June 2004 to Retained earnings.
The translation on non-monetary available-for-sale securities, the cash flow hedge reserve and net investments in foreign entities are all recorded in FTCR.
These changes have been applied retrospectively from 1 July 2004.
(f) Cash and liquid assets
The adoption of AIFRS, AASB 127 Consolidated and Separate Financial Statements and UIG 112 Consolidation – Special Purpose Entities has not had a substantial impact on the definition of cash and liquid assets. Additional entities have been consolidated into the Group, refer to Note 1(c) Consolidation. These changes have resulted in a gross-up of cash and liquid assets. For further details, refer to the change in accounting policy below.
(i) Current accounting policy
Cash and liquid assets includes cash at branches, cash at bankers, nostro balances, money at short call with an original maturity of three months or less and securities held under reverse repurchase agreements. They are brought to account at the face value or the gross value of the outstanding balance. Interest is taken to profit and loss using the effective interest method when earned.
(ii) Change in accounting policy
Under AASB 127 and UIG 112 special purpose vehicles used for the securitisation of loans and receivables by the Group will be consolidated under AIFRS. This will result in an increase in cash and liquid assets.
Under AASB 107 Cash Flow Statements, the definition of cash and liquid assets includes nostro balances. This balance was previously recorded in receivables from other financial institutions.
The change has been applied retrospectively from 1 July 2004.
(g) Receivables from other financial institutions
The adoption of AIFRS has not had a substantial impact on receivables from other financial institutions. For further details, refer to the change in accounting policy below.
(i) Current accounting policy
Receivables from other financial institutions includes loans, deposits with regulatory authorities and settlement account balances due from other banks. They are brought to account at the gross value of the outstanding balance. Interest is taken to profit and loss using the effective interest method.
(ii) Change in accounting policy
Under AASB 107 Cash Flow Statements, nostro balances, previously recorded separately in receivables from other financial institutions, have been reclassified to cash and liquid assets.
Deposits with regulatory authorities, previously recorded separately on the face of the balance sheet, have been reclassified to receivables from other financial institutions.
The change has been applied retrospectively from 1 July 2004
(h) Financial instruments
The adoption of AASB 132 Financial Instruments: Disclosure and Presentation, AASB 139 Financial Instruments: Recognition and Measurement and AASB 130 Disclosures in the Financial Statements of Banks and Similar Financial Institutions from 1 July 2005 has had a significant impact on the recognition, measurement and disclosure of financial instruments. Under these standards, the accounting policy has changed to recognise all derivatives in the balance sheet and to record all derivatives and some financial assets and liabilities at fair market value. Those financial assets and financial liabilities which are not at fair value will be carried at cost or amortised cost.
For each class of financial instrument listed below, except for restructured facilities referred to in Note 1(l) Loans, advances and other receivables, financial instruments are transacted on a commercial basis to derive an interest yield/cost with terms and conditions having due regard to the nature of the transaction and the risks involved.
Profit Announcement 35
Notes to the Financial Statementscontinued
Note 1 Accounting Policies (continued)
Under AASB 132 and AASB 139, financial instruments are required to be classified into one of the following measurement categories which determines the accounting treatment of the item:
| • | | Assets at fair value through the Income Statement (Note 1 (i)) |
| |
| • | | Available-for-sale investments (Note 1 (j)) |
| |
| • | | Loans, advances and other receivables (Note 1 (l)) |
| |
| • | | Liabilities at fair value through the Income Statement (Note 1 (x)) |
| |
| • | | Liabilities at amortised cost |
| |
| • | | Equity (Note 1 (ee)) |
The change in accounting policy on transition to AIFRS for each class of financial instrument is detailed below. The application of AASB 139 to the recognition and measurement of financial assets and financial liabilities, including derivatives, has given rise to a transition adjustment and will increase volatility in reported profits. For a summary of the change in accounting policy for hedge accounting see Note 1(ff), Derivative financial instruments.
The Group has no held to maturity investments.
In line with the exemption provided by AASB 1, comparative information has not been restated under AASB 132 and AASB 139.
Offsetting financial instruments
The Group offsets financial assets and liabilities and reports the net balance in the Balance Sheet where there is a legally enforceable right to set off, and there is an intention to settle on a net basis or to realise the asset and settle the liability simultaneously.
Derecognition of financial instruments
The derecognition of a financial instrument takes place when the Group no longer controls the contractual rights that comprise the financial instrument, which is normally the case when the instrument is sold, or all the cash flows attributable to the instrument are passed through to an independent third party and the risks and rewards have substantially been transferred.
(i) Assets at fair value through the Income Statement
Assets at fair value through the Income Statement is a new class of financial asset under AASB 139. There is a substantial change in the recognition and disclosure of these financial assets, however, there is no material change in measurement. For further details, refer to the change in accounting policy below.
(i) Current Accounting policy
Assets at fair value through the Income Statement include assets that are primarily held for trading and assets that upon initial recognition are designated by the Group as at fair value through the Income Statement at origination. The assets are recognised initially at fair value and transaction costs are taken directly to profit and loss. Changes in the fair value of assets at fair value through the Income Statement are reported in other operating income. Dividends are reflected in other operating income when earned.
Assets at fair value through the Income Statement have been reclassified into three subcategories: Trading, Insurance and Other investments.
Trading
Trading assets are short and long term public, bank and other debt securities and equities that are acquired and held for trading purposes. They are brought to account at fair value based on quoted bid prices. In a trading portfolio with offsetting risk positions, quoted mid prices are used to measure the fair value. For non-market quoted assets, fair values have been determined using valuation techniques that are based on market conditions and risks existing at balance sheet date. Changes in fair value, and the reporting of interest and dividends earned are accounted for as outlined above. Trading assets are recorded on a trade date basis.
Insurance
Insurance investment assets include investment securities that back life insurance contracts and life investment contracts. They have been classified as “Assets at fair value through the Income Statement”. Refer to Note 1(hh), Life insurance business for further details.
Other investments
Other investments include financial assets which the Group has designated as assets at fair value through the Income Statement. They are brought to account at fair value based on quoted bid prices. Quoted mid prices are used to measure assets with offsetting risk positions in a portfolio at fair value.
For non-market quoted instruments, fair values have been determined using various methods and assumptions that are based on market conditions and risks existing at balance sheet date. Changes in fair value, and the reporting of interest and dividends earned are accounted for as outlined above. Other investments are recorded on a trade date basis.
(ii) Change in accounting policy
Under AASB 132 and AASB 139, there is a substantial change in the disclosure, recognition, measurement and presentation of financial assets. The standards have been applied from 1 July 2005. The changes are summarised below:
Assets at fair value through the Income Statement is a new category of financial asset.
Trading securities have been reclassified into assets at fair value through the Income Statement.
Insurance investment assets have been reclassified into Assets at fair value through the Income Statement.
Other investments is a new category of financial assets which is disclosed under Assets at fair value through the Income Statement. Other investments are measured at fair value. They were previously carried at cost or amortised cost predominantly in investment securities.
Quoted bid prices where available, are used to account for the fair value of assets. Quoted mid prices where available, are used to account for fair value of assets where there is an offsetting risk position in a portfolio. There is no material change in the measurement of assets at fair value.
Realised gains and losses on disposal and unrealised fair value adjustments are reflected in other operating income. Interest on other investments is reported in net interest earnings using the effective interest method. Dividends are reflected in other operating income when earned.
Other investments are recorded on a trade date basis.
36 Commonwealth Bank of Australia
Notes to the Financial Statementscontinued
Note 1 Accounting Policies (continued)
(j) Available-for-sale investments
The adoption of AASB 132 and AASB 139 has had a substantial impact on the measurement and disclosure of those financial instruments now classified as available-for-sale investments. Additional entities have been consolidated into the Group, refer to Note 1(c) Consolidation. These changes have resulted in a material gross up of available-for-sale investments. For further details, refer to the change in accounting policy below.
(i) Current accounting policy
Available-for-sale investments are short and long term public, bank and other securities and include bonds, notes, bills of exchange, commercial paper, certificates of deposit, equities and rolling originations and syndications.
Available-for-sale investments are initially recognised at fair value including direct and incremental transaction costs and thereafter at fair value. Unquoted equities and investments whose fair value cannot be reliably measured are valued at cost. Gains and losses arising from changes in the fair value are reported in the available-for-sale revaluation reserve net of applicable income taxes until investments are sold, collected, otherwise disposed of, or until such investments become impaired. Interest, premiums and dividends are reflected in other operating income when earned.
Available-for-sale investments are tested for lasting impairment in line with Note 1(n) Provisions for impairment.
On disposal, the accumulated change in fair value within the available-for-sale revaluation reserve is transferred to profit and loss and reported under other operating income in available-for-sale investments.
(ii) Change in accounting policy
Under AASB 139, financial assets previously disclosed as investment securities have predominantly been reclassified to Available-for-sale investments and Loans, advances and other receivables.
Under AASB 139, the Group recognises available-for-sale investments initially at fair value, including direct and incremental transaction costs and thereafter at fair value. Investment securities which were previously recognised at cost or amortised cost have been restated to fair value. Changes in fair value have been included as a separate component of equity (available-for-sale revaluation reserve) until sale when the cumulative gain or loss is transferred to profit and loss. The change in measurement has been applied from 1 July 2005.
(k) Repurchase agreements
There is no material change in accounting policy.
Securities sold under agreements to repurchase are retained within the Available-for-sale investments or Assets at fair value through the Income Statement line items and accounted for accordingly in line with Note 1 (j) and (i) respectively.
Liability accounts are used to record the obligation to repurchase and disclosed as Deposits. Securities held under reverse repurchase agreements are recorded within Cash and liquid assets.
(l) Loans, advances and other receivables
The adoption of AASB 127, AASB132, AASB139 and UIG 112 has had a substantial impact on the recognition, measurement and disclosure of those financial instruments classified as loans, advances and other receivables. Additional entities have been consolidated into the Group, refer to Note 1(c) Consolidation. These changes have resulted in a material gross up of loans, advances and other receivables. For further details, refer to the change in accounting policy below.
(i) Current accounting policy
Loans, advances and other receivables are financial assets with fixed and determinable payments that are not quoted in an active market.
They include overdrafts, home loans, credit card and other personal lending, term loans, bill financing, redeemable preference shares, securities and finance leases. Loans, advances and other receivables are initially recognised at fair value including direct and incremental transaction costs. They are subsequently valued at amortised cost using the effective interest method. Where loans, advances and other receivables are originated with the intent to be sold immediately or in the short term, they are recorded in Assets at fair value through the Income Statement.
Note 1(m) and Note 1(n) provides additional information with respect to leasing and impairment respectively. For more details on revenue recognition refer to Note 1(d) Revenue recognition.
Non Performing Facilities
Individual provisions for impairment are recognised to reduce the carrying amount of loans and advances to their estimated recoverable amounts. Individually significant provisions are calculated based on discounted cash flows.
The unwinding of the discount from initial recognition of impairment through to recovery of the written down amount is recognised through ‘Interest Income’. In subsequent periods, interest in arrears/due on non performing facilities is taken to profit and loss when a cash payment is received/ realised and the amount is not designated as a principal payment.
Restructured Facilities
There is no change in accounting policy.
When facilities (primarily loans) have the original contractual terms modified, the accounts become classified as restructured. Such accounts will have interest accrued to profit and loss as long as the facility is performing on the modified basis in accordance with the restructured terms. If performance is not maintained, or collection of interest and/or principal is no longer probable, the account will be returned to the non performing classification. Facilities are generally kept as non performing until they are returned to a performing basis.
Assets Acquired Through Securities Enforcement
(“AATSE”)
There is no change in accounting policy.
Assets acquired in satisfaction of facilities in default (primarily loans) are recorded at net market value at the date of acquisition. Any difference between the carrying amount of the facility and the net market value of the assets acquired is represented as an individually assessed provision or written off. AATSE are further classified as Other Real Estate Owned (“OREO”) or Other Assets Acquired Through Security Enforcement (“OAATSE”). Such assets are classified in the appropriate asset classifications in the balance sheet.
Profit Announcement 37
Notes to the Financial Statementscontinued
Note 1 Accounting Policies (continued)
Impairment of loans, advances and other receivables
There has been a change in the recognition and measurement of impairment of loans, advances and other receivables as explained in Note 1(n) Provisions for impairment.
(ii) Change in accounting policy
Under AASB 139, loans are measured at amortised cost using the effective interest rate method.
As explained in Note 1(n), the Group has individually assessed provisions and collective provisions for impairment. In addition, the measurement and recognition of those provisions has changed, which is also explained in Note 1(n).
The change in measurement has been applied from 1 July 2005.
Under AASB 127 and UIG 112 special purpose vehicles used for the securitisation of loans and receivables by the Group will be consolidated under AIFRS. This will result in an increase in loans, advances and other receivables.
The change in recognition associated with AASB 127 and UIG 112 has been applied retrospectively from 1 July 2004.
(m) Leasing
The adoption of AASB 117 Leases has not had a significant impact on the recognition, measurement or disclosure of leases. The changes are minimal except and so far as leveraged leases that were ‘grandfathered leveraged leases’ are now measured and disclosed as finance leases. For further details, refer to the change in accounting policy below.
(i) Current accounting policy
Leveraged leases are accounted for with income being brought to account at the rate which yield a constant rate of return on the outstanding investment balance over the life of the transaction so as to reflect the underlying assets, liabilities, revenue and expense that flowed from the arrangements. Where a change has occurred in the estimated lease cash flows or available tax benefits at any stage during the term of the lease, the total lease profit is recalculated for the entire lease term and apportioned over the remaining lease term.
Leases where the Group transfers substantially all the risks and rewards incident to ownership of an asset to the lessee are classified as finance leases. A receivable at an amount equal to the present value of the lease payments, including any guaranteed residual value, is recognised.
AASB 117 requires income on finance lease transactions to be recognised on a basis reflecting a constant periodic return based on the lessor’s net investment outstanding in respect of the finance lease.
The difference between the gross receivable and the present value of the receivable is unearned finance income and is recognised over the term of the lease using the effective interest method. Finance lease receivables are included in loans, advances and other receivables.
Leveraged leases are accounted for with income being brought to account at the rate which yield a constant rate of return on the outstanding investment balance over the life of the transaction so as to reflect the underlying assets, liabilities, revenue and expenses that flowed from the arrangements. Where a change has occurred in the estimated lease cash flows or available tax benefits at any stage during the term of the lease, the total lease profit is recalculated for the entire lease term and apportioned over the remaining lease term.
Leases where the Group retains substantially all the risk and rewards incident to ownership of an asset are classified as operating leases.
Operating lease rental revenue and expense is recognised in profit and loss on a straight-line basis over the lease term. The Group includes assets leased out under operating leases in property, plant and equipment. These assets are depreciated over their expected useful lives on a basis consistent with similar fixed assets.
(ii) Change in accounting policy
Previously, only leveraged leases with a lease term beginning from 1 July 1999 were accounted for as finance leases with income brought to account progressively over the lease term. With the adoption of AASB 117 Leases, all leveraged leases, including those written prior to 1 July 1999 will now be measured and disclosed as finance leases.
(n) Provisions for impairment
The adoption of AASB 139 Financial Instruments: Recognition and Measurement and AASB 136 Impairment of Assets has had a substantial impact on the measurement and recognition of impairment of financial and non-financial assets. For further details, refer to the change in accounting policy below.
(i) Current accounting policy
Financial assets
Financial assets, excluding derivative assets and assets at fair value through the Income Statement, are reviewed at each balance sheet date to determine whether there is objective evidence of impairment. A financial asset or portfolio of financial assets is impaired and impairment losses are incurred if, and only if, there is objective evidence of impairment as a result of one or more loss events that occurred after the initial recognition of the asset and prior to the balance sheet date (“a loss event”) and that loss event or events has had an impact on the estimated future cash flows of the financial asset or the portfolio that can be reliably estimated. If any such indication exists, the asset’s carrying amount is written down to the asset’s estimated recoverable amount.
Loans, advances and other receivables
The Group assesses at each balance date whether there is any objective evidence of impairment.
If there is objective evidence that an impairment loss on loans, advances and other receivables has been incurred, the amount of the loss is measured as the difference between the asset’s carrying amount and the present value of the expected future cash flows (excluding future credit losses that have not been incurred), discounted at the financial asset’s original effective interest rate. Short-term balances are not discounted.
Loans and advances are presented net of provisions for loan impairment. The Group has Individually Assessed provisions and Collectively Assessed provisions. Individually assessed provisions are made against individually significant financial assets and those that are not individually significant, including groups of financial assets with similar credit risk characteristics.
All other loans and advances that do not have an individually assessed provision are assessed collectively for impairment.
38 Commonwealth Bank of Australia
Notes to the Financial Statementscontinued
Note 1 Accounting Policies (continued)
Collective provisions are maintained to reduce the carrying amount of portfolios of similar loans and advances to their estimated recoverable amounts at the balance sheet date.
The expected future cash flows for portfolios of similar assets are estimated on the basis of historical loss experience, for assets with credit risk characteristics similar to those in the group. Loss experience is adjusted on the basis of current observable data to reflect the effects of current conditions that did not affect the period on which the loss experience is based and to remove the effects of conditions in the period that do not currently exist. Increases or decreases in the provision amount are recognised in the profit and loss.
Available-for-sale investments
When a decline in the fair value of an available-for-sale investment has been recognised directly in equity and there is objective evidence that the asset is impaired, the cumulative loss that had been recognised directly in equity (refer Note 1(j)) shall be removed from equity and recognised in the profit and loss.
If in a subsequent period the amount of an impairment loss for an available-for-sale debt security decreases and the decrease can be linked objectively to an event occurring after the impairment event, the impairment is reversed through the profit and loss. However impairment losses on available for sale equity securities are not reversed while the asset is still recognised.
Goodwill and other non-financial assets
Goodwill balances and intangible assets with an indefinite useful life are assessed for impairment at each reporting date or more regularly where an indication of impairment exists. Please refer to Note 1(t) Intangibles for more details on goodwill and intangibles impairment testing. If any such indication exists, the asset’s carrying amount is written down to the asset’s estimated recoverable amount and this loss is recognised in the profit and loss in the period in which it occurs.
The carrying amounts of the Group’s other non-financial assets are reviewed at each balance sheet date to determine whether there is any indication of impairment. If any such indication exists, the asset’s recoverable amount is estimated.
The recoverable amount of an asset (other than goodwill) can be the greater of their fair value less cost to sell or value in use. The Group’s policy is to use the fair value less costs to sell in assessing recoverable amount. An impairment loss is recognised whenever the carrying amount of an asset or its cash-generating unit exceeds its recoverable amount. Impairment losses are recognised in the profit and loss.
A previously recognised impairment loss (except for goodwill) is reversed if there has been a change in the estimates used to determine the recoverable amount. However, the reversal is not to an amount higher than the carrying amount that would have been determined, net of amortisation or depreciation, if no impairment loss had been recognised in prior years.
Off-balance sheet items
Under AASB 137 Provisions, Contingent Liabilities and Contingent Assets, provisions for impairment on off-balance sheet items such as a commitment are reported in other provisions. Measurement of provisions is discussed further in Note 1(aa) Provisions.
The amounts required to bring the provisions for impairment to their assessed levels are charged to profit and loss.
(ii) Change in accounting policy
Under previous AGAAP and in line with market practice, the Group’s general provision for bad and doubtful debts was maintained to cover non identified probable losses and latent risks inherent in the overall portfolio of advances and other credit transactions.
Under AIFRS, the Group must raise impairment provisions in respect of only those advances and credit transactions, for which there is ‘objective evidence’ of impairment as at each balance sheet date.
As a result of this change, there will be a reduction in the amount of the Bank’s collective provisioning for impaired loans.
Specific provisions will now be known as individually assessed provisions and are established where objective evidence of impairment has been identified via an individual assessment of a financial asset or group of financial assets.
Individually significant provisions are assessed as the difference between the assets carrying amount and the present value of estimated future cash flows discounted at the assets original effective interest rate.
Loans and advances that do not have an individually assessed provision are assessed collectively for impairment.
The transitional provisions for loan impairment will result in adjustments to existing provisions being taken to Retained profits.
The difference between the post-tax equivalents of the previous general provision and new collective provision has been appropriated from Retained profits to a separate component of equity, general reserve for credit losses.
(o) Bank acceptances of customers
There is no change in accounting policy.
The exposure arising from the acceptance of bills of exchange that are sold into the market is brought to account as a liability. An asset of equal value is raised to reflect the offsetting claim against the drawer of the bill. Bank acceptances generate fee income that is taken to profit and loss when earned.
(p) Shares in and loans to controlled entities
There has been no substantial change in accounting policy.
Shares in controlled entities are carried in the Bank’s financial statements at the lower of cost of acquisition or recoverable amount, and loans to controlled entities are measured at amortised cost using the effective interest method.
These assets are brought to account at fair value when impaired and a provision is raised as per Note 1(n) Provisions for impairment.
(q) Investment property
The adoption of AASB 116 Property, Plant and Equipment and AASB 140 Investment Property have not had a material impact on the recognition and measurement of these assets. There have however been some disclosure changes in relation to investment property. For further details, refer to the change in accounting policy below.
(i) Current accounting policy
Investment properties are classified as properties held to earn rental income and/or for capital appreciation.
Profit Announcement 39
Notes to the Financial Statementscontinued
Note 1 Accounting Policies (continued)
The Group carries investment properties at fair value based on a valuation performed by professional valuers. Valuations are carried out annually. Fair value movements are taken to the profit and loss in the year in which they arise.
Investment properties are separately disclosed on the face of the balance sheet and in the notes to the financial statements.
(ii) Change in accounting policy
Investment properties were previously included within Property, Plant and Equipment and are now split out and separately disclosed on the face of the balance sheet and in the notes to the financial statements.
The changes in disclosure have been applied from 1 July 2005.
(r) Assets classified as held for sale
The adoption of AASB 5 Non-Current Assets Held for Sale and Discontinued Operations, and AASB 116 Property, Plant and Equipment have not had a material impact on the recognition and measurement of these assets. There have been some disclosure changes in relation to assets classified as held for sale. For further details, refer to the change in accounting policy below.
(i) Current accounting policy
Assets are classified as held for sale when their carrying amounts will be recovered principally through sale within 12 months. They are measured at the lower of carrying amount and fair value less costs to sell and if material are disclosed separately on the face of the balance sheet.
Assets classified as held for sale are neither amortised nor depreciated.
(ii) Change in accounting policy
Assets classified as held for sale were previously included within Property, Plant and Equipment and are now split out and if material, separately disclosed on the face of the balance sheet and in the notes to the financial statements.
The changes in disclosure have been applied from 1 July 2005.
(s) Property, Plant and Equipment
The adoption of AASB 5 Non-Current Assets Held for Sale and Discontinued Operations, AASB 116 Property, Plant and Equipment and AASB 140 Investment Property have not had a material impact on the recognition and measurement of these assets. There have been some disclosure changes in relation to investment property and assets classified as held for sale. For further details, refer to the change in accounting policy below.
(i) Current accounting policy
The Group measures its property assets (land and buildings) on a fair value measurement basis which is based upon independent market valuations.
Any increments in fair value is recognised in the profit and loss to the extent that it reverses a revaluation decrease of the same asset previously recognised in the profit and loss. Gains or losses on disposals are determined as the difference between the net disposal proceeds, if any, and the carrying amount of the item. Realised amounts in the Asset Revaluation Reserve are transferred to Retained profits.
Equipment is shown at cost less accumulated depreciation and provision for impairment, if any. Depreciation is calculated principally on a category basis at rates applicable to each category’s useful life using the straight-line method. It is treated as an operating expense and charged to the profit and loss. The amounts charged for the year are shown in Note 3 Operating Expenses.
Computer software is capitalised at cost and classified as Property, Plant and Equipment where it is deemed integral to the operation of associated hardware.
The useful lives of major depreciable asset categories are as follows:
| | | |
| Buildings | | |
| |
| Shell | | Maximum 30 years |
| | | |
| Integral plant and equipment | | |
| | | |
| Carpets | | 10 years |
| | | |
| All other (air-conditioning, lifts) | | 20 years |
| | | |
| Non integral plant and equipment | | |
| | | |
| Fixtures and fittings | | 10 years |
| | | |
| Leasehold improvements | | |
| |
| Leasehold Improvements | | Lesser of unexpired lease term or |
| | | lives as above |
| | | |
| Equipment | | |
| |
| Security surveillance systems | | 10 years |
| | | |
| Furniture | | 8 years |
| | | |
| Office machinery | | 5 years |
| | | |
| EFTPOS machines | | 3 years |
| |
Depreciation rates and methods underlying the calculation of depreciation of items of property, plant and equipment are kept under review to take account of any change in circumstances.
No depreciation is provided on freehold land, although, in common with all long-lived assets, it is subject to impairment testing, if deemed appropriate.
Property, plant and equipment are periodically reviewed for impairment. Where the carrying amount of an asset is greater than its estimated recoverable amount, it is written down immediately through profit and loss to its recoverable amount.
Where the Group expects the carrying amount of assets held within property, plant and equipment to be recovered principally through a sale transaction in the short-term rather than through continuing use, these assets are classified as held for sale.
(ii) Change in accounting policy
Under AASB 116 Property, Plant and Equipment, property revaluations were previously recognised on a class of asset basis where increments and decrements are offset against each other when they relate to the same class of assets. Under AIFRS, such increments and decrements can now be only offset when they relate to the same asset. This has led to revaluation amounts that were previously offset being allocated back to assets.
40 Commonwealth Bank of Australia
Notes to the Financial Statementscontinued
Note 1 Accounting Policies (continued)
Investment properties and assets classified as held for sale previously included within property, plant and equipment have been split out and if material, are separately disclosed on the face of the balance sheet and in the notes to the financial statements. For further details refer to Note 1(q) and Note 1(r) on Investment property and Assets classified as held for sale respectively.
Previously, realised amounts in the Asset Revaluation Reserve were transferred to Capital Reserve, but are now transferred to Retained profits.
The changes in disclosure have been applied from 1 July 2004.
(t) Intangibles
The adoption of AASB 138 Intangible Assets has had a substantial impact on the recognition, measurement and disclosure of Intangibles. For further details, refer to the change in accounting policy below.
(i) Current accounting policy
Goodwill
Goodwill, representing the excess of purchase consideration plus incidental expenses over the fair value of the identifiable net assets at the time of acquisition of an entity, is capitalised and brought to account in the balance sheet.
Goodwill is reviewed annually for impairment at each reporting date, or more frequently if events or changes in circumstances indicate that it might be impaired. For the purposes of impairment testing, goodwill is allocated to cash-generating units or groups of units. A cash-generating unit is the smallest identifiable group of assets that generate independent cash flows. Goodwill is allocated by the Group to cash generating units or groups of units based on how goodwill is monitored by management.
An impairment loss is recognised for a cash-generating unit if the recoverable amount of the unit/ group of units is less than the carrying amount of the unit/group of units. The recoverable amount of the cash-generating units is calculated as the fair value less costs to sell measured using readily available market data and assumptions. Impairment losses on goodwill are not subsequently reversed.
Gains and losses on the disposal of an entity are net of the carrying amount of the goodwill relating to the entity sold.
Computer software costs
Where computer software costs are not integrally related to associated hardware, the Group recognises them as an intangible asset where they are clearly identifiable, can be reliably measured and it is probable they will lead to future economic benefits that the Group controls.
The Group carries capitalised software assets at cost less amortisation and any impairment losses, if any.
These assets are amortised over the estimated useful lives on a straight-line basis at a rate applicable to the expected useful life of the asset, but which is usually 21/2 years. Software maintenance costs continue to be expensed as incurred.
Any impairment loss is recognised in the profit and loss when incurred.
Other Intangibles
Other intangibles comprise acquired management fee rights and customer lists where they are clearly identifiable, can be reliably measured and where it is probable they will lead to future economic benefits that the Group controls.
The Group carries capitalised management fee rights and customer lists at costs less amortisation and any impairment losses. These assets are either deemed indefinite and assessed annually for impairment or amortised over the estimated useful lives on a straight-line basis over a period not usually exceeding ten years.
Any impairment loss is recognised in the profit and loss when incurred.
Under AASB 138, the acquired component of any excess of the net market value over net assets of the Group’s life insurance controlled entities is classified to goodwill.
(ii) Change in accounting policy
Under AASB 138, goodwill is no longer required to be amortised, but is subject to an annual impairment test, or more frequent tests if events or changes in circumstances indicate that it might be impaired. On transition, goodwill is included on the basis of its deemed cost as at 1 July 2004 which represents the carrying amount recorded under previous AGAAP.
The AIFRS standards have not been applied retrospectively to business combinations that occurred prior to 1 July 2004 in preparing the Group’s opening AIFRS balance sheet at 30 June 2005. The only adjustment made to goodwill has been the recognition of other separately identifiable intangible assets for capitalised management fee rights and customer lists.
Computer software cost was previously included in Other assets, but has either been reclassified to intangible assets or property, plant and equipment.
Under AASB 138 the asset representing the excess of the net market value over net assets of the Group’s life insurance controlled entities can no longer be recognised in full. The acquired component has been reclassified to goodwill and the write off of the internally generated component has been reflected on transition at 1 July 2004 against the General Reserve. For further details, refer to Note 1(hh) Life Insurance Business.
(u) Other assets
The adoption of AASB 132, AASB 138 and AASB 1038 Life Insurance Contracts, has resulted in the reclassification of derivative assets, computer software costs and the asset representing the excess of the net market value of net assets of the Group’s Life Insurance controlled entities. For further details, refer to the change in accounting policy below.
(i) Current accounting policy
Other assets include all other financial assets and include interest, fees and other unrealised income receivable, and securities sold not delivered. These assets are recorded at the cash value to be realised when settled.
The net surpluses or deficits that arise within defined benefit superannuation plans are recognised and disclosed separately in other assets and bills payable and other liabilities. As the bank carries a net surplus, no funding of the Australian defined benefit superannuation plan is required, therefore the related expense has been treated as a non cash item.
Profit Announcement 41
Notes to the Financial Statementscontinued
Note 1 Accounting Policies (continued)
(ii) Change in accounting policy
Capitalised computer software cost has been reclassified to Intangible assets. Trading derivatives have been reclassified to Derivative assets.
Under AASB 138 the asset representing the excess of the net market value over net assets of the Group’s life insurance controlled entities can no longer be recognised in full.
The acquired component has been reclassified to goodwill and the write off of the internally generated component has been reflected on transition at 1 July 2004 against the General Reserve. For further details, refer to Note 1(hh) Life Insurance Business.
Under AASB 119, the surplus within the defined benefit superannuation plan has been recognised and disclosed within other assets. The change in measurement has been applied retrospectively from 1 July 2004.
(v) Deposits from Customers
The adoption of AASB 132 and AASB 139 has not had a substantial impact on deposits and other public borrowings. The changes relate to measurement and recognition. For further details, refer to the change in accounting policy below.
(i) Current accounting policy
Deposits and other public borrowings includes certificates of deposits, term deposits, savings deposits, cheque and other demand deposits, debentures and other funds raised publicly by borrowing corporations. They are brought to account at fair value plus directly attributable transaction costs at inception. Deposits and other public borrowings are subsequently stated at amortised cost. Interest and yield related fees are taken to profit and loss based on the effective interest method when incurred.
Where the Group has hedged the deposits with derivative instruments, hedge accounting rules are applied (refer to Note 1(ff) Derivative financial instruments).
(ii) Change in accounting policy
Interest and yield related fees are taken to profit and loss based on the effective interest method when incurred, whereas previously interest was taken to profit and loss on an accrual basis when incurred. There has been no substantial change in the carrying value of deposits and other public borrowings as a result of this change.
The change has been applied from 1 July 2005.
(w) Payables to other financial institutions
The adoption of AASB 132 and AASB 139 has not had a substantial impact on payables to other financial institutions. The changes relate to measurement and recognition. For further details, refer to the change in accounting policy below.
(i) Current accounting policy
Payables to other financial institutions includes deposits, vostro balances and settlement account balances due to other banks. They are brought to account at fair value plus directly attributable transaction costs at inception.
Payables to other financial institutions are subsequently stated at amortised cost. Interest and yield related fees are taken to profit and loss using the effective interest method when incurred.
(ii) Change in accounting policy
Interest and yield related fees are taken to the profit and loss based on the effective interest method when incurred, whereas previously interest was taken to profit and loss on an accrual basis when incurred. There has been no substantial change in the carrying value of Payables to other financial institutions as a result of this change.
The liabilities are measured at fair value plus directly attributable transaction costs at inception. They are subsequently stated at amortised cost. They were previously carried at the gross value of the outstanding balance. The change has been applied from 1 July 2005.
(x) Liabilities at fair value through the Income Statement
Liabilities at fair value through the Income Statement is a new class of financial liabilities under AASB 139. There is a substantial change in the recognition, measurement and disclosure of these liabilities. For further details, refer to the change in accounting policy below.
(i) Current accounting policy
The Group designates certain liabilities as at fair value through the Income Statement on origination where those liabilities are managed on a fair value basis. Changes in the fair value of liabilities through the Income Statement are reported in profit and loss. For quoted liabilities quoted offer prices are used to measure fair value. Quoted mid prices are used to measure liabilities at fair value through the Income Statement with offsetting risk positions in a portfolio at fair value. For non-market quoted liabilities, fair values have been determined using valuation techniques.
(ii) Change in accounting policy
Under AASB 139, certain financial liabilities that were predominantly disclosed as deposits from customers and debt issues at amortised cost under previous AGAAP, are now reclassified to liabilities at fair value through the Income Statement. The change in measurement has been applied from 1 July 2005.
(y) Income taxes
The adoption of AASB 112 Income Taxes and UIG 1052 Tax Consolidation Accounting has had an impact on the measurement and disclosure of income taxes of the tax-consolidated Group, and thus, of various members of the Group. For further details, refer to the change in accounting policy below.
(i) Current accounting policy
Income tax on the profit and loss for the year comprises current and deferred tax.
Income tax is recognised in the profit and loss, except to the extent that it relates to items recognised directly to equity, in which case it is recognised in equity.
Current tax is the expected tax payable on the taxable income for the year, using tax rates enacted or substantially enacted at the balance sheet date, and any adjustment to tax payable in respect of previous years.
Deferred tax is provided using the balance sheet liability method, providing for temporary differences between the carrying amounts of assets and liabilities for financial reporting purposes and the amounts used for taxation purposes.
42 Commonwealth Bank of Australia
Notes to the Financial Statementscontinued
Note 1 Accounting Policies (continued)
The amount of deferred tax provided is based on the expected manner of realisation or settlement of the carrying amount of assets and liabilities, using tax rates enacted or substantially enacted at the balance sheet date and are expected to apply when the deferred tax asset is realised or the deferred tax liability is settled.
A deferred tax asset is recognised only to the extent that it is probable that future taxable profits will be available against which the asset can be utilised. Deferred tax assets are reduced to the extent that it is no longer probable that the related tax benefit will be realised.
The Commonwealth Bank of Australia elected to be taxed as a single entity under the tax consolidation system with effect from 1 July 2002.
The Bank has formally notified the Australian Taxation Office of its adoption of the tax consolidation regime. In addition to the Bank electing to be taxed as a single entity under the tax consolidation regime, the measurement and disclosure of deferred tax assets and liabilities has been performed in accordance with the principles in AASB 112, and on a stand alone basis under UIG 1052.
Any current tax liabilities/assets (after the elimination of intra-group transactions) and deferred tax assets arising from unused tax losses assumed by the Bank from the subsidiaries in the tax consolidated group are recognised in conjunction with any tax funding arrangement amounts (refer below). Any difference between these amounts is recognised by the Bank as an equity contribution to or distribution from the subsidiary.
The Bank recognises deferred tax assets arising from unused tax losses of the tax-consolidated group to the extent that it is probable that future taxable profits of the tax-consolidated group will be available against which the asset can be utilised.
Any subsequent period adjustments to deferred tax assets arising from unused tax losses assumed from subsidiaries are recognised by the Bank only.
The members of the tax-consolidated group have entered into a tax funding arrangement which sets out the funding obligations of members of the tax-consolidated group in respect of tax amounts.
(ii) Change in accounting policy
A “balance sheet” approach to tax-effect accounting is followed under AIFRS replacing the previous “liability method”. This approach recognises deferred tax balances when there is a difference between the carrying value of an asset or liability and its tax base. Also, unused tax losses are now recognised as deferred tax assets to the extent that it is probable that future taxable profits will be available, whereas previously the tax losses had to be virtually certain of being utilised. As at 1 July 2004 these changes in approach did not result in any material adjustment to Shareholders’ Equity other than as a result of other AIFRS transition adjustments.
In addition, deferred tax assets/liabilities are now separately disclosed on the face of the Balance Sheet. Additional disclosures have been provided in the notes to the financial statements.
(z) Employee benefits
The adoption of AASB 119 Employee Benefits and AASB 2 Share-based Payments have had a substantial impact on the recognition, measurement and disclosure of net surpluses and/or deficits of the defined benefit superannuation plans. For further details, refer to the change in accounting policy below.
(i) Current accounting policy
Annual leave
The provision for annual leave represents the current outstanding liability to employees at balance sheet date.
Long service leave
The provision for long service leave is discounted to the present value and is subject to actuarial review and is maintained at a level that accords with actuarial advice.
Other employee benefits
The provision for other employee entitlements represents liabilities for staff housing loan benefits, a subsidy to a registered health fund with respect to retired employees and current employees, and employee incentives under employee share plans and bonus schemes.
The level of these provisions has been determined in accordance with the requirements of AASB 119.
Under AASB 2 Share-based Payments, the Group engages in equity settled share-based compensation in respect of services received from certain of its employees. The fair value of the share-based compensation is calculated at grant date and amortised to profit and loss against the Equity Compensation Reserve over the vesting period, subject to service and performance conditions being met.
When allocating share based payments, the Bank purchases shares on market and recognises them at cost as a deduction to Share capital (Treasury Shares). On settlement the shares are issued and recognised against the Equity Compensation Reserve.
Defined benefit superannuation plan
The Group currently sponsors two defined benefit superannuation plans for its employees. The assets and liabilities of these plans are legally held in separate trustee-administered funds. They are calculated separately for each plan by assessing the fair value of plan assets and deducting the amount of future benefit that employees have earned in return for their service in current and prior periods discounted to present value. The discount rate is the yield at balance sheet date on government securities which have terms to maturity approximating to the terms of the related liability. The defined benefit superannuation plan surpluses and/or deficits are calculated by fund actuaries. Contributions to all superannuation plans are made in accordance with the rules of the plans. As the Australian plan is in surplus, no funding is currently necessary.
Actuarial gains and losses related to defined benefit superannuation plans are directly recorded in retained profits. The net surpluses or deficits that arise within defined benefit superannuation plans are recognised and disclosed separately in other assets and bills payable and other liabilities.
Defined contribution superannuation plan
The Group sponsors a number of defined contribution superannuation plans. Certain plans permit employees to make contributions and earn matching or other contributions from the Group. The Group recognises contributions due in respect of the accounting period in the profit and loss. Any contributions unpaid at the balance sheet date are included as a liability.
Profit Announcement 43
Notes to the Financial Statementscontinued
Note 1 Accounting Policies (continued)
Superannuation plan expense
Under AIFRS, an additional non-cash expense is recognised reflecting the accrual accounting charge to profit and loss associated with defined benefit superannuation plans.
(ii) Change in accounting policy
The Group sponsors two defined benefit superannuation plans on behalf of its employees. Previously, the net surpluses and/or deficits of these plans were not included in the financial statements.
Under AASB 119, the surpluses or deficits that arise within defined benefit superannuation plans are recognised and disclosed separately in other assets and bills payable and other liabilities. From 1 July 2004, the actuarial gains and losses relating to defined benefit superannuation plans are recorded in retained profits. On transition to AIFRS, the comparative period beginning 1 July 2004 recorded an opening Retained profits adjustment where an additional non-cash expense is recognised reflecting the accrual accounting charge to profit and loss associated with defined benefit superannuation plans.
Under previous AGAAP, the Bank accrued all share-based compensation on a cost basis and amortised it to expense over the vesting period where there were performance hurdles to be met. Shares in the Bank were purchased by a Trust when the shares were granted and held until they are vested to the employee. Under AASB 2, AASB 119 and AASB 132 the fair value of the share-based compensation is calculated at grant date and amortised to the profit and loss over the vesting period, subject to service and performance conditions being met.
Shares in the Bank held by the Trust will be consolidated, reclassified as ‘Treasury Shares’ and accounted for as a deduction from Share capital.
(aa) Provisions
The adoption of AASB 137 Provisions, Contingent Liabilities and Contingent Assets has not had any material impact on provisions.
(i) Current accounting policy
A provision is recognised in the balance sheet when the Group has a legal or constructive obligation as a result of a past event, and where it is probable that an outflow of economic benefits will be required to settle the obligation and a reliable estimate of the amount of the obligation can be made.
Provision for dividend
A provision for dividend payable is recognised when dividends are declared in the period in which they are approved by the Group’s shareholders.
Provisions for restructuring
Provisions for restructuring are brought to account where there is a detailed formal plan for restructure and a demonstrated commitment to that plan.
Provision for ‘Which new Bank’ costs
On 19 September 2003, the Group launched its “Which new Bank” customer service vision. This is a three year transformation programme and involves the Bank in additional expenditure in the key areas of staff training and skilling, systems and process simplification, and technology. Such expenses provided for principally comprise redundancies and process improvements.
Provision for self-insurance
The provision for self-insurance covers certain non-lending losses and non-transferred insurance risks. Actuarial reviews are carried out at regular intervals with provisioning effected in accordance with actuarial advice.
(bb) Debt issues
The adoption of AASB 127 and AASB 139 and UIG 112 has had a substantial impact on the recognition and measurement of debt issues.
Additional entities have been consolidated into the Group, refer to Note 1(c) Consolidation. These changes have resulted in a material gross up of debt issues.
Certain debt issues are designated within fair value hedging relationships and as a result the debt hedge has been measured at fair value for the risk that has been hedged.
For further details, refer to the change in accounting policy below.
(i) Current accounting policy
Debt issues are short and long term debt issues of the Group including commercial paper, notes, term loans and medium term notes. Commercial paper, floating, fixed and structured debt issues are recorded at cost or amortised cost using the effective interest method. Premiums, discounts and associated issue expenses are recognised using the effective interest method through the profit and loss from the date of issue to ensure that securities attain their redemption values by maturity date.
Interest is charged against profit and loss using the effective interest method when incurred. Any profits or losses arising from redemption prior to maturity are taken to the profit and loss in the period in which they are realised.
Hedging
The Group hedges interest rate and foreign currency risk on certain debt issues. When hedge accounting is applied to fixed rate debt issues, the carrying values are adjusted for changes in fair value related to the hedged risks rather than carried at amortised cost. Refer to Note 1(ff) Derivative financial instruments.
(ii) Change in accounting policy
Premiums, discounts and associated issue expenses are recognised using the effective interest method through the profit and loss each year from the date of issue to ensure securities attain their redemption values by maturity date.
Under previous AGAAP, these items were recognised on an accrual basis through the profit and loss.
The requirement to separate embedded derivatives from debt issues is new under AASB 139. The change has been applied from 1 July 2005.
Debt issued by entities used to securitise assets of the Group, and certain asset-backed conduit entities, are consolidated under AIFRS. This results in material gross-ups of debt issues and the related interest expense (assets and related income are similarly grossed up). This change has been applied retrospectively from 1 July 2004.
44 Commonwealth Bank of Australia
Notes to the Financial Statementscontinued
Note 1 Accounting Policies (continued)
(cc) Bills payable and other liabilities
The adoption of AASB 119, AASB 127 and AASB 139 and UIG 112 has not had a substantial impact on Bills payable and other liabilities. For further details, refer to the change in accounting policy below.
(i) Current accounting policy
Bills payable and other liabilities includes interest, fees, defined benefit superannuation plan deficit, other unrealised expenses payable and securities purchased not delivered.
The superannuation plan deficit is recorded in line with Note 1(z) Employee benefits while the remaining liabilities are recorded at amortised cost using the effective interest method.
(ii) Change in accounting policy
Additional entities have been consolidated into the Group, refer to Note 1(c) Consolidation. These changes have resulted in a reduction of bills payable and other liabilities due to inter company eliminations.
Market revaluation of trading derivatives previously recorded in bills payable and other liabilities have been reclassified to derivative financial instruments from 1 July 2005.
Under AASB 119, the deficit within one defined benefit superannuation plan has been recognised and disclosed in bills payable and other liabilities. The change in measurement has been applied retrospectively from 1 July 2004.
(dd) Loan capital
The adoption of AASB 132 and AASB 139 has had a substantial impact on the disclosure and measurement of loan capital. Certain hybrid financial instruments of the Group previously classified as equity instruments, have now been classified as loan capital. For further details, refer to the change in accounting policy below.
(i) Current accounting policy
Loan capital is debt issued by the Group with terms and conditions, such as being undated or subordinated, which qualify the debt issue for inclusion as capital under APRA Prudential Standards. Loan capital debt issues are initially recorded at fair value plus transaction costs that are directly attributable to the loan capital debt issue. After initial recognition the loan capital debt issue shall be measured at amortised cost using the effective interest method.
Interest inclusive of premiums, discounts and associated issue expenses are recognised using the effective interest method over the expected life of the instrument through the profit and loss each year from the date of issue so that they attain their redemption values by maturity date. Any profits or losses arising from redemption prior to expected maturity are taken to the profit and loss in the period in which they are realised.
(ii) Change in accounting policy
From 1 July 2005, under AASB 132, certain hybrid financial instruments of the Group which were previously classified as equity with the associated distribution reported as dividends paid, are now classified as loan capital and the associated distribution reported as interest expense.
Interest, inclusive of premiums, discounts and associated issue expenses are amortised through profit and loss each year using the effective interest method.
Previously, they were taken to the profit and loss on a straight line basis when incurred.
(ee) Shareholders’ equity
The adoption of AASB 132 has had a substantial impact on the recognition and disclosure of shareholder’s equity. For further details, refer to the change in accounting policy below.
(i) Current accounting policy
Ordinary share capital is the amount of paid up capital from the issue of ordinary shares.
Under AASB 132, Treasury Shares are deducted from Ordinary share capital. Gains or losses on the reissue of Treasury Shares are recognised in Shareholders’ Equity within Other contributed capital.
Other contributed capital represents the movement between acquisition and reissue price of Treasury Shares.
General reserve is derived from revenue profits and is available for dividend except for undistributable profits in respect of the Group’s life insurance businesses.
Capital reserve was derived from capital profits and is available for dividend.
A General Reserve for Credit Loss has been appropriated from Retained profits to comply with APRA’s proposed prudential requirements.
(ii) Change in accounting policy
From 1 July 2004, under AASB 127 Treasury Shares are deducted from ordinary share capital. The gain or loss on reissue of Treasury Shares is recognised in Other contributed capital. The minority interests in controlled unit trusts of the life insurance companies no longer qualify as equity. As a result, the Group has, on adoption of AIFRS, reclassified outside equity interests in life insurance statutory funds and other funds as liabilities.
From 1 July 2005 certain hybrid financial instruments previously recorded in Shareholders’ Equity have been reclassified as Loan capital.
(ff) Derivative financial instruments
The adoption of AASB 132 and 139 has had a substantial impact on the recognition, measurement and disclosure of derivative financial instruments. For further details, refer to the change in accounting policy below.
(i) Current accounting policy
The Group has a significant volume of derivative financial instruments that include foreign exchange contracts, forward rate agreements, futures, options and interest rate, currency, equity and credit swaps.
Derivative financial instruments are used as part of the Group’s trading activities and to hedge certain assets and liabilities. All derivatives that do not meet the hedging criteria under AASB 139 are classified as derivatives held for trading.
The Group initially recognises derivative financial instruments in the balance sheet at the fair value of consideration given or received. They are subsequently remeasured to fair value based on quoted market prices, broker or dealer price quotations. A positive revaluation amount of a contract is reported as an asset and a negative revaluation amount of a contract as a liability.
Profit Announcement 45
Notes to the Financial Statementscontinued
Note 1 Accounting Policies (continued)
Changes in fair value of trading derivatives are reflected in the profit and loss immediately as they occur unless a derivative is designated within a hedging relationship.
Derivative financial instruments utilised for hedging relationships
The Group also uses derivative instruments as part of its asset and liability management activities to manage exposures to interest rate, foreign currency and credit risks, including exposures arising from forecast transactions. Hedge accounting can be applied subject to certain rules for fair value hedges, cash flow hedges and hedges of foreign operations. Cash flow and fair value hedges are the predominant hedging models applied by the Group.
Swaps
Interest rate swap receipts and payments are accrued to the profit and loss using the effective interest method as interest of the hedged item or class of items being hedged over the term for which the swap is effective as a hedge of that designated item.
Similarly with cross currency swaps, interest rate receipts and payments are brought to account on the same basis outlined in the previous paragraph. In addition, the initial principal flows are revalued to market at the current market exchange rate with revaluation gains and losses taken to profit and loss against revaluation losses and gains of the underlying hedged item or class of items.
Fair value hedges
For fair value hedges, the change in fair value of the hedging derivative, and the hedged risk of the hedged item, is recognised in the Income Statement within Other operating income. If the fair value hedge relationship is terminated for reasons other than the derecognising of the hedged item, fair value hedge accounting ceases and the fair value of the hedged item is amortised to profit and loss over the remaining term of the original hedge. If the hedged item is derecognised the unamortised fair value adjustment is recognised immediately in the profit and loss.
Cash flow hedges
A fair valuation gain or loss associated with the effective portion of a derivative designated as a cash flow hedge is recognised initially in Shareholders’ Equity within the cash flow hedge reserve. Amounts from the cash flow hedge reserve are transferred to the profit and loss when the cash flows on the hedged item are recognised in profit and loss. Gains and losses resulting from cash flow hedge ineffectiveness are recorded in the profit and loss.
This represents the amount by which changes in the fair value of the expected cash flow of the hedging derivative differ from the fair value of the changes (or expected changes) in the cash flow of the hedged item.
Where the hedged item is derecognised, the cumulative gain or loss is recognised immediately in the profit and loss. If for reasons other than the derecognition of the hedged item, cash flow hedge accounting ceases, the cumulative gains or losses are amortised over the remaining term of the original hedge.
Embedded derivatives
A derivative may be embedded within a host contract. If the host contract is not already carried at fair value with changes in fair value reported in the profit and loss, the embedded derivative is separated from the host contract where the economic characteristics and risks of the embedded derivative are not closely related to the economic characteristics and risks of the host contract. This is then accounted for as a stand-alone derivative instrument at fair value.
(ii) Change in accounting policy
The adoption of AASB 132 and AASB 139 has had a substantial impact on the recognition, measurement and disclosure of derivative financial instruments. The changes are summarised below:
Derivative assets and derivative liabilities are to be recognised at fair value and disclosed separately on the face of the balance sheet.
The Group complies with new hedge accounting rules which include the use of predominantly fair value or cash flow hedges, the designation of hedging relationships and the documentation of these relationships.
Embedded derivatives are now required to be identified, separated and fair valued provided they are not closely related to their host contract.
| (gg) | | Commitments to extend credit, letters of credit, guarantees, warranties and indemnities issued |
The adoption of AASB 132 and AASB 139 has had a substantial change in the disclosure, recognition, measurement and presentation of certain financial liabilities which were previously treated as contingent liabilities. For further details, refer to change in accounting policy below.
(i) Current accounting policy
Contingent liabilities are possible obligations whose existence will be confirmed only by uncertain future events or present obligations where the transfer of economic benefit is uncertain or cannot be reliably measured. Contingent liabilities are not recognised but are disclosed unless they are remote.
Financial guarantees are given to banks, financial institutions and other bodies on behalf of customers to secure loans, overdrafts and other banking facilities, and to other parties in connection with the performance of customers under obligations related to contracts, advance payments made by other parties, tenders, retentions and the payment of import duties.
Financial guarantee contracts are initially recognised in the financial statements at fair value on the date that the guarantee was given.
Subsequent to initial recognition, the bank’s liabilities under such guarantees are measured at the higher of the initial measurement, less amortisation calculated to recognise in the profit and loss the fee income earned over the period, and the best estimate of the expenditure required to settle any financial obligation arising as a result of the guarantees at the balance sheet date.
Any increase in the liability relating to guarantees is taken to the profit and loss. Any liability remaining is recognised in the profit and loss when the guarantee is discharged, cancelled or expires.
(ii) Change in accounting policy
Under AGAAP, credit related instruments (other than credit derivatives) were treated as contingent liabilities and these are not shown on the balance sheet unless, and until, the Group is called upon to make a payment under the instrument.
46 Commonwealth Bank of Australia
Notes to the Financial Statementscontinued
Note 1 Accounting Policies (continued)
Fees received for providing these instruments are taken to profit over the life of the instrument and reflected in fees and commissions receivable.
Under AIFRS, the Group recognises financial guarantee contracts as financial liabilities, initially at fair value through profit and loss and subsequently at the higher of the initial measurement, less amortisation calculated to recognise in the profit and loss the fee income earned over the period, and the best estimate of the expenditure required to settle any financial obligation arising as a result of the guarantees at the balance sheet date.
(hh) Life Insurance Business
The adoption of AASB 4 Insurance Contracts and AASB 1038 Life Insurance Contracts has impacted on the measurement, recognition and disclosure of the life insurance business.
Under AASB 4, life insurance contracts are accounted for in accordance with AASB 1038 (which is largely consistent with previous AGAAP except there is a change in determination of discount rates) while investment contracts are accounted for a as financial instruments with a separate management services element in accordance with AASB 139 and AASB 118. For further details, refer to the change in accounting policy below.
(i) Current accounting policy
The Group’s life insurance business is comprised of insurance contracts and investment contracts as defined by AASB 4.
Insurance contracts are accounted for in accordance with the requirements of AASB 1038. Investment contracts are accounted for in accordance with AASB 139. Details are set out below.
All assets, liabilities, revenues, expenses and equity are included in the financial report irrespective of whether they are designated as relating to policyholders or to shareholders.
All assets backing insurance liabilities are classified as assets at fair value through the Income Statement. They are brought to account at fair value based on quoted bid prices or using valuation techniques.
Life insurance contract liabilities are measured at net present value of future receipts from and payments to policyholders using a risk free discount rate (or expected fund earning rate where benefits are contractually linked to the asset performance), and are calculated in accordance with the principles of Margin on Services (MoS) profit reporting as set out in Actuarial Standard AS 1.04: Valuation of Policy Liabilities issued by the Life Insurance Actuarial Standards Board.
Life investment contract liabilities are measured in accordance with AASB 139 as liabilities with changes in fair value taken to the Income Statement.
Premiums and claims are separated on a product basis into their revenue, expense and change in liability components unless the separation is not practicable or the components cannot be reliably measured.
Returns on all investments controlled by life insurance entities within the Group are recognised as revenues. Investments in the Group’s own equity instruments held within the life insurance statutory funds and other funds, are treated as Treasury Shares in accordance with Note 1(ee) Shareholders’ Equity.
Initial entry fee income on investment contracts issued by life insurance entities is recognised upfront where the Group provides financial advice. Other fees are deferred over the life of the underlying investment contract.
Participating benefits vested in relation to the financial year, other than transfers from unvested policyholder benefits liabilities, are recognised as expenses.
Reinsurance contracts entered into are recognised on a gross basis.
Premiums and Claims
(i) Life insurance contracts
Premiums received for providing services and bearing risks are recognised as revenue. Premiums with a regular due date are recognised as revenue on an accruals basis. Premiums with no due date are recognised on a cash received basis. Insurance contract claims are recognised as an expense when a liability has been established.
(ii) Investment contracts
Premiums received, include the fee portion of the premium recognised as revenue over the period the underlying service is provided and the deposit portion recognised as an increase in investment contract liabilities. Premiums with no due date are recognised on a cash received basis. Fees earned for managing the funds invested are recognised as revenue. Claims under investment contracts represent withdrawals of investment deposits and are recognised as a reduction in investment contract liabilities.
Life Insurance Liabilities and Profit
Insurance contract policy liabilities are calculated in a way that allows for the systematic release of planned profit margins as services are provided to policyowners and the revenues relating to those services are received. Selected profit carriers including premiums and anticipated policy payments are used to determine profit recognition.
Investment assets are held in excess of those required to meet life insurance contract and investment contract liabilities. Investment earnings are directly influenced by market conditions and as such this component of profit will vary from year to year.
Participating Policies
Insurance contract policy liabilities attributable to participating policies include the value of future planned shareholder profit margins and an allowance for future supportable bonuses.
The value of supportable bonuses and planned shareholder profit margins account for all profit on participating policies based on best estimate assumptions.
Under Margin on Services profit recognition methodology, the value of supportable bonuses and the shareholder profit margin relating to a reporting year will emerge as planned profits in that year.
Life Insurance Contract Acquisition Costs
Acquisition costs for life insurance contracts include the fixed and variable costs of acquiring new business. These costs are effectively deferred through the determination of life insurance contract liabilities at the balance date to the extent that they are deemed recoverable from premium or contract charges.
Deferred acquisition costs are effectively amortised over the expected life of the life insurance contract.
Investment Contract Acquisition Costs
Acquisition costs for investment contracts include the fixed and variable costs of acquiring new business.
Profit Announcement 47
Notes to the Financial Statementscontinued
Note 1 Accounting Policies (continued)
However, the deferral of investment contract acquisition costs is limited by the application of AASB 118 and 139 to the extent that only incremental transaction costs (for example commissions and volume bonuses) are deferred and minimum investment contract liability is no less than the contract surrender value.
Managed Fund Units on Issue — held by minority unitholders
The life insurance statutory funds and other funds include controlling interests in trusts and companies, and the total amounts of each underlying asset, liability, revenue and expense of the controlled entities are recognised in the consolidated financial statements.
When a controlled unit trust is consolidated, the share of the unit holder liability attributable to the controlling entity is eliminated but amounts due to external unit holders remain as liabilities in the consolidated balance sheet. The share of the net assets of controlled companies attributable to minority unit holders is disclosed separately on the balance sheet. In the Income Statement, the net profit or loss of the controlled entities relating to minority interests is removed before arriving at the net profit or loss attributable to shareholders of the parent entity.
(ii) Change in accounting policy
The changes in the accounting policy for the life insurance business apply retrospectively from 1 July 2004 and the remainder on 1 July 2005.
The following are changes which have been applied retrospectively from 1 July 2004:
(a) Under AASB 1038, the asset representing the excess of the net market value over net assets of the Bank’s life insurance controlled entities is no longer recognised in full. As a result, the Group has ceased to recognise any movement in this asset. The internally generated component has been written off against the General Reserve; and the acquired component has been reclassified as Goodwill within the balance sheet and subjected to annual impairment test. For further details on goodwill, refer to Note 1(t) Intangibles.
(b) Under previous AGAAP, direct investments in the Group’s own equity securities by the Group’s life insurance statutory funds are recognised in the balance sheet at market value. Under AASB 127 these assets have been reclassified as ‘Treasury Shares’ and accounted for as a deduction from Ordinary share capital. For further details, refer to Note 1(ee) Shareholders Equity.
The following are changes which have been applied from 1 July 2005:
(a) AASB 1038 requires income from investment contracts sold by life insurance businesses to be shown separately from income from insurance contracts sold by insurance companies. Insurance contracts are accounted for in accordance with the requirements of AASB 1038, and investment contracts are accounted for in accordance with AASB 118, 139 and 1038.
(b) Under AIFRS, the actuarial calculation of insurance contract liabilities is affected by a change in the determination of the discount rate applied for some contracts.
(c) Certain acquisition costs related to investment contracts which were deferred under previous AGAAP can no longer be deferred under AIFRS.
(d) On transition to AIFRS, the minority interests in controlled unit trusts of the life insurance companies no longer qualify as equity. As a result, the Group has, on adoption of AIFRS, reclassified outside equity interests in life insurance statutory funds and other funds as liabilities.
(e) Initial entry fee income on investment contracts issued by life insurance entities is recognised upfront where the Group provides financial advice. Other fees are deferred over the life of the underlying investment contract.
(f) AASB 1038 requires separate disclosure of investment contract and insurance contract liabilities.
(ii) Asset Securitisation
The adoption of AASB 127, 132, 139 and UIG 112 has had a substantial impact on the recognition of asset securitisation. However there is no material change in disclosure and measurement of asset securitisation. For further details, refer to the change in accounting policy below.
(i) Current accounting policy
The Group conducts an asset securitisation program through which it packages and sells assets as securities to investors. The Group is entitled to any residual income of the program after all payments due to investors and costs of the program have been met. Therefore the Group is considered to hold the majority of the residual risks and benefits within the entities through which asset securitisation is conducted and therefore consolidates these entities.
Additional entities have been consolidated into the Group, refer to Note 1(c) Consolidation. These changes have resulted in material gross-ups of individual asset, liability and profit and loss line items of the Group.
The liabilities associated with the asset securitisation entities and related issue costs are accounted for on an amortised cost basis using the effective interest method. Interest rate swaps and liquidity facilities are provided at arm’s length to the program by the Group in accordance with APRA Prudential Guidelines.
The derivatives return the risks and rewards of ownership of the securitised assets to the Bank and consequently the Bank cannot derecognise these assets. An imputed liability is recognised inclusive of the derivative and any related fees.
For further details on the treatment of the securitisation entities, refer to Note 1(c) Consolidation.
(ii) Change in accounting policy
AIFRS requires the consolidation of certain asset securitisation entities that were not consolidated under previous AGAAP. AIFRS also requires the recognition by the Bank of assets and liabilities that were not recognised under the previous AGAAP. This has resulted in the gross up of the entities’ assets and liabilities recorded within the Balance Sheet. The changes have been applied from 1 July 2004.
(jj) Fiduciary activities
(i) Current accounting policy
There is no change in accounting policy.
The Bank and designated controlled entities act as Responsible Entity, Trustee and/or Manager for a number of Wholesale, Superannuation and Investment Funds, Trusts and Approved Deposit Funds.
48 Commonwealth Bank of Australia
Notes to the Financial Statementscontinued
Note 1 Accounting Policies (continued)
The assets and liabilities of these Trusts and Funds are not included in the consolidated financial statements as the Group does not have direct or indirect control of the Trusts and Funds as defined by AASB 1024. Commissions and fees earned in respect of the activities are included in the Income Statement of the Group and the designated controlled entity.
(kk) Comparative figures
Where necessary, comparative figures have been adjusted to conform with changes in presentation in these financial statements.
Comparative figures have been prepared in accordance with AIFRS as outlined in Note 1(a) and (b) except for the adoption of AASB 132 Financial Instruments: Disclosure and Presentation, AASB 139 Financial Instruments: Recognition and Measurement, AASB 4 Insurance Contracts, AASB 1023 General Insurance Contracts and AASB 1038 Life Insurance Contracts. These standards have not been applied against comparative information in line with the exemption provided by AASB 1 First-time adoption of Australian Equivalents to International Financial Reporting Standards.
The Group has continued to apply its previous AGAAP in preparing the comparative information within the scope of the above standards.
(ll) Roundings
The amounts contained in this report and the financial statements are presented in Australian Dollars and have been rounded to the nearest million dollars unless otherwise stated, under the option available to the Company under ASIC Class Order 98/100 (as amended by ASIC Class Order 04/667).
(mm) Explanation of transition to Australian equivalents to IFRS
As stated in Note 1(a), these are the Group’s first consolidated financial statements prepared in accordance with Australian equivalents to IFRS.
As required by AASB 1, the accounting policies set out in Note 1 have been applied in preparing the financial statements for the half year ended 31 December 2005, the comparative information presented in these financial statements for the half years ended 31 December 2004 and 30 June 2005 and in the preparation of an opening Australian equivalents to IFRS balance sheet at 1 July 2004 (the Group’s date of transition).
As noted in Note 1(b) and 1(jj) comparative figures and the opening Australian equivalents to IFRS balance sheet at 1 July 2004 have been prepared in accordance with IFRS as outlined in Note 1(a) and 1(b) except for the adoption of AASB 132 Financial Instruments: Disclosure and Presentation, AASB 139 Financial Instruments: Recognition and Measurement, AASB 4 Insurance Contracts, AASB 1023 General Insurance Contracts and AASB 1038 Life Insurance Contracts.
These standards have not been applied against comparative information in line with the exemption provided by AASB 1 First-time adoption of Australian Equivalents to International Financial Reporting Standards.
In preparing its opening Australian equivalents to IFRS balance sheet, the Group has adjusted amounts reported previously in financial statements prepared in accordance with the previous basis of accounting (Australian GAAP).
An explanation of how the transition from previous GAAP to Australian equivalents to IFRS has affected the Group’s financial position and financial performance is set out in the following tables and the notes that accompany the tables.
Profit Announcement 49
Notes to the Financial Statementscontinued
Note 1 Accounting Policies(continued)
Explanation of AIFRS Transition Adjustments
In the following reconciliations, AIFRS impacts have been shown as Reclassifications, Gross-Ups and Re-Measurements. The major impacts are as follows:
(i) Reclassifications
Relates to the reclassification of various assets and liabilities in line with AIFRS disclosure requirements.
Significant items reclassified for periods prior to 1 July 2005 included:
| • | | Investment properties reclassified from Property, Plant and Equipment to a separate line on the face of the Balance Sheet (refer note 1 (q)); |
| |
| • | | Capitalised computer software reclassified from Other assets to Intangible assets — computer software costs (refer note 1 (t)); |
| |
| • | | The acquired portion of excess market value over net assets is reclassified from Other assets to Intangible assets — goodwill (refer note 1 (t)); and |
| |
| • | | Separation and reclassification of deferred tax assets and tax liabilities (refer note 1 (y)). |
Additional items reclassified with effect from 1 July 2005 include:
| • | | Derivative assets and liabilities reclassified from Other assets and Other liabilities to separate lines on the face of the Balance Sheet (refer note 1 (ff)); |
| • | | Insurance and trading assets reclassified to Assets at fair value through the Income Statement (refer note 1 (i)); |
| • | | Investment securities predominately reclassified to Available-for-sale investments (refer note 1 (j)); |
| • | | Some Deposits from customers and Debt issues reclassified to Liabilities at fair value through the Income Statement (refer note 1 (x)); |
| • | | Reclassification of minority interests in Insurance Statutory funds and other funds to liabilities (refer note 1 (hh)); and |
| • | | Reclassification of preference share capital and other equity instruments from shareholders’ equity to loan capital (refer note 1 (dd)). |
There is no net impact on net assets, shareholders’ equity nor net profit.
(ii) Gross-up
Impact of the consolidation of certain special purpose vehicles related to the securitisation of Bank assets, and certain other customer asset securitisations. On transition to AIFRS, consolidation of these vehicles has the effect of grossing up individual asset, liability and profit and loss line items. This has no net impact on net assets, shareholders’ equity nor net profit.
(iii) Re-measurements
Relates to AIFRS transition adjustments which involve a change in the measurement basis relative to previous Australian GAAP. Affected line items are explained by reference to the relevant accounting policy note. Material impacts are further explained in the tables on page 57 to 60, and referenced to the re-measure column of the following AIFRS transition tables.
50 Commonwealth Bank of Australia
Notes to the Financial Statementscontinued
Note 1 Accounting Policy(continued)
(mm) Effect of Transition to Australian Equivalents of IFRS
Balance Sheet reconciliation
| | | | | | | | | | | | | | | | | | | | | | | | | | | | | | | | | |
| | | 1 Jul 2004 | |
| | | Transition Adjustments | |
| | | Policy | | | AGAAP | | | Reclass | | | Gross-up | | | Re-Measure | | | | | | | | | | | AIFRS | |
| | | Note(2) | | | Group $M | | | $M | | | $M | | | $M(1) | | | | | | | Total $M | | | Group $M | |
| |
Assets | | | | | | | | | | | | | | | | | | | | | | | | | | | | | | | | |
| Cash and liquid assets | | | (f | ) | | | 6,453 | | | | 168 | | | | 153 | | | | — | | | | | | | | 321 | | | | 6,774 | |
| Receivables from other financial institutions | | | (g | ) | | | 8,369 | | | | (130 | ) | | | — | | | | — | | | | | | | | (130 | ) | | | 8,239 | |
| Assets at fair value through Income Statement: | | | | | | | | | | | | | | | | | | | | | | | | | | | | | | | | |
| Trading | | | (i | ) | | | 14,896 | | | | — | | | | 3 | | | | — | | | | | | | | 3 | | | | 14,899 | |
| Insurance | | (i),(hh | ) | | | 28,942 | | | | (16 | ) | | | — | | | | (301 | ) | | A | | | | | (317 | ) | | | 28,625 | |
| Investment securities | | | | | | | 11,447 | | | | — | | | | 531 | | | | — | | | | | | | | 531 | | | | 11,978 | |
| Loans, advances, and other receivables | | | (l),(m),(n | ) | | | 189,391 | | | | — | | | | 7,605 | | | | 24 | | | | | | | | 7,629 | | | | 197,020 | |
| Bank acceptances of customers | | | (o | ) | | | 15,019 | | | | — | | | | — | | | | — | | | | | | | | — | | | | 15,019 | |
| Deposits with regulatory authorities | | | (g | ) | | | 38 | | | | (38 | ) | | | — | | | | — | | | | | | | | (38 | ) | | | — | |
| Investment property | | | (q | ) | | | — | | | | 252 | | | | — | | | | — | | | | | | | | 252 | | | | 252 | |
| Property, plant and equipment | | | (s | ) | | | 1,204 | | | | (228 | ) | | | — | | | | 31 | | | | | | | | (197 | ) | | | 1,007 | |
| Investment in associates | | | (c | ) | | | 239 | | | | — | | | | — | | | | — | | | | | | | | — | | | | 239 | |
| Intangible assets | | | (t | ) | | | 4,705 | | | | 2,836 | | | | — | | | | — | | | | | | | | 2,836 | | | | 7,541 | |
| Deferred tax assets | | | (y | ) | | | — | | | | 564 | | | | — | | | | 23 | | | H | | | | | 587 | | | | 587 | |
| Other assets | | | (u | ) | | | 25,292 | | | | (3,408 | ) | | | (17 | ) | | | (2,512 | ) | | I | | | | | (5,937 | ) | | | 19,355 | |
| |
Total assets | | | | | | | 305,995 | | | | — | | | | 8,275 | | | | (2,735 | ) | | | | | | | 5,540 | | | | 311,535 | |
| |
| | | | | | | | | | | | | | | | | | | | | | | | | | | | | | | | | |
Liabilities | | | | | | | | | | | | | | | | | | | | | | | | | | | | | | | | |
| |
| Deposits from customers | | | (v | ) | | | 163,177 | | | | — | | | | 24 | | | | — | | | | | | | | 24 | | | | 163,201 | |
| Payables to other financial institution | | | (w | ) | | | 6,641 | | | | — | | | | — | | | | — | | | | | | | | — | | | | 6,641 | |
| Bank acceptances | | | (o | ) | | | 15,019 | | | | — | | | | — | | | | — | | | | | | | | — | | | | 15,019 | |
| Income tax liability | | | (y | ) | | | 811 | | | | (811 | ) | | | — | | | | — | | | | | | | | (811 | ) | | | — | |
| Current tax liabilities | | | (y | ) | | | — | | | | 426 | | | | — | | | | — | | | | | | | | 426 | | | | 426 | |
| Deferred tax liabilities | | | (y | ) | | | — | | | | 385 | | | | — | | | | 188 | | | L | | | | | 573 | | | | 573 | |
| Other provisions | | (z),(aa | ) | | | 1,011 | | | | — | | | | — | | | | (85 | ) | | M | | | | | (85 | ) | | | 926 | |
| Insurance policyholder liabilities | | (hh | ) | | | 24,638 | | | | — | | | | — | | | | — | | | | | | | | — | | | | 24,638 | |
| Debt issues | | (bb | ) | | | 44,042 | | | | — | | | | 8,732 | | | | | | | | | | | | 8,732 | | | | 52,774 | |
| Bills payable and other liabilities | | (cc | ) | | | 19,140 | | | | — | | | | (481 | ) | | | 77 | | | P | | | | | (404 | ) | | | 18,736 | |
| Loan capital | | (dd | ) | | | 6,631 | | | | — | | | | — | | | | — | | | | | | | | — | | | | 6,631 | |
| |
Total liabilities | | | | | | | 281,110 | | | | — | | | | 8,275 | | | | 180 | | | | | | | | 8,455 | | | | 289,565 | |
| |
Net assets | | | | | | | 24,885 | | | | — | | | | — | | | | (2,915 | ) | | | | | | | (2,915 | ) | | | 21,970 | |
| |
| | | | | | | | | | | | | | | | | | | | | | | | | | | | | | | | | |
Shareholders’ Equity | | | | | | | | | | | | | | | | | | | | | | | | | | | | | | | | |
| |
| Share capital: | | | | | | | | | | | | | | | | | | | | | | | | | | | | | | | | |
| Ordinary share capital | | (ee | ) | | | 13,359 | | | | — | | | | — | | | | (371 | ) | | R | | | | | (371 | ) | | | 12,988 | |
| Preference share capital | | | | | | | 687 | | | | — | | | | — | | | | — | | | | | | | | — | | | | 687 | |
| Other equity instruments | | | | | | | 1,573 | | | | — | | | | — | | | | — | | | | | | | | — | | | | 1,573 | |
| Reserves | | (ee | ) | | | 3,946 | | | | 492 | | | | — | | | | (3,045 | ) | | S | | | | | (2,553 | ) | | | 1,393 | |
| Retained profits | | | | | | | 2,840 | | | | (492 | ) | | | — | | | | 501 | | | T | | | | | 9 | | | | 2,849 | |
| |
| Shareholders’ equity attributable to members of the Bank | | | | | | | 22,405 | | | | — | | | | — | | | | (2,915 | ) | | | | | | | (2,915 | ) | | | 19,490 | |
| Minority interests: | | | | | | | | | | | | | | | | | | | | | | | | | | | | | | | | |
| Controlled entities | | | | | | | 304 | | | | — | | | | — | | | | — | | | | | | | | — | | | | 304 | |
| Insurance statutory funds and other funds | | (hh | ) | | | 2,176 | | | | — | | | | — | | | | — | | | | | | | | — | | | | 2,176 | |
| |
Total shareholders’ equity | | | | | | | 24,885 | | | | — | | | | — | | | | (2,915 | ) | | | | | | | (2,915 | ) | | | 21,970 | |
| |
| | |
| (1) | | References relate to explanations of the key AIFRS re-measure adjustment set out on pages 57 to 60. |
| |
| (2) | | References relate to key Accounting Policies as set out on pages 33 to 49. |
Profit Announcement 51
Notes to the Financial Statementscontinued
Note 1 Accounting Policy(continued)
(mm) Effect of Transition to Australian Equivalents of IFRS
Balance Sheet reconciliation
| | | | | | | | | | | | | | | | | | | | | | | | | | | | | | | | | |
| | | 31 Dec 2004 | |
| | | Transition Adjustments | |
| | | Policy | | | AGAAP | | | Reclass | | | Gross-up | | | Re-Measure | | | | | | | | | | | AIFRS | |
| | | Note(1) | | | Group $M | | | $M | | | $M | | | $M | | | | | | | Total $M | | | Group $M | |
| |
Assets | | | | | | | | | | | | | | | | | | | | | | | | | | | | | | | | |
| Cash and liquid assets | | | (f | ) | | | 5,648 | | | | 90 | | | | 167 | | | | | | | | | | | | 257 | | | | 5,905 | |
| Receivables from other financial institutions | | | (g | ) | | | 6,456 | | | | (59 | ) | | | — | | | | | | | | | | | | (59 | ) | | | 6,397 | |
| Assets at fair value through Income Statement: | | | | | | | | | | | | | | | | | | | | | | | | | | | | | | | | |
| Trading | | | (i | ) | | | 15,881 | | | | — | | | | 3 | | | | — | | | | | | | | 3 | | | | 15,884 | |
| Insurance | | (i),(hh | ) | | | 28,232 | | | | (16 | ) | | | — | | | | (251 | ) | | A | | | | | (267 | ) | | | 27,965 | |
| Investment securities | | | | | | | 11,022 | | | | — | | | | 597 | | | | — | | | | | | | | 597 | | | | 11,619 | |
| Loans, advances, and other receivables | | | (l),(m),(n | ) | | | 206,346 | | | | — | | | | 6,391 | | | | 18 | | | | | | | | 6,409 | | | | 212,755 | |
| Bank acceptances of customers | | | (o | ) | | | 16,297 | | | | — | | | | — | | | | — | | | | | | | | — | | | | 16,297 | |
| Deposits with regulatory authorities | | | (g | ) | | | 32 | | | | (32 | ) | | | — | | | | — | | | | | | | | (32 | ) | | | — | |
| Investment property | | | (q | ) | | | — | | | | 252 | | | | — | | | | — | | | | | | | | 252 | | | | 252 | |
| Property, plant and equipment | | | (s | ) | | | 1,262 | | | | (229 | ) | | | — | | | | 30 | | | | | | | | (199 | ) | | | 1,063 | |
| Investment in associates | | | (c | ) | | | 233 | | | | — | | | | — | | | | — | | | | | | | | — | | | | 233 | |
| Intangible assets | | | (t | ) | | | 4,555 | | | | 2,922 | | | | — | | | | 161 | | | G | | | | | 3,083 | | | | 7,638 | |
| Deferred tax assets | | | (y | ) | | | — | | | | 579 | | | | — | | | | 27 | | | H | | | | | 606 | | | | 606 | |
| Other assets | | | (u | ) | | | 24,988 | | | | (3,507 | ) | | | (30 | ) | | | (2,706 | ) | | I | | | | | (6,243 | ) | | | 18,745 | |
| |
Total assets | | | | | | | 320,952 | | | | — | | | | 7,128 | | | | (2,721 | ) | | | | | | | 4,407 | | | | 325,359 | |
| |
| | | | | | | | | | | | | | | | | | | | | | | | | | | | | | | | | |
Liabilities | | | | | | | | | | | | | | | | | | | | | | | | | | | | | | | | |
| |
| Deposits from customers | | | (v | ) | | | 167,425 | | | | — | | | | (2 | ) | | | — | | | | | | | | (2 | ) | | | 167,423 | |
| Payables to other financial institution | | | (w | ) | | | 9,512 | | | | — | | | | — | | | | — | | | | | | | | — | | | | 9,512 | |
| Bank acceptances | | | (o | ) | | | 16,297 | | | | — | | | | — | | | | — | | | | | | | | — | | | | 16,297 | |
| Income tax liability | | | (y | ) | | | 1,195 | | | | (1,195 | ) | | | — | | | | — | | | | | | | | (1,195 | ) | | | — | |
| Current tax liabilities | | | (y | ) | | | — | | | | 424 | | | | — | | | | — | | | | | | | | 424 | | | | 424 | |
| Deferred tax liabilities | | | (y | ) | | | — | | �� | | 771 | | | | — | | | | 211 | | | L | | | | | 982 | | | | 982 | |
| Other provisions | | (z),(aa | ) | | | 904 | | | | — | | | | — | | | | (55 | ) | | M | | | | | (55 | ) | | | 849 | |
| Insurance policyholder liabilities | | (hh | ) | | | 24,967 | | | | — | | | | — | | | | — | | | | | | | | — | | | | 24,967 | |
| Debt issues | | (bb | ) | | | 51,346 | | | | — | | | | 7,504 | | | | — | | | | | | | | 7,504 | | | | 58,850 | |
| Bills payable and other liabilities | | (cc | ) | | | 18,438 | | | | — | | | | (374 | ) | | | 89 | | | P | | | | | (285 | ) | | | 18,153 | |
| Loan capital | | (dd | ) | | | 5,801 | | | | — | | | | — | | | | — | | | | | | | | — | | | | 5,801 | |
| |
Total liabilities | | | | | | | 295,885 | | | | — | | | | 7,128 | | | | 245 | | | | | | | | 7,373 | | | | 303,258 | |
| |
Net assets | | | | | | | 25,067 | | | | — | | | | — | | | | (2,966 | ) | | | | | | | (2,966 | ) | | | 22,101 | |
| |
| | | | | | | | | | | | | | | | | | | | | | | | | | | | | | | | | |
Shareholders’ Equity | | | | | | | | | | | | | | | | | | | | | | | | | | | | | | | | |
| |
| Share capital: | | | | | | | | | | | | | | | | | | | | | | | | | | | | | | | | |
| Ordinary share capital | | (ee | ) | | | 13,647 | | | | — | | | | — | | | | (303 | ) | | R | | | | | (303 | ) | | | 13,344 | |
| Preference share capital | | | | | | | 687 | | | | — | | | | — | | | | — | | | | | | | | — | | | | 687 | |
| Other equity instruments | | | | | | | 1,573 | | | | — | | | | — | | | | — | | | | | | | | — | | | | 1,573 | |
| Reserves | | (ee | ) | | | 3,959 | | | | 492 | | | | — | | | | (3,353 | ) | | S | | | | | (2,861 | ) | | | 1,098 | |
| Retained profits | | | | | | | 3,159 | | | | (492 | ) | | | — | | | | 690 | | | T | | | | | 198 | | | | 3,357 | |
| |
| Shareholders’ equity attributable to members of the Bank | | | | | | | 23,025 | | | | — | | | | — | | | | (2,966 | ) | | | | | | | (2,966 | ) | | | 20,059 | |
| Minority interests: | | | | | | | | | | | | | | | | | | | | | | | | | | | | | | | | |
| Controlled entities | | | | | | | 629 | | | | — | | | | — | | | | — | | | | | | | | — | | | | 629 | |
| Insurance statutory funds and other funds | | (hh | ) | | | 1,413 | | | | — | | | | — | | | | — | | | | | | | | — | | | | 1,413 | |
| |
Total shareholders’ equity | | | | | | | 25,067 | | | | — | | | | — | | | | (2,966 | ) | | | | | | | (2,966 | ) | | | 22,101 | |
| |
| | |
| (1) | | References relate to key Accounting Policies as set out on pages 33 to 49. |
52 Commonwealth Bank of Australia
Notes to the Financial Statementscontinued
Note 1 Accounting Policy(continued)
(mm) Effect of Transition to Australian Equivalents of IFRS
Balance Sheet reconciliation
| | | | | | | | | | | | | | | | | | | | | | | | | | | | | | | | | |
| | | 30 Jun 2005 | |
| | | Transition Adjustments | |
| | | Policy | | | AGAAP | | | Reclass | | | Gross-up | | | Re-Measure | | | | | | | | | | | AIFRS | |
| | | Note(1) | | | Group $M | | | $M | | | $M | | | $M | | | | | | | Total $M | | | Group $M | |
| |
Assets | | | | | | | | | | | | | | | | | | | | | | | | | | | | | | | | |
| Cash and liquid assets | | | (f | ) | | | 5,715 | | | | 163 | | | | 177 | | | | — | | | | | | | | 340 | | | | 6,055 | |
| Receivables from other financial institutions | | | (g | ) | | | 6,205 | | | | (118 | ) | | | — | | | | — | | | | | | | | (118 | ) | | | 6,087 | |
| Assets at fair value through Income Statement: | | | | | | | | | | | | | | | | | | | | | | | | | | | | | | | | |
| Trading | | | (i | ) | | | 14,628 | | | | — | | | | 3 | | | | — | | | | | | | | 3 | | | | 14,631 | |
| Insurance | | (i),(hh | ) | | | 27,837 | | | | (16 | ) | | | — | | | | (337 | ) | | A | | | | | (353 | ) | | | 27,484 | |
| Investment securities | | | | | | | 10,272 | | | | — | | | | 566 | | | | — | | | | | | | | 566 | | | | 10,838 | |
| Loans, advances, and other receivables | | | (l),(m),(n | ) | | | 217,516 | | | | — | | | | 10,818 | | | | 12 | | | | | | | | 10,830 | | | | 228,346 | |
| Bank acceptances of customers | | | (o | ) | | | 16,786 | | | | — | | | | — | | | | — | | | | | | | | — | | | | 16,786 | |
| Deposits with regulatory authorities | | | (g | ) | | | 45 | | | | (45 | ) | | | — | | | | — | | | | | | | | (45 | ) | | | — | |
| Investment property | | | (q | ) | | | — | | | | 252 | | | | — | | | | — | | | | | | | | 252 | | | | 252 | |
| Property, plant and equipment | | | (s | ) | | | 1,344 | | | | (237 | ) | | | — | | | | 25 | | | | | | | | (212 | ) | | | 1,132 | |
| Investment in associates | | | (c | ) | | | 52 | | | | — | | | | — | | | | — | | | | | | | | — | | | | 52 | |
| Intangible assets | | | (t | ) | | | 4,394 | | | | 2,941 | | | | — | | | | 321 | | | G | | | | | 3,262 | | | | 7,656 | |
| Deferred tax assets | | | (y | ) | | | — | | | | 627 | | | | — | | | | 24 | | | H | | | | | 651 | | | | 651 | |
| Other assets | | | (u | ) | | | 24,241 | | | | (3,567 | ) | | | (37 | ) | | | (3,203 | ) | | I | | | | | (6,807 | ) | | | 17,434 | |
| |
Total assets | | | | | | | 329,035 | | | | — | | | | 11,527 | | | | (3,158 | ) | | | | | | | 8,369 | | | | 337,404 | |
| |
| | | | | | | | | | | | | | | | | | | | | | | | | | | | | | | | | |
Liabilities | | | | | | | | | | | | | | | | | | | | | | | | | | | | | | | | |
| |
| Deposits from customers | | | (v | ) | | | 168,029 | | | | — | | | | (3 | ) | | | — | | | | | | | | (3 | ) | | | 168,026 | |
| Payables to other financial institution | | | (w | ) | | | 8,023 | | | | — | | | | — | | | | — | | | | | | | | — | | | | 8,023 | |
| Bank acceptances | | | (o | ) | | | 16,786 | | | | — | | | | — | | | | — | | | | | | | | — | | | | 16,786 | |
| Income tax liability | | | (y | ) | | | 1,550 | | | | (1,550 | ) | | | — | | | | — | | | | | | | | (1,550 | ) | | | — | |
| Current tax liabilities | | | (y | ) | | | — | | | | 833 | | | | — | | | | — | | | | | | | | 833 | | | | 833 | |
| Deferred tax liabilities | | | (y | ) | | | — | | | | 717 | | | | — | | | | 204 | | | L | | | | | 921 | | | | 921 | |
| Other provisions | | (z),(aa | ) | | | 895 | | | | — | | | | — | | | | (24 | ) | | M | | | | | (24 | ) | | | 871 | |
| Insurance policyholder liabilities | | (hh | ) | | | 24,694 | | | | — | | | | — | | | | — | | | | | | | | — | | | | 24,694 | |
| Debt issues | | (bb | ) | | | 58,621 | | | | — | | | | 12,144 | | | | — | | | | | | | | 12,144 | | | | 70,765 | |
| Bills payable and other liabilities | | (cc | ) | | | 18,086 | | | | | | | | (614 | ) | | | 79 | | | P | | | | | (535 | ) | | | 17,551 | |
| Loan capital | | (dd | ) | | | 6,291 | | | | — | | | | — | | | | — | | | | | | | | — | | | | 6,291 | |
| |
Total liabilities | | | | | | | 302,975 | | | | — | | | | 11,527 | | | | 259 | | | | | | | | 11,786 | | | | 314,761 | |
| |
Net assets | | | | | | | 26,060 | | | | — | | | | — | | | | (3,417 | ) | | | | | | | (3,417 | ) | | | 22,643 | |
| |
| | | | | | | | | | | | | | | | | | | | | | | | | | | | | | | | | |
Shareholders’ Equity | | | | | | | | | | | | | | | | | | | | | | | | | | | | | | | | |
| |
| Share capital: | | | | | | | | | | | | | | | | | | | | | | | | | | | | | | | | |
| Ordinary share capital | | (ee | ) | | | 13,871 | | | | — | | | | — | | | | (385 | ) | | R | | | | | (385 | ) | | | 13,486 | |
| Preference share capital | | | | | | | 687 | | | | — | | | | — | | | | — | | | | | | | | — | | | | 687 | |
| Other equity instruments | | | | | | | 1,573 | | | | — | | | | — | | | | — | | | | | | | | — | | | | 1,573 | |
| Reserves | | (ee | ) | | | 4,624 | | | | 492 | | | | — | | | | (3,851 | ) | | S | | | | | (3,359 | ) | | | 1,265 | |
| Retained profits | | | | | | | 3,516 | | | | (492 | ) | | | — | | | | 819 | | | T | | | | | 327 | | | | 3,843 | |
| |
| Shareholders’ equity attributable to members of the Bank | | | | | | | 24,271 | | | | — | | | | — | | | | (3,417 | ) | | | | | | | (3,417 | ) | | | 20,854 | |
| Minority interests: | | | | | | | | | | | | | | | | | | | | | | | | | | | | | | | | |
| Controlled entities | | | | | | | 631 | | | | — | | | | — | | | | — | | | | | | | | — | | | | 631 | |
| Insurance statutory funds and other funds | | (hh | ) | | | 1,158 | | | | — | | | | — | | | | — | | | | | | | | — | | | | 1,158 | |
| |
Total shareholders’ equity | | | | | | | 26,060 | | | | — | | | | — | | | | (3,417 | ) | | | | | | | (3,417 | ) | | | 22,643 | |
| |
| | |
| (1) | | References relate to key Accounting Policies as set out on pages 33 to 49. |
Profit Announcement 53
Notes to the Financial Statementscontinued
Note 1 Accounting Policy (continued)
(mm) Effect of Transition to Australian Equivalents of IFRS
Balance Sheet reconciliation
| | | | | | | | | | | | | | | | | | | | | | | | | | | | | | | | | |
| | | 1 Jul 2005 | |
| | | Transition Adjustments |
| | | Policy | | | AGAAP | | | Reclass | | | Gross-up | | | Re-Measure | | | | | | | | | | | AIFRS | |
| | | Note(1) | | | Group $M | | | $M | | | $M | | | $M | | | | | | | Total $M | | | Group $M | |
| |
Assets | | | | | | | | | | | | | | | | | | | | | | | | | | | | | | | | |
| Cash and liquid assets | | | (f) | | | 5,715 | | | | 163 | | | | 177 | | | | — | | | | | | | | 340 | | | | 6,055 | |
| Receivables from other financial institutions | | | (g) | | | 6,205 | | | | (627 | ) | | | — | | | | — | | | | | | | | (627 | ) | | | 5,578 | |
| Assets at fair value through Income Statement: | | | | | | | | | | | | | | | | | | | | | | | | | | | | | | | | |
| Trading | | | (i) | | | 14,628 | | | | (436 | ) | | | 3 | | | | — | | | | | | | | (433 | ) | | | 14,195 | |
| Insurance | | (i),(hh) | | | 27,837 | | | | (16 | ) | | | — | | | | (352 | ) | | | A | | | | (368 | ) | | | 27,469 | |
| Other | | | (i) | | | — | | | | 3,402 | | | | — | | | | — | | | | | | | | 3,402 | | | | 3,402 | |
| Derivative assets | | (ff) | | | — | | | | 12,096 | | | | — | | | | (2,292 | ) | | | B | | | | 9,804 | | | | 9,804 | |
| Investment securities | | | | | | | 10,272 | | | | (10,838 | ) | | | 566 | | | | — | | | | | | | | (10,272 | ) | | | — | |
| Available-for-sale investments | | | (j) | | | — | | | | 9,706 | | | | — | | | | 85 | | | | C | | | | 9,791 | | | | 9,791 | |
| Loans, advances, and other receivables | | | (l),(m), | (n) | | | 217,516 | | | | (1,146 | ) | | | 10,818 | | | | 574 | | | | D-F | | | | 10,246 | | | | 227,762 | |
| Bank acceptances of customers | | | (o) | | | 16,786 | | | | — | | | | — | | | | — | | | | | | | | — | | | | 16,786 | |
| Deposits with regulatory authorities | | | (g) | | | 45 | | | | (45 | ) | | | — | | | | — | | | | | | | | (45 | ) | | | — | |
| Investment property | | | (q) | | | — | | | | 252 | | | | — | | | | — | | | | | | | | 252 | | | | 252 | |
| Property, plant and equipment | | | (s) | | | 1,344 | | | | (238 | ) | | | — | | | | 25 | | | | | | | | (213 | ) | | | 1,131 | |
| Investment in associates | | | (c) | | | 52 | | | | — | | | | — | | | | — | | | | | | | | — | | | | 52 | |
| Intangible assets | | | (t) | | | 4,394 | | | | 2,941 | | | | — | | | | 321 | | | | G | | | | 3,262 | | | | 7,656 | |
| Deferred tax assets | | | (y) | | | — | | | | 627 | | | | — | | | | 241 | | | | H | | | | 868 | | | | 868 | |
| Other assets | | | (u) | | | 24,241 | | | | (16,165 | ) | | | (37 | ) | | | (3,670 | ) | | | I | | | | (19,872 | ) | | | 4,369 | |
| |
Total assets | | | | | | | 329,035 | | | | (324 | ) | | | 11,527 | | | | (5,068 | ) | | | | | | | 6,135 | | | | 335,170 | |
| |
| | | | | | | | | | | | | | | | | | | | | | | | | | | | | | | | | |
Liabilities | | | | | | | | | | | | | | | | | | | | | | | | | | | | | | | | |
| Deposits from customers | | | (v) | | | 168,029 | | | | (8,272 | ) | | | (3 | ) | | | 66 | | | | J | | | | (8,209 | ) | | | 159,820 | |
| Payables to other financial institution | | | (w) | | | 8,023 | | | | (16 | ) | | | — | | | | — | | | | | | | | (16 | ) | | | 8,007 | |
| Liabilities at fair value through the Income Statement | | | (x) | | | — | | | | 12,437 | | | | — | | | | — | | | | | | | | 12,437 | | | | 12,437 | |
| Derivative Liabilities | | (ff) | | | — | | | | 11,913 | | | | — | | | | (609 | ) | | | K | | | | 11,304 | | | | 11,304 | |
| Bank acceptances | | | (o) | | | 16,786 | | | | — | | | | — | | | | — | | | | | | | | — | | | | 16,786 | |
| Income tax liability | | | (y) | | | 1,550 | | | | (1,550 | ) | | | — | | | | — | | | | | | | | (1,550 | ) | | | — | |
| Current tax liabilities | | | (y) | | | — | | | | 833 | | | | — | | | | — | | | | | | | | 833 | | | | 833 | |
| Deferred tax liabilities | | | (y) | | | — | | | | 717 | | | | — | | | | 444 | | | | L | | | | 1,161 | | | | 1,161 | |
| Other provisions | | (z),(aa) | | | 895 | | | | 16 | | | | | | | | (24 | ) | | | M | | | | (8 | ) | | | 887 | |
| Insurance policyholder liabilities | | (hh) | | | 24,694 | | | | — | | | | — | | | | 342 | | | | N | | | | 342 | | | | 25,036 | |
| Debt issues | | (bb) | | | 58,621 | | | | (4,240 | ) | | | 12,144 | | | | (1,046 | ) | | | O | | | | 6,858 | | | | 65,479 | |
| Managed fund units on issue | | (hh) | | | — | | | | 1,158 | | | | — | | | | — | | | | | | | | 1,158 | | | | 1,158 | |
| Bills payable and other liabilities | | (cc) | | | 18,086 | | | | (12,162 | ) | | | (614 | ) | | | (282 | ) | | | P | | | | (13,058 | ) | | | 5,028 | |
| Loan capital | | (dd) | | | 6,291 | | | | 2,260 | | | | — | | | | (194 | ) | | | Q | | | | 2,066 | | | | 8,357 | |
| |
Total liabilities | | | | | | | 302,975 | | | | 3,094 | | | | 11,527 | | | | (1,303 | ) | | | | | | | 13,318 | | | | 316,293 | |
| |
Net assets | | | | | | | 26,060 | | | | (3,418 | ) | | | — | | | | (3,765 | ) | | | | | | | (7,183 | ) | | | 18,877 | |
| |
| | | | | | | | | | | | | | | | | | | | | | | | | | | | | | | | | |
Shareholders’ Equity | | | | | | | | | | | | | | | | | | | | | | | | | | | | | | | | |
| Share capital: | | | | | | | | | | | | | | | | | | | | | | | | | | | | | | | | |
| Ordinary share capital | | (ee) | | | 13,871 | | | | — | | | | — | | | | (385 | ) | | | R | | | | (385 | ) | | | 13,486 | |
| Preference share capital | | | | | | | 687 | | | | (687 | ) | | | — | | | | — | | | | | | | | (687 | ) | | | — | |
| Other equity instruments | | | | | | | 1,573 | | | | (1,573 | ) | | | — | | | | — | | | | | | | | (1,573 | ) | | | — | |
| Reserves | | (ee) | | | 4,624 | | | | 750 | | | | — | | | | (3,729 | ) | | | S | | | | (2,979 | ) | | | 1,645 | |
| Retained profits | | | | | | | 3,516 | | | | (750 | ) | | | — | | | | 349 | | | | T | | | | (401 | ) | | | 3,115 | |
| |
| Shareholders’ equity attributable to members of the Bank | | | | | | | 24,271 | | | | (2,260 | ) | | | — | | | | (3,765 | ) | | | | | | | (6,025 | ) | | | 18,246 | |
| Minority interests: | | | | | | | | | | | | | | | | | | | | | | | | | | | | | | | | |
| Controlled entities | | | | | | | 631 | | | | — | | | | — | | | | — | | | | | | | | — | | | | 631 | |
| Insurance statutory funds and other funds | | (hh) | | | 1,158 | | | | (1,158 | ) | | | — | | | | — | | | | | | | | (1,158 | ) | | | — | |
| |
Total shareholders’ equity | | | | | | | 26,060 | | | | (3,418 | ) | | | — | | | | (3,765 | ) | | | | | | | (7,183 | ) | | | 18,877 | |
| |
| (1) | | References relate to key Accounting Policies as set out on pages 33 to 49. |
54 Commonwealth Bank of Australia
Notes to the Financial Statementscontinued
Note 1 Accounting Policy (continued)
(mm) Effect of Transition to Australian Equivalents of IFRS
Income Statement Reconciliation
| | | | | | | | | | | | | | | | | | | | | | | | | | | | | |
| | | Half Year Ended 31 Dec 2004 | |
| | | Transition Adjustments | |
| | | | | | | | | | | | | | | | | | | | | | | AIFRS | | | | |
| | | Policy | | | AGAAP | | | Gross-up | | | Re-Measure | | | | | | | Transition | | | AIFRS | |
| | | Note(2) | | | Group $M | | | $M | | | $M | | | | | | | $M | | | Group $M | |
| |
| Interest Income | | | (m | ) | | | 7,840 | | | | 255 | | | | (6 | ) | | | | | | | 249 | | | | 8,089 | |
| Interest Expense | | | | | | | 4,907 | | | | 224 | | | | | | | | | | | | 224 | | | | 5,131 | |
| |
| Net Interest Income | | | | | | | 2,933 | | | | 31 | | | | (6 | ) | | | | | | | 25 | | | | 2,958 | |
| Other operating income | | | | | | | 1,412 | | | | (29 | ) | | | — | | | | | | | | (29 | ) | | | 1,383 | |
| |
| Net banking operating income | | | | | | | 4,345 | | | | 2 | | | | (6 | ) | | | | | | | (4 | ) | | | 4,341 | |
| | | | | | | | | | | | | | | | | | | | | | | | | | | | | |
| Funds management income including investment contract premiums | | | | | | | 611 | | | | — | | | | (6 | ) | | | | | | | (6 | ) | | | 605 | |
| Investment revenue | | (hh) | | | 1,223 | | | | — | | | | 11 | | | | U | | | | 11 | | | | 1,234 | |
| Claims and investment contract liability expense | | | | | | | (1,143 | ) | | | — | | | | — | | | | | | | | — | | | | (1,143 | ) |
| |
| Net funds management and investment contract operating income | | | | | | | 691 | | | | — | | | | 5 | | | | | | | | 5 | | | | 696 | |
| | | | | | | | | | | | | | | | | | | | | | | | | | | | | |
| Premiums from insurance contracts | | | | | | | 575 | | | | — | | | | — | | | | | | | | — | | | | 575 | |
| Investment revenue | | | | | | | 716 | | | | — | | | | — | | | | | | | | — | | | | 716 | |
| Claims and policy liability expense from insurance contracts | | | | | | | (751 | ) | | | — | | | | — | | | | | | | | — | | | | (751 | ) |
| |
| Insurance contracts margin on services operating income | | | | | | | 540 | | | | — | | | | — | | | | | | | | — | | | | 540 | |
| | | | | | | | | | | | | | | | | | | | | | | | | | | | | |
| Net funds management and insurance operating income | | | | | | | 1,231 | | | | — | | | | 5 | | | | | | | | 5 | | | | 1,236 | |
| |
| |
| Total net operating income | | | | | | | 5,576 | | | | 2 | | | | (1 | ) | | | | | | | 1 | | | | 5,577 | |
| |
| | | | | | | | | | | | | | | | | | | | | | | | | | | | | |
| Bad and doubtful debts expense | | | | | | | 146 | | | | — | | | | — | | | | | | | | — | | | | 146 | |
| Operating expenses: | | | | | | | | | | | | | | | | | | | | | | | | | | | | |
| Comparable business | | | | | | | 2,828 | | | | 2 | | | | 11 | | | | | | | | 13 | | | | 2,841 | |
| Which new Bank | | | | | | | 28 | | | | — | | | | — | | | | | | | | — | | | | 28 | |
| |
| Total operating expenses | | | | | | | 2,856 | | | | 2 | | | | 11 | | | | | | | | 13 | | | | 2,869 | |
| |
| | | | | | | | | | | | | | | | | | | | | | | | | | | | | |
| Defined benefit superannuation plan expense | | | (z | ) | | | — | | | | — | | | | (40 | ) | | | V | | | | (40 | ) | | | (40 | ) |
| Appraisal value uplift | | (hh) | | | 265 | | | | — | | | | (265 | ) | | | W | | | | (265 | ) | | | — | |
| Goodwill amortisation | | | (t | ) | | | (162 | ) | | | — | | | | 162 | | | | X | | | | 162 | | | | — | |
| |
Profit before income tax | | | | | | | 2,677 | | | | — | | | | (155 | ) | | | | | | | (155 | ) | | | 2,522 | |
| Income tax expense | | | (y | ) | | | 813 | | | | — | | | | (8 | ) | | | | | | | (8 | ) | | | 805 | |
| |
Profit after income tax | | | | | | | 1,864 | | | | — | | | | (147 | ) | | | | | | | (147 | ) | | | 1,717 | |
| Minority interest | | | | | | | (5 | ) | | | — | | | | — | | | | | | | | — | | | | (5 | ) |
| |
Net profit attributable to members of the Bank | | | | | | | 1,859 | | | | — | | | | (147 | ) | | | | | | | (147 | ) | | | 1,712 | |
| |
| | | | | | | | | | | | | | | | | | | | | | | | | | | | | |
| Net profit after income tax comprises: | | | | | | | | | | | | | | | | | | | | | | | | | | | | |
| Net profit after income tax (“underlying basis”) | | | | | | | 1,664 | | | | — | | | | (23 | ) | | | | | | | (23 | ) | | | 1,641 | |
| Shareholder investment returns | | | | | | | 111 | | | | — | | | | — | | | | | | | | — | | | | 111 | |
| Which new Bank | | | | | | | (19 | ) | | | — | | | | — | | | | | | | | — | | | | (19 | ) |
| |
| Net profit after income tax (“cash basis”) | | | | | | | 1,756 | | | | — | | | | (23 | ) | | | | | | | (23 | ) | | | 1,733 | |
| |
| Defined benefit superannuation plan expense | | | (z | ) | | | — | | | | — | | | | (28 | ) | | | | | | | (28 | ) | | | (28 | ) |
| Treasury share valuation adjustment | | (hh) | | | — | | | | — | | | | 7 | | | | | | | | 7 | | | | 7 | |
| |
Net profit after income tax (“statutory basis”)(1) | | | | | | | 1,756 | | | | — | | | | (44 | ) | | | | | | | (44 | ) | | | 1,712 | |
| |
| (1) | | AGAAP Net profit after income tax (“statutory basis”) excludes the impact of appraisal value and goodwill amortisation. |
| |
| (2) | | References relate to key Accounting Policies as set out on pages 33 to 49. |
Profit Announcement 55
Notes to the Financial Statementscontinued
Note 1 Accounting Policy(continued)
(mm) Effect of Transition to Australian Equivalents of IFRS
Income Statement Reconciliation
| | | | | | | | | | | | | | | | | | | | | | | | | | | | | |
| | | Half Year Ended 30 Jun 2005 | |
| | | Transition Adjustments | |
| | | | | | | | | | | | | | | | | | | | | | | AIFRS | | | | |
| | | Policy | | | AGAAP | | | Gross-up | | | Re-Measure | | | | | | | Transition | | | AIFRS | |
| | | Note(2) | | | Group $M | | | $M | | | $M | | | | | | | $M | | | Group $M | |
| |
| Interest Income | | | (m | ) | | | 8,354 | | | | 343 | | | | (5 | ) | | | | | | | 338 | | | | 8,692 | |
| Interest Expense | | | | | | | 5,321 | | | | 303 | | | | — | | | | | | | | 303 | | | | 5,624 | |
| |
| Net Interest Income | | | | | | | 3,033 | | | | 40 | | | | (5 | ) | | | | | | | 35 | | | | 3,068 | |
| Other operating income | | | | | | | 1,503 | | | | (41 | ) | | | — | | | | | | | | (41 | ) | | | 1,462 | |
| |
| Net banking operating income | | | | | | | 4,536 | | | | (1 | ) | | | (5 | ) | | | | | | | (6 | ) | | | 4,530 | |
| | | | | | | | | | | | | | | | | | | | | | | | | | | | | |
| Funds management income including investment contract premiums | | | | | | | 650 | | | | — | | | | (8 | ) | | | | | | | (8 | ) | | | 642 | |
| Investment revenue | | (hh) | | | 785 | | | | — | | | | (63 | ) | | | U | | | | (63 | ) | | | 722 | |
| Claims and investment contract liability expense | | | | | | | (728 | ) | | | — | | | | — | | | | | | | | — | | | | (728 | ) |
| |
| Net funds management and investment contract operating income | | | | | | | 707 | | | | — | | | | (71 | ) | | | | | | | (71 | ) | | | 636 | |
| | | | | | | | | | | | | | | | | | | | | | | | | | | | | |
| Premiums from insurance contracts | | | | | | | 557 | | | | — | | | | — | | | | | | | | — | | | | 557 | |
| Investment revenue | | | | | | | 470 | | | | — | | | | — | | | | | | | | — | | | | 470 | |
| Claims and policy liability expense from insurance contracts | | | | | | | (492 | ) | | | — | | | | — | | | | | | | | — | | | | (492 | ) |
| |
| Insurance contracts margin on services operating income | | | | | | | 535 | | | | — | | | | — | | | | | | | | — | | | | 535 | |
| | | | | | | | | | | | | | | | | | | | | | | | | | | | | |
| Net funds management and insurance operating income | | | | | | | 1,242 | | | | — | | | | (71 | ) | | | | | | | (71 | ) | | | 1,171 | |
| | | | | | | | | | | | | | | | | | | | | | | | | | | | | |
| |
| Total net operating income | | | | | | | 5,778 | | | | (1 | ) | | | (76 | ) | | | | | | | (77 | ) | | | 5,701 | |
| |
| | | | | | | | | | | | | | | | | | | | | | | | | | | | | |
| Bad and doubtful debts expense | | | | | | | 176 | | | | — | | | | — | | | | | | | | — | | | | 176 | |
| Operating expenses: | | | | | | | | | | | | | | | | | | | | | | | | | | | | |
| Comparable business | | | | | | | 2,869 | | | | (1 | ) | | | 10 | | | | | | | | 9 | | | | 2,878 | |
| Which new Bank | | | | | | | 122 | | | | — | | | | — | | | | | | | | — | | | | 122 | |
| |
| Total operating expenses | | | | | | | 2,991 | | | | (1 | ) | | | 10 | | | | | | | | 9 | | | | 3,000 | |
| |
| |
| Defined benefit superannuation plan expense | | | (z | ) | | | — | | | | — | | | | (35 | ) | | | V | | | | (35 | ) | | | (35 | ) |
| Appraisal value uplift | | (hh) | | | 513 | | | | — | | | | (513 | ) | | | W | | | | (513 | ) | | | — | |
| Goodwill amortisation | | | (t | ) | | | (163 | ) | | | — | | | | 163 | | | | X | | | | 163 | | | | — | |
| |
Profit before income tax | | | | | | | 2,961 | | | | — | | | | (471 | ) | | | | | | | (471 | ) | | | 2,490 | |
| Income tax expense | | | (y | ) | | | 824 | | | | — | | | | (27 | ) | | | | | | | (27 | ) | | | 797 | |
| |
Profit after income tax | | | | | | | 2,137 | | | | — | | | | (444 | ) | | | | | | | (444 | ) | | | 1,693 | |
| Minority interest | | | | | | | (5 | ) | | | — | | | | — | | | | | | | | — | | | | (5 | ) |
| |
Net profit attributable to members of the Bank | | | | | | | 2,132 | | | | — | | | | (444 | ) | | | | | | | (444 | ) | | | 1,688 | |
| |
| | | | | | | | | | | | | | | | | | | | | | | | | | | | | |
| Net profit after income tax comprises: | | | | | | | | | | | | | | | | | | | | | | | | | | | | |
| Net profit after income tax (“underlying basis”) | | | | | | | 1,802 | | | | — | | | | (23 | ) | | | | | | | (23 | ) | | | 1,779 | |
| Shareholder investment returns | | | | | | | 66 | | | | — | | | | — | | | | | | | | — | | | | 66 | |
| Which new Bank | | | | | | | (86 | ) | | | — | | | | — | | | | | | | | — | | | | (86 | ) |
| |
| Net profit after income tax (“cash basis”) | | | | | | | 1,782 | | | | — | | | | (23 | ) | | | | | | | (23 | ) | | | 1,759 | |
| |
| Defined benefit superannuation plan expense | | | (z | ) | | | — | | | | — | | | | (25 | ) | | | | | | | (25 | ) | | | (25 | ) |
| Treasury share valuation adjustment | | (hh) | | | — | | | | — | | | | (46 | ) | | | | | | | (46 | ) | | | (46 | ) |
| |
Net profit after income tax (“statutory basis”)(1) | | | | | | | 1,782 | | | | — | | | | (94 | ) | | | | | | | (94 | ) | | | 1,688 | |
| |
| (1) | | AGAAP Net profit after income tax (“statutory basis”) excludes the impact of appraisal value and goodwill amortisation. |
| |
| (2) | | References relate to key Accounting Policies as set out on pages 33 to 49. |
56 Commonwealth Bank of Australia
Notes to the Financial Statementscontinued
Note 1 Effect of Transition to Australian Equivalents to IFRS
(mm) Explanation of AIFRS Re-measure Transition Adjustments
AIFRS Balance Sheet Impacts
| | | | | | | | | | | |
| Re-measure | | | | | | | | |
| Adjustment | | | | | | | | |
| Reference | | Transition Date | | Adjustment $M | | Explanation of material AIFRS re-measurements | | |
| |
| A | | Insurance Assets at Fair Value through Income Statement (refer note 1 (i) and (hh)) |
| |
| | | 1 July 2004 | | | (301 | ) | | The recognition of direct investments in | | |
| | | | | | | | | Commonwealth Bank shares by the Bank’s life insurance statutory funds as ‘Treasury Shares’ results in the reversal of the fair value of these shares from consolidated Insurance assets while the cost of these shares is reversed from ordinary share capital (refer adjustment R). The associated insurance policyholder liability is not reversed, resulting in an accounting mismatch (see Adjustment U). | | |
| | | 31 December 2004 | | | (251 | ) | | As above. | | |
| | | 30 June 2005 | | | (337 | ) | | As above. | | |
| | | 1 July 2005 | | | (352 | ) | | As above, also includes impact of valuing assets held by life insurance using bid prices rather than mid prices (-$15m). | | |
| | | | | | | | | | | |
B | | Derivative assets (refer note 1 (ff)) | | | | | | | | |
| |
| | | 1 July 2004 | | — | | | | |
| | | 31 December 2004 | | — | | | | |
| | | 30 June 2005 | | — | | | | |
| | | 1 July 2005 | | | (2,292 | ) | | Principally relates to the elimination of internal swaps; and an adjustment to re-measure derivatives that were previously accrual accounted. | | |
| | | | | | | | | | | |
| C | | Available-for-sale investments (refer note 1 (j)) |
| |
| | | 1 July 2004 | | — | | | | |
| | | 31 December 2004 | | — | | | | |
| | | 30 June 2005 | | — | | | | |
| | | 1 July 2005 | | | 85 | | | Revaluation of available-for-sale (‘AFS’) assets from cost to fair value. AFS assets are principally comprised of those assets classified as investment securities under previous Australian GAAP, which were measured on a cost basis. | | |
| | | | | | | | | | | |
| D | | Loans, advances and other receivables — gross (refer note 1 (l)) |
| |
| | | 1 July 2004 | | — | | | | |
| | | 31 December 2004 | | — | | | | |
| | | 30 June 2005 | | — | | | | |
| | | 1 July 2005 | | | 295 | | | Principally relates to two adjustments: (1) re-measurement to fair value of loan assets designated within fair value hedging relationships. Such loan assets are initially measured on an amortised cost basis, and then adjusted to fair value to offset the mark-to-market movement on the associated fair value hedge derivative(+$399m); and (2) capitalisation of the net fee income integral to the yield of an originated loan results in the recognition of an unamortised deferred income balance (-$122m). | | |
| | | | | | | | | | | |
| E | | Loans, advances and other receivables — collective provision for impairment (refer note 1 (n)) |
| |
| | | 1 July 2004 | | — | | | | |
| | | 31 December 2004 | | — | | | | |
| | | 30 June 2005 | | — | | | | |
| | | 1 July 2005 | | | 294 | | | Reflects the difference between the previous Australian GAAP general provision for impairment and the AIFRS collective provision for impairment, net of reclassifications. Under AIFRS, collective provisions are recognised where there is objective evidence of impairment, and includes an estimate of losses which have been incurred but not reported as at balance date. | | |
| | | | | | | | | | | |
| F | | Loans, advances and other receivables — individually assessed provisions for impairment (refer note 1 (n)) |
| |
| | | 1 July 2004 | | — | | | | |
| | | 31 December 2004 | | — | | | | |
| | | 30 June 2005 | | — | | | | |
| | | 1 July 2005 | | | (15 | ) | | Reflects the difference between the previous Australian GAAP specific provision for impairment and the AIFRS individually assessed provisions. This difference relates to the impact of discounting of expected cash flows on recovery. | | |
G | | Intangible assets (refer note 1 (t)) | | | | | | | | |
| |
| | | 1 July 2004 | | — | | | | |
| | | 31 December 2004 | | | 161 | | | Goodwill no longer amortised under AIFRS. Reflects the reversal of amortisation of goodwill for the half year ended 31 December 2004. | | |
| | | 30 June 2005 | | | 321 | | | As above for the full year ended 30 June 2005. | | |
| | | 1 July 2005 | | | 321 | | | As above. | | |
Profit Announcement 57
Notes to the Financial Statementscontinued
Note 1 Effect of Transition to Australian Equivalents to IFRS
(mm) Explanation of AIFRS Re-measure Transition Adjustments
AIFRS Balance Sheet Impacts
| | | | | | | | | | | |
| Re-measure | | | | | | | | |
| Adjustment | | | | | | | | |
| Reference | | Transition Date | | Adjustment $M | | Explanation of material AIFRS re-measurements | | |
| |
| H | | Deferred tax assets (refer note 1 (y)) |
| |
| | | 1 July 2004 | | | 23 | | | Principally relates to the deferred tax asset recognised on the defined benefit superannuation plan deficit liability, under the AIFRS “balance sheet” approach to tax-effect accounting. | | |
| | | 31 December 2004 | | | 27 | | | As above. | | |
| | | 30 June 2005 | | | 24 | | | As above. | | |
| | | 1 July 2005 | | | 241 | | | As above, and also includes deferred tax assets related to various AIFRS adjustments such as hedge accounting, loan impairment provisioning and revenue and expense recognition. | | |
| | | | | | | | | | | |
| I | | Other assets (refer note 1 (u)) |
| |
| | | 1 July 2004 | | | (2,512 | ) | | Principally relates to two adjustments: (1) the reversal of internally generated appraisal value excess (-$3,123m); and (2) the recognition of the defined benefit superannuation plan surplus asset (+$633m). Refer to adjustments R and S. | | |
| | | 31 December 2004 | | | (2,706 | ) | | As above, though adjustments become (1) -$3,388m; and (2) +$706m. | | |
| | | 30 June 2005 | | | (3,203 | ) | | As above, though adjustments become (1) -$3,901m; and (2) +$717m. | | |
| | | 1 July 2005 | | | (3,670 | ) | | As above, also includes hedging impact of -$473 m, which relates to the elimination of interest receivable on hedged derivatives. | | |
| | | | | | | | | | | |
| J | | Deposits from customers (refer note 1 (v)) |
| |
| | | 1 July 2004 | | — | | | | | |
| | | 31 December 2004 | | — | | | | | |
| | | 30 June 2005 | | — | | | | | |
| | | 1 July 2005 | | | 66 | | | Represents the revaluation of deposits designated within fair value hedge relationships. | | |
| | | | | | | | | | | |
| K | | Derivative liabilities (refer note 1 (ff)) |
| |
| | | 1 July 2004 | | — | | | | | |
| | | 31 December 2004 | | — | | | | | |
| | | 30 June 2005 | | — | | | | | |
| | | 1 July 2005 | | | (609 | ) | | Principally relates to the elimination of internal swaps; initial recognition of embedded derivatives at fair value; and an adjustment to re-measure derivatives that were previously accrual accounted. | | |
| | | | | | | | | | | |
| L | | Deferred tax liabilities (refer note 1 (y)) |
| |
| | | 1 July 2004 | | | 188 | | | Principally relates to the deferred tax liability recognised on the defined benefit superannuation plan surplus asset, under the AIFRS “balance sheet” approach to tax-effect accounting. Refer adjustment I above. | | |
| | | 31 December 2004 | | | 211 | | | As above. | | |
| | | 30 June 2005 | | | 204 | | | As above. | | |
| | | 1 July 2005 | | | 444 | | | As above, and also includes deferred tax liabilities related to various AIFRS adjustments such as hedge accounting, re-measurement of available-for-sale assets, and revenue and expense recognition. | | |
| | | | | | | | | | | |
| M | | Other provisions (refer note 1 (z) and (aa)) |
| |
| | | 1 July 2004 | | | (85 | ) | | Principally relates to the reversal of accrued liabilities in respect of employee share-based compensation. This is a one-off adjustment in the comparative period due to the discontinuance of the mandatory component of the Equity Participation Plan. | | |
| | | 31 December 2004 | | | (55 | ) | | As above. | | |
| | | 30 June 2005 | | | (24 | ) | | As above. | | |
| | | 1 July 2005 | | | (24 | ) | | As above. | | |
| | | | | | | | | | | |
| N | | Insurance policyholder liabilities (refer note 1 (hh)) |
| |
| | | 1 July 2004 | | — | | | | | |
| | | 31 December 2004 | | — | | | | | |
| | | 30 June 2005 | | — | | | | | |
| | | 1 July 2005 | | | 342 | | | Relates to measurement differences in the actuarial calculation of policyholder liabilities under AIFRS. Impact primarily driven by a change in the discount rates applied to some contracts, and the write off of deferred acquisition costs related to investment-style products of the Wealth Management business. | | |
58 Commonwealth Bank of Australia
Notes to the Financial Statementscontinued
Note 1 Effect of Transition to Australian Equivalents to IFRS
(mm) Explanation of AIFRS Re-measure Transition Adjustments
AIFRS Balance Sheet Impacts
| | | | | | | | | | | |
| Re-measure | | | | | | | | |
| Adjustment | | | | | | | | |
| Reference | | Transition Date | | Adjustment $M | | Explanation of material AIFRS re-measurements | | |
| |
| O | | Debt issues (refer note 1 (bb)) |
| |
| | | 1 July 2004 | | — | | | | |
| | | 31 December 2004 | | — | | | | |
| | | 30 June 2005 | | — | | | | |
| | | 1 July 2005 | | | (1,046 | ) | | Represents the revaluation of debt issues designated within fair value hedge relationships. | | |
| | | | | | | | | | | |
| P | | Bills payable and other liabilities (refer note 1 (cc)) |
| |
| | | 1 July 2004 | | | 77 | | | Relates to the recognition of the defined benefit superannuation plan deficit liability. | | |
| | | 31 December 2004 | | | 89 | | | As above. | | |
| | | 30 June 2005 | | | 79 | | | As above. | | |
| | | 1 July 2005 | | | (282 | ) | | As above, also includes impact of the elimination of interest payable on hedge derivatives. | | |
| | | | | | | | | | | |
| Q | | Loan Capital (refer note 1 (dd)) |
| |
| | | 1 July 2004 | | — | | | | |
| | | 31 December 2004 | | — | | | | |
| | | 30 June 2005 | | — | | | | |
| | | 1 July 2005 | | | (194 | ) | | Relates to the impact of fair value hedging and foreign currency re-translation of hybrid instrument reclassified from equity. | | |
| | | | | | | | | | | |
| R | | Ordinary share capital (refer note 1 (ee)) |
| |
| | | 1 July 2004 | | | (371 | ) | | Relates to two adjustments: (1) recognition of direct investments in Commonwealth Bank shares by the Bank’s life insurance statutory funds as ‘Treasury Shares’ results in the reversal of the cost of these shares from ordinary share capital (-$245m, being fair value of $301m less market value appreciation $46m (less $10m tax effect)); and (2) the consolidation of the Employee Share Scheme Trust, which holds shares in the Bank on behalf of employees, results in the reversal of the cost of these shares from ordinary share capital (-$126m). | | |
| | | 31 December 2004 | | | (303 | ) | | As above, though adjustments become (1) ($205m); and (2) ($98m). | | |
| | | 30 June 2005 | | | (385 | ) | | As above, though adjustments become (1) ($253m); and (2) ($132m). | | |
| | | 1 July 2005 | | | (385 | ) | | As above. | | |
| | | | | | | | | | | |
| S | | Reserves (refer note 1 (ee)) |
| |
| | | 1 July 2004 | | | (3,045 | ) | | Principally relates to the reversal from general reserve of the internally generated appraisal value excess (-$3,123m). | | |
| | | 31 December 2004 | | | (3,353 | ) | | As above (-$3,388m). | | |
| | | 30 June 2005 | | | (3,851 | ) | | As above (-$3,901m). | | |
| | | 1 July 2005 | | | (3,729 | ) | | As above, also includes the impact of the recognition of available-for-sale revaluation reserve; cash flow hedge reserve; and the retranslation of certain hybrid financial instruments on reclassification from equity to loan capital. | | |
| | | | | | | | | | | |
T | | Retained profits | | | | | | | | |
| |
| | | 1 July 2004 | | | 501 | | | Principally relates to three adjustments: (1) Recognition of the net after tax surplus on the Bank’s defined benefit superannuation plans (+$389m) comprising an opening surplus of ($443m) less an opening deficit of (-$54m); (2) adjustment related to employee share-based compensation accounting under AIFRS (+$141m); and (3) the reversal of the cumulative market value appreciation on life insurance treasury shares (-$46m). | | |
| | | 31 December 2004 | | | 690 | | | As above, though adjustments become (1) +$432m; (2) +$126m; and (3) -$39m, together with (4) the reversal of goodwill amortisation for the half year (+$161m) | | |
| | | 30 June 2005 | | | 819 | | | As above, though adjustments become (1) +$447m; (2) +$112m; and (3) -$66m, together with (4) the reversal of goodwill amortisation for the full year (+$321m) | | |
| | | 1 July 2005 | | | 349 | | | As above, also includes the impact of (1) the initial recognition of derivative financial instruments on initial application of hedge accounting and recognition of embedded derivatives (-$282m); (2) change in calculation of life insurance policy holder liabilities and DAC (-$260m); (3) revenue and expense recognition adjustments (-$167m); and (4) recalculation of loan impairment provisions (+$195m). | | |
| | | | | | | | | | | |
| U | | Funds Management Investment Revenue (refer note 1 (hh)) |
| |
| | | 31 December 2004 | | | 11 | | | Relates to reversal of net losses on treasury shares held in the life insurance statutory funds. | | |
| | | 30 June 2005 | | | (63 | ) | | Relates to reversal of net gains on treasury shares held in the life insurance statutory funds. | | |
Profit Announcement 59
Notes to the Financial Statementscontinued
Note 1 Effect of Transition to Australian Equivalents to IFRS
(mm) Explanation of AIFRS Re-measure Transition Adjustments
AIFRS Balance Sheet Impacts
| | | | | | | | | | | |
| Re-measure | | | | | | | | |
| Adjustment | | | | | | | | |
| Reference | | Transition Date | | Adjustment $M | | Explanation of material AIFRS re-measurements | | |
| |
| V | | Defined Benefit Superannuation Plan Expense (refer note 1 (hh)) |
| |
| | | 31 December 2004 | | | (40 | ) | | Relates to the additional, non-cash expense item reflecting the accrual accounting charge to profit and loss associated with accounting for defined benefit superannuation plans. | | |
| | | 30 June 2005 | | | (35 | ) | | As above. | | |
| | | | | | | | | | | |
| W | | Appraisal Value Uplift (refer note 1 (t)) |
| |
| | | 31 December 2004 | | | (265 | ) | | Relates to the reversal of the appraisal value uplift on cessation of appraisal value accounting under AIFRS. | | |
| | | 30 June 2005 | | | (513 | ) | | As above. | | |
| | | | | | | | | | | |
| X | | Goodwill Amortisation (refer note 1 (t)) |
| |
| | | 31 December 2004 | | | 162 | | | Relates to the reversal of goodwill amortisation under AIFRS. | | |
| | | 30 June 2005 | | | 163 | | | As above. | | |
Note 2 Income from Ordinary Activities
| | | | | | | | | | | | | |
| | | | | | | |
| | | Half Year Ended | |
| | | 31/12/05 | | | 30/06/05 | | | 31/12/04 | |
| | | $M | | | $M | | | $M | |
| |
Banking | | | | | | | | | | | | |
| Interest income | | | 9,638 | | | | 8,692 | | | | 8,089 | |
| Fees and commissions | | | 1,204 | | | | 1,152 | | | | 1,126 | |
| Trading income | | | 244 | | | | 221 | | | | 219 | |
| Gain/loss on disposal of non-trading instruments | | | 1 | | | | (11 | ) | | | 2 | |
| Other financial instruments (including hedging derivatives) | | | (69 | ) | | | — | | | | — | |
| Dividends | | | 1 | | | | 2 | | | | 1 | |
| Other income | | | 35 | | | | 98 | | | | 35 | |
| |
| | | | 11,054 | | | | 10,154 | | | | 9,472 | |
| |
| | | | | | | | | | | | | |
Funds Management, Investment contract and Insurance contract revenue | | | | | | | | | | | | |
| Funds management and investment contract income including premiums | | | 737 | | | | 642 | | | | 605 | |
| Insurance contract premiums and related income | | | 573 | | | | 557 | | | | 575 | |
Investment income(1) | | | 2,072 | | | | 1,193 | | | | 1,950 | |
| |
| | | | 3,382 | | | | 2,392 | | | | 3,130 | |
| |
Total income from ordinary activities | | | 14,436 | | | | 12,546 | | | | 12,602 | |
| |
| (1) | | December 2005 includes profit on sale of the Hong Kong business $145 million. |
60 Commonwealth Bank of Australia
Notes to the Financial Statementscontinued
Note 3 Operating Expenses
| | | | | | | | | | | | | |
| | | Half Year Ended | |
| | | 31/12/05 | | | 30/06/05 | | | 31/12/04 | |
| | | $M | | | $M | | | $M | |
| |
Staff Expenses | | | | | | | | | | | | |
| Salaries and wages | | | 1,182 | | | | 1,132 | | | | 1,142 | |
| Superannuation contributions | | | 4 | | | | 6 | | | | 1 | |
| Provisions for employee entitlements | | | 35 | | | | 40 | | | | 27 | |
| Payroll tax | | | 61 | | | | 56 | | | | 59 | |
| Fringe benefits tax | | | 17 | | | | 16 | | | | 16 | |
| Other staff expenses | | | 65 | | | | 52 | | | | 52 | |
| |
| Comparable business | | | 1,364 | | | | 1,302 | | | | 1,297 | |
| Which new Bank | | | — | | | | 43 | | | | 7 | |
| |
| Total staff expenses (excluding share based compensation) | | | 1,364 | | | | 1,345 | | | | 1,304 | |
| Share Based Compensation | | | 22 | | | | 37 | | | | 37 | |
| |
| Total staff expenses | | | 1,386 | | | | 1,382 | | | | 1,341 | |
| |
| | | | | | | | | | | | | |
Occupancy and Equipment Expenses | | | | | | | | | | | | |
| Operating lease rentals | | | 169 | | | | 163 | | | | 168 | |
| Depreciation Buildings | | | 11 | | | | 11 | | | | 10 | |
| Leasehold improvements | | | 28 | | | | 29 | | | | 29 | |
| Equipment | | | 33 | | | | 36 | | | | 27 | |
| Operating lease assets | | | 4 | | | | 8 | | | | — | |
| Repairs and maintenance | | | 34 | | | | 36 | | | | 35 | |
| Other | | | 31 | | | | 25 | | | | 36 | |
| |
| Comparable business | | | 310 | | | | 308 | | | | 305 | |
| Which new Bank | | | — | | | | 10 | | | | 3 | |
| |
| Total occupancy and equipment expenses | | | 310 | | | | 318 | | | | 308 | |
| |
| | | | | | | | | | | | | |
Information Technology Services | | | | | | | | | | | | |
| Projects and development | | | 185 | | | | 165 | | | | 166 | |
| Data processing | | | 118 | | | | 120 | | | | 128 | |
| Desktop | | | 76 | | | | 71 | | | | 79 | |
| Communications | | | 102 | | | | 103 | | | | 101 | |
| Software amortisation (intangible) | | | 16 | | | | 13 | | | | 4 | |
| IT Equipment Depreciation | | | 5 | | | | 4 | | | | 2 | |
| |
| Comparable business | | | 502 | | | | 476 | | | | 480 | |
| Which new Bank | | | — | | | | 39 | | | | 13 | |
| |
| Total information technology services | | | 502 | | | | 515 | | | | 493 | |
| |
| | | | | | | | | | | | | |
Other Expenses | | | | | | | | | | | | |
| Postage | | | 58 | | | | 56 | | | | 56 | |
| Stationery | | | 51 | | | | 52 | | | | 56 | |
| Fees and commissions | | | 314 | | | | 295 | | | | 319 | |
| Advertising, marketing and loyalty | | | 146 | | | | 152 | | | | 136 | |
| Amortisation of other intangible assets (excluding software) | | | 2 | | | | 1 | | | | 2 | |
| Non lending losses | | | 52 | | | | 63 | | | | 40 | |
| Other | | | 146 | | | | 136 | | | | 113 | |
| |
| Comparable business | | | 769 | | | | 755 | | | | 722 | |
| Which new Bank | | | — | | | | 30 | | | | 5 | |
| |
| Total other expenses | | | 769 | | | | 785 | | | | 727 | |
| |
| | | | | | | | | | | | | |
Comparable business | | | 2,967 | | | | 2,878 | | | | 2,841 | |
Which new Bank | | | — | | | | 122 | | | | 28 | |
| |
Total Operating Expenses | | | 2,967 | | | | 3,000 | | | | 2,869 | |
| |
Which new Bank
On 19 September 2003, the Bank launched the Which new Bank service vision. This is a three year transformation program and results in the Bank incurring additional expenditure in the key areas of staff training and skilling, systems and process simplification, and technology.
Total Full Time Equivalent (FTE) numbers have reduced to 34,918 at 31 December 2005 (includes domestic and offshore staff, as well as staff employed on Which new Bank projects). This compares to 35,313 at 30 June 2005. Total FTE’s (excluding those working on Which new Bank projects and offshore) have reduced by 2,513 since the commencement of Which new Bank. This includes 3,528 redundancies.
Profit Announcement 61
Notes to the Financial Statementscontinued
Note 4 Income Tax Expense
| | | | | | | | | | | | | |
| | | Half Year Ended | |
| | | 31/12/05 | | | 30/06/05 | | | 31/12/04 | |
| | | $M | | | $M | | | $M | |
| |
Profit from Ordinary Activities before Income Tax | | | | | | | | | | | | |
| Banking | | | 2,252 | | | | 2,056 | | | | 2,001 | |
| Funds management | | | 319 | | | | 220 | | | | 289 | |
| Insurance | | | 427 | | | | 250 | | | | 272 | |
| Superannuation plan expense | | | (27 | ) | | | (35 | ) | | | (40 | ) |
| |
| | | | 2,971 | | | | 2,491 | | | | 2,522 | |
| |
Prima Facie Income Tax at 30% | | | | | | | | | | | | |
| Banking | | | 676 | | | | 617 | | | | 600 | |
| Funds management | | | 96 | | | | 66 | | | | 87 | |
| Insurance | | | 128 | | | | 75 | | | | 82 | |
| Superannuation plan expense | | | (8 | ) | | | (11 | ) | | | (12 | ) |
| |
| | | | 892 | | | | 747 | | | | 757 | |
| |
| | | | | | | | | | | | | |
Tax effect of expenses that are non-deductible/income non-assessable in determining taxable profit: | | | | | | | | | | | | |
| | | | | | | | | | | | | |
Current period | | | | | | | | | | | | |
| Tax consolidation adjustment | | | (1 | ) | | | — | | | | — | |
| Individually assessed provisions for offshore impairment losses on financial instruments not tax affected | | | — | | | | 2 | | | | 2 | |
| Taxation offsets (net of accruals) | | | (18 | ) | | | (22 | ) | | | (26 | ) |
| Tax adjustment referable to policyholder income | | | 141 | | | | 82 | | | | 78 | |
| Non assessable income — life insurance surplus | | | — | | | | (14 | ) | | | (16 | ) |
| Non—assessable capital gains | | | (45 | ) | | | — | | | | — | |
| Tax losses recognised | | | (3 | ) | | | (7 | ) | | | (2 | ) |
| Other | | | (13 | ) | | | 2 | | | | 19 | |
| |
| | | | 61 | | | | 43 | | | | 55 | |
| |
| | | | | | | | | | | | | |
Prior periods | | | | | | | | | | | | |
| Other | | | 1 | | | | 7 | | | | (7 | ) |
| |
Total income tax expense | | | 954 | | | | 797 | | | | 805 | |
| |
| | | | | | | | | | | | | |
Income Tax Attributable to Profit from Ordinary Activities | | | | | | | | | | | | |
| Banking | | | 640 | | | | 604 | | | | 593 | |
| Funds management | | | 62 | | | | 40 | | | | 48 | |
| Insurance | | | 51 | | | | 36 | | | | 53 | |
| |
| Corporate tax | | | 753 | | | | 680 | | | | 694 | |
| Policyholder tax | | | 201 | | | | 117 | | | | 111 | |
| |
Total income tax expense | | | 954 | | | | 797 | | | | 805 | |
| |
| | | | | | | | | | | | | |
| | | | | | | | | | | | | |
| Effective Tax Rate | | % | | | % | | | % | |
| Total — corporate | | | 27.2 | | | | 28.7 | | | | 28.8 | |
| Banking — corporate | | | 28.8 | | | | 29.9 | | | | 30.2 | |
| Funds management — corporate | | | 29.5 | | | | 23.8 | | | | 20.3 | |
| Insurance — corporate | | | 15.2 | | | | 19.5 | | | | 24.9 | |
| |
New Zealand Subsidiaries
Certain subsidiaries of the Bank in New Zealand are being audited by the Inland Revenue Department as part of the normal Inland Revenue Department procedures, with a particular focus on structured finance transactions. No tax assessments have been issued.
62 Commonwealth Bank of Australia
Notes to the Financial Statementscontinued
Note 5 Loans, Advances and Other Receivables
| | | | | | | | | | | | | |
| | | Half Year Ended | |
| | | 31/12/05 | | | 30/06/05 | | | 31/12/04 | |
| | | $M | | | $M | | | $M | |
| |
Australia | | | | | | | | | | | | |
| Overdrafts | | | 2,220 | | | | 2,564 | | | | 2,271 | |
| Housing loans | | | 135,990 | | | | 129,913 | | | | 121,704 | |
| Credit card outstandings | | | 6,870 | | | | 6,682 | | | | 6,456 | |
| Lease financing | | | 4,906 | | | | 5,055 | | | | 5,572 | |
| Bills discounted | | | 3,898 | | | | 3,399 | | | | 2,964 | |
| Term loans | | | 51,938 | | | | 46,451 | | | | 43,329 | |
| Redeemable preference share financing | | | 6 | | | | 9 | | | | 39 | |
| Other lending | | | 401 | | | | 389 | | | | 334 | |
| |
Total Australia | | | 206,229 | | | | 194,462 | | | | 182,669 | |
| |
| | | | | | | | | | | | | |
Overseas | | | | | | | | | | | | |
| Overdrafts | | | 2,694 | | | | 2,660 | | | | 2,521 | |
| Housing loans | | | 23,349 | | | | 20,765 | | | | 18,945 | |
| Credit card outstandings | | | 478 | | | | 406 | | | | 409 | |
| Lease financing | | | 124 | | | | 195 | | | | 165 | |
| Term loans | | | 12,839 | | | | 12,804 | | | | 11,018 | |
| Redeemable preference share financing | | | 894 | | | | — | | | | 247 | |
| Other lending | | | 34 | | | | 192 | | | | 18 | |
| Other securities | | | 1,726 | | | | — | | | | — | |
| |
Total overseas | | | 42,138 | | | | 37,022 | | | | 33,323 | |
| |
Gross loans, advances and other receivables | | | 248,367 | | | | 231,484 | | | | 215,992 | |
| |
| | | | | | | | | | | | | |
| Less: | | | | | | | | | | | | |
| Provisions for impairment: | | | | | | | | | | | | |
Collective provision(1) | | | (1,041 | ) | | | (1,390 | ) | | | (1,379 | ) |
Individually assessed provisions(1) | | | (179 | ) | | | (157 | ) | | | (180 | ) |
| Unearned income: | | | | | | | | | | | | |
| Term loans | | | (921 | ) | | | (889 | ) | | | (824 | ) |
| Lease financing | | | (620 | ) | | | (683 | ) | | | (827 | ) |
Interest reserved(2) | | | — | | | | (19 | ) | | | (27 | ) |
| |
| | | | (2,761 | ) | | | (3,138 | ) | | | (3,237 | ) |
| |
Net loans, advances and other receivables | | | 245,606 | | | | 228,346 | | | | 212,755 | |
| |
| | |
| (1) | | Collective provision and individually assessed provisions re-calculated under AIFRS for 31 December 2005. |
| |
| (2) | | Interest reserved are not recognised under AIFRS from 1 July 2005. |
Note 6 Asset Quality
| | | | | | | | | | | | | |
| | | Half Year Ended | |
| | | 31/12/05 | | | 30/06/05 | | | 31/12/04 | |
| | | $M | | | $M | | | $M | |
| |
Total Impaired Assets | | | | | | | | | | | | |
| Gross non–accruals | | | 396 | | | | 395 | | | | 445 | |
Less interest reserved(1) | | | — | | | | (19 | ) | | | (27 | ) |
| |
| | | | 396 | | | | 376 | | | | 418 | |
| Less individually assessed provisions for impairment | | | (179 | ) | | | (157 | ) | | | (180 | ) |
| |
Total net impaired assets | | | 217 | | | | 219 | | | | 238 | |
| |
| | | | | | | | | | | | | |
| Net impaired assets by geographical segment | | | | | | | | | | | | |
| Australia | | | 214 | | | | 218 | | | | 238 | |
| Overseas | | | 3 | | | | 1 | | | | — | |
| |
Total | | | 217 | | | | 219 | | | | 238 | |
| |
| | |
| (1) | | Interest and fees reserved are not recognised under AIFRS from 1 July 2005. |
Profit Announcement 63
Notes to the Financial Statementscontinued
Note 6 Asset Quality(continued)
| | | | | | | | | | | | | |
| | | Half Year Ended | |
| | | 31/12/05 | | | 30/06/05 | | | 31/12/04 | |
| | | $M | | | $M | | | $M | |
| |
Provisions for impairment | | | | | | | | | | | | |
Collective provisions | | | | | | | | | | | | |
Opening balance(1) | | | 1,021 | | | | 1,379 | | | | 1,393 | |
| Charge against profit and loss | | | 188 | | | | 176 | | | | 146 | |
| Transfer to individually assessed provisions | | | (200 | ) | | | (180 | ) | | | (172 | ) |
| Impairment losses recovered | | | 57 | | | | 41 | | | | 40 | |
| Adjustments for exchange rate fluctuations and other items | | | 1 | | | | 2 | | | | — | |
| |
| | | | 1,067 | | | | 1,418 | | | | 1,407 | |
| Impairment losses written off | | | (26 | ) | | | (28 | ) | | | (28 | ) |
| |
| Closing balance | | | 1,041 | | | | 1,390 | | | | 1,379 | |
| |
| | | | | | | | | | | | | |
Individually assessed provisions | | | | | | | | | | | | |
Opening balance(1) | | | 191 | | | | 180 | | | | 143 | |
| Transfer from collective provision for: | | | | | | | | | | | | |
| New and increased provisioning | | | 214 | | | | 205 | | | | 203 | |
| Less write–back of provisions no longer required | | | (14 | ) | | | (25 | ) | | | (31 | ) |
| |
| Net transfer | | | 200 | | | | 180 | | | | 172 | |
| |
| | | | | | | | | | | | | |
| Adjustments for exchange rate fluctuations and other items | | | (3 | ) | | | — | | | | (3 | ) |
| Impairment losses | | | (209 | ) | | | (203 | ) | | | (132 | ) |
| |
| Closing balance | | | 179 | | | | 157 | | | | 180 | |
| |
Total provisions for impairment | | | 1,220 | | | | 1,547 | | | | 1,559 | |
| General reserve for credit losses (pre-tax equivalent) | | | 404 | | | | — | | | | — | |
Total provisions including general reserve for credit losses | | | 1,624 | | | | 1,547 | | | | 1,559 | |
| |
| | |
| (1) | | The opening balance at 1 July 2005 includes the impact of adopting AIFRS 132, AIFRS 137 and AIFRS 139 which have not been applied to the 2005 comparatives in accordance with AASB 1. |
| | | | | | | | | | | | | |
| | | % | | | % | | | % | |
| |
Provision Ratios | | | | | | | | | | | | |
Specific provisions for impairment as a % of gross impaired assets net of interest reserved(1) | | | — | | | | 41.8 | | | | 43.1 | |
Total provisions for impairment as a % of gross impaired assets net of interest reserved(1) | | | 308.1 | | | | 411.4 | | | | 373.0 | |
| General provisions as a % of risk weighted assets | | | — | | | | 0.73 | | | | 0.76 | |
| Individually assessed provisions for impairment as a % of gross impaired assets | | | 45.2 | | | | — | | | | — | |
| Total provisions for impairment plus general reserve for credit losses (pre-tax equivalent) as a % of gross impaired assets | | | 410.1 | | | | — | | | | — | |
| Collective provision plus general reserve for credit losses (pre-tax equivalent) as a % of risk weighted assets | | | 0.71 | | | | — | | | | — | |
| | |
| (1) | | Interest reserved not recognised under AIFRS. |
Coverage Ratios under AIFRS
The re-measurement of impairment provisions under AIFRS has resulted in a lower level of total provisions previously assessed using Australian GAAP. However the Australian prudential regulator, APRA, has proposed that banks maintain a provisioning benchmark of 0.5% of risk weighted assets to adequately cover potential credit losses. The Group has subsequently established a General Reserve for Credit Losses, which together with the Collective Provisions (net of deferred tax) will satisfy this requirement.
| | | | | | | | | | | | | |
Impaired Asset Ratios | | | | | | | | | | | | |
| Gross impaired assets net of interest reserved as % of risk weighted assets | | | 0.20 | | | | 0.20 | | | | 0.23 | |
| Net impaired assets as % of: | | | | | | | | | | | | |
| Risk weighted assets | | | 0.11 | | | | 0.12 | | | | 0.13 | |
| Total shareholders’ equity | | | 1.09 | | | | 0.97 | | | | 1.08 | |
| |
Provisioning Policy
Provisions for impairment are maintained at an amount adequate to cover incurred credit related losses.
The Group first assesses whether objective evidence of impairment exists individually for financial assets that are individually significant and individually or collectively for financial assets that are not individually significant. If there is objective evidence of impairment, the amount of the loss is measured as the difference between the assets carrying amount and the present value of the expected future cash flows discounted at the financial assets original effective interest rate. Short term balances are not discounted.
For credit risk management purposes both collective provisions ($1,041 million) and general reserve for credit losses (pre-tax equivalent) ($404 million) are available to support possible credit losses and the total of $1,445 million equates to 0.71% of risk weighted assets. This percentage can be compared with the previous general provisions assessed under AGAAP of 0.73% at 30 June 2005 and 0.76% at 31 December 2004.
64 Commonwealth Bank of Australia
Notes to the Financial Statementscontinued
Note 6 Asset Quality (continued)
| | | | | | | | | | | | | |
| | | Half Year Ended | |
| | | 31/12/05 | | | 30/06/05 | | | 31/12/04 | |
| | | $M | | | $M | | | $M | |
| |
Impaired Assets | | | | | | | | | | | | |
| Income received: | | | | | | | | | | | | |
| Current period | | | — | | | | 2 | | | | 3 | |
| Prior period | | | — | | | | 2 | | | | 2 | |
| |
Total income received(1) | | | — | | | | 4 | | | | 5 | |
| |
| | | | | | | | | | | | | |
Interest income forgone(1) | | | — | | | | 7 | | | | 6 | |
| |
| | | | | | | | | | | | | |
| (1) Interest reserved is no longer recognised under AIFRS | | | | | | | | | | | | |
| | | | | | | | | | | | | |
Movement in Impaired Asset Balances | | | | | | | | | | | | |
| Gross impaired assets at period beginning | | | 395 | | | | 445 | | | | 363 | |
| New and increased | | | 365 | | | | 383 | | | | 386 | |
| Balances written off | | | (209 | ) | | | (216 | ) | | | (134 | ) |
| Returned to performing or repaid | | | (155 | ) | | | (217 | ) | | | (170 | ) |
| |
Gross impaired assets at period end | | | 396 | | | | 395 | | | | 445 | |
| |
| | | | | | | | | | | | | |
| | | Half Year Ended | |
| | | 31/12/05 | | | 30/06/05 | | | 31/12/04 | |
| | | $M | | | $M | | | $M | |
| |
Loans Accruing but Past Due 90 Days or More (consumer segment) | | | | | | | | | | | | |
| Housing loans | | | 154 | | | | 183 | | | | 176 | |
| Other loans | | | 119 | | | | 119 | | | | 94 | |
| |
Total | | | 273 | | | | 302 | | | | 270 | |
| |
Note 7 Deposits and Other Public Borrowings
| | | | | | | | | | | | | |
| | | Half Year Ended | |
| | | 31/12/05 | | | 30/06/05 | | | 31/12/04 | |
| | | $M | | | $M | | | $M | |
| |
Australia | | | | | | | | | | | | |
| Certificates of deposits | | | 17,351 | | | | 16,041 | | | | 18,594 | |
| Term deposits | | | 42,959 | | | | 41,582 | | | | 40,738 | |
| On demand and short-time deposits | | | 77,902 | | | | 75,407 | | | | 72,853 | |
| Deposits not bearing interest | | | 6,149 | | | | 5,823 | | | | 5,855 | |
| Securities sold under agreements to repurchase and short sales | | | 1,092 | | | | 2,258 | | | | 2,766 | |
| |
Total Australia | | | 145,453 | | | | 141,111 | | | | 140,806 | |
| |
| | | | | | | | | | | | | |
Overseas | | | | | | | | | | | | |
| Certificates of deposits | | | 935 | | | | 3,105 | | | | 3,213 | |
| Term deposits | | | 13,992 | | | | 13,617 | | | | 13,719 | |
| On demand and short-time deposits | | | 7,024 | | | | 8,633 | | | | 7,662 | |
| Deposits not bearing interest | | | 1,222 | | | | 1,155 | | | | 1,158 | |
| Securities sold under agreements to repurchase and short sales | | | 97 | | | | 405 | | | | 865 | |
| |
Total overseas | | | 23,270 | | | | 26,915 | | | | 26,617 | |
| |
Total deposits and other public borrowings | | | 168,723 | | | | 168,026 | | | | 167,423 | |
| |
Profit Announcement 65
Notes to the Financial Statementscontinued
Note 8 Financial Reporting by Segments
This note sets out segment reporting in accordance with statutory reporting requirements. Refer to the business analysis at the front of this report for detailed profit and loss accounts by segment.
| | | | | | | | | | | | | | | | | |
| | | Half Year Ended 31 December 2005 | |
| | | | | | | Funds | | | | | | | |
| | | Banking | | | Management | | | Insurance | | | Total | |
| | | $M | | | $M | | | $M | | | $M | |
| |
Primary Segment | | | | | | | | | | | | | | | | |
Business Segments | | | | | | | | | | | | | | | | |
Income Statement | | | | | | | | | | | | | | | | |
| |
| Interest income | | | 9,638 | | | | — | | | | — | | | | 9,638 | |
| Premium and related revenue | | | — | | | | — | | | | 573 | | | | 573 | |
| Other income | | | 1,416 | | | | 2,116 | | | | 693 | | | | 4,225 | |
| |
| Total revenue | | | 11,054 | | | | 2,116 | | | | 1,266 | | | | 14,436 | |
| |
| | | | | | | | | | | | | | | | | |
| Interest expense | | | 6,354 | | | | — | | | | — | | | | 6,354 | |
| |
| | | | | | | | | | | | | | | | | |
| Segment result before income tax | | | 2,225 | | | | 319 | | | | 427 | | | | 2,971 | |
| Income tax expense | | | (640 | ) | | | (171 | ) | | | (143 | ) | | | (954 | ) |
| |
| Segment result after income tax | | | 1,585 | | | | 148 | | | | 284 | | | | 2,017 | |
| Minority interests | | | (15 | ) | | | (3 | ) | | | — | | | | (18 | ) |
| |
| Segment result after income tax and minority interests | | | 1,570 | | | | 145 | | | | 284 | | | | 1,999 | |
| |
Net profit attributable to shareholders of the Bank | | | 1,570 | | | | 145 | | | | 284 | | | | 1,999 | |
| |
| |
Non–Cash Expenses | | | | | | | | | | | | | | | | |
| Intangible asset amortisation | | | 18 | | | | — | | | | — | | | | 18 | |
| Bad and doubtful debts expense | | | 188 | | | | — | | | | — | | | | 188 | |
| Depreciation | | | 76 | | | | 2 | | | | 3 | | | | 81 | |
| Superannuation plan expense | | | 27 | | | | — | | | | — | | | | 27 | |
| Which new Bank initiative | | | — | | | | — | | | | — | | | | — | |
| | | | | | | | | | | | | | | | | |
Balance Sheet | | | | | | | | | | | | | | | | |
| Total assets | | | 321,477 | | | | 19,650 | | | | 10,066 | | | | 351,193 | |
| Acquisition of property, plant & equipment, intangibles and other non–current assets | | | 122 | | | | 81 | | | | 20 | | | | 223 | |
| Associate investments | | | 119 | | | | 2 | | | | 70 | | | | 191 | |
| Total liabilities | | | 307,055 | | | | 16,500 | | | | 7,788 | | | | 331,343 | |
| |
66 Commonwealth Bank of Australia
Notes to the Financial Statementscontinued
Note 8 Financial Reporting by Segments(continued)
| | | | | | | | | | | | | | | | | |
| | | Half Year Ended 31 December 2004 | |
| | | | | | | Funds | | | | | | | |
| | | Banking | | | Management | | | Insurance | | | Total | |
| | | $M | | | $M | | | $M | | | $M | |
| |
Primary Segment | | | | | | | | | | | | | | | | |
Business Segments | | | | | | | | | | | | | | | | |
Income Statement | | | | | | | | | | | | | | | | |
| |
| Interest income | | | 8,089 | | | | — | | | | — | | | | 8,089 | |
| Premium and related revenue | | | — | | | | — | | | | 575 | | | | 575 | |
| Other income | | | 1,383 | | | | 1,839 | | | | 716 | | | | 3,938 | |
| |
| Total revenue | | | 9,472 | | | | 1,839 | | | | 1,291 | | | | 12,602 | |
| |
| | | | | | | | | | | | | | | | | |
| Interest expense | | | 5,131 | | | | — | | | | — | | | | 5,131 | |
| |
| | | | | | | | | | | | | | | | | |
| Segment result before income tax and goodwill impairment | | | 1,961 | | | | 289 | | | | 272 | | | | 2,522 | |
| Income tax expense | | | (593 | ) | | | (100 | ) | | | (112 | ) | | | (805 | ) |
| |
| Segment result after income tax and before goodwill impairment | | | 1,368 | | | | 189 | | | | 160 | | | | 1,717 | |
| Minority interest | | | (2 | ) | | | (3 | ) | | | — | | | | (5 | ) |
| |
| Segment result after income tax and minority interests before goodwill impairment | | | 1,366 | | | | 186 | | | | 160 | | | | 1,712 | |
| |
Net profit attributable to shareholders of the Bank | | | 1,366 | | | | 186 | | | | 160 | | | | 1,712 | |
| |
| | | | | | | | | | | | | | | | | |
Non–Cash Expenses | | | | | | | | | | | | | | | | |
| Intangible asset amortisation | | | 6 | | | | — | | | | — | | | | 6 | |
| Bad and doubtful debts expense | | | 146 | | | | — | | | | — | | | | 146 | |
| Depreciation | | | 60 | | | | 4 | | | | 4 | | | | 68 | |
| Superannuation plan expense | | | 40 | | | | — | | | | — | | | | 40 | |
| Which new Bank initiative | | | 15 | | | | 12 | | | | 1 | | | | 28 | |
| | | | | | | | | | | | | | | | | |
Balance Sheet | | | | | | | | | | | | | | | | |
| Total assets | | | 292,293 | | | | 16,779 | | | | 16,287 | | | | 325,359 | |
| Acquisition of property, plant & equipment, intangibles and | | | | | | | | | | | | | | | | |
| other non–current assets | | | 134 | | | | 4 | | | | 6 | | | | 144 | |
| Associate investments | | | 188 | | | | 1 | | | | 44 | | | | 233 | |
| Total liabilities | | | 276,005 | | | | 17,152 | | | | 10,101 | | | | 303,258 | |
| |
Profit Announcement 67
Notes to the Financial Statementscontinued
Note 8 Financial Reporting by Segments(continued)
| | | | | | | | | | | | | | | | | |
| | | Half Year Ended | |
| | | 31/12/05 | | | | | | | 31/12/04 | | | | |
| | | $M | | | % | | | $M | | | % | |
| |
Secondary Segment | | | | | | | | | | | | | | | | |
Geographical Segment | | | | | | | | | | | | | | | | |
Financial Performance | | | | | | | | | | | | | | | | |
| |
Revenue | | | | | | | | | | | | | | | | |
| Australia | | | 11,574 | | | | 80.2 | | | | 10,106 | | | | 80.2 | |
| New Zealand | | | 1,982 | | | | 13.7 | | | | 1,561 | | | | 12.4 | |
Other countries(1) | | | 880 | | | | 6.1 | | | | 935 | | | | 7.4 | |
| |
| | | | 14,436 | | | | 100.0 | | | | 12,602 | | | | 100.0 | |
| |
Net Profit Attributable to Shareholders of the Bank | | | | | | | | | | | | | | | | |
| Australia | | | 1,547 | | | | 77.4 | | | | 1,429 | | | | 83.5 | |
| New Zealand | | | 192 | | | | 9.6 | | | | 173 | | | | 10.1 | |
Other countries(1) | | | 260 | | | | 13.0 | | | | 110 | | | | 6.4 | |
| |
| | | | 1,999 | | | | 100.0 | | | | 1,712 | | | | 100.0 | |
| |
Assets | | | | | | | | | | | | | | | | |
| Australia | | | 287,191 | | | | 81.8 | | | | 265,746 | | | | 81.7 | |
| New Zealand | | | 45,401 | | | | 12.9 | | | | 39,269 | | | | 12.1 | |
Other countries(1) | | | 18,601 | | | | 5.3 | | | | 20,344 | | | | 6.2 | |
| |
| | | | 351,193 | | | | 100.0 | | | | 325,359 | | | | 100.0 | |
| |
| | | | | | | | | | | | | | | | | |
Acquisition of Property, Plant & Equipment and Intangibles and Other Non–current Assets | | | | | | | | | | | | | | | | |
| Australia | | | 201 | | | | 90.1 | | | | 129 | | | | 89.6 | |
| New Zealand | | | 17 | | | | 7.6 | | | | 11 | | | | 7.6 | |
Other countries(1) | | | 5 | | | | 2.3 | | | | 4 | | | | 2.8 | |
| |
| | | | 223 | | | | 100.0 | | | | 144 | | | | 100.0 | |
| |
| | |
| (1) | | Other countries were: United Kingdom, United States of America, Japan, Singapore, Malta, Hong Kong, Grand Cayman, Fiji, Indonesia, China and Vietnam. |
The geographical segment represents the location in which the transaction was booked.
68 Commonwealth Bank of Australia
Notes to the Financial Statementscontinued
Note 9 Detailed Consolidated Statement of Changes in Equity
| | | | | | | | | | | | | |
| | | 31/12/05 | | | 30/06/05 | | | 31/12/04 | |
| | | $M | | | $M | | | $M | |
| |
Equity reconciliations | | | | | | | | | | | | |
Ordinary Share Capital | | | | | | | | | | | | |
| Opening balance | | | 13,486 | | | | 13,344 | | | | 13,359 | |
AIFRS transition adjustment(1) | | | — | | | | — | | | | (371 | ) |
| |
| Restated opening balance | | | 13,486 | | | | 13,344 | | | | 12,988 | |
| Buy back | | | (1 | ) | | | — | | | | — | |
| Dividend reinvestment plan | | | 262 | | | | 200 | | | | 246 | |
| Employee share ownership schemes | | | 35 | | | | 23 | | | | 43 | |
(Purchase)/sale and vesting of treasury shares(2) | | | 19 | | | | (81 | ) | | | 68 | |
| Issue costs | | | — | | | | — | | | | (1 | ) |
| |
| Closing balance | | | 13,801 | | | | 13,486 | | | | 13,344 | |
| |
Preference Share Capital | | | | | | | | | | | | |
| Opening balance | | | 687 | | | | 687 | | | | 687 | |
AIFRS transition adjustments(3) | | | (687 | ) | | | — | | | | — | |
| Restated opening balance | | | — | | | | 687 | | | | 687 | |
| |
| Closing balance | | | — | | | | 687 | | | | 687 | |
| |
Other Equity Instruments | | | | | | | | | | | | |
| Opening balance | | | 1,573 | | | | 1,573 | | | | 1,573 | |
AIFRS transition adjustments(3) | | | (1,573 | ) | | | — | | | | — | |
| Restated opening balance | | | — | | | | 1,573 | | | | 1,573 | |
| |
| Closing balance | | | — | | | | 1,573 | | | | 1,573 | |
| |
Retained profits | | | | | | | | | | | | |
| Opening balance | | | 3,843 | | | | 3,357 | | | | 2,840 | |
AIFRS transition adjustments(4) | | | (728 | ) | | | — | | | | 9 | |
| |
| Restated opening balance | | | 3,115 | | | | 3,357 | | | | 2,849 | |
| Actuarial gains and losses from defined benefit superannuation plan | | | 68 | | | | 39 | | | | 71 | |
| Realised gains and dividend income on treasury shares held within | | | | | | | | | | | | |
the bank’s life insurance statutory funds(2) | | | 25 | | | | 21 | | | | — | |
| Operating profit attributable to members of the Bank | | | 1,999 | | | | 1,688 | | | | 1,712 | |
| |
| Total available for appropriation | | | 5,207 | | | | 5,105 | | | | 4,632 | |
Transfers to general reserve(5) | | | (106 | ) | | | (109 | ) | | | 101 | |
| Transfers to general reserve for credit loss | | | (25 | ) | | | — | | | | — | |
| Interim dividend — cash component | | | — | | | | (883 | ) | | | — | |
| Interim dividend — dividend reinvestment plan | | | — | | | | (200 | ) | | | — | |
| Payment of final dividend — cash component | | | (1,173 | ) | | | — | | | | (1,069 | ) |
| Payment of final dividend — dividend reinvestment plan | | | (262 | ) | | | — | | | | (246 | ) |
| Other dividends | | | — | | | | (70 | ) | | | (61 | ) |
| |
Closing balance | | | 3,641 | | | | 3,843 | | | | 3,357 | |
| |
Reserves | | | | | | | | | | | | |
General Reserve | | | | | | | | | | | | |
| Opening balance | | | 982 | | | | 873 | | | | 3,810 | |
AIFRS transition adjustments(6) | | | — | | | | — | | | | (2,836 | ) |
| |
| Restated opening balances | | | 982 | | | | 873 | | | | 974 | |
| Appropriation from profits | | | 106 | | | | 109 | | | | (101 | ) |
| |
| Closing balance | | | 1,088 | | | | 982 | | | | 873 | |
| |
Capital Reserve | | | | | | | | | | | | |
| Opening balance | | | 282 | | | | 280 | | | | 280 | |
| Reversal of revaluation surplus/(deficit) on sale of property | | | 2 | | | | 2 | | | | — | |
| |
| Closing balance | | | 284 | | | | 282 | | | | 280 | |
| |
| | |
| (1) | | Relates to the initial recognition of treasury shares held within the employee share scheme trust and the Bank’s life insurance statutory funds |
| |
| (2) | | Relates to movements in treasury shares held within life insurance statutory funds and the employee share scheme trust. |
| |
| (3) | | Reclassification of hybrid financial instruments from equity to liabilities |
| |
| (4) | | Comprises: |
| | • | | Actuarial and other movements within the defined benefit surplus superannuation plan; |
| |
| | • | | Net movement in the calculation of life insurance policyholder liabilities; |
| |
| | • | | Adjustment in respect of realised gains and dividend income on treasury shares; |
| |
| | • | | Deferral of initial entry fee income earned by life insurance entities; |
| |
| | • | | Adjustment to the fair value calculation for assets held by the life insurance business; |
| |
| | • | | Adjustment in respect of derivative financial instruments; |
| |
| | • | | Deferral of previously recognised net income and expenses within the banking business; |
| |
| | • | | Foreign exchange adjustment on the reclassification of hybrid financial instruments; and |
| |
| | • | | Adjustment to fair value calculation for trading assets within the banking portfolios and for other financial instruments designated as fair value through profit and loss. |
| | |
| (5) | | Appraisal Value Uplift of $265 million has been removed from the appropriation line of the General Reserve for the six months ended December 2004. |
| |
| (6) | | Net write down of the internally generated appraisal value of the life insurance and funds management business. |
Profit Announcement 69
Notes to the Financial Statementscontinued
Note 9 Detailed Consolidated Statement of Changes in Equity (continued)
| | | | | | | | | | | | | |
| | | 31/12/05 | | | 30/06/05 | | | 31/12/04 | |
| | | $M | | | $M | | | $M | |
| |
Asset Revaluation Reserve | | | | | | | | | | | | |
| Opening balance | | | 119 | | | | 92 | | | | 61 | |
AFRIS transition adjustment(1) | | | — | | | | — | | | | 31 | |
| |
| Restated opening balance | | | 119 | | | | 92 | | | | 92 | |
| Revaluation of investments and properties | | | — | | | | 29 | | | | — | |
| Transfers on sale of properties | | | (2 | ) | | | (2 | ) | | | — | |
| |
| Closing balance | | | 117 | | | | 119 | | | | 92 | |
| |
Foreign Currency Translation Reserve | | | | | | | | | | | | |
| Opening balance | | | (141 | ) | | | (151 | ) | | | (205 | ) |
AIFRS transition adjustments(2) | | | 27 | | | | — | | | | 205 | |
| |
| Restated opening balances | | | (114 | ) | | | (151 | ) | | | — | |
| Currency translation adjustments | | | 80 | | | | 10 | | | | (151 | ) |
| Transfer to the Income Statement | | | 41 | | | | — | | | | — | |
| Tax on translation adjustments | | | (17 | ) | | | — | | | | — | |
| |
| Closing balance | | | (10 | ) | | | (141 | ) | | | (151 | ) |
| |
Cash Flow Hedge Reserve | | | | | | | | | | | | |
| Opening balance | | | — | | | | — | | | | — | |
AIFRS transition adjustments(3) | | | 39 | | | | — | | | | — | |
| |
| Restated opening balance | | | 39 | | | | — | | | | — | |
| Gains/(losses) on cash flow hedging instruments: | | | | | | | | | | | | |
| Recognised in equity | | | 23 | | | | — | | | | — | |
| Transferred to income statements | | | 11 | | | | — | | | | — | |
| Tax on cash flow hedging instruments | | | (11 | ) | | | | | | | | |
| Current Period movement | | | 23 | | | | — | | | | — | |
| |
| Closing balance | | | 62 | | | | — | | | | | |
| |
Employee Compensation Reserve | | | | | | | | | | | | |
| Opening balance | | | 23 | | | | 4 | | | | — | |
AIFRS transition adjustments(4) | | | — | | | | — | | | | 47 | |
| |
| Restated opening balance | | | 23 | | | | 4 | | | | 47 | |
| Current period movement | | | (5 | ) | | | 19 | | | | (43 | ) |
| |
| Closing balance | | | 18 | | | | 23 | | | | 4 | |
| |
General Reserve for Credit Loss(5) | | | | | | | | | | | | |
| Opening balance | | | — | | | | — | | | | — | |
AIFRS transition adjustment(6) | | | 258 | | | | — | | | | — | |
| |
| Restated opening balance | | | 258 | | | | — | | | | — | |
| Current period movement appropriation from/(to) retained profits | | | 25 | | | | — | | | | — | |
| |
| Closing balance | | | 283 | | | | — | | | | — | |
| |
Available-for-Sale Investments | | | | | | | — | | | | — | |
| Opening balance | | | — | | | | — | | | | — | |
AIFRS transition adjustments(7) | | | 56 | | | | — | | | | — | |
| |
| Restated opening balance | | | 56 | | | | — | | | | — | |
| Net gains/(losses) on available-for-sale investments | | | (10 | ) | | | — | | | | — | |
| Net gain/(loss) on available-for-sale investments transferred to the income statement on disposal | | | 1 | | | | — | | | | — | |
| Impairment of available-for-sale investments transferred to the income statement | | | (3 | ) | | | — | | | | — | |
| Tax on available-for-sale investments | | | (1 | ) | | | — | | | | — | |
| Current period movement | | | (13 | ) | | | — | | | | — | |
| |
| Closing balance | | | 43 | | | | — | | | | — | |
| |
Total Reserves | | | 1,885 | | | | 1,265 | | | | 1,098 | |
| |
Shareholders’ Equity Attributable to Members of the Bank | | | 19,327 | | | | 20,854 | | | | 20,059 | |
| |
Shareholders’ Equity Attributable to Minority Interests | | | 523 | | | | 1,789 | | | | 2,042 | |
| |
Total Shareholders’ Equity | | | 19,850 | | | | 22,643 | | | | 22,101 | |
| |
| | |
| (1) | | Change in valuation methodology for owner-occupied property. |
| |
| (2) | | Transfer to retained profits on 1 July 2004; and re-translation on 1 July 2005 due to change in recognition and measurement of financial instruments. |
| |
| (3) | | Initial recognition of the cash flow hedge reserves on 1 July 2005. |
| |
| (4) | | Initial recognition of employee (equity) compensation reserve on 1 July 2004. |
| |
| (5) | | The opening balance of the general reserve for credit loss has been appropriated from retained profits. The amount is the tax effected difference between the former general provision at 30 June 2005, $1,390 million, and the opening transition balance of the collective provision, $1,021 million. The general reserve for credit loss has been established to satisfy the proposed APRA prudential requirement for banks to maintain a general reserve for credit loss, and allowable collective provisions, at a minimum level of 0.5% of risk weighted assets. |
| |
| (6) | | Initial recognition of a general reserve for credit loss arising in the recalculation of loan impairment provisions on 1 July 2005. |
| |
| (7) | | Initial recognition of the available-for-sale investment reserve on 1 July 2005. |
70 Commonwealth Bank of Australia
Notes to the Financial Statementscontinued
Note 10 Statement of Cash Flows
(a) Reconciliation of Operating Profit after Income Tax to Net Cash Provided by Operating Activities
| | | | | | | | | | | | | |
| | | Half Year Ended | |
| | | 31/12/05 | | | 30/06/05 | | | 31/12/04 | |
| | | $M | | | $M | | | $M | |
| |
| Net profit after income tax | | | 2,017 | | | | 1,693 | | | | 1,717 | |
| Decrease/(Increase) in interest receivable | | | (120 | ) | | | 94 | | | | (111 | ) |
| Increase/(decrease) in interest payable | | | (34 | ) | | | (43 | ) | | | 107 | |
| Net decrease/(increase) in trading securities | | | — | | | | 1,727 | | | | (1,409 | ) |
| Net (increase) in assets at fair value through the Income Statement (excluding life insurance) | | | (1,060 | ) | | | — | | | | — | |
| Net (gain)/loss on sale of investments | | | — | | | | (7 | ) | | | (1 | ) |
| Net (gain)/loss on sale of controlled entities and associates | | | (145 | ) | | | 13 | | | | — | |
| (Increase)/decrease in derivative assets | | | 1,566 | | | | — | | | | — | |
| (Gain)/loss on sale property plant and equipment | | | (5 | ) | | | (3 | ) | | | (1 | ) |
| Charge for bad and doubtful debts | | | 188 | | | | 176 | | | | 146 | |
| Depreciation and amortisation | | | 99 | | | | 102 | | | | 74 | |
| Increase in liabilities in liabilities at fair value through Income Statement (excluding life insurance) | | | 3,704 | | | | — | | | | — | |
| Increase in derivative liabilities | | | (1,874 | ) | | | — | | | | — | |
| (Decrease)/increase in other provisions | | | (46 | ) | | | 4 | | | | (90 | ) |
| (Decrease)/increase in income taxes payable | | | (258 | ) | | | 410 | | | | (4 | ) |
| (Decrease)/increase in deferred income taxes payable | | | (12 | ) | | | (54 | ) | | | 386 | |
| (Increase)/decrease in deferred tax assets | | | (66 | ) | | | (74 | ) | | | (12 | ) |
| (Increase)/decrease in accrued fees/reimbursements receivable | | | (136 | ) | | | (24 | ) | | | (17 | ) |
| Increase/(decrease) in accrued fees and other items payable | | | 217 | | | | 281 | | | | (175 | ) |
| Amortisation of premium on investment securities | | | — | | | | (7 | ) | | | 3 | |
| Unrealised (gain)/loss on revaluation of trading securities | | | — | | | | 689 | | | | (281 | ) |
| Unrealised (gain)/loss on revaluation of assets at fair value through the Income Statement (excluding life insurance) | | | 10 | | | | — | | | | — | |
| Change in life insurance contract policy liabilities | | | 16 | | | | (272 | ) | | | 328 | |
| Revaluation of life insurance assets | | | (272 | ) | | | 80 | | | | (745 | ) |
| Gain on sale of life insurance assets | | | (26 | ) | | | (158 | ) | | | (396 | ) |
| Increase/(decrease) in managed fund units on sale | | | (123 | ) | | | — | | | | — | |
| Other | | | 10 | | | | 100 | | | | 120 | |
| |
Net Cash used in Operating Activities | | | 3,650 | | | | 4,727 | | | | (361 | ) |
| |
(b) Reconciliation of Cash
For the purposes of the statement of cash flows, cash includes cash, money at short call, at call deposits with other financial institutions and settlement account balances with other banks.
| | | | | | | | | | | | | |
| | | Half Year Ended | |
| | | 31/12/05 | | | 30/06/05 | | | 31/12/04 | |
| | | $M | | | $M | | | $M | |
| |
| Notes, coins and cash | | | 3,023 | | | | 1,723 | | | | 1,999 | |
| Other short term liquid assets | | | 581 | | | | 859 | | | | 615 | |
Receivables due from other financial institutions — at call(1) | | | 2,754 | | | | 2,893 | | | | 4,096 | |
Payables due to other financial institutions — at call(1) | | | (5,626 | ) | | | (4,199 | ) | | | (5,133 | ) |
| |
Cash and Cash Equivalents at end of half year | | | 732 | | | | 1,276 | | | | 1,577 | |
| |
| | |
| (1) | | At call includes receivables and payables due from and to financial institutions within three months. |
(c) Disposal of Controlled Entities
| | | | | | | | | | | | | |
| | | Half Year Ended | |
| | | 31/12/05 | | | 30/06/05 | | | 31/12/04 | |
| | | $M | | | $M | | | $M | |
| |
Disposal proceeds | | | 608 | | | | — | | | | — | |
| Net cash disposed on sale of controlled entities | | | (55 | ) | | | — | | | | — | |
| |
| Net cash inflows | | | 553 | | | | — | | | | — | |
| |
| | | | | | | | | | | | | |
Fair value of net tangible assets disposed | | | | | | | — | | | | — | |
| Net book value of assets disposed | | | 463 | | | | — | | | | — | |
| Profit/(loss) on sale | | | 145 | | | | — | | | | — | |
| |
| | | | 608 | | | | | | | | | |
| |
| | | | | | | | | | | | | |
Inflow of cash from disposal | | | 608 | | | | — | | | | — | |
| |
| Cash proceeds | | | 608 | | | | — | | | | — | |
| |
Profit Announcement 71
Notes to the Financial Statementscontinued
Note 11 Events after the end of the Financial Period
Dividends
The Directors have declared a fully franked dividend of 94 cents per share – amounting to $1,211 million for the half year ended 31 December 2005.
The Directors are not aware of any other matter or circumstance that has occurred since the end of the half year that has significantly affected or may significantly affect the operation of the Bank, the results of those operations or the state of affairs of the Bank in subsequent financial years.
Note 12 Contingent Liabilities
There have been no material changes in contingent liabilities since those disclosed in the financial statements for the year ended 30 June 2005, refer to note 38 of the 2005 Annual Report.
Note 13 Acquisitions of Business Interests
Hangzhou City Commercial Bank
During the half year, the Bank acquired a 19.9% interest in Hangzhou City Commercial Bank (HZB) for A$102 million. HZB is one of the top five city commercial banks by assets in mainland China.
Acquisition of CFS PRT Limited and GRM Ltd
On 6 October 2005, the Bank acquired of 40% of Colonial First State Property Retail Trust Limited and 60% of Gandel Retail Management Trust Ltd for A$367 million, principally representing the purchase of management rights. These acquisitions brought the Bank’s total holding in these entities to 100%.
These entities engage in property and funds management and were previously jointly held by the Bank and the Gandel group. Completion of this acquisition, being cash settlement and the finalisation of the independent fair valuations on the acquired assets, will occur during the half year ending 30 June 2006.
| | | |
| 72 | | Commonwealth Bank of Australia |
Directors’ Declaration
In accordance with a resolution of the Directors of the Commonwealth Bank of Australia we state that in the opinion of the Directors:
| (a) | | The half year consolidated financial statements and notes as set out on pages 28 to 72 are in accordance with the Corporations Act and: |
| | (i) | | give a true and fair view of the financial position as at 31 December 2005 and the performance for the half year ended on that date of the consolidated entity; and |
| |
| | (ii) | | comply with Accounting Standard AASB 134: Interim Financial Reporting and the Corporations Regulations 2001; and |
| (b) | | there are reasonable grounds to believe that the company will be able to pay its debts as and when they become due and payable. Signed in accordance with a resolution of the Directors. |
| | | |
| |  |
| J M Schubert | | R J Norris |
| Chairman | | Managing Director and Chief Executive Officer |
Dated: 15 February 2006
Independent Review Report
Independent review report to members of Commonwealth Bank of Australia
Scope
The financial report and directors’ responsibility
The financial report comprises the balance sheet, income statement, statement of recognised income and expense, cash flow statement and accompanying notes to the financial statements for the consolidated entity comprising both Commonwealth Bank of Australia (the company) and the entities it controlled during the half-year, and the directors’ declaration for the company, for the period ended 31 December 2005.
The directors of the company are responsible for preparing a financial report that gives a true and fair view of the financial position and performance of the consolidated entity, and that complies with Accounting Standard AASB 134 “Interim Financial Reporting”, in accordance with theCorporations Act 2001. This includes responsibility for the maintenance of adequate accounting records and internal controls that are designed to prevent and detect fraud and error, and for the accounting policies and accounting estimates inherent in the financial report.
Review approach
We conducted an independent review of the financial report in order to make a statement about it to the members of the company, and in order for the company to lodge the financial report with the Australian Stock Exchange and the Australian Securities and Investments Commission.
Our review was conducted in accordance with Australian Auditing Standards applicable to review engagements, in order to state whether, on the basis of the procedures described, anything has come to our attention that would indicate that the financial report is not presented fairly in accordance with theCorporations Act 2001, Accounting Standard AASB 134 “Interim Financial Reporting” and other mandatory financial reporting requirements in Australia, so as to present a view which is consistent with our understanding of the consolidated entity’s financial position, and of its performance as represented by the results of its operations and cash flows.
A review is limited primarily to inquiries of company personnel and analytical procedures applied to the financial data. These procedures do not provide all the evidence that would be required in an audit, thus the level of assurance is less than given in an audit. We have not performed an audit and, accordingly, we do not express an audit opinion.
Independence
We are independent of the company, and have met the independence requirements of Australian professional ethical pronouncements and theCorporations Act 2001. We have given to the directors of the company a written Auditor’s Independence Declaration, a copy of which is included in the Directors’ Report. In addition to our review of the financial report, we were engaged to undertake other non-audit services. The provision of these services has not impaired our independence.
Statement
Based on our review, which is not an audit, we have not become aware of any matter that makes us believe that the financial report of the consolidated entity, comprising Commonwealth Bank of Australia and the entities it controlled during the half-year, is not in accordance with:
| (a) | | theCorporations Act 2001, including: |
| | (i) | | giving a true and fair view of the financial position of the consolidated entity at 31 December 2005 and of its performance for the half-year ended on that date; and |
| |
| | (ii) | | complying with Accounting Standard AASB 134 “Interim Financial Reporting” and theCorporations Regulations 2001; and |
| (b) | | other mandatory financial reporting requirements in Australia. |

Ernst & Young

S J Ferguson
Partner
Sydney
15 February 2006
| | | |
| 74 | | Commonwealth Bank of Australia |
Appendices
| | | | | |
| | | 76 | |
| | | 76 | |
| | | 77 | |
| | | 79 | |
| | | 80 | |
| | | 81 | |
| | | 82 | |
| | | 84 | |
| | | 87 | |
| | | 89 | |
| | | 90 | |
| | | 91 | |
| | | 92 | |
| | | 92 | |
| | | 93 | |
| | | 95 | |
| | | 98 | |
| | | 100 | |
| | | 101 | |
Appendices
1. Net Interest Income
| | | | | | | | | | | | | | | | | | | | | |
| | | Half Year Ended | |
| | | 31/12/05 | | | 30/06/05 | | | 31/12/04 | | | Dec 05 vs | | | Dec 05 vs | |
| | | $M | | | $M | | | $M | | | Jun 05 % | | | Dec 04 % | |
| |
Interest Income | | | | | | | | | | | | | | | | | | | | |
| Loans | | | 8,555 | | | | 7,703 | | | | 7,143 | | | | 11 | | | | 20 | |
| Other financial institutions | | | 175 | | | | 128 | | | | 101 | | | | 37 | | | | 73 | |
| Cash and liquid assets | | | 103 | | | | 91 | | | | 107 | | | | 13 | | | | (4 | ) |
| Investment securities | | | — | | | | 379 | | | | 344 | | | large | | large |
| Assets at fair value through the Income Statement | | | 511 | | | | 391 | | | | 394 | | | | 31 | | | | 30 | |
| Available-for-sale investments | | | 294 | | | | — | | | | — | | | | — | | | | — | |
| |
Total interest income | | | 9,638 | | | | 8,692 | | | | 8,089 | | | | 11 | | | | 19 | |
| |
| | | | | | | | | | | | | | | | | | | | | |
Interest Expense | | | | | | | | | | | | | | | | | | | | |
| Deposits | | | 3,891 | | | | 3,626 | | | | 3,437 | | | | (7 | ) | | | (13 | ) |
| Other financial institutions | | | 213 | | | | 131 | | | | 126 | | | | (63 | ) | | | (69 | ) |
| Liabilities at fair value through the Income Statement | | | 261 | | | | — | | | | — | | | | — | | | | — | |
| Debt issues | | | 1,667 | | | | 1,681 | | | | 1,403 | | | | 1 | | | | (19 | ) |
| Loan capital | | | 322 | | | | 186 | | | | 165 | | | | (73 | ) | | | (95 | ) |
| |
Total interest expense | | | 6,354 | | | | 5,624 | | | | 5,131 | | | | (13 | ) | | | (24 | ) |
| |
Net interest income | | | 3,284 | | | | 3,068 | | | | 2,958 | | | | (7 | ) | | | (11 | ) |
| |
2. Net Interest Margin
| | | | | | | | | | | | | |
| | | Half Year Ended | |
| | | 31/12/05 | | | 30/06/05 | | | 31/12/04 | |
| | | % | | | % | | | % | |
| |
Australia | | | | | | | | | | | | |
Interest spread(1) | | | 2.30 | | | | 2.33 | | | | 2.33 | |
Benefit of interest free liabilities, provisions and equity(2) | | | 0.26 | | | | 0.27 | | | | 0.23 | |
| |
Net interest margin(3) | | | 2.56 | | | | 2.60 | | | | 2.56 | |
| |
| | | | | | | | | | | | | |
Overseas | | | | | | | | | | | | |
Interest spread(1) | | | 0.97 | | | | 0.94 | | | | 1.12 | |
Benefit of interest free liabilities, provisions and equity(2) | | | 0.65 | | | | 0.71 | | | | 0.65 | |
| |
Net interest margin(3) | | | 1.62 | | | | 1.65 | | | | 1.77 | |
| |
| | | | | | | | | | | | | |
Total Bank | | | | | | | | | | | | |
Interest spread(1) | | | 2.05 | | | | 2.07 | | | | 2.09 | |
Benefit of interest free liabilities, provisions and equity(2) | | | 0.36 | | | | 0.37 | | | | 0.34 | |
| |
Net interest margin(3) | | | 2.41 | | | | 2.44 | | | | 2.43 | |
| |
| | |
| (1) | | Difference between the average interest rate earned and the average interest rate paid on funds. |
| |
| (2) | | A portion of the Bank’s interest earning assets is funded by interest free liabilities and shareholders’ equity. The benefit to the Bank of these interest free funds is the amount it would cost to replace them at the average cost of funds. |
| |
| (3) | | Net interest income divided by average interest earning assets for the year. |
| | | |
| 76 | | Commonwealth Bank of Australia |
Appendices
3. Average Balances and Related Interest
The following table lists the major categories of interest earning assets and interest bearing liabilities of the Bank together with the respective interest earned or paid and the average interest rate for each of the periods ending 31 December 2005, 30 June 2005 and 31 December 2004. Averages used were predominately daily averages. Interest is accounted for based on product yield, while all trading gains and losses are disclosed as trading income within other banking income.
Where assets or liabilities are hedged, the amounts are shown net of the hedge, however individual items not separately hedged may be affected by movements in exchange rates.
The overseas component comprises overseas branches of the Bank and overseas domiciled controlled entities.
Non-accrual loans were included in interest earning assets under loans, advances and other.
There was no increase in the official cash rate in Australia during the six months ended 31 December 2005, while rates in New Zealand increased by a total of 50 basis points during the period.
Average Balances
| | | | | | | | | | | | | | | | | | | | | | | | | | | | | | | | | | | | | |
| | | Half Year Ended 31/12/05 | | | Half Year Ended 30/06/05 | | | Half Year Ended 31/12/04 | |
| | | Avg Bal | | | Income | | | Yield | | | Avg Bal | | | Income | | | Yield | | | Avg Bal | | | Income | | | Yield | |
| Interest Earning Assets | | $M | | | $M | | | % | | | $M | | | $M | | | % | | | $M | | | $M | | | % | |
| |
| Home loans excluding securitisation | | | 144,879 | | | | 4,925 | | | | 6.74 | | | | 136,102 | | | | 4,529 | | | | 6.71 | | | | 128,135 | | | | 4,240 | | | | 6.56 | |
Personal(1) | | | 15,878 | | | | 868 | | | | 10.84 | | | | 15,342 | | | | 810 | | | | 10.65 | | | | 13,901 | | | | 731 | | | | 10.43 | |
| Business and corporate | | | 64,975 | | | | 2,410 | | | | 7.36 | | | | 60,261 | | | | 2,021 | | | | 6.76 | | | | 57,226 | | | | 1,918 | | | | 6.65 | |
| |
Loans, Advances and Other Receivables | | | 225,732 | | | | 8,203 | | | | 7.21 | | | | 211,705 | | | | 7,360 | | | | 7.01 | | | | 199,262 | | | | 6,889 | | | | 6.86 | |
| |
| Cash and other liquid assets | | | 10,965 | | | | 278 | | | | 5.03 | | | | 10,969 | | | | 219 | | | | 4.03 | | | | 10,986 | | | | 208 | | | | 3.76 | |
| Assets at fair value through Income Statement (excluding life insurance) | | | 18,822 | | | | 511 | | | | 5.39 | | | | 14,960 | | | | 391 | | | | 5.27 | | | | 15,803 | | | | 394 | | | | 4.95 | |
| Investment Securities | | | — | | | | — | | | | — | | | | 12,723 | | | | 379 | | | | 6.01 | | | | 13,099 | | | | 344 | | | | 5.21 | |
| Available-for-sale investments | | | 11,650 | | | | 294 | | | | 5.01 | | | | — | | | | — | | | | — | | | | — | | | | — | | | | — | |
| |
Non Lending Interest Earning Assets | | | 41,437 | | | | 1,083 | | | | 5.18 | | | | 38,652 | | | | 989 | | | | 5.16 | | | | 39,888 | | | | 946 | | | | 4.70 | |
| |
Total interest earning assets (excluding securitisation)(2) | | | 267,169 | | | | 9,286 | | | | 6.89 | | | | 250,357 | | | | 8,349 | | | | 6.73 | | | | 239,150 | | | | 7,835 | | | | 6.50 | |
| Securitisation home loan assets | | | 10,013 | | | | 352 | | | | 6.97 | | | | 9,932 | | | | 343 | | | | 6.96 | | | | 7,227 | | | | 254 | | | | 6.97 | |
| Non interest earning assets | | | 67,613 | | | | | | | | | | | | 70,197 | | | | | | | | | | | | 70,448 | | | | | | | | | |
| |
Total Average Assets | | | 344,795 | | | | | | | | | | | | 330,486 | | | | | | | | | | | | 316,825 | | | | | | | | | |
| |
| | | | | | | | | | | | | | | | | | | | | | | | | | | | | | | | | | | | | |
Interest Bearing Liabilities | | | | | | | | | | | | | | | | | | | | | | | | | | | | | | | | | | | | |
| |
| Transaction deposits | | | 33,259 | | | | 466 | | | | 2.78 | | | | 32,454 | | | | 414 | | | | 2.57 | | | | 31,132 | | | | 356 | | | | 2.27 | |
| Savings deposits | | | 39,075 | | | | 695 | | | | 3.53 | | | | 38,193 | | | | 638 | | | | 3.37 | | | | 38,249 | | | | 636 | | | | 3.30 | |
| Investment deposits | | | 64,948 | | | | 1,984 | | | | 6.06 | | | | 65,577 | | | | 1,870 | | | | 5.75 | | | | 62,498 | | | | 1,748 | | | | 5.55 | |
| Certificates of deposits and other | | | 19,500 | | | | 746 | | | | 7.59 | | | | 25,467 | | | | 704 | | | | 5.57 | | | | 26,193 | | | | 697 | | | | 5.28 | |
| |
Total Interest Bearing Deposits | | | 156,782 | | | | 3,891 | | | | 4.92 | | | | 161,691 | | | | 3,626 | | | | 4.52 | | | | 158,072 | | | | 3,437 | | | | 4.31 | |
| |
| Payable due to other financial Institutions | | | 8,982 | | | | 213 | | | | 4.70 | | | | 8,181 | | | | 131 | | | | 3.23 | | | | 7,820 | | | | 126 | | | | 3.20 | |
| Liabilities at fair value through the Income Statement | | | 15,084 | | | | 261 | | | | 3.43 | | | | — | | | | — | | | | — | | | | — | | | | — | | | | — | |
| Debt issue | | | 57,696 | | | | 1,352 | | | | 4.65 | | | | 54,277 | | | | 1,378 | | | | 5.12 | | | | 48,556 | | | | 1,179 | | | | 4.82 | |
| Loan Capital | | | 8,585 | | | | 322 | | | | 7.44 | | | | 6,203 | | | | 186 | | | | 6.05 | | | | 6,471 | | | | 165 | | | | 5.06 | |
| Other interest bearing liabilities | | | | | | | | | | | | | | | | | | | | | | | | | | | | | | | | | | | | |
| |
Total Interest Bearing Liabilities | | | 247,129 | | | | 6,039 | | | | 4.85 | | | | 230,352 | | | | 5,321 | | | | 4.66 | | | | 220,919 | | | | 4,907 | | | | 4.41 | |
| Securitisation debt issues | | | 11,231 | | | | 315 | | | | 5.56 | | | | 11,124 | | | | 303 | | | | 5.49 | | | | 8,718 | | | | 224 | | | | 5.10 | |
Non Interest Bearing Liabilities | | | 65,161 | | | | | | | | | | | | 66,609 | | | | | | | | | | | | 65,524 | | | | | | | | | |
| |
Total Average Liabilities | | | 323,521 | | | | | | | | | | | | 308,085 | | | | | | | | | | | | 295,161 | | | | | | | | | |
| |
| | |
| (1) | | Personal includes personal loans, credit cards, and margin loans. |
| |
| (2) | | Used for calculating net interest margin. |
Profit Announcement 77
Appendices
3. Average Balances and Related Interest(continued)
| | | | | | | | | | | | | | | | | | | | | | | | | | | | | | | | | | | | | |
| | | Half Year Ended 31/12/05 | | | Half Year Ended 30/06/05 | | | Half Year Ended 31/12/04 | |
| | | Avg Bal | | | Income | | | Yield | | | Avg Bal | | | Income | | | Yield | | | Avg Bal | | | Income | | | Yield | |
| Net Interest Margin | | $M | | | $M | | | % | | | $M | | | $M | | | % | | | $M | | | $M | | | % | |
| |
| Total interest earning assets excluding securitisation | | | 267,169 | | | | 9,286 | | | | 6.90 | | | | 250,357 | | | | 8,349 | | | | 6.73 | | | | 239,150 | | | | 7,835 | | | | 6.50 | |
| Total interest bearing liabilities excluding securitisation | | | 247,129 | | | | 6,039 | | | | 4.85 | | | | 230,352 | | | | 5,321 | | | | 4.66 | | | | 220,919 | | | | 4,907 | | | | 4.41 | |
| |
Net interest income & interest spread (excluding securitisation) | | | | | | | 3,247 | | | | 2.05 | | | | | | | | 3,028 | | | | 2.07 | | | | | | | | 2,928 | | | | 2.09 | |
| |
| Benefit of free funds | | | | | | | | | | | 0.36 | | | | | | | | | | | | 0.37 | | | | | | | | | | | | 0.34 | |
| |
Net interest margin | | | | | | | | | | | 2.41 | | | | | | | | | | | | 2.44 | | | | | | | | | | | | 2.43 | |
| |
| | | | | | | | | | | | | | | | | | | | | |
| | | | | | | | | | | | | | | Dec 05 vs | | | Dec 05 vs | |
| Reconciliation of Net Interest Margin | | 31/12/05 | | | 30/06/05 | | | 31/12/04 | | | Jun 05 % | | | Dec 04 % | |
| |
Net interest income on AGAAP equivalent basis (1)($M) | | | 3,241 | | | | 3,033 | | | | 2,933 | | | | 7 | | | | 11 | |
| Average interest earning assets (excl securitisation) ($M) | | | 267,169 | | | | 250,357 | | | | 239,150 | | | | 7 | | | | 12 | |
| Net interest margin pro-forma basis % | | | 2.41 | | | | 2.44 | | | | 2.43 | | | (3)bpts | | (2)bpts |
| |
| | |
| (1) | | Refer page 93 for a reconciliation of Net Interest Income (AIFRS to AGAAP equivalent) |
Geographical analysis of key categories
| | | | | | | | | | | | | | | | | | | | | | | | | | | | | | | | | | | | | |
| | | Half Year Ended 31/12/05 | | | Half Year Ended 30/06/05 | | | Half Year Ended 31/12/04 | |
| | | Avg Bal | | | Income | | | Yield | | | Avg Bal | | | Income | | | Yield | | | Avg Bal | | | Income | | | Yield | |
| Loans, Advances and Other | | $M | | | $M | | | % | | | $M | | | $M | | | % | | | $M | | | $M | | | % | |
| |
| Australia | | | 186,994 | | | | 6,797 | | | | 7.21 | | | | 176,197 | | | | 6,080 | | | | 6.96 | | | | 166,382 | | | | 5,742 | | | | 6.85 | |
| Overseas | | | 38,738 | | | | 1,406 | | | | 7.20 | | | | 35,508 | | | | 1,280 | | | | 7.27 | | | | 32,880 | | | | 1,147 | | | | 6.92 | |
| |
Total | | | 225,732 | | | | 8,203 | | | | 7.21 | | | | 211,705 | | | | 7,360 | | | | 7.01 | | | | 199,262 | | | | 6,889 | | | | 6.86 | |
| |
| | | | | | | | | | | | | | | | | | | | | | | | | | | | | | | | | | | | | |
Non Lending Interest Earning Assets | | | | | | | | | | | | | | | | | | | | | | | | | | | | | | | | | | | | |
| Australia | | | 23,560 | | | | 628 | | | | 5.29 | | | | 21,633 | | | | 574 | | | | 5.35 | | | | 22,399 | | | | 564 | | | | 4.99 | |
| Overseas | | | 17,877 | | | | 455 | | | | 5.05 | | | | 17,019 | | | | 415 | | | | 4.92 | | | | 17,489 | | | | 382 | | | | 4.33 | |
| |
Total | | | 41,437 | | | | 1,083 | | | | 5.18 | | | | 38,652 | | | | 989 | | | | 5.16 | | | | 39,888 | | | | 946 | | | | 4.70 | |
| |
| | | | | | | | | | | | | | | | | | | | | | | | | | | | | | | | | | | | | |
Total Interest Bearing Deposits | | | | | | | | | | | | | | | | | | | | | | | | | | | | | | | | | | | | |
| Australia | | | 134,212 | | | | 3,083 | | | | 4.56 | | | | 135,402 | | | | 2,756 | | | | 4.10 | | | | 133,344 | | | | 2,666 | | | | 3.97 | |
| Overseas | | | 22,570 | | | | 808 | | | | 7.10 | | | | 26,289 | | | | 870 | | | | 6.67 | | | | 24,728 | | | | 771 | | | | 6.19 | |
| |
Total | | | 156,782 | | | | 3,891 | | | | 4.92 | | | | 161,691 | | | | 3,626 | | | | 4.52 | | | | 158,072 | | | | 3,437 | | | | 4.31 | |
| |
| | | | | | | | | | | | | | | | | | | | | | | | | | | | | | | | | | | | | |
Other Interest Bearing Liabilities | | | | | | | | | | | | | | | | | | | | | | | | | | | | | | | | | | | | |
| Australia | | | 56,359 | | | | 1,498 | | | | 5.27 | | | | 44,260 | | | | 1,289 | | | | 5.87 | | | | 40,027 | | | | 1,177 | | | | 5.83 | |
| Overseas | | | 33,989 | | | | 650 | | | | 3.79 | | | | 24,401 | | | | 406 | | | | 3.36 | | | | 22,820 | | | | 293 | | | | 2.55 | |
| |
Total | | | 90,348 | | | | 2,148 | | | | 4.72 | | | | 68,661 | | | | 1,695 | | | | 4.98 | | | | 62,847 | | | | 1,470 | | | | 4.64 | |
| |
The overseas component comprises overseas branches of the Bank and overseas domiciled controlled entities. Overseas intragroup borrowing’s have been adjusted into the interest spread and margin calculations to more appropriately reflect the overseas cost of funds. Non–accrual loans were included in interest earning assets under loans, advances and other receivables.
In calculating net interest margin, assets, liabilities, interest income and interest expense related to securitisation vehicles have been excluded. This has been done to more accurately reflect the Banks underlying net margin.
78 Commonwealth Bank of Australia
Appendices
4. Interest Rate and Volume Analysis
| | | | | | | | | |
| | | Half Year Ended | |
| | | 31/12/05 | | | 31/12/05 | |
| | | vs 31/12/04 | | | vs 30/06/05 | |
| | | Increase/ | | | Increase/ | |
| | | (Decrease) | | | (Decrease) | |
| Change in Net Interest Income | | $M | | | $M | |
| |
| Due to changes in average volume of interest earning assets and interest bearing liabilities | | | 342 | | | | 206 | |
| Due to changes in interest margin | | | (23 | ) | | | (37 | ) |
| Due to variation in time period | | | — | | | | 50 | |
| |
Change in net interest income | | | 319 | | | | 219 | |
| |
| | | | | | | | | | | | | | | | | | | | | | | | | |
| | | Dec 05 vs Jun 05 | | | Dec 05 vs Dec 04 | |
| | | Volume | | | Rate | | | Total | | | Volume | | | Rate | | | Total | |
| Interest Earning Assets | | $M | | | $M | | | $M | | | $M | | | $M | | | $M | |
| |
| Home loans | | | 295 | | | | 101 | | | | 396 | | | | 562 | | | | 123 | | | | 685 | |
| Personal | | | 29 | | | | 29 | | | | 58 | | | | 106 | | | | 31 | | | | 137 | |
| Business and corporate | | | 166 | | | | 223 | | | | 389 | | | | 274 | | | | 218 | | | | 492 | |
| |
Loans, advances and other receivables | | | 499 | | | | 344 | | | | 843 | | | | 939 | | | | 375 | | | | 1,314 | |
| |
| Cash and other liquid assets | | | — | | | | 59 | | | | 59 | | | | — | | | | 70 | | | | 70 | |
| Assets at fair value through Income Statement (excluding life insurance) | | | 103 | | | | 17 | | | | 120 | | | | 78 | | | | 39 | | | | 117 | |
| Investment securities | | | (189 | ) | | | (190 | ) | | | (379 | ) | | | (173 | ) | | | (171 | ) | | | (344 | ) |
| Available-for-sale investments | | | (30 | ) | | | (55 | ) | | | (85 | ) | | | (37 | ) | | | (13 | ) | | | (50 | ) |
| |
Non lending interest earning assets | | | 72 | | | | 22 | | | | 94 | | | | 39 | | | | 98 | | | | 137 | |
| |
Total interest earning assets | | | 572 | | | | 365 | | | | 937 | | | | 946 | | | | 505 | | | | 1,451 | |
| Securitisation home loan assets | | | 3 | | | | 6 | | | | 9 | | | | 98 | | | | — | | | | 98 | |
| |
| | | | | | | | | | | | | | | | | | | | | | | | | |
Interest Bearing Liabilities | | | | | | | | | | | | | | | | | | | | | | | | |
| |
| Transaction deposits | | | 11 | | | | 41 | | | | 52 | | | | 27 | | | | 83 | | | | 110 | |
| Savings deposits | | | 15 | | | | 42 | | | | 57 | | | | 14 | | | | 45 | | | | 59 | |
| Investment deposits | | | (19 | ) | | | 133 | | | | 114 | | | | 72 | | | | 164 | | | | 236 | |
| Certificates of deposits and other | | | (197 | ) | | | 239 | | | | 42 | | | | (217 | ) | | | 266 | | | | 49 | |
| |
Total interest bearing deposits | | | (116 | ) | | | 381 | | | | 265 | | | | (30 | ) | | | 484 | | | | 454 | |
| |
| Payable due to other financial institutions | | | 16 | | | | 66 | | | | 82 | | | | 23 | | | | 64 | | | | 87 | |
| Liabilities at fair value through Income Statement | | | 131 | | | | 130 | | | | 261 | | | | 131 | | | | 130 | | | | 261 | |
| Debt issues | | | 83 | | | | (109 | ) | | | (26 | ) | | | 218 | | | | (45 | ) | | | 173 | |
| Loan capital | | | 80 | | | | 56 | | | | 136 | | | | 67 | | | | 90 | | | | 157 | |
| Other interest bearing liabilities | | | — | | | | — | | | | — | | | | — | | | | — | | | | — | |
| |
Total interest bearing liabilities | | | 399 | | | | 319 | | | | 718 | | | | 611 | | | | 521 | | | | 1,132 | |
| |
| Securitised debt issues | | | 3 | | | | 9 | | | | 12 | | | | 68 | | | | 23 | | | | 91 | |
| |
Profit Announcement 79
Appendices
4. Interest Rate and Volume Analysis(continued)
These volume and rate analyses were for half year periods. The calculations were based on balances over the half year. The volume and rate variances for total interest earning assets and liabilities have been calculated separately (rather than being the sum of the individual categories).
| | | | | | | | | | | | | | | | | | | | | | | | | |
| | | Dec 05 vs Jun 05 | | | Dec 05 vs Dec 04 | |
| | | Volume | | | Rate | | | Total | | | Volume | | | Rate | | | Total | |
| Geographical analysis of key categories | | $M | | | $M | | | $M | | | SM | | | $M | | | $M | |
| |
Loans, Advances and Other | | | | | | | | | | | | | | | | | | | | | | | | |
| Australia | | | 383 | | | | 334 | | | | 717 | | | | 730 | | | | 325 | | | | 1,055 | |
| Overseas | | | 117 | | | | 9 | | | | 126 | | | | 208 | | | | 51 | | | | 259 | |
| |
Total | | | 499 | | | | 344 | | | | 843 | | | | 939 | | | | 375 | | | | 1,314 | |
| |
| | | | | | | | | | | | | | | | | | | | | | | | | |
Non Lending Interest Earning Assets | | | | | | | | | | | | | | | | | | | | | | | | |
| Australia | | | 51 | | | | 3 | | | | 54 | | | | 30 | | | | 34 | | | | 64 | |
| Overseas | | | 21 | | | | 19 | | | | 40 | | | | 9 | | | | 64 | | | | 73 | |
| |
Total | | | 72 | | | | 22 | | | | 94 | | | | 39 | | | | 98 | | | | 137 | |
| |
| | | | | | | | | | | | | | | | | | | | | | | | | |
Total Interest Bearing Deposits | | | | | | | | | | | | | | | | | | | | | | | | |
| Australia | | | (26 | ) | | | 353 | | | | 327 | | | | 19 | | | | 398 | | | | 417 | |
| Overseas | | | (128 | ) | | | 66 | | | | (62 | ) | | | (72 | ) | | | 109 | | | | 37 | |
| |
Total | | | (116 | ) | | | 381 | | | | 265 | | | | (30 | ) | | | 484 | | | | 454 | |
| |
| | | | | | | | | | | | | | | | | | | | | | | | | |
Other Interest Bearing Liabilities | | | | | | | | | | | | | | | | | | | | | | | | |
| Australia | | | 337 | | | | (128 | ) | | | 209 | | | | 457 | | | | (136 | ) | | | 321 | |
| Overseas | | | 171 | | | | 73 | | | | 244 | | | | 178 | | | | 179 | | | | 357 | |
| |
Total | | | 525 | | | | (72 | ) | | | 453 | | | | 649 | | | | 29 | | | | 678 | |
| |
5. Other Banking Operating Income
| | | | | | | | | | | | | | | | | | | | | |
| | | Half Year Ended | |
| | | 31/12/05 | | | 30/06/05 | | | 31/12/04 | | | Dec 05 vs | | | Dec 05 vs | |
| | | $M | | | $M | | | $M | | | Jun 05 % | | | Dec 04 % | |
| |
| Lending fees | | | 389 | | | | 384 | | | | 349 | | | | 1 | | | | 11 | |
| Commission and other fees | | | 815 | | | | 768 | | | | 777 | | | | 6 | | | | 5 | |
| Trading income | | | 244 | | | | 221 | | | | 219 | | | | 10 | | | | 11 | |
| Net (loss)/gain on disposal of non-trading instruments: | | | | | | | | | | | | | | | | | | | | |
| Loans | | | — | | | | (14 | ) | | | 1 | | | | — | | | | — | |
| Available-for-sale investments | | | 1 | | | | — | | | | — | | | | — | | | | — | |
| Net revaluation gain transferred from equity | | | 3 | | | | — | | | | — | | | | — | | | | — | |
| Funding specific provision | | | (3 | ) | | | — | | | | — | | | | — | | | | — | |
| Other financial instruments (incl hedging derivatives) | | | (69 | ) | | | — | | | | — | | | | — | | | | — | |
| Dividends | | | 1 | | | | 2 | | | | 1 | | | | (50 | ) | | | — | |
| Net profit/(loss) on sale of property, plant and equipment | | | — | | | | 3 | | | | 1 | | | large | | | large | |
| Other | | | 35 | | | | 98 | | | | 35 | | | | (64 | ) | | | — | |
| |
Total other banking operating income | | | 1,416 | | | | 1,462 | | | | 1,383 | | | | (3 | ) | | | 2 | |
| |
80 Commonwealth Bank of Australia
Appendices
6. Operating Expenses
| | | | | | | | | | | | | | | | | | | | | |
| | | Half Year Ended | |
| | | | | | | | | | | | | | | Dec 05 vs | | | Dec 05 vs | |
| | | 31/12/05 | | | 30/06/05 | | | 31/12/04 | | | Jun 05 | | | Dec 04 | |
| Expenses(1) | | $M | | | $M | | | $M | | | % | | | % | |
| |
| Operating expenses | | | 2,967 | | | | 2,878 | | | | 2,841 | | | | (3 | ) | | | (4 | ) |
| Which new Bank | | | — | | | | 122 | | | | 28 | | | large | | | large | |
| |
Total | | | 2,967 | | | | 3,000 | | | | 2,869 | | | | 1 | | | | (3 | ) |
| |
| | | | | | | | | | | | | | | | | | | | | |
| | | Half Year Ended | |
| | | | | | | | | | | | | | | Dec 05 vs | | | Dec 05 vs | |
| | | 31/12/05 | | | 30/06/05 | | | 31/12/04 | | | Jun 05 | | | Dec 04 | |
| Expenses by Segment(1) | | $M | | | $M | | | $M | | | % | | | % | |
| |
Operating expenses | | | | | | | | | | | | | | | | | | | | |
| Banking | | | 2,260 | | | | 2,201 | | | | 2,179 | | | | (3 | ) | | | (4 | ) |
| Funds management | | | 459 | | | | 398 | | | | 400 | | | | (15 | ) | | | (15 | ) |
| Insurance | | | 248 | | | | 279 | | | | 262 | | | | 11 | | | | 5 | |
| |
| | | | 2,967 | | | | 2,878 | | | | 2,841 | | | | (3 | ) | | | (4 | ) |
| |
Which new Bank | | | | | | | | | | | | | | | | | | | | |
| Banking | | | — | | | | 97 | | | | 15 | | | large | | | large | |
| Funds management | | | — | | | | 24 | | | | 12 | | | large | | | large | |
| Insurance | | | — | | | | 1 | | | | 1 | | | large | | | large | |
| |
| | | | — | | | | 122 | | | | 28 | | | large | | | large | |
| |
Total | | | 2,967 | | | | 3,000 | | | | 2,869 | | | | 1 | | | | (3 | ) |
| |
| | | | | | | | | | | | | | | | | | | | | |
| | | Half Year Ended | |
| | | | | | | | | | | | | | | Dec 05 vs | | | Dec 05 vs | |
| | | 31/12/05 | | | 30/06/05 | | | 31/12/04 | | | Jun 05 | | | Dec 04 | |
| Expenses by Category(1) | | $M | | | $M | | | $M | | | % | | | % | |
| |
| Staff | | | 1,364 | | | | 1,302 | | | | 1,297 | | | | (5 | ) | | | (5 | ) |
Share based compensation(2) | | | 22 | | | | 37 | | | | 37 | | | | 41 | | | | 41 | |
| Occupancy and equipment | | | 310 | | | | 308 | | | | 305 | | | | (1 | ) | | | (2 | ) |
| Information technology services | | | 502 | | | | 476 | | | | 480 | | | | (5 | ) | | | (5 | ) |
| Other expenses | | | 769 | | | | 755 | | | | 722 | | | | (2 | ) | | | (7 | ) |
| |
Operating expenses | | | 2,967 | | | | 2,878 | | | | 2,841 | | | | (3 | ) | | | (4 | ) |
| |
| Which new Bank | | | — | | | | 122 | | | | 28 | | | large | | | large | |
| |
Total | | | 2,967 | | | | 3,000 | | | | 2,869 | | | | 1 | | | | (3 | ) |
| |
| | |
| (1) | | For further breakdown of operating expenses refer to Note 3 on page 61. |
| |
| (2) | | Reduction in share based compensation reflects the cessation of the mandatory component of the equity participation plan in February 2005, which is now paid in cash and included within salaries and wages. |
Capitalisation of Computer Software Costs
Capitalised computer software costs (net of amortisation) totalled $188 million as at 31 December 2005 (June 2005: $182 million and December 2004: $163 million). Expenditure in the period principally comprises development of Which new Bank customer focussed systems.
Profit Announcement 81
Appendices
7. Integrated Risk Management (Excludes Insurance and Funds Management)
The major categories of risk actively managed by the Bank include credit risk, liquidity and funding risk, market risk and other operational risks. The 2005 Annual Report pages 30 to 32, Integrated Risk Management, detail the major risks managed by a diversified financial institution.
Credit Risk
The Bank uses a portfolio approach for the management of its credit risk. A key element is a well diversified portfolio. The Bank is using various portfolio management tools to assist in diversifying the credit portfolio. The 8.1% exposure to ‘Property and Business Services’ in the table below includes 0.6% of commercial property exposure for which the risk has effectively been transferred to third party investors by way of a synthetic securitisation transaction.
The commercial portfolio remains well rated and we experience low actual bad debts during the year.
| | | | | | | | | | | | | |
| | | 31/12/05 | | | 30/06/05 | | | 31/12/04 | |
| Industry on Balance Sheet Exposure | | % | | | % | | | % | |
| |
| Accommodation, cafes and restaurants | | | 1.0 | | | | 1.2 | | | | 1.1 | |
| Agriculture, forestry and fishing | | | 3.0 | | | | 3.2 | | | | 3.2 | |
| Communication services | | | 0.3 | | | | 0.3 | | | | 0.3 | |
| Construction | | | 1.4 | | | | 1.4 | | | | 1.4 | |
| Cultural and recreational services | | | 0.6 | | | | 0.7 | | | | 0.8 | |
| Electricity, gas and water supply | | | 1.9 | | | | 1.7 | | | | 1.4 | |
| Finance and insurance | | | 11.4 | | | | 11.6 | | | | 10.7 | |
| Government administration and defence | | | 1.4 | | | | 1.6 | | | | 2.5 | |
| Health and community services | | | 1.6 | | | | 1.8 | | | | 1.7 | |
| Manufacturing | | | 2.9 | | | | 3.2 | | | | 3.1 | |
| Mining | | | 0.8 | | | | 0.7 | | | | 0.6 | |
| Personal and other services | | | 0.5 | | | | 0.5 | | | | 0.4 | |
| Property and business services | | | 8.1 | | | | 8.4 | | | | 8.1 | |
| Retail trade | | | 1.8 | | | | 2.0 | | | | 2.0 | |
| Transport and storage | | | 2.0 | | | | 2.1 | | | | 2.0 | |
| Wholesale trade | | | 1.4 | | | | 1.3 | | | | 1.1 | |
| Consumer | | | 59.9 | | | | 58.3 | | | | 59.6 | |
| |
| | | | 100.0 | | | | 100.0 | | | | 100.0 | |
| |
The Bank is traditionally a large home loan provider in both Australia and New Zealand (see “Consumer” above), where historically losses have been less than 0.03% of the portfolio in most years.
| | | | | | | | | | | | | |
| | | 31/12/05 | | | 30/06/05 | | | 31/12/04 | |
| Regional Credit Exposure | | % | | | % | | | % | |
| |
| Australia | | | 82.9 | | | | 83.8 | | | | 83.4 | |
| New Zealand | | | 13.5 | | | | 11.7 | | | | 12.7 | |
| Europe | | | 2.2 | | | | 3.1 | | | | 2.2 | |
| Americas | | | 0.7 | | | | 0.7 | | | | 1.3 | |
| Asia | | | 0.6 | | | | 0.6 | | | | 0.3 | |
| Other | | | 0.1 | | | | 0.1 | | | | 0.1 | |
| |
| | | | 100.0 | | | | 100.0 | | | | 100.0 | |
| |
The Bank has the bulk of committed exposures concentrated in Australia and New Zealand.
| | | | | | | | | | | | | |
| | | 31/12/05 | | | 30/06/05 | | | 31/12/04 | |
| Commercial Portfolio Quality | | % | | | % | | | % | |
| |
| AAA/AA | | | 29 | | | | 32 | | | | 32 | |
| A | | | 22 | | | | 18 | | | | 18 | |
| BBB | | | 16 | | | | 16 | | | | 16 | |
| Other | | | 33 | | | | 34 | | | | 34 | |
| |
| | | | 100 | | | | 100 | | | | 100 | |
| |
As a percentage of commercial portfolio exposure (including finance and insurances) which has been individually risk rated, the Bank has 67% of commercial exposures at investment grade quality.
| | | | | | | | | | | | | |
| Consumer Portfolio Quality | | 31/12/05 | | | 30/06/05 | | | 31/12/04 | |
| |
| Housing loans accruing but past 90 days or more ($M) | | | 154 | | | | 183 | | | | 176 | |
Housing loan balances ($M)(1) | | | 150,215 | | | | 139,859 | | | | 134,258 | |
| Arrears rate (%) | | | 0.10 | | | | 0.13 | | | | 0.13 | |
| |
| (1) | | Housing loan balances are net of securitisation and include home equity and similar facilities. |
82 Commonwealth Bank of Australia
Appendices
7. Integrated Risk Management(continued)
The Bank in its daily operations is exposed to a number of market risks (which are detailed in the 2005 Annual Report under Integrated Risk Management (pages 30 to 32) and Note 39 Market Risk).
Interest Rate Risk
Interest rate risk in the balance sheet is discussed within Note 39 of the 2005 Annual Report.
Next 12 months’ Earnings
The potential impact on net interest earnings of a 1% parallel rate shock and the expected change in price of assets and liabilities held for purposes other than trading is as follows:
| | | | | | | | | | | | | |
| | | 31/12/05 | | | 30/06/05 | | | 31/12/04 | |
| Interest Rate Risk | | % | | | % | | | % | |
| |
| (expressed as a % of expected next 12 months’ earnings) | | | | | | | | | | | | |
| Average monthly exposure | | | 1.2 | | | | 1.1 | | | | 1.0 | |
| High month exposure | | | 1.8 | | | | 1.5 | | | | 1.5 | |
| Low month exposure | | | 0.2 | | | | 0.5 | | | | 0.5 | |
| |
Value at Risk (VaR)
VaR within Financial Markets Trading is discussed in the 2005 Annual Report (page 31 Integrated Risk Management). The following table provides a summary of VaR by type.
| | | | | | | | | | | | | |
| | | Average VaR | | | Average VaR | | | Average VaR | |
| | | During | | | During | | | During | |
| | | December 2005 | | | June 2005 | | | December 2004 | |
| | | Half Year | | | Half Year | | | Half Year | |
| VaR Expressed based on 97. 5% confidence | | $M | | | $M | | | $M | |
| |
Group | | | | | | | | | | | | |
| Interest rate risk | | | 2.65 | | | | 3.44 | | | | 3.68 | |
| Exchange rate risk | | | 0.53 | | | | 0.26 | | | | 0.58 | |
| Implied volatility risk | | | 0.61 | | | | 0.49 | | | | 0.53 | |
| Equities risk | | | 0.08 | | | | 0.04 | | | | 0.22 | |
| Commodities risk | | | 0.36 | | | | 0.18 | | | | 0.34 | |
| Prepayment risk | | | 0.28 | | | | 0.38 | | | | 0.54 | |
| ASB Bank | | | 0.36 | | | | 0.22 | | | | 0.26 | |
| Diversification benefit | | | (1.40 | ) | | | (0.98 | ) | | | (1.64 | ) |
| |
| Total general market risk | | | 3.47 | | | | 4.03 | | | | 4.51 | |
| Credit spread risk | | | 5.74 | | | | 4.85 | | | | 4.67 | |
| |
Total | | | 9.21 | | | | 8.88 | | | | 9.18 | |
| |
| | | | | | | | | | | | | |
| | | Average VaR | | | Average VaR | | | Average VaR | |
| | | During | | | During | | | During | |
| | | December 2005 | | | June 2005 | | | December 2004 | |
| | | Half Year | | | Half Year | | | Half Year | |
| VaR Expressed based on 99. 0% confidence | | $M | | | $M | | | $M | |
| |
Group | | | | | | | | | | | | |
| Interest rate risk | | | 3.36 | | | | 4.78 | | | | 4.72 | |
| Exchange rate risk | | | 0.62 | | | | 0.31 | | | | 0.70 | |
| Implied volatility risk | | | 0.95 | | | | 0.73 | | | | 0.70 | |
| Equities risk | | | 0.09 | | | | 0.05 | | | | 0.30 | |
| Commodities risk | | | 0.45 | | | | 0.21 | | | | 0.41 | |
| Prepayment risk | | | 0.28 | | | | 0.38 | | | | 0.54 | |
| ASB Bank | | | 0.48 | | | | 0.32 | | | | 0.34 | |
| Diversification benefit | | | (1.93 | ) | | | (1.28 | ) | | | (2.01 | ) |
| |
| Total general market risk | | | 4.30 | | | | 5.50 | | | | 5.70 | |
| Credit spread risk | | | 6.81 | | | | 5.75 | | | | 5.54 | |
| |
Total | | | 11.11 | | | | 11.25 | | | | 11.24 | |
| |
Profit Announcement 83
Appendices
8. Capital Adequacy
| | | | | | | | | | | | | |
| | | 31/12/05 | | | 30/06/05 | | | 31/12/04 | |
| Risk-Weighted Capital Ratios | | % | | | % | | | % | |
| |
| Tier One | | | 7.54 | | | | 7.46 | | | | 7.46 | |
| Tier Two | | | 3.28 | | | | 3.21 | | | | 3.13 | |
| Less deductions | | | (1.01 | ) | | | (0.92 | ) | | | (0.99 | ) |
| |
Total | | | 9.81 | | | | 9.75 | | | | 9.60 | |
| |
Adjusted Common Equity(1) | | | 5.00 | | | | 4.91 | | | | 4.76 | |
| |
| | | | | | | | | | | | | |
| | | 31/12/05 | | | 30/06/05 | | | 31/12/04 | |
| Regulatory Capital | | $M | | | $M | | | $M | |
| |
Tier One capital | | | | | | | | | | | | |
| Shareholders’ equity | | | 19,850 | | | | 26,060 | | | | 25,067 | |
Reverse effect to shareholder’s equity of AIFRS transition(2) (3) | | | 7,183 | | | | | | | | — | |
Reverse effect AIFRS during 6 months to 31 December 2005:(2) | | | | | | | | | | | | |
Purchase/(sale) and vesting of treasury shares(4) | | | (18 | ) | | | — | | | | — | |
Actuarial gains and losses from defined benefits superannuation plan(4) | | | (68 | ) | | | — | | | | — | |
Realised gains and dividend income on treasury shares held with in the Bank’s life insurance statutory funds(4) | | | (25 | ) | | | — | | | | — | |
Cash flow hedge reserve(4) | | | (23 | ) | | | — | | | | — | |
Employee compensation reserve(4) | | | 5 | | | | — | | | | — | |
General reserve for credit loss(4) | | | (25 | ) | | | — | | | | — | |
Available-for-sale investments(4) | | | 13 | | | | — | | | | — | |
Defined benefit superannuation plan expense(5) | | | 19 | | | | — | | | | — | |
Treasury share valuation adjustment(5) | | | 43 | | | | — | | | | — | |
| Other | | | 31 | | | | — | | | | — | |
| |
| Adjusted shareholders’ equity per APRA’s transitional arrangements | | | 26,985 | | | | 26,060 | | | | 25,067 | |
| Eligible loan capital | | | 317 | | | | 304 | | | | 298 | |
Estimated reinvestment under Dividend Reinvestment Plan(6) | | | 221 | | | | 272 | | | | 206 | |
| Foreign currency translation reserve related to non-consolidated subsidiaries | | | 160 | | | | 211 | | | | 216 | |
| Deduct: | | | | | | | | | | | | |
Asset revaluation reserve(7) | | | (117 | ) | | | (92 | ) | | | (61 | ) |
| Expected dividend | | | (1,211 | ) | | | (1,434 | ) | | | (1,083 | ) |
Goodwill(8) | | | (4,392 | ) | | | (4,394 | ) | | | (4,555 | ) |
Intangible component of investment in non–consolidated subsidiaries(9) | | | (5,397 | ) | | | (5,397 | ) | | | (4,964 | ) |
| Minority interest in entities controlled by non–consolidated subsidiaries | | | — | | | | (111 | ) | | | (111 | ) |
| Minority interest in insurance statutory funds and other funds | | | (1,158 | ) | | | (1,158 | ) | | | (1,413 | ) |
| Capitalised expenses | | | (107 | ) | | | (107 | ) | | | (98 | ) |
| Other | | | (11 | ) | | | (13 | ) | | | (15 | ) |
| |
Total Tier One capital | | | 15,290 | | | | 14,141 | | | | 13,487 | |
| |
Tier Two capital | | | | | | | | | | | | |
Collective provision for impairment losses(10) | | | 1,041 | | | | — | | | | — | |
General reserve for credit loss (pre-tax equivalent)(10) | | | 404 | | | | — | | | | — | |
| |
| General provision for bad and doubtful debts | | | 1,445 | | | | 1,389 | | | | 1,379 | |
| FITB related to general provision for bad and doubtful debts | | | (434 | ) | | | (414 | ) | | | (411 | ) |
Asset revaluation reserve(7) | | | 117 | | | | 92 | | | | 61 | |
| Upper Tier Two note and bond issues | | | 232 | | | | 237 | | | | 250 | |
Lower Tier Two note and bond issues(11) (12) | | | 5,349 | | | | 4,783 | | | | 4,374 | |
| Other | | | (65 | ) | | | — | | | | — | |
| |
Total Tier Two capital | | | 6,644 | | | | 6,087 | | | | 5,653 | |
| |
Total Capital | | | 21,934 | | | | 20,228 | | | | 19,140 | |
| |
| (1) | | Adjusted Common Equity (“ACE”) is one measure considered by Standard & Poor’s in evaluating the Bank’s credit rating. The ACE ratio has been calculated in accordance with the pre AIFRS Standard & Poor’s methodology. |
| |
| (2) | | APRA requires regulatory capital to continue to be calculated in accordance with AGAAP accounting principles until 1 July 2006. As such, all material changes to capital resulting from the Bank adopting AIFRS accounting standards on 1 July 2005 have been reversed from regulatory capital. |
| |
| (3) | | Refer to page 54 for details of the 1 July 2005 changes to Shareholders’ Equity upon transition to AIFRS. |
| |
| (4) | | Refer to pages 69 and 70 for details of changes to Shareholders’ Equity during the 6 months to 31 December 2005. |
| |
| (5) | | Refer to page 28 for details of the AIFRS profit adjustments during the 6 months to 31 December 2005. |
| |
| (6) | | Based on reinvestment experience related to the Bank’s Dividend Reinvestment Plan. |
| |
| (7) | | The Bank agreed with APRA to adopt AIFRS on 1 July 2005 for the reporting of the Asset Revaluation Reserve. |
| |
| (8) | | Consistent with APRA requirements goodwill is reported on an AGAAP basis. |
| |
| (9) | | Per APRA’s transitional arrangements, it was agreed to deduct the value as at 30 June 2005 of the intangible component of the carrying value of the life insurance and funds management business from Tier 1 capital, until 1 July 2006. |
| |
| (10) | | APRA requires the Bank to continue loan impairment provisioning on an AGAAP basis until 1 July 2006. As such the Bank has established a General Reserve for Credit Loss. The addition of the Collective Provision and the General Reserve for Credit Loss approximates the level of the former provision. |
| |
| (11) | | APRA requires these Lower Tier Two note and bond issues to be included as if they were un–hedged. |
| |
| (12) | | For regulatory capital purposes, Lower Tier Two note and bond issues are amortised by 20% of the original amount during each of the last five years to maturity. |
84 Commonwealth Bank of Australia
Appendices
8. Capital Adequacy(continued)
| | | | | | | | | | | | | |
| | | 31/12/05 | | | 30/06/05 | | | 31/12/04 | |
| Regulatory Capital | | $M | | | $M | | | $M | |
| |
Total capital | | | 21,934 | | | | 20,228 | | | | 19,140 | |
| Deduct: | | | | | | | | | | | | |
| Investment in non–consolidated subsidiaries (net of intangible component deducted from Tier One capital): | | | | | | | | | | | | |
| Shareholders’ net tangible assets in life and funds management businesses | | | (1,517 | ) | | | (2,513 | ) | | | (2,460 | ) |
Reverse effect of transition to AIFRS(1) | | | (592 | ) | | | — | | | | — | |
| Capital in other non-consolidated subsidiaries | | | (321 | ) | | | (348 | ) | | | (404 | ) |
Value of acquired inforce business(2) | | | (1,339 | ) | | | (1,152 | ) | | | (1,152 | ) |
| Less: non-recourse debt | | | 1,851 | | | | 2,292 | | | | 2,240 | |
| |
| | | | (1,918 | ) | | | (1,721 | ) | | | (1,776 | ) |
| Other deductions | | | (130 | ) | | | (28 | ) | | | (27 | ) |
| |
Capital base | | | 19,886 | | | | 18,479 | | | | 17,337 | |
| |
| (1) | | APRA requires regulatory capital to continue to be calculated in accordance with AGAAP accounting principles until 1 July 2006. As such, all material changes to capital resulting from the Bank adopting AIFRS accounting standards on 1 July 2005 have been reversed from regulatory capital. |
| |
| (2) | | Per APRA’s transitional arrangements, it was agreed to deduct the value as at 30 June 2005 of acquired in force business from Total Capital, until 1 July 2006. However, values as at 30 June 2005 have been adjusted to reflect the acquisition of the Gandel Group interests in Colonial First State Property Retail Trust and Gandel Retail Management Trust. |
| | | | | | | | | | | | | |
| | | 31/12/05 | | | 30/06/05 | | | 31/12/04 | |
| Adjusted Common Equity(1) | | $M | | | $M | | | $M | |
| |
Tier One capital | | | 15,290 | | | | 14,141 | | | | 13,487 | |
| Deduct: | | | | | | | | | | | | |
| Eligible loan capital | | | (317 | ) | | | (304 | ) | | | (298 | ) |
| Preference share capital | | | (687 | ) | | | (687 | ) | | | (687 | ) |
| Other equity instruments | | | (1,573 | ) | | | (1,573 | ) | | | (1,573 | ) |
| Minority interest (net of minority interest component deducted from Tier One capital) | | | (523 | ) | | | (520 | ) | | | (518 | ) |
| Investment in non–consolidated subsidiaries (net of intangible component deducted from Tier One capital) | | | (1,918 | ) | | | (1,721 | ) | | | (1,776 | ) |
| Other deductions | | | (130 | ) | | | (28 | ) | | | (27 | ) |
| |
Total Adjusted Common Equity | | | 10,142 | | | | 9,308 | | | | 8,608 | |
| |
| (1) | | Adjusted Common Equity (“ACE”) is one measure considered by Standard & Poor’s in evaluating the Bank’s credit rating. The ACE ratio has been calculated in accordance with the pre AIFRS Standard & Poor’s methodology. |
| | | | | | | | | | | | | | | | | | | | | | | | | | | | | |
| | | | | | | | | | | | | | | Risk | | | | |
| | | Face Value | | | Weights | | | Risk-Weighted Balance | |
| | | 31/12/05 | | | 30/06/05 | | | 31/12/04 | | | | | | | 31/12/05 | | | 30/06/05 | | | 31/12/04 | |
| | | $M | | | $M | | | $M | | | % | | | $M | | | $M | | | $M | |
| |
Risk-Weighted Assets | | | | | | | | | | | | | | | | | | | | | | | | | | | | |
| | | | | | | | | | | | | | | | | | | | | | | | | | | | | |
On balance sheet assets | | | | | | | | | | | | | | | | | | | | | | | | | | | | |
| Cash, claims on Reserve Bank, short term claims on Australian Commonwealth and State Government and Territories, and other zero–weighted assets | | | 25,677 | | | | 27,447 | | | | 27,741 | | | | 0 | | | | — | | | | — | | | | — | |
| Claims on OECD banks and local governments | | | 18,771 | | | | 14,754 | | | | 14,718 | | | | 20 | | | | 3,754 | | | | 2,951 | | | | 2,944 | |
| Advances secured by residential property | | | 154,274 | | | | 143,746 | | | | 137,589 | | | | 50 | | | | 77,137 | | | | 71,873 | | | | 68,795 | |
| All other assets | | | 99,794 | | | | 92,510 | | | | 87,961 | | | | 100 | | | | 99,794 | | | | 92,510 | | | | 87,961 | |
| |
Total on balance sheet assets — credit risk | | | 298,516 | | | | 278,457 | | | | 268,009 | | | | | | | | 180,685 | | | | 167,334 | | | | 159,700 | |
| |
Total off balance sheet exposures — credit risk | | | | | | | | | | | | | | | | | | | 18,626 | | | | 19,371 | | | | 18,300 | |
| |
Risk-weighted assets — market risk | | | | | | | | | | | | | | | | | | | 3,356 | | | | 2,854 | | | | 2,674 | |
| |
Total risk-weighted assets | | | | | | | | | | | | | | | | | | | 202,667 | | | | 189,559 | | | | 180,674 | |
| |
profit Announcement 85
Appendices
8. Capital Adequacy(continued)
Active Capital Management
The Bank maintains a strong capital position. The Tier One Capital Ratio increased from 7.46% to 7.54% and the Total Capital Ratio increased from 9.75% to 9.81% during the six months to 31 December 2005. The Bank’s credit ratings remained unchanged.
During the period, the Bank achieved strong growth in Risk Weighted Assets from $190 billion to $203 billion.
The Bank adopted the Australian equivalent of International Financial Reporting Standards (“AIFRS”) on 1 July 2005. However, APRA requires reporting under AGAAP accounting principles to continue for regulatory capital purposes until the expected introduction of revised prudential standards on 1 July 2006. The Bank has agreed transitional reporting arrangements with APRA whereby all material impacts of the adoption of AIFRS are reversed for regulatory reporting purposes.
The following significant initiatives were undertaken to actively manage the Bank’s capital:
Tier One Capital
| • | | Issue of $262 million shares in October 2005 to satisfy the Dividend Reinvestment Plan (“DRP”) in respect of the final dividend for 2004/05; |
| • | | In accordance with APRA guidelines, the estimated issue of $221 million shares to satisfy the DRP in respect of the interim dividend for 2005/06. |
Further details of these transactions are provided in Appendix 9
Tier Two Capital
| • | | Issue of the equivalent of A$767 million Lower Tier Two capital; |
| • | | In accordance with APRA guidelines, the reduction in Tier Two note and bond issues of A$197 million due to amortisation; |
| • | | The call and maturity of the equivalent of A$78 million of Tier Two note and bond issues; and |
| • | | Increase in Tier Two note and bond issues of $71 million resulting from changes in foreign exchange movements (whilst these notes are hedged, the unhedged value is included in the calculation of regulatory capital in accordance with APRA regulations). |
Deductions from Total Capital
The following movements in deductions have occurred during the period:
| • | | The Bank acquired a 19.9% interest in Hangzhou City Commercial Bank for A$102 million. |
| • | | $182 million increase in retained profits of the insurance and funds management business. |
| • | | As a result of the sale of CMG Asia in October 2005, the $145 million profit realised on the sale of the business was repatriated to the Bank and $463 million was used to repay part of the non-recourse debt funding in the Bank’s life and funds management business. |
As required by APRA, the Bank’s investment in its life insurance and funds management companies is deducted from regulatory capital to arrive at the Bank’s Capital Ratios. The Bank’s insurance and funds management companies held an estimated A$208 million excess over regulatory capital requirements at 31 December 2005 in aggregate. The decrease in surplus capital reflects the liability arising upon the acquisition of Gandel in October 2005. Upon funding of the acquisition in January and April 2006, the surplus capital of the insurance and funds management companies will increase by $367 million.
86 Commonweath Bank of Australia
Appendices
9. Share Capital
| | | | | | | | | |
| | | Half Year Ended 31 December 2005 | |
| Ordinary Share Capital | | Shares Issued | | | $M | |
| |
| Opening balance 1 July 2005 (including treasury shares deduction) | | | 1,266,764,403 | | | | 13,486 | |
| Dividend reinvestment plan: 2004/2005 Final Dividend | | | 7,032,857 | | | | 262 | |
| Share buy back | | | (25,000 | ) | | | (1 | ) |
| Exercise of executive options | | | 1,278,700 | | | | 36 | |
| (Purchase)/sale and vesting of treasury shares | | | 2,744,268 | | | | 18 | |
| |
| Closing balance 31 December 2005 | | | 1,277,795,228 | | | | 13,801 | |
| |
| | | | | | | | | |
| | | 31/12/05 | | | 30/6/05 | |
| Shares on Issue | | Shares Issued | | | Shares Issued | |
| |
| Opening balance (excluding treasury share deduction) | | | 1,280,276,172 | | | | 1,273,876,008 | |
| Dividend reinvestment plan issue: | | | | | | | | |
| 2004/2005 Final dividend fully paid ordinary shares at $37.19 | | | 7,032,857 | | | | — | |
| 2004/2005 Interim dividend fully paid ordinary shares at $39.90 | | | — | | | | 5,581,364 | |
| Share buy back | | | (25,000 | ) | | | — | |
| Exercise under executive option plan | | | 1,278,700 | | | | 818,800 | |
| |
| Closing balance (excluding treasury shares deduction) | | | 1,288,562,729 | | | | 1,280,276,172 | |
| Less treasury shares | | | (10,767,501 | ) | | | (13,511,769 | ) |
| |
| Closing balance | | | 1,277,795,228 | | | | 1,266,764,403 | |
| |
Terms and Conditions of Ordinary Share Capital
Ordinary shares have the right to receive dividends as declared and in the event of winding up the company, to participating in the proceeds from sale of surplus assets in proportion to the number of and amount paid up on shares held.
A shareholder has one vote on a show of hands and one vote for each fully paid share on a poll. A shareholder may be present at a general meeting in person or by proxy or attorney, and if a body corporate it may also authorise a representative.
Dividend Franking Account
After fully franking the interim dividend to be paid for the half year ended 31 December 2005 the amount of credits available, as at 31 December 2005 to frank dividends for subsequent financial years is $324 million (June 2005: $194 million). This figure is based on the combined franking accounts of the Bank at 31 December 2005, which have been adjusted for franking credits that will arise from the payment of income tax payable on profits for the half year ended 31 December 2005, franking debits that will arise from the payment of dividends proposed for the year and franking credits that the Bank may be prevented from distributing in subsequent financial periods. The Bank expects the future tax payments will generate sufficient franking credits for the Bank to be able to fully frank future dividend payments. These calculations have been based on the taxation law as at 31 December 2005.
Dividends
The Directors have declared a fully franked interim dividend of 94 cents per share amounting to $1,211 million. The dividend will be payable on 5 April 2006 to shareholders on the register at 5pm on 24 February 2006.
Dividends per share are based on net profit after tax (“cash basis” excluding the profit on sale of the Hong Kong business) per share, having regard to a range of factors including:
| • | | Current and expected rates of business growth and the mix of business; |
| • | | Capital needs to support economic, regulatory and credit ratings requirements; |
| • | | The rate of return on assets; and |
| • | | Investments and/or divestments to support business development. |
| Dividends paid since the end of the previous financial year: |
| • | | As declared in last year’s Annual Report, a fully franked final dividend of 112 cents per share amounting to $1,435 million was paid on 23 September 2005. The payment comprised cash disbursements of $1,173 million with $262 million being reinvested by participants through the Dividend Reinvestment Plan. |
Share Buy Back
On 28 October 2005 the Bank announced an on-market buy back of up to $500 million of the Bank’s ordinary shares. The buy back is being undertaken as part of the Bank’s active capital management.
Dividend Reinvestment Plan
The Bank expects to issue around $221 million of shares in respect of the Dividend Reinvestment Plan for the interim dividend for 2005/06.
The Dividend Reinvestment Plan continues to be capped at 10,000 shares per shareholder.
Record Date
The register closes for determination of dividend entitlement and for participation in the DRP at 5:00pm on 24 February 2006 at Link Market Services, Locked Bag A14, Sydney South, 1235.
Ex Dividend Date
The ex-dividend date is 20 February 2006.
Profit Annoucement 87
Appendices
10. Life Company Policy Liabilities
Policy Liabilities
Appropriately qualified actuaries have been appointed in respect of each life insurance business and they have reviewed and satisfied themselves as to the accuracy of the policy liabilities included in this financial report, including compliance with the regulations of the Life Insurance Act (Life Act) 1995 where appropriate.
| | | | | | | | | | | | | |
| | | 31/12/05 | | | 30/06/05 | | | 31/12/04 | |
| Components of Policy Liabilities | | $M | | | $M | | | $M | |
| |
Future policy benefits(1) | | | 24,861 | | | | 27,790 | | | | 27,701 | |
| Future bonuses | | | 1,106 | | | | 1,385 | | | | 1,362 | |
| Future expenses | | | 1,851 | | | | 1,829 | | | | 1,757 | |
| Future profit margins | | | 1,224 | | | | 1,795 | | | | 1,596 | |
| Future charges for acquisition expenses | | | (450 | ) | | | (540 | ) | | | (542 | ) |
| Balance of future premiums | | | (5,604 | ) | | | (7,660 | ) | | | (6,966 | ) |
| Provisions for bonuses not allocated to participating policyholders | | | 67 | | | | 95 | | | | 59 | |
| |
Total policy liabilities | | | 23,055 | | | | 24,694 | | | | 24,967 | |
| |
| (1) | | Including bonuses credited to policyholders in prior years. |
Taxation
Taxation has been allowed for in the determination of policy liabilities in accordance with the relevant legislation applicable in each territory.
Actuarial Methods and Assumptions
Policy liabilities have been calculated in accordance with AASB 1038 (Life Insurance Contracts), AASB 139 (Financial instruments: Recognition and Measurement) and the Margin on Services (MoS) methodology as set out in Actuarial Standard 1.04 – Valuation Standard (‘AS1.04’) issued by the Insurance Actuarial Standards Board (‘LIASB’). The principal methods and profit carriers used for particular product groups were as follows:
| | | | | |
| | | | |
| Product Type | | Method | | Profit Carrier |
| |
| | | | | |
Individual | | | | |
| |
| Conventional | | Projection | | Bonuses or expected claim payments |
| Investment account | | Projection | | Bonuses or funds under management |
| Investment linked | | Accumulation | | Not applicable |
| Lump sum risk | | Projection | | Premiums/claims |
| Income stream risk | | Projection | | Expected claim payments |
| Immediate annuities | | Projection | | Annuity payments |
| |
| | | | | |
Group | | | | |
| |
| Investment account | | Projection | | Bonuses or funds under management |
| Investment linked | | Accumulation | | Not applicable |
| Lump sum risk | | Accumulation | | Not applicable |
| Income stream risk | | Projection | | Expected claim payments |
| |
The ‘Projection Method’ measures the present values of estimated future policy cash flows to calculate policy liabilities. The policy cash flows incorporate investment income, premiums, expenses, redemptions and benefit payments.
The ‘Accumulation Method’ for investment linked measures the accumulation of amounts invested by policyholders plus investment earnings less fees specified in the policy to calculate policy liabilities.
Bonuses were amounts added, at the discretion of the life insurer, to the benefits currently payable under Participating Business. Under the Life Act, bonuses are a distribution to policyholders of profits and may take a number of forms including reversionary bonuses, interest credits and terminal bonuses (payable on the termination of the policy).
Actuarial assumptions
Set out on the next page is a summary of the material assumptions used in the calculation of policy liabilities.
Discount rates
These were the rates used to discount future cash flows to determine their net present value in the policy liabilities. The discount rates were risk free rates or were determined with reference to the expected earnings rate of the assets that support the policy liabilities adjusted for taxation where relevant. The following table shows the applicable rates for the major classes of business in Australia and New-Zealand. The changes relate to changes in long term earnings rates and asset mix.
88 Commonweath Bank of Australia
Appendices
10. Life Company Policy Liabilities(continued)
| | | | | | | | | |
| | | December 2005 | | | June 2005 | |
| Class of Business | | Rate Range % | | | Rate Range % | |
| |
| Traditional — ordinary business (after tax) | | | 5.59 — 6.34 | | | | 5.52 — 6.26 | |
| Traditional — superannuation business (after tax) | | | 6.82 — 7.76 | | | | 6.74 — 7.67 | |
| Annuity business (after tax) | | | 5.61 — 5.88 | | | | 5.71 — 6.49 | |
| Term insurance — ordinary business (before tax) | | | 5.02 — 5.32 | | | | 5.11 — 5.50 | |
| Term insurance — superannuation business (before tax) | | | 5.02 — 5.32 | | | | 5.11 — 5.50 | |
| Income Protection business (before tax) | | | 5.02 — 5.32 | | | | 5.11 | |
| Investment linked — ordinary business (after tax) | | | 4.03 — 5.80 | | | | 4.98 — 5.69 | |
| Investment linked — superannuation business (after tax) | | | 4.89 — 6.81 | | | | 6.50 — 6.71 | |
| Investment linked — exempt (after tax) | | | 5.75 — 7.72 | | | | 7.38 — 7.61 | |
| Investment account — ordinary business (after tax) | | | 3.80 | | | | 3.74 | |
| Investment account — superannuation business (after tax) | | | 4.63 | | | | 4.55 | |
| Investment account — exempt (after tax) | | | 5.40 | | | | 5.31 | |
| |
Bonuses
The calculation assumes that the long-term supportable bonuses will be paid, which is in line with company bonus philosophy. There have been no significant changes to these assumptions.
Maintenance expenses
The maintenance expenses are based on an internal analysis of experience and are assumed to increase in line with inflation each year and to be sufficient to cover the cost of servicing the business in the coming year after adjusting for one off expenses. For Participating Business, expenses continue on the previous charging basis with adjustments for actual experience and are assumed to increase in line with inflation each year.
Investment management expenses
There have been no significant changes to the investment management expense assumptions.
Inflation
The inflation assumption is consistent with the investment earning assumptions.
Benefit indexation
The indexation rates were based on an analysis of past experience and estimated long term inflation and vary by business and product type. There have been no significant changes to these assumptions.
Taxation
The taxation basis and rates assumed vary by territory and product type.
Voluntary discontinuance
Discontinuance rates were based on recent company and industry experience and vary by territory, product, age and duration in force. There have been no significant changes to these assumptions.
Surrender values
Current surrender value bases were assumed to apply in the future. There have been no significant changes to these assumptions.
Unit price growth
Unit prices were assumed to grow in line with assumed investment earnings assumptions, net of asset charges as per current company practice. There have been no significant changes to these assumptions.
Mortality and morbidity
Rates vary by sex, age, product type and smoker status. Rates were based on standard mortality tables applicable to each territory e.g. IA90-92 in Australia for risk, IM/IF80 for annuities, adjusted for recent company and industry experience where appropriate.
Solvency
Australian life insurers
Australian life insurers are required to hold prudential reserves in excess of the amount of policy liabilities. These reserves are required to support capital adequacy requirements and provide protection against adverse experience. Actuarial Standard AS2.04 ‘Solvency Standard’ (‘AS2.04’) prescribes a minimum capital requirement and the minimum level of assets required to be held in each insurance fund. All controlled Australian insurance entities complied with the solvency requirements of AS2.04. Further information is available from the individual statutory returns of subsidiary life insurers.
Overseas life insurers
Overseas insurance subsidiaries were required to hold reserves in excess of policy liabilities in accordance with local Acts and prudential rules. Each of the overseas subsidiaries complied with local requirements.
Managed assets & fiduciary activities
Arrangements were in place to ensure that asset management and other fiduciary activities of controlled entities were independent of the insurance funds and other activities of the Bank.
Disaggregated information
Life Insurance business is conducted through a number of life insurance entities in Australia and overseas. Under the Australian Life Insurance Act 1995, life insurance business is conducted within one or more separate statutory funds that were distinguished from each other and from the shareholders’ funds.
profit Announcement 89
Appendices
11. Intangible Assets
| | | | | | | | | | | | | |
| | | 31/12/05 | | | 30/06/05 | | | 31/12/04 | |
| Total Intangible Assets | | $M | | | $M | | | $M | |
| |
| Goodwill | | | 7,214 | | | | 7,214 | | | | 7,214 | |
| Computer software costs | | | 188 | | | | 182 | | | | 163 | |
| Other | | | 338 | | | | 260 | | | | 261 | |
| |
Total | | | 7,740 | | | | 7,656 | | | | 7,638 | |
| |
| | | | | | | | | | | | | |
Goodwill | | | | | | | | | | | | |
| Purchased goodwill — Colonial | | | 6,705 | | | | 6,705 | | | | 6,705 | |
| Purchased goodwill — other | | | 509 | | | | 509 | | | | 509 | |
| |
| Total goodwill | | | 7,214 | | | | 7,214 | | | | 7,214 | |
| |
| | | | | | | | | | | | | |
Goodwill (reconciliation) | | | | | | | | | | | | |
| Opening balance | | | 7,214 | | | | 7,214 | | | | 7,184 | |
| Additions | | | — | | | | — | | | | 30 | |
| |
| Total goodwill | | | 7,214 | | | | 7,214 | | | | 7,214 | |
| |
| | | | | | | | | | | | | |
Computer Software Costs | | | | | | | | | | | | |
| Cost | | | 228 | | | | 206 | | | | 174 | |
| Accumulated amortisation | | | (40 | ) | | | (24 | ) | | | (11 | ) |
| |
| Total computer software costs | | | 188 | | | | 182 | | | | 163 | |
| |
| | | | | | | | | | | | | |
Computer Software Costs (reconciliation) | | | | | | | | | | | | |
| Opening balance | | | 182 | | | | 163 | | | | 107 | |
| Additions: | | | | | | | | | | | | |
| From internal development | | | 22 | | | | 32 | | | | 60 | |
| Amortisation | | | (16 | ) | | | (13 | ) | | | (4 | ) |
| |
| Closing balance | | | 188 | | | | 182 | | | | 163 | |
| |
| | | | | | | | | | | | | |
Other | | | | | | | | | | | | |
| Cost | | | 347 | | | | 267 | | | | 267 | |
| Accumulated amortisation | | | (9 | ) | | | (7 | ) | | | (6 | ) |
| |
| Total other | | | 338 | | | | 260 | | | | 261 | |
| |
| | | | | | | | | | | | | |
Other (reconciliation) | | | | | | | | | | | | |
| Opening balance | | | 260 | | | | 261 | | | | 250 | |
| Additions: | | | | | | | | | | | | |
| From acquisitions | | | 80 | | | | — | | | | 13 | |
| Amortisation | | | (2 | ) | | | (1 | ) | | | (2 | ) |
| |
| Closing balance | | | 338 | | | | 260 | | | | 261 | |
| |
90 Commonwealth Bank of Australia
Appendices
12. ASB Bank Group
| | | | | | | | | | | | | | | | | | | | | | | | | |
| | | Half Year Ended | |
| | | 31/12/05 | | | 30/06/05 | | | 31/12/04 | | | 31/12/05 | | | 30/06/05 | | | 31/12/04 | |
| Income Statement | | NZ$M | | | NZ$M | | | NZ$M | | | A$M | | | A$M | | | A$M | |
| |
| Interest income | | | 1,534 | | | | 1,403 | | | | 1,279 | | | | 1,419 | | | | 1,295 | | | | 1,129 | |
| Interest expense | | | 1,142 | | | | 1,008 | | | | 898 | | | | 1,056 | | | | 930 | | | | 793 | |
| |
Net interest earnings | | | 392 | | | | 395 | | | | 381 | | | | 363 | | | | 365 | | | | 336 | |
| Other income | | | 175 | | | | 137 | | | | 131 | | | | 162 | | | | 127 | | | | 116 | |
| |
Total operating income | | | 567 | | | | 532 | | | | 512 | | | | 525 | | | | 492 | | | | 452 | |
| Impairment losses on advances | | | 10 | | | | 8 | | | | 8 | | | | 9 | | | | 7 | | | | 7 | |
| |
Total operating income after debt provisions expense | | | 557 | | | | 524 | | | | 504 | | | | 516 | | | | 485 | | | | 445 | |
Total operating expense | | | 243 | | | | 234 | | | | 236 | | | | 225 | | | | 216 | | | | 208 | |
| Salaries and other staff expense | | | 134 | | | | 130 | | | | 128 | | | | 124 | | | | 120 | | | | 113 | |
| Building occupancy and equipment expense | | | 43 | | | | 40 | | | | 40 | | | | 40 | | | | 37 | | | | 35 | |
| Information technology expense | | | 26 | | | | 25 | | | | 27 | | | | 24 | | | | 23 | | | | 24 | |
| Other expenses | | | 40 | | | | 39 | | | | 41 | | | | 37 | | | | 36 | | | | 36 | |
| |
Net surplus before taxation | | | 314 | | | | 290 | | | | 268 | | | | 291 | | | | 269 | | | | 237 | |
| Taxation | | | 97 | | | | 93 | | | | 86 | | | | 90 | | | | 86 | | | | 76 | |
| |
Net surplus after taxation | | | 217 | | | | 197 | | | | 182 | | | | 201 | | | | 183 | | | | 161 | |
| |
| | | | | | | | | | | | | | | | | | | | | | | | | |
| | | As At | |
| | | 31/12/05 | | | 30/06/05 | | | 31/12/04 | | | 31/12/05 | | | 30/06/05 | | | 31/12/04 | |
| Balance Sheet | | NZ$M | | | NZ$M | | | NZ$M | | | A$M | | | A$M | | | A$M | |
| |
Assets | | | | | | | | | | | | | | | | | | | | | | | | |
| Cash and liquid assets | | | 123 | | | | 53 | | | | 140 | | | | 115 | | | | 49 | | | | 128 | |
| Due from other banks | | | 1,500 | | | | 521 | | | | 1,159 | | | | 1,401 | | | | 478 | | | | 1,057 | |
| Money market advances | | | 1,540 | | | | — | | | | — | | | | 1,438 | | | | — | | | | — | |
| Securities at fair value through Income Statement | | | 2,323 | | | | — | | | | — | | | | 2,169 | | | | — | | | | — | |
| Derivative assets | | | 326 | | | | — | | | | — | | | | 304 | | | | — | | | | — | |
| Investment securities | | | — | | | | 399 | | | | 414 | | | | — | | | | 366 | | | | 377 | |
| Other securities | | | — | | | | 2,497 | | | | 3,076 | | | | — | | | | 2,291 | | | | 2,804 | |
| Advances to customers | | | 35,611 | | | | — | | | | — | | | | 33,250 | | | | — | | | | — | |
| Advances | | | — | | | | 34,978 | | | | 31,554 | | | | — | | | | 32,089 | | | | 28,764 | |
| General provisions for bad and doubtful debts | | | — | | | | (123 | ) | | | (115 | ) | | | — | | | | (113 | ) | | | (105 | ) |
| Property, plant and equipment | | | 146 | | | | 149 | | | | 132 | | | | 136 | | | | 137 | | | | 120 | |
| Intangible assets | | | 16 | | | | 15 | | | | 17 | | | | 15 | | | | 14 | | | | 15 | |
| Other assets | | | 164 | | | | 293 | | | | 238 | | | | 153 | | | | 269 | | | | 217 | |
| Deferred taxation benefit | | | — | | | | 14 | | | | 10 | | | | — | | | | 13 | | | | 9 | |
| |
Total assets | | | 41,749 | | | | 38,796 | | | | 36,625 | | | | 38,981 | | | | 35,593 | | | | 33,386 | |
| |
Total interest earning and discount bearing assets | | | 40,943 | | | | 38,395 | | | | 36,205 | | | | 38,229 | | | | 35,225 | | | | 33,004 | |
| |
| | | | | | | | | | | | | | | | | | | | | | | | | |
Liabilities | | | | | | | | | | | | | | | | | | | | | | | | |
| Deposits and other borrowings | | | | | | | | | | | | | | | | | | | | | | | | |
| Money and market deposits | | | 14,532 | | | | — | | | | — | | | | 13,568 | | | | — | | | | — | |
| Derivative liabilities | | | 291 | | | | — | | | | — | | | | 272 | | | | — | | | | — | |
| Deposits from customers | | | 19,447 | | | | — | | | | — | | | | 18,158 | | | | — | | | | — | |
| Deposits | | | — | | | | 31,959 | | | | 28,978 | | | | — | | | | 29,320 | | | | 26,416 | |
| Due to other banks | | | 4,482 | | | | 4,091 | | | | 4,834 | | | | 4,185 | | | | 3,753 | | | | 4,407 | |
| Other liabilities | | | 295 | | | | 463 | | | | 493 | | | | 275 | | | | 425 | | | | 449 | |
| Deferred taxation liabilities | | | 14 | | | | — | | | | — | | | | 13 | | | | — | | | | — | |
| Provision for taxation | | | 37 | | | | 14 | | | | 45 | | | | 35 | | | | 13 | | | | 41 | |
| Subordinated debt | | | — | | | | — | | | | 151 | | | | — | | | | — | | | | 138 | |
| |
Total liabilities | | | 39,098 | | | | 36,527 | | | | 34,501 | | | | 36,506 | | | | 33,511 | | | | 31,451 | |
| |
| | | | | | | | | | | | | | | | | | | | | | | | | |
Shareholder Equity | | | | | | | | | | | | | | | | | | | | | | | | |
| Contributed capital — ordinary shareholder | | | 323 | | | | 323 | | | | 323 | | | | 302 | | | | 296 | | | | 294 | |
| Asset revaluation reserve | | | 18 | | | | 18 | | | | 14 | | | | 17 | | | | 17 | | | | 13 | |
| Cash flow hedge reserves | | | 57 | | | | — | | | | — | | | | 53 | | | | — | | | | — | |
| Accumulated surplus | | | 1,703 | | | | 1,378 | | | | 1,237 | | | | 1,590 | | | | 1,264 | | | | 1,128 | |
| Ordinary shareholders’ equity | | | 2,101 | | | | 1,719 | | | | 1,574 | | | | 1,962 | | | | 1,577 | | | | 1,435 | |
| Contributed capital — perpetual preference shareholders | | | 550 | | | | 550 | | | | 550 | | | | 514 | | | | 505 | | | | 501 | |
| Total shareholders’ equity | | | 2,651 | | | | 2,269 | | | | 2,124 | | | | 2,476 | | | | 2,082 | | | | 1,936 | |
| |
Total liabilities and shareholders’ equity | | | 41,749 | | | | 38,796 | | | | 36,625 | | | | 38,982 | | | | 35,593 | | | | 33,387 | |
| |
Total interest and discount bearing liabilities | | | 37,164 | | | | 34,802 | | | | 32,718 | | | | 34,700 | | | | 31,928 | | | | 29,825 | |
| |
| | | | | | | | | | | | | |
| | | 31/12/05 | | | 30/06/05 | | | 31/12/04 | |
| Exchange Rates | | A$M | | | A$M | | | A$M | |
| |
| Closing rate | | | 1. 071 | | | | 1. 090 | | | | 1. 097 | |
| Average rate | | | 1. 081 | | | | 1. 083 | | | | 1. 133 | |
| |
Profit Announcement 91
Appendices
13. Sale of the Hong Kong Business
The Bank sold its life insurance and financial planning business in Hong Kong on 7 July 2005. The transaction was completed on 18 October 2005, and a profit of A$145 million was realised. To assist with the period-on-period comparison of the Bank’s operating performance, the operating result of the Hong Kong business set out below needs to be excluded from the Insurance segment and the consolidated result.
| | | | | | | | | | | | | |
| | | Half Year Ended |
| | | 31/12/05 | | | 30/06/05 | | | 31/12/04 | |
| | | $M | | | $M | | | $M | |
| |
| Insurance income | | | 42 | | | | 67 | | | | 61 | |
| |
Total income | | | 42 | | | | 67 | | | | 61 | |
| Operating expenses | | | 33 | | | | 62 | | | | 63 | |
| |
Total expenses | | | 33 | | | | 62 | | | | 63 | |
| |
Operating performance | | | 9 | | | | 5 | | | | (2 | ) |
| Shareholder investment returns — pre tax | | | 1 | | | | 16 | | | | 34 | |
| |
Shareholder operating profit before tax | | | 10 | | | | 21 | | | | 32 | |
Operating profit after tax | | | 10 | | | | 21 | | | | 32 | |
| |
Net profit after tax — cash | | | 10 | | | | 21 | | | | 32 | |
| |
Net profit after tax — underlying | | | 9 | | | | 5 | | | | (2 | ) |
| |
14. Associates and joint ventures (ASX Appendix 4D)
| | | | | | | | | |
| Details of entities over which control was lost during the year | | Date control lost | | Ownership Interest Held (%) | |
| |
| CMG Asia Limited | | 18 October 2005 | | | 100 | % |
| Commserve Financial Limited | | 18 October 2005 | | | 100 | % |
| Financial Solutions Limited | | 18 October 2005 | | | 100 | % |
| |
| | | | | |
| Details of associates and joint ventures | | | |
| As at 31 December 2005 | | Ownership Interest Held (%) | |
| |
| Computer Fleet Management | | | 50 | % |
| Cyberlynx Procurement Services | | | 50 | % |
| PT Astra CMG Life | | | 50 | % |
| AMTD Group Limited (formerly Allday Enterprises Limited) | | | 30 | % |
| China Life CMG Life Assurance Company | | | 49 | % |
| Bao Minh CMG Life Insurance Company | | | 50 | % |
| CMG CH China Funds Management Limited | | | 50 | % |
| Colonial First State Private Ltd | | | 50 | % |
| BAC Airports Pty Ltd | | | 33 | % |
| Hangzhou City Commercial Bank | | | 20 | % |
| 452 Capital Pty Limited | | | 30 | % |
| |
92 Commonwealth Bank of Australia
Appendices
15. Summary of Major AIFRS Impacts
| | | | | | | | | | | | | | | | | | | | | |
| | | Half Year Ended |
| | | 31/12/05 | | | 30/06/05 | | | 31/12/04 | | | Dec 05 vs | | | Dec 05 vs | |
| | | $M | | | $M | | | $M | | | Jun 05 % | | | Dec 04 % | |
| |
Net Interest Income (AIFRS basis) | | | 3,284 | | | | 3,068 | | | | 2,958 | | | | 7 | | | | 11 | |
| AIFRS Impacts: | | | | | | | | | | | | | | | | | | | | |
Reclassification of Securitisation OBI (1) | | | (37 | ) | | | (40 | ) | | | (31 | ) | | | | | | | | |
Income Deferral — Banking (2) | | | (8 | ) | | | 5 | | | | 6 | | | | | | | | | |
Hybrid Instruments(3) | | | 57 | | | | — | | | | — | | | | | | | | | |
Hedging & Derivatives(4) | | | (55 | ) | | | — | | | | — | | | | | | | | | |
| |
Net Interest Income (AGAAP equivalent) | | | 3,241 | | | | 3,033 | | | | 2,933 | | | | 7 | | | | 11 | |
| |
| | | | | | | | | | | | | | | | | | | | | |
Other Banking Income (AIFRS basis) | | | 1,416 | | | | 1,462 | | | | 1,383 | | | | (3 | ) | | | 2 | |
| AIFRS Impacts: | | | | | | | | | | | | | | | | | | | | |
Reclassification of Securitisation to NIE (1) | | | 37 | | | | 41 | | | | 29 | | | | | | | | | |
Income Deferral — Banking (2) | | | 6 | | | | — | | | | — | | | | | | | | | |
Hedging & Derivatives (4) | | | 69 | | | | — | | | | — | | | | | | | | | |
| |
Other Banking Income (AGAAP equivalent) | | | 1,528 | | | | 1,503 | | | | 1,412 | | | | 2 | | | | 8 | |
| |
| | | | | | | | | | | | | | | | | | | | | |
Total Banking Income (AIFRS basis) | | | 4,700 | | | | 4,530 | | | | 4,341 | | | | 4 | | | | 8 | |
| Total AIFRS Impacts | | | 69 | | | | 6 | | | | 4 | | | | | | | | | |
| |
Total Banking Income (AGAAP equivalent) | | | 4,769 | | | | 4,536 | | | | 4,345 | | | | 5 | | | | 10 | |
| |
| | | | | | | | | | | | | | | | | | | | | |
Funds Management Income (AIFRS cash basis) | | | 715 | | | | 638 | | | | 609 | | | | 12 | | | | 17 | |
| AIFRS Impacts: | | | | | | | | | | | | | | | | | | | | |
Income Deferral — Funds Management (5) | | | 20 | | | | 8 | | | | 6 | | | | | | | | | |
| |
Funds Management Income (AGAAP equivalent) | | | 735 | | | | 646 | | | | 615 | | | | 14 | | | | 20 | |
| |
| | | | | | | | | | | | | | | | | | | | | |
Insurance Income (AIFRS cash basis) | | | 386 | | | | 387 | | | | 360 | | | | — | | | | 7 | |
| AIFRS Impacts: | | | | | | | | | | | | | | | | | | | | |
Income Deferral & DAC — Insurance (5) | | | (8 | ) | | | — | | | | — | | | | | | | | | |
| |
Insurance Income (AGAAP equivalent) | | | 378 | | | | 387 | | | | 360 | | | | (2 | ) | | | 5 | |
| |
| | | | | | | | | | | | | | | | | | | | | |
Operating Expenses — comparable business (AIFRS basis) | | | 2,967 | | | | 2,878 | | | | 2,841 | | | | 3 | | | | 4 | |
| AIFRS Impacts: | | | | | | | | | | | | | | | | | | | | |
Volume Expense Deferral — Funds Management (5) | | | 18 | | | | 8 | | | | 6 | | | | | | | | | |
Share-Based Compensation & Other — Banking (6) | | | (10 | ) | | | (17 | ) | | | (19 | ) | | | | | | | | |
| |
Operating Expenses (AGAAP equivalent) | | | 2,975 | | | | 2,869 | | | | 2,828 | | | | 4 | | | | 5 | |
| |
| | | | | | | | | | | | | | | | | | | | | |
Bad and Doubtful Debts Expense (AIFRS basis) | | | 188 | | | | 176 | | | | 146 | | | | 7 | | | | 29 | |
| AIFRS Impacts: | | | | | | | | | | | | | | | | | | | | |
Movement in General Reserve for Credit Losses (7) | | | 35 | | | | — | | | | — | | | | | | | | | |
| |
Bad and Doubtful Debts Expense (AGAAP equivalent) | | | 223 | | | | 176 | | | | 146 | | | | 27 | | | | 53 | |
| |
| | | | | | | | | | | | | | | | | | | | | |
Total AIFRS Impact on Net Profit Before Tax (“cash basis”) | | | 38 | | | | 23 | | | | 23 | | | | | | | | | |
| |
| | | | | | | | | | | | | | | | | | | | | |
Total AIFRS Impact on Net Profit After Tax (“cash basis”)(8) | | | 45 | | | | 23 | | | | 23 | | | | | | | | | |
AIFRS Non-cash items: | | | | | | | | | | | | | | | | | | | | |
| Defined benefit superannuation plan expense | | | 19 | | | | 25 | | | | 28 | | | | | | | | | |
| Treasury share valuation adjustment | | | 43 | | | | 46 | | | | (7 | ) | | | | | | | | |
| |
Total AIFRS Non-Cash Items After Tax | | | 62 | | | | 71 | | | | 21 | | | | | | | | | |
| |
| | | | | | | | | | | | | | | | | | | | | |
Total AIFRS Impact on Net Profit After Tax (“statutory basis”) | | | 107 | | | | 94 | | | | 44 | | | | | | | | | |
| |
| | |
| Description of AIFRS Impacts: |
| |
| (1) | | Reclassification of Securitisation income from other banking income to net interest income. |
| |
| (2) | | Includes the netting of Fees and Commissions against Interest Income , and measuring on an effective yield basis. |
| |
| (3) | | On reclassification of hybrid instruments from equity to loan capital, preference share dividends paid are reclassified to interest paid. |
| |
| (4) | | Reclassification of interest expense on non-hedged derivatives to other banking income, and measuring all derivatives on a Fair Value basis. |
| |
| (5) | | Capitalisation and amortisation of certain funds management and insurance revenue and expense items. |
| |
| (6) | | Principally relates to share-based compensation expense arising on the final issue under the mandatory Equity Participation Plan. |
| |
| (7) | | Recalculation of loan impairment provisions. |
| |
| (8) | | Due to the tax treatment of distributions on some hybrid instruments, and non-deductibility of other expenses (e.g. share based compensation) the tax effected AIFRS impact is larger than the pre-tax impact. |
Profit Announcement 93
Appendices
15. Summary of Major AIFRS Impacts(continued)
| | | | | | | | | | | | | | | | | | | | | |
| | | Half Year Ended |
| | | 31/12/05 | | | 30/06/05 | | | 31/12/04 | | | Dec 05 vs | | | Dec 05 vs | |
| | | $M | | | $M | | | $M | | | Jun 05 | % | | Dec 04 | % |
| |
| Net Profit After Tax (“underlying basis“) (AIFRS) | | | 1,875 | | | | 1,779 | | | | 1,641 | | | | 5 | | | | 14 | |
| AIFRS Impact | | | 45 | | | | 23 | | | | 23 | | | | | | | | | |
| |
Net Profit After Tax (“underlying basis”) (AGAAP equivalent) | | | 1,920 | | | | 1,802 | | | | 1,664 | | | | 7 | | | | 15 | |
| |
| | | | | | | | | | | | | | | | | | | | | |
| Net Profit ex HK sale After Tax (“cash basis”) (AIFRS) | | | 1,916 | | | | 1,759 | | | | 1,733 | | | | 9 | | | | 11 | |
| AIFRS Impact | | | 45 | | | | 23 | | | | 23 | | | | | | | | | |
| |
Net Profit ex HK sale After Tax (“cash basis”) (AGAAP equivalent) | | | 1,961 | | | | 1,782 | | | | 1,756 | | | | 10 | | | | 12 | |
| |
| | | | | | | | | | | | | | | | | | | | | |
| Net Profit After Tax (“statutory basis”) (AIFRS) | | | 1,999 | | | | 1,688 | | | | 1,712 | | | | 18 | | | | 17 | |
| AIFRS Impact | | | 107 | | | | 94 | | | | 44 | | | | | | | | | |
| |
Net Profit After Tax (“statutory basis”) (AGAAP equivalent)(1) | | | 2,106 | | | | 1,782 | | | | 1,756 | | | | 18 | | | | 20 | |
| |
| | | | | | | | | | | | | |
| | | Half Year Ended |
| | | 31/12/05 | | | 30/06/05 | | | 31/12/04 | |
| | | $M | | | $M | | | $M | |
| |
Weighted average number of shares — cash basic (number) | | | | | | | | | | | | |
| |
| AIFRS | | | 1,281 | | | | 1,273 | | | | 1,265 | |
AIFRS Adjustments (2) | | | 4 | | | | 4 | | | | 4 | |
| |
| AGAAP | | | 1,285 | | | | 1,277 | | | | 1,269 | |
| |
| | | | | | | | | | | | | |
Weighted average number of shares — cash diluted (number) | | | | | | | | | | | | |
| |
| AIFRS | | | 1,333 | | | | 1,329 | | | | 1,331 | |
AIFRS Adjustments (3) | | | (47 | ) | | | (51 | ) | | | (61 | ) |
| |
| AGAAP | | | 1,286 | | | | 1,278 | | | | 1,270 | |
| |
| | | | | | | | | | | | | |
Weighted average number of shares — statutory basic (number) | | | | | | | | | | | | |
| |
| AIFRS | | | 1,273 | | | | 1,264 | | | | 1,256 | |
AIFRS Adjustments (4) | | | 12 | | | | 13 | | | | 13 | |
| |
| AGAAP | | | 1,285 | | | | 1,277 | | | | 1,269 | |
| |
| | | | | | | | | | | | | |
Net Assets ($M) | | | | | | | | | | | | |
| |
| AIFRS | | | 19,850 | | | | 22,643 | | | | 22,101 | |
AIFRS Adjustments (5) | | | — | | | | 3,417 | | | | 2,966 | |
| |
| AGAAP | | | 19,850 | | | | 26,060 | | | | 25,067 | |
| |
| | | | | | | | | | | | | |
Intangible Assets ($M) | | | | | | | | | | | | |
| |
| AIFRS | | | 7,740 | | | | 7,656 | | | | 7,638 | |
AIFRS Adjustments (6) | | | — | | | | (3,262 | ) | | | (3,083 | ) |
| |
| AGAAP | | | 7,740 | | | | 4,394 | | | | 4,555 | |
| |
| | | | | | | | | | | | | |
Average Interest Earning Assets ($M) | | | | | | | | | | | | |
| |
| AIFRS | | | 267,169 | | | | 250,357 | | | | 239,150 | |
AIFRS Adjustments (7) | | | — | | | | (771 | ) | | | (748 | ) |
| |
| AGAAP | | | 267,169 | | | | 249,586 | | | | 238,402 | |
| |
| | |
| Description of AIFRS Impacts: |
| |
| (1) | | Net profit after tax (“statutory basis”) (AGAAP equivalent) excludes the impact of appraisal value uplifts and goodwill amortisation from comparative periods. |
| |
| (2) | | Relates to the deduction of “Treasury Shares” held within the employee share scheme trust. |
| |
| (3) | | Relates to the dilutive impact under AIFRS which requires inclusion of hybrid instruments which have any probability of conversion to ordinary shares. |
| |
| (4) | | Relates to the deduction of all Treasury Shares. |
| |
| (5) | | Relates principally to the write-off of internally-generated appraisal value excess. |
| |
| (6) | | Relates principally to the reclassification of acquired appraisal value excess from Other assets to Intangible assets. |
| |
| (7) | | Average interest earning assets are increased under AIFRS due to the consolidation of non-home loan securitisation assets. |
94 Commonwealth Bank of Australia
Appendices
16. Analysis Template
| | | | | | | | | | | | | | | | | |
| | | Half Year Ended | | | |
| | | 31/12/05 | | | 30/06/05 | | | 31/12/04 | | | Page | |
| Profit Summary — Input Schedule | | $M | | | $M | | | $M | | | References | |
| |
Income | | | | | | | | | | | | | | | | |
| Net interest income | | | 3,284 | | | | 3,068 | | | | 2,958 | | | Page 4 |
| Other banking operating income | | | 1,416 | | | | 1,462 | | | | 1,383 | | | Page 4 |
| |
| Total banking Income | | | 4,700 | | | | 4,530 | | | | 4,341 | | | Page 9 |
| Operating income | | | 715 | | | | 638 | | | | 609 | | | Page 19 |
| Shareholder investment returns | | | 7 | | | | 9 | | | | 24 | | | Page 19 |
| |
| Funds management income | | | 722 | | | | 647 | | | | 633 | | | Page 19 |
| Operating income – life insurance | | | 347 | | | | 363 | | | | 330 | | | Page 23 |
| Operating income – general insurance | | | 39 | | | | 24 | | | | 30 | | | Page 23 |
| |
| Operating income insurance | | | 386 | | | | 387 | | | | 360 | | | Page 23 |
| Shareholder investment returns | | | 57 | | | | 83 | | | | 121 | | | Page 25 |
| Profit on sale of the Hong Kong business | | | 145 | | | | — | | | | — | | | Page 3 |
| Insurance income | | | 588 | | | | 470 | | | | 481 | | | Page 23 |
| |
Total income | | | 6,010 | | | | 5,647 | | | | 5,455 | | | Page 4 |
| |
Expenses | | | | | | | | | | | | | | | | |
| Banking | | | 2,260 | | | | 2,201 | | | | 2,179 | | | Page 9 |
| Funds management | | | 459 | | | | 398 | | | | 400 | | | Page 19 |
| Insurance | | | 248 | | | | 279 | | | | 262 | | | Page 23 |
| |
| Operating expenses | | | 2,967 | | | | 2,878 | | | | 2,841 | | | Page 4 |
| Banking | | | — | | | | 97 | | | | 15 | | | Page 9 |
| Funds management | | | — | | | | 24 | | | | 12 | | | Page 19 |
| Insurance | | | — | | | | 1 | | | | 1 | | | Page 23 |
| |
| Which new Bank expenses | | | — | | | | 122 | | | | 28 | | | Page 4 |
| |
Total expenses | | | 2,967 | | | | 3,000 | | | | 2,869 | | | Page 4 |
| |
| Profit before bad and doubtful debt expense | | | 3,043 | | | | 2,647 | | | | 2,586 | | | Page 4 |
| Bad and doubtful debt expense | | | 188 | | | | 176 | | | | 146 | | | Page 4 |
| |
| Profit before tax expense | | | 2,855 | | | | 2,471 | | | | 2,440 | | | Page 4 |
| Income tax – corporate | | | 776 | | | | 707 | | | | 702 | | | Page 4 |
| |
| Operating profit after tax | | | 2,079 | | | | 1,764 | | | | 1,738 | | | Page 4 |
| Minority interest (OEI) | | | 18 | | | | 5 | | | | 5 | | | Page 4 |
| |
Net profit after tax & OEI – cash basis | | | 2,061 | | | | 1,759 | | | | 1,733 | | | Page 4 |
| |
| Defined benefit superannuation plan expense | | | (19 | ) | | | (25 | ) | | | (28 | ) | | Page 4 |
| Treasury share valuation adjustment | | | (43 | ) | | | (46 | ) | | | 7 | | | Page 4 |
| |
Net profit after tax & OEI – statutory | | | 1,999 | | | | 1,688 | | | | 1,712 | | | Page 4 |
| |
| Investment return on shareholder funds | | | 209 | | | | 92 | | | | 145 | | | Page 25 |
| Tax expense on shareholder investment returns | | | 23 | | | | 26 | | | | 34 | | | Page 25 |
| |
| Which new Bank transformation expenses | | | — | | | | 122 | | | | 28 | | | Page 7 |
| Tax expense on Which new Bank transformation expenses | | | — | | | | (36 | ) | | | (9 | ) | | Page 7 |
| |
Which new Bank expenses – after tax | | | — | | | | 86 | | | | 19 | | | Page 7 |
| |
Net profit after tax – cash – underlying | | | 1,875 | | | | 1,779 | | | | 1,641 | | | Page 3 |
| |
Profit Annoucement 95
Appendices
16. Analysis Template(continued)
| | | | | | | | | | | | | | | | | |
| | | Half Year Ended | | | | | | | |
| | | 31/12/05 | | | 30/06/05 | | | 31/12/04 | | | Page | |
| Profit Summary — Input Schedule | | $M | | | $M | | | $M | | | References | |
| |
Other Data | | | | | | | | | | | | | | | | |
| Net interest income (excluding securitisation) | | | 3,247 | | | | 3,028 | | | | 2,928 | | | Page 78 |
| Average interest earning assets | | | 267,169 | | | | 250,357 | | | | 239,150 | | | Page 77 |
Average net assets(1) | | | 21,247 | | | | 22,372 | | | | 22,036 | | | Page 29 |
Average minority interest(1) | | | 1,156 | | | | 1,916 | | | | 2,261 | | | Page 29 |
Average preference shares & other equity instruments(1) | | | 1,130 | | | | 2,260 | | | | 2,260 | | | Page 29 |
Average treasury shares(1) | | | (376 | ) | | | (344 | ) | | | (337 | ) | | Page 87 |
Average defined benefit superannuation plan net surplus(1) | | | 471 | | | | 440 | | | | 411 | | | Page 28 |
| Preference dividends | | | 80 | | | | 70 | | | | 61 | | | Page 28 |
| Preference dividends (after tax) | | | 46 | | | | 45 | | | | 45 | | | Page 28 |
| Average number of shares – statutory | | | 1,273 | | | | 1,264 | | | | 1,256 | | | Page 3 |
| Average number of shares – fully diluted – statutory | | | 1,324 | | | | 1,320 | | | | 1,323 | | | | — | |
| Average number of shares – cash and underlying | | | 1,281 | | | | 1,273 | | | | 1,265 | | | | — | |
| Average number of shares – fully diluted – cash and underlying | | | 1,333 | | | | 1,329 | | | | 1,331 | | | | — | |
| Dividends per share (cents) | | | 94 | | | | 112 | | | | 85 | | | Page 3 |
| No of shares at end of period | | | 1,289 | | | | 1,280 | | | | 1,274 | | | Page 87 |
| Average funds under administration | | | 130,179 | | | | 120,507 | | | | 112,185 | | | Page 19 |
| Operating expenses – internal | | | 5 | | | | 5 | | | | 5 | | | Page 19 |
Average inforce premiums(1) | | | 1,241 | | | | 1,232 | | | | 1,183 | | | Page 24 |
| Net assets | | | 19,850 | | | | 22,643 | | | | 22,101 | | | Page 29 |
| Total intangible assets | | | 7,740 | | | | 7,656 | | | | 7,638 | | | Page 29 |
| Minority interests | | | 523 | | | | 1,789 | | | | 2,042 | | | Page 29 |
| Preference share capital | | | — | | | | 687 | | | | 687 | | | Page 29 |
| Other equity instruments | | | — | | | | 1,573 | | | | 1,573 | | | Page 29 |
| Tier one capital | | | 15,290 | | | | 14,141 | | | | 13,487 | | | Page 84 |
| Eligible loan capital | | | 317 | | | | 304 | | | | 298 | | | Page 85 |
| Preference share capital | | | 687 | | | | 687 | | | | 687 | | | Page 85 |
| Minority interest (net of minority interest component deducted from Tier One capital) | | | 523 | | | | 520 | | | | 518 | | | Page 85 |
| Investment in non consolidated subsidiaries (net of Intangible component deducted from Tier One capital) | | | 1,918 | | | | 1,721 | | | | 1,776 | | | Page 85 |
| Other deductions | | | 130 | | | | 28 | | | | 27 | | | Page 85 |
| Risk-weighted assets | | | 202,667 | | | | 189,559 | | | | 180,674 | | | Page 85 |
| |
| | |
| (1) | | Average of opening & closing balance |
96 Commonwealth Bank of Australia
Appendices
16. Analysis Template(continued)
| | | | | | | | | | | | | |
| | | Half Year Ended | |
| | | 31/12/05 | | | 30/06/05 | | | 31/12/04 | |
| Ratio's – Output Summary | | $M | | | $M | | | $M | |
| |
EPS | | | | | | | | | | | | |
| |
Earnings per share – cash basis | | | 160.9 | | | | 132.7 | | | | 132.1 | |
| |
| Net profit after tax – cash basis | | | 2,061 | | | | 1,759 | | | | 1,733 | |
| less preference dividends | | | — | | | | (70 | ) | | | (61 | ) |
| Adjusted profit for EPS calculation | | | 2,061 | | | | 1,689 | | | | 1,672 | |
| Average number of shares | | | 1,281 | | | | 1,273 | | | | 1,265 | |
| Add back preference dividends (after tax) | | | 46 | | | | 45 | | | | 45 | |
| Adjusted diluted profit for EPS calculation | | | 2,107 | | | | 1,734 | | | | 1,717 | |
| Diluted average number of shares | | | 1,333 | | | | 1,329 | | | | 1,331 | |
EPS diluted – cash basis | | | 158.1 | | | | 130.6 | | | | 128.9 | |
| |
Earnings per share – underlying basis | | | 146.4 | | | | 134.2 | | | | 124.9 | |
| |
| Net profit after tax – underlying | | | 1,875 | | | | 1,779 | | | | 1,641 | |
| less preference dividends | | | — | | | | (70 | ) | | | (61 | ) |
| Adjusted profit for EPS calculation | | | 1,875 | | | | 1,709 | | | | 1,580 | |
| Average number of shares | | | 1,281 | | | | 1,273 | | | | 1,265 | |
DPS | | | | | | | | | | | | |
| |
Dividends | | | | | | | | | | | | |
| |
| Dividends per share | | | 94 | | | | 112 | | | | 85 | |
| No of shares at end of period | | | 1,289 | | | | 1,280 | | | | 1,274 | |
Total dividend | | | 1,211 | | | | 1,434 | | | | 1,083 | |
Dividend payout ratio – cash basis | | | | | | | | | | | | |
| |
| Net profit after tax – cash basis | | | 2,061 | | | | 1,759 | | | | 1,733 | |
| less preference dividends | | | — | | | | (70 | ) | | | (61 | ) |
| NPAT – ordinary shareholders | | | 2,061 | | | | 1,689 | | | | 1,672 | |
| Total dividend | | | 1,211 | | | | 1,434 | | | | 1,083 | |
Payout ratio – cash basis | | | 58.8 | | | | 84.9 | | | | 64.8 | |
| |
Dividend cover | | | | | | | | | | | | |
| |
| NPAT – ordinary shareholders | | | 2,061 | | | | 1,689 | | | | 1,672 | |
| Total dividend | | | 1,211 | | | | 1,434 | | | | 1,083 | |
Dividend cover – cash | | | 1.7 | | | | 1.2 | | | | 1.5 | |
| |
ROE | | | | | | | | | | | | |
| |
Return on equity – cash | | | | | | | | | | | | |
| |
| Average net assets | | | 21,247 | | | | 22,372 | | | | 22,036 | |
| Less: | | | | | | | | | | | | |
| Average minority interests | | | (1,156 | ) | | | (1,916 | ) | | | (2,261 | ) |
| Preference shares | | | (1,130 | ) | | | (2,260 | ) | | | (2,260 | ) |
| |
| Average equity | | | 18,961 | | | | 18,196 | | | | 17,515 | |
| Less average treasury shares | | | (376 | ) | | | (344 | ) | | | (337 | ) |
| Less average defined benefit superannuation plan net surplus | | | 471 | | | | 440 | | | | 411 | |
| |
| Net average equity | | | 18,866 | | | | 18,100 | | | | 17,442 | |
| NPAT (“cash basis”) | | | 2,061 | | | | 1,759 | | | | 1,733 | |
| less preference dividends | | | — | | | | (70 | ) | | | (61 | ) |
| |
| Adjusted profit for ROE calculation | | | 2,061 | | | | 1,689 | | | | 1,672 | |
| Return on equity – cash | | | 21.7 | | | | 18.8 | | | | 19.0 | |
| |
Return on equity – underlying | | | | | | | | | | | | |
| |
| Average net assets | | | 21,247 | | | | 22,372 | | | | 22,036 | |
| Average minority interests | | | (1,156 | ) | | | (1,916 | ) | | | (2,261 | ) |
| Preference shares | | | (1,130 | ) | | | (2,260 | ) | | | (2,260 | ) |
| |
| Average equity | | | 18,961 | | | | 18,196 | | | | 17,515 | |
| Less average treasury shares | | | (376 | ) | | | (344 | ) | | | (337 | ) |
| Less average defined benefit superannuation plan net surplus | | | 471 | | | | 440 | | | | 411 | |
| |
| Net | | | 18,866 | | | | 18,100 | | | | 17,441 | |
| NPAT (“underlying basis”) | | | 1,875 | | | | 1,779 | | | | 1,641 | |
| Less preference dividends | | | — | | | | (70 | ) | | | (61 | ) |
| |
| Adjusted profit for ROE calculation | | | 1,875 | | | | 1,709 | | | | 1,580 | |
Return on equity – underlying | | | 19.7 | | | | 19.0 | | | | 18.0 | |
| |
NIM | | | | | | | | | | | | |
| |
| Net interest income (excluding securitisation) | | | 3,247 | | | | 3,028 | | | | 2,928 | |
| Average interest earning assets (excluding securitisation) | | | 267,169 | | | | 250,357 | | | | 239,150 | |
| NIM % pa | | | 2.41 | | | | 2.44 | | | | 2.43 | |
| |
Profit Announcement 97
Appendices
16. Analysis Template(continued)
| | | | | | | | | | | | | |
| | | Half Year Ended | |
| | | 31/12/05 | | | 30/06/05 | | | 31/12/04 | |
| Ratio’s – Output Summary | | $M | | | $M | | | $M | |
| |
Productivity | | | | | | | | | | | | |
Banking expense to income ratio | | | | | | | | | | | | |
| Expenses including Which new Bank expenses | | | 2,260 | | | | 2,298 | | | | 2,194 | |
| Banking Income | | | 4,700 | | | | 4,530 | | | | 4,341 | |
Expense to Income – cash | | | 48.1 | | | | 50.7 | | | | 50.5 | |
| |
| Operating expenses | | | 2,260 | | | | 2,201 | | | | 2,179 | |
| Banking Income | | | 4,700 | | | | 4,530 | | | | 4,341 | |
Expense to income – underlying | | | 48.1 | | | | 48.6 | | | | 50.2 | |
| |
Funds management expenses to average FUA ratio | | | | | | | | | | | | |
| |
| Expenses | | | 459 | | | | 422 | | | | 412 | |
| Average funds under administration | | | 130,179 | | | | 120,507 | | | | 112,185 | |
Expenses to average FUA – cash | | | 0.70 | | | | 0.71 | | | | 0.73 | |
| |
Insurance expenses to average in-force premiums ratio | | | | | | | | | | | | |
| |
| Operating expenses – external | | | 248 | | | | 280 | | | | 263 | |
| Operating expenses – internal | | | 5 | | | | 5 | | | | 5 | |
| Total expenses | | | 253 | | | | 285 | | | | 268 | |
| Average inforce premiums | | | 1,241 | | | | 1,232 | | | | 1,183 | |
Expenses to average in-force premiums – cash | | | 40.5 | | | | 46.6 | | | | 44.9 | |
| |
| Operating expenses – external | | | 248 | | | | 279 | | | | 262 | |
| Operating expenses – internal | | | 5 | | | | 5 | | | | 5 | |
| Total expenses | | | 253 | | | | 284 | | | | 267 | |
| Average inforce premiums | | | 1,241 | | | | 1,232 | | | | 1,183 | |
Expenses to average in-force premiums – underlying | | | 40.5 | | | | 46.5 | | | | 44.8 | |
| |
Net Tangible Assets (NTA) per share | | | | | | | | | | | | |
| |
| Net assets | | | 19,850 | | | | 22,643 | | | | 22,101 | |
| Less: | | | | | | | | | | | | |
| Intangible assets | | | (7,740 | ) | | | (7,656 | ) | | | (7,638 | ) |
| Minority interests | | | (523 | ) | | | (1,789 | ) | | | (2,042 | ) |
| Preference share capital | | | — | | | | (687 | ) | | | (687 | ) |
| Other equity instruments | | | — | | | | (1,573 | ) | | | (1,573 | ) |
| |
| Total net tangible assets | | | 11,587 | | | | 10,938 | | | | 10,161 | |
| No of shares at end of period | | | 1,289 | | | | 1,280 | | | | 1,274 | |
Net tangible assets (NTA) per share ($) | | | 8.99 | | | | 8.54 | | | | 7.98 | |
| |
ACE ratio | | | | | | | | | | | | |
| |
| Tier one capital | | | 15,290 | | | | 14,141 | | | | 13,487 | |
| Deduct: | | | | | | | | | | | | |
| Eligible loan capital | | | (317 | ) | | | (304 | ) | | | (298 | ) |
| Preference share capital | | | (687 | ) | | | (687 | ) | | | (687 | ) |
| Other equity instruments | | | (1,573 | ) | | | (1,573 | ) | | | (1,573 | ) |
| Minority Interest (net of minority interest component deducted from Tier One capital) | | | (523 | ) | | | (520 | ) | | | (518 | ) |
| Investment in non-consolidated subsidiaries (net of intangible component deducted from Tier One capital) | | | (1,918 | ) | | | (1,721 | ) | | | (1,776 | ) |
| Other deductions | | | (130 | ) | | | (28 | ) | | | (27 | ) |
| |
| Total Adjusted Common Equity | | | 10,142 | | | | 9,308 | | | | 8,608 | |
| Risk weighted assets | | | 202,667 | | | | 189,559 | | | | 180,674 | |
ACE ratio (%) | | | 5.00 | | | | 4.91 | | | | 4.76 | |
| |
98 Commonwealth Bank of Australia
Appendices
17. Summary
| | | | | | | | | | | | | | | | | | | | | | | | | | | | | | | | | | | | | |
| | | Half Year Ended | |
| | | | | | | | | | | | | | | | | | | | | | | | | | | Dec 05 | | | | | | | Dec 05 | |
| Total | | | | | | Page | | | 31/12/05 | | | 30/06/05 | | | 31/12/04 | | | | | | | v Jun 05 % | | | | | | | v Dec 04 % | |
| |
| Net profit after tax – underlying | | $ | M | | | | 3 | | | | 1,875 | | | | 1,779 | | | | 1,641 | | | | 96 | | | | 5 | | | | 234 | | | | 14 | |
| Net profit after tax – cash basis | | $ | M | | | | 3 | | | | 2,061 | | | | 1,759 | | | | 1,733 | | | | 302 | | | | 17 | | | | 328 | | | | 19 | |
| Defined benefit superannuation plan expense | | $ | M | | | | 4 | | | | (19 | ) | | | (25 | ) | | | (28 | ) | | | 6 | | | | 24 | | | | 9 | | | | 32 | |
| Treasury shares valuation adjustment | | $ | M | | | | 4 | | | | (43 | ) | | | (46 | ) | | | 7 | | | | 3 | | | | 7 | | | | (50 | ) | | large | |
| Net profit after tax – statutory | | $ | M | | | | 3 | | | | 1,999 | | | | 1,688 | | | | 1,712 | | | | 311 | | | | 18 | | | | 287 | | | | 17 | |
| Earnings per share cash basis – basic (cents) | | cents | | | | 3 | | | | 160.9 | | | | 132.7 | | | | 132.1 | | | | 28.2 | | | | 21.3 | | | | 28.8 | | | | 21.8 | |
| Dividend per share | | cents | | | | 3 | | | | 94 | | | | 112 | | | | 85 | | | | (18 | ) | | | (16 | ) | | | 9 | | | | 11 | |
| Dividend pay-out ratio cash basis | | | % | | | | 3 | | | | 58.8 | | | | 84.9 | | | | 64.8 | | | | | | | | | | | | | | | | | |
| Tier 1 capital | | | % | | | | 4 | | | | 7.54 | | | | 7.46 | | | | 7.46 | | | | | | | 8bpts | | | | | | | 8bpts | |
| Total capital | | | % | | | | 4 | | | | 9.81 | | | | 9.75 | | | | 9.60 | | | | | | | 6bpts | | | | | | | 21bpts | |
| Adjusted common equity | | | % | | | | 4 | | | | 5.00 | | | | 4.91 | | | | 4.76 | | | | | | | 9bpts | | | | | | | 24bpts | |
| Number of full time equivalent staff | | No. | | | | — | | | | 34,918 | | | | 35,313 | | | | 35,442 | | | | (395 | ) | | | (1 | ) | | | (524 | ) | | | (1 | ) |
| Return on equity – cash | | | % | | | | 3 | | | | 21.7 | | | | 18.8 | | | | 19.0 | | | | | | | 290bpts | | | | | | | 270bpts | |
| Return on equity – underlying | | | % | | | | 3 | | | | 19.7 | | | | 19.0 | | | | 18.0 | | | | | | | 70bpts | | | | | | | 170bpts | |
| Weighted average number of shares – statutory | | No. | | | | 3 | | | | 1,273 | | | | 1,264 | | | | 1,256 | | | | 9 | | | | 1 | | | | 17 | | | | 1 | |
| Net tangible assets per share | | $ | | | | | 98 | | | | 8.99 | | | | 8.54 | | | | 7.98 | | | | 0.45 | | | | 5.3 | | | | 1.01 | | | | 12.6 | |
| |
| | | | | | | | | | | | | | | | | | | | | | | | | | | | | | | | | | | | | |
Banking | | | | | | | | | | | | | | | | | | | | | | | | | | | | | | | | | | | | |
| |
| Net profit after tax – underlying | | $ | M | | | | 3 | | | | 1,589 | | | | 1,509 | | | | 1,404 | | | | 80 | | | | 5 | | | | 185 | | | | 13 | |
| Net profit after tax – cash basis | | $ | M | | | | 9 | | | | 1,589 | | | | 1,440 | | | | 1,394 | | | | 149 | | | | 10 | | | | 195 | | | | 14 | |
| Net Interest Income | | $ | M | | | | 9 | | | | 3,284 | | | | 3,068 | | | | 2,958 | | | | 216 | | | | 7 | | | | 326 | | | | 11 | |
| Net Interest Margin | | | % | | | | 6 | | | | 2.41 | | | | 2.44 | | | | 2.43 | | | | | | | (3)bpts | | | | | | | (2)bpts | |
| Other banking income | | $ | M | | | | 9 | | | | 1,416 | | | | 1,462 | | | | 1,383 | | | | (46 | ) | | | (3 | ) | | | 33 | | | | 2 | |
| Other banking income/total bank income | | | % | | | | — | | | | 30.1 | | | | 32.3 | | | | 31.9 | | | | | | | (215)bpts | | | | | | | (173)bpts | |
| Expense to income ratio – underlying | | | % | | | | 9 | | | | 48.1 | | | | 48.6 | | | | 50.2 | | | | | | | 49bpts | | | | | | | 210bpts | |
| Average interest earning assets | | $ | M | | | | 9 | | | | 267,169 | | | | 250,357 | | | | 239,150 | | | | 16,812 | | | | 7 | | | | 28,019 | | | | 12 | |
| Average interest earning liabilities | | $ | M | | | | 9 | | | | 247,129 | | | | 230,352 | | | | 220,919 | | | | 16,777 | | | | 7 | | | | 26,210 | | | | 12 | |
| Bad and doubtful debts expense | | $ | M | | | | 4 | | | | 188 | | | | 176 | | | | 146 | | | | (12 | ) | | | (7 | ) | | | (42 | ) | | | (29 | ) |
| Bad and doubtful debts expense to risk-weighted assets (annual) | | | % | | | | 9 | | | | 0.19 | | | | 0.19 | | | | 0.16 | | | | | | | | — | | | | | | | (3)bpts | |
| Collective provision plus general reserve for credit | | | | | | | | | | | | | | | | | | | | | | | | | | | | | | | | | | | | |
| losses (pre-tax equivalent) to risk weighted assets | | | % | | | | 9 | | | | 0.71 | | | | — | | | | — | | | | n/a | | | | n/a | | | | n/a | | | | n/a | |
| General provision to risk weighted assets | | | % | | | | 9 | | | | — | | | | 0.73 | | | | 0.76 | | | | | | | | — | | | | | | | | — | |
Total provisions(1)plus general reserve | | | | | | | | | | | | | | | | | | | | | | | | | | | | | | | | | | | | |
| for credit losses (pre-tax) to gross impaired assets | | | % | | | | 9 | | | | 410.1 | | | | — | | | | — | | | | n/a | | | | n/a | | | | n/a | | | | n/a | |
Total provision(1) to gross impaired assets | | | % | | | | 9 | | | | 308.1 | | | | 411.4 | | | | 373.0 | | | | | | | large | | | | | | | large | |
| Individually provisioned to Impaired Assets | | | % | | | | 12 | | | | 45.2 | | | | 41.8 | | | | 43.1 | | | | | | | 340bpts | | | | | | | 210bpts | |
| Risk weighted assets | | $ | M | | | | 9 | | | | 202,667 | | | | 189,559 | | | | 180,674 | | | | 13,108 | | | | 7 | | | | 21,993 | | | | 12 | |
| |
| | | | | | | | | | | | | | | | | | | | | | | | | | | | | | | | | | | | | |
Funds Management | | | | | | | | | | | | | | | | | | | | | | | | | | | | | | | | | | | | |
| |
| Net profit after tax – underlying | | $ | M | | | | 3 | | | | 183 | | | | 181 | | | | 170 | | | | 2 | | | | 1 | | | | 13 | | | | 8 | |
| Net profit after tax – cash basis | | $ | M | | | | 19 | | | | 188 | | | | 170 | | | | 179 | | | | 18 | | | | 11 | | | | 9 | | | | 5 | |
| Shareholder investment returns | | $ | M | | | | 19 | | | | 7 | | | | 9 | | | | 24 | | | | (2 | ) | | | (22 | ) | | | (17 | ) | | | (71 | ) |
| Average funds under administration | | $ | M | | | | 19 | | | | 130,179 | | | | 120,507 | | | | 112,185 | | | | 9,672 | | | | 8 | | | | 17,994 | | | | 16 | |
| Net (outflows) / inflows | | $ | M | | | | 19 | | | | 2,695 | | | | (394 | ) | | | 850 | | | | 3,089 | | | large | | | | 1,845 | | | large | |
| Income to average funds under administration | | | % | | | | 19 | | | | 1.10 | | | | 1.08 | | | | 1.09 | | | | | | | 2bpts | | | | | | | 1bpt | |
| Expenses to average funds under administration | | | % | | | | 19 | | | | 0.70 | | | | 0.71 | | | | 0.73 | | | | | | | 1bpt | | | | | | | 3bpts | |
| |
| | | | | | | | | | | | | | | | | | | | | | | | | | | | | | | | | | | | | |
Insurance | | | | | | | | | | | | | | | | | | | | | | | | | | | | | | | | | | | | |
| |
| Net profit after tax – underlying | | $ | M | | | | 3 | | | | 103 | | | | 89 | | | | 67 | | | | 14 | | | | 16 | | | | 36 | | | | 54 | |
| Net profit after tax – cash basis | | $ | M | | | | 23 | | | | 284 | | | | 149 | | | | 160 | | | | 135 | | | | 91 | | | | 124 | | | | 78 | |
| Shareholder investment returns | | $ | M | | | | 23 | | | | 202 | | | | 83 | | | | 121 | | | | 119 | | | large | | | | 81 | | | | 67 | |
| Inforce premiums | | $ | M | | | | 24 | | | | 1,216 | | | | 1,265 | | | | 1,199 | | | | (49 | ) | | | (4 | ) | | | 17 | | | | 1 | |
| Expenses to Average Inforce premiums – underlying | | | % | | | | 23 | | | | 40.5 | | | | 46.5 | | | | 44.8 | | | | | | | 600bpts | | | | | | | 430bpts | |
| |
| (1) | | Impairment provision ratios have changed because of the re-measurement under AIFRS. |
Profit Announcement 99
Appendices
18. Definitions
| | | |
| Term | | Description |
| |
| Banking | | Banking operations includes retail; business, corporate and institutional; Asia Pacific banking; treasury and centre support functions. Retail banking operations include banking services which were distributed through the Premium and Retail distribution divisions. Business, Corporate and Institutional banking includes banking services which were distributed to all business customers through the Premium Business Services division and the small business customers which were serviced through the Premium and Retail divisions and funding operations. Asia Pacific banking includes offshore banking subsidiaries, primarily ASB Bank operations in New Zealand. |
| | | |
| Borrowing Corporation | | ‘Borrowing Corporation’ as defined by Section 9 of the Corporations Act 2001 is CBFC Limited, Colonial Finance Limited and their controlled entities. |
| | | |
| Dividend Payout Ratio | | Dividends paid on ordinary shares divided by earnings (earnings are net of dividends on preference shares). |
| | | |
| DRP | | Dividend reinvestment plan. |
| | | |
| DRP Participation | | The percentage of total issued capital participating in the dividend reinvestment plan. |
| | | |
| Earnings Per Share | | Calculated in accordance with the revised AASB 1027: Earnings per Share. Dividends paid on preference shares and other equity instruments are deducted from earnings to arrive at earnings per share (30 June 2005: $70 million and 31 December 2004: $61 million). |
| | | |
| Funds Management | | Funds management business includes funds management within the Wealth Management division and International Financial Services division. |
| | | |
| Insurance | | Insurance business includes the life risk business within the Wealth Management division and the International Financial Services division and general insurance financial results. The insurance segment as reported on page 22 includes the operating performance of the Hong Kong business up to the effective date of sale (18 October 2005). Refer to appendix 13. |
| | | |
| Net Profit after Tax (“Cash Basis”) | | Represents profit after tax and minority interests, before superannuation plan expense and treasury share adjustment. |
| | | |
| Net Profit after Tax (“Statutory Basis”) | | Represents profit after tax, minority interests, defined benefit superannuation plan expense and treasury shares. This is equivalent to the statutory item “Net Profit attributable to Members of the Group”. |
| | | |
| Net profit after tax (“underlying basis”) | | Represents net profit after tax (“cash basis”) excluding Which new Bank and shareholder investment returns. |
| | | |
| Net Tangible Assets per Share | | Net assets excluding goodwill, Minority interests, preference shares and other equity instruments divided by ordinary shares on issue at the end of the period. |
| | | |
| Overseas | | ‘Overseas’ represents amounts booked in branches and controlled entities outside Australia . |
| | | |
| Return on Average Shareholders’ Equity | | Based on net profit after tax, minority interests applied to average shareholders equity, excluding minority interests. |
| | | |
| Return on Average Shareholders Equity Cash Basis | | As per the return on average shareholder equity, excluding the effect of defined benefit superannuation plan expense and treasury shares valuation adjustment. |
| | | |
| Return on Average Total Assets | | Based on profit after tax and Minority interests. Averages were based on beginning and end of period balances. |
| | | |
| Staff Numbers | | Staff numbers include all permanent full time staff, part time staff equivalents and external contractors employed by 3rd party agencies. |
| | | |
| Underlying Expense to Income Ratio | | Represents operating expenses (excluding Which new Bank) as a percentage of total operating revenue. |
| | | |
| Weighted Average Number of Shares (“Statutory Basis”) | | Includes an adjustment to exclude “Treasury Shares” related to investments in the Bank’s shares held by both the life insurance statutory funds and by the employee share scheme trust. |
| | | |
| Weighted Average Number of Shares (“Cash Basis”) | | Includes an adjustment to exclude only those “Treasury Shares” related to the investment in the Bank’s shares held by the life insurance statutory funds. |
100 Commonwealth Bank of Australia
Appendices
19. Market Share Definitions
Banking
| | | |
| |
Retail | | |
| Home Loans | | Total Household Loans(APRA) – MISA (Pre Sep 04) + Securitised Assets (APRA) + Homepath. |
| | | |
| | | Total Housing Loans (incl securitisations) (from RBA which includes NBFI’s unlike APRA).(1) |
| | | |
| Credit Cards | | CBA Total Credit Card Lending (APRA). |
| | | |
| | | Total Credit Cards with Interest Free + Total Credit Cards without Interest Free (from RBA which includes NBFI’s unlike APRA).(1) |
| | | |
| Retail Deposits | | CBA Current Deposits with banks + Term (excl CD’s) + Other (All as reported to RBA) |
| | | |
| | | Total Current Deposits with banks + Term (excl CD’s) + Other with banks.(1) |
| | | |
| Household Deposits | | CBA Household Deposits (as reported to APRA) — MISA (Pre Sep 04) |
| | | |
| | | Total Bank Household Deposits (from APRA monthly banking statistics) |
| | | |
Non-revolving
personal lending | | CBA Household Other Personal Term Loans + Leasing (as reported to APRA) |
| | | |
| | | Total Bank Other Personal Lending Fixed Loans (from RBA monthly bulletin statistics) |
| | | |
| APRA Other Household Lending | | CBA Term Personal Lending + Margin Lending net balances + Personal Leasing + Revolving credit (i.e. line of credit & overdrafts) |
| | | |
| | | Total Market Term Personal Lending + Margin Lending for most banks but not all of them (i.e. Adelaide Bank’s Leverage Equities business is not a banking entity and thus not in APRA’s figures) + Personal Leasing Revolving credit, i.e. line of credit & overdrafts. Some banks put part of their Home Equity loan product balances in other lending (e.g NAB, WBC & SGB, but not CBA & ANZ) |
| | | |
Business | | |
| | | |
| | | CBA business lending and credit (specific ‘business lending’ categories in lodged APRA returns - 320.0, 320.1 and 320.4) |
| | | |
| Business Lending | | Total of business lending and credit to the private non-financial sector by all financial intermediaries (sourced from RBA table Lending & Credit Aggregates which is in turn sourced from specific ‘business lending’ categories in lodged APRA returns — 320.0, 320.1 and 320.4) (includes bills on issue and securitised business loans).(1) |
| | | |
Funds Management | | |
| | | |
| Retail market share | | Total funds in CBA Wealth Management retail investment products (including WM products badged by other
parties) |
| | | |
| (admin view): | | Total funds in retail investment products market |
| | | |
| Platforms/ | | Total funds in CBA Wealth Management platforms and masterfunds (including WM platforms badged by other parties) |
| | | |
| masterfunds: | | Total funds in platform/masterfund market |
| |
| New Zealand retail | | Total ASB + Sovereign + JMNZ Retail net Funds under Management |
| | | |
| | | Total Market net Retail Funds under Management |
Insurance | | |
| Australia | | Total risk inforce premium of all CBA Group Australian life insurance companies |
| | | |
| (Total Risk) | | Total risk inforce premium for all Australian life insurance companies (from Plan for Life) |
| | | |
| Australia | | (Individual lump sum + individual risk income) inforce premium of all CBA Group Australian life insurance companies |
| | | |
| (Individual Risk) | | Individual risk inforce premium for all Australian life insurance companies (from Plan for Life) |
| | | |
| New Zealand | | Total Sovereign (inforce annual premium income + new business – exits – other) |
| | | |
| | | Total inforce premium for New Zealand (from ISI statistics) |
| (1) | | The RBA restates the total of all financial intermediaries retrospectively when required. This may be due to a change in definition, the inclusion of a new participant or correction of errors in prior returns. CBA restates its market share where the RBA total has changed based on current balances less implied percentage growth rates now reported by the RBA for previous months. |
Profit Announcement 101


