UNITED STATES
SECURITIES AND EXCHANGE COMMISSION
Washington, D.C. 20549
FORM N-CSR
CERTIFIED SHAREHOLDER REPORT OF REGISTERED
MANAGEMENT INVESTMENT COMPANIES
Investment Company Act file number 811- 5979
John Hancock California Tax-Free Income Fund
(Exact name of registrant as specified in charter)
601 Congress Street, Boston, Massachusetts 02210
(Address of principal executive offices) (Zip code)
Alfred P. Ouellette
Senior Counsel and Assistant Secretary
601 Congress Street
Boston, Massachusetts 02210
(Name and address of agent for service)
Registrant's telephone number, including area code: 617-663-4324
| Date of fiscal year end: | August 31 |
| | |
| | |
| Date of reporting period: | February 28, 2007 |
ITEM 1. REPORT TO SHAREHOLDERS.

CEO corner

| TABLE OF CONTENTS |
|
| |
| Your fund at a glance |
| page 1 |
|
| |
| Managers’ report |
| page 2 |
|
| |
| A look at performance |
| page 6 |
|
| |
| Your expenses |
| page 8 |
|
| |
| Fund’s investments |
| page 1 0 |
|
| |
| Financial statements |
| page 1 8 |
|
| |
| Notes to financial |
| statements |
| page 2 4 |
|
| |
| For more information |
| page 3 2 |
|
To Our Shareholders,
The U.S. financial markets turned in strong results over the last six months, as earlier concerns of rising inflation, a housing slowdown and high energy prices gave way to news of slower, but still resilient, economic growth, stronger than expected corporate earnings and dampened inflation fears and energy costs. This environment also led the Federal Reserve Board to hold short-term interest rates steady. Even with a sharp decline in the last days of the period, the broad stock market returned 8.93% for the six months ended February 28, 2007, as measured by the S&P 500 Index. With interest rates remaining relatively steady, fixed-income securities also produced positive results.
But after a remarkably long period of calm, the financial markets were rocked at the end of the period by a dramatic sell-off in China’s stock market, which had ripple effects on financial markets worldwide. In the United States, for example, the Dow Jones Industrial Average had its steepest one-day percentage decline in nearly four years on February 27, 2007. The event served to jog investors out of their seemingly casual attitude toward risk and remind them of the simple fact that stock markets move in two directions — down as well as up.
It was also a good occasion to bring to mind several important investment principles that we believe are at the foundation of successful investing. First, keep a long-term approach to investing, avoiding emotional reactions to daily market moves. Second, maintain a well-diversified portfolio that is appropriate for your goals, risk profile and time horizons.
After the market’s moves of the last six months, we encourage investors to sit back, take stock and set some realistic expectations. While history bodes well for the market in 2007 (since 1939, the S&P 500 Index has always produced positive results in the third year of a presidential term), there are no guarantees, and opinions are divided on the future of this more-than-four-year-old bull market. The recent downturn bolsters this uncertainty, although we believe it was a healthy correction for which we were overdue.
The latest events could also be a wake-up call to contact your financial professional to determine whether changes are in order to your investment mix. Some asset groups have had long runs of outperformance. Others had truly outsized returns in 2006. These trends argue for a look to determine if these categories now represent a larger stake in your portfolios than prudent diversification would suggest they should. After all, we believe investors with a well-balanced portfolio and a marathon — not a sprint — approach to investing, stand a better chance of weathering the market’s short-term twists and turns and reaching their long-term goals.
Sincerely,

Keith F. Hartstein,
President and Chief Executive Officer
This commentary reflects the CEO’s views as of February 28, 2007. They are subject to change at any time.
Your fund at a glance
The Fund seeks a high level of current income, consistent with preservation of capital, that is exempt from federal and California personal income taxes. In pursuing this goal, the Fund normally invests at least 80% of its assets in securities of any maturity exempt from federal and California personal income tax.
Over the last six months
►Municipal bonds posted positive results, although they lagged the performance of the broad taxable bond market.
►The Fund’s return surpassed its peer group average and benchmark index.
►Lower-grade bonds were the best performers in the portfolio, while higher-quality bonds lagged.
John Hancock California Tax-Free Income Fund
Fund performance for the six months ended February 28, 2007.
| Top 10 holdings | |
| Santa Ana Financing Auth, 7-1-24, 6.250% | 3.7% |
|
| San Francisco, City of, 7-1-31, 5.000% | 3.3% |
|
| San Bernardino, County of, 8-1-17, 5.500% | 2.8% |
|
| Puerto Rico Aqueduct & Sewer Auth, 7-1-11, 8.022% | 2.6% |
|
| California, State of, 3-1-16, 7.008% | 2.2% |
|
| Puerto Rico, Commonwealth of, 7-1-15, 6.500% | 2.1% |
|
| Santa Clara County Financing Auth, 5-15-17, 5.500% | 1.9% |
|
| New Haven Unified School District, 8-1-22, Zero | 1.9% |
|
| California, State of, 4-1-29, 4.750% | 1.8% |
|
| San Deigo Unified School District, 7-1-28, 5.250% | 1.7% |
|
| As a percentage of net assets on February 28, 2007. | |
1
Managers’ report
John Hancock
California Tax-Free Income Fund
Municipal bonds gained ground for the six months ended February 28, 2007, although they trailed the taxable bond market. The Lehman Brothers Municipal Bond Index returned 2.89%, while the Lehman Brothers Aggregate Bond Index — a broad measure of the taxable bond market — returned 3.66% .
The modest gains in the municipal bond market masked an increase in volatility during the six-month period as investors reacted to changing economic conditions. Since the beginning of 2006, the U.S. economy has gradually slowed, led by a noteworthy decline in the housing market. However, sporadic signs of economic resiliency created some uncertainty regarding the underlying strength of the economy. As a result, economic reports over the last few months of the period had a magnified effect, causing greater fluctuations in the municipal bond market.
Inflation remained generally under control during the period, thanks largely to a 10% decline in energy prices. The combination of slowing economic growth and benign inflation led the Federal Reserve to hold short-term interest rates steady throughout the six-month period, after raising rates 17 times between June 2004 and June 2006. Consequently, the municipal yield curve remained flat, with short- and long-term bond yields nearly equal.
Municipal bond issuance, which had been relatively low for much of 2006, rose sharply in late 2006 and early 2007. Nonetheless, the
SCORECARD
| INVESTMENT | | PERIOD’S PERFORMANCE... AND WHAT’S BEHIND THE NUMBERS |
| Land-development | ▲ | Mostly unrated securities that held up well in the face of a weak |
| bonds | | housing market |
| Tobacco bonds | ▲ | Demand for yield provided a lift |
| Shorter-term bonds | ▼ | Steady interest rate policy from the Fed led to underperformance |
| | | relative to longer-term bonds |
2

Portfolio Managers, MFC Global Investment Management (U.S.) LLC
Dianne Sales, CFA, and Frank A. Lucibella, CFA
increase in supply had little impact on municipal bond performance as strong investor demand helped absorb the new issues.
California credit environment
Stability was the theme for California and the state’s credit quality. Governor Arnold Schwarzenegger was re-elected to a second term in November 2006, and the economy remained healthy, sustaining the state’s solid tax revenues. Although California has made some notable progress toward erasing the debt incurred during the 2001 downturn, the state still faces some structural budgetary imbalances that need to be corrected. With a Republican governor and a Democratic legislature, these budget negotiations will likely be difficult.
| “The modest gains in the |
| municipal bond market |
| masked an increase in volatility |
| during the six-month period as |
| investors reacted to changing |
| economic conditions.,, |
Fund performance
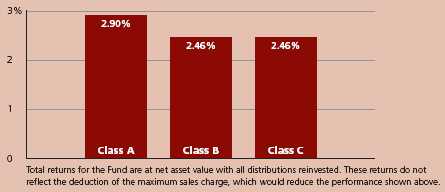
For the six months ended February 28, 2007, John Hancock California Tax-Free Income Fund’s Class A, Class B and Class C shares posted total returns of 2.90%, 2.46% and 2.46%, respectively, at net asset value. By comparison, the average return of Morningstar’s Muni California Long Fund category was 2.75% 1 and the Lehman Brothers Municipal Bond Index returned 2.89% . Keep in mind that your net asset value return will be different from the Fund’s performance if you were not invested in the Fund for the entire period or did not reinvest all distributions. See pages six and seven for historical performance information.
California Tax-Free Income Fund
3
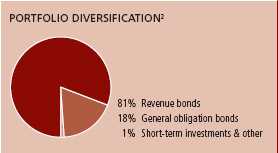
| SECTOR DISTRIBUTION2 |
| General obligation | |
| bonds | 18% |
| Revenue bonds | |
| Transportation | 10% |
| Special tax | 8% |
| Correctional facilities | 8% |
| Health | 7% |
| Water & sewer | 6% |
| Tobacco | 6% |
| Leasing contracts | 4% |
| Tax allocation | 3% |
| Education | 3% |
| Housing | 2% |
| Economic development | 2% |
| Pollution | 1% |
| All other | 21% |
Yield sings
The best-performing segments of the Fund were lower-quality bonds, reflecting the impact of coupon income on municipal bond performance during the period. The bulk of the return in the municipal market came from interest income, allowing higher-yielding securities to produce the best returns. In addition, strong demand for yield in a relatively low interest rate environment contributed to the outperformance of higher-yielding bonds.
The Fund’s land-development bonds performed well despite pronounced weakness in the housing sector. We have been very careful and selective about adding new holdings in this area because of the slumping housing market and the subsequent bankruptcies of several subprime mortgage lenders. Most land-based bonds we own are backed by seasoned projects that are already well developed and, therefore, less vulnerable to any downturn in the housing market.
Other high-yielding segments of the portfolio that outperformed during the six-month period included transportation bonds and tobacco-related bonds. The portfolio’s transportation bonds finance projects ranging from toll road construction to rapid transit systems. The tobacco bonds are backed by the proceeds from a legal settlement between the major tobacco companies and the state of California (as well as 45 other states).
We also benefited from our exposure to private higher education bonds. In particular, we found pockets of opportunity among lower-quality education bonds — mostly rated A and BBB — that were among the better performers in the portfolio during the six-month period.
Pre-refundings
Several Fund holdings were pre-refunded during the period. In a pre-refunding, a municipality issues new bonds and invests the proceeds in Treasury securities until they are needed to pay off the older bonds. The Treasury-bond backing typically enhances the credit quality of the old bonds, which in turn has a positive impact on their value. Some of the portfolio’s correctional facility bonds were pre-refunded during the period, boosting their overall performance.
California Tax-Free Income Fund
4
Timing is everything
Another factor that added value to Fund performance was timely adjustments to the interest rate sensitivity of the portfolio. For example, we increased the portfolio’s cash position ahead of the municipal market’s decline in late 2006, which helped mitigate the impact on portfolio performance. In early 2007, we re-established some positions in longer-term securities, increasing the portfolio’s interest rate sensitivity, and this paid off as the municipal market rallied in February.
| “The best-performing segments |
| of the Fund were lower-quality |
| bonds, reflecting the impact of |
| coupon income on municipal |
| bond performance during |
| the period.,, |
Outlook
The U.S. economy has held up better than expected, though further slowing is likely. In general, however, we expect municipal credit quality and tax revenues in California to remain fairly stable over the next six months. Although new municipal bond issuance in 2007 is expected to be in line with last year’s issuance levels, the state of California recently approved $45 billion in general obligation debt to be issued over the next several years. The magnitude of this new issuance, which will be used to fund infrastructure improvements, may have an impact on the California municipal market.
With regard to the Fund, we intend to maintain our focus on producing an above-average level of tax-free income through a diversified portfolio of California municipal bonds.
This commentary reflects the views of the portfolio managers through of Fund’s period discussed in this report. The managers’ statements reflect their own opinions. As such, they are in no way guarantees of future events and are not intended to be used as investment advice or a recommendation regarding any specific security. They are also subject to change at any time as market and other conditions warrant.
1 Figures from Morningstar, Inc. include reinvested dividends and do not take into account sales charges. Actual load-adjusted performance is lower.
2 As a percentage of net assets on February 28, 2007.
California Tax-Free Income Fund
5
A look at performance
For the periods ending February 28, 2007
| | | Average annual returns | | Cumulative total returns | | | SEC 30- |
| | | with maximum sales charge (POP) | | with maximum sales charge (POP) | | | day yield |
| | Inception | | | | Since | | | | | Since | as of |
| Class | date | 1-year | 5-year | 10-year | inception | 6 months | 1-year | 5-year | 10-year | inception | 2-28-07 |
|
| A | 12-29-89 | 0.24% | 3.89% | 4.92% | — | –1.78% | 0.24% | 21.04% | 61.68% | — | 3.78% |
|
| B | 12-31-91 | –0.89 | 3.63 | 4.74 | — | –2.54 | –0.89 | 19.53 | 58.97 | — | 3.12 |
|
| C | 4-1-99 | 3.11 | 3.98 | — | 3.86% | 1.46 | 3.11 | 21.53 | — | 34.93% | 3.11 |
|
Performance figures assume all distributions are reinvested. POP (Public Offering Price) figures reflect maximum sales charge on Class A shares of 4.5% and the applicable contingent deferred sales charge (CDSC) on Class B and Class C shares. The returns for Class C shares have been adjusted to reflect the elimination of the front-end sales charge effective July 15, 2004. The Class B shares’ CDSC declines annually between years 1–6 according to the following schedule: 5, 4, 3, 3, 2, 1%. No sales charge will be assessed after the sixth year. Class C shares held for less than one year are subject to a 1% CDSC.
The returns reflect past results and should not be considered indicative of future performance. The return and principal value of an investment will fluctuate so that shares, when redeemed, may be worth more or less than their original cost. Due to market volatility, the Fund’s current performance may be higher or lower than the performance shown. For performance data current to the most recent month-end, please call 1-800-225-5291 or visit the Fund’s Web site at www.jhfunds.com.
The performance table above and the chart on the next page do not reflect the deduction of taxes that a shareholder would pay on fund distributions or the redemption of fund shares. Please note that a portion of the Fund’s income may be subject to taxes, and some investors may be subject to the Alternative Minimum Tax (AMT). Also note that capital gains are taxable.
The Fund’s performance results reflect any applicable expense reductions, without which the expenses would increase and results would have been less favorable.
California Tax-Free Income Fund
6
Growth of $10,000
This chart shows what happened to a hypothetical $10,000 investment in California Tax-Free Income Fund Class A shares for the period indicated. For comparison, we’ve shown the same investment in the Lehman Brothers Municipal Bond Index.

| | | | With maximum | |
| Class | Period beginning | Without sales charge | sales charge | Index |
|
| B1 | 2-28-97 | $15,897 | $15,897 | $17,490 |
|
| C1 | 4-1-99 | 13,493 | 13,493 | 15,077 |
|
Assuming all distributions were reinvested for the period indicated, the table above shows the value of a $10,000 investment in the Fund’s Class B and Class C shares, respectively, as of February 28, 2007. The Class C shares investment with maximum sales charge has been adjusted to reflect the elimination of the front-end sales charge effective July 15, 2004. Performance of the classes will vary based on the difference in sales charges paid by shareholders investing in the different classes and the fee structure of those classes.
Lehman Brothers Municipal Bond Index is an unmanaged index that includes municipal bonds and is commonly used as a measure of bond performance.
It is not possible to invest directly in an index. Index figures do not reflect sales charges which would have resulted in lower values if they did.
1 No contingent deferred sales charge applicable.
California Tax-Free Income Fund
7
Your expenses
These examples are intended to help you understand your ongoing operating expenses.
Understanding fund expenses
As a shareholder of the Fund, you incur two types of costs:
■ Transaction costs which include sales charges (loads) on purchases or redemptions (varies by share class), minimum account fee charge, etc.
■ Ongoing operating expenses including management fees, distribution and service fees (if applicable) and other fund expenses.
We are going to present only your ongoing operating expenses here.
Actual expenses/actual returns
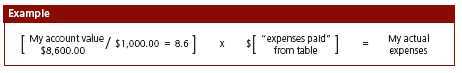
This example is intended to provide information about your fund’s actual ongoing operating expenses, and is based on your fund’s actual return. It assumes an account value of $1,000.00 on September 1, 2006, with the same investment held until February 28, 2007.
| | Account value | Ending value | Expenses paid during period |
| | on 9-1-06 | on 2-28-07 | ended 2-28-071 |
|
| Class A | $1,000.00 | $1,029.00 | $4.16 |
|
| Class B | 1,000.00 | 1,024.60 | 8.40 |
|
| Class C | 1,000.00 | 1,024.60 | 8.40 |
|
Together with the value of your account, you may use this information to estimate the operating expenses that you paid over the period. Simply divide your account value at February 28, 2007, by $1,000.00, then multiply it by the “expenses paid” for your share class from the table above. For example, for an account value of $8,600.00, the operating expenses should be calculated as follows:
California Tax-Free Income Fund
8
Hypothetical example for comparison purposes
This table allows you to compare your fund’s ongoing operating expenses with those of any other fund. It provides an example of the Fund’s hypothetical account values and hypothetical expenses based on each class’s actual expense ratio and an assumed 5% annual return before expenses (which is not your fund’s actual return). It assumes an account value of $1,000.00 on September 1, 2006, with the same investment held until February 28, 2007. Look in any other fund shareholder report to find its hypothetical example and you will be able to compare these expenses.
| | Account value | Ending value | Expenses paid during period |
| | on 9-1-06 | on 2-28-07 | ended 2-28-071 |
|
| Class A | $1,000.00 | $1,021.10 | $4.14 |
|
| Class B | 1,000.00 | 1,016.90 | 8.37 |
|
| Class C | 1,000.00 | 1,016.90 | 8.37 |
|
Remember, these examples do not include any transaction costs, such as sales charges; therefore, these examples will not help you to determine the relative total costs of owning different funds. If transaction costs were included, your expenses would have been higher. See the prospectus for details regarding transaction costs.
1 Expenses are equal to the Fund’s annualized expense ratio of 0.82%, 1.67% and 1.67% for Class A, Class B and Class C, respectively, multiplied by the average account value over the period, multiplied by number of days in most recent fiscal half-year/365 or 366 (to reflect the one-half year period).
California Tax-Free Income Fund
9
F I N A N C I A L S T A T E M E N T S
Fund’s investments
Securities owned by the Fund on 2-28-07 (unaudited)
This schedule is divided into two main categories: tax-exempt long-term bonds and short-term investments. Tax-exempt long-term bonds are broken down by state or territory. Under each state or territory is a list of securities owned by the Fund. Short-term investments, which represent the Fund’s cash position, are listed last.
| | Interest | | Maturity | Credit | Par value | |
| State, issuer, description | rate | | date | rating (A) | (000) | Value |
|
| Tax-exempt long-term bonds 98.90% | | | | | $335,265,035 |
| (Cost $308,065,087) | | | | | | |
| California 88.92% | | | | | | 301,443,037 |
|
| ABAG Finance Auth for | | | | | | |
| Nonprofit Corps, | | | | | | |
| Rev San Diego Hosp Assn Ser 2001A | 6.125% | | 08-15-20 | BBB+ | $2,000 | 2,170,280 |
|
| Adelanto Public Financing Auth, | | | | | | |
| Rev Ref Asset Backed Bond | 4.450 | | 09-15-15 | BB | 1,210 | 1,212,359 |
|
| Anaheim, City of, | | | | | | |
| Rev Ref Cert of Part Reg | | | | | | |
| Convention Ctr (P) | 9.047 | | 07-16-23 | AAA | 2,000 | 2,121,200 |
|
| Anaheim Public Financing Auth, | | | | | | |
| Rev Lease Cap Apprec Sub Pub Imp | | | | | | |
| Proj Ser 1997C | Zero | | 09-01-18 | AAA | 3,000 | 1,869,930 |
|
| Antioch Public Financing Auth, | | | | | | |
| Rev Ref Reassessment Sub | | | | | | |
| Ser 1998B (G) | 5.850 | | 09-02-15 | BB+ | 1,375 | 1,442,856 |
|
| Belmont Community Facilities District, | | | | | | |
| Rev Special Tax Dist No. 2000 1 | | | | | | |
| Library Proj Ser 2004A | 5.750 | | 08-01-24 | Aaa | 1,000 | 1,216,640 |
|
| California County Tobacco | | | | | | |
| Securitization Agency, | | | | | | |
| Rev Asset Backed Bond Fresno | | | | | | |
| County Fdg Corp | 6.000 | | 06-01-35 | BBB | 1,765 | 1,878,348 |
| Rev Asset Backed Bond Kern County | | | | | | |
| Corp Ser 2002A | 6.125 | | 06-01-43 | BBB | 5,000 | 5,350,700 |
| Rev Asset Backed Bond Los Angeles | | | | | | |
| County (Step Coupon 5.250%, | | | | | | |
| 12-01-10) (O) | Zero | | 06-01-21 | Baa3 | 5,000 | 4,418,500 |
| Rev Asset Backed Bond Sanislaus | | | | | | |
| Fdg Ser 2002A | 5.500 | | 06-01-33 | Baa3 | 1,000 | 1,041,020 |
|
| California Department of | | | | | | |
| Water Resources, | | | | | | |
| Rev Pwr Supply Ser 2002A | 5.375 | | 05-01-21 | A– | 4,000 | 4,373,480 |
|
| California Educational Facilities Auth, | | | | | | |
| Rev College & Univ Proj | 5.000 | | 02-01-26 | Baa3 | 3,500 | 3,652,985 |
| Rev Ref Pooled College & Univ | | | | | | |
| Financing Ser 1993B | 6.125 | | 06-01-09 | Baa2 | 15 | 15,030 |
| Rev Ref Woodbury Univ | 5.000 | | 01-01-30 | BBB– | 2,000 | 2,068,020 |
| Rev Univ of San Diego Ser 2002A | 5.500 | | 10-01-32 | A2 | 1,435 | 1,545,782 |
See notes to financial statements
California Tax-Free Income Fund
10
F I N A N C I A L S T A T E M E N T S
| | Interest | | Maturity | Credit | Par value | |
| State, issuer, description | rate | | date | rating (A) | (000) | Value |
|
| California (continued) | | | | | | |
|
| California Health Facilities Financing Auth, | | | | | |
| Rev Catholic Healthcare West | | | | | | |
| Ser 2004G | 5.250% | | 07-01-23 | A | $1,000 | $1,065,040 |
| Rev Kaiser Permanente Ser 2006A | 5.250 | | 04-01-39 | A+ | 2,500 | 2,673,000 |
| Rev Ref Cedars Sinai Med Ctr | 5.000 | | 11-15-34 | A2 | 2,000 | 2,090,360 |
| Rev Ref Insd Hlth Facil-Small | | | | | | |
| Facil Ser 1994B | 7.500 | | 04-01-22 | A+ | 525 | 526,559 |
|
| California Infrastructure & | | | | | | |
| Economic Development Bank, | | | | | | |
| Rev J David Gladstone Inst Proj | 5.250 | | 10-01-34 | A– | 1,000 | 1,051,660 |
| Rev Kaiser Hosp Asst I LLC | | | | | | |
| Ser 2001A | 5.550 | | 08-01-31 | A+ | 3,000 | 3,194,970 |
|
| California Municipal Finance Auth, | | | | | | |
| Rev Ref Amern Heritage Education | | | | | | |
| Foundation Proj Ser 2006A | 5.250 | | 06-01-26 | BBB– | 1,000 | 1,056,980 |
|
| California Pollution Control | | | | | | |
| Financing Auth, | | | | | | |
| Rev Poll Control Pacific Gas & | | | | | | |
| Electric Ser 1996A | 5.350 | | 12-01-16 | AAA | 1,000 | 1,071,390 |
| Rev Solid Waste Disposal Keller | | | | | | |
| Canyon Landfill Co Proj | 6.875 | | 11-01-27 | BB– | 2,000 | 2,012,100 |
| Rev Waste Mgmt Inc Proj Ser 2005C | 5.125 | | 11-01-23 | BBB | 2,000 | 2,111,280 |
|
| California State Economic Recovery Auth, | | | | | | |
| Gen Oblig Unltd Ser 2004B | 5.000 | | 07-01-23 | AA+ | 2,000 | 2,038,360 |
|
| California State Public Works Board, | | | | | | |
| Rev Lease Dept of Corrections | | | | | | |
| Ser 2003C | 5.500 | | 06-01-18 | A | 5,000 | 5,522,800 |
| Rev Ref Lease Dept of Corrections | | | | | | |
| State Prisons Ser 1993A | 5.000 | | 12-01-19 | AAA | 5,000 | 5,473,850 |
| Rev Ref Lease Various Univ of | | | | | | |
| Calif Projs Ser 1993A | 5.500 | | 06-01-21 | AA– | 1,250 | 1,251,137 |
|
| California State University, | | | | | | |
| Rev Ref Systemwide Ser 2005C | 5.000 | | 11-01-38 | AAA | 5,000 | 5,344,250 |
|
| California Statewide Communities | | | | | | |
| Develop Auth, | | | | | | |
| Ref Rev Cert of Part Univ Corp | | | | | | |
| Calif State Univ | 6.000 | | 04-01-26 | AAA | 1,620 | 1,639,165 |
| Rev Ref Sr Living Presbyterian | | | | | | |
| Homes Ser 2006A | 4.875 | | 11-15-36 | BBB+ | 2,000 | 2,039,420 |
|
| California Statewide Financing Auth, | | | | | | |
| Rev Tobacco Settlement Asset | | | | | | |
| Backed Bond 2002A | 6.000 | | 05-01-37 | Baa3 | 2,500 | 2,658,650 |
| Rev Tobacco Settlement Asset | | | | | | |
| Backed Bond 2002B | 6.000 | | 05-01-37 | Baa3 | 4,000 | 4,253,840 |
|
| California, State of, | | | | | | |
| Gen Oblig Unltd | 5.125 | | 04-01-23 | A+ | 2,000 | 2,146,600 |
| Gen Oblig Unltd | 5.125 | | 11-01-24 | A+ | 3,500 | 3,739,050 |
| Gen Oblig Unltd (P) | 3.450 | | 05-01-34 | AA+ | 975 | 975,000 |
| Gen Oblig Unltd Ref (P) | 7.008 | | 03-01-16 | AAA | 6,255 | 7,293,830 |
| Gen Oblig Unltd Ref | 5.000 | | 06-01-34 | A+ | 2,000 | 2,111,660 |
| Gen Oblig Unltd Ref | 4.750 | | 04-01-29 | AAA | 6,000 | 6,103,260 |
See notes to financial statements
California Tax-Free Income Fund
11
F I N A N C I A L S T A T E M E N T S
| Interest | | Maturity | Credit | Par value | |
| State, issuer, description | rate | | date | rating (A) | (000) | Value |
|
| California (continued) | | | | | | |
|
| Capistrano Unified School District, | | | | | | |
| Rev Spec Tax Cmty Facil Dist No. 90 2 (G) | 6.000% | | 09-01-33 | BB | $750 | $801,090 |
| Rev Spec Tax Cmty Facil Dist No. 90 2 (G) | 5.875 | | 09-01-23 | BB | 500 | 535,215 |
| Rev Spec Tax Cmty Facil Dist No. 92 1 (G) | 7.100 | | 09-01-21 | AA | 1,950 | 2,022,735 |
| Rev Spec Tax Cmty Facil Dist No. 98 2 (G) | 5.750 | | 09-01-29 | AA | 2,470 | 2,644,110 |
|
| Carson, City of, | | | | | | |
| Rev Spec Assessment Imp Bond Act | | | | | | |
| of 1915 Dist No. 2001 1 (G) | 6.375 | | 09-02-31 | AA | 1,375 | 1,416,635 |
|
| Center Unified School District, | | | | | | |
| Gen Oblig Unltd Ref Cap Apprec | | | | | | |
| Ser 1997C | Zero | | 09-01-16 | AAA | 2,145 | 1,466,837 |
|
| Chula Vista Industrial | | | | | | |
| Development Agency, | | | | | | |
| Rev San Diego Gas Ser 2005D | 5.000 | | 12-01-27 | A+ | 1,500 | 1,592,235 |
| Rev Ref Tax Alloc Bayfront Ser 2006B (G) | 5.250 | | 10-01-27 | BB+ | 1,250 | 1,278,987 |
|
| Contra Costa County Public | | | | | | |
| Financing Auth, | | | | | | |
| Rev Ref Lease Various Cap Facil | | | | | | |
| Ser 1999 A | 5.000 | | 06-01-28 | AAA | 3,000 | 3,088,800 |
|
| Corona Community Facilities District, | | | | | | |
| Rev Special Tax Escrow 97 2 (G) | 5.875 | | 09-01-23 | BB+ | 1,300 | 1,347,970 |
|
| Eastern Municipal Water District, | | | | | | |
| Rev Water & Sewer Ctfs Partn | | | | | | |
| Ser 2006A | 5.000 | | 07-01-32 | AAA | 2,965 | 3,178,539 |
|
| Foothill/Eastern Transportation | | | | | | |
| Corridor Agency, | | | | | | |
| Rev Ref Toll Rd Cap Apprec | Zero | | 01-15-25 | BBB– | 6,615 | 2,421,818 |
| Rev Ref Toll Rd Cap Apprec | Zero | | 01-15-36 | BBB– | 30,000 | 5,598,900 |
|
| Fresno Joint Powers | | | | | | |
| Financing Auth, | | | | | | |
| Rev Ref Ser 1994A | 6.550 | | 09-02-12 | BBB+ | 800 | 801,624 |
|
| Fresno, City of, | | | | | | |
| Rev Swr Ser A 1 | 5.250 | | 09-01-19 | AAA | 1,000 | 1,124,680 |
|
| Fullerton Community Facilities | | | | | | |
| District, | | | | | | |
| Rev Spec Tax Amerige Heights Dist | | | | | | |
| No. 1 (G) | 6.200 | | 09-01-32 | BB | 1,000 | 1,070,250 |
|
| Golden State Tobacco | | | | | | |
| Securitization Corp, | | | | | | |
| Rev Asset Backed Bond Ser 2003A | 6.250 | | 06-01-33 | BBB | 3,000 | 3,359,130 |
| Rev Asset Backed Bond Ser 2003B | 5.500 | | 06-01-43 | AAA | 5,000 | 5,495,450 |
|
| Inglewood Unified School District | | | | | | |
| Facilities Financing Auth, | | | | | | |
| Rev Ref Ser 2007 | 5.250 | | 10-15-26 | AAA | 5,000 | 5,844,200 |
|
| Irvine, City of, | | | | | | |
| Rev Meadows Mobile Home Park | | | | | | |
| Ser 1998A (G) | 5.700 | | 03-01-28 | BBB– | 3,975 | 4,102,836 |
|
| Laguna Salada Union School | | | | | | |
| District, | | | | | | |
| Gen Oblig Unltd Ser 2000C | Zero | | 08-01-26 | AAA | 1,000 | 443,480 |
See notes to financial statements
California Tax-Free Income Fund
12
F I N A N C I A L S T A T E M E N T S
| | Interest | | Maturity | Credit | Par value | |
| State, issuer, description | rate | | date | rating (A) | (000) | Value |
|
| California (continued) | | | | | | |
|
| Lancaster School District, | | | | | | |
| Rev Ref Cert of Part Cap Apprec | Zero | | 04-01-19 | AAA | $1,730 | $1,049,072 |
| Rev Ref Cert of Part Cap Apprec | Zero | | 04-01-22 | AAA | 1,380 | 732,628 |
|
| Lee Lake Water District, | | | | | | |
| Rev Spec Tax Cmty Facil Dist No. | | | | | | |
| 2 Montecito Ranch (G) | 6.125% | | 09-01-27 | BB | 1,200 | 1,276,452 |
|
| Long Beach, City of, | | | | | | |
| Rev Ref Harbor Ser 1998A | 6.000 | | 05-15-18 | AAA | 2,660 | 3,123,611 |
| Rev Spec Tax Cmty Facil Dist No. | | | | | | |
| 6 Pike (G) | 6.250 | | 10-01-26 | BB– | 2,500 | 2,679,600 |
|
| Los Angeles Community Facilities District, | | | | | | |
| Rev Spec Tax No. 3 Cascades | | | | | | |
| Business Park Proj (G) | 6.400 | | 09-01-22 | BB+ | 655 | 673,491 |
|
| Los Angeles Community | | | | | | |
| Redevelopment Financing Auth, | | | | | | |
| Rev Multi Family Grand Central | | | | | | |
| Square Ser 1993A | 5.850 | | 12-01-26 | BBB– | 2,000 | 2,019,000 |
|
| Los Angeles Unified School District, | | | | | | |
| Gen Oblig Unltd Election of 1997 | | | | | | |
| Ser 2002E | 5.500 | | 07-01-17 | AAA | 1,500 | 1,640,340 |
|
| Millbrae, City of, | | | | | | |
| Rev Magnolia of Milbrae Proj | | | | | | |
| Ser 1997A (G) | 7.375 | | 09-01-27 | BB | 2,500 | 2,595,100 |
|
| Modesto, City of, | | | | | | |
| Rev Spec Tax Cmnty Facs Dist No. | | | | | | |
| 04-1 2 (G) | 5.100 | | 09-01-26 | BB | 2,000 | 2,042,300 |
|
| New Haven Unified School District, | | | | | | |
| Gen Oblig Unltd Cap Apprec | | | | | | |
| Ser 1998B | Zero | | 08-01-22 | AAA | 14,200 | 6,303,806 |
|
| Newport Beach, City of, | | | | | | |
| Rev Hoag Mem Presbyterian | | | | | | |
| Hosp (P) | 3.490 | | 10-01-22 | AA | 1,000 | 1,000,000 |
|
| Northern California | | | | | | |
| Transmission Agency, | | | | | | |
| Rev Ref Calif-Oregon Transm Proj | | | | | | |
| Ser 1990A | 7.000 | | 05-01-13 | AAA | 100 | 114,937 |
|
| Orange Cove Irrigation District, | | | | | | |
| Rev Ref Cert of Part Rehab Proj | 5.000 | | 02-01-17 | AAA | 2,045 | 2,067,720 |
|
| Orange, County of, | | | | | | |
| Rev Ref Spec Assessment Imp Bond | | | | | | |
| Act 1915 Ltd Oblig Dist No. 01-1 (G) | 5.000 | | 09-02-26 | BB | 500 | 512,550 |
| Rev Spec Assessment Imp Bond Act | | | | | | |
| 1915 Ltd Oblig (G) | 5.750 | | 09-02-33 | BB | 1,570 | 1,624,055 |
| Rev Spec Tax Cmty Facil Dist No. 1 | | | | | | |
| Ladera Ranch Ser 2000A (G) | 6.250 | | 08-15-30 | AA | 1,000 | 1,038,310 |
|
| Oxnard, City of, | | | | | | |
| Rev Special Tax District No. 3 — | | | | | | |
| Seabridge (G) | 5.000 | | 09-01-35 | BB | 1,500 | 1,517,775 |
See notes to financial statements
California Tax-Free Income Fund
13
F I N A N C I A L S T A T E M E N T S
| | Interest | | Maturity | Credit | Par value | |
| State, issuer, description | rate | | date | rating (A) | (000) | Value |
|
| California (continued) | | | | | | |
|
| Paramount Unified School District, | | | | | | |
| Gen Oblig Unltd Cap Apprec Bonds | | | | | | |
| Ser 2001B | Zero | | 09-01-25 | AAA | $4,735 | $2,154,520 |
|
| Pasadena, City of, | | | | | | |
| Cert of Part Ref Old Pasadena | | | | | | |
| Parking Facil Proj | 6.250% | | 01-01-18 | AA | 985 | 1,116,901 |
|
| Poway, City of, | | | | | | |
| Rev Ref Cmty Facil Dist No. 88 1 | | | | | | |
| Pkwy Business Ctr (G) | 6.750 | | 08-15-15 | BB | 1,000 | 1,056,690 |
|
| Rancho Santa Fe Community | | | | | | |
| Services District, | | | | | | |
| Rev Spec Tax Cmty Facil Dist No. 1 (G) | 6.700 | | 09-01-30 | BB | 1,000 | 1,065,060 |
|
| Redondo Beach Public Financing Auth, | | | | | | |
| Rev South Bay Center Redevel Proj (G) | 7.000 | | 07-01-16 | BBB+ | 950 | 970,938 |
|
| Riverside County Asset Leasing Corp, | | | | | | |
| Rev Leasehold Linked Ctfs | | | | | | |
| Riverside County Ser 1993A | 6.500 | | 06-01-12 | A+ | 1,000 | 1,116,020 |
|
| Roseville Natural Gas Finance Auth, | | | | | | |
| Rev Asset Backed Bond | 5.000 | | 02-15-24 | AA– | 1,000 | 1,105,340 |
|
| Sacramento City Financing Auth, | | | | | | |
| Rev Convention Ctr Hotel Sr | | | | | | |
| Ser 1999A (G) | 6.250 | | 01-01-30 | BB+ | 5,000 | 5,207,200 |
|
| San Bernardino, County of, | | | | | | |
| Rev Cert of Part Cap Facil Proj Ser 1992B | 6.875 | | 08-01-24 | AAA | 350 | 464,513 |
| Rev Ref Cert of Part Med Ctr Fin Proj | 5.500 | | 08-01-17 | AAA | 8,750 | 9,633,925 |
|
| San Bruno Park School District, | | | | | | |
| Gen Oblig Unltd Cap Apprec Ser 2000B | Zero | | 08-01-21 | AAA | 1,015 | 557,276 |
| Gen Oblig Unltd Cap Apprec Ser 2000B | Zero | | 08-01-23 | AAA | 1,080 | 541,296 |
|
| San Diego County Water Auth, | | | | | | |
| Rev Ref Cert of Part Inverse Floater (P) | 7.687 | | 04-23-08 | AAA | 1,000 | 1,047,180 |
| Rev Ref Cert of Part Inverse Floater (P) | 7.687 | | 04-22-09 | AAA | 400 | 434,456 |
|
| San Diego Redevelopment Agency, | | | | | | |
| Rev Ref Tax Alloc Cap Apprec | | | | | | |
| Ser 1999B (G) | Zero | | 09-01-17 | BB | 1,600 | 942,576 |
| Rev Ref Tax Alloc Cap Apprec | | | | | | |
| Ser 1999B (G) | Zero | | 09-01-18 | BB | 1,700 | 937,686 |
| Rev Ref Tax Alloc City Heights | | | | | | |
| Proj Ser 1999A (G) | 5.800 | | 09-01-28 | BB | 1,395 | 1,444,285 |
| Rev Tax Alloc City Heights Proj | | | | | | |
| Ser 1999A (G) | 5.750 | | 09-01-23 | BB | 1,000 | 1,033,890 |
|
| San Diego Unified School District, | | | | | | |
| Gen Oblig Ref Election 1998 | | | | | | |
| Ser 2006F-1 | 5.250 | | 07-01-28 | AAA | 5,000 | 5,891,200 |
| Gen Oblig Unltd Cap Apprec | | | | | | |
| Ser 1999A | Zero | | 07-01-21 | AAA | 2,500 | 1,377,375 |
| Gen Oblig Unltd Election of 1998 | | | | | | |
| Ser 2000B | 5.000 | | 07-01-25 | AAA | 2,450 | 2,553,831 |
See notes to financial statements
California Tax-Free Income Fund
14
F I N A N C I A L S T A T E M E N T S
| Interest | | Maturity | Credit | Par value | |
| State, issuer, description | rate | | date | rating (A) | (000) | Value |
|
| California (continued) | | | | | | |
|
| San Francisco City & County | | | | | | |
| Redevelopment Agency, | | | | | | |
| Rev Cmty Facil Dist No. 6 Mission | | | | | | |
| Ser 2001A (G) | 6.000% | | 08-01-25 | BB | $2,500 | $2,618,825 |
| Rev Spec Tax Cmnty Facil Dist No. | | | | | | |
| 6 Ser 2005A (G) | 5.150 | | 08-01-35 | BB | 1,250 | 1,279,113 |
|
| San Francisco, City of, | | | | | | |
| Rev Bay Area Rapid Tran Dist Sales Tax | 5.000 | | 07-01-31 | AAA | 10,500 | 11,161,710 |
|
| San Francisco State | | | | | | |
| Building Auth, | | | | | | |
| Rev Ref Lease Dept of Gen Serv | | | | | | |
| Ser 1993A | 5.000 | | 10-01-13 | A | 2,145 | 2,248,904 |
|
| San Joaquin Hills Transportation | | | | | | |
| Corridor Agency, | | | | | | |
| Rev Ref Toll Rd Conv Cap Apprec | | | | | | |
| Ser 1997A | 5.750 | | 01-15-21 | BB– | 5,000 | 5,336,150 |
| Rev Toll Rd Sr Lien | Zero | | 01-01-14 | AAA | 5,000 | 3,838,900 |
| Rev Toll Rd Sr Lien | Zero | | 01-01-22 | AAA | 6,500 | 3,522,870 |
|
| San Marcos Public Facilities Auth, | | | | | | |
| Rev Sub Tax Increment Proj Area 3 | | | | | | |
| Ser 1999A (G) | 6.000 | | 08-01-31 | AA | 1,305 | 1,392,396 |
|
| San Mateo County Joint | | | | | | |
| Power Auth, | | | | | | |
| Rev Ref Lease Cap Proj Prog | 5.000 | | 07-01-21 | AAA | 1,815 | 2,011,528 |
|
| Santa Ana Financing Auth, | | | | | | |
| Rev Lease Police Admin & Hldg | | | | | | |
| Facil Ser 1994A | 6.250 | | 07-01-19 | AAA | 1,790 | 2,177,213 |
| Rev Lease Police Admin & Hldg | | | | | | |
| Facil Ser 1994A | 6.250 | | 07-01-24 | AAA | 10,000 | 12,615,800 |
| Rev Ref Mainplace Proj | | | | | | |
| Ser 1998D (G) | 5.600 | | 09-01-19 | BBB– | 1,000 | 1,092,110 |
|
| Santa Clara County | | | | | | |
| Financing Auth, | | | | | | |
| Rev Ref Lease Multiple Facil | | | | | | |
| Projs Ser 2000B | 5.500 | | 05-15-17 | AAA | 6,000 | 6,379,260 |
|
| Santa Clara, County of, | | | | | | |
| General Obligation Unltd | 5.250 | | 09-01-24 | AAA | 2,500 | 2,890,725 |
|
| Santa Fe Springs Community | | | | | | |
| Development Commission, | | | | | | |
| Rev Tax Alloc Cap Apprec Cons | | | | | | |
| Redev Proj Ser 2006A | Zero | | 09-01-20 | AAA | 1,275 | 725,195 |
|
| Santa Margarita Water District, | | | | | | |
| Rev Spec Tax Cmty Facil Dist No. 99 1 (G) | 6.000 | | 09-01-30 | BB+ | 500 | 535,215 |
|
| Santaluz Community Facilities District, | | | | | | |
| Rev Spec Tax Dist No. 2 Imp Area | | | | | | |
| No. 1 (G) | 6.375 | | 09-01-30 | BB | 1,495 | 1,511,161 |
|
| Southern California Public Power Auth, | | | | | | |
| Rev Ref Southern Transm Proj | Zero | | 07-01-13 | AAA | 4,400 | 3,444,100 |
|
| Tobacco Securitization Auth of | | | | | | |
| Northern California, | | | | | | |
| Rev Asset Backed Bond Ser 2001A | 5.375 | | 06-01-41 | AAA | 1,000 | 1,070,260 |
See notes to financial statements
California Tax-Free Income Fund
15
F I N A N C I A L S T A T E M E N T S
| | Interest | | Maturity | Credit | Par value | |
| State, issuer, description | rate | | date | rating (A) | (000) | Value |
|
| California (continued) | | | | | | |
|
| Torrance, City of, | | | | | | |
| Rev Ref Hosp Torrance Mem Med Ctr | | | | | | |
| Ser 2001A | 5.500% | | 06-01-31 | A+ | $2,000 | $2,115,600 |
|
| Tustin Unified School District, | | | | | | |
| Rev Spec Tax Cmty Facil Dist No. 97 1 | 6.375 | | 09-01-35 | AAA | 1,000 | 1,061,010 |
|
| Vallejo Sanitation and Flood | | | | | | |
| Control District, | | | | | | |
| Rev Ref Cert of Part | 5.000 | | 07-01-19 | AAA | 2,500 | 2,767,225 |
|
| West Covina Redevelopment Agency, | | | | | | |
| Rev Ref Cmty Facil Dist Fashion | | | | | | |
| Plaza Proj | 6.000 | | 09-01-22 | AA | 3,000 | 3,528,000 |
| Puerto Rico 9.98% | | | | | | 33,821,998 |
|
| Puerto Rico Aqueduct & | | | | | | |
| Sewer Auth, | | | | | | |
| Rev Inverse Floater (Gtd) (P) | 8.022 | | 07-01-11 | AAA | 7,500 | 8,827,200 |
|
| Puerto Rico Highway & | | | | | | |
| Transportation Auth, | | | | | | |
| Rev Ref Ser 1996Z | 6.250 | | 07-01-14 | AAA | 3,250 | 3,787,453 |
| Rev Ref Ser 1998A | 5.000 | | 07-01-38 | AAA | 5,000 | 5,138,300 |
|
| Puerto Rico Ind’l, Tourist, Ed’l, | | | | | | |
| Med & Environmental Control | | | | | | |
| Facilities Financing Auth, | | | | | | |
| Rev Hosp de La Concepcion Ser 2000A | 6.500 | | 11-15-20 | AA | 500 | 549,200 |
|
| Puerto Rico Public Finance Corp, | | | | | | |
| Rev Commonwealth Approp Ser 2002E | 5.700 | | 08-01-25 | Aaa | 2,500 | 2,643,025 |
|
| Puerto Rico, Commonwealth of, | | | | | | |
| Gen Oblig Unltd | 6.500 | | 07-01-15 | BBB | 6,000 | 7,087,320 |
| Gen Oblig Unltd Ser 975 (P) | 6.130 | | 07-01-18 | Aaa | 5,000 | 5,789,500 |
See notes to financial statements
California Tax-Free Income Fund
16
F I N A N C I A L S T A T E M E N T S
| | Interest | Par value | |
| Issuer, description, maturity date | rate | (000) | Value |
|
| Short-term investments 0.04% | | | $142,000 |
| (Cost $142,000) | | | |
| Joint Repurchase Agreement 0.04% | | | 142,000 |
|
| Investment in a joint repurchase agreement transaction | | | |
| with Cantor Fitzgerald LP — Dated 2-28-07, due 3-1-07 | | | |
| (Secured by U.S. Treasury Inflation Indexed Notes 1.875% | | | |
| due 7-15-13 and 2.000% due 7-15-14). | | | |
| Maturity value: $142,021 | 5.270% | $142 | 142,000 |
|
| Total investments (Cost $308,207,087) 98.94% | | | $335,407,035 |
|
| |
| Other assets and liabilities, net 1.06% | | | $3,588,300 |
|
| |
| Total net assets 100.00% | | | $338,995,335 |
(A) Credit ratings are unaudited and are rated by Moody’s Investors Service or Fitch where Standard & Poor’s ratings are not available unless indicated otherwise.
(G) Security rated internally by John Hancock Advisers, LLC.
(O) Cash interest will be paid on this obligation at the stated rate beginning on the stated date.
( P) Represents rate in effect on February 28, 2007.
The percentage shown for each investment category is the total value of that category as a percentage of the net assets of the Fund.
See notes to financial statements
California Tax-Free Income Fund
17
F I N A N C I A L S T A T E M E N T S
Financial statements
| Statement of assets and liabilities 2-28-07 (unaudited) |
| |
| This Statement of Assets and Liabilities is the Fund’s balance sheet. It shows the value of what the Fund owns, is due and owes. You’ll also find the net asset value and the maximum offering price per share. |
|
| |
| |
| |
| Assets | |
|
| Investments at value (cost $308,207,087) | $335,407,035 |
| Cash | 925 |
| Receivable for shares sold | 178,330 |
| Interest receivable | 3,979,181 |
| Other assets | 94,666 |
| Total assets | 339,660,137 |
| |
| Liabilities | |
|
| Payable for shares repurchased | 299,067 |
| Dividends payable | 38,516 |
| Payable to affiliates | |
| Management fees | 141,444 |
| Distribution and service fees | 10,343 |
| Other | 21,392 |
| Other payables and accrued expenses | 154,040 |
| Total liabilities | 664,802 |
| |
| Net assets | |
|
| Capital paid-in | 311,362,497 |
| Accumulated net realized gain on investments | 174,556 |
| Net unrealized appreciation of investments | 27,199,948 |
| Accumulated net investment income | 258,334 |
| Net assets | $338,995,335 |
| |
| Net asset value per share | |
|
| Based on net asset values and shares outstanding — the Fund has an | |
| unlimited number of shares authorized with no par value | |
| Class A ($309,621,344 ÷ 28,111,094 shares) | $11.01 |
| Class B ($19,284,502 ÷ 1,750,799 shares) | $11.01 |
| Class C ($10,089,489 ÷ 916,120 shares) | $11.01 |
| |
| Maximum offering price per share | |
|
| Class A1 ($11.01 ÷ 95.5%) | $11.53 |
| |
| 1 On single retail sales of less than $100,000. On sales of $100,000 or more and on group sales the offering price |
| is reduced. | |
See notes to financial statements
California Tax-Free Income Fund
18
F I N A N C I A L S T A T E M E N T S
Statement of operations For the period ended 2-28-07 (unaudited)1
This Statement of Operations summarizes the Fund’s investment income earned and expenses incurred in operating the Fund. It also shows net gains (losses) for the period stated.
| Investment income | |
|
| Interest | $8,589,160 |
| Total investment income | 8,589,160 |
|
| Expenses | |
|
| Investment management fees (Note 2) | 900,344 |
| Distribution and service fees (Note 2) | 373,319 |
| Transfer agent fees (Note 2) | 67,585 |
| Accounting and legal services fees (Note 2) | 23,245 |
| Compliance fees | 4,210 |
| Custodian fees | 42,440 |
| Professional fees | 22,043 |
| Printing | 11,411 |
| Blue sky fees | 7,560 |
| Trustees’ fees | 6,938 |
| Miscellaneous | 9,010 |
| Total expenses | 1,468,105 |
| Less expense reductions (Note 2) | (72) |
| Net expenses | 1,468,033 |
| Net investment income | 7,121,127 |
| |
| Realized and unrealized gain | |
|
| Net realized gain on investments | 1,688,767 |
| Change in net unrealized appreciation (depreciation) of investments | 675,586 |
| Net realized gain on investments | 2,364,353 |
| Increase in net assets from operations | $9,485,480 |
| |
| 1 Semiannual period from 9-1-06 through 2-28-07. | |
See notes to financial statements
California Tax-Free Income Fund
19
S T N E M E T A T S
L A C I N A N I F
Statement of changes in net assets
These Statements of Changes in Net Assets show how the value of the Fund’s net assets has changed during the last two periods. The difference reflects earnings less expenses, any investment gains and losses, distributions, if any, paid to shareholders and the net of Fund share transactions.
| | Year | Period |
| | ended | ended |
| | 8-31-06 | 2-28-071 |
|
| Increase (decrease) in net assets | | |
| From operations | | |
| Net investment income | $14,766,240 | $7,121,127 |
| Net realized gain | 2,994,563 | 1,688,767 |
| Change in net unrealized appreciation (depreciation) | (7,884,136) | 675,586 |
| Increase in net assets resulting from operations | 9,876,667 | 9,485,480 |
| Distributions to shareholders | | |
| From net investment income | | |
| Class A | (13,401,500) | (6,384,203) |
| Class B | (1,031,238) | (370,765) |
| Class C | (257,800) | (146,704) |
| | (14,690,538) | (6,901,672) |
| From Fund share transactions | (12,939,321) | 8,537,092 |
|
| Net assets | | |
| Beginning of period | 345,627,627 | 327,874,435 |
| End of period2 | $327,874,435 | $338,995,335 |
1 Semiannual period from 9-1-06 through 2-28-07. Unaudited.
2 Includes accumulated net investment income of $38,879 and $258,334, respectively.
See notes to financial statements
California Tax-Free Income Fund
20
F I N A N C I A L S T A T E M E N T S
Financial highlights
The Financial Highlights show how the Fund’s net asset value for a share has changed since the end of the previous period.
| CLASS A SHARES | | | | | | |
| |
| Period ended | 8-31-021,2 | 8-31-031 | 8-31-041 | 8-31-051 | 8-31-06 | 2-28-073 |
|
| Per share operating performance | | | | | | |
| Net asset value, | | | | | | |
| beginning of period | $11.11 | $11.06 | $10.60 | $10.91 | $11.08 | $10.93 |
| Net investment income4 | 0.54 | 0.53 | 0.52 | 0.51 | 0.49 | 0.23 |
| Net realized and unrealized | | | | | | |
| gain (loss) on investments | (0.06) | (0.47) | 0.30 | 0.16 | (0.15) | 0.08 |
| Total from investment operations | 0.48 | 0.06 | 0.82 | 0.67 | 0.34 | 0.31 |
| Less distributions | | | | | | |
| From net investment income | (0.53) | (0.52) | (0.51) | (0.50) | (0.49) | (0.23) |
| Net asset value, end of period | $11.06 | $10.60 | $10.91 | $11.08 | $10.93 | $11.01 |
| Total return5 (%) | 4.526 | 0.48 | 7.84 | 6.24 | 3.196 | 2.906,7 |
|
| Ratios and supplemental data | | | | | | |
| Net assets, end of period | | | | | | |
| (in millions) | $347 | $308 | $308 | $306 | $296 | $310 |
| Ratio of net expenses to average | | | | | | |
| net assets (%) | 0.84 | 0.84 | 0.83 | 0.86 | 0.82 | 0.828 |
| Ratio of gross expenses to average | | | | | | |
| net assets (%) | 0.849 | 0.84 | 0.83 | 0.86 | 0.829 | 0.829 |
| Ratio of net investment income | | | | | | |
| to average net assets (%) | 4.95 | 4.79 | 4.72 | 4.59 | 4.53 | 4.428 |
| Portfolio turnover (%) | 15 | 18 | 21 | 13 | 33 | 227 |
See notes to financial statements
California Tax-Free Income Fund
21
F I N A N C I A L S T A T E M E N T S
Financial highlights
| CLASS B SHARES | | | | | | |
| |
| Period ended | 8-31-021,2 | 8-31-031 | 8-31-041 | 8-31-051 | 8-31-06 | 2-28-073 |
|
| Per share operating performance | | | | | | |
| Net asset value, | | | | | | |
| beginning of period | $11.11 | $11.06 | $10.60 | $10.91 | $11.08 | $10.93 |
| Net investment income4 | 0.45 | 0.44 | 0.42 | 0.41 | 0.40 | 0.19 |
| Net realized and unrealized | | | | | | |
| gain (loss) on investments | (0.06) | (0.47) | 0.31 | 0.16 | (0.15) | 0.08 |
| Total from investment operations | 0.39 | (0.03) | 0.73 | 0.57 | 0.25 | 0.27 |
| Less distributions | | | | | | |
| From net investment income | (0.44) | (0.43) | (0.42) | (0.40) | (0.40) | (0.19) |
| Net asset value, end of period | $11.06 | $10.60 | $10.91 | $11.08 | $10.93 | $11.01 |
| Total return5 (%) | 3.676 | (0.37) | 6.93 | 5.35 | 2.326 | 2.466,7 |
|
| Ratios and supplemental data | | | | | | |
| Net assets, end of period | | | | | | |
| (in millions) | $65 | $55 | $43 | $32 | $24 | $19 |
| Ratio of net expenses to average | | | | | | |
| net assets (%) | 1.65 | 1.69 | 1.69 | 1.71 | 1.67 | 1.678 |
| Ratio of gross expenses to average | | | | | | |
| net assets (%) | 1.699 | 1.69 | 1.69 | 1.71 | 1.679 | 1.679 |
| Ratio of net investment income | | | | | | |
| to average net assets (%) | 4.14 | 3.95 | 3.87 | 3.75 | 3.68 | 3.568 |
| Portfolio turnover (%) | 15 | 18 | 21 | 13 | 33 | 227 |
See notes to financial statements
California Tax-Free Income Fund
22
F I N A N C I A L S T A T E M E N T S
Financial highlights
| CLASS C SHARES | | | | | | |
| |
| Period ended | 8-31-021,2 | 8-31-031 | 8-31-041 | 8-31-051 | 8-31-06 | 2-28-073 |
|
| Per share operating performance | | | | | | |
| Net asset value, | | | | | | |
| beginning of period | $11.11 | $11.06 | $10.60 | $10.91 | $11.08 | $10.93 |
| Net investment income4 | 0.45 | 0.43 | 0.42 | 0.41 | 0.40 | 0.19 |
| Net realized and unrealized | | | | | | |
| gain (loss) on investments | (0.06) | (0.47) | 0.31 | 0.16 | (0.15) | 0.08 |
| Total from investment operations | 0.39 | (0.04) | 0.73 | 0.57 | 0.25 | 0.27 |
| Less distributions | | | | | | |
| From net investment income | (0.44) | (0.42) | (0.42) | (0.40) | (0.40) | (0.19) |
| Net asset value, end of period | $11.06 | $10.60 | $10.91 | $11.08 | $10.93 | $11.01 |
| Total return5 (%) | 3.646 | (0.37) | 6.93 | 5.35 | 2.326 | 2.466,7 |
|
| Ratios and supplemental data | | | | | | |
| Net assets, end of period | | | | | | |
| (in millions) | $8 | $9 | $7 | $7 | $8 | $10 |
| Ratio of net expenses to average | | | | | | |
| net assets (%) | 1.69 | 1.69 | 1.69 | 1.71 | 1.67 | 1.678 |
| Ratio of gross expenses to average | | | | | | |
| net assets (%) | 1.699 | 1.69 | 1.69 | 1.71 | 1.679 | 1.679 |
| Ratio of net investment income | | | | | | |
| to average net assets (%) | 4.10 | 3.93 | 3.87 | 3.74 | 3.68 | 3.568 |
| Portfolio turnover (%) | 15 | 18 | 21 | 13 | 33 | 227 |
1 Audited by previous auditor.
2 As required, effective 9-1-01, the Fund adopted the provisions of the AICPA Audit and Accounting Guide for Investment Companies, as revised, relating to the amortization of premiums and accretion of discounts on debt securities. The effect of this change on per share amounts for the year ended 8-31-02 was to increase net investment income per share by $0.01, increase net realized and unrealized losses per share by $0.01 and, had the Fund not made these changes to amortization and accretion, the ratio of net investment income to average net assets would have been 4.88%, 4.07% and 4.03%, for Class A, Class B and Class C shares, respectively. Per share ratios and supplemental data for periods prior to 9-1-01, have not been restated to reflect this change in presentation.
3 Semiannual period from 9-1-06 through 2-28-07. Unaudited.
4 Based on the average of the shares outstanding.
5 Assumes dividend reinvestment and does not reflect the effect of sales charges.
6 Total returns would have been lower had certain expenses not been reduced during the periods shown.
7 Not annualized.
8 Annualized.
9 Does not take into consideration expense reductions during the periods shown.
See notes to financial statements
California Tax-Free Income Fund
23
Notes to financial statements (unaudited)
Note 1 Accounting policies
John Hancock California Tax-Free Income Fund (the “Fund”) is a non-diversified open-end management investment company registered under the Investment Company Act of 1940 (the “1940 Act”), as amended. The Fund seeks a high level of current income, consistent with the preservation of capital, that is exempt from federal and California personal income taxes. Since the Fund invests primarily in California issuers, the Fund may be affected by political, economic or regulatory developments in the state of California.
The Trustees have authorized the issuance of multiple classes of shares of the Fund, designated as Class A, Class B and Class C shares. The shares of each class represent an interest in the same portfolio of investments of the Fund and have equal rights as to voting, redemptions, dividends and liquidation, except that certain expenses, subject to the approval of the Trustees, may be applied differently to each class of shares in accordance with current regulations of the Securities and Exchange Commission (the “SEC”) and the Internal Revenue Service. Shareholders of a class that bears distribution and service expenses under the terms of a distribution plan have exclusive voting rights to that distribution plan. Class B shares will convert to Class A shares eight years after purchases.
Significant accounting policies of the Fund are as follows:
Valuation of investments
Securities in the Fund’s portfolio are valued on the basis of market quotations, valuations provided by independent pricing services or at fair value as determined in good faith in accordance with procedures approved by the Trustees. Short-term debt investments which have a remaining maturity of 60 days or less may be valued at amortized cost, which approximates market value.
Joint repurchase agreement
Pursuant to an exemptive order issued by the SEC, the Fund, along with other registered investment companies having a management contract with John Hancock Advisers, LLC (the “Adviser”), a wholly owned subsidiary of John Hancock Financial Services, Inc., a subsidiary of Manulife Financial Corporation (“MFC”), may participate in a joint repurchase agreement transaction. Aggregate cash balances are invested in one or more large repurchase agreements, whose underlying securities are obligations of the U.S. government and/or its agencies. The Fund’s custodian bank receives delivery of the underlying securities for the joint account on the Fund’s behalf. The Adviser is responsible for ensuring that the agreement is fully collateralized at all times.
Investment transactions
Investment transactions are accounted for on a trade date plus one basis for daily net asset value calculations. However, for financial reporting purposes, investment transactions are reported on trade date. Net realized gains and losses on sales of investments are determined on the identified cost basis.
Discount and premium on securities
The Fund accretes discount and amortizes premium from par value on securities from either the date of issue or the date of purchase over the life of the security.
Class allocations
Income, common expenses and realized and unrealized gains (losses) are determined at the fund level and allocated daily to each class of shares based on the appropriate net asset value of the respective classes. Distribution and service fees, if any, are calculated daily at the class level based on the appropriate net asset value
California Tax-Free Income Fund
24
of each class and the specific expense rate(s) applicable to each class.
Expenses
The majority of expenses are directly identifiable to an individual fund. Expenses that are not readily identifiable to a specific fund are allocated in such a manner as deemed equitable, taking into consideration, among other things, the nature and type of expense and the relative sizes of the funds.
Bank borrowings
The Fund is permitted to have bank borrowings for temporary or emergency purposes, including the meeting of redemption requests that otherwise might require the untimely disposition of securities. The Fund has entered into a syndicated line of credit agreement with various banks. This agreement enables the Fund to participate, with other funds managed by the Adviser, in an unsecured line of credit with banks, which permits borrowings of up to $150 million, collectively. Interest is charged to each fund based on its borrowing. In addition, a commitment fee is charged to each fund based on the average daily unused portion of the line of credit and is allocated among the participating funds. The Fund had no borrowing activity under the line of credit during the period ended February 28, 2007.
Federal income taxes
The Fund qualifies as a “regulated investment company” by complying with the applicable provisions of the Internal Revenue Code and will not be subject to federal income tax on taxable income that is distributed to shareholders. Therefore, no federal income tax provision is required. For federal income tax purposes, the Fund has $1,072,410 of a capital loss carryforward available, to the extent provided by regulations, to offset future net realized capital gains. To the extent that such carryforward is used by the Fund, no capital gains distributions will be made. The loss carryforward expires as follows: August 31, 2011 — $481,714 and August 31, 2012 — $590,696.
New accounting pronouncements
In June 2006, Financial Accounting Standards Board (“FASB”) Interpretation No. 48, Accounting for Uncertainty in Income Taxes (the “Interpretation”) was issued, and is effective for fiscal years beginning after December 15, 2006 and is to be applied to all open tax years as of the effective date. This Interpretation prescribes a minimum threshold for financial statement recognition of the benefit of a tax position taken or expected to be taken in a tax return, and requires certain expanded disclosures. Management is currently evaluating the application of the Interpretation to the Fund and has not at this time quantified the impact, if any, resulting from the adoption of this Interpretation on the Fund’s financial statements. The Fund will implement this pronouncement no later than February 28, 2008.
In September 2006, FASB Standard No. 157, Fair Value Measurements (“FAS 157”), was issued and is effective for fiscal years beginning after November 15, 2007. FAS 157 defines fair value, establishing a framework for measuring fair value and expands disclosure about fair value measurements. Management is currently evaluating the application of FAS 157 to the Fund and its impact, if any, resulting from the adoption of FAS 157 on the Fund’s financial statements.
Interest and distributions
Interest income on investment securities is recorded on the accrual basis.
The Fund records distributions to shareholders from net investment income and net realized gains, if any, on the ex-dividend date. The Fund’s net investment income is declared daily as dividends to shareholders of record as of the close of business on the preceding day and distributed monthly. During the year ended August 31, 2006, the tax character of distributions paid was as follows: ordinary income $94,280 and exempt income $14,596,258. Distributions paid by the Fund with respect to each class of shares are calculated in the same manner, at the same time and are in the same amount, except for the effect of expenses that may be applied differently to each class.
Such distributions, on a tax basis, are determined in conformity with income tax regulations, which may differ from accounting principles generally accepted in the United States of America. Distributions in excess of tax
California Tax-Free Income Fund
25
basis earnings and profits, if any, are reported in the Fund’s financial statements as a return of capital.
Use of estimates
The preparation of these financial statements, in accordance with accounting principles generally accepted in the United States of America, incorporates estimates made by management in determining the reported amount of assets, liabilities, revenues and expenses of the Fund. Actual results could differ from these estimates.
Note 2
Management fee and transactions with affiliates and others
The Fund has an investment management contract with the Adviser. Under the investment management contract, the Fund pays a monthly management fee to the Adviser equivalent, on an annual basis, to the sum of: (a) 0.55% of the first $500,000,000 of the Fund’s average daily net asset value and (b) 0.50% of the Fund’s average daily net asset value in excess of $500,000,000.
Effective December 31, 2005, the investment management teams of the Adviser were reorganized into Sovereign Asset Management LLC (“Sovereign”), a wholly owned indirect subsidiary of John Hancock Life Insurance Company (“JHLICO”), a subsidiary of MFC. The Adviser remains the principal advisor on the Fund and Sovereign acts as subadviser under the supervision of the Adviser. The restructuring did not have an impact on the Fund, which continues to be managed using the same investment philosophy and process. The Fund is not responsible for payment of the subadvisory fees.
Effective October 1, 2006, Sovereign changed its name to MFC Global Investment Management (U.S.), LLC.
The Fund has an agreement with its custodian bank, under which custody fees are reduced by balance credits applied during the period. Accordingly, the expense reductions related to custody fee offsets amounted to $72, which had no impact on the Fund’s ratio of expenses to average net assets, for the period ended February 28, 2007. If the Fund had not entered into this agreement, the assets not invested, on which these balance credits were earned, could have produced taxable income.
The Fund has a Distribution Agreement with John Hancock Funds, LLC (“JH Funds”), a wholly owned subsidiary of the Adviser. The Fund has adopted Distribution Plans with respect to Class A, Class B and Class C, pursuant to Rule 12b-1 under the 1940 Act, as amended, to reimburse JH Funds for the services it provides as distributor of shares of the Fund. Accordingly, the Fund makes monthly payments to JH Funds at an annual rate not to exceed 0.15% of Class A average daily net asset value and 1.00% of Class B and Class C average daily net asset value. A maximum of 0.25% of such payments may be service fees, as defined by the Conduct Rules of the National Association of Securities Dealers. Under the Conduct Rules, curtailment of a portion of the Fund’s 12b-1 payments could occur under certain circumstances.
Expenses under the agreements described above for the period ended February 28, 2007, were as follows:
| | Distribution and |
| Share class | service fees |
|
| |
| Class A | $223,000 |
| Class B | 107,552 |
| Class C | 42,767 |
| Total | $373,319 |
Class A shares are assessed up-front sales charges. During the period ended February 28, 2007, JH Funds received net up-front sales charges of $107,030 with regard to sales of Class A shares. Of this amount, $13,944 was retained and used for printing prospectuses, advertising, sales literature and other purposes; $92,298 was paid as sales commissions to unrelated broker-dealers and $788 was paid as sales commissions to sales personnel of Signator Investors, Inc. (“Signator Investors”), a related broker-dealer. The Adviser’s indirect parent, JHLICO, is the indirect sole shareholder of Signator Investors.
Class B shares that are redeemed within six years of purchase are subject to a contingent deferred sales charge (“CDSC”) at declining
California Tax-Free Income Fund
26
rates, beginning at 5.00% of the lesser of the current market value at the time of redemption or the original purchase cost of the shares being redeemed. Class C shares that are redeemed within one year of purchase are subject to a CDSC at a rate of 1.00% of the lesser of the current market value at the time of redemption or the original purchase cost of the shares being redeemed. Proceeds from the CDSCs are paid to JH Funds and are used, in whole or in part, to defray its expenses for providing distribution-related services to the Fund in connection with the sale of Class B and Class C shares. During the period ended February 28, 2007, CDSCs received by JH Funds amounted to $26,470 for Class B shares and $397 for Class C shares.
The Fund has a transfer agent agreement with John Hancock Signature Services, Inc. (“Signature Services”), an indirect subsidiary of JHLICO. The Fund pays a monthly transfer agent fee at an annual rate of 0.01% of each class’s average daily net asset values, plus a fee based on the number of shareholder accounts and reimbursement for certain out-of-pocket expenses, aggregated and allocated to each class on the basis of its relative net asset value.
The Fund has an agreement with the Adviser and affiliates to perform necessary tax, accounting and legal services for the Fund. The compensation for the period amounted to $23,245. The Fund reimbursed JHLICO for certain compliance costs, included in the Fund’s Statement of Operations.
Mr. James R. Boyle is Chairman of the Adviser, as well as affiliated Trustee of the Fund, and is compensated by the Adviser and/or its affiliates. The compensation of unaffiliated Trustees is borne by the Fund. The unaffiliated Trustees may elect to defer, for tax purposes, their receipt of this compensation under the John Hancock Group of Funds Deferred Compensation Plan. The Fund makes investments into other John Hancock funds, as applicable, to cover its liability for the deferred compensation. Investments to cover the Fund’s deferred compensation liability are recorded on the Fund’s books as an other asset. The deferred compensation liability and the related other asset are always equal and are marked to market on a periodic basis to reflect any income earned by the investments, as well as any unrealized gains or losses. The Deferred Compensation Plan investments had no impact on the operations of the Fund.
California Tax-Free Income Fund
27
Note 3
Fund share transactions
This listing illustrates the number of Fund shares sold, reinvested and repurchased during the last two periods, along with the corresponding dollar value.
| | Year ended 8-31-06 | Period ended 2-28-071 |
| | Shares | Amount | Shares | Amount |
|
| Class A shares | | | | |
| Sold | 2,004,815 | $21,719,304 | 1,936,808 | $21,211,428 |
| Distributions reinvested | 679,611 | 7,377,136 | 319,922 | 3,511,456 |
| Repurchased | (3,193,562) | (34,676,276) | (1,270,344) | (13,938,003) |
| Net increase (decrease) | (509,136) | ($5,579,836) | 986,386 | $10,784,881 |
|
| |
| Class B shares | | | | |
| Sold | 145,122 | $1,582,348 | 44,676 | $489,312 |
| Distributions reinvested | 50,615 | 549,557 | 18,119 | 198,871 |
| Repurchased | (947,874) | (10,292,087) | (487,912) | (5,346,444) |
| Net decrease | (752,137) | ($8,160,182) | (425,117) | ($4,658,261) |
|
| |
| Class C shares | | | | |
| Sold | 156,607 | $1,702,088 | 279,642 | $3,067,792 |
| Distributions reinvested | 12,137 | 131,707 | 7,247 | 79,545 |
| Repurchased | (95,189) | (1,033,098) | (67,040) | (736,865) |
| Net increase | 73,555 | $800,697 | 219,849 | $2,410,472 |
|
| |
| Net increase (decrease) | (1,187,718) | ($12,939,321) | 781,118 | $8,537,092 |
1 Semiannual period from 9-1-06 through 2-28-07. Unaudited.
Note 4
Investment transactions
Purchases and proceeds from sales or maturities of securities, other than short-term securities and obligations of the U.S. government, during the period ended February 28, 2007, aggregated $78,624,579 and $72,014,782, respectively.
The cost of investments owned on February 28, 2007, including short-term investments, for federal income tax purposes was $306,621,176. Gross unrealized appreciation and depreciation of investments aggregated $28,798,967 and $13,108, respectively, resulting in net unrealized appreciation of $28,785,859. The difference between book basis and tax basis net unrealized appreciation of investments is attributable primarily to amortization of premiums and accretion of discounts on debt securities.
California Tax-Free Income Fund
28
Board Consideration of and Continuation of Investment Advisory Agreement and Subadvisory Agreement: John Hancock California Tax-Free Income Fund
The Investment Company Act of 1940 (the “1940 Act”) requires the Board of Trustees (the “Board”) of John Hancock California Tax-Free Income Fund (the “Trust”), including a majority of the Trustees who have no direct or indirect interest in the investment advisory agreement and are not “interested persons” of the Trust, as defined in the 1940 Act (the “Independent Trustees”), annually to review and consider the continuation of: (i) the investment advisory agreement (the “Advisory Agreement”) with John Hancock Advisers, LLC (the “Adviser”) and (ii) the investment subadvisory agreement (the “Subadvisory Agreement”) with Sovereign Asset Management LLC (the “Subadviser”) for the John Hancock California Tax-Free Income Fund (the “Fund”). The Advisory Agreement and the Subadvisory Agreement are collectively referred to as the “Advisory Agreements.”
At meetings held on May 1–2 and June 5–6,1 2006, the Board considered the factors and reached the conclusions described below relating to the selection of the Adviser and Subadviser and the continuation of the Advisory Agreements. During such meetings, the Board’s Contracts/ Operations Committee and the Independent Trustees also met in executive sessions with their independent legal counsel.
In evaluating the Advisory Agreements, the Board, including the Contracts/Operations Committee and the Independent Trustees, reviewed a broad range of information requested for this purpose by the Independent Trustees, including: (i) the investment performance of the Fund relative to a category of relevant funds (the “Category”) and a peer group of comparable funds (the “Peer Group”) each selected by Morningstar Inc. (“Morningstar”), an independent provider of investment company data, for a range of periods ended December 31, 2005; (ii) advisory and other fees incurred by, and the expense ratios of, the Fund relative to a Category and a Peer Group; (iii) the advisory fees of comparable portfolios of other clients of the Adviser and the Subadviser; (iv) the Adviser’s financial results and condition, including its, and certain of its affiliates’, profitability from services performed for the Fund; (v) b reakpoints in the Fund’s and the Peer Group’s fees and information about economies of scale; (vi) the Adviser’s and Subadviser’s record of compliance with applicable laws and regulations with the Fund’s investment policies and restrictions and with the applicable Code of Ethics, and the structure and responsibilities of the Adviser’s and Subadviser’s compliance department; (vii) the background and experience of senior management and investment professionals and (viii) the nature, cost and character of advisory and non-investment management services provided by the Adviser and its affiliates and by the Subadviser.
The Board’s review and conclusions were based on a comprehensive consideration of all information presented to the Board and not the result of any single controlling factor. It was based on performance and other information as of December 31, 2005; facts may have changed between that date and the date of this shareholders report. The key factors considered by the Board and the conclusions reached are described below.
Nature, extent and quality of services
The Board considered the ability of the Adviser and the Subadviser, based on their resources, reputation and other attributes, to attract and retain qualified investment professionals, including research, advisory and supervisory personnel. The Board further considered the compliance programs and compliance records of the Adviser and Subadviser. In addition, the Board took into account the administrative services provided to the Fund by the Adviser and its affiliates.
Based on the above factors, together with those referenced below, the Board concluded that, within the context of its full deliberations, the nature, extent and quality of the investment advisory services provided to the Fund by the Adviser and Subadviser were sufficient to support renewal of the Advisory Agreements.
29
Fund performance
The Board considered the performance results for the Fund over various time periods ended December 31, 2005. The Board also considered these results in comparison to the performance of the Category, as well as the Fund’s benchmark index. Morningstar determined the Category and Peer Group for the Fund. The Board reviewed with a representative of Morningstar the methodology used by Morningstar to select the funds in the Category and the Peer Group.
The Board noted that the Fund’s performance during the periods under review was generally competitive with the performance of the Peer Group and Category medians, and its benchmark index, the Lehman Brothers Municipal CA Index. The Board noted that, for the 3-, 5- and 10-year periods under review, the Fund’s performance was equal to or not appreciably lower than the performance of the Peer Group median, and was lower than the performance of the Category median and benchmark index. The Board viewed favorably that the more recent performance of the Fund for the 1-year period ended December 31, 2005 was higher than the performance of the Peer Group and Category medians and not appreciably lower than the benchmark index.
Investment advisory fee and subadvisory fee rates and expenses
The Board reviewed and considered the contractual investment advisory fee rate payable by the Fund to the Adviser for investment advisory services (the “Advisory Agreement Rate”). The Board received and considered information comparing the Advisory Agreement Rate with the advisory fees for the Peer Group and Category. The Board noted that the Advisory Agreement Rate was not appreciably higher than the median rate of the Peer Group and Category.
The Board received and considered expense information regarding the Fund’s various components, including advisory fees, distribution and fees other than advisory and distribution fees, including transfer agent fees, custodian fees and other miscellaneous fees (e.g., fees for accounting and legal services). The Board considered comparisons of these expenses to the Peer Group median. The Board also received and considered expense information regarding the Fund’s total operating expense ratio (“Expense Ratio”). The Board received and considered information comparing the Expense Ratio of the Fund to that of the Category and Peer Group medians. The Board noted that the Fund’s Expense Ratio was equal to or not appreciably higher than the Category and Peer Group medians.
The Adviser also discussed the Morningstar data and rankings, and other relevant information, for the Fund. Based on the above-referenced considerations and other factors, the Board concluded that the Fund’s overall expense results and performance supported the re-approval of the Advisory Agreements.
The Board also received information about the investment subadvisory fee rate (the “Subadvisory Agreement Rate”) payable by the Adviser to the Subadviser for investment subadvisory services. The Board concluded that the Subadvisory Agreement Rate was fair and equitable, based on its consideration of the factors described here.
Profitability
The Board received and considered a detailed profitability analysis of the Adviser based on the Advisory Agreements, as well as on other relationships between the Fund and the Adviser and its affiliates, including the Subadviser. The Board concluded that, in light of the costs of providing investment management and other services to the Fund, the profits and other ancillary benefits reported by the Adviser were not unreasonable.
Economies of scale
The Board received and considered general information regarding economies of scale with respect to the management of the Fund, including the Fund’s ability to appropriately benefit from economies of scale under the Fund’s fee structure. The Board recognized the inherent limitations of any analysis of economies of scale, stemming largely from the Board’s understanding that most of the Adviser’s costs are not specific to individual Funds, but rather are incurred across a variety of products and services.
30
To the extent the Board and the Adviser were able to identify actual or potential economies of scale from Fund-specific or allocated expenses, in order to ensure that any such economies continue to be reasonably shared with the Fund as its assets increase, the Adviser and the Board agreed to continue the existing breakpoints to the Advisory Agreement Rate.
Information about services to other clients
The Board also received information about the nature, extent and quality of services and fee rates offered by the Adviser and Subadviser to their other clients, including other registered investment companies, institutional investors and separate accounts. The Board concluded that the Advisory Agreement Rate and the Subadvisory Agreement Rate were not unreasonable, taking into account fee rates offered to others by the Adviser and Subadviser, respectively, after giving effect to differences in services.
Other benefits to the Adviser
The Board received information regarding potential “fall-out” or ancillary benefits received by the Adviser and its affiliates as a result of the Adviser’s relationship with the Fund. Such benefits could include, among others, benefits directly attributable to the relationship of the Adviser with the Fund and benefits potentially derived from an increase in the business of the Adviser as a result of its relationship with the Fund (such as the ability to market to shareholders other financial products offered by the Adviser and its affiliates).
The Board also considered the effectiveness of the Adviser’s, Subadviser’s and Fund’s policies and procedures for complying with the requirements of the federal securities laws, including those relating to best execution of portfolio transactions and brokerage allocation.
Other factors and broader review
As discussed above, the Board reviewed detailed materials received from the Adviser and Subadviser as part of the annual re-approval process. The Board also regularly reviews and assesses the quality of the services that the Fund receives throughout the year. In this regard, the Board reviews reports of the Adviser at least quarterly, which include, among other things, a detailed portfolio review, detailed fund performance reports and compliance reports. In addition, the Board meets with portfolio managers and senior investment officers at various times throughout the year.
After considering the above-described factors and based on its deliberations and its evaluation of the information described above, the Board concluded that approval of the continuation of the Advisory Agreements for the Fund was in the best interest of the Fund and its shareholders. Accordingly, the Board unanimously approved the continuation of the Advisory Agreements.
1 The Board previously considered information about the Subadvisory Agreement at the September and December 2005 Board meetings in connection with the Adviser’s reorganization.
31
For more information
The Fund’s proxy voting policies, procedures and records are available without charge, upon request:
| By phone | On the Fund’s Web site | On the SEC’s Web site |
| 1-800-225-5291 | www.jhfunds.com/proxy | www.sec.gov |
|
| |
| Trustees | Francis V. Knox, Jr. | Custodian |
| Ronald R. Dion, Chairman | Chief Compliance Officer | The Bank of New York |
| James R. Boyle† | Gordon M. Shone | One Wall Street |
| James F. Carlin | Treasurer | New York, NY 10286 |
| Richard P. Chapman, Jr.* | John G. Vrysen | |
| William H. Cunningham | Chief Financial Officer | Transfer agent |
| Charles L. Ladner* | | John Hancock Signature |
| Dr. John A. Moore* | | Services, Inc. |
| Patti McGill Peterson* | Investment adviser | 1 John Hancock Way, |
| Steven R. Pruchansky | John Hancock Advisers, LLC | Suite 1000 |
| *Members of the Audit Committee | 601 Congress Street | Boston, MA 02217-1000 |
| †Non-Independent Trustee | Boston, MA 02210-2805 | |
| | |
| Subadviser | Legal counsel |
| Officers | MFC Global Investment | Kirkpatrick & Lockhart |
| Keith F. Hartstein | Management (U.S.), LLC | Preston Gates Ellis LLP |
| President and | 101 Huntington Avenue | 1 Lincoln Street |
| Chief Executive Officer | Boston, MA 02199 | Boston, MA 02110-2950 |
| Thomas M. Kinzler | | |
| Secretary and | Principal distributor | |
| Chief Legal Officer | John Hancock Funds, LLC | |
| 601 Congress Street | |
| Boston, MA 02210-2805 | |
The Fund’s investment objective, risks, charges and expenses are included in the prospectus and should be considered carefully before investing. For a prospectus, call your financial professional, call John Hancock Funds at 1-800-225-5291 or visit the Fund’s Web site at www.jhfunds.com. Please read the prospectus carefully before investing or sending money.
| How to contact us | |
|
| |
| Internet | www.jhfunds.com | |
|
| |
| Mail | Regular mail: | Express mail: |
| | John Hancock | John Hancock |
| | Signature Services, Inc. | Signature Services, Inc. |
| | 1 John Hancock Way, Suite 1000 | Mutual Fund Image Operations |
| | Boston, MA 02217-1000 | 380 Stuart Street |
| | | Boston, MA 02116 |
|
| |
| Phone | Customer service representatives | 1-800-225-5291 |
| | EASI-Line | 1-800-338-8080 |
| | TDD line | 1-800-554-6713 |
A listing of month-end portfolio holdings is available on our Web site, www.jhfunds.com. A more detailed portfolio holdings summary is available on a quarterly basis 60 days after the fiscal quarter on our Web site or upon request by calling 1-800-225-5291, or on the Securities and Exchange Commission’s Web site, www.sec.gov.
32
J O H N H A N C O C K F A M I L Y O F F U N D S
| EQUITY | INTERNATIONAL |
| Balanced Fund | Greater China Opportunities Fund |
| Classic Value Fund | International Allocation Portfolio |
| Classic Value Fund II | International Classic Value Fund |
| Classic Value Mega Cap Fund | International Core Fund |
| Core Equity Fund | International Fund |
| Focused Equity Fund | International Growth Fund |
| Global Shareholder Yield Fund | |
| Growth Fund | INCOME |
| Growth Opportunities Fund | Bond Fund |
| Growth Trends Fund | Government Income Fund |
| Intrinsic Value Fund | High Yield Fund |
| Large Cap Equity Fund | Investment Grade Bond Fund |
| Large Cap Select Fund | Strategic Income Fund |
| Mid Cap Equity Fund | |
| Mid Cap Growth Fund | TAX-FREE INCOME |
| Multi Cap Growth Fund | California Tax-Free Income Fund |
| Small Cap Equity Fund | High Yield Municipal Bond Fund |
| Small Cap Fund | Massachusetts Tax-Free Income Fund |
| Small Cap Intrinsic Value Fund | New York Tax-Free Income Fund |
| Sovereign Investors Fund | Tax-Free Bond Fund |
| U.S. Core Fund | |
| U.S. Global Leaders Growth Fund | MONEY MARKET |
| Value Opportunities Fund | Money Market Fund |
| | U.S. Government Cash Reserve |
| ASSET ALLOCATION | |
| Allocation Core Portfolio | CLOSED-END |
| Allocation Growth + Value Portfolio | Bank and Thrift Opportunity Fund |
| Lifecycle 2010 Portfolio | Financial Trends Fund, Inc. |
| Lifecycle 2015 Portfolio | Income Securities Trust |
| Lifecycle 2020 Portfolio | Investors Trust |
| Lifecycle 2025 Portfolio | Patriot Global Dividend Fund |
| Lifecycle 2030 Portfolio | Patriot Preferred Dividend Fund |
| Lifecycle 2035 Portfolio | Patriot Premium Dividend Fund I |
| Lifecycle 2040 Portfolio | Patriot Premium Dividend Fund II |
| Lifecycle 2045 Portfolio | Patriot Select Dividend Trust |
| Lifecycle Retirement Portfolio | Preferred Income Fund |
| Lifestyle Aggressive Portfolio | Preferred Income II Fund |
| Lifestyle Balanced Portfolio | Preferred Income III Fund |
| Lifestyle Conservative Portfolio | Tax-Advantaged Dividend Income Fund |
| Lifestyle Growth Portfolio | |
| Lifestyle Moderate Portfolio | |
| |
| SECTOR | |
| Financial Industries Fund | |
| Health Sciences Fund | |
| Real Estate Fund | |
| Regional Bank Fund | |
| Technology Fund | |
| Technology Leaders Fund | |
For more complete information on any John Hancock Fund and an Open-End fund prospectus, which includes charges and expenses, call your financial professional, or John Hancock Funds at 1-800-225-5291 for Open-End fund information and 1-800-852-0218 for Closed-End fund information. Please read the Open-End fund prospectus carefully before investing or sending money.

1-800-225-5291
1-800-554-6713 TDD
1-800-338-8080 EASI-Line
www.jhfunds.com
Now available: electronic delivery
www.jhfunds.com/edelivery
This report is for the information of the shareholders of John Hancock California Tax-Free Income Fund.
530SA 2/07
4/07
ITEM 2. CODE OF ETHICS.
As of the end of the period, February 28, 2007, the registrant has adopted a code of ethics, as defined in Item 2 of Form N-CSR, that applies to its Chief Executive Officer, Chief Financial Officer and Treasurer (respectively, the principal executive officer, the principal financial officer and the principal accounting officer, the “Senior Financial Officers”). A copy of the code of ethics is filed as an exhibit to this Form N-CSR.
ITEM 3. AUDIT COMMITTEE FINANCIAL EXPERT.
Not applicable at this time.
ITEM 4. PRINCIPAL ACCOUNTANT FEES AND SERVICES.
Not applicable at this time.
ITEM 5. AUDIT COMMITTEE OF LISTED REGISTRANTS.
Not applicable at this time.
ITEM 6. SCHEDULE OF INVESTMENTS.
Not applicable.
ITEM 7. DISCLOSURE OF PROXY VOTING POLICIES AND PROCEDURES FOR CLOSED-END MANAGEMENT INVESTMENT COMPANIES.
Not applicable.
ITEM 8. PORTFOLIO MANAGERS OF CLOSED-END MANAGEMENT INVESTMENT COMPANIES.
Not applicable.
ITEM 9. PURCHASES OF EQUITY SECURITIES BY CLOSED-END MANAGEMENT INVESTMENT COMPANY AND AFFILIATED PURCHASERS.
Not applicable.
ITEM 10. SUBMISSION OF MATTERS TO A VOTE OF SECURITY HOLDERS.
There were no material changes to previously disclosed John Hancock Funds – Governance Committee Charter.
ITEM 11. CONTROLS AND PROCEDURES.
(a) Based upon their evaluation of the registrant's disclosure controls and procedures as conducted within 90 days of the filing date of this Form N-CSR, the registrant's principal executive officer and principal financial officer have concluded that those disclosure controls and procedures provide reasonable assurance that the material information required to be disclosed by the registrant on this report is recorded, processed, summarized and reported within the time periods specified in the Securities and Exchange Commission's rules and forms.
(b) There were no changes in the registrant's internal control over financial reporting that occurred during the registrant's most recent fiscal half-year (the registrant's second fiscal half-
year in the case of an annual report) that have materially affected, or are reasonably likely to materially affect, the registrant's internal control over financial reporting.
ITEM 12. EXHIBITS.
(a)(1) Code of Ethics for Senior Financial Officers is attached.
(a)(2) Separate certifications for the registrant's principal executive officer and principal financial officer, as required by Section 302 of the Sarbanes-Oxley Act of 2002 and Rule 30a-2(a) under the Investment Company Act of 1940, are attached.
(b) Separate certifications for the registrant's principal executive officer and principal financial officer, as required by 18 U.S.C. Section 1350, as adopted pursuant to Section 906 of the Sarbanes-Oxley Act of 2002, and Rule 30a-2(b) under the Investment Company Act of 1940, are attached. The certifications furnished pursuant to this paragraph are not deemed to be "filed" for purposes of Section 18 of the Securities Exchange Act of 1934, or otherwise subject to the liability of that section. Such certifications are not deemed to be incorporated by reference into any filing under the Securities Act of 1933 or the Securities Exchange Act of 1934, except to the extent that the Registrant specifically incorporates them by reference.
(c)(1) Submission of Matters to a vote of Security Holders is attached. See attached “John Hancock Funds – Governance Committee Charter.
(c)(2) Proxy Voting Policies and Procedures are attached.
(c)(3) Contact person at the registrant.
SIGNATURES
Pursuant to the requirements of the Securities Exchange Act of 1934 and the Investment Company Act of 1940, the registrant has duly caused this report to be signed on its behalf by the undersigned, thereunto duly authorized.
John Hancock California Tax-Free Income Fund
By: /s/ Keith F. Hartstein
-------------------------------------
Keith F. Hartstein
President and Chief Executive Officer
Date: April 30, 2007
Pursuant to the requirements of the Securities Exchange Act of 1934 and the Investment Company Act of 1940, this report has been signed below by the following persons on behalf of the registrant and in the capacities and on the dates indicated.
By: /s/ Keith F. Hartstein
-------------------------------------
Keith F. Hartstein
President and Chief Executive Officer
Date: April 30, 2007
By: /s/ John G. Vrysen
-------------------------------------
John G. Vrysen
Chief Financial Officer
Date: April 30, 2007