UNITED STATES
SECURITIES AND EXCHANGE COMMISSION
Washington, D.C. 20549
FORM N-CSR
CERTIFIED SHAREHOLDER REPORT OF REGISTERED
MANAGEMENT INVESTMENT COMPANIES
Investment Company Act file number 811- 05979
John Hancock California Tax-Free Income Fund
(Exact name of registrant as specified in charter)
200 Berkeley Street, Boston, Massachusetts 02116
(Address of principal executive offices) (Zip code)
Salvatore Schiavone
Treasurer
200 Berkeley Street
Boston, Massachusetts 02116
(Name and address of agent for service)
Registrant’s telephone number, including area code: 617-663-4497
Date of fiscal year end: May 31
Date of reporting period: November 30, 2020
| ITEM 1. | REPORTS TO STOCKHOLDERS |

Dear shareholder,
Despite heightened fears over the coronavirus (COVID-19),most global financial markets delivered positive returns for the 6 months ended November 30, 2020.During the rampant sell-off earlier in the year,many investors reacted by exiting higher-risk assets and moving into cash,leading to a liquidity crunch in the fixed-income markets.In response to the sell-off,the U.S.Federal Reserve acted quickly,lowering interest rates to near zero and reinstating quantitative easing,as well as announcing its plans for broad support of debt markets.Many other nations followed suit and credit spreads rebounded off their highs as liquidity concerns eased.
As the year progressed,however,economic growth has slowed as the ongoing spread of COVID-19 continues to create uncertainty among businesses and investors.Lockdowns and curfews in certain areas have been reinstated,affecting the level of unemployment and the pace of hiring.Consumer spending also remains far below prepandemic levels.
Your financial professional can help position your portfolio so that it’s sufficiently diversified to seek to meet your long-term objectives and to withstand the inevitable bouts of market volatility along the way.
On behalf of everyone at John Hancock Investment Management,I’d like to take this opportunity to welcome new shareholders and thank existing shareholders for the continued trust you’ve placed in us.
Sincerely,

Andrew G.Arnott
President and CEO,
John Hancock Investment Management
Head ofWealth and Asset Management,
United States and Europe
This commentary reflects the CEO’s views as of this report’s period end and are subject to change at any time. Diversification does not guarantee investment returns and does not eliminate risk of loss.All investments entail risks,including the possible loss of principal.For more up-to-date information,you can visit our website at jhinvestments.com.
John Hancock
California Tax-Free Income Fund
| | |
| SEMIANNUAL REPORT | JOHN HANCOCK CALIFORNIA TAX-FREE INCOME FUND | | 1 |
INVESTMENT OBJECTIVE
The fund seeks a high level of current income, consistent with preservation of capital, that is exempt from federal and California personal income taxes.
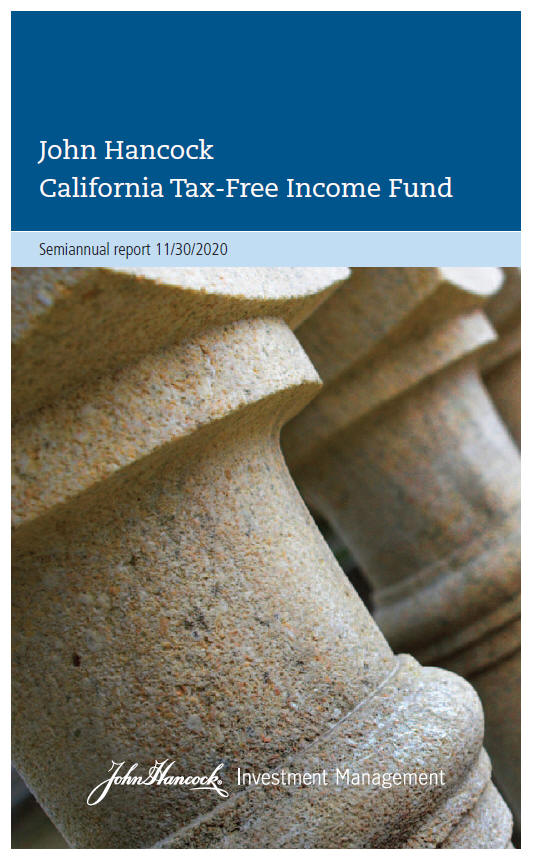
AVERAGE ANNUAL TOTAL RETURNS AS OF 11/30/2020 (%)
The Bloomberg Barclays California Municipal Bond Index is an unmanaged index comprising California investment-grade municipal bonds.
It is not possible to invest directly in an index.Index figures do not reflect expenses or sales charges, which would result in lower returns.
The fund’s Morningstar category average is a group of funds with similar investment objectives and strategies and is the equal-weighted return of all funds per category.Morningstar places funds in certain categories based on their historical portfolio holdings.Figures from Morningstar,Inc.include reinvested distributions and do not take into account sales charges.Actual load-adjusted performance is lower.
The past performance shown here reflects reinvested distributions and the beneficial effect of any expense reductions,and does not guarantee future results.Performance of the other share classes will vary based on the difference in the fees and expenses of those classes.Shares will fluctuate in value and,when redeemed,may be worth more or less than their original cost.Current month-end performance may be lower or higher than the performance cited,and can be found at jhinvestments.com or by calling 800-225-5291.For further information on the fund’s objectives,risks, and strategy,see the fund’s prospectus.
| | |
| 2 | | JOHN HANCOCK CALIFORNIA TAX-FREE INCOME FUND | SEMIANNUAL REPORT |
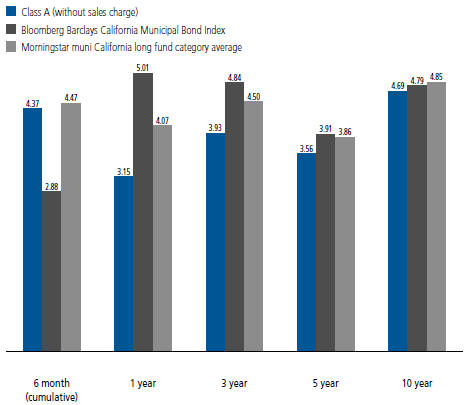
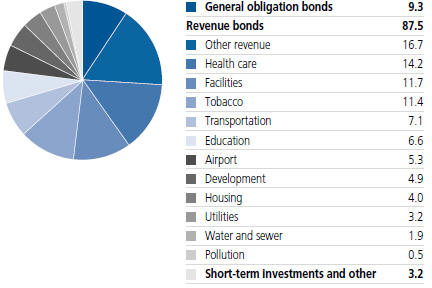
PORTFOLIO COMPOSITION AS OF 11/30/2020 (% of net assets)
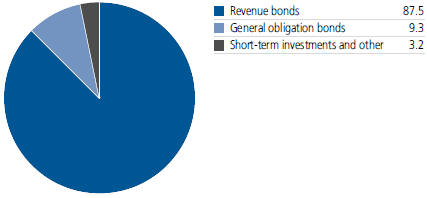
QUALITY COMPOSITION AS OF 11/30/2020 (% of net assets)
Ratings are from Moody’s Investors Service,Inc.If not available,we have used Standard & Poor’s Ratings Services.In the absence of ratings from these agencies,we have used Fitch Ratings,Inc. “Not rated”securities are those with no ratings available from these agencies.All ratings are as of 11-30-20 and do not reflect subsequent downgrades or upgrades,if any.
A note about risks
The fund is subject to various risks as described in the fund’s prospectus.A widespread health crisis such as a global pandemic could cause substantial market volatility,exchange trading suspensions and closures,impact the ability to complete redemptions,and affect fund performance.For example,the novel coronavirus disease (COVID-19) has resulted in significant disruptions to global business activity. The impact of a health crisis and other epidemics and pandemics that may arise in the future,could affect the global economy in ways that cannot necessarily be foreseen at the present time.A health crisis may exacerbate other pre-existing political,social,and economic risks.Any such impact could adversely affect the fund’s performance,resulting in losses to your investment.For more information, please refer to the “Principal risks”section of the prospectus.
| | |
| SEMIANNUAL REPORT | JOHN HANCOCK CALIFORNIA TAX-FREE INCOME FUND | | 3 |
SECTOR COMPOSITION AS OF 11/30/2020 (% of net assets)
| | |
| 4 | | JOHN HANCOCK CALIFORNIA TAX-FREE INCOME FUND | SEMIANNUAL REPORT |
TOTAL RETURNS FOR THE PERIOD ENDED NOVEMBER 30, 2020
| | | | | | | | | | | | | | | | | | | | | | | | | | | | | | | | | | | | | | | | | | | | | | |
Average annual total returns (%) with maximum sales charge | | | | | Cumulative total returns (%) with maximum sales charge | | | | | SEC 30-day yield (%) subsidized | | | | | SEC 30-day yield (%) unsubsidized† | | | | | Tax-
equivalent
subsidized
yield (%)† | |
| | | | | 1-year | | | 5-year | | | 10-year | | | | | 6-month | | | 5-year | | | 10-year | | | | | as of
11-30-20 | | | | | as of 11-30-20 | | | | | as of
11-30-20 | |
Class A | | | | | -0.98 | | | | 2.71 | | | | 4.27 | | | | | | 0.23 | | | | 14.32 | | | | 51.92 | | | | | | 1.32 | | | | | | 1.31 | | | | | | 2.57 | |
Class C | | | | | 1.39 | | | | 2.79 | | | | 4.06 | | | | | | 2.98 | | | | 14.74 | | | | 48.90 | | | | | | 0.64 | | | | | | 0.53 | | | | | | 1.25 | |
Class I1,2 | | | | | 3.31 | | | | 3.68 | | | | 4.75 | | | | | | 4.45 | | | | 19.78 | | | | 59.07 | | | | | | 1.53 | | | | | | 1.52 | | | | | | 2.98 | |
Class R61,2 | | | | | 3.34 | | | | 3.68 | | | | 4.75 | | | | | | 4.56 | | | | 19.82 | | | | 59.11 | | | | | | 1.56 | | | | | | 1.55 | | | | | | 3.04 | |
Index 1†† | | | | | 5.01 | | | | 3.91 | | | | 4.79 | | | | | | 2.88 | | | | 21.15 | | | | 59.61 | | | | | | — | | | | | | — | | | | | | — | |
Index 2†† | | | | | 4.89 | | | | 3.93 | | | | 4.36 | | | | | | 3.29 | | | | 21.25 | | | | 53.20 | | | | | | — | | | | | | — | | | | | | — | |
Performance figures assume all distributions have been reinvested.Figures reflect maximum sales charges on Class A shares of 4.0% and the applicable contingent deferred sales charge (CDSC) on Class C shares.The returns for Class A shares have been adjusted to reflect the reduction in the maximum sales charge from 4.5% to 4.0%, effective 2-3-14.Class C shares sold within one year of purchase are subject to a 1% CDSC.Sales charges are not applicable to Class I and Class R6 shares.
The expense ratios of the fund,both net (including any fee waivers and/or expense limitations) and gross (excluding any fee waivers and/or expense limitations),are set forth according to the most recent publicly available prospectus for the fund and may differ from those disclosed in the Financial highlights tables in this report.Net expenses reflect contractual expense limitations in effect until September 30, 2021 and are subject to change.Had the contractual fee waivers and expense limitations not been in place,gross expenses would apply.The expense ratios are as follows:
| | | | | | | | | | |
| | | | Class A | | Class C | | Class I | | Class R6 |
| | Gross (%) | | 0.85 | | 1.70 | | 0.70 | | 0.67 |
| | Net (%) | | 0.84 | | 1.59 | | 0.69 | | 0.66 |
Please refer to the most recent prospectus and annual or semiannual report for more information on expenses and any expense limitation arrangements for each class.
The returns reflect past results and should not be considered indicative of future performance. The return and principal value of an investment will fluctuate so that shares, when redeemed, may be worth more or less than their original cost. Due to market volatility and other factors, the fund’s current performance may be higher or lower than the performance shown. For current to the most recent month-end performance data, please call 800–225–5291 or visit the fund’s website at jhinvestments.com.
The performance table above and the chart on the next page do not reflect the deduction of taxes that a shareholder would pay on fund distributions or the redemption of fund shares. The fund’s performance results reflect any applicable fee waivers or expense reductions, without which the expenses would increase and results would have been less favorable.
| | † | Unsubsidized yield reflects what the yield would have been without the effect of reimbursements and waivers. Tax-equivalent yield is based on the maximum federal income tax rate of 40.8% and a state tax rate of 13.3%. | |
| | †† | Index 1 is the Bloomberg Barclays California Municipal Bond Index; Index 2 is the Bloomberg Barclays Municipal Bond Index. | |
See the following page for footnotes.
| | |
| SEMIANNUAL REPORT | JOHN HANCOCK CALIFORNIA TAX-FREE INCOME FUND | | 5 |
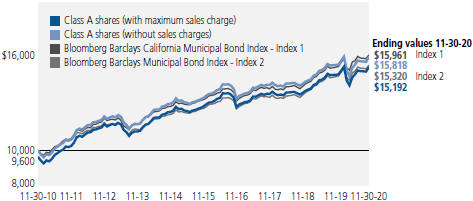
This chart and table show what happened to a hypothetical $10,000 investment in John Hancock California Tax-Free Income Fund for the share classes and periods indicated,assuming all distributions were reinvested.For comparison,we’ve shown the same investment in two separate indexes.
| | | | | | | | | | |
| | | Start date | | With maximum
sales charge ($) | | Without
sales charge ($) | | Index 1 ($) | | Index 2 ($) |
Class C3 | | 11-30-10 | | 14,890 | | 14,890 | | 15,961 | | 15,320 |
Class I1,2 | | 11-30-10 | | 15,907 | | 15,907 | | 15,961 | | 15,320 |
Class R61,2 | | 11-30-10 | | 15,911 | | 15,911 | | 15,961 | | 15,320 |
The values shown in the chart for Class A shares with maximum sales charge have been adjusted to reflect the reduction in the Class A shares’ maximum sales charge from 4.5% to 4.0%, which became effective on 2-3-14.
The Bloomberg Barclays California Municipal Bond Index is an unmanaged index comprising California investment-grade municipal bonds.
The Bloomberg Barclays Municipal Bond Index is an unmanaged index representative of the tax-exempt bond market.
It is not possible to invest directly in an index.Index figures do not reflect expenses or sales charges, which would result in lower returns.
Footnotes related to performance pages
| | 1 | Class I shares and Class R6 shares were first offered on 2-13-17 and 8-30-17,respectively.Returns prior to these dates are those of Class A shares that have not been adjusted for class-specific expenses; otherwise,returns would vary. | |
| | 2 | For certain types of investors,as described in the fund’s prospectus. | |
| | 3 | The contingent deferred sales charge is not applicable. | |
| | |
| 6 | | JOHN HANCOCK CALIFORNIA TAX-FREE INCOME FUND | SEMIANNUAL REPORT |
These examples are intended to help you understand your ongoing operating expenses of investing in the fund so you can compare these costs with the ongoing costs of investing in other mutual funds.
Understanding fund expenses
As a shareholder of the fund,you incur two types of costs:
| | ∎ | Transaction costs, which include sales charges (loads) on purchases or redemptions (varies by share class), minimum account fee charge, etc. | |
| | ∎ | Ongoing operating expenses, including management fees, distribution and service fees (if applicable), and other fund expenses. | |
We are presenting only your ongoing operating expenses here.
Actual expenses/actual returns
The first line of each share class in the table on the following page is intended to provide information about the fund’s actual ongoing operating expenses,and is based on the fund’s actual return.It assumes an account value of $1,000.00 on June 1, 2020, with the same investment held until November 30, 2020.
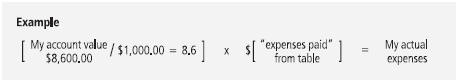
Together with the value of your account,you may use this information to estimate the operating expenses that you paid over the period.Simply divide your account value at November 30, 2020, by $1,000.00, then multiply it by the “expenses paid”for your share class from the table.For example,for an account value of $8,600.00, the operating expenses should be calculated as follows:
Hypothetical example for comparison purposes
The second line of each share class in the table on the following page allows you to compare the fund’s ongoing operating expenses with those of any other fund.It provides an example of the fund’s hypothetical account values and hypothetical expenses based on each class’s actual expense ratio and an assumed 5% annualized return before expenses (which is not the class’s actual return).It assumes an account value of $1,000.00 on June 1, 2020, with the same investment held until November 30, 2020. Look in any other fund shareholder report to find its hypothetical example and you will be able to compare these expenses.Please remember that these hypothetical account values and expenses may not be used to estimate the actual ending account balance or expenses you paid for the period.
| | |
| SEMIANNUAL REPORT | JOHN HANCOCK CALIFORNIA TAX-FREE INCOME FUND | | 7 |
Remember,these examples do not include any transaction costs,therefore,these examples will not help you to determine the relative total costs of owning different funds.If transaction costs were included,your expenses would have been higher. See the prospectus for details regarding transaction costs.
SHAREHOLDER EXPENSE EXAMPLE CHART
| | | | | | | | | | | | | | | | | | |
| | | | | Account value on 6-1-2020 | | | Ending value on 11-30-2020 | | | Expenses paid during period ended 11-30-20201 | | | Annualized expense ratio | |
Class A | | Actual expenses/actual returns | | | $1,000.00 | | | | $1,043.70 | | | | $4.35 | | | | 0.85 | % |
| | | Hypothetical example | | | 1,000.00 | | | | 1,020.80 | | | | 4.31 | | | | 0.85 | % |
Class C | | Actual expenses/actual returns | | | 1,000.00 | | | | 1,039.80 | | | | 8.18 | | | | 1.60 | % |
| | | Hypothetical example | | | 1,000.00 | | | | 1,017.00 | | | | 8.09 | | | | 1.60 | % |
Class I | | Actual expenses/actual returns | | | 1,000.00 | | | | 1,044.50 | | | | 3.59 | | | | 0.70 | % |
| | | Hypothetical example | | | 1,000.00 | | | | 1,021.60 | | | | 3.55 | | | | 0.70 | % |
Class R6 | | Actual expenses/actual returns | | | 1,000.00 | | | | 1,045.60 | | | | 3.38 | | | | 0.66 | % |
| | | Hypothetical example | | | 1,000.00 | | | | 1,021.80 | | | | 3.35 | | | | 0.66 | % |
| | 1 | Expenses are equal to the annualized expense ratio, multiplied by the average account value over the period, multiplied by 183/365 (to reflect the one-half year period). |
| | |
| 8 | | JOHN HANCOCK CALIFORNIA TAX-FREE INCOME FUND | SEMIANNUAL REPORT |
AS OF 11-30-20 (unaudited)
| | | | | | | | | | | | | | | | |
| | | Rate (%) | | | Maturity date | | | Par value^ | | | Value | |
| | | | |
Municipal bonds 96.8% | | | | | | | | | | | | | | | $207,968,921 | |
| | | | |
(Cost $192,585,264) | | | | | | | | | | | | | | | | |
| | | | |
California 94.0% | | | | | | | | | | | | | | | 202,032,792 | |
| | | | |
ABAG Finance Authority for Nonprofit Corps.
Sharp HealthCare, Series A | | | 5.000 | | | | 08-01-43 | | | | 2,000,000 | | | | 2,184,060 | |
| | | | |
Burbank Unified School District
Convertible Capital Appreciation Election
2013, GO (0.000% to 8-1-23, then 4.500% thereafter) | | | 0.000 | | | | 08-01-37 | | | | 1,770,000 | | | | 1,928,521 | |
| | | | |
California Community Housing Agency
Annadel Apartments, Series A (A) | | | 5.000 | | | | 04-01-49 | | | | 1,000,000 | | | | 1,119,260 | |
| | | | |
California Community Housing Agency
Serenity at Larkspur, Series A (A) | | | 5.000 | | | | 02-01-50 | | | | 1,000,000 | | | | 1,129,500 | |
| | | | |
California Community Housing Agency
Verdant at Green Valley Project, Series A (A) | | | 5.000 | | | | 08-01-49 | | | | 1,000,000 | | | | 1,108,070 | |
| | | | |
California County Tobacco Securitization Agency
Fresno County Funding Corp. | | | 6.000 | | | | 06-01-35 | | | | 1,570,000 | | | | 1,571,837 | |
| | | | |
California County Tobacco Securitization Agency
Kern County Tobacco Funding Corp. | | | 5.000 | | | | 06-01-40 | | | | 1,500,000 | | | | 1,579,020 | |
| | | | |
California County Tobacco Securitization Agency
Merced County Tobacco Funding Corp. | | | 5.000 | | | | 06-01-50 | | | | 500,000 | | | | 568,230 | |
| | | | |
California County Tobacco Securitization Agency
Sonoma County Securitization Corp. | | | 4.000 | | | | 06-01-49 | | | | 400,000 | | | | 453,920 | |
| | | | |
California County Tobacco Securitization Agency
Tobacco Settlement Revenue, Series A | | | 4.000 | | | | 06-01-49 | | | | 1,000,000 | | | | 1,137,890 | |
| | | | |
California County Tobacco Securitization Agency
Tobacco Settlement Revenue, Series B1 | | | 5.000 | | | | 06-01-49 | | | | 500,000 | | | | 591,175 | |
| | | | |
California Educational Facilities Authority
Pepperdine University | | | 5.000 | | | | 10-01-49 | | | | 1,500,000 | | | | 1,786,755 | |
| | | | |
California Educational Facilities Authority
University of Redlands, Series A | | | 5.000 | | | | 10-01-35 | | | | 1,000,000 | | | | 1,097,060 | |
| | | | |
California Enterprise Development Authority
Academy for Academic Excellence Project, Series A (A) | | | 5.000 | | | | 07-01-40 | | | | 430,000 | | | | 466,292 | |
| | | | |
California Enterprise Development Authority
Academy for Academic Excellence Project, Series A (A) | | | 5.000 | | | | 07-01-50 | | | | 350,000 | | | | 375,928 | |
| | | | |
California Enterprise Development Authority
Academy for Academic Excellence Project,
Series A (A) | | | 5.000 | | | | 07-01-55 | | | | 240,000 | | | | 256,622 | |
| | | | |
California Health Facilities Financing Authority
Children’s Hospital, Series A | | | 5.000 | | | | 08-15-47 | | | | 1,000,000 | | | | 1,160,900 | |
| | | | |
California Health Facilities Financing Authority
City of Hope Obligated Group | | | 4.000 | | | | 11-15-45 | | | | 1,000,000 | | | | 1,155,030 | |
| | | | |
California Health Facilities Financing Authority
CommonSpirit Health Obligated Group, Series A | | | 4.000 | | | | 04-01-40 | | | | 1,500,000 | | | | 1,748,625 | |
| | | | |
California Health Facilities Financing Authority
El Camino Hospital | | | 5.000 | | | | 02-01-42 | | | | 1,000,000 | | | | 1,182,340 | |
| | | | |
| SEE NOTES TO FINANCIAL STATEMENTS | | SEMIANNUAL REPORT | JOHN HANCOCK CALIFORNIA TAX-FREE INCOME FUND | | 9 |
| | | | | | | | | | | | | | | | |
| | | Rate (%) | | | Maturity date | | | Par value^ | | | Value | |
| | | | |
California (continued) | | | | | | | | | | | | | | | | |
| | | | |
California Health Facilities Financing Authority
El Camino Hospital | | | 5.000 | | | | 02-01-47 | | | | 1,425,000 | | | | $1,671,824 | |
| | | | |
California Health Facilities Financing Authority
Lucile Packard Children’s Hospital, Series A | | | 5.000 | | | | 08-15-43 | | | | 1,000,000 | | | | 1,113,900 | |
| | | | |
California Health Facilities Financing Authority
Lucile Packard Children’s Hospital, Series B | | | 5.000 | | | | 08-15-55 | | | | 1,000,000 | | | | 1,162,010 | |
| | | | |
California Health Facilities Financing Authority
Standford Health Care, Series A | | | 4.000 | | | | 08-15-50 | | | | 1,000,000 | | | | 1,173,770 | |
| | | | |
California Housing Finance
Series A | | | 4.250 | | | | 01-15-35 | | | | 982,257 | | | | 1,125,549 | |
| | | | |
California Municipal Finance Authority
Channing House Project, Series A (B) | | | 4.000 | | | | 05-15-40 | | | | 1,500,000 | | | | 1,725,405 | |
| | | | |
California Municipal Finance Authority
HumanGood Obligated Group, Series A | | | 5.000 | | | | 10-01-44 | | | | 1,000,000 | | | | 1,158,340 | |
| | | | |
California Municipal Finance Authority
LINXS APM Project, AMT | | | 5.000 | | | | 12-31-43 | | | | 1,000,000 | | | | 1,172,590 | |
| | | | |
California Municipal Finance Authority
Paradise Valley Estates Project, Series A (B) | | | 5.000 | | | | 01-01-49 | | | | 1,500,000 | | | | 1,812,810 | |
| | | | |
California Municipal Finance Authority
Retirement Housing Foundation Obligation Group, Series A | | | 5.000 | | | | 11-15-31 | | | | 1,500,000 | | | | 1,810,980 | |
| | | | |
California Municipal Finance Authority
West Village Student Housing Project at UC Davis (B) | | | 4.000 | | | | 05-15-48 | | | | 1,365,000 | | | | 1,497,391 | |
| | | | |
California Municipal Finance Authority
Wineville School Project, Series A (B) | | | 5.000 | | | | 10-01-42 | | | | 2,000,000 | | | | 2,287,000 | |
| | | | |
California Pollution Control Financing Authority
San Diego County Water Authority Desalination Project Pipeline (A) | | | 5.000 | | | | 07-01-39 | | | | 1,000,000 | | | | 1,176,270 | |
| | | | |
California Pollution Control Financing Authority
San Diego County Water Authority Desalination Project Pipeline (A) | | | 5.000 | | | | 11-21-45 | | | | 1,500,000 | | | | 1,740,660 | |
| | | | |
California Pollution Control Financing Authority
Waste Management, Inc., Series A1, AMT | | | 3.375 | | | | 07-01-25 | | | | 1,000,000 | | | | 1,111,770 | |
| | | | |
California Pollution Control Financing Authority
Waste Management, Inc., Series A3, AMT | | | 4.300 | | | | 07-01-40 | | | | 4,675,000 | | | | 5,334,689 | |
| | | | |
California Public Finance Authority
Excelsior Charter Schools Project, Series A (A) | | | 5.000 | | | | 06-15-50 | | | | 500,000 | | | | 528,795 | |
| | | | |
California Public Finance Authority
Excelsior Charter Schools Project, Series A (A) | | | 5.000 | | | | 06-15-55 | | | | 500,000 | | | | 527,325 | |
| | | | |
California Public Finance Authority
Henry Mayo Newhall Hospital | | | 5.000 | | | | 10-15-47 | | | | 2,000,000 | | | | 2,231,960 | |
| | | | |
California Public Finance Authority
Trinity Classical Academy, Series A (A) | | | 5.000 | | | | 07-01-44 | | | | 110,000 | | | | 110,759 | |
| | | | |
California Public Finance Authority
Trinity Classical Academy, Series A (A) | | | 5.000 | | | | 07-01-54 | | | | 325,000 | | | | 322,956 | |
| | | | |
California School Finance Authority
Aspire Public Schools (A) | | | 5.000 | | | | 08-01-46 | | | | 1,275,000 | | | | 1,438,315 | |
| | | | |
| 10 | | JOHN HANCOCK CALIFORNIA TAX-FREE INCOME FUND | SEMIANNUAL REPORT | | SEE NOTES TO FINANCIAL STATEMENTS |
| | | | | | | | | | | | | | | | |
| | | Rate (%) | | | Maturity date | | | Par value^ | | | Value | |
| | | | |
California (continued) | | | | | | | | | | | | | | | | |
| | | | |
California School Finance Authority
Granada Hills Charter High School Obligated Group (A) | | | 5.000 | | | | 07-01-43 | | | | 1,000,000 | | | | $1,116,090 | |
| | | | |
California School Finance Authority
KIPP LA Project, Series A (A) | | | 5.000 | | | | 07-01-47 | | | | 1,500,000 | | | | 1,747,440 | |
| | | | |
California State Public Works Board
Various Capital Projects, Series C | | | 5.000 | | | | 11-01-44 | | | | 1,000,000 | | | | 1,287,210 | |
| | | | |
California State Public Works Board
Various Correctional Facilities, Series A | | | 5.000 | | | | 09-01-39 | | | | 2,500,000 | | | | 2,881,925 | |
| | | | |
California Statewide Communities Development Authority
Adventist Health System, Series A | | | 5.000 | | | | 03-01-48 | | | | 1,885,000 | | | | 2,266,618 | |
| | | | |
California Statewide Communities Development Authority
CHF Irvine LLC | | | 5.000 | | | | 05-15-40 | | | | 1,485,000 | | | | 1,634,139 | |
| | | | |
California Statewide Communities Development Authority
Emanate Health, Series A | | | 4.000 | | | | 04-01-45 | | | | 250,000 | | | | 287,930 | |
| | | | |
California Statewide Communities Development Authority
Front Porch Communities and Services, Series A | | | 5.000 | | | | 04-01-47 | | | | 500,000 | | | | 563,965 | |
| | | | |
California Statewide Communities Development Authority
Infrastructure Program Revenue, Series B | | | 5.000 | | | | 09-02-44 | | | | 1,000,000 | | | | 1,065,160 | |
| | | | |
California Statewide Communities Development Authority
Redlands Community Hospital | | | 5.000 | | | | 10-01-46 | | | | 2,000,000 | | | | 2,266,860 | |
| | | | |
California Statewide Communities Development Authority
Redwoods Project (B) | | | 5.375 | | | | 11-15-44 | | | | 1,500,000 | | | | 1,688,085 | |
| | | | |
California Statewide Financing Authority
Tobacco Settlement, Series A | | | 6.000 | | | | 05-01-37 | | | | 2,500,000 | | | | 2,509,750 | |
| | | | |
California Statewide Financing Authority
Tobacco Settlement, Series B | | | 6.000 | | | | 05-01-37 | | | | 3,000,000 | | | | 3,011,700 | |
| | | | |
City of Belmont
Library Project, Series A (B) | | | 5.750 | | | | 08-01-24 | | | | 825,000 | | | | 927,135 | |
| | | | |
City of Irvine
Community Facilities District, No. 2013-3 Great Park | | | 5.000 | | | | 09-01-49 | | | | 2,000,000 | | | | 2,228,420 | |
| | | | |
City of La Verne
Brethren Hillcrest Homes | | | 5.000 | | | | 05-15-36 | | | | 750,000 | | | | 808,988 | |
| | | | |
City of Long Beach
Alamitos Bay Marina Project | | | 5.000 | | | | 05-15-45 | | | | 1,000,000 | | | | 1,104,420 | |
| | | | |
City of Long Beach
Community Facilities District 6-Pike Project | | | 6.250 | | | | 10-01-26 | | | | 1,795,000 | | | | 1,799,900 | |
| | | | |
City of Long Beach
Harbor Revenue, Series A | | | 5.000 | | | | 05-15-49 | | | | 2,000,000 | | | | 2,473,820 | |
| | | | |
City of Los Angeles Department of Airports
Airport Revenue, Series C, AMT | | | 5.000 | | | | 05-15-35 | | | | 1,000,000 | | | | 1,294,300 | |
| | | | |
| SEE NOTES TO FINANCIAL STATEMENTS | | SEMIANNUAL REPORT | JOHN HANCOCK CALIFORNIA TAX-FREE INCOME FUND | | 11 |
| | | | | | | | | | | | | | | | |
| | | Rate (%) | | | Maturity date | | | Par value^ | | | Value | |
| | | | |
California (continued) | | | | | | | | | | | | | | | | |
| | | | |
City of Los Angeles Department of Airports
Los Angeles International Airport, Series D, AMT | | | 4.000 | | | | 05-15-44 | | | | 2,000,000 | | | | $2,286,200 | |
| | | | |
City of San Clemente
Community Facilities District, No. 2006-1 | | | 5.000 | | | | 09-01-46 | | | | 1,965,000 | | | | 2,194,473 | |
| | | | |
City of San Francisco Public Utilities Commission Water Revenue
Green Bonds, Series A | | | 5.000 | | | | 11-01-45 | | | | 1,500,000 | | | | 1,755,705 | |
| | | | |
City of San Mateo
Community Facilities District, No. 2008-1 Bay Meadows | | | 5.500 | | | | 09-01-44 | | | | 2,000,000 | | | | 2,112,340 | |
| | | | |
College of the Sequoias Tulare Area
Improvement District No. 3
Election of 2008, Series B, GO (B)(C) | | | 2.291 | | | | 08-01-40 | | | | 2,890,000 | | | | 1,839,138 | |
| | | | |
Foothill-Eastern Transportation Corridor Agency
Highway Revenue Tolls, Series A | | | 5.750 | | | | 01-15-46 | | | | 5,000,000 | | | | 5,618,300 | |
| | | | |
Golden State Tobacco Securitization Corp.
Series A | | | 5.000 | | | | 06-01-40 | | | | 5,000,000 | | | | 5,818,499 | |
| | | | |
Golden State Tobacco Securitization Corp.
Series A | | | 5.000 | | | | 06-01-45 | | | | 3,250,000 | | | | 3,753,945 | |
| | | | |
Golden State Tobacco Securitization Corp.
Series A-1 | | | 3.500 | | | | 06-01-36 | | | | 1,785,000 | | | | 1,818,005 | |
| | | | |
Golden State Tobacco Securitization Corp.
Series A-1 | | | 5.000 | | | | 06-01-47 | | | | 1,610,000 | | | | 1,661,456 | |
| | | | |
Hastings Campus Housing Finance Authority
California Campus Housing Revenue, Series A | | | 5.000 | | | | 07-01-45 | | | | 1,000,000 | | | | 1,061,320 | |
| | | | |
Inland Valley Development Agency
Series A | | | 5.000 | | | | 09-01-44 | | | | 2,500,000 | | | | 2,761,775 | |
| | | | |
Los Angeles Community Facilities District
Cascades Business Park | | | 6.400 | | | | 09-01-22 | | | | 165,000 | | | | 166,176 | |
| | | | |
Los Angeles County Metropolitan Transportation Authority
Sales Tax Revenue, Series A | | | 4.000 | | | | 06-01-35 | | | | 250,000 | | | | 312,398 | |
| | | | |
Los Angeles County Public Works Financing Authority
Series D | | | 5.000 | | | | 12-01-45 | | | | 3,000,000 | | | | 3,514,230 | |
| | | | |
Los Angeles County Regional Financing Authority
Montecedro, Inc. Project, Series A (B) | | | 5.000 | | | | 11-15-44 | | | | 1,355,000 | | | | 1,457,330 | |
| | | | |
Los Angeles Department of Water
Power Waterworks Revenue, Series A | | | 5.000 | | | | 07-01-50 | | | | 1,000,000 | | | | 1,313,700 | |
| | | | |
Los Angeles Department of Water & Power
Power Systems, Series D | | | 5.000 | | | | 07-01-44 | | | | 1,000,000 | | | | 1,143,830 | |
| | | | |
Los Angeles Unified School District
Series RYQ, GO | | | 4.000 | | | | 07-01-44 | | | | 1,500,000 | | | | 1,795,560 | |
| | | | |
Marin Healthcare District
Election of 2013, GO | | | 4.000 | | | | 08-01-45 | | | | 1,000,000 | | | | 1,104,910 | |
| | | | |
Metropolitan Water District of Southern California
Series A | | | 5.000 | | | | 10-01-49 | | | | 1,500,000 | | | | 1,959,660 | |
| | | | |
Morgan Hill Redevelopment Successor Agency
Series A | | | 5.000 | | | | 09-01-33 | | | | 1,750,000 | | | | 1,974,858 | |
| | | | |
| 12 | | JOHN HANCOCK CALIFORNIA TAX-FREE INCOME FUND | SEMIANNUAL REPORT | | SEE NOTES TO FINANCIAL STATEMENTS |
| | | | | | | | | | | | | | | | |
| | | Rate (%) | | | Maturity date | | | Par value^ | | | Value | |
| | | | |
California (continued) | | | | | | | | | | | | | | | | |
| | | | |
M-S-R Energy Authority
Natural Gas Revenue, Series B | | | 6.500 | | | | 11-01-39 | | | | 1,500,000 | | | | $2,482,050 | |
| | | | |
Norman Y. Mineta San Jose International Airport SJC
Series A, AMT | | | 5.000 | | | | 03-01-47 | | | | 3,000,000 | | | | 3,510,600 | |
| | | | |
Oakland Unified School District
Series A, GO | | | 5.000 | | | | 08-01-40 | | | | 1,500,000 | | | | 1,740,615 | |
| | | | |
Orange County Community Facilities District
2017-1 Esencia Village, Series A | | | 5.000 | | | | 08-15-47 | | | | 2,000,000 | | | | 2,337,980 | |
| | | | |
Pacifica School District
Series C, GO (B)(C) | | | 0.826 | | | | 08-01-26 | | | | 1,000,000 | | | | 953,810 | |
| | | | |
Port of Los Angeles
Series A, AMT | | | 5.000 | | | | 08-01-44 | | | | 2,000,000 | | | | 2,244,080 | |
| | | | |
River Islands Public Financing Authority
Community Facilities District, No. 2003-1 | | | 5.500 | | | | 09-01-45 | | | | 750,000 | | | | 796,080 | |
| | | | |
River Islands Public Financing Authority
Community Facilities District, No. 2003-1, Series A | | | 5.000 | | | | 09-01-48 | | | | 1,250,000 | | | | 1,399,538 | |
| | | | |
River Islands Public Financing Authority
Lathrop Irrigation District Electric Revenue (B) | | | 4.000 | | | | 09-01-35 | | | | 1,125,000 | | | | 1,346,254 | |
| | | | |
Riverside County Transportation Commission
Series A | | | 5.750 | | | | 06-01-48 | | | | 1,000,000 | | | | 1,085,030 | |
| | | | |
Sacramento Municipal Utility District
Electric Revenue, Series H | | | 4.000 | | | | 08-15-45 | | | | 1,500,000 | | | | 1,811,190 | |
| | | | |
San Diego Public Facilities Financing Authority
Capital Improvement Projects, Series A | | | 5.000 | | | | 10-15-44 | | | | 1,000,000 | | | | 1,170,560 | |
| | | | |
San Diego Public Facilities Financing Authority
Series A | | | 3.000 | | | | 08-01-49 | | | | 1,500,000 | | | | 1,642,215 | |
| | | | |
San Diego Public Facilities Financing Authority
Series A | | | 4.000 | | | | 08-01-45 | | | | 500,000 | | | | 609,385 | |
| | | | |
San Diego Unified School District
Series I, GO (C) | | | 3.538 | | | | 07-01-39 | | | | 1,250,000 | | | | 649,025 | |
| | | | |
San Francisco Bay Area Rapid Transit District
Election 2016, Series C1, GO | | | 3.000 | | | | 08-01-50 | | | | 1,500,000 | | | | 1,615,290 | |
| | | | |
San Francisco City & County Airport Commission
International Airport Revenue, Second Series 2020-B | | | 4.000 | | | | 05-01-37 | | | | 1,000,000 | | | | 1,197,800 | |
| | | | |
San Francisco City & County Airport Commission
Series E, AMT | | | 5.000 | | | | 05-01-50 | | | | 1,500,000 | | | | 1,837,305 | |
| | | | |
San Francisco City & County Airport Commission
Special Facilities Lease, SFO Fuel Company LLC, Series A, AMT | | | 5.000 | | | | 01-01-47 | | | | 2,000,000 | | | | 2,416,180 | |
| | | | |
San Francisco City & County Redevelopment Successor Agency
Department of General Services Lease, No. 6, Mission Bay South, Series A | | | 5.150 | | | | 08-01-35 | | | | 1,250,000 | | | | 1,256,950 | |
| | | | |
San Francisco City & County Redevelopment Successor Agency
Mission Bay Project, Series A | | | 5.000 | | | | 08-01-43 | | | | 1,000,000 | | | | 1,119,210 | |
| | | | |
San Joaquin Hills Transportation Corridor Agency
Highway Revenue Tolls, Series A | | | 5.000 | | | | 01-15-44 | | | | 2,500,000 | | | | 2,775,400 | |
| | | | |
| SEE NOTES TO FINANCIAL STATEMENTS | | SEMIANNUAL REPORT | JOHN HANCOCK CALIFORNIA TAX-FREE INCOME FUND | | 13 |
| | | | | | | | | | | | | | | | |
| | | Rate (%) | | | Maturity date | | | Par value^ | | | Value | |
| | | | |
California (continued) | | | | | | | | | | | | | | | | |
| | | | |
San Mateo Joint Powers Financing Authority
Capital Projects Program (B) | | | 5.000 | | | | 07-01-21 | | | | 925,000 | | | | $950,697 | |
| | | | |
Santa Ana Financing Authority
Police Administration & Holding Facility, Series A (B) | | | 6.250 | | | | 07-01-24 | | | | 4,115,000 | | | | 4,635,794 | |
| | | | |
Santa Ana Financing Authority
Prerefunded, Police Administration & Holding Facility, Series A (B) | | | 6.250 | | | | 07-01-24 | | | | 4,115,000 | | | | 4,620,363 | |
| | | | |
Santa Margarita Water District
Community Facilities District, No. 2013-1 | | | 5.625 | | | | 09-01-43 | | | | 745,000 | | | | 815,216 | |
| | | | |
Santee School District
Election of 2006, Series E, GO (B)(C) | | | 2.741 | | | | 05-01-51 | | | | 1,530,000 | | | | 664,158 | |
| | | | |
South Orange County Public Financing Authority
Series A | | | 5.000 | | | | 08-15-33 | | | | 1,000,000 | | | | 1,047,210 | |
| | | | |
South Orange County Public Financing Authority
Series A | | | 5.000 | | | | 08-15-34 | | | | 450,000 | | | | 470,943 | |
| | | | |
Southern California Public Power Authority
Apex Power Project, Series A | | | 5.000 | | | | 07-01-38 | | | | 1,000,000 | | | | 1,143,830 | |
| | | | |
Southern California Public Power Authority
Natural Gas Project Revenue, Series A | | | 5.250 | | | | 11-01-26 | | | | 2,000,000 | | | | 2,500,540 | |
| | | | |
State of California
Construction Bonds, GO | | | 5.000 | | | | 10-01-49 | | | | 1,000,000 | | | | 1,279,580 | |
| | | | |
State of California
Various Purpose, GO | | | 3.000 | | | | 03-01-50 | | | | 1,500,000 | | | | 1,603,710 | |
| | | | |
State of California
Various Purpose, GO | | | 5.000 | | | | 04-01-32 | | | | 2,000,000 | | | | 2,827,900 | |
| | | | |
State of California
Various Purpose-Bid Group B, GO | | | 5.000 | | | | 08-01-36 | | | | 1,000,000 | | | | 1,288,880 | |
| | | | |
Sweetwater Union High School District
Ad Valorem Property Tax, GO | | | 4.000 | | | | 08-01-42 | | | | 500,000 | | | | 544,880 | |
| | | | |
Transbay Joint Powers Authority
Tax Allocation, Series A | | | 5.000 | | | | 10-01-32 | | | | 345,000 | | | | 448,824 | |
| | | | |
Turlock Irrigation District
Electricity, Power & Light Revenues | | | 5.000 | | | | 01-01-41 | | | | 1,000,000 | | | | 1,311,200 | |
| | | | |
University of California
Series AZ | | | 5.000 | | | | 05-15-48 | | | | 1,500,000 | | | | 1,867,710 | |
| | | | |
West Covina Community Development
Commission Successor Agency Fashion Plaza | | | 6.000 | | | | 09-01-22 | | | | 1,565,000 | | | | 1,672,124 | |
| | | | |
William S. Hart Union High School District
Community Facilities District, No. 2015-1 | | | 5.000 | | | | 09-01-47 | | | | 1,000,000 | | | | 1,118,920 | |
| | | | |
Puerto Rico 2.8% | | | | | | | | | | | | | | | 5,936,129 | |
| | | | |
Puerto Rico Sales Tax Financing Corp.
Series A-1 (C) | | | 2.546 | | | | 07-01-31 | | | | 1,500,000 | | | | 1,145,190 | |
| | | | |
Puerto Rico Sales Tax Financing Corp.
Series A-1 | | | 4.750 | | | | 07-01-53 | | | | 1,500,000 | | | | 1,625,895 | |
| | | | |
Puerto Rico Sales Tax Financing Corp.
Series A-1 (C) | | | 4.763 | | | | 07-01-46 | | | | 7,500,000 | | | | 2,241,825 | |
| | | | |
| 14 | | JOHN HANCOCK CALIFORNIA TAX-FREE INCOME FUND | SEMIANNUAL REPORT | | SEE NOTES TO FINANCIAL STATEMENTS |
| | | | | | | | | | | | | | | | |
| | | Rate (%) | | | Maturity date | | | Par value^ | | | Value | |
| | | | |
Puerto Rico (continued) | | | | | | | | | | | | | | | | |
| | | | |
Puerto Rico Sales Tax Financing Corp.
Series A-2 | | | 4.784 | | | | 07-01-58 | | | | 850,000 | | | | $923,219 | |
| | | | |
| | | | | | | | | Par value^ | | | Value | |
| | | | |
Short-term investments 2.3% | | | | | | | | | | | | | | | $4,902,000 | |
| | | | |
(Cost $4,902,000) | | | | | | | | | | | | | | | | |
| | | | |
Repurchase agreement 2.3% | | | | | | | | | | | | | | | $4,902,000 | |
| | | | |
Barclays Tri-Party Repurchase Agreement dated 11-30-20 at 0.070% to be repurchased at $3,381,007 on 12-1-20, collateralized by $2,890,100 U.S. Treasury Bonds, 2.375% due 11-15-49 (valued at $3,448,725) | | | | | | | | | | | 3,381,000 | | | | 3,381,000 | |
| | | | |
Repurchase Agreement with State Street Corp. dated 11-30-20 at 0.000% to be repurchased at $1,521,000 on 12-1-20, collateralized by $1,511,000 U.S. Treasury Notes, 1.875% due 1-31-22 (valued at $1,551,439) | | | | | | | | | | | 1,521,000 | | | | 1,521,000 | |
| |
Total investments (Cost $197,487,264) 99.1% | | | | $212,870,921 | |
| |
| | | | | |
| |
Other assets and liabilities, net 0.9% | | | | 2,000,556 | |
| |
| | | | | |
| |
Total net assets 100.0% | | | | $214,871,477 | |
The percentage shown for each investment category is the total value of the category as a percentage of the net assets of the fund.
^All par values are denominated in U.S.dollars unless otherwise indicated.
Security Abbreviations and Legend
| | |
| AMT | | Interest earned from these securities may be considered a tax preference item for purpose of the Federal Alternative Minimum Tax. |
| |
| GO | | General Obligation |
| |
| (A) | | These securities are exempt from registration under Rule 144A of the Securities Act of 1933. Such securities may be resold, normally to qualified institutional buyers, in transactions exempt from registration. |
| |
| (B) | | Bond is insured by one or more of the companies listed in the insurance coverage table below. |
| |
| (C) | | Zero coupon bonds are issued at a discount from their principal amount in lieu of paying interest periodically. Rate shown is the effective yield at period end. |
At 11-30-20,the aggregate cost of investments for federal income tax purposes was $195,916,139.Net unrealized appreciation aggregated to $16,954,782,of which $17,074,003 related to gross unrealized appreciation and $119,221 related to gross unrealized depreciation.
| | | | |
| Insurance coverage | | As a % of total investments | |
| |
National Public Finance Guarantee Corp. | | | 5.2 | |
| |
California Mortgage Insurance | | | 3.2 | |
| |
Assured Guaranty Municipal Corp. | | | 1.8 | |
| |
Build America Mutual Assurance Company | | | 1.8 | |
| |
Ambac Financial Group, Inc. | | | 0.4 | |
| |
TOTAL | | | 12.4 | |
| | | | |
| SEE NOTES TO FINANCIAL STATEMENTS | | SEMIANNUAL REPORT | JOHN HANCOCK CALIFORNIA TAX-FREE INCOME FUND | | 15 |
| | | | |
|
| STATEMENT OF ASSETS AND LIABILITIES 11-30-20 (unaudited) | |
| |
| | | | |
| |
Assets | | | | |
| |
Unaffiliated investments, at value (Cost $197,487,264) | | | $212,870,921 | |
| |
Cash | | | 129 | |
| |
Interest receivable | | | 2,448,949 | |
| |
Receivable for fund shares sold | | | 138,847 | |
| |
Other assets | | | 16,072 | |
| |
Total assets | | | 215,474,918 | |
| |
Liabilities | | | | |
| |
Distributions payable | | | 53,221 | |
| |
Payable for fund shares repurchased | | | 333,481 | |
| |
Payable to affiliates | | | | |
| |
Investment management fees | | | 96,324 | |
| |
Accounting and legal services fees | | | 6,392 | |
| |
Transfer agent fees | | | 7,228 | |
| |
Distribution and service fees | | | 22,159 | |
| |
Trustees’ fees | | | 230 | |
| |
Other liabilities and accrued expenses | | | 84,406 | |
| |
Total liabilities | | | 603,441 | |
| |
Net assets | | | $214,871,477 | |
| |
Net assets consist of | | | | |
| |
Paid-in capital | | | $197,794,850 | |
| |
Total distributable earnings (loss) | | | 17,076,627 | |
| |
Net assets | | | $214,871,477 | |
| | | | |
| |
Net asset value per share | | | | |
| |
Based on net asset value and shares outstanding - the fund has an unlimited number of shares authorized with no par value | | | | |
| |
Class A ($182,003,695 ÷ 16,594,671 shares)1 | | | $10.97 | |
| |
Class C ($13,293,975 ÷ 1,212,144 shares)1 | | | $10.97 | |
| |
Class I ($12,452,520 ÷ 1,134,761 shares) | | | $10.97 | |
| |
Class R6 ($7,121,287 ÷ 648,706 shares) | | | $10.98 | |
| |
Maximum offering price per share | | | | |
| |
Class A (net asset value per share ÷ 96%)2 | | | $11.43 | |
| 1 | Redemption price per share is equal to net asset value less any applicable contingent deferred sales charge. |
| 2 | On single retail sales of less than $100,000. On sales of $100,000 or more and on group sales the offering price is reduced. |
| | | | |
| 16 | | JOHN HANCOCK CALIFORNIA TAX-FREE INCOME FUND | SEMIANNUAL REPORT | | SEE NOTES TO FINANCIAL STATEMENTS |
| | | | |
|
| STATEMENT OF OPERATIONS For the six months ended 11-30-20 (unaudited) | |
| |
| | | | |
| |
Investment income | | | | |
Interest | | $ | 3,911,224 | |
Expenses | | | | |
Investment management fees | | | 583,751 | |
Distribution and service fees | | | 207,902 | |
Accounting and legal services fees | | | 20,389 | |
Transfer agent fees | | | 45,048 | |
Trustees’ fees | | | 1,840 | |
Custodian fees | | | 26,997 | |
State registration fees | | | 6,971 | |
Printing and postage | | | 18,717 | |
Professional fees | | | 29,841 | |
Other | | | 11,285 | |
Total expenses | | | 952,741 | |
Less expense reductions | | | (15,232 | ) |
Net expenses | | | 937,509 | |
Net investment income | | | 2,973,715 | |
Realized and unrealized gain (loss) | | | | |
Net realized gain (loss) on | | | | |
Unaffiliated investments | | | 1,169,155 | |
| | | | 1,169,155 | |
Change in net unrealized appreciation (depreciation) of | | | | |
Unaffiliated investments | | | 4,961,461 | |
| | | | 4,961,461 | |
Net realized and unrealized gain | | | 6,130,616 | |
Increase in net assets from operations | | $ | 9,104,331 | |
| | | | |
| SEE NOTES TO FINANCIAL STATEMENTS | | SEMIANNUAL REPORT | JOHN HANCOCK CALIFORNIA TAX-FREE INCOME FUND | | 17 |
| | | | | | | | |
|
STATEMENTS OF CHANGES IN NET ASSETS | |
| | |
| | | | | | | | |
| | | Six months ended
11-30-20
(unaudited) | | | Year ended
5-31-20 | |
Increase (decrease) in net assets | | | | | | | | |
From operations | | | | | | | | |
Net investment income | | | $2,973,715 | | | | $6,569,649 | |
Net realized gain (loss) | | | 1,169,155 | | | | (845,679) | |
Change in net unrealized appreciation (depreciation) | | | 4,961,461 | | | | (3,587,750) | |
Increase in net assets resulting from operations | | | 9,104,331 | | | | 2,136,220 | |
Distributions to shareholders | | | | | | | | |
From earnings | | | | | | | | |
Class A | | | (2,492,228) | | | | (6,845,190) | |
Class B1 | | | (2,166) | | | | (11,003) | |
Class C | | | (154,039) | | | | (537,072) | |
Class I | | | (191,858) | | | | (483,472) | |
Class R6 | | | (113,264) | | | | (204,555) | |
Total distributions | | | (2,953,555) | | | | (8,081,292) | |
From fund share transactions | | | (2,423,602) | | | | 7,406,442 | |
Total increase | | | 3,727,174 | | | | 1,461,370 | |
Net assets | | | | | | | | |
Beginning of period | | | 211,144,303 | | | | 209,682,933 | |
End of period | | | $214,871,477 | | | | $211,144,303 | |
| 1 | Share class was redesignated during the period. Refer to Note 5 for further details. |
| | | | |
| 18 | | JOHN HANCOCK CALIFORNIA TAX-FREE INCOME FUND | SEMIANNUAL REPORT | | SEE NOTES TO FINANCIAL STATEMENTS |
| | | | | | | | | | | | | | | | | | | | | | | | |
| | | | | | |
| CLASS A SHARES Period ended | | 11-30-201 | | | 5-31-20 | | | 5-31-19 | | | 5-31-18 | | | 5-31-17 | | | 5-31-16 | |
| | | | | | |
Per share operating performance | | | | | | | | | | | | | | | | | | | | | | | | |
| | | | | | |
Net asset value, beginning of period | | | $10.66 | | | | $10.94 | | | | $10.73 | | | | $10.90 | | | | $11.22 | | | | $10.91 | |
| | | | | | |
Net investment income2 | | | 0.15 | | | | 0.34 | | | | 0.36 | | | | 0.36 | | | | 0.37 | | | | 0.39 | |
| | | | | | |
Net realized and unrealized gain (loss) on investments | | | 0.31 | | | | (0.20 | ) | | | 0.22 | | | | (0.16 | ) | | | (0.30 | ) | | | 0.32 | |
| | | | | | |
Total from investment operations | | | 0.46 | | | | 0.14 | | | | 0.58 | | | | 0.20 | | | | 0.07 | | | | 0.71 | |
| | | | | | |
Less distributions | | | | | | | | | | | | | | | | | | | | | | | | |
| | | | | | |
From net investment income | | | (0.15 | ) | | | (0.34 | ) | | | (0.36 | ) | | | (0.37 | ) | | | (0.39 | ) | | | (0.40 | ) |
| | | | | | |
From net realized gain | | | — | | | | (0.08 | ) | | | (0.01 | ) | | | — | | | | — | | | | — | |
| | | | | | |
Total distributions | | | (0.15 | ) | | | (0.42 | ) | | | (0.37 | ) | | | (0.37 | ) | | | (0.39 | ) | | | (0.40 | ) |
| | | | | | |
Net asset value, end of period | | | $10.97 | | | | $10.66 | | | | $10.94 | | | | $10.73 | | | | $10.90 | | | | $11.22 | |
| | | | | | |
Total return (%)3,4 | | | 4.375 | | | | 1.22 | | | | 5.57 | | | | 1.85 | | | | 0.63 | | | | 6.63 | |
| | | | | | |
Ratios and supplemental data | | | | | | | | | | | | | | | | | | | | | | | | |
| | | | | | |
Net assets, end of period (in millions) | | | $182 | | | | $173 | | | | $176 | | | | $181 | | | | $213 | | | | $254 | |
| | | | | | |
Ratios (as a percentage of average net assets): | | | | | | | | | | | | | | | | | | | | | | | | |
| | | | | | |
Expenses before reductions | | | 0.85 | 6 | | | 0.85 | | | | 0.86 | | | | 0.85 | | | | 0.83 | | | | 0.84 | |
| | | | | | |
Expenses including reductions | | | 0.85 | 6 | | | 0.84 | | | | 0.85 | | | | 0.84 | | | | 0.83 | | | | 0.83 | |
| | | | | | |
Net investment income | | | 2.84 | 6 | | | 3.12 | | | | 3.42 | | | | 3.37 | | | | 3.35 | | | | 3.53 | |
| | | | | | |
Portfolio turnover (%) | | | 9 | | | | 22 | | | | 22 | | | | 9 | | | | 17 | | | | 20 | |
| 1 | Six months ended 11-30-20. Unaudited. |
| 2 | Based on average daily shares outstanding. |
| 3 | Total returns would have been lower had certain expenses not been reduced during the applicable periods. |
| 4 | Does not reflect the effect of sales charges, if any. |
| | | | |
| SEE NOTES TO FINANCIAL STATEMENTS | | SEMIANNUAL REPORT | JOHN HANCOCK CALIFORNIA TAX-FREE INCOME FUND | | 19 |
| | | | | | | | | | | | | | | | | | | | | | | | |
| | | | | | |
CLASS C SHARES Period ended | | | 11-30-20 | 1 | | | 5-31-20 | | | | 5-31-19 | | | | 5-31-18 | | | | 5-31-17 | | | | 5-31-16 | |
| | | | | | |
Per share operating performance | | | | | | | | | | | | | | | | | | | | | | | | |
| | | | | | |
Net asset value, beginning of period | | | $10.66 | | | | $10.94 | | | | $10.73 | | | | $10.90 | | | | $11.22 | | | | $10.91 | |
| | | | | | |
Net investment income2 | | | 0.11 | | | | 0.26 | | | | 0.28 | | | | 0.28 | | | | 0.29 | | | | 0.31 | |
| | | | | | |
Net realized and unrealized gain (loss) on investments | | | 0.31 | | | | (0.20 | ) | | | 0.22 | | | | (0.16 | ) | | | (0.31 | ) | | | 0.32 | |
| | | | | | |
Total from investment operations | | | 0.42 | | | | 0.06 | | | | 0.50 | | | | 0.12 | | | | (0.02 | ) | | | 0.63 | |
| | | | | | |
Less distributions | | | | | | | | | | | | | | | | | | | | | | | | |
| | | | | | |
From net investment income | | | (0.11 | ) | | | (0.26 | ) | | | (0.28 | ) | | | (0.29 | ) | | | (0.30 | ) | | | (0.32 | ) |
| | | | | | |
From net realized gain | | | — | | | | (0.08 | ) | | | (0.01 | ) | | | — | | | | — | | | | — | |
| | | | | | |
Total distributions | | | (0.11 | ) | | | (0.34 | ) | | | (0.29 | ) | | | (0.29 | ) | | | (0.30 | ) | | | (0.32 | ) |
| | | | | | |
Net asset value, end of period | | | $10.97 | | | | $10.66 | | | | $10.94 | | | | $10.73 | | | | $10.90 | | | | $11.22 | |
| | | | | | |
Total return (%)3,4 | | | 3.985 | | | | 0.47 | | | | 4.78 | | | | 1.09 | | | | (0.13 | ) | | | 5.83 | |
| | | | | | |
Ratios and supplemental data | | | | | | | | | | | | | | | | | | | | | | | | |
| | | | | | |
Net assets, end of period (in millions) | | | $13 | | | | $16 | | | | $19 | | | | $21 | | | | $30 | | | | $36 | |
| | | | | | |
Ratios (as a percentage of average net assets): | | | | | | | | | | | | | | | | | | | | | | | | |
| | | | | | |
Expenses before reductions | | | 1.70 | 6 | | | 1.70 | | | | 1.71 | | | | 1.70 | | | | 1.68 | | | | 1.69 | |
| | | | | | |
Expenses including reductions | | | 1.60 | 6 | | | 1.59 | | | | 1.60 | | | | 1.59 | | | | 1.58 | | | | 1.58 | |
| | | | | | |
Net investment income | | | 2.09 | 6 | | | 2.37 | | | | 2.67 | | | | 2.62 | | | | 2.60 | | | | 2.78 | |
| | | | | | |
Portfolio turnover (%) | | | 9 | | | | 22 | | | | 22 | | | | 9 | | | | 17 | | | | 20 | |
| 1 | Six months ended 11-30-20. Unaudited. |
| 2 | Based on average daily shares outstanding. |
| 3 | Total returns would have been lower had certain expenses not been reduced during the applicable periods. |
| 4 | Does not reflect the effect of sales charges, if any. |
| | | | |
| 20 | | JOHN HANCOCK CALIFORNIA TAX-FREE INCOME FUND | SEMIANNUAL REPORT | | SEE NOTES TO FINANCIAL STATEMENTS |
| | | | | | | | | | | | | | | | | | | | |
| | | | | |
CLASS I SHARES Period ended | | | 11-30-20 | 1 | | | 5-31-20 | | | | 5-31-19 | | | | 5-31-18 | | | | 5-31-17 | 2 |
| | | | | |
Per share operating performance | | | | | | | | | | | | | | | | | | | | |
| | | | | |
Net asset value, beginning of period | | | $10.66 | | | | $10.94 | | | | $10.73 | | | | $10.91 | | | | $10.70 | |
| | | | | |
Net investment income3 | | | 0.16 | | | | 0.35 | | | | 0.38 | | | | 0.38 | | | | 0.12 | |
| | | | | |
Net realized and unrealized gain (loss) on investments | | | 0.31 | | | | (0.20 | ) | | | 0.22 | | | | (0.17 | ) | | | 0.21 | |
| | | | | |
Total from investment operations | | | 0.47 | | | | 0.15 | | | | 0.60 | | | | 0.21 | | | | 0.33 | |
| | | | | |
Less distributions | | | | | | | | | | | | | | | | | | | | |
| | | | | |
From net investment income | | | (0.16 | ) | | | (0.35 | ) | | | (0.38 | ) | | | (0.39 | ) | | | (0.12 | ) |
| | | | | |
From net realized gain | | | — | | | | (0.08 | ) | | | (0.01 | ) | | | — | | | | — | |
| | | | | |
Total distributions | | | (0.16 | ) | | | (0.43 | ) | | | (0.39 | ) | | | (0.39 | ) | | | (0.12 | ) |
| | | | | |
Net asset value, end of period | | | $10.97 | | | | $10.66 | | | | $10.94 | | | | $10.73 | | | | $10.91 | |
| | | | | |
Total return (%)4 | | | 4.455 | | | | 1.37 | | | | 5.72 | | | | 1.91 | | | | 3.095 | |
| | | | | |
Ratios and supplemental data | | | | | | | | | | | | | | | | | | | | |
| | | | | |
Net assets, end of period (in millions) | | | $12 | | | | $15 | | | | $10 | | | | $10 | | | | $5 | |
| | | | | |
Ratios (as a percentage of average net assets): | | | | | | | | | | | | | | | | | | | | |
| | | | | |
Expenses before reductions | | | 0.70 | 6 | | | 0.70 | | | | 0.71 | | | | 0.70 | | | | 0.67 | 6 |
| | | | | |
Expenses including reductions | | | 0.70 | 6 | | | 0.69 | | | | 0.70 | | | | 0.69 | | | | 0.66 | 6 |
| | | | | |
Net investment income | | | 2.98 | 6 | | | 3.25 | | | | 3.58 | | | | 3.53 | | | | 3.76 | 6 |
| | | | | |
Portfolio turnover (%) | | | 9 | | | | 22 | | | | 22 | | | | 9 | | | | 17 | 7 |
| 1 | Six months ended 11-30-20. Unaudited. |
| 2 | The inception date for Class I shares is 2-13-17. |
| 3 | Based on average daily shares outstanding. |
| 4 | Total returns would have been lower had certain expenses not been reduced during the applicable periods. |
| 7 | Portfolio turnover is shown for the period from 6-1-16 to 5-31-17. |
| | | | |
| SEE NOTES TO FINANCIAL STATEMENTS | | SEMIANNUAL REPORT | JOHN HANCOCK CALIFORNIA TAX-FREE INCOME FUND | | 21 |
| | | | | | | | | | | | | | | | |
| | | | |
CLASS R6 SHARES Period ended | | | 11-30-20 | 1 | | | 5-31-20 | | | | 5-31-19 | | | | 5-31-18 | 2 |
| | | | |
Per share operating performance | | | | | | | | | | | | | | | | |
| | | | |
Net asset value, beginning of period | | | $10.66 | | | | $10.94 | | | | $10.73 | | | | $10.95 | |
| | | | |
Net investment income3 | | | 0.16 | | | | 0.36 | | | | 0.38 | | | | 0.29 | |
| | | | |
Net realized and unrealized gain (loss) on investments | | | 0.32 | | | | (0.20 | ) | | | 0.22 | | | | (0.22 | ) |
| | | | |
Total from investment operations | | | 0.48 | | | | 0.16 | | | | 0.60 | | | | 0.07 | |
| | | | |
Less distributions | | | | | | | | | | | | | | | | |
| | | | |
From net investment income | | | (0.16 | ) | | | (0.36 | ) | | | (0.38 | ) | | | (0.29 | ) |
| | | | |
From net realized gain | | | — | | | | (0.08 | ) | | | (0.01 | ) | | | — | |
| | | | |
Total distributions | | | (0.16 | ) | | | (0.44 | ) | | | (0.39 | ) | | | (0.29 | ) |
| | | | |
Net asset value, end of period | | | $10.98 | | | | $10.66 | | | | $10.94 | | | | $10.73 | |
| | | | |
Total return (%)4 | | | 4.565 | | | | 1.40 | | | | 5.76 | | | | 0.665 | |
| | | | |
Ratios and supplemental data | | | | | | | | | | | | | | | | |
| | | | |
Net assets, end of period (in millions) | | | $7 | | | | $7 | | | | $4 | | | | $2 | |
| | | | |
Ratios (as a percentage of average net assets): | | | | | | | | | | | | | | | | |
| | | | |
Expenses before reductions | | | 0.67 | 6 | | | 0.67 | | | | 0.68 | | | | 0.68 | 6 |
| | | | |
Expenses including reductions | | | 0.66 | 6 | | | 0.66 | | | | 0.67 | | | | 0.67 | 6 |
| | | | |
Net investment income | | | 3.00 | 6 | | | 3.28 | | | | 3.58 | | | | 3.56 | 6 |
| | | | |
Portfolio turnover (%) | | | 9 | | | | 22 | | | | 22 | | | | 9 | 7 |
| 1 | Six months ended 11-30-20. Unaudited. |
| 2 | The inception date for Class R6 shares is 8-30-17. |
| 3 | Based on average daily shares outstanding. |
| 4 | Total returns would have been lower had certain expenses not been reduced during the applicable periods. |
| 7 | Portfolio turnover is shown for the period from 6-1-17 to 5-31-18. |
| | | | |
| 22 | | JOHN HANCOCK CALIFORNIA TAX-FREE INCOME FUND | SEMIANNUAL REPORT | | SEE NOTES TO FINANCIAL STATEMENTS |
|
Notes to financial statements (unaudited) |
Note 1 — Organization
John Hancock California Tax-Free Income Fund (the fund) is a series of John Hancock California Tax-Free Income Fund (the Trust), an open-end management investment company organized as a Massachusetts business trust and registered under the Investment Company Act of 1940, as amended (the 1940 Act). The investment objective of the fund is to seek a high level of current income, consistent with preservation of capital, that is exempt from federal and California personal income taxes.
The fund may offer multiple classes of shares. The shares currently outstanding are detailed in the Statement of assets and liabilities. Class A and Class C shares are offered to all investors. Class I shares are offered to institutions and certain investors. Class R6 shares are only available to certain retirement plans, institutions and other investors. Class C shares convert to Class A shares eight years after purchase (certain exclusions may apply). Shareholders of each class have exclusive voting rights to matters that affect that class. The distribution and service fees, if any, and transfer agent fees for each class may differ.
Note 2 — Significant accounting policies
The financial statements have been prepared in conformity with accounting principles generally accepted in the United States of America (US GAAP), which require management to make certain estimates and assumptions as of the date of the financial statements. Actual results could differ from those estimates and those differences could be significant. The fund qualifies as an investment company under Topic 946 of Accounting Standards Codification of US GAAP.
Events or transactions occurring after the end of the fiscal period through the date that the financial statements were issued have been evaluated in the preparation of the financial statements. The following summarizes the significant accounting policies of the fund:
Security valuation. Investments are stated at value as of the scheduled close of regular trading on the New York Stock Exchange (NYSE), normally at 4:00 P.M., Eastern Time. In case of emergency or other disruption resulting in the NYSE not opening for trading or the NYSE closing at a time other than the regularly scheduled close, the net asset value (NAV) may be determined as of the regularly scheduled close of the NYSE pursuant to the fund’s Valuation Policies and Procedures.
In order to value the securities, the fund uses the following valuation techniques: Debt obligations are typically valued based on evaluated prices provided by an independent pricing vendor. Independent pricing vendors utilize matrix pricing, which takes into account factors such as institutional-size trading in similar groups of securities, yield, quality, coupon rate, maturity, type of issue, trading characteristics and other market data, as well as broker supplied prices.
Other portfolio securities and assets, for which reliable market quotations are not readily available, are valued at fair value as determined in good faith by the fund’s Pricing Committee following procedures established by the Board of Trustees. The frequency with which these fair valuation procedures are used cannot be predicted and fair value of securities may differ significantly from the value that would have been used had a ready market for such securities existed.
The fund uses a three-tier hierarchy to prioritize the pricing assumptions, referred to as inputs, used in valuation techniques to measure fair value. Level 1 includes securities valued using quoted prices in active markets for identical securities, including registered investment companies. Level 2 includes securities valued using other significant observable inputs. Observable inputs may include quoted prices for similar securities, interest rates, prepayment speeds and credit risk. Prices for securities valued using these inputs are received from independent pricing vendors and brokers and are based on an evaluation of the inputs described. Level 3 includes securities valued using significant unobservable inputs when market prices are not readily available or reliable, including the fund’s own assumptions in determining the fair value of investments. Factors used in determining value may include market or issuer specific events or trends, changes in interest rates and credit quality. The inputs or
| | | | |
| | SEMIANNUAL REPORT | JOHN HANCOCK CALIFORNIA TAX-FREE INCOME FUND | | 23 |
methodology used for valuing securities are not necessarily an indication of the risks associated with investing in those securities. Changes in valuation techniques and related inputs may result in transfers into or out of an assigned level within the disclosure hierarchy.
As of November 30, 2020, all investments are categorized as Level 2 under the hierarchy described above.
Repurchase agreements. The fund may enter into repurchase agreements. When the fund enters into a repurchase agreement, it receives collateral that is held in a segregated account by the fund’s custodian, or for tri-party repurchase agreements, collateral is held at a third-party custodian bank in a segregated account for the benefit of the fund. The collateral amount is marked-to-market and monitored on a daily basis to ensure that the collateral held is in an amount not less than the principal amount of the repurchase agreement plus any accrued interest. Collateral received by the fund for repurchase agreements is disclosed in the Fund’s investments as part of the caption related to the repurchase agreement.
Repurchase agreements are typically governed by the terms and conditions of the Master Repurchase Agreement and/or Global Master Repurchase Agreement (collectively, MRA). Upon an event of default, the non-defaulting party may close out all transactions traded under the MRA and net amounts owed. Absent an event of default, assets and liabilities resulting from repurchase agreements are not offset in the Statement of assets and liabilities. In the event of a default by the counterparty, realization of the collateral proceeds could be delayed, during which time the collateral value may decline or the counterparty may have insufficient assets to pay claims resulting from close-out of the transactions.
Security transactions and related investment income. Investment security transactions are accounted for on a trade date plus one basis for daily NAV calculations. However, for financial reporting purposes, investment transactions are reported on trade date. Interest income is accrued as earned. Interest income includes coupon interest and amortization/accretion of premiums/discounts on debt securities. Debt obligations may be placed in a non-accrual status and related interest income may be reduced by stopping current accruals and writing off interest receivable when the collection of all or a portion of interest has become doubtful. Gains and losses on securities sold are determined on the basis of identified cost and may include proceeds from litigation.
Overdraft. The fund may have the ability to borrow from banks for temporary or emergency purposes, including meeting redemption requests that otherwise might require the untimely sale of securities. Pursuant to the fund’s custodian agreement, the custodian may loan money to the fund to make properly authorized payments. The fund is obligated to repay the custodian for any overdraft, including any related costs or expenses. The custodian may have a lien, security interest or security entitlement in any fund property that is not otherwise segregated or pledged, to the extent of any overdraft, and to the maximum extent permitted by law.
Line of credit. Effective June 25, 2020, the fund and other affiliated funds have entered into a syndicated line of credit agreement with Citibank, N.A. as the administrative agent that enables them to participate in a $1 billion unsecured committed line of credit. Excluding commitments designated for a certain fund and subject to the needs of all other affiliated funds, the fund can borrow up to an aggregate commitment amount of $850 million, subject to asset coverage and other limitations as specified in the agreement. Each participating fund paid an upfront fee in connection with this line of credit agreement, which is charged based on a combination of fixed and asset-based allocations and amortized over 365 days. Prior to June 25, 2020, the fund and other affiliated funds had a similar agreement that enabled them to participate in a $750 million unsecured committed line of credit. A commitment fee payable at the end of each calendar quarter, based on the average daily unused portion of the line of credit, is charged to each participating fund based on a combination of fixed and asset-based allocations and is reflected in Other expenses on the Statement of operations. For the six months ended November 30, 2020, the fund had no borrowings under the line of credit. Commitment fees, including upfront fees, for the six months ended November 30, 2020 were $3,145.
| | | | |
| 24 | | JOHN HANCOCK CALIFORNIA TAX-FREE INCOME FUND | SEMIANNUAL REPORT | | |
Expenses. Within the John Hancock group of funds complex, expenses that are directly attributable to an individual fund are allocated to such fund. Expenses that are not readily attributable to a specific fund are allocated among all funds in an equitable manner, taking into consideration, among other things, the nature and type of expense and the fund’s relative net assets. Expense estimates are accrued in the period to which they relate and adjustments are made when actual amounts are known.
Class allocations. Income, common expenses and realized and unrealized gains (losses) are determined at the fund level and allocated daily to each class of shares based on the net assets of the class. Class-specific expenses, such as distribution and service fees, if any, and transfer agent fees, for all classes, are charged daily at the class level based on the net assets of each class and the specific expense rates applicable to each class.
Federal income taxes. The fund intends to continue to qualify as a regulated investment company by complying with the applicable provisions of the Internal Revenue Code and will not be subject to federal income tax on taxable income that is distributed to shareholders. Therefore, no federal income tax provision is required.
As of May 31, 2020, the fund had no uncertain tax positions that would require financial statement recognition, derecognition or disclosure. The fund’s federal tax returns are subject to examination by the Internal Revenue Service for a period of three years.
Distribution of income and gains. Distributions to shareholders from net investment income and net realized gains, if any, are recorded on the ex-date. The fund generally declares dividends daily and pays them monthly. Capital gain distributions, if any, are typically distributed annually.
Distributions paid by the fund with respect to each class of shares are calculated in the same manner, at the same time and in the same amount, except for the effect of class level expenses that may be applied differently to each class.
Such distributions, on a tax basis, are determined in conformity with income tax regulations, which may differ from US GAAP. The final determination of tax characteristics of the fund’s distribution will occur at the end of the year and will subsequently be reported to shareholders.
Capital accounts within the financial statements are adjusted for permanent book-tax differences. These adjustments have no impact on net assets or the results of operations. Temporary book-tax differences, if any, will reverse in a subsequent period. Book-tax differences are primarily attributable to accretion on debt securities.
Note 3 — Guarantees and indemnifications
Under the Trust’s organizational documents, its Officers and Trustees are indemnified against certain liabilities arising out of the performance of their duties to the Trust, including the fund. Additionally, in the normal course of business, the fund enters into contracts with service providers that contain general indemnification clauses. The fund’s maximum exposure under these arrangements is unknown, as this would involve future claims that may be made against the fund that have not yet occurred. The risk of material loss from such claims is considered remote.
Note 4 — Fees and transactions with affiliates
John Hancock Investment Management LLC (the Advisor) serves as investment advisor for the fund. John Hancock Investment Management Distributors LLC (the Distributor), an affiliate of the Advisor, serves as principal underwriter of the fund. The Advisor and the Distributor are indirect, principally owned subsidiaries of Manulife Financial Corporation.
Management fee. The fund has an investment management agreement with the Advisor under which the fund pays a monthly management fee to the Advisor, equivalent on an annual basis, to the sum of: (a) 0.550% of the first $500 million of the fund’s average daily net assets, (b) 0.500% of the next $500 million of the fund’s average daily net assets, (c) 0.475% of the next $1 billion of the fund’s average daily net assets; and (d) 0.450% of the
| | |
| SEMIANNUAL REPORT | JOHN HANCOCK CALIFORNIA TAX-FREE INCOME FUND | | 25 |
fund’s average daily net assets in excess of $2 billion. The Advisor has a subadvisory agreement with Manulife Investment Management (US) LLC, an indirectly owned subsidiary of Manulife Financial Corporation and an affiliate of the Advisor. The fund is not responsible for payment of the subadvisory fees.
The Advisor has contractually agreed to waive a portion of its management fee and/or reimburse expenses for certain funds of the John Hancock group of funds complex, including the fund (the participating portfolios). This waiver is based upon aggregate net assets of all the participating portfolios. The amount of the reimbursement is calculated daily and allocated among all the participating portfolios in proportion to the daily net assets of each fund. During the six months ended November 30, 2020, this waiver amounted to 0.01% of the fund’s average daily net assets, on an annualized basis. This arrangement expires on July 31, 2022, unless renewed by mutual agreement of the fund and the Advisor based upon a determination that this is appropriate under the circumstances at that time.
For the six months ended November 30, 2020, the expense reductions described above amounted to the following:
| | | | |
| Class | | Expense reduction | |
Class A | | | $6,406 | |
Class B | | | 7 | |
Class C | | | 538 | |
| | | | |
| Class | | Expense reduction | |
Class I | | | $467 | |
Class R6 | | | 273 | |
Total | | | $7,691 | |
Expenses waived or reimbursed in the current fiscal period are not subject to recapture in future fiscal periods.
The investment management fees, including the impact of the waivers and reimbursements as described above, incurred for the six months ended November 30, 2020, were equivalent to a net annual effective rate of 0.54% of the fund’s average daily net assets.
Accounting and legal services. Pursuant to the Accounting and Legal Services Agreement, the fund reimburses the Advisor for all expenses associated with providing the administrative, financial, legal, compliance, accounting and recordkeeping services to the fund, including the preparation of all tax returns, periodic reports to shareholders and regulatory reports, among other services. These expenses are allocated to each share class based on its relative net assets at the time the expense was incurred. These accounting and legal services fees incurred, for the six months ended November 30, 2020, amounted to an annual rate of 0.02% of the fund’s average daily net assets.
Distribution and service plans. The fund has a distribution agreement with the Distributor. The fund has adopted distribution and service plans for certain classes as detailed below pursuant to Rule 12b-1 under the 1940 Act, to pay the Distributor for services provided as the distributor of shares of the fund. The fund may pay up to the following contractual rates of distribution and service fees under these arrangements, expressed as an annual percentage of average daily net assets for each class of the fund’s shares:
| | | | |
| Class | | Rule 12b-1 Fee | |
Class A | | | 0.15% | |
Class B | | | 1.00% | |
Class C | | | 1.00% | |
Class B was redesignated during the period. Refer to Note 5 for further details.
The fund’s Distributor has contractually agreed to waive 0.10% of Rule12b-1 fees for Class C shares. The current waiver agreement expires on September 30, 2021, unless renewed by mutual agreement of the fund and the Distributor based upon a determination that this is appropriate under the circumstances at the time. This contractual waiver amounted to $7,438 for Class C shares for the six months ended November 30, 2020.
| | |
| 26 | | JOHN HANCOCK CALIFORNIA TAX-FREE INCOME FUND | SEMIANNUAL REPORT |
Prior to October 14, 2020, the fund’s distributor contractually agreed to waive 0.10% of Rule 12b-1 fees for Class B. This contractual waiver amounted to $103 for the six months ended November 30, 2020.
Sales charges. Class A shares are assessed up-front sales charges, which resulted in payments to the Distributor amounting to $58,053 for the six months ended November 30, 2020. Of this amount, $8,307 was retained and used for printing prospectuses, advertising, sales literature and other purposes and $49,746 was paid as sales commissions to broker-dealers.
Class A and Class C shares may be subject to contingent deferred sales charges (CDSCs). Certain Class A shares that are acquired through purchases of $1 million or more and are redeemed within one year of purchase are subject to a 1.00% sales charge. Class C shares that are redeemed within one year of purchase are subject to a 1.00% CDSC. CDSCs are applied to the lesser of the current market value at the time of redemption or the original purchase cost of the shares being redeemed. Proceeds from CDSCs are used to compensate the Distributor for providing distribution-related services in connection with the sale of these shares. During the six months ended November 30, 2020, CDSCs received by the Distributor amounted to $2,302 and $1,211 for Class A and Class C shares, respectively.
Transfer agent fees. The John Hancock group of funds has a complex-wide transfer agent agreement with John Hancock Signature Services, Inc. (Signature Services), an affiliate of the Advisor. The transfer agent fees paid to Signature Services are determined based on the cost to Signature Services (Signature Services Cost) of providing recordkeeping services. It also includes out-of-pocket expenses, including payments made to third-parties for recordkeeping services provided to their clients who invest in one or more John Hancock funds. In addition, Signature Services Cost may be reduced by certain fees that Signature Services receives in connection with retirement and small accounts. Signature Services Cost is calculated monthly and allocated, as applicable, to five categories of share classes: Retail Share and Institutional Share Classes of Non-Municipal Bond Funds, Class R6 Shares, Retirement Share Classes and Municipal Bond Share Classes. Within each of these categories, the applicable costs are allocated to the affected John Hancock affiliated funds and/or classes, based on the relative average daily net assets.
Class level expenses. Class level expenses for the six months ended November 30, 2020 were as follows:
| | | | | | | | |
| Class | | Distribution and service fees | | | Transfer agent fees | |
Class A | | | $132,493 | | | | $38,491 | |
Class B | | | 1,035 | | | | 45 | |
Class C | | | 74,374 | | | | 3,250 | |
Class I | | | — | | | | 2,810 | |
Class R6 | | | — | | | | 452 | |
Total | | | $207,902 | | | | $45,048 | |
Trustee expenses. The fund compensates each Trustee who is not an employee of the Advisor or its affiliates. The costs of paying Trustee compensation and expenses are allocated to the fund based on its net assets relative to other funds within the John Hancock group of funds complex.
| | |
| SEMIANNUAL REPORT | JOHN HANCOCK CALIFORNIA TAX-FREE INCOME FUND | | 27 |
Note 5 — Fund share transactions
Transactions in fund shares for the six months ended November 30, 2020 and for the year ended May 31, 2020 were as follows:
| | | | | | | | | | | | | | | | |
| | | Six Months Ended 11-30-20 | | | Year Ended 5-31-20 | |
| | | | |
| | | Shares | | | Amount | | | Shares | | | Amount | |
| | | | |
Class A shares | | | | | | | | | | | | | | | | |
| | | | |
Sold | | | 1,149,263 | | | | $12,475,981 | | | | 2,742,491 | | | | $29,865,452 | |
| | | | |
Distributions reinvested | | | 200,848 | | | | 2,182,063 | | | | 550,117 | | | | 6,010,551 | |
| | | | |
Repurchased | | | (1,010,962 | ) | | | (10,965,451 | ) | | | (3,128,085 | ) | | | (33,652,400 | ) |
| | | | |
Net increase | | | 339,149 | | | | $3,692,593 | | | | 164,523 | | | | $2,223,603 | |
| | | | |
Class B shares | | | | | | | | | | | | | | | | |
| | | | |
Distributions reinvested | | | 181 | | | | $1,965 | | | | 1,002 | | | | $10,964 | |
| | | | |
Repurchased | | | (26,912 | ) | | | (291,004 | ) | | | (16,021 | ) | | | (174,085 | ) |
| | | | |
Net decrease | | | (26,731 | ) | | | $(289,039 | ) | | | (15,019 | ) | | | $(163,121 | ) |
| | | | |
Class C shares | | | | | | | | | | | | | | | | |
| | | | |
Sold | | | 77,968 | | | | $845,268 | | | | 156,921 | | | | $1,731,793 | |
| | | | |
Distributions reinvested | | | 12,685 | | | | 137,801 | | | | 44,733 | | | | 488,997 | |
| | | | |
Repurchased | | | (333,514 | ) | | | (3,623,873 | ) | | | (488,762 | ) | | | (5,312,564 | ) |
| | | | |
Net decrease | | | (242,861 | ) | | | $(2,640,804 | ) | | | (287,108 | ) | | | $(3,091,774 | ) |
| | | | |
Class I shares | | | | | | | | | | | | | | | | |
| | | | |
Sold | | | 278,043 | | | | $3,012,054 | | | | 1,001,484 | | | | $10,757,915 | |
| | | | |
Distributions reinvested | | | 17,220 | | | | 187,152 | | | | 43,138 | | | | 471,429 | |
| | | | |
Repurchased | | | (597,542 | ) | | | (6,474,460 | ) | | | (557,882 | ) | | | (5,999,036 | ) |
| | | | |
Net increase (decrease) | | | (302,279 | ) | | | $(3,275,254 | ) | | | 486,740 | | | | $5,230,308 | |
| | | | |
Class R6 shares | | | | | | | | | | | | | | | | |
| | | | |
Sold | | | 453,262 | | | | $4,918,178 | | | | 395,872 | | | | $4,305,698 | |
| | | | |
Distributions reinvested | | | 10,417 | | | | 113,264 | | | | 18,767 | | | | 204,555 | |
| | | | |
Repurchased | | | (455,438 | ) | | | (4,942,540 | ) | | | (122,698 | ) | | | (1,302,827 | ) |
| | | | |
Net increase | | | 8,241 | | | | $88,902 | | | | 291,941 | | | | $3,207,426 | |
| | | | |
Total net increase (decrease) | | | (224,481 | ) | | | $(2,423,602 | ) | | | 641,077 | | | | $7,406,442 | |
On June 25, 2020, the Board of Trustees approved redesignations of certain share classes. As a result of the redesignations, Class B was terminated, and shareholders in this class became shareholders of the respective class identified below, with the same or lower total net expenses. The following amount is included in the amount repurchased of the terminated class and the amount sold of the redesignated class.
| | | | |
| Redesignation | | Effective date | | Amount |
| Class B shares as Class A shares | | October 14, 2020 | | $267,162 |
| | |
| 28 | | JOHN HANCOCK CALIFORNIA TAX-FREE INCOME FUND | SEMIANNUAL REPORT |
Note 6 — Purchase and sale of securities
Purchases and sales of securities, other than short-term investments, amounted to $19,592,902 and $25,100,247, respectively, for the six months ended November 30, 2020.
Note 7 — State or region risk
To the extent that the fund invests heavily in bonds from any given state or region, its performance could be disproportionately affected by factors particular to that state or region. These factors may include economic or political changes, tax-base erosion, possible state constitutional limits on tax increases, detrimental budget deficits and other financial difficulties, and changes to the credit ratings assigned to those states’ municipal issuers.
Note 8 — Coronavirus (COVID-19) pandemic
The novel COVID-19 disease has resulted in significant disruptions to global business activity. A widespread health crisis such as a global pandemic could cause substantial market volatility, exchange trading suspensions and closures, impact the ability to complete redemptions, and affect fund performance.
| | |
| SEMIANNUAL REPORT | JOHN HANCOCK CALIFORNIA TAX-FREE INCOME FUND | | 29 |
CONTINUATION OF INVESTMENT ADVISORY AND SUBADVISORY AGREEMENTS
Evaluation of Advisory and Subadvisory Agreements by the Board of Trustees
This section describes the evaluation by the Board of Trustees (the Board) of John Hancock California Tax-Free Income Fund (the Trust) of the Advisory Agreement (the Advisory Agreement) with John Hancock Investment Management LLC (the Advisor) and the Subadvisory Agreement (the Subadvisory Agreement) with Manulife Investment (US) LLC (the Subadvisor), for John Hancock California Tax-Free Income Fund (the fund). The Advisory Agreement and Subadvisory Agreement are collectively referred to as the Agreements. Prior to the June 23-25, 2020 telephonic1 meeting at which the Agreements were approved, the Board also discussed and considered information regarding the proposed continuation of the Agreements at a telephonic meeting held on May 26-27, 2020.
Approval of Advisory and Subadvisory Agreements
At telephonic meetings held on June 23-25, 2020, the Board, including the Trustees who are not parties to any Agreement or considered to be interested persons of the Trust under the Investment Company Act of 1940, as amended (the 1940 Act) (the Independent Trustees), reapproved for an annual period the continuation of the Advisory Agreement between the Trust and the Advisor and the Subadvisory Agreement between the Advisor and the Subadvisor with respect to the fund.
In considering the Advisory Agreement and the Subadvisory Agreement, the Board received in advance of the meetings a variety of materials relating to the fund, the Advisor and the Subadvisor, including comparative performance, fee and expense information for a peer group of similar funds prepared by an independent third-party provider of fund data, performance information for an applicable benchmark index; and, with respect to the Subadvisor, comparative performance information for comparably managed accounts, as applicable, and other information provided by the Advisor and the Subadvisor regarding the nature, extent and quality of services provided by the Advisor and the Subadvisor under their respective Agreements, as well as information regarding the Advisor’s revenues and costs of providing services to the fund and any compensation paid to affiliates of the Advisor. At the meetings at which the renewal of the Advisory Agreement and Subadvisory Agreement are considered, particular focus is given to information concerning fund performance, comparability of fees and total expenses, and profitability. However, the Board noted that the evaluation process with respect to the Advisor and the Subadvisor is an ongoing one. In this regard, the Board also took into account discussions with management and information provided to the Board (including its various committees) at prior meetings with respect to the services provided by the Advisor and the Subadvisor to the fund, including quarterly performance reports prepared by management containing reviews of investment results and prior presentations from the Subadvisor with respect to the fund. The information received and considered by the Board in connection with the May and June meetings and throughout the year was both written and oral. The Board noted the affiliation of the Subadvisor with the Advisor, noting any potential conflicts of interest. The Board also considered the nature, quality, and extent of non-advisory services, if any, to be provided to the fund by the Advisor’s affiliates, including distribution services. The Board considered the Advisory Agreement and the Subadvisory Agreement separately in the course of its review. In doing so, the Board noted the respective roles of the Advisor and Subadvisor in providing services to the fund.
1On March 25, 2020, as a result of health and safety measures put in place to combat the global COVID-19 pandemic, the Securities and Exchange Commission issued an exemptive order (the “Order”) pursuant to Sections 6(c) and 38(a) of the Investment Company Act of 1940, as amended (the “1940 Act”), that temporarily exempts registered investment management companies from the in-person voting requirements under the 1940 Act, subject to certain requirements, including that votes taken pursuant to the Order are ratified at the next in-person meeting. The Board determined that reliance on the Order was necessary or appropriate due to the circumstances related to current or potential effects of COVID-19 and therefore, the Board’s May and June meetings were held telephonically in reliance on the Order.
| | |
| 30 | | JOHN HANCOCK CALIFORNIA TAX-FREE INCOME FUND | SEMIANNUAL REPORT |
Throughout the process, the Board asked questions of and requested additional information from management. The Board is assisted by counsel for the Trust and the Independent Trustees are also separately assisted by independent legal counsel throughout the process. The Independent Trustees also received a memorandum from their independent legal counsel discussing the legal standards for their consideration of the proposed continuation of the Agreements and discussed the proposed continuation of the Agreements in private sessions with their independent legal counsel at which no representatives of management were present.
Approval of Advisory Agreement
In approving the Advisory Agreement with respect to the fund, the Board, including the Independent Trustees, considered a variety of factors, including those discussed below. The Board also considered other factors (including conditions and trends prevailing generally in the economy, the securities markets, and the industry) and did not treat any single factor as determinative, and each Trustee may have attributed different weights to different factors. The Board’s conclusions may be based in part on its consideration of the advisory and subadvisory arrangements in prior years and on the Board’s ongoing regular review of fund performance and operations throughout the year.
Nature, extent, and quality of services. Among the information received by the Board from the Advisor relating to the nature, extent, and quality of services provided to the fund, the Board reviewed information provided by the Advisor relating to its operations and personnel, descriptions of its organizational and management structure, and information regarding the Advisor’s compliance and regulatory history, including its Form ADV. The Board also noted that on a regular basis it receives and reviews information from the Trust’s Chief Compliance Officer (CCO) regarding the fund’s compliance policies and procedures established pursuant to Rule 38a-1 under the 1940 Act. The Board observed that the scope of services provided by the Advisor, and of the undertakings required of the Advisor in connection with those services, including maintaining and monitoring its own and the fund’s compliance programs, risk management programs, liquidity management programs and cybersecurity programs, had expanded over time as a result of regulatory, market and other developments. The Board considered that the Advisor is responsible for the management of the day-to-day operations of the fund, including, but not limited to, general supervision of and coordination of the services provided by the Subadvisor, and is also responsible for monitoring and reviewing the activities of the Subadvisor and third-party service providers. The Board also considered the significant risks assumed by the Advisor in connection with the services provided to the fund including entrepreneurial risk in sponsoring new funds and ongoing risks including investment, operational, enterprise, litigation, regulatory and compliance risks with respect to all funds.
In considering the nature, extent, and quality of the services provided by the Advisor, the Trustees also took into account their knowledge of the Advisor’s management and the quality of the performance of the Advisor’s duties, through Board meetings, discussions and reports during the preceding year and through each Trustee’s experience as a Trustee of the Trust and of the other trusts in the John Hancock group of funds complex (the John Hancock Fund Complex).
In the course of their deliberations regarding the Advisory Agreement, the Board considered, among other things:
| | (a) | the skills and competency with which the Advisor has in the past managed the Trust’s affairs and its subadvisory relationship, the Advisor’s oversight and monitoring of the Subadvisor’s investment performance and compliance programs, such as the Subadvisor’s compliance with fund policies and objectives, review of brokerage matters, including with respect to trade allocation and best execution and the Advisor’s timeliness in responding to performance issues; |
| | (b) | the background, qualifications and skills of the Advisor’s personnel; |
| | (c) | the Advisor’s compliance policies and procedures and its responsiveness to regulatory changes and fund industry developments; |
| | |
| SEMIANNUAL REPORT | JOHN HANCOCK CALIFORNIA TAX-FREE INCOME FUND | | 31 |
| | (d) | the Advisor’s administrative capabilities, including its ability to supervise the other service providers for the fund, as well as the Advisor’s oversight of any securities lending activity, its monitoring of class action litigation and collection of class action settlements on behalf of the fund, and bringing loss recovery actions on behalf of the fund; |
| | (e) | the financial condition of the Advisor and whether it has the financial wherewithal to provide a high level and quality of services to the fund; |
| | (f) | the Advisor’s initiatives intended to improve various aspects of the Trust’s operations and investor experience |
| | (h) | the Advisor’s reputation and experience in serving as an investment advisor to the Trust and the benefit to shareholders of investing in funds that are part of a family of funds offering a variety of investments. |
The Board concluded that the Advisor may reasonably be expected to continue to provide a high quality of services under the Advisory Agreement with respect to the fund.
Investment performance. In considering the fund’s performance, the Board noted that it reviews at its regularly scheduled meetings information about the fund’s performance results. In connection with the consideration of the Advisory Agreement, the Board:
| | (a) | reviewed information prepared by management regarding the fund’s performance; |
| | (b) | considered the comparative performance of an applicable benchmark index; |
| | (c) | considered the performance of comparable funds, if any, as included in the report prepared by an independent third-party provider of fund data; and |
| | (d) | took into account the Advisor’s analysis of the fund’s performance and its plans and recommendations regarding the Trust’s subadvisory arrangements generally. |
The Board noted that while it found the data provided by the independent third-party generally useful it recognized its limitations, including in particular that the data may vary depending on the end date selected and the results of the performance comparisons may vary depending on the selection of the peer group. The Board noted that the fund outperformed its benchmark index and peer group median for the ten-year period and underperformed its benchmark index and peer group median for the one-, three and five-year periods ended December 31, 2019. The Board took into account management’s discussion of the factors that contributed to the fund’s performance for the benchmark index and peer group median for the one-, three- and five-year periods, including the impact of past and current market conditions on the fund’s strategy and management’s outlook for the fund. The Board concluded that the fund’s performance is being monitored and reasonable addressed, where appropriate.
Fees and expenses. The Board reviewed comparative information prepared by an independent third-party provider of fund data, including, among other data, the fund’s contractual and net management fees (and subadvisory fees, to the extent available) and total expenses as compared to similarly situated investment companies deemed to be comparable to the fund in light of the nature, extent and quality of the management and advisory and subadvisory services provided by the Advisor and the Subadvisor. The Board considered the fund’s ranking within a smaller group of peer funds chosen by the independent third-party provider, as well as the fund’s ranking within a broader group of funds. In comparing the fund’s contractual and net management fees to those of comparable funds, the Board noted that such fees include both advisory and administrative costs. The Board noted that net management fees and net total expenses for the fund are higher than the peer group median.
| | |
| 32 | | JOHN HANCOCK CALIFORNIA TAX-FREE INCOME FUND | SEMIANNUAL REPORT |
The Board took into account management’s discussion of the fund’s expenses. The Board also took into account management’s discussion with respect to the overall management fee and the fees of the Subadvisor, including the amount of the advisory fee retained by the Advisor after payment of the subadvisory fee, in each case in light of the services rendered for those amounts and the risks undertaken by the Advisor. The Board also noted that the Advisor pays the subadvisory fee. In addition, the Board took into account that management had agreed to implement an overall fee waiver across the complex, including the fund, which is discussed further below. The Board also noted actions taken over the past several years to reduce the fund’s operating expenses. The Board also noted that, in addition, the Advisor is currently waiving fees and/or reimbursing expenses with respect to the fund and that the fund has breakpoints in its contractual management fee schedule that reduce management fees as assets increase. The Board also noted that the fund’s distributor, an affiliate of the Advisor, has agreed to waive a portion of its Rule 12b-1 fee for a share class of the fund. The Board noted that the fund has a voluntary fee waiver and/or expense reimbursement, which reduces certain expenses of the fund. The Board reviewed information provided by the Advisor concerning the investment advisory fee charged by the Advisor or one of its advisory affiliates to other clients (including other funds in the John Hancock Fund Complex) having similar investment mandates, if any. The Board considered any differences between the Advisor’s and Subadvisor’s services to the fund and the services they provide to other comparable clients or funds. The Board concluded that the advisory fee paid with respect to the fund is reasonable in light of the nature, extent and quality of the services provided to the fund under the Advisory Agreement.
Profitability/Fall out benefits. In considering the costs of the services to be provided and the profits to be realized by the Advisor and its affiliates (including the Subadvisor) from the Advisor’s relationship with the Trust, the Board:
| | (a) | reviewed financial information of the Advisor; |
| | (b) | reviewed and considered information presented by the Advisor regarding the net profitability to the Advisor and its affiliates with respect to the fund; |
| | (c) | received and reviewed profitability information with respect to the John Hancock Fund Complex as a whole and with respect to the fund; |
| | (d) | received information with respect to the Advisor’s allocation methodologies used in preparing the profitability data and considered that the Advisor hired an independent third-party consultant to provide an analysis of the Advisor’s allocation methodologies; |
| | (e) | considered that the John Hancock insurance companies that are affiliates of the Advisor, as shareholders of the Trust directly or through their separate accounts, receive certain tax credits or deductions relating to foreign taxes paid and dividends received by certain funds of the Trust and noted that these tax benefits, which are not available to participants in qualified retirement plans under applicable income tax law, are reflected in the profitability information reviewed by the Board; |
| | (f) | considered that the Advisor also provides administrative services to the fund on a cost basis pursuant to an administrative services agreement; |
| | (g) | noted that affiliates of the Advisor provide transfer agency services and distribution services to the fund, and that the fund’s distributor also receives Rule 12b-1 payments to support distribution of the fund; |
| | (h) | noted that the fund’s Subadvisor is an affiliate of the Advisor; |
| | (i) | noted that the Advisor also derives reputational and other indirect benefits from providing advisory services to the fund; |
| | (j) | noted that the subadvisory fee for the fund is paid by the Advisor; |
| | |
| SEMIANNUAL REPORT | JOHN HANCOCK CALIFORNIA TAX-FREE INCOME FUND | | 33 |
| | (k) | considered the Advisor’s ongoing costs and expenditures necessary to improve services, meet new regulatory and compliance requirements, and adapt to other challenges impacting the fund industry; and |
| | (l) | considered that the Advisor should be entitled to earn a reasonable level of profits in exchange for the level of services it provides to the fund and the risks that it assumes as Advisor, including entrepreneurial, operational, reputational, litigation and regulatory risk. |
Based upon its review, the Board concluded that the level of profitability, if any, of the Advisor and its affiliates (including the Subadvisor) from their relationship with the fund was reasonable and not excessive.
Economies of scale. In considering the extent to which economies of scale would be realized as the fund grows and whether fee levels reflect these economies of scale for the benefit of fund shareholders, the Board:
| | (a) | considered that the Advisor has contractually agreed to waive a portion of its management fee for certain funds of the John Hancock Fund Complex, including the fund (the participating portfolios) or otherwise reimburse the expenses of the participating portfolios (the reimbursement). This waiver is based upon aggregate net assets of all the participating portfolios. The amount of the reimbursement is calculated daily and allocated among all the participating portfolios in proportion to the daily net assets of each fund; |
| | (b) | reviewed the fund’s advisory fee structure and concluded that: (i) the fund’s fee structure contains breakpoints at the subadvisory fee level and that such breakpoints are reflected as breakpoints in the advisory fees for the fund; and (ii) although economies of scale cannot be measured with precision, these arrangements permit shareholders of the fund to benefit from economies of scale if the fund grows. The Board also took into account management’s discussion of the fund’s advisory fee structure; and |
| | (c) | the Board also considered the effect of the fund’s growth in size on its performance and fees. The Board also noted that if the fund’s assets increase over time, the fund may realize other economies of scale. |
Approval of Subadvisory Agreement
In making its determination with respect to approval of the Subadvisory Agreement, the Board reviewed:
| | (1) | information relating to the Subadvisor’s business, including current subadvisory services to the Trust (and other funds in the John Hancock Fund Complex); |
| | (2) | the historical and current performance of the fund and comparative performance information relating to an applicable benchmark index and comparable funds; and |
| | (3) | the subadvisory fee for the fund, including any breakpoints, and to the extent available, comparable fee information prepared by an independent third-party provider of fund data. |
Nature, extent, and quality of services. With respect to the services provided by the Subadvisor, the Board received information provided to the Board by the Subadvisor, including the Subadvisor’s Form ADV, as well as took into account information presented throughout the past year. The Board considered the Subadvisor’s current level of staffing and its overall resources, as well as received information relating to the Subadvisor’s compensation program. The Board reviewed the Subadvisor’s history and investment experience, as well as information regarding the qualifications, background, and responsibilities of the Subadvisor’s investment and compliance personnel who provide services to the fund. The Board also considered, among other things, the Subadvisor’s compliance program and any disciplinary history. The Board also considered the Subadvisor’s risk assessment and monitoring process. The Board reviewed the Subadvisor’s regulatory history, including whether it was involved in any regulatory actions or investigations as well as material litigation, and any settlements and amelioratory actions undertaken, as
| | |
| 34 | | JOHN HANCOCK CALIFORNIA TAX-FREE INCOME FUND | SEMIANNUAL REPORT |
appropriate. The Board noted that the Advisor conducts regular, periodic reviews of the Subadvisor and its operations, including regarding investment processes and organizational and staffing matters. The Board also noted that the Trust’s CCO and his staff conduct regular, periodic compliance reviews with the Subadvisor and present reports to the Independent Trustees regarding the same, which includes evaluating the regulatory compliance systems of the Subadvisor and procedures reasonably designed to assure compliance with the federal securities laws. The Board also took into account the financial condition of the Subadvisor.
The Board considered the Subadvisor’s investment process and philosophy. The Board took into account that the Subadvisor’s responsibilities include the development and maintenance of an investment program for the fund that is consistent with the fund’s investment objective, the selection of investment securities and the placement of orders for the purchase and sale of such securities, as well as the implementation of compliance controls related to performance of these services. The Board also received information with respect to the Subadvisor’s brokerage policies and practices, including with respect to best execution and soft dollars.
Subadvisor compensation. In considering the cost of services to be provided by the Subadvisor and the profitability to the Subadvisor of its relationship with the fund, the Board noted that the fees under the Subadvisory Agreement are paid by the Advisor and not the fund. The Board also received information and took into account any other potential conflicts of interest the Advisor might have in connection with the Subadvisory Agreement.
In addition, the Board considered other potential indirect benefits that the Subadvisor and its affiliates may receive from the Subadvisor’s relationship with the fund, such as the opportunity to provide advisory services to additional funds in the John Hancock Fund Complex and reputational benefits.
Subadvisory fees. The Board considered that the fund pays an advisory fee to the Advisor and that, in turn, the Advisor pays a subadvisory fee to the Subadvisor. As noted above, the Board also considered the fund’s subadvisory fees as compared to similarly situated investment companies deemed to be comparable to the fund as included in the report prepared by the independent third-party provider of fund data, to the extent available. The Board also noted that the limited size of the Lipper peer group was not sufficient for comparative purposes. The Board also took into account the subadvisory fees paid by the Advisor to the Subadvisor with respect to the fund and compared them to fees charged by the Subadvisor to manage other subadvised portfolios and portfolios not subject to regulation under the 1940 Act, as applicable.
Subadvisor performance. As noted above, the Board considered the fund’s performance as compared to the fund’s peer group median and the benchmark index and noted that the Board reviews information about the fund’s performance results at its regularly scheduled meetings. The Board noted the Advisor’s expertise and resources in monitoring the performance, investment style and risk-adjusted performance of the Subadvisor. The Board was mindful of the Advisor’s focus on the Subadvisor’s performance. The Board also noted the Subadvisor’s long-term performance record for similar accounts, as applicable.
The Board’s decision to approve the Subadvisory Agreement was based on a number of determinations, including the following:
| | (1) | the Subadvisor has extensive experience and demonstrated skills as a manager; |
| | (2) | the performance of the fund is being monitored and reasonably addressed, where appropriate |
| | (3) | the subadvisory fee is reasonable in relation to the level and quality of services being provided under the Subadvisory Agreement; and |
| | (4) | noted that the subadvisory fees are paid by the Advisor not the fund and that the subadvisory fee breakpoints are reflected as breakpoints in the advisory fees for the fund in order to permit shareholders to benefit from economies of scale if the fund grows. |
* * *
| | |
| SEMIANNUAL REPORT | JOHN HANCOCK CALIFORNIA TAX-FREE INCOME FUND | | 35 |
Based on the Board’s evaluation of all factors that the Board deemed to be material, including those factors described above, the Board, including the Independent Trustees, concluded that renewal of the Advisory Agreement and the Subadvisory Agreement would be in the best interest of the fund and its shareholders. Accordingly, the Board, and the Independent Trustees voting separately, approved the Advisory Agreement and Subadvisory Agreement for an additional one-year period.
| | |
| 36 | | JOHN HANCOCK CALIFORNIA TAX-FREE INCOME FUND | SEMIANNUAL REPORT |
| | |
Trustees Hassell H. McClellan, Chairperson Steven R. Pruchansky, Vice Chairperson Andrew G. Arnott† Charles L. Bardelis* James R. Boyle Peter S. Burgess* William H. Cunningham Grace K. Fey Marianne Harrison† Deborah C. Jackson James M. Oates* Frances G. Rathke*,1 Gregory A. Russo Officers Andrew G. Arnott President Charles A. Rizzo Chief Financial Officer Salvatore Schiavone Treasurer Christopher (Kit) Sechler Secretary and Chief Legal Officer Trevor Swanberg2 Chief Compliance Officer * Member of the Audit Committee † Non-Independent Trustee 1 Appointed as Independent Trustee effective as of September 15, 2020 2 Effective July 31, 2020 | | Investment advisor John Hancock Investment Management LLC Subadvisor Manulife Investment Management (US) LLC Portfolio Managers Dennis DiCicco Jeffrey N. Given, CFA Principal distributor John Hancock Investment Management Distributors LLC Custodian State Street Bank and Trust Company Transfer agent John Hancock Signature Services, Inc. Legal counsel K&L Gates LLP |
The fund’s proxy voting policies and procedures, as well as the fund proxy voting record for the most recent twelve month period ended June 30, are available free of charge on the Securities and Exchange Commission (SEC) website at sec.gov or on our website.
All of the fund’s holdings as of the end of the third month of every fiscal quarter are filed with the SEC on Form N-PORT within 60 days of the end of the fiscal quarter. The fund’s Form N-PORT filings are available on our website and the SEC’s website, sec.gov.
We make this information on your fund, as well as monthly portfolio holdings, and other fund details available on our website at jhinvestments.com or by calling 800-225-5291.
| | | | |
| You can also contact us: | | | | |
| | | |
| 800-225-5291 | | Regular mail: | | Express mail: |
| jhinvestments.com | | John Hancock Signature Services, Inc. | | John Hancock Signature Services, Inc. |
| | | P.O. Box 219909 | | 430 W 7th Street |
| | | Kansas City, MO 64121-9909 | | Suite 219909 |
| | | | | Kansas City, MO 64105-1407 |
| | |
| SEMIANNUAL REPORT | JOHN HANCOCK CALIFORNIA TAX-FREE INCOME FUND | | 37 |
Protect yourself by using eDelivery
Signing up for the electronic delivery of your statements and other financial publications is a great way to help protect your privacy. eDelivery provides you with secure, instant access to all of your statements in one convenient location.
| | | | | | |
| | |
BENEFITS OF EDELIVERY | | | | |
| | | |
| ∎ | | Added security: Password protection helps you safely retrieve documents online | | | | |
| | | |
| ∎ | | Save time: Receive instant email notification once statements are available | | 
| | |
| ∎ | | Reduce clutter: View documents online to reduce the amount of paper for filing, shredding, or recycling | | |
| | |
SIGN UP FOR EDELIVERY TODAY! | | | | |
Direct shareholders
If you receive statements directly through John Hancock Investment Management and would like to participate in eDelivery, go to jhinvestments.com/login. To log in to your account, click on the “Log in” button on the page’s top right corner. In the “Access your investments account” area, go to the “Individual retirement or mutual fund account” section and select the option that applies to you. Please be aware that you may be required to provide your account number and certain personal account information.
You may revoke your consent at any time by simply visiting jhinvestments.com/login and following the instructions above. You may also revoke consent by calling 800-225-5291 or by writing to us at the following address: John Hancock Signature Services, P.O. Box 219909, Kansas City, MO 64121-9909. We reserve the right to deliver documents to you on paper at any time should the need arise.
Brokerage account shareholders
If you receive statements directly from your bank or broker and would like to participate in eDelivery, go to icsdelivery/live or contact your financial representative.
Not part of the shareholder report
Get your questions answered by using our shareholder resources
| | | | | | |
ONLINE | | | | |
| | |
| ∎ | | Visit jhinvestments.com to access a range of resources for individual investors, from account details and fund information to forms and our latest insight on the markets and economy. | | | | |
| | |
| ∎ | | Use our Fund Compare tool to compare thousands of funds and ETFs across dozens of risk and performance metrics—all powered by Morningstar. | | | | |
| | |
| ∎ | | Visit our online Tax Center, where you’ll find helpful taxpayer resources all year long, including tax forms, planning guides, and other fund-specific information. | | | | |
| | |
| ∎ | | Follow us on Facebook, Twitter, and LinkedIn to get the latest updates on the markets and what’s trending now. | | | | |
| |
BY PHONE | | | | |
| |
Call our customer service representatives at 800-225-5291, Monday to Thursday, 8:00A.M. to 7:00P.M., and Friday, 8:00A.M. to 6:00P.M., Eastern time. We’re here to help! | | | | |
Not part of the shareholder report
|
John Hancock family of funds |
DOMESTIC EQUITY FUNDS
Blue Chip Growth
Classic Value
Disciplined Value
Disciplined Value Mid Cap
Equity Income
Financial Industries
Fundamental All Cap Core
Fundamental Large Cap Core
New Opportunities
Regional Bank
Small Cap Core
Small Cap Growth
Small Cap Value
U.S. Global Leaders Growth
U.S. Growth
GLOBAL AND INTERNATIONAL EQUITY FUNDS
Disciplined Value International
Emerging Markets
Emerging Markets Equity
Fundamental Global Franchise
Global Equity
Global Shareholder Yield
Global Thematic Opportunities
International Dynamic Growth
International Growth
International Small Company
INCOME FUNDS
Bond
California Tax-Free Income
Emerging Markets Debt
Floating Rate Income
Government Income
High Yield
High Yield Municipal Bond
Income
Investment Grade Bond
Money Market
Short Duration Bond
Short Duration Credit Opportunities
Strategic Income Opportunities
Tax-Free Bond
ALTERNATIVE AND SPECIALTY FUNDS
Absolute Return Currency
Alternative Asset Allocation
Alternative Risk Premia
Diversified Macro
Infrastructure
Multi-Asset Absolute Return
Real Estate Securities
Seaport Long/Short
A fund’s investment objectives, risks, charges, and expenses should be considered carefully before investing. The prospectus contains this and other important information about the fund. To obtain a prospectus, contact your financial professional, call John Hancock Investment Management at 800-225-5291, or visit our website at jhinvestments.com. Please read the prospectus carefully before investing or sending money.
ASSET ALLOCATION
Balanced
Multi-Asset High Income
Multi-Index Lifetime Portfolios
Multi-Index Preservation Portfolios
Multimanager Lifestyle Portfolios
Multimanager Lifetime Portfolios
Retirement Income 2040
EXCHANGE-TRADED FUNDS
John Hancock Multifactor Consumer Discretionary ETF
John Hancock Multifactor Consumer Staples ETF
John Hancock Multifactor Developed International ETF
John Hancock Multifactor Emerging Markets ETF
John Hancock Multifactor Energy ETF
John Hancock Multifactor Financials ETF
John Hancock Multifactor Healthcare ETF
John Hancock Multifactor Industrials ETF
John Hancock Multifactor Large Cap ETF
John Hancock Multifactor Materials ETF
John Hancock Multifactor Media and Communications ETF
John Hancock Multifactor Mid Cap ETF
John Hancock Multifactor Small Cap ETF
John Hancock Multifactor Technology ETF
John Hancock Multifactor Utilities ETF
ENVIRONMENTAL, SOCIAL, AND GOVERNANCE FUNDS
ESG All Cap Core
ESG Core Bond
ESG International Equity
ESG Large Cap Core
CLOSED-END FUNDS
Financial Opportunities
Hedged Equity & Income
Income Securities Trust
Investors Trust
Preferred Income
Preferred Income II
Preferred Income III
Premium Dividend
Tax-Advantaged Dividend Income
Tax-Advantaged Global Shareholder Yield
John Hancock Multifactor ETF shares are bought and sold at market price (not NAV), and are not individually redeemed from the fund. Brokerage commissions will reduce returns.
John Hancock ETFs are distributed by Foreside Fund Services, LLC, and are subadvised by Dimensional Fund Advisors LP. Foreside is not affiliated with John Hancock Investment Management Distributors LLC or Dimensional Fund Advisors LP.
Dimensional Fund Advisors LP receives compensation from John Hancock in connection with licensing rights to the John Hancock Dimensional indexes. Dimensional Fund Advisors LP does not sponsor, endorse, or sell, and makes no representation as to the advisability of investing in, John Hancock Multifactor ETFs.
|
John Hancock Investment Management A trusted brand John Hancock Investment Management is a premier asset manager with a heritage of financial stewardship dating back to 1862. Helping our shareholders pursue their financial goals is at the core of everything we do. It’s why we support the role of professional financial advice and operate with the highest standards of conduct and integrity. A better way to invest We serve investors globally through a unique multimanager approach: We search the world to find proven portfolio teams with specialized expertise for every strategy we offer, then we apply robust investment oversight to ensure they continue to meet our uncompromising standards and serve the best interests of our shareholders. Results for investors Our unique approach to asset management enables us to provide a diverse set of investments backed by some of the world’s best managers, along with strong risk-adjusted returns across asset classes. |
|
 |
John Hancock Investment Management Distributors LLC ◾ Member FINRA, SIPC 200 Berkeley Street ◾ Boston, MA 02116-5010 ◾ 800-225-5291 ◾ jhinvestments.com
This report is for the information of the shareholders of John Hancock California Tax-Free Income Fund. It is not authorized for distribution to prospective investors unless preceded or accompanied by a prospectus.
| | |
 | | |
| |
| | 53SA 11/20 |
| MF1438823 | | 1/2021 |
ITEM 2. CODE OF ETHICS.
Not applicable at this time.
ITEM 3. AUDIT COMMITTEE FINANCIAL EXPERT.
Not applicable at this time.
ITEM 4. PRINCIPAL ACCOUNTANT FEES AND SERVICES.
Not applicable at this time.
ITEM 5. AUDIT COMMITTEE OF LISTED REGISTRANTS.
Not applicable at this time.
ITEM 6. SCHEDULE OF INVESTMENTS.
Not applicable.
ITEM 7. DISCLOSURE OF PROXY VOTING POLICIES AND PROCEDURES FOR CLOSED-END MANAGEMENT INVESTMENT COMPANIES.
Not applicable.
ITEM 8. PORTFOLIO MANAGERS OF CLOSED-END MANAGEMENT INVESTMENT COMPANIES.
Not applicable.
ITEM 9. PURCHASES OF EQUITY SECURITIES BY CLOSED-END MANAGEMENT INVESTMENT COMPANY AND AFFILIATED PURCHASERS.
Not applicable.
ITEM 10. SUBMISSION OF MATTERS TO A VOTE OF SECURITY HOLDERS.
(a) The registrant has adopted procedures by which shareholders may recommend nominees to the registrant’s Board of Trustees. A copy of the procedures is filed as an exhibit to this Form N-CSR. See attached “John Hancock Funds – Nominating and Governance Committee Charter”.
ITEM 11. CONTROLS AND PROCEDURES.
(a) EVALUATION OF DISCLOSURE CONTROLS AND PROCEDURES. The registrant maintains disclosure controls and procedures that are designed to ensure that information required to be disclosed in this Form N-CSR is recorded, processed, summarized and reported within the time periods specified in the rules and forms of the Securities and Exchange Commission. Such disclosure and procedures include controls and procedures designed to ensure that such information is accumulated and communicated to the registrant’s management, including its principal executive officer and principal financial officer, as appropriate, to allow timely decisions regarding required disclosure.
Within 90 days prior to the filing date of this Form N-CSR, the registrant had carried out an evaluation, under the supervision and with the participation of the registrant’s management, including the registrant’s principal executive officer and the registrant’s principal financial officer, of the effectiveness of the design and operation of the registrant’s disclosure controls and
procedures relating to information required to be disclosed on Form N-CSR. Based on such evaluation, the registrant’s principal executive officer and principal financial officer concluded that the registrant’s disclosure controls and procedures are operating effectively to ensure that:
(i) information required to be disclosed in this Form N-CSR is recorded, processed, summarized and reported within the periods specified in the rules and forms of the Securities and Exchange Commission, and
(ii) information is accumulated and communicated to the registrant’s management, including its principal executive officer and principal financial officer, as appropriate, to allow timely decisions regarding required disclosure.
(b) CHANGE IN REGISTRANT’S INTERNAL CONTROL: Not applicable.
ITEM 12. DISCLOSURE OF SECURITIES LENDING ACTIVITIES FOR CLOSED-END MANAGEMENT INVESTMENT COMPANIES.
Not applicable.
ITEM 13. EXHIBITS.
(a)(1) Separate certifications for the registrant’s principal executive officer and principal financial officer, as required by Section 302 of the Sarbanes-Oxley Act of 2002 and Rule 30a-2(a) under the Investment Company Act of 1940, are attached.
(b)(1) Separate certifications for the registrant’s principal executive officer and principal financial officer, as required by 18 U.S.C. Section 1350, as adopted pursuant to Section 906 of the Sarbanes-Oxley Act of 2002, and Rule 30a-2(b) under the Investment Company Act of 1940, are attached. The certifications furnished pursuant to this paragraph are not deemed to be “filed” for purposes of Section 18 of the Securities Exchange Act of 1934, or otherwise subject to the liability of that section. Such certifications are not deemed to be incorporated by reference into any filing under the Securities Act of 1933 or the Securities Exchange Act of 1934, except to the extent that the Registrant specifically incorporates them by reference.
(c)(1) Submission of Matters to a Vote of Security Holders is attached. See attached “John Hancock Funds – Nominating and Governance Committee Charter”.
SIGNATURES
Pursuant to the requirements of the Securities Exchange Act of 1934 and the Investment Company Act of 1940, the registrant has duly caused this report to be signed on its behalf by the undersigned, thereunto duly authorized.
| | |
| John Hancock California Tax-Free Income Fund |
| |
| By: | | /s/ Andrew Arnott |
| | Andrew Arnott |
| | President |
| |
| Date: | | January 7, 2021 |
Pursuant to the requirements of the Securities Exchange Act of 1934 and the Investment Company Act of 1940, this report has been signed below by the following persons on behalf of the registrant and in the capacities and on the dates indicated.
| | |
| By: | | /s/ Andrew Arnott |
| | Andrew Arnott |
| | President |
| |
| Date: | | January 7, 2021 |
| |
| By: | | /s/ Charles A. Rizzo |
| | Charles A. Rizzo |
| | Chief Financial Officer |
| |
| Date: | | January 7, 2021 |