 Bryn Mawr Bank Corporation NASDAQ: BMTC First Quarter 2010 Update Exhibit 99.1 |
 1 This presentation contains certain forward-looking statements. Forward-looking statements can be identified by the fact that they do not relate strictly to historical or current facts. They often include the words believe, expect, anticipate, intend, plan, estimate or words of similar meaning. Forward-looking statements, by their nature, are subject to risks and uncertainties. A number of factors, many of which are beyond Bryn Mawr Bank Corporation's (“the Corporation”) control could cause actual conditions, events or results to differ significantly from those described in the forward looking statements. Information regarding the factors and risks that can affect the Corporation’s business, financial condition and results of operation is contained in the Corporation’s filings with the Securities and Exchange Commission, which are available at http://www.sec.gov. Forward-looking statements speak only as of the date they are made. The Corporation does not undertake to update forward-looking statements. Safe Harbor |
 2 Where to Find More Information About the First Keystone Financial, Inc. Merger The Corporation has filed with the Securities and Exchange Commission ("SEC") a Registration Statement on Form S-4 concerning the proposed merger of First Keystone Financial, Inc. into the Corporation (the “Merger”). The Registration Statement includes a prospectus for the offer and sale of the Corporation’s Common Shares to First Keystone Financial, Inc.'s shareholders as well as a proxy statement for the solicitation of proxies from First Keystone Financial, Inc.'s shareholders for use at the meeting at which the Merger will be voted upon. The combined prospectus and proxy statement and other documents filed by the Corporation with the SEC contain important information about the Corporation, First Keystone Financial, Inc., and the Merger. We urge investors and First Keystone Financial, Inc.'s shareholders to read carefully the combined prospectus and proxy statement and other documents filed with the SEC, including any amendments or supplements also filed with the SEC. First Keystone Financial, Inc.'s shareholders in particular should read the combined prospectus and proxy statement carefully before making a decision concerning the Merger. Investors and shareholders may obtain a free copy of the combined prospectus and proxy statement – along with other filings containing information about the Corporation – at the SEC’s website at http://www.sec.gov. Copies of the combined prospectus and proxy statement, and the filings with the SEC incorporated by reference in the combined prospectus and proxy statement, can also be obtained free of charge by directing a request to Bryn Mawr Bank Corporation, 801 Lancaster Avenue, Bryn Mawr, PA 19010, attention Geoff Halberstadt, Secretary, telephone (610) 581-4873. |
 3 Bryn Mawr Bank Corporation Profile Founded in 1889 – 120 year history A unique business model with a traditional commercial bank ($1.2 billion) and a trust company ($3.1 billion) under one roof Wholly owned subsidiary – The Bryn Mawr Trust Company Located on Philadelphia’s affluent “Main Line” |
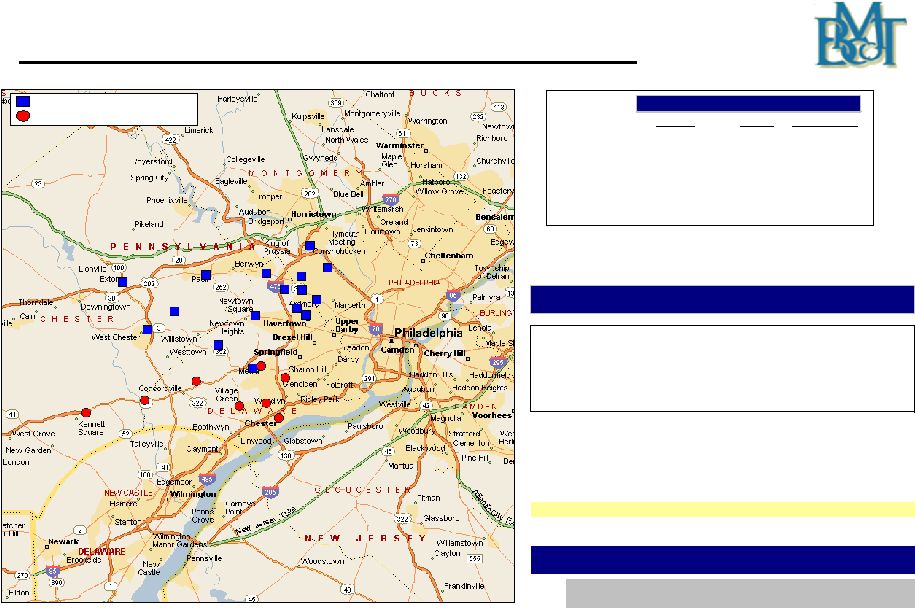
 4 Chester Bucks Montgomery Berks State of Delaware Philadelphia New Jersey Delaware New Jersey The Franchise Footprint 9 Full Service Branches/ 7 Life Care Facilities Average Household Income $84,600 $41,000 $- $20,000 $40,000 $60,000 $80,000 $100,000 BMTC Target Market Penna. State Average Percent of Population with College Degree 59% 22% 0% 10% 20% 30% 40% 50% 60% 70% BMTC Target Market Penna. State Average Source: Public School Review Life Care Facilities Branch Offices |
 5 Investment Considerations A great brand & franchise Solid financial fundamentals Excellent credit quality Outstanding target market demographics New business initiatives driving growth Well-capitalized $3.1 billion wealth management business that provides a significant source of non-interest income |
 6 Experienced Management Team Chairman, President and CEO – Ted Peters Lending – Joseph Keefer Wealth Management – Frank Leto Retail Banking – Alison Gers Finance – Duncan Smith Risk Management – Geoffrey Halberstadt |
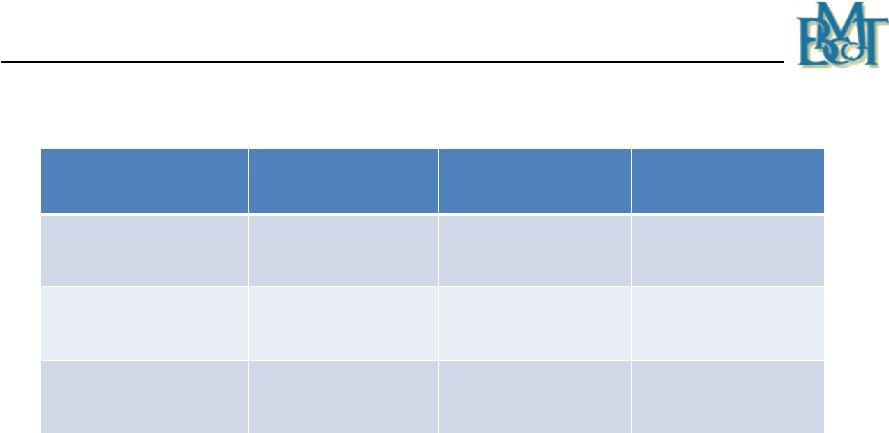
 7 Financial Highlights First Qtr 2010 Fourth Qtr 2009 First Qtr 2009 12/31 2009 12/31 2008 Portfolio Loans & Leases ($ in millions) $893 $886 $893 $886 $900 Wealth Assets in Total ($ in billions) $3.11 $2.87 $1.96 $2.87 $2.15 Non-performing Loans as a % of Portfolio Loans and Leases 0.77% 0.78% 0.45% 0.78% 0.65% Tangible Book Value Per Share $10.56 $10.40 $9.78 $10.40 $9.55 Tangible Common Equity Ratio 7.82% 7.51% 7.20% 7.51% 7.13% Dividends Declared $0.14 $0.14 $0.14 $0.56 $0.54 |
 8 Financial Highlights - continued 1 st Qtr 2010 4 th Qtr 2009 3 rd Qtr 2009 2 nd Qtr 2009 1 st Qtr 2009 Net Income ($ in millions) $2.22 $2.64 $2.62 $2.45 $2.63 Basic Earnings Per Common Share $0.25 $0.30 $0.30 $0.28 $0.31 Diluted Earnings Per Common Share $0.25 $0.30 $0.30 $0.28 $0.31 Dividend Declared Per Share $0.14 $0.14 $0.14 $0.14 $0.14 |
 9 2010 Strategies Complete the merger with First Keystone Financial Inc. in the third quarter and introduce Bryn Mawr Trust services to its customers Focus on the net interest margin Continued emphasis on strong credit quality Raise capital as needed Monitor expenses Use banking industry turmoil to attract new clients Opportunistic expansion Expand our Wealth Management offerings |
 Growth Initiatives |
 11 Announced acquisition of First Keystone Financial, Inc. Announced on November 2, 2009 Approximately $500 million in assets Expands footprint in Delaware and Chester (southeastern PA) counties with 8 branches New opportunities for BMTC Wealth Management, Business Banking, Retail Banking and Mortgage Banking Anticipate a July 2010 legal close Growth Initiatives |
 12 Growth Initiatives - continued Bryn Mawr Asset Management “Lift out” strategy Four investment advisers hired Approximately $150 million in new assets as of April 30, 2010 Additional opportunities being evaluated Institutional Trust and Escrow Services |
 13 BMTC of Delaware The Delaware Advantage Generation Skipping Trusts Directed Trusts $403 million in assets at March 31, 2010 Branch Office Expansion and Modernization West Chester Regional Banking Center Branch Wayne and Paoli branch modernizations completed Havertown branch modernization scheduled for 2010 Growth Initiatives - continued |
 14 Growth Initiatives -continued Small Ticket National Leasing Business “Lift out” strategy Leases outstanding: $44.0 million at 3/31/2010 Planned lease portfolio reduction of $13.7 million in the last 12 months Average yield 10.48% Quarterly lease charge-offs have continuously decreased since 12/31/2008 Changes made in underwriting standards and collection process have improved results |
 15 First Keystone Financial, Inc. – Transaction Summary (1) Based upon BMTC’s average daily closing price for twenty consecutive trading days ending 10/30/2009 ($16.76) Acquiror: Bryn Mawr Bank Corporation (NASDAQ: BMTC) Seller: First Keystone Financial, Inc. (NASDAQ: FKFS) Consideration: Each share of FKFS common stock will be exchanged for 0.6973 BMTC shares Transaction Value: Merger Consideration Adjustment: Per Share Merger Consideration subject to downward adjustment based on the rise of FKFS delinquencies above Board Representation: Donald Guthrie (Chairman of the FKFS Board of Directors) will join the BMTC Bank and Holding Company Boards as a Director Closing Condition: Aggregate amount of FKFS delinquencies must be less than $16.5 million Required Approvals: Customary Regulatory Expected Closing: July 2010 0.6973 BMTC shares (1) and $2.06 in cash $34 million (approximate at announcement) a specified level as of the month-end preceding the merger |
 16 Merger Consideration Adjustment FKF Delinquencies At Month-End Preceding Closing Adjusted Amount Of BMBC Stock To Be Received For Each FKF Share Adjusted Per Share Cash Consideration For Each FKF Share Deal Value with BMTC Stock Valued at $16.00 per Share (in millions) Less Than $10.5 million 0.6973 $2.06 $32.156 $10.5 - $12.5 million 0.6834 $2.02 $31.518 $12.5 - $14.5 million 0.6718 $1.98 $30.969 $14.5 - $16.5 million 0.6589 $1.95 $30.393 $16.5 million or more 0.6485 $1.92 $29.916 Delinquencies are defined in the merger agreement as all loans delinquent 30 days or more, non-accruing loans, other real estate owned, troubled debt restructurings and the aggregate amount of loans charged-off between 10/01/2008 and the month-end preceding closing in excess of $2.5 million. FKF delinquencies at 3/31/2010 were $13.1 million. |
 17 First Keystone Financial Inc. - Transaction Highlights Expands branch footprint into the attractive demographic markets of Delaware and Chester County, Pennsylvania Important component of strategic plan Enhances long-term franchise value Complementary business mix Both banks have a “community focus” Significant potential synergies identified in wealth management services and residential mortgage originations Transaction elements Extensive due diligence performed Conservative credit mark estimated Achievable cost savings identified Material earnings per share accretion after expensing merger related costs Pro forma tangible book value per share is not expected to be materially changed Attractive internal rate of return Pro Forma capital ratios remain significantly above “well capitalized” levels |
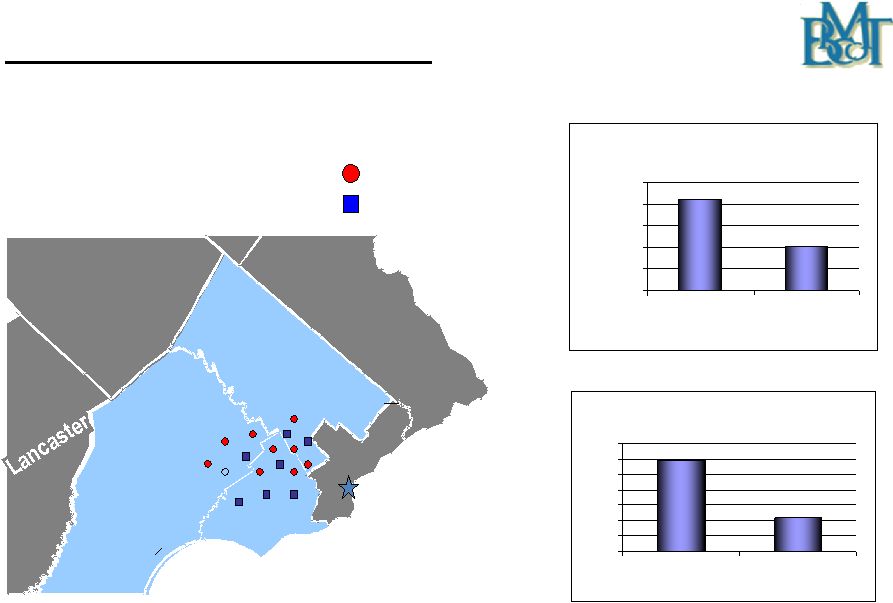
 18 Source: SNL Financial Pro forma financials do not include merger adjustments BMTC data as of 3/31/2010; FKFS data as of 3/31/2010 (1) Includes 7 limited service retirement community branches Pro Forma Deposit Market Share – Delaware County, PA Bryn Mawr Bank Corp. (16) First Keystone Financial, Inc. (8) Expanding Southeast PA Footprint Delaware, PA 2009 Total 2009 Deposits Total in Market Branch Market Share Rank Institution (ST) Count ($000) (%) 1 Wells Fargo & Co. (CA) 21 1,630 15.3 2 Royal Bank of Scotland Group 23 1,585 14.9 3 Toronto-Dominion Bank 15 1,360 12.8 4 Citigroup Inc. (NY) 3 1,040 9.8 5 PNC Financial Services Group (PA) 11 929 8.7 6 Banco Santander S.A. 13 830 7.8 Pro Forma 14 563 5.3 7 Beneficial Mutual Bncp (MHC) (PA) 7 386 3.6 8 Alliance Bancorp of Penn (MHC) (PA) 8 338 3.2 9 First Keystone Financial (PA) 7 337 3.2 10 Bryn Mawr Bank Corp. (PA) 7 226 2.1 Top 10 115 8,662 81.3 Market Total 181 10,651 100.0 ($ in millions) BMTC FKFS Pro Forma Assets $1,221 $489 $1,710 Loans 895 302 1,198 Deposits 914 331 1,246 Branches 16 (1) 8 24 Pro Forma Financials |
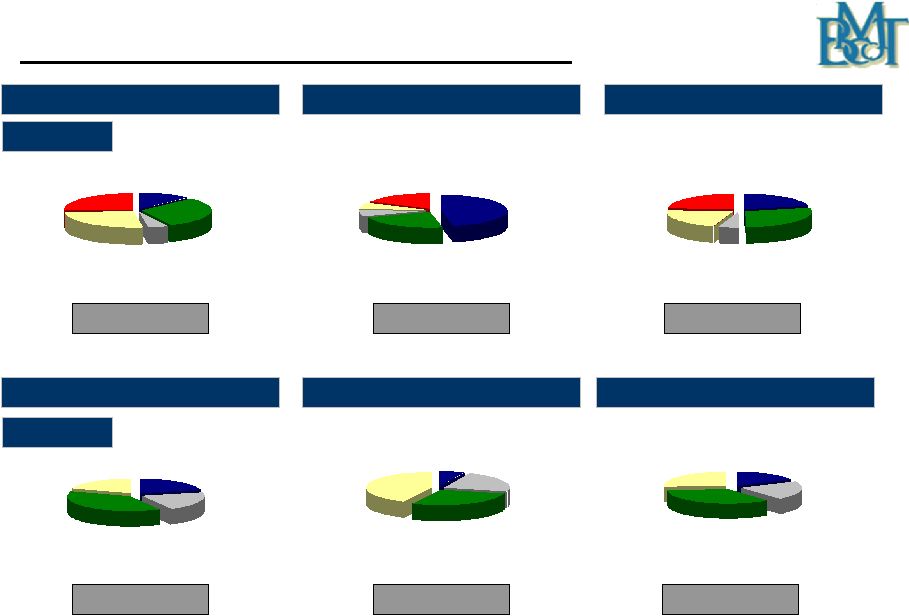 19 Time Deposits 25.8% NOW & Other Trans. Accts. 21.4% MMDA, Savings, & Other 35.4% Demand Deposits 17.4% Consumer & Leases 23.8% Commercial 21.3% Comm. RE 28.6% Construction RE 5.1% Res. RE 21.1% Consumer & Leases 26.0% Commercial 26.2% Comm. RE 30.8% Construction RE 4.6% Res. RE 12.4% Pro Forma Loans and Deposits Source: Company filings FKFS loan and deposit data as of 3/31/2010 BMTC loan and deposit data as of 3/31/2010; totals include loans held for sale Time Deposits 19.7% NOW & Other Trans. Accts. 20.9% MMDA, Savings, & Other 38.1% Demand Deposits 21.3% Deposits Loans BMTC Stand Alone Total: $895M Total: $1.2B Total: $914M Total: $1.2B Res. RE 47.1% Construction RE 6.3% Comm. RE 22.2% Commercial 6.9% Consumer & Leases 17.6% Time Deposits 42.7% NOW & Other Trans. Accts. 22.8% MMDA & Savings 28.0% Demand Deposits 6.5% Total: $302M Total: $331M BMTC Stand Alone FKFS Stand Alone BMTC Pro Forma FKFS Stand Alone BMTC Pro Forma |
 20 First Keystone Financial Inc. - Due Diligence Extensive due diligence conducted by BMTC and third parties Extensive credit due diligence conducted BMTC and third party loan review Reviewed over 80% of commercial portfolio (CRE, C&I, and Construction) Multiple Construction / Commercial Real Estate sites visited Conservative credit mark estimated at 4% to 5% of total loans outstanding including existing Allowance for Loan Loss balance. Estimated securities portfolio Mark–to–Market KPMG conducted tax and accounting due diligence |
 Financial Review Bryn Mawr Bank Corporation Only As of March 31, 2010 |
 22 First Quarter 2010 Results Net Income of $2.2 million Diluted earnings per share of $0.25 Net Income includes: $3.1 million charge-off largely attributable to one commercial relationship Security gains of $1.5 million Merger and due diligence related costs associated with the pending merger with First Keystone Financial Inc. of $347 thousand |
 23 First Quarter 2010 Results - continued Wealth Management Assets were $3.1 billion – up 8.3% from the fourth quarter 2009 Revenue from Wealth Management services was $3.8 million - up 6.5% from the fourth quarter 2009 Tax-equivalent net interest margin at 4.06%, the third consecutive quarterly increase Deposit levels of $914.4 million at 3/31/2010 as new core transaction account openings remain strong |
 24 First Quarter 2010 Results - continued No OTTI charges recorded in the first quarter of 2010 or for the years ended December 31, 2009, 2008 and 2007 Lease portfolio net charge-offs continue to decline ($1.4 million Q1 2009 to $545 thousand Q1 2010) Loan quality strong with non-performing loans and leases of 77 basis points at 3/31/2010 Professional fees higher due to collection activities and other initiatives |
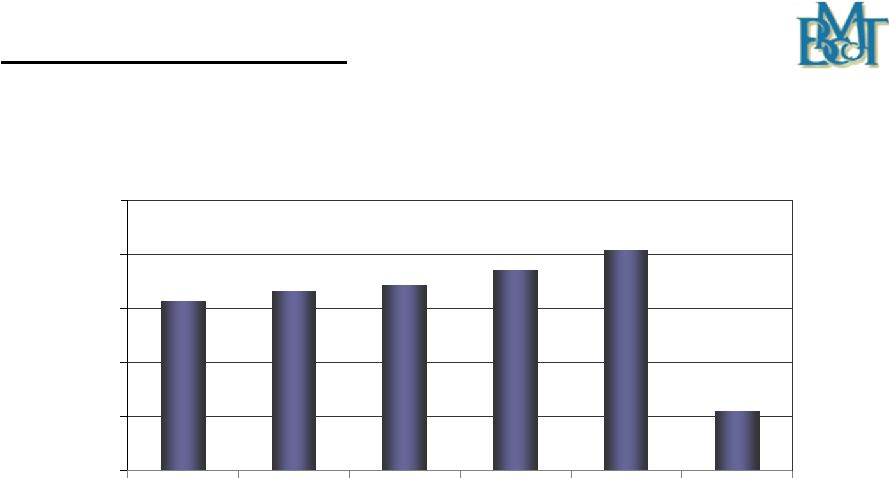
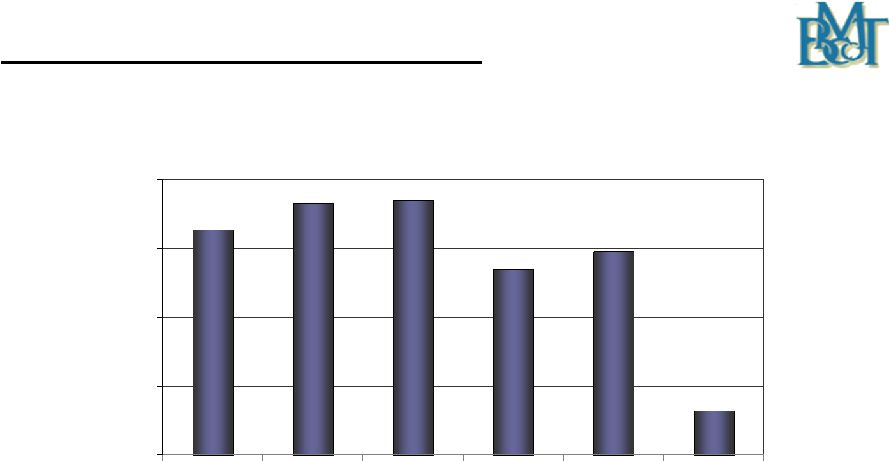 25 Diluted Earnings Per Share $1.31 $1.46 $1.48 $1.08 $1.18 $0.25 $0.00 $0.40 $0.80 $1.20 $1.60 2005 2006 2007* 2008 2009** 2010 YTD** * Excludes $0.10 per share gain on sale of real estate ** Figure includes merger related costs |
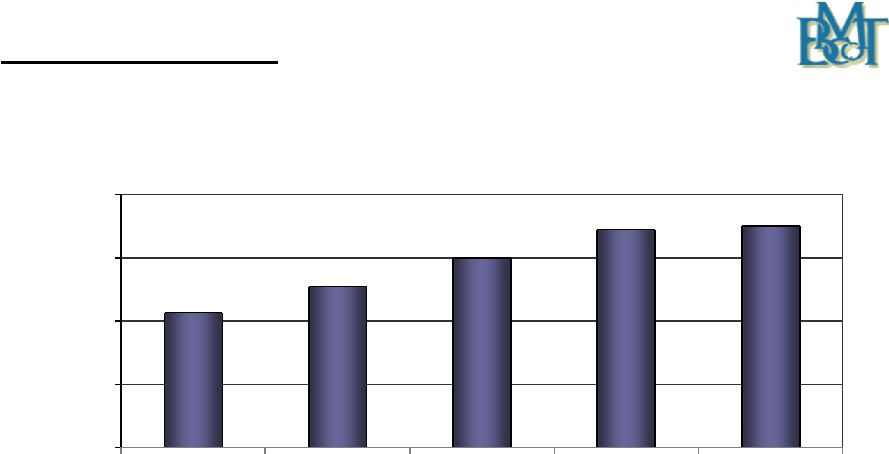
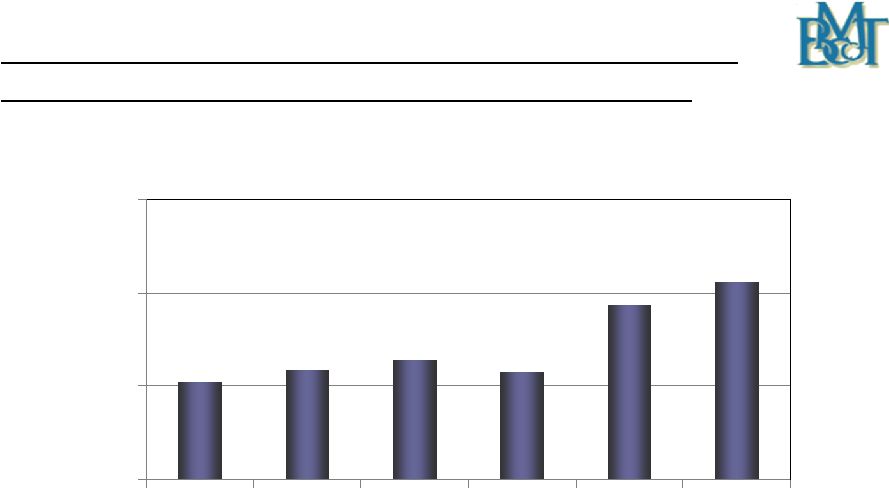
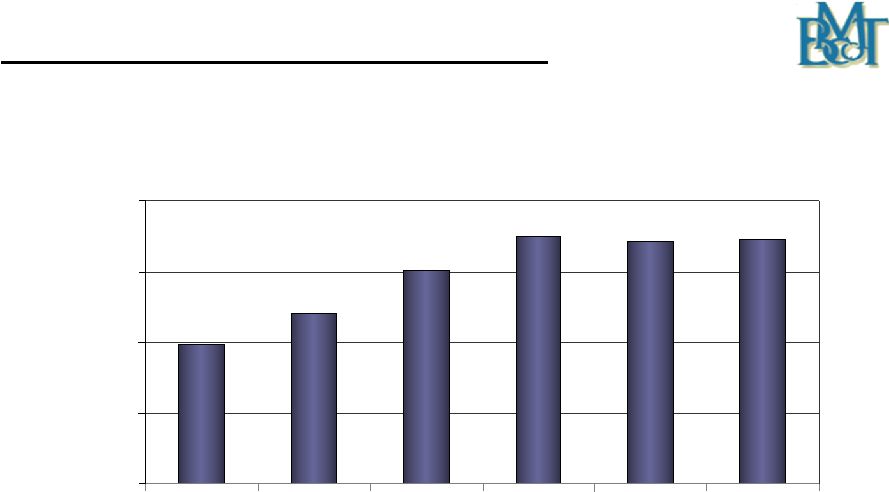 26 Portfolio Loan & Lease Growth Total Portfolio Loans & Leases Outstanding CAGR : 10.5% (2005-2009) $595 $681 $803 $900 $886 $893 $200 $400 $600 $800 $1,000 2005 2006 2007 2008 2009 3/31/2010 ($ in millions) |
 27 Asset Quality Asset Quality First Qtr 2010 Fourth Qtr 2009 First Qtr 2009 Nonaccrual loans and leases $5,880 $6,246 $3,251 90+ days past due loans – still accruing $1,015 $668 $744 Nonperforming loans and leases $6,895 $6,914 $3,995 Other nonperforming assets - $1,025 $1,315 Nonperforming assets $6,895 $7,939 $5,311 Nonperforming loans and leases / portfolio loans 0.77% 0.78% 0.45% Nonperforming assets / assets 0.56% 0.64% 0.45% ($ in thousands) |
 28 Asset Quality First Qtr 2010 Fourth Qtr 2009 First Qtr 2009 Allowance for loan and lease losses $9,740 $10,424 $10,137 Net loan and lease charge-offs (annualized) / average loans 1.70% 0.53% 0.80% Delinquency rate – loans and leases > 30 days 1.10% 1.10% 1.01% Delinquent loans and leases - 30-89 days $2,917 $2,678 $5,077 Delinquency rate – loans and leases 30-89 days 0.33% 0.30% 0.57% TDR’s excluded from non-performing loans $3,894 $1,622 - Allowance for loan and leases losses / loans and leases 1.09% 1.18% 1.13% Allowance for loan and lease loss / nonperforming loans and leases 141.3% 150.8% 253.7% Asset Quality - continued ($ in thousands) |
 29 0.07% 0.12% 0.25% 0.78% 0.78% 0.77% 0.0% 0.3% 0.6% 0.9% 2005 2006 2007 2008 2009 3/31/2010 Asset Quality - Continued Nonperforming loans and leases as a % of portfolio loans and leases |
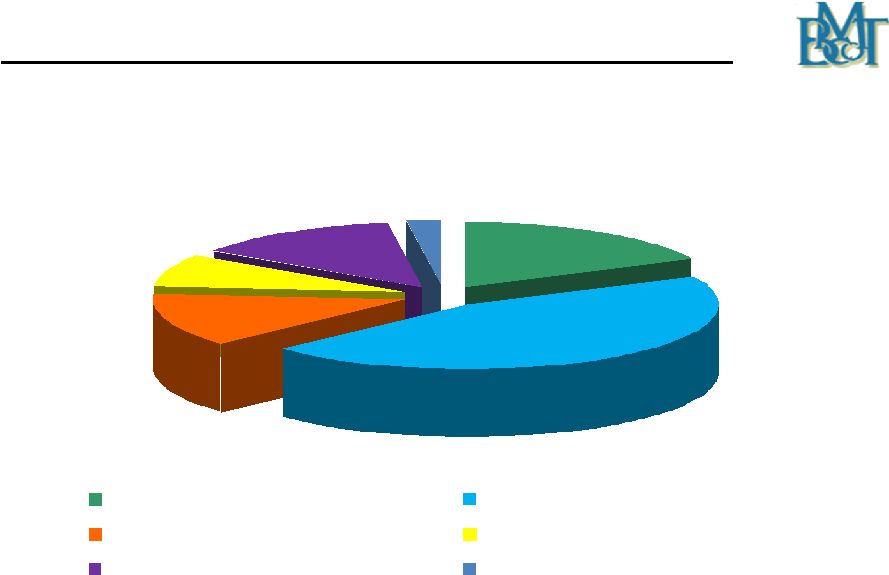
 30 Loan Composition at March 31, 2010 $275 $234 $188 $110 $42 $44 Commercial Mortgages Commercial & Industrial Home Equity Lines & Loans & Consumer Loans Residential Mortgages Construction Leases ($ in millions) |
 31 $31.3 $33.3 $34.2 $37.1 $40.8 $11.1 $0 $10 $20 $30 $40 $50 2005 2006 2007 2008 2009 2010 YTD Net Interest Income CAGR: 6.9% (2005-2009) Note: Not on a tax-equivalent basis ($ in millions) |
 32 3.63% 3.62% 3.59% 3.72% 3.85% 4.06% 3.2% 3.4% 3.6% 3.8% 4.0% 4.2% Dec-08 Mar-09 Jun-09 Sep-09 Dec-09 Mar-10 Net Interest Margin On a tax equivalent basis |
 33 $626 $709 $798 $888 $899 $200 $400 $600 $800 $1,000 2006 2007 2008 2009 1stQ 2010 Deposit Growth Average Annual Deposits ($ in millions) |
 34 Average Deposits & Borrowed Funds Mix First Quarter 2010 $23 $144 $85 $140 $484 $189 Non-Interest Bearing DDA Savings, NOW & Money Market Time Deposits Wholesale Deposits, IND & IDC Borrowed Funds Subordinated Debt ($ in millions) |
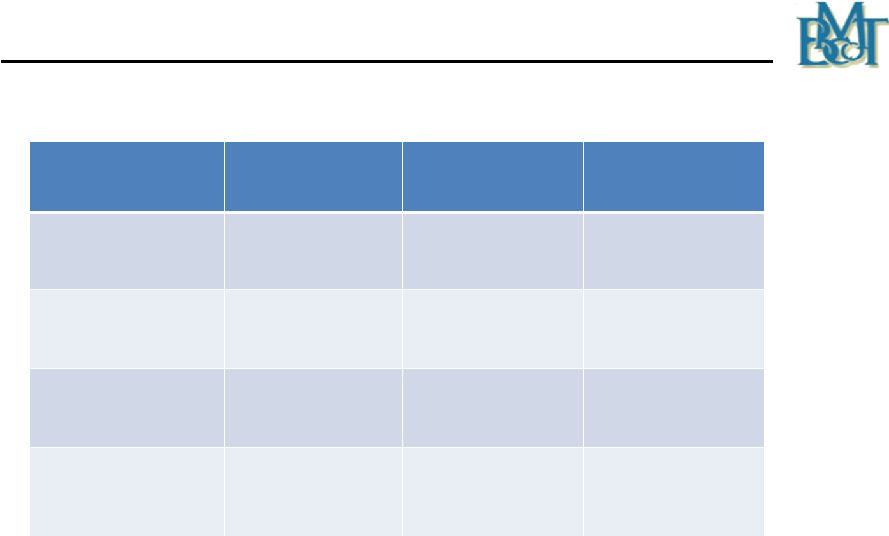
 35 Investment Portfolio as of March 31, 2010 SECURITY DESCRIPTION (AFS) Amortized Cost Fair Value Unrealized Gain / Loss U. S. Government Agency $ 94,774 $ 94,808 $ 34 State, County & Municipal 24,270 24,431 161 FNMA/FHLMC Mortgage Backed Securities 12,979 13,386 407 GNMA Mortgage Backed Securities 2,524 2,518 (6) Foreign Debt Securities 1,250 1,250 - Bond – Mutual Funds 37,115 37,423 308 Total Investment Portfolio $ 172,912 $ 173,816 $ 904 Note: Other assets at March 31, 2010 include approximately $8 million of FHLB of Pittsburgh common stock at cost which is not paying a dividend and cannot be redeemed. ($ in thousands) |
 36 Capital Considerations Bryn Mawr Bank Corporation elected not to take TARP Capital Maintains a “well capitalized” capital position Selectively add capital as needed to maintain capital levels and fund asset growth and acquisitions Additional earn out payments for Lau Associates at the end of 2010 and 2011 Active Dividend Reinvestment and Direct Stock Purchase Plan (DRIP/DSPP) |
 37 Capital Position - Bryn Mawr Bank Corporation 3/31/2010 12/31/2009 3/31/2009 Tier I 9.70% 9.41% 8.96% Total (Tier II) 12.78% 12.53% 11.41% Tier I Leverage 8.63% 8.35% 8.05% Tangible Common Equity 7.82% 7.51% 7.20% |
 38 Capital Position - Bryn Mawr Trust Company (“Bank”) 3/31/2010 12/31/2009 3/31/2009 Tier I 9.32% 9.06% 8.56% Total (Tier II) 12.41% 12.20% 11.02% Tier I Leverage 8.28% 8.03% 7.68% |
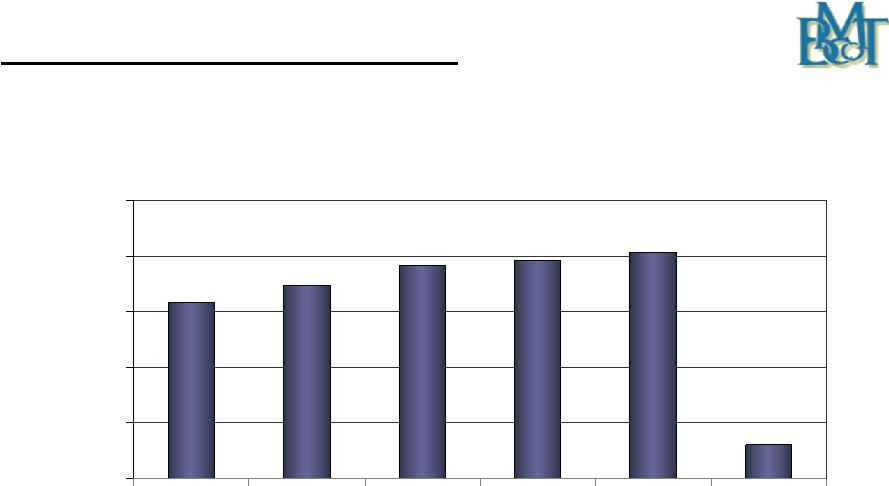
 39 $2.04 $2.18 $2.28 $2.15 $2.87 $3.11 $1.0 $2.0 $3.0 $4.0 2005 2006 2007 2008 2009 3/31/2010 Wealth Management Assets Under Management, Administration, Supervision and Brokerage (1) ($ in billions) (1) Excludes Community Bank’s assets 2005 - 2007 |
 40 $11.5 $12.4 $13.5 $13.8 $14.2 $3.8 $2.0 $5.0 $8.0 $11.0 $14.0 $17.0 2005 2006 2007 2008 2009 2010 YTD Wealth Management Fees CAGR: 5.4% (2005 – 2009) ($ in millions) |
 41 Summary Outstanding franchise in a stable market Focus on Wealth Services, Business Banking and Private Banking Investing in growth opportunities today for earnings growth tomorrow Announced acquisition will expand footprint Sound business strategy, strong asset quality, well capitalized and solid risk management procedures serve as a foundation for expansion |
 Thank You Joseph Keefer, EVP 610-581-4869 jkeefer@bmtc.com Duncan Smith, CFO 610-526 –2466 jdsmith@bmtc.com Ted Peters, Chairman 610-581-4800 tpeters@bmtc.com Frank Leto, EVP 610-581-4730 fleto@bmtc.com ******************************************* ******************************************* |