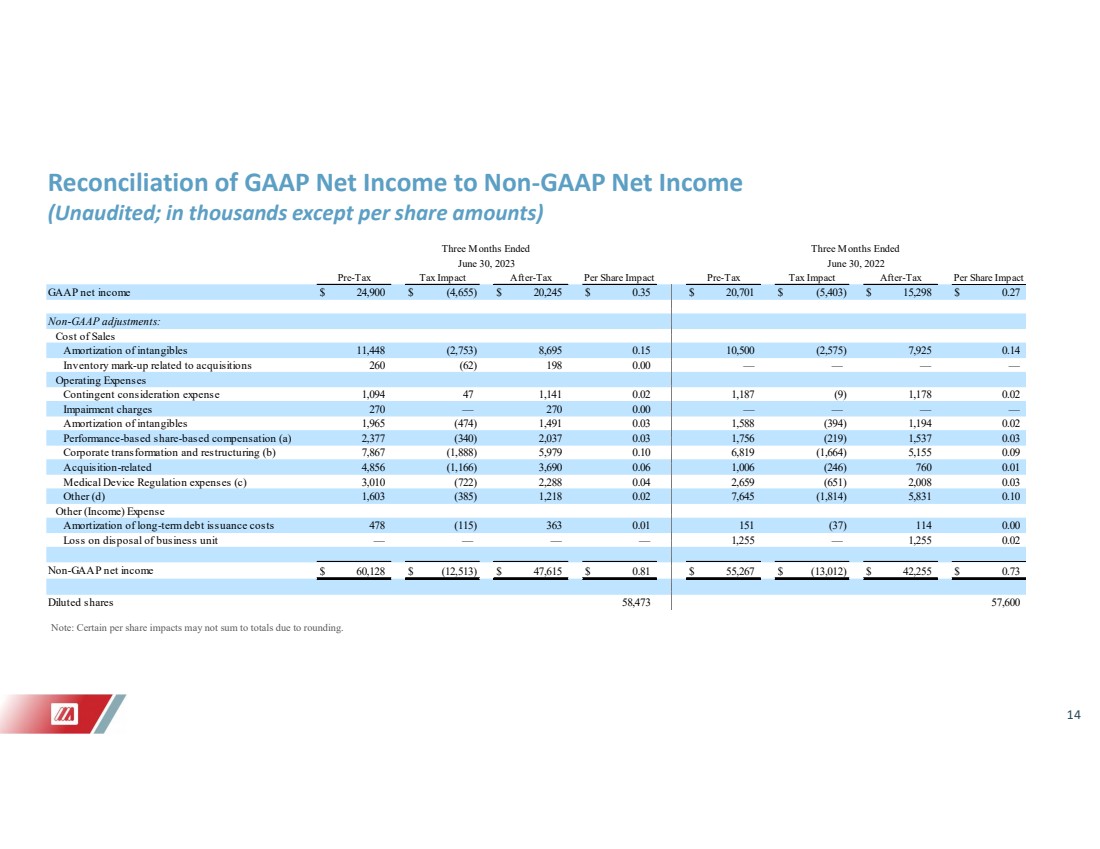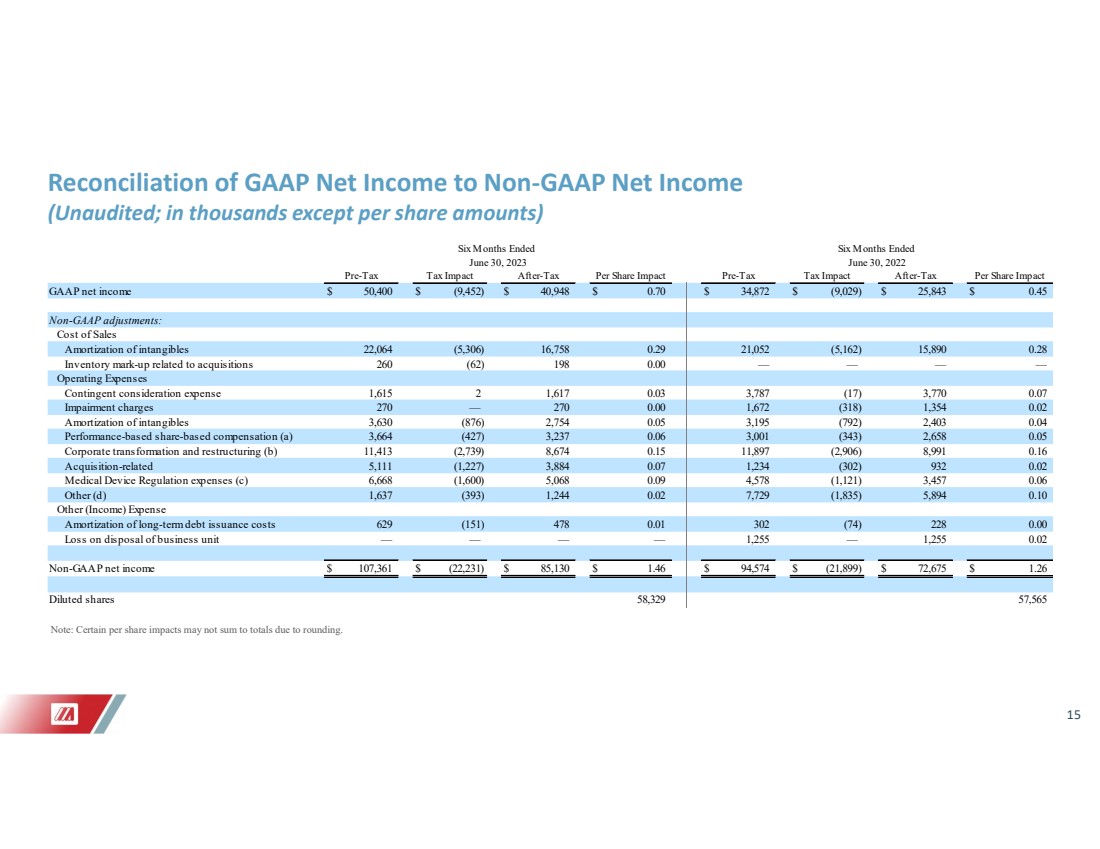
| 15 Reconciliation of GAAP Net Income to Non-GAAP Net Income (Unaudited; in thousands except per share amounts) Note: Certain per share impacts may not sum to totals due to rounding. GAAP net income $ 50,400 $ (9,452) $ 40,948 $ 0.70 $ 34,872 $ (9,029) $ 25,843 $ 0.45 Non-GAAP adjustments: Cost of Sales Amortization of intangibles 22,064 (5,306) 16,758 0.29 21,052 (5,162) 15,890 0.28 Inventory mark-up related to acquisitions 260 (62) 198 0.00 — — — — Operating Expenses Contingent consideration expense 1,615 2 1,617 0.03 3,787 (17) 3,770 0.07 Impairment charges 270 — 270 0.00 1,672 (318) 1,354 0.02 Amortization of intangibles 3,630 (876) 2,754 0.05 3,195 (792) 2,403 0.04 Performance-based share-based compensation (a) 3,664 (427) 3,237 0.06 3,001 (343) 2,658 0.05 Corporate transformation and restructuring (b) 11,413 (2,739) 8,674 0.15 11,897 (2,906) 8,991 0.16 Acquisition-related 5,111 (1,227) 3,884 0.07 1,234 (302) 932 0.02 Medical Device Regulation expenses (c) 6,668 (1,600) 5,068 0.09 4,578 (1,121) 3,457 0.06 Other (d) 1,637 (393) 1,244 0.02 7,729 (1,835) 5,894 0.10 Other (Income) Expense Amortization of long-term debt issuance costs 629 (151) 478 0.01 302 (74) 228 0.00 Loss on disposal of business unit — — — — 1,255 — 1,255 0.02 Non-GAAP net income $ 107,361 $ (22,231) $ 85,130 $ 1.46 $ 94,574 $ (21,899) $ 72,675 $ 1.26 Diluted shares 58,329 57,565 Six Months Ended Six Months Ended June 30, 2023 June 30, 2022 Pre-Tax Tax Impact After-Tax Per Share Impact Pre-Tax Tax Impact After-Tax Per Share Impact |