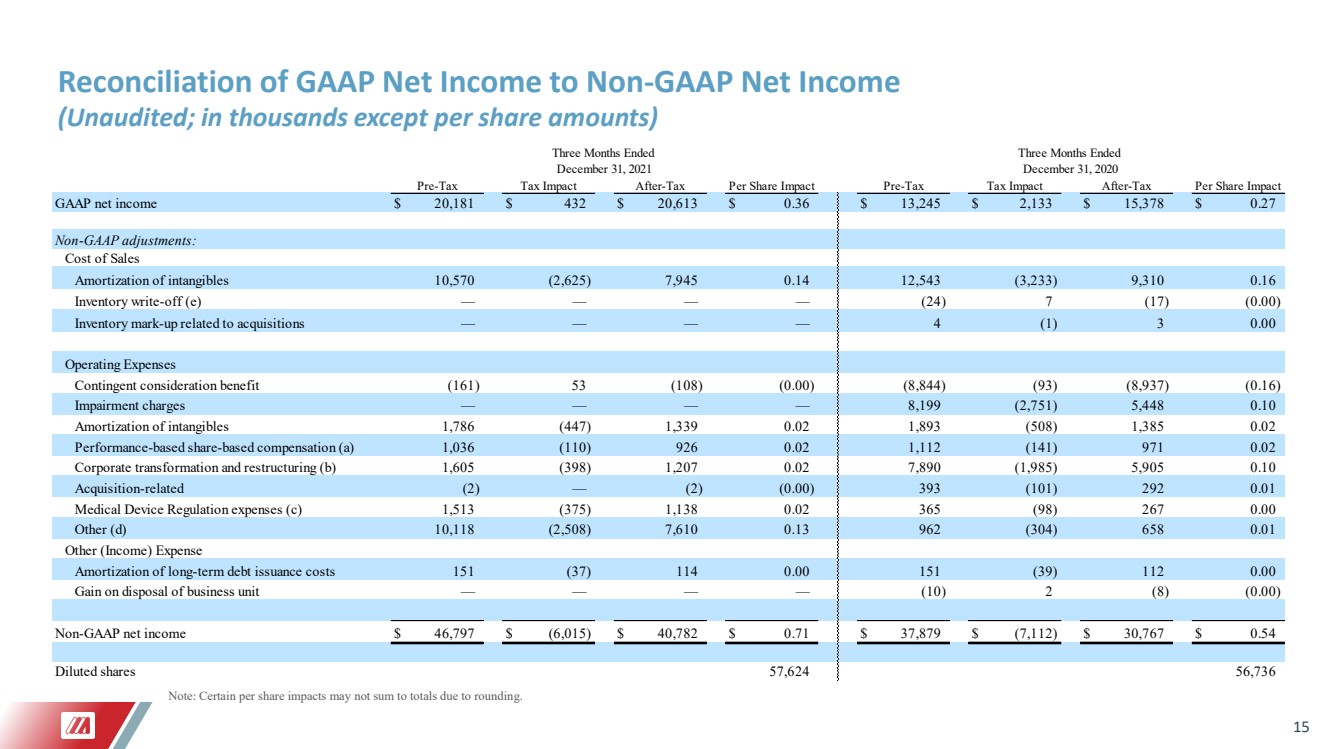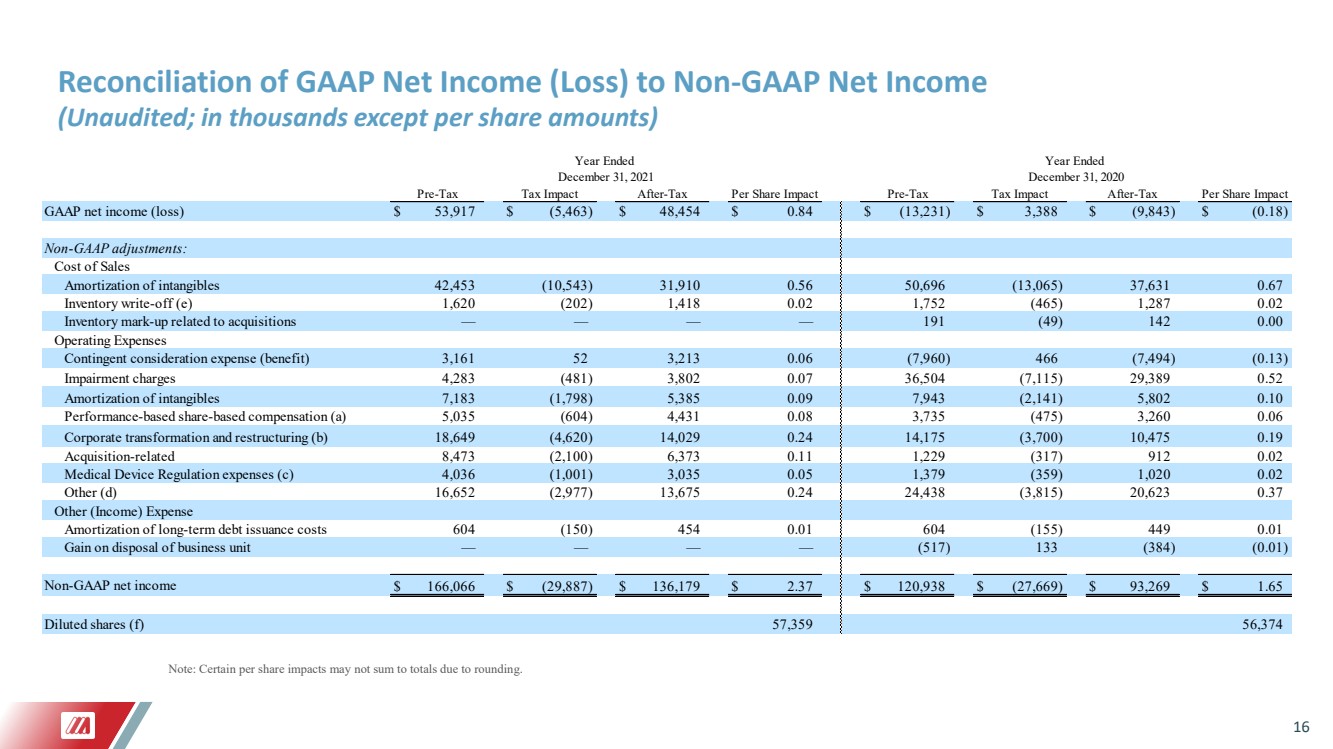
| 16 Reconciliation of GAAP Net Income (Loss) to Non - GAAP Net Income (Unaudited ; in thousands except per share amounts) Note: Certain per share impacts may not sum to totals due to rounding. GAAP net income (loss) $ 53,917 $ (5,463) $ 48,454 $ 0.84 $ (13,231) $ 3,388 $ (9,843) $ (0.18) Non-GAAP adjustments: Cost of Sales Amortization of intangibles 42,453 (10,543) 31,910 0.56 50,696 (13,065) 37,631 0.67 Inventory write-off (e) 1,620 (202) 1,418 0.02 1,752 (465) 1,287 0.02 Inventory mark-up related to acquisitions — — — — 191 (49) 142 0.00 Operating Expenses Contingent consideration expense (benefit) 3,161 52 3,213 0.06 (7,960) 466 (7,494) (0.13) Impairment charges 4,283 (481) 3,802 0.07 36,504 (7,115) 29,389 0.52 Amortization of intangibles 7,183 (1,798) 5,385 0.09 7,943 (2,141) 5,802 0.10 Performance-based share-based compensation (a) 5,035 (604) 4,431 0.08 3,735 (475) 3,260 0.06 Corporate transformation and restructuring (b) 18,649 (4,620) 14,029 0.24 14,175 (3,700) 10,475 0.19 Acquisition-related 8,473 (2,100) 6,373 0.11 1,229 (317) 912 0.02 Medical Device Regulation expenses (c) 4,036 (1,001) 3,035 0.05 1,379 (359) 1,020 0.02 Other (d) 16,652 (2,977) 13,675 0.24 24,438 (3,815) 20,623 0.37 Other (Income) Expense Amortization of long-term debt issuance costs 604 (150) 454 0.01 604 (155) 449 0.01 Gain on disposal of business unit — — — — (517) 133 (384) (0.01) Non-GAAP net income $ 166,066 $ (29,887) $ 136,179 $ 2.37 $ 120,938 $ (27,669) $ 93,269 $ 1.65 Diluted shares (f) 57,359 56,374 Year Ended Year Ended December 31, 2021 December 31, 2020 After-Tax Per Share Impact Pre-Tax Tax Impact After-Tax Per Share Impact Pre-Tax Tax Impact |