Q2 FISCAL 2010 PREPARED REMARKS
THE LONG-TERM VIEW: Technology leadership + winning in the market = 20% EPS CAGR
Our long-term financial goal is simple: We intend to deliver 20% non-GAAP EPS growth annually for the next 5 years. Our goal is to deliver this result through what we call our “Winning in the Market” strategy; which means primarily through accelerating organic revenue growth coupled with modest margin improvement. The table below illustrates these goals. We are maintaining our FY’10 revenue target of $1,015 million despite unfavorable FX movement. Our current guidance assumes $1.36 USD/EURO, which is down from the $1.46 USD/EURO rate used last quarter to establish the $1,015 million target, which negatively impacts revenue by approximately $18 milli on for FY’10 and which makes achieving these full year targets more challenging. Our FY’10 non-GAAP EPS target remains unchanged at $1.00.

Our strategy is equally straight-forward: We believe we are the technology leader in attractive growth markets. We characterize the markets we participate in with the 4-box graphic below. We expect our technology leadership position in the growth markets to translate into growth rates in excess of the overall market growth rates – especially in the PLM half of our business. We expect our overall revenue growth rates to accelerate over the next few years as our revenue mix continues to shift from ‘Desktop’ to ‘Enterprise.’ In Q1 and Q2, we had a 143% and 107% year-over-year improvement, respectively, in PLM license revenue.
We provide data points such as “Domino Account Wins” and “New ProductPoint Customers” in the pages that follow to support our claims that we are the technology leader, that we are gaining market share, and that ultimately we are “Winning in the Market.”
Non-GAAP Supplemental Information
We provide non-GAAP supplemental information to our GAAP information. PTC's reasons for providing this information are described at the end of this document. GAAP information corresponding to the non-GAAP information provided is contained in “Q2 FY’10 Expenses Commentary and FY’10 & Q3 Outlook” below and in the attached tables, along with a reconciliation between the GAAP and non-GAAP information.
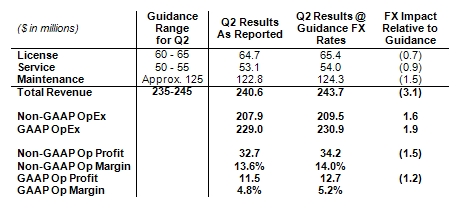
Q2 FY’10: Stronger than it looks; revenue negatively impacted by $3.1 million compared to guidance FX rates
Our Q2 results were consistent with our guidance. We delivered 7% year over year revenue growth, with license sales up 54% (3% and 48% on a constant currency basis, respectively). As expected, our maintenance and services businesses were flat and down, respectively, as we continue to work through the impact of soft license sales in 2009. We delivered non-GAAP EPS of $0.20, up from $0.15 in Q2 ‘09. (GAAP EPS was $0.08 compared to $0.06 in Q2’09).
Highlights of this quarter’s results are:
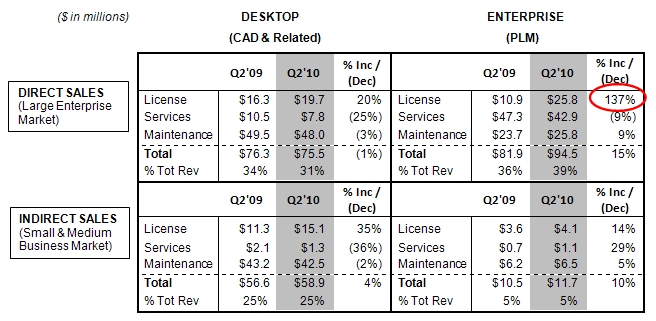
| 1) | A 137% increase in our PLM license revenue in the large enterprise market |
| 2) | 2 new Domino account wins in Q2, bringing our total to 13 vs. a target of 15 by the end of FY’10 |
| 3) | Continued signs of recovery in the CAD and SMB businesses; both had flattish revenues on a sequential basis, but both businesses have sequential license revenue growth |
We believe our PLM license revenue results and Domino account momentum continue to demonstrate what we believe is a fundamental shift in the competitive dynamic of our industry: Our Windchill PLM platform is separating itself from the pack and we are in an increasingly clear technology leadership position.
Our Q2 results continue to suggest signs of improvement in customer spending. We are currently seeing the most strength in large, Windchill-led engagements, with PLM license revenue up year-over-year in all regions and up sequentially in all regions except North America (which had a particularly strong quarter in Q1). We also saw modest sequential license revenue growth in the Indirect (SMB) space, which indicates that while overall spend is still subdued, these customers are also beginning to invest for growth again as well. While perhaps not quite the time to do a victory lap just yet, we view this as an encouraging sign.
Prior to Q2, we had announced 11 domino wins (see page 7 for further definition of dominoes). This quarter we won 2 additional domino accounts who we cannot name at this time due to customer requests, but one is a large global retailer and the other a large player in the industrial space. On our Q1 earnings call we increased
our goal from 12 domino account wins by the end of FY’10 to 15; we continue to believe we can achieve this goal. In addition to domino account wins, we are also actively engaged in more than 200 important Windchill-led competitive displacements with other large companies around the world.
Our product portfolio is being received very well in the market. Customers continue to expand their view of PLM from an engineering centric CAD data management solution into a robust enterprise solution with thousands of users across the extended enterprise. We have significant new releases of Windchill®, Pro/ENGINEER®, Arbortext®, CoCreate® and Mathcad® scheduled for FY’11. We continue to make progress on our new embedded software, program portfolio management and SharePoint initiatives. In addition, we continue to invest in our product analytics platform which enables customers to perform business intelligence-like analytics on their in-process product designs.
We are very optimistic about the long-term opportunity for PTC and will continue to make strategic investments that we believe are critical to delivering value to our customers and to enabling us to gain market share. In addition to investments to expand our technology leadership position, we are also planning to add 30 more solutions oriented sales teams during FY’10, which will significantly increase our distribution capacity as we enter FY’11. We expect these investments to help us drive toward our goal of 20% non-GAAP EPS CAGR over the next 5 years.
Q2 RESULTS VS. GUIDANCE: Close to the high-end of the range excluding $3.1 million FX negative impact to revenue
Total revenue for Q2 was $241 million, up 7% from Q2’09. Our Q2 revenue and non-GAAP EPS of $0.20 were within our guidance range of $235 to $245 million and non-GAAP EPS of $0.14 to $0.20. Q2 GAAP EPS was $0.08 and our GAAP operating expense was $229 million. The table below outlines our Q2 revenue and non-GAAP operating expenses relative to the guidance we provided, both on an as reported basis as well as using the currency rates we based our guidance on (USD / EURO of $1.46 and YEN / USD of 90). The net negative impact of currency movements on our Q2 results was approximately $0.01 EPS.
OUTLOOK FOR Q3 AND FY’10: Q3 license growth of 30%, FY’10 license growth increased to 35% to 40% y-y
In providing guidance for Q3 and setting targets for FY’10, we are weighing company specific factors such as our pipeline of opportunities and our maintenance and services base as well as external considerations, including the macroeconomic environment, currency, and visibility into customer spending patterns. We are using the following currency assumptions in our Q3 guidance: USD / EURO rate of $1.36 and YEN / USD of 91.
For FY’10 we are maintaining our revenue target of $1,015 million. However, the impact of the lower FX rate we are now using in our guidance negatively impacts our revenue by approximately $18 million, which makes achieving this target more challenging. Our forecasted mix of revenue is changing slightly; we are increasing our license revenue growth expectation from 30% to 35% - 40% year-over-year growth, or to approximately $295 million. This is offset by a decrease to our services and maintenance revenue forecast, as the ‘hangover’ from soft license sales in FY’09 is lasting longer than we had originally anticipated. We are maintaining our FY’10 non-GAAP operating margin target of 16% and our non-GAAP EPS target of $1.00. (On a GAAP basis our operating margin targe t is 7.5% and our EPS target is $0.50).
For Q3, we are initiating revenue guidance of $235 to $245 million with non-GAAP EPS of $0.14 to $0.20. The impact of the lower guidance FX rate in Q3 is approximately $7 million in revenue. Our Q3 guidance includes license revenue of approximately $65 million, which is up approximately 30% on a year-over-year basis. (On a GAAP basis, we expect EPS of $0.02 to $0.07). Our maintenance and services revenue are expected to be flat on a year-over-year basis.
Q2 REVENUE BY 4-BOX (GAAP): Upper right hand box leads the way, with license growth in all markets
We began reporting our revenue in the 4-box matrix below in Q1’10 because we believe this provides valuable insight into how our business is performing by both product mix and distribution channel.
The horizontal axis highlights Desktop vs. Enterprise solutions
| · | Desktop solutions include Pro/E, Mathcad and a portion of CoCreate and Arbortext revenue |
| · | Enterprise solutions include Windchill, ProductViewTM, ProductPoint®, InSightTM and a portion of Arbortext and CoCreate revenue |
The vertical axis highlights Direct vs. Indirect go-to market strategies
| · | Direct sales focuses primarily on the large enterprise market |
| · | Indirect sales (primarily our VAR reseller channel) focuses primarily on the SMB market |
License revenue is up year-over-year in all markets with continued strong performance in the Large Enterprise market space (‘upper right hand box’). Our total PLM revenue for Q2 was $106.2 million, up 15% compared to Q2’09. With $229 million in revenue H1’10, our PLM business remains on track to be close to a $500 million business in FY’10.
Our other markets are stabilizing; license revenue is up sequentially in all markets (except upper right due to a particularly strong quarter in Q1). Maintenance is down slightly in CAD and growing in PLM. Our services business remains soft, but given the strength of license revenue over the past 3 quarters we expect the services business to return to growth over the coming quarters.
REVENUE TRENDS
Certain reclassifications between Direct and Indirect and Desktop and Enterprise revenue from previously reported results (Q1’08 through Q1’10) are reflected below. The reclassifications are not significant.
DIRECT SALES: PLM market continues to drive growth
Our direct sales force is primarily focused on large enterprise customers. We have approximately 277 direct sales reps. These reps are primarily focused on selling our Product Development System, which incorporates all of our primary product families, to large enterprise customers. The table below outlines direct revenue performance. Key metrics we provide in addition to revenue regarding our Direct Sales / Large Enterprise Market performance also include Large Deals and Domino Account wins (details below).
| ($ in millions) | Q1 '08 | Q2 '08 | Q3 '08 | Q4 '08 | FY '08 | Q1 '09 | Q2 ‘09 | Q3 ‘09 | Q4 ‘09 | FY ‘09 | Q1’10 | Q2’10 |
| Direct | $166.7 | $176.9 | $185.6 | $211.7 | $740.9 | $164.2 | $158.2 | $161.0 | $179.6 | $663.0 | $186.6 | $170.0 |
| As % of Rev. | 69% | 69% | 68% | 71% | 69% | 68% | 70% | 71% | 73% | 71% | 72% | 71% |
| Y-Y Change | | | | | | (2%) | (11%) | (13%) | (15%) | (11%) | 14% | 7% |
| Q-Q Change | | | | | | (23%) | (4%) | 2% | 12% | | 4% | (9%) |
Q2 direct account revenue, which includes Strategic Account Management (SAM) accounts, was up 7% year over year. As you can see from the 4-box detail on page 8, our growth in this space was driven by 15% growth in the PLM market, offset by our results in the mature CAD market (-1% y-y).
LARGE DEAL ACTIVITY: Customers continue to make significant investments in PLM
Large deal activity is a significant growth driver and has historically tended to generate 13% to 15% of our total revenue in any given quarter, with the exception of Q4, which historically has been higher. Large deal activity is driven primarily by direct sales reps. We define “large deals” as recognizing more than $1 million of license and services revenue from a customer during a quarter.
($ in millions) | Q1'08 | Q2'08 | Q3'08 | Q4'08 | FY'08 | Q1'09 | Q2'09 | Q3'09 | Q4'09 | FY'09 | Q1’10 | Q2’10 |
| Number of Large Deals | 12 | 16 | 13 | 24 | 65 | 9 | 9 | 9 | 19 | 46 | 10 | 18 |
| L&S Revenue | $32.0 | $37.5 | $35.5 | $60.1 | $165.2 | $24.2 | $24.7 | $27.8 | $50.1 | $126.8 | $49.9 | $39.4 |
| Avg. Deal Size | $2.7 | $2.3 | $2.7 | $2.5 | $2.5 | $2.7 | $2.7 | $3.1 | $2.6 | $2.8 | $5.0 | $2.2 |
| % of Total Revenue | 13% | 15% | 13% | 20% | 15% | 10% | 11% | 12% | 20% | 14% | 19% | 16% |
In Q2 we had 18 large deals totaling $39.4 million. 8 of these customers were in North America, 4 were in Europe and 6 were in Asia. While average deal size in Q2 was lower than usual, we are encouraged that more customers appear to be re-accelerating their PLM investments and view this as another positive sign of global recovery.
We continue to have a strong pipeline of large deals that we are working on world-wide. We are winning competitive deals with large global companies (see ‘Dominoes’ below) and are actively engaged in more than 200 competitive displacement campaigns with other large global companies.
DOMINO ACCOUNT UPDATE: On track with 13 dominoes to date (goal of 15 by end of FY’10)
At our June ‘09 investor event, we outlined what we are calling our “domino account strategy.” Domino wins are defined as competitive wins at some of the world’s largest discrete manufacturing companies whose primary PLM solutions are not PTC products, and who have conducted comprehensive benchmarks of the major PLM technologies available today and selected PTC as the winner. These wins are important because we believe they serve as a “signpost” signaling the technological superiority of our products. We believe the logical conclusion of winning in a significant number of ‘domino’ accounts is that PTC has become the unambiguous market leader. As we demonstrate the real value of our technology in the initial installation phase, we expect these acco unts will be significant customers for years to come.
The table below outlines domino account wins by major vertical over the past few quarters. Our goal is to win 15 domino accounts by the end of FY’10.
In Q2 we won 2 new domino accounts who we cannot name at this time due to customer requests, but one is a large global retailer and the other a large player in the industrial space.
UPPER LEFT BOX (DIRECT SPACE / DESKTOP PRODUCTS)
| ($ in millions) | Q1 '08 | Q2 '08 | Q3 '08 | Q4 '08 | FY '08 | Q1 '09 | Q2'09 | Q3'09 | Q4'09 | FY'09 | | Q2'10 |
| Q1'10 |
| License | $26.2 | $29.6 | $23.2 | $35.7 | $114.7 | $17.5 | $16.3 | $16.9 | $24.1 | $74.8 | $15.6 | $19.7 |
| Services | $11.0 | $13.1 | $13.2 | $13.3 | $50.6 | $10.6 | $10.5 | $9.5 | $8.9 | $39.5 | $9.0 | $7.8 |
| Maintenance | $47.4 | $49.1 | $53.2 | $53.7 | $203.4 | $52.2 | $49.5 | $48.7 | $49.1 | $199.5 | $50.7 | $48.0 |
| Total | $84.6 | $91.8 | $89.6 | $102.7 | $368.7 | $80.3 | $76.3 | $75.1 | $82.1 | $313.8 | $75.3 | $75.5 |
| | | | | | | | | | | | | |
| % of Tot Rev | 35% | 36% | 33% | 34% | 34% | 33% | 34% | 33% | 33% | 34% | 29% | 31% |
| Y-Y Change | | | | | | (5%) | (17%) | (16%) | (20%) | (15%) | (6%) | (1%) |
| Q-Q Change | | | | | | (22%) | (5%) | (2%) | 9% | | (8%) | -% |
While this market is extremely important from a strategic perspective, we believe it is a mature market with limited long-term growth opportunity. Even though this market continues to be soft from a new license and services perspective, we did achieve sequential license improvement in this market in Q2, which we view as an encouraging sign of recovery. Importantly, our maintenance paying base in this market remains solid. Our primary products in this market are Pro/ENGINEER and Arbortext authoring solutions.
UPPER RIGHT BOX (DIRECT SPACE / ENTERPRISE PRODUCTS)
| ($ in millions) | Q1 '08 | Q2 '08 | Q3 '08 | Q4 '08 | FY '08 | Q1 '09 | Q2'09 | Q3'09 | Q4'09 | FY'09 | | Q2'10 |
| Q1'10 |
| License | $20.2 | $22.9 | $29.8 | $39.5 | $112.4 | $13.9 | $10.9 | $18.9 | $31.6 | $75.3 | $41.0 | $25.8 |
| Services | $39.8 | $40.7 | $42.8 | $45.4 | $168.7 | $45.4 | $47.3 | $42.9 | $40.9 | $176.5 | $44.8 | $42.9 |
| Maintenance | $22.1 | $21.5 | $23.4 | $24.1 | $91.1 | $24.6 | $23.7 | $24.1 | $25.0 | $97.4 | $25.5 | $25.8 |
| Total | $82.1 | $85.1 | $96.0 | $109.0 | $372.2 | $83.9 | $81.9 | $85.9 | $97.5 | $349.2 | $111.3 | $94.5 |
| | | | | | | | | | | | | |
| % of Tot Rev | 34% | 33% | 35% | 36% | 35% | 35% | 36% | 38% | 40% | 37% | 43% | 39% |
| Y-Y Change | | | | | | 2% | (4%) | (10%) | (11%) | (6%) | 33% | 15% |
| Q-Q Change | | | | | | (23%) | (3%) | 5% | 13% | | 14% | (15%) |
From a near- to medium-term growth perspective, we believe this market offers the most significant opportunity. Large enterprises are increasingly investing in PLM solutions and we believe PTC’s Windchill is the premier PLM solution on the market today. We achieved 194% and 137% year-over-year license revenue growth in this market in Q1 and Q2, respectively, and we continue to expect significant year-over-year growth in Q3. Our services business remains stable and our maintenance business continues to grow in this market. Our primary products in this market are Windchill, ProductView, InSight, Relex and Arbortext enterprise solutions.
INDIRECT SALES: Strong maintenance base and continued signs of improving end markets
Our indirect sales are primarily from the Small and Medium Businesses (SMB) market. We continue to have approximately 112 channel business development managers supporting more than 420 channel partners who are focused primarily on selling our MCAD products such as Pro/ENGINEER, Mathcad and CoCreate, as well as Windchill PDMLink® and ProductPoint (our Microsoft SharePoint-based version of Windchill), into the SMB marketplace. We began in fiscal 2009 to develop a network of enterprise resellers to further expand our core Windchill ecosystem. This program is progressing well. A key metric we provide (in addition to revenue) regarding our Indirect Sales / SMB Market performance is ProductPoint wins (details below).
| ($ in millions) | Q1 '08 | Q2 '08 | Q3 '08 | Q4 '08 | FY '08 | Q1 '09 | Q2 ‘09 | Q3 ‘09 | Q4 ‘09 | FY ‘09 | Q1’10 | Q2’10 |
| Indirect | $74.6 | $80.8 | $86.2 | $87.8 | $329.4 | $76.2 | $67.1 | $65.1 | $66.8 | $275.2 | $71.8 | $70.6 |
| As % of Rev | 31% | 31% | 32% | 29% | 31% | 32% | 30% | 29% | 27% | 29% | 28% | 29% |
| Y-Y Change | | | | | | 2% | (17%) | (25%) | (24%) | (17%) | (6%) | 5% |
| Q-Q Change | | | | | | (13%) | (12%) | (3%) | 3% | | 7% | (2%) |
In Q2 indirect account revenue was up 5% year over year. Given that this market is made up of SMB companies, we believe this market continues to be heavily impacted by ongoing macroeconomic conditions. Importantly, as reflected in the 4-box detail, we are continuing to see an important sign of improvement in the SMB space: license revenue is up sequentially in both the lower left and lower right boxes.
ProductPoint Win Update: On track to meet new goal of 400 ProductPoints wins by FY’10
At our June ’09 investor event, we outlined our social product development platform. Essentially, this is leveraging social computing technologies in the product development process. We have built our solution, called ProductPoint, on the Microsoft SharePoint technology stack and have developed a joint go-to-market strategy with Microsoft. After surpassing our original goal of 100 wins by the end of FY’09, we set a new target of 400 wins by the end of FY’10. We believe that achieving this goal will serve as a signpost of our ongoing thought leadership in the industry and the market potential of our social computing platform. As shown in the table below, with 321 wins to-date, we are on track to meet this goal.
| | Q1’09 | Q2’09 | Q3’09 | Q4’09 | FY’09 | Q1’10 | Q2’10 | FY’10 Goal |
| ProductPoint Wins | 16 | 29 | 37 | 65 | 147 | 69 | 105 | 400 |
LOWER LEFT BOX (INDIRECT SPACE / DESKTOP PRODUCTS)
| ($ in millions) | Q1 '08 | Q2 '08 | Q3 '08 | Q4 '08 | FY '08 | Q1 '09 | Q2'09 | Q3'09 | Q4'09 | FY'09 | | Q2'10 |
| Q1'10 |
| License | $19.7 | $21.4 | $21.4 | $23.5 | $86.0 | $14.6 | $11.3 | $10.2 | $11.7 | $47.8 | $14.5 | $15.1 |
| Services | $2.6 | $2.4 | $2.5 | $2.8 | $10.3 | $2.1 | $2.1 | $1.7 | $1.3 | $7.2 | $1.4 | $1.3 |
| Maintenance | $39.4 | $44.9 | $47.9 | $48.2 | $180.4 | $47.3 | $43.2 | $42.6 | $43.0 | $176.1 | $44.4 | $42.5 |
| Total | $61.7 | $68.7 | $71.8 | $74.5 | $276.7 | $64.0 | $56.6 | $54.5 | $56.0 | $231.1 | $60.3 | $58.9 |
| | | | | | | | | | | | | |
| % of Tot Rev | 26% | 27% | 26% | 25% | 26% | 27% | 25% | 24% | 23% | 25% | 23% | 25% |
| Y-Y Change | | | | | | 4% | (18%) | (24%) | (25%) | (16%) | (6%) | 4% |
| Q-Q Change | | | | | | (14%) | (12%) | (4%) | 3% | | 8% | (2%) |
We believe this market continues to offer long-term growth potential. However, given that the customer base is primarily comprised of SMB customers, which we believe continue to be impacted by the global economic situation, this market has remained soft through the first half of FY’10. Importantly, however, our maintenance paying base in this market remains solid, and we are seeing signs of improvement in new sales: this is our third sequential quarter of license revenue improvement. Our primary products in this market are Pro/ENGINEER, CoCreate, Mathcad and Arbortext authoring solutions.
LOWER RIGHT BOX (INDIRECT SPACE / ENTERPRISE PRODUCTS)
| ($ in millions) | Q1 '08 | Q2 '08 | Q3 '08 | Q4 '08 | FY '08 | Q1 '09 | Q2'09 | Q3'09 | Q4'09 | FY'09 | | Q2'10 |
| Q1'10 |
| License | $4.9 | $3.9 | $5.5 | $5.0 | $19.3 | $4.5 | $3.6 | $3.4 | $3.3 | $14.8 | $3.7 | $4.1 |
| Services | $2.1 | $1.8 | $2.1 | $1.3 | $7.3 | $1.0 | $0.7 | $0.8 | $0.7 | $3.2 | $0.7 | $1.1 |
| Maintenance | $5.9 | $6.4 | $6.8 | $7.0 | $26.1 | $6.7 | $6.2 | $6.4 | $6.8 | $26.1 | $7.1 | $6.5 |
| Total | $12.9 | $12.1 | $14.4 | $13.3 | $52.7 | $12.2 | $10.5 | $10.6 | $10.8 | $44.1 | $11.5 | $11.7 |
| | | | | | | | | | | | | |
| % of Tot Rev | 5% | 5% | 5% | 5% | 5% | 5% | 5% | 5% | 4% | 5% | 4% | 5% |
| Y-Y Change | | | | | | (6%) | (12%) | (26%) | (20%) | (16%) | (6%) | 10% |
| Q-Q Change | | | | | | (9%) | (13%) | (1%) | 2% | | 7% | 2% |
From a medium- to long-term growth perspective, we believe this market offers a significant growth opportunity. Again, given that the customer base is primarily comprised of SMB companies, which we believe continue to be impacted by the global economic situation, this market has remained soft through the first half of FY’10. However, SMB customers are increasingly interested in PLM solutions and we believe PTC’s Windchill is an excellent product for larger companies in the SMB space. We are also seeing encouraging interest for our ProductPoint offering in the SMB market. Our primary products in this market are Windchill, ProductPoint, CoCreate and Arbortext enterprise solutions.
REVENUE BY LINE OF BUSINESS
LICENSE: Strong y-y license revenue growth (down sequentially due to unseasonably strong Q1)
License sales generate the highest gross margins, which are in the mid- to high 90% range on a non-GAAP basis. License revenue historically has tended to represent 28% to 35% of our total revenues in any given quarter, with Q4 generally being our strongest quarter. Given the macroeconomic environment in FY’09, license revenue was closer to 20% of total revenue. We expect license revenue to be closer to 30% of total revenue in FY’10.
| ($ in millions) | Q1'08 | Q2'08 | Q3'08 | Q4'08 | FY'08 | Q1'09 | Q2'09 | Q3'09 | Q4'09 | FY'09 | Q1 ‘10 | Q2 ‘10 |
| License | $71.0 | $77.8 | $79.9 | $103.7 | $332.4 | $50.5 | $42.1 | $49.4 | $70.7 | $212.7 | $74.8 | $64.7 |
| % of Total Revenue | 29% | 30% | 29% | 35% | 31% | 21% | 19% | 22% | 29% | 23% | 29% | 27% |
| Y-Y Change | | | | | | (29%) | (46%) | (38%) | (32%) | (36%) | 48% | 54% |
| Q-Q Change | | | | | | (51%) | (17%) | 18% | 43% | | 6% | (14%) |
Q2 License revenue of $64.7 million was up 54% year over year (48% on a constant currency basis). On a sequential basis, our license revenue was down 14% due to a handful of large deals in Q1 which drove an uncharacteristically strong Q1. Our products continue to perform very well in competitive benchmarks.
Looking forward to Q3, we are expecting license revenue to be up approximately 30% on a year-over-year basis. For FY’10, we are expecting license revenue to be up approximately 35% - 40% compared to FY’09.
SERVICES: The ‘hangover’ from soft license sales in FY’09 continues…
Our services business provides significant value to our customers, helping them re-engineer their global product development business processes and implement our solutions and providing them with training on our software. Services revenue has historically tended to represent 20% to 25% of our total revenues in any given quarter.
| ($ in millions) | Q1'08 | Q2'08 | Q3'08 | Q4'08 | FY'08 | Q1'09 | Q2'09 | Q3'09 | Q4'09 | FY'09 | Q1 ‘10 | Q2 ‘10 |
| Services | $55.5 | $58.0 | $60.6 | $62.8 | $236.9 | $59.1 | $60.6 | $54.9 | $51.8 | $226.4 | $55.9 | $53.1 |
| % of Total Revenue | 23% | 23% | 22% | 21% | 22% | 25% | 27% | 24% | 21% | 24% | 22% | 22% |
| Y-Y Change | | | | | | 6% | 5% | (9%) | (18%) | (4%) | (5%) | (12%) |
| Q-Q Change | | | | | | (6%) | 3% | (10%) | (6%) | | 8% | (5%) |
Q2 Services revenue of $53.1 million was down 12% year over year (16% on a constant currency basis), reflecting the soft license sales we had in FY’09. Our training business, which typically represents about 15% of our total services revenue, was down 18% year over year. Our consulting business, which primarily supports Windchill implementations, was down 12% year over year. Our services non-GAAP net margins were 2.7%, compared to 7.7% in Q2’09, primarily due to softer than anticipated Q2 services revenue.
Looking forward to Q3, we are expecting services revenue to be up modestly on a sequential basis. We have a solid backlog of services engagements that provides near-term visibility into our services business, however, significantly reduced year-over-year Windchill license revenue in the early part of FY’09 continue to have an adverse impact on our services revenue. With recent increases in Windchill license revenue, we have seen an increase in services booking activity and, therefore, we expect services revenue to return to growth over the coming quarters.
Our primary initiatives for the services business are to continue to enable our customers to realize value from their PLM implementations, improve our services net margins and expand our Windchill services ecosystem by adding Service Partners. We launched the “Service Advantage Program” at the beginning of fiscal 2009 and we are making solid progress. We already have a network of partners in North America and Europe, and are launching the program in Asia.
MAINTENANCE: 1.156 million seats and counting… Seat growth continues, revenue growth in sight.
Our maintenance business is an important barometer of customer satisfaction with our solutions. It is also a strong source of recurring revenue for PTC. Maintenance gross margins are in the mid- to high 80% range. Maintenance revenue has historically tended to represent 45% to 50% of our total revenues in any given quarter, with Q4 usually being lower as a percent of total revenue due to historically strong performance of license sales in that quarter.
| ($ in millions) | Q1'08 | Q2'08 | Q3'08 | Q4'08 | FY'08 | Q1'09 | Q2'09 | Q3'09 | Q4'09 | FY'09 | Q1 ‘10 | Q2 ‘10 |
| Maintenance | $114.8 | $121.9 | $131.3 | $133.0 | $501.0 | $130.8 | $122.6 | $121.8 | $123.9 | $499.1 | $127.7 | $122.8 |
| % of Total Revenue | 48% | 47% | 48% | 44% | 47% | 54% | 54% | 54% | 50% | 53% | 49% | 51% |
| Y-Y Change | | | | | | 14% | 1% | (7%) | (7%) | -% | (2%) | -% |
| Q-Q Change | | | | | | (2%) | (6%) | (1%) | 2% | | 3% | (4%) |
Q2 maintenance revenue of $122.8 million was flat year over year (down 3% on a constant currency basis). On a sequential basis, Q2 was down 4%, which reflects the normal seasonality of our maintenance business and was further impacted by deteriorating FX rates from Q1 to Q2 (impact of $2.2 million). We believe our maintenance business reflects a solid customer base and the stickiness of our products – even in a difficult macroeconomic environment.
Looking forward to Q3, we are expecting a modest sequential decrease in maintenance revenue. For FY’10 we are now expecting maintenance revenue to be flat to down modestly on a year-over-year basis due to unfavorable FX movements and the impact of soft license revenue in FY’09.
Active Maintenance Seats
We have more than 1,100,000 active maintenance seats of PTC software in use today. We believe the solid base of maintenance-paying customers is a testament to the quality of our products and we also view it as one of our largest assets.
Beginning in Q1’10, we have changed the definition of ‘Active Maintenance Seats.’ Previously, we counted software packages as 1 seat (usually Pro/ENGINEER), despite the fact that many of the packages include seats of our other products such as Windchill, Arbortext, Mathcad, etc. In our new methodology a software package with multiple products will result in a seat of each product being included in the disclosure below. We believe this definition better reflects the number of active seats of our software products in use. The table below outlines our active maintenance seat trends using this new methodology for both current and prior year results.
Active Maintenance Seats
(in 000’s) | Q1'08 | Q2'08 | Q3'08 | Q4'08 | FY'08 | Q1'09 | Q2'09 | Q3'09 | Q4'09 | FY'09 | Q1’10 | Q2’10 |
| Pro/E | 130.9 | 132.3 | 134.4 | 135.2 | 135.2 | 138.5 | 132.3 | 132.2 | 133.0 | 133.0 | 133.5 | 131.8 |
| Windchill | 638.4 | 658.2 | 688.6 | 722.9 | 722.9 | 733.4 | 714.2 | 719.4 | 718.5 | 718.5 | 848.0 | 878.8 |
| All Others | 152.9 | 151.6 | 153.6 | 150.3 | 150.3 | 154.8 | 149.3 | 149.5 | 147.8 | 147.8 | 146.2 | 145.9 |
| Total | 922.2 | 942.1 | 976.6 | 1,008.4 | 1,008.4 | 1,026.7 | 995.8 | 1,001.1 | 999.3 | 999.3 | 1,127.7 | 1,156.5 |
We experienced another sequential increase in active maintenance seats in Q2, driven by a strong demand for Windchill in the large enterprise market. We saw modest deterioration in Pro/E seats and other seats in Q2, which we believe is a reflection of the macroeconomic impact on the SMB market. Our overall attach and renewal rates continue to remain strong.
REVENUE BY REGION: Signs of global stability
| ($ in millions) | Q1'08 | Q2'08 | Q3'08 | Q4'08 | FY'08 | Q1'09 | Q2'09 | Q3'09 | Q4'09 | FY'09 | Q1 ‘10 | Q2 ‘10 |
| Americas | $84.4 | $88.1 | $90.0 | $102.0 | $364.5 | $83.6 | $79.6 | $85.6 | $103.1 | $351.9 | $107.1 | $84.0 |
| % of Total Rev | 35% | 34% | 33% | 34% | 34% | 35% | 35% | 38% | 42% | 38% | 42% | 35% |
| Y-Y Change | | | | | | (1%) | (10%) | (5%) | 1% | (4%) | 28% | 6% |
| Q-Q Change | | | | | | (18%) | (5%) | 8% | 20% | | 4% | (22%) |
Americas revenue in Q2 of $84.0 million was up 6% compared with last year, but down 22% sequentially due to a particularly strong Q1. Compared to Q2’09, indirect revenue in the Americas in Q2 was down 9%, although we did achieve modest year-over-year and sequential license revenue growth in this space. Direct revenue was up 9% year over year. Q2 license revenue in the Americas was down 57% sequentially, again primarily due to our particularly strong performance in Q1.
| ($ in millions) | Q1'08 | Q2'08 | Q3'08 | Q4'08 | FY'08 | Q1'09 | Q2'09 | Q3'09 | Q4'09 | FY'09 | Q1 ‘10 | Q2 ‘10 |
| Europe | $101.7 | $106.1 | $111.7 | $130.5 | $450.0 | $99.2 | $89.7 | $91.3 | $92.2 | $372.4 | $99.2 | $93.5 |
| % of Total Rev | 42% | 41% | 41% | 44% | 42% | 41% | 40% | 40% | 37% | 40% | 38% | 39% |
| Y-Y Change | | | | | | (2%) | (16%) | (18%) | (29%) | (17%) | -% | 4% |
| Q-Q Change | | | | | | (24%) | (10%) | 2% | 1% | | 8% | (6%) |
Europe revenue was $93.5 million in Q2, up 4% (down 4% on a constant currency basis) compared with last year, but down 6% sequentially. Compared to Q2’09, indirect revenue in Europe was up 7% and direct revenue was up 3%. Q2 license revenue in Europe was up 15% sequentially, with the indirect space down 2% and the direct space up 29%.
| ($ in millions) | Q1'08 | Q2'08 | Q3'08 | Q4'08 | FY'08 | Q1'09 | Q2'09 | Q3'09 | Q4'09 | FY'09 | Q1 ‘10 | Q2 ‘10 |
| Japan | $25.2 | $29.9 | $35.7 | $27.4 | $118.2 | $25.8 | $30.5 | $24.5 | $23.3 | $104.1 | $23.2 | $29.7 |
| % of Total Rev | 10% | 12% | 13% | 9% | 11% | 11% | 14% | 11% | 10% | 11% | 9% | 12% |
| Y-Y Change | | | | | | 3% | 2% | (31%) | (15%) | (12%) | (10%) | (3%) |
| Q-Q Change | | | | | | (6%) | 18% | (20%) | (5%) | | (1%) | 28% |
Japan revenue was $29.7 million in Q2, down 3% (4% on a constant currency basis) compared with last year, but up 28% sequentially. Compared to Q2’09, indirect revenue in Japan was up 6% and direct revenue was down 7%. Q2 license revenue in Japan was up 259% sequentially.
| ($ in millions) | Q1'08 | Q2'08 | Q3'08 | Q4'08 | FY'08 | Q1'09 | Q2'09 | Q3'09 | Q4'09 | FY'09 | Q1 ‘10 | Q2 ‘10 |
| Pacific Rim | $30.0 | $33.6 | $34.4 | $39.6 | $137.6 | $31.8 | $25.5 | $24.7 | $27.8 | $109.8 | $28.9 | $33.4 |
| % of Total Rev | 12% | 13% | 13% | 13% | 13% | 13% | 11% | 11% | 11% | 12% | 11% | 14% |
| Y-Y Change | | | | | | 6% | (24%) | (28%) | (30%) | (20%) | (9%) | 31% |
| Q-Q Change | | | | | | (20%) | (20%) | (3%) | 13% | | 4% | 16% |
Pacific Rim revenue was $33.4 million in Q2, up 31% (27% on a constant currency basis) compared with last year and up 16% sequentially. (China, which represents a significant portion of our Pac Rim revenue, increased 46% compared to Q2’09). Compared to Q2’09, indirect revenue in the Pac Rim was up 32% and direct revenue was up 30%. Q2 license revenue in the Pac Rim was up 40% sequentially.
CURRENCY IMPACT ON RESULTS COMPARED TO THE YEAR AGO PERIOD
Because we have a global business, with Europe and Asia historically representing approximately 65% of our revenue, our results are impacted by currency fluctuations. On a constant currency basis, our revenue increased 3% year over year. Currency fluctuations favorably impacted Q2 revenue by $8.6 million and unfavorably impacted Q2 non-GAAP expenses by $5.9 million compared to Q2’09. GAAP expenses were unfavorably impacted by $6.5 million compared to Q2'09.
Constant Currency (assumes Q2’09 currency rates)
| | Q2'10 | Q2’10 | Q2’09 | | Q2’10 Const. FX | Q2’10 Actual |
| ($ in millions) | Actual | Const. FX | Actual | | Vs. Q2’09 Actual |
| License | $64.7 | $62.4 | $42.1 | | 48% | 54% |
| Services | $53.1 | $51.1 | $60.6 | | -16% | -12% |
| Maintenance | $122.8 | $118.4 | $122.6 | | -3% | -% |
| Total | $240.6 | $231.9 | $225.3 | | 3% | 7% |
| | Q2’10 | Q2’10 | Q2’09 | | Q2’10 Const. FX | Q2’10 Actual |
| ($ in millions) | Actual | Const. FX | Actual | | Vs. Q2’09 Actual |
| Americas | $84.0 | $83.9 | $79.6 | | 5% | 6% |
| Europe | $93.5 | $86.4 | $89.7 | | -4% | 4% |
| Japan | $29.7 | $29.2 | $30.5 | | -4% | -3% |
| Pacific Rim | $33.4 | $32.4 | $25.5 | | 27% | 31% |
| Total | $240.6 | $231.9 | $225.3 | | 3% | 7% |
Looking forward, the guidance we are providing assumes exchange rates of approximately USD 1.36 / EURO and YEN 91 / USD. The average USD / EURO rate for the past two years has been approximately $1.43. We do not forecast currency movements, rather we provide detailed constant currency commentary. Currency can significantly impact our results. For example, in FY’09 currency was a considerable headwind for PTC when compared to FY’08: revenue was negatively impacted by $39 million and expenses were positively impacted by $36 million.
Q2 FY’10 EXPENSES COMMENTARY AND FY’10 & Q3 OUTLOOK
Q2 non-GAAP results exclude $12.3 million of stock-based compensation expense, $8.9 million of acquisition-related intangible asset amortization and $6.7 million of income tax adjustments. The Q2 results include a non-GAAP tax rate of 27% and a GAAP tax rate of 18%.
FY’10 non-GAAP guidance excludes the following full-year estimated expenses and their tax effects, as well as any one-time tax items:
| · | Approximately $49 million of expense related to stock-based compensation |
| · | Approximately $34 million of acquisition-related intangible asset amortization expense |
Q3’10 non-GAAP guidance excludes the following estimated expenses and their tax effects:
| · | Approximately $12 million of expense related to stock-based compensation |
| · | Approximately $9 million of acquisition-related intangible asset amortization expense |
INCOME STATEMENT
Our Q2 non-GAAP operating margins and EPS were stronger than expected primarily due to strong license sales and lower than anticipated expenses. Our Q2’10 non-GAAP operating expenses were $207.9 million, up 3% (flat on a constant currency basis) from Q2 of last year. Q2’10 GAAP operating expenses were $229.0 million. From an operating performance perspective, we achieved 13.6% non-GAAP operating margin in Q2’10, compared to 10.5% last year. GAAP operating margin was 4.8% for Q2’10 compared to (0.6%) in Q2’09.
Looking forward, we are expecting non-GAAP operating expenses for FY’10 to be approximately $855 million and Q3 expenses to be $212 to $215 million, depending on amount and mix of revenue. GAAP operating expenses for FY’10 are expected to be approximately $940 million. Q3 GAAP operating expenses are expected to be approximately $233 to $236 million.
As you will note from the table below, our R&D and S&M expense as a percentage of revenue in FY’09 and Q2’10 were higher than in previous years, reflecting our strategy to continue to invest in our business in order to better position PTC for the future. Primary areas of investment in the business continue to include:
| 1) | Increased investment in our direct sales force and our reseller channel |
| 2) | Investing in R&D to extend our technology leadership position with further enhancements to our core product families including Windchill, Pro/ENGINEER, InSight, CoCreate, Arbortext, Mathcad and ProductPoint |
| 3) | Enhancing and leveraging the value of our services business through expansion of our services ecosystem |
We believe these investments will drive revenue growth and create considerable operating leverage opportunities over time.
NON-GAAP OPERATING EXPENSES
| ($ in millions) | Q1'08 | Q2'08 | Q3'08 | Q4'08 | FY'08 | Q1'09 | Q2'09 | Q3'09 | Q4'09 | FY'09 | Q1’10 | Q2’10 |
| Cost of License | $1.8 | $2.2 | $2.7 | $3.5 | $10.2 | $2.9 | $2.3 | $2.4 | $2.7 | $10.2 | $3.2 | $3.3 |
| % of Revenue | 1% | 1% | 1% | 1% | 1% | 1% | 1% | 1% | 1% | 1% | 1% | 1% |
| Cost of Service | $68.6 | $71.6 | $74.3 | $76.9 | $291.4 | $73.5 | $71.0 | $64.1 | $63.0 | $271.6 | $68.0 | $66.7 |
| % of Revenue | 28% | 28% | 27% | 26% | 27% | 31% | 32% | 28% | 26% | 29% | 26% | 28% |
| R&D | $39.3 | $43.4 | $45.1 | $44.8 | $172.6 | $46.1 | $43.2 | $44.6 | $46.4 | $180.3 | $48.0 | $47.6 |
| % of Revenue | 16% | 17% | 17% | 15% | 16% | 19% | 19% | 20% | 19% | 19% | 19% | 20% |
| S&M | $68.2 | $70.4 | $75.6 | $80.5 | $294.7 | $77.0 | $69.2 | $70.3 | $72.1 | $288.6 | $75.5 | $71.6 |
| % of Revenue | 28% | 27% | 28% | 27% | 27% | 32% | 31% | 31% | 29% | 31% | 29% | 30% |
| G&A | $20.4 | $17.4 | $16.9 | $19.6 | $74.3 | $18.3 | $16.0 | $15.3 | $16.9 | $66.6 | $18.6 | $18.7 |
| % of Revenue | 8% | 7% | 6% | 7% | 7% | 8% | 7% | 7% | 7% | 7% | 7% | 8% |
| Total Expenses | $198.3 | $205.0 | $214.6 | $225.3 | $843.2 | $217.8 | $201.7 | $196.7 | $201.1 | $817.3 | $213.3 | $207.9 |
| % of Total Revenue | 82% | 79% | 79% | 75% | 78% | 91% | 89% | 87% | 82% | 87% | 83% | 86% |
TAX RATE
Q2 non-GAAP tax rate was 27%, slightly below our expected non-GAAP tax rate of 28%. Our GAAP tax rate was 18%.
Looking forward, the Q3 guidance assumes a non-GAAP tax rate of 23% and a GAAP tax rate of 15%. The FY’10 target assumes a non-GAAP tax rate of 25% and a GAAP tax rate of 17%.
SHARE COUNT / SHARE REPURCHASE
We had 119.9 million fully diluted weighted average shares outstanding for Q2. We repurchased 2.4 million shares during the quarter for $40 million. We have $35 million remaining under our current authorization to repurchase shares.
Looking forward, we expect to have approximately 120 million fully diluted shares outstanding for Q3 and for the full fiscal year. We are planning to repurchase a total of approximately $60 million worth of our stock in FY’10; with $45 million completed through Q2’10 and an additional $15 million planned for H2’10.
BALANCE SHEET: Cash flow positive and a solid cash position
CASH / CASH FLOW FROM OPERATIONS
For Q2’10, our cash balance was $223 million, down $8 million from the end of Q1’10. $68 million was provided from operations in Q2’10. The cash balance at the end of Q2’10 also reflects:
| · | Capital Expenditures: $9 M |
| · | Share repurchase: $40 M |
| · | FX impact on cash: $4 M unfavorable |
DSO
DSO for Q2’10 was 57 days, compared with 57 days in Q1’10 and 53 days in Q2’09. We continue to have strong DSOs in a challenging economic environment.
OUTSTANDING DEBT
We made debt repayments of $20 million during the quarter and were positively impacted $3 million by currency fluctuations on our outstanding balance during Q2’10. At the end of Q2’10 we had an outstanding balance of $34 million on our $230 million revolving credit facility, which is scheduled to expire in February 2011.
Looking forward, by the end of FY’10, we currently expect to retire this debt and enter into a new revolving credit facility.
MISCELLANEOUS COMMENTS
HEADCOUNT
Total headcount was 5,205 at the end of Q2, up slightly from 5,158 at the end of Q1’10.
M&A
We view M&A primarily as a strategic vehicle to further enhance our product portfolio and growth opportunity. We intend to remain opportunistic as it relates to M&A throughout the course of FY’10. We have approximately $196 million available under our revolving credit facility as well as available cash with which to execute strategic M&A opportunities. However, the majority of our M&A opportunities comprise small, strategic technology tuck-ins. For example, early in Q2 we acquired technology in the fast growing carbon information management market, enhancing our product analytics platform with “green product development” capabilities.
WRAP-UP
Q2 was a strong quarter for PTC. From a strategic perspective, our technology leadership position is paying dividends: Windchill license revenue is up significantly; we are winning in strategically important “domino” accounts; and we are engaged in more than 200 competitive displacement opportunities. These signs, coupled with broader signals of economic stability (e.g. the large enterprise market is starting to spend again and we saw sequential license growth in the CAD and SMB markets in Q2), give us confidence in our guidance for FY’10 (although FX rates make achieving our revenue target more challenging).
We are very optimistic about the long-term opportunity for the PLM market and PTC and intend to continue to make prudent, strategic investments that we believe are critical to delivering value to our customers and gaining market share, while remaining committed to our goal of 20% non-GAAP EPS growth for 2010 and beyond.
Thank you for your on-going support.
Important Information About Non-GAAP References
PTC provides non-GAAP supplemental information to its financial results. Non-GAAP operating expenses, margin and EPS exclude stock-based compensation expense, amortization of acquired intangible assets, acquired in-process research and development expense, restructuring charges, and the related tax effects of the preceding items and any one-time tax items. PTC provides this non-GAAP information to facilitate period-to-period comparisons of its operational performance by adjusting for certain non-cash and certain episodic expenses. We believe that providing non-GAAP measures affords investors a view of our operating results that may be more easily compared to peer companies. PTC management also uses this and other non-GAAP financial information to evaluate, manage and plan our business because th e information provides additional insight into ongoing financial performance. In addition, compensation of our executives is based in part on the performance of our business based on these non-GAAP measures. However, non-GAAP information should not be construed as an alternative to GAAP information as the items excluded from the non-GAAP measures often have a material impact on PTC’s financial results. Management uses, and investors should use, non-GAAP measures in conjunction with our GAAP results. We calculate revenue and expenses on a constant currency basis to obtain a view of the performance of our business without the effect of differences in foreign currency exchange rates used for translation. We calculate these measures by applying the applicable prior period exchange rates to current period revenues and expenses.
Important Note About Our Revised Revenue Reporting
The revenue reporting provided today reflects “Indirect” revenue which includes not only revenue from our reseller channel but also revenue from other accounts classified as “Indirect.” Previously we had reported revenue only from our reseller channel. This change resulted in a reallocation of approximately $40 million (4% of total revenue) and $57 million (5% of total revenue) from direct revenue to indirect revenue for the years ended September 30, 2009 and 2008, respectively. Also note that the definitions of “Desktop” and “Enterprise” we use today are not identical to those we used when we last reported those categories in our SEC filings for the period ended September 30, 2007 or periods prior to that. All historical revenu e amounts provided in this document have been revised to reflect the “direct/indirect” classification and “Desktop/Enterprise” classification we use today.
Forward-Looking Statements
Statements in these prepared remarks that are not historic facts, including statements about our fiscal 2010 and other future financial and growth expectations, anticipated tax rates, the expected impact of our planned strategic investments on our future success, expected market growth rates and the long-term prospects for PTC are forward-looking statements that involve risks and uncertainties that could cause actual results to differ materially from those projected. These risks include the possibility that customers may not purchase our solutions when or at the rates we expect, the possibility the foreign currency exchange rates may vary from our expectations and thereby affect our reported revenue and expense, the possibility that we may not achieve the license growth rates that we expect, which could result in a different mix of revenue between license, service and maintenance and could impact our EPS results, the possibility that our customers may not renew maintenance at historic rates and that our services business may not recover when we expect, the possibility that strategic customer wins may not generate the revenue we expect, the possibility that our strategic investments may not have the effects we expect, the possibility that we will experience a shortfall in revenue that causes us to decrease or eliminate planned strategic investments in our business or planned share repurchases and debt repayments, the possibility that we may be unable to attain or maintain a technology leadership position or that any such leadership position may not generate the revenue we expect, the possibility that planned product releases may be delayed, the possibility that we may be unable to draw upon our revolving credit facility when or to the extent we decide to do so, and the possibility that we may be unable to enter into a new credit facility. In addition, our assumptions concerning our future GAAP and non-GAAP effective income tax rates are based on estimates and other factors that could change, including the geographic mix of our revenue, expenses (including restructuring charges) and profits and loans and cash repatriations from foreign subsidiaries. Other risks and uncertainties that could cause actual results to differ materially from those projected are detailed from time to time in reports we file with the Securities and Exchange Commission, including our Annual Report on Form 10-K and our Quarterly Reports on Form 10-Q.
| PARAMETRIC TECHNOLOGY CORPORATION |
| NON-GAAP FINANCIAL MEASURES AND RECONCILIATIONS (UNAUDITED) |
| (in thousands) |
| GAAP OPERATING EXPENSES | | Q1 '08 | | | Q2 '08 | | | Q3 '08 | | | Q4 '08 | | | FY '08 | | | Q1 '09 | | | Q2 '09 | | | Q3 '09 | | | Q4 '09 | | | FY '09 | | | | Q1’10 | | | | Q2’10 | |
| Cost of license revenue | | $ | 4,805 | | | $ | 6,778 | | | $ | 8,980 | | | $ | 9,560 | | | $ | 30,123 | | | $ | 7,584 | | | $ | 6,976 | | | $ | 7,644 | | | $ | 7,758 | | | $ | 29,962 | | | $ | 8,147 | | | $ | 8,232 | |
| Cost of service revenue | | | 70,980 | | | | 73,875 | | | | 76,582 | | | | 79,226 | | | | 300,663 | | | | 75,741 | | | | 72,302 | | | | 66,162 | | | | 65,592 | | | | 279,797 | | | | 70,524 | | | | 68,934 | |
| Sales and marketing | | | 71,028 | | | | 73,359 | | | | 78,762 | | | | 83,731 | | | | 306,880 | | | | 79,862 | | | | 71,387 | | | | 73,823 | | | | 76,297 | | | | 301,369 | | | | 78,598 | | | | 75,137 | |
| Research and development | | | 41,548 | | | | 45,734 | | | | 47,374 | | | | 47,366 | | | | 182,022 | | | | 48,361 | | | | 44,752 | | | | 46,562 | | | | 48,826 | | | | 188,501 | | | | 50,690 | | | | 49,960 | |
| General and administrative | | | 23,551 | | | | 20,808 | | | | 20,294 | | | | 23,176 | | | | 87,829 | | | | 21,437 | | | | 17,693 | | | | 19,245 | | | | 22,295 | | | | 80,670 | | | | 24,071 | | | | 22,807 | |
| Amortization of acquired intangible assets | | | 2,893 | | | | 4,315 | | | | 4,044 | | | | 4,327 | | | | 15,579 | | | | 3,868 | | | | 3,815 | | | | 3,827 | | | | 4,110 | | | | 15,620 | | | | 4,058 | | | | 3,975 | |
| In-process research and development | | | 1,887 | | | | - | | | | - | | | | - | | | | 1,887 | | | | - | | | | - | | | | 300 | | | | - | | | | 300 | | | | - | | | | - | |
| Restructuring charge, net | | | 9,685 | | | | 1,892 | | | | 3,790 | | | | 4,735 | | | | 20,102 | | | | - | | | | 9,788 | | | | 6,609 | | | | 6,274 | | | | 22,671 | | | | - | | | | - | |
| GAAP Operating Expenses | | $ | 226,377 | | | $ | 226,761 | | | $ | 239,826 | | | $ | 252,121 | | | $ | 945,085 | | | $ | 236,853 | | | $ | 226,713 | | | $ | 224,172 | | | $ | 231,152 | | | $ | 918,890 | | | $ | 236,088 | | | $ | 229,045 | |
| | | | | | | | | | | | | | | | | | | | | | | | | | | | | | | | | | | | | | | | | | | | | | | | | |
| ADJUSTMENTS TO DERIVE NON-GAAP MEASURES | | Q1 '08 | | | Q2 '08 | | | Q3 '08 | | | Q4 '08 | | | FY '08 | | | Q1 '09 | | | Q2 '09 | | | Q3 '09 | | | Q4 '09 | | | FY '09 | | | | Q1’10 | | | | Q2’10 | |
| Cost of license revenue | | | | | | | | | | | | | | | | | | | | | | | | | | | | | | | | | | | | | | | | | | | | | | | | |
| Acquired intangible amortization | | $ | 2,954 | | | $ | 4,607 | | | $ | 6,289 | | | $ | 5,991 | | | $ | 19,841 | | | $ | 4,668 | | | $ | 4,703 | | | $ | 5,221 | | | $ | 5,082 | | | $ | 19,674 | | | $ | 4,898 | | | $ | 4,928 | |
| Stock-based compensation | | | - | | | | 14 | | | | 12 | | | | 12 | | | | 38 | | | | 14 | | | | 3 | | | | 11 | | | | 22 | | | | 50 | | | | 17 | | | | 2 | |
| Cost of service revenue | | | | | | | | | | | | | | | | | | | | | | | | | | | | | | | | | | | | | | | | | | | | | | | | |
| Acquired intangible amortization | | | 17 | | | | 17 | | | | 17 | | | | 16 | | | | 67 | | | | 8 | | | | - | | | | - | | | | - | | | | 8 | | | | - | | | | - | |
| Stock-based compensation | | | 2,347 | | | | 2,222 | | | | 2,298 | | | | 2,305 | | | | 9,172 | | | | 2,255 | | | | 1,291 | | | | 2,055 | | | | 2,562 | | | | 8,163 | | | | 2,580 | | | | 2,241 | |
| Sales and marketing | | | | | | | | | | | | | | | | | | | | | | | | | | | | | | | | | | | | | | | | | | | | | | | | |
| Stock-based compensation | | | 2,867 | | | | 2,936 | | | | 3,130 | | | | 3,296 | | | | 12,229 | | | | 2,908 | | | | 2,193 | | | | 3,491 | | | | 4,205 | | | | 12,797 | | | | 3,074 | | | | 3,520 | |
| Research and development | | | | | | | | | | | | | | | | | | | | | | | | | | | | | | | | | | | | | | | | | | | | | | | | |
| Stock-based compensation | | | 2,270 | | | | 2,337 | | | | 2,322 | | | | 2,500 | | | | 9,429 | | | | 2,258 | | | | 1,566 | | | | 1,986 | | | | 2,404 | | | | 8,214 | | | | 2,659 | | | | 2,383 | |
| General and administrative | | | | | | | | | | | | | | | | | | | | | | | | | | | | | | | | | | | | | | | | | | | | | | | | |
| Stock-based compensation | | | 3,119 | | | | 3,420 | | | | 3,387 | | | | 3,602 | | | | 13,528 | | | | 3,096 | | | | 1,677 | | | | 3,969 | | | | 5,362 | | | | 14,104 | | | | 5,525 | | | | 4,146 | |
| Amortization of acquired intangible assets | | | 2,893 | | | | 4,315 | | | | 4,044 | | | | 4,327 | | | | 15,579 | | | | 3,868 | | | | 3,815 | | | | 3,827 | | | | 4,110 | | | | 15,620 | | | | 4,058 | | | | 3,975 | |
| In-process research and development | | | 1,887 | | | | - | | | | - | | | | - | | | | 1,887 | | | | - | | | | - | | | | 300 | | | | - | | | | 300 | | | | - | | | | - | |
| Restructuring charge, net | | | 9,685 | | | | 1,892 | | | | 3,790 | | | | 4,735 | | | | 20,102 | | | | - | | | | 9,788 | | | | 6,609 | | | | 6,274 | | | | 22,671 | | | | - | | | | - | |
| Non-GAAP Adjustments | | $ | 28,039 | | | $ | 21,760 | | | $ | 25,289 | | | $ | 26,784 | | | $ | 101,872 | | | $ | 19,075 | | | $ | 25,036 | | | $ | 27,469 | | | $ | 30,021 | | | $ | 101,601 | | | $ | 22,811 | | | $ | 21,195 | |
| | | | | | | | | | | | | | | | | | | | | | | | | | | | | | | | | | | | | | | | | | | | | | | | | |
| | | | | | | | | | | | | | | | | | | | | | | | | | | | | | | | | | | | | | | | | | | | | | | | | |
| NON-GAAP OPERATING EXPENSES | | Q1 '08 | | | Q2 '08 | | | Q3 '08 | | | Q4 '08 | | | FY '08 | | | Q1 '09 | | | Q2 '09 | | | Q3 '09 | | | Q4 '09 | | | FY '09 | | | | Q1’10 | | | | Q2’10 | |
| Cost of license revenue | | $ | 1,851 | | | $ | 2,157 | | | $ | 2,679 | | | $ | 3,557 | | | $ | 10,244 | | | $ | 2,902 | | | $ | 2,270 | | | $ | 2,412 | | | $ | 2,654 | | | $ | 10,238 | | | $ | 3,232 | | | $ | 3,302 | |
| Cost of service revenue | | | 68,616 | | | | 71,636 | | | | 74,267 | | | | 76,905 | | | | 291,424 | | | | 73,478 | | | | 71,011 | | | | 64,107 | | | | 63,030 | | | | 271,626 | | | | 67,944 | | | | 66,693 | |
| Sales and marketing | | | 68,161 | | | | 70,423 | | | | 75,632 | | | | 80,435 | | | | 294,651 | | | | 76,954 | | | | 69,194 | | | | 70,332 | | | | 72,092 | | | | 288,572 | | | | 75,524 | | | | 71,617 | |
| Research and development | | | 39,278 | | | | 43,397 | | | | 45,052 | | | | 44,866 | | | | 172,593 | | | | 46,103 | | | | 43,186 | | | | 44,576 | | | | 46,422 | | | | 180,287 | | | | 48,031 | | | | 47,577 | |
| General and administrative | | | 20,432 | | | | 17,388 | | | | 16,907 | | | | 19,574 | | | | 74,301 | | | | 18,341 | | | | 16,016 | | | | 15,276 | | | | 16,933 | | | | 66,566 | | | | 18,546 | | | | 18,661 | |
| Amortization of acquired intangible assets | | | - | | | | - | | | | - | | | | - | | | | - | | | | - | | | | - | | | | - | | | | - | | | | - | | | | - | | | | - | |
| In-process research and development | | | - | | | | - | | | | - | | | | - | | | | - | | | | - | | | | - | | | | - | | | | - | | | | - | | | | - | | | | - | |
| Restructuring charge, net | | | - | | | | - | | | | - | | | | - | | | | - | | | | - | | | | - | | | | - | | | | - | | | | - | | | | - | | | | - | |
| Non-GAAP Operating Expenses | | $ | 198,338 | | | $ | 205,001 | | | $ | 214,537 | | | $ | 225,337 | | | $ | 843,213 | | | $ | 217,778 | | | $ | 201,677 | | | $ | 196,703 | | | $ | 201,131 | | | $ | 817,289 | | | $ | 213,277 | | | $ | 207,850 | |