Q2 FISCAL 2012 PREPARED REMARKS
Technology and market leadership, margin growth, commitment to long-term targets
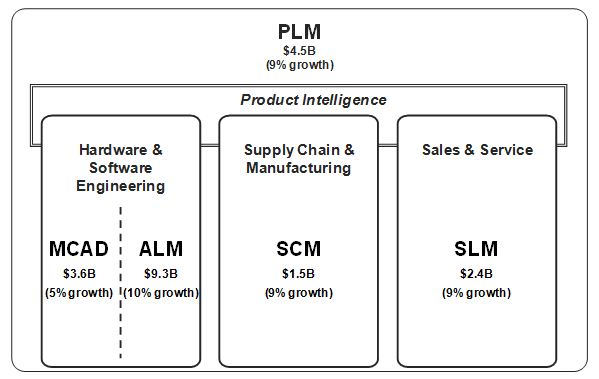
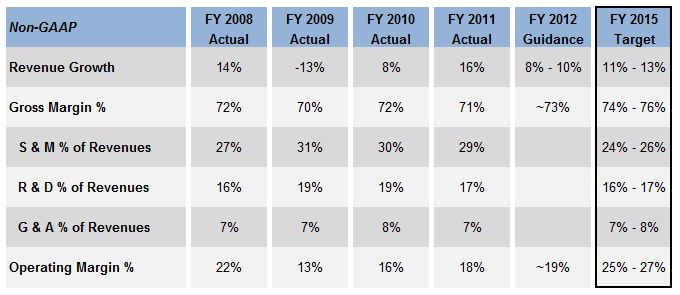
Our long-term financial goal is simple: We intend to deliver non-GAAP operating margin expansion over the next three years, reaching the 25% to 27% range in FY’15. Our goal is to deliver this result by driving revenue growth from a broad set of software solutions spanning our customers’ entire product “lifecycle” – from engineering, through supply chain and into after-market services - coupled with approximately 200bps of annual margin improvement. The table below illustrates these goals. While our Q2 results were disappointing, causing us to reduce our license revenue growth target for FY’12, we are strategically positioned in attractive growth markets and remain confident in our ability to drive long-term growth and profitability.
Our solutions are focused on the following five market segments: Mechanical CAD (MCAD), Product Lifecycle Management (PLM), Application Lifecycle Management (ALM), Services Lifecycle Management (SLM) and Supply Chain Management (SCM). We characterize the markets we participate in with the graphic below. Industry analysts estimate that four of these five markets will grow at a 9-10% CAGR from 2009 to 2014, with the more mature MCAD market growing approximately 5% over the same time frame.
Non-GAAP Supplemental Information
We provide non-GAAP supplemental information to our GAAP information. PTC's reasons for providing this information are described at the end of this document. GAAP information corresponding to the non-GAAP information provided is contained in “Q2 FY’12 Expenses Commentary and Q3 & FY’12 Outlook” below and in the attached tables. References to non-GAAP revenue for Q2’12 in the discussion that follows exclude an approximately $1 million effect of purchase accounting on the fair value of the acquired deferred maintenance balance of MKS Inc. A reconciliation to the corresponding GAAP revenue amount is provided in the revenue tables affected by the adjustment.
Q2 FY’12 Summary: Results in line with preliminary results outlook
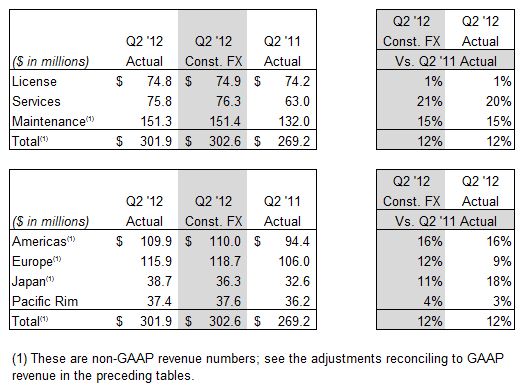
Total non-GAAP revenue for Q2 was $301.9 million (up 12% year over year on both a reported and constant currency basis). Non-GAAP revenue included $23 million from MKS and 4CS (approximately $22 million on a GAAP basis). Excluding MKS and 4CS, total non-GAAP revenue growth was 4% year over year. License revenue of $74.8 million was in line with our preliminary Q2 estimate from April 5, 2012 – up 1% year over year and down 10% on an organic basis.
We delivered non-GAAP maintenance revenue of $151.3 million (up 15% year over year, slightly ahead of our guidance) and we delivered stronger than anticipated services revenue of $75.8 million (up 20% year over year), driven primarily by continued adoption of our PLM and SLM solutions. Excluding MKS and 4CS, year over year, our maintenance and services revenues were up 7% and 12%, respectively. Importantly, we delivered solid, non-GAAP services net margins of 14%, well above our expectations for the quarter, due to an unusually favorable services mix. We now expect our non-GAAP services net margin to be approximately 10% to 11% in FY’12.
Our Q2 non-GAAP EPS of $0.30 (up 15% year over year) was slightly ahead of the preliminary estimate from April 5, 2012 of $0.26 to $0.28, due primarily to better than expected services margins and lower sales commission and bonus expense. There was no material impact to Q2 non-GAAP EPS from currency effects or the tax rate we used when we established our Q2 guidance. Our guidance for Q3 assumes $1.30 USD/EURO.
Key Points:
| 1) | License revenue of $74.8 million was below our initial guidance of $80 million to $95 million due to a large transaction in Europe that did not close and lower than expected performance in North America, particularly with respect to new large deals, resulting in year-over-year decreases in European license revenue and Americas license revenue of 6% and 4% respectively. Japan and Pacific Rim license revenue performance was solid in Q2 with growth of 17% and 9%, respectively. |
| 2) | PLM license revenue, while negatively impacted by our European and North American performance, grew in line with our longer-term growth targets on a year-over-year basis. MCAD license revenue performance was solid in the quarter, particularly in our channel, though, as expected, overall experienced a year-over-year decline due to very strong results in Q2’11. ALM (MKS) license revenue was in line with expectations. |
| 3) | We had 25 large deals (>$1M in license and services revenue) that contributed $56.4 million in revenue, flat year over year. Large deal license revenue, which typically comprises approximately 50% to 60% of total large deal revenue, was 30% in Q2’12, reflecting the lower than expected contribution from Europe and North America. |
| 4) | We ended the quarter with 346 quota-carrying reps (up 26% YoY). We plan to continue to add sales capacity to increase our overall pipeline by addressing adjacent growth opportunities within our existing customer base and targeting new customers. |
| 5) | Even with lower-than-expected license revenue in Q2, we grew our non-GAAP operating profit by 20% year over year due to diligence on operating expenses. |
| 6) | We ended Q2’12 with $224 million of cash, up from $187 million at the end of Q1’12, reflecting strong operating cash flow, $40 million used to repay our revolving credit facility and $15 million used for stock repurchases. |
| 7) | In Q2’12, as previously announced, as part of our ongoing strategy to enhance customer focus, expand our addressable market opportunities and accelerate profitability, we implemented a restructuring of our business and recorded restructuring charges of $21 million, primarily for severance and related costs associated with 168 employees notified of termination during the quarter. |
Q3 AND FY’12 OUTLOOK: Targets reflect moderated license outlook and commitment to margin expansion.
In providing guidance for Q3 and setting targets for FY’12, we are weighing company specific factors such as our pipeline of opportunities and our maintenance and services base as well as external considerations, including the macroeconomic environment, currency, and visibility into customer spending patterns. This guidance assumes a relatively stable economic environment. In addition, while our pipeline for “mega deals” (license revenue greater than $5 million) remains promising, we have been conservative when considering mega deal license contribution in our FY’12 guidance. Our Q3 license revenue guidance assumes no contribution from “mega deals”. While our full year, FY’12 license revenue target assumes some contribution from mega deals, it does not, however, assume that we will close the large European transaction that did not close in Q2.
In FY’12, we expect MKS and 4CS (acquired in Q3’11 and Q4’11 respectively) to add approximately $90 million in revenue (approximately $3 million of which is non-GAAP). We launched several initiatives in FY’11 to improve our services non-GAAP net margins to approximately 15% over the longer-term. For FY’12, we now expect non-GAAP services net margins of approximately 10% to 11% as a result of these initiatives and the strong Q2 services net margin performance. Over the long-term we expect to continue to improve services non-GAAP margins and reduce services mix through the expansion of our services partner ecosystem and solutions that fundamentally require less services.
REVENUE TRENDS
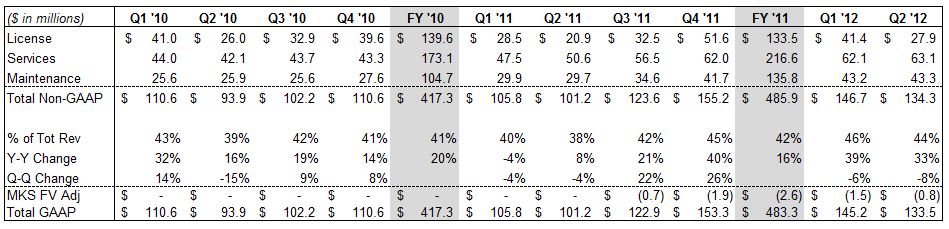
LICENSE: Results impacted by large deal activity in Europe and North America
License sales generate the highest gross margins, which are in the mid- to high 90% range on a non-GAAP basis. License revenue historically has tended to represent 28% to 33% of our total revenue in any given quarter, with Q4 generally being our strongest quarter.
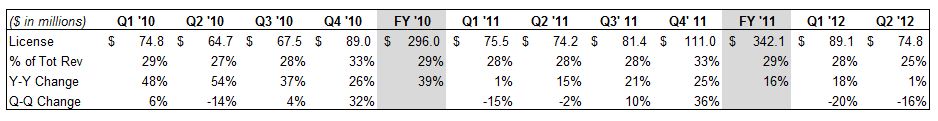
Q2 License revenue of $74.8 million was up 1% year over year (1% on a constant currency basis). Excluding MKS and 4CS, license revenue was down 10% year over year (10% on a constant currency basis). License revenue in Q2 was below our original expectations due to a large transaction in Europe that did not close and lower than expected performance in North America. License performance in our PLM segment, while negatively impacted by results in Europe and North America, grew in-line with our longer-term growth targets on a year-over-year basis. MCAD license revenue performance was solid, particularly in our channel, though, as expected, overall experienced a year-over-year decline due to very strong results in Q2’11. ALM (MKS) license revenue was in line with expectations.
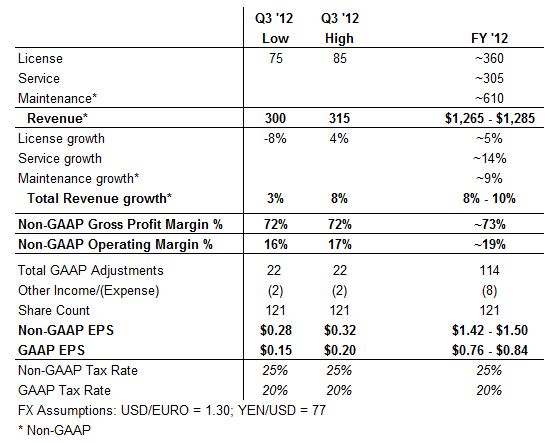
Looking forward to Q3, we are expecting license revenue of $75 to $85 million, which assumes no contribution from mega deals. For FY’12, we are expecting total license revenue growth of approximately 5% on a year-over-year basis, and organic growth of 1%. Note that while our FY’12 license guidance assumes contribution from mega deals, we have removed the large European transaction that did not close in Q2 from our forecast and have been conservative with respect to other transactions we are targeting to close in FY’12.
LARGE DEAL ACTIVITY:
Large deal activity is a significant growth driver and has historically tended to generate 20% to 25% of our total revenue in any given quarter, with the exception of Q4, which typically is at the high end. Large deal activity is driven primarily by direct sales teams. We define “large deals” as recognizing more than $1 million of license and service revenue from a customer during a quarter. License revenue typically comprises approximately 50% to 60% of the total large deal revenue each quarter.
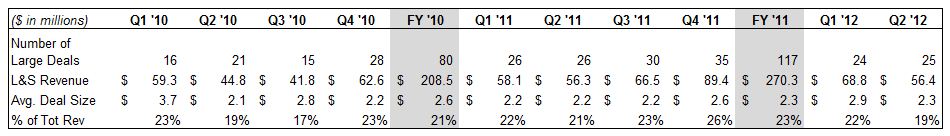
In Q2 we had 25 large deals totaling $56.4 million. 9 of these customers were in North America, 11 were in Europe and 5 were in Asia. Large deal license revenue was 30% of total large deal revenue in Q2’12, reflecting the lower than expected contribution from Europe and North America. The mix of large deal revenue was weighted more heavily towards PLM in Q2’12 compared to the mix in Q2’11 in which our MCAD business experienced strong performance. We have a strong pipeline of large deals that we are working on worldwide.
We are winning competitive deals with large global companies and are actively engaged in a substantial number of competitive opportunities with other large global companies.
SALES CAPACITY TRENDS:
A key part of our growth strategy is increasing the number of quota-carrying sales reps as we penetrate adjacent market opportunities (i.e. ALM, SLM, and SCM) within our existing customer base and target new customers. We ended the quarter with 346 quota-carrying reps, an increase of 26% year over year. The modest decline we experienced from Q1’12 to Q2’12 was due in part to the organizational re-alignment that took place during the quarter. We expect to see sequential growth going forward.
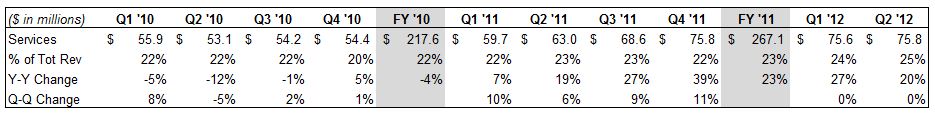
SERVICES: Strong growth demonstrates accelerating adoption of our solutions
Our services business provides significant value to our customers, helping them re-engineer their global product development business processes and implement our solutions - and providing them with training on our software. Services revenue has historically tended to represent 20% to 25% of our total revenues in any given quarter.
Q2 Services revenue of $75.8 million was up 20% year over year (up 21% on a constant currency basis), primarily due to ongoing engagements with PLM and SLM customers. Our training business, which typically represents about 15% of our total services revenue, was up 10% year over year. Our consulting business, which primarily supports Windchill implementations, was up 22% year over year. This is our 7th consecutive quarter of year-over-year services growth. We delivered solid, non-GAAP services net margin of 14% in Q2’12 (up 990 basis points from the FY’11 non-GAAP services net margin of 4%), due to an unusually favorable services mix in the quarter.
Looking forward to Q3, we are expecting services revenue to be up approximately 12% on a year-over-year basis. For FY’12 we are expecting services revenue to grow approximately 14% on a year-over-year basis. We have a solid backlog of services engagements that provides near-term visibility into our services business. With the completion of phase 1 of the Hyundai-Kia engagement in Q1’12, benefit from strategic initiatives to improve our services profitability, and our solid Q2 results, we expect to achieve services non-GAAP net margins of approximately 10% to 11% in FY’12. Over the long term we expect to continue to improve services non-GAAP margins into the mid-teens and reduce services mix through the expansion of our services ecosystem and delivery of solutions that fundamentally require less services.
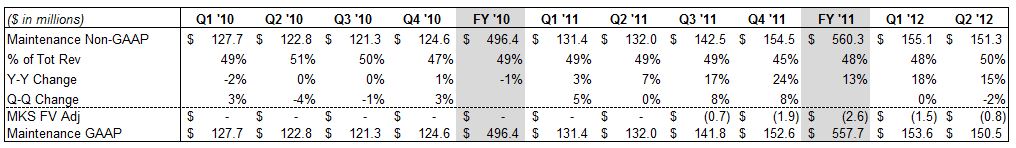
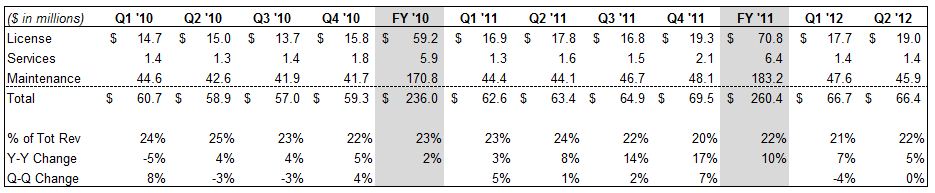
MAINTENANCE: More than 1.5 million active seats
Our maintenance business is an important barometer of customer satisfaction with our solutions. It is also a strong source of recurring revenue for PTC. Maintenance gross margins are in the mid- to high 80% range. Maintenance revenue has historically tended to represent 45% to 50% of our total revenues in any given quarter, with Q4 usually being at the low end as a percent of total revenue due to historically strong performance of license sales in that quarter.
Q2 maintenance revenue of $151.3 million was up 15% year over year (up 15% on a constant currency basis), reflecting strong execution and MKS. Excluding MKS and 4CS, maintenance revenue was up 7% year over year. We believe our maintenance business reflects a solid customer base and the importance customers attribute to our products.
Looking forward to Q3, we are expecting approximately 7% maintenance revenue growth on a year-over-year basis. For FY’12 we are expecting approximately 9% maintenance revenue growth on a year-over-year basis.
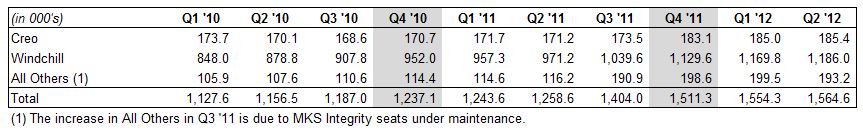
Active Maintenance Seats
We have more than 1.5 million active maintenance seats of PTC software in use today. We believe the solid base of maintenance-paying customers is a testament to the quality of our products and we also view it as one of our most important assets.
Our overall attach and renewal rates continue to remain strong.
REVENUE BY REGION
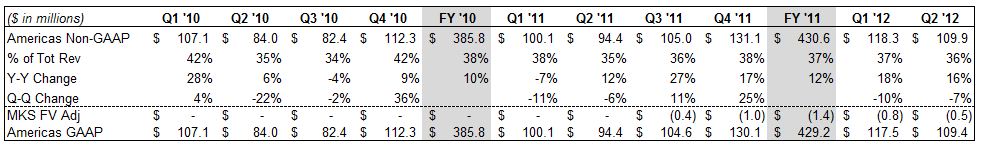
Americas:
Americas revenue in Q2 of $109.9 million was up 16% compared with last year. Q2 license revenue in the Americas was down 4% year over year, due primarily to lower than expected levels of new large deals in the quarter. Solid performance in MCAD and ALM was offset primarily by lower than expected performance in PLM. Sequentially, total revenue was down 7% and license revenue was down 36%.
Europe:
Europe revenue was $115.9 million in Q2, up 9% (12% on a constant currency basis) compared with last year. Q2 license revenue in Europe was down 6% year over year, primarily reflecting the effect of a mega deal that did not close in the quarter. Sequentially, total revenue was down 13% and license revenue was down 31%.
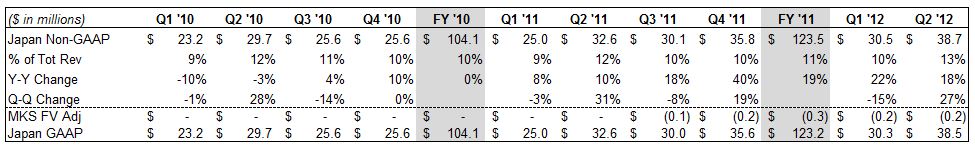
Japan:
Japan revenue was $38.7 million in Q2, up 18% (up 11% on a constant currency basis) compared with last year. Q2 license revenue in Japan was up 17% compared with last year. Sequentially, total revenue was up 27% and license revenue was up 174%.
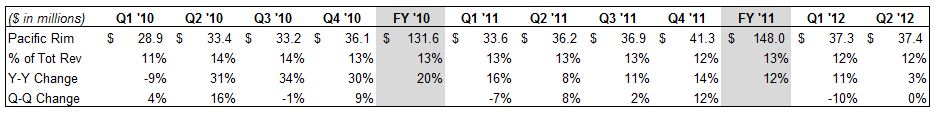
Pacific Rim:
Pacific Rim revenue was $37.4 million in Q2, up 3% (4% on a constant currency basis) compared with last year. Q2 license revenue in the Pac Rim was up 9% compared with last year. Sequentially, total revenue was flat and license revenue was up 11%. China, which represents a significant portion of our Pac Rim revenue, decreased 10% compared to Q2’11.
CURRENCY IMPACT ON RESULTS COMPARED TO THE YEAR AGO PERIOD
Because we have a global business, with Europe and Asia historically representing approximately 65% of our revenue, our results are impacted by currency fluctuations. On a constant currency basis, our revenue increased 12% year over year. Currency fluctuations unfavorably impacted Q2 GAAP and non-GAAP revenue by $0.7 million and favorably impacted Q2 GAAP and non-GAAP expenses by $1.7 million and $1.4 million, respectively, compared to Q2’11 currency rates.
Constant Currency (assumes Q2’11 currency rates)
Looking forward, the guidance we are providing assumes exchange rates of approximately 1.30 USD / EURO and 77 YEN / USD. Our actual simple average Q2 ’12 Fx rate was $1.31 USD / EURO. We do not forecast currency movements; rather we provide detailed constant currency commentary. Currency can significantly impact our results. For example, in FY ’11 and FY’10 currency was a tailwind for PTC when compared to the prior year: revenue was positively impacted by $37 million and $15 million, respectively, and non-GAAP expenses were negatively impacted by $21 million and $10 million, respectively.
As a simple rule of thumb, based on current revenue and expense levels, a $0.10 move on the USD/EURO exchange rate will impact annualized revenue by approximately $30 to $35 million and EPS by approximately $0.07 to $0.08.
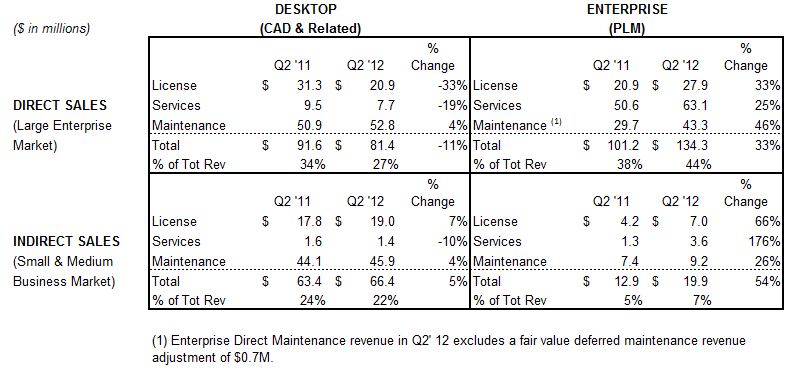
REVENUE BY 4-BOX
We historically characterized our business using the “4-Box” framework below and will provide this view of our quarterly financial results through FY’12.
Certain reclassifications between Direct and Indirect and Desktop and Enterprise revenue from previously reported results (Q1’10 through Q1’12) are reflected below. Indirect revenue is comprised of revenue from our reseller channel and from customers classified as Indirect. To the extent a customer changes between the Direct and Indirect classification, we reclassify their historical revenue to align to the current period classification. The reclassifications of prior quarter and annual Direct and Indirect and Desktop and Enterprise revenue were not more than 2% for any single quarterly or annual reporting period.
The horizontal axis highlights Desktop vs. Enterprise solutions
| · | Desktop solutions include Creo Parametric TM, Mathcad® and a portion of Creo® Elements/Direct TM and a portion of Arbortext® revenue |
| · | Enterprise solutions include Windchill®,Creo View TM, a portion of Arbortext revenue, and Integrity TM |
The vertical axis highlights Direct vs. Indirect go-to market strategies
| · | Direct sales focuses primarily on the large enterprise market |
| · | Indirect sales (primarily our VAR reseller channel) focuses primarily on the SMB market |
UPPER LEFT BOX (DIRECT SPACE / DESKTOP PRODUCTS)
UPPER RIGHT BOX (DIRECT SPACE / ENTERPRISE PRODUCTS)
LOWER LEFT BOX (INDIRECT SPACE / DESKTOP PRODUCTS)
LOWER RIGHT BOX (INDIRECT SPACE / ENTERPRISE PRODUCTS)
Q2 FY’12 EXPENSES COMMENTARY AND Q3 & FY’12 OUTLOOK
Q2 non-GAAP results exclude $12.7 million of stock-based compensation expense, $9.1 million of acquisition- related intangible asset amortization, $0.4 million of acquisition-related expenses related to MKS and 4CS, a $0.7 million fair value adjustment related to MKS deferred maintenance revenue, a $20.8 million restructuring charge and $11.4 million of income tax adjustments. The Q2 non-GAAP results include a tax rate of 25% and 121.4 million diluted shares outstanding. The Q2 GAAP results include a tax rate of 9% and 121.4 million diluted shares outstanding.
Q3’12 non-GAAP guidance excludes the following estimated expenses and their tax effects:
| · | Approximately $0.2 million of a fair value deferred maintenance revenue adjustment |
| · | Approximately $12 million of expense related to stock-based compensation |
| · | Approximately $9 million of acquisition-related intangible asset amortization expense |
FY’12 non-GAAP guidance excludes the following full-year estimated expenses and their tax effects, as well as any one-time tax items:
| · | Approximately $21 million of restructuring charge |
| · | Approximately $3 million of a fair value deferred maintenance revenue adjustment |
| · | Approximately $51 million of expense related to stock-based compensation |
| · | Approximately $36 million of acquisition-related intangible asset amortization expense |
| · | Approximately $1 million of other expense |
| · | Approximately $3 million of acquisition-related expenses |
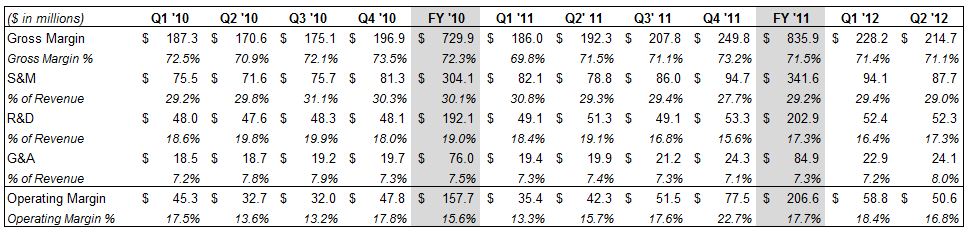
NON-GAAP OPERATING MARGINS
INCOME STATEMENT
Our Q2’12 non-GAAP gross margin was $215 million, or 71.1%, compared to $192 million, or 71.5% in the year ago period as higher services margins were offset by a less favorable revenue mix. Q2’12 GAAP gross margin was $208 million, or 69.0%, compared to $187 million, or 69.6% in Q2’11.
Our Q2’12 non-GAAP operating expenses were $164 million, up from $150 million in Q2’11, reflecting the acquisition of MKS and investments we have made in the business to add sales capacity and to improve our product portfolio.
From an operating performance perspective, we achieved 16.8% non-GAAP operating margin in Q2’12, compared to 15.7% last year. GAAP operating margin was 2.3% for Q2’12 compared to 9.0% in Q2’11.
Looking forward, we are expecting Q3‘12 non-GAAP gross margins of 72% and non-GAAP operating expenses of approximately $168 million to $172 million, reflecting primarily expenses related to increased commission expenses, annual merit increases, expenses related to our annual User Group Conference, as well as planned sales headcount hires.
For FY ‘12, we are expecting non-GAAP gross margins of approximately 73%, with non-GAAP services margins of approximately 10% to 11% and non-GAAP operating margins of approximately 19%.
Over the longer-term we intend to increase our non-GAAP operating margin to the 25% to 27% range primarily through increased efficiency in our global sales organization, improved non-GAAP gross margin (74% to 76% range) and more favorable services revenue mix.
We made significant investments in FY’09 and FY’10 that have helped us achieve a technology leadership position and have driven substantial revenue growth. In FY’12 we are continuing to invest in sales capacity to capitalize on our technology leadership position, driving revenue growth and creating further operating leverage opportunities over time. Looking forward, we expect to continue to increase our R&D investments, while having
R&D as a percentage of revenue to continue to trend toward more normalized historical levels as it did over the back half of FY’11.
TAX RATE
Q2 non-GAAP tax rate was 25%, compared to our expected rate of 25%. Our GAAP tax rate was 9% compared to our expected rate of 21%.
Looking forward, the Q3 guidance assumes a non-GAAP tax rate of 25% and a GAAP tax rate of 20%. The FY’12 target assumes a non-GAAP tax rate of 25% and a GAAP tax rate of 20%.
STOCK-BASED COMPENSATION
Expenses related to stock-based compensation were 4.2% of non-GAAP revenue in Q2 ’12, compared to 3.7% of non-GAAP revenue in Q2’11. We expect this percentage to decrease to 4.0% in FY’12. In FY’13, we expect that stock-based compensation as a percentage of non-GAAP revenue will continue to trend down annually, ultimately reaching a sustainable long-term target of 3%.
SHARE COUNT / SHARE REPURCHASE
We had 121.4 million fully diluted weighted average shares outstanding for Q2. Our Board has authorized us to repurchase up to $100 million worth of our shares in the period October 1, 2011 through September 30, 2012. We repurchased approximately 0.6 million shares for $15 million during Q2.
Looking forward, we expect to have approximately 121 million fully diluted shares outstanding for Q3 and for the full fiscal year. We intend to repurchase an additional $40 million worth of shares in the remainder of FY ‘12. Our long-term goal is to repurchase stock to offset dilution.
BALANCE SHEET: Solid cash position
CASH / CASH FLOW FROM OPERATIONS
For Q2’12, our cash balance was $224 million, up from $187 million at the end of Q1’12. We generated $96.5 million from operations in Q2. Uses of cash in the quarter included capital expenditures of $9 million, payments on debt of $40 million, and repurchases of stock of $15 million.
Looking forward, we expect to have approximately $210 million in cash at the end of Q3.
DSO
We continue to have strong DSOs of 62 days in Q2’12 compared to 63 days in Q1’12 and 60 days in Q2’11.
OUTSTANDING DEBT
At the end of Q2’12, the balance outstanding under our $300 million revolving credit facility was $160 million. As planned, we paid down $40 million in Q2, and expect to reduce the outstanding balance by an additional $30 million by the end of FY’12.
MISCELLANEOUS COMMENTS
HEADCOUNT
Total headcount was 5,981 at the end of Q2 compared to 6,110 at the end of Q1. Headcount at the end of Q2’11 was 5,395.
M&A
We view M&A primarily as a strategic vehicle to further enhance our product portfolio and growth opportunity. We intend to remain opportunistic as it relates to M&A. While we purchased MKS in Q3’11, a large transaction for us, historically, the majority of our M&A opportunities have comprised small, strategic technology tuck-ins. For example, in FY’09 we acquired Relex to expand our quality lifecycle management capabilities and Synapsis (InSight) to build out our product analytics platform, in FY’10 we acquired technology in the fast growing carbon information management market, further enhancing our product analytics platform with “green product development” capabilities, and in Q4’11 we acquired 4CS to enhance our after-market services solutions. We will evaluate other strategic acquisition opportunities of varying size as they arise.
Other Information
As previously disclosed, we have undertaken an investigation of payments by certain business partners and expenses by certain employees in China that raise questions of compliance with laws, including the Foreign Corrupt Practices Act, and/or compliance with our business policies, and we have disclosed the results of that investigation to the United States Department of Justice and the Securities and Exchange Commission. We are cooperating to provide additional information as requested. We are unable to predict the outcome of this matter, which could include fines or other sanctions. In addition, the remedial actions we are taking relating to this matter could adversely affect our revenue in China.
Important Information About Non-GAAP References
PTC provides non-GAAP supplemental information to its financial results. Non-GAAP revenue, operating expenses, margin and EPS exclude a fair value adjustment related to MKS deferred maintenance revenue, stock-based compensation expense, gain on litigation resolution, foreign currency transaction losses related to our acquisition of MKS and a litigation resolution, amortization of acquired intangible assets, acquired in-process research and development expense, acquisition-related expenses, restructuring charges, and the related tax effects of the preceding items and any one-time tax items. We use these non-GAAP measures, and we believe that they assist our investors, to make period-to-period comparisons of our operational performance because they provide a view of our operating results without items that are not, in our view, indicative of our core operating results. We believe that these non-GAAP measures help illustrate underlying trends in our business, and we use the measures to establish budgets and operational goals, communicated internally and externally, for managing our business and evaluating our performance. We believe that providing non-GAAP measures affords investors a view of our operating results that may be more easily compared to the results of peer companies. In addition, compensation of our executives is based in part on the performance of our business based on these non-GAAP measures. However, non-GAAP information should not be construed as an alternative to GAAP information as the items excluded from the non-GAAP measures often have a material impact on PTC’s financial results. Management uses, and investors should consider, non-GAAP measures in conjunction with our GAAP results.
Forward-Looking Statements
Statements in these prepared remarks that are not historic facts, including statements about our third quarter and fiscal 2012 and other future financial and growth expectations, anticipated tax rates, the expected impact of our planned strategic investments on our future success, expected market growth rates and the long-term prospects for PTC, are forward-looking statements that involve risks and uncertainties that could cause actual results to differ materially from those projected. These risks include the possibility that customers may not purchase our solutions when or at the rates we expect, the possibility the foreign currency exchange rates may vary from our expectations and thereby affect our reported revenue and expense, the possibility that we may not achieve the license, services or maintenance growth rates that we expect, which could result in a different mix of revenue between license, service and maintenance and could impact our EPS results, the possibility the
increases in sales capacity may not generate the additional sales pipeline and revenue that we expect, the possibility that our strategic investments, restructuring and realignment may not have the effects or generate the revenue growth or operating margin improvements we expect, the possibility that we may be unable to attain or maintain a technology leadership position or that any such leadership position may not generate the revenue we expect, the possibility that we may be unable to achieve our profitability targets with lower license revenue, and the possibility that new product releases and the MKS and 4CS businesses may not generate the revenues we expect. In addition, our assumptions concerning our future GAAP and non-GAAP effective income tax rates are based on estimates and other factors that could change, including the geographic mix of our revenue, expenses and profits and loans and cash repatriations from foreign subsidiaries. Other risks and uncertainties that could cause actual results to differ materially from those projected are detailed from time to time in reports we file with the Securities and Exchange Commission, including our Annual Report on Form 10-K and our Quarterly Reports on Form 10-Q.
| NON-GAAP FINANCIAL MEASURES AND RECONCILIATIONS (UNAUDITED) | |
| (in thousands) | |
| GAAP MARGINS | | | | | | | | | | | | | | | | | | | | | | | | | | | | | | |
| | | | | | | | | | | | | | | | | | | | | | | | | | | | | | | |
| | | Q1 '10 | | | | | | Q2 '10 | | | | | | Q3 '10 | | | | | | Q4 '10 | | | | | | FY '10 | | | | |
| Revenue | | $ | 258,429 | | | | | | $ | 240,556 | | | | | | $ | 242,998 | | | | | | $ | 268,066 | | | | | | $ | 1,010,049 | | | | |
| Cost of license revenue | | | 8,147 | | | | | | | 8,232 | | | | | | | 7,621 | | | | | | | 7,047 | | | | | | | 31,047 | | | | |
| Cost of service revenue | | | 70,524 | | | | | | | 68,934 | | | | | | | 67,090 | | | | | | | 70,100 | | | | | | | 276,648 | | | | |
| Gross Margin | | $ | 179,758 | | | | 69.6 | % | | $ | 163,390 | | | | 67.9 | % | | $ | 168,287 | | | | 69.3 | % | | $ | 190,919 | | | | 71.2 | % | | $ | 702,354 | | | | 69.5 | % |
| | | | | | | | | | | | | | | | | | | | | | | | | | | | | | | | | | | | | | | | | |
| Sales & marketing | | $ | 78,598 | | | | 30.4 | % | | $ | 75,137 | | | | 31.2 | % | | $ | 79,121 | | | | 32.6 | % | | $ | 84,676 | | | | 31.6 | % | | $ | 317,532 | | | | 31.4 | % |
| Research & development | | | 50,690 | | | | 19.6 | % | | | 49,960 | | | | 20.8 | % | | | 50,597 | | | | 20.8 | % | | | 50,320 | | | | 18.8 | % | | | 201,567 | | | | 20.0 | % |
| General & administrative | | | 24,071 | | | | 9.3 | % | | | 22,807 | | | | 9.5 | % | | | 22,755 | | | | 9.4 | % | | | 23,242 | | | | 8.7 | % | | | 92,875 | | | | 9.2 | % |
| Amortization of acquired intangible assets | | | 4,058 | | | | 1.6 | % | | | 3,975 | | | | 1.7 | % | | | 3,836 | | | | 1.6 | % | | | 3,736 | | | | 1.4 | % | | | 15,605 | | | | 1.5 | % |
| Restructuring charge | | | | | | | | | | | | | | | | | | | | | | | | | | | - | | | | | | | | - | | | | | |
| Operating Expenses | | $ | 157,417 | | | | 60.9 | % | | $ | 151,879 | | | | 63.1 | % | | $ | 156,309 | | | | 64.3 | % | | $ | 161,974 | | | | 60.4 | % | | $ | 627,579 | | | | 62.1 | % |
| | | | | | | | | | | | | | | | | | | | | | | | | | | | | | | | | | | | | | | | | |
| GAAP Operating Margin | | $ | 22,341 | | | | 8.6 | % | | $ | 11,511 | | | | 4.8 | % | | $ | 11,978 | | | | 4.9 | % | | $ | 28,945 | | | | 10.8 | % | | $ | 74,775 | | | | 7.4 | % |
| | | | | | | | | | | | | | | | | | | | | | | | | | | | | | | | | | | | | | | | | |
| | | | | | | | | | | | | | | | | | | | | | | | | | | | | | | | | | | | | | | | | |
| ADJUSTMENTS TO DERIVE NON-GAAP MEASURES | | | | | | | | | | | | | |
| | | | | | | | | | | | | | | | | | | | | | | | | | | | | | | | | | | | | | | | | |
| | | Q1 '10 | | | | | | | Q2 '10 | | | | | | | Q3 '10 | | | | | | | Q4 '10 | | | | | | | FY '10 | | | | | |
| Revenue: | | | | | | | | | | | | | | | | | | | | | | | | | | | | | | | | | | | | | | | | |
| Fair value of deferred revenue | | $ | - | | | | 0.0 | % | | $ | - | | | | 0.0 | % | | $ | - | | | | 0.0 | % | | $ | - | | | | 0.0 | % | | $ | - | | | | 0.0 | % |
| Cost of license revenue: | | | | | | | | | | | | | | | | | | | | | | | | | | | | | | | | | | | | | |
| Acquired intangible amortization | | | 4,898 | | | | 1.9 | % | | | 4,928 | | | | 2.0 | % | | | 4,659 | | | | 1.9 | % | | | 3,882 | | | | 1.4 | % | | | 18,367 | | | | 1.8 | % |
| Stock-based compensation | | | 17 | | | | 0.0 | % | | | 2 | | | | 0.0 | % | | | 2 | | | | 0.0 | % | | | 3 | | | | 0.0 | % | | | 24 | | | | 0.0 | % |
| Cost of service revenue: | | | | | | | | | | | | | | | | | | | | | | | | | | | | | | | | | | | | | |
| Stock-based compensation | | | 2,580 | | | | 1.0 | % | | | 2,241 | | | | 0.9 | % | | | 2,186 | | | | 0.9 | % | | | 2,115 | | | | 0.8 | % | | | 9,122 | | | | 0.9 | % |
| Sales & marketing: | | | | | | | | | | | | | | | | | | | | | | | | | | | | | | | | | | | | | | | | |
| Stock-based compensation | | | 3,074 | | | | 1.2 | % | | | 3,520 | | | | 1.5 | % | | | 3,471 | | | | 1.4 | % | | | 3,367 | | | | 1.3 | % | | | 13,432 | | | | 1.3 | % |
| Research & development: | | | | | | | | | | | | | | | | | | | | | | | | | | | | | | | | | | | | | |
| Stock-based compensation | | | 2,659 | | | | 1.0 | % | | | 2,383 | | | | 1.0 | % | | | 2,252 | | | | 0.9 | % | | | 2,186 | | | | 0.8 | % | | | 9,480 | | | | 0.9 | % |
| General & administrative: | | | | | | | | | | | | | | | | | | | | | | | | | | | | | | | | | | | | | |
| Stock-based compensation | | | 5,525 | | | | 2.1 | % | | | 4,146 | | | | 1.7 | % | | | 3,599 | | | | 1.5 | % | | | 3,583 | | | | 1.3 | % | | | 16,853 | | | | 1.7 | % |
| Acquisition-related costs | | | - | | | | 0.0 | % | | | - | | | | 0.0 | % | | | - | | | | 0.0 | % | | | - | | | | 0.0 | % | | | - | | | | 0.0 | % |
| Amortization of acquired intangible assets | | | 4,058 | | | | 1.6 | % | | | 3,975 | | | | 1.7 | % | | | 3,836 | | | | 1.6 | % | | | 3,736 | | | | 1.4 | % | | | 15,605 | | | | 1.5 | % |
| Restructuring charge | | | | | | | | | | | | | | | | | | | | | | | | | | | - | | | | | | | | - | | | | | |
| Non-GAAP adjustments | | $ | 22,811 | | | | 8.8 | % | | $ | 21,195 | | | | 8.8 | % | | $ | 20,005 | | | | 8.2 | % | | $ | 18,872 | | | | 7.0 | % | | $ | 82,883 | | | | 8.2 | % |
| | | | | | | | | | | | | | | | | | | | | | | | | | | | | | | | | | | | | | | | | |
| NON-GAAP MARGINS | | | | | | | | | | | | | | | | | | | | | | | | | | | | | | | | | | | | | |
| | | Q1 '10 | | | | | | | Q2 '10 | | | | | | | Q3 '10 | | | | | | | Q4 '10 | | | | | | | FY '10 | | | | | |
| Revenue | | $ | 258,429 | | | | | | | $ | 240,556 | | | | | | | $ | 242,998 | | | | | | | $ | 268,066 | | | | | | | $ | 1,010,049 | | | | | |
| Cost of license revenue | | | 3,232 | | | | | | | | 3,302 | | | | | | | | 2,960 | | | | | | | | 3,162 | | | | | | | | 12,656 | | | | | |
| Cost of service revenue | | | 67,944 | | | | | | | | 66,693 | | | | | | | | 64,904 | | | | | | | | 67,985 | | | | | | | | 267,526 | | | | | |
| Gross Margin | | $ | 187,253 | | | | 72.5 | % | | $ | 170,561 | | | | 70.9 | % | | $ | 175,134 | | | | 72.1 | % | | $ | 196,919 | | | | 73.5 | % | | $ | 729,867 | | | | 72.3 | % |
| | | | | | | | | | | | | | | | | | | | | | | | | | | | | | | | | | | | | | | | | |
| Sales & marketing | | $ | 75,524 | | | | 29.2 | % | | $ | 71,617 | | | | 29.8 | % | | $ | 75,650 | | | | 31.1 | % | | $ | 81,309 | | | | 30.3 | % | | $ | 304,100 | | | | 30.1 | % |
| Research & development | | | 48,031 | | | | 18.6 | % | | | 47,577 | | | | 19.8 | % | | | 48,345 | | | | 19.9 | % | | | 48,134 | | | | 18.0 | % | | | 192,087 | | | | 19.0 | % |
| General & administrative | | | 18,546 | | | | 7.2 | % | | | 18,661 | | | | 7.8 | % | | | 19,156 | | | | 7.9 | % | | | 19,659 | | | | 7.3 | % | | | 76,022 | | | | 7.5 | % |
| Amortization of acquired intangible assets | | | - | | | | 0.0 | % | | | - | | | | 0.0 | % | | | - | | | | 0.0 | % | | | - | | | | 0.0 | % | | | - | | | | 0.0 | % |
| Restructuirng charge | | | - | | | | 0.0 | % | | | - | | | | 0.0 | % | | | - | | | | 0.0 | % | | | - | | | | 0.0 | % | | | - | | | | 0.0 | % |
| Operating Expenses | | $ | 142,101 | | | | 55.0 | % | | $ | 137,855 | | | | 57.3 | % | | $ | 143,151 | | | | 58.9 | % | | $ | 149,102 | | | | 55.6 | % | | $ | 572,209 | | | | 56.7 | % |
| | | | | | | | | | | | | | | | | | | | | | | | | | | | | | | | | | | | | | | | | |
| Non-GAAP Operating Margin | | $ | 45,152 | | | | 17.5 | % | | $ | 32,706 | | | | 13.6 | % | | $ | 31,983 | | | | 13.2 | % | | $ | 47,817 | | | | 17.8 | % | | $ | 157,658 | | | | 15.6 | % |
| | | | | | | | | | | | | | | | | | | | | | | | | | | | | | | | | | | | | | | | | |
| NON-GAAP FINANCIAL MEASURES AND RECONCILIATIONS (UNAUDITED) | |
| (in thousands) | |
| GAAP MARGINS | | | | | | | | | | | | | | | | | | | | | | | | | | | | | | | | | | | | | | | | | | |
| | | | | | | | | | | | | | | | | | | | | | | | | | | | | | | | | | | | | | | | | | | |
| | | Q1 '11 | | | | | | Q2 '11 | | | | | | Q3 '11 | | | | | | Q4 '11 | | | | | | FY '11 | | | | | | Q1 '12 | | | | | | Q2 '12 | | | | |
| Revenue | | $ | 266,552 | | | | | | $ | 269,189 | | | | | | $ | 291,783 | | | | | | $ | 339,425 | | | | | | $ | 1,166,949 | | | | | | $ | 318,276 | | | | | | $ | 301,125 | | | | |
| Cost of license revenue | | | 5,954 | | | | | | | 6,558 | | | | | | | 7,617 | | | | | | | 8,663 | | | | | | | 28,792 | | | | | | | 7,659 | | | | | | | 7,824 | | | | |
| Cost of service revenue | | | 80,107 | | | | | | | 75,213 | | | | | | | 82,792 | | | | | | | 89,864 | | | | | | | 327,976 | | | | | | | 90,560 | | | | | | | 85,392 | | | | |
| Gross Margin | | $ | 180,491 | | | | 67.7 | % | | $ | 187,418 | | | | 69.6 | % | | $ | 201,374 | | | | 69.0 | % | | $ | 240,898 | | | | 71.0 | % | | $ | 810,181 | | | | 69.4 | % | | $ | 220,057 | | | | 69.1 | % | | $ | 207,909 | | | | 69.0 | % |
| | | | | | | | | | | | | | | | | | | | | | | | | | | | | | | | | | | | | | | | | | | | | | | | | | | | | | | | | |
| Sales & marketing | | $ | 84,521 | | | | 31.7 | % | | $ | 81,163 | | | | 30.2 | % | | $ | 89,106 | | | | 30.5 | % | | $ | 98,261 | | | | 28.9 | % | | $ | 353,051 | | | | 30.3 | % | | $ | 97,778 | | | | 30.7 | % | | $ | 90,962 | | | | 30.2 | % |
| Research & development | | | 51,522 | | | | 19.3 | % | | | 53,051 | | | | 19.7 | % | | | 51,103 | | | | 17.5 | % | | | 55,730 | | | | 16.4 | % | | | 211,406 | | | | 18.1 | % | | | 54,993 | | | | 17.3 | % | | | 54,576 | | | | 18.1 | % |
| General & administrative | | | 23,484 | | | | 8.8 | % | | | 24,712 | | | | 9.2 | % | | | 31,882 | | | | 10.9 | % | | | 30,213 | | | | 8.9 | % | | | 110,291 | | | | 9.5 | % | | | 29,572 | | | | 9.3 | % | | | 29,534 | | | | 9.8 | % |
| Amortization of acquired intangible assets | | | 3,854 | | | | 1.4 | % | | | 4,266 | | | | 1.6 | % | | | 4,753 | | | | 1.6 | % | | | 5,446 | | | | 1.6 | % | | | 18,319 | | | | 1.6 | % | | | 5,209 | | | | 1.6 | % | | | 5,132 | | | | 1.7 | % |
| Restructuring charge | | | - | | | | | | | | - | | | | | | | | - | | | | | | | | - | | | | | | | | - | | | | | | | | - | | | | 0.0 | % | | | 20,802 | | | | 6.9 | % |
| Operating Expenses | | $ | 163,381 | | | | 61.3 | % | | $ | 163,192 | | | | 60.6 | % | | $ | 176,844 | | | | 60.6 | % | | $ | 189,650 | | | | 55.9 | % | | $ | 693,067 | | | | 59.4 | % | | $ | 187,552 | | | | 58.9 | % | | $ | 201,006 | | | | 66.8 | % |
| | | | | | | | | | | | | | | | | | | | | | | | | | | | | | | | | | | | | | | | | | | | | | | | | | | | | | | | | |
| GAAP Operating Margin | | $ | 17,110 | | | | 6.4 | % | | $ | 24,226 | | | | 9.0 | % | | $ | 24,530 | | | | 8.4 | % | | $ | 51,248 | | | | 15.1 | % | | $ | 117,114 | | | | 10.0 | % | | $ | 32,505 | | | | 10.2 | % | | $ | 6,903 | | | | 2.3 | % |
| | | | | | | | | | | | | | | | | | | | | | | | | | | | | | | | | | | | | | | | | | | | | | | | | | | | | | | | | |
| | | | | | | | | | | | | | | | | | | | | | | | | | | | | | | | | | | | | | | | | | | | | | | | | | | | | | | | | |
| ADJUSTMENTS TO DERIVE NON-GAAP MEASURES | | | | | | | | | | | | | | | | | | | | | | | | | | | | | | | | | | | | | | | | | | | | | | | | | | | | | |
| | | | | | | | | | | | | | | | | | | | | | | | | | | | | | | | | | | | | | | | | | | | | | | | | | | | | | | | | |
| | | Q1 '11 | | | | | | | Q2 '11 | | | | | | | Q3 '11 | | | | | | | Q4 '11 | | | | | | | FY '11 | | | | | | | Q1 '12 | | | | | | | Q2 '12 | | | | | |
| Revenue: | | | | | | | | | | | | | | | | | | | | | | | | | | | | | | | | | | | | | | | | | | | | | | | | | | | | | | | | |
| Fair value of deferred revenue | | $ | - | | | | 0.0 | % | | $ | - | | | | 0.0 | % | | $ | 693 | | | | 0.2 | % | | $ | 1,913 | | | | 0.6 | % | | $ | 2,606 | | | | 0.2 | % | | $ | 1,522 | | | | 0.5 | % | | $ | 736 | | | | 0.2 | % |
| Cost of license revenue: | | | | | | | | | | | | | | | | | | | | | | | | | | | | | | | | | | | | | | | | | | | | | | | | | | | | | | | | |
| Acquired intangible amortization | | | 3,363 | | | | 1.3 | % | | | 3,339 | | | | 1.2 | % | | | 3,895 | | | | 1.3 | % | | | 4,796 | | | | 1.4 | % | | | 15,393 | | | | 1.3 | % | | | 4,103 | | | | 1.3 | % | | | 3,931 | | | | 1.3 | % |
| Stock-based compensation | | | 3 | | | | 0.0 | % | | | 3 | | | | 0.0 | % | | | 4 | | | | 0.0 | % | | | 5 | | | | 0.0 | % | | | 15 | | | | 0.0 | % | | | 5 | | | | 0.0 | % | | | 7 | | | | 0.0 | % |
| Cost of service revenue: | | | | | | | | | | | | | | | | | | | | | | | | | | | | | | | | | | | | | | | | | | | | | | | | | | | | | | | | |
| Stock-based compensation | | | 2,137 | | | | 0.8 | % | | | 1,583 | | | | 0.6 | % | | | 1,857 | | | | 0.6 | % | | | 2,155 | | | | 0.6 | % | | | 7,732 | | | | 0.7 | % | | | 2,513 | | | | 0.8 | % | | | 2,171 | | | | 0.7 | % |
| Sales & marketing: | | | | | | | | | | | | | | | | | | | | | | | | | | | | | | | | | | | | | | | | | | | | | | | | | | | | | | | | |
| Stock-based compensation | | | 2,429 | | | | 0.9 | % | | | 2,350 | | | | 0.9 | % | | | 3,062 | | | | 1.0 | % | | | 3,587 | | | | 1.1 | % | | | 11,428 | | | | 1.0 | % | | | 3,728 | | | | 1.2 | % | | | 3,306 | | | | 1.1 | % |
| Research & development: | | | | | | | | | | | | | | | | | | | | | | | | | | | | | | | | | | | | | | | | | | | | | | | | | | | | | | | | |
| Stock-based compensation | | | 2,393 | | | | 0.9 | % | | | 1,749 | | | | 0.6 | % | | | 2,010 | | | | 0.7 | % | | | 2,395 | | | | 0.7 | % | | | 8,547 | | | | 0.7 | % | | | 2,549 | | | | 0.8 | % | | | 2,240 | | | | 0.7 | % |
| General & administrative: | | | | | | | | | | | | | | | | | | | | | | | | | | | | | | | | | | | | | | | | | | | | | | | | | | | | | | | | |
| Stock-based compensation | | | 4,065 | | | | 1.5 | % | | | 4,186 | | | | 1.6 | % | | | 4,627 | | | | 1.6 | % | | | 4,802 | | | | 1.4 | % | | | 17,680 | | | | 1.5 | % | | | 4,587 | | | | 1.4 | % | | | 4,968 | | | | 1.6 | % |
| Acquisition-related costs | | | - | | | | 0.0 | % | | | 608 | | | | 0.2 | % | | | 6,041 | | | | 2.1 | % | | | 1,112 | | | | 0.3 | % | | | 7,761 | | | | 0.7 | % | | | 2,068 | | | | 0.6 | % | | | 444 | | | | 0.1 | % |
| Amortization of acquired intangible assets | | | 3,854 | | | | 1.4 | % | | | 4,266 | | | | 1.6 | % | | | 4,753 | | | | 1.6 | % | | | 5,446 | | | | 1.6 | % | | | 18,319 | | | | 1.6 | % | | | 5,209 | | | | 1.6 | % | | | 5,132 | | | | 1.7 | % |
| Restructuring charge | | | - | | | | | | | | - | | | | | | | | - | | | | | | | | - | | | | | | | | - | | | | | | | | - | | | | 0.0 | % | | | 20,802 | | | | 6.9 | % |
| Non-GAAP adjustments | | $ | 18,244 | | | | 6.8 | % | | $ | 18,084 | | | | 6.7 | % | | $ | 26,942 | | | | 9.2 | % | | $ | 26,211 | | | | 7.7 | % | | $ | 89,481 | | | | 7.7 | % | | $ | 26,284 | | | | 8.3 | % | | $ | 43,737 | | | | 14.5 | % |
| | | | | | | | | | | | | | | | | | | | | | | | | | | | | | | | | | | | | | | | | | | | | | | | | | | | | | | | | |
| NON-GAAP MARGINS | | | | | | | | | | | | | | | | | | | | | | | | | | | | | | | | | | | | | | | | | | | | | | | | | | | | | | | | |
| | | Q1 '11 | | | | | | | Q2 '11 | | | | | | | Q3 '11 | | | | | | | Q4 '11 | | | | | | | FY '11 | | | | | | | Q1 '12 | | | | | | | Q2 '12 | | | | | |
| Revenue | | $ | 266,552 | | | | | | | $ | 269,189 | | | | | | | $ | 292,476 | | | | | | | $ | 341,338 | | | | | | | $ | 1,169,555 | | | | | | | $ | 319,798 | | | | | | | $ | 301,861 | | | | | |
| Cost of license revenue | | | 2,588 | | | | | | | | 3,216 | | | | | | | | 3,718 | | | | | | | | 3,862 | | | | | | | | 13,384 | | | | | | | | 3,551 | | | | | | | | 3,886 | | | | | |
| Cost of service revenue | | | 77,970 | | | | | | | | 73,630 | | | | | | | | 80,935 | | | | | | | | 87,709 | | | | | | | | 320,244 | | | | | | | | 88,047 | | | | | | | | 83,221 | | | | | |
| Gross Margin | | $ | 185,994 | | | | 69.8 | % | | $ | 192,343 | | | | 71.5 | % | | $ | 207,823 | | | | 71.1 | % | | $ | 249,767 | | | | 73.2 | % | | $ | 835,927 | | | | 71.5 | % | | $ | 228,200 | | | | 71.4 | % | | $ | 214,754 | | | | 71.1 | % |
| | | | | | | | | | | | | | | | | | | | | | | | | | | | | | | | | | | | | | | | | | | | | | | | | | | | | | | | | |
| Sales & marketing | | $ | 82,092 | | | | 30.8 | % | | $ | 78,813 | | | | 29.3 | % | | $ | 86,044 | | | | 29.4 | % | | $ | 94,674 | | | | 27.7 | % | | $ | 341,623 | | | | 29.2 | % | | $ | 94,050 | | | | 29.4 | % | | $ | 87,656 | | | | 29.0 | % |
| Research & development | | | 49,129 | | | | 18.4 | % | | | 51,302 | | | | 19.1 | % | | | 49,093 | | | | 16.8 | % | | | 53,335 | | | | 15.6 | % | | | 202,859 | | | | 17.3 | % | | | 52,444 | | | | 16.4 | % | | | 52,336 | | | | 17.3 | % |
| General & administrative | | | 19,419 | | | | 7.3 | % | | | 19,918 | | | | 7.4 | % | | | 21,214 | | | | 7.3 | % | | | 24,299 | | | | 7.1 | % | | | 84,850 | | | | 7.3 | % | | | 22,917 | | | | 7.2 | % | | | 24,122 | | | | 8.0 | % |
| Amortization of acquired intangible assets | | | - | | | | 0.0 | % | | | - | | | | 0.0 | % | | | - | | | | 0.0 | % | | | - | | | | 0.0 | % | | | - | | | | 0.0 | % | | | - | | | | 0.0 | % | | | - | | | | 0.0 | % |
| Restructuirng charge | | | - | | | | 0.0 | % | | | - | | | | 0.0 | % | | | - | | | | 0.0 | % | | | - | | | | 0.0 | % | | | - | | | | 0.0 | % | | | - | | | | 0.0 | % | | | - | | | | 0.0 | % |
| Operating Expenses | | $ | 150,640 | | | | 56.5 | % | | $ | 150,033 | | | | 55.7 | % | | $ | 156,351 | | | | 53.5 | % | | $ | 172,308 | | | | 50.5 | % | | $ | 629,332 | | | | 53.8 | % | | $ | 169,411 | | | | 53.0 | % | | $ | 164,114 | | | | 54.4 | % |
| | | | | | | | | | | | | | | | | | | | | | | | | | | | | | | | | | | | | | | | | | | | | | | | | | | | | | | | | |
| Non-GAAP Operating Margin | | $ | 35,354 | | | | 13.3 | % | | $ | 42,310 | | | | 15.7 | % | | $ | 51,472 | | | | 17.6 | % | | $ | 77,459 | | | | 22.7 | % | | $ | 206,595 | | | | 17.7 | % | | $ | 58,789 | | | | 18.4 | % | | $ | 50,640 | | | | 16.8 | % |
| | | | | | | | | | | | | | | | | | | | | | | | | | | | | | | | | | | | | | | | | | | | | | | | | | | | | | | | | |
| PARAMETRIC TECHNOLOGY CORPORATION | |
| NON-GAAP FINANCIAL MEASURES AND RECONCILIATIONS (UNAUDITED) | |
| (in thousands, except per share data) | |
| | | | | | | | | | | | | | | | |
| | | | | | Three Months Ended | | | Six Months Ended | |
| | | | | | March 31, | | | April 2, | | | March 31, | | | April 2, | |
| | | | | | 2012 | | | 2011 | | | 2012 | | | 2011 | |
| | | | | | | | | | | | | | | | |
| GAAP revenue | | $ | 301,125 | | | $ | 269,189 | | | $ | 619,401 | | | $ | 535,741 | |
| | Fair value of acquired MKS deferred maintenance | | | | | | | | | | | | | |
| | | revenue | | | 736 | | | | - | | | | 2,258 | | | | - | |
| Non-GAAP revenue | | $ | 301,861 | | | $ | 269,189 | | | $ | 621,659 | | | $ | 535,741 | |
| | | | | | | | | | | | | | | | | | | | |
| GAAP gross margin | | $ | 207,909 | | | $ | 187,418 | | | $ | 427,966 | | | $ | 367,909 | |
| | Fair value of acquired MKS deferred maintenance | | | | | | | | | | | | | |
| | | revenue | | | 736 | | | | - | | | | 2,258 | | | | - | |
| | Stock-based compensation | | | 2,178 | | | | 1,586 | | | | 4,696 | | | | 3,726 | |
| | Amortization of acquired intangible assets | | | | | | | | | | | | | |
| | | included in cost of license revenue | | | 3,931 | | | | 3,339 | | | | 8,034 | | | | 6,702 | |
| Non-GAAP gross margin | | $ | 214,754 | | | $ | 192,343 | | | $ | 442,954 | | | $ | 378,337 | |
| | | | | | | | | | | | | | | | | | | | |
| GAAP operating income | | $ | 6,903 | | | $ | 24,226 | | | $ | 39,408 | | | $ | 41,336 | |
| | Fair value of acquired MKS deferred maintenance | | | | | | | | | | | | | |
| | | revenue | | | 736 | | | | - | | | | 2,258 | | | | - | |
| | Stock-based compensation | | | 12,692 | | | | 9,871 | | | | 26,074 | | | | 20,898 | |
| | Amortization of acquired intangible assets | | | | | | | | | | | | | |
| | | included in cost of license revenue | | | 3,931 | | | | 3,339 | | | | 8,034 | | | | 6,702 | |
| | Amortization of acquired intangible assets | | | 5,132 | | | | 4,266 | | | | 10,341 | | | | 8,120 | |
| | Acquisition-related charges included in | | | | | | | | | | | | | |
| | | general and administrative expenses | | | 444 | | | | 608 | | | | 2,512 | | | | 608 | |
| | Restructuring charges | | | 20,802 | | | | - | | | | 20,802 | | | | - | |
Non-GAAP operating income (1) | | $ | 50,640 | | | $ | 42,310 | | | $ | 109,429 | | | $ | 77,664 | |
| | | | | | | | | | | | | | | | | | | | |
| GAAP net income | | $ | 3,569 | | | $ | 19,017 | | | $ | 25,692 | | | $ | 32,277 | |
| | Fair value of acquired MKS deferred maintenance | | | | | | | | | | | | | |
| | | revenue | | | 736 | | | | - | | | | 2,258 | | | | - | |
| | Stock-based compensation | | | 12,692 | | | | 9,871 | | | | 26,074 | | | | 20,898 | |
| | Amortization of acquired intangible assets | | | | | | | | | | | | | |
| | | included in cost of license revenue | | | 3,931 | | | | 3,339 | | | | 8,034 | | | | 6,702 | |
| | Amortization of acquired intangible assets | | | 5,132 | | | | 4,266 | | | | 10,341 | | | | 8,120 | |
| | Acquisition-related charges included in | | | | | | | | | | | | | |
| | | general and administrative expenses | | | 444 | | | | 608 | | | | 2,512 | | | | 608 | |
| | Restructuring charges | | | 20,802 | | | | - | | | | 20,802 | | | | - | |
| | Non-operating foreign currency transaction loss (2) | | | - | | | | - | | | | 761 | | | | 722 | |
| | Income tax adjustments (3) | | | (11,412 | ) | | | (5,848 | ) | | | (18,090 | ) | | | (11,658 | ) |
| Non-GAAP net income | | $ | 35,894 | | | $ | 31,253 | | | $ | 78,384 | | | $ | 57,669 | |
| | | | | | | | | | | | | | | | | | | | |
| GAAP diluted earnings per share | | $ | 0.03 | | | $ | 0.16 | | | $ | 0.21 | | | $ | 0.27 | |
| | Stock-based compensation | | | 0.10 | | | | 0.08 | | | | 0.22 | | | | 0.17 | |
| | Amortization of acquired intangibles | | | 0.07 | | | | 0.06 | | | | 0.15 | | | | 0.12 | |
| | Acquisition-related charge | | | - | | | | 0.01 | | | | 0.02 | | | | 0.01 | |
| | Restructuring charges | | | 0.17 | | | | - | | | | 0.17 | | | | - | |
| | Income tax adjustments | | | (0.09 | ) | | | (0.05 | ) | | | (0.15 | ) | | | (0.10 | ) |
| | All other items identified above | | | 0.02 | | | | - | | | | 0.03 | | | | 0.01 | |
| Non-GAAP diluted earnings per share | | $ | 0.30 | | | $ | 0.26 | | | $ | 0.65 | | | $ | 0.48 | |
| | | | | | | | | | | | | | | | | | | | |
| | | (1 | ) | Operating margin impact of non-GAAP adjustments: | | | | | | | | | | | | | |
| | | | | | | Three Months Ended | | | Six Months Ended | |
| | | | | | | March 31, | | | April 2, | | | March 31, | | | April 2, | |
| | | | | | | | 2012 | | | | 2011 | | | | 2012 | | | | 2011 | |
| | GAAP operating margin | | | 2.3 | % | | | 9.0 | % | | | 6.4 | % | | | 7.7 | % |
| | | | | Fair value of deferred maintenance revenue | | | 0.2 | % | | | 0.0 | % | | | 0.4 | % | | | 0.0 | % |
| | | | | Stock-based compensation | | | 4.2 | % | | | 3.7 | % | | | 4.2 | % | | | 3.9 | % |
| | | | | Amortization of acquired intangibles | | | 3.0 | % | | | 2.8 | % | | | 3.0 | % | | | 2.8 | % |
| | | | | Acquisition-related charges | | | 0.1 | % | | | 0.2 | % | | | 0.4 | % | | | 0.1 | % |
| | | | | Restructuring charges | | | 6.9 | % | | | 0.0 | % | | | 3.4 | % | | | 0.0 | % |
| | Non-GAAP operating margin | | | 16.8 | % | | | 15.7 | % | | | 17.6 | % | | | 14.5 | % |
| | | | | | | | | | | | | | | | | | | | | |
| | | (2 | ) | In the first quarter of 2012 we recorded $0.8 million of foreign currency transaction losses related to MKS legal entity mergers completed during the quarter. In the first quarter of 2011 we recorded $0.7 million of foreign currency losses related to a previously announced litigation settlement in Japan. | |
| | | | | | | | | | | | | | | | | | | | | |
| | | (3 | ) | Reflects the tax effects of non-GAAP adjustments for the three and six months ended March 31, 2012 and April 2, 2011, which are calculated by applying the applicable tax rate by jurisdiction to the non-GAAP adjustments listed above, as well as a one-time non-cash charge of $1.4 million related to the impact from a reduction in the statutory tax rate in Japan on deferred tax assets from a litigation settlement recorded in the first quarter of 2012. | |
| | | | | | | | | | | | | | | | | | | | | |