Q3 FISCAL 2013 PREPARED REMARKS
Technology and market leadership, margin growth, commitment to long-term targets
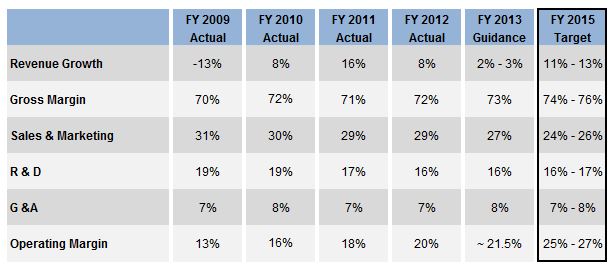
Our long-term financial goal is simple: We intend to deliver non-GAAP operating margin expansion, reaching the 25% to 27% range in FY’15. We plan to achieve this goal through a combination of revenue growth from a broad set of software solutions spanning our customers’ entire product “lifecycle” and cost efficiencies within our operating model. The table below illustrates these goals. Given the continued slowdown within the global manufacturing industry (for reference see http://investor.ptc.com), which impacted license revenue results over the last few quarters, headwinds from unfavorable currency movements (particularly the JPY), and the continued soft macroeconomic environment (particularly in Europe and China), we believe it is prudent to provide guidance that reflects moderated revenue growth for FY’13. Accordingly, we are now targeting FY’13 non-GAAP revenues of approximately $1,280 to $1,290 million. We are also narrowing our FY’13 non-GAAP EPS guidance to $1.72 to $1.77 reflecting our vigilance on cost controls and commitment to profitability despite a softer revenue expectation. While we are tempering our near-term revenue outlook, we saw a strengthening in our pipeline, which we view as a positive sign for the longer-term as this pipeline matures over the coming quarters. We believe that as the economic backdrop improves, we will be well positioned to re-accelerate our revenue growth.
The company is focused on the following five markets: Computer Aided Design (CAD), Product Lifecycle Management (PLM), Application Lifecycle Management (ALM), Supply Chain Management (SCM), and Services Lifecycle Management (SLM). We characterize the markets we participate in with the graphic below. The graphic depicts PTC’s addressable market with market size and growth estimates from industry analysts. Industry analysts estimate that four of these five markets will grow at a 9-11% CAGR from 2010 to 2015, with the more mature CAD market growing approximately 6% over the same time frame.
Beginning in Q1’13, we began providing additional revenue disclosure that we believe provides valuable insight into how our business is performing within the markets we serve. Along with line of business, geographic and large deal metrics, we are reporting revenue in three solution areas: CAD, SLM and “Extended PLM”, which
encompasses our PLM, ALM and SCM businesses. Each of these solution areas serves a market with unique secular and cyclical dynamics, growth rates, and “buyers” within our customer base.
Revenue from product families is mapped to the following areas:
| · | CAD: PTC Creo® and PTC Mathcad® |
| · | Extended PLM: PTC Windchill® and PTC Integrity TM |
| · | SLM: PTC Arbortext® and PTC Servigistics® |
Non-GAAP Supplemental Information
We provide non-GAAP supplemental information to our GAAP information. PTC's reasons for providing this information are described at the end of this document.
Q3 FY’13 - Key Points
| 1) | Our Q3 non-GAAP EPS of $0.45 was up 22% year over year (up 30% on a constant currency basis), at the high end of our guidance range due to better than planned services margins and continued focus on cost efficiency as part of our commitment to margin expansion. There was no material impact to Q3 non-GAAP EPS from currency effects relative to guidance. |
| 2) | Total non-GAAP revenue for Q3 was $315.5 million, up 1% year over year (up 4% on a constant currency basis), and was at the low end of our guidance range. Servigistics delivered Q3 non-GAAP revenue of $23.0 million, in line with our expectations. |
| 3) | License revenue of $79.9 million was at the low end of our Q3 guidance range and was down 5% year over year (down 1% on a constant currency basis). Total license revenue, including $4.5 million from Servigistics, was strong in the Americas and Japan (favorably impacted by a large deal, partially offset by unfavorable Fx movements). However, our organic license growth was impacted by the soft macroeconomic environment in Europe and the Pac Rim (particularly China). Q3 results included one mega deal (license revenue of greater than $5 million). |
| 4) | We delivered non-GAAP support revenue of $163.1 million, above our guidance, up 7% year over year and up 9% on a constant currency basis. Results included $8.7 million in non-GAAP support revenue from Servigistics. |
| 5) | Services revenue of $72.5 million (down 3% year over year, 2% on a constant currency basis) was below our guidance reflecting continued pressure on large license transactions. Results included $9.8 million in revenue from Servigistics. We delivered non-GAAP services gross margins of 15.1% for the quarter, up from 13.6% in Q2 ’13 and 13.9% in Q3 ‘12. |
| 6) | We had 33 large deals (>$1M in license and services revenue recognized in the quarter) that contributed $68.3 million in revenue, a 9% decrease year over year. |
| 7) | We ended the quarter with 338 quota-carrying sales representatives, down 3% year over year. Given the growth in sales capacity we achieved over the past two years and continued concern about the global macroeconomic environment, our focus has been improving the productivity of the increased capacity we now have rather than continuing to add capacity. |
| 8) | We generated $85 million in operating cash flow and used $40 million to partially repay our credit facility and $20 million for stock repurchases, resulting in an ending cash balance of $257 million. |
Q4 AND FY’13 OUTLOOK: Targets reflect commitment to margin expansion, despite difficult macro
In providing guidance for Q4 and FY’13, we are weighing company specific factors such as our pipeline of opportunities and our support and services base as well as external considerations, including the macroeconomic environment which weakened again over the last quarter (including in global manufacturing), currency, and visibility into customer spending patterns. We are now targeting FY’13 non-GAAP revenue of $1,280 to $1,290 million, reflecting concerns around the timing of global economic recovery. Relative to our previous non-GAAP FY’13 revenue guidance, approximately half of the reduction is due to lower expected services revenue, primarily due to the softer license performance and outlook. We expect that Servigistics will contribute at least $90 million in non-GAAP revenue in FY’13. We are narrowing our FY’13 non-GAAP EPS guidance range to $1.72 to $1.77 reflecting our vigilance on cost controls and commitment to profitability despite a softer revenue expectation.
Q4 and FY’13 Guidance Table
FY’14 PRELIMINARY DIRECTIONAL COMMENTARY: Targeting low to mid-single digit revenue growth and 15% – 20% non-GAAP EPS growth
We are currently in the midst of our annual planning process, and will be providing formal FY’14 guidance in conjunction with our Q4 earnings release in October. However, we wanted to provide some directional insight into our current thinking about our next fiscal year. Assuming a stabilizing macroeconomic environment and no significant currency fluctuations, we are currently targeting low to mid-single digit revenue growth in FY’14 and 15% to 20% non-GAAP EPS growth. This is based on the size and strength of our pipeline reflecting increasing customer interest in our solutions, coupled with our initiatives and commitment to enhancing profitability.
REVENUE TRENDS
Year-over-year changes in revenue on a constant currency (FX) basis in the tables that follow compare actual reported results converted into U.S. dollars based on the corresponding prior year’s foreign currency exchange rates to reported results for the comparable prior year period. Results of Servigistics have been included in our results of operations since October 2, 2012. References to organic revenue in the discussion that follows exclude Servigistics revenue.
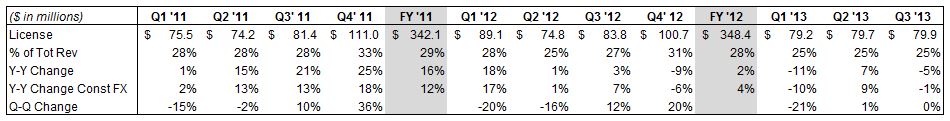
LICENSE: Strong Americas and Japan performance offset by soft Europe and Pac Rim and continued pressure on large deals
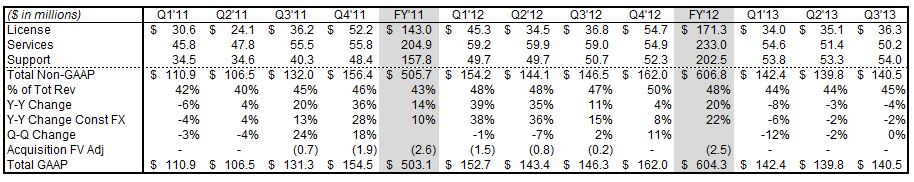
License sales generate the highest non-GAAP gross margins, which are approximately 96%. License revenue historically has tended to represent 28% to 33% of our total revenue in any given quarter, with Q4 generally being our strongest quarter.
Q3 License revenue of $79.9 million was down 5% year over year (down 1% on a constant currency basis), at the low end of our guidance range of $80 million to $90 million, reflecting growth in the Americas and Japan (positively impacted by a large deal, partially offset by unfavorable Fx movements), with year-over-year growth of 44% and 41%, respectively, offset by soft results in Europe and the Pac Rim with year-over-year declines of 31% and 30%, respectively, reflecting the challenging macro environment in those regions. Servigistics delivered Q3 license revenue of $4.5 million, in line with our expectations. Organic license revenue was down 10% (down 7% on a constant currency basis).
Looking forward to Q4 we are expecting license revenue of $95 to $105 million; for FY’13, we are expecting total license revenue of $335 to $345 million, a decrease of (1%) to (4%) year over year.
LARGE DEAL ACTIVITY:
Large deals are a significant growth driver and have historically tended to generate 20% to 25% of our total revenue in any given quarter, with Q4 typically at the high end of the range. Large deals are driven primarily by direct sales teams. We define “large deals” as recognizing more than $1 million of license and service revenue from a customer during a quarter. License revenue has historically comprised approximately 50% of the total large deal revenue in any quarter, although that percentage has been lower in recent quarters.

In Q3 we had 33 large deals totaling $68.3 million. 14 of these customers were in the Americas, 12 were in Europe and 7 were in Asia. Large deal license revenue was 47% of total large deal revenue in Q3’13. Despite the macroeconomic environment, we continue to have a strong pipeline of large deals that we are working on worldwide, though the timing of closing and the size of large deals is being impacted by the environment. We have recently won competitive deals with large global companies and are actively engaged in a substantial number of competitive opportunities with other large global companies.
SALES CAPACITY TRENDS:
A key part of our long-term growth strategy last year was to increase the number of quota-carrying sales reps as we penetrate adjacent market opportunities (i.e. ALM, SLM, and SCM) within our existing customer base and target new customers. Given the significant growth in sales capacity we achieved over the past two years (up 22%) and concerns over the macroeconomic outlook, our focus more recently has been on improving the productivity of the increased capacity we now have. We ended the quarter with 338 quota-carrying reps, a 3% decrease year over year.
SERVICES: Margin improvement and partner ecosystem traction
Our services business provides significant value to our customers, helping them re-engineer their global product development business processes and implement our solutions - and providing them with training on our software. Services revenue has historically tended to represent 20% to 25% of our total revenues in any given quarter.
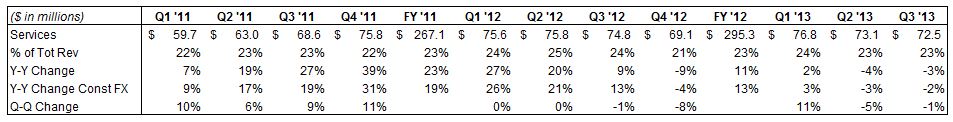
Q3 Services revenue of $72.5 million was down 3% year over year (down 2% on a constant currency basis), including $9.8 million in revenue from Servigistics. On an organic basis, services revenue was down 16% (down 15% on a constant currency basis). Our consulting services revenue, which primarily supports PTC Windchill implementations, was down 3% year over year (down 18% on an organic basis). This primarily reflects lower levels of large license transactions over the past year and the soft macro environment. Our training business, which typically represents about 15% of our total services revenue, was down 1% year over year (down 3% on an organic basis). We are having considerable success with our partner ecosystem, which has had year-to-date bookings growth of 75% on a year-over-year basis. We delivered solid, non-GAAP services gross margin of 15.1% in Q3’13 (up 1.5 percentage points from the Q2’13 non-GAAP services gross margin of 13.6%), exceeding our target of at least 13%.
Looking forward to Q4, we are expecting services revenue to be up approximately 1% on a year-over-year basis. For FY’13 we are now expecting services revenue to be down approximately 1% year over year (vs. our previous guidance of approximately 3% growth). Our lower anticipated Services revenue reflects lower anticipated license revenue and the challenging macro environment. We are revising our FY’13 non-GAAP services margins expectation to approximately 14%, up from our previous expectation of approximately 13%. We remain committed to achieving non-GAAP services margins of approximately 15% by FY’15 and reducing our mix of direct services through the expansion of our services partner ecosystem and the development of solutions that fundamentally require less services.
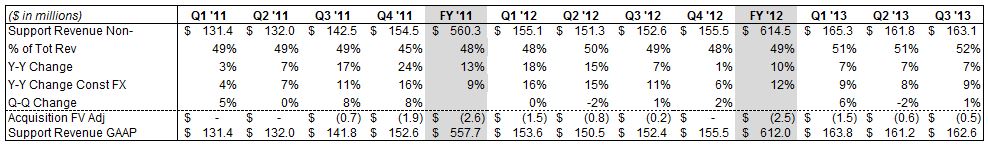
SUPPORT: More than 1.8 million active seats
Our support business is an important barometer of customer satisfaction with our solutions. It is also a strong source of recurring revenue for PTC. Support gross margins are approximately 88% on a non-GAAP basis. Support revenue has historically tended to represent 45% to 50% of our total revenues in any given quarter, with Q4 usually being at the low end as a percent of total revenue due to historically strong performance of license sales in that quarter.
Q3 non-GAAP support revenue of $163.1 million was up 7% year over year (up 9% on a constant currency basis), including 1% year-over-year organic growth (3% on a constant currency basis) and the contribution of $8.7 million from Servigistics.
Looking forward to Q4, we are expecting non-GAAP support revenue to increase approximately 6% on a year-over-year basis. For FY’13 we are expecting approximately 7% non-GAAP support revenue growth on a year-over-year basis.
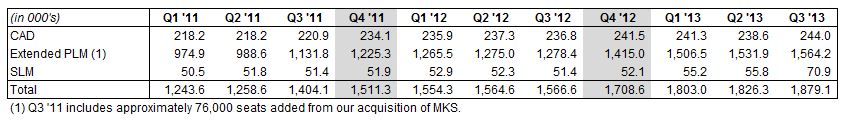
Active Support Seats
REVENUE BY SOLUTION AREA
The following tables provide license, services and support revenue for each of our solution areas. Results include combined revenue from direct sales and our channel.
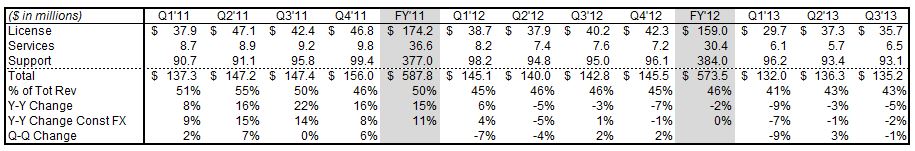
CAD:
CAD revenue in Q3 was down 5% (down 2% on a constant currency basis) compared with the year-ago period primarily due to lower license revenue in Europe and the Pac Rim, partially offset by strong license growth in the Americas and Japan, which benefitted from a large transaction in Q3’13. CAD channel revenue, which represents approximately 40% of total CAD revenue, was down 2% year-over-year (up 1% on a constant currency basis).
Extended PLM:
Q3 Extended PLM revenue, which includes our PLM, ALM and SCM solutions, was down 4% year over year (down 2% on a constant currency basis). We delivered strong SCM license revenue compared to a relatively soft quarter in the year ago period, offset by soft PLM and ALM license revenue. On the whole, our Extended PLM performance was stronger in Americas and Japan (also impacted by a large transaction, partially offset by Fx), and softer in Europe and the Pac Rim, reflecting the challenging macro environment in those regions. We remain confident in our competitive positioning in Extended PLM and growth prospects as macroeconomic conditions improve.
SLM:
Q3 SLM license revenue included $4.5 million of license revenue from Servigistics offset by a 51% decline in organic license revenue. Including Servigistics, license revenue performance – as with our other solution areas - was strong in the Americas and Japan, and soft in Europe and the Pac Rim. While not contributing significantly to our revenues in Q3, we won a significant and strategically important long-term SLM contract with a leading European automotive company, supporting our view on the long-term growth opportunity in this market.
REVENUE BY REGION
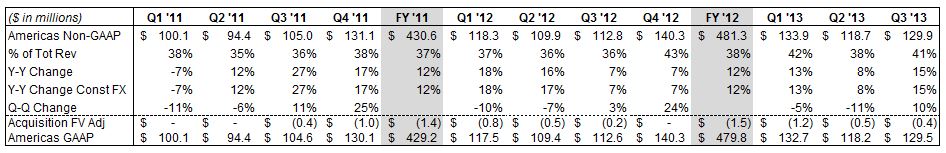
Americas:
Americas non-GAAP revenue in Q3 of $129.9 million was up 15% year over year. Organic revenue was down 1% year over year reflecting organic license growth of 22% and support growth of 4%, offset by a 24% decline in services revenue. While the macroeconomic environment remains mixed in the Americas, our pipeline continues to build and we are optimistic about the outlook for this region. We expect Americas license revenue to be up significantly sequentially in Q4 (consistent with normal seasonality for this region), however, we expect year-over-year license performance to be down, given the very strong Q4’12 performance in the Americas.
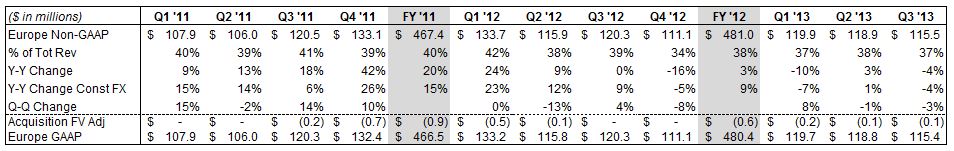
Europe:
Europe non-GAAP revenue was $115.5 million in Q3, down 4% year over year (both as reported and on a constant currency basis). Q3 license revenue in Europe was down 31% year over year. Total organic revenue was down 6% year over year while organic license revenue was down 31%. Despite the uncertain macroeconomic environment in Europe, we are currently expecting significant license revenue growth in Europe in Q4 on both a sequential and year-over-year basis.
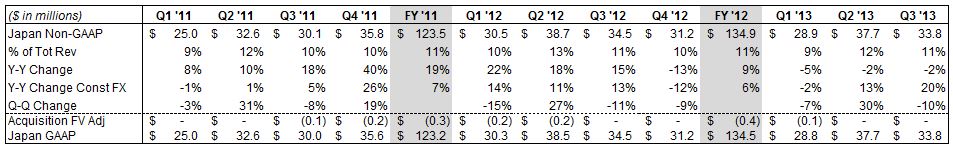
Japan:
Japan non-GAAP revenue was $33.8 million in Q3, down 2% (up 20% on a constant currency basis) year over year. Q3 license revenue in Japan was up 41% (up 76% on a constant currency basis) compared with last year. Organic license revenue and organic total revenue were up 39% and down 7%, respectively. Organic license revenue growth benefited from large deal activity including a mega deal ($5M+ in license revenue) with a global electronics manufacturer that invested in a broad range of PTC solutions. Looking forward, we are expecting significant year-over-year license revenue improvement in Japan in Q4, despite unfavorable Fx movements, however, we expect Japan to be down sequentially, given the strong performance in Q3’13.
Pacific Rim:
Pacific Rim non-GAAP revenue was $36.3 million in Q3, down 17%, both as reported and on a constant currency basis compared with last year. Q3 license revenue in the Pac Rim was down 30% compared with last year (31% on a constant currency basis). Organic license revenue and total revenue were down 30% and 17%, respectively. Our outlook calls for significant sequential and year-over-year improvement in license revenue in the Pac Rim in Q4.
CURRENCY IMPACT ON RESULTS COMPARED TO THE YEAR AGO PERIOD
We have a global business, with Europe and Asia historically representing approximately 60% to 65% of our revenue. We do not forecast currency movements; rather we provide detailed constant currency commentary. Currency can significantly impact our results. For example, in FY’12, currency was a headwind for PTC and negatively impacted non-GAAP revenue by $25 million and favorably impacted GAAP and non-GAAP expenses by $19 million and $18 million, respectively. In FY ’11 and FY’10 currency was a tailwind for us when compared to the prior year: non-GAAP revenue was positively impacted by $37 million and $15 million, respectively, and non-GAAP expenses were negatively impacted by $21 million and $10 million, respectively.
As a simple rule of thumb, based on current revenue and expense levels, a $0.10 move on the USD / EURO exchange rate will impact annualized revenue by approximately $35 to $40 million and EPS by approximately $0.08 to $0.10. Given the recent appreciation in the YEN / USD exchange rate, we also note that a 10 YEN move versus the USD will impact annualized revenue by approximately $13 to $17 million and expenses by approximately $6 to $8 million.
Q3 non-GAAP revenue was up 4% year over year on a constant currency basis, down 4% on an organic constant currency basis. Currency fluctuations unfavorably impacted Q3 non-GAAP revenue by $7.7 million and favorably impacted Q3 GAAP and non-GAAP expenses by $3.4 million and $3.3 million, respectively, compared to Q3’12 currency rates.
Looking forward, the guidance we are providing assumes exchange rates of approximately 1.30 USD / EURO and 100 YEN / USD. Our actual simple average Q4 ’12 Fx rate was $1.24 USD / EURO and 79 YEN / USD.
Q3 FY’13 EXPENSES COMMENTARY AND Q4 & FY’13 OUTLOOK
We implemented cost reduction actions in Q1’13, Q2’13 and Q3 ’13 and recorded total restructuring charges of $35 million, primarily attributable to severance costs as part of our commitment to improve our operating efficiencies and to further our commitment to enhance long-term profitability. We paid $27 million of that amount in the first three quarters of 2013. These restructuring actions were substantially completed in the third fiscal quarter of 2013, with the full impact of the expense reductions expected to be realized in the fourth fiscal quarter of 2013. These cost actions are expected to reduce our operating expenses by approximately $10 million per quarter, and are a component of our FY’13 non-GAAP EPS target of $1.72 to $1.77.
Q3 non-GAAP results exclude $11.2 million of stock-based compensation expense, $11.1 million of acquisition-related intangible asset amortization, $3.1 million of restructuring charges, and $0.9 million of acquisition-related costs. The Q3 non-GAAP results include a tax rate of 21% and 120.8 million diluted shares outstanding. The Q3 GAAP results include a tax rate of 26% and 120.8 million diluted shares outstanding.
Q4’13 non-GAAP guidance excludes the following estimated expenses and their income tax effects, as well as any additional discrete tax items and restructuring costs
| · | Approximately $13 million of expense related to stock-based compensation |
| · | Approximately $11 million of acquisition-related intangible asset amortization expense |
| · | Approximately $1 million of restructuring charges |
FY’13 non-GAAP guidance excludes the following full-year estimated expenses/gains and their income tax effects, as well as any additional discrete tax items and restructuring costs
| · | Approximately $35 million of restructuring charges |
| · | Approximately $3 million of a fair value deferred support revenue adjustment |
| · | Approximately $48 million of expense related to stock-based compensation |
| · | Approximately $45 million of acquisition-related intangible asset amortization expense |
| · | Approximately $8 million of acquisition-related expenses |
| · | Approximately $5 million of legal settlement gains |
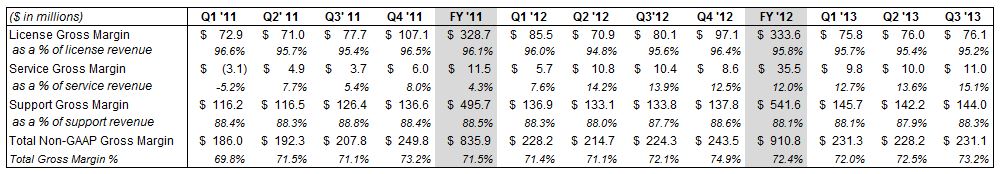
NON-GAAP GROSS MARGINS
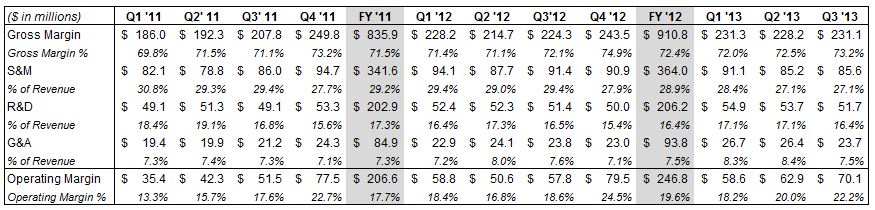
NON-GAAP OPERATING MARGINS
Our Q3’13 non-GAAP gross margin was $231 million, or 73.2%, compared to $224 million, or 72.1% in the year ago period primarily due to improved services margins. Q3’13 GAAP gross margin was $224 million, or 71.1%, compared to $218 million, or 70.1% in Q3’12.
Our Q3’13 non-GAAP operating expenses were $161 million ($181 million on a GAAP basis), compared to $167 million in Q3’12 ($187 million on a GAAP basis), reflecting cost reductions, continued discipline on organic operating expenses, and favorable currency impact, partially offset by the Servigistics acquisition.
From an operating performance perspective, we achieved 22.2% non-GAAP operating margin (23.1% on a constant currency basis) in Q3’13, compared to 18.6% in Q3’12. GAAP operating margin was 13.7% (14.7% on a constant currency basis) for Q3’13 compared to 10.0% in Q3’12.
Looking forward, we are expecting Q4‘13 non-GAAP gross margin of approximately 75%, GAAP gross margin of approximately 73%, non-GAAP operating margin of approximately 25% and GAAP operating margin of approximately 17%. For FY ‘13, we are expecting non-GAAP gross margin of approximately 73%, GAAP gross margin of 71%, non-GAAP operating margin of approximately 21.5%, and GAAP operating margin of approximately 11%.
Over the longer term we intend to increase our non-GAAP operating margin to the 25% to 27% range primarily through increased efficiency in our global sales organization, improved non-GAAP gross margin (74% to 76% range) due to improved non-GAAP services margin and more favorable revenue mix.
TAX RATE
Our Q3 non-GAAP tax rate was 21% and our GAAP tax rate was 26%.
Looking forward, the Q4 guidance assumes a non-GAAP tax rate of 23% and a GAAP tax rate of 27%. The FY’13 target now assumes a non-GAAP tax rate of 21% and a GAAP tax rate of 5%.
STOCK-BASED COMPENSATION
Expenses related to stock-based compensation were 3.5% of non-GAAP revenue in Q3 ’13, compared to 4.3% of non-GAAP revenue in Q3’12. Over time, we expect that stock-based compensation as a percentage of non-GAAP revenue will trend down annually, ultimately reaching a sustainable long-term target of 3%.
SHARE COUNT / SHARE REPURCHASE
We had 120.8 million fully diluted weighted average shares outstanding for Q3. Our Board has authorized us to repurchase up to $100 million worth of our shares in the period October 1, 2012 through September 30, 2013. We repurchased $20 million worth of shares in Q3 and have repurchased $55 million to-date against this authorization.
Looking forward, we expect to have approximately 121 million fully diluted shares outstanding for Q4 ’13 and 121 million outstanding for the full fiscal year. We intend to repurchase $20 million worth of shares in Q4’13. Our long-term philosophy is to repurchase shares to offset dilution.
BALANCE SHEET: Solid cash position
CASH / CASH FLOW FROM OPERATIONS
For Q3’13, our cash balance was $257 million, up from $241 million at the end of Q2’13. We generated $85 million from operations in Q3. Uses of cash in the quarter included debt repayments of $40 million, share repurchases of $20 million and capital expenditures of $7 million.
DSO
We continue to have strong DSOs of 58 days in Q3’13 compared to 62 days in Q2’13 and 59 days in Q3’12.
OUTSTANDING DEBT
At the end of Q3’13, the balance outstanding under our $450 million credit facility was $268 million. We repaid $40 million of the balance outstanding under our credit facility in Q3 ’13, and we expect to repay $30 million in Q4’13.
MISCELLANEOUS COMMENTS
HEADCOUNT
Total headcount was 5,987 at the end of Q3, compared to 5,971 at the end of Q2. It is worth noting that we added approximately 400 heads added in connection with our acquisition of Servigistics early in Q1’13. Headcount at the end of Q3’12 was 5,907.
M&A
We view M&A primarily as a strategic vehicle to further enhance our product portfolio and growth opportunity. We intend to remain opportunistic as it relates to M&A. The majority of our M&A opportunities have comprised small, strategic technology tuck-ins, including our recently announced acquisition of Enigma which closed on July 11. This acquisition was primarily a technology and domain expertise acquisition supporting PTC’s strategic SLM portfolio and will expand the existing capabilities of PTC’s Technical Information and Services Parts Information solutions. Enigma provides software that helps organizations deliver information related to products, parts, and services. This information is delivered as part of an integrated digital library to service engineers and technicians who work at customer sites, in maintenance depots, or in dealer environments. Enigma has fewer than 50 employees in the U.S., Israel, United Kingdom, and Sweden and generates mid-single digit millions in annual revenue. The purchase price of Enigma was less than $10 million. We continue to evaluate strategic acquisition opportunities of varying size as they arise, and have completed larger transactions such as MKS in Q3’11 and Servigistics in Q1’13. Our forecasted financial, cash and debt positions described above are exclusive of the effects of any M&A that we may complete.
Other Information
As we have previously disclosed, we have been cooperating to provide information to the U.S. Securities and Exchange Commission and the Department of Justice concerning payments and expenses by certain of our business partners in China and/or by employees of our Chinese subsidiary that raise questions concerning compliance with laws, including the U.S. Foreign Corrupt Practices Act. Resolution of this matter could include fines and penalties; however we are unable to estimate an amount and we have not recorded a liability for this matter. If we are required to record a liability for this matter this could materially impact our results for the period in which the liability is recorded.
Important Information About Non-GAAP References
PTC provides non-GAAP supplemental information to its financial results. Non-GAAP revenue, operating expenses, margin and EPS exclude a fair value adjustment related to acquired deferred support revenue from MKS and Servigistics, stock-based compensation expense, foreign currency transaction losses related to our acquisition of MKS, amortization of acquired intangible assets, acquisition-related expenses, restructuring charges, identified discrete items included in non-operating (expense) income, net and the related tax effects of the preceding items and any other identified tax items. Constant currency measures are calculated by multiplying results by the exchange rates in effect for the comparable periods in the prior year and assumes no change in tax rates. We use these non-GAAP measures, and we believe that they assist our investors, to make period-to-period comparisons of our operational performance because they provide a view of our operating results without items that are not, in our view, indicative of our core operating results. We believe that these non-GAAP measures help illustrate underlying trends in our business, and we use the measures to establish budgets and operational goals, communicated internally and externally, for managing our business and evaluating our performance. We believe that providing non-GAAP measures affords investors a view of our operating results that may be more easily compared to the results of peer companies. In addition, compensation of our executives is based in part on the performance of our business based on these non-GAAP measures. However, non-GAAP information should not be construed as an alternative to GAAP information as the items excluded from the non-GAAP measures often have a material impact on PTC’s financial results. Management uses, and investors should consider, non-GAAP measures in conjunction with our GAAP results.
Forward-Looking Statements
Statements in these prepared remarks that are not historic facts, including statements about our fourth quarter and full fiscal 2013 and other future financial and growth expectations, anticipated tax rates, expected market growth rates and the long-term prospects for PTC, are forward-looking statements that involve risks and uncertainties that could cause actual results to differ materially from those projected. These risks include the possibility that the macroeconomic climate may not improve or may deteriorate, the possibility that customers may not purchase our solutions when or at the rates we expect, the possibility that our pipeline of opportunities may not convert or generate the revenue we expect, the possibility that we will be unable to achieve planned services margins and operating margin improvements, the possibility that foreign currency exchange rates may vary from our expectations and thereby affect our reported revenue and expense, the possibility that we may not achieve the license, services or support revenue that we expect, which could result in a different mix of revenue between license, service and support and could impact our EPS results, the possibility that our restructurings and cost containment measures may not generate the operating margin improvements we expect and could adversely affect our revenue, the possibility that we may be unable to achieve our profitability targets with lower license revenue or without additional restructuring or cost containment measures, the possibility that our expanded SLM solutions, including Servigistics and Enigma, may not generate the revenue we expect, the possibility that sales personnel productivity may not increase as we expect and generate the additional sales pipeline and revenue that we expect, the possibility that we may be unable to attain or maintain a technology leadership position or that any such leadership position may not generate the revenue we expect, the possibility that the markets in which we operate may not grow at the rates we expect, and the possibility that remedial actions relating to our previously announced investigation in China could adversely affect our revenue and that fines and penalties may be assessed against PTC in connection with the China matter. In addition, our assumptions concerning our future GAAP and non-GAAP effective income tax rates are based on estimates and other factors that could change, including the geographic mix of our revenue, expenses and profits and loans and cash repatriations from foreign subsidiaries. Other risks and uncertainties that could cause actual results to differ materially from those projected are detailed from time to time in reports we file with the Securities and Exchange Commission, including our Annual Report on Form 10-K and our Quarterly Reports on Form 10-Q.