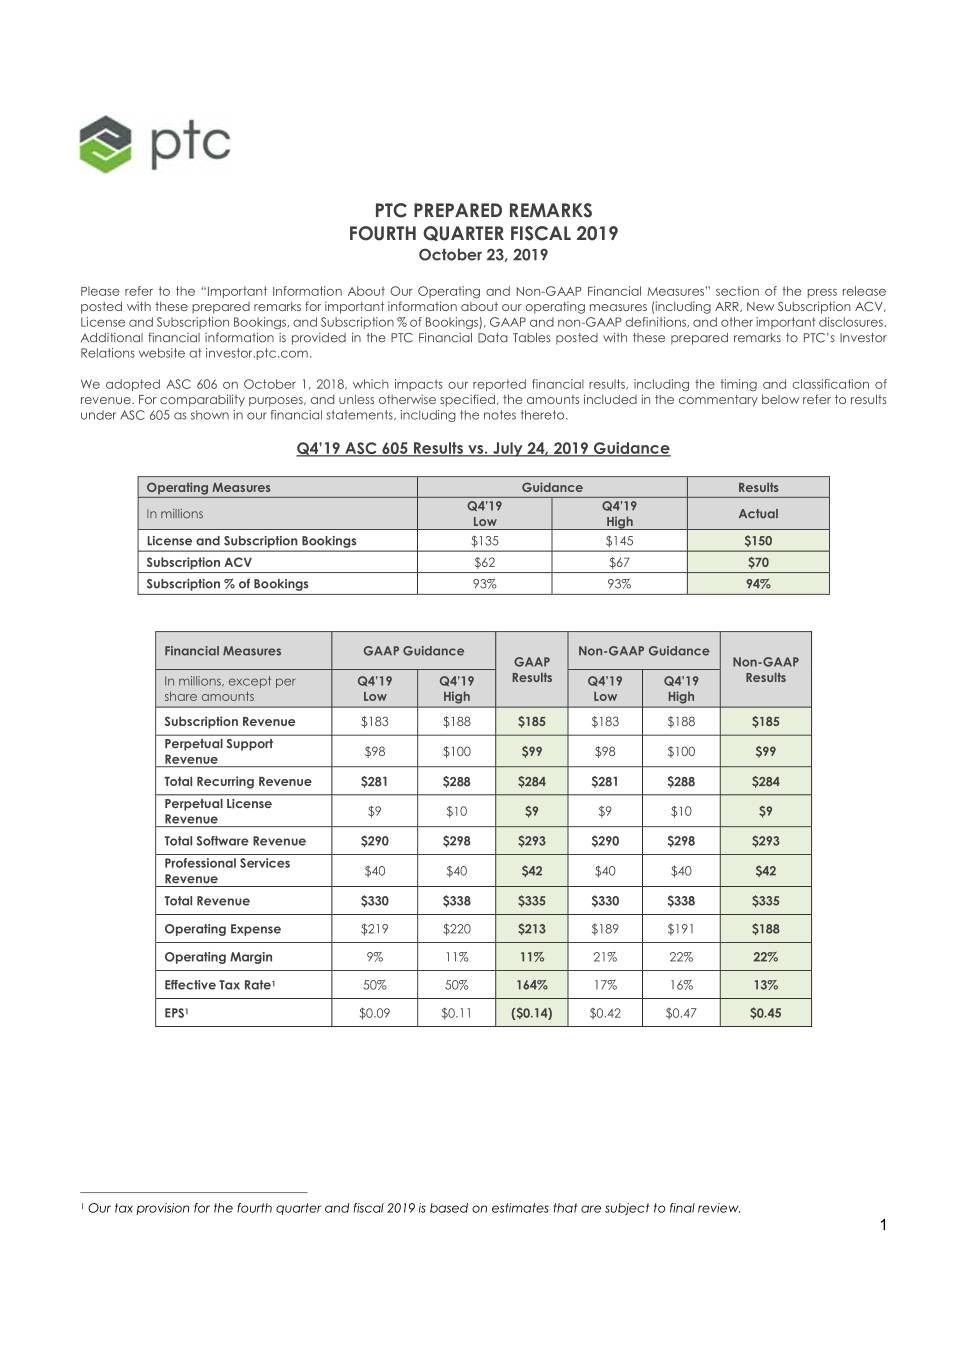
PTC PREPARED REMARKS FOURTH QUARTER FISCAL 2019 October 23, 2019 Please refer to the “Important Information About Our Operating and Non-GAAP Financial Measures” section of the press release posted with these prepared remarks for important information about our operating measures (including ARR, New Subscription ACV, License and Subscription Bookings, and Subscription % of Bookings), GAAP and non-GAAP definitions, and other important disclosures. Additional financial information is provided in the PTC Financial Data Tables posted with these prepared remarks to PTC’s Investor Relations website at investor.ptc.com. We adopted ASC 606 on October 1, 2018, which impacts our reported financial results, including the timing and classification of revenue. For comparability purposes, and unless otherwise specified, the amounts included in the commentary below refer to results under ASC 605 as shown in our financial statements, including the notes thereto. Q4’19 ASC 605 Results vs. July 24, 2019 Guidance Operating Measures Guidance Results Q4’19 Q4’19 In millions Actual Low High License and Subscription Bookings $135 $145 $150 Subscription ACV $62 $67 $70 Subscription % of Bookings 93% 93% 94% Financial Measures GAAP Guidance Non-GAAP Guidance GAAP Non-GAAP In millions, except per Q4’19 Q4’19 Results Q4’19 Q4’19 Results share amounts Low High Low High Subscription Revenue $183 $188 $185 $183 $188 $185 Perpetual Support $98 $100 $99 $98 $100 $99 Revenue Total Recurring Revenue $281 $288 $284 $281 $288 $284 Perpetual License $9 $10 $9 $9 $10 $9 Revenue Total Software Revenue $290 $298 $293 $290 $298 $293 Professional Services $40 $40 $42 $40 $40 $42 Revenue Total Revenue $330 $338 $335 $330 $338 $335 Operating Expense $219 $220 $213 $189 $191 $188 Operating Margin 9% 11% 11% 21% 22% 22% Effective Tax Rate1 50% 50% 164% 17% 16% 13% EPS1 $0.09 $0.11 ($0.14) $0.42 $0.47 $0.45 1 Our tax provision for the fourth quarter and fiscal 2019 is based on estimates that are subject to final review. 1
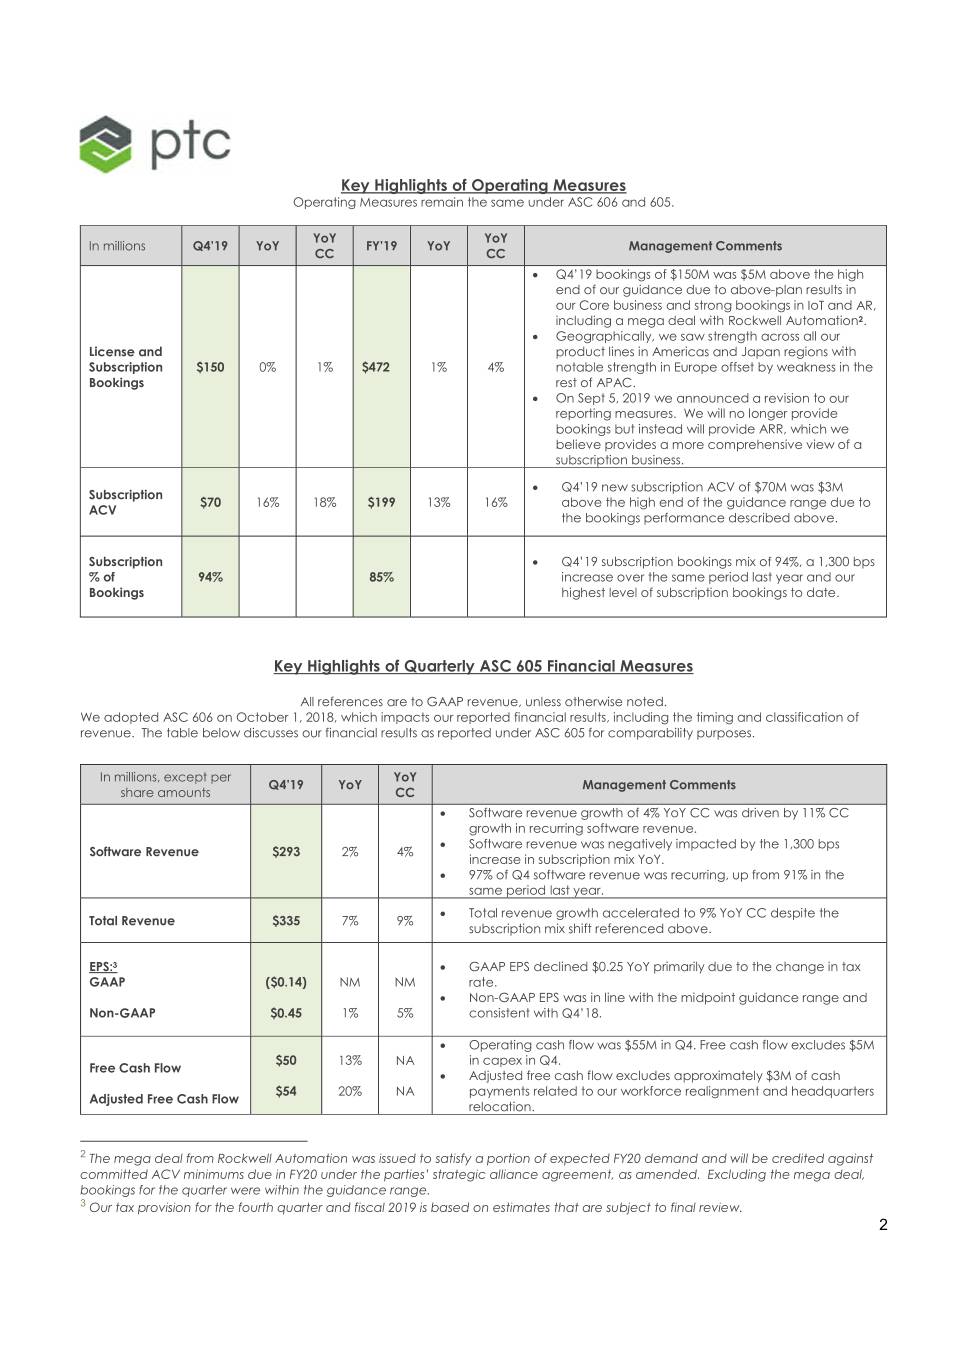
Key Highlights of Operating Measures Operating Measures remain the same under ASC 606 and 605. YoY YoY In millions Q4’19 YoY FY’19 YoY Management Comments CC CC Q4’19 bookings of $150M was $5M above the high end of our guidance due to above-plan results in our Core business and strong bookings in IoT and AR, including a mega deal with Rockwell Automation2. Geographically, we saw strength across all our License and product lines in Americas and Japan regions with Subscription $150 0% 1% $472 1% 4% notable strength in Europe offset by weakness in the Bookings rest of APAC. On Sept 5, 2019 we announced a revision to our reporting measures. We will no longer provide bookings but instead will provide ARR, which we believe provides a more comprehensive view of a subscription business. Q4’19 new subscription ACV of $70M was $3M Subscription $70 16% 18% $199 13% 16% above the high end of the guidance range due to ACV the bookings performance described above. Subscription Q4’19 subscription bookings mix of 94%, a 1,300 bps % of 94% 85% increase over the same period last year and our Bookings highest level of subscription bookings to date. Key Highlights of Quarterly ASC 605 Financial Measures All references are to GAAP revenue, unless otherwise noted. We adopted ASC 606 on October 1, 2018, which impacts our reported financial results, including the timing and classification of revenue. The table below discusses our financial results as reported under ASC 605 for comparability purposes. In millions, except per YoY Q4’19 YoY Management Comments share amounts CC Software revenue growth of 4% YoY CC was driven by 11% CC growth in recurring software revenue. Software revenue was negatively impacted by the 1,300 bps Software Revenue $293 2% 4% increase in subscription mix YoY. 97% of Q4 software revenue was recurring, up from 91% in the same period last year. Total revenue growth accelerated to 9% YoY CC despite the Total Revenue $335 7% 9% subscription mix shift referenced above. EPS:3 GAAP EPS declined $0.25 YoY primarily due to the change in tax GAAP ($0.14) NM NM rate. Non-GAAP EPS was in line with the midpoint guidance range and Non-GAAP $0.45 1% 5% consistent with Q4’18. Operating cash flow was $55M in Q4. Free cash flow excludes $5M $50 13% NA in capex in Q4. Free Cash Flow Adjusted free cash flow excludes approximately $3M of cash $54 20% NA payments related to our workforce realignment and headquarters Adjusted Free Cash Flow relocation. 2 The mega deal from Rockwell Automation was issued to satisfy a portion of expected FY20 demand and will be credited against committed ACV minimums due in FY20 under the parties’ strategic alliance agreement, as amended. Excluding the mega deal, bookings for the quarter were within the guidance range. 3 Our tax provision for the fourth quarter and fiscal 2019 is based on estimates that are subject to final review. 2
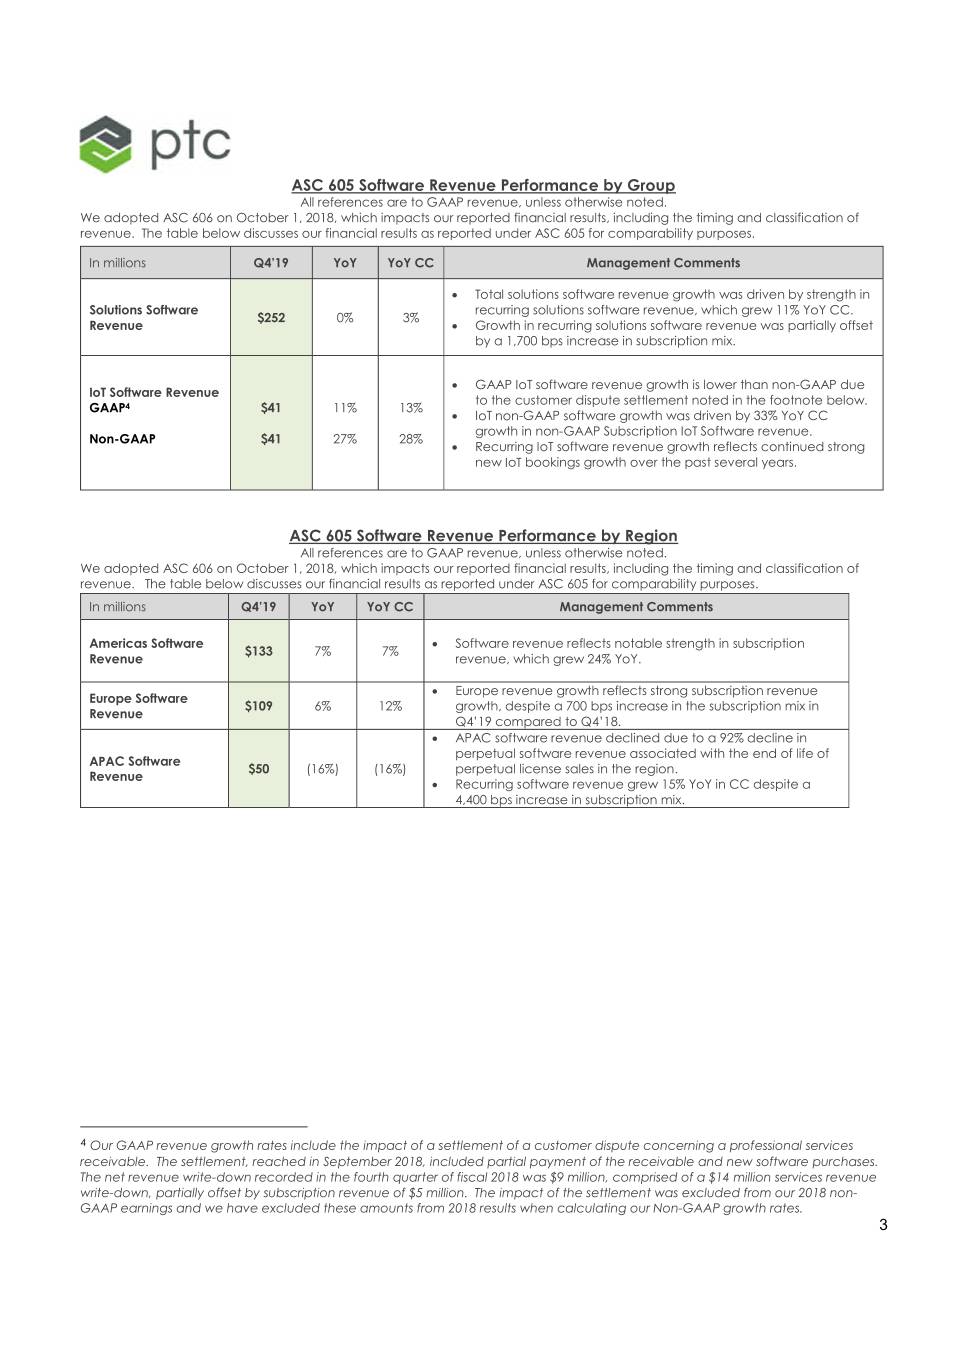
ASC 605 Software Revenue Performance by Group All references are to GAAP revenue, unless otherwise noted. We adopted ASC 606 on October 1, 2018, which impacts our reported financial results, including the timing and classification of revenue. The table below discusses our financial results as reported under ASC 605 for comparability purposes. In millions Q4’19 YoY YoY CC Management Comments Total solutions software revenue growth was driven by strength in Solutions Software recurring solutions software revenue, which grew 11% YoY CC. $252 0% 3% Revenue Growth in recurring solutions software revenue was partially offset by a 1,700 bps increase in subscription mix. GAAP IoT software revenue growth is lower than non-GAAP due IoT Software Revenue to the customer dispute settlement noted in the footnote below. GAAP4 $41 11% 13% IoT non-GAAP software growth was driven by 33% YoY CC growth in non-GAAP Subscription IoT Software revenue. Non-GAAP $41 27% 28% Recurring IoT software revenue growth reflects continued strong new IoT bookings growth over the past several years. ASC 605 Software Revenue Performance by Region All references are to GAAP revenue, unless otherwise noted. We adopted ASC 606 on October 1, 2018, which impacts our reported financial results, including the timing and classification of revenue. The table below discusses our financial results as reported under ASC 605 for comparability purposes. In millions Q4’19 YoY YoY CC Management Comments Americas Software Software revenue reflects notable strength in subscription $133 7% 7% Revenue revenue, which grew 24% YoY. Europe revenue growth reflects strong subscription revenue Europe Software $109 6% 12% growth, despite a 700 bps increase in the subscription mix in Revenue Q4’19 compared to Q4’18. APAC software revenue declined due to a 92% decline in perpetual software revenue associated with the end of life of APAC Software $50 (16%) (16%) perpetual license sales in the region. Revenue Recurring software revenue grew 15% YoY in CC despite a 4,400 bps increase in subscription mix. 4 Our GAAP revenue growth rates include the impact of a settlement of a customer dispute concerning a professional services receivable. The settlement, reached in September 2018, included partial payment of the receivable and new software purchases. The net revenue write-down recorded in the fourth quarter of fiscal 2018 was $9 million, comprised of a $14 million services revenue write-down, partially offset by subscription revenue of $5 million. The impact of the settlement was excluded from our 2018 non- GAAP earnings and we have excluded these amounts from 2018 results when calculating our Non-GAAP growth rates. 3
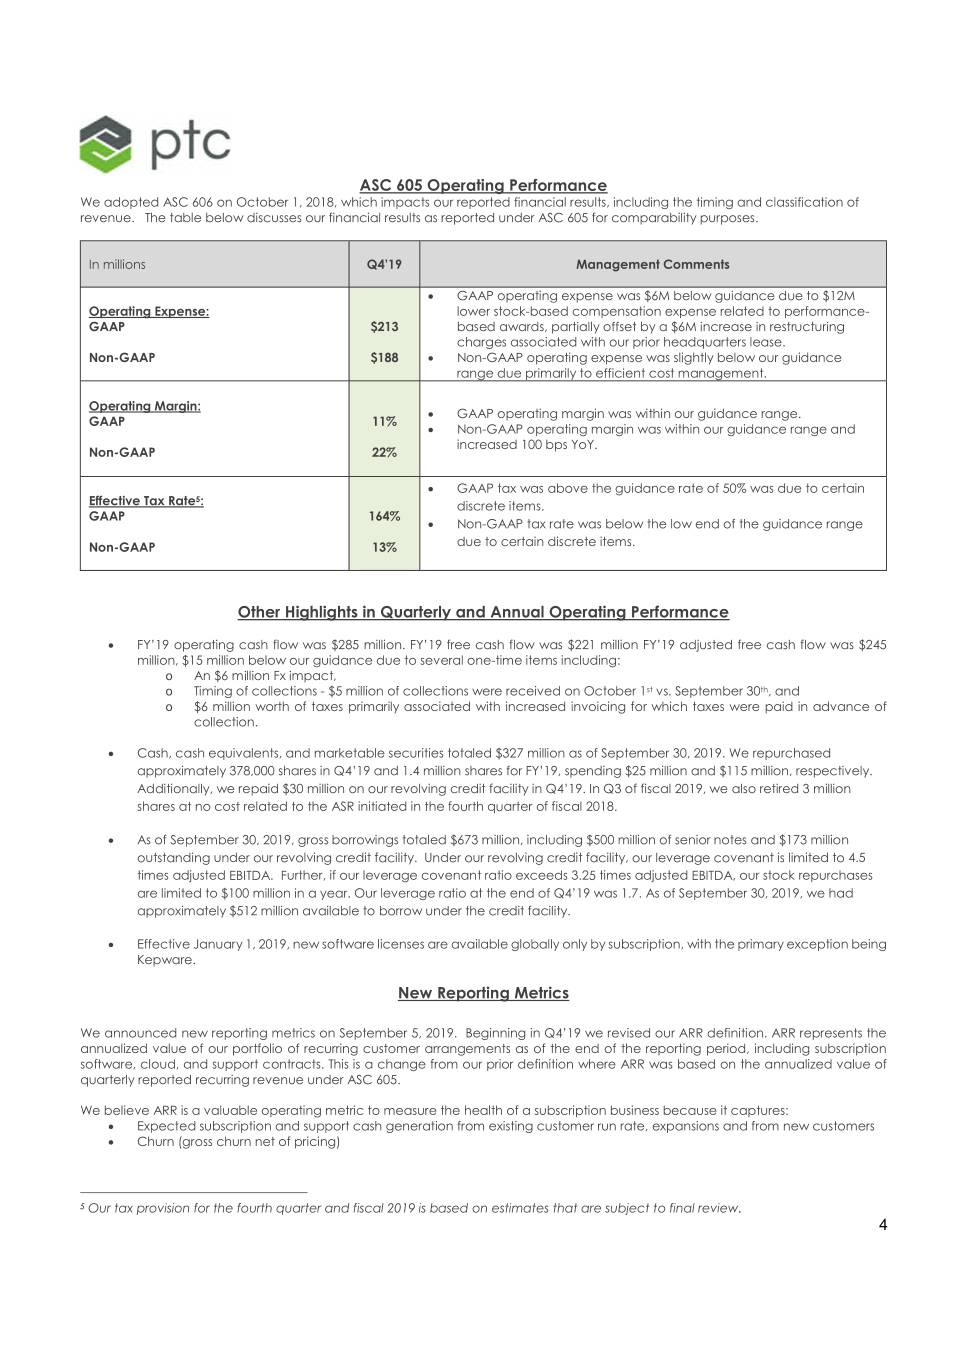
ASC 605 Operating Performance We adopted ASC 606 on October 1, 2018, which impacts our reported financial results, including the timing and classification of revenue. The table below discusses our financial results as reported under ASC 605 for comparability purposes. In millions Q4’19 Management Comments GAAP operating expense was $6M below guidance due to $12M Operating Expense: lower stock-based compensation expense related to performance- GAAP $213 based awards, partially offset by a $6M increase in restructuring charges associated with our prior headquarters lease. Non-GAAP $188 Non-GAAP operating expense was slightly below our guidance range due primarily to efficient cost management. Operating Margin: GAAP operating margin was within our guidance range. GAAP 11% Non-GAAP operating margin was within our guidance range and increased 100 bps YoY. Non-GAAP 22% GAAP tax was above the guidance rate of 50% was due to certain 5 Effective Tax Rate : discrete items. GAAP 164% Non-GAAP tax rate was below the low end of the guidance range Non-GAAP 13% due to certain discrete items. Other Highlights in Quarterly and Annual Operating Performance FY’19 operating cash flow was $285 million. FY’19 free cash flow was $221 million FY’19 adjusted free cash flow was $245 million, $15 million below our guidance due to several one-time items including: o An $6 million Fx impact, o Timing of collections - $5 million of collections were received on October 1st vs. September 30th, and o $6 million worth of taxes primarily associated with increased invoicing for which taxes were paid in advance of collection. Cash, cash equivalents, and marketable securities totaled $327 million as of September 30, 2019. We repurchased approximately 378,000 shares in Q4’19 and 1.4 million shares for FY’19, spending $25 million and $115 million, respectively. Additionally, we repaid $30 million on our revolving credit facility in Q4’19. In Q3 of fiscal 2019, we also retired 3 million shares at no cost related to the ASR initiated in the fourth quarter of fiscal 2018. As of September 30, 2019, gross borrowings totaled $673 million, including $500 million of senior notes and $173 million outstanding under our revolving credit facility. Under our revolving credit facility, our leverage covenant is limited to 4.5 times adjusted EBITDA. Further, if our leverage covenant ratio exceeds 3.25 times adjusted EBITDA, our stock repurchases are limited to $100 million in a year. Our leverage ratio at the end of Q4’19 was 1.7. As of September 30, 2019, we had approximately $512 million available to borrow under the credit facility. Effective January 1, 2019, new software licenses are available globally only by subscription, with the primary exception being Kepware. New Reporting Metrics We announced new reporting metrics on September 5, 2019. Beginning in Q4’19 we revised our ARR definition. ARR represents the annualized value of our portfolio of recurring customer arrangements as of the end of the reporting period, including subscription software, cloud, and support contracts. This is a change from our prior definition where ARR was based on the annualized value of quarterly reported recurring revenue under ASC 605. We believe ARR is a valuable operating metric to measure the health of a subscription business because it captures: Expected subscription and support cash generation from existing customer run rate, expansions and from new customers Churn (gross churn net of pricing) 5 Our tax provision for the fourth quarter and fiscal 2019 is based on estimates that are subject to final review. 4
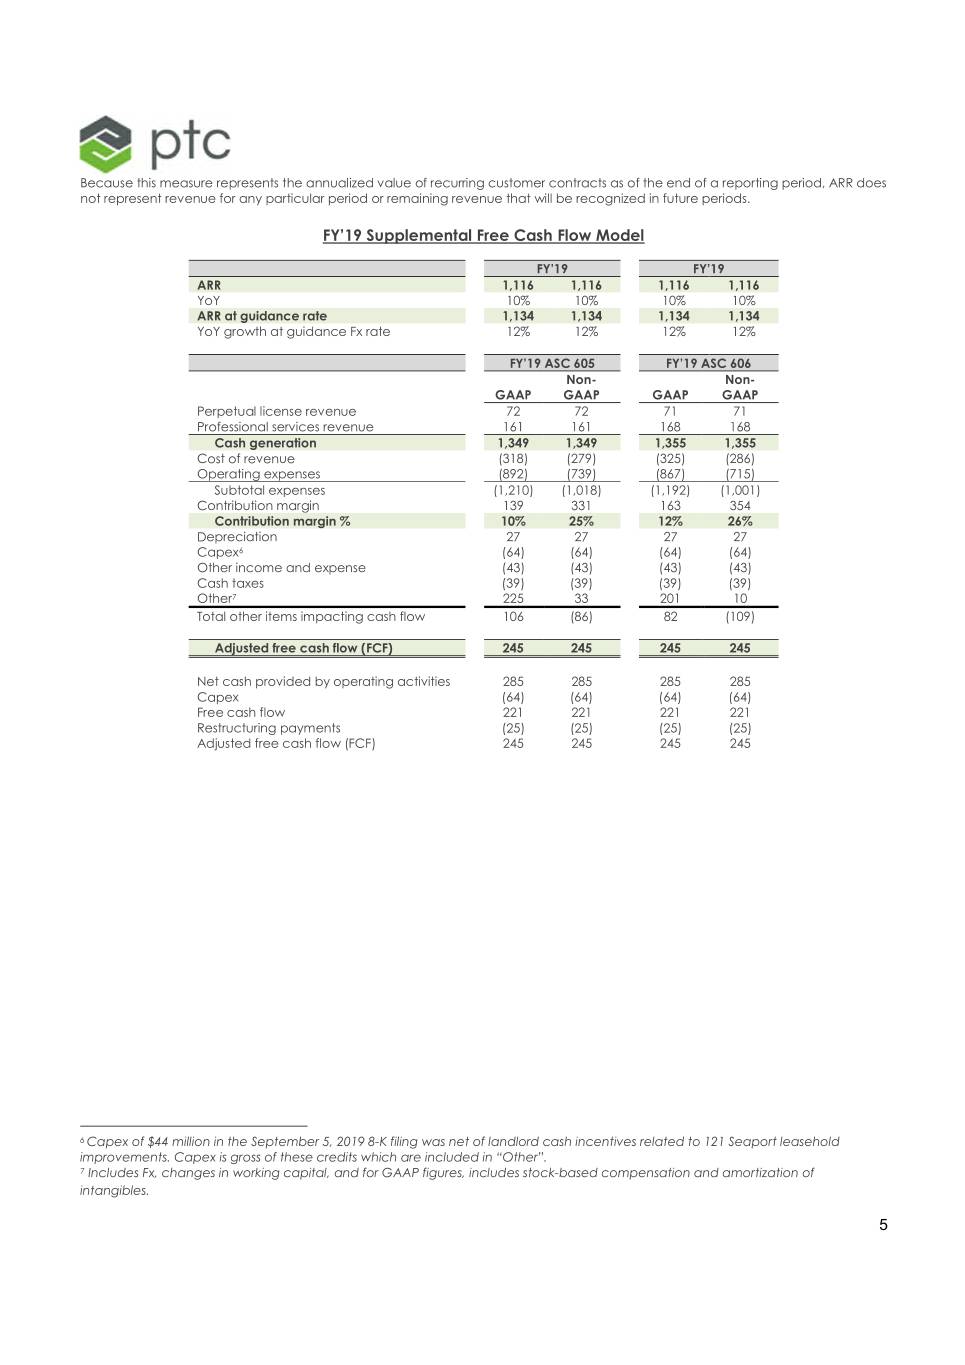
Because this measure represents the annualized value of recurring customer contracts as of the end of a reporting period, ARR does not represent revenue for any particular period or remaining revenue that will be recognized in future periods. FY’19 Supplemental Free Cash Flow Model FY’19 FY’19 ARR 1,116 1,116 1,116 1,116 YoY 10% 10% 10% 10% ARR at guidance rate 1,134 1,134 1,134 1,134 YoY growth at guidance Fx rate 12% 12% 12% 12% FY’19 ASC 605 FY’19 ASC 606 Non- Non- GAAP GAAP GAAP GAAP Perpetual license revenue 72 72 71 71 Professional services revenue 161 161 168 168 Cash generation 1,349 1,349 1,355 1,355 Cost of revenue (318) (279) (325) (286) Operating expenses (892) (739) (867) (715) Subtotal expenses (1,210) (1,018) (1,192) (1,001) Contribution margin 139 331 163 354 Contribution margin % 10% 25% 12% 26% Depreciation 27 27 27 27 Capex6 (64) (64) (64) (64) Other income and expense (43) (43) (43) (43) Cash taxes (39) (39) (39) (39) Other7 225 33 201 10 Total other items impacting cash flow 106 (86) 82 (109) Adjusted free cash flow (FCF) 245 245 245 245 Net cash provided by operating activities 285 285 285 285 Capex (64) (64) (64) (64) Free cash flow 221 221 221 221 Restructuring payments (25) (25) (25) (25) Adjusted free cash flow (FCF) 245 245 245 245 6 Capex of $44 million in the September 5, 2019 8-K filing was net of landlord cash incentives related to 121 Seaport leasehold improvements. Capex is gross of these credits which are included in “Other”. 7 Includes Fx, changes in working capital, and for GAAP figures, includes stock-based compensation and amortization of intangibles. 5
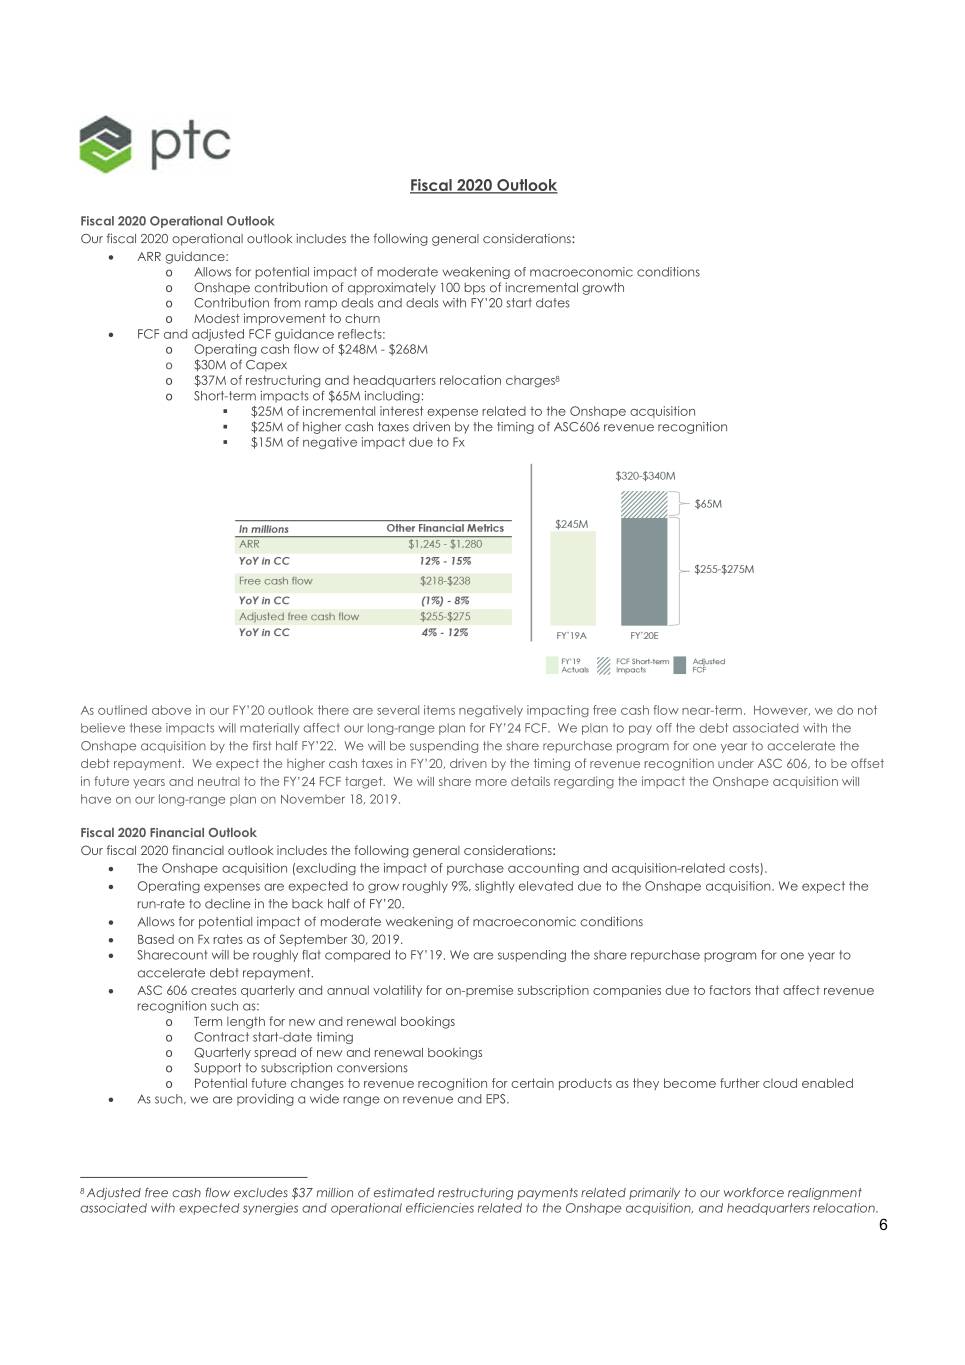
Fiscal 2020 Outlook Fiscal 2020 Operational Outlook Our fiscal 2020 operational outlook includes the following general considerations: ARR guidance: o Allows for potential impact of moderate weakening of macroeconomic conditions o Onshape contribution of approximately 100 bps of incremental growth o Contribution from ramp deals and deals with FY’20 start dates o Modest improvement to churn FCF and adjusted FCF guidance reflects: o Operating cash flow of $248M - $268M o $30M of Capex o $37M of restructuring and headquarters relocation charges8 o Short-term impacts of $65M including: . $25M of incremental interest expense related to the Onshape acquisition . $25M of higher cash taxes driven by the timing of ASC606 revenue recognition . $15M of negative impact due to Fx As outlined above in our FY’20 outlook there are several items negatively impacting free cash flow near-term. However, we do not believe these impacts will materially affect our long-range plan for FY’24 FCF. We plan to pay off the debt associated with the Onshape acquisition by the first half FY’22. We will be suspending the share repurchase program for one year to accelerate the debt repayment. We expect the higher cash taxes in FY’20, driven by the timing of revenue recognition under ASC 606, to be offset in future years and neutral to the FY’24 FCF target. We will share more details regarding the impact the Onshape acquisition will have on our long-range plan on November 18, 2019. Fiscal 2020 Financial Outlook Our fiscal 2020 financial outlook includes the following general considerations: The Onshape acquisition (excluding the impact of purchase accounting and acquisition-related costs). Operating expenses are expected to grow roughly 9%, slightly elevated due to the Onshape acquisition. We expect the run-rate to decline in the back half of FY’20. Allows for potential impact of moderate weakening of macroeconomic conditions Based on Fx rates as of September 30, 2019. Sharecount will be roughly flat compared to FY’19. We are suspending the share repurchase program for one year to accelerate debt repayment. ASC 606 creates quarterly and annual volatility for on-premise subscription companies due to factors that affect revenue recognition such as: o Term length for new and renewal bookings o Contract start-date timing o Quarterly spread of new and renewal bookings o Support to subscription conversions o Potential future changes to revenue recognition for certain products as they become further cloud enabled As such, we are providing a wide range on revenue and EPS. 8 Adjusted free cash flow excludes $37 million of estimated restructuring payments related primarily to our workforce realignment associated with expected synergies and operational efficiencies related to the Onshape acquisition, and headquarters relocation. 6

For fiscal year ending September 30, 2020, the company expects: In millions except per share amounts GAAP Non-GAAP(1) Revenue $1,410-$1,510 $1,410-$1,510 Effective tax rate 20% 19% Diluted shares outstanding 116 116 Diluted earnings per share $0.59-$1.22 $1.95-$2.60 (1) The FY’20 non-GAAP revenue and non-GAAP EPS guidance exclude the estimated items outlined in the table below, as well as any tax effects and discrete tax items (which are not known nor reflected). In millions FY’20 Restructuring charges $25 Intangible asset amortization expense $49 Stock-based compensation expense $119 Total Estimated Pre-Tax GAAP adjustments $193 Estimates for the effect of acquisition accounting on fair value of acquired deferred revenue, intangible amortization and acquisition- related charges related primarily to the Onshape acquisition are not reflected in the FY’20 revenue and EPS guidance table above. 7
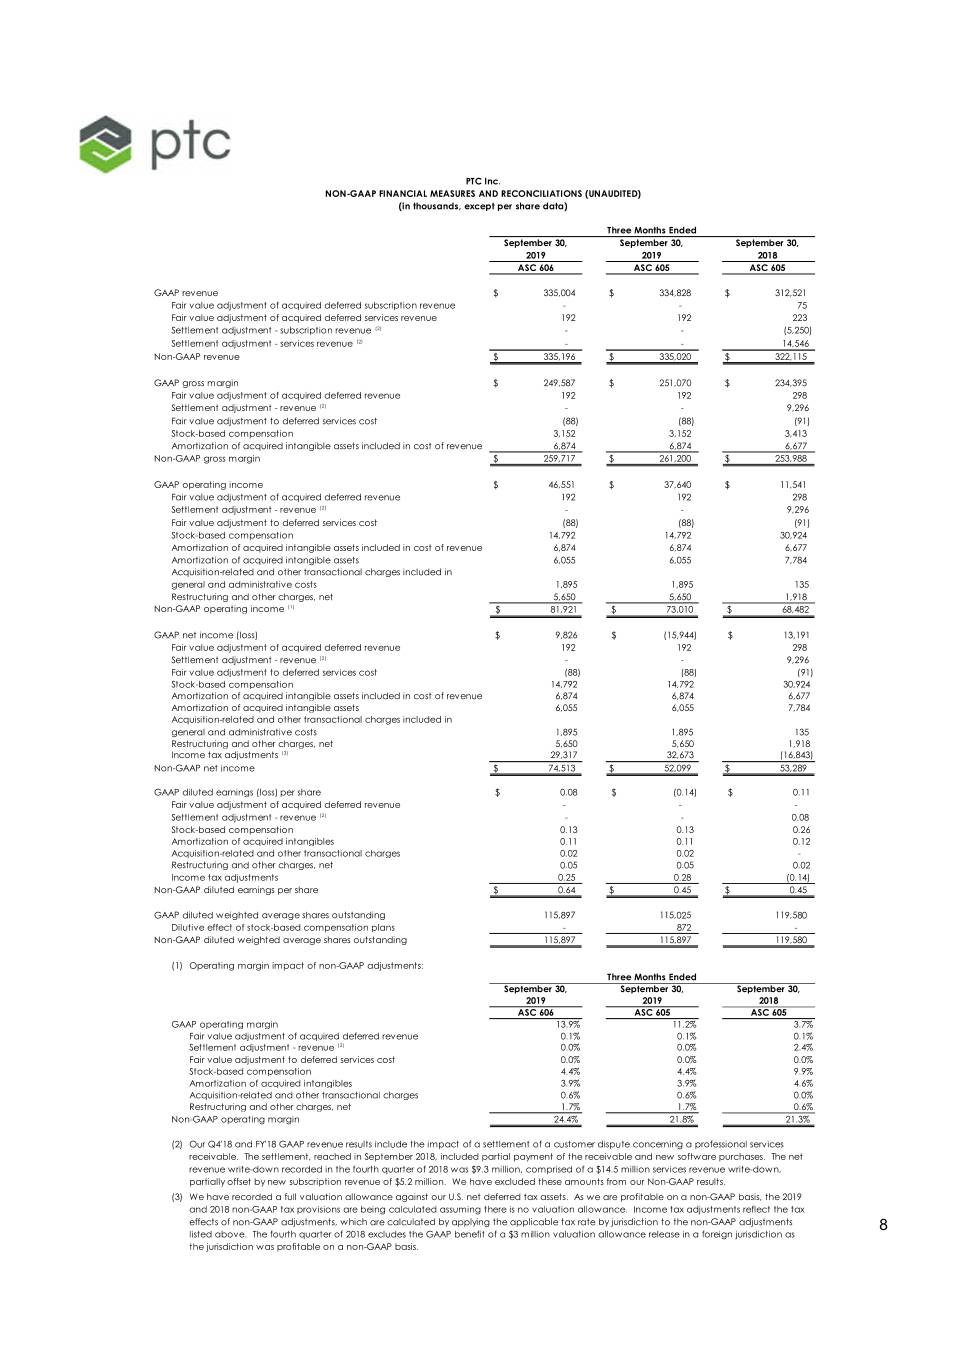
PTC Inc. NON-GAAP FINANCIAL MEASURES AND RECONCILIATIONS (UNAUDITED) (in thousands, except per share data) Three Months Ended September 30, September 30, September 30, 2019 2019 2018 ASC 606 ASC 605 ASC 605 GAAP revenue $ 335,004 $ 334,828 $ 312,521 Fair value adjustment of acquired deferred subscription revenue - - 75 Fair value adjustment of acquired deferred services revenue 192 192 223 Settlement adjustment - subscription revenue (2) - - (5,250) Settlement adjustment - services revenue (2) - - 14,546 Non-GAAP revenue $ 335,196 $ 335,020 $ 322,115 GAAP gross margin $ 249,587 $ 251,070 $ 234,395 Fair value adjustment of acquired deferred revenue 192 192 298 Settlement adjustment - revenue (2) - - 9,296 Fair value adjustment to deferred services cost (88) (88) (91) Stock-based compensation 3,152 3,152 3,413 Amortization of acquired intangible assets included in cost of revenue 6,874 6,874 6,677 Non-GAAP gross margin $ 259,717 $ 261,200 $ 253,988 GAAP operating income $ 46,551 $ 37,640 $ 11,541 Fair value adjustment of acquired deferred revenue 192 192 298 Settlement adjustment - revenue (2) - - 9,296 Fair value adjustment to deferred services cost (88) (88) (91) Stock-based compensation 14,792 14,792 30,924 Amortization of acquired intangible assets included in cost of revenue 6,874 6,874 6,677 Amortization of acquired intangible assets 6,055 6,055 7,784 Acquisition-related and other transactional charges included in general and administrative costs 1,895 1,895 135 Restructuring and other charges, net 5,650 5,650 1,918 Non-GAAP operating income (1) $ 81,921 $ 73,010 $ 68,482 GAAP net income (loss) $ 9,826 $ (15,944) $ 13,191 Fair value adjustment of acquired deferred revenue 192 192 298 Settlement adjustment - revenue (2) - - 9,296 Fair value adjustment to deferred services cost (88) (88) (91) Stock-based compensation 14,792 14,792 30,924 Amortization of acquired intangible assets included in cost of revenue 6,874 6,874 6,677 Amortization of acquired intangible assets 6,055 6,055 7,784 Acquisition-related and other transactional charges included in general and administrative costs 1,895 1,895 135 Restructuring and other charges, net 5,650 5,650 1,918 Income tax adjustments (3) 29,317 32,673 (16,843) Non-GAAP net income $ 74,513 $ 52,099 $ 53,289 GAAP diluted earnings (loss) per share $ 0.08 $ (0.14) $ 0.11 Fair value adjustment of acquired deferred revenue - - - Settlement adjustment - revenue (2) - - 0.08 Stock-based compensation 0.13 0.13 0.26 Amortization of acquired intangibles 0.11 0.11 0.12 Acquisition-related and other transactional charges 0.02 0.02 - Restructuring and other charges, net 0.05 0.05 0.02 Income tax adjustments 0.25 0.28 (0.14) Non-GAAP diluted earnings per share $ 0.64 $ 0.45 $ 0.45 GAAP diluted weighted average shares outstanding 115,897 115,025 119,580 Dilutiveeffectofstock-basedcompensationplans - 872 - Non-GAAP diluted weighted average shares outstanding 115,897 115,897 119,580 (1) Operating margin impact of non-GAAP adjustments: Three Months Ended September 30, September 30, September 30, 2019 2019 2018 ASC 606 ASC 605 ASC 605 GAAP operating margin 13.9% 11.2% 3.7% Fair value adjustment of acquired deferred revenue 0.1% 0.1% 0.1% Settlement adjustment - revenue (2) 0.0% 0.0% 2.4% Fair value adjustment to deferred services cost 0.0% 0.0% 0.0% Stock-based compensation 4.4% 4.4% 9.9% Amortization of acquired intangibles 3.9% 3.9% 4.6% Acquisition-related and other transactional charges 0.6% 0.6% 0.0% Restructuring and other charges, net 1.7% 1.7% 0.6% Non-GAAP operating margin 24.4% 21.8% 21.3% (2) Our Q4'18 and FY'18 GAAP revenue results include the impact of a settlement of a customer dispute concerning a professional services receivable. The settlement, reached in September 2018, included partial payment of the receivable and new software purchases. The net revenue write-down recorded in the fourth quarter of 2018 was $9.3 million, comprised of a $14.5 million services revenue write-down, partially offset by new subscription revenue of $5.2 million. We have excluded these amounts from our Non-GAAP results. (3) We have recorded a full valuation allowance against our U.S. net deferred tax assets. As we are profitable on a non-GAAP basis, the 2019 and 2018 non-GAAP tax provisions are being calculated assuming there is no valuation allowance. Income tax adjustments reflect the tax effects of non-GAAP adjustments, which are calculated by applying the applicable tax rate by jurisdiction to the non-GAAP adjustments 8 listed above. The fourth quarter of 2018 excludes the GAAP benefit of a $3 million valuation allowance release in a foreign jurisdiction as the jurisdiction was profitable on a non-GAAP basis.
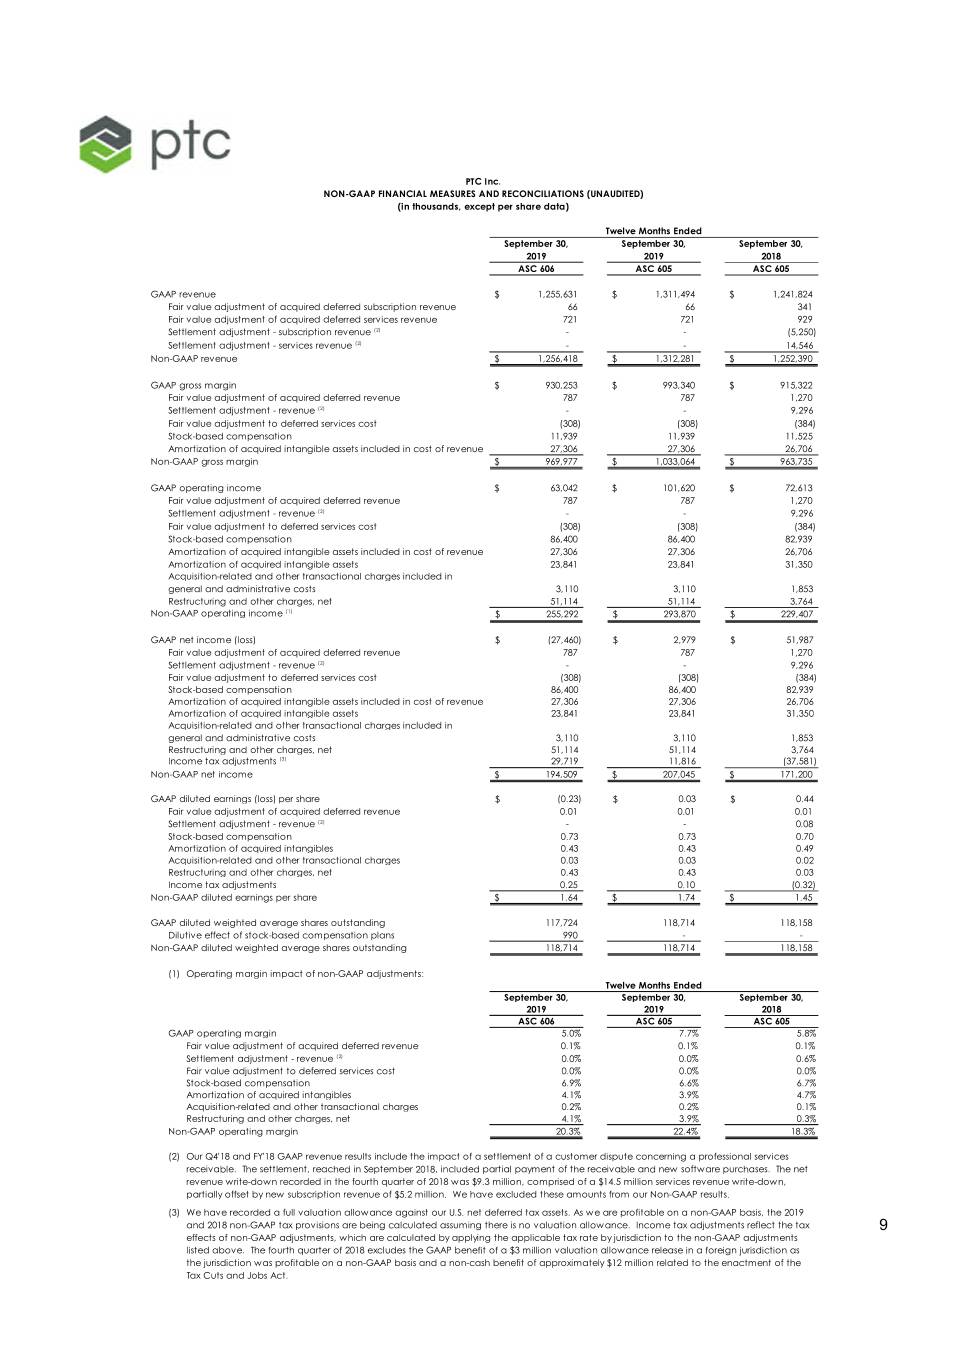
PTC Inc. NON-GAAP FINANCIAL MEASURES AND RECONCILIATIONS (UNAUDITED) (in thousands, except per share data) Twelve Months Ended September 30, September 30, September 30, 2019 2019 2018 ASC 606 ASC 605 ASC 605 GAAP revenue $ 1,255,631 $ 1,311,494 $ 1,241,824 Fairvalueadjustmentofacquireddeferredsubscriptionrevenue 66 66 341 Fair value adjustment of acquired deferred services revenue 721 721 929 Settlement adjustment - subscription revenue (2) - - (5,250) Settlement adjustment - services revenue (2) - - 14,546 Non-GAAP revenue $ 1,256,418 $ 1,312,281 $ 1,252,390 GAAP gross margin $ 930,253 $ 993,340 $ 915,322 Fair value adjustment of acquired deferred revenue 787 787 1,270 Settlement adjustment - revenue (2) - - 9,296 Fair value adjustment to deferred services cost (308) (308) (384) Stock-based compensation 11,939 11,939 11,525 Amortization of acquired intangible assets included in cost of revenue 27,306 27,306 26,706 Non-GAAP gross margin $ 969,977 $ 1,033,064 $ 963,735 GAAP operating income $ 63,042 $ 101,620 $ 72,613 Fair value adjustment of acquired deferred revenue 787 787 1,270 Settlement adjustment - revenue (2) - - 9,296 Fair value adjustment to deferred services cost (308) (308) (384) Stock-based compensation 86,400 86,400 82,939 Amortization of acquired intangible assets included in cost of revenue 27,306 27,306 26,706 Amortization of acquired intangible assets 23,841 23,841 31,350 Acquisition-related and other transactional charges included in general and administrative costs 3,110 3,110 1,853 Restructuring and other charges, net 51,114 51,114 3,764 Non-GAAP operating income (1) $ 255,292 $ 293,870 $ 229,407 GAAP net income (loss) $ (27,460) $ 2,979 $ 51,987 Fair value adjustment of acquired deferred revenue 787 787 1,270 Settlement adjustment - revenue (2) - - 9,296 Fair value adjustment to deferred services cost (308) (308) (384) Stock-based compensation 86,400 86,400 82,939 Amortization of acquired intangible assets included in cost of revenue 27,306 27,306 26,706 Amortization of acquired intangible assets 23,841 23,841 31,350 Acquisition-related and other transactional charges included in general and administrative costs 3,110 3,110 1,853 Restructuring and other charges, net 51,114 51,114 3,764 Income tax adjustments (3) 29,719 11,816 (37,581) Non-GAAP net income $ 194,509 $ 207,045 $ 171,200 GAAP diluted earnings (loss) per share $ (0.23) $ 0.03 $ 0.44 Fairvalueadjustmentofacquireddeferredrevenue 0.01 0.01 0.01 Settlement adjustment - revenue (2) - - 0.08 Stock-based compensation 0.73 0.73 0.70 Amortization of acquired intangibles 0.43 0.43 0.49 Acquisition-related and other transactional charges 0.03 0.03 0.02 Restructuring and other charges, net 0.43 0.43 0.03 Incometaxadjustments 0.25 0.10 (0.32) Non-GAAP diluted earnings per share $ 1.64 $ 1.74 $ 1.45 GAAP diluted weighted average shares outstanding 117,724 118,714 118,158 Dilutiveeffectofstock-basedcompensationplans 990 - - Non-GAAP diluted weighted average shares outstanding 118,714 118,714 118,158 (1) Operating margin impact of non-GAAP adjustments: Twelve Months Ended September 30, September 30, September 30, 2019 2019 2018 ASC 606 ASC 605 ASC 605 GAAP operating margin 5.0% 7.7% 5.8% Fair value adjustment of acquired deferred revenue 0.1% 0.1% 0.1% Settlement adjustment - revenue (2) 0.0% 0.0% 0.6% Fair value adjustment to deferred services cost 0.0% 0.0% 0.0% Stock-based compensation 6.9% 6.6% 6.7% Amortization of acquired intangibles 4.1% 3.9% 4.7% Acquisition-related and other transactional charges 0.2% 0.2% 0.1% Restructuring and other charges, net 4.1% 3.9% 0.3% Non-GAAP operating margin 20.3% 22.4% 18.3% (2) Our Q4'18 and FY'18 GAAP revenue results include the impact of a settlement of a customer dispute concerning a professional services receivable. The settlement, reached in September 2018, included partial payment of the receivable and new software purchases. The net revenue write-down recorded in the fourth quarter of 2018 was $9.3 million, comprised of a $14.5 million services revenue write-down, partially offset by new subscription revenue of $5.2 million. We have excluded these amounts from our Non-GAAP results. (3) We have recorded a full valuation allowance against our U.S. net deferred tax assets. As we are profitable on a non-GAAP basis, the 2019 and 2018 non-GAAP tax provisions are being calculated assuming there is no valuation allowance. Income tax adjustments reflect the tax 9 effects of non-GAAP adjustments, which are calculated by applying the applicable tax rate by jurisdiction to the non-GAAP adjustments listed above. The fourth quarter of 2018 excludes the GAAP benefit of a $3 million valuation allowance release in a foreign jurisdiction as the jurisdiction was profitable on a non-GAAP basis and a non-cash benefit of approximately $12 million related to the enactment of the Tax Cuts and Jobs Act.
Important Disclosures Important Information About Our Operating and Non-GAAP Financial Measures PTC provides non-GAAP supplemental information to its financial results. We use these non-GAAP measures, and we believe that they assist our investors, to make period-to-period comparisons of our operational performance because they provide a view of our operating results without items that are not, in our view, indicative of our operating results. We believe that these non-GAAP measures help illustrate underlying trends in our business, and we use the measures to establish budgets and operational goals, communicated internally and externally, for managing our business and evaluating our performance. We believe that providing non-GAAP measures affords investors a view of our operating results that may be more easily compared to the results of peer companies. In addition, compensation of our executives is based in part on the performance of our business based on these non- GAAP measures. However, non-GAAP information should not be construed as an alternative to GAAP information as the items excluded from the non-GAAP measures often have a material impact on our financial results and such items often recur. Management uses, and investors should consider, non-GAAP measures in conjunction with our GAAP results. Non-GAAP revenue, non-GAAP operating expense, non-GAAP operating margin, non-GAAP gross profit, non-GAAP gross margin, non-GAAP net income and non-GAAP EPS exclude the effect of the following items: fair value of acquired deferred revenue, fair value adjustment to deferred services cost, stock-based compensation, amortization of acquired intangible assets, acquisition- related and other transactional charges included in general and administrative costs, restructuring and headquarters relocation charges, and income tax adjustments. Additional information about the items we exclude from our non-GAAP financial measures and the reasons we exclude them can be found in “Non-GAAP Financial Measures” of our Annual Report on Form 10-K for the fiscal year ended September 30, 2018. PTC also provides information on “free cash flow” and “adjusted free cash flow” to enable investors to assess our ability to generate cash without incurring additional external financings and to evaluate our performance against our announced long-term goal of returning approximately 50% of our free cash flow to shareholders via stock repurchases. Free cash flow is net cash provided by (used in) operating activities less capital expenditures; adjusted free cash flow is free cash flow excluding restructuring payments and certain identified non-ordinary course payments. Free cash flow and adjusted free cash flow are not measures of cash available for discretionary expenditures. Forward-Looking Statements Statements in this press release that are not historic facts, including statements about our future financial and growth expectations and targets, are forward-looking statements that involve risks and uncertainties that could cause actual results to differ materially from those projected. These risks include: the macroeconomic and/or global manufacturing climates may deteriorate due to, among other factors, the geopolitical environment, including the focus on technology transactions with non-U.S. entities and potential expanded prohibitions, and ongoing trade tensions and tariffs; our businesses, including our Internet of Things (IoT) and Augmented Reality businesses, may not expand and/or generate the revenue we expect if customers are slower to adopt those technologies than we expect or adopt competing technologies; bookings associated with minimum ACV commitments under our Strategic Alliance Agreement with Rockwell Automation may not result in subscription contracts sold through to end-user customers; the Onshape acquisition may not close when or as we expect and may not provide the competitive benefit we expect; we may be unable to generate sufficient operating cash flow to repay the Onshape debt when or as we expect or to return 50% of free cash flow to shareholders and other uses of cash or our credit facility limits or other matters could preclude such repayments or share repurchases; we may be unable to expand our outstanding credit facility as we expect, which could adversely affect our liquidity and our credit rating; we may be unable to expand our partner ecosystem as we expect; and our partners may not generate the revenue we expect. In addition, our assumptions concerning our future GAAP and non-GAAP effective income tax rates are based on estimates and other factors that could change, including the geographic mix of our revenue, expenses and profits. Other risks and uncertainties that could cause actual results to differ materially from those projected are detailed from time to time in reports we file with the Securities and Exchange Commission, including our most recent Annual Report on Form 10-K and Quarterly Reports on Form 10-Q. 10


