UNITED STATES
SECURITIES AND EXCHANGE COMMISSION
Washington, D.C. 20549
FORM 10-K
ANNUAL REPORT UNDER SECTION 13 OR 15(d) OF THE
SECURITIES EXCHANGE ACT OF 1934
For the Fiscal Year Ended: September 30, 2005
Commission File Number: 0-18059
PARAMETRIC TECHNOLOGY CORPORATION
(Exact name of registrant as specified in its charter)
| | |
| Massachusetts | | 04-2866152 |
(State or other jurisdiction of incorporation or organization) | | (I.R.S. Employer Identification Number) |
140 Kendrick Street, Needham, MA 02494
(Address of principal executive offices, including zip code)
(781) 370-5000
(Registrant’s telephone number, including area code)
| | |
Securities registered pursuant to Section 12(b) of the Act: | | Securities registered pursuant to Section 12(g) of the Act: |
| |
| None | | Common Stock, $.01 par value per share |
| |
| | | Series A Junior Participating Preferred Stock Purchase Rights |
| | | (Title of Class) |
Indicate by check mark whether the registrant (i) has filed all reports required to be filed by Section 13 or 15(d) of the Securities Exchange Act of 1934 during the preceding 12 months (or for such shorter period that the registrant was required to file such reports) and (ii) has been subject to such filing requirements for the past 90 days. YES x NO ¨
Indicate by check mark if disclosure of delinquent filers pursuant to Item 405 of Regulation S-K is not contained herein and will not be contained, to the best of the registrant’s knowledge, in definitive proxy or information statements incorporated by reference in Part III of this Form 10-K, or any amendment to this Form 10-K. x
Indicate by check mark whether the registrant is an accelerated filer (as defined in Rule 12b-2 of the Securities Exchange Act of 1934). YES x NO ¨
Indicate by check mark whether the registrant is a shell company (as defined in Rule 12b-2 of the Securities Exchange Act of 1934). YES ¨ NO x
The aggregate market value of our voting stock held by non-affiliates was approximately $1,532,173,156 on April 1, 2005 based on the last reported sale price of our common stock on the Nasdaq National Market on that day. There were 271,648,750 shares of our common stock outstanding on that day and 277,398,787 shares of our common stock outstanding on November 30, 2005.
DOCUMENTS INCORPORATED BY REFERENCE
Portions of the definitive Proxy Statement in connection with the 2006 Annual Meeting of Stockholders (2006 Proxy Statement) are incorporated by reference into Part III.
PARAMETRIC TECHNOLOGY CORPORATION
ANNUAL REPORT ON FORM 10-K FOR FISCAL YEAR 2005
Table of Contents
i
Forward-Looking Statements
Statements in this Annual Report on Form 10-K about our anticipated financial results and growth, as well as about the development of our products and markets, are forward looking statements that are based on our current plans and assumptions. Important information about the bases for these plans and assumptions and factors that may cause our actual results to differ materially from these statements are discussed in “Management’s Discussion and Analysis of Financial Condition and Results of Operations” beginning on page 9 below, and generally throughout this report.
Unless otherwise indicated, all references to a year reflect our fiscal year that ends on September 30.
PART I
Overview
Parametric Technology Corporation (PTC) develops, markets and supports product lifecycle management (PLM) and enterprise content management (ECM) software solutions and related services that help companies improve their processes for developing physical and information products.
The PLM market encompasses the mechanical computer-aided design, manufacturing and engineering (CAD, CAM and CAE) market and the collaboration and data management solutions market, as well as many previously isolated markets that address various other phases of the product lifecycle. These include product data management (PDM), component and supplier management, visualization and digital mockup, enterprise application integration, program and project management, after market service and portfolio management, requirements management, customer needs management, manufacturing planning, and technical and marketing publications.
The ECM market encompasses companies in multiple verticals and includes technologies for business process management, compliance management, document management, dynamic publishing, document archival and retrieval, knowledge management, records management and Web content management. Within the ECM market, PTC focuses its development on a subset of solutions that optimize the development of dynamic publications, such as those associated with technical manuals, service documents and regulatory and compliance data sets, as well as government and financial document publishing and content management.
Our software solutions include:
| • | | a suite of mechanical computer-aided design and XML-based document authoring tools (our Desktop Solutions); and |
| • | | a range of Internet-based collaboration, content and process management, and publishing technologies (our Enterprise Solutions). |
These software solutions enable companies to:
| • | | create digital product content as represented by product designs and component-based documents (collectively, “digital products”); |
| • | | collaborate globally on the development of content with cross-functional teams consisting of members within an organization and from the extended enterprise; |
| • | | control content and automate processes over the course of a product’s lifecycle; and |
| • | | communicate relevant product information across the extended enterprise and to customers through multiple channels using dynamic publications. |
Our software solutions historically focused on addressing the design engineering needs of manufacturing companies. Over time, we expanded our software solutions to enable customers to leverage engineering content across an extended enterprise and design chain. As part of this process, we diversified our product portfolio to include our Windchill content and process management
1
software and our recently acquired Arbortext dynamic publishing software. Our product development system for manufacturing companies, which is a combination of all of our solutions (Pro/ENGINEER®, Windchill® and Arbortext®), enables customers to meet a broad set of needs across the product development lifecycle. Additionally, the combination of Windchill and the Arbortext products will enable us to extend our product development system to address the content management and dynamic publishing needs of companies in vertical markets we previously have not served, such as the life sciences, publishing, government and financial services markets.
Our PLM solutions suite addresses significant challenges that manufacturing companies face in their product and documentation development processes: more frequent change, heterogeneity of systems, regulatory compliance, and increased communication inside and outside the manufacturing enterprise to support growing globalization and outsourcing of development activities, increasingly transparent supply chains, and growing services and maintenance strategies. With our PLM software solutions suite, we provide our manufacturing customers with a product development system that permits individuals—regardless of their roles in the commercialization of a product, the computer-based tools they use, or their location geographically or in the supply chain—to participate in and impact the product development process across the digital product value chain. We have devoted significant resources to our enterprise solutions and their integration with our design software and continue to integrate our products more tightly and make them easier to deploy. We believe this will create significant added value for our customers.
For customers in the life sciences, publishing, government and financial services markets, our combined Windchill and Arbortext solutions will enable us to address significant inefficiencies in cross-functional or complex documentation development processes. Today, most companies use traditional desktop publishing tools that involve a significant amount of manual work to maintain accurate documentation. This causes considerable additional work in environments where multiple authors contribute to the development of content, content changes frequently, multiple organizations within a company have specialized requirements but use similar content, or regulatory compliance drives the need for standardization across all information outputs. Our combination of Windchill and Arbortext solutions is the only single-vendor offering that fully addresses these problems. Our product development system for these vertical markets provides customers the ability to create compound documents from reusable content components, manage the content and processes to enable teams to work together, and configure and publish the information for a variety of uses and audiences, in a variety of formats.
Our solutions are complemented by our experienced services and technical support organizations, as well as resellers and other strategic partners. Our services and technical support organizations provide training, consulting, implementation and support services to customers worldwide. Our resellers supplement our direct sales force and provide greater geographic and small account coverage, primarily for our design solutions, and our strategic partners provide complementary product and/or service offerings.
Acquisitions
We completed four strategic acquisitions in 2004 and 2005:
| | | | |
Company
| | Technology
| | Date Acquired
|
Arbortext, Inc. | | Enterprise Publishing Software | | Fourth Quarter 2005 |
Polyplan Technologies, Inc. | | Manufacturing Process Planning | | Third Quarter 2005 |
Aptavis Technologies Corporation | | Windchill-based Solutions for the Retail, Footwear and Apparel Industry | | Third Quarter 2005 |
OHIO Design Automation, Inc. | | Electronic Design Collaboration Software | | Third Quarter 2004 |
Our acquisition of Arbortext enables us to provide solutions to create, manage and dynamically publish information concurrently with the development of related products or services, improving time-to-market and quality and reducing cost. The acquisition provides us with new opportunities within our existing markets and with increased access to new markets such as life sciences, publishing, government and financial services. Based in Ann Arbor, Michigan, Arbortext had approximately 250 employees in offices around the world and generated revenue of approximately $40 million for the twelve months ended June 30, 2005.
Our acquisition of Polyplan Technologies helps us enable concurrent development of products and related manufacturing process plans. We are focusing on providing an easy-to-use and affordable solution for use by mainstream manufacturing engineers who are not satisfied with the manufacturing process management tools available today. We do not expect the Polyplan acquisition to contribute revenue in the near term as we work to integrate the technology with our solutions.
2
Through our prior business relationship with Aptavis Technologies, we increased our penetration of the footwear and apparel market, and our solution for this market that uses the Aptavis technology has been adopted by leading footwear and apparel manufacturers and retailers. Our acquisition of Aptavis enables us to more fully integrate the Aptavis technology into our product offerings and to further develop the technology to address the requirements of international customers. Although we expect this business to continue to grow, the revenue contribution from the Aptavis technology historically has not been material and we do not expect this to change in the near term as a result of this acquisition.
Our acquisition of OHIO Design Automation enables us to offer the InterComm™ suite of electronic design collaboration solutions to enable enterprise-wide visualization, verification, annotation, and automated comparison of electronic design content. These solutions are targeted toward high tech and electronics manufacturers and other manufacturers of products that contain electronic components. We offer the InterComm products both as stand alone solutions and as part of the Windchill product line.
We believe these acquisitions enhance the value and appeal of our product development system by adding capabilities that are valuable to both our existing customers and customers in new vertical industries. The new capabilities we are adding enable our customers to create more downstream deliverables, such as manufacturing process plans, and to address complex documentation requirements, such as maintenance instructions, operator manuals, promotional materials and regulatory filings. At the same time, these acquisitions provide increased access to new markets where we can offer configurations of our product development system that are targeted to these new markets.
Our Principal Products and Services
Our Desktop Solutions and our Enterprise Solutions are aligned under a unified product strategy using a common architecture. This strategy capitalizes on existing product synergies to offer integral product development solutions.
Our comprehensive product development system offers our customers the capabilities to improve their product development and documentation processes. These processes involve the entire enterprise and extend to supplier, partner, and customer participants. Our approach reduces complexity for our customers by ensuring that our solutions work together in a cohesive system. Our product development system enables our customers to create, collaborate, control and communicate digital product information across the extended enterprise and design chain. These capabilities are enabled by a system architecture that is built from the ground up to address the needs of the distributed product development environment. Our product development system architecture is:
| • | | integral, sharing a common database schema, common business objects and seamless user interface; |
| • | | internet-based, designed for the Web; it enables our product development system to deploy seamlessly across existing Intranet and Internet infrastructures to accommodate a distributed value chain; and |
| • | | interoperable, integrating easily with other systems using standard protocols and integration approaches. |
We describe our integrated portfolio of Desktop Solutions and Enterprise Solutions that address specific business challenges that occur in the product lifecycle below.
DESKTOP SOLUTIONS
Our Desktop Solutions include our integrated CAD/CAM/CAE software as well as document authoring tools added through our recent acquisition of Arbortext. Our principal Desktop Solutions are Pro/ENGINEER and Arbortext Editor. The family of Pro/ENGINEER software addresses a broad spectrum of engineering disciplines essential to the development of virtually all manufactured products, ranging from consumer products to jet aircraft. Manufacturers compete on the basis of cost, time to market and product performance criteria, which are significantly affected by the quality and length of the product development process. Pro/ENGINEER improves product quality and reduces time to market by enabling end-users easily to evaluate multiple design alternatives and to share data with bi-directional associativity. Our Arbortext document authoring solutions help companies create documents the same way Pro/ENGINEER helps them create product designs by allowing the creation of reusable content as components and as compound documents. Arbortext’s approach to document authoring helps companies reduce authoring and translation costs and improve the accuracy and consistency of the information they produce.
3
The key features of Pro/ENGINEER and Arbortext Editor are described below.
Pro/ENGINEER is a three-dimensional product design solution based on a parametric, feature-based solid modeler that enables changes made during the design process to be associatively updated throughout the design. Pro/ENGINEER consists of capabilities for detailed design (CAD), manufacturing/production (CAM), and simulation/analysis (CAE), as well as facilities for exchanging CAD data with a multitude of sources and in varied standard formats, allowing companies to create more innovative, differentiated and functional products quickly and easily.
Our offerings within the Pro/ENGINEER family include:
Pro/ENGINEER CAD solutions:foundational design capabilities for part and assembly modeling, basic surfacing, production drawing creation, welding, sheet metal design and photo rendering. Extended design capabilities include advanced styling and surfacing tools and solutions for electrical and mechanical systems design involving large assemblies, cable harnesses, and piping.
Pro/ENGINEER CAM solutions:solutions that enable designers to create downstream manufacturing deliverables such as molds and progressive dies, numerical control (NC) tool paths, and inspection programs. By directly referencing Pro/ENGINEER designs, production and tooling engineers can handle tooling design and detailing, NC process planning, NC programming, and inspection/verification, automatically responding to changes to the design with no data translation obstacles.
Pro/ENGINEER CAE solutions: solutions that allow engineers to test and optimize designs for structural, dynamic, thermal, and durability performance. These solutions provide benefits by minimizing physical prototyping, increasing engineering creativity, and helping deliver higher quality products in less time.
Arbortext Editor™ is an XML-based authoring tool that enables the creation of dynamic content for multiple output types with features that give authors control over content collection, personalization, assembly and publishing. Arbortext Editor looks and works like familiar word processing software, but is able to create components of content, aggregate those components into publications and customize those publications dynamically. The underlying principles of Arbortext Editor are similar to those of Pro/ENGINEER, with similar benefits – documents can be created by multiple contributors and the document components are reusable because we separate the content from its formatting and style. Consequently, when changes to content are made, those changes will be reflected wherever that content is used.
ENTERPRISE SOLUTIONS
Since their introduction in 1998, our Enterprise Solutions have evolved to address expanding customer needs. Our suite of Windchill and Arbortext solutions are designed to help companies manage the process of developing products and documentation across an extended enterprise. Windchill is a sophisticated, Internet-based content management system that specializes in the management of complex data and relationships, processes and publications. The other products in our Enterprise Solutions category use the Windchill content management system to leverage the content for use in other processes, such as manufacturing, procurement, technical publications and after market services. With our Enterprise Solutions, our customers can improve time to market, increase the number of new products they introduce, improve product quality, reduce product cost, reduce development cost, and improve content reuse.
Our principal Enterprise Solutions include:
Windchill PDMLink™: a product content management solution that is used to control information by facilitating data accessibility and automating and managing the product development process throughout the life of a product. Windchill PDMLink is fluent with workgroup level CAD content management as well as complete enterprise-wide product content management and enables document management, change management and configuration management. Optional modules of Windchill PDMLink include:
Windchill PartsLink™ Classification and Reuse: a solution that allows companies to organize internal design libraries and make them available to their engineering teams through flexible, easy-to-use searching mechanisms, maximizing part reuse. For example, with this module engineers can quickly and effectively select the “right” part by comparing important functional, supply chain, and environmental compliance characteristics.
Windchill Supplier Management: a solution that helps customers improve part and manufacturer source selection across multiple product lines and geographies. Approved manufacturer and vendor lists (AML, AVL) are developed based on a variety of characteristics, including environmental regulatory compliance, lifecycle status and end-of-life risk, and component and supplier preferences.
4
Windchill ProjectLink™: a collaborative project management solution that enables companies (including their employees, partners, suppliers, and customers) to work together on projects through Internet-based compartmentalized workspaces. Windchill ProjectLink also has capabilities for project plan development, milestone and deliverable tracking, activity assignment and management, and on-line discussion forums.
Pro/INTRALINK®: a Windchill-based Pro/ENGINEER workgroup data management solution that provides centralized vaulting and revision control of Pro/ENGINEER models, relationships, and capabilities for improved information security and accuracy. A subset of the capabilities found in Windchill PDMLink, Pro/INTRALINK is used for Pro/ENGINEER-only data management within the engineering department.
Visualization and Digital MockUp: visualization and digital mock-up solutions that support the integration of 2D and 3D product data, regardless of source. ProductView is a visualization solution designed to enable multiple parties to view, markup, and collaborate on all forms of digital product data. DIVISION® MockUp is a sophisticated visualization tool that enables real-time design collaboration, analysis, and simulation of an entire digital product model, regardless of CAD authoring tools or team location.
InterComm: a suite of electronic design collaboration solutions that enable enterprise-wide visualization, verification, annotation, and automated comparison of the electronic design intent. The InterComm solutions provide easy access to complex CAE and electronic computer aided design data created in leading electronic design automation tools.
PTC PLM On Demand: hosted by IBM, these solutions provide companies with flexibility to pursue their product lifecycle management initiatives in an “on demand” model and are provided in two service options:
Standard: hosted out-of-the-box versions of Windchill PDMLink and Windchill ProjectLink solutions for small- and medium-sized businesses. This deployment option reduces the typical barriers to entry, including cost and implementation time and risk, making our PLM solutions accessible to companies with limited resources.
Dedicated: an offering for companies that need robust PLM technology and process consulting with an on demand delivery model. This deployment option enables larger customers to take advantage of the full Windchill software suite and the IBM on demand infrastructure to maintain flexibility in fast-changing business environments.
Windchill Integrations: turn-key solutions that enable cross-application data compatibility and information exchange. These integrations are key to any enterprise environment and include robust support for MCAD, ECAD and software configuration management applications, major ERP systems, and a flexible standards-based application for other enterprise integrations.
Arbortext Publishing Engine™: a server-based system that assembles XML and SGML content and automatically publishes audience-specific content in both print and electronic forms, with high-quality layout and formatting. This system can reduce publishing costs, improve time-to-market and increase productivity.
SERVICES
Maintenance Services
We offer maintenance support plans for our software products. Customers who participate in our maintenance support plans receive periodic software updates and new releases. Active maintenance plan customers also have direct access to our global technical support team of certified engineers, an ISO 9001 accredited organization, for timely and accurate issue resolution. In addition, we provide self-service support tools that allow our customers quick, dynamic access at all times to an extensive amount of technical support information.
Consulting and Training Services
Our software solutions and maintenance support offerings are complemented by additional offerings from our services organization, as well as from third-party resellers and other strategic partners. We offer the following comprehensive portfolio of services to help customers select the “right” technology to support organizational and strategic goals:
Implementation Services: a wide range of technology installation, configuration, and migration services, from pre-packaged “quick start” deployments to full system integration.
5
Process and Technology Adoption Services: consulting services to facilitate widespread acceptance and use of our solutions within our customers’ organizations by addressing organizational challenges and competing priorities.
Training Services: an extensive curriculum of instructor-led courses and computer-based training resources to accelerate adoption of the product development system and realize value across the entire enterprise.
Product Development
For our products to remain competitive, we must provide our customers with new and innovative software solutions. As a result, we continue to spend on research and development, and we look for opportunities to acquire new technologies suited to our customers’ needs. We must also efficiently manage our development resources to ensure the appropriate balance among product lines, based on both product development plans and customer demand.
Our ability to rapidly develop new design products is facilitated by the modular structure of our software code. This structure enables functional capabilities of existing products to be used in new software applications or modules, thereby reducing the amount of new code required to develop additional products. Much of our Enterprise Solutions technology is Internet-centric, Java-based, object-oriented software and our products depend on these evolving technologies. We also license certain technologies from third parties to augment the functionality of our products. We generally pay these third parties either periodic royalties or fixed fees for the use of their technologies and rely on them for development and other support. We continually review the associated costs, development resource savings, support levels, and, if applicable, experience with the third party to determine whether the use of such technologies is beneficial.
Over the past few years, we have focused much of our research and development investment on integrating our products into a unified product development system. This strategy is supported by changes we have made to both our product planning and product testing processes. These planning and testing phase changes ensure that the products work together in a cohesive system across specific customer business processes.
We also work closely with our customers to define improvements and enhancements to our products. Customers become involved in the software design process to help validate feasibility and to provide feedback on functionality early in the development of our products. In addition, we maintain software and hardware partner programs designed to provide partners both with access to our products and with the mechanisms and environment to facilitate the integration of complementary products with our product lines. Through our open software toolkits, program members can build tightly integrated solutions that satisfy the various requirements of our customers.
Our fiscal year research and development expenses were $118.3 million in 2005, $108.0 million in 2004 and $128.4 million in 2003. Additional information about our research and development expenditures may be found in “Item 7. Management’s Discussion and Analysis of Financial Condition and Results of Operations—Results of Operations—Costs and Expenses—Research and Development” beginning on page 19 below.
Sales and Marketing
We derive most of our revenue from products and services distributed directly by our sales force to our end-user customers. We also offer products through third-party distributors. Our direct sales force focuses on large accounts, while our reseller channel provides a cost-effective means of covering the small- and medium-sized business market.
Within our direct sales force, we have both strategic accounts and general business accounts units. The strategic accounts unit is further divided into vertical groups, such as aerospace and defense, automotive, consumer products, electronics and high technology, footwear and apparel, industrial products and life sciences. This vertical orientation is mirrored in our services delivery organization and, increasingly, in the products we deliver to strategic accounts. In addition, we continue to broaden our indirect distribution channel through alliances with third-party resellers and other strategic partners who provide products and/or services that complement our offerings. Our resellers distribute our design products, including Pro/ENGINEER, and provide related services throughout North America, Europe and parts of Asia/Pacific; our other strategic partners help complement our product development system with ancillary offerings. We recently authorized some of our resellers to distribute our Windchill Link solutions and PLM On Demand to the small- and medium-sized business market.
6
Financial information about our international and domestic operations, including by segment and principal products, may be found in Note M of “Notes to Consolidated Financial Statements” and the section titled “Management’s Discussion and Analysis of Financial Condition and Results of Operations” beginning on page 9 below.
Competition
We compete primarily in the PLM market, including the design solutions market, and the ECM market, including the document management market and the document publishing market.
We compete in the PLM market with a number of companies that offer solutions that address specific functional areas covered by our solutions, including: Dassault Systemes SA and UGS Corp. for traditional design solutions, PDM solutions, manufacturing planning solutions and visualization and digital mock-up solutions; Agile Software Corp. and MatrixOne Inc. for PDM solutions; and i2 Technologies, Inc. for part sourcing solutions. In addition, we compete with larger, better-known enterprise-solution companies with established customers that have entered the PLM market and offer solutions integrated with their other enterprise software applications. For example, SAP AG offers a solution that controls product data within the larger framework of its ERP solution. We believe our PLM solutions are more specifically targeted toward the product development processes within manufacturing companies and offer broader and deeper functionality in those processes.
We and our resellers compete with design products from companies such as Autodesk, Inc. and Solidworks, a subsidiary of Dassault Systemes, for sales to smaller manufacturing customers.
We compete in the ECM market with repository-based collaboration software solutions such as IBM Lotus Notes, Microsoft Sharepoint, and EMC’s Documentum eRoom.
We compete with EMC Documentum, FileNet, Hummingbird, and OpenText in the document management market and with EMC Documentum, Adobe Framemaker, and the Microsoft Office suite in the document publishing market.
Proprietary Rights
Our software products and our trademarks, including our company names, product names and logos, are proprietary. We protect our intellectual property rights in these items by relying on copyrights, trademarks, patents and common law safeguards, including trade secret protection, as well as restrictions on disclosures and transferability contained in our agreements with other parties.
We believe that, due to the rapid pace of innovation within our industry, the technological and creative skills of our personnel are as important to establishing and maintaining a technology leadership position within the industry as are the various legal protections surrounding our technology.
Our proprietary rights are subject to risks and uncertainties described under the subheading “Important Factors That May Affect Future Results” in “Management’s Discussion and Analysis of Financial Condition and Results of Operations” below. You should read that discussion, which is incorporated into this section by reference.
PTC, the PTC Logo, Parametric Technology Corporation, The Product Development Company, Product First, The way to Product First, Create Collaborate Control Communicate, Simple Powerful Connected, Pro/ENGINEER, Wildfire, Pro/DESKTOP, Pro/INTRALINK, MECHANICA, GRANITE, Windchill, Windchill ProjectLink, Windchill PartsLink, Windchill DynamicDesignLink, Windchill PDMLink, InterComm, FlexPLM, Arbortext and all product names in the PTC product family are trademarks or registered trademarks of PTC or our subsidiaries in the United States and/or other countries.
Backlog
We generally ship our products within 30 days after acceptance of a customer order. A high percentage of our license revenue historically has been generated in the third month of each fiscal quarter, and this revenue tends to be concentrated in the later part of that month. Accordingly, orders may exist at the end of a quarter that have not been shipped and not been recognized as revenue. We do not believe that our backlog at any particular point in time is indicative of future sales levels.
7
Employees
As of September 30, 2005, we had 3,751 employees, including 1,087 in sales and marketing; 1,037 in customer support, training and consulting; 385 in general and administration; and 1,242 in product development. Of these employees, 1,702 were located in the United States and 2,049 were located outside the United States.
Website Access to Reports and Code of Business Conduct and Ethics
We make available free of charge on our website atwww.ptc.com the following reports as soon as reasonably practicable after electronically filing them with, or furnishing them to, the SEC: our Annual Report on Form 10-K; our Quarterly Reports on Form 10-Q; our Current Reports on Form 8-K; and amendments to those reports filed or furnished pursuant to Sections 13(a) or 15(d) of the Securities Exchange Act of 1934. Our Proxy Statements for our Annual Meetings and our Section 16 trading reports on SEC Forms 3, 4 and 5 also are available on our website. The reference to our website is not intended to incorporate information on our website into this document by reference.
Our Code of Business Conduct and Ethics also is available on our website. Additional information about this code and amendments and waivers thereto can be found below in Part III, Item 10 of this Annual Report.
Executive Officers of the Registrant
Information about our executive officers is incorporated by reference from Part III, Item 10 of this Annual Report.
Other Information
PTC was incorporated in Massachusetts in 1985 and is headquartered in Needham, Massachusetts.
ITEM 2. Properties
We currently lease 114 offices used in operations in the United States and internationally through our non-U.S. subsidiaries, predominately as sales and/or support offices and for research and development work. Of our total of approximately 1,136,000 square feet of leased facilities used in operations, approximately 550,000 square feet are located in the U.S., including 316,000 square feet of our headquarters facility located in Needham, Massachusetts. The lease for our headquarters began in December 2000 and expires in December 2012, subject to certain renewal rights. We also lease space comprising approximately 415,000 square feet, which is not used for our current operations and is primarily subleased to third parties. As described in Notes B and G of “Notes to Consolidated Financial Statements,” lease commitments on unused facilities in excess of expected sublease income have been included in our restructuring provisions. We continue to engage in subleasing and early lease termination initiatives to employ alternate uses for these excess facilities. We believe that our facilities are adequate for our present needs.
ITEM 3. Legal Proceedings
On May 30, 2003, a lawsuit was filed against us in the U.S. District Court for the District of Massachusetts by Rand A Technology Corporation and Rand Technologies Limited (together, “Rand”). Rand historically had been our largest distributor. The complaint alleges various breaches of a revised one-year distribution agreement entered into in December 2002, as well as other agreements between Rand and us, and also asserts certain non-contract claims. The complaint, as amended, seeks equitable relief and substantial damages. On November 24, 2003, we filed our substantive response to Rand’s complaint and asserted counterclaims against Rand. During the second quarter of 2005, Rand quantified its claimed actual damages as being in excess of $50 million and Rand asserts that this amount should be trebled by the court. As a result of several recent rulings by the court, some of Rand’s claims have been dismissed and Rand’s possible maximum recovery in the lawsuit may have been reduced. In addition, the court has excluded the testimony of the damages expert hired by Rand to substantiate Rand’s damages quantification. The court has also issued a ruling granting PTC summary judgment on one of PTC’s counterclaims against Rand. Despite these rulings, several of Rand’s claims, as well as certain of our counterclaims, remain to be tried before a jury. We believe Rand’s claims and its damages assessment associated with those claims are without merit and will continue to contest them vigorously. We also intend diligently to prosecute our counterclaims. We cannot predict the ultimate resolution of this action at this time, and we cannot assure you that this action, if determined adversely to us, will not have a material adverse impact on our financial condition or results of operations.
8
We also are subject to various legal proceedings and claims that arise in the ordinary course of business. We currently believe that resolving these other matters will not have a material adverse impact on our financial condition or results of operations.
ITEM 4. Submission of Matters to a Vote of Security Holders
No matters were submitted to a vote of security holders during the last quarter of 2005.
PART II
ITEM 5. Market for Registrant’s Common Equity, Related Stockholder Matters and Issuer Purchases of Equity Securities
Information with respect to this item may be found in the section captioned “Quarterly Financial Information” on page F-38 below.
On September 30, 2005, the close of our fiscal year, our common stock was held by 5,372 shareholders of record. As of November 30, 2005, our common stock was held by 5,330 shareholders of record. We do not pay cash dividends on our common stock and retain earnings for use in our business. We review our dividend policy periodically, but we cannot assure you that our review will cause us to pay any dividends in the future.
ITEM 6. Selected Financial Data
Information with respect to this item may be found in the section captioned “Five-Year Summary of Selected Financial Data” on page F-38 below.
ITEM 7. Management’s Discussion and Analysis of Financial Condition and Results of Operations
Forward-Looking Statements
Statements in this Annual Report on Form 10-K about our anticipated financial results and growth, as well as about the development of our products and markets, are forward-looking statements that are based on our current plans and assumptions. Important information about the bases for these plans and assumptions and factors that may cause our actual results to differ materially from these statements are contained below and in “Important Factors That May Affect Future Results” beginning on page 31.
Unless otherwise indicated, all references to a year reflect our fiscal year that ends on September 30.
9
Executive Overview
In 2004, we focused on and achieved a significant turnaround in profitability. In 2005, we focused on increasing revenue and profitability with a view towards our longer-term goal of achieving $1 billion in revenue in 2008. As we discuss in detail below, for 2005, we achieved 9% year-over-year revenue growth and net income more than double that of the prior year. We achieved these results through organic growth in revenue from our core solutions and through strategic acquisitions.
The following graphs for the prior three years illustrate two consecutive years of improved revenue, operating income and earnings per share:
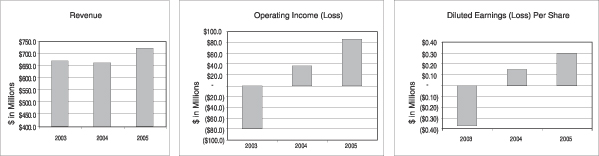
We believe our operating results in 2005 reflect successful execution of our strategic initiatives, which focused on improving our product and service offerings, our distribution model, our competitive position and our marketing message, and are also attributable to the results of our restructuring program completed in 2004. Revenue increased in both Enterprise Solutions and Desktop Solutions, primarily due to increased sales of consulting and training and maintenance services. We increased sales of our services and solutions through expansion of our services delivery organization and our reseller channel, increased adoption of Pro/ENGINEER Wildfire and implementation of Windchill, and the addition of Arbortext products. Our operating expenses were below 2003 levels due to our restructuring program, but increased over 2004 due to incremental expenditures we made to support our revenue growth in 2005 and to support anticipated future revenue growth. In 2006, we intend to continue to grow revenue and earnings through organic growth of our core solutions and through strategic acquisitions.
Acquisitions
We completed four acquisitions in 2004 and 2005 that we believe will help accelerate our long-term growth. We purchased Arbortext, Inc., a provider of enterprise publishing software, in the fourth quarter of 2005; Polyplan Technologies, Inc., a provider of manufacturing process planning technology, in the third quarter of 2005; Aptavis Technologies Corporation, a provider of Windchill-based solutions for the retail, footwear and apparel industry, in the third quarter of 2005; and OHIO Design Automation, Inc., a provider of electronic design collaboration software, in the third quarter of 2004. We believe Arbortext will contribute significantly to our planned growth in 2006 as its solutions facilitate timely, accurate and product-specific technical publications, solving a problem faced by our traditional installed base of discrete manufacturing customers. It also provides us entry into vertical markets we previously have not served, including the life sciences, publishing, government and financial services markets. As a stand-alone company, Arbortext generated revenue of approximately $40 million for the twelve months ended June 30, 2005. Our acquisitions of Polyplan, Aptavis and OHIO Design are important because they provide increased access to new markets where we can provide different configurations of our product development system, although we do not expect these acquisitions to contribute significant revenue in the near term. You can find more information about these acquisitions under the subheading “Acquisitions” of the “Business” section of this report, which begins on page 2.
Market Opportunities
We believe demand for our traditional CAD/CAM/CAE solutions has begun to grow again modestly and that the broader PLM market continues to present an opportunity for more meaningful growth. We believe the overall market for PLM solutions is evolving as manufacturers seek to improve their total product development processes instead of focusing on individual productivity in engineering or manufacturing. These product development processes have become increasingly complex as companies develop and manufacture products across geographic and corporate boundaries (a trend referred to as “global product development”).
10
Additionally, we believe there is a growing opportunity in the small- and medium-sized business market as these manufacturers migrate from two-dimensional design tools to entry-level three-dimensional design tools. We believe these smaller manufacturers have a need for and will invest in collaboration and data management solutions over the next several years.
Finally, we recently entered the ECM market as the result of our acquisition of Arbortext. We believe potential for significant growth exists in the portion of the ECM market that Arbortext addressed as a stand-alone solution. In addition, we believe we have an incremental opportunity to sell our Windchill solutions into vertical markets beyond our core manufacturing base as a result of the combination of Windchill and Arbortext into a dynamic publishing and related content management solution.
Fiscal Year 2006
In support of our goal to increase revenue and earnings in 2006, while remaining focused on profitability, we plan to continue:
| • | | improving our product and service offerings; |
| • | | maintaining and growing revenue from our traditional vertical market segments; |
| • | | leveraging and optimizing our distribution model, including, when appropriate, making measured increases to our direct sales force, reseller channel and services organization; |
| • | | making additional strategic investments in solutions for vertical market segments outside our traditional market segments as demand for our products dictate, including those serviced by newly acquired companies; |
| • | | enhancing our relationships with strategic accounts; |
| • | | implementing strategic initiatives in the Asia-Pacific market; and |
| • | | pursuing corporate development opportunities, including mergers and acquisitions and strategic partnerships. |
Our success will depend on, among other factors, our ability to:
| • | | optimize our sales and services coverage and productivity through, among other means, effective use and management of our internal resources in combination with our resellers and other strategic partners and appropriate investment in our distribution channel; |
| • | | integrate newly acquired businesses into our operations and execute future corporate development initiatives while remaining focused on organic growth opportunities, including penetration of strategic vertical markets; |
| • | | differentiate our products and services from those of our competitors to effectively pursue opportunities within the small- and medium-sized business market and with strategic larger accounts; |
| • | | manage the development and enhancement of our expanding product line using our geographically dispersed development resources; and |
| • | | help our customers expand their product development technology infrastructure to a more robust PLM product development system in order to further their global product development initiatives. |
We discuss additional factors affecting our revenue and operating results under Important Factors That May Affect Future Results beginning on page 31.
11
Results of Operations
Overview
The following is a summary of our results of operations for the last three years, which includes the results of operations of companies we acquired beginning on their acquisition date. A detailed discussion of these results follows the table below:
| | | | | | | | | | | | | | | | | |
| | | 2005
| | Percent Change
| | | 2004
| | | Percent Change
| | | 2003
| |
| | | (Dollar amounts in millions) | |
Total revenue | | $ | 720.7 | | 9 | % | | $ | 660.0 | | | (2 | )% | | $ | 671.9 | |
Total costs and expenses | | | 634.9 | | 2 | % | | | 622.6 | | | (17 | )% | | | 751.6 | |
| | |
|
| | | | |
|
|
| | | | |
|
|
|
Operating income (loss) | | | 85.8 | | 129 | % | | | 37.4 | | | 147 | % | | | (79.7 | ) |
Other income (expense), net | | | 5.5 | | | | | | (0.4 | ) | | | | | | (2.8 | ) |
| | |
|
| | | | |
|
|
| | | | |
|
|
|
Income (loss) before income taxes | | | 91.3 | | | | | | 37.0 | | | | | | | (82.5 | ) |
Provision for income taxes | | | 7.7 | | | | | | 2.2 | | | | | | | 15.8 | |
| | |
|
| | | | |
|
|
| | | | |
|
|
|
Net income (loss) | | $ | 83.6 | | 140 | % | | $ | 34.8 | | | 135 | % | | $ | (98.3 | ) |
| | |
|
| | | | |
|
|
| | | | |
|
|
|
| • | | License revenue was $209.7 million in 2005, $198.9 million in 2004 and $205.3 million in 2003. |
| • | | Service revenue was $511.0 million in 2005, $461.1 million in 2004 and $466.6 million in 2003. |
| • | | Enterprise Solutions revenue was $217.6 million in 2005, $179.3 million in 2004 and $173.5 million in 2003. |
| • | | Desktop Solutions revenue was $503.1 million in 2005, $480.7 million in 2004 and $498.4 million in 2003. |
| • | | Total costs and expenses, including restructuring and other charges (credits) and stock-based compensation expense, was $634.9 million in 2005, $622.6 million in 2004 and $751.6 million in 2003. |
| • | | Restructuring and other charges (credits) were $(1.3) million in 2005, $42.9 million in 2004 and $30.9 million in 2003. |
| • | | We adopted SFAS No. 123(R), “Share-Based Payment,” at the beginning of the fourth quarter of 2005. Stock-based compensation expense was $15.5 million in 2005, $0.4 million in 2004 and $0.5 million in 2003. |
| • | | The provision for income taxes in 2005 is net of tax benefits totaling $12.1 million due to favorable resolutions of tax audits in a non-US jurisdiction. In 2004, the provision for income taxes is net of a one-time benefit of $18.9 million due to a favorable resolution of prior-year tax audits with the Internal Revenue Service. |
| • | | Net income (loss) was $83.6 million in 2005, $34.8 million in 2004 and $(98.3) million in 2003. The improvement in our 2005 results compared to 2004 is primarily attributable to higher revenues and lower restructuring charges, partially offset by measured increases in our operating cost structure and the adoption of stock-based compensation expensing in 2005. The improvement in 2004 results compared to 2003 is primarily attributable to reductions in our operating cost structure. |
12
The following table shows certain consolidated financial data as a percentage of our total revenue for the last three years:
| | | | | | | | | |
| | | September 30,
| |
| | | 2005
| | | 2004
| | | 2003
| |
Revenue: | | | | | | | | | |
License | | 29 | % | | 30 | % | | 31 | % |
Service | | 71 | | | 70 | | | 69 | |
| | |
|
| |
|
| |
|
|
Total revenue | | 100 | | | 100 | | | 100 | |
| | |
|
| |
|
| |
|
|
Costs and expenses: | | | | | | | | | |
Cost of license revenue | | 1 | | | 1 | | | 2 | |
Cost of service revenue | | 28 | | | 26 | | | 31 | |
Sales and marketing | | 34 | | | 34 | | | 44 | |
Research and development | | 16 | | | 16 | | | 19 | |
General and administrative | | 9 | | | 9 | | | 10 | |
Amortization of acquired intangible assets | | — | | | 1 | | | 1 | |
In-process research and development | | — | | | — | | | — | |
Restructuring and other charges (credits) | | — | | | 7 | | | 5 | |
| | |
|
| |
|
| |
|
|
Total costs and expenses | | 88 | | | 94 | | | 112 | |
| | |
|
| |
|
| |
|
|
Operating income (loss) | | 12 | | | 6 | | | (12 | ) |
Interest income | | 1 | | | — | | | — | |
Other expense, net | | — | | | (1 | ) | | (1 | ) |
| | |
|
| |
|
| |
|
|
Income (loss) before income taxes | | 13 | | | 5 | | | (13 | ) |
Provision for income taxes | | 1 | | | — | | | 2 | |
| | |
|
| |
|
| |
|
|
Net income (loss) | | 12 | % | | 5 | % | | (15 | )% |
| | |
|
| |
|
| |
|
|
Revenue
Our revenue consists of software license revenue and service revenue, which includes software maintenance as well as consulting, implementation, training and other technical support revenue.
We report our revenue in two product categories:
| • | | Enterprise Solutions, which includes Windchill, Pro/INTRALINK 8.0, Arbortext Publishing Engine and all other solutions that help companies collaborate, manage and publish information across an extended enterprise; and |
| • | | Desktop Solutions, which includes Pro/ENGINEER, Arbortext Editor and all other solutions that help companies create content and improve desktop productivity. |
We previously reported our revenue in the following two categories: Design Solutions and Collaboration and Control Solutions. In the fourth quarter of 2005, as a result of the Arbortext acquisition, we redefined our product categories. This redefinition required no reclassifications of prior reported revenues between our two product categories. Revenue historically reported as Design Solutions is now reported as Desktop Solutions, and revenue historically reported as Collaboration and Control Solutions is now reported as Enterprise Solutions.
We recently launched Pro/INTRALINK 8.0, which is based on our Windchill technology. Our prior Pro/INTRALINK product was not Windchill-based and was either used as a stand-alone product or together with Windchill. In previous periods, half of Pro/INTRALINK revenue was allocated to Design Solutions and half was allocated to Collaboration and Control Solutions. As a result of the new technology configuration of Pro/INTRALINK 8.0, beginning in the fourth quarter of 2005, all Pro/INTRALINK revenue is fully classified as Enterprise Solutions.
13
Total Revenue
The following table illustrates trends from 2003 to 2005 in our software license and in our service revenues, as well as by product category and geography:
| | | | | | | | | | | | | | | |
| | | 2005
| | Percent Change
| | | 2004
| | Percent Change
| | | 2003
|
| | | (Dollar amounts in millions) |
License revenue | | $ | 209.7 | | 5 | % | | $ | 198.9 | | (3 | )% | | $ | 205.3 |
Service revenue: | | | | | | | | | | | | | | | |
Maintenance revenue | | | 342.6 | | 6 | % | | | 323.4 | | 5 | % | | | 309.1 |
Consulting and training service revenue | | | 168.4 | | 22 | % | | | 137.7 | | (13 | )% | | | 157.5 |
| | |
|
| | | | |
|
| | | | |
|
|
Total service revenue | | | 511.0 | | 11 | % | | | 461.1 | | (1 | )% | | | 466.6 |
| | |
|
| | | | |
|
| | | | |
|
|
Total revenue | | $ | 720.7 | | 9 | %* | | $ | 660.0 | | (2 | )%* | | $ | 671.9 |
| | |
|
| | | | |
|
| | | | |
|
|
Revenue by product category: | | | | | | | | | | | | | | | |
Enterprise Solutions revenue | | $ | 217.6 | | 21 | % | | $ | 179.3 | | 3 | % | | $ | 173.5 |
Desktop Solutions revenue | | | 503.1 | | 5 | % | | | 480.7 | | (4 | )% | | | 498.4 |
Revenue by geography: | | | | | | | | | | | | | | | |
North America | | $ | 272.0 | | 17 | % | | $ | 232.9 | | (7 | )% | | $ | 249.4 |
Europe | | | 254.2 | | 6 | %* | | | 240.2 | | — | %* | | | 239.8 |
Asia Pacific | | | 194.5 | | 4 | %* | | | 186.9 | | 2 | %* | | | 182.7 |
| * | On a consistent foreign currency basis from the prior period, total revenue increased 7% in 2005 compared to 2004 and decreased 7% in 2004 compared to 2003; revenue in Europe increased 1% in 2005 compared to 2004 and decreased 10% in 2004 compared to 2003; and revenue in Asia-Pacific increased 2% in 2005 compared to 2004 and decreased 3% in 2004 compared to 2003. |
In 2005, we had year-over-year revenue growth in both Desktop Solutions and Enterprise Solutions. This growth reflects increases in consulting and training services and in maintenance, as well as an increase in the number of new seats sold in both product categories. We attribute this growth to execution of our strategic initiatives described above as well as increased technology spending by our customers, particularly in North America. The improvements reflect both organic growth as well as revenue from sales of newly acquired products, particularly Arbortext products. Historically, Arbortext generated revenue for the twelve months ended June 30, 2005 of approximately $40 million, which is not included in our results for 2005. Since the acquisition date (July 19, 2005), Arbortext has been included in our 2005 results of operations. License revenue accounted for 29%, 30% and 31% of total revenue in 2005, 2004 and 2003, respectively, while consulting and training service revenue, which has a lower gross profit margin, accounted for 23%, 21% and 23% of total revenue in 2005, 2004 and 2003, respectively. We enter into customer contracts that may result in revenue being recognized over multiple reporting periods. License and/or consulting and training services revenue of $1 million or more within a quarter recognized from such contracts was $85.1 million, $77.0 million and $71.5 million in 2005, 2004 and 2003, respectively. Increases in consulting and training services revenue are due primarily to the emphasis we have placed on providing customers with process consulting, training and adoption services that help customers improve their product development processes and adoption of our solutions. As we have increased our service revenues and expanded our service product offerings, including computer-based training products that have a higher margin than other service products, we have also improved our service margins, an important part of our overall strategy. Maintenance revenue represented 48%, 49% and 46% of total revenues in 2005, 2004 and 2003, respectively.
We attribute the total revenue declines from 2003 to 2004 to a number of factors, including the relative saturation and increased competitiveness of the North American and European markets for design solutions, economic factors resulting in reluctance of our customers to consummate large software purchases, our reduced delivery capacity caused by headcount reductions in our services business, the weakness in technology spending in the global manufacturing economy during that period and the relative infancy of the PLM market. The increase in maintenance revenue in 2004 over 2003 was primarily attributable to customers’ adoption of Pro/ENGINEER Wildfire and prior period growth in Windchill-based solutions license revenue.
14
We derived 62%, 65% and 63% of our total revenue from sales to customers outside of North America in 2005, 2004 and 2003, respectively. We believe the improvements in our 2005 revenue in North America are attributable to implementation of our strategic initiatives and also indicate that the economy in that region, where the manufacturing sector and related technology spending had been weak over the past several years, improved over 2004. In addition to our organic growth in North America, the acquisition of Arbortext, whose revenues were concentrated in that region, also contributed to our growth there. The increase in European revenue in 2005 compared to 2004 is due primarily to improving sales and services performance in strategic accounts and favorable foreign currency exchange as noted above. Revenue performance in Asia-Pacific in 2005 compared to 2004 reflects a 12% increase in revenues in the Pacific Rim, partially offset by a 1% decrease in revenues in Japan. Japan experienced a decline in license revenue from large deals, partially offset by an increase in consulting and training revenue. We believe the Asia-Pacific region continues to present an important growth opportunity because global manufacturing companies have continued to invest in that region and the market in that region for both our Desktop Solutions and Enterprise Solutions is relatively unsaturated.
We have been building and diversifying our reseller channel to become less dependent on a small number of resellers and to provide the resources necessary for more effective distribution of our products. Although we typically receive lower revenue per seat for an indirect sale versus a direct sale, we believe that using diverse and geographically dispersed resellers that focus on smaller businesses provides an efficient and cost effective means to reach these customers and allows our direct sales force to focus on larger sales opportunities. Total sales from our reseller channel, which are primarily for our CAD/CAM/CAE design solutions, were $138.6 million (19% of total revenue) in 2005, $135.9 million (21% of total revenue) in 2004 and $106.0 million (16% of total revenue) in 2003. We attribute this performance to our efforts to expand our reseller channel and to the success of Pro/ENGINEER Wildfire among small- and medium-sized businesses as Pro/ENGINEER Wildfire has become increasingly competitive in this market, both relative to our historic offerings as well as to competitive offerings in this market segment. We continue to see growth in reseller channel revenue in North America and Europe. While reseller channel performance in Asia-Pacific was not as strong as in our other regions in 2005, we recently made organizational and infrastructure changes to our reseller channel in that region that we expect will result in higher revenue growth in Asia-Pacific in 2006.
Enterprise Solutions Revenue
The following table illustrates trends from 2003 to 2005 in our Enterprise Solutions software license revenue and service revenue:
| | | | | | | | | | | | | | | |
| | | 2005
| | Percent Change
| | | 2004
| | Percent Change
| | | 2003
|
| | | (Dollar amounts in millions) |
Enterprise Solutions: | | | | | | | | | | | | | | | |
License revenue | | $ | 71.1 | | 19 | % | | $ | 59.6 | | 3 | % | | $ | 57.7 |
Service revenue: | | | | | | | | | | | | | | | |
Maintenance revenue | | | 56.3 | | 19 | % | | | 47.4 | | 37 | % | | | 34.5 |
Consulting and training service revenue | | | 90.2 | | 25 | % | | | 72.3 | | (11 | )% | | | 81.3 |
| | |
|
| | | | |
|
| | | | |
|
|
Total service revenue | | | 146.5 | | 22 | % | | | 119.7 | | 3 | % | | | 115.8 |
| | |
|
| | | | |
|
| | | | |
|
|
Total revenue | | $ | 217.6 | | 21 | % | | $ | 179.3 | | 3 | % | | $ | 173.5 |
| | |
|
| | | | |
|
| | | | |
|
|
Total revenue from our Enterprise Solutions software and related services was 30%, 27% and 26% of our total revenue in 2005, 2004 and 2003, respectively.
The increase in Enterprise Solutions revenue in 2005 compared to 2004 was due to:
| • | | stronger sales of software licenses, maintenance and consulting and training services, which reflects our success in marketing incremental adoption of our solutions; |
| • | | more wide-spread adoption of our solutions by both our existing and new customers; |
| • | | revenue contribution, particularly license revenue, from the acquisition of Arbortext; and |
| • | | the recent launch of Pro/INTRALINK (which is now Windchill-based). |
15
Enterprise Solutions license revenue grew 19% and 3% in 2005 and 2004, respectively, compared to the previous periods. The number of new Windchill seats added during the year was 42% higher in 2005 than in 2004, compared to a decline of 12% in 2004 from 2003. Increases in our Enterprise Solutions maintenance revenue and consulting and training service revenue are due primarily to an increase in the number of new users of our enterprise solutions as new customers are added and existing customers expand their implementation to additional users. The increase in 2005 reflects organic growth as well as growth from the acquisition of Arbortext. Consulting and training service revenue growth is also attributable to our focus on new process consulting offerings. Consulting and training service revenues in 2004 were adversely affected by our reduced services delivery capacity due to our 2004 headcount reductions.
We believe our success in growing Enterprise Solutions revenue is attributable in large part to our targeted Windchill-based solutions (including our Windchill Link solutions) and related services packages. These solutions can be implemented in incremental fashion in accordance with our product development system adoption roadmap, which provides customers with a suggested approach for purchasing and implementing our solutions in stages, and reduce customers’ initial required investments.
We believe we can increase our Enterprise Solutions revenue by improving our ability to sell enterprise solutions to small- and medium-sized businesses. To achieve this, we are expanding our distribution of PLM solutions by offering qualified resellers the ability to sell our Windchill Link solutions as well as related services. In addition, during 2005, we began to offer on demand versions of several Windchill Link solutions that help minimize customers’ cost of ownership and reduce implementation time. We describe these on demand solutions under “Item 1. Business – Our Principal Products and Services – Enterprise Solutions” beginning on page 4. The revenue contribution from these initiatives was not material in 2005.
Desktop Solutions Revenue
The following table illustrates trends from 2003 to 2005 in our Desktop Solutions software license revenue and service revenue:
| | | | | | | | | | | | | | | |
| | | 2005
| | Percent
Change
| | | 2004
| | Percent
Change
| | | 2003
|
| | | (Dollar amounts in millions) |
Desktop Solutions: | | | | | | | | | | | | | | | |
License revenue | | $ | 138.6 | | (1 | )% | | $ | 139.3 | | (6 | )% | | $ | 147.6 |
Service revenue: | | | | | | | | | | | | | | | |
Maintenance revenue | | | 286.3 | | 4 | % | | | 276.0 | | 1 | % | | | 274.6 |
Consulting and training service revenue | | | 78.2 | | 20 | % | | | 65.4 | | (14 | )% | | | 76.2 |
| | |
|
| | | | |
|
| | | | |
|
|
Total service revenue | | | 364.5 | | 7 | % | | | 341.4 | | (3 | )% | | | 350.8 |
| | |
|
| | | | |
|
| | | | |
|
|
Total revenue | | $ | 503.1 | | 5 | % | | $ | 480.7 | | (4 | )% | | $ | 498.4 |
| | |
|
| | | | |
|
| | | | |
|
|
Total revenue from our Desktop Solutions and related services was 70%, 73% and 74% of our total revenue in 2005, 2004 and 2003, respectively. The year-over-year decline in license revenue in 2005 and 2004 was primarily due to lower revenue from high-end packages, particularly from large deals in Japan in 2004 not replicated in 2005. Despite lower revenue from high-end packages, sales of our low-end and mid-range packages within our installed base and to new customers increased and we experienced a 12% increase in the total number of new Pro/ENGINEER seats added during each of 2005 and 2004 compared to new seats added in the previous periods. We believe such sales provide the foundation for long-term relationships and repeat business, as well as for potential sales of services and our overall product development system within these accounts. Increases in our Desktop Solutions maintenance and consulting and training revenue are due primarily to the increase in new seats over the past two years and improvements in our renewal rates. We believe these trends are a reflection of further customer adoption of Pro/ENGINEER Wildfire. The increase in Desktop Solutions consulting and training service revenue is also due to higher revenue from sales of consulting services and training packages, including computer-based training products, that help our customers improve user proficiency and engineering productivity. The decrease in Desktop Solutions total service revenue in 2004 was due in large part to license revenue declines in prior periods as well as our reduced services delivery capacity caused by our 2004 headcount reductions.
16
We believe that our decision to offer Pro/ENGINEER packages with differing price points and functionality will continue to contribute to adoption of these solutions. We designed these packages to address our customers’ purchasing patterns and to better compete in the small- and medium-sized business segment of our market. Because our low- and high-end offerings are based on the same architecture, our solutions are scalable between different types of users or as customer needs grow, which differentiates our products from others in the marketplace. Our Desktop Solutions are now more competitive with lower-end modeling tools on the market that are known for ease of use, while maintaining the functionality for which Pro/ENGINEER is known.
Despite recent signs of improvement, Desktop Solutions revenue continues to be adversely affected by the relative maturity and saturation of the North American and European CAD/CAM/CAE markets, the difficulty associated with displacing incumbent product design systems in the discrete market for computer-aided design solutions, and increased competition and price pressure from products offering more limited functionality at lower cost. However, despite declines in 2005 Desktop Solutions revenue in Japan compared to the comparable prior period, we believe the Asia-Pacific region continues to present an opportunity for growth because the market is relatively unsaturated, the number of mechanical engineers is growing, and companies are continuing to migrate from two-dimensional to three-dimensional design tools. To address this, we have made recent organizational and infrastructure changes in our reseller channel in that region that we expect will result in higher revenue growth in Asia-Pacific in 2006.
Costs and Expenses
Over the past several years, we have made significant investments necessary to transform our business from providing a single line of technical software with a largely direct distribution model supplemented by a small number of channel partners to providing a family of enterprise solutions with an expanded channel and partner-involved distribution model. In 2003, after completing a significant portion of this transformation, we implemented a restructuring plan to reduce our cost structure, which we completed in the fourth quarter of 2004. All cost and expense categories in 2004 and 2003 were impacted by restructuring actions taken in those periods. The following table illustrates trends from 2003 to 2005 in our costs and expenses:
| | | | | | | | | | | | | | | | |
| | | 2005
| | | Percent Change
| | | 2004
| | Percent Change
| | | 2003
|
| | | (Dollar amounts in millions) |
Costs and Expenses | | | | | | | | | | | | | | | | |
Cost of license revenue | | $ | 8.4 | | | 3 | % | | $ | 8.2 | | (25 | )% | | $ | 11.0 |
Cost of service revenue | | | 199.8 | | | 15 | % | | | 173.9 | | (16 | )% | | | 207.5 |
Sales and marketing | | | 243.8 | | | 8 | % | | | 226.1 | | (24 | )% | | | 298.5 |
Research and development | | | 118.3 | | | 10 | % | | | 108.0 | | (16 | )% | | | 128.4 |
General and administrative | | | 63.6 | | | 9 | % | | | 58.3 | | (16 | )% | | | 69.4 |
Amortization of acquired intangible assets | | | 1.6 | | | (68 | )% | | | 5.2 | | (12 | )% | | | 5.9 |
In-process research and development | | | 0.7 | | | 100 | % | | | — | | — | % | | | — |
Restructuring and other charges (credits) | | | (1.3 | ) | | (103 | )% | | | 42.9 | | 39 | % | | | 30.9 |
| | |
|
|
| | | | |
|
| | | | |
|
|
Total costs and expenses | | $ | 634.9 | | | 2 | %* | | $ | 622.6 | | (17 | )%* | | $ | 751.6 |
| | |
|
|
| | | | |
|
| | | | |
|
|
| * | On a consistent foreign currency basis from the prior period, total costs and expenses were flat from 2004 to 2005 and decreased 20% in 2004 compared to 2003. |
As described in Note A of “Notes to Consolidated Financial Statements,” effective July 3, 2005, we adopted SFAS No. 123(R), “Share-Based Payment.” Accordingly, for the three months ended September 30, 2005, stock-based compensation was accounted for under SFAS No. 123(R), which requires the expensing of the fair value of stock-based awards in our consolidated statement of operations, while for the nine months ended July 2, 2005 and for 2004 and 2003, stock-based compensation was accounted for under APB No. 25, “Accounting for Stock Issued to Employees,” which required only the expensing of the intrinsic value of stock-based awards. In the fourth quarter of fiscal 2005, we granted to our employees, directors, and officers an aggregate of 1,928,000 shares of restricted stock (809,000 shares of which were performance-based awards that could be earned in whole or in part (subject to further time-based vesting) upon achievement of 2005 performance criteria) and 3,390,007 restricted stock units, each of which represents the right to receive one share of our common stock. Also, in the fourth quarter of 2005, we offered eligible
17
employees the opportunity to exchange eligible stock options for a cash payment. Employees holding approximately 18.3 million eligible stock options elected to participate in the stock option exchange. Accounting for the stock option exchange was recorded in our consolidated financial statements in the fourth quarter of 2005. The aggregate amount of the cash payments made to employees in exchange for their eligible options was $12.7 million and was paid in the fourth quarter. Of the total cash payments made in connection with the stock option exchange, $0.5 million was recorded as compensation expense and $12.2 million was recorded as a charge to stockholders’ equity, in accordance with the provisions of SFAS No. 123(R). The amounts in the table above include stock-based compensation expense from our stock-based awards and completing the stock option exchange as follows:
| | | | | | | | | |
| | | Year ended September 30,
|
| | | 2005
| | 2004
| | 2003
|
| | | (in millions) |
Cost of license revenue | | $ | 0.1 | | $ | — | | $ | — |
Cost of service revenue | | | 2.6 | | | — | | | — |
Sales and marketing | | | 5.1 | | | — | | | — |
Research and development | | | 3.8 | | | 0.4 | | | 0.5 |
General and administrative | | | 3.9 | | | — | | | — |
| | |
|
| |
|
| |
|
|
Total stock-based compensation expense | | $ | 15.5 | | $ | 0.4 | | $ | 0.5 |
| | |
|
| |
|
| |
|
|
Total costs and expenses increased to $634.9 million in 2005 compared to $622.6 million in 2004. Headcount increased to 3,751 at the end of 2005 from 3,042 at the end of 2004. Our increase in costs and expenses, including headcount, was primarily due to the following:
| • | | we made measured increases in our sales organization by adding direct sales representatives to support our strategic accounts and by adding other personnel to support our indirect distribution channel; |
| • | | we added services delivery capacity to address customer demand; |
| • | | we adopted SFAS No. 123(R) and revised our stock-based compensation program; |
| • | | we completed three acquisitions in the second half of 2005 that added operating costs and increased headcount by over 250 employees; |
| • | | we invested in research and development programs aimed at adding vertical functionality to our products; and |
| • | | we invested in strategic corporate development initiatives and in ongoing Sarbanes-Oxley compliance work in the general and administrative area. |
These increases were partially offset by a decrease in restructuring and other charges.
We anticipate that we will make additional measured increases to operating expenses to support our base business and to fund the revenue-generating initiatives described above and inExecutive Overview beginning on page 10.
Total costs and expenses decreased to $622.6 million in 2004 compared to $751.6 million in 2003, primarily as a result of our restructuring plan initiated in 2003 and completed in the fourth quarter of 2004. In 2004, to achieve our objective of restoring profitability, we implemented cost cutting measures that reduced our headcount, resulting in lower aggregate salaries, benefits and related costs. As a result, our headcount decreased to 3,042 at the end of 2004 from 3,500 at the end of 2003. In addition, our cost reduction initiatives resulted in reduced facility charges, including rent and related overhead costs. Primarily as a result of headcount reductions and lease costs related to excess facilities, we recorded restructuring and other charges of $42.9 million and $30.9 million in 2004 and 2003, respectively. SeeRestructuring and Other Charges (Credits) below and Note B of “Notes to Consolidated Financial Statements” for further discussion.
18
Cost of License Revenue
Our cost of license revenue consists of fixed and variable costs associated with reproducing and distributing software and documentation as well as royalties paid to third parties for technology embedded in or licensed with our software products. Cost of license revenue as a percentage of license revenue was 4% for 2005 and 2004 and 5% for 2003. This ratio varies depending on the product mix sold and the effect of fixed and variable royalties in relation to the level of license revenue. The decrease in cost of license revenue in 2004 compared to 2003 was primarily due to lower royalty costs of approximately $2.2 million in 2004, resulting primarily from lower revenue. Cost of license revenue in 2005 includes amortization of purchased software from our recent acquisitions totaling $0.6 million compared with none in 2004 and 2003. We expect amortization of purchased software from our completed acquisitions to total approximately $3.1 million in 2006.
Cost of Service Revenue
Our cost of service revenue includes costs associated with training, customer support and consulting personnel, such as salaries and related costs, third-party subcontractor fees, costs associated with the release of maintenance updates (including related royalty costs) and facility costs. Cost of service revenue as a percentage of service revenue was 39% in 2005, 38% in 2004 and 44% in 2003. Service related employee headcount increased 28% at the end of 2005 after a decrease of 17% at the end of 2004, each compared to the prior year. At the end of 2005, 2004 and 2003, services headcount was 1,019, 797 and 955, respectively. Total salaries, commissions, benefits and travel costs were higher by an aggregate of approximately $14.0 million (including $2.6 million related to the change in accounting for stock-based compensation described above) in 2005 compared to 2004. These costs were higher due to planned increases, including by acquisition, in our services delivery capacity and higher commissions due to the increase in service revenue, partially offset by reductions in employee benefit costs, primarily medical and costs related to employees on global assignments. The cost of third-party consulting services was $8.2 million higher in 2005 compared to 2004, due to the use of such services in support of increases in training and professional services revenue. Royalty costs were $3.5 million higher in 2005 compared to 2004, due primarily to the $5.0 million one-time benefit recorded in 2004 described below. The decreased cost of service revenue in 2004 compared to 2003 was due to the reduction in employee headcount in our services organization at the end of 2004 as compared to the end of 2003, resulting in a $16.9 million reduction in compensation, benefit and travel costs. In addition, royalty costs were $11.5 million lower in 2004 than in 2003, primarily as a result of a contract renegotiation finalized in the second quarter of 2004, resulting in a one-time benefit of $5.0 million from the reversal of an accrual established in the fourth quarter of 2003.
Sales and Marketing
Our sales and marketing expenses primarily include salaries and benefits, sales commissions, advertising and marketing programs, travel and facility costs. Sales and marketing expenses as a percentage of total revenue were 34% in 2005 and 2004 and 44% in 2003. Total sales and marketing employee headcount increased 15% at the end of 2005 and decreased 15% at the end of 2004, compared to the prior year. At the end of 2005, 2004 and 2003, sales and marketing headcount was 1,087, 945 and 1,114, respectively. Total salaries, commissions, benefits and travel costs were higher by an aggregate of approximately $23.4 million (including $5.1 million related to the change in accounting for stock-based compensation described above) in 2005 compared to 2004. These costs were higher in 2005 due to planned increases, including by acquisition, in headcount and higher commissions, due primarily to changes to our commission structure and to increased license and service revenue. These costs were partially offset by lower costs related to fewer employees on global assignments. In addition, marketing program costs were $2.7 million higher in 2005 compared to 2004. These cost increases were partially offset by a $5.0 million decrease in depreciation, rent, telephone and office support costs due to facility closures and consolidations. Compared to 2003, total sales and marketing expenses decreased 24% in 2004, primarily as a result of headcount reductions, as well as reductions in marketing program costs, which were $8.4 million lower in 2004.
Research and Development
Our research and development expenses consist principally of salaries and benefits, costs of computer equipment and facility expenses. We released a new version of Windchill in the third quarter of 2005 and we are scheduled to release the next version of Pro/ENGINEER Wildfire in the spring of 2006. Research and development expenses as a percentage of total revenue were 16% in
19
2005 and 2004 and 19% in 2003. Research and development headcount increased 28% at the end of 2005 and decreased 16% at the end of 2004, compared to the prior year. At the end of 2005, 2004 and 2003, research and development headcount was 1,242, 971 and 1,083, respectively. Total salaries, benefits, and travel costs were higher in 2005 compared to 2004 by an aggregate of approximately $11.2 million (including $3.8 million related to the change in accounting for stock-based compensation described above). In addition, the cost of third-party development services was higher by $3.0 million. The decrease in expenses in 2004 compared to 2003 was due primarily to shifting certain development activities to our existing facilities in India where overall research and development costs are lower, to lower depreciation and telecommunication costs, and to cost reductions from our restructuring plan completed in 2004, which resulted in lower headcount at the end of 2004 compared to the end of 2003.
General and Administrative
Our general and administrative expenses include the costs of our corporate, finance, information technology, human resources, legal and administrative functions as well as bad debt expense. General and administrative expenses as a percentage of total revenue were 9% in 2005 and 2004 and 10% in 2003. General and administrative headcount increased by 23% at the end of 2005 after a decrease of 7% at the end of 2004, compared to the prior year. At the end of 2005, 2004 and 2003, general and administrative headcount was 385, 314 and 336, respectively. Total salaries, benefits, and travel costs were higher in 2005 compared to 2004 by an aggregate of approximately $6.9 million (including $3.9 million related to the change in accounting for stock-based compensation described above). In addition, the cost of outside professional services increased by $3.5 million, primarily related to corporate development initiatives and Sarbanes-Oxley compliance. These increases were partially offset by a $4.1 million reduction in depreciation, rent, office support and insurance costs and a $1.5 million decrease in bad debt expense. The decrease in expenses in 2004 compared to 2003 was primarily due to a reduction in headcount as well as lower depreciation, bad debt expense and insurance costs. The decreases were partially offset by an increase in compensation expense associated with incentive plan bonuses for which targets were met in 2004. Bad debt expense in 2005, 2004 and 2003 was $1.6 million, $3.1 million and $5.1 million, respectively. We attribute these decreases in bad debt expense to improved credit risk management and improving economic conditions.
Amortization of Acquired Intangible Assets
The amortization of acquired intangible assets line item on the statement of operations represents the amortization of non-product related intangible assets from acquisitions. Amortization of these acquisition-related intangibles, which totaled $1.6 million, $5.2 million and $5.9 million in 2005, 2004 and 2003, respectively, primarily relates to the amortization of customer-related intangibles. The decrease in 2005 compared to 2004 was due to certain intangible assets being fully amortized in 2004, partially offset by amortization of intangible assets resulting from our acquisitions in 2004 and 2005. We expect amortization of non-product related intangible assets from our completed acquisitions to total approximately $4.6 million in 2006.
Our acquisition of Arbortext in the fourth quarter of 2005 resulted in an increase in intangible assets and goodwill of $196.7 million, including $35.3 million of customer lists, $10.5 million of purchased software, $0.8 million of trademarks, which are being amortized over estimated useful lives of 10 years, 3-5 years and 5 years, respectively, and $150.1 million of goodwill.
Our acquisitions of Polyplan Technologies, Inc. and Aptavis Technologies Corporation in the third quarter of 2005 resulted in an increase in intangible assets and goodwill of $8.9 million, including $3.3 million in other intangible assets primarily comprised of purchased software, which is being amortized over 3 years and $5.6 million of goodwill.
Our acquisition of OHIO Design Automation, Inc. in the third quarter of 2004 resulted in an increase in intangible assets and goodwill of $10.4 million, including $1.8 million for customer lists and $1.6 million for purchased software, which are being amortized over estimated useful lives of 5 years and 3 years, respectively, and $7.0 million of goodwill.
In-process Research and Development
Purchased in-process research and development of $0.7 million was written-off in the fourth quarter of 2005 and relates to two Arbortext projects under development, for which technological feasibility had not yet been established at the acquisition date and for which there was no alternative future use. The value of the purchased in-process research and development was determined
20
using the residual income approach, which discounts expected future cash flows from projects under development to their net present value. These development projects are expected to be completed by the third quarter of 2006, and the expected cost to complete was approximately $2 million as of the acquisition date.
Restructuring and Other Charges (Credits)
In 2005, 2004 and 2003, we recorded restructuring and other charges (credits) of $(1.3) million, $42.9 million and $30.9 million, respectively, primarily associated with reductions in workforce and excess facility obligations to reduce our cost structure and to improve profitability. During those same periods, we made cash payments related to restructuring and other charges (including payments relating to restructuring and other charges recorded prior to 2003) of $10.8 million, $40.6 million and $24.4 million, respectively. Amounts not yet paid at September 30, 2005 related to restructuring and other charges taken during the current and all prior periods were $34.4 million, including $2.9 million recorded in connection with our acquisition of Arbortext, and primarily relate to excess facility obligations to be paid out through 2014. Of the total amount accrued at September 30, 2005, we expect to make cash disbursements within the next twelve months estimated at $11 million for restructuring charges incurred in 2005 and prior periods and $3 million for costs associated with the execution of our Arbortext integration plan.
In the fourth quarter of 2005, we recorded a net credit to restructuring and other charges of $1.3 million. The restructuring credit includes a $3.0 million credit for changes in our estimated liabilities for facilities that we vacated, offset by $1.7 million of severance and termination costs related to nine employees terminated during the period. The $3.0 million credit is due primarily to reoccupying, in the fourth quarter of 2005, a portion of our headquarters facility that was previously vacated and included in restructuring costs in a prior period. The space was available for sublease and was being marketed, but was reoccupied due to space requirements related to our three acquisitions completed in 2005 and general business growth. As of September 30, 2005, substantially all of our remaining headquarters excess space has been sublet.
In 2004, we recorded restructuring and other charges of $21.0 million for severance and termination benefits related to 459 employees terminated during 2004 and $21.9 million related primarily to excess facilities. The charges for excess facilities were primarily related to gross lease commitments in excess of estimated sublease income for excess facilities. Of the total restructuring and other charges recorded in 2004, $1.9 million was non-cash for the write-off of leasehold improvements related to the excess facilities. We completed the restructuring program in the fourth quarter of 2004.
In 2003, we recorded restructuring charges of $17.9 million for severance and termination benefits related to 361 employees terminated during 2003. We also recorded charges of $11.6 million related to excess facilities and $1.4 million of other costs, primarily related to the write-off of acquired technology. The increases in the liability for excess facilities in 2003 related primarily to revised estimates of gross lease commitments in excess of expected sublease income for leases assumed in our 1998 acquisition of Computervision Corporation as well as to consolidation of existing leased facilities.
Interest Income
Interest income relates to earnings on the investment of our available cash balances and totaled $6.9 million, $3.5 million and $3.3 million in 2005, 2004 and 2003, respectively. The increase in 2005 is related primarily to higher average cash balances and interest rates. We expect this amount to be lower in 2006 due to the fact that we used $198.9 million of cash to acquire Arbortext and other businesses in the second half of 2005. The modest increase in interest income in 2004 compared to 2003 was due to higher average cash balances, partially offset by lower interest rates.
Other Expense, Net
Other expense, net includes costs of hedging contracts, certain realized and unrealized foreign currency transaction gains or losses, charges incurred in connection with financing customer contracts, write-downs of investments and foreign exchange gains or losses resulting from the required period-end currency remeasurement of the financial statements of our subsidiaries that use the U.S. dollar as their functional currency. A large portion of our revenue and expenses is transacted in foreign currencies. To reduce our exposure to fluctuations in foreign exchange rates, we engage in hedging transactions involving the use of foreign currency forward contracts, primarily in Western European and Asian currencies. Other expense, net totaled $1.4 million, $3.9 million and
21
$6.1 million in 2005, 2004 and 2003, respectively. The decreases in other expense, net in 2005 and 2004 compared to the prior years were due primarily to lower charges in connection with financing customer contracts, which were $0.8 million in 2005, $2.1 million in 2004 and $3.9 million in 2003.
Income Taxes
Our effective tax rate was 8% on pre-tax income of $91.3 million in 2005, 6% on pre-tax income of $37.0 million in 2004, and 19% on a pre-tax loss of $82.4 million in 2003. The difference between the statutory federal income tax rate of 35% and the effective tax rate of 8% in 2005 was primarily due to a tax benefit of $12.1 million arising from the reduction of our tax liabilities upon the favorable resolution of tax audits in a foreign jurisdiction and to taxes in certain foreign jurisdictions with a lower effective tax rate, partially offset by U.S. operating losses that could not be benefited. The difference between the statutory federal income tax rate of 35% and the effective tax rate of 6% in 2004 was due primarily to an $18.9 million one-time tax benefit related to a U.S. federal income tax refund described below, partially offset by U.S. operating losses that could not be benefited and to taxes payable in certain foreign jurisdictions. The difference between the statutory federal income tax rate of 35% and the effective tax rate provision of 19% in 2003 was due primarily to U.S. operating losses that could not be benefited and to taxes payable in certain foreign jurisdictions. As a result of operating losses incurred in recent years and uncertainty as to the extent and timing of profitability in future periods, in 2002 we increased our valuation allowance for our remaining net deferred tax assets by approximately $48.0 million through the provision for income taxes. Due to the uncertainty regarding the realizability of deferred tax assets (see Critical Accounting Policies below and Note F of “Notes to Consolidated Financial Statements”), in 2005, 2004 and 2003 we maintained our full valuation allowance for deferred tax assets in the U.S., primarily related to operating loss carryforwards, and in certain other foreign jurisdictions.
In the normal course of business, PTC and its subsidiaries are examined by various taxing authorities, including the Internal Revenue Service (IRS) in the United States. In 2005, we recorded tax benefits of $12.1 million arising from the reduction of our tax liabilities upon the favorable resolution of foreign jurisdiction tax audits. In fiscal 2004, the IRS concluded its examination of our income tax returns for fiscal years 1998 through 2000 resulting in a tax refund, including interest, to us of $39.5 million. We received notice of the refund amount in the fourth quarter of 2004, and we received the refund in the first quarter of 2005. The refund resulted in a nonrecurring tax benefit of $18.9 million in 2004. At September 30, 2004, income taxes receivable included expected refunds of U.S. federal income taxes and related interest totaling $39.5 million, respectively.
Critical Accounting Policies and Estimates
We have prepared our consolidated financial statements in accordance with accounting principles generally accepted in the United States of America. In preparing our financial statements, we make estimates, assumptions and judgments that can have a significant impact on our reported revenues, results from operations, and net income (loss), as well as on the value of certain assets and liabilities on our balance sheet. These estimates, assumptions and judgments about future events and their effects on our results cannot be determined with certainty, and are made based on our historical experience and on other assumptions that we believe to be reasonable under the circumstances. These estimates may change as new events occur or additional information is obtained, and we may periodically be faced with uncertainties, the outcomes of which are not within our control and may not be known for a prolonged period of time.
While there are a number of accounting policies, methods and estimates affecting our financial statements described in Note A ofNotes to Consolidated Financial Statements, the areas that are our most important critical accounting policies and estimates are described below and include:
| • | | valuation of assets and liabilities of business combinations; |
| • | | valuation of goodwill and intangible assets; |
| • | | accounting for income taxes; |
| • | | accounting for pensions; |
22
| • | | accounting for stock-based compensation; |
| • | | allowance for accounts and other receivables; and |
A critical accounting policy is one that is both material to the presentation of our financial statements and requires us to make difficult, subjective or complex judgments that could have a material effect on our financial condition and results of operations. Critical accounting policies require us to make assumptions about matters that are highly uncertain at the time of the estimate, and different estimates that we could have used, or changes in the estimate that are reasonably likely to occur, may have a material impact on our financial condition or results of operations. Because the use of estimates is inherent in the financial reporting process, actual results could differ from those estimates.
Accounting policies, guidelines and interpretations related to our critical accounting policies and estimates are generally subject to numerous sources of authoritative guidance and are often reexamined by accounting standards rule makers and regulators. These rule makers and/or regulators may promulgate interpretations, guidance or regulations that may result in changes to our accounting policies, which could have a material impact on our financial position and results of operations.
Revenue Recognition
While we apply the guidance of Statement of Position (SOP) No. 97-2,Software Revenue Recognition, and Statement of Position No. 98-9,Modification of SOP 97-2, Software Revenue Recognition with Respect to Certain Transactions, both issued by the American Institute of Certified Public Accountants, as well as SEC Staff Accounting Bulletin 104,Revenue Recognition, we exercise judgment and use estimates in connection with the determination of the amounts of software license and services revenues to be recognized in each accounting period. Our primary judgments involve the following:
| • | | determining whether collection is probable; |
| • | | assessing whether the fee is fixed or determinable; |
| • | | determining whether service arrangements, including modifications and customization of the underlying software, are not essential to the functionality of the licensed software and thus would qualify as “service transactions” under SOP 97-2, resulting in the revenue for license and service elements of an agreement to be recorded separately; and |
| • | | determining the fair value of services and maintenance elements included in multiple-element arrangements, which is the basis for allocating and deferring revenue for such services and maintenance. |
We derive revenues from three primary sources: (1) software licenses, (2) maintenance services and (3) consulting and training services. Revenue by type for 2005, 2004 and 2003 is as follows:
| | | | | | | | | |
| | | Year ended September 30,
|
| | | 2005
| | 2004
| | 2003
|
| | | (in thousands) |
License revenue | | $ | 209,717 | | $ | 198,860 | | $ | 205,301 |
Maintenance services revenue | | | 342,569 | | | 323,420 | | | 309,091 |
Consulting and training services revenue | | | 168,433 | | | 137,749 | | | 157,548 |
| | |
|
| |
|
| |
|
|
Total revenue | | $ | 720,719 | | $ | 660,029 | | $ | 671,940 |
| | |
|
| |
|
| |
|
|
For software license arrangements that do not require significant modification or customization of the underlying software, we recognize revenue when: (1) persuasive evidence of an arrangement exists, (2) delivery has occurred (generally, FOB shipping point or electronic distribution), (3) the fee is fixed or determinable, and (4) collection is probable. Substantially all of our license revenues are recognized in this manner.
Our software is distributed primarily through our direct sales force. In addition, we have an indirect distribution channel through alliances with resellers. Revenue arrangements with resellers are recognized on a sell-through basis; that is, when we receive
23
persuasive evidence that the reseller has sold the products to an end-user customer. We do not offer contractual rights of return, stock balancing, or price protection to our resellers, and actual product returns from them have been insignificant to date. As a result, we do not maintain reserves for product returns and related allowances.
At the time of each sale transaction, we must make an assessment of the collectibility of the amount due from the customer. Revenue is only recognized at that time if management deems that collection is probable. In making this assessment, we consider customer credit-worthiness and historical payment experience. At that same time, we assess whether fees are fixed or determinable and free of contingencies or significant uncertainties. If the fee is not fixed or determinable, revenue is recognized only as payments become due from the customer, provided that all other revenue recognition criteria are met. In assessing whether the fee is fixed or determinable, we consider the payment terms of the transaction and our collection experience in similar transactions without making concessions, among other factors. Our software license arrangements generally do not include customer acceptance provisions. However, if an arrangement includes an acceptance provision, we record revenue only upon the earlier of (1) receipt of written acceptance from the customer or (2) expiration of the acceptance period.
Our software arrangements often include implementation and consulting services that are sold separately under consulting engagement contracts or as part of the software license arrangement. When we determine that such services are not essential to the functionality of the licensed software and qualify as “service transactions” under SOP 97-2, we record revenue separately for the license and service elements of these arrangements. Generally, we consider that a service is not essential to the functionality of the software based on various factors, including if the services may be provided by independent third parties experienced in providing such consulting and implementation in coordination with dedicated customer personnel. If an arrangement does not qualify for separate accounting of the license and service elements, then license revenue is recognized together with the consulting services using either the percentage-of-completion or completed-contract method of contract accounting. Contract accounting is also applied to any software arrangements that include customer-specific acceptance criteria or where the license payment is tied to the performance of consulting services. Under the percentage-of-completion method, we estimate the stage of completion of contracts with fixed or “not to exceed” fees based on hours or costs incurred to date as compared with estimated total project hours or costs at completion. If we do not have a sufficient basis to measure progress towards completion, revenue is recognized upon completion of the contract. When total cost estimates exceed revenues, we accrue for the estimated losses immediately. The use of the percentage-of-completion method of accounting requires significant judgment relative to estimating total contract costs, including assumptions relative to the length of time to complete the project, the nature and complexity of the work to be performed, and anticipated changes in salaries and other costs. When adjustments in estimated contract costs are determined, such revisions may have the effect of adjusting, in the current period, the earnings applicable to performance in prior periods.
We generally use the residual method to recognize revenues from arrangements that include one or more elements to be delivered at a future date, when evidence of the fair value of all undelivered elements exists. Under the residual method, the fair value of the undelivered elements (e.g., maintenance, consulting and training services) based on vendor-specific objective evidence (VSOE) is deferred and the remaining portion of the arrangement fee is allocated to the delivered elements (i.e., software license). If evidence of the fair value of one or more of the undelivered services does not exist, all revenues are deferred and recognized when delivery of all of those services has occurred or when fair values can be established. We determine VSOE of the fair value of services revenues based upon our recent pricing for those services when sold separately. VSOE of the fair value of maintenance services may also be determined based on a substantive maintenance renewal clause, if any, within a customer contract. Our current pricing practices are influenced primarily by product type, purchase volume, maintenance term and customer location. We review services revenues sold separately and maintenance renewal rates on a periodic basis and update, when appropriate, our VSOE of fair value for such services to ensure that it reflects our recent pricing experience.
Valuation of Assets and Liabilities of Business Combinations
In accordance with business combination accounting, we allocate the purchase price of acquired companies to the tangible and intangible assets acquired, liabilities assumed, and in-process research and development based on their estimated fair values. Determining these fair values requires management to make significant estimates and assumptions, especially with respect to intangible assets.
Our identifiable intangible assets acquired consist of developed technology, core technology, tradenames, customer lists and contracts, software support agreements and related relationships and consulting contracts. Developed technology consists of
24
products that have reached technological feasibility. Core technology represents a combination of processes, inventions and trade secrets related to the design and development of acquired products. Customer lists and contracts and software support agreements and related relationships represent the underlying relationships and agreements with customers of the acquiree’s installed base. We have generally valued intangible assets using a discounted cash flow model. Critical estimates in valuing certain of the intangible assets include but are not limited to:
| • | | future expected cash flows from software license sales, maintenance and customer support agreements, consulting contracts, customer contracts and related customer relationships and acquired developed technologies and trademarks and trade names; |
| • | | expected costs to develop the in-process research and development into commercially viable products and estimating cash flows from the projects when completed; |
| • | | the acquired company’s brand awareness and market position, as well as assumptions about the period of time the acquired brand will continue to be used by the combined company; and |
| • | | discount rates used to determine the present value of estimated future cash flows. |
In addition, we estimate the useful lives of our intangible assets based upon the expected period over which we anticipate generating economic benefits from the related intangible asset.
Net tangible assets consist of the fair values of tangible assets less the fair values of assumed liabilities and obligations. Except for deferred revenues and restructuring reserves, net tangible assets were generally valued by us at the respective carrying amounts recorded by the acquiree, as we believed that their carrying values approximated their fair values at the acquisition date.
The values assigned to deferred revenue reflect an amount equivalent to the estimated cost plus an appropriate profit margin to perform the services related to the acquiree’s software support contracts. Restructuring reserves include the severance costs related to employees of the acquiree, planned closure of certain facilities and other costs associated with exiting activities of the acquiree.
Our estimates of fair value are based upon assumptions believed to be reasonable at that time, but which are inherently uncertain and unpredictable. Assumptions may be incomplete or inaccurate, and unanticipated events and circumstances may occur which may affect the accuracy or validity of such assumptions, estimates or actual results.
Valuation of Goodwill and Acquired Intangible Assets
Our net goodwill and acquired intangible assets totaled $258.8 million and $56.5 million as of September 30, 2005 and 2004, respectively. As described in Note M of “Notes to Consolidated Financial Statements”, we have two reporting units: (1) our software products reportable segment, and (2) our services reportable segment. As of September 30, 2005 and 2004, goodwill and acquired intangible assets in the aggregate attributable to our software products reportable segment was $242.6 million and $56.5 million, respectively, and attributable to our services reportable segment was $16.2 million and $0 million, respectively. The increase in goodwill and acquired intangible assets in 2005 is due primarily to our acquisition of Arbortext, which resulted in goodwill and acquired intangible assets of $196.7 million.
We assess the impairment of goodwill and identifiable intangible assets on at least an annual basis and whenever events or changes in circumstances indicate that the carrying value of the asset may not be recoverable. Factors we consider important (on an overall company basis and reportable segment basis, as applicable) that could trigger an impairment review include significant underperformance relative to historical or projected future operating results, significant changes in our use of the acquired assets or a significant change in the strategy for our business, significant negative industry or economic trends, a significant decline in our stock price for a sustained period, or a reduction of our market capitalization relative to net book value.
The goodwill impairment test prescribed by SFAS No. 142,Goodwill and Other Intangible Assets, requires us to identify reporting units and to determine estimates of the fair values of our reporting units as of the date we test for impairment. To conduct these tests of goodwill, the fair value of the reporting unit is compared to its carrying value. If the reporting unit’s carrying value exceeded its fair value, we would record an impairment loss equal to the difference between the carrying value of goodwill and its fair value. We estimate the fair values of our reporting units using discounted cash flow valuation models. Those models require estimates of future revenues, profits, capital expenditures, working capital and discount rates for each reporting unit. We estimate these amounts by evaluating historical trends, current budgets, operating plans and industry data. We conduct our annual impairment test of goodwill and indefinite lived assets as of the end of the third quarter of each fiscal year. We completed our annual impairment review as of the end of the third quarter of 2005 and concluded that no impairment charge was required as of that date.
25
For long-lived assets and identifiable intangible assets other than goodwill, we reassess the recoverability of the asset based on projected undiscounted future cash flows over the asset’s remaining life if an event occurs or circumstances change that would, more likely than not, reduce the fair value of the reportable segment below its carrying value. When the carrying value of the asset exceeds its undiscounted cash flows, we record an impairment loss equal to the excess of the carrying value over the fair value of the asset, determined using projected discounted future cash flows of the asset. Determining the fair value of our reporting units for the purpose of testing the potential impairment of individual assets and goodwill requires significant judgment by management. Different judgments could yield different results.
Accounting for Income Taxes
As part of the process of preparing our consolidated financial statements, we are required to calculate our income tax expense based on taxable income by jurisdiction. There are many transactions and calculations where the ultimate tax outcome is uncertain. Some of these uncertainties arise as a consequence of revenue-sharing and cost-reimbursement arrangements among related entities and the differing tax treatment of revenue and cost items across various jurisdictions. If a foreign jurisdiction were to require us to revise our cost reimbursement arrangements, that revision could affect our tax liability.
The income tax accounting process also involves estimating our actual current tax liability, together with assessing temporary differences resulting from differing treatment of items for tax and accounting purposes. These differences result in deferred tax assets and liabilities, which are included within our consolidated balance sheet. We must then assess the likelihood that our deferred tax assets will be recovered from future taxable income and, to the extent we believe that it is more likely than not that all or a portion of deferred tax assets will not be realized, we must establish a valuation allowance as a charge to income tax expense. In 2002, we increased our deferred tax valuation allowance and recorded a corresponding $48.0 million charge to income tax expense and, in 2005, 2004 and 2003, we have fully reserved for additional deferred tax assets in the U.S. and certain foreign jurisdictions, primarily related to net operating loss carryforwards generated. The decision to record the valuation allowance required significant management judgment. Had we not recorded this valuation allowance, we would have reported materially different results. Significant management judgment is required to determine when the realization of our deferred tax assets in the future is considered more likely than not. If and when we conclude that realization is more likely than not, we will record a reduction to our valuation allowance that will increase net income, goodwill and/or additional paid-in-capital in the period such determination is made. While we have realized consolidated operating profits over the last several quarters, we have not yet concluded that realization of all of our deferred tax assets in the future is more likely than not. In the fourth quarter of 2005, due principally to the tax expense associated with the grant and vesting of restricted stock units and the stock option exchange, our U.S. legal entities incurred a taxable loss. Net deferred tax assets at September 30, 2005 were $4.1 million, comprised of deferred tax assets of $188.1 million, deferred tax liabilities of $31.4 million and a valuation allowance of $152.6 million. Our deferred tax assets consist primarily of net operating loss carryforwards.
Accounting for Pensions
We sponsor a frozen pension plan covering mostly inactive participants in the United States. We make several assumptions that are used in calculating the expense and liability of the plans. These key assumptions include the expected long-term rate of return on plan assets and the discount rate. In selecting the expected long-term rate of return on assets, we consider the average future rate of earnings expected on the funds invested or to be invested to provide for the benefits under the pension plan. This includes considering the plan’s asset allocations and the expected returns likely to be earned over the life of this plan. The discount rate reflects the estimated rate at which an amount that is invested in a portfolio of high-quality debt instruments would provide the future cash flows necessary to pay benefits when they come due. In addition, our actuarial consultants determine the expense and liabilities of the plan using other assumptions for future experience, such as mortality rates. The actuarial assumptions used by us may differ materially from actual results due to changing market and economic conditions or longer or shorter life spans of the participants. Our actual results could differ materially from those we estimated, which could require us to record a greater amount of pension expense in future years. For both 2005 and 2004, we used a discount rate of 6.0% and an expected return on plan assets of 7.5%.
Certain of our foreign subsidiaries also sponsor pension plans. Accounting and reporting for these plans requires the use of country-specific assumptions for discount rates and expected rates of return on assets. We apply a consistent methodology in determining
26
the key assumptions which, in addition to future experience assumptions such as mortality rates, are used by our actuaries to determine our liability and expense for each of these plans. For both 2005 and 2004, we used weighted average discount rates of 5.5% and a weighted average expected return on plan assets of 4.8%.
The most sensitive assumptions used in calculating the expense and liability of our pension plans are the discount rate and the expected return on plan assets. A 50 basis point change to our discount rate and expected return on plan assets assumptions would not have changed our pension expense for the year ended September 30, 2005 by more than $1.0 million.
Accounting for Stock-Based Awards
We adopted SFAS No. 123(R),Share-Based Payment,on July 3, 2005, effective with the beginning of our fourth quarter. SFAS No. 123(R) requires us to measure the cost of employee services received in exchange for an award of equity instruments based on the grant-date fair value of the award using an option pricing model. That cost is recognized as an expense over the period during which an employee is required to provide service in exchange for the award. Prior to the adoption of SFAS No. 123(R), we determined stock-based compensation in accordance with APB No. 25,Accounting for Stock Issued to Employees, which required only the expensing of the intrinsic value of stock-based awards. As substantially all of our stock options issued to employees have had no intrinsic value at their date of grant, our recognized stock-based compensation expenses were immaterial prior to adoption of SFAS No. 123(R).
We historically granted stock options to employees and offered employees the opportunity to purchase shares under our employee stock purchase plan. We did not grant any stock options during 2005 and, in mid-2005, we suspended offerings under our employee stock purchase plan.
Going forward, we plan to use restricted shares and restricted stock units as our principal equity incentive awards. In the fourth quarter of 2005, we granted shares of restricted stock to our directors and executive officers and granted restricted stock units to our employees. Half of the shares of restricted stock granted to our executive officers have time-based vesting requirements and half of them have performance-based vesting requirements, subject to subsequent time-based restrictions. Under SFAS No. 123(R), we will determine the fair value of restricted shares and restricted stock units based on the excess of the fair market value of our common stock at the date of grant as compared to the exercise price, if any, of the award. In determining the amount of expense to be recorded for restricted shares and restricted stock units, judgment is required by us to estimate forfeitures of the awards and to assess the probability of achievement of performance-based award targets. If actual forfeitures or actual performance-based target achievement differs from our estimates, our results of operations could be impacted.
Allowance for Accounts and Other Receivables
Management judgment is required in assessing the collectibility of customer accounts and other receivables, for which we generally do not require collateral. We maintain allowances for doubtful accounts for estimated losses resulting from the inability of our customers to make required payments. In determining the adequacy of the allowance for doubtful accounts, management specifically analyzes individual accounts receivable, historical bad debts, customer concentrations, customer credit-worthiness, current economic conditions, accounts receivable aging trends and changes in our customer payment terms. The following table summarizes our accounts receivable and related reserve balances at September 30, 2005 and 2004:
| | | | | | | | |
| | | September 30,
| |
| | | 2005
| | | 2004
| |
| | | (Dollar amounts in thousands) | |
Gross accounts receivable | | $ | 153,227 | | | $ | 136,733 | |
Allowances for doubtful accounts | | | (5,730 | ) | | | (6,340 | ) |
| | |
|
|
| |
|
|
|
Net accounts receivable | | $ | 147,497 | | | $ | 130,393 | |
| | |
|
|
| |
|
|
|
Accounts receivable reserves as a percentage of gross accounts receivable | | | 3.7 | % | | | 4.6 | % |
If the financial condition of our customers were to deteriorate, additional allowances might be required, resulting in future operating expenses that are not included in the allowance for doubtful accounts. Our customer base consists of large numbers of geographically diverse customers dispersed across many industries, and no individual customer comprised more than 10% of our net trade accounts receivable for any period presented.
27
Restructuring Charges
We periodically record restructuring charges resulting from restructuring our operations (including consolidations and/or relocations of operations), changes to our strategic plan, or managerial responses to declines in demand, increasing costs, or other environmental factors. The determination of restructuring charges requires management judgment and may include costs related to employee benefits, such as costs of severance and termination benefits, and estimates of costs for future lease commitments on excess facilities, net of estimated future sublease income. In determining the amount of the facilities charge, we are required to estimate such factors as future vacancy rates, the time required to sublet properties and sublease rates. These estimates are reviewed quarterly based on known real estate market conditions and the credit-worthiness of subtenants, and may result in revisions to established facility reserves. We have accrued $29.7 million as of September 30, 2005 related to excess facilities (compared to $41.7 million at September 30, 2004), representing gross lease commitments with agreements expiring at various dates through 2014 of approximately $62.0 million, net of committed and estimated sublease income of approximately $31.3 million and a present value factor of $1.0 million. We have entered into signed sublease arrangements for approximately $24.5 million, with the remaining $6.8 million based on future estimated sublease arrangements, including $6.0 million for space currently available for sublease. If our sublease assumptions prove to be inaccurate, we may need to make changes in these estimates that would affect our results of operations and potentially our financial condition.
Liquidity and Capital Resources
| | | | | | | | | | | | |
| | | September 30,
| |
| | | 2005
| | | 2004
| | | 2003
| |
| | | (in thousands) | |
Cash and cash equivalents | | $ | 204,423 | | | $ | 294,887 | | | $ | 205,312 | |
| | |
|
|
| |
|
|
| |
|
|
|
Activity for the year included the following: | | | | | | | | | | | | |
Cash provided by operating activities | | $ | 128,139 | | | $ | 101,336 | | | $ | 6,495 | |
Cash (used) provided by investing activities | | | (215,032 | ) | | | (22,270 | ) | | | 5,505 | |
Cash (used) provided by financing activities | | | (2,018 | ) | | | 9,712 | | | | 7,521 | |
| | | |
Cash provided by operating activities included the following: | | | | | | | | | | | | |
Cash disbursements for restructuring and other charges | | | (10,758 | ) | | | (40,620 | ) | | | (24,442 | ) |
Federal income tax refunds received | | | 39,523 | | | | — | | | | — | |
Cash (used) provided by investing activities included the following: | | | | | | | | | | | | |
Cash paid to acquire businesses, net of cash acquired | | | (198,897 | ) | | | (9,822 | ) | | | — | |
Cash (used) provided by financing activities included the following: | | | | | | | | | | | | |
Cash payments for stock option exchange | | | (12,733 | ) | | | — | | | | — | |
We invest our cash with highly rated financial institutions and in diversified domestic and international money market mutual funds. The portfolio is invested in short-term instruments to ensure cash is available to meet requirements as needed. At September 30, 2005, cash and cash equivalents totaled $204.4 million, down from $294.9 million at September 30, 2004. The decrease in cash and cash equivalents in 2005 is due primarily to acquisitions of businesses which used cash of $198.9 million, payments for the stock option exchange described below totaling $12.7 million, and additions to property, equipment and intangible assets of $16.1 million, offset by $128.1 million of cash provided by operations and $10.2 million provided by net proceeds from the issuance of common stock under our employee stock plans. The increase in cash and cash equivalents during 2004 consisted primarily of $101.3 million provided by operations and $9.7 million provided by net proceeds from the issuance of common stock under our employee stock plans, partially offset by $12.4 million for capital additions to property, equipment and intangible assets and $9.8 million for the acquisition of OHIO Design.
Cash provided by operations was $128.1 million in 2005 compared to $101.3 million in 2004. The higher cash provided by operations was due primarily to:
| • | | improved profitability in 2005 versus 2004 (net income increased $48.8 million to $83.6 million in 2005 from $34.8 million in 2004, due in part to lower restructuring charges); |
28
| • | | receipt of a federal income tax refund of $39.5 million in the first quarter of 2005; and |
| • | | lower cash disbursements for restructuring and other charges in 2005. |
These increases were offset by increases in current and noncurrent accounts receivable due in part to increased revenue in 2005 (days sales outstanding remaining relatively flat at 68 days at September 30, 2005 compared to 69 days at September 30, 2004) and to our decision to decrease our sales of accounts receivable to third-party financial institutions in 2005 compared to prior years.
Cash provided by operations was $101.3 million in 2004 compared to $6.5 million in 2003. The higher cash provided by operations in 2004 as compared to 2003 was due primarily to:
| • | | improved profitability in 2004 versus 2003 (net income increased $133.1 million to $34.8 million in 2004 from a net loss of $98.3 million in 2003); |
| • | | an increase in deferred revenue of $5.0 million in 2004 compared to a decrease in deferred revenue of $27.5 million in 2003; and |
| • | | pension contributions of $2.7 million in 2004 compared to $10.7 million in 2003. |
These increases were partially offset by:
| • | | net tax payments made of $5.7 million in 2004 compared to $53.3 million in net refunds received in 2003; and |
| • | | cash expenditures for restructuring and other charges of $40.6 million in 2004 compared to $24.4 million in 2003. |
Days sales outstanding in accounts receivable improved to 69 days at September 30, 2004 from 77 days at September 30, 2003.
Cash and cash equivalents (used) provided by investing activities was ($215.0) million in 2005, compared to ($22.3) million in 2004 and $5.5 million in 2003. In 2005 and 2004, we had cash expenditures of $198.9 million and $9.8 million, respectively, for business acquisitions. During the fourth quarter of 2005, we completed the acquisition of Arbortext for approximately $192 million net of cash acquired. Cash used for additions to property, equipment and intangible assets was $16.1 million, $12.5 million and $25.9 million in 2005, 2004 and 2003, respectively. Cash used for additions to property, equipment and intangible assets decreased in 2004 due to the completion of our investment in a new ERP system in 2003 and to lower capital requirements as a result of our restructuring plan initiated in 2003 and completed in 2004, which reduced the number of our operating facilities and employee headcount. Our expenditures for property and equipment consist primarily of computer equipment, software, office equipment and facility improvements. Cash provided by investing activities in 2003 included net proceeds from sales and maturities of investments of $31.4 million as we moved our investment portfolio to short-term securities to minimize interest rate risk.
Cash (used) provided by financing activities was ($2.0) million in 2005, $9.7 million in 2004 and $7.5 million in 2003. The decrease in 2005 compared to 2004 is primarily due to payments of $12.7 million related to the stock option exchange described below. The increase in 2004 compared to 2003 was due primarily to higher proceeds from the issuance of common stock under employee stock plans. Cash proceeds from the issuance of our common stock under our stock plans were $10.2 million, $9.7 million and $7.7 million in 2005, 2004 and 2003, respectively.
In December 2004, the Financial Accounting Standard Board (FASB) issued SFAS No. 123(R),Share-Based Payment, regarding revised accounting rules for company-sponsored stock purchase plans. In light of these accounting changes, we suspended offerings under our employee stock purchase plan (ESPP) as of the date of the offering that was to have commenced on February 1, 2005.
On March 10, 2005, our stockholders approved amendments to our 2000 Equity Incentive Plan that (1) authorized us to exchange and cancel certain outstanding out-of-the-money non-executive employee stock options for either cash or shares of restricted stock, (2) authorize the grant of restricted stock units, and (3) enable us to grant a greater number of shares of restricted stock as equity awards. The amendments are designed to reduce the overall number of employee stock options outstanding and reduce potential stockholder dilution. We completed the option exchange on August 3, 2005. We paid $12.7 million in exchange for 18.3 million options. Going forward, we anticipate that we will make more use of restricted stock and restricted stock unit grants, which require
29
fewer shares to deliver comparable value than stock options . The use of restricted shares and restricted stock units, coupled with suspension of the ESPP, will result in lower cash proceeds to us. The ESPP and exercise of employee stock options generated cash proceeds of $10.2 million and $9.7 million in 2005 and 2004, respectively.
In September 1998, our Board of Directors authorized the repurchase of up to 20.0 million shares of our common stock and in July 2000 increased the shares authorized for repurchase to 40.0 million. We made no repurchases in 2005 and 2004. Since 1998, and through September 30, 2005, we repurchased, at a cost of $366.8 million, a total of 31.2 million shares of the 40.0 million shares authorized.
We believe that existing cash and cash equivalents together with cash generated from operations will be sufficient to meet our working capital and capital expenditure requirements through at least the next twelve months. During 2006, we expect to make cash disbursements estimated at $11 million for restructuring charges incurred in 2005 and prior periods and $3 million for costs associated with the execution of our Arbortext integration plan. Capital expenditures for 2006 are currently anticipated to be approximately $15 million and we estimate contributions to our defined benefit plans to be approximately $4 million.
We completed two acquisitions in the first quarter of 2006 for an aggregate purchase price of approximately $12 million. These acquisitions add to our global consulting and training services organization. The first was of an entity based solely in German-speaking Europe and expands our consulting delivery capacity and expertise in that region. The second was of the assets of a U.S. company that developed and provided training solutions for our products. We do not expect any significant revenue contribution in the near-term from these acquisitions.
We have evaluated, and expect to continue to evaluate, possible strategic transactions, including possible dispositions of certain businesses, on an ongoing basis and at any given time may be engaged in discussions or negotiations with respect to possible strategic transactions. Our cash position could be reduced and we may incur debt obligations to the extent we complete any significant transactions.
Contractual Obligations
We lease office facilities and certain equipment under operating leases that expire at various dates through 2014, including an operating lease agreement related to our headquarters office in Needham, Massachusetts entered into in 2000, which expires in December 2012, subject to certain renewal rights. These leases qualify for operating lease accounting treatment and, as such, are not included on our balance sheet. At September 30, 2005, our contractual obligations, including future minimum lease payments, net of sublease income, under noncancellable operating leases, are as follows:
| | | | | | | | | | | | | | | |
| | | Payments due by period
|
Contractual Obligations
| | Total
| | Less than
1 year
| | 1-3 years
| | 3-5 years
| | More than
5 years
|
| | | (in millions) |
Capital lease obligations | | $ | 1.4 | | $ | 0.4 | | $ | 0.8 | | $ | 0.2 | | $ | — |
Operating leases (1) | | | 158.6 | | | 36.2 | | | 55.8 | | | 40.9 | | | 25.7 |
Purchase obligations (2) | | | 21.4 | | | 16.9 | | | 4.5 | | | — | | | — |
Pension liabilities (3) | | | 49.6 | | | 4.2 | | | 8.5 | | | — | | | 36.9 |
| | |
|
| |
|
| |
|
| |
|
| |
|
|
Total | | $ | 231.0 | | $ | 57.7 | | $ | 69.6 | | $ | 41.1 | | $ | 62.6 |
| | |
|
| |
|
| |
|
| |
|
| |
|
|
| (1) | The future minimum lease payments above include minimum future lease payments for excess facilities, net of estimated sublease income under existing sublease arrangements. See Note G of “Notes to Consolidated Financial Statements.” |
| (2) | Purchase obligations represent minimum commitments due to third parties, including royalty contracts, research and development contracts, telecommunication contracts, information technology maintenance contracts in support of internal-use software and hardware and other marketing and consulting contracts. Contracts for which our commitment is variable based on volumes, with no fixed minimum quantities, and contracts that can be cancelled without payment penalties have been excluded. The purchase obligations included above are in addition to accounts payable, accrued expenses and other liabilities recorded on our September 30, 2005 consolidated balance sheet. |
30
| (3) | These obligations relate to our U.S. and international pension plans. These liabilities are not subject to fixed payment terms. Payment amounts in 2006 include minimum funding requirements and anticipated discretionary funding. Payments beyond 2006 have been estimated based on the plans’ current funded status and actuarial assumptions. In addition, we may, at our discretion, make additional voluntary contributions to the plans. See Note L of “Notes to Consolidated Financial Statements” for further discussion. |
As of September 30, 2005, we have letters of credit and bank guarantees outstanding of approximately $6.3 million, primarily related to the lease of our headquarters in Needham, Massachusetts.
Off-Balance Sheet Arrangements
We have not created, and are not party to, any special-purpose or off-balance sheet entities for the purpose of raising capital, incurring debt or operating parts of our business that are not consolidated (to the extent of our ownership interest therein) into our financial statements. We have not entered into any transactions with unconsolidated entities whereby we have subordinated retained interests, derivative instruments or other contingent arrangements that expose us to material continuing risks, contingent liabilities, or any other obligation under a variable interest in an unconsolidated entity that provides financing, liquidity, market risk or credit risk support to us.
New Accounting Pronouncements
In accordance with recently issued accounting pronouncements, we will be required to comply with certain changes in accounting rules and regulations.
Accounting for Conditional Asset Retirement Obligations
In March 2005, the FASB issued Interpretation No. 47,Accounting for Conditional Asset Retirement Obligations, an interpretation of FASB Statement No. 143 (FIN 47). FIN 47 is effective for fiscal years ending after December 15, 2005. FIN 47 clarifies that an entity is required to recognize a liability for the fair value of a conditional asset retirement obligation when incurred if the liability’s fair value can be reasonably estimated and clarifies when an entity would have sufficient information to reasonably estimate the fair value of an asset retirement obligation. We do not expect that the adoption of FIN 47 will have a material impact on our results of operations or financial position.
Accounting Changes and Error Correction
On June 7, 2005, the FASB issued Statement No. 154,Accounting Changes and Error Corrections, a replacement of APB Opinion No. 20,Accounting Changes, and Statement No. 3,Reporting Accounting Changes in Interim Financial Statements (SFAS No. 154). SFAS No. 154 changes the requirements for the accounting for and reporting of a change in accounting principle. Previously, most voluntary changes in accounting principles required recognition in a cumulative effect adjustment within net income of the period of the change. SFAS No. 154 requires retrospective application to prior periods’ financial statements, unless it is impracticable to determine either the period-specific effects or the cumulative effect of the change. SFAS No. 154 is effective for accounting changes made in fiscal years beginning after December 15, 2005; however, this standard does not change the transition provisions of any existing accounting pronouncements. We will determine the impact of this standard on our consolidated financial statements when an accounting change or error correction occurs.
Important Factors That May Affect Future Results
The following are important factors we have identified that could affect our future results. They should be considered when evaluating forward-looking statements contained in this Annual Report on Form 10-K and otherwise made by us or on our behalf, because these factors could cause actual results and conditions to differ materially from those projected in forward-looking statements.
31
I. Operational Considerations
Our operating results fluctuate within each quarter and from quarter to quarter, making our future revenues and operating results difficult to predict.
While our sales cycle varies substantially from customer to customer, a high percentage of our revenue has historically been generated in the third month of each fiscal quarter, and this revenue tends to be concentrated in the later part of that month. Our orders early in a quarter will not generally occur at a rate which, if sustained throughout the quarter, would be sufficient to assure that we will meet our revenue targets for any particular quarter. Moreover, our transition from a one-product company to a multi-product company, our increased use of indirect distribution channels through alliances with resellers and other strategic partners and our shift in business emphasis to offering a product development system comprised of components that can be purchased in stages have resulted in more unpredictable and often longer sales cycles for products and services. Accordingly, our quarterly results may be difficult to predict prior to the end of the quarter. Any inability to obtain large orders or orders in large volumes or to make shipments or perform services in the period immediately preceding the end of any particular quarter may cause the results for that quarter to fall short of our revenue targets. In addition, our operating expenses are based on expected future revenue and are largely fixed for the short term. As a result, a revenue shortfall in any quarter could cause our earnings for that quarter to fall below expectations as well. Any failure to meet our quarterly revenue or earnings targets could adversely impact the market price of our stock.
Other factors that may cause quarter-to-quarter revenue and earnings fluctuations or that may affect our ability to make quarter-end shipments include the following:
| • | | our sales incentive structure is weighted more heavily toward the end of the fiscal year, and the revenue for the first quarter historically has been lower and more difficult to predict than that for the fourth quarter of the immediately preceding fiscal year; |
| • | | variability in the levels of professional service revenues and the mix of our license and service revenues; |
| • | | declines in license sales may adversely affect the size of our installed base and our level of service revenue; |
| • | | the outsourcing of our software distribution operations to third-party vendors may lessen our ability to undertake corrective measures or alternative operations in the event shipping systems or processes are interrupted or are hampered due to conditions beyond our or our vendor’s control at the end of any particular quarter; |
| • | | a significant portion of our revenue is in foreign currency and major shifts in foreign currency exchange rates could impact our reported revenue; and |
| • | | we may incur expenses in connection with our defense or settlement of legal actions we are defending that would increase our operating expenses for the quarter in which those expenses are incurred. |
In addition, the levels of quarterly or annual software or service revenue in general, or for particular geographic areas, may not be comparable to those achieved in previous periods.
General economic and political conditions may impact our results.
Our revenue growth and profitability depends on the overall demand for software and related services. Over the past several years, this demand has been adversely affected by unfavorable economic conditions, as customers have reduced, or have deferred, spending on information technology improvements, which, in turn, has affected our operating results. Although we recently have seen modest improvements in information technology spending, a return to unfavorable economic conditions could materially and adversely affect us.
Political and social events in recent years, including concerns regarding terrorism, have the potential to put further pressure on economic conditions both domestically and internationally. The potential turmoil that may result from such events contributes to the uncertainty of the economic climate. The impact of such conditions may have a materially adverse impact on our business, operating results, and financial position.
Our cost structure is relatively fixed in the short term, which makes it difficult to reduce our expenses quickly in response to declines in revenue or revenue growth.
We made incremental expenditures to support our revenue growth in 2005 and to support anticipated future growth. Our expenses associated with headcount and facilities can be difficult to reduce quickly due to the nature of those items. If revenue does not grow
32
at the rate we expect or if it declines, our expenses may constitute a larger percentage of our operating budget than we planned, which would adversely affect our profitability.
We use, in tandem with our direct sales force, third parties, such as resellers and other strategic partners, for the distribution and implementation of our software solutions, which makes it more difficult to manage the sales process.
We have entered into relationships with groups of geographically dispersed resellers and other strategic partners to promote, sell and/or implement our products, which can reduce our control over the sales process and the delivery of services to our customers. Our ability to distribute and implement our software solutions through third parties will depend on:
| • | | our ability to enter into agreements with appropriate third parties that can deliver our products and/or services in appropriate markets; |
| • | | the third party’s ability to learn, promote and implement our products; |
| • | | our ability to efficiently manage our sales channels by effectively coordinating and managing joint activities (including sales, marketing, implementation, support and customer service); and |
| • | | our ability to optimize our sales and services coverage and productivity through, among other means, effective use and management of our internal resources in combination with our resellers and other strategic partners, including, when appropriate, making measured increases to our internal resources and investing in our reseller channel and other strategic partners. |
We may be unable to implement new initiatives successfully.
Part of our recent success has resulted from our ability to implement new initiatives, including new product introductions, technology acquisitions, and organizational changes. Our future operating results will continue to depend upon:
| • | | our successful implementation of a unified PLM product strategy, including the realignment and efficient use of our internal resources, the management of multiple development and distribution processes and effective mitigation of disruption that may result from organizational change; |
| • | | our ability to deliver an integrated and comprehensive suite of solutions and to capitalize on existing synergies by offering a comprehensive product development system; |
| • | | our ability to integrate acquired technologies into our integrated suite of products and successfully manage newly acquired businesses, including potentially overlapping distribution channels, while continuing to focus on opportunities for organic revenue growth from our existing core solutions; |
| • | | our ability to appropriately allocate and implement cost containment measures, including transferring activities to lower cost regions, that increase profitability while maintaining adequate resources for effective and coordinated organizational performance; |
| • | | the success of our sales coverage optimization initiatives, including: |
| | • | | the effectiveness of our organizational sales model, including the integration of distribution channels of newly acquired companies, |
| | • | | our ability to manage our internal sales organization effectively, including ensuring that we have the appropriate number of sales representatives with the skills and knowledge necessary to sell our products and educate our customers about our products, in order to create and meet demand for our products, and |
| | • | | our ability to broaden and effectively use indirect distribution channels through alliances with resellers and other strategic partners; |
| • | | our ability to anticipate and meet evolving customer content creation and data management requirements, and successfully deliver products and services that meet those requirements at an enterprise level; |
33
| • | | our ability to identify and penetrate additional industry sectors and vertical market segments that represent growth opportunities, including those in which we historically have not participated and have little experience, both through new product and sales initiatives and through acquisitions; |
| • | | our ability to execute customer satisfaction initiatives and programs in order to retain our customer base and to develop customer references upon which we can expand that base; |
| • | | our ability to effectively use our current resources, as reduced by our past cost reduction programs, to undertake one or more strategic initiatives while maintaining recurring operations at satisfactory levels; and |
| • | | our ability, in concert with our other strategic investment initiatives, to continue to invest in the Asia-Pacific region, which we believe represents opportunities for growth. |
We may be unable to successfully acquire and integrate strategic businesses and any businesses we acquire may not achieve the revenue and earnings we anticipated.
The success of our long-term strategic plan depends in part on our ability to acquire strategic businesses. If we are unable to identify and acquire appropriate strategic businesses, or if the businesses we acquire do not generate the revenue and earnings we expect, we may not achieve our revenue targets.
In addition, business combinations involve a number of factors that affect operations, including:
| • | | diversion of management’s attention; |
| • | | entry into unfamiliar markets; |
| • | | assumption of unanticipated legal or financial liabilities; |
| • | | becoming significantly leveraged as a result of incurring debt to finance an acquisition; |
| • | | unanticipated operating difficulties in connection with the acquired entities, including potential declines in revenue of the acquired entity; |
| • | | impairment of acquired intangible assets, including goodwill; and |
| • | | dilution to our earnings per share if we were to issue stock. |
As a result, we may fail to successfully integrate and manage businesses that we may acquire without incurring substantial expenses, delays or other problems that could negatively impact our results of operations. If our short-term liquidity declines or we are forced to divert attention from other initiatives due to resource constraints in connection with acquisition-related activity, our ability to implement other strategic initiatives or make investments in our operational infrastructure could be impaired.
We are dependent on key personnel whose loss could cause delays in our product development and sales efforts.
Our success depends upon our ability to attract and retain highly skilled technical, managerial and sales personnel. Competition for such personnel in our industry is intense. This competition is even greater in offshore regions where we have shifted certain research and development resources and where concerted efforts to solicit employees are not uncommon. We assume that we will continue to be able to attract and retain such personnel. Our failure to do so, however, could have a material adverse effect on our business.
We must continually modify and enhance our products to keep pace with changing technology, and we may experience delays in developing and debugging our software.
We must continually modify and enhance our products to keep pace with changes in computer software, hardware and database technology, as well as emerging Internet standards. We must also continually expend efforts to review and fix errors (“bugs”) found in our current and upcoming software releases. Our ability to remain competitive will depend on our ability to:
| • | | enhance our current offerings and develop new products and services that keep pace with technological developments and effectively undertake “debugging” efforts through: |
34
| | • | | internal research and development and quality assurance programs, |
| | • | | acquisition of technology, and |
| | • | | strategic partnerships; |
| • | | meet evolving customer requirements, especially ease-of-use and interoperability; |
| • | | adequately utilize our development resources in the face of a challenging economic climate; and |
| • | | license appropriate technology from third parties for inclusion in our products. |
Also, as is common in the computer software industry, we may from time to time experience delays in our product development and “debugging” efforts. Our performance could be hurt by significant delays in developing, completing or shipping new or enhanced products. Moreover, if significant bugs were found in our software products, we could be adversely impacted by negative customer reaction and could experience delays in our new product development efforts, as development resources might need to be shifted toward our debugging efforts. Among other things, such delays could cause us to incorrectly predict the fiscal quarter in which we will realize revenue from the shipment of the new or enhanced products and give our competitors a greater opportunity to market competing products.
We may be adversely affected by a decline in demand for PLM solutions.
We currently derive our license and service revenues predominantly from our integrated PLM software products and services and we expect this to continue into the future. As a result, factors affecting the demand for PLM software solutions or pricing pressures on this single category could have a material adverse effect on our financial condition and results of operations.
We depend on sales within the discrete manufacturing market.
A large amount of our revenues are related to sales to customers in the discrete manufacturing sector. A decline in spending in this sector could have a material adverse effect on our financial condition and results of operations.
We depend on sales from outside the United States that could be adversely affected by changes in the international markets.
A significant portion of our business comes from outside the United States. Accordingly, our performance could be adversely affected by economic downturns in Europe or the Asia-Pacific region. Another consequence of significant international business is that a large percentage of our revenues and expenses are denominated in foreign currencies that fluctuate in value. Although we may from time to time enter into foreign exchange forward contracts and/or foreign exchange option contracts to offset a portion of the foreign exchange fluctuations, unanticipated events may have a material impact on our results. Other risks associated with international business include:
| • | | changes in regulatory practices and tariffs; |
| • | | staffing and managing international operations, including the difficulties in providing cost-effective, incentive based compensation to attract skilled workers; |
| • | | longer collection cycles in certain areas; |
| • | | potential changes in tax and other laws; |
| • | | greater difficulty in protecting intellectual property rights; and |
| • | | general economic and political conditions. |
We may be unable to adequately protect our proprietary rights.
Our software products and our trademarks, including our company names, product names and logos, are proprietary. We protect our intellectual property rights in these items by relying on copyrights, trademarks, patents and common law safeguards, including trade secret protection, as well as restrictions on disclosures and transferability contained in our agreements with other parties.
35
Despite these measures, the laws of all relevant jurisdictions may not afford adequate protection to our products and other intellectual property. In addition, we frequently encounter attempts by individuals and companies to pirate our software solutions. If our measures to protect our intellectual property rights fail, others may be able to use those rights, which could reduce our competitiveness and harm our business.
Intellectual property infringement claims could be asserted against us, which could be expensive to defend and could result in the loss of our rights.
The software industry is characterized by frequent litigation regarding copyright, patent and other intellectual property rights. While we have not, to date, had any significant claims of this type asserted against us, such claims could be asserted against us in the future. If a lawsuit of this type is filed, it could result in significant expense to us and divert the efforts of our technical and management personnel. We cannot be sure that we would prevail against any such asserted claims. If we did not prevail, we could be prevented from using that intellectual property or required to enter into royalty or licensing agreements, which might not be available on terms acceptable to us, or at all. In addition to possible claims with respect to our proprietary information, some of our products contain technology developed by and licensed from third parties and we may likewise be susceptible to infringement claims with respect to these third-party technologies.
II. Product Related Considerations
Increasing competition in the computer-aided design marketplace may reduce our revenues.
A large portion of our revenues are currently derived from our computer-aided design solutions and there are an increasing number of competitive design products, some of which emphasize lower price points and ease of use compared to the more robust functionality of our solutions. This increased competition makes attracting new customers more difficult. In addition, some competitive products have reached a level of functionality whereby product differentiation is less likely, in and of itself, to dislodge incumbent design systems, given the training, data conversion, and other startup costs associated with system replacement. Although Pro/ENGINEER Wildfire, which focuses on PLM interoperability and ease of use, and other initiatives are designed to address these competitive pressures, increased competition and further market acceptance of competitive products could have a negative effect on pricing and revenue for our products, which could have a material adverse affect on our results.
In addition, even though our design software is capable of performing on a variety of platforms as compared to several of our competitors whose products focus on single platform applications (particularly Windows-based platforms), we may be unable to create a competitive advantage by offering multiple platform applications.
As we expand the breadth of our product line and add to the vertical markets in which we serve, we may face increased pressure to provide enhanced products, which may be difficult with our limited development resources.
We continue to enhance our existing product line by releasing updates as well as new products/modules. Our competitive position and operating results could suffer if:
| • | | we fail to anticipate or to respond adequately to customer requirements or to technological developments, particularly those of our competitors; |
| • | | we are unable to meet customer requirements for functionality enhancements of our growing product line; |
| • | | we delay the development, production, testing, marketing or availability of new or enhanced products or services; |
| • | | customers fail to accept such new or enhanced products or services; or |
| • | | we fail to execute our integrated product strategy initiative. |
Growth in the computer-aided design solutions industry has slowed.
Growth in certain segments of the computer-aided design solutions industry has slowed and, coupled with decreased functional differentiation among flexible engineering tools, may adversely affect our ability to penetrate the market for new customers and
36
recapture our market share. Over the long term, we believe our emphasis on PLM solutions will allow us to differentiate our CAD/CAM/CAE solutions from the competition and stabilize sales of our CAD/CAM/CAE solutions products while we seek to increase sales of our enterprise solutions. However, the strategy may not be successful or may take longer than we expect. Our operating results in any quarter could be materially adversely affected if these assumptions are incorrect.
Our assumptions about the Product Lifecycle Management (PLM) market opportunity may be wrong.
We have identified PLM as a market opportunity for us and have devoted significant resources toward capitalizing on that opportunity. We offer a suite of PLM solutions and related services targeted at this market based on our enterprise solutions, together with our desktop solutions. This suite includes software and services that use Internet technologies to enable our customers’ employees, suppliers and customers to collaboratively develop, build, distribute and manage products throughout their entire lifecycle. Because the market for software products that enable companies to collaborate on product information on an enterprise-wide level is newly emerging, we cannot be sure of the size of this market, whether it will grow, whether companies will elect to use our products or acquire PLM solutions from other sources, or forego PLM initiatives altogether.
In addition, companies that have already invested substantial resources in other methods of sharing product information in the design-through-manufacture process may be reluctant to adopt a new approach that may replace, limit or compete with their existing systems or methods. We expect that we will continue to need to educate prospective customers about the uses and benefits of our products. Demand for and market acceptance of our products will be affected by the success of those efforts.
We must successfully differentiate our products and services from those of our competitors.
The success of our PLM strategy will depend in large part on the ability of our solutions to meet customer expectations, especially with respect to:
| • | | return on investment and value creation; |
| • | | ease and rapidity of installation; |
| • | | full capability, functionality and performance; |
| • | | ability to support a large, diverse and geographically dispersed user base, including the ability to support global product development programs; and |
| • | | quality and efficiency of the services performed by us and our partners relating to implementation and configuration. |
Our opportunity in the small- and medium-sized business market for our solutions when manufacturers migrate from two-dimensional design tools to entry-level three-dimensional design tools depends on large part on our ability to educate consumers on the benefits and ease of use of our products. Likewise with larger strategic customers, we must differentiate our products’ capabilities from those of our competitors, including larger companies with established enterprise-wide relationships with these customers.
Our solutions strategy is developing.
We are pursuing a strategy to provide a series of easily deployable PLM solutions that address specific business challenges that arise at points along the product lifecycle timeline (our Windchill Link solutions). By offering pre-configured, fully integrated applications that can be implemented quickly, our strategy is designed both to solve customers’ problems relating to costly, large-scale implementation projects and to provide customers with the ability to deploy a product development system that meets their evolving requirements. If we are unable to provide these solutions or are unable to meet customer expectations, our overall revenue may be adversely affected.
We have also been enhancing our suite of products to allow us to offer solutions aimed at vertical industries outside the discrete manufacturing market that we have traditionally served. These include ECM solutions for customers in the life sciences, financial
37
services, government and publishing markets and our enterprise solutions specially configured for the retail, footwear and apparel industry. While these solutions are generally comprised of a subset of our overall PLM solutions configured to meet the specific needs of the vertical industry, we may be unable to penetrate these markets, support these solutions or maintain customer relationships in order to attain sustained business. If we are unable to do so, our success in these new markets will be limited.
Our Windchill Link solutions may crowd out service revenue and our initiatives to use select resellers to distribute these solutions may put pressure on license margins.
Our introduction of our Windchill Link solutions, which have been developed to permit quick installation and provide customers more autonomy over solving their problems, may have an adverse effect on our service revenue. Additionally, we also have begun to offer a limited number of qualified resellers the ability to offer our Windchill Link solutions. We believe that facilitating ease of implementation and entering into these relationships will best serve to expand the coverage of our PLM software solutions, generate sufficient additional license revenue to compensate for reduced margins, and provide the necessary regional coverage for their implementation and support. If these assumptions are inaccurate or if projected additional license revenue and/or broader market coverage does not materialize, our revenues may be adversely affected.
PLM software solutions must meet our customers’ expectations for integration with existing systems to generate references for new accounts.
Our PLM software must integrate with our customers’ and their partners’ existing computer systems and software programs. In certain cases, we use third-party technologies to facilitate these integrations. As many of our customers will be facing these integration issues for the first time, particularly in the context of collaborating with customers, supply chain partners and other members of the extended enterprise, our customers could become dissatisfied with our products or services if systems integration proves to be difficult, costly or time consuming, and our operating results could be adversely affected. Moreover, due to the emerging nature of the industry and technology, the sales process relies in large part on customer references. Accordingly, if our customers become dissatisfied, future business and revenues may be adversely affected.
Competition is increasing, which may reduce our profits and limit or reduce our market share.
The market for our PLM software solutions is new, highly fragmented, rapidly changing and increasingly competitive. We expect competition to intensify, which could result in price reductions for our products and services, reduced gross margins and loss of market share. Our primary competition comes from:
| • | | larger, more well-known enterprise software providers who may seek to extend the functionality of their products to encompass PLM or who may develop and/or purchase PLM technology; and |
| • | | other vendors of engineering information management software. |
In addition, analysts expect future consolidation within the software industry, which could give rise to new competitors. To compete effectively in this evolving industry, we must:
| • | | successfully develop solutions that are technologically superior to those of our competitors; |
| • | | effectively demonstrate the value proposition offered by our solutions, including return on investment and value creation; and |
| • | | overcome the perception, based on our historical roots, that we are solely a mechanical computer aided design (MCAD) company. |
Further, our services organization may face increasing competition for follow-on consulting, implementation and education services from other third-party consultants and service providers, including those of larger, better known consulting firms that exert considerable influence within portions of our customer base. To overcome the influence of larger enterprise software and consulting firms within our customer base, we must successfully demonstrate the superiority of our offerings as well as a high level of customer satisfaction.
38
III. Other Considerations
If companies are unable to use the Internet as a medium of secure collaboration, our PLM strategy would be seriously harmed.
The use of the Internet for collaboration is still relatively new. If the infrastructure for the Internet does not efficiently support enterprises and their supply chain partners, or if concerns over the secure transmission of confidential information over public networks inhibit the growth of the Internet as a means of collaborating across enterprises, companies and their supply chain partners may not adopt or continue to use the Internet as a medium of exchanging product information. If this happens, we may be unable to retain customers or to attract new customers, which would impede our planned growth.
If we implement a reverse stock split, our total market capitalization after the reverse stock split may be lower than the total market capitalization before the reverse stock split and the market price of PTC common stock following the reverse stock split may not exceed or remain higher than the market price before the proposed reverse stock split.
On March 10, 2005, our stockholders authorized us to implement a 2-for-5 reverse stock split at any time before our 2006 annual meeting, which will be held on March 1, 2006. If we implement the proposed reverse stock split, the total market capitalization of PTC common stock (the aggregate value of all PTC common stock at the then market price) after the reverse stock split may not be equal to or greater than the total market capitalization before the reverse stock split and the per share market price of PTC common stock following the reverse stock split may not trade at or above a price in direct proportion to the reduction in the number of shares of PTC common stock outstanding before the reverse stock split. For example, based on the closing market price of PTC common stock on December 9, 2005 of $5.81 per share, if the Board of Directors decided to implement the reverse stock split, the per share post-split market price of PTC common stock may not remain at or above $14.525 per share or greater.
In addition, a decline in the market price of PTC common stock after the reverse stock split may result in a greater percentage decline than would occur in the absence of a reverse stock split and the liquidity of PTC common stock could be adversely affected following such a reverse stock split.
Further, a reverse stock split would increase the number of stockholders who own odd lots (less than 100 shares), potentially increasing their trading costs as holders of odd lots typically incur higher costs to sell their shares and may have greater difficulty in effecting sales.
Finally, the increased proportion of authorized and unissued shares to outstanding shares as a result of a reverse stock split could, in certain circumstances, have an anti-takeover effect. For example, it would permit issuances that would dilute the stock ownership of a person seeking to effect a change in the composition of the Board of Directors or contemplating a tender offer or other transaction for the combination of PTC with another company.
Our stock price has been highly volatile, which may make it harder to resell your shares at a time and at a price that is favorable to you.
Market prices for securities of software companies have generally been volatile. In particular, the market price of these stocks has been and may continue to be subject to significant fluctuations unrelated or disproportionate to the operating performance of these companies. The trading prices and valuations of these stocks, and of ours, may not be predictable. Negative changes in the public’s perception of the prospects of software companies, or of PTC or the PLM market generally, could depress our stock price regardless of our results.
Also, traditionally, a large percentage of our common stock has been held by institutional investors. Purchases and sales of our common stock by these institutional investors could have a significant impact on the market price of the stock. For more information about those investors, please see our proxy statement with respect to our most recent annual meeting of stockholders and Schedules 13D and 13G filed with the SEC with respect to our common stock.
We are currently defending a lawsuit seeking substantial damages in which we could be liable.
On May 30, 2003, a lawsuit was filed against us in the U.S. District Court for the District of Massachusetts by Rand A Technology Corporation and Rand Technologies Limited (together, “Rand”). Rand historically had been our largest distributor. The complaint
39
alleges various breaches of a revised one-year distribution agreement entered into in December 2002, as well as other agreements between Rand and us, and also asserts certain non-contract claims. The complaint, as amended, seeks equitable relief and substantial damages. On November 24, 2003, we filed our substantive response to Rand’s complaint and asserted counterclaims against Rand. During the second quarter of 2005, Rand quantified its claimed actual damages as being in excess of $50 million and Rand asserts that this amount should be trebled by the court. As a result of several recent rulings by the court, some of Rand’s claims have been dismissed while others will proceed to trial and Rand’s possible maximum recovery under the lawsuit may have been reduced. In addition, the court has excluded the testimony of the damages expert hired by Rand to substantiate Rand’s damages quantification. The court has also issued a ruling granting PTC summary judgment on one of PTC’s counterclaims against Rand. Despite these rulings, several of Rand’s claims, as well as certain of our counterclaims, remain to be tried before a jury. We believe Rand’s claims and its damages assessment associated with those claims are without merit and will continue to contest them vigorously. We also intend diligently to prosecute our counterclaims. We cannot predict the ultimate resolution of this action at this time, and we cannot assure you that this action, if determined adversely to us, will not have a material adverse impact on our financial condition or results of operations.
ITEM 7A. Quantitative and Qualitative Disclosures about Market Risk
We face exposure to financial market risks, including adverse movements in foreign currency exchange rates and changes in interest rates. These exposures may change over time as business practices evolve and could have a material adverse impact on our financial results.
Foreign currency exchange risk
Our earnings and cash flows are subject to fluctuations due to changes in foreign currency exchange rates. Our most significant foreign currency exposures relate to Western European countries and Japan. We enter into various hedging transactions to manage this risk. We do not enter into or hold foreign currency derivative financial instruments for trading or speculative purposes.
Our non-U.S. revenues generally are transacted through our non-U.S. subsidiaries and typically are denominated in their local currency. In addition, our non-U.S. expenses that are incurred by our non-U.S. subsidiaries typically are denominated in their local currency. Approximately 62%, 65% and 63% of our total revenue was from sales to customers outside of North America in 2005, 2004 and 2003, respectively. Approximately 45%, 45% and 43% of our total expenses were incurred by our subsidiaries domiciled outside of North America in 2005, 2004 and 2003, respectively.
Our exposure to foreign currency exchange rate fluctuations arises in part from intercompany transactions, with most intercompany transactions occurring between a U.S. dollar functional currency entity and a foreign currency denominated entity. Intercompany transactions typically are denominated in the local currency of the non-U.S. subsidiary in order to centralize foreign currency risk. Also, both PTC (the parent company) and our non-U.S. subsidiaries may transact business with our customers and vendors in a currency other than their functional currency (“transaction risk”). In addition, we are exposed to foreign exchange rate fluctuations as the financial results and balances of our non-U.S. subsidiaries are translated into U.S. dollars (“translation risk”). If sales to customers outside of the United States continue to comprise a growing percentage of total revenues, our exposure to fluctuations in currency exchange rates could increase.
Our foreign currency risk management strategy is principally designed to mitigate the future potential financial impact of changes in the value of transactions and balances denominated in foreign currency, resulting from changes in foreign currency exchange rates. Our foreign currency hedging program uses forward contracts to manage the foreign currency exposures that exist as part of our ongoing business operations. The contracts primarily are denominated in European currencies and Japanese Yen, and have maturities of less than three months.
Generally, we do not designate foreign currency forward contracts as hedges for accounting purposes, and changes in the fair value of these instruments are recognized immediately in earnings. Because we enter into forward contracts only as an economic hedge, any gain or loss on the underlying foreign-denominated balance would be offset by the loss or gain on the forward contract. Gains and losses on forward contracts and foreign denominated receivables and payables are included in other income (expense), net. As
40
of September 30, 2005 and 2004, we had outstanding forward contracts with notional amounts equivalent to approximately $56.7 million ($18.3 million in Euros, $15.5 million in British Pounds, $6.5 million in Japanese Yen, $5.0 million in Korean Won and $11.4 million in other currencies) and $83.3 million ($58.9 million in Euros, $12.1 million in British Pounds, $6.4 million in Japanese Yen and $5.9 million in other currencies), respectively.
We periodically use foreign currency option contracts to hedge specific forecasted net cash flow transactions that are derived from anticipated non-U.S. revenue. Foreign currency option contracts are designated as cash flow hedges for accounting purposes and changes in the fair value of the option contract are deferred in accumulated other comprehensive income and reclassified into earnings when the underlying forecasted transaction impacts earnings. As of September 30, 2005 and 2004, there were no foreign currency option contracts outstanding.
Cash and cash equivalents
As of September 30, 2005, cash equivalents are invested in highly liquid investments with maturities of three months or less when purchased. We invest our cash with highly rated financial institutions in North America, Europe and Asia/Pacific and in diversified domestic and international money market mutual funds. At September 30, 2005, we had $77.0 million, $64.5 million, $49.2 million and $13.7 million of cash and cash equivalents in the United States, Europe, Japan and other non-U.S. countries, principally in Asia/Pacific, respectively. Given the short maturities and investment grade quality of the portfolio holdings at September 30, 2005, a hypothetical 10% change in interest rates would not materially affect the fair value of our cash and cash equivalents.
Our invested cash is subject to interest rate and, for non-U.S. operations, foreign currency risk. In a declining interest rate environment, we would experience a decrease in interest income. The opposite holds true in a rising interest rate environment. Over the past several years, the U.S. Federal Reserve Board, European Central Bank and Bank of England have changed certain benchmark interest rates, which has led to declines and increases in market interest rates. These changes in market interest rates have resulted in fluctuations in interest income earned on our cash and cash equivalents. Interest income will continue to fluctuate based on changes in market interest rates and levels of cash available for investment. Our consolidated cash balances were impacted unfavorably in 2005 and favorably in 2004 by the weakening and strengthening, respectively, of foreign currencies relative to the U.S. dollar, particularly with respect to the Euro and the Japanese Yen.
ITEM 8. Financial Statements and Supplementary Data
The consolidated financial statements and notes to the consolidated financial statements are attached as APPENDIX A below.
ITEM 9. Changes in and Disagreements with Accountants on Accounting and Financial Disclosure
None.
ITEM 9A. Controls and Procedures
Effectiveness of Disclosure Controls and Procedures
Our management, under the supervision and with the participation of our Chief Executive Officer and Chief Financial Officer (our principal executive officer and principal financial officer, respectively), has evaluated the effectiveness of the design and operation of our disclosure controls and procedures (as defined in Rules 13a-15(e) and 15d-15(e) under the Securities Exchange Act of 1934, as amended) as of the end of the period covered by this report. Based on this evaluation, our Chief Executive Officer and Chief Financial Officer concluded that our disclosure controls and procedures are effective to ensure that information required to be disclosed by us in reports that we file or submit under the Exchange Act is recorded, processed, summarized and reported within the time periods specified in the SEC rules and forms, and that information is accumulated and communicated to our management as appropriate to allow timely decisions regarding required disclosures.
41
On November 2, 2005, we announced that we had identified irregularities in certain sales orders in the Asia-Pacific region. Our Audit Committee, using outside advisors, undertook an investigation regarding the accounting impact of order practices in the region. That investigation has been completed and we have determined that the errors identified in the investigation, which principally relate to our 2001-2003 fiscal years, are not material to our reported financial results for prior and current periods and do not require restatement of those results. In order to address the matters identified during the investigation and during our assessment of our internal control over financial reporting, we are implementing enhancements to our sales and finance procedures in the Asia-Pacific region in fiscal year 2006. We are continuing to review business practices in the region to ensure compliance with our policies.
Management’s Annual Report on Internal Control over Financial Reporting
Our management is responsible for establishing and maintaining adequate internal control over financial reporting. Internal control over financial reporting is defined in Rules 13a-15(f) and 15d-15(f) of the Exchange Act as a process designed by, or under the supervision of, our principal executive and principal financial officers and effected by our board of directors, management and other personnel, to provide reasonable assurance regarding the reliability of financial reporting and the preparation of financial statements for external purposes in accordance with generally accepted accounting principles and includes those policies and procedures that:
| • | | Pertain to the maintenance of records that in reasonable detail accurately and fairly reflect the transactions and dispositions of our assets; |
| • | | Provide reasonable assurance that transactions are recorded as necessary to permit preparation of financial statements in accordance with generally accepted accounting principles, and that our receipts and expenditures are being made only in accordance with authorizations of our management and directors; and |
| • | | Provide reasonable assurance regarding prevention or timely detection of unauthorized acquisition, use or disposition of our assets that could have a material effect on the financial statements. |
Because of its inherent limitations, internal control over financial reporting may not prevent or detect misstatements. Projections of any evaluation of effectiveness to future periods are subject to the risk that controls may become inadequate because of changes in conditions, or that the degree of compliance with the policies or procedures may deteriorate.
Our management assessed the effectiveness of our internal control over financial reporting as of September 30, 2005 using the criteria set forth by the Committee of Sponsoring Organizations of the Treadway Commission (COSO) inInternal Control-Integrated Framework. Management excluded Arbortext, Inc. from its assessment of internal control over financial reporting as of September 30, 2005 because it was acquired by us in a purchase business combination during the fourth quarter of 2005. Arbortext, Inc. is a wholly owned subsidiary whose total assets and total revenues each represented less than 3% of our related consolidated financial statement amounts as of and for the year ended September 30, 2005.
Based on this assessment and those criteria, our management concluded that, as of September 30, 2005, our internal control over financial reporting was effective.
Our management’s assessment of the effectiveness of our internal control over financial reporting as of September 30, 2005 has been audited by PricewaterhouseCoopers LLP, an independent registered public accounting firm, as stated in their report which appears under Item 8.
Changes in Internal Control Over Financial Reporting
There was no change in our internal control over financial reporting (as defined in Rules 13a-15(f) and 15d-15(f) under the Exchange Act) that occurred during the quarter ended September 30, 2005 that has materially affected, or is reasonably likely to materially affect, our internal control over financial reporting.
ITEM 9B. Other Information
None.
42
PART III
ITEM 10. Directors and Executive Officers of the Registrant
Information with respect to our directors and executive officers, including the qualifications of certain members of the Audit Committee of our Board of Directors, may be found in the sections captioned “Proposal 1: Elect Two Directors,” “Who Are Our Directors,” “The Committees of the Board,” “Certain Relationships and Transactions” and “Section 16(a) Beneficial Ownership Reporting Compliance” appearing in our 2006 Proxy Statement. We incorporate that information into this Item 10 by reference.
Our executive officers are:
| | | | |
Name
| | Age
| | Position
|
C. Richard Harrison | | 50 | | Chief Executive Officer and President |
Barry F. Cohen | | 61 | | Executive Vice President, Strategic Services and Partners |
Paul J. Cunningham | | 43 | | Executive Vice President, Worldwide Sales |
Anthony DiBona | | 50 | | Executive Vice President, Global Maintenance Support |
James E. Heppelmann | | 41 | | Executive Vice President and Chief Product Officer |
Cornelius F. Moses | | 47 | | Executive Vice President and Chief Financial Officer |
Aaron C. von Staats | | 40 | | Senior Vice President, General Counsel and Clerk |
Mr. Harrison has been Chief Executive Officer and President of PTC since March 2000. Prior to that, Mr. Harrison served as President and Chief Operating Officer since August 1994.
Mr. Cohen has been Executive Vice President, Strategic Services and Partners since August 2002. Prior to that, Mr. Cohen served as Executive Vice President, Marketing and Human Resources from December 2000 to July 2002 and Executive Vice President, Marketing from January 1998 to November 2000.
Mr. Cunningham has been Executive Vice President, Worldwide Sales since October 2002. Prior to that, Mr. Cunningham served as Executive Vice President, Americas Sales from July 2000 to September 2002, and from October 1998 to June 2000 he was Executive Vice President, Primary Sales.
Mr. DiBona has been Executive Vice President, Global Maintenance Support since April 2003. Prior to that, Mr. DiBona led the PTC Global Business Partner Group from April 2000 to April 2003. Mr. DiBona joined PTC in August 1998 as Executive Vice President, PTC Major Account Sales.
Mr. Heppelmann has been Executive Vice President and Chief Product Officer beginning February 2003 after being our Executive Vice President, Software Solutions and Chief Technology Officer since June 2001. Prior to that, Mr. Heppelmann was Executive Vice President, General Manager Windchill Solutions from November 2000 to June 2001. He had served as Executive Vice President and General Manager of Windchill Netmarkets from July 2000 to November 2000 and Senior Vice President of Windchill from January 1998 to July 2000.
Mr. Moses joined PTC in June 2003 as our Executive Vice President, Chief Financial Officer and Treasurer and since March 2004 has been our Executive Vice President and Chief Financial Officer. Prior to joining PTC, Mr. Moses was Executive Vice President and Chief Financial Officer of Axcelis Technologies, Inc., a semiconductor equipment manufacturer, from October 2000 to June 2003. Prior to that, Mr. Moses was Senior Vice President, Chief Financial Officer of Bradlees, Inc., a discount retail chain, from 1996.
Mr. von Staats has been Senior Vice President, General Counsel and Clerk since February 2003. Previously, he served as Vice President, North American Counsel from December 2001 through January 2003 and prior to that served as Regional Corporate Counsel, North America from June 1998 through November 2001.
We have adopted the PTC Code of Business Conduct and Ethics, a code of ethics that applies to our Chief Executive Officer, Chief Financial Officer, and Controller, as well as others. A copy of the PTC Code of Business Conduct and Ethics is publicly available on our website at www.ptc.com. If we make any substantive amendments to the PTC Code of Business Conduct and Ethics or grant any waiver, including any implicit waiver, from a provision of the code to our Chief Executive Officer, Chief Financial Officer or Controller, we will disclose the nature of such amendment or waiver in a current report on Form 8-K.
43
ITEM 11. Executive Compensation
Information with respect to executive compensation may be found under the headings captioned “How We Compensate Our Directors” and “Information About Executive Compensation” appearing in our 2006 Proxy Statement. Such information is incorporated herein by reference.
ITEM 12. Security Ownership of Certain Beneficial Owners and Management
Information with respect to security ownership may be found under the heading captioned “Information About PTC Common Stock Ownership” appearing in our 2006 Proxy Statement. Such information is incorporated herein by reference.
EQUITY COMPENSATION PLANS
The following table sets forth information regarding our equity compensation plans as of September 30, 2005:
| | | | | | | | | | |
Plan Category
| | Number of securities to be issued upon exercise of outstanding options,
warrants and rights
| | | Weighted-average
exercise price of
outstanding options
warrants and rights
| | | Number of securities remaining available for
future issuance under equity compensation plans
| |
Equity compensation plans approved by security holders | | 17,682,046 | (1) | | $ | 5.70 | (2) | | 16,781,949 | (3)(4) |
Equity compensation plans not approved by security holders | | 19,831,262 | (5) | | $ | 5.73 | (5) | | 0 | |
| | |
|
| | | | | |
|
|
Total | | 37,513,308 | (1)(5) | | $ | 5.72 | (2)(5) | | 16,781,949 | (3)(4) |
| (1) | Includes 2,259,441 shares of our common stock issuable upon vesting of outstanding restricted stock units granted under our 2000 Equity Incentive Plan (the “2000 EIP”). |
| (2) | The weighted-average exercise price does not take into account the shares issuable upon vesting of outstanding restricted stock units, which have no exercise price. |
| (3) | Comprised of 9,510,269 shares of our common stock available for issuance under the 2000 EIP and 7,271,680 shares of our common stock available for issuance under our 2000 Employee Stock Purchase Plan. |
| (4) | In addition to stock option awards, the 2000 EIP provides for the issuance of stock appreciation rights (SARs). SARs are rights to receive any excess in value of shares of common stock over the exercise price; the Compensation Committee of our Board of Directors determines whether they are settled in cash, common stock or other of our securities, awards or other property and may define the manner of determining the excess in value of the shares of common stock. Under our 2000 EIP, the Committee also may make awards of common stock subject to certain restrictions during a specified period, such as the participant’s continued service with PTC or the company achieving certain financial goals. The participant generally will forfeit the shares if the specified conditions are not met and the participant cannot transfer the shares before termination of that period. The participant is, however, entitled to vote the shares and receive any dividends during the restriction period. The Committee also may award common stock without restrictions to recognize outstanding achievements or as a supplement to restricted stock awards when PTC’s performance exceeds established financial goals. The Committee determines what, if anything, the participant must pay to receive such a stock award. |
| (5) | Excludes 84,638 shares of our common stock issuable upon exercise of outstanding options assumed in connection with our mergers or other acquisition transactions; these options have a weighted-average exercise price of $4.11. |
Non-Stockholder Approved Plan
PTC maintained the 1997 Non-Statutory Stock Option Plan until March 10, 2005, at which time, in connection with stockholder approval of certain amendments to the 2000 EIP, we terminated all future offerings under that plan.
Plans Assumed in Connection with a Merger or Other Acquisition Transaction
PTC has also assumed stock options under certain equity plans in connection with certain mergers and acquisitions. These plans are all inactive and no future options may be granted under them.
44
ITEM 13. Certain Relationships and Related Transactions
Information with respect to this item may be found under the heading “Information About Certain Insider Relationships” appearing in our 2006 Proxy Statement. Such information is incorporated herein by reference.
ITEM 14. Principal Accounting Fees and Services
Information with respect to this item may be found under the heading “Information About Our Independent Registered Public Accounting Firm” appearing in our 2006 Proxy Statement. Such information is incorporated herein by reference.
45
PART IV
ITEM 15. Exhibits, Financial Statement Schedules
(a) Documents Filed as Part of Form 10-K
| | | | |
1. | | Financial Statements | | |
| | | Consolidated Balance Sheets as of September 30, 2005 and 2004 | | F-1 |
| | | Consolidated Statements of Operations for the years ended September 30, 2005, 2004 and 2003 | | F-2 |
| | | Consolidated Statements of Cash Flows for the years ended September 30, 2005, 2004 and 2003 | | F-3 |
| | | Consolidated Statements of Stockholders’ Equity for the years ended September 30, 2005, 2004 and 2003 | |
F-4 |
| | | Consolidated Statements of Comprehensive Income (Loss) for the years ended September 30, 2005, 2004 and 2003 | |
F-4 |
| | | Notes to Consolidated Financial Statements | | F-5 |
| | | Report of Independent Registered Public Accounting Firm | | F-36 |
| | |
2. | | Financial Statement Schedules | | |
| | | Schedules have been omitted since they are either not required, not applicable, or the information is otherwise included. | | |
| | |
3. | | Exhibits | | |
| | | We hereby file the exhibits listed in the Exhibit Index. | | |
(b) Exhibits
We hereby file the exhibits listed in the attached Exhibit Index.
(c) Financial Statement Schedules
None.
46
SIGNATURES
Pursuant to the requirements of Section 13 or 15(d) of the Securities Exchange Act of 1934, the Registrant has duly caused this report to be signed on its behalf by the undersigned, thereunto duly authorized on the 14th day of December, 2005.
| | |
PARAMETRIC TECHNOLOGY CORPORATION |
| |
By: | | /s/ C. RICHARD HARRISON
|
| | | C. Richard Harrison Chief Executive Officer and President |
47
POWER OF ATTORNEY
We, the undersigned officers and directors of Parametric Technology Corporation, hereby severally constitute Cornelius F. Moses, III and Aaron C. von Staats, Esq., and each of them singly, our true and lawful attorneys with full power to them, and each of them singly, to sign for us and in our names in the capacities indicated below any and all subsequent amendments to this report, and to file the same, with exhibits thereto and other documents in connection therewith, with the Securities and Exchange Commission, hereby ratifying and confirming all that each of said attorneys-in-fact may do or cause to be done by virtue hereof.
Pursuant to the requirements of the Securities Exchange Act of 1934, this report has been signed below by the following persons on behalf of the Registrant and in the capacities indicated below, on the 14th day of December, 2005.
| | |
Signature
| | Title
|
| |
(i) Principal Executive Officer: | | |
| |
/s/ C. RICHARD HARRISON
C. Richard Harrison | | Chief Executive Officer and President |
| |
(ii) Principal Financial and Accounting Officer: | | |
| |
/s/ CORNELIUS F. MOSES, III
Cornelius F. Moses, III | | Executive Vice President and Chief Financial Officer |
| |
(iii) Board of Directors: | | |
| |
/s/ NOEL G. POSTERNAK
Noel G. Posternak | | Chairman of the Board of Directors |
| |
/s/ C. RICHARD HARRISON
C. Richard Harrison | | Director |
| |
/s/ ROBERT N.GOLDMAN
Robert N. Goldman | | Director |
| |
/s/ DONALD K. GRIERSON
Donald K. Grierson | | Director |
| |
/s/ OSCAR B. MARX, III
Oscar B. Marx, III | | Director |
| |
/s/ JOSEPH M. O’DONNELL
Joseph M. O’Donnell | | Director |
| |
/s/ MICHAEL E. PORTER
Michael E. Porter | | Director |
48
EXHIBIT INDEX
| | | | |
Exhibit Number
| | | | |
| 2.1 | | — | | Amended and Restated Agreement and Plan of Merger by and among Parametric Technology Corporation, PTC Maple Corporation, Arbortext, Inc. and the Stockholder Representative dated July 15, 2005 (filed as Exhibit 2.1 to our current report on Form 8-K filed on July 21, 2005 (File No. 0-18059) and incorporated herein by reference). |
| | |
| 3.1(a) | | — | | Restated Articles of Organization of Parametric Technology Corporation adopted February 4, 1993 (filed as Exhibit 3.1 to our Quarterly Report on Form 10-Q for the fiscal quarter ended March 30, 1996 (File No. 0-18059) and incorporated herein by reference). |
| | |
| 3.1(b) | | — | | Articles of Amendment to Restated Articles of Organization adopted February 9, 1996 (filed as Exhibit 4.1(b) to our Registration Statement on Form S-8 (Registration No. 333-01297) and incorporated herein by reference). |
| | |
| 3.1(c) | | — | | Articles of Amendment to Restated Articles of Organization adopted February 13, 1997 (filed as Exhibit 4.1(b) to our Registration Statement on Form S-8 (Registration No. 333-22169) and incorporated herein by reference). |
| | |
| 3.1(d) | | — | | Articles of Amendment to Restated Articles of Organization adopted February 10, 2000 (filed as Exhibit 3.1 to our Quarterly Report on Form 10-Q for the fiscal quarter ended April 1, 2000 (File No. 0-18059) and incorporated herein by reference). |
| | |
| 3.1(e) | | — | | Certificate of Vote of Directors establishing Series A Junior Participating Preferred Stock (filed as Exhibit 3.1(e) to our Annual Report on Form 10-K for the fiscal year ended September 30, 2000 (File No. 0-18059) and incorporated herein by reference). |
| | |
| 3.2 | | — | | By-Laws, as amended and restated, of Parametric Technology Corporation (filed as Exhibit 3.2 to our Annual Report on Form 10-K for the fiscal year ended September 30, 2000 (File No. 0-18059) and incorporated herein by reference). |
| | |
| 4.1 | | — | | Rights Agreement effective as of January 5, 2001 between Parametric Technology Corporation and American Stock Transfer & Trust Company (filed as Exhibit 4.1 to our Annual Report on Form 10-K for the fiscal year ended September 30, 2000 (File No. 0-18059) and incorporated herein by reference). |
| | |
| 10.1* | | — | | Parametric Technology Corporation 2000 Equity Incentive Plan (filed as Exhibit 10.1 to our Quarterly Report on Form 10-Q for the fiscal quarter ended April 2, 2005 (File No. 0-18059) and incorporated herein by reference). |
| | |
| 10.2* | | — | | Parametric Technology Corporation 1997 Incentive Stock Option Plan (filed as Exhibit 10.2 to our Quarterly Report on Form 10-Q for the fiscal quarter ended July 3, 2004 (File No. 0-18059) and incorporated herein by reference). |
| | |
| 10.3* | | — | | Amendment to Parametric Technology Corporation 1997 Incentive Stock Option Plan (filed as Exhibit 10.2 to our Quarterly Report on Form 10-Q for the fiscal quarter ended March 31, 2001 (File No. 0-18059) and incorporated herein by reference). |
| | |
| 10.4 | | — | | Parametric Technology Corporation 1997 Nonstatutory Stock Option Plan (filed as Exhibit 10.4 to our Quarterly Report on Form 10-Q for the fiscal quarter ended July 3, 2004 (File No. 0-18059) and incorporated herein by reference). |
| | |
| 10.5* | | — | | Parametric Technology Corporation 1987 Incentive Stock Option Plan, as amended (filed as Exhibit 10.2 to our Annual Report on Form 10-K for the fiscal year ended September 30, 1999 (File No. 0-18059) and incorporated herein by reference). |
| | |
| 10.6* | | — | | Parametric Technology Corporation 1996 Directors Stock Option Plan, as amended (filed as Exhibit 10.4 to our Annual Report on Form 10-K for the fiscal year ended September 30, 1999 (File No. 0-18059) and incorporated herein by reference). |
| | |
| 10.7* | | — | | Computervision Corporation 1992 Stock Option Plan as amended September 15, 1994, April 18, 1995 and December 5, 1996 (filed as Exhibit 10.3 to the Annual Report on Form 10-K of Computervision Corporation for the fiscal year ended December 31, 1996 (File No. 1-7760/0-20290) and incorporated herein by reference). |
| | |
| 10.8* | | — | | Executive Agreement with C. Richard Harrison, Chief Executive Officer, dated January 21, 2003 (filed as Exhibit 10.1 to our Quarterly Report on Form 10-Q for the fiscal quarter ended December 28, 2002 (File No. 0-18059) and incorporated herein by reference). |
49
| | | | |
Exhibit Number
| | | | |
| 10.9* | | — | | Form of Executive Agreement with certain executive officers, together with schedule identifying each executive officer (filed as Exhibit 10.1 to our Quarterly Report on Form 10-Q for the fiscal quarter ended April 3, 2004 (File No. 0-18059) and incorporated herein by reference). |
| | |
| 10.10* | | — | | Amended and Restated Consulting Agreement with Michael E. Porter dated July 28, 2005 (filed as Exhibit 1.1 to our Current Report on Form 8-K filed on July 29, 2005 (File No. 0-18059) and incorporated herein by reference). |
| | |
| 10.11* | | — | | PTC Executive Incentive Performance Plan (filed as Exhibit 10.22 to our Annual Report on Form 10-K for our fiscal year ended September 30, 2004 (File No. 0-18059) and incorporated herein by reference). |
| | |
| 10.12* | | — | | Director compensation information (incorporated herein by reference from Item 1.01 of our Current Report on Form 8-K filed on May 23, 2005 (File No. 0-18059)). |
| | |
| 10.13* | | — | | Executive Officer compensation information. |
| | |
| 10.14 | | — | | Lease dated December 14, 1999 by and between PTC and Boston Properties Limited Partnership (filed as Exhibit 10.21 to our Annual Report on Form 10-K for the fiscal year ended September 30, 2000 (File No. 0-18059) and incorporated herein by reference). |
| | |
| 10.15 | | — | | Amended and Restated Lease Agreement dated as of January 1, 1995 between United Trust Fund Limited Partnership and Computervision Corporation (filed as Exhibit 10.20 to the Annual Report on Form 10-K of Computervision Corporation for the fiscal year ended December 31, 1995 (File No. 1-7760/0-20290) and incorporated herein by reference). |
| | |
| 21.1 | | — | | Subsidiaries of Parametric Technology Corporation. |
| | |
| 23.1 | | — | | Consent of PricewaterhouseCoopers LLP, an independent registered public accounting firm. |
| | |
| 31.1 | | — | | Certification of the Chief Executive Officer Pursuant to Exchange Act Rules 13(a)-14(a) and 15d-14(a). |
| | |
| 31.2 | | — | | Certification of the Chief Financial Officer Pursuant to Exchange Act Rules 13(a)-14(a) and 15d-14(a). |
| | |
| 32** | | — | | Certification of Periodic Financial Report Pursuant to 18 U.S.C. Section 1350. |
| * | Identifies a management contract or compensatory plan or arrangement in which an executive officer or director of PTC participates. |
| ** | Indicates that the exhibit is being furnished with this report and is not filed as a part of it. |
50
APPENDIX A
PARAMETRIC TECHNOLOGY CORPORATION
CONSOLIDATED BALANCE SHEETS
(in thousands, except per share data)
| | | | | | | | |
| | | September 30,
| |
| | | 2005
| | | 2004
| |
ASSETS | | | | | | | | |
Current assets: | | | | | | | | |
Cash and cash equivalents | | $ | 204,423 | | | $ | 294,887 | |
Accounts receivable, net of allowance for doubtful accounts of $5,730 and $6,340 at September 30, 2005 and 2004, respectively | | | 147,497 | | | | 130,393 | |
Prepaid expenses | | | 21,875 | | | | 21,675 | |
Other current assets (Note A) | | | 48,210 | | | | 35,818 | |
Income taxes receivable (Note F) | | | — | | | | 39,523 | |
Deferred tax assets | | | 1,722 | | | | 444 | |
| | |
|
|
| |
|
|
|
Total current assets | | | 423,727 | | | | 522,740 | |
Property and equipment, net | | | 52,551 | | | | 55,780 | |
Goodwill | | | 200,628 | | | | 45,221 | |
Acquired intangible assets, net | | | 58,210 | | | | 11,322 | |
Deferred tax assets | | | 2,422 | | | | — | |
Other assets | | | 49,085 | | | | 41,277 | |
| | |
|
|
| |
|
|
|
Total assets | | $ | 786,623 | | | $ | 676,340 | |
| | |
|
|
| |
|
|
|
LIABILITIES AND STOCKHOLDERS’ EQUITY | | | | | | | | |
Current liabilities: | | | | | | | | |
Accounts payable | | $ | 19,915 | | | $ | 19,067 | |
Accrued expenses and other current liabilities | | | 43,753 | | | | 39,420 | |
Accrued compensation and benefits | | | 67,517 | | | | 58,086 | |
Accrued income taxes | | | 29,695 | | | | 39,428 | |
Deferred revenue (Note A) | | | 183,882 | | | | 156,240 | |
| | |
|
|
| |
|
|
|
Total current liabilities | | | 344,762 | | | | 312,241 | |
| | |
Other liabilities (Notes B and L) | | | 101,432 | | | | 100,197 | |
Deferred revenue | | | 16,585 | | | | 20,424 | |
Deferred tax liabilities | | | — | | | | 1,527 | |
| | |
Commitments and contingencies (Note G) | | | | | | | | |
| | |
Stockholders’ equity: | | | | | | | | |
Preferred stock, $0.01 par value; 5,000 shares authorized; none issued | | | — | | | | — | |
Common stock, $0.01 par value; 500,000 shares authorized; 275,074 and 269,509 shares issued and outstanding at September 30, 2005 and 2004, respectively | | | 2,751 | | | | 2,695 | |
Additional paid-in capital | | | 1,673,685 | | | | 1,662,421 | |
Accumulated deficit | | | (1,303,558 | ) | | | (1,387,150 | ) |
Accumulated other comprehensive loss | | | (49,034 | ) | | | (36,015 | ) |
| | |
|
|
| |
|
|
|
Total stockholders’ equity | | | 323,844 | | | | 241,951 | |
| | |
|
|
| |
|
|
|
Total liabilities and stockholders’ equity | | $ | 786,623 | | | $ | 676,340 | |
| | |
|
|
| |
|
|
|
The accompanying notes are an integral part of the consolidated financial statements.
F-1
PARAMETRIC TECHNOLOGY CORPORATION
CONSOLIDATED STATEMENTS OF OPERATIONS
(in thousands, except per share data)
| | | | | | | | | | | | |
| | | Year ended September 30,
| |
| | | 2005
| | | 2004
| | | 2003
| |
Revenue: | | | | | | | | | | | | |
License | | $ | 209,717 | | | $ | 198,860 | | | $ | 205,301 | |
Service | | | 511,002 | | | | 461,169 | | | | 466,639 | |
| | |
|
|
| |
|
|
| |
|
|
|
Total revenue | | | 720,719 | | | | 660,029 | | | | 671,940 | |
| | |
|
|
| |
|
|
| |
|
|
|
Costs and expenses: | | | | | | | | | | | | |
Cost of license revenue | | | 8,444 | | | | 8,234 | | | | 10,990 | |
Cost of service revenue | | | 199,798 | | | | 173,941 | | | | 207,496 | |
Sales and marketing | | | 243,758 | | | | 226,054 | | | | 298,479 | |
Research and development | | | 118,267 | | | | 107,992 | | | | 128,425 | |
General and administrative | | | 63,605 | | | | 58,264 | | | | 69,418 | |
Amortization of acquired intangible assets (Note E) | | | 1,638 | | | | 5,195 | | | | 5,861 | |
In-process research and development | | | 730 | | | | — | | | | — | |
Restructuring and other charges (credits) (Note B) | | | (1,307 | ) | | | 42,933 | | | | 30,896 | |
| | |
|
|
| |
|
|
| |
|
|
|
Total costs and expenses | | | 634,933 | | | | 622,613 | | | | 751,565 | |
| | |
|
|
| |
|
|
| |
|
|
|
Operating income (loss) | | | 85,786 | | | | 37,416 | | | | (79,625 | ) |
Interest income | | | 6,878 | | | | 3,484 | | | | 3,260 | |
Other expense, net | | | (1,352 | ) | | | (3,861 | ) | | | (6,064 | ) |
| | |
|
|
| |
|
|
| |
|
|
|
Income (loss) before income taxes | | | 91,312 | | | | 37,039 | | | | (82,429 | ) |
Provision for income taxes | | | 7,720 | | | | 2,226 | | | | 15,851 | |
| | |
|
|
| |
|
|
| |
|
|
|
Net income (loss) | | $ | 83,592 | | | $ | 34,813 | | | $ | (98,280 | ) |
| | |
|
|
| |
|
|
| |
|
|
|
Earnings (loss) per share—Basic (Note A) | | $ | 0.31 | | | $ | 0.13 | | | $ | (0.37 | ) |
Earnings (loss) per share—Diluted (Note A) | | $ | 0.30 | | | $ | 0.13 | | | $ | (0.37 | ) |
Weighted average shares outstanding—Basic | | | 271,339 | | | | 267,704 | | | | 264,149 | |
Weighted average shares outstanding—Diluted | | | 279,952 | | | | 273,183 | | | | 264,149 | |
The accompanying notes are an integral part of the consolidated financial statements.
F-2
PARAMETRIC TECHNOLOGY CORPORATION
CONSOLIDATED STATEMENTS OF CASH FLOWS
(in thousands)
| | | | | | | | | | | | |
| | | Year ended September 30,
| |
| | | 2005
| | | 2004
| | | 2003
| |
Cash flows from operating activities: | | | | | | | | | | | | |
Net income (loss) | | $ | 83,592 | | | $ | 34,813 | | | $ | (98,280 | ) |
Adjustments to reconcile net income (loss) to net cash provided by operating activities: | | | | | | | | | | | | |
Depreciation and amortization | | | 25,881 | | | | 35,157 | | | | 41,637 | |
Provision for loss on accounts receivable | | | 1,624 | | | | 3,135 | | | | 5,079 | |
Stock-based compensation | | | 15,466 | | | | 437 | | | | 456 | |
Write-down of investments | | | — | | | | 181 | | | | 393 | |
Deferred income taxes | | | (5,989 | ) | | | 399 | | | | 42 | |
Non-cash portion of restructuring and other charges, net | | | (266 | ) | | | 1,941 | | | | 1,469 | |
In-process research and development | | | 730 | | | | — | | | | — | |
Changes in operating assets and liabilities, net of effects of acquisitions: | | | | | | | | | | | | |
Accounts receivable | | | (10,313 | ) | | | 14,934 | | | | 24,904 | |
Accounts payable and accrued expenses | | | (13,355 | ) | | | (5,240 | ) | | | (8,388 | ) |
Accrued compensation and benefits | | | 5,320 | | | | 1,506 | | | | 4,394 | |
Deferred revenue | | | 9,501 | | | | 4,997 | | | | (27,533 | ) |
Income taxes receivable, net of accrued income taxes | | | 29,809 | | | | (6,319 | ) | | | 59,238 | |
Other current assets and prepaid expenses | | | 2,616 | | | | 14,201 | | | | 8,165 | |
Other noncurrent assets and liabilities | | | (16,477 | ) | | | 1,194 | | | | (5,081 | ) |
| | |
|
|
| |
|
|
| |
|
|
|
Net cash provided by operating activities | | | 128,139 | | | | 101,336 | | | | 6,495 | |
| | |
|
|
| |
|
|
| |
|
|
|
Cash flows from investing activities: | | | | | | | | | | | | |
Additions to property and equipment | | | (14,958 | ) | | | (10,924 | ) | | | (20,824 | ) |
Additions to other intangible assets | | | (1,177 | ) | | | (1,524 | ) | | | (5,108 | ) |
Acquisitions of businesses, net of cash acquired | | | (198,897 | ) | | | (9,822 | ) | | | — | |
Purchases of investments | | | — | | | | — | | | | (17,119 | ) |
Proceeds from sales and maturities of investments | | | — | | | | — | | | | 48,556 | |
| | |
|
|
| |
|
|
| |
|
|
|
Net cash (used) provided by investing activities | | | (215,032 | ) | | | (22,270 | ) | | | 5,505 | |
| | |
|
|
| |
|
|
| |
|
|
|
Cash flows from financing activities: | | | | | | | | | | | | |
Proceeds from issuance of common stock | | | 10,162 | | | | 9,712 | | | | 7,688 | |
Payments to employees for stock option exchange | | | (12,733 | ) | | | — | | | | — | |
Tax benefit from stock-based awards | | | 1,117 | | | | — | | | | — | |
Payments of capital lease obligations | | | (270 | ) | | | — | | | | — | |
Other | | | (294 | ) | | | — | | | | (167 | ) |
| | |
|
|
| |
|
|
| |
|
|
|
Net cash (used) provided by financing activities | | | (2,018 | ) | | | 9,712 | | | | 7,521 | |
| | |
|
|
| |
|
|
| |
|
|
|
Effect of exchange rate changes on cash and cash equivalents | | | (1,553 | ) | | | 797 | | | | 6,966 | |
| | |
|
|
| |
|
|
| |
|
|
|
Net increase (decrease) in cash and cash equivalents | | | (90,464 | ) | | | 89,575 | | | | 26,487 | |
Cash and cash equivalents, beginning of year | | | 294,887 | | | | 205,312 | | | | 178,825 | |
| | |
|
|
| |
|
|
| |
|
|
|
Cash and cash equivalents, end of year | | $ | 204,423 | | | $ | 294,887 | | | $ | 205,312 | |
| | |
|
|
| |
|
|
| |
|
|
|
Supplemental disclosures of cash flow information: | | | | | | | | | | | | |
Property and equipment acquired under capital leases | | $ | 1,521 | | | | — | | | | — | |
| | |
|
|
| |
|
|
| |
|
|
|
The accompanying notes are an integral part of the consolidated financial statements.
F-3
PARAMETRIC TECHNOLOGY CORPORATION
CONSOLIDATED STATEMENTS OF STOCKHOLDERS’ EQUITY
(in thousands)
| | | | | | | | | | | | | | | | | | | | | | | |
| | | Common Stock
| | | Additional
Paid-In
Capital
| | | Accumulated
Deficit
| | | Accumulated
Other
Comprehensive
Income (Loss)
| | | Total
Stockholders’
Equity
| |
| | | Shares
| | | Amount
| | | | | |
Balance as of October 1, 2002 | | 262,584 | | | $ | 2,626 | | | $ | 1,644,198 | | | $ | (1,323,517 | ) | | $ | (33,379 | ) | | $ | 289,928 | |
Common stock issued for employee stock purchase and option plans | | 3,851 | | | | 39 | | | | 7,649 | | | | — | | | | — | | | | 7,688 | |
Compensation expense from restricted stock grants | | — | | | | — | | | | 456 | | | | — | | | | — | | | | 456 | |
Retirement of treasury stock | | (52 | ) | | | (1 | ) | | | — | | | | (166 | ) | | | — | | | | (167 | ) |
Net loss | | — | | | | — | | | | — | | | | (98,280 | ) | | | — | | | | (98,280 | ) |
Foreign currency translation adjustment | | — | | | | — | | | | — | | | | — | | | | 813 | | | | 813 | |
Unrealized gain on investments | | — | | | | — | | | | — | | | | — | | | | 111 | | | | 111 | |
Minimum pension liability adjustment | | — | | | | — | | | | — | | | | — | | | | (5,391 | ) | | | (5,391 | ) |
| | |
|
| |
|
|
| |
|
|
| |
|
|
| |
|
|
| |
|
|
|
Balance as of September 30, 2003 | | 266,383 | | | | 2,664 | | | | 1,652,303 | | | | (1,421,963 | ) | | | (37,846 | ) | | | 195,158 | |
Common stock issued for employee stock purchase and option plans | | 3,126 | | | | 31 | | | | 9,681 | | | | — | | | | — | | | | 9,712 | |
Compensation expense from restricted stock grants | | — | | | | — | | | | 437 | | | | — | | | | — | | | | 437 | |
Net income | | — | | | | — | | | | — | | | | 34,813 | | | | — | | | | 34,813 | |
Foreign currency translation adjustment | | — | | | | — | | | | — | | | | — | | | | 815 | | | | 815 | |
Unrealized loss on investments | | — | | | | — | | | | — | | | | — | | | | (154 | ) | | | (154 | ) |
Minimum pension liability adjustment | | — | | | | — | | | | — | | | | — | | | | 1,170 | | | | 1,170 | |
| | |
|
| |
|
|
| |
|
|
| |
|
|
| |
|
|
| |
|
|
|
Balance as of September 30, 2004 | | 269,509 | | | | 2,695 | | | | 1,662,421 | | | | (1,387,150 | ) | | | (36,015 | ) | | | 241,951 | |
Common stock issued for employee stock-based awards | | 5,924 | | | | 60 | | | | 10,102 | | | | — | | | | — | | | | 10,162 | |
Shares surrendered by employees to pay taxes related to stock-based awards | | (359 | ) | | | (4 | ) | | | (2,319 | ) | | | — | | | | — | | | | (2,323 | ) |
Stock option exchange for cash | | — | | | | — | | | | (12,246 | ) | | | — | | | | — | | | | (12,246 | ) |
Compensation expense from stock-based awards | | — | | | | — | | | | 14,977 | | | | — | | | | — | | | | 14,977 | |
Tax benefit realized from stock-based awards | | — | | | | — | | | | 750 | | | | — | | | | — | | | | 750 | |
Net income | | — | | | | — | | | | — | | | | 83,592 | | | | — | | | | 83,592 | |
Foreign currency translation adjustment | | — | | | | — | | | | — | | | | — | | | | (2,395 | ) | | | (2,395 | ) |
Unrealized gain on investments | | — | | | | — | | | | — | | | | — | | | | 1,030 | | | | 1,030 | |
Minimum pension liability adjustment | | — | | | | — | | | | — | | | | — | | | | (11,654 | ) | | | (11,654 | ) |
| | |
|
| |
|
|
| |
|
|
| |
|
|
| |
|
|
| |
|
|
|
Balance as of September 30, 2005 | | 275,074 | | | $ | 2,751 | | | $ | 1,673,685 | | | $ | (1,303,558 | ) | | $ | (49,034 | ) | | $ | 323,844 | |
| | |
|
| |
|
|
| |
|
|
| |
|
|
| |
|
|
| |
|
|
|
CONSOLIDATED STATEMENTS OF COMPREHENSIVE INCOME (LOSS)
(in thousands)
| | | | | | | | | | | | |
| |
| | | Year ended September 30,
| |
| | | 2005
| | | 2004
| | | 2003
| |
Comprehensive income (loss): | | | | | | | | | | | | |
Net income (loss) | | $ | 83,592 | | | $ | 34,813 | | | $ | (98,280 | ) |
| | |
|
|
| |
|
|
| |
|
|
|
Other comprehensive income (loss), net of tax: | | | | | | | | | | | | |
Foreign currency translation adjustment, net of tax of $0 for all periods | | | (2,395 | ) | | | 815 | | | | 813 | |
Unrealized gain (loss) on investment securities, net of tax of $0 for all periods | | | 1,030 | | | | (154 | ) | | | 111 | |
Minimum pension liability adjustment, net of tax of $0 for all periods | | | (11,654 | ) | | | 1,170 | | | | (5,391 | ) |
| | |
|
|
| |
|
|
| |
|
|
|
Other comprehensive income (loss) | | | (13,019 | ) | | | 1,831 | | | | (4,467 | ) |
| | |
|
|
| |
|
|
| |
|
|
|
Comprehensive income (loss) | | $ | 70,573 | | | $ | 36,644 | | | $ | (102,747 | ) |
| | |
|
|
| |
|
|
| |
|
|
|
The accompanying notes are an integral part of the consolidated financial statements.
F-4
PARAMETRIC TECHNOLOGY CORPORATION
NOTES TO CONSOLIDATED FINANCIAL STATEMENTS
A. Description of Business and Summary of Significant Accounting Policies
Business
Parametric Technology Corporation (PTC) was incorporated in 1985 and is headquartered in Needham, Massachusetts. PTC develops, markets and supports product lifecycle management (PLM) and enterprise content management (ECM) software solutions and related services that help companies improve their processes for developing physical and information products. Our solutions, which include a suite of mechanical computer-aided design and document authoring tools (our Desktop Solutions) and a range of Internet-based collaboration, content and process management, and publishing technologies (our Enterprise Solutions), enable companies to create digital product content as represented by product designs and component-based documents, collaborate globally on the development of content with cross-functional teams consisting of members within an organization and from the extended enterprise, control content and automate processes over the course of a product’s lifecycle, and communicate relevant product information across the extended enterprise and to customers through multiple channels using dynamic publications. Our software solutions are complemented by our services and technical support organizations, as well as third-party resellers and other strategic partners, who provide training, consulting, ancillary product offerings, implementation and support to customers worldwide.
Basis of Presentation
Our fiscal year-end is September 30. The consolidated financial statements include the parent company and its wholly owned subsidiaries, including those operating outside the U.S. All intercompany balances and transactions have been eliminated in the financial statements. Certain reclassifications have been made for consistent presentation, including the reclassification on the September 30, 2004 consolidated balance sheet of $20.4 million of deferred revenue to non-current liabilities from current liabilities. We also reclassified a pension plan liability of $10.0 million to accrued compensation and benefits and other liabilities from other assets, where the liability offset other pension plan prepaid assets. We also have made reclassifications within cash flows from operating activities on the consolidated statement of cash flows for the years ended September 30, 2004 and 2003 to conform to the 2005 presentation. We prepare our financial statements under generally accepted accounting principles that require management to make estimates and assumptions that affect the amounts reported and the related disclosures. Actual results could differ from these estimates.
Foreign Currency Translation
For our international operations where the functional currency is the local currency, we translate assets and liabilities at exchange rates in effect at the balance sheet date and record translation adjustments in stockholders’ equity. As of September 30, 2005 and 2004, cumulative translation adjustment gains of $1.3 million and $3.7 million, respectively, were included in the accumulated other comprehensive income (loss) component of stockholders’ equity. For our international operations where the U.S. dollar is the functional currency, we remeasure monetary assets and liabilities using exchange rates in effect at the balance sheet date and nonmonetary assets and liabilities at historical rates and record resulting exchange gains or losses in other expense in the statement of operations. We translate income statement amounts at average rates for the period. Transaction gains and losses are recorded in other expense, net in the statement of operations.
F-5
PARAMETRIC TECHNOLOGY CORPORATION
NOTES TO CONSOLIDATED FINANCIAL STATEMENTS—(Continued)
Revenue Recognition
We derive revenues from three primary sources: (1) software licenses, (2) maintenance services and (3) consulting and training services. Revenue by type for 2005, 2004 and 2003 is as follows:
| | | | | | | | | |
| | | Year ended September 30,
|
| | | 2005
| | 2004
| | 2003
|
| | | (in thousands) |
License revenue | | $ | 209,717 | | $ | 198,860 | | $ | 205,301 |
Maintenance services revenue | | | 342,569 | | | 323,420 | | | 309,091 |
Consulting and training services revenue | | | 168,433 | | | 137,749 | | | 157,548 |
| | |
|
| |
|
| |
|
|
Total revenue | | $ | 720,719 | | $ | 660,029 | | $ | 671,940 |
| | |
|
| |
|
| |
|
|
While we apply the guidance of Statement of Position (SOP) No. 97-2,Software Revenue Recognition, and Statement of Position No. 98-9,Modification of SOP 97-2, Software Revenue Recognition with Respect to Certain Transactions, both issued by the American Institute of Certified Public Accountants, as well as SEC Staff Accounting Bulletin 104,Revenue Recognition in Financial Statements, we exercise judgment and use estimates in connection with the determination of the amounts of software license and services revenues to be recognized in each accounting period.
For software license arrangements that do not require significant modification or customization of the underlying software, we recognize revenue when: (1) persuasive evidence of an arrangement exists, (2) delivery has occurred (generally, FOB shipping point or electronic distribution), (3) the fee is fixed or determinable, and (4) collection is probable. Substantially all of our license revenues are recognized in this manner.
Our software is distributed primarily through our direct sales force. In addition, we have an indirect distribution channel through alliances with resellers. Revenue arrangements with resellers are recognized on a sell-through basis; that is, when we receive persuasive evidence that the reseller has sold the products to an end-user customer. We do not offer contractual rights of return, stock balancing, or price protection to our resellers, and actual product returns from them have been insignificant to date. As a result, we do not maintain reserves for product returns and related allowances.
At the time of each sale transaction, we must make an assessment of the collectibility of the amount due from the customer. Revenue is only recognized at that time if management deems that collection is probable. In making this assessment, we consider customer credit-worthiness and historical payment experience. At that same time, we assess whether fees are fixed or determinable and free of contingencies or significant uncertainties. If the fee is not fixed or determinable, revenue is recognized only as payments become due from the customer, provided that all other revenue recognition criteria are met. In assessing whether the fee is fixed or determinable, we consider the payment terms of the transaction and our collection experience in similar transactions without making concessions, among other factors. Our software license arrangements generally do not include customer acceptance provisions. However, if an arrangement includes an acceptance provision, we record revenue only upon the earlier of (1) receipt of written acceptance from the customer or (2) expiration of the acceptance period.
Our software arrangements often include implementation and consulting services that are sold separately under consulting engagement contracts or as part of the software license arrangement. When we determine that such services are not essential to the functionality of the licensed software and qualify as “service transactions” under SOP 97-2, we record revenue separately for the license and service elements of these arrangements. Generally, we consider that a service is not essential to the functionality of the software based on various factors, including if the services may be provided by independent third parties experienced in providing such consulting and implementation in coordination with dedicated customer personnel. If an arrangement does not qualify for separate accounting of the license and service elements, then license revenue is recognized together with the consulting services using either the percentage-of-completion or completed-contract method of contract accounting. Contract accounting is also
F-6
PARAMETRIC TECHNOLOGY CORPORATION
NOTES TO CONSOLIDATED FINANCIAL STATEMENTS—(Continued)
applied to any software arrangements that include customer-specific acceptance criteria or where the license payment is tied to the performance of consulting services. Under the percentage-of-completion method, we estimate the stage of completion of contracts with fixed or “not to exceed” fees based on hours or costs incurred to date as compared with estimated total project hours or costs at completion. If we do not have a sufficient basis to measure progress towards completion, revenue is recognized upon completion of the contract. When total cost estimates exceed revenues, we accrue for the estimated losses immediately. The use of the percentage-of-completion method of accounting requires significant judgment relative to estimating total contract costs, including assumptions relative to the length of time to complete the project, the nature and complexity of the work to be performed, and anticipated changes in salaries and other costs. When adjustments in estimated contract costs are determined, such revisions may have the effect of adjusting in the current period the earnings applicable to performance in prior periods.
We generally use the residual method to recognize revenues from arrangements that include one or more elements to be delivered at a future date, when evidence of the fair value of all undelivered elements exists. Under the residual method, the fair value of the undelivered elements (e.g., maintenance, consulting and training services) based on vendor-specific objective evidence (VSOE) is deferred and the remaining portion of the arrangement fee is allocated to the delivered elements (i.e., software license). If evidence of the fair value of one or more of the undelivered services does not exist, all revenues are deferred and recognized when delivery of all of those services has occurred or when fair values can be established. We determine VSOE of the fair value of services revenues based upon our recent pricing for those services when sold separately. VSOE of the fair value of maintenance services may also be determined based on a substantive maintenance renewal clause, if any, within a customer contract. Our current pricing practices are influenced primarily by product type, purchase volume, maintenance term and customer location. We review services revenues sold separately and maintenance renewal rates on a periodic basis and update, when appropriate, our VSOE of fair value for such services to ensure that it reflects our recent pricing experience.
Significant incremental discounts offered in multiple-element arrangements that would be characterized as separate elements are infrequent and are allocated to software license revenues under the residual method. In limited circumstances, where a customer receives a subscription-based license, license revenue is recognized ratably over the term of the arrangement. In limited circumstances, where the right to use the software license is contingent upon current payments of maintenance, fees for software and maintenance are recognized ratably over the initial maintenance term.
Maintenance services generally include rights to unspecified upgrades (when and if available), telephone and Internet-based support, updates and bug fixes. Maintenance revenue is recognized ratably over the term of the maintenance contract on a straight-line basis. It is uncommon for us to offer a specified upgrade to an existing product; however, in such instances, all revenue of the arrangement is deferred until the future upgrade is delivered.
When consulting qualifies for separate accounting, consulting revenues under time and materials billing arrangements are recognized as the services are performed. Consulting revenues under fixed-priced contracts are generally recognized using the percentage-of-completion method. If there is a significant uncertainty about the project completion or receipt of payment for the consulting services, revenue is deferred until the uncertainty is sufficiently resolved. Reimbursements of out-of-pocket expenditures incurred in connection with providing consulting services are included in services revenue, with the offsetting expense recorded in cost of services revenue.
Training services include on-site training, classroom training, and computer-based training and assessment. Training revenues are recognized as the related training services are provided.
F-7
PARAMETRIC TECHNOLOGY CORPORATION
NOTES TO CONSOLIDATED FINANCIAL STATEMENTS—(Continued)
Deferred Revenue
Deferred revenue primarily relates to software maintenance agreements billed to customers for which the services have not yet been provided. The liability associated with performing these services is included in deferred revenue and, if not yet paid, the related amount is included in other current assets. Billed but uncollected maintenance-related amounts included in other current assets at September 30, 2005 and 2004 were $46.1 million and $33.3 million, respectively. Deferred revenue consisted of the following:
| | | | | | |
| | | September 30,
|
| | | 2005
| | 2004
|
| | | (in thousands) |
Deferred maintenance revenue | | $ | 163,321 | | $ | 146,797 |
Deferred other service revenue | | | 24,931 | | | 23,637 |
Deferred license revenue | | | 12,215 | | | 6,230 |
| | |
|
| |
|
|
Total deferred revenue | | $ | 200,467 | | $ | 176,664 |
| | |
|
| |
|
|
Cash, Cash Equivalents and Marketable Investments
Our cash equivalents, short-term investments, and marketable investments are invested in debt instruments of financial institutions, government entities and corporations and in mutual funds. We have established guidelines relative to credit ratings, diversification and maturities that are intended to maintain safety and liquidity. Cash equivalents include highly liquid investments with maturity periods of three months or less when purchased. Short-term investments include those investments with maturities in excess of three months but less than one year. Marketable investments are those with maturities in excess of one year. At September 30, 2005 and 2004, marketable investments were $1.4 million and $0.5 million, respectively, which we included in other assets on the consolidated balance sheets.
Our cash equivalents, short-term and marketable investments are classified as available for sale and reported at fair value, with unrealized gains and losses included in the accumulated other comprehensive income (loss) component of stockholders’ equity and amortization or accretion of premium or discount included in interest income. As of September 30, 2005 and 2004, unrealized gains from investments of $1.1 million and $0.1 million, respectively, are included in the accumulated other comprehensive income (loss) component of stockholders’ equity.
Concentration of Credit Risk and Fair Value of Financial Instruments
The amounts reflected in the consolidated balance sheets for cash and cash equivalents, accounts receivable and accounts payable approximate their fair value due to their short maturities. Financial instruments that potentially subject us to concentration of credit risk consist primarily of investments, trade receivables and foreign currency derivatives. Our cash, cash equivalents, investments and derivatives are placed with financial institutions with high credit standings. Our credit risk for derivatives is also mitigated due to the short-term nature of the contracts. Our customer base consists of large numbers of geographically diverse customers dispersed across many industries, and no individual customer comprised more than 10% of our net trade accounts receivable as of September 30, 2005 or 2004.
Allowance for Doubtful Accounts
We maintain allowances for doubtful accounts for estimated losses resulting from the inability of our customers to make required payments. In determining the adequacy of the allowance for doubtful accounts, management specifically analyzes individual accounts receivable, historical bad debts, customer concentrations, customer credit-worthiness, current economic conditions, accounts receivable aging trends and changes in our customer payment terms. Our allowance for doubtful accounts on trade accounts receivable was $5.7 million as of September 30, 2005, $6.3 million as of September 30, 2004, $6.8 million as of
F-8
PARAMETRIC TECHNOLOGY CORPORATION
NOTES TO CONSOLIDATED FINANCIAL STATEMENTS—(Continued)
September 30, 2003, and $6.2 million as of September 30, 2002. Uncollectible trade accounts receivable written-off, net of recoveries, were $2.2 million, $3.6 million and $4.5 million for 2005, 2004 and 2003, respectively. Provisions for bad debt expense were $1.6 million, $3.1 million and $5.1 million in 2005, 2004 and 2003, respectively.
Transfers of Financial Assets
We offer our customers the option to purchase software and services through payment plans. We occasionally transfer future payments under certain of these contracts to third-party financial institutions on a non-recourse basis. We record such transfers as sales of the related accounts receivable when we surrender control of such receivables under the provisions of Statement of Financial Accounting Standards (SFAS) No. 140,Accounting for Transfers and Servicing of Financial Assets and Extinguishments of Liabilities.
Derivatives
We apply SFAS No. 133,Accounting for Derivative Instruments and Hedging Activities, which established accounting and reporting standards for derivative instruments, including certain derivative instruments embedded in other contracts, and for hedging activities. All derivatives, whether designated in a hedging relationship or not, are required to be recorded on the balance sheet at fair value. SFAS No. 133 also requires that changes in the derivative’s fair value be recognized currently in earnings unless specific hedge accounting criteria are met, and that we formally document, designate, and assess the effectiveness of transactions that receive hedge accounting. The effectiveness of the derivative as a hedging instrument is based on changes in its market value being highly correlated with changes in the market value of the underlying hedged item.
Derivatives are financial instruments whose values are derived from one or more underlying financial instruments, such as foreign currency. We enter into derivative transactions, specifically foreign currency forward contracts, to manage our exposure to fluctuations in foreign exchange rates. The contracts are primarily in Western European currencies and Japanese Yen and typically have maturities of less than three months. Any derivative we enter into is designated at inception as a hedge of risks associated with specific assets, liabilities or future commitments and is monitored to determine if it remains an effective hedge. We do not enter into or hold derivatives for trading or speculative purposes.
We routinely use forward contracts to hedge specific foreign currency-denominated receivables. These contracts, with maturities of less than three months, generally are an exchange of foreign currencies for U.S. dollars at maturity at rates agreed to at inception of the contracts. All foreign currency transactions and all outstanding forward contracts are marked-to-market at the end of each accounting period with unrealized gains and losses recorded in the statement of operations. As of September 30, 2005 and 2004, we had outstanding forward contracts with notional amounts equivalent to approximately $56.7 million ($18.3 million in Euros, $15.5 million in British Pounds, $6.5 million in Japanese Yen, $5.0 million in Korean Won and $11.4 million in other currencies) and $83.3 million ($58.9 million in Euros, $12.1 million in British Pounds, $6.4 million in Japanese Yen and $5.9 million in other currencies), respectively. Net realized and unrealized gains and losses associated with exchange rate fluctuations on forward contracts and the underlying foreign currency exposure being hedged were immaterial for all periods presented.
Property and Equipment
Property and equipment are recorded at cost and depreciated using the straight-line method over their estimated useful lives. Computer hardware and software are typically amortized over three to five years, and furniture and fixtures over three to eight years. Leasehold improvements are amortized over the shorter of their useful lives or the remaining terms of the related leases. Property and equipment under capital leases are amortized over the lesser of the lease terms or their estimated useful lives. Maintenance and repairs are charged to expense when incurred; additions and improvements are capitalized. When an item is sold or retired, the cost and related accumulated depreciation is relieved, and the resulting gain or loss, if any, is recognized in income.
F-9
PARAMETRIC TECHNOLOGY CORPORATION
NOTES TO CONSOLIDATED FINANCIAL STATEMENTS—(Continued)
Computer Software Costs
We incur costs to develop computer software to be licensed or otherwise marketed to customers. Research and development costs are expensed as incurred, except for costs of internally developed or externally purchased software that qualify for capitalization. Software development costs incurred subsequent to the establishment of technological feasibility, but prior to the general release of the product, are capitalized and, upon general release, are amortized using the straight-line method over the expected life of the related products. The straight-line method approximates the same amount of expense as that calculated using the ratio that current period gross product revenues bear to total anticipated gross product revenues. Computer software costs capitalized in 2005, 2004 and 2003 totaled $1.2 million, $1.5 million and $4.1 million, respectively. In addition, as described in Note D, $13.7 million and $1.6 million of software was capitalized in connection with our acquisitions of businesses in 2005 and 2004.
Goodwill, Acquired Intangible Assets and Long-lived Assets
Goodwill is the amount by which the cost of acquired net assets in a business acquisition exceeded the fair values of net identifiable assets on the date of our purchase.
Intangible assets with indefinite useful lives, including goodwill, assembled workforce and certain trademarks, are evaluated for impairment annually, or more frequently if events or changes in circumstances indicate that the asset might be impaired. Factors we consider important, on an overall company basis and reportable-segment basis, when applicable, that could trigger an impairment review include significant underperformance relative to historical or projected future operating results, significant changes in our use of the acquired assets or the strategy for our overall business, significant negative industry or economic trends, a significant decline in our stock price for a sustained period and a reduction of our market capitalization relative to net book value. To conduct these tests of goodwill and indefinite-lived intangible assets, the fair value of the reporting unit is compared to its carrying value. If the reporting unit’s carrying value exceeds its fair value, we record an impairment loss to the extent that the carrying value of goodwill exceeds its implied fair value. We estimate the fair values of our reporting units using discounted cash flow valuation models.
Long-lived assets primarily include property and equipment and intangible assets with finite lives (purchased software, capitalized software, customer lists and certain trademarks). In accordance with SFAS No. 144,Accounting for the Impairment or Disposal of Long-Lived Assets,we periodically review long-lived assets for impairment whenever events or changes in business circumstances indicate that the carrying amount of the assets may not be fully recoverable or that the useful lives of those assets are no longer appropriate. Each impairment test is based on a comparison of the undiscounted cash flows to the recorded value of the asset. If impairment is indicated, the asset is written down to its estimated fair value based on a discounted cash flow analysis.
Advertising Expenses
Advertising costs are expensed as incurred. Total advertising expenses incurred were $2.7 million, $1.1 million and $5.9 million in 2005, 2004 and 2003, respectively.
Income Taxes
Our income tax expense includes U.S. and international income taxes. Certain items of income and expense are not reported in tax returns and financial statements in the same year. The tax effects of these differences are reported as deferred tax assets and liabilities. Deferred tax assets are recognized for the estimated future tax effects of deductible temporary differences and tax operating loss and credit carryforwards. Changes in deferred tax assets and liabilities are recorded in the provision for income taxes. We assess the likelihood that our deferred tax assets will be recovered from future taxable income and, to the extent we believe that it is more likely than not that all or a portion of deferred tax assets will not be realized, we establish a valuation allowance. To the extent we establish a valuation allowance or increase this allowance in a period, we include an expense within the tax provision in the statement of operations.
F-10
PARAMETRIC TECHNOLOGY CORPORATION
NOTES TO CONSOLIDATED FINANCIAL STATEMENTS—(Continued)
Earnings Per Share (EPS)
Basic EPS is calculated by dividing net income (loss) by the weighted average number of shares outstanding during the period. Unvested restricted shares, although legally issued and outstanding, are not considered outstanding for purposes of calculating basic earnings per share. Diluted EPS is calculated by dividing net income (loss) by the weighted average number of shares outstanding plus the dilutive effect, if any, of outstanding stock options, restricted shares and restricted stock units using the treasury stock method. The following table presents the calculation for both basic and diluted EPS:
| | | | | | | | | | |
| | | Year ended September 30,
| |
| | | 2005
| | 2004
| | 2003
| |
| | | (in thousands, except per share) | |
Net income (loss) | | $ | 83,592 | | $ | 34,813 | | $ | (98,280 | ) |
| | |
|
| |
|
| |
|
|
|
Weighted average shares outstanding | | | 271,339 | | | 267,704 | | | 264,149 | |
Dilutive effect of employee stock options, restricted shares and restricted stock units | | | 8,613 | | | 5,479 | | | — | |
| | |
|
| |
|
| |
|
|
|
Diluted weighted average shares outstanding | | | 279,952 | | | 273,183 | | | 264,149 | |
| | |
|
| |
|
| |
|
|
|
Basic earnings (loss) per share | | $ | 0.31 | | $ | 0.13 | | $ | (0.37 | ) |
Diluted earnings (loss) per share | | $ | 0.30 | | $ | 0.13 | | $ | (0.37 | ) |
Stock options to purchase 37.0 million, 48.2 million and 67.4 million shares for 2005, 2004 and 2003, respectively, had exercise prices per share that were greater than the average market price of our common stock for those periods. These shares were excluded from the computation of diluted EPS as the effect would have been anti-dilutive. For the fourth quarter of fiscal 2005, the treasury stock method included consideration of unrecognized compensation expense and any tax benefits as additional proceeds. Due to the net losses generated in 2003, the effect of outstanding stock options for the purchase of an additional 3.5 million shares was excluded from the computation of diluted EPS for that period as the effect would also have been anti-dilutive.
Stock-Based Compensation
In December 2004, the Financial Accounting Standards Board issued Statement of Financial Accounting Standards No. 123 (revised 2004),Share-Based Payment(SFAS No. 123(R)). We adopted SFAS No. 123(R) on July 3, 2005, effective with the beginning of our fourth quarter. SFAS No. 123(R) requires us to measure the cost of employee services received in exchange for an award of equity instruments based on the grant-date fair value of the award using an option pricing model. That cost is recognized over the period during which an employee is required to provide service in exchange for the award. We elected to adopt the modified prospective application method as provided by SFAS No. 123(R) and, accordingly, financial statement amounts for the periods prior to adoption presented in this Form 10-K have not been restated to reflect the fair value method of expensing prescribed by SFAS No. 123(R).
The fair value of restricted shares and restricted stock units granted in 2005 was based on the fair market value of our stock on the date of grant. The weighted average fair value of restricted shares and restricted stock units granted in 2005 was $6.35. Pre-vesting forfeiture rates for purposes of determining stock-based compensation were estimated by us to be 0% for directors and executive officers, 3% for vice president level employees and 6% for all other employees.
F-11
PARAMETRIC TECHNOLOGY CORPORATION
NOTES TO CONSOLIDATED FINANCIAL STATEMENTS—(Continued)
The following table shows stock-based compensation expense recorded from our stock-based awards and our stock option exchange (see Note J for a description of the types of stock-based awards and the stock option exchange) as reflected in our Consolidated Statements of Operations:
| | | | | | | | | |
| | | Year ended September 30,
|
| | | 2005
| | 2004
| | 2003
|
| | | (in thousands) |
Cost of license revenue | | $ | 61 | | $ | — | | $ | — |
Cost of service revenue | | | 2,644 | | | — | | | — |
Sales and marketing | | | 5,113 | | | — | | | — |
Research and development | | | 3,723 | | | 437 | | | 456 |
General and administrative | | | 3,925 | | | — | | | — |
| | |
|
| |
|
| |
|
|
Total stock-based compensation expense | | $ | 15,466 | | $ | 437 | | $ | 456 |
| | |
|
| |
|
| |
|
|
Prior to July 3, 2005, we accounted for stock-based compensation using the intrinsic value method prescribed in Accounting Principles Board Opinion (APB) No. 25,Accounting for Stock Issued to Employees, (APB No. 25) and related interpretations. Under APB No. 25, no compensation cost is recognized when the option price is equal to the market price of the underlying stock on the date of grant. As permitted by APB No. 25, prior to July 3, 2005, we generally did not recognize compensation expense in connection with stock option grants to employees, directors and officers under our plans. However, we did recognize compensation expense of $0.3 million, $0.4 million and $0.5 million in 2005, 2004 and 2003, respectively, in connection with a restricted stock grant to an executive officer of the company in May 2002. The following table illustrates the effect on net income (loss) and net earnings (loss) per share if we had applied the fair value recognition provisions of SFAS No. 123 to all stock-based awards to employees.
| | | | | | | | | | | | |
| | | Year ended September 30,
| |
| | | 2005
| | | 2004
| | | 2003
| |
| | | (in thousands, except per share
amounts) | |
Net income (loss), as reported | | $ | 83,592 | | | $ | 34,813 | | | $ | (98,280 | ) |
Stock-based compensation cost included in reported net income (loss), net of tax of $367 for 2005 and $0 for 2004 and 2003 | | | 15,099 | | | | 437 | | | | 456 | |
Stock-based compensation expense determined under fair value based method, net of tax of $367 for 2005 and $0 for 2004 and 2003 | | | (34,762 | ) | | | (34,104 | ) | | | (51,699 | ) |
| | |
|
|
| |
|
|
| |
|
|
|
Pro forma net income (loss) | | $ | 63,929 | | | $ | 1,146 | | | $ | (149,523 | ) |
| | |
|
|
| |
|
|
| |
|
|
|
Earnings (loss) per share: | | | | | | | | | | | | |
Basic—as reported | | $ | 0.31 | | | $ | 0.13 | | | $ | (0.37 | ) |
Diluted—as reported | | $ | 0.30 | | | $ | 0.13 | | | $ | (0.37 | ) |
Basic—pro forma | | $ | 0.24 | | | $ | 0.00 | | | $ | (0.57 | ) |
Diluted—pro forma | | $ | 0.23 | | | $ | 0.00 | | | $ | (0.57 | ) |
The illustrative disclosures above include the amortization of the fair value of options over their vesting schedules. The pro forma net income (loss) for 2005, 2004 and 2003 includes an income tax valuation allowance fully offsetting any income tax benefit related to the pro forma stock-based employee compensation expense for those periods, except for a $0.4 million tax benefit in 2005 related to certain profitable foreign jurisdictions. The effects indicated above of applying SFAS No. 123 are not necessarily representative of the effects on similar illustrative disclosures in future years.
F-12
PARAMETRIC TECHNOLOGY CORPORATION
NOTES TO CONSOLIDATED FINANCIAL STATEMENTS—(Continued)
There were no stock options granted during 2005. The fair value of stock options granted in 2004 and 2003 and employee stock purchase plan shares granted in 2005, 2004 and 2003 was estimated at the date of grant using the Black-Scholes option-pricing model assuming the following weighted-average assumptions:
| | | | | | | | | |
| | | Year ended
September 30,
| |
| | | 2005
| | | 2004
| | | 2003
| |
Expected life for options (years) | | — | | | 4.0 | | | 4.0 | |
Risk-free interest rates for options | | — | | | 3.2 | % | | 2.9 | % |
Expected life for employee stock purchase plan shares (months) | | 6.0 | | | 6.0 | | | 6.0 | |
Risk-free interest rates for employee stock purchase plan shares | | 1.6 | % | | 1.1 | % | | 3.2 | % |
Volatility | | 65 | % | | 74 | % | | 75 | % |
Dividend yield | | — | | | — | | | — | |
The weighted average fair value of employee stock options granted was $2.50 in 2004 and $1.60 in 2003. The weighted average fair value of shares granted under the stock purchase plan was $1.52 in 2005, $1.23 in 2004 and $0.98 in 2003.
The Black-Scholes option-pricing model was developed for use in estimating the fair value of traded options that have no vesting restrictions and are fully transferable. In addition, option valuation models require the input of highly subjective assumptions, including the expected stock price volatility. Our options have characteristics significantly different from those of traded options and changes in the subjective input assumptions can materially affect the fair value estimate.
As of September 30, 2005, total unrecognized compensation cost related to unvested awards, including stock options, restricted shares and restricted stock units, was approximately $41.3 million. We expect approximately 55%, 40% and 5% of this amount to be recognized as compensation expense in fiscal 2006, 2007 and 2008, respectively.
Recent Accounting Pronouncements
Accounting for Conditional Asset Retirement Obligations
In March 2005, the FASB issued Interpretation No. 47,Accounting for Conditional Asset Retirement Obligations, an interpretation of FASB Statement No. 143 (FIN 47). FIN 47 is effective for fiscal years ending after December 15, 2005. FIN 47 clarifies that an entity is required to recognize a liability for the fair value of a conditional asset retirement obligation when incurred if the liability’s fair value can be reasonably estimated and clarifies when an entity would have sufficient information to reasonably estimate the fair value of an asset retirement obligation. We do not expect that the adoption of FIN 47 will have a material impact on our results of operations or financial position.
Accounting Changes and Error Correction
On June 7, 2005, the FASB issued Statement No. 154,Accounting Changes and Error Corrections, a replacement of APB Opinion No. 20,Accounting Changes, and Statement No. 3,Reporting Accounting Changes in Interim Financial Statements (SFAS No. 154). SFAS No. 154 changes the requirements for the accounting for and reporting of a change in accounting principle. Previously, most voluntary changes in accounting principles required recognition in a cumulative effect adjustment within net income of the period of the change. SFAS No. 154 requires retrospective application to prior periods’ financial statements, unless it is impracticable to determine either the period-specific effects or the cumulative effect of the change. SFAS No. 154 is effective for accounting changes made in fiscal years beginning after December 15, 2005; however, this standard does not change the transition provisions of any existing accounting pronouncements. We will determine the impact of this standard on our consolidated financial statements when an accounting change or error correction occurs.
F-13
PARAMETRIC TECHNOLOGY CORPORATION
NOTES TO CONSOLIDATED FINANCIAL STATEMENTS—(Continued)
B. Restructuring and Other Charges (Credits)
In the fourth quarter of 2005, we recorded a net credit to restructuring and other charges of $1.3 million. The restructuring credit includes a $3.0 million credit for changes in our estimated liabilities for facilities that we vacated, offset by $1.7 million of severance and termination costs related to nine employees terminated during the period. The $3.0 million credit is due primarily to reoccupying, in the fourth quarter of 2005, a portion of our headquarters facility that was previously vacated and included in restructuring costs in a prior period. The space was available for sublease and was being marketed, but was reoccupied due to space requirements related to our three acquisitions completed in 2005 and general business growth. As of September 30, 2005, substantially all of our remaining headquarters excess space has been sublet.
In 2004, we recorded total restructuring and other charges of $42.9 million. The restructuring and other charges were comprised of $21.0 million for severance and termination benefits related to 459 employees terminated during 2004 and $21.9 million related primarily to excess facilities. The charges for excess facilities were primarily related to gross lease commitments in excess of estimated sublease income for excess facilities. Of the total restructuring and other charges recorded in 2004, $1.9 million was non-cash for the write-off of leasehold improvements related to the excess facilities. We completed the restructuring program in the fourth quarter of 2004.
In 2003, we recorded total restructuring and other charges of $30.9 million. The restructuring and other charges were comprised of $17.9 million for severance and termination benefits related to 361 employees terminated during 2003. We also recorded charges of $11.6 million related to excess facilities and $1.4 million of other costs, primarily related to the write-off of acquired technology. The increases in the liability for excess facilities in 2003 related primarily to revised estimates of gross lease commitments in excess of expected sublease income for leases assumed in our 1998 acquisition of Computervision Corporation and consolidating existing leased facilities.
The following table summarizes restructuring and other charges reserve activity for the three years ended September 30, 2005:
| | | | | | | | | | | | |
| | | Employee Severance
and Related Benefits
| | | Facility Closures
and Other Costs
| | | Total
| |
| | | (in thousands) | |
Balance, October 1, 2002 | | $ | 2,655 | | | $ | 35,309 | | | $ | 37,964 | |
Charges to operations | | | 17,855 | | | | 13,041 | | | | 30,896 | |
Cash disbursements | | | (15,667 | ) | | | (8,775 | ) | | | (24,442 | ) |
Non-cash utilization | | | — | | | | (1,469 | ) | | | (1,469 | ) |
| | |
|
|
| |
|
|
| |
|
|
|
Balance, September 30, 2003 | | | 4,843 | | | | 38,106 | | | | 42,949 | |
Charges to operations | | | 21,033 | | | | 21,900 | | | | 42,933 | |
Cash disbursements | | | (25,488 | ) | | | (15,132 | ) | | | (40,620 | ) |
Non-cash utilization | | | — | | | | (1,941 | ) | | | (1,941 | ) |
| | |
|
|
| |
|
|
| |
|
|
|
Balance, September 30, 2004 | | | 388 | | | | 42,933 | | | | 43,321 | |
Charges (credits) to operations | | | 1,684 | | | | (2,991 | ) | | | (1,307 | ) |
Cash disbursements | | | (809 | ) | | | (9,949 | ) | | | (10,758 | ) |
Other | | | — | | | | 266 | | | | 266 | |
| | |
|
|
| |
|
|
| |
|
|
|
Balance, September 30, 2005 | | $ | 1,263 | | | $ | 30,259 | | | $ | 31,522 | |
| | |
|
|
| |
|
|
| |
|
|
|
The accrual for facility closures and related costs is included in accrued expenses and other current liabilities and other long-term liabilities in the consolidated balance sheet, and the accrual for employee severance and related benefits is included in accrued compensation and benefits. As of September 30, 2005, of the $31.5 million remaining in accrued restructuring charges, $11.0 million was included in current liabilities and $20.5 million was included in other long-term liabilities, principally for facility costs to be paid out through 2014. As described in Note D, as of September 30, 2005 we also have $2.9 million in current liabilities for restructuring charges related to our integration of Arbortext.
F-14
PARAMETRIC TECHNOLOGY CORPORATION
NOTES TO CONSOLIDATED FINANCIAL STATEMENTS—(Continued)
C. Property and Equipment
Property and equipment consisted of the following:
| | | | | | | | |
| | | September 30,
| |
| | | 2005
| | | 2004
| |
| | | (in thousands) | |
Computer hardware and software | | $ | 153,641 | | | $ | 149,920 | |
Furniture and fixtures | | | 16,738 | | | | 17,803 | |
Leasehold improvements | | | 30,346 | | | | 32,634 | |
| | |
|
|
| |
|
|
|
Gross property and equipment | | | 200,725 | | | | 200,357 | |
Accumulated depreciation and amortization | | | (148,174 | ) | | | (144,577 | ) |
| | |
|
|
| |
|
|
|
Net property and equipment | | $ | 52,551 | | | $ | 55,780 | |
| | |
|
|
| |
|
|
|
Depreciation expense was $21.7 million, $26.9 million and $33.5 million in 2005, 2004 and 2003, respectively. In 2005, we disposed of $17.3 million of fully depreciated property and equipment and we entered into several capital leases totaling $1.5 million, the obligations of which are reflected in current and noncurrent liabilities on our September 30, 2005 consolidated balance sheet. We also recorded property and equipment of $1.4 million as a result of our three acquisitions completed during the year.
D. Acquisitions
Arbortext
On July 19, 2005, we completed the acquisition of all of the outstanding capital stock of Arbortext, Inc., a provider of enterprise publishing software. We believe that the Arbortext acquisition will enhance our product development system by adding documentation capabilities. The aggregate purchase price for the acquisition was approximately $194.8 million in cash, including $3.1 million of acquisition-related transaction costs. Included in the aggregate purchase price is the consideration paid to cancel and terminate all Arbortext unvested and unexercised stock options. No PTC common stock or stock options were issued in the acquisition. Acquisition-related transaction costs include our estimate of investment banking, legal and accounting fees and other external costs directly related to the acquisition. Results of operations for Arbortext have been included in the accompanying consolidated statement of operations beginning July 20, 2005.
There are no contingent payments, options, or commitments specified in the acquisition agreement. Any retention bonuses due to key employees of Arbortext are not material and are being expensed over the relevant service period.
F-15
PARAMETRIC TECHNOLOGY CORPORATION
NOTES TO CONSOLIDATED FINANCIAL STATEMENTS—(Continued)
The acquisition of Arbortext has been accounted for as a business combination. Assets acquired and liabilities assumed were recorded at their fair values as of July 19, 2005. The fair values of intangible assets were based on valuations using an income approach, with estimates and assumptions provided by management of Arbortext and PTC. The excess of the purchase price over the tangible assets, identifiable intangible assets and assumed liabilities was recorded as goodwill. The purchase price allocation is final except for the impact, if any, of a potential legal proceeding surrounding a royalty obligation. Based upon the valuations, the total purchase price was allocated as follows:
| | | | |
| | | (in millions)
| |
Goodwill | | $ | 150.1 | |
Identifiable intangible assets | | | 46.6 | |
Cash and cash equivalents | | | 2.3 | |
Accounts receivable | | | 9.8 | |
Property and equipment | | | 1.3 | |
Accounts payable and accrued expenses | | | (5.4 | ) |
Deferred revenue, net of fair value adjustment | | | (7.6 | ) |
Restructuring reserves | | | (3.0 | ) |
Net deferred tax liabilities | | | (18.2 | ) |
Reduction in valuation allowance for deferred tax assets of PTC | | | 18.2 | |
In-process research and development | | | 0.7 | |
| | |
|
|
|
Total purchase price allocation | | $ | 194.8 | |
| | |
|
|
|
Identifiable intangible assets acquired consist of developed technology, core technology, tradenames, customer contracts, software support agreements and related relationships and consulting contracts. Developed technology (products that have reached technological feasibility) includes products in most of Arbortext’s product lines. Core technology represents a combination of Arbortext’s processes, inventions and trade secrets related to the design and development of its applications products. Developed and core technologies total $10.5 million and are being amortized over 3 to 5 years (weighted average life of 4.7 years). Customer relationship intangibles represent the underlying relationships and agreements with Arbortext’s customers. Customer relationship intangibles total $35.3 million and are being amortized over 10 years. Tradenames totaled $0.8 million and are being amortized over 5 years.
Purchased in-process research and development of $0.7 million was written-off in the fourth quarter of 2005 and relates to two projects under development, for which technological feasibility had not yet been established at the acquisition date and for which there was no alternative future use. The value of the purchased in-process research and development was determined using the residual income approach, which discounts expected future cash flows from projects under development to their net present value. These development projects are expected to be completed by the third quarter of 2006, and the expected cost to complete was approximately $2 million at the acquisition date.
Net tangible assets consist of the fair values of tangible assets less the fair values of assumed liabilities and obligations. Except for deferred revenues and restructuring reserves, net tangible assets were valued at the respective carrying amounts recorded by Arbortext, as we believed that their carrying values approximated their fair values at the acquisition date. Deferred revenues reflect an amount equivalent to the estimated cost plus an appropriate profit margin to perform the services related to Arbortext’s software support contracts. Restructuring reserves include the severance costs related to Arbortext employees, planned closure of certain Arbortext facilities and other costs associated with exiting activities of Arbortext. Although we have not completed our integration of Arbortext, we currently estimate that total restructuring costs associated with exiting activities of Arbortext will be approximately $3.0 million.
F-16
PARAMETRIC TECHNOLOGY CORPORATION
NOTES TO CONSOLIDATED FINANCIAL STATEMENTS—(Continued)
This transaction resulted in $150.1 million of purchase price that exceeded the estimated fair values of tangible and intangible assets and liabilities, which was allocated to goodwill. We believe that the high amount of goodwill relative to identifiable intangible assets was the result of several factors including: (1) the potential to sell Arbortext’s XML-based authoring and publishing products into our traditional manufacturing customer base; (2) the potential to sell our product development system, primarily our collaboration and control products, into Arbortext’s traditional customer base, including customers in markets such as life sciences, financial services, government and publishing; (3) our intention to combine our products to provide software products that enable customers to create, manage and dynamically publish information concurrently with the development of their related products or services; (4) our intention to leverage our larger direct and indirect sales force and our intellectual property to attract new contracts and revenue; and (5) our intention to leverage our established presence in international regions and markets, specifically the Asia/Pacific region, in which Arbortext did not have a significant presence.
None of the goodwill or intangible assets acquired in the acquisition is deductible for income tax purposes. As a result, and in accordance with SFAS No. 109, Income Taxes, we recorded in the purchase accounting a deferred tax liability of $18.2 million, equal to the tax effect of the amount of the acquired intangible assets other than goodwill. As a result of recording that deferred tax liability, we also reduced our valuation allowance recorded against our U.S. pre-acquisition net deferred tax assets by a corresponding amount. In addition, in the acquisition, we acquired approximately $17.7 million of net deferred tax assets of Arbortext, which consisted primarily of net operating loss carryforwards. However, we recorded such assets with a full valuation allowance due to the significant uncertainty about whether those deferred tax assets will be realized. If and when such acquired deferred tax assets are realized, we will adjust the purchase price allocation by reducing the amount of goodwill recorded.
Pro Forma Financial Information (unaudited)
The unaudited financial information in the table below summarizes the combined results of operations of PTC and Arbortext, on a pro forma basis, as though the companies had been combined as of the beginning of fiscal 2004. The pro forma financial information is presented for informational purposes only and is not indicative of the results of operations that would have been achieved if the acquisition had taken place at the beginning of fiscal 2004. The pro forma financial information includes the amortization charges from acquired intangible assets, adjustments to interest income and the related tax effects.
| | | | | | |
| | | Year ended
September 30,
|
| | | 2005
| | 2004
|
| | | (in millions, except
per share amounts) |
Revenue | | $ | 754.5 | | $ | 692.6 |
Net income | | | 72.1 | | | 22.9 |
Earnings per share—Basic | | $ | 0.27 | | $ | 0.09 |
Earnings per share—Diluted | | $ | 0.26 | | $ | 0.08 |
Polyplan and Aptavis
During the third quarter of 2005, we acquired Polyplan Technologies Inc., a provider of manufacturing process planning technology, and Aptavis Technologies Corporation, a provider of Windchill-based solutions for the retail, footwear and apparel industry for an aggregate total of $6.8 million in cash. These acquisitions were accounted for as business combinations and resulted in $5.6 million of goodwill and $3.3 million in other acquired intangible assets, primarily comprised of purchased software, which is being amortized over 3 years. Values assigned to intangible assets are not deductible for tax purposes. Our results of operations prior to the acquisition, if presented on a pro forma basis, would not differ materially from our reported results.
F-17
PARAMETRIC TECHNOLOGY CORPORATION
NOTES TO CONSOLIDATED FINANCIAL STATEMENTS—(Continued)
OHIO Design
In the third quarter of 2004, we acquired OHIO Design Automation, Inc. (OHIO-DA), a provider of electronics design collaboration software, for $9.8 million in cash. The purchase price was allocated to assets acquired and liabilities assumed based on our estimates of fair value. The values assigned included intangible assets of $1.8 million for customer lists and $1.6 million for purchased software, which are being amortized over estimated useful lives of 5 years and 3 years, respectively. The excess purchase price over the amounts allocated to assets acquired and liabilities assumed of $7.0 million was recorded as goodwill. Results of operations of OHIO-DA have been included in our consolidated financial statements since the acquisition date. Values assigned to intangible assets are not deductible for tax purposes. Our results of operations prior to the acquisition, if presented on a pro forma basis, would not differ materially from our reported results.
E. Goodwill and Acquired Intangible Assets
We have two reportable segments: (1) software products and (2) services. As of September 30, 2005 and 2004, goodwill and acquired intangible assets in the aggregate attributable to our software products reportable segment was $242.6 million and $56.5 million, respectively, and attributable to our services reportable segment was $16.2 million and $0 million, respectively. Goodwill and other intangible assets are tested for impairment at least annually, or on an interim basis if an event occurs or circumstances change that would, more likely than not, reduce the fair value of the reporting segment below its carrying value. We completed our annual impairment review as of July 2, 2005 and concluded that no impairment charge was required as of that date. There have not been any events or changes in circumstances that indicate that the carrying values of goodwill or acquired intangible assets may not be recoverable.
Goodwill and acquired intangible assets consisted of the following:
| | | | | | | | | | | | | | | | | | |
| | | September 30, 2005
| | September 30, 2004
|
| | | Gross
Carrying
Amount
| | Accumulated
Amortization
| | Net Book
Value
| | Gross
Carrying
Amount
| | Accumulated
Amortization
| | Net Book
Value
|
| | | (in thousands) |
Goodwill and intangible assets with indefinite lives (not amortized): | | | | | | | | | | | | | | | | | | |
Goodwill | | $ | 304,760 | | $ | 104,132 | | $ | 200,628 | | $ | 150,223 | | $ | 105,002 | | $ | 45,221 |
Trademarks | | | 10,155 | | | 6,033 | | | 4,122 | | | 10,232 | | | 6,078 | | | 4,154 |
| | |
|
| |
|
| |
|
| |
|
| |
|
| |
|
|
| | | | 314,915 | | | 110,165 | | | 204,750 | | | 160,455 | | | 111,080 | | | 49,375 |
Intangible assets with finite lives (amortized): | | | | | | | | | | | | | | | | | | |
Purchased software | | | 45,150 | | | 30,135 | | | 15,015 | | | 30,385 | | | 29,060 | | | 1,325 |
Capitalized software | | | 22,877 | | | 20,556 | | | 2,321 | | | 22,877 | | | 18,654 | | | 4,223 |
Customer lists and relationships | | | 45,981 | | | 10,045 | | | 35,936 | | | 10,665 | | | 9,045 | | | 1,620 |
Trademarks and tradenames | | | 850 | | | 34 | | | 816 | | | — | | | — | | | — |
Other | | | 316 | | | 316 | | | — | | | 316 | | | 316 | | | — |
| | |
|
| |
|
| |
|
| |
|
| |
|
| |
|
|
| | | | 115,174 | | | 61,086 | | | 54,088 | | | 64,243 | | | 57,075 | | | 7,168 |
| | |
|
| |
|
| |
|
| |
|
| |
|
| |
|
|
Total goodwill and acquired intangible assets | | $ | 430,089 | | $ | 171,251 | | $ | 258,838 | | $ | 224,698 | | $ | 168,155 | | $ | 56,543 |
| | |
|
| |
|
| |
|
| |
|
| |
|
| |
|
|
The changes in the carrying amounts of goodwill and intangible assets with indefinite lives at September 30, 2005 from September 30, 2004 are due to the impact of acquisitions completed in the third and fourth quarters of 2005 (described in Note D) and foreign currency translation adjustments related to those asset balances that are recorded in non-U.S. currencies.
F-18
PARAMETRIC TECHNOLOGY CORPORATION
NOTES TO CONSOLIDATED FINANCIAL STATEMENTS—(Continued)
Movements in goodwill, presented by reportable segment, were as follows:
| | | | | | | | | | | |
| | | Software
Products Segment
| | | Services Segment
| | Total
| |
| | | (in thousands) | |
Balance, October 1, 2003 | | $ | 140,310 | | | $ | — | | $ | 140,310 | |
Acquisition of OHIO–DA | | | 7,037 | | | | — | | | 7,037 | |
Foreign currency translation adjustments | | | 2,876 | | | | — | | | 2,876 | |
| | |
|
|
| |
|
| |
|
|
|
Balance, September 30, 2004 | | | 150,223 | | | | — | | | 150,223 | |
Acquisition of Aptavis | | | 1,553 | | | | — | | | 1,553 | |
Acquisition of Polyplan | | | 4,026 | | | | — | | | 4,026 | |
Acquisition of Arbortext | | | 137,996 | | | | 12,080 | | | 150,076 | |
Foreign currency translation adjustments | | | (1,118 | ) | | | — | | | (1,118 | ) |
| | |
|
|
| |
|
| |
|
|
|
Balance, September 30, 2005 | | $ | 292,680 | | | $ | 12,080 | | $ | 304,760 | |
| | |
|
|
| |
|
| |
|
|
|
The aggregate amortization expense for intangible assets with finite lives recorded for the years ended September 30, 2005, 2004 and 2003 was reflected in our consolidated statements of operations as follows:
| | | | | | | | | |
| | | Year ended September 30,
|
| | | 2005
| | 2004
| | 2003
|
| | | (in thousands) |
Amortization of acquired intangible assets | | $ | 1,638 | | $ | 5,195 | | $ | 5,861 |
Cost of license revenue | | | 2,547 | | | 3,018 | | | 3,240 |
| | |
|
| |
|
| |
|
|
Total amortization expense | | $ | 4,185 | | $ | 8,213 | | $ | 9,101 |
| | |
|
| |
|
| |
|
|
The estimated aggregate future amortization expense for intangible assets with finite lives remaining as of September 30, 2005 is $9.4 million for 2006, $8.6 million for 2007, $7.5 million for 2008, $6.4 million for 2009, $5.2 million for 2010 and $17.0 million thereafter.
F. Income Taxes
Our income (loss) before taxes consisted of the following:
| | | | | | | | | | | | |
| | | Year ended September 30,
| |
| | | 2005
| | | 2004
| | | 2003
| |
| | | (in thousands) | |
Domestic | | $ | (5,118 | ) | | $ | (4,697 | ) | | $ | (92,349 | ) |
Foreign | | | 96,430 | | | | 41,736 | | | | 9,920 | |
| | |
|
|
| |
|
|
| |
|
|
|
Total | | $ | 91,312 | | | $ | 37,039 | | | $ | (82,429 | ) |
| | |
|
|
| |
|
|
| |
|
|
|
F-19
PARAMETRIC TECHNOLOGY CORPORATION
NOTES TO CONSOLIDATED FINANCIAL STATEMENTS—(Continued)
Our provision for (benefit from) income taxes consisted of the following:
| | | | | | | | | | | |
| | | Year ended September 30,
|
| | | 2005
| | | 2004
| | | 2003
|
| | | (in thousands) |
Current: | | | | | | | | | | | |
Federal | | $ | 3,043 | | | $ | (19,150 | ) | | $ | — |
State | | | 750 | | | | 301 | | | | 500 |
Foreign | | | 9,916 | | | | 20,676 | | | | 15,309 |
| | |
|
|
| |
|
|
| |
|
|
| | | | 13,709 | | | | 1,827 | | | | 15,809 |
| | |
|
|
| |
|
|
| |
|
|
Deferred: | | | | | | | | | | | |
Federal | | | — | | | | — | | | | — |
State | | | — | | | | — | | | | — |
Foreign | | | (5,989 | ) | | | 399 | | | | 42 |
| | |
|
|
| |
|
|
| |
|
|
| | | | (5,989 | ) | | | 399 | | | | 42 |
| | |
|
|
| |
|
|
| |
|
|
Total provision for income taxes | | $ | 7,720 | | | $ | 2,226 | | | $ | 15,851 |
| | |
|
|
| |
|
|
| |
|
|
The reconciliation between the statutory federal income tax rate and our effective income tax rate is shown below:
| | | | | | | | | |
| | | Year ended September 30,
| |
| | | 2005
| | | 2004
| | | 2003
| |
Statutory federal income tax provision (benefit) | | 35 | % | | 35 | % | | (35 | )% |
State income taxes, net of federal tax benefit | | 1 | | | 1 | | | 1 | |
Foreign dividends | | 18 | | | — | | | — | |
Change in valuation allowance | | (27 | ) | | 28 | | | 42 | |
Tax audit and examination settlements | | (13 | ) | | (69 | ) | | — | |
Foreign rate differences | | (7 | ) | | 12 | | | 7 | |
Other, net | | 1 | | | (1 | ) | | 4 | |
| | |
|
| |
|
| |
|
|
Effective income tax rate | | 8 | % | | 6 | % | | 19 | % |
| | |
|
| |
|
| |
|
|
In 2005, we recorded tax benefits of $12.1 million arising from the reduction of our tax liabilities upon the favorable resolution of tax audits in a foreign jurisdiction. In 2004, we received notification from the Internal Revenue Service (IRS) that we would receive a tax refund related to income tax returns for the years 1998 through 2000 totaling $39.5 million, which resulted in a nonrecurring tax benefit of $18.9 million in 2004. We received net refunds of approximately $23.9 million in 2005 and $53.3 million in 2003 and we made net income tax payments of approximately $5.7 million in 2004.
F-20
PARAMETRIC TECHNOLOGY CORPORATION
NOTES TO CONSOLIDATED FINANCIAL STATEMENTS—(Continued)
The significant temporary differences that created deferred tax assets and liabilities are shown below:
| | | | | | | | |
| | | September 30,
| |
| | | 2005
| | | 2004
| |
| | | (in thousands) | |
Deferred tax assets: | | | | | | | | |
Net operating loss carryforwards | | $ | 116,956 | | | $ | 108,345 | |
Restructuring reserves not currently deductible | | | 11,864 | | | | 15,943 | |
Other reserves not currently deductible | | | 21,611 | | | | 5,886 | |
Minimum pension liability | | | 20,262 | | | | 13,570 | |
Foreign tax credits | | | 7,605 | | | | 7,605 | |
Amortization of intangible assets | | | 6,538 | | | | 9,810 | |
Depreciation | | | — | | | | 2,489 | |
Other | | | 3,230 | | | | 741 | |
| | |
|
|
| |
|
|
|
Gross deferred tax assets | | | 188,066 | | | | 164,389 | |
Valuation allowance | | | (152,564 | ) | | | (142,000 | ) |
| | |
|
|
| |
|
|
|
Total deferred tax assets | | | 35,502 | | | | 22,389 | |
| | |
|
|
| |
|
|
|
Deferred tax liabilities: | | | | | | | | |
Acquired intangible assets not deductible | | | (19,795 | ) | | | (1,511 | ) |
Investment in foreign subsidiaries | | | — | | | | (7,776 | ) |
Pension | | | (8,927 | ) | | | (9,939 | ) |
Other | | | (2,636 | ) | | | (4,246 | ) |
| | |
|
|
| |
|
|
|
Total deferred tax liabilities | | | (31,358 | ) | | | (23,472 | ) |
| | |
|
|
| |
|
|
|
Net deferred tax assets (liabilities) | | $ | 4,144 | | | $ | (1,083 | ) |
| | |
|
|
| |
|
|
|
As a result of operating losses incurred in recent years and uncertainty as to the extent and timing of profitability in future periods, we concluded in 2002 that it was more likely than not that the net deferred tax assets would not be realized and, accordingly, we increased our deferred tax valuation allowance for our remaining net deferred tax assets at that time. Although we realized consolidated net income before tax in 2005 and 2004 of $91.3 million and $37.0 million, respectively, we have maintained a full deferred tax valuation allowance against deferred tax assets in the United States as a result of continuing operating losses in the U.S., which is the source of the majority of our net deferred tax assets. While we have realized consolidated operating profits over the last several quarters, we have not yet concluded that realization of all of our deferred tax assets in the future is more likely than not. In the fourth quarter of 2005, our U.S. legal entities incurred a taxable loss, due principally to the tax expense associated with the grant and vesting of restricted stock units and the stock option exchange.
Significant management judgment is required to determine when the realization of our deferred tax assets in the future is considered more likely than not. If and when we conclude that realization is more likely than not, we will record a reduction to our valuation allowance that will result in an increase to net income and adjustments to goodwill, accumulated other comprehensive loss, and additional paid-in-capital in the period such determination is made. Based on the amount of the valuation allowance as of September 30, 2005, if we were to decide that a reversal of the entire valuation allowance was appropriate, the following would be recorded: (1) a $10.4 million income tax benefit and a $9.0 million credit to accumulated other comprehensive loss in stockholders’ equity related primarily to our minimum pension liability; (2) an $11.9 million increase to additional paid-in capital related to deductions taken in our tax returns for stock-based awards to employees; (3) a $17.7 million reduction of goodwill related to deferred tax assets (primarily net operating loss carryforwards) recorded with a full valuation allowance in our acquisition of Arbortext; and (4) a $103.6 million income tax benefit. In addition, an income tax benefit of $19.0 million would be recorded with an increase to goodwill, related to the deferred tax liabilities we recorded in our acquisitions due to the fact that the acquired intangible assets (other than goodwill) were not deductible for tax purposes.
F-21
PARAMETRIC TECHNOLOGY CORPORATION
NOTES TO CONSOLIDATED FINANCIAL STATEMENTS—(Continued)
Net deferred tax assets (liabilities) increased by $5.2 million to $4.1 million at September 30, 2005 from September 30, 2004, resulting in a deferred tax benefit of $6.0 million included in the consolidated statement of operations partially offset by a deferred tax liability of $0.8 million recorded in purchase accounting for acquired intangible assets not deductible for tax purposes in a profitable foreign jurisdiction. Net deferred tax liabilities include $19.8 million as of September 30, 2005 for the tax effects of having acquired intangible assets that are not deductible for tax purposes, primarily from our acquisition of Arbortext. Due to PTC and Arbortext having net operating loss carryforwards available and full valuation allowances recorded against their net deferred tax asset positions, the net deferred tax liability recorded in purchase accounting was fully offset with a decrease in the valuation allowance.
Our valuation allowance was $152.6 million as of September 30, 2005, $142.0 million as of September 30, 2004, $131.5 million as of September 30, 2003 and $96.3 million as of September 30, 2002. In 2005, the valuation allowance was increased by $10.6 million. Increases to the valuation allowance were primarily due to:
| | • | | the recording of deferred tax assets, primarily net operating loss (NOL) carryforwards and an offsetting valuation allowance of $17.7 million in the purchase accounting for Arbortext; |
| | • | | the recording of net operating loss carryforwards and an offsetting valuation allowance of a foreign jurisdiction of $15.7 million not previously recorded; |
| | • | | a net increase in U.S. net operating loss carryforwards and offsetting valuation allowances of $3.3 million; |
| | • | | a net increase in deferred tax assets, primarily for net operating losses, of $4.8 million for foreign jurisdictions with a full valuation allowance; and |
| | • | | a net increase in deferred tax assets and offsetting valuation allowance of $7.2 million related to the minimum pension liability included in accumulated other comprehensive loss. |
These increases were partially offset by decreases to the valuation allowance primarily due to:
| | • | | the repatriation of $48.1 million of earnings ($18.8 million tax-effected) from our foreign subsidiaries in the form of dividends; |
| | • | | the establishment of deferred tax liabilities of $19.8 million for acquired intangible assets not deductible for tax purposes, which were reduced to $18.2 million as of September 30, 2005; and |
| | • | | the reversal of $4.1 million of valuation allowances in certain foreign jurisdictions due to consistent profitability, which was recorded as an income tax benefit in our statement of operations. |
In 2004, the valuation allowance was increased by $10.5 million primarily to reserve for additional Computervision NOL carryforwards recorded as a result of the conclusion of the IRS examination of our income tax returns for 1998 through 2000 discussed below. In 2003, the valuation allowance was increased by $34.7 million to reserve for deferred tax assets primarily related to net operating loss carryforwards.
We adopted SFAS No. 123(R) on July 3, 2005, effective with the beginning of our fourth quarter. We incurred approximately $15.2 million of expense related to stock-based compensation in the fourth quarter of 2005 including expense for past stock option grants, employee stock option exchange payments in excess of fair market value and equity awards granted in the fourth quarter of 2005 described further in Note J, Stock Plans. Accounting for the tax effects of stock-based awards requires that we establish a
deferred tax asset as the book compensation is recognized. Upon the settlement of the stock-based awards (i.e., exercise, vest, forfeiture or cancellation), the actual tax deduction is compared with the cumulative book compensation cost and any excess tax deduction is considered a “windfall tax benefit and is tracked in a “windfall tax benefit pool” to offset any future tax deduction shortfalls. At the date of adoption of SFAS No. 123(R) we were required to calculate our cumulative “windfall tax benefit pool” as if we had been following the recognition provisions of SFAS No. 123 since that standard went into effect. Taking into account the stock option exchange and forfeiture of stock options by executive officers our “windfall tax benefit pool” was not material as of September 30, 2005.
F-22
PARAMETRIC TECHNOLOGY CORPORATION
NOTES TO CONSOLIDATED FINANCIAL STATEMENTS—(Continued)
At September 30, 2005 and 2004, accrued income taxes of $29.7 million and $39.4 million, respectively, primarily represented income taxes payable and related income tax accruals. At September 30, 2004, income taxes receivable of $39.5 million represented expected refunds of U.S. federal income taxes and related interest. In the normal course of business, PTC and its subsidiaries are examined by various taxing authorities, including the IRS in the United States. In 2005, we recorded tax benefits of $12.1 million due to favorable resolutions of tax audits in a foreign jurisdiction. In 2004, the IRS concluded its examination of our income tax returns for years 1998 through 2000, and notification of a $39.5 million refund amount was received in the fourth quarter of 2004. The refund resulted in a nonrecurring tax benefit of $18.9 million in 2004 and the recording of $6.5 million of additional tax-effected NOLs available for carryforward, which were offset by an increase in our deferred tax valuation allowance. The $39.5 million refund was received in the first quarter of 2005. During 2005, the IRS commenced its examination of our income tax returns for the years 2001 and 2002.
For U.S. tax return purposes, NOLs and tax credits are generally available to be carried forward to future years subject to certain limitations. At September 30, 2005, we had U.S. federal NOL carryforwards of $40.3 million, which expire in 2023 and 2024, available to offset taxable income in future years. In addition, we have U.S. federal NOL carryforwards of $34.8 million resulting from our 2005 acquisition of Arbortext, which expire beginning in 2007 through 2024, and U.S. federal NOL carryforwards of $169.7 million resulting from our January 1998 acquisition of Computervision, which expire beginning in 2008 through 2018. The utilization of the Arbortext and Computervision NOLs is limited as a result of the change in ownership rules under Internal Revenue Code Section 382. We also have loss carryforwards in non-U.S. jurisdictions totaling $82 million, the majority of which do not expire. There are limitations imposed on the utilization of such NOLs that could further restrict the recognition of any tax benefits.
The American Jobs Creation Act
In October 2004, the American Jobs Creation Act of 2004 (AJCA) became law. The AJCA contains several provisions that apply to us. The AJCA creates a temporary incentive for U.S. multinational corporations to repatriate accumulated income abroad by providing an 85% dividends received deduction for certain dividends from controlled foreign corporations. Due to the availability of net operating loss (NOL) carryforwards in the U.S., we have not and do not intend to avail ourselves of the provisions of the AJCA for any repatriations of accumulated income. While it has been our historical practice to permanently reinvest all foreign earnings into our foreign operations, in 2005 we repatriated approximately $48 million from our foreign subsidiaries. Repatriation of these earnings did not result in any significant incremental charge to our income tax provision as a result of utilizing U.S. NOL carryforwards for which we had previously maintained a full valuation allowance. If we decide to repatriate any additional foreign earnings, we may be required to establish a deferred tax liability on such earnings through a charge to our income tax provision. The cumulative amount of undistributed earnings of our subsidiaries for which U.S. income taxes have not been provided totaled approximately $73.5 million and $73.4 million as of September 30, 2005 and 2004, respectively.
The AJCA also provides U.S. corporations with an income tax deduction equal to a stipulated percentage of qualified income from domestic production activities (“qualified activities”). The deduction, which cannot exceed 50% of annual wages paid, is phased in as follows: 3% of qualified activities in 2006 and 2007; 6% in 2008 through 2010; and 9% in 2011 and thereafter. We believe that we qualify for the deduction. The tax benefit of the deduction would generally be accounted for in the periods in which the qualifying activities occur, generally the years in which the deductions are taken in the tax returns. This benefit would be included in our annual effective tax rate, but would not result in a remeasurement of deferred income taxes. The AJCA may have an impact on our tax rate for future years. However, we have maintained a full deferred tax valuation allowance on U.S. deferred taxes and, as a result, we do not expect the AJCA to materially affect our financial position or results of operations.
F-23
PARAMETRIC TECHNOLOGY CORPORATION
NOTES TO CONSOLIDATED FINANCIAL STATEMENTS—(Continued)
G. Commitments and Contingencies
Leasing Arrangements
We lease office facilities and certain equipment under operating leases expiring at various dates through 2014. Certain leases require us to pay for taxes, insurance, maintenance and other operating expenses in addition to rent. Lease expense, net of sublease income, was $30.1 million, $32.9 million and $39.5 million in 2005, 2004 and 2003, respectively. At September 30, 2005, our future minimum lease payments (net of sublease income) under noncancellable operating leases are as follows:
| | | |
Year ending September 30,
| | (in thousands)
|
2006 | | $ | 36,245 |
2007 | | | 30,592 |
2008 | | | 25,187 |
2009 | | | 23,257 |
2010 | | | 17,620 |
Thereafter | | | 25,731 |
| | |
|
|
Total minimum lease payments | | $ | 158,632 |
| | |
|
|
Future minimum lease payments under capital leases are approximately $0.4 million per year through 2008, and $0.2 million in 2009.
As a result of restructuring and cost saving initiatives in current and prior years, certain leased facilities are excess. As of September 30, 2005, we had $29.7 million reserved for facility obligations in excess of sublease income. Our total future rental income under current sublease arrangements for excess facilities is $24.7 million ($5.2 million in 2006, $5.3 million in 2007, $5.3 million in 2008, $5.4 million in 2009, $1.8 million in 2010 and $1.7 million thereafter). The future minimum lease payments above include minimum future lease payments for excess facilities, net of sublease income under existing sublease arrangements.
As of September 30, 2005 and 2004, we had letters of credit and bank guarantees outstanding of approximately $6.3 million, of which $1.4 million was collateralized, and $6.4 million, of which $0.4 million was collateralized, respectively, primarily related to our corporate headquarters lease in Needham, Massachusetts.
Legal Proceedings
On May 30, 2003, a lawsuit was filed against us in the U.S. District Court for the District of Massachusetts by Rand A Technology Corporation and Rand Technologies Limited (together, “Rand”). Rand historically had been our largest distributor. The complaint alleges various breaches of a revised one-year distribution agreement entered into in December 2002, as well as other agreements between Rand and us, and also asserts certain non-contract claims. The complaint, as amended, seeks equitable relief and substantial damages. On November 24, 2003, we filed our substantive response to Rand’s complaint and asserted counterclaims against Rand. During the second quarter of 2005, Rand quantified its claimed actual damages as being in excess of $50 million and Rand asserts that this amount should be trebled by the court. As a result of several recent rulings by the court, some of Rand’s claims have been dismissed while others will proceed to trial and Rand’s possible maximum recovery under the lawsuit may have been reduced. In addition, the court has excluded the testimony of the damages expert hired by Rand to substantiate Rand’s damages quantification. The court has also issued a ruling granting PTC summary judgment on one of PTC’s counterclaims against Rand. Despite these rulings, several of Rand’s claims, as well as certain of our counterclaims, remain to be tried before a jury. We believe Rand’s claims and its damages assessment associated with those claims are without merit and will continue to contest them vigorously. We also intend diligently to prosecute our counterclaims. We cannot predict the ultimate resolution of this action at this time, and we cannot assure you that this action, if determined adversely to us, will not have a material adverse impact on our financial condition or results of operations. No liability has been accrued as of September 30, 2005 related to this matter.
F-24
PARAMETRIC TECHNOLOGY CORPORATION
NOTES TO CONSOLIDATED FINANCIAL STATEMENTS—(Continued)
We also are subject to various legal proceedings and claims that arise in the ordinary course of business. We currently believe that resolving these other matters will not have a material adverse impact on our financial condition or results of operations.
Guarantees and Indemnification Obligations
We enter into standard indemnification agreements in our ordinary course of business. Pursuant to these agreements, we indemnify, hold harmless, and agree to reimburse the indemnified party for losses suffered or incurred by the indemnified party, generally our business partners or customers, in connection with patent, copyright or other intellectual property infringement claims by any third party with respect to our current products, as well as claims relating to property damage or personal injury resulting from the performance of services by us or our subcontractors. The maximum potential amount of future payments we could be required to make under these indemnification agreements is unlimited. Historically, our costs to defend lawsuits or settle claims relating to such indemnity agreements have been minimal and we accordingly believe the estimated fair value of these agreements is immaterial.
We warrant that our software products will perform in all material respects in accordance with our standard published specifications in effect at the time of delivery of the licensed products for a specified period of time (generally 90 to 180 days). Additionally, we generally warrant that our consulting services will be performed consistent with generally accepted industry standards. In most cases, liability for these warranties is capped. If necessary, we would provide for the estimated cost of product and service warranties based on specific warranty claims and claim history; however, we have never incurred significant cost under our product or services warranties. As a result, we believe the estimated fair value of these agreements is immaterial.
H. Stockholders’ Equity
Preferred Stock
We may issue up to 5.0 million shares of our preferred stock in one or more series. Our Board of Directors is authorized to fix the rights and terms for any series of preferred stock without additional shareholder approval. In November 2000, our Board of Directors authorized and designated 500,000 shares of preferred stock as Series A Junior Participating Preferred Stock for issuance pursuant to our Shareholder Rights Plan discussed below in Note I. As of September 30, 2005 and 2004, there were no outstanding shares of preferred stock.
Common Stock
Our Articles of Organization authorize us to issue up to 500 million shares of our common stock. Our Board of Directors has authorized us to repurchase up to 40.0 million shares. Through September 30, 2005, we had repurchased 31.2 million shares at a cost of $366.8 million. The repurchased shares were available to be used for stock option exercises, employee stock purchase plans and potential acquisitions. All shares of our common stock repurchased are automatically restored to the status of authorized and unissued.
I. Shareholder Rights Plan
In November 2000, our Board of Directors adopted a Shareholder Rights Plan and declared a dividend distribution of one share purchase right (a “Right”) for each outstanding share of our common stock to stockholders of record at the close of business on January 5, 2001. Each share of common stock newly issued after that date also carries with it one Right. Each Right entitles the record holder to purchase from us one one-thousandth of a share of our Series A Junior Participating Preferred Stock at an exercise
F-25
PARAMETRIC TECHNOLOGY CORPORATION
NOTES TO CONSOLIDATED FINANCIAL STATEMENTS—(Continued)
price of $60.00 per unit, subject to adjustment. The Rights become exercisable ten (10) days after the earlier of our announcement that a person has acquired 15% or more of our outstanding common stock or an announcement of a tender offer which would result in a person or group acquiring 15% or more of our common stock; in either case, the Board of Directors can extend the 10 day period. If we have not redeemed or exchanged the Rights and a person becomes the beneficial owner of 15% or more of our common stock (a “Triggering Event”), each holder of a Right will have the right to purchase shares of our common stock having a value equal to two times the exercise price of the Right. If, at any time following the Triggering Event, we are acquired in a merger or other business combination transaction in which we are not the surviving corporation or more than 50% of our assets or earning power is sold to a person or group, each holder of a Right will have the right to purchase shares of common stock of the acquiring person, group or entity having a value equal to two times the exercise price of the Right. The Rights expire on January 5, 2011, and may be redeemed by us for $.001 per Right.
J. Stock Plans
Employee Stock Purchase Plans
We have an employee stock purchase plan that qualifies as an “employee stock purchase plan” under Section 423 of the Internal Revenue Code. Under the plan, shares of our common stock can be purchased at 85% of the lower of the fair market value of the stock on the first or the last day of each six-month offering period. Employee purchases in any year are limited to the lesser of $25,000 worth of stock, determined by the fair market value of the common stock at the time the offering begins, or 15% of his or her base pay. As of September 30, 2005, 18.0 million shares of common stock were authorized for issuance under the plan and 7.3 million shares were available for issuance under the plan. During fiscal 2005, 2004 and 2003, employees purchased 1.0 million, 2.2 million and 3.7 million shares of common stock under the plan at average prices of $3.86, $3.02 and $1.98, respectively. SFAS No. 123(R) includes revised accounting rules for company-sponsored stock purchase plans. In light of these accounting changes, we indefinitely suspended offerings under the ESPP with the offering that was to have commenced on February 1, 2005.
Equity Incentive Plans
As described in Note A, Stock-Based Compensation, SFAS No. 123(R) was issued in December 2004. SFAS No. 123(R) requires us to measure the cost of employee services received in exchange for an award of equity instruments based on the grant-date fair value of the award using an option pricing model. That cost is recognized over the period during which an employee is required to provide services in exchange for the award. We adopted SFAS No. 123(R) on July 3, 2005, effective with the beginning of our fourth quarter. We incurred approximately $15.2 million of expense related to stock-based compensation in the fourth quarter of 2005, including expense for past stock option grants, equity awards granted in the fourth quarter of 2005 described below, and employee stock option exchange payments in excess of fair market value.
On March 10, 2005, our stockholders approved amendments to our 2000 Equity Incentive Plan that (1) authorized us to exchange and cancel certain outstanding out-of-the-money non-executive employee stock options for either cash or shares of restricted stock (the “Exchange”), (2) authorize the grant of restricted stock units, and (3) enable us to grant a greater number of shares of restricted stock as equity awards. The amendments were designed to reduce the overall number of employee stock options outstanding and reduce potential stockholder dilution. In connection with the amendments to our 2000 Equity Incentive Plan, we agreed not to make any further grants under any plan other than that plan.
Our 2000 Equity Incentive Plan provides for grants of nonqualified and incentive stock options, restricted stock, restricted stock units and stock appreciation rights to our employees, directors, officers and consultants. We historically have granted stock options. For those options, the option exercise price is typically the fair market value at the date of grant, and they generally vest over four years and expire ten years from the date of grant. Going forward, we plan to use restricted stock and restricted stock units as the principal equity incentive awards.
F-26
PARAMETRIC TECHNOLOGY CORPORATION
NOTES TO CONSOLIDATED FINANCIAL STATEMENTS—(Continued)
On July 6, 2005, we filed a Tender Offer Statement on Schedule TO with the Securities and Exchange Commission (the “SEC”) outlining the terms of the Exchange. In the Exchange, we offered eligible employees the opportunity to exchange outstanding stock options with exercise prices equal to or greater than $9 per share granted under our participating incentive plans for a cash payment. The offer period commenced on July 6, 2005 and expired on August 3, 2005. Employees holding approximately 18.3 million eligible stock options elected to participate in the Exchange. Accounting for the Exchange was recorded in our consolidated financial statements in the fourth quarter of 2005. The aggregate amount of the cash payments made to employees in exchange for their eligible options was $12.7 million and was paid in the fourth quarter. Of the total cash payments made in connection with the Exchange, $0.5 million was recorded as compensation expense and $12.2 million was recorded as a charge to additional paid-in capital in stockholders’ equity, in accordance with the provisions of SFAS No. 123(R).
In July and August 2005, we granted equity incentive awards for the 2005 fiscal year, which grants had been delayed from the beginning of the fiscal year pending our adoption of SFAS No. 123(R). We granted to our non-employee directors an aggregate of 210,000 shares of restricted stock, the restrictions on which lapse in three substantially equal installments on each of November 1, 2005, November 1, 2006 and November 1, 2007. We also granted, primarily to our executive officers, an aggregate of 1,618,000 shares of restricted stock, 809,000 of which were performance-based and could be earned in whole or in part upon achievement of 2005 performance criteria. The restrictions on the restricted stock granted to those officers, including the performance-based shares earned, lapse in three substantially equal installments on each of November 1, 2005, November 1, 2006 and November 1, 2007. In November 2005, the Compensation Committee of our Board of Directors determined that 92% of the 2005 performance criteria had been achieved, resulting in the removal of all restrictions with respect to 744,280 shares of restricted stock and the forfeiture of 64,720 shares. In addition, in July and August 2005, we granted an aggregate of 3,390,007 restricted stock units to our employees. Each restricted stock unit represents the right to receive one share of our common stock. The restricted stock units generally vest, and the shares issuable upon such vesting are issued, in three substantially equal installments. The first installment of 1,094,935 shares were vested and issued on September 27, 2005 and therefore were then reflected as outstanding shares of common stock in our consolidated financial statements. For accounting purposes, granted restricted stock units are not reflected as outstanding common stock until vested. The remaining two installments will vest and be issued on each of November 1, 2006 and November 1, 2007. Also, in connection with a consulting agreement we entered into with Michael E. Porter, a non-employee director, we granted to Mr. Porter 100,000 shares of restricted stock, the restrictions on which will lapse in three substantially equal annual installments, beginning on the first anniversary of the date of grant.
As of September 30, 2005, 9.5 million shares were available for grant under our equity incentive plan. As of September 30, 2005, 37.6 million shares were reserved for issuance upon the exercise of stock options and vesting of restricted stock units granted and outstanding, and 1.2 million shares of restricted stock were outstanding, the restrictions on which had not lapsed.
The following table shows restricted share and restricted stock unit activity for the three years ended September 30, 2005:
| | | | | | | | | |
| | | September 30,
| |
| | | 2005
| | | 2004
| | | 2003
| |
| | | (in thousands) | |
Beginning balance of outstanding restricted share and restricted stock units | | 125 | | | 250 | | | 375 | |
Granted | | 5,318 | | | — | | | — | |
Vested | | (1,235 | ) | | (125 | ) | | (125 | ) |
Forfeited or not earned | | (87 | ) | | — | | | — | |
| | |
|
| |
|
| |
|
|
Ending balance of outstanding restricted share and restricted stock units | | 4,121 | | | 125 | | | 250 | |
| | |
|
| |
|
| |
|
|
Shares granted in 2005 were net of 359,057 shares retained by us to cover employee tax withholdings of $2.3 million.
F-27
PARAMETRIC TECHNOLOGY CORPORATION
NOTES TO CONSOLIDATED FINANCIAL STATEMENTS—(Continued)
The following table shows stock option activity for the three years ended September 30, 2005:
| | | | | | | | | | | | | | | | | | |
| | | September 30,
|
| | | 2005
| | 2004
| | 2003
|
| | | Shares
| | | Weighted
Average
Exercise
Price
| | Shares
| | | Weighted
Average
Exercise
Price
| | Shares
| | | Weighted
Average
Exercise
Price
|
| | | (shares in thousands) |
Outstanding: | | | | | | | | | | | | | | | | | | |
Beginning balance | | 66,284 | | | $ | 9.73 | | 68,963 | | | $ | 10.22 | | 74,485 | | | $ | 11.12 |
Granted | | — | | | | — | | 7,560 | | | | 4.40 | | 8,775 | | | | 2.79 |
Cancelled (1) | | (28,930 | ) | | | 15.08 | | (9,192 | ) | | | 9.86 | | (14,138 | ) | | | 10.45 |
Exercised | | (2,015 | ) | | | 3.22 | | (1,047 | ) | | | 2.88 | | (159 | ) | | | 2.40 |
| | |
|
| | | | |
|
| | | | |
|
| | | |
Ending balance | | 35,339 | | | | 5.72 | | 66,284 | | | | 9.73 | | 68,963 | | | | 10.22 |
| | |
|
| | | | |
|
| | | | |
|
| | | |
Exercisable | | 23,878 | | | | 6.56 | | 45,411 | | | | 12.19 | | 43,413 | | | | 13.06 |
| | |
|
| | | | |
|
| | | | |
|
| | | |
| (1) | Options cancelled in 2005 include options for 18.3 million shares cancelled in connection with the Exchange as described above and options for 3.3 million shares forfeited voluntarily by executive officers. |
Certain employees have disposed of stock acquired through the employee stock purchase plan and the exercise of incentive stock options earlier than the mandatory holding period required for certain tax treatment. These dispositions, together with the tax benefits realized from the exercise of nonqualified stock options, create tax benefits that, when realized, will be recorded as increases to additional paid-in capital. In 2005, a tax benefit of $0.8 million was recorded related to stock-based tax deductions expected to be realized in certain profitable foreign subsidiaries. In 2005, 2004 and 2003, no tax benefit was not recorded due to the uncertainty of its realization.
For various price ranges, information for options outstanding and exercisable at September 30, 2005 was as follows:
| | | | | | | | | | | | |
| | | Outstanding Options
| | Exercisable Options
|
| | | Shares (in thousands)
| | Weighted
Average
Remaining
Life (years)
| | Weighted
Average
Exercise
Price
| | Shares (in thousands)
| | Weighted
Average
Exercise Price
|
$0.10-$3.21 | | 6,359 | | 7.05 | | $ | 2.49 | | 3,741 | | $ | 2.54 |
$3.25-$3.62 | | 7,046 | | 7.16 | | $ | 3.45 | | 4,005 | | $ | 3.41 |
$3.79-$4.59 | | 6,244 | | 8.19 | | $ | 4.27 | | 2,150 | | $ | 4.14 |
$4.85-$5.27 | | 5,914 | | 6.62 | | $ | 5.03 | | 4,867 | | $ | 5.03 |
$5.44-$9.94 | | 6,464 | | 4.98 | | $ | 8.60 | | 5,803 | | $ | 8.65 |
$9.96-$55.95 | | 3,312 | | 3.73 | | $ | 15.06 | | 3,312 | | $ | 15.06 |
| | |
| | | | | | |
| | | |
$0.10-$55.95 | | 35,339 | | 6.51 | | $ | 5.72 | | 23,878 | | $ | 6.56 |
| | |
| | | | | | |
| | | |
K. Employee Benefit Plan
We offer a savings plan to eligible U.S. employees. The plan is intended to qualify under Section 401(k) of the Internal Revenue Code. Participating employees may defer up to 15% of their pre-tax compensation, as defined, but not more than statutory limits. Prior to January 1, 2004, we contributed 50% of the amount contributed by the employee, up to a maximum of 10% of the employee’s earnings. Effective January 1, 2004, the employer match was reduced to 6% of the employee’s earnings. Our matching contributions vest at a rate of 25% per year of service. We made matching contributions of $2.8 million, $3.1 million and $5.2 million in 2005, 2004 and 2003, respectively.
F-28
PARAMETRIC TECHNOLOGY CORPORATION
NOTES TO CONSOLIDATED FINANCIAL STATEMENTS—(Continued)
L. Pension Plans
We maintain defined benefit pension plans covering certain employees of Computervision, which we acquired in 1998. Benefits are based upon length of service and average compensation and generally vest after five years of service. The prepaid (accrued) pension cost was actuarially computed using assumptions applicable to each subsidiary plan and economic environment. We adjust our minimum pension liability related to our plans due to changes in actuarial assumptions and performance of plan investments, as shown below.
U.S. Pension Plan
Effective April 1, 1990, the benefits under the U.S. pension plan were frozen indefinitely. We contribute all amounts deemed necessary on an actuarial basis to satisfy Internal Revenue Service funding requirements. Plan assets consist primarily of mutual funds invested in equity and fixed income securities.
International Pension Plans
Effective in 1998, benefits under the international plans were frozen indefinitely. Plan assets consist primarily of investments in local government securities and insurance company investments.
The following table presents the actuarial assumptions used in accounting for the pension plans:
| | | | | | | | | | | | | | | | | | |
| | | U.S. Plan
| | | International Plans
| |
| | | 2005
| | | 2004
| | | 2003
| | | 2005
| | | 2004
| | | 2003
| |
Weighted Average Assumptions Used to Determine Benefit Obligations at Measurement Date (September 30) | | | | | | | | | | | | | | | | | | |
Discount rate | | 5.50 | % | | 6.00 | % | | 6.00 | % | | 4.9 | % | | 5.5 | % | | 5.5 | % |
Rate of increase in future compensation | | — | | | — | | | — | | | — | | | — | | | — | |
Weighted Average Assumptions Used to Determine Net Periodic Pension Cost for Fiscal Years Ended September 30 | | | | | | | | | | | | | | | | | | |
Discount rate | | 6.00 | % | | 6.00 | % | | 6.75 | % | | 5.5 | % | | 5.5 | % | | 5.8 | % |
Rate of increase in future compensation | | — | | | — | | | — | | | — | | | — | | | — | |
Rate of return on plan assets | | 7.50 | % | | 7.50 | % | | 7.50 | % | | 4.8 | % | | 4.8 | % | | 4.7 | % |
In selecting the expected long-term rate of return on assets, we considered the current investment portfolio and the investment return goals in the plans’ investment policy statements. We, with input from the plans’ professional investment managers, also considered the average rate of earnings expected on the funds invested or to be invested to provide plan benefits. This process included determining expected returns for the various asset classes that comprise the plans’ target asset allocation. This basis for selecting the long-term asset return assumptions is consistent with the prior year.
For the U.S. plan, the long-term total return goal, presently 7.50%, includes income plus realized and unrealized gains and/or losses on the plan assets. Utilizing generally accepted diversification techniques, the plan’s assets, in aggregate and at the individual portfolio level, are invested so that the total portfolio risk exposure and risk-adjusted returns best meet the plan’s long-term liabilities to employees. Plan asset allocations are reviewed periodically and rebalanced to achieve target allocation among the asset categories when necessary.
The international plans’ assets are invested primarily in fixed income securities. The rate of return is expected to be in line with fixed income local government bonds with comparable terms.
F-29
PARAMETRIC TECHNOLOGY CORPORATION
NOTES TO CONSOLIDATED FINANCIAL STATEMENTS—(Continued)
The actuarially computed components of net periodic pension cost are shown below:
| | | | | | | | | | | | | | | | | | | | | | | | |
| | | U.S. Plan
| | | International Plans
| |
| | | 2005
| | | 2004
| | | 2003
| | | 2005
| | | 2004
| | | 2003
| |
| | | (in thousands) | |
Interest cost of projected benefit obligation | | $ | 4,649 | | | $ | 4,455 | | | $ | 4,267 | | | $ | 2,525 | | | $ | 2,375 | | | $ | 2,171 | |
Expected return on plan assets | | | (4,568 | ) | | | (4,220 | ) | | | (3,501 | ) | | | (1,299 | ) | | | (1,299 | ) | | | (1,267 | ) |
Amortization of prior service cost | | | — | | | | — | | | | — | | | | 19 | | | | 19 | | | | 17 | |
Recognized actuarial loss | | | 1,274 | | | | 1,307 | | | | 1,199 | | | | 589 | | | | 559 | | | | 293 | |
| | |
|
|
| |
|
|
| |
|
|
| |
|
|
| |
|
|
| |
|
|
|
Net periodic pension cost | | $ | 1,355 | | | $ | 1,542 | | | $ | 1,965 | | | $ | 1,834 | | | $ | 1,654 | | | $ | 1,214 | |
| | |
|
|
| |
|
|
| |
|
|
| |
|
|
| |
|
|
| |
|
|
|
The following tables display the change in benefit obligation, plan assets, funded status and amounts recognized in the balance sheet:
| | | | | | | | | | | | | | | | | | | | | | | | |
| | | U.S. Plan
| | | International Plans
| | | Total
| |
| | | 2005
| | | 2004
| | | 2005
| | | 2004
| | | 2005
| | | 2004
| |
| | | (in thousands) | |
Change in Benefit Obligation | | | | | | | | | | | | |
Accumulated and projected benefit obligation—beginning of year | | $ | 77,947 | | | $ | 74,683 | | | $ | 44,922 | | | $ | 40,857 | | | $ | 122,869 | | | $ | 115,540 | |
Interest cost | | | 4,649 | | | | 4,455 | | | | 2,525 | | | | 2,375 | | | | 7,174 | | | | 6,830 | |
Actuarial loss | | | 8,959 | | | | 431 | | | | 9,396 | | | | 344 | | | | 18,355 | | | | 775 | |
Foreign exchange impact | | | — | | | | — | | | | (1,670 | ) | | | 3,650 | | | | (1,670 | ) | | | 3,650 | |
Benefits paid | | | (1,727 | ) | | | (1,622 | ) | | | (1,943 | ) | | | (2,304 | ) | | | (3,670 | ) | | | (3,926 | ) |
| | |
|
|
| |
|
|
| |
|
|
| |
|
|
| |
|
|
| |
|
|
|
Accumulated and projected benefit obligation—end of year | | $ | 89,828 | | | $ | 77,947 | | | $ | 53,230 | | | $ | 44,922 | | | $ | 143,058 | | | $ | 122,869 | |
| | |
|
|
| |
|
|
| |
|
|
| |
|
|
| |
|
|
| |
|
|
|
Change in Plan Assets and Funded Status | | | | | | | | | | | | | | | | | | | | | | | | |
Plan assets at fair value—beginning of year | | $ | 61,857 | | | $ | 55,968 | | | $ | 26,695 | | | $ | 25,527 | | | $ | 88,552 | | | $ | 81,495 | |
Actual return on plan assets | | | 6,656 | | | | 5,011 | | | | 2,490 | | | | 969 | | | | 9,146 | | | | 5,980 | |
Employer contributions | | | — | | | | 2,500 | | | | — | | | | 170 | | | | — | | | | 2,670 | |
Foreign exchange impact | | | — | | | | — | | | | (764 | ) | | | 2,333 | | | | (764 | ) | | | 2,333 | |
Benefits paid | | | (1,727 | ) | | | (1,622 | ) | | | (1,751 | ) | | | (2,304 | ) | | | (3,478 | ) | | | (3,926 | ) |
| | |
|
|
| |
|
|
| |
|
|
| |
|
|
| |
|
|
| |
|
|
|
Plan assets at fair value—end of year | | | 66,786 | | | | 61,857 | | | | 26,670 | | | | 26,695 | | | | 93,456 | | | | 88,552 | |
Accumulated and projected benefit obligation—end of year | | | 89,828 | | | | 77,947 | | | | 53,230 | | | | 44,922 | | | | 143,058 | | | | 122,869 | |
| | |
|
|
| |
|
|
| |
|
|
| |
|
|
| |
|
|
| |
|
|
|
Funded status | | | (23,042 | ) | | | (16,090 | ) | | | (26,560 | ) | | | (18,227 | ) | | | (49,602 | ) | | | (34,317 | ) |
Unrecognized actuarial loss | | | 46,074 | | | | 40,477 | | | | 15,494 | | | | 8,475 | | | | 61,568 | | | | 48,952 | |
Unrecognized prior service cost | | | — | | | | — | | | | 235 | | | | 261 | | | | 235 | | | | 261 | |
| | |
|
|
| |
|
|
| |
|
|
| |
|
|
| |
|
|
| |
|
|
|
Net prepaid (accrued) benefit cost | | $ | 23,032 | | | $ | 24,387 | | | $ | (10,831 | ) | | $ | (9,491 | ) | | $ | 12,201 | | | $ | 14,896 | |
| | |
|
|
| |
|
|
| |
|
|
| |
|
|
| |
|
|
| |
|
|
|
F-30
PARAMETRIC TECHNOLOGY CORPORATION
NOTES TO CONSOLIDATED FINANCIAL STATEMENTS—(Continued)
| | | | | | | | | | | | | | | | | | | | | | | | |
| | | U.S. Plan
| | | International Plans
| | | Total
| |
| | | September 30,
| |
| | | 2005
| | | 2004
| | | 2005
| | | 2004
| | | 2005
| | | 2004
| |
| | | (in thousands) | |
Amounts Recognized in the Balance Sheet | | | | | | | | | | | | | | | | | | | | | | | | |
Accrued benefit liability | | $ | (23,042 | ) | | $ | (16,090 | ) | | $ | (26,560 | ) | | $ | (19,390 | ) | | $ | (49,602 | ) | | $ | (35,480 | ) |
Intangible asset | | | — | | | | — | | | | 235 | | | | 261 | | | | 235 | | | | 261 | |
Minimum pension liability (1) | | | 46,074 | | | | 40,477 | | | | 15,494 | | | | 9,638 | | | | 61,568 | | | | 50,115 | |
| | |
|
|
| |
|
|
| |
|
|
| |
|
|
| |
|
|
| |
|
|
|
Net prepaid (accrued) benefit cost | | $ | 23,032 | | | $ | 24,387 | | | $ | (10,831 | ) | | $ | (9,491 | ) | | $ | 12,201 | | | $ | 14,896 | |
| | |
|
|
| |
|
|
| |
|
|
| |
|
|
| |
|
|
| |
|
|
|
| (1) | Included in the accumulated other comprehensive income (loss) component of stockholders’ equity (in accordance with SFAS No. 130,Reporting Comprehensive Income). |
Our 2005 and 2004 consolidated balance sheets include the minimum pension liability of $61.6 million and $50.1 million, respectively, in other long-term liabilities, prepaid benefit cost of $21.8 million and $24.9 million, respectively, in prepaid expenses and other noncurrent assets, and $9.6 million and $10.0 million, respectively, in accrued compensation and benefits and other noncurrent liabilities. The increase (decrease) in the minimum pension liability, totaling $11.7 million, $(1.2) million, and $5.4 million for 2005, 2004 and 2003, respectively, has been included in other comprehensive income (loss) in the accompanying Statements of Comprehensive Income (Loss). The increase in the minimum pension liability in 2005 was due primarily to changes in the discount rate and mortality rate actuarial assumptions.
The following table shows the percentage of total plan assets for each major category of plan assets:
| | | | | | | | | | | | |
| | | U.S. Plan
| | | International Plans
| |
| | | September 30,
| |
| | | 2005
| | | 2004
| | | 2005
| | | 2004
| |
Asset Category | | | | | | | | | | | | |
Equity securities | | 61 | % | | 60 | % | | — | | | — | |
Fixed income securities | | 39 | % | | 40 | % | | 100 | % | | 100 | % |
| | |
|
| |
|
| |
|
| |
|
|
| | | 100 | % | | 100 | % | | 100 | % | | 100 | % |
| | |
|
| |
|
| |
|
| |
|
|
We periodically review the pension plans’ investments in the various asset classes. The current asset allocation target is 60% equity securities and 40% fixed income securities for the U.S. plan and 100% fixed income securities for the international plans. The plan’s investment managers are provided specific guidelines under which they are to invest the assets assigned to them. In general, investment managers are expected to remain fully invested in their asset class with further limitations on risk as related to investments in a single security, portfolio turnover and credit quality.
The U.S. plan’s investment policy prohibits the use of derivatives associated with leverage and speculation or investments in securities issued by PTC, except through index-related strategies and/or commingled funds. An investment committee oversees management of the pension plan’s assets.
Based on actuarial valuations and, in 2003, additional voluntary contributions, we contributed $0.0 million, $2.7 million and $10.7 million in 2005, 2004 and 2003, respectively, to the plans. We have minimum funding requirements of $0.4 million in 2006. However, we expect to make voluntary contributions of approximately $4 million to the plan.
F-31
PARAMETRIC TECHNOLOGY CORPORATION
NOTES TO CONSOLIDATED FINANCIAL STATEMENTS—(Continued)
As of September 30, 2005, benefit payments expected to be paid over the next ten years are outlined in the following table:
| | | | | | | | | |
| | | U.S. Plan
| | International
Plans
| | Total
|
| | | (in thousands) |
Year ending September 30, | | | | | | | | | |
2006 | | $ | 2,090 | | $ | 388 | | $ | 2,478 |
2007 | | | 2,327 | | | 364 | | | 2,691 |
2008 | | | 2,648 | | | 1,163 | | | 3,811 |
2009 | | | 3,052 | | | 1,059 | | | 4,111 |
2010 | | | 3,350 | | | 1,584 | | | 4,934 |
2011-2015 | | | 22,906 | | | 11,911 | | | 34,817 |
M. Segment Information
Operating segments are defined as components of an enterprise about which separate financial information is available that is evaluated regularly by the chief operating decision maker, or decision-making group, in deciding how to allocate resources and in assessing performance. Our chief operating decision-making group is our executive officers. We have two operating and reportable segments: (1) software products, which include license and maintenance revenue (including new releases and technical support); and (2) services, which include consulting, implementation, training and other support revenue. In our Consolidated Statements of Operations, maintenance revenue is included in service revenue. We do not allocate certain sales, marketing or administrative expenses to our operating segments, as these activities are managed separately.
We report our revenue in two product categories:
| | • | | Enterprise Solutions, which includes Windchill, Pro/INTRALINK 8.0, Arbortext Publishing Engine and all other solutions that help companies collaborate, manage and publish information across an extended enterprise; and |
| | • | | Desktop Solutions, which includes Pro/ENGINEER, Arbortext Editor and all other solutions that help companies create content and improve desktop productivity. |
We previously reported our revenue in the following two categories: Design Solutions and Collaboration and Control Solutions. In the fourth quarter of 2005, as a result of the Arbortext acquisition, we redefined our product categories. This redefinition required no reclassifications of prior reported revenues between our two product categories. Revenue historically reported as Design Solutions is now reported as Desktop Solutions, and revenue historically reported as Collaboration and Control Solutions is now reported as Enterprise Solutions.
We recently launched Pro/INTRALINK 8.0, which is based on our Windchill technology. Our prior Pro/INTRALINK product was not Windchill-based and was either used as a stand-alone product or together with Windchill. In previous periods, half of Pro/INTRALINK revenue was allocated to Design Solutions and half was allocated to Collaboration and Control Solutions. As a result of the new technology configuration of Pro/INTRALINK 8.0, beginning in the fourth quarter of 2005, all Pro/INTRALINK revenue is fully classified as Enterprise Solutions.
F-32
PARAMETRIC TECHNOLOGY CORPORATION
NOTES TO CONSOLIDATED FINANCIAL STATEMENTS—(Continued)
The revenue and operating income (loss) attributable to these operating segments are summarized as follows:
| | | | | | | | | | | | |
| | | Year ended September 30,
| |
| | | 2005
| | | 2004
| | | 2003
| |
| | | (in thousands) | |
Revenue: | | | | | | | | | | | | |
Software Products Segment: | | | | | | | | | | | | |
License: | | | | | | | | | | | | |
Desktop Solutions | | $ | 138,583 | | | $ | 139,294 | | | $ | 147,642 | |
Enterprise Solutions | | | 71,134 | | | | 59,566 | | | | 57,659 | |
| | |
|
|
| |
|
|
| |
|
|
|
Total software products license revenue | | | 209,717 | | | | 198,860 | | | | 205,301 | |
| | |
|
|
| |
|
|
| |
|
|
|
Maintenance (1): | | | | | | | | | | | | |
Desktop Solutions | | | 286,255 | | | | 276,008 | | | | 274,557 | |
Enterprise Solutions | | | 56,314 | | | | 47,412 | | | | 34,534 | |
| | |
|
|
| |
|
|
| |
|
|
|
Total software products maintenance revenue | | | 342,569 | | | | 323,420 | | | | 309,091 | |
| | |
|
|
| |
|
|
| |
|
|
|
Total software products revenue | | | 552,286 | | | | 522,280 | | | | 514,392 | |
| | |
|
|
| |
|
|
| |
|
|
|
Services Segment: | | | | | | | | | | | | |
Desktop Solutions | | | 78,291 | | | | 65,385 | | | | 76,252 | |
Enterprise Solutions | | | 90,142 | | | | 72,364 | | | | 81,296 | |
| | |
|
|
| |
|
|
| |
|
|
|
Total services revenue | | | 168,433 | | | | 137,749 | | | | 157,548 | |
| | |
|
|
| |
|
|
| |
|
|
|
Total revenue: | | | | | | | | | | | | |
Desktop Solutions | | | 503,129 | | | | 480,687 | | | | 498,451 | |
Enterprise Solutions | | | 217,590 | | | | 179,342 | | | | 173,489 | |
| | |
|
|
| |
|
|
| |
|
|
|
Total revenue | | $ | 720,719 | | | $ | 660,029 | | | $ | 671,940 | |
| | |
|
|
| |
|
|
| |
|
|
|
Operating income (loss): (2) (3) | | | | | | | | | | | | |
Software products | | $ | 373,769 | | | $ | 349,059 | | | $ | 308,424 | |
Services | | | 19,350 | | | | (6,072 | ) | | | 1,678 | |
Sales and marketing expenses (4) | | | (244,449 | ) | | | (242,604 | ) | | | (312,346 | ) |
Unallocated expenses (5) | | | (62,884 | ) | | | (62,967 | ) | | | (77,381 | ) |
| | |
|
|
| |
|
|
| |
|
|
|
Total operating income (loss) | | $ | 85,786 | | | $ | 37,416 | | | $ | (79,625 | ) |
| | |
|
|
| |
|
|
| |
|
|
|
| (1) | Maintenance revenue is included in Service Revenue in the consolidated statement of operations. |
| (2) | The operating income (loss) reported does not represent the total operating results for each operating segment as it does not contain an allocation of sales, marketing, corporate and general administrative expenses incurred in support of the operating segments. |
| (3) | We recorded restructuring and other charges (credits) and in-process research and development of $(0.6) million, $42.9 million and $30.9 million in 2005, 2004 and 2003, respectively. In 2005, 2004 and 2003, software products included $(0.7), $9.5 million and $6.6 million, respectively; services included $0.1 million, $12.2 million and $2.5 million, respectively; sales and marketing expenses included $0.7 million, $16.5 million and $13.9 million, respectively; and unallocated expenses included $(0.7) million, $4.7 million and $7.9 million, respectively, of the restructuring and other charges (credits) recorded in those respective periods. |
| (4) | Represents all sales and marketing expenses including the related portion of restructuring and other charges. |
| (5) | Unallocated expenses represent all corporate and general and administrative expenses including the related portion of restructuring and other charges. |
F-33
PARAMETRIC TECHNOLOGY CORPORATION
NOTES TO CONSOLIDATED FINANCIAL STATEMENTS—(Continued)
Data for the geographic regions in which we operate is presented below:
| | | | | | | | | |
| | | Year ended September 30,
|
| | | 2005
| | 2004
| | 2003
|
| | | (in thousands) |
Revenue: | | | | | | | | | |
North America | | $ | 271,974 | | $ | 232,883 | | $ | 249,371 |
Europe (1) | | | 254,178 | | | 240,269 | | | 239,800 |
Asia/Pacific (2) | | | 194,567 | | | 186,877 | | | 182,769 |
| | |
|
| |
|
| |
|
|
Total revenue | | $ | 720,719 | | $ | 660,029 | | $ | 671,940 |
| | |
|
| |
|
| |
|
|
Long-lived assets: | | | | | | | | | |
North America | | $ | 309,970 | | $ | 106,557 | | $ | 121,173 |
Europe (3) | | | 37,709 | | | 36,162 | | | 35,609 |
Asia/Pacific | | | 11,279 | | | 10,396 | | | 13,067 |
| | |
|
| |
|
| |
|
|
Total long-lived assets | | $ | 358,958 | | $ | 153,115 | | $ | 169,849 |
| | |
|
| |
|
| |
|
|
| (1) | Includes revenue in Germany totaling $77.5 million, $72.7 million and $71.3 million for 2005, 2004 and 2003, respectively. |
| (2) | Includes revenue in Japan totaling $110.7 million, $111.8 million and $100.4 million for 2005, 2004 and 2003, respectively. |
| (3) | The long-lived assets for Europe as of September 30, 2004 and 2003 include a reclassification of prepaid pension assets to conform to the 2005 presentation. |
Our international revenue is presented based on the location of our customer. We license products to customers worldwide. Our sales and marketing operations outside the United States are conducted principally through our international sales subsidiaries throughout Europe and the Asia/Pacific region. Intercompany sales and transfers between geographic areas are accounted for at prices that are designed to be representative of unaffiliated party transactions.
N. Subsequent Events
We completed two acquisitions subsequent to year-end for an aggregate purchase price of approximately $12 million. These acquisitions add to our global consulting and training services organization. The first was of an entity based solely in German-speaking Europe and expands our consulting delivery capacity and expertise in that region. The second was of the assets of a U.S. company that developed and provided training solutions for our products. We do not expect any significant revenue contribution in the near-term from these acquisitions.
On November 9, 2005, we granted an aggregate of 2,156,054 shares of restricted stock, primarily to our executive officers. Of those shares, an aggregate of 422,054 performance-based shares were issued in connection with our Executive Incentive Performance Plan for the 2006 fiscal year performance period (the “EIP Shares”) and an aggregate of 1,734,000 shares were issued as part of our annual equity incentive program (“Annual Shares”). The restrictions on the EIP Shares will lapse based on achievement of performance criteria established by the Compensation Committee of our Board of Directors on the grant date. The restrictions on the EIP Shares that are finally earned under these criteria lapse on the later of November 9, 2006 or the date the Compensation Committee determines the extent to which those criteria have been achieved. Half of the Annual Shares are performance-based and are subject to the same performance criteria used in our Executive Incentive Performance Plan described above. Annual Shares earned under these criteria are then subject to time-based restrictions that lapse as to substantially one-third of such shares on each of (i) the later of November 9, 2006 or the date the Compensation Committee determines the performance criteria have been achieved, (ii) November 9, 2007 and (iii) November 9, 2008. The remaining half of the Annual Shares is subject only to time-based restrictions that lapse as to substantially one-third of the shares on each of November 9, 2006, November 9, 2007 and November 9, 2008.
F-34
PARAMETRIC TECHNOLOGY CORPORATION
NOTES TO CONSOLIDATED FINANCIAL STATEMENTS—(Continued)
We also issued an aggregate of 2,809,897 restricted stock units in October and November 2005. Of those restricted stock units, (i) 26,321 were issued in connection with the two acquisitions described above and vest in three substantially equal installments on each of the first, second and third anniversaries of the closing date of the respective transaction, (ii) 804,553 are performance-based and were issued in connection with our employee management incentive plans for 2006 and will vest to the extent specified performance criteria are achieved on the later November 9, 2006 or the date the Compensation Committee determines the extent to which the performance criteria have been achieved, and (iii) 1,979,023 were issued to employees as part of our annual equity incentive program and vest in three substantially equal installments on each of November 9, 2006, 2007 and 2008.
F-35
REPORT OF INDEPENDENT REGISTERED PUBLIC ACCOUNTING FIRM
To the Board of Directors and Stockholders of Parametric Technology Corporation:
We have completed an integrated audit of Parametric Technology Corporation’s 2005 consolidated financial statements and of its internal control over financial reporting as of September 30, 2005 and audits of its 2004 and 2003 consolidated financial statements in accordance with the standards of the Public Company Accounting Oversight Board (United States). Our opinions, based on our audits, are presented below.
Consolidated financial statements
In our opinion, the consolidated financial statements listed in the index appearing under Item 15(a)(1) present fairly, in all material respects, the financial position of Parametric Technology Corporation and its subsidiaries at September 30, 2005 and 2004, and the results of their operations and their cash flows for each of the three years in the period ended September 30, 2005 in conformity with accounting principles generally accepted in the United States of America. These financial statements are the responsibility of the Company’s management. Our responsibility is to express an opinion on these financial statements based on our audits. We conducted our audits of these statements in accordance with the standards of the Public Company Accounting Oversight Board (United States). Those standards require that we plan and perform the audit to obtain reasonable assurance about whether the financial statements are free of material misstatement. An audit of financial statements includes examining, on a test basis, evidence supporting the amounts and disclosures in the financial statements, assessing the accounting principles used and significant estimates made by management, and evaluating the overall financial statement presentation. We believe that our audits provide a reasonable basis for our opinion.
Internal control over financial reporting
Also, in our opinion, management’s assessment, included in Management’s Annual Report on Internal Control Over Financial Reporting appearing under Item 9A, that the Company maintained effective internal control over financial reporting as of September 30, 2005 based on criteria established inInternal Control—Integrated Framework issued by the Committee of Sponsoring Organizations of the Treadway Commission (COSO), is fairly stated, in all material respects, based on those criteria. Furthermore, in our opinion, the Company maintained, in all material respects, effective internal control over financial reporting as of September 30, 2005, based on criteria established inInternal Control—Integrated Framework issued by the COSO. The Company’s management is responsible for maintaining effective internal control over financial reporting and for its assessment of the effectiveness of internal control over financial reporting. Our responsibility is to express opinions on management’s assessment and on the effectiveness of the Company’s internal control over financial reporting based on our audit. We conducted our audit of internal control over financial reporting in accordance with the standards of the Public Company Accounting Oversight Board (United States). Those standards require that we plan and perform the audit to obtain reasonable assurance about whether effective internal control over financial reporting was maintained in all material respects. An audit of internal control over financial reporting includes obtaining an understanding of internal control over financial reporting, evaluating management’s assessment, testing and evaluating the design and operating effectiveness of internal control, and performing such other procedures as we consider necessary in the circumstances. We believe that our audit provides a reasonable basis for our opinions.
A company’s internal control over financial reporting is a process designed to provide reasonable assurance regarding the reliability of financial reporting and the preparation of financial statements for external purposes in accordance with generally accepted accounting principles. A company’s internal control over financial reporting includes those policies and procedures that (i) pertain to the maintenance of records that, in reasonable detail, accurately and fairly reflect the transactions and dispositions of the assets of the company; (ii) provide reasonable assurance that transactions are recorded as necessary to permit preparation of financial statements in accordance with generally accepted accounting principles, and that receipts and expenditures of the company are being made only in accordance with authorizations of management and directors of the company; and (iii) provide reasonable assurance regarding prevention or timely detection of unauthorized acquisition, use, or disposition of the company’s assets that could have a material effect on the financial statements.
F-36
Because of its inherent limitations, internal control over financial reporting may not prevent or detect misstatements. Also, projections of any evaluation of effectiveness to future periods are subject to the risk that controls may become inadequate because of changes in conditions, or that the degree of compliance with the policies or procedures may deteriorate.
As described in Management’s Annual Report on Internal Control over Financial Reporting, management has excluded Arbortext, Inc. from its assessment of internal control over financial reporting as of September 30, 2005 because it was acquired by the Company in a purchase business combination during 2005. We have also excluded Arbortext, Inc. from our audit of internal control over financial reporting. Arbortext, Inc. is a wholly owned subsidiary whose total assets and total revenues each represented less than 3% of the related consolidated financial statement amounts as of and for the year ended September 30, 2005.
/s/ PricewaterhouseCoopers LLP
Boston, Massachusetts
December 14, 2005
F-37
FIVE-YEAR SUMMARY OF SELECTED FINANCIAL DATA
| | | | | | | | | | | | | | | | | | |
| | | September 30,
| |
| | | 2005 (1)
| | 2004
| | 2003
| | | 2002
| | | 2001
| |
| | | (in thousands, except per share data) | |
Revenue | | $ | 720,719 | | $ | 660,029 | | $ | 671,940 | | | $ | 741,957 | | | $ | 937,549 | |
Operating income (loss) | | | 85,786 | | | 37,416 | | | (79,625 | ) | | | (78,486 | ) | | | (5,772 | ) |
Net income (loss) | | | 83,592 | | | 34,813 | | | (98,280 | ) | | | (93,621 | ) | | | (10,138 | ) |
Earnings (loss) per share—Basic | | | 0.31 | | | 0.13 | | | (0.37 | ) | | | (0.36 | ) | | | (0.04 | ) |
Earnings (loss) per share—Diluted | | | 0.30 | | | 0.13 | | | (0.37 | ) | | | (0.36 | ) | | | (0.04 | ) |
Total assets (2) | | | 786,623 | | | 676,340 | | | 610,066 | | | | 682,519 | | | | 810,724 | |
Working capital (3) | | | 78,965 | | | 210,499 | | | 137,349 | | | | 207,016 | | | | 165,839 | |
Long-term liabilities, less current portion (2) (3) | | | 118,017 | | | 122,148 | | | 112,863 | | | | 100,022 | | | | 82,362 | |
Stockholders’ equity | | | 323,844 | | | 241,951 | | | 195,158 | | | | 289,928 | | | | 385,092 | |
| (1) | The financial position and results of operations for 2005 reflect our acquisition of Arbortext, Inc. on July 19, 2005 for $194.8 million in cash. Results of operations for Arbortext have been included in the statement of operations beginning July 20, 2005. |
| (2) | Total assets and long-term liabilities reflect the reclassification of a pension plan liability from other assets, where the liability offset other pension plan prepaid assets. The amount reclassified to long-term liabilities from other assets is $10.0 million in 2004; $9.1 million in 2003, $7.6 million in 2002 and $6.9 million in 2001 to conform to the 2005 presentation. |
| (3) | Working capital and long-term liabilities reflect the reclassification of deferred revenue classified as current in prior years to long-term deferred revenue of $20.4 million in 2004, $18.8 million in 2003, $23.1 million in 2002 and $26.3 million in 2001 to conform to the 2005 presentation. |
QUARTERLY FINANCIAL INFORMATION (UNAUDITED)
(in thousands, except per share data)
| | | | | | | | | | | | | |
| | | September 30,
2005
| | July 2,
2005
| | April 2,
2005
| | January 1,
2005
| |
Revenue | | $ | 195,092 | | $ | 180,334 | | $ | 176,103 | | $ | 169,190 | |
Operating income | | | 11,568 | | | 26,514 | | | 24,492 | | | 23,212 | |
Net income | | | 17,275 | | | 26,654 | | | 20,504 | | | 19,159 | |
Earnings per share—Basic | | | 0.06 | | | 0.10 | | | 0.08 | | | 0.07 | |
Earnings per share—Diluted | | | 0.06 | | | 0.10 | | | 0.07 | | | 0.07 | |
Common stock prices: (1) | | | | | | | | | | | | | |
High | | $ | 7.17 | | $ | 6.70 | | $ | 5.94 | | $ | 6.09 | |
Low | | $ | 6.04 | | $ | 4.84 | | $ | 5.15 | | $ | 4.83 | |
| | | | |
| | | September 30,
2004
| | July 3,
2004
| | April 3,
2004
| | January 3,
2004
| |
Revenue | | $ | 170,134 | | $ | 168,377 | | $ | 164,708 | | $ | 156,810 | |
Operating income (loss) | | | 27,938 | | | 22,722 | | | 7,846 | | | (21,090 | ) |
Net income (loss) | | | 42,044 | | | 16,135 | | | 3,171 | | | (26,537 | ) |
Earnings (loss) per share—Basic | | | 0.16 | | | 0.06 | | | 0.01 | | | (0.10 | ) |
Earnings (loss) per share—Diluted | | | 0.15 | | | 0.06 | | | 0.01 | | | (0.10 | ) |
Common stock prices: (1) | | | | | | | | | | | | | |
High | | $ | 5.28 | | $ | 5.34 | | $ | 5.04 | | $ | 4.00 | |
Low | | $ | 4.06 | | $ | 4.20 | | $ | 4.06 | | $ | 3.07 | |
| (1) | The common stock prices are based on the NASDAQ National Market daily closing stock price. Our common stock is traded on the NASDAQ National Market under the symbol “PMTC”. |
F-38