
GTECH Holdings Corporation
W. Bruce Turner
President & Chief Executive Officer
Jaymin B. Patel
Sr. Vice President & Chief Financial Officer
Fiscal Year 2006
Third Quarter Earnings Conference Call
December 16, 2005
8:30 AM

Safe Harbor Act. . .
Comments made during this presentation may contain forward-
looking statements, including, without limitation, statements relating
to the future operations and financial performance of the Company
and the Company’s future strategies. Such forward-looking
statements reflect management’s assessment based on information
currently available, but are not guarantees and are subject to risks and
uncertainties, which would cause the results to differ materially from
those contemplated in the forward-looking statements. These risks
and uncertainties include, but are not limited to, those set forth here
and in the Company’s filings with the SEC.
Fiscal Year 2006 – Third Quarter Earnings Conference Call
2

Agenda. . .
Fiscal Year 2006 – Third Quarter Earnings Conference Call
3
W. Bruce Turner, Chief Executive Officer
Welcome
Q3 Performance Review
Strategy Update
Jaymin B. Patel, Chief Financial Officer
Review of Q3 and Year to Date Financial Results
Financial Outlook
Q3 FY’06 Strategic Progress. . .
Fiscal Year 2006 – Third Quarter Earnings Conference Call
Arizona
California – POS expansion
New Jersey
Jamaica
Dresser Wayne
* “KING KONG” is copyrighted by Universal Studios and licensed to GTECH Corporation by Universal Studios Licensing LLLP. All Rights Reserved.
4
Financial results at high end of our expectations
Key wins / Extensions
New Games
“KING KONG” – themed games
Club Keno® re-launch – Georgia
EuroMillions – largest multi-jurisdictional game in the world
Upcoming Launches – HotTrax® Champions and Pick ’n PlayTM

Q3 FY’06 Strategic Progress. . .
Fiscal Year 2006 – Third Quarter Earnings Conference Call
5
Gaming Solutions
NASPL – WinWaveTM
G2E – Dynamic Floor Management system
Atronic
12 new games
eMillionsTM
HarmonyTM video slot machine
Rhode Island expansion
Licensing activity continues
82 Commercial Gaming licenses issued
13 pending

Q3 FY’06 Strategic Progress. . .
Fiscal Year 2006 – Third Quarter Earnings Conference Call
Responding to RFPs
6
New contract opportunities
Greece
Taiwan
Virginia
North Carolina – RFP expected
Gaming Solutions opportunities
Rhode Island expansion
Acqueduct and Yonkers
Florida (Broward County) and Pennsylvania
Potential gaming in Indiana, Kentucky, Maryland and
Massachusetts

(1)All percentage points are rounded to the nearest percent
(2)Reflects impact of contract wins/losses, jackpot activity, contractual rate changes, foreign exchange changes, the
impact of acquisitions, and the net change of revenue withholdings and new contract terms in Brazil.
Fiscal Year 2006 – Third Quarter Earnings Conference Call
27.2 +19%
2.6 +12%
1.7 +7%
22.9
Commercial
Svcs. / Other
$M % (1)
251.9
7.3
94.4
127.3
FY’05
7.3 +3%
1.3 +18%
(9.2) -10%
12.6 +10%
Net, All
Other(2)
270.9 +8%
8.9 +23%
91.4 -3%
143.4 +13%
FY’06
11.7 +5%
0.3 +5%
6.2 +7%
3.5 +3%
Same
Store
Sales
GTECH
Total
$M % (1)
Gaming
Solutions
$M % (1)
International
Lottery
$M % (1)
U.S.
Lottery
$M % (1)
Service Revenue Analysis. . .
Q3 FY’06 vs. Q3 FY’05
7

Key Financial Highlights. . .
Q3 FY’06
Fiscal Year 2006 – Third Quarter Earnings Conference Call
8
Service Revenue
+$19M
Product Sales
$29M
Gross Profit Margins
39%
Service Margins
39%
Product Margins
41%
Operating Expenses
$45M
Operating Expense Ratio
15%
Net Income
$48M
Diluted Earnings Per Share
$0.37
Fiscal Year 2006 – Third Quarter Earnings Conference Call
(1)
For a calculation, explanation, and reconciliation to the GAAP measure, see Supplemental Financial
Data in the Investor Presentation section of our Website www.gtech.com
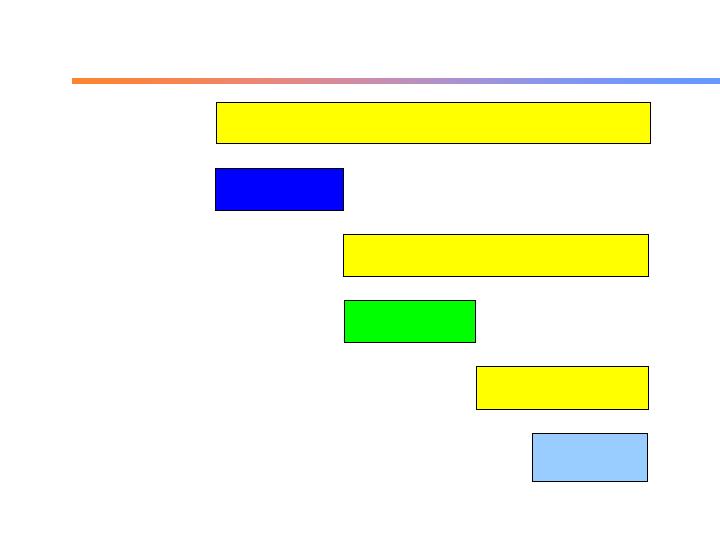
Cash Flow. . .
Q3 FY’06
Cash from
Operations
Maintenance
Capital (1)
Investing for
Growth (1)
Recurring Free
Cash Flow
Free Cash Flow
$93M
$30M
$63M
$26M
$37M
Cash Returned
to Shareholders
$11M Dividends
9

Total Revenue. . .
FY’06 YTD
$88M
$64M
$53M
$54M
$453M
$397M
$342M
$404M
FY’06 YTD
FY’05 YTD
Fiscal Year 2006 – Third Quarter Earnings Conference Call
10
Fiscal Year 2006 – Third Quarter Earnings Conference Call
(1)
For a calculation, explanation, and reconciliation to the GAAP measure, see Supplemental Financial
Data in the Investor Presentation section of our Website www.gtech.com
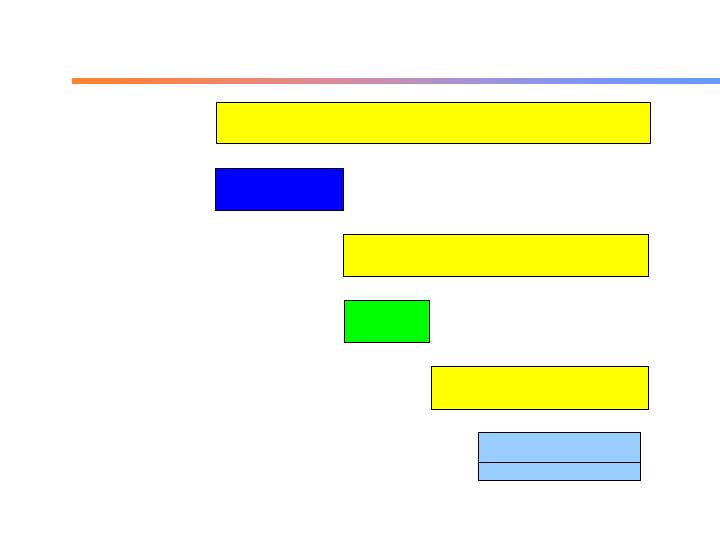
Cash Flow. . .
FY’06 YTD
Cash from
Operations
Maintenance
Capital (1)
Investing for
Growth (1)
Recurring Free
Cash Flow
Free Cash Flow
$308M
$85M
$223M
$36M
$31M Dividends
$32M Share Repurchases
$63M Total
$187M
Cash Returned
to Shareholders
11

Return on Capital Employed. . .
FY’06 YTD vs. FY’05
Fiscal Year 2006 – Third Quarter Earnings Conference Call
For a calculation and an explanation of ROCE, see Supplemental Financial Data in the Investor Presentation
section of our Website www.gtech.com
12
Average Capital Employed
+$161M
+12% year over year
ROCE
15.0%
Excluding cash balances +330bps
18.3%

Q4 FY’06
(1) Based on Diluted Share Estimate of 131M Shares
Q4 FY’06 Guidance. . .
As of December 16, 2005
Fiscal Year 2006 – Third Quarter Earnings Conference Call
13
Service Revenue Growth
5% - 7%
Product Sales
$85M - $95M
Service Margins
39% - 41%
Product Margins
41% - 43%
Tax Rate
34% - 35%
Earnings per Share (1)
$0.45 - $0.48

FY’06
(1) Based on a diluted share estimate of 131M shares
FY’06 Guidance. . .
As of December 16, 2005
Fiscal Year 2006 – Third Quarter Earnings Conference Call
14
Service Revenue Growth
9% - 10%
Product Sales
$190M - $200M
Service Margins
40% - 41%
Product Margins
40% - 42%
Full-Year Effective Tax Rate
~34%
Earnings per Share(1); Excluding impact of SFAS 123R
$1.63 - $1.66
Net Cash Invested
$190M - $200M
Free Cash Flow
$210M - $230M
EBITDA
$530M - $540M
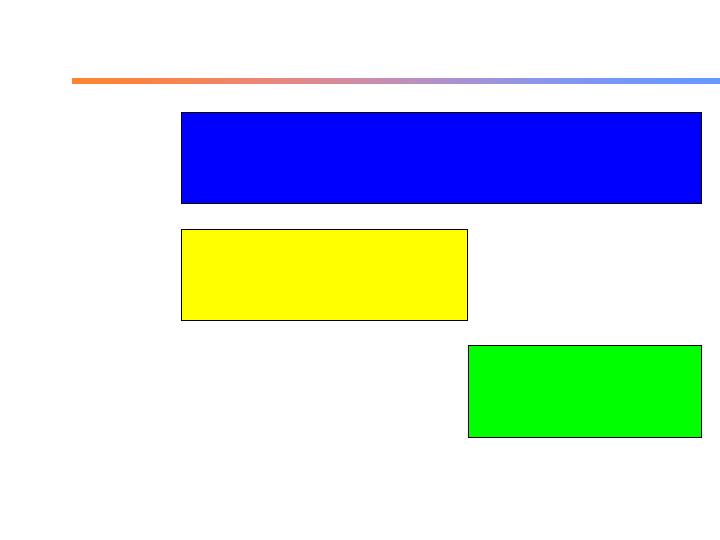
$410M - $420M
Cash from
Operations
Capital
Expenditures
$190M - $200M
$210M - $230M
Free Cash Flow
Cash Flow. . .
FY’06 Guidance
Fiscal Year 2006 – Third Quarter Earnings Conference Call
15
Q&A. . .
Fiscal Year 2006 – Third Quarter Earnings Conference Call
16

Summary. . .
Business growth continues
Long-term strategy remains on track
Confident in our ability to meet objectives for
FY’06 and beyond
Fiscal Year 2006 – Third Quarter Earnings Conference Call
17