Washington, D.C. 20549
Nuveen Municipal Advantage Fund, Inc.
Kevin J. McCarthy
Form N-CSR is to be used by management investment companies to file reports with the Commission not later than 10 days after the transmission to stockholders of any report that is required to be transmitted to stockholders under Rule 30e-1 under the Investment Company Act of 1940 (17 CFR 270.30e-1). The Commission may use the information provided on Form N-CSR in its regulatory, disclosure review, inspection, and policymaking roles.
A registrant is required to disclose the information specified by Form N-CSR, and the Commission will make this information public. A registrant is not required to respond to the collection of information contained in Form N-CSR unless the Form displays a currently valid Office of Management and Budget ("OMB") control number. Please direct comments concerning the accuracy of the information collection burden estimate and any suggestions for reducing the burden to Secretary, Securities and Exchange Commission, 450 Fifth Street, NW, Washington, DC 20549-0609. The OMB has reviewed this collection of information under the clearance requirements of 44 U.S.C. ss. 3507.
ITEM 1. REPORTS TO STOCKHOLDERS.
INVESTMENT ADVISER NAME CHANGE
Effective January 1, 2011, Nuveen Asset Management, the Funds’ investment adviser, changed its name to Nuveen Fund Advisors, Inc. (“Nuveen Fund Advisors”).
Concurrently, Nuveen Fund Advisors formed a wholly-owned subsidiary, Nuveen Asset Management, LLC, to house its portfolio management capabilities.
NUVEEN INVESTMENTS COMPLETES STRATEGIC COMBINATION WITH FAF ADVISORS
On December 31, 2010, Nuveen Investments completed the strategic combination between Nuveen Asset Management, LLC, the largest investment affiliate of Nuveen Investments, and FAF Advisors. As part of this transaction, U.S. Bancorp – the parent of FAF Advisors – received cash consideration and a 9.5% stake in Nuveen Investments in exchange for the long-term investment business of FAF Advisors, including investment management responsibilities for the non-money market mutual funds of the First American Funds family.
The approximately $27 billion of mutual fund and institutional assets managed by FAF Advisors, along with the investment professionals managing these assets and other key personnel, have become part of Nuveen Asset Management, LLC. With these additions to Nuveen Asset Management, LLC, this affiliate now manages more than $100 billion of assets across a broad range of strategies from municipal and taxable fixed income to traditional and specialized equity investments.
This combination does not affect the investment objectives or strategies of the Funds in this report. Over time, Nuveen Investments expects that the combination will provide even more ways to meet the needs of investors who work with financial advisors and consultants by enhancing the multi-boutique model of Nuveen Investments, which also includes highly respected investment teams at HydePark, NWQ Investment Management, Santa Barbara Asset Management, Symphony Asset Management, Tradewinds Global Investors and Winslow Capital. Nuveen Investments managed approximately $206 billion of assets as of March 31, 2011.
Table of Contents
| | |
| Chairman’s Letter to Shareholders | 4 |
| | |
| Portfolio Managers’ Comments | 5 |
| | |
| Common Share Dividend and Share Price Information | 11 |
| | |
| Performance Overviews | 12 |
| | |
| Portfolios of Investments | 18 |
| | |
| Statement of Assets and Liabilities | 81 |
| | |
| Statement of Operations | 83 |
| | |
| Statement of Changes in Net Assets | 84 |
| | |
| Statement of Cash Flows | 86 |
| | |
| Financial Highlights | 88 |
| | |
| Notes to Financial Statements | 94 |
| | |
| Board Approval of Sub-Advisory Arrangements | 107 |
| | |
| Reinvest Automatically, Easily and Conveniently | 108 |
| | |
| Glossary of Terms Used in this Report | 110 |
| | |
| Other Useful Information | 115 |
Chairman’s
Letter to Shareholders
Dear Shareholders,
In 2010, the global economy recorded another year of recovery from the financial and economic crises of 2008, but many of the factors that caused the downturn still weigh on the prospects for continued improvement. In the U.S., ongoing weakness in housing values has put pressure on homeowners and mortgage lenders. Similarly, the strong earnings recovery for corporations and banks is only slowly being translated into increased hiring or more active lending. Globally, deleveraging by private and public borrowers has inhibited economic growth and that process is far from complete.
Encouragingly, constructive actions are being taken by governments around the world to deal with economic issues. In the U.S., the recent passage of a stimulatory tax bill relieved some of the pressure on the Federal Reserve to promote economic expansion through quantitative easing and offers the promise of sustained economic growth. A number of European governments are undertaking programs that could significantly reduce their budget deficits. Governments across the emerging markets are implementing various steps to deal with global capital flows without undermining international trade and investment.
The success of these government actions could determine whether 2011 brings further economic recovery and financial market progress. One risk associated with the extraordinary efforts to strengthen U.S. economic growth is that the debt of the U.S. government will continue to grow to unprecedented levels. Another risk is that over time there could be inflationary pressures on asset values in the U.S. and abroad, because what happens in the U.S. impacts the rest of the world economy. Also, these various actions are being taken in a setting of heightened global economic uncertainty, primarily about the supplies of energy and other critical commodities. In this challenging environment, your Nuveen investment team continues to seek sustainable investment opportunities and to remain alert to potential risks in a recovery still facing many headwinds. On your behalf, we monitor their activities to assure they maintain their investment disciplines.
As you will note elsewhere in this report, on December 31, 2010, Nuveen Investments completed a strategic combination with FAF Advisors, Inc., the manager of the First American Funds. The combination adds highly respected and distinct investment teams to meet the needs of investors and their advisors and is designed to benefit all fund shareholders by creating a fund organization with the potential for further economies of scale and the ability to draw from even greater talent and expertise to meet those investor needs.
As of the end of May 2011, Nuveen Investments had completed the refinancing of all of the Auction Rate Preferred Securities issued by its taxable closed-end funds and 91% of the MuniPreferred shares issued by its tax-exempt closed-end funds. Please consult the Nuveen Investments web site, www.Nuveen.com, for the current status of this important refinancing program.
As always, I encourage you to contact your financial consultant if you have any questions about your investment in a Nuveen fund. On behalf of the other members of your Fund Board, we look forward to continuing to earn your trust in the months and years ahead.
Sincerely,
Robert P. Bremner
Chairman of the Board
June 21, 2011
Portfolio Managers’ Comments
Nuveen Performance Plus Municipal Fund, Inc. (NPP)
Nuveen Municipal Advantage Fund, Inc. (NMA)
Nuveen Municipal Market Opportunity Fund, Inc. (NMO)
Nuveen Dividend Advantage Municipal Fund (NAD)
Nuveen Dividend Advantage Municipal Fund 2 (NXZ)
Nuveen Dividend Advantage Municipal Fund 3 (NZF)
Portfolio managers Tom Spalding and Paul Brennan review key investment strategies and the six-month performance of these six national Funds. A 34-year veteran of Nuveen, Tom has managed NXZ since its inception in 2001 and NPP, NMA, NMO and NAD since 2003. With 20 years of industry experience, including 14 years at Nuveen, Paul assumed portfolio management responsibility for NZF in 2006.
What key strategies were used to manage these Funds during the six-month reporting period ended April 30, 2011?
After rallying strongly through most of 2010, municipal bond prices generally declined during this six-month period, impacted by investor concerns about inflation, the federal deficit and the deficit’s impact on demand for U.S. Treasury securities. Adding to this market pressure was media coverage of the strained finances of many state and local governments. As a result, money began to flow out of municipal bond funds, as yields rose and valuations declined. Toward the end of this period, we saw the environment in the municipal market improve, as some buyers were attracted by municipal bond valuations and yields, resulting in declining yields and rising valuations.
The municipal bond market also was affected by a significant decline in new tax-exempt issuance during this period. One reason for this decrease was the heavy issuance of taxable municipal debt at the end of 2010 under the Build America Bond (BAB) program. During November and December 2010, taxable BABs issuance nationwide totaled $31.5 billion, accounting for 34.5% of new bonds in the municipal market. Since interest payments from BABs represent taxable income, we did not view these bonds as appropriate investment opportunities for these Funds. The BAB program expired December 31, 2010, after Congress failed to include legislation extending the program in the tax bill it passed earlier that month. In addition to the BAB program’s impact on tax-exempt issuance during the November-December period, borrowers trying to take advantage of the program’s favorable terms before its termination at year end accelerated issuance that potentially would have come to market as tax-exempt bonds in 2011, choosing instead to issue taxable BABs during the last two months of 2010. Due in part to this, national municipal issuance was down 49% for the first four months of 2011 compared with the same period in 2010.
Certain statements in this report are forward-looking statements. Discussions of specific investments are for illustration only and are not intended as recommendations of individual investments. The forward-looking statements and other views expressed herein are those of the portfolio managers as of the date of this report. Actual future results or occurrences may differ significantly from those anticipated in any forward-looking statements, and the views expressed herein are subject to change at any time, due to numerous market and other factors. The Funds disclaim any obligation to update publicly or revise any forward-looking statements or views expressed herein.
Any reference to credit ratings for portfolio holdings denotes the highest rating assigned by a Nationally Recognized Statistical Rating Organization (NRSRO) such as Standard & Poor’s (S&P), Moody’s or Fitch. AAA, AA, A and BBB ratings are investment grade; BB, B, CCC, CC, C and D ratings are below investment grade. Holdings and ratings may change over time.
Because of the constrained issuance of tax-exempt municipal bonds, we continued to take a bottom-up approach to discovering undervalued sectors and individual credits with the potential to perform well over the long term. During this period, we found value in essential services sectors such as health care, transportation, (specifically toll roads and airports), and general obligation and other tax-supported bonds issued by state and local governments for infrastructure projects. NPP, NMA, NMO, NAD and NXZ also bought some industrial development revenue bonds with good call protection. The majority of our purchases were sector-based rather than geographically focused, although we continued to keep our holdings well diversified by state. For the most part, the Funds focused on longer bonds in order to take advantage of attractive yields at the longer end of the municipal yield curve. The purchases of longer bonds also protected the Funds’ durations and yield curve positionings.
During the last months of 2010, some of our investment activity resulted from opportunities created by the provisions of the BAB program. For example, tax-exempt supply was more plentiful in the health care sector because, as 501(c)(3) (nonprofit) organizations, hospitals generally did not qualify for the BAB program and continued to issue bonds in the tax-exempt municipal market. In addition, bonds with proceeds earmarked for refundings, working capital and private activities were not covered by the BAB program, and this resulted in attractive opportunities in other sectors of the market, such as airports.
Cash for new purchases during this period was generated primarily by the proceeds from bond calls and maturing bonds, which we worked to redeploy to keep the Funds as fully invested as possible. Overall, selling was minimal.
As of April 30, 2011, all six of these Funds continued to use inverse floating rate securities. We employ inverse floaters as a form of leverage for a variety of reasons, including duration management, income enhancement and total return enhancement.
How did the Funds perform?
Individual results for these Funds, as well as relevant index and peer group information, are presented in the accompanying table.
Average Annual Total Returns on Common Share Net Asset Value*
For periods ended 4/30/11
| | | | | | | | | | | | | | |
| Fund | | 6-Month | 1-Year | 5-Year | 10-Year |
| NPP | | | -5.76 | % | | -0.40 | % | | 3.78 | % | | 5.40 | % |
| NMA | | | -6.13 | % | | -0.29 | % | | 3.35 | % | | 5.43 | % |
| NMO | | | -7.94 | % | | -3.27 | % | | 2.44 | % | | 4.56 | % |
| NAD | | | -6.81 | % | | -1.30 | % | | 3.31 | % | | 5.75 | % |
| NXZ | | | -5.88 | % | | -3.17 | % | | 3.16 | % | | 5.98 | % |
| NZF | | | -3.63 | % | | 1.40 | % | | 4.17 | % | | N/A | |
| | | | | | | | | | | | | | |
Standard & Poor’s (S&P) National Municipal Bond Index1 | | | -1.99 | % | | 1.98 | % | | 4.18 | % | | 4.94 | % |
Lipper General Leveraged Municipal Debt Funds Average2 | | | -5.81 | % | | 0.10 | % | | 3.04 | % | | 5.25 | % |
| * | Six-month returns are cumulative; all other returns are annualized. |
| | Past performance is not predictive of future results. Current performance may be higher or lower than the data shown. Returns do not reflect the deduction of taxes that shareholders may have to pay on Fund distributions or upon the sale of Fund shares. |
| | For additional information, see the individual Performance Overview for your Fund in this report. |
| 1 | The Standard & Poor’s (S&P) National Municipal Bond Index is an unleveraged, market value-weighted index designed to measure the performance of the tax-exempt, investment-grade U.S. municipal bond market. This index does not reflect any initial or ongoing expenses and is not available for direct investment. |
| 2 | The Lipper General Leveraged Municipal Debt Funds Average is calculated using the returns of all closed-end funds in this category for each period as follows: 6-month, 74 funds; 1-year, 73 funds; 5-year, 70 funds; and 10-year, 51 funds. Lipper returns account for the effects of management fees and assume reinvestment of dividends, but do not reflect any applicable sales charges. The Lipper average is not available for direct investment. |
For the six months ended April 30, 2011, the cumulative returns on common share net asset value (NAV) for these six Funds underperformed the return for the Standard & Poor’s (S&P) National Municipal Bond Index. For the same period, NPP and NZF exceeded the average return for the Lipper General Leveraged Municipal Debt Funds Average, NXZ performed in line with this benchmark, and NMA, NMO and NAD lagged the Lipper group average.
Key management factors that influenced the Funds’ returns during this period included duration and yield curve positioning, credit exposure and sector allocation. The use of leverage also had an impact on the Funds’ performance. Leverage is discussed in more detail below.
During this period, municipal bonds with shorter maturities generally outperformed other maturity categories, with credits at the longest end of the yield curve posting the weakest returns. The underperformance of longer bonds was due in part to the rise in municipal yields at the longer end of the curve. Among these six Funds, NZF and NXZ were the most advantageously situated in terms of duration and yield curve positioning, with more exposure to the outperforming shorter part of the yield curve. The other four Funds had longer durations, and their greater exposure to the underperforming long part of the curve detracted from their performance for this period. Overall, variations in duration and yield curve positioning among the Funds accounted for the majority of the differences in performance.
Credit exposure also played a role in performance. During the market reversal of late 2010, as the redemption activity in high-yield funds increased, lower-rated credits were negatively impacted. For the period as a whole, bonds rated BBB generally underper-formed those rated AAA. As of April 30, 2011, NMA, NMO, and NAD had the heaviest weightings of bonds rated BBB, while NZF held the fewest BBB rated bonds as well as the largest allocation of bonds rated AAA.
Holdings that generally helped the Funds’ returns included housing, resource recovery, and general obligation and other tax-supported bonds. In general, these Funds had relatively light exposures to housing, which limited their participation in the performance of this sector. During this period, pre-refunded bonds, which are often backed by U.S. Treasury securities, also were among the strongest performers, primarily due to their shorter effective maturities and higher credit quality. As of April 30, 2011, NXZ had the largest exposure to pre-refunded bonds among these Funds, while NAD had the smallest allocation. In contrast, the industrial development revenue, health care and transportation sectors turned in relatively weaker performance. NMA and NAD, in particular, were heavily weighted in the health care sector, which hampered their performance.
IMPACT OF THE FUNDS’ LEVERAGE STRATEGIES ON PERFORMANCE
One important factor impacting the returns of all these Funds relative to the comparative indexes was the Funds’ use of leverage. The Funds use leverage because their managers believe that, over time, leveraging provides opportunities for additional income and total return for common shareholders. However, use of leverage also can expose common shareholders to additional volatility. For example, as the prices of securities held by a Fund decline, the negative impact of these valuation changes on common share net asset value and common shareholder total return is magnified by the
use of leverage. This is what happened in these Funds during the period, as the use of leverage hurt their overall performance.
RECENT DEVELOPMENTS REGARDING THE FUNDS’ REDEMPTION OF AUCTION RATE PREFERRED SHARES
Shortly after their respective inceptions, each of the Funds issued auction rate preferred shares (ARPS) to create structural leverage. As noted in past shareholder reports, the ARPS issued by many closed-end funds, including these Funds, have been hampered by a lack of liquidity since February 2008. Since that time, more ARPS have been submitted for sale in each of their regularly scheduled auctions than there have been offers to buy. In fact, offers to buy have been almost completely nonexistent since late February 2008. This means that these auctions have “failed to clear,” and that many, or all, of the ARPS shareholders who wanted to sell their shares in these auctions were unable to do so. This lack of liquidity in ARPS did not lower the credit quality of these shares, and ARPS shareholders unable to sell their shares continued to receive distributions at the “maximum rate” applicable to failed auctions, as calculated in accordance with the pre-established terms of the ARPS. In the recent market, with short term rates at multi-generational lows, those maximum rates also have been low.
One continuing implication for common shareholders from the auction failures is that each Fund’s cost of leverage likely has been incrementally higher at times than it otherwise might have been had the auctions continued to be successful. As a result, each Fund’s common share earnings likely have been incrementally lower at times than they otherwise might have been.
As noted in past shareholder reports, the Nuveen funds’ Board of Directors/Trustees authorized several methods that can be used separately or in combination to refinance a portion of the Nuveen funds’ outstanding ARPS. Some funds have utilized tender option bonds (TOBs), also known as inverse floating rate securities, for leverage purposes. The amount of TOBs that a fund may use varies according to the composition of each fund’s portfolio. Some funds have a greater ability to use TOBs than others. Some funds have issued Variable Rate Demand Preferred (VRDP) Shares or Variable MuniFund Term Preferred (VMTP) Shares, which are a floating rate form of preferred stock with a mandatory term redemption. Some funds have issued MuniFund Term Preferred (MTP) Shares, a fixed rate form of preferred stock with a mandatory redemption period of three to five years.
While all these efforts have reduced the total amount of outstanding ARPS issued by the Nuveen funds, the funds cannot provide any assurance on when the remaining outstanding ARPS might be redeemed.
During 2010 and 2011, certain Nuveen leveraged closed-end funds (including NMA, NAD, NXZ and NZF) received a demand letter from a law firm on behalf of purported holders of common shares of each such fund, alleging that Nuveen and the funds’ officers and Board of Directors/Trustees breached their fiduciary duties related to the redemption at par of the funds’ ARPS. In response, the Board established an ad hoc Demand Committee consisting of certain of its disinterested and independent Board members to investigate the claims. The Demand Committee retained independent counsel to assist it in conducting an extensive investigation. Based upon its investigation, the Demand Committee found that it was not in the best interests of each fund or its
shareholders to take the actions suggested in the demand letters, and recommended that the full Board reject the demands made in the demand letters. After reviewing the findings and recommendation of the Demand Committee, the full Board of each fund unanimously adopted the Demand Committee’s recommendation.
Subsequently, the funds that received demand letters (including NAD, NXZ and NZF) were named in a consolidated complaint as nominal defendants in a putative shareholder derivative action captioned Martin Safier, et al. v. Nuveen Asset Management, et al. that was filed in the Circuit Court of Cook County, Illinois, Chancery Division (the “Cook County Chancery Court”) on February 18, 2011 (the “Complaint”). The Complaint, filed on behalf of purported holders of each fund’s common shares, also name Nuveen Fund Advisors, Inc. as a defendant, together with current and former Officers and interested Director/Trustees of each of the funds (together with the nominal defendants, collectively, the “Defendants”). The Complaint contains the same basic allegations contained in the demand letters. The suits seek a declaration that the Defendants have breached their fiduciary duties, an order directing the Defendants not to redeem any ARPS at their liquidation value using fund assets, indeterminate monetary damages in favor of the funds and an award of plaintiffs’ costs and disbursements in pursuing the action. Nuveen Fund Advisors, Inc. believes that the Complaint is without merit, and is defending vigorously against these charges.
As of April 30, 2011, the amount of ARPS redeemed at par by the Funds is as shown in the accompanying table.
| | | | | | | | |
| Fund | | ARPS Redeemed | | % of Original ARPS |
| NPP | | $ | 479,000,000 | | | 100.0 | % |
| NMA | | $ | 358,000,000 | | | 100.0 | % |
| NMO | | $ | 380,000,000 | | | 100.0 | % |
| NAD | | $ | 174,925,000 | | | 59.3 | % |
| NXZ | | $ | 222,000,000 | | | 100.0 | % |
| NZF | | $ | 143,600,000 | | | 46.0 | % |
MTP Shares
As of April 30, 2011, and as noted in a previous shareholder report, the following Funds have issued and outstanding MTP Shares, at liquidation value, as shown in the accompanying table.
| | | | | |
| Fund | | MTP Shares at Liquidation Value |
| NAD | | $ | 144,300,000 |
| NZF | | $ | 70,000,000 |
During the current reporting period, the following Fund completed the issuance of MTP Shares as shown in the accompanying table. The net proceeds from this offerings was used to refinance a portion of the Fund’s outstanding ARPS at par. The newly-issued MTP Shares trade on the New York Stock Exchange (NYSE). These MTP Shares are included in the total amount of MTP Shares outstanding in the preceding table.
| | | | | | | | | | | | | | |
| Fund | | MTP Shares Issued at Liquidation Value | | MTP Series | | Annual Interest Rate | NYSE Ticker |
| NZF | | $ | 70,000,000 | | | 2016 | | | 2.80 | % | | NZF PrC |
VMTP Shares
During the current reporting period, the following Fund completed the issuance of VMTP Shares as shown in the accompanying table. The net proceeds from this offering was used to refinance the Fund’s remaining outstanding ARPS at par.
| | | | | | | | |
| Fund | | VMTP Series | | VMTP Shares Issued at Liquidation Value |
| NPP | | | 2014 | | $ | 421,700,000 |
As noted previously, VMTP is a newly-developed instrument that essentially replaces all or a portion of the ARPS used as leverage and potentially could be used to refinance all or a portion of the ARPS of other funds. VMTP is offered only to qualified institutional buyers, defined pursuant to Rule 144A under the Securities Act of 1933.
VRDP Shares
As of April 30, 2011, and as noted in a previous shareholder report, the following Funds have issued and outstanding VRDP Shares, at liquidation value, as shown in the accompanying table.
| Fund | | VRDP Shares at Liquidation Value |
| NMA | | $ | 296,800,000 |
| NMO | | $ | 350,900,000 |
| NXZ | | $ | 196,000,000 |
(Refer to Notes to Financial Statements, Footnote 1 – General Information and Significant Accounting Policies and Footnote 4 – Fund Shares for further details on MTP, VMTP and VRDP Shares.)
At the time this report was prepared, all 84 of the Nuveen closed-end municipal funds that had issued ARPS have redeemed at par all or a portion of these shares. These redemptions bring the total amount of Nuveen’s municipal closed-end funds’ ARPS redemptions to approximately $10.0 billion of the approximately $11.0 billion originally outstanding.
For up-to-date information, please visit the Nuveen CEF Auction Rate Preferred Resource Center at: http://www.nuveen.com/arps.
Regulatory Matter
During May 2011, Nuveen Securities, LLC entered into a settlement with the Financial Industry Regulatory Authority (FINRA) with respect to certain allegations regarding Nuveen-sponsored closed-end fund ARPS marketing brochures. As part of this settlement, Nuveen Securities, LLC neither admitted to nor denied FINRA’s allegations. Nuveen Securities, LLC is the broker-dealer subsidiary of Nuveen Investments.
The settlement with FINRA concludes an investigation that followed the widespread failure of auctions for ARPS and other auction rate securities, which generally began in mid-February 2008. In the settlement, FINRA alleged that certain marketing materials provided by Nuveen Securities, LLC were false and misleading. Nuveen Securities, LLC agreed to a censure and the payment of a $3 million fine.
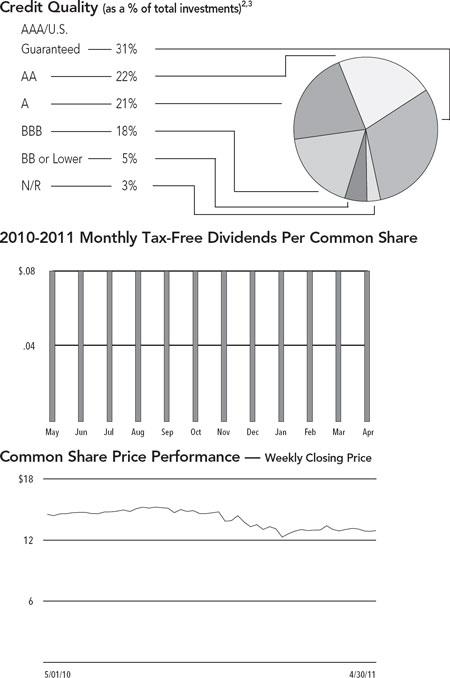
Common Share Dividend
and Share Price Information
The monthly dividends of all six Funds in this report remained stable throughout the six-month reporting period ended April 30, 2011.
Due to normal portfolio activity, common shareholders of the following Funds received capital gains and/or net ordinary income distributions in December 2010 as follows:
| | | | | | | | |
| Fund | | Long-Term Capital Gains (per share) | | Short-Term Capital Gains and/or Ordinary Income (per share) |
| NPP | | $ | 0.0905 | | $ | 0.0081 |
| NZF | | $ | 0.0156 | | | — |
All of the Funds in this report seek to pay stable dividends at rates that reflect each Fund’s past results and projected future performance. During certain periods, each Fund may pay dividends at a rate that may be more or less than the amount of net investment income actually earned by the Fund during the period. If a Fund has cumulatively earned more than it has paid in dividends, it holds the excess in reserve as undistributed net investment income (UNII) as part of the Fund’s NAV. Conversely, if a Fund has cumulatively paid dividends in excess of its earnings, the excess constitutes negative UNII that is likewise reflected in the Fund’s NAV. Each Fund will, over time, pay all of its net investment income as dividends to shareholders. As of April 30, 2011, all six of the Funds in this report had positive UNII balances, based upon our best estimate, for tax purposes and positive UNII balances for financial reporting purposes.
COMMON SHARE REPURCHASES AND SHARE PRICE INFORMATION
Since the inception of the Funds’ repurchase program, the Funds have not repurchased any of their outstanding common shares.
As of April 30, 2011, and during the six-month reporting period, the Funds’ common share prices were trading at (+) premiums or (-) discounts to their common share NAVs as shown in the accompanying table.
| | | | | | | | |
| Fund | | 4/30/11 (-)Discount | Six-Month Average (-)Discount |
| NPP | | | (-)3.62 | % | | (-)3.92 | % |
| NMA | | | (-)2.91 | % | | (-)2.86 | % |
| NMO | | | (-)0.96 | % | | (-)0.92 | % |
| NAD | | | (-)3.48 | % | | (-)4.52 | % |
| NXZ | | | (-)3.58 | % | | (-)4.41 | % |
| NZF | | | (-)3.58 | % | | (-)4.48 | % |
| NPP | | Nuveen Performance |
| Performance | | Plus Municipal |
| OVERVIEW | | Fund, Inc. |
| | | as of April 30, 2011 |
| Fund Snapshot | | | | |
| Common Share Price | | $ | 13.33 | |
| Common Share Net Asset Value (NAV) | | $ | 13.83 | |
| Premium/(Discount) to NAV | | | -3.62 | % |
| Market Yield | | | 7.07 | % |
Taxable-Equivalent Yield1 | | | 9.82 | % |
Net Assets Applicable to Common Shares ($000) | | $ | 829,253 | |
| Leverage (as a % of managed assets) | | | | |
| Structural Leverage | | | 32.19 | % |
| Effective Leverage | | | 36.70 | % |
| Average Annual Total Return (Inception 6/22/89) | | | | | | | |
| | | | On Share Price | | On NAV |
| 6-Month (Cumulative) | | | -7.33 | % | | -5.76 | % |
| 1-Year | | | 0.43 | % | | -0.40 | % |
| 5-Year | | | 4.46 | % | | 3.78 | % |
| 10-Year | | | 5.91 | % | | 5.40 | % |
| States4 (as a % of total investments) | | | | |
| Illinois | | | 17.2 | % |
| California | | | 13.4 | % |
| Colorado | | | 6.4 | % |
| Florida | | | 4.9 | % |
| New Jersey | | | 4.6 | % |
| Ohio | | | 4.2 | % |
| Texas | | | 4.0 | % |
| Nevada | | | 3.5 | % |
| New York | | | 3.4 | % |
| Massachusetts | | | 3.0 | % |
| Michigan | | | 2.5 | % |
| Washington | | | 2.4 | % |
| Pennsylvania | | | 2.3 | % |
| Louisiana | | | 2.2 | % |
| Puerto Rico | | | 2.1 | % |
| Indiana | | | 2.0 | % |
| South Carolina | | | 1.9 | % |
| Minnesota | | | 1.6 | % |
| Iowa | | | 1.6 | % |
| Arizona | | | 1.5 | % |
| Virginia | | | 1.5 | % |
| Other | | | 13.8 | % |
| Portfolio Composition4 (as a % of total investments) | | | | |
| Tax Obligation/Limited | | | 17.6 | % |
| Transportation | | | 16.5 | % |
| Health Care | | | 13.9 | % |
| U.S. Guaranteed | | | 13.8 | % |
| Tax Obligation/General | | | 13.2 | % |
| Utilities | | | 7.7 | % |
| Consumer Staples | | | 6.6 | % |
| Other | | | 10.7 | % |
| | Refer to the Glossary of Terms Used in this Report for further definition of the terms used within this Fund’s Performance Overview page. |
| 1 | Taxable-Equivalent Yield represents the yield that must be earned on a fully taxable investment in order to equal the yield of the Fund on an after-tax basis. It is based on a federal income tax rate of 28%. When comparing this Fund to investments that generate qualified dividend income, the Taxable-Equivalent Yield is lower. |
| 2 | The Fund paid shareholders a capital gain and net ordinary income distribution in December 2010 of $0.0986 per share. |
| 3 | Ratings shown are the highest of Standard & Poor’s Group, Moody’s Investor Service, Inc. or Fitch, Inc. AAA includes bonds with an implied AAA rating since they are backed by U.S. Government or agency securities. AAA, AA, A and BBB ratings are investment grade; BB, B, CCC, CC, C and D ratings are below-investment grade. Holdings designated N/R are not rated by any of these national rating agencies. |
| 4 | Holdings are subject to change. |
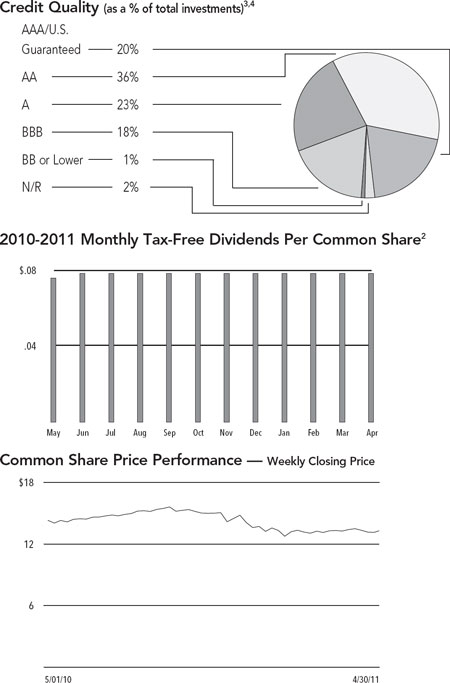
| NMA | | Nuveen Municipal |
| Performance | | Advantage |
| OVERVIEW | | |
| Fund Snapshot | | | | |
| Common Share Price | | $ | 12.99 | |
Common Share Net Asset Value (NAV) | | $ | 13.38 | |
| Premium/(Discount) to NAV | | | -2.91 | % |
| Market Yield | | | 7.62 | % |
Taxable-Equivalent Yield1 | | | 10.58 | % |
Net Assets Applicable to Common Shares ($000) | | $ | 581,888 | |
| Leverage (as a % of managed assets) | | | | |
| Structural Leverage | | | 32.10 | % |
| Effective Leverage | | | 37.06 | % |
Average Annual Total Return (Inception 12/19/89) | | | On Share Price | | On NAV |
| 6-Month (Cumulative) | | | -9.60 | % | | -6.13 | % |
| 1-Year | | | -2.59 | % | | -0.29 | % |
| 5-Year | | | 3.33 | % | | 3.35 | % |
| 10-Year | | | 5.93 | % | | 5.43 | % |
| States3 (as a % of total investments) | | | | |
| California | | | 13.1 | % |
| Texas | | | 10.3 | % |
| Louisiana | | | 9.0 | % |
| Illinois | | | 8.1 | % |
| Colorado | | | 6.2 | % |
| Puerto Rico | | | 5.0 | % |
| Ohio | | | 4.8 | % |
| Washington | | | 4.4 | % |
| New York | | | 3.5 | % |
| Pennsylvania | | | 3.2 | % |
| New Jersey | | | 2.5 | % |
| Tennessee | | | 2.5 | % |
| Nevada | | | 2.4 | % |
| Florida | | | 2.1 | % |
| South Carolina | | | 2.1 | % |
| Arizona | | | 2.0 | % |
| North Carolina | | | 1.8 | % |
| Massachusetts | | | 1.7 | % |
| Indiana | | | 1.6 | % |
| Other | | | 13.7 | % |
| Portfolio Composition3 (as a % of total investments) | | | | |
| Health Care | | | 20.1 | % |
| Utilities | | | 15.9 | % |
| Tax Obligation/General | | | 13.1 | % |
| Tax Obligation/Limited | | | 12.5 | % |
| Transportation | | | 11.8 | % |
| U.S. Guaranteed | | | 10.9 | % |
| Consumer Staples | | | 6.5 | % |
| Other | | | 9.2 | % |
| | |
| | Refer to the Glossary of Terms Used in this Report for further definition of the terms used within this Fund’s Performance Overview page. |
| 1 | Taxable-Equivalent Yield represents the yield that must be earned on a fully taxable investment in order to equal the yield of the Fund on an after-tax basis. It is based on a federal income tax rate of 28%. When comparing this Fund to investments that generate qualified dividend income, the Taxable-Equivalent Yield is lower. |
| 2 | Ratings shown are the highest of Standard & Poor’s Group, Moody’s Investor Service, Inc. or Fitch, Inc. AAA includes bonds with an implied AAA rating since they are backed by U.S. Government or agency securities. AAA, AA, A and BBB ratings are investment grade; BB, B, CCC, CC, C and D ratings are below-investment grade. Holdings designated N/R are not rated by any of these national rating agencies. |
| 3 | Holdings are subject to change. |
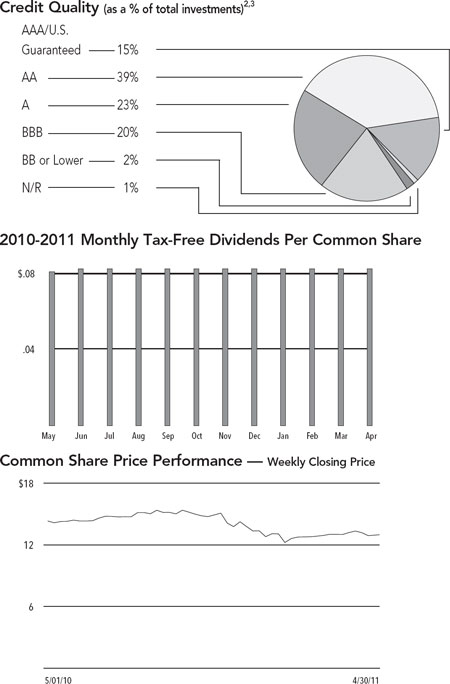
| NMO | | Nuveen Municipal |
| | Market Opportunity |
| | Fund, Inc. |
| | | as of April 30, 2011 |
| Fund Snapshot | | | | |
| Common Share Price | | $ | 12.43 | |
Common Share Net Asset Value (NAV) | | $ | 12.55 | |
| Premium/(Discount) to NAV | | | -0.96 | % |
| Market Yield | | | 7.87 | % |
Taxable-Equivalent Yield1 | | | 10.93 | % |
Net Assets Applicable to Common Shares ($000) | | $ | 574,974 | |
| Leverage (as a % of managed assets) | | | | |
| Structural Leverage | | | 36.89 | % |
| Effective Leverage | | | 39.55 | % |
| Average Annual Total Return (Inception 3/21/90) | | | | | | | |
| | | | On Share Price | | On NAV |
| 6-Month (Cumulative) | | | -11.20 | % | | -7.94 | % |
| 1-Year | | | -4.19 | % | | -3.27 | % |
| 5-Year | | | 3.79 | % | | 2.44 | % |
| 10-Year | | | 5.07 | % | | 4.56 | % |
| States3 | | | | |
| (as a % of total investments) | | | | |
| California | | | 14.5 | % |
| Illinois | | | 10.0 | % |
| Texas | | | 8.6 | % |
| Washington | | | 6.3 | % |
| Ohio | | | 5.2 | % |
| Puerto Rico | | | 4.8 | % |
| New York | | | 4.4 | % |
| Pennsylvania | | | 4.2 | % |
| Colorado | | | 4.1 | % |
| Nevada | | | 3.9 | % |
| North Carolina | | | 3.8 | % |
| South Carolina | | | 3.3 | % |
| New Jersey | | | 2.5 | % |
| Florida | | | 2.2 | % |
| Louisiana | | | 2.0 | % |
| Alaska | | | 1.8 | % |
| Michigan | | | 1.8 | % |
| Indiana | | | 1.7 | % |
| Virginia | | | 1.7 | % |
| Other | | | 13.2 | % |
| Portfolio Composition3 | | | | |
| (as a % of total investments) | | | | |
| Transportation | | | 16.8 | % |
| Health Care | | | 16.6 | % |
| Tax Obligation/General | | | 15.6 | % |
| Tax Obligation/Limited | | | 12.7 | % |
| U.S. Guaranteed | | | 10.4 | % |
| Utilities | | | 8.9 | % |
| Consumer Staples | | | 6.9 | % |
| Other | | | 12.1 | % |
| | Refer to the Glossary of Terms Used in this Report for further definition of the terms used within this Fund’s Performance Overview page. |
| 1 | Taxable-Equivalent Yield represents the yield that must be earned on a fully taxable investment in order to equal the yield of the Fund on an after-tax basis. It is based on a federal income tax rate of 28%. When comparing this Fund to investments that generate qualified dividend income, the Taxable-Equivalent Yield is lower. |
| 2 | Ratings shown are the highest of Standard & Poor’s Group, Moody’s Investor Service, Inc. or Fitch, Inc. AAA includes bonds with an implied AAA rating since they are backed by U.S. Government or agency securities. AAA, AA, A and BBB ratings are investment grade; BB, B, CCC, CC, C and D ratings are below-investment grade. Holdings designated N/R are not rated by any of these national rating agencies. |
| 3 | Holdings are subject to change. |
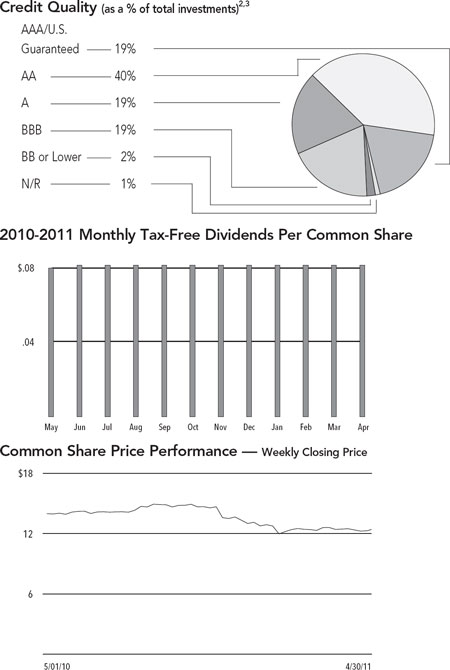
| NAD | | Nuveen Dividend |
| Performance | | Advantage |
| OVERVIEW | | |
| Fund Snapshot | | | | |
| Common Share Price | | $ | 12.76 | |
Common Share Net Asset Value (NAV) | | $ | 13.22 | |
| Premium/(Discount) to NAV | | | -3.48 | % |
| Market Yield | | | 7.15 | % |
Taxable-Equivalent Yield1 | | | 9.93 | % |
Net Assets Applicable to Common Shares ($000) | | $ | 519,587 | |
| Leverage (as a % of managed assets) | | | | |
| Structural Leverage | | | 32.35 | % |
| Effective Leverage | | | 36.42 | % |
| Average Annual Total Return (Inception 5/26/99) | | | | | | | |
| | | | On Share Price | | On NAV |
| 6-Month (Cumulative) | | | -8.20 | % | | -6.81 | % |
| 1-Year | | | -3.17 | % | | -1.30 | % |
| 5-Year | | | 3.87 | % | | 3.31 | % |
| 10-Year | | | 5.01 | % | | 5.75 | % |
| States3 (as a % of total municipal bonds) | | | | |
| Illinois | | | 19.2 | % |
| Florida | | | 7.1 | % |
| New York | | | 6.3 | % |
| Washington | | | 5.8 | % |
| California | | | 5.8 | % |
| Texas | | | 4.9 | % |
| Louisiana | | | 4.8 | % |
| Wisconsin | | | 4.7 | % |
| New Jersey | | | 4.5 | % |
| Colorado | | | 4.0 | % |
| Puerto Rico | | | 3.8 | % |
| Nevada | | | 3.4 | % |
| Indiana | | | 2.8 | % |
| Ohio | | | 2.4 | % |
| Rhode Island | | | 2.0 | % |
| Pennsylvania | | | 1.9 | % |
| Michigan | | | 1.8 | % |
| Other | | | 14.8 | % |
| Portfolio Composition3 (as a % of total investments) | | | | |
| Health Care | | | 21.5 | % |
| Tax Obligation/Limited | | | 17.8 | % |
| Tax Obligation/General | | | 17.7 | % |
| Transportation | | | 14.4 | % |
| Consumer Staples | | | 6.1 | % |
| Education and Civic Organizations | | | 5.1 | % |
| Housing/Multifamily | | | 4.3 | % |
| Investment Companies | | | 0.1 | % |
| Other | | | 13.0 | % |
| | Refer to the Glossary of Terms Used in this Report for further definition of the terms used within this Fund’s Performance Overview page. |
| 1 | Taxable-Equivalent Yield represents the yield that must be earned on a fully taxable investment in order to equal the yield of the Fund on an after-tax basis. It is based on a federal income tax rate of 28%. When comparing this Fund to investments that generate qualified dividend income, the Taxable-Equivalent Yield is lower. |
| 2 | Ratings shown are the highest of Standard & Poor’s Group, Moody’s Investor Service, Inc. or Fitch, Inc. AAA includes bonds with an implied AAA rating since they are backed by U.S. Government or agency securities. AAA, AA, A and BBB ratings are investment grade; BB, B, CCC, CC, C and D ratings are below-investment grade. Holdings designated N/R are not rated by any of these national rating agencies. |
| 3 | Holdings are subject to change. |
| NXZ | | Nuveen Dividend |
| Performance | | Advantage |
| | Municipal Fund 2 |
| | | as of April 30, 2011 |
| Fund Snapshot | | | | |
| Common Share Price | | $ | 12.93 | |
Common Share Net Asset Value (NAV) | | $ | 13.41 | |
| Premium/(Discount) to NAV | | | -3.58 | % |
| Market Yield | | | 7.42 | % |
Taxable-Equivalent Yield1 | | | 10.31 | % |
| Net Assets Applicable to Common Shares ($000) | | $ | 394,954 | |
| Leverage (as a % of managed assets) | | | | |
| Structural Leverage | | | 33.17 | % |
| Effective Leverage | | | 33.17 | % |
| Average Annual Total Return (Inception 3/27/01) | | | | | | | |
| | | On Share Price | On NAV |
| 6-Month (Cumulative) | | | -8.62 | % | | -5.88 | % |
| 1-Year | | | -4.82 | % | | -3.17 | % |
| 5-Year | | | 1.84 | % | | 3.16 | % |
| 10-Year | | | 5.11 | % | | 5.98 | % |
| States3 (as a % of total investments) | | | | |
| Texas | | | 16.7 | % |
| California | | | 11.9 | % |
| Illinois | | | 9.7 | % |
| Colorado | | | 7.3 | % |
| New York | | | 5.4 | % |
| Michigan | | | 5.0 | % |
| New Mexico | | | 3.9 | % |
| Louisiana | | | 3.5 | % |
| Alabama | | | 3.5 | % |
| Florida | | | 3.5 | % |
| Kansas | | | 2.9 | % |
| Indiana | | | 2.6 | % |
| Puerto Rico | | | 2.2 | % |
| New Jersey | | | 1.8 | % |
| Washington | | | 1.8 | % |
| Hawaii | | | 1.7 | % |
| District of Columbia | | | 1.6 | % |
| Other | | | 15.0 | % |
| Portfolio Composition3 (as a % of total investments) | | | | |
| U.S. Guaranteed | | | 23.4 | % |
| Tax Obligation/Limited | | | 19.6 | % |
| Health Care | | | 13.7 | % |
| Transportation | | | 13.2 | % |
| Tax Obligation/General | | | 7.1 | % |
| Consumer Staples | | | 7.0 | % |
| Utilities | | | 4.4 | % |
| Other | | | 11.6 | % |
| | Refer to the Glossary of Terms Used in this Report for further definition of the terms used within this Fund’s Performance Overview page. |
| 1 | Taxable-Equivalent Yield represents the yield that must be earned on a fully taxable investment in order to equal the yield of the Fund on an after-tax basis. It is based on a federal income tax rate of 28%. When comparing this Fund to investments that generate qualified dividend income, the Taxable-Equivalent Yield is lower. |
| 2 | Ratings shown are the highest of Standard & Poor’s Group, Moody’s Investor Service, Inc. or Fitch, Inc. AAA includes bonds with an implied AAA rating since they are backed by U.S. Government or agency securities. AAA, AA, A and BBB ratings are investment grade; BB, B, CCC, CC, C and D ratings are below-investment grade. Holdings designated N/R are not rated by any of these national rating agencies. |
| 3 | Holdings are subject to change. |
| NZF | | Nuveen Dividend |
| Performance | | Advantage |
| OVERVIEW | | Municipal Fund 3 |
| Fund Snapshot | | | | |
| Common Share Price | | $ | 13.20 | |
Common Share Net Asset Value (NAV) | | $ | 13.69 | |
| Premium/(Discount) to NAV | | | -3.58 | % |
| Market Yield | | | 7.45 | % |
Taxable-Equivalent Yield1 | | | 10.35 | % |
Net Assets Applicable to Common Shares ($000) | | $ | 553,001 | |
| Leverage (as a % of managed assets) | | | | |
| Structural Leverage | | | 27.51 | % |
| Effective Leverage | | | 36.18 | % |
| Average Annual Total Return (Inception 9/25/01) | | | | | | | |
| | | On Share Price | On NAV |
| 6-Month (Cumulative) | | | -5.95 | % | | -3.63 | % |
| 1-Year | | | 0.55 | % | | 1.40 | % |
| 5-Year | | | 3.87 | % | | 4.17 | % |
| Since Inception | | | 5.25 | % | | 5.87 | % |
| States4 (as a % of total municipal bonds) | | | | |
| Texas | | | 15.5 | % |
| Illinois | | | 11.0 | % |
| Washington | | | 8.8 | % |
| California | | | 8.2 | % |
| Michigan | | | 6.2 | % |
| Colorado | | | 4.2 | % |
| Indiana | | | 4.0 | % |
| Georgia | | | 3.8 | % |
| Iowa | | | 3.7 | % |
| New York | | | 3.4 | % |
| New Jersey | | | 3.2 | % |
| Louisiana | | | 3.0 | % |
| Nevada | | | 2.5 | % |
| Kentucky | | | 2.4 | % |
| Missouri | | | 2.0 | % |
| Massachusetts | | | 2.0 | % |
| Maryland | | | 1.8 | % |
| Other | | | 14.3 | % |
| Portfolio Composition4 (as a % of total investments) | | | | |
| U.S. Guaranteed | | | 26.2 | % |
| Transportation | | | 18.3 | % |
| Health Care | | | 13.2 | % |
| Tax Obligation/General | | | 9.2 | % |
| Tax Obligation/Limited | | | 7.6 | % |
| Water and Sewer | | | 4.8 | % |
| Education and Civic Organizations | | | 4.7 | % |
| Consumer Staples | | | 4.4 | % |
| Investment Companies | | | 0.4 | % |
| Other | | | 11.2 | % |
| | Refer to the Glossary of Terms Used in this Report for further definition of the terms used within this Fund’s Performance Overview page. |
| 1 | Taxable-Equivalent Yield represents the yield that must be earned on a fully taxable investment in order to equal the yield of the Fund on an after-tax basis. It is based on a federal income tax rate of 28%. When comparing this Fund to investments that generate qualified dividend income, the Taxable-Equivalent Yield is lower. |
| 2 | The Fund paid shareholders a capital gains distribution in December 2010 of $0.0156 per share. |
| 3 | Ratings shown are the highest of Standard & Poor’s Group, Moody’s Investor Service, Inc. or Fitch, Inc. AAA includes bonds with an implied AAA rating since they are backed by U.S. Government or agency securities. AAA, AA, A and BBB ratings are investment grade; BB, B, CCC, CC, C and D ratings are below-investment grade. Holdings designated N/R are not rated by any of these national rating agencies. |
| 4 | Holdings are subject to change. |
| | | Nuveen Performance Plus Municipal Fund, Inc. |
| NPP | | Portfolio of Investments |
| | | April 30, 2011 (Unaudited) |
| | Principal | | | Optional Call | | | | |
| | Amount (000) | | Description (1) | Provisions (2) | Ratings (3) | | Value | |
| | | | Alabama – 0.2% (0.1% of Total Investments) | | | | | |
| | | | Jefferson County, Alabama, Sewer Revenue Refunding Warrants, Series 1997A: | | | | | |
| $ | 1,435 | | 5.625%, 2/01/22 – FGIC Insured | 7/11 at 100.00 | Caa3 | $ | 878,378 | |
| | 1,505 | | 5.375%, 2/01/27 – FGIC Insured | 7/11 at 100.00 | Caa3 | | 922,068 | |
| | 2,940 | | Total Alabama | | | | 1,800,446 | |
| | | | Alaska – 0.2% (0.1% of Total Investments) | | | | | |
| | 2,465 | | Northern Tobacco Securitization Corporation, Alaska, Tobacco Settlement Asset-Backed Bonds, Series 2006A, 5.000%, 6/01/46 | 6/14 at 100.00 | Baa3 | | 1,467,562 | |
| | | | Arizona – 2.3% (1.5% of Total Investments) | | | | | |
| | 1,000 | | Arizona State Transportation Board, Highway Revenue Bonds, Series 2002B, 5.250%, 7/01/22 (Pre-refunded 7/01/12) | 7/12 at 100.00 | AAA | | 1,057,330 | |
| | 7,780 | | Phoenix Civic Improvement Corporation, Arizona, Junior Lien Airport Revenue Bonds, Series 2010A, 5.000%, 7/01/40 | No Opt. Call | A+ | | 7,133,093 | |
| | | | Phoenix Civic Improvement Corporation, Arizona, Senior Lien Airport Revenue Bonds, Series 2002B: | | | | | |
| | 5,365 | | 5.750%, 7/01/15 – FGIC Insured (Alternative Minimum Tax) | 7/12 at 100.00 | AA– | | 5,579,278 | |
| | 5,055 | | 5.750%, 7/01/16 – FGIC Insured (Alternative Minimum Tax) | 7/12 at 100.00 | AA– | | 5,236,576 | |
| | 19,200 | | Total Arizona | | | | 19,006,277 | |
| | | | Arkansas – 0.5% (0.3% of Total Investments) | | | | | |
| | 5,080 | | Independence County, Arkansas, Hydroelectric Power Revenue Bonds, Series 2003, 5.350%, 5/01/28 – ACA Insured | 5/13 at 100.00 | N/R | | 3,387,039 | |
| | 1,000 | | Washington County, Arkansas, Hospital Revenue Bonds, Washington Regional Medical Center, Series 2005A, 5.000%, 2/01/35 | 2/15 at 100.00 | Baa1 | | 934,060 | |
| | 6,080 | | Total Arkansas | | | | 4,321,099 | |
| | | | California – 20.3% (13.4% of Total Investments) | | | | | |
| | 3,500 | | Alameda Corridor Transportation Authority, California, Subordinate Lien Revenue Bonds, Series 2004A, 0.000%, 10/01/25 – AMBAC Insured | 10/17 at 100.00 | A– | | 2,755,235 | |
| | 15,870 | | Anaheim Public Finance Authority, California, Subordinate Lease Revenue Bonds, Public Improvement Project, Series 1997C, 0.000%, 9/01/20 – AGM Insured | No Opt. Call | AA+ | | 9,236,975 | |
| | | | California Department of Water Resources, Power Supply Revenue Bonds, Series 2002A: | | | | | |
| | 4,000 | | 6.000%, 5/01/15 (Pre-refunded 5/01/12) | 5/12 at 101.00 | Aaa | | 4,261,960 | |
| | 3,175 | | 5.375%, 5/01/22 (Pre-refunded 5/01/12) | 5/12 at 101.00 | Aaa | | 3,363,055 | |
| | 3,365 | | California Health Facilities Financing Authority, Health Facility Revenue Bonds, Adventist Health System/West, Series 2003A, 5.000%, 3/01/33 | 3/13 at 100.00 | A | | 3,006,964 | |
| | | | California Health Facilities Financing Authority, Revenue Bonds, Kaiser Permanante System, Series 2006: | | | | | |
| | 5,000 | | 5.000%, 4/01/37 | 4/16 at 100.00 | A+ | | 4,276,500 | |
| | 7,000 | | 5.250%, 4/01/39 | 4/16 at 100.00 | A+ | | 6,155,590 | |
| | 2,380 | | California Infrastructure Economic Development Bank, Revenue Bonds, J. David Gladstone Institutes, Series 2001, 5.250%, 10/01/34 | 10/11 at 101.00 | A– | | 2,089,164 | |
| | 2,330 | | California Municipal Finance Authority, Revenue Bonds, Eisenhower Medical Center, Series 2010A, 5.750%, 7/01/40 | 7/20 at 100.00 | Baa1 | | 2,096,930 | |
| | 3,700 | | California Pollution Control Financing Authority, Revenue Bonds, Pacific Gas and Electric Company, Series 2004C, 4.750%, 12/01/23 – FGIC Insured (Alternative Minimum Tax) | 6/17 at 100.00 | A3 | | 3,672,842 | |
| | 5,000 | | California State, General Obligation Bonds, Series 2005, 5.000%, 3/01/31 | 3/16 at 100.00 | A1 | | 4,916,300 | |
| | 16,000 | | California State, Various Purpose General Obligation Bonds, Series 2007, 5.000%, 6/01/37 | 6/17 at 100.00 | A1 | | 14,971,360 | |
| | 6,435 | | California, General Obligation Refunding Bonds, Series 2002, 6.000%, 4/01/16 – AMBAC Insured | No Opt. Call | A1 | | 7,566,402 | |
| | 5,000 | | Coast Community College District, Orange County, California, General Obligation Bonds, Series 2006C, 0.000%, 8/01/32 – AGM Insured | 8/18 at 100.00 | AA+ | | 4,094,700 | |
| | 7,240 | | Desert Community College District, Riverside County, California, General Obligation Bonds, Election 2004 Series 2007C, 0.000%, 8/01/28 – AGM Insured | 8/17 at 56.01 | AA+ | | 2,295,080 | |
| | Principal | | | Optional Call | | | | |
| | Amount (000) | | Description (1) | Provisions (2) | Ratings (3) | | Value | |
| | | | California (continued) | | | | | |
| $ | 10,000 | | Golden State Tobacco Securitization Corporation, California, Tobacco Settlement Asset-Backed Bonds, Series 2003A-1, 6.750%, 6/01/39 (Pre-refunded 6/01/13) | 6/13 at 100.00 | AAA | $ | 11,231,800 | |
| | | | Golden State Tobacco Securitization Corporation, California, Tobacco Settlement Asset-Backed Bonds, Series 2007A-1: | | | | | |
| | 2,500 | | 4.500%, 6/01/27 | 6/17 at 100.00 | BBB– | | 1,876,425 | |
| | 1,500 | | 5.125%, 6/01/47 | 6/17 at 100.00 | Baa3 | | 915,225 | |
| | 10,000 | | Golden State Tobacco Securitization Corporation, California, Tobacco Settlement Asset-Backed Bonds, Series 2007A-2, 0.000%, 6/01/37 | 6/22 at 100.00 | Baa3 | | 5,725,900 | |
| | 5,000 | | Los Angeles Community College District, California, General Obligation Bonds, Series 2007C, 5.000%, 8/01/32 – FGIC Insured | 8/17 at 100.00 | Aa1 | | 4,964,050 | |
| | | | Los Angeles Department of Water and Power, California, Waterworks Revenue Bonds, Series 2003A: | | | | | |
| | 3,390 | | 5.000%, 7/01/38 – FGIC Insured | 7/12 at 100.00 | AA | | 3,367,321 | |
| | 5,500 | | 5.125%, 7/01/40 – FGIC Insured | 7/12 at 100.00 | AA | | 5,507,095 | |
| | 2,495 | | Los Angeles Department of Water and Power, California, Waterworks Revenue Bonds, Series 2009A, 5.375%, 7/01/34 | No Opt. Call | AA | | 2,586,816 | |
| | 3,300 | | M-S-R Energy Authority, California, Gas Revenue Bonds, Series 2009B, 6.500%, 11/01/39 | No Opt. Call | A | | 3,404,676 | |
| | 1,000 | | Mt. Diablo Hospital District, California, Insured Hospital Revenue Bonds, Series 1993A, 5.125%, 12/01/23 – AMBAC Insured (ETM) | 7/11 at 100.00 | N/R (4) | | 1,111,640 | |
| | 13,450 | | Ontario Redevelopment Financing Authority, San Bernardino County, California, Revenue Refunding Bonds, Redevelopment Project 1, Series 1995, 7.200%, 8/01/17 – NPFG Insured | No Opt. Call | Baa1 | | 15,123,449 | |
| | 2,325 | | Palmdale Community Redevelopment Agency, California, Restructured Single Family Mortgage Revenue Bonds, Series 1986D, 8.000%, 4/01/16 (Alternative Minimum Tax) (ETM) | No Opt. Call | AAA | | 2,930,314 | |
| | 4,795 | | Palomar Pomerado Health, California, General Obligation Bonds, Election of 2004, Series 2007A, 5.000%, 8/01/32 – NPFG Insured | No Opt. Call | A+ | | 4,509,410 | |
| | 1,830 | | San Diego Public Facilities Financing Authority, California, Water Utility Revenue Bonds, Tender Option Bond Trust 3504, 19.580%, 2/01/33 (IF) | 8/19 at 100.00 | Aa2 | | 2,032,105 | |
| | 2,000 | | San Francisco Airports Commission, California, Revenue Refunding Bonds, San Francisco International Airport, Second Series 2001, Issue 27B, 5.125%, 5/01/26 – FGIC Insured | 11/11 at 100.00 | A1 | | 2,000,700 | |
| | | | San Joaquin Hills Transportation Corridor Agency, Orange County, California, Toll Road Revenue Refunding Bonds, Series 1997A: | | | | | |
| | 7,210 | | 0.000%, 1/15/23 – NPFG Insured | No Opt. Call | Baa1 | | 2,816,370 | |
| | 12,500 | | 0.000%, 1/15/32 – NPFG Insured | No Opt. Call | Baa1 | | 1,726,625 | |
| | 3,000 | | 0.000%, 1/15/35 – NPFG Insured | No Opt. Call | Baa1 | | 307,590 | |
| | 4,005 | | San Mateo Union High School District, San Mateo County, California, General Obligation Bonds, Election of 2000, Series 2002B, 0.000%, 9/01/26 – FGIC Insured | No Opt. Call | Aa1 | | 1,610,090 | |
| | 2,875 | | Tobacco Securitization Authority of Northern California, Tobacco Settlement Asset-Backed Bonds, Series 2005A-1, 4.750%, 6/01/23 | 6/15 at 100.00 | BBB | | 2,430,151 | |
| | 5,245 | | Vacaville Unified School District, California, General Obligation Bonds, Series 2005, 5.000%, 8/01/30 – NPFG Insured | 8/15 at 100.00 | A+ | | 5,225,331 | |
| | 12,000 | | Walnut Valley Unified School District, Los Angeles County, California, General Obligation Refunding Bonds, Series 1997A, 7.200%, 2/01/16 – NPFG Insured | 8/11 at 103.00 | AA– | | 12,553,080 | |
| | 205,915 | | Total California | | | | 168,715,220 | |
| | | | Colorado – 9.8% (6.4% of Total Investments) | | | | | |
| | 5,240 | | Adams 12 Five Star Schools, Adams County, Colorado, General Obligation Bonds, Series 2005, 5.000%, 12/15/24 – AGM Insured | 12/15 at 100.00 | AA+ | | 5,467,678 | |
| | 3,000 | | Colorado Educational and Cultural Facilities Authority, Charter School Revenue Bonds, Peak-to-Peak Charter School, Series 2004, 5.250%, 8/15/34 – SYNCORA GTY Insured | 8/14 at 100.00 | A | | 2,770,560 | |
| | 1,000 | | Colorado Health Facilities Authority, Colorado, Revenue Bonds, Valley View Hospital Association, Series 2007, 5.250%, 5/15/42 | 5/17 at 100.00 | BBB | | 820,420 | |
| | 10,000 | | Colorado Health Facilities Authority, Health Facilities Revenue Bonds, Sisters of Charity of Leavenworth Health Services Corporation, Series 2010A, 5.000%, 1/01/40 | No Opt. Call | AA | | 9,187,700 | |
| | 5,860 | | Colorado Health Facilities Authority, Revenue Refunding Bonds, Catholic Health Initiatives, Series 2001, 5.250%, 9/01/21 (Pre-refunded 9/01/11) | 9/11 at 100.00 | Aa2 (4) | | 5,959,093 | |
| | 4,500 | | Denver City and County, Colorado, Airport System Revenue Refunding Bonds, Series 2001A, 5.500%, 11/15/16 – FGIC Insured (Alternative Minimum Tax) | 11/11 at 100.00 | A+ | | 4,586,895 | |
| | | Nuveen Performance Plus Municipal Fund, Inc. (continued) |
| NPP | | Portfolio of Investments |
April 30, 2011 (Unaudited)
| | Principal | | | Optional Call | | | | |
| | Amount (000) | | Description (1) | Provisions (2) | Ratings (3) | | Value | |
| | | | Colorado (continued) | | | | | |
| $ | 20,000 | | Denver Convention Center Hotel Authority, Colorado, Senior Revenue Bonds, Convention Center Hotel, Series 2003A, 5.000%, 12/01/33 (Pre-refunded 12/01/13) – SYNCORA GTY Insured | 12/13 at 100.00 | N/R (4) | $ | 22,009,600 | |
| | 13,055 | | E-470 Public Highway Authority, Colorado, Senior Revenue Bonds, Series 1997B, 0.000%, 9/01/21 – NPFG Insured | No Opt. Call | Baa1 | | 6,626,718 | |
| | | | E-470 Public Highway Authority, Colorado, Senior Revenue Bonds, Series 2000B: | | | | | |
| | 16,200 | | 0.000%, 9/01/32 – NPFG Insured | No Opt. Call | Baa1 | | 3,100,842 | |
| | 33,120 | | 0.000%, 9/01/33 – NPFG Insured | No Opt. Call | Baa1 | | 5,841,706 | |
| | | | E-470 Public Highway Authority, Colorado, Toll Revenue Bonds, Series 2004A: | | | | | |
| | 5,000 | | 0.000%, 9/01/28 – NPFG Insured | No Opt. Call | Baa1 | | 1,337,850 | |
| | 18,500 | | 0.000%, 3/01/36 – NPFG Insured | No Opt. Call | Baa1 | | 2,592,590 | |
| | 755 | | Jefferson County School District R1, Colorado, General Obligation Bonds, Series 2004, 5.000%, 12/15/22 (Pre-refunded 12/15/14) – AGM Insured (UB) | 12/14 at 100.00 | AA+ | | 862,119 | |
| | | | Regional Transportation District, Colorado, Denver Transit Partners Eagle P3 Project Private Activity Bonds, Series 2010: | | | | | |
| | 5,000 | | 6.500%, 1/15/30 | 7/20 at 100.00 | Baa3 | | 5,054,550 | |
| | 3,750 | | 6.000%, 1/15/41 | 7/20 at 100.00 | Baa3 | | 3,435,488 | |
| | 1,905 | | University of Colorado Hospital Authority, Revenue Bonds, Series 1999A, 5.000%, 11/15/29 – AMBAC Insured | 5/11 at 100.00 | A3 | | 1,775,174 | |
| | 146,885 | | Total Colorado | | | | 81,428,983 | |
| | | | District of Columbia – 1.5% (1.0% of Total Investments) | | | | | |
| | 4,545 | | District of Columbia Tobacco Settlement Corporation, Tobacco Settlement Asset-Backed Bonds, Series 2001, 6.250%, 5/15/24 | 5/11 at 101.00 | BBB | | 4,357,337 | |
| | 4,245 | | District of Columbia, Revenue Bonds, National Public Radio, Series 2010A, 5.000%, 4/01/43 | 4/15 at 100.00 | AA– | | 4,049,772 | |
| | 5,000 | | Washington Convention Center Authority, District of Columbia, Dedicated Tax Revenue Bonds, Senior Lien Refunding Series 2007A, 4.500%, 10/01/30 – AMBAC Insured | 10/16 at 100.00 | A1 | | 4,430,550 | |
| | 13,790 | | Total District of Columbia | | | | 12,837,659 | |
| | | | Florida – 7.4% (4.9% of Total Investments) | | | | | |
| | 1,700 | | Beacon Tradeport Community Development District, Miami-Dade County, Florida, Special Assessment Bonds, Commercial Project, Series 2002A, 5.625%, 5/01/32 – RAAI Insured | 5/12 at 102.00 | N/R | | 1,444,762 | |
| | | | Broward County Housing Finance Authority, Florida, Multifamily Housing Revenue Bonds, Venice Homes Apartments, Series 2001A: | | | | | |
| | 1,545 | | 5.700%, 1/01/32 – AGM Insured (Alternative Minimum Tax) | 7/11 at 100.00 | AA+ | | 1,544,876 | |
| | 1,805 | | 5.800%, 1/01/36 – AGM Insured (Alternative Minimum Tax) | 7/11 at 100.00 | AA+ | | 1,804,910 | |
| | 5,300 | | Escambia County Health Facilities Authority, Florida, Revenue Bonds, Ascension Health Credit Group, Series 2003A, 5.250%, 11/15/14 | No Opt. Call | AA+ | | 5,923,174 | |
| | 3,865 | | Florida Housing Finance Corporation, Homeowner Mortgage Revenue Bonds, Series 2006-2, 4.950%, 7/01/37 (Alternative Minimum Tax) | 1/16 at 100.00 | AA+ | | 3,732,740 | |
| | 7,000 | | Hillsborough County Aviation Authority, Florida, Revenue Bonds, Tampa International Airport, Series 2003A, 5.250%, 10/01/17 – NPFG Insured (Alternative Minimum Tax) | 10/13 at 100.00 | Aa3 | | 7,350,420 | |
| | 805 | | Jacksonville, Florida, Capital Improvement Revenue Bonds, Series 1998 Refunding, Stadium Project, 4.750%, 10/01/25 – AMBAC Insured | 7/11 at 100.00 | N/R | | 753,383 | |
| | 10,000 | | JEA, Florida, Electric System Revenue Bonds, Series Three 2006A, 5.000%, 10/01/41 – AGM Insured (UB) | 4/15 at 100.00 | AA+ | | 9,800,400 | |
| | 10,750 | | Martin County Industrial Development Authority, Florida, Industrial Development Revenue Bonds, Indiantown Cogeneration LP, Series 1994A, 7.875%, 12/15/25 (Alternative Minimum Tax) | 6/11 at 100.00 | BB+ | | 10,803,750 | |
| | 2,570 | | Miami-Dade County Housing Finance Authority, Florida, Multifamily Mortgage Revenue Bonds, Country Club Villas II Project, Series 2001-1A, 5.850%, 1/01/37 – AGM Insured (Alternative Minimum Tax) | 6/11 at 100.00 | AA+ | | 2,571,105 | |
| | 3,500 | | Miami-Dade County, Florida, Aviation Revenue Bonds, Miami International Airport, Series 2005A, 5.000%, 10/01/37 – SYNCORA GTY Insured (Alternative Minimum Tax) | 10/15 at 100.00 | A2 | | 2,919,805 | |
| | 5,000 | | Miami-Dade County, Florida, Aviation Revenue Bonds, Miami International Airport, Series 2010A-1, 5.375%, 10/01/41 | 10/20 at 100.00 | A2 | | 4,764,150 | |
| | 2,500 | | Miami-Dade County, Florida, Aviation Revenue Bonds, Miami International Airport, Series 2010B, 5.000%, 10/01/27 | 10/20 at 100.00 | A2 | | 2,490,200 | |
| | Principal | | | Optional Call | | | | |
| | Amount (000) | | Description (1) | Provisions (2) | Ratings (3) | | Value | |
| | | | Florida (continued) | | | | | |
| | | | Port Saint Lucie, Florida, Special Assessment Revenue Bonds, Southwest Annexation District 1B, Series 2007: | | | | | |
| $ | 2,000 | | 5.000%, 7/01/33 – NPFG Insured | 7/17 at 100.00 | Baa1 | $ | 1,650,040 | |
| | 4,700 | | 5.000%, 7/01/40 – NPFG Insured | 7/17 at 100.00 | Baa1 | | 3,757,039 | |
| | 63,040 | | Total Florida | | | | 61,310,754 | |
| | | | Georgia – 1.1% (0.7% of Total Investments) | | | | | |
| | 5,000 | | Atlanta, Georgia, Water and Wastewater Revenue Bonds, Series 1999A, 5.500%, 11/01/22 – FGIC Insured | No Opt. Call | A1 | | 5,495,250 | |
| | 2,000 | | DeKalb County Hospital Authority, Georgia, Anticipation Certificates Revenue Bonds, DeKalb Medical Center, Inc. Project, Series 2010, 6.000%, 9/01/30 | 9/20 at 100.00 | N/R | | 1,875,980 | |
| | 2,000 | | George L. Smith II World Congress Center Authority, Atlanta, Georgia, Revenue Refunding Bonds, Domed Stadium Project, Series 2000, 5.500%, 7/01/20 – NPFG Insured (Alternative Minimum Tax) | 7/11 at 100.00 | Baa1 | | 2,004,640 | |
| | 9,000 | | Total Georgia | | | | 9,375,870 | |
| | | | Idaho – 0.1% (0.0% of Total Investments) | | | | | |
| | 230 | | Idaho Housing and Finance Association, Single Family Mortgage Bonds, Series 2000D, 6.200%, 7/01/14 (Alternative Minimum Tax) | 7/11 at 100.00 | Aa3 | | 234,474 | |
| | 275 | | Idaho Housing and Finance Association, Single Family Mortgage Bonds, Series 2000G-2, 5.950%, 7/01/25 (Alternative Minimum Tax) | 7/11 at 100.00 | Aa2 | | 286,652 | |
| | 505 | | Total Idaho | | | | 521,126 | |
| | | | Illinois – 26.2% (17.2% of Total Investments) | | | | | |
| | 10,000 | | Chicago Board of Education, Illinois, Unlimited Tax General Obligation Bonds, Dedicated Tax Revenues, Series 1998B-1, 0.000%, 12/01/19 – FGIC Insured | No Opt. Call | Aa2 | | 6,491,300 | |
| | 10,000 | | Chicago Board of Education, Illinois, Unlimited Tax General Obligation Bonds, Dedicated Tax Revenues, Series 1999A, 0.000%, 12/01/20 – FGIC Insured | No Opt. Call | Aa2 | | 6,073,800 | |
| | | | Chicago, Illinois, General Obligation Bonds, City Colleges, Series 1999: | | | | | |
| | 32,170 | | 0.000%, 1/01/21 – FGIC Insured | No Opt. Call | Aa3 | | 19,124,100 | |
| | 32,670 | | 0.000%, 1/01/22 – FGIC Insured | No Opt. Call | Aa3 | | 18,044,948 | |
| | 9,240 | | Chicago, Illinois, Revenue Bonds, Midway Airport, Series 1996A, 5.500%,
1/01/29 – NPFG Insured | 7/11 at 100.00 | A | | 9,241,386 | |
| | 1,665 | | Chicago, Illinois, Third Lien General Airport Revenue Bonds, O’Hare International Airport, Series 2005A, 5.000%, 1/01/33 – FGIC Insured | 1/16 at 100.00 | A1 | | 1,547,268 | |
| | 5,325 | | Cook County, Illinois, General Obligation Bonds, Refunding Series 2010A, 5.250%, 11/15/33 | 11/20 at 100.00 | AA | | 5,340,709 | |
| | | | DuPage County Forest Preserve District, Illinois, General Obligation Bonds, Series 2000: | | | | | |
| | 8,000 | | 0.000%, 11/01/18 | No Opt. Call | AAA | | 6,193,600 | |
| | 15,285 | | 0.000%, 11/01/19 | No Opt. Call | AAA | | 11,180,825 | |
| | 5,000 | | Illinois Educational Facilities Authority, Revenue Bonds, University of Chicago, Refunding Series 2003A, 5.000%, 7/01/33 | 7/13 at 100.00 | Aa1 | | 5,017,500 | |
| | 1,500 | | Illinois Finance Authority, Revenue Bonds, Central DuPage Health, Series 2009B, 5.500%, 11/01/39 | 11/19 at 100.00 | AA | | 1,433,595 | |
| | 2,000 | | Illinois Finance Authority, Revenue Bonds, Children’s Memorial Hospital, Series 2008A, 5.250%, 8/15/47 – AGC Insured (UB) | 8/18 at 100.00 | AA+ | | 1,759,680 | |
| | 5,245 | | Illinois Finance Authority, Revenue Bonds, Loyola University of Chicago, Tender Option Bond Trust 1137, 9.156%, 7/01/15 (IF) | No Opt. Call | Aa1 | | 4,889,074 | |
| | 3,000 | | Illinois Finance Authority, Revenue Bonds, Memorial Health System, Series 2009, 5.500%, 4/01/34 | No Opt. Call | A+ | | 2,828,550 | |
| | 1,000 | | Illinois Finance Authority, Revenue Bonds, University of Chicago, Series 2004A, 5.000%, 7/01/34 | 7/14 at 100.00 | Aa1 | | 999,250 | |
| | 2,250 | | Illinois Finance Authority, Revenue Refunding Bonds, Silver Cross Hospital and Medical Centers, Series 2008A, 6.000%, 8/15/23 | 8/18 at 100.00 | BBB | | 2,247,638 | |
| | 4,990 | | Illinois Finance Authority, Student Housing Revenue Bonds, Educational Advancement Fund Inc., Refunding Series 2007A, 5.250%, 5/01/34 | 5/17 at 100.00 | Baa3 | | 4,062,060 | |
| | 4,590 | | Illinois Health Facilities Authority, FHA-Insured Mortgage Revenue Refunding Bonds, Sinai Health System, Series 2003, 5.150%, 2/15/37 | 8/13 at 100.00 | Aa2 | | 4,318,456 | |
| | 1,195 | | Illinois Health Facilities Authority, Revenue Bonds, Lake Forest Hospital, Series 2002A, 5.750%, 7/01/29 | 7/12 at 100.00 | AA+ | | 1,206,890 | |
| | | Nuveen Performance Plus Municipal Fund, Inc. (continued) |
| NPP | | Portfolio of Investments |
April 30, 2011 (Unaudited)
| | Principal | | | Optional Call | | | | |
| | Amount (000) | | Description (1) | Provisions (2) | Ratings (3) | | Value | |
| | | | Illinois (continued) | | | | | |
| $ | 3,610 | | Illinois Health Facilities Authority, Revenue Bonds, Lake Forest Hospital, Series 2003, 6.000%, 7/01/33 | 7/13 at 100.00 | AA+ | $ | 3,628,555 | |
| | 2,320 | | Illinois Health Facilities Authority, Revenue Bonds, Silver Cross Hospital and Medical Centers, Series 1999, 5.250%, 8/15/15 | 7/11 at 100.00 | BBB | | 2,328,213 | |
| | 7,250 | | Kane, Kendall, LaSalle, and Will Counties, Illinois, Community College District 516, General Obligation Bonds, Series 2005E, 0.000%, 12/15/24 – FGIC Insured | 12/13 at 57.71 | AA+ | | 3,335,508 | |
| | 5,000 | | Metropolitan Pier and Exposition Authority, Illinois, Revenue Bonds, McCormick Place Expansion Project, Series 2002A, 5.250%, 6/15/42 – NPFG Insured | 6/12 at 101.00 | AAA | | 4,663,250 | |
| | 10,650 | | Metropolitan Pier and Exposition Authority, Illinois, Revenue Bonds, McCormick Place Hospitality Facility, Series 1996A, 7.000%, 7/01/26 (ETM) | No Opt. Call | AAA | | 14,091,122 | |
| | | | Metropolitan Pier and Exposition Authority, Illinois, Revenue Refunding Bonds, McCormick Place Expansion Project, Series 1996A: | | | | | |
| | 9,400 | | 0.000%, 12/15/18 – NPFG Insured | No Opt. Call | A2 | | 6,645,142 | |
| | 16,570 | | 0.000%, 12/15/20 – NPFG Insured | No Opt. Call | A2 | | 10,208,280 | |
| | 23,550 | | 0.000%, 12/15/22 – NPFG Insured | No Opt. Call | A2 | | 12,636,695 | |
| | 13,190 | | 0.000%, 12/15/24 – NPFG Insured | No Opt. Call | A2 | | 6,132,954 | |
| | 5,100 | | Metropolitan Pier and Exposition Authority, Illinois, Revenue Refunding Bonds, McCormick Place Expansion Project, Series 1998A, 5.500%, 12/15/23 – FGIC Insured | No Opt. Call | AAA | | 5,466,333 | |
| | 5,180 | | Metropolitan Pier and Exposition Authority, Illinois, Revenue Refunding Bonds, McCormick Place Expansion Project, Series 1998A, 5.500%, 12/15/23 – FGIC Insured (ETM) | No Opt. Call | A2 (4) | | 6,098,103 | |
| | 3,000 | | Metropolitan Pier and Exposition Authority, Illinois, Revenue Refunding Bonds, McCormick Place Expansion Project, Series 2002B, 5.750%, 6/15/23 – NPFG Insured | 6/12 at 101.00 | AAA | | 3,137,310 | |
| | 2,685 | | Midlothian, Illinois, General Obligation Bonds, Series 2010A, 5.000%, 2/01/30 – AGM Insured | 2/20 at 100.00 | AA+ | | 2,553,032 | |
| | 17,865 | | Regional Transportation Authority, Cook, DuPage, Kane, Lake, McHenry and Will Counties, Illinois, General Obligation Bonds, Series 1999, 5.750%, 6/01/23 – AGM Insured | No Opt. Call | AA+ | | 19,301,345 | |
| | 10,000 | | Will County Community High School District 210 Lincoln-Way, Illinois, General Obligation Bonds, Series 2006, 0.000%, 1/01/23 – AGM Insured | No Opt. Call | Aa2 | | 5,230,600 | |
| | 290,495 | | Total Illinois | | | | 217,457,071 | |
| | | | Indiana – 3.1% (2.0% of Total Investments) | | | | | |
| | 2,465 | | Danville Multi-School Building Corporation, Indiana, First Mortgage Refunding Bonds, Series 2001, 5.250%, 7/15/18 – AMBAC Insured | 7/11 at 100.00 | A | | 2,482,871 | |
| | 3,000 | | Hospital Authority of Delaware County, Indiana, Hospital Revenue Bonds, Cardinal Health System, Series 2006, 5.250%, 8/01/36 | 8/16 at 100.00 | Baa3 | | 2,563,800 | |
| | 750 | | Indiana Health Facility Financing Authority, Hospital Revenue Bonds, Clarian Health Obligation Group, Series 2006B, 5.000%, 2/15/23 | 2/16 at 100.00 | A+ | | 754,200 | |
| | 1,900 | | Indiana Health Facility Financing Authority, Hospital Revenue Refunding Bonds, Columbus Regional Hospital, Series 1993, 7.000%, 8/15/15 – AGM Insured | No Opt. Call | AA+ | | 2,112,743 | |
| | 4,320 | | Indiana Health Facility Financing Authority, Revenue Bonds, Ancilla Systems Inc. Obligated Group, Series 1997, 5.250%, 7/01/22 – NPFG Insured (ETM) | 7/11 at 100.00 | BBB (4) | | 4,334,990 | |
| | 3,000 | | Indiana Health Facility Financing Authority, Revenue Bonds, Community Foundation of Northwest Indiana, Series 2007, 5.500%, 3/01/37 | 3/17 at 100.00 | BBB+ | | 2,706,030 | |
| | 2,000 | | Indiana Health Facility Financing Authority, Revenue Bonds, Community Hospitals of Indiana, Series 2005A, 5.000%, 5/01/35 – AMBAC Insured | 5/15 at 100.00 | A | | 1,751,900 | |
| | 3,105 | | Indiana University, Student Fee Revenue Bonds, Series 2003O, 5.250%, 8/01/20 – FGIC Insured | 8/13 at 100.00 | Aaa | | 3,343,526 | |
| | 1,000 | | Marion County Convention and Recreational Facilities Authority, Indiana, Excise Taxes Lease Rental Revenue Refunding Senior Bonds, Series 2001A, 5.000%, 6/01/21 – NPFG Insured | 6/11 at 100.00 | Baa1 | | 1,003,790 | |
| | 2,395 | | Shelbyville Central Renovation School Building Corporation, Indiana, First Mortgage Bonds, Series 2005, 4.375%, 7/15/26 – NPFG Insured | 7/15 at 100.00 | AA+ | | 2,397,611 | |
| | 1,800 | | Sunman Dearborn High School Building Corporation, Indiana, First Mortgage Bonds, Series 2005, 5.000%, 7/15/25 – NPFG Insured | 1/15 at 100.00 | AA+ | | 1,856,394 | |
| | 25,735 | | Total Indiana | | | | 25,307,855 | |
| | Principal | | | Optional Call | | | | |
| | Amount (000) | | Description (1) | Provisions (2) | Ratings (3) | | Value | |
| | | | Iowa – 2.4% (1.6% of Total Investments) | | | | | |
| $ | 1,500 | | Iowa Finance Authority, Health Facility Revenue Bonds, Care Initiatives Project, Series 2006A, 5.500%, 7/01/21 | 7/16 at 100.00 | BB+ | $ | 1,311,255 | |
| | | | Iowa Tobacco Settlement Authority, Asset Backed Settlement Revenue Bonds, Series 2005C: | | | | | |
| | 5,000 | | 5.375%, 6/01/38 | 6/15 at 100.00 | BBB | | 3,546,550 | |
| | 4,440 | | 5.500%, 6/01/42 | 6/15 at 100.00 | BBB | | 3,039,757 | |
| | 5,400 | | 5.625%, 6/01/46 | 6/15 at 100.00 | BBB | | 3,641,544 | |
| | 4,500 | | Iowa Tobacco Settlement Authority, Tobacco Asset-Backed Revenue Bonds, Series 2005B, 5.600%, 6/01/34 | 6/17 at 100.00 | BBB | | 3,592,800 | |
| | 5,000 | | Iowa Tobacco Settlement Authority, Tobacco Settlement Asset-Backed Revenue Bonds, Series 2001B, 5.600%, 6/01/35 (Pre-refunded 6/01/11) | 6/11 at 101.00 | AAA | | 5,073,550 | |
| | 25,840 | | Total Iowa | | | | 20,205,456 | |
| | | | Kansas – 1.1% (0.7% of Total Investments) | | | | | |
| | 3,790 | | Kansas Department of Transportation, Highway Revenue Bonds, Series 2004A, 5.000%, 3/01/23 (UB) | 3/14 at 100.00 | AAA | | 4,081,489 | |
| | 3,200 | | Wyandotte County Unified School District 500, Kansas, General Obligation Bonds, Series 2001, 4.000%, 9/01/21 (Pre-refunded 9/01/11) – AGM Insured | 9/11 at 100.00 | AA+ (4) | | 3,240,544 | |
| | 3,730 | | Wyandotte County-Kansas City Unified Government, Kansas, Sales Tax Special Obligation Capital Appreciation Revenue Bonds Redevelopment Project Area
B – Major Multi-Sport Athletic Complex Project, Subordinate Lien Series 2010B, 0.000%, 6/01/21 | No Opt. Call | N/R | | 2,066,308 | |
| | 10,720 | | Total Kansas | | | | 9,388,341 | |
| | | | Louisiana – 3.4% (2.2% of Total Investments) | | | | | |
| | 420 | | East Baton Rouge Mortgage Finance Authority, Louisiana, GNMA/FNMA Mortgage-Backed Securities Program Single Family Mortgage Revenue Refunding Bonds, Series 1997B-1, 5.750%, 10/01/26 | 10/11 at 100.00 | Aaa | | 420,265 | |
| | 4,000 | | Lafayette City and Parish, Louisiana, Utilities Revenue Bonds, Series 2004, 5.250%, 11/01/25 – NPFG Insured | 11/14 at 100.00 | A+ | | 4,190,560 | |
| | 4,750 | | Louisiana Public Facilities Authority, Revenue Bonds, Baton Rouge General Hospital, Series 2004, 5.250%, 7/01/33 – NPFG Insured | 7/14 at 100.00 | Baa1 | | 4,682,313 | |
| | 1,000 | | Louisiana State University and Agricultural and Mechanical College Board of Supervisors, Auxiliary Revenue Bonds, University Health Sciences Center Projects, Series 2000, 6.375%, 5/01/31 – NPFG Insured | 5/12 at 100.00 | Baa1 | | 1,007,800 | |
| | | | Tobacco Settlement Financing Corporation, Louisiana, Tobacco Settlement Asset-Backed Bonds, Series 2001B: | | | | | |
| | 9,100 | | 5.500%, 5/15/30 | 5/11 at 101.00 | A | | 8,983,520 | |
| | 9,485 | | 5.875%, 5/15/39 | 5/11 at 101.00 | A– | | 8,656,296 | |
| | 28,755 | | Total Louisiana | | | | 27,940,754 | |
| | | | Maine – 0.7% (0.4% of Total Investments) | | | | | |
| | 5,680 | | Portland, Maine, Airport Revenue Bonds, Series 2003A, 5.000%, 7/01/32 – AGM Insured | 7/13 at 100.00 | AA+ | | 5,563,333 | |
| | | | Maryland – 1.6% (1.1% of Total Investments) | | | | | |
| | 2,550 | | Maryland Health and Higher Educational Facilities Authority, Revenue Bonds, Washington County Hospital, Series 2008, 6.000%, 1/01/28 | No Opt. Call | BBB– | | 2,497,190 | |
| | 7,720 | | Maryland Transportation Authority, Airport Parking Revenue Bonds, Baltimore-Washington International Airport Passenger Facility, Series 2002B, 5.125%, 3/01/20 – AMBAC Insured (Alternative Minimum Tax) | 3/12 at 101.00 | A2 | | 7,865,676 | |
| | 3,010 | | Takoma Park, Maryland, Hospital Facilities Revenue Refunding and Improvement Bonds, Washington Adventist Hospital, Series 1995, 6.500%, 9/01/12 – AGM Insured (ETM) | No Opt. Call | AA+ (4) | | 3,151,109 | |
| | 13,280 | | Total Maryland | | | | 13,513,975 | |
| | | Nuveen Performance Plus Municipal Fund, Inc. (continued) |
| NPP | | Portfolio of Investments |
April 30, 2011 (Unaudited)
| | Principal | | | Optional Call | | | | |
| | Amount (000) | | Description (1) | Provisions (2) | Ratings (3) | | Value | |
| | | | Massachusetts – 4.6% (3.0% of Total Investments) | | | | | |
| $ | 6,250 | | Massachusetts Department of Transportation, Metropolitan Highway System Revenue Bonds, Senior Lien Series 2010B, 5.000%, 1/01/37 | 1/20 at 100.00 | A | $ | 5,971,250 | |
| | | | Massachusetts Development Finance Authority, Revenue Bonds, 100 Cambridge Street Redevelopment, M/SRBC Project, Series 2002A: | | | | | |
| | 4,000 | | 5.125%, 8/01/28 – NPFG Insured | 2/12 at 100.00 | Baa1 | | 3,941,160 | |
| | 5,625 | | 5.125%, 2/01/34 – NPFG Insured | 2/12 at 100.00 | Baa1 | | 5,111,775 | |
| | 8,730 | | Massachusetts Health and Educational Facilities Authority, Revenue Bonds, Berkshire Health System, Series 2005F, 5.000%, 10/01/19 – AGC Insured | 10/15 at 100.00 | AA+ | | 9,097,271 | |
| | 500 | | Massachusetts Health and Educational Facilities Authority, Revenue Bonds, CareGroup Inc., Series 2008E-1 &2, 5.125%, 7/01/38 | 7/18 at 100.00 | A3 | | 435,060 | |
| | 1,595 | | Massachusetts Health and Educational Facilities Authority, Revenue Bonds, Southcoast Health System Obligated Group, Series 1998A, 4.750%, 7/01/27 – NPFG Insured | 7/11 at 100.00 | A2 | | 1,422,214 | |
| | 5,745 | | Massachusetts Industrial Finance Agency, Resource Recovery Revenue Refunding Bonds, Ogden Haverhill Project, Series 1998A, 5.600%, 12/01/19 (Alternative Minimum Tax) | 6/11 at 100.00 | A– | | 5,759,994 | |
| | 890 | | Massachusetts, General Obligation Bonds, Consolidated Loan, Series 2002C, 5.250%, 11/01/30 (Pre-refunded 11/01/12) | 11/12 at 100.00 | Aa1 (4) | | 952,798 | |
| | | | Massachusetts, General Obligation Bonds, Consolidated Loan, Series 2002E: | | | | | |
| | 1,255 | | 5.250%, 1/01/22 (Pre-refunded 1/01/13) – FGIC Insured | 1/13 at 100.00 | Aa1 (4) | | 1,349,865 | |
| | 3,745 | | 5.250%, 1/01/22 (Pre-refunded 1/01/13) – FGIC Insured | 1/13 at 100.00 | Aa1 (4) | | 4,028,085 | |
| | 38,335 | | Total Massachusetts | | | | 38,069,472 | |
| | | | Michigan – 3.9% (2.5% of Total Investments) | | | | | |
| | 5,000 | | Detroit, Michigan, Second Lien Sewerage Disposal System Revenue Bonds, Series 2005A, 5.000%, 7/01/35 – NPFG Insured | 7/15 at 100.00 | A | | 4,489,050 | |
| | 2,000 | | Kalamazoo Hospital Finance Authority, Michigan, Hospital Revenue Refunding Bonds, Bronson Methodist Hospital, Series 2010, 5.250%, 5/15/36 – AGM Insured | 5/20 at 100.00 | Aa3 | | 1,869,340 | |
| | 1,430 | | Michigan State Building Authority, Revenue Bonds, Facilities Program, Series 2001I, 5.000%, 10/15/24 | 10/11 at 100.00 | Aa3 | | 1,434,347 | |
| | 70 | | Michigan State Building Authority, Revenue Bonds, Facilities Program, Series 2001I, 5.000%, 10/15/24 (Pre-refunded 10/15/11) | 10/11 at 100.00 | A+ (4) | | 71,481 | |
| | 6,250 | | Michigan State Building Authority, Revenue Bonds, Refunding Series 2006IA, 0.000%, 10/15/30 – FGIC Insured | 10/16 at 50.02 | Aa3 | | 1,813,875 | |
| | 5,000 | | Michigan State Building Authority, Revenue Refunding Bonds, Facilities Program, Series 2003II, 5.000%, 10/15/29 – NPFG Insured | 10/13 at 100.00 | Aa3 | | 5,004,450 | |
| | 7,115 | | Michigan State Hospital Finance Authority, Hospital Revenue Refunding Bonds, Henry Ford Health System, Series 2003A, 5.500%, 3/01/16 (Pre-refunded 3/01/13) | 3/13 at 100.00 | A1 (4) | | 7,749,516 | |
| | 3,070 | | Michigan Strategic Fund, Collateralized Limited Obligation Pollution Control Revenue Refunding Bonds, Detroit Edison Company, Series 1999A, 5.550%, 9/01/29 – NPFG Insured (Alternative Minimum Tax) | 9/11 at 100.00 | A | | 3,070,675 | |
| | 3,050 | | Michigan Tobacco Settlement Finance Authority, Tobacco Settlement Asset-Backed Revenue Bonds, Series 2008A, 6.875%, 6/01/42 | 6/18 at 100.00 | Baa3 | | 2,689,551 | |
| | 2,500 | | Royal Oak Hospital Finance Authority, Michigan, Hospital Revenue and Refunding Bonds, William Beaumont Hospital Obligated Group, Series 2009W, 6.375%, 8/01/29 | 8/19 at 100.00 | A1 | | 2,563,325 | |
| | 1,150 | | Royal Oak Hospital Finance Authority, Michigan, Hospital Revenue Bonds, William Beaumont Hospital, Refunding Series 2009V, 8.250%, 9/01/39 | 9/18 at 100.00 | A1 | | 1,307,493 | |
| | 36,635 | | Total Michigan | | | | 32,063,103 | |
| | | | Minnesota – 2.5% (1.6% of Total Investments) | | | | | |
| | 17,280 | | St. Paul Housing and Redevelopment Authority, Minnesota, Sales Tax Revenue Refunding Bonds, Civic Center Project, Series 1996, 7.100%, 11/01/23 – AGM Insured | 11/15 at 103.00 | AA+ | | 20,382,623 | |
| | | | Mississippi – 1.5% (1.0% of Total Investments) | | | | | |
| | 9,750 | | Mississippi Business Finance Corporation, Pollution Control Revenue Refunding Bonds, System Energy Resources Inc. Project, Series 1998, 5.875%, 4/01/22 | 10/11 at 100.00 | BBB | | 9,557,340 | |
| | 2,475 | | Mississippi Hospital Equipment and Facilities Authority, Revenue Bonds, Baptist Memorial Healthcare, Series 2004B-1, 5.000%, 9/01/24 (UB) | 9/14 at 100.00 | AA | | 2,511,284 | |
| | 12,225 | | Total Mississippi | | | | 12,068,624 | |
| | Principal | | | Optional Call | | | | |
| | Amount (000) | | Description (1) | Provisions (2) | Ratings (3) | | Value | |
| | | | Missouri – 1.7% (1.1% of Total Investments) | | | | | |
| $ | 2,000 | | Bi-State Development Agency of the Missouri-Illinois Metropolitan District, Mass Transit Sales Tax Appropriation Bonds, Metrolink Cross County Extension Project, Series 2002B, 5.000%, 10/01/32 – AGM Insured | 10/13 at 100.00 | AA+ | $ | 2,007,600 | |
| | 6,350 | | Kansas City, Missouri, Airport Revenue Bonds, General Improvement Projects, Series 2003B, 5.250%, 9/01/17 – FGIC Insured | 9/12 at 100.00 | A+ | | 6,640,068 | |
| | 1,845 | | Missouri Health and Educational Facilities Authority, Revenue Bonds, BJC Health System, Series 2003, 5.250%, 5/15/18 | 5/13 at 100.00 | AA | | 1,955,165 | |
| | 3,815 | | Missouri Health and Educational Facilities Authority, Revenue Bonds, SSM Healthcare System, Series 2001A, 5.250%, 6/01/28 (Pre-refunded 6/01/11) – AMBAC Insured | 6/11 at 101.00 | AA– (4) | | 3,870,050 | |
| | 14,010 | | Total Missouri | | | | 14,472,883 | |
| | | | Montana – 0.6% (0.4% of Total Investments) | | | | | |
| | 280 | | Montana Board of Housing, Single Family Mortgage Bonds, Series 2000A-2, 6.450%, 6/01/29 (Alternative Minimum Tax) | 6/11 at 100.00 | AA+ | | 285,029 | |
| | 4,795 | | Montana Higher Education Student Assistance Corporation, Student Loan Revenue Bonds, Subordinate Series 1998B, 5.500%, 12/01/31 (Alternative Minimum Tax) | 6/11 at 100.00 | A2 | | 4,639,930 | |
| | 5,075 | | Total Montana | | | | 4,924,959 | |
| | | | Nevada – 5.3% (3.5% of Total Investments) | | | | | |
| | 10,900 | | Clark County School District, Nevada, General Obligation Bonds, Series 2002C, 5.500%, 6/15/19 (Pre-refunded 6/15/12) – NPFG Insured | 6/12 at 100.00 | AA (4) | | 11,530,456 | |
| | 24,195 | | Clark County, Nevada, Passenger Facility Charge Revenue Bonds, Las Vegas-McCarran International Airport, Series 2010A, 5.250%, 7/01/42 | 1/20 at 100.00 | Aa3 | | 22,547,562 | |
| | | | Director of Nevada State Department of Business and Industry, Revenue Bonds, Las Vegas Monorail Project, First Tier, Series 2000: | | | | | |
| | 3,500 | | 0.000%, 1/01/21 – AMBAC Insured | No Opt. Call | N/R | | 486,430 | |
| | 2,780 | | 0.000%, 1/01/28 – AMBAC Insured | No Opt. Call | N/R | | 254,231 | |
| | 6,980 | | 5.375%, 1/01/40 – AMBAC Insured (5) | 7/11 at 100.00 | N/R | | 1,750,444 | |
| | 5,000 | | Reno, Nevada, Health Facilities Revenue Bonds, Catholic Healthcare West, Series 2007A, 5.250%, 7/01/31 | 7/17 at 100.00 | A | | 4,686,350 | |
| | 2,500 | | Reno, Nevada, Health Facilities Revenue Bonds, Catholic Healthcare West, Series 2007A, Trust 2634, 18.488%, 7/01/31 – BHAC Insured (IF) | 7/17 at 100.00 | AA+ | | 2,493,100 | |
| | 55,855 | | Total Nevada | | | | 43,748,573 | |
| | | | New Hampshire – 1.9% (1.2% of Total Investments) | | | | | |
| | 5,000 | | New Hampshire Business Finance Authority, Revenue Bonds, Elliot Hospital Obligated Group Issue, Series 2009A, 6.125%, 10/01/39 | 10/19 at 100.00 | BBB+ | | 4,930,150 | |
| | | | New Hampshire Housing Finance Authority, FHLMC Multifamily Housing Remarketed Revenue Bonds, Countryside LP, Series 1994: | | | | | |
| | 3,725 | | 6.000%, 7/01/18 (Alternative Minimum Tax) | 7/11 at 100.50 | Aaa | | 3,766,533 | |
| | 6,945 | | 6.100%, 7/01/24 (Alternative Minimum Tax) | 7/11 at 100.50 | Aaa | | 7,019,312 | |
| | 15,670 | | Total New Hampshire | | | | 15,715,995 | |
| | | | New Jersey – 7.0% (4.6% of Total Investments) | | | | | |
| | 1,500 | | New Jersey Health Care Facilities Financing Authority, New Jersey, Revenue Bonds, Saint Peters University Hospital, Series 2007, 5.750%, 7/01/37 | 7/18 at 100.00 | BBB– | | 1,285,770 | |
| | 2,110 | | New Jersey Higher Education Assistance Authority, Student Loan Revenue Bonds, Series 2000A, 6.000%, 6/01/13 – NPFG Insured (Alternative Minimum Tax) | 6/11 at 100.00 | Aaa | | 2,117,153 | |
| | 4,500 | | New Jersey Transportation Trust Fund Authority, Transportation System Bonds, Series 2001C, 5.500%, 12/15/18 – AGM Insured | No Opt. Call | AA+ | | 5,093,550 | |
| | 9,250 | | New Jersey Transportation Trust Fund Authority, Transportation System Bonds, Series 2003C, 5.500%, 6/15/23 (Pre-refunded 6/15/13) | 6/13 at 100.00 | AAA | | 10,208,670 | |
| | | | New Jersey Transportation Trust Fund Authority, Transportation System Bonds, Series 2006C: | | | | | |
| | 10,000 | | 0.000%, 12/15/30 – FGIC Insured | No Opt. Call | A+ | | 2,749,300 | |
| | 38,000 | | 0.000%, 12/15/33 – AGM Insured | No Opt. Call | AA+ | | 8,219,780 | |
| | 10,000 | | New Jersey Turnpike Authority, Revenue Bonds, Series 2003A, 5.000%, 1/01/20 – AGM Insured (UB) | 7/13 at 100.00 | AA+ | | 10,589,800 | |
| | | Nuveen Performance Plus Municipal Fund, Inc. (continued) |
| NPP | | Portfolio of Investments |
April 30, 2011 (Unaudited)
| | Principal | | | Optional Call | | | | |
| | Amount (000) | | Description (1) | Provisions (2) | Ratings (3) | | Value | |
| | | | New Jersey (continued) | | | | | |
| $ | 8,920 | | Tobacco Settlement Financing Corporation, New Jersey, Tobacco Settlement Asset-Backed Bonds, Series 2002, 5.750%, 6/01/32 (Pre-refunded 6/01/12) | 6/12 at 100.00 | AAA | $ | 9,290,269 | |
| | 4,450 | | Tobacco Settlement Financing Corporation, New Jersey, Tobacco Settlement Asset-Backed Bonds, Series 2003, 6.750%, 6/01/39 (Pre-refunded 6/01/13) | 6/13 at 100.00 | AAA | | 5,007,096 | |
| | 5,000 | | Tobacco Settlement Financing Corporation, New Jersey, Tobacco Settlement Asset-Backed Bonds, Series 2007-1A, 4.750%, 6/01/34 | 6/17 at 100.00 | Baa3 | | 3,105,950 | |
| | 93,730 | | Total New Jersey | | | | 57,667,338 | |
| | | | New York – 5.2% (3.4% of Total Investments) | | | | | |
| | 5,500 | | Dormitory Authority of the State of New York, FHA-Insured Mortgage Revenue Bonds, Kaleida Health, Series 2004, 5.050%, 2/15/25 | 2/14 at 100.00 | AAA | | 5,573,920 | |
| | 1,740 | | Dormitory Authority of the State of New York, Insured Revenue Bonds, 853 Schools Program, Gateway-Longview Inc., Series 1998A, 5.500%, 7/01/18 – AMBAC Insured | 7/11 at 100.00 | N/R | | 1,741,827 | |
| | 1,500 | | Dormitory Authority of the State of New York, Revenue Bonds, St. Barnabas Hospital, Series 1997, 5.450%, 8/01/35 – AMBAC Insured | 8/11 at 100.00 | N/R | | 1,500,015 | |
| | 13,220 | | Metropolitan Transportation Authority, New York, Dedicated Tax Fund Bonds, Series 2002A, 5.500%, 11/15/26 – AGM Insured | 11/12 at 100.00 | AA+ | | 13,742,190 | |
| | 13,600 | | Metropolitan Transportation Authority, New York, Transportation Revenue Bonds, Series 2006B, 4.500%, 11/15/32 – AGM Insured (UB) | 11/16 at 100.00 | AA+ | | 12,692,064 | |
| | 2,000 | | New York City Transitional Finance Authority, New York, Future Tax Secured Bonds, Fiscal Series 2004B, 5.000%, 8/01/24 | 8/13 at 100.00 | AAA | | 2,102,260 | |
| | 3,000 | | New York State Energy Research and Development Authority, Pollution Control Revenue Bonds, Rochester Gas and Electric Corporation, Series 1998A, 5.950%, 9/01/33 – NPFG Insured (Alternative Minimum Tax) | 9/11 at 100.00 | Baa1 | | 2,957,790 | |
| | 2,650 | | Port Authority of New York and New Jersey, Special Project Bonds, JFK International Air Terminal LLC Project, Eigth Series 2010, 6.000%, 12/01/42 | 12/20 at 100.00 | BBB– | | 2,549,830 | |
| | 43,210 | | Total New York | | | | 42,859,896 | |
| | | | North Carolina – 1.7% (1.1% of Total Investments) | | | | | |
| | 5,500 | | Charlotte-Mecklenberg Hospital Authority, North Carolina, Carolinas HealthCare System Revenue Bonds, Series 2008A, 5.000%, 1/15/39 | 1/18 at 100.00 | AA– | | 5,200,305 | |
| | 4,900 | | Charlotte-Mecklenburg Hospital Authority, North Carolina, Healthcare System Revenue Bonds, DBA Carolinas Healthcare System, Series 2005A, 5.000%, 1/15/45 (Pre-refunded 1/15/15) | 1/15 at 100.00 | AAA | | 5,587,568 | |
| | 3,500 | | North Carolina Medical Care Commission, Healthcare Facilities Revenue Bonds, Duke University Health System, Series 2009A, 5.000%, 6/01/42 | 6/19 at 100.00 | AA | | 3,350,935 | |
| | 13,900 | | Total North Carolina | | | | 14,138,808 | |
| | | | North Dakota – 0.5% (0.3% of Total Investments) | | | | | |
| | 3,910 | | Fargo, North Dakota, Health System Revenue Bonds, Sanford Series 2011, 6.250%, 11/01/31 | 11/21 at 100.00 | AA– | | 4,081,374 | |
| | | | Ohio – 6.4% (4.2% of Total Investments) | | | | | |
| | 10,000 | | American Municipal Power Ohio Inc., General Revenue Bonds, Prairie State Energy Campus Project Series 2008A, 5.250%, 2/15/43 | 2/18 at 100.00 | A1 | | 9,742,800 | |
| | | | Buckeye Tobacco Settlement Financing Authority, Ohio, Tobacco Settlement Asset-Backed Revenue Bonds, Senior Lien, Series 2007A-2: | | | | | |
| | 5,650 | | 5.125%, 6/01/24 | 6/17 at 100.00 | Baa3 | | 4,365,529 | |
| | 5,640 | | 5.875%, 6/01/30 | 6/17 at 100.00 | Baa3 | | 4,070,050 | |
| | 4,875 | | 5.750%, 6/01/34 | 6/17 at 100.00 | Baa3 | | 3,358,875 | |
| | 3,045 | | 6.000%, 6/01/42 | 6/17 at 100.00 | Baa3 | | 2,114,022 | |
| | 14,830 | | 5.875%, 6/01/47 | 6/17 at 100.00 | Baa3 | | 10,005,653 | |
| | 5,300 | | Buckeye Tobacco Settlement Financing Authority, Ohio, Tobacco Settlement Asset-Backed Revenue Bonds, Senior Lien, Series 2007A-3, 0.000%, 6/01/37 | 6/22 at 100.00 | Baa3 | | 3,372,337 | |
| | 6,720 | | Cleveland, Ohio, Airport System Revenue Bonds, Series 2001A, 5.000%,
1/01/31 – AGM Insured | 7/11 at 100.00 | AA+ | | 6,299,462 | |
| | 2,305 | | Lucas County, Ohio, Hospital Revenue Bonds, ProMedica Healthcare Obligated Group, Series 2011A, 6.000%, 11/15/41 | 11/21 at 100.00 | AA– | | 2,312,053 | |
| | 3,650 | | Montgomery County, Ohio, Revenue Bonds, Catholic Health Initiatives, Series 2004A, 5.000%, 5/01/30 | 5/14 at 100.00 | AA | | 3,549,625 | |
| | Principal | | | Optional Call | | | | |
| | Amount (000) | | Description (1) | Provisions (2) | Ratings (3) | | Value | |
| | | | Ohio (continued) | | | | | |
| $ | 3,425 | | Ohio Municipal Electric Generation Agency, Beneficial Interest Certificates, Belleville Hydroelectric Project – Joint Venture 5, Series 2004, 5.000%,
2/15/19 – AMBAC Insured | 2/14 at 100.00 | A1 | $ | 3,595,325 | |
| | 65,440 | | Total Ohio | | | | 52,785,731 | |
| | | | Pennsylvania – 3.4% (2.3% of Total Investments) | | | | | |
| | 1,250 | | Allegheny County Hospital Development Authority, Pennsylvania, University of Pittsburgh Medical Center Revenue Bonds, Series 2009A, 5.500%, 8/15/34 | No Opt. Call | Aa3 | | 1,222,600 | |
| | | | Bethlehem Authority, Northampton and Lehigh Counties, Pennsylvania, Guaranteed Water Revenue Bonds, Series 1998: | | | | | |
| | 3,125 | | 0.000%, 5/15/22 – AGM Insured | No Opt. Call | AA+ | | 1,973,344 | |
| | 3,125 | | 0.000%, 5/15/23 – AGM Insured | No Opt. Call | AA+ | | 1,847,469 | |
| | 3,135 | | 0.000%, 5/15/24 – AGM Insured | No Opt. Call | AA+ | | 1,743,029 | |
| | 3,155 | | 0.000%, 5/15/26 – AGM Insured | No Opt. Call | AA+ | | 1,538,757 | |
| | 4,145 | | 0.000%, 11/15/26 – AGM Insured | No Opt. Call | AA+ | | 1,973,932 | |
| | 2,800 | | 0.000%, 5/15/28 – AGM Insured | No Opt. Call | AA+ | | 1,194,704 | |
| | 3,000 | | 0.000%, 11/15/28 – AGM Insured | No Opt. Call | AA+ | | 1,248,450 | |
| | 1,000 | | Pennsylvania Economic Development Financing Authority, Senior Lien Resource Recovery Revenue Bonds, Northampton Generating Project, Series 1994A, 6.500%, 1/01/13 (Alternative Minimum Tax) | 7/11 at 100.00 | CC | | 643,180 | |
| | 100 | | Pennsylvania Economic Development Financing Authority, Subordinate Resource Recovery Revenue Bonds, Northampton Generating Project, Series 1994C, 6.875%, 1/01/12 (Alternative Minimum Tax) (5) | No Opt. Call | N/R | | 24,500 | |
| | 5,000 | | Pennsylvania Turnpike Commission, Turnpike Subordinate Revenue Bonds, Series 2009C, 0.000%, 6/01/33 – AGM Insured | 6/26 at 100.00 | AA+ | | 3,960,950 | |
| | 11,890 | | Philadelphia Hospitals and Higher Education Facilities Authority, Pennsylvania, Health System Revenue Bonds, Jefferson Health System, Series 2010B, 5.000%, 5/15/40 | 5/20 at 100.00 | AA | | 11,016,085 | |
| | 41,725 | | Total Pennsylvania | | | | 28,387,000 | |
| | | | Puerto Rico – 3.1% (2.1% of Total Investments) | | | | | |
| | 13,125 | | Puerto Rico Sales Tax Financing Corporation, Sales Tax Revenue Bonds, First Subordinate Series 2010A, 0.000%, 8/01/33 | 8/29 at 100.00 | A+ | | 9,312,056 | |
| | 8,625 | | Puerto Rico Sales Tax Financing Corporation, Sales Tax Revenue Bonds, First Subordinate Series 2010C, 5.250%, 8/01/41 | 8/20 at 100.00 | A+ | | 7,792,774 | |
| | | | Puerto Rico Sales Tax Financing Corporation, Sales Tax Revenue Bonds, Series 2007A: | | | | | |
| | 25,000 | | 0.000%, 8/01/47 – AMBAC Insured | No Opt. Call | Aa2 | | 2,166,500 | |
| | 64,335 | | 0.000%, 8/01/54 – AMBAC Insured | No Opt. Call | Aa2 | | 3,349,923 | |
| | 3,750 | | Puerto Rico Sales Tax Financing Corporation, Sales Tax Revenue Bonds, Tender Option Bonds Trust 3101, 18.336%, 8/01/57 (IF) | 8/17 at 100.00 | Aa2 | | 3,278,400 | |
| | 114,835 | | Total Puerto Rico | | | | 25,899,653 | |
| | | | Rhode Island – 0.7% (0.5% of Total Investments) | | | | | |
| | 2,000 | | Kent County Water Authority, Rhode Island, General Revenue Bonds, Series 2002A, 5.000%, 7/15/23 – NPFG Insured | 7/12 at 100.00 | A | | 2,029,820 | |
| | | | Rhode Island Health and Educational Building Corporation, Revenue Refunding Bonds, Salve Regina University, Series 2002: | | | | | |
| | 1,260 | | 5.250%, 3/15/17 – RAAI Insured | 3/12 at 101.00 | N/R | | 1,279,769 | |
| | 1,080 | | 5.250%, 3/15/18 – RAAI Insured | 3/12 at 101.00 | N/R | | 1,094,310 | |
| | 1,735 | | Rhode Island Tobacco Settlement Financing Corporation, Tobacco Settlement Asset-Backed Bonds, Series 2002A, 6.125%, 6/01/32 | 6/12 at 100.00 | BBB | | 1,662,668 | |
| | 6,075 | | Total Rhode Island | | | | 6,066,567 | |
| | | | South Carolina – 2.8% (1.9% of Total Investments) | | | | | |
| | 2,725 | | Medical University Hospital Authority, South Carolina, FHA-Insured Mortgage Revenue Bonds, Series 2004A, 5.250%, 2/15/25 – NPFG Insured | 8/14 at 100.00 | Baa1 | | 2,770,126 | |
| | | | Piedmont Municipal Power Agency, South Carolina, Electric Revenue Bonds, Series 2004A-2: | | | | | |
| | 26,955 | | 0.000%, 1/01/31 – AMBAC Insured | No Opt. Call | A– | | 8,093,778 | |
| | 14,700 | | 0.000%, 1/01/32 – AMBAC Insured | No Opt. Call | A– | | 4,118,940 | |
| | 8,330 | | Tobacco Settlement Revenue Management Authority, South Carolina, Tobacco Settlement Asset-Backed Bonds, Series 2001B, 6.000%, 5/15/22 (Pre-refunded 5/15/11) | 5/11 at 101.00 | BBB (4) | | 8,426,711 | |
| | 52,710 | | Total South Carolina | | | | 23,409,555 | |
| | | Nuveen Performance Plus Municipal Fund, Inc. (continued) |
| NPP | | Portfolio of Investments |
April 30, 2011 (Unaudited)
| | Principal | | | Optional Call | | | | |
| | Amount (000) | | Description (1) | Provisions (2) | Ratings (3) | | Value | |
| | | | Tennessee – 1.2% (0.8% of Total Investments) | | | | | |
| $ | 2,860 | | Johnson City Health and Educational Facilities Board, Tennessee, Hospital Revenue Refunding and Improvement Bonds, Johnson City Medical Center, Series 1998C, 5.125%, 7/01/25 (Pre-refunded 7/01/23) – NPFG Insured | 7/23 at 100.00 | Baa1 (4) | $ | 2,868,637 | |
| | 115 | | Memphis-Shelby County Airport Authority, Tennessee, Airport Revenue Bonds, Series 1999D, 6.000%, 3/01/24 – AMBAC Insured (Alternative Minimum Tax) | 9/11 at 100.00 | A2 | | 115,151 | |
| | 6,000 | | Metropolitan Government of Nashville-Davidson County Health and Educational Facilities Board, Tennessee, Revenue Refunding and Improvement Bonds, Meharry Medical College, Series 1996, 6.000%, 12/01/19 – AMBAC Insured | 12/17 at 100.00 | N/R | | 6,711,600 | |
| | 8,975 | | Total Tennessee | | | | 9,695,388 | |
| | | | Texas – 6.0% (4.0% of Total Investments) | | | | | |
| | 5,000 | | Bexar Metropolitan Water District, Texas, Waterworks System Revenue Bonds, Series 2006, 5.000%, 5/01/35 – NPFG Insured | 5/16 at 100.00 | A1 | | 4,732,700 | |
| | 2,500 | | Capital Area Cultural Education Facilities Finance Corporation, Texas, Revenue Bonds, The Roman Catholic Diocese of Austin, Series 2005B. Remarketed, 6.125%, 4/01/45 | 4/20 at 100.00 | Baa2 | | 2,401,750 | |
| | | | Central Texas Regional Mobility Authority, Travis and Williamson Counties, Toll Road Revenue Bonds, Series 2005: | | | | | |
| | 4,000 | | 5.000%, 1/01/35 – FGIC Insured | 1/15 at 100.00 | BBB | | 3,258,920 | |
| | 13,000 | | 5.000%, 1/01/45 – FGIC Insured | 1/15 at 100.00 | BBB | | 10,129,600 | |
| | 1,570 | | Harris County-Houston Sports Authority, Texas, Junior Lien Revenue Refunding Bonds, Series 2001B, 5.250%, 11/15/40 – NPFG Insured | 11/11 at 100.00 | Baa1 | | 1,138,062 | |
| | 4,000 | | Houston Community College System, Texas, Limited Tax General Obligation Bonds, Series 2003, 5.000%, 2/15/27 – AMBAC Insured (UB) | 2/13 at 100.00 | AA+ | | 4,089,680 | |
| | 3,885 | | Houston Independent School District, Public Facility Corporation, Harris County, Texas, Lease Revenue Bonds, Cesar E. Chavez High School, Series 1998A, 0.000%, 9/15/19 – AMBAC Insured | No Opt. Call | AA | | 2,779,523 | |
| | 1,600 | | Houston, Texas, Senior Lien Airport System Revenue Bonds, Refunding Series 2009A, 5.500%, 7/01/39 | 7/18 at 100.00 | AA– | | 1,623,520 | |
| | 33,855 | | Leander Independent School District, Williamson and Travis Counties, Texas, General Obligation Bonds, Series 2006, 0.000%, 8/15/40 | 8/14 at 23.67 | AAA | | 6,232,706 | |
| | 19,300 | | Leander Independent School District, Williamson and Travis Counties, Texas, General Obligation Bonds, Series 2008, 0.000%, 8/15/41 | 8/17 at 24.20 | AAA | | 3,250,892 | |
| | 3,480 | | Pearland, Texas, General Obligation Bonds, Series 2002, 5.000%, 3/01/27 (Pre-refunded 3/01/12) – FGIC Insured | 3/12 at 100.00 | AA– (4) | | 3,615,476 | |
| | 2,890 | | Tarrant County Cultural Education Facilities Finance Corporation, Texas, Hospital Revenue Bonds, Scott & White HealthCare Project, Series 2010, 5.500%, 8/15/45 | 8/20 at 100.00 | A1 | | 2,753,043 | |
| | 4,000 | | Tarrant Regional Water District, Texas, Water Revenue Refunding and Improvement Bonds, Series 1999, 5.000%, 3/01/22 – AGM Insured | 3/13 at 100.00 | AAA | | 4,194,000 | |
| | 99,080 | | Total Texas | | | | 50,199,872 | |
| | | | Utah – 1.2% (0.8% of Total Investments) | | | | | |
| | 3,000 | | Riverton, Utah, Hospital Revenue Bonds, IHC Health Services, Inc., Series 2009, 5.000%, 8/15/41 | 8/19 at 100.00 | AA+ | | 2,796,450 | |
| | 1,485 | | Utah Housing Corporation, Single Family Mortgage Bonds, Series 2002A-1, 5.300%, 7/01/18 (Alternative Minimum Tax) | 1/12 at 100.00 | AA– | | 1,512,398 | |
| | 390 | | Utah Housing Finance Agency, Single Family Mortgage Bonds, Series 2000D-1, 6.050%, 7/01/14 (Alternative Minimum Tax) | 7/11 at 100.00 | AA– | | 397,320 | |
| | 485 | | Utah Housing Finance Agency, Single Family Mortgage Bonds, Series 2000E-1, Class II, 6.150%, 1/01/27 (Alternative Minimum Tax) | 7/11 at 100.00 | AA | | 485,243 | |
| | 475 | | Utah Housing Finance Agency, Single Family Mortgage Bonds, Series 2000E-1, Class III, 6.000%, 1/01/15 (Alternative Minimum Tax) | 7/11 at 100.00 | AA– | | 483,811 | |
| | Principal | | | Optional Call | | | | |
| | Amount (000) | | Description (1) | Provisions (2) | Ratings (3) | | Value | |
| | | | Utah (continued) | | | | | |
| $ | 650 | | Utah Housing Finance Agency, Single Family Mortgage Bonds, Series 2001A-2, 5.650%, 7/01/27 (Alternative Minimum Tax) | 7/11 at 100.00 | AA | $ | 650,312 | |
| | 475 | | Utah Housing Finance Agency, Single Family Mortgage Bonds, Series 2001B-1, 5.750%, 7/01/19 (Alternative Minimum Tax) | 7/11 at 100.00 | Aaa | | 490,675 | |
| | 3,000 | | Utah Water Finance Agency, Revenue Bonds, Pooled Loan Financing Program, Series 2002C, 5.250%, 10/01/28 (Pre-refunded 10/01/12) – AMBAC Insured | 10/12 at 100.00 | N/R (4) | | 3,204,570 | |
| | 9,960 | | Total Utah | | | | 10,020,779 | |
| | | | Virgin Islands – 0.8% (0.5% of Total Investments) | | | | | |
| | 4,700 | | Virgin Islands Public Finance Authority, Gross Receipts Taxes Loan Note, Series 2003, 5.000%, 10/01/33 – RAAI Insured | 10/14 at 100.00 | BBB+ | | 4,072,550 | |
| | 2,500 | | Virgin Islands Public Finance Authority, Revenue Bonds, Refinery Project – Hovensa LLC, Series 2003, 6.125%, 7/01/22 (Alternative Minimum Tax) | 1/14 at 100.00 | Baa3 | | 2,334,825 | |
| | 7,200 | | Total Virgin Islands | | | | 6,407,375 | |
| | | | Virginia – 2.2% (1.5% of Total Investments) | | | | | |
| | 10,500 | | Metropolitan Washington DC Airports Authority, Virginia, Dulles Toll Road Revenue Bonds, Series 2009C, 0.000%, 10/01/41 – AGC Insured | 10/26 at 100.00 | AA+ | | 7,631,190 | |
| | 18,000 | | Metropolitan Washington DC Airports Authority, Virginia, Dulles Toll Road Revenue Bonds, Dulles Metrorail Capital Appreciation, Series 2010B, 0.000%, 10/01/44 | 10/28 at 100.00 | BBB+ | | 10,623,240 | |
| | 28,500 | | Total Virginia | | | | 18,254,430 | |
| | | | Washington – 3.6% (2.4% of Total Investments) | | | | | |
| | 12,235 | | Chelan County Public Utility District 1, Washington, Columbia River-Rock Island Hydro-Electric System Revenue Refunding Bonds, Series 1997A, 0.000%, 6/01/26 – NPFG Insured | No Opt. Call | AA | | 5,499,755 | |
| | | | Cowlitz County Public Utilities District 1, Washington, Electric Production Revenue Bonds, Series 2004: | | | | | |
| | 465 | | 5.000%, 9/01/22 – FGIC Insured | 9/14 at 100.00 | A1 | | 479,373 | |
| | 3,100 | | 5.000%, 9/01/28 – FGIC Insured | 9/14 at 100.00 | A1 | | 3,121,576 | |
| | 5,000 | | Energy Northwest, Washington, Electric Revenue Refunding Bonds, Nuclear Project 1, Series 2003A, 5.500%, 7/01/16 (UB) | 7/13 at 100.00 | Aaa | | 5,460,800 | |
| | 2,000 | | Washington State Health Care Facilities Authority, Revenue Bonds, Fred Hutchinson Cancer Research Center, Series 2009A, 6.000%, 1/01/33 | 7/19 at 100.00 | A | | 2,007,480 | |
| | 10,000 | | Washington State Health Care Facilities Authority, Revenue Bonds, Providence Health Care Services, Series 2006A, 4.625%, 10/01/34 – FGIC Insured (UB) | 10/16 at 100.00 | AA | | 8,521,700 | |
| | 5,000 | | Washington State Housing Finance Commission, Non-Profit Housing Revenue Bonds, Kline Galland Center, Series 1999, 6.000%, 7/01/29 – RAAI Insured | 7/11 at 100.00 | N/R | | 4,875,450 | |
| | 37,800 | | Total Washington | | | | 29,966,134 | |
| | | | West Virginia – 0.6% (0.4% of Total Investments) | | | | | |
| | 5,000 | | Mason County, West Virginia, Pollution Control Revenue Bonds, Appalachian Power Company, Series 2003L, 5.500%, 10/01/22 (Mandatory put 10/01/11) | 10/11 at 100.00 | BBB (4) | | 5,020,000 | |
| | | Nuveen Performance Plus Municipal Fund, Inc. (continued) |
| NPP | | Portfolio of Investments |
April 30, 2011 (Unaudited)
| | Principal | | | Optional Call | | | | |
| | Amount (000) | | Description (1) | Provisions (2) | Ratings (3) | | Value | |
| | | | Wisconsin – 2.0% (1.3% of Total Investments) | | | | | |
| $ | 11,620 | | Wisconsin Health and Educational Facilities Authority, Revenue Bonds, Marshfield Clinic, Series 1999, 6.250%, 2/15/29 – RAAI Insured | 8/11 at 100.00 | BBB+ | $ | 11,618,722 | |
| | 5,350 | | Wisconsin Housing and Economic Development Authority, Home Ownership Revenue Bonds, Series 2005C, 4.875%, 3/01/36 (Alternative Minimum Tax) (UB) | 9/14 at 100.00 | AA | | 5,209,830 | |
| | 16,970 | | Total Wisconsin | | | | 16,828,552 | |
| $ | 1,714,430 | | Total Investments (cost $1,282,652,166) – 152.3% | | | | 1,263,296,465 | |
| | | | Floating Rate Obligations – (4.9)% | | | | (40,825,000 | ) |
| | | | Variable MuniFund Term Preferred Shares, at Liquidation Value – (50.8)% (6) | | | | (421,700,000 | ) |
| | | | Other Assets Less Liabilities – 3.4% | | | | 28,481,244 | |
| | | | Net Assets Applicable to Common Shares – 100% | | | $ | 829,252,709 | |
| (1) | | All percentages shown in the Portfolio of Investments are based on net assets applicable to Common shares unless otherwise noted. |
| (2) | | Optional Call Provisions: Dates (month and year) and prices of the earliest optional call or redemption. There may be other call provisions at varying prices at later dates. Certain mortgage-backed securities may be subject to periodic principal paydowns. |
| (3) | | Ratings: Using the highest of Standard & Poor’s Group (“Standard & Poor’s”), Moody’s Investor Service, Inc. (“Moody’s”) or Fitch, Inc. (“Fitch”) rating. Ratings below BBB by Standard & Poor’s, Baa by Moody’s or BBB by Fitch are considered to be below investment grade. Holdings designated N/R are not rated by any of these national rating agencies. |
| (4) | | Backed by an escrow or trust containing sufficient U.S. Government or U.S. Government agency securities, which ensure the timely payment of principal and interest. Such investments are normally considered to be equivalent to AAA rated securities. |
| (5) | | At or subsequent to the end of the reporting period, this security is non-income producing. Non-income producing security, in the case of a bond, generally denotes that the issuer has (1) defaulted on the payment of principal or interest, (2) is under the protection of the Federal Bankruptcy Court or (3) the Fund’s Adviser has concluded that the issue is not likely to meet its future interest payment obligations and has directed the Fund’s custodian to cease accruing additional income on the Fund’s records. |
| (6) | | Variable MuniFund Term Preferred Shares, at Liquidation Value as a percentage of Total Investments is 33.4%. |
| N/R | | Not rated. |
| (ETM) | | Escrowed to maturity. |
| (IF) | | Inverse floating rate investment. |
| (UB) | | Underlying bond of an inverse floating rate trust reflected as a financing transaction. See Notes to Financial Statements, Footnote 1 – General Information and Significant Accounting Policies, Inverse Floating Rate Securities for more information. |
See accompanying notes to financial statements.
| | | Nuveen Municipal Advantage Fund, Inc. |
| NMA | | Portfolio of Investments |
| | | April 30, 2011 (Unaudited) |
| | Principal | | | Optional Call | | | | |
| | Amount (000) | | Description (1) | Provisions (2) | Ratings (3) | | Value | |
| | | | Alabama – 0.8% (0.5% of Total Investments) | | | | | |
| $ | 5,155 | | Phenix City Industrial Development Board, Alabama, Environmental Improvement Revenue Bonds, MeadWestvaco Corporation, Series 2002A, 6.350%, 5/15/35 (Alternative Minimum Tax) | 5/12 at 100.00 | BBB | $ | 4,971,636 | |
| | | | Alaska – 0.9% (0.6% of Total Investments) | | | | | |
| | | | Alaska Housing Finance Corporation, General Housing Purpose Bonds, Series 2005A: | | | | | |
| | 1,125 | | 5.250%, 12/01/34 – FGIC Insured (UB) | 12/14 at 100.00 | AA+ | | 1,136,655 | |
| | 1,280 | | 5.250%, 12/01/41 – FGIC Insured (UB) | 12/14 at 100.00 | AA+ | | 1,287,040 | |
| | | | Northern Tobacco Securitization Corporation, Alaska, Tobacco Settlement Asset-Backed Bonds, Series 2006A: | | | | | |
| | 850 | | 4.625%, 6/01/23 | 6/14 at 100.00 | Baa3 | | 746,487 | |
| | 3,250 | | 5.000%, 6/01/46 | 6/14 at 100.00 | Baa3 | | 1,934,919 | |
| | 6,505 | | Total Alaska | | | | 5,105,101 | |
| | | | Arizona – 3.2% (2.0% of Total Investments) | | | | | |
| | 3,465 | | Arizona Board of Regents, Certificates of Participation, Arizona State University, Refunding Series 2006, 5.000%, 7/01/25 – NPFG Insured | No Opt. Call | AA– | | 3,559,144 | |
| | 4,905 | | Maricopa County Industrial Development Authority, Arizona, Health Facility Revenue Bonds, Catholic Healthcare West, Series 2007A, 5.250%, 7/01/32 | 7/17 at 100.00 | A | | 4,566,800 | |
| | 10,700 | | Phoenix Civic Improvement Corporation, Arizona, Senior Lien Airport Revenue Bonds, Series 2008A, 5.000%, 7/01/38 | 7/18 at 100.00 | AA– | | 10,269,431 | |
| | 19,070 | | Total Arizona | | | | 18,395,375 | |
| | | | California – 20.6% (13.1% of Total Investments) | | | | | |
| | 3,500 | | Alameda Corridor Transportation Authority, California, Subordinate Lien Revenue Bonds, Series 2004A, 0.000%, 10/01/25 – AMBAC Insured | 10/17 at 100.00 | A– | | 2,755,235 | |
| | | | Calexico Unified School District, Imperial County, California, General Obligation Bonds, Series 2005B: | | | | | |
| | 4,070 | | 0.000%, 8/01/32 – FGIC Insured | No Opt. Call | A | | 897,923 | |
| | 6,410 | | 0.000%, 8/01/34 – FGIC Insured | No Opt. Call | A | | 1,210,593 | |
| | 3,000 | | California Health Facilities Financing Authority, Health Facility Revenue Bonds, Adventist Health System/West, Series 2003A, 5.000%, 3/01/33 | 3/13 at 100.00 | A | | 2,680,800 | |
| | 7,500 | | California State Public Works Board, Lease Revenue Bonds, Department of Mental Health, Coalinga State Hospital, Series 2004A, 5.125%, 6/01/29 | 6/14 at 100.00 | A2 | | 7,061,100 | |
| | 11,200 | | California State, General Obligation Bonds, Series 2003, 5.250%, 2/01/28 | 8/13 at 100.00 | A1 | | 11,278,288 | |
| | 4,250 | | California State, General Obligation Bonds, Various Purpose Series 2010, 5.250%, 11/01/40 | 11/20 at 100.00 | A1 | | 4,116,848 | |
| | 16,000 | | California State, Various Purpose General Obligation Bonds, Series 2007, 5.000%, 6/01/37 | 6/17 at 100.00 | A1 | | 14,971,360 | |
| | 2,750 | | California Statewide Community Development Authority, Revenue Bonds, Methodist Hospital Project, Series 2009, 6.750%, 2/01/38 | 8/19 at 100.00 | Aa2 | | 3,000,113 | |
| | 9,955 | | Capistrano Unified School District, Orange County, California, Special Tax Bonds, Community Facilities District, Series 2005, 0.000%, 9/01/31 – FGIC Insured | No Opt. Call | BBB | | 2,158,941 | |
| | | | Colton Joint Unified School District, San Bernardino County, California, General Obligation Bonds, Series 2006C: | | | | | |
| | 3,800 | | 0.000%, 2/01/33 – FGIC Insured | 2/15 at 38.73 | Aa3 | | 827,488 | |
| | 3,795 | | 0.000%, 2/01/37 – FGIC Insured | No Opt. Call | Aa3 | | 597,978 | |
| | 6,980 | | Contra Costa County, California, GNMA Mortgage-Backed Securities Program Home Mortgage Revenue Bonds, Series 1989, 7.750%, 5/01/22 (Alternative Minimum Tax) (ETM) | No Opt. Call | AAA | | 8,928,537 | |
| | 8,145 | | Cupertino Union School District, Santa Clara County, California, General Obligation Bonds, Series 2003B, 0.000%, 8/01/25 – FGIC Insured | 8/13 at 55.54 | Aa1 | | 3,447,941 | |
| | 2,510 | | Folsom Cordova Unified School District, Sacramento County, California, General Obligation Bonds, School Facilities Improvement District 1, Series 2004B, 0.000%, 10/01/28 – NPFG Insured | No Opt. Call | Aa3 | | 786,885 | |
| | 3,360 | | Folsom Cordova Unified School District, Sacramento County, California, General Obligation Bonds, School Facilities Improvement District 2, Series 2002A, 0.000%, 7/01/27 – NPFG Insured | No Opt. Call | Aa2 | | 1,164,643 | |
| | 2,315 | | Gateway Unified School District, California, General Obligation Bonds, Series 2004B, 0.000%, 8/01/32 – FGIC Insured | No Opt. Call | A1 | | 518,977 | |
| | | Nuveen Municipal Advantage Fund, Inc. (continued) |
| NMA | | Portfolio of Investments |
April 30, 2011 (Unaudited)
| | Principal | | | Optional Call | | | | |
| | Amount (000) | | Description (1) | Provisions (2) | Ratings (3) | | Value | |
| | | | California (continued) | | | | | |
| $ | 3,000 | | Golden State Tobacco Securitization Corporation, California, Enhanced Tobacco Settlement Asset-Backed Revenue Bonds, Series 2005A, 0.000%, 6/01/26 – AGM Insured | No Opt. Call | AA+ | $ | 1,190,160 | |
| | 1,000 | | Golden State Tobacco Securitization Corporation, California, Tobacco Settlement Asset-Backed Bonds, Series 2007A-1, 5.125%, 6/01/47 | 6/17 at 100.00 | Baa3 | | 610,150 | |
| | 5,000 | | Los Angeles Department of Water and Power, California, Waterworks Revenue Bonds, Series 2003A, 5.125%, 7/01/40 – FGIC Insured | 7/12 at 100.00 | AA | | 5,006,450 | |
| | 1,275 | | Madera Unified School District, Madera County, California, General Obligation Bonds, Series 2002, 5.250%, 8/01/23 – AGM Insured | 8/12 at 100.00 | AA+ | | 1,321,028 | |
| | 2,200 | | M-S-R Energy Authority, California, Gas Revenue Bonds, Series 2009C, 6.500%, 11/01/39 | No Opt. Call | A | | 2,269,784 | |
| | | | North Orange County Community College District, California, General Obligation Bonds, Series 2003B: | | | | | |
| | 7,735 | | 0.000%, 8/01/25 – FGIC Insured | No Opt. Call | Aa1 | | 3,319,939 | |
| | 4,180 | | 0.000%, 8/01/26 – FGIC Insured | No Opt. Call | Aa1 | | 1,661,466 | |
| | 2,590 | | Palmdale Community Redevelopment Agency, California, Residential Mortgage Revenue Refunding Bonds, Series 1991B, 7.375%, 2/01/12 (ETM) | No Opt. Call | AAA | | 2,709,062 | |
| | 5,000 | | Palmdale Community Redevelopment Agency, California, Single Family Restructured Mortgage Revenue Bonds, Series 1986A, 8.000%, 3/01/16 (Alternative Minimum Tax) (ETM) | No Opt. Call | AAA | | 6,283,450 | |
| | 9,315 | | Perris, California, GNMA Mortgage-Backed Securities Program Single Family Mortgage Revenue Bonds, Series 1989A, 7.600%, 1/01/23 (Alternative Minimum Tax) (ETM) | No Opt. Call | AAA | | 11,690,045 | |
| | 3,205 | | San Diego Community College District, California, General Obligation Bonds, Series 2005, 5.000%, 5/01/25 – AGM Insured | 5/15 at 100.00 | AA+ | | 3,336,501 | |
| | 1,830 | | San Diego Public Facilities Financing Authority, California, Water Utility Revenue Bonds, Tender Option Bond Trust 3504, 19.580%, 2/01/33 (IF) | 8/19 at 100.00 | Aa2 | | 2,032,105 | |
| | 7,660 | | San Joaquin Hills Transportation Corridor Agency, Orange County, California, Senior Lien Toll Road Revenue Bonds, Series 1993, 0.000%, 1/01/24 (ETM) | No Opt. Call | AAA | | 4,683,630 | |
| | | | San Joaquin Hills Transportation Corridor Agency, Orange County, California, Toll Road Revenue Refunding Bonds, Series 1997A: | | | | | |
| | 7,205 | | 0.000%, 1/15/23 – NPFG Insured | No Opt. Call | Baa1 | | 2,814,417 | |
| | 23,000 | | 0.000%, 1/15/35 – NPFG Insured | No Opt. Call | Baa1 | | 2,358,190 | |
| | 7,250 | | San Jose-Evergreen Community College District, Santa Clara County, California, General Obligation Bonds, Series 2005A, 0.000%, 9/01/29 – NPFG Insured | 9/15 at 47.82 | Aa1 | | 2,152,380 | |
| | 190,985 | | Total California | | | | 119,842,407 | |
| | | | Colorado – 9.7% (6.2% of Total Investments) | | | | | |
| | 1,600 | | Arkansas River Power Authority, Colorado, Power Revenue Bonds, Series 2006, 5.250%, 10/01/40 – SYNCORA GTY Insured | 10/16 at 100.00 | BBB | | 1,316,640 | |
| | 9,440 | | Colorado Health Facilities Authority, Colorado, Revenue Bonds, Catholic Health Initiatives, Series 2006A, 4.500%, 9/01/38 | 9/16 at 100.00 | AA | | 7,890,896 | |
| | 3,335 | | Colorado Health Facilities Authority, Colorado, Revenue Bonds, Catholic Health Initiatives, Series 2009A, 5.500%, 7/01/34 | 7/19 at 100.00 | AA | | 3,347,773 | |
| | 7,500 | | Colorado Health Facilities Authority, Health Facilities Revenue Bonds, Sisters of Charity of Leavenworth Health Services Corporation, Series 2010A, 5.000%, 1/01/40 | No Opt. Call | AA | | 6,890,775 | |
| | 1,150 | | Colorado Health Facilities Authority, Revenue Bonds, Poudre Valley Health System, Series 2005C, 5.250%, 3/01/40 – AGM Insured | 9/18 at 102.00 | AA+ | | 1,080,471 | |
| | | | Denver City and County, Colorado, Airport Revenue Bonds, Series 2006: | | | | | |
| | 5,365 | | 5.000%, 11/15/23 – FGIC Insured (UB) | 11/16 at 100.00 | A+ | | 5,594,354 | |
| | 3,300 | | 5.000%, 11/15/24 – FGIC Insured | 11/16 at 100.00 | A+ | | 3,417,579 | |
| | 4,340 | | 5.000%, 11/15/25 – FGIC Insured (UB) | 11/16 at 100.00 | A+ | | 4,464,645 | |
| | 2,000 | | Denver Convention Center Hotel Authority, Colorado, Senior Revenue Bonds, Convention Center Hotel, Series 2006, 4.750%, 12/01/35 – SYNCORA GTY Insured | 11/16 at 100.00 | BBB– | | 1,488,560 | |
| | | | E-470 Public Highway Authority, Colorado, Senior Revenue Bonds, Series 1997B: | | | | | |
| | 2,650 | | 0.000%, 9/01/16 – NPFG Insured | No Opt. Call | Baa1 | | 2,016,094 | |
| | 8,645 | | 0.000%, 9/01/26 – NPFG Insured | No Opt. Call | Baa1 | | 2,782,047 | |
| | Principal | | | Optional Call | | | | |
| | Amount (000) | | Description (1) | Provisions (2) | Ratings (3) | | Value | |
| | | | Colorado (continued) | | | | | |
| | | | E-470 Public Highway Authority, Colorado, Senior Revenue Bonds, Series 2000B: | | | | | |
| $ | 7,500 | | 0.000%, 9/01/29 – NPFG Insured | No Opt. Call | Baa1 | $ | 1,836,975 | |
| | 10,000 | | 0.000%, 9/01/31 – NPFG Insured | No Opt. Call | Baa1 | | 2,076,400 | |
| | 10,000 | | 0.000%, 9/01/32 – NPFG Insured | No Opt. Call | Baa1 | | 1,914,100 | |
| | | | Platte River Power Authority, Colorado, Power Revenue Refunding Bonds, Series 2002EE: | | | | | |
| | 1,030 | | 5.375%, 6/01/17 (Pre-refunded 6/01/12) | 6/12 at 100.00 | AA (4) | | 1,086,290 | |
| | 4,890 | | 5.375%, 6/01/18 (Pre-refunded 6/01/12) | 6/12 at 100.00 | AA (4) | | 5,157,238 | |
| | | | Platte River Power Authority, Colorado, Power Revenue Refunding Bonds, Series 2002EE: | | | | | |
| | 970 | | 5.375%, 6/01/17 | 6/12 at 100.00 | AA | | 1,013,272 | |
| | 110 | | 5.375%, 6/01/18 | 6/12 at 100.00 | AA | | 114,491 | |
| | 3,110 | | Regional Transportation District, Colorado, Denver Transit Partners Eagle P3 Project Private Activity Bonds, Series 2010, 6.000%, 1/15/34 | 7/20 at 100.00 | Baa3 | | 2,905,424 | |
| | 86,935 | | Total Colorado | | | | 56,394,024 | |
| | | | District of Columbia – 0.2% (0.1% of Total Investments) | | | | | |
| | 1,145 | | District of Columbia Housing Finance Agency, GNMA/FNMA Single Family Mortgage Revenue Bonds, Series 1997B, 5.900%, 12/01/28 (Alternative Minimum Tax) | 6/11 at 100.00 | AAA | | 1,186,150 | |
| | | | Florida – 3.3% (2.1% of Total Investments) | | | | | |
| | 2,770 | | Florida Housing Finance Corporation, Housing Revenue Bonds, Stratford Point Apartments, Series 2000O-1, 5.850%, 12/01/31 – AGM Insured (Alternative Minimum Tax) | 6/11 at 100.00 | AA+ | | 2,770,747 | |
| | 3,500 | | JEA St. John’s River Power Park System, Florida, Revenue Refunding Bonds, Issue 2, Series 2002-17, 5.000%, 10/01/17 | 10/11 at 100.00 | Aa2 | | 3,557,015 | |
| | 14,730 | | South Miami Health Facilities Authority, Florida, Hospital Revenue, Baptist Health System Obligation Group, Series 2007, 5.000%, 8/15/42 (UB) | 8/17 at 100.00 | AA | | 13,133,415 | |
| | 21,000 | | Total Florida | | | | 19,461,177 | |
| | | | Georgia – 1.8% (1.1% of Total Investments) | | | | | |
| | 4,000 | | Augusta, Georgia, Water and Sewerage Revenue Bonds, Series 2004, 5.250%, 10/01/39 – AGM Insured | 10/14 at 100.00 | AA+ | | 4,025,320 | |
| | 2,900 | | Coffee County Hospital Authority, Georgia, Revenue Bonds, Coffee County Regional Medical Center, Series 2004, 5.000%, 12/01/26 | 12/14 at 100.00 | BBB– | | 2,614,524 | |
| | 1,250 | | DeKalb County Hospital Authority, Georgia, Anticipation Certificates Revenue Bonds, DeKalb Medical Center, Inc. Project, Series 2010, 6.000%, 9/01/30 | 9/20 at 100.00 | N/R | | 1,172,488 | |
| | 2,500 | | Franklin County Industrial Building Authority, Georgia, Revenue Bonds, Ty Cobb Regional Medical Center Project, Series 2010, 7.625%, 12/01/30 | 12/20 at 100.00 | N/R | | 2,452,500 | |
| | 10,650 | | Total Georgia | | | | 10,264,832 | |
| | | | Hawaii – 0.0% (0.0% of Total Investments) | | | | | |
| | 210 | | Hawaii Housing Finance and Development Corporation, Single Family Mortgage Purchase Revenue Bonds, Series 1997A, 5.750%, 7/01/30 (Alternative Minimum Tax) | 7/11 at 100.00 | AAA | | 211,612 | |
| | | | Illinois – 12.7% (8.1% of Total Investments) | | | | | |
| | 4,345 | | Chicago Board of Education, Illinois, Unlimited Tax General Obligation Bonds, Dedicated Tax Revenues, Series 1998B-1, 0.000%, 12/01/28 – FGIC Insured | No Opt. Call | Aa2 | | 1,371,412 | |
| | 4,260 | | Chicago Board of Education, Illinois, Unlimited Tax General Obligation Bonds, Dedicated Tax Revenues, Series 1999A, 0.000%, 12/01/31 – FGIC Insured | No Opt. Call | Aa2 | | 1,053,157 | |
| | 5,000 | | Chicago, Illinois, Second Lien Passenger Facility Charge Revenue Bonds, O’Hare International Airport, Series 2001A, 5.375%, 1/01/32 – AMBAC Insured (Alternative Minimum Tax) | 7/11 at 101.00 | A2 | | 4,634,950 | |
| | 7,100 | | Cook County, Illinois, General Obligation Bonds, Refunding Series 2010A, 5.250%, 11/15/33 | 11/20 at 100.00 | AA | | 7,120,945 | |
| | 1,500 | | Illinois Finance Authority, Revenue Bonds, Central DuPage Health, Series 2009B, 5.500%, 11/01/39 | 11/19 at 100.00 | AA | | 1,433,595 | |
| | 2,000 | | Illinois Finance Authority, Revenue Bonds, Children’s Memorial Hospital, Series 2008A, 5.250%, 8/15/47 – AGC Insured (UB) | 8/18 at 100.00 | AA+ | | 1,759,680 | |
| | 8,395 | | Illinois Finance Authority, Revenue Bonds, Loyola University of Chicago, Tender Option Bond Trust 1137, 9.156%, 7/01/15 (IF) | No Opt. Call | Aa1 | | 7,825,315 | |
| | 2,500 | | Illinois Finance Authority, Revenue Bonds, Silver Cross Hospital and Medical Centers, Series 2009, 6.875%, 8/15/38 | 8/19 at 100.00 | BBB | | 2,488,975 | |
| | | Nuveen Municipal Advantage Fund, Inc. (continued) |
| NMA | | Portfolio of Investments |
April 30, 2011 (Unaudited)
| | Principal | | | Optional Call | | | | |
| | Amount (000) | | Description (1) | Provisions (2) | Ratings (3) | | Value | |
| | | | Illinois (continued) | | | | | |
| $ | 4,000 | | Illinois Finance Authority, Revenue Refunding Bonds, Silver Cross Hospital and Medical Centers, Series 2008A, 6.000%, 8/15/23 | 8/18 at 100.00 | BBB | $ | 3,995,800 | |
| | 6,000 | | Illinois Health Facilities Authority, Revenue Bonds, Condell Medical Center, Series 2002, 5.750%, 5/15/22 (Pre-refunded 5/15/12) | 5/12 at 100.00 | Aaa | | 6,325,200 | |
| | 5,115 | | Illinois Health Facilities Authority, Revenue Bonds, Loyola University Health System, Series 1997A, 5.000%, 7/01/24 – NPFG Insured | 7/11 at 100.00 | Baa1 | | 4,725,749 | |
| | 10,740 | | Lake and McHenry Counties Community Unit School District 118, Wauconda, Illinois, General Obligation Bonds, Series 2005B, 0.000%, 1/01/23 – AGM Insured | 1/15 at 66.94 | Aa3 | | 5,617,664 | |
| | 1,090 | | Metropolitan Pier and Exposition Authority, Illinois, Revenue Bonds, McCormick Place Expansion Project, Series 1993A, 0.000%, 6/15/21 – FGIC Insured | No Opt. Call | A2 | | 646,490 | |
| | 3,175 | | Metropolitan Pier and Exposition Authority, Illinois, Revenue Bonds, McCormick Place Expansion Project, Series 2002A, 0.000%, 6/15/41 – NPFG Insured | No Opt. Call | AAA | | 422,212 | |
| | 6,000 | | Metropolitan Pier and Exposition Authority, Illinois, Revenue Refunding Bonds, McCormick Place Expansion Project, Series 1996A, 0.000%, 6/15/24 – NPFG Insured | No Opt. Call | A2 | | 2,874,780 | |
| | 4,310 | | Regional Transportation Authority, Cook, DuPage, Kane, Lake, McHenry and Will Counties, Illinois, General Obligation Bonds, Series 1990A, 7.200%, 11/01/20 – AMBAC Insured | No Opt. Call | Aa3 | | 5,118,556 | |
| | 1,940 | | University of Illinois, Auxiliary Facilities Systems Revenue Bonds, Series 2003A, 5.000%, 4/01/23 – AMBAC Insured | 4/13 at 100.00 | Aa2 | | 1,967,878 | |
| | 7,500 | | Valley View Public Schools, Community Unit School District 365U of Will County, Illinois, General Obligation Bonds, Series 2005, 0.000%, 11/01/25 – NPFG Insured | No Opt. Call | AA | | 3,241,725 | |
| | 23,125 | | Will County Community High School District 210 Lincoln-Way, Illinois, General Obligation Bonds, Series 2006, 0.000%, 1/01/24 – AGM Insured | No Opt. Call | Aa2 | | 11,274,363 | |
| | 108,095 | | Total Illinois | | | | 73,898,446 | |
| | | | Indiana – 2.5% (1.6% of Total Investments) | | | | | |
| | 2,600 | | Crown Point Multi-School Building Corporation, Indiana, First Mortgage Bonds, Crown Point Community School Corporation, Series 2000, 0.000%, 1/15/24 – NPFG Insured | No Opt. Call | A | | 1,307,592 | |
| | 1,570 | | Hospital Authority of Delaware County, Indiana, Hospital Revenue Refunding Bonds, Cardinal Health System, Series 1997, 5.000%, 8/01/16 – AMBAC Insured | 7/11 at 100.00 | N/R | | 1,540,829 | |
| | 4,030 | | Indiana Finance Authority Health System Revenue Bonds, Sisters of St. Francis Health Services, Inc. Obligated Group, Series 2009, 5.250%, 11/01/39 | 11/19 at 100.00 | Aa3 | | 3,738,550 | |
| | 6,000 | | Indiana Finance Authority, Revenue Bonds, Trinity Health Care Group, Refunding Series 2009A, 5.250%, 12/01/38 | 12/19 at 100.00 | AA | | 5,579,340 | |
| | 2,435 | | Indiana Health Facility Financing Authority, Revenue Bonds, Community Foundation of Northwest Indiana, Series 2007, 5.500%, 3/01/37 | 3/17 at 100.00 | BBB+ | | 2,196,394 | |
| | 1,005 | | St. Joseph County Hospital Authority, Indiana, Revenue Bonds, Madison Center Inc., Series 1999, 5.450%, 2/15/12 (5) | 8/11 at 100.00 | N/R | | 261,099 | |
| | 17,640 | | Total Indiana | | | | 14,623,804 | |
| | | | Iowa – 1.7% (1.1% of Total Investments) | | | | | |
| | 6,300 | | Iowa Tobacco Settlement Authority, Asset Backed Settlement Revenue Bonds, Series 2005C, 5.375%, 6/01/38 | 6/15 at 100.00 | BBB | | 4,468,653 | |
| | 250 | | Iowa Tobacco Settlement Authority, Tobacco Asset-Backed Revenue Bonds, Series 2005B, 5.600%, 6/01/34 | 6/17 at 100.00 | BBB | | 199,600 | |
| | 5,000 | | Iowa Tobacco Settlement Authority, Tobacco Settlement Asset-Backed Revenue Bonds, Series 2001B, 5.600%, 6/01/35 (Pre-refunded 6/01/11) | 6/11 at 101.00 | AAA | | 5,073,550 | |
| | 11,550 | | Total Iowa | | | | 9,741,803 | |
| | | | Kansas – 1.2% (0.8% of Total Investments) | | | | | |
| | 3,715 | | Overland Park Development Corporation, Kansas, First Tier Revenue Bonds, Overland Park Convention Center, Series 2007A, 5.125%, 1/01/22 – AMBAC Insured | 1/17 at 100.00 | Baa3 | | 3,416,351 | |
| | 1,750 | | Wamego, Kansas, Pollution Control Revenue Bonds, Kansas Gas and Electric Company, Series 2004, 5.300%, 6/01/31 – NPFG Insured | 6/14 at 100.00 | BBB+ | | 1,755,583 | |
| | 3,730 | | Wyandotte County-Kansas City Unified Government, Kansas, Sales Tax Special Obligation Capital Appreciation Revenue Bonds Redevelopment Project Area
B – Major Multi-Sport Athletic Complex Project, Subordinate Lien Series 2010B, 0.000%, 6/01/21 | No Opt. Call | N/R | | 2,066,308 | |
| | 9,195 | | Total Kansas | | | | 7,238,242 | |
| | Principal | | | Optional Call | | | | |
| | Amount (000) | | Description (1) | Provisions (2) | Ratings (3) | | Value | |
| | | | Kentucky – 1.4% (0.9% of Total Investments) | | | | | |
| $ | 6,015 | | Kentucky Economic Development Finance Authority, Hospital Facilities Revenue Bonds, Owensboro Medical Health System, Series 2010B, 6.375%, 3/01/40 | 6/20 at 100.00 | Baa2 | $ | 5,707,513 | |
| | 1,500 | | Kentucky Economic Development Finance Authority, Hospital Revenue Bonds, Baptist Healthcare System, Series 2009A, 5.375%, 8/15/24 | 8/19 at 100.00 | Aa3 | | 1,534,830 | |
| | 1,000 | | Kentucky Economic Development Finance Authority, Louisville Arena Project Revenue Bonds, Louisville Arena Authority, Inc., Series 2008-A1, 6.000%, 12/01/33 – AGC Insured | 6/18 at 100.00 | AA+ | | 1,025,720 | |
| | 8,515 | | Total Kentucky | | | | 8,268,063 | |
| | | | Louisiana – 14.1% (9.0% of Total Investments) | | | | | |
| | 13,500 | | DeSoto Parish, Louisiana, Pollution Control Revenue Refunding Bonds, Cleco Utility Group Inc. Project, Series 1999, 5.875%, 9/01/29 – AMBAC Insured | 9/11 at 100.00 | BBB | | 13,499,325 | |
| | | | Louisiana Public Facilities Authority, Extended Care Facilities Revenue Bonds, Comm-Care Corporation Project, Series 1994: | | | | | |
| | 405 | | 11.000%, 2/01/14 (ETM) | No Opt. Call | N/R (4) | | 470,177 | |
| | 3,735 | | 11.000%, 2/01/14 (ETM) | No Opt. Call | N/R (4) | | 4,336,074 | |
| | 6,650 | | Louisiana Public Facilities Authority, Revenue Bonds, Baton Rouge General Hospital, Series 2004, 5.250%, 7/01/33 – NPFG Insured | 7/14 at 100.00 | Baa1 | | 6,555,238 | |
| | 9,000 | | Louisiana Public Facilities Authority, Revenue Bonds, Ochsner Clinic Foundation Project, Series 2007A, 5.500%, 5/15/47 | 5/17 at 100.00 | Baa1 | | 7,492,590 | |
| | 28 | | Louisiana State, Gasoline and Fuels Tax Revenue Bonds, Series 2006A, Trust 660, 15.745%, 5/01/34 (IF) | 5/16 at 100.00 | Aa1 | | 18,672 | |
| | | | Louisiana State, Gasoline and Fuels Tax Revenue Bonds, Series 2006A: | | | | | |
| | 10,000 | | 5.000%, 5/01/41 – FGIC Insured (UB) | 5/16 at 100.00 | Aa1 | | 10,006,500 | |
| | 20,690 | | 4.500%, 5/01/41 – FGIC Insured (UB) | 5/16 at 100.00 | Aa1 | | 18,926,178 | |
| | | | Tobacco Settlement Financing Corporation, Louisiana, Tobacco Settlement Asset-Backed Bonds, Series 2001B: | | | | | |
| | 7,505 | | 5.500%, 5/15/30 | 5/11 at 101.00 | A | | 7,408,936 | |
| | 14,365 | | 5.875%, 5/15/39 | 5/11 at 101.00 | A– | | 13,109,930 | |
| | 85,878 | | Total Louisiana | | | | 81,823,620 | |
| | | | Maryland – 0.9% (0.5% of Total Investments) | | | | | |
| | 5,000 | | Washington Suburban Sanitary District, Montgomery and Prince George’s Counties, Maryland, General Obligation Bonds, Consolidated Public Improvement, Series 2010A, 2.000%, 6/01/11 | No Opt. Call | AAA | | 5,007,900 | |
| | | | Massachusetts – 2.7% (1.7% of Total Investments) | | | | | |
| | 2,500 | | Massachusetts Bay Transportation Authority, Sales Tax Revenue Bonds, Senior Lien Series 2003A, 5.250%, 7/01/11 | No Opt. Call | AAA | | 2,521,525 | |
| | 8,825 | | Massachusetts Department of Transportation, Metropolitan Highway System Revenue Bonds, Senior Lien Series 2010B, 5.000%, 1/01/32 | 1/20 at 100.00 | A | | 8,813,086 | |
| | 620 | | Massachusetts Health and Educational Facilities Authority, Revenue Bonds, CareGroup Inc., Series 2008E-1 &2, 5.125%, 7/01/33 | 7/18 at 100.00 | A3 | | 551,819 | |
| | 1,750 | | Massachusetts Health and Educational Facilities Authority, Revenue Bonds, UMass Memorial Healthcare, Series 1998A, 5.000%, 7/01/28 – AMBAC Insured | 7/11 at 100.00 | BBB+ | | 1,597,138 | |
| | 2,300 | | Massachusetts Health and Educational Facilities Authority, Revenue Refunding Bonds, Suffolk University Issue, Series 2009A, 5.750%, 7/01/39 | 7/19 at 100.00 | BBB | | 2,181,734 | |
| | 15,995 | | Total Massachusetts | | | | 15,665,302 | |
| | | | Michigan – 1.1% (0.7% of Total Investments) | | | | | |
| | 6,250 | | Michigan State Building Authority, Revenue Bonds, Refunding Series 2006IA, 0.000%, 10/15/30 – FGIC Insured | 10/16 at 50.02 | Aa3 | | 1,813,875 | |
| | 2,000 | | Michigan State Hospital Finance Authority, Hospital Revenue Bonds, Oakwood Obligated Group, Series 2003, 5.500%, 11/01/11 | No Opt. Call | A | | 2,038,320 | |
| | 3,050 | | Michigan Tobacco Settlement Finance Authority, Tobacco Settlement Asset-Backed Revenue Bonds, Series 2008A, 6.875%, 6/01/42 | 6/18 at 100.00 | Baa3 | | 2,689,551 | |
| | 11,300 | | Total Michigan | | | | 6,541,746 | |
| | | Nuveen Municipal Advantage Fund, Inc. (continued) |
| NMA | | Portfolio of Investments |
April 30, 2011 (Unaudited)
| | Principal | | | Optional Call | | | | |
| | Amount (000) | | Description (1) | Provisions (2) | Ratings (3) | | Value | |
| | | | Missouri – 1.0% (0.6% of Total Investments) | | | | | |
| $ | 1,500 | | Bi-State Development Agency of the Missouri-Illinois Metropolitan District, Mass Transit Sales Tax Appropriation Bonds, Metrolink Cross County Extension Project, Series 2002B, 5.000%, 10/01/32 – AGM Insured | 10/13 at 100.00 | AA+ | $ | 1,505,700 | |
| | 12,005 | | Kansas City Municipal Assistance Corporation, Missouri, Leasehold Revenue Bonds, Series 2004B-1, 0.000%, 4/15/29 – AMBAC Insured | No Opt. Call | AA– | | 4,081,340 | |
| | 40 | | Missouri Housing Development Commission, Single Family Mortgage Revenue Bonds, Homeownership Loan Program, Series 2000A-1, 7.500%, 3/01/31 (Alternative Minimum Tax) | 9/11 at 100.00 | AAA | | 41,539 | |
| | 13,545 | | Total Missouri | | | | 5,628,579 | |
| | | | Nevada – 3.6% (2.4% of Total Investments) | | | | | |
| | 15,000 | | Clark County, Nevada, Airport Revenue Bonds, Subordinte Lien Series 2010B, 5.750%, 7/01/42 | 1/20 at 100.00 | Aa3 | | 15,161,850 | |
| | | | Director of Nevada State Department of Business and Industry, Revenue Bonds, Las Vegas Monorail Project, First Tier, Series 2000: | | | | | |
| | 3,025 | | 0.000%, 1/01/16 – AMBAC Insured | No Opt. Call | N/R | | 571,302 | |
| | 7,910 | | 5.375%, 1/01/40 – AMBAC Insured (5) | 7/11 at 100.00 | N/R | | 1,983,670 | |
| | 3,750 | | Henderson, Nevada, Healthcare Facility Revenue Refunding Bonds, Catholic Healthcare West, Series 2007B, Trust 2633, 18.765%, 7/01/31 – BHAC Insured (IF) | 7/17 at 100.00 | AA+ | | 3,910,200 | |
| | 165 | | Nevada Housing Division, Single Family Mortgage Bonds, Senior Series 1997C-2, 5.750%, 4/01/29 (Alternative Minimum Tax) | 10/11 at 100.00 | Aaa | | 169,460 | |
| | 29,850 | | Total Nevada | | | | 21,796,482 | |
| | | | New Hampshire – 0.3% (0.2% of Total Investments) | | | | | |
| | 1,500 | | New Hampshire Business Finance Authority, Revenue Bonds, Elliot Hospital Obligated Group Issue, Series 2009A, 6.125%, 10/01/39 | 10/19 at 100.00 | BBB+ | | 1,479,045 | |
| | | | New Jersey – 3.9% (2.5% of Total Investments) | | | | | |
| | 15,000 | | New Jersey Transportation Trust Fund Authority, Transportation System Bonds, Series 2006C, 0.000%, 12/15/30 – FGIC Insured | No Opt. Call | A+ | | 4,123,950 | |
| | | | Tobacco Settlement Financing Corporation, New Jersey, Tobacco Settlement Asset-Backed Bonds, Series 2002: | | | | | |
| | 9,735 | | 5.750%, 6/01/32 (Pre-refunded 6/01/12) | 6/12 at 100.00 | AAA | | 10,139,100 | |
| | 5,050 | | 6.125%, 6/01/42 (Pre-refunded 6/01/12) | 6/12 at 100.00 | AAA | | 5,367,544 | |
| | 5,000 | | Tobacco Settlement Financing Corporation, New Jersey, Tobacco Settlement Asset-Backed Bonds, Series 2007-1A, 4.750%, 6/01/34 | 6/17 at 100.00 | Baa3 | | 3,105,950 | |
| | 34,785 | | Total New Jersey | | | | 22,736,544 | |
| | | | New Mexico – 0.5% (0.3% of Total Investments) | | | | | |
| | 3,000 | | Santa Fe Public School District, Santa Fe County, New Mexico, General Obligation Bonds, Series 2009, 2.500%, 8/01/11 | No Opt. Call | Aa1 | | 3,017,220 | |
| | | | New York – 5.4% (3.5% of Total Investments) | | | | | |
| | 7,000 | | Metropolitan Transportation Authority, New York, State Service Contract Refunding Bonds, Series 2002A, 5.125%, 1/01/29 | 7/12 at 100.00 | AA– | | 7,018,830 | |
| | 4,975 | | New York City Industrial Development Agency, New York, Special Facilities Revenue Bonds, British Airways PLC, Series 1998, 5.250%, 12/01/32 (Alternative Minimum Tax) | 6/11 at 100.00 | BB– | | 3,664,884 | |
| | 3,000 | | New York City Industrial Development Agency, New York, Special Facilities Revenue Bonds, British Airways PLC, Series 2002, 7.625%, 12/01/32 (Alternative Minimum Tax) | 12/12 at 101.00 | BB– | | 3,013,950 | |
| | 10,000 | | New York City Municipal Water Finance Authority, New York, Water and Sewerage System Revenue Bonds, Series 2004B, 5.000%, 6/15/36 – AGM Insured (UB) | 12/14 at 100.00 | AAA | | 10,040,500 | |
| | | | Port Authority of New York and New Jersey, Special Project Bonds, JFK International Air Terminal LLC Project, Eigth Series 2010: | | | | | |
| | 6,065 | | 6.500%, 12/01/28 | 12/15 at 100.00 | BBB– | | 6,202,918 | |
| | 1,660 | | 6.000%, 12/01/36 | 12/20 at 100.00 | BBB– | | 1,612,391 | |
| | 32,700 | | Total New York | | | | 31,553,473 | |
| | Principal | | | Optional Call | | | | |
| | Amount (000) | | Description (1) | Provisions (2) | Ratings (3) | | Value | |
| | | | North Carolina – 2.8% (1.8% of Total Investments) | | | | | |
| $ | 3,000 | | North Carolina Eastern Municipal Power Agency, Power System Revenue Bonds, Series 2005, 5.250%, 1/01/20 – AMBAC Insured | 1/16 at 100.00 | A– | $ | 3,248,940 | |
| | 980 | | North Carolina Housing Finance Agency, Home Ownership Revenue Bonds, 1998 Trust Agreement, Series 10A, 5.400%, 7/01/32 – AMBAC Insured (Alternative Minimum Tax) | 7/11 at 100.00 | AA | | 976,247 | |
| | 3,645 | | North Carolina Housing Finance Agency, Home Ownership Revenue Bonds, 1998 Trust Agreement, Series 7A, 6.250%, 1/01/29 (Alternative Minimum Tax) | 7/11 at 100.00 | AA | | 3,647,151 | |
| | 3,465 | | North Carolina Housing Finance Agency, Home Ownership Revenue Bonds, 1998 Trust Agreement, Series 9A, 5.875%, 7/01/31 (Alternative Minimum Tax) | 7/11 at 100.00 | AA | | 3,466,040 | |
| | 3,500 | | North Carolina Medical Care Commission, Healthcare Facilities Revenue Bonds, Duke University Health System, Series 2009A, 5.000%, 6/01/42 | 6/19 at 100.00 | AA | | 3,350,935 | |
| | 1,900 | | North Carolina Turnpike Authority, Triangle Expressway System Revenue Bonds, Series 2009A, 5.750%, 1/01/39 – AGC Insured | 1/19 at 100.00 | AA+ | | 1,931,027 | |
| | 16,490 | | Total North Carolina | | | | 16,620,340 | |
| | | | North Dakota – 0.6% (0.4% of Total Investments) | | | | | |
| | 1,500 | | Fargo, North Dakota, Health System Revenue Bonds, Sanford Series 2011, 6.000%, 11/01/28 | 11/21 at 100.00 | AA– | | 1,558,020 | |
| | 2,350 | | Ward County Health Care, North Dakota, Revenue Bonds, Trinity Obligated Group, Series 2006, 5.125%, 7/01/25 | 7/16 at 100.00 | BBB+ | | 2,250,478 | |
| | 3,850 | | Total North Dakota | | | | 3,808,498 | |
| | | | Ohio – 7.5% (4.8% of Total Investments) | | | | | |
| | 4,220 | | Akron, Bath and Copley Joint Township Hospital District, Ohio, Hospital Facilities Revenue Bonds, Summa Health System, Series 1998A, 5.375%, 11/15/18 | 5/11 at 100.00 | Baa1 | | 4,221,730 | |
| | 10,000 | | American Municipal Power Ohio Inc., General Revenue Bonds, Prairie State Energy Campus Project Series 2008A, 5.250%, 2/15/43 | 2/18 at 100.00 | A1 | | 9,742,800 | |
| | | | Buckeye Tobacco Settlement Financing Authority, Ohio, Tobacco Settlement Asset-Backed Revenue Bonds, Senior Lien, Series 2007A-2: | | | | | |
| | 1,595 | | 5.125%, 6/01/24 | 6/17 at 100.00 | Baa3 | | 1,232,393 | |
| | 2,700 | | 5.875%, 6/01/30 | 6/17 at 100.00 | Baa3 | | 1,948,428 | |
| | 9,135 | | 5.750%, 6/01/34 | 6/17 at 100.00 | Baa3 | | 6,294,015 | |
| | 3,920 | | 6.000%, 6/01/42 | 6/17 at 100.00 | Baa3 | | 2,721,499 | |
| | 5,895 | | 5.875%, 6/01/47 | 6/17 at 100.00 | Baa3 | | 3,977,298 | |
| | 5,275 | | Buckeye Tobacco Settlement Financing Authority, Ohio, Tobacco Settlement Asset-Backed Revenue Bonds, Senior Lien, Series 2007A-3, 0.000%, 6/01/37 | 6/22 at 100.00 | Baa3 | | 3,356,430 | |
| | 7,050 | | Ohio Air Quality Development Authority, Ohio, Revenue Bonds, Ohio Valley Electric Corporation Project, Series 2009E, 5.625%, 10/01/19 | No Opt. Call | BBB– | | 7,108,445 | |
| | 2,650 | | Ohio, General Obligation Bonds, Higher Education, Series 2003A, 5.000%, 5/01/22 | 5/13 at 100.00 | AA+ | | 2,785,707 | |
| | 52,440 | | Total Ohio | | | | 43,388,745 | |
| | | | Oklahoma – 2.5% (1.6% of Total Investments) | | | | | |
| | 1,675 | | Oklahoma Development Finance Authority, Health System Revenue Bonds, Integris Baptist Medical Center, Series 2008B, 5.250%, 8/15/38 | 8/18 at 100.00 | AA– | | 1,665,235 | |
| | 12,000 | | Oklahoma Development Finance Authority, Revenue Bonds, Saint John Health System, Series 2007, 5.000%, 2/15/42 | 2/17 at 100.00 | A | | 11,096,640 | |
| | 2,000 | | Oklahoma Municipal Power Authority, Power Supply System Revenue Bonds, Series 2007, 4.500%, 1/01/47 – FGIC Insured | 1/17 at 100.00 | A | | 1,738,960 | |
| | 15,675 | | Total Oklahoma | | | | 14,500,835 | |
| | | | Oregon – 0.5% (0.3% of Total Investments) | | | | | |
| | 3,000 | | Oregon State Facilities Authority, Revenue Bonds, Willamette University, Series 2007A, 5.000%, 10/01/36 | 10/17 at 100.00 | A | | 2,701,170 | |
| | | Nuveen Municipal Advantage Fund, Inc. (continued) |
| NMA | | Portfolio of Investments |
April 30, 2011 (Unaudited)
| | | | | | | | | |
| | Principal | | | Optional Call | | | | |
| | Amount (000) | | Description (1) | Provisions (2) | Ratings (3) | | Value | |
| | | | Pennsylvania – 5.0% (3.2% of Total Investments) | | | | | |
| $ | 5,000 | | Allegheny County Hospital Development Authority, Pennsylvania, University of Pittsburgh Medical Center Revenue Bonds, Series 2009A, 5.625%, 8/15/39 | No Opt. Call | Aa3 | $ | 4,940,200 | |
| | 1,250 | | Erie Water Authority, Pennsylvania, Water Revenue Bonds, Series 2008, 5.000%, 12/01/43 – AGM Insured | 12/18 at 100.00 | AA+ | | 1,225,313 | |
| | 7,100 | | Montgomery County Industrial Development Authority, Pennsylvania, FHA Insured Mortgage Revenue Bonds, New Regional Medical Center Project, Series 2010, 5.750%, 8/01/30 | 8/15 at 100.00 | AA | | 7,714,718 | |
| | 1,000 | | Pennsylvania Higher Educational Facilities Authority, Revenue Bonds, Widener University, Series 2003, 5.375%, 7/15/29 | 7/13 at 100.00 | BBB+ | | 1,000,220 | |
| | 1,500 | | Pennsylvania Housing Finance Agency, Single Family Mortgage Revenue Bonds, Series 2006-96A, 4.650%, 10/01/31 (Alternative Minimum Tax) (UB) | 10/16 at 100.00 | AA+ | | 1,365,240 | |
| | 2,600 | | Pennsylvania Turnpike Commission, Turnpike Revenue Bonds, Series 2004A, 5.500%, 12/01/31 – AMBAC Insured | 12/14 at 100.00 | Aa3 | | 2,628,496 | |
| | 10,000 | | Philadelphia Hospitals and Higher Education Facilities Authority, Pennsylvania, Health System Revenue Bonds, Jefferson Health System, Series 2010B, 5.250%, 5/15/30 | 5/20 at 100.00 | AA | | 9,987,800 | |
| | 28,450 | | Total Pennsylvania | | | | 28,861,987 | |
| | | | Puerto Rico – 7.9% (5.0% of Total Investments) | | | | | |
| | 5,000 | | Puerto Rico Electric Power Authority, Power Revenue Bonds, Series 2005RR, 5.000%, 7/01/26 – SYNCORA GTY Insured | 7/15 at 100.00 | A3 | | 4,754,500 | |
| | 10,000 | | Puerto Rico Electric Power Authority, Power Revenue Bonds, Series 2010XX, 5.750%, 7/01/36 | 7/20 at 100.00 | A3 | | 9,676,500 | |
| | 10,070 | | Puerto Rico Highway and Transportation Authority, Highway Revenue Bonds, Series 2007N, 5.250%, 7/01/39 – FGIC Insured | No Opt. Call | A3 | | 8,862,909 | |
| | 10,000 | | Puerto Rico Sales Tax Financing Corporation, Sales Tax Revenue Bonds, First Subordinate Series 2009A, 6.000%, 8/01/42 | 8/19 at 100.00 | A+ | | 10,018,200 | |
| | 9,310 | | Puerto Rico Sales Tax Financing Corporation, Sales Tax Revenue Bonds, First Subordinate Series 2010C, 5.250%, 8/01/41 | 8/20 at 100.00 | A+ | | 8,411,678 | |
| | 4,000 | | Puerto Rico, General Obligation Bonds, Series 2000B, 5.625%, 7/01/19 – NPFG Insured | 7/11 at 100.00 | A3 | | 4,002,360 | |
| | 48,380 | | Total Puerto Rico | | | | 45,726,147 | |
| | | | Rhode Island – 1.3% (0.9% of Total Investments) | | | | | |
| | 1,235 | | Rhode Island Health and Educational Building Corporation, Hospital Financing Revenue Bonds, Lifespan Obligated Group, Series 1996, 5.500%, 5/15/16 – NPFG Insured | 7/11 at 100.00 | A3 | | 1,237,198 | |
| | 7,000 | | Rhode Island Housing and Mortgage Finance Corporation, Homeownership Opportunity Bond Program, Series 50A, 4.650%, 10/01/34 | 10/14 at 100.00 | AA+ | | 6,497,890 | |
| | 8,235 | | Total Rhode Island | | | | 7,735,088 | |
| | | | South Carolina – 3.3% (2.1% of Total Investments) | | | | | |
| | 10,000 | | Greenville County School District, South Carolina, Installment Purchase Revenue Bonds, Series 2002, 6.000%, 12/01/20 (Pre-refunded 12/01/12) | 12/12 at 101.00 | AA (4) | | 10,975,600 | |
| | 2,500 | | Lexington County Health Service District, South Carolina, Hospital Revenue Refunding and Improvement Bonds, Series 2003, 5.750%, 11/01/28 (Pre-refunded 11/01/13) | 11/13 at 100.00 | AA– (4) | | 2,816,025 | |
| | 3,000 | | Myrtle Beach, South Carolina, Hospitality and Accommodation Fee Revenue Bonds, Series 2004A, 5.000%, 6/01/36 – FGIC Insured | 6/14 at 100.00 | A+ | | 2,745,630 | |
| | 1,220 | | Piedmont Municipal Power Agency, South Carolina, Electric Revenue Bonds, Series 2004A-2, 0.000%, 1/01/23 – FGIC Insured | No Opt. Call | A– | | 652,785 | |
| | 2,125 | | South Carolina Public Service Authority, Revenue Refunding Bonds, Santee Cooper Electric System, Series 2003A, 5.000%, 1/01/21 – AMBAC Insured | 7/13 at 100.00 | Aa2 | | 2,270,626 | |
| | 18,845 | | Total South Carolina | | | | 19,460,666 | |
| | | | South Dakota – 0.5% (0.3% of Total Investments) | | | | | |
| | 2,945 | | South Dakota Health and Educational Facilities Authority, Revenue Bonds, Sanford Health, Series 2007, 5.000%, 11/01/40 | 5/17 at 100.00 | AA– | | 2,759,760 | |
| | Principal | | | Optional Call | | | | |
| | Amount (000) | | Description (1) | Provisions (2) | Ratings (3) | | Value | |
| | | | Tennessee – 3.9% (2.5% of Total Investments) | | | | | |
| $ | 6,000 | | Knox County Health, Educational and Housing Facilities Board, Tennessee, Hospital Revenue Bonds, Baptist Health System of East Tennessee Inc., Series 2002, 6.500%, 4/15/31 | 4/12 at 101.00 | A1 | $ | 6,224,580 | |
| | 20,415 | | Knox County Health, Educational and Housing Facilities Board, Tennessee, Hospital Revenue Refunding Bonds, Covenant Health, Series 2002A, 0.000%, 1/01/18 – AGM Insured | 1/13 at 75.87 | AA+ | | 14,598,767 | |
| | 1,750 | | Metropolitan Government of Nashville-Davidson County, Tennessee, Electric System Revenue Bonds, Series 2001A, 5.125%, 5/15/26 | 5/11 at 100.00 | AA+ | | 1,753,360 | |
| | 1,500 | | Sumner County Health, Educational, and Housing Facilities Board, Tennessee, Revenue Refunding Bonds, Sumner Regional Health System Inc., Series 2007, 5.500%, 11/01/46 (5), (6) | 11/17 at 100.00 | N/R | | 75,150 | |
| | 29,665 | | Total Tennessee | | | | 22,651,857 | |
| | | | Texas – 16.2% (10.3% of Total Investments) | | | | | |
| | 2,000 | | Abilene Higher education Authority, Inc., Texas, Student Loan Revenue Bonds, Subordinate Series 1998B, 5.050%, 7/01/13 (Pre-Refunded 6/01/11) (Alternative Minimum Tax) | 6/11 at 100.00 | Aa3 (4) | | 2,004,040 | |
| | 11,810 | | Brazos River Authority, Texas, Pollution Control Revenue Refunding Bonds, TXU Electric Company, Series 2001C, 5.750%, 5/01/36 (Mandatory put 11/01/11) (Alternative Minimum Tax) | No Opt. Call | CC | | 11,568,958 | |
| | 6,000 | | Brazos River Authority, Texas, Revenue Refunding Bonds, Houston Lighting and Power Company, Series 1998, 5.050%, 11/01/18 – AMBAC Insured (Alternative Minimum Tax) | No Opt. Call | A3 | | 5,944,620 | |
| | 2,000 | | Capital Area Cultural Education Facilities Finance Corporation, Texas, Revenue Bonds, The Roman Catholic Diocese of Austin, Series 2005B. Remarketed, 6.125%, 4/01/45 | 4/20 at 100.00 | Baa2 | | 1,921,400 | |
| | 4,250 | | Ennis Independent School District, Ellis County, Texas, General Obligation Bonds, Series 2006, 0.000%, 8/15/26 | 8/16 at 60.73 | Aaa | | 2,008,890 | |
| | 8,400 | | Gulf Coast Waste Disposal Authority, Texas, Waste Disposal Revenue Bonds, Valero Energy Corporation, Series 1999, 5.700%, 4/01/32 (Alternative Minimum Tax) | 10/11 at 100.00 | BBB | | 7,717,584 | |
| | 7,500 | | Harris County Health Facilities Development Corporation, Texas, Thermal Utility Revenue Bonds, TECO Project, Series 2003, 5.000%, 11/15/30 – NPFG Insured | 11/13 at 100.00 | AA | | 7,522,875 | |
| | 1,540 | | Houston Community College System, Texas, Limited Tax General Obligation Bonds, Series 2003, 5.000%, 2/15/28 – AMBAC Insured (UB) | 2/13 at 100.00 | AA+ | | 1,562,977 | |
| | 3,460 | | Houston Community College System, Texas, Limited Tax General Obligation Bonds, Series 2003, 5.000%, 2/15/28 (Pre-refunded 2/15/13) – AMBAC Insured | 2/13 at 100.00 | AA+ (4) | | 3,731,921 | |
| | 2,000 | | Houston, Texas, Water Conveyance System Contract, Certificates of Participation, Series 1993A-J, 6.800%, 12/15/11 – AMBAC Insured | No Opt. Call | N/R | | 2,047,220 | |
| | 6,080 | | Laredo Independent School District, Webb County, Texas, General Obligation Bonds, Series 2006, 5.000%, 8/01/29 | 8/16 at 100.00 | AAA | | 6,360,835 | |
| | 9,150 | | Leander Independent School District, Williamson and Travis Counties, Texas, General Obligation Bonds, Series 2004, 0.000%, 8/15/31 | 8/12 at 33.31 | AAA | | 2,846,016 | |
| | 9,345 | | Leander Independent School District, Williamson and Travis Counties, Texas, General Obligation Bonds, Series 2005, 0.000%, 8/15/34 – FGIC Insured | 8/15 at 35.34 | AA– | | 2,550,998 | |
| | 16,305 | | Matagorda County Navigation District 1, Texas, Revenue Bonds, Reliant Energy Inc., Series 1999B, 5.950%, 5/01/30 (Alternative Minimum Tax) | 11/11 at 100.00 | BBB– | | 15,198,217 | |
| | | | North Texas Tollway Authority, First Tier System Revenue Refunding Bonds, Capital Appreciation Series 2008I: | | | | | |
| | 2,555 | | 0.000%, 1/01/42 – AGC Insured | 1/25 at 100.00 | AA+ | | 2,046,581 | |
| | 7,000 | | 0.000%, 1/01/43 | 1/25 at 100.00 | A2 | | 5,577,670 | |
| | 3,500 | | Northside Independent School District, Bexar County, Texas, General Obligation Bonds, Series 2001A, 5.000%, 8/01/27 | 8/11 at 100.00 | AAA | | 3,525,480 | |
| | 3,425 | | Sabine River Authority, Texas, Pollution Control Revenue Refunding Bonds, TXU Electric Company, Series 2001A, 5.500%, 5/01/22 (Mandatory put 11/01/11) | No Opt. Call | CC | | 3,355,096 | |
| | 4,700 | | Sam Rayburn Municipal Power Agency, Texas, Power Supply System Revenue Refunding Bonds, Series 2002A, 6.000%, 10/01/21 | 10/12 at 100.00 | Baa2 | | 4,769,325 | |
| | 3,000 | | Wylie Independent School District, Collin County, Texas, General Obligation Bonds, Series 2005, 0.000%, 8/15/21 | 8/15 at 74.57 | AAA | | 1,884,750 | |
| | 114,020 | | Total Texas | | | | 94,145,453 | |
| | | Nuveen Municipal Advantage Fund, Inc. (continued) |
| NMA | | Portfolio of Investments |
April 30, 2011 (Unaudited)
| | Principal | | | Optional Call | | | | |
| | Amount (000) | | Description (1) | Provisions (2) | Ratings (3) | | Value | |
| | | | Utah – 0.5% (0.3% of Total Investments) | | | | | |
| $ | 3,000 | | Riverton, Utah, Hospital Revenue Bonds, IHC Health Services, Inc., Series 2009, 5.000%, 8/15/41 | 8/19 at 100.00 | AA+ | $ | 2,796,450 | |
| | | | Virgin Islands – 0.3% (0.2% of Total Investments) | | | | | |
| | 1,480 | | Virgin Islands Public Finance Authority, Matching Fund Revenue Loan Note – Diageo Project, Series 2009A, 6.750%, 10/01/37 | 10/19 at 100.00 | BBB | | 1,534,064 | |
| | | | Virginia – 0.3% (0.2% of Total Investments) | | | | | |
| | 2,855 | | Tobacco Settlement Financing Corporation of Virginia, Tobacco Settlement Asset-Backed Bonds, Series 2007B2, 0.000%, 6/01/46 | 6/17 at 100.00 | Baa3 | | 1,665,379 | |
| | | | Washington – 6.9% (4.4% of Total Investments) | | | | | |
| | 1,260 | | Central Puget Sound Regional Transit Authority, Washington, Sales Tax and Motor Vehicle Excise Tax Bonds, Series 1999, 4.750%, 2/01/28 – FGIC Insured | 8/11 at 100.00 | AAA | | 1,260,302 | |
| | 8,810 | | Chelan County Public Utility District 1, Washington, Hydro Consolidated System Revenue Bonds, Series 2001A, 5.600%, 1/01/36 – NPFG Insured (Alternative Minimum Tax) (UB) | 7/11 at 101.00 | AA | | 8,676,088 | |
| | 5,665 | | Chelan County Public Utility District 1, Washington, Hydro Consolidated System Revenue Bonds, Series 2002B, 5.250%, 7/01/37 – AMBAC Insured (Alternative Minimum Tax) | 7/12 at 100.00 | AA | | 5,287,258 | |
| | 10,730 | | Chelan County Public Utility District 1, Washington, Hydro Consolidated System Revenue Refunding Bonds, Series 2001C, 5.650%, 7/01/32 – NPFG Insured (Alternative Minimum Tax) (UB) | 7/11 at 101.00 | AA | | 10,754,894 | |
| | 2,485 | | Grant County Public Utility District 2, Washington, Revenue Bonds, Wanapum Hydroelectric Development, Series 2006B, 5.000%, 1/01/32 – NPFG Insured | No Opt. Call | AA– | | 2,480,055 | |
| | 5,000 | | Port of Seattle, Washington, Special Facility Revenue Bonds, Terminal 18, Series 1999B, 6.000%, 9/01/20 – NPFG Insured (Alternative Minimum Tax) | 9/11 at 100.00 | Baa1 | | 5,004,400 | |
| | 2,000 | | Washington State Health Care Facilities Authority, Revenue Bonds, Fred Hutchinson Cancer Research Center, Series 2009A, 6.000%, 1/01/33 | 7/19 at 100.00 | A | | 2,007,480 | |
| | 2,315 | | Washington State Tobacco Settlement Authority, Tobacco Settlement Asset-Backed Revenue Bonds, Series 2002, 6.625%, 6/01/32 | 6/13 at 100.00 | BBB | | 2,300,531 | |
| | 1,595 | | Washington State, General Obligation Bonds, Series 2002A-R-03, 5.000%, 1/01/17 – NPFG Insured | 1/12 at 100.00 | AA+ | | 1,637,395 | |
| | 1,270 | | Washington State, Motor Vehicle Fuel Tax General Obligation Bonds, Series 2003F, 0.000%, 12/01/24 – NPFG Insured | No Opt. Call | AA+ | | 686,549 | |
| | 41,130 | | Total Washington | | | | 40,094,952 | |
| | | | West Virginia – 0.9% (0.6% of Total Investments) | | | | | |
| | 5,000 | | Mason County, West Virginia, Pollution Control Revenue Bonds, Appalachian Power Company, Series 2003L, 5.500%, 10/01/22 (Mandatory put 10/01/11) | 10/11 at 100.00 | BBB (4) | | 5,020,000 | |
| | | | Wisconsin – 2.4% (1.5% of Total Investments) | | | | | |
| | 535 | | Badger Tobacco Asset Securitization Corporation, Wisconsin, Tobacco Settlement Asset-Backed Bonds, Series 2002, 5.750%, 6/01/12 (ETM) | No Opt. Call | AAA | | 565,468 | |
| | 4,005 | | Badger Tobacco Asset Securitization Corporation, Wisconsin, Tobacco Settlement Asset-Backed Bonds, Series 2002, 6.125%, 6/01/27 (Pre-refunded 6/01/12) | 6/12 at 100.00 | AAA | | 4,157,911 | |
| | 565 | | Green Bay, Wisconsin, Water System Revenue Bonds, Series 2004, 5.000%, 11/01/29 – AGM Insured | 11/14 at 100.00 | Aa2 | | 572,695 | |
| | 5,000 | | Madison, Wisconsin, Industrial Development Revenue Refunding Bonds, Madison Gas and Electric Company Projects, Series 2002A, 5.875%, 10/01/34 (Alternative Minimum Tax) | 4/12 at 100.00 | AA– | | 5,005,950 | |
| | Principal | | | Optional Call | | | | |
| | Amount (000) | | Description (1) | Provisions (2) | Ratings (3) | | Value | |
| | | | Wisconsin (continued) | | | | | |
| $ | 3,000 | | Southeast Wisconsin Professional Baseball Park District, Sales Tax Revenue Refunding Bonds, Series 1998A, 5.500%, 12/15/19 – NPFG Insured | No Opt. Call | AA– | $ | 3,573,840 | |
| | 13,105 | | Total Wisconsin | | | | 13,875,864 | |
| $ | 1,138,768 | | Total Investments (cost $949,386,064) – 156.8% | | | | 912,199,838 | |
| | | | Floating Rate Obligations – (10.3)% | | | | (59,788,333 | ) |
| | | | Variable Rate Demand Preferred Shares, at Liquidation Value – (51.0)% (7) | | | | (296,800,000 | ) |
| | | | Other Assets Less Liabilities – 4.5% | | | | 26,276,526 | |
| | | | Net Assets Applicable to Common Shares – 100% | | | $ | 581,888,031 | |
| (1) | | All percentages shown in the Portfolio of Investments are based on net assets applicable to Common shares unless otherwise noted. |
| (2) | | Optional Call Provisions: Dates (month and year) and prices of the earliest optional call or redemption. There may be other call provisions at varying prices at later dates. Certain mortgage-backed securities may be subject to periodic principal paydowns. |
| (3) | | Ratings: Using the highest of Standard & Poor’s Group (“Standard & Poor’s”), Moody’s Investor Service, Inc. (“Moody’s”) or Fitch, Inc. (“Fitch”) rating. Ratings below BBB by Standard & Poor’s, Baa by Moody’s or BBB by Fitch are considered to be below investment grade. Holdings designated N/R are not rated by any of these national rating agencies. |
| (4) | | Backed by an escrow or trust containing sufficient U.S. Government or U.S. Government agency securities, which ensure the timely payment of principal and interest. Such investments are normally considered to be equivalent to AAA rated securities. |
| (5) | | At or subsequent to the end of the reporting period, this security is non-income producing. Non-income producing security, in the case of a bond, generally denotes that the issuer has (1) defaulted on the payment of principal or interest, (2) is under the protection of the Federal Bankruptcy Court or (3) the Fund’s Adviser has concluded that the issue is not likely to meet its future interest payment obligations and has directed the Fund’s custodian to cease accruing additional income on the Fund’s records. |
| (6) | | For fair value measurement disclosure purposes, investment categorized as Level 3. See Notes to Financial Statements, Footnote 1 – General Information and Significant Accounting Policies, Investment Valuation for more information. |
| (7) | | Variable Rate Demand Preferred Shares, at Liquidation Value as a percentage of Total Investments is 32.5%. |
| N/R | | Not rated. |
| (ETM) | | Escrowed to maturity. |
| (IF) | | Inverse floating rate investment. |
| (UB) | | Underlying bond of an inverse floating rate trust reflected as a financing transaction. See Notes to Financial Statements, Footnote 1 – General Information and Significant Accounting Policies, Inverse Floating Rate Securities for more information. |
See accompanying notes to financial statements.
| | | Nuveen Municipal Market Opportunity Fund, Inc. |
| NMO | | Portfolio of Investments |
| | | April 30, 2011 (Unaudited) |
| | Principal | | | Optional Call | | | | |
| | Amount (000) | | Description (1) | Provisions (2) | Ratings (3) | | Value | |
| | | | Alabama – 0.6% (0.4% of Total Investments) | | | | | |
| | | | Henry County Water Authority, Alabama, Water Revenue Bonds, Series 2006: | | | | | |
| $ | 1,935 | | 5.000%, 1/01/36 – RAAI Insured | 1/16 at 100.00 | N/R | $ | 1,613,538 | |
| | 2,485 | | 5.000%, 1/01/41 – RAAI Insured | 1/16 at 100.00 | N/R | | 2,005,518 | |
| | 4,420 | | Total Alabama | | | | 3,619,056 | |
| | | | Alaska – 3.0% (1.8% of Total Investments) | | | | | |
| | | | Alaska Housing Finance Corporation, General Housing Purpose Bonds, Series 2005A: | | | | | |
| | 1,125 | | 5.250%, 12/01/34 – FGIC Insured (UB) | 12/14 at 100.00 | AA+ | | 1,136,655 | |
| | 1,275 | | 5.250%, 12/01/41 – FGIC Insured (UB) | 12/14 at 100.00 | AA+ | | 1,282,013 | |
| | 7,000 | | Alaska Housing Finance Corporation, General Housing Purpose Bonds, Series 2005B-2, 5.250%, 12/01/30 – NPFG Insured | 6/15 at 100.00 | AA+ | | 7,045,640 | |
| | 13,025 | | Northern Tobacco Securitization Corporation, Alaska, Tobacco Settlement Asset-Backed Bonds, Series 2006A, 5.000%, 6/01/46 | 6/14 at 100.00 | Baa3 | | 7,754,563 | |
| | 22,425 | | Total Alaska | | | | 17,218,871 | |
| | | | California – 23.7% (14.5% of Total Investments) | | | | | |
| | 12,500 | | Anaheim Public Finance Authority, California, Subordinate Lease Revenue Bonds, Public Improvement Project, Series 1997C, 0.000%, 9/01/35 – AGM Insured | No Opt. Call | AA+ | | 1,927,750 | |
| | 1,350 | | Antelope Valley Union High School District, Los Angeles County, California, General Obligation Bonds, Series 2004B, 0.000%, 8/01/29 – NPFG Insured | No Opt. Call | Aa2 | | 411,858 | |
| | | | Bay Area Toll Authority, California, Revenue Bonds, San Francisco Bay Area Toll Bridge, Series 2009F-1: | | | | | |
| | 2,500 | | 5.125%, 4/01/39 | 4/19 at 100.00 | AA | | 2,470,975 | |
| | 2,500 | | 5.625%, 4/01/44 | 4/19 at 100.00 | AA | | 2,585,375 | |
| | 8,000 | | Beverly Hills Unified School District, Los Angeles County, California, General Obligation Bonds, Series 2009, 0.000%, 8/01/33 | No Opt. Call | Aa1 | | 2,007,360 | |
| | 7,800 | | California County Tobacco Securitization Agency, Tobacco Settlement Asset-Backed Bonds, Los Angeles County Securitization Corporation, Series 2006A, 5.600%, 6/01/36 | 12/18 at 100.00 | Baa3 | | 5,585,502 | |
| | 5,000 | | California Department of Water Resources Central Valley Project Water System Revenue Bonds, Series 2009-AF, 5.000%, 12/01/29 | No Opt. Call | AAA | | 5,269,100 | |
| | 2,730 | | California Department of Water Resources, Water System Revenue Bonds, Central Valley Project, Series 2003Y, 5.000%, 12/01/25 – FGIC Insured | 6/13 at 100.00 | AAA | | 2,855,607 | |
| | 1,350 | | California Educational Facilities Authority, Revenue Refunding Bonds, Loyola Marymount University, Series 2001A, 0.000%, 10/01/39 – NPFG Insured | No Opt. Call | A2 | | 176,405 | |
| | 4,295 | | California Health Facilities Financing Authority, Health Facility Revenue Bonds, Adventist Health System/West, Series 2003A, 5.000%, 3/01/33 | 3/13 at 100.00 | A | | 3,838,012 | |
| | 9,000 | | California Health Facilities Financing Authority, Revenue Bonds, Kaiser Permanante System, Series 2006, 5.250%, 3/01/45 | 3/16 at 100.00 | A+ | | 7,749,810 | |
| | | | California State, General Obligation Bonds, Various Purpose Series 2010: | | | | | |
| | 7,000 | | 5.250%, 3/01/30 | 3/20 at 100.00 | A1 | | 7,090,860 | |
| | 4,250 | | 5.250%, 11/01/40 | 11/20 at 100.00 | A1 | | 4,116,848 | |
| | 25,000 | | California State, Various Purpose General Obligation Bonds, Series 2005, 4.750%, 3/01/35 – NPFG Insured (UB) | 3/16 at 100.00 | A1 | | 22,539,750 | |
| | 1,550 | | California Statewide Community Development Authority, Revenue Bonds, St. Joseph Health System, Series 2007A, 5.750%, 7/01/47 – FGIC Insured | 7/18 at 100.00 | AA– | | 1,453,079 | |
| | 10,445 | | Castaic Lake Water Agency, California, Certificates of Participation, Water System Improvement Project, Series 1999, 0.000%, 8/01/29 – AMBAC Insured | No Opt. Call | AA | | 3,243,381 | |
| | 8,365 | | Cupertino Union School District, Santa Clara County, California, General Obligation Bonds, Series 2003B, 0.000%, 8/01/26 – FGIC Insured | 8/13 at 52.66 | Aa1 | | 3,285,856 | |
| | 5,000 | | Golden State Tobacco Securitization Corporation, California, Enhanced Tobacco Settlement Asset-Backed Bonds, Series 2003B, 5.000%, 6/01/38 (Pre-refunded 6/01/13) – AMBAC Insured | 6/13 at 100.00 | AAA | | 5,435,000 | |
| | Principal | | | Optional Call | | | | |
| | Amount (000) | | Description (1) | Provisions (2) | Ratings (3) | | Value | |
| | | | California (continued) | | | | | |
| | | | Golden State Tobacco Securitization Corporation, California, Enhanced Tobacco Settlement Asset-Backed Revenue Bonds, Series 2005A: | | | | | |
| $ | 3,500 | | 0.000%, 6/01/26 – AGM Insured | No Opt. Call | AA+ | $ | 1,388,520 | |
| | 3,000 | | 5.000%, 6/01/45 | 6/15 at 100.00 | A2 | | 2,466,240 | |
| | 1,000 | | Golden State Tobacco Securitization Corporation, California, Tobacco Settlement Asset-Backed Bonds, Series 2007A-1, 5.125%, 6/01/47 | 6/17 at 100.00 | Baa3 | | 610,150 | |
| | 1,500 | | Lincoln Unified School District, Placer County, California, Community Facilities District 1, Special Tax Bonds, Series 2005, 0.000%, 9/01/26 – AMBAC Insured | No Opt. Call | N/R | | 470,730 | |
| | 490 | | Los Angeles Department of Water and Power, California, Electric Plant Revenue Bonds, Second Series 1993, 4.750%, 10/15/20 (ETM) | 7/11 at 100.00 | AA– (4) | | 491,401 | |
| | 995 | | Los Angeles Department of Water and Power, California, Electric Plant Revenue Bonds, Series 1994, 5.375%, 2/15/34 (ETM) | 7/11 at 100.00 | AA– (4) | | 998,532 | |
| | 2,500 | | Los Angeles Department of Water and Power, California, Power System Revenue Bonds, Series 2005A-2, 5.000%, 7/01/22 – AGM Insured | No Opt. Call | AA+ | | 2,665,275 | |
| | 5,000 | | Los Angeles Department of Water and Power, California, Waterworks Revenue Bonds, Series 2003A, 5.125%, 7/01/40 – FGIC Insured | 7/12 at 100.00 | AA | | 5,006,450 | |
| | 2,200 | | M-S-R Energy Authority, California, Gas Revenue Bonds, Series 2009B, 6.500%, 11/01/39 | No Opt. Call | A | | 2,269,784 | |
| | 14,000 | | New Haven Unified School District, California, General Obligation Bonds, Refunding Series 2009, 0.000%, 8/01/34 – AGC Insured | No Opt. Call | AA+ | | 2,910,180 | |
| | 1,000 | | Pajaro Valley Unified School District, Santa Cruz County, California, General Obligation Bonds, Series 2005B, 0.000%, 8/01/29 – AGM Insured | No Opt. Call | AA+ | | 297,840 | |
| | 5,000 | | Palomar Pomerado Health Care District, California, Certificates of Participation, Series 2010, 6.000%, 11/01/30 | 11/20 at 100.00 | Baa3 | | 4,571,350 | |
| | 4,795 | | Palomar Pomerado Health, California, General Obligation Bonds, Election of 2004, Series 2007A, 5.000%, 8/01/32 – NPFG Insured | No Opt. Call | A+ | | 4,509,410 | |
| | 8,040 | | Placentia-Yorba Linda Unified School District, Orange County, California, Certificates of Participation, Series 2006, 0.000%, 10/01/34 – FGIC Insured | No Opt. Call | A+ | | 1,490,294 | |
| | 3,205 | | San Diego Community College District, California, General Obligation Bonds, Series 2005, 5.000%, 5/01/25 – AGM Insured | 5/15 at 100.00 | AA+ | | 3,336,501 | |
| | | | San Joaquin Hills Transportation Corridor Agency, Orange County, California, Toll Road Revenue Refunding Bonds, Series 1997A: | | | | | |
| | 5,000 | | 5.650%, 1/15/17 – NPFG Insured | 1/14 at 102.00 | Baa1 | | 4,591,200 | |
| | 26,000 | | 0.000%, 1/15/35 – NPFG Insured | No Opt. Call | Baa1 | | 2,665,780 | |
| | 5,000 | | San Jose-Evergreen Community College District, Santa Clara County, California, General Obligation Bonds, Series 2005A, 0.000%, 9/01/28 – NPFG Insured | 9/15 at 50.47 | Aa1 | | 1,597,500 | |
| | 7,345 | | Sanger Unified School District, Fresno County, California, General Obligation Bonds, Series 2006A, 5.000%, 8/01/27 – AGM Insured | 8/16 at 102.00 | AA+ | | 7,373,278 | |
| | 4,825 | | Santa Monica Community College District, Los Angeles County, California, General Obligation Bonds, Series 2005C, 0.000%, 8/01/25 – NPFG Insured | 8/15 at 61.27 | Aa1 | | 2,042,519 | |
| | 2,550 | | Vista Unified School District, San Diego County, California, General Obligation Bonds, Series 2004B, 5.000%, 8/01/28 – FGIC Insured | 8/13 at 100.00 | Aa2 | | 2,553,035 | |
| | 225,580 | | Total California | | | | 136,348,497 | |
| | | | Colorado – 6.7% (4.1% of Total Investments) | | | | | |
| | 1,085 | | Arkansas River Power Authority, Colorado, Power Revenue Bonds, Series 2006, 5.250%, 10/01/40 – SYNCORA GTY Insured | 10/16 at 100.00 | BBB | | 892,847 | |
| | 6,385 | | Broomfield, Colorado, Sales and Use Tax Revenue Refunding and Improvement Bonds, Series 2002A, 5.500%, 12/01/22 – AMBAC Insured | 12/12 at 100.00 | Aa3 | | 6,680,115 | |
| | 7,200 | | Colorado Health Facilities Authority, Health Facilities Revenue Bonds, Sisters of Charity of Leavenworth Health Services Corporation, Series 2010A, 5.000%, 1/01/40 | No Opt. Call | AA | | 6,615,144 | |
| | | | E-470 Public Highway Authority, Colorado, Senior Revenue Bonds, Series 2000B: | | | | | |
| | 6,200 | | 0.000%, 9/01/22 – NPFG Insured | No Opt. Call | Baa1 | | 2,896,082 | |
| | 9,650 | | 0.000%, 9/01/30 – NPFG Insured | No Opt. Call | Baa1 | | 2,176,847 | |
| | 15,960 | | 0.000%, 9/01/33 – NPFG Insured | No Opt. Call | Baa1 | | 2,815,025 | |
| | | Nuveen Municipal Market Opportunity Fund, Inc. (continued) |
| NMO | | Portfolio of Investments |
April 30, 2011 (Unaudited)
| | Principal | | | Optional Call | | | | |
| | Amount (000) | | Description (1) | Provisions (2) | Ratings (3) | | Value | |
| | | | Colorado (continued) | | | | | |
| | | | E-470 Public Highway Authority, Colorado, Toll Revenue Bonds, Series 2004B: | | | | | |
| $ | 3,800 | | 0.000%, 9/01/27 – NPFG Insured | 9/20 at 67.94 | Baa1 | $ | 1,081,670 | |
| | 13,300 | | 0.000%, 9/01/31 – NPFG Insured | 9/20 at 53.77 | Baa1 | | 2,702,826 | |
| | 6,250 | | 0.000%, 9/01/32 – NPFG Insured | 9/20 at 50.83 | Baa1 | | 1,169,625 | |
| | 10,000 | | 0.000%, 3/01/36 – NPFG Insured | 9/20 at 41.72 | Baa1 | | 1,389,100 | |
| | 10,000 | | Regional Transportation District, Colorado, Denver Transit Partners Eagle P3 Project Private Activity Bonds, Series 2010, 6.500%, 1/15/30 | 7/20 at 100.00 | Baa3 | | 10,109,099 | |
| | 89,830 | | Total Colorado | | | | 38,528,380 | |
| | | | District of Columbia – 1.5% (0.9% of Total Investments) | | | | | |
| | 10,000 | | Washington Convention Center Authority, District of Columbia, Dedicated Tax Revenue Bonds, Senior Lien Refunding Series 2007A, 4.500%, 10/01/30 – AMBAC Insured | 10/16 at 100.00 | A1 | | 8,861,100 | |
| | | | Florida – 3.6% (2.2% of Total Investments) | | | | | |
| | 5,235 | | Florida Housing Finance Corporation, Homeowner Mortgage Revenue Bonds, Series 2008, Trust 1191, 8.683%, 1/01/27 (Alternative Minimum Tax) (IF) | 1/17 at 100.00 | AA+ | | 4,336,360 | |
| | 3,750 | | Florida State Board of Education, Lottery Revenue Bonds, Series 2010C, 2.000%, 7/01/11 | No Opt. Call | AAA | | 3,760,875 | |
| | 2,500 | | Miami-Dade County, Florida, Aviation Revenue Bonds, Miami International Airport, Series 2010A-1, 5.375%, 10/01/41 | 10/20 at 100.00 | A2 | | 2,382,075 | |
| | 3,000 | | Miami-Dade County, Florida, Aviation Revenue Bonds, Miami International Airport, Series 2010B, 5.000%, 10/01/26 | 10/20 at 100.00 | A2 | | 3,007,710 | |
| | 4,000 | | Orlando, Florida, Tourist Development Tax Revenue Bonds, Senior Lien 6th Cent Contract Payments, Series 2008A, 5.250%, 11/01/23 – AGC Insured | 11/17 at 100.00 | AA+ | | 3,974,640 | |
| | 3,500 | | South Miami Health Facilities Authority, Florida, Hospital Revenue, Baptist Health System Obligation Group, Series 2007, 5.000%, 8/15/37 | 8/17 at 100.00 | AA | | 3,172,364 | |
| | 21,985 | | Total Florida | | | | 20,634,024 | |
| | | | Georgia – 1.8% (1.1% of Total Investments) | | | | | |
| | 10,000 | | Gainesville and Hall County Hospital Authority, Georgia, Revenue Anticipation Certificates, Northeast Georgia Health Services Inc., Series 2010B, 5.250%, 2/15/45 | 2/41 at 100.00 | A+ | | 9,243,600 | |
| | 1,245 | | Royston Hospital Authority, Georgia, Revenue Anticipation Certificates, Ty Cobb Healthcare System Inc., Series 1999, 6.500%, 7/01/27 | 7/11 at 100.00 | N/R | | 1,106,930 | |
| | 11,245 | | Total Georgia | | | | 10,350,530 | |
| | | | Illinois – 16.4% (10.0% of Total Investments) | | | | | |
| | 4,595 | | Bolingbrook, Illinois, General Obligation Refunding Bonds, Series 2002B, 0.000%, 1/01/32 – FGIC Insured | No Opt. Call | Aa3 | | 1,099,308 | |
| | | | Chicago Board of Education, Illinois, Unlimited Tax General Obligation Bonds, Dedicated Tax Revenues, Series 1999A: | | | | | |
| | 4,600 | | 0.000%, 12/01/20 – FGIC Insured | No Opt. Call | Aa2 | | 2,793,948 | |
| | 1,000 | | 5.500%, 12/01/26 – FGIC Insured | No Opt. Call | Aa2 | | 1,010,820 | |
| | 4,000 | | Chicago, Illinois, Motor Fuel Tax Revenue Bonds, Series 2003A, 5.000%,
1/01/33 – AMBAC Insured | 7/13 at 100.00 | AA+ | | 3,924,480 | |
| | 5,000 | | Chicago, Illinois, Motor Fuel Tax Revenue Bonds, Series 2008A, 5.000%,
1/01/38 – AGC Insured | 1/18 at 100.00 | AA+ | | 4,783,300 | |
| | 1,450 | | Chicago, Illinois, Motor Fuel Tax Revenue Refunding Bonds, Series 1993, 5.375%, 1/01/14 – AMBAC Insured | No Opt. Call | AA+ | | 1,530,852 | |
| | 5,250 | | Chicago, Illinois, Revenue Bonds, Midway Airport, Series 1998B, 5.000%,
1/01/28 – NPFG Insured | 7/11 at 100.00 | A | | 5,191,148 | |
| | 2,000 | | Chicago, Illinois, Third Lien General Airport Revenue Bonds, O’Hare International Airport, Series 2003C-2, 5.250%, 1/01/30 – AGM Insured (Alternative Minimum Tax) | 1/14 at 100.00 | AA+ | | 1,943,080 | |
| | 7,100 | | Cook County, Illinois, General Obligation Bonds, Refunding Series 2010A, 5.250%, 11/15/33 | 11/20 at 100.00 | AA | | 7,120,945 | |
| | 1,780 | | Illinois Educational Facilities Authority, Revenue Bonds, University of Chicago, Refunding Series 2003A, 5.000%, 7/01/33 | 7/13 at 100.00 | Aa1 | | 1,786,230 | |
| | 10,000 | | Illinois Finance Authority, Illinois, Northwestern University, Revenue Bonds, Series 2006, 5.000%, 12/01/42 (UB) | 12/15 at 100.00 | AAA | | 9,960,200 | |
| | 3,000 | | Illinois Finance Authority, Revenue Bonds, Memorial Health System, Series 2009, 5.500%, 4/01/34 | No Opt. Call | A+ | | 2,828,550 | |
| | 5,450 | | Illinois Finance Authority, Revenue Bonds, OSF Healthcare System, Refunding Series 2010A, 6.000%, 5/15/39 | 5/20 at 100.00 | A | | 5,298,654 | |
| | Principal | | | Optional Call | | | | |
| | Amount (000) | | Description (1) | Provisions (2) | Ratings (3) | | Value | |
| | | | Illinois (continued) | | | | | |
| $ | 5,550 | | Illinois Finance Authority, Revenue Refunding Bonds, Silver Cross Hospital and Medical Centers, Series 2008A, 5.500%, 8/15/30 | 8/18 at 100.00 | BBB | $ | 4,759,125 | |
| | 2,160 | | Illinois Health Facilities Authority, Revenue Bonds, Sherman Health Systems, Series 1997, 5.250%, 8/01/17 – AMBAC Insured | 7/11 at 100.00 | BBB | | 2,160,259 | |
| | | | Lake and McHenry Counties Community Unit School District 118, Wauconda, Illinois, General Obligation Bonds, Series 2005B: | | | | | |
| | 10,230 | | 0.000%, 1/01/22 – AGM Insured | 1/15 at 70.63 | Aa3 | | 5,763,071 | |
| | 6,780 | | 0.000%, 1/01/24 – AGM Insured | 1/15 at 63.44 | Aa3 | | 3,305,521 | |
| | 1,975 | | Lake County Community High School District 127, Grayslake, Illinois, General Obligation Bonds, Series 2002A, 9.000%, 2/01/13 – FGIC Insured | No Opt. Call | AAA | | 2,217,866 | |
| | 2,330 | | Metropolitan Pier and Exposition Authority, Illinois, Revenue Bonds, McCormick Place Expansion Project, Refunding Series 2010B-2, 5.000%, 6/15/50 | No Opt. Call | AAA | | 1,996,880 | |
| | | | Metropolitan Pier and Exposition Authority, Illinois, Revenue Bonds, McCormick Place Expansion Project, Series 2002A: | | | | | |
| | 6,500 | | 0.000%, 6/15/25 – NPFG Insured | 6/22 at 101.00 | AAA | | 4,930,900 | |
| | 3,270 | | 5.000%, 12/15/28 – NPFG Insured | 6/12 at 101.00 | AAA | | 3,272,093 | |
| | 3,700 | | 0.000%, 6/15/30 – NPFG Insured | No Opt. Call | AAA | | 1,125,429 | |
| | 3,280 | | 0.000%, 6/15/37 – NPFG Insured | No Opt. Call | AAA | | 577,411 | |
| | 11,715 | | 0.000%, 12/15/38 – NPFG Insured | No Opt. Call | AAA | | 1,861,631 | |
| | 9,170 | | 0.000%, 6/15/39 – NPFG Insured | No Opt. Call | AAA | | 1,401,818 | |
| | 6,500 | | Metropolitan Pier and Exposition Authority, Illinois, Revenue Refunding Bonds, McCormick Place Expansion Project, Series 2002B, 5.750%, 6/15/23 – NPFG Insured | 6/12 at 101.00 | AAA | | 6,797,505 | |
| | 2,080 | | Midlothian, Illinois, General Obligation Bonds, Series 2010A, 5.250%, 2/01/34 | 2/20 at 100.00 | AA+ | | 2,025,941 | |
| | 2,685 | | Sterling, Whiteside County, Illinois, General Obligation Bonds, Recovery Zone Facility Series 2010A, 5.250%, 5/01/31 – AGM Insured | 5/20 at 100.00 | AA+ | | 2,690,719 | |
| | 133,150 | | Total Illinois | | | | 94,157,684 | |
| | | | Indiana – 2.8% (1.7% of Total Investments) | | | | | |
| | 4,695 | | Indiana Educational Facilities Authority, Revenue Bonds, Butler University, Series 2001, 5.500%, 2/01/26 – NPFG Insured | 8/11 at 100.00 | Baa1 | | 4,704,295 | |
| | 4,030 | | Indiana Finance Authority Health System Revenue Bonds, Sisters of St. Francis Health Services, Inc. Obligated Group, Series 2009, 5.250%, 11/01/39 | 11/19 at 100.00 | Aa3 | | 3,738,550 | |
| | 6,000 | | Indiana Finance Authority, Revenue Bonds, Trinity Health Care Group, Refunding Series 2009A, 5.250%, 12/01/38 | 12/19 at 100.00 | AA | | 5,579,340 | |
| | 2,000 | | Petersburg, Indiana, Pollution Control Revenue Refunding Bonds, Indianapolis Power and Light Company, Series 1991, 5.750%, 8/01/21 | 8/11 at 102.00 | A3 | | 2,002,040 | |
| | 16,725 | | Total Indiana | | | | 16,024,225 | |
| | | | Iowa – 2.0% (1.2% of Total Investments) | | | | | |
| | 970 | | Iowa Finance Authority, Health Facility Revenue Bonds, Care Initiatives Project, Series 2006A, 5.000%, 7/01/19 | 7/16 at 100.00 | BB+ | | 846,868 | |
| | 5,000 | | Iowa Tobacco Settlement Authority, Tobacco Asset-Backed Revenue Bonds, Series 2005B, 5.600%, 6/01/34 | 6/17 at 100.00 | BBB | | 3,992,000 | |
| | 6,685 | | Iowa Tobacco Settlement Authority, Tobacco Settlement Asset-Backed Revenue Bonds, Series 2001B, 5.600%, 6/01/35 (Pre-refunded 6/01/11) | 6/11 at 101.00 | AAA | | 6,783,335 | |
| | 12,655 | | Total Iowa | | | | 11,622,203 | |
| | | | Kansas – 1.2% (0.7% of Total Investments) | | | | | |
| | 2,500 | | Kansas Development Finance Authority, Water Pollution Control Revolving Fund Leveraged Bonds, Series 2002-II, 5.500%, 11/01/21 (Pre-refunded 11/01/12) | 11/12 at 100.00 | AAA | | 2,687,725 | |
| | 3,715 | | Overland Park Development Corporation, Kansas, First Tier Revenue Bonds, Overland Park Convention Center, Series 2007A, 5.125%, 1/01/22 – AMBAC Insured | 1/17 at 100.00 | Baa3 | | 3,416,350 | |
| | 600 | | Salina, Kansas, Hospital Revenue Bonds, Salina Regional Medical Center, Series 2006, 4.625%, 10/01/31 | 4/16 at 100.00 | A1 | | 549,888 | |
| | 6,815 | | Total Kansas | | | | 6,653,963 | |
| | | Nuveen Municipal Market Opportunity Fund, Inc. (continued) |
| NMO | | Portfolio of Investments |
April 30, 2011 (Unaudited)
| | | | | | | | | |
| | Principal | | | Optional Call | | | | |
| | Amount (000) | | Description (1) | Provisions (2) | Ratings (3) | | Value | |
| | | | Kentucky – 0.2% (0.1% of Total Investments) | | | | | |
| $ | 1,000 | | Kentucky Economic Development Finance Authority, Louisville Arena Project Revenue Bonds, Louisville Arena Authority, Inc., Series 2008-A1, 6.000%, 12/01/38 – AGC Insured | 6/18 at 100.00 | AA+ | $ | 1,013,460 | |
| | | | Louisiana – 3.2% (2.0% of Total Investments) | | | | | |
| | 7,415 | | Louisiana Local Government Environmental Facilities and Community Development Authority, Revenue Bonds, Baton Rouge Community College Facilities Corporation, Series 2002, 5.000%, 12/01/32 – NPFG Insured | 12/12 at 100.00 | Baa1 | | 6,337,601 | |
| | | | Louisiana Public Facilities Authority, Revenue Bonds, Baton Rouge General Hospital, Series 2004: | | | | | |
| | 1,765 | | 5.250%, 7/01/24 – NPFG Insured | 7/14 at 100.00 | Baa1 | | 1,790,328 | |
| | 3,350 | | 5.250%, 7/01/33 – NPFG Insured | 7/14 at 100.00 | Baa1 | | 3,302,263 | |
| | 7,850 | | Tobacco Settlement Financing Corporation, Louisiana, Tobacco Settlement Asset-Backed Bonds, Series 2001B, 5.875%, 5/15/39 | 5/11 at 101.00 | A– | | 7,164,146 | |
| | 20,380 | | Total Louisiana | | | | 18,594,338 | |
| | | | Maryland – 1.2% (0.7% of Total Investments) | | | | | |
| | 4,410 | | Maryland Community Development Administration, Department of Housing and Community Development, Residential Revenue Bonds, Series 2007D, 4.900%, 9/01/42 (Alternative Minimum Tax) | 3/17 at 100.00 | Aa2 | | 3,981,260 | |
| | 2,500 | | Maryland Department of Transportation, Consolidated Transportation Revenue Bonds, Series 2002, 5.500%, 2/01/16 | No Opt. Call | AAA | | 2,951,975 | |
| | 6,910 | | Total Maryland | | | | 6,933,235 | |
| | | | Michigan – 3.0% (1.8% of Total Investments) | | | | | |
| | 5,000 | | Detroit Water Supply System, Michigan, Water Supply System Revenue Bonds, Series 2006D, 4.625%, 7/01/32 – AGM Insured | 7/16 at 100.00 | AA+ | | 4,226,550 | |
| | 5,000 | | Michigan State Hospital Finance Authority, Hospital Revenue Bonds, Henry Ford Health System, Refunding Series 2009, 5.750%, 11/15/39 | 11/19 at 100.00 | A1 | | 4,687,750 | |
| | 3,050 | | Michigan Tobacco Settlement Finance Authority, Tobacco Settlement Asset-Backed Revenue Bonds, Series 2008A, 6.875%, 6/01/42 | 6/18 at 100.00 | Baa3 | | 2,689,551 | |
| | 1,150 | | Royal Oak Hospital Finance Authority, Michigan, Hospital Revenue Bonds, William Beaumont Hospital, Refunding Series 2009V, 8.250%, 9/01/39 | 9/18 at 100.00 | A1 | | 1,307,493 | |
| | 3,795 | | Utica Community Schools, Macomb County, Michigan, General Obligation Bonds, Series 2004, 5.000%, 5/01/19 | 11/13 at 100.00 | AA | | 4,077,272 | |
| | 17,995 | | Total Michigan | | | | 16,988,616 | |
| | | | Minnesota – 1.0% (0.6% of Total Investments) | | | | | |
| | 930 | | Minnesota Agricultural and Economic Development Board, Healthcare System Revenue Bonds, Fairview Hospital and Healthcare Services, Series 2000A, 6.375%, 11/15/29 | 11/11 at 100.00 | A | | 932,939 | |
| | 1,460 | | Minnesota Housing Finance Agency, Single Family Remarketed Mortgage Bonds, Series 1998H-2, 6.050%, 7/01/31 (Alternative Minimum Tax) | 7/11 at 101.00 | AA+ | | 1,504,676 | |
| | 2,685 | | St. Paul Housing and Redevelopment Authority, Minnesota, Sales Tax Revenue Refunding Bonds, Civic Center Project, Series 1996, 7.100%, 11/01/23 – AGM Insured | 11/15 at 103.00 | AA+ | | 3,167,092 | |
| | 5,075 | | Total Minnesota | | | | 5,604,707 | |
| | | | Mississippi – 1.0% (0.6% of Total Investments) | | | | | |
| | 5,900 | | Mississippi Business Finance Corporation, Pollution Control Revenue Refunding Bonds, System Energy Resources Inc. Project, Series 1998, 5.875%, 4/01/22 | 10/11 at 100.00 | BBB | | 5,783,416 | |
| | | | Missouri – 0.8% (0.5% of Total Investments) | | | | | |
| | | | Kansas City Municipal Assistance Corporation, Missouri, Leasehold Revenue Bonds, Series 2004B-1: | | | | | |
| | 8,000 | | 0.000%, 4/15/27 – AMBAC Insured | No Opt. Call | AA– | | 3,147,840 | |
| | 5,000 | | 0.000%, 4/15/31 – AMBAC Insured | No Opt. Call | AA– | | 1,472,800 | |
| | 13,000 | | Total Missouri | | | | 4,620,640 | |
| | Principal | | | Optional Call | | | | |
| | Amount (000) | | Description (1) | Provisions (2) | Ratings (3) | | Value | |
| | | | Nebraska – 1.9% (1.2% of Total Investments) | | | | | |
| $ | 11,690 | | Omaha Convention Hotel Corporation, Nebraska, Convention Center Revenue Bonds, Series 2007, 5.000%, 2/01/35 – AMBAC Insured | 2/17 at 100.00 | Aa3 | $ | 11,134,959 | |
| | | | Nevada – 6.3% (3.9% of Total Investments) | | | | | |
| | 15,000 | | Clark County, Nevada, Airport Revenue Bonds, Subordinte Lien Series 2010B, 5.750%, 7/01/42 | 1/20 at 100.00 | Aa3 | | 15,161,850 | |
| | 11,615 | | Clark County, Nevada, Passenger Facility Charge Revenue Bonds, Las Vegas-McCarran International Airport, Series 2010A, 5.250%, 7/01/42 | 1/20 at 100.00 | Aa3 | | 10,824,135 | |
| | | | Director of Nevada State Department of Business and Industry, Revenue Bonds, Las Vegas Monorail Project, First Tier, Series 2000: | | | | | |
| | 6,125 | | 0.000%, 1/01/17 – AMBAC Insured | No Opt. Call | N/R | | 1,087,371 | |
| | 8,500 | | 0.000%, 1/01/26 – AMBAC Insured | No Opt. Call | N/R | | 874,905 | |
| | 7,860 | | 0.000%, 1/01/27 – AMBAC Insured | No Opt. Call | N/R | | 761,948 | |
| | 19,300 | | 5.375%, 1/01/40 – AMBAC Insured (5) | 7/11 at 100.00 | N/R | | 4,840,054 | |
| | 2,135 | | Reno, Nevada, Capital Improvement Revenue Bonds, Series 2005B, 0.000%, 6/01/37 – FGIC Insured | 6/15 at 33.61 | A | | 295,249 | |
| | 2,500 | | Reno, Nevada, Health Facilities Revenue Bonds, Catholic Healthcare West, Series 2007A, Trust 2634, 18.488%, 7/01/31 – BHAC Insured (IF) | 7/17 at 100.00 | AA+ | | 2,493,100 | |
| | 73,035 | | Total Nevada | | | | 36,338,612 | |
| | | | New Hampshire – 0.5% (0.3% of Total Investments) | | | | | |
| | 3,000 | | New Hampshire Business Finance Authority, Revenue Bonds, Elliot Hospital Obligated Group Issue, Series 2009A, 6.125%, 10/01/39 | 10/19 at 100.00 | BBB+ | | 2,958,090 | |
| | | | New Jersey – 4.0% (2.5% of Total Investments) | | | | | |
| | 18,400 | | New Jersey Health Care Facilities Financing Authority, Revenue Bonds, Saint Barnabas Health Care System, Series 2006A, 0.000%, 7/01/37 | 1/17 at 35.47 | BBB- | | 2,403,592 | |
| | 35,000 | | New Jersey Transportation Trust Fund Authority, Transportation System Bonds, Series 2006C, 0.000%, 12/15/34 – AGM Insured | No Opt. Call | AA+ | | 7,011,200 | |
| | 5,065 | | New Jersey Turnpike Authority, Revenue Bonds, Growth and Income Securities, Series 2004B, 0.000%, 1/01/35 – AMBAC Insured | 1/17 at 100.00 | A+ | | 3,999,071 | |
| | 3,000 | | Rahway Valley Sewerage Authority, New Jersey, Sewer Revenue Bonds, Series 2005A, 0.000%, 9/01/25 – NPFG Insured | No Opt. Call | Aa2 | | 1,311,810 | |
| | 3,525 | | Tobacco Settlement Financing Corporation, New Jersey, Tobacco Settlement Asset-Backed Bonds, Series 2002, 6.125%, 6/01/42 (Pre-refunded 6/01/12) | 6/12 at 100.00 | AAA | | 3,746,652 | |
| | 2,100 | | Tobacco Settlement Financing Corporation, New Jersey, Tobacco Settlement Asset-Backed Bonds, Series 2003, 6.375%, 6/01/32 (Pre-refunded 6/01/13) | 6/13 at 100.00 | AAA | | 2,308,257 | |
| | 4,000 | | Tobacco Settlement Financing Corporation, New Jersey, Tobacco Settlement Asset-Backed Bonds, Series 2007-1A, 5.000%, 6/01/41 | 6/17 at 100.00 | Baa3 | | 2,496,000 | |
| | 71,090 | | Total New Jersey | | | | 23,276,582 | |
| | | | New Mexico – 1.3% (0.8% of Total Investments) | | | | | |
| | 5,925 | | New Mexico Hospital Equipment Loan Council, Hospital Revenue Bonds, Presbyterian Healthcare Services, Series 2001A, 5.500%, 8/01/21 (Pre-refunded 8/01/11) | 8/11 at 101.00 | AA– (4) | | 6,063,823 | |
| | 1,275 | | University of New Mexico, Revenue Refunding Bonds, Series 1992A, 6.250%, 6/01/12 | No Opt. Call | AA | | 1,312,727 | |
| | 7,200 | | Total New Mexico | | | | 7,376,550 | |
| | | | New York – 7.2% (4.4% of Total Investments) | | | | | |
| | 7,000 | | Brooklyn Areba Local Development Corporation, New York, Payment in Lieu of Taxes Revenue Bonds, Barclays Center Project, Series 2009, 0.000%, 7/15/45 | No Opt. Call | BBB– | | 623,560 | |
| | 2,500 | | Dormitory Authority of the State of New York, Revenue Bonds, The New York and Presbyterian Hospital Project, Series 2007, 5.250%, 8/15/26 – AGM Insured | 8/14 at 100.00 | AA+ | | 2,588,375 | |
| | 3,000 | | Long Island Power Authority, New York, Electric System General Revenue Bonds, Series 2006B, 5.000%, 12/01/35 | 6/16 at 100.00 | A– | | 2,925,270 | |
| | 3,500 | | Monroe County Industrial Development Corporation, New York, FHA Insured Mortgage Revenue Bonds, Unity Hospital of Rochestor Project, Series 2010, 5.750%, 8/15/30 | 2/21 at 100.00 | Aa2 | | 3,885,385 | |
| | 5 | | New York City, New York, General Obligation Bonds, Fiscal Series 1997H, 6.125%, 8/01/25 | 7/11 at 100.00 | AA | | 5,018 | |
| | 4,865 | | New York City, New York, General Obligation Bonds, Fiscal Series 2002A, 5.750%, 8/01/16 | 8/12 at 100.00 | AA | | 5,130,921 | |
| | | Nuveen Municipal Market Opportunity Fund, Inc. (continued) |
| NMO | | Portfolio of Investments |
April 30, 2011 (Unaudited)
| | Principal | | | Optional Call | | | | |
| | Amount (000) | | Description (1) | Provisions (2) | Ratings (3) | | Value | |
| | | | New York (continued) | | | | | |
| $ | 135 | | New York City, New York, General Obligation Bonds, Fiscal Series 2002A, 5.750%, 8/01/16 (Pre-refunded 8/01/12) | 8/12 at 100.00 | Aa2 (4) | $ | 144,115 | |
| | | | New York City, New York, General Obligation Bonds, Fiscal Series 2002G: | | | | | |
| | 735 | | 5.000%, 8/01/17 | 8/12 at 100.00 | AA | | 767,869 | |
| | 5,410 | | 5.750%, 8/01/18 | 8/12 at 100.00 | AA | | 5,697,379 | |
| | | | New York City, New York, General Obligation Bonds, Fiscal Series 2002G: | | | | | |
| | 265 | | 5.000%, 8/01/17 (Pre-refunded 8/01/12) | 8/12 at 100.00 | Aa2 (4) | | 280,404 | |
| | 1,120 | | 5.750%, 8/01/18 (Pre-refunded 8/01/12) | 8/12 at 100.00 | AA (4) | | 1,195,622 | |
| | 8,550 | | Port Authority of New York and New Jersey, Special Project Bonds, JFK International Air Terminal LLC Project, Eigth Series 2010, 5.500%, 12/01/31 | 12/20 at 100.00 | BBB– | | 8,230,658 | |
| | 10,000 | | Port Authority of New York and New Jersey, Special Project Bonds, JFK International Air Terminal LLC, Sixth Series 1997, 5.750%, 12/01/22 – NPFG Insured (Alternative Minimum Tax) | 6/11 at 100.00 | Baa1 | | 9,625,700 | |
| | 47,085 | | Total New York | | | | 41,100,276 | |
| | | | North Carolina – 6.2% (3.8% of Total Investments) | | | | | |
| | 1,900 | | Charlotte-Mecklenburg Hospital Authority, North Carolina, Healthcare System Revenue Bonds, DBA Carolinas Healthcare System, Series 2005A, 5.000%, 1/15/45 (Pre-refunded 1/15/15) | 1/15 at 100.00 | AAA | | 2,166,608 | |
| | 17,000 | | North Carolina Capital Facilities Financing Agency, Revenue Bonds, Duke University, Series 2005A, 5.000%, 10/01/41 | 10/15 at 100.00 | AA+ | | 17,123,250 | |
| | 3,000 | | North Carolina Eastern Municipal Power Agency, Power System Revenue Bonds, Series 2005, 5.250%, 1/01/20 – AMBAC Insured | 1/16 at 100.00 | A– | | 3,248,940 | |
| | 4,000 | | North Carolina Medical Care Commission, Health System Revenue Bonds, Mission St. Joseph’s Health System, Series 2007, 4.500%, 10/01/31 (UB) | 10/17 at 100.00 | AA | | 3,472,840 | |
| | 7,500 | | North Carolina Municipal Power Agency 1, Catawba Electric Revenue Bonds, Series 2003A, 5.250%, 1/01/19 – NPFG Insured | 1/13 at 100.00 | A | | 7,928,025 | |
| | 1,900 | | North Carolina Turnpike Authority, Triangle Expressway System Revenue Bonds, Series 2009A, 5.750%, 1/01/39 – AGC Insured | 1/19 at 100.00 | AA+ | | 1,931,027 | |
| | 35,300 | | Total North Carolina | | | | 35,870,690 | |
| | | | North Dakota – 0.3% (0.2% of Total Investments) | | | | | |
| | 1,500 | | Fargo, North Dakota, Health System Revenue Bonds, Sanford Series 2011, 6.000%, 11/01/28 | 11/21 at 100.00 | AA– | | 1,558,020 | |
| | | | Ohio – 8.4% (5.2% of Total Investments) | | | | | |
| | | | Buckeye Tobacco Settlement Financing Authority, Ohio, Tobacco Settlement Asset-Backed Revenue Bonds, Senior Lien, Series 2007A-2: | | | | | |
| | 4,415 | | 5.375%, 6/01/24 | 6/17 at 100.00 | Baa3 | | 3,463,744 | |
| | 110 | | 5.125%, 6/01/24 | 6/17 at 100.00 | Baa3 | | 84,993 | |
| | 1,250 | | 5.875%, 6/01/30 | 6/17 at 100.00 | Baa3 | | 902,050 | |
| | 6,215 | | 5.750%, 6/01/34 | 6/17 at 100.00 | Baa3 | | 4,282,135 | |
| | 4,300 | | 6.000%, 6/01/42 | 6/17 at 100.00 | Baa3 | | 2,985,318 | |
| | 4,750 | | 5.875%, 6/01/47 | 6/17 at 100.00 | Baa3 | | 3,204,778 | |
| | 6,000 | | Butler County, Ohio, Hospital Facilities Revenue Bonds, UC Health, Series 2010, 5.250%, 11/01/29 | 11/20 at 100.00 | BBB+ | | 5,164,680 | |
| | 10,000 | | Columbus City School District, Franklin County, Ohio, General Obligation Bonds, Series 2006, 4.250%, 12/01/32 – AGM Insured (UB) | 12/16 at 100.00 | AA+ | | 9,348,300 | |
| | 5,705 | | Montgomery County, Ohio, Hospital Facilities Revenue Bonds, Kettering Medical Center, Series 1999, 6.300%, 4/01/12 | No Opt. Call | A | | 5,953,681 | |
| | 5,500 | | Ohio Air Quality Development Authority, Ohio, Revenue Bonds, Ohio Valley Electric Corporation Project, Series 2009E, 5.625%, 10/01/19 | No Opt. Call | BBB– | | 5,545,595 | |
| | 7,500 | | Ohio State, Hospital Facility Revenue Refunding Bonds, Cleveland Clinic Health System Obligated Group, Series 2009A, 5.500%, 1/01/39 | 1/19 at 100.00 | Aa2 | | 7,478,250 | |
| | 55,745 | | Total Ohio | | | | 48,413,524 | |
| | Principal | | | Optional Call | | | | |
| | Amount (000) | | Description (1) | Provisions (2) | Ratings (3) | | Value | |
| | | | Oklahoma – 0.3% (0.2% of Total Investments) | | | | | |
| $ | 1,675 | | Oklahoma Development Finance Authority, Health System Revenue Bonds, Integris Baptist Medical Center, Series 2008B, 5.250%, 8/15/38 | 8/18 at 100.00 | AA– | $ | 1,665,235 | |
| | | | Oregon – 0.9% (0.5% of Total Investments) | | | | | |
| | 5,000 | | Oregon Health Sciences University, Revenue Bonds, Series 2002A, 5.250%, 7/01/22 – NPFG Insured | 1/13 at 100.00 | A1 | | 5,085,250 | |
| | | | Pennsylvania – 6.8% (4.2% of Total Investments) | | | | | |
| | 3,000 | | Allegheny County Hospital Development Authority, Pennsylvania, University of Pittsburgh Medical Center Revenue Bonds, Series 2009A, 5.625%, 8/15/39 | No Opt. Call | Aa3 | | 2,964,120 | |
| | 5,000 | | Delaware County Industrial Development Authority, Pennsylvania, Resource Recovery Revenue Refunding Bonds, Series 1997A, 6.200%, 7/01/19 | 7/11 at 100.00 | BB+ | | 4,906,100 | |
| | 5,975 | | Pennsylvania Turnpike Commission, Motor License Fund-Enhanced Subordinate Special Revenue Bonds, Series 2010A, 0.000%, 12/01/34 | 12/20 at 100.00 | Aa3 | | 4,416,302 | |
| | 10,000 | | Pennsylvania Turnpike Commission, Turnpike Subordinate Revenue Bonds, Series 2009C, 0.000%, 6/01/33 – AGM Insured | 6/26 at 100.00 | AA+ | | 7,921,900 | |
| | 7,550 | | Pennsylvania, General Obligation Bonds, Second Series 2001, 5.000%, 9/15/14 (Pre-refunded 9/15/11) | 9/11 at 101.00 | Aa1 (4) | | 7,761,174 | |
| | 11,890 | | Philadelphia Hospitals and Higher Education Facilities Authority, Pennsylvania, Health System Revenue Bonds, Jefferson Health System, Series 2010B, 5.000%, 5/15/40 | 5/20 at 100.00 | AA | | 11,016,085 | |
| | 43,415 | | Total Pennsylvania | | | | 38,985,681 | |
| | | | Puerto Rico – 7.8% (4.8% of Total Investments) | | | | | |
| | 3,330 | | Puerto Rico Aqueduct and Sewerage Authority, Revenue Bonds, Senior Lien Series 2008A, 6.000%, 7/01/44 | 7/18 at 100.00 | Baa1 | | 3,138,558 | |
| | 8,000 | | Puerto Rico Electric Power Authority, Power Revenue Bonds, Series 2010XX, 5.750%, 7/01/36 | 7/20 at 100.00 | A3 | | 7,741,200 | |
| | 4,300 | | Puerto Rico Housing Finance Authority, Capital Fund Program Revenue Bonds, Series 2003, 4.500%, 12/01/23 (UB) | 12/13 at 100.00 | AA+ | | 4,280,220 | |
| | 8,200 | | Puerto Rico Housing Finance Authority, Capital Fund Program Revenue Bonds, Series 2003, 4.500%, 12/01/23 (Pre-refunded 12/01/13) | 12/13 at 100.00 | AAA | | 8,959,894 | |
| | 10,000 | | Puerto Rico Sales Tax Financing Corporation, Sales Tax Revenue Bonds, First Subordinate Series 2009A, 6.000%, 8/01/42 | 8/19 at 100.00 | A+ | | 10,018,200 | |
| | 4,310 | | Puerto Rico Sales Tax Financing Corporation, Sales Tax Revenue Bonds, First Subordinate Series 2010C, 5.250%, 8/01/41 | 8/20 at 100.00 | A+ | | 3,894,128 | |
| | 7,000 | | Puerto Rico Sales Tax Financing Corporation, Sales Tax Revenue Bonds, Series 2007A, 0.000%, 8/01/40 – NPFG Insured | No Opt. Call | Aa2 | | 1,012,340 | |
| | 6,355 | | Puerto Rico, The Children’s Trust Fund, Tobacco Settlement Asset-Backed Refunding Bonds, Series 2002, 5.375%, 5/15/33 | 5/12 at 100.00 | BBB | | 5,584,011 | |
| | 51,495 | | Total Puerto Rico | | | | 44,628,551 | |
| | | | Rhode Island – 0.5% (0.3% of Total Investments) | | | | | |
| | 3,310 | | Rhode Island Tobacco Settlement Financing Corporation, Tobacco Settlement Asset-Backed Bonds, Series 2002A, 6.250%, 6/01/42 | 6/12 at 100.00 | BBB | | 2,863,282 | |
| | | | South Carolina – 5.4% (3.3% of Total Investments) | | | | | |
| | 24,730 | | Greenville County School District, South Carolina, Installment Purchase Revenue Bonds, Series 2002, 5.500%, 12/01/22 (Pre-refunded 12/01/12) | 12/12 at 101.00 | Aaa | | 26,947,045 | |
| | 3,560 | | South Carolina Public Service Authority, Revenue Refunding Bonds, Santee Cooper Electric System, Series 2003A, 5.000%, 1/01/20 – AMBAC Insured | 7/13 at 100.00 | Aa2 | | 3,798,449 | |
| | 28,290 | | Total South Carolina | | | | 30,745,494 | |
| | | | Tennessee – 0.8% (0.5% of Total Investments) | | | | | |
| | 5,000 | | Knox County Health, Educational and Housing Facilities Board, Tennessee, Hospital Revenue Bonds, East Tennessee Children’s Hospital, Series 2003A, 5.000%, 7/01/23 – RAAI Insured | 7/13 at 100.00 | BBB+ | | 4,743,750 | |
| | | Nuveen Municipal Market Opportunity Fund, Inc. (continued) |
| NMO | | Portfolio of Investments |
April 30, 2011 (Unaudited)
| | | | | | | | | |
| | Principal | | | Optional Call | | | | |
| | Amount (000) | | Description (1) | Provisions (2) | Ratings (3) | | Value | |
| | | | Texas – 13.9% (8.6% of Total Investments) | | | | | |
| $ | 2,500 | | Alliance Airport Authority, Texas, Special Facilities Revenue Bonds, American Airlines Inc., Series 2007, 5.250%, 12/01/29 (Alternative Minimum Tax) | 12/12 at 100.00 | CCC+ | $ | 1,642,725 | |
| | 11,255 | | Brazos River Authority, Texas, Pollution Control Revenue Refunding Bonds, TXU Electric Company, Series 2001C, 5.750%, 5/01/36 (Mandatory put 11/01/11) (Alternative Minimum Tax) | No Opt. Call | CC | | 11,025,285 | |
| | 1,000 | | Cedar Hill Independent School District, Dallas County, Texas, General Obligation Bonds, Series 2002, 0.000%, 8/15/32 – FGIC Insured | No Opt. Call | AA– | | 289,310 | |
| | 15,000 | | Central Texas Regional Mobility Authority, Travis and Williamson Counties, Toll Road Revenue Bonds, Series 2005, 5.000%, 1/01/45 – FGIC Insured | 1/15 at 100.00 | BBB | | 11,688,000 | |
| | 2,500 | | Comal Independent School District, Comal, Bexar, Guadalupe, Hays, and Kendall Counties, Texas, General Obligation Bonds, Series 2005A, 0.000%, 2/01/23 | No Opt. Call | Aaa | | 1,548,775 | |
| | 6,000 | | Dallas-Ft. Worth International Airport Facility Improvement Corporation, Texas, Revenue Bonds, American Airlines Inc., Series 1999, 6.375%, 5/01/35 (Alternative Minimum Tax) | 11/11 at 100.00 | CCC+ | | 4,388,220 | |
| | | | Ennis Independent School District, Ellis County, Texas, General Obligation Bonds, Series 2006: | | | | | |
| | 3,950 | | 0.000%, 8/15/30 | 8/16 at 49.21 | Aaa | | 1,431,875 | |
| | 4,000 | | 0.000%, 8/15/31 | 8/16 at 46.64 | Aaa | | 1,349,560 | |
| | 1,000 | | Harris County, Texas, Toll Toad Unlimited Tax and Subordinate Lien Revenue Forward Refunding Bonds, Series 2001, 6.000%, 8/01/11 – FGIC Insured | No Opt. Call | AAA | | 1,014,560 | |
| | 1,715 | | Houston, Texas, Hotel Occupancy Tax and Special Revenue Bonds, Convention and Entertainment Project, Series 2001B, 0.000%, 9/01/32 – AMBAC Insured | No Opt. Call | A2 | | 395,050 | |
| | 1,250 | | Houston, Texas, Junior Lien Water and Sewerage System Revenue Refunding Bonds, Series 2001A, 5.000%, 12/01/20 – AGM Insured | 12/11 at 100.00 | AA+ | | 1,279,500 | |
| | 2,400 | | Houston, Texas, Senior Lien Airport System Revenue Bonds, Refunding Series 2009A, 5.500%, 7/01/39 | 7/18 at 100.00 | AA– | | 2,435,280 | |
| | 9,350 | | Leander Independent School District, Williamson and Travis Counties, Texas, General Obligation Bonds, Series 2005, 0.000%, 8/15/32 – FGIC Insured | 8/15 at 39.49 | AA– | | 2,924,026 | |
| | 6,000 | | Leander Independent School District, Williamson and Travis Counties, Texas, General Obligation Bonds, Series 2006, 0.000%, 8/15/33 | 8/14 at 35.27 | AAA | | 1,768,620 | |
| | 11,850 | | Lower Colorado River Authority, Texas, Contract Revenue Refunding Bonds, Transmission Services Corporation, Series 2003B, 5.000%, 5/15/31 – AGM Insured | No Opt. Call | AA+ | | 11,861,021 | |
| | 4,000 | | North Texas Tollway Authority, First Tier System Revenue Refunding Bonds, Capital Appreciation Series 2008I, 0.000%, 1/01/43 | 1/25 at 100.00 | A2 | | 3,187,240 | |
| | 3,500 | | San Antonio, Texas, Electric and Gas Revenue Bonds, Series 2008A, 5.500%, 2/01/12 | No Opt. Call | Aa1 | | 3,636,570 | |
| | 3,295 | | Tarrant County Cultural & Educational Facilities Financing Corporation, Texas, Revenue Bonds, Series 2007, Residuals 1762, 16.974%, 2/15/36 (IF) | 2/17 at 100.00 | AA– | | 2,158,489 | |
| | 2,890 | | Tarrant County Cultural Education Facilities Finance Corporation, Texas, Hospital Revenue Bonds, Scott & White HealthCare Project, Series 2010, 5.500%, 8/15/45 | 8/20 at 100.00 | A1 | | 2,753,043 | |
| | 5,165 | | Texas State, General Obligation Bonds, Water Financial Assistance, Series 2010B, 5.000%, 8/01/11 | No Opt. Call | Aaa | | 5,227,755 | |
| | 5,000 | | White Settlement Independent School District, Tarrant County, Texas, General Obligation Bonds, Series 2005, 0.000%, 8/15/34 | 8/15 at 36.81 | AAA | | 1,398,750 | |
| | 3,970 | | Wichita Falls, Wichita County, Texas, Priority Lien Water and Sewerage System Revenue Bonds, Series 2001, 5.000%, 8/01/21 (Pre-refunded 8/01/11) – AMBAC Insured | 8/11 at 100.00 | AA– (4) | | 4,018,275 | |
| | | | Wylie Independent School District, Collin County, Texas, General Obligation Bonds, Series 2005: | | | | | |
| | 3,000 | | 0.000%, 8/15/23 | 8/15 at 67.10 | AAA | | 1,671,450 | |
| | 2,000 | | 0.000%, 8/15/24 | 8/15 at 63.56 | AAA | | 1,049,600 | |
| | 112,590 | | Total Texas | | | | 80,142,979 | |
| | | | Utah – 0.5% (0.3% of Total Investments) | | | | | |
| | 3,000 | | Riverton, Utah, Hospital Revenue Bonds, IHC Health Services, Inc., Series 2009, 5.000%, 8/15/41 | 8/19 at 100.00 | AA+ | | 2,796,450 | |
| | Principal | | | Optional Call | | | | |
| | Amount (000) | | Description (1) | Provisions (2) | Ratings (3) | | Value | |
| | | | Virginia – 2.7% (1.7% of Total Investments) | | | | | |
| $ | 21,500 | | Metropolitan Washington DC Airports Authority, Virginia, Dulles Toll Road Revenue Bonds, Series 2009C, 0.000%, 10/01/41 – AGC Insured | 10/26 at 100.00 | AA+ | $ | 15,625,770 | |
| | | | Washington – 10.3% (6.3% of Total Investments) | | | | | |
| | 2,755 | | Cowlitz County, Washington, Special Sewerage Revenue Refunding Bonds, CSOB Wastewater Treatment Facilities, Series 2002, 5.500%, 11/01/16 – FGIC Insured | No Opt. Call | A1 | | 3,038,600 | |
| | 2,700 | | Energy Northwest, Washington, Electric Revenue Bonds, Nuclear Project 1, Refunding Series 2008D, 5.000%, 7/01/11 | No Opt. Call | Aaa | | 2,722,086 | |
| | 10,000 | | Energy Northwest, Washington, Electric Revenue Refunding Bonds, Nuclear Project 3, Series 2001A, 5.500%, 7/01/17 (Pre-refunded 7/01/11) – AGM Insured | 7/11 at 101.00 | Aaa | | 10,190,500 | |
| | 820 | | King County, Washington, Sewer Revenue Bonds, Series 2001, 5.000%, 1/01/23 (Pre-refunded 1/01/12) – FGIC Insured | 1/12 at 100.00 | Aa2 (4) | | 845,773 | |
| | 1,680 | | King County, Washington, Sewer Revenue Bonds, Series 2001, 5.000%,
1/01/23 – FGIC Insured | 1/12 at 100.00 | AA+ | | 1,714,003 | |
| | 2,150 | | Seattle, Washington, General Obligation Refunding and Improvement Bonds, Series 2002, 4.500%, 12/01/20 | 12/12 at 100.00 | AAA | | 2,202,546 | |
| | 3,000 | | Spokane County School District 81, Spokane, Washington, General Obligation Bonds, Series 2005, 5.000%, 6/01/24 – NPFG Insured | 6/15 at 100.00 | Aa1 | | 3,160,950 | |
| | 3,520 | | Washington State Health Care Facilities Authority, Revenue Bonds, Children’s Hospital and | 10/11 at 100.00 | Aa3 (4) | | 3,588,288 | |
| | | | Regional Medical Center, Series 2001, 5.000%, 10/01/21 (Pre-refunded
10/01/11) – AMBAC Insured | | | | | |
| | 8,000 | | Washington State Health Care Facilities Authority, Revenue Bonds, MultiCare Health System, Series 2008A, 5.250%, 8/15/34 – AGM Insured | 5/18 at 100.00 | AA+ | | 7,867,360 | |
| | 10,480 | | Washington State Tobacco Settlement Authority, Tobacco Settlement Asset-Backed Revenue Bonds, Series 2002, 6.500%, 6/01/26 | 6/13 at 100.00 | BBB | | 10,565,831 | |
| | 9,000 | | Washington State, Motor Vehicle Fuel Tax General Obligation Bonds, Series 2002C, 5.000%, 1/01/21 (Pre-refunded 1/01/12) – AGM Insured | 1/12 at 100.00 | AA+ (4) | | 9,284,760 | |
| | 9,000 | | Washington State, Motor Vehicle Fuel Tax General Obligation Bonds, Series 2003C, 0.000%, 6/01/28 – FGIC Insured | No Opt. Call | AA+ | | 3,831,570 | |
| | 63,105 | | Total Washington | | | | 59,012,267 | |
| | | | Wisconsin – 2.7% (1.7% of Total Investments) | | | | | |
| | 2,280 | | Badger Tobacco Asset Securitization Corporation, Wisconsin, Tobacco Settlement Asset-Backed Bonds, Series 2002, 6.125%, 6/01/27 (Pre-refunded 6/01/12) | 6/12 at 100.00 | AAA | | 2,367,050 | |
| | 1,755 | | Wisconsin Health and Educational Facilities Authority, Revenue Bonds, Divine Savior Healthcare, Series 2006, 4.750%, 5/01/25 | 5/16 at 100.00 | BBB | | 1,518,040 | |
| | 1,250 | | Wisconsin Health and Educational Facilities Authority, Revenue Bonds, United Lutheran Program for the Aging Inc., Series 1998, 5.700%, 3/01/28 | 9/11 at 100.00 | N/R | | 1,064,250 | |
| | 9,920 | | Wisconsin State, General Fund Annual Appropriation Revenue Bonds, Refunding Series 2009A, 5.750%, 5/01/33 | 5/19 at 100.00 | AA– | | 10,577,597 | |
| | 15,205 | | Total Wisconsin | | | | 15,526,937 | |
| | | Nuveen Municipal Market Opportunity Fund, Inc. (continued) |
| NMO | | Portfolio of Investments |
April 30, 2011 (Unaudited)
| | Principal | | | Optional Call | | | | |
| | Amount (000) | | Description (1) | Provisions (2) | Ratings (3) | | Value | |
| | | | Wyoming – 0.7% (0.4% of Total Investments) | | | | | |
| $ | 4,080 | | Campbell County, Wyoming Solid Waste Facilities Revenue Bonds, Basin Electric Power Cooperative – Dry Fork Station Facilities, Series 2009A, 5.750%, 7/15/39 | 7/19 at 100.00 | A1 | $ | 4,181,470 | |
| $ | 1,288,400 | | Total Investments (cost $1,005,041,850) – 163.1% | | | | 937,587,364 | |
| | | | Floating Rate Obligations – (7.6)% | | | | (43,530,000 | ) |
| | | | Variable Rate Demand Preferred Shares, at Liquidation Value – (61.0)% (6) | | | | (350,900,000 | ) |
| | | | Other Assets Less Liabilities – 5.5% | | | | 31,816,722 | |
| | | | Net Assets Applicable to Common Shares – 100% | | | $ | 574,974,086 | |
| (1) | | All percentages shown in the Portfolio of Investments are based on net assets applicable to Common shares unless otherwise noted. |
| (2) | | Optional Call Provisions: Dates (month and year) and prices of the earliest optional call or redemption. There may be other call provisions at varying prices at later dates. Certain mortgage-backed securities may be subject to periodic principal paydowns. |
| (3) | | Ratings: Using the highest of Standard & Poor’s Group (“Standard & Poor’s”), Moody’s Investor Service, Inc. (“Moody’s”) or Fitch, Inc. (“Fitch”) rating. Ratings below BBB by Standard & Poor’s, Baa by Moody’s or BBB by Fitch are considered to be below investment grade. Holdings designated N/R are not rated by any of these national rating agencies. |
| (4) | | Backed by an escrow or trust containing sufficient U.S. Government or U.S. Government agency securities, which ensure the timely payment of principal and interest. Such investments are normally considered to be equivalent to AAA rated securities. |
| (5) | | At or subsequent to the end of the reporting period, this security is non-income producing. Non-income producing security, in the case of a bond, generally denotes that the issuer has (1) defaulted on the payment of principal or interest, (2) is under the protection of the Federal Bankruptcy Court or (3) the Fund’s Adviser has concluded that the issue is not likely to meet its future interest payment obligations and has directed the Fund’s custodian to cease accruing additional income on the Fund’s records. |
| (6) | | Variable Rate Demand Preferred Shares, at Liquidation Value as a percentage of Total Investments is 37.4%. |
| N/R | | Not rated. |
| (ETM) | | Escrowed to maturity. |
| (IF) | | Inverse floating rate investment. |
| (UB) | | Underlying bond of an inverse floating rate trust reflected as a financing transaction. See Notes to Financial Statements, Footnote 1 – General Information and Significant Accounting Policies, Inverse Floating Rate Securities for more information. |
See accompanying notes to financial statements.
| | | Nuveen Dividend Advantage Municipal Fund |
| NAD | | Portfolio of Investments |
| | | April 30, 2011 (Unaudited) |
| | Principal | | | Optional Call | | | | |
| | Amount (000) | | Description (1) | Provisions (2) | Ratings (3) | | Value | |
| | | | Municipal Bonds – 156.8% (99.9% of Total Investments) | | | | | |
| | | | Alabama – 0.3% (0.2% of Total Investments) | | | | | |
| $ | 1,600 | | Alabama 21st Century Authority, Tobacco Settlement Revenue Bonds, Series 2000, 5.750%, 12/01/20 | 6/11 at 101.00 | A– | $ | 1,605,759 | |
| | | | Alaska – 0.2% (0.1% of Total Investments) | | | | | |
| | 750 | | Alaska Housing Finance Corporation, General Housing Purpose Bonds, Series 2005A, 5.250%, 12/01/34 – FGIC Insured (UB) | 12/14 at 100.00 | AA+ | | 757,769 | |
| | | | Arizona – 2.8% (1.8% of Total Investments) | | | | | |
| | | | Phoenix Civic Improvement Corporation, Arizona, Senior Lien Airport Revenue Bonds, Series 2008A: | | | | | |
| | 2,350 | | 5.000%, 7/01/33 | 7/18 at 100.00 | AA– | | 2,334,278 | |
| | 8,200 | | 5.000%, 7/01/38 | 7/18 at 100.00 | AA– | | 7,870,032 | |
| | 5,000 | | Salt Verde Financial Corporation, Arizona, Senior Gas Revenue Bonds, Citigroup Energy Inc Prepay Contract Obligations, Series 2007, 5.000%, 12/01/37 | No Opt. Call | A | | 4,160,650 | |
| | 15,550 | | Total Arizona | | | | 14,364,960 | |
| | | | California – 9.1% (5.8% of Total Investments) | | | | | |
| | 1,535 | | Alameda Corridor Transportation Authority, California, Senior Lien Revenue Bonds, Series 1999A, 0.000%, 10/01/37 – NPFG Insured | No Opt. Call | A | | 192,504 | |
| | 6,000 | | Anaheim Public Finance Authority, California, Subordinate Lease Revenue Bonds, Public Improvement Project, Series 1997C, 0.000%, 9/01/28 – AGM Insured | No Opt. Call | AA+ | | 1,707,780 | |
| | 3,000 | | California Health Facilities Financing Authority, Revenue Bonds, Sutter Health, Series 2007A, 5.000%, 11/15/42 | 11/16 at 100.00 | AA– | | 2,581,140 | |
| | 5,000 | | California State, General Obligation Bonds, Series 2005, 5.000%, 3/01/31 | 3/16 at 100.00 | A1 | | 4,916,300 | |
| | 4,250 | | California State, General Obligation Bonds, Various Purpose Series 2010, 5.250%, 11/01/40 | 11/20 at 100.00 | A1 | | 4,116,848 | |
| | 6,750 | | California Statewide Community Development Authority, Revenue Bonds, Methodist Hospital Project, Series 2009, 6.750%, 2/01/38 | 8/19 at 100.00 | Aa2 | | 7,363,913 | |
| | 65 | | California, General Obligation Bonds, Series 1997, 5.000%, 10/01/18 – AMBAC Insured | 7/11 at 100.00 | A1 | | 65,159 | |
| | 5,000 | | Corona-Norco Unified School District, Riverside County, California, General Obligation Bonds, Election 2006 Series 2007A, 5.000%, 8/01/31 – AGM Insured | No Opt. Call | AA+ | | 4,927,600 | |
| | 2,000 | | Dublin Unified School District, Alameda County, California, General Obligation Bonds, Series 2007C, 0.000%, 8/01/31 – NPFG Insured | 8/17 at 49.41 | Aa2 | | 486,540 | |
| | | | Golden State Tobacco Securitization Corporation, California, Enhanced Tobacco Settlement Asset-Backed Revenue Bonds, Series 2005A: | | | | | |
| | 3,500 | | 0.000%, 6/01/26 – AGM Insured | No Opt. Call | AA+ | | 1,388,520 | |
| | 9,925 | | 5.000%, 6/01/45 – AGC Insured | 6/15 at 100.00 | AA+ | | 8,440,318 | |
| | | | Golden State Tobacco Securitization Corporation, California, Tobacco Settlement Asset-Backed Bonds, Series 2007A-1: | | | | | |
| | 5,750 | | 5.000%, 6/01/33 | 6/17 at 100.00 | Baa3 | | 3,838,413 | |
| | 1,000 | | 5.125%, 6/01/47 | 6/17 at 100.00 | Baa3 | | 610,150 | |
| | 2,200 | | M-S-R Energy Authority, California, Gas Revenue Bonds, Series 2009C, 6.500%, 11/01/39 | No Opt. Call | A | | 2,269,784 | |
| | 1,495 | | Palmdale Civic Authority, California, Revenue Refinancing Bonds, Civic Center Project, Series 1997A, 5.375%, 7/01/12 – NPFG Insured | 7/11 at 100.00 | Baa1 | | 1,497,796 | |
| | | | San Joaquin Hills Transportation Corridor Agency, Orange County, California, Toll Road Revenue Refunding Bonds, Series 1997A: | | | | | |
| | 2,000 | | 0.000%, 1/15/29 – NPFG Insured | No Opt. Call | Baa1 | | 377,440 | |
| | 17,000 | | 0.000%, 1/15/35 – NPFG Insured | No Opt. Call | Baa1 | | 1,743,010 | |
| | 575 | | Seaside Redevelopment Agency, California, Tax Allocation Bonds, Merged Project Area, Series 2003, 5.375%, 8/01/18 – NPFG Insured | 8/13 at 100.00 | A | | 586,523 | |
| | 77,045 | | Total California | | | | 47,109,738 | |
| | | Nuveen Dividend Advantage Municipal Fund (continued) |
| NAD | | Portfolio of Investments |
April 30, 2011 (Unaudited)
| | Principal | | | Optional Call | | | | |
| | Amount (000) | | Description (1) | Provisions (2) | Ratings (3) | | Value | |
| | | | Colorado – 6.3% (4.0% of Total Investments) | | | | | |
| $ | 1,125 | | Antelope Heights Metropolitan District, Colorado, Limited Tax General Obligation Bonds, Series 2007, 5.000%, 12/01/37 – RAAI Insured | 12/17 at 100.00 | N/R | $ | 807,863 | |
| | 3,330 | | Colorado Health Facilities Authority, Colorado, Revenue Bonds, Catholic Health Initiatives, Series 2009A, 5.500%, 7/01/34 | 7/19 at 100.00 | AA | | 3,342,754 | |
| | | | Denver City and County, Colorado, Airport Special Facilities Revenue Bonds, Rental Car Projects, Series 1999A: | | | | | |
| | 2,170 | | 6.000%, 1/01/12 – NPFG Insured (Alternative Minimum Tax) | 7/11 at 100.00 | A– | | 2,178,897 | |
| | 675 | | 6.000%, 1/01/13 – NPFG Insured (Alternative Minimum Tax) | 7/11 at 100.00 | A– | | 677,363 | |
| | 4,500 | | Denver City and County, Colorado, Airport System Revenue Refunding Bonds, Series 2001A, 5.500%, 11/15/11 – FGIC Insured (Alternative Minimum Tax) | No Opt. Call | A+ | | 4,618,394 | |
| | 1,475 | | Denver, Colorado, FHA-Insured Multifamily Housing Revenue Bonds, Boston Lofts Project, Series 1997A, 5.750%, 10/01/27 (Alternative Minimum Tax) | 10/11 at 100.00 | B | | 1,379,774 | |
| | 8,515 | | E-470 Public Highway Authority, Colorado, Senior Revenue Bonds, Series 1997B, 0.000%, 9/01/25 – NPFG Insured | No Opt. Call | Baa1 | | 3,005,114 | |
| | 25,000 | | E-470 Public Highway Authority, Colorado, Senior Revenue Bonds, Series 2000B, 0.000%, 9/01/31 – NPFG Insured | No Opt. Call | Baa1 | | 5,191,000 | |
| | 60,000 | | E-470 Public Highway Authority, Colorado, Toll Revenue Bonds, Series 2004A, 0.000%, 3/01/36 – NPFG Insured | No Opt. Call | Baa1 | | 8,408,400 | |
| | 12,500 | | E-470 Public Highway Authority, Colorado, Toll Revenue Bonds, Series 2006A, 0.000%, 9/01/38 – NPFG Insured | 9/26 at 54.77 | Baa1 | | 1,372,125 | |
| | 2,000 | | Metropolitan Football Stadium District, Colorado, Sales Tax Revenue Bonds, Series 1999A, 0.000%, 1/01/12 – NPFG Insured | No Opt. Call | Baa1 | | 1,983,440 | |
| | 121,290 | | Total Colorado | | | | 32,965,124 | |
| | | | Connecticut – 0.3% (0.2% of Total Investments) | | | | | |
| | 4,335 | | Mashantucket Western Pequot Tribe, Connecticut, Subordinate Special Revenue Bonds, Series 2007A, 5.750%, 9/01/34 | 11/17 at 100.00 | N/R | | 1,630,864 | |
| | | | Florida – 11.1% (7.1% of Total Investments) | | | | | |
| | 1,255 | | Florida Housing Finance Agency, Housing Revenue Bonds, Mar Lago Village Apartments, Series 1997F, 5.800%, 12/01/17 – AMBAC Insured (Alternative Minimum Tax) | 6/11 at 100.00 | N/R | | 1,255,251 | |
| | 15,000 | | Florida State Board of Education, Public Education Capital Outlay Bonds, Series 2005E, 4.500%, 6/01/35 (UB) | 6/15 at 101.00 | AAA | | 13,945,950 | |
| | 2,500 | | Marion County Hospital District, Florida, Revenue Bonds, Munroe Regional Medical Center, Series 2007, 5.000%, 10/01/34 | 10/17 at 100.00 | A3 | | 2,204,675 | |
| | 13,625 | | Martin County Industrial Development Authority, Florida, Industrial Development Revenue Bonds, Indiantown Cogeneration LP, Series 1994A, 7.875%, 12/15/25 (Alternative Minimum Tax) | 6/11 at 100.00 | BB+ | | 13,693,125 | |
| | | | South Miami Health Facilities Authority, Florida, Hospital Revenue, Baptist Health System Obligation Group, Series 2007: | | | | | |
| | 22,000 | | 5.000%, 8/15/37 (UB) | 8/17 at 100.00 | AA | | 19,940,579 | |
| | 7,370 | | 5.000%, 8/15/42 (UB) | 8/17 at 100.00 | AA | | 6,571,166 | |
| | 61,750 | | Total Florida | | | | 57,610,746 | |
| | | | Georgia – 1.7% (1.1% of Total Investments) | | | | | |
| | 5,000 | | Cobb County Development Authority, Georgia, Student Housing Revenue Bonds, KSU Village II Real Estate Foundation LLC Project, Series 2007A, 5.250%, 7/15/38 – AMBAC Insured | 7/17 at 100.00 | Baa2 | | 4,143,300 | |
| | 5,000 | | Franklin County Industrial Building Authority, Georgia, Revenue Bonds, Ty Cobb Regional Medical Center Project, Series 2010, 8.000%, 12/01/40 | 12/20 at 100.00 | N/R | | 4,894,199 | |
| | 10,000 | | Total Georgia | | | | 9,037,499 | |
| | | | Idaho – 0.1% (0.1% of Total Investments) | | | | | |
| | 110 | | Idaho Housing and Finance Association, Single Family Mortgage Bonds, Series 1999E, 5.750%, 1/01/21 (Alternative Minimum Tax) | 7/11 at 100.00 | Aa2 | | 113,852 | |
| | 140 | | Idaho Housing and Finance Association, Single Family Mortgage Bonds, Series 2000D, 6.350%, 7/01/22 (Alternative Minimum Tax) | 7/11 at 100.00 | Aa2 | | 142,817 | |
| | 180 | | Idaho Housing and Finance Association, Single Family Mortgage Bonds, Series 2000E, 5.950%, 7/01/20 (Alternative Minimum Tax) | 7/11 at 100.00 | Aaa | | 184,286 | |
| | 430 | | Total Idaho | | | | 440,955 | |
| | Principal | | | Optional Call | | | | |
| | Amount (000) | | Description (1) | Provisions (2) | Ratings (3) | | Value | |
| | | | Illinois – 30.1% (19.2% of Total Investments) | | | | | |
| $ | 1,070 | | Channahon, Illinois, Revenue Refunding Bonds, Morris Hospital, Series 1999, 5.750%, 12/01/12 | 6/11 at 101.00 | BBB+ | $ | 1,083,011 | |
| | 2,205 | | Chicago Board of Education, Illinois, Unlimited Tax General Obligation Bonds, Dedicated Tax Revenues, Series 1998B-1, 0.000%, 12/01/29 – FGIC Insured | No Opt. Call | Aa2 | | 647,476 | |
| | 7,250 | | Chicago Board of Education, Illinois, Unlimited Tax General Obligation Bonds, Dedicated Tax Revenues, Series 1999A, 5.500%, 12/01/26 – FGIC Insured | No Opt. Call | Aa2 | | 7,328,445 | |
| | | | Chicago, Illinois, FHA/GNMA Multifamily Housing Revenue Bonds, Archer Court Apartments, Series 1999A: | | | | | |
| | 625 | | 5.500%, 12/20/19 (Alternative Minimum Tax) | 10/11 at 100.00 | AA– | | 628,325 | |
| | 1,210 | | 5.600%, 12/20/29 (Alternative Minimum Tax) | 10/11 at 100.00 | AA– | | 1,211,089 | |
| | 1,925 | | 5.650%, 12/20/40 (Alternative Minimum Tax) | 10/11 at 100.00 | AA– | | 1,925,193 | |
| | 22,750 | | Chicago, Illinois, General Obligation Refunding Bonds, Emergency Telephone System, Series 1999, 5.500%, 1/01/23 – FGIC Insured | No Opt. Call | Aa3 | | 23,693,898 | |
| | 1,655 | | Chicago, Illinois, Motor Fuel Tax Revenue Refunding Bonds, Series 1993, 5.375%, 1/01/14 – AMBAC Insured | No Opt. Call | AA+ | | 1,747,283 | |
| | 3,340 | | Chicago, Illinois, Third Lien General Airport Revenue Bonds, O’Hare International Airport, Series 2005A, 5.000%, 1/01/33 – FGIC Insured | 1/16 at 100.00 | A1 | | 3,103,829 | |
| | 190 | | DuPage County Community School District 200, Wheaton, Illinois, General Obligation Bonds, Series 2003B, 5.250%, 11/01/20 – AGM Insured | 11/13 at 100.00 | Aa3 | | 204,659 | |
| | 810 | | DuPage County Community School District 200, Wheaton, Illinois, General Obligation Bonds, Series 2003B, 5.250%, 11/01/20 (Pre-refunded 11/01/13) – AGM Insured | 11/13 at 100.00 | Aa3 (4) | | 900,842 | |
| | 3,935 | | Illinois Development Finance Authority, Local Government Program Revenue Bonds, Lake County School District 116 – Round Lake, Series 1999, 0.000%, 1/01/15 – NPFG Insured | No Opt. Call | Baa1 | | 3,443,046 | |
| | 5,000 | | Illinois Educational Facilities Authority, Revenue Bonds, University of Chicago, Refunding Series 2003A, 5.000%, 7/01/33 | 7/13 at 100.00 | Aa1 | | 5,017,500 | |
| | 1,500 | | Illinois Finance Authority, Revenue Bonds, Central DuPage Health, Series 2009B, 5.500%, 11/01/39 | 11/19 at 100.00 | AA | | 1,433,595 | |
| | 2,000 | | Illinois Finance Authority, Revenue Bonds, Children’s Memorial Hospital, Series 2008A, 5.250%, 8/15/47 – AGC Insured (UB) | 8/18 at 100.00 | AA+ | | 1,759,680 | |
| | 1,000 | | Illinois Finance Authority, Revenue Bonds, Edward Health Services Corporation, Series 2008A, 5.500%, 2/01/40 – AMBAC Insured | 2/18 at 100.00 | A+ | | 935,680 | |
| | 5,570 | | Illinois Finance Authority, Revenue Bonds, University of Chicago, Series 2004A, 5.000%, 7/01/34 | 7/14 at 100.00 | Aa1 | | 5,565,823 | |
| | 1,225 | | Illinois Finance Authority, Revenue Bonds, University of Chicago, Series 2007, 5.000%, 7/01/19 | 7/17 at 100.00 | Aa1 | | 1,349,068 | |
| | 4,000 | | Illinois Finance Authority, Revenue Refunding Bonds, Silver Cross Hospital and Medical Centers, Series 2008A, 6.000%, 8/15/23 | 8/18 at 100.00 | BBB | | 3,995,800 | |
| | 5,980 | | Illinois Finance Authority, Student Housing Revenue Bonds, Educational Advancement Fund Inc., Refunding Series 2007A, 5.250%, 5/01/34 | 5/17 at 100.00 | Baa3 | | 4,867,959 | |
| | 9,800 | | Illinois Health Facilities Authority, Remarketed Revenue Bonds, University of Chicago Project, Series 1985A, 5.500%, 8/01/20 | 8/11 at 103.00 | Aa1 | | 10,121,342 | |
| | 10,720 | | Illinois Health Facilities Authority, Revenue Bonds, Loyola University Health System, Series 1997A, 5.000%, 7/01/24 – NPFG Insured | 7/11 at 100.00 | Baa1 | | 9,904,208 | |
| | 1,500 | | Illinois Housing Development Authority, Housing Finance Bonds, Series 2005E, 4.800%, 1/01/36 – FGIC Insured | 1/15 at 100.00 | AA | | 1,381,815 | |
| | 2,000 | | Kane & DeKalb Counties, Illinois, Community United School District 301, General Obligation Bonds, Series 2006, 0.000%, 12/01/21 – NPFG Insured | No Opt. Call | A1 | | 1,157,500 | |
| | 11,345 | | Lake and McHenry Counties Community Unit School District 118, Wauconda, Illinois, General Obligation Bonds, Series 2005B, 0.000%, 1/01/25 – AGM Insured | 1/15 at 60.14 | Aa3 | | 5,157,324 | |
| | 3,000 | | Lombard Public Facilities Corporation, Illinois, First Tier Conference Center and Hotel Revenue Bonds, Series 2005A-1, 7.125%, 1/01/36 | 1/16 at 100.00 | N/R | | 2,007,660 | |
| | | | Metropolitan Pier and Exposition Authority, Illinois, Revenue Refunding Bonds, McCormick Place Expansion Project, Series 1996A: | | | | | |
| | 12,250 | | 0.000%, 12/15/22 – NPFG Insured | No Opt. Call | A2 | | 6,573,228 | |
| | 13,000 | | 0.000%, 12/15/23 – NPFG Insured | No Opt. Call | A2 | | 6,465,810 | |
| | 3,000 | | Metropolitan Pier and Exposition Authority, Illinois, Revenue Refunding Bonds, McCormick Place Expansion Project, Series 2002B, 5.750%, 6/15/23 – NPFG Insured | 6/12 at 101.00 | AAA | | 3,137,310 | |
| | | Nuveen Dividend Advantage Municipal Fund (continued) |
| NAD | | Portfolio of Investments |
April 30, 2011 (Unaudited)
| | Principal | | | Optional Call | | | | |
| | Amount (000) | | Description (1) | Provisions (2) | Ratings (3) | | Value | |
| | | | Illinois (continued) | | | | | |
| $ | 1,840 | | Oak Park, Illinois, General Obligation Bonds, Series 2005B, 0.000%, 11/01/27 – SYNCORA GTY Insured | 11/15 at 54.13 | Aa2 | $ | 697,967 | |
| | | | Regional Transportation Authority, Cook, DuPage, Kane, Lake, McHenry and Will Counties, Illinois, General Obligation Bonds, Series 1999: | | | | | |
| | 22,650 | | 5.750%, 6/01/19 – AGM Insured | No Opt. Call | AA+ | | 25,289,178 | |
| | 3,500 | | 5.750%, 6/01/23 – AGM Insured | No Opt. Call | AA+ | | 3,781,400 | |
| | 1,300 | | Schaumburg, Illinois, General Obligation Bonds, Series 2004B, 5.250%,
12/01/34 – FGIC Insured | 12/14 at 100.00 | Aaa | | 1,311,765 | |
| | 10,000 | | Will County Community High School District 210 Lincoln-Way, Illinois, General Obligation Bonds, Series 2006, 0.000%, 1/01/23 – AGM Insured | No Opt. Call | Aa2 | | 5,230,600 | |
| | 4,500 | | Will County School District 122, New Lenox, Illinois, General Obligation Bonds, Series 2000B, 0.000%, 11/01/18 – AGM Insured | No Opt. Call | Aa3 | | 3,198,915 | |
| | 183,645 | | Total Illinois | | | | 156,258,223 | |
| | | | Indiana – 4.4% (2.8% of Total Investments) | | | | | |
| | 1,630 | | Hospital Authority of Delaware County, Indiana, Hospital Revenue Refunding Bonds, Cardinal Health System, Series 1997, 5.000%, 8/01/16 – AMBAC Insured | 7/11 at 100.00 | N/R | | 1,599,715 | |
| | 4,000 | | Indiana Finance Authority, Revenue Bonds, Trinity Health Care Group, Refunding Series 2009A, 5.250%, 12/01/38 | 12/19 at 100.00 | AA | | 3,719,560 | |
| | 2,000 | | Indiana Health Facility Financing Authority, Revenue Bonds, Community Foundation of Northwest Indiana, Series 2007, 5.500%, 3/01/37 | 3/17 at 100.00 | BBB+ | | 1,804,020 | |
| | 5,865 | | Indiana Housing and Community Development Authority, Single Family Mortgage Revenue Bonds, Tender Option Bond Trust 1847, 7.863%, 1/01/25 (Alternative Minimum Tax) (IF) | 1/17 at 100.00 | Aaa | | 5,297,327 | |
| | 6,675 | | Indiana Municipal Power Agency, Power Supply Revenue Bonds, Series 2007A, 5.000%, 1/01/42 – NPFG Insured | 1/17 at 100.00 | A+ | | 6,210,553 | |
| | 3,965 | | Marion County Convention and Recreational Facilities Authority, Indiana, Excise Taxes Lease Rental Revenue Subordinate Bonds, Series 1997A, 5.000%, 6/01/22 – NPFG Insured | 7/11 at 100.00 | Baa1 | | 3,973,604 | |
| | 24,135 | | Total Indiana | | | | 22,604,779 | |
| | | | Iowa – 0.9% (0.6% of Total Investments) | | | | | |
| | 7,000 | | Iowa Tobacco Settlement Authority, Asset Backed Settlement Revenue Bonds, Series 2005C, 5.625%, 6/01/46 | 6/15 at 100.00 | BBB | | 4,720,519 | |
| | | | Kansas – 1.7% (1.1% of Total Investments) | | | | | |
| | 3,825 | | Wichita, Kansas, Water and Sewerage Utility Revenue Bonds, Series 1999, 4.000%, 10/01/18 – FGIC Insured | 10/11 at 100.00 | Aa2 | | 3,829,169 | |
| | 2,945 | | Wyandotte County-Kansas City Unified Government, Kansas, Sales Tax Special Obligation Bonds, Redevelopment Project Area B, Series 2005, 5.000%, 12/01/20 | 12/15 at 100.00 | N/R | | 2,976,129 | |
| | 3,730 | | Wyandotte County-Kansas City Unified Government, Kansas, Sales Tax Special Obligation Capital Appreciation Revenue Bonds Redevelopment Project Area
B – Major Multi-Sport Athletic Complex Project, Subordinate Lien Series 2010B, 0.000%, 6/01/21 | No Opt. Call | N/R | | 2,066,308 | |
| | 10,500 | | Total Kansas | | | | 8,871,606 | |
| | | | Kentucky – 1.2% (0.7% of Total Investments) | | | | | |
| | | | Kentucky Economic Development Finance Authority, Hospital System Revenue Refunding and Improvement Bonds, Appalachian Regional Healthcare Inc., Series 1997: | | | | | |
| | 1,850 | | 5.850%, 10/01/17 | 10/11 at 100.00 | BB– | | 1,728,196 | |
| | 4,990 | | 5.875%, 10/01/22 | 10/11 at 100.00 | BB– | | 4,304,873 | |
| | 6,840 | | Total Kentucky | | | | 6,033,069 | |
| | | | Louisiana – 7.5% (4.8% of Total Investments) | | | | | |
| | 1,750 | | Louisiana Local Government Environmental Facilities and Community Development Authority, GNMA Collateralized Mortgage Revenue Refunding Bonds, Sharlo Apartments, Series 2002A, 6.500%, 6/20/37 | 6/12 at 105.00 | Aaa | | 1,853,023 | |
| | 5,350 | | Louisiana Public Facilities Authority, Revenue Bonds, Baton Rouge General Hospital, Series 2004, 5.250%, 7/01/33 – NPFG Insured | 7/14 at 100.00 | Baa1 | | 5,273,763 | |
| | 9,000 | | Louisiana Public Facilities Authority, Revenue Bonds, Ochsner Clinic Foundation Project, Series 2007A, 5.500%, 5/15/47 | 5/17 at 100.00 | Baa1 | | 7,492,590 | |
| | 5,445 | | Louisiana State, Gasoline and Fuels Tax Revenue Bonds, Series 2006A, 4.500%, 5/01/41 – FGIC Insured (UB) | 5/16 at 100.00 | Aa1 | | 4,980,814 | |
| | Principal | | | Optional Call | | | | |
| | Amount (000) | | Description (1) | Provisions (2) | Ratings (3) | | Value | |
| | | | Louisiana (continued) | | | | | |
| $ | 13,570 | | Louisiana Transportation Authority, Senior Lien Toll Road Revenue Bonds, Series 2005B, 0.000%, 12/01/28 – AMBAC Insured | 7/11 at 40.01 | AA– | $ | 4,550,157 | |
| | | | Tobacco Settlement Financing Corporation, Louisiana, Tobacco Settlement Asset-Backed Bonds, Series 2001B: | | | | | |
| | 8,870 | | 5.500%, 5/15/30 | 5/11 at 101.00 | A | | 8,756,464 | |
| | 6,750 | | 5.875%, 5/15/39 | 5/11 at 101.00 | A– | | 6,160,253 | |
| | 50,735 | | Total Louisiana | | | | 39,067,064 | |
| | | | Massachusetts – 2.7% (1.7% of Total Investments) | | | | | |
| | 1,440 | | Boston Industrial Development Financing Authority, Massachusetts, Subordinate Revenue Bonds, Crosstown Center Project, Series 2002, 8.000%, 9/01/35 (Alternative Minimum Tax) | 9/12 at 102.00 | N/R | | 431,626 | |
| | 2,500 | | Massachusetts Bay Transportation Authority, Sales Tax Revenue Bonds, Senior Lien Series 2003A, 5.250%, 7/01/11 | No Opt. Call | AAA | | 2,521,525 | |
| | 4,365 | | Massachusetts Health and Educational Facilities Authority, Revenue Bonds, Berkshire Health System, Series 2005F, 5.000%, 10/01/19 – AGC Insured | 10/15 at 100.00 | AA+ | | 4,548,636 | |
| | 620 | | Massachusetts Health and Educational Facilities Authority, Revenue Bonds, CareGroup Inc., Series 2008E-1 &2, 5.125%, 7/01/33 | 7/18 at 100.00 | A3 | | 551,819 | |
| | 2,300 | | Massachusetts Health and Educational Facilities Authority, Revenue Refunding Bonds, Suffolk University Issue, Series 2009A, 5.750%, 7/01/39 | 7/19 at 100.00 | BBB | | 2,181,734 | |
| | 2,925 | | Massachusetts Housing Finance Agency, Housing Bonds, Series 2009F, 5.700%, 6/01/40 | 12/18 at 100.00 | AA– | | 2,836,051 | |
| | 785 | | Massachusetts Port Authority, Special Facilities Revenue Bonds, US Airways Group Inc., Series 1996A, 5.875%, 9/01/23 – NPFG Insured (Alternative Minimum Tax) | 9/11 at 100.00 | Baa1 | | 679,127 | |
| | 1,000 | | Massachusetts Turnpike Authority, Metropolitan Highway System Revenue Bonds, Senior Series 1997A, 0.000%, 1/01/24 – NPFG Insured | No Opt. Call | A | | 505,910 | |
| | 15,935 | | Total Massachusetts | | | | 14,256,428 | |
| | | | Michigan – 2.9% (1.8% of Total Investments) | | | | | |
| | 6,000 | | Detroit, Michigan, Second Lien Sewerage Disposal System Revenue Bonds, Series 2005A, 5.000%, 7/01/35 – NPFG Insured | 7/15 at 100.00 | A | | 5,386,860 | |
| | 3,215 | | Detroit, Michigan, Water Supply System Revenue Bonds, Series 2004A, 5.250%, 7/01/18 – NPFG Insured | 7/16 at 100.00 | A2 | | 3,310,003 | |
| | 3,480 | | Michigan State Building Authority, Revenue Bonds, Facilities Program, Series 2001I, 5.125%, 10/15/20 | 10/11 at 100.00 | Aa3 | | 3,528,407 | |
| | 1,500 | | Michigan State Hospital Finance Authority, Hospital Revenue Bonds, Oakwood Obligated Group, Series 2003, 5.500%, 11/01/11 | No Opt. Call | A | | 1,528,740 | |
| | 1,150 | | Royal Oak Hospital Finance Authority, Michigan, Hospital Revenue Bonds, William Beaumont Hospital, Refunding Series 2009V, 8.250%, 9/01/39 | 9/18 at 100.00 | A1 | | 1,307,493 | |
| | 15,345 | | Total Michigan | | | | 15,061,503 | |
| | | | Minnesota – 1.4% (0.9% of Total Investments) | | | | | |
| | 6,375 | | Minneapolis Health Care System, Minnesota, Revenue Bonds, Fairview Hospital and Healthcare Services, Series 2008A, 6.625%, 11/15/28 | 11/18 at 100.00 | A | | 6,853,508 | |
| | 470 | | Minnesota Housing Finance Agency, Single Family Mortgage Bonds, Series 1998H-1, 5.650%, 7/01/31 (Alternative Minimum Tax) | 7/11 at 100.00 | AA+ | | 485,919 | |
| | 6,845 | | Total Minnesota | | | | 7,339,427 | |
| | | | Missouri – 2.4% (1.5% of Total Investments) | | | | | |
| | | | Kansas City Municipal Assistance Corporation, Missouri, Leasehold Revenue Bonds, Series 2004B-1: | | | | | |
| | 7,000 | | 0.000%, 4/15/27 – AMBAC Insured | No Opt. Call | AA– | | 2,754,360 | |
| | 5,000 | | 0.000%, 4/15/29 – AMBAC Insured | No Opt. Call | AA– | | 1,699,850 | |
| | | | Missouri Health and Educational Facilities Authority, Revenue Bonds, SSM Healthcare System, Series 2001A: | | | | | |
| | 300 | | 5.250%, 6/01/21 (Pre-refunded 6/01/11) – AMBAC Insured | 6/11 at 101.00 | AA– (4) | | 304,329 | |
| | 1,885 | | 5.250%, 6/01/21 (Pre-refunded 6/01/11) – AMBAC Insured | 6/11 at 101.00 | AA– (4) | | 1,912,201 | |
| | 2,185 | | 5.250%, 6/01/21 (Pre-refunded 6/01/11) – AMBAC Insured | 6/11 at 101.00 | AA– (4) | | 2,216,530 | |
| | 3,670 | | 5.250%, 6/01/28 (Pre-refunded 6/01/11) – AMBAC Insured | 6/11 at 101.00 | AA– (4) | | 3,722,958 | |
| | 20,040 | | Total Missouri | | | | 12,610,228 | |
| | | Nuveen Dividend Advantage Municipal Fund (continued) |
| NAD | | Portfolio of Investments |
April 30, 2011 (Unaudited)
| | Principal | | | Optional Call | | | | |
| | Amount (000) | | Description (1) | Provisions (2) | Ratings (3) | | Value | |
| | | | Montana – 0.3% (0.2% of Total Investments) | | | | | |
| $ | 385 | | Montana Board of Housing, Single Family Mortgage Bonds, Series 2000A-2, 6.450%, 6/01/29 (Alternative Minimum Tax) | 6/11 at 100.00 | AA+ | $ | 391,915 | |
| | 1,000 | | Montana Higher Education Student Assistance Corporation, Student Loan Revenue Bonds, Subordinate Series 1999B, 6.400%, 12/01/32 (Alternative Minimum Tax) | 6/11 at 100.00 | A2 | | 977,080 | |
| | 1,385 | | Total Montana | | | | 1,368,995 | |
| | | | Nevada – 5.3% (3.4% of Total Investments) | | | | | |
| | 10,000 | | Clark County, Nevada, Airport Revenue Bonds, Subordinte Lien Series 2010B, 5.750%, 7/01/42 | 1/20 at 100.00 | Aa3 | | 10,107,900 | |
| | 9,675 | | Clark County, Nevada, Passenger Facility Charge Revenue Bonds, Las Vegas-McCarran International Airport, Series 2010A, 5.250%, 7/01/42 | 1/20 at 100.00 | Aa3 | | 9,016,229 | |
| | | | Director of Nevada State Department of Business and Industry, Revenue Bonds, Las Vegas Monorail Project, First Tier, Series 2000: | | | | | |
| | 8,000 | | 0.000%, 1/01/19 – AMBAC Insured | No Opt. Call | N/R | | 1,256,320 | |
| | 4,000 | | 5.625%, 1/01/32 – AMBAC Insured (5) | 1/12 at 100.00 | N/R | | 1,003,480 | |
| | 3,000 | | 5.375%, 1/01/40 – AMBAC Insured (5) | 7/11 at 100.00 | N/R | | 752,340 | |
| | 3,750 | | Henderson, Nevada, Healthcare Facility Revenue Refunding Bonds, Catholic Healthcare West, Series 2007B, Trust 2633, 18.765%, 7/01/31 – BHAC Insured (IF) | 7/17 at 100.00 | AA+ | | 3,910,200 | |
| | 1,500 | | Las Vegas Redevelopment Agency, Nevada, Tax Increment Revenue Bonds, Series 2009A, 8.000%, 6/15/30 | 6/19 at 100.00 | A | | 1,666,140 | |
| | 39,925 | | Total Nevada | | | | 27,712,609 | |
| | | | New Jersey – 7.1% (4.5% of Total Investments) | | | | | |
| | 6,850 | | New Jersey Educational Facilities Authority, Revenue Refunding Bonds, University of Medicine and Dentistry of New Jersey, Series 2009B, 5.750%, 12/01/15 | No Opt. Call | Baa1 | | 7,476,090 | |
| | 1,830 | | New Jersey Higher Education Assistance Authority, Student Loan Revenue Bonds, Series 2000A, 6.000%, 6/01/13 – NPFG Insured (Alternative Minimum Tax) | 6/11 at 100.00 | Aaa | | 1,836,204 | |
| | 4,130 | | New Jersey Transit Corporation, Certificates of Participation, Federal Transit Administration Grants, Series 2002A, 5.500%, 9/15/13 – AMBAC Insured | No Opt. Call | Aa3 | | 4,460,235 | |
| | 4,000 | | New Jersey Transportation Trust Fund Authority, Transportation System Bonds, Series 1999A, 5.750%, 6/15/18 | No Opt. Call | A+ | | 4,534,080 | |
| | 20,000 | | New Jersey Transportation Trust Fund Authority, Transportation System Bonds, Series 2006C, 0.000%, 12/15/28 – AMBAC Insured | No Opt. Call | A+ | | 6,476,400 | |
| | | | Tobacco Settlement Financing Corporation, New Jersey, Tobacco Settlement Asset-Backed Bonds, Series 2002: | | | | | |
| | 6,940 | | 5.750%, 6/01/32 (Pre-refunded 6/01/12) | 6/12 at 100.00 | AAA | | 7,228,079 | |
| | 3,165 | | 6.125%, 6/01/42 (Pre-refunded 6/01/12) | 6/12 at 100.00 | AAA | | 3,364,015 | |
| | 1,365 | | Tobacco Settlement Financing Corporation, New Jersey, Tobacco Settlement Asset-Backed Bonds, Series 2003, 6.750%, 6/01/39 (Pre-refunded 6/01/13) | 6/13 at 100.00 | AAA | | 1,535,884 | |
| | 48,280 | | Total New Jersey | | | | 36,910,987 | |
| | | | New Mexico – 1.5% (0.9% of Total Investments) | | | | | |
| | 4,000 | | Santa Fe Public School District, Santa Fe County, New Mexico, General Obligation Bonds, Series 2009, 2.500%, 8/01/11 | No Opt. Call | Aa1 | | 4,022,960 | |
| | 3,730 | | University of New Mexico, FHA-Insured Mortgage Hospital Revenue Bonds, Series 2004, 5.000%, 7/01/32 – AGM Insured | 7/14 at 100.00 | AA+ | | 3,730,298 | |
| | 7,730 | | Total New Mexico | | | | 7,753,258 | |
| | | | New York – 9.9% (6.3% of Total Investments) | | | | | |
| | 2,170 | | Dormitory Authority of the State of New York, Insured Revenue Bonds, Franciscan Health Partnership Obligated Group – Frances Shervier Home and Hospital, Series 1997, 5.500%, 7/01/17 – RAAI Insured | 7/11 at 100.00 | A3 | | 2,171,693 | |
| | 7,500 | | Dormitory Authority of the State of New York, Secured Hospital Revenue Refunding Bonds, Wyckoff Heights Medical Center, Series 1998H, 5.300%, 8/15/21 – NPFG Insured | 8/11 at 100.00 | AA– | | 7,507,425 | |
| | 6,000 | | New York City Industrial Development Agency, New York, American Airlines-JFK International Airport Special Facility Revenue Bonds, Series 2005, 7.750%, 8/01/31 (Alternative Minimum Tax) | 8/16 at 101.00 | B– | | 6,076,680 | |
| | 4,755 | | New York City Industrial Development Agency, New York, Revenue Bonds, Yankee Stadium Project PILOT, Series 2009A, 7.000%, 3/01/49 – AGC Insured | 3/19 at 100.00 | AA+ | | 5,171,918 | |
| | 5,000 | | New York City Municipal Water Finance Authority, New York, Water and Sewerage System Revenue Bonds, Series 2004B, 5.000%, 6/15/36 – AGM Insured (UB) | 12/14 at 100.00 | AAA | | 5,020,250 | |
| | Principal | | | Optional Call | | | | |
| | Amount (000) | | Description (1) | Provisions (2) | Ratings (3) | | Value | |
| | | | New York (continued) | | | | | |
| $ | 8,800 | | New York City Sales Tax Asset Receivable Corporation, New York, Dedicated Revenue Bonds, Local Government Assistance Corporation, Series 2004A, 5.000%, 10/15/32 – AMBAC Insured (UB) | 10/14 at 100.00 | AAA | $ | 8,937,984 | |
| | | | Port Authority of New York and New Jersey, Special Project Bonds, JFK International Air Terminal LLC Project, Eigth Series 2010: | | | | | |
| | 5,000 | | 6.500%, 12/01/28 | 12/15 at 100.00 | BBB– | | 5,113,700 | |
| | 1,670 | | 6.000%, 12/01/36 | 12/20 at 100.00 | BBB– | | 1,622,104 | |
| | 10,000 | | Port Authority of New York and New Jersey, Special Project Bonds, JFK International Air Terminal LLC, Sixth Series 1997, 5.900%, 12/01/17 – NPFG Insured (Alternative Minimum Tax) | 6/11 at 100.00 | Baa1 | | 9,999,400 | |
| | 50,895 | | Total New York | | | | 51,621,154 | |
| | | | North Carolina – 1.1% (0.7% of Total Investments) | | | | | |
| | 1,500 | | Charlotte-Mecklenberg Hospital Authority, North Carolina, Carolinas HealthCare System Revenue Bonds, Series 2008A, 5.250%, 1/15/24 – AGC Insured | 1/18 at 100.00 | AA– | | 1,573,290 | |
| | 3,830 | | Charlotte-Mecklenburg Hospital Authority, North Carolina, Healthcare System Revenue Bonds, DBA Carolinas Healthcare System, Series 2005A, 5.000%, 1/15/45 (Pre-refunded 1/15/15) | 1/15 at 100.00 | AAA | | 4,367,426 | |
| | 5,330 | | Total North Carolina | | | | 5,940,716 | |
| | | | North Dakota – 1.6% (1.0% of Total Investments) | | | | | |
| | 4,325 | | Bismarck, North Dakota, Health Care Revenue Bonds, St. Alexius Medical Center, Series 1998A, 5.250%, 7/01/15 – AGM Insured | 7/11 at 100.00 | AA+ | | 4,337,370 | |
| | 3,910 | | Fargo, North Dakota, Health System Revenue Bonds, Sanford Series 2011, 6.250%, 11/01/31 | 11/21 at 100.00 | AA– | | 4,081,375 | |
| | 8,235 | | Total North Dakota | | | | 8,418,745 | |
| | | | Ohio – 3.7% (2.4% of Total Investments) | | | | | |
| | 2,300 | | Amherst Exempted Village School District, Ohio, Unlimited Tax General Obligation School Improvement Bonds, Series 2001, 5.125%, 12/01/21 (Pre-refunded 12/01/11) – FGIC Insured | 12/11 at 100.00 | Aa2 (4) | | 2,364,653 | |
| | | | Buckeye Tobacco Settlement Financing Authority, Ohio, Tobacco Settlement Asset-Backed Revenue Bonds, Senior Lien, Series 2007A-2: | | | | | |
| | 1,275 | | 5.375%, 6/01/24 | 6/17 at 100.00 | Baa3 | | 1,000,289 | |
| | 160 | | 5.125%, 6/01/24 | 6/17 at 100.00 | Baa3 | | 123,626 | |
| | 1,800 | | 5.875%, 6/01/30 | 6/17 at 100.00 | Baa3 | | 1,298,952 | |
| | 1,740 | | 5.750%, 6/01/34 | 6/17 at 100.00 | Baa3 | | 1,198,860 | |
| | 3,930 | | 5.875%, 6/01/47 | 6/17 at 100.00 | Baa3 | | 2,651,532 | |
| | 6,000 | | Butler County, Ohio, Hospital Facilities Revenue Bonds, UC Health, Series 2010, 5.250%, 11/01/29 | 11/20 at 100.00 | BBB+ | | 5,164,680 | |
| | 3,650 | | Montgomery County, Ohio, Revenue Bonds, Catholic Health Initiatives, Series 2004A, 5.000%, 5/01/30 | 5/14 at 100.00 | AA | | 3,549,625 | |
| | 1,000 | | Ohio Air Quality Development Authority, Ohio, Revenue Bonds, Ohio Valley Electric Corporation Project, Series 2009E, 5.625%, 10/01/19 | No Opt. Call | BBB– | | 1,008,290 | |
| | 840 | | Warren County, Ohio, Limited Tax General Obligations, Series 1997, 5.500%, 12/01/17 | 6/11 at 100.00 | Aa1 | | 843,251 | |
| | 22,695 | | Total Ohio | | | | 19,203,758 | |
| | | | Oregon – 0.5% (0.3% of Total Investments) | | | | | |
| | 2,355 | | Portland, Oregon, Downtown Waterfront Urban Renewal and Redevelopment Revenue Bonds, Series 2000A, 5.500%, 6/15/20 – AMBAC Insured | 6/11 at 100.00 | Aa3 | | 2,355,683 | |
| | | | Pennsylvania – 3.0% (1.9% of Total Investments) | | | | | |
| | 1,250 | | Erie Water Authority, Pennsylvania, Water Revenue Bonds, Series 2008, 5.000%, 12/01/43 – AGM Insured | 12/18 at 100.00 | AA+ | | 1,225,313 | |
| | 1,500 | | Pennsylvania Housing Finance Agency, Single Family Mortgage Revenue Bonds, Series 2006-96A, 4.650%, 10/01/31 (Alternative Minimum Tax) (UB) | 10/16 at 100.00 | AA+ | | 1,365,240 | |
| | 8,200 | | Pennsylvania Turnpike Commission, Turnpike Revenue Bonds, Capital Appreciation Series 2009E, 0.000%, 12/01/38 | 12/27 at 100.00 | A– | | 5,670,792 | |
| | 5,000 | | Pennsylvania Turnpike Commission, Turnpike Subordinate Revenue Bonds, Series 2009C, 0.000%, 6/01/33 – AGM Insured | 6/26 at 100.00 | AA+ | | 3,960,950 | |
| | 3,205 | | Philadelphia School District, Pennsylvania, General Obligation Bonds, Series 2002B, 5.625%, 8/01/16 (Pre-refunded 8/01/12) – FGIC Insured | 8/12 at 100.00 | Aa2 (4) | | 3,412,876 | |
| | 19,155 | | Total Pennsylvania | | | | 15,635,171 | |
| | | Nuveen Dividend Advantage Municipal Fund (continued) |
| NAD | | Portfolio of Investments |
April 30, 2011 (Unaudited)
| | Principal | | | Optional Call | | | | |
| | Amount (000) | | Description (1) | Provisions (2) | Ratings (3) | | Value | |
| | | | Puerto Rico – 5.9% (3.8% of Total Investments) | | | | | |
| $ | 2,500 | | Puerto Rico Aqueduct and Sewerage Authority, Revenue Bonds, Senior Lien Series 2008A, 6.000%, 7/01/44 | 7/18 at 100.00 | Baa1 | $ | 2,356,275 | |
| | 4,300 | | Puerto Rico Housing Finance Authority, Capital Fund Program Revenue Bonds, Series 2003, 4.500%, 12/01/23 (Pre-refunded 12/01/13) (UB) | 12/13 at 100.00 | AA+ (4) | | 4,280,220 | |
| | 8,200 | | Puerto Rico Housing Finance Authority, Capital Fund Program Revenue Bonds, Series 2003, 4.500%, 12/01/23 (Pre-refunded 12/01/13) | 12/13 at 100.00 | AAA | | 8,959,894 | |
| | 12,845 | | Puerto Rico Infrastructure Financing Authority, Special Tax Revenue Bonds, Series 2005A, 0.000%, 7/01/42 – FGIC Insured | No Opt. Call | A3 | | 1,257,654 | |
| | 10,000 | | Puerto Rico Sales Tax Financing Corporation, Sales Tax Revenue Bonds, First Subordinate Series 2009A, 6.000%, 8/01/42 | 8/19 at 100.00 | A+ | | 10,018,200 | |
| | 4,310 | | Puerto Rico Sales Tax Financing Corporation, Sales Tax Revenue Bonds, First Subordinate Series 2010C, 5.250%, 8/01/41 | 8/20 at 100.00 | A+ | | 3,894,128 | |
| | 42,155 | | Total Puerto Rico | | | | 30,766,371 | |
| | | | Rhode Island – 3.1% (2.0% of Total Investments) | | | | | |
| | 2,015 | | Central Falls, Rhode Island, General Obligation School Bonds, Series 1999, 6.250%, 5/15/20 – RAAI Insured | 5/11 at 100.00 | B3 | | 1,500,349 | |
| | | | Rhode Island Housing & Mortgage Finance Corporation, Homeownership Opportunity 57-B Bond Program, Series 2008, Trust 1177: | | | | | |
| | 1,500 | | 9.479%, 4/01/23 (Alternative Minimum Tax) (IF) | 4/17 at 100.00 | AA+ | | 1,501,380 | |
| | 1,000 | | 9.579%, 4/01/23 (Alternative Minimum Tax) (IF) | 4/17 at 100.00 | AA+ | | 968,460 | |
| | 12,500 | | Rhode Island Tobacco Settlement Financing Corporation, Tobacco Settlement Asset-Backed Bonds, Series 2002A, 6.125%, 6/01/32 | 6/12 at 100.00 | BBB | | 11,978,875 | |
| | 17,015 | | Total Rhode Island | | | | 15,949,064 | |
| | | | South Carolina – 0.7% (0.4% of Total Investments) | | | | | |
| | 2,045 | | Florence County, South Carolina, Hospital Revenue Bonds, McLeod Regional Medical Center, Series 2004A, 5.250%, 11/01/27 – AGM Insured | 11/14 at 100.00 | AA+ | | 2,066,145 | |
| | 1,500 | | Greenville, South Carolina, Hospital Facilities Revenue Bonds, Series 2001, 5.000%, 5/01/31 – AMBAC Insured | 5/12 at 100.00 | AA– | | 1,404,510 | |
| | 3,545 | | Total South Carolina | | | | 3,470,655 | |
| | | | Tennessee – 0.9% (0.6% of Total Investments) | | | | | |
| | 430 | | Memphis-Shelby County Airport Authority, Tennessee, Airport Revenue Bonds, Series 1999D, 6.000%, 3/01/24 – AMBAC Insured (Alternative Minimum Tax) | 9/11 at 100.00 | A2 | | 430,563 | |
| | 2,425 | | Memphis-Shelby County Airport Authority, Tennessee, Airport Revenue Bonds, Series 2001B, 5.125%, 3/01/26 – AGM Insured | 9/11 at 100.00 | AA+ | | 2,426,382 | |
| | 2,310 | | Sullivan County Health Educational and Housing Facilities Board, Tennessee, Revenue Bonds, Wellmont Health System, Series 2006C, 5.250%, 9/01/36 | 9/16 at 100.00 | BBB+ | | 1,913,720 | |
| | 1,500 | | Sumner County Health, Educational, and Housing Facilities Board, Tennessee, Revenue Refunding Bonds, Sumner Regional Health System Inc., Series 2007, 5.500%, 11/01/46 (5), (6) | 11/17 at 100.00 | N/R | | 75,150 | |
| | 6,665 | | Total Tennessee | | | | 4,845,815 | |
| | | | Texas – 7.7% (4.9% of Total Investments) | | | | | |
| | 2,560 | | Brazos River Authority, Texas, Pollution Control Revenue Refunding Bonds, TXU Electric Company, Series 1999C, 7.700%, 3/01/32 (Alternative Minimum Tax) | 4/13 at 101.00 | Ca | | 1,079,578 | |
| | 2,000 | | Capital Area Cultural Education Facilities Finance Corporation, Texas, Revenue Bonds, The Roman Catholic Diocese of Austin, Series 2005B. Remarketed, 6.125%, 4/01/45 | 4/20 at 100.00 | Baa2 | | 1,921,400 | |
| | 2,820 | | Central Texas Regional Mobility Authority, Travis and Williamson Counties, Toll Road Revenue Bonds, Series 2005, 5.000%, 1/01/45 – FGIC Insured | 1/15 at 100.00 | BBB | | 2,197,344 | |
| | 820 | | Dallas Area Rapid Transit, Texas, Senior Lien Sales Tax Revenue Bonds, Series 2001, 5.000%, 12/01/31 (Pre-refunded 12/01/11) – AMBAC Insured | 12/11 at 100.00 | AA+ (4) | | 842,812 | |
| | 2,610 | | Granbury Independent School District, Counties of Hood, Johnson, Parker, and Somervell, Texas, Unlimited Tax School Building and Refunding Bonds, Series 1999, 0.000%, 8/01/11 | No Opt. Call | AAA | | 2,607,338 | |
| | 2,305 | | Harris County-Houston Sports Authority, Texas, Senior Lien Revenue Refunding Bonds, Series 2001A, 0.000%, 11/15/20 – NPFG Insured | No Opt. Call | Baa1 | | 1,046,193 | |
| | Principal | | | Optional Call | | | | |
| | Amount (000) | | Description (1) | Provisions (2) | Ratings (3) | | Value | |
| | | | Texas (continued) | | | | | |
| | | | Houston, Texas, Hotel Occupancy Tax and Special Revenue Bonds, Convention and Entertainment Project, Series 2001B: | | | | | |
| $ | 3,130 | | 0.000%, 9/01/30 – AMBAC Insured | No Opt. Call | A2 | $ | 838,245 | |
| | 12,030 | | 0.000%, 9/01/31 – AMBAC Insured | No Opt. Call | A2 | | 2,985,966 | |
| | 30,095 | | Leander Independent School District, Williamson and Travis Counties, Texas, General Obligation Bonds, Series 2004, 0.000%, 8/15/34 | 8/12 at 27.94 | AAA | | 7,834,330 | |
| | 9,345 | | Leander Independent School District, Williamson and Travis Counties, Texas, General Obligation Bonds, Series 2005, 0.000%, 8/15/33 – FGIC Insured | 8/15 at 37.33 | AA– | | 2,724,254 | |
| | 33,160 | | Leander Independent School District, Williamson and Travis Counties, Texas, General Obligation Bonds, Series 2006, 0.000%, 8/15/38 | 8/14 at 26.50 | AAA | | 6,923,808 | |
| | 1,000 | | San Antonio, Texas, Water System Revenue Bonds, Series 2005, 4.750%, 5/15/37 – NPFG Insured | 5/15 at 100.00 | Aa1 | | 991,850 | |
| | 3,295 | | Tarrant County Cultural & Educational Facilities Financing Corporation, Texas, Revenue Bonds, Series 2007, Residuals 1761, 16.974%, 2/15/36 (IF) | 2/17 at 100.00 | AA– | | 2,158,489 | |
| | 7,000 | | White Settlement Independent School District, Tarrant County, Texas, General Obligation Bonds, Series 2005, 0.000%, 8/15/35 | 8/15 at 34.92 | AAA | | 1,836,590 | |
| | | | Wylie Independent School District, Collin County, Texas, General Obligation Bonds, Series 2005: | | | | | |
| | 3,000 | | 0.000%, 8/15/20 | 8/15 at 78.46 | AAA | | 2,013,270 | |
| | 3,000 | | 0.000%, 8/15/22 | 8/15 at 70.77 | AAA | | 1,778,100 | |
| | 118,170 | | Total Texas | | | | 39,779,567 | |
| | | | Utah – 0.1% (0.1% of Total Investments) | | | | | |
| | | | Utah Housing Finance Agency, Single Family Mortgage Bonds, Series 1999C-2, Class II: | | | | | |
| | 125 | | 5.700%, 7/01/19 (Alternative Minimum Tax) | 7/11 at 100.75 | Aaa | | 128,996 | |
| | 35 | | 5.750%, 7/01/21 (Alternative Minimum Tax) | 7/11 at 100.75 | Aa2 | | 35,030 | |
| | 275 | | Utah Housing Finance Agency, Single Family Mortgage Bonds, Series 2000F-2, Class III, 6.000%, 1/01/15 (Alternative Minimum Tax) | 7/11 at 100.00 | AA– | | 275,349 | |
| | 435 | | Total Utah | | | | 439,375 | |
| | | | Virginia – 0.8% (0.5% of Total Investments) | | | | | |
| | 1,500 | | Fairfax County Economic Development Authority, Virginia, Residential Care Facilities Mortgage Revenue Bonds, Goodwin House, Inc., Series 2007A, 5.125%, 10/01/42 | 10/17 at 100.00 | N/R | | 1,267,155 | |
| | 2,930 | | Virginia Beach, Virginia, General Obligation Bonds, Series 2008A, 5.000%, 10/01/11 | No Opt. Call | AAA | | 2,988,893 | |
| | 4,430 | | Total Virginia | | | | 4,256,048 | |
| | | | Washington – 9.2% (5.8% of Total Investments) | | | | | |
| | 4,000 | | Energy Northwest, Washington, Electric Revenue Refunding Bonds, Nuclear Project 3, Series 2003A, 5.500%, 7/01/17 – SYNCORA GTY Insured | 7/13 at 100.00 | Aaa | | 4,342,480 | |
| | | | Port of Seattle, Washington, Special Facility Revenue Bonds, Terminal 18, Series 1999B: | | | | | |
| | 1,755 | | 6.000%, 9/01/15 – NPFG Insured (Alternative Minimum Tax) | 9/11 at 100.00 | Baa1 | | 1,758,563 | |
| | 2,590 | | 6.000%, 9/01/16 – NPFG Insured (Alternative Minimum Tax) | 9/11 at 100.00 | Baa1 | | 2,594,714 | |
| | | | Port of Seattle, Washington, Special Facility Revenue Bonds, Terminal 18, Series 1999C: | | | | | |
| | 875 | | 6.000%, 9/01/15 – NPFG Insured (Alternative Minimum Tax) | 9/11 at 100.00 | Baa1 | | 876,776 | |
| | 1,260 | | 6.000%, 9/01/16 – NPFG Insured (Alternative Minimum Tax) | 9/11 at 100.00 | Baa1 | | 1,262,293 | |
| | 2,000 | | Washington State Health Care Facilities Authority, Revenue Bonds, Fred Hutchinson Cancer Research Center, Series 2009A, 6.000%, 1/01/33 | 7/19 at 100.00 | A | | 2,007,480 | |
| | 5,955 | | Washington State Tobacco Settlement Authority, Tobacco Settlement Asset-Backed Revenue Bonds, Series 2002, 6.500%, 6/01/26 | 6/13 at 100.00 | BBB | | 6,003,771 | |
| | 3,350 | | Washington, General Obligation Compound Interest Bonds, Series 1999S-2, 0.000%, 1/01/18 – AGM Insured | No Opt. Call | AA+ | | 2,742,746 | |
| | | | Washington, General Obligation Compound Interest Bonds, Series 1999S-3: | | | | | |
| | 17,650 | | 0.000%, 1/01/20 | No Opt. Call | AA+ | | 13,052,528 | |
| | 18,470 | | 0.000%, 1/01/21 | No Opt. Call | AA+ | | 12,968,156 | |
| | 57,905 | | Total Washington | | | | 47,609,507 | |
| | | | Wisconsin – 7.3% (4.7% of Total Investments) | | | | | |
| | 1,690 | | Green Bay, Wisconsin, Water System Revenue Bonds, Series 2004, 5.000%, 11/01/29 (Pre-refunded 11/01/14) – AGM Insured | 11/14 at 100.00 | Aa2 (4) | | 1,931,788 | |
| | 560 | | Green Bay, Wisconsin, Water System Revenue Bonds, Series 2004, 5.000%, 11/01/29 – AGM Insured | 11/14 at 100.00 | Aa2 | | 567,627 | |
| | | Nuveen Dividend Advantage Municipal Fund (continued) |
| NAD | | Portfolio of Investments |
April 30, 2011 (Unaudited)
| | | | | | | | | |
| | Principal | | | Optional Call | | | | |
| | Amount (000) | | Description (1) | Provisions (2) | Ratings (3) | | Value | |
| | | | Wisconsin (continued) | | | | | |
| $ | 7,410 | | Wisconsin Health and Educational Facilities Authority, Revenue Bonds, Ascension Health, Series 2006A, 5.000%, 11/15/36 | 11/16 at 100.00 | AA+ | $ | 6,972,291 | |
| | 4,330 | | Wisconsin Health and Educational Facilities Authority, Revenue Bonds, Childrens Hospital of Wisconsin Inc., Series 2008B, 5.500%, 8/15/29 | 2/20 at 100.00 | AA– | | 4,347,580 | |
| | 4,380 | | Wisconsin Health and Educational Facilities Authority, Revenue Bonds, Kenosha Hospital and Medical Center Inc., Series 1999, 5.625%, 5/15/29 | 5/11 at 100.00 | A | | 4,357,793 | |
| | 12,700 | | Wisconsin Health and Educational Facilities Authority, Revenue Bonds, Mercy Health System Corporation, Series 1999, 5.500%, 8/15/25 – AMBAC Insured | 8/11 at 100.00 | A2 | | 12,701,016 | |
| | 2,200 | | Wisconsin Health and Educational Facilities Authority, Revenue Bonds, Wheaton Franciscan Services Inc., Series 2003A, 5.125%, 8/15/33 | 8/13 at 100.00 | BBB+ | | 1,866,791 | |
| | 5,000 | | Wisconsin State, General Fund Annual Appropriation Revenue Bonds, Refunding Series 2009A, 6.000%, 5/01/36 | 5/19 at 100.00 | AA– | | 5,382,902 | |
| | 38,270 | | Total Wisconsin | | | | 38,127,788 | |
| $ | 1,128,345 | | Total Municipal Bonds (cost $856,414,911) | | | | 814,511,526 | |
| | | | | | | | | |
| | Shares | | Description (1) | | | | Value | |
| | | | Investment Companies – 0.1% (0.1% of Total Investments) | | | | | |
| | 8,812 | | BlackRock MuniHoldings Fund Inc. | | | $ | 127,862 | |
| | 32,332 | | Invesco Van Kampen Quality Municipal Income Trust | | | | 385,397 | |
| | | | Total Investment Companies (cost $528,388) | | | | 513,259 | |
| | | | Total Investments (cost $856,943,299) – 156.9% | | | | 815,024,785 | |
| | | | Floating Rate Obligations – (9.9)% | | | | (51,605,000) | |
| | | | MuniFund Term Preferred Shares, at Liquidation Value – (27.8)% (7) | | | | (144,300,000) | |
| | | | Other Assets Less Liabilities – 3.9% | | | | 20,542,199 | |
| | | | Auction Rate Preferred Shares, at Liquidation Value – (23.1)% (7) | | | | (120,075,000) | |
| | | | Net Assets Applicable to Common Shares – 100% | | | $ | 519,586,984 | |
| (1) | | All percentages shown in the Portfolio of Investments are based on net assets applicable to Common shares unless otherwise noted. |
| (2) | | Optional Call Provisions: Dates (month and year) and prices of the earliest optional call or redemption. There may be other call provisions at varying prices at later dates. Certain mortgage-backed securities may be subject to periodic principal paydowns. |
| (3) | | Ratings: Using the highest of Standard & Poor’s Group (“Standard & Poor’s”), Moody’s Investor Service, Inc. (“Moody’s”) or Fitch, Inc. (“Fitch”) rating. Ratings below BBB by Standard & Poor’s, Baa by Moody’s or BBB by Fitch are considered to be below investment grade. Holdings designated N/R are not rated by any of these national rating agencies. |
| (4) | | Backed by an escrow or trust containing sufficient U.S. Government or U.S. Government agency securities, which ensure the timely payment of principal and interest. Such investments are normally considered to be equivalent to AAA rated securities. |
| (5) | | At or subsequent to the end of the reporting period, this security is non-income producing. Non-income producing security, in the case of a bond, generally denotes that the issuer has (1) defaulted on the payment of principal or interest, (2) is under the protection of the Federal Bankruptcy Court or (3) the Fund’s Adviser has concluded that the issue is not likely to meet its future interest payment obligations and has directed the Fund’s custodian to cease accruing additional income on the Fund’s records. |
| (6) | | For fair value measurement disclosure purposes, investment categorized as Level 3. See Notes to Financial Statements, Footnote 1 – General Information and Significant Accounting Policies, Investment Valuation for more information. |
| (7) | | MuniFund Term Preferred Shares and Auction Rate Preferred Shares, at Liquidation Value as a percentage of Total Investments are 17.7% and 14.7%, respectively. |
| N/R | | Not rated. |
| (IF) | | Inverse floating rate investment. |
| (UB) | | Underlying bond of an inverse floating rate trust reflected as a financing transaction. See Notes to Financial Statements, Footnote 1 – General Information and Significant Accounting Policies, Inverse Floating Rate Securities for more information. |
See accompanying notes to financial statements.
| | | Nuveen Dividend Advantage Municipal Fund 2 |
| NXZ | | Portfolio of Investments |
| | | April 30, 2011 (Unaudited) |
| | Principal | | | Optional Call | | | | |
| | Amount (000) | | Description (1) | Provisions (2) | Ratings (3) | | Value | |
| | | | Alabama – 5.2% (3.5% of Total Investments) | | | | | |
| $ | 2,030 | | Alabama Special Care Facilities Financing Authority, Revenue Bonds, Ascension Health, Series 2006C-2, 5.000%, 11/15/39 | 11/16 at 100.00 | AA+ | $ | 1,898,456 | |
| | 18,500 | | Huntsville Healthcare Authority, Alabama, Revenue Bonds, Series 2001A, 5.750%, 6/01/31 (Pre-refunded 6/01/11) | 6/11 at 101.00 | A1 (4) | | 18,774,910 | |
| | 20,530 | | Total Alabama | | | | 20,673,366 | |
| | | | Alaska – 0.9% (0.6% of Total Investments) | | | | | |
| | 2,290 | | Anchorage, Alaska, Water Revenue Bonds, Refunding Series 2007, 5.000%, 5/01/37 – NPFG Insured | No Opt. Call | AA | | 2,281,733 | |
| | 2,200 | | Northern Tobacco Securitization Corporation, Alaska, Tobacco Settlement Asset-Backed Bonds, Series 2006A, 5.000%, 6/01/46 | 6/14 at 100.00 | Baa3 | | 1,309,792 | |
| | 4,490 | | Total Alaska | | | | 3,591,525 | |
| | | | Arizona – 1.8% (1.2% of Total Investments) | | | | | |
| | 4,500 | | Phoenix Civic Improvement Corporation, Arizona, Junior Lien Airport Revenue Bonds, Series 2010A, 5.000%, 7/01/40 | No Opt. Call | A+ | | 4,125,825 | |
| | 3,120 | | Phoenix Civic Improvement Corporation, Arizona, Senior Lien Airport Revenue Bonds, Series 2002B, 5.250%, 7/01/32 – FGIC Insured (Alternative Minimum Tax) | 7/12 at 100.00 | AA– | | 3,009,677 | |
| | 7,620 | | Total Arizona | | | | 7,135,502 | |
| | | | Arkansas – 0.2% (0.1% of Total Investments) | | | | | |
| | 655 | | Arkansas Development Finance Authority, Single Family Mortgage Revenue Bonds, GNMA Mortgage-Backed Securities Program, Series 2002C, 5.400%, 1/01/34 (Alternative Minimum Tax) | 1/12 at 100.00 | AAA | | 649,871 | |
| | | | California – 17.8% (11.9% of Total Investments) | | | | | |
| | 9,000 | | California County Tobacco Securitization Agency, Tobacco Settlement Asset-Backed Bonds, Los Angeles County Securitization Corporation, Series 2006A, 5.600%, 6/01/36 | 12/18 at 100.00 | Baa3 | | 6,444,810 | |
| | 6,000 | | California Educational Facilities Authority, Revenue Bonds, Stanford University, Series 2001Q, 5.250%, 12/01/32 | 6/11 at 101.00 | AAA | | 6,076,800 | |
| | 4,080 | | California Health Facilities Financing Authority, Revenue Bonds, Kaiser Permanante System, Series 2006, 5.000%, 4/01/37 – BHAC Insured | 4/16 at 100.00 | AA+ | | 3,922,267 | |
| | 4,250 | | California State, General Obligation Bonds, Various Purpose Series 2010, 5.250%, 11/01/40 | 11/20 at 100.00 | A1 | | 4,116,848 | |
| | 4,000 | | Coast Community College District, Orange County, California, General Obligation Bonds, Series 2005, 0.000%, 8/01/22 – NPFG Insured | No Opt. Call | Aa1 | | 2,148,000 | |
| | 20,000 | | Golden State Tobacco Securitization Corporation, California, Enhanced Tobacco Settlement Asset-Backed Revenue Bonds, Series 2005A, 5.000%, 6/01/45 – FGIC Insured | 6/15 at 100.00 | A2 | | 16,441,600 | |
| | 5,000 | | Golden State Tobacco Securitization Corporation, California, Tobacco Settlement Asset-Backed Bonds, Series 2003A-1, 6.750%, 6/01/39 (Pre-refunded 6/01/13) | 6/13 at 100.00 | AAA | | 5,615,900 | |
| | | | Golden State Tobacco Securitization Corporation, California, Tobacco Settlement Asset-Backed Bonds, Series 2007A-1: | | | | | |
| | 2,050 | | 5.000%, 6/01/33 | 6/17 at 100.00 | Baa3 | | 1,368,478 | |
| | 1,000 | | 5.125%, 6/01/47 | 6/17 at 100.00 | Baa3 | | 610,150 | |
| | 6,000 | | Los Angeles Regional Airports Improvement Corporation, California, Sublease Revenue Bonds, Los Angeles International Airport, American Airlines Inc. Terminal 4 Project, Series 2002C, 7.500%, 12/01/24 (Alternative Minimum Tax) | 12/12 at 102.00 | B– | | 6,007,200 | |
| | 10,885 | | Norwalk La Mirada Unified School District, Los Angeles County, California, General Obligation Bonds, Series 2005, 0.000%, 8/01/25 – FGIC Insured | No Opt. Call | Aa3 | | 4,336,040 | |
| | 5,000 | | Palomar Pomerado Health, California, General Obligation Bonds, Series 2009A, 0.000%, 8/01/38 – AGC Insured | 8/29 at 100.00 | AA+ | | 3,079,500 | |
| | 2,000 | | Rancho Mirage Joint Powers Financing Authority, California, Revenue Bonds, Eisenhower Medical Center, Series 2007A, 5.000%, 7/01/47 | 7/17 at 100.00 | Baa1 | | 1,531,740 | |
| | 3,200 | | Redlands Unified School District, San Bernardino County, California, General Obligation Bonds, Series 2003, 0.000%, 7/01/27 – AGM Insured | No Opt. Call | AA+ | | 1,121,408 | |
| | 3,000 | | San Joaquin Delta Community College District, California, General Obligation Bonds, Election 2004 Series 2008B, 0.000%, 8/01/29 – AGM Insured | 8/18 at 53.32 | AA+ | | 881,910 | |
| | | Nuveen Dividend Advantage Municipal Fund 2 (continued) |
| NXZ | | Portfolio of Investments |
| | | April 30, 2011 (Unaudited) |
| | Principal | | | Optional Call | | | | |
| | Amount (000) | | Description (1) | Provisions (2) | Ratings (3) | | Value | |
| | | | California (continued) | | | | | |
| $ | 12,500 | | San Joaquin Hills Transportation Corridor Agency, Orange County, California, Toll Road Revenue Refunding Bonds, Series 1997A, 0.000%, 1/15/32 – NPFG Insured | No Opt. Call | Baa1 | $ | 1,726,625 | |
| | 5,000 | | San Jose, California, Airport Revenue Bonds, Series 2007A, 6.000%, 3/01/47 – AMBAC Insured (Alternative Minimum Tax) | 3/17 at 100.00 | A | | 5,045,750 | |
| | 40 | | Yuba County Water Agency, California, Yuba River Development Revenue Bonds, Pacific Gas and Electric Company, Series 1966A, 4.000%, 3/01/16 | 9/11 at 100.00 | Baa1 | | 39,256 | |
| | 103,005 | | Total California | | | | 70,514,282 | |
| | | | Colorado – 11.0% (7.3% of Total Investments) | | | | | |
| | 2,245 | | Colorado Educational and Cultural Facilities Authority, Charter School Revenue Bonds, Peak-to-Peak Charter School, Series 2001, 7.500%, 8/15/21 (Pre-refunded 8/15/11) | 8/11 at 100.00 | AAA | | 2,289,967 | |
| | 2,000 | | Colorado Health Facilities Authority, Colorado, Revenue Bonds, Valley View Hospital Association, Series 2007, 5.250%, 5/15/42 | 5/17 at 100.00 | BBB | | 1,640,840 | |
| | | | Denver City and County, Colorado, Airport Revenue Bonds, Series 2006A: | | | | | |
| | 5,365 | | 5.000%, 11/15/23 – FGIC Insured (UB) | 11/16 at 100.00 | A+ | | 5,594,354 | |
| | 3,300 | | 5.000%, 11/15/24 – FGIC Insured | 11/16 at 100.00 | A+ | | 3,417,579 | |
| | 4,335 | | 5.000%, 11/15/25 – FGIC Insured (UB) | 11/16 at 100.00 | A+ | | 4,459,501 | |
| | 10,000 | | E-470 Public Highway Authority, Colorado, Senior Revenue Bonds, Capital Appreciation Series 2010A, 0.000%, 9/01/41 | No Opt. Call | Baa2 | | 975,600 | |
| | 8,000 | | E-470 Public Highway Authority, Colorado, Toll Revenue Bonds, Series 2004B, 0.000%, 9/01/28 – NPFG Insured | 9/20 at 63.99 | Baa1 | | 2,091,120 | |
| | 1,280 | | Eagle County Air Terminal Corporation, Colorado, Airport Terminal Revenue Bonds, Series 2001, 7.125%, 5/01/31 (Alternative Minimum Tax) | 11/11 at 101.00 | N/R | | 1,200,051 | |
| | 755 | | Jefferson County School District R1, Colorado, General Obligation Bonds, Series 2004, 5.000%, 12/15/22 (Pre-refunded 12/15/14) – AGM Insured (UB) | 12/14 at 100.00 | AA+ (4) | | 862,119 | |
| | 5,000 | | Northwest Parkway Public Highway Authority, Colorado, Revenue Bonds, Senior Series 2001A, 5.250%, 6/15/41 (Pre-refunded 6/15/11) – AGM Insured | 6/11 at 102.00 | AA+ (4) | | 5,131,450 | |
| | | | Northwest Parkway Public Highway Authority, Colorado, Senior Lien Revenue Bonds, Series 2001B: | | | | | |
| | 22,000 | | 0.000%, 6/15/28 (Pre-refunded 6/15/11) – AGM Insured | 6/11 at 35.65 | AA+ (4) | | 7,835,740 | |
| | 17,650 | | 0.000%, 6/15/29 (Pre-refunded 6/15/11) – AMBAC Insured | 6/11 at 33.46 | N/R (4) | | 5,898,983 | |
| | 1,000 | | Plaza Metropolitan District 1, Lakewood, Colorado, Tax Increment Revenue Bonds, Series 2003, 8.000%, 12/01/25 | 6/14 at 101.00 | N/R | | 984,880 | |
| | 960 | | Regional Transportation District, Colorado, Certificates of Participation, Series 2010A, 5.375%, 6/01/31 | 6/20 at 100.00 | Aa3 | | 976,522 | |
| | 83,890 | | Total Colorado | | | | 43,358,706 | |
| | | | District of Columbia – 2.3% (1.6% of Total Investments) | | | | | |
| | 835 | | District of Columbia Tobacco Settlement Corporation, Tobacco Settlement Asset-Backed Bonds, Series 2001, 6.250%, 5/15/24 | 5/11 at 101.00 | BBB | | 800,523 | |
| | 4,250 | | District of Columbia, Revenue Bonds, National Public Radio, Series 2010A, 5.000%, 4/01/43 | 4/15 at 100.00 | AA– | | 4,054,543 | |
| | 5,000 | | Washington Convention Center Authority, District of Columbia, Dedicated Tax Revenue Bonds, Senior Lien Refunding Series 2007A, 4.500%, 10/01/30 – AMBAC Insured | 10/16 at 100.00 | A1 | | 4,430,550 | |
| | 10,085 | | Total District of Columbia | | | | 9,285,616 | |
| | | | Florida – 5.2% (3.5% of Total Investments) | | | | | |
| | 15,000 | | Jacksonville, Florida, Transportation Revenue Bonds, Series 2001, 5.250%, 10/01/29 – NPFG Insured | 10/11 at 100.00 | Aa2 | | 15,033,000 | |
| | 3,000 | | Miami-Dade County, Florida, Aviation Revenue Bonds, Miami International Airport, Series 2002, 5.375%, 10/01/32 – FGIC Insured (Alternative Minimum Tax) | 10/12 at 100.00 | A2 | | 2,773,710 | |
| | | | Port Saint Lucie, Florida, Special Assessment Revenue Bonds, Southwest Annexation District 1B, Series 2007: | | | | | |
| | 2,000 | | 5.000%, 7/01/33 – NPFG Insured | 7/17 at 100.00 | Baa1 | | 1,650,040 | |
| | 1,500 | | 5.000%, 7/01/40 – NPFG Insured | 7/17 at 100.00 | Baa1 | | 1,199,055 | |
| | 21,500 | | Total Florida | | | | 20,655,805 | |
| | Principal | | | Optional Call | | | | |
| | Amount (000) | | Description (1) | Provisions (2) | Ratings (3) | | Value | |
| | | | Georgia – 2.1% (1.4% of Total Investments) | | | | | |
| $ | 2,000 | | DeKalb County Hospital Authority, Georgia, Anticipation Certificates Revenue Bonds, DeKalb Medical Center, Inc. Project, Series 2010, 6.000%, 9/01/30 | 9/20 at 100.00 | N/R | $ | 1,875,980 | |
| | 2,000 | | Franklin County Industrial Building Authority, Georgia, Revenue Bonds, Ty Cobb Regional Medical Center Project, Series 2010, 8.125%, 12/01/45 | 12/20 at 100.00 | N/R | | 1,956,340 | |
| | 5,000 | | Gainesville and Hall County Hospital Authority, Georgia, Revenue Anticipation Certificates, Northeast Georgia Health Services Inc., Series 2010B, 5.125%, 2/15/40 | No Opt. Call | A+ | | 4,588,550 | |
| | 9,000 | | Total Georgia | | | | 8,420,870 | |
| | | | Hawaii – 2.5% (1.7% of Total Investments) | | | | | |
| | | | Honolulu Board of Water Supply, Hawaii, Water System Revenue Bonds, Series 2001: | | | | | |
| | 3,000 | | 5.250%, 7/01/26 (Pre-refunded 7/01/11) – AGM Insured | 7/11 at 100.00 | AA+ (4) | | 3,025,890 | |
| | 6,725 | | 5.250%, 7/01/31 (Pre-refunded 7/01/11) – AGM Insured | 7/11 at 100.00 | AA+ (4) | | 6,783,037 | |
| | 9,725 | | Total Hawaii | | | | 9,808,927 | |
| | | | Illinois – 14.5% (9.7% of Total Investments) | | | | | |
| | 3,485 | | Chicago, Illinois, FHA/GNMA Collateralized Multifamily Housing Revenue Bonds, Stone Terrace Apartments, Series 2001A, 5.750%, 12/20/42 (Alternative Minimum Tax) | 12/11 at 100.00 | AAA | | 3,493,852 | |
| | 555 | | Chicago, Illinois, FNMA/GNMA Collateralized Single Family Mortgage Revenue Bonds, Series 2001A, 6.250%, 10/01/32 (Alternative Minimum Tax) | 10/11 at 105.00 | AAA | | 573,609 | |
| | 5,000 | | Chicago, Illinois, General Obligation Bonds, City Colleges, Series 1999, 0.000%, 1/01/34 – | No Opt. Call | Aa3 | | 1,081,150 | |
| | | | FGIC Insured | | | | | |
| | 3,985 | | Chicago, Illinois, General Obligation Bonds, Series 2001A, 5.250%, 1/01/33 – NPFG Insured | 1/12 at 100.00 | Aa3 | | 3,732,550 | |
| | 7,100 | | Cook County, Illinois, General Obligation Bonds, Refunding Series 2010A, 5.250%, 11/15/33 | 11/20 at 100.00 | AA | | 7,120,945 | |
| | 3,180 | | Illinois Development Finance Authority, Revenue Bonds, Chicago Charter School Foundation, Series 2002A, 6.250%, 12/01/32 (Pre-refunded 12/01/12) | 12/12 at 100.00 | N/R (4) | | 3,453,480 | |
| | 910 | | Illinois Development Finance Authority, Revenue Bonds, Illinois Wesleyan University, Series 2001, 5.500%, 9/01/32 – AMBAC Insured | 9/11 at 100.00 | BBB+ | | 841,159 | |
| | 4,090 | | Illinois Development Finance Authority, Revenue Bonds, Illinois Wesleyan University, Series 2001, 5.500%, 9/01/32 (Pre-refunded 9/01/11) – AMBAC Insured | 9/11 at 100.00 | BBB+ (4) | | 4,157,935 | |
| | 3,100 | | Illinois Development Finance Authority, Revenue Bonds, Midwestern University, Series 2001B, 6.000%, 5/15/31 (Pre-refunded 5/15/11) | 5/11 at 101.00 | AAA | | 3,138,440 | |
| | 9,630 | | Illinois Finance Authority, Revenue Bonds, Palos Community Hospital, Series 2007A, 5.000%, 5/15/32 – NPFG Insured | 5/17 at 100.00 | Baa1 | | 8,435,206 | |
| | 2,500 | | Illinois Finance Authority, Revenue Bonds, Silver Cross Hospital and Medical Centers, Series 2009, 6.875%, 8/15/38 | 8/19 at 100.00 | BBB | | 2,488,975 | |
| | 6,965 | | Illinois Finance Authority, Student Housing Revenue Bonds, Educational Advancement Fund Inc., Refunding Series 2007A, 5.250%, 5/01/34 | 5/17 at 100.00 | Baa3 | | 5,669,789 | |
| | 2,275 | | Illinois Housing Development Authority, Homeowner Mortgage Revenue Bonds, Series 2006C2, 5.050%, 8/01/27 (Alternative Minimum Tax) | 2/16 at 100.00 | AA | | 2,240,124 | |
| | 1,535 | | Illinois, Sales Tax Revenue Bonds, Series 2001, 5.500%, 6/15/16 | No Opt. Call | AAA | | 1,540,280 | |
| | 740 | | Illinois, Sales Tax Revenue Bonds, Series 2001, 5.500%, 6/15/16 (Pre-refunded 6/15/11) | 6/11 at 100.00 | A1 (4) | | 744,921 | |
| | 2,500 | | Kane & DeKalb Counties, Illinois, Community United School District 301, General Obligation Bonds, Series 2006, 0.000%, 12/01/23 – NPFG Insured | No Opt. Call | A1 | | 1,249,625 | |
| | | | Metropolitan Pier and Exposition Authority, Illinois, Revenue Bonds, McCormick Place Expansion Project, Series 2002A: | | | | | |
| | 7,500 | | 0.000%, 12/15/30 – NPFG Insured | No Opt. Call | AAA | | 2,211,375 | |
| | 10,000 | | 0.000%, 12/15/36 – NPFG Insured | No Opt. Call | AAA | | 1,824,400 | |
| | 1,701 | | Montgomery, Illinois, Lakewood Creek Project Special Assessment Bonds, Series 2007, 4.700%, 3/01/30 – RAAI Insured | 3/16 at 100.00 | N/R | | 1,366,873 | |
| | 3,360 | | Northfield Township High School District 225, Cook County, Illinois, Glenbrook, General Obligation School Bonds, Series 2007B, 0.000%, 12/01/24 | 12/16 at 69.01 | AAA | | 1,728,418 | |
| | 80,111 | | Total Illinois | | | | 57,093,106 | |
| | | Nuveen Dividend Advantage Municipal Fund 2 (continued) |
| NXZ | | Portfolio of Investments |
April 30, 2011 (Unaudited)
| | Principal | | | Optional Call | | | | |
| | Amount (000) | | Description (1) | Provisions (2) | Ratings (3) | | Value | |
| | | | Indiana – 4.0% (2.6% of Total Investments) | | | | | |
| $ | 2,295 | | Indiana Health Facility Financing Authority, Hospital Revenue Bonds, Methodist Hospitals Inc., Series 2001, 5.500%, 9/15/31 | 9/11 at 100.00 | BBB | $ | 1,872,697 | |
| | 1,900 | | Indiana Health Facility Financing Authority, Hospital Revenue Refunding Bonds, Columbus Regional Hospital, Series 1993, 7.000%, 8/15/15 – AGM Insured | No Opt. Call | AA+ | | 2,112,743 | |
| | 1,000 | | Indiana Health Facility Financing Authority, Revenue Bonds, Community Foundation of Northwest Indiana, Series 2007, 5.500%, 3/01/37 | 3/17 at 100.00 | BBB+ | | 902,010 | |
| | 5,180 | | Indiana Municipal Power Agency, Power Supply Revenue Bonds, Series 2007A, 5.000%, 1/01/42 – NPFG Insured | 1/17 at 100.00 | A+ | | 4,819,576 | |
| | 4,000 | | Indiana Transportation Finance Authority, Highway Revenue Bonds, Series 2003A, 5.000%, 6/01/23 (Pre-refunded 6/01/13) – AGM Insured | 6/13 at 100.00 | AA+ (4) | | 4,365,840 | |
| | 6,100 | | St. Joseph County Hospital Authority, Indiana, Revenue Bonds, Madison Center Inc., Series 1999, 5.800%, 2/15/24 (5) | 8/11 at 100.00 | N/R | | 1,584,780 | |
| | 20,475 | | Total Indiana | | | | 15,657,646 | |
| | | | Iowa – 1.5% (1.0% of Total Investments) | | | | | |
| | 1,000 | | Iowa Higher Education Loan Authority, Private College Facility Revenue Bonds, Wartburg College, Series 2002, 5.500%, 10/01/28 (Pre-refunded 10/01/12) – ACA Insured | 10/12 at 100.00 | N/R (4) | | 1,070,250 | |
| | 6,340 | | Iowa Tobacco Settlement Authority, Tobacco Asset-Backed Revenue Bonds, Series 2005B, 5.600%, 6/01/34 | 6/17 at 100.00 | BBB | | 5,061,856 | |
| | 7,340 | | Total Iowa | | | | 6,132,106 | |
| | | | Kansas – 4.3% (2.9% of Total Investments) | | | | | |
| | 17,000 | | Wichita, Kansas, Hospital Facilities Revenue Refunding and Improvement Bonds, Via Christi Health System Inc., Series 2001-III, 5.625%, 11/15/31 | 11/11 at 101.00 | A+ | | 16,989,120 | |
| | | | Kentucky – 0.3% (0.2% of Total Investments) | | | | | |
| | 1,000 | | Kentucky Economic Development Finance Authority, Louisville Arena Project Revenue Bonds, Louisville Arena Authority, Inc., Series 2008-A1, 6.000%, 12/01/38 – AGC Insured | 6/18 at 100.00 | AA+ | | 1,013,460 | |
| | | | Louisiana – 5.3% (3.5% of Total Investments) | | | | | |
| | 3,960 | | Louisiana State, Gasoline and Fuels Tax Revenue Bonds, Series 2006A, 4.500%, 5/01/41 – FGIC Insured (UB) | 5/16 at 100.00 | Aa1 | | 3,622,410 | |
| | 18,825 | | Tobacco Settlement Financing Corporation, Louisiana, Tobacco Settlement Asset-Backed Bonds, Series 2001B, 5.875%, 5/15/39 | 5/11 at 101.00 | A– | | 17,180,260 | |
| | 22,785 | | Total Louisiana | | | | 20,802,670 | |
| | | | Maryland – 0.2% (0.1% of Total Investments) | | | | | |
| | 1,000 | | Westminster, Maryland, Educational Facilities Revenue Bonds, McDaniel College, Series 2006, 4.500%, 11/01/36 | 11/16 at 100.00 | BBB+ | | 773,010 | |
| | | | Massachusetts – 0.4% (0.2% of Total Investments) | | | | | |
| | 1,500 | | Massachusetts Health and Education Facilities Authority, Revenue Bonds, Partners HealthCare System, Series 2010J, 5.000%, 7/01/39 | 7/19 at 100.00 | AA | | 1,411,470 | |
| | | | Michigan – 7.4% (5.0% of Total Investments) | | | | | |
| | 5,865 | | Detroit, Michigan, Senior Lien Sewerage Disposal System Revenue Bonds, Series 2003A, 5.000%, 7/01/32 – AGM Insured | 7/13 at 100.00 | AA+ | | 5,383,659 | |
| | 20,000 | | Detroit, Michigan, Senior Lien Water Supply System Revenue Bonds, Series 2001A, 5.500%, 7/01/33 (Pre-refunded 7/01/11) – FGIC Insured | 7/11 at 101.00 | A (4) | | 20,381,000 | |
| | 4,000 | | Michigan Municipal Bond Authority, Public School Academy Revenue Bonds, Detroit Academy of Arts and Sciences Charter School, Series 2001A, 8.000%, 10/01/31 | 10/11 at 100.00 | B1 | | 3,615,000 | |
| | 29,865 | | Total Michigan | | | | 29,379,659 | |
| | | | Minnesota – 1.3% (0.9% of Total Investments) | | | | | |
| | 5,000 | | Minneapolis, Minnesota, Health Care System Revenue Bonds,S Fairview Health Services, Series 2008B, 6.500%, 11/15/38 – AGC Insured | 11/18 at 100.00 | AA+ | | 5,335,400 | |
| | | | Montana – 0.4% (0.3% of Total Investments) | | | | | |
| | 1,665 | | Montana Board of Housing, Single Family Program Bonds, Series 2001A-2, 5.700%, 6/01/32 (Alternative Minimum Tax) | 6/11 at 100.00 | AA+ | | 1,665,233 | |
| | Principal | | | Optional Call | | | | |
| | Amount (000) | | Description (1) | Provisions (2) | Ratings (3) | | Value | |
| | | | Nevada – 1.8% (1.2% of Total Investments) | | | | | |
| $ | 12,275 | | Director of Nevada State Department of Business and Industry, Revenue Bonds, Las Vegas Monorail Project, First Tier, Series 2000, 5.375%, 1/01/40 – AMBAC Insured (5) | 7/11 at 100.00 | N/R | $ | 3,078,325 | |
| | 3,500 | | Director of Nevada State Department of Business and Industry, Revenue Bonds, Las Vegas Monorail Project, Second Tier, Series 2000, 7.375%, 1/01/40 (5) | 1/12 at 100.00 | N/R | | 6,125 | |
| | 2,000 | | Henderson, Nevada, Healthcare Facility Revenue Refunding Bonds, Catholic Healthcare West, Series 2007B, Trust 2633, 18.765%, 7/01/31 – BHAC Insured (IF) | 7/17 at 100.00 | AA+ | | 2,085,440 | |
| | 1,750 | | Reno, Nevada, Health Facilities Revenue Bonds, Catholic Healthcare West, Series 2007A, Trust 2634, 18.488%, 7/01/31 – BHAC Insured (IF) | 7/17 at 100.00 | AA+ | | 1,745,170 | |
| | 19,525 | | Total Nevada | | | | 6,915,060 | |
| | | | New Hampshire – 2.3% (1.5% of Total Investments) | | | | | |
| | 8,000 | | New Hampshire Business Finance Authority, Pollution Control Remarketed Revenue Refunding Bonds, Connecticut Light and Power Company, Series 1992A, 5.850%, 12/01/22 | 10/11 at 100.50 | BBB+ | | 8,071,120 | |
| | 1,025 | | New Hampshire Housing Finance Authority, Single Family Mortgage Acquisition Bonds, Series 2001A, 5.700%, 1/01/31 (Alternative Minimum Tax) | 5/11 at 100.00 | Aa2 | | 1,025,133 | |
| | 9,025 | | Total New Hampshire | | | | 9,096,253 | |
| | | | New Jersey – 2.7% (1.8% of Total Investments) | | | | | |
| | 3,995 | | New Jersey Economic Development Authority, Special Facilities Revenue Bonds, Continental Airlines Inc., Series 2000, 7.000%, 11/15/30 (Alternative Minimum Tax) | 5/11 at 101.00 | B | | 3,913,742 | |
| | 310 | | Tobacco Settlement Financing Corporation, New Jersey, Tobacco Settlement Asset-Backed Bonds, Series 2002, 5.750%, 6/01/32 (Pre-refunded 6/01/12) | 6/12 at 100.00 | AAA | | 322,868 | |
| | | | Tobacco Settlement Financing Corporation, New Jersey, Tobacco Settlement Asset-Backed Bonds, Series 2003: | | | | | |
| | 2,200 | | 6.375%, 6/01/32 (Pre-refunded 6/01/13) | 6/13 at 100.00 | AAA | | 2,418,174 | |
| | 425 | | 6.750%, 6/01/39 (Pre-refunded 6/01/13) | 6/13 at 100.00 | AAA | | 478,206 | |
| | 3,085 | | 6.250%, 6/01/43 (Pre-refunded 6/01/13) | 6/13 at 100.00 | AAA | | 3,439,281 | |
| | 10,015 | | Total New Jersey | | | | 10,572,271 | |
| | | | New Mexico – 5.9% (3.9% of Total Investments) | | | | | |
| | | | New Mexico Hospital Equipment Loan Council, Hospital Revenue Bonds, Presbyterian Healthcare Services, Series 2001A: | | | | | |
| | 12,000 | | 5.500%, 8/01/25 (Pre-refunded 8/01/11) | 8/11 at 101.00 | AA– (4) | | 12,281,160 | |
| | 10,800 | | 5.500%, 8/01/30 (Pre-refunded 8/01/11) | 8/11 at 101.00 | AA– (4) | | 11,053,044 | |
| | 22,800 | | Total New Mexico | | | | 23,334,204 | |
| | | | New York – 8.0% (5.4% of Total Investments) | | | | | |
| | 12,020 | | Brooklyn Areba Local Development Corporation, New York, Payment in Lieu of Taxes Revenue Bonds, Barclays Center Project, Series 2009, 0.000%, 7/15/46 | No Opt. Call | BBB– | | 980,832 | |
| | 12,800 | | Metropolitan Transportation Authority, New York, Transportation Revenue Bonds, Series 2006B, 4.500%, 11/15/32 – AGM Insured (UB) | 11/16 at 100.00 | AA+ | | 11,945,472 | |
| | 5,000 | | New York City Industrial Development Agency, New York, Special Facilities Revenue Bonds, JFK Airport – American Airlines Inc., Series 2002B, 8.500%, 8/01/28 (Alternative Minimum Tax) | 8/12 at 101.00 | B– | | 5,109,200 | |
| | 12,000 | | New York City Municipal Water Finance Authority, New York, Water and Sewerage System Revenue Bonds, Fiscal Series 2001C, 5.125%, 6/15/33 (UB) | 7/11 at 101.00 | AAA | | 12,051,480 | |
| | 1,670 | | Port Authority of New York and New Jersey, Special Project Bonds, JFK International Air Terminal LLC Project, Eigth Series 2010, 6.000%, 12/01/36 | 12/20 at 100.00 | BBB– | | 1,622,104 | |
| | 43,490 | | Total New York | | | | 31,709,088 | |
| | | | North Carolina – 0.7% (0.4% of Total Investments) | | | | | |
| | 2,950 | | North Carolina Capital Facilities Financing Agency, Revenue Bonds, Johnson and Wales University, Series 2003A, 5.000%, 4/01/33 – SYNCORA GTY Insured | 4/13 at 100.00 | N/R | | 2,664,234 | |
| | | | North Dakota – 0.3% (0.2% of Total Investments) | | | | | |
| | 1,025 | | North Dakota Housing Finance Agency, Home Mortgage Finance Program Refunding Bonds, Series 2001A, 5.550%, 1/01/32 (Alternative Minimum Tax) | 7/11 at 100.00 | Aa1 | | 1,027,768 | |
| | | Nuveen Dividend Advantage Municipal Fund 2 (continued) |
| NXZ | | Portfolio of Investments |
April 30, 2011 (Unaudited)
| | Principal | | | Optional Call | | | | |
| | Amount (000) | | Description (1) | Provisions (2) | Ratings (3) | | Value | |
| | | | Ohio – 1.9% (1.3% of Total Investments) | | | | | |
| | | | Buckeye Tobacco Settlement Financing Authority, Ohio, Tobacco Settlement Asset-Backed Revenue Bonds, Senior Lien, Series 2007A-2: | | | | | |
| $ | 10,000 | | 5.750%, 6/01/34 | 6/17 at 100.00 | Baa3 | $ | 6,890,000 | |
| | 1,000 | | 5.875%, 6/01/47 | 6/17 at 100.00 | Baa3 | | 674,690 | |
| | 11,000 | | Total Ohio | | | | 7,564,690 | |
| | | | Oklahoma – 0.9% (0.6% of Total Investments) | | | | | |
| | 3,500 | | Grand River Dam Authority, Oklahoma, Revenue Bonds, Series 2010A, 5.250%, 6/01/40 | 6/20 at 100.00 | A | | 3,527,510 | |
| | | | Oregon – 1.3% (0.8% of Total Investments) | | | | | |
| | 5,000 | | Oregon Department of Administrative Services, Certificates of Participation, Series 2001D, 5.000%, 5/01/26 – AMBAC Insured | 11/11 at 101.00 | AA | | 5,036,750 | |
| | | | Puerto Rico – 3.2% (2.2% of Total Investments) | | | | | |
| | 2,500 | | Puerto Rico Sales Tax Financing Corporation, Sales Tax Revenue Bonds, First Subordinate Series 2009A, 6.000%, 8/01/42 | 8/19 at 100.00 | A+ | | 2,504,550 | |
| | 9,310 | | Puerto Rico Sales Tax Financing Corporation, Sales Tax Revenue Bonds, First Subordinate Series 2010C, 5.250%, 8/01/41 | 8/20 at 100.00 | A+ | | 8,411,678 | |
| | | | Puerto Rico Sales Tax Financing Corporation, Sales Tax Revenue Bonds, Series 2007A: | | | | | |
| | 30,000 | | 0.000%, 8/01/54 – AMBAC Insured | No Opt. Call | Aa2 | | 1,562,100 | |
| | 6,150 | | 0.000%, 8/01/56 | No Opt. Call | Aa2 | | 279,825 | |
| | 47,960 | | Total Puerto Rico | | | | 12,758,153 | |
| | | | South Carolina – 1.7% (1.2% of Total Investments) | | | | | |
| | 21,570 | | Piedmont Municipal Power Agency, South Carolina, Electric Revenue Bonds, Series 2004A-2, 0.000%, 1/01/30 – AMBAC Insured | No Opt. Call | A– | | 6,935,402 | |
| | | | Texas – 25.0% (16.7% of Total Investments) | | | | | |
| | 10,000 | | Central Texas Regional Mobility Authority, Travis and Williamson Counties, Toll Road Revenue Bonds, Series 2005, 5.000%, 1/01/45 – FGIC Insured | 1/15 at 100.00 | BBB | | 7,792,000 | |
| | | | Dallas-Fort Worth International Airport Public Facility Corporation, Texas, Airport Hotel Revenue Bonds, Series 2001: | | | | | |
| | 15,000 | | 5.250%, 1/15/26 – AGM Insured | 7/11 at 100.00 | AA+ | | 15,007,950 | |
| | 1,750 | | 5.200%, 1/15/31 – AGM Insured | 7/11 at 100.00 | AA+ | | 1,750,158 | |
| | 6,000 | | Decatur Hospital Authority, Texas, Revenue Bonds, Wise Regional Health System, Series 2004A, 7.125%, 9/01/34 | 9/14 at 100.00 | N/R | | 5,673,060 | |
| | 10,000 | | Gulf Coast Industrial Development Authority, Texas, Solid Waste Disposal Revenue Bonds, Citgo Petroleum Corporation Project, Series 1998, 8.000%, 4/01/28 (Alternative Minimum Tax) | 4/12 at 100.00 | Ba2 | | 10,063,700 | |
| | 1,715 | | Harris County-Houston Sports Authority, Texas, Junior Lien Revenue Bonds, Series 2001H, 0.000%, 11/15/37 – NPFG Insured | 11/31 at 69.08 | Baa1 | | 167,847 | |
| | 31,170 | | Harris County-Houston Sports Authority, Texas, Junior Lien Revenue Refunding Bonds, Series 2001B, 5.250%, 11/15/40 – NPFG Insured | 11/11 at 100.00 | Baa1 | | 22,594,510 | |
| | 4,465 | | Harris County-Houston Sports Authority, Texas, Revenue Bonds, Third Lien Series 2004-A3, 0.000%, 11/15/35 – NPFG Insured | 11/24 at 52.47 | Baa1 | | 520,619 | |
| | 40,000 | | Harris County-Houston Sports Authority, Texas, Senior Lien Revenue Refunding Bonds, Series 2001A, 0.000%, 11/15/40 – NPFG Insured | 11/30 at 54.04 | Baa1 | | 3,185,600 | |
| | | | Hays Consolidated Independent School District, Hays County, Texas, General Obligation School Building Bonds, Series 2001: | | | | | |
| | 10,715 | | 0.000%, 8/15/25 (Pre-refunded 8/15/11) | 8/11 at 43.18 | AAA | | 4,620,094 | |
| | 12,940 | | 0.000%, 8/15/26 (Pre-refunded 8/15/11) | 8/11 at 40.60 | AAA | | 5,247,041 | |
| | | | Houston, Texas, Hotel Occupancy Tax and Special Revenue Bonds, Convention and Entertainment Project, Series 2001B: | | | | | |
| | 5,000 | | 0.000%, 9/01/30 – AMBAC Insured | No Opt. Call | A2 | | 1,339,050 | |
| | 5,540 | | 0.000%, 9/01/31 – AMBAC Insured | No Opt. Call | A2 | | 1,375,083 | |
| | 10,000 | | North Texas Tollway Authority, First Tier System Revenue Refunding Bonds, Series 2008D, 0.000%, 1/01/28 – AGC Insured | No Opt. Call | AA+ | | 3,584,100 | |
| | 3,295 | | Tarrant County Cultural & Educational Facilities Financing Corporation, Texas, Revenue Bonds, Series 2007, Residuals 1760-3, 16.974%, 2/15/36 (IF) | 2/17 at 100.00 | AA– | | 2,158,489 | |
| | 2,890 | | Tarrant County Cultural Education Facilities Finance Corporation, Texas, Hospital Revenue Bonds, Scott & White HealthCare Project, Series 2010, 5.500%, 8/15/45 | 8/20 at 100.00 | A1 | | 2,753,043 | |
| | Principal | | | Optional Call | | | | |
| | Amount (000) | | Description (1) | Provisions (2) | Ratings (3) | | Value | |
| | | | Texas (continued) | | | | | |
| $ | 1,000 | | Texas Turnpike Authority, Central Texas Turnpike System Revenue Bonds, First Tier Series 2002A, 0.000%, 8/15/28 – AMBAC Insured | 8/12 at 39.43 | BBB+ | $ | 305,270 | |
| | 10,500 | | Texas, General Obligation Bonds, Water Financial Assistance Program, Series 2001, 5.250%, 8/01/35 | 8/11 at 100.00 | Aaa | | 10,571,820 | |
| | 181,980 | | Total Texas | | | | 98,709,434 | |
| | | | Virginia – 0.4% (0.3% of Total Investments) | | | | | |
| | 1,500 | | Virginia Housing Development Authority, Commonwealth Mortgage Bonds, Series 2001H-1, 5.375%, 7/01/36 – NPFG Insured | 7/11 at 100.00 | AAA | | 1,500,734 | |
| | | | Washington – 2.7% (1.8% of Total Investments) | | | | | |
| | 2,500 | | Washington State Health Care Facilities Authority, Revenue Bonds, Kadlec Regional Medical Center, Series 2010, 5.500%, 12/01/39 | 12/20 at 100.00 | Baa2 | | 2,103,500 | |
| | 7,500 | | Washington State Health Care Facilities Authority, Revenue Bonds, Sisters of Providence Health System, Series 2001A, 5.250%, 10/01/21 – NPFG Insured | 10/11 at 100.00 | AA | | 7,608,225 | |
| | 855 | | Washington State Tobacco Settlement Authority, Tobacco Settlement Asset-Backed Revenue Bonds, Series 2002, 6.500%, 6/01/26 | 6/13 at 100.00 | BBB | | 862,001 | |
| | 10,855 | | Total Washington | | | | 10,573,726 | |
| | | | West Virginia – 2.0% (1.3% of Total Investments) | | | | | |
| | 5,000 | | Mason County, West Virginia, Pollution Control Revenue Bonds, Appalachian Power Company, Series 2003L, 5.500%, 10/01/22 (Mandatory put 10/01/11) | 10/11 at 100.00 | BBB | | 5,020,000 | |
| | 2,950 | | West Virginia Economic Development Authority, Solid Waste Disposal Facilities Revenue Bonds, Appalachian Power Company Project, Series 2010, 5.375%, 12/01/38 | 12/20 at 100.00 | BBB | | 2,801,614 | |
| | 7,950 | | Total West Virginia | | | | 7,821,614 | |
| | | | Wisconsin – 0.3% (0.2% of Total Investments) | | | | | |
| | 1,000 | | Wisconsin Health and Educational Facilities Authority, Revenue Bonds, Divine Savior Healthcare, Series 2002A, 7.375%, 5/01/26 (Pre-refunded 5/01/12) | 5/12 at 100.00 | N/R (4) | | 1,068,329 | |
| $ | 859,386 | | Total Investments (cost $618,711,664) – 149.7% | | | | 591,162,570 | |
| | | | Floating Rate Obligations – (6.8)% | | | | (26,660,000 | ) |
| | | | Variable Rate Demand Preferred Shares, at Liquidation Value – (49.6)% (6) | | | | (196,000,000 | ) |
| | | | Other Assets Less Liabilities – 6.7% | | | | 26,451,056 | |
| | | | Net Assets Applicable to Common Shares – 100% | | | $ | 394,953,626 | |
| (1) | | All percentages shown in the Portfolio of Investments are based on net assets applicable to Common shares unless otherwise noted. |
| (2) | | Optional Call Provisions: Dates (month and year) and prices of the earliest optional call or redemption. There may be other call provisions at varying prices at later dates. Certain mortgage-backed securities may be subject to periodic principal paydowns. |
| (3) | | Ratings: Using the highest of Standard & Poor’s Group (“Standard & Poor’s”), Moody’s Investor Service, Inc. (“Moody’s”) or Fitch, Inc. (“Fitch”) rating. Ratings below BBB by Standard & Poor’s, Baa by Moody’s or BBB by Fitch are considered to be below investment grade. Holdings designated N/R are not rated by any of these national rating agencies. |
| (4) | | Backed by an escrow or trust containing sufficient U.S. Government or U.S. Government agency securities, which ensure the timely payment of principal and interest. Such investments are normally considered to be equivalent to AAA rated securities. |
| (5) | | At or subsequent to the end of the reporting period, this security is non-income producing. Non-income producing security, in the case of a bond, generally denotes that the issuer has (1) defaulted on the payment of principal or interest, (2) is under the protection of the Federal Bankruptcy Court or (3) the Fund’s Adviser has concluded that the issue is not likely to meet its future interest payment obligations and has directed the Fund’s custodian to cease accruing additional income on the Fund’s records. |
| (6) | | Variable Rate Demand Preferred Shares, at Liquidation Value as a percentage of Total Investments are 33.2%. |
| N/R | | Not rated. |
| (IF) | | Inverse floating rate investment. |
| (UB) | | Underlying bond of an inverse floating rate trust reflected as a financing transaction. See Notes to Financial Statements, Footnote 1 – General Information and Significant Accounting Policies, Inverse Floating Rate Securities for more information. |
See accompanying notes to financial statements.
| | | Nuveen Dividend Advantage Municipal Fund 3 |
| NZF | | Portfolio of Investments |
| | | April 30, 2011 (Unaudited) |
| | Principal | | | Optional Call | | | | |
| | Amount (000) | | Description (1) | Provisions (2) | Ratings (3) | | Value | |
| | | | Municipal Bonds – 149.0% (99.0% of Total Investments) | | | | | |
| | | | Alabama – 1.7% (1.1% of Total Investments) | | | | | |
| $ | 3,500 | | Alabama Special Care Facilities Financing Authority, Revenue Bonds, Ascension Health, Series 2006C-2, 5.000%, 11/15/36 (UB) | 11/16 at 100.00 | AA+ | $ | 3,384,745 | |
| | 5,655 | | Alabama State Port Authority, Revenue Bonds, State Docks Department Facilities, Series 2001, 5.250%, 10/01/26 (Pre-refunded 10/01/11) – AMBAC Insured (Alternative Minimum Tax) | 10/11 at 100.00 | BBB (4) | | 5,762,388 | |
| | 9,155 | | Total Alabama | | | | 9,147,133 | |
| | | | Alaska – 0.1% (0.1% of Total Investments) | | | | | |
| | 1,000 | | Northern Tobacco Securitization Corporation, Alaska, Tobacco Settlement Asset-Backed Bonds, Series 2006A, 5.000%, 6/01/46 | 6/14 at 100.00 | Baa3 | | 595,359 | |
| | | | Arizona – 1.0% (0.7% of Total Investments) | | | | | |
| | 3,390 | | Arizona State Transportation Board, Highway Revenue Bonds, Series 2006, Trust 3151, 13.409%, 7/01/16 (IF) | No Opt. Call | AAA | | 3,652,895 | |
| | 2,200 | | Salt Verde Financial Corporation, Arizona, Senior Gas Revenue Bonds, Citigroup Energy Inc Prepay Contract Obligations, Series 2007, 5.000%, 12/01/37 | No Opt. Call | A | | 1,830,685 | |
| | 5,590 | | Total Arizona | | | | 5,483,580 | |
| | | | Arkansas – 0.7% (0.5% of Total Investments) | | | | | |
| | | | Sebastian County Health Facilities Board, Arkansas, Hospital Revenue Improvement Bonds, Sparks Regional Medical Center, Series 2001A: | | | | | |
| | 1,805 | | 5.500%, 11/01/13 (Pre-refunded 11/01/11) | 11/11 at 101.00 | N/R (4) | | 1,869,365 | |
| | 1,900 | | 5.500%, 11/01/14 (Pre-refunded 11/01/11) | 11/11 at 101.00 | N/R (4) | | 1,967,754 | |
| | 3,705 | | Total Arkansas | | | | 3,837,119 | |
| | | | California – 12.3% (8.2% of Total Investments) | | | | | |
| | | | California Health Facilities Financing Authority, Health Facility Revenue Bonds, Adventist Health System/West, Series 2003A: | | | | | |
| | 2,175 | | 5.000%, 3/01/28 | 3/13 at 100.00 | A | | 2,029,253 | |
| | 140 | | 5.000%, 3/01/33 | 3/13 at 100.00 | A | | 125,104 | |
| | 3,400 | | California Health Facilities Financing Authority, Revenue Bonds, Providence Health & Services, Series 2009B, 5.500%, 10/01/39 | 10/19 at 100.00 | AA | | 3,390,140 | |
| | 2,900 | | California Health Facilities Financing Authority, Revenue Bonds, Sutter Health, Series 2007A, 5.000%, 11/15/42 (UB) | 11/16 at 100.00 | AA– | | 2,495,102 | |
| | 5,000 | | California Infrastructure Economic Development Bank, Revenue Bonds, Kaiser Hospital Assistance LLC, Series 2001A, 5.550%, 8/01/31 | 8/11 at 102.00 | A+ | | 4,822,850 | |
| | 5,355 | | California Statewide Community Development Authority, Revenue Bonds, Sutter Health, Tender Option Bond Trust 3175, 13.619%, 5/15/14 (IF) | No Opt. Call | AA– | | 4,934,472 | |
| | 20 | | California, General Obligation Veterans Welfare Bonds, Series 2001BZ, 5.350%, 12/01/21 – NPFG Insured (Alternative Minimum Tax) | 6/11 at 100.00 | AA | | 20,011 | |
| | | | Ceres Unified School District, Stanislaus County, California, General Obligation Bonds, Series 2002B: | | | | | |
| | 2,180 | | 0.000%, 8/01/31 – FGIC Insured | 8/12 at 32.87 | A+ | | 526,405 | |
| | 3,300 | | 0.000%, 8/01/32 – FGIC Insured | 8/12 at 30.97 | A+ | | 724,779 | |
| | 11,865 | | Golden State Tobacco Securitization Corporation, California, Tobacco Settlement Asset-Backed Bonds, Series 2007A-1, 5.125%, 6/01/47 | 6/17 at 100.00 | Baa3 | | 7,239,430 | |
| | 7,150 | | Grossmont Healthcare District, California, General Obligation Bonds, Series 2011B, 6.125%, 7/15/40 | 7/21 at 100.00 | Aa2 | | 7,532,025 | |
| | | | Los Angeles Regional Airports Improvement Corporation, California, Lease Revenue Refunding Bonds, LAXFUEL Corporation at Los Angeles International Airport, Series 2001: | | | | | |
| | 10,510 | | 5.750%, 1/01/16 – AMBAC Insured (Alternative Minimum Tax) | 1/12 at 100.00 | A– | | 10,640,955 | |
| | 5,000 | | 5.375%, 1/01/21 – AMBAC Insured (Alternative Minimum Tax) | 1/12 at 100.00 | A– | | 5,005,150 | |
| | 1,500 | | 5.250%, 1/01/23 – AMBAC Insured (Alternative Minimum Tax) | 1/12 at 100.00 | A– | | 1,462,215 | |
| | 10,000 | | 5.500%, 1/01/32 – AMBAC Insured (Alternative Minimum Tax) | 1/12 at 100.00 | A– | | 8,824,100 | |
| | 12,000 | | Palomar Pomerado Health, California, General Obligation Bonds, Convertible Capital Appreciation, Election 2004 Series 2010A, 0.000%, 8/01/40 | 8/30 at 100.00 | A+ | | 6,577,080 | |
| | Principal | | | Optional Call | | | | |
| | Amount (000) | | Description (1) | Provisions (2) | Ratings (3) | | Value | |
| | | | California (continued) | | | | | |
| $ | 10,000 | | San Joaquin Hills Transportation Corridor Agency, Orange County, California, Toll Road Revenue Refunding Bonds, Series 1997A, 0.000%, 1/15/35 – NPFG Insured | No Opt. Call | Baa1 | $ | 1,025,300 | |
| | 3,000 | | San Mateo County Community College District, California, General Obligation Bonds, Series 2006C, 0.000%, 9/01/30 – NPFG Insured | No Opt. Call | Aaa | | 925,590 | |
| | 95,495 | | Total California | | | | 68,299,961 | |
| | | | Colorado – 6.3% (4.2% of Total Investments) | | | | | |
| | 2,250 | | Canterberry Crossing Metropolitan District II, Parker, Colorado, Limited Tax General Obligation Bonds, Series 2002, 7.375%, 12/01/32 (Pre-refunded 12/01/12) | 12/12 at 100.00 | N/R (4) | | 2,458,418 | |
| | 1,535 | | Colorado Educational and Cultural Facilities Authority, Charter School Revenue Bonds, Belle Creek Education Center, Series 2002A, 7.625%, 3/15/32 (Pre-refunded 3/15/13) | 3/13 at 100.00 | N/R (4) | | 1,704,940 | |
| | 1,775 | | Colorado Educational and Cultural Facilities Authority, Charter School Revenue Bonds, Weld County School District 6 – Frontier Academy, Series 2001, 7.375%, 6/01/31 Pre-refunded 6/01/11) | 6/11 at 100.00 | Ba1 (4) | | 1,785,952 | |
| | 3,090 | | Colorado Educational and Cultural Facilities Authority, Revenue Bonds, Montessori Peaks Academy, Series 2006A, 5.400%, 5/01/26 | 5/16 at 102.00 | N/R | | 2,535,530 | |
| | 3,380 | | Colorado Housing Finance Authority, Multifamily Project Bonds, Class I, Series 2001A-1, 5.500%, 4/01/31 (Alternative Minimum Tax) | 10/11 at 100.00 | AAA | | 3,380,642 | |
| | 5,000 | | Compark Business Campus Metropolitan District, Colorado, General Obligation Limited Tax Bonds, Series 2007A, 5.600%, 12/01/34 – RAAI Insured | 12/17 at 100.00 | N/R | | 3,803,900 | |
| | | | Denver City and County, Colorado, Airport Revenue Bonds, Series 2006: | | | | | |
| | 5,365 | | 5.000%, 11/15/23 – FGIC Insured | 11/16 at 100.00 | A+ | | 5,594,354 | |
| | 3,300 | | 5.000%, 11/15/24 – FGIC Insured | 11/16 at 100.00 | A+ | | 3,417,579 | |
| | 4,335 | | 5.000%, 11/15/25 – FGIC Insured | 11/16 at 100.00 | A+ | | 4,459,501 | |
| | 2,000 | | Denver City and County, Colorado, Airport System Revenue Refunding Bonds, Series 2001A, 5.500%, 11/15/16 – FGIC Insured (Alternative Minimum Tax) | 11/11 at 100.00 | A+ | | 2,038,620 | |
| | | | Maher Ranch Metropolitan District 4, Colorado, General Obligation Limited Tax Bonds, Series 2007: | | | | | |
| | 950 | | 5.125%, 12/01/27 – RAAI Insured | 12/17 at 100.00 | N/R | | 785,688 | |
| | 2,000 | | 5.250%, 12/01/36 – RAAI Insured | 12/17 at 100.00 | N/R | | 1,524,140 | |
| | 1,000 | | Plaza Metropolitan District 1, Lakewood, Colorado, Tax Increment Revenue Bonds, Series 2003, 8.000%, 12/01/25 | 6/14 at 101.00 | N/R | | 984,880 | |
| | 630 | | Regional Transportation District, Colorado, Certificates of Participation, Series 2010A, 5.375%, 6/01/31 | 6/20 at 100.00 | Aa3 | | 640,842 | |
| | 36,610 | | Total Colorado | | | | 35,114,986 | |
| | | | Delaware – 0.1% (0.1% of Total Investments) | | | | | |
| | 520 | | Delaware State Housing Authority, Multifamily Mortgage Revenue Bonds, Series 2001A, 5.400%, 7/01/24 | 7/12 at 100.00 | N/R | | 536,915 | |
| | | | District of Columbia – 0.7% (0.5% of Total Investments) | | | | | |
| | 1,335 | | Washington Convention Center Authority, District of Columbia, Dedicated Tax Revenue Bonds, Tender Option Bond Trust 1606, 11.376%, 10/01/30 – AMBAC Insured (IF) | 10/16 at 100.00 | AA+ | | 1,107,796 | |
| | 3,335 | | Washington Convention Center Authority, District of Columbia, Dedicated Tax Revenue Bonds, Tender Option Bond Trust 1730, 11.352%, 10/01/30 – AMBAC Insured (IF) | 10/16 at 100.00 | AA+ | | 2,767,415 | |
| | 4,670 | | Total District of Columbia | | | | 3,875,211 | |
| | | | Florida – 1.6% (1.1% of Total Investments) | | | | | |
| | | | Orange County Housing Finance Authority, Florida, Multifamily Housing Revenue Bonds, Oak Glen Apartments, Series 2001G: | | | | | |
| | 1,105 | | 5.400%, 12/01/32 – AGM Insured | 12/11 at 100.00 | AA+ | | 1,099,365 | |
| | 2,195 | | 5.450%, 12/01/41 – AGM Insured | 12/11 at 100.00 | AA+ | | 2,140,673 | |
| | 5,455 | | South Miami Health Facilities Authority, Florida, Hospital Revenue, Baptist Health System Obligation Group, Series 2007, 5.000%, 8/15/42 (UB) | 8/17 at 100.00 | AA | | 4,863,733 | |
| | 1,000 | | Tolomato Community Development District, Florida, Special Assessment Bonds, Series 2007, 6.650%, 5/01/40 | 5/18 at 100.00 | N/R | | 668,830 | |
| | 9,755 | | Total Florida | | | | 8,772,601 | |
| | | Nuveen Dividend Advantage Municipal Fund 3 (continued) |
| NZF | | Portfolio of Investments |
April 30, 2011 (Unaudited)
| | | | | | | | | |
| | Principal | | | Optional Call | | | | |
| | Amount (000) | | Description (1) | Provisions (2) | Ratings (3) | | Value | |
| | | | Georgia – 5.6% (3.8% of Total Investments) | | | | | |
| $ | 5,000 | | Atlanta, Georgia, Airport General Revenue Bonds, Series 2000B, 5.625%,
1/01/30 – FGIC Insured (Alternative Minimum Tax) | 7/11 at 100.50 | A+ | $ | 5,008,050 | |
| | 15,000 | | Atlanta, Georgia, Airport General Revenue Refunding Bonds, Series 2010C, 5.250%, 1/01/30 | 1/21 at 100.00 | A1 | | 15,146,099 | |
| | 2,700 | | Atlanta, Georgia, Tax Allocation Bonds, Atlantic Station Project, Series 2001, 7.900%, 12/01/24 (Pre-refunded 12/01/11) | 12/11 at 101.00 | AAA | | 2,848,122 | |
| | 3,000 | | Franklin County Industrial Building Authority, Georgia, Revenue Bonds, Ty Cobb Regional Medical Center Project, Series 2010, 8.125%, 12/01/45 | 12/20 at 100.00 | N/R | | 2,934,510 | |
| | 2,000 | | Fulton County Residential Care Facilities Authority, Georgia, Revenue Bonds, Elderly Care, Lenbrook Square Project, Series 2006A, 5.125%, 7/01/42 | 7/17 at 100.00 | N/R | | 1,205,840 | |
| | 3,740 | | Gainesville and Hall County Hospital Authority, Georgia, Revenue Anticipation Certificates, Northeast Georgia Health Services Inc., Series 2001, 5.500%, 5/15/31 (Pre-refunded 5/15/11) | 5/11 at 100.00 | N/R (4) | | 3,748,602 | |
| | 500 | | Gainesville Redevelopment Authority, Georgia, Educational Facilities Revenue Bonds, Riverside Military Academy Project, Series 2007, 5.125%, 3/01/37 | 3/17 at 100.00 | N/R | | 358,200 | |
| | 31,940 | | Total Georgia | | | | 31,249,423 | |
| | | | Illinois – 16.5% (10.9% of Total Investments) | | | | | |
| | 8,375 | | Chicago, Illinois, Revenue Bonds, Midway Airport, Series 2001A, 5.500%,
1/01/19 – AGM Insured (Alternative Minimum Tax) | 1/12 at 100.00 | AA+ | | 8,436,220 | |
| | 4,950 | | Chicago, Illinois, Second Lien Passenger Facility Charge Revenue Bonds, O’Hare International Airport, Series 2001A, 5.375%, 1/01/32 – AMBAC Insured (Alternative Minimum Tax) | 7/11 at 101.00 | A2 | | 4,588,601 | |
| | 2,220 | | Chicago, Illinois, Second Lien Wastewater Transmission Revenue Bonds, Series 2001A, 5.500%, 1/01/16 – NPFG Insured | No Opt. Call | Aa3 | | 2,501,429 | |
| | 10,000 | | Chicago, Illinois, Senior Lien Water Revenue Bonds, Series 2001, 5.000%, 11/01/26 (Pre-refunded 11/01/11) – AMBAC Insured | 11/11 at 100.00 | Aa2 (4) | | 10,237,700 | |
| | 1,165 | | Chicago, Illinois, Third Lien General Airport Revenue Bonds, O’Hare International Airport, Series 2005A, 5.000%, 1/01/33 – FGIC Insured | 1/16 at 100.00 | A1 | | 1,082,623 | |
| | 8,875 | | Cook County, Illinois, General Obligation Bonds, Refunding Series 2010A, 5.250%, 11/15/33 | 11/20 at 100.00 | AA | | 8,901,181 | |
| | 2,415 | | Illinois Finance Authority, General Obligation Debt Certificates, Local Government Program – Kankakee County, Series 2005B, 5.000%, 12/01/24 – AMBAC Insured | 12/14 at 100.00 | A2 | | 2,420,868 | |
| | 3,465 | | Illinois Finance Authority, Revenue Bonds, Sherman Health Systems, Series 2007A, 5.500%, 8/01/37 | 8/17 at 100.00 | BBB | | 2,984,405 | |
| | 9,000 | | Illinois Health Facilities Authority, Revenue Bonds, Covenant Retirement Communities Inc., Series 2001, 5.875%, 12/01/31 | 12/11 at 101.00 | BBB– | | 8,346,690 | |
| | 15,000 | | Illinois Health Facilities Authority, Revenue Bonds, Loyola University Health System, Series 2001A, 6.125%, 7/01/31 (Pre-refunded 7/01/11) | 7/11 at 100.00 | Baa3 (4) | | 15,147,750 | |
| | 5,000 | | Lake County School District 38, Big Hallow, Illinois, General Obligation Bonds, Series 2005, 0.000%, 2/01/22 – AMBAC Insured | No Opt. Call | N/R | | 2,482,750 | |
| | 7,000 | | Lombard Public Facilities Corporation, Illinois, First Tier Conference Center and Hotel Revenue Bonds, Series 2005A-1, 7.125%, 1/01/36 | 1/16 at 100.00 | N/R | | 4,684,540 | |
| | 12,000 | | Metropolitan Pier and Exposition Authority, Illinois, McCormick Place Expansion Project Refunding Bonds, Series 2010A, 5.500%, 6/15/50 | 6/20 at 100.00 | AAA | | 11,191,560 | |
| | 45,000 | | Metropolitan Pier and Exposition Authority, Illinois, Revenue Bonds, McCormick Place Expansion Project, Capital Appreciation Refunding Series 2010B-1, 0.000%, 6/15/43 – AGM Insured | No Opt. Call | AAA | | 5,201,550 | |
| | 2,790 | | Metropolitan Pier and Exposition Authority, Illinois, Revenue Refunding Bonds, McCormick Place Expansion Project, Series 1998A, 5.500%, 6/15/29 – FGIC Insured | No Opt. Call | AAA | | 2,904,669 | |
| | 137,255 | | Total Illinois | | | | 91,112,536 | |
| | | | Indiana – 6.0% (4.0% of Total Investments) | | | | | |
| | | | Clark-Pleasant Community School Building Corporation, Indiana, First Mortgage Bonds, Series 2001: | | | | | |
| | 1,255 | | 5.000%, 7/15/21 (Pre-refunded 1/15/12) – AMBAC Insured | 1/12 at 100.00 | AA+ (4) | | 1,296,189 | |
| | 1,000 | | 5.000%, 1/15/26 (Pre-refunded 1/15/12) – AMBAC Insured | 1/12 at 100.00 | AA+ (4) | | 1,032,820 | |
| | | | Evansville Vanderburgh Public Library Lease Corporation, Indiana, First Mortgage Bonds, Series 2001: | | | | | |
| | 2,000 | | 5.750%, 7/15/18 (Pre-refunded 1/15/12) – NPFG Insured | 1/12 at 100.00 | A+ (4) | | 2,077,760 | |
| | 2,750 | | 5.125%, 1/15/24 (Pre-refunded 1/15/12) – NPFG Insured | 1/12 at 100.00 | A+ (4) | | 2,844,710 | |
| | Principal | | | Optional Call | | | | |
| | Amount (000) | | Description (1) | Provisions (2) | Ratings (3) | | Value | |
| | | | Indiana (continued) | | | | | |
| $ | 1,250 | | Hamilton Southeastern Cumberland Campus School Building Corporation, Indiana, First Mortgage Bonds, Series 2001, 5.125%, 1/15/23 (Pre-refunded 1/15/12) – AMBAC Insured | 1/12 at 100.00 | A (4) | $ | 1,293,050 | |
| | 9,500 | | Indiana Educational Facilities Authority, Revenue Bonds, Butler University, Series 2001, 5.500%, 2/01/26 – NPFG Insured | 8/11 at 100.00 | Baa1 | | 9,518,810 | |
| | 4,230 | | Indiana Finance Authority, Educational Facilities Revenue Bonds, Tudor Park Foundation, Series 2005B, 5.000%, 6/01/24 | 6/15 at 100.00 | Aa3 | | 4,346,663 | |
| | 2,600 | | Indiana Health Facility Financing Authority, Revenue Bonds, Community Hospitals of Indiana, Series 2005A, 5.000%, 5/01/35 – AMBAC Insured | 5/15 at 100.00 | A | | 2,277,470 | |
| | 3,500 | | University of Southern Indiana, Student Fee Revenue Bonds, Series 2001H, 5.000%, 10/01/21 – AMBAC Insured | 10/11 at 100.00 | A1 | | 3,518,970 | |
| | | | Vigo County Hospital Authority, Indiana, Revenue Bonds, Union Hospital, Series 2007: | | | | | |
| | 2,500 | | 5.750%, 9/01/42 | 9/17 at 100.00 | N/R | | 1,874,775 | |
| | 2,500 | | 5.800%, 9/01/47 | 9/17 at 100.00 | N/R | | 1,859,250 | |
| | 1,090 | | Wayne County Jail Holding Corporation, Indiana, First Mortgage Bonds, Series 2001, 5.500%, 7/15/22 (Pre-refunded 1/15/13) – AMBAC Insured | 1/13 at 101.00 | A1 (4) | | 1,192,547 | |
| | 34,175 | | Total Indiana | | | | 33,133,014 | |
| | | | Iowa – 5.5% (3.7% of Total Investments) | | | | | |
| | 2,000 | | Iowa Finance Authority, Healthcare Revenue Bonds, Great River Medical Center, Series 2001, 5.250%, 5/15/31 – AGM Insured | 5/11 at 100.00 | Aa3 | | 1,943,220 | |
| | 1,000 | | Iowa Tobacco Settlement Authority, Asset Backed Settlement Revenue Bonds, Series 2005C, 5.625%, 6/01/46 | 6/15 at 100.00 | BBB | | 674,360 | |
| | | | Iowa Tobacco Settlement Authority, Tobacco Settlement Asset-Backed Revenue Bonds, Series 2001B: | | | | | |
| | 23,665 | | 5.300%, 6/01/25 (Pre-refunded 6/01/11) | 6/11 at 101.00 | AAA | | 23,999,150 | |
| | 3,950 | | 5.600%, 6/01/35 (Pre-refunded 6/01/11) | 6/11 at 101.00 | AAA | | 4,008,105 | |
| | 30,615 | | Total Iowa | | | | 30,624,835 | |
| | | | Kansas – 0.3% (0.2% of Total Investments) | | | | | |
| | | | Manhattan Health Care Facility Revenue Bonds, Kansas, Meadowlarks Hills Retirement, Series 2007B: | | | | | |
| | 1,000 | | 5.125%, 5/15/37 | 5/14 at 103.00 | N/R | | 750,570 | |
| | 1,000 | | 5.125%, 5/15/42 | 5/14 at 103.00 | N/R | | 733,900 | |
| | 2,000 | | Total Kansas | | | | 1,484,470 | |
| | | | Kentucky – 3.6% (2.4% of Total Investments) | | | | | |
| | 1,000 | | Kentucky Economic Development Finance Authority, Louisville Arena Project Revenue Bonds, Louisville Arena Authority, Inc., Series 2008-A1, 6.000%, 12/01/42 – AGC Insured | 6/18 at 100.00 | AA+ | | 1,014,040 | |
| | 18,500 | | Louisville and Jefferson County Metropolitan Sewer District, Kentucky, Sewer and Drainage System Revenue Bonds, Series 2001A, 5.125%, 5/15/27 – NPFG Insured | 11/11 at 101.00 | AA– | | 18,756,595 | |
| | 19,500 | | Total Kentucky | | | | 19,770,635 | |
| | | | Louisiana – 4.6% (3.0% of Total Investments) | | | | | |
| | 3,000 | | Louisiana Local Government Environmental Facilities & Community Development Authority, Revenue Bonds, Westlake Chemical Corporation Project, Series 2007, 6.750%, 11/01/32 | 11/17 at 100.00 | BBB– | | 3,064,080 | |
| | 3,700 | | Louisiana Public Facilities Authority, Revenue Bonds, Ochsner Clinic Foundation Project, Series 2007A, 5.500%, 5/15/47 | 5/17 at 100.00 | Baa1 | | 3,080,287 | |
| | 20,890 | | Tobacco Settlement Financing Corporation, Louisiana, Tobacco Settlement Asset-Backed Bonds, Series 2001B, 5.875%, 5/15/39 | 5/11 at 101.00 | A– | | 19,064,841 | |
| | 27,590 | | Total Louisiana | | | | 25,209,208 | |
| | | | Maine – 0.2% (0.1% of Total Investments) | | | | | |
| | 1,075 | | Maine State Housing Authority, Single Family Mortgage Purchase Bonds, Series 2001B, 5.500%, 11/15/32 (Alternative Minimum Tax) | 5/11 at 100.00 | AA+ | | 1,074,946 | |
| | | Nuveen Dividend Advantage Municipal Fund 3 (continued) |
| NZF | | Portfolio of Investments |
April 30, 2011 (Unaudited)
| | Principal | | | Optional Call | | | | |
| | Amount (000) | | Description (1) | Provisions (2) | Ratings (3) | | Value | |
| | | | Maryland – 2.6% (1.7% of Total Investments) | | | | | |
| $ | 1,000 | | Howard County, Maryland, Retirement Community Revenue Bonds, Vantage House, Series 2007B, 5.250%, 4/01/37 | 4/17 at 100.00 | N/R | $ | 664,410 | |
| | 1,570 | | Maryland Community Development Administration, Insured Multifamily Housing Mortgage Loan Revenue Bonds, Series 2001B, 5.250%, 7/01/21 (Alternative Minimum Tax) | 7/11 at 100.00 | Aa2 | | 1,571,664 | |
| | 2,000 | | Maryland Economic Development Corporation, Revenue Bonds, Chesapeake Bay Hyatt Conference Center, Series 2006A, 5.000%, 12/01/31 | 12/16 at 100.00 | N/R | | 1,210,140 | |
| | 10,600 | | Maryland Energy Financing Administration, Revenue Bonds, AES Warrior Run Project, Series 1995, 7.400%, 9/01/19 (Alternative Minimum Tax) | 7/11 at 100.00 | N/R | | 10,598,622 | |
| | 555 | | Maryland Health and Higher Educational Facilities Authority, Revenue Bonds, Mercy Ridge Retirement Community, Series 2007, 4.750%, 7/01/34 | 7/17 at 100.00 | A– | | 478,660 | |
| | 15,725 | | Total Maryland | | | | 14,523,496 | |
| | | | Massachusetts – 3.0% (2.0% of Total Investments) | | | | | |
| | 1,375 | | Massachusetts Development Finance Agency, Revenue Bonds, Orchard Cove, Series 2007, 5.250%, 10/01/26 | 10/12 at 102.00 | N/R | | 1,107,851 | |
| | 1,000 | | Massachusetts Health and Educational Facilities Authority, Revenue Bonds, Milton Hospital Project, Series 2005D, 5.250%, 7/01/30 | 7/15 at 100.00 | BB– | | 769,660 | |
| | 1,600 | | Massachusetts Health and Educational Facilities Authority, Revenue Refunding Bonds, Suffolk University Issue, Series 2009A, 5.750%, 7/01/39 | 7/19 at 100.00 | BBB | | 1,517,728 | |
| | 4,700 | | Massachusetts Housing Finance Agency, Single Family Housing Revenue Bonds, Series 2008, Trust 3145, 15.250%, 6/01/16 (IF) | No Opt. Call | AA | | 5,425,304 | |
| | 5,000 | | Massachusetts Port Authority, Special Facilities Revenue Bonds, Delta Air Lines Inc., Series 2001A, 5.500%, 1/01/18 – AMBAC Insured (Alternative Minimum Tax) | 7/11 at 101.00 | N/R | | 4,555,300 | |
| | 3,465 | | Massachusetts Water Resources Authority, General Revenue Bonds, Series 2007A, 4.500%, 8/01/46 – AGM Insured (UB) (7) | 2/17 at 100.00 | AA+ | | 3,166,733 | |
| | 17,140 | | Total Massachusetts | | | | 16,542,576 | |
| | | | Michigan – 9.3% (6.2% of Total Investments) | | | | | |
| | 15,000 | | Detroit City School District, Wayne County, Michigan, Unlimited Tax School Building and Site Improvement Bonds, Series 2001A, 6.000%, 5/01/29 – AGM Insured (UB) | No Opt. Call | AA+ | | 15,373,050 | |
| | 2,000 | | Garden City Hospital Finance Authority, Michigan, Revenue Bonds, Garden City Hospital Obligated Group, Series 2007A, 5.000%, 8/15/38 | 8/17 at 100.00 | N/R | | 1,255,280 | |
| | 11,000 | | Kent Hospital Finance Authority, Michigan, Revenue Bonds, Spectrum Health, Series 2001A, 5.500%, 1/15/31 (Pre-refunded 7/15/11) | 7/11 at 101.00 | AA (4) | | 11,229,130 | |
| | 1,165 | | Michigan State Building Authority, Revenue Bonds, Facilities Program, Series 2001I, 5.500%, 10/15/18 | 10/11 at 100.00 | Aa3 | | 1,184,281 | |
| | 70 | | Michigan State Building Authority, Revenue Bonds, Facilities Program, Series 2001I, 5.500%, 10/15/18 (Pre-refunded 10/15/11) | 10/11 at 100.00 | A+ (4) | | 71,642 | |
| | 3,210 | | Michigan State Hospital Finance Authority, Hospital Revenue Refunding Bonds, Sisters of Mercy Health Corporation, Series 1993P, 5.375%, 8/15/14 – NPFG Insured (ETM) | No Opt. Call | BBB (4) | | 3,419,132 | |
| | | | Michigan State Hospital Finance Authority, Hospital Revenue Refunding Bonds, Sparrow Obligated Group, Series 2001: | | | | | |
| | 1,400 | | 5.500%, 11/15/21 (Pre-refunded 11/15/11) | 11/11 at 101.00 | A+ (4) | | 1,452,962 | |
| | 2,500 | | 5.625%, 11/15/31 (Pre-refunded 11/15/11) | 11/11 at 101.00 | A+ (4) | | 2,596,250 | |
| | 3,500 | | Michigan State Hospital Finance Authority, Revenue Bonds, Trinity Health Care Group, Series 2006A, 5.000%, 12/01/31 (UB) | 12/16 at 100.00 | AA | | 3,281,670 | |
| | 12,640 | | Royal Oak Hospital Finance Authority, Michigan, Hospital Revenue Bonds, William Beaumont Hospital, Series 2001M, 5.250%, 11/15/31 – NPFG Insured | 11/11 at 100.00 | A1 | | 11,363,486 | |
| | 52,485 | | Total Michigan | | | | 51,226,883 | |
| | | | Minnesota – 1.3% (0.8% of Total Investments) | | | | | |
| | 2,200 | | Dakota County Community Development Agency, Minnesota, GNMA Collateralized Multifamily Housing Revenue Bonds, Rose Apartments Project, Series 2001, 6.350%, 10/20/37 (Alternative Minimum Tax) | 10/11 at 105.00 | Aaa | | 2,241,580 | |
| | 3,000 | | Minnesota State, General Obligation Bonds, Various Purpose, Refunding Series 2010D, 5.000%, 8/01/18 | No Opt. Call | AAA | | 3,564,570 | |
| | Principal | | | Optional Call | | | | |
| | Amount (000) | | Description (1) | Provisions (2) | Ratings (3) | | Value | |
| | | | Minnesota (continued) | | | | | |
| $ | 1,375 | | Saint Paul Port Authority, Minnesota, Lease Revenue Bonds, Regions Hospital Parking Ramp Project, Series 2007-1, 5.000%, 8/01/36 | 8/16 at 100.00 | N/R | $ | 1,148,854 | |
| | 6,575 | | Total Minnesota | | | | 6,955,004 | |
| | | | Mississippi – 0.9% (0.6% of Total Investments) | | | | | |
| | 2,155 | | Mississippi Business Finance Corporation, GNMA Collateralized Retirement Facility Mortgage Revenue Refunding Bonds, Aldersgate Retirement Community Inc. Project, Series 1999A, 5.450%, 5/20/34 | 5/11 at 101.00 | AAA | | 2,150,712 | |
| | 3,000 | | Mississippi Hospital Equipment and Facilities Authority, Revenue Bonds, Baptist Memorial Healthcare, Series 2004B-1, 5.000%, 9/01/24 (UB) | 9/14 at 100.00 | AA | | 3,043,980 | |
| | 5,155 | | Total Mississippi | | | | 5,194,692 | |
| | | | Missouri – 3.0% (2.0% of Total Investments) | | | | | |
| | 1,495 | | Cape Girardeau County Industrial Development Authority, Missouri, Health Facilities Revenue Bonds, Southeast Missouri Hospital Association, Series 2007, 5.000%, 6/01/36 | 6/17 at 100.00 | N/R | | 1,264,755 | |
| | 1,000 | | Clinton County Industrial Development Authority, Missouri, Revenue Bonds, Cameron Regional Medical Center, Series 2007, 5.000%, 12/01/32 | 12/17 at 100.00 | N/R | | 698,590 | |
| | 1,825 | | Fenton, Missouri, Tax Increment Refunding and Improvement Revenue Bonds, Gravois Bluffs Redevelopment Project, Series 2002, 6.125%, 10/01/21 (Pre-refunded 10/01/12) | 10/12 at 100.00 | N/R (4) | | 1,960,926 | |
| | | | Missouri Development Finance Board, Cultural Facilities Revenue Bonds, Nelson Gallery Foundation, Series 2001A: | | | | | |
| | 3,335 | | 5.250%, 12/01/19 (Pre-refunded 12/01/11) – NPFG Insured | 12/11 at 100.00 | AA– (4) | | 3,431,215 | |
| | 3,510 | | 5.250%, 12/01/20 (Pre-refunded 12/01/11) – NPFG Insured | 12/11 at 100.00 | AA– (4) | | 3,611,264 | |
| | 3,695 | | 5.250%, 12/01/21 (Pre-refunded 12/01/11) – NPFG Insured | 12/11 at 100.00 | AA– (4) | | 3,801,601 | |
| | 2,040 | | 5.250%, 12/01/22 (Pre-refunded 12/01/11) – NPFG Insured | 12/11 at 100.00 | AA– (4) | | 2,098,854 | |
| | 16,900 | | Total Missouri | | | | 16,867,205 | |
| | | | Montana – 0.9% (0.6% of Total Investments) | | | | | |
| | 5,000 | | Montana Board of Investments, Exempt Facility Revenue Bonds, Stillwater Mining Company, Series 2000, 8.000%, 7/01/20 (Alternative Minimum Tax) | 7/11 at 100.50 | B+ | | 5,008,650 | |
| | | | Nebraska – 1.1% (0.7% of Total Investments) | | | | | |
| | 4,525 | | Nebraska Investment Finance Authority, Single Family Housing Revenue Bonds, Series 2010A, 6.050%, 9/01/41 | 9/20 at 100.00 | AAA | | 4,632,469 | |
| | 1,005 | | Omaha Public Power District, Nebraska, Separate Electric System Revenue Bonds, Nebraska City 2, Series 2006A, Trust 11673, 19.815%, 8/01/40 – AMBAC Insured (IF) | 2/17 at 100.00 | AA+ | | 1,328,711 | |
| | 5,530 | | Total Nebraska | | | | 5,961,180 | |
| | | | Nevada – 3.8% (2.5% of Total Investments) | | | | | |
| | 10,000 | | Clark County, Nevada, Airport Revenue Bonds, Subordinte Lien Series 2010B, 5.750%, 7/01/42 | 1/20 at 100.00 | Aa3 | | 10,107,900 | |
| | 6,000 | | Clark County, Nevada, Passenger Facility Charge Revenue Bonds, Las Vegas-McCarran International Airport, Series 2010A, 5.250%, 7/01/42 | 1/20 at 100.00 | Aa3 | | 5,591,460 | |
| | 2,000 | | Director of Nevada State Department of Business and Industry, Revenue Bonds, Las Vegas Monorail Project, First Tier, Series 2000, 5.375%, 1/01/40 – AMBAC Insured (5) | 7/11 at 100.00 | N/R | | 501,560 | |
| | 4,000 | | Director of Nevada State Department of Business and Industry, Revenue Bonds, Las Vegas Monorail Project, Second Tier, Series 2000, 7.375%, 1/01/40 (5) | 1/12 at 100.00 | N/R | | 7,000 | |
| | 145 | | Nevada Housing Division, Single Family Mortgage Bonds, Senior Series 1998A-1, 5.300%, 4/01/18 (Alternative Minimum Tax) | 10/11 at 100.00 | Aaa | | 148,352 | |
| | 4,290 | | University of Nevada, Revenue Bonds, Community College System, Series 2001A, 5.250%, 7/01/26 (Pre-refunded 1/01/12) – FGIC Insured | 1/12 at 100.00 | Aa2 (4) | | 4,433,501 | |
| | 26,435 | | Total Nevada | | | | 20,789,773 | |
| | | | New Hampshire – 0.4% (0.2% of Total Investments) | | | | | |
| | 2,000 | | New Hampshire Health and Education Authority, Hospital Revenue Bonds, Concord Hospital, Series 2001, 5.500%, 10/01/21 – AGM Insured | 10/11 at 101.00 | Aa3 | | 2,029,160 | |
| | | Nuveen Dividend Advantage Municipal Fund 3 (continued) |
| NZF | | Portfolio of Investments |
April 30, 2011 (Unaudited)
| | Principal | | | Optional Call | | | | |
| | Amount (000) | | Description (1) | Provisions (2) | Ratings (3) | | Value | |
| | | | New Jersey – 4.7% (3.2% of Total Investments) | | | | | |
| $ | 10,000 | | New Jersey Economic Development Authority, Water Facilities Revenue Bonds, American Water Company, Series 2002A, 5.250%, 11/01/32 – AMBAC Insured (Alternative Minimum Tax) | 11/12 at 101.00 | A2 | $ | 9,650,300 | |
| | 620 | | New Jersey Health Care Facilities Financing Authority, Revenue Bonds, Somerset Medical Center, Series 2003, 5.500%, 7/01/33 | 7/13 at 100.00 | Ba2 | | 461,230 | |
| | 4,125 | | New Jersey Transit Corporation, Certificates of Participation, Federal Transit Administration Grants, Series 2002A, 5.500%, 9/15/13 – AMBAC Insured | No Opt. Call | Aa3 | | 4,454,835 | |
| | 12,970 | | New Jersey Transportation Trust Fund Authority, Transportation System Bonds, Capital Appreciation Series 2010A, 0.000%, 12/15/33 | No Opt. Call | A+ | | 2,951,713 | |
| | 20,000 | | New Jersey Transportation Trust Fund Authority, Transportation System Bonds, Series 2006C, 0.000%, 12/15/33 – AGM Insured | No Opt. Call | AA+ | | 4,326,200 | |
| | 7,045 | | Tobacco Settlement Financing Corporation, New Jersey, Tobacco Settlement Asset-Backed Bonds, Series 2007-1A, 4.750%, 6/01/34 | 6/17 at 100.00 | Baa3 | | 4,376,284 | |
| | 54,760 | | Total New Jersey | | | | 26,220,562 | |
| | | | New York – 5.1% (3.4% of Total Investments) | | | | | |
| | 900 | | Albany Industrial Development Agency, New York, Revenue Bonds, Brighter Choice Charter Schools, Series 2007A, 5.000%, 4/01/32 | 4/17 at 100.00 | N/R | | 696,402 | |
| | | | Brooklyn Areba Local Development Corporation, New York, Payment in Lieu of Taxes Revenue Bonds, Barclays Center Project, Series 2009: | | | | | |
| | 1,275 | | 6.000%, 7/15/30 | 1/20 at 100.00 | BBB– | | 1,236,725 | |
| | 3,400 | | 0.000%, 7/15/44 | No Opt. Call | BBB– | | 332,418 | |
| | 1,780 | | East Rochester Housing Authority, New York, GNMA Secured Revenue Bonds, Gates Senior Housing Inc., Series 2001, 5.300%, 4/20/31 | 10/11 at 101.00 | N/R | | 1,696,927 | |
| | 5,010 | | Hudson Yards Infrastructure Corporation, New York, Revenue Bonds, Series 2006A, 4.500%, 2/15/47 – NPFG Insured | 2/17 at 100.00 | A | | 3,812,810 | |
| | 4,155 | | Monroe County Airport Authority, New York, Revenue Refunding Bonds, Greater Rochester International Airport, Series 1999, 5.750%, 1/01/13 – NPFG Insured (Alternative Minimum Tax) | No Opt. Call | Baa1 | | 4,354,066 | |
| | 8,000 | | New York City Industrial Development Agency, New York, American Airlines-JFK International Airport Special Facility Revenue Bonds, Series 2005, 7.750%, 8/01/31 (Alternative Minimum Tax) | 8/16 at 101.00 | B– | | 8,102,240 | |
| | 3,125 | | New York City Municipal Water Finance Authority, New York, Water and Sewer System Revenue Bonds, Second Generation Resolution, Fiscal 2011 Series EE, 5.375%, 6/15/43 | 12/20 at 100.00 | AA+ | | 3,229,188 | |
| | 910 | | New York City, New York, General Obligation Bonds, Fiscal Series 2002G, 5.625%, 8/01/20 – NPFG Insured | 8/12 at 100.00 | AA | | 956,929 | |
| | 1,590 | | New York City, New York, General Obligation Bonds, Fiscal Series 2002G, 5.625%, 8/01/20 (Pre-refunded 8/01/12) – NPFG Insured | 8/12 at 100.00 | AA (4) | | 1,694,876 | |
| | 2,000 | | New York State Tobacco Settlement Financing Corporation, Tobacco Settlement Asset-Backed and State Contingency Contract-Backed Bonds, Series 2003B-1C, 5.500%, 6/01/16 | 6/11 at 100.00 | AA– | | 2,014,120 | |
| | 32,145 | | Total New York | | | | 28,126,701 | |
| | | | North Carolina – 1.1% (0.7% of Total Investments) | | | | | |
| | 1,710 | | Charlotte-Mecklenberg Hospital Authority, North Carolina, Carolinas HealthCare System Revenue Bonds, Series 2008, Trust 1149, 14.873%, 7/15/32 (IF) | 1/18 at 100.00 | AA- | | 1,340,486 | |
| | 1,200 | | Charlotte-Mecklenburg Hospital Authority, North Carolina, Health Care System Revenue Bonds, Carolinas Health Care, Series 2007A, 5.000%, 1/15/31 | 1/17 at 100.00 | AA- | | 1,169,088 | |
| | 1,750 | | Charlotte-Mecklenburg Hospital Authority, North Carolina, Healthcare System Revenue Bonds, DBA Carolinas Healthcare System, Series 2005A, 4.875%, 1/15/32 (Pre-refunded 1/15/15) | 1/15 at 100.00 | AAA | | 1,987,633 | |
| | 515 | | North Carolina Municipal Power Agency 1, Catawba Electric Revenue Bonds, Series 2003A, 5.500%, 1/01/13 (ETM) | No Opt. Call | N/R (4) | | 556,967 | |
| | 1,085 | | North Carolina Municipal Power Agency 1, Catawba Electric Revenue Bonds, Series 2003A, 5.500%, 1/01/13 | No Opt. Call | A | | 1,164,433 | |
| | 6,260 | | Total North Carolina | | | | 6,218,607 | |
| | Principal | | | Optional Call | | | | |
| | Amount (000) | | Description (1) | Provisions (2) | Ratings (3) | | Value | |
| | | | Ohio – 0.8% (0.5% of Total Investments) | | | | | |
| | | | Buckeye Tobacco Settlement Financing Authority, Ohio, Tobacco Settlement Asset-Backed Revenue Bonds, Senior Lien, Series 2007A-2: | | | | | |
| $ | 3,135 | | 5.125%, 6/01/24 | 6/17 at 100.00 | Baa3 | $ | 2,422,289 | |
| | 710 | | 5.875%, 6/01/30 | 6/17 at 100.00 | Baa3 | | 512,364 | |
| | 685 | | 5.750%, 6/01/34 | 6/17 at 100.00 | Baa3 | | 471,965 | |
| | 1,570 | | 5.875%, 6/01/47 | 6/17 at 100.00 | Baa3 | | 1,059,263 | |
| | 6,100 | | Total Ohio | | | | 4,465,881 | |
| | | | Oklahoma – 2.0% (1.3% of Total Investments) | | | | | |
| | | | Oklahoma Development Finance Authority, Revenue Bonds, Saint John Health System, Series 2007: | | | | | |
| | 4,370 | | 5.000%, 2/15/37 | 2/17 at 100.00 | A | | 4,104,697 | |
| | 955 | | 5.000%, 2/15/42 | 2/17 at 100.00 | A | | 883,108 | |
| | 6,305 | | Tulsa County Industrial Authority, Oklahoma, Health Care Revenue Bonds, Saint Francis Health System, Series 2006, 5.000%, 12/15/36 (UB) | 12/16 at 100.00 | AA+ | | 6,058,159 | |
| | 88 | | Tulsa County Industrial Authority, Oklahoma, Health Care Revenue Bonds, Saint Francis Health System, Series 2008, Trust 3500, 8.356%, 6/15/30 (IF) | 12/16 at 100.00 | AA+ | | 81,729 | |
| | 11,718 | | Total Oklahoma | | | | 11,127,693 | |
| | | | Oregon – 0.9% (0.6% of Total Investments) | | | | | |
| | 4,700 | | Oregon Health, Housing, Educational and Cultural Facilities Authority, Revenue Bonds, PeaceHealth Project, Series 2001, 5.250%, 11/15/21 – AMBAC Insured | 11/11 at 101.00 | A+ | | 4,770,829 | |
| | | | Pennsylvania – 1.3% (0.8% of Total Investments) | | | | | |
| | 500 | | Bucks County Industrial Development Authority, Pennsylvania, Charter School Revenue Bonds, School Lane Charter School, Series 2007A, 5.000%, 3/15/37 | 3/17 at 100.00 | BBB | | 381,185 | |
| | 3,500 | | Pennsylvania Economic Development Financing Authority, Senior Lien Resource Recovery Revenue Bonds, Northampton Generating Project, Series 1994A, 6.600%, 1/01/19 (Alternative Minimum Tax) | 7/11 at 100.00 | CC | | 1,929,585 | |
| | 1,400 | | Pennsylvania Higher Educational Facilities Authority, Revenue Bonds, St. Joseph’s University, Series 2010A, 5.000%, 11/01/40 | 11/20 at 100.00 | A– | | 1,288,840 | |
| | 3,205 | | Philadelphia School District, Pennsylvania, General Obligation Bonds, Series 2002B, 5.625%, 8/01/16 (Pre-refunded 8/01/12) – FGIC Insured | 8/12 at 100.00 | Aa2 (4) | | 3,412,876 | |
| | 8,605 | | Total Pennsylvania | | | | 7,012,486 | |
| | | | Puerto Rico – 0.4% (0.3% of Total Investments) | | | | | |
| | 2,500 | | Puerto Rico Sales Tax Financing Corporation, Sales Tax Revenue Bonds, Series 2007A, 5.250%, 8/01/57 | 8/17 at 100.00 | Aa2 | | 2,421,400 | |
| | | | Tennessee – 0.3% (0.2% of Total Investments) | | | | | |
| | 3,680 | | Knox County Health, Educational and Housing Facilities Board, Tennessee, Hospital Revenue Refunding Bonds, Covenant Health, Series 2006, 0.000%, 1/01/41 | 1/17 at 30.07 | A– | | 524,032 | |
| | 275 | | Sullivan County Health Educational and Housing Facilities Board, Tennessee, Revenue Bonds, Wellmont Health System, Series 2006C, 5.250%, 9/01/36 | 9/16 at 100.00 | BBB+ | | 227,824 | |
| | | | Sumner County Health, Educational, and Housing Facilities Board, Tennessee, Revenue Refunding Bonds, Sumner Regional Health System Inc., Series 2007: | | | | | |
| | 800 | | 5.500%, 11/01/37 (5), (6) | 11/17 at 100.00 | N/R | | 40,080 | |
| | 2,800 | | 5.500%, 11/01/46 (5), (6) | 11/17 at 100.00 | N/R | | 140,280 | |
| | 730 | | Tennessee Housing Development Agency, Homeownership Program Bonds, Series 2001-3A, 5.200%, 7/01/22 (Alternative Minimum Tax) | 7/11 at 100.00 | AA+ | | 730,562 | |
| | 8,285 | | Total Tennessee | | | | 1,662,778 | |
| | | | Texas – 23.2% (15.4% of Total Investments) | | | | | |
| | 5,445 | | Board of Regents, University of Texas System, Financing System Revenue Bonds, Series 2006F, 4.250%, 8/15/36 (UB) | 2/17 at 100.00 | AAA | | 5,088,135 | |
| | 3,850 | | Dallas-Ft. Worth International Airport, Texas, Joint Revenue Refunding and Improvement Bonds, Series 2001A, 5.500%, 11/01/35 – NPFG Insured (Alternative Minimum Tax) | 11/11 at 100.00 | A+ | | 3,682,949 | |
| | 5,000 | | Decatur Hospital Authority, Texas, Revenue Bonds, Wise Regional Health System, Series 2004A, 7.000%, 9/01/25 | 9/14 at 100.00 | N/R | | 4,876,000 | |
| | 4,040 | | Harris County, Texas, Tax and Revenue Certificates of Obligation, Series 2001, 5.000%, 8/15/27 (Pre-refunded 8/15/11) | 8/11 at 100.00 | AAA | | 4,096,600 | |
| | | Nuveen Dividend Advantage Municipal Fund 3 (continued) |
| NZF | | Portfolio of Investments |
| | | April 30, 2011 (Unaudited) |
| | Principal | | | Optional Call | | | | |
| | Amount (000) | | Description (1) | Provisions (2) | Ratings (3) | | Value | |
| | | | Texas (continued) | | | | | |
| $ | 6,000 | | Houston, Texas, Junior Lien Water and Sewerage System Revenue Refunding Bonds, Series 2001B, 5.500%, 12/01/29 – NPFG Insured (ETM) | No Opt. Call | N/R (4) | $ | 6,927,480 | |
| | 7,000 | | Houston, Texas, Subordinate Lien Airport System Revenue Bonds, Series 1998B, 5.250%, 7/01/14 – NPFG Insured (Alternative Minimum Tax) | 7/11 at 100.00 | A | | 7,016,030 | |
| | | | Houston, Texas, Subordinate Lien Airport System Revenue Refunding Bonds, Series 2001A: | | | | | |
| | 2,525 | | 5.500%, 7/01/13 – FGIC Insured (Alternative Minimum Tax) | 1/12 at 100.00 | A | | 2,594,842 | |
| | 2,905 | | 5.500%, 7/01/14 – FGIC Insured (Alternative Minimum Tax) | 1/12 at 100.00 | A | | 2,985,352 | |
| | 14,200 | | Hutto Independent School District, Williamson County, Texas, General Obligation Bonds, Series 2007A, 4.750%, 8/01/43 (UB) | 8/16 at 100.00 | AAA | | 14,117,782 | |
| | | | Jefferson County Health Facilities Development Corporation, Texas, FHA-Insured Mortgage Revenue Bonds, Baptist Hospital of Southeast Texas, Series 2001: | | | | | |
| | 8,500 | | 5.400%, 8/15/31 (Pre-refunded 8/15/11) – AMBAC Insured | 8/11 at 100.00 | N/R (4) | | 8,615,515 | |
| | 8,500 | | 5.500%, 8/15/41 (Pre-refunded 8/15/11) – AMBAC Insured | 8/11 at 100.00 | N/R (4) | | 8,618,065 | |
| | 3,090 | | Laredo Independent School District, Webb County, Texas, General Obligation Refunding Bonds, Series 2001, 5.000%, 8/01/25 | 8/11 at 100.00 | AAA | | 3,116,327 | |
| | 7,610 | | Laredo Independent School District, Webb County, Texas, General Obligation Refunding Bonds, Series 2001, 5.000%, 8/01/25 (Pre-refunded 8/01/11) | 8/11 at 100.00 | Aaa | | 7,702,538 | |
| | 8,000 | | Lower Colorado River Authority, Texas, Transmission Contract Refunding Revenue Bonds, LCRA Transmission Services Corporation Project, Refunding & Improvement Series 2010, 5.000%, 5/15/40 | 5/20 at 100.00 | A | | 7,634,640 | |
| | 1,750 | | Martin County Hospital District, Texas, Combination Limited Tax and Revenue Bonds, Series 2011A, 7.250%, 4/01/36 | 4/21 at 100.00 | N/R | | 1,733,935 | |
| | 2,500 | | Matagorda County Navigation District 1, Texas, Collateralized Revenue Refunding Bonds, Houston Light and Power Company, Series 1997, 5.125%, 11/01/28 – AMBAC Insured (Alternative Minimum Tax) | No Opt. Call | A3 | | 2,387,350 | |
| | 3,150 | | North Texas Tollway Authority, Second Tier System Revenue Refunding Bonds, Series 2008F, 5.750%, 1/01/38 | 1/18 at 100.00 | A3 | | 3,065,990 | |
| | | | North Texas Tollway Authority, Special Projects System Revenue Bonds, Series 2011A: | | | | | |
| | 4,370 | | 0.000%, 9/01/43 | 9/31 at 100.00 | AA | | 2,050,273 | |
| | 9,130 | | 0.000%, 9/01/45 | 9/31 at 100.00 | AA | | 4,941,613 | |
| | 3,045 | | Port of Houston Authority, Harris County, Texas, General Obligation Port Improvement Bonds, Series 2001B, 5.500%, 10/01/17 – FGIC Insured (Alternative Minimum Tax) | 10/11 at 100.00 | AAA | | 3,078,282 | |
| | 3,500 | | Southwest Higher Education Authority Inc, Texas, Revenue Bonds, Southern Methodist University, Series 2010, 5.000%, 10/01/41 | No Opt. Call | AA– | | 3,454,045 | |
| | 7,700 | | Tarrant County Cultural & Educational Facilities Financing Corporation, Texas, Revenue Bonds, Texas Health Resources, Series 2007A, 5.000%, 2/15/36 (UB) | 2/17 at 100.00 | AA– | | 7,036,029 | |
| | 8,820 | | Texas Department of Housing and Community Affairs, Residential Mortgage Revenue Bonds, Series 2001A, 5.350%, 7/01/33 (Alternative Minimum Tax) | 7/11 at 100.00 | AAA | | 8,662,034 | |
| | | | White Settlement Independent School District, Tarrant County, Texas, General Obligation Bonds, Series 2006: | | | | | |
| | 9,110 | | 0.000%, 8/15/37 | 8/15 at 31.98 | AAA | | 2,083,639 | |
| | 9,110 | | 0.000%, 8/15/40 | 8/15 at 27.11 | AAA | | 1,727,529 | |
| | 7,110 | | 0.000%, 8/15/44 | 8/15 at 21.88 | AAA | | 1,057,541 | |
| | 155,960 | | Total Texas | | | | 128,350,515 | |
| | | | Utah – 0.4% (0.3% of Total Investments) | | | | | |
| | | | Utah Housing Corporation, Single Family Mortgage Bonds, Series 2001E: | | | | | |
| | 665 | | 5.200%, 1/01/18 (Alternative Minimum Tax) | 7/11 at 100.00 | AA– | | 668,132 | |
| | 240 | | 5.500%, 1/01/23 (Alternative Minimum Tax) | 7/11 at 100.00 | Aaa | | 246,206 | |
| | | | Utah Housing Corporation, Single Family Mortgage Bonds, Series 2001F-1: | | | | | |
| | 1,075 | | 4.950%, 7/01/18 (Alternative Minimum Tax) | 7/11 at 100.00 | AA– | | 1,092,813 | |
| | 360 | | 5.300%, 7/01/23 (Alternative Minimum Tax) | 7/11 at 100.00 | Aaa | | 366,667 | |
| | 2,340 | | Total Utah | | | | 2,373,818 | |
| | | | Virginia – 0.2% (0.1% of Total Investments) | | | | | |
| | 1,000 | | Chesterfield County Health Center Commission, Virginia, Mortgage Revenue Bonds, Lucy Corr Village, Series 2005, 5.375%, 12/01/28 | 12/15 at 100.00 | N/R | | 848,650 | |
| | Principal | | | Optional Call | | | | |
| | Amount (000) | | Description (1) | Provisions (2) | Ratings (3) | | Value | |
| | | | Washington – 13.1% (8.7% of Total Investments) | | | | | |
| | | | Bellingham Housing Authority, Washington, Housing Revenue Bonds, Varsity Village Project, Series 2001A: | | | | | |
| $ | 1,000 | | 5.500%, 12/01/27 – NPFG Insured | 12/11 at 100.00 | Aaa | $ | 1,006,110 | |
| | 2,000 | | 5.600%, 12/01/36 – NPFG Insured | 12/11 at 100.00 | Aaa | | 2,007,000 | |
| | 2,500 | | King County, Washington, Sewer Revenue Bonds, Series 2009, 5.250%, 1/01/42 | 1/19 at 100.00 | AA+ | | 2,559,225 | |
| | | | Port of Seattle, Washington, Revenue Bonds, Series 2001B: | | | | | |
| | 2,535 | | 5.625%, 4/01/18 – FGIC Insured (Alternative Minimum Tax) (UB) | 10/11 at 100.00 | Aa2 | | 2,577,816 | |
| | 16,000 | | 5.100%, 4/01/24 – FGIC Insured (Alternative Minimum Tax) (UB) | 7/11 at 100.00 | Aa2 | | 16,001,280 | |
| | 1,440 | | Public Utility District 1, Benton County, Washington, Electric Revenue Refunding Bonds, Series 2001A, 5.625%, 11/01/15 (Pre-refunded 11/01/11) – AGM Insured | 11/11 at 100.00 | AA+ (4) | | 1,478,491 | |
| | 650 | | Public Utility District 1, Benton County, Washington, Electric Revenue Refunding Bonds, Series 2001A, 5.625%, 11/01/15 – AGM Insured | 11/11 at 100.00 | AA+ | | 664,957 | |
| | 4,530 | | Tacoma, Washington, Solid Waste Utility Revenue Refunding Bonds, Series 2001, 5.250%, 12/01/21 (Pre-refunded 12/01/11) – AMBAC Insured | 12/11 at 100.00 | AA (4) | | 4,660,691 | |
| | 3,720 | | Washington State Health Care Facilities Authority, Revenue Bonds, Children’s Hospital and Regional Medical Center, Series 2001, 5.375%, 10/01/18 (Pre-refunded 10/01/11) – AMBAC Insured | 10/11 at 100.00 | Aa3 (4) | | 3,798,046 | |
| | | | Washington State Health Care Facilities Authority, Revenue Bonds, Good Samaritan Hospital, Series 2001: | | | | | |
| | 5,480 | | 5.500%, 10/01/21 (Pre-refunded 10/01/11) – RAAI Insured | 10/11 at 101.00 | BBB– (4) | | 5,652,565 | |
| | 25,435 | | 5.625%, 10/01/31 (Pre-refunded 10/01/11) – RAAI Insured | 10/11 at 101.00 | BBB– (4) | | 26,249,429 | |
| | | | Washington State Health Care Facilities Authority, Revenue Bonds, Group Health Cooperative of Puget Sound, Series 2001: | | | | | |
| | 3,005 | | 5.375%, 12/01/17 – AMBAC Insured | 12/11 at 101.00 | BBB | | 3,052,509 | |
| | 2,915 | | 5.375%, 12/01/18 – AMBAC Insured | 12/11 at 101.00 | BBB | | 2,953,216 | |
| | 71,210 | | Total Washington | | | | 72,661,335 | |
| | | | Wisconsin – 2.4% (1.6% of Total Investments) | | | | | |
| | | | Appleton, Wisconsin, Waterworks Revenue Refunding Bonds, Series 2001: | | | | | |
| | 3,705 | | 5.375%, 1/01/20 (Pre-refunded 1/01/12) – FGIC Insured | 1/12 at 100.00 | N/R (4) | | 3,830,785 | |
| | 1,850 | | 5.000%, 1/01/21 (Pre-refunded 1/01/12) – FGIC Insured | 1/12 at 100.00 | N/R (4) | | 1,908,146 | |
| | 1,000 | | Wisconsin Health and Educational Facilities Authority, Revenue Bonds, Franciscan Sisters of Christian Charity HealthCare Ministry, Series 2007, 5.000%, 9/01/33 | 9/17 at 100.00 | BBB+ | | 851,560 | |
| | 350 | | Wisconsin Health and Educational Facilities Authority, Revenue Bonds, Froedtert and Community Health Obligated Group, Series 2001, 5.375%, 10/01/30 | 10/11 at 101.00 | AA– | | 350,291 | |
| | 3,650 | | Wisconsin Health and Educational Facilities Authority, Revenue Bonds, Froedtert and Community Health Obligated Group, Series 2001, 5.375%, 10/01/30 (Pre-refunded 10/01/11) | 10/11 at 101.00 | AA– (4) | | 3,763,041 | |
| | 2,500 | | Wisconsin Health and Educational Facilities Authority, Revenue Bonds, Marshfield Clinic, Series 2001B, 6.000%, 2/15/25 | 2/12 at 100.00 | BBB+ | | 2,506,225 | |
| | 330 | | Wisconsin Health and Educational Facilities Authority, Revenue Bonds, Wheaton Franciscan Services Inc., Series 2003A, 5.125%, 8/15/33 | 8/13 at 100.00 | BBB+ | | 280,018 | |
| | 13,385 | | Total Wisconsin | | | | 13,490,066 | |
| $ | 982,563 | | Total Municipal Bonds (cost $852,788,119) | | | | 824,171,872 | |
| | | | | | | | | |
| | Shares | | Description (1) | | | | Value | |
| | | | Investment Companies – 0.6% (0.4% of Total Investments) | | | | | |
| | 6,266 | | BlackRock MuniHoldings Fund Inc. | | | $ | 90,920 | |
| | 26,880 | | Dreyfus Strategic Municipal Fund | | | | 211,277 | |
| | 131,278 | | DWS Municipal Income Trust | | | | 1,537,265 | |
| | 43,020 | | Invesco Van Kampen Investment Grade Municipal Trust | | | | 566,573 | |
| | 30,000 | | Invesco Van Kampen Municipal Opportunity Trust | | | | 386,700 | |
| | 43,420 | | PIMCO Municipal Income Fund II | | | | 438,542 | |
| | | | Total Investment Companies (cost $3,325,133) | | | | 3,231,277 | |
| | | Nuveen Dividend Advantage Municipal Fund 3 (continued) |
| NZF | | Portfolio of Investments |
April 30, 2011 (Unaudited)
| | Principal | | | Optional Call | | | | |
| | Amount (000) | | Description (1) | Provisions (2) | Ratings (3) | | Value | |
| | | | Short-Term Investments – 0.9% (0.6% of Total Investments) | | | | | |
| | | | South Carolina – 0.9% (0.6% of Total Investments) | | | | | |
| $ | 4,730 | | South Carolina Educational Facilities Authority, Charleston Southern University Education Facilities Revenue Bond, Variable Rate Demand Series 2003, 0.270%, 4/01/28 (8) | 5/11 at 100.00 | N/R | $ | 4,730,000 | |
| $ | 4,730 | | Total Short-Term Investments (cost $4,730,000) | | | | 4,730,000 | |
| | | | Total Investments (cost $860,843,252) – 150.5% | | | | 832,133,149 | |
| | | | Floating Rate Obligations – (11.1)% | | | | (61,132,000) | |
| | | | MuniTerm Preferred Shares, at Liquidation Value – (12.7)% (9) | | | | (70,000,000) | |
| | | | Other Assets Less Liabilities – 3.8% | | | | 20,399,964 | |
| | | | Auction Rate Preferred Shares at Liquidation Value – (30.5)% (9) | | | | (168,400,000) | |
| | | | Net Assets Applicable to Common Shares – 100% | | | $ | 553,001,113 | |
| (1) | | All percentages shown in the Portfolio of Investments are based on net assets applicable to Common shares unless otherwise noted. |
| (2) | | Optional Call Provisions: Dates (month and year) and prices of the earliest optional call or redemption. There may be other call provisions at varying prices at later dates. Certain mortgage-backed securities may be subject to periodic principal paydowns. |
| (3) | | Ratings: Using the highest of Standard & Poor’s Group (“Standard & Poor’s”), Moody’s Investor Service, Inc. (“Moody’s”) or Fitch, Inc. (“Fitch”) rating. Ratings below BBB by Standard & Poor’s, Baa by Moody’s or BBB by Fitch are considered to be below investment grade. Holdings designated N/R are not rated by any of these national rating agencies. |
| (4) | | Backed by an escrow or trust containing sufficient U.S. Government or U.S. Government agency securities, which ensure the timely payment of principal and interest. Such investments are normally considered to be equivalent to AAA rated securities. |
| (5) | | At or subsequent to the end of the reporting period, this security is non-income producing. Non-income producing security, in the case of a bond, generally denotes that the issuer has (1) defaulted on the payment of principal or interest, (2) is under the protection of the Federal Bankruptcy Court or (3) the Fund’s Adviser has concluded that the issue is not likely to meet its future interest payment obligations and has directed the Fund’s custodian to cease accruing additional income on the Fund’s records. |
| (6) | | For fair value measurement disclosure purposes, investment categorized as Level 3. See Notes to Financial Statements, Footnote 1 – General Information and Significant Accounting Policies, Investment Valuation for more information. |
| (7) | | Investment, or portion of investment, has been pledged to collateralize the net payment obligations of investments in inverse floating rate transactions. |
| (8) | | Investment has a maturity of more than one year, but has variable rate and demand features which qualify it as a short-term investment. The rate disclosed is that in effect at the end of the reporting period. This rate changes periodically based on market conditions or a specified market index. |
| (9) | | MuniFund Term Preferred Shares and Auction Rate Preferred Shares, at Liquidation Value as a percentage of Total Investments are 8.4% and 20.2%, respectively. |
| N/R | | Not rated. |
| (ETM) | | Escrowed to maturity. |
| (IF) | | Inverse floating rate investment. |
| (UB) | | Underlying bond of an inverse floating rate trust reflected as a financing transaction. See Notes to Financial Statements, Footnote 1 – General Information and Significant Accounting Policies, Inverse Floating Rate Securities for more information. |
See accompanying notes to financial statements.
| | | Statement of |
| | | Assets & Liabilities |
| | | April 30, 2011 (Unaudited) |
| | | Performance Plus | | Municipal Advantage | | Market Opportunity | |
| | | (NPP | ) | (NMA | ) | (NMO | ) |
| Assets | | | | | | | | | | |
| Investments, at value (cost $1,282,652,166, $949,386,064 and $1,005,041,850, respectively) | | $ | 1,263,296,465 | | $ | 912,199,838 | | $ | 937,587,364 | |
| Cash | | | 14,156,274 | | | 1,583,416 | | | 7,060,180 | |
| Receivables: | | | | | | | | | | |
| Dividends and interest | | | 18,242,171 | | | 15,420,637 | | | 15,370,577 | |
| Investments sold | | | 10,000 | | | 10,707,134 | | | 9,205,000 | |
| Deferred offering costs | | | 1,673,393 | | | 2,054,038 | | | 4,061,310 | |
| Other assets | | | 317,030 | | | 445,183 | | | 432,986 | |
| Total assets | | | 1,297,695,333 | | | 942,410,246 | | | 973,717,417 | |
| Liabilities | | | | | | | | | | |
| Floating rate obligations | | | 40,825,000 | | | 59,788,333 | | | 43,530,000 | |
| Payables: | | | | | | | | | | |
| Auction Rate Preferred share dividends | | | 12,066 | | | — | | | — | |
| Common share dividends | | | 4,142,261 | | | 3,070,577 | | | 3,265,632 | |
| Interest | | | 520,251 | | | — | | | — | |
| Offering costs | | | 249,154 | | | 243,099 | | | 393,751 | |
| MuniFund Term Preferred (MTP) shares, at liquidation value | | | — | | | — | | | — | |
| Variable MuniFund Term Preferred (VMTP) shares, at liquidation value | | | 421,700,000 | | | — | | | — | |
| Variable Rate Demand Preferred (VRDP) shares, at liquidation value | | | — | | | 296,800,000 | | | 350,900,000 | |
| Accrued expenses: | | | | | | | | | | |
| Management fees | | | 636,099 | | | 409,397 | | | 396,894 | |
| Other | | | 357,793 | | | 210,809 | | | 257,054 | |
| Total liabilities | | | 468,442,624 | | | 360,522,215 | | | 398,743,331 | |
| Auction Rate Preferred shares (ARPS), at liquidation value | | | — | | | — | | | — | |
| Net assets applicable to Common shares | | $ | 829,252,709 | | $ | 581,888,031 | | $ | 574,974,086 | |
| Common shares outstanding | | | 59,952,462 | | | 43,502,742 | | | 45,809,174 | |
| Net asset value per Common share outstanding (net assets applicable to Common shares, divided by Common shares outstanding) | | $ | 13.83 | | $ | 13.38 | | $ | 12.55 | |
| Net assets applicable to Common shares consist of: | | | | | | | | | | |
| Common shares, $.01 par value per share | | $ | 599,525 | | $ | 435,027 | | $ | 458,092 | |
| Paid-in surplus | | | 838,916,306 | | | 608,197,679 | | | 639,096,126 | |
| Undistributed (Over-distribution of) net investment income | | | 17,262,981 | | | 9,157,952 | | | 7,838,360 | |
| Accumulated net realized gain (loss) | | | (8,170,402 | ) | | 1,283,599 | | | (4,964,006 | ) |
| Net unrealized appreciation (depreciation) | | | (19,355,701 | ) | | (37,186,226 | ) | | (67,454,486 | ) |
| Net assets applicable to Common shares | | $ | 829,252,709 | | $ | 581,888,031 | | $ | 574,974,086 | |
| Authorized shares: | | | | | | | | | | |
| Common | | | 200,000,000 | | | 200,000,000 | | | 200,000,000 | |
| ARPS | | | 1,000,000 | | | 1,000,000 | | | 1,000,000 | |
| MTP | | | — | | | — | | | — | |
| VMTP | | | Unlimited | | | — | | | — | |
| VRDP | | | — | | | Unlimited | | | Unlimited | |
See accompanying notes to financial statements.
| | | Statement of |
| | | Assets & Liabilities (continued) |
| | | April 30, 2011 (Unaudited) |
| | | | | | | | | | | |
| | | Dividend Advantage | | Dividend Advantage 2 | | Dividend Advantage 3 | |
| | | (NAD | ) | (NXZ | ) | (NZF | ) |
| Assets | | | | | | | | | | |
| Investments, at value (cost $856,943,299, $618,711,664 and $860,843,252, respectively) | | $ | 815,024,785 | | $ | 591,162,570 | | $ | 832,133,149 | |
| Cash | | | 8,970,092 | | | 246,751 | | | 7,482,669 | |
| Receivables: | | | | | | | | | | |
| Dividends and interest | | | 13,371,333 | | | 11,110,151 | | | 14,918,011 | |
| Investments sold | | | 50,968 | | | 15,577,229 | | | 656,846 | |
| Deferred offering costs | | | 2,002,216 | | | 2,106,015 | | | 1,325,669 | |
| Other assets | | | 214,967 | | | 239,623 | | | 203,737 | |
| Total assets | | | 839,634,361 | | | 620,442,339 | | | 856,720,081 | |
| Liabilities | | | | | | | | | | |
| Floating rate obligations | | | 51,605,000 | | | 26,660,000 | | | 61,132,000 | |
| Payables: | | | | | | | | | | |
| Auction Rate Preferred share dividends | | | 16,806 | | | — | | | 11,989 | |
| Common share dividends | | | 2,877,538 | | | 2,277,967 | | | 3,206,285 | |
| Interest | | | 324,675 | | | — | | | 163,333 | |
| Offering costs | | | 211,269 | | | 108,461 | | | 250,041 | |
| MuniFund Term Preferred (MTP) shares, at liquidation value | | | 144,300,000 | | | — | | | 70,000,000 | |
| Variable MuniFund Term Preferred (VMTP) shares, at liquidation value | | | — | | | — | | | — | |
| Variable Rate Demand Preferred (VRDP) shares, at liquidation value | | | — | | | 196,000,000 | | | — | |
| Accrued expenses: | | | | | | | | | | |
| Management fees | | | 402,512 | | | 294,387 | | | 391,739 | |
| Other | | | 234,577 | | | 147,898 | | | 163,581 | |
| Total liabilities | | | 199,972,377 | | | 225,488,713 | | | 135,318,968 | |
| Auction Rate Preferred shares (ARPS), at liquidation value | | | 120,075,000 | | | — | | | 168,400,000 | |
| Net assets applicable to Common shares | | $ | 519,586,984 | | $ | 394,953,626 | | $ | 553,001,113 | |
| Common shares outstanding | | | 39,296,352 | | | 29,461,808 | | | 40,392,021 | |
| Net asset value per Common share outstanding (net assets applicable to Common shares, divided by Common shares outstanding) | | $ | 13.22 | | $ | 13.41 | | $ | 13.69 | |
| Net assets applicable to Common shares consist of: | | | | | | | | | | |
| Common shares, $.01 par value per share | | $ | 392,964 | | $ | 294,618 | | $ | 403,920 | |
| Paid-in surplus | | | 550,828,919 | | | 420,334,455 | | | 575,733,715 | |
| Undistributed (Over-distribution of) net investment income | | | 10,751,430 | | | 5,961,835 | | | 10,185,779 | |
| Accumulated net realized gain (loss) | | | (467,815 | ) | | (4,088,188 | ) | | (4,612,198 | ) |
| Net unrealized appreciation (depreciation) | | | (41,918,514 | ) | | (27,549,094 | ) | | (28,710,103 | ) |
| Net assets applicable to Common shares | | $ | 519,586,984 | | $ | 394,953,626 | | $ | 553,001,113 | |
| Authorized shares: | | | | | | | | | | |
| Common | | | Unlimited | | | Unlimited | | | Unlimited | |
| ARPS | | | Unlimited | | | Unlimited | | | Unlimited | |
| MTP | | | Unlimited | | | — | | | Unlimited | |
| VMTP | | | — | | | — | | | — | |
| VRDP | | | — | | | Unlimited | | | — | |
See accompanying notes to financial statements.
| | | Statement of |
| | | Operations |
| | | Six Months Ended April 30, 2011 (Unaudited) |
| | | Performance Plus | | Municipal Advantage | | Market Opportunity | | Dividend Advantage | | Dividend Advantage 2 | | Dividend Advantage 3 | |
| | | (NPP | ) | (NMA | ) | (NMO | ) | (NAD | ) | (NXZ | ) | (NZF | ) |
| Investment Income | | $ | 35,888,197 | | $ | 26,491,337 | | $ | 26,586,348 | | $ | 23,649,535 | | $ | 18,128,297 | | $ | 24,238,421 | |
| Expenses | | | | | | | | | | | | | | | | | | | |
| Management fees | | | 3,890,994 | | | 2,774,296 | | | 2,853,509 | | | 2,471,176 | | | 1,811,423 | | | 2,607,619 | |
| Auction fees | | | 198,133 | | | 121,284 | | | 176,424 | | | 89,316 | | | 98,544 | | | 145,814 | |
| Dividend disbursing agent fees | | | 28,137 | | | — | | | — | | | 14,877 | | | — | | | 14,877 | |
| Shareholders’ servicing agent fees and expenses | | | 51,122 | | | 32,204 | | | 34,181 | | | 24,807 | | | 1,898 | | | 8,113 | |
| Interest expense and amortization of offering costs | | | 1,407,134 | | | 941,207 | | | 1,021,569 | | | 2,339,628 | | | 557,740 | | | 1,074,558 | |
| Liquidity fees on VRDP shares | | | — | | | 1,920,806 | | | 1,796,887 | | | — | | | 1,003,675 | | | — | |
| Custodian’s fees and expenses | | | 107,044 | | | 75,031 | | | 78,318 | | | 68,252 | | | 52,405 | | | 67,438 | |
| Directors’/Trustees’ fees and expenses | | | 16,879 | | | 13,087 | | | 13,286 | | | 11,443 | | | 8,670 | | | 11,728 | |
| Professional fees | | | 98,460 | | | 100,532 | | | 280,977 | | | 128,541 | | | 134,507 | | | 38,252 | |
| Shareholders’ reports – printing and mailing expenses | | | 75,625 | | | 31,570 | | | 51,965 | | | 33,054 | | | 21,998 | | | 28,105 | |
| Stock exchange listing fees | | | 10,045 | | | 7,285 | | | 7,638 | | | 22,284 | | | 2,038 | | | 2,795 | |
| Investor relations expense | | | 31,237 | | | 21,113 | | | 22,199 | | | 15,503 | | | 12,347 | | | 16,471 | |
| Other expenses | | | 41,184 | | | 25,741 | | | 27,532 | | | 29,617 | | | 21,208 | | | 22,300 | |
| Total expenses before custodian fee credit and expense reimbursement | | | 5,955,994 | | | 6,064,156 | | | 6,364,485 | | | 5,248,498 | | | 3,726,453 | | | 4,038,070 | |
| Custodian fee credit | | | (7,489 | ) | | (8,743 | ) | | (7,524 | ) | | (9,085 | ) | | (6,071 | ) | | (8,700 | ) |
| Expense reimbursement | | | — | | | — | | | — | | | — | | | (123,892 | ) | | (215,066 | ) |
| Net expenses | | | 5,948,505 | | | 6,055,413 | | | 6,356,961 | | | 5,239,413 | | | 3,596,490 | | | 3,814,304 | |
| Net investment income | | | 29,939,692 | | | 20,435,924 | | | 20,229,387 | | | 18,410,122 | | | 14,531,807 | | | 20,424,117 | |
| Realized and Unrealized Gain(Loss) | | | | | | | | | | | | | | | | | | | |
| Net realized gain (loss) from investments | | | (1,764,004 | ) | | 3,687,389 | | | 187,456 | | | 4,479,750 | | | 2,792,794 | | | (1,476,912 | ) |
| Change in net unrealized appreciation (depreciation) of investments | | | (80,478,387 | ) | | (63,982,599 | ) | | (72,119,667 | ) | | (62,099,178 | ) | | (43,053,802 | ) | | (40,508,757 | ) |
| Net realized and unrealized gain (loss) | | | (82,242,391 | ) | | (60,295,210 | ) | | (71,932,211 | ) | | (57,619,428 | ) | | (40,261,008 | ) | | (41,985,669 | ) |
| Distributions to Auction Rate Preferred Shareholders | | | | | | | | | | | | | | | | | | | |
| From net investment income | | | (617,092 | ) | | — | | | — | | | (243,637 | ) | | — | | | (402,855 | ) |
| From accumulated net realized gains | | | (115,631 | ) | | — | | | — | | | — | | | — | | | (9,510 | ) |
| Decrease in net assets applicable to Common shares from distributions to Auction Rate Preferred shareholders | | | (732,723 | ) | | — | | | — | | | (243,637 | ) | | — | | | (412,365 | ) |
| Net increase (decrease) in net assets applicable to Common shares from operations | | $ | (53,035,422 | ) | $ | (39,859,286 | ) | $ | (51,702,824 | ) | $ | (39,452,943 | ) | $ | (25,729,201 | ) | $ | (21,973,917 | ) |
See accompanying notes to financial statements.
| | | Statement of |
| | | Changes in Net Assets (Unaudited) |
| | | Performance Plus (NPP) | | Municipal Advantage (NMA) | | Market Opportunity (NMO) | |
| | | Six Months Ended 4/30/11 | | Year Ended 10/31/10 | | Six Months Ended 4/30/11 | | Year Ended 10/31/10 | | Six Months Ended 4/30/11 | | Year Ended 10/31/10 | |
| Operations | | | | | | | | | | | | | | | | | | | |
| Net investment income | | $ | 29,939,692 | | $ | 61,961,159 | | $ | 20,435,924 | | $ | 43,865,457 | | $ | 20,229,387 | | $ | 45,415,957 | |
| Net realized gain (loss) from investments | | | (1,764,004 | ) | | 5,333,340 | | | 3,687,389 | | | 2,499,059 | | | 187,456 | | | 7,021,125 | |
| Change in net unrealized appreciation (depreciation) of investments | | | (80,478,387 | ) | | 36,406,331 | | | (63,982,599 | ) | | 29,929,503 | | | (72,119,667 | ) | | 18,357,610 | |
| Distributions to Auction Rate Preferred Shareholders: | | | | | | | | | | | | | | | | | | | |
| From net investment income | | | (617,092 | ) | | (1,674,198 | ) | | — | | | (355,444 | ) | | — | | | (606,064 | ) |
| From accumulated net realized gains | | | (115,631 | ) | | (47,490 | ) | | — | | | (183,376 | ) | | — | | | — | |
| Net increase (decrease) in net assets applicable to Common shares from operations | | | (53,035,422 | ) | | 101,979,142 | | | (39,859,286 | ) | | 75,755,199 | | | (51,702,824 | ) | | 70,188,628 | |
| Distributions to Common Shareholders | | | | | | | | | | | | | | | | | | | |
| From net investment income | | | (28,613,787 | ) | | (55,177,839 | ) | | (21,522,544 | ) | | (42,290,819 | ) | | (22,385,381 | ) | | (43,873,378 | ) |
| From accumulated net realized gains | | | (5,533,612 | ) | | (814,831 | ) | | — | | | (2,827,574 | ) | | — | | | — | |
| Decrease in net assets applicable to Common shares from distributions to Common shareholders | | | (34,147,399 | ) | | (55,992,670 | ) | | (21,522,544 | ) | | (45,118,393 | ) | | (22,385,381 | ) | | (43,873,378 | ) |
| Capital Share Transactions | | | | | | | | | | | | | | | | | | | |
| Net proceeds from Common shares issued to shareholders due to reinvestment of distributions | | | 283,901 | | | 292,445 | | | 905,902 | | | 2,913,988 | | | 1,045,705 | | | 2,382,420 | |
| Net increase (decrease) in net assets applicable to Common shares from capital share transactions | | | 283,901 | | | 292,445 | | | 905,902 | | | 2,913,988 | | | 1,045,705 | | | 2,382,420 | |
| Net increase (decrease) in net assets applicable to Common shares | | | (86,898,920 | ) | | 46,278,917 | | | (60,475,928 | ) | | 33,550,794 | | | (73,042,500 | ) | | 28,697,670 | |
| Net assets applicable to Common shares at the beginning of period | | | 916,151,629 | | | 869,872,712 | | | 642,363,959 | | | 608,813,165 | | | 648,016,586 | | | 619,318,916 | |
| Net assets applicable to Common shares at the end of period | | $ | 829,252,709 | | $ | 916,151,629 | | $ | 581,888,031 | | $ | 642,363,959 | | $ | 574,974,086 | | $ | 648,016,586 | |
| Undistributed (Over-distribution of) net investment income at the end of period | | $ | 17,262,981 | | $ | 16,554,168 | | $ | 9,157,952 | | $ | 10,244,572 | | $ | 7,838,360 | | $ | 9,994,354 | |
See accompanying notes to financial statements.
| | | Dividend Advantage (NAD) | | Dividend Advantage 2 (NXZ) | | Dividend Advantage 3 (NZF) | |
| | | Six Months Ended 4/30/11 | | Year Ended 10/31/10 | | Six Months Ended 4/30/11 | | Year Ended 10/31/10 | | Six Months Ended 4/30/11 | | Year Ended 10/31/10 | |
| Operations | | | | | | | | | | | | | | | | | | | |
| Net investment income | | $ | 18,410,122 | | $ | 39,281,244 | | $ | 14,531,807 | | $ | 30,012,369 | | $ | 20,424,117 | | $ | 43,023,730 | |
| Net realized gain (loss) from investments | | | 4,479,750 | | | 1,079,125 | | | 2,792,794 | | | 1,450,091 | | | (1,476,912 | ) | | 786,636 | |
| Change in net unrealized appreciation (depreciation) of investments | | | (62,099,178 | ) | | 27,410,233 | | | (43,053,802 | ) | | 6,351,263 | | | (40,508,757 | ) | | 20,450,314 | |
| Distributions to Auction Rate Preferred Shareholders: | | | | | | | | | | | | | | | | | | | |
| From net investment income | | | (243,637 | ) | | (724,675 | ) | | — | | | — | | | (402,855 | ) | | (880,640 | ) |
| From accumulated net realized gains | | | — | | | — | | | — | | | — | | | (9,510 | ) | | (125,552 | ) |
| Net increase (decrease) in net assets applicable to Common shares from operations | | | (39,452,943 | ) | | 67,045,927 | | | (25,729,201 | ) | | 37,813,723 | | | (21,973,917 | ) | | 63,254,488 | |
| Distributions to Common Shareholders | | | | | | | | | | | | | | | | | | | |
| From net investment income | | | (17,918,790 | ) | | (35,752,124 | ) | | (14,141,332 | ) | | (28,615,006 | ) | | (19,872,502 | ) | | (38,518,652 | ) |
| From accumulated net realized gains | | | — | | | — | | | — | | | — | | | (630,116 | ) | | (2,547,863 | ) |
| Decrease in net assets applicable to Common shares from distributions to Common shareholders | | | (17,918,790 | ) | | (35,752,124 | ) | | (14,141,332 | ) | | (28,615,006 | ) | | (20,502,618 | ) | | (41,066,515 | ) |
| Capital Share Transactions | | | | | | | | | | | | | | | | | | | |
| Net proceeds from Common shares issued to shareholders due to reinvestment of distributions | | | 63,949 | | | 66,815 | | | 59,744 | | | 312,251 | | | 64,704 | | | 137,143 | |
| Net increase (decrease) in net assets applicable to Common shares from capital share transactions | | | 63,949 | | | 66,815 | | | 59,744 | | | 312,251 | | | 64,704 | | | 137,143 | |
| Net increase (decrease) in net assets applicable to Common shares | | | (57,307,784 | ) | | 31,360,618 | | | (39,810,789 | ) | | 9,510,968 | | | (42,411,831 | ) | | 22,325,116 | |
| Net assets applicable to Common shares at the beginning of period | | | 576,894,768 | | | 545,534,150 | | | 434,764,415 | | | 425,253,447 | | | 595,412,944 | | | 573,087,828 | |
| Net assets applicable to Common shares at the end of period | | $ | 519,586,984 | | $ | 576,894,768 | | $ | 394,953,626 | | $ | 434,764,415 | | $ | 553,001,113 | | $ | 595,412,944 | |
| Undistributed (Over-distribution of) net investment income at the end of period | | $ | 10,751,430 | | $ | 10,503,735 | | $ | 5,961,835 | | $ | 5,571,360 | | $ | 10,185,779 | | $ | 10,037,019 | |
See accompanying notes to financial statements.
| | | Statement of |
| | | Cash Flows |
| | | Six months ended April 30, 2011 (Unaudited) |
| | | Performance Plus | | Municipal Advantage | | Market Opportunity | |
| | | (NPP | ) | (NMA | ) | (NMO | ) |
| Cash Flows from Operating Activities: | | | | | | | | | | |
| Net Increase (Decrease) In Net Assets Applicable to Common Shares from Operations | | $ | (53,035,422 | ) | $ | (39,859,286 | ) | $ | (51,702,824 | ) |
| Adjustments to reconcile the net increase (decrease) in net assets applicable to Common shares from operations to net cash provided by (used in) operating activities: | | | | | | | | | | |
| Purchases of investments | | | (61,152,069 | ) | | (78,690,787 | ) | | (72,867,258 | ) |
| Proceeds from sales and maturities of investments | | | 83,859,031 | | | 94,773,516 | | | 53,454,071 | |
| Proceeds from (Purchases of) short-term investments, net | | | — | | | — | | | — | |
| Amortization (Accretion) of premiums and discounts, net | | | (7,285,814 | ) | | (3,291,936 | ) | | (3,830,335 | ) |
| (Increase) Decrease in: | | | | | | | | | | |
| Receivable for dividends and interest | | | 128,312 | | | 532,803 | | | 632,515 | |
| Receivable for investments sold | | | 785,000 | | | (10,112,134 | ) | | 51,939,000 | |
| Other assets | | | (18,654 | ) | | (15,701 | ) | | (37,331 | ) |
| Increase (Decrease) in: | | | | | | | | | | |
| Payable for investments purchased | | | — | | | — | | | (11,733,982 | ) |
| Payable for Auction Rate Preferred share dividends | | | (13,620 | ) | | — | | | — | |
| Payable for interest | | | 520,251 | | | — | | | — | |
| Accrued management fees | | | (75,685 | ) | | (54,243 | ) | | (63,614 | ) |
| Accrued other liabilities | | | (132,790 | ) | | (128,071 | ) | | (117,298 | ) |
| Net realized (gain) loss from investments | | | 1,764,004 | | | (3,687,389 | ) | | (187,456 | ) |
| Change in net unrealized (appreciation) depreciation of investments | | | 80,478,387 | | | 63,982,599 | | | 72,119,667 | |
| Taxes paid on undistributed capital gains | | | (373 | ) | | (181,644 | ) | | (4,366 | ) |
| Net cash provided by (used in) operating activities | | | 45,820,558 | | | 23,267,727 | | | 37,600,789 | |
| Cash Flows from Financing Activities: | | | | | | | | | | |
| (Increase) Decrease in deferred offering costs | | | (1,673,393 | ) | | 35,885 | | | 69,790 | |
| Increase (Decrease) in: | | | | | | | | | | |
| Cash overdraft balance | | | — | | | — | | | (9,292,196 | ) |
| Floating rate obligations | | | (1,500,000 | ) | | (7,906,650 | ) | | — | |
| Payable for offering costs | | | 249,154 | | | (195 | ) | | — | |
| ARPS, at liquidation value | | | (419,900,000 | ) | | — | | | — | |
| MTP shares, at liquidation value | | | — | | | — | | | — | |
| VMTP shares, at liquidation value | | | 421,700,000 | | | — | | | — | |
| Cash distributions paid to Common shareholders | | | (33,841,564 | ) | | (20,600,367 | ) | | (21,318,203 | ) |
| Net cash provided by (used in) financing activities | | | (34,965,803 | ) | | (28,471,327 | ) | | (30,540,609 | ) |
| Net Increase (Decrease) in Cash | | | 10,854,755 | | | (5,203,600 | ) | | 7,060,180 | |
| Cash at the beginning of period | | | 3,301,519 | | | 6,787,016 | | | — | |
| Cash at the End of Period | | $ | 14,156,274 | | $ | 1,583,416 | | $ | 7,060,180 | |
Supplemental Disclosure of Cash Flow Information
Non-cash financing activities not included herein consist of reinvestments of Common share distributions of $283,901, $905,902 and $1,045,705 for Performance Plus (NPP), Municipal Advantage (NMA) and Market Opportunity (NMO), respectively.
| | | | | | | | | | | |
| | | Performance Plus | | Municipal Advantage | | Market Opportunity | |
| | | (NPP | ) | (NMA | ) | (NMO | ) |
| Cash paid for interest (excluding amortization of offering costs) | | $ | 780,276 | | $ | 905,517 | | $ | 951,779 | |
See accompanying notes to financial statements.
| | | Dividend Advantage | | Dividend Advantage 2 | | Dividend Advantage 3 | |
| | | (NAD | ) | (NXZ | ) | (NZF | ) |
| Cash Flows from Operating Activities: | | | | | | | | | | |
| Net Increase (Decrease) In Net Assets Applicable to Common Shares from Operations | | $ | (39,452,943 | ) | $ | (25,729,201 | ) | $ | (21,973,917 | ) |
| Adjustments to reconcile the net increase (decrease) in net assets applicable to Common shares from operations to net cash provided by (used in) operating activities: | | | | | | | | | | |
| Purchases of investments | | | (81,244,089 | ) | | (89,709,257 | ) | | (78,303,221 | ) |
| Proceeds from sales and maturities of investments | | | 81,902,551 | | | 98,572,064 | | | 95,276,606 | |
| Proceeds from (Purchases of) short-term investments, net | | | — | | | — | | | (4,730,000 | ) |
| Amortization (Accretion) of premiums and discounts, net | | | (4,053,088 | ) | | (2,020,307 | ) | | (753,293 | ) |
| (Increase) Decrease in: | | | | | | | | | | |
| Receivable for dividends and interest | | | (333,933 | ) | | 285,773 | | | 190,088 | |
| Receivable for investments sold | | | 19,377,157 | | | (7,467,229 | ) | | 198,134 | |
| Other assets | | | (21,004 | ) | | (14,141 | ) | | (24,678 | ) |
| Increase (Decrease) in: | | | | | | | | | | |
| Payable for investments purchased | | | (5,859,060 | ) | | — | | | — | |
| Payable for Auction Rate Preferred share dividends | | | (2,150 | ) | | — | | | (1,187 | ) |
| Payable for interest | | | — | | | — | | | 163,333 | |
| Accrued management fees | | | (49,917 | ) | | (6,555 | ) | | (37,610 | ) |
| Accrued other liabilities | | | (32,796 | ) | | (25,843 | ) | | (37,712 | ) |
| Net realized (gain) loss from investments | | | (4,479,750 | ) | | (2,792,794 | ) | | 1,476,912 | |
| Change in net unrealized (appreciation) depreciation of investments | | | 62,099,178 | | | 43,053,802 | | | 40,508,757 | |
| Taxes paid on undistributed capital gains | | | (3,781 | ) | | (244 | ) | | — | |
| Net cash provided by (used in) operating activities | | | 27,846,375 | | | 14,146,068 | | | 31,952,212 | |
| Cash Flows from Financing Activities: | | | | | | | | | | |
| (Increase) Decrease in deferred offering costs | | | 237,867 | | | 36,493 | | | (1,325,669 | ) |
| Increase (Decrease) in: | | | | | | | | | | |
| Cash overdraft balance | | | (1,211,715 | ) | | — | | | — | |
| Floating rate obligations | | | — | | | (1,650 | ) | | (7,276,650 | ) |
| Payable for offering costs | | | (53,021 | ) | | — | | | 250,041 | |
| ARPS, at liquidation value | | | — | | | — | | | (68,550,000 | ) |
| MTP shares, at liquidation value | | | — | | | — | | | 70,000,000 | |
| VMTP shares, at liquidation value | | | — | | | — | | | — | |
| Cash distributions paid to Common shareholders | | | (17,849,414 | ) | | (14,077,408 | ) | | (20,435,333 | ) |
| Net cash provided by (used in) financing activities | | | (18,876,283 | ) | | (14,042,565 | ) | | (27,337,611 | ) |
| Net Increase (Decrease) in Cash | | | 8,970,092 | | | 103,503 | | | 4,614,601 | |
| Cash at the beginning of period | | | — | | | 143,248 | | | 2,868,068 | |
| Cash at the End of Period | | $ | 8,970,092 | | $ | 246,751 | | $ | 7,482,669 | |
Supplemental Disclosure of Cash Flow Information
Non-cash financing activities not included herein consist of reinvestments of Common share distributions of $63,949, $59,744 and $64,704 for Dividend Advantage (NAD), Dividend Advantage 2 (NXZ) and Dividend Advantage 3 (NZF), respectively.
| | | | | | | | | | | |
| | | Dividend Advantage | | Dividend Advantage 2 | | Dividend Advantage 3 | |
| | | (NAD | ) | (NXZ | ) | (NZF | ) |
| Cash paid for interest (excluding amortization of offering costs) | | $ | 2,088,261 | | $ | 521,247 | | $ | 808,223 | |
See accompanying notes to financial statements.
| | | Financial |
| | | Highlights (Unaudited) |
| | | |
| | Selected data for a Common share outstanding throughout each period: |
| | | | | | Investment Operations | | Less Distributions | | | | | | | | | | |
| | | Beginning Common Share Net Asset Value | | Net Investment Income | | Net Realized/ Unrealized Gain (Loss | ) | Distributions from Net Investment Income to Auction Rate Preferred Share- holders | (a) | Distributions from Capital Gains to Auction Rate Preferred Share– holders | (a) | Total | | Net Investment Income to Common Share- holders | | Capital Gains to Common Share– holders | | Total | | Discount from Common Shares Repur- chased and Retired | | Ending Common Share Net Asset Value | | Ending Market Value | |
| Performance Plus (NPP) | | | | | | | | | | | | | | | | | | | | | | | | | |
| Year Ended 10/31: | | | | | | | | | | | | | | | | | | | | | | | | | | | | | | | |
| 2011(f) | | $ | 15.29 | | $ | .50 | | $ | (1.38 | ) | $ | (.01 | ) | $ | — | * | $ | (.89 | ) | $ | (.48 | ) | $ | (.09 | ) | $ | (.57 | ) | $ | — | | $ | 13.83 | | $ | 13.33 | |
| 2010 | | | 14.52 | | | 1.03 | | | .70 | | | (.03 | ) | | — | * | | 1.70 | | | (.92 | ) | | (.01 | ) | | (.93 | ) | | — | | | 15.29 | | | 15.00 | |
| 2009 | | | 12.69 | | | 1.03 | | | 1.65 | | | (.06 | ) | | — | | | 2.62 | | | (.79 | ) | | — | | | (.79 | ) | | — | | | 14.52 | | | 13.48 | |
| 2008 | | | 15.22 | | | 1.02 | | | (2.56 | ) | | (.29 | ) | | — | | | (1.83 | ) | | (.70 | ) | | — | | | (.70 | ) | | — | | | 12.69 | | | 11.50 | |
| 2007 | | | 15.78 | | | .99 | | | (.47 | ) | | (.27 | ) | | (.01 | ) | | .24 | | | (.75 | ) | | (.05 | ) | | (.80 | ) | | — | | | 15.22 | | | 13.59 | |
| 2006 | | | 15.51 | | | 1.00 | | | .38 | | | (.25 | ) | | — | | | 1.13 | | | (.84 | ) | | (.02 | ) | | (.86 | ) | | — | | | 15.78 | | | 15.09 | |
| | | | | | | | | | | | | | | | | | | | | | | | | | |
| Municipal Advantage (NMA) | | | | | | | | | | | | | | | | | | | | | | | | | |
| Year Ended 10/31: | | | | | | | | | | | | | | | | | | | | | | | | | | | | | | | |
| 2011(f) | | | 14.79 | | | .47 | | | (1.38 | ) | | — | | | — | | | (.91 | ) | | (.50 | ) | | — | | | (.50 | ) | | — | | | 13.38 | | | 12.99 | |
| 2010 | | | 14.08 | | | 1.01 | | | .76 | | | (.01 | ) | | — | * | | 1.76 | | | (.98 | ) | | (.07 | ) | | (1.05 | ) | | — | | | 14.79 | | | 14.92 | |
| 2009 | | | 12.12 | | | 1.10 | | | 1.76 | | | (.06 | ) | | — | | | 2.80 | | | (.84 | ) | | — | | | (.84 | ) | | — | | | 14.08 | | | 13.41 | |
| 2008 | | | 15.20 | | | 1.08 | | | (3.06 | ) | | (.30 | ) | | (.01 | ) | | (2.29 | ) | | (.77 | ) | | (.02 | ) | | (.79 | ) | | — | | | 12.12 | | | 11.41 | |
| 2007 | | | 15.88 | | | 1.07 | | | (.63 | ) | | (.29 | ) | | — | | | .15 | | | (.83 | ) | | — | | | (.83 | ) | | — | | | 15.20 | | | 13.95 | |
| 2006 | | | 15.70 | | | 1.08 | | | .27 | | | (.26 | ) | | — | | | 1.09 | | | (.90 | ) | | (.01 | ) | | (.91 | ) | | — | | | 15.88 | | | 15.85 | |
| | | ARPS at End of Period | | VMTP Shares at End of Period | | VRDP Shares at End of Period | |
| | | Aggregate Amount Outstanding (000) | | Liquidation Value Per Share | | Asset Coverage Per Share | | Aggregate Amount Outstanding (000) | | Liquidation Value Per Share | | Asset Coverage Per Share | | Aggregate Amount Outstanding (000) | | Liquidation Value Per Share | | Asset Coverage Per Share | |
| Performance Plus (NPP) | | | | | | | | | | | | | | | | | | | |
| Year Ended 10/31: | | | | | | | | | | | | | | | | | | | | | | |
| 2011(f) | | $ | — | | $ | — | | $ | — | | $ | 421,700 | | $ | 100,000 | | $ | 296,645 | | $ | — | | $ | — | | $ | — | |
| 2010 | | | 419,900 | | | 25,000 | | | 79,546 | | | — | | | — | | | — | | | — | | | — | | | — | |
| 2009 | | | 419,900 | | | 25,000 | | | 76,790 | | | — | | | — | | | — | | | — | | | — | | | — | |
| 2008 | | | 439,650 | | | 25,000 | | | 68,244 | | | — | | | — | | | — | | | — | | | — | | | — | |
| 2007 | | | 479,000 | | | 25,000 | | | 72,603 | | | — | | | — | | | — | | | — | | | — | | | — | |
| 2006 | | | 479,000 | | | 25,000 | | | 74,333 | | | — | | | — | | | — | | | — | | | — | | | — | |
| | | | | | | | | | | | | | | | | | | | |
| Municipal Advantage (NMA) | | | | | | | | | | | | | | | | | | | |
| Year Ended 10/31: | | | | | | | | | | | | | | | | | | | |
| 2011(f) | | | — | | | — | | | — | | | — | | | — | | | — | | | 296,800 | | | 100,000 | | | 296,054 | |
| 2010 | | | — | | | — | | | — | | | — | | | — | | | — | | | 296,800 | | | 100,000 | | | 316,430 | |
| 2009 | | | 293,200 | | | 25,000 | | | 76,911 | | | — | | | — | | | — | | | — | | | — | | | — | |
| 2008 | | | 341,650 | | | 25,000 | | | 63,314 | | | — | | | — | | | — | | | — | | | — | | | — | |
| 2007 | | | 358,000 | | | 25,000 | | | 70,866 | | | — | | | — | | | — | | | — | | | — | | | — | |
| 2006 | | | 358,000 | | | 25,000 | | | 72,743 | | | — | | | — | | | — | | | — | | | — | | | — | |
| | | | | | | | Ratios/Supplemental Data | |
| | Total Returns | | | | | Ratios to Average Net Assets Applicable to Common Shares(c)(d) | | | | |
| | Based on Market Value | (b) | Based on Common Share Net Asset Value | (b) | Ending Net Assets Applicable to Common Shares (000 | ) | Expenses Including Interest | (e) | Expenses Excluding Interest | | Net Investment Income | | Portfolio Turnover Rate | |
| | | | | | | | | | | | | | | | | | | | | | |
| | | (7.33 | )% | | (5.76 | )% | $ | 829,253 | | | 1.45 | %** | | 1.13 | %** | | 7.27 | %** | | 5 | % |
| | | 18.65 | | | 12.07 | | | 916,152 | | | 1.13 | | | 1.10 | | | 6.93 | | | 14 | |
| | | 24.78 | | | 21.20 | | | 869,873 | | | 1.23 | | | 1.18 | | | 7.59 | | | 6 | |
| | | (10.71 | ) | | (12.49 | ) | | 760,496 | | | 1.25 | | | 1.17 | | | 6.96 | | | 9 | |
| | | (4.97 | ) | | 1.53 | | | 912,066 | | | 1.16 | | | 1.14 | | | 6.38 | | | 6 | |
| | | 10.78 | | | 7.50 | | | 945,222 | | | 1.15 | | | 1.15 | | | 6.44 | | | 9 | |
| | | | | | | | | | | | | | | | | | | | | | |
| | | | | | | | | | | | | | | | | | | | | | |
| | | (9.60 | ) | | (6.13 | ) | | 581,888 | | | 2.10 | ** | | 1.79 | ** | | 7.09 | ** | | 8 | |
| | | 19.58 | | | 12.90 | | | 642,364 | | | 1.66 | | | 1.46 | | | 7.04 | | | 16 | |
| | | 25.70 | | | 23.89 | | | 608,813 | | | 1.31 | | | 1.22 | | | 8.51 | | | 9 | |
| | | (13.16 | ) | | (15.65 | ) | | 523,602 | | | 1.38 | | | 1.21 | | | 7.50 | | | 13 | |
| | | (7.08 | ) | | 1.06 | | | 656,806 | | | 1.40 | | | 1.17 | | | 6.87 | | | 10 | |
| | | 10.68 | | | 7.16 | | | 683,675 | | | 1.18 | | | 1.18 | | | 6.92 | | | 11 | |
| (a) | The amounts shown are based on Common share equivalents. |
| (b) | Total Return Based on Market Value is the combination of changes in the market price per share and the effect of reinvested dividend income and reinvested capital gains distributions, if any, at the average price paid per share at the time of reinvestment. The last dividend declared in the period, which is typically paid on the first business day of the following month, is assumed to be reinvested at the ending market price. The actual reinvestment for the last dividend declared in the period may take place over several days, and in some instances may not be based on the market price, so the actual reinvestment price may be different from the price used in the calculation. |
| | Total returns are not annualized. |
| | Total Return Based on Common Share Net Asset Value is the combination of changes in Common share net asset value, reinvested dividend income at net asset value and reinvested capital gains distributions at net asset value, if any. The last dividend declared in the period, which is typically paid on the first business day of the following month, is assumed to be reinvested at the ending net asset value. The actual reinvest price for the last dividend declared in the period may often be based on the Fund’s market price (and not its net asset value), and therefore may be different from the price used in the calculation. Total returns are not annualized. |
| (c) | Ratios do not reflect the effect of dividend payments to Auction Rate Preferred shareholders, where applicable; Net Investment Income ratios reflect income earned and expenses incurred on assets attributable to ARPS, VMTP shares and/or VRDP shares, where applicable. |
| (d) | Ratios do not reflect the effect of custodian fee credits earned on the Fund’s net cash on deposit with the custodian bank, where applicable. |
| (e) | The expense ratios reflect, among other things, payments to VMTP shareholders, VRDP shareholders and/or the interest expense deemed to have been paid by the Fund on the floating rate certificates issued by the special purpose trusts for the self-deposited inverse floaters held by the Fund, where applicable, each as described in Footnote 1 – General Information and Significant Accounting Policies, Variable MuniFund Term Preferred shares, Variable Rate Demand Preferred Shares and Inverse Floating Rate Securities, respectively. |
| (f) | For the six months ended April 30, 2011. |
| * | Rounds to less than $.01 per share. |
| ** | Annualized. |
See accompanying notes to financial statements.
| | | Financial |
| | | Highlights (Unaudited) (continued) |
| | | |
| | Selected data for a Common share outstanding throughout each period: |
| | | | | | Investment Operations | | Less Distributions | | | | | | | | | | |
| | | Beginning Common Share Net Asset Value | | Net Investment Income | | Net Realized/ Unrealized Gain (Loss | ) | Distributions from Net Investment Income to Auction Rate Preferred Share- holders | (a) | Distributions from Capital Gains to Auction Rate Preferred Share– holders | (a) | Total | | Net Investment Income to Common Share- holders | | Capital Gains to Common Share– holders | | Total | | Discount from Common Shares Repur- chased and Retired | | Ending Common Share Net Asset Value | | Ending Market Value | |
| Market Opportunity (NMO) | | | | | | | | | | | | | | | | | | | | | | | | | |
| Year Ended 10/31: | | | | | | | | | | | | | | | | | | | | | | | | | |
| 2011(f) | | $ | 14.17 | | $ | .44 | | $ | (1.57 | ) | $ | — | | $ | — | | $ | (1.13 | ) | $ | (.49 | ) | $ | — | | $ | (.49 | ) | $ | — | | $ | 12.55 | | $ | 12.43 | |
| 2010 | | | 13.59 | | | .99 | | | .56 | | | (.01 | ) | | — | | | 1.54 | | | (.96 | ) | | — | | | (.96 | ) | | — | | | 14.17 | | | 14.55 | |
| 2009 | | | 12.23 | | | 1.10 | | | 1.13 | | | (.06 | ) | | — | | | 2.17 | | | (.81 | ) | | — | | | (.81 | ) | | — | | | 13.59 | | | 13.32 | |
| 2008 | | | 14.83 | | | 1.03 | | | (2.59 | ) | | (.31 | ) | | — | | | (1.87 | ) | | (.73 | ) | | — | | | (.73 | ) | | — | | | 12.23 | | | 11.52 | |
| 2007 | | | 15.41 | | | 1.04 | | | (.56 | ) | | (.30 | ) | | — | | | .18 | | | (.76 | ) | | — | | | (.76 | ) | | — | | | 14.83 | | | 13.53 | |
| 2006 | | | 15.14 | | | 1.02 | | | .34 | | | (.26 | ) | | — | | | 1.10 | | | (.83 | ) | | — | | | (.83 | ) | | — | | | 15.41 | | | 15.00 | |
| | | | | | | | | | | | | | | | | | | | | | | | | | | | | |
| Dividend Advantage (NAD) | | | | | | | | | | | | | | | | | | | | | | | | | |
| Year Ended 10/31: | | | | | | | | | | | | | | | | | | | | | | | | | |
| 2011(f) | | | 14.68 | | | .47 | | | (1.46 | ) | | (.01 | ) | | — | | | (1.00 | ) | | (.46 | ) | | — | | | (.46 | ) | | — | | | 13.22 | | | 12.76 | |
| 2010 | | | 13.89 | | | 1.00 | | | .72 | | | (.02 | ) | | — | | | 1.70 | | | (.91 | ) | | — | | | (.91 | ) | | — | | | 14.68 | | | 14.40 | |
| 2009 | | | 11.77 | | | 1.07 | | | 1.93 | | | (.05 | ) | | — | | | 2.95 | | | (.83 | ) | | — | | | (.83 | ) | | — | | | 13.89 | | | 12.89 | |
| 2008 | | | 14.90 | | | 1.05 | | | (3.14 | ) | | (.27 | ) | | — | | | (2.36 | ) | | (.77 | ) | | — | | | (.77 | ) | | — | | | 11.77 | | | 10.72 | |
| 2007 | | | 15.54 | | | 1.04 | | | (.60 | ) | | (.27 | ) | | — | | | .17 | | | (.81 | ) | | — | | | (.81 | ) | | — | | | 14.90 | | | 13.63 | |
| 2006 | | | 15.28 | | | 1.04 | | | .32 | | | (.24 | ) | | — | | | 1.12 | | | (.86 | ) | | — | | | (.86 | ) | | — | | | 15.54 | | | 15.30 | |
| | | ARPS at End of Period | | MTP Shares at End of Period | | ARPS and MTP Shares at End of Period | | VRDP Shares at End of Period | |
| | | Aggregate Amount Outstanding (000 | ) | Liquidation Value Per Share | | Asset Coverage Per Share | | Aggregate Amount Outstanding (000 | ) | Liquidation Value Per Share | | Ending Market Value Per Share | | Average Market Value Per Share | | Asset Coverage Per Share | | Asset Coverage Per $1 Liquidation Preference | | Aggregate Amount Outstanding (000 | ) | Liquidation Value Per Share | | Asset Coverage Per Share | |
| Market Opportunity (NMO) | | | | | | | | | | | | | | | | | | | | | | | | | | | | |
| Year Ended 10/31: | | | | | | | | | | | | | | | | | | | | | | |
| 2011(f) | | $ | — | | $ | — | | $ | — | | $ | — | | $ | — | | $ | — | | $ | — | | $ | — | | $ | — | | $ | 350,900 | | $ | 100,000 | | $ | 263,857 | |
| 2010 | | | — | | | — | | | — | | | — | | | — | | | — | | | — | | | — | | | — | | | 350,900 | | | 100,000 | | | 284,673 | |
| 2009 | | | 346,675 | | | 25,000 | | | 69,661 | | | — | | | — | | | — | | | — | | | — | | | — | | | — | | | — | | | — | |
| 2008 | | | 361,675 | | | 25,000 | | | 63,525 | | | — | | | — | | | — | | | — | | | — | | | — | | | — | | | — | | | — | |
| 2007 | | | 380,000 | | | 25,000 | | | 69,446 | | | — | | | — | | | — | | | — | | | — | | | — | | | — | | | — | | | — | |
| 2006 | | | 380,000 | | | 25,000 | | | 71,155 | | | — | | | — | | | — | | | — | | | — | | | — | | | — | | | — | | | — | |
| | | | | | | | | | | | | | | | | | | | | | | | | | | | | |
| Dividend Advantage (NAD) | | | | | | | | | | | | | | | | | | | | | | |
| Year Ended 10/31: | | | | | | | | | | | | | | | | | | | | | | | |
| 2011(f) | | | 120,075 | | | 25,000 | | | 74,134 | | | 144,300 | | | 10.00 | | | 10.01 | | | 10.02 | | | 29.65 | | | 2.97 | | | — | | | — | | | — | |
| 2010 | | | 120,075 | | | 25,000 | | | 79,553 | | | 144,300 | | | 10.00 | | | 10.10 | | | 10.10 | ^ | | 31.82 | | | 3.18 | | | — | | | — | | | — | |
| 2009 | | | 261,800 | | | 25,000 | | | 77,095 | | | — | | | — | | | — | | | — | | | — | | | — | | | — | | | — | | | — | |
| 2008 | | | 266,800 | | | 25,000 | | | 68,343 | | | — | | | — | | | — | | | — | | | — | | | — | | | — | | | — | | | — | |
| 2007 | | | 295,000 | | | 25,000 | | | 74,618 | | | — | | | — | | | — | | | — | | | — | | | — | | | — | | | — | | | — | |
| 2006 | | | 295,000 | | | 25,000 | | | 76,722 | | | — | | | — | | | — | | | — | | | — | | | — | | | — | | | — | | | — | |
| | | | | | | Ratios/Supplemental Data | |
| Total Returns | | | | | Ratios to Average Net Assets Applicable to Common Shares Before Reimbursement(c) | | Ratios to Average Net Assets Applicable to Common Shares After Reimbursement(c)(d) | | | | |
Based on Market Value | (b) | Based on Common Share Net Asset Value | (b) | Ending Net Assets Applicable to Common Shares (000 | ) | Expenses Including Interest | (e) | Expenses Excluding Interest | | Net Investment Income | | Expenses Including Interest | (e) | Expenses Excluding Interest | | Net Investment Income | | Portfolio Turnover Rate | |
| | | | | | | | | | | | | | | | | | | | | | | | | | | | | | |
| | (11.20 | )% | | (7.94 | )% | $ | 574,974 | | | 2.22 | %* | | 1.89 | %* | | 7.04 | %* | | N/A | | | N/A | | | N/A | | | 6 | % |
| | 17.03 | | | 11.71 | | | 648,017 | | | 1.70 | | | 1.50 | | | 7.17 | | | N/A | | | N/A | | | N/A | | | 26 | |
| | 23.67 | | | 18.30 | | | 619,319 | | | 1.32 | | | 1.25 | | | 8.58 | | | N/A | | | N/A | | | N/A | | | 10 | |
| | (9.87 | ) | | (13.07 | ) | | 557,346 | | | 1.36 | | | 1.23 | | | 7.33 | | | N/A | | | N/A | | | N/A | | | 8 | |
| | (5.00 | ) | | 1.20 | | | 675,577 | | | 1.38 | | | 1.19 | | | 6.87 | | | N/A | | | N/A | | | N/A | | | 5 | |
| | 11.92 | | | 7.49 | | | 701,559 | | | 1.19 | | | 1.19 | | | 6.73 | | | N/A | | | N/A | | | N/A | | | 14 | |
| | | | | | | | | | | | | | | | | | | | | | | | | | | | | | |
| | | | | | | | | | | | | | | | | | | | | | | | | | | | | | |
| | (8.20 | ) | | (6.81 | ) | | 519,587 | | | 2.02 | * | | 1.22 | * | | 7.09 | * | | 2.02 | %* | | 1.22 | %* | | 7.09 | %* | | 10 | |
| | 19.17 | | | 12.60 | | | 576,895 | | | 1.61 | | | 1.13 | | | 6.99 | | | 1.61 | | | 1.13 | | | 6.99 | | | 8 | |
| | 28.86 | | | 25.78 | | | 545,534 | | | 1.26 | | | 1.17 | | | 8.38 | | | 1.21 | | | 1.12 | | | 8.43 | | | 9 | |
| | (16.46 | ) | | (16.42 | ) | | 462,554 | | | 1.36 | | | 1.15 | | | 7.33 | | | 1.22 | | | 1.02 | | | 7.46 | | | 11 | |
| | (5.96 | ) | | 1.10 | | | 585,496 | | | 1.24 | | | 1.13 | | | 6.60 | | | 1.03 | | | .92 | | | 6.81 | | | 11 | |
| | 11.19 | | | 7.59 | | | 610,316 | | | 1.12 | | | 1.12 | | | 6.54 | | | .85 | | | .85 | | | 6.81 | | | 8 | |
| (a) | The amounts shown are based on Common share equivalents. |
| (b) | Total Return Based on Market Value is the combination of changes in the market price per share and the effect of reinvested dividend income and reinvested capital gains distributions, if any, at the average price paid per share at the time of reinvestment. The last dividend declared in the period, which is typically paid on the first business day of the following month, is assumed to be reinvested at the ending market price. The actual reinvestment for the last dividend declared in the period may take place over several days, and in some instances may not be based on the market price, so the actual reinvestment price may be different from the price used in the calculation. |
| | Total returns are not annualized. |
| | Total Return Based on Common Share Net Asset Value is the combination of changes in Common share net asset value, reinvested dividend income at net asset value and reinvested capital gains distributions at net asset value, if any. The last dividend declared in the period, which is typically paid on the first business day of the following month, is assumed to be reinvested at the ending net asset value. The actual reinvest price for the last dividend declared in the period may often be based on the Fund’s market price (and not its net asset value), and therefore may be different from the price used in the calculation. Total returns are not annualized. |
| (c) | Ratios do not reflect the effect of dividend payments to Auction Rate Preferred shareholders, where applicable; Net Investment Income ratios reflect income earned and expenses incurred on assets attributable to ARPS, MTP shares and/or VRDP shares, where applicable. |
| (d) | After expense reimbursement from the Adviser, where applicable. Ratios do not reflect the effect of custodian fee credits earned on the Fund’s net cash on deposit with the custodian bank, where applicable. As of July 31, 2009, the Adviser is no longer reimbursing Dividend Advantage (NAD) for any fees and expenses. |
| (e) | The expense ratios reflect, among other things, payments to MTP shareholders, VRDP shareholders and/or the interest expense deemed to have been paid by the Fund on the floating rate certificates issued by the special purpose trusts for the self-deposited inverse floaters held by the Fund, where applicable, each as described in Footnote 1 – General Information and Significant Accounting Polices, MuniFund Term Preferred Shares, Variable Rate Demand Preferred Shares and Inverse Floating Rate Securities, respectively. |
| (f) | For the six months ended April 30, 2011. |
| ^ | For the period March 16, 2010 (issuance date of shares) through October 31, 2010. |
| N/A | Fund does not have a contractual reimbursement agreement with the Adviser. |
| * | Annualized. |
See accompanying notes to financial statements.
| | | Financial |
| | | Highlights (Unaudited) (continued) |
| | | |
| | Selected data for a Common share outstanding throughout each period: |
| | | | | | Investment Operations | | Less Distributions | | | | | | | | | | |
| | | Beginning Common Share Net Asset Value | | Net Investment Income | | Net Realized/ Unrealized Gain (Loss | ) | Distributions from Net Investment Income to Auction Rate Preferred Share- holders | (a) | Distributions from Capital Gains to Auction Rate Preferred Share– holders | (a) | Total | | Net Investment Income to Common Share- holders | | Capital Gains to Common Share– holders | | Total | | Discount from Common Shares Repur- chased and Retired | | Ending Common Share Net Asset Value | | Ending Market Value | |
| Dividend Advantage 2 (NXZ) | | | | | | | | | | | | | | | | | | | | | | | | | |
| Year Ended 10/31: | | | | | | | | | | | | | | | | | | | | | | | | | | | | | | | |
| 2011(f) | | $ | 14.76 | | $ | .49 | | $ | (1.36 | ) | $ | — | | $ | — | | $ | (.87 | ) | $ | (.48 | ) | $ | — | | $ | (.48 | ) | $ | — | | $ | 13.41 | | $ | 12.93 | |
| 2010 | | | 14.45 | | | 1.02 | | | .26 | | | — | | | — | | | 1.28 | | | (.97 | ) | | — | | | (.97 | ) | | — | | | 14.76 | | | 14.67 | |
| 2009 | | | 12.71 | | | 1.04 | | | 1.59 | | | — | | | — | | | 2.63 | | | (.89 | ) | | — | | | (.89 | ) | | — | | | 14.45 | | | 14.14 | |
| 2008 | | | 15.55 | | | 1.05 | | | (2.81 | ) | | (.20 | ) | | — | | | (1.96 | ) | | (.88 | ) | | — | | | (.88 | ) | | — | | | 12.71 | | | 12.35 | |
| 2007 | | | 16.02 | | | 1.13 | | | (.43 | ) | | (.27 | ) | | — | | | .43 | | | (.90 | ) | | — | | | (.90 | ) | | — | | | 15.55 | | | 15.48 | |
| 2006 | | | 15.80 | | | 1.12 | | | .32 | | | (.24 | ) | | — | | | 1.20 | | | (.98 | ) | | — | | | (.98 | ) | | — | | | 16.02 | | | 16.50 | |
| | | | | | | | | | | | | | | | | | | | | | | | | | |
| Dividend Advantage 3 (NZF) | | | | | | | | | | | | | | | | | | | | | | | | | |
| Year Ended 10/31: | | | | | | | | | | | | | | | | | | | | | | | | | | | | | | | |
| 2011(f) | | | 14.74 | | | .51 | | | (1.04 | ) | | (.01 | ) | | — | * | | (.54 | ) | | (.49 | ) | | (.02 | ) | | (.51 | ) | | — | | | 13.69 | | | 13.20 | |
| 2010 | | | 14.19 | | | 1.06 | | | .52 | | | (.02 | ) | | — | * | | 1.56 | | | (.95 | ) | | (.06 | ) | | (1.01 | ) | | — | | | 14.74 | | | 14.58 | |
| 2009 | | | 12.10 | | | 1.08 | | | 1.91 | | | (.05 | ) | | — | | | 2.94 | | | (.85 | ) | | — | | | (.85 | ) | | — | | | 14.19 | | | 13.38 | |
| 2008 | | | 15.03 | | | 1.06 | | | (2.95 | ) | | (.27 | ) | | — | | | (2.16 | ) | | (.77 | ) | | — | | | (.77 | ) | | — | | | 12.10 | | | 10.72 | |
| 2007 | | | 15.54 | | | 1.07 | | | (.44 | ) | | (.27 | ) | | (.01 | ) | | .35 | | | (.84 | ) | | (.02 | ) | | (.86 | ) | | — | | | 15.03 | | | 13.85 | |
| 2006 | | | 15.32 | | | 1.07 | | | .29 | | | (.24 | ) | | — | | | 1.12 | | | (.90 | ) | | — | | | (.90 | ) | | — | | | 15.54 | | | 15.88 | |
| | | ARPS at End of Period | | MTP Shares at End of Period | | ARPS and MTP Shares at End of Period | | VRDP Shares at End of Period | |
| | | Aggregate Amount Outstanding (000 | ) | Liquidation Value Per Share | | Asset Coverage Per Share | | Aggregate Amount Outstanding (000 | ) | Liquidation Value Per Share | | Ending Market Value Per Share | | Average Market Value Per Share | | Asset Coverage Per Share | | Asset Coverage Per $1 Liquidation Preference | | Aggregate Amount Outstanding (000 | ) | Liquidation Value Per Share | | Asset Coverage Per Share | |
| Dividend Advantage 2 (NXZ) | | | | | | | | | | | | | | | | | | | | | | | | | |
| Year Ended 10/31: | | | | | | | | | | | | | | | | | | | | | | | | | | | | | | | |
| 2011(f) | | $ | — | | $ | — | | $ | — | | $ | — | | $ | — | | $ | — | | $ | — | | $ | — | | $ | — | | $ | 196,000 | | $ | 100,000 | | $ | 301,507 | |
| 2010 | | | — | | | — | | | — | | | — | | | — | | | — | | | — | | | — | | | — | | | 196,000 | | | 100,000 | | | 321,819 | |
| 2009 | | | — | | | — | | | — | | | — | | | — | | | — | | | — | | | — | | | — | | | 196,000 | | | 100,000 | | | 316,966 | |
| 2008 | | | — | | | — | | | — | | | — | | | — | | | — | | | — | | | — | | | — | | | 196,000 | | | 100,000 | | | 290,785 | |
| 2007 | | | 222,000 | | | 25,000 | | | 76,463 | | | — | | | — | | | — | | | — | | | — | | | — | | | — | | | — | | | — | |
| 2006 | | | 222,000 | | | 25,000 | | | 77,949 | | | — | | | — | | | — | | | — | | | — | | | — | | | — | | | — | | | — | |
| | | | | | | | | | | | | | | | | | | | | | | | | | |
| Dividend Advantage 3 (NZF) | | | | | | | | | | | | | | | | | | | | | | | | | |
| Year Ended 10/31: | | | | | | | | | | | | | | | | | | | | | | | | | | | | | | | |
| 2011(f) | | | 168,400 | | | 25,000 | | | 82,991 | | | 70,000 | | | 10.00 | | | 10.02 | | | 9.99 | ^ | | 33.20 | | | 3.32 | | | — | | | — | | | — | |
| 2010 | | | 236,950 | | | 25,000 | | | 87,821 | | | — | | | — | | | — | | | — | | | — | | | — | | | — | | | — | | | — | |
| 2009 | | | 236,950 | | | 25,000 | | | 85,465 | | | — | | | — | | | — | | | — | | | — | | | — | | | — | | | — | | | — | |
| 2008 | | | 270,775 | | | 25,000 | | | 70,108 | | | — | | | — | | | — | | | — | | | — | | | — | | | — | | | — | | | — | |
| 2007 | | | 312,000 | | | 25,000 | | | 73,630 | | | — | | | — | | | — | | | — | | | — | | | — | | | — | | | — | | | — | |
| 2006 | | | 312,000 | | | 25,000 | | | 75,227 | | | — | | | — | | | — | | | — | | | — | | | — | | | — | | | — | | | — | |
| | | | | | | | Ratios/Supplemental Data | |
| | Total Returns | | | | | Ratios to Average Net Assets Applicable to Common Shares Before Reimbursement(c) | | Ratios to Average Net Assets Applicable to Common Shares After Reimbursement(c)(d) | | | | |
| | Based on Market Value | (b) | Based on Common Share Net Asset Value | (b) | Ending Net Assets Applicable to Common Shares (000 | ) | Expenses Including Interest | (e) | Expenses Excluding Interest | | Net Investment Income | | Expenses Including Interest | (e) | Expenses Excluding Interest | | Net Investment Income | | Portfolio Turnover Rate | |
| | | | | | | | | | | | | | | | | | | | | |
| | | (8.62 | )% | | (5.88 | )% | $ | 394,954 | | | 1.88 | %** | | 1.61 | %** | | 7.25 | %** | | 1.81 | %** | | 1.55 | %** | | 7.31 | %** | | 15 | % |
| | | 10.89 | | | 9.12 | | | 434,764 | | | 1.79 | | | 1.57 | | | 6.85 | | | 1.68 | | | 1.47 | | | 6.95 | | | 5 | |
| | | 22.63 | | | 21.41 | | | 425,253 | | | 1.91 | | | 1.47 | | | 7.59 | | | 1.73 | | | 1.29 | | | 7.77 | | | 2 | |
| | | (15.21 | ) | | (13.23 | ) | | 373,940 | | | 1.71 | | | 1.22 | | | 6.82 | | | 1.45 | | | .96 | | | 7.08 | | | 10 | |
| | | (.78 | ) | | 2.76 | | | 456,992 | | | 1.25 | | | 1.11 | | | 6.83 | | | .93 | | | .79 | | | 7.16 | | | 5 | |
| | | 11.95 | | | 7.86 | | | 470,189 | | | 1.11 | | | 1.11 | | | 6.70 | | | .72 | | | .72 | | | 7.09 | | | 5 | |
| | | | | | | | | | | | | | | | | | | | | | | | | | | | | | | |
| | | | | | | | | | | | | | | | | | | | | | | | | | | | | | | |
| | | (5.95 | ) | | (3.63 | ) | | 553,001 | | | 1.47 | ** | | 1.12 | ** | | 7.35 | ** | | 1.39 | ** | | 1.04 | ** | | 7.43 | ** | | 9 | |
| | | 17.04 | | | 11.41 | | | 595,413 | | | 1.17 | | | 1.08 | | | 7.21 | | | 1.02 | | | .93 | | | 7.36 | | | 7 | |
| | | 33.89 | | | 25.08 | | | 573,088 | | | 1.26 | | | 1.15 | | | 7.98 | | | 1.04 | | | .92 | | | 8.20 | | | 2 | |
| | | (17.85 | ) | | (14.99 | ) | | 488,561 | | | 1.34 | | | 1.15 | | | 7.08 | | | 1.04 | | | .85 | | | 7.37 | | | 7 | |
| | | (7.72 | ) | | 2.31 | | | 606,908 | | | 1.32 | | | 1.13 | | | 6.65 | | | .94 | | | .76 | | | 7.02 | | | 14 | |
| | | 16.90 | | | 7.57 | | | 626,836 | | | 1.13 | | | 1.13 | | | 6.51 | | | .68 | | | .68 | | | 6.96 | | | 9 | |
| (a) | The amounts shown are based on Common share equivalents. |
| (b) | Total Return Based on Market Value is the combination of changes in the market price per share and the effect of reinvested dividend income and reinvested capital gains distributions, if any, at the average price paid per share at the time of reinvestment. The last dividend declared in the period, which is typically paid on the first business day of the following month, is assumed to be reinvested at the ending market price. The actual reinvestment for the last dividend declared in the period may take place over several days, and in some instances may not be based on the market price, so the actual reinvestment price may be different from the price used in the calculation. |
| | Total returns are not annualized. |
| | Total Return Based on Common Share Net Asset Value is the combination of changes in Common share net asset value, reinvested dividend income at net asset value and reinvested capital gains distributions at net asset value, if any. The last dividend declared in the period, which is typically paid on the first business day of the following month, is assumed to be reinvested at the ending net asset value. The actual reinvest price for the last dividend declared in the period may often be based on the Fund’s market price (and not its net asset value), and therefore may be different from the price used in the calculation. Total returns are not annualized. |
| (c) | Ratios do not reflect the effect of dividend payments to Auction Rate Preferred shareholders, where applicable; Net Investment Income ratios reflect income earned and expenses incurred on assets attributable to ARPS, MTP shares and/or VRDP shares, where applicable. |
| (d) | After expense reimbursement from the Adviser, where applicable. Ratios do not reflect the effect of custodian fee credits earned on the Fund’s net cash on deposit with the custodian bank, where applicable. As of March 31, 2011, the Adviser is no longer reimbursing Dividend Advantage 2 (NXZ) for any fees and expenses. |
| (e) | The expense ratios reflect, among other things, payments to MTP shareholders, VRDP shareholders and/or the interest expense deemed to have been paid by the Fund on the floating rate certificates issued by the special purpose trusts for the self-deposited inverse floaters held by the Fund, where applicable, each as described in Footnote 1 – General Information and Significant Accounting Policies, MuniFund Term Preferred shares, Variable Rate Demand Preferred Shares and Inverse Floating Rate Securities, respectively. |
| (f) | For the six months ended April 30, 2011. |
| * | Rounds to less than $.01 per share. |
| ** | Annualized. |
| ^ | For the period December 20, 2010 (issuance date of shares) through April 30, 2011. |
See accompanying notes to financial statements.
| | | Notes to |
| | | Financial Statements (Unaudited) |
1. General Information and Significant Accounting Policies
General Information
The funds covered in this report and their corresponding Common share stock exchange symbols are Nuveen Performance Plus Municipal Fund, Inc. (NPP), Nuveen Municipal Advantage Fund, Inc. (NMA), Nuveen Municipal Market Opportunity Fund, Inc. (NMO), Nuveen Dividend Advantage Municipal Fund (NAD), Nuveen Dividend Advantage Municipal Fund 2 (NXZ) and Nuveen Dividend Advantage Municipal Fund 3 (NZF) (collectively, the “Funds”). Performance Plus (NPP), Municipal Advantage (NMA), Market Opportunity (NMO) and Dividend Advantage (NAD) are traded on the New York Stock Exchange (“NYSE”) while Dividend Advantage 2 (NXZ) and Dividend Advantage 3 (NZF) are traded on the NYSE Amex. The Funds are registered under the Investment Company Act of 1940, as amended, as closed-end, management investment companies.
Effective January 1, 2011, the Funds’ adviser, Nuveen Asset Management, a wholly-owned subsidiary of Nuveen Investments, Inc. (“Nuveen”), changed its name to Nuveen Fund Advisors, Inc. (the “Adviser”). Concurrently, the Adviser formed a wholly-owned subsidiary, Nuveen Asset Management, LLC (the “Sub-Adviser”), to house its portfolio management capabilities and to serve as the Funds’ sub-adviser, and the Funds’ portfolio managers became employee of the Sub-Adviser. This allocation of responsibilities between the Adviser and the Sub-Adviser affects each of the Funds. The Adviser will compensate the Sub-Adviser for the portfolio management services it provides to the Funds from each Fund’s management fee.
Each Fund seeks to provide current income exempt from regular federal income tax by investing primarily in a portfolio of municipal obligations issued by state and local government authorities or certain U.S. territories.
Significant Accounting Policies
The following is a summary of significant accounting policies followed by the Funds in the preparation of their financial statements in accordance with U.S. generally accepted accounting principles (“U.S. GAAP”).
Investment Valuation
Prices of municipal bonds are provided by a pricing service approved by the Funds’ Board of Directors/Trustees. These securities are generally classified as Level 2 for fair value measurement purposes. When price quotes are not readily available (which is usually the case for municipal bonds) the pricing service establishes a security’s fair value using methods that may include consideration of the following: yields or prices of investments of comparable quality, type of issue, coupon, maturity and rating, market quotes or indications of value from security dealers, evaluations of anticipated cash flows or collateral, general market conditions and other information and analysis, including the obligor’s credit characteristics considered relevant. In pricing certain securities, particularly less liquid and lower quality securities, the pricing service may consider information about a security, its issuer, or market activity, provided by the Adviser. These securities are generally classified as Level 2 or Level 3 depending on the priority of the significant inputs. Investments in investment companies are valued at their respective net asset values on the valuation date. These investment vehicles are generally classified as Level 1.
Certain securities may not be able to be priced by the pre-established pricing methods as described above. Such securities may be valued by the Funds’ Board of Directors/Trustees or its designee at fair value. These securities generally include, but are not limited to, restricted securities (securities which may not be publicly sold without registration under the Securities Act of 1933, as amended) for which a pricing service is unable to provide a market price; securities whose trading has been formally suspended; debt securities that have gone into default and for which there is no current market quotation; a security whose market price is not available from a pre-established pricing source; a security with respect to which an event has occurred that is likely to materially affect the value of the security after the market has closed but before the calculation of a Fund’s net asset value (as may be the case in non-U.S. markets on which the security is primarily traded) or make it difficult or impossible to obtain a reliable market quotation; and a security whose price, as provided by the pricing service, is not deemed to reflect the security’s fair value. As a general principle, the fair value of a security would appear to be the amount that the owner might reasonably expect to receive for it in a current sale. A variety of factors may be considered in determining the fair value of these securities, which may include consideration of the following: yields or prices of investments of comparable quality, type of issue, coupon, maturity and rating, market quotes or indications of value from security dealers, evaluations of anticipated cash flows or collateral, general market conditions and other information and analysis, including the obligor’s credit characteristics considered relevant. These securities are generally classified as Level 2 or Level 3 depending on the priority of the significant inputs. Regardless of the method employed to value a particular security, all valuations are subject to review by the Funds’ Board of Directors/Trustees or its designee.
Refer to Footnote 2 – Fair Value Measurements for further details on the leveling of securities held by the Funds as of the end of the reporting period.
Investment Transactions
Investment transactions are recorded on a trade date basis. Realized gains and losses from transactions are determined on the specific identification method, which is the same basis used for federal income tax purposes. Investments purchased on a when-issued/delayed delivery basis may have extended settlement periods. Any investments so purchased are subject to market fluctuation during this period. The Funds have instructed the custodian to segregate assets with a current value at least equal to the amount of the when-issued/delayed delivery purchase commitments. At April 30, 2011, there were no such outstanding purchase commitments in any of the Funds.
Investment Income
Investment income, which reflects the amortization of premiums and includes accretion of discounts for financial reporting purposes, is recorded on an accrual basis. Investment income also reflects paydown gains and losses, if any.
Professional Fees
Professional fees presented on the Statement of Operations consist of legal fees incurred in the normal course of operations, audit fees, tax consulting fees and, in some cases, workout expenditures. Workout expenditures are incurred in an attempt to protect or enhance an investment, or to pursue other claims or legal actions on behalf of Fund shareholders.
Income Taxes
Each Fund is a separate taxpayer for federal income tax purposes. Each Fund intends to distribute substantially all of its net investment income and net capital gains to shareholders and to otherwise comply with the requirements of Subchapter M of the Internal Revenue Code applicable to regulated investment companies. Therefore, no federal income tax provision is required. Furthermore, each Fund intends to satisfy conditions that will enable interest from municipal securities, which is exempt from regular federal income tax, to retain such tax-exempt status when distributed to shareholders of the Funds. Net realized capital gains and ordinary income distributions paid by the Funds are subject to federal taxation.
For all open tax years and all major taxing jurisdictions, management of the Funds has concluded that there are no significant uncertain tax positions that would require recognition in the financial statements. Open tax years are those that are open for examination by taxing authorities (i.e., generally the last four tax year ends and the interim tax period since then). Furthermore, management of the Funds is also not aware of any tax positions for which it is reasonably possible that the total amounts of unrecognized tax benefits will significantly change in the next twelve months.
Dividends and Distributions to Common Shareholders
Dividends from net investment income are declared monthly. Net realized capital gains and/or market discount from investment transactions, if any, are distributed to shareholders at least annually. Furthermore, capital gains are distributed only to the extent they exceed available capital loss carryforwards.
Distributions to Common shareholders of net investment income, net realized capital gains and/or market discount, if any, are recorded on the ex-dividend date. The amount and timing of distributions are determined in accordance with federal income tax regulations, which may differ from U.S. GAAP.
Auction Rate Preferred Shares
Each Fund is authorized to issue Auction Rate Preferred Shares (“ARPS”). The following Funds have issued and outstanding ARPS, $25,000 stated value per share, which approximates market value, as a means of effecting financial leverage. Each Fund’s ARPS are issued in more than one Series. The dividend rate paid by the Funds on each Series is determined every seven days, pursuant to a dutch auction process overseen by the auction agent, and is payable at the end of each rate period. As of April 30, 2011, the number of ARPS outstanding, by Series and in total, for each Fund is as follows:
| | | Dividend Advantage | | Dividend Advantage 3 | |
| | | (NAD | ) | (NZF | ) |
| | | | | | | | |
| Number of shares: | | | | | | | |
| Series M | | | 1,628 | | | — | |
| Series T | | | 1,628 | | | — | |
| Series W | | | — | | | 2,246 | |
| Series TH | | | 1,547 | | | 2,245 | |
| Series F | | | — | | | 2,245 | |
| Total | | | 4,803 | | | 6,736 | |
Beginning in February 2008, more shares for sale were submitted in the regularly scheduled auctions for the ARPS issued by the Funds than there were offers to buy. This meant that these auctions “failed to clear,’’ and that many ARPS shareholders who wanted to sell their shares in these auctions were unable to do so. ARPS shareholders unable to sell their shares received distributions at the “maximum rate’’ applicable to failed auctions as
| | | Notes to |
| | | Financial Statements (Unaudited) (continued) |
calculated in accordance with the pre-established terms of the ARPS. As of April 30, 2011, the aggregate amount of outstanding ARPS redeemed by each Fund is as follows:
| | | | | | | | | | | | | | | | | | | | |
| | | Performance Plus | | Municipal Advantage | | Market Opportunity | | Dividend Advantage | | Dividend Advantage 2 | | Dividend Advantage 3 | |
| | | (NPP | ) | (NMA | ) | (NMO | ) | (NAD | ) | (NXZ | ) | (NZF | ) |
| ARPS redeemed, at liquidation value | | $ | 479,000,000 | | $ | 358,000,000 | | $ | 380,000,000 | | $ | 174,925,000 | | $ | 222,000,000 | | $ | 143,600,000 | |
During the fiscal year ended October 31, 2010, lawsuits pursuing claims made in a demand letter alleging that Dividend Advantage (NAD), Dividend Advantage 2 (NXZ) and Dividend Advantage 3’s (NZF) Board of Directors/Trustees breached their fiduciary duties related to the redemption at par of their ARPS had been filed on behalf of shareholders of Dividend Advantage (NAD), Dividend Advantage 2 (NXZ) and Dividend Advantage 3 (NZF), against the Adviser, the Nuveen holding company, the majority owner of the holding company, the lone interested trustee, and current and former officers of Dividend Advantage (NAD), Dividend Advantage 2 (NXZ) and Dividend Advantage 3 (NZF). Nuveen and the other named defendants believe these lawsuits to be without merit, and all named parties intend to defend themselves vigorously. Dividend Advantage (NAD), Dividend Advantage 2 (NXZ) and Dividend Advantage 3 (NZF) believe that these lawsuits will not have a material effect on them or on the Adviser’s ability to serve as investment adviser to them.
MuniFund Term Preferred Shares
The following Funds have issued and outstanding MuniFund Term Preferred (“MTP”) Shares, with a $10 stated value per share. Proceeds from the issuance of MTP Shares, net of offering expenses, were used to redeem all, or a portion of, each Fund’s outstanding ARPS. Each Fund’s MTP Shares are issued in one Series. Dividends, which are recognized as interest expense for financial reporting purposes, are paid monthly at a fixed annual rate, subject to adjustments in certain circumstances. The MTP Shares trade on the NYSE. As of April 30, 2011, the number of MTP Shares outstanding, annual interest rate and the NYSE “ticker” symbol for each Fund are as follows:
| | | | | | | | | | | | | | | | | | | | |
| | | Dividend Advantage (NAD) | | Dividend Advantage 3 (NZF) | |
| | | Shares Outstanding | | Annual Interest Rate | | NYSE Ticker | | Shares Outstanding | | Annual Interest Rate | | NYSE Ticker | |
| | | | | | | | | | | | | | | | | | | | |
| Series: | | | | | | | | | | | | | | | | | | | |
| 2015 | | | 14,430,000 | | | 2.70 | % | | NAD Pr C | | | — | | | — | | | — | |
| 2016 | | | — | | | — | | | — | | | 7,000,000 | | | 2.80 | % | | NZF Pr C | |
Each Fund is obligated to redeem its MTP Shares by the date as specified in its offering document (“Term Redemption Date”), unless earlier redeemed or repurchased by the Fund. MTP Shares are subject to optional and mandatory redemption in certain circumstances. MTP Shares are subject to redemption at the option of each Fund (“Optional Redemption Date”), subject to a payment of premium for one year following the Optional Redemption Date (“Premium Expiration Date”), and at par thereafter. MTP Shares also are subject to redemption, at the option of each Fund, at par in the event of certain changes in the credit rating of the MTP Shares. Each Fund may be obligated to redeem certain of the MTP Shares if the Fund fails to maintain certain asset coverage and leverage ratio requirements and such failures are not cured by the applicable cure date. The redemption price per share is equal to the sum of the liquidation value per share plus any accumulated but unpaid dividends. The Term Redemption Date, Optional Redemption Date and Premium Expiration Date for each Fund’s MTP Shares are as follows:
| | | | | | | | |
| | | Dividend Advantage | | Dividend Advantage 3 | |
| | | (NAD | ) | (NZF | ) |
| | | Series 2015 | | Series 2016 | |
| Term Redemption Date | | | April 1, 2015 | | | January 1, 2016 | |
| Optional Redemption Date | | | April 1, 2011 | | | January 1, 2012 | |
| Premium Expiration Date | | | March 31, 2012 | | | December 31, 2012 | |
The average liquidation value of all series of MTP Shares outstanding for each Fund during the six months ended April 30, 2011, was as follows:
| | | | | | | | |
| | | Dividend Advantage | | Dividend Advantage 3 | |
| | | (NAD | ) | (NZF | )* |
| Average liquidation value of MTP Shares outstanding | | $ | 144,300,000 | | $ | 69,696,970 | |
| * | For the period December 20, 2010 (issuance date of shares) through April 30, 2011. |
For financial reporting purposes only, the liquidation value of MTP Shares is recorded as a liability on the Statement of Assets and Liabilities. Unpaid dividends on MTP Shares are recognized as a component of “Interest payable” on the Statement of Assets and Liabilities. Dividends paid on MTP Shares are recognized as a component of “Interest expense and amortization of offering costs” on the Statement of Operations.
Variable Rate MuniFund Term Preferred Shares
Performance Plus (NPP) has issued and outstanding $421,700,000 Series 2014 Variable Rate MuniFund Term Preferred (“VMTP”) Shares, with $100,000 liquidation value per share. Performance Plus (NPP) issued its VMTP Shares in a privately negotiated offering in February 2011. Proceeds from the issuance of VMTP Shares, net of offering expenses, were used to redeem all of the Fund’s outstanding ARPS. The VMTP Shares were offered to qualified institutional buyers pursuant to Rule 144A under the Securities Act of 1933.
The Fund is obligated to redeem its VMTP Shares on March 1, 2014, unless earlier redeemed or repurchased by the Fund. VMTP Shares are subject to optional and mandatory redemption in certain circumstances. The VMTP Shares are subject to redemption at the option of the Fund, subject to payment of a premium until February 29, 2012, and at par thereafter. The Fund may be obligated to redeem certain of the VMTP Shares if the Fund fails to maintain certain asset coverage and leverage ratio requirements and such failures are not cured by the applicable cure date. The redemption price per share is equal to the sum of the liquidation value per share plus any accumulated but unpaid dividends.
Dividends on MTP shares (which are treated as interest payments for financial reporting purposes) are set weekly.
For financial reporting purposes only, the liquidation value of VMTP Shares is recorded as a liability on the Statement of Assets and Liabilities. Unpaid dividends on VMTP Shares are recognized as a component of “Interest payable” on the Statement of Assets and Liabilities. Dividends paid on VMTP Shares are recognized as a component of “Interest expense and amortization of offering costs” on the Statement of Operations.
The average liquidation value outstanding and average annualized dividend rate of VMTP Shares for the Fund during the period February 24, 2011 (issuance date of shares) through April 30, 2011 were $421,700,000 and 1.50%, respectively.
Variable Rate Demand Preferred Shares
The following funds have issued and outstanding Variable Rate Demand Preferred (“VRDP”) Shares, with a $100,000 liquidation value per share. Municipal Advantage (NMA), Market Opportunity (NMO) and Dividend Advantage 2 (NXZ) issued their VRDP Shares in a privately negotiated offering during March 2010, March 2010 and August 2008, respectively. Concurrent with renewing agreements with the liquidity provider for its VRDP Shares in June 2010, Dividend Advantage 2 (NXZ) exchanged all of its 1,960 Series 1 VRDP Shares for 1,960 Series 2 VRDP Shares. The principal difference in terms between Series 1 and Series 2 VRDP Shares in Dividend Advantage 2 (NXZ) is the requirement that the Fund redeem VRDP Shares owned by the liquidity provider if the VRDP Shares have been owned by the liquidity provider through six months of continuous, unsuccessful remarketing. Proceeds of each Fund’s offering were used to redeem all, or a portion of, each Fund’s outstanding ARPS. The VRDP Shares were offered to qualified institutional buyers pursuant to Rule 144A under the Securities Act of 1933. As of April 30, 2011, the number of VRDP Shares outstanding and maturity date for each Fund are as follows:
| | | | | | | | | | | |
| | | Municipal Advantage | | Market Opportunity | | Dividend Advantage 2 | |
| | | (NMA | ) | (NMO | ) | (NXZ | ) |
| Series | | | 1 | | | 1 | | | 2 | |
| Shares outstanding | | | 2,968 | | | 3,509 | | | 1,960 | |
| Maturity | | | March 1, 2040 | | | March 1, 2040 | | | August 1, 2040 | |
VRDP Shares include a liquidity feature that allows VRDP shareholders to have their shares purchased by a liquidity provider with whom each Fund has contracted in the event that purchase orders for VRDP Shares in a remarketing are not sufficient in number to be matched with the sale orders in that remarketing. Each Fund is required to redeem any VRDP Shares that are still owned by the liquidity provider after six months of continuous, unsuccessful remarketing.
Dividends on the VRDP Shares (which are treated as interest payments for financial reporting purposes) are set weekly at a rate established by a remarketing agent; therefore, the market value of the VRDP Shares is expected to approximate its liquidation value. If remarketings for VRDP Shares are continuously unsuccessful for six months, the maximum rate is designed to escalate according to a specified schedule in order to enhance the remarketing agent’s ability to successfully remarket the VRDP Shares.
Subject to certain conditions, VRDP Shares may be redeemed, in whole or in part, at any time at the option of each Fund. Each Fund may also redeem certain of the VRDP Shares if the Fund fails to maintain certain asset coverage requirements and such failures are not cured by the applicable cure date. The redemption price per share is equal to the sum of the liquidation value per share plus any accumulated but unpaid dividends.
| | | Notes to |
| | | Financial Statements (Unaudited) (continued) |
The average liquidation value outstanding and annualized dividend rate of VRDP Shares for each Fund during the six months ended April 30, 2011, were as follows:
| | | | | | | | | | | |
| | | Municipal Advantage | | Market Opportunity | | Dividend Advantage 2 | |
| | | (NMA | ) | (NMO | ) | (NXZ | ) |
| Average liquidation value outstanding | | $ | 296,800,000 | | $ | 350,900,000 | | $ | 196,000,000 | |
| Annualized dividend rate | | | 0.47 | % | | 0.47 | % | | 0.44 | % |
For financial reporting purposes only, the liquidation value of VRDP Shares is recognized as a liability on the Statement of Assets and Liabilities. Unpaid dividends on VRDP Shares are recognized as a component of “Interest payable” on the Statement of Assets and Liabilities. Dividends paid on the VRDP Shares are recognized as a component of “Interest expense and amortization of offering costs” on the Statement of Operations. In addition to interest expense, each Fund also pays a per annum liquidity fee to the liquidity provider, which is recognized as “Liquidity fees on VRDP shares” on the Statement of Operations.
Inverse Floating Rate Securities
Each Fund is authorized to invest in inverse floating rate securities. An inverse floating rate security is created by depositing a municipal bond, typically with a fixed interest rate, into a special purpose trust created by a broker-dealer. In turn, this trust (a) issues floating rate certificates, in face amounts equal to some fraction of the deposited bond’s par amount or market value, that typically pay short-term tax-exempt interest rates to third parties, and (b) issues to a long-term investor (such as one of the Funds) an inverse floating rate certificate (sometimes referred to as an “inverse floater”) that represents all remaining or residual interest in the trust. The income received by the inverse floater holder varies inversely with the short-term rate paid to the floating rate certificates’ holders, and in most circumstances the inverse floater holder bears substantially all of the underlying bond’s downside investment risk and also benefits disproportionately from any potential appreciation of the underlying bond’s value. The price of an inverse floating rate security will be more volatile than that of the underlying bond because the interest rate is dependent on not only the fixed coupon rate of the underlying bond but also on the short-term interest paid on the floating rate certificates, and because the inverse floating rate security essentially bears the risk of loss of the greater face value of the underlying bond.
A Fund may purchase an inverse floating rate security in a secondary market transaction without first owning the underlying bond (referred to as an “externally-deposited inverse floater”), or instead by first selling a fixed-rate bond to a broker-dealer for deposit into the special purpose trust and receiving in turn the residual interest in the trust (referred to as a “self-deposited inverse floater”). The inverse floater held by a Fund gives the Fund the right (a) to cause the holders of the floating rate certificates to tender their notes at par, and (b) to have the broker transfer the fixed-rate bond held by the trust to the Fund, thereby collapsing the trust. An investment in an externally-deposited inverse floater is identified in the Portfolio of Investments as “(IF) – Inverse floating rate investment.” An investment in a self-deposited inverse floater is accounted for as a financing transaction. In such instances, a fixed-rate bond deposited into a special purpose trust is identified in the Portfolio of Investments as “(UB) – Underlying bond of an inverse floating rate trust reflected as a financing transaction,” with the Fund accounting for the short-term floating rate certificates issued by the trust as “Floating rate obligations” on the Statement of Assets and Liabilities. In addition, the Fund reflects in “Investment Income” the entire earnings of the underlying bond and recognizes the related interest paid to the holders of the short-term floating rate certificates as a component of “Interest expense and amortization of offering costs” on the Statement of Operations.
During the six months ended April 30, 2011, each Fund invested in externally-deposited inverse floaters and/or self-deposited inverse floaters.
Each Fund may also enter into shortfall and forbearance agreements (sometimes referred to as a “recourse trust” or “credit recovery swap”) (such agreements referred to herein as “Recourse Trusts”) with a broker-dealer by which a Fund agrees to reimburse the broker-dealer, in certain circumstances, for the difference between the liquidation value of the fixed-rate bond held by the trust and the liquidation value of the floating rate certificates issued by the trust plus any shortfalls in interest cash flows. Under these agreements, a Fund’s potential exposure to losses related to or on inverse floaters may increase beyond the value of a Fund’s inverse floater investments as a Fund may potentially be liable to fulfill all amounts owed to holders of the floating rate certificates. At period end, any such shortfall is recognized as “Unrealized depreciation on Recourse Trusts” on the Statement of Assets and Liabilities.
At April 30, 2011, each Fund’s maximum exposure to externally-deposited Recourse Trusts is as follows:
| | | | | | | | | | | | | | | | | | | | |
| | | Performance Plus | | Municipal Advantage | | Market Opportunity | | Dividend Advantage | | Dividend Advantage 2 | | Dividend Advantage 3 | |
| | | (NPP | ) | (NMA | ) | (NMO | ) | (NAD | ) | (NXZ | ) | (NZF | ) |
| Maximum exposure to Recourse Trusts | | $ | 18,750,000 | | $ | 11,250,000 | | $ | 7,500,000 | | $ | 11,250,000 | | $ | 5,250,000 | | $ | — | |
The average floating rate obligations outstanding and average annual interest rate and fees related to self-deposited inverse floaters during the six months ended April 30, 2011, were as follows:
| | | | | | | | | | | | | | | | | | | | |
| | | Performance Plus | | Municipal Advantage | | Market Opportunity | | Dividend Advantage | | Dividend Advantage 2 | | Dividend Advantage 3 | |
| | | (NPP) | | (NMA) | | (NMO) | | (NAD) | | (NXZ) | | (NZF) | |
| Average floating rate obligations outstanding | | $ | 41,685,221 | | $ | 64,814,024 | | $ | 43,530,000 | | $ | 51,605,000 | | $ | 26,660,000 | | $ | 66,668,464 | |
| Average annual interest rate and fees | | | 0.75 | % | | 0.67 | % | | 0.62 | % | | 0.55 | % | | 0.71 | % | | 0.71 | % |
Derivative Financial Instruments
Each Fund is authorized to invest in certain derivative instruments, including foreign currency forwards, futures, options and swap contracts. Although each Fund is authorized to invest in such derivative instruments, and may do so in the future, they did not make any such investments during the six months ended April 30, 2011.
Market and Counterparty Credit Risk
In the normal course of business each Fund may invest in financial instruments and enter into financial transactions where risk of potential loss exists due to changes in the market (market risk) or failure of the other party to the transaction to perform (counterparty credit risk). The potential loss could exceed the value of the financial assets recorded on the financial statements. Financial assets, which potentially expose each Fund to counterparty credit risk, consist principally of cash due from counterparties on forward, option and swap transactions, when applicable. The extent of each Fund’s exposure to counterparty credit risk in respect to these financial assets approximates their carrying value as recorded on the Statement of Assets and Liabilities. Futures contracts, when applicable, expose a Fund to minimal counterparty credit risk as they are exchange traded and the exchange’s clearinghouse, which is counterparty to all exchange traded futures, guarantees the futures contracts against default.
Each Fund helps manage counterparty credit risk by entering into agreements only with counterparties the Adviser believes have the financial resources to honor their obligations and by having the Adviser monitor the financial stability of the counterparties. Additionally, counterparties may be required to pledge collateral daily (based on the daily valuation of the financial asset) on behalf of each Fund with a value approximately equal to the amount of any unrealized gain above a pre-determined threshold. Reciprocally, when each Fund has an unrealized loss, the Funds have instructed the custodian to pledge assets of the Funds as collateral with a value approximately equal to the amount of the unrealized loss above a pre-determined threshold. Collateral pledges are monitored and subsequently adjusted if and when the valuations fluctuate, either up or down, by at least the predetermined threshold amount.
Zero Coupon Securities
Each Fund is authorized to invest in zero coupon securities. A zero coupon security does not pay a regular interest coupon to its holders during the life of the security. Tax-exempt income to the holder of the security comes from accretion of the difference between the original purchase price of the security at issuance and the par value of the security at maturity and is effectively paid at maturity. The market prices of zero coupon securities generally are more volatile than the market prices of securities that pay interest periodically.
Offering Costs
Costs incurred by Performance Plus (NPP) in connection with its offering of VMTP Shares ($1,780,000) were recorded as a deferred charge and will be amortized over the life of the shares. Costs incurred by Municipal Advantage (NMA), Market Opportunity (NMO) and Dividend Advantage 2 (NXZ) in connection with their offerings of VRDP Shares ($2,134,000, $4,214,000 and $2,270,000, respectively), were recorded as deferred charges and will be amortized over the life of the shares. Costs incurred by Dividend Advantage (NAD) and Dividend Advantage 3 (NZF) in connection with their offerings of MTP Shares ($2,559,500 and $1,435,000, respectively), were recorded as deferred charges and will be amortized over the life of the shares. Each Fund’s amortized deferred charges are recognized as a component of “Interest expense and amortization of offering costs” on the Statement of Operations.
Custodian Fee Credit
Each Fund has an arrangement with the custodian bank whereby certain custodian fees and expenses are reduced by net credits earned on each Fund’s cash on deposit with the bank. Such deposit arrangements are an alternative to overnight investments. Credits for cash balances may be offset by charges for any days on which a Fund overdraws its account at the custodian bank.
Indemnifications
Under the Funds’ organizational documents, their officers and directors/trustees are indemnified against certain liabilities arising out of the performance of their duties to the Funds. In addition, in the normal course of business, the Funds enter into contracts that provide general indemnifications to other parties. The Funds’ maximum exposure under these arrangements is unknown as this would involve future claims that may be made against the Funds that have not yet occurred. However, the Funds have not had prior claims or losses pursuant to these contracts and expect the risk of loss to be remote.
| | | Notes to |
| | | Financial Statements (Unaudited) (continued) |
Use of Estimates
The preparation of financial statements in conformity with U.S. GAAP requires management to make estimates and assumptions that affect the reported amounts of assets and liabilities at the date of the financial statements and the reported amounts of increases and decreases in net assets applicable to Common shares from operations during the reporting period. Actual results may differ from those estimates.
2. Fair Value Measurements
Fair value is defined as the price that the Funds would receive upon selling an investment or transferring a liability in an orderly transaction to an independent buyer in the principal or most advantageous market of the investment. A three-tier hierarchy is used to maximize the use of observable market data and minimize the use of unobservable inputs and to establish classification of fair value measurements for disclosure purposes.
Observable inputs reflect the assumptions market participants would use in pricing the asset or liability. Observable inputs are based on market data obtained from sources independent of the reporting entity. Unobservable inputs reflect the reporting entity’s own assumptions about the assumptions market participants would use in pricing the asset or liability. Unobservable inputs are based on the best information available in the circumstances. The three-tier hierarchy of inputs is summarized in the three broad levels listed below:
| | |
| | Level 1 – Quoted prices in active markets for identical securities. |
| | Level 2 – Other significant observable inputs (including quoted prices for similar securities, interest rates, prepayment speeds, credit risk, etc.). |
| | Level 3 – Significant unobservable inputs (including management’s assumptions in determining the fair value of investments). |
The inputs or methodologies used for valuing securities are not an indication of the risk associated with investing in those securities. The following is a summary of each Fund’s fair value measurements as of April 30, 2011:
| Performance Plus (NPP) | | Level 1 | | Level 2 | | Level 3 | | Total | |
| Investments: | | | | | | | | | | | | | |
| Municipal Bonds | | $ | — | | $ | 1,263,296,465 | | $ | — | | $ | 1,263,296,465 | |
| Municipal Advantage (NMA) | | Level 1 | | Level 2 | | Level 3 | | Total | |
| Investments: | | | | | | | | | | | | | |
| Municipal Bonds | | $ | — | | $ | 912,124,688 | | $ | 75,150 | | $ | 912,199,838 | |
| Market Opportunity (NMO) | | Level 1 | | Level 2 | | Level 3 | | Total | |
| Investments: | | | | | | | | | | | | | |
| Municipal Bonds | | $ | — | | $ | 937,587,364 | | $ | — | | $ | 937,587,364 | |
| Dividend Advantage (NAD) | | Level 1 | | Level 2 | | Level 3 | | Total | |
| Investments: | | | | | | | | | | | | | |
| Municipal Bonds | | $ | — | | $ | 814,436,376 | | $ | 75,150 | | $ | 814,511,526 | |
| Investment Companies | | | 513,259 | | | — | | | — | | | 513,259 | |
| Total | | $ | 513,259 | | $ | 814,436,376 | | $ | 75,150 | | $ | 815,024,785 | |
| Dividend Advantage 2 (NXZ) | | Level 1 | | Level 2 | | Level 3 | | Total | |
| Investments: | | | | | | | | | | | | | |
| Municipal Bonds | | $ | — | | $ | 591,162,570 | | $ | — | | $ | 591,162,570 | |
| Dividend Advantage 3 (NZF) | | Level 1 | | Level 2 | | Level 3 | | Total | |
| | | | | | | | | | | | | | |
| Investments: | | | | | | | | | | | | | |
| Municipal Bonds | | $ | — | | $ | 823,991,512 | | $ | 180,360 | | $ | 824,171,872 | |
| Investment Companies | | | 3,231,277 | | | — | | | — | | | 3,231,277 | |
| Short-Term Investments | | | — | | | 4,730,000 | | | — | | | 4,730,000 | |
| Total | | $ | 3,231,277 | | $ | 828,721,512 | | $ | 180,360 | | $ | 832,133,149 | |
The following is a reconciliation of the Funds’ Level 3 investments held at the beginning and end of the measurement period:
| | | | | | | | | | | | | | |
| | | Municipal Advantage | | Dividend Advantage | | Dividend Advantage 2 | | Dividend Advantage 3 | |
| | | (NMA | ) | (NAD | ) | (NXZ | ) | (NZF | ) |
| | | Level 3 Municipal Bonds | | Level 3 Municipal Bonds | | Level 3 Municipal Bonds | | Level 3 Municipal Bonds | |
| Balance at the beginning of period | | $ | 462,475 | | $ | 78,062 | | $ | 2,333,250 | | $ | 187,349 | |
| Gains (losses): | | | | | | | | | | | | | |
| Net realized gains (losses) | | | 6,799 | | | 6,799 | | | — | | | (17,141 | ) |
| Net change in unrealized appreciation (depreciation) | | | (133,025 | ) | | (9,711 | ) | | (748,519 | ) | | 10,152 | |
| Purchases at cost | | | — | | | — | | | — | | | — | |
| Sales at proceeds | | | — | | | — | | | — | | | — | |
| Net discounts (premiums) | | | — | | | — | | | 49 | | | — | |
| Transfers in to | | | — | | | — | | | — | | | — | |
| Transfers out of | | | (261,099 | ) | | — | | | (1,584,780 | ) | | — | |
| Balance at the end of period | | $ | 75,150 | | $ | 75,150 | | $ | — | | $ | 180,360 | |
| Net change in unrealized appreciation (depreciation) during the period of Level 3 securities held as of April 30, 2011 | | $ | (9,711 | ) | $ | (9,711 | ) | $ | — | | $ | 10,152 | |
During the six months ended April 30, 2011, the Funds recognized no significant transfers to/from Level 1 or Level 2. Transfers in and/or out of Level 3 are shown using end of period values.
3. Derivative Instruments and Hedging Activities
The Funds record derivative instruments at fair value, with changes in fair value recognized on the Statement of Operations, when applicable. Even though the Funds’ investments in derivatives may represent economic hedges, they are not considered to be hedge transactions for financial reporting purposes. The Funds did not invest in derivative instruments during the six months ended April 30, 2011.
4. Fund Shares
Common Shares
Since the inception of the Fund’s repurchase program, the Funds have not repurchased any of their outstanding Common shares.
Transactions in Common shares were as follows:
| | | | | | | | | | | | | | | | | | | | |
| | | Performance Plus (NPP) | | Municipal Advantage (NMA) | | Market Opportunity (NMO) | |
| | | Six Months Ended 4/30/11 | | Year Ended 10/31/10 | | Six Months Ended 4/30/11 | | Year Ended 10/31/10 | | Six Months Ended 4/30/11 | | Year Ended 10/31/10 | |
| Common shares issued to shareholders due to reinvestment of distributions | | | 19,498 | | | 18,891 | | | 64,969 | | | 202,701 | | | 80,513 | | | 170,873 | |
| | | Dividend Advantage (NAD) | | Dividend Advantage 2 (NXZ) | | Dividend Advantage 3 (NZF) | |
| | | Six Months Ended 4/30/11 | | Year Ended 10/31/10 | | Six Months Ended 4/30/11 | | Year Ended 10/31/10 | | Six Months Ended 4/30/11 | | Year Ended 10/31/10 | |
| Common shares issued to shareholders due to reinvestment of distributions | | | 4,564 | | | 4,490 | | | 4,192 | | | 21,264 | | | 4,537 | | | 9,310 | |
| | | Notes to |
| | | Financial Statements (Unaudited) (continued) |
Preferred Shares
Transactions in ARPS were as follows:
| | | | | | | | | | | | | | | | | | | | | | | | | | |
| | | Performance Plus (NPP) | | Municipal Advantage (NMA) | |
| | | Six Months Ended 4/30/11 | | Year Ended 10/31/10 | | Six Months Ended 4/30/11 | | Year Ended 10/31/10 | |
| | | Shares | | Amount | | Shares | | Amount | | Shares | | Amount | | Shares | | Amount | |
| ARPS redeemed: | | | | | | | | | | | | | | | | | | | | | | | | | |
| Series M | | | 3,507 | | $ | 87,675,000 | | | — | | $ | — | | | — | | $ | — | | | 2,457 | | $ | 61,425,000 | |
| Series T | | | 3,506 | | | 87,650,000 | | | — | | | — | | | — | | | — | | | 2,457 | | | 61,425,000 | |
| Series W | | | 3,505 | | | 87,625,000 | | | — | | | — | | | — | | | — | | | 2,456 | | | 61,400,000 | |
| Series TH | | | 2,770 | | | 69,250,000 | | | — | | | — | | | — | | | — | | | 1,901 | | | 47,525,000 | |
| Series F | | | 3,508 | | | 87,700,000 | | | — | | | — | | | — | | | — | | | 2,457 | | | 61,425,000 | |
| Total | | | 16,796 | | $ | 419,900,000 | | | — | | $ | — | | | — | | $ | — | | | 11,728 | | $ | 293,200,000 | |
| | | Market Opportunity (NMO) | | Dividend Advantage (NAD) | |
| | | Six Months Ended 4/30/11 | | Year Ended 10/31/10 | | Six Months Ended 4/30/11 | | Year Ended 10/31/10 | |
| | | Shares | | Amount | | Shares | | Amount | | Shares | | Amount | | Shares | | Amount | |
| ARPS redeemed: | | | | | | | | | | | | | | | | | | | | | | | | | |
| Series M | | | — | | $ | — | | | 3,649 | | $ | 91,225,000 | | | — | | $ | — | | | 1,922 | | $ | 48,050,000 | |
| Series T | | | — | | | — | | | 3,648 | | | 91,200,000 | | | — | | | — | | | 1,921 | | | 48,025,000 | |
| Series W | | | — | | | — | | | 2,920 | | | 73,000,000 | | | — | | | — | | | — | | | — | |
| Series TH | | | — | | | — | | | — | | | — | | | — | | | — | | | 1,826 | | | 45,650,000 | |
| Series F | | | — | | | — | | | 3,650 | | | 91,250,000 | | | — | | | — | | | — | | | — | |
| Total | | | — | | $ | — | | | 13,867 | | $ | 346,675,000 | | | — | | $ | — | | | 5,669 | | $ | 141,725,000 | |
| | | Dividend Advantage 3 (NZF) | |
| | | Six Months Ended 4/30/11 | | Year Ended 10/31/10 | |
| | | Shares | | Amount | | Shares | | Amount | |
| ARPS redeemed: | | | | | | | | | | | | | |
| Series W | | | 913 | | $ | 22,825,000 | | | — | | $ | — | |
| Series TH | | | 914 | | | 22,850,000 | | | — | | | — | |
| Series F | | | 915 | | | 22,875,000 | | | — | | | — | |
| Total | | | 2,742 | | $ | 68,550,000 | | | — | | $ | — | |
Transactions in MTP Shares were as follows:
| | | Dividend Advantage (NAD) | | Dividend Advantage 3 (NZF) | |
| | | Six Months Ended 4/30/11 | | Year Ended 10/31/10 | | Six Months Ended 4/30/11 | | Year Ended 10/31/10 | |
| | | Shares | | Amount | | Shares | | Amount | | Shares | | Amount | | Shares | | Amount | |
| MTP Shares issued: | | | | | | | | | | | | | | | | | | | | | | | | | |
| Series 2015 | | | — | | $ | — | | | 14,430,000 | | $ | 144,300,000 | | | — | | $ | — | | | — | | $ | — | |
| Series 2016 | | | — | | | — | | | — | | | — | | | 7,000,000 | | | 70,000,000 | | | — | | | — | |
| Total | | | — | | $ | — | | | 14,430,000 | | $ | 144,300,000 | | | 7,000,000 | | $ | 70,000,000 | | | — | | $ | — | |
Transactions in VMTP Shares were as follows:
| | | | | | | | | | | | | | |
| | | Performance Plus (NPP) | |
| | | Six Months Ended 4/30/11 | | Year Ended 10/31/10 | |
| | | Shares | | Amount | | Shares | | Amount | |
| VMTP Shares issued: | | | | | | | | | | | | | |
| Series 2014 | | | 4,217 | | $ | 421,700,000 | | | — | | $ | — | |
Transactions in VRDP Shares were as follows:
| | | | | | | | | | | | | | | | | | | | | | | | | | |
| | | Municipal Advantage (NMA) | | Market Opportunity (NMO) | |
| | | Six Months Ended 4/30/11 | | Year Ended 10/31/10 | | Six Months Ended 4/30/11 | | Year Ended 10/31/10 | |
| | | Shares | | Amount | | Shares | | Amount | | Shares | | Amount | | Shares | | Amount | |
| VRDP Shares issued: | | | | | | | | | | | | | | | | | | | | | | | | | |
| Series 1 | | | — | | $ | — | | | 2,968 | | $ | 296,800,000 | | | — | | $ | — | | | 3,509 | | $ | 350,900,000 | |
During the fiscal year ended October 31, 2010, Dividend Advantage 2 (NXZ) completed a private exchange offer in which all of its 1,960 Series 1 VRDP Shares were exchanged for 1,960 Series 2 VRDP Shares.
5. Investment Transactions
Purchases and sales (including maturities but excluding short-term investments, where applicable) during the six months ended April 30, 2011, were as follows:
| | | | | | | | | | | | | | | | | | | |
| | Performance Plus | | Municipal Advantage | | Market Opportunity | | Dividend Advantage | | Dividend Advantage 2 | | Dividend Advantage 3 | |
| | (NPP | ) | (NMA | ) | (NMO | ) | (NAD | ) | (NXZ | ) | (NZF | ) |
| Purchases | | $ | 61,152,069 | | | $ | 78,690,787 | | | $ | 72,867,258 | | | $ | 81,244,089 | | | $ | 89,709,257 | | | $ | 78,303,221 | |
| Sales and maturities | | | 83,859,031 | | | | 94,773,516 | | | | 53,454,071 | | | | 81,902,551 | | | | 98,572,064 | | | | 95,276,606 | |
6. Income Tax Information
The following information is presented on an income tax basis. Differences between amounts for financial statement and federal income tax purposes are primarily due to the timing differences in recognizing taxable market discount, timing differences in recognizing certain gains and losses on investment transactions and the treatment of investments in inverse floating rate securities reflected as financing transactions, if any. To the extent that differences arise that are permanent in nature, such amounts are reclassified within the capital accounts as detailed below. Temporary differences do not require reclassification. Temporary and permanent differences do not impact the net asset values of the Funds.
At April 30, 2011, the cost and unrealized appreciation (depreciation) of investments, as determined on a federal income tax basis, were as follows:
| | | | | | | | | | | | | | | | | | | |
| | Performance Plus | | Municipal Advantage | | Market Opportunity | | Dividend Advantage | | Dividend Advantage 2 | | Dividend Advantage 3 | |
| | (NPP | ) | (NMA | ) | (NMO | ) | (NAD | ) | (NXZ | ) | (NZF | ) |
| Cost of investments | | $ | 1,245,339,730 | | | $ | 894,038,957 | | | $ | 960,904,206 | | | $ | 804,357,926 | | | $ | 595,281,638 | | | $ | 800,950,023 | |
| Gross unrealized: | | | | | | | | | | | | | | | | | | | | | | | | |
| Appreciation | | $ | 45,100,548 | | | $ | 23,152,833 | | | $ | 19,779,376 | | | $ | 25,270,634 | | | $ | 16,007,937 | | | $ | 17,609,234 | |
| Depreciation | | | (67,963,829 | ) | | | (64,779,805 | ) | | | (86,626,560 | ) | | | (66,209,355 | ) | | | (46,794,161 | ) | | | (47,506,235 | ) |
| Net unrealized appreciation (depreciation) of investments | | $ | (22,863,281 | ) | | $ | (41,626,972 | ) | | $ | (66,847,184 | ) | | $ | (40,938,721 | ) | | $ | (30,786,224 | ) | | $ | (29,897,001 | ) |
Permanent differences, primarily due to federal taxes paid, taxable market discount and distribution character reclassifications, resulted in reclassifications among the Funds’ components of Common share net assets at October 31, 2010, the Funds’ last tax year end, as follows:
| | | | | | | | | | | | | | | | | | | |
| | Performance Plus | | Municipal Advantage | | Market Opportunity | | Dividend Advantage | | Dividend Advantage 2 | | Dividend Advantage 3 | |
| | (NPP | ) | (NMA | ) | (NMO | ) | (NAD | ) | (NXZ | ) | (NZF | ) |
| Paid-in surplus | | $ | (14,354 | ) | | $ | (44,077 | ) | | $ | (82,335 | ) | | $ | (319,910 | ) | | $ | (710,096 | ) | | $ | — | |
| Undistributed (Over-distribution of) net investment income | | | (295,300 | ) | | | 40,235 | | | | (118,648 | ) | | | 318,426 | | | | 635,555 | | | | (3,071 | ) |
| Accumulated net realized gain (loss) | | | 309,654 | | | | 3,842 | | | | 200,983 | | | | 1,484 | | | | 74,541 | | | | 3,071 | |
| | | Notes to |
| | | Financial Statements (Unaudited) (continued) |
The tax components of undistributed net tax-exempt income, net ordinary income and net long-term capital gains at October 31, 2010, the Funds’ last tax year end, were as follows:
| | | | | | | | | | | | | | | | | | | |
| | Performance Plus | | Municipal Advantage | | Market Opportunity | | Dividend Advantage | | Dividend Advantage 2 | | Dividend Advantage 3 | |
| | (NPP | ) | (NMA | ) | (NMO | ) | (NAD | ) | (NXZ | ) | (NZF | ) |
| Undistributed net tax-exempt income * | | $ | 19,969,255 | | | $ | 11,572,786 | | | $ | 12,834,483 | | | $ | 11,751,685 | | | $ | 7,112,008 | | | $ | 13,088,050 | |
| Undistributed net ordinary income ** | | | 496,191 | | | | 403,062 | | | | 28,857 | | | | 25,093 | | | | 486 | | | | — | |
| Undistributed net long-term capital gains | | | 5,536,530 | | | | 3,489,441 | | | | — | | | | — | | | | — | | | | 640,607 | |
| * | Undistributed net tax-exempt income (on a tax basis) has not been reduced for the dividend declared on October 1, 2010, paid on November 1, 2010. |
| ** | Net ordinary income consists of taxable market discount income and net short-term capital gains, if any. |
The tax character of distributions paid during the Funds’ last tax year ended October 31, 2010, was designated for purposes of the dividends paid deduction as follows:
| | | | | | | | | | | | | | | | | | | |
| | Performance Plus | | Municipal Advantage | | Market Opportunity | | Dividend Advantage | | Dividend Advantage 2 | | Dividend Advantage 3 | |
| | (NPP | ) | (NMA | ) | (NMO | ) | (NAD | ) | (NXZ | ) | (NZF | ) |
| Distributions from net tax-exempt income | | $ | 56,430,144 | | | $ | 43,084,415 | | | $ | 45,084,665 | | | $ | 38,498,093 | | | $ | 28,872,454 | | | $ | 39,033,313 | |
| Distributions from net ordinary income ** | | | 23,738 | | | | 63,961 | | | | — | | | | — | | | | 409,165 | | | | 830,966 | |
| Distributions from net long-term capital gains | | | 863,865 | | | | 3,011,399 | | | | — | | | | — | | | | — | | | | 1,901,758 | |
| ** | Net ordinary income consists of taxable market discount income and net short-term capital gains, if any. |
At October 31, 2010, the Funds’ last tax year end, the following Funds had unused capital loss carryforwards available for federal income tax purposes to be applied against future capital gains, if any. If not applied, the carryforwards will expire as follows:
| | | | | | | | | | |
| | | Market Opportunity | | | Dividend Advantage | | | Dividend Advantage 2 | |
| | | (NMO | ) | | (NAD | ) | | (NXZ | ) |
| Expiration: | | | | | | | | | |
| October 31, 2011 | | $ | — | | | $ | 3,513,691 | | | $ | — | |
| October 31, 2013 | | | — | | | | 104,762 | | | | — | |
| October 31, 2014 | | | 1,437,187 | | | | — | | | | — | |
| October 31, 2015 | | | 1,902,879 | | | | — | | | | 862,140 | |
| October 31, 2016 | | | 1,398,166 | | | | — | | | | — | |
| October 31, 2017 | | | — | | | | 424,278 | | | | — | |
| Total | | $ | 4,738,232 | | | $ | 4,042,731 | | | $ | 862,140 | |
During Funds’ last tax year ended October 31, 2010, the following Funds utilized capital loss carryforwards as follows:
| | | | | | | | | | |
| | Market Opportunity | | Dividend Advantage | | Dividend Advantage 2 | |
| | (NMO | ) | (NAD | ) | (NXZ | ) |
| Utilized capital loss carryforwards | | $ | 6,894,937 | | | $ | 1,080,609 | | | $ | 1,524,632 | |
7. Management Fees and Other Transactions with Affiliates
Each Fund’s management fee is separated into two components — a fund-level fee, based only on the amount of assets within each individual Fund, and a complex-level fee, based on the aggregate amount of all fund assets managed by the Adviser. This pricing structure enables each Fund’s shareholders to benefit from growth in the assets within their respective Fund as well as from growth in the amount of complex-wide assets managed by the Adviser.
The annual fund-level fee for each Fund, payable monthly, is calculated according to the following schedules:
| | | |
| | Performance Plus (NPP) |
| | Municipal Advantage (NMA) |
| | Market Opportunity (NMO) |
| Average Daily Managed Assets* | Fund-Level Fee Rate |
| For the first $125 million | .4500 | % |
| For the next $125 million | .4375 | |
| For the next $250 million | .4250 | |
| For the next $500 million | .4125 | |
| For the next $1 billion | .4000 | |
| For the next $3 billion | .3875 | |
| For managed assets over $5 billion | .3750 | |
| | Dividend Advantage (NAD) |
| | Dividend Advantage 2 (NXZ) |
| | Dividend Advantage 3 (NZF) |
| Average Daily Managed Assets* | Fund-Level Fee Rate |
| For the first $125 million | .4500 | % |
| For the next $125 million | .4375 | |
| For the next $250 million | .4250 | |
| For the next $500 million | .4125 | |
| For the next $1 billion | .4000 | |
| For managed assets over $2 billion | .3750 | |
The annual complex-level fee for each Fund, payable monthly, is calculated according to the following schedule:
| | | |
| Complex-Level Managed Asset Breakpoint Level* | Effective Rate at Breakpoint Level |
| $55 billion | .2000 | % |
| $56 billion | .1996 | |
| $57 billion | .1989 | |
| $60 billion | .1961 | |
| $63 billion | .1931 | |
| $66 billion | .1900 | |
| $71 billion | .1851 | |
| $76 billion | .1806 | |
| $80 billion | .1773 | |
| $91 billion | .1691 | |
| $125 billion | .1599 | |
| $200 billion | .1505 | |
| $250 billion | .1469 | |
| $300 billion | .1445 | |
| * | For the fund-level and complex-level fees, managed assets include closed-end fund assets managed by the Adviser that are attributable to financial leverage. For these purposes, financial leverage includes the funds’ use of preferred stock and borrowings and certain investments in the residual interest certificates (also called inverse floating rate securities) in tender option bond (TOB) trusts, including the portion of assets held by a TOB trust that has been effectively financed by the trust’s issuance of floating rate securities, subject to an agreement by the Adviser as to certain funds to limit the amount of such assets for determining managed assets in certain circumstances. The complex-level fee is calculated based upon the aggregate daily managed assets of all Nuveen funds that constitute “eligible assets.” Eligible assets do not include assets attributable to investments in other Nuveen funds or assets in excess of $2 billion added to the Nuveen fund complex in connection with the Adviser’s assumption of the management of the former First American Funds effective January 1, 2011. As of April 30, 2011, the complex-level fee rate for these Funds was .1785%. |
The management fee compensates the Adviser for overall investment advisory and administrative services and general office facilities. The Adviser has entered into Sub-Advisory Agreements with the Sub-Adviser under which the Sub-Adviser manages the investment portfolios of the Funds. The Sub-Adviser is compensated for its services to the Funds from the management fees paid to the Adviser.
The Funds pay no compensation directly to those of its directors/trustees who are affiliated with the Adviser or to its officers, all of whom receive remuneration for their services to the Funds from the Adviser or its affiliates. The Board of Directors/Trustees has adopted a deferred compensation plan for independent directors/trustees that enables directors/trustees to elect to defer receipt of all or a portion of the annual compensation they are entitled to receive from certain Nuveen-advised funds. Under the plan, deferred amounts are treated as though equal dollar amounts had been invested in shares of select Nuveen-advised funds.
| | | Notes to |
| | | Financial Statements (Unaudited) (continued) |
For the first ten years of Dividend Advantage 2’s (NXZ) operations, the Adviser has agreed to reimburse the Fund, as a percentage of average daily managed assets, for fees and expenses in the amounts and for the time periods set forth below:
| | | | | | | |
Year Ending March 31, | | | Year Ending March 31, | | | |
| | | | | | | |
| 2001* | .30 | % | 2007 | | .25 | % |
| 2002 | .30 | | 2008 | | .20 | |
| 2003 | .30 | | 2009 | | .15 | |
| 2004 | .30 | | 2010 | | .10 | |
| 2005 | .30 | | 2011 | | .05 | |
| 2006 | .30 | | | | | |
| * | From the commencement of operations. |
The Adviser has not agreed to reimburse Dividend Advantage 2 (NXZ) for any portion of its fees and expenses beyond March 31, 2011.
For the first ten years of Dividend Advantage 3’s (NZF) operations, the Adviser has agreed to reimburse the Fund, as a percentage of average daily managed assets, for fees and expenses in the amounts and for the time periods set forth below:
| | | | | | | |
| Year Ending | | | Year Ending | | | |
| September 30, | | | September 30, | | | |
| | | | | | | |
| 2001* | .30 | % | 2007 | | .25 | % |
| 2002 | .30 | | 2008 | | .20 | |
| 2003 | .30 | | 2009 | | .15 | |
| 2004 | .30 | | 2010 | | .10 | |
| 2005 | .30 | | 2011 | | .05 | |
| 2006 | .30 | | | | | |
| * | From the commencement of operations. |
The Adviser has not agreed to reimburse Dividend Advantage 3 (NZF) for any portion of its fees and expenses beyond September 30, 2011.
8. New Accounting Pronouncement
Fair Value Measurements and Disclosures
On May 12, 2011, the Financial Accounting Standards Board (“FASB”) issued an Accounting Standard Update (“ASU”) modifying Topic 820, Fair Value Measurements and Disclosures. At the same time, the International Accounting Standards Board (“IASB”) issued International Financial Reporting Standard (“IFRS”) 13, Fair Value Measurement. The objective by the FASB and IASB is convergence of their guidance on fair value measurements and disclosures. Specifically, the ASU requires reporting entities to disclose i) the amounts of any transfers between Level 1 and Level 2, and the reasons for the transfers, ii) for Level 3 fair value measurements, a) quantitative information about significant unobservable inputs used, b) a description of the valuation processes used by the reporting entity and c) a narrative description of the sensitivity of the fair value measurement to changes in unobservable inputs if a change in those inputs might result in a significantly higher or lower fair value measurement. The effective date of the ASU is for interim and annual periods beginning after December 15, 2011. At this time, management is evaluating the implications of this guidance and the impact it will have on the financial statement amounts and footnote disclosures, if any.
9. Subsequent Events
Regulatory Matters
Subsequent to the reporting period, Nuveen Securities, LLC (“Nuveen Securities”) entered into a settlement with the Financial Industry Regulatory Authority (“FINRA”) with respect to certain allegations regarding Nuveen-sponsored closed-end fund ARPS marketing brochures. As part of this settlement, Nuveen Securities neither admitted to nor denied FINRA’s allegations. Nuveen Securities is the broker-dealer subsidiary of Nuveen. The settlement with FINRA concludes an investigation that followed the widespread failure of auctions for ARPS and other auction rate securities, which generally began in mid-February 2008. In the settlement, FINRA alleged that certain marketing materials provided by Nuveen Securities were false and misleading. Nuveen Securities agreed to a censure and the payment of a $3 million fine.
Distributions to Shareholders
During May 2011, Municipal Advantage (NMA) declared a capital gains distribution, which was paid on July 1, 2011, to shareholders of record on June 15, 2011, as follows:
| | | Municipal | |
| | | Advantage | |
| | | (NMA | ) |
| | | | |
| Capital gains distribution per share | | $ | 0.0783 | |
Board Approval of Sub-Advisory
Arrangements (Unaudited)
At a meeting held on May 25-26, 2010 (the “May Meeting”), the Boards of Trustees or Directors (as the case may be) (each, a “Board” and each Trustee or Director, a “Board Member”) of the Funds, including a majority of the Board Members who are not parties to the advisory agreements or “interested persons” of any parties (the “Independent Board Members”), considered and approved the advisory agreements (each, an “Advisory Agreement”) between each Fund and Nuveen Asset Management (the “Adviser”). Since the May Meeting, Nuveen has engaged in an internal restructuring (the “Restructuring”) pursuant to which the portfolio management services provided by the Adviser to the Funds were transferred to Nuveen Asset Management, LLC (“NAM LLC”), a newly-organized wholly-owned subsidiary of the Adviser and the Adviser changed its name to Nuveen Fund Advisors, Inc. (“NFA”). The Adviser, under its new name NFA, continues to serve as investment adviser to the Funds and, in that capacity, will continue to provide various oversight, administrative, compliance and other services. To effectuate the foregoing, NFA entered into sub-advisory agreements with NAM LLC on behalf of the Funds (each, a “Sub-Advisory Agreement”). Under each Sub-Advisory Agreement, NAM LLC, subject to the oversight of NFA and the Board, will furnish an investment program, make investment decisions for, and place all orders for the purchase and sale of securities for the portion of the respective Fund’s investment portfolio allocated to it by NFA. There have been no changes to the advisory fees paid by the Funds; rather, NFA will pay a portion of the investment advisory fee it receives to NAM LLC for its sub-advisory services. The Independent Board Members reviewed the allocation of fees between NFA and NAM LLC. NFA and NAM LLC do not anticipate any reduction in the nature or level of services provided to the Funds following the Restructuring. The personnel of NFA who engaged in portfolio management activities prior to the spinoff of NAM LLC are not expected to materially change as a result of the spinoff. In light of the foregoing, at a meeting held on November 16-18, 2010, the Board Members, including a majority of the Independent Board Members, approved the Sub-Advisory Agreements on behalf of the Funds. Given that the Restructuring was not expected to reduce the level or nature of services provided and the advisory fees paid by the Funds were the same, the factors considered and determinations made at the May Meeting in approving the Advisory Agreements were equally applicable to the approval of the Sub-Advisory Agreements. For a discussion of these considerations, please see the shareholder report of the Funds that was first issued after the May Meeting for the period including May 2010.
Reinvest Automatically,
Easily and Conveniently
Nuveen makes reinvesting easy. A phone call is all it takes to set up your reinvestment account.
Nuveen Closed-End Funds Automatic Reinvestment Plan
Your Nuveen Closed-End Fund allows you to conveniently reinvest distributions in additional Fund shares.
By choosing to reinvest, you’ll be able to invest money regularly and automatically, and watch your investment grow through the power of compounding. Just like distributions in cash, there may be times when income or capital gains taxes may be payable on distributions that are reinvested.
It is important to note that an automatic reinvestment plan does not ensure a profit, nor does it protect you against loss in a declining market.
Easy and convenient
To make recordkeeping easy and convenient, each month you’ll receive a statement showing your total distributions, the date of investment, the shares acquired and the price per share, and the total number of shares you own.
How shares are purchased
The shares you acquire by reinvesting will either be purchased on the open market or newly issued by the Fund. If the shares are trading at or above net asset value at the time of valuation, the Fund will issue new shares at the greater of the net asset value or 95% of the then-current market price. If the shares are trading at less than net asset value, shares for your account will be purchased on the open market. If the Plan Agent begins purchasing Fund shares on the open market while shares are trading below net asset value, but the Fund’s shares subsequently trade at or above their net asset value before the Plan Agent is able to complete its purchases, the Plan Agent may cease open-market purchases and may invest the uninvested portion of the distribution in newly-issued Fund shares at a price equal to the greater of the shares’ net asset value or 95% of the shares’ market value on the last business day immediately prior to the purchase date. Distributions received to purchase shares in the open market will normally be invested shortly after the distribution payment date. No interest will be paid on distributions awaiting reinvestment. Because the market price of the shares may increase before purchases are completed, the average purchase price per share may
exceed the market price at the time of valuation, resulting in the acquisition of fewer shares than if the distribution had been paid in shares issued by the Fund. A pro rata portion of any applicable brokerage commissions on open market purchases will be paid by Plan participants. These commissions usually will be lower than those charged on individual transactions.
Flexible
You may change your distribution option or withdraw from the Plan at any time, should your needs or situation change.
You can reinvest whether your shares are registered in your name, or in the name of a brokerage firm, bank, or other nominee. Ask your investment advisor if his or her firm will participate on your behalf. Participants whose shares are registered in the name of one firm may not be able to transfer the shares to another firm and continue to participate in the Plan.
The Fund reserves the right to amend or terminate the Plan at any time. Although the Fund reserves the right to amend the Plan to include a service charge payable by the participants, there is no direct service charge to participants in the Plan at this time.
Call today to start reinvesting distributions
For more information on the Nuveen Automatic Reinvestment Plan or to enroll in or withdraw from the Plan, speak with your financial advisor or call us at (800) 257-8787.
Glossary of Terms
Used in this Report
| | |
| ■ | Auction Rate Bond: An auction rate bond is a security whose interest payments are adjusted periodically through an auction process, which process typically also serves as a means for buying and selling the bond. Auctions that fail to attract enough buyers for all the shares offered for sale are deemed to have “failed,” with current holders receiving a formula-based interest rate until the next scheduled auction. |
| | |
| ■ | Average Annual Total Return: This is a commonly used method to express an investment’s performance over a particular, usually multi-year time period. It expresses the return that would have been necessary each year to equal the investment’s actual cumulative performance (including change in NAV or market price and reinvested dividends and capital gains distributions, if any) over the time period being considered. |
| | |
| ■ | Average Effective Maturity: The market-value-weighted average of the effective maturity dates of the individual securities including cash. In the case of a bond that has been advance-refunded to a call date, the effective maturity is the date on which the bond is scheduled to be redeemed using the proceeds of an escrow account. In most other cases the effective maturity is the stated maturity date of the security. |
| | |
| ■ | Inverse Floaters: Inverse floating rate securities, also known as inverse floaters, are created by depositing a municipal bond, typically with a fixed interest rate, into a special purpose trust created by a broker-dealer. This trust, in turn, (a) issues floating rate certificates typically paying short-term tax-exempt interest rates to third parties in amounts equal to some fraction of the deposited bond’s par amount or market value, and (b) issues an inverse floating rate certificate (sometimes referred to as an “inverse floater”) to an investor (such as a Fund) interested in gaining investment exposure to a long-term municipal bond. The income received by the holder of the inverse floater varies inversely with the short-term rate paid to the floating rate certificates’ holders, and in most circumstances the holder of the inverse floater bears substantially all of the underlying bond’s downside investment risk. The holder of the inverse floater typically also benefits disproportionately from any potential appreciation of the underlying bond’s value. Hence, an inverse floater essentially represents an investment in the underlying bond on a leveraged basis. |
| | |
| ■ | Leverage: Using borrowed money to invest in securities or other assets. |
| ■ | Leverage-Adjusted Duration: Duration is a measure of the expected period over which a bond’s principal and interest will be paid, and consequently is a measure of the sensitivity of a bond’s or bond Fund’s value to changes when market interest rates change. Generally, the longer a bond’s or Fund’s duration, the more the price of the bond or Fund will change as interest rates change. Leverage-adjusted duration takes into account the leveraging process for a Fund and therefore is longer than the duration of the Fund’s portfolio of bonds. |
| | |
| ■ | Market Yield (also known as Dividend Yield or Current Yield): An investment’s current annualized dividend divided by its current market price. |
| | |
| ■ | Net Asset Value (NAV): A Fund’s NAV per common share is calculated by subtracting the liabilities of the Fund (including any Preferred shares issued in order to leverage the Fund) from its total assets and then dividing the remainder by the number of common shares outstanding. Fund NAVs are calculated at the end of each business day. |
| | |
| ■ | Pre-Refunding: Pre-Refunding, also known as advanced refundings or refinancings, is a procedure used by state and local governments to refinance municipal bonds to lower interest expenses. The issuer sells new bonds with a lower yield and uses the proceeds to buy U.S. Treasury securities, the interest from which is used to make payments on the higher-yielding bonds. Because of this collateral, pre-refunding generally raises a bond’s credit rating and thus its value. |
| | |
| ■ | Structural Leverage: Structural Leverage consists of preferred shares or debt issued by the fund. Both of these are part of a fund’s capital structure. Structural leverage is sometimes referred to as “‘40 Act Leverage” and is subject to asset coverage limits set in the Investment Company Act of 1940. |
| | |
| ■ | Taxable-Equivalent Yield: The yield necessary from a fully taxable investment to equal, on an after-tax basis, the yield of a municipal bond investment. |
| | |
| Zero Coupon Bond: A zero coupon bond does not pay a regular interest coupon to its holders during the life of the bond. Tax-exempt income to the holder of the bond comes from accretion of the difference between the original purchase price of the bond at issuance and the par value of the bond at maturity and is effectively paid at maturity. The market prices of zero coupon bonds generally are more volatile than the market prices of bonds that pay interest periodically. |
Notes
Notes
Notes
Other Useful Information
Board of
Directors/Trustees
John P. Amboian
Robert P. Bremner
Jack B. Evans
William C. Hunter
David J. Kundert
William J. Schneider
Judith M. Stockdale
Carole E. Stone
Virginia L. Stringer
Terence J. Toth
Fund Manager
Nuveen Fund Advisers, Inc.
333 West Wacker Drive
Chicago, IL 60606
Custodian
State Street Bank
& Trust Company
Boston, MA
Transfer Agent and
Shareholder Services
State Street Bank & Trust
Company
Nuveen Funds
P.O. Box 43071
Providence, RI 02940-3071
(800) 257-8787
Legal Counsel
Chapman and Cutler LLP
Chicago, IL
Independent Registered
Public Accounting Firm
Ernst & Young LLP
Chicago, IL
Quarterly Portfolio of Investments and Proxy Voting Information
You may obtain (i) each Fund’s quarterly portfolio of investments, (ii) information regarding how the Funds voted proxies relating to portfolio securities held during the most recent twelve-month period ended June 30, and (iii) a description of the policies and procedures that the Funds used to determine how to vote proxies relating to portfolio securities without charge, upon request, by calling Nuveen Investments toll-free at (800) 257-8787 or on Nuveen’s website at www.nuveen.com.
You may also obtain this and other Fund information directly from the Securities and Exchange Commission (SEC). The SEC may charge a copying fee for this information. Visit the SEC on-line at http://www.sec.gov or in person at the SEC’s Public Reference Room in Washington, D.C. Call the SEC at (202) 942-8090 for room hours and operation. You may also request Fund information by sending an e-mail request to publicinfo@sec.gov or by writing to the SEC’s Public References Section at 100 F Street NE, Washington, D.C. 20549.
CEO Certification Disclosure
Each Fund’s Chief Executive Officer (CEO) has submitted to the New York Stock Exchange (NYSE) the annual CEO certification as required by Section 303A.12(a) of the NYSE Listed Company Manual.
Each Fund has filed with the SEC the certification of its Chief Executive Officer and Chief Financial Officer required by Section 302 of the Sarbanes-Oxley Act.
Common and Preferred Share Information
Each Fund intends to repurchase and/or redeem shares of its own common and/or auction rate preferred stock in the future at such times and in such amounts as is deemed advisable. During the period covered by this report, the Funds repurchased and/or redeemed shares of their common and/or auction rate preferred stock as shown in the accompanying table.
| | | | | | | | |
| Fund | | Common Shares Repurchased | | Auction Rate Preferred Shares Redeemed |
| NPP | | | — | | | 16,796 | |
| NMA | | | — | | | — | |
| NMO | | | — | | | — | |
| NAD | | | — | | | — | |
| NXZ | | | — | | | — | |
| NZF | | | — | | | 2,742 | |
Any future repurchases and/or redemptions will be reported to shareholders in the next annual or semi-annual report.
Nuveen Investments:
Serving Investors for Generations
Since 1898, financial advisors and their clients have relied on Nuveen Investments to provide dependable investment solutions through continued adherence to proven, long-term investing principles. Today, we offer a range of high quality equity and fixed-income solutions designed to be integral components of a well-diversified core portfolio.
Focused on meeting investor needs.
Nuveen Investments is a global investment management firm that seeks to help secure the long-term goals of institutions and high net worth investors as well as the consultants and financial advisors who serve them. We market our growing range of specialized investment solutions under the high-quality brands of HydePark, NWQ, Nuveen Asset Management, Santa Barbara, Symphony, Tradewinds and Winslow Capital. In total, Nuveen Investments managed approximately $206 billion of assets as of March 31, 2011.
Find out how we can help you.
To learn more about how the products and services of Nuveen Investments may be able to help you meet your financial goals, talk to your financial advisor, or call us at (800) 257-8787. Please read the information provided carefully before you invest.
Investors should consider the investment objective and policies, risk considerations, charges and expenses of any investment carefully. Where applicable, be sure to obtain a prospectus, which contains this and other relevant information. To obtain a prospectus, please contact your securities representative or Nuveen Investments, 333 W. Wacker Dr., Chicago, IL 60606. Please read the prospectus carefully before you invest or send money.
Learn more about Nuveen Funds at: www.nuveen.com/cef
| | Nuveen makes things e-simple. | |
| | | |
| | It only takes a minute to sign up for e-Reports. Once enrolled, you’ll receive an e-mail as soon as your Nuveen Fund information is ready - no more waiting for delivery by regular mail. Just click on the link within the e-mail to see the report and save it on your computer if you wish. | |
| | | |
| | Free e-Reports right to your e-mail! | |
| | | |
| | www.investordelivery.com | |
| | If you receive your Nuveen Fund distributions and statements from your financial advisor or brokerage account. | |
| | | |
| | OR | |
| | | |
| | www.nuveen.com/accountaccess | |
| | If you receive your Nuveen Fund distributions and statements directly from Nuveen. | |
Distributed by
Nuveen Securities, LLC
333 West Wacker Drive
Chicago, IL 60606
www.nuveen.com
ESA-B-0411D
ITEM 2. CODE OF ETHICS.
Not applicable to this filing.
ITEM 3. AUDIT COMMITTEE FINANCIAL EXPERT.
Not applicable to this filing.
ITEM 4. PRINCIPAL ACCOUNTANT FEES AND SERVICES.
Not applicable to this filing.
ITEM 5. AUDIT COMMITTEE OF LISTED REGISTRANTS.
Not applicable to this filing.
ITEM 6. SCHEDULE OF INVESTMENTS.
(a) See Portfolio of Investments in Item 1.
(b) Not applicable.
ITEM 7. DISCLOSURE OF PROXY VOTING POLICIES AND PROCEDURES FOR CLOSED-END MANAGEMENT INVESTMENT COMPANIES.
Not applicable to this filing.
ITEM 8. PORTFOLIO MANAGERS OF CLOSED-END MANAGEMENT INVESTMENT COMPANIES.
Not applicable to this filing.
ITEM 9. PURCHASES OF EQUITY SECURITIES BY CLOSED-END MANAGEMENT INVESTMENT COMPANY AND AFFILIATED PURCHASERS.
Not applicable.
ITEM 10. SUBMISSION OF MATTERS TO A VOTE OF SECURITY HOLDERS.
There have been no material changes to the procedures by which shareholders may recommend nominees to the registrant's Board of Directors or Trustees implemented after the registrant last provided disclosure in response to this Item.
ITEM 11. CONTROLS AND PROCEDURES.
ITEM 12. EXHIBITS.
File the exhibits listed below as part of this Form.
Pursuant to the requirements of the Securities Exchange Act of 1934 and the Investment Company Act of 1940, the registrant has duly caused this report to be signed on its behalf by the undersigned, thereunto duly authorized.
Kevin J. McCarthy
Pursuant to the requirements of the Securities Exchange Act of 1934 and the Investment Company Act of 1940, this report has been signed below by the following persons on behalf of the registrant and in the capacities and on the dates indicated.
Gifford R. Zimmerman
Stephen D. Foy