UNITED STATES
SECURITIES AND EXCHANGE COMMISSION
Washington, D.C. 20549
FORM N-CSR
CERTIFIED SHAREHOLDER REPORT
OF
REGISTERED MANAGEMENT INVESTMENT COMPANIES
Investment Company Act file number: 811-05972
| Name of Registrant: | Vanguard International Equity Index Funds |
| Address of Registrant: | P.O. Box 2600 |
| | Valley Forge, PA 19482 |
| Name and address of agent for service: | Anne E. Robinson, Esquire |
| | P.O. Box 876 |
| | Valley Forge, PA 19482 |
Registrant’s telephone number, including area code: (610) 669-1000
Date of fiscal year end: October 31
Date of reporting period: November 1, 2020—October 31, 2021
Item 1: Reports to Shareholders
Annual Report | October 31, 2021
Vanguard International Stock Index Funds
| Vanguard European Stock Index Fund |
| Vanguard Pacific Stock Index Fund |
Contents
Your Fund’s Performance at a Glance
| 1 |
About Your Fund’s Expenses
| 2 |
European Stock Index Fund
| 4 |
Pacific Stock Index Fund
| 41 |
Please note: The opinions expressed in this report are just that—informed opinions. They should not be considered promises or advice. Also, please keep in mind that the information and opinions cover the period through the date on the front of this report. Of course, the risks of investing in your fund are spelled out in the prospectus.
Your Fund’s Performance at a Glance
| • | For the 12 months ended October 31, 2021, returns for Vanguard European Stock Index Fund ranged from 42.12% for Investor Shares to 42.35% for Institutional Plus Shares. Returns for Vanguard Pacific Stock Index Fund ranged from 23.09% for Investor Shares to 23.27% for ETF Shares (based on net asset value). |
| • | The global economy continued to recover from the sharp pandemic-induced contraction in the spring of 2020. Countries that were more successful in containing the virus, whether through vaccinations, lockdowns, or both, generally fared better economically. Swift and extensive fiscal and monetary support from policymakers was also key to the rebound. Even amid concerns toward the end of the fiscal year about inflation and the prospect of less accommodative monetary policy, stock returns for the period were excellent. |
| • | The United Kingdom made the strongest contribution to return for the European fund, followed by France and Germany. Among sectors, financials, industrials, and consumer discretionary made the strongest contributions. Telecommunications, real estate, and utilities contributed less to returns. |
| • | For the Pacific fund, Japan, which represents more than half the index, contributed most to its return. Among sectors, financials, industrials, and consumer discretionary led the way, while utilities, telecommunications, consumer staples, and energy brought up the rear. |
Market Barometer
| | Average Annual Total Returns
Periods Ended October 31, 2021 |
| | One Year | Three Years | Five Years |
| Stocks | | | |
| Russell 1000 Index (Large-caps) | 43.51% | 22.01% | 19.16% |
| Russell 2000 Index (Small-caps) | 50.80 | 16.47 | 15.52 |
| Russell 3000 Index (Broad U.S. market) | 43.90 | 21.62 | 18.91 |
| FTSE All-World ex US Index (International) | 30.23 | 12.42 | 10.05 |
| Bonds | | | |
Bloomberg U.S. Aggregate Bond Index
(Broad taxable market) | -0.48% | 5.63% | 3.10% |
Bloomberg Municipal Bond Index
(Broad tax-exempt market) | 2.64 | 5.17 | 3.41 |
| FTSE Three-Month U.S. Treasury Bill Index | 0.05 | 1.08 | 1.12 |
| CPI | | | |
| Consumer Price Index | 6.22% | 3.03% | 2.73% |
About Your Fund’s Expenses
As a shareholder of the fund, you incur ongoing costs, which include costs for portfolio management, administrative services, and shareholder reports (like this one), among others. Operating expenses, which are deducted from a fund’s gross income, directly reduce the investment return of the fund.
A fund’s expenses are expressed as a percentage of its average net assets. This figure is known as the expense ratio. The following examples are intended to help you understand the ongoing costs (in dollars) of investing in your fund and to compare these costs with those of other mutual funds. The examples are based on an investment of $1,000 made at the beginning of the period shown and held for the entire period.
The accompanying table illustrates your fund’s costs in two ways:
| • | Based on actual fund return. This section helps you to estimate the actual expenses that you paid over the period. The ”Ending Account Value“ shown is derived from the fund‘s actual return, and the third column shows the dollar amount that would have been paid by an investor who started with $1,000 in the fund. You may use the information here, together with the amount you invested, to estimate the expenses that you paid over the period. |
To do so, simply divide your account value by $1,000 (for example, an $8,600 account value divided by $1,000 = 8.6), then multiply the result by the number given for your fund under the heading ”Expenses Paid During Period.“
| • | Based on hypothetical 5% yearly return. This section is intended to help you compare your fund‘s costs with those of other mutual funds. It assumes that the fund had a yearly return of 5% before expenses, but that the expense ratio is unchanged. In this case—because the return used is not the fund’s actual return—the results do not apply to your investment. The example is useful in making comparisons because the Securities and Exchange Commission requires all mutual funds to calculate expenses based on a 5% return. You can assess your fund’s costs by comparing this hypothetical example with the hypothetical examples that appear in shareholder reports of other funds. |
Note that the expenses shown in the table are meant to highlight and help you compare ongoing costs only and do not reflect transaction costs incurred by the fund for buying and selling securities. Further, the expenses do not include any purchase, redemption, or account service fees described in the fund prospectus. If such fees were applied to your account, your costs would be higher. Your fund does not carry a “sales load.”
The calculations assume no shares were bought or sold during the period. Your actual costs may have been higher or lower, depending on the amount of your investment and the timing of any purchases or redemptions.
You can find more information about the fund’s expenses, including annual expense ratios, in the Financial Statements section of this report. For additional information on operating expenses and other shareholder costs, please refer to your fund’s current prospectus.
| Six Months Ended October 31, 2021 | | | |
| | Beginning
Account Value
4/30/2021 | Ending
Account Value
10/31/2021 | Expenses
Paid During
Period |
| Based on Actual Fund Return | | | |
| European Stock Index Fund | | | |
| Investor Shares | $1,000.00 | $1,058.00 | $1.19 |
| FTSE Europe ETF Shares | 1,000.00 | 1,058.80 | 0.42 |
| Admiral™ Shares | 1,000.00 | 1,058.90 | 0.52 |
| Institutional Shares | 1,000.00 | 1,058.80 | 0.42 |
| Institutional Plus Shares | 1,000.00 | 1,058.90 | 0.36 |
| Pacific Stock Index Fund | | | |
| Investor Shares | $1,000.00 | $996.70 | $1.16 |
| FTSE Pacific ETF Shares | 1,000.00 | 997.20 | 0.40 |
| Admiral Shares | 1,000.00 | 997.10 | 0.50 |
| Institutional Shares | 1,000.00 | 997.30 | 0.40 |
| Based on Hypothetical 5% Yearly Return | | | |
| European Stock Index Fund | | | |
| Investor Shares | $1,000.00 | $1,024.05 | $1.17 |
| FTSE Europe ETF Shares | 1,000.00 | 1,024.80 | 0.41 |
| Admiral Shares | 1,000.00 | 1,024.70 | 0.51 |
| Institutional Shares | 1,000.00 | 1,024.80 | 0.41 |
| Institutional Plus Shares | 1,000.00 | 1,024.85 | 0.36 |
| Pacific Stock Index Fund | | | |
| Investor Shares | $1,000.00 | $1,024.05 | $1.17 |
| FTSE Pacific ETF Shares | 1,000.00 | 1,024.80 | 0.41 |
| Admiral Shares | 1,000.00 | 1,024.70 | 0.51 |
| Institutional Shares | 1,000.00 | 1,024.80 | 0.41 |
The calculations are based on expenses incurred in the most recent six-month period. The funds' annualized six-month expense ratios for that period are: for the European Stock Index Fund, 0.23% for Investor Shares, 0.08% for FTSE Europe ETF Shares, 0.10% for Admiral Shares, 0.08% for Institutional Shares, and 0.07% for Institutional Plus Shares; and for the Pacific Stock Index Fund, 0.23% for Investor Shares, 0.08% for FTSE Pacific ETF Shares, 0.10% for Admiral Shares, and 0.08% for Institutional Shares. The dollar amounts shown as “Expenses Paid" are equal to the annualized expense ratio multiplied by the average account value over the period, multiplied by the number of days in the most recent six-month period, then divided by the number of days in the most recent 12-month period (184/365).
European Stock Index Fund
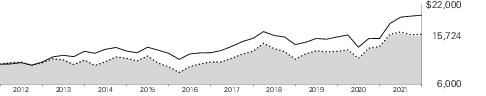
All of the returns in this report represent past performance, which is not a guarantee of future results that may be achieved by the fund. (Current performance may be lower or higher than the performance data cited. For performance data current to the most recent month-end, visit our website at vanguard.com/performance.) Note, too, that both investment returns and principal value can fluctuate widely, so an investor’s shares, when sold, could be worth more or less than their original cost. The returns shown do not reflect taxes that a shareholder would pay on fund distributions or on the sale of fund shares.
Cumulative Performance: October 31, 2011, Through October 31, 2021
Initial Investment of $10,000
| | | Average Annual Total Returns
Periods Ended October 31, 2021 | |
| | | One
Year | Five
Years | Ten
Years | Final Value
of a $10,000
Investment |
 | European Stock Index Fund Investor Shares | 42.12% | 10.96% | 7.83% | $21,256 |
 | Spliced European Stock Index | 42.33 | 11.16 | 7.85 | 21,291 |
 | FTSE Global All Cap ex US Index | 30.96 | 10.06 | 7.09 | 19,836 |
Spliced European Stock Index: MSCI Europe Index through March 26, 2013; FTSE Developed Europe Index through September 30, 2015; FTSE Developed Europe All Cap Index thereafter. Benchmark returns are adjusted for withholding taxes.
| | | | |
| | | One
Year | Five
Years | Ten
Years | Final Value
of a $10,000
Investment |
FTSE Europe
ETF Shares Net Asset Value | 42.34% | 11.13% | 8.00% | $21,592 |
| FTSE Europe ETF Shares Market Price | 42.73 | 11.22 | 8.02 | 21,627 |
| Spliced European Stock Index | 42.33 | 11.16 | 7.85 | 21,291 |
| FTSE Global All Cap ex US Index | 30.96 | 10.06 | 7.09 | 19,836 |
See Financial Highlights for dividend and capital gains information.
European Stock Index Fund
| | | Average Annual Total Returns
Periods Ended October 31, 2021 | |
| | | One
Year | Five
Years | Ten
Years | Final Value
of a $10,000
Investment |
European Stock Index Fund
Admiral Shares | 42.30% | 11.12% | 7.98% | $21,558 |
| Spliced European Stock Index | 42.33 | 11.16 | 7.85 | 21,291 |
| FTSE Global All Cap ex US Index | 30.96 | 10.06 | 7.09 | 19,836 |
| | | | |
| | | One
Year | Five
Years | Ten
Years | Final Value
of a $5,000,000
Investment |
European Stock Index Fund
Institutional Shares | 42.34% | 11.13% | 8.01% | $10,802,701 |
| Spliced European Stock Index | 42.33 | 11.16 | 7.85 | 10,645,747 |
| FTSE Global All Cap ex US Index | 30.96 | 10.06 | 7.09 | 9,918,026 |
| | | | |
| | | One
Year | Five
Years | Since
Inception
(12/5/2014) | Final Value
of a $100,000,000
Investment |
| European Stock Index Fund Institutional Plus Shares | 42.35% | 11.16% | 6.52% | $154,633,940 |
| Spliced European Stock Index | 42.33 | 11.16 | 6.50 | 154,451,190 |
| FTSE Global All Cap ex US Index | 30.96 | 10.06 | 6.79 | 157,396,270 |
“Since Inception” performance is calculated from the Institutional Plus Shares’ inception date for both the fund and its comparative standard(s).
Cumulative Returns of ETF Shares: October 31, 2011, Through October 31, 2021
| | One
Year | Five
Years | Ten
Years |
| FTSE Europe ETF Shares Market Price | 42.73% | 70.19% | 116.27% |
| FTSE Europe ETF Shares Net Asset Value | 42.34 | 69.51 | 115.92 |
| Spliced European Stock Index | 42.33 | 69.73 | 112.91 |
For the ETF Shares, the market price is determined by the midpoint of the bid-offer spread as of the closing time of the New York Stock Exchange (generally 4 p.m., Eastern time). The net asset value is also determined as of the NYSE closing time. For more information about how the ETF Shares' market prices have compared with their net asset value, visit vanguard.com, select your ETF, and then select the Price and Performance tab. The ETF premium/discount analysis there shows the percentages of days on which the ETF Shares' market price was above or below the NAV.
See Financial Highlights for dividend and capital gains information.
European Stock Index Fund
| United Kingdom | 23.9% |
| France | 15.5 |
| Switzerland | 14.2 |
| Germany | 13.4 |
| Netherlands | 7.5 |
| Sweden | 6.5 |
| Italy | 4.1 |
| Denmark | 4.0 |
| Spain | 3.7 |
| Finland | 2.2 |
| Belgium | 1.7 |
| Norway | 1.5 |
| Other | 1.8 |
The table reflects the fund’s investments, except for short-term investments and derivatives.
The fund may invest in derivatives (such as futures and swap contracts) for various reasons, including, but not limited to, attempting to remain fully invested and tracking its target index as closely as possible.
European Stock Index Fund
The fund files its complete schedule of portfolio holdings with the Securities and Exchange Commission (SEC) for the first and third quarters of each fiscal year as an exhibit to its reports on Form N-PORT. The fund’s Form N-PORT reports are available on the SEC’s website at www.sec.gov.
| | | Shares | Market
Value•
($000) |
| Common Stocks (99.3%) |
| Austria (0.5%) |
| | Erste Group Bank AG | 610,998 | 26,203 |
| | OMV AG | 305,140 | 18,474 |
| | Verbund AG | 142,328 | 14,837 |
| | voestalpine AG | 247,083 | 9,384 |
| 1 | BAWAG Group AG | 142,287 | 8,949 |
| | Wienerberger AG | 241,886 | 8,563 |
| | ANDRITZ AG | 150,359 | 8,540 |
| | Raiffeisen Bank International AG | 277,126 | 8,098 |
| | IMMOFINANZ AG | 201,679 | 4,829 |
| | CA Immobilien Anlagen AG (XWBO) | 89,761 | 3,852 |
| | Mayr Melnhof Karton AG | 18,477 | 3,637 |
| * | Lenzing AG | 28,508 | 3,438 |
| | Oesterreichische Post AG | 71,595 | 3,023 |
| | Telekom Austria AG Class A | 298,323 | 2,578 |
| | S IMMO AG | 108,601 | 2,576 |
| | Vienna Insurance Group AG Wiener Versicherung Gruppe | 84,323 | 2,456 |
| | EVN AG | 79,371 | 2,241 |
| | UNIQA Insurance Group AG | 236,249 | 2,199 |
| | AT&S Austria Technologie & Systemtechnik AG | 54,955 | 2,109 |
| | Strabag SE (Bearer) | 31,919 | 1,370 |
| *,2 | DO & CO AG | 14,289 | 1,294 |
| | Palfinger AG | 21,567 | 953 |
| * | Schoeller-Bleckmann Oilfield Equipment AG | 22,926 | 935 |
| * | Flughafen Wien AG | 22,140 | 730 |
| | Agrana Beteiligungs AG | 23,831 | 503 |
| * | Porr AG | 22,195 | 319 |
| * | Porr AG Rights Exp.11/3/2021 | 22,195 | 4 |
| *,3 | CA Immobilien Anlagen AG | 152,202 | — |
| | | | 142,094 |
| | | Shares | Market
Value•
($000) |
| Belgium (1.7%) |
| | Anheuser-Busch InBev SA | 1,803,343 | 110,305 |
| | KBC Group NV | 591,250 | 55,059 |
| * | Argenx SE | 109,614 | 33,000 |
| | UCB SA | 260,042 | 31,082 |
| | Groupe Bruxelles Lambert SA | 225,705 | 26,189 |
| | Umicore SA | 440,410 | 25,252 |
| | Ageas SA | 382,698 | 18,617 |
| | Solvay SA | 148,892 | 17,699 |
| | Sofina SA | 32,804 | 14,516 |
| | Warehouses De Pauw CVA | 304,140 | 13,849 |
| | Cofinimmo SA | 64,476 | 10,402 |
| | Aedifica SA | 77,152 | 10,288 |
| 2 | Elia Group SA | 75,747 | 8,837 |
| | D'ieteren Group | 49,358 | 8,511 |
| | Ackermans & van Haaren NV | 48,025 | 8,259 |
| | Proximus SADP | 301,501 | 5,678 |
| | Etablissements Franz Colruyt NV | 110,244 | 5,413 |
| | Melexis NV | 43,584 | 5,027 |
| | Euronav NV | 409,311 | 4,356 |
| | VGP NV | 16,302 | 4,216 |
| | KBC Ancora | 76,073 | 3,966 |
| | Montea NV | 26,171 | 3,885 |
| | Telenet Group Holding NV | 97,050 | 3,487 |
| | Barco NV | 148,892 | 3,356 |
| | Shurgard Self Storage SA | 54,309 | 3,328 |
| | Bekaert SA | 74,913 | 3,281 |
| | Gimv NV | 41,691 | 2,693 |
| * | Xior Student Housing NV | 43,925 | 2,598 |
| | Fagron | 134,041 | 2,324 |
| * | Tessenderlo Group SA | 55,458 | 2,024 |
| | Befimmo SA | 46,486 | 1,901 |
| * | bpost SA | 218,432 | 1,871 |
| | Retail Estates NV | 21,677 | 1,736 |
| * | Kinepolis Group NV | 27,364 | 1,724 |
| * | Ontex Group NV | 165,917 | 1,565 |
| | Cie d'Entreprises CFE | 15,147 | 1,549 |
| * | AGFA-Gevaert NV | 344,725 | 1,499 |
| | Econocom Group SA NV | 257,777 | 1,090 |
| *,2 | Mithra Pharmaceuticals SA | 48,226 | 1,059 |
European Stock Index Fund
| | | Shares | Market
Value•
($000) |
| | Orange Belgium SA | 32,148 | 729 |
| | Van de Velde NV | 12,390 | 430 |
| | Wereldhave Belgium Comm VA | 5,568 | 314 |
| | | | 462,964 |
| Denmark (3.9%) |
| | Novo Nordisk A/S Class B | 3,418,139 | 374,816 |
| | DSV A/S | 423,189 | 98,356 |
| | Vestas Wind Systems A/S | 2,171,396 | 93,869 |
| * | Genmab A/S | 127,521 | 57,289 |
| 1 | Orsted A/S | 405,600 | 57,288 |
| | Coloplast A/S Class B | 286,413 | 46,776 |
| | AP Moller - Maersk A/S Class B | 12,259 | 35,526 |
| | Carlsberg A/S Class B | 211,451 | 34,914 |
| | Novozymes A/S Class B | 427,562 | 31,451 |
| | Pandora A/S | 208,201 | 29,135 |
| | AP Moller - Maersk A/S Class A | 8,992 | 24,689 |
| | Danske Bank A/S | 1,416,946 | 23,977 |
| | Chr Hansen Holding A/S | 220,919 | 17,585 |
| | GN Store Nord A/S | 279,390 | 16,978 |
| | Tryg A/S | 663,819 | 15,754 |
| | Royal Unibrew A/S | 103,754 | 12,889 |
| * | Demant A/S | 227,664 | 11,037 |
| | Ambu A/S Class B | 369,808 | 10,527 |
| | SimCorp A/S | 85,442 | 10,347 |
| 1 | Netcompany Group A/S | 70,483 | 8,026 |
| * | ISS A/S | 397,613 | 7,934 |
| | Ringkjoebing Landbobank A/S | 62,097 | 7,889 |
| * | Bavarian Nordic A/S | 135,722 | 6,511 |
| * | ALK-Abello A/S | 14,062 | 6,095 |
| | ROCKWOOL International A/S Class B | 13,225 | 6,048 |
| * | Jyske Bank A/S (Registered) | 121,443 | 5,925 |
| | Topdanmark A/S | 91,633 | 4,863 |
| * | NKT A/S | 93,097 | 4,486 |
| | Sydbank A/S | 126,916 | 4,361 |
| | FLSmidth & Co. A/S | 108,231 | 4,115 |
| | H Lundbeck A/S | 126,900 | 3,534 |
| * | Dfds A/S | 64,285 | 3,332 |
| | Chemometec A/S | 21,901 | 3,321 |
| * | Zealand Pharma A/S | 94,653 | 3,037 |
| 1 | Scandinavian Tobacco Group A/S Class A | 128,678 | 2,893 |
| | Schouw & Co. A/S | 27,631 | 2,688 |
| * | NTG Nordic Transport Group A/S Class A | 29,319 | 2,397 |
| | Spar Nord Bank A/S | 172,023 | 2,217 |
| * | Nilfisk Holding A/S | 59,329 | 2,069 |
| * | Drilling Co. of 1972 A/S | 46,484 | 1,666 |
| | D/S Norden A/S | 52,974 | 1,280 |
| 2 | Alm Brand A/S | 129,073 | 996 |
| | | | 1,098,886 |
| Finland (2.1%) |
| * | Nokia OYJ | 12,130,281 | 69,622 |
| | Nordea Bank Abp | 5,654,691 | 69,252 |
| | Sampo OYJ Class A | 1,087,922 | 57,835 |
| | | Shares | Market
Value•
($000) |
| | Kone OYJ Class B | 844,957 | 57,625 |
| | Neste OYJ | 895,472 | 49,853 |
| | UPM-Kymmene OYJ | 1,146,983 | 40,478 |
| | Nordea Bank Abp (XHEL) | 2,279,724 | 27,893 |
| | Fortum OYJ | 928,695 | 27,619 |
| | Stora Enso OYJ Class R | 1,232,670 | 20,511 |
| | Kesko OYJ Class B | 578,701 | 18,834 |
| | Elisa OYJ | 308,835 | 18,638 |
| | Wartsila OYJ Abp | 1,047,106 | 14,521 |
| | Metso Outotec OYJ | 1,300,035 | 13,061 |
| | Valmet OYJ | 286,166 | 11,617 |
| | Nokian Renkaat OYJ | 290,469 | 10,908 |
| | Orion OYJ Class B | 223,588 | 9,682 |
| | Kojamo OYJ | 419,589 | 9,401 |
| | Huhtamaki OYJ | 199,182 | 8,685 |
| * | QT Group OYJ | 40,746 | 6,592 |
| | Konecranes OYJ Class A | 154,857 | 6,441 |
| | TietoEVRY OYJ (XHEL) | 181,062 | 5,553 |
| | Cargotec OYJ Class B | 104,020 | 5,387 |
| * | Outokumpu OYJ | 719,393 | 4,481 |
| | Metsa Board OYJ | 370,272 | 3,427 |
| | Neles OYJ | 225,404 | 3,378 |
| | Revenio Group OYJ | 49,700 | 3,279 |
| | Kemira OYJ | 188,693 | 2,898 |
| | Uponor OYJ | 115,978 | 2,833 |
| | Sanoma OYJ | 160,755 | 2,502 |
| | Tokmanni Group Corp. | 103,383 | 2,352 |
| | YIT OYJ | 347,579 | 2,048 |
| 1 | Terveystalo OYJ | 134,633 | 1,752 |
| | Citycon OYJ | 161,798 | 1,330 |
| | TietoEVRY OYJ | 38,768 | 1,203 |
| | F-Secure OYJ | 205,142 | 1,158 |
| | Raisio OYJ Class V | 254,518 | 1,031 |
| *,2 | Finnair OYJ | 1,273,860 | 973 |
| | Oriola OYJ Class B | 271,746 | 623 |
| *,3 | Ahlstrom-Munksjo OYJ Rights | 19,422 | 401 |
| | | | 595,677 |
| France (15.4%) |
| | LVMH Moet Hennessy Louis Vuitton SE | 537,037 | 421,102 |
| | TotalEnergies SE | 5,222,668 | 261,525 |
| | Sanofi | 2,340,980 | 235,138 |
| | Schneider Electric SE | 1,139,478 | 196,467 |
| * | L'Oreal SA Loyalty Shares | 355,795 | 162,760 |
| | BNP Paribas SA | 2,330,878 | 156,023 |
| * | Airbus SE | 1,197,888 | 153,668 |
| | EssilorLuxottica SA | 635,347 | 131,452 |
| | AXA SA | 4,142,114 | 120,507 |
| | Kering SA | 157,971 | 118,563 |
| | Vinci SA | 1,079,629 | 115,423 |
| * | Air Liquide SA Loyalty Shares | 687,371 | 114,762 |
| | Hermes International | 66,630 | 105,803 |
| | Pernod Ricard SA | 449,622 | 103,440 |
| | Safran SA | 749,581 | 100,886 |
| | Danone SA | 1,292,684 | 84,265 |
| | Dassault Systemes SE | 1,432,377 | 83,647 |
| | Capgemini SE | 337,036 | 78,584 |
| | L'Oreal SA (XPAR) | 162,246 | 74,220 |
European Stock Index Fund
| | | Shares | Market
Value•
($000) |
| | Cie de Saint-Gobain | 1,021,510 | 70,497 |
| | STMicroelectronics NV | 1,365,757 | 64,845 |
| | Legrand SA | 576,114 | 62,848 |
| | Cie Generale des Etablissements Michelin SCA | 376,785 | 59,237 |
| | Societe Generale SA | 1,672,194 | 55,858 |
| | Teleperformance | 124,989 | 52,209 |
| | Air Liquide SA (XPAR) | 312,284 | 52,138 |
| | Orange SA | 4,125,423 | 44,988 |
| | Veolia Environnement SA | 1,327,045 | 43,340 |
| | Credit Agricole SA | 2,664,761 | 40,203 |
| * | Engie SA Loyalty Shares | 2,421,494 | 34,446 |
| | Publicis Groupe SA | 491,681 | 33,008 |
| | Eurofins Scientific SE | 261,410 | 30,850 |
| *,1 | Worldline SA | 523,192 | 30,511 |
| | Edenred | 536,042 | 29,006 |
| | Sartorius Stedim Biotech | 51,685 | 28,487 |
| | Carrefour SA | 1,354,397 | 24,520 |
| | Alstom SA | 634,094 | 22,598 |
| | Vivendi SE | 1,606,082 | 20,691 |
| | Thales SA | 215,683 | 19,903 |
| 1 | Euronext NV | 176,272 | 19,831 |
| | Bureau Veritas SA | 611,997 | 19,452 |
| | Arkema SA | 141,990 | 19,423 |
| | Bouygues SA | 458,626 | 18,581 |
| | Suez SA | 815,515 | 18,566 |
| | Eiffage SA | 164,580 | 16,939 |
| | Engie SA (XPAR) | 1,147,294 | 16,320 |
| | Gecina SA | 110,905 | 15,520 |
| | Valeo | 516,452 | 15,174 |
| | Getlink SE | 982,495 | 15,122 |
| * | Renault SA | 396,473 | 14,287 |
| * | Accor SA | 392,871 | 14,059 |
| * | EDF | 941,514 | 13,876 |
| | Rexel SA | 652,440 | 12,968 |
| | Bollore SA | 2,128,128 | 12,369 |
| * | SOITEC | 45,722 | 12,174 |
| | BioMerieux | 91,493 | 11,653 |
| | SCOR SE | 336,638 | 11,333 |
| | Faurecia SE (XPAR) | 213,396 | 11,145 |
| | Orpea SA | 104,968 | 10,964 |
| 1 | Amundi SA | 122,435 | 10,909 |
| | Remy Cointreau SA | 52,927 | 10,692 |
| * | Sodexo SA ACT Loyalty Shares | 109,891 | 10,691 |
| | Atos SE | 204,822 | 10,686 |
| * | Ubisoft Entertainment SA | 203,251 | 10,643 |
| | Alten SA | 61,706 | 9,943 |
| 1 | La Francaise des Jeux SAEM | 188,735 | 9,800 |
| | Covivio | 107,828 | 9,339 |
| | Klepierre SA | 388,097 | 9,239 |
| * | Aeroports de Paris | 61,071 | 8,148 |
| | CNP Assurances | 320,588 | 8,032 |
| | Wendel SE | 58,477 | 7,790 |
| | Ipsen SA | 73,980 | 7,657 |
| * | TechnipFMC plc (XNYS) | 988,348 | 7,354 |
| | SES SA Class A GDR | 811,118 | 7,285 |
| * | SEB SA Loyalty Shares | 44,083 | 6,907 |
| | SPIE SA | 267,359 | 6,501 |
| | �� | Shares | Market
Value•
($000) |
| | Rubis SCA | 202,045 | 6,475 |
| | Nexans SA | 63,487 | 6,370 |
| * | Elis SA (XPAR) | 319,185 | 6,061 |
| | Sopra Steria Group SACA | 30,646 | 6,026 |
| * | Sodexo SA (XPAR) | 58,136 | 5,656 |
| | Eutelsat Communications SA | 393,635 | 5,595 |
| | ICADE | 69,967 | 5,487 |
| | Dassault Aviation SA | 50,016 | 5,227 |
| * | Eurazeo SA | 54,401 | 5,099 |
| | Virbac SA | 9,245 | 4,686 |
| | Korian SA | 139,254 | 4,639 |
| | Gaztransport Et Technigaz SA | 55,458 | 4,584 |
| * | Technip Energies NV | 294,766 | 4,537 |
| 1 | Verallia SA | 116,157 | 4,300 |
| | Nexity SA | 93,096 | 4,256 |
| * | JCDecaux SA | 156,012 | 4,070 |
| | IPSOS | 82,638 | 3,873 |
| | Imerys SA | 84,525 | 3,664 |
| | Eurazeo SE | 38,542 | 3,613 |
| | SEB SA (XPAR) | 20,941 | 3,281 |
| | Cie Plastic Omnium SA | 117,586 | 3,264 |
| | Trigano SA | 17,168 | 3,223 |
| | Coface SA | 224,427 | 3,209 |
| | Societe BIC SA | 54,530 | 3,170 |
| | Metropole Television SA | 139,446 | 3,074 |
| * | Casino Guichard Perrachon SA | 119,104 | 2,970 |
| * | Elis SA | 155,925 | 2,960 |
| *,2 | Air France-KLM | 610,413 | 2,875 |
| | Interparfums SA | 34,263 | 2,772 |
| | Somfy SA | 13,876 | 2,724 |
| | Rothschild & Co. | 60,396 | 2,664 |
| *,1,2 | Neoen SA (XPAR) | 57,126 | 2,630 |
| *,2 | Vallourec SA | 326,628 | 2,611 |
| 1 | ALD SA | 173,047 | 2,579 |
| | Electricite de France SA (XPAR) | 171,958 | 2,534 |
| | Television Francaise 1 | 227,373 | 2,434 |
| | Fnac Darty SA | 36,827 | 2,391 |
| * | Derichebourg SA | 200,398 | 2,281 |
| | Faurecia SE | 41,719 | 2,152 |
| 1 | Maisons du Monde SA | 92,663 | 2,102 |
| * | ID Logistics Group | 5,117 | 1,882 |
| * | Sodexo SA | 19,189 | 1,867 |
| *,1 | Elior Group SA | 218,502 | 1,729 |
| | Quadient SA | 71,428 | 1,708 |
| * | Albioma SA Loyalty Shares | 42,934 | 1,689 |
| *,2 | Solutions 30 SE | 178,592 | 1,616 |
| | Robertet SA | 1,458 | 1,601 |
| * | Eramet SA | 19,068 | 1,594 |
| | PEUGEOT Investment | 10,990 | 1,533 |
| | Altarea SCA | 7,159 | 1,531 |
| * | Voltalia SA (Registered) | 57,365 | 1,494 |
| | Mercialys SA | 133,961 | 1,455 |
| | Vicat SA | 32,838 | 1,402 |
| * | Akka Technologies | 24,969 | 1,383 |
| * | Lagardere SA | 50,774 | 1,342 |
| | Carmila SA | 85,251 | 1,292 |
| | Cie de L'Odet SE | 838 | 1,266 |
European Stock Index Fund
| | | Shares | Market
Value•
($000) |
| * | Beneteau SA | 79,180 | 1,209 |
| | Mersen SA | 30,917 | 1,160 |
| *,1 | X-Fab Silicon Foundries SE | 115,752 | 1,156 |
| * | CGG SA | 1,488,008 | 1,076 |
| | Manitou BF SA | 26,369 | 896 |
| | Pharmagest Interactive | 7,859 | 863 |
| | Vilmorin & Cie SA | 12,813 | 815 |
| | Bonduelle SCA | 30,228 | 775 |
| | Jacquet Metals SACA | 27,016 | 659 |
| | Albioma SA (XPAR) | 15,580 | 613 |
| * | Lisi | 21,296 | 592 |
| * | GL Events | 27,306 | 577 |
| | Guerbet | 11,757 | 519 |
| *,1 | SMCP SA | 60,438 | 496 |
| | AKWEL | 17,843 | 456 |
| * | Tarkett SA | 18,758 | 432 |
| | Lisi (XPAR) | 14,182 | 394 |
| * | Rallye SA | 46,045 | 296 |
| * | Etablissements Maurel et Prom SA | 100,373 | 289 |
| | Boiron SA | 5,440 | 263 |
| *,3 | Bourbon Corp. | 37,237 | 158 |
| | | | 4,281,986 |
| Germany (13.3%) |
| | SAP SE | 2,387,693 | 345,765 |
| | Siemens AG (Registered) | 1,618,964 | 263,214 |
| | Allianz SE (Registered) | 884,633 | 205,421 |
| | Daimler AG (Registered) | 1,810,133 | 179,678 |
| | BASF SE | 1,970,901 | 141,853 |
| | adidas AG | 412,290 | 134,943 |
| | Infineon Technologies AG | 2,806,879 | 131,450 |
| | Deutsche Telekom AG (Registered) | 7,035,089 | 130,833 |
| | Deutsche Post AG (Registered) | 2,105,265 | 130,331 |
| | Bayer AG (Registered) | 2,116,067 | 119,257 |
| | Muenchener Rueckversicherungs-Gesellschaft AG in Muenchen (Registered) | 301,813 | 89,363 |
| | Volkswagen AG Preference Shares | 394,274 | 88,488 |
| | Vonovia SE | 1,239,633 | 75,200 |
| | Bayerische Motoren Werke AG | 694,161 | 70,135 |
| | Merck KGaA | 278,227 | 65,752 |
| | Deutsche Boerse AG | 395,263 | 65,616 |
| | E.ON SE | 4,660,050 | 59,089 |
| * | Deutsche Bank AG (Registered) | 4,398,918 | 56,505 |
| | RWE AG | 1,354,606 | 52,141 |
| *,1 | Delivery Hero SE | 405,275 | 50,548 |
| *,1 | Zalando SE | 469,564 | 44,365 |
| | Fresenius SE & Co. KGaA | 878,283 | 39,921 |
| 1 | Siemens Healthineers AG | 596,852 | 39,694 |
| | Symrise AG Class A | 271,779 | 37,593 |
| | Henkel AG & Co. KGaA Preference Shares | 388,810 | 34,833 |
| | | Shares | Market
Value•
($000) |
| | Sartorius AG Preference Shares | 53,423 | 34,604 |
| | Porsche Automobil Holding SE Preference Shares | 330,161 | 34,362 |
| | Brenntag SE | 333,261 | 31,706 |
| | Fresenius Medical Care AG & Co. KGaA | 437,378 | 29,055 |
| * | HelloFresh SE | 352,279 | 28,548 |
| * | Continental AG | 232,578 | 27,345 |
| | Puma SE | 214,309 | 26,585 |
| * | Siemens Energy AG | 917,452 | 26,331 |
| * | QIAGEN NV | 475,557 | 26,205 |
| | MTU Aero Engines AG | 115,019 | 25,619 |
| 1 | Covestro AG | 387,645 | 24,824 |
| | HeidelbergCement AG | 319,824 | 24,084 |
| | Hannover Rueck SE | 129,444 | 23,634 |
| | LEG Immobilien SE (XETR) | 157,273 | 23,393 |
| | Beiersdorf AG | 214,690 | 22,829 |
| | Volkswagen AG | 68,777 | 22,359 |
| | KION Group AG | 168,402 | 18,394 |
| | Aroundtown SA | 2,589,510 | 17,996 |
| | GEA Group AG | 356,584 | 17,562 |
| | Henkel AG & Co. KGaA | 204,119 | 17,046 |
| * | Commerzbank AG | 2,237,963 | 16,344 |
| | Carl Zeiss Meditec AG (Bearer) | 78,741 | 15,858 |
| * | Evotec SE | 314,637 | 15,252 |
| | Knorr-Bremse AG | 142,581 | 15,048 |
| | Nemetschek SE | 116,398 | 13,364 |
| | Evonik Industries AG | 412,352 | 13,361 |
| | Bechtle AG | 176,160 | 13,214 |
| 1 | Scout24 SE | 180,307 | 12,558 |
| | LANXESS AG | 186,146 | 12,543 |
| * | thyssenkrupp AG | 1,004,255 | 10,454 |
| | Bayerische Motoren Werke AG Preference Shares | 120,591 | 10,279 |
| * | CTS Eventim AG & Co. KGaA | 126,626 | 9,210 |
| | Rheinmetall AG | 93,311 | 9,054 |
| | United Internet AG (Registered) | 234,704 | 8,661 |
| *,2 | Deutsche Lufthansa AG (Registered) | 1,284,808 | 8,493 |
| | Uniper SE | 189,973 | 8,398 |
| | TAG Immobilien AG | 271,829 | 8,258 |
| *,1 | Auto1 Group SE | 197,299 | 7,763 |
| | FUCHS PETROLUB SE Preference Shares | 158,141 | 7,585 |
| *,2 | zooplus AG | 13,354 | 7,386 |
| | alstria office REIT-AG | 382,851 | 7,156 |
| * | K+S AG (Registered) | 411,581 | 7,092 |
| | Rational AG | 7,137 | 7,084 |
| | HUGO BOSS AG | 111,570 | 6,986 |
| | Freenet AG | 269,283 | 6,935 |
| 2 | Hella GmbH & Co. KGaA | 94,886 | 6,581 |
| | Aurubis AG | 76,006 | 6,549 |
| 1 | Befesa SA | 85,658 | 6,373 |
| | Gerresheimer AG | 67,860 | 6,226 |
| 2 | Siltronic AG (XETR) | 37,976 | 5,925 |
| | Deutsche Wohnen SE | 114,675 | 5,874 |
| | Wacker Chemie AG | 32,182 | 5,816 |
European Stock Index Fund
| | | Shares | Market
Value•
($000) |
| * | Sixt SE | 33,257 | 5,734 |
| | ProSiebenSat.1 Media SE | 335,043 | 5,612 |
| * | Talanx AG | 115,006 | 5,531 |
| * | Fraport AG Frankfurt Airport Services Worldwide | 77,056 | 5,515 |
| | Grand City Properties SA | 215,180 | 5,512 |
| | CANCOM SE | 79,098 | 5,468 |
| | AIXTRON SE | 227,661 | 5,407 |
| * | Hypoport SE | 8,680 | 5,344 |
| | Jungheinrich AG Preference Shares | 103,805 | 5,264 |
| | Vantage Towers AG | 147,682 | 5,079 |
| *,1 | TeamViewer AG | 339,534 | 5,068 |
| * | RTL Group SA | 83,160 | 4,803 |
| | Duerr AG | 105,659 | 4,789 |
| 2 | Varta AG | 30,305 | 4,670 |
| | Stroeer SE & Co. KGaA | 53,770 | 4,560 |
| | Eckert & Ziegler Strahlen- und Medizintechnik AG | 29,894 | 4,476 |
| | CompuGroup Medical SE & Co. KGaA | 52,522 | 4,390 |
| | Software AG | 105,925 | 4,357 |
| 2 | Encavis AG | 202,483 | 4,243 |
| | Jenoptik AG | 109,622 | 4,196 |
| | Aareal Bank AG | 129,313 | 4,134 |
| *,2 | Nordex SE | 223,121 | 4,100 |
| | Stabilus SA | 52,663 | 3,955 |
| | Telefonica Deutschland Holding AG | 1,448,023 | 3,773 |
| | Dermapharm Holding SE | 36,996 | 3,721 |
| | METRO AG | 279,123 | 3,528 |
| | Pfeiffer Vacuum Technology AG | 14,086 | 3,516 |
| | Fielmann AG | 52,513 | 3,463 |
| * | MorphoSys AG | 73,306 | 3,450 |
| | VERBIO Vereinigte BioEnergie AG | 42,711 | 3,396 |
| 1 | Deutsche Pfandbriefbank AG | 265,616 | 3,296 |
| 1 | DWS Group GmbH & Co. KGaA | 75,047 | 3,246 |
| | Krones AG | 31,297 | 3,225 |
| | HOCHTIEF AG | 41,179 | 3,177 |
| * | Salzgitter AG | 83,093 | 3,049 |
| | Norma Group SE | 68,773 | 2,955 |
| | 1&1 AG | 100,021 | 2,911 |
| * | Nagarro SE | 14,197 | 2,856 |
| | Traton SE | 108,303 | 2,797 |
| | Sartorius AG | 4,539 | 2,789 |
| * | flatexDEGIRO AG | 121,600 | 2,762 |
| | Sixt SE Preference Shares | 27,034 | 2,679 |
| | Suedzucker AG | 168,813 | 2,678 |
| 1,2 | ADLER Group SA | 196,348 | 2,663 |
| * | Vitesco Technologies Group AG Class A | 46,220 | 2,650 |
| 1 | Instone Real Estate Group SE | 99,705 | 2,628 |
| | PATRIZIA AG | 93,899 | 2,595 |
| | STRATEC SE | 15,477 | 2,472 |
| 2 | S&T AG | 102,610 | 2,466 |
| | | Shares | Market
Value•
($000) |
| | Hornbach Holding AG & Co. KGaA | 18,270 | 2,310 |
| *,1 | Shop Apotheke Europe NV | 15,222 | 2,308 |
| | FUCHS PETROLUB SE | 61,772 | 2,276 |
| | Deutsche EuroShop AG | 110,065 | 2,240 |
| 2 | GRENKE AG | 56,696 | 2,211 |
| * | Deutz AG | 260,524 | 2,184 |
| | Bilfinger SE | 59,959 | 2,107 |
| * | Kloeckner & Co. SE Preference Shares | 155,542 | 2,090 |
| * | Global Fashion Group SA | 222,110 | 2,000 |
| | DIC Asset AG | 113,709 | 1,996 |
| | Draegerwerk AG & Co. KGaA Preference Shares | 24,751 | 1,950 |
| | KWS Saat SE & Co. KGaA | 22,320 | 1,905 |
| * | CECONOMY AG | 388,197 | 1,894 |
| | Atoss Software AG | 8,367 | 1,893 |
| | Wacker Neuson SE | 54,698 | 1,795 |
| | Indus Holding AG | 42,815 | 1,685 |
| | New Work SE | 6,287 | 1,535 |
| | Secunet Security Networks AG | 2,886 | 1,515 |
| | Basler AG | 8,091 | 1,491 |
| | Washtec AG | 22,557 | 1,468 |
| | Deutsche Beteiligungs AG | 31,586 | 1,460 |
| | Zeal Network SE | 32,864 | 1,444 |
| | Schaeffler AG Preference Shares | 160,185 | 1,273 |
| | Hamburger Hafen und Logistik AG | 55,400 | 1,243 |
| | BayWa AG | 29,293 | 1,239 |
| | Takkt AG | 73,389 | 1,199 |
| | Hensoldt AG | 65,407 | 1,058 |
| * | Koenig & Bauer AG | 29,520 | 1,042 |
| | Vossloh AG | 19,328 | 1,036 |
| * | SGL Carbon SE | 106,085 | 1,014 |
| | SMA Solar Technology AG | 18,536 | 980 |
| * | ElringKlinger AG | 62,414 | 882 |
| | Wuestenrot & Wuerttembergische AG | 39,614 | 825 |
| | Hornbach Baumarkt AG | 17,232 | 775 |
| | TLG Immobilien AG | 16,752 | 614 |
| | Bertrandt AG | 9,355 | 610 |
| | CropEnergies AG | 42,040 | 603 |
| | Hella GmbH & Co. KGaA | 1,569 | 109 |
| | Steico SE | 685 | 90 |
| | Draegerwerk AG & Co. KGaA | 10 | 1 |
| | | | 3,703,447 |
| Ireland (0.4%) |
| | Kerry Group plc Class A | 331,468 | 44,476 |
| | Kingspan Group plc | 325,340 | 37,455 |
| * | Bank of Ireland Group plc | 1,968,825 | 11,729 |
| | Glanbia plc (XDUB) | 415,383 | 6,783 |
| * | AIB Group plc | 1,698,518 | 4,597 |
European Stock Index Fund
| | | Shares | Market
Value•
($000) |
| * | Dalata Hotel Group plc | 480,222 | 2,054 |
| | Hibernia REIT plc | 1,403,817 | 2,051 |
| * | Cairn Homes plc (XDUB) | 1,516,626 | 1,969 |
| * | Irish Continental Group plc | 341,832 | 1,680 |
| *,2,3 | Irish Bank Resolution Corp. | 2,503,596 | — |
| | | | 112,794 |
| Italy (4.1%) |
| | Enel SpA | 16,733,200 | 140,087 |
| | Intesa Sanpaolo SpA | 35,773,505 | 101,675 |
| | Eni SpA | 5,407,534 | 77,503 |
| | Ferrari NV | 261,687 | 62,095 |
| | UniCredit SpA | 4,684,626 | 61,928 |
| | Assicurazioni Generali SpA | 2,773,394 | 60,391 |
| | Stellantis NV | 2,669,731 | 53,300 |
| | CNH Industrial NV | 2,119,022 | 36,501 |
| | Stellantis NV (XNYS) | 1,684,979 | 33,644 |
| | Moncler SpA | 463,024 | 33,321 |
| | Snam SpA (MTAA) | 4,788,675 | 27,122 |
| | FinecoBank Banca Fineco SpA | 1,316,660 | 25,145 |
| | Terna - Rete Elettrica Nazionale | 3,033,143 | 22,599 |
| *,1 | Nexi SpA | 1,266,254 | 22,017 |
| | Prysmian SpA | 566,107 | 21,404 |
| | EXOR NV | 222,432 | 20,982 |
| * | Atlantia SpA | 1,058,997 | 20,469 |
| | Mediobanca Banca di Credito Finanziario SpA | 1,496,693 | 17,860 |
| | Davide Campari-Milano NV | 1,063,706 | 15,109 |
| | Amplifon SpA | 278,045 | 14,149 |
| 1 | Poste Italiane SpA | 982,029 | 14,025 |
| | Recordati Industria Chimica e Farmaceutica SpA | 208,705 | 13,077 |
| | Interpump Group SpA | 172,611 | 12,715 |
| | Tenaris SA | 1,003,605 | 11,176 |
| | DiaSorin SpA | 48,326 | 10,925 |
| | Banco BPM SpA | 3,250,338 | 10,108 |
| | Telecom Italia SpA | 28,156,916 | 10,045 |
| | Reply SpA | 48,304 | 9,376 |
| 1 | Infrastrutture Wireless Italiane SpA | 757,689 | 8,371 |
| | Azimut Holding SpA | 263,030 | 7,575 |
| 1 | Pirelli & C SpA | 1,136,482 | 6,990 |
| | Hera SpA | 1,679,268 | 6,870 |
| | A2A SpA | 3,232,559 | 6,802 |
| | Italgas SpA | 1,055,201 | 6,704 |
| * | Leonardo SpA | 866,765 | 6,360 |
| | De' Longhi SpA | 151,248 | 5,917 |
| | Unipol Gruppo SpA | 1,029,362 | 5,912 |
| * | Banca Generali SpA | 121,492 | 5,716 |
| | Banca Mediolanum SpA | 515,300 | 5,193 |
| | ERG SpA | 141,553 | 5,113 |
| | BPER Banca | 2,253,328 | 4,941 |
| | Buzzi Unicem SpA | 199,928 | 4,663 |
| * | Brunello Cucinelli SpA | 71,941 | 4,365 |
| | Iren SpA | 1,335,066 | 4,149 |
| | Brembo SpA | 312,452 | 4,104 |
| | | Shares | Market
Value•
($000) |
| | Banca Popolare di Sondrio SCPA | 822,362 | 3,574 |
| 1 | BFF Bank SpA | 393,465 | 3,523 |
| | Telecom Italia SpA Savings Shares | 8,316,947 | 3,162 |
| * | Autogrill SpA | 401,455 | 3,152 |
| * | Salvatore Ferragamo SpA | 143,616 | 3,056 |
| | Sesa SpA | 15,568 | 3,054 |
| 1 | Technogym SpA | 286,409 | 3,010 |
| 1 | Anima Holding SpA | 564,829 | 3,001 |
| 1 | Carel Industries SpA | 95,118 | 2,745 |
| | UnipolSai Assicurazioni SpA | 914,732 | 2,649 |
| *,2 | Saipem SpA | 1,205,921 | 2,642 |
| | Tamburi Investment Partners SpA | 220,156 | 2,485 |
| | Falck Renewables SpA | 242,659 | 2,447 |
| *,1 | Enav SpA | 536,920 | 2,356 |
| 1 | GVS SpA | 150,104 | 2,231 |
| | ACEA SpA | 90,494 | 1,963 |
| * | Societa Cattolica Di Assicurazione SpA | 256,811 | 1,953 |
| | Tinexta SpA | 42,614 | 1,889 |
| | Danieli & C Officine Meccaniche SpA Savings Shares | 85,967 | 1,857 |
| | SOL SpA | 78,314 | 1,800 |
| | Gruppo MutuiOnline SpA | 35,691 | 1,743 |
| 2 | Webuild SpA (MTAA) | 692,020 | 1,713 |
| | Mediaset NV | 601,853 | 1,691 |
| | MARR SpA | 69,222 | 1,631 |
| | Maire Tecnimont SpA | 340,099 | 1,465 |
| | Zignago Vetro SpA | 65,109 | 1,312 |
| | Credito Emiliano SpA | 164,318 | 1,247 |
| 1 | RAI Way SpA | 197,732 | 1,197 |
| | Piaggio & C SpA | 352,318 | 1,181 |
| 1 | doValue SpA | 122,419 | 1,174 |
| | Danieli & C Officine Meccaniche SpA | 34,193 | 1,151 |
| * | Cerved Group SpA | 86,236 | 1,035 |
| | Cementir Holding NV | 97,369 | 1,022 |
| | Italmobiliare SpA | 29,065 | 1,020 |
| | Banca IFIS SpA | 54,019 | 999 |
| * | Tod's SpA | 17,974 | 991 |
| * | Biesse SpA | 29,627 | 917 |
| * | Saras SpA | 1,224,960 | 909 |
| *,2 | Juventus Football Club SpA | 1,053,140 | 852 |
| * | CIR SpA-Compagnie Industriali | 1,529,140 | 842 |
| *,2 | Fincantieri SpA | 1,023,726 | 805 |
| | Datalogic SpA | 41,515 | 755 |
| *,2 | Banca Monte dei Paschi di Siena SpA | 564,787 | 675 |
| * | Immobiliare Grande Distribuzione SIIQ SpA | 139,457 | 611 |
| * | Arnoldo Mondadori Editore SpA | 241,655 | 559 |
| | DeA Capital SpA | 209,617 | 324 |
| | Rizzoli Corriere Della Sera Mediagroup SpA | 199,843 | 164 |
| * | Webuild SpA | 61,414 | 72 |
| | | | 1,139,099 |
European Stock Index Fund
| | | Shares | Market
Value•
($000) |
| Netherlands (7.5%) |
| | ASML Holding NV | 852,411 | 692,925 |
| *,1 | Adyen NV | 62,193 | 187,656 |
| | Prosus NV | 1,898,030 | 167,184 |
| | ING Groep NV | 8,409,554 | 127,564 |
| | Koninklijke Philips NV | 1,950,635 | 92,022 |
| | Koninklijke DSM NV | 357,905 | 78,194 |
| | Koninklijke Ahold Delhaize NV | 2,096,761 | 68,213 |
| | Wolters Kluwer NV | 563,170 | 58,974 |
| | Heineken NV | 512,243 | 56,700 |
| | Universal Music Group NV | 1,608,231 | 46,692 |
| | ASM International NV | 103,025 | 46,628 |
| | ArcelorMittal SA | 1,369,472 | 46,316 |
| | Akzo Nobel NV | 402,773 | 46,285 |
| | NN Group NV | 673,549 | 36,006 |
| *,1 | Just Eat Takeaway.com NV | 389,041 | 27,947 |
| | IMCD NV | 122,414 | 27,181 |
| | Koninklijke KPN NV | 7,130,450 | 21,305 |
| | Heineken Holding NV | 227,335 | 21,068 |
| * | Unibail-Rodamco-Westfield | 290,725 | 20,759 |
| | Aegon NV | 3,802,169 | 19,286 |
| | Randstad NV | 237,751 | 17,082 |
| | BE Semiconductor Industries NV | 153,523 | 14,027 |
| | ASR Nederland NV | 292,390 | 13,668 |
| 1 | ABN AMRO Bank NV GDR | 892,363 | 13,125 |
| 1 | Signify NV | 270,559 | 13,110 |
| | Aalberts NV | 207,426 | 11,481 |
| | Arcadis NV | 155,475 | 7,578 |
| * | InPost SA | 434,324 | 6,201 |
| | APERAM SA | 101,685 | 6,063 |
| | Corbion NV | 127,160 | 6,038 |
| * | OCI NV | 206,661 | 5,858 |
| | Koninklijke Vopak NV | 139,536 | 5,553 |
| * | Galapagos NV | 103,348 | 5,481 |
| | SBM Offshore NV | 346,803 | 5,475 |
| | JDE Peet's NV | 179,150 | 5,217 |
| | TKH Group NV GDR | 88,998 | 5,070 |
| | Boskalis Westminster | 168,811 | 5,035 |
| *,1 | Basic-Fit NV | 97,959 | 4,756 |
| | PostNL NV | 1,040,861 | 4,517 |
| *,1 | GrandVision NV | 105,618 | 3,466 |
| *,1 | Intertrust NV | 192,354 | 2,908 |
| 1 | CTP NV | 130,020 | 2,761 |
| *,1 | Alfen Beheer BV | 24,024 | 2,706 |
| | Eurocommercial Properties NV | 111,847 | 2,610 |
| * | Sligro Food Group NV | 74,338 | 1,991 |
| | AMG Advanced Metallurgical Group NV | 66,504 | 1,962 |
| 1 | Flow Traders | 55,904 | 1,898 |
| * | Accell Group NV | 45,646 | 1,882 |
| * | Fugro NV | 216,923 | 1,839 |
| | NSI NV | 40,843 | 1,637 |
| * | Koninklijke BAM Groep NV | 532,306 | 1,545 |
| | Wereldhave NV | 85,948 | 1,334 |
| * | TomTom NV | 144,902 | 1,245 |
| | Vastned Retail NV | 35,369 | 1,008 |
| | Brunel International NV | 44,381 | 610 |
| 1 | B&S Group Sarl | 53,465 | 483 |
| | | Shares | Market
Value•
($000) |
| | ForFarmers NV | 64,477 | 307 |
| | | | 2,076,432 |
| Norway (1.5%) |
| | DNB Bank ASA | 2,205,098 | 52,474 |
| | Equinor ASA | 2,068,820 | 52,420 |
| | Mowi ASA | 951,038 | 27,577 |
| | Telenor ASA | 1,365,550 | 21,576 |
| | Norsk Hydro ASA | 2,878,046 | 21,141 |
| | Yara International ASA | 350,211 | 18,303 |
| | TOMRA Systems ASA | 252,585 | 16,325 |
| | Orkla ASA | 1,639,543 | 15,947 |
| | Storebrand ASA | 1,000,528 | 10,731 |
| | Bakkafrost P/F | 108,953 | 10,079 |
| * | Nordic Semiconductor ASA | 336,069 | 9,985 |
| | Schibsted ASA Class B | 218,092 | 9,893 |
| * | Adevinta ASA | 594,822 | 9,825 |
| | Aker BP ASA | 232,384 | 8,917 |
| | Gjensidige Forsikring ASA | 358,104 | 8,916 |
| | Salmar ASA | 116,090 | 8,857 |
| | Schibsted ASA Class A | 157,196 | 8,122 |
| * | NEL ASA | 2,953,474 | 6,253 |
| | SpareBank 1 SR-Bank ASA | 383,503 | 5,882 |
| | Kongsberg Gruppen ASA | 162,758 | 5,341 |
| | Borregaard ASA | 214,664 | 5,213 |
| 1 | Scatec ASA | 254,811 | 5,026 |
| | Leroy Seafood Group ASA | 551,375 | 5,013 |
| 1 | Entra ASA | 191,404 | 4,778 |
| | Aker ASA Class A | 51,342 | 4,732 |
| | SpareBank 1 SMN | 277,562 | 4,623 |
| | Subsea 7 SA | 506,692 | 4,548 |
| * | Bank Norwegian ASA | 334,038 | 4,143 |
| * | Kahoot! ASA | 644,466 | 3,864 |
| *,1 | Crayon Group Holding ASA | 145,418 | 3,396 |
| | Atea ASA | 180,246 | 3,368 |
| | Veidekke ASA | 233,679 | 3,367 |
| | Austevoll Seafood ASA | 192,627 | 2,608 |
| | TGS ASA | 252,074 | 2,325 |
| 1 | Elkem ASA | 566,670 | 2,252 |
| 1 | Sbanken ASA | 161,999 | 1,900 |
| * | DNO ASA | 1,166,819 | 1,701 |
| | Bonheur ASA | 42,896 | 1,696 |
| | Frontline Ltd. | 190,635 | 1,695 |
| * | MPC Container Ships A/S | 651,663 | 1,544 |
| * | Grieg Seafood ASA | 119,985 | 1,334 |
| * | Wallenius Wilhelmsen ASA | 226,694 | 1,039 |
| | Sparebank 1 Oestlandet | 62,717 | 1,033 |
| * | Hexagon Composites ASA | 242,846 | 978 |
| 1 | BW LPG Ltd. | 170,979 | 914 |
| | Stolt-Nielsen Ltd. | 48,112 | 742 |
| | Norway Royal Salmon ASA | 30,677 | 646 |
| | BW Offshore Ltd. | 190,421 | 620 |
| | Ocean Yield ASA | 120,373 | 585 |
| * | BW Energy Ltd. | 147,580 | 483 |
European Stock Index Fund
| | | Shares | Market
Value•
($000) |
| * | Borr Drilling Ltd. | 3,037 | 3 |
| | | | 404,733 |
| Poland (0.6%) |
| * | Powszechna Kasa Oszczednosci Bank Polski SA | 1,837,243 | 22,495 |
| | Polski Koncern Naftowy ORLEN SA | 667,897 | 14,405 |
| | Powszechny Zaklad Ubezpieczen SA | 1,202,489 | 12,031 |
| | KGHM Polska Miedz SA | 293,482 | 11,285 |
| | Bank Polska Kasa Opieki SA | 336,716 | 11,125 |
| *,1 | Allegro.eu SA | 830,729 | 9,404 |
| *,1 | Dino Polska SA | 103,038 | 9,209 |
| | LPP SA | 2,387 | 8,588 |
| 2 | CD Projekt SA | 140,778 | 6,146 |
| | Santander Bank Polska SA | 63,421 | 5,899 |
| | Polskie Gornictwo Naftowe i Gazownictwo SA | 3,745,276 | 5,647 |
| | Cyfrowy Polsat SA | 572,102 | 5,116 |
| * | mBank SA | 27,410 | 3,879 |
| * | PGE Polska Grupa Energetyczna SA | 1,574,285 | 3,874 |
| * | Grupa Lotos SA | 210,490 | 3,272 |
| * | Alior Bank SA | 201,441 | 3,180 |
| | KRUK SA | 36,990 | 3,086 |
| * | Bank Millennium SA | 1,323,992 | 3,039 |
| | Asseco Poland SA | 122,339 | 3,013 |
| * | Orange Polska SA | 1,407,268 | 2,744 |
| * | CCC SA | 61,046 | 1,847 |
| * | Tauron Polska Energia SA | 2,018,092 | 1,664 |
| * | Jastrzebska Spolka Weglowa SA | 109,493 | 1,425 |
| * | AmRest Holdings SE | 153,759 | 1,235 |
| * | Enea SA | 458,053 | 1,163 |
| | Bank Handlowy w Warszawie SA | 70,243 | 1,020 |
| * | Grupa Azoty SA | 100,832 | 753 |
| | Warsaw Stock Exchange | 56,564 | 624 |
| | Ciech SA | 57,711 | 514 |
| | Eurocash SA | 168,984 | 417 |
| * | Mercator Medical SA | 6,287 | 162 |
| | Kernel Holding SA | 1,214 | 18 |
| | | | 158,279 |
| Portugal (0.3%) |
| | EDP - Energias de Portugal SA | 6,087,749 | 34,351 |
| | EDP Renovaveis SA | 517,828 | 14,421 |
| | Jeronimo Martins SGPS SA | 526,083 | 11,918 |
| | Galp Energia SGPS SA | 1,107,818 | 11,508 |
| * | Banco Comercial Portugues SA Class R | 16,689,276 | 3,011 |
| | REN - Redes Energeticas Nacionais SGPS SA | 843,663 | 2,570 |
| | Sonae SGPS SA | 2,074,907 | 2,284 |
| | Navigator Co. SA | 550,254 | 2,151 |
| | CTT-Correios de Portugal SA | 325,548 | 1,789 |
| | | Shares | Market
Value•
($000) |
| | NOS SGPS SA | 447,570 | 1,746 |
| | Altri SGPS SA | 155,147 | 1,005 |
| | Corticeira Amorim SGPS SA | 71,868 | 1,001 |
| * | Greenvolt-Energias Renovaveis SA | 77,790 | 611 |
| | Semapa-Sociedade de Investimento e Gestao | 9,817 | 138 |
| | | | 88,504 |
| Spain (3.6%) |
| | Iberdrola SA (XMAD) | 12,702,527 | 150,134 |
| | Banco Santander SA | 36,856,120 | 139,798 |
| | Banco Bilbao Vizcaya Argentaria SA | 14,331,632 | 100,295 |
| | Industria de Diseno Textil SA | 2,262,911 | 81,972 |
| 1 | Cellnex Telecom SA | 1,308,055 | 80,445 |
| * | Amadeus IT Group SA | 915,747 | 61,262 |
| | Telefonica SA | 10,670,525 | 46,349 |
| | Repsol SA | 2,792,925 | 35,773 |
| | Ferrovial SA | 1,024,537 | 32,343 |
| | CaixaBank SA | 9,478,557 | 27,248 |
| *,1 | Aena SME SA | 151,291 | 24,848 |
| | Red Electrica Corp. SA | 927,172 | 19,305 |
| 2 | Naturgy Energy Group SA | 638,590 | 16,788 |
| | Grifols SA | 711,752 | 16,303 |
| | Endesa SA | 682,432 | 15,739 |
| * | Siemens Gamesa Renewable Energy SA | 481,438 | 13,064 |
| | ACS Actividades de Construccion y Servicios SA | 488,025 | 12,791 |
| | Enagas SA | 534,798 | 12,001 |
| * | Banco de Sabadell SA | 12,093,673 | 9,733 |
| | Acciona SA | 48,991 | 9,408 |
| | Fluidra SA | 239,847 | 9,160 |
| | Bankinter SA | 1,480,191 | 8,150 |
| | Merlin Properties Socimi SA | 713,941 | 7,732 |
| | Inmobiliaria Colonial Socimi SA | 727,717 | 7,076 |
| | Acerinox SA | 455,704 | �� 6,344 |
| | Viscofan SA | 83,687 | 5,723 |
| | Mapfre SA | 2,138,127 | 4,527 |
| | Grupo Catalana Occidente SA | 111,305 | 3,953 |
| | Laboratorios Farmaceuticos Rovi SA | 47,434 | 3,328 |
| | Ebro Foods SA | 165,361 | 3,282 |
| * | Indra Sistemas SA | 263,679 | 3,189 |
| | Zardoya Otis SA | 385,447 | 3,099 |
| | CIE Automotive SA | 112,178 | 3,053 |
| | Linea Directa Aseguradora SA Cia de Seguros y Reaseguros | 1,486,160 | 2,984 |
| | Cia de Distribucion Integral Logista Holdings SA | 136,310 | 2,905 |
| 1 | Unicaja Banco SA | 2,651,195 | 2,837 |
| | Applus Services SA | 306,657 | 2,776 |
| * | Solaria Energia y Medio Ambiente SA | 131,034 | 2,622 |
European Stock Index Fund
| | | Shares | Market
Value•
($000) |
| | Faes Farma SA | 628,840 | 2,562 |
| | Almirall SA | 158,372 | 2,355 |
| | Pharma Mar SA | 28,939 | 2,251 |
| | Sacyr SA (XMAD) | 786,256 | 2,241 |
| | Construcciones y Auxiliar de Ferrocarriles SA | 40,564 | 1,787 |
| * | Mediaset Espana Comunicacion SA | 325,713 | 1,699 |
| * | Melia Hotels International SA | 221,553 | 1,635 |
| *,1 | Gestamp Automocion SA | 338,537 | 1,514 |
| | Prosegur Cia de Seguridad SA | 518,108 | 1,470 |
| 1 | Global Dominion Access SA | 239,424 | 1,284 |
| 1 | Neinor Homes SA | 93,335 | 1,204 |
| 1 | Aedas Homes SA | 41,488 | 1,192 |
| | Fomento de Construcciones y Contratas SA | 87,183 | 1,111 |
| *,1 | Metrovacesa SA | 95,492 | 837 |
| * | Lar Espana Real Estate Socimi SA | 127,865 | 779 |
| * | Ence Energia y Celulosa SA | 271,926 | 700 |
| * | Atresmedia Corp. de Medios de Comunicacion SA | 167,833 | 684 |
| *,2 | Tecnicas Reunidas SA | 67,716 | 612 |
| 1 | Prosegur Cash SA | 824,021 | 566 |
| *,2 | Distribuidora Internacional de Alimentacion SA | 30,509,061 | 558 |
| * | NH Hotel Group SA (XMAD) | 51,716 | 188 |
| | | | 1,015,568 |
| Sweden (6.5%) |
| | Investor AB Class B | 4,173,004 | 96,288 |
| | Atlas Copco AB Class A | 1,364,001 | 87,840 |
| | Volvo AB Class B | 3,253,715 | 75,874 |
| | Telefonaktiebolaget LM Ericsson Class B | 6,469,545 | 70,618 |
| | Hexagon AB Class B | 3,838,421 | 61,774 |
| | Sandvik AB | 2,317,692 | 58,774 |
| | Assa Abloy AB Class B | 1,975,270 | 57,960 |
| 1 | Evolution AB | 347,404 | 56,398 |
| | Skandinaviska Enskilda Banken AB Class A | 3,118,710 | 48,770 |
| | Swedbank AB Class A | 2,162,261 | 46,897 |
| | Atlas Copco AB Class B | 808,265 | 43,803 |
| | Essity AB Class B | 1,311,693 | 42,488 |
| | Nibe Industrier AB Class B | 2,579,446 | 38,366 |
| | Svenska Handelsbanken AB Class A | 3,223,302 | 36,947 |
| | H & M Hennes & Mauritz AB Class B | 1,887,342 | 35,506 |
| | Epiroc AB Class A | 1,367,826 | 34,033 |
| | EQT AB | 607,998 | 32,114 |
| | Swedish Match AB | 3,317,686 | 29,253 |
| | | Shares | Market
Value•
($000) |
| | Alfa Laval AB | 675,862 | 28,991 |
| | Telia Co. AB | 5,519,187 | 21,739 |
| | Getinge AB Class B | 480,158 | 21,488 |
| *,1 | Sinch AB | 1,105,622 | 21,045 |
| | Boliden AB | 588,874 | 20,760 |
| | Svenska Cellulosa AB SCA Class B | 1,318,681 | 20,604 |
| | Investor AB Class A | 883,506 | 20,440 |
| * | Kinnevik AB Class B | 519,948 | 20,408 |
| | Skanska AB Class B | 772,083 | 19,631 |
| | SKF AB Class B | 826,261 | 19,190 |
| | Indutrade AB | 602,766 | 17,571 |
| | Industrivarden AB Class A | 508,497 | 16,774 |
| | Epiroc AB Class B | 781,743 | 16,607 |
| | Lundin Energy AB | 407,362 | 16,088 |
| * | Fastighets AB Balder Class B | 217,132 | 15,744 |
| | Tele2 AB Class B | 1,075,197 | 15,196 |
| | Sagax AB Class B | 375,424 | 14,694 |
| | Lifco AB Class B | 489,984 | 14,287 |
| | Samhallsbyggnadsbolaget i Norden AB | 1,991,586 | 13,351 |
| | Husqvarna AB Class B | 927,633 | 13,220 |
| 1 | Thule Group AB | 225,165 | 13,010 |
| | Trelleborg AB Class B | 522,863 | 11,967 |
| | Castellum AB | 446,004 | 11,888 |
| | Industrivarden AB Class C | 351,469 | 11,433 |
| | Electrolux AB Class B | 493,517 | 11,229 |
| | Investment AB Latour Class B | 307,330 | 11,163 |
| | Securitas AB Class B | 663,796 | 10,997 |
| | Beijer Ref AB Class B | 523,501 | 10,743 |
| | Avanza Bank Holding AB | 265,062 | 10,538 |
| | Volvo AB Class A | 437,678 | 10,347 |
| * | Swedish Orphan Biovitrum AB | 378,134 | 10,276 |
| 1 | Dometic Group AB | 689,031 | 10,050 |
| | Vitrolife AB | 148,549 | 9,668 |
| * | Nordic Entertainment Group AB Class B | 163,318 | 9,470 |
| | Fabege AB | 556,373 | 9,417 |
| | Holmen AB Class B | 206,518 | 9,169 |
| | L E Lundbergforetagen AB Class B | 157,966 | 9,107 |
| | AddTech AB Class B | 404,443 | 9,048 |
| | Elekta AB Class B | 771,654 | 8,985 |
| | AddLife AB Class B | 217,751 | 8,896 |
| | ICA Gruppen AB | 167,179 | 8,651 |
| | AAK AB | 368,122 | 8,052 |
| | BillerudKorsnas AB | 379,096 | 7,940 |
| * | SSAB AB Class B | 1,473,516 | 7,365 |
| | Nordnet AB publ | 366,466 | 7,024 |
| | Sweco AB Class B | 430,229 | 6,851 |
| | Wihlborgs Fastigheter AB | 285,709 | 6,774 |
| * | Sectra AB Class B | 276,202 | 6,722 |
| | Arjo AB Class B | 481,689 | 6,569 |
| | Nyfosa AB | 389,056 | 6,567 |
| 1 | Bravida Holding AB | 433,926 | 6,527 |
| | Wallenstam AB Class B | 358,583 | 6,294 |
| | AFRY AB | 210,863 | 6,275 |
| | Hexpol AB | 533,158 | 6,239 |
| | JM AB | 150,609 | 6,102 |
European Stock Index Fund
| | | Shares | Market
Value•
($000) |
| | Mips AB | 47,076 | 5,700 |
| 2 | Kungsleden AB | 407,359 | 5,602 |
| | Saab AB Class B | 198,363 | 5,530 |
| | Axfood AB | 224,265 | 5,499 |
| | Bure Equity AB | 117,820 | 5,469 |
| | Instalco AB | 101,704 | 5,406 |
| | Peab AB Class B | 427,978 | 5,379 |
| | Nolato AB Class B | 373,738 | 4,941 |
| | Lindab International AB | 148,030 | 4,850 |
| | Intrum AB | 167,586 | 4,757 |
| | Corem Property Group AB Class B | 1,401,183 | 4,651 |
| | Biotage AB | 141,234 | 4,570 |
| | Loomis AB Class B | 162,976 | 4,398 |
| | Medicover AB Class B | 123,942 | 3,758 |
| * | Electrolux Professional AB Class B | 484,439 | 3,743 |
| | Hufvudstaden AB Class A | 230,041 | 3,681 |
| | Catena AB | 58,953 | 3,592 |
| | NCC AB Class B | 205,011 | 3,552 |
| | HMS Networks AB | 60,365 | 3,447 |
| | Mycronic AB | 147,149 | 3,415 |
| * | Pandox AB Class B | 191,451 | 3,374 |
| | Troax Group AB | 72,830 | 2,982 |
| | Bilia AB Class A | 164,946 | 2,933 |
| | Vitec Software Group AB Class B | 48,774 | 2,879 |
| * | BICO Group AB Class B | 54,958 | 2,756 |
| * | SSAB AB Class A | 470,120 | 2,679 |
| * | VNV Global AB | 181,278 | 2,660 |
| * | Modern Times Group MTG AB Class B | 230,725 | 2,646 |
| | Ratos AB Class B | 429,304 | 2,472 |
| | Granges AB | 226,393 | 2,469 |
| | Concentric AB | 80,556 | 2,371 |
| * | Cint Group AB | 152,955 | 2,314 |
| *,1 | Boozt AB | 131,621 | 2,217 |
| | Atrium Ljungberg AB Class B | 96,061 | 2,206 |
| | Dios Fastigheter AB | 179,596 | 2,089 |
| * | BHG Group AB | 174,388 | 2,011 |
| | Platzer Fastigheter Holding AB Class B | 115,446 | 1,881 |
| | SkiStar AB | 89,813 | 1,873 |
| * | Mekonomen AB | 90,710 | 1,871 |
| * | Betsson AB Class B | 257,658 | 1,798 |
| | Bonava AB Class B | 181,318 | 1,791 |
| 1 | Munters Group AB | 229,038 | 1,695 |
| | Samhallsbyggnadsbolaget i Norden AB Class D | 465,344 | 1,693 |
| 1 | Resurs Holding AB | 303,426 | 1,635 |
| | Systemair AB | 156,775 | 1,513 |
| | Nobia AB | 243,894 | 1,503 |
| | Cloetta AB Class B | 448,601 | 1,425 |
| * | SAS AB | 7,957,045 | 1,385 |
| *,1,2 | Scandic Hotels Group AB | 282,918 | 1,368 |
| * | Kinnevik AB Class A | 31,547 | 1,273 |
| | INVISIO AB | 68,922 | 1,247 |
| | Fagerhult AB | 145,996 | 1,170 |
| | Investment AB Oresund | 63,038 | 1,096 |
| * | Karo Pharma AB | 162,957 | 1,074 |
| | | Shares | Market
Value•
($000) |
| * | Hansa Biopharma AB | 93,717 | 1,065 |
| *,1 | Attendo AB | 228,186 | 981 |
| | Telefonaktiebolaget LM Ericsson Class A | 82,164 | 900 |
| | Clas Ohlson AB Class B | 83,018 | 894 |
| | Corem Property Group AB Preference Shares | 23,360 | 893 |
| | Sagax AB Class D | 223,833 | 854 |
| * | Collector AB | 166,669 | 821 |
| * | Camurus AB | 40,830 | 767 |
| | Svenska Handelsbanken AB Class B | 50,630 | 640 |
| | Skandinaviska Enskilda Banken AB Class C | 11,504 | 184 |
| | NCC AB Class A | 8,396 | 147 |
| | Svenska Cellulosa AB SCA Class A | 4,171 | 66 |
| *,1,2 | Oncopeptides AB | 102,926 | 47 |
| | | | 1,801,432 |
| Switzerland (14.1%) |
| | Nestle SA (Registered) | 6,068,210 | 800,441 |
| | Roche Holding AG | 1,512,526 | 585,944 |
| | Novartis AG (Registered) | 4,563,428 | 377,454 |
| | Zurich Insurance Group AG | 319,966 | 141,816 |
| | Cie Financiere Richemont SA Class A (Registered) | 1,098,869 | 135,986 |
| | Lonza Group AG (Registered) | 159,560 | 131,126 |
| | UBS Group AG (Registered) | 7,000,810 | 127,434 |
| | ABB Ltd. (Registered) | 3,650,746 | 120,778 |
| | Sika AG (Registered) | 304,914 | 103,299 |
| | Givaudan SA (Registered) | 19,856 | 93,560 |
| | Partners Group Holding AG | 48,284 | 84,350 |
| | Alcon Inc. | 989,377 | 82,038 |
| | Swiss Re AG | 621,893 | 60,246 |
| | Geberit AG (Registered) | 73,289 | 57,235 |
| | Credit Suisse Group AG (Registered) | 5,165,292 | 53,728 |
| | Sonova Holding AG (Registered) | 114,316 | 47,369 |
| | Straumann Holding AG (Registered) | 21,692 | 45,156 |
| | Holcim Ltd. | 766,529 | 38,236 |
| | SGS SA (Registered) | 12,661 | 37,483 |
| | Swiss Life Holding AG (Registered) | 66,961 | 36,733 |
| | Kuehne + Nagel International AG (Registered) | 107,851 | 33,968 |
| | Julius Baer Group Ltd. | 459,126 | 33,210 |
| | Swisscom AG (Registered) | 54,775 | 29,826 |
| | Chocoladefabriken Lindt & Spruengli AG Ptg. Ctf. | 2,309 | 27,227 |
European Stock Index Fund
| | | Shares | Market
Value•
($000) |
| | Logitech International SA (Registered) | 317,844 | 26,589 |
| 1 | VAT Group AG | 55,188 | 26,382 |
| | Chocoladefabriken Lindt & Spruengli AG (Registered) | 215 | 25,828 |
| | Schindler Holding AG Ptg. Ctf. | 87,602 | 22,810 |
| | Holcim Ltd. (XSWX) | 415,132 | 20,813 |
| | Temenos AG (Registered) | 131,301 | 20,102 |
| | SIG Combibloc Group AG | 722,511 | 18,896 |
| | Barry Callebaut AG (Registered) | 7,663 | 17,746 |
| | Roche Holding AG (Bearer) | 40,430 | 17,390 |
| | Swatch Group AG (Bearer) | 62,240 | 17,131 |
| | Adecco Group AG (Registered) | 330,491 | 16,650 |
| | Tecan Group AG (Registered) | 27,030 | 16,561 |
| | Swiss Prime Site AG (Registered) | 162,209 | 16,491 |
| | Baloise Holding AG (Registered) | 96,389 | 15,361 |
| | EMS-Chemie Holding AG (Registered) | 15,284 | 15,161 |
| | Vifor Pharma AG | 111,048 | 14,339 |
| | Georg Fischer AG (Registered) | 8,816 | 13,339 |
| | PSP Swiss Property AG (Registered) | 92,872 | 11,610 |
| | Belimo Holding AG (Registered) | 19,882 | 11,559 |
| | Bachem Holding AG (Registered) Class B | 13,379 | 10,770 |
| * | ams AG | 530,033 | 10,494 |
| | Schindler Holding AG (Registered) | 40,871 | 10,493 |
| | Clariant AG (Registered) | 485,030 | 10,211 |
| | Helvetia Holding AG (Registered) | 74,429 | 8,856 |
| | Siegfried Holding AG (Registered) | 8,707 | 8,375 |
| 1 | Galenica AG | 103,500 | 7,581 |
| * | Flughafen Zurich AG (Registered) | 40,812 | 7,370 |
| * | Dufry AG (Registered) | 133,339 | 7,060 |
| | Bucher Industries AG (Registered) | 13,888 | 7,009 |
| | Allreal Holding AG (Registered) | 30,409 | 6,431 |
| | DKSH Holding AG | 77,149 | 6,184 |
| | Daetwyler Holding AG (Bearer) | 15,753 | 6,128 |
| | Comet Holding AG (Registered) | 15,902 | 5,917 |
| * | Zur Rose Group AG | 16,394 | 5,831 |
| | Interroll Holding AG (Registered) | 1,178 | 5,715 |
| | Vontobel Holding AG (Registered) | 59,006 | 5,464 |
| | Inficon Holding AG (Registered) | 4,134 | 5,304 |
| | BKW AG | 38,574 | 5,111 |
| | | Shares | Market
Value•
($000) |
| | Softwareone Holding AG | 218,443 | 5,062 |
| 2 | Stadler Rail AG | 113,663 | 4,992 |
| | Swatch Group AG (Registered) | 93,791 | 4,990 |
| * | Idorsia Ltd. | 242,239 | 4,987 |
| | Banque Cantonale Vaudoise (Registered) | 60,887 | 4,902 |
| | SFS Group AG | 36,230 | 4,880 |
| | dormakaba Holding AG | 6,487 | 4,808 |
| | Mobimo Holding AG (Registered) | 13,845 | 4,666 |
| | Emmi AG (Registered) | 4,174 | 4,356 |
| | Forbo Holding AG (Registered) | 2,224 | 4,327 |
| | Cembra Money Bank AG | 62,601 | 4,179 |
| | OC Oerlikon Corp. AG (Registered) | 398,569 | 4,058 |
| | Kardex Holding AG (Registered) | 12,568 | 3,876 |
| | Bystronic AG | 2,795 | 3,843 |
| | Swissquote Group Holding SA (Registered) | 18,493 | 3,751 |
| | Sulzer AG (Registered) | 37,147 | 3,652 |
| | Landis+Gyr Group AG | 52,954 | 3,640 |
| * | Dottikon Es Holding AG (Registered) | 9,488 | 3,484 |
| | Valiant Holding AG (Registered) | 34,243 | 3,389 |
| | Huber + Suhner AG (Registered) | 36,690 | 3,264 |
| *,1 | Sensirion Holding AG | 22,006 | 3,172 |
| | VZ Holding AG | 28,721 | 2,916 |
| | Schweiter Technologies AG (Bearer) | 2,017 | 2,897 |
| | Burckhardt Compression Holding AG | 6,711 | 2,827 |
| *,2 | Meyer Burger Technology AG | 5,899,996 | 2,816 |
| | St. Galler Kantonalbank AG (Registered) | 6,052 | 2,789 |
| * | Aryzta AG | 1,978,126 | 2,587 |
| | LEM Holding SA (Registered) | 1,002 | 2,429 |
| | Zehnder Group AG | 20,786 | 2,237 |
| *,1 | Medacta Group SA | 13,198 | 2,210 |
| | Bossard Holding AG (Registered) Class A | 5,615 | 2,062 |
| | Arbonia AG | 93,492 | 2,033 |
| * | Komax Holding AG (Registered) | 7,698 | 1,962 |
| *,1 | Medmix AG | 36,883 | 1,763 |
| | ALSO Holding AG (Registered) | 5,789 | 1,718 |
| | Vetropack Holding AG Class A (Registered) | 27,081 | 1,667 |
| * | Valora Holding AG (Registered) | 8,066 | 1,535 |
| | Leonteq AG | 22,910 | 1,517 |
| | Intershop Holding AG | 2,387 | 1,493 |
| * | Bobst Group SA (Registered) | 16,704 | 1,360 |
European Stock Index Fund
| | | Shares | Market
Value•
($000) |
| | Bell Food Group AG (Registered) | 4,158 | 1,335 |
| * | Rieter Holding AG (Registered) | 6,421 | 1,333 |
| * | Ascom Holding AG (Registered) | 76,599 | 1,192 |
| *,2 | COSMO Pharmaceuticals NV | 15,477 | 1,177 |
| *,2 | Basilea Pharmaceutica AG (Registered) | 25,116 | 1,175 |
| | EFG International AG | 163,534 | 1,147 |
| | Ypsomed Holding AG (Registered) | 6,633 | 1,098 |
| * | u-blox Holding AG | 14,952 | 1,094 |
| * | Autoneum Holding AG | 6,230 | 975 |
| | Hiag Immobilien Holding AG | 6,145 | 651 |
| * | Swiss Steel Holding AG | 1,650,373 | 634 |
| * | Implenia AG (Registered) | 29,596 | 604 |
| | VP Bank AG Class A | 4,736 | 533 |
| * | APG SGA SA | 2,162 | 489 |
| * | Aryzta AG (XSWX) | 24,200 | 32 |
| | | | 3,912,270 |
| United Kingdom (23.8%) |
| | AstraZeneca plc | 3,333,082 | 416,973 |
| | HSBC Holdings plc | 44,000,096 | 265,108 |
| | Diageo plc | 4,944,717 | 246,008 |
| | GlaxoSmithKline plc | 10,644,890 | 220,997 |
| | BP plc | 42,859,339 | 205,335 |
| | Royal Dutch Shell plc Class B | 7,995,647 | 183,490 |
| | Royal Dutch Shell plc Class A | 7,634,329 | 174,894 |
| | British American Tobacco plc | 4,915,613 | 170,987 |
| | Unilever plc (XLON) | 2,988,502 | 160,010 |
| | Rio Tinto plc | 2,339,912 | 145,897 |
| | Glencore plc | 28,531,183 | 142,673 |
| | Unilever plc | 2,568,823 | 137,518 |
| | Prudential plc (XLON) | 5,912,424 | 120,660 |
| | BHP Group plc | 4,477,543 | 118,259 |
| | Reckitt Benckiser Group plc | 1,364,349 | 110,762 |
| | Lloyds Banking Group plc | 152,538,234 | 104,394 |
| | Anglo American plc | 2,648,414 | 100,754 |
| | Barclays plc | 36,474,517 | 100,651 |
| | National Grid plc | 7,646,699 | 97,905 |
| | Experian plc | 1,969,538 | 90,306 |
| | Vodafone Group plc | 59,715,586 | 88,012 |
| * | Compass Group plc | 3,836,332 | 81,409 |
| | Ashtead Group plc | 962,866 | 80,698 |
| | London Stock Exchange Group plc | 782,038 | 76,127 |
| | Ferguson plc | 482,188 | 72,552 |
| * | Flutter Entertainment plc (XDUB) | 357,050 | 67,378 |
| | RELX plc | 2,074,819 | 64,335 |
| | Tesco plc | 16,449,416 | 60,736 |
| | RELX plc (XLON) | 1,930,115 | 59,872 |
| | BAE Systems plc | 6,952,163 | 52,420 |
| | SSE plc | 2,245,934 | 50,578 |
| | Legal & General Group plc | 12,764,861 | 50,342 |
| | CRH plc | 991,999 | 47,471 |
| | Segro plc | 2,580,856 | 45,615 |
| | | Shares | Market
Value•
($000) |
| | Aviva plc | 8,432,466 | 45,501 |
| | Imperial Brands plc | 2,028,911 | 42,812 |
| | 3i Group plc | 2,051,221 | 38,307 |
| | Croda International plc | 290,049 | 37,541 |
| | Standard Chartered plc | 5,499,969 | 37,196 |
| | WPP plc | 2,493,069 | 36,037 |
| * | Entain plc | 1,254,847 | 35,162 |
| | Natwest Group plc | 11,288,201 | 34,036 |
| | Spirax-Sarco Engineering plc | 158,233 | 33,778 |
| | CRH plc (XDUB) | 697,592 | 33,371 |
| | Halma plc | 816,842 | 33,126 |
| | Smith & Nephew plc | 1,893,838 | 32,707 |
| * | Rolls-Royce Holdings plc | 18,015,509 | 32,515 |
| | Rentokil Initial plc | 4,006,975 | 32,252 |
| * | BT Group plc | 16,180,689 | 30,741 |
| | Next plc | 273,408 | 29,799 |
| | Smurfit Kappa Group plc | 558,417 | 29,285 |
| * | InterContinental Hotels Group plc | 393,668 | 27,575 |
| | Royal Dutch Shell plc Class A (XLON) | 1,191,185 | 27,446 |
| | Bunzl plc | 726,379 | 26,847 |
| | Mondi plc (XLON) | 1,042,696 | 26,040 |
| * | Ocado Group plc | 1,045,839 | 25,812 |
| | Persimmon plc | 682,693 | 25,436 |
| | St. James's Place plc | 1,143,566 | 24,704 |
| | Intertek Group plc | 346,953 | 23,235 |
| * | Informa plc | 3,226,794 | 22,955 |
| | Burberry Group plc | 864,854 | 22,857 |
| | Sage Group plc | 2,275,635 | 22,132 |
| | Kingfisher plc | 4,544,713 | 20,858 |
| | United Utilities Group plc | 1,467,172 | 20,853 |
| | Severn Trent plc | 538,479 | 20,167 |
| | Melrose Industries plc | 9,333,877 | 20,138 |
| | Barratt Developments plc | 2,174,160 | 19,737 |
| * | Whitbread plc | 433,733 | 19,404 |
| | Admiral Group plc | 478,455 | 18,795 |
| | Associated British Foods plc | 747,177 | 18,273 |
| | Intermediate Capital Group plc | 597,854 | 17,933 |
| | DCC plc | 212,840 | 17,759 |
| | Rightmove plc | 1,856,512 | 17,549 |
| * | Meggitt plc | 1,675,549 | 17,203 |
| | Hargreaves Lansdown plc | 812,642 | 17,100 |
| 1 | Auto Trader Group plc | 2,032,444 | 16,850 |
| | B&M European Value Retail SA | 1,921,593 | 16,648 |
| | Taylor Wimpey plc | 7,781,617 | 16,464 |
| | Abrdn plc | 4,633,700 | 16,107 |
| | Smiths Group plc | 855,259 | 15,880 |
| | JD Sports Fashion plc | 1,058,991 | 15,784 |
| | Dechra Pharmaceuticals plc | 225,239 | 15,746 |
| | Electrocomponents plc | 1,011,545 | 15,563 |
| | Howden Joinery Group plc | 1,227,267 | 15,449 |
| | M&G plc | 5,590,683 | 15,274 |
| | Johnson Matthey plc | 408,146 | 15,255 |
| | J Sainsbury plc | 3,694,947 | 15,134 |
European Stock Index Fund
| | | Shares | Market
Value•
($000) |
| | Antofagasta plc | 746,703 | 14,565 |
| | Coca-Cola HBC AG | 418,909 | 14,519 |
| | Land Securities Group plc | 1,540,915 | 14,476 |
| | DS Smith plc | 2,747,986 | 14,415 |
| | Polymetal International plc | 764,991 | 14,142 |
| | Berkeley Group Holdings plc | 226,323 | 13,500 |
| | British Land Co. plc | 1,987,948 | 13,423 |
| | Pearson plc | 1,621,878 | 13,346 |
| | Weir Group plc | 556,323 | 13,196 |
| | IMI plc | 566,871 | 12,659 |
| | Spectris plc | 245,975 | 12,656 |
| | AVEVA Group plc | 254,760 | 12,406 |
| | Tritax Big Box REIT plc | 4,010,209 | 12,341 |
| | Phoenix Group Holdings plc | 1,348,719 | 12,110 |
| | Bellway plc | 264,909 | 12,020 |
| | Hikma Pharmaceuticals plc | 362,948 | 11,963 |
| | Schroders plc | 240,654 | 11,921 |
| * | ITV plc | 8,018,087 | 11,801 |
| | Future plc | 243,847 | 11,764 |
| | Direct Line Insurance Group plc | 2,918,502 | 11,665 |
| | Royal Mail plc | 1,976,098 | 11,392 |
| * | S4 Capital plc | 1,119,913 | 11,122 |
| | Diploma plc | 261,821 | 10,760 |
| | Genus plc | 140,181 | 10,630 |
| * | Marks & Spencer Group plc | 4,211,223 | 10,586 |
| | Evraz plc | 1,241,236 | 10,543 |
| * | Centrica plc | 12,600,309 | 10,401 |
| | Travis Perkins plc | 487,070 | 10,297 |
| | UNITE Group plc | 684,634 | 10,222 |
| | Derwent London plc | 218,856 | 10,123 |
| | Endeavour Mining plc | 397,991 | 10,074 |
| 1 | ConvaTec Group plc | 3,438,397 | 10,062 |
| | Pennon Group plc | 604,763 | 9,646 |
| | Inchcape plc | 843,080 | 9,515 |
| | Man Group plc | 2,994,570 | 9,511 |
| | Games Workshop Group plc | 70,465 | 9,307 |
| 1 | Avast plc | 1,196,997 | 9,161 |
| | Rotork plc | 1,871,208 | 9,046 |
| | Greggs plc | 214,747 | 8,976 |
| | Tate & Lyle plc | 1,007,435 | 8,927 |
| | Grafton Group plc | 472,874 | 8,686 |
| | IG Group Holdings plc | 780,230 | 8,466 |
| | Hiscox Ltd. | 722,797 | 8,224 |
| | Vistry Group plc | 473,765 | 7,934 |
| *,1 | Watches of Switzerland Group plc | 497,627 | 7,727 |
| 1 | Quilter plc | 3,596,893 | 7,658 |
| | Hays plc | 3,339,183 | 7,567 |
| * | Virgin Money UK plc | 2,671,763 | 7,423 |
| | Big Yellow Group plc | 362,888 | 7,337 |
| | Safestore Holdings plc | 442,594 | 7,276 |
| | Softcat plc | 269,084 | 7,152 |
| *,1 | Countryside Properties plc | 1,108,195 | 7,134 |
| | Britvic plc | 575,319 | 6,984 |
| | HomeServe plc | 591,017 | 6,904 |
| * | Beazley plc | 1,296,582 | 6,896 |
| * | easyJet plc | 797,026 | 6,794 |
| | | Shares | Market
Value•
($000) |
| | LondonMetric Property plc | 1,897,922 | 6,788 |
| | Pets at Home Group plc | 1,020,948 | 6,737 |
| * | Carnival plc | 333,004 | 6,722 |
| | Ultra Electronics Holdings plc | 150,814 | 6,683 |
| | Grainger plc | 1,582,116 | 6,654 |
| * | THG plc | 2,229,949 | 6,610 |
| * | IWG plc | 1,550,981 | 6,578 |
| | Investec plc | 1,429,921 | 6,476 |
| | Close Brothers Group plc | 321,457 | 6,332 |
| * | Playtech plc | 656,270 | 6,244 |
| | Drax Group plc | 854,036 | 6,211 |
| | Pagegroup plc | 673,573 | 6,112 |
| | Computacenter plc | 164,095 | 6,033 |
| | Primary Health Properties plc | 2,829,681 | 5,943 |
| * | SSP Group plc | 1,682,690 | 5,928 |
| * | WH Smith plc | 267,898 | 5,735 |
| | Assura plc | 5,683,157 | 5,666 |
| | OSB Group plc | 807,008 | 5,567 |
| | Victrex plc | 176,837 | 5,530 |
| | Savills plc | 282,969 | 5,503 |
| *,1 | Wizz Air Holdings plc | 86,351 | 5,461 |
| | Great Portland Estates plc | 543,045 | 5,430 |
| * | International Consolidated Airlines Group SA | 2,410,598 | 5,399 |
| * | Dr. Martens plc | 1,064,071 | 5,379 |
| | Cranswick plc | 112,978 | 5,340 |
| * | Indivior plc | 1,575,621 | 5,259 |
| | Domino's Pizza Group plc | 989,922 | 5,244 |
| | Spirent Communications plc | 1,306,891 | 5,132 |
| | Shaftesbury plc | 597,338 | 5,098 |
| * | Ascential plc | 923,223 | 5,098 |
| | Renishaw plc | 73,316 | 5,045 |
| | Synthomer plc | 723,213 | 5,012 |
| | Balfour Beatty plc | 1,387,870 | 4,825 |
| | Fresnillo plc | 397,968 | 4,684 |
| | Genuit Group plc | 502,323 | 4,558 |
| | Ashmore Group plc | 985,338 | 4,553 |
| | Serco Group plc | 2,580,696 | 4,458 |
| | QinetiQ Group plc | 1,202,649 | 4,438 |
| | IntegraFin Holdings plc | 565,957 | 4,427 |
| | Bodycote plc | 401,677 | 4,400 |
| *,1 | Network International Holdings plc | 996,990 | 4,398 |
| | Hill & Smith Holdings plc | 171,661 | 4,308 |
| | Redrow plc | 486,664 | 4,285 |
| *,1 | Trainline plc | 985,648 | 4,282 |
| *,2 | TUI AG | 1,272,118 | 4,260 |
| | Dunelm Group plc | 241,820 | 4,240 |
| * | John Wood Group plc | 1,433,570 | 4,180 |
| | Marshalls plc | 429,676 | 4,162 |
| | Sanne Group plc | 326,321 | 4,034 |
| | Paragon Banking Group plc | 536,959 | 4,025 |
| 2 | Hammerson plc | 9,012,952 | 3,957 |
| | Sirius Real Estate Ltd. | 2,105,153 | 3,889 |
European Stock Index Fund
| | | Shares | Market
Value•
($000) |
| * | Mediclinic International plc | 839,949 | 3,843 |
| | Plus500 Ltd. | 213,142 | 3,837 |
| | Liontrust Asset Management plc | 125,326 | 3,736 |
| * | Firstgroup plc | 2,646,866 | 3,639 |
| | Lancashire Holdings Ltd. | 525,518 | 3,627 |
| | Currys plc | 2,175,330 | 3,617 |
| * | National Express Group plc | 1,151,863 | 3,604 |
| | TP ICAP Group plc | 1,692,035 | 3,593 |
| | Oxford Instruments plc | 113,629 | 3,575 |
| | IP Group plc | 2,155,273 | 3,557 |
| * | Frasers Group plc | 400,188 | 3,527 |
| | Capital & Counties Properties plc | 1,563,648 | 3,527 |
| *,2 | TUI AG (XETR) | 1,053,132 | 3,503 |
| | Rathbone Brothers plc | 130,198 | 3,501 |
| | AJ Bell plc | 621,614 | 3,484 |
| * | Helios Towers plc | 1,647,875 | 3,483 |
| *,1 | Aston Martin Lagonda Global Holdings plc | 146,854 | 3,428 |
| | Kainos Group plc | 120,214 | 3,258 |
| | Workspace Group plc | 288,697 | 3,246 |
| | Moneysupermarket.com Group plc | 1,116,704 | 3,242 |
| | Euromoney Institutional Investor plc | 225,979 | 3,232 |
| 1 | Airtel Africa plc | 2,150,803 | 3,225 |
| | Jupiter Fund Management plc | 932,189 | 3,193 |
| | Brewin Dolphin Holdings plc | 618,374 | 3,187 |
| * | Bytes Technology Group plc (XLON) | 432,055 | 3,161 |
| * | Energean plc | 255,476 | 3,139 |
| * | Auction Technology Group plc | 160,440 | 3,109 |
| * | C&C Group plc | 856,940 | 3,033 |
| | FDM Group Holdings plc | 183,883 | 3,021 |
| | 888 Holdings plc | 574,339 | 3,008 |
| | Vesuvius plc | 460,910 | 2,972 |
| | Centamin plc | 2,318,844 | 2,963 |
| | Redde Northgate plc | 537,571 | 2,924 |
| | Clarkson plc | 53,214 | 2,916 |
| | Morgan Advanced Materials plc | 612,872 | 2,897 |
| | Micro Focus International plc | 581,749 | 2,851 |
| * | Provident Financial plc | 548,843 | 2,773 |
| * | Just Group plc | 2,216,122 | 2,773 |
| | Rhi Magnesita NV | 60,221 | 2,767 |
| | Coats Group plc | 3,105,470 | 2,741 |
| * | Oxford Biomedica plc | 131,451 | 2,727 |
| * | Mitie Group plc | 3,018,443 | 2,712 |
| | Ferrexpo plc | 627,567 | 2,677 |
| | Morgan Sindall Group plc | 86,403 | 2,677 |
| | Cairn Energy plc | 1,062,454 | 2,653 |
| | Crest Nicholson Holdings plc | 531,982 | 2,596 |
| | Essentra plc | 648,914 | 2,585 |
| *,1 | Biffa plc | 472,656 | 2,585 |
| * | J D Wetherspoon plc | 183,742 | 2,579 |
| | | Shares | Market
Value•
($000) |
| | Ninety One plc | 696,534 | 2,473 |
| | Chemring Group plc | 600,942 | 2,396 |
| * | Capita plc | 3,645,865 | 2,366 |
| * | Babcock International Group plc | 538,827 | 2,353 |
| * | Elementis plc | 1,227,381 | 2,340 |
| | Premier Foods plc | 1,545,328 | 2,319 |
| | Telecom Plus plc | 134,898 | 2,304 |
| | XP Power Ltd. | 31,994 | 2,298 |
| 1 | Ibstock plc | 836,551 | 2,285 |
| | Hilton Food Group plc | 138,028 | 2,208 |
| * | Harbour Energy plc | 461,099 | 2,207 |
| 1 | TI Fluid Systems plc Class B | 606,696 | 2,198 |
| | NCC Group plc | 626,897 | 2,131 |
| * | Senior plc | 908,714 | 1,995 |
| * | Greencore Group plc | 1,116,979 | 1,975 |
| *,2 | Petropavlovsk plc | 6,045,956 | 1,959 |
| *,1 | Spire Healthcare Group plc | 604,952 | 1,951 |
| * | Tullow Oil plc | 3,081,764 | 1,935 |
| | Keller Group plc | 151,536 | 1,908 |
| * | Restaurant Group plc | 1,561,673 | 1,884 |
| * | Mitchells & Butlers plc | 542,140 | 1,880 |
| *,2 | Cineworld Group plc | 2,129,671 | 1,783 |
| | Bank of Georgia Group plc | 83,235 | 1,727 |
| *,1 | Equiniti Group plc | 702,353 | 1,715 |
| | TBC Bank Group plc | 78,072 | 1,675 |
| *,1 | Trustpilot Group plc | 381,947 | 1,650 |
| | Avon Protection plc | 61,639 | 1,638 |
| | UK Commercial Property REIT Ltd. | 1,573,269 | 1,633 |
| * | PureTech Health plc | 335,288 | 1,616 |
| * | Moonpig Group plc | 348,472 | 1,593 |
| | Wickes Group plc | 540,940 | 1,592 |
| | BMO Commercial Property Trust Ltd. | 1,126,805 | 1,577 |
| | Picton Property Income Ltd. | 1,183,105 | 1,570 |
| | Halfords Group plc | 427,291 | 1,557 |
| * | Marston's plc | 1,339,490 | 1,456 |
| | Helical plc | 217,643 | 1,372 |
| | Hochschild Mining plc | 675,072 | 1,316 |
| * | AO World plc | 606,423 | 1,216 |
| 1 | Vivo Energy plc | 829,869 | 1,200 |
| | AG Barr plc | 174,468 | 1,183 |
| | PZ Cussons plc | 399,474 | 1,174 |
| | Devro plc | 368,662 | 1,087 |
| 1 | ContourGlobal plc | 378,619 | 1,031 |
| * | SIG plc | 1,433,495 | 1,018 |
| * | Rank Group plc | 448,362 | 1,008 |
| | CLS Holdings plc | 329,353 | 1,008 |
| *,2 | Petrofac Ltd. (XLON) | 566,612 | 1,004 |
| * | Go-Ahead Group plc | 92,654 | 998 |
| * | Stagecoach Group plc | 883,598 | 964 |
| 1 | CMC Markets plc | 235,821 | 810 |
| *,1 | Funding Circle Holdings plc | 335,169 | 719 |
| | Hunting plc | 287,216 | 665 |
| | Micro Focus International plc ADR | 122,776 | 603 |
| 1 | Bakkavor Group plc | 326,486 | 563 |
| 1 | Alfa Financial Software Holdings plc | 199,282 | 524 |
European Stock Index Fund
| | | Shares | Market
Value•
($000) |
| *,1,3 | Finablr plc | 304,209 | 46 |
| * | Petrofac Ltd. | 141,651 | 28 |
| *,2,3 | Intu Properties plc | 1,544,041 | — |
| *,3 | NMC Health plc | 157,105 | — |
| *,3 | Carillion plc | 1,000,411 | — |
| | | | 6,611,104 |
Total Common Stocks
(Cost $26,557,478) | 27,605,269 |
| Temporary Cash Investments (0.4%) |
| Money Market Fund (0.4%) |
| 4,5 | Vanguard Market Liquidity Fund, 0.070% (Cost $104,622) | 1,046,230 | 104,623 |
| Total Investments (99.7%) (Cost $26,662,100) | 27,709,892 |
| Other Assets and Liabilities—Net (0.3%) | 87,466 |
| Net Assets (100%) | 27,797,358 |
| Cost is in $000. |
| • | See Note A in Notes to Financial Statements. |
| * | Non-income-producing security. |
| 1 | Security exempt from registration under Rule 144A of the Securities Act of 1933. Such securities may be sold in transactions exempt from registration, normally to qualified institutional buyers. At October 31, 2021, the aggregate value was $1,106,091,000, representing 4.0% of net assets. |
| 2 | Includes partial security positions on loan to broker-dealers. The total value of securities on loan is $74,362,000. |
| 3 | Security value determined using significant unobservable inputs. |
| 4 | Affiliated money market fund available only to Vanguard funds and certain trusts and accounts managed by Vanguard. Rate shown is the 7-day yield. |
| 5 | Collateral of $81,488,000 was received for securities on loan. |
| ADR—American Depositary Receipt. |
| GDR—Global Depositary Receipt. |
| Ptg. Ctf.—Participating Certificates. |
| REIT—Real Estate Investment Trust. |
Derivative Financial Instruments Outstanding as of Period End
| Futures Contracts |
| | | | ($000) |
| | Expiration | Number of
Long (Short)
Contracts | Notional
Amount | Value and
Unrealized
Appreciation
(Depreciation) |
| Long Futures Contracts | | | | |
| Euro Stoxx 50 Index | December 2021 | 2,820 | 138,123 | 2,234 |
| FTSE 100 Index | December 2021 | 666 | 65,843 | 1,825 |
| | | | | 4,059 |
European Stock Index Fund
| Forward Currency Contracts |
| | Contract
Settlement
Date | Contract Amount (000) | Unrealized
Appreciation
($000) | Unrealized
Depreciation
($000) |
| Counterparty | Receive | Deliver |
| Morgan Stanley Capital Services Inc. | 12/15/21 | CHF | 8,374 | USD | 9,108 | 51 | — |
| Bank of America, N.A. | 12/15/21 | EUR | 102,818 | USD | 121,893 | — | (2,900) |
| Morgan Stanley Capital Services Inc. | 12/15/21 | EUR | 42,962 | USD | 50,800 | — | (1,079) |
| State Street Bank & Trust Co. | 12/15/21 | EUR | 38,866 | USD | 46,106 | — | (1,126) |
| Royal Bank of Canada | 12/15/21 | EUR | 5,334 | USD | 6,192 | — | (18) |
| Goldman Sachs International | 12/15/21 | EUR | 2,298 | USD | 2,668 | — | (8) |
| Morgan Stanley Capital Services Inc. | 12/15/21 | GBP | 23,643 | USD | 32,556 | — | (193) |
| Bank of America, N.A. | 12/15/21 | GBP | 14,795 | USD | 20,440 | — | (189) |
| Goldman Sachs International | 12/15/21 | GBP | 5,657 | USD | 7,811 | — | (68) |
| UBS AG | 12/15/21 | GBP | 3,790 | USD | 5,246 | — | (59) |
| State Street Bank & Trust Co. | 12/15/21 | GBP | 3,531 | USD | 4,804 | 29 | — |
| Royal Bank of Canada | 12/15/21 | GBP | 2,345 | USD | 3,204 | 6 | — |
| Bank of America, N.A. | 12/15/21 | USD | 86,619 | CHF | 79,555 | — | (391) |
| UBS AG | 12/15/21 | USD | 3,247 | CHF | 3,000 | — | (34) |
| Barclays Bank plc | 12/15/21 | USD | 7,606 | DKK | 47,864 | 158 | — |
| State Street Bank & Trust Co. | 12/15/21 | USD | 85,048 | EUR | 72,381 | 1,280 | — |
| Morgan Stanley Capital Services Inc. | 12/15/21 | USD | 24,736 | EUR | 21,255 | 137 | — |
| UBS AG | 12/15/21 | USD | 15,416 | EUR | 13,325 | — | (5) |
| UBS AG | 12/15/21 | USD | 12,651 | EUR | 10,796 | 157 | — |
| BNP Paribas | 12/15/21 | USD | 11,919 | GBP | 8,676 | 43 | — |
| Goldman Sachs International | 12/15/21 | USD | 10,155 | GBP | 7,390 | 40 | — |
| Morgan Stanley Capital Services Inc. | 12/15/21 | USD | 2,910 | GBP | 2,138 | — | (16) |
| Standard Chartered Bank | 12/15/21 | USD | 261 | GBP | 190 | 1 | — |
| UBS AG | 12/15/21 | USD | 609 | SEK | 5,292 | — | (7) |
| | | | | | | 1,902 | (6,093) |
| CHF—Swiss franc. |
| DKK—Danish krone. |
| EUR—euro. |
| GBP—British pound. |
| SEK—Swedish krona. |
| USD—U.S. dollar. |
At October 31, 2021, the counterparties had deposited in segregated accounts cash of $6,000 in connection with open forward currency contracts.
See accompanying Notes, which are an integral part of the Financial Statements.
European Stock Index Fund
Statement of Assets and Liabilities
|
| ($000s, except shares and per-share amounts) | Amount |
| Assets | |
| Investments in Securities, at Value | |
| Unaffiliated Issuers (Cost $26,557,478) | 27,605,269 |
| Affiliated Issuers (Cost $104,622) | 104,623 |
| Total Investments in Securities | 27,709,892 |
| Investment in Vanguard | 898 |
| Cash Collateral Pledged—Futures Contracts | 15,968 |
| Cash Collateral Pledged—Forward Currency Contracts | 3,390 |
| Foreign Currency, at Value (Cost $22,035) | 21,941 |
| Receivables for Investment Securities Sold | 27,241 |
| Receivables for Accrued Income | 106,319 |
| Receivables for Capital Shares Issued | 9,318 |
| Variation Margin Receivable—Futures Contracts | 989 |
| Unrealized Appreciation—Forward Currency Contracts | 1,902 |
| Total Assets | 27,897,858 |
| Liabilities | |
| Due to Custodian | 3,637 |
| Payables for Investment Securities Purchased | 1,067 |
| Collateral for Securities on Loan | 81,488 |
| Payables for Capital Shares Redeemed | 7,200 |
| Payables to Vanguard | 1,015 |
| Unrealized Depreciation—Forward Currency Contracts | 6,093 |
| Total Liabilities | 100,500 |
| Net Assets | 27,797,358 |
European Stock Index Fund
Statement of Assets and Liabilities (continued)
|
| At October 31, 2021, net assets consisted of: | |
| ($000s, except shares and per-share amounts) | Amount |
| Paid-in Capital | 27,794,141 |
| Total Distributable Earnings (Loss) | 3,217 |
| Net Assets | 27,797,358 |
| |
| Investor Shares—Net Assets | |
Applicable to 732,308 outstanding $.001 par value shares of
beneficial interest (unlimited authorization) | 27,010 |
| Net Asset Value Per Share—Investor Shares | $36.88 |
| |
| ETF Shares—Net Assets | |
Applicable to 313,873,818 outstanding $.001 par value shares of
beneficial interest (unlimited authorization) | 21,546,779 |
| Net Asset Value Per Share—ETF Shares | $68.65 |
| |
| Admiral Shares—Net Assets | |
Applicable to 61,239,639 outstanding $.001 par value shares of
beneficial interest (unlimited authorization) | 5,259,010 |
| Net Asset Value Per Share—Admiral Shares | $85.88 |
| |
| Institutional Shares—Net Assets | |
Applicable to 23,452,164 outstanding $.001 par value shares of
beneficial interest (unlimited authorization) | 858,821 |
| Net Asset Value Per Share—Institutional Shares | $36.62 |
| |
| Institutional Plus Shares—Net Assets | |
Applicable to 646,229 outstanding $.001 par value shares of
beneficial interest (unlimited authorization) | 105,738 |
| Net Asset Value Per Share—Institutional Plus Shares | $163.62 |
See accompanying Notes, which are an integral part of the Financial Statements.
European Stock Index Fund
|
| | Year Ended
October 31, 2021 |
| | ($000) |
| Investment Income | |
| Income | |
| Dividends1 | 624,228 |
| Non-Cash Dividends | 76,711 |
| Interest2 | 27 |
| Securities Lending—Net | 6,864 |
| Total Income | 707,830 |
| Expenses | |
| The Vanguard Group—Note B | |
| Investment Advisory Services | 2,449 |
| Management and Administrative—Investor Shares | 52 |
| Management and Administrative—ETF Shares | 10,721 |
| Management and Administrative—Admiral Shares | 3,962 |
| Management and Administrative—Institutional Shares | 527 |
| Management and Administrative—Institutional Plus Shares | 53 |
| Marketing and Distribution—Investor Shares | 2 |
| Marketing and Distribution—ETF Shares | 443 |
| Marketing and Distribution—Admiral Shares | 118 |
| Marketing and Distribution—Institutional Shares | 18 |
| Marketing and Distribution—Institutional Plus Shares | 1 |
| Custodian Fees | 1,127 |
| Auditing Fees | 51 |
| Shareholders’ Reports—Investor Shares | — |
| Shareholders’ Reports—ETF Shares | 104 |
| Shareholders’ Reports—Admiral Shares | 48 |
| Shareholders’ Reports—Institutional Shares | 1 |
| Shareholders’ Reports—Institutional Plus Shares | — |
| Trustees’ Fees and Expenses | 7 |
| Total Expenses | 19,684 |
| Net Investment Income | 688,146 |
| Realized Net Gain (Loss) | |
| Investment Securities Sold2,3 | (271,381) |
| Futures Contracts | 37,080 |
| Forward Currency Contracts | 376 |
| Foreign Currencies | 425 |
| Realized Net Gain (Loss) | (233,500) |
European Stock Index Fund
| Statement of Operations (continued) |
| | Year Ended
October 31, 2021 |
| | ($000) |
| Change in Unrealized Appreciation (Depreciation) | |
| Investment Securities2 | 6,539,210 |
| Futures Contracts | 17,609 |
| Forward Currency Contracts | (2,081) |
| Foreign Currencies | (2,708) |
| Change in Unrealized Appreciation (Depreciation) | 6,552,030 |
| Net Increase (Decrease) in Net Assets Resulting from Operations | 7,006,676 |
| 1 | Dividends include foreign tax reclaims of $34,346,000 and are net of foreign withholding taxes of $86,091,000. |
| 2 | Interest income, realized net gain (loss), and change in unrealized appreciation (depreciation) from an affiliated company of the fund were $18,000, ($17,000), and $2,000, respectively. Purchases and sales are for temporary cash investment purposes. |
| 3 | Includes $48,097,000 of net gain (loss) resulting from in-kind redemptions. |
See accompanying Notes, which are an integral part of the Financial Statements.
European Stock Index Fund
Statement of Changes in Net Assets
|
| | Year Ended October 31, |
| | 2021
($000) | 2020
($000) |
| | | |
| Increase (Decrease) in Net Assets | | |
| Operations | | |
| Net Investment Income | 688,146 | 416,408 |
| Realized Net Gain (Loss) | (233,500) | (1,068,071) |
| Change in Unrealized Appreciation (Depreciation) | 6,552,030 | (1,538,377) |
| Net Increase (Decrease) in Net Assets Resulting from Operations | 7,006,676 | (2,190,040) |
| Distributions | | |
| Investor Shares | (669) | (468) |
| ETF Shares | (493,410) | (289,650) |
| Admiral Shares | (133,268) | (97,387) |
| Institutional Shares | (22,925) | (18,231) |
| Institutional Plus Shares | (2,736) | (1,716) |
| Total Distributions | (653,008) | (407,452) |
| Capital Share Transactions | | |
| Investor Shares | 489 | (3,442) |
| ETF Shares | 5,282,588 | 556,405 |
| Admiral Shares | 17,451 | (344,953) |
| Institutional Shares | (118,833) | (68,683) |
| Institutional Plus Shares | 8,237 | (28,288) |
| Net Increase (Decrease) from Capital Share Transactions | 5,189,932 | 111,039 |
| Total Increase (Decrease) | 11,543,600 | (2,486,453) |
| Net Assets | | |
| Beginning of Period | 16,253,758 | 18,740,211 |
| End of Period | 27,797,358 | 16,253,758 |
See accompanying Notes, which are an integral part of the Financial Statements.
European Stock Index Fund
| Investor Shares | | | | | |
For a Share Outstanding
Throughout Each Period | Year Ended October 31, |
| 2021 | 2020 | 2019 | 2018 | 2017 |
| Net Asset Value, Beginning of Period | $26.63 | $29.84 | $27.85 | $31.44 | $25.27 |
| Investment Operations | | | | | |
| Net Investment Income1 | .982 | .627 | 1.053 | .968 | .827 |
| Net Realized and Unrealized Gain (Loss) on Investments | 10.174 | (3.221) | 1.913 | (3.572) | 6.109 |
| Total from Investment Operations | 11.156 | (2.594) | 2.966 | (2.604) | 6.936 |
| Distributions | | | | | |
| Dividends from Net Investment Income | (.906) | (.616) | (.976) | (.986) | (.766) |
| Distributions from Realized Capital Gains | — | — | — | — | — |
| Total Distributions | (.906) | (.616) | (.976) | (.986) | (.766) |
| Net Asset Value, End of Period | $36.88 | $26.63 | $29.84 | $27.85 | $31.44 |
| Total Return2 | 42.12% | -8.68% | 10.90% | -8.53% | 27.77% |
| Ratios/Supplemental Data | | | | | |
| Net Assets, End of Period (Millions) | $27 | $19 | $25 | $543 | $701 |
| Ratio of Total Expenses to Average Net Assets | 0.23% | 0.23% | 0.23% | 0.23% | 0.26% |
| Ratio of Net Investment Income to Average Net Assets | 2.82% | 2.23% | 3.72% | 3.14% | 2.81% |
| Portfolio Turnover Rate3 | 3% | 3% | 3% | 6% | 4% |
| 1 | Calculated based on average shares outstanding. |
| 2 | Total returns do not include account service fees that may have applied in the periods shown. Fund prospectuses provide information about any applicable account service fees. |
| 3 | Excludes the value of portfolio securities received or delivered as a result of in-kind purchases or redemptions of the fund’s capital shares, including ETF Creation Units. |
See accompanying Notes, which are an integral part of the Financial Statements.
European Stock Index Fund
| FTSE Europe ETF Shares | | | | | |
For a Share Outstanding
Throughout Each Period | Year Ended October 31, |
| 2021 | 2020 | 2019 | 2018 | 2017 |
| Net Asset Value, Beginning of Period | $49.57 | $55.54 | $51.84 | $58.54 | $47.05 |
| Investment Operations | | | | | |
| Net Investment Income1 | 1.922 | 1.247 | 1.854 | 1.912 | 1.567 |
| Net Realized and Unrealized Gain (Loss) on Investments | 18.939 | (5.990) | 3.744 | (6.689) | 11.434 |
| Total from Investment Operations | 20.861 | (4.743) | 5.598 | (4.777) | 13.001 |
| Distributions | | | | | |
| Dividends from Net Investment Income | (1.781) | (1.227) | (1.898) | (1.923) | (1.511) |
| Distributions from Realized Capital Gains | — | — | — | — | — |
| Total Distributions | (1.781) | (1.227) | (1.898) | (1.923) | (1.511) |
| Net Asset Value, End of Period | $68.65 | $49.57 | $55.54 | $51.84 | $58.54 |
| Total Return | 42.34% | -8.50% | 11.08% | -8.44% | 27.98% |
| Ratios/Supplemental Data | | | | | |
| Net Assets, End of Period (Millions) | $21,547 | $11,659 | $13,067 | $14,624 | $17,880 |
| Ratio of Total Expenses to Average Net Assets | 0.08% | 0.08% | 0.08% | 0.09% | 0.10% |
| Ratio of Net Investment Income to Average Net Assets | 2.95% | 2.38% | 3.50% | 3.28% | 2.97% |
| Portfolio Turnover Rate2 | 3% | 3% | 3% | 6% | 4% |
| 1 | Calculated based on average shares outstanding. |
| 2 | Excludes the value of portfolio securities received or delivered as a result of in-kind purchases or redemptions of the fund’s capital shares, including ETF Creation Units. |
See accompanying Notes, which are an integral part of the Financial Statements.
European Stock Index Fund
| Admiral Shares | | | | | |
For a Share Outstanding
Throughout Each Period | Year Ended October 31, |
| 2021 | 2020 | 2019 | 2018 | 2017 |
| Net Asset Value, Beginning of Period | $62.01 | $69.48 | $64.84 | $73.23 | $58.85 |
| Investment Operations | | | | | |
| Net Investment Income1 | 2.375 | 1.553 | 2.298 | 2.353 | 2.016 |
| Net Realized and Unrealized Gain (Loss) on Investments | 23.705 | (7.502) | 4.693 | (8.338) | 14.251 |
| Total from Investment Operations | 26.080 | (5.949) | 6.991 | (5.985) | 16.267 |
| Distributions | | | | | |
| Dividends from Net Investment Income | (2.210) | (1.521) | (2.351) | (2.405) | (1.887) |
| Distributions from Realized Capital Gains | — | — | — | — | — |
| Total Distributions | (2.210) | (1.521) | (2.351) | (2.405) | (1.887) |
| Net Asset Value, End of Period | $85.88 | $62.01 | $69.48 | $64.84 | $73.23 |
| Total Return2 | 42.30% | -8.55% | 11.05% | -8.43% | 27.99% |
| Ratios/Supplemental Data | | | | | |
| Net Assets, End of Period (Millions) | $5,259 | $3,795 | $4,671 | $4,174 | $4,754 |
| Ratio of Total Expenses to Average Net Assets | 0.10% | 0.10% | 0.10% | 0.10% | 0.10% |
| Ratio of Net Investment Income to Average Net Assets | 2.93% | 2.37% | 3.47% | 3.27% | 2.97% |
| Portfolio Turnover Rate3 | 3% | 3% | 3% | 6% | 4% |
| 1 | Calculated based on average shares outstanding. |
| 2 | Total returns do not include account service fees that may have applied in the periods shown. Fund prospectuses provide information about any applicable account service fees. |
| 3 | Excludes the value of portfolio securities received or delivered as a result of in-kind purchases or redemptions of the fund’s capital shares, including ETF Creation Units. |
See accompanying Notes, which are an integral part of the Financial Statements.
European Stock Index Fund
| Institutional Shares | | | | | |
For a Share Outstanding
Throughout Each Period | Year Ended October 31, |
| 2021 | 2020 | 2019 | 2018 | 2017 |
| Net Asset Value, Beginning of Period | $26.44 | $29.63 | $27.65 | $31.23 | $25.10 |
| Investment Operations | | | | | |
| Net Investment Income1 | 1.019 | .667 | .993 | 1.014 | .873 |
| Net Realized and Unrealized Gain (Loss) on Investments | 10.110 | (3.203) | 1.998 | (3.564) | 6.068 |
| Total from Investment Operations | 11.129 | (2.536) | 2.991 | (2.550) | 6.941 |
| Distributions | | | | | |
| Dividends from Net Investment Income | (.949) | (.654) | (1.011) | (1.030) | (.811) |
| Distributions from Realized Capital Gains | — | — | — | — | — |
| Total Distributions | (.949) | (.654) | (1.011) | (1.030) | (.811) |
| Net Asset Value, End of Period | $36.62 | $26.44 | $29.63 | $27.65 | $31.23 |
| Total Return | 42.34% | -8.54% | 11.09% | -8.42% | 28.00% |
| Ratios/Supplemental Data | | | | | |
| Net Assets, End of Period (Millions) | $859 | $710 | $870 | $760 | $756 |
| Ratio of Total Expenses to Average Net Assets | 0.08% | 0.08% | 0.08% | 0.08% | 0.08% |
| Ratio of Net Investment Income to Average Net Assets | 2.96% | 2.39% | 3.51% | 3.29% | 2.99% |
| Portfolio Turnover Rate2 | 3% | 3% | 3% | 6% | 4% |
| 1 | Calculated based on average shares outstanding. |
| 2 | Excludes the value of portfolio securities received or delivered as a result of in-kind purchases or redemptions of the fund’s capital shares, including ETF Creation Units. |
See accompanying Notes, which are an integral part of the Financial Statements.
European Stock Index Fund
| Institutional Plus Shares | | | | | |
For a Share Outstanding
Throughout Each Period | Year Ended October 31, |
| 2021 | 2020 | 2019 | 2018 | 2017 |
| Net Asset Value, Beginning of Period | $118.14 | $132.38 | $123.55 | $139.48 | $112.09 |
| Investment Operations | | | | | |
| Net Investment Income1 | 4.576 | 2.989 | 4.197 | 4.711 | 3.910 |
| Net Realized and Unrealized Gain (Loss) on Investments | 45.160 | (14.294) | 9.160 | (16.018) | 27.110 |
| Total from Investment Operations | 49.736 | (11.305) | 13.357 | (11.307) | 31.020 |
| Distributions | | | | | |
| Dividends from Net Investment Income | (4.256) | (2.935) | (4.527) | (4.623) | (3.630) |
| Distributions from Realized Capital Gains | — | — | — | — | — |
| Total Distributions | (4.256) | (2.935) | (4.527) | (4.623) | (3.630) |
| Net Asset Value, End of Period | $163.62 | $118.14 | $132.38 | $123.55 | $139.48 |
| Total Return | 42.35% | -8.52% | 11.08% | -8.36% | 28.03% |
| Ratios/Supplemental Data | | | | | |
| Net Assets, End of Period (Millions) | $106 | $70 | $106 | $170 | $122 |
| Ratio of Total Expenses to Average Net Assets | 0.07% | 0.07% | 0.07% | 0.07% | 0.07% |
| Ratio of Net Investment Income to Average Net Assets | 2.95% | 2.40% | 3.34% | 3.30% | 3.00% |
| Portfolio Turnover Rate2 | 3% | 3% | 3% | 6% | 4% |
| 1 | Calculated based on average shares outstanding. |
| 2 | Excludes the value of portfolio securities received or delivered as a result of in-kind purchases or redemptions of the fund’s capital shares, including ETF Creation Units. |
See accompanying Notes, which are an integral part of the Financial Statements.
European Stock Index Fund
Notes to Financial Statements
Vanguard European Stock Index Fund is registered under the Investment Company Act of 1940 as an open-end investment company, or mutual fund. The fund offers five classes of shares: Investor Shares, ETF Shares, Admiral Shares, Institutional Shares, and Institutional Plus Shares. Each of the share classes has different eligibility and minimum purchase requirements, and is designed for different types of investors. ETF Shares, known as Vanguard FTSE Europe ETF Shares, are listed for trading on NYSE Arca; they can be purchased and sold through a broker.
The fund invests in securities of foreign issuers, which may subject it to investment risks not normally associated with investing in securities of U.S. corporations. Market disruptions associated with the COVID-19 pandemic have had a global impact, and uncertainty exists as to the long-term implications. Such disruptions can adversely affect assets of the fund and thus fund performance.
| A. | The following significant accounting policies conform to generally accepted accounting principles for U.S. investment companies. The fund consistently follows such policies in preparing its financial statements. |
1. Security Valuation: Securities are valued as of the close of trading on the New York Stock Exchange (generally 4 p.m., Eastern time) on the valuation date. Equity securities are valued at the latest quoted sales prices or official closing prices taken from the primary market in which each security trades; such securities not traded on the valuation date are valued at the mean of the latest quoted bid and asked prices. Securities for which market quotations are not readily available, or whose values have been affected by events occurring before the fund’s pricing time but after the close of the securities’ primary markets, are valued at their fair values calculated according to procedures adopted by the board of trustees. These procedures include obtaining quotations from an independent pricing service, monitoring news to identify significant market- or security-specific events, and evaluating changes in the values of foreign market proxies (for example, ADRs, futures contracts, or exchange-traded funds), between the time the foreign markets close and the fund’s pricing time. When fair-value pricing is employed, the prices of securities used by a fund to calculate its net asset value may differ from quoted or published prices for the same securities.
Investments in Vanguard Market Liquidity Fund are valued at that fund's net asset value.
Temporary cash investments are valued using the latest bid prices or using valuations based on a matrix system (which considers such factors as security prices, yields, maturities, and ratings), both as furnished by independent pricing services.
2. Foreign Currency: Securities and other assets and liabilities denominated in foreign currencies are translated into U.S. dollars using exchange rates obtained from an independent third party as of the fund’s pricing time on the valuation date. Realized gains (losses) and unrealized appreciation (depreciation) on investment securities include the effects of changes in exchange rates since the securities were purchased, combined with the effects of changes in security prices. Fluctuations in the value of other assets and liabilities resulting from changes in exchange rates are recorded as unrealized foreign currency gains (losses) until the assets or liabilities are settled in cash, at which time they are recorded as realized foreign currency gains (losses).
3. Futures Contracts: The fund uses index futures contracts to a limited extent, with the objectives of maintaining full exposure to the stock market, maintaining liquidity, and minimizing transaction costs. The fund may purchase futures contracts to immediately invest incoming cash in the market, or sell futures in response to cash outflows, thereby simulating a fully invested position in the underlying index while maintaining a cash balance for liquidity. The primary risks associated with the use of futures contracts are imperfect correlation between changes in market values of stocks held by the fund and the prices of futures contracts, and the possibility of an illiquid market.
European Stock Index Fund
Counterparty risk involving futures is mitigated because a regulated clearinghouse is the counterparty instead of the clearing broker. To further mitigate counterparty risk, the fund trades futures contracts on an exchange, monitors the financial strength of its clearing brokers and clearinghouse, and has entered into clearing agreements with its clearing brokers. The clearinghouse imposes initial margin requirements to secure the fund’s performance and requires daily settlement of variation margin representing changes in the market value of each contract. Any securities pledged as initial margin for open contracts are noted in the Schedule of Investments.
Futures contracts are valued at their quoted daily settlement prices. The notional amounts of the contracts are not recorded in the Statement of Assets and Liabilities. Fluctuations in the value of the contracts are recorded in the Statement of Assets and Liabilities as an asset (liability) and in the Statement of Operations as unrealized appreciation (depreciation) until the contracts are closed, when they are recorded as realized gains (losses) on futures contracts.
During the year ended October 31, 2021, the fund’s average investments in long and short futures contracts represented 1% and 0% of net assets, respectively, based on the average of the notional amounts at each quarter-end during the period.
4. Forward Currency Contracts: The fund enters into forward currency contracts to protect the value of securities and related receivables and payables against changes in future foreign exchange rates. The fund’s risks in using these contracts include movement in the values of the foreign currencies relative to the U.S. dollar and the ability of the counterparties to fulfill their obligations under the contracts. The fund mitigates its counterparty risk by entering into forward currency contracts only with a diverse group of prequalified counterparties, monitoring their financial strength, entering into master netting arrangements with its counterparties, and requiring its counterparties to transfer collateral as security for their performance. In the absence of a default, the collateral pledged or received by the fund cannot be repledged, resold, or rehypothecated. The master netting arrangements provide that, in the event of a counterparty’s default (including bankruptcy), the fund may terminate the forward currency contracts, determine the net amount owed by either party in accordance with its master netting arrangements, and sell or retain any collateral held up to the net amount owed to the fund under the master netting arrangements. The forward currency contracts contain provisions whereby a counterparty may terminate open contracts if the fund’s net assets decline below a certain level, triggering a payment by the fund if the fund is in a net liability position at the time of the termination. The payment amount would be reduced by any collateral the fund has pledged. Any securities pledged as collateral for open contracts are noted in the Schedule of Investments. The value of collateral received or pledged is compared daily to the value of the forward currency contracts exposure with each counterparty, and any difference, if in excess of a specified minimum transfer amount, is adjusted and settled within two business days.
Forward currency contracts are valued at their quoted daily prices obtained from an independent third party, adjusted for currency risk based on the expiration date of each contract. The notional amounts of the contracts are not recorded in the Statement of Assets and Liabilities. Fluctuations in the value of the contracts are recorded in the Statement of Assets and Liabilities as an asset (liability) and in the Statement of Operations as unrealized appreciation (depreciation) until the contracts are closed, when they are recorded as realized gains (losses) on forward currency contracts.
European Stock Index Fund
During the year ended October 31, 2021, the fund’s average investment in forward currency contracts represented 2% of net assets, based on the average of the notional amounts at each quarter-end during the period.
5. Federal Income Taxes: The fund intends to continue to qualify as a regulated investment company and distribute all of its taxable income. The fund’s tax returns are open to examination by the relevant tax authorities until expiration of the applicable statute of limitations, which is generally three years after the filing of the tax return. Management has analyzed the fund’s tax positions taken for all open federal and state income tax years, and has concluded that no provision for income tax is required in the fund’s financial statements.
6. Distributions: Distributions to shareholders are recorded on the ex-dividend date. Distributions are determined on a tax basis at the fiscal year-end and may differ from net investment income and realized capital gains for financial reporting purposes.
7. Securities Lending: To earn additional income, the fund lends its securities to qualified institutional borrowers. Security loans are subject to termination by the fund at any time, and are required to be secured at all times by collateral in an amount at least equal to the market value of securities loaned. Daily market fluctuations could cause the value of loaned securities to be more or less than the value of the collateral received. When this occurs, the collateral is adjusted and settled before the opening of the market on the next business day. The fund further mitigates its counterparty risk by entering into securities lending transactions only with a diverse group of prequalified counterparties, monitoring their financial strength, and entering into master securities lending agreements with its counterparties. The master securities lending agreements provide that, in the event of a counterparty’s default (including bankruptcy), the fund may terminate any loans with that borrower, determine the net amount owed, and sell or retain the collateral up to the net amount owed to the fund; however, such actions may be subject to legal proceedings. While collateral mitigates counterparty risk, in the event of a default, the fund may experience delays and costs in recovering the securities loaned. The fund invests cash collateral received in Vanguard Market Liquidity Fund, and records a liability in the Statement of Assets and Liabilities for the return of the collateral, during the period the securities are on loan. Collateral investments in Vanguard Market Liquidity Fund are subject to market appreciation or depreciation. Securities lending income represents fees charged to borrowers plus income earned on invested cash collateral, less expenses associated with the loan. During the term of the loan, the fund is entitled to all distributions made on or in respect of the loaned securities.
8. Credit Facilities and Interfund Lending Program: The fund and certain other funds managed by The Vanguard Group ("Vanguard") participate in a $4.3 billion committed credit facility provided by a syndicate of lenders pursuant to a credit agreement and an uncommitted credit facility provided by Vanguard. Both facilities may be renewed annually. Each fund is individually liable for its borrowings, if any, under the credit facilities. Borrowings may be utilized for temporary or emergency purposes, subject to the fund’s regulatory and contractual borrowing restrictions. With respect to the committed credit facility, the participating funds are charged administrative fees and an annual commitment fee of 0.10% of the undrawn committed amount of the facility; these fees are allocated to the funds based on a method approved by the fund’s board of trustees and included in Management and Administrative expenses on the fund’s Statement of Operations. Any borrowings under either facility bear interest at a rate based upon the higher of the one-month London Interbank Offered Rate (or an acceptable alternate rate, if necessary), federal funds
European Stock Index Fund
effective rate, or overnight bank funding rate plus an agreed-upon spread, except that borrowings under the uncommitted credit facility may bear interest based upon an alternate rate agreed to by the fund and Vanguard.
In accordance with an exemptive order (the “Order”) from the SEC, the fund may participate in a joint lending and borrowing program that allows registered open-end Vanguard funds to borrow money from and lend money to each other for temporary or emergency purposes (the “Interfund Lending Program”), subject to compliance with the terms and conditions of the Order, and to the extent permitted by the fund’s investment objective and investment policies. Interfund loans and borrowings normally extend overnight, but can have a maximum duration of seven days. Loans may be called on one business day’s notice. The interest rate to be charged is governed by the conditions of the Order and internal procedures adopted by the board of trustees. The board of trustees is responsible for overseeing the Interfund Lending Program.
For the year ended October 31, 2021, the fund did not utilize the credit facilities or the Interfund Lending Program.
9. Other: Dividend income is recorded on the ex-dividend date. Non-cash dividends included in income, if any, are recorded at the fair value of the securities received. Interest income includes income distributions received from Vanguard Market Liquidity Fund and is accrued daily. Premiums and discounts on debt securities are amortized and accreted, respectively, to interest income over the lives of the respective securities, except for premiums on certain callable debt securities that are amortized to the earliest call date. Security transactions are accounted for on the date securities are bought or sold. Costs used to determine realized gains (losses) on the sale of investment securities are those of the specific securities sold.
Taxes on foreign dividends and capital gains have been provided for in accordance with the fund's understanding of the applicable countries' tax rules and rates. Deferred foreign capital gains tax, if any, is accrued daily based upon net unrealized gains. The fund has filed tax reclaims for previously withheld taxes on dividends earned in certain European Union countries. These filings are subject to various administrative and judicial proceedings within these countries. Such tax reclaims received during the year, if any, are included in dividend income. No other amounts for additional tax reclaims are reflected in the financial statements due to the uncertainty as to the ultimate resolution of proceedings, the likelihood of receipt of these reclaims, and the potential timing of payment.
Each class of shares has equal rights as to assets and earnings, except that each class separately bears certain class-specific expenses related to maintenance of shareholder accounts (included in Management and Administrative expenses) and shareholder reporting. Marketing and distribution expenses are allocated to each class of shares based on a method approved by the board of trustees. Income, other non-class-specific expenses, and gains and losses on investments are allocated to each class of shares based on its relative net assets.
| B. | In accordance with the terms of a Funds' Service Agreement (the “FSA”) between Vanguard and the fund, Vanguard furnishes to the fund investment advisory, corporate management, administrative, marketing, and distribution services at Vanguard’s cost of operations (as defined by the FSA). These costs of operations are allocated to the fund based on methods and guidelines approved by the board of trustees and are generally settled twice a month. |
European Stock Index Fund
Upon the request of Vanguard, the fund may invest up to 0.40% of its net assets as capital in Vanguard. At October 31, 2021, the fund had contributed to Vanguard capital in the amount of $898,000, representing less than 0.01% of the fund’s net assets and 0.36% of Vanguard’s capital received pursuant to the FSA. The fund’s trustees and officers are also directors and employees, respectively, of Vanguard.
| C. | Various inputs may be used to determine the value of the fund’s investments and derivatives. These inputs are summarized in three broad levels for financial statement purposes. The inputs or methodologies used to value securities are not necessarily an indication of the risk associated with investing in those securities. |
Level 1—Quoted prices in active markets for identical securities.
Level 2—Other significant observable inputs (including quoted prices for similar securities, interest rates, prepayment speeds, credit risk, etc.).
Level 3—Significant unobservable inputs (including the fund’s own assumptions used to determine the fair value of investments). Any investments and derivatives valued with significant unobservable inputs are noted on the Schedule of Investments.
The following table summarizes the market value of the fund’s investments and derivatives as of October 31, 2021, based on the inputs used to value them:
| | Level 1
($000) | Level 2
($000) | Level 3
($000) | Total
($000) |
| Investments | | | | |
| Assets | | | | |
| Common Stocks | 2,755 | 27,601,909 | 605 | 27,605,269 |
| Temporary Cash Investments | 104,623 | — | — | 104,623 |
| Total | 107,378 | 27,601,909 | 605 | 27,709,892 |
| Derivative Financial Instruments | | | | |
| Assets | | | | |
| Futures Contracts1 | 4,059 | — | — | 4,059 |
| Forward Currency Contracts | — | 1,902 | — | 1,902 |
| Total | 4,059 | 1,902 | — | 5,961 |
| Liabilities | | | | |
| Forward Currency Contracts | — | 6,093 | — | 6,093 |
| 1 | Includes cumulative appreciation (depreciation) on futures contracts and centrally cleared swaps, if any, as reported in the Schedule of Investments. Only current day’s variation margin is reported within the Statement of Assets and Liabilities. |
European Stock Index Fund
| D. | At October 31, 2021, the fair values of derivatives were reflected in the Statement of Assets and Liabilities as follows: |
| Statement of Assets and Liabilities | Equity
Contracts
($000) | Foreign
Exchange
Contracts
($000) | Total
($000) |
| Unrealized Appreciation—Futures Contracts1 | 4,059 | — | 4,059 |
| Unrealized Appreciation—Forward Currency Contracts | — | 1,902 | 1,902 |
| Total Assets | 4,059 | 1,902 | 5,961 |
| | | | |
| Unrealized Depreciation—Forward Currency Contracts | — | 6,093 | 6,093 |
| Total Liabilities | — | 6,093 | 6,093 |
| 1 | Includes cumulative appreciation (depreciation) on futures contracts and centrally cleared swaps, if any, as reported in the Schedule of Investments. Only current day’s variation margin is reported within the Statement of Assets and Liabilities. |
Realized net gain (loss) and the change in unrealized appreciation (depreciation) on derivatives for the year ended October 31, 2021, were:
| Realized Net Gain (Loss) on Derivatives | Equity
Contracts
($000) | Foreign
Exchange
Contracts
($000) | Total
($000) |
| Futures Contracts | 37,080 | — | 37,080 |
| Forward Currency Contracts | — | 376 | 376 |
| Realized Net Gain (Loss) on Derivatives | 37,080 | 376 | 37,456 |
| Change in Unrealized Appreciation (Depreciation) on Derivatives |
| Futures Contracts | 17,609 | — | 17,609 |
| Forward Currency Contracts | — | (2,081) | (2,081) |
| Change in Unrealized Appreciation (Depreciation) on Derivatives | 17,609 | (2,081) | 15,528 |
| E. | Permanent differences between book-basis and tax-basis components of net assets are reclassified among capital accounts in the financial statements to reflect their tax character. These reclassifications have no effect on net assets or net asset value per share. As of period end, permanent differences primarily attributable to the accounting for in-kind redemptions, foreign currency transactions, and passive foreign investment companies were reclassified between the following accounts: |
| | Amount
($000) |
| Paid-in Capital | 47,756 |
| Total Distributable Earnings (Loss) | (47,756) |
Temporary differences between book-basis and tax-basis components of total distributable earnings (loss) arise when certain items of income, gain, or loss are recognized in different periods for financial statement and tax purposes; these differences will reverse at some time in the future. The differences are primarily related to the deferral of losses from wash sales; the recognition of unrealized gains or losses from certain derivative contracts; and the recognition of unrealized gains
European Stock Index Fund
from passive foreign investment companies. As of period end, the tax-basis components of total distributable earnings (loss) are detailed in the table as follows:
| | Amount
($000) |
| Undistributed Ordinary Income | 206,975 |
| Undistributed Long-Term Gains | — |
| Capital Loss Carryforwards | (1,083,572) |
| Qualified Late-Year Losses | — |
| Net Unrealized Gains (Losses) | 879,814 |
The tax character of distributions paid was as follows:
| | Year Ended October 31, |
| | 2021
Amount
($000) | 2020
Amount
($000) |
| Ordinary Income* | 653,008 | 407,452 |
| Long-Term Capital Gains | — | — |
| Total | 653,008 | 407,452 |
| * | Includes short-term capital gains, if any. |
As of October 31, 2021, gross unrealized appreciation and depreciation for investments and derivatives based on cost for U.S. federal income tax purposes were as follows:
| | Amount
($000) |
| Tax Cost | 26,832,625 |
| Gross Unrealized Appreciation | 6,378,078 |
| Gross Unrealized Depreciation | (5,500,653) |
| Net Unrealized Appreciation (Depreciation) | 877,425 |
| F. | During the year ended October 31, 2021, the fund purchased $6,164,583,000 of investment securities and sold $859,807,000 of investment securities, other than temporary cash investments. Purchases and sales include $4,780,790,000 and $153,087,000, respectively, in connection with in-kind purchases and redemptions of the fund's capital shares. |
European Stock Index Fund
| G. | Capital share transactions for each class of shares were: |
| | Year Ended October 31, | |
| | 2021 | | 2020 |
| | Amount
($000) | Shares
(000) | | Amount
($000) | Shares
(000) |
| Investor Shares | | | | | |
| Issued | 3,204 | 92 | | 1,868 | 67 |
| Issued in Lieu of Cash Distributions | 668 | 19 | | 467 | 17 |
| Redeemed1 | (3,383) | (97) | | (5,777) | (208) |
| Net Increase (Decrease)—Investor Shares | 489 | 14 | | (3,442) | (124) |
| ETF Shares | | | | | |
| Issued | 5,436,002 | 81,366 | | 2,474,253 | 44,346 |
| Issued in Lieu of Cash Distributions | — | — | | — | — |
| Redeemed | (153,414) | (2,700) | | (1,917,848) | (44,400) |
| Net Increase (Decrease)—ETF Shares | 5,282,588 | 78,666 | | 556,405 | (54) |
| Admiral Shares | | | | | |
| Issued1 | 551,466 | 6,752 | | 538,460 | 8,286 |
| Issued in Lieu of Cash Distributions | 109,362 | 1,347 | | 79,155 | 1,275 |
| Redeemed | (643,377) | (8,067) | | (962,568) | (15,583) |
| Net Increase (Decrease)—Admiral Shares | 17,451 | 32 | | (344,953) | (6,022) |
| Institutional Shares | | | | | |
| Issued | 92,524 | 2,656 | | 102,077 | 3,718 |
| Issued in Lieu of Cash Distributions | 16,447 | 477 | | 12,382 | 468 |
| Redeemed | (227,804) | (6,526) | | (183,142) | (6,718) |
| Net Increase (Decrease)—Institutional Shares | (118,833) | (3,393) | | (68,683) | (2,532) |
| Institutional Plus Shares | | | | | |
| Issued | 13,728 | 84 | | — | — |
| Issued in Lieu of Cash Distributions | 2,736 | 18 | | 1,712 | 14 |
| Redeemed | (8,227) | (50) | | (30,000) | (224) |
| Net Increase (Decrease)—Institutional Plus Shares | 8,237 | 52 | | (28,288) | (210) |
| 1 | In November 2018, the fund announced changes to the availability and minimum investment criteria of the Investor and Admiral share classes. As a result, all of the outstanding Investor Shares automatically converted to Admiral Shares beginning in April 2019, with the exception of those held by Vanguard funds and certain other institutional investors. Investor Shares—Redeemed and Admiral Shares—Issued include 67 and 29 shares, respectively, in the amount of $2,000 from the conversion during the year ended October 31, 2020. |
| H. | Management has determined that no events or transactions occurred subsequent to October 31, 2021, that would require recognition or disclosure in these financial statements. |
All of the returns in this report represent past performance, which is not a guarantee of future results that may be achieved by the fund. (Current performance may be lower or higher than the performance data cited. For performance data current to the most recent month-end, visit our website at vanguard.com/performance.) Note, too, that both investment returns and principal value can fluctuate widely, so an investor’s shares, when sold, could be worth more or less than their original cost. The returns shown do not reflect taxes that a shareholder would pay on fund distributions or on the sale of fund shares.
Cumulative Performance: October 31, 2011, Through October 31, 2021
Initial Investment of $10,000
| | | Average Annual Total Returns
Periods Ended October 31, 2021 | |
| | | One
Year | Five
Years | Ten
Years | Final Value
of a $10,000
Investment |
| Pacific Stock Index Fund Investor Shares | 23.09% | 8.78% | 7.54% | $20,684 |
| Spliced Pacific Stock Index | 23.55 | 8.91 | 7.54 | 20,687 |
| FTSE Global All Cap ex US Index | 30.96 | 10.06 | 7.09 | 19,836 |
Spliced Pacific Stock Index: MSCI Pacific Index through March 26, 2013; FTSE Developed Asia Pacific Index through September 30, 2015; FTSE Developed Asia Pacific All Cap Index thereafter. Benchmark returns are adjusted for withholding taxes.
| | | | |
| | | One
Year | Five
Years | Ten
Years | Final Value
of a $10,000
Investment |
FTSE Pacific
ETF Shares Net Asset Value | 23.27% | 8.95% | 7.70% | $20,998 |
| FTSE Pacific ETF Shares Market Price | 22.97 | 8.91 | 7.72 | 21,041 |
| Spliced Pacific Stock Index | 23.55 | 8.91 | 7.54 | 20,687 |
| FTSE Global All Cap ex US Index | 30.96 | 10.06 | 7.09 | 19,836 |
See Financial Highlights for dividend and capital gains information.
| | | Average Annual Total Returns
Periods Ended October 31, 2021 | |
| | | One
Year | Five
Years | Ten
Years | Final Value
of a $10,000
Investment |
Pacific Stock Index Fund
Admiral Shares | 23.25% | 8.93% | 7.69% | $20,983 |
| Spliced Pacific Stock Index | 23.55 | 8.91 | 7.54 | 20,687 |
| FTSE Global All Cap ex US Index | 30.96 | 10.06 | 7.09 | 19,836 |
| | | | |
| | | One
Year | Five
Years | Ten
Years | Final Value
of a $5,000,000
Investment |
Pacific Stock Index Fund
Institutional Shares | 23.25% | 8.95% | 7.71% | $10,513,060 |
| Spliced Pacific Stock Index | 23.55 | 8.91 | 7.54 | 10,343,674 |
| FTSE Global All Cap ex US Index | 30.96 | 10.06 | 7.09 | 9,918,026 |
Cumulative Returns of ETF Shares: October 31, 2011, Through October 31, 2021
| | One
Year | Five
Years | Ten
Years |
| FTSE Pacific ETF Shares Market Price | 22.97% | 53.23% | 110.41% |
| FTSE Pacific ETF Shares Net Asset Value | 23.27 | 53.53 | 109.98 |
| Spliced Pacific Stock Index | 23.55 | 53.24 | 106.87 |
For the ETF Shares, the market price is determined by the midpoint of the bid-offer spread as of the closing time of the New York Stock Exchange (generally 4 p.m., Eastern time). The net asset value is also determined as of the NYSE closing time. For more information about how the ETF Shares' market prices have compared with their net asset value, visit vanguard.com, select your ETF, and then select the Price and Performance tab. The ETF premium/discount analysis there shows the percentages of days on which the ETF Shares' market price was above or below the NAV.
See Financial Highlights for dividend and capital gains information.
| Japan | 57.5% |
| Australia | 18.0 |
| South Korea | 13.5 |
| Hong Kong | 7.2 |
| Singapore | 2.8 |
| New Zealand | 1.0 |
| Other | — |
The table reflects the fund’s investments, except for short-term investments and derivatives.
The fund may invest in derivatives (such as futures and swap contracts) for various reasons, including, but not limited to, attempting to remain fully invested and tracking its target index as closely as possible.
The fund files its complete schedule of portfolio holdings with the Securities and Exchange Commission (SEC) for the first and third quarters of each fiscal year as an exhibit to its reports on Form N-PORT. The fund’s Form N-PORT reports are available on the SEC’s website at www.sec.gov.
| | | Shares | Market
Value•
($000) |
| Common Stocks (99.4%) |
| Australia (17.9%) |
| | Commonwealth Bank of Australia | 1,725,215 | 136,744 |
| | CSL Ltd. | 458,251 | 104,271 |
| | BHP Group Ltd. | 2,982,196 | 81,912 |
| | National Australia Bank Ltd. | 3,312,884 | 72,029 |
| | Westpac Banking Corp. | 3,698,203 | 71,949 |
| | Australia & New Zealand Banking Group Ltd. | 2,849,117 | 60,631 |
| 1 | Macquarie Group Ltd. | 337,180 | 49,778 |
| | Wesfarmers Ltd. | 1,126,702 | 48,748 |
| | Woolworths Group Ltd. | 1,225,321 | 35,295 |
| | Transurban Group (XASX) | 3,095,159 | 31,537 |
| | Goodman Group | 1,825,256 | 30,221 |
| | Rio Tinto Ltd. | 368,315 | 25,234 |
| | Aristocrat Leisure Ltd. | 661,508 | 23,462 |
| * | Afterpay Ltd. | 225,148 | 20,858 |
| | Amcor plc GDR | 1,573,818 | 19,048 |
| | James Hardie Industries plc GDR | 453,813 | 17,829 |
| | Woodside Petroleum Ltd. | 973,349 | 17,016 |
| | Coles Group Ltd. | 1,293,069 | 16,757 |
| | Fortescue Metals Group Ltd. | 1,589,786 | 16,566 |
| | Newcrest Mining Ltd. | 830,841 | 15,567 |
| | Sonic Healthcare Ltd. | 484,939 | 14,715 |
| * | Xero Ltd. | 126,841 | 14,463 |
| | QBE Insurance Group Ltd. | 1,488,716 | 13,329 |
| | South32 Ltd. | 4,848,453 | 13,079 |
| | ASX Ltd. | 197,222 | 12,403 |
| | Telstra Corp. Ltd. | 4,240,540 | 12,257 |
| | Scentre Group | 5,295,594 | 12,079 |
| | Suncorp Group Ltd. | 1,301,977 | 11,521 |
| | Cochlear Ltd. | 65,436 | 10,945 |
| | Brambles Ltd. | 1,417,356 | 10,753 |
| | Ramsay Health Care Ltd. | 178,473 | 9,539 |
| | Santos Ltd. | 1,746,655 | 9,172 |
| | | Shares | Market
Value•
($000) |
| | Dexus Industria REIT (XASX) | 1,116,007 | 9,154 |
| | Insurance Australia Group Ltd. | 2,496,328 | 9,045 |
| | SEEK Ltd. | 359,181 | 8,927 |
| | Mirvac Group | 4,026,961 | 8,594 |
| | Stockland | 2,444,959 | 8,428 |
| * | Sydney Airport | 1,339,351 | 8,306 |
| | BlueScope Steel Ltd. | 517,807 | 8,091 |
| | Tabcorp Holdings Ltd. | 2,131,114 | 8,024 |
| | Northern Star Resources Ltd. | 1,156,295 | 8,005 |
| | Computershare Ltd. (XASX) | 552,698 | 7,865 |
| | GPT Group | 1,994,487 | 7,787 |
| | APA Group | 1,199,276 | 7,441 |
| | Medibank Pvt Ltd. | 2,832,308 | 7,118 |
| | Origin Energy Ltd. | 1,807,124 | 6,921 |
| | Oil Search Ltd. | 2,130,954 | 6,903 |
| | Endeavour Group Ltd. | 1,277,574 | 6,565 |
| | Treasury Wine Estates Ltd. | 738,433 | 6,443 |
| | Domino's Pizza Enterprises Ltd. | 62,475 | 6,409 |
| | REA Group Ltd. | 52,260 | 6,343 |
| | Charter Hall Group | 480,384 | 6,303 |
| | OZ Minerals Ltd. | 329,288 | 6,264 |
| | Ampol Ltd. | 248,419 | 5,746 |
| | Lendlease Corp. Ltd. | 704,706 | 5,583 |
| | IDP Education Ltd. | 184,023 | 5,207 |
| * | Lynas Rare Earths Ltd. | 928,451 | 5,179 |
| | ALS Ltd. | 503,477 | 5,050 |
| | Vicinity Centres | 3,844,970 | 5,021 |
| | carsales.com Ltd. | 262,391 | 4,910 |
| | Orica Ltd. | 416,252 | 4,778 |
| | Evolution Mining Ltd. | 1,745,054 | 4,738 |
| | IGO Ltd. | 637,390 | 4,667 |
| | Aurizon Holdings Ltd. | 1,814,350 | 4,626 |
| | Atlas Arteria Ltd. | 977,808 | 4,595 |
| | JB Hi-Fi Ltd. | 117,626 | 4,491 |
| | Incitec Pivot Ltd. | 1,969,868 | 4,457 |
| * | Pilbara Minerals Ltd. | 2,637,613 | 4,423 |
| | Bank of Queensland Ltd. | 664,218 | 4,422 |
| | Mineral Resources Ltd. | 143,940 | 4,232 |
| * | NEXTDC Ltd. | 460,765 | 4,113 |
| | | Shares | Market
Value•
($000) |
| * | Orocobre Ltd. | 591,741 | 3,996 |
| | Reece Ltd. | 262,860 | 3,986 |
| | Alumina Ltd. | 2,588,422 | 3,912 |
| | Bendigo & Adelaide Bank Ltd. | 548,019 | 3,838 |
| | Magellan Financial Group Ltd. | 141,620 | 3,725 |
| | Challenger Ltd. | 692,794 | 3,639 |
| | Reliance Worldwide Corp. Ltd. | 827,532 | 3,639 |
| | Qube Holdings Ltd. | 1,494,843 | 3,610 |
| | Downer EDI Ltd. | 733,117 | 3,505 |
| | AusNet Services Ltd. | 1,852,903 | 3,446 |
| | WiseTech Global Ltd. | 87,706 | 3,418 |
| 2 | Ansell Ltd. | 133,893 | 3,206 |
| | Altium Ltd. | 114,929 | 3,202 |
| | Nine Entertainment Co. Holdings Ltd. | 1,524,282 | 3,192 |
| | Metcash Ltd. | 1,034,775 | 3,189 |
| | Worley Ltd. | 386,555 | 3,176 |
| | Iluka Resources Ltd. | 442,524 | 3,157 |
| | Breville Group Ltd. | 141,318 | 3,145 |
| * | Qantas Airways Ltd. | 747,731 | 3,028 |
| * | AMP Ltd. | 3,530,812 | 2,889 |
| | Cleanaway Waste Management Ltd. | 1,417,115 | 2,882 |
| | AGL Energy Ltd. | 641,198 | 2,765 |
| * | Crown Resorts Ltd. | 357,938 | 2,698 |
| | ARB Corp. Ltd. | 70,898 | 2,611 |
| | Steadfast Group Ltd. | 717,132 | 2,523 |
| * | Star Entertainment Grp Ltd. | 890,188 | 2,474 |
| | nib holdings Ltd. | 481,327 | 2,424 |
| | Shopping Centres Australasia Property Group | 1,146,081 | 2,408 |
| | Washington H Soul Pattinson & Co. Ltd. | 96,182 | 2,369 |
| | CSR Ltd. | 521,071 | 2,339 |
| | Harvey Norman Holdings Ltd. | 621,243 | 2,331 |
| | National Storage REIT | 1,277,519 | 2,313 |
| * | Zip Co. Ltd. | 466,940 | 2,308 |
| | Seven Group Holdings Ltd. | 141,147 | 2,305 |
| *,2 | Flight Centre Travel Group Ltd. | 151,680 | 2,295 |
| | Eagers Automotive Ltd. | 203,392 | 2,285 |
| | Orora Ltd. | 906,919 | 2,269 |
| | Healius Ltd. | 610,395 | 2,235 |
| | Bapcor Ltd. | 370,574 | 2,235 |
| * | Boral Ltd. | 454,499 | 2,193 |
| * | Corporate Travel Management Ltd. | 111,649 | 2,069 |
| | IOOF Holdings Ltd. | 665,719 | 2,060 |
| | Premier Investments Ltd. | 87,644 | 2,034 |
| * | Uniti Group Ltd. | 653,773 | 2,015 |
| | TPG Telecom Ltd. | 385,558 | 1,968 |
| | Charter Hall Long Wale REIT | 532,476 | 1,953 |
| | Beach Energy Ltd. | 1,845,775 | 1,939 |
| | Sims Ltd. | 175,741 | 1,913 |
| * | Imugene Ltd. | 5,004,877 | 1,884 |
| * | Megaport Ltd. | 139,018 | 1,881 |
| | | Shares | Market
Value•
($000) |
| | Pendal Group Ltd. | 365,719 | 1,850 |
| | Pro Medicus Ltd. | 44,484 | 1,796 |
| | IRESS Ltd. | 196,690 | 1,793 |
| | Link Administration Holdings Ltd. | 536,783 | 1,767 |
| | Super Retail Group Ltd. | 177,889 | 1,745 |
| * | Whitehaven Coal Ltd. | 875,826 | 1,733 |
| | Centuria Capital Group | 702,660 | 1,708 |
| * | Liontown Resources Ltd. | 1,179,238 | 1,700 |
| 3 | Viva Energy Group Ltd. | 958,533 | 1,689 |
| *,2 | Webjet Ltd. | 350,938 | 1,679 |
| | Charter Hall Retail REIT | 529,310 | 1,642 |
| | Waypoint REIT | 789,450 | 1,628 |
| | Ingenia Communities Group | 328,595 | 1,625 |
| | BWP Trust | 506,457 | 1,623 |
| * | Chalice Mining Ltd. | 318,509 | 1,607 |
| | Perpetual Ltd. | 53,969 | 1,543 |
| | Sandfire Resources Ltd. (XASX) | 361,204 | 1,522 |
| | Technology One Ltd. | 162,204 | 1,506 |
| * | Perseus Mining Ltd. | 1,264,662 | 1,500 |
| | CIMIC Group Ltd. | 96,881 | 1,460 |
| * | Champion Iron Ltd. | 427,957 | 1,429 |
| * | Paladin Energy Ltd. | 2,131,347 | 1,416 |
| | Credit Corp. Group Ltd. | 58,083 | 1,382 |
| * | PointsBet Holdings Ltd. | 219,140 | 1,376 |
| | Lifestyle Communities Ltd. | 82,621 | 1,364 |
| | Abacus Property Group | 497,584 | 1,344 |
| | InvoCare Ltd. | 153,231 | 1,313 |
| | Centuria Industrial REIT | 474,951 | 1,310 |
| | Pinnacle Investment Management Group Ltd. | 99,802 | 1,298 |
| | Elders Ltd. | 141,045 | 1,281 |
| 2 | Clinuvel Pharmaceuticals Ltd. | 42,062 | 1,233 |
| * | EVENT Hospitality and Entertainment Ltd. | 97,857 | 1,211 |
| | Arena REIT | 354,349 | 1,206 |
| | Collins Foods Ltd. | 123,539 | 1,199 |
| | Deterra Royalties Ltd. | 400,319 | 1,178 |
| | IPH Ltd. | 180,763 | 1,174 |
| | Bega Cheese Ltd. | 285,147 | 1,168 |
| | Australian Ethical Investment Ltd. | 112,227 | 1,160 |
| | Aventus Group | 449,125 | 1,159 |
| * | Nanosonics Ltd. | 252,884 | 1,136 |
| * | Temple & Webster Group Ltd. | 117,642 | 1,133 |
| * | Nufarm Ltd. | 340,723 | 1,122 |
| | Adbri Ltd. | 492,038 | 1,108 |
| * | Silver Lake Resources Ltd. | 868,878 | 1,100 |
| | Blackmores Ltd. | 14,916 | 1,065 |
| | | Shares | Market
Value•
($000) |
| 2 | HUB24 Ltd. | 44,110 | 1,060 |
| | Costa Group Holdings Ltd. (XASX) | 471,925 | 1,043 |
| *,3 | Life360 Inc. GDR | 124,264 | 1,030 |
| | AUB Group Ltd. | 62,174 | 1,025 |
| | GrainCorp Ltd. Class A | 213,250 | 1,014 |
| | Netwealth Group Ltd. | 76,648 | 1,007 |
| * | De Grey Mining Ltd. | 1,209,165 | 1,006 |
| * | Tyro Payments Ltd. | 328,824 | 1,004 |
| | Ramelius Resources Ltd. | 839,313 | 1,001 |
| | Charter Hall Social Infrastructure REIT | 346,792 | 998 |
| | Regis Resources Ltd. | 659,079 | 988 |
| | Imdex Ltd. | 453,898 | 981 |
| | Nickel Mines Ltd. | 1,229,146 | 974 |
| | Codan Ltd. | 127,025 | 969 |
| | Gold Road Resources Ltd. | 924,036 | 958 |
| * | ioneer Ltd. | 1,842,042 | 953 |
| | Appen Ltd. | 116,092 | 946 |
| | Rural Funds Group | 449,319 | 943 |
| | Domain Holdings Australia Ltd. | 212,680 | 924 |
| | Brickworks Ltd. | 51,303 | 921 |
| | Cromwell Property Group | 1,478,034 | 905 |
| | GUD Holdings Ltd. | 96,928 | 897 |
| | Centuria Office REIT | 476,971 | 866 |
| | Lovisa Holdings Ltd. | 52,501 | 865 |
| | St. Barbara Ltd. | 771,390 | 848 |
| * | PolyNovo Ltd. | 613,683 | 848 |
| | Hansen Technologies Ltd. | 173,762 | 830 |
| | United Malt Grp Ltd. | 265,762 | 813 |
| *,3 | Coronado Global Resources Inc. GDR | 787,131 | 811 |
| * | West African Resources Ltd. | 833,652 | 810 |
| * | Telix Pharmaceuticals Ltd. | 177,365 | 810 |
| * | Vulcan Energy Resources Ltd. | 84,689 | 808 |
| | Growthpoint Properties Australia Ltd. | 246,329 | 773 |
| * | City Chic Collective Ltd. | 164,145 | 768 |
| * | Australian Strategic Materials Ltd. | 93,987 | 755 |
| | Platinum Asset Management Ltd. | 326,095 | 753 |
| | Genworth Mortgage Insurance Australia Ltd. | 424,025 | 737 |
| | Jumbo Interactive Ltd. | 57,338 | 723 |
| * | EML Payments Ltd. | 319,933 | 718 |
| | Data#3 Ltd. | 163,173 | 699 |
| | Monadelphous Group Ltd. | 91,114 | 695 |
| | SeaLink Travel Group Ltd. | 124,157 | 688 |
| | Dexus Industria REIT | 270,329 | 688 |
| * | nearmap Ltd. | 401,646 | 673 |
| | | Shares | Market
Value•
($000) |
| | Hotel Property Investments | 247,556 | 668 |
| | Baby Bunting Group Ltd. | 148,688 | 663 |
| * | Betmakers Technology Group Ltd. | 673,774 | 626 |
| * | oOh!media Ltd. | 455,297 | 625 |
| *,2 | Redbubble Ltd. | 195,951 | 615 |
| * | Dubber Corp. Ltd. | 266,462 | 614 |
| *,2 | Mesoblast Ltd. | 505,081 | 608 |
| | Western Areas Ltd. | 253,147 | 606 |
| | Select Harvests Ltd. | 107,934 | 603 |
| * | G8 Education Ltd. | 715,403 | 595 |
| * | Omni Bridgeway Ltd. | 252,996 | 595 |
| | NRW Holdings Ltd. | 428,143 | 594 |
| | Dicker Data Ltd. | 51,580 | 585 |
| | GWA Group Ltd. | 284,175 | 583 |
| * | Karoon Energy Ltd. | 421,754 | 580 |
| | MyState Ltd. | 146,731 | 576 |
| | GDI Property Group | 644,723 | 569 |
| | Johns Lyng Group Ltd. | 115,983 | 567 |
| * | Bellevue Gold Ltd. | 875,221 | 563 |
| | Accent Group Ltd. | 287,948 | 539 |
| 2 | Kogan.com Ltd. | 70,421 | 531 |
| | Home Consortium Ltd. | 88,738 | 531 |
| * | Nuix Ltd. | 216,050 | 506 |
| | Tassal Group Ltd. | 188,270 | 504 |
| * | Eclipx Group Ltd. | 263,285 | 497 |
| | Perenti Global Ltd. | 635,368 | 492 |
| | McMillan Shakespeare Ltd. | 46,728 | 484 |
| 2 | HomeCo Daily Needs REIT | 442,158 | 480 |
| | Austal Ltd. | 336,995 | 479 |
| | Senex Energy Ltd. | 139,536 | 466 |
| | Infomedia Ltd. | 446,728 | 465 |
| | Inghams Group Ltd. | 164,819 | 462 |
| | SmartGroup Corp. Ltd. | 75,860 | 459 |
| | Bravura Solutions Ltd. | 217,294 | 458 |
| | Money3 Corp. Ltd. | 179,057 | 449 |
| | Southern Cross Media Group Ltd. | 249,608 | 438 |
| | Integral Diagnostics Ltd. | 123,848 | 438 |
| * | Fineos Corp. Ltd. GDR | 144,735 | 437 |
| * | Capricorn Metals Ltd. | 223,574 | 432 |
| * | Syrah Resources Ltd. | 449,822 | 429 |
| * | PPK Group Ltd. | 43,544 | 429 |
| | Westgold Resources Ltd. | 290,422 | 425 |
| | BWX Ltd. | 119,660 | 421 |
| | Pact Group Holdings Ltd. | 178,823 | 418 |
| | Sigma Healthcare Ltd. | 943,082 | 404 |
| | Australian Pharmaceutical Industries Ltd. | 350,988 | 399 |
| 2 | Emeco Holdings Ltd. | 477,615 | 397 |
| * | Mayne Pharma Group Ltd. | 1,549,295 | 397 |
| | | Shares | Market
Value•
($000) |
| * | Alkane Resources Ltd. | 554,737 | 372 |
| * | Resolute Mining Ltd. | 1,149,510 | 361 |
| * | Australian Agricultural Co. Ltd. | 300,551 | 358 |
| * | Cooper Energy Ltd. | 1,607,812 | 351 |
| * | Carnarvon Petroleum Ltd. | 1,319,102 | 338 |
| | Estia Health Ltd. | 213,349 | 337 |
| * | Audinate Group Ltd. | 50,891 | 326 |
| * | Seven West Media Ltd. | 908,266 | 313 |
| * | Aurelia Metals Ltd. | 1,089,347 | 310 |
| | New Hope Corp. Ltd. | 200,282 | 303 |
| * | Starpharma Holdings Ltd. Class A | 380,693 | 302 |
| * | Andromeda Metals Ltd. | 2,251,162 | �� 298 |
| * | Opthea Ltd. | 305,895 | 296 |
| | Service Stream Ltd. | 435,275 | 288 |
| * | Myer Holdings Ltd. | 701,712 | 286 |
| *,2 | Paradigm Biopharmaceuticals Ltd. | 183,396 | 285 |
| * | Superloop Ltd. | 279,328 | 272 |
| | Australian Finance Group Ltd. | 136,508 | 271 |
| *,2 | Electro Optic Systems Holdings Ltd. | 108,613 | 262 |
| | Cedar Woods Properties Ltd. | 57,580 | 259 |
| *,1 | Japara Healthcare Ltd. | 239,690 | 253 |
| | Virtus Health Ltd. | 59,758 | 250 |
| | OFX Group Ltd. | 208,339 | 250 |
| | Macmahon Holdings Ltd. | 1,569,313 | 243 |
| | SG Fleet Group Ltd. | 119,815 | 230 |
| | Jupiter Mines Ltd. | 1,264,559 | 224 |
| *,2 | Humm Group Ltd. | 334,630 | 223 |
| | Mount Gibson Iron Ltd. | 603,625 | 192 |
| * | Marley Spoon AG GDR | 241,379 | 186 |
| *,2 | Bubs Australia Ltd. | 452,742 | 177 |
| | Regis Healthcare Ltd. | 116,544 | 172 |
| *,2 | AMA Group Ltd. | 440,765 | 162 |
| | Navigator Global Investments Ltd. | 110,169 | 156 |
| | MACA Ltd. | 246,293 | 142 |
| * | New Century Resources Ltd. | 975,649 | 114 |
| * | Dacian Gold Ltd. | 558,053 | 96 |
| | Vita Group Ltd. | 127,742 | 80 |
| *,1 | Bgp Holdings plc | 15,642,708 | 59 |
| * | Minerals 260 Ltd. | 99,270 | 35 |
| * | Juno Minerals Ltd. | 64,385 | 7 |
| | | | 1,558,404 |
| China (0.0%) |
| *,1,2 | China Fishery Group Ltd. | 754,600 | 42 |
| | | Shares | Market
Value•
($000) |
| Hong Kong (7.2%) |
| | AIA Group Ltd. | 12,236,512 | 137,135 |
| | Hong Kong Exchanges & Clearing Ltd. | 1,282,164 | 77,240 |
| | Techtronic Industries Co. Ltd. | 1,260,656 | 25,900 |
| | Link REIT | 2,116,998 | 18,755 |
| | Sun Hung Kai Properties Ltd. | 1,403,974 | 18,614 |
| | CK Hutchison Holdings Ltd. | 2,732,559 | 18,320 |
| * | BeiGene Ltd. | 605,600 | 16,746 |
| | Hong Kong & China Gas Co. Ltd. | 10,718,260 | 16,651 |
| | CLP Holdings Ltd. | 1,612,860 | 15,791 |
| | Hang Seng Bank Ltd. | 738,752 | 14,038 |
| | Jardine Matheson Holdings Ltd. | 210,452 | 12,224 |
| | CK Asset Holdings Ltd. | 1,936,433 | 11,961 |
| * | Galaxy Entertainment Group Ltd. | 2,192,062 | 11,795 |
| | BOC Hong Kong Holdings Ltd. | 3,664,259 | 11,611 |
| | Wharf Real Estate Investment Co. Ltd. | 1,682,283 | 9,502 |
| | Power Assets Holdings Ltd. | 1,390,707 | 8,499 |
| | Lenovo Group Ltd. | 7,668,000 | 8,327 |
| | MTR Corp. Ltd. | 1,477,686 | 8,061 |
| | Hongkong Land Holdings Ltd. | 1,185,847 | 6,549 |
| | New World Development Co. Ltd. | 1,441,539 | 6,253 |
| *,3 | ESR Cayman Ltd. | 1,842,441 | 5,962 |
| | Xinyi Glass Holdings Ltd. | 2,066,640 | 5,824 |
| * | Sands China Ltd. | 2,467,136 | 5,623 |
| | Henderson Land Development Co. Ltd. | 1,308,190 | 5,478 |
| | Wharf Holdings Ltd. | 1,394,283 | 4,848 |
| | Hang Lung Properties Ltd. | 2,085,841 | 4,841 |
| 3 | Budweiser Brewing Co. APAC Ltd. | 1,735,500 | 4,760 |
| 3 | WH Group Ltd. | 6,685,593 | 4,687 |
| | Sino Land Co. Ltd. | 3,484,443 | 4,580 |
| | Want Want China Holdings Ltd. | 5,599,220 | 4,342 |
| | SITC International Holdings Co. Ltd. | 1,202,586 | 4,065 |
| | CK Infrastructure Holdings Ltd. | 625,813 | 3,773 |
| | Chow Tai Fook Jewellery Group Ltd. | 1,830,218 | 3,733 |
| | Tingyi Cayman Islands Holding Corp. | 1,943,900 | 3,628 |
| | ASM Pacific Technology Ltd. | 313,736 | 3,395 |
| | PRADA SpA | 525,004 | 3,309 |
| | Swire Pacific Ltd. Class A | 511,252 | 3,214 |
| | | Shares | Market
Value•
($000) |
| | AAC Technologies Holdings Inc. | 699,757 | 3,024 |
| | Swire Properties Ltd. | 1,088,235 | 2,918 |
| *,3 | Samsonite International SA | 1,349,297 | 2,902 |
| | Minth Group Ltd. | 688,783 | 2,738 |
| | Man Wah Holdings Ltd. | 1,587,852 | 2,457 |
| | PCCW Ltd. | 4,434,133 | 2,283 |
| | Microport Scientific Corp. | 481,919 | 2,267 |
| | Hysan Development Co. Ltd. | 632,571 | 2,196 |
| | Hang Lung Group Ltd. | 921,920 | 2,159 |
| | Bank of East Asia Ltd. | 1,303,132 | 2,140 |
| | Pacific Basin Shipping Ltd. | 4,348,236 | 2,007 |
| | Vitasoy International Holdings Ltd. | 784,304 | 1,891 |
| 3 | BOC Aviation Ltd. | 213,525 | 1,869 |
| | Kerry Properties Ltd. | 611,090 | 1,727 |
| | L'Occitane International SA | 475,123 | 1,699 |
| | Huabao International Holdings Ltd. | 872,071 | 1,631 |
| * | Yue Yuen Industrial Holdings Ltd. | 746,158 | 1,584 |
| | NWS Holdings Ltd. | 1,528,887 | 1,518 |
| | NagaCorp Ltd. | 1,612,972 | 1,480 |
| *,2 | SJM Holdings Ltd. | 1,989,639 | 1,480 |
| | Fortune REIT | 1,371,996 | 1,423 |
| *,2 | Wynn Macau Ltd. | 1,540,829 | 1,378 |
| | VTech Holdings Ltd. | 174,650 | 1,345 |
| 3 | Js Global Lifestyle Co. Ltd. | 660,500 | 1,223 |
| * | Vobile Group Ltd. | 1,324,000 | 1,165 |
| | Luk Fook Holdings International Ltd. | 414,406 | 1,129 |
| | Champion REIT | 2,132,900 | 1,119 |
| * | MMG Ltd. | 2,416,286 | 1,116 |
| | Dairy Farm International Holdings Ltd. | 311,001 | 1,111 |
| | Lee & Man Paper Manufacturing Ltd. | 1,435,000 | 1,079 |
| * | Melco International Development Ltd. | 829,274 | 1,077 |
| | Swire Pacific Ltd. Class B | 1,023,186 | 1,075 |
| | Nexteer Automotive Group Ltd. | 833,211 | 1,028 |
| | HKBN Ltd. | 857,157 | 1,027 |
| | Uni-President China Holdings Ltd. | 1,174,038 | 1,001 |
| * | Shangri-La Asia Ltd. | 1,226,928 | 998 |
| | First Pacific Co. Ltd. | 2,489,939 | 995 |
| *,1,2,3 | Razer Inc. | 3,945,000 | 991 |
| | LK Technology Holdings Ltd. | 375,341 | 937 |
| * | Cathay Pacific Airways Ltd. | 982,504 | 906 |
| | Powerlong Real Estate Holdings Ltd. | 1,293,000 | 886 |
| *,3 | Jacobio Pharmaceuticals Group Co. Ltd. | 386,400 | 878 |
| | | Shares | Market
Value•
($000) |
| | Johnson Electric Holdings Ltd. | 377,019 | 835 |
| | IGG Inc. | 877,628 | 816 |
| | Towngas China Co. Ltd. | 1,158,140 | 795 |
| | Hong Kong Technology Venture Co. Ltd. | 523,142 | 787 |
| | Jinchuan Group International Resources Co. Ltd. | 4,812,000 | 776 |
| | Sunlight REIT | 1,313,089 | 758 |
| | CP Pokphand Co. Ltd. | 5,308,400 | 751 |
| | United Energy Group Ltd. | 7,838,000 | 693 |
| | Vinda International Holdings Ltd. | 248,000 | 684 |
| | Kerry Logistics Network Ltd. | 273,111 | 662 |
| * | Realord Group Holdings Ltd. | 382,000 | 595 |
| *,2 | MGM China Holdings Ltd. | 809,336 | 594 |
| | Haitong International Securities Group Ltd. | 2,473,891 | 569 |
| | Great Eagle Holdings Ltd. | 204,000 | 561 |
| *,3 | Everest Medicines Ltd. | 97,000 | 556 |
| 3 | Asiainfo Technologies Ltd. | 336,800 | 555 |
| | VSTECS Holdings Ltd. | 584,000 | 551 |
| | Cafe de Coral Holdings Ltd. | 298,447 | 545 |
| | EC Healthcare | 367,000 | 528 |
| * | Glory Sun Financial Group Ltd. | 15,200,000 | 527 |
| * | OCI International Holdings Ltd. | 1,026,600 | 521 |
| | China Tobacco International HK Co. Ltd. | 226,000 | 519 |
| | Vesync Co. Ltd. | 359,000 | 505 |
| | Truly International Holdings Ltd. | 1,539,603 | 502 |
| | Value Partners Group Ltd. | 978,665 | 501 |
| | SUNeVision Holdings Ltd. | 543,000 | 499 |
| | Shui On Land Ltd. | 3,315,066 | 491 |
| | Prosperity REIT | 1,207,661 | 475 |
| | Texhong Textile Group Ltd. | 318,500 | 475 |
| | Stella International Holdings Ltd. | 389,000 | 465 |
| | CITIC Telecom International Holdings Ltd. | 1,300,470 | 461 |
| | K Wah International Holdings Ltd. | 1,149,843 | 460 |
| * | Shun Tak Holdings Ltd. | 1,653,370 | 452 |
| *,3 | Hua Medicine | 827,500 | 439 |
| | Dah Sing Financial Holdings Ltd. | 138,260 | 429 |
| * | FIH Mobile Ltd. | 2,736,581 | 426 |
| | | Shares | Market
Value•
($000) |
| *,3 | Antengene Corp. Ltd. | 300,500 | 398 |
| | Powerlong Commercial Management Holdings Ltd. | 169,500 | 379 |
| *,3 | JW Cayman Therapeutics Co. Ltd. (XHKG) | 200,000 | 366 |
| | Canvest Environmental Protection Group Co. Ltd. | 633,675 | 364 |
| 3 | Xiabuxiabu Catering Management China Holdings Co. Ltd. | 494,000 | 360 |
| * | China Travel International Investment Hong Kong Ltd. | 2,352,268 | 341 |
| | Guotai Junan International Holdings Ltd. | 2,336,336 | 339 |
| 2 | C-Mer Eye Care Holdings Ltd. | 338,000 | 329 |
| *,3 | Frontage Holdings Corp. | 558,000 | 325 |
| | Dah Sing Banking Group Ltd. | 334,756 | 320 |
| | Sun Hung Kai & Co. Ltd. | 614,182 | 319 |
| | Chow Sang Sang Holdings International Ltd. | 220,922 | 314 |
| * | Pou Sheng International Holdings Ltd. | 1,851,253 | 312 |
| | Far East Consortium International Ltd. | 930,493 | 307 |
| *,2 | Apollo Future Mobility Group Ltd. | 4,416,000 | 306 |
| * | GCL New Energy Holdings Ltd. | 6,297,422 | 295 |
| | Asia Cement China Holdings Corp. | 384,000 | 293 |
| | United Laboratories International Holdings Ltd. | 451,873 | 287 |
| | Beijing Tong Ren Tang Chinese Medicine Co. Ltd. | 213,000 | 271 |
| | Road King Infrastructure Ltd. | 233,814 | 237 |
| * | Cosmopolitan International Holdings Ltd. | 1,748,000 | 234 |
| | Dynam Japan Holdings Co. Ltd. | 251,344 | 233 |
| *,1 | Convoy | 10,860,141 | 233 |
| * | Sa Sa International Holdings Ltd. | 1,012,953 | 221 |
| * | Lifestyle International Holdings Ltd. | 416,907 | 218 |
| * | Television Broadcasts Ltd. | 278,247 | 216 |
| | Chinese Estates Holdings Ltd. | 447,000 | 215 |
| | | Shares | Market
Value•
($000) |
| * | Esprit Holdings Ltd. (XHKG) | 2,371,795 | 206 |
| | Pacific Textiles Holdings Ltd. | 411,697 | 206 |
| | SmarTone Telecommunications Holdings Ltd. | 350,235 | 204 |
| | Giordano International Ltd. | 1,014,590 | 198 |
| *,2,3 | FIT Hon Teng Ltd. | 976,000 | 196 |
| | CMBC Capital Holdings Ltd. | 15,380,000 | 187 |
| | Hutchison Telecommunications Hong Kong Holdings Ltd. | 1,160,301 | 185 |
| 2,3 | VPower Group International Holdings Ltd. | 832,000 | 163 |
| 3 | Crystal International Group Ltd. | 477,500 | 152 |
| 3 | IMAX China Holding Inc. | 102,275 | 150 |
| *,2 | Digital Domain Holdings Ltd. | 1,767,803 | 148 |
| | Singamas Container Holdings Ltd. | 1,139,323 | 134 |
| | Texwinca Holdings Ltd. | 585,037 | 120 |
| * | CITIC Resources Holdings Ltd. | 1,618,000 | 114 |
| | Lee's Pharmaceutical Holdings Ltd. | 236,812 | 111 |
| * | China LNG Group Ltd. | 1,674,344 | 87 |
| * | Suncity Group Holdings Ltd. | 1,980,000 | 75 |
| *,1 | Brightoil | 2,476,222 | 64 |
| *,1 | MH Development NPV | 366,000 | 55 |
| * | Macau Legend Development Ltd. | 425,000 | 43 |
| * | NewOcean Energy Holdings Ltd. | 298,995 | 10 |
| *,1 | Agritrade Resources Ltd. | 2,330,000 | — |
| | | | 627,489 |
| Japan (57.1%) |
| | Toyota Motor Corp. | 12,448,025 | 219,635 |
| | Sony Group Corp. | 1,252,139 | 144,993 |
| | Keyence Corp. | 182,066 | 109,898 |
| | Recruit Holdings Co. Ltd. | 1,348,466 | 89,699 |
| | SoftBank Group Corp. | 1,354,170 | 73,311 |
| | Shin-Etsu Chemical Co. Ltd. | 401,350 | 71,574 |
| | Tokyo Electron Ltd. | 149,584 | 69,711 |
| | Mitsubishi UFJ Financial Group Inc. | 12,527,272 | 68,693 |
| | Daikin Industries Ltd. | 267,873 | 58,668 |
| | Hitachi Ltd. | 936,928 | 53,990 |
| | Hoya Corp. | 361,246 | 53,179 |
| | Nidec Corp. | 468,566 | 51,897 |
| | KDDI Corp. | 1,695,766 | 51,857 |
| | Honda Motor Co. Ltd. | 1,723,786 | 50,986 |
| | | Shares | Market
Value•
($000) |
| | Daiichi Sankyo Co. Ltd. | 1,905,447 | 48,079 |
| | Nintendo Co. Ltd. | 107,695 | 47,564 |
| | Takeda Pharmaceutical Co. Ltd. | 1,546,124 | 43,393 |
| | Murata Manufacturing Co. Ltd. | 575,879 | 42,718 |
| | Sumitomo Mitsui Financial Group Inc. | 1,313,988 | 42,638 |
| | ITOCHU Corp. | 1,357,392 | 38,714 |
| | Mitsubishi Corp. | 1,209,321 | 38,454 |
| | FANUC Corp. | 193,468 | 38,233 |
| | Softbank Corp. | 2,747,767 | 37,506 |
| | Mitsui & Co. Ltd. | 1,599,557 | 36,605 |
| | Fast Retailing Co. Ltd. | 51,980 | 34,505 |
| | Nippon Telegraph & Telephone Corp. | 1,224,286 | 34,303 |
| | Tokio Marine Holdings Inc. | 649,824 | 34,226 |
| | SMC Corp. | 57,229 | 34,152 |
| | Mizuho Financial Group Inc. | 2,560,737 | 33,797 |
| | Denso Corp. | 458,203 | 33,218 |
| | Fujitsu Ltd. | 189,282 | 32,714 |
| | Seven & i Holdings Co. Ltd. | 775,649 | 32,565 |
| | Astellas Pharma Inc. | 1,869,201 | 31,512 |
| | Oriental Land Co. Ltd. | 187,790 | 29,660 |
| | Terumo Corp. | 668,232 | 29,480 |
| | FUJIFILM Holdings Corp. | 355,987 | 27,510 |
| | Central Japan Railway Co. | 181,252 | 26,887 |
| | Mitsubishi Electric Corp. | 1,979,814 | 26,588 |
| | Panasonic Corp. | 2,134,735 | 26,398 |
| | Kao Corp. | 464,025 | 26,249 |
| | Shiseido Co. Ltd. | 389,338 | 25,979 |
| | Bridgestone Corp. | 578,528 | 25,594 |
| | M3 Inc. | 425,088 | 25,051 |
| | Chugai Pharmaceutical Co. Ltd. | 655,338 | 24,503 |
| | ORIX Corp. | 1,215,511 | 24,160 |
| | Komatsu Ltd. | 918,637 | 24,060 |
| | Sysmex Corp. | 190,911 | 23,671 |
| | Kubota Corp. | 1,094,105 | 23,308 |
| | Japan Tobacco Inc. | 1,177,069 | 23,107 |
| | Olympus Corp. | 1,060,820 | 22,981 |
| | Canon Inc. | 997,611 | 22,685 |
| | East Japan Railway Co. | 362,145 | 22,557 |
| | Dai-ichi Life Holdings Inc. | 1,046,195 | 22,010 |
| | Shimano Inc. | 78,333 | 21,856 |
| | Mitsui Fudosan Co. Ltd. | 928,160 | 21,221 |
| | Daiwa House Industry Co. Ltd. | 636,070 | 20,984 |
| | Suzuki Motor Corp. | 451,147 | 20,120 |
| | Asahi Group Holdings Ltd. | 427,454 | 19,398 |
| | Eisai Co. Ltd. | 268,134 | 18,999 |
| | | Shares | Market
Value•
($000) |
| | Toshiba Corp. | 435,258 | 18,774 |
| | Kyocera Corp. | 307,192 | 17,985 |
| | Omron Corp. | 186,189 | 17,806 |
| | Shionogi & Co. Ltd. | 272,307 | 17,755 |
| | Mitsubishi Estate Co. Ltd. | 1,164,259 | 17,693 |
| | Japan Post Holdings Co. Ltd. | 2,293,321 | 17,622 |
| | Lasertec Corp. | 76,646 | 16,626 |
| | Z Holdings Corp. | 2,660,688 | 16,518 |
| | Otsuka Holdings Co. Ltd. | 417,521 | 16,513 |
| | Advantest Corp. | 200,449 | 16,434 |
| | Sumitomo Corp. | 1,143,101 | 16,289 |
| | Aeon Co. Ltd. | 702,238 | 16,155 |
| | Unicharm Corp. | 397,034 | 16,057 |
| | MS&AD Insurance Group Holdings Inc. | 463,168 | 14,964 |
| | Kikkoman Corp. | 182,899 | 14,959 |
| | Bandai Namco Holdings Inc. | 194,143 | 14,836 |
| | Nomura Holdings Inc. | 3,078,614 | 14,662 |
| | Sumitomo Realty & Development Co. Ltd. | 404,520 | 14,619 |
| | Nippon Steel Corp. | 833,416 | 14,612 |
| | Sompo Holdings Inc. | 336,420 | 14,589 |
| | Ajinomoto Co. Inc. | 486,634 | 14,570 |
| | NEC Corp. | 268,759 | 13,761 |
| | Nitori Holdings Co. Ltd. | 74,337 | 13,657 |
| | Marubeni Corp. | 1,605,743 | 13,625 |
| | Toyota Industries Corp. | 159,272 | 13,540 |
| | Kirin Holdings Co. Ltd. | 777,301 | 13,530 |
| | Secom Co. Ltd. | 197,897 | 13,491 |
| | Asahi Kasei Corp. | 1,266,616 | 13,306 |
| | TDK Corp. | 365,181 | 13,275 |
| | Japan Exchange Group Inc. | 530,884 | 12,570 |
| | NTT Data Corp. | 623,157 | 12,501 |
| * | Renesas Electronics Corp. | 1,006,663 | 12,383 |
| | Obic Co. Ltd. | 66,688 | 12,332 |
| | Sumitomo Mitsui Trust Holdings Inc. | 371,836 | 12,231 |
| | Subaru Corp. | 623,248 | 12,225 |
| | Sekisui House Ltd. | 584,925 | 12,161 |
| | MISUMI Group Inc. | 285,711 | 11,950 |
| | ENEOS Holdings Inc. | 2,913,559 | 11,748 |
| | Nippon Yusen KK | 161,759 | 11,656 |
| | Makita Corp. | 247,915 | 11,506 |
| | Yaskawa Electric Corp. | 263,520 | 11,414 |
| | Nitto Denko Corp. | 145,447 | 11,365 |
| | West Japan Railway Co. | 233,057 | 11,002 |
| | Shimadzu Corp. | 269,740 | 10,959 |
| | SG Holdings Co. Ltd. | 433,600 | 10,888 |
| | Mitsubishi Chemical Holdings Corp. | 1,303,146 | 10,787 |
| | MINEBEA MITSUMI Inc. | 404,099 | 10,231 |
| | Sumitomo Electric Industries Ltd. | 768,303 | 10,198 |
| | | Shares | Market
Value•
($000) |
| | Nomura Research Institute Ltd. | 254,439 | 10,186 |
| * | Nissan Motor Co. Ltd. | 1,973,630 | 10,046 |
| | Yamaha Corp. | 158,861 | 10,037 |
| | Toyota Tsusho Corp. | 227,207 | 9,855 |
| | Toray Industries Inc. | 1,554,678 | 9,688 |
| | Nippon Building Fund Inc. | 1,486 | 9,654 |
| | AGC Inc. | 189,624 | 9,442 |
| | Sumitomo Metal Mining Co. Ltd. | 239,863 | 9,305 |
| | Ono Pharmaceutical Co. Ltd. | 439,101 | 9,213 |
| | Daifuku Co. Ltd. | 98,964 | 9,111 |
| | Pan Pacific International Holdings Corp. | 424,008 | 8,903 |
| | Rakuten Group Inc. | 811,265 | 8,882 |
| | MEIJI Holdings Co. Ltd. | 138,799 | 8,759 |
| | Nippon Paint Holdings Co. Ltd. | 806,395 | 8,628 |
| | Daiwa Securities Group Inc. | 1,534,676 | 8,622 |
| | Yamaha Motor Co. Ltd. | 302,744 | 8,439 |
| | Kyowa Kirin Co. Ltd. | 255,402 | 8,400 |
| | Yamato Holdings Co. Ltd. | 341,500 | 8,395 |
| | Resona Holdings Inc. | 2,194,613 | 8,244 |
| | Dentsu Group Inc. | 223,373 | 8,163 |
| | Nihon M&A Center Holdings Inc. | 263,724 | 8,098 |
| | JFE Holdings Inc. | 524,604 | 8,016 |
| | Japan Real Estate Investment Corp. | 1,297 | 7,950 |
| | Daito Trust Construction Co. Ltd. | 63,322 | 7,851 |
| | Inpex Corp. | 929,432 | 7,751 |
| | Rohm Co. Ltd. | 83,919 | 7,673 |
| | Sumitomo Chemical Co. Ltd. | 1,549,530 | 7,633 |
| | Hamamatsu Photonics KK | 128,539 | 7,629 |
| | Disco Corp. | 28,071 | 7,568 |
| | Nippon Prologis REIT Inc. | 2,249 | 7,512 |
| | Mitsubishi Heavy Industries Ltd. | 293,239 | 7,499 |
| | Tokyo Gas Co. Ltd. | 431,134 | 7,481 |
| | Chubu Electric Power Co. Inc. | 707,602 | 7,324 |
| | Nissan Chemical Corp. | 131,442 | 7,316 |
| | TOTO Ltd. | 149,466 | 7,221 |
| | GLP J-REIT | 4,405 | 7,185 |
| | Mitsui OSK Lines Ltd. | 113,765 | 7,173 |
| | Nexon Co. Ltd. | 417,414 | 7,105 |
| | Tokyu Corp. | 501,301 | 7,067 |
| | Isuzu Motors Ltd. | 525,254 | 7,066 |
| | T&D Holdings Inc. | 542,655 | 6,960 |
| | Hankyu Hanshin Holdings Inc. | 222,035 | 6,884 |
| | Kansai Electric Power Co. Inc. | 741,816 | 6,830 |
| | | Shares | Market
Value•
($000) |
| | Yakult Honsha Co. Ltd. | 135,130 | 6,828 |
| | Odakyu Electric Railway Co. Ltd. | 314,056 | 6,809 |
| | JSR Corp. | 187,068 | 6,785 |
| | Lixil Corp. | 263,802 | 6,777 |
| | Nomura Real Estate Master Fund Inc. | 4,512 | 6,757 |
| | TIS Inc. | 245,375 | 6,685 |
| | Trend Micro Inc. | 117,822 | 6,659 |
| | Ibiden Co. Ltd. | 110,279 | 6,626 |
| | CyberAgent Inc. | 395,212 | 6,622 |
| | Idemitsu Kosan Co. Ltd. | 241,922 | 6,607 |
| | Koito Manufacturing Co. Ltd. | 116,121 | 6,589 |
| | Aisin Corp. | 178,252 | 6,523 |
| | Osaka Gas Co. Ltd. | 402,965 | 6,495 |
| | Taiyo Yuden Co. Ltd. | 127,281 | 6,451 |
| | Japan Metropolitan Fund Investment | 6,942 | 6,376 |
| | Dai Nippon Printing Co. Ltd. | 253,480 | 6,280 |
| | SBI Holdings Inc. | 241,072 | 6,248 |
| | Ricoh Co. Ltd. | 638,704 | 6,220 |
| | Fuji Electric Co. Ltd. | 126,700 | 6,195 |
| | Daiwa House REIT Investment Corp. | 2,151 | 6,173 |
| | Keio Corp. | 116,825 | 5,897 |
| | Obayashi Corp. | 693,229 | 5,852 |
| * | Kintetsu Group Holdings Co. Ltd. | 183,854 | 5,787 |
| | Hirose Electric Co. Ltd. | 34,211 | 5,721 |
| | BayCurrent Consulting Inc. | 13,647 | 5,664 |
| | Sekisui Chemical Co. Ltd. | 342,960 | 5,634 |
| | Kajima Corp. | 457,342 | 5,631 |
| | Azbil Corp. | 131,896 | 5,623 |
| | Kurita Water Industries Ltd. | 111,864 | 5,525 |
| | Toho Co. Ltd. (XTKS) | 115,799 | 5,441 |
| | MonotaRO Co. Ltd. | 237,516 | 5,413 |
| | Nissin Foods Holdings Co. Ltd. | 70,725 | 5,406 |
| | Mitsui Chemicals Inc. | 181,588 | 5,399 |
| | SUMCO Corp. | 281,852 | 5,386 |
| | GMO Payment Gateway Inc. | 42,492 | 5,384 |
| | Taisei Corp. | 170,090 | 5,337 |
| | Konami Holdings Corp. | 96,806 | 5,327 |
| | Mazda Motor Corp. | 588,632 | 5,294 |
| | Santen Pharmaceutical Co. Ltd. | 369,907 | 5,214 |
| | Otsuka Corp. | 105,574 | 5,200 |
| | Tobu Railway Co. Ltd. | 207,699 | 5,171 |
| | Asahi Intecc Co. Ltd. | 193,552 | 5,102 |
| | Kobayashi Pharmaceutical Co. Ltd. | 63,514 | 5,085 |
| | MatsukiyoCocokara & Co. | 114,649 | 5,083 |
| | | Shares | Market
Value•
($000) |
| | Yokogawa Electric Corp. | 253,764 | 5,071 |
| | Ebara Corp. | 92,430 | 5,044 |
| | Capcom Co. Ltd. | 186,936 | 5,031 |
| | Seiko Epson Corp. | 280,513 | 4,995 |
| | Open House Co. Ltd. | 77,224 | 4,925 |
| | Suntory Beverage & Food Ltd. | 126,514 | 4,909 |
| | Tosoh Corp. | 288,873 | 4,865 |
| | Brother Industries Ltd. | 246,557 | 4,767 |
| | Persol Holdings Co. Ltd. | 175,811 | 4,726 |
| | TOPPAN Inc. | 292,672 | 4,724 |
| | Ryohin Keikaku Co. Ltd. | 236,000 | 4,651 |
| | Kansai Paint Co. Ltd. | 200,186 | 4,636 |
| | Concordia Financial Group Ltd. | 1,161,033 | 4,615 |
| | Hoshizaki Corp. | 54,356 | 4,571 |
| | Food & Life Cos. Ltd. | 104,868 | 4,545 |
| | Tsuruha Holdings Inc. | 36,831 | 4,543 |
| | NGK Insulators Ltd. | 270,905 | 4,511 |
| | Oji Holdings Corp. | 907,809 | 4,500 |
| | Nippon Express Co. Ltd. | 71,751 | 4,491 |
| | Keisei Electric Railway Co. Ltd. | 139,252 | 4,481 |
| | Showa Denko KK | 178,066 | 4,466 |
| * | Tokyo Electric Power Co. Holdings Inc. | 1,598,207 | 4,427 |
| | Asics Corp. | 177,105 | 4,414 |
| | Square Enix Holdings Co. Ltd. | 80,254 | 4,396 |
| | Lion Corp. | 260,621 | 4,340 |
| | Orix JREIT Inc. | 2,613 | 4,335 |
| | Shizuoka Bank Ltd. | 531,899 | 4,283 |
| | Kakaku.com Inc. | 128,769 | 4,273 |
| | Nippon Shinyaku Co. Ltd. | 53,160 | 4,259 |
| | Nisshin Seifun Group Inc. | 268,705 | 4,243 |
| * | Kawasaki Kisen Kaisha Ltd. | 86,714 | 4,180 |
| | Advance Residence Investment Corp. | 1,268 | 4,168 |
| | Marui Group Co. Ltd. | 211,658 | 4,154 |
| | Shimizu Corp. | 564,548 | 4,136 |
| | Sojitz Corp. | 249,753 | 4,121 |
| | Hakuhodo DY Holdings Inc. | 249,943 | 4,075 |
| | Toyo Suisan Kaisha Ltd. | 93,575 | 4,032 |
| | Hulic Co. Ltd. | 418,541 | 4,024 |
| | Chiba Bank Ltd. | 638,766 | 3,959 |
| | Miura Co. Ltd. | 101,443 | 3,902 |
| * | Hitachi Metals Ltd. | 203,886 | 3,860 |
| | Welcia Holdings Co. Ltd. | 103,364 | 3,859 |
| | Nabtesco Corp. | 118,721 | 3,853 |
| | Ito En Ltd. | 57,534 | 3,832 |
| | Rinnai Corp. | 37,236 | 3,823 |
| * | ANA Holdings Inc. | 162,001 | 3,775 |
| | Mitsubishi Gas Chemical Co. Inc. | 187,290 | 3,769 |
| | Nikon Corp. | 335,704 | 3,701 |
| | | Shares | Market
Value•
($000) |
| | Iida Group Holdings Co. Ltd. | 149,638 | 3,689 |
| | Stanley Electric Co. Ltd. | 146,149 | 3,684 |
| | Tokyo Century Corp. | 64,083 | 3,669 |
| | Kyushu Railway Co. | 163,470 | 3,659 |
| | ZOZO Inc. | 113,768 | 3,652 |
| | Tokyu Fudosan Holdings Corp. | 627,919 | 3,638 |
| | United Urban Investment Corp. | 2,904 | 3,620 |
| | SCREEN Holdings Co. Ltd. | 38,717 | 3,599 |
| | NH Foods Ltd. | 102,160 | 3,593 |
| | Haseko Corp. | 273,591 | 3,562 |
| | Koei Tecmo Holdings Co. Ltd. | 76,443 | 3,558 |
| | USS Co. Ltd. | 220,457 | 3,553 |
| | Nippon Sanso Holdings Corp. | 147,432 | 3,481 |
| | Hitachi Construction Machinery Co. Ltd. | 108,737 | 3,469 |
| | Bank of Kyoto Ltd. | 76,835 | 3,456 |
| | NOF Corp. | 68,472 | �� 3,436 |
| | TechnoPro Holdings Inc. | 107,123 | 3,424 |
| | Mitsubishi HC Capital Inc. (XTKS) | 681,829 | 3,419 |
| | Industrial & Infrastructure Fund Investment Corp. | 1,863 | 3,416 |
| | Hikari Tsushin Inc. | 21,995 | 3,391 |
| | Kose Corp. | 29,166 | 3,387 |
| | Kyushu Electric Power Co. Inc. | 474,378 | 3,342 |
| | Nagoya Railroad Co. Ltd. | 199,350 | 3,294 |
| | Kuraray Co. Ltd. | 359,067 | 3,249 |
| | Amada Co. Ltd. | 326,369 | 3,224 |
| | NGK Spark Plug Co. Ltd. | 201,187 | 3,214 |
| | Benefit One Inc. | 63,580 | 3,209 |
| * | Japan Airlines Co. Ltd. | 148,441 | 3,195 |
| | Itochu Techno-Solutions Corp. | 100,914 | 3,188 |
| | Japan Post Bank Co. Ltd. | 408,203 | 3,185 |
| | Iwatani Corp. | 53,811 | 3,178 |
| | Jeol Ltd. | 41,724 | 3,162 |
| | Tohoku Electric Power Co. Inc. | 487,240 | 3,161 |
| | Japan Prime Realty Investment Corp. | 852 | 3,125 |
| | Casio Computer Co. Ltd. | 219,560 | 3,107 |
| | Rohto Pharmaceutical Co. Ltd. | 101,347 | 3,097 |
| | NSK Ltd. | 459,110 | 3,085 |
| | Rakus Co. Ltd | 97,301 | 3,084 |
| | Japan Post Insurance Co. Ltd. | 189,476 | 3,074 |
| | Kawasaki Heavy Industries Ltd. | 151,455 | 3,073 |
| | Fukuoka Financial Group Inc. | 169,926 | 3,053 |
| | | Shares | Market
Value•
($000) |
| | Sohgo Security Services Co. Ltd. | 71,189 | 3,046 |
| * | Skylark Holdings Co. Ltd. | 224,367 | 3,040 |
| | Oracle Corp. Japan | 32,017 | 3,030 |
| | Sega Sammy Holdings Inc. | 209,067 | 2,973 |
| | Denka Co. Ltd. | 90,771 | 2,972 |
| | Sumitomo Heavy Industries Ltd. | 114,803 | 2,956 |
| | IHI Corp. | 126,165 | 2,947 |
| | Sekisui House REIT Inc. | 3,856 | 2,915 |
| | Keikyu Corp. | 257,404 | 2,905 |
| 2 | Shinsei Bank Ltd. | 175,764 | 2,903 |
| | Air Water Inc. | 186,869 | 2,859 |
| | Nomura Real Estate Holdings Inc. | 116,720 | 2,846 |
| | NET One Systems Co. Ltd. | 86,712 | 2,844 |
| | COMSYS Holdings Corp. | 114,591 | 2,837 |
| | Yamada Denki Co. Ltd. | 742,373 | 2,837 |
| | Nifco Inc. | 87,910 | 2,804 |
| | LaSalle Logiport REIT | 1,685 | 2,801 |
| | Activia Properties Inc. | 682 | 2,796 |
| | Aozora Bank Ltd. | 121,921 | 2,789 |
| * | Japan Airport Terminal Co. Ltd. | 55,383 | 2,747 |
| | Tokyo Tatemono Co. Ltd. | 186,639 | 2,743 |
| | Medipal Holdings Corp. | 151,551 | 2,742 |
| | Ulvac Inc. | 48,475 | 2,720 |
| | Toho Gas Co. Ltd. | 91,382 | 2,707 |
| | Sumitomo Forestry Co. Ltd. | 141,686 | 2,706 |
| | Japan Hotel REIT Investment Corp. | 4,448 | 2,686 |
| | Tokai Carbon Co. Ltd. | 204,186 | 2,671 |
| | Nichirei Corp. | 109,301 | 2,662 |
| | Keihan Holdings Co. Ltd. | 101,143 | 2,661 |
| | Isetan Mitsukoshi Holdings Ltd. | 363,113 | 2,655 |
| | Horiba Ltd. | 40,420 | 2,650 |
| | Hino Motors Ltd. | 279,656 | 2,645 |
| | Shinko Electric Industries Co. Ltd. | 65,193 | 2,626 |
| | Japan Logistics Fund Inc. | 877 | 2,623 |
| | Cosmos Pharmaceutical Corp. | 17,026 | 2,602 |
| | Mitsui Fudosan Logistics Park Inc. | 486 | 2,584 |
| | Teijin Ltd. | 192,306 | 2,581 |
| | Sugi Holdings Co. Ltd. | 35,931 | 2,573 |
| | Pigeon Corp. | 110,795 | 2,566 |
| | Taiheiyo Cement Corp. | 119,936 | 2,548 |
| | Alfresa Holdings Corp. | 180,500 | 2,545 |
| | Chugoku Electric Power Co. Inc. | 305,267 | 2,532 |
| | Takara Holdings Inc. | 184,179 | 2,519 |
| | | Shares | Market
Value•
($000) |
| | THK Co. Ltd. | 116,299 | 2,501 |
| * | SHIFT Inc. | 10,800 | 2,491 |
| | Nihon Kohden Corp. | 77,951 | 2,480 |
| | SCSK Corp. | 122,115 | 2,471 |
| | Mitsubishi Materials Corp. | 126,968 | 2,465 |
| | Tokyo Ohka Kogyo Co. Ltd. | 38,716 | 2,461 |
| | Sanwa Holdings Corp. | 210,474 | 2,455 |
| | Sumitomo Dainippon Pharma Co. Ltd. | 173,062 | 2,447 |
| | Hisamitsu Pharmaceutical Co. Inc. | 71,603 | 2,443 |
| | Nippon Accommodations Fund Inc. | 438 | 2,443 |
| | Taisho Pharmaceutical Holdings Co. Ltd. | 45,510 | 2,442 |
| 2 | Anritsu Corp. | 146,853 | 2,435 |
| | EXEO Group Inc. | 105,284 | 2,434 |
| | Kewpie Corp. | 110,974 | 2,434 |
| | J Front Retailing Co. Ltd. | 261,538 | 2,424 |
| | Zenkoku Hosho Co. Ltd. | 49,465 | 2,390 |
| | Konica Minolta Inc. | 478,441 | 2,368 |
| | Kaneka Corp. | 61,330 | 2,352 |
| | Lawson Inc. | 48,471 | 2,344 |
| | Morinaga Milk Industry Co. Ltd. | 39,813 | 2,333 |
| | Seibu Holdings Inc. | 213,604 | 2,333 |
| | Sumitomo Rubber Industries Ltd. | 188,845 | 2,327 |
| | Sharp Corp. | 195,015 | 2,300 |
| | Zensho Holdings Co. Ltd. | 99,070 | 2,288 |
| | Electric Power Development Co. Ltd. | 172,608 | 2,282 |
| | DIC Corp. | 86,019 | 2,278 |
| * | Sansan Inc. | 19,573 | 2,274 |
| | Kenedix Office Investment Corp. | 359 | 2,273 |
| | Relo Group Inc. | 107,616 | 2,238 |
| | House Foods Group Inc. | 77,954 | 2,237 |
| | Nankai Electric Railway Co. Ltd. | 112,390 | 2,231 |
| | Sankyu Inc. | 49,368 | 2,229 |
| | Ship Healthcare Holdings Inc. | 84,510 | 2,220 |
| | Tsumura & Co. | 70,865 | 2,209 |
| | Nippon Electric Glass Co. Ltd. | 86,364 | 2,205 |
| | Fancl Corp. | 72,668 | 2,203 |
| * | PeptiDream Inc. | 90,730 | 2,193 |
| | ADEKA Corp. | 98,438 | 2,190 |
| | Kadokawa Corp. | 41,244 | 2,178 |
| | Suzuken Co. Ltd. | 77,593 | 2,160 |
| | SMS Co. Ltd. | 54,968 | 2,133 |
| | Kagome Co. Ltd. | 83,834 | 2,127 |
| | JTEKT Corp. | 240,310 | 2,127 |
| | Kamigumi Co. Ltd. | 105,585 | 2,126 |
| | Kinden Corp. | 129,121 | 2,119 |
| | JGC Holdings Corp. | 225,014 | 2,115 |
| | | Shares | Market
Value•
($000) |
| | AEON REIT Investment Corp. | 1,564 | 2,114 |
| | Infomart Corp. | 215,832 | 2,106 |
| | Mori Hills REIT Investment Corp. | 1,553 | 2,106 |
| * | Mitsubishi Motors Corp. | 655,791 | 2,099 |
| | Penta-Ocean Construction Co. Ltd. | 302,475 | 2,084 |
| | Goldwin Inc. | 34,432 | 2,083 |
| | Calbee Inc. | 80,650 | 2,078 |
| | Daicel Corp. | 277,179 | 2,075 |
| | Frontier Real Estate Investment Corp. | 466 | 2,062 |
| | Invincible Investment Corp. | 5,214 | 2,061 |
| | Sundrug Co. Ltd. | 69,793 | 2,043 |
| | Credit Saison Co. Ltd. | 165,725 | 2,032 |
| | Hulic REIT Inc. | 1,336 | 2,024 |
| | Mebuki Financial Group Inc. | 985,970 | 2,019 |
| | Ube Industries Ltd. | 108,200 | 2,016 |
| | Coca-Cola Bottlers Japan Holdings Inc. | 146,399 | 2,015 |
| | Nagase & Co. Ltd. | 118,885 | 2,012 |
| | Shimamura Co. Ltd. | 23,751 | 2,011 |
| | Nishi-Nippon Railroad Co. Ltd. | 81,247 | 2,001 |
| | Japan Steel Works Ltd. | 67,881 | 1,994 |
| | Alps Alpine Co. Ltd. | 203,620 | 1,990 |
| | Nippo Corp. | 56,263 | 1,990 |
| | Outsourcing Inc. | 103,530 | 1,986 |
| | Daiwa Securities Living Investments Corp. | 1,961 | 1,981 |
| | Daiseki Co. Ltd. | 42,184 | 1,969 |
| * | RENOVA Inc. | 44,700 | 1,966 |
| | Topcon Corp. | 110,014 | 1,961 |
| | Yamazaki Baking Co. Ltd. | 128,941 | 1,959 |
| | Katitas Co. Ltd. | 53,500 | 1,953 |
| | Mitsubishi Logistics Corp. | 69,800 | 1,949 |
| | Kenedix Residential Next Investment Corp. | 1,011 | 1,944 |
| | SHO-BOND Holdings Co. Ltd. | 46,186 | 1,935 |
| | Nihon Unisys Ltd. | 68,499 | 1,925 |
| | Internet Initiative Japan Inc. | 54,846 | 1,919 |
| 2 | NTT UD REIT Investment Corp. | 1,445 | 1,918 |
| | Dowa Holdings Co. Ltd. | 45,729 | 1,910 |
| | Ushio Inc. | 106,437 | 1,904 |
| | DMG Mori Co. Ltd. | 110,024 | 1,895 |
| | Ezaki Glico Co. Ltd. | 52,158 | 1,893 |
| | Fuji Corp. | 81,136 | 1,893 |
| | K's Holdings Corp | 182,160 | 1,880 |
| | Nippon Kayaku Co. Ltd. | 177,418 | 1,869 |
| | Comforia Residential REIT Inc. | 640 | 1,865 |
| | | Shares | Market
Value•
($000) |
| | Yokohama Rubber Co. Ltd. | 109,912 | 1,860 |
| | Kobe Steel Ltd. | 316,106 | 1,857 |
| | Fujitec Co. Ltd. | 81,540 | 1,852 |
| | Toyo Seikan Group Holdings Ltd. | 155,231 | 1,843 |
| | Zeon Corp. | 154,614 | 1,834 |
| | Daiwa Office Investment Corp. | 283 | 1,827 |
| | Amano Corp. | 73,680 | 1,823 |
| | Menicon Co. Ltd. | 48,084 | 1,805 |
| | DeNA Co. Ltd. | 97,635 | 1,804 |
| | Mirait Holdings Corp. | 93,538 | 1,799 |
| | INFRONEER Holdings Inc. | 214,195 | 1,774 |
| | Aeon Mall Co. Ltd. | 120,901 | 1,771 |
| | Mabuchi Motor Co. Ltd. | 51,361 | 1,771 |
| | Aica Kogyo Co. Ltd. | 57,255 | 1,755 |
| | Toyo Tire Corp. | 105,430 | 1,753 |
| | Mitsui High-Tec Inc. | 22,688 | 1,752 |
| | Benesse Holdings Inc. | 76,518 | 1,751 |
| | Seino Holdings Co. Ltd. | 144,210 | 1,747 |
| | Justsystems Corp. | 33,342 | 1,723 |
| * | Park24 Co. Ltd. | 112,212 | 1,719 |
| | GMO internet Inc. | 62,112 | 1,715 |
| | Kenedix Retail REIT Corp. | 666 | 1,699 |
| | Pola Orbis Holdings Inc. | 79,252 | 1,692 |
| | Hoshino Resorts REIT Inc. | 256 | 1,672 |
| | Hirogin Holdings Inc. | 303,526 | 1,672 |
| | Nippon Suisan Kaisha Ltd. | 292,275 | 1,661 |
| * | Nishimatsu Construction Co. Ltd. | 57,341 | 1,654 |
| | Sawai Group Holdings Co. Ltd. | 36,948 | 1,630 |
| | As One Corp. | 11,842 | 1,623 |
| | Rengo Co. Ltd. | 214,026 | 1,623 |
| | Hachijuni Bank Ltd. | 483,806 | 1,617 |
| | Sotetsu Holdings Inc. | 83,438 | 1,614 |
| | Toyoda Gosei Co. Ltd. | 78,659 | 1,610 |
| | Tokyu REIT Inc. | 956 | 1,604 |
| | Ain Holdings Inc. | 27,107 | 1,600 |
| | Nippon Shokubai Co. Ltd. | 30,552 | 1,596 |
| | Descente Ltd. | 41,988 | 1,592 |
| | Tokyo Seimitsu Co. Ltd. | 38,621 | 1,573 |
| | Digital Garage Inc. | 33,648 | 1,572 |
| | Toda Corp. | 249,420 | 1,571 |
| | OKUMA Corp. | 32,840 | 1,565 |
| | GS Yuasa Corp. | 71,738 | 1,562 |
| 2 | Kobe Bussan Co. Ltd. | 45,000 | 1,550 |
| | FP Corp. | 45,386 | 1,541 |
| | Daiwabo Holdings Co. Ltd. | 87,480 | 1,540 |
| | Maruichi Steel Tube Ltd. | 67,327 | 1,530 |
| | | Shares | Market
Value•
($000) |
| | Mitsubishi Estate Logistics REIT Investment Corp. | 352 | 1,522 |
| | Nichias Corp. | 61,939 | 1,517 |
| | Jafco Co. Ltd. | 23,855 | 1,511 |
| * | Fujikura Ltd. | 279,922 | 1,510 |
| | AEON Financial Service Co. Ltd. | 118,331 | 1,503 |
| | Sapporo Holdings Ltd. | 69,008 | 1,497 |
| | Sumitomo Bakelite Co. Ltd. | 32,850 | 1,476 |
| | Toagosei Co. Ltd. | 132,014 | 1,475 |
| | Japan Elevator Service Holdings Co. Ltd. | 68,000 | 1,474 |
| | TS Tech Co. Ltd. | 110,022 | 1,472 |
| | NIPPON REIT Investment Corp. | 383 | 1,472 |
| | Mitsui Mining & Smelting Co. Ltd. | 51,245 | 1,470 |
| | Fujitsu General Ltd. | 59,840 | 1,467 |
| | Daiichikosho Co. Ltd. | 40,207 | 1,460 |
| | Cosmo Energy Holdings Co. Ltd. | 71,301 | 1,458 |
| | Daio Paper Corp. | 82,566 | 1,453 |
| | Yoshinoya Holdings Co. Ltd. | 74,402 | 1,451 |
| | Furukawa Electric Co. Ltd. | 66,173 | 1,448 |
| | Iyo Bank Ltd. | 295,225 | 1,444 |
| | NSD Co. Ltd. | 75,452 | 1,438 |
| | Sanrio Co. Ltd. | 63,076 | 1,413 |
| | Meitec Corp. | 23,481 | 1,412 |
| | Mori Trust Sogo REIT Inc. | 1,092 | 1,411 |
| | H.U. Group Holdings Inc. | 57,042 | 1,407 |
| | JCR Pharmaceuticals Co. Ltd. | 57,232 | 1,405 |
| | Takashimaya Co. Ltd. | 151,257 | 1,401 |
| | Asahi Holdings Inc. | 78,516 | 1,401 |
| | PALTAC Corp. | 31,552 | 1,397 |
| | OSG Corp. | 83,797 | 1,394 |
| | Gunma Bank Ltd. | 451,272 | 1,393 |
| | Takara Bio Inc. | 53,386 | 1,393 |
| | Systena Corp. | 75,180 | 1,389 |
| | Kyushu Financial Group Inc. | 411,491 | 1,386 |
| | Yamaguchi Financial Group Inc. | 248,004 | 1,385 |
| | Bic Camera Inc. | 160,493 | 1,384 |
| | Hazama Ando Corp. | 202,659 | 1,372 |
| | Kaken Pharmaceutical Co. Ltd. | 34,539 | 1,362 |
| | Kokuyo Co. Ltd. | 89,407 | 1,361 |
| | Chugoku Bank Ltd. | 187,301 | 1,359 |
| | Fuyo General Lease Co. Ltd. | 20,811 | 1,353 |
| | Japan Excellent Inc. | 1,112 | 1,343 |
| | Hitachi Transport System Ltd. | 33,999 | 1,339 |
| | Kyudenko Corp. | 42,218 | 1,339 |
| | Tadano Ltd. | 122,466 | 1,337 |
| | NOK Corp. | 114,029 | 1,324 |
| * | Raksul Inc. | 23,900 | 1,315 |
| | | Shares | Market
Value•
($000) |
| | Yamato Kogyo Co. Ltd. | 39,154 | 1,313 |
| | Takasago Thermal Engineering Co. Ltd. | 71,398 | 1,306 |
| | NHK Spring Co. Ltd. | 172,841 | 1,304 |
| | Daido Steel Co. Ltd. | 33,945 | 1,301 |
| | Toyota Boshoku Corp. | 67,526 | 1,298 |
| | Nippon Gas Co. Ltd. | 104,551 | 1,297 |
| | Nipro Corp. | 127,248 | 1,293 |
| | Citizen Watch Co. Ltd. | 294,381 | 1,284 |
| | Yaoko Co. Ltd. | 21,501 | 1,280 |
| | Tokuyama Corp. | 74,382 | 1,274 |
| | CKD Corp. | 64,045 | 1,270 |
| | Milbon Co. Ltd. | 21,214 | 1,270 |
| | Hitachi Zosen Corp. | 161,534 | 1,267 |
| | Glory Ltd. | 58,343 | 1,256 |
| | Sankyo Co. Ltd. | 51,578 | 1,252 |
| | en japan Inc. | 31,400 | 1,247 |
| | Hanwa Co. Ltd. | 41,529 | 1,247 |
| | Lintec Corp. | 55,667 | 1,243 |
| | Resorttrust Inc. | 69,894 | 1,239 |
| | Wacoal Holdings Corp. | 61,567 | 1,233 |
| | OBIC Business Consultants Co. Ltd. | 24,906 | 1,230 |
| | Toei Co. Ltd. | 6,268 | 1,230 |
| | Nisshinbo Holdings Inc. | 158,811 | 1,226 |
| | Acom Co. Ltd. | 365,926 | 1,220 |
| | Kotobuki Spirits Co. Ltd. | 18,213 | 1,218 |
| | Mizuho Leasing Co. Ltd. | 39,366 | 1,216 |
| | Izumi Co. Ltd. | 39,715 | 1,204 |
| | Duskin Co. Ltd. | 49,695 | 1,197 |
| | NEC Networks & System Integration Corp. | 74,085 | 1,192 |
| | Fuji Oil Holdings Inc. | 50,690 | 1,190 |
| * | Oisix ra daichi Inc. | 28,354 | 1,188 |
| | Fujimi Inc. | 18,710 | 1,177 |
| | ABC-Mart Inc. | 24,166 | 1,162 |
| | Mani Inc. | 67,815 | 1,156 |
| | Fukuyama Transporting Co. Ltd. | 28,945 | 1,153 |
| | Monex Group Inc. | 176,818 | 1,151 |
| | Heiwa Real Estate REIT Inc. | 817 | 1,141 |
| | Toyobo Co. Ltd. | 94,592 | 1,136 |
| | Hankyu Hanshin REIT Inc. | 760 | 1,121 |
| | Trusco Nakayama Corp. | 46,318 | 1,120 |
| | Kureha Corp. | 17,226 | 1,119 |
| | Nikkon Holdings Co. Ltd. | 56,953 | 1,113 |
| | Ariake Japan Co. Ltd. | 17,017 | 1,108 |
| | Morinaga & Co. Ltd. | 31,310 | 1,106 |
| | Kanematsu Corp. | 94,314 | 1,095 |
| | Daishi Hokuetsu Financial Group Inc. | 48,548 | 1,087 |
| | | Shares | Market
Value•
($000) |
| | Shikoku Electric Power Co. Inc. | 166,025 | 1,081 |
| | CRE Logistics REIT Inc. | 555 | 1,080 |
| | TOKAI Holdings Corp. | 141,475 | 1,074 |
| | Sanken Electric Co. Ltd. | 20,396 | 1,072 |
| | Seven Bank Ltd. | 506,672 | 1,071 |
| | Hokuetsu Corp. | 161,556 | 1,067 |
| | Macnica Fuji Electronics Holdings Inc. | 45,159 | 1,062 |
| | Mixi Inc. | 46,042 | 1,055 |
| | Okamura Corp. | 79,823 | 1,053 |
| | Nihon Parkerizing Co. Ltd. | 105,351 | 1,051 |
| | Fuji Seal International Inc. | 47,503 | 1,045 |
| | KH Neochem Co. Ltd. | 40,537 | 1,042 |
| * | Shochiku Co. Ltd. | 9,556 | 1,040 |
| | Nippon Paper Industries Co. Ltd. | 101,409 | 1,039 |
| | Heiwa Corp. | 58,156 | 1,037 |
| | Heiwa Real Estate Co. Ltd. | 32,835 | 1,037 |
| | Wacom Co. Ltd. | 159,031 | 1,029 |
| | Takuma Co. Ltd. | 78,552 | 1,028 |
| | Senko Group Holdings Co. Ltd. | 115,510 | 1,027 |
| | Canon Marketing Japan Inc. | 51,589 | 1,022 |
| | DCM Holdings Co. Ltd. | 104,762 | 1,021 |
| | Tsubakimoto Chain Co. | 34,444 | 1,018 |
| | Kusuri no Aoki Holdings Co. Ltd. | 15,126 | 1,007 |
| | NS Solutions Corp. | 29,848 | 1,003 |
| | Maruha Nichiro Corp. | 44,432 | 1,002 |
| | Joyful Honda Co. Ltd. | 72,514 | 997 |
| | Star Asia Investment Corp. | 1,859 | 986 |
| | Valor Holdings Co. Ltd. | 46,525 | 985 |
| | Sumitomo Osaka Cement Co. Ltd. | 35,126 | 984 |
| | Pilot Corp. | 26,584 | 975 |
| | Sakata Seed Corp. | 32,250 | 973 |
| | Hokuhoku Financial Group Inc. | 135,905 | 972 |
| | Fukuoka REIT Corp. | 653 | 969 |
| | Shoei Co. Ltd. | 21,700 | 966 |
| | Nippon Light Metal Holdings Co. Ltd. | 58,134 | 965 |
| | Toshiba TEC Corp. | 24,487 | 964 |
| | Toho Holdings Co. Ltd. | 59,560 | 964 |
| | Nishi-Nippon Financial Holdings Inc. | 165,242 | 964 |
| | Seiren Co. Ltd. | 47,682 | 962 |
| | Ichigo Office REIT Investment Corp. | 1,268 | 961 |
| | Fuji Soft Inc. | 18,703 | 952 |
| | Itoham Yonekyu Holdings Inc. | 153,936 | 939 |
| | | Shares | Market
Value•
($000) |
| | EDION Corp. | 98,257 | 933 |
| | Kiyo Bank Ltd. | 70,900 | 931 |
| | Sangetsu Corp. | 66,605 | 917 |
| | Megmilk Snow Brand Co. Ltd. | 47,106 | 912 |
| | Dexerials Corp. | 44,780 | 906 |
| 2 | Colowide Co. Ltd. | 62,237 | 900 |
| | Toridoll Holdings Corp. | 37,300 | 898 |
| | Tokyo Steel Manufacturing Co. Ltd. | 80,549 | 896 |
| | Shiga Bank Ltd. | 54,864 | 888 |
| | Global One Real Estate Investment Corp. | 853 | 879 |
| | Aiful Corp. | 263,642 | 878 |
| * | NTN Corp. | 404,517 | 877 |
| | Sumitomo Warehouse Co. Ltd. | 53,836 | 866 |
| | Hokuriku Electric Power Co. | 181,242 | 863 |
| | Fuji Kyuko Co. Ltd. | 21,393 | 862 |
| | SOSiLA Logistics REIT Inc. | 570 | 857 |
| | Iriso Electronics Co. Ltd. | 18,607 | 855 |
| | BeNext-Yumeshin Group Co. | 65,474 | 854 |
| | DTS Corp. | 38,312 | 850 |
| | Kumagai Gumi Co. Ltd. | 34,337 | 850 |
| | Rorze Corp. | 8,856 | 849 |
| | Kintetsu World Express Inc. | 35,235 | 846 |
| | Meidensha Corp. | 40,115 | 844 |
| | Takeuchi Manufacturing Co. Ltd. | 32,741 | 841 |
| | Nitto Boseki Co. Ltd. | 26,069 | 836 |
| | San-In Godo Bank Ltd. | 170,798 | 836 |
| | Autobacs Seven Co. Ltd. | 64,414 | 833 |
| | Starts Corp. Inc. | 34,360 | 826 |
| | Fuso Chemical Co. Ltd. | 17,912 | 825 |
| | Earth Corp. | 13,439 | 825 |
| | Kyoritsu Maintenance Co. Ltd. | 21,988 | 824 |
| | JINS Holdings Inc. | 13,030 | 824 |
| | Kandenko Co. Ltd. | 106,114 | 823 |
| | Maruwa Co. Ltd. | 7,262 | 814 |
| | Taiyo Holdings Co. Ltd. | 30,440 | 814 |
| | UT Group Co. Ltd. | 25,400 | 813 |
| | Nippon Soda Co. Ltd. | 26,972 | 810 |
| | Central Glass Co. Ltd. | 43,316 | 807 |
| | JCU Corp. | 19,898 | 799 |
| | 77 Bank Ltd. | 78,270 | 798 |
| * | Royal Holdings Co. Ltd. | 43,779 | 795 |
| | eRex Co. Ltd. | 34,361 | 787 |
| | Tokai Rika Co. Ltd. | 56,170 | 786 |
| | | Shares | Market
Value•
($000) |
| | Itochu Advance Logistics Investment Corp. | 551 | 785 |
| | Nagawa Co. Ltd. | 8,300 | 785 |
| | IR Japan Holdings Ltd. | 8,500 | 784 |
| | TKC Corp. | 25,464 | 781 |
| | Midac Holdings Co. Ltd. | 16,435 | 781 |
| | Musashi Seimitsu Industry Co. Ltd. | 41,204 | 776 |
| *,2 | HIS Co. Ltd. | 34,448 | 775 |
| | Japan Lifeline Co. Ltd. | 71,708 | 772 |
| | Arcs Co. Ltd. | 40,041 | 769 |
| | Sumitomo Mitsui Construction Co. Ltd. | 180,432 | 766 |
| | Awa Bank Ltd. | 41,023 | 764 |
| | Information Services International-Dentsu Ltd. | 21,592 | 755 |
| | ZERIA Pharmaceutical Co. Ltd. | 42,105 | 754 |
| | Funai Soken Holdings Inc. | 27,156 | 754 |
| | Nojima Corp. | 34,350 | 753 |
| | Japan Material Co. Ltd. | 54,036 | 751 |
| | Sanki Engineering Co. Ltd. | 59,398 | 748 |
| | Nippn Corp. | 52,163 | 747 |
| | Daihen Corp. | 17,807 | 743 |
| | Mochida Pharmaceutical Co. Ltd. | 25,380 | 740 |
| | Raito Kogyo Co. Ltd. | 41,488 | 738 |
| | Kohnan Shoji Co. Ltd. | 23,577 | 737 |
| | Tri Chemical Laboratories Inc. | 24,500 | 733 |
| | Nichiha Corp. | 25,468 | 732 |
| | Juroku Financial Group Inc. | 40,237 | 731 |
| | S-Pool Inc. | 65,260 | 730 |
| | Nextage Co. Ltd. | 39,800 | 729 |
| | Taikisha Ltd. | 25,467 | 727 |
| | Kissei Pharmaceutical Co. Ltd. | 36,252 | 725 |
| | Gree Inc. | 85,839 | 724 |
| | Digital Arts Inc. | 8,856 | 723 |
| | Orient Corp. | 526,345 | 722 |
| | Aeon Hokkaido Corp. | 62,300 | 720 |
| | Toyo Ink SC Holdings Co. Ltd. | 40,822 | 719 |
| | Kumiai Chemical Industry Co. Ltd. | 96,337 | 718 |
| | Matsui Securities Co. Ltd. | 99,723 | 715 |
| | Transcosmos Inc. | 23,677 | 714 |
| | GLOBERIDE Inc. | 19,600 | 709 |
| | Ogaki Kyoritsu Bank Ltd. | 42,619 | 708 |
| *,2 | giftee Inc. | 20,941 | 708 |
| | Round One Corp. | 58,601 | 705 |
| | Zojirushi Corp. | 50,698 | 703 |
| | | Shares | Market
Value•
($000) |
| | Japan Aviation Electronics Industry Ltd. | 42,291 | 701 |
| | Paramount Bed Holdings Co. Ltd. | 37,022 | 691 |
| | Nomura Co. Ltd. | 69,940 | 690 |
| | Prima Meat Packers Ltd. | 29,365 | 690 |
| | Tokai Tokyo Financial Holdings Inc. | 196,734 | 682 |
| | Oki Electric Industry Co. Ltd. | 82,910 | 681 |
| | Makino Milling Machine Co. Ltd. | 18,913 | 680 |
| | Usen-Next Holdings Co. Ltd. | 22,894 | 674 |
| | Hokkaido Electric Power Co. Inc. | 161,970 | 673 |
| | Noevir Holdings Co. Ltd. | 13,727 | 671 |
| | Atom Corp. | 99,351 | 670 |
| | BML Inc. | 18,903 | 664 |
| 2 | Nishimatsuya Chain Co. Ltd. | 51,980 | 663 |
| | Eizo Corp. | 17,210 | 658 |
| | Nanto Bank Ltd. | 37,921 | 654 |
| | MCJ Co. Ltd. | 57,608 | 649 |
| | Takara Leben Real Estate Investment Corp. | 662 | 645 |
| * | SRE Holdings Corp. | 9,283 | 645 |
| | Takara Standard Co. Ltd. | 48,381 | 643 |
| | Dip Corp. | 17,806 | 639 |
| | Okasan Securities Group Inc. | 186,256 | 637 |
| | Mirai Corp. | 1,379 | 637 |
| | Nippon Densetsu Kogyo Co. Ltd. | 41,038 | 633 |
| | Jaccs Co. Ltd. | 23,684 | 632 |
| | San-Ai Oil Co. Ltd. | 48,442 | 631 |
| | Elecom Co. Ltd. | 41,122 | 629 |
| * | M&A Capital Partners Co. Ltd. | 11,144 | 629 |
| | GungHo Online Entertainment Inc. | 33,234 | 624 |
| | H2O Retailing Corp. | 78,000 | 623 |
| | Max Co. Ltd. | 39,118 | 623 |
| | Hioki EE Corp. | 8,859 | 619 |
| | MOS Food Services Inc. | 22,186 | 619 |
| | eGuarantee Inc. | 27,800 | 619 |
| | Nachi-Fujikoshi Corp. | 16,313 | 618 |
| | UACJ Corp. | 26,569 | 616 |
| 2 | Starts Proceed Investment Corp. | 293 | 616 |
| | Nippon Pillar Packing Co. Ltd. | 25,100 | 613 |
| | Create SD Holdings Co. Ltd. | 19,899 | 612 |
| | Life Corp. | 18,610 | 611 |
| | KYORIN Holdings Inc. | 39,787 | 611 |
| | Suruga Bank Ltd. | 166,283 | 610 |
| | Ai Holdings Corp. | 32,236 | 608 |
| | Towa Pharmaceutical Co. Ltd. | 23,580 | 606 |
| | Okinawa Electric Power Co. Inc. | 49,344 | 605 |
| | | Shares | Market
Value•
($000) |
| | Japan Securities Finance Co. Ltd. | 79,081 | 604 |
| | Tomy Co. Ltd. | 63,386 | 602 |
| | Showa Sangyo Co. Ltd. | 24,186 | 602 |
| | Saizeriya Co. Ltd. | 22,281 | 601 |
| | Nippon Steel Trading Corp. | 13,235 | 598 |
| | SAMTY Co. Ltd. | 26,900 | 598 |
| | LITALICO Inc. | 19,800 | 598 |
| | Nisshin Oillio Group Ltd. | 22,490 | 596 |
| | Ichibanya Co. Ltd. | 14,724 | 595 |
| | San-A Co. Ltd. | 16,516 | 595 |
| | Nissha Co. Ltd. | 36,128 | 592 |
| | Okinawa Financial Group Inc. | 26,780 | 589 |
| * | Nippon Sheet Glass Co. Ltd. | 104,982 | 587 |
| | Komeri Co. Ltd. | 25,370 | 586 |
| | Kanamoto Co. Ltd. | 27,275 | 584 |
| | Daibiru Corp. | 41,887 | 583 |
| | Mandom Corp. | 40,027 | 582 |
| | Gunze Ltd. | 15,022 | 579 |
| | Mitsubishi Pencil Co. Ltd. | 48,092 | 577 |
| | Heiwado Co. Ltd. | 33,262 | 576 |
| 2 | Create Restaurants Holdings Inc. | 83,776 | 576 |
| | Mori Trust Hotel REIT Inc. | 463 | 575 |
| | Eiken Chemical Co. Ltd. | 34,156 | 574 |
| | Inabata & Co. Ltd. | 38,798 | 574 |
| | Musashino Bank Ltd. | 36,551 | 574 |
| | Tsugami Corp. | 41,762 | 574 |
| 2 | Pharma Foods International Co. Ltd. | 25,306 | 574 |
| 2 | Kura Sushi Inc. | 17,710 | 573 |
| | Fujimori Kogyo Co. Ltd. | 13,930 | 573 |
| | Kato Sangyo Co. Ltd. | 20,299 | 572 |
| | Tocalo Co. Ltd. | 46,656 | 572 |
| | Yokogawa Bridge Holdings Corp. | 28,359 | 572 |
| | Anicom Holdings Inc. | 73,336 | 572 |
| | Noritake Co. Ltd. | 13,040 | 570 |
| | Mitsubishi Logisnext Co. Ltd. | 61,761 | 568 |
| | FCC Co. Ltd. | 40,838 | 565 |
| | Morita Holdings Corp. | 44,916 | 565 |
| | Maeda Kosen Co. Ltd. | 19,400 | 563 |
| | Hyakugo Bank Ltd. | 191,338 | 555 |
| | Totetsu Kogyo Co. Ltd. | 25,270 | 550 |
| | Yodogawa Steel Works Ltd. | 25,170 | 550 |
| | ValueCommerce Co. Ltd. | 13,900 | 549 |
| | SBS Holdings Inc. | 15,400 | 548 |
| | Kitz Corp. | 81,488 | 545 |
| | Osaka Organic Chemical Industry Ltd. | 18,200 | 545 |
| | Token Corp. | 6,666 | 544 |
| | | Shares | Market
Value•
($000) |
| | Yamazen Corp. | 58,692 | 544 |
| | Ichigo Inc. | 181,243 | 543 |
| | Shizuoka Gas Co. Ltd. | 51,338 | 542 |
| | Hogy Medical Co. Ltd. | 19,596 | 537 |
| | Tokyotokeiba Co. Ltd. | 13,530 | 536 |
| | Hosiden Corp. | 50,734 | 535 |
| *,2 | Change Inc. | 29,700 | 535 |
| | Intage Holdings Inc. | 31,650 | 534 |
| | Comture Corp. | 19,700 | 534 |
| | Maruwa Unyu Kikan Co. Ltd. | 38,088 | 533 |
| | Mitani Sekisan Co. Ltd. | 8,400 | 533 |
| | Topre Corp. | 46,012 | 532 |
| | Monogatari Corp. | 8,542 | 532 |
| | North Pacific Bank Ltd. | 256,693 | 531 |
| *,2 | Chiyoda Corp. | 144,208 | 527 |
| | T Hasegawa Co. Ltd. | 21,599 | 527 |
| | Okumura Corp. | 20,385 | 526 |
| | Idec Corp. | 24,679 | 523 |
| | KOMEDA Holdings Co. Ltd. | 28,858 | 523 |
| | Prestige International Inc. | 76,106 | 522 |
| | Japan Petroleum Exploration Co. Ltd. | 28,637 | 521 |
| | ASKUL Corp. | 38,010 | 516 |
| | Shima Seiki Manufacturing Ltd. | 26,768 | 515 |
| | Seiko Holdings Corp. | 24,393 | 514 |
| | Kameda Seika Co. Ltd. | 13,138 | 514 |
| | Shibuya Corp. | 19,404 | 513 |
| | Tsubaki Nakashima Co. Ltd. | 36,602 | 513 |
| | Nichicon Corp. | 54,114 | 512 |
| | Ohsho Food Service Corp. | 9,750 | 512 |
| | Giken Ltd. | 13,337 | 509 |
| | One REIT Inc. | 189 | 507 |
| | Nissin Electric Co. Ltd. | 40,790 | 506 |
| | Cybozu Inc. | 21,288 | 505 |
| | Tamura Corp. | 73,547 | 505 |
| | Nippon Seiki Co. Ltd. | 50,091 | 504 |
| | Megachips Corp. | 15,917 | 503 |
| | Bunka Shutter Co. Ltd. | 51,648 | 503 |
| 2 | Daiho Corp. | 14,924 | 503 |
| | Sato Holdings Corp. | 21,793 | 502 |
| * | MedPeer Inc. | 16,688 | 501 |
| | Inaba Denki Sangyo Co. Ltd. | 20,860 | 500 |
| | TBS Holdings Inc. | 31,537 | 499 |
| | Nikkiso Co. Ltd. | 56,220 | 498 |
| | Samty Residential Investment Corp. | 472 | 498 |
| | Shibaura Machine Co. Ltd. | 21,293 | 496 |
| | S Foods Inc. | 17,036 | 493 |
| | Solasto Corp. | 40,700 | 493 |
| | Aeon Delight Co. Ltd. | 16,014 | 492 |
| | Towa Corp. | 22,438 | 489 |
| | Strike Co. Ltd. | 12,830 | 484 |
| | | Shares | Market
Value•
($000) |
| | Zuken Inc. | 12,535 | 483 |
| | Mitsuuroko Group Holdings Co. Ltd. | 40,200 | 481 |
| | Pasona Group Inc. | 17,220 | 481 |
| | Carta Holdings Inc. | 22,300 | 479 |
| | Arcland Sakamoto Co. Ltd. | 31,880 | 477 |
| | Noritz Corp. | 29,741 | 477 |
| | Hirata Corp. | 7,815 | 477 |
| | United Arrows Ltd. | 23,678 | 474 |
| | Sanyo Chemical Industries Ltd. | 9,552 | 473 |
| | KYB Corp. | 17,627 | 472 |
| | Future Corp. | 16,016 | 468 |
| * | Leopalace21 Corp. | 217,176 | 468 |
| | Osaka Soda Co. Ltd. | 18,419 | 468 |
| | Aida Engineering Ltd. | 51,234 | 465 |
| | Japan Wool Textile Co. Ltd. | 58,100 | 464 |
| | Raiznext Corp. | 42,823 | 463 |
| | United Super Markets Holdings Inc. | 50,735 | 463 |
| | Chudenko Corp. | 23,582 | 462 |
| | Roland Corp. | 11,200 | 461 |
| | Nagaileben Co. Ltd. | 22,383 | 460 |
| | Nippon Ceramic Co. Ltd. | 17,710 | 460 |
| *,2 | euglena Co. Ltd. | 64,908 | 460 |
| | Direct Marketing MiX Inc. | 12,000 | 460 |
| | Adastria Co. Ltd. | 24,672 | 458 |
| | Organo Corp. | 7,193 | 457 |
| | Nippon Signal Co. Ltd. | 52,521 | 454 |
| | Riso Kagaku Corp. | 21,483 | 453 |
| | Sanyo Denki Co. Ltd. | 7,859 | 452 |
| | Kaga Electronics Co. Ltd. | 16,418 | 451 |
| | Okamoto Industries Inc. | 12,831 | 450 |
| | Sekisui Jushi Corp. | 24,171 | 450 |
| 2 | Aruhi Corp. | 38,721 | 449 |
| | Retail Partners Co. Ltd. | 42,200 | 441 |
| | Ryosan Co. Ltd. | 21,378 | 441 |
| | Fuji Media Holdings Inc. | 42,384 | 439 |
| | Shinmaywa Industries Ltd. | 53,729 | 439 |
| | Riken Keiki Co. Ltd. | 15,620 | 433 |
| | Maxell Ltd. | 35,902 | 432 |
| | Tokyu Construction Co. Ltd. | 60,880 | 430 |
| | Yellow Hat Ltd. | 26,366 | 430 |
| | Pacific Industrial Co. Ltd. | 41,992 | 428 |
| | Saibu Gas Holdings Co. Ltd. | 20,892 | 427 |
| | Hyakujushi Bank Ltd. | 32,678 | 423 |
| | SKY Perfect JSAT Holdings Inc. | 111,330 | 418 |
| | HI-LEX Corp. | 26,100 | 417 |
| | Keihanshin Building Co. Ltd. | 33,031 | 413 |
| | Mitsui-Soko Holdings Co. Ltd. | 20,500 | 411 |
| | | Shares | Market
Value•
($000) |
| * | Curves Holdings Co. Ltd. | 52,568 | 410 |
| | Keiyo Bank Ltd. | 104,953 | 409 |
| | Nitta Corp. | 17,811 | 408 |
| | Yokowo Co. Ltd. | 18,340 | 408 |
| | Daiichi Jitsugyo Co. Ltd. | 8,757 | 407 |
| | WingArc1st Inc. | 21,100 | 407 |
| | FULLCAST Holdings Co. Ltd. | 17,396 | 406 |
| | Avex Inc. | 29,555 | 404 |
| | Maruzen Showa Unyu Co. Ltd. | 13,238 | 404 |
| | Belc Co. Ltd. | 8,158 | 403 |
| | Fukushima Galilei Co. Ltd. | 10,148 | 403 |
| | Link And Motivation Inc. | 38,000 | 402 |
| | Axial Retailing Inc. | 12,534 | 399 |
| | Shoei Foods Corp. | 11,541 | 398 |
| | gremz Inc. | 17,300 | 398 |
| | Nissan Shatai Co. Ltd. | 55,910 | 397 |
| | Arata Corp. | 11,149 | 395 |
| | Noritsu Koki Co. Ltd. | 19,005 | 395 |
| | Yuasa Trading Co. Ltd. | 14,726 | 394 |
| 2 | Insource Co. Ltd. | 19,700 | 394 |
| | Base Co. Ltd. | 9,300 | 393 |
| | Kanto Denka Kogyo Co. Ltd. | 42,587 | 392 |
| | Trancom Co. Ltd. | 5,572 | 391 |
| | Ringer Hut Co. Ltd. | 20,098 | 390 |
| | Mizuno Corp. | 16,715 | 389 |
| | Relia Inc. | 37,706 | 386 |
| | Weathernews Inc. | 5,274 | 385 |
| | Ricoh Leasing Co. Ltd. | 12,137 | 385 |
| | Nippon Koei Co. Ltd. | 12,635 | 384 |
| | Star Micronics Co. Ltd. | 29,243 | 384 |
| | Teikoku Sen-I Co. Ltd. | 21,303 | 384 |
| | Micronics Japan Co. Ltd. | 28,947 | 383 |
| | Exedy Corp. | 25,663 | 382 |
| | Kyokuto Kaihatsu Kogyo Co. Ltd. | 27,862 | 381 |
| | DyDo Group Holdings Inc. | 7,959 | 379 |
| | Chilled & Frozen Logistics Holdings Co. Ltd. | 25,600 | 379 |
| | Hamakyorex Co. Ltd. | 13,629 | 378 |
| | SWCC Showa Holdings Co. Ltd. | 19,399 | 378 |
| | Restar Holdings Corp. | 22,627 | 378 |
| | Hokkoku Financial Holdings Inc. | 21,684 | 378 |
| | Optex Group Co. Ltd. | 29,568 | 377 |
| | Genky DrugStores Co. Ltd. | 7,800 | 376 |
| | Bell System24 Holdings Inc. | 29,248 | 376 |
| | Oiles Corp. | 25,171 | 374 |
| | Sakata INX Corp. | 38,706 | 374 |
| | Argo Graphics Inc. | 13,300 | 370 |
| | | Shares | Market
Value•
($000) |
| | Nichi-iko Pharmaceutical Co. Ltd. | 48,705 | 370 |
| | Itochu Enex Co. Ltd. | 41,788 | 369 |
| | Konishi Co. Ltd. | 23,680 | 368 |
| | Plenus Co. Ltd. | 21,590 | 368 |
| | Nohmi Bosai Ltd. | 20,000 | 367 |
| | Shikoku Chemicals Corp. | 29,844 | 367 |
| | Nippon Kanzai Co. Ltd. | 15,025 | 365 |
| | Kanematsu Electronics Ltd. | 11,145 | 364 |
| | Nishio Rent All Co. Ltd. | 14,733 | 364 |
| | Nippon Television Holdings Inc. | 33,762 | 364 |
| | RS Technologies Co. Ltd. | 6,700 | 364 |
| | Chugoku Marine Paints Ltd. | 46,736 | 362 |
| | Fujibo Holdings Inc. | 9,949 | 361 |
| | Wakita & Co. Ltd. | 39,899 | 361 |
| | Nippon Road Co. Ltd. | 4,974 | 360 |
| | Toyo Tanso Co. Ltd. | 13,235 | 360 |
| | VT Holdings Co. Ltd. | 80,194 | 359 |
| | Kisoji Co. Ltd. | 19,100 | 359 |
| | Nitto Kogyo Corp. | 24,077 | 358 |
| | TOMONY Holdings Inc. | 132,808 | 355 |
| | Hiday Hidaka Corp. | 24,749 | 354 |
| | Matsuda Sangyo Co. Ltd. | 11,843 | 354 |
| | Ishihara Sangyo Kaisha Ltd. | 32,039 | 353 |
| | Iino Kaiun Kaisha Ltd. | 72,895 | 352 |
| | Koa Corp. | 26,069 | 352 |
| * | Matsuya Co. Ltd. | 36,619 | 350 |
| | Alpen Co. Ltd. | 14,328 | 350 |
| | Sanyo Special Steel Co. Ltd. | 21,177 | 349 |
| | Sinko Industries Ltd. | 19,209 | 349 |
| | Tsukishima Kikai Co. Ltd. | 34,137 | 349 |
| | Nippon Denko Co. Ltd. | 107,376 | 347 |
| | Takasago International Corp. | 13,333 | 347 |
| | Joshin Denki Co. Ltd. | 16,614 | 346 |
| | Nippon Carbon Co. Ltd. | 8,951 | 346 |
| | Mitsuboshi Belting Ltd. | 19,401 | 345 |
| 2 | Tokyo Electron Device Ltd. | 5,672 | 344 |
| | Senshu Ikeda Holdings Inc. | 244,764 | 344 |
| | Riso Kyoiku Co. Ltd. | 82,000 | 343 |
| 2 | Toa Corp. | 15,618 | 343 |
| | Toho Zinc Co. Ltd. | 12,538 | 343 |
| | J Trust Co. Ltd. | 65,343 | 342 |
| | Siix Corp. | 30,836 | 342 |
| | Doutor Nichires Holdings Co. Ltd. | 23,871 | 342 |
| | Broadleaf Co. Ltd. | 71,326 | 342 |
| | Infocom Corp. | 17,815 | 342 |
| | Fujicco Co. Ltd. | 20,301 | 341 |
| | Bank of Nagoya Ltd. | 16,018 | 341 |
| | | Shares | Market
Value•
($000) |
| | T-Gaia Corp. | 19,004 | 339 |
| | IDOM Inc. | 49,353 | 338 |
| | Toppan Forms Co. Ltd. | 35,016 | 337 |
| | ESPEC Corp. | 16,612 | 337 |
| | Taihei Dengyo Kaisha Ltd. | 14,230 | 336 |
| | Pressance Corp. | 20,263 | 336 |
| | Toyo Construction Co. Ltd. | 66,670 | 334 |
| | TechMatrix Corp. | 21,000 | 333 |
| | YAMABIKO Corp. | 30,247 | 330 |
| * | W-Scope Corp. | 41,283 | 330 |
| | METAWATER Co. Ltd. | 19,496 | 330 |
| | Furukawa Co. Ltd. | 29,647 | 328 |
| | Mitsubishi Shokuhin Co. Ltd. | 12,735 | 328 |
| | Nittetsu Mining Co. Ltd. | 5,672 | 327 |
| | Doshisha Co. Ltd. | 20,797 | 326 |
| | Obara Group Inc. | 10,145 | 325 |
| | Sakai Moving Service Co. Ltd. | 7,859 | 324 |
| | Zenrin Co. Ltd. | 35,095 | 324 |
| | Elan Corp. | 30,000 | 324 |
| | KFC Holdings Japan Ltd. | 12,734 | 323 |
| * | Nippon Chemi-Con Corp. | 17,196 | 323 |
| | Tsurumi Manufacturing Co. Ltd. | 20,904 | 322 |
| | Airtrip Corp. | 9,500 | 322 |
| | Nippon Thompson Co. Ltd. | 62,394 | 321 |
| | Seikagaku Corp. | 36,422 | 321 |
| | Tenma Corp. | 13,434 | 320 |
| | Uchida Yoko Co. Ltd. | 7,559 | 320 |
| | Hosokawa Micron Corp. | 11,542 | 319 |
| | Toho Titanium Co. Ltd. | 30,250 | 319 |
| | Fuji Co. Ltd. | 18,016 | 318 |
| | Belluna Co. Ltd. | 45,177 | 317 |
| | TPR Co. Ltd. | 24,872 | 317 |
| | Qol Holdings Co. Ltd. | 21,327 | 317 |
| | Hokuto Corp. | 18,305 | 316 |
| | Sintokogio Ltd. | 48,078 | 316 |
| | Tamron Co. Ltd. | 13,427 | 316 |
| | COLOPL Inc. | 43,782 | 316 |
| | Piolax Inc. | 21,888 | 315 |
| | Komori Corp. | 48,087 | 314 |
| * | Mitsui E&S Holdings Co. Ltd. | 61,557 | 314 |
| | Financial Products Group Co. Ltd. | 54,318 | 314 |
| | Yukiguni Maitake Co. Ltd. | 25,000 | 314 |
| | Chofu Seisakusho Co. Ltd. | 17,311 | 313 |
| * | Atrae Inc. | 14,676 | 313 |
| | Japan Pulp & Paper Co. Ltd. | 9,249 | 312 |
| 2 | V-Cube Inc. | 20,628 | 312 |
| | Modec Inc. | 17,909 | 308 |
| | Tokai Corp. | 16,018 | 308 |
| | Daiken Corp. | 14,035 | 307 |
| | | Shares | Market
Value•
($000) |
| | Tokushu Tokai Paper Co. Ltd. | 7,860 | 307 |
| | Daikyonishikawa Corp. | 50,945 | 306 |
| | KeePer Technical Laboratory Co. Ltd. | 10,626 | 306 |
| | Nippon Yakin Kogyo Co. Ltd. | 12,631 | 305 |
| | Toho Bank Ltd. | 169,750 | 304 |
| | DKS Co. Ltd. | 10,000 | 303 |
| | Torii Pharmaceutical Co. Ltd. | 11,642 | 302 |
| | Yokohama Reito Co. Ltd. | 39,527 | 302 |
| | Tokyo Kiraboshi Financial Group Inc. | 23,265 | 301 |
| | V Technology Co. Ltd. | 7,958 | 300 |
| | ARTERIA Networks Corp. | 21,200 | 299 |
| * | Vision Inc. | 22,313 | 299 |
| | Aomori Bank Ltd. | 17,210 | 297 |
| | Asahi Diamond Industrial Co. Ltd. | 48,160 | 296 |
| | Ines Corp. | 20,288 | 296 |
| | Katakura Industries Co. Ltd. | 19,501 | 296 |
| | Union Tool Co. | 8,756 | 296 |
| | Alconix Corp. | 19,620 | 296 |
| | PAL GROUP Holdings Co. Ltd. | 20,302 | 294 |
| 2 | Kansai Super Market Ltd. | 18,112 | 294 |
| | Tachi-S Co. Ltd. | 24,271 | 294 |
| | Bando Chemical Industries Ltd. | 37,903 | 293 |
| | Oyo Corp. | 19,102 | 293 |
| | G-7 Holdings Inc. | 16,000 | 293 |
| | MEC Co. Ltd. | 10,646 | 293 |
| | Onward Holdings Co. Ltd. | 97,959 | 290 |
| | NS United Kaiun Kaisha Ltd. | 9,155 | 288 |
| | Shin-Etsu Polymer Co. Ltd. | 31,932 | 288 |
| | Marudai Food Co. Ltd. | 19,196 | 286 |
| | Konoike Transport Co. Ltd. | 26,159 | 286 |
| | Mimasu Semiconductor Industry Co. Ltd. | 13,034 | 285 |
| | Key Coffee Inc. | 14,522 | 284 |
| | Sinfonia Technology Co. Ltd. | 24,678 | 284 |
| | Daito Pharmaceutical Co. Ltd. | 10,050 | 283 |
| | TV Asahi Holdings Corp. | 18,600 | 282 |
| | Yondoshi Holdings Inc. | 18,618 | 282 |
| | Marusan Securities Co. Ltd. | 53,329 | 281 |
| | Valqua Ltd. | 13,931 | 281 |
| | Keiyo Co. Ltd. | 38,414 | 280 |
| *,2 | Optim Corp. | 17,782 | 280 |
| | | Shares | Market
Value•
($000) |
| | Dainichiseika Color & Chemicals Manufacturing Co. Ltd. | 12,019 | 278 |
| | Daikokutenbussan Co. Ltd. | 4,877 | 278 |
| | Eagle Industry Co. Ltd. | 25,976 | 277 |
| | Kurabo Industries Ltd. | 16,604 | 277 |
| | Fukui Bank Ltd. | 21,296 | 275 |
| | Sodick Co. Ltd. | 35,114 | 271 |
| | Pack Corp. | 10,146 | 270 |
| | Starzen Co. Ltd. | 14,332 | 270 |
| | Roland DG Corp. | 10,246 | 269 |
| | Hibiya Engineering Ltd. | 15,995 | 269 |
| | JAC Recruitment Co. Ltd. | 13,734 | 269 |
| | Inageya Co. Ltd. | 22,165 | 268 |
| | Hoosiers Holdings | 43,400 | 268 |
| | Daiwa Industries Ltd. | 23,977 | 267 |
| | Sanyo Electric Railway Co. Ltd. | 15,123 | 266 |
| | Miroku Jyoho Service Co. Ltd. | 16,712 | 264 |
| 2 | Rock Field Co. Ltd. | 17,912 | 264 |
| | J-Oil Mills Inc. | 16,316 | 263 |
| | Japan Transcity Corp. | 49,476 | 263 |
| | Bank of the Ryukyus Ltd. | 39,342 | 262 |
| * | Kappa Create Co. Ltd. | 21,493 | 261 |
| | Dai-Dan Co. Ltd. | 12,369 | 260 |
| | Computer Engineering & Consulting Ltd. | 21,728 | 259 |
| * | Aoyama Trading Co. Ltd. | 37,582 | 258 |
| | Shin Nippon Air Technologies Co. Ltd. | 12,000 | 258 |
| | San ju San Financial Group Inc. | 21,073 | 258 |
| | Koshidaka Holdings Co. Ltd. | 42,168 | 258 |
| | Nippon Rietec Co. Ltd. | 18,500 | 258 |
| | Ryobi Ltd. | 24,477 | 257 |
| | Enigmo Inc. | 27,100 | 257 |
| | Aichi Bank Ltd. | 8,459 | 256 |
| * | KNT-CT Holdings Co. Ltd. | 17,349 | 255 |
| | Mitsui DM Sugar Holdings Co. Ltd. | 14,329 | 255 |
| | Aichi Steel Corp. | 10,847 | 253 |
| | Unipres Corp. | 31,020 | 253 |
| | Ichikoh Industries Ltd. | 50,744 | 252 |
| | Pacific Metals Co. Ltd. | 13,833 | 251 |
| | JVCKenwood Corp. | 145,475 | 251 |
| | Sakai Chemical Industry Co. Ltd. | 13,428 | 250 |
| | Sinanen Holdings Co. Ltd. | 8,160 | 250 |
| | Tanseisha Co. Ltd. | 30,449 | 250 |
| | TOC Co. Ltd. | 44,392 | 249 |
| | | Shares | Market
Value•
($000) |
| | Arcland Service Holdings Co. Ltd. | 12,536 | 249 |
| | Geo Holdings Corp. | 23,364 | 248 |
| | Miyazaki Bank Ltd. | 13,771 | 248 |
| | Komatsu Matere Co. Ltd. | 30,943 | 248 |
| 2 | YA-MAN Ltd. | 23,370 | 248 |
| | Fujio Food Group Inc. | 20,800 | 248 |
| | I'll Inc. | 16,700 | 248 |
| | Sumitomo Densetsu Co. Ltd. | 12,835 | 246 |
| | Vector Inc. | 21,694 | 246 |
| | Meisei Industrial Co. Ltd. | 40,984 | 244 |
| | Medical Data Vision Co. Ltd. | 18,726 | 242 |
| * | Open Door Inc. | 10,900 | 241 |
| 2 | Tama Home Co. Ltd. | 11,700 | 241 |
| | Shinwa Co. Ltd. | 12,349 | 240 |
| | Warabeya Nichiyo Holdings Co. Ltd. | 12,239 | 240 |
| | Furuno Electric Co. Ltd. | 22,289 | 239 |
| | Kyoei Steel Ltd. | 19,402 | 239 |
| | GMO GlobalSign Holdings KK | 5,811 | 239 |
| | Denyo Co. Ltd. | 13,729 | 238 |
| | Taki Chemical Co. Ltd. | 4,300 | 238 |
| | Maxvalu Tokai Co. Ltd. | 10,400 | 238 |
| | Riken Vitamin Co. Ltd. | 14,428 | 237 |
| | Sun Frontier Fudousan Co. Ltd. | 25,204 | 237 |
| | Takamatsu Construction Group Co. Ltd. | 13,429 | 236 |
| | Tonami Holdings Co. Ltd. | 5,969 | 236 |
| | Itochu-Shokuhin Co. Ltd. | 5,076 | 235 |
| | Anest Iwata Corp. | 29,550 | 235 |
| | Okabe Co. Ltd. | 38,911 | 234 |
| | Canon Electronics Inc. | 16,916 | 233 |
| | DKK Co. Ltd. | 10,546 | 233 |
| | Tosei Corp. | 24,273 | 233 |
| | Kyokuyo Co. Ltd. | 8,657 | 232 |
| | Nichiden Corp. | 11,540 | 232 |
| | Press Kogyo Co. Ltd. | 79,693 | 232 |
| | Sumitomo Seika Chemicals Co. Ltd. | 8,159 | 232 |
| | Shinko Shoji Co. Ltd. | 28,830 | 232 |
| | Nissei ASB Machine Co. Ltd. | 7,063 | 231 |
| | Tachibana Eletech Co. Ltd. | 17,100 | 231 |
| | Poletowin Pitcrew Holdings Inc. | 25,600 | 231 |
| | Sparx Group Co. Ltd. | 88,900 | 231 |
| | Aiphone Co. Ltd. | 11,145 | 230 |
| | Okuwa Co. Ltd. | 23,977 | 230 |
| | Melco Holdings Inc. | 5,559 | 230 |
| | Shindengen Electric Manufacturing Co. Ltd. | 6,464 | 230 |
| | | Shares | Market
Value•
($000) |
| | Hodogaya Chemical Co. Ltd. | 5,373 | 229 |
| | Matsuyafoods Holdings Co. Ltd. | 7,163 | 229 |
| * | Oriental Shiraishi Corp. | 96,929 | 229 |
| | Alpha Systems Inc. | 5,967 | 228 |
| | G-Tekt Corp. | 18,104 | 226 |
| | Digital Holdings Inc. | 14,700 | 225 |
| | Macromill Inc. | 31,887 | 225 |
| | JP-Holdings Inc. | 100,445 | 224 |
| | Sumida Corp. | 19,355 | 224 |
| | Mie Kotsu Group Holdings Inc. | 51,136 | 224 |
| | Chubu Shiryo Co. Ltd. | 23,379 | 223 |
| | Oita Bank Ltd. | 14,029 | 223 |
| | Yonex Co. Ltd. | 33,828 | 223 |
| | TSI Holdings Co. Ltd. | 73,484 | 223 |
| | WDB Holdings Co. Ltd. | 7,076 | 223 |
| | Media Do Co. Ltd. | 5,930 | 223 |
| | Ebase Co. Ltd. | 33,400 | 223 |
| | Tosho Co. Ltd. | 12,931 | 222 |
| | Aisan Industry Co. Ltd. | 30,051 | 221 |
| | Proto Corp. | 17,900 | 221 |
| | Shikoku Bank Ltd. | 33,436 | 220 |
| | Cawachi Ltd. | 11,246 | 219 |
| | Rheon Automatic Machinery Co. Ltd. | 18,386 | 219 |
| | Ehime Bank Ltd. | 32,341 | 218 |
| | Takara Leben Co. Ltd. | 80,012 | 218 |
| | Shin Nippon Biomedical Laboratories Ltd. | 17,210 | 218 |
| | Goldcrest Co. Ltd. | 15,126 | 217 |
| | Bank of Iwate Ltd. | 15,124 | 217 |
| | Futaba Corp. | 31,735 | 216 |
| | Mitsubishi Research Institute Inc. | 5,771 | 216 |
| 2 | Yamashin-Filter Corp. | 35,599 | 216 |
| | Fukui Computer Holdings Inc. | ��� 5,969 | 215 |
| | Japan Medical Dynamic Marketing Inc. | 11,155 | 214 |
| | Daido Metal Co. Ltd. | 39,634 | 213 |
| | Stella Chemifa Corp. | 8,459 | 212 |
| | World Holdings Co. Ltd. | 8,400 | 210 |
| * | BrainPad Inc. | 4,380 | 210 |
| | Onoken Co. Ltd. | 14,130 | 209 |
| | EM Systems Co. Ltd. | 31,500 | 209 |
| | Enplas Corp. | 7,851 | 208 |
| | Futaba Industrial Co. Ltd. | 53,129 | 208 |
| | Riken Technos Corp. | 43,193 | 208 |
| | Sumitomo Riko Co. Ltd. | 31,833 | 207 |
| | JM Holdings Co. Ltd. | 12,600 | 207 |
| | Fujiya Co. Ltd. | 9,951 | 206 |
| | Kamei Corp. | 20,196 | 206 |
| | LEC Inc. | 22,484 | 206 |
| | Vital KSK Holdings Inc. | 30,842 | 206 |
| | CI Takiron Corp. | 38,420 | 205 |
| | | Shares | Market
Value•
($000) |
| | Akita Bank Ltd. | 16,024 | 204 |
| | AOKI Holdings Inc. | 33,423 | 204 |
| | Yamanashi Chuo Bank Ltd. | 28,156 | 203 |
| | Chiyoda Integre Co. Ltd. | 10,546 | 202 |
| | YAKUODO Holdings Co. Ltd. | 9,552 | 202 |
| 2 | SB Technology Corp. | 7,300 | 201 |
| | Nissin Sugar Co. Ltd. | 13,400 | 200 |
| | Hakuto Co. Ltd. | 11,645 | 199 |
| | Xebio Holdings Co. Ltd. | 21,398 | 199 |
| | Yamagata Bank Ltd. | 27,958 | 199 |
| | Ryoyo Electro Corp. | 9,506 | 198 |
| | Yurtec Corp. | 33,551 | 197 |
| | Toyo Corp. | 20,795 | 197 |
| | Kitanotatsujin Corp. | 54,100 | 197 |
| | Teikoku Electric Manufacturing Co. Ltd. | 15,418 | 196 |
| | CONEXIO Corp. | 15,324 | 196 |
| | Fukuda Corp. | 4,776 | 194 |
| | Icom Inc. | 9,055 | 193 |
| | Halows Co. Ltd. | 7,861 | 193 |
| | Toenec Corp. | 6,568 | 193 |
| | Yorozu Corp. | 18,513 | 193 |
| | Nichiban Co. Ltd. | 11,800 | 192 |
| | ES-Con Japan Ltd. | 26,600 | 191 |
| | World Co. Ltd. | 15,500 | 190 |
| | Ryoden Corp. | 11,940 | 189 |
| | Tekken Corp. | 11,842 | 189 |
| | Fudo Tetra Corp. | 11,771 | 187 |
| | Kyosan Electric Manufacturing Co. Ltd. | 44,483 | 187 |
| | Happinet Corp. | 14,134 | 186 |
| | Shibusawa Warehouse Co. Ltd. | 9,556 | 186 |
| | JDC Corp. | 35,500 | 186 |
| | FIDEA Holdings Co. Ltd. | 17,890 | 185 |
| | Nagatanien Holdings Co. Ltd. | 10,048 | 184 |
| | Tokyo Energy & Systems Inc. | 18,910 | 184 |
| | ZIGExN Co. Ltd. | 51,600 | 184 |
| | Studio Alice Co. Ltd. | 9,656 | 183 |
| | Nippon Coke & Engineering Co. Ltd. | 136,722 | 183 |
| | Sanoh Industrial Co. Ltd. | 20,698 | 183 |
| | Amuse Inc. | 9,354 | 182 |
| | CTS Co. Ltd. | 25,891 | 181 |
| | Riken Corp. | 7,660 | 181 |
| * | PIA Corp. | 5,171 | 180 |
| * | Iseki & Co. Ltd. | 12,431 | 180 |
| | Osaki Electric Co. Ltd. | 36,610 | 180 |
| | LIFULL Co. Ltd. | 57,339 | 180 |
| | Advan Group Co. Ltd. | 20,987 | 179 |
| | Hito Communications Holdings Inc. | 9,253 | 179 |
| * | Kintetsu Department Store Co. Ltd. | 7,958 | 178 |
| | | Shares | Market
Value•
($000) |
| | K&O Energy Group Inc. | 12,436 | 178 |
| | Nihon Chouzai Co. Ltd. | 12,338 | 178 |
| | Topy Industries Ltd. | 16,918 | 177 |
| | Nippon Parking Development Co. Ltd. | 139,410 | 176 |
| | Tayca Corp. | 15,288 | 176 |
| | Moriroku Holdings Co. Ltd. | 10,200 | 175 |
| | Gakken Holdings Co. Ltd. | 17,812 | 174 |
| | Ichiyoshi Securities Co. Ltd. | 30,438 | 174 |
| | Koatsu Gas Kogyo Co. Ltd. | 25,873 | 174 |
| | Feed One Co. Ltd. | 26,468 | 174 |
| | Marvelous Inc. | 27,269 | 173 |
| | Mitsuba Corp. | 30,939 | 173 |
| | Shinnihon Corp. | 23,682 | 173 |
| | Nichireki Co. Ltd. | 14,600 | 173 |
| | Grace Technology Inc. | 18,742 | 172 |
| | Aichi Corp. | 24,182 | 171 |
| | Kurimoto Ltd. | 11,945 | 171 |
| | BRONCO BILLY Co. Ltd. | 8,059 | 171 |
| | ASKA Pharmaceutical Holdings Co. Ltd. | 19,704 | 171 |
| | Dai Nippon Toryo Co. Ltd. | 22,386 | 170 |
| | France Bed Holdings Co. Ltd. | 21,498 | 170 |
| | Sankyo Seiko Co. Ltd. | 33,535 | 170 |
| | Optorun Co. Ltd. | 8,400 | 170 |
| | Arakawa Chemical Industries Ltd. | 15,422 | 168 |
| | Kenko Mayonnaise Co. Ltd. | 12,438 | 167 |
| * | Unitika Ltd. | 52,343 | 167 |
| 2 | Kamakura Shinsho Ltd. | 20,500 | 166 |
| | Kanagawa Chuo Kotsu Co. Ltd. | 5,370 | 165 |
| | Kyodo Printing Co. Ltd. | 7,165 | 165 |
| | St. Marc Holdings Co. Ltd. | 12,234 | 165 |
| | Neturen Co. Ltd. | 30,740 | 164 |
| | Taiko Pharmaceutical Co. Ltd. | 23,131 | 164 |
| | Sankyo Tateyama Inc. | 24,977 | 163 |
| | CMK Corp. | 42,981 | 162 |
| | Cosel Co. Ltd. | 19,897 | 162 |
| | FAN Communications Inc. | 40,603 | 161 |
| | Rokko Butter Co. Ltd. | 10,944 | 160 |
| | Toyo Kanetsu KK | 7,260 | 160 |
| | Chori Co. Ltd. | 9,952 | 159 |
| | Nihon Nohyaku Co. Ltd. | 33,681 | 158 |
| | Tochigi Bank Ltd. | 101,542 | 158 |
| | SRA Holdings | 6,168 | 158 |
| * | KLab Inc. | 28,264 | 158 |
| | Krosaki Harima Corp. | 3,781 | 157 |
| | | Shares | Market
Value•
($000) |
| | Nitto Kohki Co. Ltd. | 9,450 | 157 |
| | Oro Co. Ltd. | 4,700 | 156 |
| | Bank of Saga Ltd. | 12,244 | 154 |
| | MTI Ltd. | 24,078 | 154 |
| * | Sagami Holdings Corp. | 17,211 | 154 |
| | Yahagi Construction Co. Ltd. | 22,986 | 154 |
| | Fuso Pharmaceutical Industries Ltd. | 6,867 | 153 |
| | Tomoku Co. Ltd. | 9,056 | 153 |
| *,2 | Japan Display Inc. | 508,239 | 152 |
| | JSP Corp. | 11,248 | 151 |
| | Kanaden Corp. | 16,616 | 150 |
| | Nissin Corp. | 10,549 | 150 |
| | Central Security Patrols Co. Ltd. | 6,202 | 149 |
| | Hochiki Corp. | 13,600 | 149 |
| | Nippon Sharyo Ltd. | 8,068 | 149 |
| | Towa Bank Ltd. | 33,647 | 149 |
| | Toa Corp. (XTKS) | 20,697 | 148 |
| * | Istyle Inc. | 42,576 | 148 |
| * | Fujita Kanko Inc. | 6,965 | 147 |
| | Elematec Corp. | 14,728 | 147 |
| | Hokkaido Gas Co. Ltd. | 10,949 | 147 |
| | ST Corp. | 10,349 | 147 |
| | Sanei Architecture Planning Co. Ltd. | 9,400 | 147 |
| | Nippon Beet Sugar Manufacturing Co. Ltd. | 10,051 | 146 |
| | CAC Holdings Corp. | 10,247 | 145 |
| | Torishima Pump Manufacturing Co. Ltd. | 18,601 | 144 |
| | Seika Corp. | 9,954 | 143 |
| | Tatsuta Electric Wire and Cable Co. Ltd. | 31,744 | 143 |
| | Asahi Co. Ltd. | 12,343 | 143 |
| | Chiyoda Co. Ltd. | 21,187 | 142 |
| | Hisaka Works Ltd. | 19,202 | 142 |
| | Kawada Technologies Inc. | 4,080 | 141 |
| | Achilles Corp. | 12,130 | 140 |
| 2 | Sourcenext Corp. | 77,200 | 139 |
| | Ministop Co. Ltd. | 11,444 | 139 |
| | Shimizu Bank Ltd. | 10,263 | 139 |
| | Chuo Spring Co. Ltd. | 15,928 | 138 |
| * | WATAMI Co. Ltd. | 15,818 | 137 |
| | Furukawa Battery Co. Ltd. | 9,763 | 136 |
| 2 | Raccoon Holdings Inc. | 9,747 | 136 |
| | Maezawa Kyuso Industries Co. Ltd. | 14,416 | 135 |
| | Kyokuto Securities Co. Ltd. | 20,100 | 135 |
| | ASAHI YUKIZAI Corp. | 11,044 | 133 |
| | Foster Electric Co. Ltd. | 18,598 | 133 |
| | Fuji Pharma Co. Ltd. | 13,730 | 132 |
| | Yushin Precision Equipment Co. Ltd. | 19,504 | 132 |
| * | Akebono Brake Industry Co. Ltd. | 64,876 | 131 |
| | | Shares | Market
Value•
($000) |
| | Honeys Holdings Co. Ltd. | 14,230 | 131 |
| | Toa Oil Co. Ltd. | 5,273 | 131 |
| | Akatsuki Inc. | 4,800 | 131 |
| | Pronexus Inc. | 13,931 | 130 |
| | Chukyo Bank Ltd. | 11,145 | 129 |
| | Okura Industrial Co. Ltd. | 6,964 | 129 |
| | Taisei Lamick Co. Ltd. | 5,274 | 127 |
| | Fixstars Corp. | 18,700 | 127 |
| 2 | Tokyo Individualized Educational Institute Inc. | 20,004 | 126 |
| | Takaoka Toko Co. Ltd. | 9,752 | 126 |
| | I-PEX Inc. | 6,966 | 125 |
| | Ateam Inc. | 8,657 | 125 |
| | Japan Best Rescue System Co. Ltd. | 12,400 | 125 |
| | Hokkan Holdings Ltd. | 9,355 | 124 |
| | Mars Group Holdings Corp. | 8,558 | 124 |
| | Zuiko Corp. | 16,128 | 124 |
| | NEC Capital Solutions Ltd. | 6,866 | 124 |
| | Artnature Inc. | 19,006 | 123 |
| | Sekisui Kasei Co. Ltd. | 24,382 | 122 |
| | Nihon Tokushu Toryo Co. Ltd. | 13,800 | 121 |
| | Nihon Trim Co. Ltd. | 3,879 | 119 |
| | Wowow Inc. | 5,849 | 119 |
| *,2 | OSAKA Titanium Technologies Co. Ltd. | 17,314 | 119 |
| * | Toho Co. Ltd. | 8,659 | 116 |
| * | Gurunavi Inc. | 24,584 | 114 |
| | Godo Steel Ltd. | 8,458 | 112 |
| * | Kourakuen Holdings Corp. | 8,557 | 111 |
| | Central Sports Co. Ltd. | 5,146 | 110 |
| | Tv Tokyo Holdings Corp. | 5,674 | 108 |
| * | RPA Holdings Inc. | 28,222 | 108 |
| | Aeon Fantasy Co. Ltd. | 6,370 | 106 |
| | Kojima Co. Ltd. | 20,493 | 106 |
| | CMIC Holdings Co. Ltd. | 8,158 | 106 |
| | Tsutsumi Jewelry Co. Ltd. | 5,567 | 104 |
| | Nisso Corp. | 16,400 | 104 |
| | Airport Facilities Co. Ltd. | 19,815 | 101 |
| | Ohara Inc. | 8,300 | 101 |
| * | TerraSky Co. Ltd. | 5,090 | 98 |
| * | FDK Corp. | 10,764 | 97 |
| | Osaka Steel Co. Ltd. | 9,448 | 97 |
| | Taiho Kogyo Co. Ltd. | 13,235 | 93 |
| | Ubicom Holdings Inc. | 3,600 | 92 |
| * | Tokyo Base Co. Ltd. | 14,500 | 90 |
| 2 | Inaba Seisakusho Co. Ltd. | 7,463 | 88 |
| | Chuetsu Pulp & Paper Co. Ltd. | 8,359 | 86 |
| | Shimojima Co. Ltd. | 8,651 | 86 |
| | Takihyo Co. Ltd. | 5,276 | 83 |
| | | Shares | Market
Value•
($000) |
| | Sac's Bar Holdings Inc. | 17,116 | 83 |
| * | COOKPAD Inc. | 39,391 | 82 |
| | Fibergate Inc. | 6,726 | 81 |
| | Corona Corp. Class A | 9,840 | 79 |
| | Daisyo Corp. | 8,858 | 79 |
| *,2 | Jamco Corp. | 9,155 | 79 |
| | Cleanup Corp. | 16,030 | 78 |
| * | CHIMNEY Co. Ltd. | 5,968 | 77 |
| | Gecoss Corp. | 9,850 | 74 |
| | Takamiya Co. Ltd. | 17,916 | 71 |
| | Kanamic Network Co. Ltd. | 13,200 | 70 |
| | Linical Co. Ltd. | 9,651 | 68 |
| * | Gunosy Inc. | 11,600 | 67 |
| * | Right On Co. Ltd. | 10,250 | 64 |
| *,2 | Heroz Inc. | 3,000 | 51 |
| * | Robot Home Inc. | 16,182 | 40 |
| | Nakayama Steel Works Ltd. | 9,829 | 37 |
| *,2 | Laox Co. Ltd. | 20,983 | 34 |
| * | Edulab Inc. | 2,100 | 30 |
| 2 | GCA Corp. | 1,700 | 21 |
| | | | 4,982,179 |
| New Zealand (1.0%) |
| | Fisher & Paykel Healthcare Corp. Ltd. | 579,681 | 12,987 |
| * | Auckland International Airport Ltd. | 1,216,250 | 6,971 |
| | Spark New Zealand Ltd. | 1,894,930 | 6,203 |
| | Mainfreight Ltd. | 75,340 | 4,855 |
| | Contact Energy Ltd. | 819,649 | 4,810 |
| | Meridian Energy Ltd. | 1,262,158 | 4,521 |
| | Fletcher Building Ltd. | 850,802 | 4,376 |
| | Ryman Healthcare Ltd. | 421,994 | 4,367 |
| *,2 | a2 Milk Co. Ltd. | 752,201 | 3,543 |
| | Mercury NZ Ltd. | 698,473 | 3,072 |
| | Infratil Ltd. | 514,473 | 3,053 |
| | Summerset Group Holdings Ltd. | 241,873 | 2,516 |
| | EBOS Group Ltd. | 96,502 | 2,509 |
| | Chorus Ltd. | 463,818 | 2,118 |
| | Goodman Property Trust | 1,114,026 | 1,986 |
| | SKYCITY Entertainment Group Ltd. | 764,130 | 1,752 |
| | Precinct Properties New Zealand Ltd. | 1,415,110 | 1,694 |
| | Freightways Ltd. | 181,959 | 1,689 |
| | Kiwi Property Group Ltd. | 1,621,385 | 1,360 |
| | Z Energy Ltd. | 492,503 | 1,271 |
| | Genesis Energy Ltd. | 537,976 | 1,257 |
| | Argosy Property Ltd. | 859,658 | 962 |
| * | Pushpay Holdings Ltd. | 669,225 | 913 |
| | Vital Healthcare Property Trust | 399,090 | 838 |
| | Arvida Group Ltd. | 554,775 | 793 |
| | Heartland Group Holdings Ltd. | 469,922 | 791 |
| | Oceania Healthcare Ltd. | 746,193 | 748 |
| | | Shares | Market
Value•
($000) |
| | Vector Ltd. | 225,485 | 662 |
| | Skellerup Holdings Ltd. | 147,477 | 658 |
| * | Pacific Edge Ltd. | 607,092 | 640 |
| * | Air New Zealand Ltd. | 478,039 | 573 |
| | Kathmandu Holdings Ltd. | 483,336 | 551 |
| * | Serko Ltd. | 77,445 | 434 |
| | Stride Property Group | 238,443 | 407 |
| | Scales Corp. Ltd. | 99,647 | 383 |
| * | Vista Group International Ltd. | 179,170 | 325 |
| * | Restaurant Brands New Zealand Ltd. | 23,921 | 267 |
| * | Tourism Holdings Ltd. | 124,256 | 245 |
| * | Synlait Milk Ltd. | 89,863 | 232 |
| * | SKY Network Television Ltd. | 160,426 | 218 |
| * | Arvida Group Ltd. Rights Exp.11/08/2021 | 84,440 | 9 |
| | | | 87,559 |
| Singapore (2.8%) |
| | DBS Group Holdings Ltd. | 1,819,213 | 42,511 |
| | Oversea-Chinese Banking Corp. Ltd. | 3,548,997 | 31,025 |
| | United Overseas Bank Ltd. | 1,303,590 | 25,913 |
| | Singapore Telecommunications Ltd. | 7,609,515 | 14,117 |
| | Ascendas REIT | 3,520,010 | 8,062 |
| | CapitaLand Integrated Commercial Trust | 4,865,571 | 7,748 |
| | Wilmar International Ltd. | 2,147,816 | 6,867 |
| * | Capitaland Investment Ltd. | 2,627,805 | 6,703 |
| | Singapore Exchange Ltd. | 845,818 | 6,070 |
| | Keppel Corp. Ltd. | 1,454,860 | 5,806 |
| * | Singapore Airlines Ltd. | 1,291,483 | 4,975 |
| | Singapore Technologies Engineering Ltd. | 1,563,030 | 4,439 |
| | Mapletree Logistics Trust | 2,951,329 | 4,426 |
| | Mapletree Industrial Trust | 1,896,121 | 3,871 |
| | Venture Corp. Ltd. | 263,816 | 3,685 |
| | Mapletree Commercial Trust | 2,254,137 | 3,646 |
| | Genting Singapore Ltd. | 6,045,494 | 3,496 |
| | Frasers Logistics & Commercial Trust | 2,648,756 | 2,983 |
| | UOL Group Ltd. | 509,897 | 2,735 |
| | City Developments Ltd. | 487,317 | 2,645 |
| | ComfortDelGro Corp. Ltd. | 2,129,304 | 2,468 |
| 1 | Singapore Press Holdings Ltd. | 1,644,257 | 2,434 |
| | | Shares | Market
Value•
($000) |
| | Suntec REIT | 2,156,066 | 2,387 |
| | NetLink NBN Trust | 3,103,600 | 2,347 |
| | Keppel DC REIT | 1,321,778 | 2,340 |
| * | SATS Ltd. | 666,841 | 2,074 |
| | Frasers Centrepoint Trust | 1,131,943 | 2,024 |
| | Mapletree North Asia Commercial Trust | 2,293,700 | 1,738 |
| | Keppel REIT | 2,058,782 | 1,723 |
| | Jardine Cycle & Carriage Ltd. | 101,127 | 1,691 |
| | Ascott Residence Trust | 1,894,298 | 1,448 |
| | Sembcorp Industries Ltd. | 963,968 | 1,439 |
| | Parkway Life REIT | 406,654 | 1,406 |
| | Keppel Infrastructure Trust | 3,469,580 | 1,365 |
| | Haw Par Corp. Ltd. | 133,000 | 1,243 |
| | Golden Agri-Resources Ltd. | 6,053,150 | 1,187 |
| | Hutchison Port Holdings Trust Class U | 5,015,299 | 1,080 |
| | Manulife US REIT | 1,493,575 | 1,063 |
| | CapitaLand China Trust | 1,147,830 | 1,040 |
| | iFAST Corp. Ltd. | 159,400 | 1,025 |
| * | Sembcorp Marine Ltd. | 17,453,725 | 1,023 |
| | Raffles Medical Group Ltd. | 965,037 | 982 |
| | Ascendas India Trust | 914,200 | 944 |
| | ESR-REIT | 2,630,560 | 938 |
| | ARA LOGOS Logistics Trust | 1,380,343 | 923 |
| 1 | SPH REIT | 1,222,120 | 885 |
| | Cromwell European REIT | 283,680 | 866 |
| | Starhill Global REIT | 1,590,101 | 761 |
| | CDL Hospitality Trusts | 844,653 | 752 |
| | Keppel Pacific Oak US REIT | 907,400 | 721 |
| | Olam International Ltd. | 562,700 | 709 |
| | Singapore Post Ltd. | 1,389,029 | 675 |
| | AIMS APAC REIT | 631,400 | 674 |
| | OUE Commercial REIT | 1,875,216 | 625 |
| | AEM Holdings Ltd. | 197,400 | 615 |
| | First Resources Ltd. | 464,389 | 613 |
| | StarHub Ltd. | 601,070 | 553 |
| | Far East Hospitality Trust | 1,139,089 | 545 |
| | Lendlease Global Commercial REIT | 822,000 | 534 |
| | Prime US REIT | 603,753 | 522 |
| | Wing Tai Holdings Ltd. | 333,152 | 479 |
| | Sabana Industrial REIT | 1,319,259 | 426 |
| | Sheng Siong Group Ltd. | 398,299 | 420 |
| | Nanofilm Technologies International Ltd. | 144,700 | 406 |
| | | Shares | Market
Value•
($000) |
| * | Thomson Medical Group Ltd. | 6,192,700 | 391 |
| | Riverstone Holdings Ltd. | 565,500 | 361 |
| * | SIA Engineering Co. Ltd. | 214,009 | 345 |
| | Frasers Hospitality Trust | 713,300 | 254 |
| *,1 | Best World International Ltd. | 259,100 | 249 |
| | Lippo Malls Indonesia Retail Trust | 5,016,496 | 208 |
| | First REIT | 947,408 | 186 |
| | Asian Pay Television Trust | 1,761,217 | 176 |
| * | COSCO Shipping International Singapore Co. Ltd. | 847,800 | 173 |
| | Silverlake Axis Ltd. | 702,936 | 167 |
| | Bumitama Agri Ltd. | 289,847 | 118 |
| * | Yoma Strategic Holdings Ltd. | 1,014,847 | 104 |
| *,1 | Eagle Hospitality Trust | 700,500 | 96 |
| *,1 | Hyflux Ltd. | 516,932 | 80 |
| *,1,2 | Ezra Holdings Ltd. | 1,786,900 | 15 |
| *,2 | Ezion Holdings Ltd. Warrants Exp. 4/16/23 | 1,048,679 | — |
| | | | 244,759 |
| South Korea (13.4%) |
| | Samsung Electronics Co. Ltd. | 4,765,749 | 285,340 |
| | NAVER Corp. | 136,495 | 47,457 |
| | Samsung Electronics Co. Ltd. Preference Shares | 849,740 | 46,681 |
| | SK Hynix Inc. | 524,798 | 46,261 |
| | LG Chem Ltd. | 47,305 | 33,944 |
| | Samsung SDI Co. Ltd. | 53,205 | 33,569 |
| | Kakao Corp. | 277,191 | 29,821 |
| | Hyundai Motor Co. | 150,412 | 26,902 |
| | Kia Corp. | 259,317 | 18,923 |
| | KB Financial Group Inc. | 388,496 | 18,805 |
| * | Celltrion Inc. | 107,847 | 18,567 |
| | POSCO | 65,835 | 16,698 |
| | Shinhan Financial Group Co. Ltd. | 497,521 | 16,243 |
| | Hyundai Mobis Co. Ltd. | 64,474 | 13,937 |
| * | SK Innovation Co. Ltd. | 55,705 | 11,617 |
| | Hana Financial Group Inc. | 296,810 | 11,445 |
| | LG Electronics Inc. | 107,920 | 11,165 |
| *,3 | Samsung Biologics Co. Ltd. | 13,727 | 10,226 |
| | LG Household & Health Care Ltd. | 9,273 | 9,281 |
| | NCSoft Corp. | 17,269 | 9,279 |
| | Samsung C&T Corp. | 86,222 | 8,442 |
| *,2 | HMM Co. Ltd. | 355,340 | 8,130 |
| | Samsung Electro-Mechanics Co. Ltd. | 55,963 | 7,621 |
| | | Shares | Market
Value•
($000) |
| | KT&G Corp. | 108,018 | 7,503 |
| | SK Inc. | 31,984 | 6,675 |
| | Samsung Fire & Marine Insurance Co. Ltd. | 33,147 | 6,570 |
| | LG Corp. | 83,114 | 6,498 |
| *,2 | Doosan Heavy Industries & Construction Co. Ltd. | 298,870 | 6,252 |
| | Woori Financial Group Inc. | 523,757 | 5,954 |
| 1 | SK Telecom Co. Ltd. | 22,295 | 5,903 |
| * | Celltrion Healthcare Co. Ltd. | 75,105 | 5,222 |
| | Amorepacific Corp. | 33,495 | 5,212 |
| * | HYBE Co. Ltd. | 17,757 | 5,101 |
| | Korea Electric Power Corp. | 259,971 | 5,037 |
| | Korea Zinc Co. Ltd. | 10,174 | 4,684 |
| * | Korean Air Lines Co. Ltd. | 178,951 | 4,666 |
| | Samsung SDS Co. Ltd. | 32,850 | 4,318 |
| * | SK Bioscience Co. Ltd. | 20,285 | 3,983 |
| | Coway Co. Ltd. | 57,751 | 3,916 |
| * | Korea Shipbuilding & Offshore Engineering Co. Ltd. | 44,208 | 3,909 |
| *,2 | LG Display Co. Ltd. | 229,472 | 3,878 |
| | Samsung Life Insurance Co. Ltd. | 64,746 | 3,745 |
| | S-Oil Corp. | 41,839 | 3,661 |
| | L&F Co. Ltd. | 22,606 | 3,579 |
| | POSCO Chemical Co. Ltd. | 27,665 | 3,452 |
| * | Samsung Engineering Co. Ltd. | 159,431 | 3,391 |
| * | Hanwha Solutions Corp. | 95,963 | 3,367 |
| * | HLB Inc. | 90,088 | 3,244 |
| * | Samsung Heavy Industries Co. Ltd. | 582,435 | 3,183 |
| | Hyundai Engineering & Construction Co. Ltd. | 73,451 | 3,175 |
| | Ecopro BM Co. Ltd. | 8,790 | 3,090 |
| | SKC Co. Ltd. | 19,156 | 2,945 |
| | E-MART Inc. | 20,238 | 2,913 |
| | Hyundai Steel Co. | 76,178 | 2,912 |
| | Korea Investment Holdings Co. Ltd. | 38,927 | 2,911 |
| | Lotte Chemical Corp. | 14,985 | 2,882 |
| *,2 | Pearl Abyss Corp. | 31,513 | 2,806 |
| | Hyundai Motor Co. Preference Shares (XKRS) | 33,392 | 2,805 |
| | LG Uplus Corp. | 227,779 | 2,803 |
| | Hyundai Heavy Industries Holdings Co. Ltd. | 51,572 | 2,796 |
| | Hyundai Glovis Co. Ltd. | 18,742 | 2,699 |
| | Samsung Securities Co. Ltd. | 66,205 | 2,691 |
| | | Shares | Market
Value•
($000) |
| | Hankook Tire & Technology Co. Ltd. | 75,512 | 2,675 |
| | LG Innotek Co. Ltd. | 14,778 | 2,656 |
| | Kumho Petrochemical Co. Ltd. | 17,905 | 2,635 |
| | CJ CheilJedang Corp. | 8,041 | 2,613 |
| 2 | Wemade Co. Ltd. | 16,623 | 2,601 |
| * | Kangwon Land Inc. | 109,102 | 2,596 |
| | Yuhan Corp. | 48,912 | 2,509 |
| | Industrial Bank of Korea | 258,841 | 2,450 |
| | Mirae Asset Securities Co. Ltd. | 323,951 | 2,417 |
| * | F&F Co. Ltd. | 3,164 | 2,363 |
| | LG Chem Ltd. Preference Shares | 7,177 | 2,357 |
| | DB Insurance Co. Ltd. | 46,136 | 2,345 |
| | Hansol Chemical Co. Ltd. | 8,175 | 2,307 |
| | BNK Financial Group Inc. | 299,906 | 2,261 |
| | Orion Corp.Republic of Korea | 22,045 | 2,230 |
| | Hotel Shilla Co. Ltd. | 28,900 | 2,165 |
| | GS Engineering & Construction Corp. | 59,101 | 2,097 |
| | SK Chemicals Co. Ltd. | 13,495 | 2,085 |
| * | OCI Co. Ltd. | 18,329 | 2,031 |
| * | SK Biopharmaceuticals Co. Ltd. | 24,899 | 2,016 |
| | Hanon Systems | 160,510 | 1,988 |
| * | DL E&C Co. Ltd. | 16,350 | 1,893 |
| | GS Holdings Corp. | 52,151 | 1,889 |
| * | Hyosung Advanced Materials Corp. | 3,056 | 1,867 |
| * | Kakao Games Corp. | 27,184 | 1,858 |
| *,2 | Celltrion Pharm Inc. | 18,976 | 1,848 |
| * | Mando Corp. | 33,809 | 1,815 |
| | DB HiTek Co. Ltd. | 36,512 | 1,805 |
| 3 | Netmarble Corp. | 16,886 | 1,788 |
| | Korea Aerospace Industries Ltd. | 65,476 | 1,720 |
| | Hanmi Pharm Co. Ltd. | 7,492 | 1,694 |
| 2 | Fila Holdings Corp. | 52,818 | 1,683 |
| * | Alteogen Inc. | 27,796 | 1,665 |
| | CJ ENM Co. Ltd. | 10,514 | 1,590 |
| | Iljin Materials Co. Ltd. | 18,243 | 1,577 |
| 2 | Hyosung TNC Corp. | 3,022 | 1,554 |
| 2 | Shinsegae Inc. | 7,152 | 1,521 |
| | Cheil Worldwide Inc. | 74,357 | 1,519 |
| * | Hyundai Rotem Co. Ltd. | 76,492 | 1,481 |
| 2 | Shin Poong Pharmaceutical Co. Ltd. | 33,181 | 1,478 |
| | Kolon Industries Inc. | 19,129 | 1,464 |
| | NH Investment & Securities Co. Ltd. | 129,260 | 1,460 |
| | SK Materials Co. Ltd. | 4,439 | 1,453 |
| | Meritz Fire & Marine Insurance Co. Ltd. | 59,146 | 1,406 |
| | | Shares | Market
Value•
($000) |
| | S-1 Corp. | 19,688 | 1,404 |
| | Hanwha Aerospace Co. Ltd. | 36,042 | 1,392 |
| | KCC Corp. | 4,853 | 1,387 |
| | Hyundai Marine & Fire Insurance Co. Ltd. | 61,619 | 1,386 |
| | DGB Financial Group Inc. | 154,909 | 1,373 |
| | LEENO Industrial Inc. | 9,347 | 1,370 |
| * | Eubiologics Co. Ltd. | 32,622 | 1,336 |
| 2 | Seegene Inc. | 29,122 | 1,332 |
| *,2 | Doosan Fuel Cell Co. Ltd. | 29,081 | 1,305 |
| * | Hyundai Mipo Dockyard Co. Ltd. | 20,050 | 1,304 |
| * | SM Entertainment Co. Ltd. | 19,336 | 1,303 |
| 2 | Ecopro Co. Ltd. | 15,092 | 1,298 |
| | JYP Entertainment Corp. | 28,675 | 1,290 |
| | Green Cross Corp. | 5,428 | 1,277 |
| | LOTTE Fine Chemical Co. Ltd. | 17,397 | 1,270 |
| | Douzone Bizon Co. Ltd. | 18,172 | 1,269 |
| 2 | CS Wind Corp. | 20,751 | 1,239 |
| 2 | WONIK IPS Co. Ltd. | 35,311 | 1,226 |
| | AMOREPACIFIC Group | 28,726 | 1,223 |
| | Hanwha Corp. | 42,028 | 1,210 |
| | Meritz Securities Co. Ltd. | 295,977 | 1,183 |
| | Youngone Corp. | 30,813 | 1,179 |
| * | Ecopro HN Co. Ltd. | 12,573 | 1,171 |
| | KIWOOM Securities Co. Ltd. | 12,685 | 1,144 |
| | AfreecaTV Co. Ltd. | 6,877 | 1,139 |
| | JB Financial Group Co. Ltd. | 147,513 | 1,121 |
| | Hyundai Wia Corp. | 15,369 | 1,110 |
| | Com2uSCorp | 9,965 | 1,098 |
| | GS Retail Co. Ltd. | 39,024 | 1,077 |
| | Hyundai Department Store Co. Ltd. | 14,983 | 1,064 |
| | Osstem Implant Co. Ltd. | 9,941 | 1,054 |
| *,2 | Daewoo Shipbuilding & Marine Engineering Co. Ltd. | 47,251 | 1,049 |
| * | Genexine Inc. | 18,598 | 1,046 |
| | CJ Corp. | 12,609 | 1,037 |
| | Hyundai Elevator Co. Ltd. | 24,932 | 1,035 |
| *,2 | KMW Co. Ltd. | 29,091 | 1,028 |
| | HDC Hyundai Development Co-Engineering & Construction Class E | 46,785 | 1,026 |
| | LG Electronics Inc. Preference Shares | 18,591 | 1,023 |
| | Pan Ocean Co. Ltd. | 193,588 | 1,002 |
| * | HLB Life Science Co. Ltd. | 77,344 | 990 |
| | Lotte Shopping Co. Ltd. | 10,972 | 988 |
| | LS Corp. | 18,312 | 982 |
| | | Shares | Market
Value•
($000) |
| | Koh Young Technology Inc. | 60,761 | 960 |
| * | Hugel Inc. | 6,154 | 956 |
| * | Korea Gas Corp. | 25,017 | 950 |
| | Chunbo Co. Ltd. | 3,871 | 941 |
| 2 | Hite Jinro Co. Ltd. | 31,245 | 932 |
| * | Hanjin Kal Corp. | 19,759 | 927 |
| | Samsung Card Co. Ltd. | 31,402 | 922 |
| | Soulbrain Co. Ltd. | 4,096 | 919 |
| | Posco International Corp. | 48,810 | 909 |
| * | CJ Logistics Corp. | 7,437 | 904 |
| * | Daewoo Engineering & Construction Co. Ltd. | 167,792 | 898 |
| | Dongsuh Cos. Inc. | 30,224 | 892 |
| * | GeneOne Life Science Inc. | 41,447 | 891 |
| | BGF retail Co. Ltd. | 6,320 | 878 |
| | Meritz Financial Group Inc. | 30,549 | 874 |
| 2 | LX Semicon Co. Ltd. | 9,070 | 853 |
| * | CosmoAM&T Co. Ltd. | 23,529 | 851 |
| | Daejoo Electronic Materials Co. Ltd. | 9,462 | 851 |
| * | Cosmax Inc. | 7,847 | 835 |
| 2 | Dongjin Semichem Co. Ltd. | 27,658 | 833 |
| | Eo Technics Co. Ltd. | 8,913 | 822 |
| * | Foosung Co. Ltd. | 47,810 | 821 |
| | Hanwha Systems Co. Ltd. | 57,570 | 810 |
| | Hanwha Life Insurance Co. Ltd. | 269,756 | 804 |
| | LS Electric Co. Ltd. | 15,814 | 800 |
| | LG Household & Health Care Ltd. Preference Shares | 1,556 | 799 |
| | Hanssem Co. Ltd. | 9,165 | 798 |
| * | Doosan Bobcat Inc. | 24,398 | 797 |
| | NongShim Co. Ltd. | 3,280 | 795 |
| * | Creative & Innovative System | 50,111 | 792 |
| | Dongkuk Steel Mill Co. Ltd. | 53,712 | 784 |
| | Solus Advanced Materials Co. Ltd. | 10,994 | 777 |
| * | Naturecell Co. Ltd. | 45,572 | 773 |
| | KEPCO Plant Service & Engineering Co. Ltd. | 21,543 | 771 |
| | Korean Reinsurance Co. | 92,025 | 762 |
| * | SOLUM Co. Ltd. | 33,661 | 758 |
| | Lotte Corp. | 27,012 | 757 |
| *,2 | Paradise Co. Ltd. | 49,997 | 746 |
| | Chong Kun Dang Pharmaceutical Corp. | 7,427 | 746 |
| | MegaStudyEdu Co. Ltd. | 11,052 | 728 |
| | KEPCO Engineering & Construction Co. Inc. | 11,866 | 720 |
| 2 | Dawonsys Co. Ltd. | 24,780 | 699 |
| | Hyosung Corp. | 7,858 | 696 |
| | | Shares | Market
Value•
($000) |
| | Mirae Asset Securities Co. Ltd. Preference Shares | 163,465 | 678 |
| | Hanmi Semiconductor Co. Ltd. | 24,538 | 676 |
| | SSANGYONG C&E Co. Ltd. | 100,216 | 675 |
| | Hanmi Science Co. Ltd. | 13,807 | 671 |
| | Green Cross Holdings Corp. | 26,706 | 670 |
| * | Hana Tour Service Inc. | 9,300 | 665 |
| * | Mezzion Pharma Co. Ltd. | 4,914 | 660 |
| | PharmaResearch Co. Ltd. | 8,368 | 660 |
| * | Hanall Biopharma Co. Ltd. | 37,629 | 659 |
| *,2 | Hyundai Bioscience Co. Ltd. | 32,639 | 659 |
| * | Asiana Airlines Inc. | 33,741 | 652 |
| * | ST Pharm Co. Ltd. | 8,669 | 650 |
| | LOTTE REIT Co. Ltd. | 133,315 | 646 |
| * | NHN KCP Corp. | 13,142 | 645 |
| | SK Networks Co. Ltd. | 147,072 | 641 |
| * | Chabiotech Co. Ltd. | 37,619 | 630 |
| * | Next Science Co. Ltd. | 39,750 | 627 |
| | Innocean Worldwide Inc. | 12,369 | 623 |
| * | MedPacto Inc. | 12,799 | 620 |
| * | Hanjin Heavy Industries & Construction Co. Ltd. | 75,504 | 619 |
| *,2 | LegoChem Biosciences Inc. | 15,952 | 616 |
| * | NHN Corp. | 8,977 | 615 |
| | NICE Information Service Co. Ltd. | 36,118 | 611 |
| *,2 | Oscotec Inc. | 23,786 | 610 |
| * | Kumho Tire Co. Inc. | 132,573 | 606 |
| * | Helixmith Co. Ltd. | 28,943 | 591 |
| *,2 | NKMax Co. Ltd. | 26,054 | 583 |
| * | YG Entertainment Inc. | 9,618 | 580 |
| | Kolmar Korea Co. Ltd. | 15,152 | 579 |
| * | Duk San Neolux Co. Ltd. | 12,436 | 578 |
| | Hyundai Motor Co. Preference Shares | 6,845 | 573 |
| * | Pharmicell Co. Ltd. | 53,148 | 569 |
| * | CJ CGV Co. Ltd. | 20,767 | 568 |
| | Daewoong Co. Ltd. | 20,737 | 562 |
| * | Medytox Inc. | 4,351 | 559 |
| * | Vaxcell-Bio Therapeutics Co. Ltd. | 10,142 | 559 |
| *,2 | GemVax & Kael Co. Ltd. | 34,864 | 557 |
| | Daewoong Pharmaceutical Co. Ltd. | 4,602 | 553 |
| | DoubleUGames Co. Ltd. | 10,014 | 550 |
| | | Shares | Market
Value•
($000) |
| | SFA Engineering Corp. | 18,068 | 546 |
| * | Innox Advanced Materials Co. Ltd. | 14,990 | 545 |
| | DL Holdings Co. Ltd. | 9,606 | 542 |
| | Sebang Global Battery Co. Ltd. | 7,694 | 541 |
| | Zinus Inc. | 8,071 | 541 |
| | Samsung SDI Co. Ltd. Preference Shares | 1,670 | 541 |
| 2 | S&S Tech Corp. | 16,782 | 530 |
| | Ottogi Corp. | 1,285 | 529 |
| *,2 | Sam Chun Dang Pharm Co. Ltd. | 13,052 | 527 |
| | LX International Corp. | 22,569 | 526 |
| 2 | Eugene Technology Co. Ltd. | 13,794 | 526 |
| * | Hyosung Chemical Corp. | 2,114 | 524 |
| | Samsung Fire & Marine Insurance Co. Ltd. Preference Shares | 3,435 | 520 |
| * | Lotte Tour Development Co. Ltd. | 29,908 | 516 |
| | Poongsan Corp. | 17,884 | 507 |
| * | Hanwha Investment & Securities Co. Ltd. | 106,248 | 505 |
| * | Cellivery Therapeutics Inc. | 11,764 | 504 |
| | Samyang Holdings Corp. | 5,670 | 500 |
| | Park Systems Corp. | 4,897 | 497 |
| * | UniTest Inc. | 19,384 | 491 |
| * | Amicogen Inc. | 17,718 | 490 |
| | PI Advanced Materials Co. Ltd. | 12,650 | 490 |
| | Hyundai Autoever Corp. | 4,871 | 488 |
| | SIMMTECH Co. Ltd. | 18,344 | 483 |
| *,2 | Ananti Inc. | 42,383 | 481 |
| | IS Dongseo Co. Ltd. | 12,417 | 481 |
| | Seoul Semiconductor Co. Ltd. | 37,584 | 481 |
| | Daeduck Electronics Co. Ltd. | 32,323 | 476 |
| | Korea Petrochemical Ind Co. Ltd. | 2,990 | 475 |
| *,2 | Taihan Electric Wire Co. Ltd. | 245,837 | 472 |
| | Tokai Carbon Korea Co. Ltd. | 4,410 | 472 |
| | Doosan Co. Ltd. | 5,309 | 470 |
| | Nature Holdings Co. Ltd. | 16,611 | 468 |
| | Hyundai Greenfood Co. Ltd. | 55,838 | 464 |
| | Green Cross LabCell Corp. | 5,592 | 464 |
| | Taekwang Industrial Co. Ltd. | 540 | 462 |
| | Handsome Co. Ltd. | 12,627 | 456 |
| | Boryung Pharmaceutical Co. Ltd. | 36,721 | 454 |
| | | Shares | Market
Value•
($000) |
| 2 | RFHIC Corp. | 16,829 | 453 |
| | Daou Technology Inc. | 22,517 | 450 |
| | Daishin Securities Co. Ltd. Preference Shares | 27,511 | 447 |
| | Amorepacific Corp. Preference Shares | 7,136 | 440 |
| | Hanjin Transportation Co. Ltd. | 14,714 | 438 |
| | DongKook Pharmaceutical Co. Ltd. | 22,809 | 438 |
| | LIG Nex1 Co. Ltd. | 10,928 | 438 |
| | Mcnex Co. Ltd. | 11,654 | 434 |
| * | TY Holdings Co. Ltd. | 18,650 | 434 |
| * | Humasis Co. Ltd. | 31,188 | 432 |
| | Korea Electric Terminal Co. Ltd. | 6,653 | 431 |
| * | SFA Semicon Co. Ltd. | 79,370 | 431 |
| | KCC Glass Corp. | 8,356 | 431 |
| | Huchems Fine Chemical Corp. | 18,895 | 428 |
| * | Cellid Co. Ltd. | 6,935 | 427 |
| * | iNtRON Biotechnology Inc. | 25,591 | 423 |
| | Lotte Chilsung Beverage Co. Ltd. | 3,376 | 422 |
| * | ABLBio Inc. | 23,008 | 422 |
| | Bukwang Pharmaceutical Co. Ltd. | 37,601 | 421 |
| * | Eoflow Co. Ltd. | 9,185 | 419 |
| * | Studio Dragon Corp. | 5,602 | 414 |
| * | NEPES Corp. | 13,723 | 413 |
| * | Vidente Co. Ltd. | 32,963 | 410 |
| *,2 | KH Vatec Co. Ltd. | 19,694 | 408 |
| 2 | Tesna Inc. | 10,384 | 406 |
| | Daishin Securities Co. Ltd. | 22,679 | 405 |
| | SL Corp. | 14,372 | 405 |
| | JR REIT XXVII | 84,667 | 403 |
| | Partron Co. Ltd. | 49,414 | 397 |
| | ESR Kendall Square REIT Co. Ltd. | 68,066 | 397 |
| * | Hyundai Construction Equipment Co. Ltd. | 11,431 | 396 |
| | Korea United Pharm Inc. | 9,469 | 396 |
| | SK Discovery Co. Ltd. | 9,687 | 395 |
| * | Hyundai Electric & Energy System Co. Ltd. | 20,603 | 391 |
| | Ahnlab Inc. | 5,395 | 379 |
| * | Eyegene Inc. | 18,918 | 377 |
| 2 | BH Co. Ltd. | 23,385 | 376 |
| | Hanwha Corp. Preference Shares | 26,298 | 370 |
| *,2 | Hyundai Doosan Infracore Co. Ltd. | 41,010 | 369 |
| | Dentium Co. Ltd. | 6,176 | 366 |
| *,2 | Enzychem Lifesciences Corp. | 6,398 | 365 |
| | Hankook & Co. Co. Ltd. | 25,320 | 363 |
| | Samwha Capacitor Co. Ltd. | 7,443 | 363 |
| | | Shares | Market
Value•
($000) |
| *,2 | Ace Technologies Corp. | 29,322 | 361 |
| | L&C Bio Co. Ltd. | 12,180 | 357 |
| *,2 | Webzen Inc. | 15,384 | 356 |
| * | Hyosung Heavy Industries Corp. | 6,137 | 355 |
| | Daesang Corp. | 17,321 | 354 |
| * | Shinsung E&G Co. Ltd. | 173,262 | 351 |
| * | OliX Pharmaceuticals Inc. | 10,430 | 344 |
| | Korea Real Estate Investment & Trust Co. Ltd. | 171,141 | 343 |
| * | Jusung Engineering Co. Ltd. | 35,485 | 342 |
| * | DIO Corp. | 10,429 | 337 |
| | GOLFZON Co. Ltd. | 2,753 | 334 |
| | LX Hausys Ltd. | 5,605 | 334 |
| * | Korea Line Corp. | 137,116 | 332 |
| | Hanil Cement Co. Ltd. | 20,020 | 332 |
| * | Insun ENT Co. Ltd. | 31,364 | 326 |
| | Ilyang Pharmaceutical Co. Ltd. | 12,745 | 325 |
| * | Binex Co. Ltd. | 22,811 | 324 |
| * | Yungjin Pharmaceutical Co. Ltd. | 80,680 | 324 |
| * | CrystalGenomics Inc. | 54,880 | 323 |
| | Daea TI Co. Ltd. | 56,219 | 319 |
| | HDC Holdings Co. Ltd. | 35,160 | 318 |
| * | CMG Pharmaceutical Co. Ltd. | 95,798 | 316 |
| | Interpark Corp. | 54,673 | 314 |
| | SK Securities Co. Ltd. | 373,367 | 314 |
| | TES Co. Ltd. | 13,707 | 314 |
| 2 | Shinsegae International Inc. | 2,180 | 314 |
| | Hyundai Home Shopping Network Corp. | 5,188 | 311 |
| | Hansae Co. Ltd. | 15,534 | 309 |
| | Orion Holdings Corp. | 22,426 | 307 |
| | Young Poong Corp. | 523 | 307 |
| * | Krafton Inc. | 764 | 307 |
| * | LX Holdings Corp. | 39,991 | 303 |
| * | Modetour Network Inc. | 13,449 | 298 |
| | Posco ICT Co. Ltd. | 51,039 | 293 |
| | SNT Motiv Co. Ltd. | 6,754 | 292 |
| | Halla Holdings Corp. | 6,651 | 291 |
| *,2 | G-treeBNT Co. Ltd. | 20,748 | 291 |
| * | Samsung Pharmaceutical Co. Ltd. | 56,690 | 284 |
| | Dong-A Socio Holdings Co. Ltd. | 3,114 | 282 |
| * | Lutronic Corp. | 17,457 | 282 |
| | Advanced Process Systems Corp. | 13,743 | 279 |
| | Yuanta Securities Korea Co. Ltd. | 72,004 | 278 |
| | KUMHOE&C Co. Ltd. | 26,585 | 275 |
| | | Shares | Market
Value•
($000) |
| * | Komipharm International Co. Ltd. | 35,613 | 274 |
| | Mirae Asset Life Insurance Co. Ltd. | 75,034 | 274 |
| | NICE Holdings Co. Ltd. | 18,837 | 273 |
| | Dong-A ST Co. Ltd. | 4,366 | 273 |
| | ITM Semiconductor Co. Ltd. | 6,778 | 271 |
| * | Hanwha General Insurance Co. Ltd. | 69,810 | 270 |
| | Tongyang Inc. | 187,196 | 269 |
| *,2 | Kuk-il Paper Manufacturing Co. Ltd. | 73,045 | 269 |
| * | Cafe24 Corp. | 10,798 | 267 |
| * | Inscobee Inc. | 94,801 | 266 |
| * | KH Feelux Co. Ltd. | 102,348 | 266 |
| * | Gamevil Inc. | 4,143 | 264 |
| * | Medipost Co. Ltd. | 13,210 | 258 |
| | Dongwon Industries Co. Ltd. | 1,318 | 257 |
| | Huons Co. Ltd. | 5,822 | 252 |
| | LOTTE Himart Co. Ltd. | 10,553 | 251 |
| | Hyundai Bioland Co. Ltd. | 14,601 | 250 |
| | LF Corp. | 15,869 | 249 |
| * | Neowiz | 11,060 | 249 |
| * | Anterogen Co. Ltd. | 4,910 | 247 |
| | HS Industries Co. Ltd. | 42,627 | 246 |
| | Binggrae Co. Ltd. | 5,135 | 245 |
| | KISWIRE Ltd. | 10,178 | 240 |
| | KTB Investment & Securities Co. Ltd. | 42,380 | 239 |
| | JW Pharmaceutical Corp. | 11,850 | 237 |
| | Songwon Industrial Co. Ltd. | 15,319 | 236 |
| * | Hancom Inc. | 13,741 | 236 |
| * | Grand Korea Leisure Co. Ltd. | 16,802 | 235 |
| * | Sangsangin Co. Ltd. | 29,855 | 229 |
| * | Seojin System Co. Ltd. | 7,612 | 225 |
| | Seobu T&D | 29,893 | 224 |
| | SK Gas Ltd. | 1,890 | 223 |
| | Vieworks Co. Ltd. | 6,552 | 222 |
| | InBody Co. Ltd. | 9,496 | 221 |
| | INTOPS Co. Ltd. | 11,060 | 221 |
| | Cuckoo Homesys Co. Ltd. | 5,915 | 221 |
| | Huons Global Co. Ltd. | 5,161 | 218 |
| | i-SENS Inc. | 7,553 | 217 |
| | Namhae Chemical Corp. | 18,726 | 215 |
| | Jeil Pharmaceutical Co. Ltd. | 7,294 | 212 |
| | Seah Besteel Corp. | 11,393 | 211 |
| * | Solid Inc. | 36,942 | 211 |
| | Chongkundang Holdings Corp. | 2,972 | 209 |
| | Youlchon Chemical Co. Ltd. | 10,925 | 206 |
| * | S-MAC Co. Ltd. | 207,309 | 206 |
| | | Shares | Market
Value•
($000) |
| | Harim Holdings Co. Ltd. | 24,651 | 204 |
| | Sungwoo Hitech Co. Ltd. | 39,271 | 203 |
| | Youngone Holdings Co. Ltd. | 4,977 | 200 |
| | Namyang Dairy Products Co. Ltd. | 504 | 198 |
| | Dongwon F&B Co. Ltd. | 1,109 | 195 |
| | Kolon Corp. | 6,437 | 195 |
| | Nexen Tire Corp. | 29,801 | 193 |
| | Kwang Dong Pharmaceutical Co. Ltd. | 28,923 | 192 |
| | OptoElectronics Solutions Co. Ltd. | 6,701 | 192 |
| *,2 | Telcon RF Pharmaceutical Inc. | 65,678 | 191 |
| * | STCUBE | 26,847 | 190 |
| | Hansol Paper Co. Ltd. | 15,350 | 190 |
| | Samchully Co. Ltd. | 2,334 | 189 |
| | Maeil Dairies Co. Ltd. | 3,138 | 189 |
| | KC Tech Co. Ltd. | 9,680 | 187 |
| | Eugene Investment & Securities Co. Ltd. | 56,837 | 185 |
| * | Namsun Aluminum Co. Ltd. | 73,435 | 185 |
| | CJ CheilJedang Corp. Preference Shares | 1,096 | 182 |
| | Tongyang Life Insurance Co. Ltd. | 31,110 | 182 |
| | Samyang Corp. | 3,076 | 180 |
| | iMarketKorea Inc. | 19,079 | 180 |
| * | Eutilex Co. Ltd. | 8,376 | 180 |
| 1 | Green Cross Cell Corp. | 5,374 | 177 |
| * | Aprogen pharmaceuticals Inc. | 199,372 | 175 |
| | Taeyoung Engineering & Construction Co. Ltd. | 18,406 | 175 |
| | ENF Technology Co. Ltd. | 6,925 | 172 |
| | Woongjin Thinkbig Co. Ltd. | 59,387 | 170 |
| | Hyundai Engineering & Construction Co. Ltd. Preference Shares | 1,249 | 170 |
| | KISCO Corp. | 21,795 | 168 |
| * | Sambu Engineering & Construction Co. Ltd. | 92,419 | 165 |
| * | SCM Lifescience Co. Ltd. | 9,630 | 165 |
| | NS Shopping Co. Ltd. | 13,483 | 161 |
| | KC Co. Ltd. | 8,089 | 159 |
| *,2 | Soulbrain Holdings Co. Ltd. | 4,255 | 159 |
| | ICD Co. Ltd. | 14,626 | 157 |
| | | Shares | Market
Value•
($000) |
| * | Wonik Holdings Co. Ltd. | 34,924 | 156 |
| | Lotte Confectionery Co. Ltd. | 1,403 | 155 |
| | Dae Han Flour Mills Co. Ltd. | ��� 1,098 | 154 |
| | KT Skylife Co. Ltd. | 17,601 | 153 |
| * | Hansol Technics Co. Ltd. | 26,180 | 152 |
| * | Peptron Inc. | 15,974 | 152 |
| | SPC Samlip Co. Ltd. | 2,283 | 150 |
| | LG HelloVision Co. Ltd. | 25,075 | 149 |
| * | AbClon Inc. | 10,799 | 149 |
| | E1 Corp. | 3,252 | 146 |
| | Sung Kwang Bend Co. Ltd. | 18,185 | 143 |
| | Korea Asset In Trust Co. Ltd. | 36,837 | 139 |
| | Hankook Shell Oil Co. Ltd. | 577 | 138 |
| * | Lock&Lock Co. Ltd. | 15,263 | 137 |
| * | CJ Freshway Corp. | 4,781 | 135 |
| | Daeduck Co. Ltd. | 21,369 | 134 |
| *,1,2 | SillaJen Inc. | 48,243 | 132 |
| | Eusu Holdings Co. Ltd. | 25,616 | 131 |
| | Humedix Co. Ltd. | 5,513 | 131 |
| * | Dongsung Pharmaceutical Co. Ltd. | 17,023 | 130 |
| | Toptec Co. Ltd. | 17,206 | 129 |
| | TK Corp. | 12,480 | 126 |
| | Byucksan Corp. | 39,891 | 125 |
| | Kyobo Securities Co. Ltd. | 16,417 | 124 |
| * | Interflex Co. Ltd. | 11,070 | 123 |
| | DB Financial Investment Co. Ltd. | 19,746 | 120 |
| | Kolmar Korea Holdings Co. Ltd. | 5,952 | 118 |
| | BGF Co. Ltd. | 24,184 | 115 |
| * | Able C&C Co. Ltd. | 17,353 | 114 |
| | Hyundai Corp. | 7,187 | 113 |
| | Cuckoo Holdings Co. Ltd. | 5,760 | 111 |
| | Muhak Co. Ltd. | 13,199 | 110 |
| | AK Holdings Inc. | 4,810 | 109 |
| | Hanil Holdings Co. Ltd. | 9,090 | 109 |
| | Hyundai Livart Furniture Co. Ltd. | 7,935 | 108 |
| | Lotte Food Co. Ltd. | 327 | 107 |
| | Aekyung Industrial Co. Ltd. | 5,626 | 107 |
| 2 | F&F Holdings Co. Ltd. | 3,178 | 106 |
| * | SBS Media Holdings Co. Ltd. | 60,070 | 106 |
| | SNT Dynamics Co. Ltd. | 12,792 | 102 |
| | Hansol Holdings Co. Ltd. | 30,188 | 98 |
| | | Shares | Market
Value•
($000) |
| * | CUROCOM Co. Ltd. | 79,337 | 95 |
| | Sam Young Electronics Co. Ltd. | 8,881 | 92 |
| | Cell Biotech Co. Ltd. | 5,861 | 90 |
| | Daekyo Co. Ltd. | 24,343 | 90 |
| | Dae Hwa Pharmaceutical Co. Ltd. | 10,363 | 89 |
| | Samsung Electronics Co. Ltd. GDR (Registered) | 58 | 87 |
| * | Sindoh Co. Ltd. | 3,064 | 86 |
| * | Coreana Cosmetics Co. Ltd. | 22,740 | 83 |
| * | Homecast Co. Ltd. | 27,476 | 73 |
| * | KakaoBank Corp. | 1,055 | 57 |
| *,1 | Y2 Solution Co. Ltd. | 48,272 | 50 |
| * | Enzychem Lifesciences Rights Exp.12/17/2021 | 3,892 | 33 |
| * | GeneOne Life Science Inc. Rights Exp. 11/25/2021 | 5,073 | 16 |
| | | | 1,171,282 |
Total Common Stocks
(Cost $7,966,363) | 8,671,714 |
| Temporary Cash Investments (1.1%) |
| Money Market Fund (1.1%) |
| 4,5 | Vanguard Market Liquidity Fund, 0.070% (Cost $96,343) | 963,434 | 96,343 |
| Total Investments (100.5%) (Cost $8,062,706) | 8,768,057 |
| Other Assets and Liabilities—Net (-0.5%) | (43,871) |
| Net Assets (100%) | 8,724,186 |
| Cost is in $000. |
| • | See Note A in Notes to Financial Statements. |
| * | Non-income-producing security. |
| 1 | Security value determined using significant unobservable inputs. |
| 2 | Includes partial security positions on loan to broker-dealers. The total value of securities on loan is $70,265,000. |
| 3 | Security exempt from registration under Rule 144A of the Securities Act of 1933. Such securities may be sold in transactions exempt from registration, normally to qualified institutional buyers. At October 31, 2021, the aggregate value was $42,476,000, representing 0.5% of net assets. |
| 4 | Affiliated money market fund available only to Vanguard funds and certain trusts and accounts managed by Vanguard. Rate shown is the 7-day yield. |
| 5 | Collateral of $84,401,000 was received for securities on loan, of which $82,471,000 is held in Vanguard Market Liquidity Fund and $1,930,000 is held in cash. |
| GDR—Global Depositary Receipt. |
| REIT—Real Estate Investment Trust. |
Derivative Financial Instruments Outstanding as of Period End
| Futures Contracts |
| | | | ($000) |
| | Expiration | Number of
Long (Short)
Contracts | Notional
Amount | Value and
Unrealized
Appreciation
(Depreciation) |
| Long Futures Contracts | | | | |
| KOSPI 200 Index | December 2021 | 110 | 9,134 | (504) |
| S&P ASX 200 Index | December 2021 | 93 | 12,733 | (73) |
| Topix Index | December 2021 | 189 | 33,041 | (1,051) |
| | | | | (1,628) |
| Forward Currency Contracts |
| | Contract
Settlement
Date | Contract Amount (000) | Unrealized
Appreciation
($000) | Unrealized
Depreciation
($000) |
| Counterparty | Receive | Deliver |
| Royal Bank of Canada | 12/15/21 | AUD | 11,533 | USD | 8,349 | 329 | — |
| Bank of America, N.A. | 12/15/21 | AUD | 8,050 | USD | 5,942 | 115 | — |
| Royal Bank of Canada | 12/15/21 | JPY | 3,836,822 | USD | 34,949 | — | (1,268) |
| Morgan Stanley Capital Services Inc. | 12/15/21 | KRW | 6,260,758 | USD | 5,359 | — | (7) |
| Morgan Stanley Capital Services Inc. | 12/15/21 | USD | 7,969 | AUD | 10,762 | — | (127) |
| UBS AG | 12/15/21 | USD | 16,968 | JPY | 1,923,207 | 85 | — |
| BNP Paribas | 12/15/21 | USD | 10,756 | JPY | 1,197,924 | 240 | — |
| Morgan Stanley Capital Services Inc. | 12/15/21 | USD | 6,893 | JPY | 785,014 | 1 | — |
| | | | | | | 770 | (1,402) |
| AUD—Australian dollar. |
| JPY—Japanese yen. |
| KRW—Korean won. |
| USD—U.S. dollar. |
See accompanying Notes, which are an integral part of the Financial Statements.
Statement of Assets and Liabilities
|
| ($000s, except shares and per-share amounts) | Amount |
| Assets | |
| Investments in Securities, at Value | |
| Unaffiliated Issuers (Cost $7,966,363) | 8,671,714 |
| Affiliated Issuers (Cost $96,343) | 96,343 |
| Total Investments in Securities | 8,768,057 |
| Investment in Vanguard | 299 |
| Cash | 9,136 |
| Cash Collateral Pledged—Futures Contracts | 3,117 |
| Cash Collateral Pledged—Forward Currency Contracts | 1,080 |
| Foreign Currency, at Value (Cost $5,600) | 5,592 |
| Receivables for Accrued Income | 40,891 |
| Receivables for Capital Shares Issued | 370 |
| Unrealized Appreciation—Forward Currency Contracts | 770 |
| Other Assets | 1,563 |
| Total Assets | 8,830,875 |
| Liabilities | |
| Payables for Investment Securities Purchased | 14,165 |
| Collateral for Securities on Loan | 84,401 |
| Payables for Capital Shares Redeemed | 5,826 |
| Payables to Vanguard | 336 |
| Variation Margin Payable—Futures Contracts | 559 |
| Unrealized Depreciation—Forward Currency Contracts | 1,402 |
| Total Liabilities | 106,689 |
| Net Assets | 8,724,186 |
Statement of Assets and Liabilities (continued)
|
| At October 31, 2021, net assets consisted of: | |
| ($000s, except shares and per-share amounts) | Amount |
| Paid-in Capital | 8,226,745 |
| Total Distributable Earnings (Loss) | 497,441 |
| Net Assets | 8,724,186 |
| |
| Investor Shares—Net Assets | |
Applicable to 781,338 outstanding $.001 par value shares of
beneficial interest (unlimited authorization) | 12,032 |
| Net Asset Value Per Share—Investor Shares | $15.40 |
| |
| ETF Shares—Net Assets | |
Applicable to 67,607,355 outstanding $.001 par value shares of
beneficial interest (unlimited authorization) | 5,462,828 |
| Net Asset Value Per Share—ETF Shares | $80.80 |
| |
| Admiral Shares—Net Assets | |
Applicable to 28,354,436 outstanding $.001 par value shares of
beneficial interest (unlimited authorization) | 2,833,741 |
| Net Asset Value Per Share—Admiral Shares | $99.94 |
| |
| Institutional Shares—Net Assets | |
Applicable to 27,178,806 outstanding $.001 par value shares of
beneficial interest (unlimited authorization) | 415,585 |
| Net Asset Value Per Share—Institutional Shares | $15.29 |
See accompanying Notes, which are an integral part of the Financial Statements.
|
| | Year Ended
October 31, 2021 |
| | ($000) |
| Investment Income | |
| Income | |
| Dividends1 | 211,109 |
| Interest2 | 20 |
| Securities Lending—Net | 1,088 |
| Total Income | 212,217 |
| Expenses | |
| The Vanguard Group—Note B | |
| Investment Advisory Services | 1,274 |
| Management and Administrative—Investor Shares | 25 |
| Management and Administrative—ETF Shares | 2,635 |
| Management and Administrative—Admiral Shares | 2,096 |
| Management and Administrative—Institutional Shares | 224 |
| Marketing and Distribution—Investor Shares | 1 |
| Marketing and Distribution—ETF Shares | 137 |
| Marketing and Distribution—Admiral Shares | 72 |
| Marketing and Distribution—Institutional Shares | 9 |
| Custodian Fees | 578 |
| Auditing Fees | 52 |
| Shareholders’ Reports—Investor Shares | — |
| Shareholders’ Reports—ETF Shares | 192 |
| Shareholders’ Reports—Admiral Shares | 24 |
| Shareholders’ Reports—Institutional Shares | 18 |
| Trustees’ Fees and Expenses | 3 |
| Total Expenses | 7,340 |
| Net Investment Income | 204,877 |
| Realized Net Gain (Loss) | |
| Investment Securities Sold2,3 | (23,493) |
| Futures Contracts | 16,216 |
| Forward Currency Contracts | (1,966) |
| Foreign Currencies | (209) |
| Realized Net Gain (Loss) | (9,452) |
| Statement of Operations (continued) |
| | Year Ended
October 31, 2021 |
| | ($000) |
| Change in Unrealized Appreciation (Depreciation) | |
| Investment Securities2 | 1,285,463 |
| Futures Contracts | (309) |
| Forward Currency Contracts | (420) |
| Foreign Currencies | (1,125) |
| Change in Unrealized Appreciation (Depreciation) | 1,283,609 |
| Net Increase (Decrease) in Net Assets Resulting from Operations | 1,479,034 |
| 1 | Dividends are net of foreign withholding taxes of $16,589,000. |
| 2 | Interest income, realized net gain (loss), and change in unrealized appreciation (depreciation) from an affiliated company of the fund were $19,000, less than $1,000, and less than $1,000, respectively. Purchases and sales are for temporary cash investment purposes. |
| 3 | Includes $63,561,000 of net gain (loss) resulting from in-kind redemptions. |
See accompanying Notes, which are an integral part of the Financial Statements.
Statement of Changes in Net Assets
|
| | Year Ended October 31, |
| | 2021
($000) | 2020
($000) |
| | | |
| Increase (Decrease) in Net Assets | | |
| Operations | | |
| Net Investment Income | 204,877 | 151,374 |
| Realized Net Gain (Loss) | (9,452) | (108,322) |
| Change in Unrealized Appreciation (Depreciation) | 1,283,609 | (58,157) |
| Net Increase (Decrease) in Net Assets Resulting from Operations | 1,479,034 | (15,105) |
| Distributions | | |
| Investor Shares | (265) | (244) |
| ETF Shares | (116,979) | (89,477) |
| Admiral Shares | (65,199) | (57,428) |
| Institutional Shares | (10,274) | (10,826) |
| Total Distributions | (192,717) | (157,975) |
| Capital Share Transactions | | |
| Investor Shares | 241 | (1,158) |
| ETF Shares | 1,097,611 | 14,284 |
| Admiral Shares | 89,575 | (145,559) |
| Institutional Shares | (68,312) | (96,202) |
| Net Increase (Decrease) from Capital Share Transactions | 1,119,115 | (228,635) |
| Total Increase (Decrease) | 2,405,432 | (401,715) |
| Net Assets | | |
| Beginning of Period | 6,318,754 | 6,720,469 |
| End of Period | 8,724,186 | 6,318,754 |
See accompanying Notes, which are an integral part of the Financial Statements.
| Investor Shares | | | | | |
For a Share Outstanding
Throughout Each Period | Year Ended October 31, |
| 2021 | 2020 | 2019 | 2018 | 2017 |
| Net Asset Value, Beginning of Period | $12.79 | $13.01 | $12.24 | $13.56 | $11.42 |
| Investment Operations | | | | | |
| Net Investment Income1 | .349 | .283 | .309 | .347 | .295 |
| Net Realized and Unrealized Gain (Loss) on Investments | 2.600 | (.209) | .801 | (1.336) | 2.141 |
| Total from Investment Operations | 2.949 | .074 | 1.110 | (.989) | 2.436 |
| Distributions | | | | | |
| Dividends from Net Investment Income | (.339) | (.294) | (.340) | (.331) | (.296) |
| Distributions from Realized Capital Gains | — | — | — | — | — |
| Total Distributions | (.339) | (.294) | (.340) | (.331) | (.296) |
| Net Asset Value, End of Period | $15.40 | $12.79 | $13.01 | $12.24 | $13.56 |
| Total Return2 | 23.09% | 0.52% | 9.39% | -7.53% | 21.71% |
| Ratios/Supplemental Data | | | | | |
| Net Assets, End of Period (Millions) | $12 | $10 | $11 | $225 | $296 |
| Ratio of Total Expenses to Average Net Assets | 0.23% | 0.23% | 0.23% | 0.23% | 0.26% |
| Ratio of Net Investment Income to Average Net Assets | 2.25% | 2.28% | 2.50% | 2.51% | 2.44% |
| Portfolio Turnover Rate3 | 5% | 4% | 4% | 4% | 3% |
| 1 | Calculated based on average shares outstanding. |
| 2 | Total returns do not include account service fees that may have applied in the periods shown. Fund prospectuses provide information about any applicable account service fees. |
| 3 | Excludes the value of portfolio securities received or delivered as a result of in-kind purchases or redemptions of the fund’s capital shares, including ETF Creation Units. |
See accompanying Notes, which are an integral part of the Financial Statements.
| FTSE Pacific ETF Shares | | | | | |
For a Share Outstanding
Throughout Each Period | Year Ended October 31, |
| 2021 | 2020 | 2019 | 2018 | 2017 |
| Net Asset Value, Beginning of Period | $67.11 | $68.25 | $64.24 | $71.13 | $59.92 |
| Investment Operations | | | | | |
| Net Investment Income1 | 1.993 | 1.577 | 1.823 | 1.895 | 1.677 |
| Net Realized and Unrealized Gain (Loss) on Investments | 13.594 | (1.091) | 4.071 | (6.940) | 11.195 |
| Total from Investment Operations | 15.587 | .486 | 5.894 | (5.045) | 12.872 |
| Distributions | | | | | |
| Dividends from Net Investment Income | (1.897) | (1.626) | (1.884) | (1.845) | (1.662) |
| Distributions from Realized Capital Gains | — | — | — | — | — |
| Total Distributions | (1.897) | (1.626) | (1.884) | (1.845) | (1.662) |
| Net Asset Value, End of Period | $80.80 | $67.11 | $68.25 | $64.24 | $71.13 |
| Total Return | 23.27% | 0.68% | 9.53% | -7.34% | 21.89% |
| Ratios/Supplemental Data | | | | | |
| Net Assets, End of Period (Millions) | $5,463 | $3,630 | $3,708 | $3,927 | $5,015 |
| Ratio of Total Expenses to Average Net Assets | 0.08% | 0.08% | 0.08% | 0.09% | 0.10% |
| Ratio of Net Investment Income to Average Net Assets | 2.45% | 2.42% | 2.80% | 2.65% | 2.60% |
| Portfolio Turnover Rate2 | 5% | 4% | 4% | 4% | 3% |
| 1 | Calculated based on average shares outstanding. |
| 2 | Excludes the value of portfolio securities received or delivered as a result of in-kind purchases or redemptions of the fund’s capital shares, including ETF Creation Units. |
See accompanying Notes, which are an integral part of the Financial Statements.
| Admiral Shares | | | | | |
For a Share Outstanding
Throughout Each Period | Year Ended October 31, |
| 2021 | 2020 | 2019 | 2018 | 2017 |
| Net Asset Value, Beginning of Period | $83.00 | $84.41 | $79.43 | $87.97 | $74.10 |
| Investment Operations | | | | | |
| Net Investment Income1 | 2.399 | 1.938 | 2.251 | 2.360 | 2.049 |
| Net Realized and Unrealized Gain (Loss) on Investments | 16.866 | (1.354) | 5.031 | (8.618) | 13.876 |
| Total from Investment Operations | 19.265 | .584 | 7.282 | (6.258) | 15.925 |
| Distributions | | | | | |
| Dividends from Net Investment Income | (2.325) | (1.994) | (2.302) | (2.282) | (2.055) |
| Distributions from Realized Capital Gains | — | — | — | — | — |
| Total Distributions | (2.325) | (1.994) | (2.302) | (2.282) | (2.055) |
| Net Asset Value, End of Period | $99.94 | $83.00 | $84.41 | $79.43 | $87.97 |
| Total Return2 | 23.25% | 0.66% | 9.50% | -7.36% | 21.90% |
| Ratios/Supplemental Data | | | | | |
| Net Assets, End of Period (Millions) | $2,834 | $2,279 | $2,493 | $2,202 | $2,388 |
| Ratio of Total Expenses to Average Net Assets | 0.10% | 0.10% | 0.10% | 0.10% | 0.10% |
| Ratio of Net Investment Income to Average Net Assets | 2.39% | 2.40% | 2.80% | 2.64% | 2.60% |
| Portfolio Turnover Rate3 | 5% | 4% | 4% | 4% | 3% |
| 1 | Calculated based on average shares outstanding. |
| 2 | Total returns do not include account service fees that may have applied in the periods shown. Fund prospectuses provide information about any applicable account service fees. |
| 3 | Excludes the value of portfolio securities received or delivered as a result of in-kind purchases or redemptions of the fund’s capital shares, including ETF Creation Units. |
See accompanying Notes, which are an integral part of the Financial Statements.
| Institutional Shares | | | | | |
For a Share Outstanding
Throughout Each Period | Year Ended October 31, |
| 2021 | 2020 | 2019 | 2018 | 2017 |
| Net Asset Value, Beginning of Period | $12.70 | $12.91 | $12.15 | $13.46 | $11.34 |
| Investment Operations | | | | | |
| Net Investment Income1 | .366 | .296 | .346 | .364 | .320 |
| Net Realized and Unrealized Gain (Loss) on Investments | 2.582 | (.199) | .770 | (1.323) | 2.118 |
| Total from Investment Operations | 2.948 | .097 | 1.116 | (.959) | 2.438 |
| Distributions | | | | | |
| Dividends from Net Investment Income | (.358) | (.307) | (.356) | (.351) | (.318) |
| Distributions from Realized Capital Gains | — | — | — | — | — |
| Total Distributions | (.358) | (.307) | (.356) | (.351) | (.318) |
| Net Asset Value, End of Period | $15.29 | $12.70 | $12.91 | $12.15 | $13.46 |
| Total Return | 23.25% | 0.72% | 9.51% | -7.37% | 21.91% |
| Ratios/Supplemental Data | | | | | |
| Net Assets, End of Period (Millions) | $416 | $400 | $508 | $443 | $408 |
| Ratio of Total Expenses to Average Net Assets | 0.08% | 0.08% | 0.08% | 0.08% | 0.08% |
| Ratio of Net Investment Income to Average Net Assets | 2.39% | 2.40% | 2.81% | 2.66% | 2.62% |
| Portfolio Turnover Rate2 | 5% | 4% | 4% | 4% | 3% |
| 1 | Calculated based on average shares outstanding. |
| 2 | Excludes the value of portfolio securities received or delivered as a result of in-kind purchases or redemptions of the fund’s capital shares, including ETF Creation Units. |
See accompanying Notes, which are an integral part of the Financial Statements.
Notes to Financial Statements
Vanguard Pacific Stock Index Fund is registered under the Investment Company Act of 1940 as an open-end investment company, or mutual fund. The fund offers four classes of shares: Investor Shares, ETF Shares, Admiral Shares, and Institutional Shares. Each of the share classes has different eligibility and minimum purchase requirements, and is designed for different types of investors. ETF Shares, known as Vanguard FTSE Pacific ETF Shares, are listed for trading on NYSE Arca; they can be purchased and sold through a broker.
The fund invests in securities of foreign issuers, which may subject it to investment risks not normally associated with investing in securities of U.S. corporations. Further, at October 31, 2021, the fund had a concentration of its investments in securities issued in Japan, and the performance of such investments may be impacted by the country's social, political, and economic conditions.
Market disruptions associated with the COVID-19 pandemic have had a global impact, and uncertainty exists as to the long-term implications. Such disruptions can adversely affect assets of the fund and thus fund performance.
| A. | The following significant accounting policies conform to generally accepted accounting principles for U.S. investment companies. The fund consistently follows such policies in preparing its financial statements. |
1. Security Valuation: Securities are valued as of the close of trading on the New York Stock Exchange (generally 4 p.m., Eastern time) on the valuation date. Equity securities are valued at the latest quoted sales prices or official closing prices taken from the primary market in which each security trades; such securities not traded on the valuation date are valued at the mean of the latest quoted bid and asked prices. Securities for which market quotations are not readily available, or whose values have been affected by events occurring before the fund’s pricing time but after the close of the securities’ primary markets, are valued at their fair values calculated according to procedures adopted by the board of trustees. These procedures include obtaining quotations from an independent pricing service, monitoring news to identify significant market- or security-specific events, and evaluating changes in the values of foreign market proxies (for example, ADRs, futures contracts, or exchange-traded funds), between the time the foreign markets close and the fund’s pricing time. When fair-value pricing is employed, the prices of securities used by a fund to calculate its net asset value may differ from quoted or published prices for the same securities.
Investments in Vanguard Market Liquidity Fund are valued at that fund's net asset value.
Temporary cash investments are valued using the latest bid prices or using valuations based on a matrix system (which considers such factors as security prices, yields, maturities, and ratings), both as furnished by independent pricing services.
2. Foreign Currency: Securities and other assets and liabilities denominated in foreign currencies are translated into U.S. dollars using exchange rates obtained from an independent third party as of the fund’s pricing time on the valuation date. Realized gains (losses) and unrealized appreciation (depreciation) on investment securities include the effects of changes in exchange rates since the securities were purchased, combined with the effects of changes in security prices. Fluctuations in the value of other assets and liabilities resulting from changes in exchange rates are recorded as unrealized foreign currency gains (losses) until the assets or liabilities are settled in cash, at which time they are recorded as realized foreign currency gains (losses).
3. Futures Contracts: The fund uses index futures contracts to a limited extent, with the objectives of maintaining full exposure to the stock market, maintaining liquidity, and minimizing transaction costs. The fund may purchase futures contracts to immediately invest incoming cash in the market, or sell futures in response to cash outflows, thereby simulating a fully invested position in
the underlying index while maintaining a cash balance for liquidity. The primary risks associated with the use of futures contracts are imperfect correlation between changes in market values of stocks held by the fund and the prices of futures contracts, and the possibility of an illiquid market. Counterparty risk involving futures is mitigated because a regulated clearinghouse is the counterparty instead of the clearing broker. To further mitigate counterparty risk, the fund trades futures contracts on an exchange, monitors the financial strength of its clearing brokers and clearinghouse, and has entered into clearing agreements with its clearing brokers. The clearinghouse imposes initial margin requirements to secure the fund’s performance and requires daily settlement of variation margin representing changes in the market value of each contract. Any securities pledged as initial margin for open contracts are noted in the Schedule of Investments.
Futures contracts are valued at their quoted daily settlement prices. The notional amounts of the contracts are not recorded in the Statement of Assets and Liabilities. Fluctuations in the value of the contracts are recorded in the Statement of Assets and Liabilities as an asset (liability) and in the Statement of Operations as unrealized appreciation (depreciation) until the contracts are closed, when they are recorded as realized gains (losses) on futures contracts.
During the year ended October 31, 2021, the fund’s average investments in long and short futures contracts represented 1% and 0% of net assets, respectively, based on the average of the notional amounts at each quarter-end during the period.
4. Forward Currency Contracts: The fund enters into forward currency contracts to protect the value of securities and related receivables and payables against changes in future foreign exchange rates. The fund’s risks in using these contracts include movement in the values of the foreign currencies relative to the U.S. dollar and the ability of the counterparties to fulfill their obligations under the contracts. The fund mitigates its counterparty risk by entering into forward currency contracts only with a diverse group of prequalified counterparties, monitoring their financial strength, entering into master netting arrangements with its counterparties, and requiring its counterparties to transfer collateral as security for their performance. In the absence of a default, the collateral pledged or received by the fund cannot be repledged, resold, or rehypothecated. The master netting arrangements provide that, in the event of a counterparty’s default (including bankruptcy), the fund may terminate the forward currency contracts, determine the net amount owed by either party in accordance with its master netting arrangements, and sell or retain any collateral held up to the net amount owed to the fund under the master netting arrangements. The forward currency contracts contain provisions whereby a counterparty may terminate open contracts if the fund’s net assets decline below a certain level, triggering a payment by the fund if the fund is in a net liability position at the time of the termination. The payment amount would be reduced by any collateral the fund has pledged. Any securities pledged as collateral for open contracts are noted in the Schedule of Investments. The value of collateral received or pledged is compared daily to the value of the forward currency contracts exposure with each counterparty, and any difference, if in excess of a specified minimum transfer amount, is adjusted and settled within two business days.
Forward currency contracts are valued at their quoted daily prices obtained from an independent third party, adjusted for currency risk based on the expiration date of each contract. The notional amounts of the contracts are not recorded in the Statement of Assets and Liabilities. Fluctuations in the value of the contracts are recorded in the Statement of Assets and Liabilities as an asset (liability) and in the Statement of Operations as unrealized appreciation (depreciation) until the contracts are closed, when they are recorded as realized gains (losses) on forward currency contracts.
During the year ended October 31, 2021, the fund’s average investment in forward currency contracts represented 1% of net assets, based on the average of the notional amounts at each quarter-end during the period.
5. Federal Income Taxes: The fund intends to continue to qualify as a regulated investment company and distribute all of its taxable income. The fund’s tax returns are open to examination by the relevant tax authorities until expiration of the applicable statute of limitations, which is generally three years after the filing of the tax return. Management has analyzed the fund’s tax positions taken for all open federal and state income tax years, and has concluded that no provision for income tax is required in the fund’s financial statements.
6. Distributions: Distributions to shareholders are recorded on the ex-dividend date. Distributions are determined on a tax basis at the fiscal year-end and may differ from net investment income and realized capital gains for financial reporting purposes.
7. Securities Lending: To earn additional income, the fund lends its securities to qualified institutional borrowers. Security loans are subject to termination by the fund at any time, and are required to be secured at all times by collateral in an amount at least equal to the market value of securities loaned. Daily market fluctuations could cause the value of loaned securities to be more or less than the value of the collateral received. When this occurs, the collateral is adjusted and settled before the opening of the market on the next business day. The fund further mitigates its counterparty risk by entering into securities lending transactions only with a diverse group of prequalified counterparties, monitoring their financial strength, and entering into master securities lending agreements with its counterparties. The master securities lending agreements provide that, in the event of a counterparty’s default (including bankruptcy), the fund may terminate any loans with that borrower, determine the net amount owed, and sell or retain the collateral up to the net amount owed to the fund; however, such actions may be subject to legal proceedings. While collateral mitigates counterparty risk, in the event of a default, the fund may experience delays and costs in recovering the securities loaned. The fund invests cash collateral received in Vanguard Market Liquidity Fund, and records a liability in the Statement of Assets and Liabilities for the return of the collateral, during the period the securities are on loan. Collateral investments in Vanguard Market Liquidity Fund are subject to market appreciation or depreciation. Securities lending income represents fees charged to borrowers plus income earned on invested cash collateral, less expenses associated with the loan. During the term of the loan, the fund is entitled to all distributions made on or in respect of the loaned securities.
8. Credit Facilities and Interfund Lending Program: The fund and certain other funds managed by The Vanguard Group ("Vanguard") participate in a $4.3 billion committed credit facility provided by a syndicate of lenders pursuant to a credit agreement and an uncommitted credit facility provided by Vanguard. Both facilities may be renewed annually. Each fund is individually liable for its borrowings, if any, under the credit facilities. Borrowings may be utilized for temporary or emergency purposes, subject to the fund’s regulatory and contractual borrowing restrictions. With respect to the committed credit facility, the participating funds are charged administrative fees and an annual commitment fee of 0.10% of the undrawn committed amount of the facility; these fees are allocated to the funds based on a method approved by the fund’s board of trustees and included in Management and Administrative expenses on the fund’s Statement of Operations. Any borrowings under either facility bear interest at a rate based upon the higher of the one-month London Interbank Offered Rate (or an acceptable alternate rate, if necessary), federal funds
effective rate, or overnight bank funding rate plus an agreed-upon spread, except that borrowings under the uncommitted credit facility may bear interest based upon an alternate rate agreed to by the fund and Vanguard.
In accordance with an exemptive order (the “Order”) from the SEC, the fund may participate in a joint lending and borrowing program that allows registered open-end Vanguard funds to borrow money from and lend money to each other for temporary or emergency purposes (the “Interfund Lending Program”), subject to compliance with the terms and conditions of the Order, and to the extent permitted by the fund’s investment objective and investment policies. Interfund loans and borrowings normally extend overnight, but can have a maximum duration of seven days. Loans may be called on one business day’s notice. The interest rate to be charged is governed by the conditions of the Order and internal procedures adopted by the board of trustees. The board of trustees is responsible for overseeing the Interfund Lending Program.
For the year ended October 31, 2021, the fund did not utilize the credit facilities or the Interfund Lending Program.
9. Other: Dividend income is recorded on the ex-dividend date. Non-cash dividends included in income, if any, are recorded at the fair value of the securities received. Interest income includes income distributions received from Vanguard Market Liquidity Fund and is accrued daily. Premiums and discounts on debt securities are amortized and accreted, respectively, to interest income over the lives of the respective securities, except for premiums on certain callable debt securities that are amortized to the earliest call date. Security transactions are accounted for on the date securities are bought or sold. Costs used to determine realized gains (losses) on the sale of investment securities are those of the specific securities sold.
Each class of shares has equal rights as to assets and earnings, except that each class separately bears certain class-specific expenses related to maintenance of shareholder accounts (included in Management and Administrative expenses) and shareholder reporting. Marketing and distribution expenses are allocated to each class of shares based on a method approved by the board of trustees. Income, other non-class-specific expenses, and gains and losses on investments are allocated to each class of shares based on its relative net assets.
| B. | In accordance with the terms of a Funds' Service Agreement (the “FSA”) between Vanguard and the fund, Vanguard furnishes to the fund investment advisory, corporate management, administrative, marketing, and distribution services at Vanguard’s cost of operations (as defined by the FSA). These costs of operations are allocated to the fund based on methods and guidelines approved by the board of trustees and are generally settled twice a month. |
Upon the request of Vanguard, the fund may invest up to 0.40% of its net assets as capital in Vanguard. At October 31, 2021, the fund had contributed to Vanguard capital in the amount of $299,000, representing less than 0.01% of the fund’s net assets and 0.12% of Vanguard’s capital received pursuant to the FSA. The fund’s trustees and officers are also directors and employees, respectively, of Vanguard.
| C. | Various inputs may be used to determine the value of the fund’s investments and derivatives. These inputs are summarized in three broad levels for financial statement purposes. The inputs or methodologies used to value securities are not necessarily an indication of the risk associated with investing in those securities. |
Level 1—Quoted prices in active markets for identical securities.
Level 2—Other significant observable inputs (including quoted prices for similar securities, interest rates, prepayment speeds, credit risk, etc.).
Level 3—Significant unobservable inputs (including the fund’s own assumptions used to determine the fair value of investments). Any investments and derivatives valued with significant unobservable inputs are noted on the Schedule of Investments.
The following table summarizes the market value of the fund’s investments and derivatives as of October 31, 2021, based on the inputs used to value them:
| | Level 1
($000) | Level 2
($000) | Level 3
($000) | Total
($000) |
| Investments | | | | |
| Assets | | | | |
| Common Stocks | — | 8,610,218 | 61,496 | 8,671,714 |
| Temporary Cash Investments | 96,343 | — | — | 96,343 |
| Total | 96,343 | 8,610,218 | 61,496 | 8,768,057 |
| Derivative Financial Instruments | | | | |
| Assets | | | | |
| Forward Currency Contracts | — | 770 | — | 770 |
| Liabilities | | | | |
| Futures Contracts1 | 1,628 | — | — | 1,628 |
| Forward Currency Contracts | — | 1,402 | — | 1,402 |
| Total | 1,628 | 1,402 | — | 3,030 |
| 1 | Includes cumulative appreciation (depreciation) on futures contracts and centrally cleared swaps, if any, as reported in the Schedule of Investments. Only current day’s variation margin is reported within the Statement of Assets and Liabilities. |
| D. | At October 31, 2021, the fair values of derivatives were reflected in the Statement of Assets and Liabilities as follows: |
| Statement of Assets and Liabilities | Equity
Contracts
($000) | Foreign
Exchange
Contracts
($000) | Total
($000) |
| Unrealized Appreciation—Forward Currency Contracts | — | 770 | 770 |
| Total Assets | — | 770 | 770 |
| | | | |
| Unrealized Depreciation—Futures Contracts1 | 1,628 | — | 1,628 |
| Unrealized Depreciation—Forward Currency Contracts | — | 1,402 | 1,402 |
| Total Liabilities | 1,628 | 1,402 | 3,030 |
| 1 | Includes cumulative appreciation (depreciation) on futures contracts and centrally cleared swaps, if any, as reported in the Schedule of Investments. Only current day’s variation margin is reported within the Statement of Assets and Liabilities. |
Realized net gain (loss) and the change in unrealized appreciation (depreciation) on derivatives for the year ended October 31, 2021, were:
| Realized Net Gain (Loss) on Derivatives | Equity
Contracts
($000) | Foreign
Exchange
Contracts
($000) | Total
($000) |
| Futures Contracts | 16,216 | — | 16,216 |
| Forward Currency Contracts | — | (1,966) | (1,966) |
| Realized Net Gain (Loss) on Derivatives | 16,216 | (1,966) | 14,250 |
| Change in Unrealized Appreciation (Depreciation) on Derivatives |
| Futures Contracts | (309) | — | (309) |
| Forward Currency Contracts | — | (420) | (420) |
| Change in Unrealized Appreciation (Depreciation) on Derivatives | (309) | (420) | (729) |
| E. | Permanent differences between book-basis and tax-basis components of net assets are reclassified among capital accounts in the financial statements to reflect their tax character. These reclassifications have no effect on net assets or net asset value per share. As of period end, permanent differences primarily attributable to the accounting for in-kind redemptions, foreign currency transactions, and passive foreign investment companies were reclassified between the following accounts: |
| | Amount
($000) |
| Paid-in Capital | 62,665 |
| Total Distributable Earnings (Loss) | (62,665) |
Temporary differences between book-basis and tax-basis components of total distributable earnings (loss) arise when certain items of income, gain, or loss are recognized in different periods for financial statement and tax purposes; these differences will reverse at some time in the future. The differences are primarily related to the deferral of losses from wash sales; the recognition of unrealized gains or losses from certain derivative contracts; the recognition of unrealized gains from passive foreign investment companies; and the classification of securities for tax purposes. As of period end, the tax-basis components of total distributable earnings (loss) are detailed in the table as follows:
| | Amount
($000) |
| Undistributed Ordinary Income | 133,889 |
| Undistributed Long-Term Gains | — |
| Capital Loss Carryforwards | (242,473) |
| Qualified Late-Year Losses | — |
| Net Unrealized Gains (Losses) | 606,025 |
The tax character of distributions paid was as follows:
| | Year Ended October 31, |
| | 2021
Amount
($000) | 2020
Amount
($000) |
| Ordinary Income* | 192,717 | 157,975 |
| Long-Term Capital Gains | — | — |
| Total | 192,717 | 157,975 |
| * | Includes short-term capital gains, if any. |
As of October 31, 2021, gross unrealized appreciation and depreciation for investments and derivatives based on cost for U.S. federal income tax purposes were as follows:
| | Amount
($000) |
| Tax Cost | 8,159,651 |
| Gross Unrealized Appreciation | 2,244,238 |
| Gross Unrealized Depreciation | (1,637,462) |
| Net Unrealized Appreciation (Depreciation) | 606,776 |
| F. | During the year ended October 31, 2021, the fund purchased $1,679,156,000 of investment securities and sold $538,741,000 of investment securities, other than temporary cash investments. Purchases and sales include $1,032,900,000 and $145,281,000, respectively, in connection with in-kind purchases and redemptions of the fund's capital shares. |
| G. | Capital share transactions for each class of shares were: |
| | Year Ended October 31, | |
| | 2021 | | 2020 |
| | Amount
($000) | Shares
(000) | | Amount
($000) | Shares
(000) |
| Investor Shares | | | | | |
| Issued | 2,019 | 131 | | 1,916 | 152 |
| Issued in Lieu of Cash Distributions | 265 | 17 | | 244 | 19 |
| Redeemed1 | (2,043) | (132) | | (3,318) | (265) |
| Net Increase (Decrease)—Investor Shares | 241 | 16 | | (1,158) | (94) |
| ETF Shares | | | | | |
| Issued | 1,267,655 | 15,614 | | 352,731 | 5,463 |
| Issued in Lieu of Cash Distributions | — | — | | — | — |
| Redeemed | (170,044) | (2,100) | | (338,447) | (5,700) |
| Net Increase (Decrease)—ETF Shares | 1,097,611 | 13,514 | | 14,284 | (237) |
| | Year Ended October 31, | |
| | 2021 | | 2020 |
| | Amount
($000) | Shares
(000) | | Amount
($000) | Shares
(000) |
| Admiral Shares | | | | | |
| Issued1 | 354,619 | 3,543 | | 269,792 | 3,400 |
| Issued in Lieu of Cash Distributions | 52,662 | 529 | | 46,110 | 544 |
| Redeemed | (317,706) | (3,175) | | (461,461) | (6,021) |
| Net Increase (Decrease)—Admiral Shares | 89,575 | 897 | | (145,559) | (2,077) |
| Institutional Shares | | | | | |
| Issued | 70,526 | 4,592 | | 43,105 | 3,713 |
| Issued in Lieu of Cash Distributions | 8,184 | 539 | | 7,616 | 588 |
| Redeemed | (147,022) | (9,454) | | (146,923) | (12,139) |
| Net Increase (Decrease)—Institutional Shares | (68,312) | (4,323) | | (96,202) | (7,838) |
| 1 | In November 2018, the fund announced changes to the availability and minimum investment criteria of the Investor and Admiral share classes. As a result, all of the outstanding Investor Shares automatically converted to Admiral Shares beginning in April 2019, with the exception of those held by Vanguard funds and certain other institutional investors. Investor Shares—Redeemed and Admiral Shares—Issued include 151 and 23 shares, respectively, in the amount of $2,000 from the conversion during the year ended October 31, 2020. |
| H. | Management has determined that no events or transactions occurred subsequent to October 31, 2021, that would require recognition or disclosure in these financial statements. |
Report of Independent Registered Public Accounting Firm
To the Board of Trustees of Vanguard International Equity Index Funds and Shareholders of Vanguard European Stock Index Fund and Vanguard Pacific Stock Index Fund
Opinions on the Financial Statements
We have audited the accompanying statements of assets and liabilities, including the schedules of investments, of Vanguard European Stock Index Fund and Vanguard Pacific Stock Index Fund (two of the funds constituting Vanguard International Equity Index Funds, hereafter collectively referred to as the "Funds") as of October 31, 2021, the related statements of operations for the year ended October 31, 2021, the statements of changes in net assets for each of the two years in the period ended October 31, 2021, including the related notes, and the financial highlights for each of the five years in the period ended October 31, 2021 (collectively referred to as the "financial statements"). In our opinion, the financial statements present fairly, in all material respects, the financial position of each of the Funds as of October 31, 2021, the results of each of their operations for the year then ended, the changes in each of their net assets for each of the two years in the period ended October 31, 2021 and the financial highlights for each of the five years in the period ended October 31, 2021 in conformity with accounting principles generally accepted in the United States of America.
Basis for Opinions
These financial statements are the responsibility of the Funds’ management. Our responsibility is to express an opinion on the Funds’ financial statements based on our audits. We are a public accounting firm registered with the Public Company Accounting Oversight Board (United States) (PCAOB) and are required to be independent with respect to the Funds in accordance with the U.S. federal securities laws and the applicable rules and regulations of the Securities and Exchange Commission and the PCAOB.
We conducted our audits of these financial statements in accordance with the standards of the PCAOB. Those standards require that we plan and perform the audit to obtain reasonable assurance about whether the financial statements are free of material misstatement, whether due to error or fraud.
Our audits included performing procedures to assess the risks of material misstatement of the financial statements, whether due to error or fraud, and performing procedures that respond to those risks. Such procedures included examining, on a test basis, evidence regarding the amounts and disclosures in the financial statements. Our audits also included evaluating the accounting principles used and significant estimates made by management, as well as evaluating the overall presentation of the financial statements. Our procedures included confirmation of securities owned as of October 31, 2021 by correspondence with the custodian, transfer agent and brokers; when replies were not received from the transfer agent or brokers, we performed other auditing procedures. We believe that our audits provide a reasonable basis for our opinions.
/s/PricewaterhouseCoopers LLP
Philadelphia, Pennsylvania
December 17, 2021
We have served as the auditor of one or more investment companies in The Vanguard Group of Funds since 1975.
Special 2021 tax information (unaudited) for Vanguard European Stock Index Fund
This information for the fiscal year ended October 31, 2021, is included pursuant to provisions of the Internal Revenue Code.
The fund distributed $593,798,000 of qualified dividend income to shareholders during the fiscal year.
The fund designates to shareholders foreign source income of $803,017,000 and foreign taxes paid of $38,996,000. Shareholders will receive more detailed information with their Form 1099-DIV in January 2022 to determine the calendar-year amounts to be included on their 2021 tax returns.
Special 2021 tax information (unaudited) for Vanguard Pacific Stock Index Fund
This information for the fiscal year ended October 31, 2021, is included pursuant to provisions of the Internal Revenue Code.
The fund distributed $156,106,000 of qualified dividend income to shareholders during the fiscal year.
The fund designates to shareholders foreign source income of $227,621,000 and foreign taxes paid of $16,471,000. Shareholders will receive more detailed information with their Form 1099-DIV in January 2022 to determine the calendar-year amounts to be included on their 2021 tax returns.
London Stock Exchange Group companies include FTSE International Limited (“FTSE”), Frank Russell Company (“Russell”), MTS Next Limited (“MTS”), and FTSE TMX Global Debt Capital Markets Inc. (“FTSE TMX”). All rights reserved. “FTSE®”, “Russell®”, “MTS®”, “FTSE TMX®” and “FTSE Russell” and other service marks and trademarks related to the FTSE or Russell indexes are trademarks of the London Stock Exchange Group companies and are used by FTSE, MTS, FTSE TMX and Russell under license. All information is provided for information purposes only. Every effort is made to ensure that all information given in this publication is accurate, but no responsibility or liability can be accepted by the London Stock Exchange Group companies nor its licensors for any errors or for any loss from use of this publication. Neither the London Stock Exchange Group companies nor any of their licensors make any claim, prediction, warranty or representation whatsoever, expressly or impliedly, either as to the results to be obtained from the use of the Indices or the fitness or suitability of the Indices for any particular purpose to which they might be put. The London Stock Exchange Group companies do not provide investment advice and nothing in this document should be taken as constituting financial or investment advice. The London Stock Exchange Group companies make no representation regarding the advisability of investing in any asset. A decision to invest in any such asset should not be made in reliance on any information herein. Indexes cannot be invested in directly. Inclusion of an asset in an index is not a recommendation to buy, sell or hold that asset. The general information contained in this publication should not be acted upon without obtaining specific legal, tax, and investment advice from a licensed professional. No part of this information may be reproduced, stored in a retrieval system or transmitted in any form or by any means, electronic, mechanical, photocopying, recording or otherwise, without prior written permission of the London Stock Exchange Group companies. Distribution of the London Stock Exchange Group companies’ index values and the use of their indexes to create financial products require a license with FTSE, FTSE TMX, MTS and/or Russell and/or its licensors.
This page intentionally left blank.
The People Who Govern Your Fund
The trustees of your mutual fund are there to see that the fund is operated and managed in your best interests since, as a shareholder, you are a part owner of the fund. Your fund’s trustees also serve on the board of directors of The Vanguard Group, Inc., which is owned by the Vanguard funds and provides services to them.
A majority of Vanguard’s board members are independent, meaning that they have no affiliation with Vanguard or the funds they oversee, apart from the sizable personal investments they have made as private individuals. The independent board members have distinguished backgrounds in business, academia, and public service. Each of the trustees and executive officers oversees 214 Vanguard funds.
Information for each trustee and executive officer of the fund appears below. That information, as well as the Vanguard fund count, is as of the date on the cover of this fund report. The mailing address of the trustees and officers is P.O. Box 876, Valley Forge, PA 19482. More information about the trustees is in the Statement of Additional Information, which can be obtained, without charge, by contacting Vanguard at 800-662-7447, or online at vanguard.com.
Interested Trustee1
Mortimer J. Buckley
Born in 1969. Trustee since January 2018. Principal occupation(s) during the past five years and other experience: chairman of the board (2019–present) of Vanguard and of each of the investment companies served by Vanguard; chief executive officer (2018–present) of Vanguard; chief executive officer, president, and trustee (2018–present) of each of the investment companies served by Vanguard; president and director (2017–present) of Vanguard; and president (2018–present) of Vanguard Marketing Corporation. Chief investment officer (2013–2017), managing director (2002–2017), head of the Retail Investor Group (2006–2012), and chief information officer (2001–2006) of Vanguard. Chairman of the board (2011–2017) and trustee (2009–2017) of the Children’s Hospital of Philadelphia; and trustee (2018–present) and vice chair (2019–present) of The Shipley School.
Independent Trustees
Emerson U. Fullwood
Born in 1948. Trustee since January 2008. Principal occupation(s) during the past five years and other experience: executive chief staff and marketing officer for North America and corporate vice president (retired 2008) of Xerox Corporation (document management products and services). Former president of the Worldwide Channels Group, Latin
America, and Worldwide Customer Service and executive chief staff officer of Developing Markets of Xerox. Executive in residence and 2009–2010 Distinguished Minett Professor at the Rochester Institute of Technology. Director of SPX FLOW, Inc. (multi-industry manufacturing). Director of the University of Rochester Medical Center, the Monroe Community College Foundation, the United Way of Rochester, North Carolina A&T University, and Roberts Wesleyan College. Trustee of the University of Rochester.
Amy Gutmann
Born in 1949. Trustee since June 2006. Principal occupation(s) during the past five years and other experience: president (2004–present) of the University of Pennsylvania. Christopher H. Browne Distinguished Professor of Political Science, School of Arts and Sciences, and professor of communication, Annenberg School for Communication, with secondary faculty appointments in the Department of Philosophy, School of Arts and Sciences, and at the Graduate School of Education, University of Pennsylvania.
F. Joseph Loughrey
Born in 1949. Trustee since October 2009. Principal occupation(s) during the past five years and other experience: president and chief operating officer (retired 2009) and vice chairman of the board (2008–2009) of Cummins Inc. (industrial machinery). Chairman of the board of Hillenbrand, Inc. (specialized consumer services). Director of the V Foundation.
1 Mr. Buckley is considered an “interested person,” as defined in the Investment Company Act of 1940, because he is an officer of the Vanguard funds.
Member of the advisory council for the College of Arts and Letters and chair of the advisory board to the Kellogg Institute for International Studies, both at the University of Notre Dame. Chairman of the board of Saint Anselm College.
Mark Loughridge
Born in 1953. Trustee since March 2012. Principal occupation(s) during the past five years and other experience: senior vice president and chief financial officer (retired 2013) of IBM (information technology services). Fiduciary member of IBM’s Retirement Plan Committee (2004–2013), senior vice president and general manager (2002–2004) of IBM Global Financing, vice president and controller (1998–2002) of IBM, and a variety of other prior management roles at IBM. Member of the Council on Chicago Booth.
Scott C. Malpass
Born in 1962. Trustee since March 2012. Principal occupation(s) during the past five years and other experience: chief investment officer (retired June 2020) and vice president (retired June 2020) of the University of Notre Dame. Assistant professor (retired June 2020) of finance at the Mendoza College of Business, University of Notre Dame, and member of the Notre Dame 403(b) Investment Committee. Member of the board of Catholic Investment Services, Inc. (investment advisors) and the board of superintendence of the Institute for the Works of Religion.
Deanna Mulligan
Born in 1963. Trustee since January 2018. Principal occupation(s) during the past five years and other experience: board chair (2020), chief executive officer (2011–2020), and president (2010–2019) of The Guardian Life Insurance Company of America. Chief operating officer (2010–2011) and executive vice president (2008–2010) of Individual Life and Disability of the Guardian Life Insurance Company of America. Member of the board of the Economic Club of New York. Trustee of the Partnership for New York City (business leadership), Chief Executives for Corporate Purpose, NewYork-Presbyterian Hospital, and the Bruce Museum (arts and science). Member of the Advisory Council for the Stanford Graduate School of Business.
André F. Perold
Born in 1952. Trustee since December 2004. Principal occupation(s) during the past five years and other experience: George Gund Professor of Finance and Banking, Emeritus at the Harvard Business School (retired 2011). Chief investment officer and co-managing partner of HighVista Strategies (private investment firm). Member of the board
(2018–present) of RIT Capital Partners (investment firm). Member of the investment committee of Partners Health Care System.
Sarah Bloom Raskin
Born in 1961. Trustee since January 2018. Principal occupation(s) during the past five years and other experience: deputy secretary (2014–2017) of the United States Department of the Treasury. Governor (2010–2014) of the Federal Reserve Board. Commissioner (2007–2010) of financial regulation for the State of Maryland. Professor (2020–present), Distinguished Fellow of the Global Financial Markets Center (2020–present), and Rubenstein Fellow (2017–2020) at Duke University. Trustee (2017–present) of Amherst College and member of Amherst College Investment Committee (2019–present). Member of the Regenerative Crisis Response Committee (2020–present).
David A. Thomas
Born in 1956. Trustee since July 2021. Principal occupation(s) during the past five years and other experience: president of Morehouse College (2018–present). Professor of business administration, emeritus at Harvard University (2017–2018). Dean (2011–2016) and professor of management (2016–2017) at the Georgetown University McDonough School of Business. Director of DTE Energy Company (2013–present). Trustee of Common Fund (2019–present).
Peter F. Volanakis
Born in 1955. Trustee since July 2009. Principal occupation(s) during the past five years and other experience: president and chief operating officer (retired 2010) of Corning Incorporated (communications equipment) and director of Corning Incorporated (2000–2010) and Dow Corning (2001–2010). Director (2012) of SPX Corporation (multi-industry manufacturing). Overseer of the Amos Tuck School of Business Administration, Dartmouth College (2001–2013). Chairman of the board of trustees of Colby-Sawyer College. Member of the BMW Group Mobility Council.
Executive Officers
Christine M. Buchanan
Born in 1970. Principal occupation(s) during the past five years and other experience: principal of Vanguard. Chief financial officer (2021–present) and treasurer (2017–present) of each of the investment companies served by Vanguard. Partner (2005–2017) at KPMG (audit, tax, and advisory services).
David Cermak
Born in 1960. Principal occupation(s) during the past five years and other experience: principal of Vanguard. Finance director (2019–present) of each of the investment companies served by Vanguard. Managing director and head (2017–present) of Vanguard Investments Singapore. Managing director and head (2017–2019) of Vanguard Investments Hong Kong. Representative director and head (2014–2017) of Vanguard Investments Japan.
John Galloway
Born in 1973. Principal occupation(s) during the past five years and other experience: principal of Vanguard. Investment stewardship officer (September 2020–present) of each of the investment companies served by Vanguard. Head of Investor Advocacy (February 2020–present) and head of Marketing Strategy and Planning (2017–2020) at Vanguard. Deputy assistant to the President of the United States (2015).
Peter Mahoney
Born in 1974. Principal occupation(s) during the past five years and other experience: principal of Vanguard. Controller (2015–present) of each of the investment companies served by Vanguard. Head of International Fund Services (2008–2014) at Vanguard.
Anne E. Robinson
Born in 1970. Principal occupation(s) during the past five years and other experience: general counsel (2016–present) of Vanguard. Secretary (2016–present) of Vanguard and of each of the investment companies served by Vanguard. Managing director (2016–present) of Vanguard. Managing director and general counsel of Global Cards and Consumer Services (2014–2016) at Citigroup. Counsel (2003–2014) at American Express.
Michael Rollings
Born in 1963. Principal occupation(s) during the past five years and other experience: finance director (2017–present) and treasurer (2017) of each of the investment companies served by Vanguard. Managing director (2016–present) of Vanguard. Chief financial officer (2016–present) of Vanguard. Director (2016–present) of Vanguard Marketing Corporation. Executive vice president and chief financial officer (2006–2016) of MassMutual Financial Group.
John E. Schadl
Born in 1972. Principal occupation(s) during the past five years and other experience: principal of Vanguard. Chief compliance officer (2019–present) of Vanguard and of each of the investment companies served by Vanguard. Assistant vice president (2019–present) of Vanguard Marketing Corporation.
Vanguard Senior Management Team
| Matthew Benchener | Thomas M. Rampulla |
| Joseph Brennan | Karin A. Risi |
| Mortimer J. Buckley | Anne E. Robinson |
| Gregory Davis | Michael Rollings |
| John James | Nitin Tandon |
| John T. Marcante | Lauren Valente |
| Chris D. Mclsaac | |
Connect with Vanguard®>vanguard.com
Fund Information > 800-662-7447
Direct Investor Account Services > 800-662-2739
Institutional Investor Services > 800-523-1036
Text Telephone for People Who Are Deaf or Hard of Hearing > 800-749-7273
This material may be used in conjunction with the offering of shares of any Vanguard fund only if preceded or accompanied by the fund’s current prospectus.
All comparative mutual fund data are from Morningstar, Inc., unless otherwise noted.
You can obtain a free copy of Vanguard’s proxy voting guidelines by visiting vanguard.com/proxyreporting or by calling Vanguard at 800-662-2739. The guidelines are also available from the SEC’s website, www.sec.gov. In addition, you may obtain a free report on how your fund voted the proxies for securities it owned during the 12 months ended June 30. To get the report, visit either vanguard.com/proxyreporting or www.sec.gov.
You can review information about your fund on the SEC’s website, and you can receive copies of this information, for a fee, by sending a request via email addressed to publicinfo@sec.gov.
Source for Bloomberg indexes: Bloomberg Index Services Limited. Copyright 2021, Bloomberg. All rights reserved.
© 2021 The Vanguard Group, Inc.
All rights reserved.
U.S. Patent Nos. 6,879,964 and 7,720,749.
Vanguard Marketing Corporation, Distributor.
Q720 122021
Annual Report | October 31, 2021
Vanguard Total World Stock Index Fund
Contents
Your Fund’s Performance at a Glance
| 1 |
About Your Fund’s Expenses
| 2 |
Performance Summary
| 4 |
Financial Statements
| 7 |
Please note: The opinions expressed in this report are just that—informed opinions. They should not be considered promises or advice. Also, please keep in mind that the information and opinions cover the period through the date on the front of this report. Of course, the risks of investing in your fund are spelled out in the prospectus.
Your Fund’s Performance at a Glance
| • | For the 12 months ended October 31, 2021, Vanguard Total World Stock Index Fund returned 37.99% for ETF Shares (based on net asset value), 37.98% for Admiral Shares, and 37.97% for Institutional Shares. Its benchmark index, the FTSE Global All Cap Index, returned 38.26%. |
| • | The global economy continued to recover from the sharp pandemic-induced contraction in the spring of 2020. Countries that were more successful in containing the virus, whether through vaccinations, lockdowns, or both, generally fared better economically. Swift and extensive fiscal and monetary support from policymakers was also key to the rebound. |
| • | U.S. stocks, which make up more than half the index’s assets, contributed nearly a quarter of its return. Europe had a solid showing, led by the U.K. and France. Among Pacific region stocks, Japan contributed most. In emerging markets, China, one of the few with a negative return for the period, detracted. |
| • | All sectors contributed positively to the index return. Technology, the largest sector in the index at more than 20%, industrials, and financials contributed most. Utilities, telecommunications, and consumer staples brought up the rear. |
Market Barometer
| | Average Annual Total Returns
Periods Ended October 31, 2021 |
| | One Year | Three Years | Five Years |
| Stocks | | | |
| Russell 1000 Index (Large-caps) | 43.51% | 22.01% | 19.16% |
| Russell 2000 Index (Small-caps) | 50.80 | 16.47 | 15.52 |
| Russell 3000 Index (Broad U.S. market) | 43.90 | 21.62 | 18.91 |
| FTSE All-World ex US Index (International) | 30.23 | 12.42 | 10.05 |
| Bonds | | | |
Bloomberg U.S. Aggregate Bond Index
(Broad taxable market) | -0.48% | 5.63% | 3.10% |
Bloomberg Municipal Bond Index
(Broad tax-exempt market) | 2.64 | 5.17 | 3.41 |
| FTSE Three-Month U.S. Treasury Bill Index | 0.05 | 1.08 | 1.12 |
| CPI | | | |
| Consumer Price Index | 6.22% | 3.03% | 2.73% |
About Your Fund’s Expenses
As a shareholder of the fund, you incur ongoing costs, which include costs for portfolio management, administrative services, and shareholder reports (like this one), among others. Operating expenses, which are deducted from a fund’s gross income, directly reduce the investment return of the fund.
A fund’s expenses are expressed as a percentage of its average net assets. This figure is known as the expense ratio. The following examples are intended to help you understand the ongoing costs (in dollars) of investing in your fund and to compare these costs with those of other mutual funds. The examples are based on an investment of $1,000 made at the beginning of the period shown and held for the entire period.
The accompanying table illustrates your fund’s costs in two ways:
| • | Based on actual fund return. This section helps you to estimate the actual expenses that you paid over the period. The ”Ending Account Value“ shown is derived from the fund‘s actual return, and the third column shows the dollar amount that would have been paid by an investor who started with $1,000 in the fund. You may use the information here, together with the amount you invested, to estimate the expenses that you paid over the period. |
To do so, simply divide your account value by $1,000 (for example, an $8,600 account value divided by $1,000 = 8.6), then multiply the result by the number given for your fund under the heading ”Expenses Paid During Period.“
| • | Based on hypothetical 5% yearly return. This section is intended to help you compare your fund‘s costs with those of other mutual funds. It assumes that the fund had a yearly return of 5% before expenses, but that the expense ratio is unchanged. In this case—because the return used is not the fund’s actual return—the results do not apply to your investment. The example is useful in making comparisons because the Securities and Exchange Commission requires all mutual funds to calculate expenses based on a 5% return. You can assess your fund’s costs by comparing this hypothetical example with the hypothetical examples that appear in shareholder reports of other funds. |
Note that the expenses shown in the table are meant to highlight and help you compare ongoing costs only and do not reflect transaction costs incurred by the fund for buying and selling securities. Further, the expenses do not include any purchase, redemption, or account service fees described in the fund prospectus. If such fees were applied to your account, your costs would be higher. Your fund does not carry a “sales load.”
The calculations assume no shares were bought or sold during the period. Your actual costs may have been higher or lower, depending on the amount of your investment and the timing of any purchases or redemptions.
You can find more information about the fund’s expenses, including annual expense ratios, in the Financial Statements section of this report. For additional information on operating expenses and other shareholder costs, please refer to your fund’s current prospectus.
| Six Months Ended October 31, 2021 | | | |
| | Beginning
Account Value
4/30/2021 | Ending
Account Value
10/31/2021 | Expenses
Paid During
Period |
| Based on Actual Fund Return | | | |
| Total World Stock Index Fund | | | |
| ETF Shares | $1,000.00 | $1,066.20 | $0.31 |
| Admiral™ Shares | 1,000.00 | 1,066.20 | 0.52 |
| Institutional Shares | 1,000.00 | 1,066.10 | 0.42 |
| Based on Hypothetical 5% Yearly Return | | | |
| Total World Stock Index Fund | | | |
| ETF Shares | $1,000.00 | $1,024.90 | $0.31 |
| Admiral Shares | 1,000.00 | 1,024.70 | 0.51 |
| Institutional Shares | 1,000.00 | 1,024.80 | 0.41 |
The calculations are based on expenses incurred in the most recent six-month period. The fund’s annualized six-month expense ratios for that period are 0.06% for ETF Shares, 0.10% for Admiral Shares, and 0.08% for Institutional Shares. The dollar amounts shown as “Expenses Paid” are equal to the annualized expense ratio multiplied by the average account value over the period, multiplied by the number of days in the most recent six-month period, then divided by the number of days in the most recent 12-month period (184/365).
Total World Stock Index Fund
All of the returns in this report represent past performance, which is not a guarantee of future results that may be achieved by the fund. (Current performance may be lower or higher than the performance data cited. For performance data current to the most recent month-end, visit our website at vanguard.com/performance.) Note, too, that both investment returns and principal value can fluctuate widely, so an investor’s shares, when sold, could be worth more or less than their original cost. The returns shown do not reflect taxes that a shareholder would pay on fund distributions or on the sale of fund shares.
Cumulative Performance: October 31, 2011, Through October 31, 2021
Initial Investment of $10,000
| | | Average Annual Total Returns
Periods Ended October 31, 2021 | |
| | | One
Year | Five
Years | Ten
Years | Final Value
of a $10,000
Investment |
 | Total World Stock Index Fund
ETF Shares Net Asset Value | 37.99% | 14.88% | 11.68% | $30,187 |
| | Total World Stock Index Fund
ETF Shares Market Price | 37.95 | 14.89 | 11.68 | 30,187 |
 | Spliced Total World Stock Index | 38.26 | 14.93 | 11.67 | 30,162 |
Spliced Total World Stock Index: FTSE All-World Index through December 18, 2011, and FTSE Global All Cap Index thereafter. Benchmark returns are adjusted for withholding taxes.
| | | | |
| | | One
Year | Since
Inception
(2/7/2019) | Final Value
of a $10,000
Investment |
Total World Stock Index Fund
Admiral Shares | 37.98% | 18.84% | $16,015 |
| Spliced Total World Stock Index | 38.26 | 18.86 | 16,025 |
“Since Inception” performance is calculated from the Admiral Shares’ inception date for both the fund and its comparative standard(s).
See Financial Highlights for dividend and capital gains information.
Total World Stock Index Fund
| | | Average Annual Total Returns
Periods Ended October 31, 2021 | |
| | | One
Year | Five
Years | Ten
Years | Final Value
of a $5,000,000
Investment |
Total World Stock Index Fund
Institutional Shares | 37.97% | 14.88% | 11.69% | $15,100,407 |
| Spliced Total World Stock Index | 38.26 | 14.93 | 11.67 | 15,081,078 |
Cumulative Returns of ETF Shares: October 31, 2011, Through October 31, 2021
| | One
Year | Five
Years | Ten
Years |
| Total World Stock Index Fund ETF Shares Market Price | 37.95% | 100.20% | 201.87% |
| Total World Stock Index Fund ETF Shares Net Asset Value | 37.99 | 100.09 | 201.87 |
| Spliced Total World Stock Index | 38.26 | 100.54 | 201.62 |
For the ETF Shares, the market price is determined by the midpoint of the bid-offer spread as of the closing time of the New York Stock Exchange (generally 4 p.m., Eastern time). The net asset value is also determined as of the NYSE closing time. For more information about how the ETF Shares' market prices have compared with their net asset value, visit vanguard.com, select your ETF, and then select the Price and Performance tab. The ETF premium/discount analysis there shows the percentages of days on which the ETF Shares' market price was above or below the NAV.
Total World Stock Index Fund
| United States | 59.3% |
| Japan | 6.3 |
| United Kingdom | 3.9 |
| China | 3.7 |
| Canada | 2.9 |
| France | 2.5 |
| Switzerland | 2.3 |
| Germany | 2.2 |
| Australia | 2.0 |
| Taiwan | 1.9 |
| India | 1.5 |
| South Korea | 1.5 |
| Netherlands | 1.2 |
| Sweden | 1.1 |
| Other | 7.7 |
The table reflects the fund’s investments, except for short-term investments and derivatives.
The fund may invest in derivatives (such as futures and swap contracts) for various reasons, including, but not limited to, attempting to remain fully invested and tracking its target index as closely as possible.
Total World Stock Index Fund
The fund files its complete schedule of portfolio holdings with the Securities and Exchange Commission (SEC) for the first and third quarters of each fiscal year as an exhibit to its reports on Form N-PORT. The fund’s Form N-PORT reports are available on the SEC’s website at www.sec.gov.
| | | Shares | Market
Value•
($000) |
| Common Stocks (99.6%) |
| Argentina (0.1%) |
| * | MercadoLibre Inc. | 19,950 | 29,546 |
| Australia (2.0%) |
| | Commonwealth Bank of Australia | 743,633 | 58,942 |
| | CSL Ltd. | 198,652 | 45,201 |
| | BHP Group Ltd. | 1,291,553 | 35,475 |
| | National Australia Bank Ltd. | 1,436,221 | 31,226 |
| | Westpac Banking Corp. | 1,596,165 | 31,054 |
| | Australia & New Zealand Banking Group Ltd. | 1,238,430 | 26,354 |
| 1 | Macquarie Group Ltd. | 146,130 | 21,573 |
| | Wesfarmers Ltd. | 495,218 | 21,426 |
| | Woolworths Group Ltd. | 521,990 | 15,036 |
| | Transurban Group (XASX) | 1,333,889 | 13,591 |
| | Goodman Group | 796,657 | 13,190 |
| | Rio Tinto Ltd. | 164,814 | 11,292 |
| | Aristocrat Leisure Ltd. | 294,345 | 10,439 |
| * | Afterpay Ltd. | 97,472 | 9,030 |
| | James Hardie Industries plc GDR | 195,261 | 7,671 |
| | Amcor plc GDR | 616,478 | 7,461 |
| | Woodside Petroleum Ltd. | 424,799 | 7,426 |
| | Fortescue Metals Group Ltd. | 705,572 | 7,352 |
| | Coles Group Ltd. | 561,253 | 7,273 |
| | Newcrest Mining Ltd. | 360,653 | 6,757 |
| | Sonic Healthcare Ltd. | 212,156 | 6,438 |
| * | Xero Ltd. | 55,449 | 6,322 |
| | QBE Insurance Group Ltd. | 651,107 | 5,830 |
| | South32 Ltd. | 2,105,487 | 5,680 |
| | ASX Ltd. | 86,713 | 5,453 |
| | Scentre Group | 2,305,749 | 5,259 |
| | Telstra Corp. Ltd. | 1,794,042 | 5,186 |
| | Suncorp Group Ltd. | 569,247 | 5,037 |
| | Brambles Ltd. | 644,383 | 4,889 |
| | | Shares | Market
Value•
($000) |
| | Cochlear Ltd. | 28,836 | 4,823 |
| | Santos Ltd. | 792,202 | 4,160 |
| | Ramsay Health Care Ltd. | 76,349 | 4,081 |
| | Dexus Industria REIT (XASX) | 492,630 | 4,041 |
| | Insurance Australia Group Ltd. | 1,096,802 | 3,974 |
| | SEEK Ltd. | 154,291 | 3,835 |
| | Stockland | 1,083,626 | 3,735 |
| | Mirvac Group | 1,694,883 | 3,617 |
| * | Sydney Airport | 559,754 | 3,471 |
| | BlueScope Steel Ltd. | 216,750 | 3,387 |
| | Computershare Ltd. (XASX) | 237,547 | 3,380 |
| | Tabcorp Holdings Ltd. | 895,469 | 3,372 |
| | Northern Star Resources Ltd. | 479,859 | 3,322 |
| | GPT Group | 825,661 | 3,223 |
| | APA Group | 499,697 | 3,100 |
| | Medibank Pvt Ltd. | 1,189,065 | 2,988 |
| | Oil Search Ltd. | 920,514 | 2,982 |
| | Origin Energy Ltd. | 776,728 | 2,975 |
| | Endeavour Group Ltd. | 546,885 | 2,810 |
| | REA Group Ltd. | 22,291 | 2,705 |
| | OZ Minerals Ltd. | 139,746 | 2,658 |
| | Domino's Pizza Enterprises Ltd. | 25,781 | 2,645 |
| | Treasury Wine Estates Ltd. | 301,339 | 2,629 |
| | Charter Hall Group | 197,787 | 2,595 |
| | Lendlease Corp. Ltd. | 295,818 | 2,344 |
| | Ampol Ltd. | 97,212 | 2,249 |
| | carsales.com Ltd. | 119,852 | 2,243 |
| | IDP Education Ltd. | 78,080 | 2,209 |
| | Orica Ltd. | 190,871 | 2,191 |
| * | Lynas Rare Earths Ltd. | 376,236 | 2,099 |
| | Vicinity Centres | 1,529,058 | 1,997 |
| | ALS Ltd. | 194,346 | 1,949 |
| | Atlas Arteria Ltd. | 412,378 | 1,938 |
| | Aurizon Holdings Ltd. | 748,612 | 1,909 |
| | IGO Ltd. | 259,904 | 1,903 |
| * | Pilbara Minerals Ltd. | 1,134,829 | 1,903 |
Total World Stock Index Fund
| | | Shares | Market
Value•
($000) |
| | Evolution Mining Ltd. | 696,093 | 1,890 |
| | Bank of Queensland Ltd. | 276,477 | 1,841 |
| | Incitec Pivot Ltd. | 805,575 | 1,823 |
| | Reece Ltd. | 120,197 | 1,823 |
| * | NEXTDC Ltd. | 197,602 | 1,764 |
| | Mineral Resources Ltd. | 59,949 | 1,762 |
| | JB Hi-Fi Ltd. | 46,042 | 1,758 |
| | Qube Holdings Ltd. | 701,277 | 1,694 |
| | Magellan Financial Group Ltd. | 63,679 | 1,675 |
| * | Orocobre Ltd. | 246,823 | 1,667 |
| | Alumina Ltd. | 1,085,401 | 1,640 |
| | Bendigo & Adelaide Bank Ltd. | 216,950 | 1,520 |
| | Challenger Ltd. | 286,194 | 1,503 |
| | Reliance Worldwide Corp. Ltd. | 340,729 | 1,498 |
| | AusNet Services Ltd. | 804,413 | 1,496 |
| | WiseTech Global Ltd. | 36,654 | 1,429 |
| | Metcash Ltd. | 459,054 | 1,415 |
| | Downer EDI Ltd. | 282,253 | 1,349 |
| | Steadfast Group Ltd. | 372,228 | 1,310 |
| | Altium Ltd. | 46,309 | 1,290 |
| * | Qantas Airways Ltd. | 316,007 | 1,280 |
| | Worley Ltd. | 154,268 | 1,268 |
| | Breville Group Ltd. | 56,460 | 1,257 |
| | Ansell Ltd. | 52,288 | 1,252 |
| | Nine Entertainment Co. Holdings Ltd. | 583,917 | 1,223 |
| | Iluka Resources Ltd. | 166,896 | 1,191 |
| | AGL Energy Ltd. | 270,059 | 1,165 |
| * | AMP Ltd. | 1,407,066 | 1,151 |
| | Bapcor Ltd. | 182,563 | 1,101 |
| * | Crown Resorts Ltd. | 144,921 | 1,092 |
| | Cleanaway Waste Management Ltd. | 536,684 | 1,091 |
| | Eagers Automotive Ltd. | 96,272 | 1,082 |
| | ARB Corp. Ltd. | 27,604 | 1,017 |
| * | Star Entertainment Grp Ltd. | 355,799 | 989 |
| | Harvey Norman Holdings Ltd. | 257,527 | 966 |
| * | Uniti Group Ltd. | 313,036 | 965 |
| | Washington H Soul Pattinson & Co. Ltd. | 39,134 | 964 |
| *,2 | Flight Centre Travel Group Ltd. | 62,838 | 951 |
| | nib holdings Ltd. | 188,364 | 948 |
| | CSR Ltd. | 209,804 | 942 |
| * | Zip Co. Ltd. | 190,478 | 941 |
| * | Boral Ltd. | 190,362 | 918 |
| | Seven Group Holdings Ltd. | 56,072 | 916 |
| | Orora Ltd. | 363,449 | 909 |
| | National Storage REIT | 492,135 | 891 |
| | Premier Investments Ltd. | 37,922 | 880 |
| | | Shares | Market
Value•
($000) |
| | Shopping Centres Australasia Property Group | 414,143 | 870 |
| | Charter Hall Long Wale REIT | 231,263 | 848 |
| | Pendal Group Ltd. | 164,721 | 833 |
| | IOOF Holdings Ltd. | 266,536 | 825 |
| * | Imugene Ltd. | 2,147,192 | 808 |
| | Healius Ltd. | 218,206 | 799 |
| *,2 | Webjet Ltd. | 165,898 | 794 |
| * | Whitehaven Coal Ltd. | 387,232 | 766 |
| * | Corporate Travel Management Ltd. | 40,888 | 758 |
| | Amcor plc | 62,832 | 758 |
| | Lifestyle Communities Ltd. | 45,419 | 750 |
| * | Chalice Mining Ltd. | 148,710 | 750 |
| * | Liontown Resources Ltd. | 519,977 | 750 |
| * | Perseus Mining Ltd. | 627,347 | 744 |
| | Pro Medicus Ltd. | 18,192 | 735 |
| | Link Administration Holdings Ltd. | 220,381 | 726 |
| | Centuria Capital Group | 298,615 | 726 |
| | Ingenia Communities Group | 144,484 | 714 |
| | Perpetual Ltd. | 24,597 | 703 |
| | Waypoint REIT | 340,272 | 702 |
| | Sims Ltd. | 64,418 | 701 |
| | Beach Energy Ltd. | 664,200 | 698 |
| * | Megaport Ltd. | 51,207 | 693 |
| | Super Retail Group Ltd. | 70,173 | 688 |
| | TPG Telecom Ltd. | 132,802 | 678 |
| * | PointsBet Holdings Ltd. | 105,113 | 660 |
| | IRESS Ltd. | 70,695 | 644 |
| * | Paladin Energy Ltd. | 941,119 | 625 |
| | BWP Trust | 194,745 | 624 |
| | AUB Group Ltd. | 37,702 | 621 |
| | Arena REIT | 182,201 | 620 |
| | Charter Hall Social Infrastructure REIT | 213,949 | 616 |
| 3 | Viva Energy Group Ltd. | 338,136 | 596 |
| | Abacus Property Group | 210,172 | 568 |
| | Charter Hall Retail REIT | 182,119 | 565 |
| * | Champion Iron Ltd. | 168,071 | 561 |
| | Deterra Royalties Ltd. | 189,302 | ��� 557 |
| | Centuria Industrial REIT | 201,668 | 556 |
| | Technology One Ltd. | 59,623 | 554 |
| | Elders Ltd. | 60,037 | 545 |
| | Sandfire Resources Ltd. (XASX) | 127,922 | 539 |
| | InvoCare Ltd. | 61,718 | 529 |
| | Rural Funds Group | 248,430 | 522 |
| | CIMIC Group Ltd. | 34,447 | 519 |
| | Blackmores Ltd. | 7,151 | 510 |
| * | Nufarm Ltd. | 154,478 | 509 |
Total World Stock Index Fund
| | | Shares | Market
Value•
($000) |
| | Credit Corp. Group Ltd. | 21,268 | 506 |
| | Bega Cheese Ltd. | 122,457 | 502 |
| | Clinuvel Pharmaceuticals Ltd. | 16,708 | 490 |
| * | EVENT Hospitality and Entertainment Ltd. | 39,152 | 485 |
| *,3 | Life360 Inc. GDR | 58,318 | 483 |
| 2 | HUB24 Ltd. | 19,929 | 479 |
| | Collins Foods Ltd. | 49,137 | 477 |
| | Brickworks Ltd. | 26,328 | 472 |
| | Lovisa Holdings Ltd. | 28,117 | 463 |
| * | Telix Pharmaceuticals Ltd. | 99,039 | 452 |
| | Pinnacle Investment Management Group Ltd. | 34,594 | 450 |
| * | Australian Strategic Materials Ltd. | 55,606 | 447 |
| | Ramelius Resources Ltd. | 372,219 | 444 |
| | Australian Ethical Investment Ltd. | 42,777 | 442 |
| | GrainCorp Ltd. Class A | 91,043 | 433 |
| * | De Grey Mining Ltd. | 517,915 | 431 |
| * | Temple & Webster Group Ltd. | 44,749 | 431 |
| * | ioneer Ltd. | 808,000 | 418 |
| | Netwealth Group Ltd. | 31,459 | 413 |
| | Aventus Group | 159,073 | 410 |
| | Dexus Industria REIT | 159,732 | 406 |
| * | Nanosonics Ltd. | 89,279 | 401 |
| | Domain Holdings Australia Ltd. | 91,179 | 396 |
| | Western Areas Ltd. | 164,101 | 393 |
| * | Silver Lake Resources Ltd. | 310,618 | 393 |
| | Adbri Ltd. | 172,872 | 389 |
| | Codan Ltd. | 50,891 | 388 |
| | Nickel Mines Ltd. | 487,238 | 386 |
| | Regis Resources Ltd. | 249,274 | 374 |
| * | Karoon Energy Ltd. | 268,395 | 369 |
| * | Capricorn Metals Ltd. | 190,001 | 367 |
| | MyState Ltd. | 93,253 | 366 |
| | Hansen Technologies Ltd. | 76,538 | 365 |
| | GDI Property Group | 410,674 | 362 |
| | Centuria Office REIT | 196,798 | 357 |
| | Hotel Property Investments | 130,574 | 353 |
| | IPH Ltd. | 54,206 | 352 |
| | Home Consortium Ltd. | 58,853 | 352 |
| *,2 | Vulcan Energy Resources Ltd. | 36,886 | 352 |
| * | West African Resources Ltd. | 358,465 | 348 |
| | Cromwell Property Group | 567,566 | 347 |
| | GUD Holdings Ltd. | 37,380 | 346 |
| | | Shares | Market
Value•
($000) |
| | Costa Group Holdings Ltd. (XASX) | 156,496 | 346 |
| * | Tyro Payments Ltd. | 112,690 | 344 |
| | Platinum Asset Management Ltd. | 145,485 | 336 |
| | Imdex Ltd. | 153,718 | 332 |
| | Appen Ltd. | 40,273 | 328 |
| * | Eclipx Group Ltd. | 172,186 | 325 |
| | SeaLink Travel Group Ltd. | 57,576 | 319 |
| | Senex Energy Ltd. | 95,075 | 318 |
| *,2 | Mesoblast Ltd. | 262,914 | 316 |
| | Genworth Mortgage Insurance Australia Ltd. | 179,466 | 312 |
| | Gold Road Resources Ltd. | 290,876 | 302 |
| * | G8 Education Ltd. | 359,410 | 299 |
| * | PolyNovo Ltd. | 214,784 | 297 |
| | Growthpoint Properties Australia Ltd. | 92,600 | 291 |
| | United Malt Grp Ltd. | 94,310 | 289 |
| * | Superloop Ltd. | 293,545 | 286 |
| | Johns Lyng Group Ltd. | 57,196 | 280 |
| | St. Barbara Ltd. | 253,880 | 279 |
| * | Betmakers Technology Group Ltd. | 296,392 | 275 |
| *,3 | Coronado Global Resources Inc. GDR | 261,832 | 270 |
| | Accent Group Ltd. | 144,190 | 270 |
| * | Dubber Corp. Ltd. | 114,926 | 265 |
| * | City Chic Collective Ltd. | 56,501 | 264 |
| * | Starpharma Holdings Ltd. Class A | 320,543 | 254 |
| | Data#3 Ltd. | 58,914 | 252 |
| | Inghams Group Ltd. | 88,279 | 248 |
| * | Audinate Group Ltd. | 38,055 | 244 |
| | Select Harvests Ltd. | 43,244 | 242 |
| | NRW Holdings Ltd. | 174,335 | 242 |
| * | EML Payments Ltd. | 105,956 | 238 |
| * | Australian Agricultural Co. Ltd. | 198,343 | 236 |
| * | Redbubble Ltd. | 74,363 | 234 |
| | Monadelphous Group Ltd. | 29,944 | 228 |
| * | oOh!media Ltd. | 165,108 | 227 |
| | GWA Group Ltd. | 108,684 | 223 |
| * | Myer Holdings Ltd. | 545,572 | 223 |
| | Omni Bridgeway Ltd. | 94,211 | 221 |
| | Dicker Data Ltd. | 19,419 | 220 |
| | Estia Health Ltd. | 138,781 | 219 |
| | Baby Bunting Group Ltd. | 48,163 | 215 |
| * | nearmap Ltd. | 127,771 | 214 |
| 2 | HomeCo Daily Needs REIT | 195,388 | 212 |
| | SmartGroup Corp. Ltd. | 34,915 | 211 |
| | Tassal Group Ltd. | 77,455 | 207 |
Total World Stock Index Fund
| | | Shares | Market
Value•
($000) |
| * | Bellevue Gold Ltd. | 321,745 | 207 |
| | Jumbo Interactive Ltd. | 16,258 | 205 |
| 2 | Emeco Holdings Ltd. | 242,499 | 202 |
| | Money3 Corp. Ltd. | 78,326 | 197 |
| * | Fineos Corp. Ltd. GDR | 64,697 | 195 |
| | Westgold Resources Ltd. | 130,456 | 191 |
| | Vita Group Ltd. | 304,606 | 190 |
| * | PPK Group Ltd. | 19,014 | 187 |
| | BWX Ltd. | 50,991 | 179 |
| * | Nuix Ltd. | 76,126 | 178 |
| | Perenti Global Ltd. | 228,452 | 177 |
| | Australian Pharmaceutical Industries Ltd. | 154,238 | 175 |
| 2 | Kogan.com Ltd. | 22,722 | 171 |
| | Integral Diagnostics Ltd. | 45,882 | 162 |
| * | Seven West Media Ltd. | 466,784 | 161 |
| | McMillan Shakespeare Ltd. | 15,440 | 160 |
| | Bravura Solutions Ltd. | 75,685 | 159 |
| | Australian Finance Group Ltd. | 79,434 | 158 |
| | Austal Ltd. | 109,789 | 156 |
| | Pact Group Holdings Ltd. | 65,730 | 154 |
| | Infomedia Ltd. | 145,778 | 152 |
| * | Mayne Pharma Group Ltd. | 564,865 | 145 |
| * | Syrah Resources Ltd. | 148,491 | 142 |
| | Sigma Healthcare Ltd. | 325,671 | 140 |
| | Southern Cross Media Group Ltd. | 76,125 | 134 |
| * | Cooper Energy Ltd. | 597,256 | 131 |
| * | Resolute Mining Ltd. | 410,631 | 129 |
| | OFX Group Ltd. | 100,137 | 120 |
| *,2 | Carnarvon Petroleum Ltd. | 469,345 | 120 |
| | Service Stream Ltd. | 177,883 | 118 |
| * | Aurelia Metals Ltd. | 391,770 | 111 |
| *,2 | Andromeda Metals Ltd. | 811,258 | 108 |
| | New Hope Corp. Ltd. | 68,583 | 104 |
| *,2 | Paradigm Biopharmaceuticals Ltd. | 65,623 | 102 |
| * | Alkane Resources Ltd. | 147,212 | 99 |
| | Macmahon Holdings Ltd. | 608,142 | 94 |
| *,2 | Electro Optic Systems Holdings Ltd. | 38,619 | 93 |
| | Mount Gibson Iron Ltd. | 286,220 | 91 |
| * | Marley Spoon AG GDR | 117,806 | 91 |
| * | Opthea Ltd. | 93,159 | 90 |
| | | Shares | Market
Value•
($000) |
| | Cedar Woods Properties Ltd. | 18,566 | 84 |
| | Virtus Health Ltd. | 20,063 | 84 |
| *,2 | AMA Group Ltd. | 215,269 | 79 |
| | Jupiter Mines Ltd. | 422,476 | 75 |
| *,1 | Japara Healthcare Ltd. | 64,092 | 68 |
| *,2 | Bubs Australia Ltd. | 168,022 | 66 |
| * | Humm Group Ltd. | 96,019 | 64 |
| * | New Century Resources Ltd. | 530,714 | 62 |
| | SG Fleet Group Ltd. | 31,301 | 60 |
| | Navigator Global Investments Ltd. | 36,584 | 52 |
| | Regis Healthcare Ltd. | 27,703 | 41 |
| | MACA Ltd. | 54,308 | 31 |
| * | Dacian Gold Ltd. | 165,962 | 29 |
| *,2 | Minerals 260 Ltd. | 43,531 | 15 |
| * | Juno Minerals Ltd. | 20,991 | 2 |
| *,1 | Bgp Holdings plc | 197,753 | 1 |
| | | | 669,393 |
| Austria (0.1%) |
| | Erste Group Bank AG | 127,640 | 5,474 |
| | OMV AG | 61,289 | 3,711 |
| | Verbund AG | 28,369 | 2,957 |
| | voestalpine AG | 49,572 | 1,883 |
| 3 | BAWAG Group AG | 28,457 | 1,790 |
| | Wienerberger AG | 48,193 | 1,706 |
| | Raiffeisen Bank International AG | 56,949 | 1,664 |
| | ANDRITZ AG | 28,995 | 1,647 |
| | IMMOFINANZ AG | 37,173 | 890 |
| | CA Immobilien Anlagen AG (XWBO) | 17,365 | 745 |
| | Mayr Melnhof Karton AG | 3,719 | ��� 732 |
| * | Lenzing AG | 5,276 | 636 |
| | Telekom Austria AG Class A | 63,074 | 545 |
| | Oesterreichische Post AG | 12,820 | 541 |
| | Vienna Insurance Group AG Wiener Versicherung Gruppe | 18,064 | 526 |
| | S IMMO AG | 22,083 | 524 |
| | EVN AG | 17,858 | 504 |
| | UNIQA Insurance Group AG | 42,174 | 393 |
| | AT&S Austria Technologie & Systemtechnik AG | 9,422 | 361 |
| * | DO & CO AG | 2,752 | 249 |
| * | Schoeller-Bleckmann Oilfield Equipment AG | 5,345 | 218 |
| | Strabag SE (Bearer) | 5,036 | 216 |
| *,2 | Porr AG | 10,423 | 150 |
| | Palfinger AG | 2,713 | 120 |
| * | Flughafen Wien AG | 3,428 | 113 |
| | Agrana Beteiligungs AG | 3,459 | 73 |
| * | Porr AG Rights Exp.11/3/2021 | 10,423 | 2 |
Total World Stock Index Fund
| | | Shares | Market
Value•
($000) |
| *,1 | CA Immobilien Anlagen AG | 30,705 | — |
| | | | 28,370 |
| Bahrain (0.0%) |
| | Ahli United Bank BSC | 2,769,761 | 2,694 |
| Belgium (0.3%) |
| | Anheuser-Busch InBev SA | 365,899 | 22,381 |
| | KBC Group NV | 120,208 | 11,194 |
| * | Argenx SE | 22,558 | 6,791 |
| | UCB SA | 53,476 | 6,392 |
| | Groupe Bruxelles Lambert SA | 45,464 | 5,275 |
| | Umicore SA | 90,607 | 5,195 |
| | Ageas SA | 79,705 | 3,878 |
| | Solvay SA | 29,953 | 3,561 |
| | Sofina SA | 6,595 | 2,918 |
| | Warehouses De Pauw CVA | 60,812 | 2,769 |
| | Cofinimmo SA | 13,043 | 2,104 |
| * | Aedifica SA | 15,511 | 2,068 |
| | Elia Group SA | 15,222 | 1,776 |
| | D'ieteren Group | 9,735 | 1,679 |
| | Ackermans & van Haaren NV | 9,624 | 1,655 |
| | Etablissements Franz Colruyt NV | 24,063 | 1,182 |
| | Proximus SADP | 55,968 | 1,054 |
| | Melexis NV | 8,228 | 949 |
| | Euronav NV | 80,811 | 860 |
| | Montea NV | 4,852 | 720 |
| | Barco NV | 31,493 | 710 |
| | VGP NV | 2,681 | 693 |
| | KBC Ancora | 13,214 | 689 |
| | Bekaert SA | 15,212 | 666 |
| | Telenet Group Holding NV | 16,754 | 602 |
| * | Xior Student Housing NV | 9,561 | 566 |
| | Gimv NV | 8,579 | 554 |
| | Shurgard Self Storage SA | 8,733 | 535 |
| * | Kinepolis Group NV | 8,060 | 508 |
| | Retail Estates NV | 5,739 | 460 |
| | Befimmo SA | 10,888 | 445 |
| | Fagron | 24,337 | 422 |
| * | Tessenderlo Group SA | 9,918 | 362 |
| * | bpost SA | 38,427 | 329 |
| * | AGFA-Gevaert NV | 66,622 | 290 |
| | Cie d'Entreprises CFE | 2,720 | 278 |
| * | Ontex Group NV | 29,502 | 278 |
| *,2 | Mithra Pharmaceuticals SA | 11,731 | 258 |
| | Econocom Group SA NV | 56,008 | 237 |
| | Orange Belgium SA | 9,315 | 211 |
| | Wereldhave Belgium Comm VA | 1,657 | 93 |
| | Van de Velde NV | 1,942 | 67 |
| | | | 93,654 |
| | | Shares | Market
Value•
($000) |
| Brazil (0.5%) |
| | Vale SA | 1,288,297 | 16,346 |
| * | Petroleo Brasileiro SA Preference Shares | 1,965,092 | 9,488 |
| * | Petroleo Brasileiro SA | 1,438,863 | 7,054 |
| | Itau Unibanco Holding SA Preference Shares | 1,454,883 | 6,009 |
| | B3 SA - Brasil Bolsa Balcao | 2,657,191 | 5,607 |
| | Vale SA Class B ADR | 428,024 | 5,449 |
| * | XP Inc. Class A | 146,688 | 4,813 |
| * | Banco Bradesco SA Preference Shares | 1,222,231 | 4,310 |
| | Weg SA | 637,436 | 4,179 |
| | Ambev SA | 1,294,763 | 3,898 |
| | Itausa SA Preference Shares | 1,984,689 | 3,605 |
| * | StoneCo. Ltd. Class A | 100,410 | 3,400 |
| * | Banco Bradesco SA ADR | 890,358 | 3,116 |
| * | Natura & Co. Holding SA | 433,723 | 2,989 |
| | Itau Unibanco Holding SA ADR | 705,875 | 2,873 |
| | JBS SA | 406,498 | 2,813 |
| * | Suzano SA | 310,315 | 2,707 |
| | Notre Dame Intermedica Participacoes SA | 218,206 | 2,481 |
| | Magazine Luiza SA | 1,283,868 | 2,459 |
| 3 | Rede D'Or Sao Luiz SA | 204,571 | 2,139 |
| | Lojas Renner SA | 366,631 | 2,094 |
| | Localiza Rent a Car SA | 249,557 | 2,003 |
| | Raia Drogasil SA | 473,200 | 1,949 |
| | Petroleo Brasileiro SA ADR | 195,307 | 1,877 |
| | Vibra Energia SA | 498,248 | 1,852 |
| | Cosan SA | 512,852 | 1,798 |
| | Banco Do Brasil SA | 347,820 | 1,756 |
| | Ambev SA ADR | 588,786 | 1,743 |
| * | Banco Bradesco SA | 561,885 | 1,692 |
| | Equatorial Energia SA | 395,876 | 1,605 |
| | Gerdau SA Preference Shares | 329,700 | 1,571 |
| | Banco BTG Pactual SA (BVMF) | 387,724 | 1,549 |
| | Centrais Eletricas Brasileiras SA | 256,482 | 1,537 |
| * | Rumo SA | 538,016 | 1,524 |
| * | BRF SA | 364,424 | 1,500 |
| * | Klabin SA | 356,900 | 1,451 |
| | Telefonica Brasil SA | 177,164 | 1,429 |
| | Petroleo Brasileiro SA ADR (XNYS) | 129,754 | 1,274 |
| 3 | Hapvida Participacoes e Investimentos SA | 609,412 | 1,246 |
| * | Embraer SA | 317,100 | 1,232 |
| | Totvs SA | 200,484 | 1,164 |
| * | Petro Rio SA | 278,575 | 1,158 |
| * | Eneva SA | 451,568 | 1,152 |
Total World Stock Index Fund
| | | Shares | Market
Value•
($000) |
| | Itau Unibanco Holding SA | 292,934 | 1,092 |
| | BB Seguridade Participacoes SA | 267,539 | 1,047 |
| * | Banco Santander Brasil SA | 157,800 | 962 |
| | CCR SA | 473,344 | 959 |
| * | Bradespar SA Preference Shares | 109,560 | 945 |
| | Cia Energetica de Minas Gerais Preference Shares | 413,101 | 943 |
| * | Americanas SA | 177,596 | 935 |
| | Cia de Saneamento Basico do Estado de Sao Paulo | 149,500 | 932 |
| | Sendas Distribuidora SA | 315,605 | 855 |
| | Hypera SA | 171,212 | 851 |
| | Marfrig Global Foods SA | 176,391 | 828 |
| | Energisa SA | 113,415 | 796 |
| * | Braskem SA Preference Shares | 79,580 | 768 |
| | Ultrapar Participacoes SA | 331,796 | 767 |
| | Sul America SA | 161,190 | 742 |
| | Gerdau SA ADR | 156,698 | 741 |
| | Centrais Eletricas Brasileiras SA Preference Shares | 122,300 | 733 |
| | Engie Brasil Energia SA | 100,692 | 694 |
| | Cia Siderurgica Nacional SA | 170,600 | 689 |
| * | Via SA | 620,989 | 677 |
| | Transmissora Alianca de Energia Eletrica SA | 96,527 | 627 |
| | Cia Paranaense de Energia Preference Shares | 576,000 | 604 |
| 3 | Locaweb Servicos de Internet SA | 185,437 | 601 |
| | Metalurgica Gerdau SA Preference Shares | 270,100 | 599 |
| 3 | Banco Inter SA Preference Shares | 273,753 | 593 |
| | TIM SA | 288,300 | 573 |
| * | Alpargatas SA Preference Shares | 83,161 | 569 |
| | Cia Energetica de Sao Paulo Preference Shares | 123,385 | 557 |
| * | Azul SA Preference Shares | 109,636 | 483 |
| | YDUQS Part | 128,600 | 475 |
| | Cia de Locacao das Americas | 135,937 | 475 |
| | Sao Martinho SA | 67,100 | 455 |
| | Cia Energetica de Minas Gerais | 153,347 | 452 |
| * | GRUPO DE MODA SOMA SA | 191,618 | 445 |
| | EDP - Energias do Brasil SA | 127,367 | 442 |
| | | Shares | Market
Value•
($000) |
| | Usinas Siderurgicas De Minas Gerais SAUsiminas Preference Shares | 179,571 | 422 |
| | CSHG Logistica FI Imobiliario | 14,107 | 417 |
| | Multiplan Empreendimentos Imobiliarios SA | 125,121 | 411 |
| * | Omega Geracao SA | 69,315 | 402 |
| | Fleury SA | 117,600 | 392 |
| | Banco Inter SA | 189,494 | 389 |
| * | BR Malls Participacoes SA | 295,118 | 375 |
| | M Dias Branco SA | 67,300 | 369 |
| | Cia Siderurgica Nacional SA ADR | 89,670 | 366 |
| | Neoenergia SA | 128,800 | 354 |
| | Pet Center Comercio E Participacoes SA | 104,100 | 346 |
| | CPFL Energia SA | 72,900 | 340 |
| | Kinea Indice de Precos FII | 18,318 | 333 |
| * | Cia de Transmissao de Energia Eletrica Paulista Preference Shares | 76,808 | 331 |
| * | IRB Brasil Resseguros SA | 393,981 | 327 |
| | Kinea Rendimentos Imobiliarios FII | 17,781 | 307 |
| | Atacadao SA | 102,671 | 303 |
| | Unipar Carbocloro SA Preference Shares | 22,570 | 299 |
| * | Cogna Educacao | 658,273 | 289 |
| * | Afya Ltd. Class A | 16,530 | 288 |
| | Lojas Americanas SA Preference Shares (BVMF) | 336,853 | 288 |
| | Cia Brasileira de Distribuicao | 63,121 | 286 |
| * | Santos Brasil Participacoes SA | 312,523 | 285 |
| | Arezzo Industria e Comercio SA | 21,500 | 282 |
| * | Porto Seguro SA | 67,744 | 280 |
| | TIM SA ADR | 28,251 | 279 |
| | Dexco SA | 99,885 | 275 |
| | Qualicorp Consultoria e Corretora de Seguros SA | 89,700 | 272 |
| | Odontoprev SA | 114,585 | 272 |
| | Cyrela Brazil Realty SA Empreendimentos e Participacoes | 108,098 | 270 |
| | Grendene SA | 177,800 | 270 |
| | Kinea Renda Imobiliaria FII | 10,840 | 261 |
| | Light SA | 151,500 | 260 |
| | Alupar Investimento SA | 61,658 | 259 |
| * | CVC Brasil Operadora e Agencia de Viagens SA | 89,583 | 254 |
Total World Stock Index Fund
| | | Shares | Market
Value•
($000) |
| | Banco Pan SA Preference Shares | 106,700 | 251 |
| | Banco Inter SA (BVMF) | 39,573 | 249 |
| | Cia de Saneamento de Minas Gerais-COPASA | 99,867 | 241 |
| | SLC Agricola SA | 30,800 | 238 |
| | Cia de Saneamento do Parana | 71,580 | 231 |
| | Banco do Estado do Rio Grande do Sul SA Class B Preference Shares | 115,998 | 224 |
| | JHSF Participacoes SA | 253,747 | 224 |
| | Cia Paranaense de Energia | 231,000 | 220 |
| | CSN Mineracao SA | 227,200 | 212 |
| | MRV Engenharia e Participacoes SA | 116,700 | 210 |
| * | Gol Linhas Aereas Inteligentes SA Preference Shares | 75,974 | 204 |
| * | Grupo Mateus SA | 156,400 | 198 |
| * | Grupo SBF SA | 51,109 | 190 |
| | Camil Alimentos SA | 106,200 | 182 |
| | Aliansce Sonae Shopping Centers SA | 50,598 | 172 |
| | Iguatemi Empresa de Shopping Centers SA | 31,500 | 167 |
| | Usinas Siderurgicas de Minas Gerais SA Usiminas | 70,700 | 161 |
| | Minerva SA | 91,760 | 158 |
| * | Anima Holding SA | 132,984 | 156 |
| | AES Brasil Energia SA | 79,497 | 154 |
| | Vivara Participacoes SA | 33,200 | 153 |
| | Raizen SA Preference Shares | 126,503 | 152 |
| | SIMPAR SA | 83,272 | 151 |
| * | Vamos Locacao de Caminhoes Maquinas e Equipamentos SA | 75,081 | 151 |
| | Cielo SA | 383,088 | 149 |
| | Cia Ferro Ligas da Bahia - FERBASA Preference Shares | 17,400 | 146 |
| | Lojas Americanas SA (BVMF) | 159,865 | 140 |
| | Movida Participacoes SA | 52,800 | 139 |
| * | Intelbras SA Industria de Telecomunicacao Eletronica Brasileira | 28,700 | 134 |
| | Randon SAImplementos E Participacoes Preference Shares | 71,064 | 128 |
| | Boa Vista Servicos SA | 76,100 | 123 |
| | | Shares | Market
Value•
($000) |
| | LOG Commercial Properties e Participacoes SA | 29,615 | 123 |
| * | EcoRodovias Infraestrutura e Logistica SA | 81,353 | 118 |
| | BR Properties SA | 89,835 | 115 |
| * | Iochpe Maxion SA | 37,596 | 112 |
| | Lojas Quero Quero SA | 54,300 | 111 |
| | Ez Tec Empreendimentos e Participacoes SA | 33,961 | 110 |
| | Marcopolo SA Preference Shares | 231,609 | 106 |
| | Ambipar Participacoes e Empreendimentos SA | 15,900 | 104 |
| * | Aeris Industria E Comercio De Equipamentos Para Geracao De Energia SA | 71,900 | 100 |
| | Cia de Saneamento do Parana Preference Shares | 139,400 | 92 |
| | MPM Corporeos SA | 51,200 | 89 |
| | Tupy SA | 23,300 | 86 |
| | Construtora Tenda SA | 27,118 | 82 |
| 3 | Meliuz SA | 138,942 | 82 |
| * | BK Brasil Operacao e Assessoria a Restaurantes SA | 65,544 | 80 |
| * | Hidrovias do Brasil SA | 151,300 | 80 |
| | Mahle-Metal Leve SA | 12,100 | 73 |
| * | Sequoia Logistica E Transportes SA | 27,700 | 64 |
| | Jereissati Participacoes SA | 12,761 | 60 |
| | Guararapes Confeccoes SA | 29,000 | 56 |
| | Enauta Participacoes SA | 23,045 | 52 |
| | Direcional Engenharia SA | 28,542 | 48 |
| | Instituto Hermes Pardini SA | 12,400 | 48 |
| | Wiz Solucoes e Corretagem de Seguros SA | 25,310 | 43 |
| 3 | Ser Educacional SA | 23,047 | 43 |
| | Even Construtora e Incorporadora SA | 35,991 | 40 |
| * | C&a Modas Ltda | 35,000 | 38 |
| * | Getnet Adquirencia e Servicos para Meios de Pagamento SA | 39,450 | 30 |
| * | Empreendimentos Pague Menos S/A | 4,601 | 8 |
| | Cosan SA ADR | 4 | — |
Total World Stock Index Fund
| | | Shares | Market
Value•
($000) |
| * | Ultrapar Participacoes Rights Exp.11/3/2021 | 23,781 | — |
| | | | 175,751 |
| Canada (2.9%) |
| | Royal Bank of Canada | 614,280 | 63,940 |
| | Toronto-Dominion Bank | 788,702 | 57,254 |
| * | Shopify Inc. Class A (XTSE) | 28,906 | 42,397 |
| | Enbridge Inc. | 880,686 | 36,890 |
| | Brookfield Asset Management Inc. Class A | 580,292 | 35,035 |
| 2 | Bank of Nova Scotia | 524,327 | 34,376 |
| | Canadian National Railway Co. | 257,990 | 34,287 |
| 2 | Bank of Montreal | 281,195 | 30,530 |
| * | Shopify Inc. Class A | 20,090 | 29,333 |
| | TC Energy Corp. | 429,922 | 23,257 |
| | Canadian Imperial Bank of Commerce | 187,205 | 22,715 |
| | Canadian Pacific Railway Ltd. | 290,964 | 22,521 |
| | Canadian Natural Resources Ltd. | 509,860 | 21,670 |
| | Nutrien Ltd. | 250,271 | 17,492 |
| | Suncor Energy Inc. | 653,963 | 17,200 |
| | Manulife Financial Corp. | 851,921 | 16,596 |
| | Waste Connections Inc. | 116,543 | 15,858 |
| | Constellation Software Inc. | 8,391 | 14,747 |
| | Sun Life Financial Inc. | 254,615 | 14,510 |
| | Alimentation Couche-Tard Inc. Class B | 346,295 | 12,989 |
| | National Bank of Canada | 147,118 | 12,180 |
| | Franco-Nevada Corp. | 83,287 | 11,884 |
| | Barrick Gold Corp. (XLON) | 568,287 | 10,428 |
| | Magna International Inc. | 123,777 | 10,068 |
| | Fortis Inc. (XTSE) | 209,382 | 9,320 |
| | Thomson Reuters Corp. | 73,787 | 8,876 |
| * | CGI Inc. | 96,145 | 8,589 |
| | Intact Financial Corp. | 62,192 | 8,337 |
| | Pembina Pipeline Corp. | 242,620 | 8,032 |
| | Wheaton Precious Metals Corp. | 198,068 | 7,996 |
| | Power Corp. of Canada | 237,960 | 7,926 |
| | Restaurant Brands International Inc. (XTSE) | 132,859 | 7,522 |
| | Rogers Communications Inc. Class B | 153,230 | 7,127 |
| | WSP Global Inc. | 51,498 | 6,982 |
| | BCE Inc. | 132,768 | 6,835 |
| | | Shares | Market
Value•
($000) |
| | Cenovus Energy Inc. | 556,195 | 6,651 |
| | Open Text Corp. | 122,466 | 6,169 |
| | First Quantum Minerals Ltd. | 244,743 | 5,794 |
| | Dollarama Inc. | 127,926 | 5,782 |
| * | Teck Resources Ltd. Class B | 203,949 | 5,692 |
| | Agnico Eagle Mines Ltd. | 107,073 | 5,683 |
| | Shaw Communications Inc. Class B | 193,789 | 5,581 |
| | Metro Inc. | 110,000 | 5,535 |
| * | Lightspeed Commerce Inc. | 56,427 | 5,500 |
| | Loblaw Cos. Ltd. | 68,840 | 5,177 |
| 2 | Emera Inc. | 110,528 | 5,142 |
| | Kirkland Lake Gold Ltd. | 117,826 | 4,967 |
| | Tourmaline Oil Corp. | 123,461 | 4,462 |
| | TELUS Corp. | 194,189 | 4,455 |
| | TFI International Inc. | 40,155 | 4,453 |
| | Fairfax Financial Holdings Ltd. | 10,818 | 4,381 |
| | Cameco Corp. | 172,763 | 4,198 |
| | Barrick Gold Corp. | 214,008 | 3,939 |
| | Algonquin Power & Utilities Corp. | 273,085 | 3,937 |
| * | Bausch Health Cos. Inc. | 138,031 | 3,869 |
| * | CAE Inc. | 126,615 | 3,840 |
| | West Fraser Timber Co. Ltd. | 47,685 | 3,818 |
| 2 | Canadian Tire Corp. Ltd. Class A | 25,243 | 3,585 |
| | Canadian Apartment Properties REIT | 73,373 | 3,583 |
| | CCL Industries Inc. Class B | 63,834 | 3,489 |
| | Great-West Lifeco Inc. | 116,386 | 3,424 |
| | George Weston Ltd. | 31,607 | 3,415 |
| | Kinross Gold Corp. | 556,658 | 3,346 |
| | FirstService Corp. | 16,651 | 3,321 |
| | Northland Power Inc. | 102,680 | 3,301 |
| | Ritchie Bros Auctioneers Inc. | 47,639 | 3,256 |
| 3 | Hydro One Ltd. | 135,779 | 3,244 |
| *,3 | Nuvei Corp. | 26,739 | 3,214 |
| | Gildan Activewear Inc. | 84,562 | 3,106 |
| | Toromont Industries Ltd. | 34,196 | 3,042 |
| | Imperial Oil Ltd. | 88,773 | 3,005 |
| * | Descartes Systems Group Inc. | 35,779 | 2,922 |
| | ARC Resources Ltd. | 297,612 | 2,854 |
| | Brookfield Infrastructure Corp. Class A | 45,752 | 2,773 |
| | RioCan REIT | 151,744 | 2,733 |
| | iA Financial Corp. Inc. | 45,999 | 2,721 |
| | Saputo Inc. | 109,166 | 2,607 |
| | TMX Group Ltd. | 23,898 | 2,587 |
| | Stantec Inc. | 45,155 | 2,496 |
| 2 | AltaGas Ltd. | 117,447 | 2,431 |
Total World Stock Index Fund
| | | Shares | Market
Value•
($000) |
| | Onex Corp. | 32,499 | 2,422 |
| 2 | Keyera Corp. | 94,247 | 2,416 |
| * | BlackBerry Ltd. | 217,979 | 2,355 |
| | Lundin Mining Corp. | 268,866 | 2,340 |
| | Pan American Silver Corp. | 89,052 | 2,279 |
| | Empire Co. Ltd. Class A | 76,049 | 2,274 |
| | Finning International Inc. | 76,088 | 2,253 |
| | Granite REIT | 26,377 | 2,138 |
| | Quebecor Inc. Class B | 78,319 | 1,996 |
| * | Ballard Power Systems Inc. | 107,860 | 1,955 |
| | Allied Properties REIT | 55,872 | 1,931 |
| | SNC-Lavalin Group Inc. | 71,410 | 1,921 |
| | GFL Environmental Inc. | 46,228 | 1,901 |
| | Element Fleet Management Corp. | 174,768 | 1,899 |
| | Colliers International Group Inc. | 12,767 | 1,852 |
| * | Ivanhoe Mines Ltd. Class A | 223,523 | 1,754 |
| | Parkland Corp. | 60,197 | 1,752 |
| * | Kinaxis Inc. | 11,152 | 1,731 |
| | B2Gold Corp. | 413,099 | 1,706 |
| | Boyd Group Services Inc. | 8,781 | 1,704 |
| | Premium Brands Holdings Corp. Class A | 15,536 | 1,679 |
| | CI Financial Corp. | 71,976 | 1,641 |
| | Capital Power Corp. | 49,759 | 1,634 |
| | Yamana Gold Inc. | 400,095 | 1,571 |
| | H&R REIT | 110,674 | 1,521 |
| *,2 | Bombardier Inc. Class B | 940,082 | 1,512 |
| | Canadian Utilities Ltd. Class A | 51,896 | 1,503 |
| | Brookfield Renewable Corp. Class A | 35,688 | 1,478 |
| * | Aritzia Inc. | 37,485 | 1,476 |
| | SSR Mining Inc. | 91,905 | 1,450 |
| | BRP Inc. | 16,366 | 1,439 |
| | IGM Financial Inc. | 34,571 | 1,373 |
| * | Air Canada Class A | 75,075 | 1,346 |
| *,2 | Canopy Growth Corp. | 105,594 | 1,335 |
| | SmartCentres REIT | 52,716 | 1,329 |
| | Choice Properties REIT | 108,928 | 1,311 |
| | Enerplus Corp. | 137,181 | 1,299 |
| | Methanex Corp. | 28,925 | 1,296 |
| | Alamos Gold Inc. Class A | 170,423 | 1,264 |
| | First Capital REIT | 86,150 | 1,231 |
| | PrairieSky Royalty Ltd. | 98,450 | 1,212 |
| | Boralex Inc. Class A | 38,408 | 1,189 |
| | Gibson Energy Inc. | 58,072 | 1,170 |
| | TransAlta Corp. | 104,337 | 1,170 |
| | | Shares | Market
Value•
($000) |
| | Crescent Point Energy Corp. | 228,595 | 1,149 |
| | Canadian Western Bank | 35,855 | 1,147 |
| * | MEG Energy Corp. | 126,331 | 1,132 |
| 2 | First Majestic Silver Corp. | 87,130 | 1,104 |
| * | Pretium Resources Inc. | 90,435 | 1,094 |
| | Atco Ltd. Class I | 32,002 | 1,086 |
| * | ATS Automation Tooling Systems Inc. | 31,706 | 1,079 |
| | Cargojet Inc. | 6,687 | 1,065 |
| | Linamar Corp. | 18,476 | 1,016 |
| | Primo Water Corp. | 63,183 | 1,006 |
| | Stella-Jones Inc. | 27,699 | 994 |
| | Innergex Renewable Energy Inc. | 58,303 | 970 |
| * | Canada Goose Holdings Inc. | 25,589 | 949 |
| | Parex Resources Inc. | 48,843 | 948 |
| * | Equinox Gold Corp. | 126,611 | 939 |
| | Osisko Gold Royalties Ltd. | 70,185 | 886 |
| | Laurentian Bank of Canada | 26,221 | 883 |
| | Brookfield Renewable Corp. Class A (XTSE) | 21,325 | 883 |
| * | Eldorado Gold Corp. | 96,121 | 860 |
| | ECN Capital Corp. | 98,373 | 855 |
| | Chartwell Retirement Residences | 86,155 | 831 |
| | Enghouse Systems Ltd. | 18,594 | 806 |
| | Maple Leaf Foods Inc. | 34,402 | 750 |
| | Centerra Gold Inc. | 95,574 | 717 |
| *,2 | Aurora Cannabis Inc. | 105,705 | 701 |
| | Russel Metals Inc. | 26,125 | 689 |
| | Whitecap Resources Inc. | 114,598 | 688 |
| * | Vermilion Energy Inc. | 62,870 | 682 |
| | Superior Plus Corp. | 61,160 | 680 |
| | Stelco Holdings Inc. | 19,417 | 674 |
| * | Home Capital Group Inc. Class B | 20,552 | 667 |
| * | Novagold Resources Inc. | 90,139 | 658 |
| * | OceanaGold Corp. | 345,291 | 645 |
| | Cominar REIT | 66,759 | 623 |
| 2 | Boardwalk REIT | 14,268 | 616 |
| | North West Co. Inc. | 21,943 | 596 |
| | Hudbay Minerals Inc. | 79,265 | 553 |
| | TransAlta Renewables Inc. | 37,359 | 553 |
| | NFI Group Inc. | 27,128 | 550 |
| | Cascades Inc. | 44,345 | 514 |
| * | IAMGOLD Corp. | 177,175 | 488 |
| * | Canfor Corp. | 23,459 | 486 |
| * | Turquoise Hill Resources Ltd. | 37,125 | 470 |
| | Aecon Group Inc. | 30,083 | 449 |
Total World Stock Index Fund
| | | Shares | Market
Value•
($000) |
| | Dye & Durham Ltd. | 13,925 | 426 |
| | Winpak Ltd. | 13,570 | 425 |
| | Artis REIT | 43,300 | 410 |
| | Transcontinental Inc. Class A | 25,901 | 410 |
| * | Celestica Inc. | 40,101 | 395 |
| * | Torex Gold Resources Inc. | 33,404 | 388 |
| * | Cronos Group Inc. | 70,696 | 367 |
| | Mullen Group Ltd. | 32,690 | 338 |
| | Cogeco Communications Inc. | 3,793 | 326 |
| | Westshore Terminals Investment Corp. | 14,700 | 318 |
| | Dream Office REIT | 15,117 | 285 |
| | Martinrea International Inc. | 29,300 | 272 |
| | First National Financial Corp. | 7,029 | 237 |
| | Brookfield Asset Management Reinsurance Partners Ltd. Class A | 3,727 | 230 |
| | Canadian Imperial Bank of Commerce (XTSE) | 1,229 | 149 |
| | GFL Environmental Inc. (XTSE) | 1,460 | 60 |
| * | Bombardier Inc. Class A | 7,478 | 13 |
| | | | 989,367 |
| Chile (0.0%) |
| | Sociedad Quimica y Minera de Chile SA Class B Preference Shares | 51,068 | 2,773 |
| | Banco De Chile | 18,709,814 | 1,624 |
| * | Empresas COPEC SA | 197,654 | 1,555 |
| | Empresas CMPC SA | 511,771 | 944 |
| | Enel Americas SA | 7,732,643 | 879 |
| | Falabella SA | 315,774 | 873 |
| | Banco Santander Chile SA | 19,589,525 | 857 |
| | Cencosud SA | 568,969 | 832 |
| | Banco de Credito e Inversiones SA | 20,824 | 701 |
| | Sociedad Quimica y Minera de Chile SA ADR | 10,910 | 599 |
| | Enel Chile SA | 12,468,240 | 511 |
| | Cia Sud Americana de Vapores SA | 7,515,641 | 488 |
| | Cia Cervecerias Unidas SA | 55,525 | 465 |
| | CAP SA | 38,966 | 386 |
| * | Parque Arauco SA | 360,481 | 356 |
| | Banco Santander Chile ADR | 18,759 | 332 |
| | Embotelladora Andina SA Preference Shares | 149,068 | 308 |
| | Cencosud Shopping SA | 263,796 | 255 |
| | Colbun SA | 3,109,604 | 215 |
| | | Shares | Market
Value•
($000) |
| * | Latam Airlines Group SA | 130,499 | 191 |
| | Aguas Andinas SA Class A | 974,615 | 186 |
| | Empresa Nacional de Telecomunicaciones SA | 52,751 | 181 |
| | Vina Concha y Toro SA | 117,757 | 171 |
| * | Inversiones Aguas Metropolitanas SA | 349,036 | 164 |
| | Enel Chile SA ADR | 65,984 | 143 |
| * | Plaza SA | 137,445 | 137 |
| * | Itau CorpBanca Chile SA | 61,154,961 | 136 |
| | AES Andes SA | 1,218,430 | 125 |
| | SMU SA | 1,180,463 | 118 |
| | Engie Energia Chile SA | 169,857 | 99 |
| * | Ripley Corp. SA | 580,437 | 98 |
| | Salfacorp SA | 196,211 | 67 |
| | SONDA SA | 157,659 | 53 |
| | Inversiones La Construccion SA | 9,475 | 34 |
| | Enel Americas SA ADR | 303 | 2 |
| *,1 | Itau CorpBanca Chile SA Rights Exp. 11/2/21 | 55,032,904 | — |
| | | | 16,858 |
| China (3.7%) |
| | Tencent Holdings Ltd. | 2,608,102 | 158,650 |
| * | Alibaba Group Holding Ltd. | 6,197,220 | 127,431 |
| *,3 | Meituan Class B | 1,693,957 | 57,643 |
| | China Construction Bank Corp. Class H | 40,591,026 | 27,625 |
| * | NIO Inc. ADR | 567,609 | 22,369 |
| *,3 | Wuxi Biologics Cayman Inc. | 1,430,240 | 21,664 |
| * | JD.com Inc. Class A | 549,424 | 21,508 |
| * | Baidu Inc. ADR | 120,381 | 19,531 |
| | Industrial & Commercial Bank of China Ltd. Class H | 32,886,245 | 18,027 |
| *,3 | Xiaomi Corp. Class B | 5,846,000 | 15,980 |
| | Ping An Insurance Group Co. of China Ltd. Class H | 2,187,966 | 15,672 |
| * | Pinduoduo Inc. ADR | 162,538 | 14,453 |
| | China Merchants Bank Co. Ltd. Class H | 1,504,398 | 12,607 |
| | NetEase Inc. | 639,355 | 12,402 |
| | BYD Co. Ltd. Class H | 298,460 | 11,415 |
| | Bank of China Ltd. Class H | 31,994,410 | 11,323 |
| | Kweichow Moutai Co. Ltd. Class A | 38,530 | 10,995 |
| | Li Ning Co. Ltd. | 965,750 | 10,657 |
| * | XPeng Inc. Class A ADR | 207,451 | 9,673 |
Total World Stock Index Fund
| | | Shares | Market
Value•
($000) |
| *,3 | Kuaishou Technology | 679,800 | 8,893 |
| | China Mengniu Dairy Co. Ltd. | 1,366,236 | 8,693 |
| *,2 | Bilibili Inc. ADR | 110,702 | 8,114 |
| | Geely Automobile Holdings Ltd. | 2,320,200 | 8,053 |
| | ANTA Sports Products Ltd. | 498,000 | 7,716 |
| | Sunny Optical Technology Group Co. Ltd. | 286,400 | 7,685 |
| | Shenzhou International Group Holdings Ltd. | 333,466 | 7,184 |
| | China Merchants Bank Co. Ltd. Class A | 805,949 | 6,789 |
| * | Trip.com Group Ltd. ADR | 237,138 | 6,773 |
| | Ping An Insurance Group Co. of China Ltd. Class A | 771,217 | 5,957 |
| | Country Garden Services Holdings Co. Ltd. | 773,141 | 5,952 |
| | China Resources Beer Holdings Co. Ltd. | 716,681 | 5,918 |
| * | ENN Energy Holdings Ltd. | 334,918 | 5,770 |
| * | Li Auto Inc. ADR | 174,598 | 5,697 |
| | Great Wall Motor Co. Ltd. Class H | 1,232,058 | 5,544 |
| *,3 | Innovent Biologics Inc. | 581,441 | 5,204 |
| | China Petroleum and Chemical Corp. (Sinopec) Class H | 9,873,337 | 4,811 |
| | China Life Insurance Co. Ltd. Class H | 2,761,271 | 4,797 |
| | China Resources Land Ltd. | 1,227,909 | 4,771 |
| | Agricultural Bank of China Class H | 13,608,500 | 4,624 |
| | BYD Co. Ltd. Class A | 94,248 | 4,606 |
| | PetroChina Co. Ltd. Class H | 9,222,000 | 4,446 |
| * | Huazhu Group Ltd. ADR | 93,853 | 4,351 |
| | Haier Smart Home Co. Ltd. Class H | 1,165,800 | 4,341 |
| 3 | Longfor Group Holdings Ltd. | 871,600 | 4,217 |
| | Wuliangye Yibin Co. Ltd. Class A | 124,200 | 4,197 |
| | CSPC Pharmaceutical Group Ltd. | 3,740,000 | 3,903 |
| | China Overseas Land & Investment Ltd. | 1,725,980 | 3,807 |
| | Xinyi Solar Holdings Ltd. | 1,828,200 | 3,798 |
| * | Kingdee International Software Group Co. Ltd. | 1,146,000 | 3,771 |
| | | Shares | Market
Value•
($000) |
| 3 | Smoore International Holdings Ltd. | 775,000 | 3,685 |
| | China Conch Venture Holdings Ltd. | 753,498 | 3,662 |
| | China Longyuan Power Group Corp. Ltd. Class H | 1,498,000 | 3,504 |
| | Sino Biopharmaceutical Ltd. | 4,550,250 | 3,355 |
| *,2 | COSCO SHIPPING Holdings Co. Ltd. Class H | 2,158,049 | 3,343 |
| | China Gas Holdings Ltd. | 1,335,674 | 3,334 |
| | Country Garden Holdings Co. | 3,470,230 | 3,266 |
| | Zijin Mining Group Co. Ltd. Class H | 2,327,301 | 3,236 |
| | China Pacific Insurance Group Co. Ltd. Class H | 1,024,400 | 3,132 |
| * | GDS Holdings Ltd. ADR | 50,523 | 3,001 |
| 3 | WuXi AppTec Co. Ltd. Class H | 140,256 | 2,995 |
| 3 | Postal Savings Bank of China Co. Ltd. Class H | 3,974,000 | 2,888 |
| | PICC Property & Casualty Co. Ltd. Class H | 3,082,330 | 2,869 |
| * | Zai Lab Ltd. ADR | 27,400 | 2,861 |
| | China Shenhua Energy Co. Ltd. Class H | 1,325,500 | 2,850 |
| *,3 | JD Health International Inc. | 315,411 | 2,769 |
| * | Alibaba Health Information Technology Ltd. | 2,112,000 | 2,645 |
| 3 | China Tower Corp. Ltd. Class H | 20,396,576 | 2,643 |
| | Industrial & Commercial Bank of China Ltd. Class A | 3,592,185 | 2,623 |
| | Zhongsheng Group Holdings Ltd. | 285,500 | 2,574 |
| | Contemporary Amperex Technology Co. Ltd. Class A | 24,940 | 2,498 |
| | LONGi Green Energy Technology Co. Ltd. Class A | 160,984 | 2,455 |
| | Sunac China Holdings Ltd. | 1,115,400 | 2,385 |
| | China Tourism Group Duty Free Corp. Ltd. Class A | 55,788 | 2,337 |
| | Anhui Conch Cement Co. Ltd. Class H | 457,000 | 2,260 |
| | China National Building Material Co. Ltd. Class H | 1,780,750 | 2,232 |
Total World Stock Index Fund
| | | Shares | Market
Value•
($000) |
| | China Resources Power Holdings Co. Ltd. | 851,400 | 2,204 |
| * | Vipshop Holdings Ltd. ADR | 195,505 | 2,182 |
| | China Resources Gas Group Ltd. | 402,000 | 2,158 |
| | CITIC Securities Co. Ltd. Class H | 837,000 | 2,125 |
| | Citic Pacific Ltd. | 2,113,000 | 2,117 |
| 3 | China Feihe Ltd. | 1,185,000 | 1,967 |
| * | Tencent Music Entertainment Group ADR | 250,060 | 1,965 |
| * | Daqo New Energy Corp. ADR | 24,403 | 1,898 |
| | Industrial Bank Co. Ltd. Class A | 636,600 | 1,853 |
| * | KE Holdings Inc. ADR | 100,933 | 1,839 |
| *,1 | GCL-Poly Energy Holdings Ltd. | 7,206,604 | 1,834 |
| * | Genscript Biotech Corp. | 414,000 | 1,832 |
| 3 | China International Capital Corp. Ltd. Class H | 728,000 | 1,802 |
| | CITIC Securities Co. Ltd. Class A | 445,217 | 1,800 |
| | Weichai Power Co. Ltd. Class H | 1,002,400 | 1,794 |
| | Agricultural Bank of China Ltd. Class A | 3,884,435 | 1,784 |
| 3 | Ganfeng Lithium Co. Ltd. Class H | 95,200 | 1,784 |
| | Ping An Bank Co. Ltd. Class A | 571,500 | 1,741 |
| | Shanxi Xinghuacun Fen Wine Factory Co. Ltd. Class A | 36,924 | 1,739 |
| | Bank of Communications Ltd. Class H | 2,908,058 | 1,730 |
| | Kingsoft Corp. Ltd. | 401,200 | 1,712 |
| | China CITIC Bank Corp. Ltd. Class H | 3,890,525 | 1,707 |
| | ZTO Express Cayman Inc. ADR | 58,119 | 1,705 |
| | Great Wall Motor Co. Ltd. Class A | 157,031 | 1,675 |
| | GF Securities Co. Ltd. Class H | 986,800 | 1,674 |
| | China Vanke Co. Ltd. Class H | 714,089 | 1,668 |
| | Haitong Securities Co. Ltd. Class H | 1,872,739 | 1,666 |
| | Chinasoft International Ltd. | 994,000 | 1,660 |
| | East Money Information Co. Ltd. Class A | 320,812 | 1,650 |
| | Shandong Weigao Group Medical Polymer Co. Ltd. Class H | 964,000 | 1,642 |
| | Tsingtao Brewery Co. Ltd. Class H | 188,322 | 1,639 |
| | Luzhou Laojiao Co. Ltd. Class A | 45,600 | 1,627 |
| | | Shares | Market
Value•
($000) |
| | Shenzhen Mindray Bio-Medical Electronics Co. Ltd. Class A | 27,488 | 1,611 |
| | Guangdong Investment Ltd. | 1,266,000 | 1,592 |
| | Wanhua Chemical Group Co. Ltd. Class A | 95,400 | 1,576 |
| | Hengan International Group Co. Ltd. | 300,230 | 1,569 |
| 3 | Fuyao Glass Industry Group Co. Ltd. Class H | 272,000 | 1,566 |
| | Bank of China Ltd. Class A | 3,238,700 | 1,543 |
| *,2 | RLX Technology Inc. ADR | 313,915 | 1,526 |
| * | Lufax Holding Ltd. ADR | 241,046 | 1,521 |
| | Jiangsu Hengrui Medicine Co. Ltd. Class A | 192,316 | 1,477 |
| | Kunlun Energy Co. Ltd. | 1,596,000 | 1,454 |
| | China Yangtze Power Co. Ltd. Class A | 435,594 | 1,448 |
| | Inner Mongolia Yili Industrial Group Co. Ltd. Class A | 212,700 | 1,426 |
| | Kingboard Holdings Ltd. | 322,340 | 1,405 |
| | China Life Insurance Co. Ltd. Class A | 299,672 | 1,390 |
| | Muyuan Foods Co. Ltd. Class A | 155,348 | 1,389 |
| | Zijin Mining Group Co. Ltd. Class A | 846,712 | 1,382 |
| * | New Oriental Education & Technology Group Inc. ADR | 667,446 | 1,368 |
| | Shanghai Fosun Pharmaceutical Group Co. Ltd. Class H | 287,639 | 1,354 |
| | China Pacific Insurance Group Co. Ltd. Class A | 311,988 | 1,333 |
| | Luxshare Precision Industry Co. Ltd. Class A | 218,869 | 1,324 |
| | Tongwei Co. Ltd. Class A | 148,100 | 1,322 |
| 3 | China Resources Mixc Lifestyle Services Ltd. | 251,400 | 1,322 |
| | Jiangsu Yanghe Brewery Joint-Stock Co. Ltd. Class A | 45,295 | 1,314 |
| *,3 | Weimob Inc. | 848,000 | 1,295 |
| | Sinopharm Group Co. Ltd. Class H | 545,000 | 1,294 |
| | China Petroleum & Chemical Corp. Class A | 1,943,380 | 1,291 |
| *,3 | China Literature Ltd. | 183,600 | 1,274 |
Total World Stock Index Fund
| | | Shares | Market
Value•
($000) |
| | Zhangzhou Pientzehuang Pharmaceutical Co. Ltd. Class A | 19,398 | 1,247 |
| | Aier Eye Hospital Group Co. Ltd. Class A | 164,012 | 1,240 |
| 2 | Dongyue Group Ltd. | 522,000 | 1,214 |
| 2 | Yihai International Holding Ltd. | 207,000 | 1,213 |
| * | 360 DigiTech Inc. ADR | 58,775 | 1,200 |
| 3 | Hangzhou Tigermed Consulting Co. Ltd. Class H | 61,000 | 1,190 |
| | China Minsheng Banking Corp. Ltd. Class H | 2,973,512 | 1,179 |
| | JOYY Inc. ADR | 23,346 | 1,176 |
| | Guangzhou Automobile Group Co. Ltd. Class H | 1,237,399 | 1,168 |
| | Dongfeng Motor Group Co. Ltd. Class H | 1,246,000 | 1,160 |
| 2,3 | Pop Mart International Group Ltd. | 194,600 | 1,148 |
| | Shanghai Pudong Development Bank Co. Ltd. Class A | 804,486 | 1,124 |
| *,2,3 | Akeso Inc. | 201,000 | 1,121 |
| *,3 | Hua Hong Semiconductor Ltd. | 222,084 | 1,114 |
| 3 | Hygeia Healthcare Holdings Co. Ltd. | 125,532 | 1,102 |
| 2,3 | Haidilao International Holding Ltd. | 394,000 | 1,099 |
| | Bank of Communications Co. Ltd. Class A | 1,547,100 | 1,092 |
| | Zhuzhou CRRC Times Electric Co. Ltd. | 226,209 | 1,081 |
| | Yunnan Energy New Material Co. Ltd. Class A | 23,600 | 1,076 |
| | Shanghai Baosight Software Co. Ltd. Class B | 268,544 | 1,074 |
| 3 | China Merchants Securities Co. Ltd. Class H | 678,160 | 1,071 |
| | ZTE Corp. Class H | 355,614 | 1,067 |
| | Fosun International Ltd. | 910,464 | 1,067 |
| | China Vanke Co. Ltd. Class A | 374,500 | 1,065 |
| | People's Insurance Co. Group of China Ltd. Class H | 3,410,000 | 1,064 |
| | New China Life Insurance Co. Ltd. Class H | 368,834 | 1,064 |
| | BYD Electronic International Co. Ltd. | 358,500 | 1,064 |
| | | Shares | Market
Value•
($000) |
| | Eve Energy Co. Ltd. Class A | 59,605 | 1,057 |
| | China Meidong Auto Holdings Ltd. | 204,000 | 1,054 |
| | China Galaxy Securities Co. Ltd. Class H | 1,878,000 | 1,046 |
| | Sungrow Power Supply Co. Ltd. Class A | 40,700 | 1,046 |
| | Autohome Inc. ADR | 26,443 | 1,041 |
| *,2 | Didi Global Inc. ADR | 127,625 | 1,030 |
| 3 | CGN Power Co. Ltd. Class H | 3,806,832 | 1,025 |
| 3 | Hansoh Pharmaceutical Group Co. Ltd. | 460,000 | 1,023 |
| | NARI Technology Co. Ltd. Class A | 166,480 | 1,014 |
| | China Molybdenum Co. Ltd. Class H | 1,638,000 | 1,013 |
| | Sany Heavy Industry Co. Ltd. Class A | 281,946 | 1,011 |
| 2 | Huaneng Power International Inc. Class H | 1,952,000 | 1,010 |
| * | iQIYI Inc. ADR | 120,072 | 994 |
| | China Everbright International Ltd. | 1,445,777 | 993 |
| | Anhui Conch Cement Co. Ltd. Class A | 167,300 | 992 |
| | China Medical System Holdings Ltd. | 585,000 | 991 |
| | China Insurance International Holdings Co. Ltd. | 650,059 | 989 |
| * | Kingsoft Cloud Holdings Ltd. ADR | 42,517 | 977 |
| 3 | Pharmaron Beijing Co. Ltd. Class H | 45,100 | 976 |
| | Foshan Haitian Flavouring & Food Co. Ltd. Class A | 52,728 | 966 |
| * | Weibo Corp. ADR | 21,480 | 966 |
| | Yangzijiang Shipbuilding Holdings Ltd. | 914,336 | 965 |
| | China Hongqiao Group Ltd. | 861,000 | 957 |
| 3 | Huatai Securities Co. Ltd. Class H | 638,564 | 950 |
| | Bosideng International Holdings Ltd. | 1,212,000 | 939 |
| | China Merchants Port Holdings Co. Ltd. | 562,000 | 937 |
| | China Northern Rare Earth Group High-Tech Co. Ltd. Class A | 117,900 | 935 |
| | Bank of Ningbo Co. Ltd. Class A | 156,500 | 933 |
| *,2,3 | Evergrande Property Services Group Ltd. | 1,823,000 | 929 |
Total World Stock Index Fund
| | | Shares | Market
Value•
($000) |
| 2 | Flat Glass Group Co. Ltd. Class H | 173,000 | 927 |
| * | Aluminum Corp. of China Ltd. Class H | 1,537,331 | 925 |
| | NAURA Technology Group Co. Ltd. Class A | 15,900 | 922 |
| * | Canadian Solar Inc. | 22,142 | 920 |
| | Hello Group Inc. ADR | 73,822 | 919 |
| * | Tongcheng-Elong Holdings Ltd. | 411,200 | 916 |
| | China Power International Development Ltd. | 1,801,851 | 905 |
| * | JinkoSolar Holding Co. Ltd. ADR | 15,089 | 903 |
| | Nine Dragons Paper Holdings Ltd. | 716,000 | 900 |
| | China Shenhua Energy Co. Ltd. Class A | 288,500 | 898 |
| | WuXi AppTec Co. Ltd. Class A | 41,584 | 896 |
| | Chongqing Zhifei Biological Products Co. Ltd. Class A | 37,500 | 882 |
| | Shimao Group Holdings Ltd. | 560,500 | 879 |
| | SAIC Motor Corp. Ltd. Class A | 276,099 | 876 |
| | CIFI Holdings Group Co. Ltd. | 1,572,000 | 873 |
| | CRRC Corp. Ltd. Class H | 1,917,000 | 866 |
| | Xinjiang Goldwind Science & Technology Co. Ltd. Class H | 387,365 | 866 |
| * | Vnet Group Inc. ADR | 55,178 | 865 |
| 3 | Topsports International Holdings Ltd. | 711,000 | 864 |
| | Far East Horizon Ltd. | 897,000 | 855 |
| 2 | Ming Yuan Cloud Group Holdings Ltd. | 263,000 | 855 |
| | Poly Developments and Holdings Group Co. Ltd. Class A | 432,799 | 849 |
| | AECC Aviation Power Co. Ltd. Class A | 91,800 | 848 |
| | Tianjin Zhonghuan Semiconductor Co. Ltd. Class A | 101,961 | 836 |
| 3 | Yadea Group Holdings Ltd. | 486,000 | 835 |
| *,3 | Jinxin Fertility Group Ltd. | 582,000 | 821 |
| | Haitian International Holdings Ltd. | 281,000 | 819 |
| | Shenzhen Inovance Technology Co. Ltd. Class A | 80,000 | 815 |
| | | Shares | Market
Value•
($000) |
| *,2,3 | Ping An Healthcare and Technology Co. Ltd. | 167,627 | 810 |
| | Jiangxi Copper Co. Ltd. Class H | 461,000 | 805 |
| | China Railway Group Ltd. Class H | 1,645,000 | 804 |
| | Beijing Enterprises Water Group Ltd. | 2,101,015 | 803 |
| *,2,3 | CanSino Biologics Inc. Class H | 31,400 | 803 |
| | Beijing Enterprises Holdings Ltd. | 208,500 | 801 |
| | China State Construction International Holdings Ltd. | 779,750 | 799 |
| | Huatai Securities Co. Ltd. Class A | 320,900 | 795 |
| 2 | Yanzhou Coal Mining Co. Ltd. Class H | 534,000 | 792 |
| | China Jinmao Holdings Group Ltd. | 2,712,000 | 792 |
| | Hopson Development Holdings Ltd. | 289,080 | 784 |
| | Guangzhou Tinci Materials Technology Co. Ltd. Class A | 30,430 | 783 |
| | GoerTek Inc. Class A | 114,500 | 778 |
| * | TAL Education Group ADR | 189,791 | 776 |
| | Cosco Shipping Ports Ltd. | 908,000 | 756 |
| | China State Construction Engineering Corp. Ltd. Class A | 1,039,800 | 756 |
| * | Noah Holdings Ltd. ADR | 17,496 | 744 |
| | China Resources Cement Holdings Ltd. | 882,000 | 742 |
| | Ganfeng Lithium Co. Ltd. Class A | 27,900 | 730 |
| | AviChina Industry & Technology Co. Ltd. Class H | 1,138,000 | 724 |
| | Kingboard Laminates Holdings Ltd. | 458,858 | 719 |
| *,3 | InnoCare Pharma Ltd. | 298,000 | 715 |
| | China Yongda Automobiles Services Holdings Ltd. | 442,000 | 703 |
| 3 | Jiumaojiu International Holdings Ltd. | 281,000 | 703 |
| | JA Solar Technology Co. Ltd. Class A | 49,300 | 703 |
| | SF Holding Co. Ltd. Class A | 69,598 | 702 |
| | China Lesso Group Holdings Ltd. | 453,000 | 700 |
Total World Stock Index Fund
| | | Shares | Market
Value•
($000) |
| * | Air China Ltd. Class H | 986,000 | 694 |
| *,2 | Gome Electrical Appliances Holdings Ltd. | 6,833,720 | 693 |
| | Seazen Group Ltd. | 876,038 | 693 |
| * | I-Mab ADR | 11,215 | 693 |
| 2,3 | Shandong Gold Mining Co. Ltd. Class H | 376,050 | 680 |
| | Shanghai Pharmaceuticals Holding Co. Ltd. Class H | 369,700 | 677 |
| | Anhui Gujing Distillery Co. Ltd. Class B | 52,300 | 674 |
| | Zhejiang Huayou Cobalt Co. Ltd. Class A | 38,800 | 673 |
| | China Grand Pharmaceutical and Healthcare Holdings Ltd. Class A | 823,080 | 659 |
| | ZTE Corp. Class A | 129,398 | 659 |
| | Sanan Optoelectronics Co. Ltd. Class A | 125,100 | 657 |
| | China Suntien Green Energy Corp. Ltd. Class H | 824,000 | 655 |
| * | China Southern Airlines Co. Ltd. Class H | 1,076,000 | 654 |
| | BOE Technology Group Co. Ltd. Class A | 850,900 | 654 |
| | Beijing Kingsoft Office Software Inc. Class A | 14,047 | 651 |
| | TravelSky Technology Ltd. Class H | 347,000 | 648 |
| 2 | Xtep International Holdings Ltd. | 492,000 | 643 |
| | Fu Shou Yuan International Group Ltd. | 744,000 | 639 |
| * | Beijing Capital International Airport Co. Ltd. Class H | 980,000 | 637 |
| | China Cinda Asset Management Co. Ltd. Class H | 3,785,000 | 632 |
| *,2,3 | ZhongAn Online P&C Insurance Co. Ltd. Class H | 173,556 | 631 |
| | Tsingtao Brewery Co. Ltd. Class A | 38,600 | 629 |
| | CRRC Corp. Ltd. Class A | 677,700 | 629 |
| | China Minsheng Banking Corp. Ltd. Class A | 1,032,100 | 627 |
| * | 51job Inc. ADR | 10,508 | 626 |
| | Baoshan Iron & Steel Co. Ltd. Class A | 562,400 | 626 |
| | | Shares | Market
Value•
($000) |
| | Will Semiconductor Co. Ltd. Shanghai Class A | 14,900 | 619 |
| | Chongqing Changan Automobile Co. Ltd. Class A | 199,220 | 609 |
| | China Everbright Bank Co. Ltd. Class A | 1,124,800 | 605 |
| | Bank of Nanjing Co. Ltd. Class A | 398,300 | 604 |
| 3 | A-Living Smart City Services Co. Ltd. | 178,500 | 593 |
| *,1,3 | China Huarong Asset Management Co. Ltd. Class H | 4,482,000 | 588 |
| | Gigadevice Semiconductor Beijing Inc. Class A | 22,151 | 587 |
| | Shenzhen Transsion Holdings Co. Ltd. Class A | 23,860 | 587 |
| 3 | Shimao Services Holdings Ltd. | 305,000 | 575 |
| | Bank of Shanghai Co. Ltd. Class A | 503,837 | 574 |
| | Wingtech Technology Co. Ltd. Class A | 33,400 | 573 |
| *,3 | 3SBio Inc. | 626,500 | 573 |
| 3 | Guotai Junan Securities Co. Ltd. Class H | 418,600 | 571 |
| | Unigroup Guoxin Microelectronics Co. Ltd. Class A | 18,000 | 570 |
| | Yanzhou Coal Mining Co. Ltd. Class A | 160,200 | 569 |
| * | Inner Mongolia BaoTou Steel Union Co. Ltd. Class A | 1,282,300 | 564 |
| | TBEA Co. Ltd. Class A | 130,500 | 552 |
| | Greentown China Holdings Ltd. | 399,879 | 551 |
| | New China Life Insurance Co. Ltd. Class A | 89,100 | 544 |
| *,3 | Alphamab Oncology | 264,000 | 542 |
| * | XD Inc. | 95,600 | 541 |
| * | Alibaba Pictures Group Ltd. | 5,090,000 | 541 |
| | Shanghai Putailai New Energy Technology Co. Ltd. Class A | 19,400 | 539 |
| *,2,3 | Yidu Tech Inc. | 168,200 | 537 |
| | Zhejiang Expressway Co. Ltd. Class H | 596,000 | 529 |
| | China Coal Energy Co. Ltd. Class H | 859,000 | 524 |
| 3 | Dali Foods Group Co. Ltd. | 939,000 | 523 |
Total World Stock Index Fund
| | | Shares | Market
Value•
($000) |
| | China Oilfield Services Ltd. Class H | 542,000 | 518 |
| * | Dada Nexus Ltd. ADR | 25,489 | 518 |
| | China Overseas Property Holdings Ltd. | 572,493 | 514 |
| | China Education Group Holdings Ltd. | 300,000 | 513 |
| *,2,3 | Kintor Pharmaceutical Ltd. | 102,000 | 509 |
| | Shenwan Hongyuan Group Co. Ltd. Class A | 629,900 | 505 |
| *,2,3 | Venus MedTech Hangzhou Inc. Class H | 109,000 | 504 |
| | Ecovacs Robotics Co. Ltd. Class A | 18,800 | 504 |
| * | Aluminum Corp. of China Ltd. Class A | 520,700 | 501 |
| | Zoomlion Heavy Industry Science and Technology Co. Ltd. Class H | 692,380 | 499 |
| | China Railway Group Ltd. Class A | 608,200 | 499 |
| | Hangzhou Tigermed Consulting Co. Ltd. Class A | 18,650 | 496 |
| | CIFI Ever Sunshine Services Group Ltd. | 278,000 | 496 |
| * | Lifetech Scientific Corp. | 1,059,998 | 492 |
| | Walvax Biotechnology Co. Ltd. Class A | 56,800 | 491 |
| | Guotai Junan Securities Co. Ltd. Class A | 178,800 | 490 |
| | China Communications Services Corp. Ltd. Class H | 886,000 | 490 |
| | COFCO Meat Holdings Ltd. | 1,261,000 | 488 |
| | Imeik Technology Development Co. Ltd. Class A | 5,000 | 487 |
| | Shenzhen International Holdings Ltd. | 402,000 | 484 |
| 3 | Legend Holdings Corp. Class H | 275,100 | 484 |
| | Iflytek Co. Ltd. Class A | 54,600 | 482 |
| * | China United Network Communications Ltd. Class A | 756,300 | 482 |
| | Maxscend Microelectronics Co. Ltd. Class A | 9,920 | 480 |
| | CGN New Energy Holdings Co. Ltd. | 510,000 | 477 |
| | | Shares | Market
Value•
($000) |
| | Wuxi Lead Intelligent Equipment Co. Ltd. Class A | 37,440 | 477 |
| | Shanghai Electric Group Co. Ltd. Class H | 1,690,000 | 476 |
| * | Hollysys Automation Technologies Ltd. | 23,767 | 474 |
| | Jiangsu Eastern Shenghong Co. Ltd. Class A | 108,900 | 463 |
| | Anhui Gujing Distillery Co. Ltd. Class A | 13,000 | 462 |
| | Hubei Xingfa Chemicals Group Co. Ltd. Class A | 59,300 | 461 |
| | Orient Securities Co. Ltd. Class A | 213,600 | 460 |
| | China Traditional Chinese Medicine Holdings Co. Ltd. | 962,000 | 458 |
| * | Zhejiang Yongtai Technology Co. Ltd. Class A | 40,800 | 457 |
| | Angang Steel Co. Ltd. Class H | 842,800 | 453 |
| | Logan Group Co. Ltd. | 452,000 | 453 |
| | Hangzhou Silan Microelectronics Co. Ltd. Class A | 46,900 | 452 |
| * | Advanced Micro-Fabrication Equipment Inc. Class A | 18,483 | 452 |
| | Agile Group Holdings Ltd. | 575,500 | 451 |
| | Metallurgical Corp. of China Ltd. Class H | 1,618,000 | 449 |
| 2 | Dongfang Electric Corp. Ltd. Class H | 280,600 | 448 |
| | Ming Yang Smart Energy Group Ltd. Class A | 92,300 | 447 |
| | China Everbright Bank Co. Ltd. Class H | 1,262,000 | 444 |
| | Lens Technology Co. Ltd. Class A | 133,400 | 444 |
| | Yuexiu Property Co. Ltd. | 505,441 | 444 |
| | China CSSC Holdings Ltd. Class A | 124,900 | 439 |
| * | Canaan Inc. ADR | 51,187 | 439 |
| | China Water Affairs Group Ltd. | 424,000 | 436 |
| | Sihuan Pharmaceutical Holdings Group Ltd. | 2,071,000 | 435 |
| 2 | Poly Property Services Co. Ltd. | 78,000 | 435 |
| * | Niu Technologies ADR | 16,570 | 434 |
| | Pharmaron Beijing Co. Ltd. Class A | 14,442 | 431 |
Total World Stock Index Fund
| | | Shares | Market
Value•
($000) |
| 3 | BAIC Motor Corp. Ltd. Class H | 1,296,900 | 430 |
| 2 | China International Marine Containers Group Co. Ltd. Class H | 217,000 | 430 |
| | Changchun High & New Technology Industry Group Inc. Class A | 10,046 | 428 |
| 2 | Guangzhou R&F Properties Co. Ltd. Class H | 678,600 | 425 |
| | BOE Technology Group Co. Ltd. Class B | 989,400 | 424 |
| | China Datang Corp Renewable Power Co. Ltd. Class H | 1,003,000 | 424 |
| *,3 | Remegen Co. Ltd. Class H | 34,000 | 423 |
| *,3 | China Logistics Property Holdings Co. Ltd. | 785,000 | 422 |
| | Kwg Group Holdings Ltd. | 481,500 | 420 |
| 2,3 | Blue Moon Group Holdings Ltd. | 466,000 | 420 |
| | Chongqing Rural Commercial Bank Co. Ltd. Class H | 1,162,000 | 418 |
| | Focus Media Information Technology Co. Ltd. Class A | 363,700 | 417 |
| | Inner Mongolia Yitai Coal Co. Ltd. Class B | 479,704 | 416 |
| | MINISO Group Holding Ltd. ADR | 27,686 | 416 |
| | Shanghai RAAS Blood Products Co. Ltd. Class A | 403,000 | 415 |
| 3 | China Railway Signal & Communication Corp. Ltd. Class H | 1,180,500 | 414 |
| 2 | Tianneng Power International Ltd. | 360,000 | 411 |
| | FinVolution Group ADR | 66,835 | 409 |
| 3 | Hope Education Group Co. Ltd. | 2,278,000 | 406 |
| | Sany Heavy Equipment International Holdings Co. Ltd. | 356,000 | 405 |
| 3 | Sunac Services Holdings Ltd. | 200,455 | 405 |
| | Greentown Service Group Co. Ltd. | 408,000 | 404 |
| | Hoshine Silicon Industry Co. Ltd. Class A | 15,700 | 404 |
| *,2,3 | Shanghai Junshi Biosciences Co. Ltd. Class H | 80,400 | 404 |
| | Sinotrans Ltd. Class H | 1,224,000 | 402 |
| | | Shares | Market
Value•
($000) |
| | Yonyou Network Technology Co. Ltd. Class A | 80,667 | 400 |
| | Guangdong Haid Group Co. Ltd. Class A | 39,077 | 400 |
| | Yunnan Baiyao Group Co. Ltd. Class A | 28,500 | 399 |
| | Fuyao Glass Industry Group Co. Ltd. Class A | 51,300 | 396 |
| 2 | Shenzhen Investment Ltd. | 1,603,953 | 393 |
| * | Shanghai International Airport Co. Ltd. Class A | 47,541 | 393 |
| *,2,3 | Luye Pharma Group Ltd. | 825,000 | 393 |
| | CIMC Enric Holdings Ltd. | 302,000 | 388 |
| * | Skyworth Group Ltd. | 695,340 | 387 |
| | SG Micro Corp. Class A | 7,650 | 387 |
| *,3 | Peijia Medical Ltd. | 158,000 | 385 |
| * | Baozun Inc. Class A | 66,536 | 384 |
| | China Oriental Group Co. Ltd. | 1,352,000 | 381 |
| | Shaanxi Coal Industry Co. Ltd. Class A | 193,300 | 379 |
| | Sinopec Shanghai Petrochemical Co. Ltd. Class H | 1,620,000 | 378 |
| | China Jushi Co. Ltd. Class A | 125,730 | 376 |
| | Zhejiang Jingsheng Mechanical & Electrical Co. Ltd. Class A | 31,200 | 373 |
| | NetDragon Websoft Holdings Ltd. | 170,000 | 372 |
| | China Everbright Ltd. | 330,000 | 371 |
| 3 | China New Higher Education Group Ltd. | 738,000 | 370 |
| | Jiangsu Hengli Hydraulic Co. Ltd. Class A | 28,672 | 368 |
| | Hangzhou First Applied Material Co. Ltd. Class A | 16,368 | 367 |
| | China National Nuclear Power Co. Ltd. Class A | 341,500 | 366 |
| | Citic Pacific Special Steel Group Co. Ltd. Class A | 122,910 | 366 |
| 2 | Tiangong International Co. Ltd. | 604,000 | 363 |
| | Shenzhen Capchem Technology Co. Ltd. Class A | 16,200 | 363 |
Total World Stock Index Fund
| | | Shares | Market
Value•
($000) |
| | Henan Shuanghui Investment & Development Co. Ltd. Class A | 78,478 | 362 |
| | Bank of Beijing Co. Ltd. Class A | 521,200 | 361 |
| | Shougang Fushan Resources Group Ltd. | 1,361,524 | 360 |
| * | Hainan Meilan International Airport Co. Ltd. Class H | 89,000 | 360 |
| 2 | Jinke Smart Services Group Co. Ltd. Class H | 66,600 | 360 |
| 2,3 | CSC Financial Co. Ltd. Class H | 340,000 | 359 |
| * | XPeng Inc. Class A | 15,444 | 358 |
| | Hundsun Technologies Inc. Class A | 36,246 | 356 |
| | China Risun Group Ltd. | 584,000 | 356 |
| | COSCO SHIPPING Development Co. Ltd. Class A | 652,900 | 354 |
| * | Guoyuan Securities Co. Ltd. Class A | 304,220 | 352 |
| | China Merchants Securities Co. Ltd. Class A | 130,987 | 352 |
| | JiuGui Liquor Co. Ltd. Class A | 10,500 | 351 |
| | Sinotruk Hong Kong Ltd. | 252,000 | 348 |
| | Chaozhou Three-Circle Group Co. Ltd. Class A | 55,600 | 348 |
| | Guangzhou Automobile Group Co. Ltd. Class A | 128,600 | 348 |
| | Jiangsu Expressway Co. Ltd. Class A | 261,600 | 347 |
| | TCL Technology Group Corp. Class A | 363,800 | 345 |
| | China BlueChemical Ltd. Class H | 1,028,000 | 344 |
| | Xinyi Energy Holdings Ltd. | 582,000 | 343 |
| | Power Construction Corp. of China Ltd. Class A | 266,200 | 343 |
| | Shanghai Lujiazui Finance & Trade Zone Development Co. Ltd. Class B | 380,411 | 338 |
| | Yihai Kerry Arawana Holdings Co. Ltd. Class A | 35,500 | 337 |
| | Weichai Power Co. Ltd. Class A | 142,300 | 336 |
| | Huaxia Bank Co. Ltd. Class A | 379,500 | 334 |
| | Sun Art Retail Group Ltd. | 568,500 | 333 |
| | | Shares | Market
Value•
($000) |
| | Shenzhen Kangtai Biological Products Co. Ltd. Class A | 18,607 | 333 |
| | Zhejiang Chint Electrics Co. Ltd. Class A | 35,100 | 331 |
| | Zhejiang Sanhua Intelligent Controls Co. Ltd. Class A | 89,010 | 330 |
| | Times China Holdings Ltd. | 480,000 | 327 |
| | Huayu Automotive Systems Co. Ltd. Class A | 78,000 | 327 |
| | Concord New Energy Group Ltd. | 3,100,000 | 327 |
| 2,3 | China Resources Pharmaceutical Group Ltd. | 676,000 | 325 |
| 2 | Zhongyu Gas Holdings Ltd. | 338,000 | 324 |
| | Bank of Hangzhou Co. Ltd. Class A | 145,400 | 324 |
| * | HUYA Inc. ADR | 39,330 | 323 |
| | China CITIC Bank Corp. Ltd. Class A | 454,900 | 323 |
| * | EHang Holdings Ltd. ADR | 13,376 | 323 |
| | Shandong Gold Mining Co. Ltd. Class A | 103,577 | 321 |
| * | Shanghai Fudan Microelectronics Group Co. Ltd. Class H | 116,000 | 318 |
| | China Molybdenum Co. Ltd. Class A | 338,200 | 318 |
| | Sunwoda Electronic Co. Ltd. Class A | 41,100 | 317 |
| 2,3 | Zhou Hei Ya International Holdings Co. Ltd. | 351,000 | 316 |
| 2 | Differ Group Holding Co. Ltd. | 1,312,000 | 316 |
| | Lao Feng Xiang Co. Ltd. Class A | 41,900 | 314 |
| | Health & Happiness H&H International Holdings Ltd. | 133,236 | 312 |
| | Montage Technology Co. Ltd. Class A | 30,642 | 312 |
| | Jiangsu Expressway Co. Ltd. Class H | 328,000 | 311 |
| | Ausnutria Dairy Corp. Ltd. | 249,000 | 311 |
| | Yuexiu Transport Infrastructure Ltd. | 476,000 | 305 |
| 2 | Fire Rock Holdings Ltd. | 968,000 | 305 |
| | China Automotive Engineering Research Institute Co. Ltd. Class A | 114,100 | 305 |
| | Ginlong Technologies Co. Ltd. Class A | 6,970 | 304 |
| | Fufeng Group Ltd. | 875,000 | 303 |
Total World Stock Index Fund
| | | Shares | Market
Value•
($000) |
| | Zoomlion Heavy Industry Science and Technology Co. Ltd. Class A | 266,700 | 303 |
| | Shenzhen Senior Technology Material Co. Ltd. Class A | 36,276 | 303 |
| | Shenzhen Expressway Co. Ltd. Class H | 318,000 | 300 |
| | Wuxi Shangji Automation Co. Ltd. Class A | 6,400 | 300 |
| | Seazen Holdings Co. Ltd. Class A | 55,900 | 299 |
| | Datang International Power Generation Co. Ltd. Class H | 1,648,000 | 298 |
| | China Merchants Shekou Industrial Zone Holdings Co. Ltd. Class A | 181,800 | 297 |
| * | Topchoice Medical Corp. Class A | 7,995 | 297 |
| | Satellite Chemical Co. Ltd. Class A | 48,440 | 295 |
| | Jiangxi Copper Co. Ltd. Class A | 80,700 | 294 |
| 2,3 | China East Education Holdings Ltd. | 306,500 | 291 |
| | Chongqing Changan Automobile Co. Ltd. Class B | 448,087 | 290 |
| | Shanghai Industrial Holdings Ltd. | 194,000 | 289 |
| * | Brilliance China Automotive Holdings Ltd. | 527,000 | 288 |
| | Guangzhou Baiyunshan Pharmaceutical Holdings Co. Ltd. Class H | 114,000 | 288 |
| | Yuexiu REIT | 658,940 | 287 |
| | Maanshan Iron & Steel Co. Ltd. Class H | 674,000 | 287 |
| 2 | Zhaojin Mining Industry Co. Ltd. Class H | 402,500 | 287 |
| | CECEP Wind-Power Corp. Class A | 248,900 | 287 |
| * | Roshow Technology Co. Ltd. Class A | 108,900 | 287 |
| * | Gotion High-tech Co. Ltd. Class A | 31,000 | 285 |
| * | Genetron Holdings Ltd. ADR | 20,640 | 284 |
| | Ingenic Semiconductor Co. Ltd. Class A | 13,200 | 284 |
| | Sealand Securities Co. Ltd. Class A | 469,570 | 283 |
| | China Oilfield Services Ltd. Class A | 122,225 | 283 |
| | | Shares | Market
Value•
($000) |
| | C&D International Investment Group Ltd. | 151,000 | 281 |
| | Sinopec Engineering Group Co. Ltd. Class H | 532,135 | 280 |
| | Asymchem Laboratories Tianjin Co. Ltd. Class A | 4,500 | 280 |
| | Suzhou Maxwell Technologies Co. Ltd. Class A | 2,340 | 280 |
| | China Construction Bank Corp. Class A | 301,800 | 280 |
| | SDIC Power Holdings Co. Ltd. Class A | 169,500 | 279 |
| * | Sinopec Oilfield Service Corp. Class A | 787,700 | 278 |
| | Beijing Bei Mo Gao Ke Friction Material Co. Ltd. Class A | 15,800 | 273 |
| | Haitong Securities Co. Ltd. Class A | 141,000 | 272 |
| *,3 | Ascentage Pharma Group International | 73,100 | 271 |
| | Mango Excellent Media Co. Ltd. Class A | 44,026 | 270 |
| | Suzhou TA&A Ultra Clean Technology Co. Ltd. Class A | 16,200 | 270 |
| | StarPower Semiconductor Ltd. Class A | 4,300 | 270 |
| *,2 | Li Auto Inc. Class A | 15,983 | 270 |
| | Zhejiang NHU Co. Ltd. Class A | 63,480 | 269 |
| | Xiamen Faratronic Co. Ltd. Class A | 8,900 | 269 |
| 3 | Joinn Laboratories China Co. Ltd. Class H | 20,900 | 269 |
| | LB Group Co. Ltd. Class A | 60,100 | 267 |
| | Hengli Petrochemical Co. Ltd. Class A | 77,500 | 267 |
| | Shandong Hualu Hengsheng Chemical Co. Ltd. Class A | 54,990 | 267 |
| | Shanghai Fosun Pharmaceutical Group Co. Ltd. Class A | 34,000 | 266 |
| | COSCO SHIPPING Energy Transportation Co. Ltd. Class H | 600,000 | 265 |
| * | LexinFintech Holdings Ltd. ADR | 49,470 | 264 |
| 2 | Tian Lun Gas Holdings Ltd. | 285,500 | 264 |
Total World Stock Index Fund
| | | Shares | Market
Value•
($000) |
| 2 | China Evergrande Group | 890,000 | 264 |
| 3 | Genertec Universal Medical Group Co. Ltd. | 349,000 | 263 |
| | GEM Co. Ltd. Class A | 153,900 | 262 |
| | Fangda Carbon New Material Co. Ltd. Class A | 156,135 | 262 |
| | China SCE Group Holdings Ltd. | 837,000 | 261 |
| | Founder Securities Co. Ltd. Class A | 204,400 | 261 |
| * | Chongqing Brewery Co. Ltd. Class A | 11,100 | 260 |
| | Flat Glass Group Co. Ltd. Class A | 30,200 | 260 |
| | China Minmetals Rare Earth Co. Ltd. Class A | 43,500 | 258 |
| | Yantai Changyu Pioneer Wine Co. Ltd. Class B | 143,033 | 257 |
| | CNNC Hua Yuan Titanium Dioxide Co. Ltd. Class A | 119,200 | 257 |
| | Lonking Holdings Ltd. | 877,000 | 256 |
| 3 | China Renaissance Holdings Ltd. | 105,800 | 256 |
| | SSY Group Ltd. | 534,336 | 254 |
| | Zhejiang Dahua Technology Co. Ltd. Class A | 74,600 | 254 |
| * | China Eastern Airlines Corp. Ltd. Class A | 333,500 | 252 |
| | Glarun Technology Co. Ltd. Class A | 109,000 | 252 |
| * | Sichuan Development Lomon Co. Ltd. Class A | 89,400 | 252 |
| *,3 | CStone Pharmaceuticals | 204,000 | 251 |
| | GD Power Development Co. Ltd. Class A | 576,899 | 251 |
| | Cangzhou Mingzhu Plastic Co. Ltd. Class A | 162,933 | 251 |
| * | SOHO China Ltd. | 983,000 | 250 |
| | Livzon Pharmaceutical Group Inc. Class H | 75,806 | 250 |
| 2,3 | Viva Biotech Holdings | 330,000 | 249 |
| | Beijing Easpring Material Technology Co. Ltd. Class A | 17,900 | 248 |
| | Huadong Medicine Co. Ltd. Class A | 43,130 | 246 |
| | Beijing Roborock Technology Co. Ltd. Class A | 1,740 | 246 |
| | | Shares | Market
Value•
($000) |
| * | Xian International Medical Investment Co. Ltd. Class A | 131,600 | 245 |
| 3 | Orient Securities Co. Ltd. Class H | 296,000 | 243 |
| | China National Chemical Engineering Co. Ltd. Class A | 148,500 | 243 |
| | Digital China Holdings Ltd. | 449,499 | 242 |
| | Guosen Securities Co. Ltd. Class A | 136,055 | 242 |
| | Luoyang Xinqianglian Slewing Bearing Co. Ltd. Class A | 6,800 | 242 |
| | Sinoma Science & Technology Co. Ltd. Class A | 40,800 | 241 |
| 3 | Shenwan Hongyuan Group Co. Ltd. Class H | 952,800 | 241 |
| | Sichuan Swellfun Co. Ltd. Class A | 12,100 | 239 |
| | Changzhou Xingyu Automotive Lighting Systems Co. Ltd. Class A | 6,700 | 239 |
| | Tofflon Science & Technology Group Co. Ltd. Class A | 36,500 | 238 |
| | Shandong Nanshan Aluminum Co. Ltd. Class A | 350,000 | 237 |
| * | Sichuan Hebang Biotechnology Co. Ltd. Class A | 425,700 | 237 |
| | Hithink RoyalFlush Information Network Co. Ltd. Class A | 13,353 | 235 |
| | Poly Property Group Co. Ltd. | 952,000 | 235 |
| | Yealink Network Technology Corp. Ltd. Class A | 19,930 | 235 |
| | COSCO SHIPPING Energy Transportation Co. Ltd. Class A | 253,800 | 235 |
| | Hualan Biological Engineering Inc. Class A | 50,375 | 234 |
| * | New Hope Liuhe Co. Ltd. Class A | 104,100 | 234 |
| | Shanghai International Port Group Co. Ltd. Class A | 265,200 | 234 |
| | Industrial Securities Co. Ltd. Class A | 163,500 | 233 |
| | West China Cement Ltd. | 1,334,000 | 233 |
| * | Yunnan Aluminium Co. Ltd. Class A | 125,400 | 233 |
| | Fujian Funeng Co. Ltd. Class A | 82,865 | 232 |
Total World Stock Index Fund
| | | Shares | Market
Value•
($000) |
| | Metallurgical Corp. of China Ltd. Class A | 367,400 | 232 |
| | Sichuan Road & Bridge Co. Ltd. Class A | 123,500 | 232 |
| * | Kuang-Chi Technologies Co. Ltd. Class A | 72,100 | 231 |
| | Jiangxi Zhengbang Technology Co. Ltd. Class A | 147,700 | 231 |
| | Jiangsu King's Luck Brewery JSC Ltd. Class A | 30,027 | 231 |
| | China Reinsurance Group Corp. Class H | 2,218,000 | 231 |
| | CMGE Technology Group Ltd. | 590,000 | 230 |
| | Huaxin Cement Co. Ltd. Class B | 128,100 | 228 |
| | Shenzhen Changhong Technology Co. Ltd. Class A | 40,600 | 226 |
| | Shenzhen Topband Co. Ltd. Class A | 97,600 | 226 |
| | CSG Holding Co. Ltd. Class B | 516,606 | 225 |
| | Xianhe Co. Ltd. Class A | 39,900 | 225 |
| * | National Silicon Industry Group Co. Ltd. Class A | 50,798 | 225 |
| | BBMG Corp. Class H | 1,331,000 | 224 |
| | Ovctek China Inc. Class A | 20,997 | 224 |
| | Red Avenue New Materials Group Co. Ltd. Class A | 25,900 | 222 |
| | China Overseas Grand Oceans Group Ltd. | 462,500 | 222 |
| | Sichuan Chuantou Energy Co. Ltd. Class A | 107,400 | 220 |
| | CECEP Solar Energy Co. Ltd. Class A | 125,590 | 219 |
| | Westone Information Industry Inc. Class A | 26,500 | 217 |
| | Jinko Power Technology Co. Ltd. Class A | 142,500 | 216 |
| | Hisense Home Appliances Group Co. Ltd. Class A | 118,200 | 215 |
| | Hongfa Technology Co. Ltd. Class A | 18,500 | 214 |
| | Lao Feng Xiang Co. Ltd. Class B | 60,294 | 213 |
| | Shan Xi Hua Yang Group New Energy Co. Ltd. Class A | 128,400 | 213 |
| | Shanghai Medicilon Inc. Class A | 1,861 | 213 |
| | | Shares | Market
Value•
($000) |
| 2 | Jiayuan International Group Ltd. | 548,000 | 212 |
| | JCET Group Co. Ltd. Class A | 43,900 | 212 |
| | Gemdale Properties & Investment Corp. Ltd. | 2,166,000 | 211 |
| | Shanxi Coking Coal Energy Group Co. Ltd. Class A | 145,470 | 211 |
| * | Zhejiang Century Huatong Group Co. Ltd. Class A | 182,300 | 211 |
| | Q Technology Group Co. Ltd. | 144,000 | 210 |
| * | Sohu.com Ltd. ADR | 10,354 | 210 |
| | Hangzhou Chang Chuan Technology Co. Ltd. Class A | 28,400 | 210 |
| | KWG Living Group Holdings Ltd. | 310,750 | 209 |
| | China Baoan Group Co. Ltd. Class A | 63,600 | 209 |
| | Beijing Wantai Biological Pharmacy Enterprise Co. Ltd. Class A | 6,020 | 208 |
| | China Zhenhua Group Science & Technology Co. Ltd. Class A | 12,800 | 207 |
| | Do-Fluoride New Materials Co. Ltd. Class A | 21,300 | 207 |
| | China Greatwall Technology Group Co. Ltd. Class A | 98,400 | 207 |
| 2,3 | Simcere Pharmaceutical Group Ltd. | 198,000 | 206 |
| | Titan Wind Energy Suzhou Co. Ltd. Class A | 61,500 | 205 |
| | Huizhou Desay Sv Automotive Co. Ltd. Class A | 12,200 | 204 |
| *,3 | Ocumension Therapeutics | 94,000 | 204 |
| 3 | Midea Real Estate Holding Ltd. | 117,800 | 203 |
| | Goke Microelectronics Co. Ltd. Class A | 7,700 | 203 |
| | Shoucheng Holdings Ltd. | 947,600 | 201 |
| | Shanghai Jinjiang International Hotels Co. Ltd. Class A | 23,900 | 201 |
| | Sino-Ocean Group Holding Ltd. | 922,500 | 200 |
| | Thunder Software Technology Co. Ltd. Class A | 9,400 | 200 |
| | Han's Laser Technology Industry Group Co. Ltd. Class A | 29,697 | 199 |
Total World Stock Index Fund
| | | Shares | Market
Value•
($000) |
| | Haier Smart Home Co. Ltd. Class A | 46,799 | 199 |
| | Tianjin Capital Environmental Protection Group Co. Ltd. Class H | 400,000 | 198 |
| | Shenzhen Overseas Chinese Town Co. Ltd. Class A | 201,900 | 198 |
| | Jiangsu Linyang Energy Co. Ltd. Class A | 111,300 | 197 |
| | YongXing Special Materials Technology Co. Ltd. Class A | 11,700 | 196 |
| | Shengyi Technology Co. Ltd. Class A | 56,300 | 196 |
| * | Jiangsu Akcome Science & Technology Co. Ltd. Class A | 243,600 | 196 |
| * | China Eastern Airlines Corp. Ltd. Class H | 496,000 | 195 |
| | Xingda International Holdings Ltd. | 858,000 | 195 |
| | Beijing Jingneng Clean Energy Co. Ltd. Class H | 646,000 | 195 |
| | Shanghai Yuyuan Tourist Mart Group Co. Ltd. Class A | 127,300 | 195 |
| | Hangcha Group Co. Ltd. Class A | 75,200 | 195 |
| | Jiangsu Guotai International Group Co. Ltd. Class A | 94,300 | 194 |
| *,2,3 | Mobvista Inc. | 200,000 | 194 |
| * | Beijing Jingyuntong Technology Co. Ltd. Class A | 108,400 | 194 |
| | Shanxi Taigang Stainless Steel Co. Ltd. Class A | 160,200 | 193 |
| | Fu Jian Anjoy Foods Co. Ltd. Class A | 6,100 | 193 |
| *,2 | Yeahka Ltd. | 63,600 | 192 |
| | Wuhan Guide Infrared Co. Ltd. Class A | 56,168 | 191 |
| | Apeloa Pharmaceutical Co. Ltd. Class A | 35,000 | 190 |
| | Wuhan DR Laser Technology Corp. Ltd. Class A | 8,800 | 190 |
| * | Chengxin Lithium Group Co. Ltd. Class A | 21,000 | 190 |
| | Joinn Laboratories China Co. Ltd. Class A | 7,560 | 189 |
| 2 | Huadian Power International Corp. Ltd. Class H | 510,000 | 188 |
| | | Shares | Market
Value•
($000) |
| | Shanghai Pharmaceuticals Holding Co. Ltd. Class A | 64,600 | 188 |
| | China Harmony New Energy Auto Holding Ltd. | 365,000 | 187 |
| * | DouYu International Holdings Ltd. ADR | 59,347 | 187 |
| | Zhejiang Juhua Co. Ltd. Class A | 76,900 | 187 |
| | XCMG Construction Machinery Co. Ltd. Class A | 194,600 | 186 |
| | Beijing New Building Materials plc Class A | 42,100 | 186 |
| | Vats Liquor Chain Store Management JSC Ltd. | 30,100 | 185 |
| | Jiangsu Azure Corp. Class A | 54,700 | 185 |
| | Tong Ren Tang Technologies Co. Ltd. Class H | 259,000 | 184 |
| | Sieyuan Electric Co. Ltd. Class A | 28,400 | 184 |
| | AVIC Electromechanical Systems Co. Ltd. Class A | 77,600 | 184 |
| * | Zhihu Inc. ADR | 22,277 | 184 |
| | Wuhu Sanqi Interactive Entertainment Network Technology Group Co. Ltd. Class A | 48,800 | 182 |
| * | Jilin Electric Power Co. Ltd. Class A | 153,700 | 182 |
| | Huaneng Power International Inc. Class A | 150,400 | 181 |
| | Tongkun Group Co. Ltd. Class A | 58,000 | 181 |
| * | Spring Airlines Co. Ltd. Class A | 19,800 | 181 |
| * | Hainan Development Holdings Nanhai Co. Ltd. Class A | 85,000 | 181 |
| | Rongsheng Petrochemical Co. Ltd. Class A | 66,900 | 180 |
| * | Shanxi Meijin Energy Co. Ltd. Class A | 102,000 | 180 |
| | Hangzhou Steam Turbine Co. Ltd. Class B | 87,657 | 179 |
| | Shanghai Industrial Urban Development Group Ltd. | 2,083,200 | 179 |
| | Inspur Electronic Information Industry Co. Ltd. Class A | 36,912 | 179 |
Total World Stock Index Fund
| | | Shares | Market
Value•
($000) |
| | Lepu Medical Technology Beijing Co. Ltd. Class A | 53,900 | 179 |
| | China Merchants Land Ltd. | 1,598,000 | 179 |
| | Ningbo Tuopu Group Co. Ltd. Class A | 21,800 | 178 |
| | Zhejiang Jiuzhou Pharmaceutical Co. Ltd. Class A | 21,700 | 178 |
| | Gemdale Corp. Class A | 111,700 | 177 |
| | Angel Yeast Co. Ltd. Class A | 20,300 | 177 |
| | Chengdu Leejun Industrial Co. Ltd. Class A | 98,500 | 177 |
| * | Lingyi iTech Guangdong Co. Class A | 169,000 | 176 |
| | Greatview Aseptic Packaging Co. Ltd. | 426,000 | 175 |
| | Jizhong Energy Resources Co. Ltd. Class A | 179,100 | 175 |
| | CTS International Logistics Corp. Ltd. Class A | 90,900 | 175 |
| 2 | Shandong Chenming Paper Holdings Ltd. Class H | 360,750 | 174 |
| | Shanghai Bairun Investment Holding Group Co. Ltd. Class A | 17,500 | 174 |
| * | Guanghui Energy Co. Ltd. Class A | 168,300 | 174 |
| 2 | China Aoyuan Group Ltd. | 437,000 | 173 |
| | ENN Natural Gas Co. Ltd. Class A | 60,100 | 173 |
| | Everbright Securities Co. Ltd. Class A | 72,700 | 173 |
| * | Burning Rock Biotech Ltd. ADR | 12,310 | 173 |
| * | Tianshan Aluminum Group Co. Ltd. Class A | 131,700 | 173 |
| | Dawning Information Industry Co. Ltd. Class A | 40,400 | 173 |
| | Shanghai Bailian Group Co. Ltd. Class B | 193,500 | 172 |
| | Guangzhou Kingmed Diagnostics Group Co. Ltd. Class A | 9,600 | 172 |
| | Shanghai Electric Group Co. Ltd. Class A | 232,100 | 172 |
| | Tianjin ZhongXin Pharmaceutical Group Corp. Ltd. Class A | 41,100 | 172 |
| | | Shares | Market
Value•
($000) |
| | Guangdong Dowstone Technology Co. Ltd. Class A | 37,900 | 171 |
| | Telling Telecommunication Holding Co. Ltd. Class A | 45,600 | 170 |
| | Shanxi Lu'an Environmental Energy Development Co. Ltd. Class A | 83,800 | 170 |
| 2,3 | China Yuhua Education Corp. Ltd. | 376,000 | 170 |
| | Jiangsu Shuangxing Color Plastic New Materials Co. Ltd. Class A | 45,700 | 169 |
| * | Sichuan New Energy Power Co. Ltd. | 38,000 | 169 |
| | Jafron Biomedical Co. Ltd. Class A | 20,770 | 168 |
| | Pingdingshan Tianan Coal Mining Co. Ltd. Class A | 125,900 | 168 |
| | Kehua Data Co. Ltd. Class A | 27,500 | 168 |
| | Zhuguang Holdings Group Co. Ltd. | 762,000 | 167 |
| | Zhuzhou Kibing Group Co. Ltd. Class A | 67,200 | 167 |
| | Livzon Pharmaceutical Group Inc. Class A | 30,300 | 166 |
| | China Merchants Energy Shipping Co. Ltd. Class A | 232,560 | 166 |
| | Bank of Chongqing Co. Ltd. Class H | 295,500 | 166 |
| | TCL Electronics Holdings Ltd. | 304,333 | 165 |
| | Xiamen Tungsten Co. Ltd. Class A | 46,600 | 165 |
| | China Dongxiang Group Co. Ltd. | 1,565,000 | 164 |
| * | Gaotu Techedu Inc. ADR | 55,673 | 164 |
| | Xinjiang Goldwind Science & Technology Co. Ltd. Class A | 56,800 | 164 |
| | Longshine Technology Group Co. Ltd. Class A | 32,400 | 164 |
| | Sinomine Resource Group Co. Ltd. Class A | 17,100 | 164 |
| | Jiangsu Yuyue Medical Equipment & Supply Co. Ltd. Class A | 29,600 | 163 |
| | Shenzhen Kedali Industry Co. Ltd. Class A | 6,000 | 163 |
Total World Stock Index Fund
| | | Shares | Market
Value•
($000) |
| | Yonghui Superstores Co. Ltd. Class A | 264,300 | 163 |
| | Beijing GeoEnviron Engineering & Technology Inc. Class A | 64,090 | 163 |
| | Shanghai Friendess Electronic Technology Corp. Ltd. Class A | 2,736 | 163 |
| | Zhejiang Orient Gene Biotech Co. Ltd. Class A | 7,305 | 163 |
| | Yanlord Land Group Ltd. | 194,600 | 162 |
| * | Inner Mongolia Xingye Mining Co. Ltd. Class A | 141,000 | 162 |
| | Qingdao TGOOD Electric Co. Ltd. Class A | 39,200 | 161 |
| | Yantai Jereh Oilfield Services Group Co. Ltd. Class A | 24,500 | 161 |
| | Huadian Power International Corp. Ltd. Class A | 234,000 | 161 |
| | AVICOPTER plc Class A | 16,400 | 161 |
| * | Suning.com Co. Ltd. Class A | 229,700 | 160 |
| | CGN Power Co. Ltd. Class A | 349,900 | 160 |
| | Beijing-Shanghai High Speed Railway Co. Ltd. Class A | 222,700 | 160 |
| * | Chengdu CORPRO Technology Co. Ltd. Class A | 41,800 | 159 |
| | QuakeSafe Technologies Co. Ltd. Class A | 10,300 | 159 |
| | Shenghe Resources Holding Co. Ltd. Class A | 49,000 | 156 |
| | Zhongjin Gold Corp. Ltd. Class A | 120,700 | 156 |
| | Sunresin New Materials Co. Ltd. Class A | 12,700 | 156 |
| | Bethel Automotive Safety Systems Co. Ltd. Class A | 16,400 | 155 |
| | Beijing United Information Technology Co. Ltd. | 8,845 | 155 |
| 1 | PAX Global Technology Ltd. | 222,000 | 154 |
| * | OneConnect Financial Technology Co. Ltd. ADR | 48,695 | 154 |
| | Dongxing Securities Co. Ltd. Class A | 89,900 | 154 |
| | COSCO SHIPPING Development Co. Ltd. Class H | 793,000 | 154 |
| | | Shares | Market
Value•
($000) |
| | Luxi Chemical Group Co. Ltd. Class A | 60,000 | 154 |
| | Shenzhen Tellus Holding Co. Ltd. Class A | 70,125 | 154 |
| | Datang International Power Generation Co. Ltd. Class A | 361,800 | 154 |
| | Zhejiang Longsheng Group Co. Ltd. Class A | 79,000 | 154 |
| | Zhejiang HangKe Technology Inc. Co. Class A | 9,491 | 154 |
| | Central China Management Co. Ltd. | 1,000,000 | 154 |
| | Changjiang Securities Co. Ltd. Class A | 135,520 | 153 |
| *,2 | Kaisa Group Holdings Ltd. | 990,262 | 152 |
| | Sichuan Yahua Industrial Group Co. Ltd. Class A | 29,700 | 152 |
| | Wuchan Zhongda Group Co. Ltd. Class A | 154,600 | 152 |
| | Hisense Home Appliances Group Co. Ltd. Class H | 141,000 | 151 |
| | Huafon Chemical Co. Ltd. Class A | 81,100 | 151 |
| | Hangzhou Robam Appliances Co. Ltd. Class A | 30,600 | 150 |
| | Nanjing King-Friend Biochemical Pharmaceutical Co. Ltd. Class A | 25,857 | 150 |
| | Beijing Yuanliu Hongyuan Electronic Technology Co. Ltd. Class A | 5,900 | 150 |
| | Western Superconducting Technologies Co. Ltd. Class A | 12,345 | 150 |
| | Gongniu Group Co. Ltd. Class A | 6,100 | 150 |
| | Sichuan Shuangma Cement Co. Ltd. Class A | 47,700 | 149 |
| | YTO Express Group Co. Ltd. Class A | 65,400 | 149 |
| | Beijing Tiantan Biological Products Corp. Ltd. Class A | 32,739 | 148 |
| | Tongling Nonferrous Metals Group Co. Ltd. Class A | 254,100 | 147 |
| | Unisplendour Corp. Ltd. Class A | 33,740 | 146 |
| | Zhefu Holding Group Co. Ltd. Class A | 130,600 | 146 |
Total World Stock Index Fund
| | | Shares | Market
Value•
($000) |
| | By-health Co. Ltd. Class A | 36,600 | 146 |
| | Ningxia Baofeng Energy Group Co. Ltd. Class A | 63,700 | 146 |
| | Shandong Linglong Tyre Co. Ltd. Class A | 26,400 | 146 |
| * | Youdao Inc. ADR | 11,928 | 146 |
| | Tibet Rhodiola Pharmaceutical Holding Co. Class A | 19,500 | 146 |
| *,2 | Comba Telecom Systems Holdings Ltd. | 522,039 | 145 |
| | Shandong Chenming Paper Holdings Ltd. Class B | 320,300 | 145 |
| | SDIC Capital Co. Ltd. Class A | 112,936 | 145 |
| | China Shineway Pharmaceutical Group Ltd. | 150,000 | 144 |
| | GRG Banking Equipment Co. Ltd. Class A | 88,897 | 144 |
| | SooChow Securities Co. Ltd. Class A | 108,160 | 143 |
| | Bank of Jiangsu Co. Ltd. Class A | 145,800 | 143 |
| * | Pangang Group Vanadium Titanium & Resources Co. Ltd. Class A | 228,000 | 142 |
| | Sangfor Technologies Inc. Class A | 4,500 | 142 |
| | Inner Mongolia Junzheng Energy & Chemical Industry Group Co. Ltd. Class A | 176,900 | 142 |
| | Sailun Group Co. Ltd. Class A | 68,100 | 142 |
| | Raytron Technology Co. Ltd. Class A | 12,578 | 142 |
| *,2,3 | JD Logistics Inc. | 36,127 | 142 |
| | Shanghai Fullhan Microelectronics Co. Ltd. Class A | 5,800 | 142 |
| | LianChuang Electronic Technology Co. Ltd. Class A | 44,500 | 141 |
| | Songcheng Performance Development Co. Ltd. Class A | 64,640 | 141 |
| | Proya Cosmetics Co. Ltd. Class A | 4,500 | 141 |
| * | Guangzhou GRG Metrology & Test Co. Ltd. Class A | 34,965 | 141 |
| | Xiamen Xiangyu Co. Ltd. Class A | 116,103 | 141 |
| | | Shares | Market
Value•
($000) |
| | Jiangsu Yangnong Chemical Co. Ltd. Class A | 7,600 | 140 |
| | China Express Airlines Co. Ltd. Class A | 81,473 | 140 |
| | Inner Mongolia Eerduosi Resources Co. Ltd. Class A | 30,200 | 140 |
| | Nanjing Securities Co. Ltd. Class A | 91,700 | 139 |
| | Shenzhen H&T Intelligent Control Co. Ltd. Class A | 38,100 | 138 |
| | Foxconn Industrial Internet Co. Ltd. Class A | 77,900 | 138 |
| | Winall Hi-Tech Seed Co. Ltd. Class A | 31,700 | 138 |
| | Kangji Medical Holdings Ltd. | 120,500 | 137 |
| | Wuhan Raycus Fiber Laser Technologies Co. Ltd. Class A | 14,352 | 137 |
| | Tianshui Huatian Technology Co. Ltd. Class A | 68,000 | 137 |
| | Tianma Microelectronics Co. Ltd. Class A | 71,200 | 137 |
| | Sichuan Kelun Pharmaceutical Co. Ltd. Class A | 49,500 | 137 |
| | Beijing Shiji Information Technology Co. Ltd. Class A | 36,960 | 137 |
| | CSC Financial Co. Ltd. Class A | 31,100 | 137 |
| * | Huazhu Group Ltd. | 29,610 | 137 |
| * | Yuan Longping High-tech Agriculture Co. Ltd. Class A | 41,400 | 136 |
| | Jiangsu Yoke Technology Co. Ltd. Class A | 11,400 | 136 |
| | China Coal Energy Co. Ltd. Class A | 124,100 | 136 |
| * | Youngy Co. Ltd. Class A | 7,800 | 136 |
| | Shanghai Jinqiao Export Processing Zone Development Co. Ltd. Class B | 148,714 | 134 |
| * | Tuya Inc. ADR | 20,616 | 134 |
| | Huolinhe Opencut Coal Industry Corp. Ltd. of Inner Mongolia Class A | 67,100 | 133 |
| | Shenzhen Energy Group Co. Ltd. Class A | 104,400 | 133 |
| | Avary Holding Shenzhen Co. Ltd. Class A | 24,400 | 133 |
Total World Stock Index Fund
| | | Shares | Market
Value•
($000) |
| | Shenzhen Sunlord Electronics Co. Ltd. Class A | 25,500 | 132 |
| * | Zhejiang Jinke Tom Culture Industry Co. Ltd. Class A | 190,700 | 132 |
| * | Inner Mongolia Yuan Xing Energy Co. Ltd. Class A | 110,100 | 132 |
| 3 | Shanghai Haohai Biological Technology Co. Ltd. Class H | 17,700 | 132 |
| 2,3 | Archosaur Games Inc. | 111,000 | 132 |
| * | Hang Zhou Great Star Industrial Co. Ltd. Class A | 26,200 | 131 |
| | Dong-E-E-Jiao Co. Ltd. Class A | 20,500 | 130 |
| | China International Marine Containers Group Co. Ltd. Class A | 47,200 | 130 |
| | Zhejiang Weixing New Building Materials Co. Ltd. Class A | 46,100 | 130 |
| | PharmaBlock Sciences Nanjing Inc. Class A | 5,460 | 130 |
| 3 | AK Medical Holdings Ltd. | 124,000 | 129 |
| | Hefei Meiya Optoelectronic Technology Inc. Class A | 20,200 | 128 |
| | Feitian Technologies Co. Ltd. Class A | 63,700 | 128 |
| * | Beijing Shougang Co. Ltd. Class A | 142,500 | 128 |
| | China Resources Medical Holdings Co. Ltd. | 182,090 | 128 |
| | G-bits Network Technology Xiamen Co. Ltd. Class A | 2,400 | 128 |
| | Jiangsu Nata Opto-electronic Material Co. Ltd. Class A | 15,800 | 128 |
| | China Foods Ltd. | 332,000 | 127 |
| | Hangjin Technology Co. Ltd. Class A | 23,800 | 127 |
| | Shanghai Electric Power Co. Ltd. Class A | 73,300 | 127 |
| | Xinyu Iron & Steel Co. Ltd. Class A | 136,500 | 126 |
| 2 | Zhenro Properties Group Ltd. | 265,000 | 126 |
| | Nanjing Hanrui Cobalt Co. Ltd. Class A | 10,200 | 126 |
| | Shenzhen SC New Energy Technology Corp. Class A | 7,100 | 126 |
| | | Shares | Market
Value•
($000) |
| | Riyue Heavy Industry Co. Ltd. Class A | 20,600 | 126 |
| | Sinolink Securities Co. Ltd. Class A | 75,200 | 126 |
| *,3 | Meitu Inc. | 578,500 | 126 |
| | Yifeng Pharmacy Chain Co. Ltd. Class A (XSHG) | 16,770 | 125 |
| | Yuzhou Group Holdings Co. Ltd. | 1,147,164 | 125 |
| | Suzhou Dongshan Precision Manufacturing Co. Ltd. Class A | 39,350 | 125 |
| | Zhuzhou Hongda Electronics Corp. Ltd. Class A | 9,600 | 125 |
| | China Kepei Education Group Ltd. | 226,000 | 125 |
| | Beijing Capital Eco-Environment Protection Group Co. Ltd. Class A | 238,800 | 125 |
| | Zhejiang Huahai Pharmaceutical Co. Ltd. Class A | 43,340 | 125 |
| | Weifu High-Technology Group Co. Ltd. Class A | 40,800 | 124 |
| | China Resources Sanjiu Medical & Pharmaceutical Co. Ltd. Class A | 32,887 | 124 |
| | Shandong Jincheng Pharmaceutical Group Co. Ltd. Class A | 27,300 | 124 |
| | Shanghai Jahwa United Co. Ltd. Class A | 16,600 | 124 |
| | CSG Holding Co. Ltd. Class A | 86,700 | 123 |
| | Tianjin Guangyu Development Co. Ltd. Class A | 46,900 | 123 |
| | Youngor Group Co. Ltd. Class A | 122,100 | 123 |
| | Skshu Paint Co. Ltd. Class A | 7,000 | 122 |
| | Tonghua Dongbao Pharmaceutical Co. Ltd. Class A | 64,200 | 122 |
| | Ningbo Sanxing Medical Electric Co. Ltd. Class A | 64,100 | 122 |
| | All Winner Technology Co. Ltd. Class A | 12,200 | 121 |
| | Weihai Guangwei Composites Co. Ltd. Class A | 11,440 | 121 |
| | Bank of Changsha Co. Ltd. Class A | 96,300 | 121 |
| | Liaoning Cheng Da Co. Ltd. Class A | 38,000 | 121 |
Total World Stock Index Fund
| | | Shares | Market
Value•
($000) |
| | Guizhou Panjiang Refined Coal Co. Ltd. Class A | 100,400 | 121 |
| | Sichuan Expressway Co. Ltd. Class A | 215,200 | 121 |
| | China Lilang Ltd. | 210,000 | 120 |
| | Heilongjiang Agriculture Co. Ltd. Class A | 55,600 | 120 |
| | Wolong Electric Group Co. Ltd. Class A | 52,100 | 120 |
| | Jointown Pharmaceutical Group Co. Ltd. Class A | 56,200 | 119 |
| | Fangda Special Steel Technology Co. Ltd. Class A | 102,800 | 119 |
| | Shanghai Wanye Enterprises Co. Ltd. Class A | 24,500 | 119 |
| | Ningbo Joyson Electronic Corp. Class A | 42,800 | 119 |
| | Hunan Valin Steel Co. Ltd. Class A | 141,000 | 118 |
| 2 | China Modern Dairy Holdings Ltd. | 626,500 | 118 |
| | Addsino Co. Ltd. Class A | 49,300 | 118 |
| 2,3 | Everbright Securities Co. Ltd. Class H | 150,600 | 118 |
| | Intco Medical Technology Co. Ltd. Class A | 14,625 | 118 |
| * | Guangdong HEC Technology Holding Co. Ltd. Class A | 71,200 | 118 |
| | Anhui Hengyuan Coal Industry and Electricity Power Co. Ltd. Class A | 107,600 | 118 |
| | Sinopec Kantons Holdings Ltd. | 308,000 | 117 |
| * | China High Speed Transmission Equipment Group Co. Ltd. | 151,000 | 117 |
| | Jiangsu Jiejie Microelectronics Co. Ltd. Class A | 24,450 | 117 |
| | Yantai Eddie Precision Machinery Co. Ltd. Class A | 20,860 | 117 |
| | Southwest Securities Co. Ltd. Class A | 155,100 | 117 |
| | Jiangsu Zhongtian Technology Co. Ltd. Class A | 74,300 | 117 |
| | Zhejiang Dingli Machinery Co. Ltd. Class A | 10,934 | 117 |
| | | Shares | Market
Value•
($000) |
| | Shandong Dongyue Organosilicon Material Co. Ltd. Class A | 34,600 | 117 |
| * | Hunan Gold Corp. Ltd. Class A | 68,600 | 116 |
| | Shandong Himile Mechanical Science & Technology Co. Ltd. Class A | 29,600 | 116 |
| | Perfect World Co. Ltd. Class A | 42,950 | 116 |
| | Bafang Electric Suzhou Co. Ltd. Class A | 3,100 | 116 |
| | Jonjee Hi-Tech Industrial And Commercial Holding Co. Ltd. Class A | 20,400 | 116 |
| * | CanSino Biologics Inc. Class A | 2,713 | 116 |
| | Oppein Home Group Inc. Class A | 5,800 | 115 |
| | Kingfa Sci & Tech Co. Ltd. Class A | 62,900 | 115 |
| | Greenland Holdings Corp. Ltd. Class A | 178,815 | 115 |
| | Kaishan Group Co. Ltd. Class A | 40,700 | 115 |
| * | GCL System Integration Technology Co. Ltd. Class A | 181,900 | 115 |
| * | BEST Inc. ADR | 70,614 | 114 |
| | Shanghai Jinjiang International Hotels Co. Ltd. Class B | 59,100 | 114 |
| | Chongqing Fuling Zhacai Group Co. Ltd. Class A | 21,000 | 114 |
| | BOC International China Co. Ltd. Class A | 54,800 | 114 |
| | Zhejiang Xinan Chemical Industrial Group Co. Ltd. Class A | 26,100 | 113 |
| | Huaibei Mining Holdings Co. Ltd. Class A | 57,100 | 113 |
| * | INKON Life Technology Co. Ltd. Class A | 49,900 | 113 |
| | Advanced Technology & Materials Co. Ltd. Class A | 83,800 | 112 |
| | Huagong Tech Co. Ltd. Class A | 24,900 | 112 |
| | An Hui Wenergy Co. Ltd. Class A | 162,200 | 111 |
| | Shenzhen Zhongjin Lingnan Nonfemet Co. Ltd. Class A | 142,900 | 111 |
Total World Stock Index Fund
| | | Shares | Market
Value•
($000) |
| | Yangzhou Yangjie Electronic Technology Co. Ltd. Class A | 13,900 | 111 |
| | Skyfame Realty Holdings Ltd. | 942,000 | 111 |
| | Qingdao Haier Biomedical Co. Ltd. Class A | 7,538 | 111 |
| | Fujian Sunner Development Co. Ltd. Class A | 31,200 | 110 |
| * | Guangdong Create Century Intelligent Equipment Group Corp. Ltd. Class A | 49,700 | 110 |
| | First Capital Securities Co. Ltd. Class A | 102,900 | 110 |
| | Jason Furniture Hangzhou Co. Ltd. Class A | 11,300 | 110 |
| | Anhui Anke Biotechnology Group Co. Ltd. Class A | 57,000 | 109 |
| * | Yunnan Tin Co. Ltd. Class A | 42,400 | 109 |
| | Ninestar Corp. Class A | 19,100 | 109 |
| | Jinneng Science&Technology Co. Ltd. Class A | 49,200 | 109 |
| | Zhejiang Wolwo Bio-Pharmaceutical Co. Ltd. Class A | 13,000 | 109 |
| | Xi'an Triangle Defense Co. Ltd. Class A | 14,100 | 109 |
| | Shanghai Zhangjiang High-Tech Park Development Co. Ltd. Class A | 41,800 | 109 |
| | Zhejiang China Commodities City Group Co. Ltd. Class A | 143,100 | 109 |
| | Xiamen ITG Group Corp. Ltd. Class A | 100,000 | 108 |
| | Hengdian Group DMEGC Magnetics Co. Ltd. Class A | 48,800 | 108 |
| | Chengdu Xingrong Environment Co. Ltd. Class A | 116,800 | 108 |
| | Winning Health Technology Group Co. Ltd. Class A | 54,600 | 108 |
| | Zibo Qixiang Tengda Chemical Co. Ltd. Class A | 61,740 | 108 |
| | Grandblue Environment Co. Ltd. Class A | 31,200 | 108 |
| * | Shanghai Zhenhua Heavy Industries Co. Ltd. Class B | 403,700 | 107 |
| | | Shares | Market
Value•
($000) |
| *,1 | Hi Sun Technology China Ltd. | 792,000 | 107 |
| | Joyoung Co. Ltd. Class A | 29,337 | 107 |
| * | Suning Universal Co. Ltd. Class A | 142,700 | 107 |
| | Beijing Dabeinong Technology Group Co. Ltd. Class A | 80,000 | 107 |
| | Guangzhou Baiyunshan Pharmaceutical Holdings Co. Ltd. Class A | 23,500 | 107 |
| | Hunan Aihua Group Co. Ltd. Class A | 19,200 | 107 |
| | Shanghai Haohai Biological Technology Co. Ltd. Class A | 4,400 | 107 |
| | Daan Gene Co. Ltd. Class A | 35,360 | 106 |
| | Beijing Originwater Technology Co. Ltd. Class A | 97,800 | 106 |
| | Sino-Platinum Metals Co. Ltd. Class A | 29,640 | 106 |
| | Shandong Sun Paper Industry JSC Ltd. Class A | 58,800 | 105 |
| | Western Securities Co. Ltd. Class A | 87,300 | 105 |
| * | Chengzhi Co. Ltd. Class A | 47,400 | 105 |
| | JNBY Design Ltd. | 63,000 | 105 |
| | Bank of Guiyang Co. Ltd. Class A | 99,500 | 105 |
| | Harbin Electric Co. Ltd. Class H | 246,000 | 104 |
| | Sinofert Holdings Ltd. | 668,000 | 104 |
| * | Shenzhen Salubris Pharmaceuticals Co. Ltd. Class A | 23,000 | 104 |
| | Chongqing Water Group Co. Ltd. Class A | 117,945 | 104 |
| | Wuhu Token Science Co. Ltd. Class A | 64,400 | 103 |
| | Beijing Enlight Media Co. Ltd. Class A | 70,600 | 103 |
| | Xiamen Kingdomway Group Co. Class A | 21,600 | 103 |
| | Xinjiang Tianshan Cement Co. Ltd. Class A | 47,800 | 102 |
| | Shanghai Lingang Holdings Corp. Ltd. Class A | 44,400 | 102 |
| | Fibocom Wireless Inc. Class A | 14,110 | 102 |
| | Shenzhen Gas Corp. Ltd. Class A | 71,700 | 102 |
| | Shenzhen Kaifa Technology Co. Ltd. Class A | 43,700 | 101 |
Total World Stock Index Fund
| | | Shares | Market
Value•
($000) |
| | Hesteel Co. Ltd. Class A | 263,800 | 101 |
| | Chacha Food Co. Ltd. Class A | 11,200 | 100 |
| | Beijing Shunxin Agriculture Co. Ltd. Class A | 19,699 | 100 |
| | Victory Giant Technology Huizhou Co. Ltd. Class A | 24,200 | 100 |
| | CNOOC Energy Technology & Services Ltd. Class A | 221,900 | 100 |
| | Yutong Bus Co. Ltd. Class A | 56,700 | 100 |
| | Haohua Chemical Science & Technology Co. Ltd. Class A | 19,700 | 100 |
| | Zhongtai Securities Co. Ltd. Class A | 69,100 | 100 |
| * | Montnets Cloud Technology Group Co. Ltd. Class A | 31,300 | 99 |
| * | NavInfo Co. Ltd. Class A | 54,100 | 99 |
| | Wanxiang Qianchao Co. Ltd. Class A | 105,400 | 99 |
| | Hengyi Petrochemical Co. Ltd. Class A | 58,000 | 99 |
| | MLS Co. Ltd. Class A | 45,400 | 99 |
| | Shanxi Blue Flame Holding Co. Ltd. Class A | 69,300 | 99 |
| | Sinofibers Technology Co. Ltd. Class A | 11,200 | 99 |
| *,3 | Red Star Macalline Group Corp. Ltd. Class H | 176,455 | 99 |
| | Hubei Energy Group Co. Ltd. Class A | 126,000 | 98 |
| | Eternal Asia Supply Chain Management Ltd. Class A | 108,900 | 98 |
| | SGIS Songshan Co. Ltd. Class A | 141,400 | 98 |
| | Shanghai Weaver Network Co. Ltd. Class A | 9,720 | 98 |
| | Jinduicheng Molybdenum Co. Ltd. Class A | 86,200 | 98 |
| | Zhejiang Crystal-Optech Co. Ltd. Class A | 39,500 | 97 |
| | Yunda Holding Co. Ltd. Class A | 33,146 | 97 |
| | Shanghai Environment Group Co. Ltd. Class A | 53,500 | 97 |
| | China Zheshang Bank Co. Ltd. Class A | 179,900 | 97 |
| | | Shares | Market
Value•
($000) |
| | Dongfang Electric Corp. Ltd. Class A | 34,300 | 97 |
| *,1 | China Zhongwang Holdings Ltd. | 442,800 | 96 |
| * | China Nonferrous Metal Industry's Foreign Engineering and Construction Co. Ltd. Class A | 119,700 | 96 |
| * | Zhongtian Financial Group Co. Ltd. Class A | 245,300 | 96 |
| * | Guosheng Financial Holding Inc. Class A | 65,600 | 96 |
| 3 | Shenzhen Hepalink Pharmaceutical Group Co. Ltd. Class H | 87,500 | 96 |
| | Quectel Wireless Solutions Co. Ltd. Class A | 3,380 | 95 |
| * | Beijing BDStar Navigation Co. Ltd. Class A | 15,400 | 95 |
| | DHC Software Co. Ltd. Class A | 87,269 | 95 |
| | Guangdong Kinlong Hardware Products Co. Ltd. Class A | 4,600 | 95 |
| | Tianfeng Securities Co. Ltd. Class A | 154,294 | 95 |
| | Humanwell Healthcare Group Co. Ltd. Class A | 29,000 | 95 |
| | Shenzhen Huaqiang Industry Co. Ltd. Class A | 41,200 | 94 |
| * | Siasun Robot & Automation Co. Ltd. Class A | 64,400 | 94 |
| * | BTG Hotels Group Co. Ltd. Class A | 24,600 | 94 |
| | Guangdong Tapai Group Co. Ltd. Class A | 59,300 | 93 |
| | First Tractor Co. Ltd. Class H | 184,000 | 93 |
| | Xinjiang Zhongtai Chemical Co. Ltd. Class A | 56,300 | 93 |
| | Leyard Optoelectronic Co. Ltd. Class A | 63,400 | 93 |
| | Anhui Jinhe Industrial Co. Ltd. Class A | 12,400 | 93 |
| | Anhui Xinhua Media Co. Ltd. Class A | 127,000 | 93 |
| | China National Software & Service Co. Ltd. Class A | 11,600 | 93 |
| | Chengtun Mining Group Co. Ltd. Class A | 57,900 | 93 |
Total World Stock Index Fund
| | | Shares | Market
Value•
($000) |
| | Zhejiang Cfmoto Power Co. Ltd. Class A | 3,700 | 93 |
| | Jinke Properties Group Co. Ltd. Class A | 132,700 | 92 |
| | Shanghai Chlor-Alkali Chemical Co. Ltd. Class B | 138,200 | 92 |
| | Xinhua Winshare Publishing and Media Co. Ltd. Class H | 126,000 | 92 |
| * | Beijing E-Hualu Information Technology Co. Ltd. Class A | 20,228 | 92 |
| | Xinyangfeng Agricultural Technology Co. Ltd. Class A | ��� 32,200 | 92 |
| | Dongjiang Environmental Co. Ltd. Class A | 86,300 | 92 |
| * | Meinian Onehealth Healthcare Holdings Co. Ltd. Class A | 81,640 | 92 |
| | AVIC Industry-Finance Holdings Co. Ltd. Class A | 151,600 | 92 |
| | Wangfujing Group Co. Ltd. Class A | 19,200 | 92 |
| | Guangdong Provincial Expressway Development Co. Ltd. Class B | 129,300 | 91 |
| * | Jiangsu Hoperun Software Co. Ltd. Class A | 22,200 | 91 |
| | FAW Jiefang Group Co. Ltd. Class A | 55,600 | 91 |
| *,3 | Maoyan Entertainment | 75,600 | 91 |
| | Shenzhen Goodix Technology Co. Ltd. Class A | 5,642 | 90 |
| | Shaanxi International Trust Co. Ltd. Class A | 185,400 | 90 |
| | Beijing Zhong Ke San Huan High-Tech Co. Ltd. Class A | 51,400 | 90 |
| | Zhongshan Public Utilities Group Co. Ltd. Class A | 66,700 | 90 |
| | Boya Bio-pharmaceutical Group Co. Ltd. Class A | 14,600 | 90 |
| | East Group Co. Ltd. Class A | 55,600 | 90 |
| | Topsec Technologies Group Inc. Class A | 31,400 | 90 |
| | | Shares | Market
Value•
($000) |
| | Shandong Pharmaceutical Glass Co. Ltd. Class A | 17,000 | 90 |
| | Inner Mongolia MengDian HuaNeng Thermal Power Corp. Ltd. Class A | 160,200 | 90 |
| | Xiamen Meiya Pico Information Co. Ltd. Class A | 37,200 | 89 |
| | Chongqing Rural Commercial Bank Co. Ltd. Class A | 149,400 | 89 |
| | China National Medicines Corp. Ltd. Class A | 18,600 | 89 |
| | Shanghai Belling Co. Ltd. Class A | 18,900 | 89 |
| * | Offcn Education Technology Co. Ltd. Class A | 53,900 | 88 |
| | Shenzhen Sunway Communication Co. Ltd. Class A | 23,700 | 88 |
| | Yunnan Copper Co. Ltd. Class A | 42,400 | 88 |
| | Xiamen C & D Inc. Class A | 70,200 | 88 |
| | Shenzhen Laibao Hi-tech Co. Ltd. Class A | 53,800 | 87 |
| | Zhejiang Hisoar Pharmaceutical Co. Ltd. Class A | 71,400 | 87 |
| | Jointo Energy Investment Co. Ltd. Hebei Class A | 108,700 | 87 |
| | Zhejiang Jiecang Linear Motion Technology Co. Ltd. Class A | 12,040 | 87 |
| | Shanghai Construction Group Co. Ltd. Class A | 170,500 | 87 |
| | Sinoma International Engineering Co. Class A | 53,400 | 87 |
| * | Shenzhen MTC Co. Ltd. Class A | 111,700 | 86 |
| * | China CAMC Engineering Co. Ltd. Class A | 84,700 | 86 |
| * | Pengdu Agriculture & Animal Husbandry Co. Ltd. Class A | 158,300 | 86 |
| | Shanxi Securities Co. Ltd. Class A | 87,770 | 86 |
| * | SPIC Dongfang New Energy Corp. Class A | 117,800 | 86 |
| | C&S Paper Co. Ltd. Class A | 32,400 | 86 |
Total World Stock Index Fund
| | | Shares | Market
Value•
($000) |
| | China South Publishing & Media Group Co. Ltd. Class A | 66,900 | 86 |
| | Shenergy Co. Ltd. Class A | 88,900 | 86 |
| | Joincare Pharmaceutical Group Industry Co. Ltd. Class A | 48,000 | 86 |
| 3 | Cathay Media And Education Group Inc. | 210,000 | 86 |
| | Nanjing Iron & Steel Co. Ltd. Class A | 154,100 | 85 |
| | Sansteel Minguang Co. Ltd. Fujian Class A | 79,600 | 85 |
| *,2 | China Maple Leaf Educational Systems Ltd. | 528,000 | 85 |
| | Guangzhou Haige Communications Group Inc. Co Class A | 57,400 | 85 |
| | China Merchants Property Operation & Service Co. Ltd. Class A | 40,430 | 85 |
| | Sanquan Food Co. Ltd. Class A | 28,160 | 85 |
| | Ningbo Zhoushan Port Co. Ltd. Class A | 144,600 | 85 |
| | China World Trade Center Co. Ltd. Class A | 39,900 | 85 |
| | Jiangxi Lianchuang Optoelectronic Science & Technology Co. Ltd. Class A | 19,700 | 85 |
| | Shanghai Jin Jiang Capital Co. Ltd. Class H | 372,000 | 84 |
| | IKD Co. Ltd. Class A | 39,200 | 84 |
| | Shenzhen Yinghe Technology Co. Ltd. Class A | 17,100 | 84 |
| | Anhui Expressway Co. Ltd. Class A | 92,100 | 84 |
| | Guangdong Baolihua New Energy Stock Co. Ltd. Class A | 92,800 | 83 |
| | Kunlun Tech Co. Ltd. Class A | 28,400 | 83 |
| | Risen Energy Co. Ltd. Class A | 22,300 | 83 |
| | Beijing Cisri-Gaona Materials & Technology Co. Ltd. Class A | 12,700 | 83 |
| * | China Tianying Inc. Class A | 112,100 | 83 |
| | Guizhou Gas Group Corp. Ltd. Class A | 53,700 | 83 |
| | Zhongliang Holdings Group Co. Ltd. | 179,500 | 83 |
| | | Shares | Market
Value•
($000) |
| | Beijing North Star Co. Ltd. Class A | 238,800 | 83 |
| | Amoy Diagnostics Co. Ltd. Class A | 6,500 | 82 |
| * | Aerospace Hi-Tech Holdings Group Ltd. Class A | 62,157 | 82 |
| | Anhui Zhongding Sealing Parts Co. Ltd. Class A | 30,600 | 82 |
| | Shenzhen YUTO Packaging Technology Co. Ltd. Class A | 16,100 | 82 |
| | ChemPartner PharmaTech Co. Ltd. Class A | 36,000 | 82 |
| | Hainan Poly Pharm Co. Ltd. Class A | 10,725 | 82 |
| | Offshore Oil Engineering Co. Ltd. Class A | 112,800 | 82 |
| | Yintai Gold Co. Ltd. Class A | 58,660 | 81 |
| * | Holitech Technology Co. Ltd. Class A | 160,300 | 81 |
| | Hangzhou Binjiang Real Estate Group Co. Ltd. Class A | 126,500 | 81 |
| * | Guangdong Golden Dragon Development Inc. Class A | 32,500 | 81 |
| | Jiangxi Wannianqing Cement Co. Ltd. Class A | 45,300 | 81 |
| | Central China Securities Co. Ltd. Class A | 113,100 | 81 |
| | Times Neighborhood Holdings Ltd. | 170,615 | 80 |
| | Tibet Tianlu Co. Ltd. Class A | 80,700 | 80 |
| | Hytera Communications Corp. Ltd. Class A | 90,200 | 80 |
| | TongFu Microelectronics Co. Ltd. Class A | 25,700 | 80 |
| | Shennan Circuits Co. Ltd. Class A | 5,740 | 80 |
| | COFCO Capital Holdings Co. Ltd. Class A | 62,300 | 80 |
| | Guolian Securities Co. Ltd. Class A | 42,200 | 80 |
| * | Pacific Securities Co Ltd./The/China Class A | 164,900 | 80 |
| | Eastern Communications Co. Ltd. Class B | 175,800 | 79 |
| | Shanghai Mechanical and Electrical Industry Co. Ltd. Class B | 61,773 | 79 |
| | Newland Digital Technology Co. Ltd. Class A | 33,399 | 79 |
Total World Stock Index Fund
| | | Shares | Market
Value•
($000) |
| | Northeast Securities Co. Ltd. Class A | 58,700 | 79 |
| | Sino Wealth Electronic Ltd. Class A | 8,250 | 79 |
| | Zhongji Innolight Co. Ltd. Class A | 15,300 | 79 |
| | Zhongyuan Environment-Protection Co. Ltd. Class A | 83,600 | 79 |
| | China Great Wall Securities Co. Ltd. Class A | 44,200 | 79 |
| | Anhui Honglu Steel Construction Group Co. Ltd. Class A | 11,900 | 79 |
| * | Beijing Chunlizhengda Medical Instruments Co. Ltd. Class H | 33,250 | 78 |
| | Shenzhen Tagen Group Co. Ltd. Class A | 99,100 | 78 |
| | COFCO Biotechnology Co. Ltd. Class A | 46,600 | 78 |
| | Yifan Pharmaceutical Co. Ltd. Class A | 30,300 | 78 |
| | Xuji Electric Co. Ltd. Class A | 25,200 | 78 |
| | Guangzhou Shiyuan Electronic Technology Co. Ltd. Class A | 6,597 | 78 |
| | Huaan Securities Co. Ltd. Class A | 97,760 | 78 |
| | Estun Automation Co. Ltd. Class A (XSEC) | 18,600 | 77 |
| * | Sinopec Oilfield Service Corp. Class H | 806,000 | 77 |
| | Wuxi Boton Technology Co. Ltd. Class A | 21,400 | 77 |
| | Wuhan Jingce Electronic Group Co. Ltd. Class A | 9,400 | 77 |
| | Milkyway Chemical Supply Chain Service Co. Ltd. Class A | 4,500 | 77 |
| | Zhejiang Medicine Co. Ltd. Class A | 31,000 | 77 |
| | Huafa Industrial Co. Ltd. Zhuhai Class A | 93,200 | 77 |
| 3 | Yangtze Optical Fibre and Cable Joint Stock Ltd. Co Class H | 46,000 | 77 |
| * | Beijing Enterprises Clean Energy Group Ltd. | 5,760,000 | 77 |
| | | Shares | Market
Value•
($000) |
| * | Southern Shuanglin Bio-pharmacy Co. Ltd. Class A | 15,600 | 77 |
| | Consun Pharmaceutical Group Ltd. | 178,000 | 76 |
| * | Chongqing Iron & Steel Co. Ltd. Class H | 378,000 | 76 |
| * | Dazhong Transportation Group Co. Ltd. Class B | 264,350 | 76 |
| * | Yatsen Holding Ltd. ADR | 26,980 | 76 |
| | Shenzhen Desay Battery Technology Co. Class A | 11,455 | 76 |
| | Shenzhen Infogem Technologies Co. Ltd. Class A | 36,900 | 76 |
| | Infore Environment Technology Group Co. Ltd. Class A | 78,200 | 76 |
| | Shanghai Liangxin Electrical Co. Ltd. Class A | 29,770 | 76 |
| | Guangdong Electric Power Development Co. Ltd. Class B | 239,743 | 75 |
| | Shenzhen Everwin Precision Technology Co. Ltd. Class A | 34,080 | 75 |
| | Financial Street Holdings Co. Ltd. Class A | 81,700 | 75 |
| | China West Construction Group Co. Ltd. Class A | 67,200 | 75 |
| | Guangdong Hongda Blasting Co. Ltd. Class A | 17,500 | 75 |
| | Keshun Waterproof Technologies Co. Ltd. Class A | 36,180 | 75 |
| | Hangzhou Dptech Technologies Co. Ltd. Class A | 11,600 | 75 |
| | Hongta Securities Co. Ltd. Class A | 42,900 | 75 |
| | Hebei Hengshui Laobaigan Liquor Co. Ltd. Class A | 22,300 | 75 |
| * | LVGEM China Real Estate Investment Co. Ltd. | 332,000 | 75 |
| | Shanghai M&G Stationery Inc. Class A | 7,600 | 75 |
| | NanJi E-Commerce Co. Ltd. Class A | 66,500 | 74 |
| | Jiangsu Nhwa Pharmaceutical Co. Ltd. Class A | 32,000 | 74 |
Total World Stock Index Fund
| | | Shares | Market
Value•
($000) |
| | Xinhua Winshare Publishing and Media Co. Ltd. Class A | 56,600 | 74 |
| * | Red Star Macalline Group Corp. Ltd. Class A | 52,250 | 74 |
| | Tianli Education International Holdings Ltd. | 358,000 | 74 |
| | Shanghai Lujiazui Finance & Trade Zone Development Co. Ltd. Class A | 43,500 | 74 |
| | Tangshan Sanyou Chemical Industries Co. Ltd. Class A | 51,300 | 74 |
| | Guangxi Guiguan Electric Power Co. Ltd. Class A | 81,800 | 74 |
| | Ronshine China Holdings Ltd. | 182,500 | 74 |
| 3 | Redco Properties Group Ltd. | 238,000 | 73 |
| | Shandong Denghai Seeds Co. Ltd. Class A | 21,800 | 73 |
| | Sinocare Inc. Class A | 19,800 | 73 |
| | Shenzhen Fastprint Circuit Tech Co. Ltd. Class A | 37,100 | 73 |
| | Hubei Dinglong Co. Ltd. Class A | 23,400 | 73 |
| | Sai Micro Electronics Inc. Class A | 19,900 | 73 |
| | Hubei Feilihua Quartz Glass Co. Ltd. Class A | 8,400 | 73 |
| | ZheJiang Dali Technology Co. Ltd. Class A | 24,720 | 73 |
| | Chinese Universe Publishing and Media Group Co. Ltd. Class A | 44,900 | 73 |
| | Shanghai Mechanical and Electrical Industry Co. Ltd. Class A | 32,100 | 73 |
| | Greattown Holdings Ltd. Class A | 131,500 | 73 |
| * | Chifeng Jilong Gold Mining Co. Ltd. Class A | 28,900 | 73 |
| | Shanghai Haixin Group Co. Class B | 210,800 | 72 |
| | Shenzhen Hepalink Pharmaceutical Group Co. Ltd. Class A | 30,000 | 72 |
| | Zhejiang Huace Film & Television Co. Ltd. Class A | 81,100 | 72 |
| | Valiant Co. Ltd. Class A | 22,500 | 72 |
| | | Shares | Market
Value•
($000) |
| | Tibet Summit Resources Co. Ltd. Class A | 15,000 | 72 |
| | Shandong Hi-speed Co. Ltd. Class A | 85,500 | 72 |
| | Hexing Electrical Co. Ltd. Class A | 39,100 | 72 |
| | Guangzhou Wondfo Biotech Co. Ltd. Class A | 13,130 | 71 |
| | Chaowei Power Holdings Ltd. | 240,000 | 71 |
| | Beijing Yanjing Brewery Co. Ltd. Class A | 68,900 | 71 |
| | Shenyang Xingqi Pharmaceutical Co. Ltd. Class A | 3,600 | 71 |
| | Laobaixing Pharmacy Chain JSC Class A | 10,220 | 70 |
| | Fujian Star-net Communication Co. Ltd. Class A | 20,600 | 70 |
| | Jiangsu Zhongnan Construction Group Co. Ltd. Class A | 116,700 | 70 |
| | OFILM Group Co. Ltd. Class A | 59,800 | 70 |
| | Henan Shenhuo Coal & Power Co. Ltd. Class A | 47,400 | 70 |
| | Guangdong Xinbao Electrical Appliances Holdings Co. Ltd. Class A | 19,900 | 70 |
| | Shanxi Coking Co. Ltd. Class A | 65,390 | 70 |
| | Anhui Expressway Co. Ltd. Class H | 116,000 | 69 |
| | Lianhe Chemical Technology Co. Ltd. Class A | 22,800 | 69 |
| | Yotrio Group Co. Ltd. Class A | 127,800 | 69 |
| * | Beijing Ultrapower Software Co. Ltd. Class A | 77,900 | 69 |
| | Huaxin Cement Co. Ltd. Class A | 26,100 | 68 |
| * | Sichuan Haite High-tech Co. Ltd. Class A | 36,800 | 68 |
| | YGSOFT Inc. Class A | 63,960 | 68 |
| | Tianjin Chase Sun Pharmaceutical Co. Ltd. Class A | 107,100 | 68 |
| | Zhejiang Yasha Decoration Co. Ltd. Class A | 58,400 | 68 |
| | Yixintang Pharmaceutical Group Co. Ltd. Class A | 13,700 | 68 |
| | Eoptolink Technology Inc. Ltd Class A | 15,262 | 68 |
Total World Stock Index Fund
| | | Shares | Market
Value•
($000) |
| | Juewei Food Co. Ltd. Class A | 6,600 | 68 |
| * | Bank of Zhengzhou Co. Ltd. Class A | 128,150 | 68 |
| | Luoxin Pharmaceuticals Group Stock Co. Ltd. Class A | 46,318 | 68 |
| | Shanghai AJ Group Co. Ltd. Class A | 67,600 | 68 |
| * | Tongda Group Holdings Ltd. | 2,100,439 | 67 |
| | Beijing SL Pharmaceutical Co. Ltd. Class A | 46,500 | 67 |
| | Jilin Aodong Pharmaceutical Group Co. Ltd. Class A | 27,200 | 67 |
| | Shenzhen Suntak Circuit Technology Co. Ltd. Class A | 31,000 | 67 |
| | Fiberhome Telecommunication Technologies Co. Ltd. Class A | 24,800 | 67 |
| * | Cinda Real Estate Co. Ltd. Class A | 133,900 | 67 |
| | Wens Foodstuffs Group Co. Ltd. Class A | 25,560 | 66 |
| | Weifu High-Technology Group Co. Ltd. Class B | 34,600 | 66 |
| * | So-Young International Inc. ADR | 16,711 | 66 |
| * | Beijing Jetsen Technology Co. Ltd. Class A | 102,600 | 66 |
| | Shanghai Pret Composites Co. Ltd. Class A | 38,400 | 66 |
| | Konka Group Co. Ltd. Class A | 75,700 | 66 |
| | Huaxi Securities Co. Ltd. Class A | 47,000 | 66 |
| | Bright Dairy & Food Co. Ltd. Class A | 30,100 | 66 |
| | State Grid Information & Communication Co. Ltd. Class A | 27,900 | 66 |
| | Tianjin 712 Communication & Broadcasting Co. Ltd. Class A | 11,000 | 65 |
| | Vatti Corp. Ltd. Class A | 69,700 | 64 |
| | B-Soft Co. Ltd. Class A | 50,960 | 64 |
| | Bank of Chengdu Co. Ltd. Class A | 32,000 | 64 |
| | Qianhe Condiment and Food Co. Ltd. Class A | 16,680 | 64 |
| | Sinopec Shanghai Petrochemical Co. Ltd. Class A | 105,100 | 64 |
| | | Shares | Market
Value•
($000) |
| | Shanghai Tunnel Engineering Co. Ltd. Class A | 79,800 | 64 |
| | Chongqing Dima Industry Co. Ltd. Class A | 177,600 | 64 |
| | Henan Zhongyuan Expressway Co. Ltd. Class A | 130,439 | 64 |
| | Zhejiang Supor Co. Ltd. Class A | 7,595 | 63 |
| | Dian Diagnostics Group Co. Ltd. Class A | 12,600 | 63 |
| * | Bohai Leasing Co. Ltd. Class A | 154,100 | 63 |
| | Jiangsu Hengshun Vinegar Industry Co. Ltd. Class A | 24,900 | 63 |
| 1 | Fantasia Holdings Group Co. Ltd. | 861,000 | 62 |
| | Shenzhen Jinjia Group Co. Ltd. Class A | 36,400 | 62 |
| | ORG Technology Co. Ltd. Class A | 59,500 | 62 |
| | Haisco Pharmaceutical Group Co. Ltd. Class A | 23,700 | 62 |
| | Suzhou Gold Mantis Construction Decoration Co. Ltd. Class A | 66,600 | 62 |
| * | Alpha Group Class A | 79,000 | 62 |
| | Dare Power Dekor Home Co. Ltd. Class A | 33,800 | 62 |
| | Guangzhou Zhujiang Brewery Co. Ltd. Class A | 40,100 | 62 |
| * | Zheshang Securities Co. Ltd. Class A | 32,100 | 62 |
| | Shenzhen Kinwong Electronic Co. Ltd. Class A | 15,300 | 62 |
| | Zhejiang Wanfeng Auto Wheel Co. Ltd. Class A | 74,500 | 61 |
| * | Genimous Technology Co. Ltd. Class A | 64,200 | 61 |
| | Betta Pharmaceuticals Co. Ltd. Class A | 4,900 | 61 |
| | Hangzhou Oxygen Plant Group Co. Ltd. Class A | 15,100 | 61 |
| * | TangShan Port Group Co. Ltd. Class A | 145,900 | 61 |
| | Shanying International Holding Co. Ltd. Class A | 119,600 | 61 |
| | Autobio Diagnostics Co. Ltd. Class A | 7,020 | 60 |
Total World Stock Index Fund
| | | Shares | Market
Value•
($000) |
| | Shanghai Jin Jiang Online Network Service Co. Ltd. Class B | 91,264 | 60 |
| | Shijiazhuang Yiling Pharmaceutical Co. Ltd. Class A | 23,800 | 60 |
| | Beibuwan Port Co. Ltd. Class A | 51,700 | 60 |
| | Shenzhen Megmeet Electrical Co. Ltd. Class A | 12,500 | 60 |
| 2 | Perennial Energy Holdings Ltd. | 295,000 | 60 |
| * | Guangshen Railway Co. Ltd. Class H | 336,000 | 59 |
| | Accelink Technologies Co. Ltd. Class A | 17,300 | 59 |
| | Xinxing Ductile Iron Pipes Co. Ltd. Class A | 102,100 | 59 |
| | Shandong Chenming Paper Holdings Ltd. Class A | 53,600 | 59 |
| | Zhejiang Hailiang Co. Ltd. Class A | 36,000 | 59 |
| * | Guangshen Railway Co. Ltd. Class A | 177,800 | 59 |
| | Zhengzhou Coal Mining Machinery Group Co. Ltd. Class A | 37,100 | 59 |
| * | Baidu Inc. Class A | 2,888 | 59 |
| | Gan & Lee Pharmaceuticals Co. Ltd. Class A | 5,611 | 59 |
| | China South City Holdings Ltd. | 778,000 | 58 |
| | WUS Printed Circuit Kunshan Co. Ltd. Class A | 36,080 | 58 |
| | Shanghai Kehua Bio-Engineering Co. Ltd. Class A | 27,200 | 58 |
| | Leo Group Co. Ltd. Class A | 162,800 | 58 |
| * | STO Express Co. Ltd. Class A | 48,400 | 58 |
| | Greenland Hong Kong Holdings Ltd. | 275,000 | 58 |
| *,3 | Ascletis Pharma Inc. | 167,000 | 58 |
| | China Merchants Expressway Network & Technology Holdings Co. Ltd. Class A | 52,800 | 58 |
| | Zhejiang Tianyu Pharmaceutical Co. Ltd. Class A | 9,720 | 58 |
| | Universal Scientific Industrial Shanghai Co. Ltd. Class A | 26,800 | 58 |
| * | Shenzhen Airport Co. Ltd. Class A | 48,400 | 57 |
| | | Shares | Market
Value•
($000) |
| | Taiji Computer Corp. Ltd. Class A | 13,019 | 57 |
| | Bluefocus Intelligent Communications Group Co. Ltd. Class A | 73,500 | 57 |
| * | Huafu Fashion Co. Ltd. Class A | 82,600 | 57 |
| | 5I5J Holding Group Co. Ltd. Class A | 123,300 | 57 |
| | People.cn Co. Ltd. Class A | 27,700 | 57 |
| | Luenmei Quantum Co. Ltd. Class A | 43,800 | 57 |
| | Anhui Kouzi Distillery Co. Ltd. Class A | 5,900 | 56 |
| * | Beijing Sanju Environmental Protection and New Material Co. Ltd. Class A | 58,600 | 56 |
| | Jiangxi Bank Co. Ltd. Class H | 126,500 | 56 |
| | BGI Genomics Co. Ltd. Class A | 4,000 | 56 |
| | Shanghai Zijiang Enterprise Group Co. Ltd. Class A | 36,800 | 56 |
| * | Grandjoy Holdings Group Co. Ltd. Class A | 107,100 | 55 |
| | Shanghai Sinyang Semiconductor Materials Co. Ltd. Class A | 8,900 | 55 |
| | Zhongfu Information Inc. Class A | 9,900 | 55 |
| | Camel Group Co. Ltd. Class A | 26,910 | 55 |
| * | Markor International Home Furnishings Co. Ltd. Class A | 104,000 | 55 |
| * | Autohome Inc. Class A | 5,444 | 55 |
| | Maccura Biotechnology Co. Ltd. Class A | 12,500 | 54 |
| 3 | Qingdao Port International Co. Ltd. Class H | 108,000 | 54 |
| * | Huangshan Tourism Development Co. Ltd. Class B | 77,426 | 54 |
| | Guangzhou Yuexiu Financial Holdings Group Co. Ltd. Class A | 45,090 | 54 |
| | Beijing Sinnet Technology Co. Ltd. Class A | 26,100 | 54 |
| * | CITIC Guoan Information Industry Co. Ltd. Class A | 153,300 | 54 |
| | CNHTC Jinan Truck Co. Ltd. Class A | 25,900 | 54 |
| | Beijing Aosaikang Pharmaceutical Co. Ltd. Class A | 29,500 | 54 |
Total World Stock Index Fund
| | | Shares | Market
Value•
($000) |
| | Zhejiang Starry Pharmaceutical Co. Ltd. Class A | 7,000 | 54 |
| | Juneyao Airlines Co. Ltd. Class A | 21,400 | 53 |
| * | Shijiazhuang Changshan BeiMing Technology Co. Ltd. Class A | 51,900 | 53 |
| | Guangdong South New Media Co. Ltd. Class A | 7,200 | 53 |
| * | C&D Property Management Group Co. Ltd. | 94,000 | 53 |
| | Beijing Capital Development Co. Ltd. Class A | 68,400 | 53 |
| * | Gree Real Estate Co. Ltd. Class A | 50,900 | 53 |
| | Shanghai Fudan-Zhangjiang Bio-Pharmaceutical Co. Ltd. Class H | 107,000 | 52 |
| | China National Accord Medicines Corp. Ltd. Class B | 20,760 | 52 |
| | Hangzhou Century Co. Ltd. Class A | 53,600 | 52 |
| * | Beijing Orient National Communication Science & Technology Co. Ltd. Class A | 37,500 | 52 |
| | Zhejiang Xianju Pharmaceutical Co. Ltd. Class A | 30,100 | 52 |
| | Nanjing Yunhai Special Metals Co. Ltd. Class A | 18,300 | 52 |
| 2,3 | China Everbright Greentech Ltd. | 149,000 | 52 |
| | Yusys Technologies Co. Ltd. Class A | 18,080 | 52 |
| | Jiangsu Provincial Agricultural Reclamation and Development Corp. | 30,100 | 52 |
| | Edifier Technology Co. Ltd. Class A | 29,474 | 52 |
| * | China Fortune Land Development Co. Ltd. Class A | 91,087 | 52 |
| | Shanghai Chinafortune Co. Ltd. Class A | 25,900 | 52 |
| | Digital China Group Co. Ltd. Class A | 22,200 | 52 |
| | Shenzhen Gongjin Electronics Co. Ltd. Class A | 41,300 | 51 |
| * | Hanergy Thin Film Pow Group Ltd. | 1,810,000 | 51 |
| | Yango Group Co. Ltd. Class A | 100,500 | 51 |
| | | Shares | Market
Value•
($000) |
| * | Tus Environmental Science And Technology Development Co. Ltd. Class A | 83,700 | 51 |
| | Caitong Securities Co. Ltd. Class A | 31,900 | 51 |
| | Nanjing Xinjiekou Department Store Co. Ltd. Class A | 33,100 | 51 |
| | Liaoning Port Co. Ltd. Class A | 191,500 | 51 |
| * | Youzu Interactive Co. Ltd. Class A | 24,100 | 50 |
| | Suzhou Anjie Technology Co. Ltd. Class A | 23,400 | 50 |
| | Guangzhou Restaurant Group Co. Ltd. Class A | 14,140 | 50 |
| | Guocheng Mining Co. Ltd. Class A | 30,854 | 48 |
| | Jiangsu Shagang Co. Ltd. Class A | 48,800 | 47 |
| | YanTai Shuangta Food Co. Ltd. Class A | 32,900 | 47 |
| * | Ourpalm Co. Ltd. Class A | 77,300 | 47 |
| *,2,3 | Koolearn Technology Holding Ltd. | 87,500 | 47 |
| | China Meheco Co. Ltd. Class A | 27,000 | 47 |
| | Shanghai Shimao Co. Ltd. Class A | 95,800 | 47 |
| | Gansu Qilianshan Cement Group Co. Ltd. Class A | 31,200 | 47 |
| | China National Accord Medicines Corp. Ltd. Class A | 8,800 | 46 |
| | Shanghai Shibei Hi-Tech Co. Ltd. Class B | 167,276 | 46 |
| * | China Fangda Group Co. Ltd. Class B | 122,000 | 46 |
| | Blue Sail Medical Co. Ltd. Class A | 20,400 | 46 |
| | Zhejiang Orient Financial Holdings Group Co. Ltd. Class A | 71,630 | 46 |
| * | Shengda Resources Co. Ltd. Class A | 25,100 | 45 |
| | Tech-Bank Food Co. Ltd. Class A | 45,920 | 45 |
| | Wuxi Taiji Industry Co. Ltd. Class A | 36,200 | 45 |
| | Qingling Motors Co. Ltd. Class H | 194,000 | 44 |
| | Hebei Chengde Lolo Co. Class A | 27,440 | 44 |
| * | Guizhou Xinbang Pharmaceutical Co. Ltd. Class A | 41,500 | 44 |
| | IReader Technology Co. Ltd. Class A | 14,800 | 44 |
| | Anhui Genuine New Materials Co. Ltd. Class A | 12,400 | 44 |
Total World Stock Index Fund
| | | Shares | Market
Value•
($000) |
| * | Tongdao Liepin Group | 30,600 | 44 |
| *,2,3 | YiChang HEC ChangJiang Pharmaceutical Co. Ltd. Class H | 92,800 | 43 |
| | INESA Intelligent Tech Inc. Class B | 98,400 | 43 |
| | Zhejiang JIULI Hi-tech Metals Co. Ltd. Class A | 21,700 | 43 |
| | Yantai Dongcheng Pharmaceutical Co. Ltd. Class A | 19,800 | 43 |
| | Shanghai Yaoji Technology Co. Ltd. Class A | 16,400 | 43 |
| | Shenzhen Kingdom Sci-Tech Co. Ltd. Class A | 21,498 | 43 |
| | Shanghai Huayi Group Co. Ltd. Class B | 63,200 | 42 |
| * | Beijing Watertek Information Technology Co. Ltd. Class A | 80,700 | 42 |
| | Shanghai AtHub Co. Ltd. Class A | 8,540 | 42 |
| | Jiajiayue Group Co. Ltd. Class A | 18,300 | 42 |
| | Shenzhen Leaguer Co. Ltd. Class A | 30,200 | 42 |
| * | Orient Group Inc. Class A | 92,500 | 42 |
| | CPMC Holdings Ltd. | 83,000 | 41 |
| | Shandong Humon Smelting Co. Ltd. Class A | 23,000 | 41 |
| | Hebei Construction Group Corp. Ltd. Class H | 160,500 | 41 |
| 2 | Colour Life Services Group Co. Ltd. | 235,000 | 41 |
| | Hubei Biocause Pharmaceutical Co. Ltd. Class A | 79,700 | 40 |
| * | Huafon Microfibre Shanghai Technology Co. Ltd. Class T | 57,300 | 40 |
| | Double Medical Technology Inc. Class A | 5,500 | 40 |
| | Suofeiya Home Collection Co. Ltd. Class A | 14,600 | 39 |
| * | Aotecar New Energy Technology Co. Ltd. Class A | 78,200 | 39 |
| | Shandong Dawn Polymer Co. Ltd. Class A | 17,200 | 39 |
| | Sichuan Expressway Co. Ltd. Class H | 166,000 | 38 |
| | Shenzhen Woer Heat-Shrinkable Material Co. Ltd. Class A | 32,800 | 38 |
| | | Shares | Market
Value•
($000) |
| | RiseSun Real Estate Development Co. Ltd. Class A | 56,200 | 38 |
| | Wisdom Education International Holdings Co. Ltd. | 224,000 | 38 |
| | DaShenLin Pharmaceutical Group Co. Ltd. Class A | 6,960 | 38 |
| | Central China Real Estate Ltd. | 248,000 | 37 |
| | Goldenmax International Technology Ltd. Class A | 17,800 | 37 |
| * | 360 Security Technology Inc. Class A | 19,798 | 37 |
| 2 | E-House China Enterprise Holdings Ltd. | 195,900 | 37 |
| | Monalisa Group Co. Ltd. Class A | 12,415 | 37 |
| | Tian Di Science & Technology Co. Ltd. Class A | 56,611 | 37 |
| | Bear Electric Appliance Co. Ltd. Class A | 4,000 | 36 |
| * | Oceanwide Holdings Co. Ltd. Class A | 125,400 | 35 |
| | Shenzhen Sunline Tech Co. Ltd. Class A | 17,900 | 35 |
| | Chengdu Fusen Noble-House Industrial Co. Ltd. Class A | 17,930 | 35 |
| | Shenzhen Sinovatio Technology Co. Ltd. Class A | 7,520 | 35 |
| | Tangshan Jidong Cement Co. Ltd. Class A | 18,500 | 34 |
| | Beijing Global Safety Technology Co. Ltd. Class A | 10,500 | 34 |
| | Shenzhen Anche Technologies Co. Ltd. Class A | 11,500 | 34 |
| | Shanghai Kinetic Medical Co. Ltd. Class A | 20,900 | 33 |
| * | YaGuang Technology Group Co. Ltd. Class A | 24,900 | 33 |
| * | Sichuan Languang Development Co. Ltd. Class A | 120,200 | 32 |
| * | Tahoe Group Co. Ltd. Class A | 104,500 | 32 |
| | Unilumin Group Co. Ltd. Class A | 24,800 | 32 |
| | Shanghai Waigaoqiao Free Trade Zone Group Co. Ltd. Class A | 15,600 | 31 |
Total World Stock Index Fund
| | | Shares | Market
Value•
($000) |
| * | Gds Holdings Ltd. Class A | 3,931 | 30 |
| | Beijing Thunisoft Corp. Ltd. Class A | 18,200 | 30 |
| | Chongqing Zongshen Power Machinery Co. Ltd. Class A | 29,000 | 30 |
| | Shenzhen World Union Group Inc. Class A | 50,700 | 30 |
| | Yangtze Optical Fibre and Cable Joint Stock Ltd. Co Class A | 6,300 | 30 |
| | Guangzhou Shangpin Home Collection Co. Ltd. Class A | 4,400 | 30 |
| | Sichuan Teway Food Group Co. Ltd. Class A | 7,800 | 30 |
| * | Shaanxi Construction Machinery Co. Ltd. Class A | 22,200 | 30 |
| | Jiangsu Jiangyin Rural Commercial Bank Co. Ltd. Class A | 47,800 | 29 |
| | China TransInfo Technology Co. Ltd. Class A | 13,400 | 28 |
| | Changchun Faway Automobile Components Co. Ltd. Class A | 17,310 | 28 |
| | PCI Technology Group Co. Ltd. Class A | 23,100 | 27 |
| | China Publishing & Media Co. Ltd. Class A | 32,300 | 27 |
| * | Berry Genomics Co. Ltd. Class A | 8,600 | 26 |
| | China Resources Double Crane Pharmaceutical Co. Ltd. Class A | 14,500 | 26 |
| | Dashang Co. Ltd. Class A | 8,500 | 26 |
| | Guomai Technologies Inc. Class A | 27,800 | 25 |
| | NSFOCUS Technologies Group Co. Ltd. Class A | 10,497 | 25 |
| * | Shanghai 2345 Network Holding Group Co. Ltd. Class A | 80,900 | 25 |
| | Shanghai Waigaoqiao Free Trade Zone Group Co. Ltd. Class B | 26,900 | 24 |
| | Chengdu Kanghong Pharmaceutical Group Co. Ltd. Class A | 8,500 | 24 |
| | | Shares | Market
Value•
($000) |
| | Central China Securities Co. Ltd. Class H | 129,988 | 24 |
| | Western Region Gold Co. Ltd. Class A | 13,400 | 24 |
| * | New Oriental Education & Technology Group Inc. | 11,770 | 24 |
| | Wangsu Science & Technology Co. Ltd. Class A | 26,600 | 23 |
| * | Visionox Technology Inc. Class A | 17,998 | 23 |
| | Henan Yuguang Gold & Lead Co. Ltd. Class A | 27,900 | 23 |
| | Sinosoft Co. Ltd. Class A | 5,880 | 23 |
| | Skyworth Digital Co. Ltd. Class A | 18,500 | 21 |
| | Beijing North Star Co. Ltd. Class H | 118,000 | 19 |
| * | Kunshan Kersen Science & Technology Co. Ltd. Class A | 12,100 | 19 |
| | Guangxi Wuzhou Communications Co. Ltd. Class A | 31,300 | 18 |
| | BBMG Corp. Class A | 38,700 | 17 |
| | Yantai Changyu Pioneer Wine Co. Ltd. Class A | 3,230 | 16 |
| * | Myhome Real Estate Development Group Co. Ltd. Class A | 61,300 | 15 |
| | Rongan Property Co. Ltd. Class A | 40,800 | 15 |
| * | Doushen Beijing Education & Technology Inc. Class A | 24,700 | 14 |
| | Jiangsu Zhangjiagang Rural Commercial Bank Co. Ltd. Class A | 14,500 | 14 |
| | Dongjiang Environmental Co. Ltd. Class H | 27,100 | 12 |
| | Fujian Cement Inc. Class A | 11,300 | 12 |
| *,1 | China Lumena New Materials Corp. | 11,900 | 8 |
| | Shandong Publishing & Media Co. Ltd. Class A | 5,700 | 5 |
| *,1 | Tianhe Chemicals Group Ltd. | 383,088 | — |
| *,1,2 | Midas Holdings Ltd. | 223,900 | — |
| *,1 | China Animal Healthcare Ltd. | 84,000 | — |
| | | | 1,256,929 |
Total World Stock Index Fund
| | | Shares | Market
Value•
($000) |
| Colombia (0.0%) |
| | Bancolombia SA ADR | 48,141 | 1,730 |
| | Interconexion Electrica SA ESP | 193,870 | 1,164 |
| | Bancolombia SA | 111,855 | 1,000 |
| | Ecopetrol SA ADR | 56,019 | 849 |
| | Ecopetrol SA | 971,880 | 735 |
| | Grupo Argos SA | 164,203 | 514 |
| | Grupo de Inversiones Suramericana SA | 75,133 | 438 |
| | Grupo Aval Acciones y Valores SA Preference Shares | 1,430,144 | 437 |
| * | Banco Davivienda SA Preference Shares | 38,989 | 351 |
| | Cementos Argos SA | 164,401 | 277 |
| | Grupo De Inversiones Suramericana SA Preference Shares | 46,730 | 234 |
| | Bancolombia SA Preference Shares | 14,574 | 131 |
| | | | 7,860 |
| Czech Republic (0.0%) |
| | CEZ A/S | 68,713 | 2,269 |
| * | Komercni banka A/S | 32,601 | 1,264 |
| *,3 | Moneta Money Bank A/S | 180,939 | 709 |
| | O2 Czech Republic A/S | 19,144 | 220 |
| | Philip Morris CR A/S | 235 | 167 |
| | | | 4,629 |
| Denmark (0.6%) |
| | Novo Nordisk A/S Class B | 691,126 | 75,785 |
| | DSV A/S | 86,526 | 20,110 |
| | Vestas Wind Systems A/S | 440,133 | 19,027 |
| * | Genmab A/S | 25,983 | 11,673 |
| 3 | Orsted A/S | 82,271 | 11,620 |
| | Coloplast A/S Class B | 58,360 | 9,531 |
| | Carlsberg A/S Class B | 43,093 | 7,115 |
| | AP Moller - Maersk A/S Class B | 2,253 | 6,529 |
| | Novozymes A/S Class B | 86,715 | 6,379 |
| | Pandora A/S | 42,913 | 6,005 |
| | AP Moller - Maersk A/S Class A | 2,110 | 5,793 |
| | Danske Bank A/S | 289,867 | 4,905 |
| | GN Store Nord A/S | 57,461 | 3,492 |
| | Chr Hansen Holding A/S | 43,477 | 3,461 |
| | Tryg A/S | 131,992 | 3,133 |
| | Royal Unibrew A/S | 21,994 | 2,732 |
| | SimCorp A/S | 18,394 | 2,227 |
| * | Demant A/S | 43,236 | 2,096 |
| | Ambu A/S Class B | 71,896 | 2,047 |
| | Ringkjoebing Landbobank A/S | 13,032 | 1,656 |
| 3 | Netcompany Group A/S | 14,419 | 1,642 |
| * | ISS A/S | 76,608 | 1,529 |
| | | Shares | Market
Value•
($000) |
| *,2 | Bavarian Nordic A/S | 28,382 | 1,362 |
| * | ALK-Abello A/S | 2,944 | 1,276 |
| | ROCKWOOL International A/S Class B | 2,578 | 1,179 |
| * | Jyske Bank A/S (Registered) | 23,235 | 1,134 |
| * | NKT A/S | 20,344 | 980 |
| | Sydbank A/S | 24,931 | 857 |
| | FLSmidth & Co. A/S | 22,499 | 855 |
| | Topdanmark A/S | 16,024 | 850 |
| * | Dfds A/S | 15,232 | 789 |
| 3 | Scandinavian Tobacco Group A/S Class A | 28,791 | 647 |
| | H Lundbeck A/S | 21,958 | 611 |
| * | Zealand Pharma A/S | 17,222 | 553 |
| | Chemometec A/S | 3,554 | 539 |
| | Spar Nord Bank A/S | 40,007 | 516 |
| * | NTG Nordic Transport Group A/S Class A | 5,879 | 481 |
| * | Nilfisk Holding A/S | 12,898 | 450 |
| | Schouw & Co. A/S | 4,587 | 446 |
| 2 | Alm Brand A/S | 34,676 | 268 |
| * | Drilling Co. of 1972 A/S | 7,206 | 258 |
| | D/S Norden A/S | 9,456 | 228 |
| | | | 222,766 |
| Egypt (0.0%) |
| * | Commercial International Bank Egypt SAE | 676,494 | 2,202 |
| * | Egyptian Financial Group-Hermes Holding Co. | 587,834 | 466 |
| * | Egypt Kuwait Holding Co. SAE (XCAI) | 294,616 | 408 |
| | Eastern Co. SAE | 372,204 | 275 |
| | Six of October Development & Investment | 224,901 | 263 |
| * | Fawry for Banking & Payment Technology Services SAE | 264,594 | 253 |
| | ElSewedy Electric Co. | 296,180 | 163 |
| * | Egypt Kuwait Holding Co. SAE | 103,346 | 141 |
| | Talaat Moustafa Group | 292,136 | 138 |
| | Oriental Weavers | 227,675 | 120 |
| | Telecom Egypt Co. | 127,965 | 110 |
| | Palm Hills Developments SAE | 548,521 | 67 |
| * | Pioneers Properties | 243,648 | 46 |
| | Medinet Nasr Housing | 166,743 | 25 |
| * | Gadwa for Industrial Development | 243,648 | 18 |
| * | Aspire Capital Holding for Financial Investments | 243,648 | 5 |
| | | | 4,700 |
Total World Stock Index Fund
| | | Shares | Market
Value•
($000) |
| Finland (0.3%) |
| * | Nokia OYJ | 2,468,166 | 14,166 |
| | Sampo OYJ Class A | 221,969 | 11,800 |
| | Kone OYJ Class B | 170,690 | 11,641 |
| | Nordea Bank Abp | 927,204 | 11,355 |
| | Neste OYJ | 182,008 | 10,133 |
| | Nordea Bank Abp (XHEL) | 679,251 | 8,311 |
| | UPM-Kymmene OYJ | 234,435 | 8,273 |
| | Fortum OYJ | 185,426 | 5,515 |
| | Stora Enso OYJ Class R | 255,805 | 4,257 |
| | Elisa OYJ | 61,594 | 3,717 |
| | Kesko OYJ Class B | 113,814 | 3,704 |
| | Wartsila OYJ Abp | 206,169 | 2,859 |
| | Metso Outotec OYJ | 261,984 | 2,632 |
| | Valmet OYJ | 57,072 | 2,317 |
| | Nokian Renkaat OYJ | 58,259 | 2,188 |
| | Orion OYJ Class B | 43,312 | 1,876 |
| | Kojamo OYJ | 78,220 | 1,753 |
| | Huhtamaki OYJ | 40,042 | 1,746 |
| * | QT Group OYJ | 8,425 | 1,363 |
| | Konecranes OYJ Class A | 31,095 | 1,293 |
| | TietoEVRY OYJ (XHEL) | 38,050 | 1,167 |
| | Cargotec OYJ Class B | 19,818 | 1,026 |
| * | Outokumpu OYJ | 149,336 | 930 |
| | Revenio Group OYJ | 11,637 | 768 |
| | Neles OYJ | 47,183 | 707 |
| | Metsa Board OYJ | 67,444 | 624 |
| | Sanoma OYJ | 33,466 | 521 |
| | Uponor OYJ | 20,557 | 502 |
| | Tokmanni Group Corp. | 21,018 | 478 |
| | Kemira OYJ | 30,367 | 466 |
| | YIT OYJ | 75,612 | 446 |
| | Citycon OYJ | 38,860 | 320 |
| | Raisio OYJ Class V | 73,906 | 299 |
| 3 | Terveystalo OYJ | 22,517 | 293 |
| | F-Secure OYJ | 41,897 | 236 |
| *,2 | Finnair OYJ | 288,850 | 221 |
| | TietoEVRY OYJ | 5,682 | 176 |
| | Oriola OYJ Class B | 39,257 | 90 |
| *,1,2 | Ahlstrom-Munksjo OYJ Rights | 4,033 | 83 |
| | | | 120,252 |
| France (2.5%) |
| | LVMH Moet Hennessy Louis Vuitton SE | 108,543 | 85,111 |
| | TotalEnergies SE | 1,055,973 | 52,878 |
| | Sanofi | 473,571 | 47,567 |
| | Schneider Electric SE | 229,802 | 39,622 |
| | BNP Paribas SA | 471,297 | 31,547 |
| * | Airbus SE | 242,884 | 31,158 |
| | EssilorLuxottica SA | 127,912 | 26,465 |
| * | L'Oreal SA Loyalty Shares | 55,237 | 25,268 |
| | AXA SA | 835,189 | 24,298 |
| | Kering SA | 32,041 | 24,048 |
| | Vinci SA | 218,467 | 23,356 |
| | Hermes International | 13,460 | 21,373 |
| | Pernod Ricard SA | 91,126 | 20,965 |
| | | Shares | Market
Value•
($000) |
| | Safran SA | 152,472 | 20,521 |
| | L'Oreal SA (XPAR) | 44,854 | 20,519 |
| * | Air Liquide SA Loyalty Shares | 106,413 | 17,767 |
| | Danone SA | 264,265 | 17,226 |
| | Dassault Systemes SE | 289,009 | 16,877 |
| | Capgemini SE | 68,473 | 15,965 |
| | Cie de Saint-Gobain | 209,564 | 14,463 |
| | Air Liquide SA (XPAR) | 86,186 | 14,389 |
| | STMicroelectronics NV | 276,677 | 13,136 |
| | Legrand SA | 117,133 | 12,778 |
| | Cie Generale des Etablissements Michelin SCA | 76,191 | 11,979 |
| | Societe Generale SA | 339,264 | 11,333 |
| | Teleperformance | 25,488 | 10,647 |
| | Orange SA | 845,814 | 9,224 |
| 2 | Veolia Environnement SA | 273,017 | 8,916 |
| | Credit Agricole SA | 539,382 | 8,138 |
| | Publicis Groupe SA | 102,062 | 6,852 |
| | Eurofins Scientific SE | 53,204 | 6,279 |
| *,3 | Worldline SA | 106,434 | 6,207 |
| | Edenred | 110,464 | 5,977 |
| | Sartorius Stedim Biotech | 10,530 | 5,804 |
| * | Engie SA Loyalty Shares | 389,176 | 5,536 |
| | Carrefour SA | 289,254 | 5,237 |
| | Alstom SA | 131,696 | 4,693 |
| | Engie SA (XPAR) | 310,533 | 4,417 |
| | Thales SA | 45,686 | 4,216 |
| | Vivendi SE | 326,566 | 4,207 |
| 3 | Euronext NV | 35,230 | 3,964 |
| | Arkema SA | 28,814 | 3,942 |
| | Bouygues SA | 94,668 | 3,836 |
| | Bureau Veritas SA | 118,279 | 3,760 |
| | Suez SA | 163,281 | 3,717 |
| | Eiffage SA | 32,937 | 3,390 |
| | Getlink SE | 205,404 | 3,161 |
| | Valeo | 106,809 | 3,138 |
| | Gecina SA | 21,749 | 3,044 |
| * | Accor SA | 82,501 | 2,952 |
| * | Renault SA | 81,482 | 2,936 |
| | Rexel SA | 127,976 | 2,544 |
| * | SOITEC | 9,237 | 2,459 |
| | Bollore SA | 421,910 | 2,452 |
| | BioMerieux | 18,549 | 2,363 |
| | Faurecia SE (XPAR) | 44,800 | 2,340 |
| 3 | Amundi SA | 26,260 | 2,340 |
| | Orpea SA | 21,724 | 2,269 |
| | SCOR SE | 67,169 | 2,261 |
| | Atos SE | 41,035 | 2,141 |
| * | Ubisoft Entertainment SA | 39,948 | 2,092 |
| | Remy Cointreau SA | 10,102 | 2,041 |
| | Alten SA | 12,488 | 2,012 |
| * | L'Oreal SA Loyalty Shares 2023 | 4,349 | 1,989 |
| 3 | La Francaise des Jeux SAEM | 37,042 | 1,923 |
| * | Elis SA (XPAR) | 98,753 | 1,875 |
| | Covivio | 21,414 | 1,855 |
Total World Stock Index Fund
| | | Shares | Market
Value•
($000) |
| | Klepierre SA | 73,274 | 1,744 |
| * | TechnipFMC plc (XNYS) | 220,434 | 1,640 |
| * | EDF | 110,051 | 1,622 |
| | CNP Assurances | 63,926 | 1,602 |
| * | Aeroports de Paris | 11,687 | 1,559 |
| * | Air Liquide | 9,106 | 1,520 |
| | Wendel SE | 11,358 | 1,513 |
| | Ipsen SA | 13,927 | 1,441 |
| | SES SA Class A GDR | 159,766 | 1,435 |
| * | Sodexo SA ACT Loyalty Shares | 14,556 | 1,416 |
| | Rubis SCA | 41,376 | 1,326 |
| * | Sodexo SA (XPAR) | 13,618 | 1,325 |
| | Nexans SA | 13,180 | 1,322 |
| | Electricite de France SA (XPAR) | 87,210 | 1,285 |
| | Sopra Steria Group SACA | 6,476 | 1,273 |
| | SPIE SA | 50,909 | 1,238 |
| | ICADE | 13,923 | 1,092 |
| | Eutelsat Communications SA | 75,447 | 1,072 |
| | Dassault Aviation SA | 10,070 | 1,052 |
| * | SEB SA Loyalty Shares | 6,405 | 1,004 |
| | Korian SA | 28,707 | 956 |
| * | Eurazeo SA | 9,906 | 929 |
| | Virbac SA | 1,817 | 921 |
| 3 | Verallia SA | 24,356 | 902 |
| | SEB SA (XPAR) | 5,574 | 873 |
| | Gaztransport Et Technigaz SA | 10,258 | 848 |
| | Eurazeo SE | 8,696 | 815 |
| * | Technip Energies NV | 52,915 | 814 |
| | Nexity SA | 17,709 | 810 |
| * | JCDecaux SA | 27,563 | 719 |
| 3 | ALD SA | 47,706 | 711 |
| | IPSOS | 14,752 | 691 |
| | Societe BIC SA | 11,740 | 682 |
| | Imerys SA | 13,791 | 598 |
| | Trigano SA | 3,101 | 582 |
| * | Albioma SA Loyalty Shares | 14,535 | 572 |
| | Cie Plastic Omnium SA | 20,423 | 567 |
| | Coface SA | 39,115 | 559 |
| | Somfy SA | 2,781 | 546 |
| *,2 | Air France-KLM | 115,805 | 545 |
| *,2,3 | Neoen SA (XPAR) | 11,575 | 533 |
| * | Sodexo SA Loyalty Shares 2023 | 5,394 | 525 |
| | Metropole Television SA | 22,757 | 502 |
| *,2 | Vallourec SA | 62,764 | 502 |
| | Interparfums SA | 6,172 | 499 |
| *,2 | Casino Guichard Perrachon SA | 19,708 | 491 |
| 3 | Maisons du Monde SA | 19,767 | 448 |
| | Mersen SA | 11,600 | 435 |
| | Mercialys SA | 36,851 | 400 |
| | Fnac Darty SA | 6,138 | 399 |
| | Rothschild & Co. | 9,000 | 397 |
| * | Derichebourg SA | 34,724 | 395 |
| | | Shares | Market
Value•
($000) |
| | Television Francaise 1 | 36,880 | 395 |
| * | ID Logistics Group | 1,017 | 374 |
| * | Akka Technologies | 6,236 | 345 |
| * | Engie SA | 24,111 | 343 |
| * | Beneteau SA | 20,566 | 314 |
| | Altarea SCA | 1,428 | 305 |
| *,3 | Elior Group SA | 38,533 | 305 |
| | Robertet SA | 277 | 304 |
| | Quadient SA | 12,082 | 289 |
| *,2 | Solutions 30 SE | 31,284 | 283 |
| * | Voltalia SA (Registered) | 10,775 | 281 |
| * | Sodexo SA | 2,851 | 277 |
| * | Lagardere SA | 9,970 | 264 |
| | PEUGEOT Investment | 1,670 | 233 |
| | Faurecia SE | 4,469 | 231 |
| * | Eramet SA | 2,680 | 224 |
| | Cie de L'Odet SE | 135 | 204 |
| | Vicat SA | 4,456 | 190 |
| * | CGG SA | 251,140 | 182 |
| | Vilmorin & Cie SA | 2,836 | 180 |
| | Carmila SA | 11,845 | 180 |
| * | Electricite de France SA (Euronext Paris) | 12,229 | 180 |
| *,3 | X-Fab Silicon Foundries SE | 14,653 | 146 |
| | Pharmagest Interactive | 1,284 | 141 |
| | Manitou BF SA | 3,706 | 126 |
| | Guerbet | 2,723 | 120 |
| * | Sodexo SA Loyalty Shares 2025 | 1,212 | 118 |
| | Bonduelle SCA | 4,520 | 116 |
| * | Lisi SA | 4,123 | 115 |
| | Jacquet Metals SACA | 4,253 | 104 |
| | Boiron SA | 2,097 | 102 |
| * | SEB SA Loyalty Shares 2022 | 580 | 91 |
| * | SEB SA Loyalty Shares 2023 | 565 | 89 |
| * | GL Events | 3,863 | 82 |
| * | Tarkett SA | 3,330 | 77 |
| * | Electricite de France SA | 4,511 | 67 |
| *,3 | SMCP SA | 7,781 | 64 |
| * | Rallye SA | 7,866 | 51 |
| | Lisi (XPAR) | 1,767 | 49 |
| | AKWEL | 1,885 | 48 |
| * | Etablissements Maurel et Prom SA | 6,895 | 20 |
| *,1 | Bourbon Corp. | 44 | — |
| * | Bourbon Corp. SA | 100 | — |
| * | CGG SA Warrants Exp. 2/21/23 | 17,186 | — |
| * | CGG SA Warrants Exp. 2/21/22 | 5,291 | — |
| | | | 865,011 |
| Germany (2.2%) |
| | SAP SE | 481,600 | 69,741 |
| | Siemens AG (Registered) | 327,335 | 53,219 |
| | Allianz SE (Registered) | 178,400 | 41,426 |
Total World Stock Index Fund
| | | Shares | Market
Value•
($000) |
| | Daimler AG (Registered) | 365,442 | 36,275 |
| | BASF SE | 397,413 | 28,603 |
| | adidas AG | 83,730 | 27,405 |
| | Infineon Technologies AG | 568,776 | 26,637 |
| 2 | Deutsche Post AG (Registered) | 427,138 | 26,443 |
| | Deutsche Telekom AG (Registered) | 1,413,133 | 26,280 |
| | Bayer AG (Registered) | 426,457 | 24,034 |
| | Muenchener Rueckversicherungs-Gesellschaft AG in Muenchen (Registered) | 60,707 | 17,975 |
| | Volkswagen AG Preference Shares | 78,207 | 17,552 |
| | Vonovia SE | 249,882 | 15,159 |
| | Bayerische Motoren Werke AG | 143,998 | 14,549 |
| | Merck KGaA | 56,486 | 13,349 |
| | Deutsche Boerse AG | 80,137 | 13,303 |
| | E.ON SE | 950,219 | 12,049 |
| * | Deutsche Bank AG (Registered) | 901,544 | 11,581 |
| | RWE AG | 275,699 | 10,612 |
| *,3 | Delivery Hero SE | 82,267 | 10,261 |
| *,3 | Zalando SE | 95,432 | 9,016 |
| | Fresenius SE & Co. KGaA | 179,286 | 8,149 |
| 3 | Siemens Healthineers AG | 118,438 | 7,877 |
| | Symrise AG Class A | 55,199 | 7,635 |
| | Sartorius AG Preference Shares | 11,433 | 7,406 |
| | Henkel AG & Co. KGaA Preference Shares | 82,513 | 7,392 |
| | Porsche Automobil Holding SE Preference Shares | 67,427 | 7,018 |
| | Brenntag SE | 68,555 | 6,522 |
| | Fresenius Medical Care AG & Co. KGaA | 89,960 | 5,976 |
| * | HelloFresh SE | 71,663 | 5,808 |
| * | Continental AG | 48,444 | 5,696 |
| | Puma SE | 44,092 | 5,470 |
| * | QIAGEN NV | 96,515 | 5,318 |
| * | Siemens Energy AG | 184,403 | 5,292 |
| | MTU Aero Engines AG | 23,715 | 5,282 |
| 3 | Covestro AG | 79,592 | 5,097 |
| | HeidelbergCement AG | 65,784 | 4,954 |
| | Hannover Rueck SE | 26,736 | 4,882 |
| | Volkswagen AG | 14,939 | 4,857 |
| | Beiersdorf AG | 44,561 | 4,738 |
| | LEG Immobilien SE (XETR) | 31,358 | 4,664 |
| | KION Group AG | 33,679 | 3,679 |
| | GEA Group AG | 71,308 | 3,512 |
| | Aroundtown SA | 498,408 | 3,464 |
| | Knorr-Bremse AG | 30,390 | 3,207 |
| * | Commerzbank AG | 438,040 | 3,199 |
| | | Shares | Market
Value•
($000) |
| | Carl Zeiss Meditec AG (Bearer) | 15,787 | 3,179 |
| | Henkel AG & Co. KGaA | 37,530 | 3,134 |
| * | Evotec SE | 60,548 | 2,935 |
| | Nemetschek SE | 24,120 | 2,769 |
| 3 | Scout24 SE | 39,101 | 2,723 |
| | Evonik Industries AG | 82,588 | 2,676 |
| | Bechtle AG | 35,360 | 2,652 |
| | LANXESS AG | 39,033 | 2,630 |
| * | thyssenkrupp AG | 188,406 | 1,961 |
| | United Internet AG (Registered) | 50,634 | 1,868 |
| * | CTS Eventim AG & Co. KGaA | 25,191 | 1,832 |
| | Bayerische Motoren Werke AG Preference Shares | 20,036 | 1,708 |
| | Rheinmetall AG | 17,165 | 1,665 |
| *,2 | Deutsche Lufthansa AG (Registered) | 241,806 | 1,598 |
| | Freenet AG | 61,974 | 1,596 |
| 2 | Siltronic AG (XETR) | 10,210 | 1,593 |
| | alstria office REIT-AG | 83,782 | 1,566 |
| *,3 | Auto1 Group SE | 39,538 | 1,556 |
| | Uniper SE | 34,845 | 1,540 |
| | TAG Immobilien AG | 50,525 | 1,535 |
| *,2 | zooplus AG | 2,672 | 1,478 |
| * | K+S AG (Registered) | 83,745 | 1,443 |
| | Rational AG | 1,447 | 1,436 |
| 2 | HUGO BOSS AG | 21,065 | 1,319 |
| 2 | Hella GmbH & Co. KGaA | 18,966 | 1,315 |
| 3 | Befesa SA | 17,180 | 1,278 |
| | Deutsche Wohnen SE | 24,717 | 1,266 |
| | Aurubis AG | 14,497 | 1,249 |
| 2 | Gerresheimer AG | 13,517 | 1,240 |
| | Wacker Chemie AG | 6,454 | 1,166 |
| *,3 | TeamViewer AG | 77,512 | 1,157 |
| | ProSiebenSat.1 Media SE | 67,005 | 1,122 |
| * | Talanx AG | 23,118 | 1,112 |
| * | Fraport AG Frankfurt Airport Services Worldwide | 15,233 | 1,090 |
| | AIXTRON SE | 45,538 | 1,082 |
| * | Hypoport SE | 1,737 | 1,069 |
| | Jungheinrich AG Preference Shares | 20,494 | 1,039 |
| | Vantage Towers AG | 29,664 | 1,020 |
| | Duerr AG | 21,874 | 991 |
| * | Sixt SE | 5,614 | 968 |
| | FUCHS PETROLUB SE Preference Shares | 19,974 | 958 |
| 2 | Varta AG | 6,189 | 954 |
| | Grand City Properties SA | 37,098 | 950 |
| | CANCOM SE | 13,655 | 944 |
| 2 | Encavis AG | 44,646 | 936 |
| * | RTL Group SA | 16,084 | 929 |
| | Software AG | 22,409 | 922 |
| | FUCHS PETROLUB SE | 24,902 | 917 |
Total World Stock Index Fund
| | | Shares | Market
Value•
($000) |
| | Eckert & Ziegler Strahlen- und Medizintechnik AG | 6,024 | 902 |
| | Jenoptik AG | 23,525 | 901 |
| *,2 | Nordex SE | 48,795 | 897 |
| | Aareal Bank AG | 26,795 | 857 |
| * | MorphoSys AG | 17,196 | 809 |
| | CompuGroup Medical SE & Co. KGaA | 9,293 | 777 |
| | Stroeer SE & Co. KGaA | 9,112 | 773 |
| 3 | Deutsche Pfandbriefbank AG | 61,741 | 766 |
| | Stabilus SA | 9,324 | 700 |
| | Sixt SE Preference Shares | 6,669 | 661 |
| | Dermapharm Holding SE | 6,569 | 661 |
| | Pfeiffer Vacuum Technology AG | 2,591 | 647 |
| | Norma Group SE | 14,554 | 625 |
| | Telefonica Deutschland Holding AG | 240,037 | 625 |
| | VERBIO Vereinigte BioEnergie AG | 7,647 | 608 |
| | 1&1 AG | 20,804 | 606 |
| | METRO AG | 47,590 | 602 |
| | Fielmann AG | 9,003 | 594 |
| | PATRIZIA AG | 20,904 | 578 |
| 3 | Instone Real Estate Group SE | 21,898 | 577 |
| * | Nagarro SE | 2,861 | 576 |
| | Krones AG | 5,577 | 575 |
| | HOCHTIEF AG | 7,437 | 574 |
| * | Salzgitter AG | 15,434 | 566 |
| 3 | DWS Group GmbH & Co. KGaA | 12,857 | 556 |
| * | flatexDEGIRO AG | 24,449 | 555 |
| * | Vitesco Technologies Group AG Class A | 9,513 | 545 |
| | Hornbach Holding AG & Co. KGaA | 4,240 | 536 |
| * | Deutz AG | 59,425 | 498 |
| | Traton SE | 19,024 | 491 |
| 2,3 | ADLER Group SA | 36,139 | 490 |
| | Bilfinger SE | 13,827 | 486 |
| | Deutsche EuroShop AG | 23,235 | 473 |
| | Suedzucker AG | 29,307 | 465 |
| | Wacker Neuson SE | 14,125 | 464 |
| 2 | S&T AG | 18,677 | 449 |
| 2 | GRENKE AG | 10,252 | 400 |
| | STRATEC SE | 2,469 | 394 |
| * | Kloeckner & Co. SE Preference Shares | 29,200 | 392 |
| | Indus Holding AG | 9,890 | 389 |
| *,3 | Shop Apotheke Europe NV | 2,509 | 381 |
| | Washtec AG | 5,714 | 372 |
| | Sartorius AG | 600 | 369 |
| * | Global Fashion Group SA | 40,481 | 365 |
| | DIC Asset AG | 20,075 | 352 |
| | | Shares | Market
Value•
($000) |
| | KWS Saat SE & Co. KGaA | 4,100 | 350 |
| | Atoss Software AG | 1,528 | 346 |
| * | CECONOMY AG | 70,503 | 344 |
| | Zeal Network SE | 7,783 | 342 |
| | Hamburger Hafen und Logistik AG | 14,775 | 331 |
| | Deutsche Beteiligungs AG | 6,560 | 303 |
| | Basler AG | 1,638 | 302 |
| | BayWa AG | 6,589 | 279 |
| | Secunet Security Networks AG | 527 | 277 |
| * | SGL Carbon SE | 26,750 | 256 |
| | New Work SE | 985 | 240 |
| | Draegerwerk AG & Co. KGaA Preference Shares | 2,998 | 236 |
| | Draegerwerk AG & Co. KGaA | 3,032 | 226 |
| | Schaeffler AG Preference Shares | 25,418 | 202 |
| | Wuestenrot & Wuerttembergische AG | 9,451 | 197 |
| | Vossloh AG | 3,545 | 190 |
| | Hensoldt AG | 11,126 | 180 |
| * | Koenig & Bauer AG | 5,007 | 177 |
| | Hornbach Baumarkt AG | 3,774 | 170 |
| | Takkt AG | 10,249 | 167 |
| 2 | SMA Solar Technology AG | 3,151 | 167 |
| * | ElringKlinger AG | 11,374 | 161 |
| | CropEnergies AG | 6,524 | 94 |
| | Bertrandt AG | 1,140 | 74 |
| | TLG Immobilien AG | 1,580 | 58 |
| | Steico SE | 146 | 19 |
| | | | 748,196 |
| Greece (0.0%) |
| | OPAP SA | 82,873 | 1,294 |
| * | Alpha Services and Holdings SA | 872,737 | 1,113 |
| * | Eurobank Ergasias Services and Holdings SA | 1,042,783 | 1,095 |
| | Hellenic Telecommunications Organization SA ADR | 117,615 | 1,044 |
| | Mytilineos SA | 52,183 | 954 |
| | JUMBO SA | 46,389 | 690 |
| | Hellenic Telecommunications Organization SA | 38,201 | 678 |
| * | National Bank of Greece SA | 213,183 | 673 |
| * | Public Power Corp. SA | 45,298 | 493 |
| | Hellenic Exchanges - Athens Stock Exchange SA | 101,689 | 436 |
| * | Piraeus Financial Holdings SA | 252,345 | 431 |
| | Terna Energy SA | 28,979 | 392 |
| * | Motor Oil Hellas Corinth Refineries SA | 19,659 | 334 |
Total World Stock Index Fund
| | | Shares | Market
Value•
($000) |
| | Holding Co. ADMIE IPTO SA | 98,417 | 290 |
| * | LAMDA Development SA | 22,404 | 185 |
| | Viohalco SA | 35,271 | 179 |
| * | GEK Terna Holding Real Estate Construction SA | 15,796 | 177 |
| | Hellenic Petroleum SA | 23,436 | 162 |
| | Athens Water Supply & Sewage Co. SA | 17,663 | 155 |
| * | Ellaktor SA | 76,010 | 121 |
| | Sarantis SA | 9,960 | 100 |
| * | Aegean Airlines SA | 12,797 | 77 |
| * | Fourlis Holdings SA | 16,670 | 74 |
| *,1 | FF Group | 12,862 | 71 |
| | | | 11,218 |
| Hong Kong (0.8%) |
| | AIA Group Ltd. | 5,272,782 | 59,092 |
| | Hong Kong Exchanges & Clearing Ltd. | 555,324 | 33,454 |
| | Techtronic Industries Co. Ltd. | 547,000 | 11,238 |
| | Sun Hung Kai Properties Ltd. | 636,982 | 8,445 |
| | Link REIT | 922,690 | 8,174 |
| | CK Hutchison Holdings Ltd. | 1,188,391 | 7,967 |
| * | BeiGene Ltd. | 263,700 | 7,292 |
| | Hong Kong & China Gas Co. Ltd. | 4,608,365 | 7,159 |
| | CLP Holdings Ltd. | 726,580 | 7,114 |
| | Hang Seng Bank Ltd. | 325,951 | 6,194 |
| | CK Asset Holdings Ltd. | 878,250 | 5,425 |
| | Jardine Matheson Holdings Ltd. | 92,362 | 5,365 |
| * | Galaxy Entertainment Group Ltd. | 954,000 | 5,133 |
| | BOC Hong Kong Holdings Ltd. | 1,551,700 | 4,917 |
| | Wharf Real Estate Investment Co. Ltd. | 724,600 | 4,093 |
| | Lenovo Group Ltd. | 3,336,000 | 3,623 |
| | Power Assets Holdings Ltd. | 590,500 | 3,609 |
| | MTR Corp. Ltd. | 621,326 | 3,389 |
| | Hongkong Land Holdings Ltd. | 498,500 | 2,753 |
| | New World Development Co. Ltd. | 613,306 | 2,660 |
| *,3 | ESR Cayman Ltd. | 799,389 | 2,587 |
| | Xinyi Glass Holdings Ltd. | 846,000 | 2,384 |
| * | Sands China Ltd. | 1,033,200 | 2,355 |
| | Henderson Land Development Co. Ltd. | 559,896 | 2,344 |
| 3 | WH Group Ltd. | 3,055,258 | 2,142 |
| | Hang Lung Properties Ltd. | 899,000 | 2,086 |
| | | Shares | Market
Value•
($000) |
| | Wharf Holdings Ltd. | 587,600 | 2,043 |
| 3 | Budweiser Brewing Co. APAC Ltd. | 728,800 | 1,999 |
| 2 | Sino Land Co. Ltd. | 1,394,279 | 1,833 |
| | Want Want China Holdings Ltd. | 2,297,467 | 1,782 |
| | SITC International Holdings Co. Ltd. | 501,000 | 1,693 |
| | CK Infrastructure Holdings Ltd. | 268,500 | 1,619 |
| | Chow Tai Fook Jewellery Group Ltd. | 771,800 | 1,574 |
| | PRADA SpA | 237,700 | 1,498 |
| | Tingyi Cayman Islands Holding Corp. | 794,000 | 1,482 |
| | ASM Pacific Technology Ltd. | 132,622 | 1,435 |
| | AAC Technologies Holdings Inc. | 317,000 | 1,370 |
| | Minth Group Ltd. | 306,000 | 1,216 |
| | Swire Pacific Ltd. Class A | 190,642 | 1,198 |
| *,3 | Samsonite International SA | 550,496 | 1,184 |
| | Swire Properties Ltd. | 422,180 | 1,132 |
| | Hysan Development Co. Ltd. | 279,000 | 969 |
| | Microport Scientific Corp. | 200,852 | 945 |
| | Man Wah Holdings Ltd. | 607,200 | 940 |
| | PCCW Ltd. | 1,820,112 | 937 |
| | Pacific Basin Shipping Ltd. | 1,988,000 | 917 |
| | Bank of East Asia Ltd. | 514,072 | 844 |
| 2 | Vitasoy International Holdings Ltd. | 336,332 | 811 |
| | Huabao International Holdings Ltd. | 407,000 | 761 |
| | Hang Lung Group Ltd. | 322,000 | 754 |
| | Kerry Properties Ltd. | 257,000 | 726 |
| 3 | BOC Aviation Ltd. | 79,100 | 692 |
| | NagaCorp Ltd. | 706,000 | 648 |
| | L'Occitane International SA | 169,500 | 606 |
| *,2 | SJM Holdings Ltd. | 804,000 | 598 |
| | Fortune REIT | 569,923 | 591 |
| * | Yue Yuen Industrial Holdings Ltd. | 271,000 | 575 |
| *,2 | Wynn Macau Ltd. | 642,000 | 574 |
| * | MMG Ltd. | 1,214,117 | 561 |
| 3 | Js Global Lifestyle Co. Ltd. | 301,000 | 557 |
| * | Vobile Group Ltd. | 626,000 | 551 |
| | NWS Holdings Ltd. | 538,500 | 535 |
| | Swire Pacific Ltd. Class B | 507,500 | 533 |
| | Kerry Logistics Network Ltd. | 220,000 | 533 |
| | VTech Holdings Ltd. | 63,200 | 487 |
| | Powerlong Real Estate Holdings Ltd. | 660,000 | 452 |
Total World Stock Index Fund
| | | Shares | Market
Value•
($000) |
| | Towngas China Co. Ltd. | 628,000 | 431 |
| | Champion REIT | 790,332 | 415 |
| | Lee & Man Paper Manufacturing Ltd. | 549,000 | 413 |
| | Uni-President China Holdings Ltd. | 468,800 | 400 |
| | Jinchuan Group International Resources Co. Ltd. | 2,457,000 | 396 |
| 2 | LK Technology Holdings Ltd. | 156,502 | 390 |
| | Dairy Farm International Holdings Ltd. | 107,700 | 385 |
| | Nexteer Automotive Group Ltd. | 312,000 | 385 |
| | CP Pokphand Co. Ltd. | 2,668,000 | 378 |
| *,1,3 | Razer Inc. | 1,489,000 | 374 |
| *,3 | Jacobio Pharmaceuticals Group Co. Ltd. | 164,400 | 374 |
| * | Melco International Development Ltd. | 278,000 | 361 |
| | First Pacific Co. Ltd. | 901,200 | 360 |
| | HKBN Ltd. | 291,689 | 349 |
| * | Shangri-La Asia Ltd. | 427,519 | 348 |
| * | Cathay Pacific Airways Ltd. | 373,090 | 344 |
| | Luk Fook Holdings International Ltd. | 126,000 | 343 |
| | Cafe de Coral Holdings Ltd. | 186,000 | 339 |
| | Prosperity REIT | 844,000 | 332 |
| | United Energy Group Ltd. | 3,706,000 | 328 |
| | Stella International Holdings Ltd. | 272,000 | 325 |
| * | China Travel International Investment Hong Kong Ltd. | 2,224,000 | 323 |
| *,2 | HengTen Networks Group Ltd. | 885,200 | 302 |
| | Hong Kong Technology Venture Co. Ltd. | 196,000 | 295 |
| * | Shun Tak Holdings Ltd. | 1,074,000 | 294 |
| | Johnson Electric Holdings Ltd. | 132,250 | 293 |
| | Vinda International Holdings Ltd. | 102,599 | 283 |
| | IGG Inc. | 288,000 | 268 |
| * | Realord Group Holdings Ltd. | 166,000 | 258 |
| | VSTECS Holdings Ltd. | 272,000 | 257 |
| 3 | IMAX China Holding Inc. | 173,500 | 254 |
| | Truly International Holdings Ltd. | 760,000 | 248 |
| | Sunlight REIT | 410,000 | 237 |
| * | GCL New Energy Holdings Ltd. | 4,970,000 | 233 |
| | Vesync Co. Ltd. | 165,000 | 232 |
| | | Shares | Market
Value•
($000) |
| | CITIC Telecom International Holdings Ltd. | 649,500 | 230 |
| | Haitong International Securities Group Ltd. | 988,038 | 227 |
| *,3 | Everest Medicines Ltd. | 39,500 | 227 |
| | Great Eagle Holdings Ltd. | 82,000 | 226 |
| | EC Healthcare | 157,000 | 226 |
| * | MGM China Holdings Ltd. | 288,800 | 212 |
| * | OCI International Holdings Ltd. | 417,200 | 212 |
| | SUNeVision Holdings Ltd. | 228,000 | 209 |
| 3 | Asiainfo Technologies Ltd. | 124,800 | 206 |
| *,3 | Hua Medicine | 381,000 | 202 |
| | K Wah International Holdings Ltd. | 490,000 | 196 |
| | Chow Sang Sang Holdings International Ltd. | 135,000 | 192 |
| * | Glory Sun Financial Group Ltd. | 5,420,000 | 188 |
| *,3 | Antengene Corp. Ltd. | 134,500 | 178 |
| | Dah Sing Financial Holdings Ltd. | 55,744 | 173 |
| | Canvest Environmental Protection Group Co. Ltd. | 291,000 | 167 |
| | Shui On Land Ltd. | 1,104,500 | 164 |
| | Value Partners Group Ltd. | 313,000 | 160 |
| * | FIH Mobile Ltd. | 1,002,000 | 156 |
| | Powerlong Commercial Management Holdings Ltd. | 68,000 | 152 |
| *,2,3 | JW Cayman Therapeutics Co. Ltd. (XHKG) | 76,500 | 140 |
| | China Tobacco International HK Co. Ltd. | 58,000 | 133 |
| | Far East Consortium International Ltd. | 401,000 | 132 |
| | Pacific Textiles Holdings Ltd. | 254,000 | 127 |
| *,2 | Apollo Future Mobility Group Ltd. | 1,824,000 | 126 |
| | Guotai Junan International Holdings Ltd. | 860,000 | 125 |
| 3 | Xiabuxiabu Catering Management China Holdings Co. Ltd. | 171,000 | 125 |
| | Road King Infrastructure Ltd. | 120,000 | 122 |
| *,1 | SMI Holdings Group Ltd. | 402,400 | 121 |
| | Texhong Textile Group Ltd. | 79,500 | 119 |
Total World Stock Index Fund
| | | Shares | Market
Value•
($000) |
| * | Esprit Holdings Ltd. (XHKG) | 1,350,519 | 117 |
| *,1,2 | Superb Summit International | 620,000 | 116 |
| * | Macau Legend Development Ltd. | 1,119,000 | 114 |
| | United Laboratories International Holdings Ltd. | 178,000 | 113 |
| * | Pou Sheng International Holdings Ltd. | 672,000 | 113 |
| | Beijing Tong Ren Tang Chinese Medicine Co. Ltd. | 86,000 | 110 |
| | Dah Sing Banking Group Ltd. | 113,537 | 109 |
| | Asia Cement China Holdings Corp. | 142,500 | 109 |
| *,3 | Frontage Holdings Corp. | 186,000 | 108 |
| | C-Mer Eye Care Holdings Ltd. | 108,000 | 105 |
| *,1 | Huiyuan Juice | 398,000 | 103 |
| * | Sa Sa International Holdings Ltd. | 455,995 | 100 |
| | SmarTone Telecommunications Holdings Ltd. | 172,000 | 100 |
| *,2 | Cosmopolitan International Holdings Ltd. | 732,000 | 98 |
| * | Lifestyle International Holdings Ltd. | 179,000 | 94 |
| | Hutchison Telecommunications Hong Kong Holdings Ltd. | 570,000 | 91 |
| *,2,3 | FIT Hon Teng Ltd. | 441,000 | 88 |
| 3 | Crystal International Group Ltd. | 275,500 | 88 |
| * | CITIC Resources Holdings Ltd. | 1,238,000 | 87 |
| | Sun Hung Kai & Co. Ltd. | 165,000 | 86 |
| * | Television Broadcasts Ltd. | 98,900 | 77 |
| | Chinese Estates Holdings Ltd. | 147,000 | 71 |
| | Giordano International Ltd. | 354,000 | 69 |
| | Lee's Pharmaceutical Holdings Ltd. | 147,500 | 69 |
| | Dynam Japan Holdings Co. Ltd. | 72,400 | 67 |
| *,1 | Convoy | 3,102,000 | 67 |
| | Singamas Container Holdings Ltd. | 548,000 | 64 |
| | CMBC Capital Holdings Ltd. | 5,250,000 | 64 |
| | Texwinca Holdings Ltd. | 292,000 | 60 |
| * | Digital Domain Holdings Ltd. | 641,000 | 54 |
| 2,3 | VPower Group International Holdings Ltd. | 259,000 | 51 |
| | | Shares | Market
Value•
($000) |
| * | China LNG Group Ltd. | 870,000 | 45 |
| *,1 | National Agricultural Holdings | 246,000 | 38 |
| * | Suncity Group Holdings Ltd. | 670,000 | 25 |
| *,1 | Long Well International Holdings Ltd. | 1,348,000 | 20 |
| *,1 | MH Development NPV | 130,000 | 19 |
| *,1 | CTEG | 424,000 | 18 |
| *,1 | Brightoil | 426,340 | 11 |
| *,1 | Real Nutrition | 143,000 | 4 |
| * | NewOcean Energy Holdings Ltd. | 41,985 | 1 |
| *,1 | Agritrade Resources Ltd. | 735,000 | — |
| *,1 | Anxin China Holdings Ltd. | 312,000 | — |
| *,1 | C Fiber Optic | 348,000 | — |
| *,1 | Hua Han Health Industry Holdings Ltd. | 214,708 | — |
| *,1,2 | Huishan Dairy | 822,401 | — |
| *,1 | Tech Pro Tech Dev | 833,600 | — |
| | | | 270,812 |
| Hungary (0.0%) |
| * | OTP Bank Nyrt | 96,660 | 5,808 |
| | Richter Gedeon Nyrt | 57,339 | 1,607 |
| | MOL Hungarian Oil & Gas plc | 146,911 | 1,256 |
| | Magyar Telekom Telecommunications plc | 209,897 | 289 |
| * | Opus Global Nyrt | 85,838 | 65 |
| | | | 9,025 |
| India (1.5%) |
| | Housing Development Finance Corp. Ltd. | 761,070 | 29,017 |
| | Reliance Industries Ltd. | 852,709 | 28,937 |
| | Infosys Ltd. | 1,029,788 | 23,045 |
| | Tata Consultancy Services Ltd. | 448,800 | 20,400 |
| 3 | Reliance Industries Ltd. GDR | 278,182 | 18,931 |
| | Hindustan Unilever Ltd. | 386,857 | 12,382 |
| | Infosys Ltd. ADR | 541,746 | 12,070 |
| | Bajaj Finance Ltd. | 103,790 | 10,293 |
| * | Axis Bank Ltd. | 994,495 | 9,896 |
| * | Bharti Airtel Ltd (XNSE) | 990,105 | 9,083 |
| | Asian Paints Ltd. | 194,085 | 8,044 |
| | ICICI Bank Ltd. | 678,754 | 7,308 |
| | Larsen & Toubro Ltd. | 305,528 | 7,237 |
| | HCL Technologies Ltd. | 472,248 | 7,231 |
| | Tata Steel Ltd. | 343,651 | 6,059 |
| | Titan Co. Ltd. | 181,730 | 5,799 |
| | Maruti Suzuki India Ltd. | 57,003 | 5,708 |
| | Tech Mahindra Ltd. | 259,523 | 5,137 |
| | UltraTech Cement Ltd. | 50,270 | 5,134 |
Total World Stock Index Fund
| | | Shares | Market
Value•
($000) |
| | Sun Pharmaceutical Industries Ltd. | 475,959 | 5,061 |
| | Mahindra & Mahindra Ltd. | 395,626 | 4,687 |
| | State Bank of India GDR (Registered) | 68,723 | 4,645 |
| | JSW Steel Ltd. | 445,670 | 3,992 |
| *,3 | Avenue Supermarts Ltd. | 64,023 | 3,971 |
| | Nestle India Ltd. | 15,514 | 3,942 |
| | ITC Ltd. | 1,295,995 | 3,870 |
| | Grasim Industries Ltd. | 167,670 | 3,863 |
| | Bajaj Finserv Ltd. | 16,172 | 3,861 |
| | Hindalco Industries Ltd. | 617,986 | 3,808 |
| | Divi's Laboratories Ltd. | 53,454 | 3,678 |
| 3 | HDFC Life Insurance Co. Ltd. | 398,847 | 3,627 |
| * | Tata Motors Ltd. | 527,240 | 3,392 |
| | Power Grid Corp. of India Ltd. | 1,360,638 | 3,370 |
| | NTPC Ltd. | 1,879,035 | 3,336 |
| | Dr. Reddy's Laboratories Ltd. | 51,943 | 3,231 |
| | Adani Ports & Special Economic Zone Ltd. | 342,996 | 3,182 |
| | Wipro Ltd. ADR | 340,800 | 3,054 |
| | Tata Consumer Products Ltd. | 263,669 | 2,857 |
| 3 | SBI Life Insurance Co. Ltd. | 186,128 | 2,852 |
| | Cipla Ltd. | 226,716 | 2,744 |
| | Info Edge India Ltd. | 32,823 | 2,671 |
| | Tata Power Co. Ltd. | 886,275 | 2,543 |
| * | Adani Green Energy Ltd. | 165,280 | 2,541 |
| * | Adani Transmission Ltd. | 107,268 | 2,527 |
| | Oil & Natural Gas Corp. Ltd. | 1,260,180 | 2,508 |
| | Britannia Industries Ltd. | 50,483 | 2,483 |
| | Apollo Hospitals Enterprise Ltd. | 43,410 | 2,476 |
| | Bharat Petroleum Corp. Ltd. | 442,866 | 2,476 |
| | UPL Ltd. | 238,373 | 2,363 |
| | Adani Total Gas Ltd. | 120,906 | 2,330 |
| | Shree Cement Ltd. | 5,812 | 2,225 |
| * | Tata Motors Ltd. Class A | 670,649 | 2,217 |
| | Vedanta Ltd. | 528,613 | 2,151 |
| * | Godrej Consumer Products Ltd. | 164,109 | 2,101 |
| | Adani Enterprises Ltd. | 109,693 | 2,088 |
| | Piramal Enterprises Ltd. | 58,918 | 2,054 |
| | Indus Towers Ltd. | 558,926 | 2,032 |
| | Hero MotoCorp Ltd. | 56,435 | 2,006 |
| | Indian Oil Corp. Ltd. | 1,170,897 | 2,005 |
| | Pidilite Industries Ltd. | 63,584 | 1,968 |
| | Eicher Motors Ltd. | 57,837 | 1,925 |
| | Coal India Ltd. | 843,652 | 1,857 |
| | | Shares | Market
Value•
($000) |
| 3 | ICICI Lombard General Insurance Co. Ltd. | 92,011 | 1,823 |
| | Wipro Ltd. | 203,506 | 1,762 |
| | Havells India Ltd. | 101,459 | 1,715 |
| * | Marico Ltd. | 225,610 | 1,715 |
| | Dabur India Ltd. | 217,800 | 1,706 |
| | Cholamandalam Investment and Finance Co. Ltd. | 205,748 | 1,694 |
| * | United Spirits Ltd. | 132,091 | 1,677 |
| * | Shriram Transport Finance Co. Ltd. | 85,438 | 1,646 |
| | Mphasis Ltd. | 37,676 | 1,634 |
| | SRF Ltd. | 57,425 | 1,626 |
| 3 | Larsen & Toubro Infotech Ltd. | 18,057 | 1,615 |
| * | SBI Cards & Payment Services Ltd. | 112,928 | 1,595 |
| | Jubilant Foodworks Ltd. | 31,906 | 1,577 |
| | Voltas Ltd. | 97,126 | 1,566 |
| | Ambuja Cements Ltd. | 288,415 | 1,563 |
| | Gail India Ltd. | 776,271 | 1,545 |
| | DLF Ltd. | 277,271 | 1,481 |
| | Zee Entertainment Enterprises Ltd. | 362,692 | 1,462 |
| | Bajaj Auto Ltd. | 29,183 | 1,447 |
| | Motherson Sumi Systems Ltd. | 480,717 | 1,441 |
| | Hindustan Petroleum Corp. Ltd. | 330,006 | 1,370 |
| | Bharat Electronics Ltd. | 475,885 | 1,317 |
| * | Page Industries Ltd. | 2,559 | 1,289 |
| * | Max Financial Services Ltd. | 98,478 | 1,282 |
| | Lupin Ltd. | 103,265 | 1,277 |
| | Indian Railway Catering & Tourism Corp. Ltd. | 112,705 | 1,277 |
| *,3 | InterGlobe Aviation Ltd. | 43,820 | 1,274 |
| * | Godrej Properties Ltd. | 42,574 | 1,272 |
| 3 | Bandhan Bank Ltd. | 323,250 | 1,263 |
| | PI Industries Ltd. | 30,931 | 1,241 |
| 3 | ICICI Prudential Life Insurance Co. Ltd. | 146,354 | 1,211 |
| | Crompton Greaves Consumer Electricals Ltd. | 193,194 | 1,203 |
| | Tata Elxsi Ltd. | 14,742 | 1,158 |
| | Aurobindo Pharma Ltd. | 124,615 | 1,149 |
| 3 | Laurus Labs Ltd. | 165,006 | 1,140 |
| | Persistent Systems Ltd. | 21,646 | 1,137 |
| | Astral Ltd. (XNSE) | 38,723 | 1,132 |
| | Federal Bank Ltd. | 866,051 | 1,131 |
| | Ashok Leyland Ltd. | 588,995 | 1,124 |
| 3 | HDFC Asset Management Co. Ltd. | 31,598 | 1,119 |
| | Trent Ltd. | 83,313 | 1,118 |
| | Mindtree Ltd. | 18,571 | 1,117 |
Total World Stock Index Fund
| | | Shares | Market
Value•
($000) |
| | MRF Ltd. | 1,076 | 1,113 |
| | Balkrishna Industries Ltd. | 33,225 | 1,094 |
| | Colgate-Palmolive India Ltd. | 52,969 | 1,093 |
| *,3 | AU Small Finance Bank Ltd. | 66,544 | 1,083 |
| * | Biocon Ltd. | 228,435 | 1,073 |
| | Siemens Ltd. | 36,516 | 1,068 |
| | ACC Ltd. | 33,921 | 1,059 |
| | Indraprastha Gas Ltd. | 164,037 | 1,040 |
| | Bharat Forge Ltd. | 100,139 | 1,030 |
| | Berger Paints India Ltd. | 103,505 | 1,027 |
| | Petronet LNG Ltd. | 333,805 | 1,025 |
| | Dixon Technologies India Ltd. | 14,883 | 994 |
| | Embassy Office Parks REIT | 209,902 | 981 |
| | Container Corp. of India Ltd. | 109,330 | 959 |
| * | Jindal Steel & Power Ltd. | 170,628 | 954 |
| * | Dalmia Bharat Ltd. | 35,344 | 952 |
| | Cadila Healthcare Ltd. | 140,857 | 948 |
| | Supreme Industries Ltd. | 30,162 | 940 |
| | Indian Hotels Co. Ltd. | 355,092 | 937 |
| | Aarti Industries Ltd. | 71,108 | 918 |
| | Deepak Nitrite Ltd. | 29,568 | 882 |
| | Tata Chemicals Ltd. | 72,907 | 881 |
| | Sundaram Finance Ltd. | 26,962 | 863 |
| * | IDFC First Bank Ltd. | 1,293,641 | 858 |
| | Atul Ltd. | 6,991 | 854 |
| | LIC Housing Finance Ltd. | 151,725 | 827 |
| | Power Finance Corp. Ltd. | 458,639 | 817 |
| | Torrent Pharmaceuticals Ltd. | 21,215 | 811 |
| | JSW Energy Ltd. | 173,029 | 806 |
| | Bata India Ltd. | 29,358 | 778 |
| * | Ipca Laboratories Ltd. | 27,057 | 776 |
| | REC Ltd. | 389,611 | 775 |
| | TVS Motor Co. Ltd. | 87,336 | 775 |
| | Escorts Ltd. | 36,828 | 774 |
| | Tata Communications Ltd. | 43,997 | 769 |
| | Gujarat Gas Ltd. | 91,074 | 758 |
| * | APL Apollo Tubes Ltd. | 70,434 | 755 |
| | Ramco Cements Ltd. | 52,530 | 750 |
| | Muthoot Finance Ltd. | 37,739 | 741 |
| *,3 | RBL Bank Ltd. | 291,379 | 706 |
| | United Breweries Ltd. | 31,665 | 702 |
| | Tube Investments of India Ltd. | 37,326 | 698 |
| | Cummins India Ltd. | 58,266 | 698 |
| | | Shares | Market
Value•
($000) |
| 3 | Indian Energy Exchange Ltd. | 73,469 | 696 |
| | Bosch Ltd. | 3,046 | 691 |
| | Navin Fluorine International Ltd. | 15,367 | 686 |
| | NMDC Ltd. | 352,458 | 676 |
| * | Max Healthcare Institute Ltd. | 151,588 | 672 |
| 3 | L&T Technology Services Ltd. | 10,273 | 650 |
| * | Oberoi Realty Ltd. | 53,475 | 647 |
| | Emami Ltd. | 90,155 | 641 |
| | Manappuram Finance Ltd. | 228,561 | 636 |
| | National Aluminium Co. Ltd. | 487,109 | 633 |
| * | Steel Authority of India Ltd. | 409,945 | 631 |
| * | Fortis Healthcare Ltd. | 192,818 | 631 |
| * | Kajaria Ceramics Ltd. | 38,260 | 625 |
| | Bajaj Holdings & Investment Ltd. | 9,560 | 618 |
| 3 | Dr Lal PathLabs Ltd. | 13,127 | 617 |
| | Relaxo Footwears Ltd. | 34,486 | 614 |
| | Varun Beverages Ltd. | 53,733 | 610 |
| * | GMR Infrastructure Ltd. | 1,118,695 | 607 |
| * | Adani Power Ltd. | 436,532 | 586 |
| | City Union Bank Ltd. | 259,238 | 584 |
| | JK Cement Ltd. | 13,051 | 579 |
| | Torrent Power Ltd. | 85,552 | 572 |
| * | Vodafone Idea Ltd. | 4,450,243 | 570 |
| | ABB India Ltd. | 19,787 | 561 |
| | Rajesh Exports Ltd. | 65,522 | 559 |
| | Amara Raja Batteries Ltd. | 61,361 | 559 |
| * | Aditya Birla Fashion and Retail Ltd. | 158,219 | 557 |
| | Mahindra & Mahindra Financial Services Ltd. | 229,981 | 553 |
| | State Bank of India | 81,983 | 552 |
| | Oracle Financial Services Software Ltd. | 9,311 | 551 |
| | Sanofi India Ltd. | 4,933 | 550 |
| | Indiabulls Housing Finance Ltd. | 186,383 | 542 |
| | Exide Industries Ltd. | 232,558 | 538 |
| * | PVR Ltd. | 23,839 | 537 |
| | Glenmark Pharmaceuticals Ltd. | 79,307 | 534 |
| | Gujarat State Petronet Ltd. | 129,583 | 530 |
| | Carborundum Universal Ltd. | 47,096 | 529 |
| | Cyient Ltd. | 36,852 | 527 |
| * | Canara Bank | 182,128 | 524 |
| * | Bharat Heavy Electricals Ltd. | 563,559 | 515 |
| | Pfizer Ltd. | 7,572 | 511 |
| | Oil India Ltd. | 166,655 | 501 |
| * | Bank of Baroda | 377,709 | 493 |
Total World Stock Index Fund
| | | Shares | Market
Value•
($000) |
| | Minda Industries Ltd. | 47,006 | 492 |
| | Coromandel International Ltd. | 46,489 | 489 |
| | Sundram Fasteners Ltd. | 43,147 | 482 |
| | Castrol India Ltd. | 256,622 | 474 |
| | Blue Star Ltd. | 36,688 | 472 |
| | Apollo Tyres Ltd. | 164,607 | 470 |
| | NHPC Ltd. | 1,145,792 | 470 |
| | Honeywell Automation India Ltd. | 836 | 469 |
| | Can Fin Homes Ltd. | 55,345 | 465 |
| | CESC Ltd. | 394,390 | 460 |
| | Kansai Nerolac Paints Ltd. | 62,764 | 458 |
| | IIFL Finance Ltd. | 104,223 | 452 |
| | Radico Khaitan Ltd. | 30,055 | 451 |
| * | CG Power & Industrial Solutions Ltd. | 227,523 | 446 |
| | Brigade Enterprises Ltd. | 71,580 | 444 |
| * | Aavas Financiers Ltd. | 11,752 | 441 |
| | SKF India Ltd. | 9,811 | 437 |
| * | IDFC Ltd. | 585,218 | 431 |
| * | Happiest Minds Technologies Ltd. | 25,214 | 430 |
| | Hatsun Agro Product Ltd. | 23,950 | 429 |
| * | Amber Enterprises India Ltd. | 9,641 | 426 |
| *,3 | Nippon Life India Asset Management Ltd. | 75,895 | 425 |
| | Alkem Laboratories Ltd. | 8,685 | 419 |
| | Rain Industries Ltd. | 136,140 | 416 |
| * | 3M India Ltd. | 1,196 | 407 |
| | Redington India Ltd. | 210,294 | 404 |
| * | NIIT Technologies Ltd. | 6,173 | 403 |
| | Century Textiles & Industries Ltd. | 38,230 | 400 |
| | India Cements Ltd. | 143,258 | 395 |
| | Cholamandalam Financial Holdings Ltd. | 41,281 | 387 |
| 3 | Brookfield India Real Estate Trust | 99,994 | 384 |
| * | Hindustan Zinc Ltd. | 90,431 | 377 |
| | Ratnamani Metals & Tubes Ltd. | 12,867 | 368 |
| | Finolex Industries Ltd. | 125,114 | 368 |
| | Natco Pharma Ltd. | 33,078 | 366 |
| | AIA Engineering Ltd. | 14,135 | 363 |
| * | Gujarat Fluorochemicals Ltd. | 14,930 | 363 |
| | DCM Shriram Ltd. | 26,845 | 355 |
| | Jubilant Pharmova Ltd. Class A (XNSE) | 44,430 | 355 |
| | Gillette India Ltd. | 4,702 | 354 |
| | Tanla Platforms Ltd. | 21,579 | 353 |
| * | Affle India Ltd. | 24,865 | 351 |
| | | Shares | Market
Value•
($000) |
| * | L&T Finance Holdings Ltd. | 316,441 | 348 |
| 3 | Endurance Technologies Ltd. | 14,247 | 347 |
| 3 | Metropolis Healthcare Ltd. | 8,691 | 345 |
| | Thermax Ltd. | 18,593 | 343 |
| | Strides Pharma Science Ltd. | 46,763 | 335 |
| * | EIH Ltd. | 178,526 | 332 |
| * | Dhani Services Ltd. | 139,298 | 332 |
| 3 | Mindspace Business Parks REIT | 75,400 | 329 |
| | Whirlpool of India Ltd. | 10,912 | 323 |
| | Computer Age Management Services Ltd. | 8,022 | 323 |
| | Mahanagar Gas Ltd. | 23,984 | 322 |
| | Prestige Estates Projects Ltd. | 55,794 | 319 |
| * | Indiabulls Real Estate Ltd. | 155,530 | 316 |
| | Central Depository Services India Ltd. | 17,379 | 315 |
| | Bayer CropScience Ltd. | 4,697 | 313 |
| | Phoenix Mills Ltd. | 24,155 | 312 |
| | Welspun India Ltd. | 168,228 | 310 |
| | Solar Industries India Ltd. | 9,275 | 308 |
| | GlaxoSmithKline Pharmaceuticals Ltd. | 15,254 | 306 |
| | Birlasoft Ltd. | 56,225 | 306 |
| | Firstsource Solutions Ltd. | 114,958 | 305 |
| | KPIT Technologies Ltd. | 73,593 | 305 |
| *,3 | Syngene International Ltd. | 41,990 | 304 |
| | Sonata Software Ltd. | 27,133 | 304 |
| | Jubilant Ingrevia Ltd. | 33,633 | 301 |
| | CRISIL Ltd. | 7,981 | 299 |
| 3 | IndiaMart InterMesh Ltd. | 3,126 | 299 |
| | Balaji Amines Ltd. | 6,454 | 299 |
| * | Intellect Design Arena Ltd. | 33,944 | 298 |
| | HFCL Ltd. | 311,698 | 298 |
| * | V-Mart Retail Ltd. | 5,403 | 294 |
| | Chambal Fertilizers and Chemicals Ltd. | 59,328 | 293 |
| * | Shriram City Union Finance Ltd. | 9,940 | 288 |
| | Schaeffler India Ltd. | 2,867 | 283 |
| | KEI Industries Ltd. | 22,836 | 279 |
| *,3 | Aster DM Healthcare Ltd. | 110,767 | 278 |
| | Ceat Ltd. | 16,571 | 277 |
| | Ajanta Pharma Ltd. | 9,775 | 277 |
| | V-Guard Industries Ltd. | 80,619 | 277 |
| | Linde India Ltd. | 8,872 | 274 |
Total World Stock Index Fund
| | | Shares | Market
Value•
($000) |
| | Alkyl Amines Chemicals Ltd. | 5,678 | 274 |
| 3 | Quess Corp. Ltd. | 23,431 | 272 |
| | JB Chemicals & Pharmaceuticals Ltd. | 12,092 | 271 |
| * | Godrej Industries Ltd. | 34,381 | 267 |
| * | Bajaj Electricals Ltd. | 18,062 | 267 |
| | Sobha Ltd. | 25,879 | 266 |
| | Bombay Burmah Trading Co. | 18,422 | 266 |
| | JK Lakshmi Cement Ltd. | 32,258 | 266 |
| | Rallis India Ltd. | 74,494 | 265 |
| | Suven Pharmaceuticals Ltd. | 38,922 | 265 |
| | Engineers India Ltd. | 271,348 | 264 |
| | KEC International Ltd. | 41,153 | 263 |
| | NBCC India Ltd. | 437,665 | 262 |
| | Sterlite Technologies Ltd. | 70,464 | 259 |
| | Zensar Technologies Ltd. | 41,885 | 259 |
| | Timken India Ltd. | 10,739 | 258 |
| | Lakshmi Machine Works Ltd. | 2,182 | 255 |
| | Polycab India Ltd. | 8,364 | 253 |
| | Great Eastern Shipping Co. Ltd. | 58,258 | 251 |
| * | TeamLease Services Ltd. | 4,127 | 247 |
| | Orient Electric Ltd. | 53,418 | 247 |
| * | EID Parry India Ltd. | 40,323 | 246 |
| 3 | Eris Lifesciences Ltd. | 22,202 | 244 |
| | Finolex Cables Ltd. | 38,898 | 243 |
| | Gateway Distriparks Ltd. | 64,049 | 239 |
| * | Suzlon Energy Ltd. | 2,636,868 | 238 |
| | Praj Industries Ltd. | 52,825 | 236 |
| | Sun TV Network Ltd. | 31,281 | 235 |
| 3 | ICICI Securities Ltd. | 23,274 | 230 |
| | NCC Ltd. | 239,084 | 228 |
| *,3 | Indian Railway Finance Corp. Ltd. | 698,889 | 226 |
| | Procter & Gamble Health Ltd. | 3,042 | 220 |
| | Hindustan Aeronautics Ltd. | 12,570 | 220 |
| | Avanti Feeds Ltd. | 29,194 | 218 |
| * | Aditya Birla Capital Ltd. | 166,880 | 216 |
| | Poly Medicure Ltd. | 17,306 | 214 |
| | Edelweiss Financial Services Ltd. | 205,827 | 213 |
| | TTK Prestige Ltd. | 1,449 | 212 |
| | PNC Infratech Ltd. | 48,109 | 209 |
| | Infibeam Avenues Ltd. (XNSE) | 339,476 | 206 |
| | Balrampur Chini Mills Ltd. | 46,302 | 203 |
| | Graphite India Ltd. | 28,273 | 203 |
| * | Mahindra CIE Automotive Ltd. | 56,317 | 201 |
| | Granules India Ltd. | 48,122 | 200 |
| | | Shares | Market
Value•
($000) |
| | Zydus Wellness Ltd. | 7,296 | 200 |
| 3 | Godrej Agrovet Ltd. | 25,053 | 199 |
| * | Reliance Power Ltd. | 1,053,346 | 199 |
| | Vinati Organics Ltd. | 7,740 | 198 |
| | Vaibhav Global Ltd. | 25,010 | 193 |
| *,3 | New India Assurance Co. Ltd. | 94,543 | 193 |
| | Alembic Pharmaceuticals Ltd. | 18,294 | 190 |
| *,3 | PNB Housing Finance Ltd. | 28,982 | 187 |
| * | Punjab National Bank | 329,505 | 186 |
| * | Bank of India | 217,534 | 174 |
| | JM Financial Ltd. | 148,001 | 174 |
| | Sumitomo Chemical India Ltd. | 34,549 | 174 |
| | Motilal Oswal Financial Services Ltd. | 14,216 | 174 |
| | Bajaj Consumer Care Ltd. | 55,712 | 173 |
| * | Narayana Hrudayalaya Ltd. | 24,758 | 173 |
| * | Union Bank of India | 270,719 | 167 |
| * | Westlife Development Ltd. | 21,378 | 166 |
| *,3 | General Insurance Corp. of India | 92,423 | 165 |
| | EPL Ltd. | 56,156 | 162 |
| | Gujarat Pipavav Port Ltd. | 102,320 | 153 |
| * | IRB Infrastructure Developers Ltd. | 48,800 | 148 |
| | Indian Bank | 63,128 | 146 |
| | eClerx Services Ltd. | 4,918 | 144 |
| * | IFCI Ltd. | 842,125 | 138 |
| | Equitas Holdings Ltd. | 78,491 | 136 |
| * | Alok Industries Ltd. | 457,474 | 135 |
| | PTC India Ltd. | 76,646 | 130 |
| | Karnataka Bank Ltd. | 140,736 | 128 |
| | Aegis Logistics Ltd. | 45,022 | 128 |
| | HEG Ltd. | 4,603 | 127 |
| * | CreditAccess Grameen Ltd. | 15,061 | 127 |
| | Vakrangee Ltd. | 236,119 | 116 |
| | AstraZeneca Pharma India Ltd. | 2,814 | 113 |
| * | Sun Pharma Advanced Research Co. Ltd. | 32,065 | 113 |
| | Karur Vysya Bank Ltd. | 167,704 | 110 |
| | Akzo Nobel India Ltd. | 3,822 | 107 |
| | KRBL Ltd. | 28,058 | 106 |
| * | South Indian Bank Ltd. | 829,833 | 104 |
| * | Symphony Ltd. | 7,065 | 98 |
| | Jindal Saw Ltd. | 61,019 | 95 |
| * | Wockhardt Ltd. | 15,956 | 91 |
| * | Yes Bank Ltd. | 509,982 | 87 |
| | Kaveri Seed Co. Ltd. | 11,057 | 77 |
| * | TV18 Broadcast Ltd. | 137,341 | 77 |
| | Care Ratings Ltd. | 8,295 | 76 |
Total World Stock Index Fund
| | | Shares | Market
Value•
($000) |
| 3 | Dilip Buildcon Ltd. | 9,318 | 75 |
| * | DCB Bank Ltd. | 60,028 | 73 |
| | Welspun Corp. Ltd. | 36,272 | 65 |
| | Multi Commodity Exchange of India Ltd. | 2,593 | 59 |
| | GE Power India Ltd. | 13,473 | 52 |
| * | Raymond Ltd. | 8,316 | 51 |
| * | Future Retail Ltd. | 65,433 | 42 |
| * | Hindustan Construction Co. Ltd. | 283,967 | 36 |
| * | Mangalore Refinery & Petrochemicals Ltd. | 45,416 | 30 |
| * | Just Dial Ltd. | 2,560 | 27 |
| * | Future Consumer Ltd. | 197,528 | 18 |
| *,1 | Amtek Auto Ltd. | 7,896 | — |
| | | | 528,208 |
| Indonesia (0.2%) |
| | Bank Central Asia Tbk PT | 21,371,520 | 11,301 |
| | Bank Rakyat Indonesia Persero Tbk PT | 28,512,043 | 8,559 |
| | Telkom Indonesia Persero Tbk PT | 20,749,040 | 5,546 |
| | Bank Mandiri Persero Tbk PT | 7,954,232 | 4,021 |
| | Astra International Tbk PT | 8,707,330 | 3,709 |
| | Bank Negara Indonesia Persero Tbk PT | 3,211,630 | 1,588 |
| | Charoen Pokphand Indonesia Tbk PT | 2,979,900 | 1,307 |
| | United Tractors Tbk PT | 737,460 | 1,227 |
| | Kalbe Farma Tbk PT | 8,758,300 | 989 |
| | Indofood Sukses Makmur Tbk PT | 2,164,100 | 971 |
| | Tower Bersama Infrastructure Tbk PT | 4,382,300 | 910 |
| | Sarana Menara Nusantara Tbk PT | 11,055,100 | 906 |
| | Indah Kiat Pulp & Paper Corp. Tbk PT | 1,352,100 | 809 |
| | Unilever Indonesia Tbk PT | 2,527,200 | 789 |
| | Adaro Energy Tbk PT | 6,340,400 | 751 |
| | Semen Indonesia Persero Tbk PT | 1,111,700 | 714 |
| | Barito Pacific Tbk PT | 9,730,200 | 644 |
| | Indofood CBP Sukses Makmur Tbk PT | 991,800 | 616 |
| | Aneka Tambang Tbk | 3,142,000 | 520 |
| | Bukit Asam Tbk PT | 2,554,900 | 484 |
| | Gudang Garam Tbk PT | 185,500 | 439 |
| | Japfa Comfeed Indonesia Tbk PT | 3,336,200 | 408 |
| | Indocement Tunggal Prakarsa Tbk PT | 467,900 | 391 |
| * | Smartfren Telecom Tbk PT | 51,136,100 | 390 |
| | | Shares | Market
Value•
($000) |
| | Ciputra Development Tbk PT | 5,047,430 | 383 |
| * | Perusahaan Gas Negara Persero Tbk PT | 3,567,300 | 380 |
| * | Pakuwon Jati Tbk PT | 9,245,100 | 327 |
| | Mitra Keluarga Karyasehat Tbk PT | 1,955,700 | 315 |
| * | Surya Citra Media Tbk PT | 10,248,500 | 304 |
| * | Summarecon Agung Tbk PT | 4,629,266 | 300 |
| * | Bumi Serpong Damai Tbk PT | 3,763,400 | 295 |
| | Bank Pembangunan Daerah Jawa Barat Dan Banten Tbk PT | 2,827,600 | 285 |
| * | Jasa Marga Persero Tbk PT | 928,317 | 276 |
| * | Surya Semesta Internusa Tbk PT | 7,697,500 | 271 |
| * | Bank Rakyat Indonesia Agroniaga Tbk PT | 1,767,900 | 263 |
| | XL Axiata Tbk PT | 1,192,400 | 260 |
| | Ace Hardware Indonesia Tbk PT | 2,595,300 | 259 |
| | Pabrik Kertas Tjiwi Kimia Tbk PT | 430,000 | 253 |
| | BFI Finance Indonesia Tbk PT | 3,321,200 | 246 |
| | Vale Indonesia Tbk PT | 710,300 | 243 |
| | Mayora Indah Tbk PT | 1,335,900 | 221 |
| | Hanjaya Mandala Sampoerna Tbk PT | 2,999,700 | 220 |
| | Indo Tambangraya Megah Tbk PT | 142,300 | 217 |
| * | Indosat Tbk PT | 429,300 | 210 |
| * | Lippo Karawaci Tbk PT | 19,524,292 | 204 |
| * | Matahari Department Store Tbk PT | 925,000 | 199 |
| | Bank BTPN Syariah Tbk PT | 728,600 | 196 |
| | AKR Corporindo Tbk PT | 616,900 | 186 |
| * | LEG Immobilien SE | 1,229,514 | 183 |
| * | Bank Tabungan Negara Persero Tbk PT | 1,289,700 | 162 |
| * | Medco Energi Internasional Tbk PT | 3,935,581 | 158 |
| * | Mitra Adiperkasa Tbk PT | 2,405,000 | 150 |
| * | Bank Bukopin Tbk PT (XIDX) | 4,919,600 | 149 |
| * | Timah Tbk PT | 1,216,300 | 137 |
| | Astra Agro Lestari Tbk PT | 170,855 | 130 |
| | Media Nusantara Citra Tbk PT | 1,784,200 | 113 |
Total World Stock Index Fund
| | | Shares | Market
Value•
($000) |
| * | Wijaya Karya Persero Tbk PT | 1,149,145 | 101 |
| * | Panin Financial Tbk PT | 7,071,800 | 91 |
| * | Waskita Karya Persero Tbk PT | 1,299,774 | 85 |
| * | Bank Pan Indonesia Tbk PT | 1,448,500 | 81 |
| | Perusahaan Perkebunan London Sumatra Indonesia Tbk PT | 725,400 | 71 |
| | Ramayana Lestari Sentosa Tbk PT | 1,190,900 | 62 |
| * | Krakatau Steel Persero Tbk PT | 1,444,300 | 54 |
| * | Adhi Karya Persero Tbk PT | 620,300 | 46 |
| * | PP Persero Tbk PT | 528,300 | 45 |
| * | Alam Sutera Realty Tbk PT | 2,990,900 | 38 |
| | Bank Danamon Indonesia Tbk PT | 189,500 | 36 |
| *,1 | Trada Alam Minera Tbk PT | 10,114,628 | 36 |
| * | Kresna Graha Investama Tbk PT | 4,091,300 | 31 |
| * | Global Mediacom Tbk PT | 1,211,000 | 23 |
| * | Totalindo Eka Persada Tbk PT | 782,320 | 3 |
| | | | 56,287 |
| Ireland (0.1%) |
| | Kerry Group plc Class A | 67,141 | 9,009 |
| | Kingspan Group plc | 67,695 | 7,793 |
| * | Bank of Ireland Group plc | 388,428 | 2,314 |
| | Glanbia plc (XDUB) | 82,126 | 1,341 |
| * | AIB Group plc | 304,704 | 825 |
| | Hibernia REIT plc | 265,010 | 387 |
| * | Dalata Hotel Group plc | 78,590 | 336 |
| * | Irish Continental Group plc | 63,570 | 313 |
| * | Cairn Homes plc | 205,327 | 266 |
| * | Cairn Homes plc (XDUB) | 45,485 | 59 |
| *,1 | Irish Bank Resolution Corp. | 14,385 | — |
| | | | 22,643 |
| Israel (0.2%) |
| * | Nice Ltd. | 28,010 | 7,918 |
| | Bank Leumi Le-Israel BM | 619,433 | 5,918 |
| | Bank Hapoalim BM | 497,656 | 4,901 |
| * | Teva Pharmaceutical Industries Ltd. | 437,925 | 3,862 |
| * | Israel Discount Bank Ltd. Class A | 510,272 | 3,083 |
| | ICL Group Ltd. | 283,974 | 2,434 |
| | Mizrahi Tefahot Bank Ltd. | 56,907 | 2,071 |
| | Elbit Systems Ltd. | 9,892 | 1,559 |
| * | Tower Semiconductor Ltd. | 46,173 | 1,512 |
| | Azrieli Group Ltd. | 14,655 | 1,371 |
| | | Shares | Market
Value•
($000) |
| * | Nova Ltd. | 12,056 | 1,287 |
| * | Bezeq The Israeli Telecommunication Corp. Ltd. | 907,508 | 1,138 |
| | Mivne Real Estate KD Ltd. | 254,909 | 929 |
| * | Enlight Renewable Energy Ltd. | 358,435 | 884 |
| | First International Bank of Israel Ltd. | 20,731 | 831 |
| * | Shikun & Binui Ltd. | 129,175 | 768 |
| | Big Shopping Centers Ltd. | 4,548 | 682 |
| | Alony Hetz Properties & Investments Ltd. | 40,612 | 665 |
| | Harel Insurance Investments & Financial Services Ltd. | 57,896 | 647 |
| * | Israel Corp. Ltd. | 1,723 | 636 |
| | REIT 1 Ltd. | 101,213 | 633 |
| * | Paz Oil Co. Ltd. | 4,895 | 624 |
| * | Melisron Ltd. | 7,323 | 620 |
| | Phoenix Holdings Ltd. | 47,581 | 602 |
| * | Clal Insurance Enterprises Holdings Ltd. | 24,123 | 596 |
| | Strauss Group Ltd. | 18,651 | 548 |
| * | Airport City Ltd. | 27,424 | 524 |
| | Maytronics Ltd. | 22,147 | 524 |
| | Ashtrom Group Ltd. | 20,230 | 473 |
| | Hilan Ltd. | 8,521 | 472 |
| | Sella Capital Real Estate Ltd. | 141,777 | 468 |
| | Electra Ltd. | 695 | 458 |
| * | Camtek Ltd. | 11,381 | 457 |
| | Amot Investments Ltd. | 59,040 | 451 |
| | Gav-Yam Lands Corp. Ltd. | 33,924 | 404 |
| | FIBI Holdings Ltd. | 9,088 | 400 |
| | Energix-Renewable Energies Ltd. | 82,368 | 388 |
| | Shufersal Ltd. | 46,489 | 385 |
| | Danel Adir Yeoshua Ltd. | 1,767 | 374 |
| * | Delek Group Ltd. | 4,481 | 373 |
| | Isracard Ltd. | 92,515 | 372 |
| | Sapiens International Corp. NV | 10,659 | 369 |
| | Fox Wizel Ltd. | �� 2,575 | 355 |
| * | Perion Network Ltd. | 12,610 | 352 |
| | Shapir Engineering and Industry Ltd. | 42,926 | 351 |
| | Matrix IT Ltd. | 12,675 | 344 |
| | Mega Or Holdings Ltd. | 8,209 | 325 |
| | AudioCodes Ltd. | 9,082 | 316 |
| | Formula Systems 1985 Ltd. | 2,809 | 303 |
| * | OPC Energy Ltd. | 28,762 | 301 |
| * | AFI Properties Ltd. | 5,687 | 295 |
| * | Summit Real Estate Holdings Ltd. | 15,005 | 273 |
| | Delek Automotive Systems Ltd. | 20,634 | 270 |
Total World Stock Index Fund
| | | Shares | Market
Value•
($000) |
| | Kenon Holdings Ltd. | 6,499 | 261 |
| | Gazit-Globe Ltd. | 29,496 | 239 |
| * | Fattal Holdings 1998 Ltd. | 2,178 | 234 |
| * | Compugen Ltd. | 36,694 | 233 |
| | Menora Mivtachim Holdings Ltd. | 9,950 | 230 |
| | Rami Levy Chain Stores Hashikma Marketing 2006 Ltd. | 2,924 | 220 |
| | Migdal Insurance & Financial Holdings Ltd. | 122,731 | 209 |
| * | Partner Communications Co. Ltd. | 39,795 | 201 |
| * | Equital Ltd. | 5,802 | 178 |
| | Delta Galil Industries Ltd. | 3,081 | 158 |
| * | Allot Ltd. | 10,427 | 154 |
| * | Oil Refineries Ltd. | 498,716 | 135 |
| * | Cellcom Israel Ltd. | 32,887 | 125 |
| * | Kamada Ltd. | 17,290 | 99 |
| | IDI Insurance Co. Ltd. | 2,463 | 99 |
| | Gilat Satellite Networks Ltd. | 10,809 | 90 |
| * | Brack Capital Properties NV | 559 | 65 |
| * | Naphtha Israel Petroleum Corp. Ltd. | 9,312 | 58 |
| * | Tera Light Ltd. | 9,950 | 25 |
| | | | 60,109 |
| Italy (0.7%) |
| | Enel SpA | 3,391,988 | 28,397 |
| | Intesa Sanpaolo SpA | 7,232,885 | 20,557 |
| | Stellantis NV | 883,337 | 17,635 |
| | Eni SpA | 1,097,079 | 15,724 |
| | UniCredit SpA | 958,798 | 12,675 |
| | Ferrari NV | 52,981 | 12,572 |
| | Assicurazioni Generali SpA | 554,541 | 12,075 |
| | CNH Industrial NV | 433,653 | 7,470 |
| | Moncler SpA | 94,738 | 6,818 |
| | Snam SpA (MTAA) | 960,814 | 5,442 |
| * | FinecoBank Banca Fineco SpA | 270,240 | 5,161 |
| | Terna - Rete Elettrica Nazionale | 638,699 | 4,759 |
| *,3 | Nexi SpA | 260,158 | 4,523 |
| | Prysmian SpA | 117,918 | 4,458 |
| | EXOR NV | 44,479 | 4,196 |
| * | Atlantia SpA | 206,318 | 3,988 |
| * | Mediobanca Banca di Credito Finanziario SpA | 311,849 | 3,721 |
| | Davide Campari-Milano NV | 206,958 | 2,940 |
| | Amplifon SpA | 56,377 | 2,869 |
| 3 | Poste Italiane SpA | 196,500 | 2,806 |
| | Recordati Industria Chimica e Farmaceutica SpA | 41,786 | 2,618 |
| | Interpump Group SpA | 34,569 | 2,546 |
| | | Shares | Market
Value•
($000) |
| | DiaSorin SpA | 9,279 | 2,098 |
| | Reply SpA | 10,585 | 2,055 |
| | Banco BPM SpA | 650,243 | 2,022 |
| | Telecom Italia SpA | 5,212,824 | 1,860 |
| | Tenaris SA | 143,956 | 1,603 |
| 3 | Infrastrutture Wireless Italiane SpA | 139,855 | 1,545 |
| | Azimut Holding SpA | 52,787 | 1,520 |
| 3 | Pirelli & C SpA | 228,210 | 1,404 |
| | Italgas SpA | 216,074 | 1,373 |
| | A2A SpA | 612,818 | 1,290 |
| | Hera SpA | 311,381 | 1,274 |
| * | Leonardo SpA | 169,792 | 1,246 |
| | Unipol Gruppo SpA | 207,594 | 1,192 |
| | De' Longhi SpA | 30,317 | 1,186 |
| | ERG SpA | 32,477 | 1,173 |
| | Banca Mediolanum SpA | 114,118 | 1,150 |
| | BPER Banca | 486,672 | 1,067 |
| * | Banca Generali SpA | 21,790 | 1,025 |
| | Telecom Italia SpA Savings Shares | 2,481,528 | 943 |
| | Buzzi Unicem SpA | 36,901 | 861 |
| * | Brunello Cucinelli SpA | 14,078 | 854 |
| | Banca Popolare di Sondrio SCPA | 193,474 | 841 |
| | Brembo SpA | 62,622 | 822 |
| | Iren SpA | 227,725 | 708 |
| 3 | Technogym SpA | 63,727 | 670 |
| 3 | BFF Bank SpA | 73,170 | 655 |
| | Tenaris SA ADR | 28,752 | 641 |
| | Sesa SpA | 3,135 | 615 |
| * | Autogrill SpA | 74,611 | 586 |
| 3 | Anima Holding SpA | 108,107 | 574 |
| * | Salvatore Ferragamo SpA | 24,532 | 522 |
| | UnipolSai Assicurazioni SpA | 175,849 | 509 |
| | Danieli & C Officine Meccaniche SpA | 14,064 | 473 |
| 3 | Carel Industries SpA | 15,923 | 459 |
| *,2 | Saipem SpA | 195,818 | 429 |
| | Gruppo MutuiOnline SpA | 8,773 | 428 |
| | Falck Renewables SpA | 42,216 | 426 |
| * | Societa Cattolica Di Assicurazione SpA | 50,964 | 387 |
| *,3 | Enav SpA | 86,759 | 381 |
| | Maire Tecnimont SpA | 87,046 | 375 |
| 3 | GVS SpA | 24,877 | 370 |
| | Tamburi Investment Partners SpA | 31,859 | 360 |
| 2 | Webuild SpA (MTAA) | 139,245 | 345 |
| | Tinexta SpA | 7,571 | 336 |
| | MARR SpA | 13,886 | 327 |
| | ACEA SpA | 14,415 | 313 |
| | SOL SpA | 12,905 | 296 |
| | Mediaset NV | 104,006 | 292 |
| | Zignago Vetro SpA | 13,478 | 272 |
| * | Tod's SpA | 4,506 | 248 |
Total World Stock Index Fund
| | | Shares | Market
Value•
($000) |
| | Danieli & C Officine Meccaniche SpA Savings Shares | 11,415 | 247 |
| *,2 | Banca Monte dei Paschi di Siena SpA | 183,756 | 220 |
| 3 | doValue SpA | 22,034 | 211 |
| | Cementir Holding NV | 19,613 | 206 |
| 3 | RAI Way SpA | 33,424 | 202 |
| | Piaggio & C SpA | 59,240 | 199 |
| * | Cerved Group SpA | 16,403 | 197 |
| * | CIR SpA-Compagnie Industriali | 356,743 | 197 |
| | Credito Emiliano SpA | 23,562 | 179 |
| | Italmobiliare SpA | 4,572 | 160 |
| | Datalogic SpA | 8,753 | 159 |
| * | Saras SpA | 179,414 | 133 |
| * | Immobiliare Grande Distribuzione SIIQ SpA | 29,470 | 129 |
| * | Arnoldo Mondadori Editore SpA | 55,412 | 128 |
| * | Biesse SpA | 4,125 | 128 |
| *,2 | Juventus Football Club SpA | 149,272 | 121 |
| | Banca IFIS SpA | 6,213 | 115 |
| *,2 | Fincantieri SpA | 123,712 | 97 |
| | DeA Capital SpA | 57,909 | 89 |
| | Rizzoli Corriere Della Sera Mediagroup SpA | 37,870 | 31 |
| * | Webuild SpA | 12,600 | 15 |
| | | | 229,514 |
| Japan (6.3%) |
| | Toyota Motor Corp. | 5,350,640 | 94,408 |
| | Sony Group Corp. | 539,300 | 62,449 |
| | Keyence Corp. | 78,632 | 47,463 |
| | Recruit Holdings Co. Ltd. | 582,027 | 38,716 |
| | SoftBank Group Corp. | 583,640 | 31,597 |
| | Shin-Etsu Chemical Co. Ltd. | 172,556 | 30,772 |
| | Tokyo Electron Ltd. | 63,400 | 29,546 |
| | Mitsubishi UFJ Financial Group Inc. | 5,371,360 | 29,454 |
| | Daikin Industries Ltd. | 115,863 | 25,376 |
| | Hitachi Ltd. | 403,552 | 23,255 |
| | Hoya Corp. | 155,751 | 22,928 |
| | KDDI Corp. | 735,500 | 22,492 |
| | Nidec Corp. | 202,996 | 22,483 |
| | Honda Motor Co. Ltd. | 744,241 | 22,013 |
| | Daiichi Sankyo Co. Ltd. | 819,500 | 20,678 |
| | Nintendo Co. Ltd. | 45,906 | 20,275 |
| | Takeda Pharmaceutical Co. Ltd. | 668,739 | 18,769 |
| | Murata Manufacturing Co. Ltd. | 248,874 | 18,461 |
| | | Shares | Market
Value•
($000) |
| | Sumitomo Mitsui Financial Group Inc. | 567,548 | 18,417 |
| | Mitsubishi Corp. | 526,700 | 16,748 |
| | FANUC Corp. | 84,491 | 16,697 |
| | ITOCHU Corp. | 584,528 | 16,671 |
| | Softbank Corp. | 1,182,533 | 16,141 |
| | Mitsui & Co. Ltd. | 696,100 | 15,930 |
| | Fast Retailing Co. Ltd. | 22,600 | 15,002 |
| | Tokio Marine Holdings Inc. | 281,452 | 14,824 |
| | Nippon Telegraph & Telephone Corp. | 527,300 | 14,774 |
| | SMC Corp. | 24,500 | 14,621 |
| | Mizuho Financial Group Inc. | 1,100,410 | 14,523 |
| | Denso Corp. | 199,400 | 14,456 |
| | Fujitsu Ltd. | 82,740 | 14,300 |
| | Seven & i Holdings Co. Ltd. | 336,600 | 14,132 |
| | Astellas Pharma Inc. | 813,200 | 13,710 |
| | Oriental Land Co. Ltd. | 82,500 | 13,030 |
| | Terumo Corp. | 288,728 | 12,737 |
| | FUJIFILM Holdings Corp. | 153,700 | 11,878 |
| | Central Japan Railway Co. | 78,819 | 11,692 |
| | Panasonic Corp. | 939,159 | 11,614 |
| | Mitsubishi Electric Corp. | 864,340 | 11,608 |
| | Kao Corp. | 202,848 | 11,475 |
| | Shiseido Co. Ltd. | 170,700 | 11,390 |
| | Bridgestone Corp. | 252,504 | 11,171 |
| | M3 Inc. | 184,938 | 10,898 |
| | ORIX Corp. | 538,560 | 10,705 |
| | Chugai Pharmaceutical Co. Ltd. | 285,400 | 10,671 |
| | Komatsu Ltd. | 401,350 | 10,512 |
| | Kubota Corp. | 487,500 | 10,385 |
| | Sysmex Corp. | 83,434 | 10,345 |
| | Japan Tobacco Inc. | 518,882 | 10,186 |
| | Olympus Corp. | 463,800 | 10,047 |
| | Canon Inc. | 435,000 | 9,892 |
| | East Japan Railway Co. | 157,205 | 9,792 |
| | Dai-ichi Life Holdings Inc. | 456,400 | 9,602 |
| | Shimano Inc. | 33,600 | 9,375 |
| | Daiwa House Industry Co. Ltd. | 281,000 | 9,270 |
| | Mitsui Fudosan Co. Ltd. | 403,600 | 9,228 |
| | Suzuki Motor Corp. | 198,371 | 8,847 |
| | Asahi Group Holdings Ltd. | 186,652 | 8,470 |
| | Toshiba Corp. | 190,100 | 8,199 |
| | Eisai Co. Ltd. | 115,400 | 8,177 |
| | Kyocera Corp. | 136,000 | 7,962 |
| | Shionogi & Co. Ltd. | 120,800 | 7,876 |
| | Omron Corp. | 81,800 | 7,823 |
| | Mitsubishi Estate Co. Ltd. | 502,891 | 7,642 |
| | Japan Post Holdings Co. Ltd. | 984,852 | 7,568 |
Total World Stock Index Fund
| | | Shares | Market
Value•
($000) |
| | Otsuka Holdings Co. Ltd. | 186,100 | 7,360 |
| | Lasertec Corp. | 33,400 | 7,245 |
| | Aeon Co. Ltd. | 310,000 | 7,131 |
| | Advantest Corp. | 86,489 | 7,091 |
| | Z Holdings Corp. | 1,138,700 | 7,069 |
| | Sumitomo Corp. | 495,000 | 7,054 |
| | Unicharm Corp. | 171,600 | 6,940 |
| | MS&AD Insurance Group Holdings Inc. | 207,856 | 6,715 |
| | Kikkoman Corp. | 80,350 | 6,572 |
| | Bandai Namco Holdings Inc. | 85,800 | 6,557 |
| | Ajinomoto Co. Inc. | 217,800 | 6,521 |
| | Nomura Holdings Inc. | 1,340,700 | 6,385 |
| | Sompo Holdings Inc. | 145,375 | 6,304 |
| | Nippon Steel Corp. | 358,558 | 6,287 |
| | Sumitomo Realty & Development Co. Ltd. | 173,846 | 6,283 |
| | Nitori Holdings Co. Ltd. | 33,700 | 6,191 |
| | Toyota Industries Corp. | 70,700 | 6,010 |
| | NEC Corp. | 117,000 | 5,991 |
| | Kirin Holdings Co. Ltd. | 340,000 | 5,918 |
| | Marubeni Corp. | 691,528 | 5,868 |
| | Secom Co. Ltd. | 85,287 | 5,814 |
| | Asahi Kasei Corp. | 550,800 | 5,786 |
| | TDK Corp. | 159,160 | 5,786 |
| | NTT Data Corp. | 282,500 | 5,667 |
| | Japan Exchange Group Inc. | 233,400 | 5,526 |
| | Obic Co. Ltd. | 29,200 | 5,400 |
| | ENEOS Holdings Inc. | 1,322,607 | 5,333 |
| | Subaru Corp. | 270,100 | 5,298 |
| | Sumitomo Mitsui Trust Holdings Inc. | 161,046 | 5,297 |
| | Sekisui House Ltd. | 254,800 | 5,297 |
| * | Renesas Electronics Corp. | 429,923 | 5,289 |
| | Nippon Yusen KK | 71,000 | 5,116 |
| | Nitto Denko Corp. | 64,900 | 5,071 |
| | Yaskawa Electric Corp. | 114,663 | 4,966 |
| | Makita Corp. | 106,700 | 4,952 |
| | MISUMI Group Inc. | 118,400 | 4,952 |
| | West Japan Railway Co. | 100,432 | 4,741 |
| | SG Holdings Co. Ltd. | 188,600 | 4,736 |
| | Mitsubishi Chemical Holdings Corp. | 570,184 | 4,720 |
| | Shimadzu Corp. | 115,500 | 4,692 |
| | MINEBEA MITSUMI Inc. | 180,584 | 4,572 |
| | Sumitomo Electric Industries Ltd. | 338,700 | 4,496 |
| | Yamaha Corp. | 71,100 | 4,492 |
| * | Nissan Motor Co. Ltd. | 847,701 | 4,315 |
| | Nomura Research Institute Ltd. | 106,869 | 4,278 |
| | | Shares | Market
Value•
($000) |
| | Toyota Tsusho Corp. | 97,600 | 4,234 |
| | Toray Industries Inc. | 677,900 | 4,224 |
| | Nippon Building Fund Inc. | 632 | 4,106 |
| | Sumitomo Metal Mining Co. Ltd. | 105,600 | 4,096 |
| | Ono Pharmaceutical Co. Ltd. | 191,700 | 4,022 |
| | Pan Pacific International Holdings Corp. | 188,900 | 3,966 |
| | AGC Inc. | 79,300 | 3,949 |
| | Rakuten Group Inc. | 355,300 | 3,890 |
| | Daiwa Securities Group Inc. | 673,900 | 3,786 |
| | Daifuku Co. Ltd. | 40,000 | 3,682 |
| | Yamato Holdings Co. Ltd. | 149,400 | 3,673 |
| | Nippon Paint Holdings Co. Ltd. | 341,200 | 3,651 |
| | Resona Holdings Inc. | 966,689 | 3,631 |
| | MEIJI Holdings Co. Ltd. | 56,734 | 3,580 |
| | Yamaha Motor Co. Ltd. | 128,400 | 3,579 |
| | Dentsu Group Inc. | 96,749 | 3,536 |
| | Nihon M&A Center Holdings Inc. | 112,300 | 3,448 |
| | Kyowa Kirin Co. Ltd. | 103,100 | 3,391 |
| | Daito Trust Construction Co. Ltd. | 26,952 | 3,342 |
| | Japan Real Estate Investment Corp. | 540 | 3,310 |
| | JFE Holdings Inc. | 215,400 | 3,291 |
| | Hamamatsu Photonics KK | 54,800 | 3,253 |
| | Inpex Corp. | 384,700 | 3,208 |
| | Sumitomo Chemical Co. Ltd. | 648,292 | 3,194 |
| | Nissan Chemical Corp. | 57,200 | 3,184 |
| | Mitsubishi Heavy Industries Ltd. | 123,087 | 3,148 |
| | Rohm Co. Ltd. | 34,300 | 3,136 |
| | Nomura Real Estate Master Fund Inc. | 2,089 | 3,128 |
| | Disco Corp. | 11,600 | 3,127 |
| | Chubu Electric Power Co. Inc. | 301,470 | 3,121 |
| | Nippon Prologis REIT Inc. | 932 | 3,113 |
| | Tokyo Gas Co. Ltd. | 177,700 | 3,084 |
| | Nexon Co. Ltd. | 179,724 | 3,059 |
| | Isuzu Motors Ltd. | 221,420 | 2,979 |
| | GLP J-REIT | 1,825 | 2,977 |
| | T&D Holdings Inc. | 231,100 | 2,964 |
| | TOTO Ltd. | 60,800 | 2,938 |
| | Tokyu Corp. | 208,100 | 2,934 |
| | Mitsui OSK Lines Ltd. | 46,139 | 2,909 |
| | Lixil Corp. | 112,900 | 2,900 |
| | Koito Manufacturing Co. Ltd. | 51,000 | 2,894 |
| | Trend Micro Inc. | 51,100 | 2,888 |
| | Hankyu Hanshin Holdings Inc. | 91,100 | 2,825 |
| | JSR Corp. | 77,700 | 2,818 |
Total World Stock Index Fund
| | | Shares | Market
Value•
($000) |
| | Odakyu Electric Railway Co. Ltd. | 129,800 | 2,814 |
| | Yakult Honsha Co. Ltd. | 55,388 | 2,799 |
| | Ricoh Co. Ltd. | 285,700 | 2,782 |
| | Dai Nippon Printing Co. Ltd. | 111,200 | 2,755 |
| | Idemitsu Kosan Co. Ltd. | 100,614 | 2,748 |
| | Kansai Electric Power Co. Inc. | 297,700 | 2,741 |
| | Aisin Corp. | 74,300 | 2,719 |
| | Osaka Gas Co. Ltd. | 167,600 | 2,701 |
| | CyberAgent Inc. | 160,968 | 2,697 |
| | Taiyo Yuden Co. Ltd. | 53,200 | 2,697 |
| | TIS Inc. | 98,900 | 2,694 |
| | Ibiden Co. Ltd. | 44,200 | 2,656 |
| | Japan Metropolitan Fund Investment | 2,890 | 2,655 |
| | SBI Holdings Inc. | 101,540 | 2,632 |
| | Daiwa House REIT Investment Corp. | 912 | 2,617 |
| | Obayashi Corp. | 306,900 | 2,591 |
| | Fuji Electric Co. Ltd. | 52,477 | 2,566 |
| | Sekisui Chemical Co. Ltd. | 156,100 | 2,565 |
| | BayCurrent Consulting Inc. | 5,857 | 2,431 |
| | Keio Corp. | 48,100 | 2,428 |
| | Asahi Intecc Co. Ltd. | 91,400 | 2,409 |
| | Azbil Corp. | 55,000 | 2,345 |
| | Kajima Corp. | 188,900 | 2,326 |
| | SUMCO Corp. | 121,326 | 2,318 |
| | Kurita Water Industries Ltd. | 46,500 | 2,297 |
| | Hirose Electric Co. Ltd. | 13,721 | 2,295 |
| * | Kintetsu Group Holdings Co. Ltd. | 72,800 | 2,292 |
| | MonotaRO Co. Ltd. | 99,844 | 2,276 |
| | Suntory Beverage & Food Ltd. | 57,800 | 2,243 |
| | Konami Holdings Corp. | 40,600 | 2,234 |
| | Taisei Corp. | 70,199 | 2,203 |
| | Mitsui Chemicals Inc. | 73,300 | 2,179 |
| | Ebara Corp. | 39,800 | 2,172 |
| | Otsuka Corp. | 44,000 | 2,167 |
| | Keisei Electric Railway Co. Ltd. | 67,200 | 2,163 |
| | Nissin Foods Holdings Co. Ltd. | 28,200 | 2,156 |
| | GMO Payment Gateway Inc. | 17,006 | 2,155 |
| | Toho Co. Ltd. (XTKS) | 45,200 | 2,124 |
| | MatsukiyoCocokara & Co. | 47,880 | 2,123 |
| | Mazda Motor Corp. | 233,900 | 2,104 |
| | Kobayashi Pharmaceutical Co. Ltd. | 26,200 | 2,098 |
| | Tobu Railway Co. Ltd. | 84,000 | 2,091 |
| | Seiko Epson Corp. | 115,900 | 2,064 |
| | Yokogawa Electric Corp. | 102,800 | 2,054 |
| | | Shares | Market
Value•
($000) |
| | Santen Pharmaceutical Co. Ltd. | 144,800 | 2,041 |
| | Capcom Co. Ltd. | 74,600 | 2,008 |
| | Asics Corp. | 79,600 | 1,984 |
| | Persol Holdings Co. Ltd. | 73,100 | 1,965 |
| | Tosoh Corp. | 116,390 | 1,960 |
| | Open House Co. Ltd. | 30,500 | 1,945 |
| | Concordia Financial Group Ltd. | 487,179 | 1,936 |
| | TOPPAN Inc. | 119,900 | 1,935 |
| | Ryohin Keikaku Co. Ltd. | 97,370 | 1,919 |
| | Showa Denko KK | 75,988 | 1,906 |
| | Nippon Express Co. Ltd. | 30,100 | 1,884 |
| | Orix JREIT Inc. | 1,132 | 1,878 |
| | Brother Industries Ltd. | 95,900 | 1,854 |
| | Sojitz Corp. | 111,860 | 1,846 |
| | Hoshizaki Corp. | 21,782 | 1,832 |
| | Advance Residence Investment Corp. | 557 | 1,831 |
| | Tsuruha Holdings Inc. | 14,800 | 1,826 |
| | Kansai Paint Co. Ltd. | 78,200 | 1,811 |
| | Food & Life Cos. Ltd. | 41,700 | 1,807 |
| * | Tokyo Electric Power Co. Holdings Inc. | ��� 648,800 | 1,797 |
| | Kakaku.com Inc. | 53,868 | 1,788 |
| | NGK Insulators Ltd. | 105,700 | 1,760 |
| | Oji Holdings Corp. | 353,300 | 1,751 |
| | Square Enix Holdings Co. Ltd. | 31,900 | 1,747 |
| * | ANA Holdings Inc. | 74,930 | 1,746 |
| | Nisshin Seifun Group Inc. | 110,320 | 1,742 |
| | Hulic Co. Ltd. | 179,071 | 1,722 |
| | Nippon Shinyaku Co. Ltd. | 21,400 | 1,714 |
| | Lion Corp. | 102,100 | 1,700 |
| * | Kawasaki Kisen Kaisha Ltd. | 35,199 | 1,697 |
| | Marui Group Co. Ltd. | 85,200 | 1,672 |
| | Hakuhodo DY Holdings Inc. | 101,600 | 1,656 |
| | Chiba Bank Ltd. | 262,200 | 1,625 |
| | Miura Co. Ltd. | 41,700 | 1,604 |
| | Shimizu Corp. | 218,700 | 1,602 |
| | United Urban Investment Corp. | 1,284 | 1,601 |
| | Ito En Ltd. | 24,000 | 1,599 |
| | Shizuoka Bank Ltd. | 198,400 | 1,598 |
| | Hikari Tsushin Inc. | 10,300 | 1,588 |
| | Welcia Holdings Co. Ltd. | 42,100 | 1,572 |
| | Rinnai Corp. | 15,200 | 1,561 |
| | Mitsubishi Gas Chemical Co. Inc. | 77,000 | 1,550 |
| | TechnoPro Holdings Inc. | 48,500 | 1,550 |
| | NH Foods Ltd. | 43,900 | 1,544 |
| * | Hitachi Metals Ltd. | 81,400 | 1,541 |
| | ZOZO Inc. | 47,900 | 1,538 |
Total World Stock Index Fund
| | | Shares | Market
Value•
($000) |
| | Toyo Suisan Kaisha Ltd. | 35,500 | 1,530 |
| | Nabtesco Corp. | 47,000 | 1,525 |
| | Industrial & Infrastructure Fund Investment Corp. | 829 | 1,520 |
| | Tokyo Century Corp. | 26,320 | 1,507 |
| | Stanley Electric Co. Ltd. | 59,700 | 1,505 |
| | Iida Group Holdings Co. Ltd. | 60,697 | 1,496 |
| | Bank of Kyoto Ltd. | 33,000 | 1,484 |
| | Koei Tecmo Holdings Co. Ltd. | 31,512 | 1,467 |
| | USS Co. Ltd. | 90,100 | 1,452 |
| | Nikon Corp. | 131,200 | 1,447 |
| | Hitachi Construction Machinery Co. Ltd. | 45,300 | 1,445 |
| | Haseko Corp. | 110,400 | 1,438 |
| | NOF Corp. | 28,600 | 1,435 |
| | SCREEN Holdings Co. Ltd. | 15,400 | 1,431 |
| | Japan Prime Realty Investment Corp. | 390 | 1,430 |
| | Kyushu Railway Co. | 63,124 | 1,413 |
| | Tokyu Fudosan Holdings Corp. | 241,886 | 1,402 |
| | Jeol Ltd. | 18,400 | 1,395 |
| | Nippon Sanso Holdings Corp. | 59,100 | 1,395 |
| | Japan Post Insurance Co. Ltd. | 84,678 | 1,374 |
| | Japan Post Bank Co. Ltd. | 175,535 | 1,370 |
| | Toho Gas Co. Ltd. | 45,700 | 1,354 |
| | Kuraray Co. Ltd. | 148,900 | 1,347 |
| | Kose Corp. | 11,500 | 1,335 |
| | Rohto Pharmaceutical Co. Ltd. | 43,700 | 1,335 |
| | Aozora Bank Ltd. | 57,990 | 1,327 |
| | Nagoya Railroad Co. Ltd. | 79,800 | 1,319 |
| | Amada Co. Ltd. | 133,300 | 1,317 |
| | Fukuoka Financial Group Inc. | 73,264 | 1,316 |
| | Iwatani Corp. | 22,200 | 1,311 |
| * | Japan Airlines Co. Ltd. | 60,845 | 1,309 |
| | Itochu Techno-Solutions Corp. | 41,400 | 1,308 |
| | Oracle Corp. Japan | 13,800 | 1,306 |
| | Tohoku Electric Power Co. Inc. | 201,000 | 1,304 |
| | Rakus Co. Ltd | 41,100 | 1,303 |
| | Kyushu Electric Power Co. Inc. | 183,900 | 1,295 |
| | Mitsubishi HC Capital Inc. (XTKS) | 258,150 | 1,294 |
| | NGK Spark Plug Co. Ltd. | 81,000 | 1,294 |
| | Casio Computer Co. Ltd. | 91,000 | 1,288 |
| | Benefit One Inc. | 25,300 | 1,277 |
| | Activia Properties Inc. | 310 | 1,271 |
| | | Shares | Market
Value•
($000) |
| | Shinsei Bank Ltd. | 76,803 | 1,268 |
| | NSK Ltd. | 186,800 | 1,255 |
| | IHI Corp. | 53,600 | 1,252 |
| | Sumitomo Heavy Industries Ltd. | 48,400 | 1,246 |
| | Sohgo Security Services Co. Ltd. | 28,900 | 1,236 |
| | Tokyo Tatemono Co. Ltd. | 83,200 | 1,223 |
| | Japan Hotel REIT Investment Corp. | 2,023 | 1,222 |
| 2 | Sega Sammy Holdings Inc. | 85,800 | 1,220 |
| | Sekisui House REIT Inc. | 1,597 | 1,207 |
| | Yamada Denki Co. Ltd. | 312,672 | 1,195 |
| | NET One Systems Co. Ltd. | 36,200 | 1,187 |
| | Nifco Inc. | 37,202 | 1,187 |
| | Denka Co. Ltd. | 36,000 | 1,179 |
| * | Skylark Holdings Co. Ltd. | 87,047 | 1,179 |
| | LaSalle Logiport REIT | 708 | 1,177 |
| | Keikyu Corp. | 103,900 | 1,173 |
| | Nomura Real Estate Holdings Inc. | 48,100 | 1,173 |
| | Japan Logistics Fund Inc. | 390 | 1,167 |
| | Nippon Accommodations Fund Inc. | 209 | 1,166 |
| | Hisamitsu Pharmaceutical Co. Inc. | 34,100 | 1,163 |
| | Air Water Inc. | 76,000 | 1,163 |
| | Ulvac Inc. | 20,600 | 1,156 |
| | Kawasaki Heavy Industries Ltd. | 56,900 | 1,155 |
| | Cosmos Pharmaceutical Corp. | 7,500 | 1,146 |
| | Horiba Ltd. | 17,300 | 1,134 |
| | DIC Corp. | 42,600 | 1,128 |
| * | Japan Airport Terminal Co. Ltd. | 22,600 | 1,121 |
| | Sumitomo Forestry Co. Ltd. | 58,700 | 1,121 |
| | Nichirei Corp. | 46,000 | 1,120 |
| | THK Co. Ltd. | 52,000 | 1,118 |
| | Alfresa Holdings Corp. | 78,700 | 1,109 |
| | Sugi Holdings Co. Ltd. | 15,400 | 1,103 |
| | Teijin Ltd. | 81,800 | 1,098 |
| | Tokai Carbon Co. Ltd. | 83,900 | 1,097 |
| | Hino Motors Ltd. | 115,200 | 1,090 |
| | Kenedix Office Investment Corp. | 171 | 1,083 |
| | Pigeon Corp. | 46,660 | 1,080 |
| | Chugoku Electric Power Co. Inc. | 129,600 | 1,075 |
| | Ship Healthcare Holdings Inc. | 40,700 | 1,069 |
| | Mitsui Fudosan Logistics Park Inc. | 200 | 1,063 |
Total World Stock Index Fund
| | | Shares | Market
Value•
($000) |
| | COMSYS Holdings Corp. | 42,698 | 1,057 |
| | Mitsubishi Materials Corp. | 53,934 | 1,047 |
| | Kinden Corp. | 63,700 | 1,045 |
| | Keihan Holdings Co. Ltd. | 39,700 | 1,044 |
| | Zenkoku Hosho Co. Ltd. | 21,600 | 1,044 |
| | Morinaga Milk Industry Co. Ltd. | 17,700 | 1,037 |
| | Taisho Pharmaceutical Holdings Co. Ltd. | 19,300 | 1,036 |
| | Taiheiyo Cement Corp. | 48,600 | 1,033 |
| | Kewpie Corp. | 47,100 | 1,033 |
| | Takara Holdings Inc. | 75,000 | 1,026 |
| | Tokyo Ohka Kogyo Co. Ltd. | 16,100 | 1,024 |
| | Sanwa Holdings Corp. | 86,000 | 1,003 |
| | Medipal Holdings Corp. | 55,400 | 1,002 |
| | Lawson Inc. | 20,700 | 1,001 |
| | Kaneka Corp. | 26,000 | 997 |
| | Shinko Electric Industries Co. Ltd. | 24,700 | 995 |
| | Relo Group Inc. | 47,553 | 989 |
| | Electric Power Development Co. Ltd. | 74,700 | 988 |
| 2 | Anritsu Corp. | 59,500 | 987 |
| * | Sansan Inc. | 8,398 | 976 |
| | Nippon Electric Glass Co. Ltd. | 38,000 | 970 |
| * | SHIFT Inc. | 4,200 | 969 |
| | SCSK Corp. | 47,700 | 965 |
| | Sumitomo Dainippon Pharma Co. Ltd. | 68,200 | 964 |
| | Isetan Mitsukoshi Holdings Ltd. | 131,100 | 958 |
| | Frontier Real Estate Investment Corp. | 215 | 951 |
| | Sumitomo Rubber Industries Ltd. | 77,072 | 950 |
| | Mebuki Financial Group Inc. | 463,350 | 949 |
| | EXEO Group Inc. | 41,000 | 948 |
| | Seibu Holdings Inc. | 86,788 | 948 |
| | Kadokawa Corp. | 17,736 | 936 |
| | Daiseki Co. Ltd. | 19,920 | 930 |
| | Kamigumi Co. Ltd. | 45,800 | 922 |
| | JGC Holdings Corp. | 98,000 | 921 |
| | Sharp Corp. | 78,029 | 920 |
| | Tsumura & Co. | 29,200 | 910 |
| * | PeptiDream Inc. | 37,500 | 906 |
| | Ushio Inc. | 50,400 | 902 |
| | Sawai Group Holdings Co. Ltd. | 20,400 | 900 |
| | House Foods Group Inc. | 31,200 | 895 |
| | Nihon Kohden Corp. | 28,100 | 894 |
| | Sankyu Inc. | 19,800 | 894 |
| | Kenedix Residential Next Investment Corp. | 460 | 885 |
| | Outsourcing Inc. | 45,900 | 881 |
| | | Shares | Market
Value•
($000) |
| | Daicel Corp. | 117,100 | 877 |
| | JTEKT Corp. | 99,100 | 877 |
| | ADEKA Corp. | 39,300 | 874 |
| | J Front Retailing Co. Ltd. | 93,800 | 869 |
| | Suzuken Co. Ltd. | 30,660 | 854 |
| | Mori Hills REIT Investment Corp. | 627 | 850 |
| | Alps Alpine Co. Ltd. | 86,567 | 846 |
| | Topcon Corp. | 47,200 | 842 |
| | Kobe Steel Ltd. | 142,600 | 838 |
| | Fuji Corp. | 35,900 | 837 |
| | Konica Minolta Inc. | 169,200 | 837 |
| | AEON REIT Investment Corp. | 619 | 837 |
| | Coca-Cola Bottlers Japan Holdings Inc. | 60,575 | 834 |
| | SMS Co. Ltd. | 21,400 | 830 |
| | Zensho Holdings Co. Ltd. | 35,500 | 820 |
| | Fujitec Co. Ltd. | 36,100 | 820 |
| | DeNA Co. Ltd. | 44,300 | 818 |
| * | RENOVA Inc. | 18,600 | 818 |
| | NIPPON REIT Investment Corp. | 210 | 807 |
| | Nankai Electric Railway Co. Ltd. | 40,600 | 806 |
| * | Park24 Co. Ltd. | 52,300 | 801 |
| | Goldwin Inc. | 13,200 | 799 |
| | GS Yuasa Corp. | 36,600 | 797 |
| | Shimamura Co. Ltd. | 9,400 | 796 |
| | Comforia Residential REIT Inc. | 273 | 796 |
| | Benesse Holdings Inc. | 34,700 | 794 |
| | Fancl Corp. | 26,100 | 791 |
| | Nishi-Nippon Railroad Co. Ltd. | 32,100 | 791 |
| | Nagase & Co. Ltd. | 46,500 | 787 |
| | Daiwa Securities Living Investments Corp. | 774 | 782 |
| | SHO-BOND Holdings Co. Ltd. | 18,600 | 779 |
| | Justsystems Corp. | 15,000 | 775 |
| | Toyo Seikan Group Holdings Ltd. | 65,200 | 774 |
| * | Mitsubishi Motors Corp. | 240,000 | 768 |
| | OKUMA Corp. | 16,100 | 767 |
| | Invincible Investment Corp. | 1,939 | 767 |
| | DMG Mori Co. Ltd. | 44,100 | 759 |
| | Kagome Co. Ltd. | 29,700 | 754 |
| | Penta-Ocean Construction Co. Ltd. | 108,800 | 750 |
| | Infomart Corp. | 76,700 | 748 |
| | Nihon Unisys Ltd. | 26,500 | 745 |
| | Ube Industries Ltd. | 40,000 | 745 |
| | Aeon Mall Co. Ltd. | 50,072 | 734 |
| | Rengo Co. Ltd. | 96,800 | 734 |
| | Hulic REIT Inc. | 483 | 732 |
| | Internet Initiative Japan Inc. | 20,900 | 731 |
| | Kenedix Retail REIT Corp. | 286 | 730 |
Total World Stock Index Fund
| | | Shares | Market
Value•
($000) |
| | Ain Holdings Inc. | 12,300 | 726 |
| | Yamazaki Baking Co. Ltd. | 47,600 | 723 |
| | Hoshino Resorts REIT Inc. | 110 | 718 |
| | Sundrug Co. Ltd. | 24,300 | 711 |
| | Japan Elevator Service Holdings Co. Ltd. | 32,800 | 711 |
| | Dowa Holdings Co. Ltd. | 17,000 | 710 |
| | Nippo Corp. | 20,000 | 708 |
| | Menicon Co. Ltd. | 18,800 | 706 |
| | Credit Saison Co. Ltd. | 57,400 | 704 |
| | Calbee Inc. | 27,200 | 701 |
| | Japan Steel Works Ltd. | 23,800 | 699 |
| | Daiwa Office Investment Corp. | 108 | 697 |
| | Ezaki Glico Co. Ltd. | 19,000 | 690 |
| 2 | NTT UD REIT Investment Corp. | 518 | 688 |
| | Katitas Co. Ltd. | 18,800 | 686 |
| | Jafco Co. Ltd. | 10,800 | 684 |
| * | Fujikura Ltd. | 126,600 | 683 |
| | Descente Ltd. | 17,900 | 679 |
| | Nippon Suisan Kaisha Ltd. | 119,000 | 676 |
| | Yokohama Rubber Co. Ltd. | 39,600 | 670 |
| | Tokyu REIT Inc. | 397 | 666 |
| | Mitsubishi Logistics Corp. | 23,800 | 665 |
| | Daiichikosho Co. Ltd. | 18,200 | 661 |
| | Mitsubishi Estate Logistics REIT Investment Corp. | 150 | 649 |
| | INFRONEER Holdings Inc. | 77,752 | 644 |
| | Sumitomo Bakelite Co. Ltd. | 14,300 | 643 |
| | Toyo Tire Corp. | 38,600 | 642 |
| | Hachijuni Bank Ltd. | 191,700 | 641 |
| | Zeon Corp. | 53,700 | 637 |
| | TS Tech Co. Ltd. | 47,600 | 637 |
| | Hitachi Zosen Corp. | 81,000 | 635 |
| | Seino Holdings Co. Ltd. | 52,300 | 634 |
| | Pilot Corp. | 17,200 | 631 |
| * | Nishimatsu Construction Co. Ltd. | 21,800 | 629 |
| | Mitsui High-Tec Inc. | 8,100 | 626 |
| | Toagosei Co. Ltd. | 55,900 | 625 |
| | Bic Camera Inc. | 72,500 | 625 |
| | Daido Steel Co. Ltd. | 16,300 | 624 |
| | Mabuchi Motor Co. Ltd. | 18,100 | 624 |
| | Nippon Shokubai Co. Ltd. | 11,900 | 622 |
| | Acom Co. Ltd. | 186,200 | 621 |
| | K's Holdings Corp | 59,968 | 619 |
| | As One Corp. | 4,500 | 617 |
| | Kyoritsu Maintenance Co. Ltd. | 16,372 | 613 |
| | | Shares | Market
Value•
($000) |
| | Mirait Holdings Corp. | 31,800 | 612 |
| | Amano Corp. | 24,700 | 611 |
| | Nippon Kayaku Co. Ltd. | 57,900 | 610 |
| | Toyobo Co. Ltd. | 50,700 | 609 |
| | FP Corp. | 17,900 | 608 |
| | Japan Excellent Inc. | 501 | 605 |
| | JCR Pharmaceuticals Co. Ltd. | 24,500 | 601 |
| | Daiwabo Holdings Co. Ltd. | 34,000 | 599 |
| | NHK Spring Co. Ltd. | 79,200 | 597 |
| | Hirogin Holdings Inc. | 107,900 | 594 |
| | GMO internet Inc. | 21,400 | 591 |
| | Fujitsu General Ltd. | 24,100 | 591 |
| | Hitachi Transport System Ltd. | 15,000 | 591 |
| | CKD Corp. | 29,700 | 589 |
| | Aica Kogyo Co. Ltd. | 19,200 | 588 |
| | Tadano Ltd. | 53,700 | 586 |
| | Mori Trust Sogo REIT Inc. | 448 | 579 |
| | Meitec Corp. | 9,600 | 577 |
| | Kyudenko Corp. | 18,100 | 574 |
| | Wacoal Holdings Corp. | 28,300 | 567 |
| | Inaba Denki Sangyo Co. Ltd. | 23,600 | 566 |
| | Tokyo Seimitsu Co. Ltd. | 13,900 | 566 |
| | Mitsui Mining & Smelting Co. Ltd. | 19,600 | 562 |
| | Fujimi Inc. | 8,900 | 560 |
| | Yamaguchi Financial Group Inc. | 100,100 | 559 |
| | Pola Orbis Holdings Inc. | 26,200 | 559 |
| | Digital Garage Inc. | 11,900 | 556 |
| | Iyo Bank Ltd. | 113,600 | 556 |
| | Glory Ltd. | 25,400 | 547 |
| *,2 | HIS Co. Ltd. | 24,200 | 544 |
| 2 | Kobe Bussan Co. Ltd. | 15,800 | 544 |
| | Sapporo Holdings Ltd. | 24,700 | 536 |
| | Toyoda Gosei Co. Ltd. | 26,100 | 534 |
| | Hankyu Hanshin REIT Inc. | 361 | 532 |
| | Sotetsu Holdings Inc. | 27,300 | 528 |
| | Toshiba TEC Corp. | 13,400 | 528 |
| | Heiwa Real Estate REIT Inc. | 378 | 528 |
| | Daio Paper Corp. | 29,900 | 526 |
| | Fukuoka REIT Corp. | 354 | 525 |
| | Kokuyo Co. Ltd. | 34,400 | 524 |
| | Cosmo Energy Holdings Co. Ltd. | 25,600 | 523 |
| | Kyushu Financial Group Inc. | 154,670 | 521 |
| | AEON Financial Service Co. Ltd. | 40,900 | 520 |
| | OBIC Business Consultants Co. Ltd. | 10,489 | 518 |
Total World Stock Index Fund
| | | Shares | Market
Value•
($000) |
| | Takara Bio Inc. | 19,800 | 517 |
| | Maruichi Steel Tube Ltd. | 22,700 | 516 |
| | NSD Co. Ltd. | 26,780 | 510 |
| | Global One Real Estate Investment Corp. | 492 | 507 |
| * | Toda Corp. | 80,400 | 506 |
| | NOK Corp. | 43,300 | 503 |
| | Heiwa Real Estate Co. Ltd. | 15,900 | 502 |
| | OSG Corp. | 30,200 | 502 |
| | SOSiLA Logistics REIT Inc. | 334 | 502 |
| * | Shochiku Co. Ltd. | 4,600 | 501 |
| | Nippon Gas Co. Ltd. | 40,200 | 499 |
| | Fukuyama Transporting Co. Ltd. | 12,500 | 498 |
| | Furukawa Electric Co. Ltd. | 22,700 | 497 |
| | Kotobuki Spirits Co. Ltd. | 7,400 | 495 |
| | Nichias Corp. | 20,200 | 495 |
| | Takashimaya Co. Ltd. | 53,500 | 495 |
| | JCU Corp. | 12,300 | 494 |
| | PALTAC Corp. | 11,100 | 492 |
| | Ichigo Office REIT Investment Corp. | 649 | 492 |
| | Tomy Co. Ltd. | 51,500 | 489 |
| | Seven Bank Ltd. | 229,600 | 485 |
| * | Raksul Inc. | 8,800 | 484 |
| | Sakata Seed Corp. | 16,000 | 483 |
| | Shikoku Electric Power Co. Inc. | 73,800 | 481 |
| | Gunma Bank Ltd. | 155,000 | 479 |
| | Nikkon Holdings Co. Ltd. | 24,500 | 479 |
| | Kaken Pharmaceutical Co. Ltd. | 12,100 | 477 |
| | ABC-Mart Inc. | 9,900 | 476 |
| | Monex Group Inc. | 73,100 | 476 |
| | Itochu Advance Logistics Investment Corp. | 334 | 476 |
| | Morinaga & Co. Ltd. | 13,400 | 474 |
| | Tokai Tokyo Financial Holdings Inc. | 136,700 | 474 |
| | Dexerials Corp. | 23,400 | 473 |
| | Toei Co. Ltd. | 2,400 | 471 |
| | Citizen Watch Co. Ltd. | 106,600 | 465 |
| | Okumura Corp. | 18,000 | 465 |
| * | Oisix ra daichi Inc. | 11,100 | 465 |
| | Tsubakimoto Chain Co. | 15,700 | 464 |
| | Nippon Light Metal Holdings Co. Ltd. | 27,830 | 462 |
| | Asahi Holdings Inc. | 25,800 | 460 |
| | Yaoko Co. Ltd. | 7,700 | 458 |
| | Round One Corp. | 38,000 | 457 |
| | Hokuetsu Corp. | 68,900 | 455 |
| | Toyota Boshoku Corp. | 23,600 | 454 |
| | H.U. Group Holdings Inc. | 18,300 | 451 |
| | | Shares | Market
Value•
($000) |
| | Yoshinoya Holdings Co. Ltd. | 23,100 | 450 |
| | Izumi Co. Ltd. | 14,800 | 449 |
| | Sanrio Co. Ltd. | 19,892 | 446 |
| | Senko Group Holdings Co. Ltd. | 50,000 | 445 |
| | Shoei Co. Ltd. | 10,000 | 445 |
| | Systena Corp. | 24,000 | 444 |
| | eRex Co. Ltd. | 19,400 | 444 |
| | Yamato Kogyo Co. Ltd. | 13,200 | 443 |
| | Chugoku Bank Ltd. | 60,900 | 442 |
| | Earth Corp. | 7,200 | 442 |
| | Hokuhoku Financial Group Inc. | 61,700 | 441 |
| | Mizuho Leasing Co. Ltd. | 14,100 | 436 |
| | Kureha Corp. | 6,700 | 435 |
| | TOKAI Holdings Corp. | 57,300 | 435 |
| | Macnica Fuji Electronics Holdings Inc. | 18,500 | 435 |
| | NS Solutions Corp. | 12,900 | 434 |
| | Hazama Ando Corp. | 63,800 | 432 |
| | Nipro Corp. | 42,400 | 431 |
| | Sanken Electric Co. Ltd. | 8,200 | 431 |
| | en japan Inc. | 10,700 | 425 |
| | Resorttrust Inc. | 23,800 | 422 |
| | Hokuriku Electric Power Co. | 88,700 | 422 |
| | Okamura Corp. | 31,900 | 421 |
| | Wacom Co. Ltd. | 64,900 | 420 |
| | Mirai Corp. | 910 | 420 |
| | Milbon Co. Ltd. | 7,000 | 419 |
| | Toridoll Holdings Corp. | 17,400 | 419 |
| | Fuyo General Lease Co. Ltd. | 6,400 | 416 |
| | Tokuyama Corp. | 24,100 | 413 |
| | Ariake Japan Co. Ltd. | 6,300 | 410 |
| | Central Glass Co. Ltd. | 21,900 | 408 |
| | Kiyo Bank Ltd. | 30,807 | 405 |
| | Fuji Soft Inc. | 7,900 | 402 |
| | Hanwa Co. Ltd. | 13,200 | 397 |
| | Nichicon Corp. | 41,600 | 394 |
| | Kusuri no Aoki Holdings Co. Ltd. | 5,900 | 393 |
| | San-A Co. Ltd. | 10,800 | 389 |
| | Nagawa Co. Ltd. | 4,100 | 388 |
| | Nisshinbo Holdings Inc. | 50,100 | 387 |
| | Sankyo Co. Ltd. | 15,900 | 386 |
| | CRE Logistics REIT Inc. | 198 | 385 |
| | DCM Holdings Co. Ltd. | 39,200 | 382 |
| | Oki Electric Industry Co. Ltd. | 46,400 | 381 |
| | Takasago Thermal Engineering Co. Ltd. | 20,800 | 381 |
| *,2 | giftee Inc. | 11,127 | 376 |
| | Mani Inc. | 22,000 | 375 |
| | Fuji Oil Holdings Inc. | 16,000 | 375 |
Total World Stock Index Fund
| | | Shares | Market
Value•
($000) |
| | Rorze Corp. | 3,900 | 374 |
| | Kohnan Shoji Co. Ltd. | 11,900 | 372 |
| | Lintec Corp. | 16,600 | 371 |
| | Oiles Corp. | 24,960 | 371 |
| | SAMTY Co. Ltd. | 16,700 | 371 |
| | Nippon Signal Co. Ltd. | 42,800 | 370 |
| | Aida Engineering Ltd. | 40,500 | 368 |
| | Toyo Ink SC Holdings Co. Ltd. | 20,900 | 368 |
| | JINS Holdings Inc. | 5,800 | 367 |
| | Nojima Corp. | 16,700 | 366 |
| | Takuma Co. Ltd. | 27,800 | 364 |
| | Hokkaido Electric Power Co. Inc. | 87,000 | 362 |
| | NEC Networks & System Integration Corp. | 22,500 | 362 |
| | Iriso Electronics Co. Ltd. | 7,700 | 354 |
| | Japan Securities Finance Co. Ltd. | 46,400 | 354 |
| | Sumitomo Warehouse Co. Ltd. | 22,000 | 354 |
| | Nihon Parkerizing Co. Ltd. | 35,200 | 351 |
| | Fuji Kyuko Co. Ltd. | 8,700 | 350 |
| | Elecom Co. Ltd. | 22,800 | 349 |
| | Nitto Boseki Co. Ltd. | 10,800 | 346 |
| * | NTN Corp. | 159,100 | 345 |
| | Sumitomo Osaka Cement Co. Ltd. | 12,300 | 345 |
| | Toho Holdings Co. Ltd. | 21,300 | 345 |
| | Tokyo Steel Manufacturing Co. Ltd. | 30,900 | 344 |
| | Star Asia Investment Corp. | 649 | 344 |
| | Mixi Inc. | 15,024 | 344 |
| | Central Sports Co. Ltd. | 16,050 | 342 |
| | Token Corp. | 4,200 | 342 |
| | Kanematsu Corp. | 29,400 | 341 |
| | Nippon Paper Industries Co. Ltd. | 33,100 | 339 |
| | Daito Pharmaceutical Co. Ltd. | 12,000 | 338 |
| | Duskin Co. Ltd. | 14,000 | 337 |
| | Riso Kagaku Corp. | 15,900 | 336 |
| | Daishi Hokuetsu Financial Group Inc. | 14,950 | 335 |
| | Asahi Diamond Industrial Co. Ltd. | 54,300 | 334 |
| | 77 Bank Ltd. | 32,700 | 334 |
| | KH Neochem Co. Ltd. | 12,900 | 332 |
| | Musashi Seimitsu Industry Co. Ltd. | 17,600 | 331 |
| | Mars Group Holdings Corp. | 22,700 | 330 |
| | BeNext-Yumeshin Group Co. | 25,300 | 330 |
| | | Shares | Market
Value•
($000) |
| | Kumagai Gumi Co. Ltd. | 13,300 | 329 |
| | Fuji Seal International Inc. | 14,900 | 328 |
| | Showa Sangyo Co. Ltd. | 13,200 | 328 |
| | Hirata Corp. | 5,380 | 328 |
| | Fuso Chemical Co. Ltd. | 7,100 | 327 |
| * | Royal Holdings Co. Ltd. | 18,000 | 327 |
| | Osaka Organic Chemical Industry Ltd. | 10,900 | 327 |
| | Meidensha Corp. | 15,500 | 326 |
| | Trusco Nakayama Corp. | 13,500 | 326 |
| | Heiwa Corp. | 18,200 | 325 |
| | Nichiha Corp. | 11,300 | 325 |
| | Sodick Co. Ltd. | 42,200 | 325 |
| | Nishi-Nippon Financial Holdings Inc. | 55,500 | 324 |
| | Joyful Honda Co. Ltd. | 23,488 | 323 |
| 2 | Colowide Co. Ltd. | 22,300 | 322 |
| | Maxell Ltd. | 26,800 | 322 |
| | Pacific Industrial Co. Ltd. | 31,500 | 321 |
| | Okinawa Electric Power Co. Inc. | 26,012 | 319 |
| | Nippon Beet Sugar Manufacturing Co. Ltd. | 21,900 | 318 |
| | Raito Kogyo Co. Ltd. | 17,900 | 318 |
| | Maruha Nichiro Corp. | 14,100 | 318 |
| | Japan Material Co. Ltd. | 22,900 | 318 |
| | Eizo Corp. | 8,300 | 317 |
| | Hibiya Engineering Ltd. | 18,700 | 314 |
| | Maruwa Co. Ltd. | 2,800 | 314 |
| | Ichiyoshi Securities Co. Ltd. | 54,700 | 312 |
| | Hyakugo Bank Ltd. | 107,800 | 312 |
| | Ringer Hut Co. Ltd. | 16,100 | 312 |
| | DTS Corp. | 14,000 | 311 |
| | Ogaki Kyoritsu Bank Ltd. | 18,700 | 311 |
| | Nippon Koei Co. Ltd. | 10,200 | 310 |
| | Okabe Co. Ltd. | 51,600 | 310 |
| | MCJ Co. Ltd. | 27,500 | 310 |
| | Aiful Corp. | 92,800 | 309 |
| | Shiga Bank Ltd. | 19,100 | 309 |
| 2 | Midac Holdings Co. Ltd. | 6,500 | 309 |
| | Takeuchi Manufacturing Co. Ltd. | 12,000 | 308 |
| | gremz Inc. | 13,400 | 308 |
| | Atom Corp. | 45,349 | 306 |
| | UT Group Co. Ltd. | 9,500 | 304 |
| | Noevir Holdings Co. Ltd. | 6,200 | 303 |
| | Musashino Bank Ltd. | 19,200 | 302 |
| | Nanto Bank Ltd. | 17,500 | 302 |
Total World Stock Index Fund
| | | Shares | Market
Value•
($000) |
| | Anicom Holdings Inc. | 38,700 | 302 |
| | Takara Leben Real Estate Investment Corp. | 309 | 301 |
| | Nippon Soda Co. Ltd. | 10,000 | 300 |
| | Yokowo Co. Ltd. | 13,495 | 300 |
| | Sangetsu Corp. | 21,700 | 299 |
| | Taiyo Holdings Co. Ltd. | 11,200 | 299 |
| | Canon Marketing Japan Inc. | 14,900 | 295 |
| | San-In Godo Bank Ltd. | 60,300 | 295 |
| | Information Services International-Dentsu Ltd. | 8,400 | 294 |
| | TKC Corp. | 9,600 | 294 |
| 2 | Yamashin-Filter Corp. | 48,551 | 294 |
| | Bunka Shutter Co. Ltd. | 29,900 | 291 |
| | Dip Corp. | 8,100 | 291 |
| | Okinawa Financial Group Inc. | 13,180 | 290 |
| | JP-Holdings Inc. | 129,900 | 289 |
| | Seiren Co. Ltd. | 14,200 | 287 |
| | Daido Metal Co. Ltd. | 53,300 | 286 |
| | Taikisha Ltd. | 10,000 | 286 |
| | LIFULL Co. Ltd. | 91,000 | 286 |
| | IR Japan Holdings Ltd. | 3,100 | 286 |
| | Mitani Sekisan Co. Ltd. | 4,500 | 286 |
| | San-Ai Oil Co. Ltd. | 21,900 | 285 |
| | Japan Lifeline Co. Ltd. | 26,400 | 284 |
| | Kandenko Co. Ltd. | 36,700 | 284 |
| | Tocalo Co. Ltd. | 23,200 | 284 |
| | Nippon Ceramic Co. Ltd. | 10,900 | 283 |
| | Financial Products Group Co. Ltd. | 48,900 | 283 |
| | Nomura Co. Ltd. | 28,600 | 282 |
| | Star Micronics Co. Ltd. | 21,500 | 282 |
| | One REIT Inc. | 105 | 282 |
| | Itoham Yonekyu Holdings Inc. | 46,072 | 281 |
| | North Pacific Bank Ltd. | 135,700 | 281 |
| | Nachi-Fujikoshi Corp. | 7,400 | 280 |
| | Kintetsu World Express Inc. | 11,600 | 279 |
| | V Technology Co. Ltd. | 7,400 | 279 |
| | Monogatari Corp. | 4,472 | 279 |
| | Kumiai Chemical Industry Co. Ltd. | 37,263 | 278 |
| | Mochida Pharmaceutical Co. Ltd. | 9,542 | 278 |
| | Nippon Thompson Co. Ltd. | 54,100 | 278 |
| | Nihon Chouzai Co. Ltd. | 19,300 | 278 |
| | | Shares | Market
Value•
($000) |
| | Osaki Electric Co. Ltd. | 56,100 | 277 |
| | Cosel Co. Ltd. | 33,800 | 275 |
| | Tokyo Individualized Educational Institute Inc. | 43,400 | 274 |
| * | Fujita Kanko Inc. | 12,800 | 271 |
| | Funai Soken Holdings Inc. | 9,750 | 271 |
| | Noritake Co. Ltd. | 6,200 | 271 |
| | Valor Holdings Co. Ltd. | 12,800 | 271 |
| | Nissha Co. Ltd. | 16,500 | 270 |
| | MEC Co. Ltd. | 9,783 | 269 |
| | Ministop Co. Ltd. | 22,000 | 268 |
| | Takasago International Corp. | 10,300 | 268 |
| | Intage Holdings Inc. | 15,800 | 267 |
| | Daihen Corp. | 6,400 | 267 |
| | Megmilk Snow Brand Co. Ltd. | 13,800 | 267 |
| | Mori Trust Hotel REIT Inc. | 215 | 267 |
| | Stella Chemifa Corp. | 10,600 | 266 |
| 2 | Kura Sushi Inc. | 8,200 | 265 |
| | Hioki EE Corp. | 3,800 | 265 |
| | Japan Aviation Electronics Industry Ltd. | 16,000 | 265 |
| | EDION Corp. | 27,900 | 265 |
| | Transcosmos Inc. | 8,800 | 265 |
| | eGuarantee Inc. | 11,900 | 265 |
| 2 | Starts Proceed Investment Corp. | 126 | 265 |
| | Chiyoda Integre Co. Ltd. | 13,800 | 264 |
| | Keiyo Bank Ltd. | 67,600 | 263 |
| | GLOBERIDE Inc. | 7,200 | 261 |
| | Digital Arts Inc. | 3,200 | 261 |
| | Paramount Bed Holdings Co. Ltd. | 14,000 | 261 |
| | MOS Food Services Inc. | 9,300 | 259 |
| | Ai Holdings Corp. | 13,700 | 259 |
| | Senshu Ikeda Holdings Inc. | 184,500 | 259 |
| | Zuken Inc. | 6,700 | 258 |
| | Aomori Bank Ltd. | 14,900 | 257 |
| | Konishi Co. Ltd. | 16,500 | 257 |
| | Oyo Corp. | 16,800 | 257 |
| | Autobacs Seven Co. Ltd. | 19,800 | 256 |
| | Giken Ltd. | 6,700 | 256 |
| | Usen-Next Holdings Co. Ltd. | 8,681 | 256 |
| | Daibiru Corp. | 18,300 | 255 |
| | Tamura Corp. | 37,000 | 254 |
| | TOMONY Holdings Inc. | 95,000 | 254 |
| | Meisei Industrial Co. Ltd. | 42,400 | 253 |
| | Future Corp. | 8,600 | 252 |
| | Aeon Fantasy Co. Ltd. | 15,200 | 252 |
| | Hyakujushi Bank Ltd. | 19,500 | 252 |
| | BML Inc. | 7,100 | 250 |
Total World Stock Index Fund
| | | Shares | Market
Value•
($000) |
| | Fuso Pharmaceutical Industries Ltd. | 11,200 | 250 |
| | Inabata & Co. Ltd. | 16,900 | 250 |
| | Key Coffee Inc. | 12,800 | 250 |
| | Tri Chemical Laboratories Inc. | 8,368 | 250 |
| | Yamazen Corp. | 26,800 | 248 |
| * | M&A Capital Partners Co. Ltd. | 4,400 | 248 |
| | Ichibanya Co. Ltd. | 6,100 | 247 |
| | PC Depot Corp. | 61,420 | 247 |
| | Kyokuyo Co. Ltd. | 9,200 | 247 |
| * | ARTERIA Networks Corp. | 17,500 | 247 |
| | Nichireki Co. Ltd. | 20,800 | 247 |
| | Samty Residential Investment Corp. | 233 | 246 |
| | Kato Sangyo Co. Ltd. | 8,700 | 245 |
| | Orient Corp. | 178,500 | 245 |
| * | Right On Co. Ltd. | 38,900 | 245 |
| | GungHo Online Entertainment Inc. | 13,070 | 245 |
| | Gree Inc. | 29,100 | 245 |
| | Hosiden Corp. | 23,100 | 244 |
| | Nissin Corp. | 17,200 | 244 |
| | Fujimori Kogyo Co. Ltd. | 5,900 | 243 |
| | CAC Holdings Corp. | 17,100 | 242 |
| | Roland DG Corp. | 9,200 | 242 |
| | Nagatanien Holdings Co. Ltd. | 13,200 | 242 |
| | S-Pool Inc. | 21,565 | 241 |
| | Prima Meat Packers Ltd. | 10,200 | 240 |
| | Rokko Butter Co. Ltd. | 16,400 | 240 |
| | Starts Corp. Inc. | 9,900 | 238 |
| | Maeda Kosen Co. Ltd. | 8,200 | 238 |
| | Fukui Bank Ltd. | 18,300 | 237 |
| | Shizuoka Gas Co. Ltd. | 22,500 | 237 |
| | Makino Milling Machine Co. Ltd. | 6,600 | 237 |
| | Sanyo Electric Railway Co. Ltd. | 13,481 | 237 |
| | Nippon Pillar Packing Co. Ltd. | 9,700 | 237 |
| | Nichiban Co. Ltd. | 14,500 | 236 |
| | Shimizu Bank Ltd. | 17,400 | 236 |
| | Qol Holdings Co. Ltd. | 15,800 | 235 |
| | Fujiya Co. Ltd. | 11,300 | 234 |
| | Arcs Co. Ltd. | 12,200 | 234 |
| | T Hasegawa Co. Ltd. | 9,600 | 234 |
| | Kenko Mayonnaise Co. Ltd. | 17,400 | 233 |
| | Komeri Co. Ltd. | 10,100 | 233 |
| | Zenrin Co. Ltd. | 25,250 | 233 |
| | DKS Co. Ltd. | 7,700 | 233 |
| * | SRE Holdings Corp. | 3,360 | 233 |
| | Nippn Corp. | 16,200 | 232 |
| | Sanki Engineering Co. Ltd. | 18,400 | 232 |
| | | Shares | Market
Value•
($000) |
| | Tokyo Kiraboshi Financial Group Inc. | 17,949 | 232 |
| | Yamanashi Chuo Bank Ltd. | 32,000 | 231 |
| | Aichi Corp. | 32,400 | 230 |
| | Nippon Parking Development Co. Ltd. | 181,900 | 230 |
| | Jaccs Co. Ltd. | 8,600 | 229 |
| | Marudai Food Co. Ltd. | 15,400 | 229 |
| | Noritz Corp. | 14,300 | 229 |
| | San ju San Financial Group Inc. | 18,680 | 229 |
| | KYORIN Holdings Inc. | 14,900 | 229 |
| | Nextage Co. Ltd. | 12,500 | 229 |
| | Matsui Securities Co. Ltd. | 31,800 | 228 |
| *,2 | Sagami Holdings Corp. | 25,400 | 228 |
| | Awa Bank Ltd. | 12,200 | 227 |
| | ZERIA Pharmaceutical Co. Ltd. | 12,700 | 227 |
| | UACJ Corp. | 9,800 | 227 |
| | Daisyo Corp. | 25,400 | 226 |
| | Taisei Lamick Co. Ltd. | 9,400 | 226 |
| | Oita Bank Ltd. | 14,100 | 225 |
| | Pacific Metals Co. Ltd. | 12,400 | 225 |
| | Osaka Steel Co. Ltd. | 21,900 | 224 |
| | Takihyo Co. Ltd. | 14,300 | 224 |
| | Shima Seiki Manufacturing Ltd. | 11,600 | 223 |
| | Furukawa Battery Co. Ltd. | 15,950 | 223 |
| | Raiznext Corp. | 20,500 | 222 |
| | Bank of the Ryukyus Ltd. | 33,200 | 221 |
| | Tonami Holdings Co. Ltd. | 5,600 | 221 |
| | Create SD Holdings Co. Ltd. | 7,200 | 221 |
| | H2O Retailing Corp. | 27,300 | 218 |
| | Okamoto Industries Inc. | 6,200 | 218 |
| | Sanyo Denki Co. Ltd. | 3,800 | 218 |
| | Sinanen Holdings Co. Ltd. | 7,100 | 218 |
| | Tokai Rika Co. Ltd. | 15,600 | 218 |
| | Nissin Sugar Co. Ltd. | 14,600 | 218 |
| | Solasto Corp. | 18,000 | 218 |
| | Max Co. Ltd. | 13,600 | 217 |
| | Shibuya Corp. | 8,200 | 217 |
| | S Foods Inc. | 7,500 | 217 |
| | Aeon Hokkaido Corp. | 18,800 | 217 |
| | Gunze Ltd. | 5,600 | 216 |
| | Fukushima Galilei Co. Ltd. | 5,400 | 215 |
| | Nippon Denko Co. Ltd. | 66,600 | 215 |
| | Suruga Bank Ltd. | 58,500 | 215 |
Total World Stock Index Fund
| | | Shares | Market
Value•
($000) |
| | Akita Bank Ltd. | 16,800 | 214 |
| | CMK Corp. | 56,900 | 214 |
| | Cybozu Inc. | 9,000 | 214 |
| | Mitsuuroko Group Holdings Co. Ltd. | 17,900 | 214 |
| | TOC Co. Ltd. | 38,200 | 214 |
| | Maruwa Unyu Kikan Co. Ltd. | 15,264 | 214 |
| | Saizeriya Co. Ltd. | 7,900 | 213 |
| | Futaba Corp. | 31,400 | 213 |
| | Morita Holdings Corp. | 16,900 | 213 |
| | Furuno Electric Co. Ltd. | 19,800 | 212 |
| | Idec Corp. | 10,000 | 212 |
| * | Toho Co. Ltd. | 15,800 | 212 |
| | Comture Corp. | 7,800 | 212 |
| | Takara Leben Co. Ltd. | 77,300 | 211 |
| | CTS Co. Ltd. | 30,179 | 211 |
| | Japan Petroleum Exploration Co. Ltd. | 11,600 | 211 |
| | United Super Markets Holdings Inc. | 23,160 | 211 |
| | ZIGExN Co. Ltd. | 59,200 | 211 |
| | Bank of Iwate Ltd. | 14,600 | 210 |
| | Kyosan Electric Manufacturing Co. Ltd. | 49,900 | 210 |
| * | Sun Frontier Fudousan Co. Ltd. | 22,300 | 209 |
| | FAN Communications Inc. | 52,800 | 209 |
| | Sumitomo Mitsui Construction Co. Ltd. | 49,120 | 208 |
| | Nippon Steel Trading Corp. | 4,600 | 208 |
| | Tekken Corp. | 13,000 | 208 |
| | Towa Pharmaceutical Co. Ltd. | 8,100 | 208 |
| | Dai Nippon Toryo Co. Ltd. | 27,200 | 207 |
| | Life Corp. | 6,300 | 207 |
| | Takara Standard Co. Ltd. | 15,600 | 207 |
| | Juroku Financial Group Inc. | 11,400 | 207 |
| | Megachips Corp. | 6,500 | 206 |
| | Prestige International Inc. | 30,000 | 206 |
| | Kaga Electronics Co. Ltd. | 7,500 | 206 |
| | Kanto Denka Kogyo Co. Ltd. | 22,400 | 206 |
| | Nihon Tokushu Toryo Co. Ltd. | 23,400 | 206 |
| | Tsugami Corp. | 15,000 | 206 |
| 2 | Pharma Foods International Co. Ltd. | 9,100 | 206 |
| | Yokogawa Bridge Holdings Corp. | 10,100 | 204 |
| | St. Marc Holdings Co. Ltd. | 15,200 | 204 |
| | | Shares | Market
Value•
($000) |
| | Melco Holdings Inc. | 4,900 | 203 |
| | YAKUODO Holdings Co. Ltd. | 9,600 | 203 |
| * | Curves Holdings Co. Ltd. | 26,104 | 203 |
| | KeePer Technical Laboratory Co. Ltd. | 7,029 | 203 |
| | Canon Electronics Inc. | 14,700 | 202 |
| | Daiho Corp. | 6,000 | 202 |
| | Warabeya Nichiyo Holdings Co. Ltd. | 10,300 | 202 |
| *,2 | Change Inc. | 11,200 | 202 |
| | Zojirushi Corp. | 14,500 | 201 |
| | Aisan Industry Co. Ltd. | 27,100 | 200 |
| 2 | V-Cube Inc. | 13,239 | 200 |
| | Yodogawa Steel Works Ltd. | 9,100 | 199 |
| | Avex Inc. | 14,500 | 198 |
| * | Kourakuen Holdings Corp. | 15,200 | 197 |
| | Adastria Co. Ltd. | 10,640 | 197 |
| | Kissei Pharmaceutical Co. Ltd. | 9,848 | 197 |
| | Tokyu Construction Co. Ltd. | 27,800 | 197 |
| | Sekisui Jushi Corp. | 10,600 | 197 |
| 2 | Create Restaurants Holdings Inc. | 28,600 | 197 |
| | BRONCO BILLY Co. Ltd. | 9,300 | 197 |
| | Tsubaki Nakashima Co. Ltd. | 14,100 | 197 |
| | Roland Corp. | 4,800 | 197 |
| | Nisshin Oillio Group Ltd. | 7,400 | 196 |
| | Seika Corp. | 13,600 | 196 |
| | Totetsu Kogyo Co. Ltd. | 9,000 | 196 |
| | Daiichi Jitsugyo Co. Ltd. | 4,200 | 195 |
| | Kitz Corp. | 29,200 | 195 |
| | Koatsu Gas Kogyo Co. Ltd. | 28,900 | 195 |
| | Mitsubishi Logisnext Co. Ltd. | 21,200 | 195 |
| | Towa Corp. | 8,951 | 195 |
| 2 | Nishimatsuya Chain Co. Ltd. | 15,200 | 194 |
| | Ohsho Food Service Corp. | 3,700 | 194 |
| | Amuse Inc. | 9,900 | 193 |
| | Tatsuta Electric Wire and Cable Co. Ltd. | 42,800 | 193 |
| | Tochigi Bank Ltd. | 124,000 | 193 |
| | Topy Industries Ltd. | 18,400 | 193 |
| | Chiyoda Co. Ltd. | 28,600 | 192 |
| | FCC Co. Ltd. | 13,900 | 192 |
| | Hogy Medical Co. Ltd. | 7,000 | 192 |
| | KOMEDA Holdings Co. Ltd. | 10,600 | 192 |
| | Kanamoto Co. Ltd. | 8,900 | 191 |
| | Feed One Co. Ltd. | 29,080 | 191 |
| | Airtrip Corp. | 5,625 | 191 |
| | Ichigo Inc. | 63,600 | 190 |
Total World Stock Index Fund
| | | Shares | Market
Value•
($000) |
| | Nissin Electric Co. Ltd. | 15,300 | 190 |
| | Ryosan Co. Ltd. | 9,200 | 190 |
| | Sekisui Kasei Co. Ltd. | 38,100 | 190 |
| | Shoei Foods Corp. | 5,500 | 190 |
| | Tokyotokeiba Co. Ltd. | 4,800 | 190 |
| | ValueCommerce Co. Ltd. | 4,800 | 189 |
| | FULLCAST Holdings Co. Ltd. | 8,066 | 188 |
| | Hokkaido Gas Co. Ltd. | 14,000 | 188 |
| | Tokyo Electron Device Ltd. | 3,100 | 188 |
| | Nihon Trim Co. Ltd. | 6,100 | 187 |
| | Fuji Pharma Co. Ltd. | 19,400 | 187 |
| | Pasona Group Inc. | 6,700 | 187 |
| | Mizuno Corp. | 8,000 | 186 |
| | Nitta Corp. | 8,100 | 186 |
| | ST Corp. | 13,100 | 186 |
| | Ubicom Holdings Inc. | 7,300 | 186 |
| | ASKUL Corp. | 13,600 | 185 |
| | SWCC Showa Holdings Co. Ltd. | 9,500 | 185 |
| | Nikkiso Co. Ltd. | 20,700 | 183 |
| * | Nippon Sheet Glass Co. Ltd. | 32,774 | 183 |
| | Riken Keiki Co. Ltd. | 6,600 | 183 |
| | CONEXIO Corp. | 14,300 | 183 |
| | Towa Bank Ltd. | 40,900 | 182 |
| | Moriroku Holdings Co. Ltd. | 10,600 | 182 |
| * | MedPeer Inc. | 6,011 | 181 |
| | Saibu Gas Holdings Co. Ltd. | 8,800 | 180 |
| | Okasan Securities Group Inc. | 52,400 | 179 |
| | Aeon Delight Co. Ltd. | 5,800 | 178 |
| | Shikoku Bank Ltd. | 27,000 | 178 |
| | Carta Holdings Inc. | 8,300 | 178 |
| | Eiken Chemical Co. Ltd. | 10,500 | 177 |
| | Nippon Densetsu Kogyo Co. Ltd. | 11,500 | 177 |
| | Gakken Holdings Co. Ltd. | 18,000 | 176 |
| | DyDo Group Holdings Inc. | 3,700 | 176 |
| | Argo Graphics Inc. | 6,300 | 175 |
| | Sato Holdings Corp. | 7,600 | 175 |
| | Trancom Co. Ltd. | 2,500 | 175 |
| | Sac's Bar Holdings Inc. | 36,100 | 175 |
| | Exedy Corp. | 11,700 | 174 |
| | Kameda Seika Co. Ltd. | 4,449 | 174 |
| | Tenma Corp. | 7,300 | 174 |
| | Belc Co. Ltd. | 3,500 | �� 173 |
| | Nippon Seiki Co. Ltd. | 17,200 | 173 |
| | Nitto Kogyo Corp. | 11,600 | 173 |
| | Noritsu Koki Co. Ltd. | 8,300 | 173 |
| | Optex Group Co. Ltd. | 13,600 | 173 |
| | | Shares | Market
Value•
($000) |
| | Sakata INX Corp. | 17,900 | 173 |
| | Shibaura Machine Co. Ltd. | 7,400 | 173 |
| | Mandom Corp. | 11,800 | 172 |
| | Nippon Kanzai Co. Ltd. | 7,100 | 172 |
| | Shinmaywa Industries Ltd. | 21,100 | 172 |
| *,2 | euglena Co. Ltd. | 24,300 | 172 |
| | Nagaileben Co. Ltd. | 8,300 | 171 |
| | Yellow Hat Ltd. | 10,500 | 171 |
| | SKY Perfect JSAT Holdings Inc. | 45,600 | 171 |
| * | CHIMNEY Co. Ltd. | 13,200 | 171 |
| | Kanematsu Electronics Ltd. | 5,200 | 170 |
| | Keihanshin Building Co. Ltd. | 13,600 | 170 |
| | Koa Corp. | 12,600 | 170 |
| | Nissan Shatai Co. Ltd. | 24,000 | 170 |
| | Mitsubishi Pencil Co. Ltd. | 14,100 | 169 |
| | Torii Pharmaceutical Co. Ltd. | 6,500 | 169 |
| | Hokkan Holdings Ltd. | 12,600 | 168 |
| | Sanyo Chemical Industries Ltd. | 3,400 | 168 |
| | Toyo Construction Co. Ltd. | 33,600 | 168 |
| | Strike Co. Ltd. | 4,443 | 168 |
| | KFC Holdings Japan Ltd. | 6,600 | 167 |
| | Hokkoku Financial Holdings Inc. | 9,600 | 167 |
| * | Chiyoda Corp. | 45,400 | 166 |
| | Heiwado Co. Ltd. | 9,600 | 166 |
| | Nippon Road Co. Ltd. | 2,300 | 166 |
| | Takamatsu Construction Group Co. Ltd. | 9,400 | 165 |
| | Axial Retailing Inc. | 5,199 | 165 |
| | Shinnihon Corp. | 22,500 | 165 |
| | Inaba Seisakusho Co. Ltd. | 14,000 | 164 |
| | Chudenko Corp. | 8,400 | 164 |
| | Link And Motivation Inc. | 15,500 | 164 |
| | Foster Electric Co. Ltd. | 22,900 | 163 |
| | Yuasa Trading Co. Ltd. | 6,100 | 163 |
| | Toyo Tanso Co. Ltd. | 6,000 | 163 |
| | LITALICO Inc. | 5,400 | 163 |
| * | Leopalace21 Corp. | 75,300 | 162 |
| | Nippon Carbon Co. Ltd. | 4,200 | 162 |
| | NS United Kaiun Kaisha Ltd. | 5,100 | 161 |
| * | KNT-CT Holdings Co. Ltd. | 10,900 | 160 |
| | Genky DrugStores Co. Ltd. | 3,300 | 159 |
| | Chugoku Marine Paints Ltd. | 20,400 | 158 |
| | KYB Corp. | 5,900 | 158 |
| | Kisoji Co. Ltd. | 8,400 | 158 |
Total World Stock Index Fund
| | | Shares | Market
Value•
($000) |
| 2 | Aruhi Corp. | 13,656 | 158 |
| | SBS Holdings Inc. | 4,400 | 157 |
| | Tamron Co. Ltd. | 6,700 | 157 |
| | Seiko Holdings Corp. | 7,400 | 156 |
| | Arata Corp. | 4,400 | 156 |
| | Nohmi Bosai Ltd. | 8,500 | 156 |
| | Tokushu Tokai Paper Co. Ltd. | 4,000 | 156 |
| | Katakura Industries Co. Ltd. | 10,200 | 155 |
| | WingArc1st Inc. | 8,000 | 154 |
| | Riso Kyoiku Co. Ltd. | 36,600 | 153 |
| | Maruzen Showa Unyu Co. Ltd. | 5,000 | 153 |
| | Toho Bank Ltd. | 85,400 | 153 |
| | United Arrows Ltd. | 7,600 | 152 |
| | ESPEC Corp. | 7,500 | 152 |
| | Union Tool Co. | 4,500 | 152 |
| | Alpen Co. Ltd. | 6,200 | 151 |
| | Alconix Corp. | 10,019 | 151 |
| | Arcland Sakamoto Co. Ltd. | 10,000 | 150 |
| | Dainichiseika Color & Chemicals Manufacturing Co. Ltd. | 6,500 | 150 |
| | Nittetsu Mining Co. Ltd. | 2,600 | 150 |
| | Topre Corp. | 13,000 | 150 |
| | HI-LEX Corp. | 9,400 | 150 |
| | VT Holdings Co. Ltd. | 33,400 | 149 |
| | Japan Pulp & Paper Co. Ltd. | 4,400 | 148 |
| | Yamagata Bank Ltd. | 20,800 | 148 |
| | Hamakyorex Co. Ltd. | 5,300 | 147 |
| | Osaka Soda Co. Ltd. | 5,800 | 147 |
| | Sumitomo Riko Co. Ltd. | 22,600 | 147 |
| | TBS Holdings Inc. | 9,300 | 147 |
| | Daikyonishikawa Corp. | 24,500 | 147 |
| | Ryoyo Electro Corp. | 7,000 | 146 |
| | Japan Wool Textile Co. Ltd. | 18,200 | 145 |
| | Shin-Etsu Polymer Co. Ltd. | 16,100 | 145 |
| | Hosokawa Micron Corp. | 5,200 | 144 |
| | Pressance Corp. | 8,700 | 144 |
| | T-Gaia Corp. | 8,000 | 143 |
| | Infocom Corp. | �� 7,459 | 143 |
| | Aichi Bank Ltd. | 4,700 | 142 |
| | Teikoku Sen-I Co. Ltd. | 7,900 | 142 |
| | Plenus Co. Ltd. | 8,300 | 141 |
| | Bell System24 Holdings Inc. | 11,000 | 141 |
| | Relia Inc. | 13,700 | 140 |
| | Ricoh Leasing Co. Ltd. | 4,400 | 140 |
| | Tachi-S Co. Ltd. | 11,500 | 139 |
| | Airport Facilities Co. Ltd. | 27,041 | 138 |
| | Daiwa Industries Ltd. | 12,400 | 138 |
| | | Shares | Market
Value•
($000) |
| | Ishihara Sangyo Kaisha Ltd. | 12,500 | 138 |
| | Direct Marketing MiX Inc. | 3,600 | 138 |
| | Proto Corp. | 11,100 | 137 |
| | Mitsui-Soko Holdings Co. Ltd. | 6,800 | 136 |
| | Shikoku Chemicals Corp. | 11,100 | 136 |
| | Tsukishima Kikai Co. Ltd. | 13,300 | 136 |
| | Tsurumi Manufacturing Co. Ltd. | 8,800 | 136 |
| * | Macromill Inc. | 19,300 | 136 |
| | Akatsuki Inc. | 4,989 | 136 |
| | Itochu Enex Co. Ltd. | 15,300 | 135 |
| | Fujio Food Group Inc. | 11,300 | 135 |
| | Aiphone Co. Ltd. | 6,500 | 134 |
| | Fujibo Holdings Inc. | 3,700 | 134 |
| | Retail Partners Co. Ltd. | 12,800 | 134 |
| | Modec Inc. | 7,800 | 134 |
| | Belluna Co. Ltd. | 18,900 | 133 |
| | Doshisha Co. Ltd. | 8,500 | 133 |
| | Hiday Hidaka Corp. | 9,236 | 132 |
| | Doutor Nichires Holdings Co. Ltd. | 9,200 | 132 |
| | Vector Inc. | 11,600 | 132 |
| | Micronics Japan Co. Ltd. | 9,900 | 131 |
| | Daikokutenbussan Co. Ltd. | 2,300 | 131 |
| | Uchida Yoko Co. Ltd. | 3,100 | 131 |
| | Base Co. Ltd. | 3,100 | 131 |
| | Kyokuto Kaihatsu Kogyo Co. Ltd. | 9,500 | 130 |
| | Yonex Co. Ltd. | 19,800 | 130 |
| * | Optim Corp. | 8,298 | 130 |
| | Fuji Media Holdings Inc. | 12,400 | 129 |
| | Siix Corp. | 11,600 | 129 |
| | Joshin Denki Co. Ltd. | 6,200 | 129 |
| | Nishio Rent All Co. Ltd. | 5,200 | 129 |
| | Nichi-iko Pharmaceutical Co. Ltd. | 16,950 | 129 |
| | Mitsubishi Shokuhin Co. Ltd. | 5,000 | 129 |
| | Restar Holdings Corp. | 7,700 | 129 |
| | Hokuto Corp. | 7,400 | 128 |
| | Iino Kaiun Kaisha Ltd. | 26,500 | 128 |
| | Matsuda Sangyo Co. Ltd. | 4,300 | 128 |
| * | Matsuya Co. Ltd. | 13,300 | 127 |
| | Tanseisha Co. Ltd. | 15,500 | 127 |
| | Broadleaf Co. Ltd. | 26,400 | 127 |
| | Toppan Forms Co. Ltd. | 13,100 | 126 |
| | Toho Zinc Co. Ltd. | 4,600 | 126 |
| | COLOPL Inc. | 17,400 | 126 |
| | Piolax Inc. | 8,700 | 125 |
Total World Stock Index Fund
| | | Shares | Market
Value•
($000) |
| | Taihei Dengyo Kaisha Ltd. | 5,300 | 125 |
| * | Vision Inc. | 9,300 | 125 |
| | Ehime Bank Ltd. | 18,400 | 124 |
| | Weathernews Inc. | 1,700 | 124 |
| | Fujicco Co. Ltd. | 7,400 | 124 |
| | Sakai Moving Service Co. Ltd. | 3,000 | 124 |
| | Bank of Nagoya Ltd. | 5,800 | 123 |
| | Sanshin Electronics Co. Ltd. | 8,600 | 123 |
| * | BrainPad Inc. | 2,570 | 123 |
| | Matsuyafoods Holdings Co. Ltd. | 3,802 | 122 |
| | PAL GROUP Holdings Co. Ltd. | 8,400 | 121 |
| | TPR Co. Ltd. | 9,500 | 121 |
| | Toa Corp. | 5,500 | 121 |
| | Wakita & Co. Ltd. | 13,400 | 121 |
| 2 | YA-MAN Ltd. | 11,400 | 121 |
| | Yondoshi Holdings Inc. | 7,900 | 120 |
| * | Mitsui E&S Holdings Co. Ltd. | 23,300 | 119 |
| | Tokai Corp. | 6,200 | 119 |
| | Konoike Transport Co. Ltd. | 10,900 | 119 |
| | Chilled & Frozen Logistics Holdings Co. Ltd. | 8,000 | 119 |
| 2 | Rock Field Co. Ltd. | 8,000 | 118 |
| | WDB Holdings Co. Ltd. | 3,740 | 118 |
| | Furukawa Co. Ltd. | 10,600 | 117 |
| | Valqua Ltd. | 5,800 | 117 |
| | Mitsuboshi Belting Ltd. | 6,500 | 116 |
| * | W-Scope Corp. | 14,500 | 116 |
| * | Istyle Inc. | 33,400 | 116 |
| | Fuji Co. Ltd. | 6,500 | 115 |
| * | Kappa Create Co. Ltd. | 9,500 | 115 |
| | Yokohama Reito Co. Ltd. | 15,100 | 115 |
| | Organo Corp. | 1,800 | 114 |
| | Okuwa Co. Ltd. | 11,800 | 113 |
| | Sanei Architecture Planning Co. Ltd. | 7,200 | 113 |
| | YAMABIKO Corp. | 10,400 | 113 |
| | Vital KSK Holdings Inc. | 16,900 | 113 |
| | Obara Group Inc. | 3,500 | 112 |
| | Sanyo Special Steel Co. Ltd. | 6,800 | 112 |
| | Sinko Industries Ltd. | 6,159 | 112 |
| | Insource Co. Ltd. | 5,600 | 112 |
| | Chubu Shiryo Co. Ltd. | 11,600 | 111 |
| | Nissei ASB Machine Co. Ltd. | 3,400 | 111 |
| | France Bed Holdings Co. Ltd. | 14,000 | 111 |
| | Japan Best Rescue System Co. Ltd. | 10,955 | 111 |
| | Press Kogyo Co. Ltd. | 37,600 | 110 |
| | | Shares | Market
Value•
($000) |
| | Rheon Automatic Machinery Co. Ltd. | 9,280 | 110 |
| | Shin Nippon Air Technologies Co. Ltd. | 5,100 | 110 |
| | SRA Holdings | 4,300 | 110 |
| | Elan Corp. | 10,200 | 110 |
| | Anest Iwata Corp. | 13,700 | 109 |
| | Seikagaku Corp. | 12,300 | 109 |
| | Unipres Corp. | 13,300 | 109 |
| | RS Technologies Co. Ltd. | 2,000 | 109 |
| | Ines Corp. | 7,400 | 108 |
| | Toyo Corp. | 11,400 | 108 |
| | METAWATER Co. Ltd. | 6,400 | 108 |
| | Goldcrest Co. Ltd. | 7,500 | 107 |
| | J Trust Co. Ltd. | 20,500 | 107 |
| 2 | Kansai Super Market Ltd. | 6,600 | 107 |
| | Nippon Yakin Kogyo Co. Ltd. | 4,449 | 107 |
| * | Atrae Inc. | 5,000 | 107 |
| | Eagle Industry Co. Ltd. | 9,900 | 106 |
| | Sinfonia Technology Co. Ltd. | 9,200 | 106 |
| | Toenec Corp. | 3,600 | 106 |
| *,2 | Open Door Inc. | 4,800 | 106 |
| | Shinwa Co. Ltd. | 5,400 | 105 |
| | Miyazaki Bank Ltd. | 5,800 | 105 |
| | Kurabo Industries Ltd. | 6,300 | 105 |
| | Sintokogio Ltd. | 15,900 | 104 |
| | Shinko Shoji Co. Ltd. | 13,000 | 104 |
| | Sumitomo Densetsu Co. Ltd. | 5,400 | 104 |
| | Keiyo Co. Ltd. | 14,200 | 103 |
| | Halows Co. Ltd. | 4,200 | 103 |
| | Miroku Jyoho Service Co. Ltd. | 6,500 | 103 |
| * | Nippon Chemi-Con Corp. | 5,500 | 103 |
| | Starzen Co. Ltd. | 5,400 | 102 |
| | Bando Chemical Industries Ltd. | 13,100 | 101 |
| | Onward Holdings Co. Ltd. | 34,000 | 101 |
| | TechMatrix Corp. | 6,400 | 101 |
| | Tama Home Co. Ltd. | 4,900 | 101 |
| | TV Asahi Holdings Corp. | 6,500 | 99 |
| | Geo Holdings Corp. | 9,300 | 99 |
| | SB Technology Corp. | 3,600 | 99 |
| * | Aoyama Trading Co. Ltd. | 14,200 | 98 |
| | Tosei Corp. | 10,200 | 98 |
| | DKK Co. Ltd. | 4,400 | 97 |
| | Yurtec Corp. | 16,500 | 97 |
| | Yorozu Corp. | 9,300 | 97 |
| | Bank of Saga Ltd. | 7,600 | 96 |
| | Chofu Seisakusho Co. Ltd. | 5,300 | 96 |
| | Hisaka Works Ltd. | 12,900 | 96 |
| | Pack Corp. | 3,600 | 96 |
| | IDOM Inc. | 13,800 | 95 |
Total World Stock Index Fund
| | | Shares | Market
Value•
($000) |
| | Alpha Systems Inc. | 2,500 | 95 |
| | Dai-Dan Co. Ltd. | 4,500 | 95 |
| | Arcland Service Holdings Co. Ltd. | 4,800 | 95 |
| | G-7 Holdings Inc. | 5,200 | 95 |
| | Hakuto Co. Ltd. | 5,492 | 94 |
| | Inageya Co. Ltd. | 7,747 | 94 |
| | G-Tekt Corp. | 7,500 | 94 |
| | Mimasu Semiconductor Industry Co. Ltd. | 4,300 | 94 |
| | Riken Vitamin Co. Ltd. | 5,700 | 94 |
| | Poletowin Pitcrew Holdings Inc. | 10,300 | 93 |
| | Sparx Group Co. Ltd. | 35,700 | 93 |
| | Itochu-Shokuhin Co. Ltd. | 2,000 | 92 |
| | Nippon Television Holdings Inc. | 8,500 | 92 |
| | World Holdings Co. Ltd. | 3,700 | 92 |
| | JAC Recruitment Co. Ltd. | 4,700 | 92 |
| | GMO GlobalSign Holdings KK | 2,222 | 92 |
| | Yukiguni Maitake Co. Ltd. | 7,300 | 92 |
| | Hito Communications Holdings Inc. | 4,700 | 91 |
| | FIDEA Holdings Co. Ltd. | 8,790 | 91 |
| | Kyodo Printing Co. Ltd. | 3,900 | 90 |
| | J-Oil Mills Inc. | 5,600 | 90 |
| | Hodogaya Chemical Co. Ltd. | 2,100 | 89 |
| | Kojima Co. Ltd. | 17,300 | 89 |
| * | Kintetsu Department Store Co. Ltd. | 4,000 | 89 |
| | Mitsui DM Sugar Holdings Co. Ltd. | 5,000 | 89 |
| | Shimojima Co. Ltd. | 9,000 | 89 |
| | Taki Chemical Co. Ltd. | 1,600 | 89 |
| | I'll Inc. | 6,000 | 89 |
| | Computer Engineering & Consulting Ltd. | 7,426 | 88 |
| | Denyo Co. Ltd. | 5,100 | 88 |
| * | PIA Corp. | 2,500 | 87 |
| | Nichiden Corp. | 4,300 | 87 |
| | Tayca Corp. | 7,561 | 87 |
| | Komatsu Matere Co. Ltd. | 10,700 | 86 |
| | Ryobi Ltd. | 8,200 | 86 |
| | TSI Holdings Co. Ltd. | 28,200 | 86 |
| | Enplas Corp. | 3,200 | 85 |
| | Marusan Securities Co. Ltd. | 16,100 | 85 |
| | Sumitomo Seika Chemicals Co. Ltd. | 3,000 | 85 |
| | | Shares | Market
Value•
($000) |
| | Shindengen Electric Manufacturing Co. Ltd. | 2,400 | 85 |
| | Sumida Corp. | 7,334 | 85 |
| | Koshidaka Holdings Co. Ltd. | 13,904 | 85 |
| | Ichikoh Industries Ltd. | 17,000 | 84 |
| * | Jamco Corp. | 9,600 | 83 |
| | Hoosiers Holdings | 13,500 | 83 |
| | K&O Energy Group Inc. | 5,800 | 83 |
| | Kitanotatsujin Corp. | 22,900 | 83 |
| | Optorun Co. Ltd. | 4,100 | 83 |
| | Enigmo Inc. | 8,700 | 83 |
| | Shin Nippon Biomedical Laboratories Ltd. | 6,500 | 82 |
| | Sakai Chemical Industry Co. Ltd. | 4,400 | 82 |
| | LEC Inc. | 9,000 | 82 |
| | Tachibana Eletech Co. Ltd. | 6,100 | 82 |
| | Mitsubishi Research Institute Inc. | 2,200 | 82 |
| | Maxvalu Tokai Co. Ltd. | 3,600 | 82 |
| | Arakawa Chemical Industries Ltd. | 7,400 | 81 |
| | Ryoden Corp. | 5,100 | 81 |
| | Japan Transcity Corp. | 15,200 | 81 |
| | Nihon Nohyaku Co. Ltd. | 17,100 | 80 |
| | Komori Corp. | 12,200 | 80 |
| | Maezawa Kyuso Industries Co. Ltd. | 8,600 | 80 |
| | Daiken Corp. | 3,600 | 79 |
| | Fukui Computer Holdings Inc. | 2,200 | 79 |
| | Krosaki Harima Corp. | 1,900 | 79 |
| | Toyo Kanetsu KK | 3,600 | 79 |
| | Chukyo Bank Ltd. | 6,700 | 78 |
| | Cawachi Ltd. | 4,000 | 78 |
| | Aichi Steel Corp. | 3,300 | 77 |
| | ES-Con Japan Ltd. | 10,700 | 77 |
| | Toho Titanium Co. Ltd. | 7,300 | 77 |
| | Kamei Corp. | 7,500 | 76 |
| 2 | Sanoh Industrial Co. Ltd. | 8,600 | 76 |
| | Toa Corp. (XTKS) | 10,600 | 76 |
| | Japan Medical Dynamic Marketing Inc. | 3,957 | 76 |
| | Teikoku Electric Manufacturing Co. Ltd. | 5,900 | 75 |
| | Nitto Kohki Co. Ltd. | 4,500 | 75 |
| | Digital Holdings Inc. | 4,895 | 75 |
| | Riken Corp. | 3,200 | 75 |
| * | Oriental Shiraishi Corp. | 31,300 | 74 |
| | Riken Technos Corp. | 15,200 | 73 |
| | JVCKenwood Corp. | 42,200 | 73 |
| | EM Systems Co. Ltd. | 11,000 | 73 |
| | Kyoei Steel Ltd. | 5,800 | 72 |
Total World Stock Index Fund
| | | Shares | Market
Value•
($000) |
| | JM Holdings Co. Ltd. | 4,400 | 72 |
| | Nippon Rietec Co. Ltd. | 5,200 | 72 |
| | Pronexus Inc. | 7,600 | 71 |
| | Onoken Co. Ltd. | 4,800 | 71 |
| | Tokyo Rakutenchi Co. Ltd. | 2,000 | 71 |
| | Zuiko Corp. | 9,200 | 71 |
| | Ohara Inc. | 5,800 | 71 |
| | Medical Data Vision Co. Ltd. | 5,500 | 71 |
| | Kanamic Network Co. Ltd. | 13,400 | 71 |
| | Advan Group Co. Ltd. | 8,200 | 70 |
| | Fudo Tetra Corp. | 4,400 | 70 |
| | Mitsuba Corp. | 12,400 | 69 |
| | Xebio Holdings Co. Ltd. | 7,400 | 69 |
| | Mie Kotsu Group Holdings Inc. | 15,900 | 69 |
| | Media Do Co. Ltd. | 1,830 | 69 |
| | World Co. Ltd. | 5,500 | 68 |
| | Futaba Industrial Co. Ltd. | 16,800 | 66 |
| | Godo Steel Ltd. | 5,000 | 66 |
| | Icom Inc. | 3,100 | 66 |
| | Corona Corp. Class A | 8,100 | 65 |
| | Taiko Pharmaceutical Co. Ltd. | 9,157 | 65 |
| * | Iseki & Co. Ltd. | 4,400 | 64 |
| | Nippon Sharyo Ltd. | 3,483 | 64 |
| | Shibusawa Warehouse Co. Ltd. | 3,300 | 64 |
| | JDC Corp. | 12,200 | 64 |
| | Grace Technology Inc. | 7,038 | 64 |
| | ASKA Pharmaceutical Holdings Co. Ltd. | 7,400 | 64 |
| | Chuetsu Pulp & Paper Co. Ltd. | 6,000 | 62 |
| | Elematec Corp. | 6,200 | 62 |
| | Neturen Co. Ltd. | 11,600 | 62 |
| | Takaoka Toko Co. Ltd. | 4,800 | 62 |
| *,2 | Heroz Inc. | 3,700 | 62 |
| 2 | Kanagawa Chuo Kotsu Co. Ltd. | 2,000 | 61 |
| * | KLab Inc. | 10,800 | 60 |
| | Happinet Corp. | 4,500 | 59 |
| | Achilles Corp. | 5,100 | 59 |
| *,2 | Japan Display Inc. | 196,500 | 59 |
| | Honeys Holdings Co. Ltd. | 6,260 | 58 |
| | Sankyo Seiko Co. Ltd. | 11,500 | 58 |
| | Tokyo Energy & Systems Inc. | 6,000 | 58 |
| | Takamiya Co. Ltd. | 14,800 | 58 |
| | Tosho Co. Ltd. | 3,300 | 57 |
| | Kurimoto Ltd. | 3,900 | 56 |
| | Hochiki Corp. | 5,000 | 55 |
| | Kanaden Corp. | 6,100 | 55 |
| | | Shares | Market
Value•
($000) |
| | Yahagi Construction Co. Ltd. | 8,200 | 55 |
| | AOKI Holdings Inc. | 8,800 | 54 |
| | Sankyo Tateyama Inc. | 8,200 | 54 |
| | ASAHI YUKIZAI Corp. | 4,400 | 53 |
| | Studio Alice Co. Ltd. | 2,800 | 53 |
| | CI Takiron Corp. | 10,000 | 53 |
| | Torishima Pump Manufacturing Co. Ltd. | 6,900 | 53 |
| * | Unitika Ltd. | 16,400 | 52 |
| | Kawada Technologies Inc. | 1,500 | 52 |
| | Central Security Patrols Co. Ltd. | 2,119 | 51 |
| | Chuo Spring Co. Ltd. | 5,600 | 49 |
| | Fukuda Corp. | 1,200 | 49 |
| | Marvelous Inc. | 7,600 | 48 |
| | NEC Capital Solutions Ltd. | 2,600 | 47 |
| | Ebase Co. Ltd. | 7,100 | 47 |
| | MTI Ltd. | 7,000 | 45 |
| | Toa Oil Co. Ltd. | 1,800 | 45 |
| | Kyokuto Securities Co. Ltd. | 6,700 | 45 |
| | Artnature Inc. | 7,000 | 45 |
| | Fixstars Corp. | 6,600 | 45 |
| * | Akebono Brake Industry Co. Ltd. | 21,900 | 44 |
| * | FDK Corp. | 4,900 | 44 |
| | Sourcenext Corp. | 24,700 | 44 |
| | Okura Industrial Co. Ltd. | 2,400 | 44 |
| | Asahi Co. Ltd. | 3,800 | 44 |
| | Tsutsumi Jewelry Co. Ltd. | 2,300 | 43 |
| | Yushin Precision Equipment Co. Ltd. | 6,400 | 43 |
| | CMIC Holdings Co. Ltd. | 3,100 | 40 |
| | Tomoku Co. Ltd. | 2,400 | 40 |
| *,2 | Laox Co. Ltd. | 23,300 | 38 |
| | Nippon Coke & Engineering Co. Ltd. | 28,400 | 38 |
| | Oro Co. Ltd. | 1,142 | 38 |
| 2 | Raccoon Holdings Inc. | 2,681 | 38 |
| | Wowow Inc. | 1,800 | 37 |
| * | WATAMI Co. Ltd. | 4,300 | 37 |
| | Tv Tokyo Holdings Corp. | 1,900 | 36 |
| *,2 | RPA Holdings Inc. | 8,948 | 34 |
| | Taiho Kogyo Co. Ltd. | 4,500 | 32 |
| | I-PEX Inc. | 1,800 | 32 |
| | JSP Corp. | 2,300 | 31 |
| | Fibergate Inc. | 2,603 | 31 |
| | Chori Co. Ltd. | 1,900 | 30 |
| | Kamakura Shinsho Ltd. | 3,700 | 30 |
| * | OSAKA Titanium Technologies Co. Ltd. | 4,100 | 28 |
| * | TerraSky Co. Ltd. | 1,312 | 25 |
Total World Stock Index Fund
| | | Shares | Market
Value•
($000) |
| | Cleanup Corp. | 5,000 | 24 |
| | Gecoss Corp. | 3,200 | 24 |
| | Nakayama Steel Works Ltd. | 5,000 | 19 |
| | Linical Co. Ltd. | 1,300 | 9 |
| * | Gunosy Inc. | 1,500 | 9 |
| | Nisso Corp. | 1,000 | 6 |
| | | | 2,142,422 |
| Jersey (0.0%) |
| * | Petrofac Ltd. | 21,555 | 4 |
| Kuwait (0.1%) |
| | National Bank of Kuwait SAKP | 2,957,531 | 9,725 |
| | Kuwait Finance House KSCP | 1,897,680 | 5,245 |
| | Agility Public Warehousing Co. KSC | 534,870 | 1,778 |
| | Mobile Telecommunications Co. KSCP | 894,692 | 1,772 |
| * | Boubyan Bank KSCP | 382,395 | 993 |
| | Mabanee Co. KPSC | 256,418 | 670 |
| | Boubyan Petrochemicals Co. KSCP | 185,530 | 566 |
| | Gulf Bank KSCP | 596,345 | 487 |
| * | Warba Bank KSCP | 495,142 | 463 |
| | Humansoft Holding Co. KSC | 36,030 | 400 |
| * | National Industries Group Holding SAK | 397,622 | 361 |
| | Qurain Petrochemical Industries Co. | 225,597 | 284 |
| * | Alimtiaz Investment Group KSC | 502,896 | 225 |
| | Burgan Bank SAK | 232,374 | 184 |
| | Kuwait Projects Co. Holding KSCP | 352,864 | 172 |
| * | Kuwait International Bank KSCP | 214,350 | 159 |
| * | Integrated Holding Co. KCSC | 74,047 | 92 |
| * | Kuwait Projects Co Holding KSCP Rights Exp. 11/2/21 | 115,386 | 3 |
| | | | 23,579 |
| Malaysia (0.2%) |
| | Public Bank Bhd. | 6,709,930 | 6,760 |
| | Malayan Banking Bhd. | 2,701,081 | 5,254 |
| | Tenaga Nasional Bhd. | 1,718,074 | 4,008 |
| | CIMB Group Holdings Bhd. | 3,006,852 | 3,794 |
| | Petronas Chemicals Group Bhd. | 1,219,189 | 2,560 |
| | Ihh Healthcare Bhd. | 1,440,220 | 2,274 |
| | Press Metal Aluminium Holdings Bhd. | 1,602,460 | 2,154 |
| | Axiata Group Bhd. | 1,841,451 | 1,760 |
| | DiGi.Com Bhd. | 1,631,600 | 1,670 |
| | | Shares | Market
Value•
($000) |
| | Sime Darby Plantation Bhd. | 1,679,975 | 1,629 |
| | Top Glove Corp. Bhd. | 2,369,800 | 1,556 |
| | PPB Group Bhd. | 326,340 | 1,433 |
| | Dialog Group Bhd. | 1,974,248 | 1,350 |
| | MISC Bhd. | 765,321 | 1,309 |
| | Maxis Bhd. | 1,093,900 | 1,235 |
| | IOI Corp. Bhd. | 1,282,540 | 1,217 |
| | Hong Leong Bank Bhd. | 252,100 | 1,146 |
| | Genting Bhd. | 862,800 | 1,080 |
| | Kuala Lumpur Kepong Bhd. | 191,600 | 1,001 |
| * | Gamuda Bhd. | 1,183,000 | 926 |
| | RHB Bank Bhd. | 683,350 | 922 |
| | Inari Amertron Bhd. | 980,975 | 919 |
| | Petronas Gas | 217,800 | 881 |
| | Hartalega Holdings Bhd. | 603,200 | 855 |
| | Genting Malaysia Bhd. | 1,032,900 | 791 |
| | Nestle Malaysia Bhd. | 24,100 | 783 |
| | Sime Darby Bhd. | 1,313,775 | 721 |
| | AMMB Holdings Bhd. | 882,900 | 716 |
| | HAP Seng Consolidated Bhd. | 351,700 | 666 |
| | Petronas Dagangan Bhd. | 133,200 | 655 |
| * | Malaysia Airports Holdings Bhd. | 407,700 | 638 |
| | IJM Corp. Bhd. | 1,339,420 | 600 |
| | QL Resources Bhd. | 473,590 | 578 |
| | Telekom Malaysia Bhd. | 401,900 | 562 |
| | Frontken Corp. Bhd. | 533,400 | 492 |
| | Westports Holdings Bhd. | 410,900 | 444 |
| | Hong Leong Financial Group Bhd. | 95,942 | 425 |
| | Alliance Bank Malaysia Bhd. | 622,400 | 413 |
| | VS Industry Bhd. | 1,044,000 | 399 |
| | Sunway REIT | 1,119,900 | 396 |
| | TIME dotCom Bhd. | 361,200 | 394 |
| | Axis REIT | 812,000 | 375 |
| | Mega First Corp. Bhd. | 428,700 | 373 |
| | My EG Services Bhd. | 1,484,500 | 373 |
| | Bursa Malaysia Bhd. | 201,650 | 365 |
| | Malaysian Pacific Industries Bhd. | 31,000 | 358 |
| 3 | MR DIY Group M Bhd | 390,900 | 356 |
| | Scientex Bhd. | 313,200 | 353 |
| | British American Tobacco Malaysia Bhd. | 94,900 | 346 |
| | AEON Credit Service M Bhd. | 101,300 | 343 |
| | D&O Green Technologies Bhd. | 233,800 | 319 |
| | IGB REIT | 764,600 | 310 |
| | Magnum Bhd. | 565,249 | 295 |
Total World Stock Index Fund
| | | Shares | Market
Value•
($000) |
| * | Kossan Rubber Industries Bhd. | 507,100 | 290 |
| | Supermax Corporation Bhd. | 620,355 | 287 |
| | Pentamaster Corp. Bhd. | 219,300 | 284 |
| | Heineken Malaysia Bhd. | 49,800 | 277 |
| | Genting Plantations Bhd. | 153,200 | 270 |
| | Fraser & Neave Holdings Bhd. | 40,700 | 266 |
| | Carlsberg Brewery Malaysia Bhd. | 48,500 | 260 |
| | Sunway Bhd. | 603,116 | 259 |
| | ViTrox Corp. Bhd. | 52,800 | 251 |
| | Syarikat Takaful Malaysia Keluarga Bhd. | 254,400 | 244 |
| | UMW Holdings Bhd | 296,100 | 244 |
| | Yinson Holdings Bhd. | 169,900 | 240 |
| | IOI Properties Group Bhd. | 756,300 | 234 |
| | YTL Corp. Bhd. | 1,490,412 | 227 |
| | KPJ Healthcare Bhd. | 816,700 | 225 |
| | Sime Darby Property Bhd. | 1,147,475 | 201 |
| | FGV Holdings Bhd. | 539,000 | 195 |
| | Malakoff Corp. Bhd. | 956,400 | 187 |
| | YTL Power International Bhd. | 1,081,000 | 184 |
| * | SP Setia Bhd. Group | 482,100 | 181 |
| | UWC Bhd. | 116,100 | 173 |
| | Malaysia Building Society Bhd. | 1,037,300 | 161 |
| * | AirAsia Group Bhd. | 547,700 | 154 |
| * | Bumi Armada Bhd. | 1,238,050 | 152 |
| | Leong Hup International Bhd. | 919,600 | 145 |
| | Berjaya Sports Toto Bhd. | 275,256 | 138 |
| | Astro Malaysia Holdings Bhd. | 557,587 | 134 |
| | DRB-Hicom Bhd. | 333,800 | 133 |
| | BerMaz Auto Bhd. | 320,120 | 125 |
| * | Sapura Energy Bhd. | 5,008,900 | 121 |
| | Padini Holdings Bhd. | 151,000 | 115 |
| 3 | Lotte Chemical Titan Holding Bhd. | 159,300 | 105 |
| | Cahya Mata Sarawak Bhd. | 244,700 | 85 |
| * | UEM Sunrise Bhd. | 780,000 | 74 |
| * | Berjaya Corp. Bhd. | 1,148,433 | 71 |
| | Malaysian Resources Corp. Bhd. | 667,900 | 66 |
| * | Velesto Energy Bhd. | 1,473,763 | 57 |
| * | WCT Holdings Bhd. | 339,641 | 51 |
| 1 | Serba Dinamik Holdings Bhd. | 386,126 | 33 |
| * | Velesto Energy Bhd. Warrants Exp. 10/18/24 | 467,368 | 7 |
| * | Sunway Bhd. Warrants Exp. 10/3/24 | 57,011 | 6 |
| | | Shares | Market
Value•
($000) |
| *,1 | Serba Dinamik Holdings Bhd. Warrants Exp. 12/5/24 | 97,620 | 2 |
| * | Malaysian Resources Corp. Bhd. Warrants Exp. 10/29/27 | 95,161 | 2 |
| | | | 68,448 |
| Mexico (0.2%) |
| | America Movil SAB de CV Series L | 13,022,475 | 11,607 |
| | Grupo Financiero Banorte SAB de CV Class O | 1,270,203 | 8,042 |
| | Wal-Mart de Mexico SAB de CV | 2,269,059 | 7,914 |
| | Fomento Economico Mexicano SAB de CV | 812,866 | 6,683 |
| | Grupo Mexico SAB de CV Series B | 1,427,983 | 6,265 |
| * | Cemex SAB de CV | 6,545,802 | 4,210 |
| | Grupo Bimbo SAB de CV Series A | 988,700 | 2,927 |
| | Grupo Televisa SAB | 1,075,734 | 2,184 |
| | Grupo Elektra SAB de CV | 27,419 | 2,105 |
| | Grupo Aeroportuario del Pacifico SAB de CV Class B | 155,850 | 1,965 |
| | Grupo Aeroportuario del Sureste SAB de CV Class B | 84,011 | 1,694 |
| | Fibra Uno Administracion SA | 1,245,073 | 1,237 |
| | Arca Continental SAB de CV | 189,300 | 1,154 |
| | Coca-Cola Femsa SAB de CV | 207,295 | 1,117 |
| | Orbia Advance Corp. SAB de CV | 422,794 | 1,099 |
| | Gruma SAB de CV Class B | 82,085 | 964 |
| * | Grupo Financiero Inbursa SAB de CV Class O | 828,500 | 832 |
| * | Grupo Aeroportuario del Centro Norte SAB de CV Class B | 116,588 | 703 |
| | Alfa SAB de CV Class A | 959,000 | 694 |
| * | Controladora Vuela Cia de Aviacion SAB de CV Class A | 359,900 | 655 |
| | Regional SAB de CV | 119,800 | 627 |
| * | Promotora y Operadora de Infraestructura SAB de CV | 82,402 | 606 |
| 3 | Banco del Bajio SA | 314,038 | 590 |
| | Prologis Property Mexico SA de CV | 253,227 | 583 |
| | Grupo Carso SAB de CV | 171,767 | 578 |
| * | Industrias Penoles SAB de CV | 45,078 | 578 |
Total World Stock Index Fund
| | | Shares | Market
Value•
($000) |
| * | Alsea SAB de CV | 262,700 | 551 |
| | GCC SAB de CV | 73,200 | 545 |
| | Kimberly-Clark de Mexico SAB de CV Class A | 313,800 | 496 |
| 3 | Macquarie Mexico Real Estate Management SA de CV | 414,800 | 495 |
| | Becle SAB de CV | 209,000 | 478 |
| | Telesites SAB de CV | 498,765 | 455 |
| | Corp. Inmobiliaria Vesta SAB de CV | 259,201 | 451 |
| | PLA Administradora Industrial S de RL de CV | 317,386 | 445 |
| | Megacable Holdings SAB de CV | 146,462 | 432 |
| * | Genomma Lab Internacional SAB de CV Class B | 388,063 | 371 |
| | Bolsa Mexicana de Valores SAB de CV | 178,300 | 342 |
| | La Comer SAB de CV | 187,574 | 338 |
| | Grupo Comercial Chedraui SA de CV | 171,300 | 338 |
| | Qualitas Controladora SAB de CV | 68,064 | 315 |
| | El Puerto de Liverpool SAB de CV Class C1 | 70,400 | 311 |
| | Concentradora Fibra Danhos SA de CV | 250,008 | 302 |
| *,3 | Grupo Traxion SAB de CV | 159,535 | 276 |
| | Banco Santander Mexico SA Institucion de Banca Multiple Grupo Financiero Santand | 208,700 | 266 |
| * | Gentera SAB de CV | 391,800 | 234 |
| | Industrias Bachoco SAB de CV Class B | 56,689 | 201 |
| | Grupo Herdez SAB de CV | 103,100 | 190 |
| *,3 | Nemak SAB de CV | 752,599 | 174 |
| * | Axtel SAB de CV | 542,336 | 123 |
| * | Alpek SAB de CV | 100,700 | 110 |
| * | Credito Real SAB de CV SOFOM ER | 219,342 | 110 |
| * | Unifin Financiera SAB de CV | 68,455 | ��� 105 |
| | Grupo Rotoplas SAB de CV | 65,251 | 90 |
| | | | 76,157 |
| Netherlands (1.2%) |
| | ASML Holding NV | 172,311 | 140,072 |
| *,3 | Adyen NV | 12,624 | 38,090 |
| | Prosus NV | 384,296 | 33,850 |
| | ING Groep NV | 1,704,922 | 25,862 |
| | Koninklijke Philips NV | 392,903 | 18,535 |
| | Koninklijke DSM NV | 72,223 | 15,779 |
| | | Shares | Market
Value•
($000) |
| | Koninklijke Ahold Delhaize NV | 425,559 | 13,844 |
| | Wolters Kluwer NV | 115,731 | 12,119 |
| | Heineken NV | 103,550 | 11,462 |
| | Akzo Nobel NV | 84,083 | 9,663 |
| | ASM International NV | 21,080 | 9,540 |
| | ArcelorMittal SA | 279,383 | 9,449 |
| | Universal Music Group NV | 320,865 | 9,316 |
| | NN Group NV | 134,409 | 7,185 |
| | IMCD NV | 25,159 | 5,586 |
| *,3 | Just Eat Takeaway.com NV | 63,078 | 4,531 |
| * | Unibail-Rodamco-Westfield | 61,883 | 4,419 |
| | Koninklijke KPN NV | 1,471,936 | 4,398 |
| | Heineken Holding NV | 45,275 | 4,196 |
| | Aegon NV | 780,673 | 3,960 |
| | Randstad NV | 46,003 | 3,305 |
| | BE Semiconductor Industries NV | 30,907 | 2,824 |
| | ASR Nederland NV | 57,064 | 2,667 |
| 3 | Signify NV | 54,643 | 2,648 |
| 3 | ABN AMRO Bank NV GDR | 168,203 | 2,474 |
| | Aalberts NV | 41,312 | 2,287 |
| | Arcadis NV | 31,262 | 1,524 |
| * | OCI NV | 49,183 | 1,394 |
| * | InPost SA | 86,930 | 1,241 |
| | Corbion NV | 23,673 | 1,124 |
| | APERAM SA | 18,693 | 1,115 |
| * | Galapagos NV | 20,777 | 1,102 |
| | SBM Offshore NV | 69,203 | 1,093 |
| | JDE Peet's NV | 36,980 | 1,077 |
| * | Just Eat Takeaway.com NV ADR | 73,832 | 1,055 |
| | Koninklijke Vopak NV | 26,367 | 1,049 |
| | TKH Group NV GDR | 17,380 | 990 |
| | Boskalis Westminster | 30,845 | 920 |
| | PostNL NV | 207,848 | 902 |
| *,3 | Basic-Fit NV | 17,995 | 874 |
| *,3 | GrandVision NV | 22,711 | 745 |
| *,3 | Intertrust NV | 38,330 | 580 |
| 3 | CTP NV | 26,060 | 553 |
| *,3 | Alfen Beheer BV | 4,423 | 498 |
| | AMG Advanced Metallurgical Group NV | 15,733 | 464 |
| | Eurocommercial Properties NV | 19,147 | 447 |
| 3 | Flow Traders | 12,164 | 413 |
| * | Accell Group NV | 9,543 | 393 |
| * | Sligro Food Group NV | 12,587 | 337 |
| | NSI NV | 7,906 | 317 |
| | Vastned Retail NV | 10,192 | 290 |
| * | Fugro NV | 32,885 | 279 |
| | Wereldhave NV | 16,890 | 262 |
| * | Koninklijke BAM Groep NV | 90,114 | 262 |
| * | TomTom NV | 21,048 | 181 |
| *,3 | Just Eat Takeaway.com NV (XLON) | 1,405 | 101 |
Total World Stock Index Fund
| | | Shares | Market
Value•
($000) |
| | ForFarmers NV | 20,499 | 98 |
| 3 | B&S Group Sarl | 7,543 | 68 |
| | Brunel International NV | 4,071 | 56 |
| | | | 419,865 |
| New Zealand (0.1%) |
| | Fisher & Paykel Healthcare Corp. Ltd. | 250,784 | 5,618 |
| * | Auckland International Airport Ltd. | 514,332 | 2,948 |
| | Spark New Zealand Ltd. | 802,180 | 2,626 |
| | Mainfreight Ltd. | 34,612 | 2,230 |
| | Contact Energy Ltd. | 347,972 | 2,042 |
| | Meridian Energy Ltd. | 503,358 | 1,803 |
| | Fletcher Building Ltd. | 345,241 | 1,776 |
| | Ryman Healthcare Ltd. | 167,185 | 1,730 |
| *,2 | a2 Milk Co. Ltd. | 337,819 | 1,591 |
| | Infratil Ltd. | 228,604 | 1,356 |
| | Mercury NZ Ltd. | 280,714 | 1,235 |
| | Summerset Group Holdings Ltd. | 105,618 | 1,099 |
| | Chorus Ltd. | 209,654 | 957 |
| | EBOS Group Ltd. | 35,516 | 923 |
| | Goodman Property Trust | 437,157 | 780 |
| | Freightways Ltd. | 74,322 | 690 |
| | SKYCITY Entertainment Group Ltd. | 284,372 | 652 |
| | Precinct Properties New Zealand Ltd. | 530,460 | 635 |
| | Kiwi Property Group Ltd. | 715,522 | 600 |
| | Z Energy Ltd. | 225,894 | 583 |
| | Genesis Energy Ltd. | 231,807 | 542 |
| | Argosy Property Ltd. | 433,607 | 485 |
| | Arvida Group Ltd. | 334,695 | 479 |
| * | Pushpay Holdings Ltd. | 257,432 | 351 |
| | Scales Corp. Ltd. | 90,087 | 346 |
| *,2 | Air New Zealand Ltd. | 276,741 | 331 |
| | Oceania Healthcare Ltd. | 327,119 | 328 |
| | Stride Property Group | 180,969 | 309 |
| | Skellerup Holdings Ltd. | 65,641 | 293 |
| | Vital Healthcare Property Trust | 137,358 | 289 |
| | Heartland Group Holdings Ltd. | 168,409 | 284 |
| | Kathmandu Holdings Ltd. | 240,079 | 274 |
| * | Vista Group International Ltd. | 149,431 | 271 |
| | Vector Ltd. | 77,157 | 226 |
| * | Serko Ltd. | 40,373 | 226 |
| * | Pacific Edge Ltd. | 182,119 | 192 |
| *,2 | Synlait Milk Ltd. | 35,408 | 91 |
| * | Tourism Holdings Ltd. | 38,634 | 76 |
| | | Shares | Market
Value•
($000) |
| * | SKY Network Television Ltd. | 55,880 | 76 |
| * | Restaurant Brands New Zealand Ltd. | 6,016 | 67 |
| * | Arvida Group Ltd. Rights Exp.11/08/2021 | 50,942 | 6 |
| | | | 37,416 |
| Norway (0.2%) |
| | Equinor ASA | 420,426 | 10,653 |
| | DNB Bank ASA | 446,915 | 10,635 |
| | Mowi ASA | 196,798 | 5,707 |
| | Norsk Hydro ASA | 599,384 | 4,403 |
| | Telenor ASA | 273,124 | 4,316 |
| | Yara International ASA | 72,331 | 3,780 |
| | TOMRA Systems ASA | 50,426 | 3,259 |
| | Orkla ASA | 327,961 | 3,190 |
| | Schibsted ASA Class B | 46,454 | 2,107 |
| | Bakkafrost P/F | 22,338 | 2,066 |
| | Storebrand ASA | 185,361 | 1,988 |
| * | Nordic Semiconductor ASA | 63,777 | 1,895 |
| * | Adevinta ASA | 113,821 | 1,880 |
| | Gjensidige Forsikring ASA | 71,843 | 1,789 |
| | Salmar ASA | 23,383 | 1,784 |
| | Aker BP ASA | 46,449 | 1,782 |
| | Schibsted ASA Class A | 30,712 | 1,587 |
| * | NEL ASA | 612,335 | 1,296 |
| | SpareBank 1 SR-Bank ASA | 76,489 | 1,173 |
| | Borregaard ASA | 44,130 | 1,072 |
| | SpareBank 1 SMN | 61,573 | 1,026 |
| 3 | Scatec ASA | 49,411 | 975 |
| | Leroy Seafood Group ASA | 105,642 | 960 |
| 3 | Entra ASA | 38,340 | 957 |
| | Aker ASA Class A | 10,319 | 951 |
| | Kongsberg Gruppen ASA | 28,481 | 935 |
| | Subsea 7 SA | 97,603 | 876 |
| *,3 | Crayon Group Holding ASA | 35,256 | 823 |
| * | Kahoot! ASA | 126,187 | 757 |
| * | Bank Norwegian ASA | 59,949 | 743 |
| | Atea ASA | 32,090 | 600 |
| | Veidekke ASA | 40,757 | 587 |
| | Austevoll Seafood ASA | 43,237 | 585 |
| | TGS ASA | 60,760 | 560 |
| 3 | Elkem ASA | 125,425 | 499 |
| 3 | Sbanken ASA | 39,235 | 460 |
| | BW Offshore Ltd. | 106,189 | 346 |
| * | Wallenius Wilhelmsen ASA | 69,324 | 318 |
| * | MPC Container Ships A/S | 132,278 | 313 |
| | Frontline Ltd. | 34,474 | 306 |
| | Bonheur ASA | 7,179 | 284 |
| * | DNO ASA | 188,320 | 275 |
| | Sparebank 1 Oestlandet | 14,697 | 242 |
Total World Stock Index Fund
| | | Shares | Market
Value•
($000) |
| * | Grieg Seafood ASA | 19,835 | 221 |
| * | Hexagon Composites ASA | 43,276 | 174 |
| | Norway Royal Salmon ASA | 7,755 | 163 |
| * | BW Energy Ltd. | 44,486 | 146 |
| | Ocean Yield ASA | 29,459 | 143 |
| 3 | BW LPG Ltd. | 23,866 | 128 |
| | Stolt-Nielsen Ltd. | 7,735 | 119 |
| | | | 81,834 |
| Pakistan (0.0%) |
| * | Lucky Cement Ltd. | 69,998 | 316 |
| | Engro Corp. Ltd. | 173,226 | 287 |
| | Fauji Fertilizer Co. Ltd. | 469,991 | 282 |
| | Bank Alfalah Ltd. | 1,284,017 | 273 |
| | Pakistan State Oil Co. Ltd. | 171,596 | 191 |
| | TRG Pakistan | 249,819 | 175 |
| | MCB Bank Ltd. | 180,931 | 173 |
| | Hub Power Co. Ltd. | 384,498 | 171 |
| | Habib Bank Ltd. | 213,200 | 157 |
| | Pakistan Oilfields Ltd. | 53,810 | 120 |
| | Pakistan Petroleum Ltd. | 260,712 | 115 |
| | Oil & Gas Development Co. Ltd. | 177,400 | 88 |
| | Millat Tractors Ltd. | 15,513 | 81 |
| | Engro Fertilizers Ltd. | 189,840 | 79 |
| | United Bank Ltd. | 95,600 | 78 |
| | Searle Co. Ltd. | 63,272 | 66 |
| * | SUI Southern Gas Co. Ltd. | 1,070,500 | 65 |
| | Nishat Mills Ltd. | 116,000 | 61 |
| * | Fauji Cement Co. Ltd. | 448,621 | 53 |
| | DG Khan Cement Co. Ltd. | 90,500 | 47 |
| | Kot Addu Power Co. Ltd. | 217,493 | 36 |
| | SUI Northern Gas Pipeline | 129,900 | 30 |
| * | National Bank of Pakistan | 129,500 | 26 |
| | | | 2,970 |
| Philippines (0.1%) |
| | SM Investments Corp. | 222,908 | 4,269 |
| | SM Prime Holdings Inc. | 3,811,550 | 2,507 |
| | Ayala Land Inc. | 3,523,200 | 2,454 |
| | Ayala Corp. | 141,365 | 2,422 |
| | Bdo Unibank Inc. | 793,074 | 1,952 |
| | International Container Terminal Services Inc. | 450,370 | 1,608 |
| | JG Summit Holdings Inc. | 1,296,763 | 1,549 |
| | PLDT Inc. | 40,800 | 1,333 |
| | Bank of The Philippine Islands | 724,950 | 1,251 |
| | Jollibee Foods Corp. | 207,330 | 968 |
| | Universal Robina Corp. | 344,140 | 944 |
| | Globe Telecom Inc. | 12,750 | 757 |
| | | Shares | Market
Value•
($000) |
| | Metropolitan Bank & Trust Co. | 687,669 | 650 |
| | AC Energy Corp. | 2,586,100 | 630 |
| | Manila Electric Co. | 100,695 | 574 |
| | GT Capital Holdings Inc. | 48,085 | 540 |
| | Security Bank Corp. | 215,650 | 517 |
| | Wilcon Depot Inc. | 747,100 | 462 |
| | San Miguel Corp. | 198,800 | 460 |
| | Aboitiz Power Corp. | 700,320 | 447 |
| * | Converge Information and Communications Technology Solutions Inc. | 661,100 | 418 |
| | San Miguel Food and Beverage Inc. | 271,770 | 409 |
| | Metro Pacific Investments Corp. | 5,426,300 | 404 |
| | Puregold Price Club Inc. | 360,980 | 302 |
| | Alliance Global Group Inc. | 1,458,100 | 301 |
| | Megaworld Corp. | 4,417,900 | 269 |
| | Robinsons Retail Holdings Inc. | 211,970 | 262 |
| | Robinson's Land Corp. | 753,861 | 255 |
| | LT Group Inc. | 1,264,300 | 252 |
| | DMCI Holdings Inc. | 1,475,900 | 233 |
| | Filinvest Land Inc. | 9,974,000 | 228 |
| * | Manila Water Co. Inc. | 427,700 | 225 |
| | Century Pacific Food Inc. | 394,200 | 221 |
| | Semirara Mining & Power Corp. Class A | 367,836 | 190 |
| | Vista Land & Lifescapes Inc. | 2,503,800 | 188 |
| * | Bloomberry Resorts Corp. | 1,343,300 | 181 |
| | First Gen Corp. | 286,238 | 171 |
| | Nickel Asia Corp. | 1,574,100 | 171 |
| | D&L Industries Inc. | 751,700 | 126 |
| * | Cebu Air Inc. | 45,640 | 40 |
| *,3 | CEMEX Holdings Philippines Inc. | 1,282,312 | 32 |
| | | | 31,172 |
| Poland (0.1%) |
| * | Powszechna Kasa Oszczednosci Bank Polski SA | 366,546 | 4,488 |
| | Polski Koncern Naftowy ORLEN SA | 133,349 | 2,876 |
| | Powszechny Zaklad Ubezpieczen SA | 241,507 | 2,416 |
| | KGHM Polska Miedz SA | 61,510 | 2,365 |
| | Bank Polska Kasa Opieki SA | 62,283 | 2,058 |
| | LPP SA | 531 | 1,910 |
| *,3 | Allegro.eu SA | 166,398 | 1,884 |
| *,3 | Dino Polska SA | 20,520 | 1,834 |
| 2 | CD Projekt SA | 26,707 | 1,166 |
Total World Stock Index Fund
| | | Shares | Market
Value•
($000) |
| | Polskie Gornictwo Naftowe i Gazownictwo SA | 751,227 | 1,133 |
| | Santander Bank Polska SA | 10,984 | 1,022 |
| | Cyfrowy Polsat SA | 113,971 | 1,019 |
| * | mBank SA | 6,177 | 874 |
| * | Alior Bank SA | 48,387 | 764 |
| * | PGE Polska Grupa Energetyczna SA | 306,199 | 753 |
| | Asseco Poland SA | 26,487 | 652 |
| | KRUK SA | 6,541 | 546 |
| * | Orange Polska SA | 271,666 | 530 |
| * | Grupa Lotos SA | 32,771 | 509 |
| * | Bank Millennium SA | 216,585 | 497 |
| * | CCC SA | 13,354 | 404 |
| * | Enea SA | 121,022 | 307 |
| * | Jastrzebska Spolka Weglowa SA | 21,805 | 284 |
| * | Tauron Polska Energia SA | 300,511 | 248 |
| * | AmRest Holdings SE | 24,770 | 199 |
| | Bank Handlowy w Warszawie SA | 11,626 | 169 |
| | Ciech SA | 13,778 | 123 |
| | Warsaw Stock Exchange | 9,251 | 102 |
| * | Grupa Azoty SA | 12,412 | 93 |
| | Eurocash SA | 25,178 | 62 |
| * | Mercator Medical SA | 619 | 16 |
| | | | 31,303 |
| Portugal (0.0%) |
| | EDP - Energias de Portugal SA | 1,264,708 | 7,136 |
| | EDP Renovaveis SA | 103,244 | 2,875 |
| | Jeronimo Martins SGPS SA | 104,303 | 2,363 |
| | Galp Energia SGPS SA | 219,151 | 2,277 |
| * | Banco Comercial Portugues SA Class R | 3,402,397 | 614 |
| | Sonae SGPS SA | 501,344 | 552 |
| | CTT-Correios de Portugal SA | 84,886 | 467 |
| | Navigator Co. SA | 112,017 | 438 |
| | REN - Redes Energeticas Nacionais SGPS SA | 129,114 | 393 |
| | Corticeira Amorim SGPS SA | 20,927 | 291 |
| | NOS SGPS SA | 74,161 | 289 |
| | Altri SGPS SA | 31,778 | 206 |
| * | Greenvolt-Energias Renovaveis SA | 23,760 | 187 |
| | | | 18,088 |
| Qatar (0.1%) |
| | Qatar National Bank QPSC | 1,910,156 | 10,763 |
| | Industries Qatar QSC | 675,716 | 2,944 |
| | Qatar Islamic Bank SAQ | 479,093 | 2,426 |
| | Masraf Al Rayan QSC | 1,508,842 | 1,978 |
| | | Shares | Market
Value•
($000) |
| | Commercial Bank PSQC | 842,836 | 1,417 |
| | Qatar Gas Transport Co. Ltd. | 1,252,611 | 1,120 |
| | Mesaieed Petrochemical Holding Co. | 1,666,185 | 1,101 |
| | Qatar Fuel QSC | 210,742 | 1,065 |
| | Qatar International Islamic Bank QSC | 328,915 | 884 |
| | Qatar Electricity & Water Co. QSC | 181,246 | 838 |
| | Qatar Aluminum Manufacturing Co. | 1,449,416 | 757 |
| | Barwa Real Estate Co. | 782,809 | 679 |
| | Doha Bank QPSC | 759,757 | 601 |
| | Ooredoo QPSC | 302,832 | 577 |
| * | Qatar Insurance Co. SAQ | 615,429 | 415 |
| * | Ezdan Holding Group QSC | 611,170 | 260 |
| | United Development Co. QSC | 604,560 | 258 |
| | Vodafone Qatar QSC | 578,060 | 257 |
| | Al Meera Consumer Goods Co. QSC | 42,068 | 226 |
| * | Gulf International Services QSC | 282,740 | 143 |
| | Medicare Group | 56,678 | 132 |
| | | | 28,841 |
| Romania (0.0%) |
| | Banca Transilvania SA | 2,015,402 | 1,183 |
| | OMV Petrom SA | 5,117,497 | 590 |
| | Societatea Nationala Nuclearelectrica SA | 18,211 | 183 |
| | Teraplast SA | 521,432 | 133 |
| | | | 2,089 |
| Russia (0.4%) |
| | LUKOIL PJSC ADR | 171,861 | 17,518 |
| | Gazprom PJSC ADR | 1,675,570 | 16,442 |
| | Sberbank of Russia PJSC ADR (XLON) | 622,780 | 12,505 |
| * | Yandex NV Class A | 139,742 | 11,576 |
| | Novatek PJSC | 451,697 | 11,469 |
| | MMC Norilsk Nickel PJSC ADR | 217,843 | 6,808 |
| | Sberbank of Russia PJSC | 1,297,011 | 6,525 |
| | Gazprom PJSC | 1,233,031 | 6,076 |
| | Rosneft Oil Co. PJSC (Registered) GDR | 465,702 | 4,146 |
| | Sberbank of Russia PJSC ADR | 174,544 | 3,501 |
| | Tatneft PSJC ADR | 54,709 | 2,496 |
| | Surgutneftegas PJSC ADR | 407,594 | 1,947 |
| | Severstal PAO PJSC | 82,549 | 1,876 |
| * | Alrosa PJSC | 1,035,310 | 1,828 |
| | Tatneft PJSC | 225,781 | 1,725 |
| | Polyus PJSC (Registered) GDR | 16,780 | 1,659 |
| | Magnit PJSC | 18,115 | 1,653 |
Total World Stock Index Fund
| | | Shares | Market
Value•
($000) |
| | Surgutneftegas PJSC Preference Shares | 3,000,000 | 1,634 |
| * | Novolipetskiy Metallurgicheskiy Kombinat PJSC | 493,984 | 1,559 |
| | Mobile TeleSystems PJSC | 325,942 | 1,428 |
| | Transneft PJSC Preference Shares | 665 | 1,427 |
| * | Moscow Exchange MICEX-RTS PJSC | 554,605 | 1,361 |
| * | Tatneft PJSC Preference Shares | 197,444 | 1,359 |
| | Magnit PJSC GDR (Registered) | 55,799 | 1,034 |
| * | United Co. Rusal International | 1,001,888 | 1,018 |
| * | Inter Rao Ues PJSC | 13,477,172 | 914 |
| | PhosAgro PJSC GDR (Registered) | 33,457 | 800 |
| | VTB Bank PJSC GDR (Registered) | 544,162 | 791 |
| * | Magnitogorsk Iron & Steel Works PJSC | 837,541 | 783 |
| | VTB Bank PJSC | 1,007,092,403 | 752 |
| * | Polyus PJSC | 3,037 | 602 |
| * | RusHydro PJSC | 48,994,242 | 562 |
| | Rostelecom PJSC | 423,403 | 557 |
| * | Credit Bank of Moscow PJSC | 5,047,800 | 509 |
| 3 | Detsky Mir PJSC | 260,150 | 503 |
| * | Aeroflot PJSC | 460,151 | 446 |
| | Sistema PJSFC | 969,800 | 369 |
| | Sistema PJSFC GDR (Registered) | 38,526 | 292 |
| | Raspadskaya OJSC | 42,160 | 257 |
| * | Federal Grid Co. | 97,070,000 | 254 |
| | Novorossiysk Commercial Sea Port PJSC | 2,266,500 | 248 |
| | Samolet Group | 3,481 | 241 |
| * | Mechel PJSC | 111,128 | 229 |
| | ROSSETI PJSC | 10,882,193 | 214 |
| | PhosAgro PJSC | 2,689 | 213 |
| | Sovcomflot PJSC | 170,280 | 205 |
| | Mechel PJSC Preference Shares | 45,248 | 189 |
| | Unipro PJSC | 4,599,900 | 177 |
| | TGC-1 PJSC | 1,082,800,000 | 170 |
| | Rosseti Lenenergo PJSC Preference Shares | 65,770 | 163 |
| | IDGC of Centre and Volga Region PJSC | 41,250,000 | 155 |
| * | OGK-2 PJSC | 12,702,000 | 126 |
| * | ENEL RUSSIA PJSC | 10,241,000 | 124 |
| | Novatek PJSC GDR (Registered) | 441 | 112 |
| | Bank St. Petersburg PJSC | 83,530 | 107 |
| * | M Video PJSC | 12,400 | 103 |
| * | Mosenergo PJSC | 3,183,467 | 101 |
| | LSR Group PJSC Class A | 8,952 | 94 |
| | Bashneft PJSC Preference Shares | 5,732 | 93 |
| | | Shares | Market
Value•
($000) |
| | Mobile TeleSystems PJSC ADR | 8,900 | 82 |
| | Surgutneftegas PJSC ADR (XLON) | 8,300 | 40 |
| | Rosneft Oil Co. PJSC | 3,288 | 30 |
| | | | 132,177 |
| Saudi Arabia (0.4%) |
| | Al Rajhi Bank | 536,930 | 19,863 |
| | Saudi National Bank | 959,594 | 16,845 |
| 3 | Saudi Arabian Oil Co. | 1,086,692 | 10,940 |
| | Saudi Basic Industries Corp. | 291,771 | 10,056 |
| | Saudi Telecom Co. | 207,711 | 6,489 |
| | Riyad Bank | 522,322 | 4,112 |
| * | Saudi Arabian Mining Co. | 180,460 | 3,935 |
| | SABIC Agri-Nutrients Co. | 79,945 | 3,508 |
| | Saudi British Bank | 378,353 | 3,344 |
| | Alinma Bank | 446,737 | 2,999 |
| | Banque Saudi Fransi | 254,965 | 2,870 |
| | Saudi Electricity Co. | 336,962 | 2,563 |
| * | Bank AlBilad | 179,209 | 2,019 |
| | Sahara International Petrochemical Co. | 160,814 | 1,888 |
| | Yanbu National Petrochemical Co. | 92,054 | 1,870 |
| * | Saudi Kayan Petrochemical Co. | 313,774 | 1,708 |
| | Arab National Bank | 276,082 | 1,696 |
| | Dr Sulaiman Al Habib Medical Services Group Co. | 37,275 | 1,649 |
| | Almarai Co. JSC | 108,153 | 1,525 |
| | Jarir Marketing Co. | 25,253 | 1,366 |
| | Etihad Etisalat Co. | 163,627 | 1,319 |
| | Savola Group | 111,497 | 1,088 |
| * | National Industrialization Co. | 157,180 | 1,046 |
| | Saudi Industrial Investment Group | 98,557 | 996 |
| | Bupa Arabia for Cooperative Insurance Co. | 25,333 | 978 |
| | Bank Al-Jazira | 176,581 | 905 |
| | Mouwasat Medical Services Co. | 18,693 | 899 |
| | Advanced Petrochemical Co. | 44,920 | 893 |
| * | Rabigh Refining & Petrochemical Co. | 101,861 | 777 |
| * | Emaar Economic City | 207,358 | 701 |
| | National Petrochemical Co. | 54,527 | 701 |
| | Co. for Cooperative Insurance | 30,507 | 700 |
| * | Dar Al Arkan Real Estate Development Co. | 265,100 | 700 |
| * | International Co. For Water & Power Projects | 31,841 | 606 |
Total World Stock Index Fund
| | | Shares | Market
Value•
($000) |
| | Abdullah Al Othaim Markets Co. | 19,519 | 602 |
| * | Saudi Research & Media Group | 12,762 | 575 |
| * | Mobile Telecommunications Co. Saudi Arabia | 155,229 | 562 |
| | Saudi Cement Co. | 32,253 | 510 |
| | Leejam Sports Co. JSC | 16,538 | 501 |
| * | Arabian Internet & Communications Services Co. | 9,355 | 497 |
| | Southern Province Cement Co. | 25,833 | 493 |
| | Qassim Cement Co. | 20,322 | 442 |
| | United Electronics Co. | 11,629 | 437 |
| * | Saudi Ground Services Co. | 43,312 | 430 |
| * | Methanol Chemicals Co. | 43,219 | 410 |
| | Arabian Centres Co. Ltd. | 57,433 | 391 |
| | Dallah Healthcare Co. | 18,853 | 365 |
| * | Saudi Airlines Catering Co. | 14,408 | 365 |
| * | Seera Group Holding | 52,491 | 324 |
| | BinDawood Holding Co. | 11,626 | 323 |
| | Jadwa REIT Saudi Fund | 82,391 | 321 |
| | Yanbu Cement Co. | 28,786 | 294 |
| | Saudia Dairy & Foodstuff Co. | 6,214 | 272 |
| * | Yamama Cement Co. | 36,625 | 271 |
| | Saudi Pharmaceutical Industries & Medical Appliances Corp. | 23,425 | 268 |
| | Aldrees Petroleum and Transport Services Co. | 13,242 | 261 |
| | United International Transportation Co. | 18,517 | 248 |
| | Arriyadh Development Co. | 34,439 | 244 |
| | Al Hammadi Co. for Development and Investment | 21,585 | 244 |
| * | Saudi Real Estate Co. | 40,611 | 242 |
| | Arabian Cement Co. | 23,203 | 241 |
| * | National Agriculture Development Co. | 24,421 | 231 |
| | National Gas & Industrialization Co. | 13,286 | 209 |
| | Saudi Ceramic Co. | 12,356 | 179 |
| | Eastern Province Cement Co. | 13,957 | 178 |
| * | Aseer Trading Tourism & Manufacturing Co. | 28,158 | 171 |
| | | Shares | Market
Value•
($000) |
| * | Zamil Industrial Investment Co. | 17,264 | 163 |
| | Astra Industrial Group | 13,957 | 161 |
| | Saudi Chemical Co. Holding | 14,736 | 149 |
| * | Saudi Public Transport Co. | 22,688 | 146 |
| | Najran Cement Co. | 28,468 | 143 |
| * | Middle East Healthcare Co. | 13,925 | 138 |
| | City Cement Co. | 21,222 | 137 |
| * | Fawaz Abdulaziz Al Hokair & Co. | 25,790 | 132 |
| * | Dur Hospitality Co. | 13,720 | 131 |
| | National Medical Care Co. | 7,877 | 128 |
| | Herfy Food Services Co. | 7,093 | 124 |
| | Hail Cement Co. | 29,572 | 117 |
| * | Mediterranean & Gulf Insurance & Reinsurance Co. | 17,756 | 110 |
| * | Al Jouf Cement Co. | 34,234 | 110 |
| | Northern Region Cement Co. | 26,787 | 106 |
| | Bawan Co. | 9,330 | 99 |
| * | Tabuk Cement Co. | 19,317 | 98 |
| * | Abdul Mohsen Al-Hokair Tourism and Development Co. | 11,319 | 67 |
| | | | 126,914 |
| Singapore (0.3%) |
| | DBS Group Holdings Ltd. | 787,878 | 18,411 |
| | Oversea-Chinese Banking Corp. Ltd. | 1,536,838 | 13,435 |
| | United Overseas Bank Ltd. | 571,500 | 11,360 |
| | Singapore Telecommunications Ltd. | 3,397,500 | 6,303 |
| | Ascendas REIT | 1,623,313 | 3,718 |
| | CapitaLand Integrated Commercial Trust | 2,048,517 | 3,262 |
| * | Capitaland Investment Ltd. | 1,206,200 | 3,077 |
| | Wilmar International Ltd. | 911,437 | 2,914 |
| | Singapore Exchange Ltd. | 354,610 | 2,545 |
| | Keppel Corp. Ltd. | 617,613 | 2,465 |
| * | Singapore Airlines Ltd. | 548,636 | 2,113 |
| | Singapore Technologies Engineering Ltd. | 658,100 | 1,869 |
| | Mapletree Logistics Trust | 1,188,347 | 1,782 |
| | Venture Corp. Ltd. | 113,700 | 1,588 |
| | Mapletree Industrial Trust | 739,892 | 1,510 |
| | Mapletree Commercial Trust | 931,759 | 1,507 |
| | Genting Singapore Ltd. | 2,502,000 | 1,447 |
Total World Stock Index Fund
| | | Shares | Market
Value•
($000) |
| | Frasers Logistics & Commercial Trust | 1,219,776 | 1,374 |
| | UOL Group Ltd. | 214,355 | 1,150 |
| | City Developments Ltd. | 192,000 | 1,042 |
| 1 | Singapore Press Holdings Ltd. | 677,400 | 1,003 |
| | NetLink NBN Trust | 1,286,100 | 972 |
| | Suntec REIT | 868,500 | 962 |
| | Keppel DC REIT | 539,088 | 955 |
| | ComfortDelGro Corp. Ltd. | 771,700 | 894 |
| | Frasers Centrepoint Trust | 487,852 | 872 |
| | Keppel REIT | 910,388 | 762 |
| * | SATS Ltd. | 242,700 | 755 |
| | Mapletree North Asia Commercial Trust | 984,300 | 746 |
| | Parkway Life REIT | 194,186 | 672 |
| | Keppel Infrastructure Trust | 1,605,235 | 631 |
| | Sembcorp Industries Ltd. | 421,231 | 629 |
| * | Golden Agri-Resources Ltd. | 3,153,719 | 619 |
| | Jardine Cycle & Carriage Ltd. | 34,888 | 583 |
| | Manulife US REIT | 783,584 | 558 |
| | Ascott Residence Trust | 717,763 | 549 |
| | CapitaLand China Trust | 599,068 | 543 |
| * | Sembcorp Marine Ltd. | 9,222,742 | 541 |
| | ARA LOGOS Logistics Trust | 783,072 | 523 |
| | Cromwell European REIT | 166,820 | 509 |
| | Haw Par Corp. Ltd. | 51,000 | 477 |
| | ESR-REIT | 1,268,372 | 452 |
| | CDL Hospitality Trusts | 483,688 | 430 |
| | Hutchison Port Holdings Trust Class U | 1,973,600 | 425 |
| | iFAST Corp. Ltd. | 64,500 | 415 |
| | Lendlease Global Commercial REIT | 636,600 | 413 |
| | OUE Commercial REIT | 1,210,175 | 403 |
| | AIMS APAC REIT | 370,400 | 396 |
| | Keppel Pacific Oak US REIT | 462,700 | 368 |
| | Ascendas India Trust | 349,600 | 361 |
| | StarHub Ltd. | 384,200 | 353 |
| | Raffles Medical Group Ltd. | 343,000 | 349 |
| | Wing Tai Holdings Ltd. | 236,700 | 341 |
| | Prime US REIT | 383,400 | 331 |
| | Olam International Ltd. | 248,000 | 313 |
| | Starhill Global REIT | 647,200 | 310 |
| 1 | SPH REIT | 411,500 | 298 |
| | First Resources Ltd. | 192,400 | 254 |
| | Singapore Post Ltd. | 499,000 | 243 |
| | | Shares | Market
Value•
($000) |
| | Frasers Hospitality Trust | 675,900 | 241 |
| | Far East Hospitality Trust | 472,400 | 226 |
| | AEM Holdings Ltd. | 69,700 | 217 |
| | Nanofilm Technologies International Ltd. | 74,400 | 209 |
| | Asian Pay Television Trust | 2,082,700 | 208 |
| | First REIT | 1,043,136 | 205 |
| * | Thomson Medical Group Ltd. | 3,104,800 | 196 |
| | Sabana Industrial REIT | 589,600 | 190 |
| | Sheng Siong Group Ltd. | 168,000 | 177 |
| * | SIA Engineering Co. Ltd. | 98,500 | 159 |
| | Riverstone Holdings Ltd. | 211,900 | 135 |
| *,1 | Best World International Ltd. | 90,400 | 87 |
| | Lippo Malls Indonesia Retail Trust | 2,006,940 | 83 |
| * | COSCO Shipping International Singapore Co. Ltd. | 379,700 | 77 |
| | Bumitama Agri Ltd. | 133,200 | 54 |
| | Silverlake Axis Ltd. | 177,499 | 42 |
| *,1 | Eagle Hospitality Trust | 242,300 | 33 |
| * | Yoma Strategic Holdings Ltd. | 310,430 | 32 |
| *,1,2 | Hyflux Ltd. | 54,000 | 8 |
| *,1,2 | Ezra Holdings Ltd. | 344,056 | 3 |
| *,2 | Ezion Holdings Ltd. Warrants Exp. 4/16/23 | 267,303 | — |
| | | | 106,664 |
| South Africa (0.4%) |
| | Naspers Ltd. Class N | 92,757 | 15,709 |
| | FirstRand Ltd. | 2,165,634 | 8,227 |
| * | MTN Group Ltd. | 792,434 | 7,106 |
| | Standard Bank Group Ltd. | 568,894 | 5,041 |
| | Impala Platinum Holdings Ltd. | 359,392 | 4,651 |
| | Sibanye Stillwater Ltd. | 1,277,981 | 4,473 |
| * | Sasol Ltd. | 239,148 | 4,017 |
| | Capitec Bank Holdings Ltd. | 35,680 | 3,986 |
| | Gold Fields Ltd. | 376,841 | 3,502 |
| | Anglogold Ltd. | 182,596 | 3,369 |
| | Bid Corp. Ltd. | 155,905 | 3,342 |
| | Sanlam Ltd. | 735,447 | 3,021 |
| | Absa Group Ltd. | 297,336 | 2,720 |
| | Anglo American Platinum Ltd. | 25,974 | 2,632 |
| | Aspen Pharmacare Holdings Ltd. | 161,049 | 2,559 |
| | Shoprite Holdings Ltd. | 199,196 | 2,364 |
| | Vodacom Group Ltd. | 246,942 | 2,187 |
Total World Stock Index Fund
| | | Shares | Market
Value•
($000) |
| * | Northam Platinum Holdings Ltd. | 142,320 | 2,131 |
| | Clicks Group Ltd. | 106,079 | 1,940 |
| | Remgro Ltd. | 214,451 | 1,891 |
| 2 | Bidvest Group Ltd. | 135,508 | 1,697 |
| 2 | Nedbank Group Ltd. | 144,067 | 1,642 |
| * | Discovery Ltd. | 171,979 | 1,578 |
| | Multichoice Group | 182,255 | 1,449 |
| | Old Mutual Ltd. | 1,455,121 | 1,433 |
| | Mr Price Group Ltd. | 109,200 | 1,425 |
| | Woolworths Holdings Ltd. | 365,356 | 1,286 |
| *,3 | Pepkor Holdings Ltd. | 732,019 | 1,154 |
| | Exxaro Resources Ltd. | 103,952 | 1,140 |
| | Growthpoint Properties Ltd. | 1,347,441 | 1,140 |
| * | Foschini Group Ltd. | 133,350 | 1,131 |
| | Reinet Investments SCA | 57,967 | 1,048 |
| | SPAR Group Ltd. | 81,505 | 1,041 |
| * | Life Healthcare Group Holdings Ltd. | 593,021 | 939 |
| 2 | Rand Merchant Investment Holdings Ltd. | 338,927 | 907 |
| | Tiger Brands Ltd. | 70,711 | 895 |
| | Harmony Gold Mining Co. Ltd. | 240,653 | 864 |
| 2 | AVI Ltd. | 162,265 | 841 |
| | Kumba Iron Ore Ltd. | 24,844 | 756 |
| * | Sappi Ltd. | 241,481 | 742 |
| | Barloworld Ltd. | 84,217 | 707 |
| | Transaction Capital Ltd. | 242,799 | 700 |
| * | Netcare Ltd. | 614,660 | 680 |
| | Investec Ltd. | 141,786 | 653 |
| * | Redefine Properties Ltd. | 2,117,381 | 624 |
| | African Rainbow Minerals Ltd. | 45,583 | 609 |
| | Royal Bafokeng Platinum Ltd. | 82,003 | 587 |
| | Resilient REIT Ltd. | 157,411 | 576 |
| | Truworths International Ltd. | 159,305 | 562 |
| | Momentum Metropolitan Holdings | 418,340 | 537 |
| | Old Mutual Ltd. (XZIM) | 523,563 | 535 |
| | Pick n Pay Stores Ltd. | 129,465 | 504 |
| | Motus Holdings Ltd. | 74,778 | 499 |
| | Ninety One plc | 130,807 | 464 |
| | Super Group Ltd. | 216,350 | 453 |
| | PSG Group Ltd. | 81,823 | 410 |
| * | Distell Group Holdings Ltd. | 33,656 | 403 |
| | Equites Property Fund Ltd. | 298,746 | 398 |
| * | Telkom SA SOC Ltd. | 117,167 | 390 |
| | Fortress REIT Ltd. Class A | 432,641 | 377 |
| | KAP Industrial Holdings Ltd. | 1,215,044 | 374 |
| | | Shares | Market
Value•
($000) |
| | Hyprop Investments Ltd. | 188,081 | 365 |
| | Ninety One Ltd. | 98,139 | 339 |
| | AECI Ltd. | 45,345 | 337 |
| | Advtech Ltd. | 263,200 | 331 |
| | Coronation Fund Managers Ltd. | 98,576 | 328 |
| 3 | Dis-chem Pharmacies Ltd. | 145,496 | 304 |
| | Omnia Holdings Ltd. | 66,723 | 276 |
| | Irongate Group | 225,316 | 275 |
| | Imperial Logistics Ltd. | 64,353 | 263 |
| * | Steinhoff International Holdings NV | 1,654,648 | 261 |
| | Santam Ltd. | 14,925 | 248 |
| | Cashbuild Ltd. | 13,879 | 242 |
| | Vukile Property Fund Ltd. | 300,173 | 239 |
| * | Liberty Holdings Ltd. | 40,336 | 238 |
| * | Thungela Resources Ltd. | 49,847 | 237 |
| | JSE Ltd. | 33,129 | 232 |
| * | Tsogo Sun Gaming Ltd. | 262,465 | 212 |
| | Reunert Ltd. | 59,789 | 197 |
| | MAS Real Estate Inc. | 167,179 | 197 |
| * | Curro Holdings Ltd. | 243,183 | 196 |
| *,2 | Bytes Technology Group plc | 26,808 | 195 |
| | SA Corporate Real Estate Ltd. | 1,346,692 | 188 |
| * | DataTec Ltd. | 67,595 | 184 |
| | Astral Foods Ltd. | 15,486 | 179 |
| * | Famous Brands Ltd. | 36,851 | 178 |
| * | Blue Label Telecoms Ltd. | 432,314 | 157 |
| | Wilson Bayly Holmes-Ovcon Ltd. | 22,336 | 155 |
| * | EPP NV | 168,559 | 132 |
| | Investec Property Fund Ltd. | 188,893 | 131 |
| * | Massmart Holdings Ltd. | 31,813 | 130 |
| | DRDGOLD Ltd. | 138,281 | 123 |
| * | Attacq Ltd. | 287,506 | 123 |
| * | Sun International Ltd. | 57,248 | 120 |
| | Raubex Group Ltd. | 55,550 | 119 |
| *,2 | Brait plc | 387,075 | 108 |
| * | Long4Life Ltd. | 272,592 | 107 |
| | Hudaco Industries Ltd. | 11,423 | 103 |
| 2 | Adcock Ingram Holdings Ltd. | 28,993 | 93 |
| * | Hosken Consolidated Investments Ltd. | 19,068 | 90 |
| | Emira Property Fund Ltd. | 143,141 | 88 |
| | Zeder Investments Ltd. | 396,625 | 82 |
| * | Fortress REIT Ltd. Class B | 440,214 | 71 |
| | Altron Ltd. Class A | 71,488 | 51 |
Total World Stock Index Fund
| | | Shares | Market
Value•
($000) |
| | Alexander Forbes Group Holdings Ltd. | 171,753 | 49 |
| * | Steinhoff International Holdings NV (XETR) | 19,964 | 3 |
| | | | 127,294 |
| South Korea (1.5%) |
| | Samsung Electronics Co. Ltd. | 1,106,581 | 66,254 |
| | Samsung Electronics Co. Ltd. GDR (Registered) | 35,714 | 53,476 |
| | Samsung Electronics Co. Ltd. Preference Shares | 422,123 | 23,190 |
| | NAVER Corp. | 58,142 | 20,215 |
| | SK Hynix Inc. | 227,442 | 20,049 |
| | Samsung SDI Co. Ltd. | 23,251 | 14,670 |
| | LG Chem Ltd. | 19,255 | 13,817 |
| | Kakao Corp. | 116,909 | 12,578 |
| | Hyundai Motor Co. | 53,387 | 9,549 |
| | Kia Corp. | 109,292 | 7,975 |
| * | Celltrion Inc. | 45,293 | 7,798 |
| | POSCO | 27,942 | 7,087 |
| | Shinhan Financial Group Co. Ltd. | 205,629 | 6,713 |
| | KB Financial Group Inc. | 122,699 | 5,939 |
| | Hyundai Mobis Co. Ltd. | 27,274 | 5,896 |
| * | SK Innovation Co. Ltd. | 23,667 | 4,936 |
| | Hana Financial Group Inc. | 123,274 | 4,753 |
| | LG Electronics Inc. | 44,336 | 4,587 |
| *,3 | Samsung Biologics Co. Ltd. | 5,627 | 4,192 |
| | NCSoft Corp. | 7,332 | 3,940 |
| | Samsung C&T Corp. | 35,747 | 3,500 |
| *,2 | HMM Co. Ltd. | 149,832 | 3,428 |
| | LG Household & Health Care Ltd. | 3,292 | 3,295 |
| | Samsung Electro-Mechanics Co. Ltd. | 23,853 | 3,248 |
| | KT&G Corp. | 46,535 | 3,232 |
| | Samsung Fire & Marine Insurance Co. Ltd. | 14,615 | 2,897 |
| | SK Inc. | 13,560 | 2,830 |
| | LG Corp. | 35,301 | 2,760 |
| * | Doosan Heavy Industries & Construction Co. Ltd. | 129,595 | 2,711 |
| | Woori Financial Group Inc. | 221,806 | 2,522 |
| | Hyundai Motor Co. Preference Shares (XKRS) | 28,230 | 2,372 |
| * | HYBE Co. Ltd. | ��� 7,763 | 2,230 |
| | Korea Electric Power Corp. | 112,986 | 2,189 |
| | | Shares | Market
Value•
($000) |
| | KB Financial Group Inc. ADR | 44,662 | 2,147 |
| * | Celltrion Healthcare Co. Ltd. | 30,461 | 2,118 |
| * | Korean Air Lines Co. Ltd. | 78,029 | 2,034 |
| | Amorepacific Corp. | 12,098 | 1,883 |
| | Korea Zinc Co. Ltd. | 3,988 | 1,836 |
| 1 | SK Telecom Co. Ltd. | 6,894 | 1,825 |
| | LG Chem Ltd. Preference Shares | 5,158 | 1,694 |
| | Samsung SDS Co. Ltd. | 12,876 | 1,692 |
| * | SK Bioscience Co. Ltd. | 8,526 | 1,674 |
| | Coway Co. Ltd. | 22,820 | 1,547 |
| * | Korea Shipbuilding & Offshore Engineering Co. Ltd. | 17,483 | 1,546 |
| | L&F Co. Ltd. | 9,750 | 1,544 |
| | Korea Investment Holdings Co. Ltd. | 20,272 | 1,516 |
| | Samsung Life Insurance Co. Ltd. | 26,035 | 1,506 |
| *,2 | LG Display Co. Ltd. | 88,734 | 1,500 |
| | S-Oil Corp. | 16,953 | 1,483 |
| * | Samsung Engineering Co. Ltd. | 69,484 | 1,478 |
| | POSCO Chemical Co. Ltd. | 11,472 | 1,431 |
| * | HLB Inc. | 39,141 | 1,410 |
| * | Hanwha Solutions Corp. | 39,566 | 1,388 |
| * | Samsung Heavy Industries Co. Ltd. | 250,017 | 1,366 |
| | Ecopro BM Co. Ltd. | 3,777 | 1,328 |
| | E-MART Inc. | 9,011 | 1,297 |
| *,2 | Pearl Abyss Corp. | 14,167 | 1,261 |
| | Lotte Chemical Corp. | 6,537 | 1,257 |
| | Hyundai Steel Co. | 32,123 | 1,228 |
| | Hyundai Engineering & Construction Co. Ltd. | 28,152 | 1,217 |
| 2 | Wemade Co. Ltd. | 7,558 | 1,183 |
| | Hyundai Heavy Industries Holdings Co. Ltd. | 21,658 | 1,174 |
| | SKC Co. Ltd. | 7,573 | 1,164 |
| | Hyundai Motor Co. Preference Shares | 13,794 | 1,154 |
| | Hyundai Glovis Co. Ltd. | 7,893 | 1,137 |
| | Samsung Securities Co. Ltd. | 27,844 | 1,132 |
| | BNK Financial Group Inc. | 143,194 | 1,080 |
| | LG Uplus Corp. | 87,571 | 1,078 |
| | DB Insurance Co. Ltd. | 20,948 | 1,065 |
| * | F&F Co. Ltd. | 1,421 | 1,061 |
| | Orion Corp.Republic of Korea | 10,485 | 1,060 |
| | Hansol Chemical Co. Ltd. | 3,728 | 1,052 |
Total World Stock Index Fund
| | | Shares | Market
Value•
($000) |
| | Kumho Petrochemical Co. Ltd. | 7,048 | 1,037 |
| | LG Innotek Co. Ltd. | 5,762 | 1,036 |
| | Mirae Asset Securities Co. Ltd. | 137,024 | 1,022 |
| | Hankook Tire & Technology Co. Ltd. | 28,708 | 1,017 |
| | SK Chemicals Co. Ltd. | 6,442 | 995 |
| | CJ CheilJedang Corp. | 3,058 | 994 |
| | Industrial Bank of Korea | 104,598 | 990 |
| | Hotel Shilla Co. Ltd. | 13,169 | 986 |
| | LG Household & Health Care Ltd. Preference Shares | 1,891 | 971 |
| * | Kangwon Land Inc. | 40,256 | 958 |
| | Yuhan Corp. | 18,341 | 941 |
| * | OCI Co. Ltd. | 8,245 | 913 |
| | GS Holdings Corp. | 24,674 | 894 |
| *,2 | Kakao Games Corp. | 12,630 | 863 |
| * | SK Biopharmaceuticals Co. Ltd. | 10,396 | 842 |
| | GS Engineering & Construction Corp. | 23,655 | 839 |
| * | Alteogen Inc. | 13,858 | 830 |
| | Hanmi Pharm Co. Ltd. | 3,528 | 797 |
| 2 | Fila Holdings Corp. | 23,974 | 764 |
| * | Hyosung Advanced Materials Corp. | 1,234 | 754 |
| * | Mando Corp. | 13,900 | 746 |
| | Hanon Systems | 59,869 | 742 |
| * | Celltrion Pharm Inc. | 7,542 | 735 |
| | DGB Financial Group Inc. | 82,047 | 727 |
| | Korea Aerospace Industries Ltd. | 27,174 | 714 |
| | DB HiTek Co. Ltd. | 14,391 | 711 |
| * | DL E&C Co. Ltd. | 6,049 | 700 |
| | CJ ENM Co. Ltd. | 4,558 | 689 |
| | LOTTE Fine Chemical Co. Ltd. | 9,334 | 681 |
| 3 | Netmarble Corp. | 6,365 | 674 |
| | Kolon Industries Inc. | 8,682 | 664 |
| | SK Telecom Co. Ltd. ADR | 22,202 | 644 |
| | LG Electronics Inc. Preference Shares | 11,659 | 642 |
| 2 | Hyosung TNC Corp. | 1,231 | 633 |
| | Meritz Fire & Marine Insurance Co. Ltd. | 26,368 | 627 |
| 2 | Seegene Inc. | 13,628 | 623 |
| | Green Cross Corp. | 2,623 | 617 |
| | Shin Poong Pharmaceutical Co. Ltd. | 13,856 | 617 |
| | S-1 Corp. | 8,589 | 612 |
| * | SM Entertainment Co. Ltd. | 9,086 | 612 |
| | JB Financial Group Co. Ltd. | 80,396 | 611 |
| | Iljin Materials Co. Ltd. | 6,986 | 604 |
| | | Shares | Market
Value•
($000) |
| | NH Investment & Securities Co. Ltd. | 52,609 | 594 |
| | AfreecaTV Co. Ltd. | 3,587 | 594 |
| | Hanwha Aerospace Co. Ltd. | 15,336 | 592 |
| 2 | Shinsegae Inc. | 2,676 | 569 |
| | SK Materials Co. Ltd. | 1,729 | 566 |
| * | Eubiologics Co. Ltd. | 13,248 | 543 |
| * | NHN Corp. | 7,912 | 542 |
| * | CJ Logistics Corp. | 4,399 | 535 |
| * | Hyundai Rotem Co. Ltd. | 27,399 | 531 |
| | KIWOOM Securities Co. Ltd. | 5,821 | 525 |
| | Cheil Worldwide Inc. | 25,636 | 524 |
| | AMOREPACIFIC Group | 12,187 | 519 |
| | Amorepacific Corp. Preference Shares | 8,349 | 514 |
| | Hanwha Corp. | 17,659 | 508 |
| * | Hyundai Mipo Dockyard Co. Ltd. | 7,746 | 504 |
| | LEENO Industrial Inc. | 3,432 | 503 |
| | Douzone Bizon Co. Ltd. | 7,122 | 497 |
| 2 | Ecopro Co. Ltd. | 5,750 | 494 |
| * | YG Entertainment Inc. | 8,173 | 493 |
| * | Doosan Fuel Cell Co. Ltd. | 10,909 | 490 |
| | JYP Entertainment Corp. | 10,605 | 477 |
| | Samsung Card Co. Ltd. | 16,192 | 475 |
| | Hyundai Marine & Fire Insurance Co. Ltd. | 20,905 | 470 |
| | KCC Corp. | 1,634 | 467 |
| | Daishin Securities Co. Ltd. | 26,048 | 465 |
| 2 | WONIK IPS Co. Ltd. | 13,396 | 465 |
| 2 | CS Wind Corp. | 7,652 | 457 |
| | Daejoo Electronic Materials Co. Ltd. | 5,071 | 456 |
| | Youngone Corp. | 11,886 | 455 |
| | Meritz Securities Co. Ltd. | 113,662 | 454 |
| | GS Retail Co. Ltd. | 16,224 | 448 |
| | Posco International Corp. | 23,993 | 447 |
| | Innocean Worldwide Inc. | 8,753 | 441 |
| | Hyundai Department Store Co. Ltd. | 6,181 | 439 |
| * | Ecopro HN Co. Ltd. | 4,704 | 438 |
| | Hyundai Wia Corp. | 5,852 | 423 |
| | Osstem Implant Co. Ltd. | 3,945 | 418 |
| | Hyundai Elevator Co. Ltd. | 10,016 | 416 |
| | Shinhan Financial Group Co. Ltd. ADR | 12,816 | 414 |
| * | Naturecell Co. Ltd. | 23,800 | 404 |
| * | CosmoAM&T Co. Ltd. | 11,149 | 403 |
Total World Stock Index Fund
| | | Shares | Market
Value•
($000) |
| *,2 | Daewoo Shipbuilding & Marine Engineering Co. Ltd. | 18,080 | 402 |
| | Com2uSCorp | 3,651 | 402 |
| | Hyundai Bioland Co. Ltd. | 23,448 | 401 |
| | Lotte Shopping Co. Ltd. | 4,432 | 399 |
| | CJ Corp. | 4,832 | 397 |
| * | CMG Pharmaceutical Co. Ltd. | 119,964 | 396 |
| * | Genexine Inc. | 7,018 | 395 |
| | Daou Technology Inc. | 19,687 | 394 |
| * | Hanjin Kal Corp. | 8,365 | 393 |
| | HDC Hyundai Development Co-Engineering & Construction Class E | 17,841 | 391 |
| | Pan Ocean Co. Ltd. | 75,465 | 390 |
| * | Cosmax Inc. | 3,643 | 388 |
| * | HLB Life Science Co. Ltd. | 30,224 | 387 |
| | Koh Young Technology Inc. | 24,035 | 380 |
| * | Daewoo Engineering & Construction Co. Ltd. | 70,785 | 379 |
| *,2 | KMW Co. Ltd. | 10,548 | 373 |
| 1 | Green Cross Cell Corp. | 11,180 | 369 |
| | DL Holdings Co. Ltd. | 6,552 | 369 |
| * | Hugel Inc. | 2,364 | 367 |
| | Soulbrain Co. Ltd. | 1,621 | 364 |
| * | Korea Gas Corp. | 9,521 | 362 |
| 2 | Hite Jinro Co. Ltd. | 12,118 | 362 |
| * | Foosung Co. Ltd. | 21,080 | 362 |
| * | Chabiotech Co. Ltd. | 21,371 | 358 |
| | Meritz Financial Group Inc. | 12,474 | 357 |
| * | GeneOne Life Science Inc. | 16,367 | 352 |
| | Chunbo Co. Ltd. | 1,444 | 351 |
| *,2 | Oscotec Inc. | 13,659 | 350 |
| | Dae Hwa Pharmaceutical Co. Ltd. | 40,553 | 347 |
| | SIMMTECH Co. Ltd. | 12,556 | 331 |
| | Dongsuh Cos. Inc. | 11,153 | 329 |
| * | Coreana Cosmetics Co. Ltd. | 88,947 | 325 |
| | Hanssem Co. Ltd. | 3,709 | 323 |
| | Poongsan Corp. | 11,418 | 323 |
| | KEPCO Engineering & Construction Co. Inc. | 5,282 | 321 |
| | Eugene Technology Co. Ltd. | 8,350 | 318 |
| | Hanwha Life Insurance Co. Ltd. | 106,085 | 316 |
| | Green Cross LabCell Corp. | 3,813 | 316 |
| | LOTTE REIT Co. Ltd. | 64,933 | 315 |
| | | Shares | Market
Value•
($000) |
| | LS Corp. | 5,861 | 314 |
| * | SOLUM Co. Ltd. | 13,957 | 314 |
| | Dongjin Semichem Co. Ltd. | 10,365 | 312 |
| | Solus Advanced Materials Co. Ltd. | 4,399 | 311 |
| | Dawonsys Co. Ltd. | 10,955 | 309 |
| | Hanwha Systems Co. Ltd. | 21,949 | 309 |
| | Lotte Corp. | 10,895 | 305 |
| | KEPCO Plant Service & Engineering Co. Ltd. | 8,533 | 305 |
| | PI Advanced Materials Co. Ltd. | 7,673 | 297 |
| | Dongkuk Steel Mill Co. Ltd. | 20,267 | 296 |
| | LS Electric Co. Ltd. | 5,854 | 296 |
| | NICE Information Service Co. Ltd. | 17,427 | 295 |
| *,2 | Creative & Innovative System | 18,667 | 295 |
| | BGF retail Co. Ltd. | 2,109 | 293 |
| 2 | LX Semicon Co. Ltd. | 3,094 | 291 |
| | Mirae Asset Securities Co. Ltd. Preference Shares | 68,360 | 284 |
| | Korean Reinsurance Co. | 34,130 | 283 |
| * | Doosan Bobcat Inc. | 8,654 | 283 |
| | CJ CheilJedang Corp. Preference Shares | 1,700 | 282 |
| * | Hanwha Investment & Securities Co. Ltd. | 59,216 | 281 |
| | Chong Kun Dang Pharmaceutical Corp. | 2,793 | 281 |
| * | Hyosung Chemical Corp. | 1,134 | 281 |
| | Ottogi Corp. | 679 | 280 |
| * | Hana Tour Service Inc. | 3,906 | 279 |
| | SSANGYONG C&E Co. Ltd. | 39,905 | 269 |
| | Green Cross Holdings Corp. | 10,638 | 267 |
| | NongShim Co. Ltd. | 1,103 | 267 |
| * | Asiana Airlines Inc. | 13,793 | 266 |
| | Hanmi Science Co. Ltd. | 5,402 | 263 |
| * | Next Science Co. Ltd. | 16,503 | 260 |
| | Dongwon Industries Co. Ltd. | 1,320 | 258 |
| | Eo Technics Co. Ltd. | 2,799 | 258 |
| | KCC Glass Corp. | 4,931 | 255 |
| | Hanjin Transportation Co. Ltd. | 8,540 | 254 |
| | Hyosung Corp. | 2,867 | 254 |
| * | Hanall Biopharma Co. Ltd. | 14,377 | 252 |
| | Tongyang Inc. | 175,206 | 251 |
| *,2 | Hyundai Bioscience Co. Ltd. | 12,430 | 251 |
Total World Stock Index Fund
| | | Shares | Market
Value•
($000) |
| * | Dongsung Pharmaceutical Co. Ltd. | 32,372 | 247 |
| * | Komipharm International Co. Ltd. | 31,541 | 243 |
| * | Hanjin Heavy Industries & Construction Co. Ltd. | 29,691 | 243 |
| * | Humasis Co. Ltd. | 17,514 | 242 |
| *,2 | NKMax Co. Ltd. | 10,750 | 241 |
| * | Mezzion Pharma Co. Ltd. | 1,770 | 238 |
| *,2 | Paradise Co. Ltd. | 15,864 | 237 |
| * | CrystalGenomics Inc. | 40,355 | 237 |
| | Hanmi Semiconductor Co. Ltd. | 8,606 | 237 |
| * | Insun ENT Co. Ltd. | 22,663 | 235 |
| * | ST Pharm Co. Ltd. | 3,130 | 235 |
| *,2 | Enzychem Lifesciences Corp. | 4,087 | 233 |
| | Kolmar Korea Co. Ltd. | 5,995 | 229 |
| * | Kumho Tire Co. Inc. | 50,020 | 229 |
| | Korea United Pharm Inc. | 5,473 | 229 |
| * | CJ CGV Co. Ltd. | 8,305 | 227 |
| *,2 | LegoChem Biosciences Inc. | 5,864 | 226 |
| * | Amicogen Inc. | 8,149 | 226 |
| * | DIO Corp. | 6,970 | 225 |
| *,2 | Telcon RF Pharmaceutical Inc. | 76,974 | 224 |
| * | Helixmith Co. Ltd. | 10,861 | 222 |
| | Seoul Semiconductor Co. Ltd. | 17,246 | 221 |
| * | NHN KCP Corp. | 4,503 | 221 |
| * | SFA Semicon Co. Ltd. | 40,560 | 220 |
| * | Pharmicell Co. Ltd. | 20,513 | 220 |
| | IS Dongseo Co. Ltd. | 5,641 | 219 |
| | LIG Nex1 Co. Ltd. | 5,464 | 219 |
| | SK Networks Co. Ltd. | 49,736 | 217 |
| | Daewoong Pharmaceutical Co. Ltd. | 1,793 | 215 |
| | Sebang Global Battery Co. Ltd. | 3,049 | 214 |
| | SFA Engineering Corp. | 7,090 | 214 |
| * | MedPacto Inc. | 4,422 | 214 |
| | MegaStudyEdu Co. Ltd. | 3,258 | 214 |
| | Samsung SDI Co. Ltd. Preference Shares | 661 | 214 |
| *,2 | Taihan Electric Wire Co. Ltd. | 110,571 | 212 |
| | JR REIT XXVII | 44,528 | 212 |
| * | Gamevil Inc. | 3,293 | 210 |
| * | Vaxcell-Bio Therapeutics Co. Ltd. | 3,812 | 210 |
| | | Shares | Market
Value•
($000) |
| | Daewoong Co. Ltd. | 7,674 | 208 |
| | PharmaResearch Co. Ltd. | 2,587 | 204 |
| | Korea Electric Terminal Co. Ltd. | 3,118 | 202 |
| | Zinus Inc. | 3,009 | 202 |
| * | Duk San Neolux Co. Ltd. | 4,300 | 200 |
| | ENF Technology Co. Ltd. | 8,056 | 200 |
| | Nature Holdings Co. Ltd. | 7,057 | 199 |
| *,2 | Sam Chun Dang Pharm Co. Ltd. | 4,904 | 198 |
| * | Medytox Inc. | 1,544 | 198 |
| | Mcnex Co. Ltd. | 5,314 | 198 |
| | Samyang Holdings Corp. | 2,219 | 196 |
| | GOLFZON Co. Ltd. | 1,620 | 196 |
| * | Solid Inc. | 33,987 | 194 |
| | LX International Corp. | 8,296 | 193 |
| | Lotte Chilsung Beverage Co. Ltd. | 1,540 | 192 |
| | DoubleUGames Co. Ltd. | 3,487 | 192 |
| | Daeduck Electronics Co. Ltd. | 13,041 | 192 |
| * | Cellivery Therapeutics Inc. | 4,476 | 192 |
| * | iNtRON Biotechnology Inc. | 11,424 | 189 |
| | Handsome Co. Ltd. | 5,208 | 188 |
| | SL Corp. | 6,678 | 188 |
| * | Seojin System Co. Ltd. | 6,324 | 187 |
| | Tokai Carbon Korea Co. Ltd. | 1,729 | 185 |
| | Hansol Holdings Co. Ltd. | 56,593 | 184 |
| | Korea Petrochemical Ind Co. Ltd. | 1,153 | 183 |
| * | NEPES Corp. | 6,078 | 183 |
| *,2 | GemVax & Kael Co. Ltd. | 11,309 | 181 |
| | TES Co. Ltd. | 7,554 | 173 |
| * | Cellid Co. Ltd. | 2,819 | 173 |
| | Daesang Corp. | 8,390 | 172 |
| | Huchems Fine Chemical Corp. | 7,579 | 172 |
| | Taekwang Industrial Co. Ltd. | 199 | 170 |
| | ESR Kendall Square REIT Co. Ltd. | 28,902 | 169 |
| | Samwha Capacitor Co. Ltd. | 3,429 | 167 |
| * | Lotte Tour Development Co. Ltd. | 9,679 | 167 |
| * | TY Holdings Co. Ltd. | 7,169 | 167 |
| | Park Systems Corp. | 1,631 | 166 |
| *,2 | Hyundai Doosan Infracore Co. Ltd. | 18,387 | 165 |
| *,2 | Ananti Inc. | 14,330 | 163 |
| * | Inscobee Inc. | 57,676 | 162 |
| | Hyundai Autoever Corp. | 1,619 | 162 |
Total World Stock Index Fund
| | | Shares | Market
Value•
($000) |
| | DongKook Pharmaceutical Co. Ltd. | 8,385 | 161 |
| | SK Discovery Co. Ltd. | 3,913 | 160 |
| * | Korea Line Corp. | 65,526 | 159 |
| * | Innox Advanced Materials Co. Ltd. | 4,344 | 158 |
| 2 | BH Co. Ltd. | 9,805 | 158 |
| | Hanwha Corp. Preference Shares | 10,942 | 154 |
| | RFHIC Corp. | 5,703 | 154 |
| * | UniTest Inc. | 6,076 | 154 |
| 2 | Tesna Inc. | 3,945 | 154 |
| * | Eyegene Inc. | 7,709 | 154 |
| * | Eoflow Co. Ltd. | 3,351 | 153 |
| * | Hancom Inc. | 8,867 | 152 |
| | Partron Co. Ltd. | 18,924 | 152 |
| * | Studio Dragon Corp. | 2,043 | 151 |
| | Hankook & Co. Co. Ltd. | 10,472 | 150 |
| | Bukwang Pharmaceutical Co. Ltd. | 13,344 | 149 |
| | Yuanta Securities Korea Co. Ltd. | 38,496 | 149 |
| * | Hyundai Construction Equipment Co. Ltd. | 4,299 | 149 |
| | Hansae Co. Ltd. | 7,440 | 148 |
| * | Webzen Inc. | 6,293 | 146 |
| * | Hyundai Electric & Energy System Co. Ltd. | 7,710 | 146 |
| | Boryung Pharmaceutical Co. Ltd. | 11,701 | 145 |
| | Ahnlab Inc. | 2,032 | 143 |
| | Binggrae Co. Ltd. | 2,977 | 142 |
| | Samsung Fire & Marine Insurance Co. Ltd. Preference Shares | 936 | 142 |
| * | ABLBio Inc. | 7,730 | 142 |
| | Korea Real Estate Investment & Trust Co. Ltd. | 69,006 | 138 |
| | Doosan Co. Ltd. | 1,562 | 138 |
| | Hanil Cement Co. Ltd. | 8,300 | 137 |
| | Interpark Corp. | 23,623 | 136 |
| | Hyundai Home Shopping Network Corp. | 2,274 | 136 |
| * | KH Feelux Co. Ltd. | 52,132 | 135 |
| * | Yungjin Pharmaceutical Co. Ltd. | 33,594 | 135 |
| | iMarketKorea Inc. | 14,356 | 135 |
| *,2 | KH Vatec Co. Ltd. | 6,489 | 134 |
| | SK Securities Co. Ltd. | 159,590 | 134 |
| | S&S Tech Corp. | 4,240 | 134 |
| * | Hyosung Heavy Industries Corp. | 2,279 | 132 |
| | SNT Motiv Co. Ltd. | 3,039 | 131 |
| | Hyundai Greenfood Co. Ltd. | 15,539 | �� 129 |
| | | Shares | Market
Value•
($000) |
| | Young Poong Corp. | 219 | 129 |
| | Dentium Co. Ltd. | 2,128 | 126 |
| | Seobu T&D | 16,847 | 126 |
| | i-SENS Inc. | 4,404 | 126 |
| | Eusu Holdings Co. Ltd. | 24,450 | 125 |
| | LOTTE Himart Co. Ltd. | 5,257 | 125 |
| * | Modetour Network Inc. | 5,632 | 125 |
| * | Ace Technologies Corp. | 10,046 | 124 |
| | Daea TI Co. Ltd. | 21,668 | 123 |
| *,2 | Krafton Inc. | 306 | 123 |
| *,2 | G-treeBNT Co. Ltd. | 8,690 | 122 |
| * | LX Holdings Corp. | 16,031 | 122 |
| | Mirae Asset Life Insurance Co. Ltd. | 33,189 | 121 |
| * | Shinsung E&G Co. Ltd. | 59,891 | 121 |
| * | Binex Co. Ltd. | 8,291 | 118 |
| | HDC Holdings Co. Ltd. | 13,059 | 118 |
| | Ilyang Pharmaceutical Co. Ltd. | 4,628 | 118 |
| * | Vidente Co. Ltd. | 9,421 | 117 |
| | LX Hausys Ltd. | 1,962 | 117 |
| | Korea Asset In Trust Co. Ltd. | 31,050 | 117 |
| * | OliX Pharmaceuticals Inc. | 3,549 | 117 |
| | Hankook Shell Oil Co. Ltd. | 484 | 116 |
| | Posco ICT Co. Ltd. | 20,195 | 116 |
| | Tongyang Life Insurance Co. Ltd. | 19,837 | 116 |
| | Orion Holdings Corp. | 8,252 | 113 |
| * | Grand Korea Leisure Co. Ltd. | 8,051 | 113 |
| | Muhak Co. Ltd. | 13,269 | 111 |
| | JW Pharmaceutical Corp. | 5,382 | 108 |
| | Dongwon F&B Co. Ltd. | 596 | 105 |
| | Halla Holdings Corp. | 2,411 | 105 |
| | NICE Holdings Co. Ltd. | 7,180 | 104 |
| * | Hanwha General Insurance Co. Ltd. | 26,925 | 104 |
| | Jeil Pharmaceutical Co. Ltd. | 3,563 | 104 |
| * | Samsung Pharmaceutical Co. Ltd. | 20,527 | 103 |
| 2 | Shinsegae International Inc. | 713 | 103 |
| * | Jusung Engineering Co. Ltd. | 10,459 | 101 |
| | Namhae Chemical Corp. | 8,782 | 101 |
| | Vieworks Co. Ltd. | 2,977 | 101 |
| | Youngone Holdings Co. Ltd. | 2,479 | 100 |
| * | Sangsangin Co. Ltd. | 12,992 | 100 |
| | KTB Investment & Securities Co. Ltd. | 17,627 | 100 |
Total World Stock Index Fund
| | | Shares | Market
Value•
($000) |
| | Huons Co. Ltd. | 2,303 | 100 |
| *,2 | Kuk-il Paper Manufacturing Co. Ltd. | 26,987 | 99 |
| | L&C Bio Co. Ltd. | 3,390 | 99 |
| | Dong-A Socio Holdings Co. Ltd. | 1,084 | 98 |
| * | S-MAC Co. Ltd. | 98,155 | 98 |
| | ITM Semiconductor Co. Ltd. | 2,429 | 97 |
| * | Sambu Engineering & Construction Co. Ltd. | 54,342 | 97 |
| * | Aprogen pharmaceuticals Inc. | 108,181 | 95 |
| | Dong-A ST Co. Ltd. | 1,528 | 95 |
| | Cuckoo Homesys Co. Ltd. | 2,535 | 95 |
| * | Neowiz | 4,212 | 95 |
| | Kolon Corp. | 3,096 | 94 |
| * | Medipost Co. Ltd. | 4,816 | 94 |
| * | Anterogen Co. Ltd. | 1,829 | 92 |
| * | Lutronic Corp. | 5,622 | 91 |
| | SNT Dynamics Co. Ltd. | 11,365 | 90 |
| | Kwang Dong Pharmaceutical Co. Ltd. | 13,372 | 89 |
| | Samchully Co. Ltd. | 1,099 | 89 |
| | Hansol Paper Co. Ltd. | 7,240 | 89 |
| | Taeyoung Engineering & Construction Co. Ltd. | 9,408 | 89 |
| | Huons Global Co. Ltd. | 2,052 | 87 |
| | Aekyung Industrial Co. Ltd. | 4,557 | 87 |
| | KUMHOE&C Co. Ltd. | 8,282 | 86 |
| | Samyang Corp. | 1,434 | 84 |
| | Youlchon Chemical Co. Ltd. | 4,378 | 83 |
| * | Cafe24 Corp. | 3,358 | 83 |
| | HS Industries Co. Ltd. | 14,294 | 82 |
| | INTOPS Co. Ltd. | 4,080 | 81 |
| | Advanced Process Systems Corp. | 3,991 | 81 |
| * | Wonik Holdings Co. Ltd. | 17,538 | 78 |
| | Sungwoo Hitech Co. Ltd. | 15,099 | 78 |
| | Chongkundang Holdings Corp. | 1,116 | 78 |
| | LF Corp. | 4,969 | 78 |
| | Kolmar Korea Holdings Co. Ltd. | 3,886 | 77 |
| | BGF Co. Ltd. | 16,233 | 77 |
| | NS Shopping Co. Ltd. | 6,400 | 76 |
| * | Hansol Technics Co. Ltd. | 12,925 | 75 |
| | LG HelloVision Co. Ltd. | 12,615 | 75 |
| | Harim Holdings Co. Ltd. | 8,995 | ��� 75 |
| | | Shares | Market
Value•
($000) |
| | SK Gas Ltd. | 627 | 74 |
| | Maeil Dairies Co. Ltd. | 1,225 | 74 |
| | KISWIRE Ltd. | 3,035 | 72 |
| | OptoElectronics Solutions Co. Ltd. | 2,511 | 72 |
| | Dae Han Flour Mills Co. Ltd. | 505 | 71 |
| | Namyang Dairy Products Co. Ltd. | 180 | 71 |
| | Songwon Industrial Co. Ltd. | 4,340 | 67 |
| * | AbClon Inc. | 4,694 | 65 |
| | Hyundai Engineering & Construction Co. Ltd. Preference Shares | 478 | 65 |
| * | Eutilex Co. Ltd. | 2,960 | 64 |
| | Seah Besteel Corp. | 3,350 | 62 |
| | Nexen Tire Corp. | 9,585 | 62 |
| *,2 | Soulbrain Holdings Co. Ltd. | 1,658 | 62 |
| * | SCM Lifescience Co. Ltd. | 3,386 | 58 |
| | Sung Kwang Bend Co. Ltd. | 7,218 | 57 |
| * | CJ Freshway Corp. | 2,037 | 57 |
| | Eugene Investment & Securities Co. Ltd. | 17,472 | 57 |
| | KISCO Corp. | 7,103 | 55 |
| * | STCUBE | 7,603 | 54 |
| | Lotte Food Co. Ltd. | 162 | 53 |
| | KC Tech Co. Ltd. | 2,755 | 53 |
| | TK Corp. | 5,206 | 52 |
| | DB Financial Investment Co. Ltd. | 8,526 | 52 |
| | Toptec Co. Ltd. | 6,950 | 52 |
| | AK Holdings Inc. | 2,228 | 51 |
| * | Namsun Aluminum Co. Ltd. | 20,329 | 51 |
| | InBody Co. Ltd. | 2,162 | 50 |
| | SPC Samlip Co. Ltd. | 758 | 50 |
| * | Able C&C Co. Ltd. | 7,592 | 50 |
| | Cuckoo Holdings Co. Ltd. | 2,530 | 49 |
| 2 | F&F Holdings Co. Ltd. | 1,435 | 48 |
| *,1,2 | SillaJen Inc. | 17,385 | 48 |
| | Sam Young Electronics Co. Ltd. | 4,528 | 47 |
| | Daeduck Co. Ltd. | 7,545 | 47 |
| * | CUROCOM Co. Ltd. | 39,320 | 47 |
| | Byucksan Corp. | 14,569 | 46 |
| * | Lock&Lock Co. Ltd. | 5,144 | 46 |
| | ICD Co. Ltd. | 4,187 | 45 |
| | E1 Corp. | 906 | 41 |
| | Kyobo Securities Co. Ltd. | 5,429 | 41 |
| | Daekyo Co. Ltd. | 11,162 | 41 |
| | KC Co. Ltd. | 2,009 | 39 |
| | Woongjin Thinkbig Co. Ltd. | 13,570 | 39 |
| * | Peptron Inc. | 3,982 | 38 |
| | Lotte Confectionery Co. Ltd. | 340 | 37 |
Total World Stock Index Fund
| | | Shares | Market
Value•
($000) |
| * | Interflex Co. Ltd. | 3,142 | 35 |
| | POSCO ADR | 528 | 33 |
| | Cell Biotech Co. Ltd. | 1,908 | 29 |
| * | Sindoh Co. Ltd. | 1,039 | 29 |
| | KT Skylife Co. Ltd. | 3,297 | 29 |
| | Humedix Co. Ltd. | 1,152 | 27 |
| | Hanil Holdings Co. Ltd. | 2,130 | 25 |
| * | SBS Media Holdings Co. Ltd. | 14,389 | 25 |
| * | KakaoBank Corp. | 426 | 23 |
| * | Homecast Co. Ltd. | 8,376 | 22 |
| | Hyundai Livart Furniture Co. Ltd. | 1,541 | 21 |
| * | Enzychem Lifesciences Rights Exp.12/17/2021 | 2,486 | 21 |
| | Hyundai Corp. | 941 | 15 |
| *,1 | Y2 Solution Co. Ltd. | 14,731 | 15 |
| * | GeneOne Life Science Inc. Rights Exp. 11/25/2021 | 2,093 | 7 |
| *,1 | Cnk International Co. Ltd. | 78 | — |
| | | | 501,096 |
| Spain (0.6%) |
| | Iberdrola SA (XMAD) | 2,564,165 | 30,306 |
| | Banco Santander SA | 7,326,638 | 27,791 |
| | Banco Bilbao Vizcaya Argentaria SA | 2,929,782 | 20,503 |
| | Industria de Diseno Textil SA | 458,972 | 16,626 |
| 3 | Cellnex Telecom SA | 267,141 | 16,429 |
| * | Amadeus IT Group SA | 186,390 | 12,469 |
| | Telefonica SA | 2,174,937 | 9,447 |
| | Repsol SA | 575,030 | 7,365 |
| | Ferrovial SA | 210,220 | 6,636 |
| | CaixaBank SA | 1,950,004 | 5,606 |
| *,3 | Aena SME SA | 31,141 | 5,115 |
| | Red Electrica Corp. SA | 185,684 | 3,866 |
| 2 | Naturgy Energy Group SA | 128,253 | 3,372 |
| | Grifols SA | 144,655 | 3,313 |
| | Endesa SA | 135,615 | 3,128 |
| | ACS Actividades de Construccion y Servicios SA | 105,461 | 2,764 |
| * | Siemens Gamesa Renewable Energy SA | 100,862 | 2,737 |
| | Enagas SA | 103,645 | 2,326 |
| * | Banco de Sabadell SA | 2,470,158 | 1,988 |
| * | Fluidra SA | 50,202 | 1,917 |
| | Acciona SA | 9,178 | 1,763 |
| | Inmobiliaria Colonial Socimi SA | 167,984 | 1,633 |
| | Bankinter SA | 284,153 | 1,565 |
| | Merlin Properties Socimi SA | 134,298 | 1,454 |
| | Acerinox SA | 91,745 | 1,277 |
| | Viscofan SA | 16,714 | 1,143 |
| | Mapfre SA | 375,765 | 796 |
| | | Shares | Market
Value•
($000) |
| | Ebro Foods SA | 36,858 | 731 |
| | Zardoya Otis SA | 89,714 | 721 |
| | Grupo Catalana Occidente SA | 19,046 | 676 |
| | Laboratorios Farmaceuticos Rovi SA | 9,529 | 669 |
| * | Solaria Energia y Medio Ambiente SA | 29,172 | 584 |
| | Linea Directa Aseguradora SA Cia de Seguros y Reaseguros | 284,153 | 570 |
| | CIE Automotive SA | 19,980 | 544 |
| | Cia de Distribucion Integral Logista Holdings SA | 25,478 | 543 |
| | Banco Santander SA ADR | 137,759 | 522 |
| * | Indra Sistemas SA | 42,840 | 518 |
| | Applus Services SA | 55,185 | 500 |
| 3 | Unicaja Banco SA | 457,926 | 490 |
| | Faes Farma SA | 109,984 | 448 |
| | Almirall SA | 28,861 | 429 |
| | Sacyr SA (XMAD) | 136,966 | 390 |
| | Pharma Mar SA | 4,999 | 389 |
| 3 | Neinor Homes SA | 26,333 | 340 |
| 3 | Aedas Homes SA | 11,224 | 323 |
| | Construcciones y Auxiliar de Ferrocarriles SA | 7,051 | 311 |
| * | Melia Hotels International SA | 37,871 | 280 |
| | Prosegur Cia de Seguridad SA | 98,413 | 279 |
| * | Mediaset Espana Comunicacion SA | 52,714 | 275 |
| 3 | Global Dominion Access SA | 47,418 | 254 |
| *,3 | Gestamp Automocion SA | 52,799 | 236 |
| | Fomento de Construcciones y Contratas SA | 17,730 | 226 |
| | Grifols SA Preference Shares | 15,452 | 203 |
| * | Atresmedia Corp. de Medios de Comunicacion SA | 33,387 | 136 |
| * | Lar Espana Real Estate Socimi SA | 21,012 | 128 |
| *,3 | Metrovacesa SA | 14,260 | 125 |
| * | Ence Energia y Celulosa SA | 44,717 | 115 |
| *,2 | Distribuidora Internacional de Alimentacion SA | 6,028,697 | 110 |
| * | Tecnicas Reunidas SA | 10,072 | 91 |
| 3 | Prosegur Cash SA | 110,532 | 76 |
| * | NH Hotel Group SA (XMAD) | 7,857 | 29 |
| *,1 | Let S Gowex SA | 3,921 | — |
| | | | 205,596 |
Total World Stock Index Fund
| | | Shares | Market
Value•
($000) |
| Sweden (1.1%) |
| 2 | Atlas Copco AB Class A | 281,091 | 18,102 |
| | Investor AB Class B | 712,108 | 16,431 |
| | Volvo AB Class B | 641,772 | 14,966 |
| | Telefonaktiebolaget LM Ericsson Class B | 1,310,650 | 14,306 |
| | Hexagon AB Class B | 765,914 | 12,326 |
| | Sandvik AB | 470,638 | 11,935 |
| | Assa Abloy AB Class B | 403,130 | 11,829 |
| 3 | Evolution AB | 70,542 | 11,452 |
| | Skandinaviska Enskilda Banken AB Class A | 634,398 | 9,921 |
| 2 | Swedbank AB Class A | 438,700 | 9,515 |
| | Essity AB Class B | 269,135 | 8,718 |
| 2 | Atlas Copco AB Class B | 156,750 | 8,495 |
| | Nibe Industrier AB Class B | 525,246 | 7,812 |
| 2 | Svenska Handelsbanken AB Class A | 650,965 | 7,462 |
| | Investor AB Class A | 317,586 | 7,347 |
| 2 | H & M Hennes & Mauritz AB Class B | 385,510 | 7,253 |
| | EQT AB | 121,369 | 6,411 |
| | Alfa Laval AB | 148,022 | 6,349 |
| | Epiroc AB Class A | 250,601 | 6,235 |
| | Swedish Match AB | 664,004 | 5,855 |
| 2 | Telia Co. AB | 1,143,039 | 4,502 |
| *,3 | Sinch AB | 227,236 | 4,325 |
| | Boliden AB | 122,459 | 4,317 |
| | Getinge AB Class B | 95,361 | 4,268 |
| * | Kinnevik AB Class B | 107,681 | 4,227 |
| | Epiroc AB Class B | 193,463 | 4,110 |
| | SKF AB Class B | 169,878 | 3,945 |
| | Skanska AB Class B | 154,276 | 3,923 |
| | Indutrade AB | 125,100 | 3,647 |
| 2 | Industrivarden AB Class A | 105,083 | 3,466 |
| | Svenska Cellulosa AB SCA Class B | 218,322 | 3,411 |
| | Lundin Energy AB | 81,049 | 3,201 |
| * | Fastighets AB Balder Class B | 43,172 | 3,130 |
| | Tele2 AB Class B | 213,174 | 3,013 |
| | Lifco AB Class B | 97,361 | 2,839 |
| | Sagax AB Class B | 71,268 | 2,789 |
| | Samhallsbyggnadsbolaget i Norden AB | 411,519 | 2,759 |
| | Volvo AB Class A | 111,354 | 2,633 |
| 3 | Thule Group AB | 45,170 | 2,610 |
| | Trelleborg AB Class B | 112,025 | 2,564 |
| 2 | Husqvarna AB Class B | 171,971 | 2,451 |
| 2 | Electrolux AB Class B | 104,062 | 2,368 |
| | Castellum AB | 88,324 | 2,354 |
| | Investment AB Latour Class B | 61,528 | 2,235 |
| | Industrivarden AB Class C | 66,282 | 2,156 |
| | | Shares | Market
Value•
($000) |
| | Securitas AB Class B | 128,038 | 2,121 |
| * | Swedish Orphan Biovitrum AB | 75,779 | 2,059 |
| | Avanza Bank Holding AB | 51,753 | 2,057 |
| 3 | Dometic Group AB | 139,520 | 2,035 |
| | Beijer Ref AB Class B | 98,970 | 2,031 |
| | Vitrolife AB | 29,807 | 1,940 |
| * | Nordic Entertainment Group AB Class B | 33,295 | 1,931 |
| | Elekta AB Class B | 164,621 | 1,917 |
| | L E Lundbergforetagen AB Class B | 31,698 | 1,827 |
| | AddTech AB Class B | 81,006 | 1,812 |
| | AddLife AB Class B | 43,403 | 1,773 |
| | Fabege AB | 103,274 | 1,748 |
| | ICA Gruppen AB | 33,369 | 1,727 |
| | Holmen AB Class B | 38,596 | 1,713 |
| | Sweco AB Class B | 98,063 | 1,561 |
| | BillerudKorsnas AB | 72,611 | 1,521 |
| | AAK AB | 68,778 | 1,504 |
| | Nordnet AB publ | 73,475 | 1,408 |
| | Sectra AB Class B | 55,270 | 1,345 |
| * | SSAB AB Class B | 266,187 | 1,330 |
| 3 | Bravida Holding AB | 87,121 | 1,310 |
| | Wihlborgs Fastigheter AB | 54,151 | 1,284 |
| | AFRY AB | 41,940 | 1,248 |
| | Nyfosa AB | 72,725 | 1,227 |
| | Mips AB | 10,110 | 1,224 |
| | JM AB | 29,862 | 1,210 |
| | Arjo AB Class B | 86,418 | 1,178 |
| | Wallenstam AB Class B | 66,298 | 1,164 |
| | Hexpol AB | 98,341 | 1,151 |
| | Saab AB Class B | 39,921 | 1,113 |
| | Axfood AB | 45,156 | 1,107 |
| | Instalco AB | 20,441 | 1,087 |
| | Bure Equity AB | 23,367 | 1,085 |
| 2 | Kungsleden AB | 76,608 | 1,054 |
| | Biotage AB | 32,349 | 1,047 |
| | Nolato AB Class B | 78,505 | 1,038 |
| | Peab AB Class B | 81,007 | 1,018 |
| | Corem Property Group AB Class B | 280,948 | 932 |
| | Loomis AB Class B | 34,372 | 928 |
| | Svenska Cellulosa AB SCA Class A | 57,595 | 909 |
| | Lindab International AB | 27,144 | 889 |
| | Intrum AB | 30,958 | 879 |
| * | Electrolux Professional AB Class B | 100,736 | 778 |
| | Mycronic AB | 30,685 | 712 |
| | NCC AB Class B | 40,700 | 705 |
| | HMS Networks AB | 12,153 | 694 |
| | Catena AB | 11,190 | 682 |
| * | SSAB AB Class A | 118,306 | 674 |
| | Medicover AB Class B | 21,610 | 655 |
| | Sagax AB Class D | 164,036 | 626 |
| | Hufvudstaden AB Class A | 37,568 | 601 |
Total World Stock Index Fund
| | | Shares | Market
Value•
($000) |
| * | Pandox AB Class B | 33,515 | 591 |
| * | Modern Times Group MTG AB Class B | 46,685 | 535 |
| | Concentric AB | 18,183 | 535 |
| | Bilia AB Class A | 29,824 | 530 |
| * | BICO Group AB Class B | 10,571 | 530 |
| | Troax Group AB | 12,645 | 518 |
| | Vitec Software Group AB Class B | 8,415 | 497 |
| | Dios Fastigheter AB | 42,250 | 492 |
| * | Cint Group AB | 32,557 | 492 |
| * | Karo Pharma AB | 65,449 | 431 |
| | Platzer Fastigheter Holding AB Class B | 26,316 | 429 |
| | Granges AB | 39,279 | 428 |
| *,2,3 | Boozt AB | 25,213 | 425 |
| * | Betsson AB Class B | 60,095 | 419 |
| | Atrium Ljungberg AB Class B | 18,027 | 414 |
| * | VNV Global AB | 28,210 | 414 |
| *,3 | Resurs Holding AB | 76,489 | 412 |
| | Ratos AB Class B | 70,826 | 408 |
| | Cloetta AB Class B | 124,219 | 395 |
| | INVISIO AB | 21,344 | 386 |
| | Investment AB Oresund | 22,015 | 383 |
| | Nobia AB | 59,879 | 369 |
| *,2 | SAS AB | 2,003,749 | 349 |
| * | BHG Group AB | 29,885 | 345 |
| | SkiStar AB | 15,371 | 321 |
| 3 | Munters Group AB | 41,835 | 310 |
| | Clas Ohlson AB Class B | 27,837 | 300 |
| | Systemair AB | 29,856 | 288 |
| | Fagerhult AB | 35,407 | 284 |
| *,2,3 | Scandic Hotels Group AB | 58,544 | 283 |
| * | Mekonomen AB | 13,668 | 282 |
| | Bonava AB Class B | 24,050 | 238 |
| 2 | Svenska Handelsbanken AB Class B | 18,027 | 228 |
| | Telefonaktiebolaget LM Ericsson Class A | 19,844 | 217 |
| | BONAVA AB | 20,064 | 207 |
| | Samhallsbyggnadsbolaget i Norden AB Class D | 54,795 | 199 |
| * | Collector AB | 39,722 | 196 |
| | Husqvarna AB Class A | 13,494 | 194 |
| *,2 | Hansa Biopharma AB | 15,806 | 180 |
| 2 | Corem Property Group AB Preference Shares | 4,687 | 179 |
| * | Kinnevik AB Class A | 4,257 | 172 |
| *,3 | Attendo AB | 38,500 | 165 |
| * | Camurus AB | 7,385 | 139 |
| | Skandinaviska Enskilda Banken AB Class C | 3,402 | 54 |
| | NCC AB Class A | 1,486 | 26 |
| *,2,3 | Oncopeptides AB | 17,118 | 8 |
| | | Shares | Market
Value•
($000) |
| *,1 | Ow Bunker A/S | 3,210 | — |
| | | | 364,729 |
| Switzerland (2.3%) |
| | Nestle SA (Registered) | 1,223,593 | 161,401 |
| | Roche Holding AG | 266,272 | 103,152 |
| | Novartis AG (Registered) | 921,338 | 76,206 |
| | Zurich Insurance Group AG | 64,528 | 28,600 |
| | Cie Financiere Richemont SA Class A (Registered) | 222,962 | 27,592 |
| | Lonza Group AG (Registered) | 32,446 | 26,664 |
| | UBS Group AG (Registered) | 1,416,154 | 25,778 |
| | ABB Ltd. (Registered) | 735,005 | 24,316 |
| | Sika AG (Registered) | 61,722 | 20,910 |
| | Givaudan SA (Registered) | 4,026 | 18,970 |
| | Roche Holding AG (Bearer) | 43,123 | 18,548 |
| | Partners Group Holding AG | 9,830 | 17,173 |
| | Alcon Inc. | 202,188 | 16,765 |
| | Swiss Re AG | 124,225 | 12,034 |
| | Geberit AG (Registered) | 14,919 | 11,651 |
| | Credit Suisse Group AG (Registered) | 1,056,072 | 10,985 |
| | Holcim Ltd. | 205,308 | 10,241 |
| | Sonova Holding AG (Registered) | 23,285 | 9,649 |
| | Straumann Holding AG (Registered) | 4,293 | 8,937 |
| | SGS SA (Registered) | 2,585 | 7,653 |
| | Swiss Life Holding AG (Registered) | 13,882 | 7,615 |
| | Kuehne + Nagel International AG (Registered) | 22,380 | 7,049 |
| | Julius Baer Group Ltd. | 94,776 | 6,855 |
| | Chocoladefabriken Lindt & Spruengli AG Ptg. Ctf. | 522 | 6,155 |
| | Swisscom AG (Registered) | 10,947 | 5,961 |
| | Logitech International SA (Registered) | 64,857 | 5,425 |
| 3 | VAT Group AG | 11,036 | 5,276 |
| | Schindler Holding AG Ptg. Ctf. | 18,932 | 4,930 |
| | Chocoladefabriken Lindt & Spruengli AG (Registered) | 39 | 4,685 |
| | Temenos AG (Registered) | 26,682 | 4,085 |
| | Swatch Group AG (Bearer) | 14,275 | 3,929 |
| | SIG Combibloc Group AG | 143,779 | 3,760 |
| | Barry Callebaut AG (Registered) | 1,534 | 3,553 |
Total World Stock Index Fund
| | | Shares | Market
Value•
($000) |
| | Adecco Group AG (Registered) | 68,093 | 3,431 |
| | Tecan Group AG (Registered) | 5,451 | 3,340 |
| | Swiss Prime Site AG (Registered) | 31,480 | 3,200 |
| | Baloise Holding AG (Registered) | 19,334 | 3,081 |
| | Georg Fischer AG (Registered) | 1,932 | 2,923 |
| | EMS-Chemie Holding AG (Registered) | 2,915 | 2,891 |
| | Vifor Pharma AG | 22,222 | 2,869 |
| | Belimo Holding AG (Registered) | 4,540 | 2,639 |
| | Clariant AG (Registered) | 105,493 | 2,221 |
| | PSP Swiss Property AG (Registered) | 17,462 | 2,183 |
| | Bachem Holding AG (Registered) Class B | 2,699 | 2,173 |
| * | ams AG | 102,992 | 2,039 |
| | Helvetia Holding AG (Registered) | 16,502 | 1,964 |
| | Schindler Holding AG (Registered) | 7,014 | 1,801 |
| | Holcim Ltd. (XSWX) | 34,256 | 1,717 |
| | Daetwyler Holding AG (Bearer) | 4,034 | 1,569 |
| | Siegfried Holding AG (Registered) | 1,609 | 1,548 |
| 3 | Galenica AG | 20,550 | 1,505 |
| * | Dufry AG (Registered) | 26,709 | 1,414 |
| * | Flughafen Zurich AG (Registered) | 7,779 | 1,405 |
| | DKSH Holding AG | 17,066 | 1,368 |
| | Bucher Industries AG (Registered) | 2,606 | 1,315 |
| | Allreal Holding AG (Registered) | 5,667 | 1,199 |
| | Comet Holding AG (Registered) | 3,187 | 1,186 |
| | Interroll Holding AG (Registered) | 238 | 1,155 |
| * | Zur Rose Group AG | 3,209 | 1,141 |
| | Vontobel Holding AG (Registered) | 11,802 | 1,093 |
| * | Idorsia Ltd. | 52,762 | 1,086 |
| | Inficon Holding AG (Registered) | 830 | 1,065 |
| | Banque Cantonale Vaudoise (Registered) | 13,100 | 1,055 |
| | Softwareone Holding AG | 43,289 | 1,003 |
| | dormakaba Holding AG | 1,320 | 978 |
| | OC Oerlikon Corp. AG (Registered) | 91,501 | 932 |
| 2 | Stadler Rail AG | 21,125 | 928 |
| | Emmi AG (Registered) | 864 | 902 |
| | SFS Group AG | 6,565 | 884 |
| | Mobimo Holding AG (Registered) | 2,592 | 874 |
| | BKW AG | 6,556 | 869 |
| | | Shares | Market
Value•
($000) |
| | Valiant Holding AG (Registered) | 8,710 | 862 |
| | Cembra Money Bank AG | 12,697 | 848 |
| | Kardex Holding AG (Registered) | 2,707 | 835 |
| | Forbo Holding AG (Registered) | 422 | 821 |
| | Landis+Gyr Group AG | 11,412 | 785 |
| | Sulzer AG (Registered) | 7,450 | 732 |
| | Bystronic AG | 520 | 715 |
| | Huber + Suhner AG (Registered) | 7,880 | 701 |
| * | Dottikon Es Holding AG (Registered) | 1,904 | 699 |
| | Swissquote Group Holding SA (Registered) | 3,158 | 641 |
| *,3 | Sensirion Holding AG | 4,421 | 637 |
| | Swatch Group AG (Registered) | 11,868 | 631 |
| | St. Galler Kantonalbank AG (Registered) | 1,296 | 597 |
| * | Meyer Burger Technology AG | 1,179,686 | 563 |
| | VZ Holding AG | 5,300 | 538 |
| * | Aryzta AG | 409,694 | 536 |
| | Schweiter Technologies AG (Bearer) | 370 | 531 |
| | Bossard Holding AG (Registered) Class A | 1,395 | 512 |
| | Burckhardt Compression Holding AG | 1,205 | 508 |
| * | Komax Holding AG (Registered) | 1,979 | 504 |
| | LEM Holding SA (Registered) | 187 | 453 |
| | Leonteq AG | 6,314 | 418 |
| | Zehnder Group AG | 3,781 | 407 |
| * | Valora Holding AG (Registered) | 2,104 | 400 |
| | Intershop Holding AG | 583 | 365 |
| *,3 | Medmix AG | 7,450 | 356 |
| *,3 | Medacta Group SA | 2,055 | 344 |
| | Arbonia AG | 15,299 | 333 |
| *,2 | Basilea Pharmaceutica AG (Registered) | 6,878 | 322 |
| | ALSO Holding AG (Registered) | 1,028 | 305 |
| * | Autoneum Holding AG | 1,863 | 292 |
| | Vetropack Holding AG Class A (Registered) | 4,376 | 269 |
| * | Implenia AG (Registered) | 12,856 | 262 |
| | Bell Food Group AG (Registered) | 785 | 252 |
| * | Ascom Holding AG (Registered) | 16,022 | 249 |
Total World Stock Index Fund
| | | Shares | Market
Value•
($000) |
| | Hiag Immobilien Holding AG | 2,215 | 235 |
| * | Bobst Group SA (Registered) | 2,817 | 229 |
| * | Rieter Holding AG (Registered) | 1,063 | 221 |
| *,2 | COSMO Pharmaceuticals NV | 2,814 | 214 |
| | Ypsomed Holding AG (Registered) | 1,264 | 209 |
| | EFG International AG | 26,628 | 187 |
| * | u-blox Holding AG | 2,049 | 150 |
| | VP Bank AG Class A | 742 | 84 |
| * | APG SGA SA | 321 | 73 |
| * | Swiss Steel Holding AG | 161,037 | 62 |
| * | Transocean Ltd. | 8,480 | 30 |
| | | | 791,366 |
| Taiwan (1.9%) |
| | Taiwan Semiconductor Manufacturing Co. Ltd. | 7,908,413 | 167,819 |
| | Taiwan Semiconductor Manufacturing Co. Ltd. ADR | 518,821 | 58,990 |
| | MediaTek Inc. | 640,558 | 21,082 |
| | Hon Hai Precision Industry Co. Ltd. | 5,211,848 | 20,119 |
| | United Microelectronics Corp. | 4,688,780 | 9,734 |
| | Fubon Financial Holding Co. Ltd. | 3,648,678 | 9,645 |
| | Formosa Plastics Corp. | 2,181,873 | 8,451 |
| | Delta Electronics Inc. | 949,311 | 8,380 |
| | Nan Ya Plastics Corp. | 2,458,423 | 7,545 |
| | Cathay Financial Holding Co. Ltd. | 3,592,895 | 7,489 |
| | CTBC Financial Holding Co. Ltd. | 7,906,715 | 6,603 |
| | China Steel Corp. | 5,364,390 | 6,468 |
| | Mega Financial Holding Co. Ltd. | 4,713,769 | 5,665 |
| | Chailease Holding Co. Ltd. | 570,830 | 5,467 |
| | ASE Technology Holding Co. Ltd. | 1,487,636 | 5,321 |
| | E.Sun Financial Holding Co. Ltd. | 5,455,396 | 5,213 |
| | Uni-President Enterprises Corp. | 2,100,992 | 5,040 |
| | Yuanta Financial Holding Co. Ltd. | 5,223,903 | 4,643 |
| | Silergy Corp. | 27,000 | 4,461 |
| | Formosa Chemicals & Fibre Corp. | 1,505,259 | 4,368 |
| | Evergreen Marine Corp. Taiwan Ltd. | 1,148,956 | 4,135 |
| | Asustek Computer Inc. | 319,169 | 4,058 |
| | Taiwan Cement Corp. | 2,299,921 | 3,991 |
| | | Shares | Market
Value•
($000) |
| | Chunghwa Telecom Co. Ltd. ADR | 97,033 | 3,833 |
| | Unimicron Technology Corp. | 558,000 | 3,825 |
| | Novatek Microelectronics Corp. | 250,025 | 3,750 |
| | Realtek Semiconductor Corp. | 205,420 | 3,695 |
| | First Financial Holding Co. Ltd. | 4,395,826 | 3,619 |
| | Taiwan Cooperative Financial Holding Co. Ltd. | 4,209,157 | 3,422 |
| | Largan Precision Co. Ltd. | 45,020 | 3,355 |
| | Quanta Computer Inc. | 1,166,450 | 3,277 |
| | Yageo Corp. | 197,473 | 3,091 |
| | China Development Financial Holding Corp. | 5,974,580 | 3,054 |
| | Chunghwa Telecom Co. Ltd. | 765,000 | 3,036 |
| | Hotai Motor Co. Ltd. | 137,288 | 3,023 |
| | Hua Nan Financial Holdings Co. Ltd. | 4,038,602 | 2,957 |
| | Taishin Financial Holding Co. Ltd. | 4,490,315 | 2,948 |
| | eMemory Technology Inc. | 31,000 | 2,575 |
| * | Yang Ming Marine Transport Corp. | 714,030 | 2,493 |
| | President Chain Store Corp. | 245,137 | 2,478 |
| | Taiwan Mobile Co. Ltd. | 690,800 | 2,437 |
| | Globalwafers Co. Ltd. | 87,000 | 2,387 |
| | Advantech Co. Ltd. | 176,674 | 2,311 |
| | Win Semiconductors Corp. | 176,151 | 2,273 |
| | Sinopac Holdings Co. | 4,414,756 | 2,248 |
| | Shanghai Commercial & Savings Bank Ltd. | 1,409,000 | 2,231 |
| | Innolux Corp. | 3,692,885 | 2,221 |
| | Vanguard International Semiconductor Corp. | 419,000 | 2,183 |
| | Pegatron Corp. | 872,954 | 2,137 |
| | Formosa Petrochemical Corp. | 586,140 | 2,110 |
| | Accton Technology Corp. | 237,000 | 2,072 |
| | Wan Hai Lines Ltd. | 348,700 | 2,012 |
| | Lite-On Technology Corp. | 909,988 | 2,008 |
| | Airtac International Group | 65,804 | 1,969 |
| | Pou Chen Corp. | 1,549,524 | 1,900 |
| | Parade Technologies Ltd. | 29,000 | 1,868 |
| | Eclat Textile Co. Ltd. | 85,166 | 1,861 |
Total World Stock Index Fund
| | | Shares | Market
Value•
($000) |
| | Shin Kong Financial Holdings Co. Ltd. | 5,138,851 | 1,811 |
| | Far Eastern New Century Corp. | 1,682,279 | 1,762 |
| | Catcher Technology Co. Ltd. | 302,310 | 1,753 |
| | momo.com Inc. | 26,700 | 1,721 |
| | Ruentex Development Co. Ltd. | 668,763 | 1,707 |
| | Chang Hwa Bank | 2,841,348 | 1,678 |
| | Compal Electronics Inc. | 1,846,323 | 1,625 |
| | Feng TAY Enterprise Co. Ltd. | 207,509 | 1,615 |
| | Sino-American Silicon Products Inc. | 234,000 | 1,603 |
| | Nan Ya Printed Circuit Board Corp. | 87,000 | 1,539 |
| | ASPEED Technology Inc. | 15,000 | 1,505 |
| | Micro-Star International Co. Ltd. | 294,000 | 1,484 |
| | Asia Cement Corp. | 931,264 | 1,483 |
| | Giant Manufacturing Co. Ltd. | 123,881 | 1,439 |
| | Hiwin Technologies Corp. | 125,363 | 1,396 |
| | AU Optronics Corp. | 2,028,000 | 1,394 |
| | Far EasTone Telecommunications Co. Ltd. | 629,000 | 1,384 |
| | Voltronic Power Technology Corp. | 23,322 | 1,366 |
| | Wistron Corp. | 1,277,152 | 1,342 |
| | AU Optronics Corp. ADR | 191,821 | 1,310 |
| | Taiwan High Speed Rail Corp. | 1,250,000 | 1,306 |
| | Walsin Lihwa Corp. | 1,388,000 | 1,297 |
| | Inventec Corp. | 1,285,554 | 1,230 |
| | Taiwan Business Bank | 3,514,597 | 1,196 |
| * | Oneness Biotech Co. Ltd. | 126,000 | 1,189 |
| | Winbond Electronics Corp. | 1,236,726 | 1,173 |
| | Foxconn Technology Co. Ltd. | 472,514 | 1,173 |
| | Chroma ATE Inc. | 179,000 | 1,169 |
| | E Ink Holdings Inc. | 349,000 | 1,157 |
| | Walsin Technology Corp. | 209,968 | 1,143 |
| | AP Memory Technology Corp. | 58,700 | 1,142 |
| | Merida Industry Co. Ltd. | 106,400 | 1,108 |
| | Synnex Technology International Corp. | 554,498 | 1,074 |
| | TA Chen Stainless Pipe | 677,072 | 1,071 |
| | WPG Holdings Ltd. | 571,440 | 1,068 |
| | Wiwynn Corp. | 32,000 | 1,025 |
| | Acer Inc. | 1,094,551 | 1,024 |
| | Kinsus Interconnect Technology Corp. | 116,000 | 1,021 |
| | | Shares | Market
Value•
($000) |
| | Elite Material Co. Ltd. | 116,000 | 1,005 |
| | Alchip Technologies Ltd. | 26,882 | 999 |
| | ASMedia Technology Inc. | 17,000 | 996 |
| * | Phison Electronics Corp. | 70,000 | 987 |
| | China Life Insurance Co. Ltd. | 937,632 | 980 |
| | Powertech Technology Inc. | 277,000 | 972 |
| | Macronix International Co. Ltd. | 678,903 | 961 |
| | Ruentex Industries Ltd. | 243,048 | 948 |
| | Gigabyte Technology Co. Ltd. | 233,000 | 946 |
| | Cheng Shin Rubber Industry Co. Ltd. | 767,379 | 942 |
| | Tripod Technology Corp. | 220,000 | 932 |
| | United Microelectronics Corp. ADR | 87,418 | 898 |
| | ITEQ Corp. | 191,244 | 885 |
| | Chicony Electronics Co. Ltd. | 302,231 | 864 |
| | Teco Electric and Machinery Co. Ltd. | 766,000 | 832 |
| | Zhen Ding Technology Holding Ltd. | 238,700 | 827 |
| * | ENNOSTAR Inc. | 304,278 | 801 |
| | Lien Hwa Industrial Holdings Corp. | 396,753 | 797 |
| | Nien Made Enterprise Co. Ltd. | 55,000 | 756 |
| * | China Airlines Ltd. | 1,195,000 | 740 |
| | Nanya Technology Corp. | 306,324 | 734 |
| | Global Unichip Corp. | 34,000 | 734 |
| | Simplo Technology Co. Ltd. | 66,640 | 718 |
| * | China Petrochemical Development Corp. | 1,633,567 | 712 |
| | Taiwan Fertilizer Co. Ltd. | 287,000 | 702 |
| | Elan Microelectronics Corp. | 116,400 | 701 |
| | FLEXium Interconnect Inc. | 202,154 | 700 |
| * | HTC Corp. | 294,491 | 696 |
| | YFY Inc. | 599,000 | 691 |
| * | Eva Airways Corp. | 1,008,817 | 685 |
| | King's Town Bank Co. Ltd. | 458,000 | 684 |
| | Genius Electronic Optical Co. Ltd. | 43,911 | 677 |
| | Sinbon Electronics Co. Ltd. | 81,499 | 674 |
| | Makalot Industrial Co. Ltd. | 76,985 | 672 |
| | Lotes Co. Ltd. | 31,800 | 663 |
Total World Stock Index Fund
| | | Shares | Market
Value•
($000) |
| | Bizlink Holding Inc. | 71,616 | 662 |
| | Tung Ho Steel Enterprise Corp. | 433,000 | 629 |
| | Taiwan Glass Industry Corp. | 636,842 | 628 |
| | Qisda Corp. | 556,000 | 621 |
| | Compeq Manufacturing Co. Ltd. | 420,000 | 611 |
| | IBF Financial Holdings Co. Ltd. | 1,064,524 | 609 |
| * | Episil Technologies Inc. | 110,666 | 609 |
| | Highwealth Construction Corp. | 373,394 | 603 |
| | Radiant Opto-Electronics Corp. | 171,314 | 600 |
| | Wafer Works Corp. | 257,601 | 598 |
| | Tong Hsing Electronic Industries Ltd. | 62,130 | 592 |
| | TXC Corp. | 158,000 | 584 |
| | King Yuan Electronics Co. Ltd. | 394,000 | 565 |
| | Faraday Technology Corp. | 76,800 | 557 |
| | Wisdom Marine Lines Co. Ltd. | 231,196 | 544 |
| | Everlight Electronics Co. Ltd. | 304,000 | 543 |
| | Taichung Commercial Bank Co. Ltd. | 1,233,918 | 530 |
| | Mitac Holdings Corp. | 511,589 | 529 |
| | Chipbond Technology Corp. | 227,000 | 527 |
| | Pan Jit International Inc. | 127,800 | 518 |
| | Chung Hung Steel Corp. | 409,000 | 516 |
| | SDI Corp. | 85,000 | 508 |
| | Eternal Materials Co. Ltd. | 380,919 | 505 |
| * | Medigen Vaccine Biologics Corp. | 57,591 | 496 |
| | Elite Semiconductor Microelectronics Technology Inc. | 96,000 | 494 |
| | International Games System Co. Ltd. | 19,000 | 489 |
| | Poya International Co. Ltd. | 27,243 | 488 |
| | Nantex Industry Co. Ltd. | 164,000 | 482 |
| | Clevo Co. | 383,628 | 476 |
| | Feng Hsin Steel Co. Ltd. | 169,000 | 475 |
| | HannStar Display Corp. | 931,265 | 474 |
| * | Yieh Phui Enterprise Co. Ltd. | 523,136 | 467 |
| | Taiwan Surface Mounting Technology Corp. | 115,250 | 465 |
| | TCI Co. Ltd. | 56,022 | 455 |
| | | Shares | Market
Value•
($000) |
| | Taiwan Secom Co. Ltd. | 125,675 | 454 |
| * | Oriental Union Chemical Corp. | 528,000 | 454 |
| | United Integrated Services Co. Ltd. | 68,200 | 451 |
| | Advanced Energy Solution Holding Co. Ltd. | 10,000 | 441 |
| | Great Wall Enterprise Co. Ltd. | 228,146 | 440 |
| | Cheng Loong Corp. | 356,000 | 436 |
| | Grand Pacific Petrochemical | 447,000 | 435 |
| | Solar Applied Materials Technology Corp. | 240,571 | 434 |
| | Asia Vital Components Co. Ltd. | 145,000 | 433 |
| | Goldsun Building Materials Co. Ltd. | 462,137 | 428 |
| | TA-I Technology Co. Ltd. | 186,750 | 427 |
| | Fitipower Integrated Technology Inc. | 55,603 | 427 |
| | Tainan Spinning Co. Ltd. | 519,543 | 425 |
| | Tong Yang Industry Co. Ltd. | 349,000 | 424 |
| | Yulon Finance Corp. | 69,575 | 422 |
| | FocalTech Systems Co. Ltd. | 72,655 | 419 |
| | King Slide Works Co. Ltd. | 27,000 | 415 |
| | TSRC Corp. | 357,925 | 413 |
| | Sitronix Technology Corp. | 42,000 | 403 |
| | Hota Industrial Manufacturing Co. Ltd. | 116,940 | 396 |
| | USI Corp. | 316,645 | 392 |
| | Ardentec Corp. | 181,903 | 390 |
| | China Steel Chemical Corp. | 87,000 | 387 |
| | Nan Kang Rubber Tire Co. Ltd. | 268,493 | 386 |
| | Shinkong Synthetic Fibers Corp. | 567,000 | 385 |
| | CTCI Corp. | 293,000 | 384 |
| | Gold Circuit Electronics Ltd. | 159,000 | 381 |
| | Formosa Taffeta Co. Ltd. | 352,000 | 380 |
| * | United Renewable Energy Co. Ltd. | 441,502 | 380 |
| | Sigurd Microelectronics Corp. | 178,781 | 378 |
| | Kinpo Electronics | 806,000 | 377 |
| | Jentech Precision Industrial Co. Ltd. | 28,000 | 372 |
| | ChipMOS Technologies Inc. | 221,682 | 369 |
| | Capital Securities Corp. | 667,220 | 364 |
| | Getac Holdings Corp. | 192,000 | 362 |
Total World Stock Index Fund
| | | Shares | Market
Value•
($000) |
| | Chin-Poon Industrial Co. Ltd. | 326,000 | 351 |
| | Kinik Co. | 129,000 | 351 |
| | Far Eastern International Bank | 926,316 | 348 |
| | Coretronic Corp. | 165,400 | 342 |
| | Primax Electronics Ltd. | 184,000 | 341 |
| | China Electric Manufacturing Corp. | 810,360 | 337 |
| | Ichia Technologies Inc. | 573,000 | 335 |
| | Topco Scientific Co. Ltd. | 67,047 | 333 |
| | Visual Photonics Epitaxy Co. Ltd. | 65,250 | 331 |
| | U-Ming Marine Transport Corp. | 174,000 | 330 |
| * | Microbio Co. Ltd. | 144,962 | 329 |
| | Far Eastern Department Stores Ltd. | 405,115 | 322 |
| | Yulon Motor Co. Ltd. | 217,430 | 322 |
| | Greatek Electronics Inc. | 112,000 | 321 |
| | Machvision Inc. | 37,404 | 316 |
| | Standard Foods Taiwan Ltd. | 168,400 | 314 |
| | WT Microelectronics Co. Ltd. | 138,986 | 314 |
| | Fusheng Precision Co. Ltd. | 46,000 | 312 |
| | Chung-Hsin Electric & Machinery Manufacturing Corp. | 208,000 | 309 |
| | Via Technologies Inc. | 135,000 | 302 |
| | Taiwan Mask Corp. | 105,158 | 302 |
| | Charoen Pokphand Enterprise | 104,000 | 299 |
| | Taiwan Union Technology Corp. | 86,000 | 297 |
| | Taiwan Sakura Corp. | 117,994 | 297 |
| | Run Long Construction Co. Ltd. | 137,376 | 296 |
| * | Ambassador Hotel | 271,000 | 295 |
| | Longchen Paper & Packaging Co. Ltd. | 338,689 | 294 |
| | Pegavision Corp. | 15,000 | 294 |
| | Transcend Information Inc. | 120,000 | 292 |
| | L&K Engineering Co. Ltd. | 278,000 | 292 |
| | Huaku Development Co. Ltd. | 89,000 | 291 |
| | Wei Chuan Foods Corp. | 354,000 | 291 |
| | RichWave Technology Corp. | 28,000 | 291 |
| * | RDC Semiconductor Co. Ltd. | 20,000 | 287 |
| | UPC Technology Corp. | 344,265 | 286 |
| | Systex Corp. | 91,000 | 283 |
| | | Shares | Market
Value•
($000) |
| | International CSRC Investment Holdings Co. | 323,447 | 280 |
| | Mercuries & Associates Holding Ltd. | 335,321 | 279 |
| | Advanced Wireless Semiconductor Co. | 48,437 | 279 |
| | Global Mixed Mode Technology Inc. | 34,000 | 276 |
| | ADATA Technology Co. Ltd. | 92,190 | 276 |
| | President Securities Corp. | 334,670 | 273 |
| * | EirGenix Inc. | 70,000 | 273 |
| | Farglory Land Development Co. Ltd. | 110,000 | 266 |
| | Topkey Corp. | 57,000 | 266 |
| | Center Laboratories Inc. | 110,775 | 265 |
| | Sunny Friend Environmental Technology Co. Ltd. | 37,000 | 265 |
| | China Motor Corp. | 104,800 | 261 |
| | XinTec Inc. | 53,000 | 259 |
| | Wistron NeWeb Corp. | 92,400 | 258 |
| * | Phihong Technology Co. Ltd. | 193,000 | 256 |
| | Asia Optical Co. Inc. | 80,000 | 255 |
| | Ta Ya Electric Wire & Cable | 282,844 | 252 |
| | Grape King Bio Ltd. | 43,000 | 251 |
| | CMC Magnetics Corp. | 787,080 | 250 |
| | Taiwan Hon Chuan Enterprise Co. Ltd. | 105,772 | 248 |
| | China General Plastics Corp. | 184,895 | 247 |
| | Bank of Kaohsiung Co. Ltd. | 604,629 | 245 |
| * | Shihlin Paper Corp. | 99,000 | 244 |
| | Ability Enterprise Co. Ltd. | 346,000 | 243 |
| | Cheng Uei Precision Industry Co. Ltd. | 173,000 | 241 |
| | Taiwan Paiho Ltd. | 77,000 | 240 |
| | Depo Auto Parts Ind Co. Ltd. | 118,000 | 239 |
| | Kenda Rubber Industrial Co. Ltd. | 217,000 | 239 |
| | O-Bank Co. Ltd. | 845,000 | 237 |
| | Basso Industry Corp. | 152,200 | 236 |
| * | PharmaEssentia Corp. | 67,648 | 236 |
| | China Chemical & Pharmaceutical Co. Ltd. | 294,000 | 234 |
| | Chilisin Electronics Corp. | 75,325 | 234 |
| * | CSBC Corp. Taiwan | 297,615 | 234 |
| | Iron Force Industrial Co. Ltd. | 92,000 | 233 |
Total World Stock Index Fund
| | | Shares | Market
Value•
($000) |
| | Chong Hong Construction Co. Ltd. | 87,152 | 231 |
| | Sunplus Technology Co. Ltd. | 171,000 | 228 |
| * | AmTRAN Technology Co. Ltd. | 359,000 | 228 |
| | Taiwan Semiconductor Co. Ltd. | 77,000 | 226 |
| | Jih Sun Financial Holdings Co. Ltd. | 481,000 | 225 |
| | Cathay Real Estate Development Co. Ltd. | 319,200 | 224 |
| | Holtek Semiconductor Inc. | 60,000 | 223 |
| | Kindom Development Co. Ltd. | 161,700 | 223 |
| | Supreme Electronics Co. Ltd. | 138,210 | 223 |
| | Advanced Ceramic X Corp. | 18,000 | 223 |
| | Ennoconn Corp. | 33,664 | 223 |
| | Pixart Imaging Inc. | 39,000 | 222 |
| | Foxsemicon Integrated Technology Inc. | 29,900 | 221 |
| | Sporton International Inc. | 27,092 | 220 |
| | General Interface Solution Holding Ltd. | 63,000 | 220 |
| | AURAS Technology Co. Ltd. | 38,000 | 218 |
| | Andes Technology Corp. | 12,000 | 218 |
| | Merry Electronics Co. Ltd. | 72,309 | 214 |
| | Taiwan FamilyMart Co. Ltd. | 23,000 | 214 |
| | Taiwan Cogeneration Corp. | 155,000 | 213 |
| | Sinyi Realty Inc. | 177,358 | 212 |
| | Dimerco Express Corp. | 68,466 | 212 |
| | Sanyang Motor Co. Ltd. | 214,000 | 209 |
| | Sensortek Technology Corp. | 10,000 | 209 |
| | Cleanaway Co. Ltd. | 27,000 | 208 |
| | Pan-International Industrial Corp. | 142,000 | 208 |
| | Century Iron & Steel Industrial Co. Ltd. | 51,000 | 208 |
| | TYC Brother Industrial Co. Ltd. | 288,000 | 207 |
| | TTY Biopharm Co. Ltd. | 83,541 | 207 |
| | Co-Tech Development Corp. | 76,000 | 205 |
| * | KMC Kuei Meng International Inc. | 28,000 | 204 |
| | | Shares | Market
Value•
($000) |
| | T3EX Global Holdings Corp. | 44,000 | 204 |
| | Arcadyan Technology Corp. | 53,099 | 201 |
| | Chunghwa Precision Test Tech Co. Ltd. | 7,000 | 200 |
| | Chun Yuan Steel Industry Co. Ltd. | 244,000 | 199 |
| | Wah Lee Industrial Corp. | 64,260 | 197 |
| | Prince Housing & Development Corp. | 412,050 | 197 |
| | Rich Development Co. Ltd. | 594,000 | 196 |
| | Flytech Technology Co. Ltd. | 74,853 | 196 |
| * | Lealea Enterprise Co. Ltd. | 470,000 | 195 |
| | Universal Vision Biotechnology Co. Ltd. | 17,000 | 195 |
| | First Steamship Co. Ltd. | 419,936 | 194 |
| | Formosa International Hotels Corp. | 36,058 | 193 |
| | Chlitina Holding Ltd. | 22,400 | 192 |
| | Aten International Co. Ltd. | 63,000 | 191 |
| | Cub Elecparts Inc. | 31,044 | 191 |
| | China Man-Made Fiber Corp. | 516,602 | 189 |
| | Tung Thih Electronic Co. Ltd. | 26,000 | 189 |
| | Holy Stone Enterprise Co. Ltd. | 44,200 | 188 |
| * | TSEC Corp. | 156,000 | 187 |
| | Yeong Guan Energy Technology Group Co. Ltd. | 80,639 | 186 |
| | Asia Polymer Corp. | 131,556 | 185 |
| | Thinking Electronic Industrial Co. Ltd. | 30,000 | 184 |
| | Tyntek Corp. | 194,000 | 183 |
| | Jess-Link Products Co. Ltd. | 144,750 | 183 |
| | Apex International Co. Ltd. | 65,000 | 183 |
| | Innodisk Corp. | 26,340 | 182 |
| | Ton Yi Industrial Corp. | 389,000 | 182 |
| | Adimmune Corp. | 115,485 | 182 |
| | Hotai Finance Co. Ltd. | 57,000 | 181 |
| | Continental Holdings Corp. | 200,000 | 181 |
| | TPK Holding Co. Ltd. | 117,958 | 180 |
| | BES Engineering Corp. | 560,000 | 177 |
| | Chang Wah Electromaterials Inc. | 144,000 | 175 |
| | Sercomm Corp. | 76,000 | 174 |
| | Silicon Integrated Systems Corp. | 198,245 | 171 |
Total World Stock Index Fund
| | | Shares | Market
Value•
($000) |
| | Zeng Hsing Industrial Co. Ltd. | 31,000 | 170 |
| | Nan Pao Resins Chemical Co. Ltd. | 34,000 | 170 |
| | Ginko International Co. Ltd. | 23,100 | 168 |
| * | TaiMed Biologics Inc. | 69,000 | 166 |
| * | Federal Corp. | 170,612 | 165 |
| | Hsin Kuang Steel Co. Ltd. | 78,000 | 163 |
| | Soft-World International Corp. | 50,000 | 162 |
| * | Etron Technology Inc. | 74,467 | 160 |
| | Fulgent Sun International Holding Co. Ltd. | 43,029 | 160 |
| | Globe Union Industrial Corp. | 288,000 | 159 |
| | Chicony Power Technology Co. Ltd. | 63,000 | 158 |
| | Hung Sheng Construction Ltd. | 181,912 | 158 |
| | AcBel Polytech Inc. | 126,000 | 157 |
| * | OBI Pharma Inc. | 41,014 | 157 |
| | Evergreen International Storage & Transport Corp. | 160,000 | 156 |
| | IEI Integration Corp. | 96,605 | 154 |
| | Shin Zu Shing Co. Ltd. | 42,691 | 153 |
| | Sonix Technology Co. Ltd. | 49,000 | 152 |
| | Darfon Electronics Corp. | 101,000 | 152 |
| | Gudeng Precision Industrial Co. Ltd. | 17,201 | 151 |
| * | Asia Pacific Telecom Co. Ltd. | 507,508 | 150 |
| | Dynapack International Technology Corp. | 43,000 | 149 |
| | St. Shine Optical Co. Ltd. | 14,000 | 149 |
| | Formosa Sumco Technology Corp. | 26,000 | 148 |
| * | Mercuries Life Insurance Co. Ltd. | 449,981 | 148 |
| | Adlink Technology Inc. | 59,584 | 144 |
| | Kaimei Electronic Corp. | 46,000 | 144 |
| | Shin Foong Specialty & Applied Materials Co. Ltd. | 22,000 | 144 |
| | Weltrend Semiconductor | 48,599 | 142 |
| | Speed Tech Corp. | 46,000 | 141 |
| | OptoTech Corp. | 91,312 | 141 |
| | Taiwan PCB Techvest Co. Ltd. | 83,000 | 140 |
| | ITE Technology Inc. | 37,000 | 139 |
| | LandMark Optoelectronics Corp. | 21,600 | 139 |
| | | Shares | Market
Value•
($000) |
| | Huang Hsiang Construction Corp. | 105,000 | 138 |
| | Posiflex Technology Inc. | 42,169 | 138 |
| * | Unitech Printed Circuit Board Corp. | 210,120 | 137 |
| | Test Research Inc. | 68,000 | 137 |
| | D-Link Corp. | 184,212 | 136 |
| | Elite Advanced Laser Corp. | 67,412 | 135 |
| | Hannstar Board Corp. | 89,059 | 134 |
| | Radium Life Tech Co. Ltd. | 352,440 | 133 |
| | Firich Enterprises Co. Ltd. | 115,127 | 133 |
| | Gourmet Master Co. Ltd. | 28,245 | 133 |
| | Acter Group Corp. Ltd. | 19,788 | 132 |
| | Lotus Pharmaceutical Co. Ltd. | 39,000 | 132 |
| | YC INOX Co. Ltd. | 115,692 | 131 |
| | Senao International Co. Ltd. | 114,000 | 131 |
| | Advanced International Multitech Co. Ltd. | 46,000 | 131 |
| * | Taiwan TEA Corp. | 174,000 | 131 |
| | Sampo Corp. | 121,600 | 130 |
| | Gamania Digital Entertainment Co. Ltd. | 62,000 | 129 |
| | Egis Technology Inc. | 27,000 | 129 |
| | YungShin Global Holding Corp. | 81,400 | 127 |
| | Unizyx Holding Corp. | 112,000 | 126 |
| | Motech Industries Inc. | 108,133 | 125 |
| | Taiwan Styrene Monomer | 190,450 | 124 |
| | Syncmold Enterprise Corp. | 48,750 | 124 |
| | Nichidenbo Corp. | 68,000 | 123 |
| | FSP Technology Inc. | 84,000 | 123 |
| | Chief Telecom Inc. | 12,000 | 123 |
| * | Chung Hwa Pulp Corp. | 152,421 | 122 |
| | Everlight Chemical Industrial Corp. | 131,240 | 121 |
| | Career Technology MFG. Co. Ltd. | 134,522 | 121 |
| | TaiDoc Technology Corp. | 19,000 | 120 |
| | Taiyen Biotech Co. Ltd. | 100,000 | 119 |
| | ScinoPharm Taiwan Ltd. | 133,245 | 119 |
| | PChome Online Inc. | 22,587 | 118 |
| | China Metal Products | 101,000 | 116 |
| | Chia Hsin Cement Corp. | 159,000 | 116 |
| * | Lingsen Precision Industries Ltd. | 125,000 | 114 |
Total World Stock Index Fund
| | | Shares | Market
Value•
($000) |
| | Hu Lane Associate Inc. | 23,575 | 114 |
| | Wowprime Corp. | 21,665 | 112 |
| | Fittech Co. Ltd. | 14,781 | 112 |
| | Namchow Holdings Co. Ltd. | 64,000 | 111 |
| | Hong Pu Real Estate Development Co. Ltd. | 140,000 | 110 |
| | Lung Yen Life Service Corp. | 67,000 | 108 |
| * | Orient Semiconductor Electronics Ltd. | 120,605 | 108 |
| | Xxentria Technology Materials Corp. | 44,000 | 107 |
| | Alpha Networks Inc. | 107,772 | 105 |
| | CyberTAN Technology Inc. | 109,000 | 104 |
| | Rexon Industrial Corp. Ltd. | 43,000 | 104 |
| | Johnson Health Tech Co. Ltd. | 49,105 | 103 |
| | Gemtek Technology Corp. | 102,000 | 101 |
| * | Gigastorage Corp. | 111,064 | 100 |
| * | Kuo Yang Construction Co. Ltd. | 116,000 | 100 |
| | Kuo Toong International Co. Ltd. | 127,374 | 98 |
| | Test Rite International Co. Ltd. | 113,000 | 98 |
| | Kung Long Batteries Industrial Co. Ltd. | 19,000 | 96 |
| | Sunonwealth Electric Machine Industry Co. Ltd. | 69,000 | 96 |
| * | Medigen Biotechnology Corp. | 49,000 | 96 |
| | Sincere Navigation Corp. | 95,790 | 96 |
| | Gloria Material Technology Corp. | 125,000 | 95 |
| * | Shining Building Business Co. Ltd. | 237,915 | 95 |
| | Ho Tung Chemical Corp. | 251,141 | 94 |
| | Taiflex Scientific Co. Ltd. | 54,800 | 94 |
| | Yulon Nissan Motor Co. Ltd. | 10,000 | 91 |
| * | Li Peng Enterprise Co. Ltd. | 240,600 | 90 |
| | Bioteque Corp. | 22,000 | 87 |
| | HannsTouch Solution Inc. | 200,133 | 86 |
| | Dyaco International Inc. | 36,000 | 84 |
| | Altek Corp. | 61,600 | 83 |
| | Quanta Storage Inc. | 59,000 | 82 |
| | Formosan Rubber Group Inc. | 99,890 | 81 |
| | Rechi Precision Co. Ltd. | 120,000 | 81 |
| | | Shares | Market
Value•
($000) |
| | Global Brands Manufacture Ltd. | 61,640 | 79 |
| | Swancor Holding Co. Ltd. | 22,000 | 78 |
| | Nidec Chaun-Choung Technology Corp. | 13,000 | 78 |
| | KEE TAI Properties Co. Ltd. | 156,000 | 74 |
| | Dynamic Electronics Co. Ltd. | 94,760 | 72 |
| * | Ritek Corp. | 202,257 | 71 |
| | Nan Liu Enterprise Co. Ltd. | 16,000 | 71 |
| * | ALI Corp. | 66,811 | 68 |
| | Sheng Yu Steel Co. Ltd. | 56,000 | 67 |
| | Vivotek Inc. | 25,000 | 67 |
| | Infortrend Technology Inc. | 127,000 | 66 |
| | Elitegroup Computer Systems Co. Ltd. | 73,000 | 62 |
| | Savior Lifetec Corp. | 81,096 | 60 |
| * | Darwin Precisions Corp. | 142,000 | 57 |
| *,1 | Unity Opto Technology Co. Ltd. | 378,000 | 56 |
| | Toung Loong Textile Manufacturing | 44,000 | 56 |
| * | AGV Products Corp. | 149,440 | 55 |
| | WUS Printed Circuit Co. Ltd. | 53,457 | 55 |
| * | Roo Hsing Co. Ltd. | 168,000 | 51 |
| * | Newmax Technology Co. Ltd. | 33,000 | 49 |
| | Gigasolar Materials Corp. | 6,400 | 47 |
| | Concraft Holding Co. Ltd. | 22,512 | 46 |
| * | Taigen Biopharmaceuticals Holdings Ltd. | 77,872 | 45 |
| * | Tong-Tai Machine & Tool Co. Ltd. | 74,560 | 43 |
| | CHC Healthcare Group | 31,268 | 41 |
| | Cyberlink Corp. | 11,000 | 36 |
| | PharmaEngine Inc. | 17,038 | 36 |
| | GeneReach Biotechnology Corp. | 11,324 | 32 |
| * | Zinwell Corp. | 43,000 | 31 |
| * | Brogent Technologies Inc. | 5,529 | 25 |
| *,1 | Pharmally International Holding Co. Ltd. | 10,673 | 22 |
| * | Li Cheng Enterprise Co. Ltd. | 28,407 | 20 |
| *,1 | Pihsiang Machinery Manufacturing Co. Ltd. | 38,000 | — |
| *,1 | Xpec Entertainment Inc. | 21,468 | — |
| | | | 636,437 |
Total World Stock Index Fund
| | | Shares | Market
Value•
($000) |
| Thailand (0.3%) |
| | PTT PCL | 6,080,880 | 6,962 |
| | CP ALL PCL | 2,443,500 | 4,721 |
| | Siam Commercial Bank PCL | 965,000 | 3,669 |
| | Airports of Thailand PCL | 1,825,350 | 3,557 |
| | Advanced Info Service PCL | 523,000 | 2,983 |
| | Kasikornbank PCL | 681,966 | 2,907 |
| | Bangkok Dusit Medical Services PCL Class F | 3,967,800 | 2,814 |
| | Gulf Energy Development PCL | 1,815,480 | 2,370 |
| | Central Pattana PCL | 1,299,800 | 2,326 |
| | Siam Cement PCL (Registered) | 195,306 | 2,325 |
| | PTT Exploration & Production PCL | 578,081 | 2,045 |
| | Siam Cement PCL NDVR | 162,800 | 1,938 |
| | PTT Global Chemical PCL | 969,515 | 1,835 |
| | Intouch Holdings PCL Class F | 721,031 | 1,636 |
| | Delta Electronics Thailand PCL | 129,100 | 1,621 |
| * | Minor International PCL | 1,630,530 | 1,610 |
| | Energy Absolute PCL | 623,400 | 1,233 |
| | Central Retail Corp. PCL | 1,106,700 | 1,161 |
| | Bangkok Bank PCL (Registered) | 300,848 | 1,113 |
| | Charoen Pokphand Foods PCL | 1,419,700 | 1,081 |
| 2 | Banpu PCL (Registered) | 3,122,704 | 1,072 |
| | Home Product Center PCL | 2,375,898 | 1,047 |
| | Indorama Ventures PCL | 823,100 | 1,045 |
| | SCG Packaging PCL | 502,100 | 973 |
| | BTS Group Holdings PCL | 3,266,611 | 941 |
| | Tisco Financial Group PCL | 330,200 | 919 |
| | Bangkok Expressway & Metro PCL | 3,340,157 | 907 |
| | PTT Oil & Retail Business PCL | 1,090,900 | 905 |
| | TMBThanachart Bank PCL | 24,144,669 | 846 |
| | Digital Telecommunications Infrastructure Fund Class F | 2,080,417 | 840 |
| 2 | KCE Electronics PCL | 311,700 | 818 |
| 2 | Krungthai Card PCL | 464,100 | 809 |
| | Thai Union Group PCL Class F | 1,236,080 | 779 |
| | Hana Microelectronics PCL | 292,700 | 707 |
| | Thai Oil PCL | 403,700 | 677 |
| | Krung Thai Bank PCL | 1,865,775 | 648 |
| | | Shares | Market
Value•
($000) |
| | Electricity Generating PCL | 113,000 | 609 |
| 2 | Global Power Synergy PCL Class F | 258,993 | 609 |
| | Kiatnakin Bank PCL | 331,900 | 601 |
| | Com7 PCL Class F | 273,800 | 593 |
| | Muangthai Capital PCL | 321,700 | 588 |
| | True Corp. PCL | 4,725,554 | 578 |
| | Bumrungrad Hospital PCL | 130,600 | 574 |
| | Osotspa PCL | 562,700 | 556 |
| | Jasmine Broadband Internet Infrastructure Fund Class F | 1,805,600 | 555 |
| | CPN Retail Growth Leasehold REIT | 852,800 | 551 |
| 2 | Carabao Group PCL Class F | 140,500 | 526 |
| | Land & Houses PCL (Registered) | 2,022,600 | 516 |
| | VGI PCL | 2,407,941 | 484 |
| | Siam Global House PCL | 775,590 | 478 |
| | IRPC PCL | 3,602,700 | 467 |
| | Srisawad Corp. PCL | 235,805 | 456 |
| | Supalai PCL | 616,000 | 435 |
| * | Asset World Corp. PCL | 3,135,100 | 432 |
| | Siam Commercial Bank PCL NVDR | 111,400 | 424 |
| | Gunkul Engineering PCL | 2,487,599 | 406 |
| 2 | Berli Jucker PCL | 384,984 | 392 |
| | Total Access Communication PCL | 336,900 | 388 |
| | Land & Houses PCL NVDR | 1,482,900 | 378 |
| 2 | CH Karnchang PCL | 575,000 | 378 |
| 2 | Ratch Group PCL | 269,924 | 370 |
| | Thonburi Healthcare Group PCL | 353,600 | 360 |
| | CK Power PCL | 2,330,445 | 356 |
| 2 | Sri Trang Gloves Thailand PCL | 385,000 | 354 |
| | Bangkok Chain Hospital PCL | 566,200 | 347 |
| | Bangkok Commercial Asset Management PCL (XBKK) | 602,800 | 346 |
| | JMT Network Services PCL Class F | 230,347 | 339 |
| | Jay Mart PCL | 263,000 | 330 |
| | Sri Trang Agro-Industry PCL | 331,096 | 325 |
| | Thailand Future Fund | 1,367,400 | 322 |
| * | Central Plaza Hotel PCL | 290,900 | 316 |
| | Bangchak Corp. PCL | 377,100 | 312 |
| | TTW PCL | 870,200 | 307 |
| | IMPACT Growth REIT | 513,000 | 306 |
| 2 | B Grimm Power PCL | 235,500 | 302 |
| | Sansiri PCL | 7,649,500 | 292 |
Total World Stock Index Fund
| | | Shares | Market
Value•
($000) |
| | WHA Premium Growth Freehold & Leasehold REIT Class F | 732,620 | 291 |
| 2 | Chularat Hospital PCL Class F | 2,340,180 | 269 |
| | Thanachart Capital PCL | 247,100 | 263 |
| | MK Restaurants Group PCL | 157,200 | 260 |
| | Thoresen Thai Agencies PCL | 707,352 | 248 |
| | WHA Corp. PCL | 2,428,602 | 248 |
| | AP Thailand PCL | 921,500 | 246 |
| | Amata Corp. PCL | 383,249 | 236 |
| 2 | Siam Makro PCL | 160,100 | 232 |
| | Dohome PCL | 317,800 | 229 |
| | Krung Thai Bank PCL NDVR | 633,000 | 220 |
| | TPI Polene PCL | 4,173,300 | 215 |
| 2 | Kerry Express Thailand PCL | 186,000 | 213 |
| | Mega Lifesciences PCL | 146,600 | 206 |
| | AEON Thana Sinsap Thailand PCL | 36,100 | 204 |
| | TQM Corp. PCL | 61,800 | 196 |
| * | STARK Corp. PCL | 1,480,800 | 196 |
| | Thai Vegetable Oil PCL | 206,400 | 194 |
| | LPN Development PCL | 1,259,200 | 189 |
| | Quality Houses PCL | 2,442,183 | 169 |
| | TOA Paint Thailand PCL | 164,400 | 164 |
| * | Bangkok Airways PCL | 457,000 | 160 |
| 2 | Sino-Thai Engineering & Construction PCL | 376,100 | 157 |
| | North Bangkok Power Plant Block 1 Infrastructure Fund - EGAT Class F | 425,900 | 157 |
| * | Star Petroleum Refining PCL | 484,700 | 153 |
| | Plan B Media Pcl Class F | 786,800 | 152 |
| | Bangkok Land PCL | 4,444,600 | 147 |
| * | BEC World PCL | 397,300 | 146 |
| | Tipco Asphalt PCL | 257,200 | 142 |
| | Bangkok Life Assurance PCL NVDR | 157,940 | 142 |
| 2 | Siam City Cement PCL | 27,700 | 141 |
| | Origin Property PCL Class F | 389,400 | 133 |
| * | Major Cineplex Group PCL | 203,500 | 131 |
| | BTS Rail Mass Transit Growth Infrastructure Fund Class F | 846,100 | 117 |
| | Banpu Power PCL | 215,100 | 114 |
| | Super Energy Corp. PCL | 3,838,700 | 112 |
| | | Shares | Market
Value•
($000) |
| * | Italian-Thai Development PCL | 1,562,400 | 110 |
| 2 | Jasmine International PCL | 1,256,900 | 109 |
| | Precious Shipping PCL | 188,100 | 103 |
| | Thaicom PCL | 303,900 | 100 |
| 2 | PTG Energy PCL | 190,400 | 90 |
| | TPI Polene Power PCL | 688,700 | 88 |
| * | Esso Thailand PCL | 357,200 | 86 |
| | Thaifoods Group PCL Class F | 649,700 | 86 |
| 2 | BCPG PCL | 215,213 | 85 |
| | Ratchthani Leasing PCL | 670,500 | 83 |
| * | U City PCL Class F | 1,520,425 | 82 |
| * | MBK PCL | 192,712 | 81 |
| | Pruksa Holding PCL | 195,300 | 81 |
| * | Banpu PCL Warrants Exp. 10/1/22 | 503,899 | 78 |
| * | Unique Engineering & Construction PCL | 382,500 | 77 |
| | Workpoint Entertainment PCL | 106,900 | 73 |
| * | Pruksa Real Estate PCL | 210,700 | 66 |
| | SPCG PCL | 120,600 | 65 |
| | BTS Group Holdings PCL NDVR | 222,000 | 64 |
| | GFPT PCL | 164,000 | 57 |
| | Kasikornbank PCL NVDR | 11,959 | 51 |
| * | Banpu PCL Warrants Exp. 10/1/23 | 486,630 | 50 |
| | Thanachart Capital PCL NDVR | 38,600 | 41 |
| * | Samart Corp. PCL | 211,300 | 40 |
| | Univentures PCL | 246,900 | 30 |
| *,1 | Thai Airways International PCL | 300,774 | 30 |
| 2 | Taokaenoi Food & Marketing PCL Class F | 123,500 | 25 |
| | Bangkok Life Assurance PCL | 16,500 | 15 |
| | Ratch Group PCL NDVR | 9,776 | 13 |
| * | BTS Group Holdings PCL Warrants Exp. 9/5/22 | 163,330 | 7 |
| * | MBK PCL Warrants Exp. 11/15/23 | 7,412 | 3 |
| * | Mbk W3 Warrants Exp. 10/22/27 | 7,709 | 3 |
| * | Vibhavadi Medical Center PCL Warrants Exp. 6/14/22 | 79,130 | 1 |
| * | BCPG PCL Warrants Exp. 11/13/23 | 1 | — |
| * | Minor International PCL Warrants Exp. 2/5/24 | 1 | — |
| * | BTS Group Holdings PCL Warrants Exp. 11/7/24 | 348,861 | — |
Total World Stock Index Fund
| | | Shares | Market
Value•
($000) |
| * | BTS Group Holdings PCL Warrants Exp. 11/20/26 | 697,722 | — |
| | | | 89,863 |
| Turkey (0.0%) |
| | BIM Birlesik Magazalar A/S | 190,649 | 1,233 |
| | Eregli Demir ve Celik Fabrikalari TAS | 564,208 | 1,178 |
| | Turkiye Garanti Bankasi A/S | 899,989 | 922 |
| | KOC Holding A/S | 364,023 | 888 |
| | Turkcell Iletisim Hizmetleri A/S | 530,684 | 847 |
| | Akbank TAS | 1,381,329 | 836 |
| * | Turkiye Petrol Rafinerileri A/S | 47,130 | 678 |
| | Aselsan Elektronik Sanayi Ve Ticaret A/S | 298,070 | 509 |
| | Turkiye Sise ve Cam Fabrikalari A/S | 547,298 | 492 |
| | Ford Otomotiv Sanayi A/S | 22,288 | 429 |
| | Haci Omer Sabanci Holding A/S | 333,446 | 388 |
| * | Cimsa Cimento Sanayi VE Ticaret A/S | 100,880 | 328 |
| | Enka Insaat ve Sanayi A/S | 283,192 | 327 |
| | Anadolu Efes Biracilik Ve Malt Sanayii A/S | 135,847 | 313 |
| * | Turk Hava Yollari AO | 203,001 | 309 |
| * | Aksa Enerji Uretim A/S Class B | 386,236 | 305 |
| | Turkiye Is Bankasi A/S Class C | 495,971 | 291 |
| * | Petkim Petrokimya Holding A/S | 410,397 | 279 |
| | Tat Gida Sanayi A/S | 272,198 | 272 |
| * | Gubre Fabrikalari TAS | 36,375 | 262 |
| * | Kardemir Karabuk Demir Celik Sanayi ve Ticaret A/S Class D | 325,697 | 254 |
| | Coca-Cola Icecek A/S | 26,410 | 233 |
| * | Sasa Polyester Sanayi A/S | 70,941 | 229 |
| | Tofas Turk Otomobil Fabrikasi A/S | 37,311 | 228 |
| | Yatas Yatak ve Yorgan Sanayi ve Ticaret A/S | 161,829 | 225 |
| * | Koza Altin Isletmeleri A/S | 19,560 | 217 |
| | Arcelik A/S | 59,514 | 209 |
| * | Oyak Cimento Fabrikalari A/S | 281,629 | 203 |
| *,3 | MLP Saglik Hizmetleri A/S | 69,471 | 196 |
| * | TAV Havalimanlari Holding A/S | 68,404 | 189 |
| | Kervan Gida Sanayi Ve Ticaret A/S | 130,593 | 158 |
| | | Shares | Market
Value•
($000) |
| * | Is Gayrimenkul Yatirim Ortakligi A/S | 756,498 | 151 |
| | Emlak Konut Gayrimenkul Yatirim Ortakligi A/S | 733,255 | 151 |
| | AG Anadolu Grubu Holding A/S | 51,361 | 147 |
| | Yapi ve Kredi Bankasi A/S | 514,749 | 146 |
| 3 | Enerjisa Enerji A/S | 116,815 | 143 |
| * | Migros Ticaret A/S | 38,712 | 142 |
| * | Hektas Ticaret TAS | 148,851 | 137 |
| 3 | Mavi Giyim Sanayi Ve Ticaret A/S Class B | 18,167 | 136 |
| | Ulker Biskuvi Sanayi A/S | 62,695 | 132 |
| | Otokar Otomotiv Ve Savunma Sanayi A/S | 3,623 | 128 |
| | Sarkuysan Elektrolitik Bakir Sanayi ve Ticaret A/S | 66,510 | 128 |
| | Turk Telekomunikasyon A/S | 160,573 | 126 |
| | Tekfen Holding A/S | 74,320 | 117 |
| * | Turkiye Halk Bankasi A/S | 242,994 | 112 |
| | Borusan Yatirim ve Pazarlama A/S | 3,077 | 112 |
| | Dogan Sirketler Grubu Holding A/S | 389,279 | 109 |
| | Iskenderun Demir ve Celik A/S | 77,436 | 109 |
| * | Bera Holding A/S | 109,865 | 109 |
| * | Koza Anadolu Metal Madencilik Isletmeleri A/S | 59,315 | 103 |
| * | Pegasus Hava Tasimaciligi A/S | 11,507 | 96 |
| | Sok Marketler Ticaret A/S | 80,871 | 94 |
| | Logo Yazilim Sanayi Ve Ticaret A/S | 19,952 | 89 |
| | Turk Traktor ve Ziraat Makineleri A/S | 4,701 | 81 |
| * | Turkiye Vakiflar Bankasi TAO Class D | 218,437 | 78 |
| | Polisan Holding A/S | 271,018 | 78 |
| | Turkiye Sinai Kalkinma Bankasi A/S | 560,984 | 76 |
| * | Zorlu Enerji Elektrik Uretim A/S | 410,334 | 70 |
| | Nuh Cimento Sanayi A/S | 14,263 | 65 |
| * | Kardemir Karabuk Demir Celik Sanayi ve Ticaret A/S Class A | 81,746 | 55 |
| | Brisa Bridgestone Sabanci Sanayi ve Ticaret A/S | 21,814 | 53 |
Total World Stock Index Fund
| | | Shares | Market
Value•
($000) |
| * | Vestel Elektronik Sanayi ve Ticaret A/S | 20,037 | 53 |
| | EGE Endustri VE Ticaret A/S | 387 | 52 |
| | Aksa Akrilik Kimya Sanayii A/S | 20,723 | 51 |
| * | Ipek Dogal Enerji Kaynaklari Arastirma Ve Uretim A/S | 35,502 | 50 |
| | Is Yatirim Menkul Degerler A/S | 29,494 | 49 |
| | Aksigorta A/S | 61,914 | 45 |
| * | Konya Cimento Sanayii A/S | 506 | 44 |
| * | NET Holding A/S | 95,198 | 42 |
| | Alarko Holding A/S | 41,515 | 41 |
| | EIS Eczacibasi Ilac ve Sinai ve Finansal Yatirimlar Sanayi ve Ticaret A/S | 60,942 | 38 |
| * | Kordsa Teknik Tekstil A/S | 12,974 | 37 |
| * | Is Finansal Kiralama A/S | 111,340 | 36 |
| * | Sekerbank Turk A/S | 330,447 | 35 |
| | Dogus Otomotiv Servis ve Ticaret A/S | 7,386 | 28 |
| | Aygaz A/S | 12,065 | 23 |
| | Kartonsan Karton Sanayi ve Ticaret A/S | 3,436 | 19 |
| * | Torunlar Gayrimenkul Yatirim Ortakligi A/S | 26,089 | 10 |
| * | Albaraka Turk Katilim Bankasi A/S | 48,631 | 9 |
| *,1 | Asya Katilim Bankasi A/S | 147,465 | — |
| | | | 17,362 |
| United Arab Emirates (0.1%) |
| | First Abu Dhabi Bank PJSC | 1,893,168 | 9,189 |
| | Emirates Telecommunications Group Co. PJSC | 750,139 | 5,232 |
| | Emirates NBD Bank PJSC | 1,089,163 | 4,144 |
| | Abu Dhabi Commercial Bank PJSC | 1,195,029 | 2,703 |
| | Aldar Properties PJSC | 1,679,068 | 1,847 |
| | Dubai Islamic Bank PJSC | 1,251,822 | 1,745 |
| | Emaar Properties PJSC | 1,512,953 | 1,656 |
| | Abu Dhabi National Oil Co. for Distribution PJSC | 1,077,713 | 1,257 |
| | Abu Dhabi Islamic Bank PJSC | 605,976 | 965 |
| * | ADNOC Drilling Co. PJSC | 655,512 | 532 |
| | Dana Gas PJSC | 1,726,644 | 486 |
| | | Shares | Market
Value•
($000) |
| | Dubai Investments PJSC | 992,931 | 461 |
| * | Air Arabia PJSC | 1,163,146 | 441 |
| * | Emaar Malls PJSC | 749,716 | 409 |
| | GFH Financial Group BSC | 1,371,936 | 316 |
| * | Emaar Development PJSC | 270,876 | 289 |
| * | DAMAC Properties Dubai Co. PJSC | 667,912 | 228 |
| * | Dubai Financial Market PJSC | 659,693 | 183 |
| | Aramex PJSC | 132,235 | 158 |
| * | RAK Properties PJSC | 603,454 | 121 |
| * | Union Properties PJSC | 1,323,013 | 95 |
| *,1 | Arabtec Holding PJSC | 245,437 | 35 |
| *,1 | Drake & Scull International PJSC | 114,862 | 12 |
| | | | 32,504 |
| United Kingdom (3.9%) |
| | AstraZeneca plc | 673,994 | 84,318 |
| | Unilever plc (XLON) | 1,122,154 | 60,082 |
| | HSBC Holdings plc | 8,870,190 | 53,444 |
| | Diageo plc | 996,713 | 49,588 |
| | GlaxoSmithKline plc | 2,150,538 | 44,647 |
| | BP plc | 8,679,984 | 41,585 |
| | Royal Dutch Shell plc Class A | 1,807,700 | 41,412 |
| | Royal Dutch Shell plc Class B | 1,593,266 | 36,563 |
| | British American Tobacco plc | 988,053 | 34,369 |
| | Rio Tinto plc | 473,429 | 29,519 |
| | Glencore plc | 5,787,678 | 28,942 |
| | RELX plc | 808,438 | 25,068 |
| | Prudential plc (XLON) | 1,195,903 | 24,406 |
| | BHP Group plc | 906,243 | 23,935 |
| | Reckitt Benckiser Group plc | 277,742 | 22,548 |
| | Lloyds Banking Group plc | 30,810,456 | 21,086 |
| | Anglo American plc | 537,296 | 20,440 |
| | Barclays plc | 7,384,511 | 20,377 |
| | National Grid plc | 1,543,816 | 19,766 |
| | Experian plc | 398,953 | 18,292 |
| | Vodafone Group plc | 12,062,073 | 17,778 |
| * | Compass Group plc | 782,564 | 16,606 |
| | Ashtead Group plc | 196,220 | 16,445 |
| | CRH plc (XDUB) | 337,028 | 16,123 |
| | London Stock Exchange Group plc | 157,382 | 15,320 |
| | Ferguson plc | 96,948 | 14,587 |
| * | Flutter Entertainment plc (XDUB) | 72,671 | 13,714 |
| | Tesco plc | 3,343,218 | 12,344 |
| | BAE Systems plc | 1,390,666 | 10,486 |
| | SSE plc | 458,228 | 10,319 |
| | Legal & General Group plc | 2,608,610 | 10,288 |
| | Segro plc | 529,336 | 9,356 |
| | Aviva plc | 1,719,002 | 9,276 |
| | Imperial Brands plc | 415,880 | 8,776 |
Total World Stock Index Fund
| | | Shares | Market
Value•
($000) |
| | 3i Group plc | 417,465 | 7,796 |
| | Croda International plc | 59,200 | 7,662 |
| | Standard Chartered plc | 1,126,092 | 7,616 |
| | WPP plc | 516,056 | 7,459 |
| * | Entain plc | 254,762 | 7,139 |
| | Spirax-Sarco Engineering plc | 32,240 | 6,882 |
| | Smith & Nephew plc | 395,431 | 6,829 |
| | Natwest Group plc | 2,259,300 | 6,812 |
| | Halma plc | 166,734 | 6,762 |
| * | Rolls-Royce Holdings plc | 3,676,173 | 6,635 |
| | Rentokil Initial plc | 821,724 | 6,614 |
| * | BT Group plc | 3,298,485 | 6,267 |
| | Next plc | 56,273 | 6,133 |
| | Smurfit Kappa Group plc | 113,627 | 5,959 |
| * | InterContinental Hotels Group plc | 81,609 | 5,716 |
| | Bunzl plc | 147,278 | 5,443 |
| * | Ocado Group plc | 213,474 | 5,269 |
| | Persimmon plc | 140,881 | 5,249 |
| | St. James's Place plc | 225,963 | 4,881 |
| | Intertek Group plc | 71,143 | 4,764 |
| * | Informa plc | 661,462 | 4,706 |
| | Burberry Group plc | 177,478 | 4,691 |
| | Sage Group plc | 469,439 | 4,566 |
| | Mondi plc (XLON) | 181,650 | 4,536 |
| | United Utilities Group plc | 306,977 | 4,363 |
| | Kingfisher plc | 932,947 | 4,282 |
| | Barratt Developments plc | 455,212 | 4,132 |
| | Melrose Industries plc | 1,914,925 | 4,132 |
| | Severn Trent plc | 107,884 | 4,040 |
| * | Whitbread plc | 90,225 | 4,036 |
| | Admiral Group plc | 95,499 | 3,751 |
| | Rightmove plc | 392,296 | 3,708 |
| | Associated British Foods plc | 147,598 | 3,610 |
| 3 | Auto Trader Group plc | 428,219 | 3,550 |
| | DCC plc | 42,404 | 3,538 |
| | Intermediate Capital Group plc | 117,511 | 3,525 |
| | Hargreaves Lansdown plc | 166,201 | 3,497 |
| * | Meggitt plc | 336,693 | 3,457 |
| | Taylor Wimpey plc | 1,629,526 | 3,448 |
| | Smiths Group plc | 181,329 | 3,367 |
| | Abrdn plc | 961,934 | 3,344 |
| | DS Smith plc | 635,971 | 3,336 |
| | Dechra Pharmaceuticals plc | 47,415 | 3,315 |
| | B&M European Value Retail SA | 377,625 | 3,272 |
| | Johnson Matthey plc | 85,203 | 3,184 |
| | Electrocomponents plc | 202,241 | 3,112 |
| | Howden Joinery Group plc | 245,526 | 3,091 |
| | | Shares | Market
Value•
($000) |
| | JD Sports Fashion plc | 206,270 | 3,074 |
| | J Sainsbury plc | 738,263 | 3,024 |
| | Antofagasta plc | 152,216 | 2,969 |
| | M&G plc | 1,076,813 | 2,942 |
| | Polymetal International plc | 158,778 | 2,935 |
| | Coca-Cola HBC AG | 83,911 | 2,908 |
| | Land Securities Group plc | 306,461 | 2,879 |
| | Pearson plc | 335,431 | 2,760 |
| | British Land Co. plc | 398,998 | 2,694 |
| | Weir Group plc | 112,692 | 2,673 |
| | Phoenix Group Holdings plc | 285,887 | 2,567 |
| | Berkeley Group Holdings plc | 42,900 | 2,559 |
| | AVEVA Group plc | 52,384 | 2,551 |
| | Spectris plc | 48,820 | 2,512 |
| | Royal Mail plc | 435,743 | 2,512 |
| | IMI plc | 110,066 | 2,458 |
| | Bellway plc | 53,134 | 2,411 |
| * | ITV plc | 1,633,736 | 2,405 |
| | Hikma Pharmaceuticals plc | 72,761 | 2,398 |
| | Tritax Big Box REIT plc | 774,570 | 2,384 |
| | Schroders plc | 48,085 | 2,382 |
| | Direct Line Insurance Group plc | 584,512 | 2,336 |
| | Evraz plc | 272,365 | 2,313 |
| | Future plc | 47,756 | 2,304 |
| | Genus plc | 29,888 | 2,266 |
| * | S4 Capital plc | 223,781 | 2,222 |
| | Diploma plc | 52,293 | 2,149 |
| * | Centrica plc | 2,557,963 | 2,112 |
| | Endeavour Mining plc | 81,695 | 2,068 |
| * | Marks & Spencer Group plc | 816,218 | 2,052 |
| | Travis Perkins plc | 96,996 | 2,051 |
| | UNITE Group plc | 136,918 | 2,044 |
| 3 | ConvaTec Group plc | 696,649 | 2,039 |
| | Derwent London plc | 41,732 | 1,930 |
| | Man Group plc | 602,045 | 1,912 |
| | Games Workshop Group plc | 14,201 | 1,876 |
| | Pennon Group plc | 115,444 | 1,841 |
| 3 | Avast plc | 240,042 | 1,837 |
| | Inchcape plc | 159,524 | 1,800 |
| | Tate & Lyle plc | 196,011 | 1,737 |
| | Rotork plc | 354,321 | 1,713 |
| | Greggs plc | 40,815 | 1,706 |
| | Grafton Group plc | 90,134 | 1,656 |
| | Hiscox Ltd. | 144,337 | 1,642 |
| *,3 | Watches of Switzerland Group plc | 103,313 | 1,604 |
| | IG Group Holdings plc | 147,724 | 1,603 |
| 3 | Quilter plc | 726,486 | 1,547 |
| | Vistry Group plc | 91,594 | 1,534 |
| * | Virgin Money UK plc | 551,698 | 1,533 |
| | Big Yellow Group plc | 72,739 | 1,471 |
| | Hays plc | 649,216 | 1,471 |
Total World Stock Index Fund
| | | Shares | Market
Value•
($000) |
| *,3 | Countryside Properties plc | 222,113 | 1,430 |
| * | Beazley plc | 266,712 | 1,419 |
| | Softcat plc | 52,980 | 1,408 |
| * | easyJet plc | 164,717 | 1,404 |
| | Safestore Holdings plc | 84,248 | 1,385 |
| * | Carnival plc | 66,750 | 1,347 |
| * | IWG plc | 316,623 | 1,343 |
| | Pets at Home Group plc | 200,641 | 1,324 |
| * | THG plc | 446,430 | 1,323 |
| | HomeServe plc | 112,181 | 1,310 |
| | Investec plc | 287,905 | 1,304 |
| * | SSP Group plc | 367,526 | 1,295 |
| | Ultra Electronics Holdings plc | 29,155 | 1,292 |
| | Britvic plc | 105,580 | 1,282 |
| | LondonMetric Property plc | 354,570 | 1,268 |
| *,2 | TUI AG | 377,831 | 1,265 |
| * | Playtech plc | 132,268 | 1,258 |
| | Savills plc | 64,523 | 1,255 |
| | Grainger plc | 296,423 | 1,247 |
| | Assura plc | 1,227,370 | 1,224 |
| | Pagegroup plc | 133,743 | 1,214 |
| *,3 | Wizz Air Holdings plc | 19,034 | 1,204 |
| | Close Brothers Group plc | 61,081 | 1,203 |
| * | WH Smith plc | 55,162 | 1,181 |
| | OSB Group plc | 170,035 | 1,173 |
| * | Indivior plc | 350,231 | 1,169 |
| | NEPI Rockcastle plc | 171,962 | 1,150 |
| | Primary Health Properties plc | 545,449 | 1,146 |
| | Computacenter plc | 31,121 | 1,144 |
| | Drax Group plc | 155,931 | 1,134 |
| | Shaftesbury plc | 130,797 | 1,116 |
| | Balfour Beatty plc | 313,400 | 1,090 |
| * | Dr. Martens plc | 213,546 | 1,079 |
| * | Ascential plc | 194,524 | 1,074 |
| | Victrex plc | 34,316 | 1,073 |
| | Great Portland Estates plc | 107,092 | 1,071 |
| | Fresnillo plc | 89,975 | 1,059 |
| | Domino's Pizza Group plc | 193,552 | 1,025 |
| | IP Group plc | 618,682 | 1,021 |
| | Renishaw plc | 14,726 | 1,013 |
| | Cranswick plc | 20,903 | 988 |
| * | International Consolidated Airlines Group SA | 424,805 | 951 |
| | Spirent Communications plc | 235,750 | 926 |
| | Serco Group plc | 522,804 | 903 |
| *,3 | Trainline plc | 204,156 | 887 |
| | Synthomer plc | 127,561 | 884 |
| *,3 | Network International Holdings plc | 200,230 | 883 |
| | Genuit Group plc | 96,632 | 877 |
| | QinetiQ Group plc | 234,654 | 866 |
| | Dunelm Group plc | 49,183 | 862 |
| | Capital & Counties Properties plc | 380,002 | 857 |
| | | Shares | Market
Value•
($000) |
| | Bodycote plc | 78,066 | 855 |
| * | John Wood Group plc | 284,282 | 829 |
| | Marshalls plc | 85,531 | 828 |
| 2 | Hammerson plc | 1,843,916 | 810 |
| | Paragon Banking Group plc | 107,879 | 809 |
| | Ashmore Group plc | 172,551 | 797 |
| | Sirius Real Estate Ltd. | 431,025 | 796 |
| | Hill & Smith Holdings plc | 31,660 | 795 |
| | IntegraFin Holdings plc | 101,662 | 795 |
| | Sanne Group plc | 63,220 | 782 |
| | Mondi plc | 30,941 | 771 |
| | Redrow plc | 86,450 | 761 |
| | Oxford Instruments plc | 23,958 | 754 |
| | Liontrust Asset Management plc | 25,212 | 752 |
| * | National Express Group plc | 239,196 | 748 |
| * | Firstgroup plc | 534,615 | 735 |
| * | Frasers Group plc | 82,705 | 729 |
| | AJ Bell plc | 126,788 | 711 |
| | TP ICAP Group plc | 330,303 | 701 |
| * | Helios Towers plc | 331,314 | 700 |
| | Lancashire Holdings Ltd. | 100,797 | 696 |
| | Rathbone Brothers plc | 25,811 | 694 |
| * | Mediclinic International plc | 150,351 | 688 |
| | Plus500 Ltd. | 37,933 | 683 |
| *,3 | Aston Martin Lagonda Global Holdings plc | 28,948 | 676 |
| | Euromoney Institutional Investor plc | 47,168 | 675 |
| | Currys plc | 398,061 | 662 |
| | Workspace Group plc | 57,989 | 652 |
| * | Energean plc | 52,887 | 650 |
| | Centamin plc | 496,741 | 635 |
| * | Auction Technology Group plc | 32,400 | 628 |
| | 888 Holdings plc | 119,822 | 627 |
| | Essentra plc | 156,794 | 624 |
| * | Just Group plc | 494,999 | 619 |
| | Redde Northgate plc | 112,792 | 614 |
| | Cairn Energy plc | 239,345 | 598 |
| | Jupiter Fund Management plc | 173,949 | 596 |
| | Kainos Group plc | 21,998 | 596 |
| * | Mitie Group plc | 656,581 | 590 |
| | Ferrexpo plc | 135,795 | 579 |
| | Telecom Plus plc | 33,610 | 574 |
| | Morgan Advanced Materials plc | 117,909 | 557 |
| 3 | Airtel Africa plc | 370,714 | 556 |
| | Brewin Dolphin Holdings plc | 107,283 | 553 |
| | Chemring Group plc | 138,188 | 551 |
| * | Oxford Biomedica plc | 26,565 | 551 |
Total World Stock Index Fund
| | | Shares | Market
Value•
($000) |
| | Moneysupermarket.com Group plc | 189,375 | 550 |
| | Morgan Sindall Group plc | 17,418 | 540 |
| * | Elementis plc | 281,773 | 537 |
| | Clarkson plc | 9,662 | 529 |
| 3 | Ibstock plc | 192,672 | 526 |
| *,3 | Biffa plc | 95,913 | 524 |
| * | Provident Financial plc | 103,065 | 521 |
| * | Babcock International Group plc | 119,058 | 520 |
| | Vesuvius plc | 80,313 | 518 |
| * | C&C Group plc | 146,342 | 518 |
| | Rhi Magnesita NV | 11,261 | 517 |
| | Crest Nicholson Holdings plc | 104,048 | 508 |
| | Hilton Food Group plc | 30,853 | 493 |
| | FDM Group Holdings plc | 29,864 | 491 |
| | Coats Group plc | 539,113 | 476 |
| * | J D Wetherspoon plc | 33,815 | 475 |
| *,2 | Petropavlovsk plc | 1,458,327 | 473 |
| * | Senior plc | 213,364 | 468 |
| * | Bytes Technology Group plc (XLON) | 63,791 | 467 |
| * | Marston's plc | 423,751 | 461 |
| * | Capita plc | 707,976 | 459 |
| | Premier Foods plc | 294,034 | 441 |
| | BMO Commercial Property Trust Ltd. | 313,967 | 439 |
| | Bank of Georgia Group plc | 20,589 | 427 |
| * | Harbour Energy plc | 88,908 | 426 |
| | NCC Group plc | 121,239 | 412 |
| * | Greencore Group plc | 232,499 | 411 |
| *,3 | Equiniti Group plc | 168,093 | 410 |
| | XP Power Ltd. | 5,694 | 409 |
| 3 | TI Fluid Systems plc Class B | 111,025 | 402 |
| * | Mitchells & Butlers plc | 112,927 | 392 |
| * | Tullow Oil plc | 619,593 | 389 |
| | TBC Bank Group plc | 17,851 | 383 |
| | Micro Focus International plc | 76,023 | 373 |
| *,3 | Spire Healthcare Group plc | 113,405 | 366 |
| | UK Commercial Property REIT Ltd. | 349,353 | 363 |
| | Devro plc | 121,917 | 360 |
| * | Restaurant Group plc | 290,865 | 351 |
| | Helical plc | 55,409 | 349 |
| *,2 | Cineworld Group plc | 400,731 | 336 |
| | AG Barr plc | 48,232 | 327 |
| | Keller Group plc | 25,893 | 326 |
| | PZ Cussons plc | 110,790 | 325 |
| | Hochschild Mining plc | 158,826 | 310 |
| 3 | ContourGlobal plc | 105,751 | 288 |
| *,3 | Trustpilot Group plc | 65,510 | 283 |
| * | PureTech Health plc | 58,134 | 280 |
| | Wickes Group plc | 93,436 | 275 |
| | | Shares | Market
Value•
($000) |
| | Halfords Group plc | 74,716 | 272 |
| | Avon Protection plc | 9,861 | 262 |
| * | Moonpig Group plc | 56,409 | 258 |
| | Micro Focus International plc ADR | 52,251 | 257 |
| | Picton Property Income Ltd. | 183,531 | 244 |
| 3 | Vivo Energy plc | 162,330 | 235 |
| | CLS Holdings plc | 71,863 | 220 |
| *,2 | TUI AG (XETR) | 64,158 | 213 |
| * | AO World plc | 101,244 | 203 |
| * | SIG plc | 283,997 | 202 |
| * | Go-Ahead Group plc | 17,800 | 192 |
| * | Stagecoach Group plc | 168,866 | 184 |
| 3 | CMC Markets plc | 46,417 | 159 |
| *,2 | Petrofac Ltd. (XLON) | 86,220 | 153 |
| * | Rank Group plc | 60,828 | 137 |
| | Hunting plc | 50,312 | 116 |
| | CRH plc | 2,038 | 98 |
| *,3 | Funding Circle Holdings plc | 42,016 | 90 |
| 3 | Bakkavor Group plc | 46,001 | 79 |
| 3 | Alfa Financial Software Holdings plc | 18,397 | 48 |
| *,1,3 | Finablr plc | 58,416 | 9 |
| *,1,2 | Intu Properties plc | 184,897 | — |
| *,1 | NMC Health plc | 26,225 | — |
| *,1 | Carillion plc | 88,745 | — |
| | | | 1,337,890 |
| United States (59.1%) |
| | Microsoft Corp. | 3,277,002 | 1,086,719 |
| | Apple Inc. | 6,829,774 | 1,023,100 |
| * | Amazon.com Inc. | 188,898 | 637,045 |
| * | Tesla Inc. | 347,018 | 386,578 |
| * | Alphabet Inc. Class A | 128,895 | 381,648 |
| * | Alphabet Inc. Class C | 124,249 | 368,449 |
| * | Meta Platforms Inc. Class A | 1,042,553 | 337,339 |
| | NVIDIA Corp. | 1,041,148 | 266,190 |
| | JPMorgan Chase & Co. | 1,290,804 | 219,295 |
| | UnitedHealth Group Inc. | 408,550 | 188,125 |
| | Johnson & Johnson | 1,144,389 | 186,398 |
| * | Berkshire Hathaway Inc. Class B | 644,709 | 185,038 |
| | Home Depot Inc. | 461,644 | 171,612 |
| | Visa Inc. Class A | 737,201 | 156,117 |
| | Bank of America Corp. | 3,215,226 | 153,624 |
| | Procter & Gamble Co. | 1,056,864 | 151,121 |
| * | Adobe Inc. | 207,422 | 134,899 |
| * | Walt Disney Co. | 789,734 | 133,520 |
| * | Netflix Inc. | 187,949 | 129,743 |
| | Mastercard Inc. Class A | 380,225 | 127,573 |
| * | salesforce.com Inc. | 401,601 | 120,356 |
| * | PayPal Holdings Inc. | 511,292 | 118,921 |
| | Exxon Mobil Corp. | 1,840,299 | 118,644 |
| | Thermo Fisher Scientific Inc. | 170,881 | 108,180 |
| | Pfizer Inc. | 2,429,388 | 106,261 |
Total World Stock Index Fund
| | | Shares | Market
Value•
($000) |
| | Cisco Systems Inc. | 1,836,859 | 102,809 |
| | Comcast Corp. Class A | 1,982,697 | 101,970 |
| | Accenture plc Class A | 275,841 | 98,969 |
| | Abbott Laboratories | 755,112 | 97,326 |
| | Merck & Co. Inc. | 1,101,866 | 97,019 |
| | PepsiCo Inc. | 598,780 | 96,763 |
| | Chevron Corp. | 839,553 | 96,120 |
| | Verizon Communications Inc. | 1,795,244 | 95,130 |
| | Coca-Cola Co. | 1,682,800 | 94,859 |
| | Costco Wholesale Corp. | 192,003 | 94,377 |
| | Eli Lilly & Co. | 368,892 | 93,979 |
| | Walmart Inc. | 622,729 | 93,048 |
| | Broadcom Inc. | 173,766 | 92,386 |
| | Wells Fargo & Co. | 1,799,928 | 92,084 |
| | NIKE Inc. Class B | 537,843 | 89,976 |
| | AbbVie Inc. | 768,875 | 88,167 |
| | Intel Corp. | 1,757,027 | 86,094 |
| | Danaher Corp. | 275,717 | 85,960 |
| | McDonald's Corp. | 323,863 | 79,525 |
| | AT&T Inc. | 3,103,438 | 78,393 |
| | Texas Instruments Inc. | 402,512 | 75,463 |
| | NextEra Energy Inc. | 852,332 | 72,729 |
| | Lowe's Cos. Inc. | 307,811 | 71,972 |
| | Linde plc | 224,081 | 71,527 |
| | Oracle Corp. | 731,903 | 70,219 |
| | Medtronic plc | 584,108 | 70,011 |
| | Intuit Inc. | 110,832 | 69,380 |
| | Union Pacific Corp. | 282,873 | 68,286 |
| | United Parcel Service Inc. Class B | 314,794 | 67,199 |
| | Honeywell International Inc. | 301,504 | 65,915 |
| | QUALCOMM Inc. | 490,396 | 65,242 |
| | Philip Morris International Inc. | 676,297 | 63,937 |
| * | Advanced Micro Devices Inc. | 526,895 | 63,349 |
| | Citigroup Inc. | 880,000 | 60,861 |
| | Morgan Stanley | 592,083 | 60,854 |
| * | ServiceNow Inc. | 85,718 | 59,811 |
| | Goldman Sachs Group Inc. | 143,917 | 59,488 |
| | BlackRock Inc. | 62,111 | 58,599 |
| | Raytheon Technologies Corp. | 654,857 | 58,191 |
| | Bristol-Myers Squibb Co. | 971,387 | 56,729 |
| | Target Corp. | 216,432 | 56,190 |
| * | Intuitive Surgical Inc. | 154,634 | 55,843 |
| | American Tower Corp. | 195,956 | 55,254 |
| | Applied Materials Inc. | 398,599 | 54,469 |
| | Starbucks Corp. | 511,936 | 54,301 |
| | Charles Schwab Corp. | 654,755 | 53,710 |
| | Amgen Inc. | 247,197 | 51,162 |
| | CVS Health Corp. | 572,304 | 51,095 |
| * | Moderna Inc. | 147,274 | 50,840 |
| | General Electric Co. | 475,989 | 49,917 |
| | | Shares | Market
Value•
($000) |
| | S&P Global Inc. | 104,804 | 49,694 |
| | Caterpillar Inc. | 238,970 | 48,752 |
| | American Express Co. | 280,370 | 48,723 |
| | International Business Machines Corp. | 388,136 | 48,556 |
| * | Boeing Co. | 233,348 | 48,310 |
| * | Berkshire Hathaway Inc. Class A | 111 | 48,052 |
| | Anthem Inc. | 106,787 | 46,466 |
| | Prologis Inc. | 319,105 | 46,257 |
| | 3M Co. | 250,902 | 44,831 |
| | Zoetis Inc. | 206,390 | 44,622 |
| * | Square Inc. Class A | 172,458 | 43,891 |
| | ConocoPhillips | 588,132 | 43,810 |
| * | Booking Holdings Inc. | 17,812 | 43,119 |
| | Deere & Co. | 122,746 | 42,017 |
| | Automatic Data Processing Inc. | 184,924 | 41,514 |
| | Blackstone Inc. | 296,374 | 41,024 |
| | Analog Devices Inc. | 234,911 | 40,755 |
| | Stryker Corp. | 151,537 | 40,319 |
| | PNC Financial Services Group Inc. | 184,021 | 38,834 |
| * | Charter Communications Inc. Class A | 55,671 | 37,572 |
| | Chubb Ltd. | 189,594 | 37,043 |
| | Truist Financial Corp. | 582,332 | 36,961 |
| | Marsh & McLennan Cos. Inc. | 220,348 | 36,754 |
| | Mondelez International Inc. Class A | 604,896 | 36,741 |
| | CSX Corp. | 985,042 | 35,629 |
| | Altria Group Inc. | 805,817 | 35,545 |
| | Gilead Sciences Inc. | 546,893 | 35,482 |
| | Lockheed Martin Corp. | 106,659 | 35,445 |
| | US Bancorp | 583,662 | 35,236 |
| | Lam Research Corp. | 62,047 | 34,968 |
| | TJX Cos. Inc. | 526,390 | 34,473 |
| | CME Group Inc. | 155,773 | 34,356 |
| | Duke Energy Corp. | 332,772 | 33,946 |
| | Micron Technology Inc. | 490,972 | 33,926 |
| | Crown Castle International Corp. | 187,944 | 33,886 |
| | Sherwin-Williams Co. | 105,769 | 33,488 |
| | Intercontinental Exchange Inc. | 240,820 | 33,344 |
| | Equinix Inc. | 39,110 | 32,738 |
| * | General Motors Co. | 598,494 | 32,576 |
| | Estee Lauder Cos. Inc. Class A | 99,700 | 32,336 |
| * | Edwards Lifesciences Corp. | 269,334 | 32,272 |
| | Norfolk Southern Corp. | 107,166 | 31,405 |
| | Aon plc Class A (XNYS) | 97,088 | 31,060 |
| | Cigna Corp. | 145,301 | 31,038 |
| | Illinois Tool Works Inc. | 135,806 | 30,946 |
Total World Stock Index Fund
| | | Shares | Market
Value•
($000) |
| * | Uber Technologies Inc. | 702,786 | 30,796 |
| * | Autodesk Inc. | 95,882 | 30,453 |
| * | Snowflake Inc. Class A | 85,185 | 30,142 |
| | Fidelity National Information Services Inc. | 270,328 | 29,936 |
| | Becton Dickinson and Co. | 124,072 | 29,726 |
| * | T-Mobile US Inc. | 256,754 | 29,534 |
| * | Ford Motor Co. | 1,710,812 | 29,221 |
| | Waste Management Inc. | 182,265 | 29,204 |
| | Capital One Financial Corp. | 192,846 | 29,126 |
| | Air Products and Chemicals Inc. | 95,740 | 28,704 |
| | Southern Co. | 458,347 | 28,564 |
| | Eaton Corp. plc | 173,112 | 28,522 |
| | Moody's Corp. | 69,960 | 28,274 |
| * | Regeneron Pharmaceuticals Inc. | 43,956 | 28,129 |
| | Colgate-Palmolive Co. | 362,182 | 27,595 |
| | HCA Healthcare Inc. | 109,713 | 27,479 |
| * | Atlassian Corp. plc Class A | 59,379 | 27,203 |
| * | Boston Scientific Corp. | 619,032 | 26,699 |
| * | Illumina Inc. | 63,897 | 26,521 |
| | Dominion Energy Inc. | 348,962 | 26,497 |
| | Activision Blizzard Inc. | 337,628 | 26,399 |
| * | DexCom Inc. | 41,992 | 26,170 |
| | Humana Inc. | 56,126 | 25,995 |
| * | Fiserv Inc. | 259,779 | 25,586 |
| * | Zoom Video Communications Inc. Class A | 93,025 | 25,549 |
| | FedEx Corp. | 107,100 | 25,225 |
| | Emerson Electric Co. | 259,543 | 25,178 |
| | KLA Corp. | 67,062 | 24,998 |
| * | IDEXX Laboratories Inc. | 37,151 | 24,748 |
| | Marvell Technology Inc. | 354,000 | 24,249 |
| * | Crowdstrike Holdings Inc. Class A | 85,974 | 24,227 |
| | Freeport-McMoRan Inc. | 639,055 | 24,105 |
| | Ecolab Inc. | 108,262 | 24,058 |
| | Progressive Corp. | 253,438 | 24,046 |
| * | Workday Inc. Class A | 81,968 | 23,769 |
| | EOG Resources Inc. | 254,653 | 23,545 |
| | Northrop Grumman Corp. | 65,189 | 23,287 |
| | MSCI Inc. Class A | 34,943 | 23,233 |
| | NXP Semiconductors NV | 115,549 | 23,209 |
| * | DocuSign Inc. Class A | 83,322 | 23,188 |
| | | Shares | Market
Value•
($000) |
| * | Lululemon Athletica Inc. | 49,671 | 23,147 |
| | Johnson Controls International plc | 311,375 | 22,846 |
| | Dollar General Corp. | 102,558 | 22,719 |
| | Exelon Corp. | 422,531 | 22,474 |
| | Roper Technologies Inc. | 45,399 | 22,149 |
| | American International Group Inc. | 374,271 | 22,116 |
| * | Synopsys Inc. | 66,174 | 22,048 |
| * | Cloudflare Inc. Class A | 112,072 | 21,823 |
| | Public Storage | 65,656 | 21,810 |
| * | Chipotle Mexican Grill Inc. Class A | 12,256 | 21,804 |
| | General Dynamics Corp. | 107,243 | 21,744 |
| | eBay Inc. | 283,046 | 21,715 |
| * | IQVIA Holdings Inc. | 82,805 | 21,647 |
| * | Align Technology Inc. | 34,510 | 21,547 |
| | IHS Markit Ltd. | 163,479 | 21,370 |
| | T Rowe Price Group Inc. | 98,051 | 21,265 |
| * | Palo Alto Networks Inc. | 41,533 | 21,144 |
| * | Twilio Inc. Class A | 72,491 | 21,121 |
| | Simon Property Group Inc. | 142,507 | 20,889 |
| | Agilent Technologies Inc. | 132,337 | 20,842 |
| | TE Connectivity Ltd. | 142,755 | 20,842 |
| * | Cadence Design Systems Inc. | 120,293 | 20,824 |
| * | Vertex Pharmaceuticals Inc. | 112,494 | 20,804 |
| | Bank of New York Mellon Corp. | 344,600 | 20,400 |
| * | Aptiv plc | 117,338 | 20,287 |
| | L3Harris Technologies Inc. | 87,114 | 20,083 |
| | Carrier Global Corp. | 379,637 | 19,828 |
| | Schlumberger NV | 612,466 | 19,758 |
| | MetLife Inc. | 314,157 | 19,729 |
| * | Fortinet Inc. | 58,521 | 19,683 |
| | Amphenol Corp. Class A | 253,248 | 19,442 |
| | Digital Realty Trust Inc. | 122,471 | 19,327 |
| | Xilinx Inc. | 107,136 | 19,284 |
| | KKR & Co. Inc. | 241,022 | 19,202 |
| * | Marriott International Inc. Class A | 118,520 | 18,966 |
| * | Veeva Systems Inc. Class A | 59,824 | 18,965 |
| | Kimberly-Clark Corp. | 146,305 | 18,945 |
| | Trane Technologies plc | 103,917 | 18,802 |
| * | O'Reilly Automotive Inc. | 29,740 | 18,508 |
| | Marathon Petroleum Corp. | 279,640 | 18,437 |
| | American Electric Power Co. Inc. | 217,300 | 18,407 |
Total World Stock Index Fund
| | | Shares | Market
Value•
($000) |
| | Global Payments Inc. | 128,307 | 18,347 |
| * | Palantir Technologies Inc. Class A | 708,697 | 18,341 |
| | Motorola Solutions Inc. | 73,473 | 18,265 |
| * | Twitter Inc. | 340,840 | 18,249 |
| | Dow Inc. | 324,977 | 18,189 |
| | Prudential Financial Inc. | 164,570 | 18,111 |
| * | Match Group Inc. | 119,571 | 18,029 |
| * | Centene Corp. | 252,330 | 17,976 |
| | Cognizant Technology Solutions Corp. Class A | 227,818 | 17,790 |
| * | SVB Financial Group | 24,696 | 17,717 |
| | Pioneer Natural Resources Co. | 94,443 | 17,659 |
| | Travelers Cos. Inc. | 108,836 | 17,510 |
| | Ross Stores Inc. | 153,944 | 17,426 |
| | Microchip Technology Inc. | 234,620 | 17,383 |
| | Electronic Arts Inc. | 123,939 | 17,382 |
| | Paychex Inc. | 140,379 | 17,306 |
| * | Spotify Technology SA | 59,794 | 17,304 |
| | Baxter International Inc. | 218,967 | 17,290 |
| * | Biogen Inc. | 64,562 | 17,217 |
| * | Hilton Worldwide Holdings Inc. | 119,527 | 17,206 |
| | Sempra Energy (XNYS) | 132,708 | 16,938 |
| * | Datadog Inc. Class A | 100,594 | 16,804 |
| | First Republic Bank | 77,519 | 16,770 |
| * | AutoZone Inc. | 9,393 | 16,765 |
| | Parker-Hannifin Corp. | 55,974 | 16,601 |
| | PPG Industries Inc. | 103,193 | 16,570 |
| | ResMed Inc. | 62,623 | 16,464 |
| | General Mills Inc. | 265,822 | 16,428 |
| | Sysco Corp. | 212,853 | 16,368 |
| | Cintas Corp. | 37,745 | 16,347 |
| | SBA Communications Corp. Class A | 47,305 | 16,336 |
| | Yum! Brands Inc. | 129,297 | 16,154 |
| | Rockwell Automation Inc. | 50,516 | 16,135 |
| * | EPAM Systems Inc. | 23,739 | 15,982 |
| | International Flavors & Fragrances Inc. | 107,819 | 15,898 |
| | HP Inc. | 523,967 | 15,892 |
| | DuPont de Nemours Inc. | 227,905 | 15,862 |
| | Allstate Corp. | 127,779 | 15,802 |
| * | HubSpot Inc. | 19,446 | 15,756 |
| | Archer-Daniels-Midland Co. | 244,867 | 15,730 |
| | State Street Corp. | 158,972 | 15,667 |
| * | Roku Inc. | 50,498 | 15,397 |
| | Aflac Inc. | 284,682 | 15,279 |
| * | CBRE Group Inc. Class A | 146,154 | 15,212 |
| | Old Dominion Freight Line Inc. | 44,503 | 15,191 |
| | | Shares | Market
Value•
($000) |
| | Constellation Brands Inc. Class A | 70,057 | 15,189 |
| | Cummins Inc. | 62,889 | 15,083 |
| | Xcel Energy Inc. | 233,359 | 15,073 |
| | Ameriprise Financial Inc. | 49,709 | 15,019 |
| | Arthur J Gallagher & Co. | 89,262 | 14,967 |
| | Otis Worldwide Corp. | 185,986 | 14,937 |
| | Williams Cos. Inc. | 530,662 | 14,906 |
| * | Mettler-Toledo International Inc. | 10,025 | 14,846 |
| | Discover Financial Services | 130,621 | 14,802 |
| | Welltower Inc. | 183,991 | 14,793 |
| | Equifax Inc. | 53,308 | 14,789 |
| * | Keysight Technologies Inc. | 81,688 | 14,705 |
| * | CoStar Group Inc. | 170,312 | 14,655 |
| | Walgreens Boots Alliance Inc. | 311,192 | 14,632 |
| | Verisk Analytics Inc. Class A | 68,817 | 14,470 |
| * | ANSYS Inc. | 38,001 | 14,424 |
| | AvalonBay Communities Inc. | 60,822 | 14,395 |
| | Nucor Corp. | 128,070 | 14,299 |
| | Phillips 66 | 191,168 | 14,296 |
| | Kinder Morgan Inc. | 849,983 | 14,237 |
| * | Copart Inc. | 91,288 | 14,176 |
| | Fastenal Co. | 248,072 | 14,160 |
| * | TransDigm Group Inc. | 22,614 | 14,107 |
| * | MongoDB Inc. Class A | 26,985 | 14,067 |
| | McKesson Corp. | 67,523 | 14,037 |
| * | Trade Desk Inc. Class A | 186,709 | 13,986 |
| | Valero Energy Corp. | 180,106 | 13,928 |
| | Equity Residential | 160,983 | 13,909 |
| * | Etsy Inc. | 55,419 | 13,893 |
| | Corteva Inc. | 321,185 | 13,859 |
| | Public Service Enterprise Group Inc. | 216,983 | 13,844 |
| | West Pharmaceutical Services Inc. | 32,081 | 13,791 |
| | American Water Works Co. Inc. | 79,109 | 13,779 |
| * | Monster Beverage Corp. | 161,590 | 13,735 |
| | Alexandria Real Estate Equities Inc. | 67,179 | 13,714 |
| | Willis Towers Watson plc | 55,724 | 13,501 |
| * | Enphase Energy Inc. | 58,263 | 13,495 |
| | Best Buy Co. Inc. | 110,204 | 13,471 |
| | Newmont Corp. | 249,076 | 13,450 |
| * | Okta Inc. | 54,108 | 13,374 |
| * | Generac Holdings Inc. | 26,820 | 13,371 |
| | PACCAR Inc. | 147,847 | 13,250 |
| | AMETEK Inc. | 100,007 | 13,241 |
| | Kroger Co. | 329,249 | 13,177 |
| | DR Horton Inc. | 147,187 | 13,139 |
Total World Stock Index Fund
| | | Shares | Market
Value•
($000) |
| | Fifth Third Bancorp | 301,013 | 13,103 |
| * | Dell Technologies Class C | 118,105 | 12,990 |
| | Zimmer Biomet Holdings Inc. | 90,407 | 12,939 |
| | Ball Corp. | 139,072 | 12,722 |
| | Albemarle Corp. | 50,762 | 12,714 |
| | Eversource Energy | 149,669 | 12,707 |
| | Stanley Black & Decker Inc. | 70,160 | 12,610 |
| * | Zebra Technologies Corp. Class A | 23,446 | 12,519 |
| | ONEOK Inc. | 195,734 | 12,453 |
| | Occidental Petroleum Corp. | 369,910 | 12,403 |
| | WEC Energy Group Inc. | 137,189 | 12,355 |
| | Kansas City Southern | 39,784 | 12,343 |
| | Republic Services Inc. Class A | 91,653 | 12,337 |
| * | Laboratory Corp. of America Holdings | 42,764 | 12,274 |
| * | DoorDash Inc. Class A | 62,760 | 12,226 |
| * | United Rentals Inc. | 32,112 | 12,174 |
| * | Paycom Software Inc. | 22,211 | 12,168 |
| | Lennar Corp. Class A | 121,090 | 12,101 |
| | Realty Income Corp. | 168,770 | 12,055 |
| | Skyworks Solutions Inc. | 71,793 | 11,999 |
| | Devon Energy Corp. | 295,148 | 11,830 |
| * | Splunk Inc. | 71,697 | 11,817 |
| * | Gartner Inc. | 35,493 | 11,780 |
| | Corning Inc. | 328,493 | 11,685 |
| | Weyerhaeuser Co. | 327,050 | 11,682 |
| | Synchrony Financial | 248,463 | 11,541 |
| * | Horizon Therapeutics plc | 96,065 | 11,519 |
| | Consolidated Edison Inc. | 152,414 | 11,492 |
| | Hershey Co. | 65,006 | 11,399 |
| | Extra Space Storage Inc. | 57,640 | 11,376 |
| | Northern Trust Corp. | 91,179 | 11,219 |
| | CDW Corp. | 59,867 | 11,174 |
| | Vulcan Materials Co. | 58,418 | 11,106 |
| | Hartford Financial Services Group Inc. | 151,446 | 11,045 |
| * | Dollar Tree Inc. | 102,224 | 11,016 |
| | Tractor Supply Co. | 50,332 | 10,931 |
| | Keurig Dr Pepper Inc. | 301,571 | 10,884 |
| * | Arista Networks Inc. | 26,463 | 10,842 |
| | Martin Marietta Materials Inc. | 27,592 | 10,839 |
| * | Zscaler Inc. | 33,933 | 10,820 |
| * | Cheniere Energy Inc. | 104,068 | 10,761 |
| | Fortive Corp. | 141,701 | 10,728 |
| * | Pinterest Inc. Class A | 239,834 | 10,706 |
| | LyondellBasell Industries NV Class A | 115,334 | 10,705 |
| | | Shares | Market
Value•
($000) |
| * | Liberty Broadband Corp. Class C | 65,883 | 10,703 |
| | Dover Corp. | 62,929 | 10,640 |
| | Nasdaq Inc. | 50,679 | 10,636 |
| * | Peloton Interactive Inc. Class A | 116,237 | 10,629 |
| | Yum China Holdings Inc. | 185,308 | 10,577 |
| | Invitation Homes Inc. | 253,806 | 10,470 |
| | VF Corp. | 142,781 | 10,406 |
| | Mid-America Apartment Communities Inc. | 50,809 | 10,376 |
| | Edison International | 164,628 | 10,360 |
| | Xylem Inc. | 79,272 | 10,352 |
| | Teradyne Inc. | 74,780 | 10,338 |
| * | Expedia Group Inc. | 62,795 | 10,324 |
| | Monolithic Power Systems Inc. | 19,630 | 10,315 |
| * | Seagen Inc. | 58,496 | 10,315 |
| | Kraft Heinz Co. | 287,170 | 10,307 |
| * | Avantor Inc. | 254,459 | 10,275 |
| * | Carvana Co. Class A | 33,689 | 10,214 |
| * | Bill.Com Holdings Inc. | 34,405 | 10,126 |
| | Hess Corp. | 122,523 | 10,117 |
| | Sun Communities Inc. | 51,505 | 10,094 |
| | Huntington Bancshares Inc. | 641,178 | 10,092 |
| | Tyson Foods Inc. Class A | 125,282 | 10,019 |
| | Regions Financial Corp. | 422,118 | 9,996 |
| * | Teladoc Health Inc. | 66,265 | 9,913 |
| * | ICON plc | 34,516 | 9,898 |
| * | Waters Corp. | 26,787 | 9,846 |
| * | Charles River Laboratories International Inc. | 21,919 | 9,835 |
| | Halliburton Co. | 393,505 | 9,834 |
| * | Catalent Inc. | 71,150 | 9,809 |
| * | Caesars Entertainment Inc. | 89,609 | 9,809 |
| * | CarMax Inc. | 71,577 | 9,800 |
| | PPL Corp. | 339,372 | 9,774 |
| * | Unity Software Inc. | 64,513 | 9,761 |
| | KeyCorp. | 418,332 | 9,735 |
| | Essex Property Trust Inc. | 28,503 | 9,689 |
| | Cerner Corp. | 129,956 | 9,654 |
| | TransUnion | 83,705 | 9,650 |
| * | VeriSign Inc. | 43,333 | 9,649 |
| * | Trimble Inc. | 109,535 | 9,570 |
| * | Tyler Technologies Inc. | 17,608 | 9,565 |
| | Ameren Corp. | 113,182 | 9,540 |
| * | Ingersoll Rand Inc. | 176,857 | 9,508 |
| | Garmin Ltd. | 65,677 | 9,431 |
| | Church & Dwight Co. Inc. | 107,823 | 9,419 |
| | DTE Energy Co. | 83,092 | 9,418 |
| | WW Grainger Inc. | 20,287 | 9,395 |
| | Duke Realty Corp. | 164,871 | 9,272 |
| | ViacomCBS Inc. Class B | 255,172 | 9,242 |
Total World Stock Index Fund
| | | Shares | Market
Value•
($000) |
| | FirstEnergy Corp. | 239,219 | 9,217 |
| | Ventas Inc. | 171,951 | 9,177 |
| | Expeditors International of Washington Inc. | 73,870 | 9,105 |
| | Broadridge Financial Solutions Inc. | 50,902 | 9,081 |
| * | Teledyne Technologies Inc. | 20,153 | 9,053 |
| * | Take-Two Interactive Software Inc. | 50,009 | 9,052 |
| | Entergy Corp. | 87,763 | 9,041 |
| * | Insulet Corp. | 29,152 | 9,038 |
| | Bio-Techne Corp. | 17,069 | 8,938 |
| * | FleetCor Technologies Inc. | 35,981 | 8,902 |
| * | ON Semiconductor Corp. | 185,144 | 8,900 |
| | PerkinElmer Inc. | 50,141 | 8,869 |
| | Citizens Financial Group Inc. | 186,953 | 8,858 |
| | Cooper Cos. Inc. | 21,214 | 8,845 |
| | McCormick & Co. Inc. | 110,218 | 8,843 |
| | Pool Corp. | 17,124 | 8,822 |
| | STERIS plc | 37,709 | 8,814 |
| | Clorox Co. | 53,813 | 8,772 |
| | NetApp Inc. | 97,406 | 8,698 |
| * | RingCentral Inc. Class A | 35,559 | 8,669 |
| * | Ulta Beauty Inc. | 23,380 | 8,589 |
| | International Paper Co. | 171,449 | 8,516 |
| | Diamondback Energy Inc. | 79,385 | 8,509 |
| * | Plug Power Inc. | 221,393 | 8,473 |
| | Healthpeak Properties Inc. | 236,927 | 8,413 |
| * | Carnival Corp. | 377,514 | 8,366 |
| | Entegris Inc. | 59,086 | 8,318 |
| | Hewlett Packard Enterprise Co. | 567,441 | 8,313 |
| | MGM Resorts International | 176,274 | 8,313 |
| * | Alnylam Pharmaceuticals Inc. | 51,895 | 8,280 |
| | M&T Bank Corp. | 56,257 | 8,277 |
| * | Royal Caribbean Cruises Ltd. | 98,035 | 8,277 |
| * | Burlington Stores Inc. | 29,761 | 8,223 |
| | Darden Restaurants Inc. | 56,932 | 8,206 |
| *,2 | Wayfair Inc. Class A | 32,911 | 8,198 |
| * | Qorvo Inc. | 48,530 | 8,164 |
| | Baker Hughes Co. Class A | 323,460 | 8,112 |
| | Genuine Parts Co. | 61,680 | 8,087 |
| * | SolarEdge Technologies Inc. | 22,737 | 8,064 |
| | AmerisourceBergen Corp. Class A | 66,066 | 8,061 |
| * | Hologic Inc. | 109,493 | 8,027 |
| | Raymond James Financial Inc. | 81,417 | 8,027 |
| | Jacobs Engineering Group Inc. | 56,738 | 7,967 |
| | | Shares | Market
Value•
($000) |
| | Cincinnati Financial Corp. | 65,550 | 7,960 |
| | Avery Dennison Corp. | 36,414 | 7,928 |
| *,2 | AMC Entertainment Holdings Inc. Class A | 223,070 | 7,890 |
| | Celanese Corp. Class A | 48,802 | 7,882 |
| | VICI Properties Inc. | 267,085 | 7,839 |
| | Quest Diagnostics Inc. | 53,382 | 7,835 |
| | Principal Financial Group Inc. | 116,770 | 7,834 |
| | Domino's Pizza Inc. | 16,019 | 7,833 |
| | Boston Properties Inc. | 68,914 | 7,831 |
| * | Zillow Group Inc. Class C | 75,145 | 7,787 |
| | Signature Bank | 26,112 | 7,777 |
| * | Markel Corp. | 5,907 | 7,757 |
| * | PG&E Corp. | 664,527 | 7,709 |
| | SS&C Technologies Holdings Inc. | 96,748 | 7,689 |
| | CMS Energy Corp. | 126,198 | 7,616 |
| | Seagate Technology Holdings plc | 85,417 | 7,608 |
| | IDEX Corp. | 34,066 | 7,582 |
| | Ally Financial Inc. | 158,503 | 7,567 |
| * | Akamai Technologies Inc. | 71,314 | 7,521 |
| * | Molina Healthcare Inc. | 25,352 | 7,497 |
| * | Bio-Rad Laboratories Inc. Class A | 9,427 | 7,491 |
| | Textron Inc. | 100,125 | 7,394 |
| | Bath & Body Works Inc. | 106,889 | 7,385 |
| | FactSet Research Systems Inc. | 16,621 | 7,378 |
| | Quanta Services Inc. | 60,662 | 7,357 |
| | AES Corp. | 292,630 | 7,354 |
| | Coterra Energy Inc. | 343,875 | 7,331 |
| | Teleflex Inc. | 20,515 | 7,323 |
| * | Coupa Software Inc. | 32,133 | 7,317 |
| | UDR Inc. | 131,552 | 7,305 |
| | JB Hunt Transport Services Inc. | 36,995 | 7,295 |
| | Westinghouse Air Brake Technologies Corp. | 79,419 | 7,206 |
| * | Ceridian HCM Holding Inc. | 57,255 | 7,171 |
| * | Exact Sciences Corp. | 75,079 | 7,149 |
| | Masco Corp. | 108,077 | 7,084 |
| | Viatris Inc. | 529,271 | 7,066 |
| | Camden Property Trust | 43,253 | 7,055 |
| * | Western Digital Corp. | 134,462 | 7,031 |
| * | Repligen Corp. | 23,990 | 6,969 |
| * | Arch Capital Group Ltd. | 166,482 | 6,962 |
| * | NVR Inc. | 1,407 | 6,887 |
Total World Stock Index Fund
| | | Shares | Market
Value•
($000) |
| | CenterPoint Energy Inc. | 261,857 | 6,819 |
| | MarketAxess Holdings Inc. | 16,670 | 6,813 |
| | Kellogg Co. | 110,409 | 6,768 |
| * | Avalara Inc. | 37,409 | 6,720 |
| | Conagra Brands Inc. | 207,266 | 6,674 |
| * | Dynatrace Inc. | 88,086 | 6,606 |
| * | Nuance Communications Inc. | 119,979 | 6,605 |
| * | LKQ Corp. | 119,516 | 6,583 |
| | Cognex Corp. | 75,025 | 6,571 |
| | Equity LifeStyle Properties Inc. | 77,606 | 6,558 |
| | Advance Auto Parts Inc. | 28,955 | 6,530 |
| | Brown & Brown Inc. | 103,284 | 6,518 |
| * | ABIOMED Inc. | 19,456 | 6,460 |
| | Nordson Corp. | 25,308 | 6,434 |
| | Evergy Inc. | 100,874 | 6,431 |
| * | Elanco Animal Health Inc. (XNYS) | 194,986 | 6,411 |
| | Omnicom Group Inc. | 93,703 | 6,379 |
| * | BioMarin Pharmaceutical Inc. | 80,223 | 6,356 |
| * | Upstart Holdings Inc. | 19,652 | 6,329 |
| | Mosaic Co. | 152,022 | 6,320 |
| | Interpublic Group of Cos. Inc. | 172,774 | 6,318 |
| | Leidos Holdings Inc. | 62,450 | 6,244 |
| | Williams-Sonoma Inc. | 33,600 | 6,241 |
| | Cboe Global Markets Inc. | 47,286 | 6,239 |
| | Alliant Energy Corp. | 110,228 | 6,236 |
| * | Masimo Corp. | 21,989 | 6,235 |
| * | Wolfspeed Inc. | 51,858 | 6,229 |
| | Eastman Chemical Co. | 59,837 | 6,225 |
| | Fortune Brands Home & Security Inc. | 60,982 | 6,184 |
| * | DraftKings Inc. Class A | 132,640 | 6,180 |
| | NortonLifeLock Inc. | 242,676 | 6,176 |
| * | Floor & Decor Holdings Inc. Class A | 44,756 | 6,083 |
| | Cardinal Health Inc. | 126,931 | 6,069 |
| | Vail Resorts Inc. | 17,592 | 6,064 |
| | WP Carey Inc. | 78,486 | 6,052 |
| * | Darling Ingredients Inc. | 70,947 | 5,996 |
| | Apollo Global Management Inc. Class A | 77,885 | 5,993 |
| * | Live Nation Entertainment Inc. | 58,918 | 5,960 |
| * | PTC Inc. | 46,667 | 5,943 |
| | Lincoln National Corp. | 82,309 | 5,939 |
| * | 10X Genomics Inc. Class A | 36,438 | 5,876 |
| | | Shares | Market
Value•
($000) |
| | Lumen Technologies Inc. | 492,283 | 5,838 |
| * | Lyft Inc. Class A | 126,530 | 5,804 |
| * | First Solar Inc. | 48,429 | 5,792 |
| | LPL Financial Holdings Inc. | 35,244 | 5,781 |
| | Iron Mountain Inc. | 126,485 | 5,773 |
| | Crown Holdings Inc. | 55,506 | 5,772 |
| | Fidelity National Financial Inc. | 119,694 | 5,735 |
| | Graco Inc. | 76,117 | 5,722 |
| | J M Smucker Co. | 46,219 | 5,678 |
| | Marathon Oil Corp. | 347,771 | 5,676 |
| | Whirlpool Corp. | 26,892 | 5,670 |
| | CH Robinson Worldwide Inc. | 58,413 | 5,665 |
| * | Globant SA | 17,722 | 5,657 |
| | DENTSPLY SIRONA Inc. | 98,806 | 5,653 |
| | Royalty Pharma plc Class A | 142,827 | 5,646 |
| * | Jones Lang LaSalle Inc. | 21,837 | 5,639 |
| | Bunge Ltd. | 60,827 | 5,635 |
| * | Las Vegas Sands Corp. | 145,180 | 5,634 |
| | Steel Dynamics Inc. | 85,157 | 5,627 |
| | Westrock Co. | 116,952 | 5,625 |
| * | F5 Networks Inc. | 26,615 | 5,620 |
| | Kimco Realty Corp. | 248,675 | 5,620 |
| | Medical Properties Trust Inc. | 263,104 | 5,612 |
| * | Check Point Software Technologies Ltd. | 46,332 | 5,541 |
| | Brown-Forman Corp. Class B | 81,569 | 5,538 |
| | Packaging Corp. of America | 40,277 | 5,533 |
| | Equitable Holdings Inc. | 163,740 | 5,485 |
| | PulteGroup Inc. | 113,336 | 5,449 |
| | Targa Resources Corp. | 99,677 | 5,449 |
| * | Incyte Corp. | 81,196 | 5,439 |
| * | Farfetch Ltd. Class A | 138,011 | 5,411 |
| | CF Industries Holdings Inc. | 95,240 | 5,410 |
| * | Trex Co. Inc. | 50,846 | 5,410 |
| | Hasbro Inc. | 56,486 | 5,409 |
| | Jack Henry & Associates Inc. | 32,442 | 5,401 |
| | Pentair plc | 72,713 | 5,379 |
| * | Zendesk Inc. | 52,481 | 5,343 |
| | Robert Half International Inc. | 47,174 | 5,334 |
| | FMC Corp. | 58,428 | 5,318 |
| | Newmont Corp. (XNYS) | 98,329 | 5,309 |
| | Atmos Energy Corp. | 57,470 | 5,294 |
| | Hormel Foods Corp. | 125,044 | 5,292 |
| * | Host Hotels & Resorts Inc. | 313,871 | 5,282 |
| * | Builders FirstSource Inc. | 90,359 | 5,265 |
| | Annaly Capital Management Inc. | 618,184 | 5,230 |
| * | Elastic NV | 30,058 | 5,215 |
Total World Stock Index Fund
| | | Shares | Market
Value•
($000) |
| | Loews Corp. | 92,877 | 5,208 |
| *,2 | VMware Inc. Class A | 34,083 | 5,170 |
| | Citrix Systems Inc. | 54,542 | 5,167 |
| * | GoDaddy Inc. Class A | 74,305 | 5,140 |
| * | GameStop Corp. Class A | 27,998 | 5,138 |
| | Howmet Aerospace Inc. | 173,042 | 5,138 |
| | Allegion plc | 39,993 | 5,131 |
| * | Penn National Gaming Inc. | 71,566 | 5,124 |
| | Booz Allen Hamilton Holding Corp. Class A | 58,905 | 5,116 |
| * | Manhattan Associates Inc. | 28,112 | 5,103 |
| | Regency Centers Corp. | 72,462 | 5,102 |
| | Comerica Inc. | 59,905 | 5,097 |
| | Fox Corp. Class A | 127,964 | 5,085 |
| | VEREIT Inc. | 100,261 | 5,043 |
| * | Axon Enterprise Inc. | 27,876 | 5,017 |
| | East West Bancorp Inc. | 62,722 | 4,985 |
| * | RH | 7,538 | 4,972 |
| | Snap-on Inc. | 24,467 | 4,972 |
| * | Paylocity Holding Corp. | 16,256 | 4,960 |
| * | Sunrun Inc. | 85,994 | 4,960 |
| * | IAC/InterActiveCorp. | 32,553 | 4,960 |
| | American Homes 4 Rent Class A | 121,522 | 4,934 |
| | BorgWarner Inc. (XNYS) | 109,329 | 4,927 |
| | Carlisle Cos. Inc. | 22,078 | 4,922 |
| | RPM International Inc. | 56,378 | 4,916 |
| * | Fair Isaac Corp. | 12,333 | 4,911 |
| | Western Alliance Bancorp | 42,149 | 4,893 |
| * | Cleveland-Cliffs Inc. | 202,038 | 4,871 |
| | Ares Management Corp. Class A | 57,277 | 4,854 |
| | Hubbell Inc. Class B | 24,282 | 4,841 |
| | Tapestry Inc. | 124,110 | 4,838 |
| * | Novavax Inc. | 32,438 | 4,828 |
| * | Five Below Inc. | 24,313 | 4,797 |
| * | Five9 Inc. | 30,261 | 4,782 |
| * | Guidewire Software Inc. | 37,970 | 4,774 |
| * | Guardant Health Inc. | 40,834 | 4,769 |
| * | Henry Schein Inc. | 62,240 | 4,752 |
| * | Deckers Outdoor Corp. | 12,009 | 4,747 |
| | CubeSmart | 86,114 | 4,737 |
| * | Black Knight Inc. | 67,370 | 4,723 |
| | Service Corp. International | 68,809 | 4,713 |
| | W R Berkley Corp. | 59,175 | 4,710 |
| * | Liberty Global plc Class C | 162,464 | 4,685 |
| * | Novocure Ltd. | 45,629 | 4,680 |
| | Coca-Cola Europacific Partners plc | 88,873 | 4,679 |
| | | Shares | Market
Value•
($000) |
| * | SiteOne Landscape Supply Inc. | 19,784 | 4,648 |
| * | Liberty Media Corp.-Liberty Formula One Class C | 82,822 | 4,621 |
| | Gaming and Leisure Properties Inc. | 94,607 | 4,587 |
| * | Opendoor Technologies Inc. | 192,932 | 4,574 |
| | Everest Re Group Ltd. | 17,444 | 4,562 |
| | Lear Corp. | 26,519 | 4,557 |
| * | DISH Network Corp. Class A | 110,149 | 4,524 |
| | Essential Utilities Inc. | 96,003 | 4,519 |
| * | Aspen Technology Inc. | 28,782 | 4,510 |
| | Zions Bancorp NA | 71,447 | 4,500 |
| | Toro Co. | 47,003 | 4,487 |
| * | Bright Horizons Family Solutions Inc. | 26,983 | 4,479 |
| | Regal Rexnord Corp. | 29,389 | 4,477 |
| | Life Storage Inc. | 33,409 | 4,470 |
| * | Crocs Inc. | 27,566 | 4,451 |
| * | Mohawk Industries Inc. | 25,053 | 4,440 |
| * | Wix.com Ltd. | 23,838 | 4,433 |
| | Hill-Rom Holdings Inc. | 28,613 | 4,432 |
| * | Silicon Laboratories Inc. | 23,296 | 4,397 |
| * | Neurocrine Biosciences Inc. | 41,699 | 4,395 |
| * | Clarivate plc | 186,573 | 4,375 |
| | Amdocs Ltd. | 56,074 | 4,365 |
| | NiSource Inc. | 176,811 | 4,362 |
| | CyrusOne Inc. | 53,014 | 4,348 |
| * | Asana Inc. Class A | 31,970 | 4,342 |
| | Lennox International Inc. | 14,504 | 4,341 |
| * | Natera Inc. | 37,625 | 4,311 |
| * | Norwegian Cruise Line Holdings Ltd. | 167,542 | 4,309 |
| | NRG Energy Inc. | 107,878 | 4,303 |
| | Owens Corning | 45,919 | 4,289 |
| | Juniper Networks Inc. | 145,145 | 4,285 |
| | A O Smith Corp. | 58,633 | 4,284 |
| * | Athene Holding Ltd. Class A | 49,159 | 4,277 |
| | APA Corp. | 162,227 | 4,252 |
| * | Middleby Corp. | 23,295 | 4,250 |
| * | Wynn Resorts Ltd. | 46,685 | 4,192 |
| * | AECOM | 61,256 | 4,188 |
| | First Horizon Corp. | 245,833 | 4,172 |
| | Lamar Advertising Co. Class A | 36,785 | 4,164 |
| | Knight-Swift Transportation Holdings Inc. | 73,348 | 4,158 |
| | Watsco Inc. | 14,357 | 4,158 |
| | Lithia Motors Inc. Class A | 12,950 | 4,134 |
| | Jefferies Financial Group Inc. | 95,908 | 4,124 |
Total World Stock Index Fund
| | | Shares | Market
Value•
($000) |
| | Reliance Steel & Aluminum Co. | 28,111 | 4,109 |
| | News Corp. Class A | 179,233 | 4,104 |
| | Tradeweb Markets Inc. Class A | 45,931 | 4,092 |
| | Cable One Inc. | 2,389 | 4,088 |
| | Universal Health Services Inc. Class B | 32,718 | 4,060 |
| * | Syneos Health Inc. | 43,464 | 4,057 |
| | Vistra Corp. | 206,669 | 4,049 |
| * | Acceleron Pharma Inc. | 23,224 | 4,045 |
| | Assurant Inc. | 25,013 | 4,035 |
| | Tetra Tech Inc. | 22,964 | 4,034 |
| | Genpact Ltd. | 81,578 | 4,026 |
| * | Intellia Therapeutics Inc. | 30,088 | 4,001 |
| | Organon & Co. | 108,814 | 3,999 |
| * | Lattice Semiconductor Corp. | 57,444 | 3,989 |
| | Federal Realty Investment Trust | 33,127 | 3,987 |
| | Rexford Industrial Realty Inc. | 59,098 | 3,971 |
| | Credicorp Ltd. | 30,580 | 3,965 |
| * | Penumbra Inc. | 14,248 | 3,940 |
| * | Dropbox Inc. Class A | 128,696 | 3,924 |
| | Carlyle Group Inc. | 69,651 | 3,911 |
| | MKS Instruments Inc. | 26,043 | 3,908 |
| | Globe Life Inc. | 43,866 | 3,905 |
| | Alcoa Corp. | 84,739 | 3,894 |
| * | XPO Logistics Inc. | 45,390 | 3,894 |
| | Jabil Inc. | 64,670 | 3,878 |
| * | GXO Logistics Inc. | 43,608 | 3,872 |
| * | Anaplan Inc. | 59,303 | 3,867 |
| | Sealed Air Corp. | 65,138 | 3,864 |
| | UGI Corp. | 88,925 | 3,860 |
| | Newell Brands Inc. | 168,331 | 3,853 |
| * | Sensata Technologies Holding plc | 69,893 | 3,851 |
| | STORE Capital Corp. | 111,928 | 3,842 |
| | New York Times Co. Class A | 70,038 | 3,823 |
| | Franklin Resources Inc. | 121,370 | 3,822 |
| | American Financial Group Inc. | 28,028 | 3,813 |
| | Autoliv Inc. | 39,161 | 3,793 |
| | Churchill Downs Inc. | 16,476 | 3,789 |
| * | Alleghany Corp. | 5,799 | 3,777 |
| | Invesco Ltd. | 148,562 | 3,775 |
| * | Discovery Inc. Class C | 167,188 | 3,772 |
| | Aramark | 103,255 | 3,767 |
| * | Chegg Inc. | 63,286 | 3,762 |
| | Tempur Sealy International Inc. | 84,526 | 3,759 |
| * | Avis Budget Group Inc. | 21,675 | 3,757 |
| | Gentex Corp. | 106,086 | 3,754 |
| * | Ciena Corp. | 69,024 | 3,747 |
| * | United Therapeutics Corp. | 19,500 | 3,720 |
| | | Shares | Market
Value•
($000) |
| * | Arrow Electronics Inc. | 32,110 | 3,717 |
| * | Berry Global Group Inc. | 56,292 | 3,689 |
| | Huntington Ingalls Industries Inc. | 18,196 | 3,689 |
| | HEICO Corp. | 26,436 | 3,685 |
| | Lamb Weston Holdings Inc. | 64,616 | 3,648 |
| * | Flex Ltd. | 215,831 | 3,648 |
| | Brooks Automation Inc. | 31,262 | 3,640 |
| | ITT Inc. | 38,690 | 3,640 |
| | Universal Display Corp. | 19,809 | 3,629 |
| | EastGroup Properties Inc. | 18,254 | 3,610 |
| | AGNC Investment Corp. | 225,804 | 3,595 |
| * | YETI Holdings Inc. | 36,350 | 3,574 |
| * | Saia Inc. | 11,390 | 3,561 |
| | Olin Corp. | 62,433 | 3,557 |
| * | Tandem Diabetes Care Inc. | 26,065 | 3,553 |
| | Apartment Income REIT Corp. | 66,258 | 3,552 |
| | Wyndham Hotels & Resorts Inc. | 41,939 | 3,543 |
| * | Smartsheet Inc. Class A | 51,134 | 3,529 |
| | Bruker Corp. | 43,865 | 3,522 |
| * | TopBuild Corp. | 13,652 | 3,508 |
| | Lincoln Electric Holdings Inc. | 24,604 | 3,504 |
| * | Omnicell Inc. | 19,621 | 3,495 |
| * | Jazz Pharmaceuticals plc | 26,267 | 3,495 |
| | First Industrial Realty Trust Inc. | 59,920 | 3,489 |
| | Macy's Inc. | 131,372 | 3,477 |
| | Reinsurance Group of America Inc. | 29,346 | 3,465 |
| * | DXC Technology Co. | 106,303 | 3,462 |
| | HEICO Corp. Class A | 27,543 | 3,462 |
| * | Capri Holdings Ltd. | 64,776 | 3,449 |
| | American Campus Communities Inc. | 64,108 | 3,444 |
| | AptarGroup Inc. | 28,459 | 3,437 |
| | Janus Henderson Group plc | 73,324 | 3,410 |
| | National Retail Properties Inc. | 74,908 | 3,398 |
| | Rollins Inc. | 96,383 | 3,396 |
| * | IAA Inc. | 56,892 | 3,394 |
| | Molson Coors Beverage Co. Class B | 76,806 | 3,386 |
| | Voya Financial Inc. | 48,537 | 3,386 |
| * | Zynga Inc. Class A | 457,875 | 3,379 |
| * | BJ's Wholesale Club Holdings Inc. | 57,568 | 3,364 |
| | Kilroy Realty Corp. | 49,842 | 3,358 |
| | Commerce Bancshares Inc. | 47,569 | 3,354 |
| | Campbell Soup Co. | 83,941 | 3,353 |
| * | Digital Turbine Inc. | 38,912 | 3,349 |
Total World Stock Index Fund
| | | Shares | Market
Value•
($000) |
| * | Scientific Games Corp. Class A | 41,794 | 3,346 |
| * | Inspire Medical Systems Inc. | 12,384 | 3,338 |
| | Dick's Sporting Goods Inc. | 26,774 | 3,326 |
| * | AerCap Holdings NV | 56,342 | 3,326 |
| | Americold Realty Trust | 112,203 | 3,307 |
| * | PVH Corp. | 30,217 | 3,304 |
| | Western Union Co. | 181,329 | 3,304 |
| * | Biohaven Pharmaceutical Holding Co. Ltd. | 23,166 | 3,297 |
| | First American Financial Corp. | 44,986 | 3,290 |
| * | Mirati Therapeutics Inc. | 17,384 | 3,286 |
| * | Mattel Inc. | 150,364 | 3,279 |
| | Morningstar Inc. | 10,350 | 3,278 |
| | Nielsen Holdings plc | 161,900 | 3,278 |
| | Oshkosh Corp. | 30,610 | 3,275 |
| | Brunswick Corp. | 35,173 | 3,274 |
| | AGCO Corp. | 26,789 | 3,274 |
| | Donaldson Co. Inc. | 54,050 | 3,244 |
| | Pinnacle West Capital Corp. | 50,101 | 3,231 |
| * | US Foods Holding Corp | 93,202 | 3,231 |
| * | Kornit Digital Ltd. | 19,316 | 3,231 |
| | Chemed Corp. | 6,675 | 3,219 |
| | Texas Pacific Land Corp. | 2,526 | 3,217 |
| | Vornado Realty Trust | 75,352 | 3,212 |
| | Kohl's Corp. | 65,941 | 3,200 |
| | Littelfuse Inc. | 10,834 | 3,191 |
| | Stifel Financial Corp. | 43,727 | 3,186 |
| | Cullen/Frost Bankers Inc. | 24,469 | 3,169 |
| * | Tenet Healthcare Corp. | 44,146 | 3,164 |
| * | PPD Inc. | 66,839 | 3,153 |
| | Concentrix Corp. | 17,655 | 3,137 |
| | People's United Financial Inc. | 182,572 | 3,129 |
| * | DaVita Inc. | 30,230 | 3,121 |
| * | Southwest Airlines Co. | 66,004 | 3,121 |
| * | Liberty Media Corp.- Liberty SiriusXM Class C | 63,083 | 3,111 |
| | Old Republic International Corp. | 120,350 | 3,109 |
| | Fox Corp. Class B | 84,019 | 3,105 |
| | Vertiv Holdings Co. Class A | 120,723 | 3,100 |
| * | Rapid7 Inc. | 24,063 | 3,098 |
| | Huntsman Corp. | 94,985 | 3,095 |
| * | Synaptics Inc. | 15,839 | 3,082 |
| | Synovus Financial Corp. | 66,106 | 3,080 |
| | Pinnacle Financial Partners Inc. | 31,863 | 3,077 |
| * | Varonis Systems Inc. Class B | 47,533 | 3,077 |
| * | PagSeguro Digital Ltd. Class A | 84,995 | 3,077 |
| | Acuity Brands Inc. | 14,955 | 3,072 |
| | | Shares | Market
Value•
($000) |
| * | Pure Storage Inc. Class A | 114,389 | 3,072 |
| * | CyberArk Software Ltd. | 17,051 | 3,071 |
| * | WEX Inc. | 20,503 | 3,069 |
| | Popular Inc. | 37,663 | 3,067 |
| | US Steel Corp. | 115,915 | 3,059 |
| * | Performance Food Group Co. | 67,487 | 3,052 |
| | SEI Investments Co. | 48,117 | 3,033 |
| | Casey's General Stores Inc. | 15,823 | 3,031 |
| | STAG Industrial Inc. | 69,555 | 3,028 |
| | Omega Healthcare Investors Inc. | 102,625 | 3,013 |
| * | Shockwave Medical Inc. | 14,097 | 3,013 |
| * | WillScot Mobile Mini Holdings Corp. | 86,682 | 3,012 |
| | EMCOR Group Inc. | 24,778 | 3,010 |
| * | Blackline Inc. | 23,643 | 3,000 |
| | Woodward Inc. | 26,538 | 2,997 |
| | Starwood Property Trust Inc. | 117,616 | 2,996 |
| | First Financial Bankshares Inc. | 58,809 | 2,983 |
| | Healthcare Trust of America Inc. Class A | 89,338 | 2,983 |
| | Brixmor Property Group Inc. | 127,073 | 2,979 |
| | RenaissanceRe Holdings Ltd. | 20,969 | 2,973 |
| | Polaris Inc. | 25,825 | 2,969 |
| * | Exelixis Inc. | 137,358 | 2,955 |
| * | Axalta Coating Systems Ltd. | 94,055 | 2,934 |
| | Advanced Drainage Systems Inc. | 25,975 | 2,930 |
| | Affiliated Managers Group Inc. | 17,431 | 2,926 |
| * | Blueprint Medicines Corp. | 26,011 | 2,926 |
| | OGE Energy Corp. | 85,626 | 2,917 |
| | Prosperity Bancshares Inc. | 38,533 | 2,902 |
| | Landstar System Inc. | 16,435 | 2,889 |
| * | Delta Air Lines Inc. | 73,676 | 2,883 |
| * | Sarepta Therapeutics Inc. | 36,253 | 2,869 |
| * | Planet Fitness Inc. Class A | 35,782 | 2,846 |
| * | Nutanix Inc. Class A | 82,901 | 2,844 |
| * | Fox Factory Holding Corp. | 17,661 | 2,843 |
| * | Envista Holdings Corp. | 72,436 | 2,832 |
| | Primerica Inc. | 16,792 | 2,825 |
| * | CACI International Inc. Class A | 9,779 | 2,813 |
| * | Stericycle Inc. | 41,952 | 2,807 |
| | Marriott Vacations Worldwide Corp. | 17,848 | 2,806 |
| * | Medpace Holdings Inc. | 12,371 | ��� 2,803 |
| | Toll Brothers Inc. | 46,570 | 2,802 |
| | Leggett & Platt Inc. | 59,693 | 2,797 |
Total World Stock Index Fund
| | | Shares | Market
Value•
($000) |
| | AMERCO | 3,790 | 2,793 |
| * | Chart Industries Inc. | 15,733 | 2,793 |
| * | RBC Bearings Inc. | 11,923 | 2,789 |
| | Royal Gold Inc. | 28,168 | 2,789 |
| * | Freshpet Inc. | 17,823 | 2,779 |
| | Perrigo Co. plc | 61,532 | 2,778 |
| * | Arrowhead Pharmaceuticals Inc. | 43,505 | 2,776 |
| * | Workiva Inc. Class A | 18,510 | 2,768 |
| | Texas Roadhouse Inc. Class A | 31,126 | 2,764 |
| | Eagle Materials Inc. | 18,499 | 2,745 |
| | Ingredion Inc. | 28,787 | 2,741 |
| * | Colfax Corp. | 52,870 | 2,729 |
| * | Everbridge Inc. | 16,999 | 2,708 |
| * | II-VI Inc. | 44,675 | 2,703 |
| | Chesapeake Energy Corp. | 42,189 | 2,689 |
| * | Teradata Corp. | 47,375 | 2,680 |
| | CoreSite Realty Corp. | 18,781 | 2,676 |
| * | Coherent Inc. | 10,507 | 2,673 |
| * | ASGN Inc. | 22,315 | 2,670 |
| * | Ambarella Inc. | 14,342 | 2,665 |
| * | Lumentum Holdings Inc. | 32,160 | 2,656 |
| | Valvoline Inc. | 77,903 | 2,646 |
| | Ovintiv Inc. | 70,469 | 2,644 |
| * | Skechers USA Inc. Class A | 57,172 | 2,642 |
| | MDU Resources Group Inc. | 85,371 | 2,623 |
| * | CRISPR Therapeutics AG | 28,725 | 2,623 |
| * | EQT Corp. | 131,427 | 2,617 |
| | Glacier Bancorp Inc. | 47,286 | 2,614 |
| | Power Integrations Inc. | 25,209 | 2,602 |
| * | Novanta Inc. | 15,047 | 2,597 |
| | Nexstar Media Group Inc. Class A | 17,306 | 2,595 |
| | Ralph Lauren Corp. Class A | 20,342 | 2,587 |
| | Encompass Health Corp. | 40,557 | 2,578 |
| | Scotts Miracle-Gro Co. | 17,363 | 2,578 |
| * | AutoNation Inc. | 21,279 | 2,577 |
| | MSA Safety Inc. | 16,831 | 2,576 |
| * | NOV Inc. | 183,476 | 2,572 |
| | KBR Inc. | 60,440 | 2,565 |
| * | Goodyear Tire & Rubber Co. | 133,830 | 2,559 |
| * | Globus Medical Inc. Class A | 33,143 | 2,558 |
| * | QuantumScape Corp. Class A | 88,369 | 2,557 |
| | Innovative Industrial Properties Inc. | 9,665 | 2,543 |
| | nVent Electric plc | 71,430 | 2,532 |
| | BWX Technologies Inc. | 44,369 | 2,518 |
| | Cousins Properties Inc. | 63,579 | 2,518 |
| | Dolby Laboratories Inc. Class A | 28,337 | 2,504 |
| | | Shares | Market
Value•
($000) |
| * | Zillow Group Inc. Class A | 23,645 | 2,500 |
| | Houlihan Lokey Inc. Class A | 22,276 | 2,497 |
| | Exponent Inc. | 21,727 | 2,494 |
| | Spirit Realty Capital Inc. | 50,963 | 2,494 |
| | Hanesbrands Inc. | 145,880 | 2,486 |
| | MGIC Investment Corp. | 152,307 | 2,461 |
| | Vontier Corp. | 72,748 | 2,461 |
| * | WESCO International Inc. | 18,990 | 2,460 |
| * | Semtech Corp. | 28,900 | 2,457 |
| * | Sprout Social Inc. Class A | 19,184 | 2,449 |
| * | Clean Harbors Inc. | 21,752 | 2,448 |
| * | MicroStrategy Inc. Class A | 3,424 | 2,448 |
| | Interactive Brokers Group Inc. Class A | 34,456 | 2,441 |
| * | Range Resources Corp. | 104,572 | 2,439 |
| * | Post Holdings Inc. | 24,011 | 2,437 |
| | Curtiss-Wright Corp. | 19,082 | 2,436 |
| * | Ziff Davis Inc. | 18,979 | 2,434 |
| * | IPG Photonics Corp. | 15,280 | 2,430 |
| * | Antero Resources Corp. | 122,191 | 2,428 |
| * | Euronet Worldwide Inc. | 21,592 | 2,422 |
| | National Instruments Corp. | 56,952 | 2,419 |
| | Graphic Packaging Holding Co. | 121,271 | 2,417 |
| * | STAAR Surgical Co. | 20,401 | 2,417 |
| | Valley National Bancorp | 182,157 | 2,415 |
| | Evercore Inc. Class A | 15,885 | 2,412 |
| * | Amedisys Inc. | 14,222 | 2,408 |
| | New York Community Bancorp Inc. | 193,516 | 2,405 |
| *,2 | Beyond Meat Inc. | 24,244 | 2,400 |
| * | Bridgebio Pharma Inc. | 48,511 | 2,395 |
| | Louisiana-Pacific Corp. | 40,496 | 2,386 |
| | Essent Group Ltd. | 49,660 | 2,384 |
| * | Upwork Inc. | 50,189 | 2,365 |
| | Thor Industries Inc. | 23,179 | 2,363 |
| * | Twist Bioscience Corp. | 19,870 | 2,361 |
| | Harley-Davidson Inc. | 64,632 | 2,358 |
| | PacWest Bancorp | 49,667 | 2,358 |
| * | Cadence Bank | 81,181 | 2,356 |
| * | Acadia Healthcare Co. Inc. | 37,978 | 2,355 |
| * | HealthEquity Inc. | 35,577 | 2,354 |
| * | Terminix Global Holdings Inc. | 58,152 | 2,354 |
| | Bank OZK | 52,664 | 2,353 |
| | Sonoco Products Co. | 40,510 | 2,348 |
| | SLM Corp. | 127,877 | 2,347 |
| | CDK Global Inc. | 53,861 | 2,344 |
Total World Stock Index Fund
| | | Shares | Market
Value•
($000) |
| * | Helen of Troy Ltd. | 10,407 | 2,341 |
| 2 | Sirius XM Holdings Inc. | 382,519 | 2,330 |
| * | Invitae Corp. | 87,679 | 2,323 |
| | OneMain Holdings Inc. | 43,816 | 2,314 |
| * | Ultragenyx Pharmaceutical Inc. | 27,476 | 2,306 |
| * | Change Healthcare Inc. | 106,966 | 2,303 |
| * | SPS Commerce Inc. | 15,004 | 2,292 |
| * | Halozyme Therapeutics Inc. | 60,154 | 2,290 |
| * | ICU Medical Inc. | 9,775 | 2,289 |
| * | Fastly Inc. Class A | 45,111 | 2,283 |
| * | ChampionX Corp. | 86,612 | 2,272 |
| * | Redfin Corp. | 44,178 | 2,268 |
| * | Credit Acceptance Corp. | 3,776 | 2,259 |
| | UFP Industries Inc. | 27,593 | 2,258 |
| | Element Solutions Inc. | 99,321 | 2,256 |
| | ManpowerGroup Inc. | 23,342 | 2,256 |
| | Sterling Bancorp | 88,360 | 2,249 |
| | Science Applications International Corp. | 25,034 | 2,248 |
| * | Boyd Gaming Corp. | 35,213 | 2,246 |
| | Armstrong World Industries Inc. | 21,197 | 2,239 |
| | Ashland Global Holdings Inc. | 23,302 | 2,237 |
| | Douglas Emmett Inc. | 68,437 | 2,237 |
| * | Fiverr International Ltd. | 13,133 | 2,237 |
| | Unum Group | 87,585 | 2,231 |
| | Lazard Ltd. Class A | 45,428 | 2,226 |
| | Watts Water Technologies Inc. Class A | 11,705 | 2,224 |
| * | NeoGenomics Inc. | 48,318 | 2,223 |
| * | Celsius Holdings Inc. | 23,006 | 2,221 |
| | Southern Copper Corp. | 36,743 | 2,204 |
| | SouthState Corp. | 28,084 | 2,193 |
| * | NCR Corp. | 55,385 | 2,190 |
| | Crane Co. | 21,130 | 2,182 |
| | Rayonier Inc. | 58,395 | 2,180 |
| | PDC Energy Inc. | 41,646 | 2,179 |
| | Webster Financial Corp. | 38,666 | 2,164 |
| | Terreno Realty Corp. | 29,553 | 2,161 |
| * | MasTec Inc. | 24,197 | 2,157 |
| * | Pacific Biosciences of California Inc. | 81,334 | 2,154 |
| | Simpson Manufacturing Co. Inc. | 20,287 | 2,152 |
| * | Herbalife Nutrition Ltd. | 46,379 | 2,152 |
| | Wintrust Financial Corp. | 24,254 | 2,146 |
| | Valmont Industries Inc. | 8,964 | 2,142 |
| | | Shares | Market
Value•
($000) |
| * | Liberty Media Corp.- Liberty SiriusXM Class A | 42,874 | 2,134 |
| * | Marathon Digital Holdings Inc. | 40,811 | 2,132 |
| | Pegasystems Inc. | 17,933 | 2,129 |
| | RLI Corp. | 19,634 | 2,127 |
| | Umpqua Holdings Corp. | 104,025 | 2,127 |
| * | Quidel Corp. | 16,002 | 2,125 |
| | CIT Group Inc. | 42,888 | 2,124 |
| | First Citizens BancShares Inc. Class A | 2,589 | 2,107 |
| | IDACORP Inc. | 20,194 | 2,107 |
| | Maximus Inc. | 24,762 | 2,094 |
| * | Tenable Holdings Inc. | 39,309 | 2,093 |
| * | Iridium Communications Inc. | 51,502 | 2,088 |
| | Wingstop Inc. | 11,975 | 2,065 |
| | Albertsons Cos. Inc. Class A | 66,654 | 2,063 |
| | Agree Realty Corp. | 29,012 | 2,062 |
| * | Integra LifeSciences Holdings Corp. | 30,999 | 2,060 |
| | Healthcare Realty Trust Inc. | 62,233 | 2,057 |
| * | National Vision Holdings Inc. | 33,335 | 2,055 |
| * | Oak Street Health Inc. | 43,464 | 2,053 |
| | Travel + Leisure Co. | 37,692 | 2,048 |
| * | Vimeo Inc. | 60,576 | 2,043 |
| * | MaxLinear Inc. | 32,401 | 2,041 |
| | UMB Financial Corp. | 20,653 | 2,041 |
| * | Hexcel Corp. | 35,960 | 2,040 |
| | Balchem Corp. | 13,320 | 2,039 |
| | National Storage Affiliates Trust | 32,625 | 2,038 |
| | HollyFrontier Corp. | 60,202 | 2,035 |
| | Hannon Armstrong Sustainable Infrastructure Capital Inc. | 33,627 | 2,031 |
| | New Residential Investment Corp. | 178,512 | 2,028 |
| | Premier Inc. Class A | 52,005 | 2,026 |
| | Flowers Foods Inc. | 81,285 | 2,012 |
| | National Fuel Gas Co. | 35,013 | 2,011 |
| * | Cirrus Logic Inc. | 24,815 | 2,005 |
| * | Univar Solutions Inc. | 78,307 | 2,003 |
| * | Evoqua Water Technologies Corp. | 47,828 | 2,001 |
| | Radian Group Inc. | 83,735 | 1,999 |
| * | Liberty Global plc Class A | 69,296 | 1,992 |
| * | Envestnet Inc. | 23,754 | 1,983 |
| * | Neogen Corp. | 46,868 | 1,983 |
| * | Nomad Foods Ltd. | 72,840 | 1,983 |
| | Black Hills Corp. | 29,819 | 1,979 |
| | Selective Insurance Group Inc. | 25,235 | 1,978 |
| * | Alkermes plc | 65,299 | 1,978 |
| | Highwoods Properties Inc. | 44,065 | 1,976 |
Total World Stock Index Fund
| | | Shares | Market
Value•
($000) |
| * | FTI Consulting Inc. | 13,719 | 1,974 |
| | Avient Corp. | 36,563 | 1,970 |
| | Gap Inc. | 86,530 | 1,963 |
| * | Q2 Holdings Inc. | 24,994 | 1,961 |
| * | Ollie's Bargain Outlet Holdings Inc. | 28,911 | 1,956 |
| * | AMN Healthcare Services Inc. | 19,806 | 1,955 |
| | Chemours Co. | 69,745 | 1,954 |
| | Ryder System Inc. | 22,992 | 1,953 |
| | Matador Resources Co. | 46,588 | 1,950 |
| * | Boston Beer Co. Inc. Class A | 3,952 | 1,946 |
| * | Livent Corp. | 68,886 | 1,944 |
| | Choice Hotels International Inc. | 13,783 | 1,938 |
| * | New Relic Inc. | 23,718 | 1,925 |
| | Signet Jewelers Ltd. | 21,515 | 1,919 |
| * | Denali Therapeutics Inc. | 39,673 | 1,918 |
| * | Ionis Pharmaceuticals Inc. | 60,194 | 1,918 |
| * | Mandiant Inc. | 109,582 | 1,911 |
| * | Inmode Ltd. | 20,102 | 1,904 |
| | Kite Realty Group Trust | 93,641 | 1,901 |
| | SL Green Realty Corp. | 27,122 | 1,900 |
| | Portland General Electric Co. | 38,358 | 1,891 |
| * | Under Armour Inc. Class C | 99,855 | 1,885 |
| | Zurn Water Solutions Corp. | 51,814 | 1,880 |
| * | Alteryx Inc. Class A | 25,671 | 1,879 |
| | Flowserve Corp. | 55,893 | 1,879 |
| | United Bankshares Inc. | 50,761 | 1,878 |
| | John Bean Technologies Corp. | 12,702 | 1,877 |
| * | Maravai LifeSciences Holdings Inc. Class A | 44,354 | 1,876 |
| | Ensign Group Inc. | 24,017 | 1,874 |
| | Blackstone Mortgage Trust Inc. Class A | 56,900 | 1,872 |
| * | Park Hotels & Resorts Inc. | 100,911 | 1,870 |
| * | API Group Corp. | 85,828 | 1,869 |
| | Franklin Electric Co. Inc. | 21,630 | 1,868 |
| | Spirit AeroSystems Holdings Inc. Class A | 45,210 | 1,867 |
| * | Atkore Inc. | 19,692 | 1,861 |
| | Kinsale Capital Group Inc. | 9,911 | 1,855 |
| * | DTE Midstream LLC | 38,545 | 1,849 |
| | Kemper Corp. | 29,029 | 1,843 |
| | Hanover Insurance Group Inc. | 14,611 | 1,841 |
| | Foot Locker Inc. | 38,586 | 1,839 |
| | Herc Holdings Inc. | 10,086 | 1,836 |
| | | Shares | Market
Value•
($000) |
| * | Mimecast Ltd. | 24,327 | 1,835 |
| * | Qualys Inc. | 14,732 | 1,834 |
| | Hawaiian Electric Industries Inc. | 45,193 | 1,833 |
| * | Progyny Inc. | 29,826 | 1,832 |
| *,2 | Tilray Inc. Class 2 | 177,627 | 1,830 |
| | Macerich Co. | 101,112 | 1,829 |
| | FNB Corp. | 156,674 | 1,825 |
| | Alliance Data Systems Corp. | 21,390 | 1,824 |
| | Chimera Investment Corp. | 116,765 | 1,823 |
| | Hancock Whitney Corp. | 36,822 | 1,822 |
| * | LHC Group Inc. | 13,503 | 1,817 |
| * | Fate Therapeutics Inc. | 33,676 | 1,812 |
| * | Ryman Hospitality Properties Inc. | 21,186 | 1,812 |
| * | Beam Therapeutics Inc. | 20,397 | 1,811 |
| | Insperity Inc. | 14,477 | 1,810 |
| | Timken Co. | 25,508 | 1,810 |
| | Korn Ferry | 23,411 | 1,808 |
| * | Sailpoint Technologies Holdings Inc. | 37,632 | 1,806 |
| | Equitrans Midstream Corp. | 174,478 | 1,799 |
| | TEGNA Inc. | 91,514 | 1,799 |
| | SYNNEX Corp. | 17,104 | 1,796 |
| | Air Lease Corp. Class A | 44,684 | 1,790 |
| * | ViaSat Inc. | 29,874 | 1,783 |
| | Spectrum Brands Holdings Inc. | 19,005 | 1,782 |
| * | nCino Inc. | 24,314 | 1,767 |
| * | TriNet Group Inc. | 17,412 | 1,763 |
| | SM Energy Co. | 51,271 | 1,760 |
| * | Alarm.com Holdings Inc. | 20,867 | 1,758 |
| * | Meritage Homes Corp. | 16,146 | 1,755 |
| | Broadstone Net Lease Inc. | 66,008 | 1,755 |
| | Moelis & Co. Class A | 24,119 | 1,754 |
| * | Overstock.com Inc. | 18,370 | 1,749 |
| * | Option Care Health Inc. | 63,859 | 1,745 |
| | Wendy's Co. | 77,787 | 1,735 |
| | Carter's Inc. | 17,584 | 1,732 |
| * | Hyatt Hotels Corp. Class A | 20,317 | 1,731 |
| | Murphy USA Inc. | 10,605 | 1,728 |
| * | LivaNova plc | 22,525 | 1,728 |
| * | Perficient Inc. | 13,933 | 1,722 |
| * | Nevro Corp. | 15,113 | 1,719 |
| * | Luminar Technologies Inc. Class A | 104,902 | 1,719 |
| * | Diodes Inc. | 17,869 | 1,717 |
| * | Vonage Holdings Corp. | 106,451 | 1,716 |
| * | Bloom Energy Corp. Class A | 54,860 | 1,715 |
| | HB Fuller Co. | 24,319 | 1,715 |
Total World Stock Index Fund
| | | Shares | Market
Value•
($000) |
| * | Southwest Gas Holdings Inc. | 24,727 | 1,712 |
| | PNM Resources Inc. | 34,388 | 1,711 |
| | ServisFirst Bancshares Inc. | 21,238 | 1,706 |
| * | Trupanion Inc. | 16,656 | 1,706 |
| * | Bumble Inc. Class A | 32,484 | 1,706 |
| | Murphy Oil Corp. | 61,218 | 1,704 |
| * | Appian Corp. Class A | 17,099 | 1,700 |
| * | Hilton Grand Vacations Inc. | 33,753 | 1,697 |
| * | Brighthouse Financial Inc. | 33,749 | 1,695 |
| * | TG Therapeutics Inc. | 54,225 | 1,693 |
| * | Casella Waste Systems Inc. Class A | 19,481 | 1,689 |
| * | AZEK Co. Inc. Class A | 45,960 | 1,686 |
| * | Asbury Automotive Group Inc. | 8,608 | 1,685 |
| * | ExlService Holdings Inc. | 13,697 | 1,680 |
| * | Victoria's Secret & Co. | 33,262 | 1,679 |
| | Papa John's International Inc. | 13,521 | 1,678 |
| * | Summit Materials Inc. Class A | 47,066 | 1,678 |
| | CONMED Corp. | 11,447 | 1,674 |
| * | LiveRamp Holdings Inc. | 31,163 | 1,668 |
| * | Sonos Inc. | 50,917 | 1,661 |
| | H&R Block Inc. | 71,757 | 1,655 |
| | CMC Materials Inc. | 12,886 | 1,654 |
| | Ovintiv Inc. (XNYS) | 44,017 | 1,652 |
| | Axis Capital Holdings Ltd. | 31,641 | 1,648 |
| | Columbia Sportswear Co. | 15,841 | 1,645 |
| * | fuboTV Inc. | 55,197 | 1,645 |
| * | Onto Innovation Inc. | 20,737 | 1,643 |
| | Assured Guaranty Ltd. | 29,511 | 1,640 |
| | Hudson Pacific Properties Inc. | 63,496 | 1,635 |
| * | Silvergate Capital Corp. Class A | 10,438 | 1,635 |
| | Triton International Ltd. | 26,262 | 1,633 |
| * | Arvinas Inc. | 18,854 | 1,632 |
| | Qurate Retail Inc. Series A | 156,135 | 1,630 |
| * | Fabrinet | 16,944 | 1,627 |
| | Community Bank System Inc. | 22,667 | 1,625 |
| | EPR Properties | 32,331 | 1,623 |
| * | Cerence Inc. | 15,394 | 1,618 |
| | Physicians Realty Trust | 84,950 | 1,615 |
| | Sensient Technologies Corp. | 16,891 | 1,615 |
| * | Hain Celestial Group Inc. | 35,969 | 1,614 |
| | MSC Industrial Direct Co. Inc. Class A | 19,161 | 1,611 |
| | | Shares | Market
Value•
($000) |
| * | ACI Worldwide Inc. | 52,482 | 1,610 |
| | American States Water Co. | 17,686 | 1,607 |
| * | Adaptive Biotechnologies Corp. | 48,004 | 1,604 |
| * | Adient plc | 38,458 | 1,601 |
| * | Verint Systems Inc. | 34,319 | 1,599 |
| * | Veoneer Inc. | 45,440 | 1,599 |
| * | Focus Financial Partners Inc. Class A | 25,424 | 1,598 |
| | Associated Banc-Corp. | 71,630 | 1,596 |
| | Penske Automotive Group Inc. | 15,010 | 1,592 |
| * | Kodiak Sciences Inc. | 13,543 | 1,586 |
| | Steven Madden Ltd. | 35,016 | 1,579 |
| * | Under Armour Inc. Class A | 71,817 | 1,577 |
| | Lexington Realty Trust | 108,197 | 1,576 |
| * | Arena Pharmaceuticals Inc. | 27,258 | 1,564 |
| | Commercial Metals Co. | 48,590 | 1,564 |
| | Sanderson Farms Inc. | 8,228 | 1,559 |
| * | Resideo Technologies Inc. | 63,071 | 1,555 |
| | Pacific Premier Bancorp Inc. | 36,901 | 1,549 |
| * | Grand Canyon Education Inc. | 19,309 | 1,539 |
| | First Hawaiian Inc. | 55,635 | 1,535 |
| | Select Medical Holdings Corp. | 46,216 | 1,535 |
| * | Blackbaud Inc. | 21,563 | 1,531 |
| * | Haemonetics Corp. | 22,266 | 1,530 |
| | New Jersey Resources Corp. | 40,400 | 1,528 |
| | Applied Industrial Technologies Inc. | 15,607 | 1,521 |
| * | Arconic Corp. | 51,536 | 1,516 |
| | BankUnited Inc. | 37,337 | 1,514 |
| * | Iovance Biotherapeutics Inc. | 62,241 | 1,513 |
| | KB Home | 37,613 | 1,510 |
| * | Sunnova Energy International Inc. | 33,893 | 1,510 |
| * | Altice USA Inc. Class A | 92,366 | 1,506 |
| | CNO Financial Group Inc. | 62,365 | 1,505 |
| | PS Business Parks Inc. | 8,468 | 1,505 |
| * | Rogers Corp. | 7,476 | 1,504 |
| | Avnet Inc. | 39,387 | 1,501 |
| * | Box Inc. Class A | 58,053 | 1,500 |
| | Allison Transmission Holdings Inc. | 44,937 | 1,499 |
| * | Magnite Inc. | 55,397 | 1,497 |
| * | Open Lending Corp. Class A | 47,490 | 1,497 |
| | Kulicke & Soffa Industries Inc. | 26,265 | 1,497 |
Total World Stock Index Fund
| | | Shares | Market
Value•
($000) |
| | Walker & Dunlop Inc. | 11,502 | 1,496 |
| * | SeaWorld Entertainment Inc. | 23,429 | 1,488 |
| * | Altair Engineering Inc. Class A | 19,104 | 1,486 |
| * | United Airlines Holdings Inc. | 32,170 | 1,484 |
| * | Insmed Inc. | 49,023 | 1,478 |
| * | Calix Inc. | 23,565 | 1,475 |
| * | Phreesia Inc. | 20,794 | 1,467 |
| | Hillenbrand Inc. | 32,216 | 1,465 |
| * | Southwestern Energy Co. | 299,032 | 1,459 |
| * | LivePerson Inc. | 28,184 | 1,452 |
| | Outfront Media Inc. | 58,353 | 1,452 |
| * | Simply Good Foods Co. | 36,482 | 1,447 |
| *,2 | Virgin Galactic Holdings Inc. | 76,799 | 1,440 |
| | Bank of Hawaii Corp. | 17,030 | 1,439 |
| | Apple Hospitality REIT Inc. | 91,474 | 1,437 |
| | Advanced Energy Industries Inc. | 15,628 | 1,435 |
| * | Madison Square Garden Sports Corp. | 7,570 | 1,435 |
| | ONE Gas Inc. | 21,322 | 1,435 |
| * | Axonics Inc. | 19,531 | 1,433 |
| * | Howard Hughes Corp. | 16,447 | 1,433 |
| * | Ingevity Corp. | 18,391 | 1,433 |
| | Home BancShares Inc. | 60,209 | 1,431 |
| * | Inari Medical Inc. | 15,779 | 1,428 |
| | California Water Service Group | 23,438 | 1,427 |
| | Continental Resources Inc. | 29,241 | 1,427 |
| * | Taylor Morrison Home Corp. Class A | 46,724 | 1,426 |
| | American Eagle Outfitters Inc. | 60,023 | 1,425 |
| * | Momentive Global Inc. | 62,185 | 1,425 |
| | eXp World Holdings Inc. | 27,499 | 1,419 |
| *,2 | Skillz Inc. Class A | 126,921 | 1,419 |
| | Brink's Co. | 20,581 | 1,418 |
| * | Skyline Champion Corp. | 22,396 | 1,418 |
| * | Academy Sports & Outdoors Inc. | 33,130 | 1,417 |
| | Kennametal Inc. | 35,615 | 1,416 |
| * | Itron Inc. | 18,174 | 1,413 |
| | JBG SMITH Properties | 48,928 | 1,412 |
| | Antero Midstream Corp. | 132,570 | 1,411 |
| | Encore Wire Corp. | 10,526 | 1,411 |
| | LCI Industries | 10,100 | 1,410 |
| * | CryoPort Inc. | 17,273 | 1,408 |
| | Investors Bancorp Inc. | 92,040 | 1,408 |
| * | 3D Systems Corp. | 49,997 | 1,408 |
| | | Shares | Market
Value•
($000) |
| | Eastern Bankshares Inc. | 67,708 | 1,406 |
| | PotlatchDeltic Corp. | 26,883 | 1,405 |
| | Aerojet Rocketdyne Holdings Inc. | 31,828 | 1,401 |
| | Hamilton Lane Inc. Class A | 13,376 | 1,398 |
| | Old National Bancorp | 81,856 | 1,398 |
| * | Veracyte Inc. | 29,135 | 1,395 |
| * | Certara Inc. | 33,697 | 1,392 |
| * | MACOM Technology Solutions Holdings Inc. Class H | 19,923 | 1,391 |
| * | Viavi Solutions Inc. | 90,333 | 1,391 |
| | SPX FLOW Inc. | 18,602 | 1,390 |
| | Silgan Holdings Inc. | 34,557 | 1,389 |
| * | Allakos Inc. | 13,783 | 1,386 |
| * | Digitalbridge Group Inc. | 206,746 | 1,385 |
| | Westlake Chemical Corp. | 14,223 | 1,384 |
| | Federated Hermes Inc. | 41,520 | 1,383 |
| | Rent-A-Center Inc. | 25,969 | 1,383 |
| * | Red Rock Resorts Inc. Class A | 25,354 | 1,380 |
| | Independent Bank Corp. (XNGS) | 16,307 | 1,378 |
| * | AtriCure Inc. | 18,287 | 1,373 |
| | Ameris Bancorp | 26,181 | 1,372 |
| | Essential Properties Realty Trust Inc. | 46,046 | 1,372 |
| | FirstCash Inc. | 15,497 | 1,371 |
| * | Integer Holdings Corp. | 15,230 | 1,371 |
| | Cabot Corp. | 25,687 | 1,370 |
| | Navient Corp. | 69,370 | 1,367 |
| * | Six Flags Entertainment Corp. | 33,182 | 1,365 |
| | Altra Industrial Motion Corp. | 26,131 | 1,363 |
| * | Shoals Technologies Group Inc. Class A | 43,869 | 1,360 |
| | Simmons First National Corp. Class A | 45,439 | 1,358 |
| | EnerSys | 16,897 | 1,352 |
| | Quaker Chemical Corp. | 5,494 | 1,351 |
| | Cracker Barrel Old Country Store Inc. | 10,120 | 1,348 |
| * | Sabre Corp. | 129,911 | 1,348 |
| | Spire Inc. | 21,464 | 1,347 |
| * | Dun & Bradstreet Holdings Inc. | 71,435 | 1,346 |
| | GATX Corp. | 14,165 | 1,344 |
| * | International Game Technology plc | 45,425 | 1,340 |
| | Group 1 Automotive Inc. | 7,444 | 1,338 |
| * | Merit Medical Systems Inc. | 19,848 | 1,335 |
| * | TripAdvisor Inc. | 40,481 | 1,335 |
| * | Liberty Broadband Corp. Class A | 8,298 | 1,334 |
Total World Stock Index Fund
| | | Shares | Market
Value•
($000) |
| * | LGI Homes Inc. | 8,931 | 1,333 |
| | Sabra Health Care REIT Inc. | 94,193 | 1,333 |
| | White Mountains Insurance Group Ltd. | 1,262 | 1,331 |
| | Dana Inc. | 59,926 | 1,330 |
| * | Cargurus Inc. | 39,611 | 1,329 |
| * | PagerDuty Inc. | 31,803 | 1,328 |
| | Lancaster Colony Corp. | 7,799 | 1,326 |
| * | Cannae Holdings Inc. | 38,628 | 1,317 |
| | Mueller Water Products Inc. Class A | 80,249 | 1,317 |
| * | Inovalon Holdings Inc. Class A | 32,260 | 1,316 |
| * | Yelp Inc. Class A | 33,982 | 1,313 |
| * | FormFactor Inc. | 32,990 | 1,312 |
| * | Masonite International Corp. | 10,891 | 1,307 |
| * | Insight Enterprises Inc. | 13,794 | 1,306 |
| * | Nordstrom Inc. | 45,468 | 1,306 |
| * | Visteon Corp. | 11,524 | 1,304 |
| | Ormat Technologies Inc. (XNYS) | 18,012 | 1,303 |
| | ALLETE Inc. | 21,147 | 1,301 |
| * | Welbilt Inc. | 54,946 | 1,300 |
| * | frontdoor Inc. | 34,844 | 1,299 |
| | Werner Enterprises Inc. | 28,591 | 1,296 |
| | Helmerich & Payne Inc. | 41,533 | 1,289 |
| | Cogent Communications Holdings Inc. | 16,821 | 1,288 |
| * | Playtika Holding Corp. | 45,303 | 1,281 |
| * | Kirby Corp. | 24,425 | 1,280 |
| * | Coty Inc. Class A | 150,870 | 1,279 |
| | Cathay General Bancorp | 30,093 | 1,270 |
| | Comfort Systems USA Inc. | 13,846 | 1,267 |
| | ABM Industries Inc. | 28,751 | 1,265 |
| * | Vicor Corp. | 8,306 | 1,259 |
| * | Texas Capital Bancshares Inc. | 20,689 | 1,254 |
| | NorthWestern Corp. | 21,961 | 1,249 |
| * | American Airlines Group Inc. | 65,022 | 1,248 |
| | Pebblebrook Hotel Trust | 55,451 | 1,245 |
| * | Prestige Consumer Healthcare Inc. | 20,753 | 1,245 |
| | Switch Inc. Class A | 49,219 | 1,244 |
| * | Mr Cooper Group Inc. | 28,308 | 1,241 |
| * | CommVault Systems Inc. | 20,141 | 1,239 |
| | WSFS Financial Corp. | 23,909 | 1,239 |
| | Herman Miller Inc. | 31,753 | 1,236 |
| * | Enstar Group Ltd. | 5,352 | 1,235 |
| * | Callaway Golf Co. | 45,635 | 1,234 |
| | Washington Federal Inc. | 34,892 | 1,234 |
| | | Shares | Market
Value•
($000) |
| | Magnolia Oil & Gas Corp. Class A | 58,799 | 1,228 |
| * | Karuna Therapeutics Inc. | 8,751 | 1,228 |
| | AAON Inc. | 17,118 | 1,227 |
| | CVB Financial Corp. | 61,254 | 1,226 |
| * | Renewable Energy Group Inc. | 19,148 | 1,225 |
| | BOK Financial Corp. | 12,065 | 1,221 |
| | Gray Television Inc. | 51,943 | 1,218 |
| | Avangrid Inc. | 23,030 | 1,214 |
| | Badger Meter Inc. | 11,871 | 1,214 |
| | MGE Energy Inc. | 15,992 | 1,214 |
| | WD-40 Co. | 5,348 | 1,214 |
| | Atlantic Union Bankshares Corp. | 33,818 | 1,213 |
| | Terex Corp. | 27,024 | 1,211 |
| | UniFirst Corp. | 6,112 | 1,210 |
| | Corporate Office Properties Trust | 44,563 | 1,209 |
| * | Mercury Systems Inc. | 23,414 | 1,207 |
| | Hecla Mining Co. | 208,560 | 1,205 |
| | World Wrestling Entertainment Inc. Class A | 19,717 | 1,205 |
| * | CNX Resources Corp. | 82,225 | 1,201 |
| * | Equity Commonwealth | 46,322 | 1,201 |
| * | Intra-Cellular Therapies Inc. | 27,808 | 1,198 |
| | Live Oak Bancshares Inc. | 13,424 | 1,197 |
| | Piper Sandler Cos. | 7,265 | 1,196 |
| | United Community Banks Inc. | 34,214 | 1,192 |
| | Artisan Partners Asset Management Inc. Class A | 24,035 | 1,191 |
| * | Domtar Corp. | 21,820 | 1,191 |
| | Mueller Industries Inc. | 22,627 | 1,191 |
| * | Axos Financial Inc. | 22,446 | 1,190 |
| | MDC Holdings Inc. | 24,290 | 1,190 |
| | Installed Building Products Inc. | 9,348 | 1,188 |
| | News Corp. Class B | 52,508 | 1,185 |
| | Patterson Cos. Inc. | 37,888 | 1,184 |
| | EVERTEC Inc. | 26,118 | 1,181 |
| * | NuVasive Inc. | 22,133 | 1,181 |
| * | Amicus Therapeutics Inc. | 112,221 | 1,178 |
| | Shutterstock Inc. | 9,651 | 1,169 |
| | Helios Technologies Inc. | 12,818 | 1,167 |
| * | Shift4 Payments Inc. Class A | 18,490 | 1,167 |
| | Wolverine World Wide Inc. | 35,104 | 1,164 |
| * | Beacon Roofing Supply Inc. | 21,977 | 1,162 |
| * | R1 RCM Inc. | 53,238 | 1,155 |
| * | SunPower Corp. | 34,310 | 1,155 |
| * | Dorman Products Inc. | 11,037 | 1,152 |
Total World Stock Index Fund
| | | Shares | Market
Value•
($000) |
| | American Equity Investment Life Holding Co. | 35,944 | 1,146 |
| | Columbia Banking System Inc. | 33,571 | 1,146 |
| | Tronox Holdings plc Class A | 49,107 | 1,145 |
| * | Appfolio Inc. Class A | 8,656 | 1,140 |
| * | 1Life Healthcare Inc. | 52,648 | 1,140 |
| | Towne Bank | 36,142 | 1,139 |
| | Moog Inc. Class A | 15,062 | 1,138 |
| | First BanCorp (XNYS) | 83,156 | 1,135 |
| * | BioCryst Pharmaceuticals Inc. | 75,987 | 1,134 |
| * | Kratos Defense & Security Solutions Inc. | 53,032 | 1,134 |
| *,2 | Nikola Corp. | 95,952 | 1,132 |
| * | Tri Pointe Homes Inc. | 46,676 | 1,129 |
| | PROG Holdings Inc. | 27,901 | 1,129 |
| | NewMarket Corp. | 3,315 | 1,127 |
| | New Fortress Energy Inc. Class A | 37,529 | 1,126 |
| * | Reata Pharmaceuticals Inc. Class A | 11,720 | 1,125 |
| * | Discovery Inc. Class A | 47,888 | 1,123 |
| * | PTC Therapeutics Inc. | 29,611 | 1,123 |
| * | CareDx Inc. | 21,950 | 1,119 |
| * | Fluor Corp. | 57,336 | 1,115 |
| * | ChargePoint Holdings Inc. | 45,003 | 1,115 |
| | Owens & Minor Inc. | 30,941 | 1,110 |
| * | Jamf Holding Corp. | 23,281 | 1,109 |
| | Xerox Holdings Corp. | 62,127 | 1,106 |
| * | Hub Group Inc. Class A | 14,058 | 1,105 |
| | ESCO Technologies Inc. | 13,060 | 1,104 |
| | Arcosa Inc. | 21,260 | 1,100 |
| * | Leslie's Inc. | 53,197 | 1,100 |
| | Stepan Co. | 9,155 | 1,099 |
| | Belden Inc. | 18,228 | 1,098 |
| * | Editas Medicine Inc. Class A | 29,912 | 1,098 |
| | Vishay Intertechnology Inc. | 57,101 | 1,097 |
| * | Green Dot Corp. Class A | 25,861 | 1,095 |
| * | Fisker Inc. | 68,137 | 1,094 |
| * | Agios Pharmaceuticals Inc. | 23,112 | 1,086 |
| | SITE Centers Corp. | 68,353 | 1,086 |
| * | SPX Corp. | 18,644 | 1,083 |
| * | Amyris Inc. | 72,942 | 1,081 |
| * | Nektar Therapeutics Class A | 71,305 | 1,081 |
| | Clearway Energy Inc. Class C | 30,396 | 1,078 |
| | | Shares | Market
Value•
($000) |
| * | Sunstone Hotel Investors Inc. | 87,184 | 1,076 |
| | Winnebago Industries Inc. | 15,851 | 1,073 |
| * | Array Technologies Inc. | 50,226 | 1,072 |
| | Compass Minerals International Inc. | 16,311 | 1,070 |
| | Otter Tail Corp. | 17,253 | 1,070 |
| * | Xencor Inc. | 27,031 | 1,069 |
| | Covanta Holding Corp. | 52,902 | 1,068 |
| | Forward Air Corp. | 10,621 | 1,068 |
| | Independent Bank Group Inc. | 14,772 | 1,068 |
| | Avista Corp. | 26,767 | 1,066 |
| * | Gentherm Inc. | 14,361 | 1,057 |
| * | MP Materials Corp. | 31,155 | 1,055 |
| | Energizer Holdings Inc. | 28,889 | 1,054 |
| * | Sotera Health Co. | 42,646 | 1,053 |
| * | FuelCell Energy Inc. | 131,440 | 1,050 |
| | Progress Software Corp. | 20,360 | 1,047 |
| * | Sprouts Farmers Market Inc. | 47,300 | 1,047 |
| * | Plexus Corp. | 11,951 | 1,044 |
| | Monro Inc. | 16,837 | 1,040 |
| * | Ortho Clinical Diagnostics Holdings plc Class H | 52,331 | 1,035 |
| | Kontoor Brands Inc. | 19,514 | 1,034 |
| * | Sanmina Corp. | 27,380 | 1,034 |
| * | Vista Outdoor Inc. | 24,718 | 1,034 |
| | Kennedy-Wilson Holdings Inc. | 46,138 | 1,032 |
| | Uniti Group Inc. | 72,009 | 1,030 |
| * | Emergent BioSolutions Inc. | 21,553 | 1,027 |
| * | Hostess Brands Inc. Class A | 54,258 | 1,026 |
| | WesBanco Inc. | 29,512 | 1,026 |
| * | Cardlytics Inc. | 13,022 | 1,024 |
| | Atlantica Sustainable Infrastructure plc | 26,032 | 1,024 |
| * | Shake Shack Inc. Class A | 14,758 | 1,021 |
| * | NetScout Systems Inc. | 37,582 | 1,017 |
| * | Abercrombie & Fitch Co. Class A | 25,701 | 1,016 |
| | ManTech International Corp. Class A | 11,756 | 1,014 |
| | Virtus Investment Partners Inc. | 3,148 | 1,007 |
| | National Health Investors Inc. | 18,674 | 1,004 |
| | Bank of NT Butterfield & Son Ltd. | 27,726 | 995 |
| * | Myriad Genetics Inc. | 32,303 | 994 |
| * | 8x8 Inc. | 43,665 | 989 |
| * | JELD-WEN Holding Inc. | 36,013 | 987 |
| * | Riot Blockchain Inc. | 36,105 | 983 |
Total World Stock Index Fund
| | | Shares | Market
Value•
($000) |
| * | Duck Creek Technologies Inc. | 31,210 | 983 |
| * | iRobot Corp. | 11,723 | 978 |
| * | PRA Group Inc. | 22,715 | 974 |
| * | Schrodinger Inc. | 17,849 | 974 |
| | Brady Corp. Class A | 18,565 | 967 |
| | Brandywine Realty Trust | 72,897 | 966 |
| * | Vroom Inc. | 50,496 | 966 |
| | Flagstar Bancorp Inc. | 20,430 | 964 |
| | Graham Holdings Co. Class B | 1,641 | 961 |
| | Santander Consumer USA Holdings Inc. | 22,966 | 958 |
| | First Midwest Bancorp Inc. | 49,533 | 954 |
| | Boise Cascade Co. | 16,796 | 951 |
| | Federal Signal Corp. | 22,217 | 951 |
| | Fulton Financial Corp. | 58,875 | 948 |
| * | Cushman & Wakefield plc | 51,564 | 948 |
| | Hilltop Holdings Inc. | 26,607 | 943 |
| * | Pacira BioSciences Inc. | 18,032 | 943 |
| | Albany International Corp. Class A | 11,680 | 942 |
| | Coca-Cola Consolidated Inc. | 2,347 | 942 |
| * | Rambus Inc. | 40,461 | 942 |
| * | Lemonade Inc. | 15,159 | 942 |
| * | Gibraltar Industries Inc. | 14,424 | 940 |
| * | Palomar Holdings Inc. | 10,273 | 939 |
| * | Magellan Health Inc. | 9,890 | 938 |
| | Piedmont Office Realty Trust Inc. Class A | 52,600 | 934 |
| * | CureVac NV | 23,294 | 933 |
| | South Jersey Industries Inc. | 40,969 | 932 |
| | Trinseo plc | 16,629 | 932 |
| | Medifast Inc. | 4,742 | 931 |
| * | Constellium SE Class A | 50,551 | 931 |
| | GrafTech International Ltd. | 86,954 | 930 |
| * | NanoString Technologies Inc. | 19,248 | 930 |
| * | iHeartMedia Inc. Class A | 47,750 | 925 |
| * | Alaska Air Group Inc. | 17,469 | 922 |
| | Jack in the Box Inc. | 9,299 | 920 |
| | TTEC Holdings Inc. | 9,745 | 920 |
| | Virtu Financial Inc. Class A | 36,935 | 919 |
| * | Dycom Industries Inc. | 11,482 | 912 |
| | Amkor Technology Inc. | 41,567 | 911 |
| | Horace Mann Educators Corp. | 23,238 | 910 |
| * | MEDNAX Inc. | 33,425 | 910 |
| | Rush Enterprises Inc. Class A | 17,465 | 910 |
| | | Shares | Market
Value•
($000) |
| | Newmark Group Inc. Class A | 61,076 | 909 |
| * | Raven Industries Inc. | 15,678 | 907 |
| * | Meredith Corp. | 15,536 | 905 |
| * | Stitch Fix Inc. Class A | 26,158 | 905 |
| | RLJ Lodging Trust | 62,664 | 904 |
| | Four Corners Property Trust Inc. | 31,087 | 902 |
| | Retail Opportunity Investments Corp. | 50,699 | 901 |
| | Trustmark Corp. | 28,229 | 898 |
| | International Bancshares Corp. | 21,142 | 896 |
| * | Vir Biotechnology Inc. | 23,695 | 894 |
| * | Evolent Health Inc. Class A | 30,515 | 893 |
| | Renasant Corp. | 23,837 | 892 |
| | SJW Group | 13,475 | 888 |
| * | Sleep Number Corp. | 10,053 | 888 |
| * | Verra Mobility Corp. Class A | 59,685 | 888 |
| | Minerals Technologies Inc. | 12,500 | 887 |
| | Washington REIT | 34,963 | 886 |
| * | Bottomline Technologies DE Inc. | 19,124 | 885 |
| * | AeroVironment Inc. | 9,921 | 884 |
| | First Merchants Corp. | 21,248 | 883 |
| * | Callon Petroleum Co. | 17,062 | 883 |
| * | O-I Glass Inc. | 67,567 | 882 |
| * | 2U Inc. | 29,764 | 879 |
| | John Wiley & Sons Inc. Class A | 16,219 | 879 |
| * | ChemoCentryx Inc. | 25,187 | 877 |
| | Innospec Inc. | 9,666 | 876 |
| | McGrath RentCorp. | 12,125 | 875 |
| * | Realogy Holdings Corp. | 50,541 | 875 |
| | Trinity Industries Inc. | 31,137 | 873 |
| * | CommScope Holding Co. Inc. | 81,297 | 871 |
| * | Covetrus Inc. | 43,046 | 869 |
| | McAfee Corp.Class A | 40,458 | 865 |
| | First Financial Bancorp | 36,185 | 860 |
| * | Sage Therapeutics Inc. | 21,274 | 859 |
| * | Accolade Inc. | 21,427 | 853 |
| * | Alexander & Baldwin Inc. | 34,669 | 850 |
| | MFA Financial Inc. | 188,396 | 850 |
| | Cohen & Steers Inc. | 8,947 | 849 |
| * | NMI Holdings Inc. Class A | 34,888 | 847 |
| | Sandy Spring Bancorp Inc. | 17,780 | 844 |
| * | Ligand Pharmaceuticals Inc. | 5,779 | 843 |
| | Telephone and Data Systems Inc. | 44,774 | 839 |
Total World Stock Index Fund
| | | Shares | Market
Value•
($000) |
| *,2 | ContextLogic Inc. Class A | 164,267 | 838 |
| * | Corcept Therapeutics Inc. | 46,527 | 837 |
| * | iRhythm Technologies Inc. | 11,914 | 836 |
| | Xperi Holding Corp. | 46,655 | 836 |
| * | Genworth Financial Inc. Class A | 202,328 | 832 |
| * | AdaptHealth Corp. Class A | 30,495 | 831 |
| * | ODP Corp. | 19,172 | 830 |
| * | Glaukos Corp. | 18,131 | 829 |
| * | Allscripts Healthcare Solutions Inc. | 60,100 | 828 |
| | InterDigital Inc. | 12,367 | 828 |
| * | Liberty Media Corp.- Liberty Formula One Class A | 15,869 | 828 |
| | PennyMac Financial Services Inc. | 13,324 | 827 |
| | J & J Snack Foods Corp. | 5,591 | 825 |
| * | Urban Outfitters Inc. | 25,781 | 823 |
| * | TreeHouse Foods Inc. | 22,733 | 822 |
| * | BigCommerce Holdings Inc. Series 1 | 17,730 | 819 |
| * | Sorrento Therapeutics Inc. | 118,757 | 815 |
| * | Cavco Industries Inc. | 3,387 | 814 |
| | Maxar Technologies Inc. | 30,641 | 814 |
| | Columbia Property Trust Inc. | 42,435 | 813 |
| | Capitol Federal Financial Inc. | 66,793 | 810 |
| * | ACADIA Pharmaceuticals Inc. | 44,892 | 806 |
| * | DiamondRock Hospitality Co. | 89,030 | 805 |
| * | Transocean Ltd. (XNYS) | 227,978 | 805 |
| * | KAR Auction Services Inc. | 54,712 | 803 |
| * | Global Blood Therapeutics Inc. | 21,885 | 799 |
| * | Liberty Latin America Ltd. Class C | 66,233 | 797 |
| * | Brinker International Inc. | 18,946 | 795 |
| | Ubiquiti Inc. | 2,600 | 794 |
| | Heartland Financial USA Inc. | 15,767 | 790 |
| * | Meritor Inc. | 32,455 | 790 |
| * | Apellis Pharmaceuticals Inc. | 25,609 | 787 |
| | Barnes Group Inc. | 18,735 | 786 |
| | Urban Edge Properties | 44,774 | 785 |
| * | LendingTree Inc. | 4,819 | 778 |
| | Apollo Commercial Real Estate Finance Inc. | 51,269 | 776 |
| | | Shares | Market
Value•
($000) |
| | Provident Financial Services Inc. | 31,359 | 776 |
| * | Xenia Hotels & Resorts Inc. | 43,576 | 776 |
| | Patrick Industries Inc. | 9,890 | 771 |
| * | SpringWorks Therapeutics Inc. | 11,498 | 771 |
| * | Grocery Outlet Holding Corp. | 34,625 | 768 |
| * | Bandwidth Inc. Class A | 8,996 | 767 |
| * | Cinemark Holdings Inc. | 40,773 | 767 |
| * | Relay Therapeutics Inc. | 23,030 | 766 |
| * | Selectquote Inc. | 57,250 | 761 |
| * | Ironwood Pharmaceuticals Inc. Class A | 59,389 | 758 |
| * | Coeur Mining Inc. | 119,410 | 756 |
| | Nu Skin Enterprises Inc. Class A | 18,810 | 755 |
| * | Jackson Financial Inc. Class A | �� 27,875 | 755 |
| * | Allegheny Technologies Inc. | 46,804 | 754 |
| * | Turning Point Therapeutics Inc. | 18,118 | 753 |
| | Two Harbors Investment Corp. | 117,174 | 752 |
| * | Stratasys Ltd. | 23,849 | 752 |
| * | Driven Brands Holdings Inc. | 23,117 | 751 |
| * | JFrog Ltd. | 22,926 | 749 |
| | Great Western Bancorp Inc. | 21,847 | 744 |
| | CareTrust REIT Inc. | 35,656 | 740 |
| | Banner Corp. | 12,752 | 737 |
| | Service Properties Trust | 68,173 | 734 |
| * | Cheesecake Factory Inc. | 18,028 | 733 |
| * | Fulgent Genetics Inc. | 8,816 | 731 |
| * | Petco Health & Wellness Co. Inc. Class A | 29,540 | 731 |
| | World Fuel Services Corp. | 23,791 | 726 |
| * | CBIZ Inc. | 19,634 | 721 |
| | Strategic Education Inc. | 10,501 | 716 |
| | Edgewell Personal Care Co. | 20,370 | 713 |
| | Tanger Factory Outlet Centers Inc. | 42,399 | 712 |
| | Vector Group Ltd. | 53,546 | 710 |
| * | CorVel Corp. | 3,860 | 707 |
| | PennyMac Mortgage Investment Trust | 35,054 | 706 |
| *,2 | Cassava Sciences Inc. | 16,325 | 704 |
| * | Avanos Medical Inc. | 22,265 | 702 |
| * | Bloomin' Brands Inc. | 32,422 | 701 |
Total World Stock Index Fund
| | | Shares | Market
Value•
($000) |
| | Mack-Cali Realty Corp. | 38,511 | 701 |
| | Worthington Industries Inc. | 12,874 | 699 |
| * | Cimpress plc | 7,821 | 699 |
| 2 | B&G Foods Inc. | 23,601 | 695 |
| | PriceSmart Inc. | 9,643 | 694 |
| * | Proto Labs Inc. | 11,574 | 692 |
| * | Central Garden & Pet Co. Class A | 14,953 | 691 |
| * | American Well Corp. Class A | 76,708 | 690 |
| | Northwest Bancshares Inc. | 49,899 | 689 |
| * | REVOLUTION Medicines Inc. | 23,385 | 688 |
| | iStar Inc. | 27,160 | 686 |
| * | Ferro Corp. | 32,447 | 682 |
| | ProAssurance Corp. | 29,710 | 681 |
| * | Avaya Holdings Corp. | 36,466 | 679 |
| * | Madison Square Garden Entertainment Corp. | 9,629 | 679 |
| * | Laureate Education Inc. Class A | 39,147 | 678 |
| * | Adtalem Global Education Inc. | 18,282 | 675 |
| | NBT Bancorp Inc. | 18,378 | 674 |
| | Patterson-UTI Energy Inc. | 78,713 | 674 |
| * | Allegro MicroSystems Inc. | 20,164 | 673 |
| * | Gates Industrial Corp. plc | 40,889 | 672 |
| * | C3.ai Inc. Class A | 14,891 | 672 |
| | American Assets Trust Inc. | 17,694 | 669 |
| | American National Group Inc. | 3,502 | 664 |
| | Argo Group International Holdings Ltd. | 12,034 | 663 |
| | Acadia Realty Trust | 30,956 | 662 |
| * | Sally Beauty Holdings Inc. | 43,100 | 658 |
| | HNI Corp. | 17,473 | 653 |
| | Sempra Energy | 5,137 | 653 |
| * | Enanta Pharmaceuticals Inc. | 7,585 | 651 |
| * | Knowles Corp. | 31,232 | 651 |
| | BGC Partners Inc. Class A | 121,014 | 650 |
| * | OSI Systems Inc. | 6,955 | 648 |
| | EnPro Industries Inc. | 7,200 | 646 |
| * | Encore Capital Group Inc. | 11,915 | 644 |
| | Acushnet Holdings Corp. | 12,584 | 641 |
| | Inter Parfums Inc. | 6,908 | 638 |
| | Methode Electronics Inc. | 15,170 | 638 |
| | Healthcare Services Group Inc. | 33,136 | 636 |
| | Big Lots Inc. | 14,278 | 632 |
| | | Shares | Market
Value•
($000) |
| | Eagle Bancorp Inc. | 11,100 | 628 |
| | Deluxe Corp. | 17,541 | 626 |
| * | Yext Inc. | 49,502 | 623 |
| * | Dicerna Pharmaceuticals Inc. | 29,777 | 620 |
| * | TTM Technologies Inc. | 46,855 | 620 |
| | Tennant Co. | 7,808 | 620 |
| | Carpenter Technology Corp. | 20,015 | 618 |
| | Stock Yards Bancorp Inc. | 10,072 | 617 |
| | Brightsphere Investment Group Inc. | 20,577 | 617 |
| * | UniQure N.V. | 20,206 | 616 |
| * | Golar LNG Ltd. | 47,306 | 616 |
| * | Bed Bath & Beyond Inc. | 43,275 | 608 |
| * | Dine Brands Global Inc. | 7,146 | 604 |
| * | Dave & Buster's Entertainment Inc. | 16,229 | 603 |
| | Global Net Lease Inc. | 37,640 | 603 |
| | Granite Construction Inc. | 16,155 | 600 |
| * | Rocket Pharmaceuticals Inc. | 20,197 | 600 |
| | St. Joe Co. | 12,698 | 597 |
| | Dillard's Inc. Class A | 2,579 | 596 |
| | Hope Bancorp Inc. | 40,854 | 596 |
| | Reynolds Consumer Products Inc. | 22,084 | 596 |
| | Northwest Natural Holding Co. | 13,032 | 588 |
| | Greif Inc. Class A | 9,000 | 582 |
| * | Oceaneering International Inc. | 42,470 | 578 |
| * | FARO Technologies Inc. | 7,831 | 576 |
| * | Harsco Corp. | 33,641 | 575 |
| | H&E Equipment Services Inc. | 12,733 | 574 |
| * | PBF Energy Inc. Class A | 39,302 | 574 |
| | Kaiser Aluminum Corp. | 5,894 | 573 |
| | Lindsay Corp. | 3,923 | 571 |
| | Oxford Industries Inc. | 6,147 | 570 |
| * | MakeMyTrip Ltd. | 17,997 | 570 |
| | Primoris Services Corp. | 21,057 | 567 |
| | Kaman Corp. | 15,779 | 565 |
| | Ladder Capital Corp. Class A | 47,112 | 565 |
| * | Bluebird Bio Inc. | 24,073 | 564 |
| | Paramount Group Inc. | 66,468 | 564 |
| | Berkshire Hills Bancorp Inc. | 20,730 | 563 |
| * | Alector Inc. | 25,740 | 560 |
| * | TriMas Corp. | 16,700 | 557 |
| | ADT Inc. | 66,414 | 555 |
Total World Stock Index Fund
| | | Shares | Market
Value•
($000) |
| | CSG Systems International Inc. | 11,066 | 554 |
| * | Surgery Partners Inc. | 13,476 | 554 |
| * | Kosmos Energy Ltd. | 153,446 | 552 |
| | Getty Realty Corp. | 17,159 | 551 |
| | Mercury General Corp. | 10,101 | 550 |
| *,2 | Inovio Pharmaceuticals Inc. | 76,930 | 549 |
| | La-Z-Boy Inc. | 16,433 | 546 |
| * | Orion Engineered Carbons SA | 28,976 | 545 |
| | Schneider National Inc. Class B | 21,826 | 544 |
| | Clearway Energy Inc. Class A | 16,425 | 542 |
| | Washington Trust Bancorp Inc. | 9,877 | 540 |
| * | Marcus & Millichap Inc. | 11,387 | 536 |
| | Materion Corp. | 7,432 | 536 |
| * | Kraton Corp. | 11,698 | 534 |
| * | MicroVision Inc. | 70,167 | 534 |
| | Standex International Corp. | 4,802 | 534 |
| | Sturm Ruger & Co. Inc. | 6,775 | 534 |
| * | USANA Health Sciences Inc. | 5,489 | 533 |
| | Westamerica BanCorp. | 9,567 | 533 |
| * | OPKO Health Inc. | 140,140 | 531 |
| | Diversified Healthcare Trust | 144,899 | 527 |
| | Redwood Trust Inc. | 38,700 | 525 |
| | Sinclair Broadcast Group Inc. Class A | 20,097 | 525 |
| | Centerspace | 5,175 | 524 |
| * | Parsons Corp. | 15,086 | 523 |
| | Safehold Inc. | 6,982 | 522 |
| | Nelnet Inc. Class A | 6,311 | 521 |
| * | Pilgrim's Pride Corp. | 18,506 | 521 |
| | First Commonwealth Financial Corp. | 33,977 | 520 |
| * | REGENXBIO Inc. | 14,409 | 511 |
| | Shenandoah Telecommunications Co. | 18,461 | 510 |
| * | Varex Imaging Corp. | 18,948 | 509 |
| * | Supernus Pharmaceuticals Inc. | 17,000 | 507 |
| * | PROS Holdings Inc. | 16,860 | 506 |
| | Cal-Maine Foods Inc. | 13,865 | 500 |
| | Enerpac Tool Group Corp. Class A | 23,877 | 499 |
| | Empire State Realty Trust Inc. Class A | 50,986 | 494 |
| | Greenbrier Cos. Inc. | 12,050 | 494 |
| | RPT Realty | 37,104 | 493 |
| | Fresh Del Monte Produce Inc. | 14,697 | 492 |
| | National Beverage Corp. | 8,696 | 490 |
| | | Shares | Market
Value•
($000) |
| * | AMC Networks Inc. Class A | 12,292 | 489 |
| | LTC Properties Inc. | 15,330 | 488 |
| * | GrowGeneration Corp. | 23,092 | 487 |
| * | Plantronics Inc. | 18,036 | 483 |
| * | Cognyte Software Ltd. | 24,134 | 481 |
| * | G-III Apparel Group Ltd. | 16,670 | 478 |
| | Archrock Inc. | 58,248 | 477 |
| | Community Trust Bancorp Inc. | 10,916 | 477 |
| * | Lions Gate Entertainment Corp. Class B | 42,090 | 476 |
| * | Brookdale Senior Living Inc. | 72,091 | 469 |
| | AZZ Inc. | 8,800 | 468 |
| * | Heron Therapeutics Inc. | 42,474 | 468 |
| | City Holding Co. | 5,856 | 466 |
| | BancFirst Corp. | 7,139 | 464 |
| * | Allogene Therapeutics Inc. | 26,816 | 462 |
| * | eHealth Inc. | 10,387 | 461 |
| | Kelly Services Inc. Class A | 25,376 | 458 |
| * | American Woodmark Corp. | 6,654 | 457 |
| | S&T Bancorp Inc. | 14,759 | 451 |
| | Buckle Inc. | 10,800 | 450 |
| * | CoreCivic Inc. | 52,311 | 450 |
| * | Desktop Metal Inc. Class A | 64,362 | 450 |
| | Employers Holdings Inc. | 11,517 | 445 |
| * | Columbia Financial Inc. | 23,841 | 444 |
| * | Sylvamo Corp. | 15,727 | 443 |
| | Brookline Bancorp Inc. | 27,418 | 440 |
| | Griffon Corp. | 16,625 | 440 |
| * | Berkeley Lights Inc. | 18,869 | 439 |
| | Astec Industries Inc. | 8,192 | 437 |
| | Delek US Holdings Inc. | 22,478 | 437 |
| * | Deciphera Pharmaceuticals Inc. | 13,068 | 436 |
| | Core Laboratories NV | 16,736 | 435 |
| | CTS Corp. | 12,100 | 431 |
| * | Huron Consulting Group Inc. | 8,567 | 430 |
| | Safety Insurance Group Inc. | 5,484 | 430 |
| * | AAR Corp. | 12,010 | 425 |
| | Universal Corp. | 9,018 | 424 |
| | Office Properties Income Trust | 16,401 | 420 |
| * | Multiplan Corp. | 96,617 | 416 |
| * | Children's Place Inc. | 5,000 | 414 |
| | EW Scripps Co. Class A | 22,243 | 414 |
| * | Atara Biotherapeutics Inc. | 26,691 | 413 |
| * | FibroGen Inc. | 36,683 | 408 |
Total World Stock Index Fund
| | | Shares | Market
Value•
($000) |
| | Lennar Corp. Class B | 4,965 | 408 |
| | Matthews International Corp. Class A | 11,719 | 403 |
| * | Tivity Health Inc. | 16,116 | 403 |
| | Weis Markets Inc. | 7,154 | 403 |
| * | Consensus Cloud Solutions Inc. | 6,326 | 401 |
| | Apartment Investment and Management Co. Class A | 52,743 | 400 |
| | Heartland Express Inc. | 24,180 | 395 |
| * | American Axle & Manufacturing Holdings Inc. | 43,342 | 394 |
| | Scholastic Corp. | 10,900 | 394 |
| * | Axsome Therapeutics Inc. | 10,124 | 390 |
| | CNA Financial Corp. | 8,700 | 390 |
| * | JetBlue Airways Corp. | 27,524 | 386 |
| 2 | ARMOUR Residential REIT Inc. | 36,562 | 385 |
| * | EchoStar Corp. Class A | 16,414 | 385 |
| * | GCP Applied Technologies Inc. | 16,995 | 384 |
| * | Dril-Quip Inc. | 16,257 | 383 |
| * | Lions Gate Entertainment Corp. Class A | 29,135 | 377 |
| | Schweitzer-Mauduit International Inc. | 10,778 | 376 |
| * | Summit Hotel Properties Inc. | 37,496 | 375 |
| | Kearny Financial Corp. | 27,587 | 370 |
| * | WW International Inc. | 21,142 | 367 |
| * | SiriusPoint Ltd. | 38,928 | 366 |
| | Steelcase Inc. Class A | 30,400 | 362 |
| | Apogee Enterprises Inc. | 8,600 | 361 |
| * | Century Aluminum Co. | 27,189 | 359 |
| * | Radius Health Inc. | 16,611 | 359 |
| | Guess? Inc. | 17,200 | 356 |
| * | Myovant Sciences Ltd. | 16,279 | 356 |
| | WisdomTree Investments Inc. | 55,362 | 354 |
| * | Imax Corp. | 18,800 | 354 |
| * | Vivint Smart Home Inc. | 38,845 | 352 |
| * | TrueBlue Inc. | 12,600 | 351 |
| * | US Ecology Inc. | 10,864 | 350 |
| * | Madrigal Pharmaceuticals Inc. | 4,472 | 348 |
| * | Innoviva Inc. | 19,900 | 347 |
| | Republic Bancorp Inc. Class A | 6,430 | 347 |
| * | Endo International plc | 80,789 | 343 |
| | | Shares | Market
Value•
($000) |
| * | NextGen Healthcare Inc. | 20,722 | 341 |
| | TFS Financial Corp. | 17,420 | 339 |
| | Ebix Inc. | 10,260 | 337 |
| | State Auto Financial Corp. | 6,500 | 334 |
| * | Workhorse Group Inc. | 48,713 | 328 |
| * | Liberty Media Corp.- Liberty Braves Class C | 11,018 | 327 |
| * | NETGEAR Inc. | 11,352 | 327 |
| | Atlas Corp. | 23,268 | 326 |
| | GEO Group Inc. | 39,698 | 325 |
| | Scorpio Tankers Inc. | 19,766 | 317 |
| | Benchmark Electronics Inc. | 13,300 | 310 |
| | Matson Inc. | 3,700 | 308 |
| | SFL Corp. Ltd. | 38,345 | 303 |
| * | ScanSource Inc. | 8,411 | 301 |
| | Neenah Inc. | 5,900 | 298 |
| * | Zogenix Inc. | 19,398 | 297 |
| | Universal Health Realty Income Trust | 5,094 | 290 |
| * | Inogen Inc. | 7,201 | 286 |
| * | Allegiant Travel Co. | 1,626 | 285 |
| | 1st Source Corp. | 5,811 | 281 |
| | Aaron's Co. Inc. | 12,027 | 281 |
| * | Natus Medical Inc. | 11,196 | 280 |
| * | Blucora Inc. | 16,400 | 271 |
| *,2 | Maxeon Solar Technologies Ltd. | 12,000 | 270 |
| * | Amneal Pharmaceuticals Inc. | 48,745 | 268 |
| * | Liberty Latin America Ltd. Class A | 22,191 | 267 |
| * | NOW Inc. | 36,496 | 264 |
| | ACCO Brands Corp. | 31,661 | 262 |
| * | Pennant Group Inc. | 9,938 | 254 |
| | Brightspire Capital Inc. Class A | 25,568 | 251 |
| | Calavo Growers Inc. | 6,226 | 250 |
| | Saul Centers Inc. | 5,132 | 238 |
| * | Orthofix Medical Inc. | 6,600 | 237 |
| * | Forrester Research Inc. | 4,285 | 228 |
| | Alexander's Inc. | 800 | 223 |
| | SolarWinds Corp. | 13,823 | 223 |
| * | Copa Holdings SA Class A | 2,965 | 219 |
| * | Taro Pharmaceutical Industries Ltd. | 3,800 | 211 |
| * | Precigen Inc. | 43,240 | 209 |
| * | Spirit Airlines Inc. | 8,709 | 190 |
| | Ormat Technologies Inc. | 2,610 | 190 |
| | CVR Energy Inc. | 9,664 | 185 |
| * | N-Able Inc. | 13,823 | 184 |
| | Tootsie Roll Industries Inc. | 5,741 | 182 |
| * | Liberty Media Corp.- Liberty Braves Class A | 5,866 | 179 |
| * | SkyWest Inc. | 4,085 | 176 |
Total World Stock Index Fund
| | | Shares | Market
Value•
($000) |
| * | Tutor Perini Corp. | 12,200 | 166 |
| | ATN International Inc. | 4,035 | 165 |
| * | Epizyme Inc. | 33,673 | 141 |
| * | US Cellular Corp. | 4,600 | 141 |
| * | Theravance Biopharma Inc. | 16,757 | 130 |
| * | Immunovant Inc. | 14,259 | 115 |
| *,1 | Alder Biopharmaceuticals Inc. CVR Exp. 12/31/21 | 8,266 | 7 |
| *,1 | Media General Inc. CVR | 21,051 | 1 |
| * | Piedmont Lithium Inc. GDR | 1,851 | 1 |
| *,1 | Ferroglobe Unit | 10,400 | — |
| | | | 20,196,030 |
Total Common Stocks
(Cost $23,060,320) | 34,053,902 |
| Temporary Cash Investments (0.8%) |
| Money Market Fund (0.8%) |
| 4,5 | Vanguard Market Liquidity Fund, 0.070% (Cost $281,376) | 2,813,871 | 281,387 |
| Total Investments (100.4%) (Cost $23,341,696) | 34,335,289 |
| Other Assets and Liabilities—Net (-0.4%) | (137,085) |
| Net Assets (100%) | 34,198,204 |
| Cost is in $000. |
| • | See Note A in Notes to Financial Statements. |
| * | Non-income-producing security. |
| 1 | Security value determined using significant unobservable inputs. |
| 2 | Includes partial security positions on loan to broker-dealers. The total value of securities on loan is $206,300,000. |
| 3 | Security exempt from registration under Rule 144A of the Securities Act of 1933. Such securities may be sold in transactions exempt from registration, normally to qualified institutional buyers. At October 31, 2021, the aggregate value was $490,362,000, representing 1.4% of net assets. |
| 4 | Affiliated money market fund available only to Vanguard funds and certain trusts and accounts managed by Vanguard. Rate shown is the 7-day yield. |
| 5 | Collateral of $223,521,000 was received for securities on loan, of which $218,790,000 is held in Vanguard Market Liquidity Fund and $4,731,000 is held in cash. |
| | ADR—American Depositary Receipt. |
| | CVR—Contingent Value Rights. |
| | GDR—Global Depositary Receipt. |
| | NVDR—Non-Voting Depository Receipt. |
| | Ptg. Ctf.—Participating Certificates. |
| | REIT—Real Estate Investment Trust. |
Total World Stock Index Fund
Derivative Financial Instruments Outstanding as of Period End
| Futures Contracts |
| | | | ($000) |
| | Expiration | Number of
Long (Short)
Contracts | Notional
Amount | Value and
Unrealized
Appreciation
(Depreciation) |
| Long Futures Contracts | | | | |
| E-mini Russell 2000 Index | December 2021 | 109 | 12,510 | 436 |
| E-mini S&P 500 Index | December 2021 | 305 | 70,104 | 3,377 |
| Euro Stoxx 50 Index | December 2021 | 286 | 14,008 | 323 |
| FTSE 100 Index | December 2021 | 60 | 5,932 | 178 |
| MSCI Emerging Markets Index | December 2021 | 286 | 18,047 | (97) |
| S&P ASX 200 Index | December 2021 | 29 | 3,970 | (36) |
| S&P TSX 60 Index | December 2021 | 19 | 3,870 | 123 |
| Topix Index | December 2021 | 50 | 8,741 | (317) |
| | | | | 3,987 |
| Forward Currency Contracts |
| | Contract
Settlement
Date | Contract Amount (000) | Unrealized
Appreciation
($000) | Unrealized
Depreciation
($000) |
| Counterparty | Receive | Deliver |
| Bank of Montreal | 12/15/21 | AUD | 1,932 | USD | 1,425 | 28 | — |
| Royal Bank of Canada | 12/15/21 | AUD | 362 | USD | 267 | 5 | — |
| Toronto-Dominion Bank | 12/15/21 | CAD | 4,574 | USD | 3,632 | 64 | — |
| Goldman Sachs International | 12/15/21 | CAD | 4,260 | USD | 3,357 | 86 | — |
| Royal Bank of Canada | 12/15/21 | CAD | 2,253 | USD | 1,796 | 24 | — |
| Morgan Stanley Capital Services Inc. | 12/15/21 | EUR | 12,014 | USD | 14,219 | — | (316) |
| Bank of Montreal | 12/15/21 | EUR | 6,156 | USD | 7,299 | — | (175) |
| BNP Paribas | 12/15/21 | EUR | 3,370 | USD | 4,010 | — | (110) |
| Royal Bank of Canada | 12/15/21 | EUR | 889 | USD | 1,032 | — | (3) |
| Royal Bank of Canada | 12/15/21 | GBP | 2,163 | USD | 2,977 | — | (15) |
| Bank of Montreal | 12/15/21 | GBP | 928 | USD | 1,282 | — | (12) |
| Royal Bank of Canada | 12/15/21 | GBP | 355 | USD | 485 | 1 | — |
| Morgan Stanley Capital Services Inc. | 12/15/21 | GBP | 213 | USD | 290 | 2 | — |
| Morgan Stanley Capital Services Inc. | 12/15/21 | INR | 498,612 | USD | 6,728 | — | (104) |
| Morgan Stanley Capital Services Inc. | 12/15/21 | JPY | 1,257,091 | USD | 11,474 | — | (437) |
| Royal Bank of Canada | 12/15/21 | JPY | 556,534 | USD | 5,045 | — | (159) |
| UBS AG | 12/15/21 | JPY | 275,732 | USD | 2,510 | — | (90) |
| Morgan Stanley Capital Services Inc. | 12/15/21 | USD | 3,442 | AUD | 4,733 | — | (119) |
| JPMorgan Chase Bank, N.A. | 12/15/21 | USD | 5,443 | CAD | 6,888 | — | (124) |
| Morgan Stanley Capital Services Inc. | 12/15/21 | USD | 3,130 | CAD | 3,992 | — | (96) |
| JPMorgan Chase Bank, N.A. | 12/15/21 | USD | 10,339 | CHF | 9,459 | — | (6) |
| Barclays Bank plc | 12/15/21 | USD | 673 | DKK | 4,237 | 14 | — |
| JPMorgan Chase Bank, N.A. | 12/15/21 | USD | 11,410 | EUR | 9,723 | 157 | — |
Total World Stock Index Fund
| Forward Currency Contracts (continued) |
| | Contract
Settlement
Date | Contract Amount (000) | Unrealized
Appreciation
($000) | Unrealized
Depreciation
($000) |
| Counterparty | Receive | Deliver |
| State Street Bank & Trust Co. | 12/15/21 | USD | 5,753 | EUR | 4,896 | 87 | — |
| JPMorgan Chase Bank, N.A. | 12/15/21 | USD | 6,773 | GBP | 4,953 | — | (8) |
| JPMorgan Chase Bank, N.A. | 12/15/21 | USD | 3,201 | HKD | 24,902 | — | — |
| BNP Paribas | 12/15/21 | USD | 11,865 | JPY | 1,321,511 | 263 | — |
| Royal Bank of Canada | 12/15/21 | USD | 6,638 | JPY | 734,827 | 188 | — |
| Deutsche Bank AG | 12/15/21 | USD | 5,570 | JPY | 612,036 | 197 | — |
| Morgan Stanley Capital Services Inc. | 12/15/21 | USD | 2,264 | KRW | 2,645,559 | 3 | — |
| | | | | | | 1,119 | (1,774) |
| AUD—Australian dollar. |
| CAD—Canadian dollar. |
| CHF—Swiss franc. |
| DKK—Danish krone. |
| EUR—euro. |
| GBP—British pound. |
| HKD—Hong Kong dollar. |
| INR—Indian rupee. |
| JPY—Japanese yen. |
| KRW—Korean won. |
| USD—U.S. dollar. |
At October 31, 2021, the counterparties had deposited in segregated accounts cash of $31,000 in connection with open forward currency contracts.
See accompanying Notes, which are an integral part of the Financial Statements.
Total World Stock Index Fund
Statement of Assets and Liabilities
|
| ($000s, except shares and per-share amounts) | Amount |
| Assets | |
| Investments in Securities, at Value | |
| Unaffiliated Issuers (Cost $23,060,320) | 34,053,902 |
| Affiliated Issuers (Cost $281,376) | 281,387 |
| Total Investments in Securities | 34,335,289 |
| Investment in Vanguard | 1,101 |
| Cash | 14,140 |
| Cash Collateral Pledged—Futures Contracts | 7,687 |
| Cash Collateral Pledged—Forward Currency Contracts | 550 |
| Foreign Currency, at Value (Cost $30,827) | 30,644 |
| Receivables for Investment Securities Sold | 9,023 |
| Receivables for Accrued Income | 52,660 |
| Receivables for Capital Shares Issued | 6,003 |
| Unrealized Appreciation—Forward Currency Contracts | 1,119 |
| Total Assets | 34,458,216 |
| Liabilities | |
| Payables for Investment Securities Purchased | 14,883 |
| Collateral for Securities on Loan | 223,521 |
| Payables for Capital Shares Redeemed | 2,565 |
| Payables to Vanguard | 909 |
| Variation Margin Payable—Futures Contracts | 128 |
| Unrealized Depreciation—Forward Currency Contracts | 1,774 |
| Deferred Foreign Capital Gains Taxes | 16,232 |
| Total Liabilities | 260,012 |
| Net Assets | 34,198,204 |
Total World Stock Index Fund
Statement of Assets and Liabilities (continued)
|
| At October 31, 2021, net assets consisted of: | |
| ($000s, except shares and per-share amounts) | Amount |
| Paid-in Capital | 23,771,730 |
| Total Distributable Earnings (Loss) | 10,426,474 |
| Net Assets | 34,198,204 |
| |
| ETF Shares—Net Assets | |
Applicable to 235,322,399 outstanding $.001 par value shares of
beneficial interest (unlimited authorization) | 25,166,040 |
| Net Asset Value Per Share—ETF Shares | $106.94 |
| |
| Admiral Shares—Net Assets | |
Applicable to 135,916,799 outstanding $.001 par value shares of
beneficial interest (unlimited authorization) | 5,149,267 |
| Net Asset Value Per Share—Admiral Shares | $37.89 |
| |
| Institutional Shares—Net Assets | |
Applicable to 17,779,235 outstanding $.001 par value shares of
beneficial interest (unlimited authorization) | 3,882,897 |
| Net Asset Value Per Share—Institutional Shares | $218.40 |
See accompanying Notes, which are an integral part of the Financial Statements.
Total World Stock Index Fund
|
| | Year Ended
October 31, 2021 |
| | ($000) |
| Investment Income | |
| Income | |
| Dividends1 | 541,537 |
| Interest2 | 99 |
| Securities Lending—Net | 4,452 |
| Total Income | 546,088 |
| Expenses | |
| The Vanguard Group—Note B | |
| Investment Advisory Services | 2,548 |
| Management and Administrative—ETF Shares | 10,648 |
| Management and Administrative—Admiral Shares | 3,538 |
| Management and Administrative—Institutional Shares | 2,416 |
| Marketing and Distribution—ETF Shares | 541 |
| Marketing and Distribution—Admiral Shares | 153 |
| Marketing and Distribution—Institutional Shares | 99 |
| Custodian Fees | 1,184 |
| Auditing Fees | 43 |
| Shareholders’ Reports—ETF Shares | 241 |
| Shareholders’ Reports—Admiral Shares | 35 |
| Shareholders’ Reports—Institutional Shares | 5 |
| Trustees’ Fees and Expenses | 8 |
| Total Expenses | 21,459 |
| Net Investment Income | 524,629 |
| Realized Net Gain (Loss) | |
| Investment Securities Sold2,3 | (107,360) |
| Futures Contracts | 41,750 |
| Swap Contracts | 13 |
| Forward Currency Contracts | (553) |
| Foreign Currencies | (1,151) |
| Realized Net Gain (Loss) | (67,301) |
Total World Stock Index Fund
| Statement of Operations (continued) |
| | Year Ended
October 31, 2021 |
| | ($000) |
| Change in Unrealized Appreciation (Depreciation) | |
| Investment Securities2,4 | 7,624,193 |
| Futures Contracts | 7,822 |
| Swap Contracts | (3) |
| Forward Currency Contracts | (66) |
| Foreign Currencies | (921) |
| Change in Unrealized Appreciation (Depreciation) | 7,631,025 |
| Net Increase (Decrease) in Net Assets Resulting from Operations | 8,088,353 |
| 1 | Dividends are net of foreign withholding taxes of $35,514,000. |
| 2 | Interest income, realized net gain (loss), and change in unrealized appreciation (depreciation) from an affiliated company of the fund were $96,000, less than $1,000, and less than $1,000, respectively. Purchases and sales are for temporary cash investment purposes. |
| 3 | Realized gain (loss) is net of foreign capital gain taxes of $56,000. |
| 4 | The change in unrealized appreciation (depreciation) is net of the change in deferred foreign capital gains taxes of $16,224,000. |
See accompanying Notes, which are an integral part of the Financial Statements.
Total World Stock Index Fund
Statement of Changes in Net Assets
|
| | Year Ended October 31, |
| | 2021
($000) | 2020
($000) |
| | | |
| Increase (Decrease) in Net Assets | | |
| Operations | | |
| Net Investment Income | 524,629 | 382,588 |
| Realized Net Gain (Loss) | (67,301) | 55,647 |
| Change in Unrealized Appreciation (Depreciation) | 7,631,025 | 627,154 |
| Net Increase (Decrease) in Net Assets Resulting from Operations | 8,088,353 | 1,065,389 |
| Distributions | | |
| ETF Shares | (351,277) | (275,179) |
| Admiral Shares | (72,781) | (51,356) |
| Institutional Shares | (65,774) | (64,101) |
| Total Distributions | (489,832) | (390,636) |
| Capital Share Transactions | | |
| Investor Shares | — | (3,594) |
| ETF Shares | 5,703,441 | 1,493,356 |
| Admiral Shares | 1,187,620 | 530,126 |
| Institutional Shares | (310,062) | 94,517 |
| Net Increase (Decrease) from Capital Share Transactions | 6,580,999 | 2,114,405 |
| Total Increase (Decrease) | 14,179,520 | 2,789,158 |
| Net Assets | | |
| Beginning of Period | 20,018,684 | 17,229,526 |
| End of Period | 34,198,204 | 20,018,684 |
See accompanying Notes, which are an integral part of the Financial Statements.
Total World Stock Index Fund
| ETF Shares | | | | | |
For a Share Outstanding
Throughout Each Period | Year Ended October 31, |
| 2021 | 2020 | 2019 | 2018 | 2017 |
| Net Asset Value, Beginning of Period | $78.87 | $76.83 | $69.96 | $72.13 | $59.62 |
| Investment Operations | | | | | |
| Net Investment Income1 | 1.838 | 1.556 | 1.801 | 1.732 | 1.512 |
| Net Realized and Unrealized Gain (Loss) on Investments | 27.954 | 2.078 | 6.825 | (2.241) | 12.528 |
| Total from Investment Operations | 29.792 | 3.634 | 8.626 | (.509) | 14.040 |
| Distributions | | | | | |
| Dividends from Net Investment Income | (1.722) | (1.594) | (1.756) | (1.661) | (1.530) |
| Distributions from Realized Capital Gains | — | — | — | — | — |
| Total Distributions | (1.722) | (1.594) | (1.756) | (1.661) | (1.530) |
| Net Asset Value, End of Period | $106.94 | $78.87 | $76.83 | $69.96 | $72.13 |
| Total Return | 37.99% | 4.87% | 12.60% | -0.82% | 23.82% |
| Ratios/Supplemental Data | | | | | |
| Net Assets, End of Period (Millions) | $25,166 | $14,070 | $12,122 | $11,372 | $9,755 |
| Ratio of Total Expenses to Average Net Assets | 0.07% | 0.08% | 0.08% | 0.09% | 0.10% |
| Ratio of Net Investment Income to Average Net Assets | 1.84% | 2.03% | 2.48% | 2.32% | 2.28% |
| Portfolio Turnover Rate2 | 6% | 6% | 7% | 9% | 10% |
| 1 | Calculated based on average shares outstanding. |
| 2 | Excludes the value of portfolio securities received or delivered as a result of in-kind purchases or redemptions of the fund’s capital shares, including ETF Creation Units. |
See accompanying Notes, which are an integral part of the Financial Statements.
Total World Stock Index Fund
| Admiral Shares | | | |
For a Share Outstanding
Throughout Each Period | Year Ended October 31, | February 7,
20191 to
October 31,
2019 |
| 2021 | 2020 | |
| Net Asset Value, Beginning of Period | $27.94 | $27.22 | $25.00 |
| Investment Operations | | | |
| Net Investment Income2 | .644 | .547 | .488 |
| Net Realized and Unrealized Gain (Loss) on Investments | 9.908 | .732 | 2.173 |
| Total from Investment Operations | 10.552 | 1.279 | 2.661 |
| Distributions | | | |
| Dividends from Net Investment Income | (.602) | (.559) | (.441) |
| Distributions from Realized Capital Gains | — | — | — |
| Total Distributions | (.602) | (.559) | (.441) |
| Net Asset Value, End of Period | $37.89 | $27.94 | $27.22 |
| Total Return3 | 37.98% | 4.83% | 10.73% |
| Ratios/Supplemental Data | | | |
| Net Assets, End of Period (Millions) | $5,149 | $2,842 | $2,181 |
| Ratio of Total Expenses to Average Net Assets | 0.10% | 0.10% | 0.10%4 |
| Ratio of Net Investment Income to Average Net Assets | 1.82% | 2.02% | 2.53%4 |
| Portfolio Turnover Rate5 | 6% | 6% | 7%6 |
| 1 | Inception. |
| 2 | Calculated based on average shares outstanding. |
| 3 | Total returns do not include account service fees that may have applied in the periods shown. Fund prospectuses provide information about any applicable account service fees. |
| 4 | Annualized. |
| 5 | Excludes the value of portfolio securities received or delivered as a result of in-kind purchases or redemptions of the fund’s capital shares, including ETF Creation Units. |
| 6 | Reflects the fund’s portfolio turnover for the fiscal year ended October 31, 2019. |
See accompanying Notes, which are an integral part of the Financial Statements.
Total World Stock Index Fund
| Institutional Shares | | | | | |
For a Share Outstanding
Throughout Each Period | Year Ended October 31, |
| 2021 | 2020 | 2019 | 2018 | 2017 |
| Net Asset Value, Beginning of Period | $161.08 | $156.89 | $142.87 | $147.32 | $121.75 |
| Investment Operations | | | | | |
| Net Investment Income1 | 3.694 | 3.176 | 3.702 | 3.531 | 3.112 |
| Net Realized and Unrealized Gain (Loss) on Investments | 57.129 | 4.265 | 13.907 | (4.578) | 25.594 |
| Total from Investment Operations | 60.823 | 7.441 | 17.609 | (1.047) | 28.706 |
| Distributions | | | | | |
| Dividends from Net Investment Income | (3.503) | (3.251) | (3.589) | (3.403) | (3.136) |
| Distributions from Realized Capital Gains | — | — | — | — | — |
| Total Distributions | (3.503) | (3.251) | (3.589) | (3.403) | (3.136) |
| Net Asset Value, End of Period | $218.40 | $161.08 | $156.89 | $142.87 | $147.32 |
| Total Return | 37.97% | 4.87% | 12.57% | -0.82% | 23.86% |
| Ratios/Supplemental Data | | | | | |
| Net Assets, End of Period (Millions) | $3,883 | $3,107 | $2,924 | $2,570 | $2,529 |
| Ratio of Total Expenses to Average Net Assets | 0.08% | 0.08% | 0.08% | 0.08% | 0.09% |
| Ratio of Net Investment Income to Average Net Assets | 1.83% | 2.03% | 2.49% | 2.33% | 2.29% |
| Portfolio Turnover Rate2 | 6% | 6% | 7% | 9% | 10% |
| 1 | Calculated based on average shares outstanding. |
| 2 | Excludes the value of portfolio securities received or delivered as a result of in-kind purchases or redemptions of the fund’s capital shares, including ETF Creation Units. |
See accompanying Notes, which are an integral part of the Financial Statements.
Total World Stock Index Fund
Notes to Financial Statements
Vanguard Total World Stock Index Fund is registered under the Investment Company Act of 1940 as an open-end investment company, or mutual fund. The fund offers three classes of shares: ETF Shares, Admiral Shares, and Institutional Shares. Each of the share classes has different eligibility and minimum purchase requirements, and is designed for different types of investors. ETF Shares are listed for trading on NYSE Arca; they can be purchased and sold through a broker. Prior to November 7, 2019, the fund offered Investor Shares. Effective at the close of business on November 7, 2019, the remaining Investor Shares were converted to Admiral Shares.
The fund invests in securities of foreign issuers, which may subject it to investment risks not normally associated with investing in securities of U.S. corporations. Market disruptions associated with the COVID-19 pandemic have had a global impact, and uncertainty exists as to the long-term implications. Such disruptions can adversely affect assets of the fund and thus fund performance.
| A. | The following significant accounting policies conform to generally accepted accounting principles for U.S. investment companies. The fund consistently follows such policies in preparing its financial statements. |
1. Security Valuation: Securities are valued as of the close of trading on the New York Stock Exchange (generally 4 p.m., Eastern time) on the valuation date. Equity securities are valued at the latest quoted sales prices or official closing prices taken from the primary market in which each security trades; such securities not traded on the valuation date are valued at the mean of the latest quoted bid and asked prices. Securities for which market quotations are not readily available, or whose values have been affected by events occurring before the fund’s pricing time but after the close of the securities’ primary markets, are valued at their fair values calculated according to procedures adopted by the board of trustees. These procedures include obtaining quotations from an independent pricing service, monitoring news to identify significant market- or security-specific events, and evaluating changes in the values of foreign market proxies (for example, ADRs, futures contracts, or exchange-traded funds), between the time the foreign markets close and the fund’s pricing time. When fair-value pricing is employed, the prices of securities used by a fund to calculate its net asset value may differ from quoted or published prices for the same securities.
Investments in Vanguard Market Liquidity Fund are valued at that fund's net asset value.
Temporary cash investments are valued using the latest bid prices or using valuations based on a matrix system (which considers such factors as security prices, yields, maturities, and ratings), both as furnished by independent pricing services.
2. Foreign Currency: Securities and other assets and liabilities denominated in foreign currencies are translated into U.S. dollars using exchange rates obtained from an independent third party as of the fund’s pricing time on the valuation date. Realized gains (losses) and unrealized appreciation (depreciation) on investment securities include the effects of changes in exchange rates since the securities were purchased, combined with the effects of changes in security prices. Fluctuations in the value of other assets and liabilities resulting from changes in exchange rates are recorded as unrealized foreign currency gains (losses) until the assets or liabilities are settled in cash, at which time they are recorded as realized foreign currency gains (losses).
3. Futures Contracts: The fund uses index futures contracts to a limited extent, with the objectives of maintaining full exposure to the stock market, maintaining liquidity, and minimizing transaction costs. The fund may purchase futures contracts to immediately invest incoming cash in the market, or sell futures in response to cash outflows, thereby simulating a fully invested position in the underlying index while maintaining a cash balance for liquidity. The primary risks associated with the use of futures contracts are imperfect correlation between changes in market values of
Total World Stock Index Fund
stocks held by the fund and the prices of futures contracts, and the possibility of an illiquid market. Counterparty risk involving futures is mitigated because a regulated clearinghouse is the counterparty instead of the clearing broker. To further mitigate counterparty risk, the fund trades futures contracts on an exchange, monitors the financial strength of its clearing brokers and clearinghouse, and has entered into clearing agreements with its clearing brokers. The clearinghouse imposes initial margin requirements to secure the fund’s performance and requires daily settlement of variation margin representing changes in the market value of each contract. Any securities pledged as initial margin for open contracts are noted in the Schedule of Investments.
Futures contracts are valued at their quoted daily settlement prices. The notional amounts of the contracts are not recorded in the Statement of Assets and Liabilities. Fluctuations in the value of the contracts are recorded in the Statement of Assets and Liabilities as an asset (liability) and in the Statement of Operations as unrealized appreciation (depreciation) until the contracts are closed, when they are recorded as realized gains (losses) on futures contracts.
During the year ended October 31, 2021, the fund’s average investments in long and short futures contracts represented 1% and 0% of net assets, respectively, based on the average of the notional amounts at each quarter-end during the period.
4. Forward Currency Contracts: The fund enters into forward currency contracts to protect the value of securities and related receivables and payables against changes in future foreign exchange rates. The fund’s risks in using these contracts include movement in the values of the foreign currencies relative to the U.S. dollar and the ability of the counterparties to fulfill their obligations under the contracts. The fund mitigates its counterparty risk by entering into forward currency contracts only with a diverse group of prequalified counterparties, monitoring their financial strength, entering into master netting arrangements with its counterparties, and requiring its counterparties to transfer collateral as security for their performance. In the absence of a default, the collateral pledged or received by the fund cannot be repledged, resold, or rehypothecated. The master netting arrangements provide that, in the event of a counterparty’s default (including bankruptcy), the fund may terminate the forward currency contracts, determine the net amount owed by either party in accordance with its master netting arrangements, and sell or retain any collateral held up to the net amount owed to the fund under the master netting arrangements. The forward currency contracts contain provisions whereby a counterparty may terminate open contracts if the fund’s net assets decline below a certain level, triggering a payment by the fund if the fund is in a net liability position at the time of the termination. The payment amount would be reduced by any collateral the fund has pledged. Any securities pledged as collateral for open contracts are noted in the Schedule of Investments. The value of collateral received or pledged is compared daily to the value of the forward currency contracts exposure with each counterparty, and any difference, if in excess of a specified minimum transfer amount, is adjusted and settled within two business days.
Forward currency contracts are valued at their quoted daily prices obtained from an independent third party, adjusted for currency risk based on the expiration date of each contract. The notional amounts of the contracts are not recorded in the Statement of Assets and Liabilities. Fluctuations in the value of the contracts are recorded in the Statement of Assets and Liabilities as an asset (liability) and in the Statement of Operations as unrealized appreciation (depreciation) until the contracts are closed, when they are recorded as realized gains (losses) on forward currency contracts.
Total World Stock Index Fund
During the year ended October 31, 2021, the fund’s average investment in forward currency contracts represented less than 1% of net assets, based on the average of the notional amounts at each quarter-end during the period.
5. Swap Contracts: The fund has entered into equity swap contracts to earn the total return on selected reference stocks in the fund’s target index. Under the terms of the swaps, the fund receives the total return on the referenced stock (i.e., receiving the increase or paying the decrease in value of the selected reference stock and receiving the equivalent of any dividends in respect of the selected referenced stock) over a specified period of time, applied to a notional amount that represents the value of a designated number of shares of the selected reference stock at the beginning of the equity swap contract. The fund also pays a floating rate that is based on short-term interest rates, applied to the notional amount. At the same time, the fund generally invests an amount approximating the notional amount of the swap in high-quality temporary cash investments.
A risk associated with all types of swaps is the possibility that a counterparty may default on its obligation to pay net amounts due to the fund. The fund’s maximum amount subject to counterparty risk is the unrealized appreciation on the swap contract. The fund mitigates its counterparty risk by entering into swaps only with a diverse group of prequalified counterparties, monitoring their financial strength, entering into master netting arrangements with its counterparties, and requiring its counterparties to transfer collateral as security for their performance. In the absence of a default, the collateral pledged or received by the fund cannot be repledged, resold, or rehypothecated. In the event of a counterparty’s default (including bankruptcy), the fund may terminate any swap contracts with that counterparty, determine the net amount owed by either party in accordance with its master netting arrangements, and sell or retain any collateral held up to the net amount owed to the fund under the master netting arrangements. The swap contracts contain provisions whereby a counterparty may terminate open contracts if the fund’s net assets decline below a certain level, triggering a payment by the fund if the fund is in a net liability position at the time of the termination. The payment amount would be reduced by any collateral the fund has pledged. Any securities pledged as collateral for open contracts are noted in the Schedule of Investments. The value of collateral received or pledged is compared daily to the value of the swap contracts exposure with each counterparty, and any difference, if in excess of a specified minimum transfer amount, is adjusted and settled within two business days.
The notional amounts of swap contracts are not recorded in the Statement of Assets and Liabilities. Swaps are valued daily based on market quotations received from independent pricing services or recognized dealers and the change in value is recorded in the Statement of Assets and Liabilities as an asset (liability) and in the Statement of Operations as unrealized appreciation (depreciation) until periodic payments are made or the termination of the swap, at which time realized gain (loss) is recorded.
During the year ended October 31, 2021, the fund’s average amounts of investments in total return swaps represented less than 1% of net assets, based on the average of notional amounts at each quarter-end during the period. The fund had no open swap contracts at October 31, 2021.
6. Federal Income Taxes: The fund intends to continue to qualify as a regulated investment company and distribute all of its taxable income. The fund’s tax returns are open to examination by the relevant tax authorities until expiration of the applicable statute of limitations, which is
Total World Stock Index Fund
generally three years after the filing of the tax return. Management has analyzed the fund’s tax positions taken for all open federal and state income tax years, and has concluded that no provision for income tax is required in the fund’s financial statements.
7. Distributions: Distributions to shareholders are recorded on the ex-dividend date. Distributions are determined on a tax basis at the fiscal year-end and may differ from net investment income and realized capital gains for financial reporting purposes.
8. Securities Lending: To earn additional income, the fund lends its securities to qualified institutional borrowers. Security loans are subject to termination by the fund at any time, and are required to be secured at all times by collateral in an amount at least equal to the market value of securities loaned. Daily market fluctuations could cause the value of loaned securities to be more or less than the value of the collateral received. When this occurs, the collateral is adjusted and settled before the opening of the market on the next business day. The fund further mitigates its counterparty risk by entering into securities lending transactions only with a diverse group of prequalified counterparties, monitoring their financial strength, and entering into master securities lending agreements with its counterparties. The master securities lending agreements provide that, in the event of a counterparty’s default (including bankruptcy), the fund may terminate any loans with that borrower, determine the net amount owed, and sell or retain the collateral up to the net amount owed to the fund; however, such actions may be subject to legal proceedings. While collateral mitigates counterparty risk, in the event of a default, the fund may experience delays and costs in recovering the securities loaned. The fund invests cash collateral received in Vanguard Market Liquidity Fund, and records a liability in the Statement of Assets and Liabilities for the return of the collateral, during the period the securities are on loan. Collateral investments in Vanguard Market Liquidity Fund are subject to market appreciation or depreciation. Securities lending income represents fees charged to borrowers plus income earned on invested cash collateral, less expenses associated with the loan. During the term of the loan, the fund is entitled to all distributions made on or in respect of the loaned securities.
9. Credit Facilities and Interfund Lending Program: The fund and certain other funds managed by The Vanguard Group ("Vanguard") participate in a $4.3 billion committed credit facility provided by a syndicate of lenders pursuant to a credit agreement and an uncommitted credit facility provided by Vanguard. Both facilities may be renewed annually. Each fund is individually liable for its borrowings, if any, under the credit facilities. Borrowings may be utilized for temporary or emergency purposes, subject to the fund’s regulatory and contractual borrowing restrictions. With respect to the committed credit facility, the participating funds are charged administrative fees and an annual commitment fee of 0.10% of the undrawn committed amount of the facility; these fees are allocated to the funds based on a method approved by the fund’s board of trustees and included in Management and Administrative expenses on the fund’s Statement of Operations. Any borrowings under either facility bear interest at a rate based upon the higher of the one-month London Interbank Offered Rate (or an acceptable alternate rate, if necessary), federal funds effective rate, or overnight bank funding rate plus an agreed-upon spread, except that borrowings under the uncommitted credit facility may bear interest based upon an alternate rate agreed to by the fund and Vanguard.
In accordance with an exemptive order (the “Order”) from the SEC, the fund may participate in a joint lending and borrowing program that allows registered open-end Vanguard funds to borrow money from and lend money to each other for temporary or emergency purposes (the “Interfund Lending Program”), subject to compliance with the terms and conditions of the Order, and to the extent permitted by the fund’s investment objective and investment policies. Interfund loans and
Total World Stock Index Fund
borrowings normally extend overnight, but can have a maximum duration of seven days. Loans may be called on one business day’s notice. The interest rate to be charged is governed by the conditions of the Order and internal procedures adopted by the board of trustees. The board of trustees is responsible for overseeing the Interfund Lending Program.
For the year ended October 31, 2021, the fund did not utilize the credit facilities or the Interfund Lending Program.
10. Other: Dividend income is recorded on the ex-dividend date. Non-cash dividends included in income, if any, are recorded at the fair value of the securities received. Interest income includes income distributions received from Vanguard Market Liquidity Fund and is accrued daily. Premiums and discounts on debt securities are amortized and accreted, respectively, to interest income over the lives of the respective securities, except for premiums on certain callable debt securities that are amortized to the earliest call date. Security transactions are accounted for on the date securities are bought or sold. Costs used to determine realized gains (losses) on the sale of investment securities are those of the specific securities sold.
Taxes on foreign dividends and capital gains have been provided for in accordance with the fund's understanding of the applicable countries' tax rules and rates. Deferred foreign capital gains tax, if any, is accrued daily based upon net unrealized gains. The fund has filed tax reclaims for previously withheld taxes on dividends earned in certain European Union countries. These filings are subject to various administrative and judicial proceedings within these countries. Such tax reclaims received during the year, if any, are included in dividend income. No other amounts for additional tax reclaims are reflected in the financial statements due to the uncertainty as to the ultimate resolution of proceedings, the likelihood of receipt of these reclaims, and the potential timing of payment.
Each class of shares has equal rights as to assets and earnings, except that each class separately bears certain class-specific expenses related to maintenance of shareholder accounts (included in Management and Administrative expenses) and shareholder reporting. Marketing and distribution expenses are allocated to each class of shares based on a method approved by the board of trustees. Income, other non-class-specific expenses, and gains and losses on investments are allocated to each class of shares based on its relative net assets.
| B. | In accordance with the terms of a Funds' Service Agreement (the “FSA”) between Vanguard and the fund, Vanguard furnishes to the fund investment advisory, corporate management, administrative, marketing, and distribution services at Vanguard’s cost of operations (as defined by the FSA). These costs of operations are allocated to the fund based on methods and guidelines approved by the board of trustees and are generally settled twice a month. |
Upon the request of Vanguard, the fund may invest up to 0.40% of its net assets as capital in Vanguard. At October 31, 2021, the fund had contributed to Vanguard capital in the amount of $1,101,000, representing less than 0.01% of the fund’s net assets and 0.44% of Vanguard’s capital received pursuant to the FSA. The fund’s trustees and officers are also directors and employees, respectively, of Vanguard.
| C. | Various inputs may be used to determine the value of the fund’s investments and derivatives. These inputs are summarized in three broad levels for financial statement purposes. The inputs or methodologies used to value securities are not necessarily an indication of the risk associated with investing in those securities. |
Total World Stock Index Fund
Level 1—Quoted prices in active markets for identical securities.
Level 2—Other significant observable inputs (including quoted prices for similar securities, interest rates, prepayment speeds, credit risk, etc.).
Level 3—Significant unobservable inputs (including the fund’s own assumptions used to determine the fair value of investments). Any investments and derivatives valued with significant unobservable inputs are noted on the Schedule of Investments.
The following table summarizes the market value of the fund’s investments and derivatives as of October 31, 2021, based on the inputs used to value them:
| | Level 1
($000) | Level 2
($000) | Level 3
($000) | Total
($000) |
| Investments | | | | |
| Assets | | | | |
| Common Stocks—North and South America | 21,487,431 | 4,130 | 8 | 21,491,569 |
| Common Stocks—Other | 247,108 | 12,285,765 | 29,460 | 12,562,333 |
| Temporary Cash Investments | 281,387 | — | — | 281,387 |
| Total | 22,015,926 | 12,289,895 | 29,468 | 34,335,289 |
| Derivative Financial Instruments | | | | |
| Assets | | | | |
| Futures Contracts1 | 4,437 | — | — | 4,437 |
| Forward Currency Contracts | — | 1,119 | — | 1,119 |
| Total | 4,437 | 1,119 | — | 5,556 |
| Liabilities | | | | |
| Futures Contracts1 | 450 | — | — | 450 |
| Forward Currency Contracts | — | 1,774 | — | 1,774 |
| Total | 450 | 1,774 | — | 2,224 |
| 1 | Includes cumulative appreciation (depreciation) on futures contracts and centrally cleared swaps, if any, as reported in the Schedule of Investments. Only current day’s variation margin is reported within the Statement of Assets and Liabilities. |
Total World Stock Index Fund
| D. | At October 31, 2021, the fair values of derivatives were reflected in the Statement of Assets and Liabilities as follows: |
| Statement of Assets and Liabilities | Equity
Contracts
($000) | Foreign
Exchange
Contracts
($000) | Total
($000) |
| Unrealized Appreciation—Futures Contracts1 | 4,437 | — | 4,437 |
| Unrealized Appreciation—Forward Currency Contracts | — | 1,119 | 1,119 |
| Total Assets | 4,437 | 1,119 | 5,556 |
| | | | |
| Unrealized Depreciation—Futures Contracts1 | 450 | — | 450 |
| Unrealized Depreciation—Forward Currency Contracts | — | 1,774 | 1,774 |
| Total Liabilities | 450 | 1,774 | 2,224 |
| 1 | Includes cumulative appreciation (depreciation) on futures contracts and centrally cleared swaps, if any, as reported in the Schedule of Investments. Only current day’s variation margin is reported within the Statement of Assets and Liabilities. |
Realized net gain (loss) and the change in unrealized appreciation (depreciation) on derivatives for the year ended October 31, 2021, were:
| Realized Net Gain (Loss) on Derivatives | Equity
Contracts
($000) | Foreign
Exchange
Contracts
($000) | Total
($000) |
| Futures Contracts | 41,750 | — | 41,750 |
| Swap Contracts | 13 | — | 13 |
| Forward Currency Contracts | — | (553) | (553) |
| Realized Net Gain (Loss) on Derivatives | 41,763 | (553) | 41,210 |
| Change in Unrealized Appreciation (Depreciation) on Derivatives |
| Futures Contracts | 7,822 | — | 7,822 |
| Swap Contracts | (3) | — | (3) |
| Forward Currency Contracts | — | (66) | (66) |
| Change in Unrealized Appreciation (Depreciation) on Derivatives | 7,819 | (66) | 7,753 |
| E. | Permanent differences between book-basis and tax-basis components of net assets are reclassified among capital accounts in the financial statements to reflect their tax character. These reclassifications have no effect on net assets or net asset value per share. As of period end, permanent differences primarily attributable to the accounting for foreign currency transactions, passive foreign investment companies, swap agreements, and tax expense on capital gains were reclassified between the following accounts: |
| | Amount
($000) |
| Paid-in Capital | 12 |
| Total Distributable Earnings (Loss) | (12) |
Temporary differences between book-basis and tax-basis components of total distributable earnings (loss) arise when certain items of income, gain, or loss are recognized in different periods
Total World Stock Index Fund
for financial statement and tax purposes; these differences will reverse at some time in the future. The differences are primarily related to the deferral of losses from wash sales; the recognition of unrealized gains or losses from certain derivative contracts; the recognition of unrealized gains from passive foreign investment companies; and the classification of securities for tax purposes. As of period end, the tax-basis components of total distributable earnings (loss) are detailed in the table as follows:
| | Amount
($000) |
| Undistributed Ordinary Income | 164,174 |
| Undistributed Long-Term Gains | — |
| Capital Loss Carryforwards | (622,416) |
| Qualified Late-Year Losses | — |
| Net Unrealized Gains (Losses) | 10,884,716 |
The tax character of distributions paid was as follows:
| | Year Ended October 31, |
| | 2021
Amount
($000) | 2020
Amount
($000) |
| Ordinary Income* | 489,832 | 390,636 |
| Long-Term Capital Gains | — | — |
| Total | 489,832 | 390,636 |
| * | Includes short-term capital gains, if any. |
As of October 31, 2021, gross unrealized appreciation and depreciation for investments and derivatives based on cost for U.S. federal income tax purposes were as follows:
| | Amount
($000) |
| Tax Cost | 23,433,969 |
| Gross Unrealized Appreciation | 12,505,587 |
| Gross Unrealized Depreciation | (1,604,485) |
| Net Unrealized Appreciation (Depreciation) | 10,901,102 |
| F. | During the year ended October 31, 2021, the fund purchased $8,410,109,000 of investment securities and sold $1,761,943,000 of investment securities, other than temporary cash investments. Purchases and sales include $4,894,243,000 and $0, respectively, in connection with in-kind purchases and redemptions of the fund's capital shares. |
The fund purchased securities from and sold securities to other Vanguard funds or accounts managed by Vanguard or its affiliates, in accordance with procedures adopted by the board of trustees in compliance with Rule 17a-7 of the Investment Company Act of 1940. For the year ended October 31, 2021, such purchases were $262,386,000 and sales were $157,694,000, resulting in net realized loss of $13,033,000; these amounts, other than temporary cash investments, are included in the purchases and sales of investment securities noted above.
Total World Stock Index Fund
| G. | Capital share transactions for each class of shares were: |
| | Year Ended October 31, | |
| | 2021 | | 2020 |
| | Amount
($000) | Shares
(000) | | Amount
($000) | Shares
(000) |
| Investor Shares | | | | | |
| Issued | — | — | | 70 | 2 |
| Issued in Lieu of Cash Distributions | — | — | | — | — |
| Redeemed1 | — | — | | (3,664) | (115) |
| Net Increase (Decrease)—Investor Shares | — | — | | (3,594) | (113) |
| ETF Shares | | | | | |
| Issued | 5,703,441 | 56,936 | | 2,214,590 | 30,406 |
| Issued in Lieu of Cash Distributions | — | — | | — | — |
| Redeemed | — | — | | (721,234) | (9,800) |
| Net Increase (Decrease)—ETF Shares | 5,703,441 | 56,936 | | 1,493,356 | 20,606 |
| Admiral Shares | | | | | |
| Issued1 | 1,998,565 | 57,315 | | 1,409,764 | 55,845 |
| Issued in Lieu of Cash Distributions | 63,440 | 1,817 | | 45,953 | 1,739 |
| Redeemed | (874,385) | (24,928) | | (925,591) | (35,995) |
| Net Increase (Decrease)—Admiral Shares | 1,187,620 | 34,204 | | 530,126 | 21,589 |
| Institutional Shares | | | | | |
| Issued | 822,546 | 4,037 | | 964,601 | 6,259 |
| Issued in Lieu of Cash Distributions | 62,725 | 314 | | 61,520 | 403 |
| Redeemed | (1,195,333) | (5,858) | | (931,604) | (6,011) |
| Net Increase (Decrease)—Institutional Shares | (310,062) | (1,507) | | 94,517 | 651 |
| 1 | In November 2018, the fund announced changes to the availability and minimum investment criteria of the Investor and Admiral share classes. As a result, all of the outstanding Investor Shares automatically converted to Admiral Shares beginning in April 2019, with the exception of those held by Vanguard funds and certain other institutional investors. Investor Shares—Redeemed and Admiral Shares—Issued include 73,932 and 85,057 shares, respectively, in the amount of $2,357,000 from the conversion during the year ended 2020. |
| H. | Management has determined that no events or transactions occurred subsequent to October 31, 2021, that would require recognition or disclosure in these financial statements. |
Report of Independent Registered Public Accounting Firm
To the Board of Trustees of Vanguard International Equity Index Funds and Shareholders of Vanguard Total World Stock Index Fund
Opinion on the Financial Statements
We have audited the accompanying statement of assets and liabilities, including the schedule of investments, of Vanguard Total World Stock Index Fund (one of the funds constituting Vanguard International Equity Index Funds, referred to hereafter as the "Fund") as of October 31, 2021, the related statement of operations for the year ended October 31, 2021, the statement of changes in net assets for each of the two years in the period ended October 31, 2021, including the related notes, and the financial highlights for each of the periods indicated therein (collectively referred to as the "financial statements"). In our opinion, the financial statements present fairly, in all material respects, the financial position of the Fund as of October 31, 2021, the results of its operations for the year then ended, the changes in its net assets for each of the two years in the period ended October 31, 2021 and the financial highlights for each of the periods indicated therein in conformity with accounting principles generally accepted in the United States of America.
Basis for Opinion
These financial statements are the responsibility of the Fund’s management. Our responsibility is to express an opinion on the Fund’s financial statements based on our audits. We are a public accounting firm registered with the Public Company Accounting Oversight Board (United States) (PCAOB) and are required to be independent with respect to the Fund in accordance with the U.S. federal securities laws and the applicable rules and regulations of the Securities and Exchange Commission and the PCAOB.
We conducted our audits of these financial statements in accordance with the standards of the PCAOB. Those standards require that we plan and perform the audit to obtain reasonable assurance about whether the financial statements are free of material misstatement, whether due to error or fraud.
Our audits included performing procedures to assess the risks of material misstatement of the financial statements, whether due to error or fraud, and performing procedures that respond to those risks. Such procedures included examining, on a test basis, evidence regarding the amounts and disclosures in the financial statements. Our audits also included evaluating the accounting principles used and significant estimates made by management, as well as evaluating the overall presentation of the financial statements. Our procedures included confirmation of securities owned as of October 31, 2021 by correspondence with the custodian, transfer agent and brokers; when replies were not received from the transfer agent or brokers, we performed other auditing procedures. We believe that our audits provide a reasonable basis for our opinion.
/s/PricewaterhouseCoopers LLP
Philadelphia, Pennsylvania
December 17, 2021
We have served as the auditor of one or more investment companies in The Vanguard Group of Funds since 1975.
Special 2021 tax information (unaudited) for Vanguard Total World Stock Index Fund
This information for the fiscal year ended October 31, 2021, is included pursuant to provisions of the Internal Revenue Code.
The fund distributed $441,312,000 of qualified dividend income to shareholders during the fiscal year.
The fund distributed $11,391,000 of qualified business income to shareholders during the fiscal year.
For corporate shareholders, 32.7% of investment income (dividend income plus short-term gains, if any) qualifies for the dividends-received deduction.
The fund designates to shareholders foreign source income of $367,125,000 and foreign taxes paid of $32,300,000. Shareholders will receive more detailed information with their Form 1099-DIV in January 2022 to determine the calendar-year amounts to be included on their 2021 tax returns.
London Stock Exchange Group companies include FTSE International Limited (“FTSE”), Frank Russell Company (“Russell”), MTS Next Limited (“MTS”), and FTSE TMX Global Debt Capital Markets Inc. (“FTSE TMX”). All rights reserved. “FTSE®”, “Russell®”, “MTS®”, “FTSE TMX®” and “FTSE Russell” and other service marks and trademarks related to the FTSE or Russell indexes are trademarks of the London Stock Exchange Group companies and are used by FTSE, MTS, FTSE TMX and Russell under license. All information is provided for information purposes only. Every effort is made to ensure that all information given in this publication is accurate, but no responsibility or liability can be accepted by the London Stock Exchange Group companies nor its licensors for any errors or for any loss from use of this publication. Neither the London Stock Exchange Group companies nor any of their licensors make any claim, prediction, warranty or representation whatsoever, expressly or impliedly, either as to the results to be obtained from the use of the Indices or the fitness or suitability of the Indices for any particular purpose to which they might be put. The London Stock Exchange Group companies do not provide investment advice and nothing in this document should be taken as constituting financial or investment advice. The London Stock Exchange Group companies make no representation regarding the advisability of investing in any asset. A decision to invest in any such asset should not be made in reliance on any information herein. Indexes cannot be invested in directly. Inclusion of an asset in an index is not a recommendation to buy, sell or hold that asset. The general information contained in this publication should not be acted upon without obtaining specific legal, tax, and investment advice from a licensed professional. No part of this information may be reproduced, stored in a retrieval system or transmitted in any form or by any means, electronic, mechanical, photocopying, recording or otherwise, without prior written permission of the London Stock Exchange Group companies. Distribution of the London Stock Exchange Group companies’ index values and the use of their indexes to create financial products require a license with FTSE, FTSE TMX, MTS and/or Russell and/or its licensors.
This page intentionally left blank.
The People Who Govern Your Fund
The trustees of your mutual fund are there to see that the fund is operated and managed in your best interests since, as a shareholder, you are a part owner of the fund. Your fund’s trustees also serve on the board of directors of The Vanguard Group, Inc., which is owned by the Vanguard funds and provides services to them.
A majority of Vanguard’s board members are independent, meaning that they have no affiliation with Vanguard or the funds they oversee, apart from the sizable personal investments they have made as private individuals. The independent board members have distinguished backgrounds in business, academia, and public service. Each of the trustees and executive officers oversees 214 Vanguard funds.
Information for each trustee and executive officer of the fund appears below. That information, as well as the Vanguard fund count, is as of the date on the cover of this fund report. The mailing address of the trustees and officers is P.O. Box 876, Valley Forge, PA 19482. More information about the trustees is in the Statement of Additional Information, which can be obtained, without charge, by contacting Vanguard at 800-662-7447, or online at vanguard.com.
Interested Trustee1
Mortimer J. Buckley
Born in 1969. Trustee since January 2018. Principal occupation(s) during the past five years and other experience: chairman of the board (2019–present) of Vanguard and of each of the investment companies served by Vanguard; chief executive officer (2018–present) of Vanguard; chief executive officer, president, and trustee (2018–present) of each of the investment companies served by Vanguard; president and director (2017–present) of Vanguard; and president (2018–present) of Vanguard Marketing Corporation. Chief investment officer (2013–2017), managing director (2002–2017), head of the Retail Investor Group (2006–2012), and chief information officer (2001–2006) of Vanguard. Chairman of the board (2011–2017) and trustee (2009–2017) of the Children’s Hospital of Philadelphia; and trustee (2018–present) and vice chair (2019–present) of The Shipley School.
Independent Trustees
Emerson U. Fullwood
Born in 1948. Trustee since January 2008. Principal occupation(s) during the past five years and other experience: executive chief staff and marketing officer for North America and corporate vice president (retired 2008) of Xerox Corporation (document management products and services). Former president of the Worldwide Channels Group, Latin
America, and Worldwide Customer Service and executive chief staff officer of Developing Markets of Xerox. Executive in residence and 2009–2010 Distinguished Minett Professor at the Rochester Institute of Technology. Director of SPX FLOW, Inc. (multi-industry manufacturing). Director of the University of Rochester Medical Center, the Monroe Community College Foundation, the United Way of Rochester, North Carolina A&T University, and Roberts Wesleyan College. Trustee of the University of Rochester.
Amy Gutmann
Born in 1949. Trustee since June 2006. Principal occupation(s) during the past five years and other experience: president (2004–present) of the University of Pennsylvania. Christopher H. Browne Distinguished Professor of Political Science, School of Arts and Sciences, and professor of communication, Annenberg School for Communication, with secondary faculty appointments in the Department of Philosophy, School of Arts and Sciences, and at the Graduate School of Education, University of Pennsylvania.
F. Joseph Loughrey
Born in 1949. Trustee since October 2009. Principal occupation(s) during the past five years and other experience: president and chief operating officer (retired 2009) and vice chairman of the board (2008–2009) of Cummins Inc. (industrial machinery). Chairman of the board of Hillenbrand, Inc. (specialized consumer services). Director of the V Foundation.
1 Mr. Buckley is considered an “interested person,” as defined in the Investment Company Act of 1940, because he is an officer of the Vanguard funds.
Member of the advisory council for the College of Arts and Letters and chair of the advisory board to the Kellogg Institute for International Studies, both at the University of Notre Dame. Chairman of the board of Saint Anselm College.
Mark Loughridge
Born in 1953. Trustee since March 2012. Principal occupation(s) during the past five years and other experience: senior vice president and chief financial officer (retired 2013) of IBM (information technology services). Fiduciary member of IBM’s Retirement Plan Committee (2004–2013), senior vice president and general manager (2002–2004) of IBM Global Financing, vice president and controller (1998–2002) of IBM, and a variety of other prior management roles at IBM. Member of the Council on Chicago Booth.
Scott C. Malpass
Born in 1962. Trustee since March 2012. Principal occupation(s) during the past five years and other experience: chief investment officer (retired June 2020) and vice president (retired June 2020) of the University of Notre Dame. Assistant professor (retired June 2020) of finance at the Mendoza College of Business, University of Notre Dame, and member of the Notre Dame 403(b) Investment Committee. Member of the board of Catholic Investment Services, Inc. (investment advisors) and the board of superintendence of the Institute for the Works of Religion.
Deanna Mulligan
Born in 1963. Trustee since January 2018. Principal occupation(s) during the past five years and other experience: board chair (2020), chief executive officer (2011–2020), and president (2010–2019) of The Guardian Life Insurance Company of America. Chief operating officer (2010–2011) and executive vice president (2008–2010) of Individual Life and Disability of the Guardian Life Insurance Company of America. Member of the board of the Economic Club of New York. Trustee of the Partnership for New York City (business leadership), Chief Executives for Corporate Purpose, NewYork-Presbyterian Hospital, and the Bruce Museum (arts and science). Member of the Advisory Council for the Stanford Graduate School of Business.
André F. Perold
Born in 1952. Trustee since December 2004. Principal occupation(s) during the past five years and other experience: George Gund Professor of Finance and Banking, Emeritus at the Harvard Business School (retired 2011). Chief investment officer and co-managing partner of HighVista Strategies (private investment firm). Member of the board
(2018–present) of RIT Capital Partners (investment firm). Member of the investment committee of Partners Health Care System.
Sarah Bloom Raskin
Born in 1961. Trustee since January 2018. Principal occupation(s) during the past five years and other experience: deputy secretary (2014–2017) of the United States Department of the Treasury. Governor (2010–2014) of the Federal Reserve Board. Commissioner (2007–2010) of financial regulation for the State of Maryland. Professor (2020–present), Distinguished Fellow of the Global Financial Markets Center (2020–present), and Rubenstein Fellow (2017–2020) at Duke University. Trustee (2017–present) of Amherst College and member of Amherst College Investment Committee (2019–present). Member of the Regenerative Crisis Response Committee (2020–present).
David A. Thomas
Born in 1956. Trustee since July 2021. Principal occupation(s) during the past five years and other experience: president of Morehouse College (2018–present). Professor of business administration, emeritus at Harvard University (2017–2018). Dean (2011–2016) and professor of management (2016–2017) at the Georgetown University McDonough School of Business. Director of DTE Energy Company (2013–present). Trustee of Common Fund (2019–present).
Peter F. Volanakis
Born in 1955. Trustee since July 2009. Principal occupation(s) during the past five years and other experience: president and chief operating officer (retired 2010) of Corning Incorporated (communications equipment) and director of Corning Incorporated (2000–2010) and Dow Corning (2001–2010). Director (2012) of SPX Corporation (multi-industry manufacturing). Overseer of the Amos Tuck School of Business Administration, Dartmouth College (2001–2013). Chairman of the board of trustees of Colby-Sawyer College. Member of the BMW Group Mobility Council.
Executive Officers
Christine M. Buchanan
Born in 1970. Principal occupation(s) during the past five years and other experience: principal of Vanguard. Chief financial officer (2021–present) and treasurer (2017–present) of each of the investment companies served by Vanguard. Partner (2005–2017) at KPMG (audit, tax, and advisory services).
David Cermak
Born in 1960. Principal occupation(s) during the past five years and other experience: principal of Vanguard. Finance director (2019–present) of each of the investment companies served by Vanguard. Managing director and head (2017–present) of Vanguard Investments Singapore. Managing director and head (2017–2019) of Vanguard Investments Hong Kong. Representative director and head (2014–2017) of Vanguard Investments Japan.
John Galloway
Born in 1973. Principal occupation(s) during the past five years and other experience: principal of Vanguard. Investment stewardship officer (September 2020–present) of each of the investment companies served by Vanguard. Head of Investor Advocacy (February 2020–present) and head of Marketing Strategy and Planning (2017–2020) at Vanguard. Deputy assistant to the President of the United States (2015).
Peter Mahoney
Born in 1974. Principal occupation(s) during the past five years and other experience: principal of Vanguard. Controller (2015–present) of each of the investment companies served by Vanguard. Head of International Fund Services (2008–2014) at Vanguard.
Anne E. Robinson
Born in 1970. Principal occupation(s) during the past five years and other experience: general counsel (2016–present) of Vanguard. Secretary (2016–present) of Vanguard and of each of the investment companies served by Vanguard. Managing director (2016–present) of Vanguard. Managing director and general counsel of Global Cards and Consumer Services (2014–2016) at Citigroup. Counsel (2003–2014) at American Express.
Michael Rollings
Born in 1963. Principal occupation(s) during the past five years and other experience: finance director (2017–present) and treasurer (2017) of each of the investment companies served by Vanguard. Managing director (2016–present) of Vanguard. Chief financial officer (2016–present) of Vanguard. Director (2016–present) of Vanguard Marketing Corporation. Executive vice president and chief financial officer (2006–2016) of MassMutual Financial Group.
John E. Schadl
Born in 1972. Principal occupation(s) during the past five years and other experience: principal of Vanguard. Chief compliance officer (2019–present) of Vanguard and of each of the investment companies served by Vanguard. Assistant vice president (2019–present) of Vanguard Marketing Corporation.
Vanguard Senior Management Team
| Matthew Benchener | Thomas M. Rampulla |
| Joseph Brennan | Karin A. Risi |
| Mortimer J. Buckley | Anne E. Robinson |
| Gregory Davis | Michael Rollings |
| John James | Nitin Tandon |
| John T. Marcante | Lauren Valente |
| Chris D. Mclsaac | |
Connect with Vanguard®>vanguard.com
Fund Information > 800-662-7447
Direct Investor Account Services > 800-662-2739
Institutional Investor Services > 800-523-1036
Text Telephone for People Who Are Deaf or Hard of Hearing > 800-749-7273
This material may be used in conjunction with the offering of shares of any Vanguard fund only if preceded or accompanied by the fund’s current prospectus.
All comparative mutual fund data are from Morningstar, Inc., unless otherwise noted.
You can obtain a free copy of Vanguard’s proxy voting guidelines by visiting vanguard.com/proxyreporting or by calling Vanguard at 800-662-2739. The guidelines are also available from the SEC’s website, www.sec.gov. In addition, you may obtain a free report on how your fund voted the proxies for securities it owned during the 12 months ended June 30. To get the report, visit either vanguard.com/proxyreporting or www.sec.gov.
You can review information about your fund on the SEC’s website, and you can receive copies of this information, for a fee, by sending a request via email addressed to publicinfo@sec.gov.
Source for Bloomberg indexes: Bloomberg Index Services Limited. Copyright 2021, Bloomberg. All rights reserved.
© 2021 The Vanguard Group, Inc.
All rights reserved.
U.S. Patent Nos. 6,879,964 and 7,720,749.
Vanguard Marketing Corporation, Distributor.
Q6280 122021
Annual Report | October 31, 2021
Vanguard FTSE International Index Funds
| Vanguard FTSE All-World ex-US Index Fund |
| Vanguard FTSE All-World ex-US Small-Cap Index Fund |
Contents
Your Fund’s Performance at a Glance
| 1 |
About Your Fund’s Expenses
| 2 |
FTSE All-World ex-US Index Fund
| 4 |
FTSE All-World ex-US Small-Cap Index Fund
| 79 |
Please note: The opinions expressed in this report are just that—informed opinions. They should not be considered promises or advice. Also, please keep in mind that the information and opinions cover the period through the date on the front of this report. Of course, the risks of investing in your fund are spelled out in the prospectus.
Your Fund’s Performance at a Glance
| • | For the 12 months ended October 31, 2021, Vanguard FTSE All-World ex-US Index Fund returned about 30%. Vanguard FTSE All-World ex-US Small-Cap Index Fund returned about 37%. Both funds slightly trailed their benchmarks in part because of differences in the prices of securities used by the fund to calculate its net asset value and the quoted or published prices for the same securities.1 |
| • | During the fiscal year, the global economy continued to recover from the sharp pandemic-induced contraction in the spring of 2020. Countries that were more successful in containing the coronavirus, whether through vaccinations, lockdowns, or both, generally fared better economically. Swift and extensive fiscal and monetary support from policymakers also was a key to the rebound. |
| • | By region, Europe contributed most to returns for both funds, while Middle Eastern stocks contributed the least. |
| • | All 11 industry sectors contributed positively to the performance of both funds. Financial and industrial stocks helped the All-World ex-US Index Fund the most. For the All-World ex-US Small-Cap Index Fund, industrials and consumer discretionary stocks contributed the most. |
Market Barometer
| | Average Annual Total Returns
Periods Ended October 31, 2021 |
| | One Year | Three Years | Five Years |
| Stocks | | | |
| Russell 1000 Index (Large-caps) | 43.51% | 22.01% | 19.16% |
| Russell 2000 Index (Small-caps) | 50.80 | 16.47 | 15.52 |
| Russell 3000 Index (Broad U.S. market) | 43.90 | 21.62 | 18.91 |
| FTSE All-World ex US Index (International) | 30.23 | 12.42 | 10.05 |
| Bonds | | | |
Bloomberg U.S. Aggregate Bond Index
(Broad taxable market) | -0.48% | 5.63% | 3.10% |
Bloomberg Municipal Bond Index
(Broad tax-exempt market) | 2.64 | 5.17 | 3.41 |
| FTSE Three-Month U.S. Treasury Bill Index | 0.05 | 1.08 | 1.12 |
| CPI | | | |
| Consumer Price Index | 6.22% | 3.03% | 2.73% |
1 See Note A-1, “Security Valuation,” in the Notes to Financial Statements.
About Your Fund’s Expenses
As a shareholder of the fund, you incur ongoing costs, which include costs for portfolio management, administrative services, and shareholder reports (like this one), among others. Operating expenses, which are deducted from a fund’s gross income, directly reduce the investment return of the fund.
A fund’s expenses are expressed as a percentage of its average net assets. This figure is known as the expense ratio. The following examples are intended to help you understand the ongoing costs (in dollars) of investing in your fund and to compare these costs with those of other mutual funds. The examples are based on an investment of $1,000 made at the beginning of the period shown and held for the entire period.
The accompanying table illustrates your fund’s costs in two ways:
| • | Based on actual fund return. This section helps you to estimate the actual expenses that you paid over the period. The ”Ending Account Value“ shown is derived from the fund‘s actual return, and the third column shows the dollar amount that would have been paid by an investor who started with $1,000 in the fund. You may use the information here, together with the amount you invested, to estimate the expenses that you paid over the period. |
To do so, simply divide your account value by $1,000 (for example, an $8,600 account value divided by $1,000 = 8.6), then multiply the result by the number given for your fund under the heading ”Expenses Paid During Period.“
| • | Based on hypothetical 5% yearly return. This section is intended to help you compare your fund‘s costs with those of other mutual funds. It assumes that the fund had a yearly return of 5% before expenses, but that the expense ratio is unchanged. In this case—because the return used is not the fund’s actual return—the results do not apply to your investment. The example is useful in making comparisons because the Securities and Exchange Commission requires all mutual funds to calculate expenses based on a 5% return. You can assess your fund’s costs by comparing this hypothetical example with the hypothetical examples that appear in shareholder reports of other funds. |
Note that the expenses shown in the table are meant to highlight and help you compare ongoing costs only and do not reflect transaction costs incurred by the fund for buying and selling securities. Further, the expenses do not include any purchase, redemption, or account service fees described in the fund prospectus. If such fees were applied to your account, your costs would be higher. Your fund does not carry a “sales load.”
The calculations assume no shares were bought or sold during the period. Your actual costs may have been higher or lower, depending on the amount of your investment and the timing of any purchases or redemptions.
You can find more information about the fund’s expenses, including annual expense ratios, in the Financial Statements section of this report. For additional information on operating expenses and other shareholder costs, please refer to your fund’s current prospectus.
| Six Months Ended October 31, 2021 | | | |
| | Beginning
Account Value
4/30/2021 | Ending
Account Value
10/31/2021 | Expenses
Paid During
Period |
| Based on Actual Fund Return | | | |
| FTSE All-World ex-US Index Fund | | | |
| ETF Shares | $1,000.00 | $1,019.80 | $0.31 |
| Admiral™ Shares | 1,000.00 | 1,019.60 | 0.56 |
| Institutional Shares | 1,000.00 | 1,019.70 | 0.41 |
| Institutional Plus Shares | 1,000.00 | 1,019.90 | 0.31 |
| FTSE All-World ex-US Small-Cap Index Fund | | | |
| ETF Shares | $1,000.00 | $1,037.80 | $0.21 |
| Admiral Shares | 1,000.00 | 1,037.40 | 0.82 |
| Institutional Shares | 1,000.00 | 1,037.40 | 0.56 |
| Based on Hypothetical 5% Yearly Return | | | |
| FTSE All-World ex-US Index Fund | | | |
| ETF Shares | $1,000.00 | $1,024.90 | $0.31 |
| Admiral Shares | 1,000.00 | 1,024.65 | 0.56 |
| Institutional Shares | 1,000.00 | 1,024.80 | 0.41 |
| Institutional Plus Shares | 1,000.00 | 1,024.90 | 0.31 |
| FTSE All-World ex-US Small-Cap Index Fund | | | |
| ETF Shares | $1,000.00 | $1,025.00 | $0.20 |
| Admiral Shares | 1,000.00 | 1,024.40 | 0.82 |
| Institutional Shares | 1,000.00 | 1,024.65 | 0.56 |
The calculations are based on expenses incurred in the most recent six-month period. The funds' annualized six-month expense ratios for that period are: for the FTSE All-World ex-US Index Fund, 0.06% for ETF Shares, 0.11% for Admiral Shares, 0.08% for Institutional Shares, and 0.06% for Institutional Plus Shares; and for the FTSE All-World ex-US Small-Cap Index Fund, 0.04% for ETF Shares, 0.16% for Admiral Shares, and 0.11% for Institutional Shares. The dollar amounts shown as “Expenses Paid" are equal to the annualized expense ratio multiplied by the average account value over the period, multiplied by the number of days in the most recent six-month period, then divided by the number of days in the most recent 12-month period (184/365).
FTSE All-World ex-US Index Fund
All of the returns in this report represent past performance, which is not a guarantee of future results that may be achieved by the fund. (Current performance may be lower or higher than the performance data cited. For performance data current to the most recent month-end, visit our website at vanguard.com/performance.) Note, too, that both investment returns and principal value can fluctuate widely, so an investor’s shares, when sold, could be worth more or less than their original cost. The returns shown do not reflect taxes that a shareholder would pay on fund distributions or on the sale of fund shares.
Cumulative Performance: October 31, 2011, Through October 31, 2021
Initial Investment of $10,000
| | | Average Annual Total Returns
Periods Ended October 31, 2021 | |
| | | One
Year | Five
Years | Ten
Years | Final Value
of a $10,000
Investment |
 | FTSE All-World ex-US Index Fund
ETF Shares Net Asset Value | 29.82% | 9.99% | 7.09% | $19,835 |
| | FTSE All-World ex-US Index Fund ETF Shares Market Price | 29.93 | 10.01 | 7.11 | 19,874 |
 | FTSE All-World ex US Index | 30.23 | 10.05 | 7.03 | 19,718 |
 | FTSE Global All Cap ex US Index | 30.96 | 10.06 | 7.09 | 19,836 |
| | | | |
| | | One
Year | Five
Years | Ten
Years | Final Value
of a $10,000
Investment |
FTSE All-World ex-US Index Fund
Admiral Shares | 29.76% | 9.96% | 7.07% | $19,798 |
| FTSE All-World ex US Index | 30.23 | 10.05 | 7.03 | 19,718 |
| FTSE Global All Cap ex US Index | 30.96 | 10.06 | 7.09 | 19,836 |
See Financial Highlights for dividend and capital gains information.
FTSE All-World ex-US Index Fund
| | | Average Annual Total Returns
Periods Ended October 31, 2021 | |
| | | One
Year | Five
Years | Ten
Years | Final Value
of a $5,000,000
Investment |
FTSE All-World ex-US Index Fund
Institutional Shares | 29.82% | 9.99% | 7.10% | $9,924,449 |
| FTSE All-World ex US Index | 30.23 | 10.05 | 7.03 | 9,859,196 |
| FTSE Global All Cap ex US Index | 30.96 | 10.06 | 7.09 | 9,918,026 |
| | | | |
| | | One
Year | Five
Years | Ten
Years | Final Value
of a $100,000,000
Investment |
| FTSE All-World ex-US Index Fund Institutional Plus Shares | 29.84% | 10.02% | 7.12% | $198,942,440 |
| FTSE All-World ex US Index | 30.23 | 10.05 | 7.03 | 197,183,920 |
| FTSE Global All Cap ex US Index | 30.96 | 10.06 | 7.09 | 198,360,510 |
Cumulative Returns of ETF Shares: October 31, 2011, Through October 31, 2021
| | One
Year | Five
Years | Ten
Years |
| FTSE All-World ex-US Index Fund ETF Shares Market Price | 29.93% | 61.11% | 98.74% |
| FTSE All-World ex-US Index Fund ETF Shares Net Asset Value | 29.82 | 60.97 | 98.35 |
| FTSE All-World ex US Index | 30.23 | 61.41 | 97.18 |
For the ETF Shares, the market price is determined by the midpoint of the bid-offer spread as of the closing time of the New York Stock Exchange (generally 4 p.m., Eastern time). The net asset value is also determined as of the NYSE closing time. For more information about how the ETF Shares' market prices have compared with their net asset value, visit vanguard.com, select your ETF, and then select the Price and Performance tab. The ETF premium/discount analysis there shows the percentages of days on which the ETF Shares' market price was above or below the NAV.
FTSE All-World ex-US Index Fund
| Japan | 15.8% |
| United Kingdom | 9.6 |
| China | 9.5 |
| France | 6.7 |
| Canada | 6.2 |
| Switzerland | 6.0 |
| Germany | 5.6 |
| Australia | 4.8 |
| Taiwan | 4.3 |
| India | 3.7 |
| South Korea | 3.5 |
| Netherlands | 3.3 |
| Sweden | 2.4 |
| Hong Kong | 2.1 |
| Italy | 1.7 |
| Denmark | 1.6 |
| Spain | 1.5 |
| Brazil | 1.3 |
| Saudi Arabia | 1.0 |
| Russia | 1.0 |
| South Africa | 1.0 |
| Other | 7.4 |
The table reflects the fund’s investments, except for short-term investments and derivatives.
The fund may invest in derivatives (such as futures and swap contracts) for various reasons, including, but not limited to, attempting to remain fully invested and tracking its target index as closely as possible.
FTSE All-World ex-US Index Fund
The fund files its complete schedule of portfolio holdings with the Securities and Exchange Commission (SEC) for the first and third quarters of each fiscal year as an exhibit to its reports on Form N-PORT. The fund’s Form N-PORT reports are available on the SEC’s website at www.sec.gov.
| | | Shares | Market
Value•
($000) |
| Common Stocks (99.2%) |
| Australia (4.7%) |
| | Commonwealth Bank of Australia | 3,214,672 | 254,802 |
| | CSL Ltd. | 856,555 | 194,901 |
| | BHP Group Ltd. | 5,546,482 | 152,345 |
| | National Australia Bank Ltd. | 6,217,068 | 135,171 |
| | Westpac Banking Corp. | 6,911,568 | 134,466 |
| | Australia & New Zealand Banking Group Ltd. | 5,360,865 | 114,082 |
| 1 | Macquarie Group Ltd. | 626,638 | 92,510 |
| | Wesfarmers Ltd. | 2,133,669 | 92,315 |
| | Woolworths Group Ltd. | 2,275,842 | 65,555 |
| | Transurban Group (XASX) | 5,733,755 | 58,422 |
| | Goodman Group | 3,421,752 | 56,654 |
| | Rio Tinto Ltd. | 699,168 | 47,902 |
| | Aristocrat Leisure Ltd. | 1,261,388 | 44,737 |
| * | Afterpay Ltd. | 420,212 | 38,928 |
| | Amcor plc GDR | 2,912,726 | 35,253 |
| | James Hardie Industries plc GDR | 841,389 | 33,055 |
| | Woodside Petroleum Ltd. | 1,812,188 | 31,680 |
| | Fortescue Metals Group Ltd. | 2,992,675 | 31,184 |
| | Coles Group Ltd. | 2,401,672 | 31,123 |
| | Newcrest Mining Ltd. | 1,539,204 | 28,838 |
| | Sonic Healthcare Ltd. | 897,542 | 27,235 |
| * | Xero Ltd. | 238,787 | 27,227 |
| | QBE Insurance Group Ltd. | 2,778,485 | 24,877 |
| | South32 Ltd. | 8,915,148 | 24,049 |
| | ASX Ltd. | 367,144 | 23,089 |
| | Telstra Corp. Ltd. | 7,869,291 | 22,746 |
| | Scentre Group | 9,825,041 | 22,410 |
| | Suncorp Group Ltd. | 2,423,774 | 21,448 |
| | Brambles Ltd. | 2,758,305 | 20,926 |
| | Cochlear Ltd. | 121,339 | 20,295 |
| | Santos Ltd. | 3,334,222 | 17,508 |
| | | Shares | Market
Value•
($000) |
| | Ramsay Health Care Ltd. | 327,526 | 17,505 |
| | Dexus Industria REIT (XASX) | 2,058,473 | 16,885 |
| | Insurance Australia Group Ltd. | 4,658,452 | 16,880 |
| | Mirvac Group | 7,490,714 | 15,986 |
| | Stockland | 4,545,639 | 15,669 |
| * | Sydney Airport | 2,494,088 | 15,467 |
| | BlueScope Steel Ltd. | 952,177 | 14,879 |
| | Northern Star Resources Ltd. | 2,145,003 | 14,850 |
| | Tabcorp Holdings Ltd. | 3,931,786 | 14,805 |
| | Computershare Ltd. (XASX) | 1,026,833 | 14,611 |
| | SEEK Ltd. | 586,060 | 14,565 |
| | GPT Group | 3,682,073 | 14,375 |
| | APA Group | 2,220,664 | 13,778 |
| | Medibank Pvt Ltd. | 5,214,872 | 13,106 |
| | Origin Energy Ltd. | 3,316,636 | 12,703 |
| | Oil Search Ltd. | 3,908,018 | 12,660 |
| | Endeavour Group Ltd. | 2,365,023 | 12,153 |
| | Treasury Wine Estates Ltd. | 1,367,542 | 11,933 |
| | Domino's Pizza Enterprises Ltd. | 114,367 | 11,732 |
| | Charter Hall Group | 886,205 | 11,627 |
| | OZ Minerals Ltd. | 604,615 | 11,501 |
| | Ampol Ltd. | 448,681 | 10,379 |
| | Lendlease Corp. Ltd. | 1,307,902 | 10,361 |
| | IDP Education Ltd. | 341,691 | 9,667 |
| | REA Group Ltd. | 79,169 | 9,609 |
| | Vicinity Centres | 7,193,782 | 9,395 |
| | ALS Ltd. | 893,280 | 8,959 |
| | Orica Ltd. | 778,417 | 8,936 |
| | Evolution Mining Ltd. | 3,222,065 | 8,748 |
| | Aurizon Holdings Ltd. | 3,419,944 | 8,719 |
| | Atlas Arteria Ltd. | 1,824,096 | 8,573 |
| | IGO Ltd. | 1,155,673 | 8,463 |
| | Incitec Pivot Ltd. | 3,679,470 | 8,325 |
| | JB Hi-Fi Ltd. | 213,046 | 8,134 |
| | carsales.com Ltd. | 429,962 | 8,046 |
| | Bank of Queensland Ltd. | 1,199,020 | 7,983 |
FTSE All-World ex-US Index Fund
| | | Shares | Market
Value•
($000) |
| * | NEXTDC Ltd. | 863,738 | 7,710 |
| | Mineral Resources Ltd. | 260,864 | 7,669 |
| | Reece Ltd. | 501,474 | 7,604 |
| | Alumina Ltd. | 4,800,394 | 7,255 |
| | Bendigo & Adelaide Bank Ltd. | 1,032,870 | 7,234 |
| | Magellan Financial Group Ltd. | 261,617 | 6,882 |
| | Qube Holdings Ltd. | 2,777,741 | 6,709 |
| | Challenger Ltd. | 1,275,592 | 6,700 |
| | AusNet Services Ltd. | 3,465,106 | 6,444 |
| | WiseTech Global Ltd. | 163,859 | 6,386 |
| | Downer EDI Ltd. | 1,301,549 | 6,223 |
| | Altium Ltd. | 208,739 | 5,815 |
| | Ansell Ltd. | 239,453 | 5,733 |
| | Worley Ltd. | 697,296 | 5,729 |
| | Metcash Ltd. | 1,854,366 | 5,715 |
| * | Qantas Airways Ltd. | 1,379,821 | 5,588 |
| | Iluka Resources Ltd. | 779,446 | 5,561 |
| | Cleanaway Waste Management Ltd. | 2,530,104 | 5,146 |
| * | AMP Ltd. | 6,228,454 | 5,096 |
| | AGL Energy Ltd. | 1,170,247 | 5,047 |
| * | Crown Resorts Ltd. | 661,489 | 4,986 |
| * | Star Entertainment Grp Ltd. | 1,593,026 | 4,427 |
| | Seven Group Holdings Ltd. | 262,100 | 4,281 |
| | Washington H Soul Pattinson & Co. Ltd. | 170,923 | 4,209 |
| | Shopping Centres Australasia Property Group | 2,002,391 | 4,207 |
| | Harvey Norman Holdings Ltd. | 1,107,537 | 4,155 |
| | Orora Ltd. | 1,652,125 | 4,133 |
| | CSR Ltd. | 897,918 | 4,031 |
| * | Flight Centre Travel Group Ltd. | 266,407 | 4,031 |
| * | Boral Ltd. | 787,670 | 3,800 |
| | IOOF Holdings Ltd. | 1,183,748 | 3,664 |
| | TPG Telecom Ltd. | 687,085 | 3,508 |
| | Beach Energy Ltd. | 3,240,394 | 3,404 |
| | Sims Ltd. | 307,221 | 3,344 |
| * | Whitehaven Coal Ltd. | 1,635,781 | 3,237 |
| | Pro Medicus Ltd. | 75,540 | 3,051 |
| | Perpetual Ltd. | 101,810 | 2,910 |
| | CIMIC Group Ltd. | 179,268 | 2,701 |
| | Deterra Royalties Ltd. | 756,601 | 2,226 |
| * | Nufarm Ltd. | 608,767 | 2,005 |
| | Adbri Ltd. | 856,505 | 1,928 |
| | Appen Ltd. | 202,402 | 1,649 |
| | Platinum Asset Management Ltd. | 558,365 | 1,289 |
| | Domain Holdings Australia Ltd. | 195,447 | 849 |
| *,1 | Bgp Holdings plc | 3,738,510 | 14 |
| | | | 2,561,985 |
| Austria (0.1%) |
| | Erste Group Bank AG | 538,256 | 23,084 |
| | OMV AG | 272,819 | 16,517 |
| | | Shares | Market
Value•
($000) |
| | Verbund AG | 125,652 | 13,098 |
| | voestalpine AG | 219,082 | 8,321 |
| | ANDRITZ AG | 139,388 | 7,917 |
| | Raiffeisen Bank International AG | 244,323 | 7,139 |
| | Telekom Austria AG Class A | 289,070 | 2,498 |
| | | | 78,574 |
| Bahrain (0.0%) |
| | Ahli United Bank BSC | 12,020,156 | 11,692 |
| Belgium (0.6%) |
| | Anheuser-Busch InBev SA | 1,577,714 | 96,504 |
| | KBC Group NV | 519,415 | 48,370 |
| * | Argenx SE | 96,324 | 28,999 |
| | UCB SA | 228,231 | 27,279 |
| | Groupe Bruxelles Lambert SA | 199,228 | 23,117 |
| | Umicore SA | 387,828 | 22,237 |
| | Ageas SA | 336,797 | 16,384 |
| | Solvay SA | 132,836 | 15,791 |
| | Sofina SA | 28,505 | 12,614 |
| | Warehouses De Pauw CVA | 259,499 | 11,817 |
| | Elia Group SA | 66,322 | 7,737 |
| | D'ieteren Group | 42,863 | 7,391 |
| | Ackermans & van Haaren NV | 41,601 | 7,154 |
| | Proximus SADP | 266,682 | 5,022 |
| | Etablissements Franz Colruyt NV | 98,628 | 4,842 |
| | Telenet Group Holding NV | 82,754 | 2,973 |
| | | | 338,231 |
| Brazil (1.3%) |
| | Vale SA | 4,854,442 | 61,594 |
| | Vale SA Class B ADR | 2,577,301 | 32,809 |
| | Petroleo Brasileiro SA ADR | 3,036,130 | 29,177 |
| | Petroleo Brasileiro SA Preference Shares | 5,221,859 | 25,213 |
| | Itau Unibanco Holding SA ADR | 6,163,038 | 25,084 |
| | B3 SA - Brasil Bolsa Balcao | 11,419,488 | 24,098 |
| | Banco Bradesco SA ADR | 5,949,271 | 20,822 |
| | Petroleo Brasileiro SA | 4,196,629 | 20,575 |
| | Weg SA | 2,768,558 | 18,150 |
| | Itausa SA Preference Shares | 8,412,560 | 15,279 |
| | Itau Unibanco Holding SA Preference Shares | 3,414,182 | 14,101 |
| | Ambev SA | 4,591,121 | 13,821 |
| * | Natura & Co. Holding SA | 1,787,886 | 12,323 |
| | JBS SA | 1,730,886 | 11,976 |
| * | Suzano SA | 1,360,585 | 11,868 |
| | Banco Bradesco SA Preference Shares | 3,158,948 | 11,138 |
FTSE All-World ex-US Index Fund
| | | Shares | Market
Value•
($000) |
| | Notre Dame Intermedica Participacoes SA | 971,522 | 11,048 |
| | Ambev SA ADR | 3,678,000 | 10,887 |
| | Magazine Luiza SA | 5,583,838 | 10,695 |
| | Petroleo Brasileiro SA ADR (XNYS) | 1,060,141 | 10,411 |
| 2 | Rede D'Or Sao Luiz SA | 885,317 | 9,255 |
| | Lojas Renner SA | 1,576,727 | 9,004 |
| | Localiza Rent a Car SA | 1,107,563 | 8,890 |
| | Raia Drogasil SA | 1,995,400 | 8,220 |
| | Banco Do Brasil SA | 1,620,166 | 8,182 |
| | Vibra Energia SA | 2,175,224 | 8,086 |
| | Cosan SA | 2,267,008 | 7,949 |
| | Banco BTG Pactual SA (BVMF) | 1,813,352 | 7,245 |
| | Banco Bradesco SA | 2,300,116 | 6,928 |
| | Equatorial Energia SA | 1,685,531 | 6,833 |
| | Centrais Eletricas Brasileiras SA | 1,127,385 | 6,758 |
| * | Rumo SA | 2,332,768 | 6,609 |
| * | Klabin SA | 1,481,380 | 6,021 |
| | Totvs SA | 1,022,263 | 5,934 |
| * | BRF SA | 1,353,689 | 5,572 |
| * | Embraer SA | 1,380,531 | 5,364 |
| * | Petro Rio SA | 1,241,900 | 5,165 |
| | Gerdau SA Preference Shares | 1,073,780 | 5,118 |
| | BB Seguridade Participacoes SA | 1,250,260 | 4,894 |
| 2 | Hapvida Participacoes e Investimentos SA | 2,355,713 | 4,817 |
| | Telefonica Brasil SA | 594,408 | 4,794 |
| | Gerdau SA ADR | 987,461 | 4,671 |
| * | Eneva SA | 1,799,400 | 4,591 |
| | Bradespar SA Preference Shares | 508,490 | 4,384 |
| | CCR SA | 2,075,992 | 4,204 |
| * | Americanas SA | 784,776 | 4,130 |
| | Banco Santander Brasil SA | 676,938 | 4,126 |
| | Ultrapar Participacoes SA | 1,745,540 | 4,036 |
| | Cia de Saneamento Basico do Estado de Sao Paulo | 625,885 | 3,904 |
| 2 | Banco Inter SA Preference Shares | 1,747,395 | 3,787 |
| | Hypera SA | 738,452 | 3,671 |
| | Sul America SA | 753,441 | 3,467 |
| * | Via SA | 3,140,198 | 3,422 |
| | Centrais Eletricas Brasileiras SA Preference Shares | 547,776 | 3,284 |
| | Energisa SA | 464,724 | 3,262 |
| | Marfrig Global Foods SA | 684,000 | 3,212 |
| | Metalurgica Gerdau SA Preference Shares | 1,333,000 | 2,955 |
| | Cia Energetica de Minas Gerais Preference Shares | 1,188,626 | 2,713 |
| | TIM SA | 1,342,230 | 2,668 |
| | | Shares | Market
Value•
($000) |
| | Transmissora Alianca de Energia Eletrica SA | 403,336 | 2,620 |
| 2 | Locaweb Servicos de Internet SA | 797,200 | 2,585 |
| | Sendas Distribuidora SA | 951,210 | 2,577 |
| | Cia Siderurgica Nacional SA | 623,427 | 2,516 |
| * | Azul SA Preference Shares | 555,426 | 2,448 |
| | Cia Siderurgica Nacional SA ADR | 577,080 | 2,355 |
| | Engie Brasil Energia SA | 323,610 | 2,231 |
| | Cia de Locacao das Americas | 621,100 | 2,171 |
| * | Alpargatas SA Preference Shares | 317,100 | 2,170 |
| * | Braskem SA Preference Shares | 224,200 | 2,163 |
| | YDUQS Part | 557,692 | 2,061 |
| | Sao Martinho SA | 300,200 | 2,037 |
| | Usinas Siderurgicas De Minas Gerais SAUsiminas Preference Shares | 848,800 | 1,993 |
| * | BR Malls Participacoes SA | 1,556,578 | 1,978 |
| | Telefonica Brasil SA ADR | 232,429 | 1,866 |
| * | Cogna Educacao | 4,238,081 | 1,862 |
| | IRB Brasil Resseguros SA | 2,070,819 | 1,721 |
| | Itau Unibanco Holding SA | 452,406 | 1,686 |
| | EDP - Energias do Brasil SA | 478,503 | 1,662 |
| | Banco Inter SA | 801,993 | 1,646 |
| | Multiplan Empreendimentos Imobiliarios SA | 487,917 | 1,601 |
| | CPFL Energia SA | 340,900 | 1,589 |
| | Cia de Transmissao de Energia Eletrica Paulista Preference Shares | 361,196 | 1,556 |
| | Cia Energetica de Sao Paulo Preference Shares | 344,200 | 1,555 |
| | Cia Energetica de Minas Gerais | 503,415 | 1,482 |
| | Sendas Distribuidora SA ADR | 107,761 | 1,454 |
| | Lojas Americanas SA Preference Shares (BVMF) | 1,697,485 | 1,453 |
| | Cyrela Brazil Realty SA Empreendimentos e Participacoes | 573,800 | 1,433 |
| | Fleury SA | 427,910 | 1,428 |
| | Atacadao SA | 481,012 | 1,418 |
| | Cia Energetica de Minas Gerais ADR | 628,957 | 1,415 |
| | Dexco SA | 511,200 | 1,405 |
| | Porto Seguro SA | 337,624 | 1,396 |
| | Cia Paranaense de Energia ADR | 273,148 | 1,396 |
FTSE All-World ex-US Index Fund
| | | Shares | Market
Value•
($000) |
| | Cia Paranaense de Energia Preference Shares | 1,234,700 | 1,295 |
| | Banco Pan SA Preference Shares | 544,200 | 1,282 |
| | M Dias Branco SA | 222,386 | 1,220 |
| * | Braskem SA ADR | 62,935 | 1,219 |
| | Odontoprev SA | 486,800 | 1,157 |
| | Neoenergia SA | 408,400 | 1,122 |
| | Qualicorp Consultoria e Corretora de Seguros SA | 328,409 | 996 |
| | Grendene SA | 625,200 | 950 |
| * | Grupo Mateus SA | 724,600 | 915 |
| | CSN Mineracao SA | 940,600 | 878 |
| | Cia Brasileira de Distribuicao | 185,342 | 838 |
| | Cielo SA | 2,133,076 | 828 |
| | Aliansce Sonae Shopping Centers SA | 234,100 | 796 |
| | SIMPAR SA | 395,200 | 718 |
| | Usinas Siderurgicas de Minas Gerais SA Usiminas | 312,400 | 713 |
| | Raizen SA Preference Shares | 552,941 | 664 |
| * | Vamos Locacao de Caminhoes Maquinas e Equipamentos SA | 316,600 | 636 |
| | Ez Tec Empreendimentos e Participacoes SA | 184,500 | 597 |
| | Cia Brasileira de Distribuicao ADR | 127,955 | 583 |
| * | BRF SA ADR | 133,815 | 553 |
| | Lojas Americanas SA (BVMF) | 583,889 | 510 |
| | Cia Paranaense de Energia | 527,080 | 502 |
| | Guararapes Confeccoes SA | 164,900 | 320 |
| | TIM SA ADR | 31,251 | 308 |
| * | Getnet Adquirencia e Servicos para Meios de Pagamento SA | 169,234 | 131 |
| * | Ultrapar Participacoes Rights Exp.11/3/2021 | 107,888 | — |
| | | | 681,854 |
| Canada (6.1%) |
| * | Shopify Inc. Class A | 207,167 | 302,485 |
| 3 | Royal Bank of Canada | 2,677,721 | 278,720 |
| | Toronto-Dominion Bank | 3,417,074 | 248,053 |
| | Enbridge Inc. | 3,774,152 | 158,090 |
| | Brookfield Asset Management Inc. Class A | 2,503,863 | 151,170 |
| | Bank of Nova Scotia | 2,275,783 | 149,206 |
| | Canadian National Railway Co. | 1,113,799 | 148,027 |
| 3 | Bank of Montreal | 1,215,048 | 131,921 |
| | | Shares | Market
Value•
($000) |
| | Canadian Imperial Bank of Commerce | 822,176 | 99,763 |
| | TC Energy Corp. | 1,840,839 | 99,583 |
| | Canadian Pacific Railway Ltd. | 1,254,829 | 97,123 |
| | Canadian Natural Resources Ltd. | 2,180,925 | 92,693 |
| | Nutrien Ltd. | 1,072,185 | 74,939 |
| | Suncor Energy Inc. | 2,788,417 | 73,338 |
| | Manulife Financial Corp. | 3,647,480 | 71,057 |
| | Waste Connections Inc. | 494,879 | 67,338 |
| | Constellation Software Inc. | 36,457 | 64,070 |
| | Sun Life Financial Inc. | 1,097,817 | 62,564 |
| | Alimentation Couche-Tard Inc. Class B | 1,491,933 | 55,960 |
| | National Bank of Canada | 630,135 | 52,168 |
| | Franco-Nevada Corp. | 357,352 | 50,990 |
| | Magna International Inc. | 527,590 | 42,916 |
| | Barrick Gold Corp. (XLON) | 2,282,009 | 41,875 |
| | Fortis Inc. (XTSE) | 883,328 | 39,320 |
| | Thomson Reuters Corp. | 316,333 | 38,051 |
| * | CGI Inc. | 416,534 | 37,211 |
| | Intact Financial Corp. | 267,469 | 35,856 |
| | Wheaton Precious Metals Corp. | 847,572 | 34,215 |
| 3 | Pembina Pipeline Corp. | 1,033,235 | 34,205 |
| | Power Corp. of Canada | 1,018,229 | 33,913 |
| | Restaurant Brands International Inc. (XTSE) | 569,185 | 32,226 |
| | Rogers Communications Inc. Class B | 653,007 | 30,371 |
| | BCE Inc. | 564,078 | 29,038 |
| | Cenovus Energy Inc. | 2,371,068 | 28,355 |
| | Dollarama Inc. | 543,009 | 24,544 |
| | Agnico Eagle Mines Ltd. | 458,726 | 24,348 |
| * | Teck Resources Ltd. Class B | 871,012 | 24,309 |
| | Metro Inc. | 465,760 | 23,435 |
| | Shaw Communications Inc. Class B | 800,123 | 23,042 |
| | Loblaw Cos. Ltd. | 303,786 | 22,848 |
| | TELUS Corp. | 838,375 | 19,232 |
| | Barrick Gold Corp. | 1,025,962 | 18,886 |
| | Fairfax Financial Holdings Ltd. | 45,809 | 18,553 |
| * | Bausch Health Cos. Inc. | 589,561 | 16,525 |
| 3 | Canadian Tire Corp. Ltd. Class A | 106,679 | 15,152 |
| | George Weston Ltd. | 139,766 | 15,101 |
| | Great-West Lifeco Inc. | 499,655 | 14,700 |
FTSE All-World ex-US Index Fund
| | | Shares | Market
Value•
($000) |
| 2 | Hydro One Ltd. | 595,227 | 14,222 |
| | Imperial Oil Ltd. | 401,082 | 13,579 |
| | Saputo Inc. | 449,953 | 10,747 |
| * | Shopify Inc. Class A (XTSE) | 4,540 | 6,659 |
| | Canadian Utilities Ltd. Class A | 222,203 | 6,437 |
| | IGM Financial Inc. | 149,578 | 5,939 |
| * | Canopy Growth Corp. | 458,401 | 5,797 |
| | Enbridge Inc. (XTSE) | 30,400 | 1,273 |
| | Brookfield Asset Management Reinsurance Partners Ltd. Class A | 17,196 | 1,059 |
| | Barrick Gold Corp. (XTSE) | 23,670 | 435 |
| | | | 3,313,632 |
| Chile (0.1%) |
| | Sociedad Quimica y Minera de Chile SA Class B Preference Shares | 137,246 | 7,454 |
| | Empresas COPEC SA | 911,749 | 7,173 |
| | Banco De Chile | 81,024,306 | 7,032 |
| | Sociedad Quimica y Minera de Chile SA ADR | 119,160 | 6,541 |
| | Empresas CMPC SA | 2,257,084 | 4,165 |
| | Banco Santander Chile ADR | 232,997 | 4,129 |
| | Falabella SA | 1,469,814 | 4,064 |
| | Cencosud SA | 2,474,211 | 3,619 |
| | Banco de Credito e Inversiones SA | 91,575 | 3,084 |
| | Cia Sud Americana de Vapores SA | 32,821,680 | 2,132 |
| | Cia Cervecerias Unidas SA | 250,001 | 2,095 |
| | Enel Americas SA ADR | 362,336 | 2,051 |
| | Enel Americas SA | 17,568,281 | 1,998 |
| | Embotelladora Andina SA Preference Shares | 687,024 | 1,419 |
| | CAP SA | 134,720 | 1,333 |
| | Enel Chile SA | 30,780,956 | 1,261 |
| * | Parque Arauco SA | 1,239,205 | 1,223 |
| | Banco Santander Chile SA | 25,843,539 | 1,131 |
| | Colbun SA | 13,117,670 | 905 |
| | Empresa Nacional de Telecomunicaciones SA | 248,092 | 850 |
| | Cencosud Shopping SA | 876,636 | 848 |
| * | Itau CorpBanca Chile SA | 307,847,806 | 683 |
| | AES Andes SA | 6,275,836 | 645 |
| 3 | Enel Chile SA ADR | 291,605 | 633 |
| | Plaza SA | 540,607 | 539 |
| *,1 | Itau CorpBanca Chile SA Rights Exp. 11/2/21 | 277,029,998 | 1 |
| | | | 67,008 |
| | | Shares | Market
Value•
($000) |
| China (9.4%) |
| | Tencent Holdings Ltd. | 11,258,604 | 684,859 |
| * | Alibaba Group Holding Ltd. | 26,755,840 | 550,171 |
| *,2 | Meituan Class B | 7,312,418 | 248,832 |
| | China Construction Bank Corp. Class H | 171,027,517 | 116,398 |
| * | NIO Inc. ADR | 2,435,749 | 95,993 |
| * | JD.com Inc. Class A | 2,391,437 | 93,618 |
| *,2 | Wuxi Biologics Cayman Inc. | 6,164,612 | 93,375 |
| * | Baidu Inc. ADR | 515,583 | 83,648 |
| | Industrial & Commercial Bank of China Ltd. Class H | 151,563,655 | 83,081 |
| | Ping An Insurance Group Co. of China Ltd. Class H | 10,878,862 | 77,922 |
| *,2 | Xiaomi Corp. Class B | 24,898,968 | 68,063 |
| | China Merchants Bank Co. Ltd. Class H | 7,520,341 | 63,022 |
| * | Pinduoduo Inc. ADR | 698,253 | 62,089 |
| | BYD Co. Ltd. Class H | 1,469,655 | 56,211 |
| | NetEase Inc. | 2,772,982 | 53,789 |
| | Bank of China Ltd. Class H | 148,002,284 | 52,378 |
| | Kweichow Moutai Co. Ltd. Class A | 164,825 | 47,034 |
| | Li Ning Co. Ltd. | 4,133,802 | 45,617 |
| * | XPeng Inc. Class A ADR | 890,875 | 41,541 |
| *,2 | Kuaishou Technology | 2,927,400 | 38,294 |
| | China Mengniu Dairy Co. Ltd. | 5,828,504 | 37,084 |
| * | Bilibili Inc. ADR | 472,941 | 34,667 |
| | Geely Automobile Holdings Ltd. | 9,983,097 | 34,648 |
| | ANTA Sports Products Ltd. | 2,130,673 | 33,012 |
| | Sunny Optical Technology Group Co. Ltd. | 1,228,418 | 32,963 |
| | Shenzhou International Group Holdings Ltd. | 1,421,649 | 30,628 |
| * | Trip.com Group Ltd. ADR | 988,056 | 28,219 |
| | Great Wall Motor Co. Ltd. Class H | 5,921,192 | 26,643 |
| | China Life Insurance Co. Ltd. Class H | 14,577,183 | 25,325 |
| | Country Garden Services Holdings Co. Ltd. | 3,274,701 | 25,210 |
| | ENN Energy Holdings Ltd. | 1,432,118 | 24,673 |
| | China Resources Beer Holdings Co. Ltd. | 2,985,630 | 24,652 |
FTSE All-World ex-US Index Fund
| | | Shares | Market
Value•
($000) |
| | China Petroleum and Chemical Corp. (Sinopec) Class H | 50,252,731 | 24,485 |
| * | Li Auto Inc. ADR | 747,490 | 24,391 |
| *,2 | Innovent Biologics Inc. | 2,490,847 | 22,294 |
| | Agricultural Bank of China Class H | 62,066,835 | 21,091 |
| | China Resources Land Ltd. | 5,219,316 | 20,279 |
| | China Merchants Bank Co. Ltd. Class A | 2,280,551 | 19,209 |
| | PetroChina Co. Ltd. Class H | 38,938,969 | 18,774 |
| * | Huazhu Group Ltd. ADR | 402,500 | 18,660 |
| | Wuliangye Yibin Co. Ltd. Class A | 508,608 | 17,187 |
| 2 | Longfor Group Holdings Ltd. | 3,494,835 | 16,908 |
| | CSPC Pharmaceutical Group Ltd. | 15,898,869 | 16,590 |
| | Xinyi Solar Holdings Ltd. | 7,976,220 | 16,569 |
| | China Overseas Land & Investment Ltd. | 7,277,129 | 16,050 |
| | China Pacific Insurance Group Co. Ltd. Class H | 5,240,025 | 16,023 |
| * | Kingdee International Software Group Co. Ltd. | 4,869,303 | 16,022 |
| | Haier Smart Home Co. Ltd. Class H | 4,220,301 | 15,715 |
| 2 | Smoore International Holdings Ltd. | 3,297,350 | 15,679 |
| | China Conch Venture Holdings Ltd. | 3,121,915 | 15,170 |
| | China Shenhua Energy Co. Ltd. Class H | 7,006,860 | 15,067 |
| | China Longyuan Power Group Corp. Ltd. Class H | 6,408,086 | 14,989 |
| | Zijin Mining Group Co. Ltd. Class H | 10,646,882 | 14,806 |
| | China Gas Holdings Ltd. | 5,682,992 | 14,185 |
| | Ping An Insurance Group Co. of China Ltd. Class A | 1,788,650 | 13,816 |
| | Sino Biopharmaceutical Ltd. | 18,546,718 | 13,676 |
| | Country Garden Holdings Co. | 14,283,793 | 13,441 |
| 2 | Postal Savings Bank of China Co. Ltd. Class H | 17,769,351 | 12,915 |
| * | GDS Holdings Ltd. ADR | 215,434 | 12,797 |
| | BYD Co. Ltd. Class A | 248,800 | 12,160 |
| | | Shares | Market
Value•
($000) |
| *,2 | JD Health International Inc. | 1,371,823 | 12,042 |
| | CITIC Securities Co. Ltd. Class H | 4,684,793 | 11,894 |
| | Anhui Conch Cement Co. Ltd. Class H | 2,403,937 | 11,887 |
| | PICC Property & Casualty Co. Ltd. Class H | 12,768,470 | 11,887 |
| | WuXi AppTec Co. Ltd. Class A | 535,421 | 11,539 |
| 2 | China Tower Corp. Ltd. Class H | 88,765,053 | 11,504 |
| * | Zai Lab Ltd. ADR | 109,728 | 11,456 |
| * | Alibaba Health Information Technology Ltd. | 8,938,719 | 11,193 |
| | Zhongsheng Group Holdings Ltd. | 1,217,104 | 10,974 |
| | Contemporary Amperex Technology Co. Ltd. Class A | 109,197 | 10,938 |
| | LONGi Green Energy Technology Co. Ltd. Class A | 708,300 | 10,799 |
| | China Tourism Group Duty Free Corp. Ltd. Class A | 256,162 | 10,729 |
| | Sunac China Holdings Ltd. | 4,720,127 | 10,094 |
| *,3 | COSCO SHIPPING Holdings Co. Ltd. Class H | 6,354,990 | 9,843 |
| | Bank of Communications Ltd. Class H | 15,696,099 | 9,337 |
| | Citic Pacific Ltd. | 9,316,697 | 9,333 |
| * | Vipshop Holdings Ltd. ADR | 832,190 | 9,287 |
| | China Resources Power Holdings Co. Ltd. | 3,587,843 | 9,286 |
| | China National Building Material Co. Ltd. Class H | 7,359,670 | 9,224 |
| | China Vanke Co. Ltd. Class H | 3,919,239 | 9,157 |
| | China Resources Gas Group Ltd. | 1,654,189 | 8,879 |
| * | Tencent Music Entertainment Group ADR | 1,099,074 | 8,639 |
| 2 | China Feihe Ltd. | 4,967,745 | 8,248 |
| | China CITIC Bank Corp. Ltd. Class H | 18,723,749 | 8,213 |
| | Tsingtao Brewery Co. Ltd. Class H | 941,438 | 8,192 |
| * | KE Holdings Inc. ADR | 437,703 | 7,975 |
| * | Genscript Biotech Corp. | 1,801,596 | 7,972 |
| | Industrial Bank Co. Ltd. Class A | 2,719,700 | 7,915 |
| | Ping An Bank Co. Ltd. Class A | 2,536,500 | 7,726 |
| | Ganfeng Lithium Co. Ltd. Class A | 291,900 | 7,643 |
FTSE All-World ex-US Index Fund
| | | Shares | Market
Value•
($000) |
| | Shanxi Xinghuacun Fen Wine Factory Co. Ltd. Class A | 159,460 | 7,512 |
| | Shandong Weigao Group Medical Polymer Co. Ltd. Class H | 4,401,946 | 7,498 |
| 2 | Fuyao Glass Industry Group Co. Ltd. Class H | 1,268,765 | 7,305 |
| | Kingsoft Corp. Ltd. | 1,672,323 | 7,136 |
| 2 | China International Capital Corp. Ltd. Class H | 2,879,627 | 7,129 |
| | Hengan International Group Co. Ltd. | 1,352,793 | 7,070 |
| | Guangdong Investment Ltd. | 5,616,664 | 7,062 |
| | Shenzhen Mindray Bio-Medical Electronics Co. Ltd. Class A | 119,965 | 7,030 |
| | Agricultural Bank of China Ltd. Class A | 15,230,200 | 6,994 |
| | East Money Information Co. Ltd. Class A | 1,353,316 | 6,959 |
| | Luzhou Laojiao Co. Ltd. Class A | 191,600 | 6,835 |
| | Wanhua Chemical Group Co. Ltd. Class A | 410,500 | 6,783 |
| | Weichai Power Co. Ltd. Class H | 3,758,334 | 6,727 |
| *,3 | RLX Technology Inc. ADR | 1,369,399 | 6,655 |
| * | Lufax Holding Ltd. ADR | 1,049,816 | 6,624 |
| | ZTO Express Cayman Inc. ADR | 225,637 | 6,618 |
| | Jiangsu Hengrui Medicine Co. Ltd. Class A | 837,418 | 6,433 |
| | China Yangtze Power Co. Ltd. Class A | 1,925,479 | 6,399 |
| | Kunlun Energy Co. Ltd. | 6,727,356 | 6,127 |
| | Kingboard Holdings Ltd. | 1,403,313 | 6,115 |
| | Muyuan Foods Co. Ltd. Class A | 649,237 | 5,805 |
| | Haitong Securities Co. Ltd. Class H | 6,468,810 | 5,755 |
| * | New Oriental Education & Technology Group Inc. ADR | 2,794,866 | 5,729 |
| | Jiangsu Yanghe Brewery Joint-Stock Co. Ltd. Class A | 197,000 | 5,715 |
| | Guangzhou Automobile Group Co. Ltd. Class H | 6,038,058 | 5,700 |
| 2 | CGN Power Co. Ltd. Class H | 21,074,536 | 5,673 |
| | Sinopharm Group Co. Ltd. Class H | 2,386,906 | 5,668 |
| | | Shares | Market
Value•
($000) |
| 2 | China Resources Mixc Lifestyle Services Ltd. | 1,075,000 | 5,655 |
| | Luxshare Precision Industry Co. Ltd. Class A | 934,239 | 5,650 |
| | Inner Mongolia Yili Industrial Group Co. Ltd. Class A | 839,600 | 5,629 |
| | New China Life Insurance Co. Ltd. Class H | 1,946,389 | 5,615 |
| | China Minsheng Banking Corp. Ltd. Class H | 14,074,169 | 5,580 |
| 3 | Yanzhou Coal Mining Co. Ltd. Class H | 3,676,861 | 5,454 |
| | Industrial & Commercial Bank of China Ltd. Class A | 7,461,400 | 5,447 |
| | Shanghai Pudong Development Bank Co. Ltd. Class A | 3,850,400 | 5,378 |
| *,2 | China Literature Ltd. | 762,029 | 5,287 |
| | Aier Eye Hospital Group Co. Ltd. Class A | 698,086 | 5,279 |
| | GF Securities Co. Ltd. Class H | 3,109,397 | 5,274 |
| | Tongwei Co. Ltd. Class A | 583,700 | 5,212 |
| 3 | Yihai International Holding Ltd. | 877,418 | 5,140 |
| 2 | Huatai Securities Co. Ltd. Class H | 3,445,385 | 5,124 |
| * | 360 DigiTech Inc. ADR | 248,250 | 5,067 |
| | JOYY Inc. ADR | 99,116 | 4,994 |
| | Zhangzhou Pientzehuang Pharmaceutical Co. Ltd. Class A | 77,597 | 4,988 |
| | Dongfeng Motor Group Co. Ltd. Class H | 5,340,643 | 4,974 |
| *,2 | Akeso Inc. | 890,000 | 4,962 |
| | Shanghai Fosun Pharmaceutical Group Co. Ltd. Class H | 1,047,566 | 4,931 |
| 2,3 | Pop Mart International Group Ltd. | 832,800 | 4,912 |
| 2,3 | Haidilao International Holding Ltd. | 1,761,237 | 4,911 |
| | Pharmaron Beijing Co. Ltd. Class A | 163,568 | 4,878 |
| | Sungrow Power Supply Co. Ltd. Class A | 189,300 | 4,866 |
| | People's Insurance Co. Group of China Ltd. Class H | 15,493,882 | 4,833 |
| | Fosun International Ltd. | 4,124,788 | 4,833 |
FTSE All-World ex-US Index Fund
| | | Shares | Market
Value•
($000) |
| 2 | Hygeia Healthcare Holdings Co. Ltd. | 545,267 | 4,787 |
| *,2 | Hua Hong Semiconductor Ltd. | 951,633 | 4,776 |
| | CITIC Securities Co. Ltd. Class A | 1,179,821 | 4,769 |
| *,3 | Didi Global Inc. ADR | 590,588 | 4,766 |
| | Bank of Ningbo Co. Ltd. Class A | 786,700 | 4,690 |
| * | Aluminum Corp. of China Ltd. Class H | 7,779,642 | 4,682 |
| | Yunnan Energy New Material Co. Ltd. Class A | 101,910 | 4,648 |
| | China Everbright International Ltd. | 6,735,484 | 4,627 |
| * | Zhuzhou CRRC Times Electric Co. Ltd. | 965,025 | 4,611 |
| | China Hongqiao Group Ltd. | 4,118,067 | 4,575 |
| * | iQIYI Inc. ADR | 551,464 | 4,566 |
| 3 | Huaneng Power International Inc. Class H | 8,800,226 | 4,555 |
| | China Molybdenum Co. Ltd. Class H | 7,263,984 | 4,491 |
| 2 | WuXi AppTec Co. Ltd. Class H | 207,398 | 4,428 |
| | China Construction Bank Corp. Class A | 4,772,000 | 4,423 |
| | BYD Electronic International Co. Ltd. | 1,488,091 | ��� 4,418 |
| 2 | Guotai Junan Securities Co. Ltd. Class H | 3,220,131 | 4,396 |
| | Eve Energy Co. Ltd. Class A | 247,364 | 4,385 |
| | Zijin Mining Group Co. Ltd. Class A | 2,683,674 | 4,382 |
| 2 | Hangzhou Tigermed Consulting Co. Ltd. Class H | 224,543 | 4,379 |
| | NARI Technology Co. Ltd. Class A | 716,080 | 4,360 |
| | Shanghai Baosight Software Co. Ltd. Class B | 1,090,229 | 4,358 |
| | China Merchants Port Holdings Co. Ltd. | 2,600,229 | 4,335 |
| 3 | Flat Glass Group Co. Ltd. Class H | 807,649 | 4,330 |
| * | Weibo Corp. ADR | 95,526 | 4,297 |
| | China Insurance International Holdings Co. Ltd. | 2,795,472 | 4,254 |
| | Shimao Group Holdings Ltd. | 2,710,246 | 4,252 |
| | ZTE Corp. Class H | 1,410,512 | 4,234 |
| | China Power International Development Ltd. | 8,290,326 | 4,165 |
| | Yangzijiang Shipbuilding Holdings Ltd. | 3,869,296 | 4,085 |
| | | Shares | Market
Value•
($000) |
| | China Meidong Auto Holdings Ltd. | 790,000 | 4,081 |
| 2 | Topsports International Holdings Ltd. | 3,321,209 | 4,035 |
| | SAIC Motor Corp. Ltd. Class A | 1,271,521 | 4,035 |
| *,2 | Evergrande Property Services Group Ltd. | 7,876,000 | 4,013 |
| | Sany Heavy Industry Co. Ltd. Class A | 1,117,000 | 4,006 |
| | Great Wall Motor Co. Ltd. Class A | 374,680 | 3,996 |
| | Autohome Inc. ADR | 101,368 | 3,989 |
| 2 | Hansoh Pharmaceutical Group Co. Ltd. | 1,782,608 | 3,963 |
| * | Kingsoft Cloud Holdings Ltd. ADR | 172,418 | 3,960 |
| | China State Construction Engineering Corp. Ltd. Class A | 5,427,429 | 3,949 |
| | Far East Horizon Ltd. | 4,136,301 | 3,944 |
| | China Galaxy Securities Co. Ltd. Class H | 6,990,117 | 3,892 |
| | China Medical System Holdings Ltd. | 2,298,850 | 3,892 |
| | Chongqing Zhifei Biological Products Co. Ltd. Class A | 163,900 | 3,853 |
| | Beijing Enterprises Water Group Ltd. | 10,067,390 | 3,848 |
| *,2 | Jinxin Fertility Group Ltd. | 2,719,161 | 3,835 |
| | NAURA Technology Group Co. Ltd. Class A | 65,600 | 3,805 |
| | China Northern Rare Earth Group High-Tech Co. Ltd. Class A | 476,100 | 3,776 |
| | Bosideng International Holdings Ltd. | 4,810,931 | 3,728 |
| | Beijing Enterprises Holdings Ltd. | 968,088 | 3,721 |
| | Jiangxi Copper Co. Ltd. Class H | 2,118,392 | 3,699 |
| | China Railway Group Ltd. Class H | 7,560,299 | 3,693 |
| * | COSCO SHIPPING Holdings Co. Ltd. Class A | 1,422,080 | 3,671 |
| | Nine Dragons Paper Holdings Ltd. | 2,911,072 | 3,661 |
| | CIFI Holdings Group Co. Ltd. | 6,562,590 | 3,643 |
| | Foshan Haitian Flavouring & Food Co. Ltd. Class A | 198,338 | 3,632 |
| 2 | China Merchants Securities Co. Ltd. Class H | 2,271,713 | 3,589 |
FTSE All-World ex-US Index Fund
| | | Shares | Market
Value•
($000) |
| *,2,3 | Ping An Healthcare and Technology Co. Ltd. | 734,708 | 3,552 |
| | Haier Smart Home Co. Ltd. Class A | 832,796 | 3,539 |
| | China Jinmao Holdings Group Ltd. | 12,099,706 | 3,535 |
| | Shandong Gold Mining Co. Ltd. Class A | 1,133,063 | 3,516 |
| | Ming Yuan Cloud Group Holdings Ltd. | 1,073,000 | 3,488 |
| * | Tongcheng-Elong Holdings Ltd. | 1,562,918 | 3,483 |
| | Shenzhen Inovance Technology Co. Ltd. Class A | 340,700 | 3,471 |
| | China Resources Cement Holdings Ltd. | 4,099,958 | 3,448 |
| | SF Holding Co. Ltd. Class A | 338,895 | 3,417 |
| * | TAL Education Group ADR | 834,008 | 3,411 |
| | Hopson Development Holdings Ltd. | 1,249,847 | 3,392 |
| | CRRC Corp. Ltd. Class H | 7,504,000 | 3,388 |
| *,2,3 | CanSino Biologics Inc. Class H | 131,459 | 3,362 |
| | Will Semiconductor Co. Ltd. Shanghai Class A | 80,296 | 3,336 |
| | China State Construction International Holdings Ltd. | 3,235,767 | 3,315 |
| | Tianjin Zhonghuan Semiconductor Co. Ltd. Class A | 403,700 | 3,311 |
| | Hello Group Inc. ADR | 265,632 | 3,307 |
| | TravelSky Technology Ltd. Class H | 1,744,759 | 3,260 |
| | China Oilfield Services Ltd. Class H | 3,398,706 | 3,250 |
| | AECC Aviation Power Co. Ltd. Class A | 351,600 | 3,249 |
| | Guangzhou Tinci Materials Technology Co. Ltd. Class A | 124,610 | 3,207 |
| | Xinjiang Goldwind Science & Technology Co. Ltd. Class H | 1,418,261 | 3,172 |
| | Sanan Optoelectronics Co. Ltd. Class A | 599,000 | 3,147 |
| * | 51job Inc. ADR | 52,642 | 3,135 |
| | Anhui Gujing Distillery Co. Ltd. Class B | 242,939 | 3,132 |
| | | Shares | Market
Value•
($000) |
| 2 | Yadea Group Holdings Ltd. | 1,818,000 | 3,124 |
| | Poly Developments and Holdings Group Co. Ltd. Class A | 1,576,895 | 3,095 |
| | Haitian International Holdings Ltd. | 1,061,947 | 3,095 |
| | Kingboard Laminates Holdings Ltd. | 1,951,118 | 3,059 |
| | GoerTek Inc. Class A | 446,920 | 3,035 |
| | JA Solar Technology Co. Ltd. Class A | 210,800 | 3,008 |
| | Iflytek Co. Ltd. Class A | 340,300 | 3,007 |
| * | I-Mab ADR | 48,440 | 2,993 |
| | CRRC Corp. Ltd. Class A | 3,174,600 | 2,945 |
| | Bank of China Ltd. Class A | 6,171,023 | 2,940 |
| | Beijing Kingsoft Office Software Inc. Class A | 63,425 | 2,938 |
| | Shanghai Pharmaceuticals Holding Co. Ltd. Class H | 1,601,819 | 2,932 |
| | China Vanke Co. Ltd. Class A | 1,028,600 | 2,925 |
| | Cosco Shipping Ports Ltd. | 3,509,097 | 2,921 |
| | Seazen Group Ltd. | 3,676,565 | 2,908 |
| 2 | Jiumaojiu International Holdings Ltd. | 1,146,000 | 2,869 |
| | AviChina Industry & Technology Co. Ltd. Class H | 4,479,567 | 2,850 |
| | China Pacific Insurance Group Co. Ltd. Class A | 656,000 | 2,802 |
| * | Brilliance China Automotive Holdings Ltd. | 5,101,410 | 2,789 |
| | Hangzhou Tigermed Consulting Co. Ltd. Class A | 103,929 | 2,767 |
| | China Coal Energy Co. Ltd. Class H | 4,530,041 | 2,764 |
| | Zhejiang Huayou Cobalt Co. Ltd. Class A | 158,500 | 2,749 |
| | Haitong Securities Co. Ltd. Class A | 1,419,926 | 2,740 |
| | Wingtech Technology Co. Ltd. Class A | 159,000 | 2,729 |
| 2 | Shimao Services Holdings Ltd. | 1,424,000 | 2,684 |
| | Baoshan Iron & Steel Co. Ltd. Class A | 2,406,200 | 2,678 |
| | Shenwan Hongyuan Group Co. Ltd. Class A | 3,328,731 | 2,667 |
| | China Cinda Asset Management Co. Ltd. Class H | 15,961,916 | 2,665 |
FTSE All-World ex-US Index Fund
| | | Shares | Market
Value•
($000) |
| | China Lesso Group Holdings Ltd. | 1,695,883 | 2,621 |
| | Unigroup Guoxin Microelectronics Co. Ltd. Class A | 82,697 | 2,618 |
| * | Alibaba Pictures Group Ltd. | 24,632,294 | 2,617 |
| * | Air China Ltd. Class H | 3,690,019 | 2,596 |
| *,3 | Gome Electrical Appliances Holdings Ltd. | 25,183,816 | 2,553 |
| | ZTE Corp. Class A | 500,779 | 2,550 |
| *,1,2 | China Huarong Asset Management Co. Ltd. Class H | 19,420,157 | 2,546 |
| | China Merchants Securities Co. Ltd. Class A | 947,567 | 2,543 |
| | Shenzhen Transsion Holdings Co. Ltd. Class A | 101,627 | 2,500 |
| | Bank of Communications Co. Ltd. Class A | 3,509,000 | 2,478 |
| | Shanghai Putailai New Energy Technology Co. Ltd. Class A | 88,840 | 2,470 |
| | China Everbright Bank Co. Ltd. Class A | 4,566,226 | 2,455 |
| | China Communications Services Corp. Ltd. Class H | 4,417,205 | 2,442 |
| | China Everbright Bank Co. Ltd. Class H | 6,920,063 | 2,434 |
| * | Dada Nexus Ltd. ADR | 119,066 | 2,418 |
| | Gigadevice Semiconductor Beijing Inc. Class A | 89,971 | 2,386 |
| | Zhejiang Expressway Co. Ltd. Class H | 2,687,007 | 2,384 |
| | Yonyou Network Technology Co. Ltd. Class A | 477,962 | 2,372 |
| | Jiangsu Expressway Co. Ltd. Class H | 2,491,275 | 2,362 |
| | China Life Insurance Co. Ltd. Class A | 507,500 | 2,354 |
| | Anhui Conch Cement Co. Ltd. Class A | 388,800 | 2,306 |
| | Chongqing Changan Automobile Co. Ltd. Class A | 750,200 | 2,294 |
| *,2,3 | ZhongAn Online P&C Insurance Co. Ltd. Class H | 626,096 | 2,277 |
| | China United Network Communications Ltd. Class A | 3,543,700 | 2,256 |
| | | Shares | Market
Value•
($000) |
| | Changchun High & New Technology Industry Group Inc. Class A | 52,682 | 2,246 |
| * | Inner Mongolia BaoTou Steel Union Co. Ltd. Class A | 5,104,725 | 2,244 |
| * | China Southern Airlines Co. Ltd. Class H | 3,681,237 | 2,239 |
| | Bank of Shanghai Co. Ltd. Class A | 1,950,691 | 2,223 |
| | Focus Media Information Technology Co. Ltd. Class A | 1,929,600 | 2,211 |
| * | Beijing Capital International Airport Co. Ltd. Class H | 3,385,292 | 2,201 |
| | Lens Technology Co. Ltd. Class A | 656,400 | 2,184 |
| | Guangdong Haid Group Co. Ltd. Class A | 212,900 | 2,181 |
| 2 | A-Living Smart City Services Co. Ltd. | 651,290 | 2,162 |
| 2 | Dali Foods Group Co. Ltd. | 3,837,757 | 2,137 |
| | BOE Technology Group Co. Ltd. Class B | 4,982,237 | 2,133 |
| | Hundsun Technologies Inc. Class A | 217,217 | 2,133 |
| | China Traditional Chinese Medicine Holdings Co. Ltd. | 4,479,306 | 2,131 |
| | Imeik Technology Development Co. Ltd. Class A | 21,800 | 2,122 |
| *,2 | 3SBio Inc. | 2,306,769 | 2,109 |
| | BOE Technology Group Co. Ltd. Class A | 2,738,200 | 2,104 |
| 2 | Ganfeng Lithium Co. Ltd. Class H | 112,279 | 2,104 |
| | Shenzhen International Holdings Ltd. | 1,733,160 | 2,087 |
| | Zhejiang Jingsheng Mechanical & Electrical Co. Ltd. Class A | 174,100 | 2,082 |
| | China CSSC Holdings Ltd. Class A | 592,500 | 2,082 |
| | GF Securities Co. Ltd. Class A | 660,600 | 2,079 |
| | Yunnan Baiyao Group Co. Ltd. Class A | 148,000 | 2,072 |
| | Yuexiu Property Co. Ltd. | 2,346,965 | 2,062 |
| | Agile Group Holdings Ltd. | 2,613,881 | 2,049 |
| | Greentown China Holdings Ltd. | 1,481,797 | 2,042 |
FTSE All-World ex-US Index Fund
| | | Shares | Market
Value•
($000) |
| | Kwg Group Holdings Ltd. | 2,332,832 | 2,034 |
| | TBEA Co. Ltd. Class A | 480,100 | 2,032 |
| | China National Nuclear Power Co. Ltd. Class A | 1,886,600 | 2,022 |
| * | Shanghai International Airport Co. Ltd. Class A | 244,400 | 2,021 |
| 2 | Sunac Services Holdings Ltd. | 998,266 | 2,015 |
| 2 | Joinn Laboratories China Co. Ltd. Class H | 155,900 | 2,006 |
| | Shanghai Lujiazui Finance & Trade Zone Development Co. Ltd. Class B | 2,253,034 | 2,004 |
| | China Railway Group Ltd. Class A | 2,432,818 | 1,995 |
| *,2 | Remegen Co. Ltd. Class H | 160,000 | 1,990 |
| * | Advanced Micro-Fabrication Equipment Inc. Class A | 81,173 | 1,984 |
| | Bank of Nanjing Co. Ltd. Class A | 1,305,765 | 1,979 |
| | Bank of Beijing Co. Ltd. Class A | 2,851,600 | 1,974 |
| | China Petroleum & Chemical Corp. Class A | 2,951,500 | 1,961 |
| | Ecovacs Robotics Co. Ltd. Class A | 73,100 | 1,960 |
| | MINISO Group Holding Ltd. ADR | 129,354 | 1,942 |
| 3 | China International Marine Containers Group Co. Ltd. Class H | 972,517 | 1,927 |
| | Inner Mongolia Yitai Coal Co. Ltd. Class B | 2,215,814 | 1,921 |
| | Citic Pacific Special Steel Group Co. Ltd. Class A | 644,353 | 1,920 |
| | Jiangsu Hengli Hydraulic Co. Ltd. Class A | 149,358 | 1,915 |
| | Logan Group Co. Ltd. | 1,911,821 | 1,915 |
| 3 | Guangzhou R&F Properties Co. Ltd. Class H | 3,009,421 | 1,883 |
| | Henan Shuanghui Investment & Development Co. Ltd. Class A | 406,100 | 1,871 |
| | Shanghai Fosun Pharmaceutical Group Co. Ltd. Class A | 238,915 | 1,871 |
| | Metallurgical Corp. of China Ltd. Class H | 6,742,030 | 1,870 |
| | | Shares | Market
Value•
($000) |
| | Maxscend Microelectronics Co. Ltd. Class A | 38,580 | 1,865 |
| | Shaanxi Coal Industry Co. Ltd. Class A | 939,200 | 1,841 |
| | China Minsheng Banking Corp. Ltd. Class A | 2,991,300 | 1,817 |
| | Jiangsu Eastern Shenghong Co. Ltd. Class A | 426,000 | 1,811 |
| | Power Construction Corp. of China Ltd. Class A | 1,390,000 | 1,789 |
| | Walvax Biotechnology Co. Ltd. Class A | 204,200 | 1,764 |
| | Hoshine Silicon Industry Co. Ltd. Class A | 68,000 | 1,749 |
| | Sun Art Retail Group Ltd. | 2,977,000 | 1,745 |
| | Huatai Securities Co. Ltd. Class A | 704,100 | 1,744 |
| | TCL Technology Group Corp. Class A | 1,838,300 | 1,743 |
| | Huaxia Bank Co. Ltd. Class A | 1,977,198 | 1,739 |
| 2 | Legend Holdings Corp. Class H | 989,579 | 1,739 |
| | Weichai Power Co. Ltd. Class A | 735,988 | 1,738 |
| 2,3 | CSC Financial Co. Ltd. Class H | 1,628,748 | 1,722 |
| | Sinotruk Hong Kong Ltd. | 1,245,884 | 1,720 |
| | Zhejiang Sanhua Intelligent Controls Co. Ltd. Class A | 459,470 | 1,703 |
| | Huayu Automotive Systems Co. Ltd. Class A | 405,269 | 1,698 |
| | Sinopec Shanghai Petrochemical Co. Ltd. Class H | 7,260,940 | 1,694 |
| | Hangzhou Silan Microelectronics Co. Ltd. Class A | 174,300 | 1,681 |
| 3 | China Everbright Ltd. | 1,488,662 | 1,674 |
| *,2,3 | Shanghai Junshi Biosciences Co. Ltd. Class H | 331,343 | 1,665 |
| | Chongqing Changan Automobile Co. Ltd. Class B | 2,547,511 | 1,646 |
| | Bank of Hangzhou Co. Ltd. Class A | 735,435 | 1,640 |
| | Shougang Fushan Resources Group Ltd. | 6,200,303 | 1,638 |
| | Sunwoda Electronic Co. Ltd. Class A | 210,900 | 1,625 |
| | Anhui Gujing Distillery Co. Ltd. Class A | 45,188 | 1,606 |
FTSE All-World ex-US Index Fund
| | | Shares | Market
Value•
($000) |
| | Shenzhen Kangtai Biological Products Co. Ltd. Class A | 89,764 | 1,605 |
| 3 | Chongqing Rural Commercial Bank Co. Ltd. Class H | 4,452,181 | 1,602 |
| | Zoomlion Heavy Industry Science and Technology Co. Ltd. Class H | 2,207,515 | 1,590 |
| | Suzhou Maxwell Technologies Co. Ltd. Class A | 13,240 | 1,586 |
| | Yihai Kerry Arawana Holdings Co. Ltd. Class A | 167,000 | 1,586 |
| | SG Micro Corp. Class A | 31,300 | 1,585 |
| | Zhejiang Chint Electrics Co. Ltd. Class A | 166,993 | 1,576 |
| | Seazen Holdings Co. Ltd. Class A | 290,897 | 1,554 |
| | China Jushi Co. Ltd. Class A | 518,653 | 1,549 |
| * | China Eastern Airlines Corp. Ltd. Class H | 3,925,171 | 1,540 |
| * | Topchoice Medical Corp. Class A | 41,278 | 1,536 |
| * | XPeng Inc. Class A | 65,978 | 1,531 |
| | China Merchants Shekou Industrial Zone Holdings Co. Ltd. Class A | 933,396 | 1,522 |
| * | Zhejiang Century Huatong Group Co. Ltd. Class A | 1,309,507 | 1,518 |
| | Wuxi Shangji Automation Co. Ltd. Class A | 32,300 | 1,513 |
| | Jinke Smart Services Group Co. Ltd. Class H | 280,200 | 1,513 |
| | Montage Technology Co. Ltd. Class A | 148,279 | 1,511 |
| * | Gotion High-tech Co. Ltd. Class A | 163,900 | 1,509 |
| *,2 | Luye Pharma Group Ltd. | 3,162,461 | 1,507 |
| | Chaozhou Three-Circle Group Co. Ltd. Class A | 240,500 | 1,504 |
| | China Shenhua Energy Co. Ltd. Class A | 480,656 | 1,496 |
| | Tsingtao Brewery Co. Ltd. Class A | 91,811 | 1,496 |
| | Orient Securities Co. Ltd. Class A | 693,092 | 1,492 |
| | Hangzhou First Applied Material Co. Ltd. Class A | 66,340 | 1,489 |
| 2,3 | China Resources Pharmaceutical Group Ltd. | 3,095,232 | 1,489 |
| | | Shares | Market
Value•
($000) |
| | SDIC Power Holdings Co. Ltd. Class A | 901,900 | 1,486 |
| * | Chongqing Brewery Co. Ltd. Class A | 63,100 | 1,480 |
| | Shanghai Electric Group Co. Ltd. Class H | 5,249,404 | 1,479 |
| | Zoomlion Heavy Industry Science and Technology Co. Ltd. Class A | 1,298,700 | 1,475 |
| | Sinopec Engineering Group Co. Ltd. Class H | 2,768,188 | 1,459 |
| | Angang Steel Co. Ltd. Class H | 2,658,568 | 1,429 |
| 2 | Orient Securities Co. Ltd. Class H | 1,738,835 | 1,427 |
| | Hengli Petrochemical Co. Ltd. Class A | 409,800 | 1,413 |
| 3 | Poly Property Services Co. Ltd. | 252,646 | 1,410 |
| | Zhejiang NHU Co. Ltd. Class A | 331,440 | 1,405 |
| | Mango Excellent Media Co. Ltd. Class A | 227,529 | 1,396 |
| * | Aluminum Corp. of China Ltd. Class A | 1,450,100 | �� 1,394 |
| | Ginlong Technologies Co. Ltd. Class A | 31,900 | 1,392 |
| | JiuGui Liquor Co. Ltd. Class A | 41,400 | 1,385 |
| | Lao Feng Xiang Co. Ltd. Class B | 391,321 | 1,380 |
| 2 | Blue Moon Group Holdings Ltd. | 1,530,000 | 1,379 |
| | Asymchem Laboratories Tianjin Co. Ltd. Class A | 22,100 | 1,374 |
| | LB Group Co. Ltd. Class A | 305,000 | 1,356 |
| 2 | BAIC Motor Corp. Ltd. Class H | 4,088,436 | 1,354 |
| | Founder Securities Co. Ltd. Class A | 1,051,600 | 1,341 |
| | Shandong Hualu Hengsheng Chemical Co. Ltd. Class A | 273,344 | 1,329 |
| | Shanghai Industrial Holdings Ltd. | 888,512 | 1,326 |
| | Wuxi Lead Intelligent Equipment Co. Ltd. Class A | 103,740 | 1,322 |
| 3 | Dongfang Electric Corp. Ltd. Class H | 826,891 | 1,319 |
| | Satellite Chemical Co. Ltd. Class A | 216,440 | 1,319 |
| 3 | Zhaojin Mining Industry Co. Ltd. Class H | 1,840,637 | 1,310 |
| | Huadong Medicine Co. Ltd. Class A | 227,800 | 1,301 |
FTSE All-World ex-US Index Fund
| | | Shares | Market
Value•
($000) |
| | Shenzhen Expressway Co. Ltd. Class H | 1,369,782 | 1,291 |
| | Zhejiang Dahua Technology Co. Ltd. Class A | 377,700 | 1,287 |
| | China Reinsurance Group Corp. Class H | 12,380,206 | 1,287 |
| | Sinoma Science & Technology Co. Ltd. Class A | 217,100 | 1,283 |
| * | New Hope Liuhe Co. Ltd. Class A | 569,100 | 1,280 |
| | Sichuan Swellfun Co. Ltd. Class A | 64,700 | 1,277 |
| * | Zhejiang Yongtai Technology Co. Ltd. Class A | 113,715 | 1,275 |
| | Thunder Software Technology Co. Ltd. Class A | 59,700 | 1,270 |
| | Sinotrans Ltd. Class H | 3,824,064 | 1,257 |
| | CSG Holding Co. Ltd. Class B | 2,877,152 | 1,253 |
| | New China Life Insurance Co. Ltd. Class A | 205,000 | 1,251 |
| | Industrial Securities Co. Ltd. Class A | 873,700 | 1,246 |
| | Everbright Securities Co. Ltd. Class A | 524,095 | 1,246 |
| 2 | Pharmaron Beijing Co. Ltd. Class H | 57,479 | 1,244 |
| 3 | Huadian Power International Corp. Ltd. Class H | 3,353,550 | 1,239 |
| | Guosen Securities Co. Ltd. Class A | 693,581 | 1,236 |
| | AVIC Electromechanical Systems Co. Ltd. Class A | 519,892 | 1,233 |
| | Sichuan Chuantou Energy Co. Ltd. Class A | 601,900 | 1,231 |
| | Yealink Network Technology Corp. Ltd. Class A | 103,668 | 1,224 |
| | Fuyao Glass Industry Group Co. Ltd. Class A | 158,400 | 1,224 |
| | Hithink RoyalFlush Information Network Co. Ltd. Class A | 68,666 | 1,210 |
| | COSCO SHIPPING Development Co. Ltd. Class H | 6,221,713 | 1,209 |
| | Jiangsu King's Luck Brewery JSC Ltd. Class A | 156,706 | 1,206 |
| | Shanghai International Port Group Co. Ltd. Class A | 1,361,200 | 1,203 |
| | | Shares | Market
Value•
($000) |
| | StarPower Semiconductor Ltd. Class A | 18,700 | 1,175 |
| | Shenzhen Capchem Technology Co. Ltd. Class A | 52,300 | 1,173 |
| | China Molybdenum Co. Ltd. Class A | 1,243,091 | 1,167 |
| | Sichuan Road & Bridge Co. Ltd. Class A | 621,470 | 1,167 |
| | JCET Group Co. Ltd. Class A | 238,700 | 1,154 |
| | Huizhou Desay Sv Automotive Co. Ltd. Class A | 68,900 | 1,153 |
| | Ovctek China Inc. Class A | 107,520 | 1,145 |
| | China National Chemical Engineering Co. Ltd. Class A | 698,100 | 1,144 |
| | Shenzhen Overseas Chinese Town Co. Ltd. Class A | 1,166,700 | 1,142 |
| | Changzhou Xingyu Automotive Lighting Systems Co. Ltd. Class A | 31,900 | 1,140 |
| | Livzon Pharmaceutical Group Inc. Class H | 344,871 | 1,136 |
| * | Li Auto Inc. Class A | 67,281 | 1,135 |
| | Sino-Ocean Group Holding Ltd. | 5,192,904 | 1,129 |
| | Jiangxi Copper Co. Ltd. Class A | 309,400 | 1,127 |
| | Hongfa Technology Co. Ltd. Class A | 97,300 | 1,126 |
| | China Baoan Group Co. Ltd. Class A | 342,200 | 1,122 |
| 3 | China Evergrande Group | 3,687,461 | 1,094 |
| | Guangzhou Kingmed Diagnostics Group Co. Ltd. Class A | 60,600 | 1,088 |
| | Hualan Biological Engineering Inc. Class A | 233,464 | 1,084 |
| 3 | Shenzhen Investment Ltd. | 4,415,151 | 1,083 |
| | Ingenic Semiconductor Co. Ltd. Class A | 50,200 | 1,078 |
| | Beijing Shiji Information Technology Co. Ltd. Class A | 288,454 | 1,068 |
| | Rongsheng Petrochemical Co. Ltd. Class A | 391,350 | 1,054 |
| | Guangzhou Baiyunshan Pharmaceutical Holdings Co. Ltd. Class H | 414,620 | 1,048 |
FTSE All-World ex-US Index Fund
| | | Shares | Market
Value•
($000) |
| | Shandong Nanshan Aluminum Co. Ltd. Class A | 1,523,300 | 1,030 |
| | GD Power Development Co. Ltd. Class A | 2,361,796 | 1,028 |
| | GEM Co. Ltd. Class A | 602,998 | 1,026 |
| | Maanshan Iron & Steel Co. Ltd. Class A | 1,540,900 | 1,023 |
| | Beijing Roborock Technology Co. Ltd. Class A | 7,237 | 1,022 |
| | Wuhan Guide Infrared Co. Ltd. Class A | 299,888 | 1,019 |
| | Yanlord Land Group Ltd. | 1,215,087 | 1,010 |
| * | Lingyi iTech Guangdong Co. Class A | 966,500 | 1,007 |
| | Shengyi Technology Co. Ltd. Class A | 288,700 | 1,004 |
| * | National Silicon Industry Group Co. Ltd. Class A | 226,790 | 1,004 |
| | Shanghai Jinjiang International Hotels Co. Ltd. Class B | 518,925 | 998 |
| | Huaxin Cement Co. Ltd. Class B | 558,269 | 992 |
| | ENN Natural Gas Co. Ltd. Class A | 342,400 | 986 |
| 2 | China Railway Signal & Communication Corp. Ltd. Class H | 2,781,353 | 976 |
| | COSCO SHIPPING Energy Transportation Co. Ltd. Class H | 2,185,306 | 966 |
| | KWG Living Group Holdings Ltd. | 1,434,130 | 966 |
| | Beijing Wantai Biological Pharmacy Enterprise Co. Ltd. Class A | 27,860 | 963 |
| | Beijing New Building Materials plc Class A | 216,496 | 954 |
| * | China Southern Airlines Co. Ltd. Class A | 930,797 | 954 |
| | XCMG Construction Machinery Co. Ltd. Class A | 992,300 | 950 |
| | Wuhu Sanqi Interactive Entertainment Network Technology Group Co. Ltd. Class A | 254,300 | 947 |
| | Datang International Power Generation Co. Ltd. Class H | 5,235,035 | 946 |
| * | Guanghui Energy Co. Ltd. Class A | 916,800 | 946 |
| | | Shares | Market
Value•
($000) |
| | Shanghai Bairun Investment Holding Group Co. Ltd. Class A | 94,780 | 942 |
| | Ningbo Tuopu Group Co. Ltd. Class A | 115,600 | 941 |
| | Do-Fluoride New Materials Co. Ltd. Class A | 96,600 | 940 |
| | CSC Financial Co. Ltd. Class A | 210,338 | 929 |
| | Angel Yeast Co. Ltd. Class A | 105,900 | 921 |
| | Times China Holdings Ltd. | 1,348,693 | 918 |
| | Gemdale Corp. Class A | 578,200 | 917 |
| | Beijing-Shanghai High Speed Railway Co. Ltd. Class A | 1,271,490 | 914 |
| | Tongkun Group Co. Ltd. Class A | 291,600 | 910 |
| 3 | China Aoyuan Group Ltd. | 2,295,786 | 907 |
| * | Kuang-Chi Technologies Co. Ltd. Class A | 280,900 | 901 |
| | Foxconn Industrial Internet Co. Ltd. Class A | 507,700 | 901 |
| | Inspur Electronic Information Industry Co. Ltd. Class A | 185,120 | 899 |
| | Westone Information Industry Inc. Class A | 109,498 | 895 |
| | Beijing Jingneng Clean Energy Co. Ltd. Class H | 2,936,579 | 888 |
| | Shanxi Taigang Stainless Steel Co. Ltd. Class A | 731,500 | 882 |
| | China Merchants Energy Shipping Co. Ltd. Class A | 1,233,776 | 882 |
| | Shanghai Electric Group Co. Ltd. Class A | 1,189,400 | 882 |
| * | SOHO China Ltd. | 3,455,542 | 878 |
| | Flat Glass Group Co. Ltd. Class A | 101,100 | 869 |
| | Xinjiang Goldwind Science & Technology Co. Ltd. Class A | 300,297 | 868 |
| | Fu Jian Anjoy Foods Co. Ltd. Class A | 27,400 | 866 |
| | Guangzhou Automobile Group Co. Ltd. Class A | 318,530 | 863 |
| * | Spring Airlines Co. Ltd. Class A | 93,543 | 855 |
| | Metallurgical Corp. of China Ltd. Class A | 1,348,900 | 853 |
| | Zhejiang Juhua Co. Ltd. Class A | 346,949 | 843 |
FTSE All-World ex-US Index Fund
| | | Shares | Market
Value•
($000) |
| * | 360 Security Technology Inc. Class A | 444,199 | 836 |
| * | Suning.com Co. Ltd. Class A | 1,189,500 | 831 |
| | Shenzhen Energy Group Co. Ltd. Class A | 651,220 | 830 |
| | By-health Co. Ltd. Class A | 207,366 | 825 |
| | Huafon Chemical Co. Ltd. Class A | 441,700 | 822 |
| | Beijing Tiantan Biological Products Corp. Ltd. Class A | 182,121 | 822 |
| | Yantai Jereh Oilfield Services Group Co. Ltd. Class A | 124,197 | 818 |
| | Fangda Carbon New Material Co. Ltd. Class A | 485,516 | 816 |
| | Dawning Information Industry Co. Ltd. Class A | 189,300 | 812 |
| | Zhongjin Gold Corp. Ltd. Class A | 619,850 | 803 |
| | Huagong Tech Co. Ltd. Class A | 177,859 | 801 |
| | Changjiang Securities Co. Ltd. Class A | 706,986 | 800 |
| * | OneConnect Financial Technology Co. Ltd. ADR | 252,115 | 799 |
| | China Greatwall Technology Group Co. Ltd. Class A | 379,300 | 798 |
| * | Hang Zhou Great Star Industrial Co. Ltd. Class A | 159,100 | 797 |
| | Zhejiang Jiuzhou Pharmaceutical Co. Ltd. Class A | 97,400 | 797 |
| | Tongling Nonferrous Metals Group Co. Ltd. Class A | 1,372,758 | 796 |
| | Zhejiang Longsheng Group Co. Ltd. Class A | 408,000 | 793 |
| | Han's Laser Technology Industry Group Co. Ltd. Class A | 118,000 | 791 |
| | China Railway Signal & Communication Corp. Ltd. Class A | 1,025,723 | 790 |
| | Hengyi Petrochemical Co. Ltd. Class A | 458,400 | 785 |
| | Dongfang Electric Corp. Ltd. Class A | 275,284 | 782 |
| | Shanxi Coking Coal Energy Group Co. Ltd. Class A | 536,920 | 780 |
| | Zhefu Holding Group Co. Ltd. Class A | 694,800 | 776 |
| | | Shares | Market
Value•
($000) |
| | Shanghai Yuyuan Tourist Mart Group Co. Ltd. Class A | 504,600 | 775 |
| | Shanghai RAAS Blood Products Co. Ltd. Class A | 751,200 | 774 |
| | YTO Express Group Co. Ltd. Class A | 338,600 | 772 |
| | AVICOPTER plc Class A | 78,400 | 771 |
| | Kunlun Tech Co. Ltd. Class A | 264,200 | 769 |
| | CECEP Wind-Power Corp. Class A | 665,300 | 767 |
| * | Gaotu Techedu Inc. ADR | 260,600 | 766 |
| * | Yunnan Aluminium Co. Ltd. Class A | 408,900 | 761 |
| | Ningxia Baofeng Energy Group Co. Ltd. Class A | 332,500 | 761 |
| | Shanxi Lu'an Environmental Energy Development Co. Ltd. Class A | 375,050 | 761 |
| | Lepu Medical Technology Beijing Co. Ltd. Class A | 228,200 | 760 |
| 3 | Jiayuan International Group Ltd. | 1,960,382 | 758 |
| | Shenghe Resources Holding Co. Ltd. Class A | 237,500 | 755 |
| | SDIC Capital Co. Ltd. Class A | ��587,784 | 753 |
| *,3 | Zhihu Inc. ADR | 91,202 | 753 |
| | Skshu Paint Co. Ltd. Class A | 43,120 | 752 |
| | Yonghui Superstores Co. Ltd. Class A | 1,221,497 | 751 |
| | Songcheng Performance Development Co. Ltd. Class A | 342,320 | 749 |
| | Jafron Biomedical Co. Ltd. Class A | 92,784 | 749 |
| | China National Software & Service Co. Ltd. Class A | 93,300 | 748 |
| | China International Capital Corp. Ltd. Class A | 99,400 | 747 |
| | Tianshui Huatian Technology Co. Ltd. Class A | 370,900 | 746 |
| | Sangfor Technologies Inc. Class A | 23,400 | 740 |
| | Inner Mongolia Junzheng Energy & Chemical Industry Group Co. Ltd. Class A | 923,300 | 740 |
FTSE All-World ex-US Index Fund
| | | Shares | Market
Value•
($000) |
| | Shenzhen SC New Energy Technology Corp. Class A | 41,000 | 730 |
| | CECEP Solar Energy Co. Ltd. Class A | 417,380 | 728 |
| 2,3 | China East Education Holdings Ltd. | 765,303 | 726 |
| | Jiangsu Yangnong Chemical Co. Ltd. Class A | 39,500 | 726 |
| | Unisplendour Corp. Ltd. Class A | 166,737 | 722 |
| | Western Securities Co. Ltd. Class A | 602,994 | 722 |
| | Beijing Dabeinong Technology Group Co. Ltd. Class A | 536,800 | 720 |
| | Shanghai Jinjiang International Hotels Co. Ltd. Class A | 85,420 | 719 |
| * | Guangdong HEC Technology Holding Co. Ltd. Class A | 432,553 | 717 |
| | BBMG Corp. Class H | 4,261,085 | 716 |
| | AVIC Industry-Finance Holdings Co. Ltd. Class A | 1,176,800 | 716 |
| | Jiangsu Yuyue Medical Equipment & Supply Co. Ltd. Class A | 129,800 | 715 |
| | Guangzhou Baiyunshan Pharmaceutical Holdings Co. Ltd. Class A | 157,100 | 714 |
| | Bank of Jiangsu Co. Ltd. Class A | 727,090 | 714 |
| | Guotai Junan Securities Co. Ltd. Class A | 259,800 | 711 |
| | Jiangsu Yoke Technology Co. Ltd. Class A | 59,700 | 711 |
| | Tianfeng Securities Co. Ltd. Class A | 1,154,280 | 711 |
| | Yifeng Pharmacy Chain Co. Ltd. Class A (XSHG) | 94,771 | 707 |
| | Ningbo Zhoushan Port Co. Ltd. Class A | 1,203,000 | 705 |
| *,2 | Red Star Macalline Group Corp. Ltd. Class H | 1,255,882 | 705 |
| | China Oilfield Services Ltd. Class A | 303,689 | 704 |
| * | Sichuan Hebang Biotechnology Co. Ltd. Class A | 1,261,800 | 702 |
| | | Shares | Market
Value•
($000) |
| | Yantai Changyu Pioneer Wine Co. Ltd. Class B | 389,084 | 699 |
| | Shanghai Jinqiao Export Processing Zone Development Co. Ltd. Class B | 771,989 | 695 |
| | COSCO SHIPPING Energy Transportation Co. Ltd. Class A | 746,800 | 693 |
| | Shanghai Friendess Electronic Technology Corp. Ltd. Class A | 11,592 | 692 |
| | Western Superconducting Technologies Co. Ltd. Class A | 56,622 | 688 |
| | Gongniu Group Co. Ltd. Class A | 27,500 | 678 |
| | Jason Furniture Hangzhou Co. Ltd. Class A | 69,400 | 675 |
| | Humanwell Healthcare Group Co. Ltd. Class A | 205,100 | 673 |
| | G-bits Network Technology Xiamen Co. Ltd. Class A | 12,600 | 673 |
| | Offshore Oil Engineering Co. Ltd. Class A | 925,300 | 672 |
| | Southwest Securities Co. Ltd. Class A | 893,700 | 672 |
| *,2 | JD Logistics Inc. | 170,817 | 671 |
| * | Pangang Group Vanadium Titanium & Resources Co. Ltd. Class A | 1,071,700 | 669 |
| | COSCO SHIPPING Development Co. Ltd. Class A | 1,224,040 | 665 |
| | Xiamen Tungsten Co. Ltd. Class A | 187,399 | 665 |
| * | Air China Ltd. Class A | 498,226 | 662 |
| | Weifu High-Technology Group Co. Ltd. Class B | 347,462 | 660 |
| | Weihai Guangwei Composites Co. Ltd. Class A | 62,200 | 660 |
| | Sieyuan Electric Co. Ltd. Class A | 101,500 | 658 |
| * | China Eastern Airlines Corp. Ltd. Class A | 872,329 | 658 |
| | Youngor Group Co. Ltd. Class A | 655,000 | 658 |
| | SooChow Securities Co. Ltd. Class A | 496,620 | 658 |
| | Hunan Valin Steel Co. Ltd. Class A | 787,000 | 657 |
FTSE All-World ex-US Index Fund
| | | Shares | Market
Value•
($000) |
| | Kingfa Sci & Tech Co. Ltd. Class A | 358,300 | 657 |
| | Shanghai Pharmaceuticals Holding Co. Ltd. Class A | 225,444 | 657 |
| | Suzhou Dongshan Precision Manufacturing Co. Ltd. Class A | 206,200 | 656 |
| | Sinolink Securities Co. Ltd. Class A | 391,100 | 655 |
| | Hubei Energy Group Co. Ltd. Class A | 842,208 | 654 |
| | Nanjing Securities Co. Ltd. Class A | 429,500 | 651 |
| | Shanghai Jahwa United Co. Ltd. Class A | 86,600 | 648 |
| | Raytron Technology Co. Ltd. Class A | 57,119 | 645 |
| | Perfect World Co. Ltd. Class A | 237,400 | 644 |
| | Wuchan Zhongda Group Co. Ltd. Class A | 654,300 | 642 |
| | Health & Happiness H&H International Holdings Ltd. | 273,604 | 640 |
| | Shanghai Mechanical and Electrical Industry Co. Ltd. Class B | 494,438 | 636 |
| | Shandong Chenming Paper Holdings Ltd. Class B | 1,407,350 | 636 |
| | Guoyuan Securities Co. Ltd. Class A | 546,000 | 633 |
| 2 | Shenwan Hongyuan Group Co. Ltd. Class H | 2,496,800 | 631 |
| | Proya Cosmetics Co. Ltd. Class A | 20,100 | 631 |
| | Guangdong Kinlong Hardware Products Co. Ltd. Class A | 30,300 | 629 |
| | Shenergy Co. Ltd. Class A | 650,000 | 629 |
| | Ninestar Corp. Class A | 108,925 | 624 |
| | Wangfujing Group Co. Ltd. Class A | 128,900 | 621 |
| | Shanghai M&G Stationery Inc. Class A | 62,300 | 617 |
| | Zhejiang Wolwo Bio-Pharmaceutical Co. Ltd. Class A | 73,600 | 616 |
| | Zhuzhou Kibing Group Co. Ltd. Class A | 248,300 | 616 |
| | Liaoning Cheng Da Co. Ltd. Class A | 193,200 | 615 |
| | Luxi Chemical Group Co. Ltd. Class A | 238,800 | 613 |
| | | Shares | Market
Value•
($000) |
| | Oppein Home Group Inc. Class A | 30,762 | 612 |
| | Jiangsu Zhongtian Technology Co. Ltd. Class A | 387,300 | 612 |
| | Shandong Linglong Tyre Co. Ltd. Class A | 110,700 | 612 |
| | Dongxing Securities Co. Ltd. Class A | 356,192 | 610 |
| | Anhui Expressway Co. Ltd. Class H | 1,022,728 | 606 |
| | Xinhua Winshare Publishing and Media Co. Ltd. Class H | 829,439 | 606 |
| | Tianma Microelectronics Co. Ltd. Class A | 312,900 | 602 |
| | Hangzhou Robam Appliances Co. Ltd. Class A | 122,700 | 600 |
| | Yantai Eddie Precision Machinery Co. Ltd. Class A | 107,240 | 599 |
| | Jiangxi Zhengbang Technology Co. Ltd. Class A | 381,181 | 596 |
| | Wens Foodstuffs Group Co. Ltd. Class A | 231,080 | 595 |
| | Jonjee Hi-Tech Industrial And Commercial Holding Co. Ltd. Class A | 104,394 | 595 |
| | Avary Holding Shenzhen Co. Ltd. Class A | 108,600 | 594 |
| | Shenzhen Kingdom Sci-Tech Co. Ltd. Class A | 295,891 | 586 |
| | Greenland Holdings Corp. Ltd. Class A | 908,954 | 584 |
| | Daan Gene Co. Ltd. Class A | 194,416 | 584 |
| | Newland Digital Technology Co. Ltd. Class A | 247,699 | 583 |
| | Zhejiang Weixing New Building Materials Co. Ltd. Class A | 205,000 | 576 |
| * | Meinian Onehealth Healthcare Holdings Co. Ltd. Class A | 510,640 | 574 |
| | Nanjing King-Friend Biochemical Pharmaceutical Co. Ltd. Class A | 99,021 | 573 |
| | Qingdao TGOOD Electric Co. Ltd. Class A | 137,700 | 567 |
| * | Yunnan Tin Co. Ltd. Class A | 221,500 | 567 |
FTSE All-World ex-US Index Fund
| | | Shares | Market
Value•
($000) |
| | TongFu Microelectronics Co. Ltd. Class A | 181,000 | 566 |
| | Shandong Sun Paper Industry JSC Ltd. Class A | 313,600 | 563 |
| | Shanghai Electric Power Co. Ltd. Class A | 325,100 | 563 |
| | Fujian Sunner Development Co. Ltd. Class A | 160,100 | 562 |
| | Chongqing Fuling Zhacai Group Co. Ltd. Class A | 103,000 | 561 |
| * | NavInfo Co. Ltd. Class A | 306,196 | 560 |
| | Intco Medical Technology Co. Ltd. Class A | 69,675 | 560 |
| | Beijing Enlight Media Co. Ltd. Class A | 382,000 | 559 |
| | CNOOC Energy Technology & Services Ltd. Class A | 1,231,600 | 556 |
| * | Yuan Longping High-tech Agriculture Co. Ltd. Class A | 169,100 | 555 |
| | Bank of Changsha Co. Ltd. Class A | 440,300 | 553 |
| | China Great Wall Securities Co. Ltd. Class A | 309,000 | 552 |
| * | Shenzhen Salubris Pharmaceuticals Co. Ltd. Class A | 122,100 | 551 |
| | Liaoning Port Co. Ltd. Class A | 2,084,400 | 551 |
| | China CITIC Bank Corp. Ltd. Class A | 774,835 | 550 |
| | Shan Xi Hua Yang Group New Energy Co. Ltd. Class A | 330,800 | 549 |
| | Winning Health Technology Group Co. Ltd. Class A | 276,380 | 546 |
| | Dong-E-E-Jiao Co. Ltd. Class A | 86,100 | 546 |
| | First Capital Securities Co. Ltd. Class A | 509,800 | 544 |
| | Hengdian Group DMEGC Magnetics Co. Ltd. Class A | 246,000 | 543 |
| * | Guangshen Railway Co. Ltd. Class H | 3,076,100 | 541 |
| | Huaneng Power International Inc. Class A | 445,200 | 537 |
| | Zhejiang Huahai Pharmaceutical Co. Ltd. Class A | 186,920 | 537 |
| * | Tuya Inc. ADR | 82,677 | 536 |
| | | Shares | Market
Value•
($000) |
| | Xinjiang Zhongtai Chemical Co. Ltd. Class A | 322,500 | 533 |
| | GRG Banking Equipment Co. Ltd. Class A | 328,787 | 532 |
| | Hesteel Co. Ltd. Class A | 1,384,800 | 532 |
| | China National Accord Medicines Corp. Ltd. Class B | 212,045 | 531 |
| | Zhejiang China Commodities City Group Co. Ltd. Class A | 693,300 | 529 |
| | Huaibei Mining Holdings Co. Ltd. Class A | 267,200 | 528 |
| * | Ourpalm Co. Ltd. Class A | 867,600 | 527 |
| 3 | Shandong Chenming Paper Holdings Ltd. Class H | 1,085,798 | 522 |
| | Shenzhen Kaifa Technology Co. Ltd. Class A | 225,500 | 522 |
| | Sichuan Kelun Pharmaceutical Co. Ltd. Class A | 188,690 | 522 |
| | Shanghai Zhangjiang High-Tech Park Development Co. Ltd. Class A | 199,900 | 521 |
| * | Sinopec Oilfield Service Corp. Class H | 5,410,803 | 520 |
| * | Shanghai 2345 Network Holding Group Co. Ltd. Class A | 1,648,370 | 518 |
| * | Xian International Medical Investment Co. Ltd. Class A | 277,200 | 517 |
| * | Shenzhen MTC Co. Ltd. Class A | 671,146 | 516 |
| | Jointown Pharmaceutical Group Co. Ltd. Class A | 241,100 | 511 |
| | Oriental Energy Co. Ltd. Class A | 283,300 | 511 |
| * | CanSino Biologics Inc. Class A | 11,970 | 510 |
| | Bank of Guiyang Co. Ltd. Class A | 483,100 | 510 |
| | Beijing Capital Eco-Environment Protection Group Co. Ltd. Class A | 968,890 | 509 |
| | Tonghua Dongbao Pharmaceutical Co. Ltd. Class A | ��� 266,977 | 508 |
| | Zhejiang Dingli Machinery Co. Ltd. Class A | 47,554 | 507 |
| | China Zheshang Bank Co. Ltd. Class A | 941,100 | 506 |
FTSE All-World ex-US Index Fund
| | | Shares | Market
Value•
($000) |
| | Yintai Gold Co. Ltd. Class A | 366,940 | 504 |
| | Yutong Bus Co. Ltd. Class A | 284,400 | 504 |
| | Zhejiang Supor Co. Ltd. Class A | 60,776 | 503 |
| | Pingdingshan Tianan Coal Mining Co. Ltd. Class A | 376,900 | 502 |
| | Nanjing Hanrui Cobalt Co. Ltd. Class A | 40,600 | 501 |
| | China Resources Sanjiu Medical & Pharmaceutical Co. Ltd. Class A | 132,100 | 498 |
| * | BTG Hotels Group Co. Ltd. Class A | 130,297 | 498 |
| | Heilongjiang Agriculture Co. Ltd. Class A | 231,300 | 497 |
| * | Beijing E-Hualu Information Technology Co. Ltd. Class A | 109,600 | 496 |
| | Addsino Co. Ltd. Class A | 205,500 | 493 |
| | Huaxin Cement Co. Ltd. Class A | 187,800 | 490 |
| * | Montnets Cloud Technology Group Co. Ltd. Class A | 155,700 | 490 |
| | Yunda Holding Co. Ltd. Class A | 167,770 | 489 |
| | Yanzhou Coal Mining Co. Ltd. Class A | 137,800 | 489 |
| * | GCL System Integration Technology Co. Ltd. Class A | 775,900 | 488 |
| * | Shanghai Zhenhua Heavy Industries Co. Ltd. Class B | 1,844,864 | 487 |
| | Beijing Shunxin Agriculture Co. Ltd. Class A | 94,995 | 484 |
| | Guangdong Electric Power Development Co. Ltd. Class B | 1,537,191 | 483 |
| | Leyard Optoelectronic Co. Ltd. Class A | 328,500 | 483 |
| * | Bank of Zhengzhou Co. Ltd. Class A | 909,910 | 481 |
| | Chengdu Xingrong Environment Co. Ltd. Class A | 517,505 | 478 |
| | FAW Jiefang Group Co. Ltd. Class A | 292,500 | 477 |
| | Inner Mongolia MengDian HuaNeng Thermal Power Corp. Ltd. Class A | 851,600 | 477 |
| * | Beijing Shougang Co. Ltd. Class A | 529,600 | 476 |
| | | Shares | Market
Value•
($000) |
| | Jinke Properties Group Co. Ltd. Class A | 684,000 | 475 |
| | Angang Steel Co. Ltd. Class A | 719,300 | 474 |
| | ZTO Express Cayman Inc. | 15,906 | 472 |
| | Shenzhen Sunway Communication Co. Ltd. Class A | 125,300 | 466 |
| | Hefei Meiya Optoelectronic Technology Inc. Class A | 73,700 | 466 |
| | Zhongtai Securities Co. Ltd. Class A | 321,300 | 465 |
| | BBMG Corp. Class A | 1,057,400 | 464 |
| | Shanghai Bailian Group Co. Ltd. Class A | 215,000 | 463 |
| | Shanghai Lingang Holdings Corp. Ltd. Class A | 201,288 | 462 |
| | Shandong Himile Mechanical Science & Technology Co. Ltd. Class A | 118,174 | 461 |
| | Jinduicheng Molybdenum Co. Ltd. Class A | 406,300 | 461 |
| | Xiamen C & D Inc. Class A | 366,700 | 459 |
| | Joincare Pharmaceutical Group Industry Co. Ltd. Class A | 254,400 | 458 |
| * | Pacific Securities Co Ltd./The/China Class A | 938,519 | 457 |
| | Guangzhou Haige Communications Group Inc. Co Class A | 308,400 | 455 |
| | Ningbo Joyson Electronic Corp. Class A | 163,500 | 454 |
| | LianChuang Electronic Technology Co. Ltd. Class A | 142,610 | 453 |
| | Beijing Originwater Technology Co. Ltd. Class A | 415,200 | 452 |
| * | Offcn Education Technology Co. Ltd. Class A | 277,400 | 451 |
| | Jizhong Energy Resources Co. Ltd. Class A | 461,603 | 451 |
| | Zhongji Innolight Co. Ltd. Class A | 87,198 | 451 |
| | Anhui Zhongding Sealing Parts Co. Ltd. Class A | 167,600 | 450 |
| | Hangzhou Shunwang Technology Co. Ltd. Class A | 203,800 | 448 |
FTSE All-World ex-US Index Fund
| | | Shares | Market
Value•
($000) |
| | Sealand Securities Co. Ltd. Class A | 740,740 | 447 |
| | Shenzhen Gas Corp. Ltd. Class A | 315,300 | 447 |
| | Yifan Pharmaceutical Co. Ltd. Class A | 174,100 | 446 |
| | Shanxi Securities Co. Ltd. Class A | 455,390 | 445 |
| | Xinyangfeng Agricultural Technology Co. Ltd. Class A | 156,400 | 444 |
| | China National Medicines Corp. Ltd. Class A | 92,700 | 442 |
| | Shijiazhuang Yiling Pharmaceutical Co. Ltd. Class A | 175,360 | 440 |
| | Yangtze Optical Fibre and Cable Joint Stock Ltd. Co Class A | 90,800 | 439 |
| | Fujian Funeng Co. Ltd. Class A | 155,800 | 436 |
| | Northeast Securities Co. Ltd. Class A | 324,100 | 436 |
| | China Galaxy Securities Co. Ltd. Class A | 282,300 | 436 |
| | Shanghai Construction Group Co. Ltd. Class A | 851,600 | 435 |
| | Huadian Power International Corp. Ltd. Class A | 630,800 | 434 |
| | DHC Software Co. Ltd. Class A | 399,300 | 433 |
| * | North Industries Group Red Arrow Co. Ltd. Class A | 103,700 | 431 |
| | Zhejiang Crystal-Optech Co. Ltd. Class A | 174,796 | 430 |
| | East Group Co. Ltd. Class A | 263,800 | 427 |
| | C&S Paper Co. Ltd. Class A | 158,800 | 423 |
| | Shanghai Waigaoqiao Free Trade Zone Group Co. Ltd. Class B | 465,271 | 420 |
| | Shandong Pharmaceutical Glass Co. Ltd. Class A | 78,800 | 419 |
| * | Hanergy Thin Film Pow Group Ltd. | 14,742,000 | 415 |
| | Kaishan Group Co. Ltd. Class A | 146,144 | 415 |
| | Shenzhen YUTO Packaging Technology Co. Ltd. Class A | 81,000 | 415 |
| | Anhui Anke Biotechnology Group Co. Ltd. Class A | 214,728 | 411 |
| | | Shares | Market
Value•
($000) |
| | Xuji Electric Co. Ltd. Class A | 132,500 | 410 |
| | Yunnan Copper Co. Ltd. Class A | 197,000 | 409 |
| | Guolian Securities Co. Ltd. Class A | 212,300 | 405 |
| | Wanxiang Qianchao Co. Ltd. Class A | 430,533 | 403 |
| | OFILM Group Co. Ltd. Class A | 343,700 | 401 |
| | Guangdong Xinbao Electrical Appliances Holdings Co. Ltd. Class A | 114,200 | 399 |
| | Shanghai Tunnel Engineering Co. Ltd. Class A | 499,144 | 399 |
| | Wolong Electric Group Co. Ltd. Class A | 172,500 | 399 |
| | China Coal Energy Co. Ltd. Class A | 362,038 | 396 |
| | Shenzhen Goodix Technology Co. Ltd. Class A | 24,666 | 395 |
| | Beijing Yanjing Brewery Co. Ltd. Class A | 380,500 | 395 |
| | Central China Securities Co. Ltd. Class H | 2,126,621 | 390 |
| * | Sinopec Oilfield Service Corp. Class A | 1,104,100 | 390 |
| | Jiangsu Linyang Energy Co. Ltd. Class A | 219,800 | 390 |
| | Sinoma International Engineering Co. Class A | 239,600 | 389 |
| | AECC Aero-Engine Control Co. Ltd. Class A | 92,500 | 386 |
| | Hongta Securities Co. Ltd. Class A | 219,830 | 386 |
| | Nanjing Iron & Steel Co. Ltd. Class A | 697,400 | 385 |
| | WUS Printed Circuit Kunshan Co. Ltd. Class A | 240,570 | 385 |
| | All Winner Technology Co. Ltd. Class A | 38,800 | 385 |
| 2,3 | Shandong Gold Mining Co. Ltd. Class H | 211,866 | 383 |
| | Fiberhome Telecommunication Technologies Co. Ltd. Class A | 141,597 | 381 |
| | Tibet Summit Resources Co. Ltd. Class A | 79,600 | 380 |
| | Tangshan Sanyou Chemical Industries Co. Ltd. Class A | 263,100 | 380 |
FTSE All-World ex-US Index Fund
| | | Shares | Market
Value•
($000) |
| | Beijing Sinnet Technology Co. Ltd. Class A | 183,600 | 379 |
| | Huolinhe Opencut Coal Industry Corp. Ltd. of Inner Mongolia Class A | 189,700 | 377 |
| | Zhejiang Wanliyang Co. Ltd. Class A | 177,600 | 375 |
| | Datang International Power Generation Co. Ltd. Class A | 882,200 | 375 |
| | Valiant Co. Ltd. Class A | 115,600 | 372 |
| | Zhejiang Weiming Environment Protection Co. Ltd. Class A | 86,218 | 370 |
| * | Beijing Orient National Communication Science & Technology Co. Ltd. Class A | 268,900 | 370 |
| | Glarun Technology Co. Ltd. Class A | 159,000 | 368 |
| | Lianhe Chemical Technology Co. Ltd. Class A | 121,610 | 367 |
| | Jilin Aodong Pharmaceutical Group Co. Ltd. Class A | 148,600 | 367 |
| | Topsec Technologies Group Inc. Class A | 127,000 | 366 |
| | Shenzhen Infogem Technologies Co. Ltd. Class A | 175,188 | 362 |
| | CMST Development Co. Ltd. Class A | 379,200 | 362 |
| | Sinosoft Co. Ltd. Class A | 91,993 | 361 |
| | Juewei Food Co. Ltd. Class A | 34,894 | 359 |
| * | Guosheng Financial Holding Inc. Class A | 244,600 | 357 |
| * | Trip.com Group Ltd. | 12,402 | 357 |
| | Yixintang Pharmaceutical Group Co. Ltd. Class A | 71,700 | 356 |
| | Sinotrans Ltd. Class A | 502,200 | 354 |
| | RiseSun Real Estate Development Co. Ltd. Class A | 527,066 | 353 |
| * | Yatsen Holding Ltd. ADR | 125,182 | 351 |
| | NanJi E-Commerce Co. Ltd. Class A | 314,099 | 351 |
| | Shenzhen Zhongjin Lingnan Nonfemet Co. Ltd. Class A | 452,300 | 350 |
| | Guangxi Guiguan Electric Power Co. Ltd. Class A | 387,200 | 350 |
| | | Shares | Market
Value•
($000) |
| | Joyoung Co. Ltd. Class A | 95,700 | 349 |
| | Dian Diagnostics Group Co. Ltd. Class A | 69,400 | 349 |
| | Bright Dairy & Food Co. Ltd. Class A | 160,300 | 349 |
| | Shandong Denghai Seeds Co. Ltd. Class A | 104,100 | 346 |
| | Tian Di Science & Technology Co. Ltd. Class A | 529,200 | 346 |
| | Boya Bio-pharmaceutical Group Co. Ltd. Class A | 56,006 | 344 |
| | Huaxi Securities Co. Ltd. Class A | 243,600 | 344 |
| | Shenzhen Everwin Precision Technology Co. Ltd. Class A | 156,497 | 343 |
| * | Guangdong Golden Dragon Development Inc. Class A | 136,800 | 339 |
| * | STO Express Co. Ltd. Class A | 282,099 | 339 |
| | Bank of Chengdu Co. Ltd. Class A | 169,900 | 339 |
| | Guangzhou Zhujiang Brewery Co. Ltd. Class A | 218,100 | 337 |
| | Sansteel Minguang Co. Ltd. Fujian Class A | 312,100 | 334 |
| | TangShan Port Group Co. Ltd. Class A | 801,200 | 334 |
| | Huaan Securities Co. Ltd. Class A | 416,260 | 333 |
| | Laobaixing Pharmacy Chain JSC Class A | 48,160 | 329 |
| * | Oceanwide Holdings Co. Ltd. Class A | 1,181,000 | 329 |
| | Zhejiang Medicine Co. Ltd. Class A | 131,900 | 329 |
| | Shanying International Holding Co. Ltd. Class A | 647,200 | 328 |
| | Guangzhou Shiyuan Electronic Technology Co. Ltd. Class A | 27,397 | 325 |
| | Lao Feng Xiang Co. Ltd. Class A | 42,669 | 320 |
| | Taiji Computer Corp. Ltd. Class A | 73,298 | 320 |
| | Zhejiang Hailiang Co. Ltd. Class A | 193,600 | 319 |
| | People.cn Co. Ltd. Class A | 155,681 | 319 |
| | Xinxing Ductile Iron Pipes Co. Ltd. Class A | 546,300 | 317 |
FTSE All-World ex-US Index Fund
| | | Shares | Market
Value•
($000) |
| * | Suning Universal Co. Ltd. Class A | 420,023 | 315 |
| | Leo Group Co. Ltd. Class A | 873,400 | 311 |
| 2,3 | Everbright Securities Co. Ltd. Class H | 398,870 | 311 |
| | ORG Technology Co. Ltd. Class A | 296,500 | 310 |
| | Tangshan Jidong Cement Co. Ltd. Class A | 170,400 | 309 |
| | Anhui Kouzi Distillery Co. Ltd. Class A | 32,600 | 308 |
| * | Hunan Gold Corp. Ltd. Class A | 180,700 | 306 |
| | Jiangsu Zhongnan Construction Group Co. Ltd. Class A | 511,300 | 306 |
| | Zhengzhou Coal Mining Machinery Group Co. Ltd. Class A | 192,900 | 306 |
| | Shennan Circuits Co. Ltd. Class A | 21,938 | 305 |
| | Zhongshan Public Utilities Group Co. Ltd. Class A | 225,500 | 304 |
| | NSFOCUS Technologies Group Co. Ltd. Class A | 128,395 | 303 |
| * | Beijing Jetsen Technology Co. Ltd. Class A | 473,700 | 303 |
| | Camel Group Co. Ltd. Class A | 148,270 | 303 |
| * | Autohome Inc. Class A | 29,824 | 301 |
| | China Merchants Expressway Network & Technology Holdings Co. Ltd. Class A | 275,373 | 300 |
| 2 | Yangtze Optical Fibre and Cable Joint Stock Ltd. Co Class H | 178,430 | 300 |
| | China Merchants Property Operation & Service Co. Ltd. Class A | 141,100 | 297 |
| | Chongqing Rural Commercial Bank Co. Ltd. Class A | 496,000 | 296 |
| | Guizhou Panjiang Refined Coal Co. Ltd. Class A | 246,400 | 296 |
| * | Shenzhen Airport Co. Ltd. Class A | 248,800 | 294 |
| | China South Publishing & Media Group Co. Ltd. Class A | 230,100 | 294 |
| | | Shares | Market
Value•
($000) |
| | Financial Street Holdings Co. Ltd. Class A | 319,790 | 293 |
| * | Siasun Robot & Automation Co. Ltd. Class A | 200,120 | 293 |
| * | Zheshang Securities Co. Ltd. Class A | 151,100 | 291 |
| | China TransInfo Technology Co. Ltd. Class A | 137,600 | 288 |
| | Suzhou Gold Mantis Construction Decoration Co. Ltd. Class A | 307,900 | 287 |
| * | Tianshan Aluminum Group Co. Ltd. Class A | 218,800 | 287 |
| | Shenzhen Huaqiang Industry Co. Ltd. Class A | 124,300 | 284 |
| | China International Marine Containers Group Co. Ltd. Class A | 103,560 | 284 |
| | Ningbo Sanxing Medical Electric Co. Ltd. Class A | 149,500 | 284 |
| | Beijing Zhong Ke San Huan High-Tech Co. Ltd. Class A | 161,881 | 283 |
| 2 | Shenzhen Hepalink Pharmaceutical Group Co. Ltd. Class H | 257,236 | 283 |
| | Inmyshow Digital Technology Group Co. Ltd. Class A | 170,900 | 283 |
| | Guangzhou Wondfo Biotech Co. Ltd. Class A | 52,060 | 282 |
| | Shanghai Huayi Group Co. Ltd. Class B | 421,647 | 281 |
| | Hytera Communications Corp. Ltd. Class A | 316,800 | 279 |
| * | Beijing Sanju Environmental Protection and New Material Co. Ltd. Class A | 292,200 | 278 |
| | Haisco Pharmaceutical Group Co. Ltd. Class A | 105,000 | 277 |
| * | China Fortune Land Development Co. Ltd. Class A | 478,047 | 275 |
| | Bluestar Adisseo Co. Class A | 133,700 | 274 |
| | Xiamen ITG Group Corp. Ltd. Class A | 253,000 | 273 |
| | Zhejiang Hisoar Pharmaceutical Co. Ltd. Class A | 225,000 | 273 |
| | Harbin Boshi Automation Co. Ltd. Class A | 142,800 | 272 |
FTSE All-World ex-US Index Fund
| | | Shares | Market
Value•
($000) |
| | Betta Pharmaceuticals Co. Ltd. Class A | 21,800 | 270 |
| | Shenzhen Hepalink Pharmaceutical Group Co. Ltd. Class A | 112,000 | 269 |
| | Gan & Lee Pharmaceuticals Co. Ltd. Class A | 25,500 | 268 |
| | Eternal Asia Supply Chain Management Ltd. Class A | 296,300 | 266 |
| | Guangzhou Yuexiu Financial Holdings Group Co. Ltd. Class A | 219,915 | 265 |
| | Zhejiang Yasha Decoration Co. Ltd. Class A | 228,011 | 265 |
| | BOC International China Co. Ltd. Class A | 127,700 | 265 |
| | Yango Group Co. Ltd. Class A | 522,797 | 263 |
| | Hangzhou Oxygen Plant Group Co. Ltd. Class A | 64,700 | 262 |
| | Beijing Capital Development Co. Ltd. Class A | 340,513 | 262 |
| | Tianjin 712 Communication & Broadcasting Co. Ltd. Class A | 44,200 | 261 |
| | Shandong Hi-speed Co. Ltd. Class A | 308,600 | 259 |
| | Wangsu Science & Technology Co. Ltd. Class A | 300,300 | 257 |
| | BGI Genomics Co. Ltd. Class A | 18,391 | 256 |
| | Bluefocus Intelligent Communications Group Co. Ltd. Class A | 324,300 | 254 |
| | China Meheco Co. Ltd. Class A | 144,800 | 252 |
| | Livzon Pharmaceutical Group Inc. Class A | 45,600 | 250 |
| | Juneyao Airlines Co. Ltd. Class A | 100,266 | 249 |
| | Huapont Life Sciences Co. Ltd. Class A | 257,600 | 249 |
| | Keboda Technology Co. Ltd. Class A | 24,000 | 248 |
| | Hangzhou Binjiang Real Estate Group Co. Ltd. Class A | 386,600 | 247 |
| | Tianjin Chase Sun Pharmaceutical Co. Ltd. Class A | 385,500 | 246 |
| | Xiangcai Co. Ltd. Class A | 182,700 | 246 |
| | | Shares | Market
Value•
($000) |
| | Xiamen Meiya Pico Information Co. Ltd. Class A | 101,500 | 244 |
| | Maccura Biotechnology Co. Ltd. Class A | 55,900 | 243 |
| | Hubei Biocause Pharmaceutical Co. Ltd. Class A | 476,932 | 242 |
| | Shenzhen Agricultural Products Group Co. Ltd. Class A | 223,300 | 242 |
| | Shanghai Bailian Group Co. Ltd. Class B | �� 271,016 | 240 |
| 2 | Qingdao Port International Co. Ltd. Class H | 476,433 | 239 |
| | Shenzhen Jinjia Group Co. Ltd. Class A | 140,500 | 238 |
| | Jiangxi Bank Co. Ltd. Class H | 540,500 | 237 |
| * | Grandjoy Holdings Group Co. Ltd. Class A | 456,788 | 235 |
| | Autobio Diagnostics Co. Ltd. Class A | 27,300 | 234 |
| * | Guizhou Xinbang Pharmaceutical Co. Ltd. Class A | 219,600 | 234 |
| | Shanghai Shibei Hi-Tech Co. Ltd. Class B | 842,160 | 233 |
| | Guangdong Baolihua New Energy Stock Co. Ltd. Class A | 260,700 | 233 |
| | Zhejiang Wanfeng Auto Wheel Co. Ltd. Class A | 282,600 | 232 |
| | Shenzhen Yan Tian Port Holding Co. Ltd. Class A | 283,100 | 229 |
| | Central China Securities Co. Ltd. Class A | 316,700 | 227 |
| * | Youzu Interactive Co. Ltd. Class A | 108,800 | 225 |
| | Toly Bread Co. Ltd. Class A | 45,628 | 224 |
| * | Beijing Ultrapower Software Co. Ltd. Class A | 254,000 | 224 |
| | Blue Sail Medical Co. Ltd. Class A | 99,100 | 224 |
| | Caitong Securities Co. Ltd. Class A | 139,600 | 224 |
| * | China Nonferrous Metal Industry's Foreign Engineering and Construction Co. Ltd. Class A | 275,400 | 221 |
| | Chinese Universe Publishing and Media Group Co. Ltd. Class A | 135,800 | 221 |
FTSE All-World ex-US Index Fund
| | | Shares | Market
Value•
($000) |
| | Suofeiya Home Collection Co. Ltd. Class A | 83,100 | 219 |
| | Shaanxi International Trust Co. Ltd. Class A | 446,000 | 217 |
| | Guangdong South New Media Co. Ltd. Class A | 29,300 | 217 |
| | Zhongshan Broad Ocean Motor Co. Ltd. Class A | 203,400 | 216 |
| | Shandong Humon Smelting Co. Ltd. Class A | 119,200 | 214 |
| | Zhejiang Huace Film & Television Co. Ltd. Class A | 240,100 | 212 |
| * | Shanghai Junshi Biosciences Co. Ltd. Class A | 28,009 | 211 |
| | Universal Scientific Industrial Shanghai Co. Ltd. Class A | 96,700 | 210 |
| | Shenzhen New Industries Biomedical Engineering Co. Ltd. Class A | 31,883 | 207 |
| | Sinopec Shanghai Petrochemical Co. Ltd. Class A | 338,000 | 206 |
| | Luolai Lifestyle Technology Co. Ltd. Class A | 100,800 | 205 |
| | Qingdao Rural Commercial Bank Corp. | 342,000 | 204 |
| * | Holitech Technology Co. Ltd. Class A | 399,600 | 203 |
| | Huafa Industrial Co. Ltd. Zhuhai Class A | 246,900 | 203 |
| | Dongguan Development Holdings Co. Ltd. Class A | 127,800 | 203 |
| | An Hui Wenergy Co. Ltd. Class A | 291,400 | 200 |
| * | Shenzhen Neptunus Bioengineering Co. Ltd. Class A | 410,300 | 199 |
| | North Huajin Chemical Industries Co. Ltd. Class A | 215,896 | 199 |
| | Shanghai Dazhong Public Utilities Group Co. Ltd. Class A | 339,500 | 199 |
| | China World Trade Center Co. Ltd. Class A | 93,200 | 198 |
| | Beijing SL Pharmaceutical Co. Ltd. Class A | 136,000 | 197 |
| | Luenmei Quantum Co. Ltd. Class A | 152,800 | 197 |
| | | Shares | Market
Value•
($000) |
| | Shanghai Shimao Co. Ltd. Class A | 394,194 | 195 |
| | China Resources Double Crane Pharmaceutical Co. Ltd. Class A | 108,900 | 194 |
| | DaShenLin Pharmaceutical Group Co. Ltd. Class A | 34,704 | 192 |
| | Huabao Flavours & Fragrances Co. Ltd. Class A | 29,400 | 192 |
| * | Huazhu Group Ltd. | 41,120 | 191 |
| | Zhejiang Runtu Co. Ltd. Class A | 137,405 | 190 |
| * | Cinda Real Estate Co. Ltd. Class A | 377,000 | 189 |
| | Shanghai Environment Group Co. Ltd. Class A | 102,800 | 187 |
| | Xinfengming Group Co. Ltd. Class A | 81,300 | 187 |
| | Chongqing Water Group Co. Ltd. Class A | 213,400 | 187 |
| | Weifu High-Technology Group Co. Ltd. Class A | 60,600 | 184 |
| | Transfar Zhilian Co. Ltd. Class A | 144,000 | 184 |
| | Shanghai Lujiazui Finance & Trade Zone Development Co. Ltd. Class A | 108,472 | 183 |
| | Autel Intelligent Technology Corp. Ltd. Class A | 18,295 | 183 |
| * | CITIC Guoan Information Industry Co. Ltd. Class A | 517,200 | 182 |
| | Chongqing Department Store Co. Ltd. Class A | 50,200 | 181 |
| | Guangxi Wuzhou Zhongheng Group Co. Ltd. Class A | 372,600 | 178 |
| * | Shijiazhuang Changshan BeiMing Technology Co. Ltd. Class A | 174,300 | 177 |
| * | Jinneng Holding Shanxi Electric Power Co. Ltd. Class A | 342,000 | 176 |
| | Anker Innovations Technology Co. Ltd. Class A | 12,000 | 175 |
| * | Guangshen Railway Co. Ltd. Class A | 505,300 | 169 |
| | Shanghai Mechanical and Electrical Industry Co. Ltd. Class A | 74,800 | 169 |
FTSE All-World ex-US Index Fund
| | | Shares | Market
Value•
($000) |
| | Suzhou Anjie Technology Co. Ltd. Class A | 77,100 | 166 |
| | Shanghai AJ Group Co. Ltd. Class A | 161,633 | 164 |
| | Zhejiang Semir Garment Co. Ltd. Class A | 138,900 | 163 |
| | JL Mag Rare-Earth Co. Ltd. Class A | 26,600 | 163 |
| | Anhui Xinhua Media Co. Ltd. Class A | 222,000 | 163 |
| | Guangxi Liugong Machinery Co. Ltd. Class A | 139,600 | 162 |
| | Rongan Property Co. Ltd. Class A | 427,200 | 159 |
| | ADAMA Ltd. Class A | 134,900 | 159 |
| | Shenzhen Kinwong Electronic Co. Ltd. Class A | 39,340 | 159 |
| | Visual China Group Co. Ltd. Class A | 75,600 | 156 |
| | Bank of Suzhou Co. Ltd. Class A | 144,000 | 155 |
| | Shanghai Flyco Electrical Appliance Co. Ltd. Class A | 24,566 | 153 |
| * | Red Star Macalline Group Corp. Ltd. Class A | 107,580 | 153 |
| | Yantai Changyu Pioneer Wine Co. Ltd. Class A | 30,900 | 152 |
| | Jiajiayue Group Co. Ltd. Class A | 66,000 | 152 |
| | Fujian Longking Co. Ltd. Class A | 119,900 | 152 |
| | Shandong Buchang Pharmaceuticals Co. Ltd. Class A | 55,700 | 152 |
| | Guangdong Electric Power Development Co. Ltd. Class A | 220,800 | 151 |
| | Opple Lighting Co. Ltd. Class A | 47,874 | 145 |
| | Chengdu Kanghong Pharmaceutical Group Co. Ltd. Class A | 49,600 | 142 |
| | Lakala Payment Co. Ltd. Class A | 37,800 | 142 |
| | Shenzhen Aisidi Co. Ltd. Class A | 83,700 | 140 |
| | Double Medical Technology Inc. Class A | 19,400 | 140 |
| * | Baidu Inc. Class A | 6,830 | 140 |
| * | Gds Holdings Ltd. Class A | 18,463 | 139 |
| | KingClean Electric Co. Ltd. Class A | 35,714 | 139 |
| | Shandong Publishing & Media Co. Ltd. Class A | 145,100 | 139 |
| | | Shares | Market
Value•
($000) |
| | CGN Power Co. Ltd. Class A | 294,300 | 134 |
| | Greattown Holdings Ltd. Class A | 241,500 | 134 |
| * | Alpha Group Class A | 166,500 | 131 |
| * | Guizhou Bailing Group Pharmaceutical Co. Ltd. Class A | 139,100 | 129 |
| | Digital China Information Service Co. Ltd. Class A | 72,800 | 127 |
| | Maanshan Iron & Steel Co. Ltd. Class H | 296,000 | 126 |
| | Xiamen Intretech Inc. Class A | 26,180 | 126 |
| | Deppon Logistics Co. Ltd. Class A | 73,700 | 126 |
| | Shanghai Waigaoqiao Free Trade Zone Group Co. Ltd. Class A | 61,500 | 124 |
| | Shanghai Industrial Development Co. Ltd. Class A | 204,300 | 124 |
| | Bank of Qingdao Co. Ltd. Class A | 167,600 | 123 |
| | Qinhuangdao Port Co. Ltd. Class A | 298,000 | 123 |
| | China Merchants Port Group Co. Ltd. Class A | 48,600 | 120 |
| | Winner Medical Co. Ltd. Class A | 10,200 | 120 |
| | Liuzhou Iron & Steel Co. Ltd. Class A | 140,100 | 119 |
| | Three Squirrels Inc. Class A | 18,000 | 119 |
| | Jiangling Motors Corp. Ltd. Class B | 105,836 | 109 |
| | Skyworth Digital Co. Ltd. Class A | 92,200 | 104 |
| | Jiangsu Expressway Co. Ltd. Class A | 76,000 | 101 |
| | Sichuan Teway Food Group Co. Ltd. Class A | 24,960 | 97 |
| | Qingdao Hanhe Cable Co. Ltd. Class A | 139,900 | 94 |
| | Jiangling Motors Corp. Ltd. Class A | 37,254 | 91 |
| | Hubei Jumpcan Pharmaceutical Co. Ltd. Class A | 36,000 | 91 |
| * | Sichuan Languang Development Co. Ltd. Class A | 324,100 | 88 |
| | Tibet Cheezheng Tibetan Medicine Co. Ltd. Class A | 22,700 | 88 |
| | Chinalin Securities Co. Ltd. Class A | 53,000 | 87 |
| | Shenzhen New Nanshan Holding Group Co. Ltd. Class A | 188,500 | 83 |
FTSE All-World ex-US Index Fund
| | | Shares | Market
Value•
($000) |
| * | New Oriental Education & Technology Group Inc. | 38,840 | 79 |
| | Jointo Energy Investment Co. Ltd. Hebei Class A | 86,600 | 69 |
| | Shandong Chenming Paper Holdings Ltd. Class A | 61,800 | 68 |
| | Shanghai Jinqiao Export Processing Zone Development Co. Ltd. Class A | 37,660 | 66 |
| | Contec Medical Systems Co. Ltd. Class A | 11,700 | 58 |
| | China West Construction Group Co. Ltd. Class A | 50,600 | 57 |
| | CSG Holding Co. Ltd. Class A | 30,500 | 43 |
| | Bengang Steel Plates Co. Ltd. Class A | 60,500 | 43 |
| *,1 | Tianhe Chemicals Group Ltd. | 3,538,329 | — |
| | | | 5,095,880 |
| Colombia (0.1%) |
| | Bancolombia SA ADR | 223,551 | 8,032 |
| | Interconexion Electrica SA ESP | 816,149 | 4,900 |
| | Ecopetrol SA | 5,845,448 | 4,420 |
| | Bancolombia SA | 473,052 | 4,231 |
| | Grupo de Inversiones Suramericana SA | 450,450 | 2,626 |
| | Ecopetrol SA ADR | 165,696 | 2,510 |
| | Grupo Aval Acciones y Valores SA Preference Shares | 7,479,782 | 2,284 |
| | Grupo Argos SA | 578,994 | 1,814 |
| | Cementos Argos SA | 937,855 | 1,582 |
| | Grupo De Inversiones Suramericana SA Preference Shares | 153,364 | 769 |
| | Grupo Aval Acciones y Valores SA ADR | 21,896 | 132 |
| | Cementos Argos SA Preference Shares | 105,809 | 124 |
| | Bancolombia SA Preference Shares | 11,063 | 99 |
| | | | 33,523 |
| Czech Republic (0.0%) |
| | CEZ A/S | 304,929 | 10,071 |
| * | Komercni banka A/S | 138,121 | 5,357 |
| *,2 | Moneta Money Bank A/S | 654,416 | 2,563 |
| | O2 Czech Republic A/S | 69,921 | 803 |
| | | | 18,794 |
| | | Shares | Market
Value•
($000) |
| Denmark (1.6%) |
| | Novo Nordisk A/S Class B | 2,987,619 | 327,607 |
| | DSV A/S | 368,846 | 85,726 |
| | Vestas Wind Systems A/S | 1,896,273 | 81,975 |
| * | Genmab A/S | 112,093 | 50,358 |
| 2 | Orsted A/S | 354,737 | 50,104 |
| | Coloplast A/S Class B | 250,638 | 40,934 |
| | Carlsberg A/S Class B | 183,170 | 30,244 |
| | AP Moller - Maersk A/S Class B | 10,354 | 30,005 |
| | Novozymes A/S Class B | 373,238 | 27,455 |
| | Pandora A/S | 181,086 | 25,341 |
| | AP Moller - Maersk A/S Class A | 8,241 | 22,627 |
| | Danske Bank A/S | 1,231,199 | 20,834 |
| | Chr Hansen Holding A/S | 194,423 | 15,476 |
| | GN Store Nord A/S | 245,012 | 14,889 |
| | Tryg A/S | 573,318 | 13,607 |
| | Royal Unibrew A/S | 87,324 | 10,848 |
| * | Demant A/S | 196,108 | 9,507 |
| | SimCorp A/S | 77,486 | 9,383 |
| | Ambu A/S Class B | 322,066 | 9,168 |
| | ROCKWOOL International A/S Class B | 11,553 | 5,283 |
| | H Lundbeck A/S | 111,861 | 3,115 |
| | | | 884,486 |
| Egypt (0.0%) |
| * | Commercial International Bank Egypt SAE | 3,140,434 | 10,223 |
| * | Egypt Kuwait Holding Co. SAE | 1,636,113 | 2,229 |
| | Eastern Co. SAE | 1,778,143 | 1,312 |
| * | Egypt Kuwait Holding Co. SAE (XCAI) | 906,274 | 1,255 |
| * | Fawry for Banking & Payment Technology Services SAE | 1,201,697 | 1,150 |
| | ElSewedy Electric Co. | 1,436,275 | 790 |
| | Telecom Egypt Co. | 582,348 | 502 |
| | | | 17,461 |
| Finland (0.9%) |
| | Nordea Bank Abp | 5,225,418 | 63,995 |
| * | Nokia OYJ | 10,599,764 | 60,837 |
| | Sampo OYJ Class A | 949,080 | 50,454 |
| | Kone OYJ Class B | 738,507 | 50,366 |
| | Neste OYJ | 780,310 | 43,441 |
| | UPM-Kymmene OYJ | 998,256 | 35,229 |
| | Fortum OYJ | 816,029 | 24,269 |
| | Nordea Bank Abp (XHEL) | 1,705,840 | 20,871 |
| | Stora Enso OYJ Class R | 1,082,243 | 18,008 |
| | Kesko OYJ Class B | 511,467 | 16,645 |
| | Elisa OYJ | 269,138 | 16,243 |
| | Wartsila OYJ Abp | 916,602 | 12,712 |
| | Metso Outotec OYJ | 1,138,165 | 11,435 |
FTSE All-World ex-US Index Fund
| | | Shares | Market
Value•
($000) |
| | Valmet OYJ | 241,293 | 9,796 |
| | Nokian Renkaat OYJ | 257,572 | 9,672 |
| | Orion OYJ Class B | 196,362 | 8,503 |
| | Kojamo OYJ | 362,977 | 8,132 |
| | Huhtamaki OYJ | 171,344 | 7,471 |
| | | | 468,079 |
| France (6.7%) |
| | LVMH Moet Hennessy Louis Vuitton SE | 469,476 | 368,126 |
| | TotalEnergies SE | 4,565,102 | 228,597 |
| | Sanofi | 2,047,077 | 205,617 |
| | Schneider Electric SE | 995,199 | 171,590 |
| | BNP Paribas SA | 2,036,183 | 136,296 |
| * | Airbus SE | 1,048,910 | 134,556 |
| * | L'Oreal SA Loyalty Shares | 290,348 | 132,821 |
| | EssilorLuxottica SA | 555,198 | 114,869 |
| | AXA SA | 3,615,843 | 105,196 |
| | Kering SA | 138,100 | 103,649 |
| | Vinci SA | 943,730 | 100,894 |
| * | Air Liquide SA Loyalty Shares | 560,609 | 93,598 |
| | Hermes International | 58,215 | 92,441 |
| | Pernod Ricard SA | 391,682 | 90,111 |
| | Safran SA | 657,900 | 88,547 |
| | Dassault Systemes SE | 1,278,392 | 74,655 |
| | L'Oreal SA (XPAR) | 161,714 | 73,977 |
| | Danone SA | 1,130,310 | 73,680 |
| | Capgemini SE | 296,767 | 69,195 |
| | Cie de Saint-Gobain | 895,265 | 61,785 |
| | STMicroelectronics NV | 1,192,872 | 56,636 |
| | Legrand SA | 505,328 | 55,126 |
| | Cie Generale des Etablissements Michelin SCA | 328,648 | 51,669 |
| | Societe Generale SA | 1,457,952 | 48,701 |
| | Air Liquide SA (XPAR) | 290,867 | 48,563 |
| | Teleperformance | 109,433 | 45,712 |
| | Orange SA | 3,610,448 | 39,372 |
| 3 | Veolia Environnement SA | 1,147,308 | 37,470 |
| | Credit Agricole SA | 2,323,088 | 35,048 |
| | Publicis Groupe SA | 423,530 | 28,433 |
| * | Engie SA Loyalty Shares | 1,983,397 | 28,214 |
| | Eurofins Scientific SE | 229,474 | 27,081 |
| *,2 | Worldline SA | 460,194 | 26,837 |
| | Edenred | 466,163 | 25,225 |
| | Sartorius Stedim Biotech | 45,371 | 25,007 |
| | Carrefour SA | 1,189,089 | 21,527 |
| | Alstom SA | 552,849 | 19,702 |
| | Vivendi SE | 1,392,694 | 17,941 |
| | Thales SA | 194,079 | 17,909 |
| 2 | Euronext NV | 154,782 | 17,414 |
| | Bureau Veritas SA | 539,394 | 17,145 |
| | Arkema SA | 124,049 | 16,969 |
| | Bouygues SA | 403,380 | 16,343 |
| | Suez SA | 702,601 | 15,996 |
| | | Shares | Market
Value•
($000) |
| | Eiffage SA | 143,927 | 14,814 |
| | Engie SA (XPAR) | 1,036,716 | 14,747 |
| | Gecina SA | 96,923 | 13,563 |
| | Valeo | 450,671 | 13,242 |
| | Getlink SE | 859,863 | 13,234 |
| * | Renault SA | 347,941 | 12,538 |
| * | Accor SA | 338,799 | 12,124 |
| | Rexel SA | 572,311 | 11,375 |
| * | EDF | 739,809 | 10,903 |
| | Bollore SA | 1,807,047 | 10,503 |
| * | SOITEC | 38,519 | 10,256 |
| | BioMerieux | 80,253 | 10,222 |
| | Faurecia SE (XPAR) | 195,318 | 10,201 |
| | SCOR SE | 293,692 | 9,887 |
| * | Ubisoft Entertainment SA | 182,576 | 9,560 |
| 2 | Amundi SA | 107,103 | 9,543 |
| | Orpea SA | 91,353 | 9,542 |
| | Atos SE | 179,381 | 9,359 |
| | Remy Cointreau SA | 45,531 | 9,198 |
| 2 | La Francaise des Jeux SAEM | 162,358 | 8,431 |
| | Klepierre SA | 343,511 | 8,178 |
| | Covivio | 94,155 | 8,155 |
| * | Aeroports de Paris | 53,560 | 7,146 |
| * | Sodexo SA ACT Loyalty Shares | 71,094 | 6,917 |
| | CNP Assurances | 272,199 | 6,820 |
| | Wendel SE | 50,833 | 6,771 |
| | Ipsen SA | 64,891 | 6,716 |
| * | TechnipFMC plc (XNYS) | 896,778 | 6,673 |
| * | SEB SA Loyalty Shares | 36,167 | 5,667 |
| | Rubis SCA | 175,574 | 5,627 |
| * | Eurazeo SA | 54,926 | 5,148 |
| | Dassault Aviation SA | 44,500 | 4,650 |
| | ICADE | 59,154 | 4,639 |
| * | Sodexo SA (XPAR) | 47,189 | 4,591 |
| * | Sodexo SA Loyalty Shares 2025 | 38,129 | 3,710 |
| | Air Liquide | 21,364 | 3,567 |
| | Electricite de France SA (XPAR) | 240,871 | 3,550 |
| * | JCDecaux SA | 132,472 | 3,456 |
| | Imerys SA | 71,094 | 3,082 |
| | SEB SA (XPAR) | 19,026 | 2,981 |
| | Cie Plastic Omnium SA | 101,050 | 2,805 |
| | Eurazeo SE | 26,128 | 2,449 |
| *,2 | Neoen SA (XPAR) | 50,727 | 2,336 |
| 2 | ALD SA | 149,338 | 2,226 |
| | Faurecia SE | 27,154 | 1,401 |
| | Engie SA | 95,379 | 1,357 |
| * | Sodexo SA | 5,047 | 491 |
| * | SEB SA Loyalty Shares 2023 | 1,260 | 197 |
| | | | 3,604,788 |
| Germany (5.6%) |
| | SAP SE | 2,094,868 | 303,360 |
| | Siemens AG (Registered) | 1,415,285 | 230,100 |
| | Allianz SE (Registered) | 773,298 | 179,568 |
| | Daimler AG (Registered) | 1,582,663 | 157,099 |
| | BASF SE | 1,723,172 | 124,023 |
FTSE All-World ex-US Index Fund
| | | Shares | Market
Value•
($000) |
| | adidas AG | 360,534 | 118,003 |
| | Infineon Technologies AG | 2,460,442 | 115,226 |
| | Deutsche Telekom AG (Registered) | 6,168,489 | 114,716 |
| | Deutsche Post AG (Registered) | 1,838,634 | 113,824 |
| | Bayer AG (Registered) | 1,853,543 | 104,461 |
| | Volkswagen AG Preference Shares | 349,025 | 78,332 |
| | Muenchener Rueckversicherungs-Gesellschaft AG in Muenchen (Registered) | 264,016 | 78,172 |
| | Vonovia SE | 1,084,510 | 65,789 |
| | Bayerische Motoren Werke AG | 612,191 | 61,853 |
| | Merck KGaA | 244,270 | 57,727 |
| | Deutsche Boerse AG | 346,235 | 57,477 |
| | E.ON SE | 4,084,839 | 51,795 |
| * | Deutsche Bank AG (Registered) | 3,840,555 | 49,333 |
| | RWE AG | 1,187,013 | 45,690 |
| *,2 | Delivery Hero SE | 353,726 | 44,119 |
| *,2 | Zalando SE | 411,110 | 38,842 |
| | Fresenius SE & Co. KGaA | 765,603 | 34,800 |
| 2 | Siemens Healthineers AG | 521,366 | 34,674 |
| | Symrise AG Class A | 237,560 | 32,860 |
| | Sartorius AG Preference Shares | 46,921 | 30,393 |
| | Porsche Automobil Holding SE Preference Shares | 288,571 | 30,033 |
| | Henkel AG & Co. KGaA Preference Shares | 324,078 | 29,033 |
| | Brenntag SE | 291,651 | 27,747 |
| | Fresenius Medical Care AG & Co. KGaA | 380,520 | 25,278 |
| * | HelloFresh SE | 306,103 | 24,806 |
| * | Continental AG | 202,864 | 23,851 |
| | Puma SE | 187,828 | 23,300 |
| * | Siemens Energy AG | 806,986 | 23,161 |
| * | QIAGEN NV | 417,688 | 23,016 |
| | MTU Aero Engines AG | 101,154 | 22,531 |
| 2 | Covestro AG | 339,692 | 21,753 |
| | HeidelbergCement AG | 281,678 | 21,212 |
| | Hannover Rueck SE | 112,959 | 20,625 |
| | LEG Immobilien SE (XETR) | 137,726 | 20,486 |
| | Beiersdorf AG | 187,578 | 19,946 |
| | Volkswagen AG | 57,542 | 18,707 |
| | Henkel AG & Co. KGaA | 194,515 | 16,244 |
| | KION Group AG | 146,137 | 15,962 |
| | Aroundtown SA | 2,267,038 | 15,755 |
| | GEA Group AG | 310,489 | 15,292 |
| * | Commerzbank AG | 1,953,065 | 14,263 |
| | Carl Zeiss Meditec AG (Bearer) | 69,020 | 13,900 |
| * | Evotec SE | 276,908 | 13,423 |
| | | Shares | Market
Value•
($000) |
| | Knorr-Bremse AG | 124,230 | 13,111 |
| | Nemetschek SE | 111,003 | 12,745 |
| | Evonik Industries AG | 361,492 | 11,713 |
| | Bechtle AG | 154,422 | 11,584 |
| | LANXESS AG | 163,765 | 11,035 |
| * | thyssenkrupp AG | 874,948 | 9,108 |
| | Bayerische Motoren Werke AG Preference Shares | 100,369 | 8,556 |
| 2 | Scout24 SE | 119,891 | 8,350 |
| | Rheinmetall AG | 81,226 | 7,881 |
| * | CTS Eventim AG & Co. KGaA | 107,581 | 7,824 |
| | United Internet AG (Registered) | 206,520 | 7,621 |
| | Uniper SE | 171,774 | 7,594 |
| *,3 | Deutsche Lufthansa AG (Registered) | 1,137,582 | 7,520 |
| *,2 | Auto1 Group SE | 174,312 | 6,858 |
| | FUCHS PETROLUB SE Preference Shares | 135,323 | 6,490 |
| | Rational AG | 6,295 | 6,248 |
| 3 | Hella GmbH & Co. KGaA | 82,482 | 5,721 |
| | Deutsche Wohnen SE | 100,003 | 5,123 |
| | Wacker Chemie AG | 27,992 | 5,058 |
| * | Talanx AG | 101,701 | 4,891 |
| | ProSiebenSat.1 Media SE | 290,085 | 4,859 |
| * | Fraport AG Frankfurt Airport Services Worldwide | 66,943 | 4,791 |
| *,2 | TeamViewer AG | 303,226 | 4,526 |
| | Vantage Towers AG | 130,421 | 4,485 |
| 3 | Varta AG | 26,228 | 4,042 |
| * | RTL Group SA | 68,363 | 3,949 |
| | Telefonica Deutschland Holding AG | 1,271,587 | 3,313 |
| | METRO AG | 243,769 | 3,082 |
| | Fielmann AG | 43,738 | 2,884 |
| | HOCHTIEF AG | 36,378 | 2,807 |
| 2 | DWS Group GmbH & Co. KGaA | 62,429 | 2,700 |
| | Traton SE | 93,823 | 2,423 |
| | Sartorius AG | 3,919 | 2,408 |
| * | Vitesco Technologies Group AG Class A | 40,702 | 2,334 |
| | 1&1 AG | 79,036 | 2,300 |
| | FUCHS PETROLUB SE | 60,009 | 2,211 |
| | | | 3,020,705 |
| Greece (0.1%) |
| | Hellenic Telecommunications Organization SA | 427,971 | 7,598 |
| | OPAP SA | 384,724 | 6,008 |
| * | Eurobank Ergasias Services and Holdings SA | 4,785,957 | 5,027 |
| * | Alpha Services and Holdings SA | 3,916,932 | 4,994 |
| | Mytilineos SA | 209,346 | 3,826 |
| | JUMBO SA | 211,567 | 3,149 |
| * | National Bank of Greece SA | 993,461 | 3,137 |
FTSE All-World ex-US Index Fund
| | | Shares | Market
Value•
($000) |
| * | Public Power Corp. SA | 216,065 | 2,350 |
| * | Piraeus Financial Holdings SA | 1,075,233 | 1,837 |
| * | Motor Oil Hellas Corinth Refineries SA | 103,905 | 1,764 |
| | Terna Energy SA | 89,106 | 1,205 |
| | Hellenic Petroleum SA | 106,801 | 736 |
| *,1 | FF Group | 60,219 | 334 |
| | | | 41,965 |
| Hong Kong (2.0%) |
| | AIA Group Ltd. | 22,741,011 | 254,859 |
| | Hong Kong Exchanges & Clearing Ltd. | 2,385,655 | 143,716 |
| | Techtronic Industries Co. Ltd. | 2,351,274 | 48,308 |
| | Sun Hung Kai Properties Ltd. | 2,690,994 | 35,678 |
| | Link REIT | 3,934,525 | 34,858 |
| | CK Hutchison Holdings Ltd. | 5,072,599 | 34,009 |
| | Hong Kong & China Gas Co. Ltd. | 20,478,110 | 31,813 |
| * | BeiGene Ltd. | 1,124,100 | 31,084 |
| | CLP Holdings Ltd. | 3,096,371 | 30,316 |
| | Hang Seng Bank Ltd. | 1,364,337 | 25,926 |
| | CK Asset Holdings Ltd. | 3,748,438 | 23,154 |
| | Jardine Matheson Holdings Ltd. | 387,432 | 22,503 |
| * | Galaxy Entertainment Group Ltd. | 4,046,061 | 21,771 |
| | BOC Hong Kong Holdings Ltd. | 6,764,030 | 21,434 |
| | Wharf Real Estate Investment Co. Ltd. | 3,113,420 | 17,585 |
| | Power Assets Holdings Ltd. | 2,600,904 | 15,895 |
| | Lenovo Group Ltd. | 14,160,809 | 15,378 |
| | MTR Corp. Ltd. | 2,691,672 | 14,683 |
| | Hongkong Land Holdings Ltd. | 2,201,954 | 12,160 |
| | New World Development Co. Ltd. | 2,703,554 | 11,726 |
| *,2 | ESR Cayman Ltd. | 3,504,314 | 11,340 |
| | Xinyi Glass Holdings Ltd. | 3,827,583 | 10,786 |
| | Henderson Land Development Co. Ltd. | 2,469,302 | 10,339 |
| * | Sands China Ltd. | 4,528,704 | 10,322 |
| | Hang Lung Properties Ltd. | 3,861,140 | 8,961 |
| | Wharf Holdings Ltd. | 2,547,643 | 8,858 |
| 2 | Budweiser Brewing Co. APAC Ltd. | 3,203,133 | 8,786 |
| 3 | Sino Land Co. Ltd. | 6,608,520 | 8,686 |
| 2 | WH Group Ltd. | 12,159,002 | 8,524 |
| | Want Want China Holdings Ltd. | 10,198,807 | 7,910 |
| | | Shares | Market
Value•
($000) |
| | SITC International Holdings Co. Ltd. | 2,237,534 | 7,563 |
| | CK Infrastructure Holdings Ltd. | 1,177,059 | 7,097 |
| | Chow Tai Fook Jewellery Group Ltd. | 3,267,497 | 6,664 |
| | Tingyi Cayman Islands Holding Corp. | 3,566,367 | 6,657 |
| | ASM Pacific Technology Ltd. | 582,400 | 6,302 |
| | Swire Pacific Ltd. Class A | 971,852 | 6,110 |
| | PRADA SpA | 969,035 | 6,108 |
| | AAC Technologies Holdings Inc. | 1,309,337 | 5,659 |
| | Swire Properties Ltd. | 2,038,492 | 5,465 |
| | Minth Group Ltd. | 1,307,714 | 5,197 |
| *,2 | Samsonite International SA | 2,407,303 | 5,178 |
| | Man Wah Holdings Ltd. | 2,854,853 | 4,418 |
| | Microport Scientific Corp. | 894,274 | 4,207 |
| | PCCW Ltd. | 7,761,776 | 3,996 |
| | Hysan Development Co. Ltd. | 1,139,877 | 3,957 |
| | Bank of East Asia Ltd. | 2,390,652 | 3,926 |
| | Hang Lung Group Ltd. | 1,630,040 | 3,817 |
| 3 | Vitasoy International Holdings Ltd. | 1,492,957 | 3,599 |
| 2 | BOC Aviation Ltd. | 380,126 | 3,326 |
| | Kerry Properties Ltd. | 1,104,233 | 3,121 |
| | L'Occitane International SA | 852,105 | 3,048 |
| | Huabao International Holdings Ltd. | 1,578,849 | 2,953 |
| * | Yue Yuen Industrial Holdings Ltd. | 1,308,824 | 2,778 |
| | Kerry Logistics Network Ltd. | 1,102,965 | 2,674 |
| *,3 | SJM Holdings Ltd. | 3,460,915 | 2,574 |
| | NWS Holdings Ltd. | 2,565,079 | 2,547 |
| | NagaCorp Ltd. | 2,770,788 | 2,543 |
| *,3 | Wynn Macau Ltd. | 2,706,120 | 2,420 |
| | VTech Holdings Ltd. | 301,620 | 2,323 |
| 2 | Js Global Lifestyle Co. Ltd. | 1,189,591 | 2,203 |
| * | MMG Ltd. | 4,671,627 | 2,158 |
| | Dairy Farm International Holdings Ltd. | 565,514 | 2,020 |
| | Lee & Man Paper Manufacturing Ltd. | 2,624,583 | 1,973 |
| | Champion REIT | 3,749,530 | 1,967 |
| | Nexteer Automotive Group Ltd. | 1,494,541 | 1,845 |
| * | Melco International Development Ltd. | 1,412,675 | 1,835 |
| | Uni-President China Holdings Ltd. | 2,110,604 | 1,799 |
| | Swire Pacific Ltd. Class B | 1,666,088 | 1,750 |
| | First Pacific Co. Ltd. | 4,265,139 | 1,704 |
FTSE All-World ex-US Index Fund
| | | Shares | Market
Value•
($000) |
| * | Cathay Pacific Airways Ltd. | 1,799,730 | 1,660 |
| * | Shangri-La Asia Ltd. | 2,026,616 | 1,649 |
| *,3 | HengTen Networks Group Ltd. | 4,343,840 | 1,482 |
| | Johnson Electric Holdings Ltd. | 640,643 | 1,418 |
| | Towngas China Co. Ltd. | 2,049,307 | 1,407 |
| 3 | Vinda International Holdings Ltd. | 469,842 | 1,295 |
| | United Energy Group Ltd. | 13,790,205 | 1,220 |
| | Cafe de Coral Holdings Ltd. | 586,419 | 1,070 |
| | Haitong International Securities Group Ltd. | 4,497,047 | 1,034 |
| * | MGM China Holdings Ltd. | 1,311,723 | 962 |
| | Shui On Land Ltd. | 6,392,076 | 947 |
| * | Shun Tak Holdings Ltd. | 3,237,139 | 885 |
| * | FIH Mobile Ltd. | 5,543,303 | 862 |
| | Dah Sing Financial Holdings Ltd. | 253,449 | 786 |
| * | China Travel International Investment Hong Kong Ltd. | 4,636,794 | 673 |
| | Guotai Junan International Holdings Ltd. | 4,476,212 | 649 |
| | Dah Sing Banking Group Ltd. | 642,105 | 614 |
| * | Lifestyle International Holdings Ltd. | 837,820 | 438 |
| *,2,3 | FIT Hon Teng Ltd. | 2,102,242 | 422 |
| | Hutchison Telecommunications Hong Kong Holdings Ltd. | 2,098,363 | 335 |
| * | Macau Legend Development Ltd. | 2,438,000 | 248 |
| *,1 | Brightoil | 3,241,567 | 83 |
| *,1,3 | Huishan Dairy | 5,503,795 | — |
| | | | 1,106,988 |
| Hungary (0.1%) |
| * | OTP Bank Nyrt | 430,505 | 25,868 |
| | Richter Gedeon Nyrt | 259,524 | 7,273 |
| | MOL Hungarian Oil & Gas plc | 669,572 | 5,722 |
| | Magyar Telekom Telecommunications plc | 694,052 | 955 |
| | | | 39,818 |
| India (3.7%) |
| | Housing Development Finance Corp. Ltd. | 3,275,076 | 124,868 |
| | Reliance Industries Ltd. | 3,388,747 | 114,998 |
| | Infosys Ltd. ADR | 4,128,417 | 91,981 |
| 2 | Reliance Industries Ltd. GDR | 1,339,632 | 91,166 |
| | | Shares | Market
Value•
($000) |
| | Tata Consultancy Services Ltd. | 1,943,626 | 88,347 |
| | Infosys Ltd. | 2,642,000 | 59,125 |
| | Hindustan Unilever Ltd. | ��� 1,663,100 | 53,231 |
| | Bajaj Finance Ltd. | 439,184 | 43,553 |
| * | Axis Bank Ltd. | 4,270,794 | 42,499 |
| * | Bharti Airtel Ltd (XNSE) | 4,278,537 | 39,248 |
| | Asian Paints Ltd. | 844,730 | 35,008 |
| | ICICI Bank Ltd. | 2,950,525 | 31,769 |
| | HCL Technologies Ltd. | 2,035,333 | 31,165 |
| | Larsen & Toubro Ltd. | 1,301,055 | 30,820 |
| | Tata Steel Ltd. | 1,495,241 | 26,362 |
| | Titan Co. Ltd. | 779,239 | 24,863 |
| | Maruti Suzuki India Ltd. | 247,729 | 24,805 |
| | Tech Mahindra Ltd. | 1,133,394 | 22,435 |
| | UltraTech Cement Ltd. | 214,848 | 21,942 |
| | Sun Pharmaceutical Industries Ltd. | 2,037,369 | 21,665 |
| * | Tata Motors Ltd. | 3,355,740 | 21,588 |
| | Mahindra & Mahindra Ltd. | 1,717,345 | 20,347 |
| | State Bank of India GDR (Registered) | 277,047 | 18,727 |
| *,2 | Avenue Supermarts Ltd. | 278,434 | 17,270 |
| | Nestle India Ltd. | 67,197 | 17,074 |
| | Bajaj Finserv Ltd. | 71,338 | 17,031 |
| | JSW Steel Ltd. | 1,876,553 | 16,807 |
| | Grasim Industries Ltd. | 718,432 | 16,552 |
| | Divi's Laboratories Ltd. | 239,154 | 16,456 |
| | ITC Ltd. | 5,509,513 | 16,450 |
| | Hindalco Industries Ltd. | 2,655,109 | 16,361 |
| 2 | HDFC Life Insurance Co. Ltd. | 1,732,169 | 15,753 |
| | NTPC Ltd. | 8,417,736 | 14,945 |
| | Power Grid Corp. of India Ltd. | 5,868,469 | 14,536 |
| | Wipro Ltd. ADR | 1,575,779 | 14,119 |
| | Adani Ports & Special Economic Zone Ltd. | 1,431,828 | 13,282 |
| | Tata Consumer Products Ltd. | 1,145,750 | 12,417 |
| 2 | SBI Life Insurance Co. Ltd. | 786,793 | 12,057 |
| | Info Edge India Ltd. | 144,669 | 11,773 |
| | Cipla Ltd. | 957,767 | 11,594 |
| * | Adani Green Energy Ltd. | 736,627 | 11,325 |
| | Oil & Natural Gas Corp. Ltd. | 5,667,633 | 11,278 |
| | Britannia Industries Ltd. | 225,021 | 11,070 |
| | Bharat Petroleum Corp. Ltd. | 1,954,497 | 10,927 |
| | Tata Power Co. Ltd. | 3,798,310 | 10,898 |
| | Apollo Hospitals Enterprise Ltd. | 185,109 | 10,559 |
| * | Adani Transmission Ltd. | 439,410 | 10,351 |
| | Adani Total Gas Ltd. | 521,235 | 10,046 |
FTSE All-World ex-US Index Fund
| | | Shares | Market
Value•
($000) |
| | UPL Ltd. | 996,389 | 9,878 |
| | Shree Cement Ltd. | 25,519 | 9,770 |
| | Dr. Reddy's Laboratories Ltd. | 152,879 | 9,510 |
| | Adani Enterprises Ltd. | 492,682 | 9,380 |
| | Vedanta Ltd. | 2,304,344 | 9,378 |
| | Indian Oil Corp. Ltd. | 5,178,307 | 8,865 |
| | Pidilite Industries Ltd. | 283,908 | 8,786 |
| | Hero MotoCorp Ltd. | 244,590 | 8,696 |
| * | Godrej Consumer Products Ltd. | 677,512 | 8,674 |
| | Indus Towers Ltd. | 2,339,151 | 8,503 |
| | Eicher Motors Ltd. | 249,349 | 8,299 |
| | Piramal Enterprises Ltd. | 237,288 | 8,271 |
| | Coal India Ltd. | 3,565,119 | 7,846 |
| | Dabur India Ltd. | 977,223 | 7,654 |
| | Havells India Ltd. | 450,375 | 7,612 |
| | SRF Ltd. | 263,040 | 7,449 |
| 2 | Larsen & Toubro Infotech Ltd. | 83,000 | 7,425 |
| 2 | ICICI Lombard General Insurance Co. Ltd. | 370,863 | 7,349 |
| | Marico Ltd. | 964,061 | 7,330 |
| | Wipro Ltd. | 845,819 | 7,324 |
| | Mphasis Ltd. | 166,939 | 7,241 |
| | Shriram Transport Finance Co. Ltd. | 375,456 | 7,232 |
| | Ambuja Cements Ltd. | 1,274,733 | 6,908 |
| | Voltas Ltd. | 427,556 | 6,892 |
| * | United Spirits Ltd. | 539,601 | 6,850 |
| | Motherson Sumi Systems Ltd. | 2,250,849 | 6,745 |
| * | SBI Cards & Payment Services Ltd. | 476,762 | 6,732 |
| | Jubilant Foodworks Ltd. | 134,537 | 6,649 |
| | Gail India Ltd. | 3,310,327 | 6,587 |
| | Bajaj Auto Ltd. | 130,527 | 6,472 |
| | Zee Entertainment Enterprises Ltd. | 1,540,270 | 6,207 |
| | Cholamandalam Investment and Finance Co. Ltd. | 746,376 | 6,145 |
| | DLF Ltd. | 1,115,395 | 5,957 |
| * | Max Financial Services Ltd. | 447,010 | 5,821 |
| 2 | Bandhan Bank Ltd. | 1,485,082 | 5,803 |
| | Hindustan Petroleum Corp. Ltd. | 1,366,228 | 5,670 |
| | Bharat Electronics Ltd. | 2,042,578 | 5,652 |
| 2 | ICICI Prudential Life Insurance Co. Ltd. | 675,893 | 5,591 |
| | Lupin Ltd. | 448,914 | 5,549 |
| | Indian Railway Catering & Tourism Corp. Ltd. | 480,675 | 5,446 |
| | PI Industries Ltd. | 135,587 | 5,440 |
| | Page Industries Ltd. | 10,657 | 5,370 |
| *,2 | InterGlobe Aviation Ltd. | 184,500 | 5,364 |
| | MRF Ltd. | 5,029 | 5,200 |
| | | Shares | Market
Value•
($000) |
| | Colgate-Palmolive India Ltd. | 247,806 | 5,112 |
| | Ashok Leyland Ltd. | 2,675,885 | 5,107 |
| 2 | HDFC Asset Management Co. Ltd. | 143,501 | 5,083 |
| | Balkrishna Industries Ltd. | 150,227 | 4,949 |
| | ACC Ltd. | 157,540 | 4,919 |
| * | Godrej Properties Ltd. | 163,560 | 4,886 |
| | Mindtree Ltd. | 81,189 | 4,885 |
| | Astral Ltd. (XNSE) | 165,398 | 4,835 |
| | Bharat Forge Ltd. | 466,382 | 4,795 |
| | Siemens Ltd. | 160,477 | 4,693 |
| 2 | Laurus Labs Ltd. | 672,330 | 4,644 |
| *,2 | AU Small Finance Bank Ltd. | 283,132 | 4,609 |
| | Trent Ltd. | 338,012 | 4,538 |
| | Aurobindo Pharma Ltd. | 490,694 | 4,524 |
| | Embassy Office Parks REIT | 962,878 | 4,500 |
| | Container Corp. of India Ltd. | 511,944 | 4,490 |
| | Aarti Industries Ltd. | 347,133 | 4,482 |
| | Petronet LNG Ltd. | 1,444,778 | 4,435 |
| | Dr Reddy's Laboratories Ltd. ADR | 71,982 | 4,423 |
| | Berger Paints India Ltd. | 436,083 | 4,325 |
| | Dalmia Bharat Ltd. | 155,990 | 4,203 |
| * | Biocon Ltd. | 892,956 | 4,194 |
| * | Jindal Steel & Power Ltd. | 747,248 | 4,177 |
| | Indraprastha Gas Ltd. | 650,831 | 4,125 |
| | Sundaram Finance Ltd. | 125,127 | 4,005 |
| | State Bank of India | 591,572 | 3,980 |
| | Power Finance Corp. Ltd. | 2,142,548 | 3,819 |
| * | IDFC First Bank Ltd. | 5,633,287 | 3,738 |
| | Tata Communications Ltd. | 208,966 | 3,653 |
| | Bosch Ltd. | 16,099 | 3,652 |
| | Federal Bank Ltd. | 2,792,892 | 3,647 |
| | Ipca Laboratories Ltd. | 126,413 | 3,624 |
| | Muthoot Finance Ltd. | 178,631 | 3,508 |
| | Torrent Pharmaceuticals Ltd. | 91,604 | 3,504 |
| | REC Ltd. | 1,731,100 | 3,445 |
| | JSW Energy Ltd. | 712,761 | 3,321 |
| | TVS Motor Co. Ltd. | 370,487 | 3,290 |
| | Bajaj Holdings & Investment Ltd. | 50,915 | 3,289 |
| | LIC Housing Finance Ltd. | 588,314 | 3,207 |
| | Gujarat Gas Ltd. | 373,843 | 3,110 |
| | Cadila Healthcare Ltd. | 455,431 | 3,064 |
| | Cummins India Ltd. | 253,601 | 3,039 |
| * | Tata Motors Ltd. Class A | 911,738 | 3,014 |
FTSE All-World ex-US Index Fund
| | | Shares | Market
Value•
($000) |
| | Bata India Ltd. | 112,282 | 2,975 |
| | Steel Authority of India Ltd. | 1,927,640 | 2,969 |
| | Oracle Financial Services Software Ltd. | 49,554 | 2,934 |
| 2 | L&T Technology Services Ltd. | 46,073 | 2,915 |
| | NMDC Ltd. | 1,480,863 | 2,842 |
| | Varun Beverages Ltd. | 249,825 | 2,838 |
| | United Breweries Ltd. | 127,180 | 2,819 |
| | Mahindra & Mahindra Financial Services Ltd. | 1,167,445 | 2,808 |
| | Emami Ltd. | 391,164 | 2,781 |
| | ABB India Ltd. | 95,839 | 2,717 |
| | Torrent Power Ltd. | 399,972 | 2,676 |
| * | Oberoi Realty Ltd. | 217,960 | 2,638 |
| * | Bank of Baroda | 1,917,638 | 2,506 |
| * | Adani Power Ltd. | 1,731,358 | 2,323 |
| | Honeywell Automation India Ltd. | 4,048 | 2,272 |
| * | Bharat Heavy Electricals Ltd. | 2,386,472 | 2,182 |
| * | GMR Infrastructure Ltd. | 3,997,146 | 2,169 |
| | Alkem Laboratories Ltd. | 44,909 | 2,167 |
| | Rajesh Exports Ltd. | 250,793 | 2,140 |
| | Coromandel International Ltd. | 202,150 | 2,125 |
| | Oil India Ltd. | 697,842 | 2,098 |
| *,2 | RBL Bank Ltd. | 842,759 | 2,041 |
| | Indiabulls Housing Finance Ltd. | 696,619 | 2,025 |
| | Exide Industries Ltd. | 846,098 | 1,957 |
| * | Vodafone Idea Ltd. | 14,700,378 | 1,882 |
| | NHPC Ltd. | 4,547,046 | 1,866 |
| | Glenmark Pharmaceuticals Ltd. | 275,961 | 1,859 |
| | Hindustan Zinc Ltd. | 431,442 | 1,799 |
| * | L&T Finance Holdings Ltd. | 1,634,811 | 1,798 |
| * | 3M India Ltd. | 5,231 | 1,778 |
| * | Canara Bank | 596,020 | 1,714 |
| | Kansai Nerolac Paints Ltd. | 233,508 | 1,704 |
| | Castrol India Ltd. | 917,394 | 1,696 |
| | Whirlpool of India Ltd. | 54,960 | 1,626 |
| | Bayer CropScience Ltd. | 23,920 | 1,595 |
| | GlaxoSmithKline Pharmaceuticals Ltd. | 78,928 | 1,585 |
| 2 | Nippon Life India Asset Management Ltd. | 264,078 | 1,478 |
| | Polycab India Ltd. | 45,166 | 1,366 |
| | Sun TV Network Ltd. | 181,693 | 1,365 |
| * | Aditya Birla Capital Ltd. | 953,912 | 1,235 |
| * | Godrej Industries Ltd. | 147,850 | 1,147 |
| | | Shares | Market
Value•
($000) |
| * | Punjab National Bank | 2,030,911 | 1,145 |
| | Hindustan Aeronautics Ltd. | 65,030 | 1,136 |
| *,2 | Indian Railway Finance Corp. Ltd. | 3,249,187 | 1,052 |
| | Gillette India Ltd. | 13,938 | 1,051 |
| * | Union Bank of India | 1,015,425 | 628 |
| * | Bank of India | 657,868 | 528 |
| * | Mangalore Refinery & Petrochemicals Ltd. | 725,523 | 477 |
| * | Yes Bank Ltd. | 2,544,587 | 437 |
| *,2 | General Insurance Corp. of India | 192,631 | 343 |
| | | | 2,008,014 |
| Indonesia (0.4%) |
| | Bank Central Asia Tbk PT | 91,052,743 | 48,147 |
| | Bank Rakyat Indonesia Persero Tbk PT | 122,696,703 | 36,831 |
| | Telkom Indonesia Persero Tbk PT | 88,013,124 | 23,525 |
| | Bank Mandiri Persero Tbk PT | 35,084,472 | 17,738 |
| | Astra International Tbk PT | 38,387,488 | 16,350 |
| | Bank Negara Indonesia Persero Tbk PT | 14,178,787 | 7,012 |
| | Charoen Pokphand Indonesia Tbk PT | 13,944,864 | 6,115 |
| | United Tractors Tbk PT | 2,829,212 | 4,706 |
| | Kalbe Farma Tbk PT | 36,201,937 | 4,088 |
| | Sarana Menara Nusantara Tbk PT | 47,442,500 | 3,889 |
| | Indofood Sukses Makmur Tbk PT | 8,467,805 | 3,801 |
| | Tower Bersama Infrastructure Tbk PT | 18,286,225 | 3,798 |
| | Semen Indonesia Persero Tbk PT | 5,477,549 | 3,520 |
| | Unilever Indonesia Tbk PT | 10,745,150 | 3,354 |
| | Barito Pacific Tbk PT | 45,990,700 | 3,043 |
| | Indah Kiat Pulp & Paper Corp. Tbk PT | 4,906,400 | 2,936 |
| | Adaro Energy Tbk PT | 23,474,263 | 2,781 |
| | Indofood CBP Sukses Makmur Tbk PT | 4,138,884 | 2,570 |
| * | Perusahaan Gas Negara Persero Tbk PT | 18,640,846 | 1,988 |
| | Gudang Garam Tbk PT | 838,686 | 1,987 |
| | Indocement Tunggal Prakarsa Tbk PT | 2,371,098 | 1,979 |
| * | Surya Citra Media Tbk PT | 51,650,895 | 1,532 |
| | Bukit Asam Tbk PT | 7,513,155 | 1,422 |
| | XL Axiata Tbk PT | 6,217,150 | 1,354 |
| * | Smartfren Telecom Tbk PT | 175,820,700 | 1,342 |
FTSE All-World ex-US Index Fund
| | | Shares | Market
Value•
($000) |
| * | Bumi Serpong Damai Tbk PT | 16,988,240 | 1,333 |
| | Vale Indonesia Tbk PT | 3,718,262 | 1,274 |
| | Hanjaya Mandala Sampoerna Tbk PT | 15,846,300 | 1,159 |
| * | Jasa Marga Persero Tbk PT | 3,751,819 | 1,114 |
| | Mayora Indah Tbk PT | 6,456,700 | 1,070 |
| * | LEG Immobilien SE | 4,904,900 | 731 |
| | Media Nusantara Citra Tbk PT | 8,802,166 | 560 |
| | Astra Agro Lestari Tbk PT | 680,225 | 516 |
| | Bank Danamon Indonesia Tbk PT | 1,024,127 | 195 |
| | | | 213,760 |
| Ireland (0.2%) |
| | Kerry Group plc Class A | 289,589 | 38,857 |
| | Kingspan Group plc | 284,494 | 32,752 |
| | Glanbia plc (XDUB) | 361,329 | 5,901 |
| * | AIB Group plc | 1,444,236 | 3,909 |
| *,1 | Irish Bank Resolution Corp. | 236,607 | — |
| | | | 81,419 |
| Israel (0.4%) |
| * | Nice Ltd. | 120,345 | 34,021 |
| | Bank Leumi Le-Israel BM | 2,727,599 | 26,061 |
| | Bank Hapoalim BM | 2,230,365 | 21,967 |
| * | Teva Pharmaceutical Industries Ltd. | 1,851,175 | 16,324 |
| * | Israel Discount Bank Ltd. Class A | 2,199,535 | 13,290 |
| | ICL Group Ltd. | 1,310,904 | 11,234 |
| | Mizrahi Tefahot Bank Ltd. | 255,802 | 9,307 |
| | Elbit Systems Ltd. | 46,764 | 7,372 |
| * | Tower Semiconductor Ltd. | 202,538 | 6,631 |
| | Azrieli Group Ltd. | 68,685 | 6,424 |
| * | Nova Ltd. | 51,665 | 5,517 |
| * | Bezeq The Israeli Telecommunication Corp. Ltd. | 3,934,100 | 4,935 |
| | Mivne Real Estate KD Ltd. | 1,287,793 | 4,695 |
| * | Enlight Renewable Energy Ltd. | 1,674,014 | 4,127 |
| | First International Bank of Israel Ltd. | 97,062 | 3,892 |
| | Alony Hetz Properties & Investments Ltd. | 196,736 | 3,221 |
| | Phoenix Holdings Ltd. | 222,918 | 2,818 |
| | Big Shopping Centers Ltd. | 18,777 | 2,816 |
| * | Melisron Ltd. | 32,243 | 2,729 |
| * | Airport City Ltd. | 129,487 | 2,472 |
| * | Israel Corp. Ltd. | 6,560 | 2,421 |
| | | Shares | Market
Value•
($000) |
| | Harel Insurance Investments & Financial Services Ltd. | 208,347 | 2,329 |
| * | Shikun & Binui Ltd. | 388,013 | 2,308 |
| * | Paz Oil Co. Ltd. | 17,613 | 2,245 |
| | Strauss Group Ltd. | 76,174 | 2,239 |
| | Amot Investments Ltd. | 275,678 | 2,107 |
| | Electra Ltd. | 3,179 | 2,095 |
| | Gav-Yam Lands Corp. Ltd. | 173,184 | 2,061 |
| | Sapiens International Corp. NV | 56,874 | 1,968 |
| | Shufersal Ltd. | 227,012 | 1,880 |
| | Maytronics Ltd. | 78,361 | 1,852 |
| | Shapir Engineering and Industry Ltd. | 197,753 | 1,619 |
| | Ashtrom Group Ltd. | 68,981 | 1,613 |
| | Energix-Renewable Energies Ltd. | 341,758 | 1,609 |
| * | OPC Energy Ltd. | 138,748 | 1,451 |
| | Kenon Holdings Ltd. | 30,319 | 1,217 |
| | Gazit-Globe Ltd. | 126,514 | 1,025 |
| * | Fattal Holdings 1998 Ltd. | 9,098 | 978 |
| * | Teva Pharmaceutical Industries Ltd. ADR | 14,374 | 126 |
| | | | 222,996 |
| Italy (1.6%) |
| | Enel SpA | 14,635,048 | 122,522 |
| | Intesa Sanpaolo SpA | 31,271,919 | 88,880 |
| | Eni SpA | 4,733,189 | 67,838 |
| | Ferrari NV | 229,069 | 54,355 |
| | UniCredit SpA | 4,095,062 | 54,135 |
| | Assicurazioni Generali SpA | 2,437,098 | 53,068 |
| | Stellantis NV | 2,078,884 | 41,504 |
| | Stellantis NV (XNYS) | 1,726,792 | 34,479 |
| | CNH Industrial NV | 1,858,978 | 32,022 |
| | Moncler SpA | 405,970 | 29,215 |
| | Snam SpA (MTAA) | 4,188,166 | 23,721 |
| * | FinecoBank Banca Fineco SpA | 1,152,564 | 22,011 |
| | Terna - Rete Elettrica Nazionale | 2,664,139 | 19,850 |
| *,2 | Nexi SpA | 1,107,957 | 19,264 |
| | Prysmian SpA | 499,786 | 18,897 |
| | EXOR NV | 196,369 | 18,524 |
| * | Atlantia SpA | 930,961 | 17,994 |
| * | Mediobanca Banca di Credito Finanziario SpA | 1,338,063 | 15,967 |
| | Davide Campari-Milano NV | 939,526 | 13,345 |
| 2 | Poste Italiane SpA | 869,164 | 12,413 |
| | Amplifon SpA | 242,642 | 12,348 |
| | Recordati Industria Chimica e Farmaceutica SpA | 185,413 | 11,617 |
| | Interpump Group SpA | 149,755 | 11,031 |
| | DiaSorin SpA | 42,594 | 9,629 |
| | Reply SpA | 42,268 | 8,204 |
| | Tenaris SA | 686,903 | 7,650 |
FTSE All-World ex-US Index Fund
| | | Shares | Market
Value•
($000) |
| | Telecom Italia SpA | 21,262,880 | 7,586 |
| 2 | Infrastrutture Wireless Italiane SpA | 663,933 | 7,335 |
| | A2A SpA | 3,055,709 | 6,430 |
| | Italgas SpA | 958,305 | 6,089 |
| 2 | Pirelli & C SpA | 973,865 | 5,990 |
| | Hera SpA | 1,462,239 | 5,982 |
| * | Leonardo SpA | 759,005 | 5,569 |
| | De' Longhi SpA | 131,935 | 5,161 |
| | Banca Mediolanum SpA | 471,933 | 4,756 |
| | Telecom Italia SpA Savings Shares | 10,559,074 | 4,014 |
| | Buzzi Unicem SpA | 171,460 | 3,999 |
| | UnipolSai Assicurazioni SpA | 793,574 | 2,298 |
| | Tenaris SA ADR | 100,657 | 2,243 |
| | | | 887,935 |
| Japan (15.7%) |
| | Toyota Motor Corp. | 23,167,735 | 408,775 |
| | Sony Group Corp. | 2,330,284 | 269,838 |
| | Keyence Corp. | 338,174 | 204,127 |
| | Recruit Holdings Co. Ltd. | 2,512,114 | 167,103 |
| | SoftBank Group Corp. | 2,519,407 | 136,394 |
| | Shin-Etsu Chemical Co. Ltd. | 746,697 | 133,161 |
| | Tokyo Electron Ltd. | 278,236 | 129,667 |
| | Mitsubishi UFJ Financial Group Inc. | 23,341,254 | 127,992 |
| | Daikin Industries Ltd. | 498,731 | 109,229 |
| | Hitachi Ltd. | 1,741,136 | 100,332 |
| | Hoya Corp. | 671,109 | 98,793 |
| | Nidec Corp. | 871,769 | 96,555 |
| | KDDI Corp. | 3,155,224 | 96,487 |
| | Honda Motor Co. Ltd. | 3,215,713 | 95,114 |
| | Nintendo Co. Ltd. | 202,165 | 89,288 |
| | Daiichi Sankyo Co. Ltd. | 3,536,869 | 89,244 |
| | Murata Manufacturing Co. Ltd. | 1,072,055 | 79,524 |
| | Sumitomo Mitsui Financial Group Inc. | 2,441,081 | 79,212 |
| | Takeda Pharmaceutical Co. Ltd. | 2,755,255 | 77,329 |
| | ITOCHU Corp. | 2,541,328 | 72,481 |
| | Mitsubishi Corp. | 2,250,472 | 71,560 |
| | FANUC Corp. | 360,810 | 71,304 |
| | Softbank Corp. | 5,099,739 | 69,610 |
| | Mitsui & Co. Ltd. | 2,993,670 | 68,509 |
| | Tokio Marine Holdings Inc. | 1,213,370 | 63,908 |
| | Fast Retailing Co. Ltd. | 96,062 | 63,768 |
| | Nippon Telegraph & Telephone Corp. | 2,274,249 | 63,722 |
| | SMC Corp. | 106,631 | 63,634 |
| | Mizuho Financial Group Inc. | 4,770,270 | 62,958 |
| | Denso Corp. | 856,484 | 62,091 |
| | | Shares | Market
Value•
($000) |
| | Fujitsu Ltd. | 353,639 | 61,119 |
| | Seven & i Holdings Co. Ltd. | 1,448,059 | 60,796 |
| | Astellas Pharma Inc. | 3,497,016 | 58,955 |
| | Oriental Land Co. Ltd. | 352,137 | 55,616 |
| | Terumo Corp. | 1,238,331 | 54,630 |
| | FUJIFILM Holdings Corp. | 664,526 | 51,353 |
| | Central Japan Railway Co. | 340,997 | 50,584 |
| | Mitsubishi Electric Corp. | 3,716,226 | 49,907 |
| | Panasonic Corp. | 4,016,584 | 49,669 |
| | Kao Corp. | 869,383 | 49,179 |
| | Shiseido Co. Ltd. | 729,984 | 48,710 |
| | Bridgestone Corp. | 1,084,002 | 47,955 |
| | M3 Inc. | 793,211 | 46,744 |
| | Chugai Pharmaceutical Co. Ltd. | 1,228,021 | 45,915 |
| | ORIX Corp. | 2,306,721 | 45,849 |
| | Komatsu Ltd. | 1,722,509 | 45,115 |
| | Sysmex Corp. | 356,518 | 44,205 |
| | Kubota Corp. | 2,045,470 | 43,575 |
| | Japan Tobacco Inc. | 2,218,475 | 43,551 |
| | Olympus Corp. | 1,983,779 | 42,975 |
| | Canon Inc. | 1,871,440 | 42,555 |
| | East Japan Railway Co. | 679,119 | 42,300 |
| | Shimano Inc. | 148,260 | 41,367 |
| | Dai-ichi Life Holdings Inc. | 1,963,525 | 41,310 |
| | Daiwa House Industry Co. Ltd. | 1,206,729 | 39,810 |
| | Mitsui Fudosan Co. Ltd. | 1,736,685 | 39,707 |
| | Suzuki Motor Corp. | 851,697 | 37,983 |
| | Asahi Group Holdings Ltd. | 790,750 | 35,884 |
| | Eisai Co. Ltd. | 498,274 | 35,306 |
| | Toshiba Corp. | 813,685 | 35,096 |
| | Kyocera Corp. | 579,921 | 33,953 |
| | Omron Corp. | 350,303 | 33,501 |
| | Shionogi & Co. Ltd. | 512,697 | 33,428 |
| | Mitsubishi Estate Co. Ltd. | 2,159,283 | 32,815 |
| | Japan Post Holdings Co. Ltd. | 4,254,625 | 32,692 |
| | Otsuka Holdings Co. Ltd. | 792,200 | 31,331 |
| | Lasertec Corp. | 143,640 | 31,158 |
| | Advantest Corp. | 373,541 | 30,626 |
| | Aeon Co. Ltd. | 1,328,785 | 30,568 |
| | Z Holdings Corp. | 4,854,622 | 30,138 |
| | Sumitomo Corp. | 2,110,827 | 30,079 |
| | Unicharm Corp. | 732,578 | 29,628 |
| | MS&AD Insurance Group Holdings Inc. | 887,048 | 28,658 |
| | Bandai Namco Holdings Inc. | 370,786 | 28,335 |
| | Kikkoman Corp. | 344,873 | 28,207 |
| | Ajinomoto Co. Inc. | 921,786 | 27,599 |
| | Nomura Holdings Inc. | 5,728,280 | 27,281 |
FTSE All-World ex-US Index Fund
| | | Shares | Market
Value•
($000) |
| | Sumitomo Realty & Development Co. Ltd. | 746,790 | 26,989 |
| | Nippon Steel Corp. | 1,534,940 | 26,912 |
| | Sompo Holdings Inc. | 618,721 | 26,832 |
| | Nitori Holdings Co. Ltd. | 140,194 | 25,755 |
| | Toyota Industries Corp. | 301,004 | 25,589 |
| | NEC Corp. | 496,284 | 25,411 |
| | Marubeni Corp. | 2,948,727 | 25,021 |
| | Kirin Holdings Co. Ltd. | 1,433,414 | 24,950 |
| | Secom Co. Ltd. | 365,973 | 24,949 |
| | TDK Corp. | 678,592 | 24,669 |
| | Asahi Kasei Corp. | 2,324,278 | 24,417 |
| | NTT Data Corp. | 1,197,009 | 24,013 |
| | Japan Exchange Group Inc. | 996,319 | 23,591 |
| | Obic Co. Ltd. | 125,169 | 23,147 |
| * | Renesas Electronics Corp. | 1,875,856 | 23,076 |
| | ENEOS Holdings Inc. | 5,643,924 | 22,758 |
| | Sumitomo Mitsui Trust Holdings Inc. | 689,398 | 22,677 |
| | Subaru Corp. | 1,142,544 | 22,411 |
| | Sekisui House Ltd. | 1,072,679 | 22,302 |
| | MISUMI Group Inc. | 523,144 | 21,880 |
| | Nippon Yusen KK | 301,948 | 21,758 |
| | Nitto Denko Corp. | 275,687 | 21,542 |
| | Makita Corp. | 457,585 | 21,237 |
| | Yaskawa Electric Corp. | 484,559 | 20,987 |
| | West Japan Railway Co. | 436,949 | 20,626 |
| | Shimadzu Corp. | 507,614 | 20,623 |
| | SG Holdings Co. Ltd. | 794,125 | 19,941 |
| | Mitsubishi Chemical Holdings Corp. | 2,403,578 | 19,895 |
| | Nomura Research Institute Ltd. | 493,238 | 19,746 |
| | MINEBEA MITSUMI Inc. | 767,256 | 19,425 |
| | Sumitomo Electric Industries Ltd. | 1,416,380 | 18,799 |
| | Yamaha Corp. | 297,052 | 18,767 |
| * | Nissan Motor Co. Ltd. | 3,654,999 | 18,603 |
| | Toyota Tsusho Corp. | 419,387 | 18,191 |
| | Nippon Building Fund Inc. | 2,771 | 18,003 |
| | Toray Industries Inc. | 2,855,306 | 17,793 |
| | AGC Inc. | 349,491 | 17,403 |
| | Sumitomo Metal Mining Co. Ltd. | 446,146 | 17,307 |
| | Ono Pharmaceutical Co. Ltd. | 812,682 | 17,051 |
| | Pan Pacific International Holdings Corp. | 799,405 | 16,785 |
| | Rakuten Group Inc. | 1,526,438 | 16,712 |
| | Daifuku Co. Ltd. | 181,488 | 16,708 |
| | Daiwa Securities Group Inc. | 2,854,902 | 16,039 |
| | MEIJI Holdings Co. Ltd. | 253,253 | 15,982 |
| | | Shares | Market
Value•
($000) |
| | Nippon Paint Holdings Co. Ltd. | 1,485,465 | 15,894 |
| | Yamaha Motor Co. Ltd. | 564,584 | 15,737 |
| | Yamato Holdings Co. Ltd. | 628,176 | 15,443 |
| | Resona Holdings Inc. | 4,106,751 | 15,427 |
| | Kyowa Kirin Co. Ltd. | 468,982 | 15,424 |
| | Daito Trust Construction Co. Ltd. | 122,275 | 15,160 |
| | Nihon M&A Center Holdings Inc. | 492,892 | 15,134 |
| | Japan Real Estate Investment Corp. | 2,419 | 14,827 |
| | JFE Holdings Inc. | 967,051 | 14,777 |
| | Dentsu Group Inc. | 403,020 | 14,728 |
| | Hamamatsu Photonics KK | 242,012 | 14,364 |
| | Inpex Corp. | 1,720,798 | 14,350 |
| | Rohm Co. Ltd. | 156,193 | 14,282 |
| | Sumitomo Chemical Co. Ltd. | 2,841,230 | 13,997 |
| | Nissan Chemical Corp. | 250,553 | 13,945 |
| | Nippon Prologis REIT Inc. | 4,164 | 13,908 |
| | Disco Corp. | 51,479 | 13,879 |
| | Tokyo Gas Co. Ltd. | 796,592 | 13,823 |
| | Mitsubishi Heavy Industries Ltd. | 537,525 | 13,746 |
| | Chubu Electric Power Co. Inc. | 1,312,115 | 13,582 |
| | Nexon Co. Ltd. | 780,872 | 13,291 |
| | TOTO Ltd. | 272,092 | 13,146 |
| | Tokyu Corp. | 927,310 | 13,073 |
| | Isuzu Motors Ltd. | 969,644 | 13,044 |
| | Mitsui OSK Lines Ltd. | 206,765 | 13,037 |
| | Trend Micro Inc. | 229,490 | 12,971 |
| | GLP J-REIT | 7,932 | 12,938 |
| | T&D Holdings Inc. | 1,002,859 | 12,862 |
| | Hankyu Hanshin Holdings Inc. | 412,325 | 12,784 |
| | Yakult Honsha Co. Ltd. | 250,898 | 12,677 |
| | Odakyu Electric Railway Co. Ltd. | 583,300 | 12,646 |
| | Kansai Electric Power Co. Inc. | 1,365,701 | 12,574 |
| | Dai Nippon Printing Co. Ltd. | 507,269 | 12,568 |
| | Lixil Corp. | 488,776 | 12,557 |
| | Nomura Real Estate Master Fund Inc. | 8,358 | 12,516 |
| | Ibiden Co. Ltd. | 204,060 | 12,261 |
| | TIS Inc. | 449,880 | 12,256 |
| | JSR Corp. | 337,313 | 12,234 |
| | Koito Manufacturing Co. Ltd. | 215,526 | 12,229 |
| | CyberAgent Inc. | 722,568 | 12,107 |
| | Idemitsu Kosan Co. Ltd. | 439,943 | 12,016 |
| | Aisin Corp. | 327,455 | 11,982 |
| | Osaka Gas Co. Ltd. | 742,191 | 11,963 |
| | Ricoh Co. Ltd. | 1,218,295 | 11,864 |
| | Taiyo Yuden Co. Ltd. | 234,050 | 11,863 |
FTSE All-World ex-US Index Fund
| | | Shares | Market
Value•
($000) |
| | SBI Holdings Inc. | 453,953 | 11,766 |
| | Japan Metropolitan Fund Investment | 12,789 | 11,747 |
| | Fuji Electric Co. Ltd. | 237,366 | 11,607 |
| | Daiwa House REIT Investment Corp. | 3,972 | 11,398 |
| | Keio Corp. | 217,899 | 10,999 |
| | Obayashi Corp. | 1,284,923 | 10,848 |
| * | Kintetsu Group Holdings Co. Ltd. | 341,481 | 10,749 |
| | Azbil Corp. | 245,810 | 10,480 |
| | Sekisui Chemical Co. Ltd. | 637,781 | 10,478 |
| | BayCurrent Consulting Inc. | 25,100 | 10,417 |
| | Kajima Corp. | 841,187 | 10,357 |
| | Hirose Electric Co. Ltd. | 61,360 | 10,261 |
| | Kurita Water Industries Ltd. | 206,602 | 10,204 |
| | MonotaRO Co. Ltd. | 441,856 | 10,071 |
| | SUMCO Corp. | 524,053 | 10,014 |
| | Nissin Foods Holdings Co. Ltd. | 130,922 | 10,008 |
| | Konami Holdings Corp. | 180,919 | 9,956 |
| | Taisei Corp. | 313,766 | 9,846 |
| | Mitsui Chemicals Inc. | 330,354 | 9,823 |
| | Toho Co. Ltd. (XTKS) | 208,407 | 9,792 |
| | Asahi Intecc Co. Ltd. | 368,667 | 9,718 |
| * | Mazda Motor Corp. | 1,079,292 | 9,707 |
| | GMO Payment Gateway Inc. | 76,035 | 9,633 |
| | Otsuka Corp. | 195,041 | 9,607 |
| | Tobu Railway Co. Ltd. | 384,686 | 9,578 |
| | Capcom Co. Ltd. | 354,270 | 9,535 |
| | Ebara Corp. | 174,297 | 9,511 |
| | Santen Pharmaceutical Co. Ltd. | 674,800 | 9,511 |
| | MatsukiyoCocokara & Co. | 210,275 | 9,324 |
| | Kobayashi Pharmaceutical Co. Ltd. | 115,549 | 9,252 |
| | Yokogawa Electric Corp. | 462,793 | 9,248 |
| | Suntory Beverage & Food Ltd. | 235,715 | 9,146 |
| | Seiko Epson Corp. | 513,058 | 9,136 |
| | Tosoh Corp. | 528,442 | 8,900 |
| | Open House Co. Ltd. | 137,383 | 8,761 |
| | Ryohin Keikaku Co. Ltd. | 443,846 | 8,747 |
| | TOPPAN Inc. | 531,607 | 8,581 |
| | Brother Industries Ltd. | 442,028 | 8,546 |
| | Keisei Electric Railway Co. Ltd. | 265,431 | 8,542 |
| | Kansai Paint Co. Ltd. | 365,402 | 8,461 |
| | Tsuruha Holdings Inc. | 68,251 | 8,418 |
| | Persol Holdings Co. Ltd. | 309,891 | 8,329 |
| | Showa Denko KK | 332,036 | 8,327 |
| | | Shares | Market
Value•
($000) |
| | Concordia Financial Group Ltd. | 2,085,684 | 8,290 |
| | Food & Life Cos. Ltd. | 191,200 | 8,287 |
| | Nippon Express Co. Ltd. | 131,681 | 8,243 |
| | Square Enix Holdings Co. Ltd. | 150,164 | 8,226 |
| | Oji Holdings Corp. | 1,658,773 | 8,222 |
| | Hoshizaki Corp. | 97,576 | 8,205 |
| * | Tokyo Electric Power Co. Holdings Inc. | 2,952,586 | 8,179 |
| | Orix JREIT Inc. | 4,898 | 8,126 |
| | Asics Corp. | 321,435 | 8,011 |
| | NGK Insulators Ltd. | 479,041 | 7,977 |
| | Lion Corp. | 475,570 | 7,920 |
| | Advance Residence Investment Corp. | 2,403 | 7,898 |
| | Nippon Shinyaku Co. Ltd. | 97,413 | 7,804 |
| | Nisshin Seifun Group Inc. | 491,204 | 7,756 |
| | Hulic Co. Ltd. | 788,164 | 7,579 |
| | Shimizu Corp. | 1,031,934 | 7,561 |
| | Shizuoka Bank Ltd. | 938,528 | 7,557 |
| | Marui Group Co. Ltd. | 383,863 | 7,533 |
| * | Kawasaki Kisen Kaisha Ltd. | 153,800 | 7,413 |
| | Toyo Suisan Kaisha Ltd. | 171,441 | 7,387 |
| | Sojitz Corp. | 444,305 | 7,331 |
| | Hakuhodo DY Holdings Inc. | 437,598 | 7,134 |
| | Kakaku.com Inc. | 214,911 | 7,132 |
| | Miura Co. Ltd. | 184,850 | 7,110 |
| * | Hitachi Metals Ltd. | 371,159 | 7,026 |
| | Welcia Holdings Co. Ltd. | 188,048 | 7,020 |
| | Ito En Ltd. | 105,323 | 7,015 |
| | Chiba Bank Ltd. | 1,127,446 | 6,988 |
| | Rinnai Corp. | 67,816 | 6,963 |
| | Koei Tecmo Holdings Co. Ltd. | 149,450 | 6,957 |
| * | ANA Holdings Inc. | 297,234 | 6,926 |
| | Nabtesco Corp. | 212,643 | 6,901 |
| | United Urban Investment Corp. | 5,523 | 6,885 |
| | Stanley Electric Co. Ltd. | 271,540 | 6,844 |
| | Tokyo Century Corp. | 118,011 | 6,757 |
| | Nikon Corp. | 611,499 | 6,742 |
| | Mitsubishi Gas Chemical Co. Inc. | 334,479 | 6,732 |
| | Kyushu Railway Co. | 300,388 | 6,724 |
| | SCREEN Holdings Co. Ltd. | 71,721 | 6,666 |
| | Tokyu Fudosan Holdings Corp. | 1,144,870 | 6,634 |
| | ZOZO Inc. | 204,856 | 6,576 |
| | NH Foods Ltd. | 186,178 | 6,547 |
| | Industrial & Infrastructure Fund Investment Corp. | 3,539 | 6,489 |
| | Iida Group Holdings Co. Ltd. | 263,011 | 6,484 |
FTSE All-World ex-US Index Fund
| | | Shares | Market
Value•
($000) |
| | TechnoPro Holdings Inc. | 198,888 | 6,356 |
| | Hikari Tsushin Inc. | 40,911 | 6,307 |
| | Nippon Sanso Holdings Corp. | 265,556 | 6,269 |
| | NOF Corp. | 124,350 | 6,241 |
| | Hitachi Construction Machinery Co. Ltd. | 195,339 | 6,232 |
| | Kose Corp. | 53,493 | 6,212 |
| | Haseko Corp. | 475,402 | 6,190 |
| | Kyushu Electric Power Co. Inc. | 870,868 | 6,135 |
| | USS Co. Ltd. | 380,321 | 6,130 |
| * | Nagoya Railroad Co. Ltd. | 369,458 | 6,104 |
| | Bank of Kyoto Ltd. | 134,567 | 6,052 |
| | Oracle Corp. Japan | 63,651 | 6,023 |
| | Japan Prime Realty Investment Corp. | 1,642 | 6,023 |
| | Japan Post Bank Co. Ltd. | 771,387 | 6,018 |
| | Japan Post Insurance Co. Ltd. | 370,639 | 6,014 |
| | Mitsubishi HC Capital Inc. (XTKS) | 1,185,933 | 5,947 |
| | Kuraray Co. Ltd. | 652,279 | 5,903 |
| | Jeol Ltd. | 77,500 | 5,874 |
| | NGK Spark Plug Co. Ltd. | 366,202 | 5,850 |
| * | Japan Airlines Co. Ltd. | 271,165 | 5,836 |
| | Rakus Co. Ltd | 181,538 | 5,754 |
| | Tohoku Electric Power Co. Inc. | 885,980 | 5,748 |
| | Amada Co. Ltd. | 580,385 | 5,734 |
| | Casio Computer Co. Ltd. | 403,308 | 5,707 |
| | Itochu Techno-Solutions Corp. | 179,826 | 5,681 |
| | Sekisui House REIT Inc. | 7,487 | 5,660 |
| | IHI Corp. | 240,824 | 5,625 |
| | NSK Ltd. | 833,558 | 5,601 |
| * | Skylark Holdings Co. Ltd. | 410,164 | 5,558 |
| | Kawasaki Heavy Industries Ltd. | 273,347 | 5,547 |
| | Iwatani Corp. | 93,900 | 5,546 |
| | Benefit One Inc. | 109,468 | 5,524 |
| | LaSalle Logiport REIT | 3,316 | 5,513 |
| | Rohto Pharmaceutical Co. Ltd. | 180,225 | 5,507 |
| | Tokyo Tatemono Co. Ltd. | 374,621 | 5,506 |
| | Sumitomo Heavy Industries Ltd. | 211,101 | 5,435 |
| | Fukuoka Financial Group Inc. | 299,612 | 5,383 |
| 3 | Shinsei Bank Ltd. | 324,244 | 5,355 |
| | Sega Sammy Holdings Inc. | 376,468 | 5,354 |
| | Sohgo Security Services Co. Ltd. | 124,744 | 5,337 |
| | Keikyu Corp. | 472,046 | 5,328 |
| | Denka Co. Ltd. | 162,541 | 5,321 |
| | | Shares | Market
Value•
($000) |
| | Activia Properties Inc. | 1,285 | 5,268 |
| | Nomura Real Estate Holdings Inc. | 214,919 | 5,240 |
| | NET One Systems Co. Ltd. | 158,856 | 5,209 |
| | COMSYS Holdings Corp. | 207,289 | 5,133 |
| | Yamada Denki Co. Ltd. | 1,341,817 | 5,127 |
| | Air Water Inc. | 332,214 | 5,083 |
| | Japan Hotel REIT Investment Corp. | 8,359 | 5,048 |
| | Toho Gas Co. Ltd. | 169,868 | 5,032 |
| | Nifco Inc. | 156,479 | 4,992 |
| | Aozora Bank Ltd. | 217,774 | 4,982 |
| | Mitsui Fudosan Logistics Park Inc. | 936 | 4,976 |
| | Ulvac Inc. | 88,146 | 4,945 |
| * | Japan Airport Terminal Co. Ltd. | 99,483 | 4,935 |
| | Cosmos Pharmaceutical Corp. | 32,163 | 4,915 |
| | Sumitomo Forestry Co. Ltd. | 257,270 | 4,914 |
| | Shinko Electric Industries Co. Ltd. | 121,000 | 4,875 |
| | Keihan Holdings Co. Ltd. | 184,635 | 4,857 |
| | Isetan Mitsukoshi Holdings Ltd. | 662,849 | 4,846 |
| | Nichirei Corp. | 198,020 | 4,823 |
| | Nippon Accommodations Fund Inc. | 862 | 4,808 |
| | Japan Logistics Fund Inc. | 1,604 | 4,798 |
| | Medipal Holdings Corp. | 265,157 | 4,797 |
| | Tokai Carbon Co. Ltd. | 365,743 | 4,784 |
| | Hino Motors Ltd. | 501,202 | 4,741 |
| | SCSK Corp. | 233,709 | 4,730 |
| | Sugi Holdings Co. Ltd. | 66,028 | 4,728 |
| | Taiheiyo Cement Corp. | 222,246 | 4,722 |
| | Pigeon Corp. | 203,382 | 4,710 |
| | Chugoku Electric Power Co. Inc. | 566,329 | 4,698 |
| | Horiba Ltd. | 71,595 | 4,694 |
| | Taisho Pharmaceutical Holdings Co. Ltd. | 86,378 | 4,635 |
| * | SHIFT Inc. | 20,000 | 4,612 |
| | Teijin Ltd. | 342,958 | 4,603 |
| | Hisamitsu Pharmaceutical Co. Inc. | 134,896 | 4,602 |
| | THK Co. Ltd. | 212,921 | 4,579 |
| | Mitsubishi Materials Corp. | 233,600 | 4,535 |
| | Zenkoku Hosho Co. Ltd. | 93,168 | 4,502 |
| | Alfresa Holdings Corp. | 318,613 | 4,491 |
| | Kenedix Office Investment Corp. | 702 | 4,445 |
FTSE All-World ex-US Index Fund
| | | Shares | Market
Value•
($000) |
| | Tokyo Ohka Kogyo Co. Ltd. | 69,578 | 4,423 |
| | Sumitomo Dainippon Pharma Co. Ltd. | 312,647 | 4,421 |
| 3 | Anritsu Corp. | 264,860 | 4,392 |
| | EXEO Group Inc. | 188,819 | 4,364 |
| * | Sansan Inc. | 37,562 | 4,364 |
| | Takara Holdings Inc. | 318,280 | 4,354 |
| | Morinaga Milk Industry Co. Ltd. | 74,237 | 4,351 |
| | Lawson Inc. | 89,558 | 4,331 |
| | Kewpie Corp. | 197,153 | 4,324 |
| * | Seibu Holdings Inc. | 394,808 | 4,313 |
| | Sharp Corp. | 365,490 | 4,311 |
| | Nihon Kohden Corp. | 134,920 | 4,293 |
| | J Front Retailing Co. Ltd. | 457,856 | 4,244 |
| | Sanwa Holdings Corp. | 361,372 | 4,215 |
| | Sankyu Inc. | 92,925 | 4,195 |
| | Electric Power Development Co. Ltd. | 317,206 | 4,193 |
| * | PeptiDream Inc. | 173,134 | 4,185 |
| | Konica Minolta Inc. | 840,862 | 4,162 |
| | Nankai Electric Railway Co. Ltd. | 207,838 | 4,125 |
| | Sumitomo Rubber Industries Ltd. | 332,743 | 4,101 |
| | Zensho Holdings Co. Ltd. | 177,428 | 4,098 |
| | Kadokawa Corp. | 77,100 | 4,071 |
| | Kaneka Corp. | 105,536 | 4,047 |
| | Relo Group Inc. | 193,806 | 4,031 |
| | Goldwin Inc. | 66,401 | 4,018 |
| | DIC Corp. | 150,930 | 3,996 |
| | Mori Hills REIT Investment Corp. | 2,934 | 3,978 |
| | House Foods Group Inc. | 135,082 | 3,876 |
| | Kinden Corp. | 235,440 | 3,864 |
| | Tsumura & Co. | 123,690 | 3,855 |
| | AEON REIT Investment Corp. | 2,851 | 3,854 |
| | Nippon Electric Glass Co. Ltd. | 150,779 | 3,850 |
| | Fancl Corp. | 126,247 | 3,828 |
| | Suzuken Co. Ltd. | 137,009 | 3,814 |
| | Alps Alpine Co. Ltd. | 385,307 | 3,765 |
| | JGC Holdings Corp. | 400,254 | 3,761 |
| | Kagome Co. Ltd. | 148,125 | 3,759 |
| 3 | Takeda Pharmaceutical Co. Ltd. ADR | 266,210 | 3,732 |
| | Ushio Inc. | 208,124 | 3,723 |
| | JTEKT Corp. | 418,264 | 3,702 |
| * | Mitsubishi Motors Corp. | 1,155,164 | 3,697 |
| | Ship Healthcare Holdings Inc. | 140,202 | 3,683 |
| | Kamigumi Co. Ltd. | 182,703 | 3,679 |
| * | RENOVA Inc. | 83,500 | 3,673 |
| | Coca-Cola Bottlers Japan Holdings Inc. | 264,504 | 3,640 |
| | | Shares | Market
Value•
($000) |
| | Penta-Ocean Construction Co. Ltd. | 526,697 | 3,629 |
| | SMS Co. Ltd. | 93,299 | 3,620 |
| | Daicel Corp. | 481,723 | 3,607 |
| | Mebuki Financial Group Inc. | 1,760,273 | 3,604 |
| | SHO-BOND Holdings Co. Ltd. | 85,757 | 3,592 |
| | Calbee Inc. | 139,195 | 3,586 |
| | Nishi-Nippon Railroad Co. Ltd. | 144,557 | 3,561 |
| | Justsystems Corp. | 68,537 | 3,542 |
| | Sundrug Co. Ltd. | 120,970 | 3,540 |
| | Internet Initiative Japan Inc. | 100,700 | 3,523 |
| | Credit Saison Co. Ltd. | 286,790 | 3,516 |
| | Yamazaki Baking Co. Ltd. | 230,470 | 3,501 |
| | Dowa Holdings Co. Ltd. | 83,714 | 3,496 |
| | Ube Industries Ltd. | 185,376 | 3,454 |
| | Ezaki Glico Co. Ltd. | 94,818 | 3,441 |
| | Menicon Co. Ltd. | 91,600 | 3,439 |
| | Shimamura Co. Ltd. | 40,267 | 3,410 |
| | Nihon Unisys Ltd. | 119,893 | 3,369 |
| | Nippo Corp. | 95,044 | 3,362 |
| | Aeon Mall Co. Ltd. | 228,172 | 3,343 |
| | Nagase & Co. Ltd. | 196,541 | 3,327 |
| | DMG Mori Co. Ltd. | 192,165 | 3,309 |
| | Yokohama Rubber Co. Ltd. | 194,563 | 3,292 |
| | Mitsubishi Logistics Corp. | 117,774 | 3,289 |
| | Daiwa Office Investment Corp. | 505 | 3,260 |
| | Toyo Seikan Group Holdings Ltd. | 271,938 | 3,229 |
| | Nippon Kayaku Co. Ltd. | 303,776 | 3,199 |
| | Zeon Corp. | 268,453 | 3,185 |
| | Seino Holdings Co. Ltd. | 262,126 | 3,176 |
| | Kobe Steel Ltd. | 540,467 | 3,175 |
| | INFRONEER Holdings Inc. | 383,045 | 3,173 |
| | Mabuchi Motor Co. Ltd. | 91,895 | 3,168 |
| | Sawai Group Holdings Co. Ltd. | 71,502 | 3,154 |
| | Toyo Tire Corp. | 188,458 | 3,134 |
| * | Park24 Co. Ltd. | 203,989 | 3,125 |
| | Nippon Shokubai Co. Ltd. | 59,700 | 3,119 |
| | Amano Corp. | 125,650 | 3,109 |
| | K's Holdings Corp | 300,533 | 3,102 |
| | GS Yuasa Corp. | 140,025 | 3,048 |
| | As One Corp. | 22,228 | 3,047 |
| | Hirogin Holdings Inc. | 552,484 | 3,044 |
| | Ain Holdings Inc. | 51,512 | 3,040 |
| | Aica Kogyo Co. Ltd. | 97,362 | 2,984 |
| | Pola Orbis Holdings Inc. | 138,870 | 2,965 |
| | Benesse Holdings Inc. | 127,209 | 2,910 |
| | GMO internet Inc. | 104,482 | 2,885 |
FTSE All-World ex-US Index Fund
| | | Shares | Market
Value•
($000) |
| | Rengo Co. Ltd. | 380,097 | 2,882 |
| | Sotetsu Holdings Inc. | 146,899 | 2,841 |
| | Mitsui Mining & Smelting Co. Ltd. | 98,745 | 2,834 |
| | Hachijuni Bank Ltd. | 843,977 | 2,821 |
| 3 | Kobe Bussan Co. Ltd. | 81,888 | 2,821 |
| | FP Corp. | 83,003 | 2,819 |
| | Toyoda Gosei Co. Ltd. | 136,020 | 2,783 |
| | AEON Financial Service Co. Ltd. | 216,174 | 2,747 |
| | Toda Corp. | 435,959 | 2,746 |
| | Sumitomo Bakelite Co. Ltd. | 59,679 | 2,682 |
| | JCR Pharmaceuticals Co. Ltd. | 106,316 | 2,609 |
| | Daio Paper Corp. | 147,800 | 2,601 |
| | OKUMA Corp. | 53,863 | 2,567 |
| | PALTAC Corp. | 57,260 | 2,535 |
| | Daiichikosho Co. Ltd. | 69,533 | 2,525 |
| | Maruichi Steel Tube Ltd. | 111,141 | 2,525 |
| | Kaken Pharmaceutical Co. Ltd. | 63,744 | 2,514 |
| | OBIC Business Consultants Co. Ltd. | 50,791 | 2,507 |
| | Furukawa Electric Co. Ltd. | 114,274 | 2,500 |
| | Fujitsu General Ltd. | 101,947 | 2,500 |
| | Morinaga & Co. Ltd. | 70,546 | 2,493 |
| | NOK Corp. | 214,539 | 2,490 |
| | Daido Steel Co. Ltd. | 64,755 | 2,481 |
| | Seven Bank Ltd. | 1,168,881 | 2,471 |
| | Sapporo Holdings Ltd. | 113,119 | 2,454 |
| | Cosmo Energy Holdings Co. Ltd. | 119,639 | 2,446 |
| | TS Tech Co. Ltd. | 182,636 | 2,444 |
| | Iyo Bank Ltd. | 494,894 | 2,421 |
| | Takashimaya Co. Ltd. | 261,126 | 2,418 |
| | Yaoko Co. Ltd. | 40,601 | 2,417 |
| | Hitachi Transport System Ltd. | 61,046 | 2,405 |
| | Yamaguchi Financial Group Inc. | 430,157 | 2,401 |
| | Acom Co. Ltd. | 715,917 | 2,388 |
| | Kyushu Financial Group Inc. | 707,376 | 2,382 |
| | OSG Corp. | 142,740 | 2,375 |
| | Takara Bio Inc. | 90,361 | 2,358 |
| | Kyudenko Corp. | 74,261 | 2,356 |
| | H.U. Group Holdings Inc. | 93,884 | 2,315 |
| | Kokuyo Co. Ltd. | 151,713 | 2,309 |
| | Kotobuki Spirits Co. Ltd. | 34,437 | 2,303 |
| | Fuyo General Lease Co. Ltd. | 35,134 | 2,283 |
| | Fukuyama Transporting Co. Ltd. | 56,372 | 2,246 |
| | Chugoku Bank Ltd. | 307,772 | 2,233 |
| | | Shares | Market
Value•
($000) |
| | Bic Camera Inc. | 258,089 | 2,226 |
| | Tokuyama Corp. | 129,882 | 2,224 |
| | Izumi Co. Ltd. | 73,328 | 2,223 |
| | Resorttrust Inc. | 122,599 | 2,173 |
| | ABC-Mart Inc. | 45,121 | 2,169 |
| | Nipro Corp. | 213,366 | 2,168 |
| | NHK Spring Co. Ltd. | 287,086 | 2,166 |
| | Ariake Japan Co. Ltd. | 32,634 | 2,125 |
| | Sankyo Co. Ltd. | 87,460 | 2,123 |
| | Toyota Boshoku Corp. | 110,265 | 2,120 |
| | Yamato Kogyo Co. Ltd. | 62,415 | 2,093 |
| | NEC Networks & System Integration Corp. | ��� 125,156 | 2,014 |
| | Fuji Oil Holdings Inc. | 85,774 | 2,013 |
| | Lintec Corp. | 89,795 | 2,005 |
| | Kusuri no Aoki Holdings Co. Ltd. | 30,090 | 2,003 |
| * | Shochiku Co. Ltd. | 17,796 | 1,936 |
| | Heiwa Corp. | 108,359 | 1,932 |
| | Mani Inc. | 112,938 | 1,925 |
| | NS Solutions Corp. | 55,976 | 1,882 |
| | Shikoku Electric Power Co. Inc. | 285,887 | 1,862 |
| | DeNA Co. Ltd. | 98,082 | 1,812 |
| | Toshiba TEC Corp. | 45,561 | 1,794 |
| | Fuji Kyuko Co. Ltd. | 41,300 | 1,664 |
| | Canon Marketing Japan Inc. | 83,118 | 1,647 |
| | Kandenko Co. Ltd. | 203,463 | 1,577 |
| | GungHo Online Entertainment Inc. | 82,975 | 1,557 |
| | Orient Corp. | 1,080,348 | 1,483 |
| | IR Japan Holdings Ltd. | 15,900 | 1,466 |
| | Information Services International-Dentsu Ltd. | 41,600 | 1,455 |
| | Itoham Yonekyu Holdings Inc. | 234,117 | 1,428 |
| | Japan Aviation Electronics Industry Ltd. | 82,881 | 1,374 |
| | Matsui Securities Co. Ltd. | 183,121 | 1,314 |
| | Elecom Co. Ltd. | 85,724 | 1,311 |
| | Noevir Holdings Co. Ltd. | 26,388 | 1,291 |
| | Tokai Rika Co. Ltd. | 89,984 | 1,260 |
| | Ichigo Inc. | 367,255 | 1,099 |
| | ASKUL Corp. | 73,422 | 997 |
| | Maruwa Unyu Kikan Co. Ltd. | 71,100 | 996 |
| | TBS Holdings Inc. | 52,717 | 834 |
| | Fuji Media Holdings Inc. | 63,709 | 660 |
| | Mitsubishi Shokuhin Co. Ltd. | 24,011 | 618 |
| | TV Asahi Holdings Corp. | 24,883 | 378 |
| | Nippon Television Holdings Inc. | 29,651 | 319 |
| | | | 8,457,736 |
FTSE All-World ex-US Index Fund
| | | Shares | Market
Value•
($000) |
| Kuwait (0.2%) |
| | National Bank of Kuwait SAKP | 12,862,028 | 42,291 |
| | Kuwait Finance House KSCP | 8,225,555 | 22,734 |
| | Mobile Telecommunications Co. KSCP | 4,015,407 | 7,952 |
| | Agility Public Warehousing Co. KSC | 2,294,963 | 7,627 |
| * | Boubyan Bank KSCP | 1,798,012 | 4,668 |
| | Mabanee Co. KPSC | 1,037,703 | 2,712 |
| | Gulf Bank KSCP | 3,139,268 | 2,566 |
| | Boubyan Petrochemicals Co. KSCP | 695,924 | 2,124 |
| | Humansoft Holding Co. KSC | 177,747 | 1,971 |
| | Burgan Bank SAK | 1,388,505 | 1,098 |
| | | | 95,743 |
| Malaysia (0.5%) |
| | Public Bank Bhd. | 28,981,295 | 29,197 |
| | Malayan Banking Bhd. | 11,261,400 | 21,905 |
| | Tenaga Nasional Bhd. | 7,310,900 | 17,055 |
| | CIMB Group Holdings Bhd. | 13,054,473 | 16,471 |
| | Petronas Chemicals Group Bhd. | 5,331,568 | 11,195 |
| | Press Metal Aluminium Holdings Bhd. | 7,130,400 | 9,584 |
| | Ihh Healthcare Bhd. | 5,577,200 | 8,805 |
| | Axiata Group Bhd. | 8,347,324 | 7,976 |
| | DiGi.Com Bhd. | 6,831,066 | 6,991 |
| | Sime Darby Plantation Bhd. | 6,724,405 | 6,520 |
| | Top Glove Corp. Bhd. | 9,922,200 | 6,516 |
| | Dialog Group Bhd. | 8,580,000 | 5,867 |
| | Maxis Bhd. | 5,129,600 | 5,790 |
| | IOI Corp. Bhd. | 5,979,265 | 5,674 |
| | PPB Group Bhd. | 1,259,760 | 5,530 |
| | MISC Bhd. | 3,171,035 | 5,424 |
| | Hong Leong Bank Bhd. | 1,185,700 | 5,390 |
| | Genting Bhd. | 4,227,200 | 5,291 |
| | Kuala Lumpur Kepong Bhd. | 885,300 | 4,626 |
| | Petronas Gas | 1,077,950 | 4,361 |
| | Genting Malaysia Bhd. | 5,256,500 | 4,028 |
| | Hartalega Holdings Bhd. | 2,808,200 | 3,981 |
| | RHB Bank Bhd. | 2,896,200 | 3,908 |
| | Nestle Malaysia Bhd. | 117,200 | 3,808 |
| | Sime Darby Bhd. | 6,507,705 | 3,572 |
| | Petronas Dagangan Bhd. | 659,600 | 3,243 |
| * | Gamuda Bhd. | 4,103,000 | 3,213 |
| * | AMMB Holdings Bhd. | 3,890,600 | 3,157 |
| | Telekom Malaysia Bhd. | 2,082,957 | 2,912 |
| | IJM Corp. Bhd. | 5,897,740 | 2,641 |
| | | Shares | Market
Value•
($000) |
| * | Malaysia Airports Holdings Bhd. | 1,665,700 | 2,605 |
| | QL Resources Bhd. | 2,053,100 | 2,506 |
| | HAP Seng Consolidated Bhd. | 1,211,400 | 2,295 |
| | Westports Holdings Bhd. | 1,912,696 | 2,065 |
| | Hong Leong Financial Group Bhd. | 411,035 | 1,821 |
| 2 | MR DIY Group M Bhd | 1,829,300 | 1,667 |
| | Supermax Corporation Bhd. | 2,917,900 | 1,352 |
| | YTL Corp. Bhd. | 8,426,924 | 1,283 |
| | Alliance Bank Malaysia Bhd. | 1,902,000 | 1,263 |
| | Fraser & Neave Holdings Bhd. | 184,700 | 1,209 |
| | British American Tobacco Malaysia Bhd. | 310,300 | 1,133 |
| | Sime Darby Property Bhd. | 6,255,305 | 1,096 |
| | IOI Properties Group Bhd. | 3,387,500 | 1,049 |
| * | AirAsia Group Bhd. | 2,772,300 | 778 |
| | Astro Malaysia Holdings Bhd. | 2,650,368 | 638 |
| | FGV Holdings Bhd. | 1,008,700 | 366 |
| | | | 247,757 |
| Mexico (0.6%) |
| | America Movil SAB de CV Series L | 56,004,293 | 49,916 |
| | Grupo Financiero Banorte SAB de CV Class O | 5,454,318 | 34,533 |
| | Wal-Mart de Mexico SAB de CV | 9,771,997 | 34,084 |
| | Fomento Economico Mexicano SAB de CV | 3,456,527 | 28,417 |
| | Grupo Mexico SAB de CV Series B | 5,964,233 | 26,165 |
| | Grupo Bimbo SAB de CV Series A | 4,259,040 | 12,607 |
| * | Cemex SAB de CV | 14,154,677 | 9,103 |
| | Grupo Televisa SAB | 4,481,761 | 9,099 |
| | Grupo Elektra SAB de CV | 118,387 | 9,091 |
| * | Cemex SAB de CV ADR | 1,388,666 | 8,929 |
| | Grupo Aeroportuario del Pacifico SAB de CV Class B | 686,127 | 8,649 |
| | Grupo Aeroportuario del Sureste SAB de CV Class B | 370,920 | 7,480 |
| | Fibra Uno Administracion SA | 5,694,689 | 5,659 |
| | Coca-Cola Femsa SAB de CV | 979,324 | 5,278 |
| | Arca Continental SAB de CV | 814,883 | 4,969 |
| | Orbia Advance Corp. SAB de CV | 1,884,179 | 4,897 |
| | Gruma SAB de CV Class B | 385,286 | 4,524 |
FTSE All-World ex-US Index Fund
| | | Shares | Market
Value•
($000) |
| * | Grupo Financiero Inbursa SAB de CV Class O | 3,854,203 | 3,870 |
| | Alfa SAB de CV Class A | 4,675,775 | 3,386 |
| | Promotora y Operadora de Infraestructura SAB de CV | 447,407 | 3,290 |
| * | Grupo Aeroportuario del Centro Norte SAB de CV Class B | 537,412 | 3,243 |
| * | Controladora Vuela Cia de Aviacion SAB de CV Class A | 1,697,000 | 3,087 |
| * | Industrias Penoles SAB de CV | 237,866 | 3,050 |
| | Grupo Carso SAB de CV | 824,945 | 2,775 |
| | Kimberly-Clark de Mexico SAB de CV Class A | 1,544,226 | 2,443 |
| 2 | Banco del Bajio SA | 1,271,900 | 2,388 |
| | Becle SAB de CV | 991,059 | 2,265 |
| | GCC SAB de CV | 294,800 | 2,193 |
| | Telesites SAB de CV | 2,284,944 | 2,084 |
| | Megacable Holdings SAB de CV | 543,295 | 1,601 |
| | El Puerto de Liverpool SAB de CV Class C1 | 356,795 | 1,579 |
| | Qualitas Controladora SAB de CV | 296,549 | 1,374 |
| | Banco Santander Mexico SA Institucion de Banca Multiple Grupo Financiero Santand | 1,037,125 | 1,321 |
| | Industrias Bachoco SAB de CV Class B | 290,320 | 1,030 |
| | Alpek SAB de CV | 672,231 | 736 |
| | Concentradora Fibra Danhos SA de CV | 427,414 | 516 |
| | | | 305,631 |
| Netherlands (3.2%) |
| | ASML Holding NV | 743,898 | 604,715 |
| *,2 | Adyen NV | 54,308 | 163,864 |
| | Prosus NV | 1,656,995 | 145,953 |
| | ING Groep NV | 7,342,705 | 111,381 |
| | Koninklijke Philips NV | 1,703,245 | 80,351 |
| | Koninklijke DSM NV | 312,129 | 68,193 |
| | Koninklijke Ahold Delhaize NV | 1,843,113 | 59,961 |
| | Wolters Kluwer NV | 493,800 | 51,710 |
| | Heineken NV | 444,201 | 49,168 |
| | ASM International NV | 90,238 | 40,840 |
| 3 | Universal Music Group NV | 1,395,829 | 40,525 |
| | ArcelorMittal SA | 1,195,604 | 40,436 |
| | Akzo Nobel NV | 350,400 | 40,267 |
| | NN Group NV | 581,750 | 31,098 |
| | | Shares | Market
Value•
($000) |
| *,2 | Just Eat Takeaway.com NV | 340,538 | 24,463 |
| | IMCD NV | 107,584 | 23,888 |
| | Koninklijke KPN NV | 6,223,934 | 18,597 |
| * | Unibail-Rodamco-Westfield | 254,336 | 18,161 |
| | Heineken Holding NV | 194,865 | 18,059 |
| | Aegon NV | 3,329,704 | 16,889 |
| | Randstad NV | 208,174 | 14,957 |
| | ASR Nederland NV | 257,999 | 12,060 |
| | BE Semiconductor Industries NV | 130,582 | 11,931 |
| 2 | Signify NV | 239,372 | 11,599 |
| 2 | ABN AMRO Bank NV GDR | 767,568 | 11,289 |
| | Aalberts NV | 179,082 | 9,912 |
| * | InPost SA | 373,204 | 5,329 |
| * | Galapagos NV | 92,253 | 4,892 |
| | Koninklijke Vopak NV | 122,908 | 4,891 |
| | JDE Peet's NV | 154,977 | 4,513 |
| *,2 | GrandVision NV | 88,648 | 2,909 |
| 2 | CTP NV | 113,512 | 2,411 |
| | | | 1,745,212 |
| New Zealand (0.2%) |
| | Fisher & Paykel Healthcare Corp. Ltd. | 1,071,607 | 24,008 |
| * | Auckland International Airport Ltd. | 2,229,050 | 12,777 |
| | Spark New Zealand Ltd. | 3,525,456 | 11,541 |
| | Mainfreight Ltd. | 150,565 | 9,703 |
| | Contact Energy Ltd. | 1,448,367 | 8,499 |
| | Meridian Energy Ltd. | 2,345,322 | 8,402 |
| | Ryman Healthcare Ltd. | 768,750 | 7,956 |
| | Fletcher Building Ltd. | 1,519,496 | 7,815 |
| *,3 | a2 Milk Co. Ltd. | 1,394,329 | 6,568 |
| | Infratil Ltd. | 952,813 | 5,653 |
| | Mercury NZ Ltd. | 1,256,170 | 5,524 |
| | SKYCITY Entertainment Group Ltd. | 1,401,360 | 3,213 |
| | Kiwi Property Group Ltd. | 2,902,346 | 2,434 |
| * | Air New Zealand Ltd. | 898,196 | 1,076 |
| | | | 115,169 |
| Norway (0.5%) |
| | DNB Bank ASA | 1,933,309 | 46,006 |
| | Equinor ASA | 1,813,997 | 45,964 |
| | Mowi ASA | 836,617 | 24,259 |
| | Telenor ASA | 1,200,618 | 18,970 |
| | Norsk Hydro ASA | 2,542,458 | 18,676 |
| | Yara International ASA | 310,598 | 16,233 |
| | TOMRA Systems ASA | 219,742 | 14,202 |
| | Orkla ASA | 1,445,530 | 14,060 |
| | Schibsted ASA Class B | 186,528 | 8,461 |
| | Salmar ASA | 102,366 | 7,810 |
| * | Adevinta ASA | 471,978 | 7,796 |
FTSE All-World ex-US Index Fund
| | | Shares | Market
Value•
($000) |
| | Gjensidige Forsikring ASA | 310,472 | 7,730 |
| | Aker BP ASA | 201,281 | 7,723 |
| | Schibsted ASA Class A | 140,880 | 7,279 |
| 2 | Scatec ASA | 227,559 | 4,489 |
| | Leroy Seafood Group ASA | 490,892 | 4,463 |
| | Aker ASA Class A | 43,707 | 4,028 |
| | | | 258,149 |
| Pakistan (0.0%) |
| | Habib Bank Ltd. | 1,334,725 | 984 |
| | Fauji Fertilizer Co. Ltd. | 1,224,622 | 736 |
| | Oil & Gas Development Co. Ltd. | 1,091,603 | 543 |
| | Pakistan Petroleum Ltd. | 1,225,773 | 543 |
| | | | 2,806 |
| Philippines (0.2%) |
| | SM Investments Corp. | 912,935 | 17,482 |
| | SM Prime Holdings Inc. | 17,143,523 | 11,277 |
| | Ayala Land Inc. | 15,070,101 | 10,496 |
| | Ayala Corp. | 612,447 | 10,495 |
| | Bdo Unibank Inc. | 3,723,421 | 9,164 |
| | International Container Terminal Services Inc. | 2,036,325 | 7,270 |
| | JG Summit Holdings Inc. | 5,707,560 | 6,816 |
| | Bank of The Philippine Islands | 3,288,588 | 5,674 |
| | PLDT Inc. | 170,286 | 5,563 |
| | Universal Robina Corp. | 1,693,379 | 4,643 |
| | Jollibee Foods Corp. | 772,268 | 3,604 |
| | Globe Telecom Inc. | 53,992 | 3,207 |
| | Metropolitan Bank & Trust Co. | 3,338,056 | 3,157 |
| | Manila Electric Co. | 492,458 | 2,806 |
| | GT Capital Holdings Inc. | 183,938 | 2,064 |
| | Metro Pacific Investments Corp. | 25,464,466 | 1,896 |
| | San Miguel Food and Beverage Inc. | 1,191,868 | 1,796 |
| | Aboitiz Power Corp. | 2,776,111 | 1,772 |
| | San Miguel Corp. | 683,885 | 1,584 |
| | Puregold Price Club Inc. | 1,786,292 | 1,497 |
| | Alliance Global Group Inc. | 6,926,348 | 1,431 |
| | Megaworld Corp. | 20,633,985 | 1,257 |
| | DMCI Holdings Inc. | 7,714,378 | 1,215 |
| | Semirara Mining & Power Corp. Class A | 2,283,100 | 1,177 |
| | LT Group Inc. | 5,394,616 | 1,077 |
| * | Bloomberry Resorts Corp. | 5,731,041 | 773 |
| | | | 119,193 |
| | | Shares | Market
Value•
($000) |
| Poland (0.2%) |
| * | Powszechna Kasa Oszczednosci Bank Polski SA | 1,610,966 | 19,724 |
| | Polski Koncern Naftowy ORLEN SA | 588,096 | 12,683 |
| | Powszechny Zaklad Ubezpieczen SA | 1,057,243 | 10,578 |
| | KGHM Polska Miedz SA | 257,626 | 9,906 |
| | Bank Polska Kasa Opieki SA | 294,931 | 9,745 |
| *,2 | Allegro.eu SA | 730,437 | 8,269 |
| *,2 | Dino Polska SA | 91,396 | 8,169 |
| | LPP SA | 2,097 | 7,545 |
| 3 | CD Projekt SA | 125,351 | 5,472 |
| | Santander Bank Polska SA | 54,880 | 5,105 |
| | Polskie Gornictwo Naftowe i Gazownictwo SA | 3,242,665 | 4,889 |
| | Cyfrowy Polsat SA | 491,207 | 4,393 |
| | | | 106,478 |
| Portugal (0.1%) |
| | EDP - Energias de Portugal SA | 5,290,524 | 29,853 |
| | EDP Renovaveis SA | 454,639 | 12,661 |
| | Jeronimo Martins SGPS SA | 455,072 | 10,309 |
| | Galp Energia SGPS SA | 951,375 | 9,883 |
| | | | 62,706 |
| Qatar (0.2%) |
| | Qatar National Bank QPSC | 8,293,069 | 46,727 |
| | Industries Qatar QSC | 2,950,094 | 12,854 |
| | Qatar Islamic Bank SAQ | 2,165,904 | 10,966 |
| | Masraf Al Rayan QSC | 6,903,361 | 9,050 |
| | Commercial Bank PSQC | 3,671,345 | 6,173 |
| | Mesaieed Petrochemical Holding Co. | 8,177,994 | 5,403 |
| | Qatar Fuel QSC | 909,323 | 4,594 |
| | Qatar Gas Transport Co. Ltd. | 5,098,664 | 4,560 |
| | Qatar Electricity & Water Co. QSC | 857,025 | 3,961 |
| | Qatar International Islamic Bank QSC | 1,388,909 | 3,734 |
| | Barwa Real Estate Co. | 3,500,850 | 3,035 |
| | Ooredoo QPSC | 1,521,618 | 2,897 |
| | Qatar Aluminum Manufacturing Co. | 5,076,011 | 2,651 |
| | Doha Bank QPSC | 2,785,438 | 2,205 |
| * | Qatar Insurance Co. SAQ | 2,941,486 | 1,985 |
| | United Development Co. QSC | 3,232,226 | 1,382 |
| | Vodafone Qatar QSC | 2,870,458 | 1,277 |
FTSE All-World ex-US Index Fund
| | | Shares | Market
Value•
($000) |
| * | Ezdan Holding Group QSC | 2,852,201 | 1,213 |
| | | | 124,667 |
| Romania (0.0%) |
| | Banca Transilvania SA | 9,457,531 | 5,551 |
| | OMV Petrom SA | 21,385,534 | 2,465 |
| | | | 8,016 |
| Russia (0.9%) |
| | Sberbank of Russia PJSC | 14,814,226 | 74,527 |
| | Gazprom PJSC ADR | 6,827,148 | 66,994 |
| | LUKOIL PJSC ADR | 509,946 | 51,979 |
| | Novatek PJSC | 1,997,552 | 50,721 |
| | Gazprom PJSC | 6,049,997 | 29,810 |
| | MMC Norilsk Nickel PJSC ADR | 724,348 | 22,637 |
| | Sberbank of Russia PJSC ADR (XLON) | 1,096,646 | 22,021 |
| | Lukoil PJSC | 208,760 | 21,304 |
| | Tatneft PJSC ADR | 403,718 | 18,463 |
| | Rosneft Oil Co. PJSC (Registered) GDR | 1,744,072 | 15,527 |
| * | Alrosa PJSC | 4,629,100 | 8,173 |
| | Polyus PJSC (Registered) GDR | 78,591 | 7,770 |
| | Surgutneftegas PJSC Preference Shares | 13,658,100 | 7,440 |
| | Magnit PJSC GDR (Registered) | 375,829 | 6,963 |
| * | Novolipetskiy Metallurgicheskiy Kombinat PJSC | 2,190,647 | 6,915 |
| | MMC Norilsk Nickel PJSC | 21,938 | 6,848 |
| | Severstal PAO GDR (Registered) | 297,905 | 6,810 |
| * | Moscow Exchange MICEX-RTS PJSC | 2,697,004 | 6,620 |
| | Transneft PJSC Preference Shares | 2,923 | 6,273 |
| | Magnit PJSC | 60,106 | 5,485 |
| | Surgutneftegas PJSC ADR | 1,031,634 | 4,928 |
| * | United Co. Rusal International | 4,778,250 | 4,854 |
| | Mobile TeleSystems PJSC | 1,080,542 | 4,735 |
| * | Inter Rao Ues PJSC | 66,599,900 | 4,515 |
| | VTB Bank PJSC | 5,529,218,867 | 4,130 |
| | PhosAgro PJSC GDR (Registered) | 162,313 | 3,883 |
| | Rosneft Oil Co. PJSC | 414,750 | 3,726 |
| * | Magnitogorsk Iron & Steel Works PJSC | 3,955,368 | 3,696 |
| | Tatneft PJSC | 470,953 | 3,599 |
| | VTB Bank PJSC GDR (Registered) | 1,904,444 | 2,768 |
| | Mobile TeleSystems PJSC ADR | 273,284 | 2,512 |
| * | RusHydro PJSC | 217,254,634 | 2,493 |
| * | Polyus PJSC | 12,097 | 2,397 |
| * | Credit Bank of Moscow PJSC | 22,920,900 | 2,313 |
| | | Shares | Market
Value•
($000) |
| | Surgutneftegas PJSC | 3,872,600 | 1,863 |
| * | Aeroflot PJSC | 1,875,381 | 1,820 |
| | Rostelecom PJSC | 1,223,758 | 1,609 |
| | Sistema PJSFC GDR (Registered) | 185,097 | 1,404 |
| * | Federal Grid Co. | 489,926,667 | 1,282 |
| | Severstal PAO PJSC | 56,174 | 1,277 |
| * | Tatneft PJSC Preference Shares | 155,400 | 1,070 |
| | ROSSETI PJSC | 54,338,896 | 1,068 |
| | PhosAgro PJSC | 12,205 | 965 |
| | Unipro PJSC | 22,147,100 | 853 |
| | Sovcomflot PJSC | 702,230 | 844 |
| | Rostelecom PJSC ADR | 98,835 | 800 |
| | Raspadskaya OJSC | 120,950 | 736 |
| * | M Video PJSC | 79,232 | 659 |
| | Bashneft PJSC Preference Shares | 37,751 | 609 |
| | Sistema PJSFC | 1,475,900 | 562 |
| * | Mosenergo PJSC | 17,082,000 | 541 |
| | Sberbank of Russia PJSC ADR | 2,249 | 45 |
| | | | 511,836 |
| Saudi Arabia (1.0%) |
| | Al Rajhi Bank | 2,300,280 | 85,095 |
| | Saudi National Bank | 4,122,716 | 72,373 |
| 2 | Saudi Arabian Oil Co. | 4,762,032 | 47,941 |
| | Saudi Basic Industries Corp. | 1,268,156 | 43,709 |
| | Saudi Telecom Co. | 900,078 | 28,117 |
| | Riyad Bank | 2,295,455 | 18,072 |
| * | Saudi Arabian Mining Co. | 758,087 | 16,528 |
| | SABIC Agri-Nutrients Co. | 353,743 | 15,521 |
| | Saudi British Bank | 1,663,190 | 14,698 |
| | Banque Saudi Fransi | 1,093,185 | 12,305 |
| | Alinma Bank | 1,826,229 | 12,262 |
| | Saudi Electricity Co. | 1,456,954 | 11,084 |
| | Yanbu National Petrochemical Co. | 417,816 | 8,490 |
| | Sahara International Petrochemical Co. | 667,155 | 7,834 |
| * | Bank AlBilad | 684,164 | 7,706 |
| | Dr Sulaiman Al Habib Medical Services Group Co. | 171,391 | 7,582 |
| * | Saudi Kayan Petrochemical Co. | 1,369,411 | 7,455 |
| | Arab National Bank | 1,096,650 | 6,738 |
| | Almarai Co. JSC | 470,111 | 6,629 |
| | Jarir Marketing Co. | 109,237 | 5,907 |
| | Etihad Etisalat Co. | 698,773 | 5,634 |
| | Savola Group | 494,392 | 4,823 |
| | Saudi Industrial Investment Group | 415,088 | 4,195 |
| | Bupa Arabia for Cooperative Insurance Co. | 106,919 | 4,127 |
| * | National Industrialization Co. | 619,085 | 4,121 |
| | Advanced Petrochemical Co. | 196,794 | 3,911 |
FTSE All-World ex-US Index Fund
| | | Shares | Market
Value•
($000) |
| | Bank Al-Jazira | 747,116 | 3,830 |
| | Mouwasat Medical Services Co. | 79,594 | 3,826 |
| * | Rabigh Refining & Petrochemical Co. | 403,788 | 3,079 |
| * | Mobile Telecommunications Co. Saudi Arabia | 802,957 | 2,906 |
| | National Petrochemical Co. | 224,620 | 2,887 |
| * | Saudi Research & Media Group | 59,831 | 2,696 |
| | Co. for Cooperative Insurance | 117,189 | 2,690 |
| * | International Co. For Water & Power Projects | 137,420 | 2,616 |
| | Abdullah Al Othaim Markets Co. | 83,806 | 2,583 |
| * | Dar Al Arkan Real Estate Development Co. | 958,674 | 2,530 |
| * | Emaar Economic City | 747,704 | 2,529 |
| | Southern Province Cement Co. | 130,766 | 2,495 |
| | Saudi Cement Co. | 142,346 | 2,248 |
| * | Arabian Internet & Communications Services Co. | 40,495 | 2,153 |
| | Arabian Centres Co. Ltd. | 291,544 | 1,985 |
| | United Electronics Co. | 52,211 | 1,961 |
| * | Saudi Airlines Catering Co. | 73,497 | 1,863 |
| | Qassim Cement Co. | 85,482 | 1,858 |
| * | Seera Group Holding | 286,115 | 1,765 |
| * | Saudi Ground Services Co. | 167,883 | 1,668 |
| | BinDawood Holding Co. | 55,209 | 1,535 |
| | Yanbu Cement Co. | 140,916 | 1,441 |
| | Dallah Healthcare Co. | 68,824 | 1,333 |
| * | Yamama Cement Co. | 178,947 | 1,321 |
| | Saudi Pharmaceutical Industries & Medical Appliances Corp. | 109,914 | 1,257 |
| | Saudia Dairy & Foodstuff Co. | 28,269 | 1,238 |
| * | Fawaz Abdulaziz Al Hokair & Co. | 131,570 | 675 |
| | | | 521,825 |
| Singapore (0.8%) |
| | DBS Group Holdings Ltd. | 3,404,334 | 79,552 |
| | Oversea-Chinese Banking Corp. Ltd. | 6,609,202 | 57,777 |
| | United Overseas Bank Ltd. | 2,439,512 | 48,493 |
| | Singapore Telecommunications Ltd. | 14,265,830 | 26,467 |
| | | Shares | Market
Value•
($000) |
| | CapitaLand Integrated Commercial Trust | 9,109,080 | 14,506 |
| | Ascendas REIT | 6,325,241 | 14,488 |
| | Wilmar International Ltd. | 4,012,418 | 12,828 |
| * | Capitaland Investment Ltd. | 4,878,528 | 12,445 |
| | Singapore Exchange Ltd. | 1,569,866 | 11,266 |
| | Keppel Corp. Ltd. | 2,685,632 | 10,717 |
| * | Singapore Airlines Ltd. | 2,368,356 | 9,123 |
| | Singapore Technologies Engineering Ltd. | 3,009,593 | 8,547 |
| | Mapletree Logistics Trust | 5,347,038 | 8,018 |
| | Venture Corp. Ltd. | 557,882 | 7,793 |
| | Mapletree Industrial Trust | 3,582,442 | 7,313 |
| | Mapletree Commercial Trust | 4,070,503 | 6,584 |
| | Genting Singapore Ltd. | 11,182,390 | 6,466 |
| | Frasers Logistics & Commercial Trust | 5,137,934 | 5,785 |
| | UOL Group Ltd. | 919,618 | 4,932 |
| | City Developments Ltd. | 875,191 | 4,751 |
| | ComfortDelGro Corp. Ltd. | 3,817,391 | 4,424 |
| 1 | Singapore Press Holdings Ltd. | 2,937,937 | 4,350 |
| | Suntec REIT | 3,857,366 | 4,271 |
| | Keppel DC REIT | 2,344,374 | 4,151 |
| | NetLink NBN Trust | 5,470,216 | 4,136 |
| * | SATS Ltd. | 1,173,517 | 3,650 |
| | Keppel REIT | 3,911,868 | 3,274 |
| | Mapletree North Asia Commercial Trust | 4,247,776 | 3,219 |
| | Jardine Cycle & Carriage Ltd. | 186,188 | 3,113 |
| | Ascott Residence Trust | 3,302,191 | 2,525 |
| | Sembcorp Industries Ltd. | 1,650,902 | 2,464 |
| | Golden Agri-Resources Ltd. | 11,662,820 | 2,287 |
| | Hutchison Port Holdings Trust Class U | 9,409,363 | 2,027 |
| * | Sembcorp Marine Ltd. | 33,387,765 | 1,957 |
| | Olam International Ltd. | 1,367,913 | 1,724 |
| | Singapore Post Ltd. | 2,762,252 | 1,343 |
| | Wing Tai Holdings Ltd. | 633,998 | 912 |
| | StarHub Ltd. | 972,097 | 894 |
| * | SIA Engineering Co. Ltd. | 402,016 | 647 |
| | | | 409,219 |
FTSE All-World ex-US Index Fund
| | | Shares | Market
Value•
($000) |
| South Africa (0.9%) |
| | Naspers Ltd. Class N | 397,546 | 67,326 |
| | FirstRand Ltd. | 9,225,321 | 35,044 |
| * | MTN Group Ltd. | 3,378,546 | 30,296 |
| | Standard Bank Group Ltd. | 2,419,247 | 21,438 |
| | Impala Platinum Holdings Ltd. | 1,523,180 | 19,714 |
| | Sibanye Stillwater Ltd. | 5,446,294 | 19,061 |
| * | Sasol Ltd. | 1,048,465 | 17,610 |
| | Capitec Bank Holdings Ltd. | 156,929 | 17,532 |
| | Gold Fields Ltd. | 1,643,270 | 15,270 |
| | Anglogold Ltd. | 787,067 | 14,520 |
| | Bid Corp. Ltd. | 632,543 | 13,557 |
| | Sanlam Ltd. | 3,300,016 | 13,555 |
| | Absa Group Ltd. | 1,322,157 | 12,095 |
| | Aspen Pharmacare Holdings Ltd. | 722,511 | 11,478 |
| | Anglo American Platinum Ltd. | 111,615 | 11,309 |
| | Shoprite Holdings Ltd. | 930,215 | 11,041 |
| * | Northam Platinum Holdings Ltd. | 652,648 | 9,774 |
| | Vodacom Group Ltd. | 1,094,360 | 9,690 |
| | Clicks Group Ltd. | 469,782 | 8,591 |
| | Remgro Ltd. | 973,913 | 8,587 |
| 3 | Bidvest Group Ltd. | 642,306 | 8,042 |
| | Old Mutual Ltd. | 7,981,512 | 7,861 |
| 3 | Nedbank Group Ltd. | 671,586 | 7,653 |
| * | Discovery Ltd. | 759,572 | 6,969 |
| | Multichoice Group | 806,810 | 6,416 |
| | Mr Price Group Ltd. | 482,805 | 6,301 |
| | Woolworths Holdings Ltd. | 1,676,557 | 5,902 |
| | Growthpoint Properties Ltd. | 6,477,329 | 5,482 |
| | Exxaro Resources Ltd. | 463,363 | 5,084 |
| * | Foschini Group Ltd. | 594,247 | 5,039 |
| | Reinet Investments SCA | 263,731 | 4,767 |
| | SPAR Group Ltd. | 361,469 | 4,615 |
| *,2 | Pepkor Holdings Ltd. | 2,897,083 | 4,568 |
| | Tiger Brands Ltd. | 319,514 | 4,045 |
| * | Life Healthcare Group Holdings Ltd. | 2,520,449 | 3,991 |
| 3 | Rand Merchant Investment Holdings Ltd. | 1,412,089 | 3,778 |
| | Harmony Gold Mining Co. Ltd. | 986,495 | 3,541 |
| * | Sappi Ltd. | 1,045,582 | 3,212 |
| 3 | AVI Ltd. | 618,917 | 3,207 |
| | Kumba Iron Ore Ltd. | 100,511 | 3,059 |
| * | Redefine Properties Ltd. | 10,309,981 | 3,040 |
| | Barloworld Ltd. | 353,454 | 2,968 |
| * | Netcare Ltd. | 2,662,354 | 2,947 |
| | Truworths International Ltd. | 765,279 | 2,698 |
| | African Rainbow Minerals Ltd. | 197,886 | 2,642 |
| | | Shares | Market
Value•
($000) |
| | Pick n Pay Stores Ltd. | 644,353 | 2,508 |
| | Momentum Metropolitan Holdings | 1,887,074 | 2,423 |
| | Investec Ltd. | 517,887 | 2,384 |
| | Royal Bafokeng Platinum Ltd. | 310,018 | 2,221 |
| | Resilient REIT Ltd. | 601,099 | 2,200 |
| | Fortress REIT Ltd. Class A | 2,243,733 | 1,958 |
| * | Distell Group Holdings Ltd. | 145,773 | 1,747 |
| * | Telkom SA SOC Ltd. | 520,871 | 1,733 |
| | Coronation Fund Managers Ltd. | 452,008 | 1,502 |
| | PSG Group Ltd. | 292,195 | 1,464 |
| 2 | Dis-chem Pharmacies Ltd. | 626,003 | 1,307 |
| * | Liberty Holdings Ltd. | 210,867 | 1,245 |
| | Santam Ltd. | 73,481 | 1,222 |
| | Old Mutual Ltd. (XZIM) | 562,975 | 575 |
| * | Fortress REIT Ltd. Class B | 1,449,035 | 233 |
| | | | 510,037 |
| South Korea (3.5%) |
| | Samsung Electronics Co. Ltd. | 4,628,271 | 277,109 |
| | Samsung Electronics Co. Ltd. GDR (Registered) | 173,398 | 259,635 |
| | NAVER Corp. | 253,315 | 88,073 |
| | SK Hynix Inc. | 966,641 | 85,210 |
| | Samsung Electronics Co. Ltd. Preference Shares | 1,423,189 | 78,184 |
| | LG Chem Ltd. | 86,608 | 62,146 |
| | Samsung SDI Co. Ltd. | 98,473 | 62,129 |
| | Kakao Corp. | 512,670 | 55,155 |
| | Hyundai Motor Co. | 260,738 | 46,634 |
| | Kia Corp. | 480,187 | 35,040 |
| * | Celltrion Inc. | 197,388 | 33,982 |
| | Hyundai Mobis Co. Ltd. | 118,988 | 25,722 |
| | POSCO ADR | 354,489 | 22,425 |
| * | SK Innovation Co. Ltd. | 101,635 | 21,196 |
| | LG Electronics Inc. | 200,574 | 20,750 |
| | Hana Financial Group Inc. | 537,222 | 20,715 |
| | KB Financial Group Inc. ADR | 419,636 | 20,172 |
| *,2 | Samsung Biologics Co. Ltd. | 24,965 | 18,599 |
| | NCSoft Corp. | 31,504 | 16,927 |
| | LG Household & Health Care Ltd. | 16,214 | 16,228 |
| | Shinhan Financial Group Co. Ltd. | 494,592 | 16,147 |
| | Samsung C&T Corp. | 155,838 | 15,259 |
| *,3 | HMM Co. Ltd. | 649,639 | 14,864 |
FTSE All-World ex-US Index Fund
| | | Shares | Market
Value•
($000) |
| 3 | Shinhan Financial Group Co. Ltd. ADR | 450,668 | 14,566 |
| | KB Financial Group Inc. | 298,784 | 14,462 |
| | Samsung Electro-Mechanics Co. Ltd. | 104,679 | 14,256 |
| | KT&G Corp. | 200,864 | 13,952 |
| | SK Inc. | 58,132 | 12,131 |
| | LG Corp. | 153,062 | 11,966 |
| | Samsung Fire & Marine Insurance Co. Ltd. | 60,196 | 11,932 |
| * | Doosan Heavy Industries & Construction Co. Ltd. | 549,993 | 11,505 |
| | Woori Financial Group Inc. | 954,582 | 10,852 |
| | Amorepacific Corp. | 60,501 | 9,415 |
| * | Celltrion Healthcare Co. Ltd. | 132,858 | 9,238 |
| * | HYBE Co. Ltd. | 31,940 | 9,176 |
| | POSCO | 33,897 | 8,597 |
| * | Korean Air Lines Co. Ltd. | 327,689 | 8,544 |
| | Korea Zinc Co. Ltd. | 18,521 | 8,527 |
| | SK Telecom Co. Ltd. ADR | 285,453 | 8,278 |
| | Samsung SDS Co. Ltd. | 59,800 | 7,860 |
| * | SK Bioscience Co. Ltd. | 37,024 | 7,270 |
| * | Korea Shipbuilding & Offshore Engineering Co. Ltd. | 80,552 | 7,122 |
| | Coway Co. Ltd. | 104,977 | 7,118 |
| *,3 | LG Display Co. Ltd. | 415,841 | 7,028 |
| | Samsung Life Insurance Co. Ltd. | 119,676 | 6,923 |
| | S-Oil Corp. | 76,738 | 6,714 |
| | POSCO Chemical Co. Ltd. | 50,855 | 6,345 |
| * | Hanwha Solutions Corp. | 179,705 | 6,305 |
| * | Samsung Engineering Co. Ltd. | 294,300 | 6,259 |
| *,3 | HLB Inc. | 164,251 | 5,915 |
| | Hyundai Engineering & Construction Co. Ltd. | 135,741 | 5,868 |
| * | Samsung Heavy Industries Co. Ltd. | 1,073,295 | 5,865 |
| | Korea Electric Power Corp. | 299,630 | 5,805 |
| | Hyundai Motor Co. Preference Shares (XKRS) | 66,545 | 5,591 |
| | Hyundai Steel Co. | 144,396 | 5,519 |
| | SKC Co. Ltd. | 35,409 | 5,444 |
| | Ecopro BM Co. Ltd. | 15,449 | 5,432 |
| | Korea Investment Holdings Co. Ltd. | 71,724 | 5,364 |
| | Lotte Chemical Corp. | 27,502 | 5,290 |
| | E-MART Inc. | 36,751 | 5,290 |
| | | Shares | Market
Value•
($000) |
| *,3 | Pearl Abyss Corp. | 58,798 | 5,235 |
| | Hyundai Heavy Industries Holdings Co. Ltd. | 93,455 | 5,067 |
| | CJ CheilJedang Corp. | 15,522 | 5,045 |
| | Hyundai Glovis Co. Ltd. | 34,796 | 5,011 |
| | LG Uplus Corp. | 402,697 | 4,956 |
| | Mirae Asset Securities Co. Ltd. | 654,787 | 4,885 |
| | Samsung Securities Co. Ltd. | 119,588 | 4,862 |
| | Hankook Tire & Technology Co. Ltd. | 137,222 | 4,862 |
| | Kumho Petrochemical Co. Ltd. | 32,616 | 4,799 |
| | LG Innotek Co. Ltd. | 26,532 | 4,769 |
| | LG Chem Ltd. Preference Shares | 14,347 | 4,713 |
| * | Kangwon Land Inc. | 194,608 | 4,631 |
| | Industrial Bank of Korea | 489,114 | 4,629 |
| | Yuhan Corp. | 86,694 | 4,448 |
| | DB Insurance Co. Ltd. | 84,122 | 4,275 |
| | BNK Financial Group Inc. | 559,600 | 4,219 |
| | Hotel Shilla Co. Ltd. | 56,232 | 4,212 |
| | GS Holdings Corp. | 115,090 | 4,168 |
| | Orion Corp.Republic of Korea | 40,913 | 4,138 |
| | GS Engineering & Construction Corp. | 110,040 | 3,905 |
| | SK Chemicals Co. Ltd. | 25,183 | 3,891 |
| | Hanon Systems | 299,901 | 3,715 |
| 2 | Netmarble Corp. | 34,990 | 3,705 |
| * | OCI Co. Ltd. | 33,302 | 3,690 |
| * | SK Biopharmaceuticals Co. Ltd. | 44,878 | 3,634 |
| | Korea Electric Power Corp. ADR | 350,836 | 3,365 |
| * | Celltrion Pharm Inc. | 34,399 | 3,351 |
| * | Mando Corp. | 61,711 | 3,312 |
| * | DL E&C Co. Ltd. | 28,328 | 3,280 |
| | Hyundai Motor Co. Preference Shares | 37,788 | 3,162 |
| | Korea Aerospace Industries Ltd. | 120,323 | 3,161 |
| | Hanmi Pharm Co. Ltd. | 13,484 | 3,048 |
| * | Alteogen Inc. | 50,805 | 3,043 |
| 3 | Fila Holdings Corp. | 95,116 | 3,030 |
| | CJ ENM Co. Ltd. | 19,381 | 2,931 |
| | NH Investment & Securities Co. Ltd. | 248,978 | 2,812 |
| | DGB Financial Group Inc. | 313,474 | 2,778 |
| 3 | Shin Poong Pharmaceutical Co. Ltd. | 62,227 | 2,771 |
| 3 | Shinsegae Inc. | 12,903 | 2,745 |
| | S-1 Corp. | 36,114 | 2,575 |
| | Cheil Worldwide Inc. | 125,264 | 2,560 |
FTSE All-World ex-US Index Fund
| | | Shares | Market
Value•
($000) |
| | Hyundai Marine & Fire Insurance Co. Ltd. | 113,848 | 2,560 |
| | Hanwha Aerospace Co. Ltd. | 64,264 | 2,482 |
| * | Hyundai Mipo Dockyard Co. Ltd. | 38,119 | 2,479 |
| 3 | Seegene Inc. | 53,750 | 2,459 |
| 1 | SK Telecom Co. Ltd. | 9,146 | 2,422 |
| | Green Cross Corp. | 10,132 | 2,384 |
| | LOTTE Fine Chemical Co. Ltd. | 31,847 | 2,325 |
| | Hanwha Corp. | 80,694 | 2,323 |
| | KCC Corp. | 8,083 | 2,311 |
| | AMOREPACIFIC Group | 53,210 | 2,265 |
| | LG Household & Health Care Ltd. Preference Shares | 4,280 | 2,197 |
| 3 | Hyundai Wia Corp. | 29,354 | 2,120 |
| * | Hanjin Kal Corp. | 42,950 | 2,016 |
| | CJ Corp. | 24,411 | 2,007 |
| *,3 | Daewoo Shipbuilding & Marine Engineering Co. Ltd. | 89,039 | 1,978 |
| | Hyundai Department Store Co. Ltd. | 27,501 | 1,953 |
| * | CJ Logistics Corp. | 15,917 | 1,935 |
| | HDC Hyundai Development Co-Engineering & Construction Class E | 87,737 | 1,924 |
| | Lotte Shopping Co. Ltd. | 21,223 | 1,910 |
| * | NHN Corp. | 27,282 | 1,869 |
| | LG Electronics Inc. Preference Shares | 32,795 | 1,805 |
| * | Korea Gas Corp. | 47,377 | 1,800 |
| * | Daewoo Engineering & Construction Co. Ltd. | 333,310 | 1,785 |
| | LS Corp. | 32,952 | 1,767 |
| | Samsung Card Co. Ltd. | 60,010 | 1,762 |
| | Pan Ocean Co. Ltd. | 335,486 | 1,736 |
| | Posco International Corp. | 91,633 | 1,707 |
| | Dongsuh Cos. Inc. | 56,812 | 1,678 |
| 3 | Hite Jinro Co. Ltd. | 55,086 | 1,644 |
| | BGF retail Co. Ltd. | 11,489 | 1,596 |
| *,3 | Paradise Co. Ltd. | 105,315 | 1,571 |
| 3 | Hanssem Co. Ltd. | 17,980 | 1,566 |
| | Hanwha Life Insurance Co. Ltd. | 512,180 | 1,526 |
| | GS Retail Co. Ltd. | 53,663 | 1,482 |
| | NongShim Co. Ltd. | 6,108 | 1,481 |
| * | Doosan Bobcat Inc. | 45,264 | 1,479 |
| | KEPCO Plant Service & Engineering Co. Ltd. | 40,103 | 1,435 |
| | Solus Advanced Materials Co. Ltd. | 20,228 | 1,429 |
| | | Shares | Market
Value•
($000) |
| | SSANGYONG C&E Co. Ltd. | 206,496 | 1,392 |
| | Lotte Corp. | 48,015 | 1,345 |
| | DL Holdings Co. Ltd. | 23,784 | 1,341 |
| | Hanmi Science Co. Ltd. | 26,625 | 1,294 |
| | SK Networks Co. Ltd. | 259,931 | 1,132 |
| * | Helixmith Co. Ltd. | 52,977 | 1,081 |
| | Medytox Inc. | 8,177 | 1,050 |
| | Ottogi Corp. | 2,515 | 1,036 |
| | Mirae Asset Securities Co. Ltd. Preference Shares | 248,621 | 1,031 |
| | Samsung Fire & Marine Insurance Co. Ltd. Preference Shares | 6,579 | 995 |
| *,3 | Hyundai Doosan Infracore Co. Ltd. | 103,659 | 933 |
| | Amorepacific Corp. Preference Shares | 13,997 | 862 |
| | Lotte Chilsung Beverage Co. Ltd. | 6,163 | 770 |
| | Samsung SDI Co. Ltd. Preference Shares | 2,021 | 655 |
| * | Krafton Inc. | 1,430 | 575 |
| * | LX Holdings Corp. | 73,052 | 554 |
| | Hanwha Corp. Preference Shares | 36,056 | 507 |
| | Hyundai Engineering & Construction Co. Ltd. Preference Shares | 2,302 | 313 |
| *,1,3 | SillaJen Inc. | 94,185 | 258 |
| | CJ CheilJedang Corp. Preference Shares | 1,095 | 182 |
| * | KakaoBank Corp. | 1,976 | 107 |
| | | | 1,869,994 |
| Spain (1.5%) |
| | Iberdrola SA (XMAD) | 11,098,239 | 131,172 |
| | Banco Santander SA | 32,191,425 | 122,105 |
| | Banco Bilbao Vizcaya Argentaria SA | 12,507,078 | 87,526 |
| | Industria de Diseno Textil SA | 1,974,942 | 71,541 |
| 2 | Cellnex Telecom SA | 1,144,834 | 70,407 |
| * | Amadeus IT Group SA | 804,153 | 53,796 |
| | Telefonica SA | 9,322,155 | 40,492 |
| | Repsol SA | 2,455,369 | 31,450 |
| | Ferrovial SA | 900,396 | 28,424 |
| | CaixaBank SA | 8,255,738 | 23,732 |
| *,2 | Aena SME SA | 132,386 | 21,743 |
| | Red Electrica Corp. SA | 816,209 | 16,995 |
| 3 | Naturgy Energy Group SA | 559,268 | 14,703 |
| | Endesa SA | 590,167 | 13,611 |
| * | Siemens Gamesa Renewable Energy SA | 424,869 | 11,529 |
FTSE All-World ex-US Index Fund
| | | Shares | Market
Value•
($000) |
| | ACS Actividades de Construccion y Servicios SA | 437,735 | 11,473 |
| | Enagas SA | 461,397 | 10,354 |
| | Grifols SA | 451,762 | 10,347 |
| | Acciona SA | 42,463 | 8,155 |
| * | Fluidra SA | 209,095 | 7,986 |
| | Bankinter SA | 1,288,125 | 7,092 |
| | Merlin Properties Socimi SA | 641,625 | 6,949 |
| | Inmobiliaria Colonial Socimi SA | 615,846 | 5,988 |
| | Mapfre SA | 1,865,396 | 3,950 |
| | Grifols SA Preference Shares | 292,833 | 3,848 |
| | Linea Directa Aseguradora SA Cia de Seguros y Reaseguros | 1,304,743 | 2,619 |
| | | | 817,987 |
| Sweden (2.4%) |
| | Investor AB Class B | 3,566,925 | 82,303 |
| | Atlas Copco AB Class A | 1,225,927 | 78,948 |
| | Volvo AB Class B | 2,904,306 | 67,726 |
| | Telefonaktiebolaget LM Ericsson Class B | 5,690,042 | 62,109 |
| | Hexagon AB Class B | 3,361,677 | 54,102 |
| | Sandvik AB | 2,025,811 | 51,372 |
| | Assa Abloy AB Class B | 1,722,745 | 50,550 |
| 2 | Evolution AB | 303,798 | 49,319 |
| | Skandinaviska Enskilda Banken AB Class A | 2,732,535 | 42,731 |
| | Swedbank AB Class A | 1,883,870 | 40,859 |
| | Essity AB Class B | 1,144,911 | 37,086 |
| | Atlas Copco AB Class B | 666,370 | 36,113 |
| | Nibe Industrier AB Class B | 2,253,705 | 33,521 |
| | Svenska Handelsbanken AB Class A | 2,758,646 | 31,621 |
| 3 | H & M Hennes & Mauritz AB Class B | 1,645,298 | 30,953 |
| | Epiroc AB Class A | 1,225,270 | 30,486 |
| | EQT AB | 531,921 | 28,096 |
| | Swedish Match AB | 2,910,116 | 25,659 |
| | Alfa Laval AB | 589,144 | 25,271 |
| | Investor AB Class A | 849,854 | 19,662 |
| | Telia Co. AB | 4,840,276 | 19,065 |
| | Getinge AB Class B | 421,312 | 18,854 |
| *,2 | Sinch AB | 974,944 | 18,558 |
| | Boliden AB | 513,404 | 18,100 |
| * | Kinnevik AB Class B | 457,716 | 17,966 |
| | Svenska Cellulosa AB SCA Class B | 1,144,812 | 17,888 |
| | Skanska AB Class B | 676,790 | 17,208 |
| | SKF AB Class B | 720,738 | 16,739 |
| | Indutrade AB | 524,429 | 15,288 |
| | Lundin Energy AB | 352,520 | 13,922 |
| * | Fastighets AB Balder Class B | 190,700 | 13,827 |
| | Epiroc AB Class B | 647,454 | 13,754 |
| | | Shares | Market
Value•
($000) |
| | Industrivarden AB Class A | 411,390 | 13,571 |
| | Tele2 AB Class B | 923,440 | 13,051 |
| | Sagax AB Class B | 324,192 | 12,689 |
| | Lifco AB Class B | 421,710 | 12,296 |
| | Husqvarna AB Class B | 798,969 | 11,386 |
| | Industrivarden AB Class C | 337,639 | 10,983 |
| | Castellum AB | 401,200 | 10,693 |
| | Trelleborg AB Class B | 455,167 | 10,418 |
| | Electrolux AB Class B | 430,946 | 9,805 |
| | Securitas AB Class B | 588,972 | 9,757 |
| | Investment AB Latour Class B | 266,841 | 9,693 |
| | Beijer Ref AB Class B | 453,044 | 9,297 |
| * | Swedish Orphan Biovitrum AB | 335,272 | 9,111 |
| | L E Lundbergforetagen AB Class B | 139,363 | 8,035 |
| | Elekta AB Class B | 679,323 | 7,910 |
| | Holmen AB Class B | 176,969 | 7,857 |
| | Volvo AB Class A | 321,255 | 7,595 |
| | ICA Gruppen AB | 144,638 | 7,484 |
| | Sweco AB Class B | 379,842 | 6,048 |
| | Saab AB Class B | 174,485 | 4,864 |
| | Svenska Handelsbanken AB Class B | 103,523 | 1,308 |
| * | Kinnevik AB Class A | 21,632 | 873 |
| | Sagax AB Class D | 217,162 | 829 |
| | Telefonaktiebolaget LM Ericsson Class A | 50,718 | 556 |
| | Husqvarna AB Class A | 14,930 | 214 |
| | Svenska Cellulosa AB SCA Class A | 13,174 | 208 |
| | Skandinaviska Enskilda Banken AB Class C | 58 | 1 |
| | | | 1,276,188 |
| Switzerland (6.0%) |
| | Nestle SA (Registered) | 5,304,180 | 699,660 |
| | Roche Holding AG | 1,314,632 | 509,281 |
| | Novartis AG (Registered) | 3,991,688 | 330,163 |
| | Zurich Insurance Group AG | 279,221 | 123,757 |
| | Cie Financiere Richemont SA Class A (Registered) | 960,639 | 118,879 |
| | Lonza Group AG (Registered) | 139,360 | 114,526 |
| | UBS Group AG (Registered) | 6,121,665 | 111,431 |
| | ABB Ltd. (Registered) | 3,190,003 | 105,536 |
| | Sika AG (Registered) | 265,796 | 90,046 |
| | Givaudan SA (Registered) | 17,345 | 81,729 |
FTSE All-World ex-US Index Fund
| | | Shares | Market
Value•
($000) |
| | Partners Group Holding AG | 42,168 | 73,666 |
| | Alcon Inc. | 865,289 | 71,749 |
| | Swiss Re AG | 542,044 | 52,511 |
| | Geberit AG (Registered) | 64,123 | 50,077 |
| | Credit Suisse Group AG (Registered) | 4,482,206 | 46,623 |
| | Sonova Holding AG (Registered) | 99,837 | 41,370 |
| | Holcim Ltd. | 798,379 | 39,825 |
| | Straumann Holding AG (Registered) | 18,944 | 39,436 |
| | SGS SA (Registered) | 11,082 | 32,808 |
| | Swiss Life Holding AG (Registered) | 58,347 | 32,007 |
| | Kuehne + Nagel International AG (Registered) | 94,399 | 29,731 |
| | Julius Baer Group Ltd. | 404,218 | 29,238 |
| | Swisscom AG (Registered) | 47,527 | 25,880 |
| | Chocoladefabriken Lindt & Spruengli AG Ptg. Ctf. | 1,995 | 23,525 |
| | Logitech International SA (Registered) | 278,188 | 23,271 |
| 2 | VAT Group AG | 48,326 | 23,101 |
| | Chocoladefabriken Lindt & Spruengli AG (Registered) | 190 | 22,825 |
| | Schindler Holding AG Ptg. Ctf. | 78,280 | 20,383 |
| | Temenos AG (Registered) | 118,823 | 18,191 |
| | Roche Holding AG (Bearer) | 42,110 | 18,112 |
| | SIG Combibloc Group AG | 629,737 | 16,469 |
| | Swatch Group AG (Bearer) | 57,290 | 15,769 |
| | Barry Callebaut AG (Registered) | 6,678 | 15,465 |
| | Adecco Group AG (Registered) | 289,300 | 14,575 |
| | Tecan Group AG (Registered) | 23,654 | 14,493 |
| | Swiss Prime Site AG (Registered) | 142,487 | 14,486 |
| | Baloise Holding AG (Registered) | 83,673 | 13,334 |
| | EMS-Chemie Holding AG (Registered) | 13,165 | 13,059 |
| | Vifor Pharma AG | 97,894 | 12,641 |
| | Holcim Ltd. (XSWX) | 230,997 | 11,581 |
| | Georg Fischer AG (Registered) | 7,542 | 11,411 |
| | PSP Swiss Property AG (Registered) | 82,318 | 10,290 |
| * | ams AG | 464,422 | 9,195 |
| | Clariant AG (Registered) | 425,010 | 8,948 |
| | Schindler Holding AG (Registered) | 33,458 | 8,590 |
| | Helvetia Holding AG (Registered) | 64,882 | 7,720 |
| | | Shares | Market
Value•
($000) |
| * | Flughafen Zurich AG (Registered) | 34,982 | 6,317 |
| | DKSH Holding AG | 66,264 | 5,311 |
| | BKW AG | 32,768 | 4,341 |
| | Banque Cantonale Vaudoise (Registered) | 51,612 | 4,155 |
| | Swatch Group AG (Registered) | 66,695 | 3,548 |
| | OC Oerlikon Corp. AG (Registered) | 343,054 | 3,493 |
| | Sulzer AG (Registered) | 32,480 | 3,193 |
| *,2 | Medmix AG | 32,480 | 1,553 |
| | | | 3,229,274 |
| Taiwan (4.3%) |
| | Taiwan Semiconductor Manufacturing Co. Ltd. | 25,946,873 | 550,601 |
| | Taiwan Semiconductor Manufacturing Co. Ltd. ADR | 3,857,753 | 438,626 |
| | MediaTek Inc. | 2,781,700 | 91,553 |
| | Hon Hai Precision Industry Co. Ltd. | 22,533,823 | 86,988 |
| | Fubon Financial Holding Co. Ltd. | 15,656,926 | 41,388 |
| | Delta Electronics Inc. | 4,055,676 | 35,801 |
| | Formosa Plastics Corp. | 9,113,873 | 35,302 |
| | Nan Ya Plastics Corp. | 10,568,615 | 32,434 |
| | Cathay Financial Holding Co. Ltd. | 15,486,661 | 32,282 |
| | CTBC Financial Holding Co. Ltd. | 34,852,939 | 29,104 |
| 3 | United Microelectronics Corp. ADR | 2,820,176 | 28,963 |
| | China Steel Corp. | 23,086,234 | 27,834 |
| | Mega Financial Holding Co. Ltd. | 20,283,777 | 24,376 |
| | Chailease Holding Co. Ltd. | 2,496,839 | 23,914 |
| | E.Sun Financial Holding Co. Ltd. | 23,579,327 | 22,531 |
| | Uni-President Enterprises Corp. | 8,993,487 | 21,575 |
| | ASE Technology Holding Co. Ltd. | 5,996,449 | 21,449 |
| | Yuanta Financial Holding Co. Ltd. | 21,794,272 | 19,373 |
| | Silergy Corp. | 115,000 | 18,999 |
| | Chunghwa Telecom Co. Ltd. ADR | 471,638 | 18,630 |
| | Formosa Chemicals & Fibre Corp. | 6,410,306 | 18,601 |
| | Evergreen Marine Corp. Taiwan Ltd. | 4,959,300 | 17,847 |
| | Taiwan Cement Corp. | 9,836,102 | 17,068 |
| | Asustek Computer Inc. | 1,341,026 | 17,050 |
| | Unimicron Technology Corp. | 2,421,975 | 16,602 |
FTSE All-World ex-US Index Fund
| | | Shares | Market
Value•
($000) |
| | Novatek Microelectronics Corp. | 1,082,916 | 16,243 |
| | United Microelectronics Corp. | 7,801,978 | 16,197 |
| | Realtek Semiconductor Corp. | 896,768 | 16,131 |
| | First Financial Holding Co. Ltd. | 18,960,212 | 15,610 |
| | Taiwan Cooperative Financial Holding Co. Ltd. | 18,123,363 | 14,736 |
| | Largan Precision Co. Ltd. | 191,848 | 14,296 |
| | Quanta Computer Inc. | 5,083,598 | 14,282 |
| | Hotai Motor Co. Ltd. | 623,000 | 13,719 |
| | Yageo Corp. | 864,000 | 13,523 |
| | China Development Financial Holding Corp. | 26,121,318 | 13,351 |
| | Taishin Financial Holding Co. Ltd. | 20,294,965 | 13,324 |
| | Hua Nan Financial Holdings Co. Ltd. | 18,184,204 | 13,315 |
| | Globalwafers Co. Ltd. | 402,000 | 11,030 |
| * | Yang Ming Marine Transport Corp. | 3,112,000 | 10,863 |
| | Taiwan Mobile Co. Ltd. | 3,054,713 | 10,774 |
| | President Chain Store Corp. | 1,059,904 | 10,712 |
| | Advantech Co. Ltd. | 787,536 | 10,299 |
| | Innolux Corp. | 16,619,370 | 9,997 |
| | Sinopac Holdings Co. | 19,505,229 | 9,934 |
| | Win Semiconductors Corp. | 767,000 | 9,899 |
| | Shanghai Commercial & Savings Bank Ltd. | 6,113,000 | 9,681 |
| | Pegatron Corp. | 3,866,038 | 9,464 |
| | Formosa Petrochemical Corp. | 2,559,580 | 9,215 |
| | Chunghwa Telecom Co. Ltd. | 2,299,207 | 9,124 |
| | Lite-On Technology Corp. | 4,086,767 | 9,019 |
| | Vanguard International Semiconductor Corp. | 1,710,466 | 8,913 |
| | Accton Technology Corp. | 1,003,000 | 8,769 |
| | Wan Hai Lines Ltd. | 1,504,272 | 8,678 |
| | Airtac International Group | 287,773 | 8,611 |
| | Parade Technologies Ltd. | 132,000 | 8,503 |
| | Shin Kong Financial Holdings Co. Ltd. | 23,908,986 | 8,426 |
| | Catcher Technology Co. Ltd. | 1,411,153 | 8,182 |
| | Eclat Textile Co. Ltd. | 370,398 | 8,094 |
| | | Shares | Market
Value•
($000) |
| | Far Eastern New Century Corp. | 7,396,819 | 7,747 |
| | momo.com Inc. | 116,600 | 7,514 |
| | Chang Hwa Bank | 12,105,716 | 7,149 |
| | Asia Cement Corp. | 4,451,519 | 7,090 |
| | Sino-American Silicon Products Inc. | 1,026,000 | 7,028 |
| | Nan Ya Printed Circuit Board Corp. | 397,000 | 7,025 |
| | Compal Electronics Inc. | 7,906,510 | 6,958 |
| | Giant Manufacturing Co. Ltd. | 570,625 | 6,627 |
| | Far EasTone Telecommunications Co. Ltd. | 3,005,643 | 6,614 |
| | Micro-Star International Co. Ltd. | 1,292,000 | 6,520 |
| | Feng TAY Enterprise Co. Ltd. | 820,532 | 6,385 |
| | Pou Chen Corp. | 4,946,125 | 6,066 |
| | AU Optronics Corp. ADR | 875,321 | 5,979 |
| | Hiwin Technologies Corp. | 521,765 | 5,810 |
| | Inventec Corp. | 5,976,064 | 5,716 |
| | Wistron Corp. | 5,417,445 | 5,693 |
| | Voltronic Power Technology Corp. | 96,000 | 5,622 |
| | Walsin Lihwa Corp. | 5,939,000 | 5,548 |
| | Winbond Electronics Corp. | 5,823,000 | 5,521 |
| | Foxconn Technology Co. Ltd. | 2,127,925 | 5,283 |
| * | Oneness Biotech Co. Ltd. | 554,000 | 5,229 |
| | Wiwynn Corp. | 159,000 | 5,094 |
| | Walsin Technology Corp. | 934,000 | 5,085 |
| | Acer Inc. | 5,430,396 | 5,083 |
| | Powertech Technology Inc. | 1,424,000 | 4,996 |
| | Synnex Technology International Corp. | 2,577,889 | 4,995 |
| | AU Optronics Corp. | 6,729,000 | 4,624 |
| | China Life Insurance Co. Ltd. | 4,130,877 | 4,318 |
| | ASMedia Technology Inc. | 73,000 | 4,279 |
| | Cheng Shin Rubber Industry Co. Ltd. | 3,446,222 | 4,230 |
| | Zhen Ding Technology Holding Ltd. | 1,211,000 | 4,194 |
| | Taiwan High Speed Rail Corp. | 3,881,000 | 4,056 |
| | Teco Electric and Machinery Co. Ltd. | 3,733,000 | 4,055 |
| | Nanya Technology Corp. | 1,621,600 | 3,888 |
| | Nien Made Enterprise Co. Ltd. | 255,000 | 3,504 |
| * | HTC Corp. | 1,442,570 | 3,409 |
FTSE All-World ex-US Index Fund
| | | Shares | Market
Value•
($000) |
| | Taiwan Fertilizer Co. Ltd. | 1,377,000 | 3,367 |
| | Chicony Electronics Co. Ltd. | 1,168,337 | 3,341 |
| | Taiwan Business Bank | 9,167,436 | 3,119 |
| * | Eva Airways Corp. | 4,521,188 | 3,069 |
| * | China Airlines Ltd. | 4,903,913 | 3,037 |
| | Taiwan Glass Industry Corp. | 3,058,089 | 3,014 |
| | Eternal Materials Co. Ltd. | 1,893,104 | 2,510 |
| | Genius Electronic Optical Co. Ltd. | 162,000 | 2,497 |
| * | ENNOSTAR Inc. | 915,000 | 2,408 |
| | Capital Securities Corp. | 3,923,587 | 2,141 |
| | Formosa Taffeta Co. Ltd. | 1,874,000 | 2,023 |
| | Taiwan Secom Co. Ltd. | 540,725 | 1,955 |
| | ASE Technology Holding Co. Ltd. ADR | 225,217 | 1,604 |
| | Yulon Motor Co. Ltd. | 1,048,377 | 1,555 |
| | U-Ming Marine Transport Corp. | 809,000 | 1,534 |
| | Far Eastern International Bank | 3,767,820 | 1,417 |
| | Transcend Information Inc. | 561,455 | 1,365 |
| | China Motor Corp. | 481,642 | 1,200 |
| * | OBI Pharma Inc. | 293,790 | 1,126 |
| | Yulon Nissan Motor Co. Ltd. | 41,000 | 374 |
| | | | 2,303,395 |
| Thailand (0.6%) |
| | PTT PCL | 26,378,878 | 30,203 |
| | CP ALL PCL | 9,946,475 | 19,217 |
| | Airports of Thailand PCL | 7,983,551 | 15,558 |
| | Siam Commercial Bank PCL | 3,336,244 | 12,685 |
| | Bangkok Dusit Medical Services PCL Class F | 17,238,600 | 12,225 |
| | Advanced Info Service PCL | 2,136,696 | 12,185 |
| | Siam Cement PCL NDVR | 952,280 | 11,336 |
| | Gulf Energy Development PCL | 8,069,540 | 10,533 |
| | Kasikornbank PCL | 2,168,118 | 9,243 |
| | PTT Exploration & Production PCL | 2,406,561 | 8,513 |
| | Central Pattana PCL | 4,639,182 | 8,302 |
| * | Minor International PCL | 7,772,755 | 7,677 |
| | PTT Global Chemical PCL | 4,055,487 | 7,675 |
| | Siam Cement PCL (Registered) | 636,394 | 7,575 |
| | Delta Electronics Thailand PCL | 569,656 | 7,151 |
| | Intouch Holdings PCL Class F | 2,688,859 | 6,100 |
| | Energy Absolute PCL | 3,021,841 | 5,977 |
| | | Shares | Market
Value•
($000) |
| | Central Retail Corp. PCL | 4,950,397 | 5,192 |
| | Charoen Pokphand Foods PCL | 6,723,328 | 5,119 |
| | Indorama Ventures PCL | 3,943,515 | 5,006 |
| | Home Product Center PCL | 10,943,692 | 4,823 |
| | Siam Commercial Bank PCL NVDR | 1,230,600 | 4,679 |
| | BTS Group Holdings PCL | 15,659,121 | 4,509 |
| 3 | SCG Packaging PCL | 2,297,400 | 4,450 |
| | Bangkok Expressway & Metro PCL | 14,903,782 | 4,045 |
| 3 | Krung Thai Bank PCL | 11,600,262 | 4,026 |
| | PTT Oil & Retail Business PCL | 4,835,900 | 4,013 |
| 3 | Bangkok Bank PCL NVDR | 1,035,900 | 3,834 |
| | Digital Telecommunications Infrastructure Fund Class F | 9,393,439 | 3,795 |
| 3 | Krungthai Card PCL | 2,127,021 | 3,708 |
| 3 | Banpu PCL (Registered) | 10,729,808 | 3,685 |
| | Thai Union Group PCL Class F | 5,098,563 | 3,211 |
| 3 | Global Power Synergy PCL Class F | 1,297,152 | 3,052 |
| | Electricity Generating PCL | 560,079 | 3,018 |
| | Thai Oil PCL | 1,796,279 | 3,014 |
| | TMBThanachart Bank PCL | 82,352,296 | 2,886 |
| 3 | Kasikornbank PCL NVDR | 658,837 | 2,809 |
| | Osotspa PCL | 2,721,791 | 2,690 |
| | Bumrungrad Hospital PCL | 599,705 | 2,634 |
| 3 | Carabao Group PCL Class F | 662,177 | 2,478 |
| | IRPC PCL | 19,107,389 | 2,475 |
| | Muangthai Capital PCL | 1,296,062 | 2,371 |
| | True Corp. PCL | 18,337,762 | 2,245 |
| 3 | Ratch Group PCL | 1,560,528 | 2,140 |
| | Srisawad Corp. PCL | 1,093,704 | 2,115 |
| 3 | Berli Jucker PCL | 2,010,682 | 2,049 |
| * | Asset World Corp. PCL | 13,585,008 | 1,874 |
| 3 | B Grimm Power PCL | 1,402,152 | 1,798 |
| | Land & Houses PCL (Registered) | 6,991,308 | 1,784 |
| | Bangkok Bank PCL (Registered) | 458,702 | 1,698 |
| | Land & Houses PCL NVDR | 6,394,100 | 1,631 |
| 3 | Sri Trang Gloves Thailand PCL | 1,612,710 | 1,483 |
| | Total Access Communication PCL | 1,039,849 | 1,199 |
| 3 | Siam Makro PCL | 633,710 | 918 |
| 3 | Siam City Cement PCL | 177,239 | 905 |
FTSE All-World ex-US Index Fund
| | | Shares | Market
Value•
($000) |
| | Intouch Holdings PCL NVDR | 366,800 | 832 |
| | Bangkok Life Assurance PCL | 716,902 | 644 |
| | Central Pattana PCL | 258,400 | 462 |
| * | Banpu PCL Warrants Exp. 10/1/22 | 1,651,623 | 256 |
| | Bumrungrad Hospital PCL NDVR | 50,700 | 223 |
| 3 | Total Access Communication PCL NDVR | 150,300 | 173 |
| * | Banpu PCL Warrants Exp. 10/1/23 | 1,595,245 | 162 |
| | Bangkok Life Assurance PCL NVDR | 83,800 | 75 |
| * | BTS Group Holdings PCL Warrants Exp. 9/5/22 | 782,956 | 34 |
| * | BTS Group Holdings PCL Warrants Exp. 11/7/24 | 1,565,912 | — |
| * | BTS Group Holdings PCL Warrants Exp. 11/20/26 | 3,131,824 | — |
| | | | 308,377 |
| Turkey (0.1%) |
| | BIM Birlesik Magazalar A/S | 854,825 | 5,530 |
| | Eregli Demir ve Celik Fabrikalari TAS | 2,515,961 | 5,253 |
| | Turkiye Garanti Bankasi A/S | 3,930,189 | 4,025 |
| | KOC Holding A/S | 1,593,227 | 3,884 |
| * | Turkiye Petrol Rafinerileri A/S | 245,387 | 3,531 |
| | Turkcell Iletisim Hizmetleri A/S | 2,166,694 | 3,456 |
| | Akbank TAS | 4,928,199 | 2,983 |
| | Turkiye Sise ve Cam Fabrikalari A/S | 2,744,476 | 2,469 |
| | Ford Otomotiv Sanayi A/S | 121,562 | 2,341 |
| | Aselsan Elektronik Sanayi Ve Ticaret A/S | 1,208,762 | 2,063 |
| | Haci Omer Sabanci Holding A/S | 1,588,763 | 1,850 |
| | Turkiye Is Bankasi A/S Class C | 2,705,586 | 1,587 |
| * | Turk Hava Yollari AO | 1,039,895 | 1,585 |
| * | Petkim Petrokimya Holding A/S | 2,280,255 | 1,550 |
| | Enka Insaat ve Sanayi A/S | 1,257,961 | 1,453 |
| | Tofas Turk Otomobil Fabrikasi A/S | 218,952 | 1,339 |
| | Arcelik A/S | 358,172 | 1,257 |
| * | Gubre Fabrikalari TAS | 146,594 | 1,056 |
| | Coca-Cola Icecek A/S | 113,188 | 1,000 |
| * | Sasa Polyester Sanayi A/S | 308,687 | 996 |
| * | Koza Altin Isletmeleri A/S | 84,344 | 937 |
| | | Shares | Market
Value•
($000) |
| * | TAV Havalimanlari Holding A/S | 316,983 | 874 |
| | Anadolu Efes Biracilik Ve Malt Sanayii A/S | 350,145 | 806 |
| | Yapi ve Kredi Bankasi A/S | 2,717,184 | 772 |
| | Turk Telekomunikasyon A/S | 883,304 | 693 |
| 2 | Enerjisa Enerji A/S | 428,357 | 526 |
| * | Turkiye Halk Bankasi A/S | 1,106,418 | 510 |
| * | Turkiye Vakiflar Bankasi TAO Class D | 1,160,767 | 415 |
| | Iskenderun Demir ve Celik A/S | 273,450 | 386 |
| | | | 55,127 |
| United Arab Emirates (0.3%) |
| | First Abu Dhabi Bank PJSC | 8,180,558 | 39,705 |
| | Emirates Telecommunications Group Co. PJSC | 3,261,140 | 22,748 |
| | Emirates NBD Bank PJSC | 4,723,316 | 17,973 |
| | Abu Dhabi Commercial Bank PJSC | 5,179,197 | 11,714 |
| | Aldar Properties PJSC | 7,231,398 | 7,957 |
| | Dubai Islamic Bank PJSC | 5,389,038 | 7,514 |
| | Emaar Properties PJSC | 6,614,089 | 7,241 |
| | Abu Dhabi National Oil Co. for Distribution PJSC | 4,608,458 | 5,374 |
| | Abu Dhabi Islamic Bank PJSC | 2,716,803 | 4,326 |
| * | ADNOC Drilling Co. PJSC | 2,837,158 | 2,302 |
| | Dana Gas PJSC | 7,589,596 | 2,137 |
| * | Emaar Malls PJSC | 3,735,923 | 2,039 |
| | Dubai Investments PJSC | 3,858,174 | 1,790 |
| * | Emaar Development PJSC | 1,561,250 | 1,665 |
| * | Air Arabia PJSC | 4,243,690 | 1,609 |
| * | DAMAC Properties Dubai Co. PJSC | 2,890,982 | 986 |
| * | Dubai Financial Market PJSC | 2,767,106 | 768 |
| | Aramex PJSC | 276,460 | 330 |
| | | | 138,178 |
| United Kingdom (9.6%) |
| | AstraZeneca plc | 2,914,206 | 364,571 |
| | HSBC Holdings plc | 38,463,561 | 231,750 |
| | Diageo plc | 4,318,767 | 214,866 |
| | GlaxoSmithKline plc | 9,319,272 | 193,476 |
| | BP plc | 37,488,366 | 179,603 |
| | Royal Dutch Shell plc Class A | 7,584,541 | 173,753 |
| | Royal Dutch Shell plc Class B | 7,119,295 | 163,379 |
| | British American Tobacco plc | 4,295,875 | 149,430 |
FTSE All-World ex-US Index Fund
| | | Shares | Market
Value•
($000) |
| | Unilever plc | 2,597,169 | 139,036 |
| | Rio Tinto plc | 2,044,803 | 127,497 |
| | Glencore plc | 24,937,255 | 124,701 |
| | Unilever plc (XLON) | 2,257,940 | 120,894 |
| | Prudential plc (XLON) | 5,168,578 | 105,480 |
| | BHP Group plc | 3,911,702 | 103,314 |
| | Reckitt Benckiser Group plc | 1,192,583 | 96,817 |
| | Lloyds Banking Group plc | 133,290,779 | 91,222 |
| | Anglo American plc | 2,314,777 | 88,061 |
| | Barclays plc | 31,866,175 | 87,934 |
| | National Grid plc | 6,695,445 | 85,726 |
| | Experian plc | 1,722,202 | 78,965 |
| | Vodafone Group plc | 52,071,859 | 76,746 |
| * | Compass Group plc | 3,350,999 | 71,110 |
| | Ashtead Group plc | 841,413 | 70,519 |
| | CRH plc (XDUB) | 1,405,996 | 67,260 |
| | London Stock Exchange Group plc | 682,542 | 66,441 |
| | Ferguson plc | 421,407 | 63,406 |
| | RELX plc | 2,009,076 | 62,296 |
| | Tesco plc | 14,404,122 | 53,184 |
| | RELX plc (XLON) | 1,494,869 | 46,371 |
| | BAE Systems plc | 6,129,207 | 46,215 |
| | SSE plc | 1,964,841 | 44,247 |
| | Legal & General Group plc | 11,143,676 | 43,948 |
| | Segro plc | 2,264,145 | 40,018 |
| | Aviva plc | 7,368,538 | 39,760 |
| | Imperial Brands plc | 1,773,829 | 37,430 |
| * | Flutter Entertainment plc (XDUB) | 193,887 | 36,588 |
| | 3i Group plc | 1,799,355 | 33,603 |
| | Croda International plc | 253,686 | 32,835 |
| | Standard Chartered plc | 4,805,723 | 32,501 |
| | WPP plc | 2,155,997 | 31,164 |
| * | Entain plc | 1,090,547 | 30,558 |
| | Natwest Group plc | 9,850,863 | 29,702 |
| | Spirax-Sarco Engineering plc | 138,162 | 29,493 |
| | Halma plc | 716,441 | 29,054 |
| | Smith & Nephew plc | 1,657,575 | 28,626 |
| * | Rolls-Royce Holdings plc | 15,769,480 | 28,461 |
| | Rentokil Initial plc | 3,512,750 | 28,274 |
| * | BT Group plc | 14,205,564 | 26,988 |
| | Next plc | 239,969 | 26,154 |
| | Smurfit Kappa Group plc | 485,123 | 25,441 |
| * | InterContinental Hotels Group plc | 343,968 | 24,094 |
| | Bunzl plc | 636,511 | 23,526 |
| * | Ocado Group plc | 920,782 | 22,725 |
| * | Flutter Entertainment plc | 117,647 | 22,271 |
| | Persimmon plc | 596,484 | 22,224 |
| | St. James's Place plc | 1,005,842 | 21,729 |
| | Sage Group plc | 2,134,745 | 20,762 |
| | Intertek Group plc | 304,459 | 20,389 |
| | Burberry Group plc | 757,906 | 20,031 |
| | | Shares | Market
Value•
($000) |
| * | Informa plc | 2,799,836 | 19,918 |
| | United Utilities Group plc | 1,296,360 | 18,425 |
| | Kingfisher plc | 3,967,991 | 18,212 |
| | Severn Trent plc | 474,155 | 17,758 |
| | Mondi plc (XLON) | 706,879 | 17,653 |
| | Melrose Industries plc | 8,150,760 | 17,586 |
| | Barratt Developments plc | 1,907,262 | 17,314 |
| * | Whitbread plc | 381,108 | 17,050 |
| | Admiral Group plc | 417,118 | 16,385 |
| | Associated British Foods plc | 657,354 | 16,076 |
| | Intermediate Capital Group plc | 524,874 | 15,744 |
| | DCC plc | 185,433 | 15,473 |
| * | Meggitt plc | 1,473,240 | 15,126 |
| | Hargreaves Lansdown plc | 714,680 | 15,039 |
| | B&M European Value Retail SA | 1,684,731 | 14,596 |
| | Taylor Wimpey plc | 6,792,553 | 14,372 |
| | Abrdn plc | 4,055,066 | 14,096 |
| | Dechra Pharmaceuticals plc | 199,226 | 13,928 |
| | Smiths Group plc | 744,772 | 13,829 |
| | JD Sports Fashion plc | 926,620 | 13,811 |
| | Howden Joinery Group plc | 1,079,768 | 13,592 |
| | Electrocomponents plc | 881,373 | 13,560 |
| | M&G plc | 4,915,337 | 13,429 |
| | Johnson Matthey plc | 359,042 | 13,419 |
| | J Sainsbury plc | 3,221,536 | 13,195 |
| | Rightmove plc | 1,346,399 | 12,727 |
| | Antofagasta plc | 649,981 | 12,678 |
| | Land Securities Group plc | 1,346,775 | 12,652 |
| | DS Smith plc | 2,407,648 | 12,630 |
| | Coca-Cola HBC AG | 364,275 | 12,626 |
| | Polymetal International plc | 677,415 | 12,523 |
| 2 | Auto Trader Group plc | 1,437,068 | 11,914 |
| | British Land Co. plc | 1,747,477 | 11,799 |
| | Berkeley Group Holdings plc | 195,925 | 11,687 |
| | AVEVA Group plc | 237,859 | 11,583 |
| | Weir Group plc | 487,421 | 11,562 |
| | Pearson plc | �� 1,404,781 | 11,559 |
| | IMI plc | 495,122 | 11,057 |
| | Phoenix Group Holdings plc | 1,185,646 | 10,645 |
| | Hikma Pharmaceuticals plc | 322,234 | 10,621 |
| | Bellway plc | 232,321 | 10,541 |
| | Schroders plc | 212,642 | 10,533 |
| * | ITV plc | 6,956,890 | 10,239 |
| | Direct Line Insurance Group plc | 2,559,035 | 10,228 |
| | Royal Mail plc | 1,702,686 | 9,816 |
| | Evraz plc | 1,088,391 | 9,245 |
FTSE All-World ex-US Index Fund
| | | Shares | Market
Value•
($000) |
| * | Centrica plc | 11,074,837 | 9,142 |
| | Travis Perkins plc | 428,979 | 9,069 |
| | Derwent London plc | 191,969 | 8,880 |
| 2 | ConvaTec Group plc | 3,012,734 | 8,816 |
| | Pennon Group plc | 537,341 | 8,571 |
| 2 | Avast plc | 1,074,234 | 8,221 |
| | Tate & Lyle plc | 882,837 | 7,823 |
| | Hiscox Ltd. | 638,746 | 7,267 |
| 2 | Quilter plc | 3,194,528 | 6,802 |
| | HomeServe plc | 525,350 | 6,137 |
| * | easyJet plc | 700,079 | 5,968 |
| * | THG plc | 1,923,560 | 5,702 |
| | NEPI Rockcastle plc | 804,636 | 5,379 |
| | Mondi plc | 200,265 | 4,993 |
| * | International Consolidated Airlines Group SA | 2,128,746 | 4,768 |
| * | Dr. Martens plc | 928,643 | 4,694 |
| *,3 | TUI AG | 1,389,625 | 4,654 |
| | Renishaw plc | 64,655 | 4,449 |
| | Fresnillo plc | 348,728 | 4,104 |
| | Ashmore Group plc | 867,826 | 4,010 |
| | CRH plc | 67,919 | 3,250 |
| *,3 | TUI AG (XETR) | 638,824 | 2,125 |
| | Wickes Group plc | 479,984 | 1,413 |
| *,1 | NMC Health plc | 140,418 | — |
| | | | 5,161,307 |
Total Common Stocks
(Cost $39,278,343) | 53,561,594 |
| Temporary Cash Investments (1.7%) |
| Money Market Fund (1.7%) |
| 4,5 | Vanguard Market Liquidity Fund, 0.070% (Cost $931,880) | 9,318,930 | 931,893 |
| Total Investments (100.9%) (Cost $40,210,223) | 54,493,487 |
| Other Assets and Liabilities—Net (-0.9%) | (462,891) |
| Net Assets (100%) | 54,030,596 |
| Cost is in $000. |
| • | See Note A in Notes to Financial Statements. |
| * | Non-income-producing security. |
| 1 | Security value determined using significant unobservable inputs. |
| 2 | Security exempt from registration under Rule 144A of the Securities Act of 1933. Such securities may be sold in transactions exempt from registration, normally to qualified institutional buyers. At October 31, 2021, the aggregate value was $1,824,264,000, representing 3.4% of net assets. |
| 3 | Includes partial security positions on loan to broker-dealers. The total value of securities on loan is $637,593,000. |
| 4 | Affiliated money market fund available only to Vanguard funds and certain trusts and accounts managed by Vanguard. Rate shown is the 7-day yield. |
| 5 | Collateral of $695,229,000 was received for securities on loan, of which $695,188,000 is held in Vanguard Market Liquidity Fund and $41,000 is held in cash. |
| | ADR—American Depositary Receipt. |
| | GDR—Global Depositary Receipt. |
| | NVDR—Non-Voting Depository Receipt. |
| | Ptg. Ctf.—Participating Certificates. |
| | REIT—Real Estate Investment Trust. |
FTSE All-World ex-US Index Fund
Derivative Financial Instruments Outstanding as of Period End
| Futures Contracts |
| | | | ($000) |
| | Expiration | Number of
Long (Short)
Contracts | Notional
Amount | Value and
Unrealized
Appreciation
(Depreciation) |
| Long Futures Contracts | | | | |
| E-mini S&P 500 Index | December 2021 | 67 | 15,400 | 496 |
| Euro Stoxx 50 Index | December 2021 | 538 | 26,351 | 855 |
| FTSE 100 Index | December 2021 | 412 | 40,732 | 1,059 |
| MSCI EAFE Index | December 2021 | 1,780 | 208,225 | (2,907) |
| MSCI Emerging Markets Index | December 2021 | 2,414 | 152,323 | (2,803) |
| S&P ASX 200 Index | December 2021 | 145 | 19,852 | (322) |
| Topix Index | December 2021 | 172 | 30,069 | (761) |
| | | | | (4,383) |
| Forward Currency Contracts |
| | Contract
Settlement
Date | Contract Amount (000) | Unrealized
Appreciation
($000) | Unrealized
Depreciation
($000) |
| Counterparty | Receive | Deliver |
| Bank of America, N.A. | 12/15/21 | AUD | 17,895 | USD | 13,208 | 256 | — |
| Royal Bank of Canada | 12/15/21 | AUD | 3,645 | USD | 2,703 | 39 | — |
| Toronto-Dominion Bank | 12/15/21 | CAD | 4,560 | USD | 3,622 | 63 | — |
| UBS AG | 12/15/21 | EUR | 30,000 | USD | 35,719 | — | (999) |
| HSBC Bank USA, N.A. | 12/15/21 | GBP | 5,198 | USD | 7,113 | 2 | — |
| BNP Paribas | 12/15/21 | INR | 2,612,963 | USD | 35,004 | — | (293) |
| UBS AG | 12/15/21 | JPY | 198,850 | USD | 1,750 | — | (5) |
| Bank of America, N.A. | 12/15/21 | USD | 75,670 | CHF | 69,499 | — | (341) |
| Bank of America, N.A. | 12/15/21 | USD | 38,930 | EUR | 32,838 | 926 | — |
| JPMorgan Chase Bank, N.A. | 12/15/21 | USD | 7,354 | GBP | 5,323 | 68 | — |
| JPMorgan Chase Bank, N.A. | 12/15/21 | USD | 3,462 | HKD | 26,935 | — | — |
| Bank of Montreal | 12/15/21 | USD | 3,410 | JPY | 374,544 | 122 | — |
| Morgan Stanley Capital Services Inc. | 12/15/21 | USD | 7,820 | KRW | 9,136,189 | 10 | — |
| Toronto-Dominion Bank | 12/15/21 | USD | 4,211 | ZAR | 60,955 | 243 | — |
| | | | | | | 1,729 | (1,638) |
| AUD—Australian dollar. |
| CAD—Canadian dollar. |
| CHF—Swiss franc. |
| EUR—euro. |
| GBP—British pound. |
| HKD—Hong Kong dollar. |
| INR—Indian rupee. |
| JPY—Japanese yen. |
| KRW—Korean won. |
| USD—U.S. dollar. |
| ZAR—South African rand. |
At October 31, 2021, the counterparties had deposited in segregated accounts securities with a value of $375,000 in connection with open forward currency contracts.
See accompanying Notes, which are an integral part of the Financial Statements.
FTSE All-World ex-US Index Fund
Statement of Assets and Liabilities
|
| ($000s, except shares and per-share amounts) | Amount |
| Assets | |
| Investments in Securities, at Value | |
| Unaffiliated Issuers (Cost $39,278,343) | 53,561,594 |
| Affiliated Issuers (Cost $931,880) | 931,893 |
| Total Investments in Securities | 54,493,487 |
| Investment in Vanguard | 1,784 |
| Cash | 82,802 |
| Cash Collateral Pledged—Futures Contracts | 30,410 |
| Cash Collateral Pledged—Forward Currency Contracts | 1,240 |
| Foreign Currency, at Value (Cost $112,255) | 111,782 |
| Receivables for Investment Securities Sold | 24,552 |
| Receivables for Accrued Income | 183,442 |
| Receivables for Capital Shares Issued | 12,468 |
| Unrealized Appreciation—Forward Currency Contracts | 1,729 |
| Total Assets | 54,943,696 |
| Liabilities | |
| Payables for Investment Securities Purchased | 121,432 |
| Collateral for Securities on Loan | 695,229 |
| Payables for Capital Shares Redeemed | 26,748 |
| Payables to Vanguard | 1,514 |
| Variation Margin Payable—Futures Contracts | 4,022 |
| Unrealized Depreciation—Forward Currency Contracts | 1,638 |
| Deferred Foreign Capital Gains Taxes | 62,517 |
| Total Liabilities | 913,100 |
| Net Assets | 54,030,596 |
FTSE All-World ex-US Index Fund
Statement of Assets and Liabilities (continued)
|
| At October 31, 2021, net assets consisted of: | |
| ($000s, except shares and per-share amounts) | Amount |
| Paid-in Capital | 42,575,626 |
| Total Distributable Earnings (Loss) | 11,454,970 |
| Net Assets | 54,030,596 |
| |
| ETF Shares—Net Assets | |
Applicable to 567,962,000 outstanding $.001 par value shares of
beneficial interest (unlimited authorization) | 35,492,662 |
| Net Asset Value Per Share—ETF Shares | $62.49 |
| |
| Admiral Shares—Net Assets | |
Applicable to 223,120,829 outstanding $.001 par value shares of
beneficial interest (unlimited authorization) | 8,667,065 |
| Net Asset Value Per Share—Admiral Shares | $38.84 |
| |
| Institutional Shares—Net Assets | |
Applicable to 46,720,162 outstanding $.001 par value shares of
beneficial interest (unlimited authorization) | 5,753,306 |
| Net Asset Value Per Share—Institutional Shares | $123.14 |
| |
| Institutional Plus Shares—Net Assets | |
Applicable to 31,574,747 outstanding $.001 par value shares of
beneficial interest (unlimited authorization) | 4,117,563 |
| Net Asset Value Per Share—Institutional Plus Shares | $130.41 |
See accompanying Notes, which are an integral part of the Financial Statements.
FTSE All-World ex-US Index Fund
|
| | Year Ended
October 31, 2021 |
| | ($000) |
| Investment Income | |
| Income | |
| Dividends1 | 1,272,596 |
| Non-Cash Dividends | 82,007 |
| Interest2 | 344 |
| Securities Lending—Net | 12,746 |
| Total Income | 1,367,693 |
| Expenses | |
| The Vanguard Group—Note B | |
| Investment Advisory Services | 2,861 |
| Management and Administrative—ETF Shares | 16,806 |
| Management and Administrative—Admiral Shares | 7,631 |
| Management and Administrative—Institutional Shares | 3,539 |
| Management and Administrative—Institutional Plus Shares | 1,717 |
| Marketing and Distribution—ETF Shares | 738 |
| Marketing and Distribution—Admiral Shares | 287 |
| Marketing and Distribution—Institutional Shares | 139 |
| Marketing and Distribution—Institutional Plus Shares | 46 |
| Custodian Fees | 5,031 |
| Auditing Fees | 50 |
| Shareholders’ Reports—ETF Shares | 398 |
| Shareholders’ Reports—Admiral Shares | 51 |
| Shareholders’ Reports—Institutional Shares | 13 |
| Shareholders’ Reports—Institutional Plus Shares | 4 |
| Trustees’ Fees and Expenses | 14 |
| Total Expenses | 39,325 |
| Net Investment Income | 1,328,368 |
| Realized Net Gain (Loss) | |
| Investment Securities Sold2,3,4 | (33,849) |
| Futures Contracts | 88,863 |
| Forward Currency Contracts | 5,282 |
| Foreign Currencies | 949 |
| Realized Net Gain (Loss) | 61,245 |
FTSE All-World ex-US Index Fund
| Statement of Operations (continued) |
| | Year Ended
October 31, 2021 |
| | ($000) |
| Change in Unrealized Appreciation (Depreciation) | |
| Investment Securities2,5 | 10,381,628 |
| Futures Contracts | 10,340 |
| Forward Currency Contracts | 2,961 |
| Foreign Currencies | (3,680) |
| Change in Unrealized Appreciation (Depreciation) | 10,391,249 |
| Net Increase (Decrease) in Net Assets Resulting from Operations | 11,780,862 |
| 1 | Dividends are net of foreign withholding taxes of $146,544,000. |
| 2 | Interest income, realized net gain (loss), and change in unrealized appreciation (depreciation) from an affiliated company of the fund were $141,000, $10,000, and $42,000, respectively. Purchases and sales are for temporary cash investment purposes. |
| 3 | Realized gain (loss) is net of foreign capital gain taxes of $76,000. |
| 4 | Includes $168,708,000 of net gain (loss) resulting from in-kind redemptions. |
| 5 | The change in unrealized appreciation (depreciation) is net of the change in deferred foreign capital gains taxes of $61,490,000. |
See accompanying Notes, which are an integral part of the Financial Statements.
FTSE All-World ex-US Index Fund
Statement of Changes in Net Assets
|
| | Year Ended October 31, |
| | 2021
($000) | 2020
($000) |
| | | |
| Increase (Decrease) in Net Assets | | |
| Operations | | |
| Net Investment Income | 1,328,368 | 950,291 |
| Realized Net Gain (Loss) | 61,245 | (501,488) |
| Change in Unrealized Appreciation (Depreciation) | 10,391,249 | (1,048,715) |
| Net Increase (Decrease) in Net Assets Resulting from Operations | 11,780,862 | (599,912) |
| Distributions | | |
| ETF Shares | (802,031) | (632,805) |
| Admiral Shares | (202,435) | (174,884) |
| Institutional Shares | (138,484) | (124,922) |
| Institutional Plus Shares | (98,843) | (75,483) |
| Total Distributions | (1,241,793) | (1,008,094) |
| Capital Share Transactions | | |
| Investor Shares | — | (1,784) |
| ETF Shares | 4,593,633 | 824,768 |
| Admiral Shares | (75,871) | 343,960 |
| Institutional Shares | (158,514) | (135,008) |
| Institutional Plus Shares | (63,263) | 618,168 |
| Net Increase (Decrease) from Capital Share Transactions | 4,295,985 | 1,650,104 |
| Total Increase (Decrease) | 14,835,054 | 42,098 |
| Net Assets | | |
| Beginning of Period | 39,195,542 | 39,153,444 |
| End of Period | 54,030,596 | 39,195,542 |
See accompanying Notes, which are an integral part of the Financial Statements.
FTSE All-World ex-US Index Fund
| ETF Shares | | | | | |
For a Share Outstanding
Throughout Each Period | Year Ended October 31, |
| 2021 | 2020 | 2019 | 2018 | 2017 |
| Net Asset Value, Beginning of Period | $49.33 | $51.58 | $47.79 | $53.65 | $44.60 |
| Investment Operations | | | | | |
| Net Investment Income1 | 1.604 | 1.211 | 1.629 | 1.557 | 1.379 |
| Net Realized and Unrealized Gain (Loss) on Investments | 13.047 | (2.166) | 3.692 | (5.911) | 9.038 |
| Total from Investment Operations | 14.651 | (.955) | 5.321 | (4.354) | 10.417 |
| Distributions | | | | | |
| Dividends from Net Investment Income | (1.491) | (1.295) | (1.531) | (1.506) | (1.367) |
| Distributions from Realized Capital Gains | — | — | — | — | — |
| Total Distributions | (1.491) | (1.295) | (1.531) | (1.506) | (1.367) |
| Net Asset Value, End of Period | $62.49 | $49.33 | $51.58 | $47.79 | $53.65 |
| Total Return | 29.82% | -1.83% | 11.42% | -8.37% | 23.73% |
| Ratios/Supplemental Data | | | | | |
| Net Assets, End of Period (Millions) | $35,493 | $24,308 | $24,652 | $21,348 | $21,640 |
| Ratio of Total Expenses to Average Net Assets | 0.07% | 0.08% | 0.08% | 0.09% | 0.11% |
| Ratio of Net Investment Income to Average Net Assets | 2.62% | 2.46% | 3.30% | 2.91% | 2.82% |
| Portfolio Turnover Rate2 | 5% | 4% | 4% | 6% | 4% |
| 1 | Calculated based on average shares outstanding. |
| 2 | Excludes the value of portfolio securities received or delivered as a result of in-kind purchases or redemptions of the fund’s capital shares, including ETF Creation Units. |
See accompanying Notes, which are an integral part of the Financial Statements.
FTSE All-World ex-US Index Fund
| Admiral Shares | | | | | |
For a Share Outstanding
Throughout Each Period | Year Ended October 31, |
| 2021 | 2020 | 2019 | 2018 | 2017 |
| Net Asset Value, Beginning of Period | $30.66 | $32.06 | $29.70 | $33.35 | $27.72 |
| Investment Operations | | | | | |
| Net Investment Income1 | .972 | .750 | 1.010 | .969 | .855 |
| Net Realized and Unrealized Gain (Loss) on Investments | 8.121 | (1.355) | 2.289 | (3.682) | 5.625 |
| Total from Investment Operations | 9.093 | (.605) | 3.299 | (2.713) | 6.480 |
| Distributions | | | | | |
| Dividends from Net Investment Income | (.913) | (.795) | (.939) | (.937) | (.850) |
| Distributions from Realized Capital Gains | — | — | — | — | — |
| Total Distributions | (.913) | (.795) | (.939) | (.937) | (.850) |
| Net Asset Value, End of Period | $38.84 | $30.66 | $32.06 | $29.70 | $33.35 |
| Total Return2 | 29.76% | -1.89% | 11.38% | -8.37% | 23.75% |
| Ratios/Supplemental Data | | | | | |
| Net Assets, End of Period (Millions) | $8,667 | $6,919 | $6,717 | $5,458 | $5,304 |
| Ratio of Total Expenses to Average Net Assets | 0.11% | 0.11% | 0.11% | 0.11% | 0.11% |
| Ratio of Net Investment Income to Average Net Assets | 2.56% | 2.46% | 3.29% | 2.89% | 2.82% |
| Portfolio Turnover Rate3 | 5% | 4% | 4% | 6% | 4% |
| 1 | Calculated based on average shares outstanding. |
| 2 | Total returns do not include account service fees that may have applied in the periods shown. Fund prospectuses provide information about any applicable account service fees. |
| 3 | Excludes the value of portfolio securities received or delivered as a result of in-kind purchases or redemptions of the fund’s capital shares, including ETF Creation Units. |
See accompanying Notes, which are an integral part of the Financial Statements.
FTSE All-World ex-US Index Fund
| Institutional Shares | | | | | |
For a Share Outstanding
Throughout Each Period | Year Ended October 31, |
| 2021 | 2020 | 2019 | 2018 | 2017 |
| Net Asset Value, Beginning of Period | $97.19 | $101.64 | $94.16 | $105.72 | $87.88 |
| Investment Operations | | | | | |
| Net Investment Income1 | 3.108 | 2.380 | 3.224 | 3.046 | 2.703 |
| Net Realized and Unrealized Gain (Loss) on Investments | 25.772 | (4.281) | 7.271 | (11.621) | 17.838 |
| Total from Investment Operations | 28.880 | (1.901) | 10.495 | (8.575) | 20.541 |
| Distributions | | | | | |
| Dividends from Net Investment Income | (2.930) | (2.549) | (3.015) | (2.985) | (2.701) |
| Distributions from Realized Capital Gains | — | — | — | — | — |
| Total Distributions | (2.930) | (2.549) | (3.015) | (2.985) | (2.701) |
| Net Asset Value, End of Period | $123.14 | $97.19 | $101.64 | $94.16 | $105.72 |
| Total Return | 29.82% | -1.87% | 11.42% | -8.35% | 23.74% |
| Ratios/Supplemental Data | | | | | |
| Net Assets, End of Period (Millions) | $5,753 | $4,658 | $4,991 | $4,719 | $5,532 |
| Ratio of Total Expenses to Average Net Assets | 0.08% | 0.08% | 0.08% | 0.08% | 0.10% |
| Ratio of Net Investment Income to Average Net Assets | 2.58% | 2.45% | 3.31% | 2.92% | 2.83% |
| Portfolio Turnover Rate2 | 5% | 4% | 4% | 6% | 4% |
| 1 | Calculated based on average shares outstanding. |
| 2 | Excludes the value of portfolio securities received or delivered as a result of in-kind purchases or redemptions of the fund’s capital shares, including ETF Creation Units. |
See accompanying Notes, which are an integral part of the Financial Statements.
FTSE All-World ex-US Index Fund
| Institutional Plus Shares | | | | | |
For a Share Outstanding
Throughout Each Period | Year Ended October 31, |
| 2021 | 2020 | 2019 | 2018 | 2017 |
| Net Asset Value, Beginning of Period | $102.93 | $107.63 | $99.71 | $111.96 | $93.06 |
| Investment Operations | | | | | |
| Net Investment Income1 | 3.312 | 2.548 | 3.403 | 3.336 | 2.863 |
| Net Realized and Unrealized Gain (Loss) on Investments | 27.296 | (4.528) | 7.725 | (12.397) | 18.928 |
| Total from Investment Operations | 30.608 | (1.980) | 11.128 | (9.061) | 21.791 |
| Distributions | | | | | |
| Dividends from Net Investment Income | (3.128) | (2.720) | (3.208) | (3.189) | (2.891) |
| Distributions from Realized Capital Gains | — | — | — | — | — |
| Total Distributions | (3.128) | (2.720) | (3.208) | (3.189) | (2.891) |
| Net Asset Value, End of Period | $130.41 | $102.93 | $107.63 | $99.71 | $111.96 |
| Total Return | 29.84% | -1.83% | 11.43% | -8.33% | 23.79% |
| Ratios/Supplemental Data | | | | | |
| Net Assets, End of Period (Millions) | $4,118 | $3,311 | $2,793 | $2,588 | $2,731 |
| Ratio of Total Expenses to Average Net Assets | 0.06% | 0.06% | 0.06% | 0.06% | 0.07% |
| Ratio of Net Investment Income to Average Net Assets | 2.60% | 2.48% | 3.30% | 2.94% | 2.86% |
| Portfolio Turnover Rate2 | 5% | 4% | 4% | 6% | 4% |
| 1 | Calculated based on average shares outstanding. |
| 2 | Excludes the value of portfolio securities received or delivered as a result of in-kind purchases or redemptions of the fund’s capital shares, including ETF Creation Units. |
See accompanying Notes, which are an integral part of the Financial Statements.
FTSE All-World ex-US Index Fund
Notes to Financial Statements
Vanguard FTSE All-World ex-US Index Fund is registered under the Investment Company Act of 1940 as an open-end investment company, or mutual fund. The fund offers four classes of shares: ETF Shares, Admiral Shares, Institutional Shares, and Institutional Plus Shares. Each of the share classes has different eligibility and minimum purchase requirements, and is designed for different types of investors. ETF Shares are listed for trading on NYSE Arca; they can be purchased and sold through a broker. Prior to November 7, 2019, the fund offered Investor Shares. Effective at the close of business on November 7, 2019, the remaining Investor Shares were converted to Admiral Shares.
The fund invests in securities of foreign issuers, which may subject it to investment risks not normally associated with investing in securities of U.S. corporations. Market disruptions associated with the COVID-19 pandemic have had a global impact, and uncertainty exists as to the long-term implications. Such disruptions can adversely affect assets of the fund and thus fund performance.
| A. | The following significant accounting policies conform to generally accepted accounting principles for U.S. investment companies. The fund consistently follows such policies in preparing its financial statements. |
1. Security Valuation: Securities are valued as of the close of trading on the New York Stock Exchange (generally 4 p.m., Eastern time) on the valuation date. Equity securities are valued at the latest quoted sales prices or official closing prices taken from the primary market in which each security trades; such securities not traded on the valuation date are valued at the mean of the latest quoted bid and asked prices. Securities for which market quotations are not readily available, or whose values have been affected by events occurring before the fund’s pricing time but after the close of the securities’ primary markets, are valued at their fair values calculated according to procedures adopted by the board of trustees. These procedures include obtaining quotations from an independent pricing service, monitoring news to identify significant market- or security-specific events, and evaluating changes in the values of foreign market proxies (for example, ADRs, futures contracts, or exchange-traded funds), between the time the foreign markets close and the fund’s pricing time. When fair-value pricing is employed, the prices of securities used by a fund to calculate its net asset value may differ from quoted or published prices for the same securities.
Investments in Vanguard Market Liquidity Fund are valued at that fund's net asset value.
Temporary cash investments are valued using the latest bid prices or using valuations based on a matrix system (which considers such factors as security prices, yields, maturities, and ratings), both as furnished by independent pricing services.
2. Foreign Currency: Securities and other assets and liabilities denominated in foreign currencies are translated into U.S. dollars using exchange rates obtained from an independent third party as of the fund’s pricing time on the valuation date. Realized gains (losses) and unrealized appreciation (depreciation) on investment securities include the effects of changes in exchange rates since the securities were purchased, combined with the effects of changes in security prices. Fluctuations in the value of other assets and liabilities resulting from changes in exchange rates are recorded as unrealized foreign currency gains (losses) until the assets or liabilities are settled in cash, at which time they are recorded as realized foreign currency gains (losses).
3. Futures Contracts: The fund uses index futures contracts to a limited extent, with the objectives of maintaining full exposure to the stock market, maintaining liquidity, and minimizing transaction costs. The fund may purchase futures contracts to immediately invest incoming cash in the market, or sell futures in response to cash outflows, thereby simulating a fully invested position in the underlying index while maintaining a cash balance for liquidity. The primary risks associated
FTSE All-World ex-US Index Fund
with the use of futures contracts are imperfect correlation between changes in market values of stocks held by the fund and the prices of futures contracts, and the possibility of an illiquid market. Counterparty risk involving futures is mitigated because a regulated clearinghouse is the counterparty instead of the clearing broker. To further mitigate counterparty risk, the fund trades futures contracts on an exchange, monitors the financial strength of its clearing brokers and clearinghouse, and has entered into clearing agreements with its clearing brokers. The clearinghouse imposes initial margin requirements to secure the fund’s performance and requires daily settlement of variation margin representing changes in the market value of each contract. Any securities pledged as initial margin for open contracts are noted in the Schedule of Investments.
Futures contracts are valued at their quoted daily settlement prices. The notional amounts of the contracts are not recorded in the Statement of Assets and Liabilities. Fluctuations in the value of the contracts are recorded in the Statement of Assets and Liabilities as an asset (liability) and in the Statement of Operations as unrealized appreciation (depreciation) until the contracts are closed, when they are recorded as realized gains (losses) on futures contracts.
During the year ended October 31, 2021, the fund’s average investments in long and short futures contracts represented 1% and 0% of net assets, respectively, based on the average of the notional amounts at each quarter-end during the period.
4. Forward Currency Contracts: The fund enters into forward currency contracts to protect the value of securities and related receivables and payables against changes in future foreign exchange rates. The fund’s risks in using these contracts include movement in the values of the foreign currencies relative to the U.S. dollar and the ability of the counterparties to fulfill their obligations under the contracts. The fund mitigates its counterparty risk by entering into forward currency contracts only with a diverse group of prequalified counterparties, monitoring their financial strength, entering into master netting arrangements with its counterparties, and requiring its counterparties to transfer collateral as security for their performance. In the absence of a default, the collateral pledged or received by the fund cannot be repledged, resold, or rehypothecated. The master netting arrangements provide that, in the event of a counterparty’s default (including bankruptcy), the fund may terminate the forward currency contracts, determine the net amount owed by either party in accordance with its master netting arrangements, and sell or retain any collateral held up to the net amount owed to the fund under the master netting arrangements. The forward currency contracts contain provisions whereby a counterparty may terminate open contracts if the fund’s net assets decline below a certain level, triggering a payment by the fund if the fund is in a net liability position at the time of the termination. The payment amount would be reduced by any collateral the fund has pledged. Any securities pledged as collateral for open contracts are noted in the Schedule of Investments. The value of collateral received or pledged is compared daily to the value of the forward currency contracts exposure with each counterparty, and any difference, if in excess of a specified minimum transfer amount, is adjusted and settled within two business days.
Forward currency contracts are valued at their quoted daily prices obtained from an independent third party, adjusted for currency risk based on the expiration date of each contract. The notional amounts of the contracts are not recorded in the Statement of Assets and Liabilities. Fluctuations in the value of the contracts are recorded in the Statement of Assets and Liabilities as an asset (liability) and in the Statement of Operations as unrealized appreciation (depreciation) until the contracts are closed, when they are recorded as realized gains (losses) on forward currency contracts.
FTSE All-World ex-US Index Fund
During the year ended October 31, 2021, the fund’s average investment in forward currency contracts represented 1% of net assets, based on the average of the notional amounts at each quarter-end during the period.
5. Federal Income Taxes: The fund intends to continue to qualify as a regulated investment company and distribute all of its taxable income. The fund’s tax returns are open to examination by the relevant tax authorities until expiration of the applicable statute of limitations, which is generally three years after the filing of the tax return. Management has analyzed the fund’s tax positions taken for all open federal and state income tax years, and has concluded that no provision for income tax is required in the fund’s financial statements.
6. Distributions: Distributions to shareholders are recorded on the ex-dividend date. Distributions are determined on a tax basis at the fiscal year-end and may differ from net investment income and realized capital gains for financial reporting purposes.
7. Securities Lending: To earn additional income, the fund lends its securities to qualified institutional borrowers. Security loans are subject to termination by the fund at any time, and are required to be secured at all times by collateral in an amount at least equal to the market value of securities loaned. Daily market fluctuations could cause the value of loaned securities to be more or less than the value of the collateral received. When this occurs, the collateral is adjusted and settled before the opening of the market on the next business day. The fund further mitigates its counterparty risk by entering into securities lending transactions only with a diverse group of prequalified counterparties, monitoring their financial strength, and entering into master securities lending agreements with its counterparties. The master securities lending agreements provide that, in the event of a counterparty’s default (including bankruptcy), the fund may terminate any loans with that borrower, determine the net amount owed, and sell or retain the collateral up to the net amount owed to the fund; however, such actions may be subject to legal proceedings. While collateral mitigates counterparty risk, in the event of a default, the fund may experience delays and costs in recovering the securities loaned. The fund invests cash collateral received in Vanguard Market Liquidity Fund, and records a liability in the Statement of Assets and Liabilities for the return of the collateral, during the period the securities are on loan. Collateral investments in Vanguard Market Liquidity Fund are subject to market appreciation or depreciation. Securities lending income represents fees charged to borrowers plus income earned on invested cash collateral, less expenses associated with the loan. During the term of the loan, the fund is entitled to all distributions made on or in respect of the loaned securities.
8. Credit Facilities and Interfund Lending Program: The fund and certain other funds managed by The Vanguard Group ("Vanguard") participate in a $4.3 billion committed credit facility provided by a syndicate of lenders pursuant to a credit agreement and an uncommitted credit facility provided by Vanguard. Both facilities may be renewed annually. Each fund is individually liable for its borrowings, if any, under the credit facilities. Borrowings may be utilized for temporary or emergency purposes, subject to the fund’s regulatory and contractual borrowing restrictions. With respect to the committed credit facility, the participating funds are charged administrative fees and an annual commitment fee of 0.10% of the undrawn committed amount of the facility; these fees are allocated to the funds based on a method approved by the fund’s board of trustees and included in Management and Administrative expenses on the fund’s Statement of Operations. Any borrowings under either facility bear interest at a rate based upon the higher of the one-month London Interbank Offered Rate (or an acceptable alternate rate, if necessary), federal funds
FTSE All-World ex-US Index Fund
effective rate, or overnight bank funding rate plus an agreed-upon spread, except that borrowings under the uncommitted credit facility may bear interest based upon an alternate rate agreed to by the fund and Vanguard.
In accordance with an exemptive order (the “Order”) from the SEC, the fund may participate in a joint lending and borrowing program that allows registered open-end Vanguard funds to borrow money from and lend money to each other for temporary or emergency purposes (the “Interfund Lending Program”), subject to compliance with the terms and conditions of the Order, and to the extent permitted by the fund’s investment objective and investment policies. Interfund loans and borrowings normally extend overnight, but can have a maximum duration of seven days. Loans may be called on one business day’s notice. The interest rate to be charged is governed by the conditions of the Order and internal procedures adopted by the board of trustees. The board of trustees is responsible for overseeing the Interfund Lending Program.
For the year ended October 31, 2021, the fund did not utilize the credit facilities or the Interfund Lending Program.
9. Other: Dividend income is recorded on the ex-dividend date. Non-cash dividends included in income, if any, are recorded at the fair value of the securities received. Interest income includes income distributions received from Vanguard Market Liquidity Fund and is accrued daily. Premiums and discounts on debt securities are amortized and accreted, respectively, to interest income over the lives of the respective securities, except for premiums on certain callable debt securities that are amortized to the earliest call date. Security transactions are accounted for on the date securities are bought or sold. Costs used to determine realized gains (losses) on the sale of investment securities are those of the specific securities sold.
Taxes on foreign dividends and capital gains have been provided for in accordance with the fund's understanding of the applicable countries' tax rules and rates. Deferred foreign capital gains tax, if any, is accrued daily based upon net unrealized gains. The fund has filed tax reclaims for previously withheld taxes on dividends earned in certain European Union countries. These filings are subject to various administrative and judicial proceedings within these countries. Such tax reclaims received during the year, if any, are included in dividend income. No other amounts for additional tax reclaims are reflected in the financial statements due to the uncertainty as to the ultimate resolution of proceedings, the likelihood of receipt of these reclaims, and the potential timing of payment.
Each class of shares has equal rights as to assets and earnings, except that each class separately bears certain class-specific expenses related to maintenance of shareholder accounts (included in Management and Administrative expenses) and shareholder reporting. Marketing and distribution expenses are allocated to each class of shares based on a method approved by the board of trustees. Income, other non-class-specific expenses, and gains and losses on investments are allocated to each class of shares based on its relative net assets.
| B. | In accordance with the terms of a Funds' Service Agreement (the “FSA”) between Vanguard and the fund, Vanguard furnishes to the fund investment advisory, corporate management, administrative, marketing, and distribution services at Vanguard’s cost of operations (as defined by the FSA). These costs of operations are allocated to the fund based on methods and guidelines approved by the board of trustees and are generally settled twice a month. |
FTSE All-World ex-US Index Fund
Upon the request of Vanguard, the fund may invest up to 0.40% of its net assets as capital in Vanguard. At October 31, 2021, the fund had contributed to Vanguard capital in the amount of $1,784,000, representing less than 0.01% of the fund’s net assets and 0.71% of Vanguard’s capital received pursuant to the FSA. The fund’s trustees and officers are also directors and employees, respectively, of Vanguard.
| C. | Various inputs may be used to determine the value of the fund’s investments and derivatives. These inputs are summarized in three broad levels for financial statement purposes. The inputs or methodologies used to value securities are not necessarily an indication of the risk associated with investing in those securities. |
Level 1—Quoted prices in active markets for identical securities.
Level 2—Other significant observable inputs (including quoted prices for similar securities, interest rates, prepayment speeds, credit risk, etc.).
Level 3—Significant unobservable inputs (including the fund’s own assumptions used to determine the fair value of investments). Any investments and derivatives valued with significant unobservable inputs are noted on the Schedule of Investments.
The following table summarizes the market value of the fund’s investments and derivatives as of October 31, 2021, based on the inputs used to value them:
| | Level 1
($000) | Level 2
($000) | Level 3
($000) | Total
($000) |
| Investments | | | | |
| Assets | | | | |
| Common Stocks—North and South America | 4,382,761 | 18,886 | 1 | 4,401,648 |
| Common Stocks—Other | 1,239,588 | 47,817,841 | 102,517 | 49,159,946 |
| Temporary Cash Investments | 931,893 | — | — | 931,893 |
| Total | 6,554,242 | 47,836,727 | 102,518 | 54,493,487 |
| Derivative Financial Instruments | | | | |
| Assets | | | | |
| Futures Contracts1 | 2,410 | — | — | 2,410 |
| Forward Currency Contracts | — | 1,729 | — | 1,729 |
| Total | 2,410 | 1,729 | — | 4,139 |
| Liabilities | | | | |
| Futures Contracts1 | 6,793 | — | — | 6,793 |
| Forward Currency Contracts | — | 1,638 | — | 1,638 |
| Total | 6,793 | 1,638 | — | 8,431 |
| 1 | Includes cumulative appreciation (depreciation) on futures contracts and centrally cleared swaps, if any, as reported in the Schedule of Investments. Only current day’s variation margin is reported within the Statement of Assets and Liabilities. |
FTSE All-World ex-US Index Fund
| D. | At October 31, 2021, the fair values of derivatives were reflected in the Statement of Assets and Liabilities as follows: |
| Statement of Assets and Liabilities | Equity
Contracts
($000) | Foreign
Exchange
Contracts
($000) | Total
($000) |
| Unrealized Appreciation—Futures Contracts1 | 2,410 | — | 2,410 |
| Unrealized Appreciation—Forward Currency Contracts | — | 1,729 | 1,729 |
| Total Assets | 2,410 | 1,729 | 4,139 |
| | | | |
| Unrealized Depreciation—Futures Contracts1 | 6,793 | — | 6,793 |
| Unrealized Depreciation—Forward Currency Contracts | — | 1,638 | 1,638 |
| Total Liabilities | 6,793 | 1,638 | 8,431 |
| 1 | Includes cumulative appreciation (depreciation) on futures contracts and centrally cleared swaps, if any, as reported in the Schedule of Investments. Only current day’s variation margin is reported within the Statement of Assets and Liabilities. |
Realized net gain (loss) and the change in unrealized appreciation (depreciation) on derivatives for the year ended October 31, 2021, were:
| Realized Net Gain (Loss) on Derivatives | Equity
Contracts
($000) | Foreign
Exchange
Contracts
($000) | Total
($000) |
| Futures Contracts | 88,863 | — | 88,863 |
| Forward Currency Contracts | — | 5,282 | 5,282 |
| Realized Net Gain (Loss) on Derivatives | 88,863 | 5,282 | 94,145 |
| Change in Unrealized Appreciation (Depreciation) on Derivatives |
| Futures Contracts | 10,340 | — | 10,340 |
| Forward Currency Contracts | — | 2,961 | 2,961 |
| Change in Unrealized Appreciation (Depreciation) on Derivatives | 10,340 | 2,961 | 13,301 |
| E. | Permanent differences between book-basis and tax-basis components of net assets are reclassified among capital accounts in the financial statements to reflect their tax character. These reclassifications have no effect on net assets or net asset value per share. As of period end, permanent differences primarily attributable to the accounting for in-kind redemptions, foreign currency transactions, passive foreign investment companies, and tax expense on capital gains were reclassified between the following accounts: |
| | Amount
($000) |
| Paid-in Capital | 165,522 |
| Total Distributable Earnings (Loss) | (165,522) |
Temporary differences between book-basis and tax-basis components of total distributable earnings (loss) arise when certain items of income, gain, or loss are recognized in different periods for financial statement and tax purposes; these differences will reverse at some time in the future. The differences are primarily related to the deferral of losses from wash sales; the recognition of
FTSE All-World ex-US Index Fund
unrealized gains or losses from certain derivative contracts; the recognition of unrealized gains from passive foreign investment companies; and the classification of securities for tax purposes. As of period end, the tax-basis components of total distributable earnings (loss) are detailed in the table as follows:
| | Amount
($000) |
| Undistributed Ordinary Income | 575,560 |
| Undistributed Long-Term Gains | — |
| Capital Loss Carryforwards | (2,952,729) |
| Qualified Late-Year Losses | — |
| Net Unrealized Gains (Losses) | 13,832,139 |
The tax character of distributions paid was as follows:
| | Year Ended October 31, |
| | 2021
Amount
($000) | 2020
Amount
($000) |
| Ordinary Income* | 1,241,793 | 1,008,094 |
| Long-Term Capital Gains | — | — |
| Total | 1,241,793 | 1,008,094 |
| * | Includes short-term capital gains, if any. |
As of October 31, 2021, gross unrealized appreciation and depreciation for investments and derivatives based on cost for U.S. federal income tax purposes were as follows:
| | Amount
($000) |
| Tax Cost | 40,597,917 |
| Gross Unrealized Appreciation | 18,680,119 |
| Gross Unrealized Depreciation | (4,785,632) |
| Net Unrealized Appreciation (Depreciation) | 13,894,487 |
| F. | During the year ended October 31, 2021, the fund purchased $7,009,211,000 of investment securities and sold $2,635,267,000 of investment securities, other than temporary cash investments. Purchases and sales include $2,966,472,000 and $299,032,000, respectively, in connection with in-kind purchases and redemptions of the fund's capital shares. |
FTSE All-World ex-US Index Fund
| G. | Capital share transactions for each class of shares were: |
| | Year Ended October 31, | |
| | 2021 | | 2020 |
| | Amount
($000) | Shares
(000) | | Amount
($000) | Shares
(000) |
| Investor Shares | | | | | |
| Issued | — | — | | 5 | — |
| Issued in Lieu of Cash Distributions | — | — | | — | — |
| Redeemed1 | — | — | | (1,789) | (86) |
| Net Increase (Decrease)—Investor Shares | — | — | | (1,784) | (86) |
| ETF Shares | | | | | |
| Issued | 4,593,633 | 75,180 | | 1,452,678 | 28,381 |
| Issued in Lieu of Cash Distributions | — | — | | — | — |
| Redeemed | — | — | | (627,910) | (13,500) |
| Net Increase (Decrease)—ETF Shares | 4,593,633 | 75,180 | | 824,768 | 14,881 |
| Admiral Shares | | | | | |
| Issued1 | 1,290,341 | 33,990 | | 3,262,290 | 120,061 |
| Issued in Lieu of Cash Distributions | 156,591 | 4,131 | | 136,906 | 4,436 |
| Redeemed | (1,522,803) | (40,678) | | (3,055,236) | (108,328) |
| Net Increase (Decrease)—Admiral Shares | (75,871) | (2,557) | | 343,960 | 16,169 |
| Institutional Shares | | | | | |
| Issued | 1,228,357 | 10,176 | | 1,200,708 | 13,238 |
| Issued in Lieu of Cash Distributions | 118,708 | 989 | | 109,841 | 1,122 |
| Redeemed | (1,505,579) | (12,372) | | (1,445,557) | (15,536) |
| Net Increase (Decrease)—Institutional Shares | (158,514) | (1,207) | | (135,008) | (1,176) |
| Institutional Plus Shares | | | | | |
| Issued | 928,541 | 7,493 | | 743,171 | 7,460 |
| Issued in Lieu of Cash Distributions | 96,141 | 756 | | 73,092 | 705 |
| Redeemed | (1,087,945) | (8,842) | | (198,095) | (1,944) |
| Net Increase (Decrease)—Institutional Plus Shares | (63,263) | (593) | | 618,168 | 6,221 |
| 1 | In November 2018, the fund announced changes to the availability and minimum investment criteria of the Investor and Admiral share classes. As a result, all of the outstanding Investor Shares automatically converted to Admiral Shares beginning in April 2019. Investor Shares—Redeemed and Admiral Shares—Issued include 1,046 and 664 shares, respectively, in the amount of $22,000 from the conversion during the year ended October 31, 2020. |
| H. | Management has determined that no events or transactions occurred subsequent to October 31, 2021, that would require recognition or disclosure in these financial statements. |
FTSE All-World ex-US Small-Cap Index Fund
All of the returns in this report represent past performance, which is not a guarantee of future results that may be achieved by the fund. (Current performance may be lower or higher than the performance data cited. For performance data current to the most recent month-end, visit our website at vanguard.com/performance.) Note, too, that both investment returns and principal value can fluctuate widely, so an investor’s shares, when sold, could be worth more or less than their original cost. The returns shown do not reflect taxes that a shareholder would pay on fund distributions or on the sale of fund shares.
Cumulative Performance: October 31, 2011, Through October 31, 2021
Initial Investment of $10,000
| | | Average Annual Total Returns
Periods Ended October 31, 2021 | |
| | | One
Year | Five
Years | Ten
Years | Final Value
of a $10,000
Investment |
| FTSE All-World ex-US Small-Cap Index Fund
ETF Shares Net Asset Value | 37.35% | 10.30% | 7.84% | $21,277 |
| | FTSE All-World ex-US Small-Cap Index Fund ETF Shares Market Price | 38.05 | 10.29 | 7.94 | 21,461 |
| FTSE Global Small-Cap ex US Index | 37.68 | 10.14 | 7.63 | 20,869 |
| FTSE Global All Cap ex US Index | 30.96 | 10.06 | 7.09 | 19,836 |
| | | | |
| | | One
Year | Since
Inception
(2/7/2019) | Final Value
of a $10,000
Investment |
FTSE All-World ex-US Small-Cap Index Fund
Admiral Shares | 37.22% | 14.39% | $14,434 |
| FTSE Global Small-Cap ex US Index | 37.68 | 14.27 | 14,390 |
| FTSE Global All Cap ex US Index | 30.96 | 12.68 | 13,850 |
“Since Inception” performance is calculated from the Admiral Shares’ inception date for both the fund and its comparative standard(s).
See Financial Highlights for dividend and capital gains information.
FTSE All-World ex-US Small-Cap Index Fund
| | | Average Annual Total Returns
Periods Ended October 31, 2021 | |
| | | One
Year | Five
Years | Ten
Years | Final Value
of a $5,000,000
Investment |
FTSE All-World ex-US Small-Cap Index Fund
Institutional Shares | 37.29% | 10.29% | 7.85% | $10,641,455 |
| FTSE Global Small-Cap ex US Index | 37.68 | 10.14 | 7.63 | 10,434,420 |
| FTSE Global All Cap ex US Index | 30.96 | 10.06 | 7.09 | 9,918,026 |
Cumulative Returns of ETF Shares: October 31, 2011, Through October 31, 2021
| | One
Year | Five
Years | Ten
Years |
| FTSE All-World ex-US Small-Cap Index Fund ETF Shares Market Price | 38.05% | 63.15% | 114.61% |
| FTSE All-World ex-US Small-Cap Index Fund ETF Shares Net Asset Value | 37.35 | 63.24 | 112.77 |
| FTSE Global Small Cap ex US Index | 37.68 | 62.11 | 108.69 |
For the ETF Shares, the market price is determined by the midpoint of the bid-offer spread as of the closing time of the New York Stock Exchange (generally 4 p.m., Eastern time). The net asset value is also determined as of the NYSE closing time. For more information about how the ETF Shares' market prices have compared with their net asset value, visit vanguard.com, select your ETF, and then select the Price and Performance tab. The ETF premium/discount analysis there shows the percentages of days on which the ETF Shares' market price was above or below the NAV.
FTSE All-World ex-US Small-Cap Index Fund
| Canada | 15.5% |
| Japan | 13.1 |
| United Kingdom | 10.1 |
| Taiwan | 7.5 |
| China | 5.4 |
| Australia | 5.4 |
| Sweden | 4.9 |
| South Korea | 4.8 |
| India | 4.4 |
| Germany | 3.6 |
| Switzerland | 3.1 |
| France | 2.2 |
| Italy | 1.8 |
| Norway | 1.6 |
| Thailand | 1.3 |
| Denmark | 1.3 |
| Spain | 1.1 |
| Netherlands | 1.1 |
| Belgium | 1.1 |
| Hong Kong | 1.0 |
| Other | 9.7 |
The table reflects the fund’s investments, except for short-term investments and derivatives.
The fund may invest in derivatives (such as futures and swap contracts) for various reasons, including, but not limited to, attempting to remain fully invested and tracking its target index as closely as possible.
FTSE All-World ex-US Small-Cap Index Fund
The fund files its complete schedule of portfolio holdings with the Securities and Exchange Commission (SEC) for the first and third quarters of each fiscal year as an exhibit to its reports on Form N-PORT. The fund’s Form N-PORT reports are available on the SEC’s website at www.sec.gov.
| | | Shares | Market
Value•
($000) |
| Common Stocks (98.4%) |
| Australia (5.3%) |
| * | Lynas Rare Earths Ltd. | 3,309,985 | 18,465 |
| * | Pilbara Minerals Ltd. | 9,067,948 | 15,208 |
| * | Orocobre Ltd. | 2,041,867 | 13,790 |
| | Reliance Worldwide Corp. Ltd. | 2,993,435 | 13,162 |
| | Steadfast Group Ltd. | 3,415,549 | 12,017 |
| | Nine Entertainment Co. Holdings Ltd. | 5,616,015 | 11,761 |
| | Breville Group Ltd. | 518,627 | 11,544 |
| | ARB Corp. Ltd. | 275,357 | 10,142 |
| | National Storage REIT | 5,086,584 | 9,209 |
| | nib holdings Ltd. | 1,809,531 | 9,112 |
| | Eagers Automotive Ltd. | 751,695 | 8,446 |
| | Healius Ltd. | 2,257,414 | 8,266 |
| *,1 | Zip Co. Ltd. | 1,665,424 | 8,231 |
| | Premier Investments Ltd. | 345,213 | 8,012 |
| | Bapcor Ltd. | 1,325,900 | 7,997 |
| | Charter Hall Long Wale REIT | 2,121,155 | 7,782 |
| * | Corporate Travel Management Ltd. | 415,946 | 7,706 |
| | IRESS Ltd. | 800,374 | 7,296 |
| * | Megaport Ltd. | 532,517 | 7,207 |
| * | Uniti Group Ltd. | 2,326,030 | 7,169 |
| * | Imugene Ltd. | 18,259,180 | 6,874 |
| | Super Retail Group Ltd. | 681,856 | 6,689 |
| | Ingenia Communities Group | 1,332,401 | 6,588 |
| | Waypoint REIT | 3,174,192 | 6,544 |
| *,1 | Webjet Ltd. | 1,344,613 | 6,435 |
| | Link Administration Holdings Ltd. | 1,947,546 | 6,412 |
| 2 | Viva Energy Group Ltd. | 3,631,123 | 6,397 |
| | Charter Hall Retail REIT | 2,058,000 | 6,385 |
| | BWP Trust | 1,958,949 | 6,276 |
| * | Liontown Resources Ltd. | 4,260,961 | 6,143 |
| | Sandfire Resources Ltd. (XASX) | 1,440,898 | 6,070 |
| | | Shares | Market
Value•
($000) |
| | Pendal Group Ltd. | 1,165,522 | 5,895 |
| * | Perseus Mining Ltd. | 4,930,404 | 5,847 |
| | Technology One Ltd. | 607,763 | 5,644 |
| | Credit Corp. Group Ltd. | 232,755 | 5,537 |
| * | Champion Iron Ltd. | 1,654,339 | 5,526 |
| * | Chalice Mining Ltd. | 1,071,256 | 5,406 |
| | Centuria Capital Group | 2,208,672 | 5,368 |
| | Arena REIT | 1,572,324 | 5,351 |
| | Abacus Property Group | 1,953,519 | 5,276 |
| | InvoCare Ltd. | 612,489 | 5,248 |
| * | Paladin Energy Ltd. | 7,770,559 | 5,164 |
| | Aventus Group | 1,978,912 | 5,104 |
| | Clinuvel Pharmaceuticals Ltd. | 169,451 | 4,966 |
| | GrainCorp Ltd. Class A | 1,040,926 | 4,947 |
| | Lifestyle Communities Ltd. | 289,262 | 4,776 |
| | IPH Ltd. | 715,304 | 4,646 |
| | Brickworks Ltd. | 257,258 | 4,617 |
| | Bega Cheese Ltd. | 1,109,533 | 4,545 |
| *,1 | PointsBet Holdings Ltd. | 708,324 | 4,449 |
| * | Nanosonics Ltd. | 978,385 | 4,397 |
| | Blackmores Ltd. | 60,056 | 4,286 |
| | Elders Ltd. | 470,644 | 4,276 |
| * | Temple & Webster Group Ltd. | 443,715 | 4,275 |
| | Rural Funds Group | 2,030,939 | 4,263 |
| * | EVENT Hospitality and Entertainment Ltd. | 342,475 | 4,239 |
| * | Silver Lake Resources Ltd. | 3,199,997 | 4,052 |
| *,2 | Life360 Inc. GDR | 483,697 | 4,010 |
| * | De Grey Mining Ltd. | 4,717,859 | 3,925 |
| * | Tyro Payments Ltd. | 1,278,722 | 3,906 |
| | Australian Ethical Investment Ltd. | 377,628 | 3,902 |
| | Costa Group Holdings Ltd. (XASX) | 1,763,061 | 3,898 |
| | Ramelius Resources Ltd. | 3,218,035 | 3,839 |
| 1 | HUB24 Ltd. | 159,765 | 3,838 |
FTSE All-World ex-US Small-Cap Index Fund
| | | Shares | Market
Value•
($000) |
| | Gold Road Resources Ltd. | 3,633,995 | 3,769 |
| | Pinnacle Investment Management Group Ltd. | 288,289 | 3,749 |
| | Regis Resources Ltd. | 2,463,717 | 3,695 |
| | GUD Holdings Ltd. | 395,302 | 3,659 |
| | Cromwell Property Group | 5,797,737 | 3,548 |
| * | ioneer Ltd. | 6,664,252 | 3,449 |
| | Centuria Industrial REIT | 1,214,515 | 3,350 |
| | Nickel Mines Ltd. | 4,114,110 | 3,259 |
| | AUB Group Ltd. | 192,376 | 3,171 |
| | Netwealth Group Ltd. | 241,121 | 3,169 |
| | Collins Foods Ltd. | 325,726 | 3,162 |
| *,1 | PolyNovo Ltd. | 2,285,329 | 3,157 |
| | Codan Ltd. | 412,307 | 3,144 |
| | St. Barbara Ltd. | 2,843,033 | 3,126 |
| | Tassal Group Ltd. | 1,129,267 | 3,025 |
| * | Australian Strategic Materials Ltd. | 366,814 | 2,948 |
| | Monadelphous Group Ltd. | 382,029 | 2,914 |
| * | Vulcan Energy Resources Ltd. | 299,596 | 2,858 |
| | Lovisa Holdings Ltd. | 166,541 | 2,745 |
| | Charter Hall Social Infrastructure REIT | 950,138 | 2,734 |
| | Home Consortium Ltd. | 452,676 | 2,707 |
| * | West African Resources Ltd. | 2,765,844 | 2,687 |
| * | EML Payments Ltd. | 1,190,342 | 2,671 |
| *,2 | Coronado Global Resources Inc. GDR | 2,590,935 | 2,670 |
| | Western Areas Ltd. | 1,108,837 | 2,655 |
| * | Omni Bridgeway Ltd. | 1,083,987 | 2,547 |
| | Imdex Ltd. | 1,147,694 | 2,480 |
| | United Malt Grp Ltd. | 789,554 | 2,416 |
| | Growthpoint Properties Australia Ltd. | 766,649 | 2,406 |
| * | Telix Pharmaceuticals Ltd. | 526,322 | 2,404 |
| | Genworth Mortgage Insurance Australia Ltd. | 1,363,075 | 2,368 |
| | Centuria Office REIT | 1,270,897 | 2,306 |
| *,1 | Mesoblast Ltd. | 1,914,767 | 2,305 |
| | Hansen Technologies Ltd. | 481,648 | 2,300 |
| | GWA Group Ltd. | 1,109,708 | 2,278 |
| | Perenti Global Ltd. | 2,936,950 | 2,274 |
| * | Betmakers Technology Group Ltd. | 2,405,374 | 2,235 |
| | Select Harvests Ltd. | 388,932 | 2,174 |
| * | nearmap Ltd. | 1,284,630 | 2,152 |
| | SeaLink Travel Group Ltd. | 381,134 | 2,111 |
| *,1 | Redbubble Ltd. | 661,592 | 2,078 |
| * | oOh!media Ltd. | 1,508,632 | 2,071 |
| | | Shares | Market
Value•
($000) |
| 1 | Kogan.com Ltd. | 274,192 | 2,067 |
| * | Dubber Corp. Ltd. | 881,413 | 2,031 |
| | Dexus Industria REIT | 793,724 | 2,020 |
| | NRW Holdings Ltd. | 1,438,183 | 1,995 |
| | Austal Ltd. | 1,376,274 | 1,956 |
| * | City Chic Collective Ltd. | 415,611 | 1,945 |
| | Jumbo Interactive Ltd. | 151,924 | 1,917 |
| * | Bellevue Gold Ltd. | 2,977,035 | 1,917 |
| | GDI Property Group | 2,151,684 | 1,897 |
| * | Karoon Energy Ltd. | 1,353,998 | 1,863 |
| * | Capricorn Metals Ltd. | 947,022 | 1,829 |
| | Dicker Data Ltd. | 155,957 | 1,768 |
| | Data#3 Ltd. | 408,981 | 1,753 |
| | Johns Lyng Group Ltd. | 348,080 | 1,701 |
| | Accent Group Ltd. | 899,436 | 1,684 |
| | Pact Group Holdings Ltd. | 692,987 | 1,619 |
| * | Eclipx Group Ltd. | 810,235 | 1,529 |
| * | PPK Group Ltd. | 154,481 | 1,523 |
| | Bravura Solutions Ltd. | 716,595 | 1,510 |
| | McMillan Shakespeare Ltd. | 142,083 | 1,470 |
| | SmartGroup Corp. Ltd. | 237,320 | 1,437 |
| * | Syrah Resources Ltd. | 1,488,737 | 1,419 |
| | Inghams Group Ltd. | 504,705 | 1,416 |
| | Senex Energy Ltd. | 418,980 | 1,400 |
| * | Nuix Ltd. | 586,756 | 1,373 |
| | Integral Diagnostics Ltd. | 386,811 | 1,368 |
| | Australian Pharmaceutical Industries Ltd. | 1,178,092 | 1,338 |
| | BWX Ltd. | 375,458 | 1,320 |
| * | Resolute Mining Ltd. | 4,128,623 | 1,297 |
| | Hotel Property Investments | 480,470 | 1,297 |
| * | Audinate Group Ltd. | 201,707 | 1,292 |
| | HomeCo Daily Needs REIT | 1,159,982 | 1,259 |
| * | Fineos Corp. Ltd. GDR | 410,160 | 1,237 |
| | Westgold Resources Ltd. | 844,749 | 1,236 |
| | Service Stream Ltd. | 1,856,334 | 1,227 |
| | Sigma Healthcare Ltd. | 2,837,086 | 1,217 |
| * | Starpharma Holdings Ltd. Class A | 1,519,254 | 1,206 |
| | Emeco Holdings Ltd. | 1,448,102 | 1,205 |
| *,1 | Andromeda Metals Ltd. | 8,773,303 | 1,163 |
| | Baby Bunting Group Ltd. | 260,291 | 1,160 |
| | MyState Ltd. | 288,709 | 1,133 |
| *,1 | Carnarvon Petroleum Ltd. | 4,076,002 | 1,046 |
| * | Opthea Ltd. | 1,079,277 | 1,044 |
| | Money3 Corp. Ltd. | 413,869 | 1,039 |
FTSE All-World ex-US Small-Cap Index Fund
| | | Shares | Market
Value•
($000) |
| | Estia Health Ltd. | 650,341 | 1,028 |
| *,1 | Paradigm Biopharmaceuticals Ltd. | 662,333 | 1,028 |
| * | Seven West Media Ltd. | 2,973,552 | 1,026 |
| * | G8 Education Ltd. | 1,234,345 | 1,026 |
| | Infomedia Ltd. | 981,063 | 1,022 |
| *,1 | Electro Optic Systems Holdings Ltd. | 415,113 | 1,000 |
| * | Australian Agricultural Co. Ltd. | 836,792 | 995 |
| * | Aurelia Metals Ltd. | 3,454,216 | 983 |
| | Southern Cross Media Group Ltd. | 531,188 | 932 |
| 1 | New Hope Corp. Ltd. | 607,726 | 921 |
| * | Superloop Ltd. | 890,463 | 866 |
| * | Alkane Resources Ltd. | 1,259,105 | 845 |
| * | Cooper Energy Ltd. | 3,667,402 | 801 |
| * | Japara Healthcare Ltd. | 757,762 | 798 |
| | Australian Finance Group Ltd. | 392,380 | 780 |
| | Cedar Woods Properties Ltd. | 166,885 | 752 |
| | Virtus Health Ltd. | 177,850 | 745 |
| *,1 | Bubs Australia Ltd. | 1,900,114 | 741 |
| | OFX Group Ltd. | 616,521 | 739 |
| | Macmahon Holdings Ltd. | 4,603,805 | 712 |
| | Jupiter Mines Ltd. | 3,864,808 | 683 |
| *,1 | Humm Group Ltd. | 987,817 | 659 |
| | SG Fleet Group Ltd. | 331,373 | 637 |
| * | Marley Spoon AG GDR | 788,189 | 609 |
| | Mount Gibson Iron Ltd. | 1,900,989 | 605 |
| 1 | Regis Healthcare Ltd. | 357,557 | 529 |
| *,1 | AMA Group Ltd. | 1,406,052 | 517 |
| | MACA Ltd. | 734,211 | 424 |
| *,1 | New Century Resources Ltd. | 2,073,021 | 242 |
| * | Myer Holdings Ltd. | 482,573 | 197 |
| * | Minerals 260 Ltd. | 356,719 | 125 |
| * | Mayne Pharma Group Ltd. | 247,008 | 63 |
| | Navigator Global Investments Ltd. | 14,500 | 20 |
| * | Juno Minerals Ltd. | 168,843 | 17 |
| | Vita Group Ltd. | 11,182 | 7 |
| | | | 634,876 |
| Austria (0.7%) |
| 2 | BAWAG Group AG | 236,043 | 14,846 |
| | Wienerberger AG | 415,393 | 14,705 |
| | IMMOFINANZ AG | 335,650 | 8,038 |
| | CA Immobilien Anlagen AG (XWBO) | 147,883 | 6,345 |
| * | Lenzing AG | 51,623 | 6,225 |
| | Oesterreichische Post AG | 126,187 | 5,327 |
| | S IMMO AG | 214,538 | 5,089 |
| | | Shares | Market
Value•
($000) |
| | Mayr Melnhof Karton AG | 25,762 | 5,071 |
| | UNIQA Insurance Group AG | 449,882 | 4,188 |
| | Vienna Insurance Group AG Wiener Versicherung Gruppe | 120,550 | 3,512 |
| | AT&S Austria Technologie & Systemtechnik AG | 80,654 | 3,095 |
| | EVN AG | 100,266 | 2,831 |
| * | Schoeller-Bleckmann Oilfield Equipment AG | 67,918 | 2,770 |
| | Strabag SE (Bearer) | 44,045 | 1,891 |
| * | DO & CO AG | 20,111 | 1,822 |
| | Palfinger AG | 27,158 | 1,200 |
| * | Flughafen Wien AG | 27,428 | 904 |
| | Agrana Beteiligungs AG | 30,733 | 649 |
| *,1 | Porr AG | 26,516 | 381 |
| * | Porr AG Rights Exp.11/3/2021 | 26,516 | 4 |
| *,3 | CA Immobilien Anlagen AG | 255,953 | — |
| | | | 88,893 |
| Belgium (1.1%) |
| | Aedifica SA | 128,972 | 17,198 |
| | Cofinimmo SA | 98,486 | 15,889 |
| | Euronav NV | 769,794 | 8,192 |
| | Melexis NV | 69,606 | 8,028 |
| | Montea NV | 53,798 | 7,985 |
| | KBC Ancora | 136,690 | 7,127 |
| | VGP NV | 23,555 | 6,092 |
| | Bekaert SA | 137,821 | 6,037 |
| | Barco NV | 265,785 | 5,991 |
| | Gimv NV | 69,187 | 4,470 |
| | Shurgard Self Storage SA | 67,935 | 4,164 |
| | Fagron | 238,181 | 4,130 |
| * | Tessenderlo Group SA | 107,783 | 3,933 |
| | Befimmo SA | 92,585 | 3,787 |
| | Xior Student Housing NV | 63,682 | 3,766 |
| * | bpost SA | 387,489 | 3,320 |
| * | AGFA-Gevaert NV | 761,704 | 3,312 |
| * | Ontex Group NV | 309,257 | 2,916 |
| * | Kinepolis Group NV | 38,081 | 2,399 |
| | Retail Estates NV | 29,801 | 2,387 |
| | Cie d'Entreprises CFE | 18,447 | 1,886 |
| | Orange Belgium SA | 70,205 | 1,592 |
| | Econocom Group SA NV | 345,502 | 1,461 |
| *,1 | Mithra Pharmaceuticals SA | 64,956 | 1,427 |
| | Van de Velde NV | 15,329 | 532 |
| | Wereldhave Belgium Comm VA | 6,639 | 374 |
| | | | 128,395 |
FTSE All-World ex-US Small-Cap Index Fund
| | | Shares | Market
Value•
($000) |
| Brazil (0.7%) |
| * | GRUPO DE MODA SOMA SA | 1,601,662 | 3,723 |
| | Pet Center Comercio E Participacoes SA | 912,143 | 3,034 |
| | CSHG Logistica FI Imobiliario | 95,363 | 2,822 |
| | Kinea Indice de Precos FII | 151,563 | 2,755 |
| | Arezzo Industria e Comercio SA | 206,015 | 2,697 |
| * | Omega Geracao SA | 449,522 | 2,607 |
| | SLC Agricola SA | 319,800 | 2,469 |
| | Light SA | 1,377,200 | 2,362 |
| | MRV Engenharia e Participacoes SA | 1,307,692 | 2,352 |
| | Minerva SA | 1,343,767 | 2,319 |
| * | Gol Linhas Aereas Inteligentes SA Preference Shares | 861,855 | 2,318 |
| | Iguatemi Empresa de Shopping Centers SA | 426,430 | 2,262 |
| | Cia de Saneamento do Parana | 689,200 | 2,229 |
| | Kinea Rendimentos Imobiliarios FII | 128,116 | 2,211 |
| * | Santos Brasil Participacoes SA | 2,407,705 | 2,197 |
| * | CVC Brasil Operadora e Agencia de Viagens SA | 757,768 | 2,144 |
| | Kinea Renda Imobiliaria FII | 85,830 | 2,063 |
| | Unipar Carbocloro SA Preference Shares | 152,426 | 2,017 |
| | Construtora Tenda SA | 496,584 | 1,501 |
| | Cia de Saneamento de Minas Gerais-COPASA | 603,723 | 1,456 |
| * | Anima Holding SA | 1,239,931 | 1,450 |
| * | Iochpe Maxion SA | 452,544 | 1,345 |
| | Alupar Investimento SA | 313,009 | 1,317 |
| | Cia Ferro Ligas da Bahia - FERBASA Preference Shares | 152,000 | 1,277 |
| * | EcoRodovias Infraestrutura e Logistica SA | 859,861 | 1,248 |
| | Banco do Estado do Rio Grande do Sul SA Class B Preference Shares | 633,300 | 1,222 |
| | Intelbras SA Industria de Telecomunicacao Eletronica Brasileira | 251,600 | 1,173 |
| | Mahle-Metal Leve SA | 194,000 | 1,171 |
| | Vivara Participacoes SA | 253,200 | 1,164 |
| | | Shares | Market
Value•
($000) |
| | Boa Vista Servicos SA | 696,600 | 1,127 |
| | Lojas Quero Quero SA | 548,800 | 1,126 |
| | Ambipar Participacoes e Empreendimentos SA | 167,400 | 1,096 |
| * | Grupo SBF SA | 291,400 | 1,081 |
| 2 | Meliuz SA | 1,697,764 | 996 |
| | Movida Participacoes SA | 362,900 | 955 |
| | AES Brasil Energia SA | 486,591 | 940 |
| * | Aeris Industria E Comercio De Equipamentos Para Geracao De Energia SA | 669,100 | 934 |
| * | BK Brasil Operacao e Assessoria a Restaurantes SA | 759,683 | 925 |
| | LOG Commercial Properties e Participacoes SA | 222,765 | 925 |
| | Randon SAImplementos E Participacoes Preference Shares | 476,688 | 858 |
| | Marcopolo SA Preference Shares | 1,739,532 | 798 |
| | MPM Corporeos SA | 455,600 | 789 |
| | JHSF Participacoes SA | 885,200 | 783 |
| | Camil Alimentos SA | 414,100 | 710 |
| | Jereissati Participacoes SA | 150,600 | 704 |
| * | Hidrovias do Brasil SA | 1,323,400 | 699 |
| | BR Properties SA | 546,406 | 698 |
| | Tupy SA | 184,931 | 684 |
| | Instituto Hermes Pardini SA | 172,400 | 671 |
| | Wiz Solucoes e Corretagem de Seguros SA | 340,900 | 583 |
| * | Sequoia Logistica E Transportes SA | 241,400 | 556 |
| | Enauta Participacoes SA | 245,100 | 555 |
| 2 | Ser Educacional SA | 189,598 | 351 |
| | Direcional Engenharia SA | 206,894 | 350 |
| | Even Construtora e Incorporadora SA | 301,022 | 332 |
| * | C&a Modas Ltda | 280,600 | 301 |
| * | Empreendimentos Pague Menos S/A | 39,395 | 66 |
| * | Vamos Locacao de Caminhoes Maquinas e Equipamentos SA | 11,012 | 22 |
| | | | 79,520 |
| Canada (15.3%) |
| | WSP Global Inc. | 416,009 | 56,398 |
| | Open Text Corp. | 949,800 | 47,843 |
FTSE All-World ex-US Small-Cap Index Fund
| | | Shares | Market
Value•
($000) |
| | First Quantum Minerals Ltd. | 2,005,477 | 47,479 |
| * | Lightspeed Commerce Inc. | 432,832 | 42,189 |
| | Kirkland Lake Gold Ltd. | 969,808 | 40,881 |
| 1 | Emera Inc. | 869,279 | 40,444 |
| | Tourmaline Oil Corp. | �� 987,357 | 35,686 |
| | TFI International Inc. | 320,735 | 35,564 |
| | Cameco Corp. | 1,443,090 | 35,063 |
| * | CAE Inc. | 1,054,737 | 31,985 |
| | West Fraser Timber Co. Ltd. | 392,727 | 31,444 |
| | Algonquin Power & Utilities Corp. | 2,114,339 | 30,478 |
| | Canadian Apartment Properties REIT | 604,353 | 29,510 |
| | CCL Industries Inc. Class B | 523,916 | 28,638 |
| | Kinross Gold Corp. | 4,551,827 | 27,364 |
| *,2 | Nuvei Corp. | 223,682 | 26,883 |
| | Ritchie Bros Auctioneers Inc. | 392,087 | 26,799 |
| | FirstService Corp. | 133,221 | 26,571 |
| | Gildan Activewear Inc. | 707,095 | 25,973 |
| | Northland Power Inc. | 788,550 | 25,353 |
| * | Descartes Systems Group Inc. | 310,138 | 25,328 |
| | Toromont Industries Ltd. | 280,421 | 24,949 |
| | ARC Resources Ltd. | 2,458,500 | 23,580 |
| | Stantec Inc. | 396,735 | 21,927 |
| | iA Financial Corp. Inc. | 368,366 | 21,791 |
| 1 | Keyera Corp. | 825,239 | 21,151 |
| | RioCan REIT | 1,138,134 | 20,499 |
| | Lundin Mining Corp. | 2,341,221 | 20,374 |
| | TMX Group Ltd. | 186,579 | 20,200 |
| | AltaGas Ltd. | 967,800 | 20,035 |
| *,1 | BlackBerry Ltd. | 1,844,339 | 19,925 |
| | Pan American Silver Corp. | 750,510 | 19,205 |
| | Onex Corp. | 255,433 | 19,036 |
| | Brookfield Renewable Corp. Class A (XTSE) | 453,878 | 18,799 |
| | Finning International Inc. | 601,969 | 17,822 |
| | GFL Environmental Inc. | 424,613 | 17,460 |
| | Element Fleet Management Corp. | 1,597,333 | 17,360 |
| | Empire Co. Ltd. Class A | 579,909 | 17,337 |
| | SNC-Lavalin Group Inc. | 636,844 | 17,130 |
| | Granite REIT | 210,997 | 17,103 |
| *,1 | Ballard Power Systems Inc. | 910,302 | 16,498 |
| | Colliers International Group Inc. | 112,207 | 16,278 |
| | CI Financial Corp. | 708,993 | 16,167 |
| * | Ivanhoe Mines Ltd. Class A | 2,032,863 | 15,950 |
| | Parkland Corp. | 545,401 | 15,869 |
| | B2Gold Corp. | 3,795,523 | 15,672 |
| | | Shares | Market
Value•
($000) |
| * | Kinaxis Inc. | 100,662 | 15,623 |
| 1 | Allied Properties REIT | 442,418 | 15,289 |
| | Quebecor Inc. Class B | 592,869 | 15,109 |
| | Boyd Group Services Inc. | 77,465 | 15,035 |
| | H&R REIT | 1,059,845 | 14,567 |
| | Yamana Gold Inc. | 3,552,198 | 13,949 |
| | Capital Power Corp. | 387,225 | 12,719 |
| | SSR Mining Inc. | 802,369 | 12,655 |
| * | Bombardier Inc. Class B | 7,765,545 | 12,487 |
| | Premium Brands Holdings Corp. Class A | 115,398 | 12,471 |
| * | Aritzia Inc. | 304,493 | 11,992 |
| | SmartCentres REIT | 474,919 | 11,969 |
| | Brookfield Infrastructure Corp. Class A | 196,762 | 11,927 |
| | First Capital REIT | 809,966 | 11,571 |
| | BRP Inc. | 130,147 | 11,444 |
| | Gibson Energy Inc. | 559,976 | 11,285 |
| * | Air Canada Class A | 615,866 | 11,042 |
| | TransAlta Corp. | 975,928 | 10,945 |
| | Alamos Gold Inc. Class A | 1,469,327 | 10,899 |
| | Choice Properties REIT | 866,111 | 10,421 |
| | Crescent Point Energy Corp. | 2,067,378 | 10,390 |
| * | MEG Energy Corp. | 1,155,202 | 10,352 |
| | Methanex Corp. | 229,103 | 10,263 |
| | PrairieSky Royalty Ltd. | 820,120 | 10,092 |
| | Primo Water Corp. | 618,555 | 9,846 |
| | Boralex Inc. Class A | 316,339 | 9,790 |
| 1 | First Majestic Silver Corp. | 766,656 | 9,713 |
| 1 | Cargojet Inc. | 60,119 | 9,572 |
| * | ATS Automation Tooling Systems Inc. | 275,010 | 9,357 |
| | Parex Resources Inc. | 472,176 | 9,168 |
| | Linamar Corp. | 165,019 | 9,076 |
| | Atco Ltd. Class I | 263,288 | 8,935 |
| | Stella-Jones Inc. | 245,331 | 8,807 |
| | Canadian Western Bank | 274,165 | 8,770 |
| * | Pretium Resources Inc. | 708,787 | 8,574 |
| | Innergex Renewable Energy Inc. | 512,295 | 8,527 |
| | Enerplus Corp. | 899,342 | 8,517 |
| | Osisko Gold Royalties Ltd. | 640,932 | 8,095 |
| | ECN Capital Corp. | 891,511 | 7,751 |
| | Chartwell Retirement Residences | 792,894 | 7,650 |
| | Whitecap Resources Inc. | 1,201,146 | 7,211 |
| * | Canada Goose Holdings Inc. | 193,115 | 7,162 |
| | Superior Plus Corp. | 627,413 | 6,981 |
| 1 | Boardwalk REIT | 160,598 | 6,928 |
FTSE All-World ex-US Small-Cap Index Fund
| | | Shares | Market
Value•
($000) |
| * | Home Capital Group Inc. Class B | 210,720 | 6,838 |
| | Enghouse Systems Ltd. | 153,927 | 6,675 |
| * | Equinox Gold Corp. | 878,352 | 6,515 |
| | Russel Metals Inc. | 246,651 | 6,503 |
| * | Novagold Resources Inc. | 888,173 | 6,488 |
| | Centerra Gold Inc. | 816,915 | 6,126 |
| | Cominar REIT | 646,974 | 6,038 |
| * | Eldorado Gold Corp. | 662,123 | 5,923 |
| | Hudbay Minerals Inc. | 839,500 | 5,854 |
| | Stelco Holdings Inc. | 167,774 | 5,825 |
| 1 | TransAlta Renewables Inc. | 390,858 | 5,786 |
| | Maple Leaf Foods Inc. | 252,015 | 5,494 |
| * | IAMGOLD Corp. | 1,887,476 | 5,201 |
| * | OceanaGold Corp. | 2,682,005 | 5,006 |
| | North West Co. Inc. | 180,475 | 4,904 |
| | Artis REIT | 508,351 | 4,814 |
| 1 | NFI Group Inc. | 226,906 | 4,598 |
| * | Turquoise Hill Resources Ltd. | 360,796 | 4,571 |
| * | Canfor Corp. | 216,088 | 4,477 |
| 1 | Transcontinental Inc. Class A | 282,092 | 4,468 |
| | Laurentian Bank of Canada | 131,265 | 4,420 |
| | Dye & Durham Ltd. | 140,320 | 4,294 |
| | Cascades Inc. | 365,787 | 4,238 |
| * | Celestica Inc. | 409,333 | 4,035 |
| * | Torex Gold Resources Inc. | 346,095 | 4,024 |
| 1 | Dream Office REIT | 199,727 | 3,768 |
| *,1 | Cronos Group Inc. | 708,400 | 3,675 |
| | Mullen Group Ltd. | 327,523 | 3,387 |
| | Martinrea International Inc. | 340,630 | 3,162 |
| | Westshore Terminals Investment Corp. | 138,113 | 2,987 |
| | Aecon Group Inc. | 191,889 | 2,862 |
| * | Vermilion Energy Inc. | 261,627 | 2,837 |
| | Winpak Ltd. | 88,871 | 2,781 |
| * | Lightspeed Commerce Inc. | 26,475 | 2,586 |
| | Cogeco Communications Inc. | 28,819 | 2,475 |
| *,1 | Aurora Cannabis Inc. | 343,140 | 2,276 |
| | First National Financial Corp. | 45,007 | 1,515 |
| | GFL Environmental Inc. (XTSE) | 11,088 | 456 |
| | | | 1,822,798 |
| Chile (0.1%) |
| | Aguas Andinas SA Class A | 9,072,363 | 1,729 |
| | Vina Concha y Toro SA | 1,097,238 | 1,596 |
| | SMU SA | 15,513,217 | 1,544 |
| * | Latam Airlines Group SA | 932,195 | 1,360 |
| | Engie Energia Chile SA | 1,509,469 | 877 |
| | | Shares | Market
Value•
($000) |
| | Salfacorp SA | 1,856,338 | 629 |
| * | Ripley Corp. SA | 2,758,809 | 467 |
| | | | 8,202 |
| China (5.3%) |
| * | Daqo New Energy Corp. ADR | 197,394 | 15,355 |
| | Chinasoft International Ltd. | 8,056,304 | 13,452 |
| *,2 | Weimob Inc. | 6,958,000 | 10,627 |
| 1 | Dongyue Group Ltd. | 3,891,000 | 9,053 |
| *,1 | JinkoSolar Holding Co. Ltd. ADR | 126,206 | 7,550 |
| * | Canadian Solar Inc. | 171,086 | 7,109 |
| * | Vnet Group Inc. ADR | 425,600 | 6,673 |
| * | Noah Holdings Ltd. ADR | 143,654 | 6,107 |
| | China Yongda Automobiles Services Holdings Ltd. | 3,673,000 | 5,844 |
| 1 | Xtep International Holdings Ltd. | 4,224,879 | 5,525 |
| * | Hollysys Automation Technologies Ltd. | 261,924 | 5,225 |
| *,2 | InnoCare Pharma Ltd. | 2,135,000 | 5,120 |
| | China Suntien Green Energy Corp. Ltd. Class H | 6,304,762 | 5,011 |
| | China Grand Pharmaceutical and Healthcare Holdings Ltd. Class A | 5,784,240 | 4,632 |
| *,1,2 | Alphamab Oncology | 2,242,000 | 4,600 |
| | China Overseas Property Holdings Ltd. | 5,075,000 | 4,559 |
| *,1,2 | Venus MedTech Hangzhou Inc. Class H | 977,000 | 4,522 |
| | China Education Group Holdings Ltd. | 2,592,000 | 4,431 |
| | CIFI Ever Sunshine Services Group Ltd. | 2,436,000 | 4,347 |
| *,1 | XD Inc. | 759,600 | 4,300 |
| *,2 | Yidu Tech Inc. | 1,336,900 | 4,266 |
| *,2 | Kintor Pharmaceutical Ltd. | 845,500 | 4,219 |
| | China Water Affairs Group Ltd. | 3,963,600 | 4,074 |
| | Xinyi Energy Holdings Ltd. | 6,616,000 | 3,901 |
| * | Lifetech Scientific Corp. | 8,400,058 | 3,901 |
| | Fu Shou Yuan International Group Ltd. | 4,390,000 | 3,769 |
| * | Niu Technologies ADR | 142,894 | 3,741 |
| | CGN New Energy Holdings Co. Ltd. | 3,894,720 | 3,645 |
| *,1 | Canaan Inc. ADR | 425,309 | 3,645 |
| | Greentown Service Group Co. Ltd. | 3,650,000 | 3,613 |
FTSE All-World ex-US Small-Cap Index Fund
| | | Shares | Market
Value•
($000) |
| *,2 | Peijia Medical Ltd. | 1,432,000 | 3,489 |
| | China Datang Corp Renewable Power Co. Ltd. Class H | 8,119,000 | 3,435 |
| * | Skyworth Group Ltd. | 6,158,710 | 3,431 |
| 1,2 | Zhou Hei Ya International Holdings Co. Ltd. | 3,801,500 | 3,417 |
| * | Baozun Inc. Class A | 577,770 | 3,335 |
| * | Hainan Meilan International Airport Co. Ltd. Class H | 819,000 | 3,314 |
| 1 | Ausnutria Dairy Corp. Ltd. | 2,614,000 | 3,270 |
| | Sany Heavy Equipment International Holdings Co. Ltd. | 2,844,000 | 3,236 |
| | FinVolution Group ADR | 524,860 | 3,212 |
| | Sihuan Pharmaceutical Holdings Group Ltd. | 15,112,000 | 3,171 |
| | COFCO Meat Holdings Ltd. | 8,183,000 | 3,167 |
| 1 | Tianneng Power International Ltd. | 2,586,468 | 2,953 |
| * | Sohu.com Ltd. ADR | 142,785 | 2,893 |
| | Digital China Holdings Ltd. | 5,241,588 | 2,826 |
| 2 | Genertec Universal Medical Group Co. Ltd. | 3,715,809 | 2,803 |
| 1 | SSY Group Ltd. | 5,889,324 | 2,798 |
| | China SCE Group Holdings Ltd. | 8,888,000 | 2,772 |
| | China Risun Group Ltd. | 4,433,000 | 2,702 |
| *,1 | Shanghai Fudan Microelectronics Group Co. Ltd. Class H | 982,000 | 2,690 |
| | Hangzhou Steam Turbine Co. Ltd. Class B | 1,310,670 | 2,681 |
| | China Oriental Group Co. Ltd. | 9,516,000 | 2,678 |
| | CIMC Enric Holdings Ltd. | 2,082,000 | 2,677 |
| *,1 | EHang Holdings Ltd. ADR | 110,656 | 2,670 |
| 1 | Tiangong International Co. Ltd. | 4,388,000 | 2,640 |
| | NetDragon Websoft Holdings Ltd. | 1,195,590 | 2,619 |
| | Differ Group Holding Co. Ltd. | 10,818,000 | 2,610 |
| *,1,2 | China Logistics Property Holdings Co. Ltd. | 4,719,000 | 2,535 |
| | Suzhou TA&A Ultra Clean Technology Co. Ltd. Class A | 151,300 | 2,519 |
| | Q Technology Group Co. Ltd. | 1,697,000 | 2,477 |
| | | Shares | Market
Value•
($000) |
| | Gemdale Properties & Investment Corp. Ltd. | 25,110,000 | 2,444 |
| 1 | Yuexiu REIT | 5,565,207 | 2,426 |
| *,3 | GCL-Poly Energy Holdings Ltd. | 9,191,000 | 2,339 |
| | Fire Rock Holdings Ltd. | 7,352,000 | 2,319 |
| * | Genetron Holdings Ltd. ADR | 166,816 | 2,297 |
| | Fufeng Group Ltd. | 6,632,864 | 2,296 |
| | Ming Yang Smart Energy Group Ltd. Class A | 472,500 | 2,287 |
| | Lonking Holdings Ltd. | 7,737,313 | 2,258 |
| 1,2 | Hope Education Group Co. Ltd. | 12,562,000 | 2,240 |
| * | LexinFintech Holdings Ltd. ADR | 416,110 | 2,222 |
| | C&D International Investment Group Ltd. | 1,192,000 | 2,219 |
| | Greatview Aseptic Packaging Co. Ltd. | 5,339,000 | 2,193 |
| 1,2 | Viva Biotech Holdings | 2,869,500 | 2,164 |
| | Jiangsu Jiangyin Rural Commercial Bank Co. Ltd. Class A | 3,607,139 | 2,154 |
| | China Zhenhua Group Science & Technology Co. Ltd. Class A | 132,400 | 2,144 |
| 1 | Zhenro Properties Group Ltd. | 4,396,000 | 2,089 |
| | Tong Ren Tang Technologies Co. Ltd. Class H | 2,938,516 | 2,085 |
| | China BlueChemical Ltd. Class H | 6,202,000 | 2,074 |
| | Hubei Xingfa Chemicals Group Co. Ltd. Class A | 265,700 | 2,065 |
| 1,2 | China Yuhua Education Corp. Ltd. | 4,528,000 | 2,052 |
| *,1 | Comba Telecom Systems Holdings Ltd. | 7,215,959 | 2,009 |
| *,1,2 | Ascentage Pharma Group International | 538,700 | 2,000 |
| * | Chengxin Lithium Group Co. Ltd. Class A | 221,200 | 1,998 |
| | Western Region Gold Co. Ltd. Class A | 1,101,667 | 1,996 |
| | Guangxi Wuzhou Communications Co. Ltd. Class A | 3,466,220 | 1,972 |
| 2 | China Renaissance Holdings Ltd. | 813,100 | 1,965 |
FTSE All-World ex-US Small-Cap Index Fund
| | | Shares | Market
Value•
($000) |
| | Guangdong Provincial Expressway Development Co. Ltd. Class B | 2,650,494 | 1,866 |
| *,1 | Yeahka Ltd. | 612,000 | 1,848 |
| * | Shanxi Meijin Energy Co. Ltd. Class A | 1,037,300 | 1,832 |
| | Concord New Energy Group Ltd. | 17,120,000 | 1,805 |
| | Shanghai Medicilon Inc. Class A | 15,737 | 1,801 |
| | Chengdu Fusen Noble-House Industrial Co. Ltd. Class A | 904,096 | 1,770 |
| 1,2 | Midea Real Estate Holding Ltd. | 1,023,000 | 1,766 |
| | Hexing Electrical Co. Ltd. Class A | 950,462 | 1,748 |
| | Zhongyu Gas Holdings Ltd. | 1,795,000 | 1,720 |
| | Sunflower Pharmaceutical Group Co. Ltd. Class A | 759,571 | 1,697 |
| *,2 | CStone Pharmaceuticals | 1,362,000 | 1,678 |
| | Hisense Home Appliances Group Co. Ltd. Class A | 918,889 | 1,675 |
| | Apeloa Pharmaceutical Co. Ltd. Class A | 307,700 | 1,670 |
| 1 | Zhuguang Holdings Group Co. Ltd. | 7,576,000 | 1,664 |
| 3 | PAX Global Technology Ltd. | 2,388,062 | 1,655 |
| 2 | AK Medical Holdings Ltd. | 1,590,000 | 1,649 |
| | Xiamen Faratronic Co. Ltd. Class A | 54,400 | 1,644 |
| | China Overseas Grand Oceans Group Ltd. | 3,378,500 | 1,620 |
| | CMGE Technology Group Ltd. | 4,129,200 | 1,610 |
| * | DouYu International Holdings Ltd. ADR | 506,532 | 1,596 |
| | Poly Property Group Co. Ltd. | 6,429,000 | 1,586 |
| *,1 | Kaisa Group Holdings Ltd. | 10,325,268 | 1,586 |
| | Titan Wind Energy Suzhou Co. Ltd. Class A | 473,200 | 1,575 |
| | Shanghai Shyndec Pharmaceutical Co. Ltd. Class A | 1,074,331 | 1,567 |
| | Bafang Electric Suzhou Co. Ltd. Class A | 42,000 | 1,566 |
| *,2 | Mobvista Inc. | 1,612,000 | 1,564 |
| *,2 | Meitu Inc. | 7,095,000 | 1,548 |
| | Shenzhen Senior Technology Material Co. Ltd. Class A | 180,744 | 1,512 |
| | | Shares | Market
Value•
($000) |
| *,2 | Ocumension Therapeutics | 696,000 | 1,512 |
| | YongXing Special Materials Technology Co. Ltd. Class A | 89,500 | 1,498 |
| 2 | Simcere Pharmaceutical Group Ltd. | 1,436,000 | 1,496 |
| | Shenzhen Kedali Industry Co. Ltd. Class A | 55,000 | 1,491 |
| | Beijing Bei Mo Gao Ke Friction Material Co. Ltd. Class A | 85,910 | 1,483 |
| | Sailun Group Co. Ltd. Class A | 702,394 | 1,466 |
| | Rongsheng Petrochemical Co. Ltd. Class A | 1,627,686 | 1,464 |
| | Shanghai Tongji Science & Technology Industrial Co. Ltd. Class A | 1,206,540 | 1,453 |
| | Beijing Easpring Material Technology Co. Ltd. Class A | 103,200 | 1,429 |
| | Luoyang Xinqianglian Slewing Bearing Co. Ltd. Class A | 40,100 | 1,428 |
| | China Minmetals Rare Earth Co. Ltd. Class A | 240,200 | 1,425 |
| * | Youdao Inc. ADR | 115,329 | 1,416 |
| * | Sichuan New Energy Power Co. Ltd. | 316,500 | 1,411 |
| * | Burning Rock Biotech Ltd. ADR | 99,519 | 1,402 |
| | China Dongxiang Group Co. Ltd. | 13,285,000 | 1,396 |
| | Tianjin Guangyu Development Co. Ltd. Class A | 527,100 | 1,379 |
| | Zhejiang HangKe Technology Inc. Co. Class A | 82,385 | 1,334 |
| | Shoucheng Holdings Ltd. | 6,295,246 | 1,333 |
| | China Resources Medical Holdings Co. Ltd. | 1,886,291 | 1,323 |
| 1 | Ronshine China Holdings Ltd. | 3,250,500 | 1,314 |
| | Beijing United Information Technology Co. Ltd. | 74,765 | 1,309 |
| | Shanghai Haohai Biological Technology Co. Ltd. Class A | 52,171 | 1,273 |
| | PharmaBlock Sciences Nanjing Inc. Class A | 53,300 | 1,267 |
FTSE All-World ex-US Small-Cap Index Fund
| | | Shares | Market
Value•
($000) |
| 2 | China New Higher Education Group Ltd. | 2,500,000 | 1,253 |
| | Eastern Communications Co. Ltd. Class A | 773,400 | 1,245 |
| | Sichuan Yahua Industrial Group Co. Ltd. Class A | 243,200 | 1,242 |
| | Red Avenue New Materials Group Co. Ltd. Class A | 144,400 | 1,236 |
| | Beijing Cisri-Gaona Materials & Technology Co. Ltd. Class A | 188,800 | 1,233 |
| | Beijing Yuanliu Hongyuan Electronic Technology Co. Ltd. Class A | 48,300 | 1,226 |
| | Xiamen Kingdomway Group Co. Class A | 257,833 | 1,224 |
| * | Sichuan Development Lomon Co. Ltd. Class A | 432,800 | 1,222 |
| | Shanghai Wanye Enterprises Co. Ltd. Class A | 252,100 | 1,220 |
| * | China Maple Leaf Educational Systems Ltd. | 7,608,000 | 1,219 |
| | Hubei Feilihua Quartz Glass Co. Ltd. Class A | 139,600 | 1,219 |
| | Yuexiu Transport Infrastructure Ltd. | 1,902,000 | 1,218 |
| | Zibo Qixiang Tengda Chemical Co. Ltd. Class A | 682,640 | 1,199 |
| | Shanghai Zijiang Enterprise Group Co. Ltd. Class A | 789,400 | 1,199 |
| | Inner Mongolia Eerduosi Resources Co. Ltd. Class A | 258,600 | 1,199 |
| | Zhuzhou Hongda Electronics Corp. Ltd. Class A | 91,400 | 1,187 |
| | Sichuan Expressway Co. Ltd. Class A | 2,101,032 | 1,184 |
| | JNBY Design Ltd. | 707,500 | 1,184 |
| | Henan Shenhuo Coal & Power Co. Ltd. Class A | 794,343 | 1,179 |
| * | Huangshan Tourism Development Co. Ltd. Class B | 1,661,215 | 1,159 |
| * | Inner Mongolia Yuan Xing Energy Co. Ltd. Class A | 965,000 | 1,153 |
| * | Youngy Co. Ltd. Class A | 66,100 | 1,149 |
| | Sinopec Kantons Holdings Ltd. | 2,989,962 | 1,138 |
| | | Shares | Market
Value•
($000) |
| | Chengtun Mining Group Co. Ltd. Class A | 710,100 | 1,135 |
| | Goke Microelectronics Co. Ltd. Class A | 43,000 | 1,131 |
| * | Roshow Technology Co. Ltd. Class A | 423,400 | 1,117 |
| | Harbin Electric Co. Ltd. Class H | 2,633,813 | 1,114 |
| | Bank of Chongqing Co. Ltd. Class H | 1,977,843 | 1,111 |
| 1 | Tian Lun Gas Holdings Ltd. | 1,198,400 | 1,109 |
| 1 | China Modern Dairy Holdings Ltd. | 5,767,000 | 1,088 |
| | China Kepei Education Group Ltd. | 1,970,000 | 1,086 |
| | Hangzhou Chang Chuan Technology Co. Ltd. Class A | 146,900 | 1,086 |
| | Zhejiang Cfmoto Power Co. Ltd. Class A | 42,100 | 1,061 |
| | CNNC Hua Yuan Titanium Dioxide Co. Ltd. Class A | 485,100 | 1,045 |
| | Telling Telecommunication Holding Co. Ltd. Class A | 275,400 | 1,028 |
| 1 | Kangji Medical Holdings Ltd. | 899,000 | 1,020 |
| | China Harmony New Energy Auto Holding Ltd. | 1,992,500 | 1,019 |
| | Qingdao Haier Biomedical Co. Ltd. Class A | 69,237 | 1,019 |
| | Ningbo Orient Wires & Cables Co. Ltd. Class A | 143,500 | 1,013 |
| | Longshine Technology Group Co. Ltd. Class A | 198,150 | 1,004 |
| | Tofflon Science & Technology Group Co. Ltd. Class A | 153,000 | 997 |
| | Shanghai Chlor-Alkali Chemical Co. Ltd. Class B | 1,477,800 | 984 |
| | West China Cement Ltd. | 5,597,200 | 978 |
| * | Jiangsu Akcome Science & Technology Co. Ltd. Class A | 1,202,200 | 969 |
| | Shandong Dongyue Organosilicon Material Co. Ltd. Class A | 285,800 | 966 |
| | Zhejiang Xinan Chemical Industrial Group Co. Ltd. Class A | 221,300 | 957 |
| * | SPIC Dongfang New Energy Corp. Class A | 1,296,150 | 951 |
FTSE All-World ex-US Small-Cap Index Fund
| | | Shares | Market
Value•
($000) |
| *,3 | China Zhongwang Holdings Ltd. | 4,366,000 | 943 |
| | Xi'an Triangle Defense Co. Ltd. Class A | 121,600 | 943 |
| | Anhui Jinhe Industrial Co. Ltd. Class A | 125,400 | 941 |
| 2 | Archosaur Games Inc. | 791,000 | 940 |
| | Sinofert Holdings Ltd. | 5,978,000 | 935 |
| | TCL Electronics Holdings Ltd. | 1,697,122 | 920 |
| | Yangzhou Yangjie Electronic Technology Co. Ltd. Class A | 115,200 | 917 |
| | Skyfame Realty Holdings Ltd. | 7,724,000 | 911 |
| | Jiangsu Azure Corp. Class A | 266,900 | 905 |
| | Chacha Food Co. Ltd. Class A | 100,700 | 897 |
| | Jiangsu Guotai International Group Co. Ltd. Class A | 427,100 | 881 |
| | Bethel Automotive Safety Systems Co. Ltd. Class A | 92,900 | 879 |
| * | Southern Shuanglin Bio-pharmacy Co. Ltd. Class A | 178,363 | 878 |
| | Shanghai Jin Jiang Capital Co. Ltd. Class H | 3,855,480 | 874 |
| | Tianli Education International Holdings Ltd. | 4,201,000 | 873 |
| * | Beijing Jingyuntong Technology Co. Ltd. Class A | 488,300 | 873 |
| | Qianhe Condiment and Food Co. Ltd. Class A | 224,452 | 863 |
| * | Jiangsu Hoperun Software Co. Ltd. Class A | 207,900 | 855 |
| | China Foods Ltd. | 2,228,000 | 851 |
| | Shenzhen Sunlord Electronics Co. Ltd. Class A | 163,700 | 845 |
| * | Jilin Electric Power Co. Ltd. Class A | 711,864 | 843 |
| | Hisense Home Appliances Group Co. Ltd. Class H | 779,173 | 837 |
| | Shanghai Belling Co. Ltd. Class A | 176,800 | 836 |
| | Wuhan Raycus Fiber Laser Technologies Co. Ltd. Class A | 87,637 | 835 |
| | Wuhu Token Science Co. Ltd. Class A | 514,910 | 826 |
| | Shenzhen Yinghe Technology Co. Ltd. Class A | 168,025 | 821 |
| | | Shares | Market
Value•
($000) |
| * | Guangdong Create Century Intelligent Equipment Group Corp. Ltd. Class A | 370,000 | 816 |
| * | Beijing Enterprises Clean Energy Group Ltd. | 60,540,000 | 814 |
| | Jiangsu Jiejie Microelectronics Co. Ltd. Class A | 168,950 | 812 |
| * | China High Speed Transmission Equipment Group Co. Ltd. | 1,038,300 | 805 |
| | Jiangsu Nata Opto-electronic Material Co. Ltd. Class A | 97,500 | 791 |
| | Vats Liquor Chain Store Management JSC Ltd. | 128,600 | 790 |
| | Riyue Heavy Industry Co. Ltd. Class A | 129,000 | 788 |
| | Sinomine Resource Group Co. Ltd. Class A | 81,900 | 788 |
| * | Chifeng Jilong Gold Mining Co. Ltd. Class A | 309,900 | 787 |
| * | Pengdu Agriculture & Animal Husbandry Co. Ltd. Class A | 1,439,500 | 781 |
| | Times Neighborhood Holdings Ltd. | 1,662,000 | 780 |
| 2 | Shanghai Haohai Biological Technology Co. Ltd. Class H | 104,100 | 779 |
| | Estun Automation Co. Ltd. Class A (XSEC) | 187,200 | 775 |
| *,1,2 | Maoyan Entertainment | 641,000 | 774 |
| | Hebei Hengshui Laobaigan Liquor Co. Ltd. Class A | 229,900 | 772 |
| | Quectel Wireless Solutions Co. Ltd. Class A | 27,450 | 770 |
| | China Shineway Pharmaceutical Group Ltd. | 800,343 | 767 |
| | Jiangsu Shuangxing Color Plastic New Materials Co. Ltd. Class A | 206,600 | 764 |
| | Grandblue Environment Co. Ltd. Class A | 217,872 | 752 |
| 1,2 | Redco Properties Group Ltd. | 2,428,000 | 746 |
| | Arcsoft Corp. Ltd. Class A | 125,620 | 745 |
FTSE All-World ex-US Small-Cap Index Fund
| | | Shares | Market
Value•
($000) |
| | Haohua Chemical Science & Technology Co. Ltd. Class A | 145,800 | 739 |
| | Anhui Honglu Steel Construction Group Co. Ltd. Class A | 111,900 | 738 |
| | Hubei Dinglong Co. Ltd. Class A | 234,000 | 735 |
| | QuakeSafe Technologies Co. Ltd. Class A | 47,600 | 735 |
| | Sinofibers Technology Co. Ltd. Class A | 82,600 | 729 |
| | Risen Energy Co. Ltd. Class A | 194,000 | 724 |
| | State Grid Information & Communication Co. Ltd. Class A | 303,100 | 722 |
| *,1 | Beijing Chunlizhengda Medical Instruments Co. Ltd. Class H | 307,000 | 720 |
| | Xianhe Co. Ltd. Class A | 127,300 | 719 |
| *,3 | Hi Sun Technology China Ltd. | 5,304,101 | 715 |
| | Riyue Heavy Industry Co. Ltd. Class A (XSHG) | 116,900 | 714 |
| | Hangjin Technology Co. Ltd. Class A | 133,800 | 711 |
| | Shenzhen Changhong Technology Co. Ltd. Class A | 127,700 | 710 |
| | Sanquan Food Co. Ltd. Class A | 233,200 | 708 |
| | Jinko Power Technology Co. Ltd. Class A | 465,400 | 704 |
| | Shanghai Fullhan Microelectronics Co. Ltd. Class A | 28,800 | 704 |
| * | Zhongtian Financial Group Co. Ltd. Class A | 1,790,700 | 703 |
| | Zhejiang Jiecang Linear Motion Technology Co. Ltd. Class A | 97,440 | 701 |
| 1 | Zhongliang Holdings Group Co. Ltd. | 1,509,000 | 699 |
| | Kehua Data Co. Ltd. Class A | 113,000 | 690 |
| | Milkyway Chemical Supply Chain Service Co. Ltd. Class A | 40,200 | 689 |
| | Hainan Poly Pharm Co. Ltd. Class A | 89,474 | 688 |
| | Consun Pharmaceutical Group Ltd. | 1,600,000 | 686 |
| | | Shares | Market
Value•
($000) |
| | Shenzhen H&T Intelligent Control Co. Ltd. Class A | 188,800 | 686 |
| | Cangzhou Mingzhu Plastic Co. Ltd. Class A | 435,980 | 673 |
| | Anji Microelectronics Technology Shanghai Co. Ltd. Class A | 18,012 | 669 |
| | Sinocare Inc. Class A | 182,300 | 668 |
| *,1 | LVGEM China Real Estate Investment Co. Ltd. | 2,932,000 | 665 |
| * | Beijing BDStar Navigation Co. Ltd. Class A | 107,100 | 664 |
| | COFCO Biotechnology Co. Ltd. Class A | 397,500 | 662 |
| | Shenzhen Kstar Science And Technology Co. Ltd. Class A | 133,100 | 662 |
| | Fangda Special Steel Technology Co. Ltd. Class A | 571,392 | 662 |
| | Sunresin New Materials Co. Ltd. Class A | 54,000 | 661 |
| | Sino Wealth Electronic Ltd. Class A | 68,772 | 659 |
| | Guangdong Hongda Blasting Co. Ltd. Class A | 152,100 | 655 |
| | Sichuan Shuangma Cement Co. Ltd. Class A | 208,000 | 651 |
| 1,2 | Cathay Media And Education Group Inc. | 1,582,000 | 650 |
| | Fibocom Wireless Inc. Class A | 89,951 | 648 |
| | Lancy Co. Ltd. Class A | 104,400 | 642 |
| | Infore Environment Technology Group Co. Ltd. Class A | 650,765 | 636 |
| * | Gree Real Estate Co. Ltd. Class A | 605,435 | 636 |
| | Tianjin ZhongXin Pharmaceutical Group Corp. Ltd. Class A | 148,500 | 621 |
| | Lushang Health Industry Development Co. Ltd. Class A | 294,800 | 616 |
| | Shenzhen Fastprint Circuit Tech Co. Ltd. Class A | 310,100 | 614 |
| | Guangdong Dowstone Technology Co. Ltd. Class A | 134,200 | 606 |
FTSE All-World ex-US Small-Cap Index Fund
| | | Shares | Market
Value•
($000) |
| * | C&D Property Management Group Co. Ltd. | 1,069,000 | 605 |
| | China Lilang Ltd. | 1,060,000 | 604 |
| | Shandong New Beiyang Information Technology Co. Ltd. Class A | 490,300 | 595 |
| | Shanghai Liangxin Electrical Co. Ltd. Class A | 233,240 | 594 |
| | MLS Co. Ltd. Class A | 266,400 | 580 |
| | Anhui Truchum Advanced Materials & Technology Co. Ltd. Class A | 354,600 | 577 |
| | Amoy Diagnostics Co. Ltd. Class A | 45,400 | 574 |
| | Shenzhen Topband Co. Ltd. Class A | 248,200 | 574 |
| * | Dazhong Transportation Group Co. Ltd. Class B | 1,993,835 | 572 |
| | Xinjiang Tianshan Cement Co. Ltd. Class A | 268,100 | 572 |
| | China Publishing & Media Co. Ltd. Class A | 671,805 | 570 |
| | First Tractor Co. Ltd. Class A | 287,300 | 569 |
| | Yantai Tayho Advanced Materials Co. Ltd. Class A | 201,900 | 568 |
| | Xingda International Holdings Ltd. | 2,488,000 | 565 |
| * | Bohai Leasing Co. Ltd. Class A | 1,376,000 | 565 |
| | CTS International Logistics Corp. Ltd. Class A | 291,080 | 561 |
| | Guangzhou Great Power Energy & Technology Co. Ltd. Class A | 120,000 | 560 |
| | CNHTC Jinan Truck Co. Ltd. Class A | 270,660 | 560 |
| | China Automotive Engineering Research Institute Co. Ltd. Class A | 209,200 | 559 |
| | Tianjin Capital Environmental Protection Group Co. Ltd. Class A | 567,800 | 555 |
| | Nantong Jianghai Capacitor Co. Ltd. Class A | 155,900 | 552 |
| | Zhejiang Orient Gene Biotech Co. Ltd. Class A | 24,713 | 552 |
| * | Tongdao Liepin Group | 382,000 | 546 |
| | | Shares | Market
Value•
($000) |
| | Long Yuan Construction Group Co. Ltd. Class A | 485,300 | 545 |
| | Nanjing Yunhai Special Metals Co. Ltd. Class A | 189,500 | 540 |
| | CPMC Holdings Ltd. | 1,094,000 | 535 |
| | Yotrio Group Co. Ltd. Class A | 979,300 | 530 |
| | Victory Giant Technology Huizhou Co. Ltd. Class A | 128,600 | 529 |
| | Jiangsu Hengshun Vinegar Industry Co. Ltd. Class A | 209,833 | 529 |
| | Keshun Waterproof Technologies Co. Ltd. Class A | 253,700 | 528 |
| | Shanghai Hanbell Precise Machinery Co. Ltd. Class A | 142,500 | 528 |
| 1,2 | China Everbright Greentech Ltd. | 1,494,000 | 525 |
| | Shanxi Coking Co. Ltd. Class A | 487,227 | 523 |
| | Wuhan Jingce Electronic Group Co. Ltd. Class A | 63,992 | 521 |
| * | Chongqing Iron & Steel Co. Ltd. Class A | 1,457,567 | 519 |
| | Shanghai Weaver Network Co. Ltd. Class A | 51,188 | 514 |
| | Renhe Pharmacy Co. Ltd. Class A | 346,200 | 513 |
| | Chengdu Wintrue Holding Co. Ltd. Class A | 204,900 | 513 |
| * | Chengzhi Co. Ltd. Class A | 231,000 | 512 |
| | Sai Micro Electronics Inc. Class A | 139,000 | 507 |
| | Zhejiang JIULI Hi-tech Metals Co. Ltd. Class A | 255,700 | 505 |
| | Shandong Bohui Paper Industrial Co. Ltd. Class A | 310,200 | 505 |
| | Winall Hi-Tech Seed Co. Ltd. Class A | 115,500 | 504 |
| * | Shandong Head Co. Ltd. Class A | 64,800 | 498 |
| | Mayinglong Pharmaceutical Group Co. Ltd. Class A | 126,500 | 497 |
| | Shanghai Jin Jiang Online Network Service Co. Ltd. Class B | 757,064 | 496 |
| | China South City Holdings Ltd. | 6,600,000 | 492 |
| | Electric Connector Technology Co. Ltd. Class A | 75,200 | 491 |
FTSE All-World ex-US Small-Cap Index Fund
| | | Shares | Market
Value•
($000) |
| | Wuxi Taiji Industry Co. Ltd. Class A | 389,800 | 488 |
| | Hebei Chengde Lolo Co. Class A | 301,760 | 487 |
| | Beijing Tongtech Co. Ltd. Class A | 107,460 | 485 |
| | Xiamen Xiangyu Co. Ltd. Class A | 399,900 | 484 |
| | Hunan Aihua Group Co. Ltd. Class A | 86,843 | 484 |
| | Hangcha Group Co. Ltd. Class A | 186,900 | 484 |
| | Shenzhen Leaguer Co. Ltd. Class A | 346,100 | 483 |
| | Wuxi Boton Technology Co. Ltd. Class A | 133,700 | 481 |
| | Beijing GeoEnviron Engineering & Technology Inc. Class A | 189,540 | 481 |
| | Hangzhou Dptech Technologies Co. Ltd. Class A | 73,667 | 478 |
| | Zhejiang Tianyu Pharmaceutical Co. Ltd. Class A | 80,200 | 475 |
| | Greenland Hong Kong Holdings Ltd. | 2,228,000 | 474 |
| | Xinyu Iron & Steel Co. Ltd. Class A | 511,863 | 473 |
| | Fantasia Holdings Group Co. Ltd. | 6,546,000 | 471 |
| | Hainan Strait Shipping Co. Ltd. Class A | 532,050 | 470 |
| | ChemPartner PharmaTech Co. Ltd. Class A | 204,900 | 468 |
| | Central China Management Co. Ltd. | 3,035,000 | 468 |
| | Jiangsu Shagang Co. Ltd. Class A | 480,000 | 466 |
| * | Chengdu CORPRO Technology Co. Ltd. Class A | 122,500 | 466 |
| * | Inner Mongolia Xingye Mining Co. Ltd. Class A | 403,700 | 464 |
| * | Sumavision Technologies Co. Ltd. Class A | 393,700 | 463 |
| *,1 | BEST Inc. ADR | 285,750 | 460 |
| 1 | First Tractor Co. Ltd. Class H | 912,954 | 460 |
| | Zhejiang Starry Pharmaceutical Co. Ltd. Class A | 58,500 | 455 |
| | Chengdu Leejun Industrial Co. Ltd. Class A | 253,100 | 455 |
| | Qingling Motors Co. Ltd. Class H | 2,008,929 | 452 |
| | Chaowei Power Holdings Ltd. | 1,534,563 | 452 |
| *,1,2 | Yixin Group Ltd. | 2,417,000 | 452 |
| | | Shares | Market
Value•
($000) |
| * | Guangzhou GRG Metrology & Test Co. Ltd. Class A | 112,100 | 451 |
| | Xinjiang Xintai Natural Gas Co. Ltd. Class A | 103,400 | 449 |
| | Suzhou Good-Ark Electronics Co. Ltd. Class A | 199,000 | 448 |
| | BrightGene Bio-Medical Technology Co. Ltd. Class A | 92,017 | 446 |
| | FAWER Automotive Parts Co. Ltd. Class A | 500,400 | 443 |
| | Hangzhou Onechance Tech Corp. Class A | 50,500 | 443 |
| * | China Tungsten And Hightech Materials Co. Ltd. Class A | 213,200 | 442 |
| | SGIS Songshan Co. Ltd. Class A | 637,100 | 441 |
| | Shanghai Haixin Group Co. Class B | 1,282,900 | 435 |
| *,1,2 | Ascletis Pharma Inc. | 1,252,000 | 435 |
| | Chengdu Kanghua Biological Products Co. Ltd. Class A | 17,400 | 433 |
| | Shenzhen Megmeet Electrical Co. Ltd. Class A | 90,200 | 432 |
| | Longhua Technology Group Luoyang Co. Ltd. Class A | 281,200 | 432 |
| | Eoptolink Technology Inc. Ltd Class A | 96,821 | 430 |
| | Ningbo Huaxiang Electronic Co. Ltd. Class A | 116,000 | 429 |
| | YanTai Shuangta Food Co. Ltd. Class A | 301,100 | 429 |
| | Zhende Medical Co. Ltd. Class A | 72,925 | 429 |
| | Bank of Chongqing Co. Ltd. Class A | 316,700 | 427 |
| | Shanghai Chinafortune Co. Ltd. Class A | 212,600 | 426 |
| | China Express Airlines Co. Ltd. Class A | 247,800 | 425 |
| | Archermind Technology Nanjing Co. Ltd. Class A | 35,600 | 425 |
| | Accelink Technologies Co. Ltd. Class A | 125,000 | 423 |
| | Guangzhou Restaurant Group Co. Ltd. Class A | 117,260 | 416 |
| | Jinhui Liquor Co. Ltd. Class A | 77,400 | 414 |
FTSE All-World ex-US Small-Cap Index Fund
| | | Shares | Market
Value•
($000) |
| | Jiangxi Lianchuang Optoelectronic Science & Technology Co. Ltd. Class A | 94,600 | 409 |
| | Tibet Rhodiola Pharmaceutical Holding Co. Class A | 54,500 | 408 |
| | Shanghai Industrial Urban Development Group Ltd. | 4,728,000 | 407 |
| | Chongqing Sanfeng Environment Group Corp. Ltd. Class A | 295,100 | 407 |
| | Wuhan DR Laser Technology Corp. Ltd. Class A | 18,800 | 406 |
| | CETC Digital Technology Co. Ltd. Class A | 77,500 | 406 |
| | Shinva Medical Instrument Co. Ltd. Class A | 119,300 | 406 |
| | Shenzhen Desay Battery Technology Co. Class A | 61,135 | 404 |
| * | Zhejiang Jinke Tom Culture Industry Co. Ltd. Class A | 583,800 | 404 |
| * | Talkweb Information System Co. Ltd. Class A | 313,800 | 404 |
| | Jinneng Science&Technology Co. Ltd. Class A | 181,800 | 402 |
| | Tongyu Heavy Industry Co. Ltd. Class A | 811,500 | 400 |
| | Shenzhen World Union Group Inc. Class A | 679,900 | 399 |
| | Shandong Jincheng Pharmaceutical Group Co. Ltd. Class A | 88,100 | 399 |
| | Anhui Genuine New Materials Co. Ltd. Class A | 111,227 | 398 |
| | Tech-Bank Food Co. Ltd. Class A | 401,497 | 394 |
| | Shenyang Xingqi Pharmaceutical Co. Ltd. Class A | 19,900 | 392 |
| | Foran Energy Group Co. Ltd. Class A | 255,510 | 389 |
| | Jiangsu Provincial Agricultural Reclamation and Development Corp. | 223,100 | 388 |
| | Beijing SuperMap Software Co. Ltd. Class A | 106,000 | 384 |
| | Jiangsu Nhwa Pharmaceutical Co. Ltd. Class A | 167,000 | 384 |
| | | Shares | Market
Value•
($000) |
| | PCI Technology Group Co. Ltd. Class A | 324,200 | 384 |
| * | Sonoscape Medical Corp. Class A | 83,300 | 383 |
| | Shanghai Sinyang Semiconductor Materials Co. Ltd. Class A | 61,600 | 381 |
| | Beijing North Star Co. Ltd. Class H | 2,368,000 | 380 |
| | Nanjing Xinjiekou Department Store Co. Ltd. Class A | 248,500 | 380 |
| | China Merchants Land Ltd. | 3,394,000 | 379 |
| | Sino-Platinum Metals Co. Ltd. Class A | 105,430 | 376 |
| * | Hainan Development Holdings Nanhai Co. Ltd. Class A | 176,900 | 376 |
| * | Henan Yuneng Holdings Co. Ltd. Class A | 322,700 | 372 |
| | Fujian Star-net Communication Co. Ltd. Class A | 108,000 | 370 |
| * | YaGuang Technology Group Co. Ltd. Class A | 274,900 | 368 |
| | Biem.L.Fdlkk Garment Co. Ltd. Class A | 94,880 | 365 |
| | Wondershare Technology Group Co. Ltd. Class A | 54,700 | 361 |
| | Shanghai Fudan-Zhangjiang Bio-Pharmaceutical Co. Ltd. Class H | 735,000 | 360 |
| * | CSG Smart Science&Technology Co. Ltd. Class A | 181,900 | 360 |
| | B-Soft Co. Ltd. Class A | 287,430 | 359 |
| | Yankershop Food Co. Ltd. Class A | 34,500 | 359 |
| * | Shenzhen Microgate Technology Co. Ltd. Class A | 160,200 | 358 |
| | Shandong Xiantan Co. Ltd. Class A | 323,100 | 357 |
| | Yusys Technologies Co. Ltd. Class A | 122,080 | 353 |
| * | Sichuan Haite High-tech Co. Ltd. Class A | 190,200 | 352 |
| | CGN Nuclear Technology Development Co. Ltd. Class A | 252,324 | 351 |
| | Shandong Hi-Speed Road & Bridge Co. Ltd. Class A | 341,400 | 351 |
FTSE All-World ex-US Small-Cap Index Fund
| | | Shares | Market
Value•
($000) |
| | Luoxin Pharmaceuticals Group Stock Co. Ltd. Class A | 238,200 | 349 |
| | GCI Science & Technology Co. Ltd. Class A | 104,700 | 348 |
| * | China Tianying Inc. Class A | 469,700 | 348 |
| | Guangdong Tapai Group Co. Ltd. Class A | 219,928 | 346 |
| | Goldenmax International Technology Ltd. Class A | 166,100 | 346 |
| | Chow Tai Seng Jewellery Co. Ltd. Class A | 116,250 | 343 |
| | Lier Chemical Co. Ltd. Class A | 97,100 | 343 |
| | Yijiahe Technology Co. Ltd. Class A | 39,200 | 342 |
| | Guangdong Great River Smarter Logistics Co. Ltd. Class A | 95,700 | 341 |
| | Zhejiang Orient Financial Holdings Group Co. Ltd. Class A | 534,305 | 340 |
| | INESA Intelligent Tech Inc. Class B | 769,006 | 338 |
| | IKD Co. Ltd. Class A | 158,100 | 338 |
| | Yantai Dongcheng Pharmaceutical Co. Ltd. Class A | 155,700 | 337 |
| | Suzhou TFC Optical Communication Co. Ltd. Class A | 83,780 | 336 |
| * | China Fangda Group Co. Ltd. Class B | 890,200 | 335 |
| | IReader Technology Co. Ltd. Class A | 112,300 | 332 |
| | Beijing Strong Biotechnologies Inc. Class A | 138,200 | 329 |
| | Shenzhen Suntak Circuit Technology Co. Ltd. Class A | 150,700 | 325 |
| | Zhejiang Narada Power Source Co. Ltd. Class A | 183,300 | 324 |
| * | Genimous Technology Co. Ltd. Class A | 339,100 | 321 |
| | Shanghai Pret Composites Co. Ltd. Class A | 186,864 | 321 |
| | Shandong Longda Meat Foodstuff Co. Ltd. Class A | 203,600 | 320 |
| * | INKON Life Technology Co. Ltd. Class A | 141,100 | 319 |
| * | Visionox Technology Inc. Class A | 252,200 | 316 |
| | | Shares | Market
Value•
($000) |
| * | China Aluminum International Engineering Corp. Ltd. Class A | 488,200 | 315 |
| | Zhejiang Jiemei Electronic & Technology Co. Ltd. Class A | 72,733 | 314 |
| | Grinm Advanced Materials Co. Ltd. Class A | 156,900 | 314 |
| | Hangzhou Boiler Group Co. Ltd. Class A | 97,700 | 314 |
| | Loncin Motor Co. Ltd. Class A | 457,700 | 313 |
| | Anhui Huilong Agricultural Means of Production Co. Ltd. Class A | 197,900 | 313 |
| * | Orient Group Inc. Class A | 685,200 | 312 |
| | DBG Technology Co. Ltd. Class A | 143,060 | 311 |
| | COFCO Capital Holdings Co. Ltd. Class A | 239,800 | 309 |
| | Client Service International Inc. Class A | 117,300 | 308 |
| | Beijing Aosaikang Pharmaceutical Co. Ltd. Class A | 169,403 | 308 |
| * | Xi'an Tian He Defense Technology Co. Ltd. Class A | 138,300 | 307 |
| | Beijing VRV Software Corp. Ltd. Class A | 348,300 | 306 |
| | Sinosteel Engineering & Technology Co. Ltd. Class A | 268,300 | 305 |
| * | Shandong Yisheng Livestock & Poultry Breeding Co. Ltd. Class A | 181,610 | 302 |
| | Wellhope Foods Co. Ltd. Class A | 211,000 | 302 |
| | Wasu Media Holding Co. Ltd. Class A | 263,700 | 301 |
| | Central China Real Estate Ltd. | 1,997,000 | 300 |
| | ZheJiang Dali Technology Co. Ltd. Class A | 100,920 | 300 |
| | Shenzhen FRD Science & Technology Co. Ltd. | 100,643 | 299 |
| | Dongjiang Environmental Co. Ltd. Class A | 279,800 | 298 |
FTSE All-World ex-US Small-Cap Index Fund
| | | Shares | Market
Value•
($000) |
| | Shenzhen Properties & Resources Development Group Ltd. Class A | 173,000 | 298 |
| | Henan Zhongyuan Expressway Co. Ltd. Class A | 602,301 | 297 |
| | Shanghai AtHub Co. Ltd. Class A | 60,200 | 294 |
| * | Shengda Resources Co. Ltd. Class A | 162,000 | 293 |
| | Zhejiang Xianju Pharmaceutical Co. Ltd. Class A | 169,500 | 292 |
| | PhiChem Corp. Class A | 105,500 | 292 |
| * | Aotecar New Energy Technology Co. Ltd. Class A | 579,100 | 291 |
| * | Luoniushan Co. Ltd. Class A | 268,600 | 287 |
| | Jiaozuo Wanfang Aluminum Manufacturing Co. Ltd. Class A | 261,700 | 287 |
| | Edifier Technology Co. Ltd. Class A | 160,900 | 284 |
| | Digital China Group Co. Ltd. Class A | 121,000 | 282 |
| | Guangdong Hybribio Biotech Co. Ltd. Class A | 64,572 | 280 |
| | Guangdong Aofei Data Technology Co. Ltd. Class A | 83,700 | 278 |
| | Zhongfu Information Inc. Class A | 50,100 | 277 |
| | Anhui Hengyuan Coal Industry and Electricity Power Co. Ltd. Class A | 251,700 | 276 |
| | Shenzhen Woer Heat-Shrinkable Material Co. Ltd. Class A | 239,600 | 275 |
| | Zhejiang Meida Industrial Co. Ltd. Class A | 107,000 | 274 |
| | Shenzhen Tagen Group Co. Ltd. Class A | 346,200 | 273 |
| | CSSC Science & Technology Co. Ltd. Class A | 136,700 | 273 |
| * | Hunan TV & Broadcast Intermediary Co. Ltd. Class A | 309,928 | 272 |
| | Shanghai Kelai Mechatronics Engineering Co. Ltd. Class A | 57,100 | 272 |
| * | Guangdong Advertising Group Co. Ltd. Class A | 383,500 | 272 |
| | | Shares | Market
Value•
($000) |
| | Beijing Ctrowell Technology Corp. Ltd. Class A | 181,800 | 270 |
| * | Bestway Marine & Energy Technology Co. Ltd. Class A | 390,400 | 270 |
| | Advanced Technology & Materials Co. Ltd. Class A | 200,000 | 266 |
| | Guocheng Mining Co. Ltd. Class A | 169,275 | 266 |
| * | Hongli Zhihui Group Co. Ltd. Class A | 150,800 | 266 |
| | Jiangxi Wannianqing Cement Co. Ltd. Class A | 147,600 | 265 |
| | Shenzhen Sunline Tech Co. Ltd. Class A | 133,900 | 263 |
| | Beibuwan Port Co. Ltd. Class A | 223,699 | 260 |
| | Yantai Zhenghai Magnetic Material Co. Ltd. Class A | 147,400 | 259 |
| | Konka Group Co. Ltd. Class A | 295,400 | 259 |
| | Qingdao Eastsoft Communication Technology Co. Ltd. Class A | 93,000 | 258 |
| | YGSOFT Inc. Class A | 241,308 | 256 |
| | Sunward Intelligent Equipment Co. Ltd. Class A | 200,700 | 254 |
| | Black Peony Group Co. Ltd. Class A | 228,740 | 254 |
| | Fujian Aonong Biological Technology Group Inc. Ltd. Class A | 158,420 | 252 |
| | Jiuzhitang Co. Ltd. Class A | 188,800 | 251 |
| | Beijing Thunisoft Corp. Ltd. Class A | 149,100 | 250 |
| | Jiangxi Huangshanghuang Group Food Co. Ltd. Class A | 115,700 | 250 |
| | Xinjiang Communications Construction Group Co. Ltd. Class A | 150,600 | 249 |
| | Gansu Shangfeng Cement Co. Ltd. Class A | 91,600 | 249 |
| * | Shaanxi Construction Machinery Co. Ltd. Class A | 184,500 | 248 |
| | Shanxi Blue Flame Holding Co. Ltd. Class A | 172,700 | 247 |
| | Haoxiangni Health Food Co. Ltd. Class A | 187,300 | 246 |
FTSE All-World ex-US Small-Cap Index Fund
| | | Shares | Market
Value•
($000) |
| | EIT Environmental Development Group Co. Ltd. Class A | 54,196 | 245 |
| * | China CAMC Engineering Co. Ltd. Class A | 241,200 | 243 |
| | Yonggao Co. Ltd. Class A | 348,100 | 240 |
| | Tianjin Teda Co. Ltd. Class A | 386,700 | 239 |
| | Xiamen Comfort Science & Technology Group Co. Ltd. Class A | 140,800 | 239 |
| | Xiamen Jihong Technology Co. Ltd. Class A | 101,000 | 239 |
| | DeHua TB New Decoration Materials Co. Ltd. Class A | 170,900 | 238 |
| * | Zhejiang Qianjiang Motorcycle Co. Ltd. Class A | 109,500 | 238 |
| * | Dazhong Transportation Group Co. Ltd. Class A | 460,400 | 237 |
| * | Guangdong Dongfang Precision Science & Technology Co. Ltd. Class A | 277,500 | 235 |
| | Shanghai Kinetic Medical Co. Ltd. Class A | 150,248 | 235 |
| | Xinhuanet Co. Ltd. Class A | 84,900 | 235 |
| | Unilumin Group Co. Ltd. Class A | 182,800 | 234 |
| | CQ Pharmaceutical Holding Co. Ltd. Class A | 310,300 | 232 |
| | Konfoong Materials International Co. Ltd. Class A | 36,700 | 230 |
| * | Anhui Tatfook Technology Co. Ltd. Class A | 166,884 | 230 |
| | Bear Electric Appliance Co. Ltd. Class A | 25,700 | 229 |
| | Chongqing Zaisheng Technology Corp. Ltd. Class A | 130,700 | 228 |
| | Hangzhou Haoyue Personal Care Co. Ltd. Class A | 26,894 | 227 |
| | Three's Co. Media Group Co. Ltd. Class A | 13,500 | 226 |
| | Shenzhen Click Technology Co. Ltd. Class A | 105,400 | 226 |
| | Wuhan Department Store Group Co. Ltd. Class A | 142,205 | 225 |
| | | Shares | Market
Value•
($000) |
| | Beijing Compass Technology Development Co. Ltd. Class A | 44,400 | 225 |
| | Eastern Communications Co. Ltd. Class B | 497,550 | 223 |
| | Guangzhou Shangpin Home Collection Co. Ltd. Class A | 32,700 | 223 |
| | Shenzhen Center Power Tech Co. Ltd. Class A | 85,800 | 223 |
| | Zhejiang Wanma Co. Ltd. Class A | 201,800 | 222 |
| * | Huafon Microfibre Shanghai Technology Co. Ltd. Class T | 313,743 | 222 |
| * | Beijing Orient Landscape & Environment Co. Ltd. Class A | 495,800 | 220 |
| * | Huafu Fashion Co. Ltd. Class A | 316,500 | 219 |
| | Hangxiao Steel Structure Co. Ltd. Class A | 390,200 | 218 |
| | Chongqing Zongshen Power Machinery Co. Ltd. Class A | 211,800 | 217 |
| | Zhuhai Bojay Electronics Co. Ltd. Class A | 27,100 | 217 |
| | Haohua Chemical Science & Technology Co. Ltd. Class A | 42,686 | 216 |
| | City Development Environment Co. Ltd. Class A | 139,720 | 216 |
| | Gansu Qilianshan Cement Group Co. Ltd. Class A | 142,500 | 215 |
| * | Yunnan Lincang Xinyuan Germanium Industrial Co. Ltd. Class A | 131,300 | 214 |
| | 263 Network Communications Co. Ltd. Class A | 362,100 | 213 |
| | Shanghai Maling Aquarius Co. Ltd. Class A | 173,700 | 212 |
| * | Beijing Bohui Innovation Biotechnology Group Co. Ltd. Class A | 178,800 | 212 |
| | Shanghai Ganglian E-Commerce Holdings Co. Ltd. Class A | 35,340 | 211 |
FTSE All-World ex-US Small-Cap Index Fund
| | | Shares | Market
Value•
($000) |
| | Inner Mongolia M-Grass Ecology And Enviroment Group Co. Ltd. Class A | 323,600 | 211 |
| | Jiangsu Changshu Rural Commercial Bank Co. Ltd. Class A | 185,500 | 210 |
| | Monalisa Group Co. Ltd. Class A | 70,100 | 209 |
| | Shenzhen Laibao Hi-tech Co. Ltd. Class A | 128,700 | 208 |
| * | China High Speed Railway Technology Co. Ltd. Class A | 610,400 | 208 |
| * | Beijing Forever Technology Co. Ltd. Class A | 115,300 | 207 |
| | Guangdong Topstar Technology Co. Ltd. Class A | 88,020 | 207 |
| | Edan Instruments Inc. Class A | 122,400 | 207 |
| * | Berry Genomics Co. Ltd. Class A | 67,900 | 206 |
| | Guangdong Huatie Tongda High-speed Railway Equipment Corp. Class A | 291,200 | 205 |
| | Beken Corp. Class A | 22,300 | 205 |
| * | Zhejiang Jingu Co. Ltd. Class A | 185,200 | 204 |
| | Shenzhen Ysstech Info-tech Co. Ltd. Class A | 132,800 | 204 |
| | Zhejiang Jingxin Pharmaceutical Co. Ltd. Class A | 160,440 | 202 |
| | 5I5J Holding Group Co. Ltd. Class A | 434,300 | 202 |
| | Zhejiang Garden Bio-Chemical High-tech Co. Ltd. Class A | 96,600 | 201 |
| | Shanghai Kehua Bio-Engineering Co. Ltd. Class A | 92,900 | 200 |
| * | Beijing Watertek Information Technology Co. Ltd. Class A | 383,300 | 199 |
| | Better Life Commercial Chain Share Co. Ltd. Class A | 188,900 | 199 |
| | Wuhan Fingu Electronic Technology Co. Ltd. Class A | 125,160 | 198 |
| | Guangdong Zhongsheng Pharmaceutical Co. Ltd. Class A | 149,800 | 197 |
| | | Shares | Market
Value•
($000) |
| | Hunan Er-Kang Pharmaceutical Co. Ltd. Class A | 308,200 | 197 |
| | Shanghai Yaoji Technology Co. Ltd. Class A | 73,800 | 196 |
| | China Harzone Industry Corp. Ltd. Class A | 154,900 | 196 |
| 1 | Colour Life Services Group Co. Ltd. | 1,118,000 | 196 |
| * | Aerospace Hi-Tech Holdings Group Ltd. Class A | 147,897 | 194 |
| * | Chongyi Zhangyuan Tungsten Industry Co. Ltd. Class A | 146,200 | 193 |
| | Changchun Faway Automobile Components Co. Ltd. Class A | 117,260 | 192 |
| | Anhui Construction Engineering Group Co. Ltd. Class A | 313,200 | 190 |
| | Guizhou Gas Group Corp. Ltd. Class A | 120,600 | 187 |
| | Shenzhen Das Intellitech Co. Ltd. Class A | 350,600 | 186 |
| | Dare Power Dekor Home Co. Ltd. Class A | 101,400 | 185 |
| | Hwa Create Co. Ltd. Class A | 139,200 | 185 |
| | Kunming Yunnei Power Co. Ltd. Class A | 364,400 | 185 |
| | KPC Pharmaceuticals Inc. Class A | 141,300 | 183 |
| * | Chongqing Iron & Steel Co. Ltd. Class H | 903,500 | 181 |
| | Zhongyuan Environment-Protection Co. Ltd. Class A | 187,200 | 178 |
| | Hangzhou Electronic Soul Network Technology Co. Ltd. Class A | 48,400 | 178 |
| | Chengdu Hongqi Chain Co. Ltd. Class A | 222,600 | 177 |
| | Shanxi Coking Co. Ltd. Class A | 165,100 | 177 |
| | Streamax Technology Co. Ltd. Class A | 33,800 | 176 |
| * | Zhuhai Orbita Aerospace Science & Technology Co. Ltd. Class A | 129,300 | 175 |
| | Changzhou Tronly New Electronic Materials Co. Ltd. Class A | 94,100 | 174 |
FTSE All-World ex-US Small-Cap Index Fund
| | | Shares | Market
Value•
($000) |
| * | Markor International Home Furnishings Co. Ltd. Class A | 328,810 | 174 |
| | Zhejiang Communications Technology Co. Ltd. | 210,200 | 171 |
| * | Xiwang Foodstuffs Co. Ltd. Class A | 235,100 | 170 |
| | Xiamen Xiangyu Co. Ltd. Class A | 140,100 | 170 |
| | Tangrenshen Group Co. Ltd. Class A | 171,600 | 168 |
| | Henan Yuguang Gold & Lead Co. Ltd. Class A | 199,800 | 168 |
| | Sichuan Jiuyuan Yinhai Software Co. Ltd. Class A | 55,920 | 167 |
| | Shandong Dawn Polymer Co. Ltd. Class A | 73,500 | 167 |
| | Canny Elevator Co. Ltd. Class A | 145,500 | 166 |
| * | Innuovo Technology Co. Ltd. Class A | 200,600 | 166 |
| | Hand Enterprise Solutions Co. Ltd. Class A | 160,100 | 165 |
| | Dashang Co. Ltd. Class A | 54,200 | 165 |
| | Tibet Tianlu Co. Ltd. Class A | 164,500 | 163 |
| | Guomai Technologies Inc. Class A | 182,500 | 163 |
| | Feitian Technologies Co. Ltd. Class A | 80,800 | 163 |
| | Beijing Science Sun Pharmaceutical Co. Ltd. Class A | 94,300 | 162 |
| * | Doushen Beijing Education & Technology Inc. Class A | 288,300 | 161 |
| | Beijing North Star Co. Ltd. Class A | 456,600 | 159 |
| | Shanghai Runda Medical Technology Co. Ltd. Class A | 98,600 | 159 |
| * | Bluedon Information Security Technology Co. Ltd. Class A | 303,900 | 158 |
| * | Tongda Group Holdings Ltd. | 4,883,519 | 157 |
| | Shenzhen Gongjin Electronics Co. Ltd. Class A | 126,600 | 157 |
| | Shenzhen Jieshun Science And Technology Industry Co. Ltd. Class A | 115,900 | 157 |
| | JSTI Group Class A | 176,900 | 156 |
| | | Shares | Market
Value•
($000) |
| * | Myhome Real Estate Development Group Co. Ltd. Class A | 625,600 | 155 |
| | Guangxi Liuzhou Pharmaceutical Co. Ltd. Class A | 65,160 | 155 |
| | Weihai Guangtai Airport Equipment Co. Ltd. Class A | 87,400 | 155 |
| | Merit Interactive Co. Ltd. Class A | 73,500 | 154 |
| * | JC Finance & Tax Interconnect Holdings Ltd. Class A | 167,300 | 152 |
| | China Publishing & Media Co. Ltd. Class A (XSHG) | 178,100 | 151 |
| | Anhui Sinonet & Xonglong Science & Technology Co. Ltd. Class A | 150,900 | 151 |
| * | Tus Environmental Science And Technology Development Co. Ltd. Class A | 248,400 | 150 |
| | Shenzhen Sinovatio Technology Co. Ltd. Class A | 31,987 | 149 |
| | Guangdong Shaoneng Group Co. Ltd. Class A | 192,900 | 148 |
| | Fujian Green Pine Co. Ltd. Class A | 95,400 | 148 |
| | Vatti Corp. Ltd. Class A | 157,100 | 145 |
| | Jiangsu Huaxicun Co. Ltd. Class A | 159,800 | 145 |
| | Anhui Korrun Co. Ltd. Class A | 41,500 | 144 |
| * | Shenzhen SDG Information Co. Ltd. Class A | 149,300 | 140 |
| | Shenzhen Comix Group Co. Ltd. Class A | 134,500 | 139 |
| | Fujian Longma Environmental Sanitation Equipment Co. Ltd. Class A | 70,880 | 139 |
| * | Kunshan Kersen Science & Technology Co. Ltd. Class A | 86,500 | 138 |
| | Beijing Global Safety Technology Co. Ltd. Class A | 42,900 | 137 |
| | CITIC Press Corp. Class A | 30,300 | 137 |
| | Jiangsu Lihua Animal Husbandry Stock Co. Ltd. Class A | 27,800 | 132 |
| | Beijing Wanji Technology Co. Ltd. Class A | 35,700 | 131 |
FTSE All-World ex-US Small-Cap Index Fund
| | | Shares | Market
Value•
($000) |
| | Shenzhen Tellus Holding Co. Ltd. Class A | 56,300 | 124 |
| | Chongqing Dima Industry Co. Ltd. Class A | 333,700 | 120 |
| * | Sou Yu Te Group Co. Ltd. Class A | 515,300 | 118 |
| | Hainan Ruize New Building Material Co. Ltd. Class A | 209,400 | 116 |
| | Shenzhen Anche Technologies Co. Ltd. Class A | 38,200 | 114 |
| *,3 | Boshiwa International Ltd. | 469,000 | 101 |
| | Shandong Xinhua Pharmaceutical Co. Ltd. Class A | 82,700 | 97 |
| | COFCO Capital Holdings Co. Ltd. Class A (XSHE) | 74,500 | 96 |
| | Fujian Cement Inc. Class A | 87,200 | 94 |
| | Lu Thai Textile Co. Ltd. Class B | 130,207 | 64 |
| *,3 | China Lumena New Materials Corp. | 98,750 | 63 |
| *,1,3 | China Fishery Group Ltd. | 1,088,512 | 61 |
| | Guangxi Wuzhou Communications Co. Ltd. Class A (XSHG) | 92,560 | 53 |
| | Beken Corp. | 5,400 | 50 |
| | Yuzhou Group Holdings Co. Ltd. | 446,391 | 49 |
| | Hebei Huijin Group Co. Ltd. Class A | 25,900 | 41 |
| | Hebei Construction Group Corp. Ltd. Class H | 121,000 | 31 |
| *,3 | Real Gold Mining Ltd. | 239,476 | 26 |
| * | Shang Gong Group Co. Ltd. Class B | 66,600 | 25 |
| | Chongqing Zaisheng Technology Corp. Ltd. Class A (XSSC) | 9,800 | 17 |
| * | Shandong Airlines Co. Ltd. Class B | 18,100 | 9 |
| *,1,3 | Midas Holdings Ltd. | 2,619,447 | — |
| *,3 | China High Precision Automation Group Ltd. | 401,000 | — |
| *,3 | China Animal Healthcare Ltd. | 1,003,918 | — |
| | | | 635,249 |
| Colombia (0.0%) |
| * | Banco Davivienda SA Preference Shares | 320,691 | 2,888 |
| Czech Republic (0.0%) |
| | Philip Morris CR A/S | 1,162 | 826 |
| | | Shares | Market
Value•
($000) |
| Denmark (1.2%) |
| 2 | Netcompany Group A/S | 124,980 | 14,232 |
| | Ringkjoebing Landbobank A/S | 105,248 | 13,371 |
| * | ISS A/S | 634,060 | 12,652 |
| * | Bavarian Nordic A/S | 225,229 | 10,806 |
| * | ALK-Abello A/S | 24,832 | 10,762 |
| * | Jyske Bank A/S (Registered) | 201,881 | 9,849 |
| * | NKT A/S | 174,366 | 8,402 |
| | Sydbank A/S | 234,367 | 8,054 |
| | Topdanmark A/S | 151,241 | 8,027 |
| | FLSmidth & Co. A/S | 188,782 | 7,178 |
| * | Dfds A/S | 106,457 | 5,517 |
| 2 | Scandinavian Tobacco Group A/S Class A | 239,146 | 5,377 |
| * | Zealand Pharma A/S | 163,227 | 5,238 |
| | Chemometec A/S | 33,418 | 5,067 |
| | Schouw & Co. A/S | 46,374 | 4,511 |
| | Spar Nord Bank A/S | 322,325 | 4,154 |
| * | NTG Nordic Transport Group A/S Class A | 47,644 | 3,895 |
| * | Drilling Co. of 1972 A/S | 89,950 | 3,224 |
| * | Nilfisk Holding A/S | 90,241 | 3,148 |
| | D/S Norden A/S | 89,856 | 2,171 |
| 1 | Alm Brand A/S | 164,084 | 1,266 |
| | | | 146,901 |
| Egypt (0.1%) |
| * | Egyptian Financial Group-Hermes Holding Co. | 2,604,238 | 2,065 |
| | Talaat Moustafa Group | 2,959,729 | 1,399 |
| | Medinet Nasr Housing | 6,570,632 | 985 |
| | Six of October Development & Investment | 653,981 | 765 |
| | Palm Hills Developments SAE | 3,865,476 | 473 |
| * | Pioneers Properties | 2,012,595 | 379 |
| | Oriental Weavers | 692,082 | 365 |
| * | Gadwa for Industrial Development | 2,012,595 | 150 |
| | Heliopolis Housing | 495,683 | 141 |
| * | Aspire Capital Holding for Financial Investments | 2,012,595 | 39 |
| | | | 6,761 |
| Finland (0.8%) |
| | Konecranes OYJ Class A | 271,842 | 11,307 |
| * | QT Group OYJ | 69,705 | 11,278 |
| | TietoEVRY OYJ (XHEL) | 311,316 | 9,547 |
| | Cargotec OYJ Class B | 183,370 | 9,496 |
| * | Outokumpu OYJ | 1,162,941 | 7,244 |
| | Metsa Board OYJ | 651,602 | 6,031 |
| | Neles OYJ | 373,797 | 5,601 |
| | Kemira OYJ | 352,731 | 5,417 |
| | Revenio Group OYJ | 80,675 | 5,323 |
FTSE All-World ex-US Small-Cap Index Fund
| | | Shares | Market
Value•
($000) |
| | Uponor OYJ | 214,940 | 5,250 |
| | Sanoma OYJ | 299,333 | 4,660 |
| | YIT OYJ | 622,106 | 3,667 |
| | Tokmanni Group Corp. | 140,246 | 3,191 |
| | Citycon OYJ | 317,697 | 2,612 |
| 2 | Terveystalo OYJ | 193,634 | 2,520 |
| | TietoEVRY OYJ | 56,975 | 1,768 |
| | F-Secure OYJ | 260,874 | 1,472 |
| | Raisio OYJ Class V | 339,385 | 1,374 |
| *,1 | Finnair OYJ | 1,621,895 | 1,239 |
| | Oriola OYJ Class B | 332,211 | 762 |
| *,3 | Ahlstrom-Munksjo OYJ Rights | 29,401 | 606 |
| | | | 100,365 |
| France (2.2%) |
| | Alten SA | 106,481 | 17,158 |
| * | Elis SA (XPAR) | 816,379 | 15,501 |
| | SES SA Class A GDR | 1,414,780 | 12,706 |
| | SPIE SA | 474,999 | 11,551 |
| | Nexans SA | 113,539 | 11,392 |
| | Sopra Steria Group SACA | 53,421 | 10,504 |
| | Eutelsat Communications SA | 677,753 | 9,633 |
| | Virbac SA | 16,208 | 8,215 |
| | Gaztransport Et Technigaz SA | 93,633 | 7,740 |
| | Nexity SA | 168,302 | 7,694 |
| | Korian SA | 228,349 | 7,607 |
| * | Technip Energies NV | 474,007 | 7,295 |
| 2 | Verallia SA | 193,635 | 7,169 |
| | IPSOS | 152,447 | 7,145 |
| | Trigano SA | 31,536 | 5,920 |
| | Metropole Television SA | 250,552 | 5,523 |
| | Societe BIC SA | 93,114 | 5,413 |
| | Coface SA | 377,878 | 5,403 |
| *,1 | Air France-KLM | 1,068,735 | 5,034 |
| | Television Francaise 1 | 459,992 | 4,925 |
| | Fnac Darty SA | 68,115 | 4,422 |
| *,1 | Casino Guichard Perrachon SA | 167,082 | 4,166 |
| | Somfy SA | 20,763 | 4,076 |
| 2 | Maisons du Monde SA | 176,327 | 4,000 |
| * | Lagardere SA | 150,169 | 3,970 |
| | Interparfums SA | 43,895 | 3,551 |
| | Rothschild & Co. | 80,489 | 3,550 |
| | Mercialys SA | 311,539 | 3,384 |
| | Quadient SA | 137,750 | 3,293 |
| * | Derichebourg SA | 280,856 | 3,196 |
| * | Vallourec SA | 387,138 | 3,095 |
| * | ID Logistics Group | 7,632 | 2,806 |
| | Vicat SA | 65,635 | 2,801 |
| *,1 | Solutions 30 SE | 291,486 | 2,637 |
| | Albioma SA (XPAR) | 63,379 | 2,493 |
| *,2 | Elior Group SA | 313,708 | 2,482 |
| * | Eramet SA | 29,388 | 2,456 |
| * | Voltalia SA (Registered) | 85,388 | 2,223 |
| * | Albioma SA Loyalty Shares | 55,888 | 2,199 |
| | Altarea SCA | 10,015 | 2,142 |
| | | Shares | Market
Value•
($000) |
| * | Akka Technologies | 37,243 | 2,062 |
| | Robertet SA | 1,830 | 2,009 |
| | PEUGEOT Investment | 13,857 | 1,933 |
| | Cie de L'Odet SE | 1,204 | 1,819 |
| * | Beneteau SA | 108,759 | 1,660 |
| | Carmila SA | 105,248 | 1,595 |
| | Mersen SA | 41,605 | 1,561 |
| *,2 | X-Fab Silicon Foundries SE | 140,387 | 1,402 |
| | Manitou BF SA | 32,920 | 1,119 |
| | Pharmagest Interactive | 9,823 | 1,078 |
| | Vilmorin & Cie SA | 16,113 | 1,025 |
| | Bonduelle SCA | 37,471 | 960 |
| * | Lisi | 31,889 | 887 |
| | Jacquet Metals SACA | �� 32,616 | 796 |
| *,1 | GL Events | 33,624 | 711 |
| | Guerbet | 14,187 | 626 |
| * | Tarkett SA | 24,374 | 562 |
| | AKWEL | 21,631 | 552 |
| * | Etablissements Maurel et Prom SA | 144,083 | 415 |
| * | Rallye SA | 60,687 | 390 |
| | Boiron SA | 8,023 | 388 |
| | Lisi (XPAR) | 13,642 | 379 |
| | Union Financiere de France BQE SA | 8,742 | 184 |
| * | Bourbon SA | 28,437 | 121 |
| *,1 | CGG SA | 117,542 | 85 |
| *,1 | Bourbon Corp. | 12,121 | 52 |
| *,2 | SMCP SA | 3,589 | 29 |
| | | | 260,870 |
| Germany (3.5%) |
| | TAG Immobilien AG | 455,965 | 13,853 |
| *,1 | zooplus AG | 23,681 | 13,098 |
| | alstria office REIT-AG | 686,610 | 12,834 |
| | Freenet AG | 477,879 | 12,308 |
| * | K+S AG (Registered) | 712,021 | 12,270 |
| | HUGO BOSS AG | 195,848 | 12,263 |
| 2 | Befesa SA | 159,582 | 11,873 |
| | Aurubis AG | 129,437 | 11,154 |
| 1 | Gerresheimer AG | 113,685 | 10,431 |
| | AIXTRON SE | 400,703 | 9,517 |
| | CANCOM SE | 137,147 | 9,482 |
| | Grand City Properties SA | 368,692 | 9,444 |
| * | Hypoport SE | 15,320 | 9,431 |
| | Jungheinrich AG Preference Shares | 181,082 | 9,183 |
| 1 | Siltronic AG (XETR) | 56,138 | 8,758 |
| | Duerr AG | 187,689 | 8,507 |
| | Sixt SE Preference Shares | 81,064 | 8,032 |
| | CompuGroup Medical SE & Co. KGaA | 95,837 | 8,011 |
| 1 | Encavis AG | 380,856 | 7,981 |
| | Stroeer SE & Co. KGaA | 92,028 | 7,805 |
| | Jenoptik AG | 199,549 | 7,638 |
| | Software AG | 184,475 | 7,587 |
| | Aareal Bank AG | 230,769 | 7,377 |
FTSE All-World ex-US Small-Cap Index Fund
| | | Shares | Market
Value•
($000) |
| | Stabilus SA | 95,593 | 7,178 |
| | Eckert & Ziegler Strahlen- und Medizintechnik AG | 47,485 | 7,110 |
| *,1 | Nordex SE | 368,662 | 6,775 |
| 2 | Deutsche Pfandbriefbank AG | 498,765 | 6,189 |
| * | Sixt SE | 35,833 | 6,178 |
| | Pfeiffer Vacuum Technology AG | 24,115 | 6,019 |
| * | MorphoSys AG | 123,684 | 5,821 |
| | Krones AG | 55,466 | 5,716 |
| | Norma Group SE | 127,609 | 5,482 |
| | VERBIO Vereinigte BioEnergie AG | 67,571 | 5,373 |
| | Dermapharm Holding SE | 52,945 | 5,325 |
| | PATRIZIA AG | 170,526 | 4,713 |
| 1 | S&T AG | 194,269 | 4,668 |
| *,1 | flatexDEGIRO AG | 203,045 | 4,612 |
| | STRATEC SE | 28,384 | 4,533 |
| * | Nagarro SE | 22,195 | 4,465 |
| * | Salzgitter AG | 120,729 | 4,430 |
| * | Deutz AG | 513,687 | 4,305 |
| | Deutsche EuroShop AG | 210,011 | 4,275 |
| *,1,2 | Shop Apotheke Europe NV | 27,982 | 4,243 |
| 1,2 | ADLER Group SA | 306,413 | 4,157 |
| * | Kloeckner & Co. SE Preference Shares | 303,030 | 4,071 |
| | Bilfinger SE | 114,411 | 4,021 |
| | Suedzucker AG | 250,784 | 3,978 |
| 1 | GRENKE AG | 90,864 | 3,543 |
| 2 | Instone Real Estate Group SE | 134,120 | 3,536 |
| * | CECONOMY AG | 722,489 | 3,525 |
| | Hornbach Holding AG & Co. KGaA | 26,837 | 3,394 |
| | KWS Saat SE & Co. KGaA | 38,915 | 3,322 |
| | New Work SE | 13,525 | 3,302 |
| * | Global Fashion Group SA | 361,040 | 3,251 |
| | Indus Holding AG | 82,094 | 3,230 |
| | Atoss Software AG | 11,738 | 2,656 |
| | Siltronic AG | 16,184 | 2,556 |
| | Schaeffler AG Preference Shares | 303,460 | 2,411 |
| | DIC Asset AG | 133,906 | 2,351 |
| | Basler AG | 12,555 | 2,314 |
| | Wacker Neuson SE | 67,155 | 2,204 |
| 1 | Draegerwerk AG & Co. KGaA Preference Shares | 27,518 | 2,168 |
| | Secunet Security Networks AG | 4,013 | 2,107 |
| | Zeal Network SE | 47,932 | 2,106 |
| | Washtec AG | 28,708 | 1,868 |
| | Deutsche Beteiligungs AG | 37,383 | 1,727 |
| * | SGL Carbon SE | 164,940 | 1,577 |
| | BayWa AG | 36,780 | 1,556 |
| | | Shares | Market
Value•
($000) |
| | Hensoldt AG | 92,386 | 1,494 |
| | Hamburger Hafen und Logistik AG | 66,117 | 1,483 |
| | Takkt AG | 86,859 | 1,419 |
| * | Koenig & Bauer AG | 35,591 | 1,256 |
| | Vossloh AG | 23,213 | 1,244 |
| 1 | SMA Solar Technology AG | 22,909 | 1,211 |
| * | ElringKlinger AG | 77,075 | 1,089 |
| | Wuestenrot & Wuerttembergische AG | 51,970 | 1,083 |
| | TLG Immobilien AG | 27,460 | 1,006 |
| | Hornbach Baumarkt AG | 20,005 | 899 |
| | Bertrandt AG | 12,735 | 831 |
| | CropEnergies AG | 52,300 | 751 |
| | Draegerwerk AG & Co. KGaA | 9,927 | 740 |
| | Steico SE | 1,167 | 153 |
| | | | 421,837 |
| Greece (0.1%) |
| | Hellenic Exchanges - Athens Stock Exchange SA | 512,343 | 2,195 |
| | Holding Co. ADMIE IPTO SA | 644,977 | 1,904 |
| * | LAMDA Development SA | 212,085 | 1,748 |
| * | GEK Terna Holding Real Estate Construction SA | 155,060 | 1,738 |
| * | Ellaktor SA | 729,567 | 1,162 |
| | Athens Water Supply & Sewage Co. SA | 113,818 | 996 |
| | Sarantis SA | 89,179 | 900 |
| | Viohalco SA | 173,897 | 880 |
| * | Fourlis Holdings SA | 114,251 | 508 |
| * | Aegean Airlines SA | 80,923 | 486 |
| * | Public Power Corp. SA | 31,801 | 346 |
| | | | 12,863 |
| Hong Kong (1.0%) |
| | Pacific Basin Shipping Ltd. | 17,049,532 | 7,868 |
| | Fortune REIT | 5,999,589 | 6,223 |
| | Luk Fook Holdings International Ltd. | 1,605,399 | 4,375 |
| *,1 | Vobile Group Ltd. | 4,882,000 | 4,295 |
| | Powerlong Real Estate Holdings Ltd. | 5,785,000 | 3,963 |
| | HKBN Ltd. | 3,151,629 | 3,776 |
| *,2 | Razer Inc. | 14,226,000 | 3,573 |
| | Sunlight REIT | 5,693,072 | 3,288 |
| | LK Technology Holdings Ltd. | 1,309,475 | 3,268 |
| | Hong Kong Technology Venture Co. Ltd. | 2,145,000 | 3,228 |
| | CITIC Telecom International Holdings Ltd. | 8,605,004 | 3,049 |
| *,2 | Jacobio Pharmaceuticals Group Co. Ltd. | 1,331,100 | 3,025 |
| | IGG Inc. | 3,250,000 | 3,022 |
FTSE All-World ex-US Small-Cap Index Fund
| | | Shares | Market
Value•
($000) |
| | CP Pokphand Co. Ltd. | 20,383,600 | 2,885 |
| | Jinchuan Group International Resources Co. Ltd. | 16,289,000 | 2,626 |
| | K Wah International Holdings Ltd. | 5,606,398 | 2,243 |
| * | Glory Sun Financial Group Ltd. | 60,168,000 | 2,084 |
| *,2 | Everest Medicines Ltd. | 352,500 | 2,022 |
| | Value Partners Group Ltd. | 3,926,434 | 2,010 |
| | Great Eagle Holdings Ltd. | 692,000 | 1,904 |
| | Vesync Co. Ltd. | 1,336,000 | 1,880 |
| | EC Healthcare | 1,268,000 | 1,824 |
| * | OCI International Holdings Ltd. | 3,332,000 | 1,692 |
| 2 | Asiainfo Technologies Ltd. | 1,023,600 | 1,686 |
| | Truly International Holdings Ltd. | 5,143,000 | 1,677 |
| * | Realord Group Holdings Ltd. | 1,066,000 | 1,660 |
| | VSTECS Holdings Ltd. | 1,698,000 | 1,602 |
| * | Pou Sheng International Holdings Ltd. | 9,483,000 | 1,596 |
| *,2 | Hua Medicine | 2,962,000 | 1,572 |
| | SUNeVision Holdings Ltd. | 1,620,000 | 1,487 |
| | Stella International Holdings Ltd. | 1,231,000 | 1,471 |
| | Prosperity REIT | 3,582,000 | 1,408 |
| *,2 | Frontage Holdings Corp. | 2,290,000 | 1,332 |
| 1 | C-Mer Eye Care Holdings Ltd. | 1,358,000 | 1,323 |
| | Texhong Textile Group Ltd. | 845,500 | 1,262 |
| *,1,2 | JW Cayman Therapeutics Co. Ltd. (XHKG) | 689,000 | 1,260 |
| *,2 | Antengene Corp. Ltd. | 900,500 | 1,193 |
| *,1 | GCL New Energy Holdings Ltd. | 25,123,541 | 1,177 |
| | Canvest Environmental Protection Group Co. Ltd. | 1,950,000 | 1,120 |
| | Powerlong Commercial Management Holdings Ltd. | 500,000 | 1,119 |
| *,1 | Apollo Future Mobility Group Ltd. | 15,732,000 | 1,089 |
| 1 | China Tobacco International HK Co. Ltd. | 469,000 | 1,078 |
| | Asia Cement China Holdings Corp. | 1,325,000 | 1,010 |
| | Far East Consortium International Ltd. | 2,804,858 | 925 |
| | | Shares | Market
Value•
($000) |
| | Chow Sang Sang Holdings International Ltd. | 634,565 | 901 |
| | United Laboratories International Holdings Ltd. | 1,374,500 | 873 |
| *,3 | SMI Holdings Group Ltd. | 2,800,800 | 842 |
| | Beijing Tong Ren Tang Chinese Medicine Co. Ltd. | 656,000 | 836 |
| | Road King Infrastructure Ltd. | 813,346 | 824 |
| * | Esprit Holdings Ltd. (XHKG) | 9,101,350 | 792 |
| | Sun Hung Kai & Co. Ltd. | 1,497,000 | 778 |
| * | Sa Sa International Holdings Ltd. | 3,414,000 | 746 |
| *,1,3 | Superb Summit International | 3,957,346 | 743 |
| * | Television Broadcasts Ltd. | 922,600 | 717 |
| | Dynam Japan Holdings Co. Ltd. | 722,440 | 669 |
| | Pacific Textiles Holdings Ltd. | 1,287,000 | 643 |
| | Singamas Container Holdings Ltd. | 5,413,960 | 637 |
| * | Cosmopolitan International Holdings Ltd. | 4,548,000 | 610 |
| | Giordano International Ltd. | 3,105,735 | 606 |
| | SmarTone Telecommunications Holdings Ltd. | 1,036,730 | 605 |
| * | Digital Domain Holdings Ltd. | 7,204,000 | 603 |
| * | CITIC Resources Holdings Ltd. | 8,074,000 | 569 |
| *,3 | Convoy | 26,130,000 | 561 |
| 2 | Crystal International Group Ltd. | 1,607,000 | 512 |
| 1,2 | VPower Group International Holdings Ltd. | 2,133,000 | 417 |
| | Texwinca Holdings Ltd. | 1,708,000 | 350 |
| *,3 | Huiyuan Juice | 1,333,000 | 346 |
| | Lee's Pharmaceutical Holdings Ltd. | 674,500 | 316 |
| *,3 | CTEG | 6,439,760 | 281 |
| *,3 | National Agricultural Holdings | 1,560,000 | 239 |
| * | China LNG Group Ltd. | 3,101,999 | 161 |
| *,3 | MH Development NPV | 1,068,000 | 159 |
| * | NewOcean Energy Holdings Ltd. | 1,790,000 | 61 |
| * | Suncity Group Holdings Ltd. | 1,108,000 | 42 |
| 2 | Xiabuxiabu Catering Management China Holdings Co. Ltd. | 36,500 | 27 |
| *,1,3 | Agritrade Resources Ltd. | 6,905,000 | — |
FTSE All-World ex-US Small-Cap Index Fund
| | | Shares | Market
Value•
($000) |
| | CMBC Capital Holdings Ltd. | 876 | — |
| * | Anxin China Holdings Ltd. | 2,621,200 | — |
| *,3 | C Fiber Optic | 2,215,200 | — |
| *,3 | Hua Han Health Industry Holdings Ltd. | 1,817,183 | — |
| *,3 | Tech Pro Tech Dev | 10,406,800 | — |
| | | | 118,636 |
| Hungary (0.0%) |
| *,1 | Opus Global Nyrt | 653,598 | 497 |
| India (4.3%) |
| | Crompton Greaves Consumer Electricals Ltd. | 1,825,419 | 11,364 |
| | Tata Elxsi Ltd. | 137,333 | 10,788 |
| | Persistent Systems Ltd. | 204,323 | 10,729 |
| | Dixon Technologies India Ltd. | 138,547 | 9,254 |
| | Deepak Nitrite Ltd. | 309,541 | 9,238 |
| | Atul Ltd. | 75,187 | 9,180 |
| | Indian Hotels Co. Ltd. | 3,132,914 | 8,264 |
| | Ramco Cements Ltd. | 570,502 | 8,142 |
| | Supreme Industries Ltd. | 247,689 | 7,716 |
| 2 | Dr Lal PathLabs Ltd. | 157,491 | 7,397 |
| * | Fortis Healthcare Ltd. | 2,195,163 | 7,185 |
| | Manappuram Finance Ltd. | 2,580,430 | 7,182 |
| | Tata Chemicals Ltd. | 556,658 | 6,729 |
| | Escorts Ltd. | 318,453 | 6,695 |
| | Navin Fluorine International Ltd. | 148,883 | 6,650 |
| | Tube Investments of India Ltd. | 331,727 | 6,207 |
| * | Max Healthcare Institute Ltd. | 1,343,394 | 5,956 |
| * | APL Apollo Tubes Ltd. | 541,638 | 5,804 |
| | CESC Ltd. | 4,301,980 | 5,016 |
| | JK Cement Ltd. | 108,381 | 4,806 |
| 2 | Indian Energy Exchange Ltd. | 501,627 | 4,755 |
| | Natco Pharma Ltd. | 420,155 | 4,644 |
| * | PVR Ltd. | 201,984 | 4,548 |
| | Pfizer Ltd. | 67,260 | 4,537 |
| | Phoenix Mills Ltd. | 350,198 | 4,521 |
| | AIA Engineering Ltd. | 176,133 | 4,519 |
| | Carborundum Universal Ltd. | 395,287 | 4,440 |
| * | CG Power & Industrial Solutions Ltd. | 2,251,451 | 4,417 |
| | Kajaria Ceramics Ltd. | 268,479 | 4,388 |
| | Birlasoft Ltd. | 801,081 | 4,363 |
| | IIFL Finance Ltd. | 996,842 | 4,322 |
| | Apollo Tyres Ltd. | 1,478,140 | 4,217 |
| | Cyient Ltd. | 293,693 | 4,198 |
| | National Aluminium Co. Ltd. | 3,163,402 | 4,110 |
| | | Shares | Market
Value•
($000) |
| | Gujarat State Petronet Ltd. | 972,604 | 3,975 |
| | NIIT Technologies Ltd. | 60,601 | 3,952 |
| | Radico Khaitan Ltd. | 260,877 | 3,914 |
| | Sundram Fasteners Ltd. | 346,349 | 3,873 |
| * | Aditya Birla Fashion and Retail Ltd. | 1,099,944 | 3,873 |
| | Relaxo Footwears Ltd. | 216,012 | 3,845 |
| | City Union Bank Ltd. | 1,682,136 | 3,788 |
| * | Happiest Minds Technologies Ltd. | 206,991 | 3,533 |
| | Redington India Ltd. | 1,813,014 | 3,487 |
| | Hatsun Agro Product Ltd. | 193,627 | 3,470 |
| * | IDFC Ltd. | 4,687,432 | 3,456 |
| * | Aavas Financiers Ltd. | 90,823 | 3,405 |
| 2 | Metropolis Healthcare Ltd. | 85,466 | 3,389 |
| | India Cements Ltd. | 1,224,976 | 3,379 |
| | Sanofi India Ltd. | 29,504 | 3,292 |
| | Tanla Platforms Ltd. | 199,466 | 3,261 |
| | Central Depository Services India Ltd. | 177,646 | 3,219 |
| | Amara Raja Batteries Ltd. | 351,472 | 3,201 |
| * | Intellect Design Arena Ltd. | 359,857 | 3,157 |
| | SKF India Ltd. | 70,417 | 3,133 |
| * | Dhani Services Ltd. | 1,271,233 | 3,030 |
| * | Gujarat Fluorochemicals Ltd. | 122,335 | 2,972 |
| 2 | Mindspace Business Parks REIT | 670,200 | 2,926 |
| | Chambal Fertilizers and Chemicals Ltd. | 588,787 | 2,911 |
| | Cholamandalam Financial Holdings Ltd. | 306,246 | 2,870 |
| | Computer Age Management Services Ltd. | 70,595 | 2,847 |
| 2 | Quess Corp. Ltd. | 243,173 | 2,820 |
| | Minda Industries Ltd. | 267,897 | 2,804 |
| | Alembic Pharmaceuticals Ltd. | 269,639 | 2,803 |
| | Firstsource Solutions Ltd. | 1,052,942 | 2,789 |
| | Jubilant Pharmova Ltd. Class A (XNSE) | 343,457 | 2,743 |
| | Sonata Software Ltd. | 244,525 | 2,737 |
| | Brigade Enterprises Ltd. | 433,035 | 2,687 |
| | Suven Pharmaceuticals Ltd. | 394,556 | 2,685 |
| 2 | IndiaMart InterMesh Ltd. | 27,762 | 2,656 |
FTSE All-World ex-US Small-Cap Index Fund
| | | Shares | Market
Value•
($000) |
| * | Amber Enterprises India Ltd. | 60,020 | 2,651 |
| | Granules India Ltd. | 631,272 | 2,621 |
| | Finolex Industries Ltd. | 882,310 | 2,598 |
| | Zensar Technologies Ltd. | 413,672 | 2,559 |
| *,2 | Syngene International Ltd. | 353,682 | 2,558 |
| | Can Fin Homes Ltd. | 300,205 | 2,520 |
| | HFCL Ltd. | 2,608,133 | 2,493 |
| | Balaji Amines Ltd. | 53,120 | 2,460 |
| | Jubilant Ingrevia Ltd. | 270,612 | 2,425 |
| | JB Chemicals & Pharmaceuticals Ltd. | 107,854 | 2,419 |
| | Schaeffler India Ltd. | 24,404 | 2,412 |
| | KEC International Ltd. | 369,502 | 2,364 |
| | KPIT Technologies Ltd. | 569,214 | 2,357 |
| * | Shriram City Union Finance Ltd. | 80,906 | 2,344 |
| * | Suzlon Energy Ltd. | 25,463,730 | 2,302 |
| | Ajanta Pharma Ltd. | 80,078 | 2,270 |
| | Solar Industries India Ltd. | 67,832 | 2,256 |
| | Linde India Ltd. | 72,445 | 2,234 |
| *,2 | Aster DM Healthcare Ltd. | 882,930 | 2,218 |
| | DCM Shriram Ltd. | 166,976 | 2,211 |
| | Sterlite Technologies Ltd. | 600,641 | 2,204 |
| | Mahanagar Gas Ltd. | 164,068 | 2,200 |
| 2 | Endurance Technologies Ltd. | 90,165 | 2,194 |
| | KEI Industries Ltd. | 178,761 | 2,183 |
| | Alkyl Amines Chemicals Ltd. | 45,199 | 2,178 |
| * | Bajaj Electricals Ltd. | 147,033 | 2,176 |
| | CRISIL Ltd. | 57,079 | 2,138 |
| * | Affle India Ltd. | 151,520 | 2,137 |
| | Rain Industries Ltd. | 689,953 | 2,106 |
| | Edelweiss Financial Services Ltd. | 2,007,260 | 2,082 |
| | Prestige Estates Projects Ltd. | 357,948 | 2,043 |
| | Blue Star Ltd. | 157,752 | 2,028 |
| | Lakshmi Machine Works Ltd. | 17,279 | 2,020 |
| * | TeamLease Services Ltd. | 33,603 | 2,013 |
| * | EID Parry India Ltd. | 324,843 | 1,985 |
| 2 | ICICI Securities Ltd. | 198,477 | 1,963 |
| | Orient Electric Ltd. | 421,968 | 1,955 |
| 2 | Eris Lifesciences Ltd. | 176,327 | 1,938 |
| | Thermax Ltd. | 104,555 | 1,928 |
| * | Indiabulls Real Estate Ltd. | 940,524 | 1,914 |
| | Zydus Wellness Ltd. | 69,674 | 1,914 |
| | Praj Industries Ltd. | 426,563 | 1,908 |
| | Sobha Ltd. | 183,154 | 1,886 |
| | Century Textiles & Industries Ltd. | 179,366 | 1,876 |
| | Balrampur Chini Mills Ltd. | 425,237 | 1,863 |
| | | Shares | Market
Value•
($000) |
| | NCC Ltd. | 1,941,321 | 1,853 |
| | Welspun India Ltd. | 998,383 | 1,839 |
| | Vinati Organics Ltd. | 69,776 | 1,785 |
| | Vaibhav Global Ltd. | 225,012 | 1,733 |
| | TTK Prestige Ltd. | 11,646 | 1,704 |
| * | EIH Ltd. | 909,148 | 1,691 |
| * | Reliance Power Ltd. | 8,923,274 | 1,690 |
| | PNC Infratech Ltd. | 387,455 | 1,683 |
| | Motilal Oswal Financial Services Ltd. | 136,682 | 1,677 |
| | Graphite India Ltd. | 232,645 | 1,670 |
| | JK Lakshmi Cement Ltd. | 198,742 | 1,637 |
| | Timken India Ltd. | 66,955 | 1,608 |
| 2 | Brookfield India Real Estate Trust | 414,636 | 1,590 |
| | V-Guard Industries Ltd. | 459,513 | 1,580 |
| * | Narayana Hrudayalaya Ltd. | 226,134 | 1,577 |
| | eClerx Services Ltd. | 53,838 | 1,572 |
| | Finolex Cables Ltd. | 249,907 | 1,564 |
| | Sumitomo Chemical India Ltd. | 307,720 | 1,550 |
| | Poly Medicure Ltd. | 124,765 | 1,543 |
| * | V-Mart Retail Ltd. | 27,854 | 1,514 |
| | Ratnamani Metals & Tubes Ltd. | 52,825 | 1,513 |
| | Great Eastern Shipping Co. Ltd. | 350,469 | 1,511 |
| | Infibeam Avenues Ltd. (XNSE) | 2,469,350 | 1,496 |
| * | Westlife Development Ltd. | 192,410 | 1,495 |
| *,2 | New India Assurance Co. Ltd. | 728,929 | 1,486 |
| | Procter & Gamble Health Ltd. | 20,502 | 1,485 |
| * | IRB Infrastructure Developers Ltd. | 487,819 | 1,480 |
| | HEG Ltd. | 53,181 | 1,466 |
| * | Alok Industries Ltd. | 4,759,279 | 1,404 |
| | Strides Pharma Science Ltd. | 192,344 | 1,378 |
| | EPL Ltd. | 478,324 | 1,376 |
| | Indian Bank | 595,710 | 1,374 |
| *,2 | PNB Housing Finance Ltd. | 212,718 | 1,374 |
| * | Mahindra CIE Automotive Ltd. | 377,355 | 1,348 |
| 2 | Godrej Agrovet Ltd. | 168,197 | 1,337 |
| | Aegis Logistics Ltd. | 447,896 | 1,275 |
| | JM Financial Ltd. | 1,072,179 | 1,262 |
| * | CreditAccess Grameen Ltd. | 147,337 | 1,238 |
| | PTC India Ltd. | 722,609 | 1,222 |
| | Gujarat Pipavav Port Ltd. | 807,038 | 1,208 |
| | Gateway Distriparks Ltd. | 319,272 | 1,190 |
| | NBCC India Ltd. | 1,958,621 | 1,173 |
| | Avanti Feeds Ltd. | 154,836 | 1,155 |
| | Bombay Burmah Trading Co. | 79,617 | 1,149 |
| | Vakrangee Ltd. | 2,270,405 | 1,119 |
| | KRBL Ltd. | 284,406 | 1,077 |
FTSE All-World ex-US Small-Cap Index Fund
| | | Shares | Market
Value•
($000) |
| 2 | Dilip Buildcon Ltd. | 132,735 | 1,067 |
| | Rallis India Ltd. | 285,503 | 1,014 |
| | Akzo Nobel India Ltd. | 33,403 | 938 |
| | Ceat Ltd. | 52,901 | 883 |
| | Care Ratings Ltd. | 90,646 | 832 |
| * | Sun Pharma Advanced Research Co. Ltd. | 225,875 | 794 |
| | Bajaj Consumer Care Ltd. | 254,023 | 787 |
| | Kaveri Seed Co. Ltd. | 111,117 | 775 |
| | Equitas Holdings Ltd. | 435,355 | 757 |
| *,2 | General Insurance Corp. of India | 421,396 | 751 |
| | Karur Vysya Bank Ltd. | 1,122,968 | 736 |
| | AstraZeneca Pharma India Ltd. | 16,987 | 683 |
| * | TV18 Broadcast Ltd. | 1,203,322 | 671 |
| | Symphony Ltd. | 47,028 | 652 |
| | Welspun Corp. Ltd. | 353,698 | 633 |
| * | Future Retail Ltd. | 924,362 | 595 |
| * | Wockhardt Ltd. | 103,829 | 593 |
| * | DCB Bank Ltd. | 433,216 | 527 |
| | Jindal Saw Ltd. | 330,453 | 513 |
| * | Raymond Ltd. | 78,329 | 480 |
| | Engineers India Ltd. | 472,027 | 459 |
| * | IFCI Ltd. | 2,754,823 | 451 |
| | Multi Commodity Exchange of India Ltd. | 19,424 | 443 |
| * | Hindustan Construction Co. Ltd. | 3,291,280 | 417 |
| | Karnataka Bank Ltd. | 452,658 | 413 |
| * | Just Dial Ltd. | 33,205 | 355 |
| * | South Indian Bank Ltd. | 2,728,102 | 342 |
| | WABCO India Ltd. | 3,113 | 310 |
| | GE Power India Ltd. | 48,512 | 188 |
| * | Future Consumer Ltd. | 1,958,769 | 182 |
| *,3 | Chennai Super Kings Cricket | 176,674 | — |
| | | | 514,159 |
| Indonesia (0.5%) |
| | Aneka Tambang Tbk | 32,758,419 | 5,421 |
| | Ciputra Development Tbk PT | 61,589,855 | 4,678 |
| * | Pakuwon Jati Tbk PT | 109,932,334 | 3,891 |
| * | Summarecon Agung Tbk PT | 58,386,047 | 3,778 |
| | Japfa Comfeed Indonesia Tbk PT | 30,582,300 | 3,736 |
| | Ace Hardware Indonesia Tbk PT | 33,690,600 | 3,357 |
| | Pabrik Kertas Tjiwi Kimia Tbk PT | 5,061,800 | 2,983 |
| | Mitra Keluarga Karyasehat Tbk PT | 17,896,300 | 2,881 |
| | Bank BTPN Syariah Tbk PT | 10,111,400 | 2,719 |
| * | Lippo Karawaci Tbk PT | 229,302,777 | 2,398 |
| | | Shares | Market
Value•
($000) |
| * | Bank Rakyat Indonesia Agroniaga Tbk PT | 14,134,200 | 2,106 |
| * | Indosat Tbk PT | 4,111,800 | 2,009 |
| | BFI Finance Indonesia Tbk PT | 26,203,000 | 1,944 |
| | Indo Tambangraya Megah Tbk PT | 1,119,200 | 1,706 |
| * | Matahari Department Store Tbk PT | 7,675,300 | 1,653 |
| | AKR Corporindo Tbk PT | 4,409,183 | 1,330 |
| * | Bank Bukopin Tbk PT (XIDX) | 42,485,200 | 1,286 |
| * | Mitra Adiperkasa Tbk PT | 19,421,700 | 1,208 |
| * | Bank Tabungan Negara Persero Tbk PT | 9,439,770 | 1,187 |
| * | Medco Energi Internasional Tbk PT | 28,799,188 | 1,157 |
| * | Timah Tbk PT | 9,609,420 | 1,080 |
| * | Waskita Karya Persero Tbk PT | 12,599,879 | 819 |
| * | Wijaya Karya Persero Tbk PT | 8,374,633 | 738 |
| | Perusahaan Perkebunan London Sumatra Indonesia Tbk PT | 7,395,529 | 729 |
| | Bank Pembangunan Daerah Jawa Barat Dan Banten Tbk PT | 6,579,300 | 662 |
| * | Bank Pan Indonesia Tbk PT | 10,474,800 | 584 |
| * | Panin Financial Tbk PT | 43,645,200 | 562 |
| * | PP Persero Tbk PT | 6,454,800 | 550 |
| * | Ramayana Lestari Sentosa Tbk PT | 7,703,600 | 402 |
| * | Alam Sutera Realty Tbk PT | 31,151,091 | 401 |
| * | Krakatau Steel Persero Tbk PT | 10,652,750 | 395 |
| * | Global Mediacom Tbk PT | 19,915,706 | 379 |
| * | Surya Semesta Internusa Tbk PT | 10,442,300 | 368 |
| * | Adhi Karya Persero Tbk PT | 4,781,800 | 355 |
| *,3 | Trada Alam Minera Tbk PT | 95,405,707 | 337 |
| * | Eagle High Plantations Tbk PT | 31,717,100 | 204 |
| * | Totalindo Eka Persada Tbk PT | 11,834,884 | 42 |
| * | Kresna Graha Investama Tbk PT | 545,800 | 4 |
| | | | 60,039 |
| Ireland (0.3%) |
| * | Bank of Ireland Group plc | 3,291,251 | 19,607 |
| | Hibernia REIT plc | 2,636,940 | 3,852 |
| * | Dalata Hotel Group plc | 846,534 | 3,621 |
FTSE All-World ex-US Small-Cap Index Fund
| | | Shares | Market
Value•
($000) |
| * | Irish Continental Group plc | 589,527 | 2,898 |
| * | Cairn Homes plc | 1,719,382 | 2,230 |
| * | Cairn Homes plc (XDUB) | 634,789 | 824 |
| | | | 33,032 |
| Israel (0.7%) |
| | REIT 1 Ltd. | 950,922 | 5,946 |
| * | Clal Insurance Enterprises Holdings Ltd. | 215,825 | 5,333 |
| | Mega Or Holdings Ltd. | 103,049 | 4,082 |
| | FIBI Holdings Ltd. | 85,298 | 3,751 |
| | Matrix IT Ltd. | 137,191 | 3,725 |
| | AudioCodes Ltd. | 103,900 | 3,617 |
| | Formula Systems 1985 Ltd. | 33,557 | 3,614 |
| | Hilan Ltd. | 64,263 | 3,562 |
| * | Camtek Ltd. | 86,312 | 3,467 |
| * | AFI Properties Ltd. | 63,906 | 3,319 |
| | Fox Wizel Ltd. | 22,219 | 3,065 |
| | Danel Adir Yeoshua Ltd. | 13,283 | 2,810 |
| * | Perion Network Ltd. | 97,336 | 2,720 |
| * | Summit Real Estate Holdings Ltd. | 125,029 | 2,271 |
| | Isracard Ltd. | 531,770 | 2,137 |
| | Delek Automotive Systems Ltd. | 151,347 | 1,982 |
| * | Allot Ltd. | 130,770 | 1,934 |
| * | Delek Group Ltd. | 23,096 | 1,924 |
| | Sella Capital Real Estate Ltd. | 576,340 | 1,903 |
| * | Compugen Ltd. | 275,529 | 1,747 |
| | Rami Levy Chain Stores Hashikma Marketing 2006 Ltd. | 20,410 | 1,537 |
| | Migdal Insurance & Financial Holdings Ltd. | 857,271 | 1,459 |
| | Delta Galil Industries Ltd. | 27,963 | 1,436 |
| | Menora Mivtachim Holdings Ltd. | 60,681 | 1,404 |
| * | Partner Communications Co. Ltd. | 273,399 | 1,382 |
| * | Equital Ltd. | 44,200 | 1,358 |
| * | Oil Refineries Ltd. | 4,292,014 | 1,161 |
| * | Cellcom Israel Ltd. | 255,774 | 968 |
| | IDI Insurance Co. Ltd. | 20,372 | 819 |
| * | Brack Capital Properties NV | 6,411 | 748 |
| | Gilat Satellite Networks Ltd. | 82,686 | 684 |
| * | Naphtha Israel Petroleum Corp. Ltd. | 89,565 | 555 |
| * | Kamada Ltd. | 81,400 | 467 |
| * | Tera Light Ltd. | 60,681 | 153 |
| | Kenon Holdings Ltd. | 2,834 | 114 |
| * | Allot Ltd. (XNGS) | 1,781 | 26 |
| | | | 77,180 |
| | | Shares | Market
Value•
($000) |
| Italy (1.8%) |
| | Banco BPM SpA | 5,488,795 | 17,069 |
| | Azimut Holding SpA | 472,297 | 13,601 |
| * | Banca Generali SpA | 212,537 | 9,999 |
| | Unipol Gruppo SpA | 1,704,937 | 9,792 |
| | BPER Banca | 3,765,754 | 8,257 |
| | ERG SpA | 226,737 | 8,191 |
| * | Brunello Cucinelli SpA | 133,703 | 8,112 |
| | Iren SpA | 2,505,412 | 7,786 |
| | Banca Popolare di Sondrio SCPA | 1,704,363 | 7,406 |
| | Brembo SpA | 557,346 | 7,321 |
| 2 | Anima Holding SpA | 1,113,833 | 5,918 |
| * | Autogrill SpA | 736,799 | 5,784 |
| 2 | BFF Bank SpA | 637,535 | 5,709 |
| | Tamburi Investment Partners SpA | 483,411 | 5,457 |
| 1 | Falck Renewables SpA | 535,169 | 5,397 |
| 2 | Technogym SpA | 480,561 | 5,051 |
| 2 | Carel Industries SpA | 164,981 | 4,761 |
| * | Salvatore Ferragamo SpA | 216,553 | 4,608 |
| | Sesa SpA | 23,169 | 4,545 |
| *,2 | Enav SpA | 968,537 | 4,250 |
| | ACEA SpA | 176,588 | ��3,831 |
| *,1 | Saipem SpA | 1,694,938 | 3,714 |
| * | Societa Cattolica Di Assicurazione SpA | 474,689 | 3,610 |
| 2 | GVS SpA | 234,082 | 3,478 |
| | Gruppo MutuiOnline SpA | 69,349 | 3,387 |
| | Danieli & C Officine Meccaniche SpA Savings Shares | 146,686 | 3,169 |
| 1 | Webuild SpA (MTAA) | 1,151,281 | 2,850 |
| | Tinexta SpA | 63,195 | 2,801 |
| | Piaggio & C SpA | 811,738 | 2,721 |
| | SOL SpA | 113,384 | 2,605 |
| | Mediaset NV | 843,752 | 2,370 |
| | MARR SpA | 99,524 | 2,345 |
| 1 | Maire Tecnimont SpA | 435,534 | 1,877 |
| | Zignago Vetro SpA | 84,385 | 1,700 |
| * | Cerved Group SpA | 136,712 | 1,641 |
| 2 | doValue SpA | ��� 169,768 | 1,628 |
| *,1 | Tod's SpA | 29,103 | 1,605 |
| 2 | RAI Way SpA | 258,035 | 1,562 |
| | Credito Emiliano SpA | 202,683 | 1,538 |
| | Italmobiliare SpA | 38,099 | 1,337 |
| | Cementir Holding NV | 126,446 | 1,328 |
| * | CIR SpA-Compagnie Industriali | 2,392,330 | 1,318 |
| * | Saras SpA | 1,771,794 | 1,315 |
| | Banca IFIS SpA | 70,878 | 1,311 |
| * | Biesse SpA | 38,131 | 1,180 |
| *,1 | Juventus Football Club SpA | 1,304,902 | 1,055 |
| *,1 | Fincantieri SpA | 1,301,747 | 1,024 |
| | Danieli & C Officine Meccaniche SpA | 28,820 | 970 |
| | Datalogic SpA | 52,135 | 948 |
FTSE All-World ex-US Small-Cap Index Fund
| | | Shares | Market
Value•
($000) |
| *,1 | Banca Monte dei Paschi di Siena SpA | 764,475 | 913 |
| * | Immobiliare Grande Distribuzione SIIQ SpA | 177,826 | 780 |
| * | Arnoldo Mondadori Editore SpA | 317,453 | 734 |
| | DeA Capital SpA | 225,174 | 348 |
| | Rizzoli Corriere Della Sera Mediagroup SpA | 311,758 | 256 |
| * | Webuild SpA | 104,185 | 122 |
| | | | 212,385 |
| Japan (12.9%) |
| | Daiseki Co. Ltd. | 205,244 | 9,580 |
| | ADEKA Corp. | 422,155 | 9,391 |
| | Infomart Corp. | 817,700 | 7,979 |
| | Outsourcing Inc. | 409,300 | 7,852 |
| | Fuji Corp. | 329,888 | 7,695 |
| | Topcon Corp. | 421,200 | 7,510 |
| | Japan Steel Works Ltd. | 255,600 | 7,509 |
| | Jafco Co. Ltd. | 118,300 | 7,495 |
| | Mirait Holdings Corp. | 377,171 | 7,254 |
| | Katitas Co. Ltd. | 195,400 | 7,135 |
| | Nippon Suisan Kaisha Ltd. | 1,218,522 | 6,925 |
| | Fujitec Co. Ltd. | 303,184 | 6,887 |
| | Frontier Real Estate Investment Corp. | 1,544 | 6,831 |
| | Descente Ltd. | 178,600 | 6,770 |
| | Meitec Corp. | 112,146 | 6,745 |
| | Invincible Investment Corp. | 16,635 | 6,577 |
| | Tokyo Seimitsu Co. Ltd. | 157,334 | 6,406 |
| | Daiwa Securities Living Investments Corp. | 6,281 | 6,345 |
| | Kenedix Residential Next Investment Corp. | 3,210 | 6,173 |
| | Digital Garage Inc. | 131,000 | 6,120 |
| | Daiwabo Holdings Co. Ltd. | 346,880 | 6,107 |
| | Nishimatsu Construction Co. Ltd. | 211,642 | 6,105 |
| | Mitsui High-Tec Inc. | 79,000 | 6,102 |
| | Japan Elevator Service Holdings Co. Ltd. | 278,500 | 6,035 |
| | Comforia Residential REIT Inc. | 2,066 | 6,022 |
| | NSD Co. Ltd. | 311,768 | 5,941 |
| * | Fujikura Ltd. | 1,098,400 | 5,925 |
| | Hulic REIT Inc. | 3,906 | 5,918 |
| | Nichias Corp. | 240,169 | 5,881 |
| | Toagosei Co. Ltd. | 516,292 | 5,770 |
| | en japan Inc. | 144,300 | 5,730 |
| | Hazama Ando Corp. | 822,679 | 5,571 |
| | Mizuho Leasing Co. Ltd. | 177,901 | 5,497 |
| | | Shares | Market
Value•
($000) |
| 1 | NTT UD REIT Investment Corp. | 4,086 | 5,424 |
| | Takasago Thermal Engineering Co. Ltd. | 293,489 | 5,369 |
| | Nippon Gas Co. Ltd. | 432,300 | 5,362 |
| | Yoshinoya Holdings Co. Ltd. | 272,320 | 5,310 |
| | Inaba Denki Sangyo Co. Ltd. | 217,200 | 5,210 |
| | Mitsubishi Estate Logistics REIT Investment Corp. | 1,203 | 5,202 |
| | NIPPON REIT Investment Corp. | 1,352 | 5,197 |
| | Macnica Fuji Electronics Holdings Inc. | 220,813 | 5,191 |
| | Asahi Holdings Inc. | 287,200 | 5,126 |
| | Systena Corp. | 273,800 | 5,060 |
| | Hokuetsu Corp. | 757,821 | 5,007 |
| | Kureha Corp. | 76,702 | 4,985 |
| | CKD Corp. | 250,300 | 4,962 |
| | Hitachi Zosen Corp. | 621,610 | 4,874 |
| | Shoei Co. Ltd. | 109,400 | 4,868 |
| | Duskin Co. Ltd. | 199,960 | 4,817 |
| | Hanwa Co. Ltd. | 160,183 | 4,812 |
| | Japan Excellent Inc. | 3,966 | 4,789 |
| | Tomy Co. Ltd. | 499,217 | 4,738 |
| | Fuji Soft Inc. | 90,974 | 4,633 |
| | Tokyu REIT Inc. | 2,753 | 4,619 |
| | Tsubakimoto Chain Co. | 155,264 | 4,588 |
| | Sanrio Co. Ltd. | 203,900 | 4,569 |
| | Hoshino Resorts REIT Inc. | 697 | 4,551 |
| | Kenedix Retail REIT Corp. | 1,780 | 4,542 |
| | Aiful Corp. | 1,329,900 | 4,431 |
| | Milbon Co. Ltd. | 73,920 | 4,426 |
| | Iriso Electronics Co. Ltd. | 95,300 | 4,378 |
| | Okamura Corp. | 330,947 | 4,367 |
| | Okumura Corp. | 169,052 | 4,366 |
| | Nihon Parkerizing Co. Ltd. | 437,361 | 4,364 |
| | Kintetsu World Express Inc. | 181,500 | 4,359 |
| | Monex Group Inc. | 667,387 | 4,346 |
| * | Raksul Inc. | 78,900 | 4,341 |
| | Heiwa Real Estate Co. Ltd. | 137,342 | 4,336 |
| | Sumitomo Warehouse Co. Ltd. | 266,855 | 4,290 |
| | Seiren Co. Ltd. | 212,100 | 4,281 |
| | Nikkon Holdings Co. Ltd. | 219,048 | 4,280 |
| | Pilot Corp. | 116,300 | 4,265 |
| | Valor Holdings Co. Ltd. | 201,400 | 4,265 |
| | Kanematsu Corp. | 367,000 | 4,262 |
| | DCM Holdings Co. Ltd. | 436,988 | 4,261 |
| | Trusco Nakayama Corp. | 175,400 | 4,241 |
| | Sakata Seed Corp. | 139,856 | 4,219 |
FTSE All-World ex-US Small-Cap Index Fund
| | | Shares | Market
Value•
($000) |
| | Takeuchi Manufacturing Co. Ltd. | 161,900 | 4,157 |
| | Tadano Ltd. | 380,300 | 4,153 |
| | Joyful Honda Co. Ltd. | 297,248 | 4,088 |
| | DTS Corp. | 183,042 | 4,061 |
| | Sangetsu Corp. | 295,020 | 4,060 |
| | EDION Corp. | 426,875 | 4,051 |
| | Tokyo Steel Manufacturing Co. Ltd. | 364,000 | 4,051 |
| | JINS Holdings Inc. | 64,000 | 4,046 |
| | Wacoal Holdings Corp. | 201,200 | 4,029 |
| | Kiyo Bank Ltd. | 305,410 | 4,011 |
| | Heiwa Real Estate REIT Inc. | 2,854 | 3,985 |
| | Funai Soken Holdings Inc. | 143,150 | 3,977 |
| | Wacom Co. Ltd. | 609,536 | 3,943 |
| | Raito Kogyo Co. Ltd. | 220,400 | 3,919 |
| | Toyobo Co. Ltd. | 326,300 | 3,918 |
| | Toei Co. Ltd. | 19,964 | 3,916 |
| | Fujimi Inc. | 62,047 | 3,902 |
| | Towa Pharmaceutical Co. Ltd. | 150,782 | 3,876 |
| | MOS Food Services Inc. | 138,358 | 3,858 |
| | Takuma Co. Ltd. | 294,500 | 3,852 |
| | Nomura Co. Ltd. | 389,400 | 3,839 |
| | Mori Trust Sogo REIT Inc. | 2,971 | 3,838 |
| | KH Neochem Co. Ltd. | 149,200 | 3,835 |
| 1 | Colowide Co. Ltd. | 264,900 | 3,830 |
| | Nippon Soda Co. Ltd. | 127,125 | 3,820 |
| | Nichiha Corp. | 132,600 | 3,812 |
| 1 | Senko Group Holdings Co. Ltd. | 428,200 | 3,809 |
| | Eizo Corp. | 98,756 | 3,777 |
| | Kumagai Gumi Co. Ltd. | 150,680 | 3,730 |
| | Glory Ltd. | 172,900 | 3,722 |
| | Citizen Watch Co. Ltd. | 849,500 | 3,705 |
| | Ai Holdings Corp. | 195,900 | 3,697 |
| | UT Group Co. Ltd. | 115,500 | 3,695 |
| | Musashi Seimitsu Industry Co. Ltd. | 195,230 | 3,674 |
| | Central Glass Co. Ltd. | 197,213 | 3,672 |
| | Kanamoto Co. Ltd. | 171,100 | 3,665 |
| | Kohnan Shoji Co. Ltd. | 117,200 | 3,665 |
| | Taikisha Ltd. | 127,788 | 3,650 |
| | Toho Holdings Co. Ltd. | 225,018 | 3,643 |
| | Digital Arts Inc. | 44,500 | 3,633 |
| | Earth Corp. | 58,943 | 3,617 |
| | TOKAI Holdings Corp. | 470,700 | 3,574 |
| | Nachi-Fujikoshi Corp. | 94,251 | 3,570 |
| | Nisshinbo Holdings Inc. | 460,800 | 3,557 |
| | | Shares | Market
Value•
($000) |
| | Gunma Bank Ltd. | 1,151,500 | 3,555 |
| | Makino Milling Machine Co. Ltd. | 98,780 | 3,554 |
| | Sanken Electric Co. Ltd. | 67,329 | 3,540 |
| | Ichibanya Co. Ltd. | 87,368 | 3,532 |
| | Sumitomo Osaka Cement Co. Ltd. | 126,000 | 3,531 |
| | Nitto Boseki Co. Ltd. | 109,011 | 3,494 |
| | Paramount Bed Holdings Co. Ltd. | 186,500 | 3,480 |
| | Sato Holdings Corp. | 150,400 | 3,467 |
| | San-In Godo Bank Ltd. | 705,900 | 3,455 |
| | Japan Lifeline Co. Ltd. | 319,600 | 3,441 |
| | Kumiai Chemical Industry Co. Ltd. | 460,250 | 3,432 |
| | Gunze Ltd. | 88,807 | 3,423 |
| | Sumitomo Mitsui Construction Co. Ltd. | 806,646 | 3,423 |
| | Transcosmos Inc. | 113,396 | 3,419 |
| | Arcs Co. Ltd. | 175,000 | 3,363 |
| | Fukuoka REIT Corp. | 2,259 | 3,353 |
| | ZERIA Pharmaceutical Co. Ltd. | 187,240 | 3,352 |
| | Japan Material Co. Ltd. | 240,300 | 3,342 |
| | Ogaki Kyoritsu Bank Ltd. | 200,274 | 3,328 |
| | Hokuhoku Financial Group Inc. | 464,700 | 3,324 |
| | Yodogawa Steel Works Ltd. | 151,833 | 3,318 |
| | Maeda Kosen Co. Ltd. | 113,900 | 3,304 |
| | Zojirushi Corp. | 236,300 | 3,278 |
| * | Oisix ra daichi Inc. | 78,118 | 3,272 |
| | San-A Co. Ltd. | 89,744 | 3,234 |
| | Toyo Ink SC Holdings Co. Ltd. | 182,454 | 3,213 |
| | Nippon Steel Trading Corp. | 70,549 | 3,190 |
| | Juroku Financial Group Inc. | 175,500 | 3,187 |
| | Takara Standard Co. Ltd. | 238,499 | 3,171 |
| | Idec Corp. | 149,100 | 3,160 |
| | Inabata & Co. Ltd. | 213,200 | 3,156 |
| | Round One Corp. | 259,700 | 3,125 |
| | Oki Electric Industry Co. Ltd. | 379,806 | 3,120 |
| | KOMEDA Holdings Co. Ltd. | 171,800 | 3,116 |
| | Create SD Holdings Co. Ltd. | 101,318 | 3,115 |
| | Life Corp. | 94,800 | 3,112 |
| | Toridoll Holdings Corp. | 127,700 | 3,074 |
| | Global One Real Estate Investment Corp. | 2,984 | 3,073 |
| | Seiko Holdings Corp. | 145,558 | 3,070 |
| | Kitz Corp. | 458,848 | 3,070 |
| | Nippon Light Metal Holdings Co. Ltd. | 184,696 | 3,065 |
FTSE All-World ex-US Small-Cap Index Fund
| | | Shares | Market
Value•
($000) |
| | Heiwado Co. Ltd. | 176,800 | 3,060 |
| | Yamazen Corp. | 323,600 | 2,998 |
| | Musashino Bank Ltd. | 189,700 | 2,980 |
| | Nagawa Co. Ltd. | 31,400 | 2,971 |
| * | NTN Corp. | 1,354,300 | 2,937 |
| | Okasan Securities Group Inc. | 857,100 | 2,932 |
| | BeNext-Yumeshin Group Co. | 223,992 | 2,920 |
| * | Royal Holdings Co. Ltd. | 160,700 | 2,917 |
| | Tsubaki Nakashima Co. Ltd. | 208,300 | 2,917 |
| | eGuarantee Inc. | 130,400 | 2,904 |
| | Nojima Corp. | 131,500 | 2,884 |
| | Dexerials Corp. | 142,000 | 2,873 |
| | Nanto Bank Ltd. | 165,900 | 2,860 |
| 1 | Okinawa Financial Group Inc. | 129,344 | 2,843 |
| | Topre Corp. | 245,200 | 2,836 |
| | Fuji Seal International Inc. | 128,800 | 2,833 |
| | Maxell Ltd. | 235,300 | 2,831 |
| 1 | Daiho Corp. | 83,900 | 2,826 |
| | Hankyu Hanshin REIT Inc. | 1,908 | 2,814 |
| | Nippn Corp. | 195,829 | 2,806 |
| | Nishi-Nippon Financial Holdings Inc. | 478,400 | 2,790 |
| | Kato Sangyo Co. Ltd. | 98,800 | 2,786 |
| | Okamoto Industries Inc. | 79,100 | 2,776 |
| | UACJ Corp. | 119,585 | 2,772 |
| | Daishi Hokuetsu Financial Group Inc. | 123,600 | 2,768 |
| | Atom Corp. | 409,857 | 2,765 |
| | Komeri Co. Ltd. | 119,700 | 2,764 |
| *,1 | HIS Co. Ltd. | 122,800 | 2,761 |
| | SOSiLA Logistics REIT Inc. | 1,824 | 2,743 |
| | Rorze Corp. | 28,600 | 2,741 |
| | Mandom Corp. | 188,454 | 2,740 |
| | Nisshin Oillio Group Ltd. | 103,052 | 2,732 |
| | Okinawa Electric Power Co. Inc. | 222,708 | 2,732 |
| 1 | Create Restaurants Holdings Inc. | 393,440 | 2,705 |
| | Aeon Delight Co. Ltd. | 88,000 | 2,703 |
| | Hogy Medical Co. Ltd. | 98,522 | 2,701 |
| | Pacific Industrial Co. Ltd. | 264,100 | 2,690 |
| | Mitsuuroko Group Holdings Co. Ltd. | 224,200 | 2,683 |
| | Itochu Advance Logistics Investment Corp. | 1,884 | 2,683 |
| | Mitsubishi Pencil Co. Ltd. | 222,900 | 2,674 |
| | FCC Co. Ltd. | 192,243 | 2,662 |
| | Noritake Co. Ltd. | 60,800 | 2,658 |
| 1 | Suruga Bank Ltd. | 721,500 | 2,647 |
| | S Foods Inc. | 91,300 | 2,644 |
| | | Shares | Market
Value•
($000) |
| | Nippon Paper Industries Co. Ltd. | 257,800 | 2,643 |
| | eRex Co. Ltd. | 115,400 | 2,643 |
| | Showa Sangyo Co. Ltd. | 105,800 | 2,632 |
| | Shiga Bank Ltd. | 162,100 | 2,623 |
| | KYORIN Holdings Inc. | 170,500 | 2,619 |
| | Ryosan Co. Ltd. | 126,957 | 2,617 |
| | Taiyo Holdings Co. Ltd. | 97,800 | 2,615 |
| | Mixi Inc. | 114,100 | 2,615 |
| | Ohsho Food Service Corp. | 49,374 | 2,593 |
| | Mitsubishi Logisnext Co. Ltd. | 281,600 | 2,590 |
| | Totetsu Kogyo Co. Ltd. | 118,700 | 2,583 |
| | TKC Corp. | 83,698 | 2,566 |
| | Nikkiso Co. Ltd. | 288,761 | 2,557 |
| | Shibuya Corp. | 96,800 | 2,557 |
| | Adastria Co. Ltd. | 137,500 | 2,551 |
| | United Arrows Ltd. | 127,267 | 2,549 |
| | Cybozu Inc. | 107,400 | 2,548 |
| | Tri Chemical Laboratories Inc. | 84,876 | 2,539 |
| | CRE Logistics REIT Inc. | 1,293 | 2,516 |
| | Dip Corp. | 70,000 | 2,512 |
| | Chudenko Corp. | 127,600 | 2,498 |
| | TPR Co. Ltd. | 195,629 | 2,493 |
| | Ichigo Office REIT Investment Corp. | 3,291 | 2,493 |
| | Nitta Corp. | 108,200 | 2,480 |
| | TOMONY Holdings Inc. | 927,000 | 2,477 |
| | GLOBERIDE Inc. | 68,400 | 2,475 |
| | Maruha Nichiro Corp. | 109,500 | 2,470 |
| | Bank of Nagoya Ltd. | 115,512 | 2,457 |
| | Morita Holdings Corp. | 194,966 | 2,453 |
| | 77 Bank Ltd. | 240,300 | 2,451 |
| | Yokowo Co. Ltd. | 110,237 | 2,450 |
| | Hiday Hidaka Corp. | 170,619 | 2,437 |
| | Tokyu Construction Co. Ltd. | 344,700 | 2,437 |
| | Kyoritsu Maintenance Co. Ltd. | 64,600 | 2,421 |
| | Tokyotokeiba Co. Ltd. | 60,900 | 2,413 |
| | Maruwa Co. Ltd. | 21,500 | 2,410 |
| | Meidensha Corp. | 114,487 | 2,410 |
| | Hokuriku Electric Power Co. | 504,000 | 2,400 |
| | Nippon Densetsu Kogyo Co. Ltd. | 153,903 | 2,372 |
| | Daihen Corp. | 56,651 | 2,365 |
| | United Super Markets Holdings Inc. | 256,350 | 2,340 |
| *,1 | euglena Co. Ltd. | 329,100 | 2,333 |
| | Fuso Chemical Co. Ltd. | 50,300 | 2,316 |
| | Shinmaywa Industries Ltd. | 283,168 | 2,314 |
FTSE All-World ex-US Small-Cap Index Fund
| | | Shares | Market
Value•
($000) |
| | Starts Corp. Inc. | 96,215 | 2,312 |
| | Nagaileben Co. Ltd. | 112,400 | 2,310 |
| | San-Ai Oil Co. Ltd. | 177,200 | 2,309 |
| *,1 | Chiyoda Corp. | 626,900 | 2,292 |
| *,1 | giftee Inc. | 67,704 | 2,289 |
| | Star Asia Investment Corp. | 4,308 | 2,285 |
| *,1 | Change Inc. | 126,400 | 2,278 |
| | JCU Corp. | 56,300 | 2,261 |
| | Tokai Tokyo Financial Holdings Inc. | 647,600 | 2,245 |
| * | Nippon Sheet Glass Co. Ltd. | 400,500 | 2,238 |
| | Strike Co. Ltd. | 58,914 | 2,223 |
| | MCJ Co. Ltd. | 196,800 | 2,216 |
| | Kameda Seika Co. Ltd. | 56,200 | 2,198 |
| 1 | Financial Products Group Co. Ltd. | 378,900 | 2,193 |
| | Optex Group Co. Ltd. | 171,900 | 2,189 |
| 1 | Mirai Corp. | 4,728 | 2,183 |
| | Hokkaido Electric Power Co. Inc. | 522,000 | 2,169 |
| | Mitani Sekisan Co. Ltd. | 33,500 | 2,126 |
| | Saibu Gas Holdings Co. Ltd. | 103,673 | 2,117 |
| | Autobacs Seven Co. Ltd. | 163,200 | 2,111 |
| | BML Inc. | 60,000 | 2,109 |
| 1 | Pharma Foods International Co. Ltd. | 93,016 | 2,108 |
| 1 | Kura Sushi Inc. | 64,300 | 2,080 |
| | Sanki Engineering Co. Ltd. | 164,667 | 2,074 |
| | Hioki EE Corp. | 29,400 | 2,053 |
| | Megmilk Snow Brand Co. Ltd. | 106,100 | 2,053 |
| | Awa Bank Ltd. | 110,100 | 2,051 |
| | Nippon Seiki Co. Ltd. | 203,532 | 2,048 |
| | Senshu Ikeda Holdings Inc. | 1,442,000 | 2,026 |
| | Prima Meat Packers Ltd. | 85,788 | 2,016 |
| | H2O Retailing Corp. | 251,200 | 2,006 |
| | Gree Inc. | 237,800 | 2,006 |
| 1 | Aruhi Corp. | 172,926 | 2,005 |
| | Daikyonishikawa Corp. | 332,900 | 2,001 |
| | Zenrin Co. Ltd. | 212,750 | 1,962 |
| | Nichi-iko Pharmaceutical Co. Ltd. | 258,302 | 1,961 |
| | S-Pool Inc. | 175,360 | 1,961 |
| | Nextage Co. Ltd. | 106,600 | 1,954 |
| | Nissha Co. Ltd. | 118,560 | 1,942 |
| | Tocalo Co. Ltd. | 158,100 | 1,939 |
| | Tsugami Corp. | 141,000 | 1,938 |
| | Anicom Holdings Inc. | 246,300 | 1,920 |
| | Kissei Pharmaceutical Co. Ltd. | 95,800 | 1,916 |
| | Arata Corp. | 53,859 | 1,907 |
| * | MedPeer Inc. | 63,200 | 1,899 |
| | | Shares | Market
Value•
($000) |
| | ValueCommerce Co. Ltd. | 48,000 | 1,894 |
| | Hyakujushi Bank Ltd. | 146,300 | 1,893 |
| | COLOPL Inc. | 261,400 | 1,889 |
| * | M&A Capital Partners Co. Ltd. | 33,300 | 1,878 |
| | Hokkoku Financial Holdings Inc. | 107,551 | 1,875 |
| | Midac Holdings Co. Ltd. | 39,410 | 1,874 |
| | Sodick Co. Ltd. | 242,978 | 1,873 |
| | Unipres Corp. | 229,380 | 1,871 |
| | St. Marc Holdings Co. Ltd. | 139,100 | 1,870 |
| | Monogatari Corp. | 29,740 | 1,853 |
| | Jaccs Co. Ltd. | ��� 69,400 | 1,851 |
| | Toho Bank Ltd. | 1,031,464 | 1,846 |
| | Onward Holdings Co. Ltd. | 618,856 | 1,830 |
| | LITALICO Inc. | 60,400 | 1,824 |
| | Saizeriya Co. Ltd. | 67,421 | 1,820 |
| | SAMTY Co. Ltd. | 81,100 | 1,803 |
| | Japan Securities Finance Co. Ltd. | 235,141 | 1,795 |
| | Comture Corp. | 65,900 | 1,787 |
| | Macromill Inc. | 253,100 | 1,784 |
| 1 | Tamura Corp. | 253,900 | 1,745 |
| | Daibiru Corp. | 123,443 | 1,718 |
| * | Leopalace21 Corp. | 791,500 | 1,705 |
| | SBS Holdings Inc. | 47,700 | 1,697 |
| | Yokogawa Bridge Holdings Corp. | 83,600 | 1,685 |
| | Pasona Group Inc. | 60,000 | 1,676 |
| | One REIT Inc. | 623 | 1,671 |
| | Fujimori Kogyo Co. Ltd. | 40,500 | 1,665 |
| | Towa Corp. | 76,365 | 1,663 |
| | Max Co. Ltd. | 104,100 | 1,658 |
| | Ryobi Ltd. | 157,787 | 1,654 |
| | Mochida Pharmaceutical Co. Ltd. | 56,500 | 1,648 |
| | Token Corp. | 19,886 | 1,622 |
| | Futaba Corp. | 238,232 | 1,620 |
| | Shizuoka Gas Co. Ltd. | 153,400 | 1,618 |
| | Intage Holdings Inc. | 95,700 | 1,616 |
| | Hyakugo Bank Ltd. | 555,700 | 1,611 |
| | Usen-Next Holdings Co. Ltd. | 54,600 | 1,607 |
| | Riso Kagaku Corp. | 75,684 | 1,597 |
| | Sekisui Jushi Corp. | 85,500 | 1,593 |
| | Link And Motivation Inc. | 150,500 | 1,590 |
| | Hosiden Corp. | 150,467 | 1,586 |
| | Prestige International Inc. | 227,400 | 1,559 |
| | Nichicon Corp. | 164,483 | 1,557 |
| 1 | Nishimatsuya Chain Co. Ltd. | 121,800 | 1,554 |
| | Roland Corp. | 37,800 | 1,554 |
| | Nissin Electric Co. Ltd. | 124,000 | 1,537 |
| | North Pacific Bank Ltd. | 741,800 | 1,535 |
| | Sanyo Denki Co. Ltd. | 26,400 | 1,517 |
FTSE All-World ex-US Small-Cap Index Fund
| | | Shares | Market
Value•
($000) |
| | Megachips Corp. | 47,781 | 1,511 |
| | Japan Petroleum Exploration Co. Ltd. | 82,300 | 1,498 |
| | KYB Corp. | 55,600 | 1,488 |
| | Curves Holdings Co. Ltd. | 189,608 | 1,477 |
| | Shima Seiki Manufacturing Ltd. | 76,300 | 1,467 |
| | Giken Ltd. | 38,100 | 1,454 |
| | Bunka Shutter Co. Ltd. | 149,000 | 1,452 |
| | Zuken Inc. | 37,500 | 1,446 |
| | Bank of Iwate Ltd. | 100,524 | 1,444 |
| | Solasto Corp. | 119,200 | 1,443 |
| | Shibaura Machine Co. Ltd. | 61,200 | 1,427 |
| | T Hasegawa Co. Ltd. | 58,400 | 1,426 |
| | Future Corp. | 48,200 | 1,410 |
| | Sanyo Chemical Industries Ltd. | 28,454 | 1,409 |
| | Noritz Corp. | 87,787 | 1,408 |
| | Ringer Hut Co. Ltd. | 72,600 | 1,408 |
| | Eiken Chemical Co. Ltd. | 83,300 | 1,400 |
| * | SRE Holdings Corp. | 20,096 | 1,396 |
| | Kanto Denka Kogyo Co. Ltd. | 151,500 | 1,394 |
| | Japan Wool Textile Co. Ltd. | 174,389 | 1,393 |
| | Hirata Corp. | 22,811 | 1,391 |
| | Carta Holdings Inc. | 64,500 | 1,386 |
| | Mizuno Corp. | 59,456 | 1,384 |
| | Nissan Shatai Co. Ltd. | 195,200 | 1,384 |
| *,1 | W-Scope Corp. | 169,400 | 1,356 |
| | Yamagata Bank Ltd. | 189,385 | 1,351 |
| | Aida Engineering Ltd. | 148,306 | 1,346 |
| | Nippon Signal Co. Ltd. | 155,016 | 1,340 |
| | Aeon Hokkaido Corp. | 115,700 | 1,336 |
| | Osaka Soda Co. Ltd. | 52,200 | 1,327 |
| | Raiznext Corp. | 122,300 | 1,322 |
| | Osaka Organic Chemical Industry Ltd. | 44,100 | 1,321 |
| | HI-LEX Corp. | 82,500 | 1,319 |
| | Kaga Electronics Co. Ltd. | 47,900 | 1,317 |
| | Noritsu Koki Co. Ltd. | 62,900 | 1,308 |
| | Nippon Ceramic Co. Ltd. | 50,000 | 1,299 |
| | Riken Keiki Co. Ltd. | 46,500 | 1,290 |
| | Yellow Hat Ltd. | 77,900 | 1,269 |
| | Maruzen Showa Unyu Co. Ltd. | 41,400 | 1,264 |
| | Insource Co. Ltd. | 62,500 | 1,251 |
| 1 | Starts Proceed Investment Corp. | 595 | 1,250 |
| | Furukawa Co. Ltd. | 112,298 | 1,243 |
| | Tokyo Electron Device Ltd. | 20,300 | 1,232 |
| | Airtrip Corp. | 36,318 | 1,231 |
| | Keiyo Bank Ltd. | 311,800 | 1,214 |
| | | Shares | Market
Value•
($000) |
| | FULLCAST Holdings Co. Ltd. | 51,946 | 1,213 |
| * | Atrae Inc. | 56,816 | 1,211 |
| | Belc Co. Ltd. | 24,300 | 1,200 |
| | Oyo Corp. | 77,900 | 1,194 |
| | Axial Retailing Inc. | 37,430 | 1,190 |
| 1 | Shoei Foods Corp. | 34,400 | 1,186 |
| | J Trust Co. Ltd. | 226,400 | 1,184 |
| | Fukushima Galilei Co. Ltd. | 29,600 | 1,177 |
| | Keihanshin Building Co. Ltd. | 94,100 | 1,176 |
| | Yuasa Trading Co. Ltd. | 44,000 | 1,176 |
| | Iino Kaiun Kaisha Ltd. | 242,336 | 1,169 |
| | Nippon Kanzai Co. Ltd. | 48,100 | 1,168 |
| | Direct Marketing MiX Inc. | 30,400 | 1,166 |
| | IDOM Inc. | 170,100 | 1,165 |
| | Nippon Pillar Packing Co. Ltd. | 47,600 | 1,162 |
| | SWCC Showa Holdings Co. Ltd. | 59,500 | 1,159 |
| | Daiichi Jitsugyo Co. Ltd. | 24,900 | 1,158 |
| | Ricoh Leasing Co. Ltd. | 36,506 | 1,157 |
| | Hamakyorex Co. Ltd. | 41,700 | 1,156 |
| | Star Micronics Co. Ltd. | 87,798 | 1,152 |
| | Trancom Co. Ltd. | 16,400 | 1,151 |
| | Avex Inc. | 84,100 | 1,148 |
| | Exedy Corp. | 77,100 | 1,148 |
| | Mitsui-Soko Holdings Co. Ltd. | 57,252 | 1,148 |
| | Restar Holdings Corp. | 68,600 | 1,147 |
| | Micronics Japan Co. Ltd. | 86,500 | 1,145 |
| | Nippon Koei Co. Ltd. | 37,500 | 1,139 |
| | Bell System24 Holdings Inc. | 88,100 | 1,132 |
| | Organo Corp. | 17,800 | 1,131 |
| * | Vision Inc. | 84,065 | 1,128 |
| | Relia Inc. | 109,500 | 1,122 |
| | Nippon Road Co. Ltd. | 15,500 | 1,121 |
| * | Nippon Chemi-Con Corp. | 59,481 | 1,118 |
| | Oiles Corp. | 75,208 | 1,117 |
| | Toho Titanium Co. Ltd. | 105,900 | 1,115 |
| | Argo Graphics Inc. | 39,900 | 1,111 |
| | Itochu Enex Co. Ltd. | 125,400 | 1,106 |
| | Plenus Co. Ltd. | 64,900 | 1,105 |
| | Takara Leben Real Estate Investment Corp. | 1,129 | 1,101 |
| 1 | Retail Partners Co. Ltd. | 104,800 | 1,096 |
| | Weathernews Inc. | 15,000 | 1,095 |
| 1 | Kisoji Co. Ltd. | 58,260 | 1,094 |
| | Sakata INX Corp. | 113,300 | 1,094 |
| | DyDo Group Holdings Inc. | 22,944 | 1,093 |
FTSE All-World ex-US Small-Cap Index Fund
| | | Shares | Market
Value•
($000) |
| | Kyokuto Kaihatsu Kogyo Co. Ltd. | 80,000 | 1,093 |
| | Nippon Carbon Co. Ltd. | 28,100 | 1,085 |
| | Shikoku Chemicals Corp. | 87,600 | 1,077 |
| | gremz Inc. | 46,800 | 1,077 |
| | Genky DrugStores Co. Ltd. | 22,300 | 1,075 |
| | Wakita & Co. Ltd. | 118,600 | 1,073 |
| | Konishi Co. Ltd. | 68,900 | 1,072 |
| | Nohmi Bosai Ltd. | 58,400 | 1,071 |
| | Base Co. Ltd. | 25,300 | 1,070 |
| | Kurabo Industries Ltd. | 63,900 | 1,065 |
| | Nitto Kogyo Corp. | 71,588 | 1,065 |
| | G-7 Holdings Inc. | 58,200 | 1,065 |
| | Fujibo Holdings Inc. | 29,300 | 1,063 |
| | Toyo Tanso Co. Ltd. | 38,910 | 1,058 |
| | ESPEC Corp. | 51,908 | 1,053 |
| | Kanematsu Electronics Ltd. | 32,200 | 1,052 |
| | VT Holdings Co. Ltd. | 234,900 | 1,051 |
| | Ishihara Sangyo Kaisha Ltd. | 95,300 | 1,051 |
| | MEC Co. Ltd. | 38,100 | 1,049 |
| | Toppan Forms Co. Ltd. | 109,000 | 1,048 |
| | Joshin Denki Co. Ltd. | 50,326 | 1,048 |
| | Nishio Rent All Co. Ltd. | 42,200 | 1,044 |
| | Arcland Sakamoto Co. Ltd. | 69,300 | 1,037 |
| | Infocom Corp. | 53,940 | 1,036 |
| | KeePer Technical Laboratory Co. Ltd. | 35,936 | 1,036 |
| | Takasago International Corp. | 39,600 | 1,032 |
| | Broadleaf Co. Ltd. | 214,500 | 1,030 |
| | Koa Corp. | 76,100 | 1,029 |
| | Chugoku Marine Paints Ltd. | 132,300 | 1,024 |
| | NS United Kaiun Kaisha Ltd. | 32,500 | 1,024 |
| 1 | Kansai Super Market Ltd. | 62,800 | 1,021 |
| | Doutor Nichires Holdings Co. Ltd. | 70,737 | 1,015 |
| | Pressance Corp. | 61,148 | 1,013 |
| | Teikoku Sen-I Co. Ltd. | 55,984 | 1,009 |
| | T-Gaia Corp. | 56,500 | 1,007 |
| 1 | Toa Corp. | 45,800 | 1,005 |
| | METAWATER Co. Ltd. | 59,200 | 1,002 |
| | RS Technologies Co. Ltd. | 18,400 | 1,001 |
| | Sanyo Special Steel Co. Ltd. | 60,370 | 996 |
| | Siix Corp. | 89,800 | 995 |
| * | Matsuya Co. Ltd. | 104,100 | 994 |
| | Matsuda Sangyo Co. Ltd. | 33,000 | 986 |
| | San ju San Financial Group Inc. | 80,452 | 986 |
| | Riso Kyoiku Co. Ltd. | 235,600 | 984 |
| | | Shares | Market
Value•
($000) |
| | Fujicco Co. Ltd. | 58,605 | 984 |
| | Taihei Dengyo Kaisha Ltd. | 41,500 | 980 |
| | Toyo Construction Co. Ltd. | 195,600 | 979 |
| | Alpen Co. Ltd. | 40,000 | 976 |
| | ARTERIA Networks Corp. | 69,200 | 976 |
| | Toho Zinc Co. Ltd. | 35,678 | 975 |
| | Mitsuboshi Belting Ltd. | 54,700 | 972 |
| | Sakai Moving Service Co. Ltd. | 23,600 | 972 |
| | Sinko Industries Ltd. | 53,441 | 970 |
| 1 | Tama Home Co. Ltd. | 47,000 | 969 |
| | KFC Holdings Japan Ltd. | 38,100 | 966 |
| | Bank of the Ryukyus Ltd. | 144,367 | 962 |
| | Nippon Denko Co. Ltd. | 297,590 | 961 |
| 1 | Chilled & Frozen Logistics Holdings Co. Ltd. | 64,600 | 957 |
| | Uchida Yoko Co. Ltd. | 22,600 | 956 |
| | YAMABIKO Corp. | 87,700 | 956 |
| *,1 | Open Door Inc. | 43,200 | 955 |
| | Chofu Seisakusho Co. Ltd. | 52,700 | 952 |
| | TechMatrix Corp. | 60,000 | 951 |
| | Obara Group Inc. | 29,540 | 947 |
| | Tsukishima Kikai Co. Ltd. | 92,600 | 947 |
| | Japan Pulp & Paper Co. Ltd. | 28,000 | 945 |
| | Fuji Co. Ltd. | 53,400 | 941 |
| | Hokuto Corp. | 54,424 | 940 |
| | Nippon Yakin Kogyo Co. Ltd. | 38,679 | 935 |
| | Doshisha Co. Ltd. | 59,300 | 929 |
| | Seikagaku Corp. | 104,564 | 923 |
| | Nittetsu Mining Co. Ltd. | 16,000 | 922 |
| | Tenma Corp. | 38,700 | 922 |
| | Hosokawa Micron Corp. | 33,200 | 919 |
| | Qol Holdings Co. Ltd. | 61,699 | 917 |
| | Elan Corp. | 84,800 | 917 |
| | Tokai Corp. | 47,400 | 912 |
| | Piolax Inc. | 63,200 | 909 |
| | Tokyo Kiraboshi Financial Group Inc. | 70,266 | 909 |
| | SKY Perfect JSAT Holdings Inc. | 242,500 | 909 |
| | Nippon Thompson Co. Ltd. | 176,400 | 908 |
| | Modec Inc. | 52,588 | 905 |
| | Daiken Corp. | 41,200 | 900 |
| 1 | V-Cube Inc. | 58,665 | 887 |
| | Aomori Bank Ltd. | 51,361 | 886 |
| | Belluna Co. Ltd. | 126,200 | 886 |
| | V Technology Co. Ltd. | 23,500 | 886 |
| | I'll Inc. | 59,700 | 886 |
| | Torii Pharmaceutical Co. Ltd. | 34,100 | 885 |
FTSE All-World ex-US Small-Cap Index Fund
| | | Shares | Market
Value•
($000) |
| | Shin-Etsu Polymer Co. Ltd. | 97,700 | 882 |
| | Katakura Industries Co. Ltd. | 57,900 | 880 |
| | Marudai Food Co. Ltd. | 59,118 | 879 |
| | Bando Chemical Industries Ltd. | 113,000 | 873 |
| | Tachi-S Co. Ltd. | 72,100 | 873 |
| | Tokushu Tokai Paper Co. Ltd. | 22,400 | 873 |
| | Daito Pharmaceutical Co. Ltd. | 30,900 | 871 |
| | Key Coffee Inc. | 44,393 | 869 |
| | Yokohama Reito Co. Ltd. | 113,600 | 869 |
| | Ines Corp. | 59,200 | 865 |
| | Union Tool Co. | 25,300 | 855 |
| * | Aoyama Trading Co. Ltd. | 124,100 | 853 |
| | Mimasu Semiconductor Industry Co. Ltd. | 39,000 | 853 |
| 1 | YA-MAN Ltd. | 80,300 | 853 |
| | Tsurumi Manufacturing Co. Ltd. | 55,100 | 849 |
| 1 | Taiko Pharmaceutical Co. Ltd. | 119,237 | 847 |
| | Asahi Diamond Industrial Co. Ltd. | 137,622 | 846 |
| | PAL GROUP Holdings Co. Ltd. | 58,500 | 846 |
| | Sintokogio Ltd. | 128,500 | 844 |
| | Alconix Corp. | 55,814 | 841 |
| | Marusan Securities Co. Ltd. | 159,455 | 840 |
| | Dainichiseika Color & Chemicals Manufacturing Co. Ltd. | 35,803 | 828 |
| | Konoike Transport Co. Ltd. | 75,600 | 827 |
| | Pack Corp. | 30,700 | 816 |
| | Valqua Ltd. | 40,400 | 815 |
| | Yondoshi Holdings Inc. | 53,700 | 815 |
| * | Optim Corp. | 51,838 | 815 |
| | Samty Residential Investment Corp. | 771 | 814 |
| | Sinfonia Technology Co. Ltd. | 70,200 | 809 |
| | Grace Technology Inc. | 88,406 | 809 |
| | Miroku Jyoho Service Co. Ltd. | 51,200 | 808 |
| | Roland DG Corp. | 30,700 | 806 |
| | Tamron Co. Ltd. | 34,300 | 806 |
| | Hibiya Engineering Ltd. | 47,800 | 804 |
| | Sanyo Electric Railway Co. Ltd. | 45,484 | 800 |
| | Medical Data Vision Co. Ltd. | 61,800 | 797 |
| | Starzen Co. Ltd. | 42,200 | 795 |
| | Fukui Bank Ltd. | 61,355 | 793 |
| | J-Oil Mills Inc. | 49,200 | 793 |
| | | Shares | Market
Value•
($000) |
| | Daiwa Industries Ltd. | 71,000 | 791 |
| | Fujio Food Group Inc. | 66,000 | 788 |
| | Computer Engineering & Consulting Ltd. | 65,970 | 785 |
| | Dai-Dan Co. Ltd. | 37,100 | 781 |
| * | Kappa Create Co. Ltd. | 64,088 | 779 |
| | Shin Nippon Air Technologies Co. Ltd. | 36,200 | 779 |
| | Inageya Co. Ltd. | 64,000 | 774 |
| | Keiyo Co. Ltd. | 106,300 | 774 |
| | Komori Corp. | 118,300 | 773 |
| | GMO GlobalSign Holdings KK | 18,778 | 773 |
| * | PIA Corp. | 22,200 | 772 |
| | Mori Trust Hotel REIT Inc. | 622 | 772 |
| 1 | Media Do Co. Ltd. | 20,521 | 771 |
| | Eagle Industry Co. Ltd. | 71,700 | 766 |
| | Yukiguni Maitake Co. Ltd. | 60,600 | 760 |
| | JAC Recruitment Co. Ltd. | 38,700 | 759 |
| | Sinanen Holdings Co. Ltd. | 24,700 | 758 |
| | TOC Co. Ltd. | 134,946 | 757 |
| | JVCKenwood Corp. | 436,740 | 753 |
| 1 | Rock Field Co. Ltd. | 50,968 | 752 |
| | Meisei Industrial Co. Ltd. | 126,000 | 751 |
| | Arcland Service Holdings Co. Ltd. | 37,800 | 750 |
| | Koshidaka Holdings Co. Ltd. | 122,308 | 749 |
| | Geo Holdings Corp. | 70,400 | 748 |
| | Sakai Chemical Industry Co. Ltd. | 40,109 | 747 |
| 1 | Daikokutenbussan Co. Ltd. | 13,100 | 746 |
| | Sumitomo Densetsu Co. Ltd. | 38,500 | 739 |
| | Vector Inc. | 65,100 | 739 |
| | Ichikoh Industries Ltd. | 148,566 | 737 |
| | Miyazaki Bank Ltd. | 40,793 | 735 |
| | Hoosiers Holdings | 118,700 | 732 |
| | Shindengen Electric Manufacturing Co. Ltd. | 20,500 | 730 |
| | Komatsu Matere Co. Ltd. | 90,800 | 727 |
| | Tanseisha Co. Ltd. | 88,300 | 724 |
| 1 | Ryoyo Electro Corp. | 34,642 | 721 |
| | Aichi Steel Corp. | 30,902 | 720 |
| | Mitsui DM Sugar Holdings Co. Ltd. | 40,400 | 718 |
| | Takamatsu Construction Group Co. Ltd. | 40,600 | 712 |
| | Proto Corp. | 57,600 | 711 |
| | Aichi Bank Ltd. | 23,504 | 710 |
| | Kyokuyo Co. Ltd. | 26,400 | 708 |
| | Warabeya Nichiyo Holdings Co. Ltd. | 36,100 | 708 |
FTSE All-World ex-US Small-Cap Index Fund
| | | Shares | Market
Value•
($000) |
| | Poletowin Pitcrew Holdings Inc. | 78,500 | 708 |
| | Anest Iwata Corp. | 88,700 | 707 |
| | Matsuyafoods Holdings Co. Ltd. | 22,100 | 707 |
| | Nichiden Corp. | 35,000 | 704 |
| | Sun Frontier Fudousan Co. Ltd. | 75,000 | 704 |
| | Furuno Electric Co. Ltd. | 65,700 | 703 |
| | Sanshin Electronics Co. Ltd. | 48,800 | 701 |
| | Pacific Metals Co. Ltd. | 38,608 | 700 |
| | Shinko Shoji Co. Ltd. | 87,100 | 700 |
| | Kyoei Steel Ltd. | 56,712 | 700 |
| | Alpha Systems Inc. | 18,200 | 695 |
| | Tonami Holdings Co. Ltd. | 17,600 | 695 |
| | Denyo Co. Ltd. | 40,000 | 694 |
| | Enplas Corp. | 25,953 | 688 |
| | Okuwa Co. Ltd. | 71,500 | 687 |
| | Tosei Corp. | 71,500 | 687 |
| | Melco Holdings Inc. | 16,600 | 686 |
| 1 | Mie Kotsu Group Holdings Inc. | 156,900 | 686 |
| | Canon Electronics Inc. | 49,794 | 685 |
| | Riken Vitamin Co. Ltd. | 41,700 | 685 |
| | DKK Co. Ltd. | 30,880 | 683 |
| | Tachibana Eletech Co. Ltd. | 50,534 | 683 |
| | SB Technology Corp. | 24,800 | 683 |
| | WingArc1st Inc. | 35,400 | 683 |
| | Press Kogyo Co. Ltd. | 234,000 | 682 |
| | Japan Transcity Corp. | 128,192 | 682 |
| | Taki Chemical Co. Ltd. | 12,300 | 681 |
| | G-Tekt Corp. | 54,500 | 679 |
| | Nichireki Co. Ltd. | 57,100 | 678 |
| | Tosho Co. Ltd. | 39,300 | 674 |
| | Nissei ASB Machine Co. Ltd. | 20,600 | 672 |
| | Shin Nippon Biomedical Laboratories Ltd. | 53,000 | 672 |
| | Sumitomo Seika Chemicals Co. Ltd. | 23,600 | 672 |
| | Yonex Co. Ltd. | 101,100 | 666 |
| | Itochu-Shokuhin Co. Ltd. | 14,400 | 665 |
| | Okabe Co. Ltd. | 109,835 | 660 |
| | Sparx Group Co. Ltd. | 254,600 | 660 |
| * | BrainPad Inc. | 13,719 | 659 |
| | Oita Bank Ltd. | 41,307 | 658 |
| | Chubu Shiryo Co. Ltd. | 68,600 | 656 |
| | Aiphone Co. Ltd. | 31,600 | 653 |
| | WDB Holdings Co. Ltd. | 20,712 | 653 |
| | Hodogaya Chemical Co. Ltd. | 15,300 | 652 |
| | | Shares | Market
Value•
($000) |
| | Maxvalu Tokai Co. Ltd. | 28,400 | 651 |
| * | Oriental Shiraishi Corp. | 275,894 | 651 |
| | Sumida Corp. | 56,109 | 649 |
| | EM Systems Co. Ltd. | 97,700 | 648 |
| | Fukui Computer Holdings Inc. | 17,900 | 646 |
| | DKS Co. Ltd. | 21,300 | 645 |
| | Daido Metal Co. Ltd. | 119,200 | 640 |
| | Riken Technos Corp. | 132,700 | 638 |
| | Rheon Automatic Machinery Co. Ltd. | 53,615 | 637 |
| | Mitsubishi Research Institute Inc. | 17,000 | 635 |
| | Goldcrest Co. Ltd. | 43,980 | 630 |
| | Ehime Bank Ltd. | 93,400 | 630 |
| | Takara Leben Co. Ltd. | 231,000 | 630 |
| | Digital Holdings Inc. | 40,945 | 628 |
| | Aisan Industry Co. Ltd. | 85,100 | 627 |
| * | Istyle Inc. | 180,200 | 627 |
| | Shikoku Bank Ltd. | 94,940 | 625 |
| | Sumitomo Riko Co. Ltd. | 95,800 | 624 |
| | AOKI Holdings Inc. | 102,004 | 623 |
| 1 | Onoken Co. Ltd. | 42,100 | 622 |
| | Kamei Corp. | 60,500 | 617 |
| | Japan Medical Dynamic Marketing Inc. | 32,118 | 617 |
| | Futaba Industrial Co. Ltd. | 156,600 | 613 |
| | Cawachi Ltd. | 31,400 | 612 |
| | Stella Chemifa Corp. | 24,200 | 608 |
| | Vital KSK Holdings Inc. | 90,700 | 605 |
| | Shinwa Co. Ltd. | 30,900 | 601 |
| | Nippon Rietec Co. Ltd. | 43,100 | 600 |
| | World Holdings Co. Ltd. | 24,000 | 599 |
| | Kitanotatsujin Corp. | 164,400 | 599 |
| | Fujiya Co. Ltd. | 28,900 | 598 |
| | YAKUODO Holdings Co. Ltd. | 28,300 | 598 |
| 1 | Yamashin-Filter Corp. | 98,613 | 597 |
| | Mitsuba Corp. | 106,024 | 593 |
| * | Iseki & Co. Ltd. | 40,887 | 591 |
| | LEC Inc. | 64,548 | 590 |
| | TSI Holdings Co. Ltd. | 193,600 | 587 |
| | JM Holdings Co. Ltd. | 35,700 | 586 |
| | Teikoku Electric Manufacturing Co. Ltd. | 46,000 | 585 |
| | Enigmo Inc. | 61,600 | 585 |
| | Toyo Corp. | 61,817 | 584 |
| 1 | Raccoon Holdings Inc. | 41,662 | 583 |
| | Yurtec Corp. | 99,400 | 582 |
| | Chiyoda Integre Co. Ltd. | 30,000 | 574 |
FTSE All-World ex-US Small-Cap Index Fund
| | | Shares | Market
Value•
($000) |
| | CONEXIO Corp. | 44,800 | 574 |
| | World Co. Ltd. | 46,800 | 574 |
| | Akita Bank Ltd. | 44,500 | 566 |
| | Fukuda Corp. | 13,900 | 566 |
| | CI Takiron Corp. | 106,200 | 566 |
| | Toenec Corp. | 19,200 | 565 |
| | Ryoden Corp. | 35,500 | 562 |
| | Marvelous Inc. | 88,000 | 559 |
| | Nichiban Co. Ltd. | 34,300 | 558 |
| | Nagatanien Holdings Co. Ltd. | 30,400 | 557 |
| | Riken Corp. | 23,600 | 557 |
| | Tekken Corp. | 34,800 | 556 |
| | Osaki Electric Co. Ltd. | 112,600 | 555 |
| | Xebio Holdings Co. Ltd. | 59,708 | 555 |
| | Ichiyoshi Securities Co. Ltd. | 96,700 | 552 |
| * | Kintetsu Department Store Co. Ltd. | 24,500 | 548 |
| | Halows Co. Ltd. | 22,300 | 548 |
| | Kyosan Electric Manufacturing Co. Ltd. | 129,100 | 543 |
| | Kanagawa Chuo Kotsu Co. Ltd. | 17,700 | 542 |
| | JDC Corp. | 103,300 | 542 |
| | Hakuto Co. Ltd. | 31,500 | 538 |
| 1 | Sanoh Industrial Co. Ltd. | 60,600 | 537 |
| | Icom Inc. | 25,200 | 536 |
| | Tayca Corp. | 46,232 | 534 |
| | ZIGExN Co. Ltd. | 150,100 | 534 |
| | Gakken Holdings Co. Ltd. | 54,400 | 533 |
| | Nippon Coke & Engineering Co. Ltd. | 398,600 | 533 |
| | K&O Energy Group Inc. | 37,200 | 533 |
| | Tokyo Energy & Systems Inc. | 54,100 | 525 |
| | Yorozu Corp. | 49,976 | 522 |
| | Happinet Corp. | 39,600 | 521 |
| | Fudo Tetra Corp. | 32,820 | 521 |
| | Amuse Inc. | 26,700 | 520 |
| | LIFULL Co. Ltd. | 165,500 | 519 |
| | Hito Communications Holdings Inc. | 26,766 | 517 |
| | Advan Group Co. Ltd. | 60,400 | 516 |
| | BRONCO BILLY Co. Ltd. | 24,200 | 513 |
| | Feed One Co. Ltd. | 77,820 | ��� 512 |
| | Shinnihon Corp. | 69,800 | 511 |
| | Nippon Parking Development Co. Ltd. | 403,300 | 510 |
| | Optorun Co. Ltd. | 24,900 | 505 |
| | Nihon Chouzai Co. Ltd. | 34,900 | 503 |
| | Moriroku Holdings Co. Ltd. | 29,100 | 499 |
| | Koatsu Gas Kogyo Co. Ltd. | 73,900 | 498 |
| | | Shares | Market
Value•
($000) |
| | FIDEA Holdings Co. Ltd. | 47,920 | 496 |
| | Aichi Corp. | 69,900 | 495 |
| * | Unitika Ltd. | 154,800 | 494 |
| | Topy Industries Ltd. | 46,979 | 493 |
| | Dai Nippon Toryo Co. Ltd. | 64,600 | 492 |
| | Shibusawa Warehouse Co. Ltd. | 25,309 | 492 |
| | ES-Con Japan Ltd. | 68,100 | 489 |
| 1 | SRA Holdings | 19,100 | 488 |
| | CTS Co. Ltd. | 69,742 | 487 |
| | Arakawa Chemical Industries Ltd. | 44,600 | 486 |
| | Studio Alice Co. Ltd. | 25,700 | 486 |
| | ASKA Pharmaceutical Holdings Co. Ltd. | 55,900 | 486 |
| | Rokko Butter Co. Ltd. | 33,000 | 483 |
| | Neturen Co. Ltd. | 90,200 | 482 |
| | Nihon Nohyaku Co. Ltd. | 102,400 | 481 |
| | CMK Corp. | 126,600 | 477 |
| | Cosel Co. Ltd. | 58,400 | 476 |
| | Sankyo Seiko Co. Ltd. | 93,397 | 475 |
| | Ubicom Holdings Inc. | 18,700 | 475 |
| | Kenko Mayonnaise Co. Ltd. | 35,300 | 474 |
| | Kyodo Printing Co. Ltd. | 20,600 | 474 |
| * | Sagami Holdings Corp. | 52,496 | 471 |
| | Sankyo Tateyama Inc. | 72,000 | 470 |
| | Toyo Kanetsu KK | 21,200 | 468 |
| | Nissin Sugar Co. Ltd. | 31,325 | 468 |
| | Nitto Kohki Co. Ltd. | 28,100 | 467 |
| | Oro Co. Ltd. | 13,967 | 462 |
| | Chori Co. Ltd. | 28,700 | 458 |
| 1 | Kamakura Shinsho Ltd. | 56,700 | 458 |
| | Ebase Co. Ltd. | 68,800 | 458 |
| | France Bed Holdings Co. Ltd. | 57,600 | 456 |
| *,1 | KNT-CT Holdings Co. Ltd. | 30,900 | 454 |
| | Yahagi Construction Co. Ltd. | 67,700 | 454 |
| | Torishima Pump Manufacturing Co. Ltd. | 58,500 | 452 |
| * | KLab Inc. | 81,060 | 452 |
| | Sanei Architecture Planning Co. Ltd. | 28,800 | 450 |
| | MTI Ltd. | 70,000 | 448 |
| | Central Security Patrols Co. Ltd. | 18,595 | 447 |
| | Tomoku Co. Ltd. | 26,300 | 444 |
| | FAN Communications Inc. | ��111,900 | 444 |
| | Fuso Pharmaceutical Industries Ltd. | 19,700 | 440 |
FTSE All-World ex-US Small-Cap Index Fund
| | | Shares | Market
Value•
($000) |
| | Hochiki Corp. | 40,100 | 440 |
| | Kurimoto Ltd. | 30,800 | 440 |
| | Krosaki Harima Corp. | 10,600 | 439 |
| | Maezawa Kyuso Industries Co. Ltd. | 47,000 | 438 |
| | Elematec Corp. | 43,300 | 432 |
| | Nissin Corp. | 30,400 | 432 |
| | Chiyoda Co. Ltd. | 64,200 | 431 |
| * | Fujita Kanko Inc. | 20,300 | 430 |
| | ST Corp. | 30,300 | 430 |
| | Nippon Beet Sugar Manufacturing Co. Ltd. | 29,200 | 424 |
| * | WATAMI Co. Ltd. | 49,000 | 424 |
| | Kanaden Corp. | 46,900 | 423 |
| | Ateam Inc. | 29,200 | 423 |
| | Japan Best Rescue System Co. Ltd. | 41,965 | 423 |
| | Bank of Saga Ltd. | 33,500 | 422 |
| | Fuji Pharma Co. Ltd. | 43,800 | 422 |
| | Toa Corp. (XTKS) | 58,900 | 422 |
| * | Akebono Brake Industry Co. Ltd. | 206,583 | 418 |
| | Achilles Corp. | 36,300 | 418 |
| 1 | Sourcenext Corp. | 232,000 | 416 |
| | Tatsuta Electric Wire and Cable Co. Ltd. | 92,400 | 416 |
| | Hokkaido Gas Co. Ltd. | 30,800 | 413 |
| | JSP Corp. | 30,700 | 413 |
| | I-PEX Inc. | 22,900 | 412 |
| | Kyokuto Securities Co. Ltd. | 61,100 | 409 |
| | Tochigi Bank Ltd. | 261,512 | 406 |
| | Towa Bank Ltd. | 91,400 | 406 |
| | Ministop Co. Ltd. | 33,100 | 403 |
| | ASAHI YUKIZAI Corp. | 33,211 | 401 |
| | Hisaka Works Ltd. | 54,100 | 401 |
| | Fixstars Corp. | 58,700 | 400 |
| | Kawada Technologies Inc. | 11,500 | 398 |
| | CAC Holdings Corp. | 27,600 | 390 |
| 1 | Asahi Co. Ltd. | 33,500 | 389 |
| | Shimizu Bank Ltd. | 28,600 | 387 |
| | Akatsuki Inc. | �� 14,200 | 387 |
| | Honeys Holdings Co. Ltd. | 41,790 | 386 |
| | Okura Industrial Co. Ltd. | 20,700 | 383 |
| | Toa Oil Co. Ltd. | 15,400 | 382 |
| | Chuo Spring Co. Ltd. | 43,600 | 378 |
| | Chukyo Bank Ltd. | 32,600 | 378 |
| | Taisei Lamick Co. Ltd. | 15,600 | 376 |
| | Yushin Precision Equipment Co. Ltd. | 55,200 | 373 |
| | Seika Corp. | 25,800 | 372 |
| | Foster Electric Co. Ltd. | 51,985 | 371 |
| | NEC Capital Solutions Ltd. | 20,400 | 368 |
| | Nihon Trim Co. Ltd. | 11,900 | 365 |
| | | Shares | Market
Value•
($000) |
| | Pronexus Inc. | 39,035 | 364 |
| | Mars Group Holdings Corp. | 25,000 | 363 |
| | Hokkan Holdings Ltd. | 26,800 | 357 |
| 1 | Nihon Tokushu Toryo Co. Ltd. | 40,500 | 356 |
| | Artnature Inc. | 54,800 | 356 |
| | Takaoka Toko Co. Ltd. | 27,400 | 355 |
| 1 | Tokyo Individualized Educational Institute Inc. | 55,312 | 349 |
| *,1 | OSAKA Titanium Technologies Co. Ltd. | 50,800 | 349 |
| | JP-Holdings Inc. | 155,400 | 346 |
| | Sekisui Kasei Co. Ltd. | 69,300 | 346 |
| | PC Depot Corp. | 84,840 | 342 |
| * | Kourakuen Holdings Corp. | 26,400 | 341 |
| | Nippon Sharyo Ltd. | 18,500 | 341 |
| | Tsutsumi Jewelry Co. Ltd. | 18,200 | 339 |
| | Central Sports Co. Ltd. | 15,675 | 334 |
| *,1 | FDK Corp. | 36,714 | 331 |
| * | Toho Co. Ltd. | 24,500 | 329 |
| | Godo Steel Ltd. | 24,700 | 327 |
| | Kojima Co. Ltd. | 63,300 | 326 |
| | Zuiko Corp. | 41,300 | 319 |
| 1 | Osaka Steel Co. Ltd. | 31,000 | 317 |
| | CMIC Holdings Co. Ltd. | 23,900 | 311 |
| * | Gurunavi Inc. | 66,500 | 308 |
| | Wowow Inc. | 15,000 | 305 |
| | Tv Tokyo Holdings Corp. | 16,000 | 303 |
| | Kanamic Network Co. Ltd. | 56,600 | 301 |
| | Aeon Fantasy Co. Ltd. | 18,100 | 300 |
| | Shimojima Co. Ltd. | 29,900 | 297 |
| | Ohara Inc. | 24,388 | 297 |
| * | Tokyo Base Co. Ltd. | 46,700 | 290 |
| | Nisso Corp. | 44,600 | 283 |
| | Corona Corp. Class A | 34,900 | 280 |
| | Taiho Kogyo Co. Ltd. | 37,900 | 267 |
| * | Japan Cash Machine Co. Ltd. | 35,200 | 265 |
| | Inaba Seisakusho Co. Ltd. | 22,200 | 261 |
| * | CHIMNEY Co. Ltd. | 20,000 | 259 |
| * | COOKPAD Inc. | 123,500 | 258 |
| | Fibergate Inc. | 21,049 | 253 |
| | Airport Facilities Co. Ltd. | 48,700 | 249 |
| 1 | Takihyo Co. Ltd. | 15,800 | 247 |
| *,1 | Jamco Corp. | 28,500 | 246 |
| | Tokyo Rakutenchi Co. Ltd. | 6,900 | 246 |
| | Sac's Bar Holdings Inc. | 50,650 | 245 |
| 1 | Chuetsu Pulp & Paper Co. Ltd. | 23,500 | 243 |
| *,1 | Heroz Inc. | 14,100 | 238 |
FTSE All-World ex-US Small-Cap Index Fund
| | | Shares | Market
Value•
($000) |
| | Daisyo Corp. | 25,700 | 229 |
| | Gecoss Corp. | 29,900 | 226 |
| | Furukawa Battery Co. Ltd. | 16,055 | 224 |
| | Takamiya Co. Ltd. | 56,000 | 220 |
| | Cleanup Corp. | 43,800 | 214 |
| *,1 | Robot Home Inc. | 82,100 | 203 |
| | Linical Co. Ltd. | 28,300 | 199 |
| * | TerraSky Co. Ltd. | 9,610 | 184 |
| * | Right On Co. Ltd. | 28,800 | 181 |
| *,1 | Edulab Inc. | 12,600 | 178 |
| | Nakayama Steel Works Ltd. | 41,900 | 159 |
| | Airtech Japan Ltd. | 10,400 | 114 |
| | Yamanashi Chuo Bank Ltd. | 10,562 | 76 |
| * | Mitsui E&S Holdings Co. Ltd. | 3,800 | 19 |
| *,1 | Laox Co. Ltd. | 9,900 | 16 |
| | Invesco Office JREIT Inc. | 47 | 9 |
| | | | 1,539,900 |
| Jersey (0.0%) |
| * | Petrofac Ltd. | 64,277 | 13 |
| Kuwait (0.1%) |
| * | National Industries Group Holding SAK | 4,979,493 | 4,528 |
| * | Warba Bank KSCP | 3,870,665 | 3,624 |
| | Qurain Petrochemical Industries Co. | 1,863,127 | 2,343 |
| * | Kuwait International Bank KSCP | 1,931,001 | 1,435 |
| * | Alimtiaz Investment Group KSC | 2,345,468 | 1,051 |
| | Kuwait Projects Co. Holding KSCP | 1,735,202 | 847 |
| * | Integrated Holding Co. KCSC | 451,360 | 561 |
| * | Kuwait Projects Co Holding KSCP Rights Exp. 11/2/21 | 567,411 | 13 |
| | | | 14,402 |
| Malaysia (0.8%) |
| | Inari Amertron Bhd. | 8,766,200 | 8,212 |
| | TIME dotCom Bhd. | 4,198,200 | 4,581 |
| | My EG Services Bhd. | 17,008,600 | 4,279 |
| | VS Industry Bhd. | 10,883,950 | 4,159 |
| | Frontken Corp. Bhd. | 4,364,650 | 4,027 |
| | Bursa Malaysia Bhd. | 2,051,254 | 3,718 |
| | Carlsberg Brewery Malaysia Bhd. | 618,100 | 3,311 |
| | D&O Green Technologies Bhd. | 2,337,000 | 3,189 |
| | Malaysian Pacific Industries Bhd. | 269,200 | 3,105 |
| | IGB REIT | 6,976,000 | 2,830 |
| | Sunway REIT | 7,979,800 | 2,818 |
| | Genting Plantations Bhd. | 1,590,673 | 2,805 |
| | Pentamaster Corp. Bhd. | 2,124,850 | 2,754 |
| | Kossan Rubber Industries Bhd. | 4,796,000 | 2,739 |
| | | Shares | Market
Value•
($000) |
| | Heineken Malaysia Bhd. | 442,200 | 2,457 |
| | ViTrox Corp. Bhd. | 479,800 | 2,279 |
| | Malakoff Corp. Bhd. | 11,626,300 | 2,274 |
| | Yinson Holdings Bhd. | 1,458,200 | 2,062 |
| | KPJ Healthcare Bhd. | 7,488,500 | 2,060 |
| | Sunway Bhd. | 4,536,388 | 1,952 |
| | Scientex Bhd. | 1,616,800 | 1,821 |
| | Axis REIT | 3,690,600 | 1,703 |
| | Mega First Corp. Bhd. | 1,936,800 | 1,685 |
| | UMW Holdings Bhd | 1,926,300 | 1,586 |
| | YTL Power International Bhd. | 9,030,200 | 1,537 |
| | Berjaya Sports Toto Bhd. | 2,794,057 | 1,404 |
| | UWC Bhd. | 892,600 | 1,328 |
| * | SP Setia Bhd. Group | 3,475,300 | 1,308 |
| * | Bumi Armada Bhd. | 9,902,000 | 1,215 |
| 2 | Lotte Chemical Titan Holding Bhd. | 1,748,705 | 1,149 |
| | Magnum Bhd. | 2,115,492 | 1,103 |
| | DRB-Hicom Bhd. | 2,292,227 | 913 |
| | AEON Credit Service M Bhd. | 261,200 | 883 |
| | Malaysia Building Society Bhd. | 5,657,600 | 876 |
| | Malaysian Resources Corp. Bhd. | 7,777,538 | 771 |
| | Padini Holdings Bhd. | 954,100 | 724 |
| * | Berjaya Corp. Bhd. | 11,511,863 | 709 |
| | BerMaz Auto Bhd. | 1,701,440 | 665 |
| | Syarikat Takaful Malaysia Keluarga Bhd. | 688,500 | 660 |
| * | Sapura Energy Bhd. | 26,113,600 | 632 |
| | Cahya Mata Sarawak Bhd. | 1,574,900 | 545 |
| | Leong Hup International Bhd. | 3,434,200 | 543 |
| * | Velesto Energy Bhd. | 10,738,180 | 414 |
| * | UEM Sunrise Bhd. | 4,211,200 | 402 |
| * | WCT Holdings Bhd. | 2,331,051 | 350 |
| | Muhibbah Engineering M Bhd. | 806,300 | 186 |
| * | Sunway Bhd. Warrants Exp. 10/3/24 | 385,748 | 41 |
| * | Velesto Energy Bhd. Warrants Exp. 10/18/24 | 2,470,020 | 39 |
| 3 | Serba Dinamik Holdings Bhd. | 321,400 | 27 |
| *,3 | Serba Dinamik Holdings Bhd. Warrants Exp. 12/5/24 | 878,820 | 15 |
| * | Pos Malaysia Bhd. | 75,000 | 13 |
| * | Malaysian Resources Corp. Bhd. Warrants Exp. 10/29/27 | 430,554 | 9 |
| | | | 90,867 |
FTSE All-World ex-US Small-Cap Index Fund
| | | Shares | Market
Value•
($000) |
| Mexico (0.4%) |
| | PLA Administradora Industrial S de RL de CV | 3,570,363 | 5,001 |
| | Corp. Inmobiliaria Vesta SAB de CV | 2,754,042 | 4,794 |
| 2 | Macquarie Mexico Real Estate Management SA de CV | 3,652,902 | 4,358 |
| | Bolsa Mexicana de Valores SAB de CV | 2,124,166 | 4,069 |
| | Prologis Property Mexico SA de CV | 1,705,203 | 3,925 |
| | Regional SAB de CV | 743,792 | 3,891 |
| * | Alsea SAB de CV | 1,823,200 | 3,827 |
| * | Genomma Lab Internacional SAB de CV Class B | 3,433,352 | 3,285 |
| | La Comer SAB de CV | 1,404,458 | 2,534 |
| | Grupo Comercial Chedraui SA de CV | 1,226,000 | 2,418 |
| *,2 | Grupo Traxion SAB de CV | 1,216,781 | 2,105 |
| * | Gentera SAB de CV | 3,172,025 | 1,898 |
| *,2 | Nemak SAB de CV | 5,927,548 | 1,368 |
| | Grupo Herdez SAB de CV | 582,183 | 1,071 |
| * | Axtel SAB de CV | 4,234,708 | 963 |
| * | Unifin Financiera SAB de CV | 527,529 | 810 |
| | Grupo Rotoplas SAB de CV | 468,168 | 646 |
| * | Credito Real SAB de CV SOFOM ER | 30,900 | 15 |
| | | | 46,978 |
| Netherlands (1.1%) |
| | Arcadis NV | 266,313 | 12,980 |
| | Corbion NV | 215,397 | 10,228 |
| | APERAM SA | 170,264 | 10,152 |
| * | OCI NV | 357,932 | 10,147 |
| | SBM Offshore NV | 574,453 | 9,070 |
| | TKH Group NV GDR | 159,110 | 9,064 |
| | Boskalis Westminster | 281,208 | 8,387 |
| *,2 | Basic-Fit NV | 164,109 | 7,968 |
| | PostNL NV | 1,813,566 | 7,871 |
| *,2 | Intertrust NV | 327,173 | 4,947 |
| | Eurocommercial Properties NV | 208,019 | 4,855 |
| *,2 | Alfen Beheer BV | 38,714 | 4,361 |
| * | Sligro Food Group NV | 134,925 | 3,615 |
| | AMG Advanced Metallurgical Group NV | 121,770 | 3,592 |
| * | Accell Group NV | 86,866 | 3,581 |
| 2 | Flow Traders | 101,160 | 3,434 |
| | NSI NV | 78,918 | 3,163 |
| * | Fugro NV | 344,485 | 2,920 |
| * | Koninklijke BAM Groep NV | 915,183 | 2,656 |
| * | TomTom NV | 266,142 | 2,287 |
| | Vastned Retail NV | 49,109 | 1,400 |
| | | Shares | Market
Value•
($000) |
| | Brunel International NV | 53,114 | 730 |
| 2 | B&S Group Sarl | 66,550 | 601 |
| | ForFarmers NV | 80,814 | 385 |
| | Wereldhave NV | 6,404 | 99 |
| *,3 | SNS Reaal | 96,364 | — |
| | | | 128,493 |
| New Zealand (0.8%) |
| | Summerset Group Holdings Ltd. | 880,042 | 9,156 |
| | EBOS Group Ltd. | 326,611 | 8,491 |
| | Chorus Ltd. | 1,720,766 | 7,858 |
| | Goodman Property Trust | 4,300,012 | 7,668 |
| | Freightways Ltd. | 670,735 | 6,228 |
| | Precinct Properties New Zealand Ltd. | 4,540,207 | 5,435 |
| | Z Energy Ltd. | 2,036,173 | 5,255 |
| | Genesis Energy Ltd. | 2,157,457 | 5,041 |
| | Argosy Property Ltd. | 3,894,586 | 4,359 |
| | Vital Healthcare Property Trust | 1,646,233 | 3,457 |
| | Kathmandu Holdings Ltd. | 2,832,489 | 3,226 |
| * | Pushpay Holdings Ltd. | 2,141,614 | 2,920 |
| | Stride Property Group | 1,412,455 | 2,408 |
| | Arvida Group Ltd. | 1,618,120 | 2,314 |
| | Skellerup Holdings Ltd. | 491,341 | 2,194 |
| | Oceania Healthcare Ltd. | 2,130,399 | 2,135 |
| | Heartland Group Holdings Ltd. | 1,215,999 | 2,047 |
| | Vector Ltd. | 688,322 | 2,019 |
| * | Pacific Edge Ltd. | 1,539,780 | 1,623 |
| * | Serko Ltd. | 219,463 | 1,230 |
| | Scales Corp. Ltd. | 286,330 | 1,100 |
| * | Vista Group International Ltd. | 590,147 | 1,070 |
| * | Restaurant Brands New Zealand Ltd. | 84,391 | 942 |
| * | Tourism Holdings Ltd. | 373,517 | 736 |
| * | SKY Network Television Ltd. | 356,745 | 485 |
| * | Synlait Milk Ltd. | 31,576 | 82 |
| * | Arvida Group Ltd. Rights Exp.11/08/2021 | 246,289 | 26 |
| | | | 89,505 |
| Norway (1.6%) |
| | Storebrand ASA | 1,715,019 | 18,394 |
| | Bakkafrost P/F | 186,839 | 17,283 |
| * | Nordic Semiconductor ASA | 578,051 | 17,174 |
| * | NEL ASA | 5,068,977 | 10,732 |
| | SpareBank 1 SR-Bank ASA | 655,991 | 10,061 |
| 2 | Entra ASA | 391,241 | 9,766 |
| | Kongsberg Gruppen ASA | 291,037 | 9,551 |
| | Borregaard ASA | 381,222 | 9,257 |
| | SpareBank 1 SMN | 499,116 | 8,313 |
FTSE All-World ex-US Small-Cap Index Fund
| | | Shares | Market
Value•
($000) |
| | Subsea 7 SA | 866,882 | 7,782 |
| * | Bank Norwegian ASA | 567,864 | 7,043 |
| * | Kahoot! ASA | 1,065,602 | 6,389 |
| | Atea ASA | 327,626 | 6,122 |
| | Veidekke ASA | 402,906 | 5,806 |
| *,2 | Crayon Group Holding ASA | 232,528 | 5,430 |
| | Austevoll Seafood ASA | 338,994 | 4,589 |
| 2 | Elkem ASA | 1,022,837 | 4,066 |
| | TGS ASA | 437,305 | 4,033 |
| 2 | Sbanken ASA | 343,173 | 4,026 |
| | Frontline Ltd. | 337,956 | 3,004 |
| * | Grieg Seafood ASA | 235,575 | 2,620 |
| * | MPC Container Ships A/S | 1,088,202 | 2,579 |
| | Bonheur ASA | 56,414 | 2,230 |
| * | DNO ASA | 1,312,878 | 1,914 |
| | Sparebank 1 Oestlandet | 79,193 | 1,305 |
| 2 | BW LPG Ltd. | 242,891 | 1,298 |
| * | Hexagon Composites ASA | 314,518 | 1,267 |
| * | Wallenius Wilhelmsen ASA | 273,516 | 1,253 |
| | Stolt-Nielsen Ltd. | 68,425 | 1,055 |
| | Norway Royal Salmon ASA | 42,862 | 902 |
| | BW Offshore Ltd. | 237,012 | 772 |
| | Ocean Yield ASA | 143,546 | 697 |
| * | BW Energy Ltd. | 163,122 | 534 |
| | | | 187,247 |
| Pakistan (0.2%) |
| * | Lucky Cement Ltd. | 790,241 | 3,572 |
| | Hub Power Co. Ltd. | 4,600,584 | 2,043 |
| | Engro Corp. Ltd. | 1,203,707 | 1,991 |
| | MCB Bank Ltd. | 1,860,210 | 1,783 |
| | Searle Co. Ltd. | 1,182,924 | 1,231 |
| | TRG Pakistan | 1,551,968 | 1,085 |
| | Pakistan State Oil Co. Ltd. | 944,998 | 1,051 |
| | Pakistan Oilfields Ltd. | 368,397 | 824 |
| | Bank Alfalah Ltd. | 3,815,256 | 810 |
| | United Bank Ltd. | 845,938 | 691 |
| | Engro Fertilizers Ltd. | 1,631,961 | 681 |
| | Millat Tractors Ltd. | 104,854 | 546 |
| * | Fauji Cement Co. Ltd. | 2,884,307 | 338 |
| | DG Khan Cement Co. Ltd. | 613,586 | 316 |
| | SUI Northern Gas Pipeline | 1,365,443 | 315 |
| * | National Bank of Pakistan | 1,415,000 | 284 |
| | Kot Addu Power Co. Ltd. | 797,108 | 130 |
| * | SUI Southern Gas Co. Ltd. | 292,369 | 18 |
| | Nishat Mills Ltd. | 30,200 | 16 |
| | | | 17,725 |
| Philippines (0.3%) |
| | AC Energy Corp. | 21,052,000 | 5,132 |
| | Security Bank Corp. | 1,875,249 | 4,499 |
| | | Shares | Market
Value•
($000) |
| * | Converge Information and Communications Technology Solutions Inc. | 5,370,600 | 3,396 |
| | Robinsons Retail Holdings Inc. | 2,401,150 | 2,964 |
| | Wilcon Depot Inc. | 4,735,300 | 2,930 |
| | Robinson's Land Corp. | 8,458,297 | 2,859 |
| * | Manila Water Co. Inc. | 3,555,285 | 1,867 |
| | Century Pacific Food Inc. | 3,302,900 | 1,854 |
| | First Gen Corp. | 1,848,087 | 1,104 |
| | Nickel Asia Corp. | 9,826,874 | 1,070 |
| | D&L Industries Inc. | 5,706,000 | 955 |
| | Vista Land & Lifescapes Inc. | 10,577,100 | 792 |
| | Filinvest Land Inc. | 26,483,400 | 605 |
| * | Cebu Air Inc. | 519,080 | 456 |
| *,2 | CEMEX Holdings Philippines Inc. | 16,558,435 | 407 |
| | | | 30,890 |
| Poland (0.5%) |
| * | mBank SA | 50,640 | 7,167 |
| * | PGE Polska Grupa Energetyczna SA | 2,565,519 | 6,313 |
| *,1 | Alior Bank SA | 335,989 | 5,303 |
| | Asseco Poland SA | 215,165 | 5,299 |
| 1 | KRUK SA | 62,066 | 5,177 |
| * | Orange Polska SA | 2,649,146 | 5,166 |
| * | Grupa Lotos SA | 322,551 | 5,014 |
| * | Bank Millennium SA | 1,928,986 | 4,428 |
| * | Tauron Polska Energia SA | 3,719,017 | 3,067 |
| *,1 | CCC SA | 85,883 | 2,599 |
| 1 | Kernel Holding SA | 166,710 | 2,518 |
| *,1 | Jastrzebska Spolka Weglowa SA | 169,345 | 2,204 |
| * | AmRest Holdings SE | 215,401 | 1,730 |
| * | Enea SA | 668,057 | 1,696 |
| | Bank Handlowy w Warszawie SA | 89,920 | 1,305 |
| * | Grupa Azoty SA | 128,641 | 961 |
| | Warsaw Stock Exchange | 75,126 | 828 |
| 1 | Eurocash SA | 266,375 | 658 |
| | Ciech SA | 70,883 | 631 |
| *,3 | CAPITEA SA | 103,234 | 97 |
| * | Mercator Medical SA | 322 | 8 |
| | | | 62,169 |
| Portugal (0.2%) |
| * | Banco Comercial Portugues SA Class R | 29,194,034 | 5,267 |
| | Navigator Co. SA | 1,048,330 | 4,098 |
| | CTT-Correios de Portugal SA | 737,033 | 4,050 |
| | REN - Redes Energeticas Nacionais SGPS SA | 1,236,286 | 3,766 |
| | NOS SGPS SA | 913,301 | 3,563 |
| | Sonae SGPS SA | 2,707,324 | 2,980 |
| | Altri SGPS SA | 193,490 | 1,254 |
FTSE All-World ex-US Small-Cap Index Fund
| | | Shares | Market
Value•
($000) |
| | Corticeira Amorim SGPS SA | 89,764 | 1,250 |
| * | Greenvolt-Energias Renovaveis SA | 75,757 | 595 |
| | | | 26,823 |
| Qatar (0.0%) |
| * | Gulf International Services QSC | 4,082,207 | 2,065 |
| | Al Meera Consumer Goods Co. QSC | 256,746 | 1,382 |
| | Medicare Group | 364,165 | 847 |
| | | | 4,294 |
| Romania (0.0%) |
| | Societatea Nationala Nuclearelectrica SA | 145,074 | 1,462 |
| | Teraplast SA | 3,549,217 | 904 |
| | | | 2,366 |
| Russia (0.1%) |
| 2 | Detsky Mir PJSC | 2,390,633 | 4,621 |
| | Mechel PJSC Preference Shares | 576,200 | 2,411 |
| | Samolet Group | 30,568 | 2,118 |
| | Novorossiysk Commercial Sea Port PJSC | 16,380,500 | 1,795 |
| * | Mechel PJSC | 477,169 | 982 |
| | LSR Group PJSC Class A | 60,095 | 632 |
| | Rosseti Lenenergo PJSC Preference Shares | 253,200 | 629 |
| | Cherkizovo Group PJSC | 12,549 | �� 627 |
| * | OGK-2 PJSC | 54,519,850 | 539 |
| | IDGC of Centre and Volga Region PJSC | 134,240,000 | 505 |
| | TGC-1 PJSC | 2,060,900,000 | 323 |
| * | ENEL RUSSIA PJSC | 24,682,000 | 299 |
| | Raspadskaya OJSC | 33,040 | 201 |
| | Bank St. Petersburg PJSC | 10,040 | 13 |
| | | | 15,695 |
| Saudi Arabia (0.4%) |
| | Aldrees Petroleum and Transport Services Co. | 226,677 | 4,471 |
| | Arriyadh Development Co. | 564,206 | 4,004 |
| * | National Agriculture Development Co. | 280,920 | 2,659 |
| | Leejam Sports Co. JSC | 85,519 | 2,588 |
| | Saudi Chemical Co. Holding | 228,873 | 2,314 |
| | Al Hammadi Co. for Development and Investment | 193,203 | 2,181 |
| * | Methanol Chemicals Co. | 225,774 | 2,142 |
| | National Gas & Industrialization Co. | 131,380 | 2,068 |
| | | Shares | Market
Value•
($000) |
| * | Aseer Trading Tourism & Manufacturing Co. | 311,090 | 1,891 |
| | Saudi Ceramic Co. | 125,575 | 1,823 |
| | Eastern Province Cement Co. | 138,164 | 1,766 |
| | Jadwa REIT Saudi Fund | 421,072 | 1,640 |
| * | Saudi Real Estate Co. | 256,746 | 1,530 |
| | Arabian Cement Co. | 141,161 | 1,469 |
| | Astra Industrial Group | 110,612 | 1,273 |
| | City Cement Co. | 194,888 | 1,259 |
| | United International Transportation Co. | 93,094 | 1,248 |
| * | Middle East Healthcare Co. | 123,015 | 1,220 |
| | Najran Cement Co. | 223,452 | 1,125 |
| * | Dur Hospitality Co. | 116,375 | 1,109 |
| * | Saudi Public Transport Co. | 163,910 | 1,056 |
| | Northern Region Cement Co. | 249,952 | 991 |
| | National Medical Care Co. | 57,256 | 929 |
| | Herfy Food Services Co. | 52,149 | 911 |
| * | Zamil Industrial Investment Co. | 92,227 | 872 |
| | Bawan Co. | 68,299 | 722 |
| * | Al Jouf Cement Co. | 191,752 | 613 |
| * | Tabuk Cement Co. | 117,247 | 595 |
| * | Mediterranean & Gulf Insurance & Reinsurance Co. | 89,526 | 556 |
| | Hail Cement Co. | 131,718 | 519 |
| * | Abdul Mohsen Al-Hokair Tourism and Development Co. | 84,105 | 497 |
| | | | 48,041 |
| Singapore (0.7%) |
| | Frasers Centrepoint Trust | 4,300,208 | 7,690 |
| | Parkway Life REIT | 1,734,181 | 5,998 |
| | Keppel Infrastructure Trust | 13,166,846 | 5,178 |
| | Haw Par Corp. Ltd. | 472,100 | 4,412 |
| | Manulife US REIT | 6,060,688 | 4,312 |
| | Ascendas India Trust | 4,072,400 | 4,207 |
| | ARA LOGOS Logistics Trust | 6,252,608 | 4,180 |
| | ESR-REIT | 10,734,429 | 3,826 |
| | Raffles Medical Group Ltd. | 3,677,184 | 3,740 |
| | Starhill Global REIT | 7,565,108 | 3,623 |
| | CDL Hospitality Trusts | 3,975,913 | 3,538 |
| | First Resources Ltd. | 2,500,529 | 3,299 |
| | Keppel Pacific Oak US REIT | 4,011,300 | 3,189 |
| | iFAST Corp. Ltd. | 494,500 | 3,181 |
| | CapitaLand China Trust | 3,409,799 | 3,088 |
| | AIMS APAC REIT | 2,657,800 | 2,838 |
FTSE All-World ex-US Small-Cap Index Fund
| | | Shares | Market
Value•
($000) |
| | Cromwell European REIT | 775,540 | 2,366 |
| | OUE Commercial REIT | 6,338,509 | 2,112 |
| | Nanofilm Technologies International Ltd. | 642,000 | 1,802 |
| | Lendlease Global Commercial REIT | 2,655,200 | 1,724 |
| | AEM Holdings Ltd. | 538,200 | 1,676 |
| | SPH REIT | 1,969,100 | 1,425 |
| | Prime US REIT | 1,583,869 | 1,369 |
| | Far East Hospitality Trust | 2,631,600 | 1,260 |
| * | Thomson Medical Group Ltd. | 19,788,100 | 1,248 |
| | Sheng Siong Group Ltd. | 1,153,400 | 1,216 |
| | Riverstone Holdings Ltd. | 1,721,300 | 1,099 |
| | Sabana Industrial REIT | 2,670,000 | 863 |
| | Frasers Hospitality Trust | 2,151,500 | 767 |
| *,3 | Best World International Ltd. | 751,600 | 723 |
| * | COSCO Shipping International Singapore Co. Ltd. | 3,208,700 | 655 |
| | Silverlake Axis Ltd. | 2,018,829 | 479 |
| | Bumitama Agri Ltd. | 855,000 | 349 |
| *,3 | Eagle Hospitality Trust | 2,004,300 | 275 |
| | First REIT | 1,397,872 | 274 |
| | Asian Pay Television Trust | 2,111,950 | 211 |
| * | Hyflux Ltd. | 1,145,286 | 178 |
| *,1 | Ezra Holdings Ltd. | 4,500,399 | 37 |
| *,1 | Ezion Holdings Ltd. Warrants Exp. 4/16/23 | 2,195,796 | — |
| | | | 88,407 |
| South Africa (0.7%) |
| | Transaction Capital Ltd. | 2,308,289 | 6,657 |
| | Ninety One plc | 1,511,916 | 5,368 |
| | Motus Holdings Ltd. | 717,547 | 4,788 |
| | AECI Ltd. | 584,294 | 4,338 |
| | Imperial Logistics Ltd. | 849,109 | 3,468 |
| | Super Group Ltd. | 1,620,454 | 3,390 |
| | JSE Ltd. | 426,449 | 2,984 |
| | KAP Industrial Holdings Ltd. | 8,506,545 | 2,618 |
| *,1 | Steinhoff International Holdings NV | 16,530,640 | 2,603 |
| | Equites Property Fund Ltd. | 1,900,592 | 2,533 |
| | Vukile Property Fund Ltd. | 3,018,014 | 2,408 |
| | Investec Property Fund Ltd. | 3,132,473 | 2,178 |
| * | Thungela Resources Ltd. | 443,982 | 2,112 |
| | Omnia Holdings Ltd. | 485,723 | 2,010 |
| | | Shares | Market
Value•
($000) |
| | Hyprop Investments Ltd. | 993,650 | 1,929 |
| | Advtech Ltd. | 1,459,291 | 1,833 |
| | Reunert Ltd. | 536,295 | 1,772 |
| * | Bytes Technology Group plc | 236,220 | 1,716 |
| | Irongate Group | 1,349,604 | 1,648 |
| | DRDGOLD Ltd. | 1,830,127 | 1,625 |
| | DataTec Ltd. | 573,467 | 1,562 |
| | Astral Foods Ltd. | 127,656 | 1,476 |
| * | Tsogo Sun Gaming Ltd. | 1,672,033 | 1,349 |
| | MAS Real Estate Inc. | 1,113,245 | 1,311 |
| | Raubex Group Ltd. | 574,858 | 1,229 |
| * | Famous Brands Ltd. | 249,213 | 1,205 |
| | Zeder Investments Ltd. | 5,782,404 | 1,201 |
| * | Sun International Ltd. | 569,134 | 1,198 |
| | SA Corporate Real Estate Ltd. | 8,506,936 | 1,189 |
| * | Massmart Holdings Ltd. | 271,193 | 1,113 |
| * | EPP NV | 1,253,329 | 983 |
| | Cashbuild Ltd. | 54,154 | 945 |
| * | Attacq Ltd. | 2,176,572 | 929 |
| | Wilson Bayly Holmes-Ovcon Ltd. | 121,725 | 846 |
| * | Hosken Consolidated Investments Ltd. | 167,457 | 792 |
| * | Long4Life Ltd. | 1,942,901 | 762 |
| | Hudaco Industries Ltd. | 84,261 | 758 |
| * | Blue Label Telecoms Ltd. | 1,662,282 | 604 |
| * | Curro Holdings Ltd. | 707,664 | 571 |
| *,1 | Brait plc | 2,011,959 | 561 |
| | Adcock Ingram Holdings Ltd. | 167,060 | 534 |
| | Alexander Forbes Group Holdings Ltd. | 1,818,457 | 521 |
| | Altron Ltd. Class A | 600,611 | 431 |
| | Emira Property Fund Ltd. | 664,696 | 410 |
| | | | 80,458 |
| South Korea (4.7%) |
| 1 | L&F Co. Ltd. | 82,813 | 13,111 |
| * | F&F Co. Ltd. | 12,619 | 9,423 |
| | Hansol Chemical Co. Ltd. | 33,382 | 9,421 |
| 1 | Wemade Co. Ltd. | 58,848 | 9,209 |
| *,1 | Hyosung Advanced Materials Corp. | 11,211 | 6,848 |
| | DB HiTek Co. Ltd. | 134,891 | 6,667 |
| * | Kakao Games Corp. | 94,215 | 6,440 |
| | Iljin Materials Co. Ltd. | 73,903 | 6,387 |
| | SK Materials Co. Ltd. | 17,905 | 5,861 |
| 1 | Hyosung TNC Corp. | 11,053 | 5,683 |
| | Kolon Industries Inc. | 73,960 | 5,659 |
| | Meritz Fire & Marine Insurance Co. Ltd. | 229,512 | 5,455 |
FTSE All-World ex-US Small-Cap Index Fund
| | | Shares | Market
Value•
($000) |
| | JYP Entertainment Corp. | 120,190 | 5,406 |
| | LEENO Industrial Inc. | 35,863 | 5,256 |
| 1 | Ecopro Co. Ltd. | 59,852 | 5,146 |
| *,1 | Doosan Fuel Cell Co. Ltd. | 112,247 | 5,039 |
| * | SM Entertainment Co. Ltd. | 74,467 | 5,017 |
| 1 | WONIK IPS Co. Ltd. | 142,720 | 4,953 |
| | Douzone Bizon Co. Ltd. | 69,782 | 4,871 |
| | JB Financial Group Co. Ltd. | 631,738 | 4,802 |
| | Meritz Securities Co. Ltd. | 1,192,517 | 4,765 |
| | Youngone Corp. | 123,825 | 4,739 |
| *,1 | Hyundai Rotem Co. Ltd. | 237,405 | 4,597 |
| 1 | CS Wind Corp. | 75,342 | 4,498 |
| * | Eubiologics Co. Ltd. | 109,650 | 4,490 |
| 1 | AfreecaTV Co. Ltd. | 26,901 | 4,457 |
| | Hyundai Elevator Co. Ltd. | 106,566 | 4,425 |
| | Com2uSCorp | 39,908 | 4,397 |
| * | Ecopro HN Co. Ltd. | 46,765 | 4,355 |
| | KIWOOM Securities Co. Ltd. | 46,543 | 4,196 |
| *,1 | KMW Co. Ltd. | 116,360 | 4,112 |
| 1 | Dongjin Semichem Co. Ltd. | 131,537 | 3,960 |
| * | Genexine Inc. | 67,701 | 3,807 |
| *,1 | HLB Life Science Co. Ltd. | 296,846 | 3,801 |
| * | Hugel Inc. | 23,694 | 3,682 |
| | Koh Young Technology Inc. | 231,441 | 3,657 |
| | Osstem Implant Co. Ltd. | 34,270 | 3,633 |
| | Daejoo Electronic Materials Co. Ltd. | 40,235 | 3,619 |
| | Daishin Securities Co. Ltd. | 196,258 | 3,505 |
| * | Cosmax Inc. | 32,628 | 3,472 |
| | Eo Technics Co. Ltd. | 36,891 | 3,403 |
| | LS Electric Co. Ltd. | 67,016 | 3,392 |
| * | Chabiotech Co. Ltd. | 200,521 | 3,358 |
| | Korean Reinsurance Co. | 398,453 | 3,300 |
| 1 | Chunbo Co. Ltd. | 13,415 | 3,262 |
| 1 | LX Semicon Co. Ltd. | 33,454 | 3,146 |
| * | GeneOne Life Science Inc. | 146,234 | 3,143 |
| * | CJ CGV Co. Ltd. | 113,769 | 3,110 |
| *,1 | Foosung Co. Ltd. | 176,076 | 3,023 |
| | Kolmar Korea Co. Ltd. | 78,940 | 3,018 |
| | Soulbrain Co. Ltd. | 13,277 | 2,980 |
| | Meritz Financial Group Inc. | 99,021 | 2,832 |
| | Dongkuk Steel Mill Co. Ltd. | 192,945 | 2,816 |
| | Hanwha Systems Co. Ltd. | 198,041 | 2,787 |
| 1 | Chong Kun Dang Pharmaceutical Corp. | 27,430 | 2,755 |
| | LOTTE REIT Co. Ltd. | 568,580 | 2,755 |
| | | Shares | Market
Value•
($000) |
| * | Mezzion Pharma Co. Ltd. | 20,377 | 2,736 |
| * | CosmoAM&T Co. Ltd. | 74,643 | 2,699 |
| * | Innox Advanced Materials Co. Ltd. | 73,642 | 2,678 |
| | Hyosung Corp. | 30,156 | 2,670 |
| * | Hanall Biopharma Co. Ltd. | 151,889 | 2,660 |
| | KEPCO Engineering & Construction Co. Inc. | 43,076 | 2,615 |
| | Innocean Worldwide Inc. | 51,027 | 2,569 |
| | Green Cross Holdings Corp. | 102,215 | 2,566 |
| *,1 | LegoChem Biosciences Inc. | 66,066 | 2,550 |
| * | SOLUM Co. Ltd. | 111,721 | 2,515 |
| | NICE Information Service Co. Ltd. | 148,417 | 2,512 |
| * | Kumho Tire Co. Inc. | 543,922 | 2,487 |
| *,1 | Hyundai Bioscience Co. Ltd. | 119,385 | 2,409 |
| | SFA Engineering Corp. | 79,620 | 2,408 |
| * | ST Pharm Co. Ltd. | 32,055 | 2,403 |
| *,1 | NEPES Corp. | 79,869 | 2,402 |
| * | Creative & Innovative System | 150,394 | 2,376 |
| *,1 | Oscotec Inc. | 89,911 | 2,307 |
| * | Pharmicell Co. Ltd. | 214,996 | 2,303 |
| * | MedPacto Inc. | 47,500 | 2,301 |
| | Samwha Capacitor Co. Ltd. | 46,688 | 2,274 |
| * | Asiana Airlines Inc. | 116,490 | 2,250 |
| * | Hana Tour Service Inc. | 31,227 | 2,232 |
| | Seoul Semiconductor Co. Ltd. | 172,787 | 2,213 |
| | Taekwang Industrial Co. Ltd. | 2,570 | 2,200 |
| | Huchems Fine Chemical Corp. | 96,923 | 2,197 |
| *,1 | GemVax & Kael Co. Ltd. | 137,093 | 2,190 |
| | Hyundai Greenfood Co. Ltd. | 262,152 | 2,180 |
| *,1 | NKMax Co. Ltd. | 97,238 | 2,177 |
| | DongKook Pharmaceutical Co. Ltd. | 113,161 | 2,175 |
| * | Next Science Co. Ltd. | 137,523 | 2,170 |
| * | Amicogen Inc. | 76,502 | 2,118 |
| *,1 | YG Entertainment Inc. | 34,675 | 2,090 |
| 1 | Dawonsys Co. Ltd. | 72,875 | 2,055 |
| 1 | Sebang Global Battery Co. Ltd. | 28,980 | 2,037 |
| *,1 | Sam Chun Dang Pharm Co. Ltd. | 50,402 | 2,036 |
| * | Vaxcell-Bio Therapeutics Co. Ltd. | 36,194 | 1,994 |
| | Daewoong Co. Ltd. | 72,559 | 1,966 |
FTSE All-World ex-US Small-Cap Index Fund
| | | Shares | Market
Value•
($000) |
| | Hanmi Semiconductor Co. Ltd. | 71,241 | 1,964 |
| | Daewoong Pharmaceutical Co. Ltd. | 16,097 | 1,935 |
| * | Cellivery Therapeutics Inc. | 45,139 | 1,934 |
| | Hyundai Home Shopping Network Corp. | 31,675 | 1,901 |
| 1 | Zinus Inc. | 27,894 | 1,868 |
| | Samyang Holdings Corp. | 21,136 | 1,863 |
| * | Hyosung Chemical Corp. | 7,474 | 1,851 |
| | Hanjin Transportation Co. Ltd. | 61,986 | 1,845 |
| * | Hanwha Investment & Securities Co. Ltd. | 383,737 | 1,823 |
| * | NHN KCP Corp. | 36,633 | 1,797 |
| * | ABLBio Inc. | 94,862 | 1,738 |
| * | Hanjin Heavy Industries & Construction Co. Ltd. | 211,712 | 1,736 |
| | Hyundai Autoever Corp. | 17,258 | 1,729 |
| 1 | SK Discovery Co. Ltd. | 42,004 | 1,715 |
| 1 | Tesna Inc. | 43,910 | 1,715 |
| | PI Advanced Materials Co. Ltd. | 43,963 | 1,703 |
| | Park Systems Corp. | 16,737 | 1,700 |
| | Doosan Co. Ltd. | 19,174 | 1,697 |
| | LX International Corp. | 72,346 | 1,686 |
| | JR REIT XXVII | 352,666 | 1,681 |
| * | Duk San Neolux Co. Ltd. | 35,836 | 1,666 |
| | Ahnlab Inc. | 23,594 | 1,657 |
| *,1 | Taihan Electric Wire Co. Ltd. | 853,975 | 1,641 |
| | MegaStudyEdu Co. Ltd. | 24,787 | 1,632 |
| *,1 | Ananti Inc. | 143,246 | 1,625 |
| *,1 | Ace Technologies Corp. | 127,810 | 1,575 |
| | Korea Electric Terminal Co. Ltd. | 24,245 | 1,569 |
| * | Lotte Tour Development Co. Ltd. | 90,878 | 1,569 |
| * | iNtRON Biotechnology Inc. | 94,586 | 1,562 |
| * | Humasis Co. Ltd. | 112,655 | 1,560 |
| *,1 | Enzychem Lifesciences Corp. | 26,818 | 1,531 |
| 1 | Posco ICT Co. Ltd. | 264,719 | 1,518 |
| | KCC Glass Corp. | 29,250 | 1,510 |
| 1 | Bukwang Pharmaceutical Co. Ltd. | 134,499 | 1,506 |
| * | Eoflow Co. Ltd. | 32,838 | 1,497 |
| | | Shares | Market
Value•
($000) |
| | PharmaResearch Co. Ltd. | 18,921 | 1,493 |
| * | Vidente Co. Ltd. | 119,074 | 1,480 |
| | Poongsan Corp. | 52,082 | 1,476 |
| | Tokai Carbon Korea Co. Ltd. | 13,770 | 1,473 |
| 1 | Eugene Technology Co. Ltd. | 38,088 | 1,452 |
| | IS Dongseo Co. Ltd. | 37,212 | 1,443 |
| | Green Cross LabCell Corp. | 17,329 | 1,437 |
| * | Cellid Co. Ltd. | 23,305 | 1,434 |
| | Mcnex Co. Ltd. | 38,455 | 1,431 |
| | LIG Nex1 Co. Ltd. | 35,448 | 1,421 |
| | Daeduck Electronics Co. Ltd. | 96,180 | 1,417 |
| 1 | S&S Tech Corp. | 44,851 | 1,416 |
| * | TY Holdings Co. Ltd. | 60,780 | 1,415 |
| 1 | SIMMTECH Co. Ltd. | 53,147 | 1,401 |
| 1 | Korea Petrochemical Ind Co. Ltd. | 8,757 | 1,392 |
| | SL Corp. | 49,368 | 1,391 |
| | Hankook Shell Oil Co. Ltd. | 5,803 | 1,387 |
| 1 | DoubleUGames Co. Ltd. | 25,203 | 1,385 |
| * | Hyundai Electric & Energy System Co. Ltd. | 70,279 | 1,335 |
| * | Hyundai Construction Equipment Co. Ltd. | 38,535 | 1,334 |
| 1 | Daea TI Co. Ltd. | 234,869 | 1,331 |
| | Handsome Co. Ltd. | 36,736 | 1,327 |
| | Dentium Co. Ltd. | 22,147 | 1,313 |
| * | Binex Co. Ltd. | 91,844 | 1,306 |
| *,1 | Webzen Inc. | 55,962 | 1,295 |
| * | Eyegene Inc. | 64,156 | 1,280 |
| | Daou Technology Inc. | 63,731 | 1,275 |
| *,1 | Yungjin Pharmaceutical Co. Ltd. | 316,309 | 1,270 |
| 1 | RFHIC Corp. | 46,465 | 1,251 |
| *,1 | G-treeBNT Co. Ltd. | 89,071 | 1,249 |
| * | UniTest Inc. | 48,683 | 1,233 |
| | Hyundai Corp. | 77,360 | 1,221 |
| * | Hancom Inc. | 69,354 | 1,190 |
| * | Hyosung Heavy Industries Corp. | 20,498 | 1,185 |
| | Daesang Corp. | 57,798 | 1,182 |
| * | Studio Dragon Corp. | 15,985 | 1,181 |
| | Korea United Pharm Inc. | 28,052 | 1,172 |
| *,1 | CMG Pharmaceutical Co. Ltd. | 354,833 | 1,171 |
| * | SFA Semicon Co. Ltd. | 212,389 | 1,154 |
| | TK Corp. | 113,487 | 1,143 |
| * | DIO Corp. | 35,057 | 1,133 |
| 1 | L&C Bio Co. Ltd. | 38,673 | 1,133 |
| * | CrystalGenomics Inc. | 192,591 | 1,132 |
| | Interpark Corp. | 196,437 | 1,127 |
FTSE All-World ex-US Small-Cap Index Fund
| | | Shares | Market
Value•
($000) |
| | Ilyang Pharmaceutical Co. Ltd. | 44,081 | 1,125 |
| * | OliX Pharmaceuticals Inc. | 33,958 | 1,119 |
| | ESR Kendall Square REIT Co. Ltd. | 191,416 | 1,117 |
| * | Korea Line Corp. | 455,846 | 1,104 |
| | Korea Asset In Trust Co. Ltd. | 288,833 | 1,093 |
| | Hankook & Co. Co. Ltd. | 75,135 | 1,076 |
| * | Modetour Network Inc. | 47,716 | 1,056 |
| *,1 | KH Vatec Co. Ltd. | 50,386 | 1,043 |
| | LX Hausys Ltd. | 17,333 | 1,034 |
| | Yuanta Securities Korea Co. Ltd. | 263,543 | 1,018 |
| * | Lutronic Corp. | 62,866 | 1,015 |
| *,1 | Naturecell Co. Ltd. | 59,785 | 1,014 |
| 1 | BH Co. Ltd. | 63,006 | 1,012 |
| | GOLFZON Co. Ltd. | 8,289 | 1,005 |
| * | Cafe24 Corp. | 40,463 | 1,000 |
| * | Shinsung E&G Co. Ltd. | 491,246 | 996 |
| * | Inscobee Inc. | 354,014 | 994 |
| * | Samsung Pharmaceutical Co. Ltd. | 196,312 | 983 |
| | Hanil Cement Co. Ltd. | 59,370 | 983 |
| | Boryung Pharmaceutical Co. Ltd. | 78,446 | 969 |
| | Tongyang Inc. | 667,833 | 958 |
| | Hansae Co. Ltd. | 46,995 | 935 |
| *,1 | Anterogen Co. Ltd. | 18,340 | 922 |
| * | Jusung Engineering Co. Ltd. | 93,435 | 900 |
| * | Neowiz | 39,657 | 895 |
| | HDC Holdings Co. Ltd. | 98,297 | 889 |
| 1 | Shinsegae International Inc. | 6,166 | 889 |
| | KTB Investment & Securities Co. Ltd. | 154,806 | 874 |
| * | KH Feelux Co. Ltd. | 332,432 | 864 |
| | SNT Motiv Co. Ltd. | 19,992 | 863 |
| | Halla Holdings Corp. | 19,666 | 859 |
| 1 | JW Pharmaceutical Corp. | 42,521 | 851 |
| | Korea Real Estate Investment & Trust Co. Ltd. | 419,928 | 842 |
| * | Solid Inc. | 146,704 | 839 |
| | Dong-A ST Co. Ltd. | 13,374 | 835 |
| 1 | Partron Co. Ltd. | 103,527 | 831 |
| * | Hanwha General Insurance Co. Ltd. | 214,277 | 830 |
| * | Komipharm International Co. Ltd. | 107,469 | 828 |
| | TES Co. Ltd. | 35,896 | 821 |
| | SK Securities Co. Ltd. | 967,085 | 814 |
| *,1 | Medipost Co. Ltd. | 41,682 | 813 |
| | | Shares | Market
Value•
($000) |
| *,1 | Kuk-il Paper Manufacturing Co. Ltd. | 220,172 | 811 |
| *,1 | Insun ENT Co. Ltd. | 77,948 | 810 |
| * | S-MAC Co. Ltd. | 813,222 | 810 |
| | Youlchon Chemical Co. Ltd. | 42,046 | 793 |
| | Young Poong Corp. | �� 1,335 | 784 |
| * | Gamevil Inc. | 12,312 | 784 |
| | Nature Holdings Co. Ltd. | 27,859 | 784 |
| * | Sambu Engineering & Construction Co. Ltd. | 437,208 | 780 |
| | NICE Holdings Co. Ltd. | 53,276 | 771 |
| | Huons Co. Ltd. | 17,663 | 766 |
| * | Sangsangin Co. Ltd. | 99,755 | 765 |
| | KUMHOE&C Co. Ltd. | 73,765 | 762 |
| | Huons Global Co. Ltd. | 17,886 | 756 |
| | Orion Holdings Corp. | 54,843 | 752 |
| | LF Corp. | 47,710 | 748 |
| 1 | LOTTE Himart Co. Ltd. | 31,381 | 746 |
| | Dong-A Socio Holdings Co. Ltd. | 8,157 | 739 |
| | NS Shopping Co. Ltd. | 62,013 | 739 |
| * | Seojin System Co. Ltd. | 24,837 | 735 |
| 1 | ITM Semiconductor Co. Ltd. | 18,203 | 727 |
| | SK Gas Ltd. | 6,136 | 725 |
| | Mirae Asset Life Insurance Co. Ltd. | 196,948 | 720 |
| | InBody Co. Ltd. | 30,586 | 712 |
| | Dongwon Industries Co. Ltd. | 3,620 | 706 |
| | HS Industries Co. Ltd. | 121,990 | 703 |
| * | Grand Korea Leisure Co. Ltd. | 50,231 | 702 |
| | KISWIRE Ltd. | 29,628 | 698 |
| | Harim Holdings Co. Ltd. | 81,455 | 676 |
| | Jeil Pharmaceutical Co. Ltd. | 23,196 | 675 |
| | i-SENS Inc. | 23,454 | 673 |
| | Daishin Securities Co. Ltd. Preference Shares | 41,378 | 672 |
| | Songwon Industrial Co. Ltd. | 43,395 | 667 |
| | Sungwoo Hitech Co. Ltd. | 127,257 | 658 |
| | Seah Besteel Corp. | 35,155 | 652 |
| | INTOPS Co. Ltd. | 32,450 | 647 |
| | Binggrae Co. Ltd. | 13,349 | 637 |
| | Advanced Process Systems Corp. | 31,225 | 635 |
| | Namyang Dairy Products Co. Ltd. | 1,602 | 629 |
| | Vieworks Co. Ltd. | 18,309 | 622 |
| | Namhae Chemical Corp. | 53,954 | 620 |
FTSE All-World ex-US Small-Cap Index Fund
| | | Shares | Market
Value•
($000) |
| | Nexen Tire Corp. | 93,392 | 605 |
| * | Eutilex Co. Ltd. | 27,484 | 590 |
| | Youngone Holdings Co. Ltd. | 14,523 | 585 |
| | iMarketKorea Inc. | 61,379 | 578 |
| | Chongkundang Holdings Corp. | 8,077 | 567 |
| | OptoElectronics Solutions Co. Ltd. | 19,758 | 566 |
| * | AbClon Inc. | 40,110 | 554 |
| | Kwang Dong Pharmaceutical Co. Ltd. | 83,083 | 553 |
| | Cuckoo Homesys Co. Ltd. | 14,684 | 548 |
| | Kolon Corp. | 17,878 | 543 |
| | Hansol Paper Co. Ltd. | 43,926 | 543 |
| | Tongyang Life Insurance Co. Ltd. | 92,674 | 542 |
| 3 | Green Cross Cell Corp. | 16,350 | 540 |
| | Dongwon F&B Co. Ltd. | 3,059 | 538 |
| | Samyang Corp. | 9,195 | 538 |
| *,1 | STCUBE | 74,225 | 526 |
| | Samchully Co. Ltd. | 6,409 | 518 |
| | Seobu T&D | 69,127 | 518 |
| | Hyundai Bioland Co. Ltd. | 29,899 | 512 |
| | ENF Technology Co. Ltd. | 20,641 | 512 |
| * | Aprogen pharmaceuticals Inc. | 579,812 | 508 |
| | Eugene Investment & Securities Co. Ltd. | 155,434 | 507 |
| | Taeyoung Engineering & Construction Co. Ltd. | 53,202 | 506 |
| | Maeil Dairies Co. Ltd. | 8,362 | 505 |
| | KC Tech Co. Ltd. | 25,990 | 501 |
| * | Peptron Inc. | 48,161 | 459 |
| | KISCO Corp. | 59,444 | 458 |
| *,1 | Soulbrain Holdings Co. Ltd. | 12,112 | 454 |
| * | SCM Lifescience Co. Ltd. | 25,791 | 442 |
| | LG HelloVision Co. Ltd. | 73,933 | 438 |
| | Woongjin Thinkbig Co. Ltd. | 152,463 | 437 |
| | BGF Co. Ltd. | 88,189 | 420 |
| 1 | F&F Holdings Co. Ltd. | 12,502 | 419 |
| | DB Financial Investment Co. Ltd. | 68,332 | 415 |
| * | Wonik Holdings Co. Ltd. | 92,558 | 413 |
| | Lotte Confectionery Co. Ltd. | 3,730 | 411 |
| *,1 | Namsun Aluminum Co. Ltd. | 155,389 | 391 |
| * | Hansol Technics Co. Ltd. | 66,760 | 387 |
| | | Shares | Market
Value•
($000) |
| | Eusu Holdings Co. Ltd. | 75,588 | 386 |
| * | Lock&Lock Co. Ltd. | 42,729 | 384 |
| | Sung Kwang Bend Co. Ltd. | 48,276 | 380 |
| | Toptec Co. Ltd. | 50,666 | 380 |
| | Kyobo Securities Co. Ltd. | 50,102 | 377 |
| | Humedix Co. Ltd. | 15,501 | 368 |
| | Dae Han Flour Mills Co. Ltd. | 2,609 | 367 |
| * | Dongsung Pharmaceutical Co. Ltd. | 47,925 | 365 |
| | ICD Co. Ltd. | 33,810 | 363 |
| * | CJ Freshway Corp. | 12,744 | 360 |
| | Kolmar Korea Holdings Co. Ltd. | 18,175 | 359 |
| | Byucksan Corp. | 112,419 | 353 |
| | Cuckoo Holdings Co. Ltd. | 18,165 | 351 |
| | Hanil Holdings Co. Ltd. | 28,780 | 344 |
| * | Able C&C Co. Ltd. | 51,601 | 339 |
| | Lotte Food Co. Ltd. | 1,024 | 335 |
| | Aekyung Industrial Co. Ltd. | 17,509 | 334 |
| | KT Skylife Co. Ltd. | 38,395 | 333 |
| | Hyundai Livart Furniture Co. Ltd. | 23,620 | 321 |
| * | Interflex Co. Ltd. | 28,626 | 318 |
| | E1 Corp. | 7,036 | 316 |
| | AK Holdings Inc. | 13,753 | 313 |
| | Hansol Holdings Co. Ltd. | 93,150 | 302 |
| | SNT Dynamics Co. Ltd. | 36,640 | 291 |
| * | CUROCOM Co. Ltd. | 242,813 | 289 |
| | Sam Young Electronics Co. Ltd. | 27,627 | 286 |
| * | Sindoh Co. Ltd. | 9,770 | 275 |
| | Daekyo Co. Ltd. | 70,719 | 263 |
| | Daeduck Co. Ltd. | 41,388 | 260 |
| * | Coreana Cosmetics Co. Ltd. | 68,106 | 249 |
| | Dae Hwa Pharmaceutical Co. Ltd. | 28,245 | 241 |
| | Cell Biotech Co. Ltd. | 14,419 | 220 |
| * | SBS Media Holdings Co. Ltd. | 122,676 | 217 |
| * | Y2 Solution Co. Ltd. | 147,206 | 154 |
| * | Enzychem Lifesciences Rights Exp.12/17/2021 | 16,317 | 140 |
| | Muhak Co. Ltd. | 13,984 | 117 |
| | KC Co. Ltd. | 3,571 | 70 |
| * | GeneOne Life Science Inc. Rights Exp. 11/25/2021 | 18,702 | 59 |
| | SPC Samlip Co. Ltd. | 580 | 38 |
| * | Homecast Co. Ltd. | 6,179 | 16 |
| * | Telcon RF Pharmaceutical Inc. | 3,871 | 11 |
FTSE All-World ex-US Small-Cap Index Fund
| | | Shares | Market
Value•
($000) |
| * | Cnk International Co. Ltd. | 35,374 | — |
| | | | 565,777 |
| Spain (1.1%) |
| * | Banco de Sabadell SA | 20,567,760 | 16,553 |
| | Acerinox SA | 765,730 | 10,661 |
| | Viscofan SA | 140,513 | 9,608 |
| | Grupo Catalana Occidente SA | 176,405 | 6,265 |
| * | Indra Sistemas SA | 477,161 | 5,771 |
| | CIE Automotive SA | 206,223 | 5,613 |
| | Applus Services SA | 589,033 | 5,332 |
| | Ebro Foods SA | 260,640 | 5,173 |
| | Laboratorios Farmaceuticos Rovi SA | 72,132 | 5,061 |
| * | Solaria Energia y Medio Ambiente SA | 240,851 | 4,820 |
| | Faes Farma SA | 1,165,263 | 4,747 |
| 2 | Unicaja Banco SA | 4,385,322 | 4,692 |
| | Sacyr SA (XMAD) | 1,474,676 | 4,204 |
| | Almirall SA | 281,490 | 4,186 |
| | Pharma Mar SA | 52,195 | 4,060 |
| | Zardoya Otis SA | 467,458 | 3,759 |
| | Cia de Distribucion Integral Logista Holdings SA | 173,101 | 3,689 |
| * | Melia Hotels International SA | 448,329 | 3,309 |
| * | Mediaset Espana Comunicacion SA | 622,661 | 3,247 |
| 2 | Neinor Homes SA | 242,491 | 3,128 |
| | Construcciones y Auxiliar de Ferrocarriles SA | 68,667 | 3,025 |
| | Prosegur Cia de Seguridad SA | 858,179 | 2,435 |
| *,2 | Gestamp Automocion SA | 413,743 | 1,850 |
| 2 | Global Dominion Access SA | 309,668 | 1,661 |
| 2 | Aedas Homes SA | 55,050 | 1,582 |
| * | Ence Energia y Celulosa SA | 550,349 | 1,416 |
| *,1 | Tecnicas Reunidas SA | 145,344 | 1,314 |
| | Fomento de Construcciones y Contratas SA | 92,081 | 1,174 |
| 2 | Metrovacesa SA | 122,725 | 1,076 |
| | Lar Espana Real Estate Socimi SA | 172,407 | 1,050 |
| *,1 | Distribuidora Internacional de Alimentacion SA | 52,288,405 | 956 |
| * | Atresmedia Corp. de Medios de Comunicacion SA | 212,316 | 866 |
| * | NH Hotel Group SA (XMAD) | 69,008 | 251 |
| *,1,3 | Let S Gowex SA | 31,105 | — |
| | | | 132,534 |
| Sweden (4.8%) |
| | Samhallsbyggnadsbolaget i Norden AB | 3,632,797 | 24,353 |
| 2 | Thule Group AB | 391,096 | 22,598 |
| | | Shares | Market
Value•
($000) |
| | Avanza Bank Holding AB | 455,928 | 18,126 |
| 2 | Dometic Group AB | 1,168,921 | 17,049 |
| | Fabege AB | 977,257 | 16,542 |
| * | Nordic Entertainment Group AB Class B | 278,775 | 16,166 |
| | Vitrolife AB | 248,023 | 16,142 |
| | AddTech AB Class B | 686,346 | 15,355 |
| | AddLife AB Class B | 355,904 | 14,540 |
| | BillerudKorsnas AB | 653,203 | 13,682 |
| | AAK AB | 615,190 | 13,456 |
| | Sectra AB Class B | 506,280 | 12,321 |
| | Nyfosa AB | 725,722 | 12,249 |
| | Wihlborgs Fastigheter AB | 507,992 | 12,044 |
| | Arjo AB Class B | 870,056 | 11,865 |
| 2 | Bravida Holding AB | 771,582 | 11,606 |
| | Nordnet AB publ | 594,168 | 11,389 |
| | JM AB | 271,918 | 11,017 |
| | AFRY AB | 365,946 | 10,889 |
| | Wallenstam AB Class B | 606,823 | 10,651 |
| | Hexpol AB | 909,907 | 10,648 |
| 1 | Kungsleden AB | 748,662 | 10,296 |
| | Bure Equity AB | 206,620 | 9,591 |
| | Nolato AB Class B | 689,080 | 9,111 |
| | Mips AB | 75,094 | 9,092 |
| | Peab AB Class B | 701,565 | 8,818 |
| | Instalco AB | 162,918 | 8,661 |
| * | SSAB AB Class B | 1,697,685 | 8,485 |
| | Axfood AB | 345,658 | 8,475 |
| | Intrum AB | 280,384 | 7,959 |
| * | SSAB AB Class A | 1,358,272 | 7,740 |
| | Loomis AB Class B | 283,710 | 7,657 |
| | Lindab International AB | 227,856 | 7,465 |
| | Biotage AB | 217,160 | 7,027 |
| | Corem Property Group AB Class B | 2,113,541 | 7,015 |
| * | Electrolux Professional AB Class B | 901,254 | 6,963 |
| | Catena AB | 104,175 | 6,347 |
| * | Pandox AB Class B | 350,586 | 6,178 |
| | Medicover AB Class B | 201,697 | 6,115 |
| | NCC AB Class B | 351,544 | 6,091 |
| | Mycronic AB | 261,002 | 6,057 |
| | Bilia AB Class A | 317,946 | 5,654 |
| | HMS Networks AB | 93,483 | 5,338 |
| | Concentric AB | 163,760 | 4,820 |
| | Hufvudstaden AB Class A | 298,852 | 4,782 |
| | Ratos AB Class B | 810,566 | 4,667 |
| | Troax Group AB | 113,942 | 4,665 |
| * | BICO Group AB Class B | 88,538 | 4,440 |
| * | Modern Times Group MTG AB Class B | 356,650 | 4,090 |
| | Vitec Software Group AB Class B | 68,674 | 4,053 |
| * | VNV Global AB | 264,085 | 3,875 |
| | Granges AB | 346,289 | 3,777 |
| | Bonava AB Class B | 362,058 | 3,577 |
| *,2 | Boozt AB | 208,384 | 3,510 |
| | Betsson AB Class B | 493,865 | 3,447 |
FTSE All-World ex-US Small-Cap Index Fund
| | | Shares | Market
Value•
($000) |
| * | Cint Group AB | 216,827 | 3,280 |
| | Atrium Ljungberg AB Class B | 132,969 | 3,053 |
| | Nobia AB | 491,333 | 3,028 |
| 2 | Resurs Holding AB | 560,084 | 3,018 |
| * | BHG Group AB | 257,219 | 2,966 |
| | Dios Fastigheter AB | 238,514 | 2,775 |
| * | Mekonomen AB | 131,479 | 2,713 |
| | Platzer Fastigheter Holding AB Class B | 161,646 | 2,634 |
| | SkiStar AB | 122,289 | 2,551 |
| | Systemair AB | 245,988 | 2,374 |
| 2 | Munters Group AB | 305,843 | 2,263 |
| *,1 | SAS AB | 12,975,339 | 2,258 |
| *,1 | Hansa Biopharma AB | 183,755 | 2,088 |
| | INVISIO AB | 112,337 | 2,033 |
| *,2 | Attendo AB | 445,597 | 1,915 |
| *,1,2 | Scandic Hotels Group AB | 376,867 | 1,823 |
| | Cloetta AB Class B | 548,981 | 1,744 |
| | Corem Property Group AB Preference Shares | 42,814 | 1,636 |
| | Fagerhult AB | 202,319 | 1,621 |
| | Investment AB Oresund | 77,504 | 1,347 |
| * | Karo Pharma AB | 203,080 | 1,338 |
| *,1 | Collector AB | 234,575 | 1,155 |
| | Clas Ohlson AB Class B | 102,908 | 1,108 |
| * | Camurus AB | 55,101 | 1,035 |
| | Samhallsbyggnadsbolaget i Norden AB Class D | 124,099 | 451 |
| | NCC AB Class A | 15,132 | 265 |
| * | Annehem Fastigheter AB Class B | 10,450 | 45 |
| *,3 | Ow Bunker A/S | 24,023 | — |
| | | | 571,043 |
| Switzerland (3.1%) |
| | Belimo Holding AG (Registered) | 34,144 | 19,851 |
| | Bachem Holding AG (Registered) Class B | 23,188 | 18,665 |
| | Siegfried Holding AG (Registered) | 14,971 | 14,400 |
| 2 | Galenica AG | 169,566 | 12,420 |
| * | Dufry AG (Registered) | 220,229 | 11,660 |
| | Comet Holding AG (Registered) | 30,911 | 11,502 |
| | Bucher Industries AG (Registered) | 22,753 | 11,483 |
| | Allreal Holding AG (Registered) | 50,239 | 10,625 |
| | Daetwyler Holding AG (Bearer) | 27,191 | 10,578 |
| | Interroll Holding AG (Registered) | 2,110 | 10,237 |
| * | Zur Rose Group AG | 28,125 | 10,004 |
| | Inficon Holding AG (Registered) | 7,525 | 9,655 |
| | | Shares | Market
Value•
($000) |
| | Vontobel Holding AG (Registered) | 103,476 | 9,583 |
| * | Idorsia Ltd. | 427,295 | 8,797 |
| | Softwareone Holding AG | 359,838 | 8,338 |
| | dormakaba Holding AG | 10,930 | 8,101 |
| | Mobimo Holding AG (Registered) | 23,763 | 8,009 |
| | Forbo Holding AG (Registered) | 3,997 | 7,776 |
| | SFS Group AG | 57,600 | 7,758 |
| 1 | Stadler Rail AG | 168,659 | 7,407 |
| | Kardex Holding AG (Registered) | 23,814 | 7,345 |
| | Cembra Money Bank AG | 107,236 | 7,159 |
| | Bystronic AG | 4,881 | 6,711 |
| 1 | Landis+Gyr Group AG | 95,483 | 6,564 |
| | Emmi AG (Registered) | 6,214 | 6,484 |
| | Huber + Suhner AG (Registered) | 69,637 | 6,194 |
| | Valiant Holding AG (Registered) | 61,854 | 6,123 |
| | Swissquote Group Holding SA (Registered) | 28,900 | 5,862 |
| | Burckhardt Compression Holding AG | 13,350 | 5,623 |
| * | Dottikon Es Holding AG (Registered) | 14,647 | 5,379 |
| | Schweiter Technologies AG (Bearer) | 3,681 | 5,286 |
| *,2 | Sensirion Holding AG | 34,742 | 5,007 |
| * | Aryzta AG | 3,825,351 | 5,002 |
| | Zehnder Group AG | 42,441 | 4,568 |
| *,1 | Meyer Burger Technology AG | 9,527,616 | 4,547 |
| | St. Galler Kantonalbank AG (Registered) | 8,888 | 4,096 |
| * | Komax Holding AG (Registered) | 15,527 | 3,958 |
| | VZ Holding AG | 35,375 | 3,591 |
| | LEM Holding SA (Registered) | 1,377 | 3,338 |
| * | Ascom Holding AG (Registered) | 203,381 | 3,166 |
| * | Valora Holding AG (Registered) | 16,577 | 3,155 |
| *,2 | Medacta Group SA | 17,325 | 2,901 |
| | Bossard Holding AG (Registered) Class A | 7,844 | 2,881 |
| * | Bobst Group SA (Registered) | 33,898 | 2,761 |
| | Intershop Holding AG | 4,376 | 2,737 |
| | Bell Food Group AG (Registered) | 8,264 | 2,653 |
| | Arbonia AG | 114,150 | 2,482 |
| *,1 | Basilea Pharmaceutica AG (Registered) | 51,546 | 2,412 |
FTSE All-World ex-US Small-Cap Index Fund
| | | Shares | Market
Value•
($000) |
| | Vetropack Holding AG Class A (Registered) | 35,559 | 2,189 |
| | ALSO Holding AG (Registered) | 7,202 | 2,137 |
| * | u-blox Holding AG | 28,512 | 2,087 |
| * | COSMO Pharmaceuticals NV | 27,050 | 2,058 |
| | Leonteq AG | 30,496 | 2,019 |
| * | Rieter Holding AG (Registered) | 9,158 | 1,901 |
| | EFG International AG | 200,456 | 1,406 |
| | Ypsomed Holding AG (Registered) | 8,358 | 1,384 |
| * | Autoneum Holding AG | 7,410 | 1,160 |
| * | Swiss Steel Holding AG | 2,492,596 | 957 |
| * | Implenia AG (Registered) | 44,421 | 906 |
| | Hiag Immobilien Holding AG | 7,900 | 837 |
| | VP Bank AG Class A | 6,295 | 709 |
| * | APG SGA SA | 2,658 | 601 |
| | | | 365,185 |
| Taiwan (7.4%) |
| | eMemory Technology Inc. | 247,000 | 20,517 |
| | Ruentex Development Co. Ltd. | 6,352,535 | 16,213 |
| | ASPEED Technology Inc. | 121,437 | 12,182 |
| | E Ink Holdings Inc. | 3,601,708 | 11,940 |
| | WPG Holdings Ltd. | 5,449,137 | 10,180 |
| | Elite Material Co. Ltd. | 1,160,519 | 10,051 |
| | Macronix International Co. Ltd. | 6,926,386 | 9,800 |
| | Chroma ATE Inc. | 1,454,040 | 9,495 |
| | Merida Industry Co. Ltd. | 898,055 | 9,354 |
| | Ruentex Industries Ltd. | 2,319,844 | 9,053 |
| | TA Chen Stainless Pipe | 5,689,745 | 9,003 |
| | Alchip Technologies Ltd. | 238,000 | 8,841 |
| | Phison Electronics Corp. | 619,962 | 8,742 |
| | Global Unichip Corp. | 394,649 | 8,517 |
| | Kinsus Interconnect Technology Corp. | 953,282 | 8,389 |
| | Tripod Technology Corp. | 1,915,327 | 8,112 |
| | Lien Hwa Industrial Holdings Corp. | 4,020,363 | 8,073 |
| | AP Memory Technology Corp. | 411,154 | 7,998 |
| | Gigabyte Technology Co. Ltd. | 1,917,271 | 7,785 |
| | Makalot Industrial Co. Ltd. | 842,795 | 7,355 |
| | Simplo Technology Co. Ltd. | 669,631 | 7,214 |
| | | Shares | Market
Value•
($000) |
| | Sinbon Electronics Co. Ltd. | 856,066 | 7,083 |
| | Elan Microelectronics Corp. | 1,151,545 | 6,933 |
| | ITEQ Corp. | 1,453,870 | 6,730 |
| | Qisda Corp. | 5,868,000 | 6,556 |
| | IBF Financial Holdings Co. Ltd. | 11,421,876 | 6,534 |
| | King Yuan Electronics Co. Ltd. | 4,504,963 | 6,464 |
| | Compeq Manufacturing Co. Ltd. | 4,417,471 | 6,429 |
| | Highwealth Construction Corp. | 3,965,375 | 6,403 |
| | Radiant Opto-Electronics Corp. | 1,733,147 | 6,072 |
| | Tong Hsing Electronic Industries Ltd. | 620,572 | 5,910 |
| | YFY Inc. | 5,086,000 | 5,863 |
| | King's Town Bank Co. Ltd. | 3,875,193 | 5,786 |
| * | Episil Technologies Inc. | 1,041,350 | 5,729 |
| | Chipbond Technology Corp. | 2,440,852 | 5,666 |
| * | China Petrochemical Development Corp. | 12,969,330 | 5,651 |
| | Great Wall Enterprise Co. Ltd. | 2,913,035 | 5,624 |
| | Poya International Co. Ltd. | 313,671 | 5,618 |
| | Tung Ho Steel Enterprise Corp. | 3,675,150 | 5,342 |
| | Faraday Technology Corp. | 725,000 | 5,262 |
| | Wafer Works Corp. | 2,233,363 | 5,180 |
| | Lotes Co. Ltd. | 241,703 | 5,036 |
| | Jentech Precision Industrial Co. Ltd. | 371,698 | 4,944 |
| | FLEXium Interconnect Inc. | 1,415,140 | 4,903 |
| | Bizlink Holding Inc. | 523,651 | 4,840 |
| | King Slide Works Co. Ltd. | 313,675 | 4,820 |
| | Taiwan Surface Mounting Technology Corp. | 1,192,530 | 4,812 |
| | Cheng Loong Corp. | 3,920,920 | 4,804 |
| | TXC Corp. | 1,261,877 | 4,664 |
| | ChipMOS Technologies Inc. | 2,804,494 | 4,663 |
| | Taichung Commercial Bank Co. Ltd. | 10,785,042 | 4,637 |
| | Pan Jit International Inc. | 1,132,000 | 4,589 |
| * | Medigen Vaccine Biologics Corp. | 533,119 | 4,588 |
| | Sigurd Microelectronics Corp. | 2,152,822 | 4,550 |
FTSE All-World ex-US Small-Cap Index Fund
| | | Shares | Market
Value•
($000) |
| | HannStar Display Corp. | 8,779,810 | 4,464 |
| | International Games System Co. Ltd. | 173,213 | 4,462 |
| | Elite Semiconductor Microelectronics Technology Inc. | 866,000 | 4,453 |
| | Goldsun Building Materials Co. Ltd. | 4,652,402 | 4,308 |
| | Wisdom Marine Lines Co. Ltd. | 1,823,241 | 4,292 |
| | Nan Kang Rubber Tire Co. Ltd. | 2,937,107 | 4,225 |
| | CTCI Corp. | 3,206,667 | 4,202 |
| | Fitipower Integrated Technology Inc. | 545,226 | 4,185 |
| | Mitac Holdings Corp. | 4,034,617 | 4,176 |
| * | United Renewable Energy Co. Ltd. | 4,823,129 | 4,155 |
| | Shinkong Synthetic Fibers Corp. | 6,060,416 | 4,112 |
| * | Yieh Phui Enterprise Co. Ltd. | 4,418,910 | 3,948 |
| | Nantex Industry Co. Ltd. | 1,339,000 | 3,937 |
| | FocalTech Systems Co. Ltd. | 679,258 | 3,915 |
| | Grand Pacific Petrochemical | 3,971,928 | 3,865 |
| | Wistron NeWeb Corp. | 1,377,495 | 3,846 |
| | Topco Scientific Co. Ltd. | 771,793 | 3,836 |
| | WT Microelectronics Co. Ltd. | 1,687,377 | 3,812 |
| | USI Corp. | 3,058,784 | 3,789 |
| | Chung Hung Steel Corp. | 3,001,000 | 3,786 |
| | TCI Co. Ltd. | 459,067 | 3,731 |
| | Feng Hsin Steel Co. Ltd. | 1,325,000 | 3,726 |
| | International CSRC Investment Holdings Co. | 4,243,997 | 3,670 |
| | Advanced Energy Solution Holding Co. Ltd. | 83,000 | 3,660 |
| | Taiwan Union Technology Corp. | 1,059,000 | 3,652 |
| | Far Eastern Department Stores Ltd. | 4,550,043 | 3,618 |
| * | Microbio Co. Ltd. | 1,574,342 | 3,577 |
| | TSRC Corp. | 3,070,046 | 3,541 |
| | Coretronic Corp. | 1,710,000 | 3,539 |
| | Yulon Finance Corp. | 579,170 | 3,514 |
| | Fusheng Precision Co. Ltd. | 509,000 | 3,455 |
| | China Steel Chemical Corp. | 766,853 | 3,408 |
| | Hota Industrial Manufacturing Co. Ltd. | 1,005,317 | 3,401 |
| | Ardentec Corp. | 1,586,851 | 3,400 |
| | Standard Foods Taiwan Ltd. | 1,800,708 | 3,357 |
| | | Shares | Market
Value•
($000) |
| | Sitronix Technology Corp. | 341,282 | ��� 3,277 |
| | Huaku Development Co. Ltd. | 999,499 | 3,270 |
| | General Interface Solution Holding Ltd. | 932,000 | 3,262 |
| | Century Iron & Steel Industrial Co. Ltd. | 794,000 | 3,235 |
| | Center Laboratories Inc. | 1,351,163 | 3,232 |
| | Clevo Co. | 2,597,944 | 3,221 |
| | Tainan Spinning Co. Ltd. | 3,876,674 | 3,173 |
| | SDI Corp. | 526,000 | 3,146 |
| | United Integrated Services Co. Ltd. | 471,200 | 3,115 |
| | RichWave Technology Corp. | 298,200 | 3,101 |
| | XinTec Inc. | 632,000 | 3,087 |
| | Chilisin Electronics Corp. | 974,440 | 3,023 |
| | Visual Photonics Epitaxy Co. Ltd. | 586,455 | 2,977 |
| | Pegavision Corp. | 146,000 | 2,866 |
| | Tong Yang Industry Co. Ltd. | 2,348,919 | 2,856 |
| | Nichidenbo Corp. | 1,525,000 | 2,768 |
| | Holtek Semiconductor Inc. | 742,279 | 2,759 |
| | Advanced Wireless Semiconductor Co. | 476,192 | 2,746 |
| | Solar Applied Materials Technology Corp. | 1,510,691 | 2,723 |
| | Gold Circuit Electronics Ltd. | 1,136,280 | 2,722 |
| * | RDC Semiconductor Co. Ltd. | 189,000 | 2,709 |
| | Merry Electronics Co. Ltd. | 905,307 | 2,678 |
| | Grape King Bio Ltd. | 445,000 | 2,594 |
| | UPC Technology Corp. | 3,081,065 | 2,563 |
| | Longchen Paper & Packaging Co. Ltd. | 2,950,868 | 2,558 |
| | Via Technologies Inc. | 1,138,000 | 2,544 |
| | Greatek Electronics Inc. | 866,000 | 2,481 |
| * | PharmaEssentia Corp. | 707,204 | 2,470 |
| | Taiwan Semiconductor Co. Ltd. | 819,000 | 2,406 |
| | Asia Vital Components Co. Ltd. | 802,337 | 2,398 |
| | Advanced Ceramic X Corp. | 190,000 | 2,354 |
| | LandMark Optoelectronics Corp. | 357,600 | 2,301 |
| * | Oriental Union Chemical Corp. | 2,601,000 | 2,237 |
| | Kenda Rubber Industrial Co. Ltd. | 2,006,000 | 2,209 |
FTSE All-World ex-US Small-Cap Index Fund
| | | Shares | Market
Value•
($000) |
| | Everlight Electronics Co. Ltd. | 1,233,725 | 2,203 |
| | ITE Technology Inc. | 586,418 | 2,199 |
| * | EirGenix Inc. | 562,855 | 2,197 |
| | ADATA Technology Co. Ltd. | 728,915 | 2,184 |
| | Taiwan Paiho Ltd. | 698,183 | 2,174 |
| | Adimmune Corp. | 1,375,343 | 2,173 |
| | Andes Technology Corp. | 118,000 | 2,146 |
| | Run Long Construction Co. Ltd. | �� 995,128 | 2,144 |
| | Silicon Integrated Systems Corp. | 2,443,462 | 2,102 |
| | President Securities Corp. | 2,560,526 | 2,086 |
| | TTY Biopharm Co. Ltd. | 828,987 | 2,050 |
| * | Shihlin Paper Corp. | 825,578 | 2,039 |
| | China General Plastics Corp. | 1,520,717 | 2,033 |
| | Universal Vision Biotechnology Co. Ltd. | 175,000 | 2,005 |
| | Global Brands Manufacture Ltd. | 1,560,361 | 1,991 |
| | Shin Zu Shing Co. Ltd. | 550,224 | 1,974 |
| * | Unitech Printed Circuit Board Corp. | 2,994,672 | 1,953 |
| | Charoen Pokphand Enterprise | 678,000 | 1,950 |
| | Arcadyan Technology Corp. | 510,737 | 1,932 |
| * | Asia Pacific Telecom Co. Ltd. | 6,531,891 | 1,931 |
| | Asia Optical Co. Inc. | 603,000 | 1,925 |
| | Asia Polymer Corp. | 1,359,151 | 1,914 |
| | Farglory Land Development Co. Ltd. | 769,854 | 1,861 |
| | Supreme Electronics Co. Ltd. | 1,135,250 | 1,835 |
| | Getac Holdings Corp. | 968,000 | 1,823 |
| | Taiwan Mask Corp. | 632,540 | 1,818 |
| | Sunplus Technology Co. Ltd. | 1,353,000 | 1,805 |
| | Co-Tech Development Corp. | 667,000 | 1,801 |
| | Taiwan Hon Chuan Enterprise Co. Ltd. | 765,401 | 1,793 |
| | Pan-International Industrial Corp. | 1,210,595 | 1,769 |
| | Hsin Kuang Steel Co. Ltd. | 842,569 | 1,761 |
| | Kinpo Electronics | 3,758,196 | 1,758 |
| | Sanyang Motor Co. Ltd. | 1,772,037 | 1,727 |
| | Pixart Imaging Inc. | 301,920 | 1,716 |
| | T3EX Global Holdings Corp. | 366,000 | 1,700 |
| | | Shares | Market
Value•
($000) |
| | Evergreen International Storage & Transport Corp. | 1,726,502 | 1,686 |
| * | TSEC Corp. | 1,401,000 | 1,682 |
| * | TaiMed Biologics Inc. | 698,000 | 1,681 |
| | Foxsemicon Integrated Technology Inc. | 226,400 | 1,671 |
| * | Taiwan TEA Corp. | 2,215,293 | 1,663 |
| | St. Shine Optical Co. Ltd. | 156,419 | 1,662 |
| * | Etron Technology Inc. | 774,524 | 1,661 |
| | OptoTech Corp. | 1,070,406 | 1,657 |
| | Global Mixed Mode Technology Inc. | 204,199 | 1,655 |
| | Sporton International Inc. | 202,159 | 1,643 |
| | Cleanaway Co. Ltd. | 213,000 | 1,640 |
| | O-Bank Co. Ltd. | 5,805,000 | 1,628 |
| | Holy Stone Enterprise Co. Ltd. | 380,769 | 1,619 |
| | Apex International Co. Ltd. | 575,000 | 1,617 |
| | Sensortek Technology Corp. | 77,000 | 1,609 |
| | Gudeng Precision Industrial Co. Ltd. | 183,511 | 1,608 |
| | Gourmet Master Co. Ltd. | 340,789 | 1,608 |
| | Tung Thih Electronic Co. Ltd. | 221,000 | 1,605 |
| | Primax Electronics Ltd. | 846,000 | 1,570 |
| | TPK Holding Co. Ltd. | 1,023,000 | 1,565 |
| | China Man-Made Fiber Corp. | 4,276,384 | 1,564 |
| | Cheng Uei Precision Industry Co. Ltd. | 1,120,000 | 1,557 |
| | Weltrend Semiconductor | 532,753 | 1,557 |
| | Ta Ya Electric Wire & Cable | 1,726,231 | 1,538 |
| | Chung-Hsin Electric & Machinery Manufacturing Corp. | 1,029,625 | 1,527 |
| | PChome Online Inc. | 292,082 | 1,525 |
| | Prince Housing & Development Corp. | 3,182,183 | 1,518 |
| * | Mercuries Life Insurance Co. Ltd. | 4,568,230 | 1,507 |
| | Wah Lee Industrial Corp. | 490,500 | 1,503 |
| | Thinking Electronic Industrial Co. Ltd. | 243,000 | 1,488 |
| | Sercomm Corp. | 644,000 | 1,476 |
| | Chang Wah Electromaterials Inc. | 1,211,000 | 1,473 |
| | AmTRAN Technology Co. Ltd. | 2,287,692 | 1,452 |
| | Federal Corp. | 1,463,505 | 1,416 |
FTSE All-World ex-US Small-Cap Index Fund
| | | Shares | Market
Value•
($000) |
| | Cub Elecparts Inc. | 228,609 | 1,408 |
| | Chong Hong Construction Co. Ltd. | 524,493 | 1,392 |
| | Hotai Finance Co. Ltd. | 438,000 | 1,391 |
| | D-Link Corp. | 1,870,407 | 1,379 |
| | YC INOX Co. Ltd. | 1,213,750 | 1,377 |
| | Chunghwa Precision Test Tech Co. Ltd. | 48,000 | 1,374 |
| | KMC Kuei Meng International Inc. | 188,000 | 1,370 |
| * | CSBC Corp. Taiwan | 1,721,956 | 1,352 |
| | Taiwan Sakura Corp. | 534,000 | 1,345 |
| | Kindom Development Co. Ltd. | 966,900 | 1,335 |
| | AcBel Polytech Inc. | 1,060,000 | 1,321 |
| | AURAS Technology Co. Ltd. | 228,000 | 1,311 |
| | Nan Pao Resins Chemical Co. Ltd. | 260,000 | 1,302 |
| | Ginko International Co. Ltd. | 178,710 | 1,297 |
| | Sonix Technology Co. Ltd. | 418,000 | 1,293 |
| | Fittech Co. Ltd. | 170,647 | 1,292 |
| | TaiDoc Technology Corp. | 205,000 | 1,290 |
| | Taiwan Cogeneration Corp. | 936,903 | 1,289 |
| | Hannstar Board Corp. | 849,438 | 1,276 |
| | Kaimei Electronic Corp. | 407,000 | 1,275 |
| | Sunny Friend Environmental Technology Co. Ltd. | 175,000 | 1,255 |
| | Vivotek Inc. | 466,699 | 1,242 |
| | Systex Corp. | 395,000 | 1,226 |
| * | Phihong Technology Co. Ltd. | 924,618 | 1,226 |
| | Chicony Power Technology Co. Ltd. | 488,000 | 1,225 |
| | Dynapack International Technology Corp. | 353,299 | 1,222 |
| | Taiwan FamilyMart Co. Ltd. | 131,000 | 1,219 |
| | Cathay Real Estate Development Co. Ltd. | 1,729,000 | 1,213 |
| * | Orient Semiconductor Electronics Ltd. | 1,355,197 | 1,213 |
| | Chlitina Holding Ltd. | 139,750 | 1,200 |
| | Mercuries & Associates Holding Ltd. | 1,430,612 | 1,192 |
| | Taiwan PCB Techvest Co. Ltd. | 704,102 | 1,189 |
| | BES Engineering Corp. | 3,657,468 | 1,157 |
| * | Lealea Enterprise Co. Ltd. | 2,773,849 | 1,154 |
| | | Shares | Market
Value•
($000) |
| | Unizyx Holding Corp. | 1,020,000 | 1,146 |
| | Hu Lane Associate Inc. | 231,500 | 1,121 |
| | Innodisk Corp. | 161,140 | 1,114 |
| | Dimerco Express Corp. | 358,792 | 1,113 |
| | Chun Yuan Steel Industry Co. Ltd. | 1,358,000 | 1,110 |
| | CMC Magnetics Corp. | 3,485,254 | 1,107 |
| | CyberTAN Technology Inc. | 1,157,571 | 1,104 |
| * | Lingsen Precision Industries Ltd. | 1,209,000 | 1,099 |
| | Sincere Navigation Corp. | 1,094,970 | 1,094 |
| * | Chung Hwa Pulp Corp. | 1,328,135 | 1,063 |
| | Shin Foong Specialty & Applied Materials Co. Ltd. | 162,469 | 1,061 |
| | Fulgent Sun International Holding Co. Ltd. | 284,270 | 1,054 |
| | Formosa Sumco Technology Corp. | 184,000 | 1,046 |
| | Continental Holdings Corp. | 1,149,000 | 1,042 |
| | Elite Advanced Laser Corp. | 517,607 | 1,040 |
| | Everlight Chemical Industrial Corp. | 1,121,649 | 1,034 |
| | Test Research Inc. | 504,371 | 1,015 |
| | Lotus Pharmaceutical Co. Ltd. | 299,000 | 1,011 |
| | Wowprime Corp. | 194,761 | 1,011 |
| | Career Technology MFG. Co. Ltd. | 1,105,584 | 997 |
| | Speed Tech Corp. | 325,000 | 994 |
| | First Steamship Co. Ltd. | 2,141,850 | 988 |
| | Gloria Material Technology Corp. | 1,279,023 | 977 |
| | Chin-Poon Industrial Co. Ltd. | 907,072 | 977 |
| | Sinyi Realty Inc. | 806,465 | 966 |
| | Aten International Co. Ltd. | 315,260 | 957 |
| | Kuo Yang Construction Co. Ltd. | 1,099,000 | 949 |
| | Sampo Corp. | 884,048 | 942 |
| | Lung Yen Life Service Corp. | 581,000 | 940 |
| | Taiwan Styrene Monomer | 1,435,579 | 938 |
| | Tyntek Corp. | 990,250 | 935 |
| | Swancor Holding Co. Ltd. | 263,000 | 934 |
| | Adlink Technology Inc. | 387,127 | 934 |
| | Darfon Electronics Corp. | 620,000 | 932 |
| | Formosa International Hotels Corp. | 173,841 | 930 |
FTSE All-World ex-US Small-Cap Index Fund
| | | Shares | Market
Value•
($000) |
| | Ennoconn Corp. | 139,011 | 922 |
| | Ton Yi Industrial Corp. | 1,950,000 | 914 |
| | Chia Hsin Cement Corp. | 1,255,000 | 912 |
| | Acter Group Corp. Ltd. | 134,481 | 898 |
| | Advanced International Multitech Co. Ltd. | 314,000 | 894 |
| | Wei Chuan Foods Corp. | 1,083,835 | 891 |
| | YungShin Global Holding Corp. | 567,647 | 889 |
| | Xxentria Technology Materials Corp. | 362,776 | 882 |
| | Ho Tung Chemical Corp. | 2,351,362 | 881 |
| | Hung Sheng Construction Ltd. | 1,004,620 | 872 |
| * | Shining Building Business Co. Ltd. | 2,176,675 | 869 |
| | Soft-World International Corp. | 268,520 | 868 |
| | Radium Life Tech Co. Ltd. | 2,284,910 | 865 |
| | Flytech Technology Co. Ltd. | 327,845 | 859 |
| | Rexon Industrial Corp. Ltd. | 355,000 | 855 |
| | Topkey Corp. | 182,000 | 848 |
| | Kinik Co. | 310,000 | 843 |
| | Kung Long Batteries Industrial Co. Ltd. | 166,000 | 842 |
| | Motech Industries Inc. | 728,339 | 842 |
| * | Ambassador Hotel | 758,000 | 826 |
| | Egis Technology Inc. | 173,000 | 824 |
| 1 | China Metal Products | 711,515 | 819 |
| | Bioteque Corp. | 207,000 | 816 |
| | Chief Telecom Inc. | 79,000 | 811 |
| | Namchow Holdings Co. Ltd. | 463,000 | 805 |
| | Test Rite International Co. Ltd. | 919,725 | 801 |
| * | Li Peng Enterprise Co. Ltd. | 2,107,915 | 787 |
| | Altek Corp. | 574,250 | 778 |
| | Gemtek Technology Corp. | 787,115 | 776 |
| * | Gigastorage Corp. | 834,627 | 752 |
| | Zeng Hsing Industrial Co. Ltd. | 136,000 | 746 |
| | Machvision Inc. | 88,157 | 745 |
| | Depo Auto Parts Ind Co. Ltd. | 365,313 | 739 |
| | Syncmold Enterprise Corp. | 287,750 | 731 |
| | Sunonwealth Electric Machine Industry Co. Ltd. | 526,000 | 729 |
| | Firich Enterprises Co. Ltd. | 601,878 | 696 |
| | Gamania Digital Entertainment Co. Ltd. | 334,000 | 694 |
| | | Shares | Market
Value•
($000) |
| | Dyaco International Inc. | 293,000 | 685 |
| | Taiflex Scientific Co. Ltd. | 391,594 | 672 |
| * | Medigen Biotechnology Corp. | 341,680 | 670 |
| * | Ritek Corp. | 1,890,048 | 666 |
| | Formosan Rubber Group Inc. | 809,089 | 657 |
| | ScinoPharm Taiwan Ltd. | 730,891 | 652 |
| * | AGV Products Corp. | 1,780,425 | 651 |
| | China Chemical & Pharmaceutical Co. Ltd. | 818,000 | 650 |
| | Savior Lifetec Corp. | 865,728 | 637 |
| * | Taigen Biopharmaceuticals Holdings Ltd. | 1,088,723 | 627 |
| | TA-I Technology Co. Ltd. | 270,500 | 619 |
| | HannsTouch Solution Inc. | 1,417,329 | 607 |
| | Taiyen Biotech Co. Ltd. | 511,877 | 607 |
| | Bank of Kaohsiung Co. Ltd. | 1,474,764 | 597 |
| | Nan Liu Enterprise Co. Ltd. | 133,000 | 589 |
| | Huang Hsiang Construction Corp. | 445,051 | 585 |
| | Nidec Chaun-Choung Technology Corp. | 97,000 | 585 |
| | Alpha Networks Inc. | 600,599 | 583 |
| | Elitegroup Computer Systems Co. Ltd. | 680,647 | 580 |
| | Johnson Health Tech Co. Ltd. | 276,283 | 580 |
| | Rich Development Co. Ltd. | 1,740,000 | 573 |
| | Dynamic Electronics Co. Ltd. | 751,004 | 568 |
| | Quanta Storage Inc. | 399,000 | 556 |
| | KEE TAI Properties Co. Ltd. | 1,167,740 | 551 |
| * | Darwin Precisions Corp. | 1,331,000 | 534 |
| | Jih Sun Financial Holdings Co. Ltd. | 1,140,000 | 533 |
| | Kuo Toong International Co. Ltd. | 683,662 | 527 |
| | Posiflex Technology Inc. | 156,822 | 514 |
| * | Roo Hsing Co. Ltd. | 1,633,000 | 496 |
| | Rechi Precision Co. Ltd. | 735,668 | 494 |
| | Gigasolar Materials Corp. | 65,600 | 479 |
| | Yeong Guan Energy Technology Group Co. Ltd. | 203,776 | 470 |
| | IEI Integration Corp. | 289,716 | 462 |
FTSE All-World ex-US Small-Cap Index Fund
| | | Shares | Market
Value•
($000) |
| | Hong Pu Real Estate Development Co. Ltd. | 587,195 | 460 |
| | PharmaEngine Inc. | 216,102 | 459 |
| | L&K Engineering Co. Ltd. | 430,000 | 452 |
| | FSP Technology Inc. | 297,428 | 434 |
| | Ichia Technologies Inc. | �� 717,000 | 419 |
| * | Brogent Technologies Inc. | 90,293 | 411 |
| | Infortrend Technology Inc. | 786,885 | 406 |
| | Sheng Yu Steel Co. Ltd. | 337,000 | 405 |
| | WUS Printed Circuit Co. Ltd. | 396,555 | 405 |
| * | ALI Corp. | 394,281 | 404 |
| | Senao International Co. Ltd. | 349,000 | 400 |
| * | Newmax Technology Co. Ltd. | 265,000 | 393 |
| | Cyberlink Corp. | 116,076 | 378 |
| | Iron Force Industrial Co. Ltd. | 149,000 | 377 |
| | Ability Enterprise Co. Ltd. | 534,099 | 376 |
| | Basso Industry Corp. | 239,000 | 370 |
| | CHC Healthcare Group | 260,727 | 345 |
| | Globe Union Industrial Corp. | 620,675 | 343 |
| | TYC Brother Industrial Co. Ltd. | 467,710 | 336 |
| * | Tong-Tai Machine & Tool Co. Ltd. | 577,429 | 333 |
| | China Electric Manufacturing Corp. | 765,980 | 318 |
| | Jess-Link Products Co. Ltd. | 246,100 | 312 |
| | GeneReach Biotechnology Corp. | 108,097 | 310 |
| * | Zinwell Corp. | 425,099 | 302 |
| * | Li Cheng Enterprise Co. Ltd. | 426,892 | 299 |
| | Toung Loong Textile Manufacturing | 216,000 | 276 |
| *,3 | Pharmally International Holding Co. Ltd. | 126,271 | 257 |
| * | Unity Opto Technology Co. Ltd. | 1,203,000 | 178 |
| * | Taiwan Land Development Corp. | 998,840 | 122 |
| | Concraft Holding Co. Ltd. | 2,997 | 6 |
| * | Pihsiang Machinery Manufacturing Co. Ltd. | 191,000 | — |
| *,3 | E Ton Solar Tech Co. Ltd. | 206,307 | — |
| *,3 | Xpec Entertainment Inc. | 125,457 | — |
| | | | 883,220 |
| | | Shares | Market
Value•
($000) |
| Thailand (1.3%) |
| 1 | KCE Electronics PCL | 3,024,900 | 7,942 |
| | Tisco Financial Group PCL | 2,130,450 | 5,928 |
| | Hana Microelectronics PCL | 2,092,346 | 5,055 |
| 1 | CPN Retail Growth Leasehold REIT | 7,746,800 | 5,004 |
| | Com7 PCL Class F | 2,106,900 | 4,565 |
| | Jasmine Broadband Internet Infrastructure Fund Class F | 13,770,863 | 4,235 |
| | Bangchak Corp. PCL | 4,865,300 | 4,031 |
| | Kiatnakin Bank PCL | 2,087,005 | 3,781 |
| 1 | Bangkok Commercial Asset Management PCL (XBKK) | 6,449,500 | 3,698 |
| | Supalai PCL | 5,133,250 | 3,621 |
| 1 | WHA Corp. PCL | 35,410,492 | 3,614 |
| 1 | Siam Global House PCL | 5,329,707 | 3,286 |
| | VGI PCL | 15,880,109 | 3,192 |
| 1 | Sri Trang Agro-Industry PCL | 3,194,623 | 3,131 |
| *,1 | Central Plaza Hotel PCL | 2,812,590 | 3,057 |
| | Thanachart Capital PCL | 2,830,795 | 3,011 |
| | Bangkok Chain Hospital PCL | 4,851,948 | 2,975 |
| 1 | Chularat Hospital PCL Class F | 24,804,360 | 2,849 |
| 1 | Gunkul Engineering PCL | 17,251,283 | 2,813 |
| 1 | Amata Corp. PCL | 4,440,997 | 2,736 |
| | Jay Mart PCL | 1,907,200 | 2,391 |
| 1 | Quality Houses PCL | 32,687,033 | 2,267 |
| | JMT Network Services PCL Class F | 1,483,300 | 2,186 |
| 1 | CH Karnchang PCL | 3,309,100 | 2,178 |
| 1 | Dohome PCL | 2,947,500 | 2,128 |
| 1 | Sino-Thai Engineering & Construction PCL | 4,608,815 | 1,921 |
| 1 | CK Power PCL | 12,116,431 | 1,850 |
| 1 | Thonburi Healthcare Group PCL | 1,758,300 | 1,790 |
| 1 | Thoresen Thai Agencies PCL | 5,030,541 | 1,763 |
| 1 | Bangkok Land PCL | 52,573,800 | 1,744 |
| | Kerry Express Thailand PCL | 1,485,500 | 1,703 |
| | Mega Lifesciences PCL | 1,186,600 | 1,668 |
| | WHA Premium Growth Freehold & Leasehold REIT Class F | 4,178,100 | 1,662 |
| 1 | Thai Vegetable Oil PCL | 1,753,800 | 1,650 |
| | Thailand Future Fund | 6,954,900 | 1,637 |
FTSE All-World ex-US Small-Cap Index Fund
| | | Shares | Market
Value•
($000) |
| | BTS Rail Mass Transit Growth Infrastructure Fund Class F | 11,578,476 | 1,599 |
| | AEON Thana Sinsap Thailand PCL | 281,300 | 1,590 |
| 1 | TTW PCL | 4,459,100 | 1,572 |
| 1 | TOA Paint Thailand PCL | 1,570,600 | 1,564 |
| | Sansiri PCL | 39,905,100 | 1,521 |
| *,1 | Star Petroleum Refining PCL | 4,615,100 | 1,459 |
| | TQM Corp. PCL | 459,500 | 1,455 |
| | AP Thailand PCL | 5,441,256 | 1,453 |
| 1 | GFPT PCL | 4,130,800 | 1,446 |
| * | STARK Corp. PCL | 10,416,600 | 1,382 |
| | TPI Polene PCL | 26,734,400 | 1,379 |
| | IMPACT Growth REIT | 2,233,600 | 1,332 |
| 1 | Jasmine International PCL | 15,223,288 | 1,314 |
| * | Major Cineplex Group PCL | 1,967,144 | 1,265 |
| | Tipco Asphalt PCL | 2,289,500 | 1,264 |
| 1 | Super Energy Corp. PCL | 40,839,200 | 1,194 |
| | North Bangkok Power Plant Block 1 Infrastructure Fund - EGAT Class F | 3,183,200 | 1,171 |
| * | BEC World PCL | 3,046,700 | 1,123 |
| 1 | Banpu Power PCL | 1,940,400 | 1,024 |
| | Tisco Financial Group PCL NDVR | 341,650 | 951 |
| | TPI Polene Power PCL | 7,082,500 | 905 |
| *,1 | Esso Thailand PCL | 3,697,900 | 885 |
| *,1 | U City PCL Class F | 15,504,548 | 837 |
| 1 | Plan B Media Pcl Class F | 4,055,600 | 785 |
| | Pruksa Holding PCL | 1,886,100 | 784 |
| | Thaifoods Group PCL Class F | 5,717,000 | 755 |
| 1 | MK Restaurants Group PCL | 455,600 | 753 |
| * | Bangkok Airways PCL | 2,143,300 | 750 |
| * | Central Plaza Hotel PCL NVDR | 670,400 | 729 |
| 1 | BCPG PCL | 1,747,937 | 691 |
| *,1 | Italian-Thai Development PCL | 9,726,110 | 687 |
| 1 | Precious Shipping PCL | 1,234,000 | 676 |
| 1 | Ratchthani Leasing PCL | 5,370,050 | 664 |
| 1 | PTG Energy PCL | 1,382,207 | 651 |
| 1 | Thaicom PCL | 1,932,040 | 635 |
| | SPCG PCL | 1,165,100 | 625 |
| 1 | Origin Property PCL Class F | 1,682,650 | 573 |
| | AP Thailand PCL NVDR | 2,127,300 | 568 |
| 1 | Workpoint Entertainment PCL | 813,700 | 555 |
| * | MBK PCL | 1,276,176 | 539 |
| | | Shares | Market
Value•
($000) |
| 1 | LPN Development PCL | 2,868,111 | 431 |
| 1 | Precious Shipping pcl NVDR | 686,000 | 376 |
| | Supalai pcl NVDR | 518,650 | 366 |
| 1 | VGI PCL NVDR | 1,808,900 | 364 |
| * | Unique Engineering & Construction PCL | 1,703,000 | 344 |
| * | Pruksa Real Estate PCL | 1,063,290 | 332 |
| | Univentures PCL | 2,493,288 | 306 |
| * | Thai Airways International PCL | 3,045,000 | 305 |
| *,1 | Samart Corp. PCL | 1,593,721 | 302 |
| | Sino-Thai Engineering & Construction PCL NVDR | 423,000 | 176 |
| 1 | TTW PCL NVDR | 490,400 | 173 |
| *,1 | Italian-Thai Development PCL NVDR | 2,448,500 | 173 |
| 1 | Taokaenoi Food & Marketing PCL Class F | 152,400 | 30 |
| * | Mbk W3 Warrants Exp. 10/22/27 | 51,047 | 17 |
| | | | 151,862 |
| Turkey (0.3%) |
| * | Kardemir Karabuk Demir Celik Sanayi ve Ticaret A/S Class D | 4,320,358 | 3,373 |
| * | Oyak Cimento Fabrikalari A/S | 2,818,954 | 2,027 |
| | Aksa Akrilik Kimya Sanayii A/S | 791,274 | 1,944 |
| | Ulker Biskuvi Sanayi A/S | 864,047 | 1,815 |
| | Sok Marketler Ticaret A/S | 1,379,273 | 1,598 |
| | Sarkuysan Elektrolitik Bakir Sanayi ve Ticaret A/S | 687,162 | 1,320 |
| * | Aksa Enerji Uretim A/S Class B | 1,620,370 | 1,280 |
| | Emlak Konut Gayrimenkul Yatirim Ortakligi A/S | 6,006,869 | 1,235 |
| | AG Anadolu Grubu Holding A/S | 391,804 | 1,122 |
| * | Hektas Ticaret TAS | 1,195,242 | 1,103 |
| 2 | Mavi Giyim Sanayi Ve Ticaret A/S Class B | 126,355 | 947 |
| | Borusan Yatirim ve Pazarlama A/S | 26,048 | 944 |
| | Nuh Cimento Sanayi A/S | 200,738 | 910 |
| * | Migros Ticaret A/S | 242,388 | 890 |
| * | Koza Anadolu Metal Madencilik Isletmeleri A/S | 493,714 | 861 |
| * | Pegasus Hava Tasimaciligi A/S | 101,209 | 842 |
FTSE All-World ex-US Small-Cap Index Fund
| | | Shares | Market
Value•
($000) |
| | Logo Yazilim Sanayi Ve Ticaret A/S | 182,908 | 812 |
| | Otokar Otomotiv Ve Savunma Sanayi A/S | 21,473 | 758 |
| | Dogan Sirketler Grubu Holding A/S | 2,527,597 | 705 |
| * | Bera Holding A/S | 691,364 | 685 |
| | Turk Traktor ve Ziraat Makineleri A/S | 37,913 | 652 |
| | Is Yatirim Menkul Degerler A/S | 374,049 | 622 |
| *,2 | MLP Saglik Hizmetleri A/S | 211,529 | 598 |
| | Kervan Gida Sanayi Ve Ticaret A/S | 488,253 | 590 |
| * | Sekerbank Turk A/S | 5,206,912 | 545 |
| * | Kardemir Karabuk Demir Celik Sanayi ve Ticaret A/S Class A | 802,234 | 541 |
| | Vestel Elektronik Sanayi ve Ticaret A/S | 201,985 | 537 |
| | Aygaz A/S | 237,706 | 451 |
| * | Kordsa Teknik Tekstil A/S | 156,422 | 449 |
| * | Cimsa Cimento Sanayi VE Ticaret A/S | 132,732 | 432 |
| | Tekfen Holding A/S | 270,599 | 425 |
| | Yatas Yatak ve Yorgan Sanayi ve Ticaret A/S | 302,098 | 420 |
| | Turkiye Sinai Kalkinma Bankasi A/S | 3,071,532 | 415 |
| | EGE Endustri VE Ticaret A/S | 3,085 | 414 |
| * | Ipek Dogal Enerji Kaynaklari Arastirma Ve Uretim A/S | 260,690 | 371 |
| | Alarko Holding A/S | 345,507 | 342 |
| | Dogus Otomotiv Servis ve Ticaret A/S | 89,568 | 336 |
| | Kartonsan Karton Sanayi ve Ticaret A/S | 59,898 | 328 |
| * | Is Gayrimenkul Yatirim Ortakligi A/S | 1,581,653 | 315 |
| | Tat Gida Sanayi A/S | 277,238 | 277 |
| | EIS Eczacibasi Ilac ve Sinai ve Finansal Yatirimlar Sanayi ve Ticaret A/S | 429,215 | 269 |
| | Brisa Bridgestone Sabanci Sanayi ve Ticaret A/S | 107,400 | 262 |
| * | Is Finansal Kiralama A/S | 769,793 | 246 |
| * | Konya Cimento Sanayii A/S | 2,641 | 231 |
| | Akcansa Cimento A/S | 140,513 | 230 |
| | Aksigorta A/S | 311,939 | 228 |
| | | Shares | Market
Value•
($000) |
| * | Zorlu Enerji Elektrik Uretim A/S | 1,336,547 | 227 |
| * | NET Holding A/S | 398,600 | 178 |
| * | Torunlar Gayrimenkul Yatirim Ortakligi A/S | 410,590 | 165 |
| | Polisan Holding A/S | 494,343 | 142 |
| * | Albaraka Turk Katilim Bankasi A/S | 327,185 | 60 |
| *,3 | Asya Katilim Bankasi A/S | 975,452 | — |
| | | | 36,469 |
| United Arab Emirates (0.0%) |
| | GFH Financial Group BSC | 9,407,510 | 2,168 |
| * | RAK Properties PJSC | 2,080,530 | 416 |
| * | Union Properties PJSC | 5,560,733 | 398 |
| *,3 | Arabtec Holding PJSC | 2,033,180 | 293 |
| *,3 | Drake & Scull International PJSC | 1,238,097 | 125 |
| | | | 3,400 |
| United Kingdom (9.9%) |
| | Spectris plc | 422,981 | 21,763 |
| | Tritax Big Box REIT plc | 6,742,418 | 20,749 |
| | Future plc | 414,157 | 19,980 |
| * | S4 Capital plc | 1,855,988 | 18,432 |
| | Genus plc | 239,558 | 18,166 |
| * | Marks & Spencer Group plc | 7,180,285 | 18,049 |
| | Diploma plc | 435,213 | 17,886 |
| | UNITE Group plc | 1,170,562 | 17,477 |
| | Man Group plc | 5,252,377 | 16,683 |
| | Games Workshop Group plc | 119,859 | 15,831 |
| | Inchcape plc | 1,361,638 | 15,368 |
| | Greggs plc | 365,906 | 15,294 |
| | Endeavour Mining plc | 600,489 | 15,200 |
| | Rotork plc | 3,075,034 | 14,865 |
| | Grafton Group plc | 785,355 | 14,425 |
| | IG Group Holdings plc | 1,302,225 | 14,130 |
| | Vistry Group plc | 787,833 | 13,193 |
| | Hays plc | 5,689,541 | 12,894 |
| *,2 | Watches of Switzerland Group plc | 810,360 | 12,583 |
| | Safestore Holdings plc | 754,776 | 12,408 |
| * | Virgin Money UK plc | 4,439,888 | 12,335 |
| | Softcat plc | 453,042 | 12,041 |
| | Big Yellow Group plc | 594,325 | 12,017 |
| | Britvic plc | 979,905 | 11,896 |
| *,2 | Countryside Properties plc | 1,842,794 | 11,862 |
| | LondonMetric Property plc | 3,246,389 | 11,611 |
| * | Beazley plc | 2,178,805 | 11,589 |
| | Pets at Home Group plc | 1,744,780 | 11,514 |
| | Grainger plc | 2,684,451 | 11,290 |
FTSE All-World ex-US Small-Cap Index Fund
| | | Shares | Market
Value•
($000) |
| | Ultra Electronics Holdings plc | 254,509 | 11,278 |
| * | IWG plc | 2,598,374 | 11,021 |
| * | Carnival plc | 545,293 | 11,007 |
| | Drax Group plc | 1,459,930 | 10,618 |
| * | Playtech plc | 1,094,596 | 10,414 |
| | Pagegroup plc | 1,143,893 | 10,379 |
| | Investec plc | 2,285,551 | 10,351 |
| * | SSP Group plc | 2,862,382 | 10,084 |
| | Close Brothers Group plc | 511,725 | 10,080 |
| | Primary Health Properties plc | 4,795,868 | 10,073 |
| * | WH Smith plc | 461,178 | 9,872 |
| | Assura plc | 9,646,487 | 9,618 |
| | OSB Group plc | 1,379,813 | 9,518 |
| | Savills plc | 487,059 | 9,473 |
| | Computacenter plc | 257,554 | 9,469 |
| | Victrex plc | 301,597 | 9,431 |
| *,2 | Wizz Air Holdings plc | 148,841 | 9,413 |
| | Great Portland Estates plc | 929,274 | 9,292 |
| | Domino's Pizza Group plc | 1,719,512 | 9,109 |
| | Cranswick plc | 190,313 | 8,995 |
| * | Indivior plc | 2,679,108 | 8,942 |
| | Spirent Communications plc | 2,217,223 | 8,706 |
| | Synthomer plc | 1,222,576 | 8,473 |
| * | Ascential plc | 1,496,850 | 8,266 |
| | Shaftesbury plc | 950,800 | 8,115 |
| | Balfour Beatty plc | 2,314,736 | 8,048 |
| | QinetiQ Group plc | 2,058,464 | 7,596 |
| *,2 | Network International Holdings plc | 1,707,228 | 7,531 |
| | IntegraFin Holdings plc | 960,567 | 7,514 |
| | Hill & Smith Holdings plc | 290,849 | 7,299 |
| | Genuit Group plc | 800,936 | 7,267 |
| | Redrow plc | 823,969 | 7,255 |
| *,2 | Trainline plc | 1,668,088 | 7,247 |
| | Dunelm Group plc | 412,601 | 7,234 |
| | Bodycote plc | 659,099 | 7,219 |
| | Serco Group plc | 4,176,218 | 7,214 |
| | Marshalls plc | 727,951 | 7,051 |
| * | John Wood Group plc | 2,414,843 | 7,042 |
| | Paragon Banking Group plc | 929,877 | 6,971 |
| 1 | Hammerson plc | 15,115,186 | 6,637 |
| * | Mediclinic International plc | 1,434,914 | 6,565 |
| | Sanne Group plc | 525,388 | 6,495 |
| | Plus500 Ltd. | 360,071 | 6,482 |
| | Sirius Real Estate Ltd. | 3,508,195 | 6,480 |
| | Liontrust Asset Management plc | 206,924 | 6,169 |
| | Oxford Instruments plc | 194,864 | 6,131 |
| *,1 | National Express Group plc | 1,947,551 | 6,094 |
| | Currys plc | 3,656,729 | 6,080 |
| | | Shares | Market
Value•
($000) |
| | Lancashire Holdings Ltd. | 879,488 | 6,070 |
| | Capital & Counties Properties plc | 2,690,193 | 6,068 |
| * | Frasers Group plc | 687,958 | 6,064 |
| * | Firstgroup plc | 4,366,935 | 6,004 |
| | AJ Bell plc | 1,061,699 | 5,951 |
| | TP ICAP Group plc | 2,798,424 | 5,943 |
| | IP Group plc | 3,541,704 | 5,845 |
| * | Helios Towers plc | 2,744,658 | 5,802 |
| | Micro Focus International plc | 1,177,780 | 5,772 |
| 2 | Airtel Africa plc | 3,731,449 | 5,594 |
| | Rathbone Brothers plc | 207,553 | 5,580 |
| | Euromoney Institutional Investor plc | 389,449 | 5,570 |
| | Moneysupermarket.com Group plc | 1,910,880 | 5,548 |
| | Kainos Group plc | 204,149 | 5,532 |
| | Workspace Group plc | 490,038 | 5,509 |
| | Brewin Dolphin Holdings plc | 1,068,203 | 5,505 |
| | Jupiter Fund Management plc | 1,593,613 | 5,458 |
| *,2 | Aston Martin Lagonda Global Holdings plc | 231,304 | 5,399 |
| * | Auction Technology Group plc | 271,177 | 5,255 |
| | FDM Group Holdings plc | 313,239 | 5,147 |
| | 888 Holdings plc | 978,451 | 5,124 |
| * | C&C Group plc | 1,440,080 | 5,097 |
| * | Energean plc | 413,893 | 5,086 |
| | Centamin plc | 3,974,720 | 5,078 |
| | Clarkson plc | 90,768 | 4,974 |
| | Rhi Magnesita NV | 107,438 | 4,937 |
| | Morgan Advanced Materials plc | 1,036,944 | 4,902 |
| | Vesuvius plc | 759,372 | 4,896 |
| | Redde Northgate plc | 897,866 | 4,885 |
| * | Provident Financial plc | 937,914 | 4,738 |
| * | Just Group plc | 3,732,294 | 4,670 |
| | Coats Group plc | 5,263,963 | 4,645 |
| | Ferrexpo plc | 1,069,301 | 4,562 |
| | Cairn Energy plc | 1,802,373 | 4,500 |
| | Morgan Sindall Group plc | 145,248 | 4,500 |
| * | Oxford Biomedica plc | 215,706 | 4,474 |
| * | Mitie Group plc | 4,947,833 | 4,446 |
| | Essentra plc | 1,095,497 | 4,363 |
| | Crest Nicholson Holdings plc | 890,443 | 4,346 |
| *,2 | Biffa plc | 773,521 | 4,230 |
| * | J D Wetherspoon plc | 295,896 | 4,153 |
| | Chemring Group plc | 1,028,457 | 4,101 |
| * | Babcock International Group plc | 931,238 | 4,067 |
| * | Elementis plc | 2,104,714 | 4,013 |
| | Telecom Plus plc | 231,794 | 3,959 |
| * | Capita plc | 6,092,808 | 3,955 |
FTSE All-World ex-US Small-Cap Index Fund
| | | Shares | Market
Value•
($000) |
| 2 | Ibstock plc | 1,417,398 | 3,871 |
| | Premier Foods plc | 2,501,847 | 3,755 |
| | XP Power Ltd. | 51,562 | 3,703 |
| * | Harbour Energy plc | 759,074 | 3,633 |
| *,1 | Petropavlovsk plc | 11,141,598 | 3,610 |
| | Hilton Food Group plc | 218,619 | 3,497 |
| | NCC Group plc | 1,025,711 | 3,487 |
| * | Bytes Technology Group plc (XLON) | 474,787 | 3,474 |
| * | Senior plc | 1,534,591 | 3,369 |
| 2 | TI Fluid Systems plc Class B | 925,561 | 3,354 |
| * | Greencore Group plc | 1,894,022 | 3,349 |
| *,2 | Spire Healthcare Group plc | 1,035,014 | 3,338 |
| * | Mitchells & Butlers plc | 953,864 | 3,308 |
| | Keller Group plc | 261,688 | 3,295 |
| * | Restaurant Group plc | 2,680,728 | 3,233 |
| *,1 | Cineworld Group plc | 3,716,662 | 3,112 |
| *,2 | Equiniti Group plc | 1,183,232 | 2,889 |
| *,2 | Trustpilot Group plc | 656,471 | 2,836 |
| | UK Commercial Property REIT Ltd. | 2,692,817 | 2,796 |
| | TBC Bank Group plc | 129,774 | 2,784 |
| | Avon Protection plc | 104,099 | 2,766 |
| | BMO Commercial Property Trust Ltd. | 1,922,524 | 2,691 |
| | Halfords Group plc | 728,265 | 2,654 |
| | Picton Property Income Ltd. | 1,990,107 | 2,641 |
| | Bank of Georgia Group plc | 126,098 | 2,617 |
| * | Moonpig Group plc | 560,374 | 2,562 |
| * | PureTech Health plc | 529,444 | 2,552 |
| * | Marston's plc | 2,320,355 | 2,522 |
| | Helical plc | 370,192 | 2,333 |
| * | AO World plc | 1,052,141 | 2,110 |
| | PZ Cussons plc | 691,961 | 2,033 |
| | AG Barr plc | 298,880 | 2,027 |
| | Hochschild Mining plc | 1,001,062 | 1,952 |
| | Devro plc | 592,846 | 1,748 |
| * | Go-Ahead Group plc | 156,012 | 1,680 |
| * | Rank Group plc | 742,500 | 1,669 |
| | CLS Holdings plc | 530,218 | 1,622 |
| 2 | ContourGlobal plc | 589,764 | 1,605 |
| * | Stagecoach Group plc | 1,465,204 | 1,598 |
| 2 | Vivo Energy plc | 1,056,381 | 1,528 |
| 2 | CMC Markets plc | 403,048 | 1,385 |
| | | Shares | Market
Value•
($000) |
| *,2 | Funding Circle Holdings plc | 544,948 | 1,170 |
| 2 | Bakkavor Group plc | 508,606 | 877 |
| * | SIG plc | 942,721 | 670 |
| *,1 | Tullow Oil plc | 832,019 | 523 |
| *,1 | Petrofac Ltd. (XLON) | 257,114 | 455 |
| 2 | Alfa Financial Software Holdings plc | 131,145 | 345 |
| *,2,3 | Finablr plc | 496,892 | 75 |
| | Hunting plc | 20,010 | 46 |
| *,1 | Intu Properties plc | 2,727,625 | — |
| * | Carillion plc | 961,048 | — |
| | | | 1,180,615 |
Total Common Stocks
(Cost $10,006,351) | 11,731,550 |
| Temporary Cash Investments (5.3%) |
| Money Market Fund (5.3%) |
| 4,5 | Vanguard Market Liquidity Fund, 0.070% (Cost $634,139) | 6,341,577 | 634,158 |
| Total Investments (103.7%) (Cost $10,640,490) | 12,365,708 |
| Other Assets and Liabilities—Net (-3.7%) | (444,976) |
| Net Assets (100%) | 11,920,732 |
| Cost is in $000. |
| • | See Note A in Notes to Financial Statements. |
| * | Non-income-producing security. |
| 1 | Includes partial security positions on loan to broker-dealers. The total value of securities on loan is $470,274,000. |
| 2 | Security exempt from registration under Rule 144A of the Securities Act of 1933. Such securities may be sold in transactions exempt from registration, normally to qualified institutional buyers. At October 31, 2021, the aggregate value was $535,224,000, representing 4.5% of net assets. |
| 3 | Security value determined using significant unobservable inputs. |
| 4 | Affiliated money market fund available only to Vanguard funds and certain trusts and accounts managed by Vanguard. Rate shown is the 7-day yield. |
| 5 | Collateral of $509,876,000 was received for securities on loan, of which $501,353,000 is held in Vanguard Market Liquidity Fund and $8,523,000 is held in cash. |
| | ADR—American Depositary Receipt. |
| | GDR—Global Depositary Receipt. |
| | NVDR—Non-Voting Depository Receipt. |
| | REIT—Real Estate Investment Trust. |
FTSE All-World ex-US Small-Cap Index Fund
Derivative Financial Instruments Outstanding as of Period End
| Futures Contracts |
| | | | ($000) |
| | Expiration | Number of
Long (Short)
Contracts | Notional
Amount | Value and
Unrealized
Appreciation
(Depreciation) |
| Long Futures Contracts | | | | |
| E-mini Russell 2000 Index | December 2021 | 584 | 67,023 | 1,231 |
| E-mini S&P 500 Index | December 2021 | 74 | 17,009 | 503 |
| MSCI EAFE Index | December 2021 | 407 | 47,611 | (457) |
| MSCI Emerging Markets Index | December 2021 | 754 | 47,577 | (1,353) |
| S&P TSX 60 Index | December 2021 | 32 | 6,518 | 187 |
| | | | | 111 |
| Forward Currency Contracts |
| | Contract
Settlement
Date | Contract Amount (000) | Unrealized
Appreciation
($000) | Unrealized
Depreciation
($000) |
| Counterparty | Receive | Deliver |
| Toronto-Dominion Bank | 12/15/21 | CAD | 2,639 | USD | 2,096 | 37 | — |
| UBS AG | 12/15/21 | EUR | 11,610 | USD | 13,610 | — | (174) |
| Morgan Stanley Capital Services Inc. | 12/15/21 | GBP | 6,010 | USD | 8,274 | — | (47) |
| Morgan Stanley Capital Services Inc. | 12/15/21 | INR | 512,088 | USD | 6,910 | — | (107) |
| JPMorgan Chase Bank, N.A. | 12/15/21 | USD | 1,274 | CHF | 1,166 | — | (1) |
| Bank of Montreal | 12/15/21 | USD | 13,765 | EUR | 11,610 | 329 | — |
| Morgan Stanley Capital Services Inc. | 12/15/21 | USD | 11,718 | EUR | 9,849 | 319 | — |
| JPMorgan Chase Bank, N.A. | 12/15/21 | USD | 12,946 | GBP | 9,371 | 119 | — |
| State Street Bank & Trust Co. | 12/15/21 | USD | 6,449 | GBP | 4,786 | — | (102) |
| Bank of Montreal | 12/15/21 | USD | 5,946 | JPY | 653,120 | 213 | — |
| | | | | | | 1,017 | (431) |
| CAD—Canadian dollar. |
| CHF—Swiss franc. |
| EUR—euro. |
| GBP—British pound. |
| INR—Indian rupee. |
| JPY—Japanese yen. |
| USD—U.S. dollar. |
At October 31, 2021, the counterparties had deposited in segregated accounts securities with a value of $550,000 in connection with open forward currency contracts.
See accompanying Notes, which are an integral part of the Financial Statements.
FTSE All-World ex-US Small-Cap Index Fund
Statement of Assets and Liabilities
|
| ($000s, except shares and per-share amounts) | Amount |
| Assets | |
| Investments in Securities, at Value | |
| Unaffiliated Issuers (Cost $10,006,351) | 11,731,550 |
| Affiliated Issuers (Cost $634,139) | 634,158 |
| Total Investments in Securities | 12,365,708 |
| Investment in Vanguard | 394 |
| Cash | 54,417 |
| Cash Collateral Pledged—Futures Contracts | 10,333 |
| Foreign Currency, at Value (Cost $26,623) | 26,494 |
| Receivables for Investment Securities Sold | 4,517 |
| Receivables for Accrued Income | 26,619 |
| Receivables for Capital Shares Issued | 1,331 |
| Unrealized Appreciation—Forward Currency Contracts | 1,017 |
| Total Assets | 12,490,830 |
| Liabilities | |
| Payables for Investment Securities Purchased | 45,729 |
| Collateral for Securities on Loan | 509,876 |
| Payables for Capital Shares Redeemed | 337 |
| Variation Margin Payable—Futures Contracts | 959 |
| Unrealized Depreciation—Forward Currency Contracts | 431 |
| Deferred Foreign Capital Gains Taxes | 12,766 |
| Total Liabilities | 570,098 |
| Net Assets | 11,920,732 |
FTSE All-World ex-US Small-Cap Index Fund
Statement of Assets and Liabilities (continued)
|
| At October 31, 2021, net assets consisted of: | |
| ($000s, except shares and per-share amounts) | Amount |
| Paid-in Capital | 10,251,211 |
| Total Distributable Earnings (Loss) | 1,669,521 |
| Net Assets | 11,920,732 |
| |
| ETF Shares—Net Assets | |
Applicable to 72,226,412 outstanding $.001 par value shares of
beneficial interest (unlimited authorization) | 9,940,713 |
| Net Asset Value Per Share—ETF Shares | $137.63 |
| |
| Admiral Shares—Net Assets | |
Applicable to 46,650,233 outstanding $.001 par value shares of
beneficial interest (unlimited authorization) | 1,584,991 |
| Net Asset Value Per Share—Admiral Shares | $33.98 |
| |
| Institutional Shares—Net Assets | |
Applicable to 1,502,060 outstanding $.001 par value shares of
beneficial interest (unlimited authorization) | 395,028 |
| Net Asset Value Per Share—Institutional Shares | $262.99 |
See accompanying Notes, which are an integral part of the Financial Statements.
FTSE All-World ex-US Small-Cap Index Fund
|
| | Year Ended
October 31, 2021 |
| | ($000) |
| Investment Income | |
| Income | |
| Dividends1 | 207,906 |
| Interest2 | 48 |
| Securities Lending—Net | 9,243 |
| Total Income | 217,197 |
| Expenses | |
| The Vanguard Group—Note B | |
| Investment Advisory Services | 1,510 |
| Management and Administrative—ETF Shares | 2,624 |
| Management and Administrative—Admiral Shares | 1,827 |
| Management and Administrative—Institutional Shares | 274 |
| Marketing and Distribution—ETF Shares | 237 |
| Marketing and Distribution—Admiral Shares | 53 |
| Marketing and Distribution—Institutional Shares | 10 |
| Custodian Fees | 1,471 |
| Auditing Fees | 44 |
| Shareholders’ Reports—ETF Shares | 421 |
| Shareholders’ Reports—Admiral Shares | 24 |
| Shareholders’ Reports—Institutional Shares | — |
| Trustees’ Fees and Expenses | 3 |
| Total Expenses | 8,498 |
| Net Investment Income | 208,699 |
| Realized Net Gain (Loss) | |
| Investment Securities Sold2,3,4 | 268,727 |
| Futures Contracts | 15,319 |
| Swap Contracts | 154 |
| Forward Currency Contracts | 584 |
| Foreign Currencies | (766) |
| Realized Net Gain (Loss) | 284,018 |
FTSE All-World ex-US Small-Cap Index Fund
| Statement of Operations (continued) |
| | Year Ended
October 31, 2021 |
| | ($000) |
| Change in Unrealized Appreciation (Depreciation) | |
| Investment Securities2,5 | 2,056,068 |
| Futures Contracts | 1,738 |
| Swap Contracts | (31) |
| Forward Currency Contracts | 535 |
| Foreign Currencies | (604) |
| Change in Unrealized Appreciation (Depreciation) | 2,057,706 |
| Net Increase (Decrease) in Net Assets Resulting from Operations | 2,550,423 |
| 1 | Dividends are net of foreign withholding taxes of $26,910,000. |
| 2 | Interest income, realized net gain (loss), and change in unrealized appreciation (depreciation) from an affiliated company of the fund were $44,000, less than $1,000, and $1,000, respectively. Purchases and sales are for temporary cash investment purposes. |
| 3 | Realized gain (loss) is net of foreign capital gain taxes of $3,767,000. |
| 4 | Includes $4,553,000 of net gain (loss) resulting from in-kind redemptions. |
| 5 | The change in unrealized appreciation (depreciation) is net of the change in deferred foreign capital gains taxes of $12,766,000. |
See accompanying Notes, which are an integral part of the Financial Statements.
FTSE All-World ex-US Small-Cap Index Fund
Statement of Changes in Net Assets
|
| | Year Ended October 31, |
| | 2021
($000) | 2020
($000) |
| | | |
| Increase (Decrease) in Net Assets | | |
| Operations | | |
| Net Investment Income | 208,699 | 137,446 |
| Realized Net Gain (Loss) | 284,018 | (4,013) |
| Change in Unrealized Appreciation (Depreciation) | 2,057,706 | (143,826) |
| Net Increase (Decrease) in Net Assets Resulting from Operations | 2,550,423 | (10,393) |
| Distributions | | |
| ETF Shares | (175,182) | (126,897) |
| Admiral Shares | (33,891) | (23,238) |
| Institutional Shares | (8,930) | (5,704) |
| Total Distributions | (218,003) | (155,839) |
| Capital Share Transactions | | |
| Investor Shares | — | (1,182) |
| ETF Shares | 3,273,463 | (454,913) |
| Admiral Shares | 90,043 | 160,273 |
| Institutional Shares | 42,985 | 19,153 |
| Net Increase (Decrease) from Capital Share Transactions | 3,406,491 | (276,669) |
| Total Increase (Decrease) | 5,738,911 | (442,901) |
| Net Assets | | |
| Beginning of Period | 6,181,821 | 6,624,722 |
| End of Period | 11,920,732 | 6,181,821 |
See accompanying Notes, which are an integral part of the Financial Statements.
FTSE All-World ex-US Small-Cap Index Fund
| ETF Shares | | | | | |
For a Share Outstanding
Throughout Each Period | Year Ended October 31, |
| 2021 | 2020 | 2019 | 2018 | 2017 |
| Net Asset Value, Beginning of Period | $102.74 | $105.96 | $100.93 | $116.30 | $96.34 |
| Investment Operations | | | | | |
| Net Investment Income1 | 2.770 | 2.177 | 2.871 | 3.019 | 2.650 |
| Net Realized and Unrealized Gain (Loss) on Investments | 35.250 | (2.905) | 5.156 | (15.269) | 20.140 |
| Total from Investment Operations | 38.020 | (.728) | 8.027 | (12.250) | 22.790 |
| Distributions | | | | | |
| Dividends from Net Investment Income | (3.130) | (2.492) | (2.997) | (3.120) | (2.830) |
| Distributions from Realized Capital Gains | — | — | — | — | — |
| Total Distributions | (3.130) | (2.492) | (2.997) | (3.120) | (2.830) |
| Net Asset Value, End of Period | $137.63 | $102.74 | $105.96 | $100.93 | $116.30 |
| Total Return | 37.35% | -0.81% | 8.28% | -10.87% | 24.16% |
| Ratios/Supplemental Data | | | | | |
| Net Assets, End of Period (Millions) | $9,941 | $4,814 | $5,400 | $5,009 | $4,568 |
| Ratio of Total Expenses to Average Net Assets | 0.07% | 0.11% | 0.11% | 0.12% | 0.13% |
| Ratio of Net Investment Income to Average Net Assets | 2.10% | 2.17% | 2.80% | 2.60% | 2.52% |
| Portfolio Turnover Rate2 | 17% | 22% | 17% | 15% | 14% |
| 1 | Calculated based on average shares outstanding. |
| 2 | Excludes the value of portfolio securities received or delivered as a result of in-kind purchases or redemptions of the fund’s capital shares, including ETF Creation Units. |
See accompanying Notes, which are an integral part of the Financial Statements.
FTSE All-World ex-US Small-Cap Index Fund
| Admiral Shares | | | |
For a Share Outstanding
Throughout Each Period | Year Ended October 31, | February 7,
20191 to
October 31,
2019 |
| 2021 | 2020 | |
| Net Asset Value, Beginning of Period | $25.37 | $26.16 | $25.00 |
| Investment Operations | | | |
| Net Investment Income2 | .626 | .524 | .572 |
| Net Realized and Unrealized Gain (Loss) on Investments | 8.739 | (.711) | .935 |
| Total from Investment Operations | 9.365 | (.187) | 1.507 |
| Distributions | | | |
| Dividends from Net Investment Income | (.755) | (.603) | (.347) |
| Distributions from Realized Capital Gains | — | — | — |
| Total Distributions | (.755) | (.603) | (.347) |
| Net Asset Value, End of Period | $33.98 | $25.37 | $26.16 |
| Total Return3 | 37.22% | -0.84% | 6.08% |
| Ratios/Supplemental Data | | | |
| Net Assets, End of Period (Millions) | $1,585 | $1,110 | $981 |
| Ratio of Total Expenses to Average Net Assets | 0.16% | 0.16% | 0.16%4 |
| Ratio of Net Investment Income to Average Net Assets | 1.94% | 2.12% | 3.07%4 |
| Portfolio Turnover Rate5 | 17% | 22% | 17%6 |
| 1 | Inception. |
| 2 | Calculated based on average shares outstanding. |
| 3 | Total returns do not include account service fees that may have applied in the periods shown. Fund prospectuses provide information about any applicable account service fees. |
| 4 | Annualized. |
| 5 | Excludes the value of portfolio securities received or delivered as a result of in-kind purchases or redemptions of the fund’s capital shares, including ETF Creation Units. |
| 6 | Reflects the fund’s portfolio turnover for the fiscal year ended October 31, 2019. |
See accompanying Notes, which are an integral part of the Financial Statements.
FTSE All-World ex-US Small-Cap Index Fund
| Institutional Shares | | | | | |
For a Share Outstanding
Throughout Each Period | Year Ended October 31, |
| 2021 | 2020 | 2019 | 2018 | 2017 |
| Net Asset Value, Beginning of Period | $196.33 | $202.46 | $192.87 | $222.24 | $184.07 |
| Investment Operations | | | | | |
| Net Investment Income1 | 4.974 | 4.111 | 5.500 | 5.748 | 5.044 |
| Net Realized and Unrealized Gain (Loss) on Investments | 67.622 | (5.479) | 9.824 | (29.138) | 38.536 |
| Total from Investment Operations | 72.596 | (1.368) | 15.324 | (23.390) | 43.580 |
| Distributions | | | | | |
| Dividends from Net Investment Income | (5.936) | (4.762) | (5.734) | (5.980) | (5.410) |
| Distributions from Realized Capital Gains | — | — | — | — | — |
| Total Distributions | (5.936) | (4.762) | (5.734) | (5.980) | (5.410) |
| Net Asset Value, End of Period | $262.99 | $196.33 | $202.46 | $192.87 | $222.24 |
| Total Return | 37.29% | -0.81% | 8.26% | -10.85% | 24.18% |
| Ratios/Supplemental Data | | | | | |
| Net Assets, End of Period (Millions) | $395 | $258 | $242 | $203 | $226 |
| Ratio of Total Expenses to Average Net Assets | 0.11% | 0.11% | 0.11% | 0.11% | 0.12% |
| Ratio of Net Investment Income to Average Net Assets | 1.99% | 2.13% | 2.81% | 2.61% | 2.53% |
| Portfolio Turnover Rate2 | 17% | 22% | 17% | 15% | 14% |
| 1 | Calculated based on average shares outstanding. |
| 2 | Excludes the value of portfolio securities received or delivered as a result of in-kind purchases or redemptions of the fund’s capital shares, including ETF Creation Units. |
See accompanying Notes, which are an integral part of the Financial Statements.
FTSE All-World ex-US Small-Cap Index Fund
Notes to Financial Statements
Vanguard FTSE All-World ex-US Small-Cap Index Fund is registered under the Investment Company Act of 1940 as an open-end investment company, or mutual fund. The fund offers three classes of shares: ETF Shares, Admiral Shares, and Institutional Shares. Each of the share classes has different eligibility and minimum purchase requirements, and is designed for different types of investors. ETF Shares are listed for trading on NYSE Arca; they can be purchased and sold through a broker. Prior to November 7, 2019, the fund offered Investor Shares. Effective at the close of business on November 7, 2019, the remaining Investor Shares were converted to Admiral Shares.
The fund invests in securities of foreign issuers, which may subject it to investment risks not normally associated with investing in securities of U.S. corporations. Market disruptions associated with the COVID-19 pandemic have had a global impact, and uncertainty exists as to the long-term implications. Such disruptions can adversely affect assets of the fund and thus fund performance.
| A. | The following significant accounting policies conform to generally accepted accounting principles for U.S. investment companies. The fund consistently follows such policies in preparing its financial statements. |
1. Security Valuation: Securities are valued as of the close of trading on the New York Stock Exchange (generally 4 p.m., Eastern time) on the valuation date. Equity securities are valued at the latest quoted sales prices or official closing prices taken from the primary market in which each security trades; such securities not traded on the valuation date are valued at the mean of the latest quoted bid and asked prices. Securities for which market quotations are not readily available, or whose values have been affected by events occurring before the fund’s pricing time but after the close of the securities’ primary markets, are valued at their fair values calculated according to procedures adopted by the board of trustees. These procedures include obtaining quotations from an independent pricing service, monitoring news to identify significant market- or security-specific events, and evaluating changes in the values of foreign market proxies (for example, ADRs, futures contracts, or exchange-traded funds), between the time the foreign markets close and the fund’s pricing time. When fair-value pricing is employed, the prices of securities used by a fund to calculate its net asset value may differ from quoted or published prices for the same securities.
Investments in Vanguard Market Liquidity Fund are valued at that fund's net asset value.
Temporary cash investments are valued using the latest bid prices or using valuations based on a matrix system (which considers such factors as security prices, yields, maturities, and ratings), both as furnished by independent pricing services.
2. Foreign Currency: Securities and other assets and liabilities denominated in foreign currencies are translated into U.S. dollars using exchange rates obtained from an independent third party as of the fund’s pricing time on the valuation date. Realized gains (losses) and unrealized appreciation (depreciation) on investment securities include the effects of changes in exchange rates since the securities were purchased, combined with the effects of changes in security prices. Fluctuations in the value of other assets and liabilities resulting from changes in exchange rates are recorded as unrealized foreign currency gains (losses) until the assets or liabilities are settled in cash, at which time they are recorded as realized foreign currency gains (losses).
3. Futures Contracts: The fund uses index futures contracts to a limited extent, with the objectives of maintaining full exposure to the stock market, maintaining liquidity, and minimizing transaction costs. The fund may purchase futures contracts to immediately invest incoming cash in the market, or sell futures in response to cash outflows, thereby simulating a fully invested position in the underlying index while maintaining a cash balance for liquidity. The primary risks associated with the use of futures contracts are imperfect correlation between changes in market values of stocks held by the fund and the prices of futures contracts, and the possibility of an illiquid market. Counterparty risk involving futures is mitigated because a regulated clearinghouse is the
FTSE All-World ex-US Small-Cap Index Fund
counterparty instead of the clearing broker. To further mitigate counterparty risk, the fund trades futures contracts on an exchange, monitors the financial strength of its clearing brokers and clearinghouse, and has entered into clearing agreements with its clearing brokers. The clearinghouse imposes initial margin requirements to secure the fund’s performance and requires daily settlement of variation margin representing changes in the market value of each contract. Any securities pledged as initial margin for open contracts are noted in the Schedule of Investments.
Futures contracts are valued at their quoted daily settlement prices. The notional amounts of the contracts are not recorded in the Statement of Assets and Liabilities. Fluctuations in the value of the contracts are recorded in the Statement of Assets and Liabilities as an asset (liability) and in the Statement of Operations as unrealized appreciation (depreciation) until the contracts are closed, when they are recorded as realized gains (losses) on futures contracts.
During the year ended October 31, 2021, the fund’s average investments in long and short futures contracts represented 1% and 0% of net assets, respectively, based on the average of the notional amounts at each quarter-end during the period.
4. Forward Currency Contracts: The fund enters into forward currency contracts to protect the value of securities and related receivables and payables against changes in future foreign exchange rates. The fund’s risks in using these contracts include movement in the values of the foreign currencies relative to the U.S. dollar and the ability of the counterparties to fulfill their obligations under the contracts. The fund mitigates its counterparty risk by entering into forward currency contracts only with a diverse group of prequalified counterparties, monitoring their financial strength, entering into master netting arrangements with its counterparties, and requiring its counterparties to transfer collateral as security for their performance. In the absence of a default, the collateral pledged or received by the fund cannot be repledged, resold, or rehypothecated. The master netting arrangements provide that, in the event of a counterparty’s default (including bankruptcy), the fund may terminate the forward currency contracts, determine the net amount owed by either party in accordance with its master netting arrangements, and sell or retain any collateral held up to the net amount owed to the fund under the master netting arrangements. The forward currency contracts contain provisions whereby a counterparty may terminate open contracts if the fund’s net assets decline below a certain level, triggering a payment by the fund if the fund is in a net liability position at the time of the termination. The payment amount would be reduced by any collateral the fund has pledged. Any securities pledged as collateral for open contracts are noted in the Schedule of Investments. The value of collateral received or pledged is compared daily to the value of the forward currency contracts exposure with each counterparty, and any difference, if in excess of a specified minimum transfer amount, is adjusted and settled within two business days.
Forward currency contracts are valued at their quoted daily prices obtained from an independent third party, adjusted for currency risk based on the expiration date of each contract. The notional amounts of the contracts are not recorded in the Statement of Assets and Liabilities. Fluctuations in the value of the contracts are recorded in the Statement of Assets and Liabilities as an asset (liability) and in the Statement of Operations as unrealized appreciation (depreciation) until the contracts are closed, when they are recorded as realized gains (losses) on forward currency contracts.
During the year ended October 31, 2021, the fund’s average investment in forward currency contracts represented less than 1% of net assets, based on the average of the notional amounts at each quarter-end during the period.
FTSE All-World ex-US Small-Cap Index Fund
5. Swap Contracts: The fund has entered into equity swap contracts to earn the total return on selected reference stocks in the fund’s target index. Under the terms of the swaps, the fund receives the total return on the referenced stock (i.e., receiving the increase or paying the decrease in value of the selected reference stock and receiving the equivalent of any dividends in respect of the selected referenced stock) over a specified period of time, applied to a notional amount that represents the value of a designated number of shares of the selected reference stock at the beginning of the equity swap contract. The fund also pays a floating rate that is based on short-term interest rates, applied to the notional amount. At the same time, the fund generally invests an amount approximating the notional amount of the swap in high-quality temporary cash investments.
A risk associated with all types of swaps is the possibility that a counterparty may default on its obligation to pay net amounts due to the fund. The fund’s maximum amount subject to counterparty risk is the unrealized appreciation on the swap contract. The fund mitigates its counterparty risk by entering into swaps only with a diverse group of prequalified counterparties, monitoring their financial strength, entering into master netting arrangements with its counterparties, and requiring its counterparties to transfer collateral as security for their performance. In the absence of a default, the collateral pledged or received by the fund cannot be repledged, resold, or rehypothecated. In the event of a counterparty’s default (including bankruptcy), the fund may terminate any swap contracts with that counterparty, determine the net amount owed by either party in accordance with its master netting arrangements, and sell or retain any collateral held up to the net amount owed to the fund under the master netting arrangements. The swap contracts contain provisions whereby a counterparty may terminate open contracts if the fund’s net assets decline below a certain level, triggering a payment by the fund if the fund is in a net liability position at the time of the termination. The payment amount would be reduced by any collateral the fund has pledged. Any securities pledged as collateral for open contracts are noted in the Schedule of Investments. The value of collateral received or pledged is compared daily to the value of the swap contracts exposure with each counterparty, and any difference, if in excess of a specified minimum transfer amount, is adjusted and settled within two business days.
The notional amounts of swap contracts are not recorded in the Statement of Assets and Liabilities. Swaps are valued daily based on market quotations received from independent pricing services or recognized dealers and the change in value is recorded in the Statement of Assets and Liabilities as an asset (liability) and in the Statement of Operations as unrealized appreciation (depreciation) until periodic payments are made or the termination of the swap, at which time realized gain (loss) is recorded.
During the year ended October 31, 2021, the fund’s average amounts of investments in total return swaps represented less than 1% of net assets, based on the average of notional amounts at each quarter-end during the period. The fund had no open swap contracts at October 31, 2021.
6. Federal Income Taxes: The fund intends to continue to qualify as a regulated investment company and distribute all of its taxable income. The fund’s tax returns are open to examination by the relevant tax authorities until expiration of the applicable statute of limitations, which is generally three years after the filing of the tax return. Management has analyzed the fund’s tax positions taken for all open federal and state income tax years, and has concluded that no provision for income tax is required in the fund’s financial statements.
7. Distributions: Distributions to shareholders are recorded on the ex-dividend date. Distributions are determined on a tax basis at the fiscal year-end and may differ from net investment income and realized capital gains for financial reporting purposes.
FTSE All-World ex-US Small-Cap Index Fund
8. Securities Lending: To earn additional income, the fund lends its securities to qualified institutional borrowers. Security loans are subject to termination by the fund at any time, and are required to be secured at all times by collateral in an amount at least equal to the market value of securities loaned. Daily market fluctuations could cause the value of loaned securities to be more or less than the value of the collateral received. When this occurs, the collateral is adjusted and settled before the opening of the market on the next business day. The fund further mitigates its counterparty risk by entering into securities lending transactions only with a diverse group of prequalified counterparties, monitoring their financial strength, and entering into master securities lending agreements with its counterparties. The master securities lending agreements provide that, in the event of a counterparty’s default (including bankruptcy), the fund may terminate any loans with that borrower, determine the net amount owed, and sell or retain the collateral up to the net amount owed to the fund; however, such actions may be subject to legal proceedings. While collateral mitigates counterparty risk, in the event of a default, the fund may experience delays and costs in recovering the securities loaned. The fund invests cash collateral received in Vanguard Market Liquidity Fund, and records a liability in the Statement of Assets and Liabilities for the return of the collateral, during the period the securities are on loan. Collateral investments in Vanguard Market Liquidity Fund are subject to market appreciation or depreciation. Securities lending income represents fees charged to borrowers plus income earned on invested cash collateral, less expenses associated with the loan. During the term of the loan, the fund is entitled to all distributions made on or in respect of the loaned securities.
9. Credit Facilities and Interfund Lending Program: The fund and certain other funds managed by The Vanguard Group ("Vanguard") participate in a $4.3 billion committed credit facility provided by a syndicate of lenders pursuant to a credit agreement and an uncommitted credit facility provided by Vanguard. Both facilities may be renewed annually. Each fund is individually liable for its borrowings, if any, under the credit facilities. Borrowings may be utilized for temporary or emergency purposes, subject to the fund’s regulatory and contractual borrowing restrictions. With respect to the committed credit facility, the participating funds are charged administrative fees and an annual commitment fee of 0.10% of the undrawn committed amount of the facility; these fees are allocated to the funds based on a method approved by the fund’s board of trustees and included in Management and Administrative expenses on the fund’s Statement of Operations. Any borrowings under either facility bear interest at a rate based upon the higher of the one-month London Interbank Offered Rate (or an acceptable alternate rate, if necessary), federal funds effective rate, or overnight bank funding rate plus an agreed-upon spread, except that borrowings under the uncommitted credit facility may bear interest based upon an alternate rate agreed to by the fund and Vanguard.
In accordance with an exemptive order (the “Order”) from the SEC, the fund may participate in a joint lending and borrowing program that allows registered open-end Vanguard funds to borrow money from and lend money to each other for temporary or emergency purposes (the “Interfund Lending Program”), subject to compliance with the terms and conditions of the Order, and to the extent permitted by the fund’s investment objective and investment policies. Interfund loans and borrowings normally extend overnight, but can have a maximum duration of seven days. Loans may be called on one business day’s notice. The interest rate to be charged is governed by the conditions of the Order and internal procedures adopted by the board of trustees. The board of trustees is responsible for overseeing the Interfund Lending Program.
For the year ended October 31, 2021, the fund did not utilize the credit facilities or the Interfund Lending Program.
FTSE All-World ex-US Small-Cap Index Fund
10. Other: Dividend income is recorded on the ex-dividend date. Non-cash dividends included in income, if any, are recorded at the fair value of the securities received. Interest income includes income distributions received from Vanguard Market Liquidity Fund and is accrued daily. Premiums and discounts on debt securities are amortized and accreted, respectively, to interest income over the lives of the respective securities, except for premiums on certain callable debt securities that are amortized to the earliest call date. Security transactions are accounted for on the date securities are bought or sold. Costs used to determine realized gains (losses) on the sale of investment securities are those of the specific securities sold.
Taxes on foreign dividends and capital gains have been provided for in accordance with the fund's understanding of the applicable countries' tax rules and rates. Deferred foreign capital gains tax, if any, is accrued daily based upon net unrealized gains. The fund has filed tax reclaims for previously withheld taxes on dividends earned in certain European Union countries. These filings are subject to various administrative and judicial proceedings within these countries. Such tax reclaims received during the year, if any, are included in dividend income. No other amounts for additional tax reclaims are reflected in the financial statements due to the uncertainty as to the ultimate resolution of proceedings, the likelihood of receipt of these reclaims, and the potential timing of payment.
Each class of shares has equal rights as to assets and earnings, except that each class separately bears certain class-specific expenses related to maintenance of shareholder accounts (included in Management and Administrative expenses) and shareholder reporting. Marketing and distribution expenses are allocated to each class of shares based on a method approved by the board of trustees. Income, other non-class-specific expenses, and gains and losses on investments are allocated to each class of shares based on its relative net assets.
| B. | In accordance with the terms of a Funds' Service Agreement (the “FSA”) between Vanguard and the fund, Vanguard furnishes to the fund investment advisory, corporate management, administrative, marketing, and distribution services at Vanguard’s cost of operations (as defined by the FSA). These costs of operations are allocated to the fund based on methods and guidelines approved by the board of trustees and are generally settled twice a month. |
Upon the request of Vanguard, the fund may invest up to 0.40% of its net assets as capital in Vanguard. At October 31, 2021, the fund had contributed to Vanguard capital in the amount of $394,000, representing less than 0.01% of the fund’s net assets and 0.16% of Vanguard’s capital received pursuant to the FSA. The fund’s trustees and officers are also directors and employees, respectively, of Vanguard.
| C. | Various inputs may be used to determine the value of the fund’s investments and derivatives. These inputs are summarized in three broad levels for financial statement purposes. The inputs or methodologies used to value securities are not necessarily an indication of the risk associated with investing in those securities. |
Level 1—Quoted prices in active markets for identical securities.
Level 2—Other significant observable inputs (including quoted prices for similar securities, interest rates, prepayment speeds, credit risk, etc.).
Level 3—Significant unobservable inputs (including the fund’s own assumptions used to determine the fair value of investments). Any investments and derivatives valued with significant unobservable inputs are noted on the Schedule of Investments.
FTSE All-World ex-US Small-Cap Index Fund
The following table summarizes the market value of the fund’s investments and derivatives as of October 31, 2021, based on the inputs used to value them:
| | Level 1
($000) | Level 2
($000) | Level 3
($000) | Total
($000) |
| Investments | | | | |
| Assets | | | | |
| Common Stocks—North and South America | 1,960,386 | — | — | 1,960,386 |
| Common Stocks—Other | 75,051 | 9,676,498 | 19,615 | 9,771,164 |
| Temporary Cash Investments | 634,158 | — | — | 634,158 |
| Total | 2,669,595 | 9,676,498 | 19,615 | 12,365,708 |
| Derivative Financial Instruments | | | | |
| Assets | | | | |
| Futures Contracts1 | 1,921 | — | — | 1,921 |
| Forward Currency Contracts | — | 1,017 | — | 1,017 |
| Total | 1,921 | 1,017 | — | 2,938 |
| Liabilities | | | | |
| Futures Contracts1 | 1,810 | — | — | 1,810 |
| Forward Currency Contracts | — | 431 | — | 431 |
| Total | 1,810 | 431 | — | 2,241 |
| 1 | Includes cumulative appreciation (depreciation) on futures contracts and centrally cleared swaps, if any, as reported in the Schedule of Investments. Only current day’s variation margin is reported within the Statement of Assets and Liabilities. |
| D. | At October 31, 2021, the fair values of derivatives were reflected in the Statement of Assets and Liabilities as follows: |
| Statement of Assets and Liabilities | Equity
Contracts
($000) | Foreign
Exchange
Contracts
($000) | Total
($000) |
| Unrealized Appreciation—Futures Contracts1 | 1,921 | — | 1,921 |
| Unrealized Appreciation—Forward Currency Contracts | — | 1,017 | 1,017 |
| Total Assets | 1,921 | 1,017 | 2,938 |
| | | | |
| Unrealized Depreciation—Futures Contracts1 | 1,810 | — | 1,810 |
| Unrealized Depreciation—Forward Currency Contracts | — | 431 | 431 |
| Total Liabilities | 1,810 | 431 | 2,241 |
| 1 | Includes cumulative appreciation (depreciation) on futures contracts and centrally cleared swaps, if any, as reported in the Schedule of Investments. Only current day’s variation margin is reported within the Statement of Assets and Liabilities. |
FTSE All-World ex-US Small-Cap Index Fund
Realized net gain (loss) and the change in unrealized appreciation (depreciation) on derivatives for the year ended October 31, 2021, were:
| Realized Net Gain (Loss) on Derivatives | Equity
Contracts
($000) | Foreign
Exchange
Contracts
($000) | Total
($000) |
| Futures Contracts | 15,319 | — | 15,319 |
| Swap Contracts | 154 | — | 154 |
| Forward Currency Contracts | — | 584 | 584 |
| Realized Net Gain (Loss) on Derivatives | 15,473 | 584 | 16,057 |
| Change in Unrealized Appreciation (Depreciation) on Derivatives |
| Futures Contracts | 1,738 | — | 1,738 |
| Swap Contracts | (31) | — | (31) |
| Forward Currency Contracts | — | 535 | 535 |
| Change in Unrealized Appreciation (Depreciation) on Derivatives | 1,707 | 535 | 2,242 |
| E. | Permanent differences between book-basis and tax-basis components of net assets are reclassified among capital accounts in the financial statements to reflect their tax character. These reclassifications have no effect on net assets or net asset value per share. As of period end, permanent differences primarily attributable to the accounting for in-kind redemptions, foreign currency transactions, passive foreign investment companies, swap agreements, and tax expense on capital gains were reclassified between the following accounts: |
| | Amount
($000) |
| Paid-in Capital | 3,821 |
| Total Distributable Earnings (Loss) | (3,821) |
Temporary differences between book-basis and tax-basis components of total distributable earnings (loss) arise when certain items of income, gain, or loss are recognized in different periods for financial statement and tax purposes; these differences will reverse at some time in the future. The differences are primarily related to the deferral of losses from wash sales; the recognition of unrealized gains or losses from certain derivative contracts; the recognition of unrealized gains from passive foreign investment companies; and the classification of securities for tax purposes. As of period end, the tax-basis components of total distributable earnings (loss) are detailed in the table as follows:
| | Amount
($000) |
| Undistributed Ordinary Income | 189,907 |
| Undistributed Long-Term Gains | — |
| Capital Loss Carryforwards | (71,440) |
| Qualified Late-Year Losses | — |
| Net Unrealized Gains (Losses) | 1,551,054 |
FTSE All-World ex-US Small-Cap Index Fund
The tax character of distributions paid was as follows:
| | Year Ended October 31, |
| | 2021
Amount
($000) | 2020
Amount
($000) |
| Ordinary Income* | 218,003 | 155,839 |
| Long-Term Capital Gains | — | — |
| Total | 218,003 | 155,839 |
| * | Includes short-term capital gains, if any. |
As of October 31, 2021, gross unrealized appreciation and depreciation for investments and derivatives based on cost for U.S. federal income tax purposes were as follows:
| | Amount
($000) |
| Tax Cost | 10,805,408 |
| Gross Unrealized Appreciation | 2,632,393 |
| Gross Unrealized Depreciation | (1,071,906) |
| Net Unrealized Appreciation (Depreciation) | 1,560,487 |
| F. | During the year ended October 31, 2021, the fund purchased $5,062,729,000 of investment securities and sold $1,705,601,000 of investment securities, other than temporary cash investments. Purchases and sales include $2,558,552,000 and $17,765,000, respectively, in connection with in-kind purchases and redemptions of the fund's capital shares. |
| G. | Capital share transactions for each class of shares were: |
| | Year Ended October 31, | |
| | 2021 | | 2020 |
| | Amount
($000) | Shares
(000) | | Amount
($000) | Shares
(000) |
| Investor Shares | | | | | |
| Issued | — | — | | 32 | 1 |
| Issued in Lieu of Cash Distributions | — | — | | — | — |
| Redeemed1 | — | — | | (1,214) | (30) |
| Net Increase (Decrease)—Investor Shares | — | — | | (1,182) | (29) |
| ETF Shares | | | | | |
| Issued | 3,295,921 | 25,570 | | 244,640 | 2,889 |
| Issued in Lieu of Cash Distributions | — | — | | — | — |
| Redeemed | (22,458) | (200) | | (699,553) | (7,000) |
| Net Increase (Decrease)—ETF Shares | 3,273,463 | 25,370 | | (454,913) | (4,111) |
| Admiral Shares | | | | | |
| Issued1 | 340,644 | 10,647 | | 470,074 | 19,863 |
| Issued in Lieu of Cash Distributions | 28,511 | 920 | | 19,873 | 738 |
| Redeemed | (279,112) | (8,662) | | (329,674) | (14,370) |
| Net Increase (Decrease)—Admiral Shares | 90,043 | 2,905 | | 160,273 | 6,231 |
FTSE All-World ex-US Small-Cap Index Fund
| | Year Ended October 31, | |
| | 2021 | | 2020 |
| | Amount
($000) | Shares
(000) | | Amount
($000) | Shares
(000) |
| Institutional Shares | | | | | |
| Issued | 157,920 | 642 | | 91,432 | 518 |
| Issued in Lieu of Cash Distributions | 8,704 | 36 | | 5,560 | 27 |
| Redeemed | (123,639) | (490) | | (77,839) | (426) |
| Net Increase (Decrease)—Institutional Shares | 42,985 | 188 | | 19,153 | 119 |
| 1 | In November 2018, the fund announced changes to the availability and minimum investment criteria of the Investor and Admiral share classes. As a result, all of the outstanding Investor Shares automatically converted to Admiral Shares beginning in April 2019. Investor Shares—Redeemed and Admiral Shares—Issued include 283 shares and 437 shares, respectively, in the amount of $12,000 from the conversion during the year ended October 31, 2020. |
At October 31, 2021, one shareholder was a record or beneficial owner of 26% of the fund’s net assets. If this shareholder were to redeem its investment in the fund, the redemption might result in an increase in the fund’s expense ratio, cause the fund to incur higher transaction costs, or lead to the realization of taxable capital gains.
| H. | Management has determined that no events or transactions occurred subsequent to October 31, 2021, that would require recognition or disclosure in these financial statements. |
Report of Independent Registered Public Accounting Firm
To the Board of Trustees of Vanguard International Equity Index Funds and Shareholders of Vanguard FTSE All-World ex-US Index Fund and Vanguard FTSE All-World ex-US Small-Cap Index Fund
Opinions on the Financial Statements
We have audited the accompanying statements of assets and liabilities, including the schedules of investments - investments summary, of Vanguard FTSE All-World ex-US Index Fund and Vanguard FTSE All-World ex-US Small-Cap Index Fund (two of the funds constituting Vanguard International Equity Index Funds, hereafter collectively referred to as the "Funds") as of October 31, 2021, the related statements of operations for the year ended October 31, 2021, the statements of changes in net assets for each of the two years in the period ended October 31, 2021 including the related notes, and the financial highlights for each of the periods indicated therein (collectively referred to as the "financial statements"). In our opinion, the financial statements present fairly, in all material respects, the financial position of each of the Funds as of October 31, 2021, the results of each of their operations for the year then ended, the changes in each of their net assets for each of the two years in the period ended October 31, 2021 and each of the financial highlights for each of the periods indicated therein in conformity with accounting principles generally accepted in the United States of America.
Basis for Opinions
These financial statements are the responsibility of the Funds’ management. Our responsibility is to express an opinion on the Funds’ financial statements based on our audits. We are a public accounting firm registered with the Public Company Accounting Oversight Board (United States) (PCAOB) and are required to be independent with respect to the Funds in accordance with the U.S. federal securities laws and the applicable rules and regulations of the Securities and Exchange Commission and the PCAOB.
We conducted our audits of these financial statements in accordance with the standards of the PCAOB. Those standards require that we plan and perform the audit to obtain reasonable assurance about whether the financial statements are free of material misstatement, whether due to error or fraud.
Our audits included performing procedures to assess the risks of material misstatement of the financial statements, whether due to error or fraud, and performing procedures that respond to those risks. Such procedures included examining, on a test basis, evidence regarding the amounts and disclosures in the financial statements. Our audits also included evaluating the accounting principles used and significant estimates made by management, as well as evaluating the overall presentation of the financial statements. Our procedures included confirmation of securities owned as of October 31, 2021 by correspondence with the custodian, transfer agent and brokers; when replies were not received from the transfer agent or brokers, we performed other auditing procedures. We believe that our audits provide a reasonable basis for our opinions.
/s/PricewaterhouseCoopers LLP
Philadelphia, Pennsylvania
December 16, 2021
We have served as the auditor of one or more investment companies in The Vanguard Group of Funds since 1975.
Special 2021 tax information (unaudited) for Vanguard FTSE All-World Ex-US Index Fund
This information for the fiscal year ended October 31, 2021, is included pursuant to provisions of the Internal Revenue Code.
The fund distributed $947,403,000 of qualified dividend income to shareholders during the fiscal year.
The fund designates to shareholders foreign source income of $1,444,789,000 and foreign taxes paid of $130,142,000. Shareholders will receive more detailed information with their Form 1099-DIV in January 2022 to determine the calendar-year amounts to be included on their 2021 tax returns.
Special 2021 tax information (unaudited) for Vanguard FTSE All-World Ex-US Small-Cap Index Fund
This information for the fiscal year ended October 31, 2021, is included pursuant to provisions of the Internal Revenue Code.
The fund distributed $127,468,000 of qualified dividend income to shareholders during the fiscal year.
The fund designates to shareholders foreign source income of $234,841,000 and foreign taxes paid of $28,206,000. Shareholders will receive more detailed information with their Form 1099-DIV in January 2022 to determine the calendar-year amounts to be included on their 2021 tax returns.
London Stock Exchange Group companies include FTSE International Limited (“FTSE”), Frank Russell Company (“Russell”), MTS Next Limited (“MTS”), and FTSE TMX Global Debt Capital Markets Inc. (“FTSE TMX”). All rights reserved. “FTSE®”, “Russell®”, “MTS®”, “FTSE TMX®” and “FTSE Russell” and other service marks and trademarks related to the FTSE or Russell indexes are trademarks of the London Stock Exchange Group companies and are used by FTSE, MTS, FTSE TMX and Russell under license. All information is provided for information purposes only. Every effort is made to ensure that all information given in this publication is accurate, but no responsibility or liability can be accepted by the London Stock Exchange Group companies nor its licensors for any errors or for any loss from use of this publication. Neither the London Stock Exchange Group companies nor any of their licensors make any claim, prediction, warranty or representation whatsoever, expressly or impliedly, either as to the results to be obtained from the use of the Indices or the fitness or suitability of the Indices for any particular purpose to which they might be put. The London Stock Exchange Group companies do not provide investment advice and nothing in this document should be taken as constituting financial or investment advice. The London Stock Exchange Group companies make no representation regarding the advisability of investing in any asset. A decision to invest in any such asset should not be made in reliance on any information herein. Indexes cannot be invested in directly. Inclusion of an asset in an index is not a recommendation to buy, sell or hold that asset. The general information contained in this publication should not be acted upon without obtaining specific legal, tax, and investment advice from a licensed professional. No part of this information may be reproduced, stored in a retrieval system or transmitted in any form or by any means, electronic, mechanical, photocopying, recording or otherwise, without prior written permission of the London Stock Exchange Group companies. Distribution of the London Stock Exchange Group companies’ index values and the use of their indexes to create financial products require a license with FTSE, FTSE TMX, MTS and/or Russell and/or its licensors.
This page intentionally left blank.
The People Who Govern Your Fund
The trustees of your mutual fund are there to see that the fund is operated and managed in your best interests since, as a shareholder, you are a part owner of the fund. Your fund’s trustees also serve on the board of directors of The Vanguard Group, Inc., which is owned by the Vanguard funds and provides services to them.
A majority of Vanguard’s board members are independent, meaning that they have no affiliation with Vanguard or the funds they oversee, apart from the sizable personal investments they have made as private individuals. The independent board members have distinguished backgrounds in business, academia, and public service. Each of the trustees and executive officers oversees 214 Vanguard funds.
Information for each trustee and executive officer of the fund appears below. That information, as well as the Vanguard fund count, is as of the date on the cover of this fund report. The mailing address of the trustees and officers is P.O. Box 876, Valley Forge, PA 19482. More information about the trustees is in the Statement of Additional Information, which can be obtained, without charge, by contacting Vanguard at 800-662-7447, or online at vanguard.com.
Interested Trustee1
Mortimer J. Buckley
Born in 1969. Trustee since January 2018. Principal occupation(s) during the past five years and other experience: chairman of the board (2019–present) of Vanguard and of each of the investment companies served by Vanguard; chief executive officer (2018–present) of Vanguard; chief executive officer, president, and trustee (2018–present) of each of the investment companies served by Vanguard; president and director (2017–present) of Vanguard; and president (2018–present) of Vanguard Marketing Corporation. Chief investment officer (2013–2017), managing director (2002–2017), head of the Retail Investor Group (2006–2012), and chief information officer (2001–2006) of Vanguard. Chairman of the board (2011–2017) and trustee (2009–2017) of the Children’s Hospital of Philadelphia; and trustee (2018–present) and vice chair (2019–present) of The Shipley School.
Independent Trustees
Emerson U. Fullwood
Born in 1948. Trustee since January 2008. Principal occupation(s) during the past five years and other experience: executive chief staff and marketing officer for North America and corporate vice president (retired 2008) of Xerox Corporation (document management products and services). Former president of the Worldwide Channels Group, Latin
America, and Worldwide Customer Service and executive chief staff officer of Developing Markets of Xerox. Executive in residence and 2009–2010 Distinguished Minett Professor at the Rochester Institute of Technology. Director of SPX FLOW, Inc. (multi-industry manufacturing). Director of the University of Rochester Medical Center, the Monroe Community College Foundation, the United Way of Rochester, North Carolina A&T University, and Roberts Wesleyan College. Trustee of the University of Rochester.
Amy Gutmann
Born in 1949. Trustee since June 2006. Principal occupation(s) during the past five years and other experience: president (2004–present) of the University of Pennsylvania. Christopher H. Browne Distinguished Professor of Political Science, School of Arts and Sciences, and professor of communication, Annenberg School for Communication, with secondary faculty appointments in the Department of Philosophy, School of Arts and Sciences, and at the Graduate School of Education, University of Pennsylvania.
F. Joseph Loughrey
Born in 1949. Trustee since October 2009. Principal occupation(s) during the past five years and other experience: president and chief operating officer (retired 2009) and vice chairman of the board (2008–2009) of Cummins Inc. (industrial machinery). Chairman of the board of Hillenbrand, Inc. (specialized consumer services). Director of the V Foundation.
1 Mr. Buckley is considered an “interested person,” as defined in the Investment Company Act of 1940, because he is an officer of the Vanguard funds.
Member of the advisory council for the College of Arts and Letters and chair of the advisory board to the Kellogg Institute for International Studies, both at the University of Notre Dame. Chairman of the board of Saint Anselm College.
Mark Loughridge
Born in 1953. Trustee since March 2012. Principal occupation(s) during the past five years and other experience: senior vice president and chief financial officer (retired 2013) of IBM (information technology services). Fiduciary member of IBM’s Retirement Plan Committee (2004–2013), senior vice president and general manager (2002–2004) of IBM Global Financing, vice president and controller (1998–2002) of IBM, and a variety of other prior management roles at IBM. Member of the Council on Chicago Booth.
Scott C. Malpass
Born in 1962. Trustee since March 2012. Principal occupation(s) during the past five years and other experience: chief investment officer (retired June 2020) and vice president (retired June 2020) of the University of Notre Dame. Assistant professor (retired June 2020) of finance at the Mendoza College of Business, University of Notre Dame, and member of the Notre Dame 403(b) Investment Committee. Member of the board of Catholic Investment Services, Inc. (investment advisors) and the board of superintendence of the Institute for the Works of Religion.
Deanna Mulligan
Born in 1963. Trustee since January 2018. Principal occupation(s) during the past five years and other experience: board chair (2020), chief executive officer (2011–2020), and president (2010–2019) of The Guardian Life Insurance Company of America. Chief operating officer (2010–2011) and executive vice president (2008–2010) of Individual Life and Disability of the Guardian Life Insurance Company of America. Member of the board of the Economic Club of New York. Trustee of the Partnership for New York City (business leadership), Chief Executives for Corporate Purpose, NewYork-Presbyterian Hospital, and the Bruce Museum (arts and science). Member of the Advisory Council for the Stanford Graduate School of Business.
André F. Perold
Born in 1952. Trustee since December 2004. Principal occupation(s) during the past five years and other experience: George Gund Professor of Finance and Banking, Emeritus at the Harvard Business School (retired 2011). Chief investment officer and co-managing partner of HighVista Strategies (private investment firm). Member of the board
(2018–present) of RIT Capital Partners (investment firm). Member of the investment committee of Partners Health Care System.
Sarah Bloom Raskin
Born in 1961. Trustee since January 2018. Principal occupation(s) during the past five years and other experience: deputy secretary (2014–2017) of the United States Department of the Treasury. Governor (2010–2014) of the Federal Reserve Board. Commissioner (2007–2010) of financial regulation for the State of Maryland. Professor (2020–present), Distinguished Fellow of the Global Financial Markets Center (2020–present), and Rubenstein Fellow (2017–2020) at Duke University. Trustee (2017–present) of Amherst College and member of Amherst College Investment Committee (2019–present). Member of the Regenerative Crisis Response Committee (2020–present).
David A. Thomas
Born in 1956. Trustee since July 2021. Principal occupation(s) during the past five years and other experience: president of Morehouse College (2018–present). Professor of business administration, emeritus at Harvard University (2017–2018). Dean (2011–2016) and professor of management (2016–2017) at the Georgetown University McDonough School of Business. Director of DTE Energy Company (2013–present). Trustee of Common Fund (2019–present).
Peter F. Volanakis
Born in 1955. Trustee since July 2009. Principal occupation(s) during the past five years and other experience: president and chief operating officer (retired 2010) of Corning Incorporated (communications equipment) and director of Corning Incorporated (2000–2010) and Dow Corning (2001–2010). Director (2012) of SPX Corporation (multi-industry manufacturing). Overseer of the Amos Tuck School of Business Administration, Dartmouth College (2001–2013). Chairman of the board of trustees of Colby-Sawyer College. Member of the BMW Group Mobility Council.
Executive Officers
Christine M. Buchanan
Born in 1970. Principal occupation(s) during the past five years and other experience: principal of Vanguard. Chief financial officer (2021–present) and treasurer (2017–present) of each of the investment companies served by Vanguard. Partner (2005–2017) at KPMG (audit, tax, and advisory services).
David Cermak
Born in 1960. Principal occupation(s) during the past five years and other experience: principal of Vanguard. Finance director (2019–present) of each of the investment companies served by Vanguard. Managing director and head (2017–present) of Vanguard Investments Singapore. Managing director and head (2017–2019) of Vanguard Investments Hong Kong. Representative director and head (2014–2017) of Vanguard Investments Japan.
John Galloway
Born in 1973. Principal occupation(s) during the past five years and other experience: principal of Vanguard. Investment stewardship officer (September 2020–present) of each of the investment companies served by Vanguard. Head of Investor Advocacy (February 2020–present) and head of Marketing Strategy and Planning (2017–2020) at Vanguard. Deputy assistant to the President of the United States (2015).
Peter Mahoney
Born in 1974. Principal occupation(s) during the past five years and other experience: principal of Vanguard. Controller (2015–present) of each of the investment companies served by Vanguard. Head of International Fund Services (2008–2014) at Vanguard.
Anne E. Robinson
Born in 1970. Principal occupation(s) during the past five years and other experience: general counsel (2016–present) of Vanguard. Secretary (2016–present) of Vanguard and of each of the investment companies served by Vanguard. Managing director (2016–present) of Vanguard. Managing director and general counsel of Global Cards and Consumer Services (2014–2016) at Citigroup. Counsel (2003–2014) at American Express.
Michael Rollings
Born in 1963. Principal occupation(s) during the past five years and other experience: finance director (2017–present) and treasurer (2017) of each of the investment companies served by Vanguard. Managing director (2016–present) of Vanguard. Chief financial officer (2016–present) of Vanguard. Director (2016–present) of Vanguard Marketing Corporation. Executive vice president and chief financial officer (2006–2016) of MassMutual Financial Group.
John E. Schadl
Born in 1972. Principal occupation(s) during the past five years and other experience: principal of Vanguard. Chief compliance officer (2019–present) of Vanguard and of each of the investment companies served by Vanguard. Assistant vice president (2019–present) of Vanguard Marketing Corporation.
Vanguard Senior Management Team
| Matthew Benchener | Thomas M. Rampulla |
| Joseph Brennan | Karin A. Risi |
| Mortimer J. Buckley | Anne E. Robinson |
| Gregory Davis | Michael Rollings |
| John James | Nitin Tandon |
| John T. Marcante | Lauren Valente |
| Chris D. Mclsaac | |
Connect with Vanguard®>vanguard.com
Fund Information > 800-662-7447
Direct Investor Account Services > 800-662-2739
Institutional Investor Services > 800-523-1036
Text Telephone for People Who Are Deaf or Hard of Hearing > 800-749-7273
This material may be used in conjunction with the offering of shares of any Vanguard fund only if preceded or accompanied by the fund’s current prospectus.
All comparative mutual fund data are from Morningstar, Inc., unless otherwise noted.
You can obtain a free copy of Vanguard’s proxy voting guidelines by visiting vanguard.com/proxyreporting or by calling Vanguard at 800-662-2739. The guidelines are also available from the SEC’s website, www.sec.gov. In addition, you may obtain a free report on how your fund voted the proxies for securities it owned during the 12 months ended June 30. To get the report, visit either vanguard.com/proxyreporting or www.sec.gov.
You can review information about your fund on the SEC’s website, and you can receive copies of this information, for a fee, by sending a request via email addressed to publicinfo@sec.gov.
Source for Bloomberg indexes: Bloomberg Index Services Limited. Copyright 2021, Bloomberg. All rights reserved.
© 2021 The Vanguard Group, Inc.
All rights reserved.
U.S. Patent Nos. 6,879,964 and 7,720,749.
Vanguard Marketing Corporation, Distributor.
Q7700 122021
Annual Report | October 31, 2021
Vanguard Global ex-U.S. Real Estate Index Fund
Contents
Your Fund’s Performance at a Glance
| 1 |
About Your Fund’s Expenses
| 2 |
Performance Summary
| 4 |
Financial Statements
| 7 |
Please note: The opinions expressed in this report are just that—informed opinions. They should not be considered promises or advice. Also, please keep in mind that the information and opinions cover the period through the date on the front of this report. Of course, the risks of investing in your fund are spelled out in the prospectus.
Your Fund’s Performance at a Glance
| • | Vanguard Global ex-U.S. Real Estate Index Fund returned 24.47% for ETF Shares, 23.87% for Admiral Shares, and 23.82% for Institutional Shares for the 12 months ended October 31, 2021. The fund’s benchmark returned 24.15%. |
| • | The global economy continued to recover from the sharp pandemic-induced contraction in the spring of 2020. Countries that were more successful in containing the virus, whether through vaccinations, lockdowns, or both, generally fared better economically. Swift and extensive fiscal and monetary support from policymakers was also key to the rebound. Despite concerns toward the end of the fiscal year about inflation and the prospect of less accommodative monetary policy, stock returns for the period were excellent. |
| • | Real estate investment trusts (REITs) benefited from the growing global economy and performed strongly, as did real estate management and development companies. By region, the Pacific and Europe contributed most to returns. |
Market Barometer
| | Average Annual Total Returns
Periods Ended October 31, 2021 |
| | One Year | Three Years | Five Years |
| Stocks | | | |
| Russell 1000 Index (Large-caps) | 43.51% | 22.01% | 19.16% |
| Russell 2000 Index (Small-caps) | 50.80 | 16.47 | 15.52 |
| Russell 3000 Index (Broad U.S. market) | 43.90 | 21.62 | 18.91 |
| FTSE All-World ex US Index (International) | 30.23 | 12.42 | 10.05 |
| Bonds | | | |
Bloomberg U.S. Aggregate Bond Index
(Broad taxable market) | -0.48% | 5.63% | 3.10% |
Bloomberg Municipal Bond Index
(Broad tax-exempt market) | 2.64 | 5.17 | 3.41 |
| FTSE Three-Month U.S. Treasury Bill Index | 0.05 | 1.08 | 1.12 |
| CPI | | | |
| Consumer Price Index | 6.22% | 3.03% | 2.73% |
Fund returns are adjusted to reflect the 0.25% fee on purchases and redemptions of fund shares. The fees do not apply to the ETF shares.
About Your Fund’s Expenses
As a shareholder of the fund, you incur ongoing costs, which include costs for portfolio management, administrative services, and shareholder reports (like this one), among others. Operating expenses, which are deducted from a fund’s gross income, directly reduce the investment return of the fund.
A fund’s expenses are expressed as a percentage of its average net assets. This figure is known as the expense ratio. The following examples are intended to help you understand the ongoing costs (in dollars) of investing in your fund and to compare these costs with those of other mutual funds. The examples are based on an investment of $1,000 made at the beginning of the period shown and held for the entire period.
The accompanying table illustrates your fund’s costs in two ways:
| • | Based on actual fund return. This section helps you to estimate the actual expenses that you paid over the period. The ”Ending Account Value“ shown is derived from the fund‘s actual return, and the third column shows the dollar amount that would have been paid by an investor who started with $1,000 in the fund. You may use the information here, together with the amount you invested, to estimate the expenses that you paid over the period. |
To do so, simply divide your account value by $1,000 (for example, an $8,600 account value divided by $1,000 = 8.6), then multiply the result by the number given for your fund under the heading ”Expenses Paid During Period.“
| • | Based on hypothetical 5% yearly return. This section is intended to help you compare your fund‘s costs with those of other mutual funds. It assumes that the fund had a yearly return of 5% before expenses, but that the expense ratio is unchanged. In this case—because the return used is not the fund’s actual return—the results do not apply to your investment. The example is useful in making comparisons because the Securities and Exchange Commission requires all mutual funds to calculate expenses based on a 5% return. You can assess your fund’s costs by comparing this hypothetical example with the hypothetical examples that appear in shareholder reports of other funds. |
Note that the expenses shown in the table are meant to highlight and help you compare ongoing costs only and do not reflect transaction costs incurred by the fund for buying and selling securities. Further, the expenses do not include any purchase, redemption, or account service fees described in the fund prospectus. If such fees were applied to your account, your costs would be higher. Your fund does not carry a “sales load.”
The calculations assume no shares were bought or sold during the period. Your actual costs may have been higher or lower, depending on the amount of your investment and the timing of any purchases or redemptions.
You can find more information about the fund’s expenses, including annual expense ratios, in the Financial Statements section of this report. For additional information on operating expenses and other shareholder costs, please refer to your fund’s current prospectus.
| Six Months Ended October 31, 2021 | | | |
| | Beginning
Account Value
4/30/2021 | Ending
Account Value
10/31/2021 | Expenses
Paid During
Period |
| Based on Actual Fund Return | | | |
| Global ex-U.S. Real Estate Index Fund | | | |
| ETF Shares | $1,000.00 | $1,013.00 | $0.61 |
| Admiral™ Shares | 1,000.00 | 1,013.00 | 0.61 |
| Institutional Shares | 1,000.00 | 1,012.80 | 0.56 |
| Based on Hypothetical 5% Yearly Return | | | |
| Global ex-U.S. Real Estate Index Fund | | | |
| ETF Shares | $1,000.00 | $1,024.60 | $0.61 |
| Admiral Shares | 1,000.00 | 1,024.60 | 0.61 |
| Institutional Shares | 1,000.00 | 1,024.65 | 0.56 |
The calculations are based on expenses incurred in the most recent six-month period. The fund’s annualized six-month expense ratios for that period are 0.12% for ETF Shares, 0.12% for Admiral Shares, and 0.11% for Institutional Shares. The dollar amounts shown as “Expenses Paid” are equal to the annualized expense ratio multiplied by the average account value over the period, multiplied by the number of days in the most recent six-month period, then divided by the number of days in the most recent 12-month period (184/365).
Global ex-U.S. Real Estate Index Fund
All of the returns in this report represent past performance, which is not a guarantee of future results that may be achieved by the fund. (Current performance may be lower or higher than the performance data cited. For performance data current to the most recent month-end, visit our website at vanguard.com/performance.) Note, too, that both investment returns and principal value can fluctuate widely, so an investor’s shares, when sold, could be worth more or less than their original cost. The returns shown do not reflect taxes that a shareholder would pay on fund distributions or on the sale of fund shares.
Cumulative Performance: October 31, 2011, Through October 31, 2021
Initial Investment of $10,000
| | | Average Annual Total Returns
Periods Ended October 31, 2021 | |
| | | One
Year | Five
Years | Ten
Years | Final Value
of a $10,000
Investment |
 | Global ex-U.S. Real Estate Index Fund
ETF Shares Net Asset Value | 24.47% | 5.87% | 6.76% | $19,231 |
| | Global ex-U.S. Real Estate Index Fund
ETF Shares Market Price | 24.65 | 5.84 | 6.79 | 19,282 |
 | S&P Global ex-U.S. Property Index | 24.15 | 5.47 | 6.26 | 18,346 |
 | MSCI All Country World Index ex USA | 29.66 | 9.77 | 6.66 | 19,057 |
| | | | |
| | | One
Year | Five
Years | Ten
Years | Final Value
of a $10,000
Investment |
Global ex-U.S. Real Estate Index Fund
Admiral Shares | 23.87% | 5.77% | 6.72% | $19,166 |
| S&P Global ex-U.S. Property Index | 24.15 | 5.47 | 6.26 | 18,346 |
Vanguard fund returns are adjusted to reflect the 0.25% fee on purchases and redemptions. The fees do not apply to the ETF Shares.
See Financial Highlights for dividend and capital gains information.
Global ex-U.S. Real Estate Index Fund
| | | Average Annual Total Returns
Periods Ended October 31, 2021 | |
| | | One
Year | Five
Years | Ten
Years | Final Value
of a $5,000,000
Investment |
Global ex-U.S. Real Estate Index Fund
Institutional Shares | 23.82% | 5.77% | 6.74% | $9,596,831 |
| S&P Global ex-U.S. Property Index | 24.15 | 5.47 | 6.26 | 9,172,939 |
Cumulative Returns of ETF Shares: October 31, 2011, Through October 31, 2021
| | One
Year | Five
Years | Ten
Years |
Global ex-U.S. Real Estate Index Fund ETF Shares
Market Price | 24.65% | 32.80% | 92.82% |
Global ex-U.S. Real Estate Index Fund ETF Shares
Net Asset Value | 24.47 | 32.98 | 92.31 |
| S&P Global ex-U.S. Property Index | 24.15 | 30.52 | 83.46 |
For the ETF Shares, the market price is determined by the midpoint of the bid-offer spread as of the closing time of the New York Stock Exchange (generally 4 p.m., Eastern time). The net asset value is also determined as of the NYSE closing time. For more information about how the ETF Shares' market prices have compared with their net asset value, visit vanguard.com, select your ETF, and then select the Price and Performance tab. The ETF premium/discount analysis there shows the percentages of days on which the ETF Shares' market price was above or below the NAV.
Vanguard fund returns are adjusted to reflect the 0.25% fee on purchases and redemptions. The fees do not apply to the ETF Shares.
Global ex-U.S. Real Estate Index Fund
| Japan | 22.5% |
| Australia | 10.1 |
| Hong Kong | 8.4 |
| China | 8.4 |
| United Kingdom | 8.3 |
| Germany | 6.0 |
| Singapore | 5.9 |
| Sweden | 4.8 |
| Canada | 3.1 |
| France | 2.7 |
| Belgium | 2.2 |
| Israel | 1.9 |
| Switzerland | 1.7 |
| India | 1.4 |
| South Africa | 1.2 |
| Philippines | 1.2 |
| Thailand | 1.0 |
| Taiwan | 1.0 |
| United Arab Emirates | 1.0 |
| Other | 7.2 |
The table reflects the fund’s investments, except for short-term investments and derivatives.
The fund may invest in derivatives (such as futures and swap contracts) for various reasons, including, but not limited to, attempting to remain fully invested and tracking its target index as closely as possible.
Global ex-U.S. Real Estate Index Fund
The fund files its complete schedule of portfolio holdings with the Securities and Exchange Commission (SEC) for the first and third quarters of each fiscal year as an exhibit to its reports on Form N-PORT. The fund’s Form N-PORT reports are available on the SEC’s website at www.sec.gov.
| | | Shares | Market
Value•
($000) |
| Common Stocks (99.3%) |
| Australia (10.0%) |
| | Goodman Group | 8,285,065 | 137,175 |
| | Scentre Group | 25,576,315 | 58,337 |
| | Dexus Industria REIT (XASX) | 5,300,147 | 43,476 |
| | Mirvac Group | 19,431,313 | 41,470 |
| | Stockland | 11,762,682 | 40,545 |
| | GPT Group | 9,439,011 | 36,850 |
| | Charter Hall Group | 2,295,519 | 30,117 |
| | Lendlease Corp. Ltd. | 3,392,331 | 26,875 |
| | Vicinity Centres | 19,064,330 | 24,898 |
| | Shopping Centres Australasia Property Group | 5,321,334 | 11,179 |
| | Charter Hall Long Wale REIT | 2,796,066 | 10,258 |
| | National Storage REIT | 5,305,576 | 9,606 |
| | Waypoint REIT | 3,868,988 | 7,977 |
| | Charter Hall Retail REIT | 2,545,870 | 7,898 |
| | Lifestyle Communities Ltd. | 468,650 | 7,738 |
| | BWP Trust | 2,373,276 | 7,604 |
| | Centuria Capital Group | 3,117,240 | 7,576 |
| | Centuria Industrial REIT | 2,644,454 | 7,294 |
| | Ingenia Communities Group | 1,455,471 | 7,196 |
| | Arena REIT | 1,697,195 | 5,776 |
| 1 | Home Consortium Ltd. | 900,694 | 5,386 |
| | Aventus Group | 2,021,758 | 5,215 |
| | Abacus Property Group | 1,856,058 | 5,013 |
| | Charter Hall Social Infrastructure REIT | 1,630,089 | 4,691 |
| | Growthpoint Properties Australia Ltd. | 1,445,636 | 4,537 |
| | Cromwell Property Group | 6,967,522 | 4,264 |
| | Centuria Office REIT | 2,170,604 | 3,939 |
| | Rural Funds Group | 1,876,183 | 3,938 |
| | Irongate Group | 2,575,762 | 3,108 |
| 1 | HomeCo Daily Needs REIT | 2,502,812 | 2,716 |
| | Dexus Industria REIT | 998,559 | 2,541 |
| | Hotel Property Investments | 858,552 | 2,318 |
| | GDI Property Group | 2,510,862 | 2,214 |
| | Cedar Woods Properties Ltd. | 314,822 | 1,418 |
| | | | 581,143 |
| | | Shares | Market
Value•
($000) |
| Austria (0.5%) |
| 1 | IMMOFINANZ AG | 473,245 | 11,333 |
| | CA Immobilien Anlagen AG (XWBO) | 230,607 | 9,895 |
| | S IMMO AG | 205,206 | 4,868 |
| *,2 | CA Immobilien Anlagen AG | 344,780 | — |
| | | | 26,096 |
| Belgium (2.2%) |
| | Warehouses De Pauw CVA | 688,729 | 31,362 |
| | Aedifica SA | 177,698 | 23,696 |
| | Cofinimmo SA | 137,534 | 22,189 |
| | VGP NV | 37,480 | 9,693 |
| | Shurgard Self Storage SA | 122,570 | 7,512 |
| | Montea NV | 50,244 | 7,458 |
| | Xior Student Housing NV | 93,178 | 5,511 |
| | Befimmo SA | 123,773 | 5,063 |
| | Retail Estates NV | 53,569 | 4,290 |
| | Care Property Invest NV | 127,004 | 3,936 |
| | Intervest Offices & Warehouses NV | 116,209 | 3,389 |
| 1 | Immobel SA | 18,503 | 1,631 |
| | | | 125,730 |
| Brazil (0.4%) |
| * | BR Malls Participacoes SA | 4,282,553 | 5,441 |
| | Multiplan Empreendimentos Imobiliarios SA | 1,328,010 | 4,358 |
| | Aliansce Sonae Shopping Centers SA | 674,137 | 2,291 |
| | Iguatemi Empresa de Shopping Centers SA | 423,130 | 2,245 |
| | JHSF Participacoes SA | 1,527,196 | 1,350 |
| | BR Properties SA | 975,571 | 1,246 |
| | LOG Commercial Properties e Participacoes SA | 213,814 | 888 |
| | Jereissati Participacoes SA | 173,858 | 813 |
| | SYN prop e tech SA | 252,998 | 570 |
| | Lavvi Empreendimentos Imobiliarios Ltda | 463,186 | 410 |
Global ex-U.S. Real Estate Index Fund
| | | Shares | Market
Value•
($000) |
| * | HBR Realty Empreendimentos Imobiliarios SA | 168,978 | 347 |
| 3 | Mitre Realty Empreendimentos E Participacoes LTDA | 262,258 | 270 |
| * | Moura Dubeux Engenharia SA | 235,122 | 200 |
| | | | 20,429 |
| Canada (3.1%) |
| | Canadian Apartment Properties REIT | 416,912 | 20,357 |
| | Tricon Capital Group Inc. | 1,205,230 | 17,539 |
| | RioCan REIT | 765,983 | 13,796 |
| | Granite REIT | 158,540 | 12,851 |
| �� | Allied Properties REIT | 307,198 | 10,616 |
| | H&R REIT | 695,884 | 9,565 |
| 1 | Choice Properties REIT | 789,393 | 9,498 |
| | SmartCentres REIT | 349,382 | 8,805 |
| 1 | Summit Industrial Income REIT | 407,520 | 7,784 |
| | First Capital REIT | 529,957 | 7,571 |
| 1 | Dream Industrial REIT | 544,029 | 7,451 |
| 1 | NorthWest Healthcare Properties REIT | 524,816 | 5,632 |
| 1 | InterRent REIT | 336,198 | 4,925 |
| 1 | Killam Apartment REIT | 265,256 | 4,874 |
| 1 | Boardwalk REIT | 112,310 | 4,845 |
| | Cominar REIT | 449,413 | 4,194 |
| | CT REIT | 254,954 | 3,657 |
| 1 | Crombie REIT | 233,971 | 3,494 |
| | Artis REIT | 313,067 | 2,965 |
| 1 | DREAM Unlimited Corp. Class A | 113,515 | 2,834 |
| 1 | Morguard Corp. | 21,202 | 2,339 |
| | Dream Office REIT | 121,898 | 2,300 |
| 1,3 | Minto Apartment REIT | 87,977 | 1,629 |
| | Morguard North American Residential REIT | 93,792 | 1,396 |
| | Slate Grocery REIT | 126,264 | 1,331 |
| 1 | True North Commercial REIT | 211,311 | 1,270 |
| | Automotive Properties REIT | 94,250 | 1,023 |
| 1 | Plaza Retail REIT | 244,350 | 898 |
| 1 | Nexus REIT | 81,071 | 869 |
| 1 | European Residential REIT | 199,955 | 730 |
| 1 | Slate Office REIT | 164,353 | 684 |
| 1 | BTB REIT | 177,652 | 599 |
| 1 | Inovalis REIT | 74,075 | 575 |
| | | | 178,896 |
| Chile (0.1%) |
| * | Parque Arauco SA | 3,363,725 | 3,321 |
| | Cencosud Shopping SA | 2,350,829 | 2,275 |
| | Plaza SA | 1,450,144 | 1,447 |
| | | | 7,043 |
| China (8.4%) |
| | China Resources Land Ltd. | 14,054,446 | 54,608 |
| | China Overseas Land & Investment Ltd. | 18,331,210 | 40,430 |
| 3 | Longfor Group Holdings Ltd. | 7,770,008 | 37,591 |
| | | Shares | Market
Value•
($000) |
| | Country Garden Holdings Co. | 35,436,163 | 33,346 |
| | Sunac China Holdings Ltd. | 12,402,278 | 26,523 |
| | Wharf Holdings Ltd. | 6,772,652 | 23,547 |
| | China Vanke Co. Ltd. Class H | 8,022,483 | 18,744 |
| | China Vanke Co. Ltd. Class A | 4,092,708 | 11,637 |
| | CIFI Holdings Group Co. Ltd. | 19,772,000 | 10,975 |
| | Shimao Group Holdings Ltd. | 6,094,664 | 9,561 |
| | Hopson Development Holdings Ltd. | 3,424,581 | 9,293 |
| | Poly Developments and Holdings Group Co. Ltd. Class A | 4,716,317 | 9,256 |
| | Seazen Group Ltd. | 9,784,000 | 7,740 |
| | China Jinmao Holdings Group Ltd. | 26,235,054 | 7,665 |
| | Agile Group Holdings Ltd. | 7,129,409 | 5,589 |
| | Yuexiu Property Co. Ltd. | 6,120,218 | 5,378 |
| 1 | Greentown China Holdings Ltd. | 3,808,314 | 5,247 |
| | China Merchants Shekou Industrial Zone Holdings Co. Ltd. Class A | 3,118,607 | 5,086 |
| 1 | Guangzhou R&F Properties Co. Ltd. Class H | 8,125,413 | 5,083 |
| | Shanghai Lujiazui Finance & Trade Zone Development Co. Ltd. Class B | 5,696,240 | 5,066 |
| *,1 | Nam Tai Property Inc. | 205,221 | 5,061 |
| | Kwg Group Holdings Ltd. | 5,794,158 | 5,051 |
| | Powerlong Real Estate Holdings Ltd. | 7,133,139 | 4,887 |
| *,1,3 | China Logistics Property Holdings Co. Ltd. | 8,970,000 | 4,818 |
| | Seazen Holdings Co. Ltd. Class A | 890,502 | 4,757 |
| 1 | Zhenro Properties Group Ltd. | 9,662,000 | 4,592 |
| | C&D International Investment Group Ltd. | 2,434,000 | 4,530 |
| | Logan Group Co. Ltd. | 4,069,984 | 4,077 |
| | China Overseas Grand Oceans Group Ltd. | 8,405,079 | 4,030 |
| 1 | Yuexiu REIT | 8,009,516 | 3,492 |
| | Sino-Ocean Group Holding Ltd. | 15,137,829 | 3,290 |
| 1 | Shenzhen Investment Ltd. | 12,408,201 | 3,043 |
| | Shoucheng Holdings Ltd. | 13,850,000 | 2,933 |
| | Gemdale Properties & Investment Corp. Ltd. | 30,078,000 | 2,927 |
| | Gemdale Corp. Class A | 1,777,232 | 2,819 |
| 1 | China Evergrande Group | 9,113,921 | 2,705 |
Global ex-U.S. Real Estate Index Fund
| | | Shares | Market
Value•
($000) |
| | Times China Holdings Ltd. | 3,875,000 | 2,637 |
| | Shui On Land Ltd. | 17,536,538 | 2,598 |
| | Zhuguang Holdings Group Co. Ltd. | 11,736,000 | 2,577 |
| | China SCE Group Holdings Ltd. | 8,061,766 | 2,514 |
| | Poly Property Group Co. Ltd. | 9,613,048 | 2,371 |
| 1 | China Aoyuan Group Ltd. | 5,963,000 | 2,355 |
| 1 | Jiayuan International Group Ltd. | 6,054,000 | 2,341 |
| * | SOHO China Ltd. | 9,193,545 | 2,335 |
| *,3 | Red Star Macalline Group Corp. Ltd. Class H | 3,952,436 | 2,217 |
| 3 | Midea Real Estate Holding Ltd. | 1,137,016 | 1,962 |
| 1 | Shinsun Holdings Group Co. Ltd. | 3,285,000 | 1,942 |
| *,1 | Kaisa Group Holdings Ltd. | 12,419,944 | 1,908 |
| | Shanghai Wanye Enterprises Co. Ltd. Class A | 377,042 | 1,824 |
| 1 | Radiance Holdings Group Co. Ltd. | 3,164,000 | 1,655 |
| | Skyfame Realty Holdings Ltd. | 13,847,012 | 1,634 |
| | Shanghai Lingang Holdings Corp. Ltd. Class A | 704,761 | 1,617 |
| | Shanghai Zhangjiang High-Tech Park Development Co. Ltd. Class A | 609,572 | 1,587 |
| | China South City Holdings Ltd. | 20,900,111 | 1,558 |
| | Jinke Properties Group Co. Ltd. Class A | 2,103,945 | 1,460 |
| | Tianjin Guangyu Development Co. Ltd. Class A | 549,750 | 1,438 |
| 1 | Zhongliang Holdings Group Co. Ltd. | 2,973,000 | 1,378 |
| 1 | Datang Group Holdings Ltd. | 2,523,000 | 1,374 |
| 1,3 | Redco Properties Group Ltd. | 4,458,000 | 1,369 |
| 1 | Dexin China Holdings Co. Ltd. | 3,951,000 | 1,326 |
| 1 | Redsun Properties Group Ltd. | 4,552,000 | 1,313 |
| | Shanghai Jinqiao Export Processing Zone Development Co. Ltd. Class B | 1,431,399 | 1,288 |
| | Shanghai Lujiazui Finance & Trade Zone Development Co. Ltd. Class A | 732,736 | 1,239 |
| | RiseSun Real Estate Development Co. Ltd. Class A | 1,778,779 | 1,193 |
| 1 | Ganglong China Property Group Ltd. | 2,052,000 | 1,139 |
| | Shanghai Lingang Holdings Corp. Ltd. Class B | 1,030,189 | 1,137 |
| | | Shares | Market
Value•
($000) |
| | Ronshine China Holdings Ltd. | 2,773,500 | 1,122 |
| | Road King Infrastructure Ltd. | 1,099,000 | 1,114 |
| 1 | Yuzhou Group Holdings Co. Ltd. | 9,954,383 | 1,085 |
| *,1 | LVGEM China Real Estate Investment Co. Ltd. | 4,752,000 | 1,079 |
| | Financial Street Holdings Co. Ltd. Class A | 1,169,518 | 1,072 |
| | China Merchants Commercial REIT | 2,930,000 | 1,042 |
| 1 | Sunkwan Properties Group Ltd. | 3,318,000 | 1,002 |
| 1 | Huijing Holdings Co. Ltd. | 4,024,000 | 989 |
| 1 | Yincheng International Holding Co. Ltd. | 2,712,000 | 959 |
| | Joy City Property Ltd. | 17,397,500 | 906 |
| * | Suning Universal Co. Ltd. Class A | 1,201,775 | 901 |
| *,1 | Leading Holdings Group Ltd. | 1,311,000 | 901 |
| | Jiangsu Zhongnan Construction Group Co. Ltd. Class A | 1,502,088 | 899 |
| * | China Fortune Land Development Co. Ltd. Class A | 1,545,164 | 889 |
| | Lushang Health Industry Development Co. Ltd. Class A | 398,498 | 833 |
| | JY Grandmark Holdings Ltd. | 2,151,000 | 831 |
| * | Gree Real Estate Co. Ltd. Class A | 769,189 | 808 |
| | Yango Group Co. Ltd. Class A | 1,604,775 | 807 |
| | Greenland Hong Kong Holdings Ltd. | 3,772,000 | 802 |
| | Hangzhou Binjiang Real Estate Group Co. Ltd. Class A | 1,222,447 | 780 |
| | Beijing Capital Development Co. Ltd. Class A | 998,076 | 767 |
| | Shanghai Industrial Urban Development Group Ltd. | 8,872,799 | 764 |
| 1 | DaFa Properties Group Ltd. | 1,118,970 | 725 |
| 1 | Jingrui Holdings Ltd. | 2,504,000 | 703 |
| | Beijing North Star Co. Ltd. Class H | 4,262,000 | 684 |
| | Huafa Industrial Co. Ltd. Zhuhai Class A | 816,824 | 671 |
| * | Grandjoy Holdings Group Co. Ltd. Class A | 1,301,002 | 669 |
| | Central China Real Estate Ltd. | 4,431,000 | 666 |
| | Shanghai Shimao Co. Ltd. Class A | 1,295,204 | 640 |
| | Shanghai Shibei Hi-Tech Co. Ltd. Class B | 2,313,109 | 639 |
| * | GR Properties Ltd. | 4,658,000 | 598 |
Global ex-U.S. Real Estate Index Fund
| | | Shares | Market
Value•
($000) |
| *,2 | Yida China Holdings Ltd. | 4,084,000 | 576 |
| | China World Trade Center Co. Ltd. Class A | 249,764 | 531 |
| | China-Singapore Suzhou Industrial Park Development Group Co. Ltd. Class A | 380,636 | 521 |
| | Shanghai Jinqiao Export Processing Zone Development Co. Ltd. Class A | 294,396 | 519 |
| | Greattown Holdings Ltd. Class A | 899,912 | 498 |
| * | Cinda Real Estate Co. Ltd. Class A | 954,393 | 479 |
| 2 | Fantasia Holdings Group Co. Ltd. | 6,439,443 | 463 |
| | Shanghai Industrial Development Co. Ltd. Class A | 702,532 | 426 |
| * | Xinji Shaxi Group Co. Ltd. | 3,273,000 | 412 |
| | Chongqing Dima Industry Co. Ltd. Class A | 979,187 | 354 |
| * | Zhong An Group Ltd. | 8,838,000 | 352 |
| | Shenzhen Properties & Resources Development Group Ltd. Class A | 203,800 | 351 |
| | Hefei Urban Construction Development Co. Ltd. Class A | 317,300 | 351 |
| 1,3 | China Vast Industrial Urban Development Co. Ltd. | 1,191,000 | 344 |
| | Shenzhen Zhenye Group Co. Ltd. Class A | 516,934 | 337 |
| | Shenzhen Special Economic Zone Real Estate & Properties Group Co. Ltd. Class A | 316,900 | 337 |
| * | Sichuan Languang Development Co. Ltd. Class A | 1,166,344 | 315 |
| * | Tahoe Group Co. Ltd. Class A | 1,005,439 | 311 |
| | Shenzhen SEG Co. Ltd. Class A | 354,078 | 308 |
| * | Silver Grant International Holdings Group Ltd. | 3,890,000 | 254 |
| | Rongan Property Co. Ltd. Class A | 616,444 | 229 |
| * | Myhome Real Estate Development Group Co. Ltd. Class A | 901,145 | 223 |
| | Beijing North Star Co. Ltd. Class A | 639,373 | 223 |
| * | Red Star Macalline Group Corp. Ltd. Class A | 155,341 | 221 |
| 1,2 | Sinic Holdings Group Co. Ltd. Class H | 2,979,000 | 191 |
| | | Shares | Market
Value•
($000) |
| | Shenzhen SEG Co. Ltd. Class B | 124,400 | 31 |
| | KWG Living Group Holdings Ltd. | 44,127 | 30 |
| | China Merchants Land Ltd. | 72,000 | 8 |
| * | C&D Property Management Group Co. Ltd. | 12,000 | 7 |
| | Central China Management Co. Ltd. | 48,000 | 7 |
| * | Guorui Properties Ltd. | 60,000 | 3 |
| | | | 484,222 |
| Egypt (0.1%) |
| | Talaat Moustafa Group | 4,784,034 | 2,260 |
| | Six of October Development & Investment | 1,310,257 | 1,534 |
| | Palm Hills Developments SAE | 6,909,705 | 846 |
| | Medinet Nasr Housing | 4,171,816 | 626 |
| | Heliopolis Housing | 1,889,687 | 536 |
| * | Emaar Misr for Development SAE | 2,958,705 | 440 |
| | | | 6,242 |
| Finland (0.3%) |
| | Kojamo OYJ | 742,105 | 16,626 |
| 1 | Citycon OYJ | 374,426 | 3,078 |
| | | | 19,704 |
| France (2.7%) |
| *,1 | Unibail-Rodamco-Westfield | 573,642 | 40,961 |
| | Gecina SA | 267,662 | 37,456 |
| | Klepierre SA | 972,721 | 23,157 |
| | Covivio | 232,973 | 20,179 |
| | ICADE | 157,810 | 12,376 |
| | Nexity SA | 243,177 | 11,117 |
| | Altarea SCA | 18,470 | 3,949 |
| | Carmila SA | 225,847 | 3,422 |
| 1 | Mercialys SA | 245,012 | 2,662 |
| | | | 155,279 |
| Germany (6.0%) |
| | Vonovia SE | 2,834,665 | 171,959 |
| | LEG Immobilien SE (XETR) | 358,740 | 53,360 |
| | Aroundtown SA | 4,768,959 | 33,142 |
| | TAG Immobilien AG | 721,025 | 21,906 |
| | alstria office REIT-AG | 877,310 | 16,399 |
| | Grand City Properties SA | 510,910 | 13,086 |
| | Deutsche Wohnen SE | 210,176 | 10,766 |
| 3 | Instone Real Estate Group SE | 231,387 | 6,100 |
| 1,3 | ADLER Group SA | 405,101 | 5,495 |
| | Deutsche EuroShop AG | 242,875 | 4,943 |
| | Hamborner REIT AG | 347,701 | 3,902 |
| | DIC Asset AG | 193,003 | 3,388 |
| | | | 344,446 |
| Greece (0.0%) |
| * | LAMDA Development SA | 332,318 | 2,739 |
Global ex-U.S. Real Estate Index Fund
| | | Shares | Market
Value•
($000) |
| Hong Kong (8.4%) |
| | Sun Hung Kai Properties Ltd. | 7,565,441 | 100,305 |
| | Link REIT | 10,306,289 | 91,308 |
| | CK Asset Holdings Ltd. | 9,691,113 | 59,863 |
| | Wharf Real Estate Investment Co. Ltd. | 7,626,652 | 43,077 |
| | Hongkong Land Holdings Ltd. | 5,747,712 | 31,740 |
| | Henderson Land Development Co. Ltd. | 6,435,936 | 26,948 |
| *,3 | ESR Cayman Ltd. | 7,086,400 | 22,931 |
| | Hang Lung Properties Ltd. | 9,078,932 | 21,071 |
| 1 | Sino Land Co. Ltd. | 15,282,022 | 20,087 |
| | Swire Properties Ltd. | 5,176,200 | 13,877 |
| | Hysan Development Co. Ltd. | 2,962,655 | 10,285 |
| | Hang Lung Group Ltd. | 4,074,103 | 9,540 |
| | Kerry Properties Ltd. | 2,863,832 | 8,095 |
| | Fortune REIT | 7,052,861 | 7,316 |
| | Champion REIT | 9,307,512 | 4,882 |
| | Sunlight REIT | 4,926,400 | 2,845 |
| | K Wah International Holdings Ltd. | 6,813,338 | 2,725 |
| | Prosperity REIT | 6,170,649 | 2,425 |
| | Far East Consortium International Ltd. | 5,507,000 | 1,816 |
| | Zensun Enterprises Ltd. | 2,634,000 | 1,497 |
| * | SF REIT | 2,553,000 | 1,251 |
| | New World Development Co. Ltd. | 84,000 | 364 |
| | Great Eagle Holdings Ltd. | 24,000 | 66 |
| | Chinese Estates Holdings Ltd. | 30,000 | 15 |
| | | | 484,329 |
| India (1.4%) |
| * | Godrej Properties Ltd. | 575,257 | 17,183 |
| | DLF Ltd. | 3,049,304 | 16,286 |
| | Embassy Office Parks REIT | 1,630,800 | 7,622 |
| * | Oberoi Realty Ltd. | 573,255 | 6,937 |
| | Phoenix Mills Ltd. | 457,005 | 5,900 |
| 3 | Mindspace Business Parks REIT | 1,080,024 | 4,715 |
| | Prestige Estates Projects Ltd. | 690,046 | 3,939 |
| | Brigade Enterprises Ltd. | 634,426 | 3,937 |
| * | Macrotech Developers Ltd. | 242,643 | 3,473 |
| * | Indiabulls Real Estate Ltd. | 1,658,737 | 3,375 |
| 3 | Brookfield India Real Estate Trust | 684,771 | 2,627 |
| | Sobha Ltd. | 177,067 | 1,823 |
| | Sunteck Realty Ltd. | 237,072 | 1,461 |
| * | Mahindra Lifespace Developers Ltd. | 383,979 | 1,413 |
| | NESCO Ltd. | 109,321 | 890 |
| * | Hemisphere Properties India Ltd. | 370,914 | 669 |
| | | | 82,250 |
| | | Shares | Market
Value•
($000) |
| Indonesia (0.3%) |
| * | Bumi Serpong Damai Tbk PT | 44,785,627 | 3,516 |
| | Ciputra Development Tbk PT | 42,927,291 | 3,260 |
| * | Summarecon Agung Tbk PT | 43,878,481 | 2,839 |
| * | Pakuwon Jati Tbk PT | 73,526,428 | 2,602 |
| * | Pollux Properti Indonesia Tbk PT | 8,605,000 | 2,006 |
| * | Lippo Karawaci Tbk PT | 159,897,749 | 1,673 |
| *,2 | Hanson International Tbk PT | 444,252,900 | 1,568 |
| * | Mega Manunggal Property Tbk PT | 22,076,300 | 896 |
| * | Alam Sutera Realty Tbk PT | 58,188,897 | 749 |
| | Puradelta Lestari Tbk PT | 42,574,000 | 674 |
| * | Kawasan Industri Jababeka Tbk PT | 28,929,400 | 323 |
| *,2 | Armidian Karyatama Tbk PT | 34,315,100 | 121 |
| * | Dms Propertindo Tbk | 144,000 | 2 |
| *,2 | Modernland Realty Tbk PT | 67,400 | — |
| | | | 20,229 |
| Ireland (0.2%) |
| | Hibernia REIT plc | 3,250,978 | 4,749 |
| | Irish Residential Properties REIT plc | 2,102,040 | 3,969 |
| | | | 8,718 |
| Israel (1.9%) |
| | Azrieli Group Ltd. | 179,186 | 16,758 |
| | Alony Hetz Properties & Investments Ltd. | 727,478 | 11,911 |
| | Mivne Real Estate KD Ltd. | 2,917,101 | 10,635 |
| * | Melisron Ltd. | 112,107 | 9,488 |
| | Big Shopping Centers Ltd. | 53,799 | 8,069 |
| | Amot Investments Ltd. | 870,157 | 6,651 |
| * | Airport City Ltd. | 323,824 | 6,182 |
| | REIT 1 Ltd. | 875,744 | 5,476 |
| | Mega Or Holdings Ltd. | 110,686 | 4,385 |
| | Gav-Yam Lands Corp. Ltd. | 295,479 | 3,517 |
| | Sella Capital Real Estate Ltd. | 1,005,724 | 3,320 |
| *,1 | Summit Real Estate Holdings Ltd. | 173,769 | 3,157 |
| | Israel Canada T.R Ltd. | 583,198 | 2,815 |
| | Gazit-Globe Ltd. | 333,292 | 2,701 |
| * | AFI Properties Ltd. | 47,812 | 2,483 |
| | YH Dimri Construction & Development Ltd. | 33,821 | 2,428 |
| * | Property & Building Corp. Ltd. | 13,305 | 1,890 |
| | Blue Square Real Estate Ltd. | 24,051 | 1,861 |
| | Isras Investment Co. Ltd. | 7,929 | 1,771 |
| | Electra Real Estate Ltd. | 99,847 | 1,556 |
| * | Brack Capital Properties NV | 11,363 | 1,326 |
| | Israel Land Development - Urban Renewal Ltd. | 74,904 | 1,049 |
Global ex-U.S. Real Estate Index Fund
| | | Shares | Market
Value•
($000) |
| | Prashkovsky Investments and Construction Ltd. | 31,097 | 980 |
| | Norstar Holdings Inc. | 111,719 | 960 |
| | | | 111,369 |
| Italy (0.0%) |
| * | Immobiliare Grande Distribuzione SIIQ SpA | 277,281 | 1,216 |
| 3 | COIMA RES SpA | 86,153 | 689 |
| | | | 1,905 |
| Japan (22.3%) |
| | Mitsui Fudosan Co. Ltd. | 4,757,457 | 108,774 |
| | Daiwa House Industry Co. Ltd. | 3,282,874 | 108,303 |
| | Mitsubishi Estate Co. Ltd. | 6,855,745 | 104,187 |
| | Sumitomo Realty & Development Co. Ltd. | 2,345,767 | 84,776 |
| | Nippon Building Fund Inc. | 8,146 | 52,924 |
| | Nippon Prologis REIT Inc. | 12,724 | 42,499 |
| | Daito Trust Construction Co. Ltd. | 339,625 | 42,108 |
| | Japan Real Estate Investment Corp. | 6,825 | 41,832 |
| | GLP J-REIT | 22,128 | 36,094 |
| | Nomura Real Estate Master Fund Inc. | 23,234 | 34,792 |
| | Japan Metropolitan Fund Investment | 34,443 | 31,637 |
| | Daiwa House REIT Investment Corp. | 10,365 | 29,744 |
| | Hulic Co. Ltd. | 2,877,937 | 27,673 |
| | Orix JREIT Inc. | 13,604 | 22,570 |
| | Advance Residence Investment Corp. | 6,825 | 22,432 |
| | United Urban Investment Corp. | 15,366 | 19,155 |
| | Industrial & Infrastructure Fund Investment Corp. | 10,201 | 18,704 |
| | Japan Prime Realty Investment Corp. | 4,721 | 17,316 |
| | Tokyu Fudosan Holdings Corp. | 2,977,944 | 17,255 |
| 1 | Sekisui House REIT Inc. | 21,139 | 15,981 |
| | Tokyo Tatemono Co. Ltd. | 1,030,083 | 15,141 |
| | Activia Properties Inc. | 3,677 | 15,075 |
| | LaSalle Logiport REIT | 8,797 | 14,626 |
| | Nomura Real Estate Holdings Inc. | 574,429 | 14,004 |
| | Nippon Accommodations Fund Inc. | 2,479 | 13,826 |
| | Mitsui Fudosan Logistics Park Inc. | 2,538 | 13,492 |
| 1 | Kenedix Office Investment Corp. | 2,114 | 13,385 |
| | Japan Logistics Fund Inc. | 4,460 | 13,341 |
| | Japan Hotel REIT Investment Corp. | 22,010 | 13,292 |
| | | Shares | Market
Value•
($000) |
| | Invincible Investment Corp. | 30,041 | 11,877 |
| | AEON REIT Investment Corp. | 8,328 | 11,258 |
| | Frontier Real Estate Investment Corp. | 2,506 | 11,087 |
| | Mori Hills REIT Investment Corp. | 8,026 | 10,882 |
| | Daiwa Securities Living Investments Corp. | 10,504 | 10,611 |
| | Kenedix Residential Next Investment Corp. | 4,908 | 9,438 |
| | Daiwa Office Investment Corp. | 1,443 | 9,314 |
| | Comforia Residential REIT Inc. | 3,108 | 9,059 |
| | Katitas Co. Ltd. | 247,892 | 9,051 |
| | Hulic REIT Inc. | 5,935 | 8,991 |
| 1 | NTT UD REIT Investment Corp. | 6,488 | 8,612 |
| | NIPPON REIT Investment Corp. | 2,218 | 8,526 |
| | Mitsubishi Estate Logistics REIT Investment Corp. | 1,927 | 8,333 |
| | Tokyu REIT Inc. | 4,578 | 7,681 |
| | Japan Excellent Inc. | 6,334 | 7,648 |
| | Kenedix Retail REIT Corp. | 2,868 | 7,318 |
| | Hoshino Resorts REIT Inc. | 1,109 | 7,241 |
| | Aeon Mall Co. Ltd. | 469,383 | 6,876 |
| | Heiwa Real Estate REIT Inc. | 4,581 | 6,396 |
| | Mori Trust Sogo REIT Inc. | 4,748 | 6,134 |
| | Ichigo Office REIT Investment Corp. | 7,456 | 5,648 |
| | Fukuoka REIT Corp. | 3,570 | 5,299 |
| | Heiwa Real Estate Co. Ltd. | 162,532 | 5,131 |
| | Hankyu Hanshin REIT Inc. | 3,430 | 5,059 |
| | Global One Real Estate Investment Corp. | 4,739 | 4,881 |
| | CRE Logistics REIT Inc. | 2,462 | 4,790 |
| | Star Asia Investment Corp. | 8,814 | 4,676 |
| | SOSiLA Logistics REIT Inc. | 3,014 | 4,532 |
| | Itochu Advance Logistics Investment Corp. | 2,777 | 3,955 |
| | Starts Corp. Inc. | 161,600 | 3,883 |
| | Daibiru Corp. | 271,557 | 3,779 |
| 1 | Mirai Corp. | 8,151 | 3,763 |
| | SAMTY Co. Ltd. | 167,400 | 3,723 |
| | Samty Residential Investment Corp. | 3,492 | 3,685 |
| | Ichigo Inc. | 1,218,400 | 3,647 |
| | One REIT Inc. | 1,182 | 3,170 |
| | Keihanshin Building Co. Ltd. | 225,000 | 2,811 |
| 1 | Starts Proceed Investment Corp. | 1,088 | 2,286 |
| | Takara Leben Real Estate Investment Corp. | 2,287 | 2,230 |
Global ex-U.S. Real Estate Index Fund
| | | Shares | Market
Value•
($000) |
| 1 | ESCON Japan REIT Investment Corp. | 1,734 | 2,152 |
| * | SRE Holdings Corp. | 30,600 | 2,126 |
| | Health Care & Medical Investment Corp. | 1,530 | 2,104 |
| * | Leopalace21 Corp. | 907,950 | 1,956 |
| 1 | Sankei Real Estate Inc. | 1,759 | 1,930 |
| | Mori Trust Hotel REIT Inc. | 1,551 | 1,926 |
| 1 | Tosei REIT Investment Corp. | 1,555 | 1,790 |
| | TOC Co. Ltd. | 246,829 | 1,384 |
| | Tosei Corp. | 139,200 | 1,338 |
| | Sun Frontier Fudousan Co. Ltd. | 135,700 | 1,273 |
| *,1 | TKP Corp. | 75,200 | 1,217 |
| | Shinoken Group Co. Ltd. | 118,200 | 1,168 |
| | Takara Leben Co. Ltd. | 408,152 | 1,112 |
| | Goldcrest Co. Ltd. | 76,040 | 1,090 |
| 1 | Ichigo Hotel REIT Investment Corp. | 1,260 | 1,078 |
| | Xymax REIT Investment Corp. | 1,035 | 1,060 |
| 1 | Ooedo Onsen REIT Investment Corp. | 1,179 | 843 |
| 1 | CRE Inc. | 52,800 | 828 |
| | Nippon Commercial Development Co. Ltd. | 53,900 | 819 |
| | Star Mica Holdings Co. Ltd. | 59,700 | 790 |
| | Marimo Regional Revitalization REIT Inc. | 676 | 782 |
| | Japan Property Management Center Co. Ltd. | 62,300 | 632 |
| | Arealink Co. Ltd. | 45,500 | 619 |
| | Dear Life Co. Ltd. | 112,300 | 564 |
| | Airport Facilities Co. Ltd. | 100,900 | 516 |
| | Tokyo Rakutenchi Co. Ltd. | 13,900 | 496 |
| 1 | Good Com Asset Co. Ltd. | 39,100 | 468 |
| 1 | Ardepro Co. Ltd. | 816,300 | 387 |
| * | Mirainovate Co. Ltd. | 178,329 | 355 |
| | | | 1,291,022 |
| Kuwait (0.2%) |
| | Commercial Real Estate Co. KSC | 7,239,283 | 3,239 |
| * | National Real Estate Co. KPSC | 4,461,954 | 3,200 |
| * | Kuwait Real Estate Co. KSC | 2,815,791 | 1,683 |
| * | Al Mazaya Holding Co. KSCP | 2,476,398 | 652 |
| | | | 8,774 |
| Malaysia (0.6%) |
| | KLCCP Stapled Group | 2,562,670 | 4,211 |
| | Sunway REIT | 9,181,534 | 3,243 |
| | IGB REIT | 7,784,400 | 3,158 |
| | IOI Properties Group Bhd. | 9,498,100 | 2,940 |
| * | SP Setia Bhd. Group | 6,607,900 | 2,487 |
| | Axis REIT | 5,367,300 | 2,477 |
| | | Shares | Market
Value•
($000) |
| | Sime Darby Property Bhd. | 13,389,900 | 2,347 |
| | Mah Sing Group Bhd. | 8,016,825 | 1,569 |
| | Matrix Concepts Holdings Bhd. | 2,954,528 | 1,533 |
| | Eco World Development Group Bhd. (XKLS) | 6,156,900 | 1,518 |
| | UOA Development Bhd. | 3,307,300 | 1,397 |
| | Pavilion REIT | 3,601,300 | 1,233 |
| | YNH Property Bhd. | 1,654,700 | 1,068 |
| | YTL Hospitality REIT | 3,764,600 | 909 |
| | OSK Holdings Bhd | 4,152,500 | 904 |
| * | UEM Sunrise Bhd. | 6,887,565 | 657 |
| | Eco World International Bhd | 4,131,600 | 489 |
| * | Sunway Bhd. Warrants Exp. 10/3/24 | 1,339,862 | 144 |
| * | Eco World Development Group Bhd. Warrants Exp. 3/26/22 | 450,320 | 1 |
| | | | 32,285 |
| Mexico (0.7%) |
| | Fibra Uno Administracion SA | 14,598,385 | 14,508 |
| | Corp. Inmobiliaria Vesta SAB de CV | 3,224,591 | 5,613 |
| | PLA Administradora Industrial S de RL de CV | 3,896,200 | 5,458 |
| | Prologis Property Mexico SA de CV | 2,215,553 | 5,100 |
| | Concentradora Fibra Danhos SA de CV | 4,062,292 | 4,909 |
| 3 | Macquarie Mexico Real Estate Management SA de CV | 3,561,380 | 4,248 |
| | | | 39,836 |
| Netherlands (0.3%) |
| 3 | CTP NV | 293,219 | 6,227 |
| �� | Eurocommercial Properties NV | 194,478 | 4,539 |
| | NSI NV | 87,119 | 3,492 |
| | Wereldhave NV | 197,779 | 3,070 |
| | Vastned Retail NV | 90,456 | 2,578 |
| | | | 19,906 |
| New Zealand (0.5%) |
| | Goodman Property Trust | 5,161,013 | 9,203 |
| | Precinct Properties New Zealand Ltd. | 5,966,963 | 7,143 |
| | Kiwi Property Group Ltd. | 7,728,405 | 6,481 |
| | Argosy Property Ltd. | 4,147,732 | 4,642 |
| | Vital Healthcare Property Trust | 1,891,035 | 3,972 |
| | | | 31,441 |
| Norway (0.4%) |
| 3 | Entra ASA | 897,341 | 22,398 |
| | Selvaag Bolig ASA | 211,998 | 1,305 |
| | | | 23,703 |
| Other (0.5%)4 |
| 5 | Vanguard Real Estate ETF | 259,314 | 28,276 |
Global ex-U.S. Real Estate Index Fund
| | | Shares | Market
Value•
($000) |
| Philippines (1.2%) |
| | SM Prime Holdings Inc. | 55,490,707 | 36,502 |
| | Ayala Land Inc. | 28,987,660 | 20,190 |
| | Megaworld Corp. | 57,927,100 | 3,529 |
| | Robinson's Land Corp. | 9,960,872 | 3,367 |
| | AREIT Inc. | 2,022,100 | 1,717 |
| | Vista Land & Lifescapes Inc. | 14,967,178 | 1,121 |
| | DDMP REIT Inc. | 30,444,000 | 1,089 |
| | Filinvest Land Inc. | 41,587,000 | 950 |
| | DoubleDragon Properties Corp. | 3,449,960 | 704 |
| | | | 69,169 |
| Poland (0.1%) |
| | Develia SA | 2,161,936 | 1,946 |
| * | EPP NV | 2,177,173 | 1,707 |
| | | | 3,653 |
| Qatar (0.2%) |
| | Barwa Real Estate Co. | 9,440,856 | 8,185 |
| * | Ezdan Holding Group QSC | 7,836,239 | 3,333 |
| | | | 11,518 |
| Romania (0.0%) |
| | MAS Real Estate Inc. | 2,099,321 | 2,472 |
| Russia (0.0%) |
| | Etalon Group plc GDR (Registered) | 970,580 | 1,530 |
| | INGRAD PJSC | 37,444 | 710 |
| | | | 2,240 |
| Saudi Arabia (0.6%) |
| * | Dar Al Arkan Real Estate Development Co. | 2,652,059 | 6,999 |
| * | Emaar Economic City | 2,053,904 | 6,947 |
| | Arabian Centres Co. Ltd. | 515,657 | 3,510 |
| | Arriyadh Development Co. | 427,863 | 3,036 |
| * | Saudi Real Estate Co. | 412,789 | 2,460 |
| | Jadwa REIT Saudi Fund | 604,629 | 2,355 |
| | Al Rajhi REIT | 587,799 | 1,912 |
| | Derayah REIT | 492,946 | 1,734 |
| | Riyad REIT Fund | 597,086 | 1,645 |
| | Alandalus Property Co. | 219,069 | 1,177 |
| | Musharaka Real Estate Income Fund | 297,551 | 792 |
| | Alahli REIT Fund 1 | 208,548 | 774 |
| | Sedco Capital REIT Fund | 152,904 | 503 |
| | Al Maather REIT Fund | 197,064 | 494 |
| | Alkhabeer REIT | 192,844 | 471 |
| * | Swicorp Wabel REIT | 203,729 | 423 |
| | | | 35,232 |
| Singapore (5.8%) |
| | CapitaLand Integrated Commercial Trust | 24,573,868 | 39,133 |
| | Ascendas REIT | 16,532,484 | 37,866 |
| * | Capitaland Investment Ltd. | 12,305,738 | 31,392 |
| | Mapletree Logistics Trust | 14,182,918 | 21,268 |
| | Mapletree Industrial Trust | 9,565,391 | 19,526 |
| | Mapletree Commercial Trust | 10,796,741 | 17,464 |
| | | Shares | Market
Value•
($000) |
| | Frasers Logistics & Commercial Trust | 14,310,252 | 16,114 |
| | City Developments Ltd. | 2,318,790 | 12,587 |
| | UOL Group Ltd. | 2,319,478 | 12,440 |
| | Suntec REIT | 10,653,627 | 11,795 |
| | Keppel DC REIT | 6,196,924 | 10,973 |
| | Frasers Centrepoint Trust | 5,313,040 | 9,501 |
| | Mapletree North Asia Commercial Trust | 10,643,166 | 8,065 |
| | Keppel REIT | 9,607,615 | 8,041 |
| | Ascott Residence Trust | 9,050,122 | 6,920 |
| | Parkway Life REIT | 1,907,397 | 6,597 |
| | Manulife US REIT | 7,127,310 | 5,071 |
| | ESR-REIT | 13,789,498 | 4,915 |
| | Cromwell European REIT | 1,514,666 | 4,622 |
| | CapitaLand China Trust | 5,080,408 | 4,601 |
| | ARA LOGOS Logistics Trust | 6,502,731 | 4,347 |
| | OUE Commercial REIT | 11,781,767 | 3,926 |
| | Ascendas India Trust | 3,571,800 | 3,690 |
| 2 | SPH REIT | 4,788,500 | 3,466 |
| | Wing Tai Holdings Ltd. | 2,350,600 | 3,383 |
| | CDL Hospitality Trusts | 3,741,306 | 3,329 |
| | Starhill Global REIT | 6,878,668 | 3,294 |
| | Keppel Pacific Oak US REIT | 3,823,500 | 3,040 |
| | Lendlease Global Commercial REIT | 4,355,200 | 2,828 |
| | Far East Hospitality Trust | 5,134,592 | 2,458 |
| | AIMS APAC REIT | 2,226,076 | 2,377 |
| | Prime US REIT | 2,744,000 | 2,371 |
| | Yanlord Land Group Ltd. | 2,800,104 | 2,328 |
| | Sasseur REIT | 2,563,000 | 1,617 |
| | OUE Ltd. | 1,428,200 | 1,463 |
| | First REIT | 5,929,226 | 1,164 |
| | IREIT Global | 2,136,953 | 1,030 |
| | Tuan Sing Holdings Ltd. | 2,469,000 | 901 |
| | EC World REIT | 1,266,900 | 751 |
| *,2 | Eagle Hospitality Trust | 2,602,300 | 356 |
| | Frasers Hospitality Trust | 44,400 | 16 |
| | Sabana Industrial REIT | 43,200 | 14 |
| | Chip Eng Seng Corp. Ltd. | 28,800 | 9 |
| | Oxley Holdings Ltd. | 45,600 | 7 |
| | Lippo Malls Indonesia Retail Trust | 31,800 | 1 |
| | | | 337,057 |
| South Africa (1.2%) |
| | NEPI Rockcastle plc | 2,338,364 | 15,632 |
| | Growthpoint Properties Ltd. | 16,907,098 | 14,310 |
| * | Redefine Properties Ltd. | 26,836,489 | 7,914 |
| | Resilient REIT Ltd. | 1,597,212 | 5,847 |
| | Fortress REIT Ltd. Class A | 5,931,949 | 5,175 |
| 1 | Equites Property Fund Ltd. | 3,497,090 | 4,661 |
| | Vukile Property Fund Ltd. | 4,338,911 | 3,462 |
| 1 | Hyprop Investments Ltd. | 1,522,765 | 2,956 |
| | Stor-Age Property REIT Ltd. | 2,126,422 | 1,953 |
Global ex-U.S. Real Estate Index Fund
| | | Shares | Market
Value•
($000) |
| | Investec Property Fund Ltd. | 2,787,043 | 1,938 |
| 1 | SA Corporate Real Estate Ltd. | 12,391,453 | 1,732 |
| * | Attacq Ltd. | 3,666,867 | 1,564 |
| | Arrowhead Properties Ltd. Class B | 4,176,014 | 1,088 |
| | Emira Property Fund Ltd. | 1,391,529 | 858 |
| * | Fortress REIT Ltd. Class B | 3,943,669 | 633 |
| | | | 69,723 |
| South Korea (0.3%) |
| | LOTTE REIT Co. Ltd. | 599,520 | 2,905 |
| | ESR Kendall Square REIT Co. Ltd. | 491,202 | 2,867 |
| | JR REIT XXVII | 566,430 | 2,699 |
| | Mirae Asset Maps Asia Pacific Real Estate 1 Investment | 421,836 | 1,788 |
| | Shinhan Alpha REIT Co. Ltd. | 210,461 | 1,451 |
| | Korea Real Estate Investment & Trust Co. Ltd. | 712,944 | 1,430 |
| | SK D&D Co. Ltd. | 36,049 | 976 |
| | Koramco Energy Plus REIT | 165,064 | 965 |
| | IGIS Value Plus REIT Co. Ltd. | 119,878 | 603 |
| | | | 15,684 |
| Spain (0.6%) |
| | Merlin Properties Socimi SA | 1,643,187 | 17,795 |
| | Inmobiliaria Colonial Socimi SA | 1,307,219 | 12,711 |
| 3 | Aedas Homes SA | 91,562 | 2,632 |
| *,3 | Metrovacesa SA | 220,355 | 1,932 |
| | Lar Espana Real Estate Socimi SA | 300,387 | 1,829 |
| | | | 36,899 |
| Sweden (4.8%) |
| * | Fastighets AB Balder Class B | 518,094 | 37,566 |
| 1 | Samhallsbyggnadsbolaget i Norden AB | 5,073,834 | 34,014 |
| | Sagax AB Class B | 820,045 | 32,096 |
| | Castellum AB | 1,120,203 | 29,857 |
| | Fabege AB | 1,336,325 | 22,619 |
| | Wallenstam AB Class B | 1,033,307 | 18,136 |
| | Wihlborgs Fastigheter AB | 658,487 | 15,612 |
| | Nyfosa AB | 827,948 | 13,974 |
| 1 | Kungsleden AB | 806,201 | 11,087 |
| | Hufvudstaden AB Class A | 579,781 | 9,277 |
| | Catena AB | 144,127 | 8,781 |
| * | Pandox AB Class B | 439,352 | 7,743 |
| | Atrium Ljungberg AB Class B | 235,534 | 5,408 |
| | Cibus Nordic Real Estate AB | 196,968 | 5,212 |
| | NP3 Fastigheter AB | 140,598 | 4,994 |
| | Dios Fastigheter AB | 423,406 | 4,926 |
| | Platzer Fastigheter Holding AB Class B | 300,429 | 4,896 |
| | | Shares | Market
Value•
($000) |
| * | K-fast Holding AB Class B | 302,029 | 2,769 |
| | Samhallsbyggnadsbolaget i Norden AB Class D | 738,672 | 2,688 |
| | Sagax AB Class D | 578,046 | 2,206 |
| 1 | Akelius Residential Property AB Class D | 1,074,585 | 2,147 |
| * | Annehem Fastigheter AB Class B | 193,547 | 831 |
| | | | 276,839 |
| Switzerland (1.7%) |
| | Swiss Prime Site AG (Registered) | 374,197 | 38,043 |
| | PSP Swiss Property AG (Registered) | 225,955 | 28,246 |
| | Allreal Holding AG (Registered) | 71,393 | 15,099 |
| | Mobimo Holding AG (Registered) | 32,514 | 10,958 |
| | Intershop Holding AG | 6,078 | 3,802 |
| | | | 96,148 |
| Taiwan (1.0%) |
| | Ruentex Development Co. Ltd. | 6,734,580 | 17,188 |
| | Highwealth Construction Corp. | 5,136,598 | 8,294 |
| | Huaku Development Co. Ltd. | 1,162,854 | 3,804 |
| | Chong Hong Construction Co. Ltd. | 1,092,297 | 2,899 |
| | Prince Housing & Development Corp. | 5,453,478 | 2,602 |
| | Kindom Development Co. Ltd. | 1,847,900 | 2,551 |
| | Farglory Land Development Co. Ltd. | 1,026,631 | 2,481 |
| | Cathay Real Estate Development Co. Ltd. | 2,445,100 | 1,715 |
| | Hung Sheng Construction Ltd. | 1,718,520 | 1,492 |
| | Sakura Development Co. Ltd. | 1,083,931 | 1,226 |
| | Advancetek Enterprise Co. Ltd. | 1,255,000 | 1,133 |
| | Chung Lien Co. Ltd. | 391,000 | 1,080 |
| | ZongTai Real Estate Development Co. Ltd. | 771,516 | 1,077 |
| | Kuo Yang Construction Co. Ltd. | 1,226,802 | 1,059 |
| | KEE TAI Properties Co. Ltd. | 2,062,869 | 974 |
| * | Shining Building Business Co. Ltd. | 2,284,869 | 912 |
| | Hong Pu Real Estate Development Co. Ltd. | 1,054,194 | 825 |
| * | King's Town Construction Co. Ltd. | 596,000 | 784 |
| | Huang Hsiang Construction Corp. | 554,000 | 728 |
| | Hung Ching Development & Construction Co. Ltd. | 670,000 | 721 |
| * | Delpha Construction Co. Ltd. | 1,149,000 | 616 |
Global ex-U.S. Real Estate Index Fund
| | | Shares | Market
Value•
($000) |
| | Yungshin Construction & Development Co. Ltd. | 273,000 | 589 |
| | GTM Holdings Corp. | 635,000 | 571 |
| * | Taiwan Land Development Corp. | 3,341,000 | 408 |
| | Yea Shin International Development Co. Ltd. | 509,000 | 385 |
| | | | 56,114 |
| Thailand (1.0%) |
| | Central Pattana PCL | 6,667,500 | 11,931 |
| | CPN Retail Growth Leasehold REIT | 9,305,435 | 6,011 |
| | Land & Houses PCL (Registered) | 17,998,800 | 4,592 |
| | Lotus's Retail Growth Freehold And Leasehold Property Fund | 8,520,230 | 4,194 |
| | WHA Corp. PCL | 38,121,386 | 3,891 |
| | Frasers Property THA | 6,951,000 | 2,786 |
| | Supalai PCL | 3,821,481 | 2,696 |
| | WHA Premium Growth Freehold & Leasehold REIT Class F | 6,558,196 | 2,609 |
| | Amata Corp. PCL | 2,798,023 | 1,724 |
| 1 | Origin Property PCL Class F | 4,765,098 | 1,624 |
| * | MBK PCL | 3,582,392 | 1,513 |
| | Quality Houses PCL | 21,391,200 | 1,483 |
| | IMPACT Growth REIT | 2,457,000 | 1,465 |
| | Bangkok Land PCL | 43,334,895 | 1,438 |
| | AP Thailand PCL | 4,861,920 | 1,298 |
| | Pruksa Holding PCL | 2,991,600 | 1,244 |
| * | Pruksa Real Estate PCL | 3,024,500 | 943 |
| 1 | SC Asset Corp. PCL | 8,625,140 | 931 |
| | Hemaraj Leasehold REIT | 3,137,700 | 861 |
| | Sansiri PCL | 22,103,525 | 842 |
| *,1 | U City PCL Class F | 15,098,624 | 815 |
| * | Singha Estate PCL | 13,228,400 | 807 |
| | Ally Leasehold REIT (XBKK) | 3,118,900 | 700 |
| | Noble Development PCL | 3,103,828 | 614 |
| 1 | LPN Development PCL | 3,088,000 | 464 |
| 1 | Sansiri PCL NDVR | 4,235,675 | 161 |
| * | Singha Estate PCL | 783,600 | 48 |
| * | Mbk W3 Warrants Exp. 10/22/27 | 143,296 | 47 |
| * | MBK PCL Warrants Exp. 11/15/23 | 127,968 | 43 |
| | SC Asset Corp. PCL NVDR | 251,197 | 29 |
| | Ally Leasehold REIT | 123,900 | 28 |
| * | Noble Development PCL Warrants Exp. 1/12/24 | 783,375 | 27 |
| * | Hemaraj Leasehold REIT | 86,200 | 24 |
| | IMPACT Growth REIT (XBKK) | 27,900 | 17 |
| *,2 | PACE Development Corp. PCL Warrants Exp. 8/29/22 | 11,308,800 | 7 |
| | | Shares | Market
Value•
($000) |
| | S Prime Growth Leasehold REIT | 30,200 | 6 |
| | | | 57,913 |
| Turkey (0.1%) |
| | Emlak Konut Gayrimenkul Yatirim Ortakligi A/S | 9,436,747 | 1,940 |
| | Yeni Gimat Gayrimenkul Ortakligi A/S | 604,795 | 948 |
| * | Ziraat Gayrimenkul Yatirim Ortakligi A/S | 4,111,466 | 854 |
| * | Sinpas Gayrimenkul Yatirim Ortakligi A/S | 1,499,349 | 630 |
| * | Is Gayrimenkul Yatirim Ortakligi A/S | 2,341,623 | 467 |
| * | Vakif Gayrimenkul Yatirim Ortakligi A/S | 2,706,341 | 447 |
| | | | 5,286 |
| United Arab Emirates (1.0%) |
| | Aldar Properties PJSC | 18,947,449 | 20,848 |
| | Emaar Properties PJSC | 17,300,034 | 18,939 |
| * | Emaar Malls PJSC | 9,677,411 | 5,282 |
| * | Emaar Development PJSC | 4,141,024 | 4,418 |
| * | DAMAC Properties Dubai Co. PJSC | 9,497,879 | 3,239 |
| * | RAK Properties PJSC | 4,766,146 | 952 |
| * | Manazel PJSC | 6,332,506 | 949 |
| * | Deyaar Development PJSC | 7,271,480 | 589 |
| * | Eshraq Investments PJSC | 5,727,226 | 504 |
| | | | 55,720 |
| United Kingdom (8.2%) |
| | Segro plc | 5,915,177 | 104,548 |
| | Land Securities Group plc | 3,702,646 | 34,784 |
| | British Land Co. plc | 4,622,595 | 31,212 |
| | UNITE Group plc | 1,966,445 | 29,361 |
| | Tritax Big Box REIT plc | 8,479,592 | 26,095 |
| | Derwent London plc | 553,052 | 25,582 |
| | Big Yellow Group plc | 851,703 | 17,220 |
| | Safestore Holdings plc | 1,038,701 | 17,075 |
| | LondonMetric Property plc | 4,484,094 | 16,038 |
| | Grainger plc | 3,649,210 | 15,348 |
| | Primary Health Properties plc | 6,556,973 | 13,771 |
| | Assura plc | 13,196,857 | 13,157 |
| | Great Portland Estates plc | 1,251,696 | 12,516 |
| | Shaftesbury plc | 1,420,011 | 12,120 |
| | Sirius Real Estate Ltd. | 5,241,359 | 9,682 |
| | Capital & Counties Properties plc | 4,195,189 | 9,462 |
| 1 | Hammerson plc | 20,712,738 | 9,095 |
| | Workspace Group plc | 633,717 | 7,125 |
| | LXI REIT plc | 3,450,152 | 6,923 |
| | GCP Student Living plc | 2,242,970 | 6,458 |
| | Supermarket Income REIT plc | 3,996,089 | 6,457 |
| | BMO Commercial Property Trust Ltd. | 3,936,879 | 5,510 |
| | UK Commercial Property REIT Ltd. | 4,227,237 | 4,389 |
Global ex-U.S. Real Estate Index Fund
| | | Shares | Market
Value•
($000) |
| | Civitas Social Housing plc | 3,064,535 | 3,936 |
| | Empiric Student Property plc | 2,976,024 | 3,599 |
| | Picton Property Income Ltd. | 2,700,141 | 3,584 |
| | Helical plc | 525,612 | 3,313 |
| | PRS REIT plc | 2,298,313 | 3,207 |
| | Impact Healthcare REIT plc | 1,729,050 | 2,797 |
| | Custodian REIT plc | 2,073,550 | 2,753 |
| | CLS Holdings plc | 896,111 | 2,742 |
| | Phoenix Spree Deutschland Ltd. | 494,099 | 2,711 |
| 3 | Regional REIT Ltd. | 2,129,453 | 2,558 |
| 3 | Triple Point Social Housing REIT plc | 1,826,813 | 2,438 |
| | Standard Life Investment Property Income Trust Ltd. | 2,005,235 | 2,020 |
| | Schroder REIT Ltd. | 2,788,394 | 1,912 |
| | Home REIT plc | 1,186,087 | 1,863 |
| | NewRiver REIT plc | 1,513,798 | 1,614 |
| | AEW UK REIT plc | 784,208 | 1,149 |
| 1,2 | Intu Properties plc | 5,001,586 | — |
| | | | 476,124 |
| Total Common Stocks (Cost $5,701,457) | 5,743,803 |
| Temporary Cash Investments (3.3%) |
| Money Market Fund (3.3%) |
| 6,7 | Vanguard Market Liquidity Fund, 0.070% (Cost $191,392) | 1,913,994 | 191,399 |
| Total Investments (102.6%) (Cost $5,892,849) | 5,935,202 |
| Other Assets and Liabilities—Net (-2.6%) | (152,495) |
| Net Assets (100%) | 5,782,707 |
| Cost is in $000. |
| • | See Note A in Notes to Financial Statements. |
| * | Non-income-producing security. |
| 1 | Includes partial security positions on loan to broker-dealers. The total value of securities on loan is $161,260,000. |
| 2 | Security value determined using significant unobservable inputs. |
| 3 | Security exempt from registration under Rule 144A of the Securities Act of 1933. Such securities may be sold in transactions exempt from registration, normally to qualified institutional buyers. At October 31, 2021, the aggregate value was $135,190,000, representing 2.3% of net assets. |
| 4 | “Other” represents securities that are not classified by the fund’s benchmark index. |
| 5 | Considered an affiliated company of the fund as the issuer is another member of The Vanguard Group. |
| 6 | Affiliated money market fund available only to Vanguard funds and certain trusts and accounts managed by Vanguard. Rate shown is the 7-day yield. |
| 7 | Collateral of $187,138,000 was received for securities on loan, of which $186,578,000 is held in Vanguard Market Liquidity Fund and $560,000 is held in cash. |
| GDR—Global Depositary Receipt. |
| NVDR—Non-Voting Depository Receipt. |
| REIT—Real Estate Investment Trust. |
Global ex-U.S. Real Estate Index Fund
Derivative Financial Instruments Outstanding as of Period End
| Futures Contracts |
| | | | ($000) |
| | Expiration | Number of
Long (Short)
Contracts | Notional
Amount | Value and
Unrealized
Appreciation
(Depreciation) |
| Long Futures Contracts | | | | |
| E-mini S&P 500 Index | December 2021 | 20 | 4,597 | 85 |
| MSCI Emerging Markets Index | December 2021 | 332 | 20,949 | (503) |
| Topix Index | December 2021 | 85 | 14,860 | (436) |
| | | | | (854) |
| Forward Currency Contracts |
| | Contract
Settlement
Date | Contract Amount (000) | Unrealized
Appreciation
($000) | Unrealized
Depreciation
($000) |
| Counterparty | Receive | Deliver |
| Deutsche Bank AG | 12/15/21 | HKD | 61,572 | USD | 7,907 | 7 | — |
| UBS AG | 12/15/21 | JPY | 1,115,054 | USD | 10,150 | — | (362) |
| UBS AG | 12/15/21 | JPY | 141,960 | USD | 1,243 | 3 | — |
| State Street Bank & Trust Co. | 11/4/21 | PHP | 824 | USD | 16 | — | — |
| Bank of America, N.A. | 12/15/21 | USD | 2,788 | AUD | 3,776 | — | (53) |
| Bank of Montreal | 12/15/21 | USD | 5,751 | EUR | 4,851 | 137 | — |
| JPMorgan Chase Bank, N.A. | 12/15/21 | USD | 3,132 | GBP | 2,267 | 29 | — |
| JPMorgan Chase Bank, N.A. | 12/15/21 | USD | 11,770 | HKD | 91,562 | 1 | — |
| Bank of America, N.A. | 12/15/21 | USD | 9,490 | JPY | 1,084,636 | — | (31) |
| Barclays Bank plc | 12/15/21 | USD | 5,268 | JPY | 586,725 | 117 | — |
| | | | | | | 294 | (446) |
| AUD—Australian dollar. |
| EUR—euro. |
| GBP—British pound. |
| HKD—Hong Kong dollar. |
| JPY—Japanese yen. |
| PHP—Philippines Peso. |
| USD—U.S. dollar. |
See accompanying Notes, which are an integral part of the Financial Statements.
Global ex-U.S. Real Estate Index Fund
Statement of Assets and Liabilities
|
| ($000s, except shares and per-share amounts) | Amount |
| Assets | |
| Investments in Securities, at Value | |
| Unaffiliated Issuers (Cost $5,679,749) | 5,715,527 |
| Affiliated Issuers (Cost $213,100) | 219,675 |
| Total Investments in Securities | 5,935,202 |
| Investment in Vanguard | 197 |
| Cash | 15,897 |
| Cash Collateral Pledged—Futures Contracts | 2,417 |
| Cash Collateral Pledged—Forward Currency Contracts | 370 |
| Foreign Currency, at Value (Cost $75,030) | 75,112 |
| Receivables for Investment Securities Sold | 40,597 |
| Receivables for Accrued Income | 22,041 |
| Receivables for Capital Shares Issued | 302 |
| Unrealized Appreciation—Forward Currency Contracts | 294 |
| Total Assets | 6,092,429 |
| Liabilities | |
| Payables for Investment Securities Purchased | 116,593 |
| Collateral for Securities on Loan | 187,138 |
| Payables for Capital Shares Redeemed | 2,362 |
| Payables to Vanguard | 305 |
| Variation Margin Payable—Futures Contracts | 449 |
| Unrealized Depreciation—Forward Currency Contracts | 446 |
| Deferred Foreign Capital Gains Taxes | 2,429 |
| Total Liabilities | 309,722 |
| Net Assets | 5,782,707 |
Global ex-U.S. Real Estate Index Fund
Statement of Assets and Liabilities (continued)
|
| At October 31, 2021, net assets consisted of: | |
| ($000s, except shares and per-share amounts) | Amount |
| Paid-in Capital | 6,260,292 |
| Total Distributable Earnings (Loss) | (477,585) |
| Net Assets | 5,782,707 |
| |
| ETF Shares—Net Assets | |
Applicable to 88,353,487 outstanding $.001 par value shares of
beneficial interest (unlimited authorization) | 5,070,609 |
| Net Asset Value Per Share—ETF Shares | $57.39 |
| |
| Admiral Shares—Net Assets | |
Applicable to 14,352,276 outstanding $.001 par value shares of
beneficial interest (unlimited authorization) | 499,417 |
| Net Asset Value Per Share—Admiral Shares | $34.80 |
| |
| Institutional Shares—Net Assets | |
Applicable to 1,835,606 outstanding $.001 par value shares of
beneficial interest (unlimited authorization) | 212,681 |
| Net Asset Value Per Share—Institutional Shares | $115.86 |
See accompanying Notes, which are an integral part of the Financial Statements.
Global ex-U.S. Real Estate Index Fund
|
| | Year Ended
October 31, 2021 |
| | ($000) |
| Investment Income | |
| Income | |
| Dividends—Unaffiliated Issuers1 | 223,160 |
| Dividends—Affiliated Issuers | 686 |
| Interest—Unaffiliated Issuers | 7 |
| Interest—Affiliated Issuers | 11 |
| Securities Lending—Net | 3,596 |
| Total Income | 227,460 |
| Expenses | |
| The Vanguard Group—Note B | |
| Investment Advisory Services | 873 |
| Management and Administrative—ETF Shares | 4,447 |
| Management and Administrative—Admiral Shares | 407 |
| Management and Administrative—Institutional Shares | 207 |
| Marketing and Distribution—ETF Shares | 127 |
| Marketing and Distribution—Admiral Shares | 18 |
| Marketing and Distribution—Institutional Shares | 7 |
| Custodian Fees | 600 |
| Auditing Fees | 40 |
| Shareholders’ Reports—ETF Shares | 195 |
| Shareholders’ Reports—Admiral Shares | 6 |
| Shareholders’ Reports—Institutional Shares | — |
| Trustees’ Fees and Expenses | 2 |
| Total Expenses | 6,929 |
| Net Investment Income | 220,531 |
| Realized Net Gain (Loss) | |
| Investment Securities Sold—Unaffiliated Issuers2,3 | 69,467 |
| Investment Securities Sold—Affiliated Issuers | 78 |
| Futures Contracts | 9,665 |
| Swap Contracts | 167 |
| Forward Currency Contracts | (131) |
| Foreign Currencies | 400 |
| Realized Net Gain (Loss) | 79,646 |
Global ex-U.S. Real Estate Index Fund
| Statement of Operations (continued) |
| | Year Ended
October 31, 2021 |
| | ($000) |
| Change in Unrealized Appreciation (Depreciation) | |
| Investment Securities—Unaffiliated Issuers4 | 869,174 |
| Investment Securities—Affiliated Issuers | 6,692 |
| Futures Contracts | (586) |
| Swap Contracts | (41) |
| Forward Currency Contracts | (34) |
| Foreign Currencies | (233) |
| Change in Unrealized Appreciation (Depreciation) | 874,972 |
| Net Increase (Decrease) in Net Assets Resulting from Operations | 1,175,149 |
| 1 | Dividends are net of foreign withholding taxes of $17,600,000. |
| 2 | Realized gain (loss) is net of foreign capital gain taxes of $2,000. |
| 3 | Includes $145,009,000 of net gain (loss) resulting from in-kind redemptions. |
| 4 | The change in unrealized appreciation (depreciation) is net of the change in deferred foreign capital gains taxes of $2,429,000. |
See accompanying Notes, which are an integral part of the Financial Statements.
Global ex-U.S. Real Estate Index Fund
Statement of Changes in Net Assets
|
| | Year Ended October 31, |
| | 2021
($000) | 2020
($000) |
| | | |
| Increase (Decrease) in Net Assets | | |
| Operations | | |
| Net Investment Income | 220,531 | 195,576 |
| Realized Net Gain (Loss) | 79,646 | (110,687) |
| Change in Unrealized Appreciation (Depreciation) | 874,972 | (1,222,266) |
| Net Increase (Decrease) in Net Assets Resulting from Operations | 1,175,149 | (1,137,377) |
| Distributions | | |
| ETF Shares | (99,846) | (358,889) |
| Admiral Shares | (9,656) | (37,035) |
| Institutional Shares | (5,091) | (14,097) |
| Total Distributions | (114,593) | (410,021) |
| Capital Share Transactions | | |
| ETF Shares | (70,397) | (372,426) |
| Admiral Shares | (13,827) | (56,772) |
| Institutional Shares | (38,740) | 27,341 |
| Net Increase (Decrease) from Capital Share Transactions | (122,964) | (401,857) |
| Total Increase (Decrease) | 937,592 | (1,949,255) |
| Net Assets | | |
| Beginning of Period | 4,845,115 | 6,794,370 |
| End of Period | 5,782,707 | 4,845,115 |
See accompanying Notes, which are an integral part of the Financial Statements.
Global ex-U.S. Real Estate Index Fund
| ETF Shares | | | | | |
For a Share Outstanding
Throughout Each Period | Year Ended October 31, |
| 2021 | 2020 | 2019 | 2018 | 2017 |
| Net Asset Value, Beginning of Period | $47.04 | $60.79 | $52.99 | $59.49 | $53.35 |
| Investment Operations | | | | | |
| Net Investment Income1 | 2.145 | 1.761 | 2.033 | 2.672 | 1.900 |
| Net Realized and Unrealized Gain (Loss) on Investments | 9.312 | (11.864) | 7.969 | (6.240) | 6.325 |
| Total from Investment Operations | 11.457 | (10.103) | 10.002 | (3.568) | 8.225 |
| Distributions | | | | | |
| Dividends from Net Investment Income | (1.107) | (3.647) | 2.202 | (2.932) | (2.085) |
| Distributions from Realized Capital Gains | — | — | — | — | — |
| Total Distributions | (1.107) | (3.647) | 2.202 | (2.932) | (2.085) |
| Net Asset Value, End of Period | $57.39 | $47.04 | $60.79 | $52.99 | $59.49 |
| Total Return | 24.47% | -17.71% | 19.47% | -6.42% | 16.13% |
| Ratios/Supplemental Data | | | | | |
| Net Assets, End of Period (Millions) | $5,071 | $4,219 | $5,945 | $5,270 | $5,122 |
| Ratio of Total Expenses to Average Net Assets | 0.12% | 0.12% | 0.12% | 0.12% | 0.14% |
| Ratio of Net Investment Income to Average Net Assets | 3.80% | 3.44% | 3.54% | 4.51% | 3.44% |
| Portfolio Turnover Rate2 | 7% | 11% | 7% | 7% | 6% |
| 1 | Calculated based on average shares outstanding. |
| 2 | Excludes the value of portfolio securities received or delivered as a result of in-kind purchases or redemptions of the fund’s capital shares, including ETF Creation Units. |
See accompanying Notes, which are an integral part of the Financial Statements.
Global ex-U.S. Real Estate Index Fund
| Admiral Shares | | | | | |
For a Share Outstanding
Throughout Each Period | Year Ended October 31, |
| 2021 | 2020 | 2019 | 2018 | 2017 |
| Net Asset Value, Beginning of Period | $28.51 | $36.84 | $32.11 | $36.05 | $32.33 |
| Investment Operations | | | | | |
| Net Investment Income1 | 1.302 | 1.079 | 1.236 | 1.620 | 1.141 |
| Net Realized and Unrealized Gain (Loss) on Investments | 5.656 | (7.199) | 4.828 | (3.784) | 3.844 |
| Total from Investment Operations | 6.958 | (6.120) | 6.064 | (2.164) | 4.985 |
| Distributions | | | | | |
| Dividends from Net Investment Income | (.668) | (2.210) | 1.334 | (1.776) | (1.265) |
| Distributions from Realized Capital Gains | — | — | — | — | — |
| Total Distributions | (.668) | (2.210) | 1.334 | (1.776) | (1.265) |
| Net Asset Value, End of Period | $34.80 | $28.51 | $36.84 | $32.11 | $36.05 |
| Total Return2 | 24.48% | -17.71% | 19.46% | -6.43% | 16.15% |
| Ratios/Supplemental Data | | | | | |
| Net Assets, End of Period (Millions) | $499 | $421 | $617 | $475 | $453 |
| Ratio of Total Expenses to Average Net Assets | 0.12% | 0.12% | 0.12% | 0.12% | 0.14% |
| Ratio of Net Investment Income to Average Net Assets | 3.80% | 3.49% | 3.55% | 4.51% | 3.44% |
| Portfolio Turnover Rate3 | 7% | 11% | 7% | 7% | 6% |
| 1 | Calculated based on average shares outstanding. |
| 2 | Total returns do not include transaction or account service fees that may have applied in the periods shown. Fund prospectuses provide information about any applicable transaction and account service fees. |
| 3 | Excludes the value of portfolio securities received or delivered as a result of in-kind purchases or redemptions of the fund’s capital shares, including ETF Creation Units. |
See accompanying Notes, which are an integral part of the Financial Statements.
Global ex-U.S. Real Estate Index Fund
| Institutional Shares | | | | | |
For a Share Outstanding
Throughout Each Period | Year Ended October 31, |
| 2021 | 2020 | 2019 | 2018 | 2017 |
| Net Asset Value, Beginning of Period | $94.98 | $122.73 | $106.98 | $120.11 | $107.71 |
| Investment Operations | | | | | |
| Net Investment Income1 | 4.376 | 3.646 | 4.143 | 5.543 | 3.889 |
| Net Realized and Unrealized Gain (Loss) on Investments | 18.763 | (24.030) | 16.064 | (12.740) | 12.741 |
| Total from Investment Operations | 23.139 | (20.384) | 20.207 | (7.197) | 16.630 |
| Distributions | | | | | |
| Dividends from Net Investment Income | (2.259) | (7.366) | 4.457 | (5.933) | (4.230) |
| Distributions from Realized Capital Gains | — | — | — | — | — |
| Total Distributions | (2.259) | (7.366) | 4.457 | (5.933) | (4.230) |
| Net Asset Value, End of Period | $115.86 | $94.98 | $122.73 | $106.98 | $120.11 |
| Total Return2 | 24.44% | -17.71% | 19.46% | -6.42% | 16.17% |
| Ratios/Supplemental Data | | | | | |
| Net Assets, End of Period (Millions) | $213 | $205 | $232 | $115 | $156 |
| Ratio of Total Expenses to Average Net Assets | 0.11% | 0.11% | 0.11% | 0.11% | 0.12% |
| Ratio of Net Investment Income to Average Net Assets | 3.84% | 3.55% | 3.57% | 4.52% | 3.46% |
| Portfolio Turnover Rate3 | 7% | 11% | 7% | 7% | 6% |
| 1 | Calculated based on average shares outstanding. |
| 2 | Total returns do not include transaction fees that may have applied in the periods shown. Fund prospectuses provide information about any applicable transaction fees. |
| 3 | Excludes the value of portfolio securities received or delivered as a result of in-kind purchases or redemptions of the fund’s capital shares, including ETF Creation Units. |
See accompanying Notes, which are an integral part of the Financial Statements.
Global ex-U.S. Real Estate Index Fund
Notes to Financial Statements
Vanguard Global ex-U.S. Real Estate Index Fund is registered under the Investment Company Act of 1940 as an open-end investment company, or mutual fund. The fund invests in securities of foreign issuers, which may subject it to investment risks not normally associated with investing in securities of U.S. corporations. The fund offers three classes of shares: ETF Shares, Admiral Shares, and Institutional Shares. Each of the share classes has different eligibility and minimum purchase requirements, and is designed for different types of investors. ETF Shares are listed for trading on Nasdaq; they can be purchased and sold through a broker.
Market disruptions associated with the COVID-19 pandemic have had a global impact, and uncertainty exists as to the long-term implications. Such disruptions can adversely affect assets of the fund and thus fund performance.
| A. | The following significant accounting policies conform to generally accepted accounting principles for U.S. investment companies. The fund consistently follows such policies in preparing its financial statements. |
1. Security Valuation: Securities are valued as of the close of trading on the New York Stock Exchange (generally 4 p.m., Eastern time) on the valuation date. Equity securities are valued at the latest quoted sales prices or official closing prices taken from the primary market in which each security trades; such securities not traded on the valuation date are valued at the mean of the latest quoted bid and asked prices. Securities for which market quotations are not readily available, or whose values have been affected by events occurring before the fund’s pricing time but after the close of the securities’ primary markets, are valued at their fair values calculated according to procedures adopted by the board of trustees. These procedures include obtaining quotations from an independent pricing service, monitoring news to identify significant market- or security-specific events, and evaluating changes in the values of foreign market proxies (for example, ADRs, futures contracts, or exchange-traded funds), between the time the foreign markets close and the fund’s pricing time. When fair-value pricing is employed, the prices of securities used by a fund to calculate its net asset value may differ from quoted or published prices for the same securities.
Investments in Vanguard Market Liquidity Fund are valued at that fund's net asset value.
Temporary cash investments are valued using the latest bid prices or using valuations based on a matrix system (which considers such factors as security prices, yields, maturities, and ratings), both as furnished by independent pricing services.
2. Foreign Currency: Securities and other assets and liabilities denominated in foreign currencies are translated into U.S. dollars using exchange rates obtained from an independent third party as of the fund’s pricing time on the valuation date. Realized gains (losses) and unrealized appreciation (depreciation) on investment securities include the effects of changes in exchange rates since the securities were purchased, combined with the effects of changes in security prices. Fluctuations in the value of other assets and liabilities resulting from changes in exchange rates are recorded as unrealized foreign currency gains (losses) until the assets or liabilities are settled in cash, at which time they are recorded as realized foreign currency gains (losses).
3. Futures Contracts: The fund uses index futures contracts to a limited extent, with the objectives of maintaining full exposure to the stock market, maintaining liquidity, and minimizing transaction costs. The fund may purchase futures contracts to immediately invest incoming cash in the market, or sell futures in response to cash outflows, thereby simulating a fully invested position in the underlying index while maintaining a cash balance for liquidity. The primary risks associated with the use of futures contracts are imperfect correlation between changes in market values of stocks held by the fund and the prices of futures contracts, and the possibility of an illiquid market.
Global ex-U.S. Real Estate Index Fund
Counterparty risk involving futures is mitigated because a regulated clearinghouse is the counterparty instead of the clearing broker. To further mitigate counterparty risk, the fund trades futures contracts on an exchange, monitors the financial strength of its clearing brokers and clearinghouse, and has entered into clearing agreements with its clearing brokers. The clearinghouse imposes initial margin requirements to secure the fund’s performance and requires daily settlement of variation margin representing changes in the market value of each contract. Any securities pledged as initial margin for open contracts are noted in the Schedule of Investments.
Futures contracts are valued at their quoted daily settlement prices. The notional amounts of the contracts are not recorded in the Statement of Assets and Liabilities. Fluctuations in the value of the contracts are recorded in the Statement of Assets and Liabilities as an asset (liability) and in the Statement of Operations as unrealized appreciation (depreciation) until the contracts are closed, when they are recorded as realized gains (losses) on futures contracts.
During the year ended October 31, 2021, the fund’s average investments in long and short futures contracts represented 1% and 0% of net assets, respectively, based on the average of the notional amounts at each quarter-end during the period.
4. Forward Currency Contracts: The fund enters into forward currency contracts to protect the value of securities and related receivables and payables against changes in future foreign exchange rates. The fund’s risks in using these contracts include movement in the values of the foreign currencies relative to the U.S. dollar and the ability of the counterparties to fulfill their obligations under the contracts. The fund mitigates its counterparty risk by entering into forward currency contracts only with a diverse group of prequalified counterparties, monitoring their financial strength, entering into master netting arrangements with its counterparties, and requiring its counterparties to transfer collateral as security for their performance. In the absence of a default, the collateral pledged or received by the fund cannot be repledged, resold, or rehypothecated. The master netting arrangements provide that, in the event of a counterparty’s default (including bankruptcy), the fund may terminate the forward currency contracts, determine the net amount owed by either party in accordance with its master netting arrangements, and sell or retain any collateral held up to the net amount owed to the fund under the master netting arrangements. The forward currency contracts contain provisions whereby a counterparty may terminate open contracts if the fund’s net assets decline below a certain level, triggering a payment by the fund if the fund is in a net liability position at the time of the termination. The payment amount would be reduced by any collateral the fund has pledged. Any securities pledged as collateral for open contracts are noted in the Schedule of Investments. The value of collateral received or pledged is compared daily to the value of the forward currency contracts exposure with each counterparty, and any difference, if in excess of a specified minimum transfer amount, is adjusted and settled within two business days.
Forward currency contracts are valued at their quoted daily prices obtained from an independent third party, adjusted for currency risk based on the expiration date of each contract. The notional amounts of the contracts are not recorded in the Statement of Assets and Liabilities. Fluctuations in the value of the contracts are recorded in the Statement of Assets and Liabilities as an asset (liability) and in the Statement of Operations as unrealized appreciation (depreciation) until the contracts are closed, when they are recorded as realized gains (losses) on forward currency contracts.
Global ex-U.S. Real Estate Index Fund
During the year ended October 31, 2021, the fund’s average investment in forward currency contracts represented 1% of net assets, based on the average of the notional amounts at each quarter-end during the period.
5. Swap Contracts: The fund has entered into equity swap contracts to earn the total return on selected reference stocks in the fund’s target index. Under the terms of the swaps, the fund receives the total return on the referenced stock (i.e., receiving the increase or paying the decrease in value of the selected reference stock and receiving the equivalent of any dividends in respect of the selected referenced stock) over a specified period of time, applied to a notional amount that represents the value of a designated number of shares of the selected reference stock at the beginning of the equity swap contract. The fund also pays a floating rate that is based on short-term interest rates, applied to the notional amount. At the same time, the fund generally invests an amount approximating the notional amount of the swap in high-quality temporary cash investments.
A risk associated with all types of swaps is the possibility that a counterparty may default on its obligation to pay net amounts due to the fund. The fund’s maximum amount subject to counterparty risk is the unrealized appreciation on the swap contract. The fund mitigates its counterparty risk by entering into swaps only with a diverse group of prequalified counterparties, monitoring their financial strength, entering into master netting arrangements with its counterparties, and requiring its counterparties to transfer collateral as security for their performance. In the absence of a default, the collateral pledged or received by the fund cannot be repledged, resold, or rehypothecated. In the event of a counterparty’s default (including bankruptcy), the fund may terminate any swap contracts with that counterparty, determine the net amount owed by either party in accordance with its master netting arrangements, and sell or retain any collateral held up to the net amount owed to the fund under the master netting arrangements. The swap contracts contain provisions whereby a counterparty may terminate open contracts if the fund’s net assets decline below a certain level, triggering a payment by the fund if the fund is in a net liability position at the time of the termination. The payment amount would be reduced by any collateral the fund has pledged. Any securities pledged as collateral for open contracts are noted in the Schedule of Investments. The value of collateral received or pledged is compared daily to the value of the swap contracts exposure with each counterparty, and any difference, if in excess of a specified minimum transfer amount, is adjusted and settled within two business days.
The notional amounts of swap contracts are not recorded in the Statement of Assets and Liabilities. Swaps are valued daily based on market quotations received from independent pricing services or recognized dealers and the change in value is recorded in the Statement of Assets and Liabilities as an asset (liability) and in the Statement of Operations as unrealized appreciation (depreciation) until periodic payments are made or the termination of the swap, at which time realized gain (loss) is recorded.
During the year ended October 31, 2021, the fund’s average amounts of investments in total return swaps represented less than 1% of net assets, based on the average of notional amounts at each quarter-end during the period. The fund had no open swap contracts at October 31, 2021.
6. Federal Income Taxes: The fund intends to continue to qualify as a regulated investment company and distribute all of its taxable income. The fund’s tax returns are open to examination by the relevant tax authorities until expiration of the applicable statute of limitations, which is
Global ex-U.S. Real Estate Index Fund
generally three years after the filing of the tax return. Management has analyzed the fund’s tax positions taken for all open federal and state income tax years, and has concluded that no provision for income tax is required in the fund’s financial statements.
7. Distributions: Distributions to shareholders are recorded on the ex-dividend date. Distributions are determined on a tax basis at the fiscal year-end and may differ from net investment income and realized capital gains for financial reporting purposes.
8. Securities Lending: To earn additional income, the fund lends its securities to qualified institutional borrowers. Security loans are subject to termination by the fund at any time, and are required to be secured at all times by collateral in an amount at least equal to the market value of securities loaned. Daily market fluctuations could cause the value of loaned securities to be more or less than the value of the collateral received. When this occurs, the collateral is adjusted and settled before the opening of the market on the next business day. The fund further mitigates its counterparty risk by entering into securities lending transactions only with a diverse group of prequalified counterparties, monitoring their financial strength, and entering into master securities lending agreements with its counterparties. The master securities lending agreements provide that, in the event of a counterparty’s default (including bankruptcy), the fund may terminate any loans with that borrower, determine the net amount owed, and sell or retain the collateral up to the net amount owed to the fund; however, such actions may be subject to legal proceedings. While collateral mitigates counterparty risk, in the event of a default, the fund may experience delays and costs in recovering the securities loaned. The fund invests cash collateral received in Vanguard Market Liquidity Fund, and records a liability in the Statement of Assets and Liabilities for the return of the collateral, during the period the securities are on loan. Collateral investments in Vanguard Market Liquidity Fund are subject to market appreciation or depreciation. Securities lending income represents fees charged to borrowers plus income earned on invested cash collateral, less expenses associated with the loan. During the term of the loan, the fund is entitled to all distributions made on or in respect of the loaned securities.
9. Credit Facilities and Interfund Lending Program: The fund and certain other funds managed by The Vanguard Group ("Vanguard") participate in a $4.3 billion committed credit facility provided by a syndicate of lenders pursuant to a credit agreement and an uncommitted credit facility provided by Vanguard. Both facilities may be renewed annually. Each fund is individually liable for its borrowings, if any, under the credit facilities. Borrowings may be utilized for temporary or emergency purposes, subject to the fund’s regulatory and contractual borrowing restrictions. With respect to the committed credit facility, the participating funds are charged administrative fees and an annual commitment fee of 0.10% of the undrawn committed amount of the facility; these fees are allocated to the funds based on a method approved by the fund’s board of trustees and included in Management and Administrative expenses on the fund’s Statement of Operations. Any borrowings under either facility bear interest at a rate based upon the higher of the one-month London Interbank Offered Rate (or an acceptable alternate rate, if necessary), federal funds effective rate, or overnight bank funding rate plus an agreed-upon spread, except that borrowings under the uncommitted credit facility may bear interest based upon an alternate rate agreed to by the fund and Vanguard.
In accordance with an exemptive order (the “Order”) from the SEC, the fund may participate in a joint lending and borrowing program that allows registered open-end Vanguard funds to borrow money from and lend money to each other for temporary or emergency purposes (the “Interfund Lending Program”), subject to compliance with the terms and conditions of the Order, and to the extent permitted by the fund’s investment objective and investment policies. Interfund loans and
Global ex-U.S. Real Estate Index Fund
borrowings normally extend overnight, but can have a maximum duration of seven days. Loans may be called on one business day’s notice. The interest rate to be charged is governed by the conditions of the Order and internal procedures adopted by the board of trustees. The board of trustees is responsible for overseeing the Interfund Lending Program.
For the year ended October 31, 2021, the fund did not utilize the credit facilities or the Interfund Lending Program.
10. Other: Dividend income is recorded on the ex-dividend date. Non-cash dividends included in income, if any, are recorded at the fair value of the securities received. Interest income includes income distributions received from Vanguard Market Liquidity Fund and is accrued daily. Premiums and discounts on debt securities are amortized and accreted, respectively, to interest income over the lives of the respective securities, except for premiums on certain callable debt securities that are amortized to the earliest call date. Security transactions are accounted for on the date securities are bought or sold. Costs used to determine realized gains (losses) on the sale of investment securities are those of the specific securities sold. Fees assessed on capital share transactions are credited to paid-in capital.
Taxes on foreign dividends and capital gains have been provided for in accordance with the fund’s understanding of the applicable countries’ tax rules and rates. Deferred foreign capital gains tax, if any, is accrued daily based upon net unrealized gains.
Each class of shares has equal rights as to assets and earnings, except that each class separately bears certain class-specific expenses related to maintenance of shareholder accounts (included in Management and Administrative expenses) and shareholder reporting. Marketing and distribution expenses are allocated to each class of shares based on a method approved by the board of trustees. Income, other non-class-specific expenses, and gains and losses on investments are allocated to each class of shares based on its relative net assets.
| B. | In accordance with the terms of a Funds' Service Agreement (the “FSA”) between Vanguard and the fund, Vanguard furnishes to the fund investment advisory, corporate management, administrative, marketing, and distribution services at Vanguard’s cost of operations (as defined by the FSA). These costs of operations are allocated to the fund based on methods and guidelines approved by the board of trustees and are generally settled twice a month. |
Upon the request of Vanguard, the fund may invest up to 0.40% of its net assets as capital in Vanguard. At October 31, 2021, the fund had contributed to Vanguard capital in the amount of $197,000, representing less than 0.01% of the fund’s net assets and 0.08% of Vanguard’s capital received pursuant to the FSA. The fund’s trustees and officers are also directors and employees, respectively, of Vanguard.
| C. | Various inputs may be used to determine the value of the fund’s investments and derivatives. These inputs are summarized in three broad levels for financial statement purposes. The inputs or methodologies used to value securities are not necessarily an indication of the risk associated with investing in those securities. |
Level 1—Quoted prices in active markets for identical securities.
Level 2—Other significant observable inputs (including quoted prices for similar securities, interest rates, prepayment speeds, credit risk, etc.).
Global ex-U.S. Real Estate Index Fund
Level 3—Significant unobservable inputs (including the fund’s own assumptions used to determine the fair value of investments). Any investments and derivatives valued with significant unobservable inputs are noted on the Schedule of Investments.
The following table summarizes the market value of the fund’s investments and derivatives as of October 31, 2021, based on the inputs used to value them:
| | Level 1
($000) | Level 2
($000) | Level 3
($000) | Total
($000) |
| Investments | | | | |
| Assets | | | | |
| Common Stocks—North and South America | 246,203 | — | — | 246,203 |
| Common Stocks—Other | 33,366 | 5,457,486 | 6,748 | 5,497,600 |
| Temporary Cash Investments | 191,399 | — | — | 191,399 |
| Total | 470,968 | 5,457,486 | 6,748 | 5,935,202 |
| Derivative Financial Instruments | | | | |
| Assets | | | | |
| Futures Contracts1 | 85 | — | — | 85 |
| Forward Currency Contracts | — | 294 | — | 294 |
| Total | 85 | 294 | — | 379 |
| Liabilities | | | | |
| Futures Contracts1 | 939 | — | — | 939 |
| Forward Currency Contracts | — | 446 | — | 446 |
| Total | 939 | 446 | — | 1,385 |
| 1 | Includes cumulative appreciation (depreciation) on futures contracts and centrally cleared swaps, if any, as reported in the Schedule of Investments. Only current day’s variation margin is reported within the Statement of Assets and Liabilities. |
| D. | At October 31, 2021, the fair values of derivatives were reflected in the Statement of Assets and Liabilities as follows: |
| Statement of Assets and Liabilities | Equity
Contracts
($000) | Foreign
Exchange
Contracts
($000) | Total
($000) |
| Unrealized Appreciation—Futures Contracts1 | 85 | — | 85 |
| Unrealized Appreciation—Forward Currency Contracts | — | 294 | 294 |
| Total Assets | 85 | 294 | 379 |
| | | | |
| Unrealized Depreciation—Futures Contracts1 | 939 | — | 939 |
| Unrealized Depreciation—Forward Currency Contracts | — | 446 | 446 |
| Total Liabilities | 939 | 446 | 1,385 |
| 1 | Includes cumulative appreciation (depreciation) on futures contracts and centrally cleared swaps, if any, as reported in the Schedule of Investments. Only current day’s variation margin is reported within the Statement of Assets and Liabilities. |
Global ex-U.S. Real Estate Index Fund
Realized net gain (loss) and the change in unrealized appreciation (depreciation) on derivatives for the year ended October 31, 2021, were:
| Realized Net Gain (Loss) on Derivatives | Equity
Contracts
($000) | Foreign
Exchange
Contracts
($000) | Total
($000) |
| Futures Contracts | 9,665 | — | 9,665 |
| Swap Contracts | 167 | — | 167 |
| Forward Currency Contracts | — | (131) | (131) |
| Realized Net Gain (Loss) on Derivatives | 9,832 | (131) | 9,701 |
| Change in Unrealized Appreciation (Depreciation) on Derivatives |
| Futures Contracts | (586) | — | (586) |
| Swap Contracts | (41) | — | (41) |
| Forward Currency Contracts | — | (34) | (34) |
| Change in Unrealized Appreciation (Depreciation) on Derivatives | (627) | (34) | (661) |
| E. | Permanent differences between book-basis and tax-basis components of net assets are reclassified among capital accounts in the financial statements to reflect their tax character. These reclassifications have no effect on net assets or net asset value per share. As of period end, permanent differences primarily attributable to the accounting for in-kind redemptions, foreign currency transactions, passive foreign investment companies, swap agreements, and tax expense on capital gains were reclassified between the following accounts: |
| | Amount
($000) |
| Paid-in Capital | 127,644 |
| Total Distributable Earnings (Loss) | (127,644) |
Temporary differences between book-basis and tax-basis components of total distributable earnings (loss) arise when certain items of income, gain, or loss are recognized in different periods for financial statement and tax purposes; these differences will reverse at some time in the future. The differences are primarily related to the deferral of losses from wash sales; the recognition of unrealized gains or losses from certain derivative contracts; the recognition of unrealized gains from passive foreign investment companies; and the classification of securities for tax purposes. As of period end, the tax-basis components of total distributable earnings (loss) are detailed in the table as follows:
| | Amount
($000) |
| Undistributed Ordinary Income | 266,075 |
| Undistributed Long-Term Gains | — |
| Capital Loss Carryforwards | (560,789) |
| Qualified Late-Year Losses | — |
| Net Unrealized Gains (Losses) | (182,871) |
Global ex-U.S. Real Estate Index Fund
The tax character of distributions paid was as follows:
| | Year Ended October 31, |
| | 2021
Amount
($000) | 2020
Amount
($000) |
| Ordinary Income* | 114,593 | 410,021 |
| Long-Term Capital Gains | — | — |
| Total | 114,593 | 410,021 |
| * | Includes short-term capital gains, if any. |
As of October 31, 2021, gross unrealized appreciation and depreciation for investments and derivatives based on cost for U.S. federal income tax purposes were as follows:
| | Amount
($000) |
| Tax Cost | 6,115,200 |
| Gross Unrealized Appreciation | 763,519 |
| Gross Unrealized Depreciation | (943,945) |
| Net Unrealized Appreciation (Depreciation) | (180,426) |
| F. | During the year ended October 31, 2021, the fund purchased $1,052,166,000 of investment securities and sold $980,204,000 of investment securities, other than temporary cash investments. Purchases and sales include $392,898,000 and $584,115,000, respectively, in connection with in-kind purchases and redemptions of the fund's capital shares. |
| G. | Capital share transactions for each class of shares were: |
| | Year Ended October 31, | |
| | 2021 | | 2020 |
| | Amount
($000) | Shares
(000) | | Amount
($000) | Shares
(000) |
| ETF Shares | | | | | |
| Issued1 | 561,742 | 9,958 | | 299,697 | 5,699 |
| Issued in Lieu of Cash Distributions | — | — | | — | — |
| Redeemed2 | (632,139) | (11,300) | | (672,123) | (13,800) |
| Net Increase (Decrease)—ETF Shares | (70,397) | (1,342) | | (372,426) | (8,101) |
| Admiral Shares | | | | | |
| Issued1 | 79,528 | 2,366 | | 125,819 | 4,401 |
| Issued in Lieu of Cash Distributions | 7,547 | 223 | | 28,790 | 825 |
| Redeemed2 | (100,902) | (2,990) | | (211,381) | (7,235) |
| Net Increase (Decrease)—Admiral Shares | (13,827) | (401) | | (56,772) | (2,009) |
Global ex-U.S. Real Estate Index Fund
| | Year Ended October 31, | |
| | 2021 | | 2020 |
| | Amount
($000) | Shares
(000) | | Amount
($000) | Shares
(000) |
| Institutional Shares | | | | | |
| Issued1 | 19,957 | 186 | | 32,658 | 330 |
| Issued in Lieu of Cash Distributions | 1,747 | 15 | | 5,630 | 48 |
| Redeemed2 | (60,444) | (524) | | (10,947) | (112) |
| Net Increase (Decrease)—Institutional Shares | (38,740) | (323) | | 27,341 | 266 |
| 1 | Includes purchase fees for fiscal 2021 and 2020 of $253,000 and $396,000, respectively (fund totals). |
| 2 | Net of redemption fees for fiscal 2021 and 2020 of $253,000 and $473,000, respectively (fund totals). |
| H. | Transactions during the period in affiliated underlying Vanguard funds were as follows: |
| | | Current Period Transactions | |
| | Oct. 31,
2020
Market
Value
($000) | Purchases
at Cost
($000) | Proceeds
from
Securities
Sold1
($000) | Realized
Net
Gain
(Loss)
($000) | Change in
Unrealized
App. (Dep.)
($000) | Income
($000) | Capital Gain
Distributions
Received
($000) | Oct. 31,
2021
Market
Value
($000) |
| Vanguard Market Liquidity Fund | 154,274 | NA2 | NA2 | (10) | 11 | 11 | — | 191,399 |
| Vanguard Real Estate ETF | 7,415 | 15,143 | 896 | 88 | 6,681 | 686 | — | 28,276 |
| Total | 161,689 | | | 78 | 6,692 | 697 | — | 219,675 |
| 1 | Does not include adjustments related to return of capital. |
| 2 | Not applicable—purchases and sales are for temporary cash investment purposes. |
| I. | Management has determined that no events or transactions occurred subsequent to October 31, 2021, that would require recognition or disclosure in these financial statements. |
Report of Independent Registered Public Accounting Firm
To the Board of Trustees of Vanguard International Equity Index Funds and Shareholders of Vanguard Global ex-U.S. Real Estate Index Fund
Opinion on the Financial Statements
We have audited the accompanying statement of assets and liabilities, including the schedule of investments, of Vanguard Global ex-U.S. Real Estate Index Fund (one of the funds constituting Vanguard International Equity Index Funds, referred to hereafter as the "Fund") as of October 31, 2021, the related statement of operations for the year ended October 31, 2021, the statement of changes in net assets for each of the two years in the period ended October 31, 2021, including the related notes, and the financial highlights for each of the five years in the period ended October 31, 2021 (collectively referred to as the "financial statements"). In our opinion, the financial statements present fairly, in all material respects, the financial position of the Fund as of October 31, 2021, the results of its operations for the year then ended, the changes in its net assets for each of the two years in the period ended October 31, 2021 and the financial highlights for each of the five years in the period ended October 31, 2021 in conformity with accounting principles generally accepted in the United States of America.
Basis for Opinion
These financial statements are the responsibility of the Fund’s management. Our responsibility is to express an opinion on the Fund’s financial statements based on our audits. We are a public accounting firm registered with the Public Company Accounting Oversight Board (United States) (PCAOB) and are required to be independent with respect to the Fund in accordance with the U.S. federal securities laws and the applicable rules and regulations of the Securities and Exchange Commission and the PCAOB.
We conducted our audits of these financial statements in accordance with the standards of the PCAOB. Those standards require that we plan and perform the audit to obtain reasonable assurance about whether the financial statements are free of material misstatement, whether due to error or fraud.
Our audits included performing procedures to assess the risks of material misstatement of the financial statements, whether due to error or fraud, and performing procedures that respond to those risks. Such procedures included examining, on a test basis, evidence regarding the amounts and disclosures in the financial statements. Our audits also included evaluating the accounting principles used and significant estimates made by management, as well as evaluating the overall presentation of the financial statements. Our procedures included confirmation of securities owned as of October 31, 2021 by correspondence with the custodian, transfer agent and brokers; when replies were not received from the transfer agent or brokers, we performed other auditing procedures. We believe that our audits provide a reasonable basis for our opinion.
/s/PricewaterhouseCoopers LLP
Philadelphia, Pennsylvania
December 16, 2021
We have served as the auditor of one or more investment companies in The Vanguard Group of Funds since 1975.
Special 2021 tax information (unaudited) for Vanguard Global ex-U.S. Real Estate Index Fund
This information for the fiscal year ended October 31, 2021, is included pursuant to provisions of the Internal Revenue Code.
The fund distributed $33,712,000 of qualified dividend income to shareholders during the fiscal year.
The fund designates to shareholders foreign source income of $240,091,000 and foreign taxes paid of $14,582,000. Shareholders will receive more detailed information with their Form 1099-DIV in January 2022 to determine the calendar-year amounts to be included on their 2021 tax returns.
The S&P Global ex-U.S. Property Index is a product of S&P Dow Jones Indices LLC, a division of S&P Global, or its affiliates (“SPDJI”), and has been licensed for use by Vanguard. Standard & Poor’s®, and S&P® are registered trademarks of Standard & Poor’s Financial Services LLC, a division of S&P Global (“S&P”) and Dow Jones® is a registered trademark of Dow Jones Trademark Holdings LLC (“Dow Jones”). The trademarks have been licensed to SPDJI and have been sublicensed for use for certain purposes by Vanguard. Vanguard Global ex-U.S. Real Estate Index Fund is not sponsored, endorsed, sold or promoted by SPDJI, Dow Jones, S&P, any of their respective affiliates (collectively, “S&P Dow Jones Indices”). S&P Dow Jones Indices make no representation or warranty, express or implied, to the owners of the Vanguard Global ex-U.S. Real Estate Index Fund or any member of the public regarding the advisability of investing in securities generally or in Vanguard Global ex-U.S. Real Estate Index Fund particularly or the ability of the S&P Global ex-U.S. Property Index to track general market performance. S&P Dow Jones Indices’ only relationship to Vanguard with respect to the S& P Global ex-U.S. Property Index is the licensing of the Index and certain trademarks, service marks and/or trade names of S&P Dow Jones Indices and/or its licensors. The S&P Global ex-U.S. Property Index is determined, composed and calculated by S&P Dow Jones Indices without regard to Vanguard or the Vanguard Global ex-U.S. Real Estate Index Fund. S&P Dow Jones Indices have no obligation to take the needs of Vanguard or the owners of Vanguard Global ex-U.S. Real Estate Index Fund into consideration in determining, composing or calculating the S&P Global ex-U.S. Property Index. S&P Dow Jones Indices are not responsible for and have not participated in the determination of the prices, and amount of Vanguard Global ex-U.S. Real Estate Index Fund or the timing of the issuance or sale of Vanguard Global ex-U.S. Real Estate Index Fund or in the determination or calculation of the equation by which Vanguard Global ex-U.S. Real Estate Index Fund is to be converted into cash, surrendered or redeemed, as the case may be. S&P Dow Jones Indices have no obligation or liability in connection with the administration, marketing or trading of Vanguard Global ex-U.S. Real Estate Index Fund. There is no assurance that investment products based on the S& P Global ex-U.S. Property Index will accurately track index performance or provide positive investment returns. S&P Dow Jones Indices LLC is not an investment advisor. Inclusion of a security within an index is not a recommendation by S&P Dow Jones Indices to buy, sell, or hold such security, nor is it considered to be investment advice.
S&P DOW JONES INDICES DOES NOT GUARANTEE THE ADEQUACY, ACCURACY, TIMELINESS AND/OR THE COMPLETENESS OF THE S&P GLOBAL EX-U.S. PROPERTY INDEX OR ANY DATA RELATED THERETO OR ANY COMMUNICATION, INCLUDING BUT NOT LIMITED TO, ORAL OR WRITTEN COMMUNICATION (INCLUDING ELECTRONIC COMMUNICATIONS) WITH RESPECT THERETO. S&P DOW JONES INDICES SHALL NOT BE SUBJECT TO ANY DAMAGES OR LIABILITY FOR ANY ERRORS, OMISSIONS, OR DELAYS THEREIN. S&P DOW JONES INDICES MAKE NO EXPRESS OR IMPLIED WARRANTIES, AND EXPRESSLY DISCLAIMS ALL WARRANTIES, OF MERCHANTABILITY OR FITNESS FOR A PARTICULAR PURPOSE OR USE OR AS TO RESULTS TO BE OBTAINED BY VANGUARD, OWNERS OF THE VANGUARD GLOBAL EX-U.S. REAL ESTATE INDEX FUND, OR ANY OTHER PERSON OR ENTITY FROM THE USE OF THE S&P GLOBAL EX-U.S. PROPERTY INDEX OR WITH RESPECT TO ANY DATA RELATED THERETO. WITHOUT LIMITING ANY OF THE FOREGOING, IN NO EVENT WHATSOEVER SHALL S&P DOW JONES INDICES BE LIABLE FOR ANY INDIRECT, SPECIAL, INCIDENTAL, PUNITIVE, OR CONSEQUENTIAL DAMAGES INCLUDING BUT NOT LIMITED TO, LOSS OF PROFITS, TRADING LOSSES, LOST TIME OR GOODWILL, EVEN IF THEY HAVE BEEN ADVISED OF THE POSSIBILITY OF SUCH DAMAGES, WHETHER IN CONTRACT, TORT, STRICT LIABILITY, OR OTHERWISE. THERE ARE NO THIRD PARTY BENEFICIARIES OF ANY AGREEMENTS OR ARRANGEMENTS BETWEEN S&P DOW JONES INDICES AND VANGUARD, OTHER THAN THE LICENSORS OF S&P DOW JONES INDICES.
This page intentionally left blank.
The People Who Govern Your Fund
The trustees of your mutual fund are there to see that the fund is operated and managed in your best interests since, as a shareholder, you are a part owner of the fund. Your fund’s trustees also serve on the board of directors of The Vanguard Group, Inc., which is owned by the Vanguard funds and provides services to them.
A majority of Vanguard’s board members are independent, meaning that they have no affiliation with Vanguard or the funds they oversee, apart from the sizable personal investments they have made as private individuals. The independent board members have distinguished backgrounds in business, academia, and public service. Each of the trustees and executive officers oversees 214 Vanguard funds.
Information for each trustee and executive officer of the fund appears below. That information, as well as the Vanguard fund count, is as of the date on the cover of this fund report. The mailing address of the trustees and officers is P.O. Box 876, Valley Forge, PA 19482. More information about the trustees is in the Statement of Additional Information, which can be obtained, without charge, by contacting Vanguard at 800-662-7447, or online at vanguard.com.
Interested Trustee1
Mortimer J. Buckley
Born in 1969. Trustee since January 2018. Principal occupation(s) during the past five years and other experience: chairman of the board (2019–present) of Vanguard and of each of the investment companies served by Vanguard; chief executive officer (2018–present) of Vanguard; chief executive officer, president, and trustee (2018–present) of each of the investment companies served by Vanguard; president and director (2017–present) of Vanguard; and president (2018–present) of Vanguard Marketing Corporation. Chief investment officer (2013–2017), managing director (2002–2017), head of the Retail Investor Group (2006–2012), and chief information officer (2001–2006) of Vanguard. Chairman of the board (2011–2017) and trustee (2009–2017) of the Children’s Hospital of Philadelphia; and trustee (2018–present) and vice chair (2019–present) of The Shipley School.
Independent Trustees
Emerson U. Fullwood
Born in 1948. Trustee since January 2008. Principal occupation(s) during the past five years and other experience: executive chief staff and marketing officer for North America and corporate vice president (retired 2008) of Xerox Corporation (document management products and services). Former president of the Worldwide Channels Group, Latin
America, and Worldwide Customer Service and executive chief staff officer of Developing Markets of Xerox. Executive in residence and 2009–2010 Distinguished Minett Professor at the Rochester Institute of Technology. Director of SPX FLOW, Inc. (multi-industry manufacturing). Director of the University of Rochester Medical Center, the Monroe Community College Foundation, the United Way of Rochester, North Carolina A&T University, and Roberts Wesleyan College. Trustee of the University of Rochester.
Amy Gutmann
Born in 1949. Trustee since June 2006. Principal occupation(s) during the past five years and other experience: president (2004–present) of the University of Pennsylvania. Christopher H. Browne Distinguished Professor of Political Science, School of Arts and Sciences, and professor of communication, Annenberg School for Communication, with secondary faculty appointments in the Department of Philosophy, School of Arts and Sciences, and at the Graduate School of Education, University of Pennsylvania.
F. Joseph Loughrey
Born in 1949. Trustee since October 2009. Principal occupation(s) during the past five years and other experience: president and chief operating officer (retired 2009) and vice chairman of the board (2008–2009) of Cummins Inc. (industrial machinery). Chairman of the board of Hillenbrand, Inc. (specialized consumer services). Director of the V Foundation.
1 Mr. Buckley is considered an “interested person,” as defined in the Investment Company Act of 1940, because he is an officer of the Vanguard funds.
Member of the advisory council for the College of Arts and Letters and chair of the advisory board to the Kellogg Institute for International Studies, both at the University of Notre Dame. Chairman of the board of Saint Anselm College.
Mark Loughridge
Born in 1953. Trustee since March 2012. Principal occupation(s) during the past five years and other experience: senior vice president and chief financial officer (retired 2013) of IBM (information technology services). Fiduciary member of IBM’s Retirement Plan Committee (2004–2013), senior vice president and general manager (2002–2004) of IBM Global Financing, vice president and controller (1998–2002) of IBM, and a variety of other prior management roles at IBM. Member of the Council on Chicago Booth.
Scott C. Malpass
Born in 1962. Trustee since March 2012. Principal occupation(s) during the past five years and other experience: chief investment officer (retired June 2020) and vice president (retired June 2020) of the University of Notre Dame. Assistant professor (retired June 2020) of finance at the Mendoza College of Business, University of Notre Dame, and member of the Notre Dame 403(b) Investment Committee. Member of the board of Catholic Investment Services, Inc. (investment advisors) and the board of superintendence of the Institute for the Works of Religion.
Deanna Mulligan
Born in 1963. Trustee since January 2018. Principal occupation(s) during the past five years and other experience: board chair (2020), chief executive officer (2011–2020), and president (2010–2019) of The Guardian Life Insurance Company of America. Chief operating officer (2010–2011) and executive vice president (2008–2010) of Individual Life and Disability of the Guardian Life Insurance Company of America. Member of the board of the Economic Club of New York. Trustee of the Partnership for New York City (business leadership), Chief Executives for Corporate Purpose, NewYork-Presbyterian Hospital, and the Bruce Museum (arts and science). Member of the Advisory Council for the Stanford Graduate School of Business.
André F. Perold
Born in 1952. Trustee since December 2004. Principal occupation(s) during the past five years and other experience: George Gund Professor of Finance and Banking, Emeritus at the Harvard Business School (retired 2011). Chief investment officer and co-managing partner of HighVista Strategies (private investment firm). Member of the board
(2018–present) of RIT Capital Partners (investment firm). Member of the investment committee of Partners Health Care System.
Sarah Bloom Raskin
Born in 1961. Trustee since January 2018. Principal occupation(s) during the past five years and other experience: deputy secretary (2014–2017) of the United States Department of the Treasury. Governor (2010–2014) of the Federal Reserve Board. Commissioner (2007–2010) of financial regulation for the State of Maryland. Professor (2020–present), Distinguished Fellow of the Global Financial Markets Center (2020–present), and Rubenstein Fellow (2017–2020) at Duke University. Trustee (2017–present) of Amherst College and member of Amherst College Investment Committee (2019–present). Member of the Regenerative Crisis Response Committee (2020–present).
David A. Thomas
Born in 1956. Trustee since July 2021. Principal occupation(s) during the past five years and other experience: president of Morehouse College (2018–present). Professor of business administration, emeritus at Harvard University (2017–2018). Dean (2011–2016) and professor of management (2016–2017) at the Georgetown University McDonough School of Business. Director of DTE Energy Company (2013–present). Trustee of Common Fund (2019–present).
Peter F. Volanakis
Born in 1955. Trustee since July 2009. Principal occupation(s) during the past five years and other experience: president and chief operating officer (retired 2010) of Corning Incorporated (communications equipment) and director of Corning Incorporated (2000–2010) and Dow Corning (2001–2010). Director (2012) of SPX Corporation (multi-industry manufacturing). Overseer of the Amos Tuck School of Business Administration, Dartmouth College (2001–2013). Chairman of the board of trustees of Colby-Sawyer College. Member of the BMW Group Mobility Council.
Executive Officers
Christine M. Buchanan
Born in 1970. Principal occupation(s) during the past five years and other experience: principal of Vanguard. Chief financial officer (2021–present) and treasurer (2017–present) of each of the investment companies served by Vanguard. Partner (2005–2017) at KPMG (audit, tax, and advisory services).
David Cermak
Born in 1960. Principal occupation(s) during the past five years and other experience: principal of Vanguard. Finance director (2019–present) of each of the investment companies served by Vanguard. Managing director and head (2017–present) of Vanguard Investments Singapore. Managing director and head (2017–2019) of Vanguard Investments Hong Kong. Representative director and head (2014–2017) of Vanguard Investments Japan.
John Galloway
Born in 1973. Principal occupation(s) during the past five years and other experience: principal of Vanguard. Investment stewardship officer (September 2020–present) of each of the investment companies served by Vanguard. Head of Investor Advocacy (February 2020–present) and head of Marketing Strategy and Planning (2017–2020) at Vanguard. Deputy assistant to the President of the United States (2015).
Peter Mahoney
Born in 1974. Principal occupation(s) during the past five years and other experience: principal of Vanguard. Controller (2015–present) of each of the investment companies served by Vanguard. Head of International Fund Services (2008–2014) at Vanguard.
Anne E. Robinson
Born in 1970. Principal occupation(s) during the past five years and other experience: general counsel (2016–present) of Vanguard. Secretary (2016–present) of Vanguard and of each of the investment companies served by Vanguard. Managing director (2016–present) of Vanguard. Managing director and general counsel of Global Cards and Consumer Services (2014–2016) at Citigroup. Counsel (2003–2014) at American Express.
Michael Rollings
Born in 1963. Principal occupation(s) during the past five years and other experience: finance director (2017–present) and treasurer (2017) of each of the investment companies served by Vanguard. Managing director (2016–present) of Vanguard. Chief financial officer (2016–present) of Vanguard. Director (2016–present) of Vanguard Marketing Corporation. Executive vice president and chief financial officer (2006–2016) of MassMutual Financial Group.
John E. Schadl
Born in 1972. Principal occupation(s) during the past five years and other experience: principal of Vanguard. Chief compliance officer (2019–present) of Vanguard and of each of the investment companies served by Vanguard. Assistant vice president (2019–present) of Vanguard Marketing Corporation.
Vanguard Senior Management Team
| Matthew Benchener | Thomas M. Rampulla |
| Joseph Brennan | Karin A. Risi |
| Mortimer J. Buckley | Anne E. Robinson |
| Gregory Davis | Michael Rollings |
| John James | Nitin Tandon |
| John T. Marcante | Lauren Valente |
| Chris D. Mclsaac | |
Connect with Vanguard®>vanguard.com
Fund Information > 800-662-7447
Direct Investor Account Services > 800-662-2739
Institutional Investor Services > 800-523-1036
Text Telephone for People Who Are Deaf or Hard of Hearing > 800-749-7273
This material may be used in conjunction with the offering of shares of any Vanguard fund only if preceded or accompanied by the fund’s current prospectus.
All comparative mutual fund data are from Morningstar, Inc., unless otherwise noted.
You can obtain a free copy of Vanguard’s proxy voting guidelines by visiting vanguard.com/proxyreporting or by calling Vanguard at 800-662-2739. The guidelines are also available from the SEC’s website, www.sec.gov. In addition, you may obtain a free report on how your fund voted the proxies for securities it owned during the 12 months ended June 30. To get the report, visit either vanguard.com/proxyreporting or www.sec.gov.
You can review information about your fund on the SEC’s website, and you can receive copies of this information, for a fee, by sending a request via email addressed to publicinfo@sec.gov.
Source for Bloomberg indexes: Bloomberg Index Services Limited. Copyright 2021, Bloomberg. All rights reserved.
© 2021 The Vanguard Group, Inc.
All rights reserved.
U.S. Patent Nos. 6,879,964 and 7,720,749.
Vanguard Marketing Corporation, Distributor.
Q7380 122021
Annual Report | October 31, 2021
Vanguard Emerging Markets Stock Index Fund
Contents
Please note: The opinions expressed in this report are just that—informed opinions. They should not be considered promises or advice. Also, please keep in mind that the information and opinions cover the period through the date on the front of this report. Of course, the risks of investing in your fund are spelled out in the prospectus.
Your Fund’s Performance at a Glance
| • | For the 12 months ended October 31, 2021, returns for Vanguard Emerging Markets Stock Index Fund ranged from 17.23% for Investor Shares to 17.51% for ETF Shares (based on net asset value). The fund trailed its benchmark index, which returned 18.48%, in part because of differences in the prices of securities used by the fund to calculate its net asset value and the quoted or published prices for the same securities.1 |
| • | The global economy continued to recover from the sharp pandemic-induced contraction in the spring of 2020. Countries that were more successful in containing the virus, whether through vaccinations, lockdowns, or both, generally fared better economically. Swift and extensive fiscal and monetary support from policymakers was also key to the rebound. Even amid concerns toward the end of the fiscal year about inflation and the prospect of less accommodative monetary policy, stock returns for the period were excellent. |
| • | At the sector level, financial and technology stocks, the two largest weightings in the index at the end of the period, powered the broad advance of emerging markets. Financials returned about 33%. Consumer discretionary stocks lagged, returning about –12%. |
| • | Among markets, Taiwan (43%) and India (55%) led the way amid widespread positive returns, outweighing China, which was a detractor at –7%. |
Market Barometer
| | Average Annual Total Returns
Periods Ended October 31, 2021 |
| | One Year | Three Years | Five Years |
| Stocks | | | |
| Russell 1000 Index (Large-caps) | 43.51% | 22.01% | 19.16% |
| Russell 2000 Index (Small-caps) | 50.80 | 16.47 | 15.52 |
| Russell 3000 Index (Broad U.S. market) | 43.90 | 21.62 | 18.91 |
| FTSE All-World ex US Index (International) | 30.23 | 12.42 | 10.05 |
| Bonds | | | |
Bloomberg U.S. Aggregate Bond Index
(Broad taxable market) | -0.48% | 5.63% | 3.10% |
Bloomberg Municipal Bond Index
(Broad tax-exempt market) | 2.64 | 5.17 | 3.41 |
| FTSE Three-Month U.S. Treasury Bill Index | 0.05 | 1.08 | 1.12 |
| CPI | | | |
| Consumer Price Index | 6.22% | 3.03% | 2.73% |
1 See Note A-1, “Security Valuation,” in the Notes to Financial Statements.
About Your Fund’s Expenses
As a shareholder of the fund, you incur ongoing costs, which include costs for portfolio management, administrative services, and shareholder reports (like this one), among others. Operating expenses, which are deducted from a fund’s gross income, directly reduce the investment return of the fund.
A fund‘s expenses are expressed as a percentage of its average net assets. This figure is known as the expense ratio. The following examples are intended to help you understand the ongoing costs (in dollars) of investing in your fund and to compare these costs with those of other mutual funds. The examples are based on an investment of $1,000 made at the beginning of the period shown and held for the entire period.
The accompanying table illustrates your fund’s costs in two ways:
| • | Based on actual fund return. This section helps you to estimate the actual expenses that you paid over the period. The ”Ending Account Value“ shown is derived from the fund’s actual return, and the third column shows the dollar amount that would have been paid by an investor who started with $1,000 in the fund. You may use the information here, together with the amount you invested, to estimate the expenses that you paid over the period. |
To do so, simply divide your account value by $1,000 (for example, an $8,600 account value divided by $1,000 = 8.6), then multiply the result by the number given for your fund under the heading ”Expenses Paid During Period.“
| • | Based on hypothetical 5% yearly return. This section is intended to help you compare your fund‘s costs with those of other mutual funds. It assumes that the fund had a yearly return of 5% before expenses, but that the expense ratio is unchanged. In this case—because the return used is not the fund’s actual return—the results do not apply to your investment. The example is useful in making comparisons because the Securities and Exchange Commission requires all mutual funds to calculate expenses based on a 5% return. You can assess your fund’s costs by comparing this hypothetical example with the hypothetical examples that appear in shareholder reports of other funds. |
Note that the expenses shown in the table are meant to highlight and help you compare ongoing costs only and do not reflect transaction costs incurred by the fund for buying and selling securities. Further, the expenses do not include any purchase, redemption, or account service fees described in the fund prospectus. If such fees were applied to your account, your costs would be higher. Your fund does not carry a “sales load.”
The calculations assume no shares were bought or sold during the period. Your actual costs may have been higher or lower, depending on the amount of your investment and the timing of any purchases or redemptions.
You can find more information about the fund’s expenses, including annual expense ratios, in the Financial Statements section of this report. For additional information on operating expenses and other shareholder costs, please refer to your fund’s current prospectus.
| Six Months Ended October 31, 2021 | | | |
| | Beginning
Account Value
4/30/2021 | Ending
Account Value
10/31/2021 | Expenses
Paid During
Period |
| Based on Actual Fund Return | | | |
| Emerging Markets Stock Index Fund | | | |
| Investor Shares | $1,000.00 | $969.90 | $1.44 |
| FTSE Emerging Markets ETF Shares | 1,000.00 | 971.40 | 0.30 |
| Admiral™ Shares | 1,000.00 | 970.90 | 0.70 |
| Institutional Shares | 1,000.00 | 970.80 | 0.50 |
| Institutional Plus Shares | 1,000.00 | 971.10 | 0.40 |
| Based on Hypothetical 5% Yearly Return | | | |
| Emerging Markets Stock Index Fund | | | |
| Investor Shares | $1,000.00 | $1,023.74 | $1.48 |
| FTSE Emerging Markets ETF Shares | 1,000.00 | 1,024.90 | 0.31 |
| Admiral Shares | 1,000.00 | 1,024.50 | 0.71 |
| Institutional Shares | 1,000.00 | 1,024.70 | 0.51 |
| Institutional Plus Shares | 1,000.00 | 1,024.80 | 0.41 |
The calculations are based on expenses incurred in the most recent six-month period. The fund’s annualized six-month expense ratios for that period are: 0.29% for Investor Shares, 0.06% for FTSE Emerging Markets ETF Shares, 0.14% for Admiral Shares, 0.10% for Institutional Shares, and 0.08% for Institutional Plus Shares. The dollar amounts shown as “Expenses Paid” are equal to the annualized expense ratio multiplied by the average account value over the period, multiplied by the number of days in the most recent six-month period, then divided by the number of days in the most recent 12-month period (184/365).
Emerging Markets Stock Index Fund
All of the returns in this report represent past performance, which is not a guarantee of future results that may be achieved by the fund. (Current performance may be lower or higher than the performance data cited. For performance data current to the most recent month-end, visit our website at vanguard.com/performance.) Note, too, that both investment returns and principal value can fluctuate widely, so an investor’s shares, when sold, could be worth more or less than their original cost. The returns shown do not reflect taxes that a shareholder would pay on fund distributions or on the sale of fund shares.
Cumulative Performance: October 31, 2011, Through October 31, 2021
Initial Investment of $10,000
| | | | Average Annual Total Returns
Periods Ended October 31, 2021 |
| | | One
Year | Five
Years | Ten
Years | Final Value
of a $10,000
Investment |
 | Emerging Markets Stock Index Fund Investor Shares | 17.23% | 8.59% | 4.63% | $15,724 |
 | Spliced Emerging Markets Index | 18.48 | 8.94 | 4.81 | 16,002 |
 | FTSE Global All Cap ex US Index | 30.96 | 10.06 | 7.09 | 19,836 |
Spliced Emerging Markets Index: Select Emerging Markets Index through August 23, 2006; MSCI Emerging Markets Index through January 9, 2013; FTSE Emerging Transition Index through June 27, 2013; FTSE Emerging Index through November 1, 2015; FTSE Emerging Markets All Cap China A Transition Index through September 18, 2016; and FTSE Emerging Markets All Cap China A Inclusion Index thereafter. Benchmark returns are adjusted for withholding taxes.
| | | | |
| | | One
Year | Five
Years | Ten
Years | Final Value
of a $10,000
Investment |
FTSE Emerging Markets
ETF Shares Net Asset Value | 17.51% | 8.81% | 4.83% | $16,028 |
FTSE Emerging Markets
ETF Shares Market Price | 18.24 | 8.83 | 4.91 | 16,150 |
| Spliced Emerging Markets Index | 18.48 | 8.94 | 4.81 | 16,002 |
| FTSE Global All Cap ex US Index | 30.96 | 10.06 | 7.09 | 19,836 |
See Financial Highlights for dividend and capital gains information.
Emerging Markets Stock Index Fund
| | | | Average Annual Total Returns
Periods Ended October 31, 2021 |
| | | One
Year | Five
Years | Ten
Years | Final Value
of a $10,000
Investment |
| Emerging Markets Stock Index Fund Admiral Shares | 17.44% | 8.77% | 4.81% | $15,989 |
| Spliced Emerging Markets Index | 18.48 | 8.94 | 4.81 | 16,002 |
| FTSE Global All Cap ex US Index | 30.96 | 10.06 | 7.09 | 19,836 |
| | | | |
| | | One
Year | Five
Years | Ten
Years | Final Value
of a $5,000,000
Investment |
| Emerging Markets Stock Index Fund Institutional Shares | 17.45% | 8.81% | 4.84% | $8,021,444 |
| Spliced Emerging Markets Index | 18.48 | 8.94 | 4.81 | 8,000,837 |
| FTSE Global All Cap ex US Index | 30.96 | 10.06 | 7.09 | 9,918,026 |
| | | | |
| | | One
Year | Five
Years | Ten
Years | Final Value
of a $100,000,000
Investment |
| Emerging Markets Stock Index Fund Institutional Plus Shares | 17.49% | 8.83% | 4.86% | $160,805,640 |
| Spliced Emerging Markets Index | 18.48 | 8.94 | 4.81 | 160,016,730 |
| FTSE Global All Cap ex US Index | 30.96 | 10.06 | 7.09 | 198,360,510 |
| Cumulative Returns of ETF Shares: October 31, 2011, Through October 31, 2021 |
| | One
Year | Five
Years | Ten
Years |
| FTSE Emerging Markets ETF Shares Market Price | 18.24% | 52.65% | 61.50% |
FTSE Emerging Markets
ETF Shares Net Asset Value | 17.51 | 52.51 | 60.28 |
| Spliced Emerging Markets Index | 18.48 | 53.44 | 60.02 |
For the ETF Shares, the market price is determined by the midpoint of the bid-offer spread as of the closing time of the New York Stock Exchange (generally 4 p.m., Eastern time). The net asset value is also determined as of the NYSE closing time. For more information about how the ETF Shares' market prices have compared with their net asset value, visit vanguard.com, select your ETF, and then select the Price and Performance tab. The ETF premium/discount analysis there shows the percentages of days on which the ETF Shares' market price was above or below the NAV.
Emerging Markets Stock Index Fund
| |
| China | 36.8% |
| Taiwan | 18.2 |
| India | 15.2 |
| Brazil | 4.8 |
| South Africa | 3.7 |
| Saudi Arabia | 3.6 |
| Russia | 3.5 |
| Thailand | 2.6 |
| Mexico | 2.2 |
| Malaysia | 2.0 |
| Indonesia | 1.6 |
| Other | 5.8 |
The table reflects the fund’s investments, except for short-term investments and derivatives.
The fund may invest in derivatives (such as futures and swap contracts) for various reasons, including, but not limited to, attempting to remain fully invested and tracking its target index as closely as possible.
Emerging Markets Stock Index Fund
The fund files its complete schedule of portfolio holdings with the Securities and Exchange Commission (SEC) for the first and third quarters of each fiscal year as an exhibit to its reports on Form N-PORT. The fund’s Form N-PORT reports are available on the SEC’s website at www.sec.gov.
| | | | | | Shares | Market
Value•
($000) |
| Common Stocks (98.9%) |
| Brazil (4.8%) |
| | Vale SA | 48,708,281 | 618,023 |
| | Petroleo Brasileiro SA | 61,073,171 | 299,425 |
| | Petroleo Brasileiro SA Preference Shares | 54,686,550 | 264,043 |
| | Itau Unibanco Holding SA Preference Shares | 49,097,105 | 202,781 |
| * | Banco Bradesco SA Preference Shares | 50,876,878 | 179,392 |
| | Ambev SA | 59,027,138 | 177,694 |
| | B3 SA - Brasil Bolsa Balcao | 84,182,210 | 177,648 |
| | WEG SA | 20,837,974 | 136,611 |
| | Itausa SA Preference Shares | 62,071,096 | 112,731 |
| | JBS SA | 12,977,303 | 89,791 |
| * | Natura & Co. Holding SA | 12,946,365 | 89,233 |
| * | Suzano SA | 9,934,149 | 86,654 |
| | Notre Dame Intermedica Participacoes SA | 7,166,557 | 81,496 |
| | Itau Unibanco Holding SA ADR | 19,349,345 | 78,752 |
| * | Magazine Luiza SA | 40,830,118 | 78,205 |
| | Vale SA Class B ADR | 5,364,050 | 68,284 |
| | Lojas Renner SA | 11,714,955 | 66,901 |
| 1 | Rede D'Or Sao Luiz SA | 6,280,940 | 65,661 |
| | Localiza Rent a Car SA | 8,086,347 | 64,905 |
| * | Banco Bradesco SA | 20,901,387 | 62,958 |
| * | Raia Drogasil SA | 15,230,678 | 62,744 |
| | Banco do Brasil SA | 11,886,522 | 60,024 |
| | Vibra Energia SA | 16,062,179 | 59,709 |
| | Gerdau SA Preference Shares | 12,200,567 | 58,151 |
| | Cosan SA | 16,287,216 | 57,111 |
| | | | | | Shares | Market
Value•
($000) |
| | Petroleo Brasileiro SA ADR | 5,639,547 | 54,196 |
| * | Banco BTG Pactual SA | 13,311,692 | 53,187 |
| * | Rumo SA | 18,198,605 | 51,560 |
| | Equatorial Energia SA | 12,697,716 | 51,477 |
| | Centrais Eletricas Brasileiras SA | 8,503,359 | 50,971 |
| | Telefonica Brasil SA | 5,974,554 | 48,188 |
| * | BRF SA | 10,851,254 | 44,664 |
| * | Klabin SA | 10,930,807 | 44,430 |
| | TOTVS SA | 7,588,128 | 44,046 |
| * | Banco Bradesco SA ADR | 12,319,151 | 43,117 |
| | BB Seguridade Participacoes SA | 9,722,499 | 38,054 |
| * | Petro Rio SA | 8,858,522 | 36,839 |
| 1 | Hapvida Participacoes e Investimentos SA | 16,253,389 | 33,234 |
| | Cia Energetica de Minas Gerais Preference Shares | 14,326,515 | 32,695 |
| * | Eneva SA | 12,466,808 | 31,809 |
| | Bradespar SA Preference Shares | 3,616,116 | 31,178 |
| | CCR SA | 15,258,818 | 30,903 |
| * | Americanas SA | 5,835,071 | 30,707 |
| * | Embraer SA | 7,551,359 | 29,342 |
| * | Hypera SA | 5,894,085 | 29,304 |
| | Ultrapar Participacoes SA | 11,780,143 | 27,239 |
| | Sul America SA | 5,207,364 | 23,962 |
| | Marfrig Global Foods SA | 5,034,722 | 23,640 |
| * | Banco Inter SA | 3,731,858 | 23,474 |
| | Sendas Distribuidora SA | 8,644,865 | 23,420 |
| | Energisa SA | 3,280,964 | 23,033 |
| * | Via SA | 20,784,572 | 22,649 |
| 2 | Banco Santander Brasil SA ADR | 3,544,365 | 21,656 |
Emerging Markets Stock Index Fund
| | | | | | Shares | Market
Value•
($000) |
| | Cia Siderurgica Nacional SA | 5,299,579 | 21,391 |
| | Transmissora Alianca de Energia Eletrica SA | 3,247,428 | 21,094 |
| | Metalurgica Gerdau SA Preference Shares | 9,373,796 | 20,778 |
| 1,2 | Shimao Services Holdings Ltd. | 10,330,000 | 19,470 |
| *,1 | Locaweb Servicos de Internet SA | 5,609,814 | 18,190 |
| *,1 | Banco Inter SA Preference Shares | 8,332,991 | 18,057 |
| * | TIM SA | 9,047,765 | 17,987 |
| * | Cia de Saneamento Basico do Estado de Sao Paulo | 2,800,253 | 17,465 |
| | Engie Brasil Energia SA | 2,522,192 | 17,389 |
| * | Cia de Locacao das Americas | 4,916,727 | 17,188 |
| * | Azul SA Preference Shares | 3,886,813 | 17,128 |
| | Centrais Eletricas Brasileiras SA Preference Shares | 2,796,401 | 16,767 |
| * | Braskem SA Preference Shares Class A | 1,685,879 | 16,268 |
| | Sao Martinho SA | 2,389,840 | 16,218 |
| * | Alpargatas SA Preference Shares | 2,333,154 | 15,970 |
| | YDUQS Participacoes SA | 4,172,630 | 15,422 |
| | Usinas Siderurgicas de Minas Gerais SA Usiminas Preference Shares Class A | 6,529,643 | 15,330 |
| | Cia Siderurgica Nacional SA ADR | 3,627,002 | 14,798 |
| * | BR Malls Participacoes SA | 11,503,147 | 14,614 |
| | EDP - Energias do Brasil SA | 4,136,860 | 14,367 |
| * | Grupo De Moda Soma SA | 6,107,577 | 14,198 |
| | Itau Unibanco Holding SA | 3,800,912 | 14,163 |
| * | IRB Brasil Resseguros SA | 15,844,722 | 13,167 |
| * | Multiplan Empreendimentos Imobiliarios SA | 3,905,377 | 12,815 |
| | Cia Energetica de Sao Paulo Preference Shares Class B | 2,787,531 | 12,595 |
| | | | | | Shares | Market
Value•
($000) |
| | Cia Paranaense de Energia ADR | 2,423,128 | 12,382 |
| | CPFL Energia SA | 2,630,847 | 12,264 |
| | Gerdau SA ADR | 2,588,905 | 12,246 |
| * | Cogna Educacao | 27,263,273 | 11,980 |
| | Atacadao SA | 4,061,475 | 11,975 |
| | Fleury SA | 3,477,601 | 11,603 |
| * | Embraer SA ADR | 735,313 | 11,419 |
| * | Cia de Saneamento do Parana | 3,524,130 | 11,396 |
| | Pet Center Comercio e Participacoes SA | 3,340,750 | 11,111 |
| | CSHG Logistica FI Imobiliario | 375,063 | 11,098 |
| | Porto Seguro SA | 2,622,996 | 10,847 |
| *,2 | Cia de Saneamento Basico do Estado de Sao Paulo ADR | 1,687,033 | 10,595 |
| | Cyrela Brazil Realty SA Empreendimentos e Participacoes | 4,224,548 | 10,547 |
| * | Lojas Americanas SA Preference Shares | 12,285,984 | 10,514 |
| | Dexco SA | 3,743,363 | 10,287 |
| | Banco Santander Brasil SA | 1,663,220 | 10,138 |
| | Cia de Transmissao de Energia Eletrica Paulista Preference Shares | 2,331,606 | 10,047 |
| | Kinea Indice de Precos FII | 535,687 | 9,737 |
| | Banco Pan SA Preference Shares | 4,087,263 | 9,625 |
| | SLC Agricola SA | 1,234,608 | 9,533 |
| | Arezzo Industria e Comercio SA | 705,392 | 9,236 |
| | Neoenergia SA | 3,345,859 | 9,189 |
| * | Braskem SA ADR | 473,534 | 9,172 |
| | Light SA | 5,108,194 | 8,761 |
| | Odontoprev SA | 3,668,519 | 8,717 |
| * | Omega Geracao SA | 1,438,893 | 8,345 |
| | Qualicorp Consultoria e Corretora de Seguros SA | 2,740,984 | 8,310 |
| | Cia Brasileira de Distribuicao | 1,817,883 | 8,223 |
| | Unipar Carbocloro SA Preference Shares Class B | 616,836 | 8,161 |
| * | Santos Brasil Participacoes SA | 8,751,186 | 7,986 |
| | MRV Engenharia e Participacoes SA | 4,439,838 | 7,985 |
Emerging Markets Stock Index Fund
| | | | | | Shares | Market
Value•
($000) |
| * | Gol Linhas Aereas Inteligentes SA Preference Shares | 2,893,077 | 7,781 |
| * | CVC Brasil Operadora e Agencia de Viagens SA | 2,749,577 | 7,780 |
| 2 | Sendas Distribuidora SA ADR | 554,044 | 7,474 |
| | Cia Paranaense de Energia Preference Shares | 7,073,762 | 7,420 |
| * | M Dias Branco SA | 1,346,925 | 7,386 |
| | Iguatemi Empresa de Shopping Centers SA | 1,236,069 | 6,557 |
| | Cia de Saneamento de Minas Gerais-COPASA | 2,692,170 | 6,492 |
| | Minerva SA | 3,655,457 | 6,309 |
| | Alupar Investimento SA | 1,472,167 | 6,193 |
| | Aliansce Sonae Shopping Centers SA | 1,788,722 | 6,079 |
| | Cielo SA | 15,663,086 | 6,078 |
| | SIMPAR SA | 3,298,500 | 5,991 |
| | Grendene SA | 3,852,509 | 5,857 |
| | Vivara Participacoes SA | 1,270,700 | 5,840 |
| | CSN Mineracao SA | 6,201,814 | 5,791 |
| * | Iochpe Maxion SA | 1,870,049 | 5,560 |
| | Cia Energetica de Minas Gerais ADR | 2,375,711 | 5,345 |
| * | Anima Holding SA | 4,484,975 | 5,245 |
| | Kinea Rendimentos Imobiliarios FII | 300,000 | 5,177 |
| * | Vamos Locacao de Caminhoes Maquinas e Equipamentos SA | 2,545,916 | 5,111 |
| * | Movida Participacoes SA | 1,886,350 | 4,963 |
| | Kinea Renda Imobiliaria FII | 200,000 | 4,808 |
| * | Raizen SA Preference Shares | 3,997,977 | 4,803 |
| | Randon SA Implementos e Participacoes Preference Shares | 2,629,234 | 4,733 |
| | Banco do Estado do Rio Grande do Sul SA Preference Shares Class B | 2,299,442 | 4,437 |
| | | | | | Shares | Market
Value•
($000) |
| | Ez Tec Empreendimentos e Participacoes SA | 1,355,878 | 4,384 |
| * | Cia Ferro Ligas da Bahia - FERBASA Preference Shares | 515,272 | 4,328 |
| | AES Brasil Energia SA | 2,224,294 | 4,296 |
| * | TIM SA ADR | 435,188 | 4,291 |
| | Lojas Quero Quero SA | 2,087,874 | 4,284 |
| * | Grupo Mateus SA | 3,291,300 | 4,158 |
| * | EcoRodovias Infraestrutura e Logistica SA | 2,764,571 | 4,012 |
| | Ambipar Participacoes e Empreendimentos SA | 608,948 | 3,987 |
| | Intelbras SA Industria de Telecomunicacao Eletronica Brasileira | 845,500 | 3,943 |
| * | Grupo SBF SA | 1,038,168 | 3,852 |
| * | Marcopolo SA Preference Shares | 7,929,831 | 3,639 |
| | BR Properties SA | ��� 2,816,674 | 3,598 |
| | Boa Vista Servicos SA | 2,199,660 | 3,558 |
| * | BK Brasil Operacao e Assessoria a Restaurantes SA | 2,777,611 | 3,381 |
| * | Tupy SA | 909,992 | 3,368 |
| | Construtora Tenda SA | 1,110,987 | 3,358 |
| 2 | Centrais Eletricas Brasileiras SA ADR | 542,798 | 3,300 |
| | Usinas Siderurgicas de Minas Gerais SA Usiminas | 1,436,600 | 3,279 |
| * | Lojas Americanas SA | 3,737,943 | 3,265 |
| | Mahle-Metal Leve SA | 525,673 | 3,174 |
| * | Camil Alimentos SA | 1,831,100 | 3,141 |
| | JHSF Participacoes SA | 3,365,000 | 2,975 |
| * | Hidrovias do Brasil SA | 5,523,700 | 2,917 |
| 1 | Meliuz SA | 4,901,198 | 2,875 |
| * | Aeris Industria E Comercio De Equipamentos Para Geracao De Energia SA | 2,008,764 | 2,805 |
Emerging Markets Stock Index Fund
| | | | | | Shares | Market
Value•
($000) |
| | LOG Commercial Properties e Participacoes SA | 666,218 | 2,766 |
| | Enauta Participacoes SA | 1,115,630 | 2,526 |
| 2 | Cia Brasileira de Distribuicao ADR | 554,044 | 2,526 |
| * | Instituto Hermes Pardini SA | 625,360 | 2,433 |
| * | Banco Inter SA Ordinary Shares | 1,116,790 | 2,291 |
| * | Guararapes Confeccoes SA | 1,179,860 | 2,289 |
| | Jereissati Participacoes SA | 487,600 | 2,279 |
| | Cia Energetica de Minas Gerais | 773,231 | 2,277 |
| | Cia Paranaense de Energia | 2,165,400 | 2,064 |
| | Wiz Solucoes e Corretagem de Seguros SA | 1,191,824 | 2,038 |
| | MPM Corporeos SA | 1,130,302 | 1,957 |
| 2 | Centrais Eletricas Brasileiras SA ADR (XNYS) | 313,592 | 1,891 |
| | Ambev SA ADR | 622,682 | 1,843 |
| | Direcional Engenharia SA | 1,079,543 | 1,825 |
| | Even Construtora e Incorporadora SA | 1,539,310 | 1,696 |
| 1 | Ser Educacional SA | 760,628 | 1,407 |
| * | Sequoia Logistica e Transportes SA | 510,000 | 1,175 |
| * | C&A Modas Ltda | 796,600 | 855 |
| | Telefonica Brasil SA ADR | 95,766 | 769 |
| *,2 | Getnet Adquirencia e Servicos para Meios de Pagamento SA ADR | 443,046 | 709 |
| * | Getnet Adquirencia e Servicos para Meios de Pagamento SA | 415,805 | 321 |
| * | Empreendimentos Pague Menos SA | 152,209 | 255 |
| * | Oi SA ADR | 1 | — |
| * | Ultrapar Participacoes SA Rights Exp. 11/3/21 | 818,243 | — |
| * | XP Inc. BDR | 1 | — |
| | | | | | | 5,301,729 |
| | | | | | Shares | Market
Value•
($000) |
| Chile (0.5%) |
| | Sociedad Quimica y Minera de Chile SA Preference Shares Class B | 1,559,630 | 84,701 |
| | Empresas COPEC SA | 6,699,857 | 52,709 |
| | Banco de Chile | 580,323,550 | 50,364 |
| | Falabella SA | 11,222,705 | 31,035 |
| | Empresas CMPC SA | 16,016,194 | 29,552 |
| | Cencosud SA | 19,001,995 | 27,796 |
| | Enel Americas SA | 225,917,642 | 25,688 |
| | Banco de Credito e Inversiones SA | 677,086 | 22,800 |
| | Banco Santander Chile | 520,077,349 | 22,759 |
| | Cia Sud Americana de Vapores SA | 241,207,209 | 15,670 |
| | Cia Cervecerias Unidas SA | 1,815,693 | 15,212 |
| | Sociedad Quimica y Minera de Chile SA ADR | 263,141 | 14,444 |
| | Banco Santander Chile ADR | 752,638 | 13,337 |
| | Enel Chile SA | 318,539,959 | 13,051 |
| | CAP SA | 1,020,097 | 10,097 |
| * | Itau CorpBanca Chile SA | 3,995,568,417 | 8,865 |
| * | Parque Arauco SA | 8,833,511 | 8,720 |
| | Aguas Andinas SA Class A | 39,065,718 | 7,443 |
| | Colbun SA | 106,778,071 | 7,364 |
| | Cencosud Shopping SA | 7,029,998 | 6,804 |
| | Embotelladora Andina SA Preference Shares Class B | 3,053,443 | 6,306 |
| | Empresa Nacional de Telecomunicaciones SA | 1,778,047 | 6,096 |
| 2 | Enel Americas SA ADR | 953,809 | 5,399 |
| | AES Andes SA | 48,752,457 | 5,010 |
| * | Latam Airlines Group SA | 3,024,840 | 4,415 |
| | Vina Concha y Toro SA | 2,982,592 | 4,337 |
| | Engie Energia Chile SA | 6,943,752 | 4,037 |
| | Plaza SA | 4,033,928 | 4,026 |
| | SMU SA | 39,524,631 | 3,935 |
| | Inversiones Aguas Metropolitanas SA | 6,741,307 | 3,168 |
Emerging Markets Stock Index Fund
| | | | | | Shares | Market
Value•
($000) |
| * | Ripley Corp. SA | 14,356,234 | 2,428 |
| | SONDA SA | 7,171,699 | 2,423 |
| | Inversiones La Construccion SA | 449,396 | 1,622 |
| | Salfacorp SA | 4,524,748 | 1,533 |
| 2 | Enel Chile SA ADR | 588,006 | 1,276 |
| | | | | | | 524,422 |
| China (36.4%) |
| | Tencent Holdings Ltd. | 82,225,744 | 5,001,774 |
| * | Alibaba Group Holding Ltd. | 195,120,828 | 4,012,203 |
| *,1 | Meituan Class B | 53,341,582 | 1,815,142 |
| | China Construction Bank Corp. Class H | 1,279,180,103 | 870,585 |
| * | NIO Inc. ADR | 17,794,034 | 701,263 |
| *,1 | Wuxi Biologics Cayman Inc. | 45,115,566 | 683,364 |
| * | JD.com Inc. Class A | 17,191,196 | 672,984 |
| | Industrial & Commercial Bank of China Ltd. Class H | 1,097,969,614 | 601,866 |
| * | Baidu Inc. ADR | 3,677,680 | 596,667 |
| | Ping An Insurance Group Co. of China Ltd. Class H | 82,016,813 | 587,465 |
| *,1 | Xiaomi Corp. Class B | 182,062,600 | 497,678 |
| | China Merchants Bank Co. Ltd. Class H | 58,358,295 | 489,051 |
| * | Pinduoduo Inc. ADR | 5,097,479 | 453,268 |
| | BYD Co. Ltd. Class H | 10,895,656 | 416,732 |
| | NetEase Inc. | 20,311,811 | 394,002 |
| | Bank of China Ltd. Class H | 1,088,580,735 | 385,251 |
| | Li Ning Co. Ltd. | 30,204,074 | 333,304 |
| *,2 | XPeng Inc. Class A ADR | 6,498,456 | 303,023 |
| *,1 | Kuaishou Technology | 21,314,200 | 278,820 |
| * | China Mengniu Dairy Co. Ltd. | 42,483,920 | 270,307 |
| *,2 | Bilibili Inc. ADR | 3,459,595 | 253,588 |
| | Geely Automobile Holdings Ltd. | 72,984,743 | 253,304 |
| | ANTA Sports Products Ltd. | 15,574,405 | 241,306 |
| | Sunny Optical Technology Group Co. Ltd. | 8,976,475 | 240,870 |
| | Great Wall Motor Co. Ltd. Class H | 49,708,875 | 223,667 |
| | | | | | Shares | Market
Value•
($000) |
| | Shenzhou International Group Holdings Ltd. | 10,367,541 | 223,360 |
| * | Trip.com Group Ltd. ADR | 7,265,546 | 207,504 |
| | Kweichow Moutai Co. Ltd. Class A (XSSC) | 716,664 | 204,506 |
| | China Life Insurance Co. Ltd. Class H | 105,794,734 | 183,794 |
| | Country Garden Services Holdings Co. Ltd. | 23,767,331 | 182,972 |
| | ENN Energy Holdings Ltd. | 10,434,155 | 179,765 |
| | China Resources Beer Holdings Co. Ltd. | 21,642,124 | 178,696 |
| * | Li Auto Inc. ADR | 5,461,794 | 178,218 |
| | China Petroleum & Chemical Corp. Class H | 365,150,822 | 177,914 |
| *,1 | Innovent Biologics Inc. | 18,341,320 | 164,161 |
| | China Resources Land Ltd. | 38,312,325 | 148,861 |
| | Agricultural Bank of China Ltd. Class H | 434,667,343 | 147,703 |
| * | Huazhu Group Ltd. ADR (XNGS) | 2,941,201 | 136,354 |
| | PetroChina Co. Ltd. Class H | 271,770,227 | 131,033 |
| | China Pacific Insurance Group Co. Ltd. Class H | 41,425,992 | 126,675 |
| | Kweichow Moutai Co. Ltd. Class A (XSHG) | 435,276 | 124,210 |
| 1 | Longfor Group Holdings Ltd. | 25,634,601 | 124,018 |
| | CSPC Pharmaceutical Group Ltd. | 116,550,529 | 121,620 |
| | Xinyi Solar Holdings Ltd. | 58,188,000 | 120,872 |
| * | Kingdee International Software Group Co. Ltd. | 36,105,284 | 118,800 |
| | Haier Smart Home Co. Ltd. Class H | 31,561,055 | 117,524 |
| | China Overseas Land & Investment Ltd. | 53,051,841 | 117,009 |
| 1 | Smoore International Holdings Ltd. | 24,062,000 | 114,419 |
Emerging Markets Stock Index Fund
| | | | | | Shares | Market
Value•
($000) |
| | China Conch Venture Holdings Ltd. | 22,767,018 | 110,633 |
| | China Longyuan Power Group Corp. Ltd. Class H | 46,726,493 | 109,295 |
| | Zijin Mining Group Co. Ltd. Class H | 77,457,097 | 107,716 |
| | China Gas Holdings Ltd. | 41,407,693 | 103,354 |
| | China Shenhua Energy Co. Ltd. Class H | 47,648,860 | 102,459 |
| | Sino Biopharmaceutical Ltd. | 136,689,444 | 100,793 |
| | Country Garden Holdings Co. Ltd. | 103,819,469 | 97,695 |
| | CITIC Securities Co. Ltd. Class H | 38,247,587 | 97,109 |
| *,2 | COSCO SHIPPING Holdings Co. Ltd. Class H | 61,334,105 | 95,001 |
| 1 | Postal Savings Bank of China Co. Ltd. Class H | 128,897,010 | 93,681 |
| * | GDS Holdings Ltd. ADR | 1,517,926 | 90,165 |
| *,1 | JD Health International Inc. | 9,887,240 | 86,795 |
| | PICC Property & Casualty Co. Ltd. Class H | 92,834,207 | 86,424 |
| | Anhui Conch Cement Co. Ltd. Class H | 17,114,135 | 84,628 |
| * | Zai Lab Ltd. ADR | 810,614 | 84,628 |
| 1 | China Tower Corp. Ltd. Class H | 649,102,936 | 84,123 |
| | Wuliangye Yibin Co. Ltd. Class A (XSHE) | 2,457,398 | 83,039 |
| * | Alibaba Health Information Technology Ltd. | 65,248,112 | 81,703 |
| | Zhongsheng Group Holdings Ltd. | 8,859,406 | 79,880 |
| | Ping An Insurance Group Co. of China Ltd. Class A | 9,891,000 | 76,403 |
| | Sunac China Holdings Ltd. | 34,419,526 | 73,607 |
| | China Tourism Group Duty Free Corp. Ltd. Class A (XSSC) | 1,677,022 | 70,238 |
| | China Resources Power Holdings Co. Ltd. | 26,225,149 | 67,877 |
| | | | | | Shares | Market
Value•
($000) |
| | China National Building Material Co. Ltd. Class H | 54,129,473 | 67,840 |
| * | Vipshop Holdings Ltd. ADR | 6,041,449 | 67,423 |
| | CITIC Ltd. | 67,278,026 | 67,399 |
| | China Resources Gas Group Ltd. | 12,312,405 | 66,085 |
| | China Vanke Co. Ltd. Class H | 27,260,200 | 63,692 |
| * | Tencent Music Entertainment Group ADR | 7,958,701 | 62,555 |
| | Bank of Communications Co. Ltd. Class H | 100,914,609 | 60,032 |
| * | Daqo New Energy Corp. ADR | 763,842 | 59,419 |
| * | KE Holdings Inc. ADR | 3,214,609 | 58,570 |
| * | Genscript Biotech Corp. | 13,134,320 | 58,118 |
| 1 | China International Capital Corp. Ltd. Class H | 23,150,740 | 57,316 |
| | China Merchants Bank Co. Ltd. Class A (XSSC) | 6,780,649 | 57,114 |
| | Contemporary Amperex Technology Co. Ltd. Class A (XSHE) | 554,300 | 55,525 |
| | Shandong Weigao Group Medical Polymer Co. Ltd. Class H | 32,045,844 | 54,585 |
| | LONGi Green Energy Technology Co. Ltd. Class A (XSSC) | 3,565,601 | 54,365 |
| 1 | WuXi AppTec Co. Ltd. Class H | 2,507,519 | 53,538 |
| | Kingsoft Corp. Ltd. | 12,209,078 | 52,097 |
| | GF Securities Co. Ltd. Class A (XSHE) | 16,533,155 | 52,031 |
| | Hengan International Group Co. Ltd. | 9,853,026 | 51,491 |
| * | Chinasoft International Ltd. | 30,497,155 | 50,922 |
| | Haitong Securities Co. Ltd. Class H | 57,164,070 | 50,854 |
| | Guangdong Investment Ltd. | 40,060,021 | 50,370 |
Emerging Markets Stock Index Fund
| | | | | | Shares | Market
Value•
($000) |
| | Wanhua Chemical Group Co. Ltd. Class A | 2,949,967 | 48,746 |
| | China CITIC Bank Corp. Ltd. Class H | 110,544,476 | 48,490 |
| *,2 | RLX Technology Inc. ADR | 9,901,376 | 48,121 |
| | Guangzhou Automobile Group Co. Ltd. Class H | 50,924,820 | 48,071 |
| 1 | Ganfeng Lithium Co. Ltd. Class H | 2,552,200 | 47,817 |
| * | Lufax Holding Ltd. ADR | 7,530,733 | 47,519 |
| | WuXi AppTec Co. Ltd. Class A (XSSC) | 2,175,564 | 46,884 |
| | Tsingtao Brewery Co. Ltd. | 5,322,736 | 46,317 |
| | ZTO Express Cayman Inc. ADR | 1,576,362 | 46,235 |
| | Kingboard Holdings Ltd. | 10,281,108 | 44,803 |
| | BYD Co. Ltd. Class A (XSEC) | 899,969 | 43,987 |
| 2 | China Minsheng Banking Corp. Ltd. Class H | 110,712,594 | 43,897 |
| | Kunlun Energy Co. Ltd. | 47,386,541 | 43,159 |
| 1 | CGN Power Co. Ltd. Class H | 158,340,514 | 42,625 |
| * | New Oriental Education & Technology Group Inc. ADR | 20,592,188 | 42,214 |
| | Weichai Power Co. Ltd. Class H | 23,532,294 | 42,122 |
| *,1,2 | Weimob Inc. | 27,194,000 | 41,535 |
| | Fuyao Glass Industry Group Co. Ltd. Class A (XSHG) | 5,370,232 | 41,483 |
| | China Merchants Bank Co. Ltd. Class A (XSHG) | 4,874,029 | 41,055 |
| | Sinopharm Group Co. Ltd. Class H | 17,276,225 | 41,023 |
| | Hangzhou Tigermed Consulting Co. Ltd. Class A | 1,533,834 | 40,832 |
| 1 | China Resources Mixc Lifestyle Services Ltd. | 7,687,600 | 40,440 |
| | Industrial Bank Co. Ltd. Class A (XSSC) | 13,893,265 | 40,434 |
| | | | | | Shares | Market
Value•
($000) |
| | Shanxi Xinghuacun Fen Wine Factory Co. Ltd. Class A (XSHG) | 839,226 | 39,535 |
| | New China Life Insurance Co. Ltd. Class H | 13,548,712 | 39,087 |
| | Industrial & Commercial Bank of China Ltd. Class A (XSSC) | 53,033,376 | 38,719 |
| *,2 | Yihai International Holding Ltd. | 6,534,648 | 38,277 |
| 2 | Yanzhou Coal Mining Co. Ltd. Class H | 25,754,023 | 38,200 |
| | Ping An Bank Co. Ltd. Class A (XSHE) | 12,522,304 | 38,143 |
| *,1 | China Literature Ltd. | 5,443,164 | 37,767 |
| | Wuliangye Yibin Co. Ltd. Class A (XSEC) | 1,107,662 | 37,429 |
| * | 360 DigiTech Inc. ADR | 1,827,277 | 37,295 |
| | Dongfeng Motor Group Co. Ltd. Class H | 39,933,430 | 37,192 |
| *,1 | Akeso Inc. | 6,665,000 | 37,156 |
| | Aier Eye Hospital Group Co. Ltd. Class A | 4,803,043 | 36,324 |
| 1,2 | Haidilao International Holding Ltd. | 12,903,000 | 35,978 |
| | Fosun International Ltd. | 30,544,125 | 35,786 |
| *,2 | DiDi Global Inc. ADR | 4,403,047 | 35,533 |
| | BYD Co. Ltd. Class A (XSHE) | 723,248 | 35,349 |
| *,1,2 | Pop Mart International Group Ltd. | 5,989,200 | 35,327 |
| | People's Insurance Co. Group of China Ltd. Class H | 112,833,422 | 35,195 |
| 1,2 | Hygeia Healthcare Holdings Co. Ltd. | 3,997,884 | 35,096 |
| | China Everbright Environment Group Ltd. | 50,782,203 | 34,885 |
| *,1 | Hua Hong Semiconductor Ltd. | 6,930,606 | 34,780 |
| | Sungrow Power Supply Co. Ltd. Class A | 1,345,192 | 34,576 |
Emerging Markets Stock Index Fund
| | | | | | Shares | Market
Value•
($000) |
| 2 | Flat Glass Group Co. Ltd. Class H | 6,415,000 | 34,389 |
| | JOYY Inc. ADR | 682,113 | 34,372 |
| * | Aluminum Corp. of China Ltd. Class H | 56,593,237 | 34,057 |
| | Shanghai Fosun Pharmaceutical Group Co. Ltd. Class H | 7,233,109 | 34,048 |
| 2 | Dongyue Group Ltd. | 14,627,339 | 34,032 |
| * | Zhuzhou CRRC Times Electric Co. Ltd. | 7,037,379 | 33,628 |
| | Luxshare Precision Industry Co. Ltd. Class A (XSHE) | 5,495,583 | 33,234 |
| | China Hongqiao Group Ltd. | 29,775,500 | 33,082 |
| | East Money Information Co. Ltd. Class A (XSEC) | 6,409,603 | 32,961 |
| | Luzhou Laojiao Co. Ltd. Class A (XSHE) | 912,999 | 32,570 |
| * | iQIYI Inc. ADR | 3,927,419 | 32,519 |
| | China Merchants Port Holdings Co. Ltd. | 19,422,671 | 32,381 |
| | China Yangtze Power Co. Ltd. Class A (XSHG) | 9,739,991 | 32,369 |
| | China Molybdenum Co. Ltd. Class H | 52,286,171 | 32,323 |
| | BYD Electronic International Co. Ltd. | 10,877,029 | 32,290 |
| | Jiangsu Hengrui Medicine Co. Ltd. Class A (XSSC) | 4,166,043 | 32,004 |
| | China Galaxy Securities Co. Ltd. Class H | 57,402,875 | 31,961 |
| | China Power International Development Ltd. | 63,417,063 | 31,860 |
| | Yangzijiang Shipbuilding Holdings Ltd. | 30,061,998 | 31,738 |
| | China Taiping Insurance Holdings Co. Ltd. | 20,855,800 | 31,736 |
| | Shanghai Baosight Software Co. Ltd. Class B | 7,923,643 | 31,676 |
| | Jiangxi Copper Co. Ltd. Class H | 18,132,722 | 31,666 |
| | ZTE Corp. Class H | 10,417,039 | 31,270 |
| | | | | | Shares | Market
Value•
($000) |
| | Muyuan Foods Co. Ltd. Class A (XSHE) | 3,485,031 | 31,163 |
| | Shimao Group Holdings Ltd. | 19,749,423 | 30,981 |
| | China Railway Group Ltd. Class H | 62,821,604 | 30,688 |
| | Eve Energy Co. Ltd. Class A | 1,708,738 | 30,289 |
| 1 | Hansoh Pharmaceutical Group Co. Ltd. | 13,607,000 | 30,250 |
| | Shanghai Pudong Development Bank Co. Ltd. Class A (XSSC) | 21,643,831 | 30,230 |
| * | Weibo Corp. ADR | 669,244 | 30,103 |
| | China Meidong Auto Holdings Ltd. | 5,800,521 | 29,965 |
| | China Medical System Holdings Ltd. | 17,646,584 | 29,880 |
| *,2 | JinkoSolar Holding Co. Ltd. ADR | 497,879 | 29,783 |
| 1 | Topsports International Holdings Ltd. | 24,462,000 | 29,718 |
| | Agricultural Bank of China Ltd. Class A (XSSC) | 64,544,395 | 29,639 |
| | Beijing Enterprises Water Group Ltd. | 77,274,691 | 29,537 |
| 2 | Huaneng Power International Inc. Class H | 56,798,822 | 29,397 |
| | Far East Horizon Ltd. | 30,831,130 | 29,396 |
| | Jiangsu Yanghe Brewery Joint-Stock Co. Ltd. Class A (XSHE) | 1,008,728 | 29,266 |
| 1 | Huatai Securities Co. Ltd. Class H | 19,668,008 | 29,249 |
| | Tongwei Co. Ltd. Class A (XSSC) | 3,247,185 | 28,994 |
| *,2 | Kingsoft Cloud Holdings Ltd. ADR | 1,261,510 | 28,977 |
| *,1,2 | Evergrande Property Services Group Ltd. | 56,861,000 | 28,969 |
| | Bosideng International Holdings Ltd. | 37,241,764 | 28,857 |
Emerging Markets Stock Index Fund
| | | | | | Shares | Market
Value•
($000) |
| | China Oilfield Services Ltd. Class H | 29,940,348 | 28,634 |
| | Anhui Gujing Distillery Co. Ltd. Class B | 2,188,408 | 28,216 |
| | CIFI Holdings Group Co. Ltd. | 50,800,897 | 28,198 |
| *,1,2 | Jinxin Fertility Group Ltd. | 19,959,500 | 28,151 |
| *,1,2 | CanSino Biologics Inc. Class H | 1,096,000 | 28,030 |
| | Inner Mongolia Yili Industrial Group Co. Ltd. Class A (XSSC) | 4,179,492 | 28,020 |
| *,3 | GCL-Poly Energy Holdings Ltd. | 109,839,000 | 27,952 |
| | Chongqing Zhifei Biological Products Co. Ltd. Class A | 1,187,871 | 27,926 |
| | Beijing Enterprises Holdings Ltd. | 7,175,267 | 27,581 |
| * | Canadian Solar Inc. | 662,209 | 27,515 |
| | Nine Dragons Paper Holdings Ltd. | 21,552,910 | 27,103 |
| 1,2 | China Merchants Securities Co. Ltd. Class H | 17,139,856 | 27,080 |
| | TravelSky Technology Ltd. Class H | 14,135,867 | 26,412 |
| | China Resources Cement Holdings Ltd. | 31,269,076 | 26,294 |
| * | Tongcheng-Elong Holdings Ltd. | 11,797,600 | 26,293 |
| | China State Construction International Holdings Ltd. | 25,528,728 | 26,156 |
| 2 | Xinjiang Goldwind Science & Technology Co. Ltd. Class H | 11,686,690 | 26,135 |
| | China Jinmao Holdings Group Ltd. | 88,927,771 | 25,980 |
| * | Vnet Group Inc. ADR | 1,652,413 | 25,910 |
| *,1,2 | Ping An Healthcare & Technology Co. Ltd. | 5,347,995 | 25,853 |
| | Autohome Inc. ADR | 656,745 | 25,843 |
| | | | | | Shares | Market
Value•
($000) |
| *,2 | Ming Yuan Cloud Group Holdings Ltd. | 7,837,000 | 25,474 |
| | Shenzhen Mindray Bio-Medical Electronics Co. Ltd. Class A (XSHE) | 434,287 | 25,448 |
| | Hopson Development Holdings Ltd. | 9,347,727 | 25,366 |
| | CRRC Corp. Ltd. Class H | 56,029,000 | 25,299 |
| * | TAL Education Group ADR | 6,125,511 | 25,053 |
| | Zhangzhou Pientzehuang Pharmaceutical Co. Ltd. Class A (XSSC) | 389,306 | 25,027 |
| | Shenzhen Mindray Bio-Medical Electronics Co. Ltd. Class A (XSEC) | 419,669 | 24,592 |
| | Ganfeng Lithium Co. Ltd. Class A (XSHE) | 921,350 | 24,123 |
| * | 51job Inc. ADR | 402,540 | 23,975 |
| | Shenzhen Inovance Technology Co. Ltd. Class A | 2,352,928 | 23,974 |
| | Agricultural Bank of China Ltd. Class A (XSHG) | 52,073,300 | 23,912 |
| | Yunnan Energy New Material Co. Ltd. (XSHE) | 520,135 | 23,721 |
| 1 | Yadea Group Holdings Ltd. | 13,736,000 | 23,601 |
| | Haitian International Holdings Ltd. | 8,070,180 | 23,521 |
| | Bank of Ningbo Co. Ltd. Class A (XSHE) | 3,943,270 | 23,508 |
| | Pharmaron Beijing Co. Ltd. Class A (XSEC) | 782,071 | 23,321 |
| | Kingboard Laminates Holdings Ltd. | 14,816,799 | 23,227 |
| | LONGi Green Energy Technology Co. Ltd. Class A (XSHG) | 1,463,429 | 22,313 |
| * | Seazen Group Ltd. | 28,162,824 | 22,279 |
Emerging Markets Stock Index Fund
| | | | | | Shares | Market
Value•
($000) |
| | Contemporary Amperex Technology Co. Ltd. Class A (XSEC) | 221,485 | 22,187 |
| | AviChina Industry & Technology Co. Ltd. Class H | 34,760,476 | 22,116 |
| | COSCO SHIPPING Ports Ltd. | 26,519,359 | 22,074 |
| 1 | Jiumaojiu International Holdings Ltd. | 8,712,000 | 21,809 |
| * | I-Mab ADR | 352,783 | 21,798 |
| | Shanghai Pharmaceuticals Holding Co. Ltd. Class H | 11,899,426 | 21,779 |
| | CRRC Corp. Ltd. Class A | 23,269,989 | 21,587 |
| | China Cinda Asset Management Co. Ltd. Class H | 128,980,276 | 21,533 |
| | Hello Group Inc. ADR | 1,702,990 | 21,202 |
| | Haier Smart Home Co. Ltd. Class A (XSSC) | 4,972,807 | 21,130 |
| *,1,3 | China Huarong Asset Management Co. Ltd. Class H | 156,726,113 | 20,546 |
| 2 | Xtep International Holdings Ltd. | 15,622,291 | 20,431 |
| | Shandong Gold Mining Co. Ltd. Class A (XSSC) | 6,572,346 | 20,395 |
| * | Noah Holdings Ltd. ADR | 479,656 | 20,390 |
| | China Lesso Group Holdings Ltd. | 13,157,317 | 20,337 |
| | China Yongda Automobiles Services Holdings Ltd. | 12,764,652 | 20,310 |
| | Bank of Communications Co. Ltd. Class A (XSSC) | 28,614,739 | 20,204 |
| | China Communications Services Corp. Ltd. Class H | 36,240,821 | 20,035 |
| | China Northern Rare Earth Group High-Tech Co. Ltd. Class A (XSSC) | 2,518,440 | 19,974 |
| | | | | | Shares | Market
Value•
($000) |
| | China State Construction Engineering Corp. Ltd. Class A (XSSC) | 27,089,170 | 19,708 |
| *,1,2 | InnoCare Pharma Ltd. | 8,212,000 | 19,693 |
| | Huatai Securities Co. Ltd. Class A (XSSC) | 7,927,031 | 19,637 |
| | NAURA Technology Group Co. Ltd. Class A (XSHE) | 337,900 | 19,599 |
| | Zijin Mining Group Co. Ltd. Class A (XSSC) | 11,970,000 | 19,544 |
| | Shenzhen Transsion Holdings Co. Ltd. Class A | 783,322 | 19,312 |
| | China Suntien Green Energy Corp. Ltd. Class H | 24,240,823 | 19,266 |
| | SAIC Motor Corp. Ltd. Class A (XSSC) | 6,056,213 | 19,219 |
| | China Coal Energy Co. Ltd. Class H | 31,471,653 | 19,200 |
| | Zhejiang Expressway Co. Ltd. Class H | 21,621,477 | 19,182 |
| | JA Solar Technology Co. Ltd. Class A (XSHE) | 1,334,700 | 19,043 |
| | Orient Securities Co. Ltd. Class A (XSSC) | 8,779,670 | 18,894 |
| | Wingtech Technology Co. Ltd. Class A | 1,098,531 | 18,854 |
| | Beijing Kingsoft Office Software Inc. Class A (XSHG) | 403,640 | 18,673 |
| | SF Holding Co. Ltd. Class A (XSHE) | 1,837,624 | 18,530 |
| *,2 | GOME Retail Holdings Ltd. | 180,860,708 | 18,333 |
| * | Alibaba Pictures Group Ltd. | 171,879,250 | 18,259 |
| | Guotai Junan Securities Co. Ltd. Class A (XSHG) | 6,631,000 | 18,157 |
| | Will Semiconductor Co. Ltd. Shanghai Class A (XSHG) | 435,800 | 18,106 |
| | China Life Insurance Co. Ltd. Class A | 3,900,190 | 18,093 |
Emerging Markets Stock Index Fund
| | | | | | Shares | Market
Value•
($000) |
| * | Air China Ltd. Class H | 25,485,808 | 17,930 |
| * | Tianqi Lithium Corp. Class A (XSHE) | 1,213,487 | 17,870 |
| * | China Southern Airlines Co. Ltd. Class H | 29,129,638 | 17,714 |
| | Jiangsu Expressway Co. Ltd. Class H | 18,574,976 | 17,613 |
| * | Hollysys Automation Technologies Ltd. | 881,169 | 17,579 |
| 2 | China Education Group Holdings Ltd. | 10,271,724 | 17,558 |
| | China Traditional Chinese Medicine Holdings Co. Ltd. | 36,850,802 | 17,535 |
| * | Dada Nexus Ltd. ADR | 861,660 | 17,500 |
| | China Vanke Co. Ltd. Class A (XSHE) | 6,147,497 | 17,479 |
| *,2 | XD Inc. | 3,081,400 | 17,443 |
| *,1,2 | ZhongAn Online P&C Insurance Co. Ltd. Class H | 4,785,993 | 17,409 |
| * | Beijing Capital International Airport Co. Ltd. Class H | 26,572,447 | 17,279 |
| *,1,2 | Venus MedTech Hangzhou Inc. Class H | 3,698,000 | 17,114 |
| *,1 | 3SBio Inc. | 18,510,086 | 16,923 |
| | Tsingtao Brewery Co. Ltd. Class A (XSHG) | 1,033,151 | 16,839 |
| | CSC Financial Co. Ltd. Class A | 3,805,410 | 16,807 |
| | China Grand Pharmaceutical & Healthcare Holdings Ltd. | 20,986,710 | 16,804 |
| *,1,2 | Alphamab Oncology | 8,177,000 | 16,777 |
| 1 | A-Living Smart City Services Co. Ltd. | 5,047,663 | 16,756 |
| | China Overseas Property Holdings Ltd. | 18,362,311 | 16,497 |
| | East Money Information Co. Ltd. Class A (XSHE) | 3,195,969 | 16,435 |
| | | | | | Shares | Market
Value•
($000) |
| | Poly Developments & Holdings Group Co. Ltd. Class A (XSSC) | 8,372,870 | 16,433 |
| 1 | Dali Foods Group Co. Ltd. | 29,260,548 | 16,292 |
| | Luzhou Laojiao Co. Ltd. Class A (XSEC) | 456,500 | 16,285 |
| | NARI Technology Co. Ltd. Class A (XSHG) | 2,657,708 | 16,183 |
| | Shenzhen International Holdings Ltd. | 13,434,978 | 16,175 |
| 2 | Greentown China Holdings Ltd. | 11,712,219 | 16,136 |
| *,1,2 | Kintor Pharmaceutical Ltd. | 3,218,000 | 16,058 |
| | Ping An Bank Co. Ltd. Class A (XSEC) | 5,245,600 | 15,978 |
| | Fuyao Glass Industry Group Co. Ltd. Class A (XSSC) | 2,067,613 | 15,971 |
| | Shanghai Lujiazui Finance & Trade Zone Development Co. Ltd. Class B | 17,862,933 | 15,887 |
| *,1,2 | Yidu Tech Inc. | 4,977,400 | 15,882 |
| | NARI Technology Co. Ltd. Class A (XSSC) | 2,603,968 | 15,855 |
| | Yuexiu Property Co. Ltd. | 18,011,332 | 15,826 |
| | KWG Group Holdings Ltd. | 18,145,297 | 15,818 |
| | Lens Technology Co. Ltd. Class A | 4,752,454 | 15,813 |
| | Guangzhou Tinci Materials Technology Co. Ltd. Class A (XSHE) | 614,129 | 15,804 |
| | Sany Heavy Industry Co. Ltd. Class A (XSSC) | 4,399,964 | 15,778 |
| | Bank of China Ltd. Class A (XSSC) | 33,064,900 | 15,751 |
| | Zoomlion Heavy Industry Science & Technology Co. Ltd. Class H | 21,772,532 | 15,682 |
| | Agile Group Holdings Ltd. | 19,869,226 | 15,576 |
Emerging Markets Stock Index Fund
| | | | | | Shares | Market
Value•
($000) |
| | Zhejiang Huayou Cobalt Co. Ltd. Class A (XSHG) | 891,337 | 15,459 |
| | Sanan Optoelectronics Co. Ltd. Class A (XSSC) | 2,937,042 | 15,431 |
| 2 | China International Marine Containers Group Co. Ltd. Class H | 7,775,578 | 15,406 |
| | Logan Group Co. Ltd. | 15,273,165 | 15,299 |
| | China Everbright Bank Co. Ltd. Class H | 43,454,956 | 15,281 |
| | China Everbright Bank Co. Ltd. Class A (XSSC) | 28,214,294 | 15,167 |
| | Jiangsu Hengrui Medicine Co. Ltd. Class A (XSHG) | 1,969,099 | 15,127 |
| | WuXi AppTec Co. Ltd. Class A (XSHG) | 696,246 | 15,004 |
| | Industrial Bank Co. Ltd. Class A (XSHG) | 5,127,801 | 14,924 |
| | CIFI Ever Sunshine Services Group Ltd. | 8,360,000 | 14,918 |
| *,1,2 | Peijia Medical Ltd. | 6,102,000 | 14,869 |
| | Foshan Haitian Flavouring & Food Co. Ltd. Class A (XSSC) | 808,217 | 14,799 |
| | China United Network Communications Ltd. Class A | 23,134,444 | 14,731 |
| | Imeik Technology Development Co. Ltd. Class A (XSHE) | 150,560 | 14,682 |
| | GoerTek Inc. Class A (XSHE) | 2,161,304 | 14,679 |
| 1 | Sunac Services Holdings Ltd. | 7,203,503 | 14,538 |
| | China Water Affairs Group Ltd. | 14,142,149 | 14,535 |
| | Zhejiang Jingsheng Mechanical & Electrical Co. Ltd. Class A | 1,194,292 | 14,279 |
| *,1 | Remegen Co. Ltd. Class H | 1,146,000 | 14,257 |
| | | | | | Shares | Market
Value•
($000) |
| | Chongqing Changan Automobile Co. Ltd. Class B | 21,981,647 | 14,207 |
| | Jiangsu Hengli Hydraulic Co. Ltd. Class A | 1,103,939 | 14,157 |
| | Maxscend Microelectronics Co. Ltd. Class A | 292,448 | 14,136 |
| *,1,2 | Shanghai Junshi Biosciences Co. Ltd. Class H | 2,805,800 | 14,102 |
| | Sany Heavy Equipment International Holdings Co. Ltd. | 12,387,954 | 14,096 |
| * | Lifetech Scientific Corp. | 30,289,059 | 14,067 |
| | MINISO Group Holding Ltd. ADR | 921,109 | 13,826 |
| * | Niu Technologies ADR | 526,360 | 13,780 |
| *,2 | Canaan Inc. ADR | 1,599,032 | 13,704 |
| 2 | China Everbright Ltd. | 12,104,100 | 13,610 |
| | China Merchants Securities Co. Ltd. Class A (XSSC) | 5,051,753 | 13,560 |
| * | Advanced Micro-Fabrication Equipment Inc. China Class A | 554,840 | 13,559 |
| | CGN New Energy Holdings Co. Ltd. | 14,404,000 | 13,482 |
| | Shenwan Hongyuan Group Co. Ltd. Class A (XSHE) | 16,751,781 | 13,424 |
| | AECC Aviation Power Co. Ltd. Class A (XSSC) | 1,448,466 | 13,384 |
| | CITIC Securities Co. Ltd. Class A (XSSC) | 3,305,200 | 13,361 |
| 1 | Pharmaron Beijing Co. Ltd. Class H | 611,400 | 13,229 |
| * | Baozun Inc. Class A | 2,290,733 | 13,222 |
| | Shanxi Xinghuacun Fen Wine Factory Co. Ltd. Class A (XSSC) | 280,320 | 13,205 |
| | Sany Heavy Industry Co. Ltd. Class A (XSHG) | 3,652,279 | 13,097 |
| | Xinyi Energy Holdings Ltd. | 22,088,000 | 13,024 |
Emerging Markets Stock Index Fund
| | | | | | Shares | Market
Value•
($000) |
| | China Petroleum & Chemical Corp. Class A | 19,536,901 | 12,981 |
| | China CITIC Bank Corp. Ltd. Class A (XSSC) | 18,288,166 | 12,972 |
| | Sinotruk Hong Kong Ltd. | 9,385,467 | 12,955 |
| | Sinopec Shanghai Petrochemical Co. Ltd. Class H | 55,152,131 | 12,869 |
| | Greentown Service Group Co. Ltd. | 12,999,893 | 12,869 |
| 1 | Legend Holdings Corp. Class H | 7,299,914 | 12,831 |
| | China Yangtze Power Co. Ltd. Class A (XSSC) | 3,847,428 | 12,786 |
| | Zhangzhou Pientzehuang Pharmaceutical Co. Ltd. Class A (XSHG) | 197,875 | 12,721 |
| | Metallurgical Corp. of China Ltd. Class H | 45,755,885 | 12,691 |
| | Inner Mongolia Yitai Coal Co. Ltd. Class B | 14,618,896 | 12,677 |
| * | Baidu Inc. Class A | 618,785 | 12,644 |
| | Unigroup Guoxin Microelectronics Co. Ltd. Class A (XSHE) | 398,093 | 12,603 |
| | China Datang Corp. Renewable Power Co. Ltd. Class H | 29,452,000 | 12,460 |
| 2 | Chongqing Rural Commercial Bank Co. Ltd. Class H | 34,570,539 | 12,436 |
| | Citic Pacific Special Steel Group Co. Ltd. Class A (XSHE) | 4,164,654 | 12,411 |
| | Zijin Mining Group Co. Ltd. Class A (XSHG) | 7,579,000 | 12,375 |
| | COSCO SHIPPING Development Co. Ltd. Class H | 63,588,529 | 12,357 |
| | Trina Solar Co. Ltd. Class A | 1,000,740 | 12,291 |
| | Sihuan Pharmaceutical Holdings Group Ltd. | 58,403,595 | 12,256 |
| | BOE Technology Group Co. Ltd. Class A (XSHE) | 15,937,654 | 12,245 |
| | | | | | Shares | Market
Value•
($000) |
| 2 | Guangzhou R&F Properties Co. Ltd. Class H | 19,567,536 | 12,241 |
| | Tianjin Zhonghuan Semiconductor Co. Ltd. Class A (XSHE) | 1,483,100 | 12,165 |
| | Angang Steel Co. Ltd. Class H | 22,522,652 | 12,107 |
| | Walvax Biotechnology Co. Ltd. Class A | 1,395,857 | 12,058 |
| | Inner Mongolia Yili Industrial Group Co. Ltd. Class A (XSHG) | 1,798,162 | 12,055 |
| 1,2 | China Resources Pharmaceutical Group Ltd. | 24,992,626 | 12,023 |
| *,1,2 | Luye Pharma Group Ltd. | 25,146,456 | 11,984 |
| | ZTE Corp. Class A (XSEC) | 2,352,274 | 11,978 |
| * | Hainan Meilan International Airport Co. Ltd. | 2,954,000 | 11,953 |
| | Baoshan Iron & Steel Co. Ltd. Class A (XSHG) | 10,736,494 | 11,950 |
| * | COFCO Joycome Foods Ltd. | 30,869,000 | �� 11,947 |
| | Fu Shou Yuan International Group Ltd. | 13,849,913 | 11,890 |
| | Shougang Fushan Resources Group Ltd. | 44,824,000 | 11,840 |
| | Sinopec Engineering Group Co. Ltd. Class H | 22,297,064 | 11,752 |
| | BOE Technology Group Co. Ltd. Class B (XSHE) | 27,240,209 | 11,662 |
| *,2 | Ausnutria Dairy Corp. Ltd. | 9,311,950 | 11,649 |
| * | XPeng Inc. Class A | 499,031 | 11,579 |
| | Sunwoda Electronic Co. Ltd. Class A | 1,502,280 | 11,572 |
| *,1,2 | Zhou Hei Ya International Holdings Co. Ltd. | 12,872,904 | 11,572 |
| *,1,2 | China Logistics Property Holdings Co. Ltd. | 21,504,409 | 11,551 |
| | FinVolution Group ADR | 1,882,568 | 11,521 |
Emerging Markets Stock Index Fund
| | | | | | Shares | Market
Value•
($000) |
| | CIMC Enric Holdings Ltd. | 8,905,019 | 11,451 |
| * | Inner Mongolia BaoTou Steel Union Co. Ltd. Class A (XSSC) | 26,036,625 | 11,444 |
| 2 | Poly Property Services Co. Ltd. | 2,048,800 | 11,437 |
| 1 | China Railway Signal & Communication Corp. Ltd. Class H | 32,579,798 | 11,429 |
| | Gigadevice Semiconductor Beijing Inc. Class A (XSSC) | 429,489 | 11,389 |
| | Yonyou Network Technology Co. Ltd. Class A (XSSC) | 2,255,185 | 11,194 |
| | Tianjin Zhonghuan Semiconductor Co. Ltd. Class A (XSEC) | 1,364,400 | 11,191 |
| | Huaxia Bank Co. Ltd. Class A (XSSC) | 12,698,440 | 11,168 |
| | Weichai Power Co. Ltd. Class A (XSHE) | 4,727,878 | 11,162 |
| | SG Micro Corp. Class A | 220,494 | 11,162 |
| | Bank of Shanghai Co. Ltd. Class A (XSHG) | 9,736,861 | 11,094 |
| | Changchun High & New Technology Industry Group Inc. Class A (XSHE) | 259,668 | 11,072 |
| | Shanghai Putailai New Energy Technology Co. Ltd. Class A (XSSC) | 397,315 | 11,046 |
| | Focus Media Information Technology Co. Ltd. Class A (XSHE) | 9,589,431 | 10,989 |
| | Shanghai Electric Group Co. Ltd. Class H | 38,897,315 | 10,959 |
| | Lao Feng Xiang Co. Ltd. Class B | 3,098,352 | 10,929 |
| * | Brilliance China Automotive Holdings Ltd. | 19,850,559 | 10,854 |
| | | | | | Shares | Market
Value•
($000) |
| | Montage Technology Co. Ltd. Class A | 1,063,994 | 10,842 |
| | Wuxi Shangji Automation Co. Ltd. Class A | 231,400 | 10,836 |
| 1 | Hangzhou Tigermed Consulting Co. Ltd. Class H | 554,700 | 10,819 |
| | Foshan Haitian Flavouring & Food Co. Ltd. Class A (XSHG) | 588,617 | 10,778 |
| | Jiangsu Yanghe Brewery Joint-Stock Co. Ltd. Class A (XSEC) | 371,209 | 10,770 |
| | Henan Shuanghui Investment & Development Co. Ltd. Class A (XSHE) | 2,333,476 | 10,753 |
| | COSCO SHIPPING Energy Transportation Co. Ltd. Class H | 24,294,261 | 10,736 |
| | Suzhou Maxwell Technologies Co. Ltd. Class A | 89,560 | 10,731 |
| | Iflytek Co. Ltd. Class A (XSHE) | 1,211,059 | 10,702 |
| | Muyuan Foods Co. Ltd. Class A (XSEC) | 1,194,367 | 10,680 |
| * | China Eastern Airlines Corp. Ltd. Class H | 27,217,558 | 10,679 |
| 2 | Tianneng Power International Ltd. | 9,346,156 | 10,672 |
| | Hundsun Technologies Inc. Class A (XSSC) | 1,082,831 | 10,632 |
| | China Shenhua Energy Co. Ltd. Class A (XSSC) | 3,404,148 | 10,597 |
| | Sinotrans Ltd. Class H | 32,010,836 | 10,523 |
| * | Aluminum Corp. of China Ltd. Class A | 10,938,600 | 10,519 |
| | Digital China Holdings Ltd. | 19,494,894 | 10,510 |
| * | Topchoice Medical Corp. Class A | 281,979 | 10,491 |
| | Guangdong Haid Group Co. Ltd. Class A (XSHE) | 1,023,667 | 10,488 |
Emerging Markets Stock Index Fund
| | | | | | Shares | Market
Value•
($000) |
| *,2 | Shanghai Fudan Microelectronics Group Co. Ltd. Class H | 3,822,000 | 10,468 |
| | Bank of Nanjing Co. Ltd. Class A (XSSC) | 6,894,868 | 10,451 |
| | Yunnan Baiyao Group Co. Ltd. Class A (XSHE) | 745,692 | 10,439 |
| | Chaozhou Three-Circle Group Co. Ltd. Class A | 1,664,608 | 10,412 |
| 2 | Jinke Smart Services Group Co. Ltd. Class H | 1,927,600 | 10,409 |
| * | Zhejiang Century Huatong Group Co. Ltd. Class A | 8,969,102 | 10,398 |
| | China Construction Bank Corp. Class A (XSSC) | 11,205,510 | 10,385 |
| 1 | BAIC Motor Corp. Ltd. Class H | 31,193,593 | 10,333 |
| 2 | Zhaojin Mining Industry Co. Ltd. Class H | 14,450,167 | 10,288 |
| * | Chongqing Brewery Co. Ltd. Class A | 434,451 | 10,192 |
| | Shanghai Industrial Holdings Ltd. | 6,826,289 | 10,186 |
| | Anhui Conch Cement Co. Ltd. Class A (XSSC) | 1,712,561 | 10,159 |
| | Iflytek Co. Ltd. Class A (XSEC) | 1,143,650 | 10,106 |
| *,2 | EHang Holdings Ltd. ADR | 415,430 | 10,024 |
| 2 | Tiangong International Co. Ltd. | 16,633,224 | 10,007 |
| | Weichai Power Co. Ltd. Class A (XSEC) | 4,204,300 | 9,926 |
| | Sun Art Retail Group Ltd. | 16,877,500 | 9,895 |
| | Sino-Ocean Group Holding Ltd. | 45,504,089 | 9,890 |
| | SAIC Motor Corp. Ltd. Class A (XSHG) | 3,106,065 | 9,857 |
| | China Reinsurance Group Corp. Class H | 94,101,940 | 9,786 |
| | China Resources Microelectronics Ltd. Class A | 1,012,886 | 9,777 |
| | | | | | Shares | Market
Value•
($000) |
| | Yihai Kerry Arawana Holdings Co. Ltd. Class A | 1,021,160 | 9,698 |
| 2 | SSY Group Ltd. | 20,337,775 | 9,661 |
| 1 | Guotai Junan Securities Co. Ltd. Class H | 7,072,136 | 9,655 |
| | Ginlong Technologies Co. Ltd. Class A | 220,850 | 9,638 |
| | China CSSC Holdings Ltd. Class A (XSSC) | 2,742,329 | 9,636 |
| | Hangzhou First Applied Material Co. Ltd. Class A | 429,134 | 9,616 |
| | Shaanxi Coal Industry Co. Ltd. Class A (XSHG) | 4,889,934 | 9,583 |
| | China Risun Group Ltd. | 15,715,000 | 9,579 |
| *,2 | Differ Group Holding Co. Ltd. | 39,622,000 | 9,558 |
| * | Shanghai International Airport Co. Ltd. Class A (XSSC) | 1,152,067 | 9,527 |
| | Suzhou TA&A Ultra Clean Technology Co. Ltd. Class A | 570,150 | 9,493 |
| | Daqin Railway Co. Ltd. Class A (XSSC) | 9,556,460 | 9,482 |
| | China National Nuclear Power Co. Ltd. Class A (XSHG) | 8,825,347 | 9,458 |
| | Bank of Ningbo Co. Ltd. Class A (XSEC) | 1,581,700 | 9,429 |
| | Shenwan Hongyuan Group Co. Ltd. Class A (XSEC) | 11,680,174 | 9,360 |
| * | Skyworth Group Ltd. | 16,741,212 | 9,327 |
| | Power Construction Corp. of China Ltd. Class A (XSSC) | 7,234,508 | 9,309 |
| 2 | Fire Rock Holdings Ltd. | 29,477,500 | 9,299 |
| | China Oriental Group Co. Ltd. | 33,037,736 | 9,298 |
| * | Shenzhen Dynanonic Co. Ltd. Class A | 94,100 | 9,262 |
| | CSG Holding Co. Ltd. Class B | 21,266,997 | 9,261 |
Emerging Markets Stock Index Fund
| | | | | | Shares | Market
Value•
($000) |
| 1,2 | Blue Moon Group Holdings Ltd. | 10,257,500 | 9,246 |
| | AECC Aviation Power Co. Ltd. Class A (XSHG) | 998,613 | 9,227 |
| 2 | Dongfang Electric Corp. Ltd. Class H | 5,711,013 | 9,113 |
| | Ecovacs Robotics Co. Ltd. Class A (XSHG) | 335,787 | 9,003 |
| | Everbright Securities Co. Ltd. Class A (XSSC) | 3,781,910 | 8,994 |
| | China Merchants Shekou Industrial Zone Holdings Co. Ltd. Class A (XSHE) | 5,482,430 | 8,942 |
| | Shenzhen Expressway Co. Ltd. Class H | 9,431,170 | 8,889 |
| | TCL Technology Group Corp. Class A (XSHE) | 9,331,822 | 8,847 |
| | Pharmaron Beijing Co. Ltd. Class A (XSHE) | 294,944 | 8,795 |
| | NetDragon Websoft Holdings Ltd. | 4,001,138 | 8,763 |
| | Yunnan Energy New Material Co. Ltd. (XSEC) | 191,600 | 8,738 |
| | Lonking Holdings Ltd. | 29,902,868 | 8,727 |
| 1 | Genertec Universal Medical Group Co. Ltd. | 11,527,168 | 8,696 |
| | Bank of Beijing Co. Ltd. Class A (XSSC) | 12,557,073 | 8,691 |
| | Bloomage Biotechnology Corp. Ltd. Class A | 334,408 | 8,680 |
| | Beijing Wantai Biological Pharmacy Enterprise Co. Ltd. Class A | 250,880 | 8,667 |
| | LB Group Co. Ltd. Class A (XSHE) | 1,949,207 | 8,665 |
| | Shanghai Fosun Pharmaceutical Group Co. Ltd. Class A (XSSC) | 1,103,599 | 8,642 |
| | China Overseas Grand Oceans Group Ltd. | 18,006,142 | 8,633 |
| | | | | | Shares | Market
Value•
($000) |
| | Huayu Automotive Systems Co. Ltd. Class A (XSSC) | 2,059,116 | 8,630 |
| | Hangzhou Steam Turbine Co. Ltd. Class B | 4,217,482 | 8,627 |
| * | LexinFintech Holdings Ltd. ADR | 1,606,358 | 8,578 |
| | Huadong Medicine Co. Ltd. Class A (XSHE) | 1,501,447 | 8,572 |
| * | Genetron Holdings Ltd. ADR | 621,649 | 8,560 |
| 2 | Huadian Power International Corp. Ltd. Class H | 23,137,909 | 8,546 |
| | StarPower Semiconductor Ltd. Class A | 135,400 | 8,476 |
| | Zhongyu Gas Holdings Ltd. | 8,843,000 | 8,474 |
| | China Jushi Co. Ltd. Class A (XSSC) | 2,826,619 | 8,444 |
| | Wuxi Lead Intelligent Equipment Co. Ltd. Class A (XSHE) | 661,281 | 8,426 |
| | Shanghai Pudong Development Bank Co. Ltd. Class A (XSHG) | 6,018,977 | 8,407 |
| | China BlueChemical Ltd. Class H | 25,064,568 | 8,381 |
| | Hengli Petrochemical Co. Ltd. Class A (XSHG) | 2,424,750 | 8,361 |
| | Yuexiu REIT | 19,132,000 | 8,342 |
| | Shenzhen Capchem Technology Co. Ltd. Class A | 371,900 | 8,339 |
| | Jiangsu Eastern Shenghong Co. Ltd. Class A (XSHE) | 1,957,200 | 8,322 |
| * | National Silicon Industry Group Co. Ltd. Class A | 1,875,919 | 8,283 |
| | Zhejiang Sanhua Intelligent Controls Co. Ltd. Class A (XSEC) | 2,231,114 | 8,270 |
| 2 | C&D International Investment Group Ltd. | 4,440,000 | 8,264 |
Emerging Markets Stock Index Fund
| | | | | | Shares | Market
Value•
($000) |
| * | BAIC BluePark New Energy Technology Co. Ltd. Class A | 3,717,812 | 8,236 |
| | Mango Excellent Media Co. Ltd. Class A (XSHE) | 1,342,130 | 8,233 |
| *,2 | Li Auto Inc. Class A | 486,845 | 8,210 |
| | Joinn Laboratories China Co. Ltd. Class A | 328,552 | 8,198 |
| | China Minsheng Banking Corp. Ltd. Class A (XSSC) | 13,476,754 | 8,185 |
| | Ningbo Ronbay New Energy Technology Co. Ltd. Class A | 455,407 | 8,182 |
| | China SCE Group Holdings Ltd. | 26,098,301 | 8,139 |
| 2 | China Evergrande Group | 27,090,057 | 8,039 |
| | Seazen Holdings Co. Ltd. Class A (XSHG) | 1,493,873 | 7,981 |
| | SDIC Power Holdings Co. Ltd. Class A (XSSC) | 4,812,507 | 7,931 |
| | Yealink Network Technology Corp. Ltd. Class A (XSHE) | 671,100 | 7,925 |
| | Datang International Power Generation Co. Ltd. Class H | 43,690,046 | 7,896 |
| | Beijing Roborock Technology Co. Ltd. Class A | 55,998 | 7,877 |
| * | Fufeng Group Ltd. | 22,606,495 | 7,826 |
| | NAURA Technology Group Co. Ltd. Class A (XSEC) | 134,700 | 7,813 |
| 1 | Fuyao Glass Industry Group Co. Ltd. Class H | 1,356,400 | 7,810 |
| | Shenzhen Kangtai Biological Products Co. Ltd. Class A (XSHE) | 434,900 | 7,776 |
| | Tsingtao Brewery Co. Ltd. Class A (XSSC) | 476,086 | 7,760 |
| | Times China Holdings Ltd. | 11,352,884 | 7,725 |
| | CITIC Securities Co. Ltd. Class A (XSHG) | 1,908,000 | 7,713 |
| | | | | | Shares | Market
Value•
($000) |
| | TBEA Co. Ltd. Class A (XSSC) | 1,811,358 | 7,668 |
| * | Chongqing Sokon Industry Group Co. Ltd. Class A | 724,628 | 7,650 |
| | Hoshine Silicon Industry Co. Ltd. Class A (XSSC) | 296,900 | 7,638 |
| | Baoshan Iron & Steel Co. Ltd. Class A (XSSC) | 6,846,784 | 7,621 |
| 2 | Q Technology Group Co. Ltd. | 5,201,424 | 7,594 |
| * | CMGE Technology Group Ltd. | 19,380,000 | 7,559 |
| | JiuGui Liquor Co. Ltd. Class A (XSHE) | 225,000 | 7,529 |
| | Yanlord Land Group Ltd. | 9,048,560 | 7,522 |
| | Ovctek China Inc. Class A (XSHE) | 705,542 | 7,511 |
| 1 | Hope Education Group Co. Ltd. | 42,060,000 | 7,501 |
| | Ingenic Semiconductor Co. Ltd. Class A | 348,916 | 7,495 |
| 2 | Zhuguang Holdings Group Co. Ltd. | 34,095,000 | 7,488 |
| | ZTE Corp. Class A (XSHE) | 1,470,465 | 7,488 |
| | BOE Technology Group Co. Ltd. Class A (XSEC) | 9,725,100 | 7,472 |
| | Poly Property Group Co. Ltd. | 30,197,038 | 7,449 |
| | 3peak Inc. Class A | 61,328 | 7,431 |
| | Yantai Changyu Pioneer Wine Co. Ltd. Class B | 4,126,142 | 7,413 |
| | Hangzhou Silan Microelectronics Co. Ltd. Class A (XSSC) | 767,600 | 7,402 |
| 2 | Shenzhen Investment Ltd. | 30,039,262 | 7,368 |
| 2 | China Aoyuan Group Ltd. | 18,589,071 | 7,342 |
| | Anhui Conch Cement Co. Ltd. Class A (XSHG) | 1,237,657 | 7,342 |
| | Chongqing Changan Automobile Co. Ltd. Class A (XSHE) | 2,382,460 | 7,287 |
| *,1,2 | Ascentage Pharma Group International | 1,962,100 | 7,285 |
Emerging Markets Stock Index Fund
| | | | | | Shares | Market
Value•
($000) |
| 1,2 | Viva Biotech Holdings | 9,658,500 | 7,282 |
| | Tongwei Co. Ltd. Class A (XSHG) | 814,000 | 7,268 |
| | Guangdong Jia Yuan Technology Shares Co. Ltd. Class A | 269,955 | 7,266 |
| | Guangzhou Baiyunshan Pharmaceutical Holdings Co. Ltd. Class H | 2,865,825 | 7,245 |
| *,2 | Yeahka Ltd. | 2,384,000 | 7,200 |
| | GoerTek Inc. Class A (XSEC) | 1,056,728 | 7,177 |
| | China National Chemical Engineering Co. Ltd. Class A | 4,372,900 | 7,167 |
| * | Yunnan Yuntianhua Co. Ltd. Class A | 1,633,500 | 7,141 |
| | China State Construction Engineering Corp. Ltd. Class A (XSHG) | 9,809,160 | 7,137 |
| | Ningbo Shanshan Co. Ltd. Class A (XSSC) | 1,089,418 | 7,135 |
| | New China Life Insurance Co. Ltd. Class A (XSSC) | 1,168,286 | 7,130 |
| 2 | Shoucheng Holdings Ltd. | 33,597,211 | 7,115 |
| | Shandong Nanshan Aluminum Co. Ltd. Class A | 10,511,013 | 7,105 |
| * | Shanxi Meijin Energy Co. Ltd. Class A | 3,995,723 | 7,057 |
| * | Amlogic Shanghai Co. Ltd. Class A | 421,718 | 7,056 |
| | Guotai Junan Securities Co. Ltd. Class A (XSSC) | 2,573,068 | 7,046 |
| | Shanghai Jinjiang International Hotels Co. Ltd. Class B | 3,662,174 | 7,045 |
| | Founder Securities Co. Ltd. Class A (XSSC) | 5,520,913 | 7,040 |
| * | DouYu International Holdings Ltd. ADR | 2,231,162 | 7,028 |
| | | | | | Shares | Market
Value•
($000) |
| | Shanghai Fosun Pharmaceutical Group Co. Ltd. Class A (XSHG) | 897,500 | 7,028 |
| | KWG Living Group Holdings Ltd. | 10,424,047 | 7,022 |
| | China Zhenhua Group Science & Technology Co. Ltd. Class A (XSHE) | 432,542 | 7,005 |
| | Luxshare Precision Industry Co. Ltd. Class A (XSEC) | 1,149,286 | 6,950 |
| | Changzhou Xingyu Automotive Lighting Systems Co. Ltd. Class A (XSHG) | 194,117 | 6,936 |
| * | Chengxin Lithium Group Co. Ltd. Class A | 764,774 | 6,907 |
| | Shanghai Putailai New Energy Technology Co. Ltd. Class A (XSHG) | 248,045 | 6,896 |
| *,1 | China Renaissance Holdings Ltd. | 2,851,500 | 6,891 |
| | Gemdale Properties & Investment Corp. Ltd. | 70,542,000 | 6,866 |
| | Concord New Energy Group Ltd. | 64,754,071 | 6,828 |
| | Shanghai Medicilon Inc. Class A | 59,652 | 6,828 |
| 2 | Zhenro Properties Group Ltd. | 14,329,508 | 6,811 |
| | Zhejiang Chint Electrics Co. Ltd. Class A (XSHG) | 717,958 | 6,774 |
| | PetroChina Co. Ltd. Class A | 7,897,590 | 6,759 |
| | Shandong Shida Shenghua Chemical Group Co. Ltd. Class A | 171,000 | 6,738 |
| | Industrial Securities Co. Ltd. Class A (XSSC) | 4,715,465 | 6,725 |
| | Wuhu Sanqi Interactive Entertainment Network Technology Group Co. Ltd. Class A | 1,804,467 | 6,718 |
Emerging Markets Stock Index Fund
| | | | | | Shares | Market
Value•
($000) |
| | Shanghai Bairun Investment Holding Group Co. Ltd. Class A | 674,874 | 6,707 |
| *,2 | SOHO China Ltd. | 26,396,030 | 6,704 |
| | China Northern Rare Earth Group High-Tech Co. Ltd. Class A (XSHG) | 843,700 | 6,692 |
| | Hisense Home Appliances Group Co. Ltd. Class A (XSHE) | 3,668,227 | 6,687 |
| *,1 | CStone Pharmaceuticals | 5,426,500 | 6,684 |
| | Shandong Hualu Hengsheng Chemical Co. Ltd. Class A (XSHG) | 1,372,363 | 6,675 |
| * | Gotion High-tech Co. Ltd. Class A (XSHE) | 724,269 | 6,670 |
| | Shenzhen Overseas Chinese Town Co. Ltd. Class A (XSHE) | 6,768,421 | 6,625 |
| | China Shenhua Energy Co. Ltd. Class A (XSHG) | 2,123,830 | 6,611 |
| | Suzhou Dongshan Precision Manufacturing Co. Ltd. Class A | 2,067,000 | 6,575 |
| | Beijing Jingneng Clean Energy Co. Ltd. Class H | 21,745,531 | 6,573 |
| | Fu Jian Anjoy Foods Co. Ltd. Class A | 206,298 | 6,518 |
| | Zhejiang Dahua Technology Co. Ltd. Class A (XSHE) | 1,908,592 | 6,502 |
| | SF Holding Co. Ltd. Class A (XSEC) | 644,205 | 6,496 |
| | Huaxin Cement Co. Ltd. Class B | 3,631,548 | 6,452 |
| | Bank of Hangzhou Co. Ltd. Class A (XSSC) | 2,885,351 | 6,436 |
| | Chongqing Changan Automobile Co. Ltd. Class A (XSEC) | 2,093,080 | 6,401 |
| | Guangzhou Kingmed Diagnostics Group Co. Ltd. Class A (XSHG) | 356,490 | 6,398 |
| | | | | | Shares | Market
Value•
($000) |
| | Guangdong Haid Group Co. Ltd. Class A (XSEC) | 622,059 | 6,373 |
| | Beijing-Shanghai High Speed Railway Co. Ltd. Class A | 8,844,242 | 6,359 |
| | Sinoma Science & Technology Co. Ltd. Class A (XSHE) | 1,072,739 | 6,338 |
| | Shanxi Taigang Stainless Steel Co. Ltd. Class A | 5,254,700 | 6,335 |
| | Shanghai International Port Group Co. Ltd. Class A (XSSC) | 7,164,734 | 6,331 |
| | Huaneng Power International Inc. Class A (XSSC) | 5,246,597 | 6,329 |
| * | Zhejiang Yongtai Technology Co. Ltd. Class A (XSHE) | 563,626 | 6,318 |
| | Bank of Chongqing Co. Ltd. Class H | 11,224,566 | 6,305 |
| | Titan Wind Energy Suzhou Co. Ltd. Class A | 1,882,872 | 6,266 |
| | Livzon Pharmaceutical Group Inc. Class A (XSHE) | 1,138,681 | 6,249 |
| | Apeloa Pharmaceutical Co. Ltd. Class A | 1,149,021 | 6,237 |
| | Zhejiang NHU Co. Ltd. Class A (XSSC) | 1,469,512 | 6,228 |
| | Shandong Chenming Paper Holdings Ltd. Class B | 13,756,746 | 6,213 |
| | Greatview Aseptic Packaging Co. Ltd. | 15,116,219 | 6,210 |
| * | Sohu.com Ltd. ADR | 305,971 | 6,199 |
| | Yuexiu Transport Infrastructure Ltd. | 9,658,501 | 6,187 |
| | Guangzhou Tinci Materials Technology Co. Ltd. Class A (XSEC) | 240,210 | 6,182 |
| | Maanshan Iron & Steel Co. Ltd. Class A (XSSC) | 9,305,792 | 6,178 |
Emerging Markets Stock Index Fund
| | | | | | Shares | Market
Value•
($000) |
| | Ningbo Orient Wires & Cables Co. Ltd. Class A | 870,999 | 6,151 |
| * | Zangge Holding Co. Ltd. Class A | 1,361,100 | 6,141 |
| | Unigroup Guoxin Microelectronics Co. Ltd. Class A (XSEC) | 193,388 | 6,122 |
| | Inner Mongolia Junzheng Energy & Chemical Industry Group Co. Ltd. Class A | 7,637,500 | 6,118 |
| | Wuhan Guide Infrared Co. Ltd. Class A (XSHE) | 1,792,611 | 6,089 |
| *,1 | Red Star Macalline Group Corp. Ltd. Class H | 10,813,570 | 6,066 |
| | Jiangsu Cnano Technology Co. Ltd. Class A | 240,093 | 6,051 |
| 1 | Simcere Pharmaceutical Group Ltd. | 5,793,000 | 6,033 |
| | Luoyang Xinqianglian Slewing Bearing Co. Ltd. Class A | 169,460 | 6,030 |
| *,2 | HUYA Inc. ADR | 733,138 | 6,026 |
| | Hongfa Technology Co. Ltd. Class A (XSHG) | 520,834 | 6,026 |
| 1,2 | China Yuhua Education Corp. Ltd. | 13,293,676 | 6,025 |
| *,1,2 | China East Education Holdings Ltd. | 6,346,500 | 6,021 |
| | Asymchem Laboratories Tianjin Co. Ltd. Class A (XSHE) | 96,376 | 5,993 |
| | Zhejiang Jiuzhou Pharmaceutical Co. Ltd. Class A | 731,570 | 5,989 |
| | Tong Ren Tang Technologies Co. Ltd. Class H | 8,420,132 | 5,975 |
| | Weifu High-Technology Group Co. Ltd. Class B | 3,140,849 | 5,966 |
| | Dawning Information Industry Co. Ltd. Class A | 1,386,935 | 5,952 |
| | | | | | Shares | Market
Value•
($000) |
| | Anhui Gujing Distillery Co. Ltd. Class A | 167,440 | 5,951 |
| * | New Hope Liuhe Co. Ltd. Class A (XSHE) | 2,640,224 | 5,939 |
| | Health & Happiness H&H International Holdings Ltd. | 2,522,451 | 5,904 |
| * | China Southern Airlines Co. Ltd. Class A | 5,759,455 | 5,902 |
| | China Resources Medical Holdings Co. Ltd. | 8,342,289 | 5,853 |
| | Sanan Optoelectronics Co. Ltd. Class A (XSHG) | 1,113,900 | 5,852 |
| * | Air China Ltd. Class A (XSHG) | 4,403,314 | 5,850 |
| 1,2 | China New Higher Education Group Ltd. | 11,666,000 | 5,847 |
| | West China Cement Ltd. | 33,436,438 | ��� 5,843 |
| | Yifeng Pharmacy Chain Co. Ltd. Class A | 777,860 | 5,805 |
| *,2 | China Common Rich Renewable Energy Investments Ltd. | 206,154,000 | 5,799 |
| | Levima Advanced Materials Corp. Class A | 639,500 | 5,797 |
| | China Everbright Bank Co. Ltd. Class A (XSHG) | 10,706,200 | 5,755 |
| 3 | PAX Global Technology Ltd. | 8,297,436 | 5,750 |
| * | Fushun Special Steel Co. Ltd. Class A | 1,722,390 | 5,746 |
| | Beijing Huafeng Test & Control Technology Co. Ltd. Class A | 61,045 | 5,722 |
| | Shanghai Friendess Electronic Technology Corp. Ltd. Class A | 95,848 | 5,720 |
| * | OneConnect Financial Technology Co. Ltd. ADR | 1,799,977 | 5,706 |
Emerging Markets Stock Index Fund
| | | | | | Shares | Market
Value•
($000) |
| | Western Superconducting Technologies Co. Ltd. Class A | 466,439 | 5,671 |
| | Beijing Yuanliu Hongyuan Electronic Technology Co. Ltd. Class A | 222,900 | 5,659 |
| | TBEA Co. Ltd. Class A (XSHG) | 1,336,069 | 5,656 |
| | BBMG Corp. Class H | 33,654,781 | 5,655 |
| | Ningxia Baofeng Energy Group Co. Ltd. Class A | 2,463,800 | 5,640 |
| *,2 | Comba Telecom Systems Holdings Ltd. | 20,200,130 | 5,625 |
| | China Vanke Co. Ltd. Class A (XSEC) | 1,977,298 | 5,622 |
| | Jiangsu King's Luck Brewery JSC Ltd. Class A (XSSC) | 728,415 | 5,604 |
| | Zhejiang Sanhua Intelligent Controls Co. Ltd. Class A (XSHE) | 1,509,449 | 5,595 |
| | Micro-Tech Nanjing Co. Ltd. Class A | 144,847 | 5,595 |
| | Haitong Securities Co. Ltd. Class A (XSSC) | 2,897,117 | 5,590 |
| 1 | Joinn Laboratories China Co. Ltd. Class H | 431,500 | 5,553 |
| | Bank of Beijing Co. Ltd. Class A (XSHG) | 7,990,662 | 5,531 |
| *,2 | Gaotu Techedu Inc. ADR | 1,879,425 | 5,526 |
| * | Youdao Inc. ADR | 449,765 | 5,523 |
| | Bank of Hangzhou Co. Ltd. Class A (XSHG) | 2,468,928 | 5,507 |
| | Gigadevice Semiconductor Beijing Inc. Class A (XSHG) | 207,690 | 5,507 |
| | Songcheng Performance Development Co. Ltd. Class A | 2,512,551 | 5,499 |
| * | Shanghai International Airport Co. Ltd. Class A (XSHG) | 662,526 | 5,479 |
| | | | | | Shares | Market
Value•
($000) |
| * | Kuang-Chi Technologies Co. Ltd. Class A (XSHE) | 1,703,004 | 5,463 |
| *,1 | Ocumension Therapeutics | 2,506,500 | 5,445 |
| | Shengyi Technology Co. Ltd. Class A (XSSC) | 1,562,060 | 5,431 |
| | China Greatwall Technology Group Co. Ltd. Class A (XSHE) | 2,581,088 | 5,428 |
| | Sichuan Swellfun Co. Ltd. Class A (XSHG) | 274,775 | 5,422 |
| | Beijing Easpring Material Technology Co. Ltd. Class A | 391,500 | 5,419 |
| * | Lingyi iTech Guangdong Co. Class A (XSHE) | 5,198,300 | 5,417 |
| *,2 | Zhihu Inc. ADR | 654,403 | 5,405 |
| 2 | Tian Lun Gas Holdings Ltd. | 5,837,000 | 5,403 |
| | ZTO Express Cayman Inc. | 181,793 | 5,392 |
| | Poly Developments & Holdings Group Co. Ltd. Class A (XSHG) | 2,745,552 | 5,388 |
| | Lepu Medical Technology Beijing Co. Ltd. Class A | 1,616,092 | 5,382 |
| | Yunnan Baiyao Group Co. Ltd. Class A (XSEC) | 382,093 | 5,349 |
| | Tianshui Huatian Technology Co. Ltd. Class A | 2,661,019 | 5,349 |
| | Raytron Technology Co. Ltd. Class A | 470,734 | 5,320 |
| * | Burning Rock Biotech Ltd. ADR | 376,458 | 5,304 |
| | Shenzhen Kedali Industry Co. Ltd. Class A | 195,400 | 5,296 |
| | China Molybdenum Co. Ltd. Class A (XSSC) | 5,636,411 | 5,292 |
| | China Minmetals Rare Earth Co. Ltd. Class A | 892,000 | 5,290 |
| | Bank of Communications Co. Ltd. Class A (XSHG) | 7,470,900 | 5,275 |
Emerging Markets Stock Index Fund
| | | | | | Shares | Market
Value•
($000) |
| *,2 | Kaisa Group Holdings Ltd. | 34,138,886 | 5,245 |
| | Huizhou Desay Sv Automotive Co. Ltd. Class A (XSHE) | 312,900 | 5,235 |
| * | COSCO SHIPPING Holdings Co. Ltd. Class A | 2,025,538 | 5,228 |
| | Hualan Biological Engineering Inc. Class A (XSHE) | 1,123,175 | 5,217 |
| | Shanghai Mechanical & Electrical Industry Co. Ltd. Class B | 4,046,069 | 5,202 |
| | China Baoan Group Co. Ltd. Class A (XSHE) | 1,584,916 | 5,199 |
| | Jiangsu Yoke Technology Co. Ltd. Class A (XSHE) | 434,400 | 5,173 |
| | Inspur Electronic Information Industry Co. Ltd. Class A (XSHE) | 1,065,310 | 5,171 |
| | YongXing Special Materials Technology Co. Ltd. Class A | 308,468 | 5,165 |
| 1,2 | Midea Real Estate Holding Ltd. | 2,991,600 | 5,163 |
| | Skshu Paint Co. Ltd. Class A | 296,048 | 5,162 |
| 1,2 | AK Medical Holdings Ltd. | 4,969,000 | 5,154 |
| | Shenzhen Senior Technology Material Co. Ltd. Class A | 614,410 | 5,138 |
| | Satellite Chemical Co. Ltd. Class A (XSEC) | 842,667 | 5,135 |
| *,1,2 | Mobvista Inc. | 5,293,000 | 5,134 |
| | China Merchants Securities Co. Ltd. Class A (XSHG) | 1,911,960 | 5,132 |
| | Will Semiconductor Co. Ltd. Shanghai Class A (XSSC) | 123,500 | 5,131 |
| | Hithink RoyalFlush Information Network Co. Ltd. Class A (XSEC) | 291,059 | 5,129 |
| | Skyfame Realty Holdings Ltd. | 43,309,804 | 5,111 |
| | By-health Co. Ltd. Class A | 1,281,506 | 5,101 |
| | | | | | Shares | Market
Value•
($000) |
| | Rongsheng Petrochemical Co. Ltd. Class A (XSHE) | 1,892,544 | 5,097 |
| | Shanghai Chlor-Alkali Chemical Co. Ltd. Class B | 7,634,490 | 5,084 |
| | China Kepei Education Group Ltd. | 9,210,000 | 5,078 |
| | Metallurgical Corp. of China Ltd. Class A (XSSC) | 8,007,833 | 5,062 |
| | Gongniu Group Co. Ltd. Class A | 205,153 | 5,055 |
| | Zhejiang Chint Electrics Co. Ltd. Class A (XSSC) | 532,088 | 5,021 |
| | Sangfor Technologies Inc. Class A | 158,382 | 5,010 |
| | Gemdale Corp. Class A (XSSC) | 3,158,608 | 5,009 |
| | China Dongxiang Group Co. Ltd. | 47,656,360 | 5,006 |
| | Livzon Pharmaceutical Group Inc. Class H | 1,518,153 | 5,001 |
| | Fangda Carbon New Material Co. Ltd. Class A (XSSC) | 2,963,392 | 4,980 |
| | Yonyou Network Technology Co. Ltd. Class A (XSHG) | 1,002,341 | 4,975 |
| | Guangzhou Baiyunshan Pharmaceutical Holdings Co. Ltd. Class A (XSSC) | 1,092,991 | 4,968 |
| | Proya Cosmetics Co. Ltd. Class A | 158,100 | 4,962 |
| | Jiangsu GoodWe Power Supply Technology Co. Ltd. Class A | 65,229 | 4,962 |
| | Guosen Securities Co. Ltd. Class A (XSHE) | 2,783,641 | 4,961 |
| 2 | China Modern Dairy Holdings Ltd. | 26,225,299 | 4,947 |
| 1,2 | Archosaur Games Inc. | 4,153,000 | 4,937 |
Emerging Markets Stock Index Fund
| | | | | | Shares | Market
Value•
($000) |
| | Guangdong Kinlong Hardware Products Co. Ltd. Class A | 237,150 | 4,922 |
| 2 | Jiayuan International Group Ltd. | 12,727,853 | 4,921 |
| | Yunnan Botanee Bio-Technology Group Co. Ltd. Class A | 139,100 | 4,913 |
| | Shanghai Jinqiao Export Processing Zone Development Co. Ltd. Class B | 5,459,358 | 4,912 |
| * | Nuode Investment Co. Ltd. Class A | 1,375,500 | 4,904 |
| * | Sichuan New Energy Power Co. Ltd. | 1,095,478 | 4,885 |
| | Sichuan Road & Bridge Co. Ltd. Class A (XSSC) | 2,601,695 | 4,884 |
| | AVIC Electromechanical Systems Co. Ltd. Class A (XSHE) | 2,057,022 | 4,880 |
| | Riyue Heavy Industry Co. Ltd. Class A | 798,360 | 4,877 |
| | Changchun High & New Technology Industry Group Inc. Class A (XSEC) | 114,350 | 4,876 |
| | GD Power Development Co. Ltd. Class A (XSSC) | 11,037,415 | 4,806 |
| *,1,2 | Maoyan Entertainment | 3,976,800 | 4,803 |
| | China Railway Group Ltd. Class A (XSSC) | 5,847,514 | 4,796 |
| | Tongkun Group Co. Ltd. Class A (XSSC) | 1,535,799 | 4,792 |
| | China Tourism Group Duty Free Corp. Ltd. Class A (XSHG) | 114,300 | 4,787 |
| | Zhejiang NHU Co. Ltd. Class A (XSHE) | 1,125,960 | 4,772 |
| | Ecovacs Robotics Co. Ltd. Class A (XSSC) | 177,900 | 4,770 |
| | Sieyuan Electric Co. Ltd. Class A | 733,100 | 4,753 |
| | | | | | Shares | Market
Value•
($000) |
| | Porton Pharma Solutions Ltd. Class A (XSEC) | 321,250 | 4,749 |
| | Hubei Xingfa Chemicals Group Co. Ltd. Class A (XSSC) | 610,750 | 4,748 |
| | Hengyi Petrochemical Co. Ltd. Class A | 2,762,100 | 4,727 |
| | Aisino Corp. Class A | 2,638,819 | 4,723 |
| | Guangdong Provincial Expressway Development Co. Ltd. Class B | 6,706,137 | 4,720 |
| | Shanghai RAAS Blood Products Co. Ltd. Class A | 4,555,299 | 4,695 |
| * | TCL Electronics Holdings Ltd. | 8,647,329 | 4,689 |
| | China Pacific Insurance Group Co. Ltd. Class A (XSHG) | 1,097,793 | 4,689 |
| | Tongling Nonferrous Metals Group Co. Ltd. Class A (XSHE) | 8,082,400 | 4,686 |
| | Zhejiang Longsheng Group Co. Ltd. Class A (XSHG) | 2,405,050 | 4,676 |
| | Zhejiang Juhua Co. Ltd. Class A (XSHG) | 1,923,462 | 4,671 |
| * | Qi An Xin Technology Group Inc. Class A | 326,133 | 4,660 |
| * | Shanghai Zhenhua Heavy Industries Co. Ltd. Class B | 17,644,195 | 4,655 |
| | Longshine Technology Group Co. Ltd. Class A (XSHE) | 917,625 | 4,648 |
| | Dongfang Electric Corp. Ltd. Class A (XSSC) | 1,632,091 | 4,634 |
| | Beijing Tongrentang Co. Ltd. Class A (XSSC) | 923,994 | 4,630 |
| | Sichuan Chuantou Energy Co. Ltd. Class A (XSSC) | 2,259,661 | 4,622 |
Emerging Markets Stock Index Fund
| | | | | | Shares | Market
Value•
($000) |
| | Yanzhou Coal Mining Co. Ltd. Class A (XSSC) | 1,301,300 | 4,618 |
| 2 | Kangji Medical Holdings Ltd. | 4,062,500 | 4,609 |
| | Zhejiang HangKe Technology Inc. Co. Class A | 284,125 | 4,600 |
| | Bank of Guiyang Co. Ltd. Class A | 4,356,227 | 4,596 |
| | Changjiang Securities Co. Ltd. Class A (XSHE) | 4,061,524 | 4,594 |
| | Thunder Software Technology Co. Ltd. Class A (XSEC) | 215,700 | 4,589 |
| | Ming Yang Smart Energy Group Ltd. Class A (XSSC) | 946,406 | 4,581 |
| * | Beijing Jingyuntong Technology Co. Ltd. Class A (XSHG) | 2,560,903 | 4,576 |
| | Sichuan Chuantou Energy Co. Ltd. Class A (XSHG) | 2,230,216 | 4,561 |
| | Perfect World Co. Ltd. Class A | 1,678,010 | 4,550 |
| | China National Nuclear Power Co. Ltd. Class A (XSSC) | 4,236,800 | 4,541 |
| | Huayu Automotive Systems Co. Ltd. Class A (XSHG) | 1,080,377 | 4,528 |
| * | GDS Holdings Ltd. Class A | 601,424 | 4,517 |
| | Focus Media Information Technology Co. Ltd. Class A (XSEC) | 3,940,617 | 4,516 |
| * | Pangang Group Vanadium Titanium & Resources Co. Ltd. Class A | 7,221,500 | 4,508 |
| | Bank of Jiangsu Co. Ltd. Class A | 4,582,387 | 4,503 |
| * | Inner Mongolia BaoTou Steel Union Co. Ltd. Class A (XSHG) | 10,223,740 | 4,494 |
| | China Merchants Energy Shipping Co. Ltd. Class A (XSHG) | 6,260,123 | 4,476 |
| | | | | | Shares | Market
Value•
($000) |
| | Xiamen Faratronic Co. Ltd. Class A (XSSC) | 148,115 | 4,475 |
| * | Sichuan Development Lomon Co. Ltd. Class A | 1,584,100 | 4,474 |
| | Hithink RoyalFlush Information Network Co. Ltd. Class A (XSHE) | 253,728 | 4,471 |
| | Hangzhou Silan Microelectronics Co. Ltd. Class A (XSHG) | 460,400 | 4,440 |
| | Beijing Shiji Information Technology Co. Ltd. Class A (XSHE) | 1,194,490 | 4,421 |
| | Xinjiang Goldwind Science & Technology Co. Ltd. Class A (XSHE) | 1,523,826 | 4,405 |
| | China CSSC Holdings Ltd. Class A (XSHG) | 1,251,700 | 4,398 |
| | Shenzhen Energy Group Co. Ltd. Class A (XSHE) | 3,449,070 | 4,396 |
| | JNBY Design Ltd. | 2,616,500 | 4,377 |
| | CECEP Wind-Power Corp. Class A (XSSC) | 3,785,316 | 4,363 |
| | Beijing United Information Technology Co. Ltd. Class A | 249,110 | 4,363 |
| | Shanghai Electric Group Co. Ltd. Class A (XSHG) | 5,884,093 | 4,362 |
| | Anhui Jinhe Industrial Co. Ltd. Class A | 580,800 | 4,359 |
| * | Jiangsu Akcome Science & Technology Co. Ltd. Class A | 5,398,521 | 4,354 |
| | China Pacific Insurance Group Co. Ltd. Class A (XSSC) | 1,018,927 | 4,352 |
| | Hoshine Silicon Industry Co. Ltd. Class A (XSHG) | 169,120 | 4,351 |
| * | Spring Airlines Co. Ltd. Class A (XSSC) | 472,836 | 4,322 |
Emerging Markets Stock Index Fund
| | | | | | Shares | Market
Value•
($000) |
| | China Shineway Pharmaceutical Group Ltd. | 4,503,885 | 4,318 |
| | Zhuzhou Hongda Electronics Corp. Ltd. Class A (XSHE) | 332,126 | 4,315 |
| | China Resources Sanjiu Medical & Pharmaceutical Co. Ltd. Class A | 1,141,579 | 4,304 |
| | Wens Foodstuffs Group Co. Ltd. Class A | 1,663,742 | 4,281 |
| | JCET Group Co. Ltd. Class A (XSHG) | 885,051 | 4,280 |
| * | Guanghui Energy Co. Ltd. Class A (XSSC) | 4,127,812 | 4,260 |
| | Shenzhen SC New Energy Technology Corp. Class A (XSHE) | 239,070 | 4,259 |
| | Shanghai Pharmaceuticals Holding Co. Ltd. Class A (XSHG) | 1,461,585 | 4,258 |
| | CECEP Solar Energy Co. Ltd. Class A (XSHE) | 2,436,430 | 4,247 |
| | China National Software & Service Co. Ltd. Class A (XSSC) | 529,634 | 4,246 |
| | Hangzhou Chang Chuan Technology Co. Ltd. Class A | 574,075 | 4,244 |
| | Chongqing Fuling Zhacai Group Co. Ltd. Class A | 778,459 | 4,242 |
| 1,2 | Shanghai Haohai Biological Technology Co. Ltd. Class H | 566,000 | 4,236 |
| | Flat Glass Group Co. Ltd. Class A | 492,500 | 4,235 |
| | Jiangsu Lopal Tech Co. Ltd. Class A | 384,101 | 4,233 |
| | Zhejiang Daily Digital Culture Group Co. Ltd. Class A (XSHG) | 3,635,787 | 4,230 |
| | Goke Microelectronics Co. Ltd. Class A | 160,649 | 4,225 |
| | Zhejiang Dahua Technology Co. Ltd. Class A (XSEC) | 1,239,421 | 4,222 |
| | | | | | Shares | Market
Value•
($000) |
| | Bank of Changsha Co. Ltd. Class A | 3,355,488 | 4,218 |
| | Angel Yeast Co. Ltd. Class A (XSHG) | 484,793 | 4,216 |
| | China Minsheng Banking Corp. Ltd. Class A (XSHG) | 6,935,960 | 4,213 |
| | Shanghai Jin Jiang Capital Co. Ltd. Class H | 18,561,780 | 4,207 |
| | Huaxin Cement Co. Ltd. Class A (XSSC) | 1,613,004 | 4,207 |
| | AVIC Industry-Finance Holdings Co. Ltd. Class A (XSSC) | 6,912,445 | 4,206 |
| | Zoomlion Heavy Industry Science & Technology Co. Ltd. Class A (XSHE) | 3,682,391 | 4,182 |
| | Consun Pharmaceutical Group Ltd. | 9,738,000 | 4,173 |
| * | Youngy Co. Ltd. Class A | 239,500 | 4,164 |
| | Beijing New Building Materials plc Class A (XSEC) | 944,497 | 4,162 |
| * | Dazhong Transportation Group Co. Ltd. Class B | 14,483,176 | 4,158 |
| | State Grid Yingda Co. Ltd. Class A (XSHG) | 3,932,201 | 4,149 |
| *,2,3 | China Zhongwang Holdings Ltd. | 19,211,219 | 4,148 |
| | China National Accord Medicines Corp. Ltd. Class B | 1,653,729 | 4,139 |
| | Foxconn Industrial Internet Co. Ltd. Class A (XSHG) | 2,330,600 | 4,135 |
| | Ningbo Tuopu Group Co. Ltd. Class A (XSSC) | 507,518 | 4,132 |
| * | Suning.com Co. Ltd. Class A (XSHE) | 5,912,122 | 4,129 |
| | Jafron Biomedical Co. Ltd. Class A (XSHE) | 510,690 | 4,120 |
| | Seazen Holdings Co. Ltd. Class A (XSSC) | 769,700 | 4,112 |
Emerging Markets Stock Index Fund
| | | | | | Shares | Market
Value•
($000) |
| | Thunder Software Technology Co. Ltd. Class A (XSHE) | 193,027 | 4,106 |
| | Inner Mongolia Eerduosi Resources Co. Ltd. Class A | 884,900 | 4,102 |
| | Shandong Linglong Tyre Co. Ltd. Class A | 738,991 | 4,085 |
| | XCMG Construction Machinery Co. Ltd. Class A (XSEC) | 4,260,700 | 4,077 |
| | Zhongjin Gold Corp. Ltd. Class A (XSSC) | 3,143,933 | 4,075 |
| | Hangzhou Dptech Technologies Co. Ltd. Class A | 625,365 | 4,060 |
| | Zhuzhou Kibing Group Co. Ltd. Class A (XSSC) | 1,635,114 | 4,058 |
| | Tofflon Science & Technology Group Co. Ltd. Class A | 622,854 | 4,058 |
| | Yonghui Superstores Co. Ltd. Class A (XSSC) | 6,583,940 | 4,048 |
| | Qingdao Haier Biomedical Co. Ltd. Class A | 274,959 | 4,047 |
| | Youngor Group Co. Ltd. Class A (XSSC) | 4,025,472 | 4,042 |
| | Kunlun Tech Co. Ltd. Class A (XSEC) | 1,387,956 | 4,038 |
| | Shanghai Lingang Holdings Corp. Ltd. Class A | 1,753,021 | 4,023 |
| * | Xian International Medical Investment Co. Ltd. Class A | 2,156,006 | 4,019 |
| | China Railway Group Ltd. Class A (XSHG) | 4,898,529 | 4,018 |
| | Arctech Solar Holding Co. Ltd. Class A | 123,592 | 4,014 |
| | Ming Yang Smart Energy Group Ltd. Class A (XSHG) | 828,600 | 4,011 |
| | Bank of Nanjing Co. Ltd. Class A (XSHG) | 2,629,276 | 3,985 |
| | | | | | Shares | Market
Value•
($000) |
| | Tianjin Guangyu Development Co. Ltd. Class A | 1,522,400 | 3,983 |
| | Yantai Eddie Precision Machinery Co. Ltd. Class A (XSHG) | 709,199 | 3,964 |
| | Guangdong Fenghua Advanced Technology Holding Co. Ltd. Class A | 878,495 | 3,958 |
| | China Great Wall Securities Co. Ltd. Class A (XSHE) | 2,214,000 | 3,955 |
| | Pylon Technologies Co. Ltd. Class A | 116,013 | 3,948 |
| | China Zheshang Bank Co. Ltd. Class A | 7,341,400 | 3,947 |
| | Xiamen Tungsten Co. Ltd. Class A (XSSC) | 1,111,059 | 3,940 |
| | Daqin Railway Co. Ltd. Class A (XSHG) | 3,964,820 | 3,934 |
| * | Tibet Mineral Development Co. Class A | 483,500 | 3,930 |
| | Avary Holding Shenzhen Co. Ltd. Class A (XSHE) | 718,384 | 3,930 |
| | Huaibei Mining Holdings Co. Ltd. Class A | 1,987,600 | 3,927 |
| | Chacha Food Co. Ltd. Class A | 440,621 | 3,925 |
| | Zhejiang Huayou Cobalt Co. Ltd. Class A (XSSC) | 226,170 | 3,923 |
| | Bank of Shanghai Co. Ltd. Class A (XSSC) | 3,424,875 | 3,902 |
| | Qingdao TGOOD Electric Co. Ltd. Class A | 947,216 | 3,901 |
| | Anhui Expressway Co. Ltd. Class H | 6,572,097 | 3,896 |
| * | Chifeng Jilong Gold Mining Co. Ltd. Class A | 1,530,688 | 3,889 |
| | AVICOPTER plc Class A (XSSC) | 395,502 | 3,888 |
| | Jiangxi Copper Co. Ltd. Class A | 1,066,444 | 3,886 |
Emerging Markets Stock Index Fund
| | | | | | Shares | Market
Value•
($000) |
| | Sinolink Securities Co. Ltd. Class A (XSSC) | 2,313,400 | 3,877 |
| | Do-Fluoride New Materials Co. Ltd. Class A (XSHE) | 398,450 | 3,876 |
| | Yantai Jereh Oilfield Services Group Co. Ltd. Class A (XSHE) | 586,842 | 3,867 |
| | Intco Medical Technology Co. Ltd. Class A | 480,525 | 3,865 |
| *,2 | BEST Inc. ADR | 2,400,118 | 3,864 |
| | AVIC Electromechanical Systems Co. Ltd. Class A (XSEC) | 1,620,145 | 3,844 |
| | Harbin Electric Co. Ltd. Class H | 9,081,875 | 3,842 |
| | Haohua Chemical Science & Technology Co. Ltd. | 757,270 | 3,837 |
| | Zhejiang Supor Co. Ltd. Class A | 462,619 | 3,829 |
| * | 360 Security Technology Inc. Class A (XSSC) | 2,032,695 | 3,824 |
| | Han's Laser Technology Industry Group Co. Ltd. Class A (XSEC) | 570,023 | 3,823 |
| | Winning Health Technology Group Co. Ltd. Class A | 1,933,768 | 3,821 |
| | Shanghai Aiko Solar Energy Co. Ltd. Class A | 1,249,200 | 3,797 |
| | Tianfeng Securities Co. Ltd. Class A (XSHG) | 6,154,760 | 3,789 |
| | Shandong Hualu Hengsheng Chemical Co. Ltd. Class A (XSSC) | 776,700 | 3,777 |
| | Hundsun Technologies Inc. Class A (XSHG) | 384,084 | 3,771 |
| 1,2 | Yangtze Optical Fibre & Cable Joint Stock Ltd. Co. Class H | 2,223,659 | 3,745 |
| | Shenzhen Sunlord Electronics Co. Ltd. Class A (XSHE) | 725,578 | 3,744 |
| | | | | | Shares | Market
Value•
($000) |
| * | Guangdong HEC Technology Holding Co. Ltd. Class A (XSHG) | 2,244,191 | 3,722 |
| | GRG Banking Equipment Co. Ltd. Class A | 2,300,350 | 3,721 |
| * | Sinofert Holdings Ltd. | 23,790,032 | 3,720 |
| | Huafon Chemical Co. Ltd. Class A (XSHE) | 1,999,101 | 3,719 |
| | Power Construction Corp. of China Ltd. Class A (XSHG) | 2,885,702 | 3,713 |
| | Shandong Gold Mining Co. Ltd. Class A (XSHG) | 1,196,180 | 3,712 |
| * | IRICO Display Devices Co. Ltd. Class A | 3,444,901 | 3,710 |
| | DBAPP Security Ltd. Class A | 81,099 | 3,710 |
| | GEM Co. Ltd. Class A (XSHE) | 2,179,354 | 3,707 |
| | China Molybdenum Co. Ltd. Class A (XSHG) | 3,941,600 | 3,701 |
| | TCL Technology Group Corp. Class A (XSEC) | 3,903,000 | 3,700 |
| * | Inner Mongolia Yuan Xing Energy Co. Ltd. Class A (XSHE) | 3,088,732 | 3,692 |
| | Luxi Chemical Group Co. Ltd. Class A | 1,437,608 | 3,689 |
| | Beijing Dabeinong Technology Group Co. Ltd. Class A (XSHE) | 2,750,387 | 3,688 |
| | Dongxing Securities Co. Ltd. Class A (XSHG) | 2,151,801 | 3,685 |
| | Liaoning Cheng Da Co. Ltd. Class A (XSSC) | 1,157,220 | 3,683 |
| | Beijing Tiantan Biological Products Corp. Ltd. Class A (XSSC) | 815,911 | 3,683 |
| | Zhejiang Weixing New Building Materials Co. Ltd. Class A (XSEC) | 1,310,729 | 3,683 |
| 1,2 | Redco Properties Group Ltd. | 11,877,640 | 3,648 |
Emerging Markets Stock Index Fund
| | | | | | Shares | Market
Value•
($000) |
| | Shenzhen Kangtai Biological Products Co. Ltd. Class A (XSEC) | 203,700 | 3,642 |
| * | Kingnet Network Co. Ltd. Class A | 5,013,432 | 3,635 |
| | Kingfa Sci & Tech Co. Ltd. Class A (XSHG) | 1,977,100 | 3,627 |
| | Sailun Group Co. Ltd. Class A (XSHG) | 1,737,560 | 3,626 |
| | PharmaBlock Sciences Nanjing Inc. Class A (XSHE) | 152,414 | 3,624 |
| | Zhejiang Zheneng Electric Power Co. Ltd. Class A (XSHG) | 6,142,762 | 3,620 |
| *,2 | Beijing Enterprises Clean Energy Group Ltd. | 268,597,198 | 3,610 |
| * | Shenzhen Salubris Pharmaceuticals Co. Ltd. Class A | 799,753 | 3,608 |
| | Westone Information Industry Inc. Class A (XSHE) | 441,179 | 3,607 |
| | Shanxi Coking Coal Energy Group Co. Ltd. Class A (XSHE) | 2,482,645 | 3,605 |
| | Hangzhou Lion Electronics Co. Ltd. Class A | 195,500 | 3,601 |
| | Jiangsu Eastern Shenghong Co. Ltd. Class A (XSEC) | 846,816 | 3,600 |
| * | Neusoft Corp. Class A (XSHG) | 2,408,466 | 3,589 |
| * | Beijing E-Hualu Information Technology Co. Ltd. Class A | 793,129 | 3,588 |
| | Hangzhou Robam Appliances Co. Ltd. Class A (XSHE) | 731,804 | 3,580 |
| | Nanjing King-Friend Biochemical Pharmaceutical Co. Ltd. Class A (XSHG) | 617,120 | 3,574 |
| | Arcsoft Corp. Ltd. Class A | 602,544 | 3,573 |
| | | | | | Shares | Market
Value•
($000) |
| * | Sichuan Hebang Biotechnology Co. Ltd. Class A (XSSC) | 6,419,863 | 3,570 |
| | KBC Corp. Ltd. Class A | 63,946 | 3,569 |
| | Xi'an Triangle Defense Co. Ltd. Class A | 458,339 | 3,555 |
| * | Vantone Neo Development Group Co. Ltd. | 2,028,010 | 3,543 |
| * | Mianyang Fulin Precision Co. Ltd. (XSHE) | 450,800 | 3,541 |
| | Zhejiang Wolwo Bio-Pharmaceutical Co. Ltd. Class A (XSHE) | 421,687 | 3,530 |
| | New China Life Insurance Co. Ltd. Class A (XSHG) | 576,700 | 3,520 |
| * | China First Heavy Industries Class A | 6,516,775 | 3,519 |
| * | New Hope Liuhe Co. Ltd. Class A (XSEC) | 1,562,521 | 3,515 |
| * | China High Speed Transmission Equipment Group Co. Ltd. | 4,530,934 | 3,513 |
| | Zibo Qixiang Tengda Chemical Co. Ltd. Class A | 1,999,306 | 3,511 |
| | SDIC Power Holdings Co. Ltd. Class A (XSHG) | 2,129,000 | 3,509 |
| *,2 | China Maple Leaf Educational Systems Ltd. | 21,870,538 | 3,503 |
| * | Ourpalm Co. Ltd. Class A | 5,763,561 | 3,502 |
| | Yangzhou Yangjie Electronic Technology Co. Ltd. Class A | 437,547 | 3,483 |
| * | Great Chinasoft Technology Co. Ltd. Class A | 1,349,100 | 3,480 |
| | Henan Mingtai Al Industrial Co. Ltd. Class A | 678,054 | 3,477 |
| | Shaanxi Coal Industry Co. Ltd. Class A (XSSC) | 1,772,483 | 3,473 |
| * | Hang Zhou Great Star Industrial Co. Ltd. Class A (XSHE) | 692,700 | 3,469 |
Emerging Markets Stock Index Fund
| | | | | | Shares | Market
Value•
($000) |
| | Shenzhen Kingdom Sci-Tech Co. Ltd. Class A (XSSC) | 1,752,398 | 3,468 |
| | Guoyuan Securities Co. Ltd. Class A (XSHE) | 2,989,442 | 3,463 |
| | Zhejiang Cfmoto Power Co. Ltd. Class A | 136,700 | 3,447 |
| * | Sinopec Oilfield Service Corp. Class A (XSHG) | 9,698,700 | 3,424 |
| | Shenergy Co. Ltd. Class A (XSHG) | 3,536,068 | 3,423 |
| | Shanghai Wanye Enterprises Co. Ltd. Class A | 706,456 | 3,418 |
| | Keda Industrial Group Co. Ltd. (XSHG) | 1,088,600 | 3,413 |
| 1,2 | Shandong Gold Mining Co. Ltd. Class H | 1,886,450 | 3,411 |
| | Shanghai Bailian Group Co. Ltd. Class B | 3,845,856 | 3,410 |
| 2 | Zhongliang Holdings Group Co. Ltd. | 7,356,500 | 3,410 |
| | Shanghai Waigaoqiao Free Trade Zone Group Co. Ltd. Class B | 3,750,086 | 3,389 |
| | Ningbo Zhoushan Port Co. Ltd. Class A (XSSC) | 5,735,663 | 3,359 |
| | Sinopec Kantons Holdings Ltd. | 8,816,976 | 3,357 |
| | China Hainan Rubber Industry Group Co. Ltd. Class A | 4,107,000 | 3,357 |
| | Heilongjiang Agriculture Co. Ltd. Class A (XSHG) | 1,560,371 | 3,355 |
| *,3 | Hi Sun Technology China Ltd. | 24,876,186 | 3,352 |
| * | Guangshen Railway Co. Ltd. Class H | 19,019,093 | 3,348 |
| | Jiangsu Yangnong Chemical Co. Ltd. Class A (XSSC) | 182,100 | 3,348 |
| | China Foods Ltd. | 8,761,153 | 3,347 |
| | Shenghe Resources Holding Co. Ltd. Class A (XSHG) | 1,051,830 | 3,344 |
| | | | | | Shares | Market
Value•
($000) |
| | Huaxia Bank Co. Ltd. Class A (XSHG) | 3,790,591 | 3,334 |
| | SDIC Capital Co. Ltd. Class A (XSSC) | 2,601,024 | 3,333 |
| | JCET Group Co. Ltd. Class A (XSSC) | 688,244 | 3,328 |
| | CNOOC Energy Technology & Services Ltd. Class A | 7,369,200 | 3,327 |
| *,1 | Meitu Inc. | 15,218,936 | 3,321 |
| * | North Industries Group Red Arrow Co. Ltd. Class A | 796,743 | 3,314 |
| | Sichuan Kelun Pharmaceutical Co. Ltd. Class A (XSHE) | 1,194,312 | 3,303 |
| | Wuchan Zhongda Group Co. Ltd. Class A (XSSC) | 3,360,100 | 3,298 |
| * | Shanghai Milkground Food Tech Co. Ltd. Class A | 422,543 | 3,298 |
| | Sichuan Swellfun Co. Ltd. Class A (XSSC) | 167,033 | 3,296 |
| | Huadian Power International Corp. Ltd. Class A (XSSC) | 4,776,691 | 3,288 |
| | ENN Natural Gas Co. Ltd. Class A (XSSC) | 1,141,802 | 3,287 |
| * | Gotion High-tech Co. Ltd. Class A (XSEC) | 356,600 | 3,284 |
| | Hengtong Optic-electric Co. Ltd. Class A (XSSC) | 1,378,105 | 3,277 |
| | China Harmony Auto Holding Ltd. | 6,386,500 | 3,266 |
| | Tianli Education International Holdings Ltd. | 15,654,000 | 3,255 |
| | Beijing Originwater Technology Co. Ltd. Class A | 2,987,418 | 3,252 |
| | Jiangsu Azure Corp. | 956,450 | 3,242 |
| | Hualan Biological Engineering Inc. Class A (XSEC) | 696,078 | 3,233 |
Emerging Markets Stock Index Fund
| | | | | | Shares | Market
Value•
($000) |
| * | Zhejiang Yongtai Technology Co. Ltd. Class A (XSEC) | 288,087 | 3,230 |
| | Baoji Titanium Industry Co. Ltd. Class A | 417,700 | 3,224 |
| | Zhejiang China Commodities City Group Co. Ltd. Class A (XSSC) | 4,221,531 | 3,221 |
| | East Group Co. Ltd. Class A | 1,984,000 | 3,212 |
| | Shanghai Haohai Biological Technology Co. Ltd. Class A | 131,582 | 3,211 |
| | Zhongtai Securities Co. Ltd. Class A | 2,215,700 | 3,207 |
| | Beijing New Building Materials plc Class A (XSHE) | 727,200 | 3,205 |
| * | Guangdong Create Century Intelligent Equipment Group Corp. Ltd. | 1,448,300 | 3,194 |
| | Oppein Home Group Inc. Class A | 160,397 | 3,191 |
| 2 | Yuzhou Group Holdings Co. Ltd. | 29,214,577 | 3,185 |
| | Beijing Bei Mo Gao Ke Friction Material Co. Ltd. Class A | 182,460 | 3,150 |
| | Huaneng Power International Inc. Class A (XSHG) | 2,599,994 | 3,136 |
| | Henan Shuanghui Investment & Development Co. Ltd. Class A (XSEC) | 680,409 | 3,135 |
| | Jason Furniture Hangzhou Co. Ltd. Class A (XSHG) | 322,318 | 3,134 |
| * | Jiangsu Hoperun Software Co. Ltd. Class A | 760,746 | 3,128 |
| | iRay Technology Co. Ltd. Class A | 43,955 | 3,122 |
| *,2 | LVGEM China Real Estate Investment Co. Ltd. | 13,724,000 | 3,115 |
| | GD Power Development Co. Ltd. Class A (XSHG) | 7,153,216 | 3,115 |
| | | | | | Shares | Market
Value•
($000) |
| | Wuxi NCE Power Co. Ltd. Class A | 137,060 | 3,115 |
| * | Yunnan Aluminium Co. Ltd. Class A (XSEC) | 1,669,852 | 3,109 |
| | BBMG Corp. Class A (XSSC) | 7,076,779 | 3,105 |
| | Guangzhou Baiyun International Airport Co. Ltd. Class A (XSHG) | 1,671,947 | 3,093 |
| | Fujian Funeng Co. Ltd. Class A (XSHG) | 1,105,261 | 3,090 |
| * | Roshow Technology Co. Ltd. Class A | 1,171,700 | 3,090 |
| | Shandong Pharmaceutical Glass Co. Ltd. Class A | 580,232 | 3,083 |
| | Zoomlion Heavy Industry Science & Technology Co. Ltd. Class A (XSEC) | 2,714,500 | 3,082 |
| | Beijing Capital Eco-Environment Protection Group Co. Ltd. Class A (XSSC) | 5,866,055 | 3,082 |
| | Beijing Enlight Media Co. Ltd. Class A | 2,100,403 | 3,073 |
| 1,2 | CSC Financial Co. Ltd. Class H | 2,905,000 | 3,071 |
| | Shanghai Hiuv New Materials Co. Ltd. Class A | 58,601 | 3,066 |
| | C&S Paper Co. Ltd. Class A (XSHE) | 1,152,090 | 3,065 |
| | Anhui Honglu Steel Construction Group Co. Ltd. Class A | 463,307 | 3,057 |
| | Shanxi Lu'an Environmental Energy Development Co. Ltd. Class A (XSSC) | 1,505,102 | 3,055 |
| | GEM Co. Ltd. Class A (XSEC) | 1,791,386 | 3,047 |
| | Shanghai Haixin Group Co. Class B | 8,967,263 | 3,043 |
| | Beijing Dahao Technology Corp. Ltd. Class A | 709,387 | 3,040 |
| | Founder Securities Co. Ltd. Class A (XSHG) | 2,383,190 | 3,039 |
Emerging Markets Stock Index Fund
| | | | | | Shares | Market
Value•
($000) |
| | Shandong Himile Mechanical Science & Technology Co. Ltd. Class A | 775,957 | 3,030 |
| | CNGR Advanced Material Co. Ltd. Class A | 127,000 | 3,016 |
| | Xinhu Zhongbao Co. Ltd. Class A (XSSC) | 6,695,254 | 3,013 |
| * | China Eastern Airlines Corp. Ltd. Class A (XSSC) | 3,992,926 | 3,012 |
| * | Wanda Film Holding Co. Ltd. Class A (XSEC) | 1,373,150 | 3,008 |
| *,2 | Beijing Chunlizhengda Medical Instruments Co. Ltd. Class H | 1,281,750 | 3,005 |
| | Unisplendour Corp. Ltd. Class A (XSHE) | 693,297 | 3,004 |
| | Chengtun Mining Group Co. Ltd. Class A (XSSC) | 1,874,962 | 2,997 |
| | Beijing Tongtech Co. Ltd. Class A | 664,380 | 2,996 |
| *,2 | Ronshine China Holdings Ltd. | 7,406,808 | 2,995 |
| * | Beiqi Foton Motor Co. Ltd. Class A (XSHG) | 5,405,876 | 2,979 |
| | Industrial & Commercial Bank of China Ltd. Class A (XSHG) | 4,078,600 | 2,978 |
| | Guolian Securities Co. Ltd. Class A | 1,561,900 | 2,977 |
| | Shanghai MicroPort Endovascular MedTech Group Co. Ltd. Class A | 82,115 | 2,976 |
| * | Tianqi Lithium Corp. Class A (XSEC) | 201,353 | 2,965 |
| | Porton Pharma Solutions Ltd. Class A (XSHE) | 200,500 | 2,964 |
| | Liaoning Port Co. Ltd. Class A | 11,206,208 | 2,963 |
| * | Offcn Education Technology Co. Ltd. Class A | 1,819,276 | 2,959 |
| | Red Avenue New Materials Group Co. Ltd. Class A (XSHG) | 345,100 | 2,953 |
| | | | | | Shares | Market
Value•
($000) |
| | Jiangsu Yuyue Medical Equipment & Supply Co. Ltd. Class A (XSHE) | 535,915 | 2,952 |
| | Southwest Securities Co. Ltd. Class A (XSSC) | 3,922,781 | 2,949 |
| | Guangdong Hongda Blasting Co. Ltd. Class A | 684,658 | 2,948 |
| | Shuangliang Eco-Energy Systems Co. Ltd. Class A (XSSC) | 1,412,260 | 2,946 |
| | Jilin Aodong Pharmaceutical Group Co. Ltd. Class A (XSHE) | 1,190,046 | 2,938 |
| | Satellite Chemical Co. Ltd. Class A (XSHE) | 481,460 | 2,934 |
| | XCMG Construction Machinery Co. Ltd. Class A (XSHE) | 3,065,215 | 2,933 |
| | Hubei Dinglong Co. Ltd. Class A | 930,908 | 2,922 |
| | China Southern Power Grid Energy Efficiency&Clean Energy Co. Ltd. Class A | 2,258,900 | 2,918 |
| | Yunda Holding Co. Ltd. Class A (XSHE) | 998,503 | 2,913 |
| * | GCL System Integration Technology Co. Ltd. Class A | 4,601,125 | 2,897 |
| | Times Neighborhood Holdings Ltd. | 6,167,032 | 2,895 |
| | Oriental Energy Co. Ltd. Class A | 1,603,721 | 2,893 |
| | Guangdong Electric Power Development Co. Ltd. Class B | 9,152,628 | 2,879 |
| | Eyebright Medical Technology Beijing Co. Ltd. Class A | 74,820 | 2,879 |
| | Beijing Tongrentang Co. Ltd. Class A (XSHG) | 574,200 | 2,877 |
| | Hongta Securities Co. Ltd. Class A | 1,638,780 | 2,874 |
Emerging Markets Stock Index Fund
| | | | | | Shares | Market
Value•
($000) |
| * | Farasis Energy Gan Zhou Co. Ltd. Class A | 549,615 | 2,868 |
| | Xinyangfeng Agricultural Technology Co. Ltd. Class A (XSHE) | 1,008,156 | 2,865 |
| | China XD Electric Co. Ltd. Class A (XSSC) | 3,385,707 | 2,863 |
| | Jiangsu Shuangxing Color Plastic New Materials Co. Ltd. Class A | 773,385 | 2,861 |
| | Ninestar Corp. Class A (XSHE) | 498,987 | 2,860 |
| | Sinodata Co. Ltd. Class A | 1,857,635 | 2,857 |
| | Nanjing Securities Co. Ltd. Class A (XSSC) | 1,882,450 | 2,855 |
| | Hubei Xingfa Chemicals Group Co. Ltd. Class A (XSHG) | 367,200 | 2,855 |
| | CHN Energy Changyuan Electric Power Co. Ltd. Class A | 2,259,194 | 2,854 |
| * | China Grand Automotive Services Group Co. Ltd. Class A (XSSC) | 6,816,940 | 2,853 |
| | Hunan Zhongke Electric Co. Ltd. Class A | 475,400 | 2,848 |
| | CNSIG Inner Mongolia Chemical Industry Co. Ltd. | 952,045 | 2,845 |
| | Jointown Pharmaceutical Group Co. Ltd. Class A (XSSC) | 1,340,895 | 2,844 |
| | Shanghai Huayi Group Co. Ltd. Class B | 4,248,843 | 2,836 |
| | Jiangsu King's Luck Brewery JSC Ltd. Class A (XSHG) | 368,662 | 2,836 |
| | Joincare Pharmaceutical Group Industry Co. Ltd. Class A (XSSC) | 1,571,541 | 2,830 |
| | | | | | Shares | Market
Value•
($000) |
| | Dian Diagnostics Group Co. Ltd. Class A | 561,937 | 2,827 |
| | Sichuan Expressway Co. Ltd. Class A (XSSC) | 5,008,410 | 2,822 |
| | Guangdong Xinbao Electrical Appliances Holdings Co. Ltd. Class A | 804,713 | 2,814 |
| | First Capital Securities Co. Ltd. Class A (XSEC) | 2,632,100 | 2,809 |
| | Greenland Holdings Corp. Ltd. Class A (XSHG) | 4,372,495 | 2,809 |
| | Haitong Securities Co. Ltd. Class A (XSHG) | 1,455,300 | 2,808 |
| | Meihua Holdings Group Co. Ltd. Class A | 2,937,500 | 2,793 |
| | Hubei Feilihua Quartz Glass Co. Ltd. Class A | 319,483 | 2,789 |
| | Hangzhou Electronic Soul Network Technology Co. Ltd. Class A | 755,864 | 2,788 |
| 1,2 | China Everbright Greentech Ltd. | 7,923,814 | 2,786 |
| * | Shanghai 2345 Network Holding Group Co. Ltd. Class A (XSEC) | 8,855,013 | 2,784 |
| | Sichuan Yahua Industrial Group Co. Ltd. Class A (XSHE) | 545,100 | 2,784 |
| | Western Securities Co. Ltd. Class A (XSHE) | 2,321,451 | 2,781 |
| * | Suning.com Co. Ltd. Class A (XSEC) | 3,976,870 | 2,777 |
| | Chengdu Xingrong Environment Co. Ltd. Class A (XSHE) | 3,004,200 | 2,775 |
| | Infore Environment Technology Group Co. Ltd. Class A (XSHE) | 2,836,726 | 2,774 |
| | Shanghai Yuyuan Tourist Mart Group Co. Ltd. (XSHG) | 1,806,254 | 2,773 |
Emerging Markets Stock Index Fund
| | | | | | Shares | Market
Value•
($000) |
| | Tianma Microelectronics Co. Ltd. Class A (XSHE) | 1,438,805 | 2,770 |
| | Hubei Energy Group Co. Ltd. Class A (XSHE) | 3,564,555 | 2,767 |
| | Westone Information Industry Inc. Class A (XSEC) | 337,394 | 2,759 |
| | SooChow Securities Co. Ltd. Class A (XSSC) | 2,080,691 | 2,756 |
| | Humanwell Healthcare Group Co. Ltd. Class A (XSHG) | 839,200 | 2,756 |
| | Jonjee Hi-Tech Industrial & Commercial Holding Co. Ltd. Class A (XSSC) | 482,625 | 2,753 |
| | Telling Telecommunication Holding Co. Ltd. Class A (XSEC) | 737,100 | 2,753 |
| | Foxconn Industrial Internet Co. Ltd. Class A (XSSC) | 1,550,700 | 2,751 |
| | Shenzhen Fortune Trend Technology Co. Ltd. Class A | 122,057 | 2,739 |
| | Hengdian Group DMEGC Magnetics Co. Ltd. Class A (XSHE) | 1,241,400 | 2,738 |
| | China Automotive Engineering Research Institute Co. Ltd. Class A | 1,024,441 | 2,738 |
| | Beijing Balance Medical Technology Co. Ltd. Class A | 77,883 | 2,732 |
| | ZWSOFT Co. Ltd. Guangzhou Class A | 58,604 | 2,728 |
| *,2,3 | Fantasia Holdings Group Co. Ltd. | 37,861,520 | 2,725 |
| | Nantong Jianghai Capacitor Co. Ltd. Class A (XSHE) | 770,148 | 2,725 |
| | Beijing Shiji Information Technology Co. Ltd. Class A (XSEC) | 733,936 | 2,716 |
| | | | | | Shares | Market
Value•
($000) |
| | Shanghai Yuyuan Tourist Mart Group Co. Ltd. (XSSC) | 1,767,885 | 2,714 |
| | Hainan Poly Pharm Co. Ltd. Class A (XSHE) | 352,626 | 2,711 |
| | Jinko Power Technology Co. Ltd. Class A | 1,789,200 | 2,708 |
| * | Shanghai Aerospace Automobile Electromechanical Co. Ltd. Class A | 1,444,129 | 2,706 |
| | Shandong Iron & Steel Co. Ltd. Class A | 9,266,308 | 2,705 |
| | Shanghai Fullhan Microelectronics Co. Ltd. Class A | 110,712 | 2,705 |
| | Shenzhen Changhong Technology Co. Ltd. Class A | 485,400 | 2,699 |
| * | NavInfo Co. Ltd. Class A (XSHE) | 1,474,200 | 2,697 |
| | Sichuan Jiuyuan Yinhai Software Co. Ltd. Class A | 899,270 | 2,694 |
| | Jiangsu Jiejie Microelectronics Co. Ltd. Class A | 560,250 | 2,691 |
| 1,2 | Cathay Media & Education Group Inc. | 6,538,000 | 2,688 |
| | Kehua Data Co. Ltd. Class A | 440,300 | 2,687 |
| | Asymchem Laboratories Tianjin Co. Ltd. Class A (XSEC) | 43,128 | 2,682 |
| | Guosen Securities Co. Ltd. Class A (XSEC) | 1,502,321 | 2,678 |
| | China Jushi Co. Ltd. Class A (XSHG) | 896,539 | 2,678 |
| | All Winner Technology Co. Ltd. Class A | 269,700 | 2,675 |
| | Wuxi Boton Technology Co. Ltd. Class A | 741,804 | 2,669 |
| | Shanghai International Port Group Co. Ltd. Class A (XSHG) | 3,013,800 | 2,663 |
Emerging Markets Stock Index Fund
| | | | | | Shares | Market
Value•
($000) |
| | Sinochem International Corp. Class A (XSSC) | 1,871,806 | 2,656 |
| | HLA Group Corp. Ltd. (XSSC) | 2,598,579 | 2,656 |
| | Ningbo Joyson Electronic Corp. Class A (XSHG) | 955,826 | 2,654 |
| | China Lilang Ltd. | 4,657,865 | 2,653 |
| | Sanquan Food Co. Ltd. Class A | 873,620 | 2,651 |
| | Wuhan Raycus Fiber Laser Technologies Co. Ltd. Class A (XSHE) | 277,830 | 2,646 |
| * | China Eastern Airlines Corp. Ltd. Class A (XSHG) | 3,498,300 | 2,639 |
| | Weihai Guangwei Composites Co. Ltd. Class A (XSHE) | 248,048 | 2,634 |
| | Vats Liquor Chain Store Management JSC Ltd. Class A | 428,658 | 2,634 |
| | Xiamen Xiangyu Co. Ltd. Class A | 2,173,328 | 2,631 |
| | Shanxi Coal International Energy Group Co. Ltd. Class A | 1,901,600 | 2,626 |
| | Anhui Anke Biotechnology Group Co. Ltd. Class A | 1,365,949 | 2,617 |
| | Wuhu Token Science Co. Ltd. Class A (XSHE) | 1,627,300 | 2,612 |
| | Guangdong Electric Power Development Co. Ltd. Class A | 3,812,800 | 2,603 |
| | Newland Digital Technology Co. Ltd. Class A (XSEC) | 1,103,678 | 2,600 |
| | Bethel Automotive Safety Systems Co. Ltd. Class A | 274,420 | 2,595 |
| | Chengdu Kanghua Biological Products Co. Ltd. Class A | 104,100 | 2,593 |
| | Boya Bio-pharmaceutical Group Co. Ltd. Class A | 421,500 | 2,589 |
| | | | | | Shares | Market
Value•
($000) |
| | Bafang Electric Suzhou Co. Ltd. Class A | 69,289 | 2,584 |
| | Shenzhen H&T Intelligent Control Co. Ltd. Class A (XSHE) | 708,842 | 2,576 |
| | Lianhe Chemical Technology Co. Ltd. Class A | 853,200 | 2,573 |
| | Risen Energy Co. Ltd. Class A | 688,900 | 2,571 |
| | Leyard Optoelectronic Co. Ltd. Class A (XSEC) | 1,748,173 | 2,570 |
| * | Suzhou Zelgen Biopharmaceutical Co. Ltd. Class A | 265,054 | 2,570 |
| * | Yunnan Tin Co. Ltd. Class A (XSEC) | 1,002,399 | 2,567 |
| | China Coal Energy Co. Ltd. Class A (XSSC) | 2,344,794 | 2,566 |
| | Wangfujing Group Co. Ltd. Class A (XSHG) | 532,350 | 2,563 |
| | Victory Giant Technology Huizhou Co. Ltd. Class A | 622,500 | 2,560 |
| | Xiamen C & D Inc. Class A (XSHG) | 2,041,900 | 2,554 |
| * | Meinian Onehealth Healthcare Holdings Co. Ltd. Class A | 2,270,886 | 2,554 |
| | Beijing Shunxin Agriculture Co. Ltd. Class A (XSHE) | 499,354 | 2,543 |
| | Jinke Properties Group Co. Ltd. Class A (XSHE) | 3,657,625 | 2,538 |
| | State Grid Information & Communication Co. Ltd. | 1,065,500 | 2,537 |
| | Topsec Technologies Group Inc. Class A (XSHE) | 879,332 | 2,533 |
| | Hesteel Co. Ltd. Class A (XSEC) | 6,588,583 | 2,532 |
| | Yintai Gold Co. Ltd. Class A (XSHE) | 1,843,853 | 2,532 |
| | Shanghai Electric Power Co. Ltd. Class A (XSSC) | 1,459,223 | 2,525 |
Emerging Markets Stock Index Fund
| | | | | | Shares | Market
Value•
($000) |
| | Unisplendour Corp. Ltd. Class A (XSEC) | 580,826 | 2,517 |
| | Hangzhou Iron & Steel Co. Class A | 3,220,086 | 2,517 |
| | Quectel Wireless Solutions Co. Ltd. Class A | 89,700 | 2,517 |
| | G-bits Network Technology Xiamen Co. Ltd. Class A (XSSC) | 47,100 | 2,514 |
| * | Huangshan Tourism Development Co. Ltd. Class B | 3,601,903 | 2,512 |
| | China Energy Engineering Corp. Ltd. Class H | 17,041,259 | 2,512 |
| | Wolong Electric Group Co. Ltd. Class A (XSSC) | 1,084,833 | 2,508 |
| | Everbright Securities Co. Ltd. Class A (XSHG) | 1,052,500 | 2,503 |
| | Tonghua Dongbao Pharmaceutical Co. Ltd. Class A (XSSC) | 1,314,348 | 2,500 |
| | Industrial Securities Co. Ltd. Class A (XSHG) | 1,751,590 | 2,498 |
| | NSFOCUS Technologies Group Co. Ltd. Class A | 1,056,718 | 2,493 |
| | Guangzhou Baiyunshan Pharmaceutical Holdings Co. Ltd. Class A (XSHG) | 548,305 | 2,492 |
| | JiuGui Liquor Co. Ltd. Class A (XSEC) | 74,400 | 2,490 |
| | Joyoung Co. Ltd. Class A | 682,392 | 2,490 |
| | Hangcha Group Co. Ltd. Class A | 961,580 | 2,489 |
| | Western Mining Co. Ltd. Class A (XSHG) | 1,223,700 | 2,480 |
| | China Enterprise Co. Ltd. Class A (XSHG) | 5,568,635 | 2,479 |
| | Shenzhen Kstar Science & Technology Co. Ltd. Class A | 497,504 | 2,476 |
| | | | | | Shares | Market
Value•
($000) |
| | China Merchants Shekou Industrial Zone Holdings Co. Ltd. Class A (XSEC) | 1,517,160 | 2,474 |
| | CNNC Hua Yuan Titanium Dioxide Co. Ltd. Class A (XSHE) | 1,148,100 | 2,473 |
| | ORG Technology Co. Ltd. Class A | 2,362,407 | 2,471 |
| | Shanghai M&G Stationery Inc. Class A (XSHG) | 249,275 | 2,471 |
| * | Pengdu Agriculture & Animal Husbandry Co. Ltd. Class A (XSHE) | 4,554,460 | 2,470 |
| * | Autohome Inc. Class A | 244,368 | 2,470 |
| | Sinosoft Co. Ltd. Class A | 629,040 | 2,469 |
| | Han's Laser Technology Industry Group Co. Ltd. Class A (XSHE) | 367,400 | 2,464 |
| | Zhefu Holding Group Co. Ltd. Class A (XSEC) | 2,202,900 | 2,461 |
| * | Yatsen Holding Ltd. ADR | 872,710 | 2,444 |
| | Shenzhen Fine Made Electronics Group Co. Ltd. Class A | 192,100 | 2,443 |
| | Tianshan Aluminum Group Co. Ltd. Class A | 1,863,065 | 2,442 |
| | Taiji Computer Corp. Ltd. Class A | 556,906 | 2,430 |
| | QuakeSafe Technologies Co. Ltd. | 157,400 | 2,430 |
| * | SPIC Dongfang New Energy Corp. Class A (XSEC) | 3,301,388 | 2,423 |
| | Elion Energy Co. Ltd. Class A | 3,123,250 | 2,422 |
| | Shanxi Coking Co. Ltd. Class A | 2,255,474 | 2,421 |
| | Huagong Tech Co. Ltd. Class A (XSHE) | 536,500 | 2,417 |
| | Ningbo Shanshan Co. Ltd. Class A (XSHG) | 368,640 | 2,414 |
Emerging Markets Stock Index Fund
| | | | | | Shares | Market
Value•
($000) |
| *,3 | China Huiyuan Juice Group Ltd. | 9,298,137 | 2,414 |
| | Shenzhen Yinghe Technology Co. Ltd. Class A | 492,360 | 2,406 |
| | Shandong Dongyue Organosilicon Material Co. Ltd. Class A (XSEC) | 711,100 | 2,404 |
| | Xingda International Holdings Ltd. | 10,579,093 | 2,403 |
| | Hunan Valin Steel Co. Ltd. Class A (XSEC) | 2,878,800 | 2,403 |
| | Sinomine Resource Group Co. Ltd. Class A | 249,600 | 2,401 |
| * | Gansu Jiu Steel Group Hongxing Iron & Steel Co. Ltd. Class A | 6,449,000 | 2,396 |
| | Zhejiang Xinan Chemical Industrial Group Co. Ltd. Class A (XSSC) | 553,079 | 2,392 |
| | Yutong Bus Co. Ltd. Class A (XSSC) | 1,347,414 | 2,387 |
| | Beijing SuperMap Software Co. Ltd. Class A | 658,700 | 2,386 |
| | Zhejiang Wanliyang Co. Ltd. Class A (XSEC) | 1,126,200 | 2,379 |
| * | China Fangda Group Co. Ltd. Class B | 6,312,683 | 2,378 |
| * | Beijing Sinohytec Co. Ltd. Class A | 61,349 | 2,377 |
| | Hangzhou Oxygen Plant Group Co. Ltd. | 586,150 | 2,376 |
| | LianChuang Electronic Technology Co. Ltd. Class A (XSHE) | 747,661 | 2,373 |
| | Shanghai Jahwa United Co. Ltd. Class A (XSSC) | 317,125 | 2,372 |
| | China Baoan Group Co. Ltd. Class A (XSEC) | 722,020 | 2,368 |
| | Sinofibers Technology Co. Ltd. Class A | 268,000 | 2,365 |
| | | | | | Shares | Market
Value•
($000) |
| | Rockchip Electronics Co. Ltd. | 141,900 | 2,357 |
| | Kaishan Group Co. Ltd. Class A | 830,608 | 2,356 |
| | Jiangsu Zhongtian Technology Co. Ltd. Class A (XSHG) | 1,490,700 | 2,356 |
| | China South City Holdings Ltd. | 31,585,258 | 2,354 |
| | SDIC Capital Co. Ltd. Class A (XSHG) | 1,831,904 | 2,347 |
| | Electric Connector Technology Co. Ltd. Class A | �� 358,005 | 2,338 |
| | Shanghai Belling Co. Ltd. Class A (XSSC) | 494,044 | 2,336 |
| | Xinhua Winshare Publishing & Media Co. Ltd. Class A (XSHG) | 1,796,153 | 2,336 |
| *,2 | Tongda Group Holdings Ltd. | 72,707,878 | 2,333 |
| | Shengyi Technology Co. Ltd. Class A (XSHG) | 671,118 | 2,333 |
| | China National Medicines Corp. Ltd. Class A (XSSC) | 488,252 | 2,326 |
| | Huolinhe Opencut Coal Industry Corp. Ltd. of Inner Mongolia Class A | 1,168,509 | 2,322 |
| | Shanxi Lanhua Sci-Tech Venture Co. Ltd. Class A | 1,360,200 | 2,320 |
| | Angang Steel Co. Ltd. Class A | 3,513,012 | 2,315 |
| | Cangzhou Mingzhu Plastic Co. Ltd. Class A | 1,498,197 | 2,312 |
| | Fiberhome Telecommunication Technologies Co. Ltd. Class A (XSSC) | 856,438 | 2,305 |
| | Beijing Thunisoft Corp. Ltd. Class A | 1,376,720 | 2,304 |
| * | Shenzhen Airport Co. Ltd. Class A | 1,947,184 | 2,303 |
| | Shanghai Jinjiang International Hotels Co. Ltd. Class A | 273,524 | 2,302 |
Emerging Markets Stock Index Fund
| | | | | | Shares | Market
Value•
($000) |
| | Hangzhou Onechance Tech Corp. Class A | 262,325 | 2,300 |
| | Zhongfu Information Inc. Class A | 416,700 | 2,300 |
| | Huizhou Desay Sv Automotive Co. Ltd. Class A (XSEC) | 137,400 | 2,299 |
| | Hengli Petrochemical Co. Ltd. Class A (XSSC) | 666,000 | 2,297 |
| * | Bohai Leasing Co. Ltd. Class A | 5,586,400 | 2,295 |
| | Fujian Sunner Development Co. Ltd. Class A (XSHE) | 652,847 | 2,292 |
| | Shandong Sun Paper Industry JSC Ltd. Class A (XSHE) | 1,277,100 | 2,291 |
| * | Pacific Shuanglin Bio-pharmacy Co. Ltd. (XSHE) | 465,203 | 2,288 |
| | Jinduicheng Molybdenum Co. Ltd. Class A (XSSC) | 2,011,640 | 2,282 |
| | YTO Express Group Co. Ltd. Class A (XSSC) | 1,000,300 | 2,281 |
| | Nanjing Iron & Steel Co. Ltd. Class A (XSSC) | 4,130,700 | 2,278 |
| | Shandong Denghai Seeds Co. Ltd. Class A (XSHE) | 683,618 | 2,275 |
| | Sailun Group Co. Ltd. Class A (XSSC) | 1,085,915 | 2,266 |
| | Xinjiang Tianshan Cement Co. Ltd. Class A | 1,061,720 | 2,264 |
| | Hefei Meiya Optoelectronic Technology Inc. Class A (XSHE) | 358,050 | 2,264 |
| | Shanghai Bright Power Semiconductor Co. Ltd. Class A | 46,870 | 2,264 |
| | Haier Smart Home Co. Ltd. Class A (XSHG) | 532,200 | 2,261 |
| | COFCO Sugar Holding Co. Ltd. Class A | 1,487,749 | 2,261 |
| | | | | | Shares | Market
Value•
($000) |
| | Chaowei Power Holdings Ltd. | 7,664,924 | 2,258 |
| | DHC Software Co. Ltd. Class A (XSHE) | 2,080,100 | 2,256 |
| *,1,2 | JD Logistics Inc. | 573,746 | 2,255 |
| | Yantai Jereh Oilfield Services Group Co. Ltd. Class A (XSEC) | 342,082 | 2,254 |
| | Hangjin Technology Co. Ltd. Class A (XSEC) | 424,000 | 2,254 |
| | G-bits Network Technology Xiamen Co. Ltd. Class A (XSHG) | 42,200 | 2,253 |
| | Hebei Hengshui Laobaigan Liquor Co. Ltd. Class A | 670,300 | 2,252 |
| | Sinoma Science & Technology Co. Ltd. Class A (XSEC) | 380,500 | 2,248 |
| | Sunyard Technology Co. Ltd. (XSHG) | 1,608,127 | 2,248 |
| | Great Wall Motor Co. Ltd. Class A | 210,700 | 2,247 |
| | Greenland Hong Kong Holdings Ltd. | 10,544,314 | 2,242 |
| * | HeiLongJiang ZBD Pharmaceutical Co. Ltd. Class A | 915,000 | 2,240 |
| | CPMC Holdings Ltd. | 4,573,319 | 2,235 |
| | ENN Natural Gas Co. Ltd. Class A (XSHG) | 776,269 | 2,235 |
| | Cathay Biotech Inc. Class A | 91,250 | 2,234 |
| | Zhejiang Dingli Machinery Co. Ltd. Class A (XSSC) | 209,400 | 2,233 |
| | Zhefu Holding Group Co. Ltd. Class A (XSHE) | 1,995,490 | 2,229 |
| | Chongqing Rural Commercial Bank Co. Ltd. Class A | 3,730,800 | 2,226 |
| * | Fujian Kuncai Material Technology Co. Ltd. Class A | 373,300 | 2,226 |
Emerging Markets Stock Index Fund
| | | | | | Shares | Market
Value•
($000) |
| | Shanghai Zhangjiang High-Tech Park Development Co. Ltd. Class A (XSSC) | 853,196 | 2,222 |
| | Guangzhou Zhujiang Brewery Co. Ltd. Class A (XSHE) | 1,435,600 | 2,221 |
| | Hunan Valin Steel Co. Ltd. Class A (XSHE) | 2,658,600 | 2,219 |
| | Wuxi Rural Commercial Bank Co. Ltd. Class A | 2,385,000 | 2,219 |
| | Shan Xi Hua Yang Group New Energy Co. Ltd. Class A (XSSC) | 1,335,200 | 2,217 |
| | Shenzhen Kaifa Technology Co. Ltd. Class A (XSHE) | 958,400 | 2,217 |
| * | Guangdong Golden Dragon Development Inc. Class A (XSHE) | 892,900 | 2,215 |
| | Wuxi Taiji Industry Co. Ltd. Class A (XSSC) | 1,770,531 | 2,214 |
| | Guangzhou Wondfo Biotech Co. Ltd. Class A | 408,418 | 2,213 |
| | Shanghai Industrial Urban Development Group Ltd. | 25,690,162 | 2,212 |
| | Qingling Motors Co. Ltd. Class H | 9,812,072 | 2,209 |
| | North China Pharmaceutical Co. Ltd. Class A | 1,585,460 | 2,201 |
| * | Guanghui Energy Co. Ltd. Class A (XSHG) | 2,129,303 | 2,198 |
| | Xiamen Kingdomway Group Co. Class A (XSHE) | 462,900 | 2,198 |
| | Yunnan Chihong Zinc&Germanium Co. Ltd. Class A (XSHG) | 2,851,638 | 2,196 |
| * | Siasun Robot & Automation Co. Ltd. Class A | 1,499,651 | 2,193 |
| | Shandong Bohui Paper Industrial Co. Ltd. Class A | 1,345,900 | 2,187 |
| | | | | | Shares | Market
Value•
($000) |
| * | Rising Nonferrous Metals Share Co. Ltd. Class A | 290,620 | 2,184 |
| | Jiangsu Guotai International Group Co. Ltd. (XSEC) | 1,057,871 | 2,182 |
| | Daan Gene Co. Ltd. Class A (XSHE) | 726,179 | 2,182 |
| | Zhejiang Weiming Environment Protection Co. Ltd. Class A (XSSC) | 508,599 | 2,181 |
| | Chengdu Wintrue Holding Co. Ltd. Class A | 868,170 | 2,174 |
| | Beijing Sinnet Technology Co. Ltd. Class A | 1,052,640 | 2,173 |
| | Sichuan Expressway Co. Ltd. Class H | 9,367,276 | 2,168 |
| * | Zhongtian Financial Group Co. Ltd. Class A | 5,523,375 | 2,168 |
| | Shennan Circuits Co. Ltd. Class A | 155,817 | 2,166 |
| | Beijing Cisri-Gaona Materials & Technology Co. Ltd. Class A (XSHE) | 331,600 | 2,166 |
| | Shanxi Lu'an Environmental Energy Development Co. Ltd. Class A (XSHG) | 1,066,800 | 2,165 |
| | Jiangsu Hengshun Vinegar Industry Co. Ltd. Class A | 856,902 | 2,160 |
| | Northeast Securities Co. Ltd. Class A (XSHE) | 1,604,558 | 2,160 |
| * | C&D Property Management Group Co. Ltd. | 3,819,000 | 2,160 |
| | Bestechnic Shanghai Co. Ltd. Class A | 61,013 | 2,159 |
| | Sunresin New Materials Co. Ltd. Class A | 176,200 | 2,158 |
| | WUS Printed Circuit Kunshan Co. Ltd. Class A (XSHE) | 1,344,614 | 2,153 |
Emerging Markets Stock Index Fund
| | | | | | Shares | Market
Value•
($000) |
| * | Pang Da Automobile Trade Co. Ltd. Class A | 8,188,100 | 2,152 |
| | Zhongshan Public Utilities Group Co. Ltd. Class A (XSHE) | 1,593,736 | 2,145 |
| | Offshore Oil Engineering Co. Ltd. Class A (XSSC) | 2,941,170 | 2,137 |
| | Western Mining Co. Ltd. Class A (XSSC) | 1,053,500 | 2,135 |
| * | Montnets Cloud Technology Group Co. Ltd. Class A (XSEC) | 675,500 | 2,126 |
| *,1,2 | Ascletis Pharma Inc. | 6,103,000 | 2,121 |
| | BOC International China Co. Ltd. Class A | 1,019,327 | 2,115 |
| | Jiangsu Yangnong Chemical Co. Ltd. Class A (XSHG) | 114,900 | 2,113 |
| * | Nations Technologies Inc. Class A | 521,400 | 2,113 |
| | Angel Yeast Co. Ltd. Class A (XSSC) | 242,888 | 2,112 |
| | Eastern Communications Co. Ltd. Class A (XSSC) | 1,312,062 | 2,112 |
| | Jiangsu Yuyue Medical Equipment & Supply Co. Ltd. Class A (XSEC) | 382,600 | 2,107 |
| * | Beijing BDStar Navigation Co. Ltd. Class A (XSHE) | 339,651 | 2,106 |
| | Yunnan Copper Co. Ltd. Class A (XSEC) | 1,013,600 | 2,104 |
| | DongFeng Automobile Co. Ltd. Class A | 1,936,312 | 2,104 |
| | Qianhe Condiment & Food Co. Ltd. Class A (XSHG) | 546,672 | 2,102 |
| | Sinopec Shanghai Petrochemical Co. Ltd. Class A | 3,447,940 | 2,101 |
| | | | | | Shares | Market
Value•
($000) |
| | Nanjing Sciyon Wisdom Technology Group Co. Ltd. Class A | 1,043,246 | 2,101 |
| * | Sichuan Meifeng Chemical IND Class A | 1,332,751 | 2,098 |
| | Chengdu XGimi Technology Co. Ltd. Class A | 26,159 | 2,094 |
| | China Merchants Expressway Network & Technology Holdings Co. Ltd. Class A | 1,918,830 | 2,093 |
| *,2,3 | National Agricultural Holdings Ltd. | 13,680,292 | 2,092 |
| * | Shanghai DZH Ltd. Class A | 1,945,300 | 2,090 |
| | Longshine Technology Group Co. Ltd. Class A (XSEC) | 412,300 | 2,088 |
| * | Verisilicon Microelectronics Shanghai Co. Ltd. Class A | 202,337 | 2,088 |
| | Shanghai M&G Stationery Inc. Class A (XSSC) | 210,300 | 2,084 |
| * | Jolywood Suzhou Sunwatt Co. Ltd. Class A | 947,510 | 2,084 |
| * | Anhui Golden Seed Winery Co. Ltd. Class A | 736,201 | 2,083 |
| | Beijing Kingsoft Office Software Inc. Class A (XSSC) | 44,953 | 2,082 |
| | First Tractor Co. Ltd. Class A (XSSC) | 1,049,289 | 2,079 |
| | Shanghai Hanbell Precise Machinery Co. Ltd. Class A | 560,880 | 2,078 |
| | YTO Express Group Co. Ltd. Class A (XSHG) | 911,106 | 2,077 |
| | Ningbo Sanxing Medical Electric Co. Ltd. Class A (XSSC) | 1,089,936 | 2,073 |
| | Yixintang Pharmaceutical Group Co. Ltd. Class A | 417,554 | 2,073 |
Emerging Markets Stock Index Fund
| | | | | | Shares | Market
Value•
($000) |
| | Jiangsu Provincial Agricultural Reclamation & Development Corp. | 1,191,892 | 2,073 |
| | Jiangsu Suzhou Rural Commercial Bank Co. Ltd. Class A | 2,423,900 | 2,072 |
| | Bluestar Adisseo Co. Class A | 1,009,941 | 2,066 |
| | YGSOFT Inc. Class A (XSEC) | 1,944,582 | 2,062 |
| | Fujian Apex Software Co. Ltd. Class A | 395,500 | 2,061 |
| * | So-Young International Inc. ADR | 519,115 | 2,051 |
| | Anhui Jianghuai Automobile Group Corp. Ltd. Class A (XSSC) | 810,628 | 2,050 |
| * | Yunnan Aluminium Co. Ltd. Class A (XSHE) | 1,100,500 | 2,049 |
| | Jiangsu Zhongtian Technology Co. Ltd. Class A (XSSC) | 1,293,400 | 2,044 |
| * | Zhejiang Jinke Tom Culture Industry Co. Ltd. Class A | 2,951,245 | 2,040 |
| | Shenzhen Fastprint Circuit Tech Co. Ltd. Class A | 1,025,700 | 2,031 |
| | Dongjiang Environmental Co. Ltd. Class A (XSHE) | 1,905,066 | 2,027 |
| | China Railway Hi-tech Industry Co. Ltd. Class A | 1,683,200 | 2,026 |
| | Shaanxi International Trust Co. Ltd. Class A (XSHE) | 4,152,880 | 2,024 |
| | Anhui Jianghuai Automobile Group Corp. Ltd. Class A (XSHG) | 798,301 | 2,019 |
| | Zhejiang Crystal-Optech Co. Ltd. Class A (XSHE) | 819,994 | 2,018 |
| | TongFu Microelectronics Co. Ltd. Class A (XSHE) | 644,588 | 2,017 |
| | | | | | Shares | Market
Value•
($000) |
| | Yango Group Co. Ltd. Class A | 4,010,183 | 2,016 |
| | Nanjing Hanrui Cobalt Co. Ltd. Class A (XSHE) | 162,400 | 2,006 |
| | BrightGene Bio-Medical Technology Co. Ltd. Class A | 414,069 | 2,006 |
| | Wuxi Lead Intelligent Equipment Co. Ltd. Class A (XSEC) | 157,305 | 2,004 |
| | Gan & Lee Pharmaceuticals Co. Ltd. Class A | 191,000 | 2,004 |
| | Jiangxi Zhengbang Technology Co. Ltd. Class A (XSHE) | 1,279,608 | 2,002 |
| | IReader Technology Co. Ltd. Class A (XSSC) | 676,494 | 2,001 |
| | Shandong Jinjing Science & Technology Co. Ltd. Class A (XSSC) | 1,271,196 | 2,001 |
| | Jinyu Bio-Technology Co. Ltd. Class A (XSSC) | 803,254 | 1,999 |
| | Winner Medical Co. Ltd. Class A | 169,761 | 1,995 |
| | Xi'An Shaangu Power Co. Ltd. Class A (XSSC) | 1,038,126 | 1,994 |
| | TDG Holdings Co. Ltd. Class A | 940,100 | 1,992 |
| | Sinocare Inc. Class A | 543,300 | 1,992 |
| * | Yuan Longping High-tech Agriculture Co. Ltd. Class A (XSEC) | 606,800 | 1,991 |
| 2 | Central China Securities Co. Ltd. Class H | 10,847,000 | 1,990 |
| * | Inspur Software Co. Ltd. Class A (XSHG) | 1,051,998 | 1,988 |
| | Henan Shenhuo Coal & Power Co. Ltd. Class A (XSHE) | 1,335,500 | 1,982 |
| | Shanxi Securities Co. Ltd. Class A (XSHE) | 2,026,110 | 1,981 |
Emerging Markets Stock Index Fund
| | | | | | Shares | Market
Value•
($000) |
| | Wuhan DR Laser Technology Corp. Ltd. Class A | 91,680 | 1,979 |
| | Orient Securities Co. Ltd. Class A (XSHG) | 917,200 | 1,974 |
| | Wangfujing Group Co. Ltd. Class A (XSSC) | 409,042 | 1,969 |
| | FAW Jiefang Group Co. Ltd. Class A | 1,206,800 | 1,967 |
| * | Beijing Jetsen Technology Co. Ltd. Class A (XSEC) | 3,068,123 | 1,966 |
| | SooChow Securities Co. Ltd. Class A (XSHG) | 1,483,170 | 1,964 |
| | Sino Wealth Electronic Ltd. Class A (XSHE) | 204,780 | 1,963 |
| | Shenzhen Sunmoon Microelectronics Co. Ltd. Class A | 59,237 | 1,963 |
| | NanJi E-Commerce Co. Ltd. Class A | 1,754,443 | 1,962 |
| | OPT Machine Vision Tech Co. Ltd. Class A | 45,987 | 1,960 |
| | Do-Fluoride New Materials Co. Ltd. Class A (XSEC) | 201,400 | 1,959 |
| | Beijing Yanjing Brewery Co. Ltd. Class A | 1,888,480 | 1,959 |
| 2 | Perennial Energy Holdings Ltd. | 9,550,000 | 1,959 |
| *,1,2 | Koolearn Technology Holding Ltd. | 3,617,500 | 1,958 |
| | Shenzhen Topband Co. Ltd. Class A | 845,600 | 1,957 |
| | Inner Mongolia MengDian HuaNeng Thermal Power Corp. Ltd. Class A (XSSC) | 3,487,528 | 1,955 |
| | Sichuan Road & Bridge Co. Ltd. Class A (XSHG) | 1,041,337 | 1,955 |
| | Jiangsu Nhwa Pharmaceutical Co. Ltd. Class A (XSHE) | 849,296 | 1,951 |
| | OFILM Group Co. Ltd. Class A (XSHE) | 1,662,925 | 1,943 |
| | | | | | Shares | Market
Value•
($000) |
| | Metallurgical Corp. of China Ltd. Class A (XSHG) | 3,066,800 | 1,939 |
| | Huatai Securities Co. Ltd. Class A (XSHG) | 782,600 | 1,939 |
| | Lushang Health Industry Development Co. Ltd. Class A | 925,879 | 1,935 |
| | Nanjing Yunhai Special Metals Co. Ltd. Class A | 676,934 | 1,930 |
| | CNHTC Jinan Truck Co. Ltd. Class A | 931,339 | 1,928 |
| | RiseSun Real Estate Development Co. Ltd. Class A (XSHE) | 2,871,785 | 1,926 |
| | Fibocom Wireless Inc. Class A | 267,370 | 1,925 |
| | Harbin Boshi Automation Co. Ltd. Class A | 1,008,732 | 1,923 |
| | Shanghai Zijiang Enterprise Group Co. Ltd. Class A (XSSC) | 1,265,015 | 1,922 |
| | Sealand Securities Co. Ltd. Class A (XSHE) | 3,177,265 | 1,917 |
| * | Saturday Co. Ltd. Class A | 608,400 | 1,914 |
| * | China Film Co. Ltd. Class A | 1,041,800 | 1,914 |
| * | BTG Hotels Group Co. Ltd. Class A (XSHG) | 499,726 | 1,910 |
| | Huaxi Securities Co. Ltd. Class A (XSHE) | 1,351,200 | 1,910 |
| | Beijing Jingneng Power Co. Ltd. Class A (XSSC) | 4,196,303 | 1,909 |
| | Tibet Summit Resources Co. Ltd. Class A (XSHG) | 399,825 | 1,908 |
| | Pengxin International Mining Co. Ltd. Class A | 2,456,000 | 1,907 |
| | Shanghai Electric Group Co. Ltd. Class A (XSSC) | 2,571,067 | 1,906 |
Emerging Markets Stock Index Fund
| | | | | | Shares | Market
Value•
($000) |
| | Zhejiang Huahai Pharmaceutical Co. Ltd. Class A (XSSC) | 662,887 | 1,905 |
| | Anhui Kouzi Distillery Co. Ltd. Class A (XSSC) | 201,427 | 1,904 |
| | Jiangsu Shagang Co. Ltd. Class A | 1,960,385 | 1,902 |
| | TangShan Port Group Co. Ltd. Class A (XSSC) | 4,553,335 | 1,900 |
| | Sai Micro Electronics Inc. Class A | 520,110 | 1,896 |
| | Maanshan Iron & Steel Co. Ltd. Class A (XSHG) | 2,855,100 | 1,896 |
| | Yifan Pharmaceutical Co. Ltd. Class A (XSHE) | 740,302 | 1,896 |
| * | Shandong Yulong Gold Co. Ltd. Class A | 717,600 | 1,893 |
| * | Wonders Information Co. Ltd. Class A | 1,073,100 | 1,891 |
| | Shenzhen Gas Corp. Ltd. Class A (XSSC) | 1,333,087 | 1,890 |
| | Ningbo Tuopu Group Co. Ltd. Class A (XSHG) | 231,855 | 1,888 |
| | Shanghai Construction Group Co. Ltd. Class A (XSSC) | 3,691,482 | 1,887 |
| * | Antong Holdings Co. Ltd. Class A | 3,140,131 | 1,886 |
| | Tangshan Sanyou Chemical Industries Co. Ltd. Class A (XSSC) | 1,304,852 | 1,883 |
| | Yantai Tayho Advanced Materials Co. Ltd. Class A | 668,261 | 1,879 |
| | Zhejiang Huahai Pharmaceutical Co. Ltd. Class A (XSHG) | 652,870 | 1,877 |
| | IKD Co. Ltd. Class A | 876,400 | 1,876 |
| * | Guangzhou GRG Metrology & Test Co. Ltd. Class A | 466,500 | 1,876 |
| | Lancy Co. Ltd. Class A | 305,100 | 1,876 |
| | | | | | Shares | Market
Value•
($000) |
| *,1,2 | YiChang HEC ChangJiang Pharmaceutical Co. Ltd. Class H | 4,010,164 | 1,875 |
| | Shanghai Weaver Network Co. Ltd. Class A (XSSC) | 186,456 | 1,874 |
| | GCI Science & Technology Co. Ltd. Class A | 562,600 | 1,868 |
| | Xianhe Co. Ltd. Class A | 330,700 | 1,867 |
| * | Chengzhi Co. Ltd. Class A (XSEC) | 842,000 | 1,865 |
| * | Aoyuan Beauty Valley Technology Co. Ltd. Class A | 751,700 | 1,864 |
| | Tianjin Chase Sun Pharmaceutical Co. Ltd. Class A | 2,920,805 | 1,863 |
| * | Pacific Securities Co. Ltd. Class A (XSSC) | 3,822,620 | 1,863 |
| | Rongsheng Petrochemical Co. Ltd. Class A (XSEC) | 691,404 | 1,862 |
| | Luyang Energy-Saving Materials Co. Ltd. | 445,340 | 1,861 |
| | COFCO Capital Holdings Co. Ltd. Class A (XSHE) | 1,446,657 | 1,861 |
| * | Xiangtan Electric Manufacturing Co. Ltd. Class A | 867,153 | 1,859 |
| | Shanghai Weaver Network Co. Ltd. Class A (XSHG) | 184,916 | 1,858 |
| | Dong-E-E-Jiao Co. Ltd. Class A (XSHE) | 293,067 | 1,857 |
| | Bank of Chengdu Co. Ltd. Class A (XSHG) | 930,600 | 1,856 |
| | Guangxi Guiguan Electric Power Co. Ltd. Class A (XSSC) | 2,050,466 | 1,853 |
| | Shandong Chenming Paper Holdings Ltd. Class A (XSHE) | 1,677,550 | 1,853 |
| | Shanghai Zhangjiang High-Tech Park Development Co. Ltd. Class A (XSHG) | 711,600 | 1,853 |
Emerging Markets Stock Index Fund
| | | | | | Shares | Market
Value•
($000) |
| | Suzhou Gold Mantis Construction Decoration Co. Ltd. Class A (XSHE) | 1,986,905 | 1,853 |
| | Shenzhen Megmeet Electrical Co. Ltd. Class A (XSHE) | 386,775 | 1,853 |
| | Wondershare Technology Group Co. Ltd. Class A | 280,684 | 1,853 |
| | Jiangsu Nata Opto-electronic Material Co. Ltd. Class A (XSEC) | 227,900 | 1,850 |
| | Huaan Securities Co. Ltd. Class A (XSHG) | 2,312,221 | 1,847 |
| * | Shenzhen MTC Co. Ltd. Class A (XSHE) | 2,400,755 | 1,844 |
| | China Wafer Level CSP Co. Ltd. Class A (XSHG) | 284,592 | 1,840 |
| | Changzhou Xingyu Automotive Lighting Systems Co. Ltd. Class A (XSSC) | 51,401 | 1,837 |
| | Chengdu Leejun Industrial Co. Ltd. Class A | 1,022,161 | 1,837 |
| | Shenzhen Infogem Technologies Co. Ltd. Class A (XSEC) | 888,200 | 1,835 |
| | Yonghui Superstores Co. Ltd. Class A (XSHG) | 2,983,495 | 1,835 |
| | Yunnan Wenshan Electric Power Co. Ltd. Class A | 566,427 | 1,832 |
| | Dongfang Electric Corp. Ltd. Class A (XSHG) | 643,700 | 1,828 |
| | Xinxing Ductile Iron Pipes Co. Ltd. Class A (XSEC) | 3,147,200 | 1,825 |
| | Bank of Chongqing Co. Ltd. Class A | 1,350,517 | 1,823 |
| | Hongfa Technology Co. Ltd. Class A (XSSC) | 156,950 | 1,816 |
| | | | | | Shares | Market
Value•
($000) |
| | Shenzhen YUTO Packaging Technology Co. Ltd. Class A (XSEC) | 354,360 | 1,814 |
| * | Nanjing Tanker Corp. Class A | 5,953,700 | 1,814 |
| * | Beijing Orient National Communication Science & Technology Co. Ltd. Class A (XSEC) | 1,316,127 | 1,813 |
| | Beijing Sifang Automation Co. Ltd. Class A (XSSC) | 617,639 | 1,810 |
| | China CITIC Bank Corp. Ltd. Class A (XSHG) | 2,539,850 | 1,802 |
| | Addsino Co. Ltd. Class A (XSEC) | 749,900 | 1,801 |
| | Wisesoft Co. Ltd. Class A | 922,865 | 1,801 |
| | PCI Technology Group Co. Ltd. Class A (XSHG) | 1,516,958 | 1,798 |
| | Zhejiang Hisoar Pharmaceutical Co. Ltd. Class A (XSHE) | 1,479,817 | 1,798 |
| | Yealink Network Technology Corp. Ltd. Class A (XSEC) | 152,059 | 1,796 |
| * | Yuan Longping High-tech Agriculture Co. Ltd. Class A (XSHE) | 547,439 | 1,796 |
| | Addsino Co. Ltd. Class A (XSHE) | 748,000 | 1,796 |
| | Bluefocus Intelligent Communications Group Co. Ltd. Class A | 2,294,419 | 1,794 |
| * | Beijing Shougang Co. Ltd. Class A (XSHE) | 1,993,600 | 1,793 |
| | Shenzhen Sunway Communication Co. Ltd. Class A (XSEC) | 481,625 | 1,792 |
| | Zhejiang Hailiang Co. Ltd. Class A (XSHE) | 1,087,716 | 1,790 |
Emerging Markets Stock Index Fund
| | | | | | Shares | Market
Value•
($000) |
| | Weihai Guangwei Composites Co. Ltd. Class A (XSEC) | 168,500 | 1,789 |
| | Kailuan Energy Chemical Co. Ltd. Class A (XSHG) | 1,477,669 | 1,785 |
| * | Chongqing Iron & Steel Co. Ltd. Class A (XSHG) | 5,006,188 | 1,784 |
| | Lier Chemical Co. Ltd. Class A | 504,444 | 1,783 |
| | Shenzhen Goodix Technology Co. Ltd. Class A (XSHG) | 111,347 | 1,781 |
| | Archermind Technology Nanjing Co. Ltd. Class A | 150,070 | 1,781 |
| | Xinhua Winshare Publishing & Media Co. Ltd. Class A (XSSC) | 1,368,770 | 1,780 |
| * | Gree Real Estate Co. Ltd. Class A (XSSC) | 1,695,100 | 1,780 |
| | Guangxi Liugong Machinery Co. Ltd. Class A | 1,530,461 | 1,778 |
| | Hebei Chengde Lolo Co. Class A (XSHE) | 1,096,852 | 1,772 |
| | Guangzhou Haige Communications Group Inc. Co. Class A (XSHE) | 1,201,147 | 1,772 |
| | Jiangsu Linyang Energy Co. Ltd. Class A (XSSC) | 998,525 | 1,770 |
| | Zhejiang Zheneng Electric Power Co. Ltd. Class A (XSSC) | 3,004,652 | 1,770 |
| | Shenzhen Sunway Communication Co. Ltd. Class A (XSHE) | 475,324 | 1,768 |
| | Tianjin ZhongXin Pharmaceutical Group Corp. Ltd. Class A (XSSC) | 422,329 | 1,767 |
| | Shenzhen Desay Battery Technology Co. Class A (XSHE) | 267,380 | 1,767 |
| | Xi'an Bright Laser Technologies Co. Ltd. Class A | 52,646 | 1,765 |
| | | | | | Shares | Market
Value•
($000) |
| | Guizhou Panjiang Refined Coal Co. Ltd. Class A (XSHG) | 1,466,300 | 1,763 |
| | Xiamen Faratronic Co. Ltd. Class A (XSHG) | 58,248 | 1,760 |
| | Jiangsu Boqian New Materials Stock Co. Ltd. Class A | 161,100 | 1,759 |
| * | HC SemiTek Corp. Class A | 944,750 | 1,755 |
| | Sinoma International Engineering Co. Class A (XSSC) | 1,078,722 | 1,753 |
| * | China Merchants Land Ltd. | 15,681,888 | 1,752 |
| | Tibet Rhodiola Pharmaceutical Holding Co. Class A | 234,317 | 1,752 |
| | Shanying International Holding Co. Ltd. Class A (XSSC) | 3,457,725 | 1,751 |
| | Dong-E-E-Jiao Co. Ltd. Class A (XSEC) | 275,700 | 1,747 |
| | Gemdale Corp. Class A (XSHG) | 1,101,700 | 1,747 |
| | Shanghai Fudan-Zhangjiang Bio-Pharmaceutical Co. Ltd. Class H | 3,561,772 | 1,746 |
| | Luolai Lifestyle Technology Co. Ltd. Class A (XSHE) | 856,783 | 1,745 |
| | Xinjiang Xintai Natural Gas Co. Ltd. Class A | 401,640 | 1,742 |
| | Shanghai Jahwa United Co. Ltd. Class A (XSHG) | 232,700 | 1,741 |
| | Accelink Technologies Co. Ltd. Class A (XSHE) | 513,948 | 1,741 |
| | Shanghai Huayi Group Co. Ltd. Class A (XSHG) | 1,096,976 | 1,740 |
| | Keda Industrial Group Co. Ltd. (XSSC) | 554,600 | 1,739 |
Emerging Markets Stock Index Fund
| | | | | | Shares | Market
Value•
($000) |
| | Shenghe Resources Holding Co. Ltd. Class A (XSSC) | 546,600 | 1,738 |
| | Guangdong Dowstone Technology Co. Ltd. Class A (XSEC) | 384,900 | 1,737 |
| | Dongguan Development Holdings Co. Ltd. Class A | 1,091,801 | 1,737 |
| * | 360 Security Technology Inc. Class A (XSHG) | 923,000 | 1,736 |
| | Huagong Tech Co. Ltd. Class A (XSEC) | 385,000 | 1,735 |
| | Amoy Diagnostics Co. Ltd. Class A | 137,300 | 1,735 |
| | Juewei Food Co. Ltd. Class A (XSHG) | 168,760 | 1,734 |
| | Shanghai Environment Group Co. Ltd. Class A | 955,007 | 1,733 |
| | Anhui Zhongding Sealing Parts Co. Ltd. Class A (XSHE) | 644,765 | 1,732 |
| | China Coal Xinji Energy Co. Ltd. Class A | 2,203,900 | 1,732 |
| * | Yibin Tianyuan Group Co. Ltd. Class A | 860,429 | 1,730 |
| | Bright Dairy & Food Co. Ltd. Class A (XSSC) | 794,000 | 1,729 |
| | Xinyu Iron & Steel Co. Ltd. Class A (XSHG) | 1,870,600 | 1,728 |
| | Central China Securities Co. Ltd. Class A (XSSC) | 2,405,400 | 1,725 |
| | Anhui Sierte Fertilizer Industry Ltd. Co. Class A | 798,125 | 1,722 |
| * | GuangYuYuan Chinese Herbal Medicine Co. Ltd. Class A | 378,240 | 1,721 |
| | Shanghai Pret Composites Co. Ltd. Class A | 1,003,062 | 1,721 |
| * | Jilin Electric Power Co. Ltd. Class A (XSHE) | 1,452,680 | 1,720 |
| | | | | | Shares | Market
Value•
($000) |
| * | Guizhou Xinbang Pharmaceutical Co. Ltd. Class A | 1,609,931 | 1,713 |
| | Tianneng Battery Group Co. Ltd. Class A | 268,678 | 1,712 |
| | Xinxiang Chemical Fiber Co. Ltd. Class A | 1,663,349 | 1,700 |
| | Tianjin 712 Communication & Broadcasting Co. Ltd. Class A (XSHG) | 288,300 | 1,700 |
| * | Sinopec Oilfield Service Corp. Class H | 17,594,608 | 1,691 |
| | Guangzhou Development Group Inc. Class A (XSHG) | 1,503,400 | 1,687 |
| | Tibet Urban Development & Investment Co. Ltd. Class A (XSHG) | 488,170 | 1,687 |
| | Zhejiang Tianyu Pharmaceutical Co. Ltd. Class A | 284,580 | 1,686 |
| | Beijing North Star Co. Ltd. Class A (XSSC) | 4,822,415 | 1,683 |
| | Tian Di Science & Technology Co. Ltd. Class A (XSSC) | 2,566,939 | 1,678 |
| | Chongqing Three Gorges Water Conservancy & Electric Power Co. Ltd. Class A (XSHG) | 1,120,400 | 1,675 |
| | Jenkem Technology Co. Ltd. Class A | 38,565 | 1,671 |
| | Jiangxi Zhengbang Technology Co. Ltd. Class A (XSEC) | 1,067,698 | 1,670 |
| | Zhejiang Orient Gene Biotech Co. Ltd. Class A (XSHG) | 74,710 | 1,670 |
| | Sichuan EM Technology Co. Ltd. Class A (XSHG) | 698,750 | 1,668 |
| | Shenzhen Fuanna Bedding & Furnishing Co. Ltd. Class A | 1,313,540 | 1,666 |
Emerging Markets Stock Index Fund
| | | | | | Shares | Market
Value•
($000) |
| | INESA Intelligent Tech Inc. Class B | 3,793,722 | 1,665 |
| | APT Medical Inc. Class A | 35,548 | 1,665 |
| * | China Tianying Inc. Class A | 2,242,000 | 1,663 |
| | Beijing Global Safety Technology Co. Ltd. Class A | 519,083 | 1,663 |
| | Fujian Sunner Development Co. Ltd. Class A (XSEC) | 472,967 | 1,660 |
| | Fujian Funeng Co. Ltd. Class A (XSSC) | 592,188 | 1,656 |
| | Zhengzhou Coal Mining Machinery Group Co. Ltd. Class A (XSSC) | 1,043,125 | 1,656 |
| * | BTG Hotels Group Co. Ltd. Class A (XSSC) | 433,200 | 1,655 |
| 1 | Qingdao Port International Co. Ltd. Class H | 3,290,915 | 1,654 |
| * | YaGuang Technology Group Co. Ltd. | 1,232,100 | 1,648 |
| | COSCO SHIPPING Specialized Carriers Co. Ltd. Class A (XSHG) | 1,991,001 | 1,645 |
| | Valiant Co. Ltd. Class A (XSHE) | 510,250 | 1,642 |
| * | Spring Airlines Co. Ltd. Class A (XSHG) | 179,600 | 1,642 |
| * | Meinian Onehealth Healthcare Holdings Co. Ltd. Class A (XSEC) | 1,459,514 | 1,641 |
| * | Shanghai Zhenhua Heavy Industries Co. Ltd. Class A | 2,989,140 | 1,641 |
| | Yunnan Chihong Zinc&Germanium Co. Ltd. Class A (XSSC) | 2,126,424 | 1,637 |
| * | Beijing Ultrapower Software Co. Ltd. Class A | 1,853,768 | 1,636 |
| * | Suning Universal Co. Ltd. Class A (XSHE) | 2,183,210 | 1,636 |
| | Hunan Aihua Group Co. Ltd. Class A (XSHG) | 293,306 | 1,635 |
| | | | | | Shares | Market
Value•
($000) |
| | Tsinghua Tongfang Co. Ltd. Class A (XSHG) | 1,923,200 | 1,630 |
| | Zhejiang Longsheng Group Co. Ltd. Class A (XSSC) | 838,400 | 1,630 |
| | Yueyang Forest & Paper Co. Ltd. Class A (XSHG) | 1,497,780 | 1,628 |
| | Mango Excellent Media Co. Ltd. Class A (XSEC) | 265,199 | 1,627 |
| | Shanghai Chinafortune Co. Ltd. Class A (XSSC) | 812,561 | 1,627 |
| | Jiangxi Bank Co. Ltd. Class H | 3,698,529 | 1,624 |
| | Bank of Xi'an Co. Ltd. Class A | 2,390,600 | 1,621 |
| | Tianjin Capital Environmental Protection Group Co. Ltd. Class H | 3,277,266 | 1,620 |
| | Suzhou Good-Ark Electronics Co. Ltd. Class A | 719,200 | 1,620 |
| | Ningbo Boway Alloy Material Co. Ltd. Class A | 623,270 | 1,620 |
| | Shanghai Liangxin Electrical Co. Ltd. Class A | 635,872 | 1,619 |
| | Beijing Dabeinong Technology Group Co. Ltd. Class A (XSEC) | 1,206,300 | 1,618 |
| | Laobaixing Pharmacy Chain JSC Class A (XSSC) | 237,020 | 1,618 |
| | Zhejiang Jiemei Electronic & Technology Co. Ltd. Class A (XSEC) | 372,934 | 1,608 |
| | Hebei Yangyuan Zhihui Beverage Co. Ltd. Class A | 352,352 | 1,607 |
| | Digiwin Software Co. Ltd. Class A | 508,994 | 1,604 |
| * | Mianyang Fulin Precision Co. Ltd. (XSEC) | 204,000 | 1,603 |
| | Xinjiang Zhongtai Chemical Co. Ltd. Class A (XSEC) | 969,500 | 1,602 |
Emerging Markets Stock Index Fund
| | | | | | Shares | Market
Value•
($000) |
| * | Zheshang Securities Co. Ltd. Class A (XSHG) | 832,600 | 1,602 |
| * | Grandjoy Holdings Group Co. Ltd. Class A (XSHE) | 3,113,300 | 1,601 |
| | Huafon Chemical Co. Ltd. Class A (XSEC) | 859,600 | 1,599 |
| | Wuchan Zhongda Group Co. Ltd. Class A (XSHG) | 1,626,115 | 1,596 |
| | Shenzhen Woer Heat-Shrinkable Material Co. Ltd. Class A | 1,390,724 | 1,596 |
| | Maccura Biotechnology Co. Ltd. Class A | 366,530 | 1,595 |
| * | Sonoscape Medical Corp. Class A | 346,467 | 1,593 |
| * | Shandong Sinobioway Biomedicine Co. Ltd. Class A | 631,460 | 1,589 |
| | Xinjiang Zhongtai Chemical Co. Ltd. Class A (XSHE) | 961,315 | 1,588 |
| | Anhui Truchum Advanced Materials & Technology Co. Ltd. Class A | 975,513 | 1,588 |
| * | Xinjiang Ba Yi Iron & Steel Co. Ltd. Class A | 1,433,500 | 1,587 |
| | Yechiu Metal Recycling China Ltd. Class A | 2,176,400 | 1,587 |
| | Grandblue Environment Co. Ltd. Class A (XSSC) | 458,060 | 1,581 |
| | Moon Environment Technology Co. Ltd. Class A | 795,284 | 1,581 |
| | Shenzhen Yan Tian Port Holding Co. Ltd. Class A | 1,948,141 | 1,577 |
| | Haisco Pharmaceutical Group Co. Ltd. Class A | 598,264 | 1,576 |
| | Keshun Waterproof Technologies Co. Ltd. Class A | 757,060 | 1,576 |
| | Camel Group Co. Ltd. Class A (XSSC) | 770,071 | 1,575 |
| | | | | | Shares | Market
Value•
($000) |
| | CMST Development Co. Ltd. Class A (XSSC) | 1,645,731 | 1,573 |
| * | Jinneng Holding Shanxi Electric Power Co. Ltd. | 3,049,346 | 1,573 |
| | Qiming Information Technology Co. Ltd. Class A | 1,066,374 | 1,573 |
| | China Merchants Property Operation & Service Co. Ltd. Class A (XSHE) | 744,416 | 1,569 |
| | Nanjing Gaoke Co. Ltd. Class A (XSSC) | 1,141,108 | 1,565 |
| * | Blivex Technology Co. Ltd. Class A | 4,172,796 | 1,564 |
| | Changjiang Securities Co. Ltd. Class A (XSEC) | 1,377,986 | 1,559 |
| | Hefei Meiya Optoelectronic Technology Inc. Class A (XSEC) | 246,158 | 1,557 |
| | Sichuan Changhong Electric Co. Ltd. Class A (XSHG) | 3,659,100 | 1,556 |
| | Shanghai Tunnel Engineering Co. Ltd. Class A (XSSC) | 1,945,380 | 1,554 |
| | Zhejiang Narada Power Source Co. Ltd. Class A | 879,962 | 1,553 |
| | Beijing Tiantan Biological Products Corp. Ltd. Class A (XSHG) | 344,111 | 1,553 |
| * | Hang Zhou Great Star Industrial Co. Ltd. Class A (XSEC) | 310,000 | 1,552 |
| | Shenzhen Tagen Group Co. Ltd. Class A | 1,970,094 | 1,551 |
| | Guangdong Great River Smarter Logistics Co. Ltd. Class A | 434,798 | 1,551 |
| | Zhejiang Xianju Pharmaceutical Co. Ltd. Class A | 898,950 | 1,550 |
| | Shenergy Co. Ltd. Class A (XSSC) | 1,600,491 | 1,549 |
Emerging Markets Stock Index Fund
| | | | | | Shares | Market
Value•
($000) |
| | Beijing Capital Development Co. Ltd. Class A (XSSC) | 2,014,531 | 1,548 |
| | Tangshan Jidong Cement Co. Ltd. Class A (XSHE) | 851,877 | 1,547 |
| | Shanghai Shibei Hi-Tech Co. Ltd. Class B | 5,596,869 | 1,546 |
| | Eoptolink Technology Inc. Ltd. Class A (XSHE) | 347,812 | 1,544 |
| | Ningbo Peacebird Fashion Co. Ltd. Class A (XSSC) | 276,031 | 1,543 |
| | Oriental Pearl Group Co. Ltd. Class A (XSHG) | 1,275,996 | 1,541 |
| | China Galaxy Securities Co. Ltd. Class A | 995,320 | 1,537 |
| | Chongqing Road & Bridge Co. Ltd. Class A | 3,813,200 | 1,537 |
| | Financial Street Holdings Co. Ltd. Class A (XSHE) | 1,676,851 | 1,537 |
| | Shandong Huatai Paper Industry Shareholding Co. Ltd. Class A | 1,517,692 | 1,536 |
| | Beijing Haohua Energy Resource Co. Ltd. Class A | 975,900 | 1,530 |
| * | China Fortune Land Development Co. Ltd. Class A (XSSC) | 2,655,465 | 1,528 |
| | Zhongji Innolight Co. Ltd. Class A (XSHE) | 295,537 | 1,528 |
| | Jiangxi Ganyue Expressway Co. Ltd. Class A | 2,901,500 | 1,527 |
| * | Shenzhen Microgate Technology Co. Ltd. Class A | 683,000 | 1,525 |
| | Shenzhen Zhongjin Lingnan Nonfemet Co. Ltd. Class A (XSEC) | 1,967,400 | 1,522 |
| | Chow Tai Seng Jewellery Co. Ltd. Class A | 515,325 | 1,521 |
| | | | | | Shares | Market
Value•
($000) |
| 2 | Hebei Construction Group Corp. Ltd. Class H | 6,015,500 | 1,521 |
| | Sansteel Minguang Co. Ltd. Fujian Class A (XSHE) | 1,418,556 | 1,520 |
| | Shenzhen Hepalink Pharmaceutical Group Co. Ltd. Class A (XSEC) | 632,221 | 1,517 |
| | Sichuan Shuangma Cement Co. Ltd. Class A (XSHE) | 484,900 | 1,517 |
| | Chinalin Securities Co. Ltd. Class A | 924,427 | 1,514 |
| | Zhongji Innolight Co. Ltd. Class A (XSEC) | 292,286 | 1,512 |
| | HLA Group Corp. Ltd. (XSHG) | 1,475,631 | 1,508 |
| | JCHX Mining Management Co. Ltd. Class A (XSHG) | 439,296 | 1,508 |
| * | Jinneng Holding Shanxi Coal Industry Co. Ltd. Class A (XSHG) | 894,535 | 1,507 |
| | Inspur Electronic Information Industry Co. Ltd. Class A (XSEC) | 310,040 | 1,505 |
| | Anhui Wanwei Updated High-Tech Material Industry Co. Ltd. Class A (XSSC) | 1,344,100 | 1,502 |
| | Zhejiang Huace Film & Television Co. Ltd. Class A | 1,700,924 | 1,500 |
| | Shandong Sun Paper Industry JSC Ltd. Class A (XSEC) | 835,800 | 1,499 |
| | Hubei Energy Group Co. Ltd. Class A (XSEC) | 1,930,290 | 1,499 |
| * | CSG Smart Science&Technology Co. Ltd. Class A | 756,395 | 1,499 |
| | YanTai Shuangta Food Co. Ltd. Class A (XSHE) | 1,051,000 | 1,499 |
| | Citic Pacific Special Steel Group Co. Ltd. Class A (XSEC) | 502,645 | 1,498 |
Emerging Markets Stock Index Fund
| | | | | | Shares | Market
Value•
($000) |
| | COFCO Biotechnology Co. Ltd. Class A | 899,900 | 1,498 |
| | Sino-Platinum Metals Co. Ltd. Class A (XSSC) | 419,357 | 1,497 |
| | Chengdu Fusen Noble-House Industrial Co. Ltd. Class A | 762,003 | 1,492 |
| | Hisense Visual Technology Co. Ltd. Class A (XSHG) | 788,700 | 1,491 |
| * | Shenzhen Sea Star Technology Co. Ltd. Class A | 1,800,100 | 1,490 |
| | Caitong Securities Co. Ltd. Class A (XSHG) | 929,500 | 1,490 |
| | Henan Zhongyuan Expressway Co. Ltd. Class A | 3,022,200 | 1,488 |
| * | Chengdu CORPRO Technology Co. Ltd. Class A (XSEC) | 390,400 | 1,487 |
| | Humanwell Healthcare Group Co. Ltd. Class A (XSSC) | 452,907 | 1,487 |
| | Jiangxi Wannianqing Cement Co. Ltd. Class A | 828,724 | 1,485 |
| | Lao Feng Xiang Co. Ltd. Class A | 197,800 | 1,484 |
| | Leader Harmonious Drive Systems Co. Ltd. Class A | 70,904 | 1,484 |
| | Hainan Strait Shipping Co. Ltd. Class A (XSHE) | 1,677,780 | 1,481 |
| | Toly Bread Co. Ltd. Class A (XSHG) | 301,409 | 1,480 |
| | Guangdong Hybribio Biotech Co. Ltd. Class A | 341,298 | 1,480 |
| * | Guosheng Financial Holding Inc. Class A (XSHE) | 1,012,873 | 1,479 |
| | Estun Automation Co. Ltd. Class A (XSEC) | 356,900 | 1,478 |
| | Daan Gene Co. Ltd. Class A (XSEC) | 491,344 | 1,476 |
| | Edifier Technology Co. Ltd. Class A | 835,300 | 1,475 |
| | | | | | Shares | Market
Value•
($000) |
| * | Genimous Technology Co. Ltd. Class A (XSEC) | 1,558,100 | 1,473 |
| | Hubei Chutian Smart Communication Co. Ltd. Class A | 3,163,800 | 1,472 |
| * | Inner Mongolia Xingye Mining Co. Ltd. Class A (XSHE) | 1,276,772 | 1,468 |
| | Anhui Yingliu Electromechanical Co. Ltd. Class A (XSHG) | 472,360 | 1,468 |
| | Wuhan Guide Infrared Co. Ltd. Class A (XSEC) | 431,831 | 1,467 |
| | Zhejiang Meida Industrial Co. Ltd. Class A (XSEC) | 572,800 | 1,467 |
| 2 | First Tractor Co. Ltd. Class H | 2,905,706 | 1,465 |
| * | Hunan Corun New Energy Co. Ltd. Class A | 1,484,230 | 1,465 |
| | Tianjin Port Co. Ltd. Class A (XSHG) | 2,315,508 | 1,464 |
| | Guangdong Tapai Group Co. Ltd. Class A (XSHE) | 931,036 | 1,464 |
| | Zhejiang Jiecang Linear Motion Technology Co. Ltd. Class A | 203,284 | 1,462 |
| | Red Avenue New Materials Group Co. Ltd. Class A (XSSC) | 170,500 | 1,459 |
| * | STO Express Co. Ltd. Class A (XSHE) | 1,212,376 | 1,459 |
| | Shanxi Coking Coal Energy Group Co. Ltd. Class A (XSEC) | 1,004,120 | 1,458 |
| | Newland Digital Technology Co. Ltd. Class A (XSHE) | 618,095 | 1,456 |
| | Pingdingshan Tianan Coal Mining Co. Ltd. Class A (XSSC) | 1,092,253 | 1,455 |
| | Tasly Pharmaceutical Group Co. Ltd. Class A (XSSC) | 686,014 | 1,453 |
Emerging Markets Stock Index Fund
| | | | | | Shares | Market
Value•
($000) |
| * | Bank of Zhengzhou Co. Ltd. Class A (XSEC) | 2,750,426 | 1,452 |
| | Guangzhou Yuexiu Financial Holdings Group Co. Ltd. Class A (XSHE) | 1,202,040 | 1,451 |
| * | Sinopec Oilfield Equipment Corp. Class A | 1,489,942 | 1,449 |
| | Guangdong Guanhao High-Tech Co. Ltd. Class A | 2,032,200 | 1,449 |
| * | Huazhu Group Ltd. | 311,870 | 1,448 |
| | Zhejiang Orient Financial Holdings Group Co. Ltd. Class A (XSEC) | 2,273,294 | 1,447 |
| | Shanghai Electric Power Co. Ltd. Class A (XSHG) | 836,400 | 1,447 |
| * | Beijing Join-Cheer Software Co. Ltd. Class A | 2,233,780 | 1,447 |
| | Hesteel Co. Ltd. Class A (XSHE) | 3,757,200 | 1,444 |
| | Hangzhou Boiler Group Co. Ltd. Class A | 450,618 | 1,443 |
| | Central China Management Co. Ltd. | 9,347,000 | 1,442 |
| * | Qingdao Zhongzi Zhongcheng Group Co. Ltd. Class A | 808,606 | 1,440 |
| | Western Securities Co. Ltd. Class A (XSEC) | 1,201,468 | 1,439 |
| | Shanghai Shyndec Pharmaceutical Co. Ltd. Class A | 986,738 | 1,439 |
| | Zhejiang Shuanghuan Driveline Co. Ltd. Class A | 350,280 | 1,439 |
| | Zhejiang Dingli Machinery Co. Ltd. Class A (XSHG) | 134,848 | 1,438 |
| | Espressif Systems Shanghai Co. Ltd. Class A | 56,052 | 1,438 |
| | Suzhou Electrical Apparatus Science Academy Co. Ltd. Class A | 884,800 | 1,436 |
| | MLS Co. Ltd. Class A (XSEC) | 658,500 | 1,433 |
| | | | | | Shares | Market
Value•
($000) |
| | B-Soft Co. Ltd. Class A | 1,147,766 | 1,433 |
| | Jafron Biomedical Co. Ltd. Class A (XSEC) | 177,470 | 1,432 |
| | Inner Mongolia MengDian HuaNeng Thermal Power Corp. Ltd. Class A (XSHG) | 2,555,201 | 1,432 |
| | Zhejiang Hailide New Material Co. Ltd. Class A | 1,186,917 | 1,432 |
| | Nanjing Xinjiekou Department Store Co. Ltd. Class A | 936,500 | 1,430 |
| | Tongyu Heavy Industry Co. Ltd. Class A | 2,901,657 | 1,429 |
| | Guangzhou Automobile Group Co. Ltd. Class A (XSSC) | 526,730 | 1,427 |
| | Biem.L.Fdlkk Garment Co. Ltd. Class A | 370,430 | 1,424 |
| * | Beijing Shougang Co. Ltd. Class A (XSEC) | 1,581,061 | 1,422 |
| | CGN Power Co. Ltd. Class A | 3,113,500 | 1,421 |
| | China Express Airlines Co. Ltd. Class A | 827,400 | 1,421 |
| | Foran Energy Group Co. Ltd. | 933,470 | 1,419 |
| | Sinotrans Ltd. Class A (XSHG) | 2,009,995 | 1,418 |
| | FAWER Automotive Parts Co. Ltd. Class A | 1,597,545 | 1,414 |
| | Blue Sail Medical Co. Ltd. Class A (XSHE) | 625,000 | 1,412 |
| * | Sumavision Technologies Co. Ltd. Class A (XSHE) | 1,200,500 | 1,411 |
| * | Lingyi iTech Guangdong Co. Class A (XSEC) | 1,352,100 | 1,409 |
| | Winall Hi-Tech Seed Co. Ltd. Class A | 323,700 | 1,408 |
| * | Zhejiang Qianjiang Motorcycle Co. Ltd. Class A | 646,849 | 1,408 |
Emerging Markets Stock Index Fund
| | | | | | Shares | Market
Value•
($000) |
| | Huafa Industrial Co. Ltd. Zhuhai Class A (XSSC) | 1,712,126 | 1,407 |
| * | Infund Holding Co. Ltd. | 1,027,334 | 1,407 |
| | Guangzhou Shiyuan Electronic Technology Co. Ltd. Class A (XSHE) | 118,600 | 1,407 |
| | Central China Real Estate Ltd. | 9,347,000 | 1,405 |
| | Toyou Feiji Electronics Co. Ltd. Class A | 1,001,635 | 1,404 |
| | AECC Aero-Engine Control Co. Ltd. Class A (XSEC) | 335,600 | 1,400 |
| * | Hainan Mining Co. Ltd. Class A (XSHG) | 586,500 | 1,400 |
| | TongFu Microelectronics Co. Ltd. Class A (XSEC) | 446,991 | 1,399 |
| | Xi'An Shaangu Power Co. Ltd. Class A (XSHG) | 728,545 | 1,399 |
| | CITIC Heavy Industries Co. Ltd. Class A (XSHG) | 2,056,652 | 1,396 |
| | Renhe Pharmacy Co. Ltd. Class A (XSHE) | 941,747 | 1,395 |
| | Befar Group Co. Ltd. Class A (XSHG) | 1,058,542 | 1,389 |
| | Jiajiayue Group Co. Ltd. Class A | 603,492 | 1,389 |
| | Shenzhen Jinjia Group Co. Ltd. Class A (XSHE) | 821,000 | 1,388 |
| | Kingfa Sci & Tech Co. Ltd. Class A (XSSC) | 755,423 | 1,386 |
| | Hangzhou Haoyue Personal Care Co. Ltd. Class A | 163,895 | 1,385 |
| | Pingdingshan Tianan Coal Mining Co. Ltd. Class A (XSHG) | 1,035,882 | 1,380 |
| * | Shenzhen Topraysolar Co. Ltd. Class A | 1,218,258 | 1,379 |
| | Zhejiang Starry Pharmaceutical Co. Ltd. Class A | 176,900 | 1,376 |
| | | | | | Shares | Market
Value•
($000) |
| * | Montnets Cloud Technology Group Co. Ltd. Class A (XSHE) | 437,000 | 1,375 |
| | Xuji Electric Co. Ltd. Class A (XSHE) | 443,400 | 1,373 |
| 2 | E-House China Enterprise Holdings Ltd. | 7,259,100 | 1,368 |
| | Fangda Special Steel Technology Co. Ltd. Class A (XSSC) | 1,181,177 | 1,368 |
| | Guocheng Mining Co. Ltd. Class A | 870,800 | 1,368 |
| | Xiamen ITG Group Corp. Ltd. Class A (XSSC) | 1,262,574 | 1,365 |
| | Tongkun Group Co. Ltd. Class A (XSHG) | 437,100 | 1,364 |
| | Shenzhen Sunline Tech Co. Ltd. Class A | 692,152 | 1,360 |
| | Appotronics Corp. Ltd. Class A | 262,714 | 1,360 |
| | Jiangsu Financial Leasing Co. Ltd. Class A | 1,645,707 | 1,355 |
| | China World Trade Center Co. Ltd. Class A (XSSC) | 635,535 | 1,351 |
| | Sunflower Pharmaceutical Group Co. Ltd. Class A | 604,108 | 1,349 |
| | Chongqing Department Store Co. Ltd. Class A | 374,760 | 1,348 |
| * | Shanghai Topcare Medical Services Co. Ltd. (XSHG) | 477,882 | 1,346 |
| | Sichuan Yahua Industrial Group Co. Ltd. Class A (XSEC) | 262,700 | 1,342 |
| * | Chongqing Taiji Industry Group Co. Ltd. Class A | 574,700 | 1,341 |
| * | Datang Huayin Electric Power Co. Ltd. Class A | 1,392,000 | 1,339 |
| | Jonjee Hi-Tech Industrial & Commercial Holding Co. Ltd. Class A (XSHG) | 234,200 | 1,336 |
Emerging Markets Stock Index Fund
| | | | | | Shares | Market
Value•
($000) |
| | CTS International Logistics Corp. Ltd. Class A (XSSC) | 692,380 | 1,334 |
| | Beijing Gehua CATV Network Co. Ltd. Class A | 1,135,600 | 1,331 |
| | Shenzhen Gas Corp. Ltd. Class A (XSHG) | 939,116 | 1,331 |
| | Beijing Aosaikang Pharmaceutical Co. Ltd. Class A | 729,946 | 1,329 |
| | Longhua Technology Group Luoyang Co. Ltd. Class A | 864,300 | 1,328 |
| | Estun Automation Co. Ltd. Class A (XSHE) | 320,100 | 1,325 |
| | Guangdong Baolihua New Energy Stock Co. Ltd. Class A (XSHE) | 1,475,460 | 1,321 |
| | Chengdu Xingrong Environment Co. Ltd. Class A (XSEC) | 1,429,300 | 1,320 |
| | Qingdao Eastsoft Communication Technology Co. Ltd. Class A | 475,500 | 1,320 |
| * | Polaris Bay Group Co. Ltd. Class A (XSHG) | 916,098 | 1,318 |
| | Universal Scientific Industrial Shanghai Co. Ltd. Class A (XSSC) | 606,052 | 1,315 |
| | Rizhao Port Co. Ltd. Class A | 3,208,600 | 1,313 |
| | Anhui Huilong Agricultural Means of Production Co. Ltd. Class A | 830,450 | 1,312 |
| | Ningbo Huaxiang Electronic Co. Ltd. Class A (XSHE) | 354,700 | 1,311 |
| | Hytera Communications Corp. Ltd. Class A (XSHE) | 1,486,765 | 1,311 |
| * | China Energy Engineering Corp. Ltd. | 3,516,100 | 1,308 |
| * | Henan Yuneng Holdings Co. Ltd. Class A | 1,133,000 | 1,307 |
| | | | | | Shares | Market
Value•
($000) |
| | Shanghai Datun Energy Resources Co. Ltd. Class A | 732,600 | 1,302 |
| | DaShenLin Pharmaceutical Group Co. Ltd. Class A | 235,447 | 1,301 |
| | China XD Electric Co. Ltd. Class A (XSHG) | 1,531,400 | 1,295 |
| | Datang International Power Generation Co. Ltd. Class A | 3,035,600 | 1,292 |
| | Greenland Holdings Corp. Ltd. Class A (XSSC) | 2,010,120 | 1,291 |
| * | Talkweb Information System Co. Ltd. Class A (XSEC) | 1,002,107 | 1,291 |
| | Cangzhou Dahua Co. Ltd. Class A | 562,800 | 1,291 |
| | Anyang Iron & Steel Inc. Class A | 2,716,980 | 1,290 |
| | INESA Intelligent Tech Inc. Class A | 1,497,190 | 1,287 |
| | Jizhong Energy Resources Co. Ltd. Class A (XSHE) | 1,315,107 | 1,285 |
| | Chinese Universe Publishing & Media Group Co. Ltd. Class A | 788,436 | 1,285 |
| | Suofeiya Home Collection Co. Ltd. Class A | 486,978 | 1,284 |
| | Shanxi Securities Co. Ltd. Class A (XSEC) | 1,309,410 | 1,280 |
| | Shanghai Baosteel Packaging Co. Ltd. Class A | 894,100 | 1,276 |
| * | Qinghai Huzhu Barley Wine Co. Ltd. Class A | 433,000 | 1,275 |
| * | Beijing Forever Technology Co. Ltd. Class A (XSEC) | 706,400 | 1,269 |
| | Anji Microelectronics Technology Shanghai Co. Ltd. Class A | 34,179 | 1,269 |
| | Jiangsu Zhongnan Construction Group Co. Ltd. Class A (XSHE) | 2,118,077 | 1,267 |
Emerging Markets Stock Index Fund
| | | | | | Shares | Market
Value•
($000) |
| | Fujian Expressway Development Co. Ltd. Class A | 3,044,400 | 1,266 |
| * | Chongqing Iron & Steel Co. Ltd. Class A (XSSC) | 3,550,536 | 1,265 |
| | Fujian Star-net Communication Co. Ltd. Class A (XSHE) | 369,581 | 1,265 |
| | YGSOFT Inc. Class A (XSHE) | 1,192,715 | 1,264 |
| | Truking Technology Ltd. Class A | 435,300 | 1,264 |
| | Shanghai Bailian Group Co. Ltd. Class A (XSHG) | 582,700 | 1,254 |
| | JL Mag Rare-Earth Co. Ltd. Class A (XSHE) | 204,800 | 1,253 |
| | Anhui Zhongding Sealing Parts Co. Ltd. Class A (XSEC) | 465,300 | 1,250 |
| | An Hui Wenergy Co. Ltd. Class A (XSHE) | 1,824,144 | 1,250 |
| | Shinva Medical Instrument Co. Ltd. Class A | 366,248 | 1,247 |
| | Guoyuan Securities Co. Ltd. Class A (XSEC) | 1,075,657 | 1,246 |
| * | Guangshen Railway Co. Ltd. Class A (XSSC) | 3,727,334 | 1,245 |
| | Zhejiang Yasha Decoration Co. Ltd. Class A (XSHE) | 1,071,760 | 1,244 |
| | Jiangxi Lianchuang Optoelectronic Science & Technology Co. Ltd. Class A (XSSC) | 287,176 | 1,243 |
| | Sun Create Electronics Co. Ltd. | 180,400 | 1,243 |
| | YLZ Information Technology Co. Ltd. Class A | 1,077,600 | 1,243 |
| | Jiangsu Changhai Composite Materials Co. Ltd. Class A | 469,128 | 1,242 |
| | Jiangsu Phoenix Publishing & Media Corp. Ltd. Class A (XSSC) | 1,130,306 | 1,242 |
| | | | | | Shares | Market
Value•
($000) |
| | Shenzhen YUTO Packaging Technology Co. Ltd. Class A (XSHE) | 242,539 | 1,242 |
| | Shanghai Titan Scientific Co. Ltd. Class A | 38,603 | 1,241 |
| | Zhejiang Weixing Industrial Development Co. Ltd. Class A | 843,040 | 1,239 |
| | China Coal Energy Co. Ltd. Class A (XSHG) | 1,130,000 | 1,237 |
| | China Animal Husbandry Industry Co. Ltd. Class A (XSHG) | 748,498 | 1,235 |
| | Wanxiang Qianchao Co. Ltd. Class A (XSHE) | 1,320,379 | 1,235 |
| | Shanghai Ganglian E-Commerce Holdings Co. Ltd. Class A | 206,924 | 1,235 |
| | Guangzhou Haige Communications Group Inc. Co. Class A (XSEC) | 835,700 | 1,233 |
| | Shenzhen Suntak Circuit Technology Co. Ltd. Class A (XSEC) | 572,400 | 1,233 |
| | Jilin Sino-Microelectronics Co. Ltd. Class A | 875,810 | 1,233 |
| | Shenzhen Huaqiang Industry Co. Ltd. Class A | 540,270 | 1,233 |
| * | Shenzhen MTC Co. Ltd. Class A (XSEC) | 1,603,800 | 1,232 |
| | Southwest Securities Co. Ltd. Class A (XSHG) | 1,636,906 | 1,231 |
| | Jiangsu Jiangyin Rural Commercial Bank Co. Ltd. Class A | 2,060,239 | 1,230 |
| * | Minmetals Development Co. Ltd. Class A (XSHG) | 922,286 | 1,230 |
| * | Visionox Technology Inc. Class A (XSHE) | 980,850 | 1,230 |
Emerging Markets Stock Index Fund
| | | | | | Shares | Market
Value•
($000) |
| | Jiaozuo Wanfang Aluminum Manufacturing Co. Ltd. Class A | 1,120,686 | 1,228 |
| | Shanghai Mechanical & Electrical Industry Co. Ltd. Class A (XSHG) | 541,700 | 1,228 |
| | Jinneng Science&Technology Co. Ltd. Class A (XSHG) | 553,455 | 1,224 |
| | Bank of Suzhou Co. Ltd. Class A | 1,136,200 | 1,224 |
| | Shaanxi Construction Engineering Group Corp. Ltd. Class A | 1,889,590 | 1,222 |
| | Minmetals Capital Co. Ltd. Class A | 1,506,360 | 1,221 |
| | Kuangda Technology Group Co. Ltd. Class A | 1,463,584 | 1,221 |
| * | Yunnan Tin Co. Ltd. Class A (XSHE) | 476,300 | 1,220 |
| | Shandong Jincheng Pharmaceutical Group Co. Ltd. Class A | 268,800 | 1,217 |
| * | Cambricon Technologies Corp. Ltd. | 101,642 | 1,216 |
| | Hisense Home Appliances Group Co. Ltd. Class A (XSEC) | 666,334 | 1,215 |
| | Tech-Bank Food Co. Ltd. Class A (XSHE) | 1,236,974 | 1,215 |
| | Jizhong Energy Resources Co. Ltd. Class A (XSEC) | 1,241,100 | 1,213 |
| * | Huaihe Energy Group Co. Ltd. Class A | 3,346,600 | 1,213 |
| | Shenma Industry Co. Ltd. Class A | 665,404 | 1,212 |
| | Shenzhen Jinjia Group Co. Ltd. Class A (XSEC) | 716,236 | 1,211 |
| | Shan Xi Hua Yang Group New Energy Co. Ltd. Class A (XSHG) | 729,300 | 1,211 |
| * | Far East Smarter Energy Co. Ltd. Class A (XSHG) | 1,229,560 | 1,210 |
| | | | | | Shares | Market
Value•
($000) |
| | Chongqing Zaisheng Technology Corp. Ltd. Class A | 694,240 | 1,209 |
| | Luenmei Quantum Co. Ltd. Class A (XSHG) | 934,180 | 1,206 |
| | Beijing Zhong Ke San Huan High-Tech Co. Ltd. Class A (XSHE) | 689,408 | 1,206 |
| * | Baoding Tianwei Baobian Electric Co. Ltd. Class A | 1,751,501 | 1,203 |
| * | Henan Huanghe Whirlwind Co. Ltd. Class A (XSHG) | 764,600 | 1,202 |
| | Suzhou TFC Optical Communication Co. Ltd. Class A (XSHE) | 299,880 | 1,202 |
| * | ZhongMan Petroleum & Natural Gas Group Corp. Ltd. | 551,800 | 1,202 |
| * | Shandong Head Co. Ltd. Class A | 156,500 | 1,202 |
| | Zhejiang Runtu Co. Ltd. Class A | 868,351 | 1,200 |
| | Sino GeoPhysical Co. Ltd. Class A | 319,165 | 1,200 |
| | Tianjin Capital Environmental Protection Group Co. Ltd. Class A (XSSC) | 1,224,361 | 1,197 |
| | Shandong Hi-Speed Road & Bridge Co. Ltd. Class A | 1,162,500 | 1,197 |
| | Beyondsoft Corp. Class A | 638,200 | 1,196 |
| | State Grid Yingda Co. Ltd. Class A (XSSC) | 1,131,046 | 1,193 |
| | Long Yuan Construction Group Co. Ltd. Class A (XSSC) | 1,061,024 | 1,191 |
| * | Guangdong Chaohua Technology Co. Ltd. Class A | 850,488 | 1,189 |
| * | Guangdong Advertising Group Co. Ltd. Class A | 1,672,622 | 1,186 |
| | Lu Thai Textile Co. Ltd. Class B | 2,415,793 | 1,184 |
Emerging Markets Stock Index Fund
| | | | | | Shares | Market
Value•
($000) |
| * | China Aluminum International Engineering Corp. Ltd. Class A | 1,830,300 | 1,182 |
| * | Gosuncn Technology Group Co. Ltd. Class A | 1,697,592 | 1,181 |
| | Zhejiang Semir Garment Co. Ltd. Class A | 1,005,620 | 1,181 |
| | Visual China Group Co. Ltd. Class A (XSEC) | 570,719 | 1,179 |
| | Yintai Gold Co. Ltd. Class A (XSEC) | 857,780 | 1,178 |
| | Wuhan Department Store Group Co. Ltd. Class A | 745,977 | 1,178 |
| * | Shandong Xinchao Energy Corp. Ltd. Class A (XSHG) | 3,400,300 | 1,176 |
| | Hengtong Optic-electric Co. Ltd. Class A (XSHG) | 494,260 | 1,175 |
| | Shenzhen Hepalink Pharmaceutical Group Co. Ltd. Class A (XSHE) | 489,180 | 1,174 |
| | Glarun Technology Co. Ltd. Class A (XSSC) | 507,941 | 1,174 |
| | Jiangsu Linyang Energy Co. Ltd. Class A (XSHG) | 661,600 | 1,173 |
| | Shenzhen Everwin Precision Technology Co. Ltd. Class A (XSEC) | 534,933 | 1,172 |
| | Beijing Urban Construction Investment & Development Co. Ltd. Class A (XSHG) | 1,706,976 | 1,172 |
| | Huabao Flavours & Fragrances Co. Ltd. Class A (XSHE) | 179,900 | 1,172 |
| | Inmyshow Digital Technology Group Co. Ltd. (XSSC) | 707,357 | 1,169 |
| | Beijing Strong Biotechnologies Inc. Class A | 490,185 | 1,168 |
| * | China Tungsten & Hightech Materials Co. Ltd. Class A | 562,960 | 1,167 |
| | | | | | Shares | Market
Value•
($000) |
| | Beijing Sanyuan Foods Co. Ltd. Class A | 1,155,178 | 1,166 |
| | Ningbo Yunsheng Co. Ltd. Class A (XSSC) | 708,831 | 1,165 |
| * | Hunan TV & Broadcast Intermediary Co. Ltd. Class A | 1,329,500 | 1,165 |
| | Wuxi Huaguang Environment & Energy Group Co. Ltd. Class A | 714,870 | 1,164 |
| | Guangzhou Shiyuan Electronic Technology Co. Ltd. Class A (XSEC) | 98,084 | 1,163 |
| | Zhejiang Juhua Co. Ltd. Class A (XSSC) | 478,140 | 1,161 |
| | Zhejiang Wanfeng Auto Wheel Co. Ltd. Class A (XSEC) | 1,411,966 | 1,161 |
| 2 | Wisdom Education International Holdings Co. Ltd. | 6,772,000 | 1,160 |
| | Shenzhen Ysstech Info-tech Co. Ltd. Class A (XSEC) | 756,000 | 1,159 |
| | Wuhan Raycus Fiber Laser Technologies Co. Ltd. Class A (XSEC) | 121,446 | 1,157 |
| * | Grand Industrial Holding Group Co. Ltd. | 311,800 | 1,157 |
| | Zhejiang Medicine Co. Ltd. Class A (XSEC) | 463,550 | 1,156 |
| | Shijiazhuang Yiling Pharmaceutical Co. Ltd. Class A (XSHE) | 460,685 | 1,156 |
| * | Yunnan Energy Investment Co. Ltd. Class A | 868,455 | 1,151 |
| | Jason Furniture Hangzhou Co. Ltd. Class A (XSSC) | 118,200 | 1,149 |
| | MLS Co. Ltd. Class A (XSHE) | 527,400 | 1,148 |
| | China Merchants Port Group Co. Ltd. Class A | 466,300 | 1,147 |
Emerging Markets Stock Index Fund
| | | | | | Shares | Market
Value•
($000) |
| | Shenzhen Agricultural Products Group Co. Ltd. Class A (XSHE) | 1,056,629 | 1,146 |
| | Baiyin Nonferrous Group Co. Ltd. Class A | 2,667,900 | 1,146 |
| | Jiangsu Guoxin Corp. Ltd. Class A | 1,130,100 | 1,145 |
| | Xuji Electric Co. Ltd. Class A (XSEC) | 369,300 | 1,144 |
| * | Guosheng Financial Holding Inc. Class A (XSEC) | 782,219 | 1,142 |
| | Bank of Qingdao Co. Ltd. Class A (XSHE) | 1,551,800 | 1,142 |
| | Kunlun Tech Co. Ltd. Class A (XSHE) | 392,631 | 1,142 |
| | Shanghai Jin Jiang Online Network Service Co. Ltd. | 1,742,110 | 1,141 |
| | Shenzhen FRD Science & Technology Co. Ltd. | 384,462 | 1,141 |
| | Leo Group Co. Ltd. Class A (XSHE) | 3,199,811 | 1,140 |
| | Nanjing Securities Co. Ltd. Class A (XSHG) | 751,560 | 1,140 |
| | AVICOPTER plc Class A (XSHG) | 115,800 | 1,138 |
| * | Shandong Yisheng Livestock & Poultry Breeding Co. Ltd. Class A (XSHE) | 684,944 | 1,138 |
| * | Xinjiang Machinery Research Institute Co. Ltd. Class A | 1,411,536 | 1,137 |
| | Wuhan Jingce Electronic Group Co. Ltd. Class A (XSEC) | 139,676 | 1,137 |
| | Client Service International Inc. Class A | 432,967 | 1,137 |
| | Jiangsu Guotai International Group Co. Ltd. (XSHE) | 550,290 | 1,135 |
| | Beijing VRV Software Corp. Ltd. Class A (XSHE) | 1,292,200 | 1,134 |
| | | | | | Shares | Market
Value•
($000) |
| | Shenzhen Laibao Hi-tech Co. Ltd. Class A | 702,487 | 1,133 |
| | Milkyway Chemical Supply Chain Service Co. Ltd. Class A | 66,100 | 1,133 |
| | Guangzhou Hengyun Enterprises Holdings Ltd. Class A | 967,676 | 1,132 |
| | CNNC Hua Yuan Titanium Dioxide Co. Ltd. Class A (XSEC) | 524,900 | 1,131 |
| * | Luoniushan Co. Ltd. Class A (XSHE) | 1,057,707 | 1,130 |
| | CTS International Logistics Corp. Ltd. Class A (XSHG) | 586,282 | 1,130 |
| | CGN Nuclear Technology Development Co. Ltd. Class A (XSHE) | 809,829 | 1,128 |
| | Yutong Bus Co. Ltd. Class A (XSHG) | 635,800 | 1,126 |
| * | Hunan Gold Corp. Ltd. Class A (XSHE) | 665,040 | 1,126 |
| * | Shanghai Guijiu Co. Ltd. Class A | 252,900 | 1,126 |
| | Beken Corp. Class A | 122,587 | 1,125 |
| | Xinjiang Joinworld Co. Ltd. Class A (XSSC) | 799,308 | 1,124 |
| | Zhongyuan Environment-Protection Co. Ltd. Class A | 1,182,268 | 1,123 |
| | Shanghai Hile Bio-Technology Co. Ltd. Class A | 539,541 | 1,123 |
| | Jiangxi Ganneng Co. Ltd. Class A | 1,296,542 | 1,122 |
| | Guangdong Zhongsheng Pharmaceutical Co. Ltd. Class A | 852,417 | 1,121 |
| * | Aotecar New Energy Technology Co. Ltd. Class A | 2,230,400 | 1,121 |
Emerging Markets Stock Index Fund
| | | | | | Shares | Market
Value•
($000) |
| | Goldenmax International Technology Ltd. Class A (XSHE) | 538,100 | 1,120 |
| | Yangtze Optical Fibre & Cable Joint Stock Ltd. Co. Class A | 231,660 | 1,119 |
| | Guangzhou Restaurant Group Co. Ltd. Class A (XSHG) | 315,241 | 1,119 |
| | Guangzhou Kingmed Diagnostics Group Co. Ltd. Class A (XSSC) | 62,100 | 1,115 |
| | Shanghai Shimao Co. Ltd. Class A (XSSC) | 2,254,512 | 1,114 |
| | Wangsu Science & Technology Co. Ltd. Class A (XSHE) | 1,301,019 | 1,113 |
| * | Jihua Group Corp. Ltd. Class A | 2,677,800 | 1,113 |
| * | Shenyang Jinbei Automotive Co. Ltd. Class A | 1,097,901 | 1,112 |
| | China Zhenhua Group Science & Technology Co. Ltd. Class A (XSEC) | 68,600 | 1,111 |
| | Joeone Co. Ltd. Class A | 502,277 | 1,111 |
| | Baotailong New Materials Co. Ltd. Class A | 1,482,100 | 1,110 |
| | Shanghai Construction Group Co. Ltd. Class A (XSHG) | 2,169,991 | 1,109 |
| | Shanghai Kinetic Medical Co. Ltd. Class A | 707,843 | 1,108 |
| * | Shaanxi Construction Machinery Co. Ltd. Class A | 820,700 | 1,104 |
| | Sealand Securities Co. Ltd. Class A (XSEC) | 1,828,130 | 1,103 |
| | Financial Street Holdings Co. Ltd. Class A (XSEC) | 1,203,460 | 1,103 |
| * | Guangdong Guanghua Sci-Tech Co. Ltd. Class A | 315,542 | 1,101 |
| | | | | | Shares | Market
Value•
($000) |
| * | Sichuan Hongda Co. Ltd. Class A | 1,907,200 | 1,096 |
| * | Whirlpool China Co. Ltd. Class A | 738,250 | 1,096 |
| * | Pacific Securities Co. Ltd. Class A (XSHG) | 2,246,635 | 1,095 |
| | China Resources Double Crane Pharmaceutical Co. Ltd. Class A (XSHG) | 613,542 | 1,094 |
| | Guangxi Wuzhou Communications Co. Ltd. Class A (XSSC) | 1,921,390 | 1,093 |
| | Guodian Nanjing Automation Co. Ltd. Class A | 687,800 | 1,092 |
| * | Vcanbio Cell & Gene Engineering Corp. Ltd. Class A | 341,400 | 1,092 |
| | Grandblue Environment Co. Ltd. Class A (XSHG) | 316,000 | 1,091 |
| | Huadian Power International Corp. Ltd. Class A (XSHG) | 1,581,717 | 1,089 |
| * | Talkweb Information System Co. Ltd. Class A (XSHE) | 844,649 | 1,088 |
| | Henan Hengxing Science & Technology Co. Ltd. Class A | 1,425,295 | 1,087 |
| | China Meheco Co. Ltd. Class A (XSHG) | 624,100 | 1,086 |
| | EIT Environmental Development Group Co. Ltd. Class A | 239,932 | 1,086 |
| * | Cinda Real Estate Co. Ltd. Class A (XSSC) | 2,163,113 | 1,085 |
| | Beibuwan Port Co. Ltd. Class A | 931,400 | 1,085 |
| | Digital China Group Co. Ltd. Class A | 463,901 | 1,083 |
| | Shandong Hi-speed Co. Ltd. Class A (XSSC) | 1,290,554 | 1,082 |
| | Juneyao Airlines Co. Ltd. Class A (XSSC) | 435,330 | 1,082 |
Emerging Markets Stock Index Fund
| | | | | | Shares | Market
Value•
($000) |
| * | Beijing Urban-Rural Commercial Group Co. Ltd. Class A | 300,848 | 1,081 |
| | ADAMA Ltd. Class A | 915,100 | 1,080 |
| | Beijing GeoEnviron Engineering & Technology Inc. Class A (XSHG) | 424,320 | 1,077 |
| | Hangjin Technology Co. Ltd. Class A (XSHE) | 202,350 | 1,076 |
| | Beijing Sanlian Hope Shin-Gosen Technical Service Co. Ltd. Class A | 345,642 | 1,074 |
| * | Tunghsu Optoelectronic Technology Co. Ltd. Class A (XSHE) | 3,465,608 | 1,073 |
| | Hunan Er-Kang Pharmaceutical Co. Ltd. Class A (XSEC) | 1,676,979 | 1,073 |
| | OFILM Group Co. Ltd. Class A (XSEC) | 917,400 | 1,072 |
| | Jiangsu Changshu Rural Commercial Bank Co. Ltd. Class A | 944,900 | 1,072 |
| * | Henan Ancai Hi-Tech Co. Ltd. Class A | 1,024,750 | 1,070 |
| * | Tellhow Sci-Tech Co. Ltd. Class A | 983,884 | 1,070 |
| | Shanghai Flyco Electrical Appliance Co. Ltd. Class A | 171,600 | 1,069 |
| | Guangzhou Great Power Energy & Technology Co. Ltd. Class A (XSHE) | 229,000 | 1,068 |
| | Beijing GeoEnviron Engineering & Technology Inc. Class A (XSSC) | 420,332 | 1,067 |
| * | Beijing Sanju Environmental Protection & New Material Co. Ltd. Class A (XSEC) | 1,120,179 | 1,066 |
| | China Meheco Co. Ltd. Class A (XSSC) | 612,560 | 1,066 |
| | | | | | Shares | Market
Value•
($000) |
| | Luxin Venture Capital Group Co. Ltd. Class A (XSHG) | 532,800 | 1,066 |
| | Shenzhen New Industries Biomedical Engineering Co. Ltd. Class A (XSHE) | 163,780 | 1,064 |
| | Shanghai Jinfeng Wine Co. Ltd. Class A | 986,045 | 1,063 |
| | Shanghai Sinyang Semiconductor Materials Co. Ltd. Class A (XSEC) | 171,800 | 1,063 |
| | DeHua TB New Decoration Materials Co. Ltd. Class A | 760,550 | 1,061 |
| | AUCMA Co. Ltd. Class A | 881,301 | 1,060 |
| | Qingdao Hanhe Cable Co. Ltd. Class A | 1,571,104 | 1,060 |
| | Grinm Advanced Materials Co. Ltd. Class A (XSSC) | 528,800 | 1,057 |
| | Huaming Power Equipment Co. Ltd. Class A | 758,043 | 1,055 |
| | Yusys Technologies Co. Ltd. Class A | 365,280 | 1,055 |
| | Dongxing Securities Co. Ltd. Class A (XSSC) | 615,613 | 1,054 |
| * | Xi'an Tian He Defense Technology Co. Ltd. Class A | 475,200 | 1,054 |
| | Contec Medical Systems Co. Ltd. Class A | 211,100 | 1,052 |
| | Ningxia Jiaze New Energy Co. Ltd. Class A | 1,234,300 | 1,051 |
| | Shandong Chenming Paper Holdings Ltd. Class A (XSEC) | 948,941 | 1,048 |
| | Sansteel Minguang Co. Ltd. Fujian Class A (XSEC) | 978,600 | 1,048 |
| | Xinhuanet Co. Ltd. Class A | 379,200 | 1,048 |
| * | Hongli Zhihui Group Co. Ltd. Class A | 593,700 | 1,047 |
Emerging Markets Stock Index Fund
| | | | | | Shares | Market
Value•
($000) |
| | Qingdao Rural Commercial Bank Corp. Class A (XSHE) | 1,751,800 | 1,046 |
| * | Henan Huanghe Whirlwind Co. Ltd. Class A (XSSC) | 664,380 | 1,044 |
| | Shenzhen Everwin Precision Technology Co. Ltd. Class A (XSHE) | 476,479 | 1,044 |
| | Jinyuan EP Co. Ltd. Class A | 615,996 | 1,043 |
| | People.cn Co. Ltd. Class A (XSHG) | 508,213 | 1,040 |
| | Xiangcai Co. Ltd. Class A | 772,800 | 1,040 |
| | Top Energy Co. Ltd. Shanxi Class A | 1,701,144 | 1,038 |
| | Xiamen Intretech Inc. Class A | 215,390 | 1,037 |
| | Shenzhen Kinwong Electronic Co. Ltd. Class A (XSHG) | 256,784 | 1,037 |
| * | Guangdong Dongfang Precision Science & Technology Co. Ltd. Class A (XSHE) | 1,220,832 | 1,033 |
| | Shanghai Bailian Group Co. Ltd. Class A (XSSC) | 479,788 | 1,033 |
| | Zhejiang Hisun Pharmaceutical Co. Ltd. Class A (XSSC) | 568,100 | 1,033 |
| | Zhejiang Guyuelongshan Shaoxing Wine Co. Ltd. Class A (XSHG) | 609,690 | 1,031 |
| | Shanghai Shibei Hi-Tech Co. Ltd. Class A | 1,294,230 | 1,030 |
| | Tonghua Dongbao Pharmaceutical Co. Ltd. Class A (XSHG) | 541,421 | 1,030 |
| | Anhui Construction Engineering Group Co. Ltd. Class A | 1,699,609 | 1,029 |
| | Dare Power Dekor Home Co. Ltd. Class A | 562,739 | 1,028 |
| | | | | | Shares | Market
Value•
($000) |
| * | CanSino Biologics Inc. Class A | 24,130 | 1,028 |
| | Jinhui Liquor Co. Ltd. Class A | 191,800 | 1,026 |
| * | Mesnac Co. Ltd. Class A | 860,489 | 1,025 |
| | Yantai Zhenghai Magnetic Material Co. Ltd. Class A (XSHE) | 582,654 | 1,025 |
| | Shanghai Yaoji Technology Co. Ltd. Class A | 386,659 | 1,025 |
| | Jiangsu Asia-Pacific Light Alloy Technology Co. Ltd. Class A | 1,305,666 | 1,025 |
| * | Beijing Bohui Innovation Biotechnology Group Co. Ltd. Class A | 865,369 | 1,025 |
| * | Anhui Tatfook Technology Co. Ltd. Class A | 741,800 | 1,024 |
| | Focus Technology Co. Ltd. Class A | 430,320 | 1,024 |
| | Tasly Pharmaceutical Group Co. Ltd. Class A (XSHG) | 482,342 | 1,022 |
| | CQ Pharmaceutical Holding Co. Ltd. Class A (XSHE) | 1,366,500 | 1,021 |
| | Guangxi Guiguan Electric Power Co. Ltd. Class A (XSHG) | 1,128,790 | 1,020 |
| * | Yunnan Lincang Xinyuan Germanium Industrial Co. Ltd. Class A | 626,595 | 1,019 |
| * | Staidson Beijing Biopharmaceuticals Co. Ltd. Class A | 474,719 | 1,019 |
| | Liuzhou Iron & Steel Co. Ltd. Class A | 1,201,700 | 1,019 |
| *,2 | Colour Life Services Group Co. Ltd. | 5,812,570 | 1,018 |
| | Beijing Capital Eco-Environment Protection Group Co. Ltd. Class A (XSHG) | 1,937,520 | 1,018 |
| | Shanghai Tianchen Co. Ltd. Class A | 728,338 | 1,014 |
Emerging Markets Stock Index Fund
| | | | | | Shares | Market
Value•
($000) |
| | Guangzhou Port Co. Ltd. Class A | 2,060,800 | 1,014 |
| * | Shijiazhuang Changshan BeiMing Technology Co. Ltd. Class A (XSHE) | 999,275 | 1,013 |
| | Zhongjin Gold Corp. Ltd. Class A (XSHG) | 781,160 | 1,013 |
| | BGI Genomics Co. Ltd. Class A (XSHE) | 72,800 | 1,013 |
| * | Beijing Sanju Environmental Protection & New Material Co. Ltd. Class A (XSHE) | 1,062,828 | 1,012 |
| | Guangzhou Guangri Stock Co. Ltd. Class A | 961,200 | 1,011 |
| | Jin Tong Ling Technology Group Co. Ltd. Class A | 1,321,100 | 1,011 |
| | City Development Environment Co. Ltd. | 654,680 | 1,010 |
| * | Youzu Interactive Co. Ltd. Class A | ��� 485,916 | 1,007 |
| | Hubei Biocause Pharmaceutical Co. Ltd. Class A (XSEC) | 1,977,200 | 1,004 |
| | Changying Xinzhi Technology Co. Ltd. Class A | 382,400 | 1,003 |
| | Jiangxi Huangshanghuang Group Food Co. Ltd. Class A | 462,301 | 1,001 |
| | Beijing Compass Technology Development Co. Ltd. Class A | 196,800 | 999 |
| | Jiangsu Nata Opto-electronic Material Co. Ltd. Class A (XSHE) | 123,000 | 999 |
| | Hangxiao Steel Structure Co. Ltd. Class A (XSHG) | 1,786,435 | 997 |
| | Suzhou Anjie Technology Co. Ltd. Class A (XSHE) | 462,649 | 997 |
| * | Fujian Qingshan Paper Industry Co. Ltd. Class A | 2,584,790 | 996 |
| | | | | | Shares | Market
Value•
($000) |
| | Shanghai SMI Holding Co. Ltd. Class A (XSHG) | 1,545,945 | 995 |
| | DBG Technology Co. Ltd. Class A | 456,680 | 993 |
| | Shenzhen Expressway Co. Ltd. Class A (XSHG) | 653,800 | 992 |
| | Leyard Optoelectronic Co. Ltd. Class A (XSHE) | 674,766 | 992 |
| | Three Squirrels Inc. Class A | 149,540 | 992 |
| | Nanjing Hanrui Cobalt Co. Ltd. Class A (XSEC) | 80,200 | 991 |
| * | Hiconics Eco-energy Technology Co. Ltd. Class A | 1,066,400 | 990 |
| | Leo Group Co. Ltd. Class A (XSEC) | 2,776,300 | 989 |
| * | Shanghai Foreign Service Holding Group Co. Ltd. (XSHG) | 830,600 | 988 |
| | CECEP Solar Energy Co. Ltd. Class A (XSEC) | 565,900 | 986 |
| * | Huafu Fashion Co. Ltd. (XSHE) | 1,425,310 | 986 |
| | Shandong Humon Smelting Co. Ltd. Class A (XSHE) | 550,100 | 986 |
| | Medicalsystem Biotechnology Co. Ltd. Class A | 346,583 | 986 |
| * | Kuang-Chi Technologies Co. Ltd. Class A (XSEC) | 306,600 | 984 |
| | Wanxiang Qianchao Co. Ltd. Class A (XSEC) | 1,051,700 | 984 |
| * | Shenzhen Invt Electric Co. Ltd. Class A | 844,252 | 983 |
| | Fujian Longking Co. Ltd. Class A (XSSC) | 773,680 | 982 |
| | Ningbo Peacebird Fashion Co. Ltd. Class A (XSHG) | 175,698 | 982 |
| | Huapont Life Sciences Co. Ltd. Class A (XSEC) | 1,014,901 | 981 |
Emerging Markets Stock Index Fund
| | | | | | Shares | Market
Value•
($000) |
| | Foshan Electrical & Lighting Co. Ltd. Class B | 2,535,261 | 979 |
| | Shanghai AJ Group Co. Ltd. Class A | 966,398 | 979 |
| * | Taiyuan Heavy Industry Co. Ltd. Class A (XSSC) | 2,206,513 | 979 |
| * | Wuhan P&S Information Technology Co. Ltd. Class A (XSHE) | 1,031,500 | 977 |
| | Fangda Special Steel Technology Co. Ltd. Class A (XSHG) | 842,878 | 976 |
| | Shenzhen Das Intellitech Co. Ltd. Class A (XSHE) | 1,832,196 | 974 |
| | China National Medicines Corp. Ltd. Class A (XSHG) | 204,086 | 972 |
| | Chengdu Hongqi Chain Co. Ltd. Class A | 1,222,800 | 970 |
| | Anhui Hengyuan Coal Industry & Electricity Power Co. Ltd. Class A (XSSC) | 885,031 | 969 |
| * | Shandong Xinchao Energy Corp. Ltd. Class A (XSSC) | 2,802,816 | 969 |
| | Insigma Technology Co. Ltd. Class A | 1,008,500 | 969 |
| * | Nanjing Quanxin Cable Technology Co. Ltd. Class A | 295,630 | 969 |
| * | Zhejiang Conba Pharmaceutical Co. Ltd. Class A (XSSC) | 1,520,861 | 968 |
| | Zhejiang Medicine Co. Ltd. Class A (XSHG) | 387,800 | 967 |
| | Xiamen C & D Inc. Class A (XSSC) | 772,400 | 966 |
| | Kunming Yunnei Power Co. Ltd. Class A | 1,904,354 | 966 |
| | Jiangsu Changbao Steeltube Co. Ltd. Class A | 1,550,700 | 965 |
| | Sinotrans Ltd. Class A (XSSC) | 1,367,100 | 964 |
| | ChemPartner PharmaTech Co. Ltd. Class A | 422,377 | 964 |
| | | | | | Shares | Market
Value•
($000) |
| | Guangzhou Development Group Inc. Class A (XSSC) | 858,971 | 964 |
| | FAW Jiefang Group Co. Ltd. | 589,943 | 962 |
| | Keboda Technology Co. Ltd. Class A | 92,881 | 961 |
| | China TransInfo Technology Co. Ltd. Class A (XSEC) | 459,400 | 960 |
| | Telling Telecommunication Holding Co. Ltd. Class A (XSHE) | 257,000 | 960 |
| | Xiamen Comfort Science & Technology Group Co. Ltd. Class A | 564,300 | 959 |
| | Shenzhen Leaguer Co. Ltd. Class A | 686,800 | 958 |
| | Chengdu Kanghong Pharmaceutical Group Co. Ltd. Class A | 334,750 | 956 |
| | Anhui Xinhua Media Co. Ltd. Class A | 1,299,982 | 956 |
| | Shenzhen Goodix Technology Co. Ltd. Class A (XSSC) | 59,656 | 954 |
| * | Sinopec Oilfield Service Corp. Class A (XSSC) | 2,703,200 | 954 |
| | Cachet Pharmaceutical Co. Ltd. Class A | 496,043 | 953 |
| | Zhongshan Broad Ocean Motor Co. Ltd. Class A (XSHE) | 893,700 | 950 |
| | Jiang Su Suyan Jingshen Co. Ltd. Class A | 761,500 | 950 |
| | Shanghai AtHub Co. Ltd. Class A (XSHG) | 194,320 | 948 |
| * | Shenzhen Neptunus Bioengineering Co. Ltd. Class A | 1,950,950 | 945 |
| | Jiangsu Changqing Agrochemical Co. Ltd. Class A | 862,109 | 945 |
| | IReader Technology Co. Ltd. Class A (XSHG) | 319,400 | 945 |
Emerging Markets Stock Index Fund
| | | | | | Shares | Market
Value•
($000) |
| | Bank of Chengdu Co. Ltd. Class A (XSSC) | 472,700 | 943 |
| | Foshan Nationstar Optoelectronics Co. Ltd. Class A | 589,283 | 943 |
| | Wangsu Science & Technology Co. Ltd. Class A (XSEC) | 1,098,938 | 941 |
| | Valiant Co. Ltd. Class A (XSEC) | 292,400 | 941 |
| | Huapont Life Sciences Co. Ltd. Class A (XSHE) | 971,200 | 939 |
| | Shanghai Runda Medical Technology Co. Ltd. Class A | 580,320 | 938 |
| * | Lander Sports Development Co. Ltd. Class A | 1,641,050 | 937 |
| | Weihai Guangtai Airport Equipment Co. Ltd. Class A | 527,943 | 937 |
| | Guangxi Yuegui Guangye Holding Co. Ltd. Class A | 887,856 | 935 |
| | GF Securities Co. Ltd. Class H | 550,800 | 934 |
| | Fortune Ng Fung Food Hebei Co. Ltd. Class A | 930,674 | 932 |
| | Eternal Asia Supply Chain Management Ltd. Class A (XSHE) | 1,037,500 | 932 |
| * | Guangdong HEC Technology Holding Co. Ltd. Class A (XSSC) | 560,960 | 930 |
| | Jinke Properties Group Co. Ltd. Class A (XSEC) | 1,338,788 | 929 |
| | Baosheng Science & Technology Innovation Co. Ltd. Class A (XSSC) | 1,225,155 | 929 |
| | Yunnan Copper Co. Ltd. Class A (XSHE) | 447,200 | 928 |
| | ZheJiang Dali Technology Co. Ltd. Class A | 312,594 | 928 |
| * | Shenzhen Chipscreen Biosciences Co. Ltd. Class A | 161,154 | 928 |
| | | | | | Shares | Market
Value•
($000) |
| | Henan Pinggao Electric Co. Ltd. Class A (XSSC) | 672,114 | 927 |
| * | Trip.com Group Ltd. | 32,191 | 925 |
| | Eternal Asia Supply Chain Management Ltd. Class A (XSEC) | 1,028,900 | 924 |
| | Yantai Dongcheng Pharmaceutical Co. Ltd. Class A (XSHE) | 426,300 | 924 |
| | Tibet Urban Development & Investment Co. Ltd. Class A (XSSC) | 267,344 | 924 |
| | Beijing Water Business Doctor Co. Ltd. Class A (XSHE) | 494,900 | 922 |
| | Stanley Agricultural Group Co. Ltd. Class A | 1,085,928 | 922 |
| | Shenzhen Kaifa Technology Co. Ltd. Class A (XSEC) | 398,300 | 921 |
| | Tibet Tianlu Co. Ltd. Class A | 927,949 | 921 |
| | Zhejiang Garden Bio-Chemical High-tech Co. Ltd. Class A (XSHE) | 440,350 | 919 |
| | Shandong Lukang Pharma Class A | 867,190 | 918 |
| | Guangdong Goworld Co. Ltd. Class A | 521,444 | 917 |
| | Guangzhou Shangpin Home Collection Co. Ltd. Class A (XSHE) | 134,315 | 916 |
| | China Publishing & Media Co. Ltd. Class A | 1,075,300 | 912 |
| * | Huludao Zinc Industry Co. Class A | 1,526,300 | 910 |
| * | China Nonferrous Metal Industry's Foreign Engineering & Construction Co. Ltd. Class A (XSHE) | 1,132,500 | 909 |
Emerging Markets Stock Index Fund
| | | | | | Shares | Market
Value•
($000) |
| | AVIC Industry-Finance Holdings Co. Ltd. Class A (XSHG) | 1,493,800 | 909 |
| * | Markor International Home Furnishings Co. Ltd. Class A | 1,715,635 | 909 |
| | China Sports Industry Group Co. Ltd. Class A | 496,700 | 909 |
| | Greattown Holdings Ltd. Class A (XSHG) | ��1,641,600 | 908 |
| | Qianjiang Water Resources Development Co. Ltd. Class A | 551,651 | 905 |
| * | KraussMaffei Co. Ltd. Class A | 864,834 | 904 |
| | Zhejiang Zhongcheng Packing Material Co. Ltd. Class A | 856,121 | 903 |
| | Anhui Genuine New Materials Co. Ltd. Class A | 252,600 | 903 |
| | Shenzhen Heungkong Holding Co. Ltd. Class A (XSSC) | 3,067,468 | 901 |
| * | CITIC Guoan Information Industry Co. Ltd. Class A (XSHE) | 2,563,300 | 900 |
| | Xiamen Meiya Pico Information Co. Ltd. Class A (XSEC) | 373,452 | 898 |
| | Guangdong Vanward New Electric Co. Ltd. Class A | 841,940 | 897 |
| | Wuhu Token Science Co. Ltd. Class A (XSEC) | 557,783 | 895 |
| | Black Peony Group Co. Ltd. Class A (XSSC) | 806,287 | 895 |
| | BGI Genomics Co. Ltd. Class A (XSEC) | 64,249 | 894 |
| | Haining China Leather Market Co. Ltd. Class A | 1,252,410 | 894 |
| | Tianjin Teda Co. Ltd. Class A | 1,439,243 | 889 |
| * | Toread Holdings Group Co. Ltd. Class A | 660,000 | 889 |
| | | | | | Shares | Market
Value•
($000) |
| | China TransInfo Technology Co. Ltd. Class A (XSHE) | 425,300 | 889 |
| | Asian Star Anchor Chain Co. Ltd. Jiangsu Class A | 858,650 | 888 |
| | Zhuzhou Kibing Group Co. Ltd. Class A (XSHG) | 357,700 | 888 |
| | Autobio Diagnostics Co. Ltd. Class A (XSSC) | 103,610 | 887 |
| | China National Software & Service Co. Ltd. Class A (XSHG) | 110,600 | 887 |
| | Tianjin Capital Environmental Protection Group Co. Ltd. Class A (XSHG) | 907,116 | 887 |
| | Zhejiang JIULI Hi-tech Metals Co. Ltd. Class A (XSSC) | 449,450 | 887 |
| | Sunstone Development Co. Ltd. Class A | 286,400 | 887 |
| * | Far East Smarter Energy Co. Ltd. Class A (XSSC) | 901,200 | 887 |
| | Shandong WIT Dyne Health Co. Ltd. Class A | 227,050 | 886 |
| | Shandong Hi-speed Co. Ltd. Class A (XSHG) | 1,057,400 | 886 |
| * | HyUnion Holding Co. Ltd. Class A (XSHE) | 1,013,582 | 885 |
| * | Neusoft Corp. Class A (XSSC) | 593,614 | 885 |
| | DHC Software Co. Ltd. Class A (XSEC) | 813,800 | 883 |
| | Nanjing Iron & Steel Co. Ltd. Class A (XSHG) | 1,601,500 | 883 |
| | Shenzhen Properties & Resources Development Group Ltd. Class A | 511,552 | 881 |
| | Hubei Biocause Pharmaceutical Co. Ltd. Class A (XSHE) | 1,733,900 | 880 |
Emerging Markets Stock Index Fund
| | | | | | Shares | Market
Value•
($000) |
| | Zhejiang Jingxin Pharmaceutical Co. Ltd. Class A (XSEC) | 698,539 | 880 |
| * | Shanxi Guoxin Energy Corp. Ltd. Class A | 1,249,726 | 879 |
| | Fangda Carbon New Material Co. Ltd. Class A (XSHG) | 522,917 | 879 |
| | New Guomai Digital Culture Co. Ltd. Class A | 559,900 | 878 |
| | Changchun Faway Automobile Components Co. Ltd. Class A | 534,768 | 877 |
| | JA Solar Technology Co. Ltd. Class A (XSEC) | 61,500 | 877 |
| | Shandong New Beiyang Information Technology Co. Ltd. Class A | 721,300 | 876 |
| | CITIC Press Corp. Class A | 192,900 | 874 |
| | Anhui Korrun Co. Ltd. Class A | 251,860 | 874 |
| | Zhejiang Wanma Co. Ltd. Class A (XSHG) | 793,972 | 873 |
| | Henan Shenhuo Coal & Power Co. Ltd. Class A (XSEC) | 587,000 | 871 |
| | Yifan Pharmaceutical Co. Ltd. Class A (XSEC) | 339,300 | 869 |
| | Huaan Securities Co. Ltd. Class A (XSSC) | 1,086,020 | 868 |
| | Betta Pharmaceuticals Co. Ltd. Class A (XSEC) | 70,200 | 868 |
| | Hongbaoli Group Corp. Ltd. Class A | 714,859 | 868 |
| * | Holitech Technology Co. Ltd. Class A (XSHE) | 1,706,396 | 868 |
| * | Beijing Lier High-temperature Materials Co. Ltd. Class A | 1,242,571 | 868 |
| * | Jiangmen Kanhoo Industry Co. Ltd. Class A | 311,117 | 868 |
| | | | | | Shares | Market
Value•
($000) |
| | Shenzhen Guangju Energy Co. Ltd. Class A | 659,888 | 866 |
| | Hanwei Electronics Group Corp. Class A | 274,002 | 866 |
| | Xinxiang Richful Lube Additive Co. Ltd. Class A | 70,500 | 866 |
| * | Shang Gong Group Co. Ltd. Class B | 2,310,622 | 864 |
| | North Electro-Optic Co. Ltd. Class A | 494,561 | 862 |
| | Zhejiang Fuchunjiang Environmental Thermoelectric Co. Ltd. Class A | 1,020,200 | 861 |
| | Yankershop Food Co. Ltd. Class A | 82,800 | 861 |
| | Beijing Shunxin Agriculture Co. Ltd. Class A (XSEC) | 168,792 | 860 |
| | Shuangliang Eco-Energy Systems Co. Ltd. Class A (XSHG) | 412,005 | 860 |
| | Top Resource Conservation & Environment Corp. Class A | 518,300 | 858 |
| | Jilin Yatai Group Co. Ltd. Class A (XSSC) | 1,597,167 | 857 |
| | Guangdong Shaoneng Group Co. Ltd. Class A | 1,112,040 | 854 |
| | Hisense Visual Technology Co. Ltd. Class A (XSSC) | 450,162 | 851 |
| | Bright Dairy & Food Co. Ltd. Class A (XSHG) | 389,800 | 849 |
| | Baoxiniao Holding Co. Ltd. Class A | 1,203,300 | 849 |
| | SGIS Songshan Co. Ltd. Class A (XSEC) | 1,225,100 | 848 |
| | Jiangsu Zhangjiagang Rural Commercial Bank Co. Ltd. Class A (XSEC) | 875,700 | 848 |
| | Sunward Intelligent Equipment Co. Ltd. Class A (XSEC) | 669,120 | 846 |
Emerging Markets Stock Index Fund
| | | | | | Shares | Market
Value•
($000) |
| | Jointo Energy Investment Co. Ltd. Hebei Class A (XSHE) | 1,058,144 | 846 |
| | Loncin Motor Co. Ltd. Class A (XSSC) | 1,237,500 | 845 |
| | Offshore Oil Engineering Co. Ltd. Class A (XSHG) | 1,162,500 | 845 |
| * | Hainan Haiyao Co. Ltd. Class A | 1,301,400 | 844 |
| | Shanghai Dazhong Public Utilities Group Co. Ltd. Class A (XSHG) | 1,437,500 | 843 |
| | Xiamen Meiya Pico Information Co. Ltd. Class A (XSHE) | 350,605 | 843 |
| | JSTI Group Class A | 950,557 | 840 |
| | Puyang Refractories Group Co. Ltd. Class A | 1,231,481 | 840 |
| * | Zhuhai Orbita Aerospace Science & Technology Co. Ltd. Class A | 620,408 | 839 |
| * | Jinneng Holding Shanxi Coal Industry Co. Ltd. Class A (XSSC) | 497,400 | 838 |
| | Shenzhen Zhongjin Lingnan Nonfemet Co. Ltd. Class A (XSHE) | 1,082,550 | 838 |
| | Shanghai Lujiazui Finance & Trade Zone Development Co. Ltd. Class A (XSHG) | 494,864 | 837 |
| | Youngor Group Co. Ltd. Class A (XSHG) | 832,608 | 836 |
| | Shanghai Jin Jiang Online Network Service Co. Ltd. Class A (XSHG) | 616,700 | 836 |
| * | JinJian Cereals Industry Co. Ltd. Class A | 650,200 | 834 |
| | Shandong Sunway Chemical Group Co. Ltd. Class A | 880,300 | 834 |
| | | | | | Shares | Market
Value•
($000) |
| | Dashang Co. Ltd. Class A | 274,100 | 834 |
| | Sinosteel Engineering & Technology Co. Ltd. Class A | 732,700 | 834 |
| | Zhuhai Port Co. Ltd. Class A | 853,300 | 833 |
| | Guangdong Meiyan Jixiang Hydropower Co. Ltd. Class A | 1,901,400 | 832 |
| * | Sichuan Hebang Biotechnology Co. Ltd. Class A (XSHG) | 1,495,340 | 832 |
| | Xinfengming Group Co. Ltd. Class A (XSHG) | 362,796 | 832 |
| | Shanxi Blue Flame Holding Co. Ltd. Class A (XSEC) | 577,896 | 828 |
| * | Nanfang Zhongjin Environment Co. Ltd. Class A | 1,775,883 | 828 |
| * | Shunfa Hengye Corp. Class A (XSHE) | 1,413,801 | 828 |
| | Shenyang Chemical Co. Ltd. Class A | 944,000 | 828 |
| * | Kingsignal Technology Co. Ltd. Class A | 620,360 | 827 |
| | 5I5J Holding Group Co. Ltd. Class A | 1,773,003 | 826 |
| | Jiangsu Zijin Rural Commercial Bank Co. Ltd. Class A (XSHG) | 1,646,800 | 826 |
| * | Jiangsu Zongyi Co. Ltd. Class A | 983,700 | 824 |
| | Autel Intelligent Technology Corp. Ltd. Class A | 82,408 | 824 |
| * | Xinlun New Materials Co. Ltd. | 1,033,500 | 823 |
| | Guizhou Tyre Co. Ltd. Class A | 1,044,976 | 822 |
| | China Resources Double Crane Pharmaceutical Co. Ltd. Class A (XSSC) | 460,351 | 821 |
| | AECC Aero-Engine Control Co. Ltd. Class A (XSHE) | 196,500 | 820 |
| | Jiangsu Yunyi Electric Co. Ltd. Class A | 878,840 | 820 |
Emerging Markets Stock Index Fund
| | | | | | Shares | Market
Value•
($000) |
| | Guangzhou Pearl River Piano Group Co. Ltd. Class A | 781,331 | 820 |
| | Tianma Microelectronics Co. Ltd. Class A (XSEC) | 425,500 | 819 |
| | Xinjiang Joinworld Co. Ltd. Class A (XSHG) | 580,008 | 816 |
| | Shanghai Guangdian Electric Group Co. Ltd. Class A | 1,596,600 | 816 |
| * | Guangshen Railway Co. Ltd. Class A (XSHG) | 2,437,700 | 814 |
| | Juneyao Airlines Co. Ltd. Class A (XSHG) | 326,939 | 812 |
| * | Guoguang Electric Co. Ltd. Class A | 480,600 | 811 |
| | Merit Interactive Co. Ltd. Class A | 384,848 | 809 |
| | Guangdong Marubi Biotechnology Co. Ltd. Class A | 148,329 | 808 |
| | Shenzhen Centralcon Investment Holding Co. Ltd. Class A | 753,044 | 807 |
| | Guangdong South New Media Co. Ltd. Class A (XSHE) | 109,080 | 807 |
| | Ovctek China Inc. Class A (XSEC) | 75,740 | 806 |
| | CMST Development Co. Ltd. Class A (XSHG) | 842,000 | 805 |
| | China Merchants Energy Shipping Co. Ltd. Class A (XSSC) | 1,123,680 | 803 |
| | Shanghai Highly Group Co. Ltd. Class B | 1,595,207 | 802 |
| | Zhejiang Yankon Group Co. Ltd. Class A | 1,406,275 | 802 |
| | Luoxin Pharmaceuticals Group Stock Co. Ltd. Class A | 547,020 | 802 |
| | Shenzhen Expressway Co. Ltd. Class A (XSSC) | 526,804 | 800 |
| | | | | | Shares | Market
Value•
($000) |
| * | Beijing Centergate Technologies Holding Co. Ltd. Class A | 773,948 | 800 |
| | Xiangyu Medical Co. Ltd. Class A | 107,228 | 799 |
| | Focused Photonics Hangzhou Inc. Class A (XSEC) | 276,196 | 798 |
| 3 | Jiangsu Rainbow Heavy Industries Co. Ltd. Class A | 933,236 | 797 |
| | Jilin Yatai Group Co. Ltd. Class A (XSHG) | 1,484,000 | 796 |
| | Gansu Shangfeng Cement Co. Ltd. Class A | 293,000 | 796 |
| * | Innuovo Technology Co. Ltd. Class A (XSHE) | 960,755 | 795 |
| | Changjiang & Jinggong Steel Building Group Co. Ltd. Class A (XSSC) | 1,281,797 | 795 |
| | Lingyun Industrial Corp. Ltd. Class A (XSSC) | 569,692 | 795 |
| | Jack Sewing Machine Co. Ltd. Class A | 251,575 | 794 |
| | Shanghai Kaibao Pharmaceutical Co. Ltd. Class A | 1,150,408 | 794 |
| | Henan Taloph Pharmaceutical Stock Co. Ltd. Class A | 622,730 | 793 |
| * | Chengzhi Co. Ltd. Class A (XSHE) | 357,628 | 792 |
| | Hangzhou Century Co. Ltd. Class A | 822,400 | 791 |
| | Beijing SDL Technology Co. Ltd. Class A | 660,800 | 791 |
| | Feitian Technologies Co. Ltd. Class A | 392,500 | 791 |
| | Shijiazhuang Yiling Pharmaceutical Co. Ltd. Class A (XSEC) | 314,300 | 790 |
| * | Ningxia Western Venture Industrial Co. Ltd. Class A | 1,478,651 | 789 |
| * | Beijing Forever Technology Co. Ltd. Class A (XSHE) | 439,194 | 789 |
Emerging Markets Stock Index Fund
| | | | | | Shares | Market
Value•
($000) |
| * | New Huadu Supercenter Co. Ltd. Class A | 1,261,000 | 788 |
| | Beijing Aerospace Changfeng Co. Ltd. Class A | 431,387 | 786 |
| | Guangdong Huatie Tongda High-speed Railway Equipment Corp. Class A (XSHE) | 1,116,230 | 786 |
| | Shanghai Zhezhong Group Co. Ltd. Class A | 251,700 | 786 |
| | Tengda Construction Group Co. Ltd. Class A | 1,637,499 | 785 |
| * | Guangdong Taiantang Pharmaceutical Co. Ltd. Class A | 895,378 | 784 |
| * | NavInfo Co. Ltd. Class A (XSEC) | 427,887 | 783 |
| | Monalisa Group Co. Ltd. Class A | 262,904 | 782 |
| | Yijiahe Technology Co. Ltd. Class A | 89,600 | 782 |
| * | Berry Genomics Co. Ltd. Class A (XSHE) | 257,298 | 781 |
| | Chongqing Zongshen Power Machinery Co. Ltd. Class A (XSHE) | 760,800 | 780 |
| | Beijing Sifang Automation Co. Ltd. Class A (XSHG) | 266,300 | 780 |
| | Guangzhou Restaurant Group Co. Ltd. Class A (XSSC) | 219,520 | 779 |
| * | Guizhou Salvage Pharmaceutical Co. Ltd. Class A | 1,556,500 | 779 |
| | Huangshan Novel Co. Ltd. Class A | 641,416 | 779 |
| | Beijing Science Sun Pharmaceutical Co. Ltd. Class A | 453,922 | 779 |
| * | Oceanwide Holdings Co. Ltd. Class A (XSHE) | 2,790,994 | 776 |
| | Hwa Create Co. Ltd. Class A | 583,500 | 776 |
| | | | | | Shares | Market
Value•
($000) |
| * | Shengda Resources Co. Ltd. Class A | 428,900 | 775 |
| | Hebei Huijin Group Co. Ltd. Class A | 485,900 | 775 |
| | Shanghai Tongji Science & Technology Industrial Co. Ltd. Class A (XSSC) | 642,481 | 774 |
| | WUS Printed Circuit Kunshan Co. Ltd. Class A (XSEC) | 482,790 | 773 |
| | Jiangsu Zhongnan Construction Group Co. Ltd. Class A (XSEC) | 1,287,637 | 770 |
| | Inner Mongolia M-Grass Ecology & Enviroment Group Co. Ltd. Class A | 1,180,320 | 769 |
| | Changshu Tianyin Electromechanical Co. Ltd. Class A | 412,893 | 769 |
| * | Dr Peng Telecom & Media Group Co. Ltd. Class A (XSSC) | 843,964 | 768 |
| * | Cultural Investment Holdings Co. Ltd. Class A | 1,818,329 | 766 |
| | Sinochem International Corp. Class A (XSHG) | 539,110 | 765 |
| | China International Marine Containers Group Co. Ltd. Class A (XSHE) | 278,040 | 763 |
| | Central China Securities Co. Ltd. Class A (XSHG) | 1,063,100 | 762 |
| | Zhuhai Bojay Electronics Co. Ltd. Class A | 95,100 | 762 |
| | Eastern Communications Co. Ltd. Class A (XSHG) | 472,200 | 760 |
| * | Zhejiang Conba Pharmaceutical Co. Ltd. Class A (XSHG) | 1,192,357 | 759 |
| | First Capital Securities Co. Ltd. Class A (XSHE) | 711,520 | 759 |
Emerging Markets Stock Index Fund
| | | | | | Shares | Market
Value•
($000) |
| * | INKON Life Technology Co. Ltd. Class A | 335,700 | 759 |
| | Beijing Teamsun Technology Co. Ltd. Class A (XSSC) | 788,986 | 758 |
| | Shanghai Kehua Bio-Engineering Co. Ltd. Class A (XSHE) | 352,700 | 758 |
| * | Shandong Airlines Co. Ltd. Class B | 1,489,541 | 756 |
| | Chongqing Water Group Co. Ltd. Class A (XSHG) | 860,600 | 755 |
| | Beijing SL Pharmaceutical Co. Ltd. Class A (XSHE) | 518,850 | 752 |
| | COSCO SHIPPING Development Co. Ltd. Class A (XSHG) | 1,384,100 | 752 |
| | China Harzone Industry Corp. Ltd. Class A (XSEC) | 593,522 | 750 |
| | Gansu Qilianshan Cement Group Co. Ltd. Class A (XSSC) | 497,350 | 750 |
| | CSSC Science & Technology Co. Ltd. Class A (XSHG) | 375,000 | 750 |
| | Fujian Aonong Biological Technology Group Inc. Ltd. Class A (XSHG) | 471,250 | 749 |
| | Three's Co. Media Group Co. Ltd. Class A | 44,593 | 748 |
| | Wuhan Fingu Electronic Technology Co. Ltd. Class A | 472,063 | 746 |
| | Zhejiang China Commodities City Group Co. Ltd. Class A (XSHG) | 976,000 | 745 |
| | Bank of China Ltd. Class A (XSHG) | 1,564,597 | 745 |
| | Changzhou Qianhong Biopharma Co. Ltd. Class A (XSHE) | 1,146,300 | 745 |
| | | | | | Shares | Market
Value•
($000) |
| | Hangzhou Cable Co. Ltd. Class A | 652,000 | 745 |
| * | Shenzhen Minkave Technology Co. Ltd. Class A | 602,150 | 745 |
| * | China Reform Health Management & Services Group Co. Ltd. Class A (XSHE) | 771,892 | 743 |
| | Changchun Gas Co. Ltd. Class A | 741,500 | 742 |
| | BBMG Corp. Class A (XSHG) | 1,692,214 | 742 |
| * | Gohigh Data Networks Technology Co. Ltd. Class A | 856,940 | 741 |
| * | Jiangsu Kanion Pharmaceutical Co. Ltd. Class A (XSHG) | 505,566 | 741 |
| | Sinolink Securities Co. Ltd. Class A (XSHG) | 441,000 | 739 |
| | Zhejiang Hangmin Co. Ltd. Class A (XSHG) | 870,745 | 739 |
| | Shenzhen Click Technology Co. Ltd. Class A | 344,000 | 737 |
| * | Shenzhen SDG Information Co. Ltd. Class A | 784,994 | 736 |
| | Beijing Wanji Technology Co. Ltd. Class A | 201,160 | 736 |
| | Xinxing Ductile Iron Pipes Co. Ltd. Class A (XSHE) | 1,266,700 | 735 |
| * | Beiqi Foton Motor Co. Ltd. Class A (XSSC) | 1,333,709 | 735 |
| | Xiamen Port Development Co. Ltd. Class A | 739,716 | 733 |
| | Shandong Buchang Pharmaceuticals Co. Ltd. Class A | 268,122 | 733 |
| | Beijing SL Pharmaceutical Co. Ltd. Class A (XSEC) | 505,196 | 732 |
| | Tsinghua Tongfang Co. Ltd. Class A (XSSC) | 863,708 | 732 |
Emerging Markets Stock Index Fund
| | | | | | Shares | Market
Value•
($000) |
| | Shenzhen Center Power Tech Co. Ltd. Class A (XSHE) | 281,850 | 732 |
| * | Guangdong Zhengye Technology Co. Ltd. Class A | 374,236 | 731 |
| * | China Oil HBP Science & Technology Co. Ltd. Class A | 1,445,600 | 730 |
| | Motic Xiamen Electric Group Co. Ltd. Class A | 486,429 | 730 |
| | China West Construction Group Co. Ltd. Class A | 649,000 | 729 |
| | Huaxin Cement Co. Ltd. Class A (XSHG) | 279,360 | 729 |
| * | Hunan Gold Corp. Ltd. Class A (XSEC) | 429,800 | 728 |
| | Lingyuan Iron & Steel Co. Ltd. Class A | 1,715,370 | 727 |
| * | UTour Group Co. Ltd. Class A | 929,925 | 725 |
| * | SPIC Dongfang New Energy Corp. Class A (XSHE) | 986,256 | 724 |
| * | Hubei Broadcasting & Television Information Network Co. Ltd. Class A | 1,403,600 | 724 |
| | Huizhou Speed Wireless Technology Co. Ltd. Class A | 443,300 | 724 |
| * | China CIFCO Investment Co. Ltd. Class A | 560,600 | 721 |
| | Eastcompeace Technology Co. Ltd. Class A | 460,242 | 721 |
| * | Shanghai Lonyer Fuels Co. Ltd. Class A | 690,800 | 721 |
| * | Nanjing Kangni Mechanical & Electrical Co. Ltd. Class A | 926,835 | 717 |
| | Shenzhen Sinovatio Technology Co. Ltd. Class A | 153,216 | 713 |
| | | | | | Shares | Market
Value•
($000) |
| * | Beijing UniStrong Science & Technology Co. Ltd. Class A | 758,400 | 713 |
| * | Harbin Pharmaceutical Group Co. Ltd. Class A (XSSC) | 1,447,577 | 712 |
| | Northeast Securities Co. Ltd. Class A (XSEC) | 528,100 | 711 |
| | FIYTA Precision Technology Co. Ltd. Class A | 420,085 | 709 |
| | First Tractor Co. Ltd. Class A (XSHG) | 357,900 | 709 |
| | Jiangsu Hongdou Industrial Co. Ltd. Class A (XSHG) | 1,515,822 | 708 |
| | Fujian Septwolves Industry Co. Ltd. Class A | 824,109 | 708 |
| | Vatti Corp. Ltd. Class A (XSHE) | 768,748 | 708 |
| | Shenzhen Aisidi Co. Ltd. Class A (XSHE) | 422,520 | 708 |
| * | Heilongjiang Interchina Water Treatment Co. Ltd. Class A | 1,993,124 | 707 |
| | Ningbo Huaxiang Electronic Co. Ltd. Class A (XSEC) | 191,100 | 706 |
| | Better Life Commercial Chain Share Co. Ltd. Class A (XSHE) | 672,220 | 706 |
| | Sino Wealth Electronic Ltd. Class A (XSEC) | 73,609 | 706 |
| | Shanghai Industrial Development Co. Ltd. Class A (XSSC) | 1,162,392 | 705 |
| | Western Region Gold Co. Ltd. Class A (XSSC) | 388,800 | 705 |
| | Shantui Construction Machinery Co. Ltd. Class A | 1,180,735 | 705 |
| * | Beijing Orient National Communication Science & Technology Co. Ltd. Class A (XSHE) | 511,595 | 705 |
Emerging Markets Stock Index Fund
| | | | | | Shares | Market
Value•
($000) |
| | Bengang Steel Plates Co. Ltd. Class B | 2,055,311 | 704 |
| 2 | Shandong Chenming Paper Holdings Ltd. Class H | 1,463,782 | 704 |
| | Zhongshan Public Utilities Group Co. Ltd. Class A (XSEC) | 523,000 | 704 |
| | Mayinglong Pharmaceutical Group Co. Ltd. Class A (XSHG) | 179,100 | 704 |
| | Shanghai Jinqiao Export Processing Zone Development Co. Ltd. Class A | 398,657 | 703 |
| | Guangdong Shirongzhaoye Co. Ltd. Class A (XSHE) | 916,961 | 698 |
| | Konfoong Materials International Co. Ltd. Class A (XSHE) | 111,476 | 698 |
| | Shenzhen Ysstech Info-tech Co. Ltd. Class A (XSHE) | 455,175 | 698 |
| | Konka Group Co. Ltd. Class A (XSEC) | 793,800 | 697 |
| | Shandong Longda Meat Foodstuff Co. Ltd. Class A | 443,200 | 697 |
| * | Kunwu Jiuding Investment Holdings Co. Ltd. Class A (XSHG) | 319,099 | 696 |
| | Guangxi Liuzhou Pharmaceutical Co. Ltd. Class A (XSHG) | 292,566 | 696 |
| * | Shaanxi Fenghuo Electronics Co. Ltd. Class A | 634,029 | 694 |
| | Der Future Science & Technology Holding Group Co. Ltd. Class A | 609,840 | 693 |
| | Yonggao Co. Ltd. Class A | 1,005,259 | 692 |
| | Wellhope Foods Co. Ltd. Class A (XSSC) | 482,801 | 691 |
| | | | | | Shares | Market
Value•
($000) |
| | Laobaixing Pharmacy Chain JSC Class A (XSHG) | 100,970 | 689 |
| | Autobio Diagnostics Co. Ltd. Class A (XSHG) | 80,470 | 689 |
| | Citic Offshore Helicopter Co. Ltd. Class A | 604,400 | 688 |
| | Henan Pinggao Electric Co. Ltd. Class A (XSHG) | 498,800 | 688 |
| | Guangzhou KingTeller Technology Co. Ltd. Class A | 817,028 | 686 |
| * | Guangdong Orient Zirconic Ind Sci & Tech Co. Ltd. Class A | 553,600 | 685 |
| * | Jiangsu Yinhe Electronics Co. Ltd. Class A | 946,533 | 685 |
| | Jinzhou Port Co. Ltd. Class B | 2,857,215 | 684 |
| | CSSC Science & Technology Co. Ltd. Class A (XSSC) | 340,900 | 682 |
| * | AECC Aero Science & Technology Co. Ltd. Class A (XSHG) | 221,200 | 681 |
| * | Xiwang Foodstuffs Co. Ltd. Class A (XSHE) | 940,740 | 681 |
| | KPC Pharmaceuticals Inc. Class A (XSSC) | 523,308 | 680 |
| * | China CAMC Engineering Co. Ltd. Class A | 673,800 | 680 |
| | 263 Network Communications Co. Ltd. Class A (XSHE) | 1,156,660 | 679 |
| | Shanghai Belling Co. Ltd. Class A (XSHG) | 143,000 | 676 |
| | SPIC Yuanda Environmental-Protection Co. Ltd. Class A | 570,600 | 675 |
| | Shenzhen Infogem Technologies Co. Ltd. Class A (XSHE) | 326,680 | 675 |
Emerging Markets Stock Index Fund
| | | | | | Shares | Market
Value•
($000) |
| * | Jiangsu Xiuqiang Glasswork Co. Ltd. Class A | 590,500 | 674 |
| * | Shenzhen Deren Electronic Co. Ltd. Class A | 457,051 | 673 |
| | Anhui Sinonet & Xonglong Science & Technology Co. Ltd. Class A | 671,702 | 673 |
| | Wuhan Jingce Electronic Group Co. Ltd. Class A (XSHE) | 82,677 | 673 |
| | Guizhou Gas Group Corp. Ltd. Class A (XSHG) | 434,972 | 673 |
| | Anhui Huamao Textile Co. Class A | 1,074,064 | 672 |
| | Shanghai ShenTong Metro Co. Ltd. Class A | 465,976 | 672 |
| | Fiberhome Telecommunication Technologies Co. Ltd. Class A (XSHG) | 249,100 | 670 |
| | Sanchuan Wisdom Technology Co. Ltd. Class A | 967,300 | 670 |
| * | Air China Ltd. Class A (XSSC) | 503,438 | 669 |
| | Jinyu Bio-Technology Co. Ltd. Class A (XSHG) | 268,996 | 669 |
| | Visual China Group Co. Ltd. Class A (XSHE) | 323,812 | 669 |
| | Advanced Technology & Materials Co. Ltd. Class A (XSHE) | 501,000 | 667 |
| | Haoxiangni Health Food Co. Ltd. Class A | 506,788 | 667 |
| | Hubei Jiuzhiyang Infrared System Co. Ltd. Class A | 151,237 | 667 |
| | Jiangsu Lianyungang Port Co. Ltd. Class A | 1,211,925 | 666 |
| * | Shanghai Metersbonwe Fashion & Accessories Co. Ltd. Class A | 1,828,400 | 665 |
| | Shandong Shengli Co. Class A | 973,577 | 664 |
| | | | | | Shares | Market
Value•
($000) |
| * | Surfilter Network Technology Co. Ltd. Class A | 617,768 | 663 |
| | Guangzhou Zhiguang Electric Co. Ltd. Class A (XSEC) | 377,400 | 663 |
| * | Chimin Health Management Co. Ltd. Class A | 306,000 | 663 |
| | China South Publishing & Media Group Co. Ltd. Class A (XSSC) | 517,249 | 662 |
| * | Zhejiang Jingxing Paper JSC Ltd. Class A | 1,126,300 | 662 |
| | Zhuhai Huajin Capital Co. Ltd. Class A | 381,017 | 661 |
| | Hongrun Construction Group Co. Ltd. Class A | 1,089,346 | 661 |
| | Tongling Nonferrous Metals Group Co. Ltd. Class A (XSEC) | 1,138,900 | 660 |
| | Hangzhou Shunwang Technology Co. Ltd. Class A | 300,600 | 660 |
| * | Shanghai Fudan Forward S & T Co. Ltd. Class A (XSHG) | 663,450 | 660 |
| | Canny Elevator Co. Ltd. Class A (XSHE) | 578,496 | 660 |
| * | Huafon Microfibre Shanghai Technology Co. Ltd. (XSHE) | 932,955 | 659 |
| * | Fujian Snowman Co. Ltd. Class A | 568,668 | 658 |
| | Betta Pharmaceuticals Co. Ltd. Class A (XSHE) | 53,200 | 658 |
| | ENC Digital Technology Co. Ltd. Class A | 482,090 | 657 |
| | Zhejiang Hisun Pharmaceutical Co. Ltd. Class A (XSHG) | 360,800 | 656 |
Emerging Markets Stock Index Fund
| | | | | | Shares | Market
Value•
($000) |
| | Hangzhou Sunrise Technology Co. Ltd. Class A | 524,066 | 655 |
| | Hainan Expressway Co. Ltd. Class A | 1,056,400 | 654 |
| | Guangzhou Zhiguang Electric Co. Ltd. Class A (XSHE) | 372,300 | 654 |
| | Tangrenshen Group Co. Ltd. Class A (XSHE) | 666,950 | 654 |
| | Jiangling Motors Corp. Ltd. Class B | 635,970 | 653 |
| * | Genimous Technology Co. Ltd. Class A (XSHE) | 691,035 | 653 |
| * | Myhome Real Estate Development Group Co. Ltd. Class A | 2,630,400 | 652 |
| * | Alpha Group Class A (XSHE) | 827,701 | 652 |
| * | Enjoyor Technology Co. Ltd. Class A (XSEC) | 602,900 | 652 |
| | Beijing Water Business Doctor Co. Ltd. Class A (XSEC) | 349,774 | 651 |
| | Ningxia Building Materials Group Co. Ltd. Class A (XSSC) | 388,388 | 650 |
| | Hunan Friendship & Apollo Commercial Co. Ltd. Class A | 1,367,900 | 649 |
| | Shenzhen World Union Group Inc. Class A (XSHE) | 1,106,550 | 649 |
| | Integrated Electronic Systems Lab Co. Ltd. Class A | 550,069 | 649 |
| * | Bluedon Information Security Technology Co. Ltd. Class A | 1,245,056 | 647 |
| * | Hybio Pharmaceutical Co. Ltd. Class A (XSEC) | 815,691 | 646 |
| | Guangdong Guanghong Holdings Co. Ltd. Class A | 720,203 | 645 |
| | | | | | Shares | Market
Value•
($000) |
| | Jointown Pharmaceutical Group Co. Ltd. Class A (XSHG) | 303,520 | 644 |
| | Anhui Guofeng Plastic Industry Co. Ltd. Class A | 716,800 | 643 |
| * | Sichuan Haite High-tech Co. Ltd. Class A (XSEC) | 346,300 | 641 |
| | An Hui Wenergy Co. Ltd. Class A (XSEC) | 934,690 | 641 |
| | Ninestar Corp. Class A (XSEC) | 111,600 | 640 |
| | China Wuyi Co. Ltd. Class A | 1,611,511 | 640 |
| | Jiangsu Huaxicun Co. Ltd. Class A (XSHE) | 704,200 | 640 |
| | Tungkong Inc. Class A | 556,076 | 640 |
| | Weifu High-Technology Group Co. Ltd. Class A | 210,600 | 639 |
| | Bros Eastern Co. Ltd. Class A (XSHG) | 778,810 | 639 |
| * | Jilin Electric Power Co. Ltd. Class A (XSEC) | 539,000 | 638 |
| | Wasu Media Holding Co. Ltd. Class A | 557,300 | 636 |
| | North Huajin Chemical Industries Co. Ltd. Class A (XSHE) | 687,903 | 634 |
| | Shandong Minhe Animal Husbandry Co. Ltd. Class A (XSHE) | 254,283 | 634 |
| | Shenyang Xingqi Pharmaceutical Co. Ltd. Class A | 32,202 | 634 |
| | Shandong Dongyue Organosilicon Material Co. Ltd. Class A (XSHE) | 187,500 | 634 |
| * | Bestway Marine & Energy Technology Co. Ltd. Class A | 913,650 | 633 |
| * | Ningbo Cixing Co. Ltd. Class A | 598,800 | 633 |
| | Huayuan Property Co. Ltd. Class A (XSSC) | 2,201,505 | 633 |
Emerging Markets Stock Index Fund
| | | | | | Shares | Market
Value•
($000) |
| * | Guizhou Bailing Group Pharmaceutical Co. Ltd. Class A (XSHE) | 681,807 | 631 |
| | JCHX Mining Management Co. Ltd. Class A (XSSC) | 183,573 | 630 |
| * | Jiangsu Etern Co. Ltd. Class A (XSHG) | 1,035,970 | 629 |
| | FSPG Hi-Tech Co. Ltd. Class A | 885,500 | 629 |
| | Tangshan Sanyou Chemical Industries Co. Ltd. Class A (XSHG) | 435,200 | 628 |
| | Anhui Heli Co. Ltd. Class A (XSSC) | 382,675 | 628 |
| | Fujian Longma Environmental Sanitation Equipment Co. Ltd. Class A (XSHG) | 321,020 | 628 |
| | Suzhou Jinhong Gas Co. Ltd. Class A | 185,431 | 628 |
| | Zhuzhou Times New Material Technology Co. Ltd. Class A | 394,800 | 627 |
| * | Bank of Zhengzhou Co. Ltd. Class A (XSHE) | 1,186,790 | 627 |
| | Hand Enterprise Solutions Co. Ltd. Class A (XSEC) | 607,000 | 626 |
| | Tangshan Jidong Cement Co. Ltd. Class A (XSEC) | 344,500 | 626 |
| * | Wutong Holding Group Co. Ltd. Class A | 1,092,522 | 625 |
| * | Inner Mongolia Yuan Xing Energy Co. Ltd. Class A (XSEC) | 521,700 | 624 |
| | Jiangnan Mould & Plastic Technology Co. Ltd. Class A | 887,900 | 624 |
| | Xiamen Tungsten Co. Ltd. Class A (XSHG) | 174,200 | 618 |
| | ZhongYeDa Electric Co. Ltd. Class A | 501,400 | 618 |
| | Zhongbai Holdings Group Co. Ltd. Class A | 794,489 | 617 |
| | | | | | Shares | Market
Value•
($000) |
| * | Wuxi Huadong Heavy Machinery Co. Ltd. Class A | 1,022,158 | 617 |
| | Lakala Payment Co. Ltd. Class A | 163,900 | 617 |
| | Shenzhen Overseas Chinese Town Co. Ltd. Class A (XSEC) | 627,000 | 614 |
| | Maoye Commercial Co. Ltd. Class A (XSSC) | 1,154,811 | 614 |
| | Hubei Fuxing Science & Technology Co. Ltd. Class A | 987,200 | 614 |
| * | Liaoning Energy Industry Co. Ltd. | 1,025,900 | 613 |
| | East China Engineering Science & Technology Co. Ltd. Class A | 319,200 | 613 |
| | Beijing eGOVA Co. Ltd. Class A (XSEC) | 312,103 | 612 |
| | Fuan Pharmaceutical Group Co. Ltd. Class A (XSHE) | 990,200 | 611 |
| | Guangzhou Great Power Energy & Technology Co. Ltd. Class A (XSEC) | 130,950 | 611 |
| | Ningbo Zhoushan Port Co. Ltd. Class A (XSHG) | 1,042,200 | 610 |
| | Jiangsu Sunshine Co. Ltd. Class A | 1,785,755 | 609 |
| | Triumph Science & Technology Co. Ltd. Class A (XSHG) | 465,200 | 609 |
| | Guomai Technologies Inc. Class A (XSHE) | 680,179 | 609 |
| | Chongqing Sanfeng Environment Group Corp. Ltd. Class A | 441,300 | 609 |
| * | Everbright Jiabao Co. Ltd. Class A | 1,502,708 | 608 |
| | Shenzhen Batian Ecotypic Engineering Co. Ltd. Class A (XSHE) | 651,251 | 608 |
Emerging Markets Stock Index Fund
| | | | | | Shares | Market
Value•
($000) |
| | Tibet Cheezheng Tibetan Medicine Co. Ltd. Class A | 157,047 | 608 |
| | Xiamen King Long Motor Group Co. Ltd. Class A | 676,646 | 607 |
| | Shenzhen SC New Energy Technology Corp. Class A (XSEC) | 34,000 | 606 |
| | Shandong Homey Aquatic Development Co. Ltd. Class A | 1,478,298 | 606 |
| * | Beijing Watertek Information Technology Co. Ltd. Class A | 1,167,800 | 606 |
| | Chongqing Three Gorges Water Conservancy & Electric Power Co. Ltd. Class A (XSSC) | 404,858 | 605 |
| | ZYNP Corp. Class A | 522,900 | 604 |
| | Anhui Yingliu Electromechanical Co. Ltd. Class A (XSSC) | 194,320 | 604 |
| | Changzhou Tronly New Electronic Materials Co. Ltd. Class A (XSEC) | 325,700 | 603 |
| | Beijing Electronic Zone High-tech Group Co. Ltd. Class A | 1,024,969 | 603 |
| | Shanghai Shimao Co. Ltd. Class A (XSHG) | 1,219,830 | 603 |
| * | Suzhou Jinfu Technology Co. Ltd. Class A | 1,089,400 | 603 |
| * | Eastone Century Technology Co. Ltd. Class A | 843,315 | 603 |
| | Jangho Group Co. Ltd. Class A (XSSC) | 616,507 | 603 |
| * | Rendong Holdings Co. Ltd. | 522,865 | 603 |
| * | Wanda Film Holding Co. Ltd. Class A (XSHE) | 274,800 | 602 |
| | PhiChem Corp. Class A | 217,100 | 601 |
| | Goldcard Smart Group Co. Ltd. (XSHE) | 353,600 | 599 |
| | | | | | Shares | Market
Value•
($000) |
| | Shenzhen Textile Holdings Co. Ltd. Class A | 444,475 | 598 |
| * | Suning Universal Co. Ltd. Class A (XSEC) | 796,549 | 597 |
| * | Beijing WKW Automotive Parts Co. Ltd. Class A | 1,023,576 | 597 |
| | Shanying International Holding Co. Ltd. Class A (XSHG) | 1,176,000 | 596 |
| | Henan Yuguang Gold & Lead Co. Ltd. Class A (XSHG) | 710,800 | 596 |
| | Zhejiang Crystal-Optech Co. Ltd. Class A (XSEC) | 241,898 | 595 |
| | Chengdu Huasun Technology Group Inc. Ltd. | 742,471 | 595 |
| * | Shanghai Shunho New Materials Technology Co. Ltd. Class A | 1,023,800 | 595 |
| | Jilin Aodong Pharmaceutical Group Co. Ltd. Class A (XSEC) | 240,700 | 594 |
| | Tianjin ZhongXin Pharmaceutical Group Corp. Ltd. Class A (XSHG) | 141,500 | �� 592 |
| | Topsec Technologies Group Inc. Class A (XSEC) | 205,200 | 591 |
| | Zhejiang Xinan Chemical Industrial Group Co. Ltd. Class A (XSHG) | 136,600 | 591 |
| * | GI Technologies Group Co. Ltd. Class A | 1,351,260 | 590 |
| * | Global Infotech Co. Ltd. Class A | 388,600 | 590 |
| | Mayinglong Pharmaceutical Group Co. Ltd. Class A (XSSC) | 149,726 | 589 |
| | Guangdong Highsun Group Co. Ltd. Class A | 1,848,180 | 589 |
Emerging Markets Stock Index Fund
| | | | | | Shares | Market
Value•
($000) |
| | Sinoma International Engineering Co. Class A (XSHG) | 361,650 | 588 |
| | Hengbao Co. Ltd. Class A | 671,300 | 588 |
| | Yabao Pharmaceutical Group Co. Ltd. Class A (XSSC) | 623,083 | 588 |
| | Duolun Technology Corp. Ltd. Class A | 587,777 | 588 |
| * | Greatoo Intelligent Equipment Inc. | 2,052,300 | 587 |
| * | Zhongfu Straits Pingtan Development Co. Ltd. Class A | 1,368,344 | 586 |
| * | Huayi Brothers Media Corp. Class A (XSHE) | 1,059,400 | 586 |
| | Guangdong Ellington Electronics Technology Co. Ltd. Class A (XSSC) | 562,164 | 585 |
| * | Gansu Yasheng Industrial Group Co. Ltd. Class A | 1,235,800 | 585 |
| | Northeast Pharmaceutical Group Co. Ltd. Class A | 712,670 | 583 |
| | Gem-Year Industrial Co. Ltd. Class A (XSSC) | 746,111 | 581 |
| | Xinhu Zhongbao Co. Ltd. Class A (XSHG) | 1,292,000 | 581 |
| | Ningbo Ligong Environment & Energy Technology Co. Ltd. Class A | 408,869 | 581 |
| | Newcapec Electronics Co. Ltd. Class A | 488,335 | 581 |
| | Hubei Jumpcan Pharmaceutical Co. Ltd. Class A (XSSC) | 230,447 | 580 |
| * | Inner Mongolia Xingye Mining Co. Ltd. Class A (XSEC) | 503,000 | 578 |
| | Chongqing Gangjiu Co. Ltd. Class A | 1,045,300 | 578 |
| | | | | | Shares | Market
Value•
($000) |
| | Befar Group Co. Ltd. Class A (XSSC) | 439,492 | 577 |
| | Xinjiang Communications Construction Group Co. Ltd. Class A | 348,800 | 577 |
| 1 | Shenzhen Hepalink Pharmaceutical Group Co. Ltd. Class H | 524,500 | 577 |
| | Zhongshan Broad Ocean Motor Co. Ltd. Class A (XSEC) | 542,300 | 576 |
| | Hangzhou Binjiang Real Estate Group Co. Ltd. Class A | 903,400 | 576 |
| | Shandong Xiantan Co. Ltd. Class A (XSHE) | 520,942 | 576 |
| * | China CYTS Tours Holding Co. Ltd. Class A (XSSC) | 367,868 | 575 |
| | RiseSun Real Estate Development Co. Ltd. Class A (XSEC) | 855,744 | 574 |
| | Shanghai Lujiazui Finance & Trade Zone Development Co. Ltd. Class A (XSSC) | 339,094 | 574 |
| | Shenzhen World Union Group Inc. Class A (XSEC) | 978,805 | 574 |
| | China Bester Group Telecom Co. Ltd. Class A (XSHG) | 262,845 | 574 |
| * | China Nonferrous Metal Industry's Foreign Engineering & Construction Co. Ltd. Class A (XSEC) | 713,400 | 573 |
| | Create Technology & Science Co. Ltd. Class A | 385,756 | 573 |
| * | Sunvim Group Co. Ltd. Class A | 909,600 | 573 |
| | Bright Real Estate Group Co. Ltd. Class A (XSSC) | 1,679,474 | 572 |
| * | Ningbo Shuanglin Auto Parts Co. Ltd. Class A | 406,900 | 572 |
Emerging Markets Stock Index Fund
| | | | | | Shares | Market
Value•
($000) |
| | Guangzhou Yuexiu Financial Holdings Group Co. Ltd. Class A (XSEC) | 472,837 | 571 |
| | Sichuan Shuangma Cement Co. Ltd. Class A (XSEC) | 182,100 | 570 |
| | Jiangsu Expressway Co. Ltd. Class A (XSHG) | 428,998 | 570 |
| | Jiangling Motors Corp. Ltd. Class A (XSHE) | 234,298 | 570 |
| | Jinduicheng Molybdenum Co. Ltd. Class A (XSHG) | 501,200 | 569 |
| | Yueyang Forest & Paper Co. Ltd. Class A (XSSC) | 523,380 | 569 |
| | China National Accord Medicines Corp. Ltd. Class A | 108,447 | 568 |
| | Shanghai Tunnel Engineering Co. Ltd. Class A (XSHG) | 711,300 | 568 |
| | Unilumin Group Co. Ltd. Class A (XSHE) | 443,838 | 568 |
| * | Zhejiang Jingu Co. Ltd. Class A | 513,560 | 567 |
| | Sufa Technology Industry Co. Ltd. CNNC Class A | 328,659 | 566 |
| * | Beijing Philisense Technology Co. Ltd. Class A (XSHE) | 878,600 | 566 |
| | Renhe Pharmacy Co. Ltd. Class A (XSEC) | 381,501 | 565 |
| * | Xining Special Steel Co. Ltd. Class A | 979,800 | 565 |
| | Gansu Jingyuan Coal Industry & Electricity Power Co. Ltd. Class A | 1,143,986 | 565 |
| | CITIC Heavy Industries Co. Ltd. Class A (XSSC) | 831,227 | 564 |
| | Shanghai Maling Aquarius Co. Ltd. Class A (XSSC) | 460,698 | 563 |
| * | China Grand Automotive Services Group Co. Ltd. Class A (XSHG) | 1,344,270 | 563 |
| | | | | | Shares | Market
Value•
($000) |
| * | Beijing Dinghan Technology Group Co. Ltd. | 523,300 | 563 |
| | Guangxi Wuzhou Zhongheng Group Co. Ltd. Class A | 1,181,900 | 563 |
| * | Royal Group Co. Ltd. Class A | 810,478 | 562 |
| | Liaoning Cheng Da Co. Ltd. Class A (XSHG) | 176,400 | 561 |
| * | Shaanxi Aerospace Power Hi-Tech Co. Ltd. Class A (XSHG) | 368,800 | 561 |
| * | Sichuan Haite High-tech Co. Ltd. Class A (XSHE) | 302,880 | 560 |
| | China Construction Bank Corp. Class A (XSHG) | 604,100 | 560 |
| * | Hanwang Technology Co. Ltd. Class A | 231,900 | 560 |
| | Realcan Pharmaceutical Group Co. Ltd. Class A (XSHE) | 1,015,910 | 560 |
| | Fujian Star-net Communication Co. Ltd. Class A (XSEC) | 163,400 | 559 |
| | Xinfengming Group Co. Ltd. Class A (XSSC) | 243,655 | 559 |
| | Anhui Wanwei Updated High-Tech Material Industry Co. Ltd. Class A (XSHG) | 500,150 | 559 |
| | Guangxi Guidong Electric Power Co. Ltd. Class A (XSHG) | 616,200 | 559 |
| | Inmyshow Digital Technology Group Co. Ltd. (XSHG) | 338,000 | 559 |
| * | Sou Yu Te Group Co. Ltd. Class A | 2,415,182 | 555 |
| | Hangzhou Weiguang Electronic Co. Ltd. Class A | 202,020 | 555 |
| | Beijing Cisri-Gaona Materials & Technology Co. Ltd. Class A (XSEC) | 84,900 | 555 |
Emerging Markets Stock Index Fund
| | | | | | Shares | Market
Value•
($000) |
| | Tianjin Port Co. Ltd. Class A (XSSC) | 875,263 | 554 |
| | Solareast Holdings Co. Ltd. Class A | 775,159 | 554 |
| | Shanghai SMI Holding Co. Ltd. Class A (XSSC) | 858,852 | 553 |
| * | ChangYuan Technology Group Ltd. (XSHG) | 607,060 | 552 |
| | Beijing Jiaxun Feihong Electrical Co. Ltd. Class A | 611,600 | 551 |
| | Citychamp Dartong Co. Ltd. Class A (XSSC) | 925,633 | 551 |
| | Vontron Technology Co. Ltd. Class A | 423,300 | 550 |
| | SGIS Songshan Co. Ltd. Class A (XSHE) | 794,400 | 550 |
| | Shandong Wohua Pharmaceutical Co. Ltd. Class A | 568,140 | 550 |
| * | Sunsea AIoT Technology Co. Ltd. Class A | 337,045 | 550 |
| * | Zhuhai Hokai Medical Instruments Co. Ltd. Class A | 779,932 | 550 |
| | Fujian Green Pine Co. Ltd. Class A | 355,400 | 550 |
| * | Shenzhen Glory Medical Co. Ltd. Class A | 766,022 | 549 |
| | Unilumin Group Co. Ltd. Class A (XSEC) | 428,200 | 548 |
| * | ChangYuan Technology Group Ltd. (XSSC) | 602,283 | 548 |
| * | Langold Real Estate Co. Ltd. Class A | 1,962,979 | 548 |
| | Shanghai Sinyang Semiconductor Materials Co. Ltd. Class A (XSHE) | 88,500 | 548 |
| | Changshu Fengfan Power Equipment Co. Ltd. Class A (XSSC) | 845,828 | 548 |
| * | Tunghsu Optoelectronic Technology Co. Ltd. Class A (XSEC) | 1,767,600 | 547 |
| | | | | | Shares | Market
Value•
($000) |
| | Chongqing Water Group Co. Ltd. Class A (XSSC) | 623,550 | 547 |
| | Anhui Heli Co. Ltd. Class A (XSHG) | 333,240 | 547 |
| | Huaren Pharmaceutical Co. Ltd. Class A (XSEC) | 856,972 | 547 |
| * | Shenzhen Infinova Ltd. Class A | 1,076,307 | 546 |
| | Tibet Summit Resources Co. Ltd. Class A (XSSC) | 114,132 | 545 |
| * | Jiangsu Sihuan Bioengineering Co. Ltd. Class A | 1,119,200 | 544 |
| | Sanjiang Shopping Club Co. Ltd. Class A | 448,200 | 544 |
| | Juewei Food Co. Ltd. Class A (XSSC) | 52,860 | 543 |
| | Digital China Information Service Co. Ltd. Class A (XSHE) | 311,643 | 543 |
| | ShaanXi Provincial Natural Gas Co. Ltd. Class A | 479,500 | 543 |
| * | Chongyi Zhangyuan Tungsten Industry Co. Ltd. Class A | 410,900 | 543 |
| | Xinjiang Xuefeng Sci-Tech Group Co. Ltd. Class A | 649,200 | 543 |
| | Fujian Rongji Software Co. Ltd. Class A | 609,300 | 542 |
| | Shandong Humon Smelting Co. Ltd. Class A (XSEC) | 301,100 | 540 |
| | Hangzhou Robam Appliances Co. Ltd. Class A (XSEC) | 110,300 | 540 |
| | Shenzhen Energy Group Co. Ltd. Class A (XSEC) | 422,900 | 539 |
| * | China High Speed Railway Technology Co. Ltd. Class A (XSEC) | 1,584,100 | 539 |
| | Yotrio Group Co. Ltd. Class A (XSHE) | 994,750 | 539 |
Emerging Markets Stock Index Fund
| | | | | | Shares | Market
Value•
($000) |
| | Sunward Intelligent Equipment Co. Ltd. Class A (XSHE) | 424,600 | 537 |
| | Beijing Beilu Pharmaceutical Co. Ltd. Class A | 471,900 | 537 |
| | Yantai Dongcheng Pharmaceutical Co. Ltd. Class A (XSEC) | 247,161 | 536 |
| | Hexing Electrical Co. Ltd. Class A (XSSC) | 291,668 | 536 |
| * | Tuya Inc. ADR | 82,665 | 536 |
| | Shanghai Rongtai Health Technology Corp. Ltd. Class A | 120,900 | 535 |
| | Shandong Xinhua Pharmaceutical Co. Ltd. Class A | 457,342 | 535 |
| | Changhong Meiling Co. Ltd. Class A | 1,078,628 | 534 |
| | Rainbow Digital Commercial Co. Ltd. Class A | 537,099 | 533 |
| | Joincare Pharmaceutical Group Industry Co. Ltd. Class A (XSHG) | 294,624 | 531 |
| * | Guangdong Shenglu Telecommunication Tech Co. Ltd. Class A (XSHE) | 649,037 | 531 |
| | Wellhope Foods Co. Ltd. Class A (XSHG) | 371,300 | 531 |
| | Zhuzhou Hongda Electronics Corp. Ltd. Class A (XSEC) | 40,800 | 530 |
| | Shenzhen Kingdom Sci-Tech Co. Ltd. Class A (XSHG) | 268,000 | 530 |
| * | Beijing BDStar Navigation Co. Ltd. Class A (XSEC) | 85,400 | 529 |
| * | Holitech Technology Co. Ltd. Class A (XSEC) | 1,039,700 | 529 |
| | Oriental Pearl Group Co. Ltd. Class A (XSSC) | 438,393 | 529 |
| | Sino-Platinum Metals Co. Ltd. Class A (XSHG) | 148,298 | 529 |
| | | | | | Shares | Market
Value•
($000) |
| | Bros Eastern Co. Ltd. Class A (XSSC) | 644,479 | 529 |
| | Wuxi Commercial Mansion Grand Orient Co. Ltd. Class A (XSHG) | 558,122 | 527 |
| | Zhengzhou Coal Mining Machinery Group Co. Ltd. Class A (XSHG) | 332,200 | 527 |
| * | Tongding Interconnection Information Co. Ltd. Class A (XSHE) | 858,300 | 527 |
| * | Zhejiang Founder Motor Co. Ltd. Class A | 418,986 | 525 |
| | Shenzhen Jieshun Science & Technology Industry Co. Ltd. Class A (XSHE) | 386,900 | 525 |
| | Advanced Technology & Materials Co. Ltd. Class A (XSEC) | 393,500 | 524 |
| * | Henan Rebecca Hair Products Co. Ltd. Class A (XSHG) | 1,267,320 | 524 |
| * | Shanghai 2345 Network Holding Group Co. Ltd. Class A (XSHE) | 1,658,514 | 521 |
| | Jinling Pharmaceutical Co. Ltd. Class A | 508,831 | 519 |
| | Xuchang Yuandong Drive Shaft Co. Ltd. Class A | 595,600 | 519 |
| | Guangdong Aofei Data Technology Co. Ltd. Class A | 156,580 | 519 |
| * | Shenzhen Zhengtong Electronics Co. Ltd. Class A | 479,100 | 518 |
| | Opple Lighting Co. Ltd. Class A | 170,700 | 517 |
| * | Hunan Jingfeng Pharmaceutical Co. Ltd. Class A | 892,853 | 517 |
| | Liaoning SG Automotive Group Co. Ltd. Class A | 926,034 | 517 |
| | Zhejiang Hangmin Co. Ltd. Class A (XSSC) | 607,439 | 516 |
Emerging Markets Stock Index Fund
| | | | | | Shares | Market
Value•
($000) |
| | Heilongjiang Agriculture Co. Ltd. Class A (XSSC) | 239,700 | 515 |
| | China International Marine Containers Group Co. Ltd. Class A (XSEC) | 187,700 | 515 |
| | Triangle Tyre Co. Ltd. Class A | 259,900 | 515 |
| | China Greatwall Technology Group Co. Ltd. Class A (XSEC) | 243,700 | �� 513 |
| | Hengdian Group DMEGC Magnetics Co. Ltd. Class A (XSEC) | 232,500 | 513 |
| * | Tus Environmental Science & Technology Development Co. Ltd. Class A | 845,482 | 512 |
| | Deluxe Family Co. Ltd. Class A (XSHG) | 1,061,600 | 512 |
| | Beijing Zhong Ke San Huan High-Tech Co. Ltd. Class A (XSEC) | 292,000 | 511 |
| * | Chang Jiang Shipping Group Phoenix Co. Ltd. Class A | 993,900 | 511 |
| | Nanjing Gaoke Co. Ltd. Class A (XSHG) | 371,520 | 510 |
| | Fujian Cement Inc. Class A | 472,320 | 509 |
| * | China Quanjude Group Co. Ltd. Class A | 364,000 | 509 |
| * | Xuzhou Handler Special Vehicle Co. Ltd. Class A | 1,041,757 | 508 |
| * | Inspur Software Co. Ltd. Class A (XSSC) | 267,926 | 506 |
| * | Pubang Landscape Architecture Co. Ltd. Class A | 1,835,497 | 505 |
| | North Huajin Chemical Industries Co. Ltd. Class A (XSEC) | 546,600 | 504 |
| | | | | | Shares | Market
Value•
($000) |
| | HPGC Renmintongtai Pharmaceutical Corp. Class A (XSHG) | 550,134 | 504 |
| | Guizhou Yibai Pharmaceutical Co. Ltd. Class A (XSHG) | 569,700 | 504 |
| | Changzheng Engineering Co. Ltd. Class A (XSSC) | 223,016 | 504 |
| | Zhejiang Communications Technology Co. Ltd. (XSEC) | 618,800 | 502 |
| | Guizhou Guihang Automotive Components Co. Ltd. Class A | 215,284 | 502 |
| | Glarun Technology Co. Ltd. Class A (XSHG) | 217,058 | 502 |
| | Shenzhen Agricultural Products Group Co. Ltd. Class A (XSEC) | 461,800 | 501 |
| | NingXia QingLong Pipes Industry Group Co. Ltd. Class A | 430,090 | 501 |
| | Guangdong Delian Group Co. Ltd. Class A | 675,035 | 501 |
| | Qingdao Rural Commercial Bank Corp. Class A (XSEC) | 838,500 | 501 |
| | Hangzhou Advance Gearbox Group Co. Ltd. Class A | 389,709 | 500 |
| * | Dr Peng Telecom & Media Group Co. Ltd. Class A (XSHG) | 548,100 | 499 |
| * | Xingmin Intelligent Transportation Systems Group Co. Ltd. Class A | 595,626 | 498 |
| | Nanjing Xinlian Electronics Co. Ltd. Class A | 855,041 | 497 |
| * | Vtron Group Co. Ltd. Class A | 864,723 | 497 |
| | Guangdong South New Media Co. Ltd. Class A (XSEC) | 67,212 | 497 |
Emerging Markets Stock Index Fund
| | | | | | Shares | Market
Value•
($000) |
| * | Zheshang Securities Co. Ltd. Class A (XSSC) | 257,100 | 495 |
| | Ningbo Sanxing Medical Electric Co. Ltd. Class A (XSHG) | 258,500 | 492 |
| * | Hainan Development Holdings Nanhai Co. Ltd. Class A | 231,700 | 492 |
| | CASIN Real Estate Development Group Co. Ltd. Class A | 1,207,301 | 491 |
| * | Chengdu CORPRO Technology Co. Ltd. Class A (XSHE) | 128,600 | 490 |
| | Xiamen Jihong Technology Co. Ltd. Class A | 206,800 | 490 |
| | Hefei Department Store Group Co. Ltd. Class A | 754,417 | 489 |
| | Wolong Real Estate Group Co. Ltd. Class A (XSSC) | 662,901 | 489 |
| * | Orient Group Inc. Class A | 1,069,700 | 488 |
| | Wuhan Yangtze Communications Industry Group Co. Ltd. Class A | 201,960 | 487 |
| | Zhejiang China Light & Textile Industrial City Group Co. Ltd. Class A (XSHG) | 1,055,320 | 486 |
| | Huaxi Securities Co. Ltd. Class A (XSEC) | 342,700 | 484 |
| * | Doushen Beijing Education & Technology Inc. Class A | 866,539 | 484 |
| | Grinm Advanced Materials Co. Ltd. Class A (XSHG) | 241,500 | 483 |
| | Sanlux Co. Ltd. Class A | 648,400 | 483 |
| | Guangzhou Hangxin Aviation Technology Co. Ltd. Class A | 226,400 | 483 |
| | Zhejiang Red Dragonfly Footwear Co. Ltd. Class A | 566,581 | 481 |
| | | | | | Shares | Market
Value•
($000) |
| | COFCO Capital Holdings Co. Ltd. Class A (XSEC) | 372,900 | 480 |
| | Tianjin Benefo Tejing Electric Co. Ltd. Class A (XSSC) | 602,466 | 480 |
| | Suzhou New District Hi-Tech Industrial Co. Ltd. Class A (XSSC) | 734,406 | 480 |
| | Skyworth Digital Co. Ltd. Class A (XSHE) | 423,200 | 479 |
| | Fujian Longxi Bearing Group Co. Ltd. Class A | 366,699 | 479 |
| | Anker Innovations Technology Co. Ltd. Class A (XSEC) | ��32,900 | 479 |
| | Jangho Group Co. Ltd. Class A (XSHG) | 488,200 | 478 |
| * | Tunghsu Azure Renewable Energy Co. Ltd. Class A (XSEC) | 928,500 | 477 |
| | Shenzhen Gongjin Electronics Co. Ltd. Class A (XSSC) | 384,348 | 477 |
| | Zhende Medical Co. Ltd. Class A | 80,800 | 475 |
| * | China Fortune Land Development Co. Ltd. Class A (XSHG) | 824,578 | 474 |
| * | Huafu Fashion Co. Ltd. (XSEC) | 683,600 | 473 |
| * | Ligeance Aerospace Technology Co. Ltd. Class A (XSHE) | 390,466 | 473 |
| | Tianjin 712 Communication & Broadcasting Co. Ltd. Class A (XSSC) | 80,000 | 472 |
| | Konka Group Co. Ltd. Class A (XSHE) | 535,900 | 471 |
| | Sichuan Tianyi Comheart Telecom Co. Ltd. Class A (XSHE) | 185,900 | 471 |
| | Jiangsu Hongdou Industrial Co. Ltd. Class A (XSSC) | 1,008,153 | 471 |
Emerging Markets Stock Index Fund
| | | | | | Shares | Market
Value•
($000) |
| | Jiangsu SINOJIT Wind Energy Technology Co. Ltd. Class A (XSSC) | 566,627 | 470 |
| | Dongjiang Environmental Co. Ltd. Class A (XSEC) | 440,600 | 469 |
| | Wenfeng Great World Chain Development Corp. Class A (XSSC) | 1,018,013 | 468 |
| | Sunyard Technology Co. Ltd. (XSSC) | 334,854 | 468 |
| | Hunan Mendale Hometextile Co. Ltd. Class A | 762,754 | 467 |
| * | Guang Dong Tloong Technology Group Co. Ltd. Class A | 723,970 | 467 |
| | Beijing Urban Construction Investment & Development Co. Ltd. Class A (XSSC) | 678,255 | 466 |
| | Longmaster Information & Technology Co. Ltd. Class A (XSEC) | 246,300 | 465 |
| * | China Dive Corp. Ltd. Class A (XSHE) | 144,317 | 465 |
| * | Jiangxi Firstar Panel Technology Co. Ltd. Class A | 946,000 | 464 |
| | Beijing Ctrowell Technology Corp. Ltd. Class A | 312,700 | 464 |
| * | Sichuan Languang Development Co. Ltd. Class A (XSHG) | 1,707,860 | 462 |
| | Gansu Qilianshan Cement Group Co. Ltd. Class A (XSHG) | 306,100 | 462 |
| | Zhejiang Communications Technology Co. Ltd. (XSHE) | 568,700 | 462 |
| | China South Publishing & Media Group Co. Ltd. Class A (XSHG) | 361,000 | 462 |
| | | | | | Shares | Market
Value•
($000) |
| * | Zhejiang Yonggui Electric Equipment Co. Ltd. Class A | 330,670 | 460 |
| | Shenzhen Suntak Circuit Technology Co. Ltd. Class A (XSHE) | 213,000 | 459 |
| | Zhejiang JIULI Hi-tech Metals Co. Ltd. Class A (XSHE) | 232,200 | 458 |
| | Chengtun Mining Group Co. Ltd. Class A (XSHG) | 286,400 | 458 |
| | Yotrio Group Co. Ltd. Class A (XSEC) | 844,600 | 457 |
| | Hangzhou Jiebai Group Co. Ltd. Class A (XSSC) | 490,657 | 457 |
| * | Tahoe Group Co. Ltd. Class A (XSHE) | 1,471,400 | 456 |
| * | LingNan Eco&Culture-Tourism Co. Ltd. Class A (XSHE) | 1,091,911 | 456 |
| * | Beijing Orient Landscape & Environment Co. Ltd. Class A | 1,025,055 | 455 |
| | Luenmei Quantum Co. Ltd. Class A (XSSC) | 351,842 | 454 |
| | Nanjing King-Friend Biochemical Pharmaceutical Co. Ltd. Class A (XSSC) | 78,247 | 453 |
| | Dongfeng Electronic Technology Co. Ltd. Class A (XSSC) | 248,888 | 453 |
| * | Shenzhen Grandland Group Co. Ltd. Class A | 1,277,051 | 451 |
| * | Shenzhen Mason Technologies Co. Ltd. Class A | 848,500 | 450 |
| * | Shijiazhuang Changshan BeiMing Technology Co. Ltd. Class A (XSEC) | 442,000 | 448 |
Emerging Markets Stock Index Fund
| | | | | | Shares | Market
Value•
($000) |
| | Shenzhen Anche Technologies Co. Ltd. Class A (XSHE) | 150,000 | 447 |
| | Rongan Property Co. Ltd. Class A (XSEC) | 1,194,572 | 444 |
| * | Guizhou Bailing Group Pharmaceutical Co. Ltd. Class A (XSEC) | 478,500 | 443 |
| | Chongqing Yukaifa Co. Ltd. Class A | 930,100 | 443 |
| * | Suzhou Chunxing Precision Mechanical Co. Ltd. Class A (XSHE) | 781,900 | 443 |
| * | Tianjin Futong Information Science & Technology Co. Ltd. Class A | 1,174,500 | 442 |
| | Poly Union Chemical Holding Group Co. Ltd. Class A | 454,501 | 442 |
| * | Hongbo Co. Ltd. Class A | 456,950 | 442 |
| | China Railway Tielong Container Logistics Co. Ltd. Class A (XSSC) | 597,800 | 441 |
| | Yanzhou Coal Mining Co. Ltd. Class A (XSHG) | 123,865 | 440 |
| | COSCO SHIPPING Energy Transportation Co. Ltd. Class A (XSHG) | 473,300 | 439 |
| | Harbin Hatou Investment Co. Ltd. Class A | 498,900 | 439 |
| * | Xiangxue Pharmaceutical Co. Ltd. Class A | 460,600 | 438 |
| * | Strait Innovation Internet Co. Ltd. Class A | 640,698 | 436 |
| * | Beijing Jetsen Technology Co. Ltd. Class A (XSHE) | 680,212 | 436 |
| * | Red Star Macalline Group Corp. Ltd. Class A | 305,030 | 434 |
| | | | | | Shares | Market
Value•
($000) |
| * | Aerospace Hi-Tech Holdings Grp Ltd. Class A (XSEC) | 330,130 | 433 |
| | Shandong Jinjing Science & Technology Co. Ltd. Class A (XSHG) | 275,100 | 433 |
| * | Qingdao Kingking Applied Chemistry Co. Ltd. Class A | 680,270 | 433 |
| | Hangzhou Zhongheng Electric Co. Ltd. Class A (XSHE) | 325,667 | 433 |
| | Jinneng Science&Technology Co. Ltd. Class A (XSSC) | 195,100 | 432 |
| * | JC Finance & Tax Interconnect Holdings Ltd. Class A (XSHE) | 475,040 | 431 |
| | Nanjing Pharmaceutical Co. Ltd. Class A | 641,662 | 430 |
| | Shenzhen Bauing Construction Holding Group Co. Ltd. Class A (XSHE) | 1,084,024 | 430 |
| * | Huatian Hotel Group Co. Ltd. Class A | 893,800 | 429 |
| | Jiangsu Jiangnan High Polymer Fiber Co. Ltd. Class A (XSSC) | 1,274,005 | 429 |
| | Ningbo Joyson Electronic Corp. Class A (XSSC) | 154,040 | 428 |
| * | Aerospace Hi-Tech Holdings Grp Ltd. Class A (XSHE) | 326,020 | 428 |
| | Wenfeng Great World Chain Development Corp. Class A (XSHG) | 928,000 | 427 |
| | Tongyu Communication Inc. Class A (XSHE) | 182,475 | 427 |
| | Konfoong Materials International Co. Ltd. Class A (XSEC) | 68,000 | 426 |
Emerging Markets Stock Index Fund
| | | | | | Shares | Market
Value•
($000) |
| | Digital China Information Service Co. Ltd. Class A (XSEC) | 243,900 | 425 |
| | Jiangxi Lianchuang Optoelectronic Science & Technology Co. Ltd. Class A (XSHG) | 98,300 | 425 |
| | Jiangsu Lihua Animal Husbandry Stock Co. Ltd. Class A | 89,400 | 425 |
| * | CITIC Guoan Information Industry Co. Ltd. Class A (XSEC) | 1,207,220 | 424 |
| | Zhejiang Wolwo Bio-Pharmaceutical Co. Ltd. Class A (XSEC) | 50,700 | 424 |
| | Transfar Zhilian Co. Ltd. Class A | 331,322 | 424 |
| | Hainan Ruize New Building Material Co. Ltd. Class A (XSHE) | 766,704 | 423 |
| | Hubei Jumpcan Pharmaceutical Co. Ltd. Class A (XSHG) | 167,500 | 422 |
| | Huadian Heavy Industries Co. Ltd. Class A (XSSC) | 604,909 | 422 |
| * | China CYTS Tours Holding Co. Ltd. Class A (XSHG) | 269,300 | 421 |
| * | Cinda Real Estate Co. Ltd. Class A (XSHG) | 837,122 | 420 |
| | Nantong Jianghai Capacitor Co. Ltd. Class A (XSEC) | 118,760 | 420 |
| * | Huafon Microfibre Shanghai Technology Co. Ltd. (XSEC) | 593,346 | 419 |
| * | Inzone Group Co. Ltd. Class A (XSHG) | 557,331 | 419 |
| | Wolong Electric Group Co. Ltd. Class A (XSHG) | 180,200 | 417 |
| | Focused Photonics Hangzhou Inc. Class A (XSHE) | 143,400 | 414 |
| | | | | | Shares | Market
Value•
($000) |
| | Zhejiang Aokang Shoes Co. Ltd. Class A | 359,876 | 414 |
| | Guangdong Topstar Technology Co. Ltd. Class A | 176,500 | 414 |
| | Andon Health Co. Ltd. Class A | 437,956 | 413 |
| | Dalian Huarui Heavy Industry Group Co. Ltd. Class A (XSHE) | 683,920 | 412 |
| * | Guizhou Broadcasting & TV Information Network Co. Ltd. Class A | 603,200 | 412 |
| | PharmaBlock Sciences Nanjing Inc. Class A (XSEC) | 17,291 | 411 |
| * | Saurer Intelligent Technology Co. Ltd. Class A | 925,900 | 411 |
| | Xinyu Iron & Steel Co. Ltd. Class A (XSSC) | 443,400 | 410 |
| * | Shanghai Jiao Yun Co. Ltd. Class A (XSSC) | 643,190 | 408 |
| * | Liaoning Shenhua Holdings Co. Ltd. | 1,326,800 | 405 |
| | Triumph Science & Technology Co. Ltd. Class A (XSSC) | ��� 309,550 | 405 |
| | Guangdong Baolihua New Energy Stock Co. Ltd. Class A (XSEC) | 451,000 | 404 |
| * | Chengdu Xinzhu Road&Bridge Machinery Co. Ltd. Class A | 614,114 | 404 |
| | MYS Group Co. Ltd. Class A (XSHE) | 789,767 | 403 |
| | Anker Innovations Technology Co. Ltd. Class A (XSHE) | 27,600 | 401 |
| | Citychamp Dartong Co. Ltd. Class A (XSHG) | 668,700 | 398 |
| | Xinyangfeng Agricultural Technology Co. Ltd. Class A (XSEC) | 139,800 | 397 |
Emerging Markets Stock Index Fund
| | | | | | Shares | Market
Value•
($000) |
| | COSCO SHIPPING Development Co. Ltd. Class A (XSSC) | 730,576 | 397 |
| | Shenzhen New Nanshan Holding Group Co. Ltd. Class A (XSHE) | 898,744 | 397 |
| | Zhejiang Wanfeng Auto Wheel Co. Ltd. Class A (XSHE) | 481,800 | 396 |
| | Shanghai Maling Aquarius Co. Ltd. Class A (XSHG) | 323,200 | 395 |
| | Zhejiang Wanliyang Co. Ltd. Class A (XSHE) | 186,300 | 394 |
| | Shanghai Chinafortune Co. Ltd. Class A (XSHG) | 196,700 | 394 |
| | Camel Group Co. Ltd. Class A (XSHG) | 190,580 | 390 |
| * | EGing Photovoltaic Technology Co. Ltd. Class A (XSSC) | 579,174 | 390 |
| * | Zhongtong Bus Co. Ltd. | 528,900 | 389 |
| | Universal Scientific Industrial Shanghai Co. Ltd. Class A (XSHG) | 178,938 | 388 |
| | Qinhuangdao Port Co. Ltd. Class A (XSSC) | 931,800 | 386 |
| * | Qinghai Spring Medicinal Resources Technology Co. Ltd. Class A | 388,781 | 386 |
| * | Shenzhen Hongtao Group Co. Ltd. Class A | 1,043,260 | 386 |
| | Zhejiang Ausun Pharmaceutical Co. Ltd. Class A | 99,240 | 386 |
| | Tianjin Benefo Tejing Electric Co. Ltd. Class A (XSHG) | 481,300 | 383 |
| | Ningbo Yunsheng Co. Ltd. Class A (XSHG) | 232,740 | 382 |
| | Shanghai New World Co. Ltd. Class A (XSHG) | 317,000 | 382 |
| | | | | | Shares | Market
Value•
($000) |
| * | Lanzhou LS Heavy Equipment Co. Ltd. Class A (XSSC) | 489,203 | 382 |
| | Shanghai Jin Jiang Online Network Service Co. Ltd. Class A (XSSC) | 280,900 | 381 |
| * | KAISA JiaYun Technology Inc. Class A | 613,020 | 380 |
| | Shenzhen Gongjin Electronics Co. Ltd. Class A (XSHG) | 306,240 | 380 |
| | Edan Instruments Inc. Class A | 225,200 | 380 |
| | Shanghai Jinjiang International Travel Co. Ltd. Class B | 268,749 | 379 |
| * | China Calxon Group Co. Ltd. Class A (XSHE) | 930,900 | 379 |
| * | JiangSu WuZhong Pharmaceutical Development Co. Ltd. Class A (XSSC) | 359,939 | 379 |
| | Shanghai New World Co. Ltd. Class A (XSSC) | 314,400 | 379 |
| | Caitong Securities Co. Ltd. Class A (XSSC) | 235,900 | 378 |
| * | Visionox Technology Inc. Class A (XSEC) | 300,796 | 377 |
| * | JiangSu WuZhong Pharmaceutical Development Co. Ltd. Class A (XSHG) | 358,400 | 377 |
| | Neway Valve Suzhou Co. Ltd. Class A (XSHG) | 251,288 | 377 |
| | Sansure Biotech Inc. Class A | 45,121 | 377 |
| | Xiamen ITG Group Corp. Ltd. Class A (XSHG) | 348,100 | 376 |
| | Shanghai DragonNet Technology Co. Ltd. Class A | 300,901 | 376 |
| | Guangzhou Holike Creative Home Co. Ltd. Class A (XSHG) | 220,658 | 370 |
Emerging Markets Stock Index Fund
| | | | | | Shares | Market
Value•
($000) |
| | Shanghai New Huang Pu Industrial Group Co. Ltd. Class A (XSHG) | 474,480 | 369 |
| | Shenzhen Batian Ecotypic Engineering Co. Ltd. Class A (XSEC) | 395,100 | 369 |
| | Xiamen Kingdomway Group Co. Class A (XSEC) | 77,600 | 368 |
| | Beijing Hualian Department Store Co. Ltd. Class A (XSHE) | 1,344,700 | 368 |
| | China World Trade Center Co. Ltd. Class A (XSHG) | 172,500 | 367 |
| * | ZJBC Information Technology Co. Ltd. Class A | 745,962 | 366 |
| | Changjiang & Jinggong Steel Building Group Co. Ltd. Class A (XSHG) | 590,400 | 366 |
| | Jiangsu SINOJIT Wind Energy Technology Co. Ltd. Class A (XSHG) | 441,600 | 366 |
| | China Merchants Property Operation & Service Co. Ltd. Class A (XSEC) | 173,700 | ��� 366 |
| * | Hainan Mining Co. Ltd. Class A (XSSC) | 153,262 | 366 |
| | Orient International Enterprise Ltd. Class A | 307,800 | 365 |
| | KPC Pharmaceuticals Inc. Class A (XSHG) | 280,088 | 364 |
| * | Harbin Pharmaceutical Group Co. Ltd. Class A (XSHG) | 739,354 | 364 |
| | Guangdong Huatie Tongda High-speed Railway Equipment Corp. Class A (XSEC) | 515,756 | 363 |
| | | | | | Shares | Market
Value•
($000) |
| | Guangzhou Baiyun International Airport Co. Ltd. Class A (XSSC) | 196,466 | 363 |
| * | Shenzhen Rapoo Technology Co. Ltd. Class A | 246,590 | 363 |
| | Hainan Poly Pharm Co. Ltd. Class A (XSEC) | 46,824 | 360 |
| * | Shaanxi Aerospace Power Hi-Tech Co. Ltd. Class A (XSSC) | 236,600 | 360 |
| | Zhejiang NetSun Co. Ltd. Class A (XSEC) | 184,600 | 356 |
| | Yantai Eddie Precision Machinery Co. Ltd. Class A (XSSC) | 63,560 | 355 |
| | Shandong Dawn Polymer Co. Ltd. Class A | 155,700 | 355 |
| | Shanxi Blue Flame Holding Co. Ltd. Class A (XSHE) | 246,440 | 353 |
| * | Henan Rebecca Hair Products Co. Ltd. Class A (XSSC) | 851,887 | 352 |
| | CSG Holding Co. Ltd. Class A | 249,200 | 352 |
| | Western Region Gold Co. Ltd. Class A (XSHG) | 194,400 | 352 |
| * | Guangdong Dongfang Precision Science & Technology Co. Ltd. Class A (XSEC) | 414,800 | 351 |
| | Shenzhen Tellus Holding Co. Ltd. Class A (XSHE) | 159,510 | 351 |
| * | Shandong Yisheng Livestock & Poultry Breeding Co. Ltd. Class A (XSEC) | 210,700 | 350 |
| | Shenzhen Kinwong Electronic Co. Ltd. Class A (XSSC) | 86,772 | 350 |
| * | Jilin Zixin Pharmaceutical Industrial Co. Ltd. Class A (XSHE) | 833,200 | 350 |
Emerging Markets Stock Index Fund
| | | | | | Shares | Market
Value•
($000) |
| | Shenzhen Noposion Agrochemicals Co. Ltd. Class A (XSHE) | 383,200 | 350 |
| | Jiangsu Phoenix Publishing & Media Corp. Ltd. Class A (XSHG) | 319,000 | 350 |
| * | Tongdao Liepin Group | 244,990 | 350 |
| | Suzhou New District Hi-Tech Industrial Co. Ltd. Class A (XSHG) | 534,800 | 349 |
| | Shanghai Kehua Bio-Engineering Co. Ltd. Class A (XSEC) | 160,900 | 346 |
| | Shenzhen H&T Intelligent Control Co. Ltd. Class A (XSEC) | 94,200 | 342 |
| | Jinxi Axle Co. Ltd. Class A (XSHG) | 640,800 | 342 |
| * | Zhejiang Asia-Pacific Mechanical & Electronic Co. Ltd. Class A | 325,300 | 342 |
| | Wuhan Keqian Biology Co. Ltd. Class A | 87,319 | 342 |
| | ChangjiangRunfa Health Industry Co. Ltd. Class A | 442,600 | 341 |
| | Shanghai AtHub Co. Ltd. Class A (XSSC) | 69,580 | 339 |
| * | MCC Meili Cloud Computing Industry Investment Co. Ltd. Class A | 399,728 | 339 |
| | Shenzhen Jieshun Science & Technology Industry Co. Ltd. Class A (XSEC) | 249,626 | 339 |
| | Sichuan Teway Food Group Co. Ltd. Class A | 87,350 | 339 |
| | Jiangsu Gian Technology Co. Ltd. Class A | 45,840 | 339 |
| | Hand Enterprise Solutions Co. Ltd. Class A (XSHE) | 327,100 | 337 |
| | | | | | Shares | Market
Value•
($000) |
| | Sichuan Changhong Electric Co. Ltd. Class A (XSSC) | 787,438 | 335 |
| | Bestsun Energy Co. Ltd. Class A | 436,100 | 333 |
| | Shandong Meichen Ecology & Environment Co. Ltd. Class A | 900,720 | 333 |
| | Ningbo David Medical Device Co. Ltd. Class A (XSEC) | 182,500 | 333 |
| | China Animal Husbandry Industry Co. Ltd. Class A (XSSC) | 201,768 | 333 |
| | China Railway Tielong Container Logistics Co. Ltd. Class A (XSHG) | 450,150 | 332 |
| | Luxin Venture Capital Group Co. Ltd. Class A (XSSC) | 165,708 | 332 |
| | Zhuzhou Qianjin Pharmaceutical Co. Ltd. Class A (XSSC) | 252,760 | 332 |
| | Shanghai Zijiang Enterprise Group Co. Ltd. Class A (XSHG) | 217,600 | 331 |
| | Zhejiang Guyuelongshan Shaoxing Wine Co. Ltd. Class A (XSSC) | 195,598 | 331 |
| * | Shenzhen Silver Basis Technology Co. Ltd. Class A | 355,546 | 330 |
| | Suzhou Gold Mantis Construction Decoration Co. Ltd. Class A (XSEC) | 353,100 | 329 |
| | Beijing Capital Development Co. Ltd. Class A (XSHG) | 428,652 | 329 |
| | Henan Yuguang Gold & Lead Co. Ltd. Class A (XSSC) | 391,300 | 328 |
| | Lucky Film Co. Class A (XSHG) | 309,500 | 328 |
Emerging Markets Stock Index Fund
| | | | | | Shares | Market
Value•
($000) |
| | Jiangsu Broadcasting Cable Information Network Corp. Ltd. Class A | 712,550 | 327 |
| | Luolai Lifestyle Technology Co. Ltd. Class A (XSEC) | 159,604 | 325 |
| * | Kunshan Kersen Science & Technology Co. Ltd. Class A (XSSC) | 203,500 | 325 |
| | Suzhou Anjie Technology Co. Ltd. Class A (XSEC) | 150,460 | 324 |
| | China Wafer Level CSP Co. Ltd. Class A (XSSC) | 50,108 | 324 |
| | Jiangsu Phoenix Property Investment Co. Ltd. Class A (XSSC) | 533,520 | 322 |
| | MYS Group Co. Ltd. Class A (XSEC) | 628,125 | 320 |
| | Qianhe Condiment & Food Co. Ltd. Class A (XSSC) | 82,920 | 319 |
| * | AECC Aero Science & Technology Co. Ltd. Class A (XSSC) | 103,600 | 319 |
| | Bear Electric Appliance Co. Ltd. Class A | 35,700 | 319 |
| | Guangzhou Shangpin Home Collection Co. Ltd. Class A (XSEC) | 46,662 | 318 |
| * | Ligeance Aerospace Technology Co. Ltd. Class A (XSEC) | 262,000 | 318 |
| * | Beijing Philisense Technology Co. Ltd. Class A (XSEC) | 492,033 | 317 |
| | Beijing Hualian Department Store Co. Ltd. Class A (XSEC) | 1,155,081 | 316 |
| | Shenzhen Aisidi Co. Ltd. Class A (XSEC) | 188,800 | 316 |
| | | | | | Shares | Market
Value•
($000) |
| | Long Yuan Construction Group Co. Ltd. Class A (XSHG) | 281,700 | 316 |
| | Maoye Commercial Co. Ltd. Class A (XSHG) | 591,102 | 314 |
| | Chongqing Dima Industry Co. Ltd. Class A (XSHG) | 868,700 | 314 |
| | Accelink Technologies Co. Ltd. Class A (XSEC) | 92,200 | 312 |
| | Shandong Denghai Seeds Co. Ltd. Class A (XSEC) | 93,900 | 312 |
| | Fujian Longking Co. Ltd. Class A (XSHG) | 245,222 | 311 |
| | Tech-Bank Food Co. Ltd. Class A (XSEC) | 315,280 | 310 |
| | Shenzhen Noposion Agrochemicals Co. Ltd. Class A (XSEC) | 338,500 | 309 |
| * | Tunghsu Azure Renewable Energy Co. Ltd. Class A (XSHE) | 597,100 | 307 |
| | Loncin Motor Co. Ltd. Class A (XSHG) | 448,250 | 306 |
| * | Sichuan Xun You Network Technology Co. Ltd. Class A (XSHE) | 152,900 | 305 |
| | Jiangsu Expressway Co. Ltd. Class A (XSSC) | 228,800 | 304 |
| | Sichuan EM Technology Co. Ltd. Class A (XSSC) | 127,140 | 304 |
| | Changzhou Tronly New Electronic Materials Co. Ltd. Class A (XSHE) | 164,114 | 304 |
| | Rongan Property Co. Ltd. Class A (XSHE) | 814,200 | 303 |
| * | Jiangsu Yueda Investment Co. Ltd. Class A (XSSC) | 486,700 | 303 |
Emerging Markets Stock Index Fund
| | | | | | Shares | Market
Value•
($000) |
| | Greattown Holdings Ltd. Class A (XSSC) | 546,421 | 302 |
| | Qinhuangdao Port Co. Ltd. Class A (XSHG) | 729,500 | 302 |
| | Shanghai Dazhong Public Utilities Group Co. Ltd. Class A (XSSC) | 513,800 | 301 |
| | Sichuan Kelun Pharmaceutical Co. Ltd. Class A (XSEC) | 108,400 | 300 |
| | Hangzhou Zhongheng Electric Co. Ltd. Class A (XSEC) | 225,600 | 300 |
| | Skyworth Digital Co. Ltd. Class A (XSEC) | 262,900 | 298 |
| | Tian Di Science & Technology Co. Ltd. Class A (XSHG) | 456,100 | 298 |
| * | Yihua Healthcare Co. Ltd. Class A (XSHE) | 495,958 | 297 |
| * | Macrolink Culturaltainment Development Co. Ltd. Class A (XSHE) | 1,056,632 | 297 |
| * | Sinosun Technology Co. Ltd. Class A | 271,600 | 295 |
| | Zhejiang Hailiang Co. Ltd. Class A (XSEC) | 178,300 | 293 |
| | Shanghai Kelai Mechatronics Engineering Co. Ltd. Class A | 61,000 | 290 |
| | Huadian Heavy Industries Co. Ltd. Class A (XSHG) | 414,676 | 289 |
| | Easyhome New Retail Group Co. Ltd. Class A | 378,500 | 289 |
| | LianChuang Electronic Technology Co. Ltd. Class A (XSEC) | 90,700 | 288 |
| | Guizhou Gas Group Corp. Ltd. Class A (XSSC) | 184,400 | 286 |
| * | Gree Real Estate Co. Ltd. Class A (XSHG) | 271,320 | 285 |
| | | | | | Shares | Market
Value•
($000) |
| * | Guangdong Golden Dragon Development Inc. Class A (XSEC) | 114,600 | 284 |
| | Zhejiang China Light & Textile Industrial City Group Co. Ltd. Class A (XSSC) | 615,704 | 284 |
| * | Kunshan Kersen Science & Technology Co. Ltd. Class A (XSHG) | 177,968 | 284 |
| | Guangdong Anjubao Digital Technology Co. Ltd. Class A | 298,900 | 283 |
| | Chongqing Dima Industry Co. Ltd. Class A (XSSC) | 778,307 | 281 |
| | Zhejiang Daily Digital Culture Group Co. Ltd. Class A (XSSC) | 241,888 | 281 |
| | CCS Supply Chain Management Co. Ltd. Class A | 327,540 | 278 |
| | Huabao Flavours & Fragrances Co. Ltd. Class A (XSEC) | 42,321 | 276 |
| | Wuxi Commercial Mansion Grand Orient Co. Ltd. Class A (XSSC) | 291,225 | 275 |
| * | Pacific Shuanglin Bio-pharmacy Co. Ltd. (XSEC) | 55,800 | 275 |
| | Zhejiang Weixing New Building Materials Co. Ltd. Class A (XSHE) | 97,600 | 274 |
| | Guangzhou Automobile Group Co. Ltd. Class A (XSHG) | 100,920 | 273 |
| * | Taiyuan Heavy Industry Co. Ltd. Class A (XSHG) | 613,100 | 272 |
| * | Yihua Healthcare Co. Ltd. Class A (XSEC) | 452,475 | 271 |
| * | STO Express Co. Ltd. Class A (XSEC) | 223,899 | 269 |
Emerging Markets Stock Index Fund
| | | | | | Shares | Market
Value•
($000) |
| * | Pengdu Agriculture & Animal Husbandry Co. Ltd. Class A (XSEC) | 495,300 | 269 |
| | Rastar Group Class A | 558,700 | 269 |
| | Hangzhou Jiebai Group Co. Ltd. Class A (XSHG) | 287,900 | 268 |
| * | Alpha Group Class A (XSEC) | 339,300 | 267 |
| | Jinxi Axle Co. Ltd. Class A (XSSC) | 501,211 | 267 |
| * | China High Speed Railway Technology Co. Ltd. Class A (XSHE) | 782,197 | 266 |
| * | Shanghai Xinhua Media Co. Ltd. Class A | 426,500 | 266 |
| * | Kama Co. Ltd. Class B | 775,500 | 264 |
| * | Simei Media Co. Ltd. Class A | 392,500 | 264 |
| * | Hengdian Entertainment Co. Ltd. Class A | 133,722 | 263 |
| | Jiangsu Zhangjiagang Rural Commercial Bank Co. Ltd. Class A (XSHE) | 270,600 | 262 |
| | Beijing Teamsun Technology Co. Ltd. Class A (XSHG) | 271,420 | 261 |
| | Changzheng Engineering Co. Ltd. Class A (XSHG) | 115,530 | 261 |
| * | Jiangsu Yueda Investment Co. Ltd. Class A (XSHG) | 417,600 | 260 |
| | CECEP Wind-Power Corp. Class A (XSHG) | 225,800 | 260 |
| | Guomai Technologies Inc. Class A (XSEC) | 287,886 | 258 |
| | LB Group Co. Ltd. Class A (XSEC) | 58,100 | 258 |
| | Goldenmax International Technology Ltd. Class A (XSEC) | 123,800 | 258 |
| | | | | | Shares | Market
Value•
($000) |
| | Wuxi Taiji Industry Co. Ltd. Class A (XSHG) | 204,420 | 256 |
| | Yabao Pharmaceutical Group Co. Ltd. Class A (XSHG) | 270,400 | 255 |
| | Streamax Technology Co. Ltd. Class A | 48,900 | 255 |
| * | Yunnan Coal & Energy Co. Ltd. Class A | 375,800 | 251 |
| | Black Peony Group Co. Ltd. Class A (XSHG) | 225,400 | 250 |
| | Chongqing Pharscin Pharmaceutical Co. Ltd. Class A | 139,600 | 249 |
| | Lingyun Industrial Corp. Ltd. Class A (XSHG) | 178,724 | 249 |
| | Beijing Bashi Media Co. Ltd. Class A (XSSC) | 439,434 | 249 |
| * | Shanghai Shenda Co. Ltd. Class A (XSSC) | 427,300 | 247 |
| | Jiangsu Phoenix Property Investment Co. Ltd. Class A (XSHG) | 409,000 | 247 |
| | Zhejiang Wanma Co. Ltd. Class A (XSHE) | 221,800 | 244 |
| * | Tahoe Group Co. Ltd. Class A (XSEC) | 788,200 | 244 |
| | Guangxi Guidong Electric Power Co. Ltd. Class A (XSSC) | 267,700 | 243 |
| | China Harzone Industry Corp. Ltd. Class A (XSHE) | 192,543 | 243 |
| | QuantumCTek Co. Ltd. Class A | 8,818 | 241 |
| | CQ Pharmaceutical Holding Co. Ltd. Class A (XSEC) | 321,900 | 240 |
| | Jiangsu Yoke Technology Co. Ltd. Class A (XSEC) | 20,100 | 239 |
| | Avary Holding Shenzhen Co. Ltd. Class A (XSEC) | 43,500 | 238 |
Emerging Markets Stock Index Fund
| | | | | | Shares | Market
Value•
($000) |
| * | Tangel Culture Co. Ltd. Class A | 416,600 | 236 |
| | Hunan Aihua Group Co. Ltd. Class A (XSSC) | 42,200 | 235 |
| | Realcan Pharmaceutical Group Co. Ltd. Class A (XSEC) | 420,100 | 232 |
| | Huaren Pharmaceutical Co. Ltd. Class A (XSHE) | 363,900 | 232 |
| | Lucky Film Co. Class A (XSSC) | 219,191 | 232 |
| * | Kunwu Jiuding Investment Holdings Co. Ltd. Class A (XSSC) | 106,168 | 231 |
| | Shanghai New Huang Pu Industrial Group Co. Ltd. Class A (XSSC) | 294,716 | 229 |
| | Huafa Industrial Co. Ltd. Zhuhai Class A (XSHG) | 276,840 | 228 |
| * | JC Finance & Tax Interconnect Holdings Ltd. Class A (XSEC) | 250,100 | 227 |
| | Hanyu Group Joint-Stock Co. Ltd. Class A | 249,500 | 225 |
| | Hexing Electrical Co. Ltd. Class A (XSHG) | 120,021 | 221 |
| | Songz Automobile Air Conditioning Co. Ltd. Class A | 187,400 | 219 |
| * | LingNan Eco&Culture-Tourism Co. Ltd. Class A (XSEC) | 521,400 | 218 |
| | Shanghai Industrial Development Co. Ltd. Class A (XSHG) | 357,890 | 217 |
| | Ningxia Building Materials Group Co. Ltd. Class A (XSHG) | 129,000 | 216 |
| * | Oceanwide Holdings Co. Ltd. Class A (XSEC) | 767,000 | 213 |
| | Xiamen International Airport Co. Ltd. Class A | 84,970 | 212 |
| | | | | | Shares | Market
Value•
($000) |
| | Canny Elevator Co. Ltd. Class A (XSEC) | 185,877 | 212 |
| | Deluxe Family Co. Ltd. Class A (XSSC) | 437,436 | 211 |
| | Guizhou Yibai Pharmaceutical Co. Ltd. Class A (XSSC) | 237,100 | 210 |
| | Suzhou TFC Optical Communication Co. Ltd. Class A (XSEC) | 52,200 | 209 |
| | China Great Wall Securities Co. Ltd. Class A (XSEC) | 115,600 | 207 |
| | Wolong Real Estate Group Co. Ltd. Class A (XSHG) | 280,100 | 207 |
| | Tianjin Tianyao Pharmaceutical Co. Ltd. Class A | 325,200 | 207 |
| | Beijing Bashi Media Co. Ltd. Class A (XSHG) | 362,236 | 205 |
| | Shanghai Pudong Construction Co. Ltd. Class A (XSHG) | 227,783 | 205 |
| * | Macrolink Culturaltainment Development Co. Ltd. Class A (XSEC) | 718,242 | 202 |
| | Zhuzhou Qianjin Pharmaceutical Co. Ltd. Class A (XSHG) | 153,960 | 202 |
| | Shaanxi Broadcast & TV Network Intermediary Group Co. Ltd. Class A | 248,200 | 201 |
| | Dalian Huarui Heavy Industry Group Co. Ltd. Class A (XSEC) | 331,600 | 200 |
| * | Shanghai Foreign Service Holding Group Co. Ltd. (XSSC) | 168,000 | 200 |
| | Shenzhen Sunlord Electronics Co. Ltd. Class A (XSEC) | 38,500 | 199 |
| * | Berry Genomics Co. Ltd. Class A (XSEC) | 65,305 | 198 |
Emerging Markets Stock Index Fund
| | | | | | Shares | Market
Value•
($000) |
| | Blue Sail Medical Co. Ltd. Class A (XSEC) | 87,564 | 198 |
| | Norinco International Cooperation Ltd. Class A | 168,845 | 198 |
| | Zhejiang Jingxin Pharmaceutical Co. Ltd. Class A (XSHE) | 155,280 | 196 |
| | Hytera Communications Corp. Ltd. Class A (XSEC) | 219,500 | 194 |
| | C&S Paper Co. Ltd. Class A (XSEC) | 72,800 | 194 |
| * | Sichuan Xun You Network Technology Co. Ltd. Class A (XSEC) | 97,194 | 194 |
| | Yantai Zhenghai Magnetic Material Co. Ltd. Class A (XSEC) | 109,800 | 193 |
| | Chongqing Zongshen Power Machinery Co. Ltd. Class A (XSEC) | 187,500 | 192 |
| * | Shanghai Jiao Yun Co. Ltd. Class A (XSHG) | 293,500 | 186 |
| | Hunan Er-Kang Pharmaceutical Co. Ltd. Class A (XSHE) | 291,100 | 186 |
| * | Grandjoy Holdings Group Co. Ltd. Class A (XSEC) | 359,500 | 185 |
| | Zhejiang Orient Financial Holdings Group Co. Ltd. Class A (XSHG) | 290,550 | 185 |
| * | EGing Photovoltaic Technology Co. Ltd. Class A (XSHG) | 271,800 | 183 |
| | Hangxiao Steel Structure Co. Ltd. Class A (XSSC) | 324,200 | 181 |
| | JL Mag Rare-Earth Co. Ltd. Class A (XSEC) | 29,120 | 178 |
| * | Jiangsu Kanion Pharmaceutical Co. Ltd. Class A (XSSC) | 121,218 | 178 |
| | | | | | Shares | Market
Value•
($000) |
| | Guangdong Tapai Group Co. Ltd. Class A (XSEC) | 110,900 | 174 |
| | Beijing eGOVA Co. Ltd. Class A (XSHE) | 88,441 | 173 |
| | Ningbo David Medical Device Co. Ltd. Class A (XSHE) | 94,800 | 173 |
| * | Beijing Jingyuntong Technology Co. Ltd. Class A (XSSC) | 96,388 | 172 |
| | Baosheng Science & Technology Innovation Co. Ltd. Class A (XSHG) | 226,569 | 172 |
| | People.cn Co. Ltd. Class A (XSSC) | 83,981 | 172 |
| | Changshu Fengfan Power Equipment Co. Ltd. Class A (XSHG) | 263,500 | 171 |
| * | Polaris Bay Group Co. Ltd. Class A (XSSC) | 118,400 | 170 |
| | Shenzhen Megmeet Electrical Co. Ltd. Class A (XSEC) | 35,200 | 169 |
| * | Suzhou Chunxing Precision Mechanical Co. Ltd. Class A (XSEC) | 293,600 | 166 |
| * | Guangzhou Pearl River Industrial Development Co. Ltd. Class A | 342,120 | 166 |
| | Guangdong Dowstone Technology Co. Ltd. Class A (XSHE) | 36,700 | 166 |
| * | Tongding Interconnection Information Co. Ltd. Class A (XSEC) | 268,000 | 165 |
| * | Jilin Zixin Pharmaceutical Industrial Co. Ltd. Class A (XSEC) | 393,700 | 165 |
| | TangShan Port Group Co. Ltd. Class A (XSHG) | 391,248 | 163 |
Emerging Markets Stock Index Fund
| | | | | | Shares | Market
Value•
($000) |
| | PCI Technology Group Co. Ltd. Class A (XSSC) | 135,900 | 161 |
| | Zhejiang Yasha Decoration Co. Ltd. Class A (XSEC) | 138,500 | 161 |
| | Shantou Dongfeng Printing Co. Ltd. Class A | 154,800 | 161 |
| * | Sumavision Technologies Co. Ltd. Class A (XSEC) | 135,700 | 160 |
| | Sichuan Expressway Co. Ltd. Class A (XSHG) | 284,100 | 160 |
| * | Shunfa Hengye Corp. Class A (XSEC) | 271,120 | 159 |
| | Shenzhen New Industries Biomedical Engineering Co. Ltd. Class A (XSEC) | 24,300 | 158 |
| | Dongfeng Electronic Technology Co. Ltd. Class A (XSHG) | 86,000 | 157 |
| | Shenzhen Comix Group Co. Ltd. Class A | 151,600 | 157 |
| | Shanghai STEP Electric Corp. Class A | 134,100 | 156 |
| | Longmaster Information & Technology Co. Ltd. Class A (XSHE) | 82,600 | 156 |
| | KingClean Electric Co. Ltd. Class A | 39,600 | 155 |
| | Guangzhou Zhujiang Brewery Co. Ltd. Class A (XSEC) | 100,200 | 155 |
| | Shenzhen Desay Battery Technology Co. Class A (XSEC) | 23,345 | 154 |
| | Gem-Year Industrial Co. Ltd. Class A (XSHG) | 196,000 | 153 |
| | | | | | Shares | Market
Value•
($000) |
| | CGN Nuclear Technology Development Co. Ltd. Class A (XSEC) | 108,598 | 151 |
| | Jiangsu Jiangnan High Polymer Fiber Co. Ltd. Class A (XSHG) | 448,520 | 151 |
| | Shandong Minhe Animal Husbandry Co. Ltd. Class A (XSEC) | 58,900 | 147 |
| | Kailuan Energy Chemical Co. Ltd. Class A (XSSC) | 121,600 | 147 |
| | Imeik Technology Development Co. Ltd. Class A (XSEC) | 1,500 | 146 |
| | Shaanxi International Trust Co. Ltd. Class A (XSEC) | 298,400 | 145 |
| | China Enterprise Co. Ltd. Class A (XSSC) | 325,000 | 145 |
| | Shenzhen Tellus Holding Co. Ltd. Class A (XSEC) | 64,297 | 141 |
| * | Minmetals Development Co. Ltd. Class A (XSSC) | 104,800 | 140 |
| | Shandong Xiantan Co. Ltd. Class A (XSEC) | 125,850 | 139 |
| | Shanghai Mechanical & Electrical Industry Co. Ltd. Class A (XSSC) | 60,430 | 137 |
| | Hainan Strait Shipping Co. Ltd. Class A (XSEC) | 152,250 | 134 |
| | Shenzhen Heungkong Holding Co. Ltd. Class A (XSHG) | 454,350 | 133 |
| | Bright Real Estate Group Co. Ltd. Class A (XSHG) | 388,531 | 132 |
| * | Sichuan Languang Development Co. Ltd. Class A (XSSC) | 484,272 | 131 |
| * | Innuovo Technology Co. Ltd. Class A (XSEC) | 158,700 | 131 |
Emerging Markets Stock Index Fund
| | | | | | Shares | Market
Value•
($000) |
| | Eoptolink Technology Inc. Ltd. Class A (XSEC) | 29,545 | 131 |
| | Tongyu Communication Inc. Class A (XSEC) | 55,500 | 130 |
| | Tianfeng Securities Co. Ltd. Class A (XSSC) | 209,400 | 129 |
| | YanTai Shuangta Food Co. Ltd. Class A (XSEC) | 90,500 | 129 |
| | Fuan Pharmaceutical Group Co. Ltd. Class A (XSEC) | 206,900 | 128 |
| | Huayuan Property Co. Ltd. Class A (XSHG) | 440,570 | 127 |
| | Sichuan Tianyi Comheart Telecom Co. Ltd. Class A (XSEC) | 49,700 | 126 |
| | Toly Bread Co. Ltd. Class A (XSSC) | 25,340 | 124 |
| | Hainan Ruize New Building Material Co. Ltd. Class A (XSEC) | 219,000 | 121 |
| | Tangrenshen Group Co. Ltd. Class A (XSEC) | 120,100 | 118 |
| * | Jiangsu Etern Co. Ltd. Class A (XSSC) | 195,000 | 118 |
| | Jointo Energy Investment Co. Ltd. Hebei Class A (XSEC) | 145,900 | 117 |
| | Shenzhen New Nanshan Holding Group Co. Ltd. Class A (XSEC) | 259,700 | 115 |
| | Fujian Aonong Biological Technology Group Inc. Ltd. Class A (XSSC) | 72,280 | 115 |
| | Beijing Jingneng Power Co. Ltd. Class A (XSHG) | 252,800 | 115 |
| | China Bester Group Telecom Co. Ltd. Class A (XSSC) | 52,000 | 114 |
| | 263 Network Communications Co. Ltd. Class A (XSEC) | 194,200 | 114 |
| | | | | | Shares | Market
Value•
($000) |
| | Shanghai Tongji Science & Technology Industrial Co. Ltd. Class A (XSHG) | 93,600 | 113 |
| * | Shanghai Shenda Co. Ltd. Class A (XSHG) | 195,100 | 113 |
| | Guangxi Liuzhou Pharmaceutical Co. Ltd. Class A (XSSC) | 46,620 | 111 |
| | Changzhou Qianhong Biopharma Co. Ltd. Class A (XSEC) | 171,350 | 111 |
| * | Huayi Brothers Media Corp. Class A (XSEC) | 195,302 | 108 |
| | Zhejiang Orient Gene Biotech Co. Ltd. Class A (XSSC) | 4,800 | 107 |
| | Zhejiang Huatong Meat Products Co. Ltd. Class A | 65,700 | 106 |
| | Guangdong Ellington Electronics Technology Co. Ltd. Class A (XSHG) | 101,000 | 105 |
| | Infore Environment Technology Group Co. Ltd. Class A (XSEC) | 105,300 | 103 |
| * | Lanzhou LS Heavy Equipment Co. Ltd. Class A (XSHG) | 129,885 | 102 |
| | Huadong Medicine Co. Ltd. Class A (XSEC) | 17,700 | 101 |
| * | Wuhan P&S Information Technology Co. Ltd. Class A (XSEC) | 105,700 | 100 |
| | Better Life Commercial Chain Share Co. Ltd. Class A (XSEC) | 94,200 | 99 |
| | Anhui Hengyuan Coal Industry & Electricity Power Co. Ltd. Class A (XSHG) | 89,440 | 98 |
Emerging Markets Stock Index Fund
| | | | | | Shares | Market
Value•
($000) |
| | Anhui Kouzi Distillery Co. Ltd. Class A (XSHG) | 10,400 | 98 |
| | GF Securities Co. Ltd. Class A (XSEC) | 29,900 | 94 |
| | Dlg Exhibitions & Events Corp. Ltd. Class A | 71,800 | 90 |
| | Shanghai Phoenix Enterprise Group Co. Ltd. Class B | 229,100 | 89 |
| | Zhejiang NetSun Co. Ltd. Class A (XSHE) | 45,000 | 87 |
| | Jiangsu Huaxicun Co. Ltd. Class A (XSEC) | 95,200 | 86 |
| | Beijing North Star Co. Ltd. Class A (XSHG) | 247,700 | 86 |
| * | China Dive Corp. Ltd. Class A (XSEC) | 26,600 | 86 |
| | Shenzhen Bauing Construction Holding Group Co. Ltd. Class A (XSEC) | 207,400 | 82 |
| | Zhejiang Hisoar Pharmaceutical Co. Ltd. Class A (XSEC) | 67,400 | 82 |
| * | Guangdong Shenglu Telecommunication Tech Co. Ltd. Class A (XSEC) | 98,000 | 80 |
| | Jiangling Motors Corp. Ltd. Class A (XSEC) | 31,900 | 78 |
| * | Shanghai Topcare Medical Services Co. Ltd. (XSSC) | 27,800 | 78 |
| * | HyUnion Holding Co. Ltd. Class A (XSEC) | 87,800 | 77 |
| * | Xiwang Foodstuffs Co. Ltd. Class A (XSEC) | 106,164 | 77 |
| | Neway Valve Suzhou Co. Ltd. Class A (XSSC) | 48,721 | 73 |
| | Zhejiang Garden Bio-Chemical High-tech Co. Ltd. Class A (XSEC) | 34,100 | 71 |
| | Changhong Meiling Co. Ltd. Class B | 231,154 | 70 |
| | | | | | Shares | Market
Value•
($000) |
| * | China Reform Health Management & Services Group Co. Ltd. Class A (XSEC) | 70,600 | 68 |
| | Vatti Corp. Ltd. Class A (XSEC) | 73,700 | 68 |
| | Bank of Qingdao Co. Ltd. Class A (XSEC) | 92,400 | 68 |
| | Jiangsu Nhwa Pharmaceutical Co. Ltd. Class A (XSEC) | 29,000 | 67 |
| | Fujian Longma Environmental Sanitation Equipment Co. Ltd. Class A (XSSC) | 34,300 | 67 |
| | Beijing VRV Software Corp. Ltd. Class A (XSEC) | 73,500 | 64 |
| * | Hybio Pharmaceutical Co. Ltd. Class A (XSHE) | 80,700 | 64 |
| | HPGC Renmintongtai Pharmaceutical Corp. Class A (XSSC) | 69,000 | 63 |
| | Zhejiang Meida Industrial Co. Ltd. Class A (XSHE) | 24,400 | 62 |
| * | Guangxi Radio & Television Information Network Corp. Ltd. Class A | 152,800 | 62 |
| * | Enjoyor Technology Co. Ltd. Class A (XSHE) | 56,200 | 61 |
| | Goldcard Smart Group Co. Ltd. (XSEC) | 35,510 | 60 |
| * | Inzone Group Co. Ltd. Class A (XSSC) | 78,132 | 59 |
| | Hebei Chengde Lolo Co. Class A (XSEC) | 36,020 | 58 |
| | COSCO SHIPPING Specialized Carriers Co. Ltd. Class A (XSSC) | 67,400 | 56 |
Emerging Markets Stock Index Fund
| | | | | | Shares | Market
Value•
($000) |
| | Shenzhen Anche Technologies Co. Ltd. Class A (XSEC) | 18,400 | 55 |
| | Guangdong Shirongzhaoye Co. Ltd. Class A (XSEC) | 70,056 | 53 |
| | Shenzhen Center Power Tech Co. Ltd. Class A (XSEC) | 17,600 | 46 |
| * | China Calxon Group Co. Ltd. Class A (XSEC) | 109,448 | 45 |
| | Zhejiang Weiming Environment Protection Co. Ltd. Class A (XSEC) | 10,400 | 45 |
| | Shanghai Pharmaceuticals Holding Co. Ltd. Class A (XSSC) | 14,594 | 43 |
| * | Luoniushan Co. Ltd. Class A (XSEC) | 40,200 | 43 |
| | Shanghai Haixin Group Co. Class A | 32,500 | 43 |
| | Yunda Holding Co. Ltd. Class A (XSEC) | 14,427 | 42 |
| | Shenzhen Das Intellitech Co. Ltd. Class A (XSEC) | 71,600 | 38 |
| | Jiangsu Zijin Rural Commercial Bank Co. Ltd. Class A (XSSC) | 71,500 | 36 |
| | Xinhua Winshare Publishing & Media Co. Ltd. Class H | 48,524 | 35 |
| * | Shanghai Xinnanyang Only Education & Technology Co. Ltd. Class A (XSSC) | 19,087 | 33 |
| | Lu Thai Textile Co. Ltd. Class A | 35,300 | 33 |
| | Eastern Communications Co. Ltd. Class B | 63,500 | 28 |
| | Guangxi Wuzhou Communications Co. Ltd. Class A | 47,100 | 27 |
| | | | | | Shares | Market
Value•
($000) |
| * | Shanghai Xinnanyang Only Education & Technology Co. Ltd. Class A (XSHG) | 15,062 | 26 |
| | Guangzhou Holike Creative Home Co. Ltd. Class A (XSSC) | 14,800 | 25 |
| | Shanghai Pudong Construction Co. Ltd. Class A (XSSC) | 15,741 | 14 |
| | Guizhou Panjiang Refined Coal Co. Ltd. Class A (XSSC) | 9,700 | 12 |
| *,3 | Shenwu Environmental Technology Co. Ltd. | 616,265 | 12 |
| * | Shanghai Fudan Forward S & T Co. Ltd. Class A (XSSC) | 10,910 | 11 |
| *,2,3 | Midas Holdings Ltd. | 202,000 | — |
| *,1,3 | Tianhe Chemicals Group Ltd. | 57,304,542 | — |
| *,2,3 | China Huishan Dairy Holdings Co. Ltd. | 70,679,103 | — |
| *,3 | China Fiber Optic Network System Group Ltd. | 17,564,000 | — |
| *,3 | Hua Han Health Industry Holdings Ltd. | 13,993,028 | — |
| *,3 | CT Environmental Group Ltd. | 38,490,600 | — |
| | | | | | | 40,396,390 |
| Colombia (0.2%) |
| | Bancolombia SA ADR | 1,635,908 | 58,778 |
| | Interconexion Electrica SA ESP | 6,399,321 | 38,422 |
| | Ecopetrol SA | 42,707,437 | 32,288 |
| | Bancolombia SA | 2,276,027 | 20,356 |
| 2 | Ecopetrol SA ADR | 1,062,121 | 16,091 |
| | Grupo de Inversiones Suramericana SA | 2,596,353 | 15,134 |
| | Grupo Aval Acciones y Valores SA Preference Shares | 48,956,397 | 14,951 |
| | Grupo Argos SA | 4,309,947 | 13,505 |
Emerging Markets Stock Index Fund
| | | | | | Shares | Market
Value•
($000) |
| * | Banco Davivienda SA Preference Shares | 1,482,616 | 13,351 |
| | Cementos Argos SA | 7,115,548 | 11,999 |
| | Bancolombia SA Preference Shares | 1,201,548 | 10,785 |
| | Grupo de Inversiones Suramericana SA Preference Shares | 1,574,290 | 7,897 |
| | Grupo Aval Acciones y Valores SA ADR | 652,479 | 3,934 |
| | | | | | | 257,491 |
| Czech Republic (0.1%) |
| | CEZ A/S | 2,296,012 | 75,831 |
| * | Komercni Banka A/S | 1,101,716 | 42,734 |
| *,1 | Moneta Money Bank A/S | 4,015,732 | 15,726 |
| 2 | O2 Czech Republic A/S | 507,158 | 5,823 |
| | Philip Morris CR A/S | 6,097 | 4,333 |
| | | | | | | 144,447 |
| Egypt (0.1%) |
| * | Commercial International Bank Egypt SAE | 23,522,358 | 76,575 |
| * | Egypt Kuwait Holding Co. SAE | 12,233,365 | 16,676 |
| | Eastern Co. SAE | 14,144,020 | 10,438 |
| * | Egyptian Financial Group-Hermes Holding Co. | 11,365,371 | 9,014 |
| * | Fawry for Banking & Payment Technology Services SAE | 7,882,214 | 7,542 |
| | Talaat Moustafa Group | 14,061,132 | 6,644 |
| | ElSewedy Electric Co. | 10,308,046 | 5,665 |
| | Telecom Egypt Co. | 4,931,977 | 4,252 |
| | Six of October Development & Investment | 3,326,445 | 3,893 |
| | Palm Hills Developments SAE | 20,332,470 | 2,489 |
| | Oriental Weavers | 3,372,486 | 1,776 |
| | Medinet Nasr Housing | 10,978,548 | 1,646 |
| * | Pioneers Properties | 4,431,189 | 835 |
| | | | | | Shares | Market
Value•
($000) |
| * | Gadwa for Industrial Development | 4,431,189 | 330 |
| * | Aspire Capital Holding for Financial Investments | 4,431,189 | 85 |
| | | | | | | 147,860 |
| Greece (0.3%) |
| | Hellenic Telecommunications Organization SA | 3,306,712 | 58,707 |
| | OPAP SA | 2,899,047 | 45,275 |
| * | Alpha Services & Holdings SA | 29,064,796 | 37,054 |
| * | Eurobank Ergasias Services & Holdings SA | 34,747,151 | 36,495 |
| | Mytilineos SA | 1,529,406 | 27,949 |
| * | National Bank of Greece SA | 7,575,640 | 23,922 |
| | JUMBO SA | 1,545,235 | 23,000 |
| * | Public Power Corp. SA | 1,685,685 | 18,337 |
| * | Piraeus Financial Holdings SA | 8,074,425 | 13,799 |
| * | Motor Oil Hellas Corinth Refineries SA | 788,339 | 13,381 |
| * | GEK Terna Holding Real Estate Construction SA | 820,672 | 9,201 |
| | Terna Energy SA | 589,333 | 7,968 |
| * | LAMDA Development SA | 949,434 | 7,825 |
| | Hellenic Petroleum SA | 758,665 | 5,231 |
| * | Ellaktor SA | 2,927,796 | 4,661 |
| | Holding Co. ADMIE IPTO SA | 1,577,580 | 4,657 |
| | Athens Water Supply & Sewage Co. SA | 523,607 | 4,583 |
| | Sarantis SA | 436,033 | 4,402 |
| | Viohalco SA | 787,919 | 3,989 |
| | Hellenic Exchanges - Athens Stock Exchange SA | 817,635 | 3,503 |
| * | Fourlis Holdings SA | 595,885 | 2,649 |
| *,3 | FF Group | 397,542 | 2,206 |
| * | Aegean Airlines SA | 121,994 | 732 |
| | | | | | | 359,526 |
| Hong Kong (0.1%) |
| 1 | China Feihe Ltd. | 36,123,000 | 59,975 |
| *,2 | HengTen Networks Group Ltd. | 32,366,709 | 11,042 |
Emerging Markets Stock Index Fund
| | | | | | Shares | Market
Value•
($000) |
| *,3 | SMI Holdings Group Ltd. | 18,314,748 | 5,508 |
| *,3 | Real Nutriceutical Group Ltd. | 1,315,000 | 34 |
| *,3 | Tech Pro Technology Development Ltd. | 122,060,000 | — |
| | | | | | | 76,559 |
| Hungary (0.3%) |
| * | OTP Bank Nyrt. | 3,158,356 | 189,778 |
| | Richter Gedeon Nyrt. | 2,048,954 | 57,420 |
| | MOL Hungarian Oil & Gas plc | 4,692,237 | 40,097 |
| | Magyar Telekom Telecommunications plc | 4,599,792 | 6,332 |
| * | Opus Global Nyrt. | 3,119,542 | 2,372 |
| | | | | | | 295,999 |
| India (15.0%) |
| | Reliance Industries Ltd. | 43,295,470 | 1,469,239 |
| | Infosys Ltd. | 49,465,229 | 1,106,973 |
| | Housing Development Finance Corp. Ltd. | 23,902,554 | 911,325 |
| | Tata Consultancy Services Ltd. | 14,220,587 | 646,390 |
| | Hindustan Unilever Ltd. | 12,153,470 | 388,998 |
| | Bajaj Finance Ltd. | 3,215,249 | 318,853 |
| * | Axis Bank Ltd. | 31,065,656 | 309,133 |
| * | Bharti Airtel Ltd. | 31,181,922 | 286,042 |
| | Asian Paints Ltd. | 6,189,181 | 256,500 |
| | HCL Technologies Ltd. | 15,161,851 | 232,161 |
| | ICICI Bank Ltd. | 21,445,779 | 230,909 |
| | Larsen & Toubro Ltd. | 9,573,905 | 226,790 |
| | Tata Steel Ltd. | 11,005,688 | 194,039 |
| | Maruti Suzuki India Ltd. | 1,802,210 | 180,451 |
| | Titan Co. Ltd. | 5,643,160 | 180,058 |
| | Tech Mahindra Ltd. | 8,248,881 | 163,279 |
| | UltraTech Cement Ltd. | 1,595,461 | 162,943 |
| | Sun Pharmaceutical Industries Ltd. | 15,203,063 | 161,663 |
| | Mahindra & Mahindra Ltd. | 12,708,034 | 150,565 |
| *,1 | Avenue Supermarts Ltd. | 2,095,209 | 129,957 |
| | State Bank of India | 18,983,147 | 127,720 |
| | Nestle India Ltd. | 499,447 | 126,905 |
| | Bajaj Finserv Ltd. | 526,885 | 125,788 |
| | JSW Steel Ltd. | 13,778,267 | 123,405 |
| | | | | | Shares | Market
Value•
($000) |
| | Grasim Industries Ltd. | 5,243,994 | 120,817 |
| | ITC Ltd. | 40,438,064 | 120,739 |
| | Divi's Laboratories Ltd. | 1,730,479 | 119,071 |
| | Hindalco Industries Ltd. | 19,284,714 | 118,836 |
| | Wipro Ltd. | 13,255,782 | 114,789 |
| 1 | HDFC Life Insurance Co. Ltd. | 12,460,498 | 113,320 |
| | NTPC Ltd. | 60,621,594 | 107,629 |
| * | Tata Motors Ltd. | 16,673,205 | 107,259 |
| | Power Grid Corp. of India Ltd. | 42,674,136 | 105,705 |
| | Adani Ports & Special Economic Zone Ltd. | 10,511,380 | 97,503 |
| | Tata Consumer Products Ltd. | 8,121,959 | 88,018 |
| 1 | SBI Life Insurance Co. Ltd. | 5,687,984 | 87,162 |
| * | Adani Green Energy Ltd. | 5,450,625 | 83,801 |
| | Cipla Ltd. | 6,864,989 | 83,104 |
| | Oil & Natural Gas Corp. Ltd. | 41,628,134 | 82,837 |
| | Info Edge India Ltd. | 1,016,266 | 82,702 |
| | Britannia Industries Ltd. | 1,670,047 | 82,156 |
| | Bharat Petroleum Corp. Ltd. | 14,109,721 | 78,882 |
| * | Tata Motors Ltd. Class A | 23,799,677 | 78,688 |
| | Apollo Hospitals Enterprise Ltd. | 1,371,470 | 78,233 |
| | Tata Power Co. Ltd. | 27,253,977 | 78,197 |
| * | Adani Transmission Ltd. | 3,219,958 | 75,850 |
| | UPL Ltd. | 7,466,819 | 74,024 |
| | Adani Total Gas Ltd. | 3,790,740 | 73,059 |
| | Shree Cement Ltd. | 184,118 | 70,488 |
| | Vedanta Ltd. | 17,090,231 | 69,549 |
| | Adani Enterprises Ltd. | 3,629,205 | 69,092 |
| | Pidilite Industries Ltd. | 2,148,734 | 66,494 |
| | Indian Oil Corp. Ltd. | 38,714,398 | 66,278 |
| | Dr Reddy's Laboratories Ltd. | 1,063,779 | 66,170 |
| * | Godrej Consumer Products Ltd. | 5,027,617 | 64,367 |
| | Indus Towers Ltd. | 17,386,708 | 63,202 |
| | Eicher Motors Ltd. | 1,881,626 | 62,628 |
| | Hero MotoCorp Ltd. | 1,728,498 | 61,451 |
| | Dabur India Ltd. | 7,689,442 | 60,228 |
Emerging Markets Stock Index Fund
| | | | | | Shares | Market
Value•
($000) |
| | Piramal Enterprises Ltd. | 1,670,176 | 58,218 |
| | Havells India Ltd. | 3,427,885 | 57,934 |
| | Coal India Ltd. | 25,858,597 | 56,908 |
| 1 | ICICI Lombard General Insurance Co. Ltd. | 2,805,113 | 55,585 |
| | SRF Ltd. | 1,911,835 | 54,142 |
| | Ambuja Cements Ltd. | 9,888,238 | 53,587 |
| | Mphasis Ltd. | 1,222,533 | 53,024 |
| | Shriram Transport Finance Co. Ltd. | 2,713,197 | 52,262 |
| 1 | Larsen & Toubro Infotech Ltd. | 580,587 | 51,941 |
| | Marico Ltd. | 6,817,775 | 51,840 |
| * | United Spirits Ltd. | 3,994,045 | 50,702 |
| | Voltas Ltd. | 3,129,976 | 50,456 |
| | Bajaj Auto Ltd. | 1,009,099 | 50,037 |
| * | SBI Cards & Payment Services Ltd. | 3,527,197 | 49,808 |
| | Jubilant Foodworks Ltd. | 995,884 | 49,220 |
| | GAIL India Ltd. | 24,468,756 | 48,688 |
| | Motherson Sumi Systems Ltd. | 16,143,061 | 48,376 |
| | DLF Ltd. | 8,526,441 | 45,538 |
| | Zee Entertainment Enterprises Ltd. | 11,121,989 | 44,819 |
| | Cholamandalam Investment & Finance Co. Ltd. | 5,433,261 | 44,736 |
| | Bharat Electronics Ltd. | 15,414,144 | 42,656 |
| 1 | Bandhan Bank Ltd. | 10,835,127 | 42,335 |
| | Reliance Industries Ltd. | 1,628,240 | 41,501 |
| | Hindustan Petroleum Corp. Ltd. | 9,913,924 | 41,147 |
| *,1 | InterGlobe Aviation Ltd. | 1,415,324 | 41,147 |
| | Indian Railway Catering & Tourism Corp. Ltd. | 3,628,460 | 41,107 |
| * | Max Financial Services Ltd. | 3,142,362 | 40,918 |
| | Crompton Greaves Consumer Electricals Ltd. | 6,551,215 | 40,785 |
| | Wipro Ltd. ADR | 4,551,838 | 40,784 |
| | Lupin Ltd. | 3,278,480 | 40,528 |
| 1 | ICICI Prudential Life Insurance Co. Ltd. | 4,802,129 | 39,721 |
| | Colgate-Palmolive India Ltd. | 1,912,933 | 39,461 |
| | PI Industries Ltd. | 978,165 | 39,242 |
| | | | | | Shares | Market
Value•
($000) |
| | Tata Elxsi Ltd. | 499,000 | 39,200 |
| | State Bank of India GDR | 574,071 | 38,805 |
| | Mindtree Ltd. | 643,613 | 38,725 |
| | Balkrishna Industries Ltd. | 1,158,671 | 38,168 |
| | Page Industries Ltd. | 74,090 | 37,333 |
| 1 | HDFC Asset Management Co. Ltd. | 1,050,112 | 37,196 |
| | Astral Ltd. | 1,233,142 | 36,051 |
| | Siemens Ltd. | 1,232,551 | 36,046 |
| | MRF Ltd. | 34,807 | 35,991 |
| | Aurobindo Pharma Ltd. | 3,856,484 | 35,555 |
| | Ashok Leyland Ltd. | 18,516,850 | 35,341 |
| | Dr Reddy's Laboratories Ltd. ADR | 570,607 | 35,058 |
| | ACC Ltd. | 1,116,074 | 34,849 |
| *,1 | AU Small Finance Bank Ltd. | 2,128,248 | 34,642 |
| | Aarti Industries Ltd. | 2,676,354 | 34,555 |
| | Bharat Forge Ltd. | 3,323,245 | 34,168 |
| * | Godrej Properties Ltd. | 1,132,901 | 33,840 |
| | Trent Ltd. | 2,507,420 | 33,661 |
| | Berger Paints India Ltd. | 3,391,094 | 33,634 |
| 1 | Laurus Labs Ltd. | 4,801,898 | 33,165 |
| | Persistent Systems Ltd. | 627,225 | 32,935 |
| | Container Corp. of India Ltd. | 3,735,301 | 32,759 |
| | Dixon Technologies India Ltd. | 487,264 | ��32,545 |
| | Petronet LNG Ltd. | 10,595,957 | 32,528 |
| | Deepak Nitrite Ltd. | 1,078,132 | 32,176 |
| * | Jindal Steel & Power Ltd. | 5,636,738 | 31,512 |
| | Indraprastha Gas Ltd. | 4,947,352 | 31,360 |
| | Embassy Office Parks REIT | 6,679,438 | 31,219 |
| | Dalmia Bharat Ltd. | 1,118,966 | 30,146 |
| | Power Finance Corp. Ltd. | 16,623,457 | 29,628 |
| | Atul Ltd. | 237,816 | 29,037 |
| | Federal Bank Ltd. | 21,759,272 | 28,416 |
| | Sundaram Finance Ltd. | 887,057 | 28,389 |
| * | Biocon Ltd. | 5,923,289 | 27,817 |
| | Tata Communications Ltd. | 1,589,651 | 27,789 |
| | Tata Chemicals Ltd. | 2,253,641 | 27,244 |
Emerging Markets Stock Index Fund
| | | | | | Shares | Market
Value•
($000) |
| * | IDFC First Bank Ltd. | 40,522,855 | 26,892 |
| | Torrent Pharmaceuticals Ltd. | 696,709 | 26,648 |
| | Muthoot Finance Ltd. | 1,353,947 | 26,589 |
| | Tube Investments of India Ltd. | 1,402,819 | 26,247 |
| | Ipca Laboratories Ltd. | 904,628 | 25,937 |
| | TVS Motor Co. Ltd. | 2,823,659 | 25,071 |
| | Indian Hotels Co. Ltd. | 9,496,090 | 25,050 |
| | REC Ltd. | 12,464,262 | 24,808 |
| | Bajaj Holdings & Investment Ltd. | 381,308 | 24,635 |
| | JSW Energy Ltd. | 5,255,705 | 24,487 |
| | Cadila Healthcare Ltd. | 3,575,011 | 24,050 |
| | Bosch Ltd. | 105,756 | 23,992 |
| | Supreme Industries Ltd. | 769,368 | 23,968 |
| | Bata India Ltd. | 898,891 | 23,820 |
| | Ramco Cements Ltd. | 1,650,506 | 23,555 |
| * | APL Apollo Tubes Ltd. | 2,162,708 | 23,176 |
| 1 | Dr Lal PathLabs Ltd. | 487,856 | 22,915 |
| * | Max Healthcare Institute Ltd. | 5,097,126 | 22,597 |
| * | Fortis Healthcare Ltd. | 6,860,180 | 22,455 |
| 1 | L&T Technology Services Ltd. | 350,674 | 22,187 |
| | Navin Fluorine International Ltd. | 492,424 | 21,994 |
| | LIC Housing Finance Ltd. | 4,030,807 | 21,969 |
| | Gujarat Gas Ltd. | 2,638,531 | 21,949 |
| | Steel Authority of India Ltd. | 14,212,442 | 21,893 |
| | United Breweries Ltd. | 956,405 | 21,202 |
| | ABB India Ltd. | 745,183 | 21,129 |
| | Manappuram Finance Ltd. | 7,575,650 | 21,085 |
| | Oracle Financial Services Software Ltd. | 354,606 | 20,996 |
| | Cummins India Ltd. | 1,740,975 | 20,866 |
| 1 | Indian Energy Exchange Ltd. | 2,167,923 | 20,549 |
| | Escorts Ltd. | 977,252 | 20,546 |
| * | Oberoi Realty Ltd. | 1,695,843 | 20,522 |
| | NMDC Ltd. | 10,672,142 | 20,482 |
| | Torrent Power Ltd. | 3,031,611 | 20,285 |
| | | | | | Shares | Market
Value•
($000) |
| | Varun Beverages Ltd. | 1,775,147 | 20,166 |
| | Mahindra & Mahindra Financial Services Ltd. | 8,350,502 | 20,087 |
| | JK Cement Ltd. | 420,934 | 18,667 |
| | Cyient Ltd. | 1,296,742 | 18,534 |
| | Emami Ltd. | 2,605,892 | 18,529 |
| | Honeywell Automation India Ltd. | 32,906 | 18,468 |
| | Relaxo Footwears Ltd. | 1,029,063 | 18,319 |
| * | Bank of Baroda | 13,454,578 | 17,579 |
| | Kajaria Ceramics Ltd. | 1,074,405 | 17,561 |
| * | Adani Power Ltd. | 13,042,417 | 17,501 |
| | Amara Raja Batteries Ltd. | 1,910,039 | 17,395 |
| | Coforge Ltd. | 266,470 | 17,376 |
| | Carborundum Universal Ltd. | 1,506,567 | 16,921 |
| | Alkem Laboratories Ltd. | 349,447 | 16,859 |
| | Rajesh Exports Ltd. | 1,961,684 | 16,739 |
| * | Bharat Heavy Electricals Ltd. | 18,062,817 | 16,513 |
| | National Aluminium Co. Ltd. | 12,660,224 | 16,448 |
| | IIFL Finance Ltd. | 3,779,432 | 16,387 |
| | Coromandel International Ltd. | 1,549,524 | 16,285 |
| | Sundram Fasteners Ltd. | 1,436,650 | 16,064 |
| * | GMR Infrastructure Ltd. | 29,210,360 | 15,854 |
| * | Aditya Birla Fashion & Retail Ltd. | 4,441,273 | 15,639 |
| | Gujarat State Petronet Ltd. | 3,804,214 | 15,547 |
| *,1 | RBL Bank Ltd. | 6,306,471 | 15,275 |
| | Tanla Platforms Ltd. | 933,277 | 15,256 |
| * | PVR Ltd. | 675,538 | 15,212 |
| * | CG Power & Industrial Solutions Ltd. | 7,744,668 | 15,193 |
| | AIA Engineering Ltd. | 589,136 | 15,116 |
| | Radico Khaitan Ltd. | 997,518 | 14,966 |
| | Apollo Tyres Ltd. | 5,218,588 | 14,887 |
| | Natco Pharma Ltd. | 1,314,482 | 14,529 |
| | Glenmark Pharmaceuticals Ltd. | 2,118,932 | 14,275 |
| * | Hindustan Zinc Ltd. | 3,408,754 | 14,212 |
| * | Vodafone Idea Ltd. | 108,347,992 | 13,873 |
Emerging Markets Stock Index Fund
| | | | | | Shares | Market
Value•
($000) |
| | Oil India Ltd. | 4,572,161 | 13,745 |
| | Pfizer Ltd. | 203,626 | 13,736 |
| | Kansai Nerolac Paints Ltd. | 1,875,448 | 13,687 |
| | Hatsun Agro Product Ltd. | 758,301 | 13,588 |
| | Birlasoft Ltd. | 2,485,329 | 13,537 |
| | Indiabulls Housing Finance Ltd. | 4,648,061 | 13,509 |
| | NHPC Ltd. | 32,871,073 | 13,490 |
| | Castrol India Ltd. | 7,209,012 | 13,328 |
| | Happiest Minds Technologies Ltd. | 778,179 | 13,282 |
| | Redington India Ltd. | 6,872,956 | 13,221 |
| | Whirlpool of India Ltd. | 444,162 | 13,140 |
| * | Aavas Financiers Ltd. | 347,966 | 13,046 |
| * | 3M India Ltd. | 38,152 | 12,970 |
| | Central Depository Services India Ltd. | 711,593 | 12,893 |
| 1 | Metropolis Healthcare Ltd. | 324,130 | 12,853 |
| *,1 | Syngene International Ltd. | 1,738,022 | 12,569 |
| | Polycab India Ltd. | 407,106 | 12,316 |
| * | Canara Bank | 4,260,590 | 12,250 |
| | Exide Industries Ltd. | 5,225,014 | 12,085 |
| | Cholamandalam Financial Holdings Ltd. | 1,279,986 | 11,997 |
| | Chambal Fertilizers & Chemicals Ltd. | 2,409,688 | 11,914 |
| | Schaeffler India Ltd. | 120,469 | 11,907 |
| * | Amber Enterprises India Ltd. | 268,693 | 11,869 |
| | Sanofi India Ltd. | 104,954 | 11,711 |
| | Phoenix Mills Ltd. | 904,871 | 11,682 |
| 1 | Nippon Life India Asset Management Ltd. | 2,070,254 | 11,584 |
| 1 | Endurance Technologies Ltd. | 475,675 | 11,576 |
| * | IDFC Ltd. | 15,674,733 | 11,556 |
| | City Union Bank Ltd. | 5,099,370 | 11,482 |
| | JB Chemicals & Pharmaceuticals Ltd. | 511,713 | 11,476 |
| * | Intellect Design Arena Ltd. | 1,306,144 | 11,459 |
| | Bayer CropScience Ltd. | 169,840 | 11,328 |
| | | | | | Shares | Market
Value•
($000) |
| | Zensar Technologies Ltd. | 1,802,817 | 11,152 |
| * | L&T Finance Holdings Ltd. | 10,138,931 | 11,151 |
| | GlaxoSmithKline Pharmaceuticals Ltd. | 552,415 | 11,094 |
| 1 | IndiaMart InterMesh Ltd. | 115,285 | 11,029 |
| | SKF India Ltd. | 244,190 | 10,865 |
| | KPIT Technologies Ltd. | 2,605,068 | 10,789 |
| * | Dhani Services Ltd. | 4,525,516 | 10,786 |
| | Can Fin Homes Ltd. | 1,279,795 | 10,745 |
| | Suven Pharmaceuticals Ltd. | 1,577,488 | 10,734 |
| 1 | Eris Lifesciences Ltd. | 976,289 | 10,732 |
| | Sonata Software Ltd. | 949,083 | 10,625 |
| * | Gujarat Fluorochemicals Ltd. | 434,934 | 10,566 |
| | KEC International Ltd. | 1,649,456 | 10,553 |
| | Firstsource Solutions Ltd. | 3,955,143 | 10,478 |
| | Hindustan Aeronautics Ltd. | 598,431 | 10,458 |
| | CESC Ltd. | 8,939,850 | 10,424 |
| 1 | Quess Corp. Ltd. | 897,150 | 10,402 |
| | Blue Star Ltd. | 796,042 | 10,231 |
| | Computer Age Management Services Ltd. | 253,544 | 10,224 |
| | Minda Industries Ltd. | 958,539 | 10,034 |
| | Mahanagar Gas Ltd. | 739,559 | 9,918 |
| | Brigade Enterprises Ltd. | 1,590,737 | 9,872 |
| | Sterlite Technologies Ltd. | 2,687,200 | 9,860 |
| | Jubilant Pharmova Ltd. Class A | 1,233,446 | 9,852 |
| | JK Lakshmi Cement Ltd. | 1,171,947 | 9,651 |
| * | Suzlon Energy Ltd. | 106,084,880 | 9,589 |
| 1 | Mindspace Business Parks REIT | 2,166,060 | 9,456 |
| | Balaji Amines Ltd. | 199,859 | 9,257 |
| | Jubilant Ingrevia Ltd. | 1,027,132 | 9,204 |
| | Zydus Wellnes Ltd. | 332,929 | 9,145 |
Emerging Markets Stock Index Fund
| | | | | | Shares | Market
Value•
($000) |
| 1 | ICICI Securities Ltd. | 922,560 | 9,126 |
| * | EID Parry India Ltd. | 1,465,134 | 8,953 |
| | Linde India Ltd. | 288,425 | 8,896 |
| | Shriram City Union Finance Ltd. | 306,599 | 8,882 |
| * | Aditya Birla Capital Ltd. | 6,833,209 | 8,849 |
| | CRISIL Ltd. | 235,028 | 8,804 |
| | Orient Electric Ltd. | 1,898,504 | 8,797 |
| | Prestige Estates Projects Ltd. | 1,538,734 | 8,784 |
| | HFCL Ltd. | 9,181,798 | 8,777 |
| | Sun TV Network Ltd. | 1,144,188 | 8,596 |
| | Ajanta Pharma Ltd. | 297,718 | 8,440 |
| | Vinati Organics Ltd. | 327,472 | 8,379 |
| *,1 | Aster DM Healthcare Ltd. | 3,312,190 | 8,322 |
| | Solar Industries India Ltd. | 250,091 | 8,316 |
| * | TeamLease Services Ltd. | 138,036 | 8,269 |
| | DCM Shriram Ltd. | 619,929 | 8,209 |
| | Gillette India Ltd. | 106,818 | 8,054 |
| | India Cements Ltd. | 2,915,434 | 8,043 |
| | Granules India Ltd. | 1,932,825 | 8,026 |
| * | Punjab National Bank | 14,175,800 | 7,993 |
| | Thermax Ltd. | 432,538 | 7,976 |
| * | Godrej Industries Ltd. | 1,025,254 | 7,953 |
| | Lakshmi Machine Works Ltd. | 67,813 | 7,929 |
| | Welspun India Ltd. | 4,268,646 | 7,864 |
| | Alkyl Amines Chemicals | 161,398 | 7,777 |
| * | Bajaj Electricals Ltd. | 522,866 | 7,739 |
| | PNC Infratech Ltd. | 1,767,969 | 7,677 |
| | Finolex Industries Ltd. | 2,602,276 | 7,662 |
| | KEI Industries Ltd. | 612,534 | 7,482 |
| | Rain Industries Ltd. | 2,433,581 | 7,428 |
| | Ratnamani Metals & Tubes Ltd. | 257,317 | 7,369 |
| | Balrampur Chini Mills Ltd. | 1,678,182 | 7,353 |
| * | Narayana Hrudayalaya Ltd. | 1,050,546 | 7,325 |
| * | Affle India Ltd. | 516,810 | 7,290 |
| | Edelweiss Financial Services Ltd. | 6,868,400 | 7,124 |
| | Great Eastern Shipping Co. Ltd. | 1,608,191 | 6,933 |
| | TTK Prestige Ltd. | 47,146 | 6,896 |
| | Praj Industries Ltd. | 1,535,361 | 6,866 |
| | | | | | Shares | Market
Value•
($000) |
| | Vaibhav Global Ltd. | 890,065 | 6,854 |
| * | Indiabulls Real Estate Ltd. | 3,358,082 | 6,832 |
| | eClerx Services Ltd. | 233,523 | 6,819 |
| * | Westlife Development Ltd. | 871,989 | 6,775 |
| | Graphite India Ltd. | 942,482 | 6,765 |
| | Sumitomo Chemical India Ltd. | 1,342,393 | 6,761 |
| * | EIH Ltd. | 3,629,037 | 6,748 |
| | Timken India Ltd. | 280,807 | 6,745 |
| | Alembic Pharmaceuticals Ltd. | 637,088 | 6,623 |
| | EPL Ltd. | 2,301,513 | 6,623 |
| | Century Textiles & Industries Ltd. | 619,407 | 6,479 |
| | Motilal Oswal Financial Services Ltd. | 515,866 | 6,330 |
| | Infibeam Avenues Ltd. | 10,335,474 | 6,263 |
| * | V-Mart Retail Ltd. | 114,492 | 6,221 |
| * | Just Dial Ltd. | 577,448 | 6,175 |
| | Akzo Nobel India Ltd. | 218,316 | 6,131 |
| | Indian Bank | 2,649,695 | 6,111 |
| | Sobha Ltd. | 589,426 | 6,070 |
| | V-Guard Industries Ltd. | 1,717,490 | 5,904 |
| | HEG Ltd. | 212,635 | 5,860 |
| | Bombay Burmah Trading Co. | 399,774 | 5,772 |
| | NCC Ltd. | 6,041,621 | 5,766 |
| | Procter & Gamble Health Ltd. | 79,145 | 5,734 |
| | Rallis India Ltd. | 1,599,947 | 5,683 |
| * | IRB Infrastructure Developers Ltd. | 1,849,471 | 5,609 |
| 1 | Indian Railway Finance Corp. Ltd. | 17,235,377 | 5,578 |
| | Finolex Cables Ltd. | 884,569 | 5,535 |
| * | Reliance Power Ltd. | 29,207,037 | 5,531 |
| *,1 | PNB Housing Finance Ltd. | 848,982 | 5,485 |
| 1 | Godrej Agrovet Ltd. | 687,193 | 5,460 |
| | Aegis Logistics Ltd. | 1,916,666 | 5,456 |
| | Gujarat Pipavav Port Ltd. | 3,574,853 | 5,351 |
| *,1 | New India Assurance Co. Ltd. | 2,606,300 | 5,314 |
| | PTC India Ltd. | 3,003,302 | 5,078 |
| | KRBL Ltd. | 1,307,115 | 4,949 |
Emerging Markets Stock Index Fund
| | | | | | Shares | Market
Value•
($000) |
| * | Mahindra CIE Automotive Ltd. | 1,370,520 | 4,894 |
| * | Union Bank of India | 7,749,795 | 4,794 |
| | Strides Pharma Science Ltd. | 668,159 | 4,787 |
| * | Alok Industries Ltd. | 15,821,397 | 4,668 |
| | NBCC India Ltd. | 7,751,625 | 4,642 |
| | Ceat Ltd. | 271,842 | 4,536 |
| * | CreditAccess Grameen Ltd. | 531,545 | 4,466 |
| *,1 | General Insurance Corp. of India | 2,498,870 | 4,456 |
| | JM Financial Ltd. | 3,770,204 | 4,438 |
| | Avanti Feeds Ltd. | 592,609 | 4,419 |
| | Bajaj Consumer Care Ltd. | 1,406,214 | 4,358 |
| * | Bank of India | 5,234,255 | 4,199 |
| | Gateway Distriparks Ltd. | 1,025,928 | 3,823 |
| | Poly Medicure Ltd. | 302,179 | 3,737 |
| * | Sun Pharma Advanced Research Co. Ltd. | 1,060,355 | 3,726 |
| | Karur Vysya Bank Ltd. | 5,618,887 | 3,683 |
| * | Yes Bank Ltd. | 21,002,133 | 3,603 |
| 1 | Dilip Buildcon Ltd. | 440,610 | 3,542 |
| | AstraZeneca Pharma India Ltd. | 86,982 | 3,496 |
| | Vakrangee Ltd. | 7,065,244 | 3,482 |
| | Welspun Corp. Ltd. | 1,847,989 | 3,307 |
| | Jindal Saw Ltd. | 2,047,039 | 3,180 |
| | Symphony Ltd. | 223,751 | 3,103 |
| * | TV18 Broadcast Ltd. | 5,500,453 | 3,068 |
| | Care Ratings Ltd. | 303,379 | 2,785 |
| * | Wockhardt Ltd. | 475,809 | 2,718 |
| | Equitas Holdings Ltd. | 1,536,310 | 2,671 |
| | Karnataka Bank Ltd. | 2,838,570 | 2,588 |
| | WABCO India Ltd. | 25,902 | 2,575 |
| * | DCB Bank Ltd. | 2,053,949 | 2,501 |
| * | Mangalore Refinery & Petrochemicals Ltd. | 3,787,344 | 2,489 |
| | Kaveri Seed Co. Ltd. | 354,789 | 2,475 |
| * | Raymond Ltd. | 387,920 | 2,377 |
| * | Future Retail Ltd. | 3,649,767 | 2,350 |
| | Multi Commodity Exchange of India Ltd. | 99,264 | 2,263 |
| * | South Indian Bank Ltd. | 16,007,364 | 2,005 |
| | Engineers India Ltd. | 1,814,572 | 1,763 |
| | | | | | Shares | Market
Value•
($000) |
| * | IFCI Ltd. | 10,283,312 | 1,682 |
| * | Hindustan Construction Co. Ltd. | 9,420,683 | 1,192 |
| * | Future Consumer Ltd. | 10,344,782 | 964 |
| | GE Power India Ltd. | 196,440 | 761 |
| 1 | Brookfield India Real Estate Trust | 62,713 | 241 |
| *,3 | Amtek Auto Ltd. | 472,160 | 17 |
| | | | | | | 16,648,862 |
| Indonesia (1.6%) |
| | Bank Central Asia Tbk. PT | 663,490,750 | 350,839 |
| | Bank Rakyat Indonesia Persero Tbk. PT | 894,462,260 | 268,503 |
| | Telkom Indonesia Persero Tbk. PT | 643,628,052 | 172,033 |
| | Bank Mandiri Persero Tbk. PT | 253,180,575 | 128,001 |
| | Astra International Tbk. PT | 281,948,081 | 120,085 |
| | Bank Negara Indonesia Persero Tbk. PT | 100,989,676 | 49,942 |
| | Charoen Pokphand Indonesia Tbk. PT | 102,709,123 | 45,038 |
| | United Tractors Tbk. PT | 20,360,227 | 33,869 |
| | Kalbe Farma Tbk. PT | 265,365,984 | 29,970 |
| | Sarana Menara Nusantara Tbk. PT | 349,302,700 | 28,630 |
| | Tower Bersama Infrastructure Tbk. PT | 137,414,885 | 28,543 |
| | Indofood Sukses Makmur Tbk. PT | 60,935,708 | 27,352 |
| | Semen Indonesia Persero Tbk. PT | 41,484,910 | 26,657 |
| | Unilever Indonesia Tbk. PT | 79,039,255 | 24,673 |
| | Barito Pacific Tbk. PT | 349,415,650 | 23,120 |
| | Indah Kiat Pulp & Paper Tbk. PT | 35,015,168 | 20,952 |
| | Adaro Energy Tbk. PT | 170,752,979 | 20,226 |
| | Aneka Tambang Tbk. | 119,416,810 | 19,762 |
| | Indofood CBP Sukses Makmur Tbk. PT | 31,455,547 | 19,529 |
| | Indocement Tunggal Prakarsa Tbk. PT | 19,748,601 | 16,486 |
Emerging Markets Stock Index Fund
| | | | | | Shares | Market
Value•
($000) |
| * | Perusahaan Gas Negara Tbk. PT | 150,004,179 | 15,999 |
| | Ciputra Development Tbk. PT | 196,250,850 | 14,906 |
| | Gudang Garam Tbk. PT | 6,135,830 | 14,536 |
| * | Pakuwon Jati Tbk. PT | 352,471,867 | 12,475 |
| * | Summarecon Agung Tbk. PT | 191,908,908 | 12,418 |
| * | Surya Citra Media Tbk. PT | 412,946,655 | 12,250 |
| | Mitra Keluarga Karyasehat Tbk. PT | 75,733,300 | 12,191 |
| | Japfa Comfeed Indonesia Tbk. PT | 98,273,200 | 12,004 |
| | XL Axiata Tbk. PT | 51,370,098 | 11,186 |
| * | Smartfren Telecom Tbk. PT | 1,297,016,500 | 9,904 |
| | Bukit Asam Tbk. PT | 51,050,044 | 9,662 |
| | Vale Indonesia Tbk. PT | 27,185,247 | 9,317 |
| | Pabrik Kertas Tjiwi Kimia Tbk. PT | 15,775,600 | 9,297 |
| | Ace Hardware Indonesia Tbk. PT | 92,891,956 | 9,257 |
| * | Jasa Marga Persero Tbk. PT | 30,445,604 | 9,037 |
| * | Bumi Serpong Damai Tbk. PT | 114,845,401 | 9,015 |
| | Bank BTPN Syariah Tbk. PT | 32,837,600 | 8,831 |
| * | Lippo Karawaci Tbk. PT | 825,285,488 | 8,632 |
| | Hanjaya Mandala Sampoerna Tbk. PT | 110,141,974 | 8,059 |
| * | Bank Rakyat Indonesia Agroniaga Tbk. PT | 52,484,200 | 7,818 |
| | Indo Tambangraya Megah Tbk. PT | 5,038,680 | 7,681 |
| | BFI Finance Indonesia Tbk. PT | 93,975,300 | 6,971 |
| | Mayora Indah Tbk. PT | 40,570,500 | 6,725 |
| | AKR Corporindo Tbk. PT | 22,157,425 | 6,685 |
| * | Indosat Tbk. PT | 13,532,700 | 6,612 |
| * | Matahari Department Store Tbk. PT | 30,406,367 | 6,549 |
| * | Bank Tabungan Negara Persero Tbk. PT | 50,224,738 | 6,317 |
| * | Mitra Adiperkasa Tbk. PT | 98,246,126 | 6,109 |
| | | | | | Shares | Market
Value•
($000) |
| * | Bank Syariah Indonesia Tbk. PT | 40,014,287 | 5,961 |
| * | Bank Bukopin Tbk. PT | 177,295,600 | 5,365 |
| * | Medco Energi Internasional Tbk. PT | 123,101,542 | 4,947 |
| | Media Nusantara Citra Tbk. PT | 67,013,424 | 4,262 |
| * | Timah Tbk. PT | 35,634,874 | 4,006 |
| | Astra Agro Lestari Tbk. PT | 5,273,013 | 3,998 |
| | Perusahaan Perkebunan London Sumatra Indonesia Tbk. PT | 37,618,295 | 3,706 |
| * | Wijaya Karya Persero Tbk. PT | 41,029,470 | 3,614 |
| * | Waskita Karya Persero Tbk. PT | 55,410,398 | 3,602 |
| | Bank Pembangunan Daerah Jawa Barat Dan Banten Tbk. PT | 33,538,499 | 3,375 |
| * | Bank Pan Indonesia Tbk. PT | 50,780,400 | 2,830 |
| * | Panin Financial Tbk. PT | 217,571,731 | 2,803 |
| * | PP Persero Tbk. PT | 32,052,095 | 2,733 |
| * | Alam Sutera Realty Tbk. PT | 164,634,154 | 2,118 |
| * | Ramayana Lestari Sentosa Tbk. PT | 39,045,066 | 2,040 |
| * | Krakatau Steel Persero Tbk. PT | 51,028,346 | 1,894 |
| * | Surya Semesta Internusa Tbk. PT | 51,470,798 | 1,812 |
| * | Adhi Karya Persero Tbk. PT | 24,013,406 | 1,783 |
| *,3 | Trada Alam Minera Tbk. PT | 487,603,966 | 1,721 |
| * | Kresna Graha Investama Tbk. PT | 181,775,948 | 1,362 |
| * | Global Mediacom Tbk. PT | 59,516,703 | 1,133 |
| | Bank Danamon Indonesia Tbk. PT | 4,776,700 | 908 |
| * | Totalindo Eka Persada Tbk. PT | 37,987,296 | 134 |
| *,3 | Sigmagold Inti Perkasa Tbk. PT | 14,934,100 | 53 |
| | | | | | | 1,790,813 |
| Kuwait (0.8%) |
| | National Bank of Kuwait SAKP | 93,169,359 | 306,349 |
| | Kuwait Finance House KSCP | 60,802,171 | 168,043 |
Emerging Markets Stock Index Fund
| | | | | | Shares | Market
Value•
($000) |
| | Ahli United Bank BSC | 83,472,446 | 81,196 |
| | Mobile Telecommunications Co. KSCP | 28,204,772 | 55,858 |
| | Agility Public Warehousing Co. KSC | 16,735,371 | 55,619 |
| * | Boubyan Bank KSCP | 13,635,460 | 35,399 |
| | Mabanee Co. KPSC | 8,021,484 | 20,961 |
| | Gulf Bank KSCP | 22,314,068 | 18,242 |
| | Boubyan Petrochemicals Co. KSCP | 5,460,427 | 16,664 |
| | Humansoft Holding Co. KSC | 1,333,717 | 14,793 |
| * | National Industries Group Holding SAK | 14,807,998 | 13,464 |
| * | Warba Bank KSCP | 12,139,443 | 11,365 |
| | Qurain Petrochemical Industries Co. | 7,131,438 | 8,970 |
| | Burgan Bank SAK | 9,431,457 | 7,455 |
| * | Kuwait International Bank KSCP | 7,862,041 | 5,843 |
| * | Alimtiaz Investment Group KSC | 10,182,693 | 4,562 |
| | Kuwait Projects Co. Holding KSCP | 7,680,180 | 3,751 |
| * | Integrated Holding Co. KCSC | 2,276,334 | 2,826 |
| | Kuwait Projects Co. Holding KSCP Rights | 2,511,418 | 59 |
| | | | | | | 831,419 |
| Malaysia (2.0%) |
| | Public Bank Bhd. | 212,443,590 | 214,026 |
| | Malayan Banking Bhd. | 82,166,612 | 159,828 |
| | Tenaga Nasional Bhd. | 53,201,451 | 124,111 |
| | CIMB Group Holdings Bhd. | 97,098,108 | 122,512 |
| | Petronas Chemicals Group Bhd. | 39,072,712 | 82,043 |
| | Press Metal Aluminium Holdings Bhd. | 52,286,840 | 70,280 |
| | IHH Healthcare Bhd. | 41,793,655 | 65,977 |
| | Axiata Group Bhd. | 60,887,249 | 58,180 |
| | DiGi.Com Bhd. | 50,234,133 | 51,409 |
| | | | | | Shares | Market
Value•
($000) |
| | Sime Darby Plantation Bhd. | 50,389,179 | 48,859 |
| | Top Glove Corp. Bhd. | 73,683,690 | 48,387 |
| | Dialog Group Bhd. | 63,784,760 | 43,617 |
| | IOI Corp. Bhd. | 45,277,790 | 42,968 |
| | Maxis Bhd. | 37,708,660 | 42,562 |
| | PPB Group Bhd. | 9,239,260 | 40,557 |
| | Genting Bhd. | 31,684,024 | 39,658 |
| | MISC Bhd. | 23,133,296 | 39,571 |
| | Hong Leong Bank Bhd. | 8,640,172 | 39,278 |
| | Kuala Lumpur Kepong Bhd. | 6,629,092 | 34,640 |
| | Petronas Gas Bhd. | 7,373,863 | 29,834 |
| | Inari Amertron Bhd. | 31,816,800 | 29,806 |
| | Hartalega Holdings Bhd. | 20,766,310 | 29,438 |
| | RHB Bank Bhd. | 21,197,000 | 28,601 |
| | Sime Darby Bhd. | 51,080,036 | 28,036 |
| | Genting Malaysia Bhd. | 34,896,437 | 26,738 |
| | Nestle Malaysia Bhd. | 787,357 | 25,579 |
| * | Gamuda Bhd. | 31,788,217 | 24,888 |
| | Telekom Malaysia Bhd. | 16,578,778 | 23,174 |
| | Petronas Dagangan Bhd. | 4,602,907 | 22,633 |
| * | AMMB Holdings Bhd. | 26,791,945 | 21,742 |
| | IJM Corp. Bhd. | 46,437,134 | 20,792 |
| * | Malaysia Airports Holdings Bhd. | 12,532,830 | 19,601 |
| | HAP Seng Consolidated Bhd. | 9,229,200 | 17,485 |
| | QL Resources Bhd. | 13,676,630 | 16,692 |
| | Westports Holdings Bhd. | 15,254,501 | 16,472 |
| | My EG Services Bhd. | 62,282,900 | 15,669 |
| | TIME dotCom Bhd. | 13,922,700 | 15,191 |
| | Bursa Malaysia Bhd. | 7,628,300 | 13,826 |
| | Frontken Corp. Bhd. | 14,956,450 | 13,801 |
| | Hong Leong Financial Group Bhd. | 3,049,141 | 13,510 |
| | Malaysian Pacific Industries Bhd. | 1,156,300 | 13,337 |
| | VS Industry Bhd. | 34,854,900 | 13,319 |
| 1 | MR DIY Group M Bhd. | 13,568,100 | 12,367 |
| | D&O Green Technologies Bhd. | 8,708,500 | 11,885 |
| | Pentamaster Corp. Bhd. | 8,762,050 | 11,356 |
Emerging Markets Stock Index Fund
| | | | | | Shares | Market
Value•
($000) |
| | Carlsberg Brewery Malaysia Bhd. | 2,045,200 | 10,956 |
| | Alliance Bank Malaysia Bhd. | 16,102,717 | 10,691 |
| | Heineken Malaysia Bhd. | 1,890,200 | 10,501 |
| | Supermax Corp. Bhd. | 22,647,512 | 10,495 |
| | Kossan Rubber Industries Bhd. | 18,289,400 | 10,444 |
| | IGB REIT | 24,630,470 | 9,991 |
| | Sunway Bhd. | 22,030,245 | 9,478 |
| | Yinson Holdings Bhd. | 6,667,900 | 9,427 |
| | KPJ Healthcare Bhd. | 32,898,600 | 9,048 |
| | YTL Corp. Bhd. | 58,893,950 | 8,967 |
| | Sunway REIT | 24,876,900 | 8,786 |
| | Scientex Bhd. | 7,777,200 | 8,761 |
| | Fraser & Neave Holdings Bhd. | 1,329,500 | 8,703 |
| | Sime Darby Property Bhd. | 49,532,542 | 8,681 |
| | ViTrox Corp. Bhd. | 1,791,604 | 8,511 |
| | Genting Plantations Bhd. | 4,579,200 | 8,075 |
| | IOI Properties Group Bhd. | 25,410,680 | 7,867 |
| | British American Tobacco Malaysia Bhd. | 1,929,034 | 7,041 |
| | Axis REIT | 15,251,500 | 7,037 |
| | Malakoff Corp. Bhd. | 34,285,300 | 6,705 |
| * | SP Setia Bhd. Group | 17,561,845 | 6,611 |
| | Berjaya Sports Toto Bhd. | 11,568,943 | 5,812 |
| | UWC Bhd. | 3,870,100 | 5,757 |
| * | AirAsia Group Bhd. | 20,384,358 | 5,722 |
| | Mega First Corp. Bhd. | 6,492,100 | 5,649 |
| * | Bumi Armada Bhd. | 45,234,728 | 5,552 |
| | Magnum Bhd. | 10,469,155 | 5,459 |
| | Astro Malaysia Holdings Bhd. | 21,222,673 | 5,107 |
| 1 | Lotte Chemical Titan Holding Bhd. | 7,770,147 | 5,107 |
| | DRB-Hicom Bhd. | 12,096,400 | 4,820 |
| | AEON Credit Service M Bhd. | 1,407,100 | 4,758 |
| | Malaysia Building Society Bhd. | 29,435,100 | 4,555 |
| | Padini Holdings Bhd. | 4,938,237 | 3,746 |
| * | Sapura Energy Bhd. | 144,428,622 | 3,497 |
| | | | | | Shares | Market
Value•
($000) |
| | Bermaz Auto Bhd. | 8,565,500 | 3,349 |
| | Syarikat Takaful Malaysia Keluarga Bhd. | 3,375,300 | 3,237 |
| | Malaysian Resources Corp. Bhd. | 29,404,100 | 2,915 |
| * | Berjaya Corp. Bhd. | 46,389,396 | 2,857 |
| | Leong Hup International Bhd. | 16,617,600 | 2,626 |
| | Cahya Mata Sarawak Bhd. | 7,274,600 | 2,517 |
| | FGV Holdings Bhd. | 5,597,000 | 2,030 |
| * | Velesto Energy Bhd. | 50,233,127 | 1,938 |
| | UMW Holdings Bhd. | 2,271,600 | 1,870 |
| * | WCT Holdings Bhd. | 11,980,664 | 1,798 |
| 3 | Serba Dinamik Holdings Bhd. | 20,562,438 | 1,733 |
| * | UEM Sunrise Bhd. | 17,439,200 | 1,664 |
| | YTL Power International Bhd. | 5,983,067 | 1,019 |
| * | Sunway Bhd. Warrants Exp. 10/3/24 | 3,473,743 | 373 |
| * | Velesto Energy Bhd. Warrants Exp. 10/18/24 | 20,487,189 | 322 |
| *,3 | Serba Dinamik Holdings Bhd. Warrants Exp. 12/5/24 | 4,443,960 | 75 |
| * | Malaysian Resources Corp. Bhd. Warrants Exp. 10/29/27 | 3,624,441 | 74 |
| | | | | | | 2,166,949 |
| Mexico (2.2%) |
| | America Movil SAB de CV | 407,822,035 | 363,490 |
| | Grupo Financiero Banorte SAB de CV | 39,651,898 | 251,050 |
| | Wal-Mart de Mexico SAB de CV | 71,279,137 | 248,618 |
| | Fomento Economico Mexicano SAB de CV | 25,073,710 | 206,138 |
| | Grupo Mexico SAB de CV Class B | 43,439,543 | 190,570 |
| * | Cemex SAB de CV | 203,625,617 | 130,950 |
| | Grupo Bimbo SAB de CV Class A | 30,927,742 | 91,545 |
| | Grupo Televisa SAB | 32,431,411 | 65,846 |
Emerging Markets Stock Index Fund
| | | | | | Shares | Market
Value•
($000) |
| | Grupo Elektra SAB de CV | 810,897 | 62,269 |
| * | Grupo Aeroportuario del Pacifico SAB de CV Class B | 4,939,158 | 62,263 |
| | Grupo Aeroportuario del Sureste SAB de CV Class B | 2,779,616 | 56,055 |
| | Fibra Uno Administracion SA de CV | 41,386,202 | 41,129 |
| | Coca-Cola Femsa SAB de CV | 7,217,659 | 38,896 |
| | Orbia Advance Corp. SAB de CV | 14,404,875 | 37,440 |
| | Arca Continental SAB de CV | 6,097,015 | 37,175 |
| | Gruma SAB de CV Class B | 2,808,287 | 32,976 |
| * | Grupo Financiero Inbursa SAB de CV | 28,024,161 | 28,136 |
| * | Grupo Aeroportuario del Centro Norte SAB de CV Class B | 3,892,668 | 23,489 |
| * | Industrias Penoles SAB de CV | 1,757,722 | 22,538 |
| | Grupo Carso SAB de CV | 6,632,942 | 22,311 |
| | Promotora y Operadora de Infraestructura SAB de CV | 3,010,884 | 22,141 |
| * | Controladora Vuela Cia de Aviacion SAB de CV Class A | 11,023,204 | 20,051 |
| | Kimberly-Clark de Mexico SAB de CV Class A | 12,294,262 | 19,449 |
| | Alfa SAB de CV Class A | 25,472,311 | 18,447 |
| 1 | Banco del Bajio SA | 9,812,018 | 18,420 |
| | Becle SAB de CV | 7,662,418 | 17,515 |
| | GCC SAB de CV | 2,343,407 | 17,432 |
| | Regional SAB de CV | 3,256,808 | 17,036 |
| | PLA Administradora Industrial S de RL de CV | 12,001,254 | 16,812 |
| | Telesites SAB de CV | 18,024,867 | 16,442 |
| | Corp. Inmobiliaria Vesta SAB de CV | 8,702,312 | 15,149 |
| * | Alsea SAB de CV | 7,167,217 | 15,046 |
| | | | | | Shares | Market
Value•
($000) |
| | Prologis Property Mexico SA de CV | 6,204,927 | 14,283 |
| | Grupo Comercial Chedraui SA de CV | 6,948,208 | 13,702 |
| | Bolsa Mexicana de Valores SAB de CV | 7,079,575 | 13,562 |
| | La Comer SAB de CV | 7,440,831 | 13,423 |
| 1 | Macquarie Mexico Real Estate Management SA de CV | 10,716,347 | 12,784 |
| | El Puerto de Liverpool SAB de CV | 2,782,339 | 12,310 |
| | Qualitas Controladora SAB de CV | 2,520,252 | 11,675 |
| *,1 | Grupo Traxion SAB de CV | 6,451,523 | 11,159 |
| * | Genomma Lab Internacional SAB de CV Class B | 11,533,851 | 11,036 |
| | Megacable Holdings SAB de CV | 3,497,713 | 10,306 |
| | Banco Santander Mexico SA Institucion de Banca Multiple Grupo Financiero Santand | 7,491,854 | 9,541 |
| * | Gentera SAB de CV | 14,201,144 | 8,498 |
| | Industrias Bachoco SAB de CV Class B | 2,266,241 | 8,038 |
| *,1 | Nemak SAB de CV | 29,179,252 | 6,732 |
| | Alpek SAB de CV Class A | 5,055,420 | 5,535 |
| | Grupo Herdez SAB de CV | 2,994,827 | 5,507 |
| * | Unifin Financiera SAB de CV | 2,787,008 | 4,280 |
| * | Axtel SAB de CV | 18,070,586 | 4,108 |
| | Concentradora Fibra Danhos SA de CV | 3,159,946 | 3,819 |
| * | Grupo Rotoplas SAB de CV | 2,433,945 | 3,361 |
| * | Credito Real SAB de CV SOFOM ER | 3,237,767 | 1,631 |
| *,3 | Empresas ICA SAB de CV | 104,678 | 8 |
| | | | | | | 2,412,122 |
| Pakistan (0.1%) |
| * | Lucky Cement Ltd. | 2,661,202 | 12,029 |
Emerging Markets Stock Index Fund
| | | | | | Shares | Market
Value•
($000) |
| | MCB Bank Ltd. | 7,877,368 | 7,551 |
| | Habib Bank Ltd. | 9,964,461 | 7,342 |
| | Engro Corp. Ltd. | 4,434,856 | 7,337 |
| | Hub Power Co. Ltd. | 14,191,423 | 6,301 |
| | TRG Pakistan | 8,597,408 | 6,011 |
| | Pakistan State Oil Co. Ltd. | 5,133,566 | 5,708 |
| | United Bank Ltd. | 6,500,682 | 5,312 |
| | Bank Alfalah Ltd. | 23,204,387 | 4,929 |
| | Pakistan Oilfields Ltd. | 2,112,545 | 4,725 |
| | Oil & Gas Development Co. Ltd. | 9,059,889 | 4,510 |
| | Pakistan Petroleum Ltd. | 9,772,177 | 4,330 |
| | Fauji Fertilizer Co. Ltd. | 5,750,862 | 3,456 |
| | Searle Co. Ltd. | 1,835,208 | 1,910 |
| * | National Bank of Pakistan | 8,941,200 | 1,793 |
| | Nishat Mills Ltd. | 2,814,900 | 1,487 |
| | Millat Tractors Ltd. | 252,066 | 1,313 |
| | SUI Northern Gas Pipeline | 5,506,800 | 1,269 |
| | Kot Addu Power Co. Ltd. | 7,660,721 | 1,253 |
| | DG Khan Cement Co. Ltd. | 1,918,420 | 986 |
| * | SUI Southern Gas Co. Ltd. | 13,074,531 | 793 |
| | Engro Fertilizers Ltd. | 1,522,741 | 635 |
| | | | | | | 90,980 |
| Philippines (0.9%) |
| | SM Investments Corp. | 6,642,717 | 127,205 |
| | SM Prime Holdings Inc. | 125,666,578 | 82,665 |
| | Ayala Land Inc. | 111,445,527 | 77,621 |
| | Ayala Corp. | 4,488,875 | 76,921 |
| | BDO Unibank Inc. | 26,862,479 | 66,114 |
| | International Container Terminal Services Inc. | 15,251,321 | 54,450 |
| | JG Summit Holdings Inc. | 41,655,618 | 49,745 |
| | Bank of the Philippine Islands | 24,874,388 | 42,916 |
| | PLDT Inc. | 1,244,874 | 40,666 |
| | Universal Robina Corp. | 12,374,031 | 33,929 |
| | Jollibee Foods Corp. | 5,549,319 | 25,898 |
| | Globe Telecom Inc. | 407,557 | 24,208 |
| | Metropolitan Bank & Trust Co. | 24,240,685 | 22,927 |
| | | | | | Shares | Market
Value•
($000) |
| | Manila Electric Co. | 3,796,703 | 21,631 |
| | AC Energy Corp. | 72,451,000 | 17,661 |
| | GT Capital Holdings Inc. | 1,438,132 | 16,137 |
| | Metro Pacific Investments Corp. | 205,611,379 | 15,310 |
| | Aboitiz Power Corp. | 21,745,229 | 13,878 |
| | San Miguel Food & Beverage Inc. | 9,076,400 | 13,675 |
| | Security Bank Corp. | 5,666,154 | 13,595 |
| | Puregold Price Club Inc. | 14,598,792 | 12,232 |
| | Wilcon Depot Inc. | 19,050,100 | 11,787 |
| | Robinsons Retail Holdings Inc. | 9,430,681 | 11,641 |
| | Alliance Global Group Inc. | 55,480,667 | 11,465 |
| * | Converge Information & Communications Technology Solutions Inc. | 17,845,800 | 11,284 |
| | San Miguel Corp. | 4,355,110 | 10,085 |
| | Megaworld Corp. | 162,443,303 | 9,897 |
| | Robinsons Land Corp. | 28,157,907 | 9,519 |
| | DMCI Holdings Inc. | 54,780,197 | 8,630 |
| * | Manila Water Co. Inc. | 15,509,628 | 8,145 |
| | Century Pacific Food Inc. | 13,546,587 | 7,604 |
| | Semirara Mining & Power Corp. Class A | 14,339,528 | 7,393 |
| | LT Group Inc. | 35,154,950 | 7,018 |
| * | Bloomberry Resorts Corp. | 47,719,249 | 6,441 |
| | D&L Industries Inc. | 28,594,290 | 4,785 |
| | First Gen Corp. | 7,560,785 | 4,516 |
| | Nickel Asia Corp. | 40,091,703 | 4,364 |
| | Vista Land & Lifescapes Inc. | 53,845,600 | 4,032 |
| * | Cebu Air Inc. | 2,539,953 | 2,232 |
| *,1 | CEMEX Holdings Philippines Inc. | 80,382,544 | 1,976 |
| | Filinvest Land Inc. | 30,946,000 | 707 |
| | | | | | | 992,905 |
| Poland (0.0%) |
| *,3 | CAPITEA SA | 245,053 | 230 |
| Qatar (0.8%) |
| | Qatar National Bank QPSC | 60,231,857 | 339,372 |
| | Industries Qatar QSC | 21,770,024 | 94,858 |
Emerging Markets Stock Index Fund
| | | | | | Shares | Market
Value•
($000) |
| | Qatar Islamic Bank SAQ | 15,615,788 | 79,060 |
| | Masraf Al Rayan QSC | 50,421,570 | 66,104 |
| | Commercial Bank PSQC | 27,481,559 | 46,208 |
| | Mesaieed Petrochemical Holding Co. | 60,212,962 | 39,781 |
| | Qatar Gas Transport Co. Ltd. | 37,242,771 | 33,307 |
| | Qatar Fuel QSC | 6,514,976 | 32,912 |
| | Qatar Electricity & Water Co. QSC | 6,498,770 | 30,035 |
| | Qatar International Islamic Bank QSC | 10,221,004 | 27,477 |
| | Ooredoo QPSC | 11,960,972 | 22,774 |
| | Barwa Real Estate Co. | 25,999,917 | 22,542 |
| | Qatar Aluminum Manufacturing Co. | 37,884,977 | 19,784 |
| | Doha Bank QPSC | 20,611,978 | 16,313 |
| * | Qatar Insurance Co. SAQ | 23,058,085 | 15,563 |
| | United Development Co. QSC | 24,513,420 | 10,480 |
| | Vodafone Qatar QSC | 20,862,055 | 9,284 |
| * | Ezdan Holding Group QSC | 21,378,331 | 9,092 |
| | Al Meera Consumer Goods Co. QSC | 1,342,490 | 7,223 |
| * | Gulf International Services QSC | 13,399,528 | 6,779 |
| | Medicare Group | 1,907,307 | 4,437 |
| | | | | | | 933,385 |
| Romania (0.1%) |
| | Banca Transilvania SA | 61,551,017 | 36,126 |
| | OMV Petrom SA | 123,069,302 | 14,186 |
| | Societatea Nationala Nuclearelectrica SA | 535,004 | 5,392 |
| | Teraplast SA | 10,497,795 | 2,673 |
| | | | | | | 58,377 |
| Russia (3.4%) |
| | Gazprom PJSC | 144,264,229 | 710,838 |
| | Sberbank of Russia PJSC | 140,548,532 | 707,071 |
| | LUKOIL PJSC | 5,244,044 | 535,165 |
| | Novatek PJSC | 10,258,967 | 260,490 |
| | MMC Norilsk Nickel PJSC | 380,327 | 118,726 |
| | Novatek PJSC GDR | 439,304 | 111,526 |
| | | | | | Shares | Market
Value•
($000) |
| | MMC Norilsk Nickel PJSC ADR | 2,836,366 | 88,639 |
| | Tatneft PJSC ADR | 1,881,548 | 86,045 |
| | Tatneft PJSC | 10,152,380 | 77,579 |
| | Rosneft Oil Co. PJSC GDR | 8,504,243 | 75,713 |
| | Rosneft Oil Co. PJSC | 7,499,415 | 67,375 |
| | Surgutneftegas PJSC Preference Shares | 110,965,123 | 60,446 |
| | Alrosa PJSC | 34,056,240 | 60,127 |
| | Magnit PJSC GDR | 3,182,533 | 58,964 |
| | Mobile TeleSystems PJSC ADR | 6,119,116 | 56,235 |
| | Severstal PAO | 2,401,603 | 54,579 |
| | Polyus PJSC GDR | 523,471 | 51,751 |
| | VTB Bank PJSC | 68,488,233,072 | 51,159 |
| | Moscow Exchange MICEX-RTS PJSC | 20,660,968 | 50,715 |
| | Transneft PJSC Preference Shares | 21,982 | 47,173 |
| | Novolipetsk Steel PJSC GDR | 1,189,254 | 37,584 |
| * | United Co. RUSAL International PJSC | 35,496,710 | 36,058 |
| | PhosAgro PJSC GDR | 1,451,373 | 34,723 |
| | Inter RAO UES PJSC | 497,967,170 | 33,758 |
| | Magnit PJSC | 326,590 | 29,805 |
| | Magnitogorsk Iron & Steel Works PJSC | 28,533,947 | 26,664 |
| 2 | Surgutneftegas PJSC ADR | 5,447,865 | 26,022 |
| | Polyus PJSC | 117,468 | 23,279 |
| | Surgutneftegas PJSC | 41,925,149 | 20,173 |
| | RusHydro PJSC | 1,657,671,418 | 19,025 |
| * | Credit Bank of Moscow PJSC | 176,163,100 | 17,780 |
| | Rostelecom PJSC | 11,792,928 | 15,508 |
| 1 | Detsky Mir PJSC | 7,640,251 | 14,768 |
| | Sistema PJSFC GDR | 1,934,593 | 14,669 |
| | Novolipetsk Steel PJSC | 4,261,817 | 13,454 |
| * | Aeroflot PJSC | 13,666,219 | 13,259 |
| | Federal Grid Co. Unified Energy System PJSC | 4,151,604,717 | 10,867 |
| | ROSSETI PJSC | 442,793,584 | 8,701 |
| | Samolet Group | 106,994 | 7,414 |
| | Unipro PJSC | 175,999,198 | 6,776 |
| * | Mechel PJSC | 2,989,465 | 6,153 |
Emerging Markets Stock Index Fund
| | | | | | Shares | Market
Value•
($000) |
| | Tatneft PJSC Preference Shares | 855,515 | 5,890 |
| | Raspadskaya OJSC | 910,080 | 5,541 |
| | Severstal PAO GDR | 206,805 | 4,728 |
| | Bashneft PJSC Preference Shares | 290,151 | 4,681 |
| | Mosenergo PJSC | 135,072,554 | 4,276 |
| | Rosseti Lenenergo PJSC Preference Shares | 1,549,766 | 3,848 |
| | Sovcomflot PJSC | 3,140,632 | 3,776 |
| | Mechel PJSC Preference Shares | 899,940 | 3,766 |
| | LSR Group PJSC Class A | 322,692 | 3,392 |
| | M.Video PJSC | 386,160 | 3,213 |
| | OGK-2 PJSC | 302,841,880 | 2,992 |
| | TGC-1 PJSC | 10,414,590,345 | 1,633 |
| * | ENEL RUSSIA PJSC | 126,293,000 | 1,531 |
| * | Mechel PJSC ADR | 164,675 | 692 |
| | PhosAgro PJSC | 4,808 | 380 |
| | Bank St. Petersburg PJSC | 248,146 | 318 |
| | Novorossiysk Commercial Sea Port PJSC | 1,163,450 | 127 |
| | IDGC of Centre & Volga Region PJSC | 21,532,404 | 81 |
| | Cherkizovo Group PJSC | 729 | 36 |
| | | | | | | 3,797,657 |
| Saudi Arabia (3.6%) |
| | Al Rajhi Bank | 16,753,231 | 619,760 |
| | Saudi National Bank | 30,019,060 | 526,976 |
| 1 | Saudi Arabian Oil Co. | 34,731,464 | 349,652 |
| | Saudi Basic Industries Corp. | 9,261,759 | 319,220 |
| | Saudi Telecom Co. | 6,545,486 | 204,472 |
| | Riyad Bank | 16,602,330 | 130,707 |
| * | Saudi Arabian Mining Co. | 5,545,486 | 120,905 |
| | SABIC Agri-Nutrients Co. | 2,578,748 | 113,150 |
| | Saudi British Bank | 12,196,283 | 107,782 |
| | Alinma Bank | 13,622,321 | 91,462 |
| | Banque Saudi Fransi | 8,012,464 | 90,187 |
| | Saudi Electricity Co. | 10,895,146 | 82,885 |
| | Yanbu National Petrochemical Co. | 3,035,363 | 61,675 |
| | | | | | Shares | Market
Value•
($000) |
| | Sahara International Petrochemical Co. | 5,064,161 | 59,469 |
| * | Saudi Kayan Petrochemical Co. | 10,566,590 | 57,521 |
| * | Bank AlBilad | 5,052,010 | 56,904 |
| | Dr Sulaiman Al Habib Medical Services Group Co. | 1,181,392 | 52,264 |
| | Almarai Co. JSC | 3,435,479 | 48,443 |
| | Arab National Bank | 7,593,226 | 46,653 |
| | Jarir Marketing Co. | 809,543 | 43,779 |
| | Etihad Etisalat Co. | 5,046,019 | 40,682 |
| | Savola Group | 3,511,964 | 34,259 |
| | Saudi Industrial Investment Group | 3,199,904 | 32,343 |
| * | National Industrialization Co. | 4,745,044 | 31,583 |
| | Bupa Arabia for Cooperative Insurance Co. | 795,435 | 30,701 |
| | Advanced Petrochemical Co. | 1,527,134 | 30,347 |
| | Bank Al-Jazira | 5,563,459 | 28,520 |
| | Mouwasat Medical Services Co. | 576,770 | 27,727 |
| * | Rabigh Refining & Petrochemical Co. | 2,993,301 | 22,826 |
| | National Petrochemical Co. | 1,734,536 | 22,291 |
| * | Mobile Telecommunications Co. Saudi Arabia | 5,904,833 | 21,373 |
| * | Emaar Economic City | 6,072,588 | 20,541 |
| * | Saudi Research & Media Group | 437,649 | 19,724 |
| * | International Co. For Water & Power Projects | 1,002,983 | 19,092 |
| | Southern Province Cement Co. | 983,741 | 18,767 |
| | Abdullah Al Othaim Markets Co. | 603,171 | 18,591 |
| | Co. for Cooperative Insurance | 796,397 | 18,284 |
| * | Dar Al Arkan Real Estate Development Co. | 6,047,664 | 15,961 |
| * | Arabian Internet & Communications Services Co. | 296,228 | 15,748 |
| | Arabian Centres Co. Ltd. | 2,298,088 | 15,645 |
| | United Electronics Co. | 411,678 | 15,461 |
Emerging Markets Stock Index Fund
| | | | | | Shares | Market
Value•
($000) |
| | Saudi Cement Co. | 927,435 | 14,650 |
| * | Saudi Airlines Catering Co. | 557,061 | 14,118 |
| | Qassim Cement Co. | 602,483 | 13,093 |
| * | Saudi Ground Services Co. | 1,212,772 | 12,052 |
| * | Seera Group Holding | 1,943,651 | 11,993 |
| | Yanbu Cement Co. | 1,134,868 | 11,609 |
| * | Yamama Cement Co. | 1,428,750 | 10,551 |
| | BinDawood Holding Co. | 371,772 | 10,335 |
| | Aldrees Petroleum & Transport Services Co. | 504,340 | 9,948 |
| | Saudia Dairy & Foodstuff Co. | 218,489 | 9,567 |
| | Dallah Healthcare Co. | 487,374 | 9,443 |
| | Saudi Pharmaceutical Industries & Medical Appliances Corp. | 817,122 | 9,345 |
| | Al Hammadi Co. for Development & Investment | 820,416 | 9,263 |
| | Leejam Sports Co. JSC | 302,826 | 9,165 |
| | Saudi Ceramic Co. | 600,852 | 8,722 |
| | Eastern Province Cement Co. | 610,308 | 7,801 |
| | National Gas & Industrialization Co. | 465,005 | 7,320 |
| | Jadwa REIT Saudi Fund | 1,824,211 | 7,104 |
| * | Saudi Real Estate Co. | 1,168,835 | 6,964 |
| | Arabian Cement Co. | 665,600 | 6,925 |
| * | National Agriculture Development Co. | 701,651 | 6,640 |
| | United International Transportation Co. | 476,695 | 6,393 |
| | City Cement Co. | 989,247 | 6,388 |
| * | Saudi Public Transport Co. | 911,818 | 5,873 |
| | Najran Cement Co. | 1,165,955 | 5,869 |
| | Arriyadh Development Co. | 825,510 | 5,858 |
| | Astra Industrial Group | 491,756 | 5,660 |
| | Northern Region Cement Co. | 1,425,266 | 5,653 |
| | | | | | Shares | Market
Value•
($000) |
| | Saudi Chemical Co. Holding | 550,457 | 5,565 |
| * | Aseer Trading Tourism & Manufacturing Co. | 844,387 | 5,132 |
| | National Medical Care Co. | 303,331 | 4,923 |
| | Bawan Co. | 445,710 | 4,713 |
| | Herfy Food Services Co. | 266,997 | 4,664 |
| * | Fawaz Abdulaziz Al Hokair & Co. | 906,592 | 4,649 |
| * | Dur Hospitality Co. | 458,183 | 4,367 |
| * | Zamil Industrial Investment Co. | 459,729 | 4,346 |
| * | Methanol Chemicals Co. | 424,890 | 4,031 |
| * | Middle East Healthcare Co. | 386,483 | 3,832 |
| * | Al Jouf Cement Co. | 1,049,330 | 3,357 |
| * | Tabuk Cement Co. | 643,569 | 3,264 |
| * | Mediterranean & Gulf Insurance & Reinsurance Co. | 439,347 | 2,731 |
| * | Abdul Mohsen Al-Hokair Tourism & Development Co. | 454,560 | 2,684 |
| | Hail Cement Co. | 511,027 | 2,014 |
| | | | | | | 3,992,906 |
| South Africa (3.7%) |
| | Naspers Ltd. | 2,901,815 | 491,433 |
| | FirstRand Ltd. | 67,491,316 | 256,378 |
| * | MTN Group Ltd. | 24,633,198 | 220,889 |
| | Standard Bank Group Ltd. | 17,522,931 | 155,278 |
| | Impala Platinum Holdings Ltd. | 11,090,043 | 143,531 |
| 2 | Sibanye Stillwater Ltd. | 39,763,406 | 139,162 |
| * | Sasol Ltd. | 7,640,973 | 128,338 |
| | Capitec Bank Holdings Ltd. | 1,135,608 | 126,867 |
| | Gold Fields Ltd. | 11,985,071 | 111,368 |
| | AngloGold Ashanti Ltd. | 5,742,605 | 105,944 |
| 2 | Bid Corp. Ltd. | 4,630,159 | 99,239 |
| | Sanlam Ltd. | 24,116,864 | 99,061 |
| | Absa Group Ltd. | 9,610,897 | 87,917 |
| | Aspen Pharmacare Holdings Ltd. | 5,355,569 | 85,082 |
| | Anglo American Platinum Ltd. | 816,791 | 82,757 |
| | Shoprite Holdings Ltd. | 6,815,959 | 80,901 |
| * | Northam Platinum Holdings Ltd. | 4,772,937 | 71,477 |
Emerging Markets Stock Index Fund
| | | | | | Shares | Market
Value•
($000) |
| | Vodacom Group Ltd. | 7,896,008 | 69,917 |
| | Old Mutual Ltd. | 62,687,874 | 64,036 |
| | Clicks Group Ltd. | 3,437,818 | 62,871 |
| | Remgro Ltd. | 7,077,647 | 62,407 |
| 2 | Bidvest Group Ltd. | 4,714,612 | 59,033 |
| | Nedbank Group Ltd. | 4,861,149 | 55,393 |
| * | Discovery Ltd. | 5,611,381 | 51,480 |
| | MultiChoice Group | 5,779,950 | 45,964 |
| | Mr Price Group Ltd. | 3,510,554 | 45,815 |
| 2 | Woolworths Holdings Ltd. | 12,210,372 | 42,981 |
| 2 | Growthpoint Properties Ltd. | 46,321,855 | 39,206 |
| | NEPI Rockcastle plc | 5,847,940 | 39,094 |
| * | Foschini Group Ltd. | 4,381,862 | 37,160 |
| | Exxaro Resources Ltd. | 3,313,518 | 36,352 |
| | SPAR Group Ltd. | 2,797,157 | 35,715 |
| | Reinet Investments SCA | 1,960,184 | 35,433 |
| *,1 | Pepkor Holdings Ltd. | 20,606,045 | 32,490 |
| * | Life Healthcare Group Holdings Ltd. | 18,800,298 | 29,772 |
| 2 | Rand Merchant Investment Holdings Ltd. | 10,396,589 | 27,816 |
| | Tiger Brands Ltd. | 2,179,871 | 27,595 |
| | Harmony Gold Mining Co. Ltd. | 7,374,110 | 26,466 |
| 2 | AVI Ltd. | 4,654,495 | 24,117 |
| * | Sappi Ltd. | 7,374,913 | 22,654 |
| * | Redefine Properties Ltd. | 76,363,779 | 22,520 |
| | Kumba Iron Ore Ltd. | 732,555 | 22,292 |
| | Barloworld Ltd. | 2,627,096 | 22,063 |
| * | Netcare Ltd. | 19,507,036 | 21,593 |
| | Transaction Capital Ltd. | 7,462,496 | 21,520 |
| | Pick n Pay Stores Ltd. | 5,145,794 | 20,029 |
| | Truworths International Ltd. | 5,593,542 | 19,721 |
| | African Rainbow Minerals Ltd. | 1,460,582 | 19,502 |
| | Investec Ltd. | 3,861,585 | 17,779 |
| | Resilient REIT Ltd. | 4,435,113 | 16,235 |
| | Royal Bafokeng Platinum Ltd. | 2,249,749 | 16,117 |
| | Momentum Metropolitan Holdings | 12,033,449 | 15,453 |
| | | | | | Shares | Market
Value•
($000) |
| | Fortress REIT Ltd. Class A (XJSE) | 17,223,160 | 15,026 |
| | Motus Holdings Ltd. | 2,243,109 | 14,967 |
| * | Telkom SA SOC Ltd. | 3,936,674 | 13,101 |
| | Coronation Fund Managers Ltd. | 3,858,776 | 12,825 |
| * | Distell Group Holdings Ltd. | 1,037,255 | 12,431 |
| | AECI Ltd. | 1,648,403 | 12,239 |
| 2 | PSG Group Ltd. | 2,185,026 | 10,947 |
| 2 | Equites Property Fund Ltd. | 7,810,146 | 10,409 |
| 1 | Dis-Chem Pharmacies Ltd. | 4,977,147 | 10,389 |
| | KAP Industrial Holdings Ltd. | 33,010,075 | 10,158 |
| | Imperial Logistics Ltd. | 2,475,568 | 10,110 |
| | Santam Ltd. | 604,192 | 10,047 |
| 2 | Super Group Ltd. | 4,782,258 | 10,005 |
| | Vukile Property Fund Ltd. | 12,410,070 | 9,901 |
| *,2 | Steinhoff International Holdings NV (XJSE) | 59,519,552 | 9,372 |
| | Advtech Ltd. | 7,329,448 | 9,207 |
| | Omnia Holdings Ltd. | 2,222,784 | 9,197 |
| * | Liberty Holdings Ltd. | 1,520,501 | 8,978 |
| | JSE Ltd. | 1,252,168 | 8,761 |
| * | Thungela Resources Ltd. | 1,725,737 | 8,208 |
| | Reunert Ltd. | 2,378,511 | 7,858 |
| 2 | Hyprop Investments Ltd. | 3,942,083 | 7,652 |
| 2 | Irongate Group | 6,136,659 | 7,495 |
| | MAS Real Estate Inc. | 5,602,006 | 6,597 |
| | DataTec Ltd. | 2,421,219 | 6,593 |
| | Ninety One Ltd. | 1,801,858 | 6,222 |
| | Astral Foods Ltd. | 535,740 | 6,196 |
| * | Massmart Holdings Ltd. | 1,360,236 | 5,581 |
| | Investec Property Fund Ltd. | 7,527,582 | 5,235 |
| | DRDGOLD Ltd. | 5,809,115 | 5,158 |
| * | Famous Brands Ltd. | 1,029,846 | 4,980 |
| * | Sun International Ltd. | 2,350,287 | 4,948 |
| | Raubex Group Ltd. | 2,286,937 | 4,889 |
| * | EPP NV | 6,202,151 | 4,864 |
| 2 | SA Corporate Real Estate Ltd. | 34,506,381 | 4,824 |
Emerging Markets Stock Index Fund
| | | | | | Shares | Market
Value•
($000) |
| | Cashbuild Ltd. | 271,351 | 4,735 |
| * | Tsogo Sun Gaming Ltd. | 5,730,043 | 4,624 |
| | Wilson Bayly Holmes-Ovcon Ltd. | 615,686 | 4,280 |
| * | Attacq Ltd. | 9,912,267 | 4,229 |
| * | Long4Life Ltd. | 10,499,295 | 4,120 |
| | Hudaco Industries Ltd. | 383,847 | 3,452 |
| * | Blue Label Telecoms Ltd. | 8,442,071 | 3,065 |
| *,2 | Brait plc | 10,744,448 | 2,997 |
| * | Hosken Consolidated Investments Ltd. | 622,421 | 2,943 |
| * | Curro Holdings Ltd. | 3,526,773 | 2,846 |
| | Zeder Investments Ltd. | 13,001,432 | 2,700 |
| | Altron Ltd. Class A | 3,383,202 | 2,430 |
| | Alexander Forbes Group Holdings Ltd. | 8,424,381 | 2,415 |
| * | Fortress REIT Ltd. Class B (XJSE) | 12,883,024 | 2,067 |
| | Emira Property Fund Ltd. | 3,150,782 | 1,942 |
| | Adcock Ingram Holdings Ltd. | 125,714 | 402 |
| * | Steinhoff International Holdings NV (XETR) | 1,075,902 | 170 |
| | | | | | | 4,049,000 |
| Taiwan (18.0%) |
| | Taiwan Semiconductor Manufacturing Co. Ltd. | 256,043,285 | 5,433,318 |
| | Taiwan Semiconductor Manufacturing Co. Ltd. ADR | 14,728,753 | 1,674,659 |
| | MediaTek Inc. | 20,274,630 | 667,293 |
| | Hon Hai Precision Industry Co. Ltd. | 163,687,761 | 631,890 |
| | Fubon Financial Holding Co. Ltd. | 114,569,033 | 302,855 |
| | Delta Electronics Inc. | 29,770,356 | 262,794 |
| | Formosa Plastics Corp. | 66,746,057 | 258,538 |
| | Nan Ya Plastics Corp. | 77,353,819 | 237,388 |
| | Cathay Financial Holding Co. Ltd. | 113,472,826 | 236,533 |
| | CTBC Financial Holding Co. Ltd. | 250,284,062 | 209,002 |
| | | | | | Shares | Market
Value•
($000) |
| | United Microelectronics Corp. | 99,621,270 | 206,811 |
| | China Steel Corp. | 168,765,308 | 203,473 |
| | Mega Financial Holding Co. Ltd. | 149,319,503 | 179,443 |
| | Chailease Holding Co. Ltd. | 18,303,096 | 175,299 |
| | ASE Technology Holding Co. Ltd. | 47,121,723 | 168,555 |
| | E.Sun Financial Holding Co. Ltd. | 174,332,816 | 166,579 |
| | Uni-President Enterprises Corp. | 65,919,868 | 158,137 |
| | Yuanta Financial Holding Co. Ltd. | 160,423,210 | 142,597 |
| | Silergy Corp. | 842,890 | 139,250 |
| | Formosa Chemicals & Fibre Corp. | 46,509,449 | 134,956 |
| | Taiwan Cement Corp. | 72,162,753 | 125,219 |
| | Asustek Computer Inc. | 9,777,937 | 124,315 |
| 2 | United Microelectronics Corp. ADR | 12,023,058 | 123,477 |
| | Unimicron Technology Corp. | 17,798,979 | 122,009 |
| | Chunghwa Telecom Co. Ltd. | 30,498,663 | 121,026 |
| | Realtek Semiconductor Corp. | 6,519,959 | 117,279 |
| | First Financial Holding Co. Ltd. | 139,850,513 | 115,141 |
| | Taiwan Cooperative Financial Holding Co. Ltd. | 132,939,992 | 108,090 |
| | Largan Precision Co. Ltd. | 1,404,076 | 104,631 |
| | Quanta Computer Inc. | 36,445,200 | 102,393 |
| | Evergreen Marine Corp. Taiwan Ltd. | 28,452,897 | 102,393 |
| | Yageo Corp. | 6,384,169 | 99,923 |
| | Hua Nan Financial Holdings Co. Ltd. | 134,360,790 | 98,384 |
| | Taishin Financial Holding Co. Ltd. | 148,791,135 | 97,681 |
| | China Development Financial Holding Corp. | 190,353,653 | �� 97,295 |
| | Hotai Motor Co. Ltd. | 4,341,154 | 95,593 |
| | Novatek Microelectronics Corp. | 5,738,560 | 86,072 |
| | Chunghwa Telecom Co. Ltd. ADR | 2,038,730 | 80,530 |
Emerging Markets Stock Index Fund
| | | | | | Shares | Market
Value•
($000) |
| | Globalwafers Co. Ltd. | 2,887,810 | 79,236 |
| * | Yang Ming Marine Transport Corp. | 22,604,725 | 78,909 |
| | eMemory Technology Inc. | 941,100 | 78,173 |
| | President Chain Store Corp. | 7,666,449 | 77,485 |
| | Taiwan Mobile Co. Ltd. | 21,659,941 | 76,399 |
| | Advantech Co. Ltd. | 5,694,361 | 74,471 |
| | SinoPac Financial Holdings Co. Ltd. | 144,161,618 | 73,420 |
| | Innolux Corp. | 119,177,372 | 71,689 |
| | Win Semiconductors Corp. | 5,552,519 | 71,663 |
| | Shanghai Commercial & Savings Bank Ltd. | 44,775,350 | 70,909 |
| | AU Optronics Corp. | 101,720,549 | 69,905 |
| | Pegatron Corp. | 27,780,213 | 68,007 |
| | Formosa Petrochemical Corp. | 18,675,977 | 67,239 |
| | Lite-On Technology Corp. | 29,489,084 | 65,076 |
| | Accton Technology Corp. | 7,332,610 | 64,108 |
| | Vanguard International Semiconductor Corp. | 12,268,640 | 63,929 |
| | Wan Hai Lines Ltd. | 10,999,606 | 63,458 |
| | Airtac International Group | 2,100,830 | 62,861 |
| | Shin Kong Financial Holding Co. Ltd. | 172,486,288 | 60,790 |
| | Parade Technologies Ltd. | 943,290 | 60,766 |
| | Eclat Textile Co. Ltd. | 2,712,209 | 59,270 |
| | Catcher Technology Co. Ltd. | 9,932,956 | 57,595 |
| | Far Eastern New Century Corp. | 53,979,963 | 56,536 |
| | Ruentex Development Co. Ltd. | 21,848,778 | 55,761 |
| | momo.com Inc. | 851,600 | 54,877 |
| | Asia Cement Corp. | 32,939,510 | 52,465 |
| | Chang Hwa Commercial Bank Ltd. | 88,277,373 | 52,129 |
| | Sino-American Silicon Products Inc. | 7,457,742 | 51,083 |
| | | | | | Shares | Market
Value•
($000) |
| | Compal Electronics Inc. | 57,669,900 | 50,753 |
| | Nan Ya Printed Circuit Board Corp. | 2,849,521 | 50,420 |
| | Giant Manufacturing Co. Ltd. | 4,234,423 | 49,180 |
| | Micro-Star International Co. Ltd. | 9,635,200 | 48,624 |
| | Feng TAY Enterprise Co. Ltd. | 6,044,132 | 47,030 |
| | ASPEED Technology Inc. | 458,010 | 45,945 |
| | Far EasTone Telecommunications Co. Ltd. | 20,746,035 | 45,650 |
| | Pou Chen Corp. | 36,732,021 | 45,049 |
| | Hiwin Technologies Corp. | 3,759,313 | 41,863 |
| | E Ink Holdings Inc. | 12,587,440 | 41,730 |
| | Wistron Corp. | 38,820,535 | 40,798 |
| | Walsin Lihwa Corp. | 43,625,405 | 40,753 |
| | Voltronic Power Technology Corp. | 694,325 | 40,663 |
| | Inventec Corp. | 41,505,966 | 39,697 |
| | Winbond Electronics Corp. | 41,369,452 | 39,224 |
| * | Oneness Biotech Co. Ltd. | 4,039,000 | 38,124 |
| | Foxconn Technology Co. Ltd. | 15,334,663 | 38,075 |
| * | Walsin Technology Corp. | 6,987,521 | 38,040 |
| | Acer Inc. | 40,339,897 | 37,757 |
| | WPG Holdings Ltd. | 19,983,720 | 37,332 |
| | Wiwynn Corp. | 1,137,280 | 36,433 |
| | Chroma ATE Inc. | 5,565,280 | 36,343 |
| | Elite Material Co. Ltd. | 4,185,156 | 36,245 |
| | Synnex Technology International Corp. | 18,430,800 | 35,711 |
| | Macronix International Co. Ltd. | 25,136,737 | 35,565 |
| | Merida Industry Co. Ltd. | 3,354,526 | 34,942 |
| | Alchip Technologies Ltd. | 923,463 | 34,302 |
| | Kinsus Interconnect Technology Corp. | 3,803,530 | 33,473 |
| * | TA Chen Stainless Pipe | 20,519,775 | 32,470 |
Emerging Markets Stock Index Fund
| | | | | | Shares | Market
Value•
($000) |
| | Powertech Technology Inc. | 9,054,550 | 31,771 |
| | Cheng Shin Rubber Industry Co. Ltd. | 25,843,095 | 31,718 |
| | AP Memory Technology Corp. | 1,600,120 | 31,128 |
| | ASMedia Technology Inc. | 528,857 | 30,998 |
| | Zhen Ding Technology Holding Ltd. | 8,867,710 | 30,709 |
| | Phison Electronics Corp. | 2,150,080 | 30,317 |
| | Lien Hwa Industrial Holdings Corp. | 15,070,970 | 30,263 |
| | Ruentex Industries Ltd. | 7,724,068 | 30,141 |
| | Taiwan High Speed Rail Corp. | 28,254,912 | 29,526 |
| | China Life Insurance Co. Ltd. | 28,026,063 | 29,295 |
| | Tripod Technology Corp. | 6,781,040 | 28,721 |
| | Gigabyte Technology Co. Ltd. | 6,908,850 | 28,055 |
| | Teco Electric & Machinery Co. Ltd. | 25,110,320 | 27,276 |
| | Taiwan Fertilizer Co. Ltd. | 10,662,186 | 26,074 |
| | Nien Made Enterprise Co. Ltd. | 1,873,560 | 25,748 |
| | Nanya Technology Corp. | 10,598,878 | 25,413 |
| | ITEQ Corp. | 5,483,357 | 25,381 |
| | Simplo Technology Co. Ltd. | 2,346,310 | 25,278 |
| | Global Unichip Corp. | 1,168,960 | 25,228 |
| | Taiwan Business Bank | 73,596,414 | 25,037 |
| | Chicony Electronics Co. Ltd. | 8,678,458 | 24,816 |
| * | HTC Corp. | 10,393,301 | 24,561 |
| | Elan Microelectronics Corp. | 3,997,870 | 24,069 |
| | Makalot Industrial Co. Ltd. | 2,700,808 | 23,571 |
| | Compeq Manufacturing Co. Ltd. | 16,055,760 | 23,365 |
| | IBF Financial Holdings Co. Ltd. | 40,701,870 | 23,283 |
| | Sinbon Electronics Co. Ltd. | 2,782,475 | 23,023 |
| * | China Airlines Ltd. | 36,621,146 | 22,677 |
| | | | | | Shares | Market
Value•
($000) |
| | Qisda Corp. | 20,266,620 | 22,642 |
| * | Episil Technologies Inc. | 4,098,149 | 22,545 |
| * | Eva Airways Corp. | 33,161,760 | 22,507 |
| | Taiwan Glass Industry Corp. | 22,427,290 | 22,105 |
| | Highwealth Construction Corp. | 13,475,321 | 21,759 |
| | King Yuan Electronics Co. Ltd. | 14,876,280 | 21,346 |
| | ENNOSTAR Inc. | 8,072,297 | 21,243 |
| | YFY Inc. | 17,616,703 | 20,309 |
| | Radiant Opto-Electronics Corp. | 5,759,751 | 20,180 |
| | Faraday Technology Corp. | 2,733,000 | 19,836 |
| | Lotes Co. Ltd. | 948,737 | 19,767 |
| | Pan Jit International Inc. | 4,864,740 | 19,721 |
| | Tong Hsing Electronic Industries Ltd. | 2,053,453 | 19,557 |
| | King's Town Bank Co. Ltd. | 13,001,184 | 19,413 |
| | Poya International Co. Ltd. | 1,048,779 | 18,785 |
| | Great Wall Enterprise Co. Ltd. | 9,675,406 | 18,678 |
| | Eternal Materials Co. Ltd. | 14,052,630 | 18,630 |
| | International Games System Co. Ltd. | 719,300 | 18,529 |
| * | China Petrochemical Development Corp. | 42,320,730 | 18,441 |
| | Chipbond Technology Corp. | 7,806,630 | 18,121 |
| | Elite Semiconductor Microelectronics Technology Inc. | 3,483,000 | 17,909 |
| | Tung Ho Steel Enterprise Corp. | 12,211,660 | 17,751 |
| | Genius Electronic Optical Co. Ltd. | 1,129,299 | 17,410 |
| | Taiwan Surface Mounting Technology Corp. | 4,310,110 | 17,391 |
| * | Medigen Vaccine Biologics Corp. | 2,006,732 | 17,269 |
| | Wafer Works Corp. | 7,234,103 | 16,780 |
Emerging Markets Stock Index Fund
| | | | | | Shares | Market
Value•
($000) |
| | Taichung Commercial Bank Co. Ltd. | 38,351,568 | 16,488 |
| * | FLEXium Interconnect Inc. | 4,679,990 | 16,214 |
| | Cheng Loong Corp. | 13,016,230 | 15,946 |
| | HannStar Display Corp. | 31,350,193 | 15,940 |
| | Visual Photonics Epitaxy Co. Ltd. | 3,073,960 | 15,604 |
| | Capital Securities Corp. | 28,586,773 | 15,603 |
| * | Yieh Phui Enterprise Co. Ltd. | 17,387,928 | 15,535 |
| | Bizlink Holding Inc. | 1,677,128 | 15,503 |
| | Formosa Taffeta Co. Ltd. | 14,328,632 | 15,469 |
| | Goldsun Building Materials Co. Ltd. | 16,656,415 | 15,423 |
| | USI Corp. | 12,431,861 | 15,400 |
| | Fitipower Integrated Technology Inc. | 1,997,375 | 15,332 |
| | Wisdom Marine Lines Co. Ltd. | 6,496,155 | 15,291 |
| | Yulon Finance Corp. | 2,501,537 | 15,177 |
| | FocalTech Systems Co. Ltd. | 2,628,482 | 15,151 |
| | TXC Corp. | 4,094,630 | 15,133 |
| * | United Renewable Energy Co. Ltd. | 17,433,629 | 15,018 |
| | Jentech Precision Industrial Co. Ltd. | 1,118,570 | 14,878 |
| | Ardentec Corp. | 6,842,522 | 14,662 |
| | Chung Hung Steel Corp. | 11,616,000 | 14,656 |
| | Shinkong Synthetic Fibers Corp. | 21,376,400 | 14,502 |
| | Nan Kang Rubber Tire Co. Ltd. | 10,057,390 | 14,468 |
| | Nantex Industry Co. Ltd. | 4,909,000 | 14,433 |
| | Mitac Holdings Corp. | 13,337,901 | 13,804 |
| | Taiwan Secom Co. Ltd. | 3,811,876 | 13,785 |
| | United Integrated Services Co. Ltd. | 2,073,800 | 13,711 |
| | ChipMOS Technologies Inc. | 8,196,148 | 13,629 |
| | King Slide Works Co. Ltd. | 883,000 | 13,569 |
| | Advanced Energy Solution Holding Co. Ltd. | 300,000 | 13,229 |
| | CTCI Corp. | 9,989,510 | 13,090 |
| | | | | | Shares | Market
Value•
($000) |
| | Sitronix Technology Corp. | 1,344,070 | 12,905 |
| | Tainan Spinning Co. Ltd. | 15,521,000 | 12,705 |
| * | Microbio Co. Ltd. | 5,571,183 | 12,658 |
| | Feng Hsin Steel Co. Ltd. | 4,458,200 | 12,538 |
| | SDI Corp. | 2,095,236 | 12,530 |
| | Far Eastern Department Stores Ltd. | 15,516,878 | 12,337 |
| | Taiwan Union Technology Corp. | 3,575,052 | 12,327 |
| | Standard Foods Corp. | 6,586,603 | 12,278 |
| | Wistron NeWeb Corp. | 4,368,787 | 12,198 |
| | Yulon Motor Co. Ltd. | 8,077,444 | 11,977 |
| | Grand Pacific Petrochemical | 12,133,304 | 11,808 |
| | TCI Co. Ltd. | 1,450,549 | 11,789 |
| | Gold Circuit Electronics Ltd. | 4,918,090 | 11,782 |
| | Solar Applied Materials Technology Corp. | 6,491,607 | 11,702 |
| | Coretronic Corp. | 5,581,900 | 11,554 |
| | U-Ming Marine Transport Corp. | 6,064,108 | 11,500 |
| | Center Laboratories Inc. | 4,802,011 | 11,486 |
| | AU Optronics Corp. ADR | 1,674,810 | 11,440 |
| | Run Long Construction Co. Ltd. | 5,268,412 | 11,350 |
| | TSRC Corp. | 9,778,940 | 11,280 |
| | Hota Industrial Manufacturing Co. Ltd. | 3,307,178 | 11,188 |
| | Asia Vital Components Co. Ltd. | 3,741,890 | 11,182 |
| | President Securities Corp. | 13,724,241 | 11,180 |
| | Fusheng Precision Co. Ltd. | 1,641,920 | 11,146 |
| | RichWave Technology Corp. | 1,066,800 | 11,093 |
| | WT Microelectronics Co. Ltd. | 4,886,651 | 11,041 |
| | Sigurd Microelectronics Corp. | 5,209,546 | 11,011 |
| | Advanced Wireless Semiconductor Co. | 1,894,266 | 10,923 |
Emerging Markets Stock Index Fund
| | | | | | Shares | Market
Value•
($000) |
| * | EirGenix Inc. | 2,792,868 | 10,900 |
| * | Asia Optical Co. Inc. | 3,398,260 | 10,850 |
| | Taiwan Mask Corp. | 3,757,272 | 10,798 |
| | XinTec Inc. | 2,182,225 | 10,660 |
| | Taiwan Paiho Ltd. | 3,411,140 | 10,623 |
| | Huaku Development Co. Ltd. | 3,212,200 | 10,508 |
| | General Interface Solution Holding Ltd. | 2,998,070 | 10,493 |
| | Getac Holdings Corp. | 5,501,420 | 10,362 |
| | Farglory Land Development Co. Ltd. | 4,280,550 | 10,345 |
| | Clevo Co. | 8,329,000 | 10,325 |
| | Greatek Electronics Inc. | 3,577,000 | 10,249 |
| | Via Technologies Inc. | 4,581,620 | 10,243 |
| * | RDC Semiconductor Co. Ltd. | 714,000 | 10,235 |
| | UPC Technology Corp. | 12,298,041 | 10,232 |
| | Far Eastern International Bank | 27,170,465 | 10,219 |
| | Transcend Information Inc. | 4,192,069 | 10,188 |
| | Longchen Paper & Packaging Co. Ltd. | 11,677,606 | 10,121 |
| | Everlight Electronics Co. Ltd. | 5,645,410 | 10,082 |
| | Pegavision Corp. | 511,000 | 10,032 |
| | Charoen Pokphand Enterprise | 3,449,676 | 9,924 |
| | Supreme Electronics Co. Ltd. | 6,127,375 | 9,905 |
| | International CSRC Investment Holdings Co. | 11,289,270 | 9,764 |
| | Kenda Rubber Industrial Co. Ltd. | 8,700,000 | 9,582 |
| | Taiwan Semiconductor Co. Ltd. | 3,261,290 | 9,581 |
| * | Oriental Union Chemical Corp. | 11,053,582 | 9,507 |
| * | PharmaEssentia Corp. | 2,710,091 | 9,467 |
| | Taiwan Hon Chuan Enterprise Co. Ltd. | 4,039,650 | 9,465 |
| | | | | | Shares | Market
Value•
($000) |
| | Chilisin Electronics Corp. | 3,036,851 | 9,421 |
| | Arcadyan Technology Corp. | 2,457,219 | 9,294 |
| | China Steel Chemical Corp. | 2,053,000 | 9,125 |
| | Primax Electronics Ltd. | 4,839,940 | 8,983 |
| | Holy Stone Enterprise Co. Ltd. | 2,089,793 | 8,888 |
| | China Motor Corp. | 3,556,844 | 8,861 |
| | Cleanaway Co. Ltd. | 1,146,000 | 8,823 |
| | Century Iron & Steel Industrial Co. Ltd. | 2,163,000 | 8,812 |
| | Topco Scientific Co. Ltd. | 1,755,342 | 8,724 |
| | Sanyang Motor Co. Ltd. | 8,924,330 | 8,697 |
| | ADATA Technology Co. Ltd. | 2,841,000 | 8,513 |
| | Merry Electronics Co. Ltd. | 2,874,999 | 8,505 |
| | Advanced Ceramic X Corp. | 683,105 | 8,462 |
| | Wah Lee Industrial Corp. | 2,753,194 | 8,434 |
| | Grape King Bio Ltd. | 1,437,529 | 8,379 |
| | Sercomm Corp. | 3,634,600 | 8,332 |
| | Cheng Uei Precision Industry Co. Ltd. | 5,958,673 | 8,284 |
| | Apex International Co. Ltd. | 2,945,000 | 8,281 |
| | Pixart Imaging Inc. | 1,451,680 | 8,250 |
| | Tong Yang Industry Co. Ltd. | 6,625,350 | 8,055 |
| | Gudeng Precision Industrial Co. Ltd. | 909,517 | 7,969 |
| | Andes Technology Corp. | 435,000 | 7,913 |
| | China General Plastics Corp. | 5,855,926 | 7,828 |
| | Holtek Semiconductor Inc. | 2,105,483 | 7,825 |
| | Kinpo Electronics | 16,670,670 | 7,799 |
| | Universal Vision Biotechnology Co. Ltd. | 668,000 | 7,653 |
| | TTY Biopharm Co. Ltd. | 3,065,160 | 7,581 |
| | Taiwan Cogeneration Corp. | 5,401,850 | 7,432 |
| | Prince Housing & Development Corp. | 15,547,270 | 7,418 |
Emerging Markets Stock Index Fund
| | | | | | Shares | Market
Value•
($000) |
| | Sporton International Inc. | 906,631 | 7,366 |
| | Pan-International Industrial Corp. | 5,036,000 | 7,360 |
| | Foxsemicon Integrated Technology Inc. | 996,642 | 7,356 |
| | Hsin Kuang Steel Co. Ltd. | 3,518,000 | 7,353 |
| | AcBel Polytech Inc. | 5,891,000 | 7,342 |
| | China Man-Made Fiber Corp. | 20,023,016 | 7,325 |
| | Chung-Hsin Electric & Machinery Manufacturing Corp. | 4,893,000 | 7,257 |
| | Adimmune Corp. | 4,581,825 | 7,240 |
| | Co-Tech Development Corp. | 2,676,000 | 7,227 |
| | Chong Hong Construction Co. Ltd. | 2,691,000 | 7,142 |
| | TPK Holding Co. Ltd. | 4,633,288 | 7,087 |
| | Sensortek Technology Corp. | 336,000 | 7,021 |
| | Sunplus Technology Co. Ltd. | 5,218,000 | 6,961 |
| | Asia Polymer Corp. | 4,913,340 | 6,920 |
| | Kindom Development Co. Ltd. | 5,000,600 | 6,903 |
| | Chunghwa Precision Test Tech Co. Ltd. | 240,153 | 6,875 |
| | Dynapack International Technology Corp. | 1,986,000 | 6,868 |
| * | OBI Pharma Inc. | 1,779,917 | 6,825 |
| | Hannstar Board Corp. | 4,527,685 | 6,800 |
| | Taiwan Sakura Corp. | 2,695,000 | 6,787 |
| * | Shihlin Paper Corp. | 2,724,433 | 6,728 |
| | Shin Zu Shing Co. Ltd. | 1,863,853 | 6,687 |
| | Global Mixed Mode Technology Inc. | 824,000 | 6,679 |
| | OptoTech Corp. | 4,291,987 | 6,642 |
| | Hotai Finance Co. Ltd. | 2,074,000 | 6,588 |
| | St. Shine Optical Co. Ltd. | 620,000 | 6,586 |
| | Silicon Integrated Systems Corp. | 7,635,819 | 6,570 |
| | PChome Online Inc. | 1,257,873 | 6,566 |
| | | | | | Shares | Market
Value•
($000) |
| * | Etron Technology Inc. | 3,059,960 | 6,564 |
| * | Taiwan TEA Corp. | 8,730,000 | 6,554 |
| | Cub Elecparts Inc. | 1,063,008 | 6,545 |
| | Ta Ya Electric Wire & Cable | 7,335,045 | 6,534 |
| | Nan Pao Resins Chemical Co. Ltd. | 1,286,000 | 6,439 |
| * | AmTRAN Technology Co. Ltd. | 10,137,000 | 6,433 |
| | Sunny Friend Environmental Technology Co. Ltd. | 896,000 | 6,428 |
| | Tung Thih Electronic Co. Ltd. | 871,000 | 6,324 |
| | Thinking Electronic Industrial Co. Ltd. | 1,029,000 | 6,303 |
| | Systex Corp. | 2,013,000 | 6,250 |
| * | TaiMed Biologics Inc. | 2,576,090 | 6,203 |
| | Taiwan PCB Techvest Co. Ltd. | 3,656,000 | 6,175 |
| | Mercuries & Associates Holding Ltd. | 7,372,824 | 6,145 |
| | BES Engineering Corp. | 19,381,000 | 6,131 |
| | T3EX Global Holdings Corp. | 1,314,000 | 6,103 |
| | LandMark Optoelectronics Corp. | 945,470 | 6,085 |
| | Evergreen International Storage & Transport Corp. | 6,222,000 | 6,076 |
| * | Mercuries Life Insurance Co. Ltd. | 18,253,494 | 6,020 |
| | YC INOX Co. Ltd. | 5,299,800 | 6,011 |
| * | Orient Semiconductor Electronics Ltd. | 6,664,792 | 5,963 |
| | KMC Kuei Meng International Inc. | 816,000 | 5,945 |
| | Chicony Power Technology Co. Ltd. | 2,364,000 | 5,935 |
| | D-Link Corp. | 8,020,000 | 5,915 |
| * | TSEC Corp. | 4,883,000 | 5,864 |
| | Taiwan FamilyMart Co. Ltd. | 628,000 | 5,846 |
| * | Federal Corp. | 5,954,040 | 5,759 |
| | ITE Technology Inc. | 1,519,000 | 5,697 |
| | Chang Wah Electromaterials Inc. | 4,683,000 | 5,697 |
Emerging Markets Stock Index Fund
| | | | | | Shares | Market
Value•
($000) |
| | Chlitina Holding Ltd. | 661,000 | 5,674 |
| | Sonix Technology Co. Ltd. | 1,824,000 | 5,643 |
| | Dimerco Express Corp. | 1,817,199 | 5,639 |
| | Test Research Inc. | 2,789,660 | 5,614 |
| | Weltrend Semiconductor | 1,901,567 | 5,557 |
| * | First Steamship Co. Ltd. | 11,925,968 | 5,502 |
| | Fulgent Sun International Holding Co. Ltd. | 1,455,893 | 5,399 |
| | Innodisk Corp. | 775,200 | 5,357 |
| * | Unitech Printed Circuit Board Corp. | 8,173,880 | 5,331 |
| * | Phihong Technology Co. Ltd. | 4,014,000 | 5,322 |
| | AURAS Technology Co. Ltd. | 919,000 | 5,284 |
| | Cathay Real Estate Development Co. Ltd. | 7,517,984 | 5,273 |
| | Hu Lane Associate Inc. | 1,078,300 | 5,221 |
| | TaiDoc Technology Corp. | 829,000 | 5,217 |
| | Fittech Co. Ltd. | 688,491 | 5,211 |
| | Everlight Chemical Industrial Corp. | 5,648,200 | 5,207 |
| | Chin-Poon Industrial Co. Ltd. | 4,806,890 | 5,177 |
| | Darfon Electronics Corp. | 3,410,000 | 5,128 |
| * | Asia Pacific Telecom Co. Ltd. | 17,233,352 | 5,095 |
| | Chun Yuan Steel Industry Co. Ltd. | 6,190,000 | 5,058 |
| * | Career Technology MFG. Co. Ltd. | 5,544,721 | 5,001 |
| * | CSBC Corp. Taiwan | 6,349,119 | 4,984 |
| * | Unizyx Holding Corp. | 4,418,000 | 4,962 |
| | Aten International Co. Ltd. | 1,629,740 | 4,949 |
| | Topkey Corp. | 1,059,000 | 4,935 |
| | Wei Chuan Foods Corp. | 5,921,600 | 4,871 |
| | Sampo Corp. | 4,557,800 | 4,854 |
| | Kaimei Electronic Corp. | 1,544,000 | 4,837 |
| | Ennoconn Corp. | 729,316 | 4,835 |
| | Lung Yen Life Service Corp. | 2,978,000 | 4,818 |
| | Nichidenbo Corp. | 2,615,460 | 4,747 |
| | | | | | Shares | Market
Value•
($000) |
| | Ho Tung Chemical Corp. | 12,634,459 | 4,733 |
| | Taiwan Styrene Monomer | 7,236,050 | 4,726 |
| | Ginko International Co. Ltd. | 648,900 | 4,710 |
| | Soft-World International Corp. | 1,457,653 | 4,709 |
| * | Adlink Technology Inc. | 1,932,895 | 4,665 |
| | Ton Yi Industrial Corp. | 9,910,000 | 4,646 |
| | Motech Industries Inc. | 4,012,574 | 4,641 |
| | Gourmet Master Co. Ltd. | 981,469 | 4,632 |
| | Chia Hsin Cement Corp. | 6,370,000 | 4,629 |
| | Flytech Technology Co. Ltd. | 1,757,650 | 4,605 |
| | Kinik Co. | 1,670,000 | 4,541 |
| | Hung Sheng Construction Ltd. | 5,211,464 | 4,523 |
| * | Lealea Enterprise Co. Ltd. | 10,857,930 | 4,516 |
| | YungShin Global Holding Corp. | 2,884,000 | 4,514 |
| * | CMC Magnetics Corp. | 14,093,950 | 4,476 |
| | Xxentria Technology Materials Corp. | 1,840,000 | 4,473 |
| | Egis Technology Inc. | 934,100 | 4,449 |
| | Gemtek Technology Corp. | 4,455,000 | 4,390 |
| | Formosa Sumco Technology Corp. | 764,000 | 4,343 |
| | Wowprime Corp. | 821,000 | 4,260 |
| | CyberTAN Technology Inc. | 4,414,000 | 4,210 |
| * | Chung Hwa Pulp Corp. | 5,252,000 | 4,204 |
| | Chief Telecom Inc. | 408,000 | 4,188 |
| | Namchow Holdings Co. Ltd. | 2,384,000 | 4,146 |
| | Radium Life Tech Co. Ltd. | 10,880,760 | 4,117 |
| | Gloria Material Technology Corp. | 5,366,640 | 4,099 |
| * | Jih Sun Financial Holdings Co. Ltd. | 8,732,000 | 4,086 |
| | China Metal Products | 3,517,000 | 4,050 |
| | Kung Long Batteries Industrial Co. Ltd. | 797,000 | 4,044 |
Emerging Markets Stock Index Fund
| | | | | | Shares | Market
Value•
($000) |
| | Formosa International Hotels Corp. | 751,000 | 4,017 |
| | Rexon Industrial Corp. Ltd. | 1,658,525 | 3,995 |
| | Lotus Pharmaceutical Co. Ltd. | 1,176,000 | 3,975 |
| | Acter Group Corp. Ltd. | 595,416 | 3,975 |
| | Sunonwealth Electric Machine Industry Co. Ltd. | 2,865,000 | 3,973 |
| | Global Brands Manufacture Ltd. | 3,108,680 | 3,966 |
| | Test Rite International Co. Ltd. | 4,499,000 | 3,917 |
| | Altek Corp. | 2,882,000 | 3,906 |
| | Speed Tech Corp. | 1,273,000 | 3,894 |
| | Sinyi Realty Inc. | 3,241,000 | 3,883 |
| * | Li Peng Enterprise Co. Ltd. | 9,936,000 | 3,712 |
| | Shin Foong Specialty & Applied Materials Co. Ltd. | 563,200 | 3,678 |
| | Sincere Navigation Corp. | 3,656,240 | 3,652 |
| | Depo Auto Parts Ind Co. Ltd. | 1,799,000 | 3,639 |
| | Gamania Digital Entertainment Co. Ltd. | 1,744,916 | 3,628 |
| | Syncmold Enterprise Corp. | 1,417,500 | 3,601 |
| * | Shining Building Business Co. Ltd. | 9,003,638 | 3,593 |
| | Kuo Yang Construction Co. Ltd. | 4,150,900 | 3,584 |
| * | Machvision Inc. | 416,306 | 3,516 |
| * | Ambassador Hotel | 3,221,000 | 3,510 |
| * | Firich Enterprises Co. Ltd. | 2,985,378 | 3,454 |
| | Taiflex Scientific Co. Ltd. | 1,971,920 | 3,386 |
| | Swancor Holding Co. Ltd. | 953,000 | 3,383 |
| * | Lingsen Precision Industries Ltd. | 3,717,000 | 3,378 |
| | Elite Advanced Laser Corp. | 1,666,349 | 3,348 |
| | ScinoPharm Taiwan Ltd. | 3,739,576 | 3,334 |
| | Formosan Rubber Group Inc. | 4,084,135 | 3,314 |
| | Tyntek Corp. | 3,436,000 | 3,243 |
| | | | | | Shares | Market
Value•
($000) |
| | Advanced International Multitech Co. Ltd. | 1,105,000 | 3,146 |
| * | Ritek Corp. | 8,822,489 | 3,107 |
| | TA-I Technology Co. Ltd. | 1,349,750 | 3,089 |
| * | Roo Hsing Co. Ltd. | 10,143,000 | 3,082 |
| | Zeng Hsing Industrial Co. Ltd. | 561,000 | 3,078 |
| * | Brogent Technologies Inc. | 665,792 | 3,031 |
| | Johnson Health Tech Co. Ltd. | 1,439,000 | 3,022 |
| | HannsTouch Solution Inc. | 7,036,115 | 3,013 |
| | Yulon Nissan Motor Co. Ltd. | 322,188 | 2,942 |
| | Nidec Chaun-Choung Technology Corp. | 488,000 | 2,941 |
| | Nan Liu Enterprise Co. Ltd. | 659,000 | 2,920 |
| | Quanta Storage Inc. | 2,078,000 | 2,897 |
| | Rich Development Co. Ltd. | 8,788,000 | 2,895 |
| | Bioteque Corp. | 733,000 | 2,891 |
| * | Medigen Biotechnology Corp. | 1,470,000 | 2,883 |
| | Bank of Kaohsiung Co. Ltd. | 6,944,257 | 2,812 |
| | KEE TAI Properties Co. Ltd. | 5,952,000 | 2,810 |
| | Elitegroup Computer Systems Co. Ltd. | 3,293,000 | 2,807 |
| | Dynamic Electronics Co. Ltd. | 3,705,533 | 2,804 |
| | China Chemical & Pharmaceutical Co. Ltd. | 3,501,000 | 2,783 |
| | Cyberlink Corp. | 841,674 | 2,742 |
| | Huang Hsiang Construction Corp. | 2,080,000 | 2,733 |
| | Yeong Guan Energy Technology Group Co. Ltd. | 1,182,180 | 2,727 |
| * | Gigastorage Corp. | 3,024,953 | 2,726 |
| | Dyaco International Inc. | 1,153,000 | 2,696 |
| | Posiflex Technology Inc. | 787,764 | 2,580 |
| | Rechi Precision Co. Ltd. | 3,808,000 | 2,557 |
| | Alpha Networks Inc. | 2,610,772 | 2,536 |
Emerging Markets Stock Index Fund
| | | | | | Shares | Market
Value•
($000) |
| | Hong Pu Real Estate Development Co. Ltd. | 3,153,000 | 2,468 |
| | IEI Integration Corp. | 1,546,920 | 2,466 |
| | PharmaEngine Inc. | 1,112,457 | 2,362 |
| * | Darwin Precisions Corp. | 5,857,900 | 2,350 |
| * | Taigen Biopharmaceuticals Holdings Ltd. | 4,011,820 | 2,312 |
| | Kuo Toong International Co. Ltd. | 2,995,514 | 2,311 |
| | FSP Technology Inc. | 1,548,120 | 2,258 |
| | Gigasolar Materials Corp. | 298,000 | 2,177 |
| | Ichia Technologies Inc. | 3,652,000 | 2,134 |
| * | Savior Lifetec Corp. | 2,857,325 | 2,101 |
| | WUS Printed Circuit Co. Ltd. | 2,013,156 | 2,056 |
| | Basso Industry Corp. | 1,277,000 | 1,977 |
| | Globe Union Industrial Corp. | 3,543,000 | 1,960 |
| * | Newmax Technology Co. Ltd. | 1,301,000 | 1,929 |
| | Taiyen Biotech Co. Ltd. | 1,596,000 | 1,892 |
| * | AGV Products Corp. | 5,064,370 | 1,852 |
| | Sheng Yu Steel Co. Ltd. | 1,532,000 | 1,839 |
| * | ALI Corp. | 1,718,275 | 1,759 |
| | TYC Brother Industrial Co. Ltd. | 2,422,000 | 1,740 |
| | Concraft Holding Co. Ltd. | 848,492 | 1,731 |
| * | Tong-Tai Machine & Tool Co. Ltd. | �� 2,993,000 | 1,725 |
| | Iron Force Industrial Co. Ltd. | 680,000 | 1,719 |
| * | Infortrend Technology Inc. | 3,282,000 | 1,693 |
| * | Zinwell Corp. | 2,356,000 | 1,671 |
| | Jess-Link Products Co. Ltd. | 1,279,750 | 1,620 |
| | China Electric Manufacturing Corp. | 3,879,180 | 1,612 |
| | Toung Loong Textile Manufacturing | 1,156,000 | 1,476 |
| | GeneReach Biotechnology Corp. | 438,565 | 1,258 |
| | | | | | Shares | Market
Value•
($000) |
| *,3 | Pharmally International Holding Co. Ltd. | 612,856 | 1,247 |
| | Senao International Co. Ltd. | 1,046,000 | 1,199 |
| * | Ability Enterprise Co. Ltd. | 1,695,491 | 1,193 |
| | Vivotek Inc. | 351,349 | 935 |
| * | Li Cheng Enterprise Co. Ltd. | 1,305,996 | 914 |
| | CHC Healthcare Group | 674,899 | 892 |
| | L&K Engineering Co. Ltd. | 845,000 | 889 |
| *,3 | Unity Opto Technology Co. Ltd. | 5,295,000 | 784 |
| * | Taiwan Land Development Corp. | 3,593,970 | 439 |
| | Continental Holdings Corp. | 412,000 | 374 |
| | O-Bank Co. Ltd. | 480,000 | 135 |
| *,3 | Pihsiang Machinery Manufacturing Co. Ltd. | 2,219,000 | — |
| *,3 | XPEC Entertainment Inc. | 988,965 | — |
| *,3 | E-Ton Solar Tech Co. Ltd. | 843,673 | — |
| *,3 | Green Energy Technology Inc. | 2,819,000 | — |
| *,3 | Ya Hsin Industrial Co. Ltd. | 5,306,018 | — |
| *,3 | Ta Ya Electric Wire & Cable Rights Exp. 11/10/21 | 267,965 | — |
| | | | | | | 19,982,224 |
| Thailand (2.5%) |
| | PTT PCL (Foreign) | 192,962,215 | 220,936 |
| | CP ALL PCL (Foreign) | 70,902,721 | 136,988 |
| | Siam Commercial Bank PCL (Foreign) | 34,550,990 | 131,369 |
| | Airports of Thailand PCL (Foreign) | 59,863,744 | 116,663 |
| | Bangkok Dusit Medical Services PCL (Foreign) | 123,064,345 | 87,270 |
| | Advanced Info Service PCL (Foreign) | 14,987,106 | 85,469 |
| | Siam Cement PCL NVDR | 6,822,296 | 81,211 |
| | Kasikornbank PCL (Foreign) | 17,495,635 | 74,586 |
Emerging Markets Stock Index Fund
| | | | | | Shares | Market
Value•
($000) |
| | Gulf Energy Development PCL (Foreign) | 55,446,215 | 72,370 |
| | PTT Exploration & Production PCL (Foreign) | 19,013,384 | 67,257 |
| | Central Pattana PCL (Foreign) | 35,677,424 | 63,844 |
| | Siam Cement PCL (Foreign) | 4,832,388 | 57,524 |
| | PTT Global Chemical PCL (Foreign) | 30,083,379 | 56,933 |
| * | Minor International PCL (Foreign) | 57,089,920 | 56,388 |
| | Delta Electronics Thailand PCL (Foreign) | 4,124,500 | 51,778 |
| | Intouch Holdings PCL (Foreign) | 19,422,600 | 44,062 |
| | Energy Absolute PCL (Foreign) | 21,314,996 | 42,157 |
| | Central Retail Corp. PCL (Foreign) | 37,332,200 | 39,158 |
| | Charoen Pokphand Foods PCL (Foreign) | 50,611,417 | 38,532 |
| | Home Product Center PCL (Foreign) | 82,524,784 | 36,367 |
| | BTS Group Holdings PCL (Foreign) | 119,595,335 | 34,437 |
| | Indorama Ventures PCL (Foreign) | 26,355,635 | 33,456 |
| | KCE Electronics PCL (Foreign) | 12,518,114 | 32,866 |
| | Bangkok Expressway & Metro PCL (Foreign) | 116,696,222 | 31,674 |
| 2 | SCG Packaging PCL (Foreign) | 15,545,500 | 30,113 |
| | Digital Telecommunications Infrastructure Fund | 74,343,613 | 30,032 |
| | PTT Oil & Retail Business PCL (Foreign) | 35,107,200 | 29,135 |
| | Bangkok Bank PCL NVDR | 7,849,800 | 29,050 |
| 2 | Krungthai Card PCL (Foreign) | 16,446,031 | 28,674 |
| 2 | Banpu PCL (Foreign) | 79,510,873 | 27,306 |
| 2 | Global Power Synergy PCL (Foreign) | 10,357,140 | 24,372 |
| | | | | | Shares | Market
Value•
($000) |
| | Thai Oil PCL (Foreign) | 14,127,355 | 23,707 |
| | Land & Houses PCL NVDR | 90,722,380 | 23,144 |
| | Bumrungrad Hospital PCL (Foreign) | 5,192,674 | 22,806 |
| | Thai Union Group PCL (Foreign) | 35,918,479 | 22,622 |
| | Electricity Generating PCL (Foreign) | 3,974,011 | 21,417 |
| | Krung Thai Bank PCL (Foreign) | 61,215,396 | 21,248 |
| | TMBThanachart Bank PCL (Foreign) | 581,249,600 | 20,371 |
| 2 | IRPC PCL (Foreign) | 152,323,114 | 19,734 |
| | Hana Microelectronics PCL (Foreign) | 7,946,783 | 19,197 |
| 2 | Com7 PCL (Foreign) | 8,233,200 | 17,839 |
| | Muangthai Capital PCL (Foreign) | 9,579,445 | 17,523 |
| | True Corp. PCL (Foreign) | 140,794,988 | 17,234 |
| | Srisawad Corp. PCL (Foreign) | 8,861,903 | 17,134 |
| 2 | Osotspa PCL (Foreign) | 16,981,300 | 16,781 |
| | Jasmine Broadband Internet Infrastructure Fund | 53,094,637 | 16,326 |
| | Tisco Financial Group PCL (Foreign) | 5,720,968 | 15,919 |
| 2 | Berli Jucker PCL (Foreign) | 14,987,490 | 15,272 |
| 2 | Carabao Group PCL (Foreign) | 4,024,705 | 15,060 |
| | Ratch Group PCL NVDR | 10,979,168 | 15,056 |
| 2 | Bangkok Commercial Asset Management PCL (Foreign) | 25,802,400 | 14,796 |
| *,2 | CPN Retail Growth Leasehold REIT | 22,706,600 | 14,668 |
| | Supalai PCL (Foreign) | 20,458,085 | 14,431 |
| 2 | Siam Global House PCL (Foreign) | 22,916,035 | 14,127 |
| 2 | Kasikornbank PCL NVDR | 3,163,075 | 13,485 |
| * | Asset World Corp. PCL (Foreign) | 97,652,300 | 13,470 |
Emerging Markets Stock Index Fund
| | | | | | Shares | Market
Value•
($000) |
| 2 | B Grimm Power PCL (Foreign) | 10,219,947 | 13,103 |
| | Kiatnakin Phatra Bank PCL (Foreign) | 7,094,270 | 12,852 |
| 2 | Bangchak Corp. PCL (Foreign) | 15,064,666 | 12,482 |
| | Bangkok Bank PCL (Foreign) | 3,257,641 | 12,056 |
| 2 | Sri Trang Gloves Thailand PCL (Foreign) | 13,050,500 | 11,998 |
| 2 | WHA Corp. PCL (Foreign) | 114,087,306 | 11,644 |
| 2 | VGI PCL (Foreign) | 57,175,784 | 11,492 |
| 2 | Sri Trang Agro-Industry PCL (Foreign) | 11,576,461 | 11,347 |
| 2 | Total Access Communication PCL NVDR | 9,083,845 | 10,475 |
| | Jay Mart PCL (Foreign) | 8,145,900 | 10,211 |
| | Thanachart Capital PCL (Foreign) | 9,551,156 | 10,161 |
| 2 | CH Karnchang PCL (Foreign) | 14,388,263 | 9,469 |
| 2 | Gunkul Engineering PCL (Foreign) | 55,721,566 | 9,086 |
| 2 | Chularat Hospital PCL (Foreign) | 78,979,346 | 9,072 |
| | Tisco Financial Group PCL NVDR | 3,244,993 | 9,030 |
| | AP Thailand PCL (Foreign) | 33,561,842 | 8,959 |
| *,2 | Central Plaza Hotel PCL (Foreign) | 8,156,313 | 8,864 |
| | Mega Lifesciences PCL (Foreign) | 6,050,800 | 8,503 |
| 2 | Dohome PCL (Foreign) | 11,490,500 | 8,296 |
| | AEON Thana Sinsap Thailand PCL (Foreign) | 1,446,800 | 8,180 |
| 2 | Sino-Thai Engineering & Construction PCL (Foreign) | 18,629,263 | 7,766 |
| 2 | CK Power PCL (Foreign) | 50,749,372 | 7,750 |
| | JMT Network Services PCL (Foreign) | 5,056,063 | 7,451 |
| 2 | TOA Paint Thailand PCL (Foreign) | 7,445,934 | 7,415 |
| 2 | TQM Corp. PCL (Foreign) | 2,331,400 | 7,381 |
| | | | | | Shares | Market
Value•
($000) |
| | Bangkok Chain Hospital PCL (Foreign) | 11,922,945 | 7,311 |
| 2 | Thonburi Healthcare Group PCL (Foreign) | 7,067,070 | 7,194 |
| | Krung Thai Bank PCL NVDR | 19,542,000 | 6,783 |
| 2 | Thoresen Thai Agencies PCL (Foreign) | 19,162,387 | 6,715 |
| | WHA Premium Growth Freehold & Leasehold REIT | 16,824,300 | 6,693 |
| | Thailand Future Fund | 27,916,700 | 6,569 |
| | TTW PCL (Foreign) | 18,606,234 | 6,561 |
| 2 | Sansiri PCL (Foreign) | 167,685,306 | 6,390 |
| 2 | Siam Makro PCL (Foreign) | 4,375,900 | 6,339 |
| 2 | Quality Houses PCL (Foreign) | 90,618,151 | 6,284 |
| | Tipco Asphalt PCL (Foreign) | 11,009,530 | 6,079 |
| * | Star Petroleum Refining PCL (Foreign) | 19,042,868 | 6,020 |
| 2 | Siam City Cement PCL (Foreign) | 1,154,106 | 5,896 |
| 2 | Bangkok Life Assurance PCL (Foreign) | 6,428,814 | 5,773 |
| 2 | Amata Corp. PCL (Foreign) | 9,318,623 | 5,741 |
| | Bangkok Land PCL (Foreign) | 170,463,378 | 5,656 |
| * | Major Cineplex Group PCL (Foreign) | 8,632,997 | 5,550 |
| * | BTS Rail Mass Transit Growth Infrastructure Fund | 38,833,573 | 5,364 |
| | North Bangkok Power Plant Block 1 Infrastructure Fund - EGAT | 13,856,100 | 5,098 |
| 2 | Thai Vegetable Oil PCL (Foreign) | 5,413,811 | 5,094 |
| 2 | Super Energy Corp. PCL (Foreign) | 173,390,819 | 5,071 |
| | Kerry Express Thailand PCL (Foreign) | 4,344,100 | 4,981 |
| | Intouch Holdings PCL NVDR | 2,153,100 | 4,884 |
| | TPI Polene PCL (Foreign) | 94,560,561 | 4,876 |
Emerging Markets Stock Index Fund
| | | | | | Shares | Market
Value•
($000) |
| *,2 | Esso Thailand PCL (Foreign) | 19,735,773 | 4,725 |
| * | BEC World PCL (Foreign) | 12,675,827 | 4,674 |
| 2 | Jasmine International PCL (Foreign) | 52,586,055 | 4,540 |
| 2 | Precious Shipping PCL (Foreign) | 8,194,263 | 4,488 |
| 2 | Banpu Power PCL (Foreign) | 7,956,139 | 4,200 |
| *,2 | STARK Corp. PCL (Foreign) | 30,226,700 | 4,011 |
| *,2 | Italian-Thai Development PCL (Foreign) | 53,232,231 | 3,762 |
| 2 | BCPG PCL (Foreign) | 9,515,142 | 3,760 |
| * | Pruksa Real Estate PCL (Foreign) | 11,775,000 | 3,673 |
| | TPI Polene Power PCL (Foreign) | 28,678,800 | 3,665 |
| | Pruksa Holding PCL (Foreign) | 8,560,530 | 3,559 |
| 2 | Plan B Media PCL (Foreign) | 17,440,500 | 3,377 |
| 2 | Ratchthani Leasing PCL (Foreign) | 26,155,350 | 3,234 |
| 2 | Thaifoods Group PCL (Foreign) | 24,111,275 | 3,183 |
| 2 | MK Restaurants Group PCL (Foreign) | 1,889,900 | 3,123 |
| * | Bangkok Airways PCL (Foreign) | 8,886,424 | 3,111 |
| *,2 | U City PCL (Foreign) | 57,031,569 | 3,080 |
| | Siam Commercial Bank PCL NVDR | 786,320 | 2,990 |
| 2 | PTG Energy PCL (Foreign) | 6,034,746 | 2,840 |
| 2 | Thaicom PCL (Foreign) | 8,311,185 | 2,732 |
| | SPCG PCL (Foreign) | 4,865,704 | 2,609 |
| | Origin Property PCL (Foreign) | 7,239,219 | 2,467 |
| 2 | IMPACT Growth REIT | 4,086,000 | 2,436 |
| 2 | GFPT PCL (Foreign) | 6,838,096 | 2,394 |
| * | MBK PCL (Foreign) | 5,498,662 | 2,322 |
| | Workpoint Entertainment PCL (Foreign) | 3,113,234 | 2,123 |
| * | Banpu PCL Warrants Exp. 9/30/22 | 12,251,813 | 1,901 |
| 2 | LPN Development PCL (Foreign) | 12,230,497 | 1,838 |
| | | | | | Shares | Market
Value•
($000) |
| *,2 | Unique Engineering & Construction PCL (Foreign) | 7,464,209 | 1,508 |
| *,2,3 | Thai Airways International PCL (Foreign) | 14,720,268 | 1,473 |
| | Univentures PCL (Foreign) | 11,781,451 | 1,447 |
| 2 | Taokaenoi Food & Marketing PCL (Foreign) | 7,187,081 | 1,433 |
| * | Banpu PCL Warrants Exp. 9/30/23 | 11,833,218 | 1,205 |
| * | Samart Corp. PCL (Foreign) | 6,186,920 | 1,174 |
| | Cal-Comp Electronics Thailand PCL (Foreign) | 12,849,822 | 1,016 |
| 2 | Ratch Group PCL (Foreign) | 704,104 | 966 |
| | Land & Houses PCL (Foreign) | 3,759,100 | 959 |
| * | BTS Group Holdings PCL Warrants Exp. 9/5/22 | 5,914,697 | 255 |
| 2 | Maybank Kim Eng Securities Thailand PCL (Foreign) | 563,800 | 209 |
| * | MBK PCL Warrants Exp. 10/25/22 | 219,946 | 73 |
| *,3 | WHA Premium Growth Freehold & Leasehold REIT Rights Exp. 11/18/21 | 1,986,949 | 18 |
| | Bangkok Life Assurance PCL | 577 | — |
| * | Minor International PCL Warrants Exp. 5/5/23 | 1 | — |
| * | BTS Group Holdings PCL Warrants Exp. 12/31/25 | 35,488,180 | — |
| | | | | | | 2,825,862 |
| Turkey (0.5%) |
| | BIM Birlesik Magazalar A/S | 6,237,367 | 40,353 |
| | Eregli Demir ve Celik Fabrikalari TAS | 18,941,435 | 39,550 |
| | Turkiye Garanti Bankasi A/S | 28,897,509 | 29,593 |
| | KOC Holding A/S | 11,292,451 | 27,533 |
Emerging Markets Stock Index Fund
| | | | | | Shares | Market
Value•
($000) |
| | Turkcell Iletisim Hizmetleri A/S | 15,419,788 | 24,599 |
| * | Turkiye Petrol Rafinerileri A/S | 1,701,623 | 24,488 |
| | Akbank TAS | 36,155,267 | 21,886 |
| | Turkiye Sise ve Cam Fabrikalari A/S | 18,743,984 | 16,861 |
| | Ford Otomotiv Sanayi A/S | 873,836 | 16,826 |
| | Haci Omer Sabanci Holding A/S | 12,915,264 | 15,036 |
| | Aselsan Elektronik Sanayi ve Ticaret A/S | 8,792,620 | 15,010 |
| * | Turk Hava Yollari AO | 8,661,782 | 13,201 |
| * | Petkim Petrokimya Holding A/S | 18,771,877 | 12,762 |
| | Turkiye Is Bankasi A/S Class C | 21,567,622 | 12,652 |
| | Enka Insaat ve Sanayi A/S | 9,477,476 | 10,944 |
| | Tofas Turk Otomobil Fabrikasi A/S | 1,665,146 | 10,180 |
| * | Kardemir Karabuk Demir Celik Sanayi ve Ticaret A/S | 12,931,827 | 10,097 |
| | Arcelik A/S | 2,617,884 | 9,184 |
| * | Gubre Fabrikalari TAS | 1,184,585 | 8,534 |
| * | Koza Altin Isletmeleri A/S | 699,760 | 7,778 |
| * | Sasa Polyester Sanayi A/S | 2,361,556 | 7,617 |
| * | TAV Havalimanlari Holding A/S | 2,575,456 | 7,105 |
| | Coca-Cola Icecek A/S | 799,942 | 7,067 |
| | Turk Telekomunikasyon A/S | 7,575,026 | 5,940 |
| | Yapi ve Kredi Bankasi A/S | 20,730,625 | 5,889 |
| | Emlak Konut Gayrimenkul Yatirim Ortakligi A/S | 27,352,878 | 5,623 |
| * | Aksa Enerji Uretim A/S Class B | 6,673,650 | 5,272 |
| | Ulker Biskuvi Sanayi A/S | 2,441,419 | 5,129 |
| | Anadolu Efes Biracilik ve Malt Sanayii A/S Class B | 2,204,380 | 5,073 |
| * | Turkiye Vakiflar Bankasi TAO | 14,066,278 | 5,027 |
| | | | | | Shares | Market
Value•
($000) |
| | AG Anadolu Grubu Holding A/S | 1,743,478 | 4,992 |
| * | Turkiye Halk Bankasi A/S | 10,479,053 | 4,829 |
| | Tekfen Holding A/S | 3,035,058 | 4,769 |
| * | Koza Anadolu Metal Madencilik Isletmeleri A/S | 2,718,778 | 4,743 |
| | Logo Yazilim Sanayi ve Ticaret A/S | 1,059,000 | 4,702 |
| | Nuh Cimento Sanayi A/S | 1,020,958 | 4,626 |
| * | Bera Holding A/S | 4,508,607 | 4,466 |
| | Sok Marketler Ticaret A/S | 3,697,717 | 4,284 |
| * | Hektas Ticaret TAS | 4,437,203 | 4,095 |
| * | Pegasus Hava Tasimaciligi A/S | 491,165 | 4,084 |
| 1 | Enerjisa Enerji A/S | 3,242,255 | 3,979 |
| | Dogan Sirketler Grubu Holding A/S | 13,114,112 | 3,658 |
| | Sarkuysan Elektrolitik Bakir Sanayi ve Ticaret A/S | 1,896,865 | 3,643 |
| 1 | Mavi Giyim Sanayi ve Ticaret A/S Class B | 482,709 | 3,618 |
| | Aksa Akrilik Kimya Sanayii A/S | 1,465,718 | 3,600 |
| | Is Yatirim Menkul Degerler A/S | 2,022,707 | 3,366 |
| * | Migros Ticaret A/S | 868,681 | 3,188 |
| | Otokar Otomotiv ve Savunma Sanayi A/S | 87,272 | 3,079 |
| | Turk Traktor ve Ziraat Makineleri A/S | 178,642 | 3,074 |
| *,1 | MLP Saglik Hizmetleri A/S Class B | 1,023,742 | 2,895 |
| | Iskenderun Demir ve Celik A/S | 1,986,681 | 2,806 |
| | Borusan Yatirim ve Pazarlama A/S | 75,951 | 2,753 |
| | Vestel Elektronik Sanayi ve Ticaret A/S | 1,015,165 | 2,700 |
| * | Oyak Cimento Fabrikalari A/S | 3,371,400 | 2,424 |
| | EGE Endustri ve Ticaret A/S | 16,393 | 2,200 |
| | Turkiye Sinai Kalkinma Bankasi A/S | 15,918,812 | 2,153 |
| * | Kordsa Teknik Tekstil A/S | 726,453 | 2,087 |
Emerging Markets Stock Index Fund
| | | | | | Shares | Market
Value•
($000) |
| | Kartonsan Karton Sanayi ve Ticaret A/S | 380,490 | 2,084 |
| * | Ipek Dogal Enerji Kaynaklari Arastirma ve Uretim A/S | 1,456,375 | 2,070 |
| | Alarko Holding A/S | 1,736,437 | 1,717 |
| | Dogus Otomotiv Servis ve Ticaret A/S | 444,130 | 1,664 |
| | Aygaz A/S | 779,642 | 1,480 |
| * | Zorlu Enerji Elektrik Uretim A/S | 8,186,587 | 1,393 |
| | Kervan Gida Sanayi ve Ticaret A/S Class B | 1,132,197 | 1,368 |
| | Aksigorta A/S | 1,858,198 | 1,358 |
| | EIS Eczacibasi Ilac ve Sinai ve Finansal Yatirimlar Sanayi ve Ticaret A/S | 2,076,227 | 1,299 |
| * | Is Gayrimenkul Yatirim Ortakligi A/S | 6,302,996 | 1,257 |
| * | Kardemir Karabuk Demir Celik Sanayi ve Ticaret A/S Class A | 1,699,474 | 1,147 |
| | Tat Gida Sanayi A/S | 1,010,468 | 1,009 |
| * | NET Holding A/S | 1,995,322 | 889 |
| | Akcansa Cimento A/S | 526,035 | 860 |
| * | Konya Cimento Sanayii A/S | 8,990 | 786 |
| * | Albaraka Turk Katilim Bankasi A/S | 4,195,622 | 775 |
| * | Cimsa Cimento Sanayi ve Ticaret A/S | 234,371 | 762 |
| * | Is Finansal Kiralama A/S | 2,304,013 | 737 |
| | Brisa Bridgestone Sabanci Sanayi ve Ticaret A/S | 299,352 | 729 |
| * | Torunlar Gayrimenkul Yatirim Ortakligi A/S | 1,647,539 | 661 |
| | Polisan Holding A/S | 2,142,054 | 616 |
| | Yatas Yatak ve Yorgan Sanayi ve Ticaret A/S | 403,688 | 561 |
| | | | | | Shares | Market
Value•
($000) |
| * | Sekerbank Turk A/S | 3,323,053 | 348 |
| *,3 | Asya Katilim Bankasi A/S | 6,317,442 | — |
| | | | | | | 549,192 |
| United Arab Emirates (0.9%) |
| | First Abu Dhabi Bank PJSC | 60,435,931 | 293,335 |
| | Emirates Telecommunications Group Co. PJSC | 24,183,741 | 168,692 |
| | Emirates NBD Bank PJSC | 35,021,478 | 133,261 |
| | Abu Dhabi Commercial Bank PJSC | 37,202,067 | 84,143 |
| | Aldar Properties PJSC | 55,811,729 | 61,409 |
| | Emaar Properties PJSC | 50,561,784 | 55,352 |
| | Dubai Islamic Bank PJSC | 33,128,976 | 46,190 |
| | Abu Dhabi National Oil Co. for Distribution PJSC | 32,039,663 | 37,364 |
| | Abu Dhabi Islamic Bank PJSC | 19,206,707 | 30,581 |
| * | ADNOC Drilling Co. PJSC | 20,764,327 | 16,846 |
| * | Emaar Malls PJSC | 28,931,184 | 15,792 |
| | Dubai Investments PJSC | 30,555,996 | 14,174 |
| | Dana Gas PJSC | 49,520,416 | 13,944 |
| * | Emaar Development PJSC | 11,187,145 | 11,935 |
| * | Air Arabia PJSC | 30,715,964 | 11,648 |
| | GFH Financial Group BSC | 38,711,961 | 8,920 |
| * | Dubai Financial Market PJSC | 23,157,693 | 6,432 |
| * | DAMAC Properties Dubai Co. PJSC | 12,200,354 | 4,160 |
| * | RAK Properties PJSC | 14,727,997 | 2,942 |
| * | Union Properties PJSC | 28,224,603 | 2,023 |
| *,3 | Arabtec Holding PJSC | 10,929,061 | 1,577 |
| *,3 | Drake & Scull International PJSC | 4,230,859 | 426 |
| | | | | | | 1,021,146 |
Total Common Stocks
(Cost $79,704,169) | 109,648,452 |
Emerging Markets Stock Index Fund
| | | | | | Shares | Market
Value•
($000) |
| Temporary Cash Investments (2.4%) |
| Money Market Fund (2.4%) |
| 4,5 | Vanguard Market Liquidity Fund, 0.070%
(Cost $2,652,866) | 26,531,416 | 2,653,142 |
Total Investments (101.3%)
(Cost $82,357,035) | | 112,301,594 |
| Other Assets and Liabilities—Net (-1.3%) | | (1,436,426) |
| Net Assets (100%) | | 110,865,168 |
| Cost is in $000. |
| • | See Note A in Notes to Financial Statements. |
| * | Non-income-producing security. |
| 1 | Security exempt from registration under Rule 144A of the Securities Act of 1933. Such securities may be sold in transactions exempt from registration, normally to qualified institutional buyers. At October 31, 2021, the aggregate value was $6,831,603,000, representing 6.2% of net assets. |
| 2 | Includes partial security positions on loan to broker-dealers. The total value of securities on loan is $1,213,196,000. |
| 3 | Security value determined using significant unobservable inputs. |
| 4 | Affiliated money market fund available only to Vanguard funds and certain trusts and accounts managed by Vanguard. Rate shown is the 7-day yield. |
| 5 | Collateral of $1,323,129,000 was received for securities on loan, of which $1,322,132,000 is held in Vanguard Market Liquidity Fund and $997,000 is held in cash. |
| | ADR—American Depositary Receipt. |
| | BDR—Brazilian Depositary Receipt. |
| | GDR—Global Depositary Receipt. |
| | NVDR—Non-Voting Depositary Receipt. |
| | REIT—Real Estate Investment Trust. |
Emerging Markets Stock Index Fund
Derivative Financial Instruments Outstanding as of Period End
| Futures Contracts |
| | | | ($000) |
| | Expiration | Number of
Long (Short)
Contracts | Notional
Amount | Value and
Unrealized
Appreciation
(Depreciation) |
| Long Futures Contracts |
| E-mini S&P 500 Index | December 2021 | 650 | 149,403 | (44) |
| MSCI Emerging Market Index | December 2021 | 11,504 | 725,902 | (17,732) |
| | | | | (17,776) |
| Forward Currency Contracts |
| | Contract
Settlement
Date | Contract Amount (000) | Unrealized
Appreciation
($000) | Unrealized
(Depreciation)
($000) |
| Counterparty | | Receive | | Deliver |
| Citibank, N.A. | 12/15/21 | INR | 18,908,200 | USD | 254,230 | — | (2,983) |
| BNP Paribas | 12/15/21 | INR | 11,357,579 | USD | 152,213 | — | (1,298) |
| Standard Chartered Bank | 12/15/21 | INR | 7,360,000 | USD | 99,315 | — | (1,518) |
| Morgan Stanley Capital Services LLC | 12/15/21 | INR | 7,360,000 | USD | 99,315 | — | (1,517) |
| Royal Bank of Canada | 12/15/21 | INR | 4,864,043 | USD | 64,235 | 396 | — |
| Toronto-Dominion Bank | 12/15/21 | USD | 78,355 | HKD | 608,766 | 104 | — |
| | | | | | | 500 | (7,316) |
| HKD—Hong Kong dollar. |
| INR—Indian rupee. |
| USD—U.S. dollar. |
Emerging Markets Stock Index Fund
| Over-the-Counter Total Return Swaps |
| Reference Entity | Termination
Date | Counterparty | Notional
Amount
($000) | Floating
Interest
Rate
Received
(Paid)1
(%) | Value and
Unrealized
Appreciation
($000) | Value and
Unrealized
(Depreciation)
($000) |
| Evergreen Marine Corp. Taiwan Ltd. | 2/22/22 | GSI | 27,150 | 3.920 | 1,861 | — |
| FTSE China A Stock Connect CNY All Cap Index | 6/17/22 | BOANA | 283,313 | 4.170 | 5,345 | — |
| Novatek Microelectronics Corp. | 2/22/22 | GSI | 30,667 | 3.920 | 2,238 | — |
| | | | | | 9,444 | — |
| 1 | Based on 1M USD London Interbank Offered Rate (LIBOR) as of the most recent payment date. Floating interest payment received/paid monthly. |
| | 1M—1-month. |
| | BOANA—Bank of America, N.A. |
| | GSI—Goldman Sachs International. |
At October 31, 2021, the counterparties had deposited in segregated accounts securities with a value of $4,729,000 in connection with open over-the-counter swap contracts.
See accompanying Notes, which are an integral part of the Financial Statements.
Emerging Markets Stock Index Fund
Statement of Assets and Liabilities
|
| ($000s, except shares and per-share amounts) | Amount |
| Assets | |
| Investments in Securities, at Value | |
| Unaffiliated Issuers (Cost $79,704,169) | 109,648,452 |
| Affiliated Issuers (Cost $2,652,866) | 2,653,142 |
| Total Investments in Securities | 112,301,594 |
| Investment in Vanguard | 3,723 |
| Cash | 997 |
| Foreign Currency, at Value (Cost $327,688) | 325,101 |
| Cash Collateral Pledged—Futures Contracts | 41,980 |
| Cash Collateral Pledged—Over-the-Counter Swap Contracts and Forward Currency Contracts | 7,880 |
| Receivables for Investment Securities Sold | 6,919 |
| Receivables for Accrued Income | 64,581 |
| Receivables for Capital Shares Issued | 156,000 |
| Unrealized Appreciation—Forward Currency Contracts | 500 |
| Unrealized Appreciation—Over-the-Counter Swap Contracts | 9,444 |
| Total Assets | 112,918,719 |
| Liabilities | |
| Due to Custodian | 4,050 |
| Payables for Investment Securities Purchased | 20,548 |
| Collateral for Securities on Loan | 1,323,129 |
| Payables for Capital Shares Redeemed | 25,612 |
| Payables to Vanguard | 2,732 |
| Variation Margin Payable—Futures Contracts | 10,458 |
| Unrealized Depreciation—Forward Currency Contracts | 7,316 |
| Deferred Foreign Capital Gains Taxes | 659,706 |
| Total Liabilities | 2,053,551 |
| Net Assets | 110,865,168 |
Emerging Markets Stock Index Fund
Statement of Assets and Liabilities (continued)
|
At October 31, 2021, net assets consisted of: |
|
| ($000s, except shares and per-share amounts) | Amount |
| Paid-in Capital | 95,546,113 |
| Total Distributable Earnings (Loss) | 15,319,055 |
| Net Assets | 110,865,168 |
| |
| Investor Shares—Net Assets | |
Applicable to 5,354,230 outstanding $.001 par value shares of
beneficial interest (unlimited authorization) | 171,460 |
| Net Asset Value Per Share—Investor Shares | $32.02 |
| |
| ETF Shares—Net Assets | |
Applicable to 1,584,793,998 outstanding $.001 par value shares of
beneficial interest (unlimited authorization) | 80,115,807 |
| Net Asset Value Per Share—ETF Shares | $50.55 |
| |
| Admiral Shares—Net Assets | |
Applicable to 420,841,280 outstanding $.001 par value shares of
beneficial interest (unlimited authorization) | 17,690,389 |
| Net Asset Value Per Share—Admiral Shares | $42.04 |
| |
| Institutional Shares—Net Assets | |
Applicable to 243,740,164 outstanding $.001 par value shares of
beneficial interest (unlimited authorization) | 7,790,773 |
| Net Asset Value Per Share—Institutional Shares | $31.96 |
| |
| Institutional Plus Shares—Net Assets | |
Applicable to 47,935,047 outstanding $.001 par value shares of
beneficial interest (unlimited authorization) | 5,096,739 |
| Net Asset Value Per Share—Institutional Plus Shares | $106.33 |
See accompanying Notes, which are an integral part of the Financial Statements.
Emerging Markets Stock Index Fund
|
| | Year Ended
October 31, 2021 |
| | ($000) |
| Investment Income | |
| Income | |
| Dividends1 | 2,536,010 |
| Interest2 | 978 |
| Securities Lending—Net | 38,606 |
| Total Income | 2,575,594 |
| Expenses | |
| The Vanguard Group—Note B | |
| Investment Advisory Services | 3,659 |
| Management and Administrative—Investor Shares | 476 |
| Management and Administrative—ETF Shares | 44,014 |
| Management and Administrative—Admiral Shares | 20,623 |
| Management and Administrative—Institutional Shares | 6,113 |
| Management and Administrative—Institutional Plus Shares | 3,102 |
| Marketing and Distribution—Investor Shares | 12 |
| Marketing and Distribution—ETF Shares | 1,634 |
| Marketing and Distribution—Admiral Shares | 639 |
| Marketing and Distribution—Institutional Shares | 216 |
| Marketing and Distribution—Institutional Plus Shares | 68 |
| Custodian Fees | 17,469 |
| Auditing Fees | 138 |
| Shareholders’ Reports—Investor Shares | 1 |
| Shareholders’ Reports—ETF Shares | 2,109 |
| Shareholders’ Reports—Admiral Shares | 225 |
| Shareholders’ Reports—Institutional Shares | 104 |
| Shareholders’ Reports—Institutional Plus Shares | 23 |
| Trustees’ Fees and Expenses | 32 |
| Total Expenses | 100,657 |
| Net Investment Income | 2,474,937 |
| Realized Net Gain (Loss) | |
| Investment Securities Sold2,3,4 | (1,288,321) |
| Futures Contracts | 189,522 |
| Swap Contracts | 52,445 |
| Forward Currency Contracts | 9,606 |
| Foreign Currencies | (4,114) |
| Realized Net Gain (Loss) | (1,040,862) |
Emerging Markets Stock Index Fund
| Statement of Operations (continued) |
| | Year Ended
October 31, 2021 |
| | ($000) |
| Change in Unrealized Appreciation (Depreciation) | |
| Investment Securities2,5 | 13,652,962 |
| Futures Contracts | (19,256) |
| Swap Contracts | 13 |
| Forward Currency Contracts | (6,816) |
| Foreign Currencies | (1,106) |
| Change in Unrealized Appreciation (Depreciation) | 13,625,797 |
| Net Increase (Decrease) in Net Assets Resulting from Operations | 15,059,872 |
| 1 | Dividends are net of foreign withholding taxes of $296,904,000. |
| 2 | Interest income, realized net gain (loss), and change in unrealized appreciation (depreciation) from an affiliated company of the fund were $945,000, $18,000, and ($18,000), respectively. Purchases and sales are for temporary cash investment purposes. |
| 3 | Realized Gain (Loss) is net of foreign capital gains taxes of $4,825,000. |
| 4 | Includes $89,733,000 of net gain (loss) resulting from in-kind redemptions. |
| 5 | The change in unrealized appreciation (depreciation) is net of the change in deferred foreign capital gains taxes of $581,693,000. |
See accompanying Notes, which are an integral part of the Financial Statements.
Emerging Markets Stock Index Fund
Statement of Changes in Net Assets
|
| | Year Ended October 31, |
| | 2021
($000) | 2020
($000) |
| Increase (Decrease) in Net Assets | | |
| Operations | | |
| Net Investment Income | 2,474,937 | 1,944,587 |
| Realized Net Gain (Loss) | (1,040,862) | (1,578,669) |
| Change in Unrealized Appreciation (Depreciation) | 13,625,797 | 5,077,712 |
| Net Increase (Decrease) in Net Assets Resulting from Operations | 15,059,872 | 5,443,630 |
| Distributions | | |
| Investor Shares | (3,538) | (5,308) |
| ETF Shares | (1,706,366) | (1,765,914) |
| Admiral Shares | (377,206) | (401,489) |
| Institutional Shares | (172,185) | (182,259) |
| Institutional Plus Shares | (114,136) | (109,778) |
| Total Distributions | (2,373,431) | (2,464,748) |
| Capital Share Transactions | | |
| Investor Shares | (14,102) | (82,198) |
| ETF Shares | 9,871,776 | (3,609,670) |
| Admiral Shares | 997,818 | (412,007) |
| Institutional Shares | 225,108 | (3,583) |
| Institutional Plus Shares | (275,630) | 1,698,268 |
| Net Increase (Decrease) from Capital Share Transactions | 10,804,970 | (2,409,190) |
| Total Increase (Decrease) | 23,491,411 | 569,692 |
| Net Assets | | |
| Beginning of Period | 87,373,757 | 86,804,065 |
| End of Period | 110,865,168 | 87,373,757 |
See accompanying Notes, which are an integral part of the Financial Statements.
Emerging Markets Stock Index Fund
| Investor Shares | | | | | |
For a Share Outstanding
Throughout Each Period | Year Ended October 31, |
| 2021 | 2020 | 2019 | 2018 | 2017 |
| Net Asset Value, Beginning of Period | $27.86 | $26.59 | $24.02 | $28.16 | $23.85 |
| Investment Operations | | | | | |
| Net Investment Income1 | .670 | .528 | .6432 | .663 | .601 |
| Net Realized and Unrealized Gain (Loss) on Investments | 4.133 | 1.456 | 2.601 | (4.187) | 4.302 |
| Total from Investment Operations | 4.803 | 1.984 | 3.244 | (3.524) | 4.903 |
| Distributions | | | | | |
| Dividends from Net Investment Income | (.643) | (.714) | (.674) | (.616) | (.593) |
| Distributions from Realized Capital Gains | — | — | — | — | — |
| Total Distributions | (.643) | (.714) | (.674) | (.616) | (.593) |
| Net Asset Value, End of Period | $32.02 | $27.86 | $26.59 | $24.02 | $28.16 |
| Total Return3 | 17.23% | 7.55% | 13.66% | -12.73% | 20.76% |
| Ratios/Supplemental Data | | | | | |
| Net Assets, End of Period (Millions) | $171 | $162 | $239 | $1,283 | $1,738 |
| Ratio of Total Expenses to Average Net Assets | 0.29% | 0.29% | 0.29% | 0.29% | 0.32% |
| Ratio of Net Investment Income to Average Net Assets | 2.05% | 2.02% | 2.48%2 | 2.36% | 2.38% |
| Portfolio Turnover Rate4 | 9% | 10% | 9% | 11% | 6% |
| 1 | Calculated based on average shares outstanding. |
| 2 | Net investment income per share and the ratio of net investment income to average net assets include $.171 and 0.66%, respectively, resulting from a special dividend from Naspers Ltd. in September 2019. |
| 3 | Total returns do not include account service fees that may have applied in the periods shown. Fund prospectuses provide information about any applicable account service fees. |
| 4 | Excludes the value of portfolio securities received or delivered as a result of in-kind purchases or redemptions of the fund’s capital shares, including ETF Creation Units. |
See accompanying Notes, which are an integral part of the Financial Statements.
Emerging Markets Stock Index Fund
| FTSE Emerging Markets ETF Shares | | | | | |
For a Share Outstanding
Throughout Each Period | Year Ended October 31, |
| 2021 | 2020 | 2019 | 2018 | 2017 |
| Net Asset Value, Beginning of Period | $43.98 | $41.99 | $37.91 | $44.47 | $37.67 |
| Investment Operations | | | | | |
| Net Investment Income1 | 1.186 | .954 | 1.3932 | 1.126 | 1.035 |
| Net Realized and Unrealized Gain (Loss) on Investments | 6.506 | 2.249 | 3.826 | (6.636) | 6.781 |
| Total from Investment Operations | 7.692 | 3.203 | 5.219 | (5.510) | 7.816 |
| Distributions | | | | | |
| Dividends from Net Investment Income | (1.122) | (1.213) | (1.139) | (1.050) | (1.016) |
| Distributions from Realized Capital Gains | — | — | — | — | — |
| Total Distributions | (1.122) | (1.213) | (1.139) | (1.050) | (1.016) |
| Net Asset Value, End of Period | $50.55 | $43.98 | $41.99 | $37.91 | $44.47 |
| Total Return | 17.51% | 7.77% | 13.95% | -12.64% | 20.98% |
| Ratios/Supplemental Data | | | | | |
| Net Assets, End of Period (Millions) | $80,116 | $61,434 | $63,089 | $53,765 | $64,967 |
| Ratio of Total Expenses to Average Net Assets | 0.08% | 0.10% | 0.10% | 0.12% | 0.14% |
| Ratio of Net Investment Income to Average Net Assets | 2.29% | 2.31% | 3.40%2 | 2.53% | 2.56% |
| Portfolio Turnover Rate3 | 9% | 10% | 9% | 11% | 6% |
| 1 | Calculated based on average shares outstanding. |
| 2 | Net investment income per share and the ratio of net investment income to average net assets include $.271 and 0.66%, respectively, resulting from a special dividend from Naspers Ltd. in September 2019. |
| 3 | Excludes the value of portfolio securities received or delivered as a result of in-kind purchases or redemptions of the fund’s capital shares, including ETF Creation Units. |
See accompanying Notes, which are an integral part of the Financial Statements.
Emerging Markets Stock Index Fund
| Admiral Shares | | | | | |
For a Share Outstanding
Throughout Each Period | Year Ended October 31, |
| 2021 | 2020 | 2019 | 2018 | 2017 |
| Net Asset Value, Beginning of Period | $36.57 | $34.91 | $31.53 | $36.99 | $31.33 |
| Investment Operations | | | | | |
| Net Investment Income1 | .949 | .784 | 1.1542 | .944 | .860 |
| Net Realized and Unrealized Gain (Loss) on Investments | 5.432 | 1.870 | 3.155 | (5.531) | 5.645 |
| Total from Investment Operations | 6.381 | 2.654 | 4.309 | (4.587) | 6.505 |
| Distributions | | | | | |
| Dividends from Net Investment Income | (.911) | (.994) | (.929) | (.873) | (.845) |
| Distributions from Realized Capital Gains | — | — | — | — | — |
| Total Distributions | (.911) | (.994) | (.929) | (.873) | (.845) |
| Net Asset Value, End of Period | $42.04 | $36.57 | $34.91 | $31.53 | $36.99 |
| Total Return3 | 17.44% | 7.72% | 13.83% | -12.64% | 21.00% |
| Ratios/Supplemental Data | | | | | |
| Net Assets, End of Period (Millions) | $17,690 | $14,541 | $14,383 | $11,632 | $12,585 |
| Ratio of Total Expenses to Average Net Assets | 0.14% | 0.14% | 0.14% | 0.14% | 0.14% |
| Ratio of Net Investment Income to Average Net Assets | 2.21% | 2.28% | 3.38%2 | 2.51% | 2.56% |
| Portfolio Turnover Rate4 | 9% | 10% | 9% | 11% | 6% |
| 1 | Calculated based on average shares outstanding. |
| 2 | Net investment income per share and the ratio of net investment income to average net assets include $.225 and 0.66%, respectively, resulting from a special dividend from Naspers Ltd. in September 2019. |
| 3 | Total returns do not include account service fees that may have applied in the periods shown. Fund prospectuses provide information about any applicable account service fees. |
| 4 | Excludes the value of portfolio securities received or delivered as a result of in-kind purchases or redemptions of the fund’s capital shares, including ETF Creation Units. |
See accompanying Notes, which are an integral part of the Financial Statements.
Emerging Markets Stock Index Fund
| Institutional Shares | | | | | |
For a Share Outstanding
Throughout Each Period | Year Ended October 31, |
| 2021 | 2020 | 2019 | 2018 | 2017 |
| Net Asset Value, Beginning of Period | $27.81 | $26.55 | $23.98 | $28.13 | $23.82 |
| Investment Operations | | | | | |
| Net Investment Income1 | .736 | .611 | .8882 | .721 | .659 |
| Net Realized and Unrealized Gain (Loss) on Investments | 4.120 | 1.415 | 2.401 | (4.198) | 4.301 |
| Total from Investment Operations | 4.856 | 2.026 | 3.289 | (3.477) | 4.960 |
| Distributions | | | | | |
| Dividends from Net Investment Income | (.706) | (.766) | (.719) | (.673) | (.650) |
| Distributions from Realized Capital Gains | — | — | — | — | — |
| Total Distributions | (.706) | (.766) | (.719) | (.673) | (.650) |
| Net Asset Value, End of Period | $31.96 | $27.81 | $26.55 | $23.98 | $28.13 |
| Total Return | 17.45% | 7.76% | 13.88% | -12.60% | 21.06% |
| Ratios/Supplemental Data | | | | | |
| Net Assets, End of Period (Millions) | $7,791 | $6,592 | $6,309 | $5,142 | $5,647 |
| Ratio of Total Expenses to Average Net Assets | 0.10% | 0.10% | 0.10% | 0.10% | 0.11% |
| Ratio of Net Investment Income to Average Net Assets | 2.25% | 2.34% | 3.43%2 | 2.55% | 2.59% |
| Portfolio Turnover Rate3 | 9% | 10% | 9% | 11% | 6% |
| 1 | Calculated based on average shares outstanding. |
| 2 | Net investment income per share and the ratio of net investment income to average net assets include $.171 and 0.66%, respectively, resulting from a special dividend from Naspers Ltd. in September 2019. |
| 3 | Excludes the value of portfolio securities received or delivered as a result of in-kind purchases or redemptions of the fund’s capital shares, including ETF Creation Units. |
See accompanying Notes, which are an integral part of the Financial Statements.
Emerging Markets Stock Index Fund
| Institutional Plus Shares | | | | | |
For a Share Outstanding
Throughout Each Period | Year Ended October 31, |
| 2021 | 2020 | 2019 | 2018 | 2017 |
| Net Asset Value, Beginning of Period | $92.51 | $88.32 | $79.77 | $93.57 | $79.26 |
| Investment Operations | | | | | |
| Net Investment Income1 | 2.412 | 2.123 | 3.1022 | 2.182 | 2.221 |
| Net Realized and Unrealized Gain (Loss) on Investments | 13.779 | 4.635 | 7.869 | (13.725) | 14.266 |
| Total from Investment Operations | 16.191 | 6.758 | 10.971 | (11.543) | 16.487 |
| Distributions | | | | | |
| Dividends from Net Investment Income | (2.371) | (2.568) | (2.421) | (2.257) | (2.177) |
| Distributions from Realized Capital Gains | — | — | — | — | — |
| Total Distributions | (2.371) | (2.568) | (2.421) | (2.257) | (2.177) |
| Net Asset Value, End of Period | $106.33 | $92.51 | $88.32 | $79.77 | $93.57 |
| Total Return | 17.49% | 7.78% | 13.93% | -12.58% | 21.04% |
| Ratios/Supplemental Data | | | | | |
| Net Assets, End of Period (Millions) | $5,097 | $4,645 | $2,784 | $1,973 | $3,991 |
| Ratio of Total Expenses to Average Net Assets | 0.08% | 0.08% | 0.08% | 0.08% | 0.09% |
| Ratio of Net Investment Income to Average Net Assets | 2.22% | 2.45% | 3.59%2 | 2.57% | 2.61% |
| Portfolio Turnover Rate3 | 9% | 10% | 9% | 11% | 6% |
| 1 | Calculated based on average shares outstanding. |
| 2 | Net investment income per share and the ratio of net investment income to average net assets include $.571 and 0.66%, respectively, resulting from a special dividend from Naspers Ltd. in September 2019. |
| 3 | Excludes the value of portfolio securities received or delivered as a result of in-kind purchases or redemptions of the fund’s capital shares, including ETF Creation Units. |
See accompanying Notes, which are an integral part of the Financial Statements.
Emerging Markets Stock Index Fund
Notes to Financial Statements
Vanguard Emerging Markets Stock Index Fund is registered under the Investment Company Act of 1940 as an open-end investment company, or mutual fund. The fund offers five classes of shares: Investor Shares, ETF Shares, Admiral Shares, Institutional Shares, and Institutional Plus Shares. Each of the share classes has different eligibility and minimum purchase requirements, and is designed for different types of investors. ETF Shares, known as Vanguard FTSE Emerging Markets ETF Shares, are listed for trading on NYSE Arca; they can be purchased and sold through a broker.
The fund invests in securities of foreign issuers, which may subject it to investment risks not normally associated with investing in securities of U.S. corporations. Further, at October 31, 2021, the fund had a concentration of its investments in securities issued in China, and the performance of such investments may be impacted by the country’s social, political, and economic conditions. Market disruptions associated with the COVID-19 pandemic have had a global impact, and uncertainty exists as to the long-term implications. Such disruptions can adversely affect assets of the fund and thus fund performance.
A. The following significant accounting policies conform to generally accepted accounting principles for U.S. investment companies. The fund consistently follows such policies in preparing its financial statements.
1. Security Valuation: Securities are valued as of the close of trading on the New York Stock Exchange (generally 4 p.m., Eastern time) on the valuation date. Equity securities are valued at the latest quoted sales prices or official closing prices taken from the primary market in which each security trades; such securities not traded on the valuation date are valued at the mean of the latest quoted bid and asked prices. Securities for which market quotations are not readily available, or whose values have been affected by events occurring before the fund's pricing time but after the close of the securities’ primary markets, are valued at their fair values calculated according to procedures adopted by the board of trustees. These procedures include obtaining quotations from an independent pricing service, monitoring news to identify significant market- or security-specific events, and evaluating changes in the values of foreign market proxies (for example, ADRs, futures contracts, or exchange-traded funds), between the time the foreign markets close and the fund’s pricing time. When fair-value pricing is employed, the prices of securities used by a fund to calculate its net asset value may differ from quoted or published prices for the same securities.
Investments in Vanguard Market Liquidity Fund are valued at that fund's net asset value.
Temporary cash investments are valued using the latest bid prices or using valuations based on a matrix system (which considers such factors as security prices, yields, maturities, and ratings), both as furnished by independent pricing services.
2. Foreign Currency: Securities and other assets and liabilities denominated in foreign currencies are translated into U.S. dollars using exchange rates obtained from an independent third party as of the fund’s pricing time on the valuation date. Realized gains (losses) and unrealized appreciation (depreciation) on investment securities include the effects of changes in exchange rates since the securities were purchased, combined with the effects of changes in security prices. Fluctuations in the value of other assets and liabilities resulting from changes in exchange rates are recorded as unrealized foreign currency gains (losses) until the assets or liabilities are settled in cash, at which time they are recorded as realized foreign currency gains (losses).
3. Futures Contracts: The fund uses index futures contracts to a limited extent, with the objectives of maintaining full exposure to the stock market, maintaining liquidity, and minimizing transaction costs. The fund may purchase futures contracts to immediately invest incoming cash in the market, or sell futures in response to cash outflows, thereby simulating a fully invested position in
Emerging Markets Stock Index Fund
the underlying index while maintaining a cash balance for liquidity. The primary risks associated with the use of futures contracts are imperfect correlation between changes in market values of stocks held by the fund and the prices of futures contracts, and the possibility of an illiquid market. Counterparty risk involving futures is mitigated because a regulated clearinghouse is the counterparty instead of the clearing broker. To further mitigate counterparty risk, the fund trades futures contracts on an exchange, monitors the financial strength of its clearing brokers and clearinghouse, and has entered into clearing agreements with its clearing brokers. The clearinghouse imposes initial margin requirements to secure the fund’s performance and requires daily settlement of variation margin representing changes in the market value of each contract. Any securities pledged as initial margin for open contracts are noted in the Schedule of Investments.
Futures contracts are valued at their quoted daily settlement prices. The notional amounts of the contracts are not recorded in the Statement of Assets and Liabilities. Fluctuations in the value of the contracts are recorded in the Statement of Assets and Liabilities as an asset (liability) and in the Statement of Operations as unrealized appreciation (depreciation) until the contracts are closed, when they are recorded as realized gains (losses) on futures contracts.
During the year ended October 31, 2021, the fund’s average investments in long and short futures contracts represented 1% and 0% of net assets, respectively, based on the average of the notional amounts at each quarter-end during the period.
4. Forward Currency Contracts: The fund enters into forward currency contracts to protect the value of securities and related receivables and payables against changes in future foreign exchange rates. The fund’s risks in using these contracts include movement in the values of the foreign currencies relative to the U.S. dollar and the ability of the counterparties to fulfill their obligations under the contracts. The fund mitigates its counterparty risk by entering into forward currency contracts only with a diverse group of prequalified counterparties, monitoring their financial strength, entering into master netting arrangements with its counterparties, and requiring its counterparties to transfer collateral as security for their performance. In the absence of a default, the collateral pledged or received by the fund cannot be repledged, resold, or rehypothecated. The master netting arrangements provide that, in the event of a counterparty’s default (including bankruptcy), the fund may terminate the forward currency contracts, determine the net amount owed by either party in accordance with its master netting arrangements, and sell or retain any collateral held up to the net amount owed to the fund under the master netting arrangements. The forward currency contracts contain provisions whereby a counterparty may terminate open contracts if the fund’s net assets decline below a certain level, triggering a payment by the fund if the fund is in a net liability position at the time of the termination. The payment amount would be reduced by any collateral the fund has pledged. Any securities pledged as collateral for open contracts are noted in the Schedule of Investments. The value of collateral received or pledged is compared daily to the value of the forward currency contracts exposure with each counterparty, and any difference, if in excess of a specified minimum transfer amount, is adjusted and settled within two business days.
Forward currency contracts are valued at their quoted daily prices obtained from an independent third party, adjusted for currency risk based on the expiration date of each contract. The notional amounts of the contracts are not recorded in the Statement of Assets and Liabilities. Fluctuations in the value of the contracts are recorded in the Statement of Assets and Liabilities as an asset (liability) and in the Statement of Operations as unrealized appreciation (depreciation) until the contracts are closed, when they are recorded as realized gains (losses) on forward currency contracts.
Emerging Markets Stock Index Fund
During the year ended October 31, 2021, the fund’s average investment in forward currency contracts represented less than 1% of net assets, based on the average of the notional amounts at each quarter-end during the period.
5. Swap Contracts: The fund has entered into equity swap contracts to earn the total return on selected reference stocks in the fund’s target index. Under the terms of the swaps, the fund receives the total return on the referenced stock (i.e., receiving the increase or paying the decrease in value of the selected reference stock and receiving the equivalent of any dividends in respect of the selected referenced stock) over a specified period of time, applied to a notional amount that represents the value of a designated number of shares of the selected reference stock at the beginning of the equity swap contract. The fund also pays a floating rate that is based on short-term interest rates, applied to the notional amount. At the same time, the fund generally invests an amount approximating the notional amount of the swap in high-quality temporary cash investments.
A risk associated with all types of swaps is the possibility that a counterparty may default on its obligation to pay net amounts due to the fund. The fund’s maximum amount subject to counterparty risk is the unrealized appreciation on the swap contract. The fund mitigates its counterparty risk by entering into swaps only with a diverse group of prequalified counterparties, monitoring their financial strength, entering into master netting arrangements with its counterparties, and requiring its counterparties to transfer collateral as security for their performance. In the absence of a default, the collateral pledged or received by the fund cannot be repledged, resold, or rehypothecated. In the event of a counterparty’s default (including bankruptcy), the fund may terminate any swap contracts with that counterparty, determine the net amount owed by either party in accordance with its master netting arrangements, and sell or retain any collateral held up to the net amount owed to the fund under the master netting arrangements. The swap contracts contain provisions whereby a counterparty may terminate open contracts if the fund's net assets decline below a certain level, triggering a payment by the fund if the fund is in a net liability position at the time of the termination. The payment amount would be reduced by any collateral the fund has pledged. Any securities pledged as collateral for open contracts are noted in the Schedule of Investments. The value of collateral received or pledged is compared daily to the value of the swap contracts exposure with each counterparty, and any difference, if in excess of a specified minimum transfer amount, is adjusted and settled within two business days.
The notional amounts of swap contracts are not recorded in the Statement of Assets and Liabilities. Swaps are valued daily based on market quotations received from independent pricing services or recognized dealers and the change in value is recorded in the Statement of Assets and Liabilities as an asset (liability) and in the Statement of Operations as unrealized appreciation (depreciation) until periodic payments are made or the termination of the swap, at which time realized gain (loss) is recorded.
During the year ended October 31, 2021, the fund’s average amounts of investments in total return swaps represented less than 1% of net assets, based on the average of notional amounts at each quarter-end during the period.
6. Federal Income Taxes: The fund intends to continue to qualify as a regulated investment company and distribute all of its taxable income. The fund’s tax returns are open to examination by the relevant tax authorities until expiration of the applicable statute of limitations, which is
Emerging Markets Stock Index Fund
generally three years after the filing of the tax return. Management has analyzed the fund’s tax positions taken for all open federal and state income tax years, and has concluded that no provision for income tax is required in the fund’s financial statements.
7. Distributions: Distributions to shareholders are recorded on the ex-dividend date. Distributions are determined on a tax basis at the fiscal year-end and may differ from net investment income and realized capital gains for financial reporting purposes.
8. Securities Lending: To earn additional income, the fund lends its securities to qualified institutional borrowers. Security loans are subject to termination by the fund at any time, and are required to be secured at all times by collateral in an amount at least equal to the market value of securities loaned. Daily market fluctuations could cause the value of loaned securities to be more or less than the value of the collateral received. When this occurs, the collateral is adjusted and settled before the opening of the market on the next business day. The fund further mitigates its counterparty risk by entering into securities lending transactions only with a diverse group of prequalified counterparties, monitoring their financial strength, and entering into master securities lending agreements with its counterparties. The master securities lending agreements provide that, in the event of a counterparty’s default (including bankruptcy), the fund may terminate any loans with that borrower, determine the net amount owed, and sell or retain the collateral up to the net amount owed to the fund; however, such actions may be subject to legal proceedings. While collateral mitigates counterparty risk, in the event of a default, the fund may experience delays and costs in recovering the securities loaned. The fund invests cash collateral received in Vanguard Market Liquidity Fund, and records a liability in the Statement of Assets and Liabilities for the return of the collateral, during the period the securities are on loan. Collateral investments in Vanguard Market Liquidity Fund are subject to market appreciation or depreciation. Securities lending income represents fees charged to borrowers plus income earned on invested cash collateral, less expenses associated with the loan. During the term of the loan, the fund is entitled to all distributions made on or in respect of the loaned securities.
9. Credit Facilities and Interfund Lending Program: The fund and certain other funds managed by The Vanguard Group ("Vanguard") participate in a $4.3 billion committed credit facility provided by a syndicate of lenders pursuant to a credit agreement and an uncommitted credit facility provided by Vanguard. Both facilities may be renewed annually. Each fund is individually liable for its borrowings, if any, under the credit facilities. Borrowings may be utilized for temporary or emergency purposes, subject to the fund’s regulatory and contractual borrowing restrictions. With respect to the committed credit facility, the participating funds are charged administrative fees and an annual commitment fee of 0.10% of the undrawn committed amount of the facility; these fees are allocated to the funds based on a method approved by the fund’s board of trustees and included in Management and Administrative expenses on the fund’s Statement of Operations. Any borrowings under either facility bear interest at a rate based upon the higher of the one-month London Interbank Offered Rate (or an acceptable alternate rate, if necessary), federal funds effective rate, or overnight bank funding rate plus an agreed-upon spread, except that borrowings under the uncommitted credit facility may bear interest based upon an alternative rate agreed to by the fund and Vanguard.
In accordance with an exemptive order (the “Order”) from the SEC, the fund may participate in a joint lending and borrowing program that allows registered open-end Vanguard funds to borrow money from and lend money to each other for temporary or emergency purposes (the “Interfund Lending Program”), subject to compliance with the terms and conditions of the Order, and to the extent permitted by the fund’s investment objective and investment policies. Interfund loans and
Emerging Markets Stock Index Fund
borrowings normally extend overnight, but can have a maximum duration of seven days. Loans may be called on one business day’s notice. The interest rate to be charged is governed by the conditions of the Order and internal procedures adopted by the board of trustees. The board of trustees is responsible for overseeing the Interfund Lending Program.
For the year ended October 31, 2021, the fund did not utilize the credit facilities or the Interfund Lending Program.
10. Other: Dividend income is recorded on the ex-dividend date. Non-cash dividends included in income, if any, are recorded at the fair value of the securities received. Interest income includes income distributions received from Vanguard Market Liquidity Fund and is accrued daily. Premiums and discounts on debt securities are amortized and accreted, respectively, to interest income over the lives of the respective securities, except for premiums on certain callable debt securities that are amortized to the earliest call date. Taxes on foreign dividends and capital gains have been provided for in accordance with the fund's understanding of the applicable countries’ tax rules and rates. Deferred foreign capital gains tax, if any, is accrued daily based upon net unrealized gains. Security transactions are accounted for on the date securities are bought or sold. Costs used to determine realized gains (losses) on the sale of investment securities are those of the specific securities sold.
Each class of shares has equal rights as to assets and earnings, except that each class separately bears certain class-specific expenses related to maintenance of shareholder accounts (included in Management and Administrative expenses) and shareholder reporting. Marketing and distribution expenses are allocated to each class of shares based on a method approved by the board of trustees. Income, other non-class-specific expenses, and gains and losses on investments are allocated to each class of shares based on its relative net assets.
B. In accordance with the terms of a Funds’ Service Agreement (the “FSA”) between Vanguard and the fund, Vanguard furnishes to the fund investment advisory, corporate management, administrative, marketing, and distribution services at Vanguard’s cost of operations (as defined by the FSA). These costs of operations are allocated to the fund based on methods and guidelines approved by the board of trustees and are generally settled twice a month.
Upon the request of Vanguard, the fund may invest up to 0.40% of its net assets as capital in Vanguard. At October 31, 2021, the fund had contributed to Vanguard capital in the amount of $3,723,000, representing less than 0.01% of the fund’s net assets and 1.49% of Vanguard’s capital received pursuant to the FSA. The fund’s trustees and officers are also directors and employees, respectively, of Vanguard.
C. Various inputs may be used to determine the value of the fund’s investments and derivatives. These inputs are summarized in three broad levels for financial statement purposes. The inputs or methodologies used to value securities are not necessarily an indication of the risk associated with investing in those securities.
Level 1—Quoted prices in active markets for identical securities.
Level 2—Other significant observable inputs (including quoted prices for similar securities, interest rates, prepayment speeds, credit risk, etc.).
Level 3—Significant unobservable inputs (including the fund’s own assumptions used to determine the fair value of investments). Any investments and derivatives valued with significant unobservable inputs are noted on the Schedule of Investments.
Emerging Markets Stock Index Fund
The following table summarizes the market value of the fund's investments and derivatives as of October 31, 2021, based on the inputs used to value them:
| | Level 1
($000) | Level 2
($000) | Level 3
($000) | Total
($000) |
| Investments | | | | |
| Assets | | | | |
| Common Stocks—North and South America | 8,476,286 | 19,470 | 8 | 8,495,764 |
| Common Stocks—Other | 6,133,199 | 94,932,599 | 86,890 | 101,152,688 |
| Temporary Cash Investments | 2,653,142 | — | — | 2,653,142 |
| Total | 17,262,627 | 94,952,069 | 86,898 | 112,301,594 |
| | | | |
| Derivative Financial Instruments | | | | |
| Assets | | | | |
| Forward Currency Contracts | — | 500 | — | 500 |
| Swap Contracts | — | 9,444 | — | 9,444 |
| Total | — | 9,944 | — | 9,944 |
| Liabilities | | | | |
| Futures Contracts1 | 17,776 | — | — | 17,776 |
| Forward Currency Contracts | — | 7,316 | — | 7,316 |
| Total | 17,776 | 7,316 | — | 25,092 |
| 1 | Includes cumulative appreciation (depreciation) on futures contracts and centrally cleared swaps, if any, as reported in the Schedule of Investments. Only current day’s variation margin is reported within the Statement of Assets and Liabilities. |
D. At October 31, 2021, the fair values of derivatives were reflected in the Statement of Assets and Liabilities as follows:
| Statement of Assets and Liabilities | Equity
Contracts
($000) | Foreign
Exchange
Contracts
($000) | Total
($000) |
| Unrealized Appreciation—Forward Currency Contracts | — | 500 | 500 |
| Unrealized Appreciation—Over-the-Counter Swap Contracts | 9,444 | — | 9,444 |
| Total Assets | 9,444 | 500 | 9,944 |
| | | | |
| Unrealized Depreciation—Futures Contracts1 | 17,776 | — | 17,776 |
| Unrealized Depreciation—Forward Currency Contracts | — | 7,316 | 7,316 |
| Total Liabilities | 17,776 | 7,316 | 25,092 |
| 1 | Includes cumulative appreciation (depreciation) on futures contracts, if any, as reported in the Schedule of Investments. Only current day’s variation margin is reported within the Statement of Assets and Liabilities. |
Emerging Markets Stock Index Fund
Realized net gain (loss) and the change in unrealized appreciation (depreciation) on derivatives for the year ended October 31, 2021, were:
| Realized Net Gain (Loss) on Derivatives | Equity
Contracts
($000) | Foreign
Exchange
Contracts
($000) | Total
($000) |
| Futures Contracts | 189,522 | — | 189,522 |
| Forward Currency Contracts | — | 9,606 | 9,606 |
| Swap Contracts | 52,445 | — | 52,445 |
| Realized Net Gain (Loss) on Derivatives | 241,967 | 9,606 | 251,573 |
| |
| Change in Unrealized Appreciation (Depreciation) on Derivatives |
| Futures Contracts | (19,256) | — | (19,256) |
| Forward Currency Contracts | — | (6,816) | (6,816) |
| Swap Contracts | 13 | — | 13 |
| Change in Unrealized Appreciation (Depreciation) on Derivatives | (19,243) | (6,816) | (26,059) |
E. Permanent differences between book-basis and tax-basis components of net assets are reclassified among capital accounts in the financial statements to reflect their tax character. These reclassifications have no effect on net assets or net asset value per share. As of period end, permanent differences primarily attributable to the accounting for in-kind redemptions, foreign currency transactions, passive foreign investment companies, swap agreements, and tax expense on capital gains were reclassified between the following accounts:
| | Amount
($000) |
| Paid-in Capital | 89,522 |
| Total Distributable Earnings (Loss) | (89,522) |
Temporary differences between book-basis and tax-basis components of total distributable earnings (loss) arise when certain items of income, gain, or loss are recognized in different periods for financial statement and tax purposes; these differences will reverse at some time in the future. The differences are primarily related to the deferral of losses from wash sales; the recognition of unrealized gains or losses from certain derivative contracts; the recognition of unrealized gains from passive foreign investment companies; and the classification of securities for tax purposes. As of period end, the tax-basis components of total distributable earnings (loss) are detailed in the table as follows:
| | Amount
($000) |
| Undistributed Ordinary Income | 764,307 |
| Undistributed Long-Term Gains | — |
| Capital Loss Carryforwards | (14,244,723) |
| Qualified Late-Year Losses | — |
| Net Unrealized Gains (Losses) | 28,799,471 |
Emerging Markets Stock Index Fund
The tax character of distributions paid was as follows:
| | Year Ended October 31, |
| | 2021
Amount
($000) | 2020
Amount
($000) |
| Ordinary Income | 2,373,431 | 2,464,748 |
| Long-Term Capital Gains | — | — |
| Total | 2,373,431 | 2,464,748 |
As of October 31, 2021, gross unrealized appreciation and depreciation for investments and derivatives based on cost for U.S. federal income tax purposes were as follows:
| | Amount
($000) |
| Tax Cost | 82,839,699 |
| Gross Unrealized Appreciation | 44,257,404 |
| Gross Unrealized Depreciation | (14,795,406) |
| Net Unrealized Appreciation (Depreciation) | 29,461,998 |
F. During the year ended October 31, 2021, the fund purchased $20,620,374,000 of investment securities and sold $9,895,309,000 of investment securities, other than temporary cash investments. Purchases and sales include $4,427,552,000 and $190,714,000, respectively, in connection with in-kind purchases and redemptions of the fund’s capital shares.
G. Capital share transactions for each class of shares were:
| | Year Ended October 31, |
| | 2021 | | 2020 |
| | Amount
($000) | Shares
(000) | | Amount
($000) | Shares
(000) |
| Investor Shares | | | | | |
| Issued | 35,281 | 1,072 | | 16,736 | 651 |
| Issued in Lieu of Cash Distributions | 3,538 | 109 | | 5,308 | 195 |
| Redeemed1 | (52,921) | (1,649) | | (104,242) | (4,022) |
| Net Increase (Decrease)—Investor Shares | (14,102) | (468) | | (82,198) | (3,176) |
| ETF Shares | | | | | |
| Issued | 9,871,776 | 187,928 | | 825,514 | 20,070 |
| Issued in Lieu of Cash Distributions | — | — | | — | — |
| Redeemed | — | — | | (4,435,184) | (125,800) |
| Net Increase (Decrease)—ETF Shares | 9,871,776 | 187,928 | | (3,609,670) | (105,730) |
| Admiral Shares | | | | | |
| Issued1 | 3,864,155 | 89,841 | | 3,245,146 | 97,262 |
| Issued in Lieu of Cash Distributions | 329,698 | 7,748 | | 348,063 | 9,830 |
| Redeemed | (3,196,035) | (74,341) | | (4,005,216) | (121,465) |
| Net Increase (Decrease)—Admiral Shares | 997,818 | 23,248 | | (412,007) | (14,373) |
Emerging Markets Stock Index Fund
| | Year Ended October 31, |
| | 2021 | | 2020 |
| | Amount
($000) | Shares
(000) | | Amount
($000) | Shares
(000) |
| Institutional Shares | | | | | |
| Issued | 2,271,838 | 69,396 | | 1,781,929 | 68,805 |
| Issued in Lieu of Cash Distributions | 161,913 | 5,003 | | 171,042 | 6,363 |
| Redeemed | (2,208,643) | (67,714) | | (1,956,554) | (75,769) |
| Net Increase (Decrease)—Institutional Shares | 225,108 | 6,685 | | (3,583) | (601) |
| Institutional Plus Shares | | | | | |
| Issued | 963,871 | 8,971 | | 1,900,916 | 21,059 |
| Issued in Lieu of Cash Distributions | 106,546 | 991 | | 103,316 | 1,160 |
| Redeemed | (1,346,047) | (12,234) | | (305,964) | (3,531) |
| Net Increase (Decrease)—Institutional Plus Shares | (275,630) | (2,272) | | 1,698,268 | 18,688 |
| 1 | In November 2018, the fund announced changes to the availability and minimum investment criteria of the Investor and Admiral share classes. As a result, all of the outstanding Investor Shares automatically converted to Admiral Shares beginning in April 2019, with the exception of those held by Vanguard funds and certain other institutional investors. Investor Shares—Redeemed and Admiral Shares—Issued include 135 and 103 shares, respectively, in the amount of $4,000 from the conversion during the year ended October 31, 2020. |
H. Management has determined that no events or transactions occurred subsequent to October 31, 2021, that would require recognition or disclosure in these financial statements.
Report of Independent Registered
Public Accounting Firm
To the Board of Trustees of Vanguard International Equity Index Funds and Shareholders of Vanguard Emerging Markets Stock Index Fund
Opinion on the Financial Statements
We have audited the accompanying statement of assets and liabilities, including the schedule of investments, of Vanguard Emerging Markets Stock Index Fund (one of the funds constituting Vanguard International Equity Index Funds, referred to hereafter as the "Fund") as of October 31, 2021, the related statement of operations for the year ended October 31, 2021, the statement of changes in net assets for each of the two years in the period ended October 31, 2021, including the related notes, and the financial highlights for each of the five years in the period ended October 31, 2021 (collectively referred to as the "financial statements"). In our opinion, the financial statements present fairly, in all material respects, the financial position of the Fund as of October 31, 2021, the results of its operations for the year then ended, the changes in its net assets for each of the two years in the period ended October 31, 2021 and the financial highlights for each of the five years in the period ended October 31, 2021 in conformity with accounting principles generally accepted in the United States of America.
Basis for Opinion
These financial statements are the responsibility of the Fund’s management. Our responsibility is to express an opinion on the Fund’s financial statements based on our audits. We are a public accounting firm registered with the Public Company Accounting Oversight Board (United States) (PCAOB) and are required to be independent with respect to the Fund in accordance with the U.S. federal securities laws and the applicable rules and regulations of the Securities and Exchange Commission and the PCAOB.
We conducted our audits of these financial statements in accordance with the standards of the PCAOB. Those standards require that we plan and perform the audit to obtain reasonable assurance about whether the financial statements are free of material misstatement, whether due to error or fraud.
Our audits included performing procedures to assess the risks of material misstatement of the financial statements, whether due to error or fraud, and performing procedures that respond to those risks. Such procedures included examining, on a test basis, evidence regarding the amounts and disclosures in the financial statements. Our audits also included evaluating the accounting principles used and significant estimates made by management, as well as evaluating the overall presentation of the financial statements. Our procedures included confirmation of securities owned as of October 31, 2021 by correspondence with the custodian, transfer agent and brokers; when replies were not received from the transfer agent or brokers, we performed other auditing procedures. We believe that our audits provide a reasonable basis for our opinion.
/s/PricewaterhouseCoopers LLP
Philadelphia, Pennsylvania
December 17, 2021
We have served as the auditor of one or more investment companies in The Vanguard Group of Funds since 1975.
Special 2021 tax information (unaudited) for Vanguard Emerging Markets Stock Index Fund
This information for the fiscal year ended October 31, 2021, is included pursuant to provisions of the Internal Revenue Code.
The fund distributed $275,149,000 of qualified dividend income to shareholders during the fiscal year.
The fund designates to shareholders foreign source income of $2,846,867,000 and foreign taxes paid of $281,120,000. Shareholders will receive more detailed information with their Form 1099-DIV in January 2022 to determine the calendar-year amounts to be included on their 2021 tax returns.
London Stock Exchange Group companies include FTSE International Limited (“FTSE”), Frank Russell Company (“Russell”), MTS Next Limited (“MTS”), and FTSE TMX Global Debt Capital Markets Inc. (“FTSE TMX”). All rights reserved. “FTSE®”, “Russell®”, “MTS®”, “FTSE TMX®” and “FTSE Russell” and other service marks and trademarks related to the FTSE or Russell indexes are trademarks of the London Stock Exchange Group companies and are used by FTSE, MTS, FTSE TMX and Russell under license. All information is provided for information purposes only. Every effort is made to ensure that all information given in this publication is accurate, but no responsibility or liability can be accepted by the London Stock Exchange Group companies nor its licensors for any errors or for any loss from use of this publication. Neither the London Stock Exchange Group companies nor any of their licensors make any claim, prediction, warranty or representation whatsoever, expressly or impliedly, either as to the results to be obtained from the use of the Indices or the fitness or suitability of the Indices for any particular purpose to which they might be put. The London Stock Exchange Group companies do not provide investment advice and nothing in this document should be taken as constituting financial or investment advice. The London Stock Exchange Group companies make no representation regarding the advisability of investing in any asset. A decision to invest in any such asset should not be made in reliance on any information herein. Indexes cannot be invested in directly. Inclusion of an asset in an index is not a recommendation to buy, sell or hold that asset. The general information contained in this publication should not be acted upon without obtaining specific legal, tax, and investment advice from a licensed professional. No part of this information may be reproduced, stored in a retrieval system or transmitted in any form or by any means, electronic, mechanical, photocopying, recording or otherwise, without prior written permission of the London Stock Exchange Group companies. Distribution of the London Stock Exchange Group companies’ index values and the use of their indexes to create financial products require a license with FTSE, FTSE TMX, MTS and/or Russell and/or its licensors.
This page intentionally left blank.
The People Who Govern Your Fund
The trustees of your mutual fund are there to see that the fund is operated and managed in your best interests since, as a shareholder, you are a part owner of the fund. Your fund’s trustees also serve on the board of directors of The Vanguard Group, Inc., which is owned by the Vanguard funds and provides services to them.
A majority of Vanguard’s board members are independent, meaning that they have no affiliation with Vanguard or the funds they oversee, apart from the sizable personal investments they have made as private individuals. The independent board members have distinguished backgrounds in business, academia, and public service. Each of the trustees and executive officers oversees 214 Vanguard funds.
Information for each trustee and executive officer of the fund appears below. That information, as well as the Vanguard fund count, is as of the date on the cover of this fund report. The mailing address of the trustees and officers is P.O. Box 876, Valley Forge, PA 19482. More information about the trustees is in the Statement of Additional Information, which can be obtained, without charge, by contacting Vanguard at 800-662-7447, or online at vanguard.com.
Interested Trustee1
Mortimer J. Buckley
Born in 1969. Trustee since January 2018. Principal occupation(s) during the past five years and other experience: chairman of the board (2019–present) of Vanguard and of each of the investment companies served by Vanguard; chief executive officer (2018–present) of Vanguard; chief executive officer, president, and trustee (2018–present) of each of the investment companies served by Vanguard; president and director (2017–present) of Vanguard; and president (2018–present) of Vanguard Marketing Corporation. Chief investment officer (2013–2017), managing director (2002–2017), head of the Retail Investor Group (2006–2012), and chief information officer (2001–2006) of Vanguard. Chairman of the board (2011–2017) and trustee (2009–2017) of the Children’s Hospital of Philadelphia; and trustee (2018–present) and vice chair (2019–present) of The Shipley School.
Independent Trustees
Emerson U. Fullwood
Born in 1948. Trustee since January 2008. Principal occupation(s) during the past five years and other experience: executive chief staff and marketing officer for North America and corporate vice president (retired 2008) of Xerox Corporation (document management products and services). Former president of the Worldwide Channels Group, Latin America, and Worldwide Customer Service and executive chief staff officer of Developing Markets of Xerox. Executive in residence and 2009–2010 Distinguished Minett Professor at the Rochester Institute of Technology. Director of SPX FLOW, Inc. (multi-industry manufacturing). Director of the University of Rochester Medical Center, the Monroe Community College Foundation, the United Way of Rochester, North Carolina A&T University, and Roberts Wesleyan College. Trustee of the University of Rochester.
Amy Gutmann
Born in 1949. Trustee since June 2006. Principal occupation(s) during the past five years and other experience: president (2004–present) of the University of Pennsylvania. Christopher H. Browne Distinguished Professor of Political Science, School of Arts and Sciences, and professor of communication, Annenberg School for Communication, with secondary faculty appointments in the Department of Philosophy, School of Arts and Sciences, and at the Graduate School of Education, University of Pennsylvania.
1 Mr. Buckley is considered an “interested person,” as defined in the Investment Company Act of 1940, because he is an officer of the Vanguard funds.
F. Joseph Loughrey
Born in 1949. Trustee since October 2009. Principal occupation(s) during the past five years and other experience: president and chief operating officer (retired 2009) and vice chairman of the board (2008–2009) of Cummins Inc. (industrial machinery). Chairman of the board of Hillenbrand, Inc. (specialized consumer services). Director of the V Foundation. Member of the advisory council for the College of Arts and Letters and chair of the advisory board to the Kellogg Institute for International Studies, both at the University of Notre Dame. Chairman of the board of Saint Anselm College.
Mark Loughridge
Born in 1953. Trustee since March 2012. Principal occupation(s) during the past five years and other experience: senior vice president and chief financial officer (retired 2013) of IBM (information technology services). Fiduciary member of IBM’s Retirement Plan Committee (2004–2013), senior vice president and general manager (2002–2004) of IBM Global Financing, vice president and controller (1998–2002) of IBM, and a variety of other prior management roles at IBM. Member of the Council on Chicago Booth.
Scott C. Malpass
Born in 1962. Trustee since March 2012. Principal occupation(s) during the past five years and other experience: chief investment officer (retired June 2020) and vice president (retired June 2020) of the University of Notre Dame. Assistant professor (retired June 2020) of finance at the Mendoza College of Business, University of Notre Dame, and member of the Notre Dame 403(b) Investment Committee. Member of the board of Catholic Investment Services, Inc. (investment advisors) and the board of superintendence of the Institute for the Works of Religion.
Deanna Mulligan
Born in 1963. Trustee since January 2018. Principal occupation(s) during the past five years and other experience: board chair (2020), chief executive officer (2011–2020), and president (2010–2019) of The Guardian Life Insurance Company of America. Chief operating officer (2010–2011) and executive vice president (2008–2010) of Individual Life and Disability of the Guardian Life Insurance Company of America. Member of the board of the Economic Club of New York. Trustee of the Partnership for New York City (business leadership), Chief Executives for Corporate Purpose, NewYork-Presbyterian Hospital, and the Bruce Museum (arts and science). Member of the Advisory Council for the Stanford Graduate School of Business.
André F. Perold
Born in 1952. Trustee since December 2004. Principal occupation(s) during the past five years and other experience: George Gund Professor of Finance and Banking, Emeritus at the Harvard Business School (retired 2011). Chief investment officer and co-managing partner of HighVista Strategies (private investment firm). Member of the board (2018–present) of RIT Capital Partners (investment firm). Member of the investment committee of Partners Health Care System.
Sarah Bloom Raskin
Born in 1961. Trustee since January 2018. Principal occupation(s) during the past five years and other experience: deputy secretary (2014–2017) of the United States Department of the Treasury. Governor (2010–2014) of the Federal Reserve Board. Commissioner (2007–2010) of financial regulation for the State of Maryland. Professor (2020–present), Distinguished Fellow of the Global Financial Markets Center (2020–present), and Rubenstein Fellow (2017–2020) at Duke University. Trustee (2017–present) of Amherst College and member of Amherst College Investment Committee (2019–present). Member of the Regenerative Crisis Response Committee (2020–present).
David A. Thomas
Born in 1956. Trustee since July 2021. Principal occupation(s) during the past five years and other experience: president of Morehouse College (2018–present). Professor of business administration, emeritus at Harvard University (2017–2018). Dean (2011–2016) and professor of management (2016–2017) at the Georgetown University McDonough School of Business. Director of DTE Energy Company (2013–present). Trustee of Common Fund (2019–present).
Peter F. Volanakis
Born in 1955. Trustee since July 2009. Principal occupation(s) during the past five years and other experience: president and chief operating officer (retired 2010) of Corning Incorporated (communications equipment) and director of Corning Incorporated (2000–2010) and Dow Corning (2001–2010). Director (2012) of SPX Corporation (multi-industry manufacturing). Overseer of the Amos Tuck School of Business Administration, Dartmouth College (2001–2013). Chairman of the board of trustees of Colby-Sawyer College. Member of the BMW Group Mobility Council.
Executive Officers
Christine M. Buchanan
Born in 1970. Principal occupation(s) during the past five years and other experience: principal of Vanguard. Chief financial officer (2021–present) and treasurer (2017–present) of each of the investment companies served by Vanguard. Partner (2005–2017) at KPMG (audit, tax, and advisory services).
David Cermak
Born in 1960. Principal occupation(s) during the past five years and other experience: principal of Vanguard. Finance director (2019–present) of each of the investment companies served by Vanguard. Managing director and head (2017–present) of Vanguard Investments Singapore. Managing director and head (2017–2019) of Vanguard Investments Hong Kong. Representative director and head (2014–2017) of Vanguard Investments Japan.
John Galloway
Born in 1973. Principal occupation(s) during the past five years and other experience: principal of Vanguard. Investment stewardship officer (September 2020–present) of each of the investment companies served by Vanguard. Head of Investor Advocacy (February 2020–present) and head of Marketing Strategy and Planning (2017–2020) at Vanguard. Deputy assistant to the President of the United States (2015).
Peter Mahoney
Born in 1974. Principal occupation(s) during the past five years and other experience: principal of Vanguard. Controller (2015–present) of each of the investment companies served by Vanguard. Head of International Fund Services (2008–2014) at Vanguard.
Anne E. Robinson
Born in 1970. Principal occupation(s) during the past five years and other experience: general counsel (2016–present) of Vanguard. Secretary (2016–present) of Vanguard and of each of the investment companies served by Vanguard. Managing director (2016–present) of Vanguard. Managing director and general counsel of Global Cards and Consumer Services (2014–2016) at Citigroup. Counsel (2003–2014) at American Express.
Michael Rollings
Born in 1963. Principal occupation(s) during the past five years and other experience: finance director (2017–present) and treasurer (2017) of each of the investment companies served by Vanguard. Managing director (2016–present) of Vanguard. Chief financial officer (2016–present) of Vanguard. Director (2016–present) of Vanguard Marketing Corporation. Executive vice president and chief financial officer (2006–2016) of MassMutual Financial Group.
John E. Schadl
Born in 1972. Principal occupation(s) during the past five years and other experience: principal of Vanguard. Chief compliance officer (2019–present) of Vanguard and of each of the investment companies served by Vanguard. Assistant vice president (2019–present) of Vanguard Marketing Corporation.
Vanguard Senior Management Team
| Matthew Benchener | Thomas M. Rampulla |
| Joseph Brennan | Karin A. Risi |
| Mortimer J. Buckley | Anne E. Robinson |
| Gregory Davis | Michael Rollings |
| John James | Nitin Tandon |
| John T. Marcante | Lauren Valente |
| Chris D. McIsaac | |
Connect with Vanguard®>vanguard.com
Fund Information > 800-662-7447
Direct Investor Account Services > 800-662-2739
Institutional Investor Services > 800-523-1036
Text Telephone for People
Who Are Deaf or Hard of Hearing > 800-749-7273
This material may be used in conjunction with the offering of shares of any Vanguard fund only if preceded or accompanied by the fund’s current prospectus.
All comparative mutual fund data are from Lipper, a Thomson Reuters Company, or Morningstar, Inc., unless otherwise noted.
You can obtain a free copy of Vanguard’s proxy voting guidelines by visiting vanguard.com/proxyreporting or by calling Vanguard at 800-662-2739. The guidelines are also available from the SEC’s website, www.sec.gov. In addition, you may obtain a free report on how your fund voted the proxies for securities it owned during the 12 months ended June 30. To get the report, visit either vanguard.com/proxyreporting or www.sec.gov.
You can review information about your fund on the SEC’s website, and you can receive copies of this information, for a fee, by sending a request via email addressed to publicinfo@sec.gov.
Source for Bloomberg indexes: Bloomberg Index Services Limited. Copyright 2021, Bloomberg. All rights reserved.
© 2021 The Vanguard Group, Inc.
All rights reserved.
U.S. Patent Nos. 6,879,964 and 7,720,749.
Vanguard Marketing Corporation, Distributor.
Q5330 122021
Item 2: Code of Ethics.
The Registrant has adopted a code of ethics that applies to the Registrant’s principal executive officer, principal financial officer, principal accounting officer or controller or persons performing similar functions. The Code of Ethics was amended during the reporting period covered by this report to make certain technical, non-material changes.
Item 3: Audit Committee Financial Expert.
All members of the Audit Committee have been determined by the Registrant’s Board of Trustees to be Audit Committee Financial Experts and to be independent: F. Joseph Loughrey, Mark Loughridge, Sarah Bloom Raskin, and Peter F. Volanakis.
Item 4: Principal Accountant Fees and Services.
(a) Audit Fees.
Audit Fees of the Registrant.
Fiscal Year Ended October 31, 2021: $418,000
Fiscal Year Ended October 31, 2020: $322,000
Aggregate Audit Fees of Registered Investment Companies in the Vanguard Group.
Fiscal Year Ended October 31, 2021: $11,244,694
Fiscal Year Ended October 31, 2020: $10,761,407
Includes fees billed in connection with audits of the Registrant, other registered investment companies in the Vanguard complex, The Vanguard Group, Inc., and Vanguard Marketing Corporation.
(b) Audit-Related Fees.
Fiscal Year Ended October 31, 2021: $2,955,181
Fiscal Year Ended October 31, 2020: $2,915,863
Includes fees billed in connection with assurance and related services provided to the Registrant, other registered investment companies in the Vanguard complex, The Vanguard Group, Inc., and Vanguard Marketing Corporation.
(c) Tax Fees.
Fiscal Year Ended October 31, 2021: $2,047,574
Fiscal Year Ended October 31, 2020: $247,168
Includes fees billed in connection with tax compliance, planning, and advice services provided to the Registrant, other registered investment companies in the Vanguard complex, The Vanguard Group, Inc., and Vanguard Marketing Corporation.
(d) All Other Fees.
Fiscal Year Ended October 31, 2021: $280,000
Fiscal Year Ended October 31, 2020: $115,000
Includes fees billed for services related to tax reported information provided to the Registrant, other registered investment companies in the Vanguard complex, The Vanguard Group, Inc., and Vanguard Marketing Corporation.
(e) (1) Pre-Approval Policies. The policy of the Registrant’s Audit Committee is to consider, and, if appropriate, approve before the principal accountant is engaged for such services, all specific audit and non-audit services provided to: the Registrant, other registered investment companies in the Vanguard complex, The Vanguard Group, Inc., and entities controlled by The Vanguard Group, Inc. that provide ongoing services to the Registrant. In making a determination, the Audit Committee considers whether the services are consistent with maintaining the principal accountant’s independence.
In the event of a contingency situation in which the principal accountant is needed to provide services in between scheduled Audit Committee meetings, the Chairman of the Audit Committee would be called on to consider and, if appropriate, pre-approve audit or permitted non-audit services in an amount sufficient to complete services through the next Audit Committee meeting, and to determine if such services would be consistent with maintaining the accountant’s independence. At the next scheduled Audit Committee meeting, services and fees would be presented to the Audit Committee for formal consideration, and, if appropriate, approval by the entire Audit Committee. The Audit Committee would again consider whether such services and fees are consistent with maintaining the principal accountant’s independence.
The Registrant’s Audit Committee is informed at least annually of all audit and non-audit services provided by the principal accountant to the Vanguard complex, whether such services are provided to: the Registrant, other registered investment companies in the Vanguard complex, The Vanguard Group, Inc., or other entities controlled by The Vanguard Group, Inc. that provide ongoing services to the Registrant.
(2) No percentage of the principal accountant’s fees or services were approved pursuant to the waiver provision of paragraph (c)(7)(i)(C) of Rule 2-01 of Regulation S-X.
(f) For the most recent fiscal year, over 50% of the hours worked under the principal accountant’s engagement were not performed by persons other than full-time, permanent employees of the principal accountant.
(g) Aggregate Non-Audit Fees.
Fiscal Year Ended October 31, 2021: $2,327,574
Fiscal Year Ended October 31, 2020: $362,168
Includes fees billed for non-audit services provided to the Registrant, other registered investment companies in the Vanguard complex, The Vanguard Group, Inc., and Vanguard Marketing Corporation.
(h) For the most recent fiscal year, the Audit Committee has determined that the provision of all non-audit services was consistent with maintaining the principal accountant’s independence.
Item 5: Audit Committee of Listed Registrants.
The Registrant is a listed issuer as defined in rule 10A-3 under the Securities Exchange Act of 1934 (“Exchange Act”). The Registrant has a separately-designated standing audit committee established in accordance with Section 3(a)(58)(A) of the Exchange Act. The Registrant’s audit committee members are: F. Joseph Loughrey, Mark Loughridge, Sarah Bloom Raskin, and Peter F. Volanakis.
Item 6: Investments.
Not applicable. The complete schedule of investments is included as part of the report to shareholders filed under Item 1 of this Form.
Item 7: Disclosure of Proxy Voting Policies and Procedures for Closed-End Management Investment Companies.
Not applicable.
Item 8: Portfolio Managers of Closed-End Management Investment Companies.
Not applicable.
Item 9: Purchase of Equity Securities by Closed-End Management Investment Company and Affiliated Purchasers.
Not applicable.
Item 10: Submission of Matters to a Vote of Security Holders.
Not applicable.
Item 11: Controls and Procedures.
(a) Disclosure Controls and Procedures. The Principal Executive and Financial Officers concluded that the Registrant’s Disclosure Controls and Procedures are effective based on their evaluation of the Disclosure Controls and Procedures as of a date within 90 days of the filing date of this report.
(b) Internal Control Over Financial Reporting. There were no significant changes in the Registrant’s Internal Control Over Financial Reporting or in other factors that could significantly affect this control subsequent to the date of the evaluation, including any corrective actions with regard to significant deficiencies and material weaknesses.
Item 12: Disclosure of Securities Lending Activities for Closed-End Management Investment Companies.
Not applicable.
Item 13: Exhibits.
Pursuant to the requirements of the Securities Exchange Act of 1934 and the Investment Company Act of 1940, the registrant has duly caused this report to be signed on its behalf by the undersigned, thereunto duly authorized.
| | VANGUARD INTERNATIONAL EQUITY INDEX FUNDS |
| | | |
| BY: | /s/ MORTIMER J. BUCKLEY* | |
| | MORTIMER J. BUCKLEY | |
| | CHIEF EXECUTIVE OFFICER | |
Date: December 20, 2021
Pursuant to the requirements of the Securities Exchange Act of 1934 and the Investment Company Act of 1940, this report has been signed below by the following persons on behalf of the registrant and in the capacities and on the dates indicated.
| | VANGUARD INTERNATIONAL EQUITY INDEX FUNDS |
| | | |
| BY: | /s/ MORTIMER J. BUCKLEY* | |
| | MORTIMER J. BUCKLEY | |
| | CHIEF EXECUTIVE OFFICER | |
Date: December 20, 2021
| | VANGUARD INTERNATIONAL EQUITY INDEX FUNDS |
| | | |
| BY: | /s/ CHRISTINE BUCHANAN* | |
| | CHRISTINE BUCHANAN | |
| | CHIEF FINANCIAL OFFICER | |
Date: December 20, 2021
* By: /s/ Anne E. Robinson
Anne E. Robinson, pursuant to a Power of Attorney filed on November 29, 2021 (see File Number 33-64845), a Power of Attorney filed on October 12, 2021 (see File Number 33-23444), and a Power of Attorney filed on August 26, 2021 (see file Number 811-02652), Incorporated by Reference.