UNITED STATES
SECURITIES AND EXCHANGE COMMISSION
Washington, D.C. 20549
FORM N-CSR
CERTIFIED SHAREHOLDER REPORT
OF
REGISTERED MANAGEMENT INVESTMENT COMPANIES
Investment Company Act file number: 811-05962
Name of Registrant: Vanguard Variable Insurance Funds
Address of Registrant:
P.O. Box 2600
Valley Forge, PA 19482
Name and address of agent for service:
Heidi Stam, Esquire
P.O. Box 876
Valley Forge, PA 19482
Registrant’s telephone number, including area code: (610) 669-1000
Date of fiscal year end: December 31
Date of reporting period: January 1, 2015 – December 31, 2015
Item 1: Reports to Shareholders

Annual Report | December 31, 2015
Vanguard Variable Insurance Fund
Balanced Portfolio Growth Portfolio REIT Index Portfolio
Capital Growth Portfolio High Yield Bond Portfolio Short-Term Investment-Grade Portfolio
Conservative Allocation Portfolio International Portfolio Small Company Growth Portfolio
Diversified Value Portfolio Mid-Cap Index Portfolio Total Bond Market Index Portfolio
Equity Income Portfolio Moderate Allocation Portfolio Total Stock Market Index Portfolio
(with underlying Equity Index Portfolio)
Equity Index Portfolio Money Market Portfolio
Vanguard’s Principles for Investing Success
We want to give you the best chance of investment success. These principles, grounded in Vanguard’s research and experience, can put you on the right path.
Goals. Create clear, appropriate investment goals.
Balance. Develop a suitable asset allocation using broadly diversified funds.
Cost. Minimize cost.
Discipline. Maintain perspective and long-term discipline.
A single theme unites these principles: Focus on the things you can control.
We believe there is no wiser course for any investor.
| |
| Contents | |
| |
| A Message from Vanguard's Chairman | 1 |
| Market Perspective | 2 |
| Balanced Portfolio | 3 |
| Capital Growth Portfolio | 25 |
| Conservative Allocation Portfolio | 37 |
| Diversified Value Portfolio | 47 |
| Equity Income Portfolio | 58 |
| Equity Index Portfolio | 73 |
| Growth Portfolio | 87 |
| High Yield Bond Portfolio | 102 |
| International Portfolio | 120 |
| Mid-Cap Index Portfolio | 137 |
| Moderate Allocation Portfolio | 150 |
| Money Market Portfolio | 160 |
| REIT Index Portfolio | 173 |
| Short-Term Investment-Grade Portfolio | 185 |
| Small Company Growth Portfolio | 223 |
| Total Bond Market Index Portfolio | 239 |
| Total Stock Market Index Portfolio | |
| (with underlying Equity Index Portfolio) | 295 |
Please note: The opinions expressed in this report are just that—informed opinions. They should not be considered promises or advice. Also, please keep in mind that the information and opinions cover the period through the date on the front of this report. Of course, the risks of investing in your fund are spelled out in the prospectus.
See the Glossary for definitions of investment terms used in this report.
About the cover: Pictured is a sailing block on the Brilliant, a 1932 schooner docked in Mystic, Connecticut. A type of pulley, the sailing block helps coordinate the setting of the sails.
At Vanguard, the intricate coordination of technology and people allows us to help millions of clients around the world reach their financial goals.
A Message from Vanguard’s Chairman

Dear Planholder,
During most of 2015, investors kept a watchful eye on U.S. economic indicators, seeking clues as to when the Federal Reserve would raise interest rates for the first time in nearly a decade. And as soon as the answer was revealed in mid-December, speculation turned to when the next rise would occur.
Other global developments—Greece again teetering on the brink of leaving the euro zone, for example, and oil prices that continued to fall—also held investors’ attention. Meanwhile, the impact of other changes remains to be seen. These include the election of new leaders in Argentina and Canada and the International Monetary Fund’s addition of China’s renminbi to its basket of reserve currencies.
Every day, Vanguard’s global economists analyze such developments, along with reams of data, and use proprietary economic indicators and statistical models to help frame investment expectations. To treat the future with the deference it deserves, they present a range and probabilities of potential longer-term outcomes, along with thoughtful analysis to spark discussion and help investors reach their goals.
In that spirit, here are some highlights from Vanguard’s latest Economic and Investment Outlook (You can read the entire paper at vanguard.com/research.):
• Global economic growth will remain “frustratingly fragile” in 2016. Longer-term, we think the global economy will ultimately converge toward a more balanced, healthier equilibrium after the debt-deleveraging cycle in the global private sector is complete (notably in China).
• At full employment, the U.S. economy is unlikely to accelerate in 2016. Yet it is on course to experience its longest expansion in nearly a century, underscoring that it is resilient in the face of global headwinds, though not immune to them.
• We anticipate a “dovish tightening” by the Fed. We see a high likelihood of an extended pause in interest rates at, say, 1%. And we expect the global low-rate environment to continue.
• Although not bearish, our outlook for global stocks and bonds remains guarded, given the low-interest-rate and low-earnings-yield environment.
Given this muted outlook, what’s the best course of action for an investor? Focus on what you can control. For example, if you’re still in saving mode, consider saving more than you think you may need, to help prepare for volatility that may lie ahead. And even if you’re spending down your assets, it’s important to continue paying attention to costs because the lower your costs, the more of your returns you can hold on to. (Keeping costs low is one of Vanguard’s four timeless principles for investing success, summarized on the facing page.)
This report starts with a brief overview of the financial markets during the past year. In the pages that follow, you’ll find a review of the performance of your portfolio. Each portfolio in Vanguard Variable Insurance Fund can serve as part of an investment program that includes a combination of stock, bond, and money market funds appropriate for your own long-term goals, risk tolerance, and time horizon.
Thank you for entrusting your assets to Vanguard.

F. William McNabb III
Chairman and Chief Executive Officer
January 15, 2016
1
Market Perspective
Key drivers were similar to 2014, but market returns were lower
Many of the forces that influenced capital markets during 2014 continued in 2015. Stock and bond returns, however, were generally lower.
Oil prices fell again, especially later in 2015, and other commodity prices also declined. Among other factors that again influenced the markets, the stronger U.S. dollar held back international stock and bond returns for U.S. investors, central bank policies diverged, merger-and-acquisition activity was brisk (a record volume of deals was announced), and economic growth in the United States was generally stronger than elsewhere.
The broad U.S. market outpaced many international stock markets
Ending more than a year of speculation, the Federal Reserve raised its short-term interest rate target to 0.25%–0.5% in mid-December and signaled that future increases were likely to be gradual. Soon after, Congress averted a federal government shutdown by approving tax and spending legislation to fund it through September 2016.
With these uncertainties removed, the broad U.S. stock market bounced back from its third-quarter drubbing with a return of more than 6% in the fourth quarter. For the 12 months ended December 31, 2015, it eked out a modest total return of 0.48%, the seventh straight calendar-year advance. Large-company stocks (as represented by the Russell 1000 Index) mostly outperformed smaller ones, as they had in 2014. Growth-oriented stocks of all sizes generally outpaced their value-oriented counterparts.
International stocks returned –4.72% for U.S.-based investors, held back in part by the stronger dollar. Measured in local currencies, the broad international market advanced. European markets were disappointed when additional monetary easing announced by the European Central Bank (ECB) in December fell short of expectations. But developed markets in Europe and the Pacific were ahead of emerging markets, which declined for the year in both dollars and local currencies; resource-rich and export-dependent developing economies have been hit hard by slower growth in China.
Central bank policies continued to diverge across the globe
While investors awaited the Fed’s move, many other central banks—including the People’s Bank of China—pursued monetary stimulus during 2015. The ECB’s significant bond-buying program and other steps helped push yields on many European sovereign bonds into negative territory.
After the Fed’s action, some other central banks also raised rates, but the Bank of Japan paved the way for additional stimulus if needed.
The broad U.S. bond market returned 0.55% for the 12 months. The benchmark 10-year Treasury note’s yield settled at 2.30%, up slightly from 2.19% at year-end 2014. Intermediate-term and higher-quality bonds were some of the best performers. High-yield bonds (not included in the investment-grade index) struggled; oil and gas-related companies, pinched by lower prices, make up a sizable slice of this segment of the bond market.
International bond markets (as measured by the Barclays Global Aggregate Index ex USD) returned –6.02% for U.S. dollar-based investors. After hedging for currency exposure, the broad market advanced modestly.
| | | |
| Market Barometer | | | |
| | Average Annual Total Returns |
| | Periods Ended December 31, 2015 |
| One Year | Three Years | Five Years |
| Stocks | | | |
| Russell 1000 Index (Large-caps) | 0.92% | 15.01% | 12.44% |
| Russell 2000 Index (Small-caps) | -4.41 | 11.65 | 9.19 |
| Russell 3000 Index (Broad U.S. market) | 0.48 | 14.74 | 12.18 |
| FTSE All-World ex US Index (International) | -4.72 | 2.04 | 1.48 |
| |
| Bonds | | | |
| Barclays U.S. Aggregate Bond Index (Broad taxable market) | 0.55% | 1.44% | 3.25% |
| Barclays Municipal Bond Index (Broad tax-exempt market) | 3.30 | 3.16 | 5.35 |
| Citigroup Three-Month U.S. Treasury Bill Index | 0.03 | 0.02 | 0.04 |
| |
| CPI | | | |
| Consumer Price Index | 0.73% | 1.00% | 1.53% |
2
Vanguard® Balanced Portfolio
Advisor’s Report
Vanguard Balanced Portfolio returned 0.09% for the 12 months ended December 31, 2015. This result lagged the 1.38% return of its blended benchmark (a mix of 65% large-capitalization stocks and 35% high-quality corporate bonds) but was ahead of the –1.20% average return of peer funds. The stock portfolio lagged its benchmark, the Standard & Poor’s 500 Index (+1.38%), while the bond portfolio modestly outperformed its benchmark, the Barclays U.S. Credit A or Better Bond Index (+0.69%).
Please note that the returns for Vanguard Variable Insurance Fund are different from those of Vanguard Variable Annuity (and other plans that invest in the fund), which take into account insurance-related expenses.
The investment environment
The S&P 500 Index outperformed the MSCI World Index and the MSCI EAFE Index, both of which declined slightly. Large-cap growth stocks generally outperformed large-cap value stocks, as measured by the Russell 1000 Growth and Russell 1000 Value Indexes.
This was a challenge for the equity portfolio compared with the S&P 500 benchmark, as our investment strategy is aimed at identifying undervalued stocks. In addition, stock returns in the S&P 500 Index were narrow and largely driven by big names such as Amazon.com, Facebook, and Alphabet (formerly known as Google). Although we did own Alphabet during the period, these companies typically have below-market yields and therefore would not meet our criteria for the portfolio’s equity portion.
The U.S. fixed income market rose modestly, with the Barclays U.S. Aggregate Bond Index returning 0.55%. The yield of the 10-year U.S. Treasury note increased from 2.19% to 2.30%. Investors grappled with a mixed global economic picture, accommodative monetary policies, and the risk that Greece might exit the euro zone.
Greece took center stage over the summer after debt negotiations broke off and it defaulted on its payment to the International Monetary Fund, producing a risk-off tone throughout the global financial markets. Fears further escalated in late August, amid an unexpected devaluation in China’s currency and deepening concerns about China’s economic slowdown and the potential spillover effects. The slide in oil prices, weakening emerging-market fundamentals, and fears of commodity-related defaults in the credit sector all weighed on investor sentiment.
At its mid-December meeting, the Federal Reserve raised the federal funds rate from a target range of 0%–0.25% to 0.25%–0.5%, ending seven years of near-zero interest rates. The Fed also reiterated that any further increase would most likely be gradual and would depend on the direction of economic data.
Our successes
In the stock portfolio, strong security selection in the information technology and financial sectors contributed to relative returns. Our overweight position and selection in health care also helped results. In IT, our positions in Microsoft and Accenture drove relative returns; in financials, relative performance was boosted by strong performance from MUFG and JPMorgan Chase and by our avoidance of weak-performing benchmark constituents Berkshire Hathaway and American Express.
Pharmaceutical company Eli Lilly was the equity portfolio’s top absolute and relative contributor during the year. Shares rose more than 25% as investors were encouraged by management’s greater focus on new product launches and pipeline advancements, boosting the stock price.
For the fixed income portfolio, selection in corporate bonds generated favorable results, particularly among financial issuers. Selection in taxable municipal
| | |
| Total Returns | | |
| | Ten Years Ended |
| | December 31, 2015 |
| Year Ended | Average |
| December 31, 2015 | Annual Return |
| Vanguard Balanced Portfolio | 0.09% | 7.31% |
| Composite Stock/Bond Index1 | 1.38 | 6.71 |
| Variable Insurance Mixed-Asset Target Growth Funds Average2 | -1.20 | 4.97 |
The figures shown represent past performance, which is not a guarantee of future results. (Current performance may be lower or higher than the performance data cited. For performance data current to the most recent month-end, visit our website at vanguard.com/performance.) Note, too, that both investment returns and principal value can fluctuate widely, so an investor’s shares, when sold, could be worth more or less than their original cost.
| | |
| Expense Ratios3 | | |
| Your Portfolio Compared With Its Peer Group | | |
| Variable Insurance |
| Mixed-Asset |
| Target Growth |
| Portfolio | Funds Average |
| Balanced Portfolio | 0.25% | 0.61% |
1 Weighted 65% S&P 500 Index and 35% Barclays U.S. Credit A or Better Bond Index.
2 Derived from data provided by Lipper, a Thomson Reuters Company.
3 The portfolio expense ratio shown is from the prospectus dated April 30, 2015, and represents estimated costs for the current fiscal year. For the fiscal year ended December 31, 2015, the Balanced expense ratio was 0.23%. The peer-group expense ratio is derived from data provided by Lipper, a Thomson Reuters Company, and captures information through year-end 2014.
3
Vanguard Balanced Portfolio
bonds and an out-of-benchmark allocation to collateralized loan obligations (a form of asset-backed security) also helped relative returns.
Our shortfalls
In the equity portfolio, weak security selection and an underweight allocation to the strong-performing consumer discretionary sector hurt relative results. Selection in consumer staples and industrials also detracted.
In consumer discretionary, Twenty-First Century Fox detracted from relative performance amid weak U.S. broadcast ratings and industry concerns about the health of the pay TV market. Not owning the strong-performing benchmark constituent Amazon.com also hurt. In consumer staples, our position in Wal-Mart Stores detracted. In industrials, our allocation to U.S.-based CSX hindered results as transportation companies generally struggled during the period. CSX’s stock was also hurt by coal industry difficulties and sluggish global growth. Although coal remains weak in the near term, we continue to hold CSX because we like its fundamentals and we believe it is trading at an attractive valuation.
The bond portfolio’s yield curve positioning detracted during the period as the curve steepened. In industrials, our overweight allocation to, and credit selection among, communications issuers also hurt relative performance.
Portfolio positioning
In the equity portfolio, our largest sector overweights were in financials and health care, and our largest underweights were in information technology and consumer discretionary.
Within health care, we favor large-cap pharmaceutical companies, including Merck and AstraZeneca. We believe that their solid pipelines are underappreciated by investors and should be sufficient for a return to modest growth. Although we are overweighted in the health care sector overall, our allocation to the biotechnology industry is significantly lower than the industry’s weighting in the S&P 500 Index.
We believe that our holdings in financials—the largest absolute sector weighting at year-end— have already discounted the low interest rates and stand to benefit from rising rates. We continue to find opportunities, particularly among banks and insurance companies, which have improved in quality in part because of increased regulation. We believe that financial companies, with less leverage and more solid underwriting than they have had historically, could withstand a future recessionary environment better than many investors are forecasting.
A sharp decline in oil prices has created a buying opportunity in the energy sector. Weak global consumption did not slow overall production as quickly as anticipated, which led to heightened uncertainty about oil. We took advantage of apathy toward the sector to add to positions in companies we believe will benefit most from the eventual rebound in oil prices, such as Exxon Mobil, Chevron, and Anadarko. Although timing the bottom in the price of oil is difficult, we believe it should occur in the next six to 12 months as oil companies reduce production; the portfolio will be positioned to advance with the recovery. As a result, we increased our energy sector exposure.
We continue to seek investment ideas that fit with our process and philosophy. For equities, we remain focused on the significance of dividends, positive capital stewardship, and franchise value. We believe we have a solid portfolio of undervalued market leaders, stocks in industries with improving supply/demand trends, and solid companies that are temporarily out of favor.
For the fixed income portfolio, we expect rates to continue to rise over the long-term as the U.S. recovery lengthens and broadens, and we remain disposed to continue to reduce the portfolio’s sensitivity to interest rates. We believe the bond portfolio is positioned for continued growth in the U.S. economic cycle, and we expect a slow and steady increase in rates as the Fed continues to adjust its monetary policy.
Our outlook is not without uncertainty, however. External forces can greatly affect our capital markets. In particular, quantitative-easing programs in Europe and Japan, tensions in Ukraine and the Middle East, rising credit concerns in the South American sovereign states, sovereign wealth funds’ sales of portions of their massive U.S. Treasury holdings to finance internal needs, and, most recently, the routs in commodities and Chinese equities represent risks we should not ignore. The sharp decline in oil and other energy prices adds to uncertainty; lower energy prices have boosted consumer spending but have also lowered the inflation numbers that drive Fed decision makers as well as depressed capital investment in the energy sector. Even the act of raising interest rates can create concerns and higher volatility.
Greater clarity about banks’ new regulatory environment makes them less inclined to support trading activities in the fixed income markets in which we invest. Companies such as Morgan Stanley, Credit Suisse, UBS, RBS, and Deutsche Bank have announced cutbacks, and we expect to see more of the same from other large market makers. This leads us toward holding more liquidity in fixed income, notably with Treasury bonds and agency mortgage-backed securities as our “all-weather” liquidity buffer. With this buffer, we seek to provide downside protection for shareholders if the economic cycle takes an unfavorable turn.
Edward P. Bousa, CFA, Senior Managing Director and Equity Portfolio Manager
John C. Keogh, Senior Managing Director and Fixed Income Portfolio Manager
Wellington Management Company LLP
January 13, 2016
4
Vanguard Balanced Portfolio
Portfolio Profile
As of December 31, 2015
| |
| Total Portfolio Characteristics | |
| |
| Yield1 | 2.43% |
| Turnover Rate | 45% |
| Expense Ratio2 | 0.25% |
| Short-Term Reserves | 2.3% |
| | |
| Total Portfolio Volatility Measures3 | |
| Portfolio Versus | Portfolio Versus |
| Composite Index4 | Broad Index5 |
| R-Squared | 0.98 | 0.94 |
| Beta | 1.00 | 0.65 |
| | | |
| Equity Characteristics | | |
| | Comparative | Broad |
| Portfolio | Index6 | Index5 |
| Number of Stocks | 93 | 504 | 3,960 |
| Median Market Cap | $109.6B | $81.0B | $51.4B |
| Price/Earnings Ratio | 17.7x | 20.5x | 21.9x |
| Price/Book Ratio | 2.2x | 2.8x | 2.7x |
| Dividend Yield | 2.7% | 2.2% | 2.1% |
| Return on Equity | 17.6% | 18.3% | 17.2% |
| Earnings Growth Rate | 6.7% | 9.2% | 9.5% |
| Foreign Holdings | 6.3% | 0.0% | 0.0% |
| | | |
| Fixed Income Characteristics | | |
| | Comparative | Broad |
| Portfolio | Index7 | Index8 |
| Number of Bonds | 740 | 3,331 | 9,681 |
| Yield to Maturity | 2.9%9 | 2.9% | 2.6% |
| Average Coupon | 3.6% | 3.6% | 3.2% |
| Average Effective | | | |
| Maturity | 9.4 years | 9.5 years | 7.9 years |
| Average Duration | 6.4 years | 6.6 years | 5.7 years |
| | |
| Ten Largest Stocks10 (% of equity portfolio) |
| |
| Wells Fargo & Co. | Diversified Banks | 3.9% |
| Microsoft Corp. | Systems Software | 3.6 |
| Merck & Co. Inc. | Pharmaceuticals | 2.9 |
| JPMorgan Chase & Co. | Diversified Banks | 2.6 |
| Alphabet Inc. | Internet Software | |
| | & Services | 2.6 |
| Verizon | Integrated | |
| Communications | Telecommunication | |
| Inc. | Services | 2.5 |
| Comcast Corp. | Cable & Satellite | 2.5 |
| Intel Corp. | Semiconductors | 2.4 |
| Chevron Corp. | Integrated Oil | |
| | & Gas | 2.3 |
| ACE Ltd. | Property | |
| | & Casualty | |
| | Insurance | 2.2 |
| Top Ten | 27.5% |
| Top Ten as % of Total Net Assets | 17.5% |
| | | |
| Sector Diversification (% of equity exposure) |
| | Comparative Broad |
| Portfolio | Index6 | Index5 |
| Consumer Discretionary | 6.7% | 12.9% | 13.4% |
| Consumer Staples | 9.8 | 10.1 | 8.8 |
| Energy | 8.7 | 6.5 | 5.9 |
| Financials | 23.9 | 16.5 | 18.3 |
| Health Care | 18.2 | 15.2 | 14.8 |
| Industrials | 11.3 | 10.1 | 10.6 |
| Information Technology | 13.6 | 20.5 | 19.8 |
| Materials | 1.6 | 2.8 | 3.1 |
| Telecommunication | | | |
| Services | 2.5 | 2.4 | 2.2 |
| Utilities | 3.7 | 3.0 | 3.1 |
Portfolio Asset Allocation

1 30-day SEC yield for the portfolio. See definition on the next page.
2 The expense ratio shown is from the prospectus dated April 30, 2015, and represents estimated costs for the current fiscal year. For the fiscal year ended December 31, 2015, the Balanced Portfolio’s expense ratio was 0.23%.
3 For an explanation of R-squared, beta, and other terms used here, see definitions on the next page.
4 Composite Stock/Bond Index, weighted 65% S&P 500 Index and 35% Barclays U.S. Credit A or Better Bond Index.
5 Dow Jones U.S. Total Stock Market Float Adjusted Index.
6 S&P 500 Index.
7 Barclays U.S. Credit A or Better Bond Index.
8 Barclays U.S. Aggregate Bond Index.
9 Before expenses.
10 The holdings listed exclude any temporary cash investments and equity index products.
5
Vanguard Balanced Portfolio
| |
| Distribution by Credit Quality1 | |
| (% of fixed income portfolio) | |
| |
| U.S. Government | 20.9% |
| Aaa | 6.2 |
| Aa | 12.9 |
| A | 40.5 |
| Baa | 19.5 |
| |
| Sector Diversification2 | |
| (% of fixed income portfolio) | |
| |
| Asset-Backed/Commercial Mortgage-Backed | 5.2% |
| Finance | 25.9 |
| Foreign | 2.9 |
| Government Mortgage-Backed | 2.3 |
| Industrial | 34.1 |
| Treasury | 18.3 |
| Utilities | 6.1 |
| Other | 5.2 |
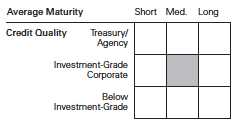
Equity Investment Focus

Fixed Income Investment Focus
30-Day SEC Yield. A portfolio’s 30-day SEC yield is derived using a formula specified by the U.S. Securities and Exchange Commission. Under the formula, data related to the portfolio’s security holdings in the previous 30 days are used to calculate the portfolio’s hypothetical net income for that period, which is then annualized and divided by the portfolio’s estimated average net assets over the calculation period. For the purposes of this calculation, a security’s income is based on its current market yield to maturity (for bonds), its actual income (for asset-backed securities), or its projected dividend yield (for stocks). Because the SEC yield represents hypothetical annualized income, it will differ—at times significantly—from the portfolio’s actual experience. As a result, the portfolio’s income distributions may be higher or lower than implied by the SEC yield.
Beta. A measure of the magnitude of a portfolio’s past share-price fluctuations in relation to the ups and downs of a given market index. The index is assigned a beta of 1.00. Compared with a given index, a portfolio with a beta of 1.20 typically would have seen its share price rise or fall by 12% when the index rose or fell by 10%. For this report, beta is based on returns over the past 36 months for both the portfolio and the index.
Credit Quality. Credit-quality ratings are measured on a scale that generally ranges from AAA (highest) to D (lowest). U.S. Treasury, U.S. Agency, and U.S. Agency mortgage-backed securities appear under “U.S. Government.” Credit-quality ratings are obtained from Barclays and are from Moody’s, Fitch, and S&P. When ratings from all three agencies are used, the median rating is shown. When ratings from two of the agencies are used, the lower rating for each issue is shown. “Not Rated” is used to classify securities for which a rating is not available. Not rated securities include a fund’s investment in Vanguard Market Liquidity Fund or Vanguard Municipal Cash Management Fund, each of which invests in high-quality money market instruments and may serve as a cash management vehicle for the Vanguard funds, trusts, and accounts.
Equity Exposure. A measure that reflects a portfolio’s investments in stocks and stock futures. Any holdings in short-term reserves are excluded.
R-Squared. A measure of how much of a portfolio’s past returns can be explained by the returns from the market in general, as measured by a given index. If a portfolio’s total returns were precisely synchronized with an index’s returns, its R-squared would be 1.00. If the portfolio’s returns bore no relationship to the index’s returns, its R-squared would be 0. For this report, R-squared is based on returns over the past 36 months for both the portfolio and the index.
1 Source: Moody’s Investor Services.
2 The agency and mortgage-backed securities sectors may include issues from government-sponsored enterprises; such issues are not backed by the full faith and credit of the U.S. government.
6
Vanguard Balanced Portfolio
Performance Summary
All of the returns in this report represent past performance, which is not a guarantee of future results that may be achieved by the portfolio. (Current performance may be lower or higher than the performance data cited. For performance data current to the most recent month-end, visit our website at vanguard.com/performance.) Note, too, that both investment returns and principal value can fluctuate widely, so an investor’s shares, when sold, could be worth more or less than their original cost. The returns shown do not reflect taxes that a shareholder would pay on portfolio distributions or on the sale of portfolio shares. Nor do the returns reflect fees and expenses associated with the annuity or life insurance program through which a shareholder invests. If these fees and expenses were included, the portfolio’s returns would be lower.
Cumulative Performance: December 31, 2005–December 31, 2015
Initial Investment of $10,000

| | | | |
| | | Average Annual Total Returns | Final Value |
| | Periods Ended December 31, 2015 | of a $10,000 |
| | One Year | Five Years | Ten Years | Investment |
| Balanced Portfolio | 0.09% | 9.00% | 7.31% | $20,247 |
| S&P 500 Index | 1.38 | 12.57 | 7.31 | 19,138 |
| Composite Stock/Bond Index1 | 1.38 | 9.76 | 6.71 | 16,237 |
| Variable Insurance Mixed-Asset | | | | |
| Target Growth Funds Average2 | -1.20 | 6.82 | 4.97 | 15,552 |
| Dow Jones U.S. Total Stock Market | | | | |
| Float Adjusted Index | 0.44 | 12.14 | 7.48 | 20,563 |
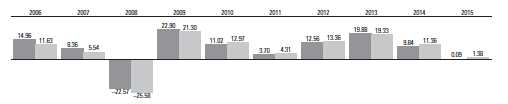
Fiscal-Year Total Returns (%): December 31, 2005–December 31, 2015
| |
| Balanced Portfolio |
| Composite Stock/Bond Index |
1 Weighted 65% S&P 500 Index and 35% Barclays U.S. Credit A or Better Bond Index.
2 Derived from data provided by Lipper, a Thomson Reuters Company.
See Financial Highlights for dividend and capital gains information.
7
Vanguard Balanced Portfolio
Financial Statements
Statement of Net Assets
As of December 31, 2015
The portfolio reports a complete list of its holdings in regulatory filings four times in each fiscal year, at the quarter-ends. For the second and fourth fiscal quarters, the lists appear in the portfolio’s semiannual and annual reports to shareholders. For the first and third fiscal quarters, the portfolio files the lists with the Securities and Exchange Commission on Form N-Q. Shareholders can look up the portfolio’s Forms N-Q on the SEC’s website at sec.gov. Forms N-Q may also be reviewed and copied at the SEC’s Public Reference Room (see the back cover of this report for further information).
| | | |
| Market |
| Value• |
| | Shares | ($000) |
| Common Stocks (64.1%) | | |
| Consumer Discretionary (4.3%) | |
| Comcast Corp. Class A | 649,989 | 36,679 |
| Ford Motor Co. | 1,321,880 | 18,625 |
| Twenty-First Century Fox | | |
| | Inc. Class A | 595,134 | 16,164 |
| Lowe’s Cos. Inc. | 174,680 | 13,283 |
| Hilton Worldwide Holdings | | |
| | Inc. | 480,126 | 10,275 |
| Bayerische Motoren | | |
| | Werke AG | 40,364 | 4,252 |
| 99,278 |
| Consumer Staples (6.3%) | | |
| CVS Health Corp. | 316,570 | 30,951 |
| Coca-Cola Co. | 407,980 | 17,527 |
| Philip Morris International | | |
| | Inc. | 182,720 | 16,063 |
| PepsiCo Inc. | 145,150 | 14,503 |
| Colgate-Palmolive Co. | 217,360 | 14,481 |
| Mondelez International Inc. | | |
| | Class A | 310,290 | 13,913 |
| Diageo plc | 469,316 | 12,816 |
| Walgreens Boots Alliance | | |
| | Inc. | 105,900 | 9,018 |
| Wal-Mart Stores Inc. | 139,230 | 8,535 |
| Costco Wholesale Corp. | 43,070 | 6,956 |
| Diageo plc ADR | 7,760 | 846 |
| 145,609 |
| Energy (5.6%) | | |
| Chevron Corp. | 382,790 | 34,436 |
| Exxon Mobil Corp. | 357,195 | 27,843 |
| TOTAL SA | 285,573 | 12,803 |
| Anadarko Petroleum Corp. | 237,230 | 11,525 |
| Royal Dutch Shell plc | | |
| | Class B | 485,276 | 11,060 |
| EOG Resources Inc. | 142,210 | 10,067 |
| Schlumberger Ltd. | 110,944 | 7,738 |
| Hess Corp. | 158,100 | 7,665 |
| Marathon Oil Corp. | 256,590 | 3,230 |
| Marathon Petroleum Corp. | 58,520 | 3,034 |
| 129,401 |
| Financials (15.2%) | | |
| Wells Fargo & Co. | 1,067,390 | 58,023 |
| JPMorgan Chase & Co. | 573,018 | 37,836 |
| ACE Ltd. | 283,120 | 33,083 |
| Prudential Financial Inc. | 333,590 | 27,158 |
| PNC Financial Services | | |
| | Group Inc. | 256,310 | 24,429 |
| | | |
| Market |
| Value• |
| | Shares | ($000) |
| BlackRock Inc. | 61,920 | 21,085 |
| Bank of America Corp. | 1,063,140 | 17,893 |
| Citigroup Inc. | 335,590 | 17,367 |
| Marsh & McLennan | | |
| | Cos. Inc. | 254,390 | 14,106 |
| MetLife Inc. | 250,473 | 12,075 |
| Northern Trust Corp. | 158,530 | 11,428 |
| Mitsubishi UFJ Financial | | |
| | Group Inc. | 1,681,430 | 10,415 |
| US Bancorp | 226,080 | 9,647 |
| American Tower | | |
| | Corporation | 94,922 | 9,203 |
| Bank of Nova Scotia | 209,660 | 8,479 |
| American International | | |
| | Group Inc. | 121,000 | 7,498 |
| Hartford Financial Services | | |
| | Group Inc. | 168,040 | 7,303 |
| UBS Group AG | 375,603 | 7,275 |
| * | Synchrony Financial | 221,500 | 6,736 |
| AvalonBay Communities | | |
| | Inc. | 23,200 | 4,272 |
| BNP Paribas SA | 73,853 | 4,178 |
| American Express Co. | 29,800 | 2,073 |
| 351,562 |
| Health Care (11.7%) | | |
| Merck & Co. Inc. | 826,349 | 43,648 |
| Bristol-Myers Squibb Co. | 439,970 | 30,265 |
| Johnson & Johnson | 253,960 | 26,087 |
| AstraZeneca plc ADR | 746,138 | 25,331 |
| Medtronic plc | 315,450 | 24,264 |
| Pfizer Inc. | 671,343 | 21,671 |
| Cardinal Health Inc. | 197,050 | 17,591 |
| Eli Lilly & Co. | 203,565 | 17,152 |
| UnitedHealth Group Inc. | 137,535 | 16,180 |
| Novartis AG | 159,545 | 13,724 |
| Baxter International Inc. | 266,600 | 10,171 |
| Roche Holding AG | 31,877 | 8,833 |
| * | Celgene Corp. | 55,140 | 6,603 |
| Gilead Sciences Inc. | 43,844 | 4,437 |
| Takeda Pharmaceutical Co. | | |
| | Ltd. | 80,300 | 4,004 |
| 269,961 |
| Industrials (7.3%) | | |
| United Parcel Service Inc. | | |
| | Class B | 254,648 | 24,505 |
| Honeywell International Inc. | 199,370 | 20,649 |
| General Electric Co. | 552,493 | 17,210 |
| Lockheed Martin Corp. | 73,820 | 16,030 |
| | | |
| Market |
| Value• |
| | Shares | ($000) |
| CSX Corp. | 527,249 | 13,682 |
| United Technologies Corp. | 115,940 | 11,138 |
| Caterpillar Inc. | 160,221 | 10,889 |
| FedEx Corp. | 69,760 | 10,394 |
| Eaton Corp. plc | 189,870 | 9,881 |
| Canadian National Railway | | |
| | Co. | 155,948 | 8,714 |
| Raytheon Co. | 64,642 | 8,050 |
| Schneider Electric SE | 118,047 | 6,706 |
| Illinois Tool Works Inc. | 56,175 | 5,206 |
| ABB Ltd. ADR | 280,048 | 4,965 |
| 168,019 |
| Information Technology (8.7%) | |
| Microsoft Corp. | 953,060 | 52,876 |
| * | Alphabet Inc. Class A | 48,610 | 37,819 |
| Intel Corp. | 1,013,220 | 34,905 |
| Cisco Systems Inc. | 964,146 | 26,181 |
| Apple Inc. | 210,742 | 22,183 |
| Accenture plc Class A | 202,100 | 21,119 |
| Texas Instruments Inc. | 124,020 | 6,798 |
| 201,881 |
| Materials (1.0%) | | |
| Praxair Inc. | 118,200 | 12,104 |
| International Paper Co. | 284,420 | 10,723 |
| BHP Billiton plc | 103,979 | 1,159 |
| 23,986 |
| Telecommunication Services (1.6%) | |
| Verizon Communications | | |
| | Inc. | 803,880 | 37,155 |
| |
| Utilities (2.4%) | | |
| NextEra Energy Inc. | 207,090 | 21,514 |
| Dominion Resources Inc. | 249,820 | 16,898 |
| Exelon Corp. | 379,870 | 10,549 |
| Duke Energy Corp. | 87,766 | 6,266 |
| 55,227 |
| Total Common Stocks | | |
| (Cost $1,154,058) | 1,482,079 |
8
| | | | | |
| Vanguard Balanced Portfolio | | | | |
| |
| |
| |
| |
| Face | Market |
| Maturity | Amount | Value • |
| | Coupon | Date | ($000) | ($000) |
| U.S. Government and Agency Obligations (7.1%) | | | |
| U.S. Government Securities (6.1%) | | | | |
| United States Treasury Note/Bond | 0.500% | 7/31/16 | 4,900 | 4,897 |
| United States Treasury Note/Bond | 0.875% | 9/15/16 | 2,200 | 2,203 |
| United States Treasury Note/Bond | 0.625% | 12/31/16 | 4,045 | 4,038 |
| United States Treasury Note/Bond | 0.875% | 1/31/17 | 534 | 534 |
| United States Treasury Note/Bond | 0.500% | 3/31/17 | 12,200 | 12,147 |
| United States Treasury Note/Bond | 0.625% | 7/31/17 | 8,000 | 7,956 |
| United States Treasury Note/Bond | 1.000% | 9/15/17 | 15,000 | 14,993 |
| United States Treasury Note/Bond | 0.750% | 10/31/17 | 9,200 | 9,151 |
| United States Treasury Note/Bond | 1.000% | 5/31/18 | 5,500 | 5,473 |
| United States Treasury Note/Bond | 1.375% | 9/30/18 | 19,000 | 19,062 |
| United States Treasury Note/Bond | 1.750% | 9/30/19 | 17,000 | 17,117 |
| United States Treasury Note/Bond | 1.375% | 2/29/20 | 4,130 | 4,083 |
| United States Treasury Note/Bond | 1.625% | 6/30/20 | 2,840 | 2,828 |
| United States Treasury Note/Bond | 2.250% | 11/15/24 | 550 | 550 |
| United States Treasury Note/Bond | 2.000% | 2/15/25 | 11,780 | 11,509 |
| United States Treasury Note/Bond | 2.875% | 5/15/43 | 13,173 | 12,827 |
| United States Treasury Note/Bond | 3.750% | 11/15/43 | 694 | 798 |
| United States Treasury Note/Bond | 3.375% | 5/15/44 | 4,410 | 4,726 |
| United States Treasury Note/Bond | 3.125% | 8/15/44 | 1,740 | 1,776 |
| United States Treasury Note/Bond | 2.500% | 2/15/45 | 6,210 | 5,563 |
| 142,231 |
| Conventional Mortgage-Backed Securities (0.8%) | | | |
| 1,2,3 Fannie Mae Pool | 3.500% | 11/1/25– | | |
| | | 1/1/46 | 7,500 | 7,737 |
| 1,2 Fannie Mae Pool | 4.500% | 11/1/33– | | |
| | | 1/1/46 | 7,479 | 8,134 |
| 1,2 Freddie Mac Gold Pool | 4.000% | 9/1/24– | | |
| | | 9/1/41 | 10 | 10 |
| 1,2 Freddie Mac Gold Pool | 4.500% | 3/1/29– | | |
| | | 1/1/46 | 1,832 | 1,993 |
| 1 | Ginnie Mae I Pool | 7.000% | 11/15/31– | | |
| | | 11/15/33 | 140 | 165 |
| 1 | Ginnie Mae I Pool | 8.000% | 9/15/30 | 67 | 69 |
| 18,108 |
| Nonconventional Mortgage-Backed Securities (0.2%) | | |
| 1,2 Fannie Mae REMICS | 3.500% | 4/25/31 | 245 | 254 |
| 1,2 Fannie Mae REMICS | 4.000% | 9/25/29– | | |
| | | 5/25/31 | 470 | 506 |
| 1,2 Freddie Mac REMICS | 3.500% | 3/15/31 | 145 | 150 |
| 1,2 Freddie Mac REMICS | 4.000% | 12/15/30– | | |
| | | 4/15/31 | 2,726 | 2,946 |
| 3,856 |
| Total U.S. Government and Agency Obligations | | | |
| (Cost $163,046) 164,195 |
| Asset-Backed/Commercial Mortgage-Backed Securities (1.6%) | | |
| 1 | Ally Master Owner Trust Series 2012-5 | 1.540% | 9/15/19 | 2,695 | 2,680 |
| 1 | Ally Master Owner Trust Series 2014-5 | 1.600% | 10/15/19 | 3,715 | 3,697 |
| 4 | American Tower Trust I | 1.551% | 3/15/18 | 380 | 377 |
| 4 | American Tower Trust I | 3.070% | 3/15/23 | 1,100 | 1,071 |
| 1 | AmeriCredit Automobile Receivables | | | | |
| | Trust 2012-1 | 4.720% | 3/8/18 | 580 | 587 |
| 1,4,5 Apidos CDO | 1.815% | 4/17/26 | 1,295 | 1,286 |
| 1,4,5 ARES CLO Ltd. | 1.835% | 4/17/26 | 1,200 | 1,192 |
| 1,4,5 Atlas Senior Loan Fund Ltd. | 1.861% | 10/15/26 | 355 | 351 |
| 1,4,5 Atlas Senior Loan Fund V Ltd. | 1.867% | 7/16/26 | 305 | 303 |
| 1 | Banc of America Commercial | | | | |
| | Mortgage Trust 2006-2 | 5.834% | 5/10/45 | 141 | 142 |
| 1 | Banc of America Commercial | | | | |
| | Mortgage Trust 2006-5 | 5.414% | 9/10/47 | 411 | 416 |
| 1 | Bear Stearns Commercial Mortgage | | | | |
| | Securities Trust 2006-PWR13 | 5.540% | 9/11/41 | 426 | 432 |
| 1,4,5 CECLO 2013-20A 144A | 1.800% | 1/25/26 | 1,300 | 1,280 |
| 1,4,5 Cent CLO | 1.813% | 7/27/26 | 420 | 416 |
| 1,4,5 Cent CLO 22 Ltd. | 1.824% | 11/7/26 | 935 | 924 |
| 1,4,5 CIFC Funding Ltd. | 1.815% | 4/18/25 | 1,185 | 1,176 |
| | | | | |
| Face | Market |
| Maturity Amount | Value • |
| | Coupon | Date | ($000) | ($000) |
| 1 | COMM 2006-C7 Mortgage Trust | 5.768% | 6/10/46 | 363 | 366 |
| 1 | COMM 2012-CCRE2 Mortgage Trust | 3.147% | 8/15/45 | 480 | 485 |
| 1 | Credit Suisse Commercial Mortgage | | | | |
| | Trust Series 2006-C4 | 5.467% | 9/15/39 | 272 | 275 |
| 1,4,5 Dryden Senior Loan Fund | 1.667% | 4/18/26 | 1,165 | 1,152 |
| 1,4 First Investors Auto Owner Trust | | | | |
| | 2013-2 | 1.230% | 3/15/19 | 92 | 91 |
| 1,4 Ford Credit Floorplan Master Owner | | | | |
| | Trust A | 2.090% | 3/15/22 | 330 | 329 |
| 1 | Ford Credit Floorplan Master Owner | | | | |
| | Trust A Series 2012-2 | 1.920% | 1/15/19 | 772 | 776 |
| 1,4 Hilton USA Trust 2013-HLT | 2.662% | 11/5/30 | 1,165 | 1,163 |
| 1,4,5 ING Investment Management Co. | 1.815% | 4/18/26 | 1,165 | 1,156 |
| 1 | LB-UBS Commercial Mortgage Trust | | | | |
| | 2006-C4 | 5.820% | 6/15/38 | 322 | 324 |
| 1,5 LB-UBS Commercial Mortgage Trust | | | | |
| | 2008-C1 | 6.087% | 4/15/41 | 713 | 762 |
| 1,4,5 Limerock CLO | 1.817% | 4/18/26 | 1,300 | 1,281 |
| 1,4,5 Madison Park Funding XII Ltd. | 1.765% | 1/19/25 | 755 | 749 |
| 1,4,5 Madison Park Funding XIII Ltd. | 1.817% | 7/20/26 | 920 | 913 |
| 1 | Merrill Lynch Mortgage Trust 2006-C1 | 5.666% | 5/12/39 | 351 | 352 |
| 1,4,5 OZLM VI Ltd. | 1.865% | 4/17/26 | 955 | 949 |
| 1 | Santander Drive Auto Receivables | | | | |
| | Trust 2013-2 | 2.570% | 3/15/19 | 515 | 514 |
| 1 | Santander Drive Auto Receivables | | | | |
| | Trust 2014-2 | 2.330% | 11/15/19 | 335 | 336 |
| 4 | SBA Tower Trust | 2.898% | 10/15/19 | 1,205 | 1,185 |
| 1,4,5 Seneca Park CLO Ltd. | 1.795% | 7/17/26 | 680 | 674 |
| 1,4,5 SFAVE Commercial Mortgage | | | | |
| | Securities Trust 2015-5AVE | 4.144% | 1/5/35 | 700 | 678 |
| 1,4,5 Shackleton CLO Ltd. | 1.795% | 7/17/26 | 660 | 654 |
| 1,4 Springleaf Funding Trust | 2.410% | 12/15/22 | 1,105 | 1,102 |
| 1,4 Springleaf Funding Trust | 3.160% | 11/15/24 | 1,375 | 1,365 |
| 1,4 Springleaf Funding Trust 2015-B | 3.480% | 5/15/28 | 590 | 588 |
| 1,4 Springleaf Mortgage Loan Trust | | | | |
| | 2013-1A | 2.310% | 6/25/58 | 220 | 218 |
| 1,4,5 SYMP 14-14AA2 144A | 1.801% | 7/14/26 | 1,125 | 1,116 |
| 1,4,5 Thacher Park CLO 2014-1 | 1.787% | 10/20/26 | 505 | 500 |
| 1 | Utility Debt Securitization Authority | | | | |
| | Series 2013T | 3.435% | 12/15/25 | 210 | 218 |
| 1,4 Westlake Automobile Receivables | | | | |
| | Trust | 0.970% | 10/16/17 | 325 | 324 |
| Total Asset-Backed/Commercial Mortgage-Backed Securities | | |
| (Cost $37,290) | 36,925 |
| Corporate Bonds (22.3%) | | | | |
| Finance (8.7%) | | | | |
| Banking (6.9%) | | | | |
| American Express Centurion Bank | 6.000% | 9/13/17 | 500 | 536 |
| American Express Co. | 1.550% | 5/22/18 | 1,635 | 1,620 |
| American Express Credit Corp. | 2.375% | 3/24/17 | 1,920 | 1,941 |
| American Express Credit Corp. | 2.125% | 7/27/18 | 1,235 | 1,243 |
| American Express Credit Corp. | 2.250% | 8/15/19 | 800 | 800 |
| Bank of America Corp. | 6.050% | 5/16/16 | 2,000 | 2,033 |
| Bank of America Corp. | 6.000% | 9/1/17 | 1,010 | 1,075 |
| Bank of America Corp. | 5.750% | 12/1/17 | 500 | 535 |
| Bank of America Corp. | 6.875% | 4/25/18 | 1,250 | 1,379 |
| Bank of America Corp. | 5.625% | 7/1/20 | 85 | 94 |
| Bank of America Corp. | 5.875% | 1/5/21 | 3,000 | 3,396 |
| Bank of America Corp. | 3.300% | 1/11/23 | 120 | 118 |
| Bank of America Corp. | 4.100% | 7/24/23 | 150 | 155 |
| Bank of America Corp. | 4.000% | 4/1/24 | 340 | 348 |
| Bank of America Corp. | 4.000% | 1/22/25 | 875 | 857 |
| Bank of America Corp. | 5.875% | 2/7/42 | 260 | 303 |
| Bank of America Corp. | 5.000% | 1/21/44 | 1,230 | 1,283 |
| Bank of America Corp. | 4.875% | 4/1/44 | 870 | 898 |
| Bank of America NA | 5.300% | 3/15/17 | 2,000 | 2,080 |
| Bank of Montreal | 1.300% | 7/15/16 | 800 | 802 |
| Bank of Montreal | 2.500% | 1/11/17 | 2,030 | 2,053 |
| Bank of New York Mellon Corp. | 2.150% | 2/24/20 | 1,580 | 1,564 |
9
| | | | | |
| Vanguard Balanced Portfolio | | | | |
| |
| |
| |
| |
| Face | Market |
| Maturity Amount | Value • |
| | Coupon | Date | ($000) | ($000) |
| Bank of New York Mellon Corp. | 3.000% | 2/24/25 | 720 | 708 |
| Bank of Nova Scotia | 2.050% | 10/30/18 | 1,600 | 1,606 |
| Bank of Nova Scotia | 2.800% | 7/21/21 | 750 | 759 |
| 4 | Bank of Tokyo-Mitsubishi UFJ Ltd. | 1.700% | 3/5/18 | 1,390 | 1,379 |
| 4 | Banque Federative du Credit Mutuel | | | | |
| | SA | 2.750% | 10/15/20 | 1,200 | 1,204 |
| 4 | Barclays Bank plc | 6.050% | 12/4/17 | 1,400 | 1,489 |
| Barclays Bank plc | 2.500% | 2/20/19 | 800 | 805 |
| Barclays Bank plc | 5.125% | 1/8/20 | 240 | 264 |
| Barclays Bank plc | 5.140% | 10/14/20 | 160 | 174 |
| Barclays Bank plc | 3.750% | 5/15/24 | 1,150 | 1,171 |
| BB&T Corp. | 4.900% | 6/30/17 | 1,000 | 1,042 |
| Bear Stearns Cos. LLC | 6.400% | 10/2/17 | 235 | 253 |
| Bear Stearns Cos. LLC | 7.250% | 2/1/18 | 425 | 468 |
| BNP Paribas SA | 2.400% | 12/12/18 | 1,300 | 1,310 |
| BNP Paribas SA | 3.250% | 3/3/23 | 305 | 304 |
| BPCE SA | 2.500% | 12/10/18 | 220 | 222 |
| BPCE SA | 2.500% | 7/15/19 | 1,400 | 1,404 |
| BPCE SA | 4.000% | 4/15/24 | 775 | 803 |
| 4 | BPCE SA | 5.150% | 7/21/24 | 1,260 | 1,270 |
| Capital One Bank USA NA | 2.150% | 11/21/18 | 1,215 | 1,204 |
| Capital One Financial Corp. | 3.150% | 7/15/16 | 300 | 303 |
| Capital One Financial Corp. | 4.750% | 7/15/21 | 400 | 434 |
| Capital One Financial Corp. | 3.750% | 4/24/24 | 1,305 | 1,315 |
| Capital One Financial Corp. | 3.200% | 2/5/25 | 1,050 | 1,015 |
| Capital One Financial Corp. | 4.200% | 10/29/25 | 310 | 306 |
| Citigroup Inc. | 1.750% | 5/1/18 | 500 | 495 |
| Citigroup Inc. | 2.500% | 9/26/18 | 500 | 504 |
| Citigroup Inc. | 2.550% | 4/8/19 | 1,800 | 1,812 |
| Citigroup Inc. | 2.500% | 7/29/19 | 965 | 962 |
| Citigroup Inc. | 2.400% | 2/18/20 | 800 | 790 |
| Citigroup Inc. | 4.500% | 1/14/22 | 1,975 | 2,115 |
| Citigroup Inc. | 6.625% | 6/15/32 | 2,000 | 2,359 |
| Citigroup Inc. | 8.125% | 7/15/39 | 101 | 144 |
| Citigroup Inc. | 5.300% | 5/6/44 | 270 | 280 |
| Compass Bank | 2.750% | 9/29/19 | 375 | 371 |
| Cooperatieve Centrale | | | | |
| | Raiffeisen-Boerenleenbank BA | 2.250% | 1/14/19 | 1,350 | 1,356 |
| 4 | Credit Agricole SA | 2.500% | 4/15/19 | 1,460 | 1,467 |
| Credit Suisse | 1.750% | 1/29/18 | 840 | 837 |
| Credit Suisse | 2.300% | 5/28/19 | 2,845 | 2,848 |
| Credit Suisse | 3.000% | 10/29/21 | 735 | 733 |
| Credit Suisse | 3.625% | 9/9/24 | 250 | 252 |
| 4 | Credit Suisse Group Funding | | | | |
| | Guernsey Ltd. | 3.800% | 9/15/22 | 1,335 | 1,331 |
| 4 | Credit Suisse Group Funding | | | | |
| | Guernsey Ltd. | 3.750% | 3/26/25 | 1,595 | 1,555 |
| Deutsche Bank AG | 2.500% | 2/13/19 | 1,000 | 1,006 |
| Fifth Third Bank | 2.875% | 10/1/21 | 425 | 424 |
| Goldman Sachs Group Inc. | 5.350% | 1/15/16 | 1,500 | 1,502 |
| Goldman Sachs Group Inc. | 5.625% | 1/15/17 | 490 | 509 |
| Goldman Sachs Group Inc. | 5.950% | 1/18/18 | 1,325 | 1,425 |
| Goldman Sachs Group Inc. | 2.375% | 1/22/18 | 555 | 560 |
| Goldman Sachs Group Inc. | 5.375% | 3/15/20 | 405 | 445 |
| Goldman Sachs Group Inc. | 2.600% | 4/23/20 | 170 | 170 |
| Goldman Sachs Group Inc. | 6.000% | 6/15/20 | 3,350 | 3,788 |
| Goldman Sachs Group Inc. | 5.250% | 7/27/21 | 865 | 957 |
| Goldman Sachs Group Inc. | 5.750% | 1/24/22 | 360 | 409 |
| Goldman Sachs Group Inc. | 3.625% | 1/22/23 | 1,205 | 1,219 |
| Goldman Sachs Group Inc. | 6.450% | 5/1/36 | 2,000 | 2,254 |
| Goldman Sachs Group Inc. | 6.750% | 10/1/37 | 1,360 | 1,589 |
| Goldman Sachs Group Inc. | 4.750% | 10/21/45 | 680 | 676 |
| 4 | HSBC Bank plc | 4.750% | 1/19/21 | 1,700 | 1,865 |
| HSBC Holdings plc | 4.000% | 3/30/22 | 2,395 | 2,513 |
| HSBC Holdings plc | 6.500% | 5/2/36 | 1,000 | 1,191 |
| HSBC Holdings plc | 6.100% | 1/14/42 | 375 | 472 |
| HSBC Holdings plc | 5.250% | 3/14/44 | 440 | 455 |
| HSBC USA Inc. | 1.625% | 1/16/18 | 1,005 | 1,000 |
| HSBC USA Inc. | 2.350% | 3/5/20 | 1,825 | 1,806 |
| | | | | |
| Face | Market |
| Maturity | Amount | Value • |
| | Coupon | Date | ($000) | ($000) |
| HSBC USA Inc. | 3.500% | 6/23/24 | 800 | 802 |
| Huntington National Bank | 2.200% | 4/1/19 | 560 | 554 |
| Huntington National Bank | 2.400% | 4/1/20 | 1,160 | 1,141 |
| 4 | ING Bank NV | 3.750% | 3/7/17 | 600 | 614 |
| 4 | ING Bank NV | 1.800% | 3/16/18 | 1,340 | 1,340 |
| JPMorgan Chase & Co. | 6.000% | 1/15/18 | 1,500 | 1,617 |
| JPMorgan Chase & Co. | 6.300% | 4/23/19 | 465 | 521 |
| JPMorgan Chase & Co. | 4.950% | 3/25/20 | 1,000 | 1,087 |
| JPMorgan Chase & Co. | 4.350% | 8/15/21 | 4,862 | 5,175 |
| JPMorgan Chase & Co. | 4.500% | 1/24/22 | 495 | 533 |
| JPMorgan Chase & Co. | 3.250% | 9/23/22 | 970 | 976 |
| JPMorgan Chase & Co. | 3.375% | 5/1/23 | 875 | 856 |
| JPMorgan Chase & Co. | 3.875% | 2/1/24 | 800 | 819 |
| JPMorgan Chase & Co. | 3.900% | 7/15/25 | 370 | 379 |
| JPMorgan Chase & Co. | 4.125% | 12/15/26 | 765 | 763 |
| JPMorgan Chase & Co. | 4.250% | 10/1/27 | 1,895 | 1,883 |
| JPMorgan Chase & Co. | 5.400% | 1/6/42 | 750 | 843 |
| JPMorgan Chase & Co. | 5.625% | 8/16/43 | 400 | 432 |
| JPMorgan Chase & Co. | 4.950% | 6/1/45 | 400 | 400 |
| 4 | Macquarie Bank Ltd. | 2.400% | 1/21/20 | 330 | 326 |
| Manufacturers & Traders Trust Co. | 2.100% | 2/6/20 | 495 | 486 |
| Manufacturers & Traders Trust Co. | 2.900% | 2/6/25 | 685 | 663 |
| Morgan Stanley | 5.450% | 1/9/17 | 1,000 | 1,038 |
| Morgan Stanley | 1.875% | 1/5/18 | 255 | 255 |
| Morgan Stanley | 2.125% | 4/25/18 | 1,375 | 1,377 |
| Morgan Stanley | 2.500% | 1/24/19 | 2,500 | 2,509 |
| Morgan Stanley | 5.625% | 9/23/19 | 645 | 711 |
| Morgan Stanley | 5.750% | 1/25/21 | 1,740 | 1,956 |
| Morgan Stanley | 3.700% | 10/23/24 | 750 | 751 |
| Morgan Stanley | 6.250% | 8/9/26 | 3,000 | 3,521 |
| Morgan Stanley | 4.300% | 1/27/45 | 850 | 805 |
| National City Corp. | 6.875% | 5/15/19 | 1,000 | 1,130 |
| 4 | Nationwide Building Society | 2.350% | 1/21/20 | 785 | 780 |
| Northern Trust Corp. | 3.450% | 11/4/20 | 255 | 266 |
| PNC Bank NA | 4.875% | 9/21/17 | 1,500 | 1,568 |
| PNC Bank NA | 3.300% | 10/30/24 | 460 | 461 |
| PNC Bank NA | 2.950% | 2/23/25 | 1,105 | 1,067 |
| PNC Bank NA | 4.200% | 11/1/25 | 255 | 269 |
| PNC Financial Services Group Inc. | 3.900% | 4/29/24 | 580 | 594 |
| Santander Bank NA | 2.000% | 1/12/18 | 715 | 710 |
| Santander Holdings USA Inc. | 2.650% | 4/17/20 | 580 | 566 |
| Santander Issuances SAU | 5.179% | 11/19/25 | 800 | 781 |
| 4 | Skandinaviska Enskilda Banken AB | 2.450% | 5/27/20 | 1,600 | 1,593 |
| State Street Corp. | 5.375% | 4/30/17 | 2,775 | 2,919 |
| Svenska Handelsbanken AB | 2.875% | 4/4/17 | 1,000 | 1,017 |
| Synchrony Financial | 3.000% | 8/15/19 | 1,055 | 1,054 |
| Synchrony Financial | 2.700% | 2/3/20 | 405 | 398 |
| UBS AG | 1.800% | 3/26/18 | 1,020 | 1,019 |
| 4 | UBS Group Funding Jersey Ltd. | 2.950% | 9/24/20 | 1,160 | 1,150 |
| US Bancorp | 3.700% | 1/30/24 | 1,560 | 1,631 |
| Wachovia Corp. | 7.500% | 4/15/35 | 1,000 | 1,294 |
| Wells Fargo & Co. | 5.625% | 12/11/17 | 820 | 880 |
| Wells Fargo & Co. | 2.150% | 1/15/19 | 2,915 | 2,930 |
| Wells Fargo & Co. | 3.000% | 1/22/21 | 505 | 513 |
| Wells Fargo & Co. | 3.500% | 3/8/22 | 640 | 659 |
| Wells Fargo & Co. | 3.450% | 2/13/23 | 930 | 931 |
| Wells Fargo & Co. | 4.480% | 1/16/24 | 1,199 | 1,262 |
| Wells Fargo & Co. | 3.000% | 2/19/25 | 890 | 860 |
| Wells Fargo & Co. | 3.550% | 9/29/25 | 860 | 866 |
| Wells Fargo & Co. | 5.606% | 1/15/44 | 2,276 | 2,519 |
| Wells Fargo & Co. | 4.900% | 11/17/45 | 515 | 517 |
| |
| Brokerage (0.0%) | | | | |
| Ameriprise Financial Inc. | 5.300% | 3/15/20 | 305 | 338 |
| |
| Finance Companies (0.4%) | | | | |
| 4 | General Electric Capital Corp. | 2.342% | 11/15/20 | 1,567 | 1,554 |
| 4 | General Electric Capital Corp. | 3.373% | 11/15/25 | 3,460 | 3,496 |
| 4 | General Electric Capital Corp. | 4.418% | 11/15/35 | 4,635 | 4,725 |
10
| | | | | |
| Vanguard Balanced Portfolio | | | | |
| |
| |
| |
| |
| Face | Market |
| Maturity | Amount | Value • |
| | Coupon | Date | ($000) | ($000) |
| Insurance (1.2%) | | | | |
| ACE INA Holdings Inc. | 5.800% | 3/15/18 | 1,295 | 1,406 |
| ACE INA Holdings Inc. | 2.300% | 11/3/20 | 170 | 168 |
| ACE INA Holdings Inc. | 3.350% | 5/15/24 | 555 | 560 |
| ACE INA Holdings Inc. | 3.350% | 5/3/26 | 395 | 394 |
| ACE INA Holdings Inc. | 4.350% | 11/3/45 | 800 | 809 |
| Aetna Inc. | 1.750% | 5/15/17 | 60 | 60 |
| 1 | Allstate Corp. | 6.125% | 5/15/67 | 1,000 | 1,000 |
| Anthem Inc. | 2.300% | 7/15/18 | 375 | 374 |
| Anthem Inc. | 3.125% | 5/15/22 | 1,610 | 1,575 |
| Anthem Inc. | 3.300% | 1/15/23 | 1,100 | 1,071 |
| Anthem Inc. | 4.650% | 8/15/44 | 276 | 263 |
| Cigna Corp. | 3.250% | 4/15/25 | 1,730 | 1,691 |
| CNA Financial Corp. | 3.950% | 5/15/24 | 135 | 135 |
| 4 | Five Corners Funding Trust | 4.419% | 11/15/23 | 210 | 219 |
| 4 | Liberty Mutual Group Inc. | 4.250% | 6/15/23 | 360 | 366 |
| Loews Corp. | 2.625% | 5/15/23 | 440 | 417 |
| 1,4 Massachusetts Mutual Life | | | | |
| | Insurance Co. | 7.625% | 11/15/23 | 2,000 | 2,440 |
| MetLife Inc. | 1.903% | 12/15/17 | 225 | 226 |
| MetLife Inc. | 3.600% | 4/10/24 | 580 | 597 |
| MetLife Inc. | 4.125% | 8/13/42 | 145 | 137 |
| MetLife Inc. | 4.875% | 11/13/43 | 530 | 554 |
| 4 | Metropolitan Life Global Funding I | 1.500% | 1/10/18 | 1,480 | 1,472 |
| 4 | Metropolitan Life Global Funding I | 1.875% | 6/22/18 | 950 | 950 |
| 4 | New York Life Global Funding | 1.650% | 5/15/17 | 600 | 602 |
| 4 | New York Life Insurance Co. | 5.875% | 5/15/33 | 2,100 | 2,448 |
| Prudential Financial Inc. | 3.000% | 5/12/16 | 450 | 453 |
| 4 | QBE Insurance Group Ltd. | 2.400% | 5/1/18 | 235 | 235 |
| 4 | Teachers Insurance & Annuity | | | | |
| | Association of America | 4.900% | 9/15/44 | 375 | 379 |
| UnitedHealth Group Inc. | 6.000% | 6/15/17 | 500 | 533 |
| UnitedHealth Group Inc. | 6.000% | 2/15/18 | 700 | 761 |
| UnitedHealth Group Inc. | 3.875% | 10/15/20 | 601 | 634 |
| UnitedHealth Group Inc. | 2.875% | 3/15/22 | 27 | 27 |
| UnitedHealth Group Inc. | 2.875% | 3/15/23 | 1,175 | 1,159 |
| UnitedHealth Group Inc. | 4.625% | 7/15/35 | 815 | 849 |
| UnitedHealth Group Inc. | 4.250% | 3/15/43 | 1,600 | 1,549 |
| UnitedHealth Group Inc. | 4.750% | 7/15/45 | 760 | 796 |
| |
| Other Finance (0.0%) | | | | |
| 4 | LeasePlan Corp. NV | 2.875% | 1/22/19 | 970 | 955 |
| |
| Real Estate Investment Trusts (0.2%) | | | | |
| AvalonBay Communities Inc. | 3.625% | 10/1/20 | 520 | 541 |
| Duke Realty LP | 6.500% | 1/15/18 | 210 | 227 |
| HCP Inc. | 3.750% | 2/1/16 | 210 | 210 |
| Realty Income Corp. | 4.650% | 8/1/23 | 640 | 665 |
| 4 | WEA Finance LLC / Westfield UK | | | | |
| | & Europe Finance plc | 1.750% | 9/15/17 | 375 | 372 |
| 4 | WEA Finance LLC / Westfield UK | | | | |
| | & Europe Finance plc | 2.700% | 9/17/19 | 1,330 | 1,318 |
| 201,818 |
| Industrial (11.5%) | | | | |
| Basic Industry (0.2%) | | | | |
| BHP Billiton Finance USA Ltd. | 3.850% | 9/30/23 | 1,050 | 989 |
| CF Industries Inc. | 5.375% | 3/15/44 | 880 | 767 |
| LyondellBasell Industries NV | 4.625% | 2/26/55 | 900 | 728 |
| Monsanto Co. | 4.700% | 7/15/64 | 230 | 176 |
| Rio Tinto Finance USA Ltd. | 6.500% | 7/15/18 | 1,500 | 1,625 |
| Rio Tinto Finance USA Ltd. | 3.750% | 9/20/21 | 685 | 666 |
| Rio Tinto Finance USA plc | 3.500% | 3/22/22 | 400 | 376 |
| |
| Capital Goods (1.1%) | | | | |
| 4 | BAE Systems Holdings Inc. | 2.850% | 12/15/20 | 160 | 159 |
| 4 | BAE Systems Holdings Inc. | 3.850% | 12/15/25 | 285 | 284 |
| Caterpillar Financial Services Corp. | 2.625% | 3/1/23 | 1,360 | 1,312 |
| Caterpillar Inc. | 3.900% | 5/27/21 | 1,170 | 1,243 |
| Caterpillar Inc. | 2.600% | 6/26/22 | 705 | 696 |
| | | | | |
| Face | Market |
| Maturity Amount | Value • |
| | Coupon | Date | ($000) | ($000) |
| Caterpillar Inc. | 3.400% | 5/15/24 | 1,185 | 1,195 |
| Caterpillar Inc. | 4.300% | 5/15/44 | 745 | 718 |
| General Dynamics Corp. | 3.875% | 7/15/21 | 355 | 375 |
| General Electric Capital Corp. | 4.625% | 1/7/21 | 321 | 352 |
| General Electric Capital Corp. | 5.300% | 2/11/21 | 228 | 257 |
| General Electric Capital Corp. | 3.150% | 9/7/22 | 967 | 990 |
| General Electric Capital Corp. | 3.100% | 1/9/23 | 360 | 365 |
| General Electric Capital Corp. | 6.750% | 3/15/32 | 135 | 175 |
| General Electric Capital Corp. | 6.150% | 8/7/37 | 633 | 791 |
| General Electric Capital Corp. | 5.875% | 1/14/38 | 443 | 542 |
| General Electric Capital Corp. | 6.875% | 1/10/39 | 187 | 255 |
| General Electric Co. | 2.700% | 10/9/22 | 610 | 607 |
| General Electric Co. | 4.125% | 10/9/42 | 320 | 313 |
| General Electric Co. | 4.500% | 3/11/44 | 1,050 | 1,079 |
| Honeywell International Inc. | 4.250% | 3/1/21 | 1,002 | 1,096 |
| Illinois Tool Works Inc. | 3.500% | 3/1/24 | 1,295 | 1,333 |
| John Deere Capital Corp. | 2.250% | 4/17/19 | 1,465 | 1,472 |
| John Deere Capital Corp. | 1.700% | 1/15/20 | 520 | 506 |
| Lockheed Martin Corp. | 2.500% | 11/23/20 | 390 | 389 |
| Lockheed Martin Corp. | 2.900% | 3/1/25 | 1,010 | 970 |
| Lockheed Martin Corp. | 4.500% | 5/15/36 | 211 | 213 |
| Lockheed Martin Corp. | 4.700% | 5/15/46 | 520 | 533 |
| Parker-Hannifin Corp. | 4.450% | 11/21/44 | 450 | 470 |
| 4 | Siemens Financieringsmaatschappij NV | 5.750% | 10/17/16 | 2,225 | 2,305 |
| 4 | Siemens Financieringsmaatschappij NV | 2.900% | 5/27/22 | 800 | 800 |
| 4 | Siemens Financieringsmaatschappij NV | 4.400% | 5/27/45 | 800 | 825 |
| United Technologies Corp. | 3.100% | 6/1/22 | 535 | 545 |
| United Technologies Corp. | 7.500% | 9/15/29 | 770 | 1,041 |
| United Technologies Corp. | 6.050% | 6/1/36 | 675 | 814 |
| United Technologies Corp. | 4.500% | 6/1/42 | 325 | 326 |
| |
| Communication (2.0%) | | | | |
| 21st Century Fox America Inc. | 4.500% | 2/15/21 | 375 | 404 |
| 21st Century Fox America Inc. | 3.000% | 9/15/22 | 245 | 242 |
| America Movil SAB de CV | 3.125% | 7/16/22 | 1,880 | 1,837 |
| America Movil SAB de CV | 4.375% | 7/16/42 | 530 | 474 |
| American Tower Corp. | 3.450% | 9/15/21 | 1,125 | 1,130 |
| AT&T Inc. | 1.400% | 12/1/17 | 1,090 | 1,084 |
| AT&T Inc. | 5.600% | 5/15/18 | 1,000 | 1,087 |
| AT&T Inc. | 2.300% | 3/11/19 | 295 | 295 |
| AT&T Inc. | 6.450% | 6/15/34 | 845 | 950 |
| CBS Corp. | 4.300% | 2/15/21 | 675 | 703 |
| Comcast Corp. | 2.850% | 1/15/23 | 240 | 238 |
| Comcast Corp. | 3.600% | 3/1/24 | 550 | 568 |
| Comcast Corp. | 4.250% | 1/15/33 | 1,032 | 1,028 |
| Comcast Corp. | 4.200% | 8/15/34 | 620 | 614 |
| Comcast Corp. | 5.650% | 6/15/35 | 110 | 128 |
| Comcast Corp. | 4.400% | 8/15/35 | 700 | 707 |
| Comcast Corp. | 6.500% | 11/15/35 | 115 | 144 |
| Comcast Corp. | 6.400% | 5/15/38 | 120 | 147 |
| Comcast Corp. | 4.650% | 7/15/42 | 1,290 | 1,304 |
| Comcast Corp. | 4.500% | 1/15/43 | 500 | 498 |
| Comcast Corp. | 4.750% | 3/1/44 | 525 | 546 |
| Comcast Corp. | 4.600% | 8/15/45 | 845 | 856 |
| 4 | Cox Communications Inc. | 4.800% | 2/1/35 | 1,540 | 1,275 |
| 4 | Deutsche Telekom International | | | | |
| | Finance BV | 4.875% | 3/6/42 | 705 | 712 |
| DIRECTV Holdings LLC / | | | | |
| | DIRECTV Financing Co. Inc. | 1.750% | 1/15/18 | 810 | 808 |
| DIRECTV Holdings LLC / | | | | |
| | DIRECTV Financing Co. Inc. | 5.200% | 3/15/20 | 255 | 276 |
| DIRECTV Holdings LLC / | | | | |
| | DIRECTV Financing Co. Inc. | 4.600% | 2/15/21 | 100 | 106 |
| Discovery Communications LLC | 5.625% | 8/15/19 | 80 | 87 |
| Discovery Communications LLC | 5.050% | 6/1/20 | 420 | 447 |
| Grupo Televisa SAB | 6.625% | 1/15/40 | 630 | 661 |
| Grupo Televisa SAB | 6.125% | 1/31/46 | 410 | 410 |
| 4 | GTP Acquisition Partners I LLC | 2.350% | 6/15/20 | 580 | 564 |
| 4 | NBCUniversal Enterprise Inc. | 1.662% | 4/15/18 | 1,920 | 1,920 |
11
| | | | | |
| Vanguard Balanced Portfolio | | | | |
| |
| |
| |
| |
| Face | Market |
| Maturity | Amount | Value • |
| | Coupon | Date | ($000) | ($000) |
| 4 | NBCUniversal Enterprise Inc. | 1.974% | 4/15/19 | 2,530 | 2,528 |
| NBCUniversal Media LLC | 4.375% | 4/1/21 | 600 | 652 |
| Orange SA | 4.125% | 9/14/21 | 1,740 | 1,835 |
| Orange SA | 9.000% | 3/1/31 | 360 | 509 |
| 4 | SBA Tower Trust | 2.933% | 12/15/17 | 840 | 843 |
| 4 | Sky plc | 2.625% | 9/16/19 | 975 | 967 |
| 4 | Sky plc | 3.750% | 9/16/24 | 1,435 | 1,391 |
| Time Warner Cable Inc. | 5.850% | 5/1/17 | 1,030 | 1,077 |
| Time Warner Cable Inc. | 8.750% | 2/14/19 | 25 | 29 |
| Time Warner Cable Inc. | 8.250% | 4/1/19 | 364 | 418 |
| Time Warner Entertainment Co. LP | 8.375% | 3/15/23 | 95 | 117 |
| Time Warner Inc. | 4.875% | 3/15/20 | 700 | 757 |
| Time Warner Inc. | 4.750% | 3/29/21 | 350 | 376 |
| Time Warner Inc. | 6.500% | 11/15/36 | 620 | 701 |
| Verizon Communications Inc. | 4.500% | 9/15/20 | 1,280 | 1,376 |
| Verizon Communications Inc. | 3.450% | 3/15/21 | 485 | 497 |
| Verizon Communications Inc. | 3.500% | 11/1/21 | 1,040 | 1,059 |
| Verizon Communications Inc. | 6.400% | 9/15/33 | 2,230 | 2,548 |
| Verizon Communications Inc. | 5.850% | 9/15/35 | 475 | 510 |
| Verizon Communications Inc. | 6.900% | 4/15/38 | 290 | 348 |
| Verizon Communications Inc. | 4.750% | 11/1/41 | 290 | 266 |
| Verizon Communications Inc. | 6.550% | 9/15/43 | 1,360 | 1,610 |
| Verizon Communications Inc. | 4.862% | 8/21/46 | 2,201 | 2,078 |
| Walt Disney Co. | 4.125% | 6/1/44 | 560 | 567 |
| |
| Consumer Cyclical (1.6%) | | | | |
| Amazon.com Inc. | 2.500% | 11/29/22 | 885 | 856 |
| Amazon.com Inc. | 4.800% | 12/5/34 | 995 | 1,044 |
| Amazon.com Inc. | 4.950% | 12/5/44 | 645 | 687 |
| 4 | American Honda Finance Corp. | 1.500% | 9/11/17 | 490 | 491 |
| 4 | American Honda Finance Corp. | 1.600% | 2/16/18 | 810 | 804 |
| American Honda Finance Corp. | 2.125% | 10/10/18 | 1,110 | 1,118 |
| AutoZone Inc. | 3.700% | 4/15/22 | 1,371 | 1,396 |
| AutoZone Inc. | 3.125% | 7/15/23 | 600 | 587 |
| CVS Health Corp. | 5.750% | 6/1/17 | 176 | 186 |
| CVS Health Corp. | 2.750% | 12/1/22 | 1,200 | 1,167 |
| CVS Health Corp. | 4.875% | 7/20/35 | 1,135 | 1,172 |
| CVS Health Corp. | 5.125% | 7/20/45 | 1,310 | 1,381 |
| 4 | Daimler Finance North America LLC | 2.375% | 8/1/18 | 900 | 902 |
| 4 | Daimler Finance North America LLC | 2.250% | 7/31/19 | 1,575 | 1,555 |
| Daimler Finance North America LLC | 8.500% | 1/18/31 | 1,000 | 1,452 |
| eBay Inc. | 1.350% | 7/15/17 | 325 | 323 |
| Ford Motor Credit Co. LLC | 2.375% | 3/12/19 | 1,700 | 1,675 |
| Ford Motor Credit Co. LLC | 3.157% | 8/4/20 | 975 | 970 |
| Home Depot Inc. | 2.250% | 9/10/18 | 975 | 997 |
| Home Depot Inc. | 2.700% | 4/1/23 | 720 | 715 |
| Home Depot Inc. | 4.400% | 3/15/45 | 780 | 807 |
| Lowe’s Cos. Inc. | 6.875% | 2/15/28 | 710 | 900 |
| Lowe’s Cos. Inc. | 6.500% | 3/15/29 | 1,000 | 1,245 |
| McDonald’s Corp. | 2.625% | 1/15/22 | 195 | 190 |
| McDonald’s Corp. | 3.250% | 6/10/24 | 140 | 139 |
| 4 | Nissan Motor Acceptance Corp. | 1.950% | 9/12/17 | 1,186 | 1,188 |
| 4 | Nissan Motor Acceptance Corp. | 1.800% | 3/15/18 | 1,100 | 1,096 |
| 4 | Nissan Motor Acceptance Corp. | 2.650% | 9/26/18 | 585 | 592 |
| PACCAR Financial Corp. | 1.600% | 3/15/17 | 1,002 | 1,004 |
| Target Corp. | 2.900% | 1/15/22 | 825 | 837 |
| Toyota Motor Credit Corp. | 1.750% | 5/22/17 | 1,200 | 1,208 |
| Toyota Motor Credit Corp. | 1.250% | 10/5/17 | 900 | 897 |
| 4 | Volkswagen Group of America | | | | |
| | Finance LLC | 2.450% | 11/20/19 | 440 | 420 |
| Wal-Mart Stores Inc. | 3.250% | 10/25/20 | 742 | 782 |
| Wal-Mart Stores Inc. | 4.250% | 4/15/21 | 1,000 | 1,106 |
| Wal-Mart Stores Inc. | 2.550% | 4/11/23 | 1,250 | 1,231 |
| Wal-Mart Stores Inc. | 5.625% | 4/15/41 | 2,790 | 3,308 |
| Wal-Mart Stores Inc. | 4.300% | 4/22/44 | 525 | 535 |
| |
| Consumer Noncyclical (3.7%) | | | | |
| AbbVie Inc. | 1.750% | 11/6/17 | 775 | 773 |
| Actavis Funding SCS | 3.000% | 3/12/20 | 475 | 474 |
| | | | | |
| Face | Market |
| Maturity Amount | Value • |
| | Coupon | Date | ($000) | ($000) |
| Actavis Funding SCS | 3.450% | 3/15/22 | 840 | 840 |
| Actavis Funding SCS | 4.850% | 6/15/44 | 450 | 445 |
| Altria Group Inc. | 4.750% | 5/5/21 | 590 | 641 |
| Altria Group Inc. | 2.850% | 8/9/22 | 455 | 445 |
| Altria Group Inc. | 4.500% | 5/2/43 | 385 | 365 |
| AmerisourceBergen Corp. | 3.500% | 11/15/21 | 1,310 | 1,337 |
| Amgen Inc. | 3.875% | 11/15/21 | 835 | 870 |
| Amgen Inc. | 5.150% | 11/15/41 | 945 | 958 |
| Anheuser-Busch InBev Worldwide Inc. | 5.375% | 1/15/20 | 820 | 907 |
| Anheuser-Busch InBev Worldwide Inc. | 4.375% | 2/15/21 | 80 | 87 |
| Anheuser-Busch InBev Worldwide Inc. | 2.500% | 7/15/22 | 4,615 | 4,431 |
| Anheuser-Busch InBev Worldwide Inc. | 3.750% | 7/15/42 | 520 | 443 |
| AstraZeneca plc | 1.950% | 9/18/19 | 390 | 388 |
| AstraZeneca plc | 2.375% | 11/16/20 | 1,180 | 1,172 |
| AstraZeneca plc | 6.450% | 9/15/37 | 615 | 767 |
| AstraZeneca plc | 4.375% | 11/16/45 | 800 | 795 |
| 1,4,5 Avery 2014 A 144A | 1.840% | 4/25/26 | 1,190 | 1,182 |
| 4 | BAT International Finance plc | 2.750% | 6/15/20 | 550 | 552 |
| 4 | BAT International Finance plc | 3.250% | 6/7/22 | 1,480 | 1,484 |
| 4 | BAT International Finance plc | 3.500% | 6/15/22 | 235 | 238 |
| 4 | Bayer US Finance LLC | 2.375% | 10/8/19 | 200 | 201 |
| 4 | Bayer US Finance LLC | 3.000% | 10/8/21 | 1,980 | 1,998 |
| 4 | Bayer US Finance LLC | 3.375% | 10/8/24 | 295 | 296 |
| Biogen Inc. | 2.900% | 9/15/20 | 550 | 548 |
| Bristol-Myers Squibb Co. | 3.250% | 11/1/23 | 990 | 1,025 |
| Cardinal Health Inc. | 1.700% | 3/15/18 | 75 | 75 |
| Cardinal Health Inc. | 2.400% | 11/15/19 | 625 | 626 |
| Cardinal Health Inc. | 3.200% | 3/15/23 | 1,065 | 1,054 |
| Cardinal Health Inc. | 3.500% | 11/15/24 | 580 | 580 |
| Cardinal Health Inc. | 4.500% | 11/15/44 | 665 | 646 |
| 4 | Cargill Inc. | 4.307% | 5/14/21 | 2,092 | 2,241 |
| 4 | Cargill Inc. | 6.875% | 5/1/28 | 645 | 790 |
| 4 | Cargill Inc. | 4.760% | 11/23/45 | 1,560 | 1,580 |
| Catholic Health Initiatives Colorado GO | 1.600% | 11/1/17 | 55 | 55 |
| Catholic Health Initiatives Colorado GO | 2.600% | 8/1/18 | 255 | 256 |
| 1 | Catholic Health Initiatives Colorado GO | 4.350% | 11/1/42 | 461 | 432 |
| Celgene Corp. | 2.250% | 5/15/19 | 160 | 158 |
| Celgene Corp. | 3.550% | 8/15/22 | 475 | 479 |
| Coca-Cola Co. | 3.300% | 9/1/21 | 300 | 313 |
| Coca-Cola Enterprises Inc. | 3.500% | 9/15/20 | 500 | 511 |
| Coca-Cola Femsa SAB de CV | 2.375% | 11/26/18 | 768 | 769 |
| Coca-Cola Femsa SAB de CV | 3.875% | 11/26/23 | 850 | 862 |
| Colgate-Palmolive Co. | 7.600% | 5/19/25 | 480 | 637 |
| Diageo Capital plc | 2.625% | 4/29/23 | 1,230 | 1,187 |
| Diageo Investment Corp. | 2.875% | 5/11/22 | 525 | 517 |
| Dignity Health California GO | 2.637% | 11/1/19 | 140 | 141 |
| Dignity Health California GO | 3.812% | 11/1/24 | 300 | 306 |
| Eli Lilly & Co. | 3.700% | 3/1/45 | 635 | 595 |
| 4 | EMD Finance LLC | 2.950% | 3/19/22 | 605 | 585 |
| 4 | EMD Finance LLC | 3.250% | 3/19/25 | 1,200 | 1,137 |
| Express Scripts Holding Co. | 2.650% | 2/15/17 | 1,072 | 1,083 |
| Express Scripts Holding Co. | 2.250% | 6/15/19 | 575 | 571 |
| Express Scripts Holding Co. | 4.750% | 11/15/21 | 160 | 172 |
| 4 | Forest Laboratories Inc. | 4.875% | 2/15/21 | 575 | 620 |
| Gilead Sciences Inc. | 2.550% | 9/1/20 | 615 | 615 |
| Gilead Sciences Inc. | 3.700% | 4/1/24 | 1,010 | 1,032 |
| Gilead Sciences Inc. | 3.500% | 2/1/25 | 560 | 563 |
| Gilead Sciences Inc. | 4.500% | 2/1/45 | 695 | 683 |
| GlaxoSmithKline Capital Inc. | 2.800% | 3/18/23 | 385 | 384 |
| GlaxoSmithKline Capital Inc. | 5.375% | 4/15/34 | 2,000 | 2,275 |
| 4 | Grupo Bimbo SAB de CV | 3.875% | 6/27/24 | 360 | 349 |
| 4 | Heineken NV | 2.750% | 4/1/23 | 340 | 328 |
| 4 | Imperial Tobacco Finance plc | 3.750% | 7/21/22 | 530 | 532 |
| 4 | Japan Tobacco Inc. | 2.100% | 7/23/18 | 545 | 547 |
| Johnson & Johnson | 5.150% | 7/15/18 | 500 | 548 |
| Kaiser Foundation Hospitals | 3.500% | 4/1/22 | 560 | 568 |
| Kaiser Foundation Hospitals | 4.875% | 4/1/42 | 355 | 364 |
| Kraft Foods Group Inc. | 2.250% | 6/5/17 | 295 | 297 |
| 4 | Kraft Heinz Foods Co. | 5.000% | 7/15/35 | 230 | 236 |
12
| | | | | |
| Vanguard Balanced Portfolio | | | | |
| |
| |
| |
| |
| Face | Market |
| Maturity Amount | Value • |
| | Coupon | Date | ($000) | ($000) |
| 4 | Kraft Heinz Foods Co. | 5.200% | 7/15/45 | 255 | 266 |
| Kroger Co. | 3.300% | 1/15/21 | 1,570 | 1,595 |
| Kroger Co. | 3.850% | 8/1/23 | 270 | 278 |
| Kroger Co. | 4.000% | 2/1/24 | 540 | 561 |
| McKesson Corp. | 3.250% | 3/1/16 | 175 | 176 |
| McKesson Corp. | 2.700% | 12/15/22 | 195 | 187 |
| McKesson Corp. | 2.850% | 3/15/23 | 190 | 182 |
| McKesson Corp. | 3.796% | 3/15/24 | 465 | 468 |
| Medtronic Inc. | 1.375% | 4/1/18 | 225 | 224 |
| Medtronic Inc. | 2.500% | 3/15/20 | 935 | 941 |
| Medtronic Inc. | 3.150% | 3/15/22 | 1,290 | 1,303 |
| Medtronic Inc. | 3.625% | 3/15/24 | 270 | 277 |
| Medtronic Inc. | 3.500% | 3/15/25 | 2,196 | 2,222 |
| Medtronic Inc. | 4.375% | 3/15/35 | 265 | 268 |
| Memorial Sloan-Kettering Cancer | | | | |
| | Center | 4.200% | 7/1/55 | 405 | 389 |
| Memorial Sloan-Kettering Cancer | | | | |
| | Center New York GO | 4.125% | 7/1/52 | 275 | 256 |
| Merck & Co. Inc. | 2.350% | 2/10/22 | 790 | 775 |
| Merck & Co. Inc. | 2.800% | 5/18/23 | 1,175 | 1,169 |
| Merck & Co. Inc. | 2.750% | 2/10/25 | 1,210 | 1,176 |
| Merck & Co. Inc. | 4.150% | 5/18/43 | 760 | 751 |
| Molson Coors Brewing Co. | 3.500% | 5/1/22 | 690 | 694 |
| Molson Coors Brewing Co. | 5.000% | 5/1/42 | 215 | 208 |
| New York & Presbyterian Hospital | 4.024% | 8/1/45 | 735 | 693 |
| Novartis Capital Corp. | 3.400% | 5/6/24 | 415 | 428 |
| Novartis Capital Corp. | 4.400% | 5/6/44 | 640 | 665 |
| Partners Healthcare System | | | | |
| | Massachusetts GO | 3.443% | 7/1/21 | 50 | 51 |
| PepsiCo Inc. | 3.125% | 11/1/20 | 330 | 342 |
| PepsiCo Inc. | 2.750% | 3/5/22 | 670 | 672 |
| PepsiCo Inc. | 4.000% | 3/5/42 | 845 | 814 |
| Pfizer Inc. | 6.200% | 3/15/19 | 1,400 | 1,576 |
| Pfizer Inc. | 3.000% | 6/15/23 | 755 | 768 |
| Philip Morris International Inc. | 4.500% | 3/26/20 | 250 | 272 |
| Philip Morris International Inc. | 4.125% | 5/17/21 | 1,025 | 1,096 |
| Philip Morris International Inc. | 2.500% | 8/22/22 | 575 | 562 |
| Philip Morris International Inc. | 2.625% | 3/6/23 | 1,150 | 1,126 |
| 1 | Procter & Gamble - Esop | 9.360% | 1/1/21 | 1,072 | 1,282 |
| 4 | Roche Holdings Inc. | 6.000% | 3/1/19 | 333 | 373 |
| 4 | Roche Holdings Inc. | 2.875% | 9/29/21 | 850 | 860 |
| 4 | SABMiller Holdings Inc. | 2.450% | 1/15/17 | 400 | 404 |
| 4 | SABMiller Holdings Inc. | 3.750% | 1/15/22 | 400 | 411 |
| Sanofi | 4.000% | 3/29/21 | 1,130 | 1,207 |
| St. Jude Medical Inc. | 2.500% | 1/15/16 | 666 | 666 |
| The Pepsi Bottling Group Inc. | 7.000% | 3/1/29 | 500 | 671 |
| Thermo Fisher Scientific Inc. | 1.850% | 1/15/18 | 530 | 529 |
| Unilever Capital Corp. | 4.250% | 2/10/21 | 2,805 | 3,061 |
| |
| Energy (1.6%) | | | | |
| 4 | BG Energy Capital plc | 4.000% | 10/15/21 | 200 | 207 |
| BP Capital Markets plc | 1.846% | 5/5/17 | 650 | 653 |
| BP Capital Markets plc | 4.750% | 3/10/19 | 795 | 852 |
| BP Capital Markets plc | 2.315% | 2/13/20 | 160 | 158 |
| BP Capital Markets plc | 4.500% | 10/1/20 | 400 | 428 |
| BP Capital Markets plc | 3.062% | 3/17/22 | 1,100 | 1,078 |
| BP Capital Markets plc | 3.245% | 5/6/22 | 650 | 647 |
| BP Capital Markets plc | 2.500% | 11/6/22 | 500 | 477 |
| BP Capital Markets plc | 3.994% | 9/26/23 | 420 | 426 |
| BP Capital Markets plc | 3.814% | 2/10/24 | 650 | 648 |
| BP Capital Markets plc | 3.506% | 3/17/25 | 1,280 | 1,245 |
| Chevron Corp. | 3.191% | 6/24/23 | 1,235 | 1,240 |
| ConocoPhillips | 5.200% | 5/15/18 | 1,500 | 1,602 |
| ConocoPhillips Co. | 2.875% | 11/15/21 | 375 | 364 |
| ConocoPhillips Co. | 3.350% | 11/15/24 | 1,095 | 1,017 |
| ConocoPhillips Co. | 3.350% | 5/15/25 | 330 | 297 |
| ConocoPhillips Co. | 4.300% | 11/15/44 | 1,570 | 1,299 |
| Devon Energy Corp. | 5.850% | 12/15/25 | 1,310 | 1,275 |
| Devon Energy Corp. | 5.000% | 6/15/45 | 565 | 428 |
| | | | | |
| Face | Market |
| Maturity | Amount | Value • |
| | Coupon | Date | ($000) | ($000) |
| Dominion Gas Holdings LLC | 3.550% | 11/1/23 | 470 | 464 |
| Encana Corp. | 6.500% | 5/15/19 | 810 | 838 |
| EOG Resources Inc. | 5.625% | 6/1/19 | 425 | 464 |
| EOG Resources Inc. | 2.625% | 3/15/23 | 1,050 | 991 |
| Halliburton Co. | 3.375% | 11/15/22 | 635 | 627 |
| Halliburton Co. | 3.500% | 8/1/23 | 1,980 | 1,931 |
| Occidental Petroleum Corp. | 4.100% | 2/1/21 | 1,120 | 1,175 |
| Occidental Petroleum Corp. | 2.700% | 2/15/23 | 250 | 235 |
| Phillips 66 | 4.875% | 11/15/44 | 280 | 248 |
| 4 | Schlumberger Holdings Corp. | 3.000% | 12/21/20 | 800 | 790 |
| 4 | Schlumberger Investment SA | 2.400% | 8/1/22 | 630 | 599 |
| Schlumberger Investment SA | 3.650% | 12/1/23 | 1,120 | 1,145 |
| Shell International Finance BV | 4.375% | 3/25/20 | 800 | 858 |
| Shell International Finance BV | 2.250% | 11/10/20 | 1,600 | 1,575 |
| Shell International Finance BV | 4.125% | 5/11/35 | 1,200 | 1,142 |
| Shell International Finance BV | 5.500% | 3/25/40 | 345 | 371 |
| Shell International Finance BV | 4.375% | 5/11/45 | 2,150 | 2,032 |
| Suncor Energy Inc. | 3.600% | 12/1/24 | 625 | 592 |
| Suncor Energy Inc. | 5.950% | 12/1/34 | 500 | 499 |
| Sunoco Logistics Partners | | | | |
| | Operations LP | 4.400% | 4/1/21 | 1,225 | 1,187 |
| Total Capital International SA | 1.550% | 6/28/17 | 1,365 | 1,365 |
| Total Capital International SA | 2.700% | 1/25/23 | 885 | 843 |
| Total Capital International SA | 3.750% | 4/10/24 | 1,400 | 1,424 |
| Total Capital SA | 2.125% | 8/10/18 | 850 | 852 |
| TransCanada PipeLines Ltd. | 3.800% | 10/1/20 | 1,220 | 1,249 |
| |
| Other Industrial (0.1%) | | | | |
| 4 | Hutchison Whampoa International | | | | |
| | 11 Ltd. | 3.500% | 1/13/17 | 305 | 310 |
| 4 | Hutchison Whampoa International | | | | |
| | 14 Ltd. | 3.625% | 10/31/24 | 750 | 744 |
| 1 | Johns Hopkins University Maryland | | | | |
| | GO | 4.083% | 7/1/53 | 690 | 683 |
| |
| Technology (0.6%) | | | | |
| Apple Inc. | 2.850% | 5/6/21 | 1,100 | 1,127 |
| Apple Inc. | 3.450% | 5/6/24 | 1,000 | 1,036 |
| Apple Inc. | 3.850% | 5/4/43 | 430 | 396 |
| Apple Inc. | 4.450% | 5/6/44 | 120 | 121 |
| Cisco Systems Inc. | 4.450% | 1/15/20 | 605 | 659 |
| Cisco Systems Inc. | 2.900% | 3/4/21 | 320 | 329 |
| EMC Corp. | 1.875% | 6/1/18 | 1,481 | 1,382 |
| EMC Corp. | 3.375% | 6/1/23 | 455 | 369 |
| International Business Machines Corp. | 3.375% | 8/1/23 | 1,750 | 1,775 |
| International Business Machines Corp. | 5.875% | 11/29/32 | 1,250 | 1,495 |
| Microsoft Corp. | 2.375% | 2/12/22 | 635 | 627 |
| Microsoft Corp. | 3.625% | 12/15/23 | 500 | 526 |
| Microsoft Corp. | 2.700% | 2/12/25 | 760 | 740 |
| Microsoft Corp. | 3.125% | 11/3/25 | 845 | 847 |
| Microsoft Corp. | 3.500% | 2/12/35 | 605 | 559 |
| Microsoft Corp. | 4.450% | 11/3/45 | 380 | 393 |
| Oracle Corp. | 2.800% | 7/8/21 | 375 | 380 |
| Oracle Corp. | 2.500% | 5/15/22 | 1,210 | 1,186 |
| Oracle Corp. | 2.950% | 5/15/25 | 355 | 346 |
| |
| Transportation (0.6%) | | | | |
| Burlington Northern Santa Fe LLC | 3.000% | 3/15/23 | 565 | 557 |
| Burlington Northern Santa Fe LLC | 3.850% | 9/1/23 | 1,630 | 1,694 |
| 1 | Continental Airlines 2007-1 Class A | | | | |
| | Pass Through Trust | 5.983% | 10/19/23 | 743 | 815 |
| 4 | ERAC USA Finance LLC | 2.750% | 3/15/17 | 205 | 208 |
| 4 | ERAC USA Finance LLC | 2.350% | 10/15/19 | 610 | 600 |
| 4 | ERAC USA Finance LLC | 4.500% | 8/16/21 | 325 | 343 |
| 4 | ERAC USA Finance LLC | 3.300% | 10/15/22 | 40 | 39 |
| 4 | ERAC USA Finance LLC | 7.000% | 10/15/37 | 1,150 | 1,395 |
| 1 | Federal Express Corp. 1998 | | | | |
| | Pass Through Trust | 6.720% | 1/15/22 | 983 | 1,104 |
| FedEx Corp. | 2.625% | 8/1/22 | 130 | 127 |
13
| | | | | |
| Vanguard Balanced Portfolio | | | | |
| |
| |
| |
| |
| Face | Market |
| Maturity Amount | Value • |
| | Coupon | Date | ($000) | ($000) |
| FedEx Corp. | 2.700% | 4/15/23 | 255 | 247 |
| FedEx Corp. | 3.200% | 2/1/25 | 425 | 414 |
| FedEx Corp. | 4.900% | 1/15/34 | 230 | 237 |
| FedEx Corp. | 3.875% | 8/1/42 | 120 | 104 |
| FedEx Corp. | 4.100% | 4/15/43 | 500 | 443 |
| FedEx Corp. | 5.100% | 1/15/44 | 340 | 352 |
| 4 | Kansas City Southern | 4.950% | 8/15/45 | 1,040 | 1,011 |
| Norfolk Southern Corp. | 7.700% | 5/15/17 | 1,500 | 1,622 |
| Southwest Airlines Co. | 5.750% | 12/15/16 | 1,500 | 1,559 |
| 1 | Southwest Airlines Co. 2007-1 | | | | |
| | Pass Through Trust | 6.150% | 2/1/24 | 391 | 437 |
| United Parcel Service Inc. | 2.450% | 10/1/22 | 425 | 420 |
| United Parcel Service Inc. | 4.875% | 11/15/40 | 460 | 512 |
| 265,907 |
| Utilities (2.1%) | | | | |
| Electric (1.9%) | | | | |
| Alabama Power Co. | 5.550% | 2/1/17 | 585 | 610 |
| Alabama Power Co. | 3.750% | 3/1/45 | 630 | 567 |
| Ameren Illinois Co. | 6.125% | 12/15/28 | 1,000 | 1,203 |
| Berkshire Hathaway Energy Co. | 6.125% | 4/1/36 | 1,000 | 1,166 |
| Commonwealth Edison Co. | 5.950% | 8/15/16 | 770 | 793 |
| Commonwealth Edison Co. | 4.350% | 11/15/45 | 220 | 221 |
| Connecticut Light & Power Co. | 5.650% | 5/1/18 | 465 | 506 |
| Consolidated Edison Co. of | | | | |
| | New York Inc. | 5.500% | 9/15/16 | 700 | 721 |
| Consolidated Edison Co. of | | | | |
| | New York Inc. | 5.300% | 12/1/16 | 890 | 924 |
| Consolidated Edison Co. of | | | | |
| | New York Inc. | 4.500% | 12/1/45 | 980 | 989 |
| Consolidated Edison Co. of | | | | |
| | New York Inc. | 4.625% | 12/1/54 | 1,365 | 1,342 |
| Delmarva Power & Light Co. | 3.500% | 11/15/23 | 305 | 313 |
| Dominion Resources Inc. | 5.200% | 8/15/19 | 750 | 817 |
| Dominion Resources Inc. | 3.625% | 12/1/24 | 1,515 | 1,501 |
| Duke Energy Carolinas LLC | 5.250% | 1/15/18 | 275 | 295 |
| Duke Energy Carolinas LLC | 5.100% | 4/15/18 | 590 | 633 |
| Duke Energy Carolinas LLC | 3.900% | 6/15/21 | 1,090 | 1,158 |
| Duke Energy Corp. | 4.800% | 12/15/45 | 1,200 | 1,213 |
| Duke Energy Florida LLC | 6.350% | 9/15/37 | 200 | 255 |
| Duke Energy Progress LLC | 6.300% | 4/1/38 | 365 | 465 |
| Duke Energy Progress LLC | 4.200% | 8/15/45 | 845 | 833 |
| Eversource Energy | 4.500% | 11/15/19 | 90 | 96 |
| Eversource Energy | 3.150% | 1/15/25 | 110 | 107 |
| Florida Power & Light Co. | 5.650% | 2/1/35 | 1,000 | 1,175 |
| Florida Power & Light Co. | 4.950% | 6/1/35 | 1,000 | 1,097 |
| Florida Power & Light Co. | 5.950% | 2/1/38 | 785 | 977 |
| Georgia Power Co. | 5.400% | 6/1/18 | 1,165 | 1,267 |
| Georgia Power Co. | 4.300% | 3/15/42 | 755 | 698 |
| National Rural Utilities Cooperative | | | | |
| | Finance Corp. | 5.450% | 2/1/18 | 1,500 | 1,606 |
| National Rural Utilities Cooperative | | | | |
| | Finance Corp. | 2.850% | 1/27/25 | 1,040 | 1,005 |
| Northern States Power Co. | 6.250% | 6/1/36 | 2,000 | 2,539 |
| Pacific Gas & Electric Co. | 4.250% | 5/15/21 | 300 | 321 |
| Pacific Gas & Electric Co. | 3.850% | 11/15/23 | 450 | 469 |
| Pacific Gas & Electric Co. | 3.750% | 2/15/24 | 305 | 315 |
| Pacific Gas & Electric Co. | 5.125% | 11/15/43 | 285 | 312 |
| PacifiCorp | 6.250% | 10/15/37 | 2,000 | 2,473 |
| Peco Energy Co. | 5.350% | 3/1/18 | 565 | 607 |
| Potomac Electric Power Co. | 6.500% | 11/15/37 | 750 | 964 |
| Public Service Electric & Gas Co. | 5.300% | 5/1/18 | 1,900 | 2,054 |
| San Diego Gas & Electric Co. | 6.000% | 6/1/26 | 600 | 738 |
| Sierra Pacific Power Co. | 3.375% | 8/15/23 | 850 | 861 |
| South Carolina Electric & Gas Co. | 6.050% | 1/15/38 | 1,000 | 1,176 |
| South Carolina Electric & Gas Co. | 5.100% | 6/1/65 | 605 | 630 |
| Southern California Edison Co. | 2.400% | 2/1/22 | 170 | 167 |
| Southern California Edison Co. | 6.000% | 1/15/34 | 1,000 | 1,212 |
| Southern California Edison Co. | 5.550% | 1/15/37 | 2,250 | 2,612 |
| | | | | |
| Face | Market |
| Maturity Amount | Value • |
| | Coupon | Date | ($000) | ($000) |
| Southern California Edison Co. | 3.600% | 2/1/45 | 141 | 128 |
| Southern Co. | 2.450% | 9/1/18 | 225 | 227 |
| Virginia Electric & Power Co. | 2.750% | 3/15/23 | 690 | 680 |
| Wisconsin Electric Power Co. | 5.700% | 12/1/36 | 690 | 825 |
| |
| Natural Gas (0.1%) | | | | |
| AGL Capital Corp. | 6.375% | 7/15/16 | 775 | 795 |
| NiSource Finance Corp. | 4.800% | 2/15/44 | 1,355 | 1,378 |
| |
| Other Utility (0.1%) | | | | |
| UGI Utilities Inc. | 5.753% | 9/30/16 | 1,170 | 1,200 |
| 47,236 |
| Total Corporate Bonds (Cost $500,974) 514,962 |
| Sovereign Bonds (U.S. Dollar-Denominated) (1.0%) | | | |
| 4 | Abu Dhabi National Energy Co. PJSC | 5.875% | 10/27/16 | 595 | 614 |
| 4 | CDP Financial Inc. | 4.400% | 11/25/19 | 1,000 | 1,083 |
| 4 | Electricite de France SA | 4.600% | 1/27/20 | 1,200 | 1,294 |
| 4 | Electricite de France SA | 4.875% | 1/22/44 | 50 | 48 |
| 4 | Electricite de France SA | 4.950% | 10/13/45 | 400 | 387 |
| 1,4 Electricite de France SA | 5.250% | 1/29/49 | 235 | 222 |
| 1,4 Electricite de France SA | 5.625% | 12/29/49 | 1,400 | 1,328 |
| International Bank for Reconstruction | | | | |
| | & Development | 4.750% | 2/15/35 | 2,000 | 2,433 |
| Korea Development Bank | 2.875% | 8/22/18 | 505 | 515 |
| Korea Development Bank | 2.500% | 3/11/20 | 2,000 | 1,995 |
| Quebec | 5.125% | 11/14/16 | 1,000 | 1,034 |
| 4 | Sinopec Group Overseas Development | | | | |
| | 2015 Ltd. | 2.500% | 4/28/20 | 1,615 | 1,589 |
| 4 | Sinopec Group Overseas Development | | | | |
| | 2015 Ltd. | 3.250% | 4/28/25 | 1,615 | 1,526 |
| 4 | State Grid Overseas Investment | | | | |
| | 2014 Ltd. | 2.750% | 5/7/19 | 1,305 | 1,316 |
| Statoil ASA | 2.250% | 11/8/19 | 580 | 578 |
| Statoil ASA | 2.900% | 11/8/20 | 1,410 | 1,424 |
| Statoil ASA | 2.750% | 11/10/21 | 850 | 837 |
| Statoil ASA | 2.450% | 1/17/23 | 382 | 361 |
| Statoil ASA | 2.650% | 1/15/24 | 360 | 341 |
| Statoil ASA | 3.700% | 3/1/24 | 640 | 646 |
| Statoil ASA | 3.250% | 11/10/24 | 795 | 775 |
| 4 | Temasek Financial I Ltd. | 2.375% | 1/23/23 | 1,130 | 1,109 |
| United Mexican States | 3.500% | 1/21/21 | 342 | 345 |
| United Mexican States | 3.600% | 1/30/25 | 610 | 590 |
| Total Sovereign Bonds (Cost $21,930) | 22,390 |
| Taxable Municipal Bonds (1.7%) | | | | |
| Atlanta GA Downtown Development | | | | |
| | Authority Revenue | 6.875% | 2/1/21 | 350 | 389 |
| Bay Area Toll Authority California | | | | |
| | Toll Bridge Revenue (San Francisco | | | | |
| | Bay Area) | 6.263% | 4/1/49 | 1,000 | 1,345 |
| Bay Area Toll Authority California | | | | |
| | Toll Bridge Revenue (San Francisco | | | | |
| | Bay Area) | 7.043% | 4/1/50 | 715 | 984 |
| California GO | 5.700% | 11/1/21 | 265 | 310 |
| California GO | 7.550% | 4/1/39 | 1,170 | 1,701 |
| California GO | 7.300% | 10/1/39 | 300 | 419 |
| California GO | 7.625% | 3/1/40 | 90 | 131 |
| California GO | 7.600% | 11/1/40 | 920 | 1,367 |
| Chicago IL Metropolitan Water | | | | |
| | Reclamation District GO | 5.720% | 12/1/38 | 215 | 247 |
| Chicago IL O’Hare International | | | | |
| | Airport Revenue | 6.845% | 1/1/38 | 530 | 594 |
| Chicago IL O’Hare International | | | | |
| | Airport Revenue | 6.395% | 1/1/40 | 425 | 532 |
| Chicago IL Transit Authority Transfer | | | | |
| | Tax Receipts Revenue | 6.899% | 12/1/40 | 385 | 444 |
| Chicago Transit Authority | 6.899% | 12/1/40 | 695 | 802 |
14
| | | | | |
| Vanguard Balanced Portfolio | | | | |
| |
| |
| |
| |
| Face | Market |
| Maturity Amount | Value • |
| | Coupon | Date | ($000) | ($000) |
| Dallas TX Area Rapid Transit Revenue | 5.999% | 12/1/44 | 750 | 983 |
| Georgia Municipal Electric Power | | | | |
| | Authority Revenue | 6.637% | 4/1/57 | 1,141 | 1,359 |
| Grand Parkway Transportation Corp. | | | | |
| | Texas System Toll Revenue | 5.184% | 10/1/42 | 1,015 | 1,194 |
| Houston TX GO | 6.290% | 3/1/32 | 580 | 710 |
| Illinois GO | 5.100% | 6/1/33 | 1,600 | 1,514 |
| Illinois Toll Highway Authority Revenue 6.184% | 1/1/34 | 750 | 933 |
| 6 | Kansas Development Finance | | | | |
| | Authority Revenue (Public Employees | | | | |
| | Retirement System) | 5.501% | 5/1/34 | 2,000 | 2,220 |
| Los Angeles CA Community College | | | | |
| | District GO | 6.750% | 8/1/49 | 405 | 572 |
| Los Angeles CA Unified School | | | | |
| | District GO | 5.750% | 7/1/34 | 1,400 | 1,687 |
| Maryland Transportation Authority | | | | |
| | Facilities Projects Revenue | 5.888% | 7/1/43 | 545 | 660 |
| Massachusetts School Building | | | | |
| | Authority Dedicated Sales Tax | | | | |
| | Revenue | 5.715% | 8/15/39 | 1,000 | 1,216 |
| New Jersey Turnpike Authority | | | | |
| | Revenue | 7.414% | 1/1/40 | 410 | 583 |
| New Jersey Turnpike Authority | | | | |
| | Revenue | 7.102% | 1/1/41 | 600 | 826 |
| New York City NY Municipal | | | | |
| | Water Finance Authority | | | | |
| | Water & Sewer System Revenue | 5.790% | 6/15/41 | 115 | 127 |
| New York City NY Municipal | | | | |
| | Water Finance Authority | | | | |
| | Water & Sewer System Revenue | 5.882% | 6/15/44 | 80 | 103 |
| New York Metropolitan | | | | |
| | Transportation Authority Revenue | 6.814% | 11/15/40 | 150 | 199 |
| New York Metropolitan | | | | |
| | Transportation Authority Revenue | | | | |
| | (Dedicated Tax Fund) | 7.336% | 11/15/39 | 325 | 474 |
| New York Metropolitan | | | | |
| | Transportation Authority Revenue | | | | |
| | (Dedicated Tax Fund) | 6.089% | 11/15/40 | 445 | 562 |
| North Texas Tollway Authority System | | | | |
| | Revenue | 6.718% | 1/1/49 | 1,555 | 2,131 |
| Oregon Department of Transportation | | | | |
| | Highway User Tax Revenue | 5.834% | 11/15/34 | 655 | 823 |
| Oregon GO | 5.902% | 8/1/38 | 490 | 597 |
| 6 | Oregon School Boards Association GO 5.528% | 6/30/28 | 2,000 | 2,298 |
| Port Authority of New York | | | | |
| | & New Jersey Revenue | 5.859% | 12/1/24 | 325 | 395 |
| Port Authority of New York | | | | |
| | & New Jersey Revenue | 6.040% | 12/1/29 | 265 | 318 |
| Port Authority of New York | | | | |
| | & New Jersey Revenue | 4.458% | 10/1/62 | 1,300 | 1,238 |
| Port Authority of New York | | | | |
| | & New Jersey Revenue | 4.810% | 10/15/65 | 640 | 650 |
| President & Fellows of Harvard College | | | | |
| | Massachusetts GO | 6.300% | 10/1/37 | 2,000 | 2,028 |
| San Antonio TX Electric | | | | |
| | & Gas Systems Revenue | 5.985% | 2/1/39 | 305 | 386 |
| University of California | 3.931% | 5/15/45 | 570 | 555 |
| University of California Regents | | | | |
| | General Revenue | 4.601% | 5/15/31 | 590 | 629 |
| University of California Regents | | | | |
| | Medical Center Revenue | 6.548% | 5/15/48 | 295 | 380 |
| University of California Regents | | | | |
| | Medical Center Revenue | 6.583% | 5/15/49 | 900 | 1,156 |
| University of California Revenue | 5.770% | 5/15/43 | 1,010 | 1,232 |
| University of California Revenue | 4.765% | 5/15/44 | 145 | 148 |
| Total Taxable Municipal Bonds (Cost $35,924) | 40,151 |
| | | | | |
| Face | Market |
| Maturity Amount | Value • |
| | Coupon | Date | ($000) | ($000) |
| Temporary Cash Investments (1.8%) | | | | |
| Repurchase Agreement (1.6%) | | | | |
| RBS Securities, Inc | | | | |
| | (Dated 12/31/15, Repurchase Value | | | | |
| | $37,100,000, collateralized by U.S. | | | | |
| | Treasury Note/Bond, 2.125%–2.750%, | | | | |
| | 8/15/21–2/15/24, with a value of | | | | |
| | $37,845,000) | 0.300% | 1/4/16 | 37,100 | 37,100 |
| |
| U.S. Government and Agency Obligations (0.2%) | | | |
| 7 | Federal Home Loan | | | | |
| | Bank Discount Notes | 0.173% | 1/29/16 | 944 | 944 |
| 7 | Federal Home Loan | | | | |
| | Bank Discount Notes | 0.180% | 2/4/16 | 617 | 617 |
| 7 | Federal Home Loan | | | | |
| | Bank Discount Notes | 0.190% | 2/12/16 | 2,205 | 2,204 |
| 3,765 |
| Total Temporary Cash Investments (Cost $40,866) | 40,865 |
| Total Investments (99.6%) (Cost $1,954,088) 2,301,567 |
| |
| Amount |
| ($000) |
| Other Assets and Liabilities (0.4%) | | | | |
| Other Assets | | | | |
| Investment in Vanguard | 204 |
| Receivables for Investment Securities Sold | 13,574 |
| Receivables for Accrued Income | 9,217 |
| Receivables for Capital Shares Issued | 326 |
| Other Assets8 | 368 |
| Total Other Assets | 23,689 |
| Liabilities | | | | |
| Payables for Investment Securities Purchased | (7,752) |
| Payables to Investment Advisor | (293) |
| Payables for Capital Shares Redeemed | (2,379) |
| Payables to Vanguard | (3,085) |
| Other Liabilities | (86) |
| Total Liabilities | (13,595) |
| Net Assets (100%) | | | | |
| Applicable to 103,577,084 outstanding $.001 par value shares of | |
| beneficial interest (unlimited authorization) 2,311,661 |
| Net Asset Value Per Share | $22.32 |
15
Vanguard Balanced Portfolio
| | |
| At December 31, 2015, net assets consisted of: | | |
| Amount |
| ($000) |
| Paid-in Capital | 1,806,052 |
| Undistributed Net Investment Income | 55,763 |
| Accumulated Net Realized Gains 102,352 |
| Unrealized Appreciation (Depreciation) | | |
| Investment Securities 347,479 |
| Futures Contracts | 34 |
| Foreign Currencies | (19) |
| Net Assets | 2,311,661 |
• See Note A in Notes to Financial Statements.
* Non-income-producing security.
1 The average or expected maturity is shorter than the final maturity shown because of the possibility of interim principal payments and prepayments or the possibility of the issue being called.
2 The issuer was placed under federal conservatorship in September 2008; since that time, its daily operations have been managed by the Federal Housing Finance Agency and it receives capital from the U.S. Treasury, as needed to maintain a positive net worth, in exchange for senior preferred stock.
3 Includes securities purchased on a when-issued or delayed-delivery basis for which the portfolio has not taken delivery as of December 31, 2015.
4 Security exempt from registration under Rule 144A of the Securities Act of 1933. Such securities may be sold in transactions exempt from registration, normally to qualified institutional buyers. At December 31, 2015, the aggregate value of these securities was $119,049,000, representing 5.1% of net assets.
5 Adjustable-rate security.
6 Scheduled principal and interest payments are guaranteed by AGM (Assured Guaranty Municipal Corporation).
7 The issuer operates under a congressional charter; its securities are generally neither guaranteed by the U.S. Treasury nor backed by the full faith and credit of the U.S. government.
8 Cash of $226,000 has been segregated as initial margin for open futures contracts.
ADR—American Depositary Receipt.
GO—General Obligation Bond.
REMICS—Real Estate Mortgage Investment Conduits.
See accompanying Notes, which are an integral part of the Financial Statements.
16
| | | |
| Vanguard Balanced Portfolio | | |
| |
| |
| Statement of Operations |
| |
| Year Ended |
| December 31, 2015 |
| | ($000) |
| Investment Income | | |
| Income | | |
| Dividends1 | 38,776 |
| Interest | 25,693 |
| Securities Lending | 88 |
| Total Income | 64,557 |
| Expenses | | |
| Investment Advisory Fees—Note B | |
| Basic Fee | 1,285 |
| Performance Adjustment | (66) |
| The Vanguard Group—Note C | | |
| Management and Administrative | 3,666 |
| Marketing and Distribution | 407 |
| Custodian Fees | 49 |
| Auditing Fees | 32 |
| Shareholders’ Reports | 38 |
| Trustees’ Fees and Expenses | 3 |
| Total Expenses | 5,414 |
| Net Investment Income | 59,143 |
| Realized Net Gain (Loss) | | |
| Investment Securities Sold 104,961 |
| Futures Contracts | (990) |
| Foreign Currencies | (14) |
| Realized Net Gain (Loss) | 103,957 |
| Change in Unrealized Appreciation | |
| (Depreciation) | | |
| Investment Securities (161,832) |
| Futures Contracts | 31 |
| Foreign Currencies | 5 |
| Change in Unrealized Appreciation | |
| (Depreciation) (161,796) |
| Net Increase (Decrease) in Net Assets | |
| Resulting from Operations | 1,304 |
| 1 Dividends are net of foreign withholding taxes of $369,000. |
| | |
| Statement of Changes in Net Assets | | |
| |
| Year Ended December 31, |
| 2015 | 2014 |
| ($000) | ($000) |
| Increase (Decrease) in Net Assets | | |
| Operations | | |
| Net Investment Income | 59,143 | 54,952 |
| Realized Net Gain (Loss) | 103,957 | 109,065 |
| Change in Unrealized Appreciation (Depreciation) | (161,796) | 42,562 |
| Net Increase (Decrease) in Net Assets Resulting from Operations | 1,304 | 206,579 |
| Distributions | | |
| Net Investment Income | (55,202) | (48,908) |
| Realized Capital Gain1 | (109,242) | (114,294) |
| Total Distributions | (164,444) | (163,202) |
| Capital Share Transactions | | |
| Issued | 206,845 | 229,547 |
| Issued in Lieu of Cash Distributions | 164,444 | 163,202 |
| Redeemed | (230,337) | (191,161) |
| Net Increase (Decrease) from Capital Share Transactions | 140,952 | 201,588 |
| Total Increase (Decrease) | (22,188) | 244,965 |
| Net Assets |
| Beginning of Period | 2,333,849 | 2,088,884 |
| End of Period2 | 2,311,661 | 2,333,849 |
1 Includes fiscal 2015 and 2014 short-term gain distributions totaling $5,133,000 and $12,866,000, respectively. Short-term gain distributions are treated as ordinary income dividends for tax purposes.
2 Net Assets—End of Period includes undistributed (overdistributed) net investment income of $55,763,000 and $51,836,000.
See accompanying Notes, which are an integral part of the Financial Statements.
17
| | | | | |
| Vanguard Balanced Portfolio | | | | | |
| |
| |
| Financial Highlights | | | | | |
| |
| |
| For a Share Outstanding | | | Year Ended December 31, |
| Throughout Each Period | 2015 | 2014 | 2013 | 2012 | 2011 |
| Net Asset Value, Beginning of Period | $23.99 | $23.66 | $20.70 | $18.90 | $18.70 |
| Investment Operations | |
| Net Investment Income | .576 | .569 | .540 | .547 | .552 |
| Net Realized and Unrealized Gain (Loss) | | | | | |
| on Investments | (.548) | 1.613 | 3.450 | 1.800 | .143 |
| Total from Investment Operations | .028 | 2.182 | 3.990 | 2.347 | .695 |
| Distributions | | |
| Dividends from Net Investment Income | (.570) | (.555) | (.550) | (.547) | (.495) |
| Distributions from Realized Capital Gains | (1.128) | (1.297) | (.480) | — | — |
| Total Distributions | (1.698) | (1.852) | (1.030) | (.547) | (.495) |
| Net Asset Value, End of Period | $22.32 | $23.99 | $23.66 | $20.70 | $18.90 |
| |
| Total Return | 0.09% | 9.84% | 19.88% | 12.56% | 3.70% |
| |
| Ratios/Supplemental Data | | |
| Net Assets, End of Period (Millions) | $2,312 | $2,334 | $2,089 | $1,691 | $1,430 |
| Ratio of Total Expenses to Average Net Assets1 | 0.23% | 0.25% | 0.27% | 0.26% | 0.29% |
| Ratio of Net Investment Income to | | | | | |
| Average Net Assets | 2.53% | 2.50% | 2.52% | 2.86% | 2.95% |
| Portfolio Turnover Rate2 | 45% | 70% | 31% | 24% | 36% |
1 Includes performance-based investment advisory fee increases (decreases) of 0.00%, 0.00%, 0.00%, (0.01%), and 0.00%.
2 Includes 14%, 15%, 19%, 18%, and 9% attributable to mortgage-dollar-roll activity.
Notes to Financial Statements
Vanguard Balanced Portfolio, a portfolio of Vanguard Variable Insurance Funds, is registered under the Investment Company Act of 1940 as an open-end investment company. The portfolio’s shares are only available for purchase by separate accounts of insurance companies as investments for variable annuity plans, variable life insurance contracts, or other variable benefit insurance contracts. Certain of the portfolio’s investments are in corporate debt instruments; the issuers’ abilities to meet their obligations may be affected by economic developments in their respective industries.
A. The following significant accounting policies conform to generally accepted accounting principles for U.S. investment companies. The portfolio consistently follows such policies in preparing its financial statements.
1. Security Valuation: Securities are valued as of the close of trading on the New York Stock Exchange (generally 4 p.m., Eastern time) on the valuation date. Equity securities are valued at the latest quoted sales prices or official closing prices taken from the primary market in which each security trades; such securities not traded on the valuation date are valued at the mean of the latest quoted bid and asked prices. Bonds, and temporary cash investments acquired over 60 days to maturity, are valued using the latest bid prices or using valuations based on a matrix system (which considers such factors as security prices, yields, maturities, and ratings), both as furnished by independent pricing services. Structured debt securities, including mortgages and asset-backed securities, are valued using the latest bid prices or using valuations based on a matrix system that considers such factors as issuer, tranche, nominal or option-adjusted spreads, weighted average coupon, weighted average maturity, credit enhancements, and collateral. Other temporary cash investments are valued at amortized cost, which approximates market value. Securities for which market quotations are not readily available, or whose values have been affected by events occurring before the portfolio’s pricing time but after the close of the securities’ primary markets, are valued at their fair values calculated according to procedures adopted by the board of trustees. These procedures include obtaining quotations from an independent pricing service, monitoring news to identify significant market- or security-specific events, and evaluating changes in the values of foreign market proxies (for example, ADRs, futures
18
Vanguard Balanced Portfolio
contracts, or exchange-traded funds), between the time the foreign markets close and the portfolio’s pricing time. When fair-value pricing is employed, the prices of securities used by a portfolio to calculate its net asset value may differ from quoted or published prices for the same securities.
2. Foreign Currency: Securities and other assets and liabilities denominated in foreign currencies are translated into U.S. dollars using exchange rates obtained from an independent third party as of the portfolio’s pricing time on the valuation date. Realized gains (losses) and unrealized appreciation (depreciation) on investment securities include the effects of changes in exchange rates since the securities were purchased, combined with the effects of changes in security prices. Fluctuations in the value of other assets and liabilities resulting from changes in exchange rates are recorded as unrealized foreign currency gains (losses) until the assets or liabilities are settled in cash, at which time they are recorded as realized foreign currency gains (losses).
3. Futures Contracts: The portfolio uses futures contracts to invest in fixed income asset classes with greater efficiency and lower cost than is possible through direct investment, to add value when these instruments are attractively priced, or to adjust sensitivity to changes in interest rates. The primary risks associated with the use of futures contracts are imperfect correlation between changes in market values of bonds held by the portfolio and the prices of futures contracts, and the possibility of an illiquid market. Counterparty risk involving futures is mitigated because a regulated clearinghouse is the counterparty instead of the clearing broker. To further mitigate counterparty risk, the portfolio trades futures contracts on an exchange, monitors the financial strength of its clearing brokers and clearinghouse, and has entered into clearing agreements with its clearing brokers. The clearinghouse imposes initial margin requirements to secure the portfolio’s performance and requires daily settlement of variation margin representing changes in the market value of each contract.
Futures contracts are valued at their quoted daily settlement prices. The aggregate settlement values of the contracts are not recorded in the Statement of Net Assets. Fluctuations in the value of the contracts are recorded in the Statement of Net Assets as an asset (liability) and in the Statement of Operations as unrealized appreciation (depreciation) until the contracts are closed, when they are recorded as realized futures gains (losses).
During the year ended December 31, 2015, the portfolio’s average investments in long and short futures contracts represented less than 1% and 2% of net assets, respectively, based on the average of aggregate settlement values at each quarter-end during the period.
4. To Be Announced (TBA) Transactions: A TBA transaction is an agreement to buy or sell mortgage-backed securities with agreed-upon characteristics (face amount, coupon, maturity) for settlement at a future date. The portfolio may be a seller of TBA transactions to reduce its exposure to the mortgage-backed securities market or in order to sell mortgage-backed securities it owns under delayed-delivery arrangements. When the portfolio is a buyer of TBA transactions, it maintains cash or short-term investments in an amount sufficient to meet the purchase price at the settlement date of the TBA transaction. The primary risk associated with TBA transactions is that a counterparty may default on its obligations. The portfolio mitigates its counterparty risk by, among other things, performing a credit analysis of counterparties, allocating transactions among numerous counterparties, and monitoring its exposure to each counterparty. The portfolio may also enter into a Master Securities Forward Transaction Agreement (MSFTA) with certain counterparties and require them to transfer collateral as security for their performance. Under an MSFTA, upon a counterparty default (including bankruptcy), the portfolio may terminate any TBA transactions with that counterparty, determine the net amount owed by either party in accordance with its master netting arrangements, and sell or retain any collateral held up to the net amount owed to the portfolio under the master netting arrangements.
5. Mortgage Dollar Rolls: The portfolio enters into mortgage-dollar-roll transactions, in which the portfolio sells mortgage-backed securities to a dealer and simultaneously agrees to purchase similar securities in the future at a predetermined price. The proceeds of the securities sold in mortgage-dollar-roll transactions are typically invested in high-quality short-term fixed income securities. The portfolio forgoes principal and interest paid on the securities sold, and is compensated by interest earned on the proceeds of the sale and by a lower price on the securities to be repurchased. The portfolio has also entered into mortgage-dollar-roll transactions in which the portfolio buys mortgage-backed securities from a dealer pursuant to a TBA transaction and simultaneously agrees to sell similar securities in the future at a predetermined price. The securities bought in mortgage-dollar-roll transactions are used to cover an open TBA sell position. The portfolio continues to earn interest on mortgage-backed security pools already held and receives a lower price on the securities to be sold in the future. The portfolio accounts for mortgage-dollar-roll transactions as purchases and sales; as such, these transactions may increase the portfolio’s portfolio turnover rate. Amounts to be received
19
Vanguard Balanced Portfolio
or paid in connection with open mortgage dollar rolls are included in Receivables for Investment Securities Sold (Other Assets) or Payables for Investment Securities Purchased (Liabilities) in the Statement of Net Assets.
6. Repurchase Agreements: The portfolio enters into repurchase agreements with institutional counterparties. Securities pledged as collateral to the portfolio under repurchase agreements are held by a custodian bank until the agreements mature. Each agreement requires that the market value of the collateral be sufficient to cover payments of interest and principal. The portfolio further mitigates its counterparty risk by entering into repurchase agreements only with a diverse group of prequalified counterparties, monitoring their financial strength, and entering into master repurchase agreements with its counterparties. The master repurchase agreements provide that, in the event of a counterparty’s default (including bankruptcy), the portfolio may terminate any repurchase agreements with that counterparty, determine the net amount owed, and sell or retain the collateral up to the net amount owed to the portfolio. Such action may be subject to legal proceedings, which may delay or limit the disposition of collateral.
7. Federal Income Taxes: The portfolio intends to continue to qualify as a regulated investment company and distribute all of its taxable income. Management has analyzed the portfolio’s tax positions taken for all open federal income tax years (December 31, 2012–2015), and has concluded that no provision for federal income tax is required in the portfolio’s financial statements.
8. Distributions: Distributions to shareholders are recorded on the ex-dividend date.
9. Securities Lending: To earn additional income, the portfolio lends its securities to qualified institutional borrowers. Security loans are subject to termination by the portfolio at any time and are required to be secured at all times by collateral in an amount at least equal to the market value of securities loaned. Daily market fluctuations could cause the value of loaned securities to be more or less than the value of the collateral received. When this occurs, the collateral is adjusted and settled on the next business day. The portfolio further mitigates its counterparty risk by entering into securities lending transactions only with a diverse group of prequalified counterparties, monitoring their financial strength, and entering into master securities lending agreements with its counterparties. The master securities lending agreements provide that, in the event of a counterparty’s default (including bankruptcy), the portfolio may terminate any loans with that borrower, determine the net amount owed, and sell or retain the collateral up to the net amount owed to the portfolio; however, such actions may be subject to legal proceedings. While collateral mitigates counterparty risk, in the absence of a default the portfolio may experience delays and costs in recovering the securities loaned. The portfolio invests cash collateral received in Vanguard Market Liquidity Fund, and records a liability in the Statement of Net Assets for the return of the collateral, during the period the securities are on loan. Securities lending income represents fees charged to borrowers plus income earned on invested cash collateral, less expenses associated with the loan.
10. Credit Facility: The portfolio and certain other funds managed by The Vanguard Group (“Vanguard”) participate in a $3 billion committed credit facility provided by a syndicate of lenders pursuant to a credit agreement that may be renewed annually; each fund is individually liable for its borrowings, if any, under the credit facility. Borrowings may be utilized for temporary and emergency purposes, and are subject to the portfolio’s regulatory and contractual borrowing restrictions. The participating funds are charged administrative fees and an annual commitment fee of 0.06% of the undrawn amount of the facility; these fees are allocated to the funds based on a method approved by the portfolio’s board of trustees and included in Management and Administrative expenses on the portfolio’s Statement of Operations. Any borrowings under this facility bear interest at a rate equal to the higher of the federal funds rate or LIBOR reference rate plus an agreed-upon spread.
The portfolio had no borrowings outstanding at December 31, 2015, or at any time during the period then ended.
11. Other: Dividend income is recorded on the ex-dividend date. Interest income is accrued daily. Premiums and discounts on debt securities purchased are amortized and accreted, respectively, to interest income over the lives of the respective securities. Security transactions are accounted for on the date securities are bought or sold. Costs used to determine realized gains (losses) on the sale of investment securities are those of the specific securities sold.
B. Wellington Management Company LLP provides investment advisory services to the portfolio for a fee calculated at an annual percentage rate of average net assets. The basic fee is subject to quarterly adjustments based on the portfolio’s performance relative to the combined index comprising the S&P 500 Index and the Barclays Capital U.S. Credit A or Better Bond Index for the preceding three
20
Vanguard Balanced Portfolio
years. For the year ended December 31, 2015, the investment advisory fee represented an effective annual basic rate of 0.06% of the portfolio’s average net assets before a decrease of $66,000 (0.00%) based on performance.
C. In accordance with the terms of a Funds’ Service Agreement (the “FSA”) between Vanguard and the portfolio, Vanguard furnishes to the portfolio corporate management, administrative, marketing, distribution and cash management services at Vanguard’s cost of operations (as defined by the FSA). These costs of operations are allocated to the portfolio based on methods and guidelines approved by the board of trustees. Vanguard does not require reimbursement in the current period for certain costs of operations (such as deferred compensation/benefits and risk/insurance costs); the portfolio’s liability for these costs of operations is included in Payables to Vanguard on the Statement of Net Assets.
Upon the request of Vanguard, the portfolio may invest up to 0.40% of its net assets as capital in Vanguard. At December 31, 2015, the portfolio had contributed to Vanguard capital in the amount of $204,000, representing 0.01% of the portfolio’s net assets and 0.08% of Vanguard’s capitalization. The portfolio’s trustees and officers are also directors and employees, respectively, of Vanguard.
D. Various inputs may be used to determine the value of the portfolio’s investments. These inputs are summarized in three broad levels for financial statement purposes. The inputs or methodologies used to value securities are not necessarily an indication of the risk associated with investing in those securities.
Level 1—Quoted prices in active markets for identical securities.
Level 2—Other significant observable inputs (including quoted prices for similar securities, interest rates, prepayment speeds, credit risk, etc.).
Level 3—Significant unobservable inputs (including the portfolio’s own assumptions used to determine the fair value of investments).
The following table summarizes the market value of the portfolio’s investments as of December 31, 2015, based on the inputs used to value them:
| | | |
| Level 1 | Level 2 | Level 3 |
| Investments | ($000) | ($000) | ($000) |
| Common Stocks | 1,392,128 | 89,951 | — |
| U.S. Government and Agency Obligations | — | 164,195 | — |
| Asset-Backed/Commercial Mortgage-Backed Securities | — | 36,925 | — |
| Corporate Bonds | — | 514,962 | — |
| Sovereign Bonds | — | 22,390 | — |
| Taxable Municipal Bonds | — | 40,151 | — |
| Temporary Cash Investments | — | 40,865 | — |
| Futures Contracts—Assets1 | 18 | — | — |
| Futures Contracts—Liabilities1 | (59) | — | — |
| Total | 1,392,087 | 909,439 | — |
| 1 Represents variation margin on the last day of the reporting period. |
E. At December 31, 2015, the aggregate settlement value of open futures contracts and the related unrealized appreciation (depreciation) were:
| | | | |
| | | | ($000) |
| Aggregate |
| Number of | Settlement | Unrealized |
| Long (Short) | Value | Appreciation |
| Futures Contracts | Expiration | Contracts | Long (Short) | (Depreciation) |
| 10-Year U.S. Treasury Note | March 2016 | (171) | (21,530) | 61 |
| 5-Year U.S. Treasury Note | March 2016 | (56) | (6,626) | 22 |
| Ultra Long U.S. Treasury Bond | March 2016 | 18 | 2,856 | (49) |
| 34 |
Unrealized appreciation (depreciation) on open futures contracts is required to be treated as realized gain (loss) for tax purposes.
21
Vanguard Balanced Portfolio
F. Distributions are determined on a tax basis and may differ from net investment income and realized capital gains for financial reporting purposes. Differences may be permanent or temporary. Permanent differences are reclassified among capital accounts in the financial statements to reflect their tax character. Temporary differences arise when certain items of income, expense, gain, or loss are recognized in different periods for financial statement and tax purposes. These differences will reverse at some time in the future. Differences in classification may also result from the treatment of short-term gains as ordinary income for tax purposes.
During the year ended December 31, 2015, the portfolio realized net foreign currency losses of $14,000, which decreased distributable net income for tax purposes; accordingly, such losses have been reclassified from accumulated net realized gains to undistributed net investment income.
For tax purposes, at December 31, 2015, the portfolio had $59,899,000 of ordinary income and $102,161,000 of long-term capital gains available for distribution.
At December 31, 2015, the cost of investment securities for tax purposes was $1,955,137,000. Net unrealized appreciation of investment securities for tax purposes was $346,430,000, consisting of unrealized gains of $409,987,000 on securities that had risen in value since their purchase and $63,557,000 in unrealized losses on securities that had fallen in value since their purchase.
G. During the year ended December 31, 2015, the portfolio purchased $478,633,000 of investment securities and sold $423,043,000 of investment securities, other than U.S. government securities and temporary cash investments. Purchases and sales of U.S. government securities were $609,353,000 and $609,262,000, respectively.
H. Capital shares issued and redeemed were:
| | |
| Year Ended December 31, |
| 2015 | 2014 |
| Shares | Shares |
| (000) | (000) |
| Issued | 9,057 | 9,848 |
| Issued in Lieu of Cash Distributions | 7,341 | 7,341 |
| Redeemed | (10,090) | (8,199) |
| Net Increase (Decrease) in Shares Outstanding | 6,308 | 8,990 |
At December 31, 2015, one shareholder, an insurance company separate account whose holdings in the portfolio represent the indirect investment of Vanguard Variable Annuity contract holders, was the record or beneficial owner of 78% of the portfolio’s net assets. If the shareholder were to redeem its investment in the portfolio, the redemption might result in an increase in the portfolio’s expense ratio or cause the portfolio to incur higher transaction costs.
I. Management has determined that no material events or transactions occurred subsequent to December 31, 2015, that would require recognition or disclosure in these financial statements.
22
Vanguard Balanced Portfolio
Report of Independent Registered Public Accounting Firm
To the Board of Trustees of Vanguard Variable Insurance Funds and the Shareholders of Balanced Portfolio: In our opinion, the accompanying statement of net assets and the related statements of operations and of changes in net assets and the financial highlights present fairly, in all material respects, the financial position of Balanced Portfolio (constituting a separate portfolio of Vanguard Variable Insurance Funds, hereafter referred to as the “Portfolio”) at December 31, 2015, the results of its operations for the year then ended, the changes in its net assets for each of the two years in the period then ended, and the financial highlights for each of the five years in the period then ended, in conformity with accounting principles generally accepted in the United States of America. These financial statements and financial highlights (hereafter referred to as “financial statements”) are the responsibility of the Portfolio’s management. Our responsibility is to express an opinion on these financial statements based on our audits. We conducted our audits of these financial statements in accordance with the standards of the Public Company Accounting Oversight Board (United States). Those standards require that we plan and perform the audit to obtain reasonable assurance about whether the financial statements are free of material misstatement. An audit includes examining, on a test basis, evidence supporting the amounts and disclosures in the financial statements, assessing the accounting principles used and significant estimates made by management, and evaluating the overall financial statement presentation. We believe that our audits, which included confirmation of securities at December 31, 2015 by correspondence with the custodian and brokers and the application of alternative auditing procedures where securities purchased had not been received, provide a reasonable basis for our opinion.
/s/PricewaterhouseCoopers LLP
Philadelphia, Pennsylvania
February 11, 2016
|
| |
| |
| Special 2015 tax information (unaudited) for corporate shareholders only for Vanguard |
| Balanced Portfolio, a portfolio of Vanguard Variable Insurance Funds |
| |
| This information for the fiscal year ended December 31, 2015, is included pursuant to provisions |
| of the Internal Revenue Code for corporate shareholders only. |
| |
| The portfolio distributed $104,109,000 as capital gain dividends (20% rate gain distributions) to |
| shareholders during the fiscal year. |
| |
| For corporate shareholders, 53.0% of investment income (dividend income plus short-term gains, |
| if any) qualifies for the dividends-received deduction. |
23
Vanguard Balanced Portfolio
About Your Portfolio’s Expenses
As a shareholder of the portfolio, you incur ongoing costs, which include costs for portfolio management, administrative services, and shareholder reports (like this one), among others. Operating expenses, which are deducted from a portfolio’s gross income, directly reduce the investment return of the portfolio.
A portfolio’s expenses are expressed as a percentage of its average net assets. This figure is known as the expense ratio. The following examples are intended to help you understand the ongoing costs (in dollars) of investing in your portfolio and to compare these costs with those of other mutual funds. The examples are based on an investment of $1,000 made at the beginning of the period shown and held for the entire period.
The table below illustrates your portfolio’s costs in two ways:
• Based on actual portfolio return. This section helps you to estimate the actual expenses that you paid over the period. The “Ending Account Value” shown is derived from the portfolio’s actual return, and the third column shows the dollar amount that would have been paid by an investor who started with $1,000 in the portfolio. You may use the information here, together with the amount you invested, to estimate the expenses that you paid over the period.
To do so, simply divide your account value by $1,000 (for example, an $8,600 account value divided by $1,000 = 8.6), then multiply the result by the number given for your portfolio under the heading “Expenses Paid During Period.”
• Based on hypothetical 5% yearly return. This section is intended to help you compare your portfolio’s costs with those of other mutual funds. It assumes that the portfolio had a yearly return of 5% before expenses, but that the expense ratio is unchanged. In this case—because the return used is not the portfolio’s actual return—the results do not apply to your investment. The example is useful in making comparisons because the Securities and Exchange Commission requires all mutual funds to calculate expenses based on a 5% return. You can assess your portfolio’s costs by comparing this hypothetical example with the hypothetical examples that appear in shareholder reports of other funds.
Note that the expenses shown in the table are meant to highlight and help you compare ongoing costs only and do not reflect transaction costs incurred by the portfolio for buying and selling securities. The portfolio’s expense ratio does not reflect additional fees and expenses associated with the annuity or life insurance program through which you invest.
The calculations assume no shares were bought or sold during the period. Your actual costs may have been higher or lower, depending on the amount of your investment and the timing of any purchases or redemptions.
You can find more information about the portfolio’s expenses in the Financial Statements section. For additional information on operating expenses and other shareholder costs, please refer to the prospectus.
| | | |
| Six Months Ended December 31, 2015 | | | |
| Beginning | Ending | Expenses |
| Account Value | Account Value | Paid During |
| Balanced Portfolio | 6/30/2015 | 12/31/2015 | Period1 |
| Based on Actual Portfolio Return | $1,000.00 | $997.76 | $1.21 |
| Based on Hypothetical 5% Yearly Return | 1,000.00 | 1,024.00 | 1.22 |
1 The calculations are based on expenses incurred in the most recent six-month period. The portfolio’s annualized six-month expense ratio for that period is 0.24%. The dollar amounts shown as “Expenses Paid” are equal to the annualized expense ratio multiplied by the average account value over the period, multiplied by the number of days in the most recent six-month period, then divided by the number of days in the most recent 12-month period (184/365).
24
Vanguard® Capital Growth Portfolio
Advisor’s Report
For the fiscal year ended December 31, 2015, Vanguard Capital Growth Portfolio returned 2.62%, exceeding the 1.38% return of its benchmark, the unmanaged Standard & Poor’s 500 Index, and the 2.41% average return of its variable insurance multi-capitalization growth fund competitors. Please note that the returns for Vanguard Variable Insurance Fund are different from those of Vanguard Variable Annuity (and other plans that invest in the fund), which take into account insurance-related expenses.
Relative to the S&P 500 Index, favorable sector allocations, including an underweight position in energy and overweight positions in health care and information technology, were partially offset by unfavorable stock selections.
Investment environment
After three consecutive years of double- digit gains, the S&P 500 Index returned just over 1%. Volatility was significant during the year, as investor concerns regarding China’s economy and stock market led to a correction during the third quarter. A few large-capitalization growth stocks, led by the so-called FANG group of internet companies (Facebook, Amazon, Netflix, and Google, now part of Alphabet), performed well while the broader market, especially value stocks and small-capitalization stocks, declined. The year was also characterized by record merger-and-acquisition volumes and increasing capital returns to shareholders.
In December, the Federal Reserve raised its target for the federal funds rate for the first time since 2006. Several additional rate increases are expected in 2016. Conversely, central banks in Europe, Japan, and China are not expected to tighten monetary policy in the foreseeable future.
Commodity prices fell over the course of the year as the supply of many commodities outstripped demand. After plummeting 46% in 2014, West Texas Intermediate crude oil fell a further 30% in 2015. Slowing growth in China, actions taken by OPEC, and stronger-than-expected U.S. production were cited as reasons for the ongoing price decline.
The U.S. economy continued to expand at a moderate rate, as real GDP through the third quarter of 2015 grew 2.6% from the prior-year period. The U.S. consumer benefited from an improving labor market (the unemployment rate was 5.0% in December, the lowest since 2008), low inflation (aided by lower gasoline prices), and high asset prices relative to several years ago. Notably, the average homeowner had $156,700 of home equity during the second quarter, up from $81,000 four years ago. The industrial economy faltered, hurt by weak foreign demand, budget cuts by energy firms, and an inventory correction. Companies with international sales were hurt by the strengthening U.S. dollar.
On the geopolitical front, the Middle East remained mired in conflict. Terrorist acts linked to the Islamic State took place in Paris in November and in San Bernardino, California, in December.
Outlook for U.S. equities
We find U.S. equities to be fairly valued at current levels. As of December 31, 2015, the S&P 500 Index was trading for approximately 16 times the next 12 months’ earnings, a reasonable valuation by historical standards, though the index appears more expensive on a price-to-sales basis since profit margins are near all-time highs. We continue to believe that many individual stocks are attractively valued and that stocks represent a more attractive investment than bonds at current prices.
Portfolio update and outlook
The portfolio was overweighted in information technology, health care, and industrial stocks. These sectors constituted about 80% of the portfolio’s holdings, on average (compared with a 45% combined average weighting in the S&P 500 Index).
| | |
| Total Returns | | |
| | Ten Years Ended |
| | December 31, 2015 |
| Year Ended | Average |
| December 31, 2015 | Annual Return |
| Vanguard Capital Growth Portfolio | 2.62% | 9.84% |
| S&P 500 Index | 1.38 | 7.31 |
| Variable Insurance Multi-Cap Growth Funds Average1 | 2.41 | 6.34 |
The figures shown represent past performance, which is not a guarantee of future results. (Current performance may be lower or higher than the performance data cited. For performance data current to the most recent month-end, visit our website at vanguard.com/performance.) Note, too, that both investment returns and principal value can fluctuate widely, so an investor’s shares, when sold, could be worth more or less than their original cost.
Expense Ratios2
Your Portfolio Compared With Its Peer Group
| | |
| Multi-Cap Growth |
| Portfolio | Funds Average |
| Capital Growth Portfolio | 0.40% | 0.82% |
1 Derived from data provided by Lipper, a Thomson Reuters Company.
2 The portfolio expense ratio shown is from the prospectus dated April 30, 2015, and represents estimated costs for the current fiscal year. For the fiscal year ended December 31, 2015, the Capital Growth Portfolio’s expense ratio was 0.36%. The peer-group expense ratio is derived from data provided by Lipper, a Thomson Reuters Company, and captures information through year-end 2014.
25
Vanguard Capital Growth Portfolio
As we noted, favorable sector allocations, notably in energy (underweight), health care (overweight), and information technology (overweight), were partially offset by unfavorable stock selection. Favorable selection in financials and consumer discretionary was more than offset by unfavorable selection in health care, materials, industrials, and information technology.
In the health care sector, Biogen (–10%) accounted for most of the portfolio’s negative relative return. Monsanto (–16%) and Potash Corp. (–49%) led to underperformance in the materials sector, while FedEx (–14%) was the largest detractor in the industrial sector. The portfolio’s relative return in the information technology sector was slightly negative, as outperformance in software and internet stocks was offset by underperformance in hardware, communications equipment, and semiconductor stocks. The largest positive contributors were Adobe (+29%), Google/Alphabet (+46%), Microsoft (+23%), and NVIDIA (+67%), while the largest detractors were Micron (–60%), HP Inc. (–37%), NetApp (–35%), and QUALCOMM (–31%). Outperformance in the financial sector was driven by Chubb (+31%), which agreed to be acquired by ACE, and Charles Schwab (+10%). In the consumer discretionary sector, the negative impact from the fund’s minimal exposure to Amazon (+118%) was more than offset by its investments in L Brands (+16%), Carnival (+23%), Sony (+21%), and Ross Stores (+15%).
Energy
The portfolio remains significantly underweighted in the energy sector, which was the worst-performing sector in the S&P 500 Index in 2015. We have found few compelling investments within the sector, as we believe current valuations assume a significant increase in oil prices from recent levels. We view declining production costs and slower demand from China and other emerging markets as long-term, not cyclical, trends.
Furthermore, new technologies such as vehicle electrification may reduce oil demand over the long term.
Industrials
Within industrials, we continue to find our investments in the airline sector to be attractive. Airlines stand to benefit significantly from lower oil prices since fuel represents around 30% of their costs. Moreover, the industry has consolidated significantly, and the four largest airlines now represent over 80% of total capacity. Management teams are increasingly focused on generating adequate returns on capital rather than chasing unprofitable market share. This is currently being enabled by historically high load factors (a measure of capacity utilization). In light of these industry dynamics, strong free cash flows, and low valuation multiples, we remain overweighted in airlines.
Information technology
We believe that our holdings within information technology represent compelling investments. A major technological shift is under way as software, storage, and computing power continue to move to the “cloud,” where users can rent these services over the internet. This shift is helping to enable new “big data” and mobility applications, while simultaneously increasing demand for certain types of storage and processing infrastructure. Though these trends have mixed implications for some holdings with legacy technologies, these companies’ strong competitive positions, cash-rich balance sheets, and healthy cash-flow generation enable them to invest ample resources in cloud-based offerings. In addition, we believe the low valuation multiples assigned to many of these stocks more than adequately reflect the risks associated with this transition.
Health care
We continue to believe that the health care industry’s long-term outlook is favorable. Increasing demand for health care products will be driven by demographic trends as well as the industry’s ability to develop new and more effective therapies. The industry’s pipeline includes promising new treatments for cancer, Alzheimer’s, and autoimmune diseases. In addition, the reduction in cost of genetic sequencing may result in new breakthroughs in drug development. Furthermore, the valuations of large-cap biotech and pharmaceutical companies are reasonable, with some trading at a discount to the S&P 500 Index price-to-earnings multiple in spite of their superior growth profiles.
Tempering our positive outlook is the nearer-term uncertainty over reimbursement and pricing. Last year, pharmacy benefit managers extracted higher-than-expected pricing concessions from AbbVie and Gilead as the two firms competed for market share with their new drugs for hepatitis C. The recent proposal from presidential candidate Hillary Clinton to reduce pharmaceutical spending has again raised the specter of government-negotiated or -mandated pricing. While we are mindful of these potential negatives, we believe that companies with novel drug treatments that provide significant benefits over existing therapies will continue to receive favorable reimbursement from payors.
Conclusion
We remain committed to our investment philosophy, which is to invest in attractively priced stocks for the long term. This “bottom-up” approach often results in portfolios that bear little resemblance to market indexes; therefore, our results often deviate substantially from such indexes. Furthermore, our long-term investment horizon results in low portfolio turnover, which creates the possibility for extended periods of underperformance when the stocks in our portfolio fall out of favor. We nonetheless believe that this approach can generate superior results for shareholders over the long term.
PRIMECAP Management Company
January 13, 2016
26
Vanguard Capital Growth Portfolio
Portfolio Profile
As of December 31, 2015
| | |
| Portfolio Characteristics | | |
| Comparative |
| Portfolio | Index1 |
| Number of Stocks | 99 | 504 |
| Median Market Cap | $68.3B | $81.0B |
| Price/Earnings Ratio | 21.8x | 20.5x |
| Price/Book Ratio | 3.6x | 2.8x |
| Yield2 | 1.3% | 2.2% |
| Return on Equity | 18.9% | 18.3% |
| Earnings Growth Rate | 8.6% | 9.2% |
| Foreign Holdings | 10.0% | 0.0% |
| Turnover Rate | 5% | — |
| Expense Ratio3 | 0.40% | — |
| Short-Term Reserves | 5.3% | — |
| |
| Volatility Measures | |
| Portfolio Versus |
| Comparative Index1 |
| R-Squared | 0.90 |
| Beta | 0.93 |
| | |
| Sector Diversification (% of equity exposure) |
| Comparative |
| Portfolio | Index1 |
| Consumer Discretionary | 8.6% | 12.9% |
| Consumer Staples | 0.5 | 10.1 |
| Energy | 1.4 | 6.5 |
| Financials | 6.6 | 16.5 |
| Health Care | 28.5 | 15.2 |
| Industrials | 15.9 | 10.1 |
| Information Technology | 35.6 | 20.5 |
| Materials | 1.8 | 2.8 |
| Telecommunication Services | 1.1 | 2.4 |
| Utilities | 0.0 | 3.0 |
| | |
| Ten Largest Holdings4 (% of total net assets) |
| |
| Biogen Idec Inc. | Biotechnology | 5.4% |
| Eli Lilly & Co. | Pharmaceuticals | 5.1 |
| Amgen Inc. | Biotechnology | 4.9 |
| Microsoft Corp. | Systems Software | 4.8 |
| Alphabet Inc. | Internet Software | |
| & Services | 4.7 |
| Adobe Systems Inc. | Application | |
| Software | 4.4 |
| Texas Instruments Inc. | Semiconductors | 4.2 |
| Roche Holding AG | Pharmaceuticals | 3.4 |
| Southwest Airlines Co. | Airlines | 3.2 |
| FedEx Corp. | Air Freight | |
| & Logistics | 3.1 |
| Top Ten | 43.2% |
Investment Focus

30-Day SEC Yield. A portfolio’s 30-day SEC yield is derived using a formula specified by the U.S. Securities and Exchange Commission. Under the formula, data related to the portfolio’s security holdings in the previous 30 days are used to calculate the portfolio’s hypothetical net income for that period, which is then annualized and divided by the portfolio’s estimated average net assets over the calculation period. For the purposes of this calculation, a security’s income is based on its current market yield to maturity (for bonds), its actual income (for asset-backed securities), or its projected dividend yield (for stocks). Because the SEC yield represents hypothetical annualized income, it will differ—at times significantly—from the portfolio’s actual experience. As a result, the portfolio’s income distributions may be higher or lower than implied by the SEC yield.
Beta. A measure of the magnitude of a portfolio’s past share-price fluctuations in relation to the ups and downs of a given market index. The index is assigned a beta of 1.00. Compared with a given index, a portfolio with a beta of 1.20 typically would have seen its share price rise or fall by 12% when the index rose or fell by 10%. For this report, beta is based on returns over the past 36 months for both the portfolio and the index.
Equity Exposure. A measure that reflects a portfolio’s investments in stocks and stock futures. Any holdings in short-term reserves are excluded.
R-Squared. A measure of how much of a portfolio’s past returns can be explained by the returns from the market in general, as measured by a given index. If a portfolio’s total returns were precisely synchronized with an index’s returns, its R-squared would be 1.00. If the portfolio’s returns bore no relationship to the index’s returns, its R-squared would be 0. For this report, R-squared is based on returns over the past 36 months for both the portfolio and the index.
1 S&P 500 Index.
2 30-day SEC yield for the portfolio; annualized dividend yield for the index.
3 The expense ratio shown is from the prospectus dated April 30, 2015, and represents estimated costs for the current fiscal year. For the fiscal year ended December 31, 2015, the Capital Growth Portfolio’s expense ratio was 0.36%.
4 The holdings listed exclude any temporary cash investments and equity index products.
27
Vanguard Capital Growth Portfolio
Performance Summary
All of the returns in this report represent past performance, which is not a guarantee of future results that may be achieved by the portfolio. (Current performance may be lower or higher than the performance data cited. For performance data current to the most recent month-end, visit our website at vanguard.com/performance.) Note, too, that both investment returns and principal value can fluctuate widely, so an investor’s shares, when sold, could be worth more or less than their original cost. The returns shown do not reflect taxes that a shareholder would pay on portfolio distributions or on the sale of portfolio shares. Nor do the returns reflect fees and expenses associated with the annuity or life insurance program through which a shareholder invests. If these fees and expenses were included, the portfolio’s returns would be lower.
Cumulative Performance: December 31, 2005–December 31, 2015
Initial Investment of $10,000
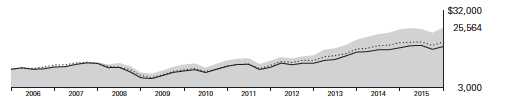
| | | | |
| | | Average Annual Total Returns | Final Value |
| | Periods Ended December 31, 2015 | of a $10,000 |
| | One Year | Five Years | Ten Years | Investment |
| Capital Growth Portfolio | 2.62% | 14.00% | 9.84% | $25,564 |
| S&P 500 Index | 1.38 | 12.57 | 7.31 | 20,242 |
| Variable Insurance Multi-Cap Growth | | | | |
| Funds Average1 | 2.41 | 10.69 | 6.34 | 18,488 |
Fiscal-Year Total Returns (%): December 31, 2005–December 31, 2015
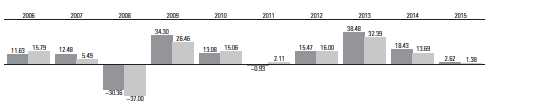
| |
| Capital Growth Portfolio |
| S&P 500 Index |
1 Derived from data provided by Lipper, a Thomson Reuters Company.
See Financial Highlights for dividend and capital gains information.
28
Vanguard Capital Growth Portfolio
Financial Statements
Statement of Net Assets
As of December 31, 2015
The portfolio reports a complete list of its holdings in regulatory filings four times in each fiscal year, at the quarter-ends. For the second and fourth fiscal quarters, the lists appear in the portfolio’s semiannual and annual reports to shareholders. For the first and third fiscal quarters, the portfolio files the lists with the Securities and Exchange Commission on Form N-Q. Shareholders can look up the portfolio’s Forms N-Q on the SEC’s website at sec.gov. Forms N-Q may also be reviewed and copied at the SEC’s Public Reference Room (see the back cover of this report for further information).
| | | |
| Market |
| Value• |
| | Shares | ($000) |
| Common Stocks (94.9%) | | |
| Consumer Discretionary (8.1%) | | |
| L Brands Inc. | 204,600 | 19,605 |
| TJX Cos. Inc. | 133,000 | 9,431 |
| Ross Stores Inc. | 175,100 | 9,422 |
| Walt Disney Co. | 86,700 | 9,111 |
| Sony Corp. ADR | 324,900 | 7,996 |
| Carnival Corp. | 140,800 | 7,671 |
| * | Amazon.com Inc. | 3,500 | 2,366 |
| Royal Caribbean Cruises Ltd. | 23,300 | 2,358 |
| * | Bed Bath & Beyond Inc. | 41,700 | 2,012 |
| Whirlpool Corp. | 6,600 | 969 |
| Time Warner Cable Inc. | 4,700 | 872 |
| VF Corp. | 13,500 | 840 |
| 72,653 |
| Consumer Staples (0.5%) | | |
| CVS Health Corp. | 41,300 | 4,038 |
| | |
| Energy (1.4%) | | |
| Schlumberger Ltd. | 58,500 | 4,080 |
| EOG Resources Inc. | 41,700 | 2,952 |
| ^ | Transocean Ltd. | 193,600 | 2,397 |
| Noble Energy Inc. | 48,800 | 1,607 |
| Exxon Mobil Corp. | 11,200 | 873 |
| National Oilwell Varco Inc. | 10,800 | 362 |
| 12,271 |
| Financials (6.2%) | | |
| Charles Schwab Corp. | 488,600 | 16,090 |
| Marsh & McLennan | | |
| | Cos. Inc. | 211,900 | 11,750 |
| Wells Fargo & Co. | 180,700 | 9,823 |
| JPMorgan Chase & Co. | 87,200 | 5,758 |
| Progressive Corp. | 120,700 | 3,838 |
| Chubb Corp. | 22,800 | 3,024 |
| US Bancorp | 53,400 | 2,279 |
| CME Group Inc. | 15,100 | 1,368 |
| Discover Financial Services | 21,400 | 1,147 |
| American Express Co. | 7,800 | 542 |
| 55,619 |
| Health Care (27.0%) | | |
| * | Biogen Inc. | 156,200 | 47,852 |
| Eli Lilly & Co. | 542,700 | 45,728 |
| Amgen Inc. | 267,971 | 43,500 |
| Roche Holding AG | 109,900 | 30,454 |
| Novartis AG ADR | 246,250 | 21,187 |
| Medtronic plc | 171,900 | 13,223 |
| Johnson & Johnson | 117,400 | 12,059 |
| * | Boston Scientific Corp. | 544,502 | 10,041 |
| Thermo Fisher Scientific Inc. | 49,700 | 7,050 |
| Abbott Laboratories | 123,300 | 5,537 |
| GlaxoSmithKline plc ADR | 58,100 | 2,344 |
| | | |
| Market |
| Value• |
| | Shares | ($000) |
| Sanofi ADR | 36,800 | 1,570 |
| AbbVie Inc. | 14,000 | 829 |
| 241,374 |
| Industrials (15.1%) | | |
| Southwest Airlines Co. | 661,750 | 28,495 |
| FedEx Corp. | 188,700 | 28,114 |
| Airbus Group SE | 213,300 | 14,374 |
| Alaska Air Group Inc. | 132,700 | 10,684 |
| Honeywell International Inc. | 69,600 | 7,208 |
| * | United Continental Holdings | | |
| | Inc. | 107,200 | 6,143 |
| Union Pacific Corp. | 71,100 | 5,560 |
| Caterpillar Inc. | 78,900 | 5,362 |
| Delta Air Lines Inc. | 90,100 | 4,567 |
| United Parcel Service Inc. | | |
| | Class B | 43,550 | 4,191 |
| Deere & Co. | 50,900 | 3,882 |
| Boeing Co. | 23,200 | 3,354 |
| American Airlines Group Inc. | 70,200 | 2,973 |
| United Technologies Corp. | 20,400 | 1,960 |
| CH Robinson Worldwide Inc. | 30,600 | 1,898 |
| Pentair plc | 28,300 | 1,402 |
| Safran SA | 18,900 | 1,298 |
| CSX Corp. | 42,500 | 1,103 |
| Rockwell Automation Inc. | 8,000 | 821 |
| Expeditors International of | | |
| | Washington Inc. | 14,100 | 636 |
| * | Hertz Global Holdings Inc. | 38,400 | 546 |
| 134,571 |
| Information Technology (33.9%) | |
| Microsoft Corp. | 766,700 | 42,536 |
| * | Adobe Systems Inc. | 420,000 | 39,455 |
| Texas Instruments Inc. | 686,500 | 37,627 |
| * | Alphabet Inc. Class A | 27,500 | 21,395 |
| * | Alphabet Inc. Class C | 27,570 | 20,922 |
| * | Alibaba Group Holding Ltd. | | |
| | ADR | 159,600 | 12,971 |
| Intel Corp. | 355,000 | 12,230 |
| Intuit Inc. | 95,500 | 9,216 |
| QUALCOMM Inc. | 182,000 | 9,097 |
| EMC Corp. | 340,700 | 8,749 |
| NVIDIA Corp. | 251,750 | 8,298 |
| Hewlett Packard Enterprise | | |
| | Co. | 506,550 | 7,700 |
| KLA-Tencor Corp. | 110,100 | 7,635 |
| * | Micron Technology Inc. | 533,500 | 7,554 |
| Telefonaktiebolaget LM | | |
| | Ericsson ADR | 717,500 | 6,895 |
| NetApp Inc. | 255,400 | 6,776 |
| Cisco Systems Inc. | 242,700 | 6,590 |
| HP Inc. | 506,550 | 5,998 |
| Oracle Corp. | 141,300 | 5,162 |
| | | |
| Market |
| Value• |
| | Shares | ($000) |
| Visa Inc. Class A | 58,200 | 4,513 |
| Activision Blizzard Inc. | 116,000 | 4,490 |
| Plantronics Inc. | 71,650 | 3,398 |
| Broadcom Corp. Class A | 45,900 | 2,654 |
| Analog Devices Inc. | 42,400 | 2,346 |
| * | BlackBerry Ltd. | 195,800 | 1,817 |
| Corning Inc. | 98,350 | 1,798 |
| * | PayPal Holdings Inc. | 31,700 | 1,148 |
| Apple Inc. | 9,500 | 1,000 |
| MasterCard Inc. Class A | 9,800 | 954 |
| * | eBay Inc. | 31,700 | 871 |
| SanDisk Corp. | 8,700 | 661 |
| * | Entegris Inc. | 46,900 | 622 |
| 303,078 |
| Materials (1.7%) | | |
| Monsanto Co. | 121,300 | 11,951 |
| Potash Corp. of | | |
| | Saskatchewan Inc. | 104,700 | 1,792 |
| Praxair Inc. | 17,400 | 1,782 |
| 15,525 |
| Telecommunication Services (1.0%) | |
| AT&T Inc. | 259,508 | 8,930 |
| Total Common Stocks | | |
| (Cost $575,118) | 848,059 |
| Temporary Cash Investment (5.3%) | |
| Money Market Fund (5.3%) | | |
| 1,2 Vanguard Market Liquidity | | |
| | Fund, 0.363% | | |
| | (Cost $47,817) | 47,817,075 | 47,817 |
| Total Investments (100.2%) | | |
| (Cost $622,935) | 895,876 |
| |
| Amount |
| ($000) |
| Other Assets and Liabilities (-0.2%) | |
| Other Assets | | |
| Investment in Vanguard | 79 |
| Receivables for Capital Shares Issued | 1,295 |
| Receivables for Accrued Income | 888 |
| Total Other Assets | 2,262 |
| Liabilities | | |
| Collateral for Securities on Loan | (2,261) |
| Payables to Investment Advisor | (334) |
| Payables for Capital Shares Redeemed | (775) |
| Payables to Vanguard | (928) |
| Other Liabilities | (11) |
| Total Liabilities | (4,309) |
| Net Assets (100%) | | |
| Applicable to 33,547,995 outstanding | |
| $.001 par value shares of beneficial | |
| interest (unlimited authorization) | 893,829 |
| Net Asset Value Per Share | $26.64 |
29
Vanguard Capital Growth Portfolio
| |
| At December 31, 2015, net assets consisted of: |
| Amount |
| ($000) |
| Paid-in Capital | 587,908 |
| Undistributed Net Investment Income | 9,669 |
| Accumulated Net Realized Gains | 23,332 |
| Unrealized Appreciation (Depreciation) | |
| Investment Securities | 272,941 |
| Foreign Currencies | (21) |
| Net Assets | 893,829 |
• See Note A in Notes to Financial Statements.
* Non-income-producing security.
^ Includes partial security positions on loan to broker-dealers. The total value of securities on loan is $2,153,000.
1 Affiliated money market fund available only to Vanguard funds and certain trusts and accounts managed by Vanguard. Rate shown is the 7-day yield.
2 Includes $2,261,000 of collateral received for securities on loan.
ADR—American Depositary Receipt.
See accompanying Notes, which are an integral part of the Financial Statements.
30
Vanguard Capital Growth Portfolio
| | | |
| Statement of Operations |
| |
| Year Ended |
| | December 31, 2015 |
| | ($000) |
| Investment Income | | |
| Income | | |
| Dividends1 | 13,461 |
| Interest 2 | 105 |
| Securities Lending | 186 |
| Total Income | 13,752 |
| Expenses | | |
| Investment Advisory Fees—Note B | 1,313 |
| The Vanguard Group—Note C | | |
| Management and Administrative | 1,603 |
| Marketing and Distribution | 164 |
| Custodian Fees | 18 |
| Auditing Fees | 31 |
| Shareholders’ Reports | 18 |
| Trustees’ Fees and Expenses | 1 |
| Total Expenses | 3,148 |
| Net Investment Income | 10,604 |
| Realized Net Gain (Loss) | | |
| Investment Securities Sold | 23,375 |
| Foreign Currencies | (14) |
| Realized Net Gain (Loss) | 23,361 |
| Change in Unrealized Appreciation | |
| (Depreciation) | | |
| Investment Securities | (12,514) |
| Foreign Currencies | (1) |
| Change in Unrealized Appreciation | |
| (Depreciation) | (12,515) |
| Net Increase (Decrease) in Net Assets | |
| Resulting from Operations | 21,450 |
1 Dividends are net of foreign withholding taxes of $336,000.
2 Interest income from an affiliated company of the portfolio was $105,000.
| | |
| Statement of Changes in Net Assets | | |
| |
| Year Ended December 31, |
| 2015 | 2014 |
| ($000) | ($000) |
| Increase (Decrease) in Net Assets | | |
| Operations | | |
| Net Investment Income | 10,604 | 9,373 |
| Realized Net Gain (Loss) | 23,361 | 28,567 |
| Change in Unrealized Appreciation (Depreciation) | (12,515) | 82,133 |
| Net Increase (Decrease) in Net Assets Resulting from Operations | 21,450 | 120,073 |
| Distributions | | |
| Net Investment Income | (9,459) | (6,008) |
| Realized Capital Gain | (28,597) | (13,257) |
| Total Distributions | (38,056) | (19,265) |
| Capital Share Transactions | | |
| Issued | 191,432 | 172,797 |
| Issued in Lieu of Cash Distributions | 38,056 | 19,265 |
| Redeemed | (148,174) | (95,031) |
| Net Increase (Decrease) from Capital Share Transactions | 81,314 | 97,031 |
| Total Increase (Decrease) | 64,708 | 197,839 |
| Net Assets |
| Beginning of Period | 829,121 | 631,282 |
| End of Period1 | 893,829 | 829,121 |
| 1 Net Assets—End of Period includes undistributed (overdistributed) net investment income of $9,669,000 and $8,538,000. |
See accompanying Notes, which are an integral part of the Financial Statements.
31
Vanguard Capital Growth Portfolio
Financial Highlights
| | | | | |
| For a Share Outstanding | | | Year Ended December 31, |
| Throughout Each Period | 2015 | 2014 | 2013 | 2012 | 2011 |
| Net Asset Value, Beginning of Period | $27.15 | $23.60 | $17.68 | $15.69 | $16.38 |
| Investment Operations | |
| Net Investment Income | .310 | .304 | .219 | .255 | .154 |
| Net Realized and Unrealized Gain (Loss) | | | | | |
| on Investments | .391 | 3.945 | 6.421 | 2.152 | (.274) |
| Total from Investment Operations | .701 | 4.249 | 6.640 | 2.407 | (.120) |
| Distributions | | |
| Dividends from Net Investment Income | (.301) | (.218) | (.250) | (.165) | (.145) |
| Distributions from Realized Capital Gains | (.910) | (.481) | (.470) | (.252) | (.425) |
| Total Distributions | (1.211) | (.699) | (.720) | (.417) | (.570) |
| Net Asset Value, End of Period | $26.64 | $27.15 | $23.60 | $17.68 | $15.69 |
| |
| Total Return | 2.62% | 18.43% | 38.48% | 15.47% | -0.93% |
| |
| Ratios/Supplemental Data | | |
| Net Assets, End of Period (Millions) | $894 | $829 | $631 | $395 | $370 |
| Ratio of Total Expenses to Average Net Assets | 0.36% | 0.40% | 0.41% | 0.41% | 0.42% |
| Ratio of Net Investment Income to | | | | | |
| Average Net Assets | 1.21% | 1.31% | 1.13% | 1.48% | 1.03% |
| Portfolio Turnover Rate | 5% | 11% | 7% | 6% | 11% |
Notes to Financial Statements
Vanguard Capital Growth Portfolio, a portfolio of Vanguard Variable Insurance Funds, is registered under the Investment Company Act of 1940 as an open-end investment company. The portfolio’s shares are only available for purchase by separate accounts of insurance companies as investments for variable annuity plans, variable life insurance contracts, or other variable benefit insurance contracts.
A. The following significant accounting policies conform to generally accepted accounting principles for U.S. investment companies. The portfolio consistently follows such policies in preparing its financial statements.
1. Security Valuation: Securities are valued as of the close of trading on the New York Stock Exchange (generally 4 p.m., Eastern time) on the valuation date. Equity securities are valued at the latest quoted sales prices or official closing prices taken from the primary market in which each security trades; such securities not traded on the valuation date are valued at the mean of the latest quoted bid and asked prices. Securities for which market quotations are not readily available, or whose values have been affected by events occurring before the portfolio’s pricing time but after the close of the securities’ primary markets, are valued at their fair values calculated according to procedures adopted by the board of trustees. These procedures include obtaining quotations from an independent pricing service, monitoring news to identify significant market- or security-specific events, and evaluating changes in the values of foreign market proxies (for example, ADRs, futures contracts, or exchange-traded funds), between the time the foreign markets close and the portfolio’s pricing time. When fair-value pricing is employed, the prices of securities used by a portfolio to calculate its net asset value may differ from quoted or published prices for the same securities. Investments in Vanguard Market Liquidity Fund are valued at that fund’s net asset value.
2. Foreign Currency: Securities and other assets and liabilities denominated in foreign currencies are translated into U.S. dollars using exchange rates obtained from an independent third party as of the portfolio’s pricing time on the valuation date. Realized gains (losses) and unrealized appreciation (depreciation) on investment securities include the effects of changes in exchange rates since the
32
Vanguard Capital Growth Portfolio
securities were purchased, combined with the effects of changes in security prices. Fluctuations in the value of other assets and liabilities resulting from changes in exchange rates are recorded as unrealized foreign currency gains (losses) until the assets or liabilities are settled in cash, at which time they are recorded as realized foreign currency gains (losses).
3. Federal Income Taxes: The portfolio intends to continue to qualify as a regulated investment company and distribute all of its taxable income. Management has analyzed the portfolio’s tax positions taken for all open federal income tax years (December 31, 2012–2015), and has concluded that no provision for federal income tax is required in the portfolio’s financial statements.
4. Distributions: Distributions to shareholders are recorded on the ex-dividend date.
5. Securities Lending: To earn additional income, the portfolio lends its securities to qualified institutional borrowers. Security loans are subject to termination by the portfolio at any time and are required to be secured at all times by collateral in an amount at least equal to the market value of securities loaned. Daily market fluctuations could cause the value of loaned securities to be more or less than the value of the collateral received. When this occurs, the collateral is adjusted and settled on the next business day. The portfolio further mitigates its counterparty risk by entering into securities lending transactions only with a diverse group of prequalified counterparties, monitoring their financial strength, and entering into master securities lending agreements with its counterparties. The master securities lending agreements provide that, in the event of a counterparty’s default (including bankruptcy), the portfolio may terminate any loans with that borrower, determine the net amount owed, and sell or retain the collateral up to the net amount owed to the portfolio; however, such actions may be subject to legal proceedings. While collateral mitigates counterparty risk, in the absence of a default the portfolio may experience delays and costs in recovering the securities loaned. The portfolio invests cash collateral received in Vanguard Market Liquidity Fund, and records a liability in the Statement of Net Assets for the return of the collateral, during the period the securities are on loan. Securities lending income represents fees charged to borrowers plus income earned on invested cash collateral, less expenses associated with the loan.
6. Credit Facility: The portfolio and certain other funds managed by The Vanguard Group (“Vanguard”) participate in a $3 billion committed credit facility provided by a syndicate of lenders pursuant to a credit agreement that may be renewed annually; each fund is individually liable for its borrowings, if any, under the credit facility. Borrowings may be utilized for temporary and emergency purposes, and are subject to the portfolio’s regulatory and contractual borrowing restrictions. The participating funds are charged administrative fees and an annual commitment fee of 0.06% of the undrawn amount of the facility; these fees are allocated to the funds based on a method approved by the portfolio’s board of trustees and included in Management and Administrative expenses on the portfolio’s Statement of Operations. Any borrowings under this facility bear interest at a rate equal to the higher of the federal funds rate or LIBOR reference rate plus an agreed-upon spread.
The portfolio had no borrowings outstanding at December 31, 2015, or at any time during the period then ended.
7. Other: Dividend income is recorded on the ex-dividend date. Interest income includes income distributions received from Vanguard Market Liquidity Fund and is accrued daily. Security transactions are accounted for on the date securities are bought or sold. Costs used to determine realized gains (losses) on the sale of investment securities are those of the specific securities sold.
B. PRIMECAP Management Company provides investment advisory services to the portfolio for a fee calculated at an annual percentage rate of average net assets. For the year ended December 31, 2015, the investment advisory fee represented an effective annual rate of 0.15% of the portfolio’s average net assets.
C. In accordance with the terms of a Funds’ Service Agreement (the “FSA”) between Vanguard and the portfolio, Vanguard furnishes to the portfolio corporate management, administrative, marketing, and distribution services at Vanguard’s cost of operations (as defined by the FSA). These costs of operations are allocated to the portfolio based on methods and guidelines approved by the board of trustees. Vanguard does not require reimbursement in the current period for certain costs of operations (such as deferred compensation/benefits and risk/insurance costs); the portfolio’s liability for these costs of operations is included in Payables to Vanguard on the Statement of Net Assets.
33
Vanguard Capital Growth Portfolio
Upon the request of Vanguard, the portfolio may invest up to 0.40% of its net assets as capital in Vanguard. At December 31, 2015, the portfolio had contributed to Vanguard capital in the amount of $79,000, representing 0.01% of the portfolio’s net assets and 0.03% of Vanguard’s capitalization. The portfolio’s trustees and officers are also directors and employees, respectively, of Vanguard.
D. Various inputs may be used to determine the value of the portfolio’s investments. These inputs are summarized in three broad levels for financial statement purposes. The inputs or methodologies used to value securities are not necessarily an indication of the risk associated with investing in those securities.
Level 1—Quoted prices in active markets for identical securities.
Level 2—Other significant observable inputs (including quoted prices for similar securities, interest rates, prepayment speeds, credit risk, etc.).
Level 3—Significant unobservable inputs (including the portfolio’s own assumptions used to determine the fair value of investments).
The following table summarizes the market value of the portfolio’s investments as of December 31, 2015, based on the inputs used to value them:
| | | |
| Level 1 | Level 2 | Level 3 |
| Investments | ($000) | ($000) | ($000) |
| Common Stocks | 801,933 | 46,126 | — |
| Temporary Cash Investments | 47,817 | — | — |
| Total | 849,750 | 46,126 | — |
E. Distributions are determined on a tax basis and may differ from net investment income and realized capital gains for financial reporting purposes. Differences may be permanent or temporary. Permanent differences are reclassified among capital accounts in the financial statements to reflect their tax character. Temporary differences arise when certain items of income, expense, gain, or loss are recognized in different periods for financial statement and tax purposes. These differences will reverse at some time in the future. Differences in classification may also result from the treatment of short-term gains as ordinary income for tax purposes.
For tax purposes, at December 31, 2015, the portfolio had $10,636,000 of ordinary income and $23,196,000 of long-term capital gains available for distribution.
At December 31, 2015, the cost of investment securities for tax purposes was $622,935,000. Net unrealized appreciation of investment securities for tax purposes was $272,941,000, consisting of unrealized gains of $299,254,000 on securities that had risen in value since their purchase and $26,313,000 in unrealized losses on securities that had fallen in value since their purchase.
F. During the year ended December 31, 2015, the portfolio purchased $110,952,000 of investment securities and sold $42,057,000 of investment securities, other than temporary cash investments.
G. Capital shares issued and redeemed were:
| | |
| Year Ended December 31, |
| 2015 | 2014 |
| Shares | Shares |
| (000) | (000) |
| Issued | 7,167 | 6,829 |
| Issued in Lieu of Cash Distributions | 1,442 | 811 |
| Redeemed | (5,603) | (3,842) |
| Net Increase (Decrease) in Shares Outstanding | 3,006 | 3,798 |
At December 31, 2015, one shareholder, an insurance company separate account whose holdings in the portfolio represent the indirect investment of Vanguard Variable Annuity contract holders, was the record or beneficial owner of 64% of the portfolio’s net assets. If the shareholder were to redeem its investment in the portfolio, the redemption might result in an increase in the portfolio’s expense ratio or cause the portfolio to incur higher transaction costs.
H. Management has determined that no material events or transactions occurred subsequent to December 31, 2015, that would require recognition or disclosure in these financial statements.
34
Vanguard Capital Growth Portfolio
Report of Independent Registered Public Accounting Firm
To the Board of Trustees of Vanguard Variable Insurance Funds and the Shareholders of Capital Growth Portfolio: In our opinion, the accompanying statement of net assets and the related statements of operations and of changes in net assets and the financial highlights present fairly, in all material respects, the financial position of Capital Growth Portfolio (constituting a separate portfolio of Vanguard Variable Insurance Funds, hereafter referred to as the “Portfolio”) at December 31, 2015, the results of its operations for the year then ended, the changes in its net assets for each of the two years in the period then ended, and the financial highlights for each of the five years in the period then ended, in conformity with accounting principles generally accepted in the United States of America. These financial statements and financial highlights (hereafter referred to as “financial statements”) are the responsibility of the Portfolio’s management. Our responsibility is to express an opinion on these financial statements based on our audits. We conducted our audits of these financial statements in accordance with the standards of the Public Company Accounting Oversight Board (United States). Those standards require that we plan and perform the audit to obtain reasonable assurance about whether the financial statements are free of material misstatement. An audit includes examining, on a test basis, evidence supporting the amounts and disclosures in the financial statements, assessing the accounting principles used and significant estimates made by management, and evaluating the overall financial statement presentation. We believe that our audits, which included confirmation of securities at December 31, 2015 by correspondence with the custodian and by agreement to the underlying ownership records of the transfer agent, provide a reasonable basis for our opinion.
/s/PricewaterhouseCoopers LLP
Philadelphia, Pennsylvania
February 11, 2016
| |
| |
| Special 2015 tax information (unaudited) for corporate shareholders only for Vanguard |
| Capital Growth Portfolio, a portfolio of Vanguard Variable Insurance Funds |
| |
| This information for the fiscal year ended December 31, 2015, is included pursuant to provisions |
| of the Internal Revenue Code for corporate shareholders only. |
| |
| The portfolio distributed $28,597,000 as capital gain dividends (20% rate gain distributions) to |
| shareholders during the fiscal year. |
| |
| For corporate shareholders, 98.5% of investment income (dividend income plus short-term gains, |
| if any) qualifies for the dividends-received deduction. |
35
Vanguard Capital Growth Portfolio
About Your Portfolio’s Expenses
As a shareholder of the portfolio, you incur ongoing costs, which include costs for portfolio management, administrative services, and shareholder reports (like this one), among others. Operating expenses, which are deducted from a portfolio’s gross income, directly reduce the investment return of the portfolio.
A portfolio’s expenses are expressed as a percentage of its average net assets. This figure is known as the expense ratio. The following examples are intended to help you understand the ongoing costs (in dollars) of investing in your portfolio and to compare these costs with those of other mutual funds. The examples are based on an investment of $1,000 made at the beginning of the period shown and held for the entire period.
The table below illustrates your portfolio’s costs in two ways:
• Based on actual portfolio return. This section helps you to estimate the actual expenses that you paid over the period. The “Ending Account Value” shown is derived from the portfolio’s actual return, and the third column shows the dollar amount that would have been paid by an investor who started with $1,000 in the portfolio. You may use the information here, together with the amount you invested, to estimate the expenses that you paid over the period.
To do so, simply divide your account value by $1,000 (for example, an $8,600 account value divided by $1,000 = 8.6), then multiply the result by the number given for your portfolio under the heading “Expenses Paid During Period.”
• Based on hypothetical 5% yearly return. This section is intended to help you compare your portfolio’s costs with those of other mutual funds. It assumes that the portfolio had a yearly return of 5% before expenses, but that the expense ratio is unchanged. In this case—because the return used is not the portfolio’s actual return—the results do not apply to your investment. The example is useful in making comparisons because the Securities and Exchange Commission requires all mutual funds to calculate expenses based on a 5% return. You can assess your portfolio’s costs by comparing this hypothetical example with the hypothetical examples that appear in shareholder reports of other funds.
Note that the expenses shown in the table are meant to highlight and help you compare ongoing costs only and do not reflect transaction costs incurred by the portfolio for buying and selling securities. The portfolio’s expense ratio does not reflect additional fees and expenses associated with the annuity or life insurance program through which you invest.
The calculations assume no shares were bought or sold during the period. Your actual costs may have been higher or lower, depending on the amount of your investment and the timing of any purchases or redemptions.
You can find more information about the portfolio’s expenses in the Financial Statements section. For additional information on operating expenses and other shareholder costs, please refer to the prospectus.
| | | |
| Six Months Ended December 31, 2015 | | | |
| Beginning | Ending | Expenses |
| Account Value | Account Value | Paid During |
| Capital Growth Portfolio | 6/30/2015 | 12/31/2015 | Period1 |
| Based on Actual Portfolio Return | $1,000.00 | $1,021.08 | $1.83 |
| Based on Hypothetical 5% Yearly Return | 1,000.00 | 1,023.39 | 1.84 |
1 The calculations are based on expenses incurred in the most recent six-month period. The portfolio’s annualized six-month expense ratio for that period is 0.36%. The dollar amounts shown as “Expenses Paid” are equal to the annualized expense ratio multiplied by the average account value over the period, multiplied by the number of days in the most recent six-month period, then divided by the number of days in the most recent 12-month period (184/365).
36
Vanguard® Conservative Allocation Portfolio
Despite periods of volatility, U.S. stocks and bonds finished 2015 with positive returns. International stocks didn’t fare as well. For the fiscal year ended December 31, 2015, the Conservative Allocation Portfolio returned 0.20%, not far from its composite benchmark index and better than the average return of its peers.
The table below shows the returns of your portfolio and its comparative standards for the past year. For additional perspective, we also present their annualized returns since the portfolio’s inception. Please note that the portfolio returns in Vanguard Variable Insurance Fund are different from those in Vanguard Variable Annuity (and other plans that invest in the fund), which take into account insurance-related expenses.
U.S. markets had a muted year; international stocks struggled
The Conservative Allocation Portfolio, as a “fund of funds,” seeks to capture the returns of its benchmark by investing in a combination of Vanguard Variable Insurance Fund (VVIF) portfolios and Vanguard index funds. Although the exact percentages may vary, the portfolio targets an asset allocation of approximately 60% bonds and 40% stocks. Its holdings consist of VVIF Total Bond Market Index Portfolio (48%), VVIF Equity Index Portfolio (23%), Vanguard Total International Bond Index Fund (12%), Vanguard Total International Stock Index Fund (12%), and Vanguard Extended Market Index Fund (5%).
The Total Bond Market Index Portfolio, which encompasses most of the U.S. bond market, returned 0.33%. A decline in the prices of its holdings offset much of its earned income. After the Federal Reserve took the long-awaited step of raising its target for short-term rates, short-term yields finished the fiscal year higher than they began it. The upward movement of intermediate- and long-term yields was more muted because of the fragile state of global growth and the subdued outlook for inflation.
Vanguard Total International Bond Index Fund, hedged against currency exposure, returned 1.04%. Without the hedging, its returns would have been negative.
In equity markets, U.S. large-capitalization stocks did better than smaller-caps, but overall returns were muted or negative. The Equity Index Portfolio returned 1.27%, and the Extended Market Index Fund, which focuses on small- and mid-cap stocks, returned –3.39%.
Energy stocks retreated sharply, punished by the steep slide of oil prices. The U.S. materials sector, which sank about –10%, was another one of the broad market’s weakest after commodity prices fell along with those of oil. Positive results came from health care and consumer-oriented companies.
International stocks generated mostly positive returns in local currency terms; however, they returned about –4.37% in U.S. dollar terms as many foreign currencies continued to weaken against the dollar. Emerging markets fared the worst.
The portfolio’s long-term record reflects expertise and low costs
For the period since its inception on October 19, 2011, the Conservative Allocation Portfolio returned 6.53% on an average annual basis—very close to the result of its target benchmark. It beat the average return of its peers by more than a full percentage point. This admirable performance is a testament to the skill of Vanguard’s equity and bond index managers, as well as the benefits of our consistently low costs.
| | |
| Total Returns | | |
| | October 19, 20111 |
| | through |
| | December 31, 2015 |
| Year Ended | Average |
| December 31, 2015 | Annual Return |
| Vanguard Conservative Allocation Portfolio | 0.20% | 6.53% |
| Conservative Allocation Composite Index 2 | 1.01 | 6.87 |
| Variable Insurance Mixed-Asset Target Conservative | | |
| Funds Average 3 | -1.28 | 5.05 |
The figures shown represent past performance, which is not a guarantee of future results. (Current performance may be lower or higher than the performance data cited. For performance data current to the most recent month-end, visit our website at vanguard.com/performance.) Note, too, that both investment returns and principal value can fluctuate widely, so an investor’s shares, when sold, could be worth more or less than their original cost.
Expense Ratios
Your Portfolio Compared With Its Peer Group
| | |
| Variable Insurance |
| Mixed-Asset |
| Target Allocation |
| Acquired Fund Fees | Conservative |
| and Expenses4 | Funds Average5 |
| Conservative Allocation Portfolio | 0.19% | 0.44% |
1 Portfolio inception.
2 Weighted 48% Barclays U.S. Aggregate Float Adjusted Index, 28% S&P Total Market Index, 12% Barclays Global Aggregate ex-USD Float Adjusted RIC Capped Index (USD Hedged), and 12% FTSE Global All Cap ex US Index as of June 3, 2013. Previously, the composite was weighted 60% Barclays U.S. Aggregate Float Adjusted Index, 28% S&P Total Market Index, and 12% MSCI ACWI ex USA IMI Index.
3 Derived from data provided by Lipper, a Thomson Reuters Company.
4 This figure—drawn from the prospectus dated April 30, 2015—represents an estimate of the weighted average of the expense ratios and any transaction fees charged by the underlying mutual funds (the “acquired” funds) in which the Conservative Allocation Portfolio invests. The Conservative Allocation Portfolio does not charge any expenses or fees of its own. For the fiscal year ended December 31, 2015, the acquired fund fees and expenses were 0.16%.
5 The peer-group expense ratio is derived from data provided by Lipper, a Thomson Reuters Company, and captures information through year-end 2014.
37
Vanguard Conservative Allocation Portfolio
Portfolio Profile
As of December 31, 2015
| |
| Total Portfolio Characteristics | |
| |
| Yield1 | 2.2% |
| Acquired Fund Fees and Expenses2 | 0.19% |
| |
| Allocation to Underlying Funds | |
| |
| Vanguard Variable Insurance Fund | |
| Total Bond Market Index Portfolio | 48.1% |
| Vanguard Variable Insurance Fund | |
| Equity Index Portfolio | 22.7 |
| Vanguard Total International Bond | |
| Index Fund Investor Shares | 12.0 |
| Vanguard Total International Stock | |
| Index Fund Investor Shares | 12.0 |
| Vanguard Extended Market Index | |
| Fund Investor Shares | 5.2 |
Portfolio Asset Allocation
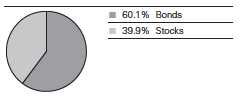
30-Day SEC Yield. A portfolio’s 30-day SEC yield is derived using a formula specified by the U.S. Securities and Exchange Commission. Under the formula, data related to the portfolio’s security holdings in the previous 30 days are used to calculate the portfolio’s hypothetical net income for that period, which is then annualized and divided by the portfolio’s estimated average net assets over the calculation period. For the purposes of this calculation, a security’s income is based on its current market yield to maturity (for bonds), its actual income (for asset-backed securities), or its projected dividend yield (for stocks). Because the SEC yield represents hypothetical annualized income, it will differ—at times significantly—from the portfolio’s actual experience. As a result, the portfolio’s income distributions may be higher or lower than implied by the SEC yield.
Acquired Fund Fees and Expenses. Portfolios that invest in other Vanguard funds incur no direct expenses, but they do bear proportionate shares of the operating, administrative, and advisory expenses of the underlying funds, and they must pay any fees charged by those funds. The figure for acquired fund fees and expenses represents a weighted average of these underlying costs. Acquired is a term that the Securities and Exchange Commission applies to any mutual fund whose shares are owned by another fund.
1 30-day SEC yield.
2 This figure—drawn from the prospectus dated April 30, 2015—represents an estimate of the weighted average of the expense ratios and any transaction fees charged by the underlying mutual funds (the “acquired” funds) in which the Conservative Allocation Portfolio invests. The Conservative Allocation Portfolio does not charge any expenses or fees of its own. For the fiscal year ended December 31, 2015, the acquired fund fees and expenses were 0.16%.
38
Vanguard Conservative Allocation Portfolio
Performance Summary
All of the returns in this report represent past performance, which is not a guarantee of future results that may be achieved by the portfolio. (Current performance may be lower or higher than the performance data cited. For performance data current to the most recent month-end, visit our website at vanguard.com/performance.) Note, too, that both investment returns and principal value can fluctuate widely, so an investor’s shares, when sold, could be worth more or less than their original cost. The returns shown do not reflect taxes that a shareholder would pay on portfolio distributions or on the sale of portfolio shares. Nor do the returns reflect fees and expenses associated with the annuity or life insurance program through which a shareholder invests. If these fees and expenses were included, the portfolio’s returns would be lower.
Cumulative Performance: October 19, 2011–December 31, 2015
Initial Investment of $10,000

| | | |
| | Average Annual Total Returns | Final Value |
| Periods Ended December 31, 2015 | of a $10,000 |
| One Year | Since Inception1 | Investment |
| Conservative Allocation Portfolio | 0.20% | 6.53% | $13,045 |
| Conservative Allocation Composite Index2 | 1.01 | 6.87 | 13,219 |
| Variable Insurance Mixed-Asset Target | | | |
| Conservative Funds Average3 | -1.28 | 5.05 | 12,297 |
| Dow Jones U.S. Total Stock Market | | | |
| Float Adjusted Index | 0.44 | 15.56 | 18,359 |
Fiscal-Year Total Returns (%): October 19, 2011–December 31, 2015
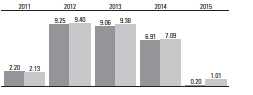
| |
| Conservative Allocation Portfolio |
| Conservative Allocation Composite Index2 |
1 October 19, 2011.
2 Weighted 48% Barclays U.S. Aggregate Float Adjusted Index, 28% S&P Total Market Index, 12% Barclays Global Aggregate ex-USD Float Adjusted RIC Capped Index (USD Hedged), and 12% FTSE Global All Cap ex US Index as of June 3, 2013. Previously, the composite was weighted 60% Barclays U.S. Aggregate Float Adjusted Index, 28% S&P Total Market Index, and 12% MSCI ACWI ex USA IMI Index.
3 Derived from data provided by Lipper, a Thomson Reuters Company.
See Financial Highlights for dividend and capital gains information.
39
Vanguard Conservative Allocation Portfolio
Financial Statements
Statement of Net Assets
As of December 31, 2015
The portfolio reports a complete list of its holdings in regulatory filings four times in each fiscal year, at the quarter-ends. For the second and fourth fiscal quarters, the lists appear in the portfolio’s semiannual and annual reports to shareholders. For the first and third fiscal quarters, the portfolio files the lists with the Securities and Exchange Commission on Form N-Q. Shareholders can look up the portfolio’s Forms N-Q on the SEC’s website at sec.gov. Forms N-Q may also be reviewed and copied at the SEC’s Public Reference Room (see the back cover of this report for further information).
| | | |
| Market |
| Value• |
| Shares | ($000) |
| Investment Companies (100.0%) | | |
| U.S. Stock Funds (27.9%) | | |
| Vanguard Variable Insurance Fund—Equity Index Portfolio | 1,357,486 | 45,136 |
| Vanguard Extended Market Index Fund Investor Shares | 162,644 | 10,346 |
| 55,482 |
| International Stock Fund (12.0%) | | |
| Vanguard Total International Stock Index Fund Investor Shares | 1,647,631 | 23,874 |
| | |
| U.S. Bond Fund (48.1%) | | |
| Vanguard Variable Insurance Fund—Total Bond Market Index Portfolio | 8,126,158 | 95,808 |
| | |
| International Bond Fund (12.0%) | | |
| Vanguard Total International Bond Index Fund Investor Shares | 2,270,085 | 23,949 |
| Total Investments (100.0%) (Cost $200,094) | | 199,113 |
| Amount |
| ($000) |
| Other Assets and Liabilities (0.0%) | |
| Other Assets | |
| Receivables for Investment Securities Sold | 51 |
| Receivables for Accrued Income | 3 |
| Receivables for Capital Shares Issued | 120 |
| Total Other Assets | 174 |
| Liabilities | |
| Payables for Capital Shares Redeemed | (141) |
| Other Liabilities | (40) |
| Total Liabilities | (181) |
| Net Assets (100%) | |
| Applicable to 8,395,212 outstanding $.001 par value shares of | |
| beneficial interest (unlimited authorization) | 199,106 |
| Net Asset Value Per Share | $23.72 |
| |
| At December 31, 2015, net assets consisted of: | |
| Amount |
| ($000) |
| Paid-in Capital | 192,372 |
| Undistributed Net Investment Income | 3,540 |
| Accumulated Net Realized Gains | 4,175 |
| Unrealized Appreciation (Depreciation) | (981) |
| Net Assets | 199,106 |
• See Note A in Notes to Financial Statements.
See accompanying Notes, which are an integral part of the Financial Statements.
40
Vanguard Conservative Allocation Portfolio
| | |
| Statement of Operations |
| |
| Year Ended |
| | December 31, 2015 |
| | ($000) |
| Investment Income | | |
| Income | | |
| Income Distributions Received | 3,578 |
| Other Income | 4 |
| Net Investment Income—Note B | 3,582 |
| Realized Net Gain (Loss) | | |
| Capital Gain Distributions Received | 1,532 |
| Affiliated Investment Securities Sold | 2,653 |
| Realized Net Gain (Loss) | 4,185 |
| Change in Unrealized Appreciation | |
| (Depreciation) of Investment Securities | (7,838) |
| Net Increase (Decrease) in Net Assets | |
| Resulting from Operations | (71) |
| | |
| Statement of Changes in Net Assets | | |
| |
| Year Ended December 31, |
| 2015 | 2014 |
| ($000) | ($000) |
| Increase (Decrease) in Net Assets | | |
| Operations | | |
| Net Investment Income | 3,582 | 2,697 |
| Realized Net Gain (Loss) | 4,185 | 2,784 |
| Change in Unrealized Appreciation (Depreciation) | (7,838) | 3,200 |
| Net Increase (Decrease) in Net Assets Resulting from Operations | (71) | 8,681 |
| Distributions | | |
| Net Investment Income | (2,725) | (1,866) |
| Realized Capital Gain1 | (2,767) | (3,046) |
| Total Distributions | (5,492) | (4,912) |
| Capital Share Transactions | | |
| Issued | 73,018 | 67,986 |
| Issued in Lieu of Cash Distributions | 5,492 | 4,912 |
| Redeemed | (33,495) | (18,517) |
| Net Increase (Decrease) from Capital Share Transactions | 45,015 | 54,381 |
| Total Increase (Decrease) | 39,452 | 58,150 |
| Net Assets |
| Beginning of Period | 159,654 | 101,504 |
| End of Period2 | 199,106 | 159,654 |
1 Includes fiscal 2015 and 2014 short-term gain distributions totaling $106,000 and $822,000, respectively. Short-term gain distributions are treated as ordinary income dividends for tax purposes.
2 Net Assets—End of Period includes undistributed (overdistributed) net investment income of $3,540,000 and $2,683,000.
See accompanying Notes, which are an integral part of the Financial Statements.
41
| | | | | |
| Vanguard Conservative Allocation Portfolio | | | | | |
| |
| |
| Financial Highlights | | | | | |
| |
| |
| | Oct. 19, |
| 20111 to |
| For a Share Outstanding | | Year Ended December 31, | Dec. 31, |
| Throughout Each Period | 2015 | 2014 | 2013 | 2012 | 2011 |
| Net Asset Value, Beginning of Period | $24.44 | $23.86 | $22.27 | $20.44 | $20.00 |
| Investment Operations | | |
| Net Investment Income | . 470 2 | .4952 | .5142 | . 424 2 | .1722 |
| Capital Gain Distributions Received | . 2012 | .1302 | . 252 2 | .1972 | — |
| Net Realized and Unrealized Gain (Loss) | | | | | |
| on Investments | (.611) | .971 | 1.229 | 1.268 | .268 |
| Total from Investment Operations | .060 | 1.596 | 1.995 | 1.889 | .440 |
| Distributions | | |
| Dividends from Net Investment Income | (.387) | (.386) | (.215) | (.041) | — |
| Distributions from Realized Capital Gains | (.393) | (.630) | (.190) | (.018) | — |
| Total Distributions | (.780) | (1.016) | (.405) | (.059) | — |
| Net Asset Value, End of Period | $23.72 | $24.44 | $23.86 | $22.27 | $20.44 |
| |
| Total Return | 0.20% | 6.91% | 9.06% | 9.25% | 2.20% |
| |
| Ratios/Supplemental Data | | |
| Net Assets, End of Period (Millions) | $199 | $160 | $102 | $61 | $11 |
| Ratio of Total Expenses to Average Net Assets | — | — | — | — | — |
| Acquired Fund Fees and Expenses | 0.16% | 0.19% | 0.19% | 0.20% | 0.25%3 |
| Ratio of Net Investment Income to | | | | | |
| Average Net Assets | 1.95% | 2.07% | 2.23% | 1.97% | 0.75%3 |
| Portfolio Turnover Rate | 15% | 13% | 37% | 17% | 20% |
1 Inception.
2 Calculated based on average shares outstanding.
3 Annualized.
See accompanying Notes, which are an integral part of the Financial Statements.
42
Vanguard Conservative Allocation Portfolio
Notes to Financial Statements
Vanguard Conservative Allocation Portfolio, a portfolio of Vanguard Variable Insurance Funds, is registered under the Investment Company Act of 1940 as an open-end investment company. The portfolio follows a balanced investment strategy by investing in selected Vanguard funds and portfolios to achieve its targeted allocation of assets to U.S. and international stocks, and U.S. and international bonds. Financial statements and other information about each underlying fund and portfolio are available on vanguard.com. The portfolio’s shares are only available for purchase by separate accounts of insurance companies as investments for variable annuity plans, variable life insurance contracts, or other variable benefit insurance contracts.
A. The following significant accounting policies conform to generally accepted accounting principles for U.S. investment companies. The portfolio consistently follows such policies in preparing its financial statements.
1. Security Valuation: Investments are valued at the net asset value of each underlying Vanguard fund determined as of the close of the New York Stock Exchange (generally 4 p.m., Eastern time) on the valuation date.
2. Federal Income Taxes: The portfolio intends to continue to qualify as a regulated investment company and distribute all of its income. Management has analyzed the portfolio’s tax positions taken for all open federal income tax years (December 31, 2012–2015), and has concluded that no provision for federal income tax is required in the portfolio’s financial statements.
3. Distributions: Distributions to shareholders are recorded on the ex-dividend date.
4. Credit Facility: The portfolio and certain other funds managed by The Vanguard Group (“Vanguard”) participate in a $3 billion committed credit facility provided by a syndicate of lenders pursuant to a credit agreement that may be renewed annually; each portfolio is individually liable for its borrowings, if any, under the credit facility. Borrowings may be utilized for temporary and emergency purposes, and are subject to the portfolio’s regulatory and contractual borrowing restrictions. The participating funds are charged administrative fees and an annual commitment fee of 0.06% of the undrawn amount of the facility; these fees are allocated to the funds based on a method approved by the fund’s board of trustees and borne by the funds in which the portfolio invests (see Note B). Any borrowings under this facility bear interest at a rate equal to the higher of the federal funds rate or LIBOR reference rate plus an agreed-upon spread.
The portfolio had no borrowings outstanding at December 31, 2015, or at any time during the period then ended.
5. Other: Income and capital gain distributions received are recorded on the ex-dividend date. Security transactions are accounted for on the date securities are bought or sold. Costs used to determine realized gains (losses) on the sale of investment securities are those of the specific securities sold.
B. In accordance with the terms of a Funds’ Service Agreement (the “FSA”) between Vanguard and the portfolio, Vanguard furnishes to the portfolio investment advisory, corporate management, administrative, marketing, and distribution services at Vanguard’s cost of operations (as defined by the FSA). These costs of operations are allocated to the portfolio based on methods and guidelines approved by the board of trustees. The FSA provides that expenses otherwise allocable to Vanguard funds-of-funds may be reduced or eliminated to the extent of savings realized by the underlying Vanguard funds by virtue of being part of a fund-of-funds. Accordingly, all expenses for services provided by Vanguard to the portfolio and all other expenses incurred by the portfolio during the period ended December 31, 2015, were borne by the underlying Vanguard funds in which the portfolio invests. The portfolio’s trustees and officers are also trustees and officers, respectively, of the underlying Vanguard funds, as well as directors and employees, respectively, of Vanguard.
C. Various inputs may be used to determine the value of the portfolio’s investments. These inputs are summarized in three broad levels for financial statement purposes. The inputs or methodologies used to value securities are not necessarily an indication of the risk associated with investing in those securities.
Level 1—Quoted prices in active markets for identical securities.
Level 2—Other significant observable inputs (including quoted prices for similar securities, interest rates, prepayment speeds, credit risk, etc.).
Level 3—Significant unobservable inputs (including the portfolio’s own assumptions used to determine the fair value of investments).
At December 31, 2015, 100% of the market value of the portfolio’s investments was determined based on Level 1 inputs.
43
Vanguard Conservative Allocation Portfolio
D. Distributions are determined on a tax basis and may differ from net investment income and realized capital gains for financial reporting purposes. Differences may be permanent or temporary. Permanent differences are reclassified among capital accounts in the financial statements to reflect their tax character. Temporary differences arise when certain items of income, expense, gain, or loss are recognized in different periods for financial statement and tax purposes. These differences will reverse at some time in the future. Differences in classification may also result from the treatment of short-term gains as ordinary income for tax purposes.
For tax purposes, at December 31, 2015, the portfolio had $3,900,000 of ordinary income and $3,814,000 of long-term capital gains available for distribution.
At December 31, 2015, the cost of investment securities for tax purposes was $200,094,000. Net unrealized depreciation of investment securities for tax purposes was $981,000, consisting of unrealized gains of $3,908,000 on securities that had risen in value since their purchase and $4,889,000 in unrealized losses on securities that had fallen in value since their purchase.
E. Capital shares issued and redeemed were:
| | |
| Year Ended December 31, |
| 2015 | 2014 |
| Shares | Shares |
| (000) | (000) |
| Issued | 3,024 | 2,840 |
| Issued in Lieu of Cash Distributions | 228 | 212 |
| Redeemed | (1,389) | (774) |
| Net Increase (Decrease) in Shares Outstanding | 1,863 | 2,278 |
F. Transactions during the period in affiliated underlying Vanguard funds were as follows:
| | | | | | |
| | Current Period Transactions | |
| Dec. 31, | Proceeds | | | Dec. 31, |
| 2014 | from | | Capital Gain | 2015 |
| Market | Purchases | Securities | Dividend | Distributions | Market |
| Value | at Cost | Sold | Income | Received | Value |
| ($000) | ($000) | ($000) | ($000) | ($000) | ($000) |
| Vanguard Extended Market | | | | | | |
| Index Fund | 8,769 | 2,992 | 964 | 121 | — | 10,346 |
| Vanguard Market Liquidity Fund | 126 | NA1 | NA1 | — | — | — |
| Vanguard Total International Bond | | | | | | |
| Index Fund | 18,597 | 5,931 | 435 | 356 | — | 23,949 |
| Vanguard Total International Stock | | | | | | |
| Index Fund | 19,000 | 10,070 | 3,644 | 583 | — | 23,874 |
| Vanguard Variable Insurance | | | | | | |
| Fund—Equity Index Portfolio | 35,715 | 17,778 | 7,389 | 645 | 1,181 | 45,136 |
| Vanguard Variable Insurance | | | | | | |
| Fund—Total Bond Market | | | | | | |
| Index Portfolio | 77,541 | 35,926 | 15,588 | 1,873 | 351 | 95,808 |
| Total | 159,748 | 72,697 | 28,020 | 3,578 | 1,532 | 199,113 |
| 1 Not applicable—purchases and sales are for temporary cash investment purposes. |
G. Management has determined that no material events or transactions occurred subsequent to December 31, 2015, that would require recognition or disclosure in these financial statements.
44
Vanguard Conservative Allocation Portfolio
Report of Independent Registered Public Accounting Firm
To the Board of Trustees of Vanguard Variable Insurance Funds and the Shareholders of Conservative Allocation Portfolio: In our opinion, the accompanying statement of net assets and the related statements of operations and of changes in net assets and the financial highlights present fairly, in all material respects, the financial position of Conservative Allocation Portfolio (constituting a separate portfolio of Vanguard Variable Insurance Funds, hereafter referred to as the “Portfolio”) at December 31, 2015, the results of its operations for the year then ended, the changes in its net assets for each of the two years in the period then ended, and the financial highlights for each of the periods indicated , in conformity with accounting principles generally accepted in the United States of America. These financial statements and financial highlights (hereafter referred to as “financial statements”) are the responsibility of the Portfolio’s management. Our responsibility is to express an opinion on these financial statements based on our audits. We conducted our audits of these financial statements in accordance with the standards of the Public Company Accounting Oversight Board (United States). Those standards require that we plan and perform the audit to obtain reasonable assurance about whether the financial statements are free of material misstatement. An audit includes examining, on a test basis, evidence supporting the amounts and disclosures in the financial statements, assessing the accounting principles used and significant estimates made by management, and evaluating the overall financial statement presentation. We believe that our audits, which included confirmation of securities at December 31, 2015 by agreement to the underlying ownership records of the transfer agent, provide a reasonable basis for our opinion.
/s/PricewaterhouseCoopers LLP
Philadelphia, Pennsylvania
February 11, 2016
| |
| |
| Special 2015 tax information (unaudited) for corporate shareholders only for Vanguard |
| Conservative Allocation Portfolio, a portfolio of Vanguard Variable Insurance Funds |
| |
| This information for the fiscal year ended December 31, 2015, is included pursuant to provisions |
| of the Internal Revenue Code for corporate shareholders only. |
| |
| The portfolio distributed $2,661,000 as capital gain dividends (20% rate gain distributions) to |
| shareholders during the fiscal year. |
| |
| For corporate shareholders, 16.3% of investment income (dividend income plus short-term gains, |
| if any) qualifies for the dividends-received deduction. |
45
Vanguard Conservative Allocation Portfolio
About Your Portfolio’s Expenses
As a shareholder of the portfolio, you incur ongoing costs, which include costs for portfolio management, administrative services, and shareholder reports (like this one), among others. Operating expenses, which are deducted from a portfolio’s gross income, directly reduce the investment return of the portfolio.
A typical portfolio’s expenses are expressed as a percentage of its average net assets. The Conservative Allocation Portfolio has no direct expenses, but bears its proportionate share of the expenses of the underlying funds in which it invests. These indirect expenses make up the acquired fund fees and expenses, also expressed as a percentage of average net assets. The following examples are intended to help you understand the ongoing costs (in dollars) of investing in your portfolio and to compare these costs with those of other mutual funds. The examples are based on an investment of $1,000 made at the beginning of the period shown and held for the entire period. The costs were calculated using the acquired fund fees and expenses for the Conservative Allocation Portfolio.
The accompanying table illustrates your portfolio’s costs in two ways:
• Based on actual portfolio return. This section helps you to estimate the actual expenses that you paid over the period. The “Ending Account Value” shown is derived from the portfolio’s actual return, and the third column shows the dollar amount that would have been paid by an investor who started with $1,000 in the portfolio. You may use the information here, together with the amount you invested, to estimate the expenses that you paid over the period.
To do so, simply divide your account value by $1,000 (for example, an $8,600 account value divided by $1,000 = 8.6), then multiply the result by the number given for your portfolio under the heading “Expenses Paid During Period.”
• Based on hypothetical 5% yearly return. This section is intended to help you compare your portfolio’s costs with those of other mutual funds. It assumes that the portfolio had a yearly return of 5% before expenses, but that the expense ratio is unchanged. In this case—because the return used is not the portfolio’s actual return—the results do not apply to your investment. The example is useful in making comparisons because the Securities and Exchange Commission requires all mutual funds to calculate expenses based on a 5% return. You can assess your portfolio’s costs by comparing this hypothetical example with the hypothetical examples that appear in shareholder reports of other funds.
Note that the expenses shown in the table are meant to highlight and help you compare ongoing costs only. The portfolio’s expense figure does not reflect additional fees and expenses associated with the annuity or life insurance program through which you invest.
The calculations assume no shares were bought or sold during the period. Your actual costs may have been higher or lower, depending on the amount of your investment and the timing of any purchases or redemptions.
You can find more information about the portfolio’s expenses in the Financial Statements section. For additional information on operating expenses and other shareholder costs, please refer to the prospectus.
| | | |
| Six Months Ended December 31, 2015 | | | |
| Beginning | Ending | Expenses |
| Account Value | Account Value | Paid During |
| Conservative Allocation Portfolio | 6/30/2015 | 12/31/2015 | Period1 |
| Based on Actual Portfolio Return | $1,000.00 | $992.05 | $0.80 |
| Based on Hypothetical 5% Yearly Return | 1,000.00 | 1,024.40 | 0.82 |
1 The calculations are based on the Conservative Allocation Portfolio’s acquired fund fees and expenses for the most recent six-month period. The Conservative Allocation Portfolio’s annualized expense figure for that period is 0.16%. The dollar amounts shown as “Expenses Paid” are equal to the annualized average weighted expense ratio for the underlying funds, multiplied by the average account value over the period, multiplied by the number of days in the most recent six-month period, then divided by the number of days in the recent 12-month period (184/365).
46
Vanguard® Diversified Value Portfolio
Advisor’s Report
Vanguard Diversified Value Portfolio returned –2.45% in 2015, ahead of the –3.83% return of its benchmark, the Russell 1000 Value Index. Please note that the returns for Vanguard Variable Insurance Fund are different from those of Vanguard Variable Annuity (and other plans that invest in the fund), which take into account insurance-related expenses.
The investment environment
In the years after the lows of March 2009, the stock market more than tripled, so it was not surprising to see a pause in 2015. Although most large-capitalization equity indexes ended roughly where they had started, there was substantial volatility in the second half of the year. Investors focused in the first half on the prospect of Greece leaving the euro zone, but the country stayed and accepted austerity in exchange for its third bailout from the International Monetary Fund, European Union, and European Central Bank. Long-term prospects for Greece remain uncertain, but because this drama has played out in slow motion over the last five years, markets took the possibility of a “Grexit” in stride.
This was not the case for the mounting concerns about global economic growth and financial contagion sparked by China’s surprise devaluation of its currency in August. The devaluation called into question the strength of China’s economy, the competitiveness of other export-oriented countries, and the Chinese government’s competency in managing the transition from a controlled economy to one that is more oriented toward the free market. The thought that China could efficiently manage its way to a slower but positive growth environment gave way to the fear that its economy was rapidly slowing and could pull the rest of the world down with it.
Nowhere was this fear clearer than in the commodity markets. The widely watched CRB (Commodity Research Bureau) index ended the year down 23%. West Texas Intermediate crude oil extended its decline to $37 per barrel, compared with over $100 18 months ago. The drop in commodity prices should continue to benefit U.S. consumers at the expense of commodity-oriented companies and commodity-exporting countries.
Although the manufacturing sector weakened with lower energy sector capital spending and a strong dollar, the overall U.S. economy remained resilient. The job market improved, and wage inflation accelerated slightly. New car sales hit an annual record, and the housing market continued its recovery. As a result, the Federal Reserve raised the federal funds rate in December for the first time in nearly a decade. Chairwoman Janet Yellen said future interest rate increases would depend on economic data, but the market consensus is skeptical that rates will rise as much as implied in the Fed’s forecasts.
Our successes and shortfalls
Relative to the benchmark, the energy sector was the largest contributor to performance thanks to a slight underweighting and strong stock selection. Refiners Marathon Petroleum and Phillips 66 led the outperformance. These refiners were spun out of the integrated oil companies in 2011 and 2012, respectively. When we added to the positions of the spun companies, the view was one of perennial low returns on invested capital and subpar management teams. As is often the case, these companies were
| |
| |
| I’d like to express my deep appreciation |
| to Jim Barrow, who has provided distin- |
| guished service as the lead manager |
| for Vanguard Diversified Value Portfolio |
| since the portfolio’s inception more than |
| 16 years ago. When Jim stepped down |
| at year-end, his portfolio management |
| responsibilities were assumed by his |
| co-managers, Jeff Fahrenbruch and |
| David Ganucheau. |
| |
| —Vanguard Chairman Bill McNabb |
| | | |
| Total Returns | | | |
| | | Ten Years Ended |
| | | December 31, 2015 |
| | Year Ended | Average |
| December 31, 2015 | Annual Return |
| Vanguard Diversified Value Portfolio | -2.45% | 6.27% |
| Russell 1000 Value Index | -3.83 | 6.16 |
| Variable Insurance Large-Cap Value Funds Average1 | -4.14 | 5.55 |
The figures shown represent past performance, which is not a guarantee of future results. (Current performance may be lower or higher than the performance data cited. For performance data current to the most recent month-end, visit our website at vanguard.com/performance.) Note, too, that both investment returns and principal value can fluctuate widely, so an investor’s shares, when sold, could be worth more or less than their original cost.
Expense Ratios2
Your Portfolio Compared With Its Peer Group
| | |
| Variable Insurance |
| Large-Cap Value |
| Portfolio | Funds Average |
| Diversified Value Portfolio | 0.34% | 0.87% |
1 Derived from data provided by Lipper, a Thomson Reuters Company.
2 The portfolio expense ratio shown is from the prospectus dated April 30, 2015, and represents estimated costs for the current fiscal year. For the fiscal year ended December 31, 2015, the Diversified Value Portfolio’s expense ratio was 0.28%. The peer-group expense ratio is derived from data provided by Lipper, a Thomson Reuters Company, and captures information through year-end 2014.
47
Vanguard Diversified Value Portfolio
managed much better on a standalone basis than they were inside a larger conglomerate. Both companies generated much higher than expected earnings, in large part because of increasing domestic crude production, and invested the proceeds wisely for the benefit of shareholders.
The consumer staples sector was another positive contributor. Imperial Tobacco outperformed significantly because of an accretive $7.1 billion acquisition of several brands that Reynolds American and Lorillard were forced to divest to complete their merger. The stock also benefited from rumors that Imperial itself could be an acquisition target.
The financial sector detracted the most. Most of the underperformance can be traced to two stocks: American Express and Navient. American Express declined after losing a profitable partnership with Costco to Citigroup, and investors feared a more competitive environment for its premium credit card customers. Navient experienced disruptions in the student loan securitization market. The Department of Education’s income-based loan repayment schemes threaten the contractual terms of student loan securitizations, but Navient believes it has the appropriate strategies to renegotiate those terms.
Our portfolio positioning
As of this writing, global growth concerns are dominating headlines, investors remain skeptical about China’s ability to engineer a soft landing for its economy, and the energy sector remains in free fall. When investors question the global growth environment, they often flock to a small group of companies they believe will continue to grow at a rapid pace. We are witnessing this phenomenon today with the so-called FANG stocks—Facebook, Amazon, Netflix, and Google (now part of Alphabet). The long-term outlook for these companies may be favorable, but this style of investing can be dangerous if investors ignore the price they are paying for the forecasted growth. At year-end, these four stocks traded at an average of 132 times their generously defined “adjusted” trailing earnings.
We remain focused on buying a concentrated portfolio of good companies trading at valuations below the broad market for what we believe are temporary or overblown reasons. There are many ways to define the quality of an investment, but the companies in our portfolio have higher-than-average returns on invested capital and free-cash-flow margins while returning a greater-than-average amount of the free cash flow to shareholders, especially through dividends. This bottom-up
investing approach leads us to a portfolio that is more defensively positioned than the broad market. The portfolio is overweighted in consumer staples and health care and underweighted in financials. We remain optimistic that the combination of a fundamental premium with a valuation advantage positions the portfolio well for the future.
Portfolio Managers:
Jeff Fahrenbruch, Managing Director
David Ganucheau, Managing Director
Barrow, Hanley, Mewhinney & Strauss, LLC
January 13, 2016
48
Vanguard Diversified Value Portfolio
Portfolio Profile
As of December 31, 2015
| | | |
| Portfolio Characteristics | | |
| | Comparative Broad |
| Portfolio | Index1 | Index2 |
| Number of Stocks | 42 | 691 | 3,960 |
| Median Market Cap | $85.5B | $54.7B | $51.4B |
| Price/Earnings Ratio | 18.6x | 18.9x | 21.9x |
| Price/Book Ratio | 2.0x | 1.8x | 2.7x |
| Yield3 | 2.8% | 2.7% | 2.1% |
| Return on Equity | 16.0% | 12.8% | 17.2% |
| Earnings Growth Rate | 4.7% | 4.9% | 9.5% |
| Foreign Holdings | 7.3% | 0.0% | 0.0% |
| Turnover Rate | 13% | — | — |
| Expense Ratio4 | 0.34% | — | — |
| Short-Term Reserves | 2.3% | — | — |
| | |
| Volatility Measures | |
| Portfolio Versus Portfolio Versus |
| Comparative Index1 | Broad Index2 |
| R-Squared | 0.95 | 0.94 |
| Beta | 0.95 | 0.95 |
| | | |
| Sector Diversification (% of equity exposure) |
| | Comparative | Broad |
| Portfolio | Index1 | Index2 |
| Consumer Discretionary | 7.0% | 5.2% | 13.4% |
| Consumer Staples | 9.8 | 7.0 | 8.8 |
| Energy | 11.6 | 12.3 | 5.9 |
| Financials | 22.2 | 30.4 | 18.3 |
| Health Care | 19.0 | 11.9 | 14.8 |
| Industrials | 11.6 | 10.4 | 10.6 |
| Information Technology | 8.7 | 11.5 | 19.8 |
| Materials | 2.6 | 2.6 | 3.1 |
| Telecommunication | | | |
| Services | 4.2 | 2.5 | 2.2 |
| Utilities | 3.3 | 6.2 | 3.1 |
| | |
| Ten Largest Holdings5 (% of total net assets) |
| Medtronic Inc. | Health Care | |
| Equipment | 4.3% |
| Wells Fargo & Co. | Diversified Banks | 4.1 |
| JPMorgan Chase & Co. | Diversified Banks | 3.9 |
| Philip Morris | | |
| International Inc. | Tobacco | 3.8 |
| PNC Financial Services | | |
| Group Inc. | Regional Banks | 3.7 |
| Imperial Tobacco Group | Tobacco | 3.4 |
| Pfizer Inc. | Pharmaceuticals | 3.3 |
| Raytheon Co. | Aerospace | |
| & Defense | 3.2 |
| Microsoft Corp. | Systems Software | 3.2 |
| Verizon | Integrated | |
| Communications Inc. | Telecommunication | |
| Services | 3.2 |
| Top Ten | 36.1% |
Investment Focus
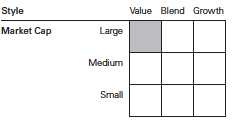
30-Day SEC Yield. A portfolio’s 30-day SEC yield is derived using a formula specified by the U.S. Securities and Exchange Commission. Under the formula, data related to the portfolio’s security holdings in the previous 30 days are used to calculate the portfolio’s hypothetical net income for that period, which is then annualized and divided by the portfolio’s estimated average net assets over the calculation period. For the purposes of this calculation, a security’s income is based on its current market yield to maturity (for bonds), its actual income (for asset-backed securities), or its projected dividend yield (for stocks). Because the SEC yield represents hypothetical annualized income, it will differ—at times significantly—from the portfolio’s actual experience. As a result, the portfolio’s income distributions may be higher or lower than implied by the SEC yield.
Beta. A measure of the magnitude of a portfolio’s past share-price fluctuations in relation to the ups and downs of a given market index. The index is assigned a beta of 1.00. Compared with a given index, a portfolio with a beta of 1.20 typically would have seen its share price rise or fall by 12% when the index rose or fell by 10%. For this report, beta is based on returns over the past 36 months for both the portfolio and the index.
Equity Exposure. A measure that reflects a portfolio’s investments in stocks and stock futures. Any holdings in short-term reserves are excluded.
R-Squared. A measure of how much of a portfolio’s past returns can be explained by the returns from the market in general, as measured by a given index. If a portfolio’s total returns were precisely synchronized with an index’s returns, its R-squared would be 1.00. If the portfolio’s returns bore no relationship to the index’s returns, its R-squared would be 0. For this report, R-squared is based on returns over the past 36 months for both the portfolio and the index.
1 Russell 1000 Value Index.
2 Dow Jones U.S. Total Stock Market Float Adjusted Index.
3 30-day SEC yield for the portfolio; annualized dividend yield for the index.
4 The expense ratio shown is from the prospectus dated April 30, 2015, and represents estimated costs for the current fiscal year. For the fiscal year ended December 31, 2015, the Diversified Value Portfolio’s expense ratio was 0.28%.
5 The holdings listed exclude any temporary cash investments and equity index products.
49
Vanguard Diversified Value Portfolio
Performance Summary
All of the returns in this report represent past performance, which is not a guarantee of future results that may be achieved by the portfolio. (Current performance may be lower or higher than the performance data cited. For performance data current to the most recent month-end, visit our website at vanguard.com/performance.) Note, too, that both investment returns and principal value can fluctuate widely, so an investor’s shares, when sold, could be worth more or less than their original cost. The returns shown do not reflect taxes that a shareholder would pay on portfolio distributions or on the sale of portfolio shares. Nor do the returns reflect fees and expenses associated with the annuity or life insurance program through which a shareholder invests. If these fees and expenses were included, the portfolio’s returns would be lower.
Cumulative Performance: December 31, 2005–December 31, 2015
Initial Investment of $10,000
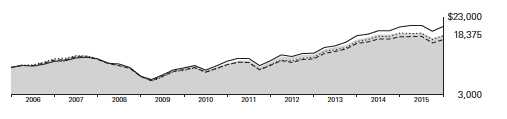
| | | | |
| | | Average Annual Total Returns | Final Value |
| | Periods Ended December 31, 2015 | of a $10,000 |
| | One Year | Five Years | Ten Years | Investment |
| Diversified Value Portfolio | -2.45% | 10.91% | 6.27% | $18,375 |
| Russell 1000 Value Index | -3.83 | 11.27 | 6.16 | 18,174 |
| Variable Insurance Large-Cap Value | | | | |
| Funds Average1 | -4.14 | 9.91 | 5.55 | 17,166 |
| Dow Jones U.S. Total Stock Market | | | | |
| Float Adjusted Index | 0.44 | 12.14 | 7.48 | 20,563 |
Fiscal-Year Total Returns (%): December 31, 2005–December 31, 2015

| |
| Diversified Value Portfolio |
| Russell 1000 Value Index |
1 Derived from data provided by Lipper, a Thomson Reuters Company.
See Financial Highlights for dividend and capital gains information.
50
Vanguard Diversified Value Portfolio
Financial Statements
Statement of Net Assets
As of December 31, 2015
The portfolio reports a complete list of its holdings in regulatory filings four times in each fiscal year, at the quarter-ends. For the second and fourth fiscal quarters, the lists appear in the portfolio’s semiannual and annual reports to shareholders. For the first and third fiscal quarters, the portfolio files the lists with the Securities and Exchange Commission on Form N-Q. Shareholders can look up the portfolio’s Forms N-Q on the SEC’s website at sec.gov. Forms N-Q may also be reviewed and copied at the SEC’s Public Reference Room (see the back cover of this report for further information).
| | | |
| Market |
| Value• |
| | Shares | ($000) |
| Common Stocks (97.9%) | | |
| Consumer Discretionary (6.9%) | |
| Ford Motor Co. | 2,025,900 | 28,545 |
| Johnson Controls Inc. | 601,800 | 23,765 |
| Target Corp. | 285,700 | 20,745 |
| 73,055 |
| Consumer Staples (9.6%) | | |
| Philip Morris International | | |
| | Inc. | 462,200 | 40,632 |
| Imperial Tobacco Group plc | | |
| | ADR | 339,100 | 35,860 |
| Altria Group Inc. | 435,200 | 25,333 |
| 101,825 |
| Energy (11.4%) | | |
| Phillips 66 | 362,272 | 29,634 |
| ConocoPhillips | 622,644 | 29,071 |
| Occidental Petroleum Corp. | 316,300 | 21,385 |
| Marathon Petroleum Corp. | 297,800 | 15,438 |
| BP plc ADR | 380,300 | 11,888 |
| Chevron Corp. | 116,100 | 10,445 |
| ^,* Seadrill Ltd. | 756,100 | 2,563 |
| 120,424 |
| Financials (21.7%) | | |
| Wells Fargo & Co. | 795,500 | 43,243 |
| JPMorgan Chase & Co. | 626,250 | 41,351 |
| PNC Financial Services | | |
| | Group Inc. | 415,572 | 39,608 |
| Bank of America Corp. | 1,649,046 | 27,754 |
| Citigroup Inc. | 462,930 | 23,957 |
| American Express Co. | 321,900 | 22,388 |
| Capital One Financial Corp. | 295,800 | 21,351 |
| Navient Corp. | 595,400 | 6,817 |
| * | SLM Corp. | 595,200 | 3,881 |
| 230,350 |
| Health Care (18.6%) | | |
| Medtronic plc | 585,800 | 45,060 |
| Pfizer Inc. | 1,088,614 | 35,140 |
| Anthem Inc. | 232,400 | 32,406 |
| Johnson & Johnson | 287,100 | 29,491 |
| Merck & Co. Inc. | 538,200 | 28,428 |
| Sanofi ADR | 625,300 | 26,669 |
| 197,194 |
| | | |
| Market |
| Value• |
| | Shares | ($000) |
| Industrials (11.3%) | | |
| Raytheon Co. | 276,000 | 34,370 |
| United Technologies Corp. | 290,500 | 27,908 |
| Honeywell International Inc. | 247,100 | 25,592 |
| General Dynamics Corp. | 148,500 | 20,398 |
| Xylem Inc. | 326,300 | 11,910 |
| 120,178 |
| Information Technology (8.6%) | |
| Microsoft Corp. | 617,500 | 34,259 |
| Oracle Corp. | 673,000 | 24,585 |
| QUALCOMM Inc. | 364,400 | 18,214 |
| Intel Corp. | 395,200 | 13,615 |
| 90,673 |
| Materials (2.5%) | | |
| Air Products & Chemicals | | |
| | Inc. | 204,100 | 26,555 |
| |
| Telecommunication Services (4.1%) | |
| Verizon Communications | | |
| | Inc. | 722,860 | 33,411 |
| AT&T Inc. | 300,127 | 10,327 |
| 43,738 |
| Utilities (3.2%) | | |
| CenterPoint Energy Inc. | 1,018,200 | 18,694 |
| Entergy Corp. | 220,600 | 15,080 |
| 33,774 |
| Total Common Stocks | | |
| (Cost $920,546) | 1,037,766 |
| Temporary Cash Investment (2.3%) | |
| Money Market Fund (2.3%) | | |
| 1,2 Vanguard Market Liquidity | | |
| | Fund, 0.363% | | |
| | (Cost $24,220) | 24,219,814 | 24,220 |
| Total Investments (100.2%) | | |
| (Cost $944,766) | 1,061,986 |
| |
| Amount |
| ($000) |
| Other Assets and Liabilities (-0.2%) | |
| Other Assets | |
| Investment in Vanguard | 95 |
| Receivables for Accrued Income | 2,279 |
| Receivables for Capital Shares Issued | 279 |
| Total Other Assets | 2,653 |
| Liabilities | |
| Collateral for Securities on Loan | (1,232) |
| Payables to Investment Advisor | (253) |
| Payables for Capital Shares Redeemed | (1,518) |
| Payables to Vanguard | (1,673) |
| Other Liabilities | (2) |
| Total Liabilities | (4,678) |
| Net Assets (100%) | |
| Applicable to 64,044,007 outstanding | |
| $.001 par value shares of beneficial | |
| interest (unlimited authorization) | 1,059,961 |
| Net Asset Value Per Share | $16.55 |
| |
| At December 31, 2015, net assets consisted of: |
| Amount |
| ($000) |
| Paid-in Capital | 856,672 |
| Undistributed Net Investment Income | 26,992 |
| Accumulated Net Realized Gains | 59,077 |
| Unrealized Appreciation (Depreciation) | 117,220 |
| Net Assets | 1,059,961 |
• See Note A in Notes to Financial Statements.
^ Includes partial security positions on loan to broker-dealers. The total value of securities on loan is $1,044,000.
* Non-income-producing security.
1 Affiliated money market fund available only to Vanguard funds and certain trusts and accounts managed by Vanguard. Rate shown is the 7-day yield
2 Includes $1,232,000 of collateral received for securities on loan.
ADR—American Depositary Receipt.
See accompanying Notes, which are an integral part of the Financial Statements.
51
Vanguard Diversified Value Portfolio
Statement of Operations
| | | |
| Year Ended |
| | December 31, 2015 |
| | ($000) |
| Investment Income | | |
| Income | | |
| Dividends1 | 31,971 |
| Interest 2 | 46 |
| Securities Lending | 38 |
| Total Income | 32,055 |
| Expenses | | |
| Investment Advisory Fees—Note B | |
| Basic Fee | 1,419 |
| Performance Adjustment | (335) |
| The Vanguard Group—Note C | | |
| Management and Administrative | 1,761 |
| Marketing and Distribution | 216 |
| Custodian Fees | 14 |
| Auditing Fees | 31 |
| Shareholders’ Reports | 16 |
| Trustees’ Fees and Expenses | 2 |
| Total Expenses | 3,124 |
| Net Investment Income | 28,931 |
| Realized Net Gain (Loss) on | | |
| Investment Securities Sold | 59,117 |
| Change in Unrealized Appreciation | |
| (Depreciation) of Investment Securities (115,268) |
| Net Increase (Decrease) in Net Assets | |
| Resulting from Operations | (27,220) |
1 Dividends are net of foreign withholding taxes of $151,000.
2 Interest income from an affiliated company of the portfolio was $46,000.
Statement of Changes in Net Assets
| | |
| Year Ended December 31, |
| 2015 | 2014 |
| ($000) | ($000) |
| Increase (Decrease) in Net Assets | | |
| Operations | | |
| Net Investment Income | 28,931 | 28,982 |
| Realized Net Gain (Loss) | 59,117 | 74,914 |
| Change in Unrealized Appreciation (Depreciation) | (115,268) | 5,239 |
| Net Increase (Decrease) in Net Assets Resulting from Operations | (27,220) | 109,135 |
| Distributions | | |
| Net Investment Income | (29,016) | (25,554) |
| Realized Capital Gain1 | (74,968) | (44,951) |
| Total Distributions | (103,984) | (70,505) |
| Capital Share Transactions | | |
| Issued | 82,020 | 187,623 |
| Issued in Lieu of Cash Distributions | 103,984 | 70,505 |
| Redeemed | (207,797) | (200,014) |
| Net Increase (Decrease) from Capital Share Transactions | (21,793) | 58,114 |
| Total Increase (Decrease) | (152,997) | 96,744 |
| Net Assets |
| Beginning of Period | 1,212,958 | 1,116,214 |
| End of Period2 | 1,059,961 | 1,212,958 |
1 Includes fiscal 2015 and 2014 short-term gain distributions totaling $3,051,000 and $0, respectively. Short-term gain distributions are treated as ordinary income dividends for tax purposes.
2 Net Assets—End of Period includes undistributed (overdistributed) net investment income of $26,992,000 and $27,077,000.
See accompanying Notes, which are an integral part of the Financial Statements.
52
| | | | | |
| Vanguard Diversified Value Portfolio | | | | | |
| |
| |
| Financial Highlights | | | | | |
| |
| |
| For a Share Outstanding | | | Year Ended December 31, |
| Throughout Each Period | 2015 | 2014 | 2013 | 2012 | 2011 |
| Net Asset Value, Beginning of Period | $18.65 | $18.10 | $14.31 | $12.57 | $12.33 |
| Investment Operations | |
| Net Investment Income | .471 | .447 | .412 | .358 | .315 |
| Net Realized and Unrealized Gain (Loss) | | | | | |
| on Investments | (.901) | 1.248 | 3.731 | 1.702 | .175 |
| Total from Investment Operations | (.430) | 1.695 | 4.143 | 2.060 | .490 |
| Distributions | | |
| Dividends from Net Investment Income | (.466) | (.415) | (.353) | (.320) | (.250) |
| Distributions from Realized Capital Gains | (1.204) | (.730) | — | — | — |
| Total Distributions | (1.670) | (1.145) | (.353) | (.320) | (.250) |
| Net Asset Value, End of Period | $16.55 | $18.65 | $18.10 | $14.31 | $12.57 |
| |
| Total Return | -2.45% | 9.83% | 29.40% | 16.50% | 3.92% |
| |
| Ratios/Supplemental Data | | |
| Net Assets, End of Period (Millions) | $1,060 | $1,213 | $1,116 | $868 | $732 |
| Ratio of Total Expenses to Average Net Assets1 | 0.28% | 0.34% | 0.35% | 0.35% | 0.39% |
| Ratio of Net Investment Income to | | | | | |
| Average Net Assets | 2.55% | 2.50% | 2.50% | 2.65% | 2.41% |
| Portfolio Turnover Rate | 13% | 16% | 20% | 14% | 14% |
1 Includes performance-based investment advisory fee increases (decreases) of (0.03%), (0.01%), (0.01%), (0.01%), and (0.01%).
Notes to Financial Statements
Vanguard Diversified Value Portfolio, a portfolio of Vanguard Variable Insurance Funds, is registered under the Investment Company Act of 1940 as an open-end investment company. The portfolio’s shares are only available for purchase by separate accounts of insurance companies as investments for variable annuity plans, variable life insurance contracts, or other variable benefit insurance contracts.
A. The following significant accounting policies conform to generally accepted accounting principles for U.S. investment companies. The portfolio consistently follows such policies in preparing its financial statements.
1. Security Valuation: Securities are valued as of the close of trading on the New York Stock Exchange (generally 4 p.m., Eastern time) on the valuation date. Equity securities are valued at the latest quoted sales prices or official closing prices taken from the primary market in which each security trades; such securities not traded on the valuation date are valued at the mean of the latest quoted bid and asked prices. Securities for which market quotations are not readily available, or whose values have been materially affected by events occurring before the portfolio’s pricing time but after the close of the securities’ primary markets, are valued by methods deemed by the board of trustees to represent fair value. Investments in Vanguard Market Liquidity Fund are valued at that fund’s net asset value.
2. Federal Income Taxes: The portfolio intends to continue to qualify as a regulated investment company and distribute all of its taxable income. Management has analyzed the portfolio’s tax positions taken for all open federal income tax years (December 31, 2012–2015), and has concluded that no provision for federal income tax is required in the portfolio’s financial statements.
3. Distributions: Distributions to shareholders are recorded on the ex-dividend date.
4. Securities Lending: To earn additional income, the portfolio lends its securities to qualified institutional borrowers. Security loans are subject to termination by the portfolio at any time and are required to be secured at all times by collateral in an amount at least equal to the market value of securities loaned. Daily market fluctuations could cause the value of loaned securities to be more or less than the value of the collateral received. When this occurs, the collateral is adjusted
53
Vanguard Diversified Value Portfolio
and settled on the next business day. The portfolio further mitigates its counterparty risk by entering into securities lending transactions only with a diverse group of prequalified counterparties, monitoring their financial strength, and entering into master securities lending agreements with its counterparties. The master securities lending agreements provide that, in the event of a counterparty’s default (including bankruptcy), the portfolio may terminate any loans with that borrower, determine the net amount owed, and sell or retain the collateral up to the net amount owed to the portfolio; however, such actions may be subject to legal proceedings. While collateral mitigates counterparty risk, in the absence of a default the portfolio may experience delays and costs in recovering the securities loaned. The portfolio invests cash collateral received in Vanguard Market Liquidity Fund, and records a liability in the Statement of Net Assets for the return of the collateral, during the period the securities are on loan. Securities lending income represents fees charged to borrowers plus income earned on invested cash collateral, less expenses associated with the loan.
5. Credit Facility: The portfolio and certain other funds managed by The Vanguard Group (“Vanguard”) participate in a $3 billion committed credit facility provided by a syndicate of lenders pursuant to a credit agreement that may be renewed annually; each fund is individually liable for its borrowings, if any, under the credit facility. Borrowings may be utilized for temporary and emergency purposes, and are subject to the portfolio’s regulatory and contractual borrowing restrictions. The participating funds are charged administrative fees and an annual commitment fee of 0.06% of the undrawn amount of the facility; these fees are allocated to the funds based on a method approved by the portfolio’s board of trustees and included in Management and Administrative expenses on the portfolio’s Statement of Operations. Any borrowings under this facility bear interest at a rate equal to the higher of the federal funds rate or LIBOR reference rate plus an agreed-upon spread.
The portfolio had no borrowings outstanding at December 31, 2015, or at any time during the period then ended.
6. Other: Dividend income is recorded on the ex-dividend date. Interest income includes income distributions received from Vanguard Market Liquidity Fund and is accrued daily. Security transactions are accounted for on the date securities are bought or sold. Costs used to determine realized gains (losses) on the sale of investment securities are those of the specific securities sold.
B. Barrow, Hanley, Mewhinney & Strauss, LLC, provides investment advisory services to the portfolio for a fee calculated at an annual percentage rate of average net assets. The basic fee is subject to quarterly adjustments based on the portfolio’s performance relative to the MSCI Prime Market 750 Index for the preceding three years. For the year ended December 31, 2015, the investment advisory fee represented an effective annual basic rate of 0.13% of the portfolio’s average net assets before a decrease of $335,000 (0.03%) based on performance.
C. In accordance with the terms of a Funds’ Service Agreement (the “FSA”) between Vanguard and the portfolio, Vanguard furnishes to the portfolio corporate management, administrative, marketing, and distribution services at Vanguard’s cost of operations (as defined by the FSA). These costs of operations are allocated to the portfolio based on methods and guidelines approved by the board of trustees. Vanguard does not require reimbursement in the current period for certain costs of operations (such as deferred compensation/benefits and risk/insurance costs); the portfolio’s liability for these costs of operations is included in Payables to Vanguard on the Statement of Net Assets.
Upon the request of Vanguard, the portfolio may invest up to 0.40% of its net assets as capital in Vanguard. At December 31, 2015, the portfolio had contributed to Vanguard capital in the amount of $95,000, representing 0.01% of the portfolio’s net assets and 0.04% of Vanguard’s capitalization. The portfolio’s trustees and officers are also directors and employees, respectively, of Vanguard.
D. Various inputs may be used to determine the value of the portfolio’s investments. These inputs are summarized in three broad levels for financial statement purposes. The inputs or methodologies used to value securities are not necessarily an indication of the risk associated with investing in those securities.
Level 1—Quoted prices in active markets for identical securities.
Level 2—Other significant observable inputs (including quoted prices for similar securities, interest rates, prepayment speeds, credit risk, etc.).
Level 3—Significant unobservable inputs (including the portfolio’s own assumptions used to determine the fair value of investments).
At December 31, 2015, 100% of the market value of the portfolio’s investments was determined based on Level 1 inputs.
54
Vanguard Diversified Value Portfolio
E. Distributions are determined on a tax basis and may differ from net investment income and realized capital gains for financial reporting purposes. Differences may be permanent or temporary. Permanent differences are reclassified among capital accounts in the financial statements to reflect their tax character. Temporary differences arise when certain items of income, expense, gain, or loss are recognized in different periods for financial statement and tax purposes. These differences will reverse at some time in the future. Differences in classification may also result from the treatment of short-term gains as ordinary income for tax purposes.
For tax purposes, at December 31, 2015, the portfolio had $28,589,000 of ordinary income and $59,053,000 of long-term capital gains available for distribution.
At December 31, 2015, the cost of investment securities for tax purposes was $944,766,000.
Net unrealized appreciation of investment securities for tax purposes was $117,220,000, consisting of unrealized gains of $240,067,000 on securities that had risen in value since their purchase and $122,847,000 in unrealized losses on securities that had fallen in value since their purchase.
F. During the year ended December 31, 2015, the portfolio purchased $139,369,000 of investment securities and sold $201,433,000 of investment securities, other than temporary cash investments.
G. Capital shares issued and redeemed were:
| | |
| Year Ended December 31, |
| 2015 | 2014 |
| Shares | Shares |
| (000) | (000) |
| Issued | 4,798 | 10,351 |
| Issued in Lieu of Cash Distributions | 6,178 | 4,059 |
| Redeemed | (11,971) | (11,035) |
| Net Increase (Decrease) in Shares Outstanding | (995) | 3,375 |
At December 31, 2015, one shareholder, an insurance company separate account whose holdings in the portfolio represent the indirect investment of Vanguard Variable Annuity contract holders, was the record or beneficial owner of 38% of the portfolio’s net assets. If the shareholder were to redeem its investment in the portfolio, the redemption might result in an increase in the portfolio’s expense ratio or cause the portfolio to incur higher transaction costs.
H. Management has determined that no material events or transactions occurred subsequent to December 31, 2015, that would require recognition or disclosure in these financial statements.
55
Vanguard Diversified Value Portfolio
Report of Independent Registered Public Accounting Firm
To the Board of Trustees of Vanguard Variable Insurance Funds and the Shareholders of Diversified Value Portfolio: In our opinion, the accompanying statement of net assets and the related statements of operations and of changes in net assets and the financial highlights present fairly, in all material respects, the financial position of Diversified Value Portfolio (constituting a separate portfolio of Vanguard Variable Insurance Funds, hereafter referred to as the “Portfolio”) at December 31, 2015, the results of its operations for the year then ended, the changes in its net assets for each of the two years in the period then ended, and the financial highlights for each of the five years in the period then ended, in conformity with accounting principles generally accepted in the United States of America. These financial statements and financial highlights (hereafter referred to as “financial statements”) are the responsibility of the Portfolio’s management. Our responsibility is to express an opinion on these financial statements based on our audits. We conducted our audits of these financial statements in accordance with the standards of the Public Company Accounting Oversight Board (United States). Those standards require that we plan and perform the audit to obtain reasonable assurance about whether the financial statements are free of material misstatement. An audit includes examining, on a test basis, evidence supporting the amounts and disclosures in the financial statements, assessing the accounting principles used and significant estimates made by management, and evaluating the overall financial statement presentation. We believe that our audits, which included confirmation of securities at December 31, 2015 by correspondence with the custodian and by agreement to the underlying ownership records of the transfer agent, provide a reasonable basis for our opinion.
/s/PricewaterhouseCoopers LLP
Philadelphia, Pennsylvania
February 11, 2016
| |
| |
| Special 2015 tax information (unaudited) for corporate shareholders only for Vanguard |
| Diversified Value Portfolio, a portfolio of Vanguard Variable Insurance Funds |
| |
| This information for the fiscal year ended December 31, 2015, is included pursuant to provisions |
| of the Internal Revenue Code for corporate shareholders only. |
| |
| The portfolio distributed $71,917,000 as capital gain dividends (20% rate gain distributions) to |
| shareholders during the fiscal year. |
| |
| For corporate shareholders, 95.6% of investment income (dividend income plus short-term gains, |
| if any) qualifies for the dividends-received deduction. |
56
Vanguard Diversified Value Portfolio
About Your Portfolio’s Expenses
As a shareholder of the portfolio, you incur ongoing costs, which include costs for portfolio management, administrative services, and shareholder reports (like this one), among others. Operating expenses, which are deducted from a portfolio’s gross income, directly reduce the investment return of the portfolio.
A portfolio’s expenses are expressed as a percentage of its average net assets. This figure is known as the expense ratio. The following examples are intended to help you understand the ongoing costs (in dollars) of investing in your portfolio and to compare these costs with those of other mutual funds. The examples are based on an investment of $1,000 made at the beginning of the period shown and held for the entire period.
The table below illustrates your portfolio’s costs in two ways:
• Based on actual portfolio return. This section helps you to estimate the actual expenses that you paid over the period. The “Ending Account Value” shown is derived from the portfolio’s actual return, and the third column shows the dollar amount that would have been paid by an investor who started with $1,000 in the portfolio. You may use the information here, together with the amount you invested, to estimate the expenses that you paid over the period.
To do so, simply divide your account value by $1,000 (for example, an $8,600 account value divided by $1,000 = 8.6), then multiply the result by the number given for your portfolio under the heading “Expenses Paid During Period.”
• Based on hypothetical 5% yearly return. This section is intended to help you compare your portfolio’s costs with those of other mutual funds. It assumes that the portfolio had a yearly return of 5% before expenses, but that the expense ratio is unchanged. In this case—because the return used is not the portfolio’s actual return—the results do not apply to your investment. The example is useful in making comparisons because the Securities and Exchange Commission requires all mutual funds to calculate expenses based on a 5% return. You can assess your portfolio’s costs by comparing this hypothetical example with the hypothetical examples that appear in shareholder reports of other funds.
Note that the expenses shown in the table are meant to highlight and help you compare ongoing costs only and do not reflect transaction costs incurred by the portfolio for buying and selling securities. The portfolio’s expense ratio does not reflect additional fees and expenses associated with the annuity or life insurance program through which you invest.
The calculations assume no shares were bought or sold during the period. Your actual costs may have been higher or lower, depending on the amount of your investment and the timing of any purchases or redemptions.
You can find more information about the portfolio’s expenses in the Financial Statements section. For additional information on operating expenses and other shareholder costs, please refer to the prospectus.
| | | |
| Six Months Ended December 31, 2015 | | | |
| Beginning | Ending | Expenses |
| Account Value | Account Value | Paid During |
| Diversified Value Portfolio | 6/30/2015 | 12/31/2015 | Period1 |
| Based on Actual Portfolio Return | $1,000.00 | $967.84 | $1.34 |
| Based on Hypothetical 5% Yearly Return | 1,000.00 | 1,023.84 | 1.38 |
1 The calculations are based on expenses incurred in the most recent six-month period. The portfolio’s annualized six-month expense ratio for that period is 0.27%. The dollar amounts shown as “Expenses Paid” are equal to the annualized expense ratio multiplied by the average account value over the period, multiplied by the number of days in the most recent six-month period, then divided by the number of days in the most recent 12-month period (184/365).
57
Vanguard® Equity Income Portfolio
Advisors’ Report
Vanguard Equity Income Portfolio returned 0.85% in 2015, modestly ahead of the 0.39% return of its benchmark, the FTSE High Dividend Yield Index, and nearly 5 percentage points ahead of the average return of peer funds. Please note that the returns for Vanguard Variable Insurance Fund are different from those of Vanguard Variable Annuity (and other plans that invest in the fund), which take into account insurance-related expenses.
The portfolio is managed by two independent advisors, a strategy that enhances diversification by providing exposure to distinct yet complementary investment approaches. It is not uncommon for different advisors to have different views about individual securities or the broader investment environment.
The advisors, the amount and percentage of the portfolio’s assets each manages, and brief descriptions of their investment strategies are presented in the accompanying table. Each advisor has also provided a discussion of the investment environment that existed during 2015 and its effect on the portfolio’s positioning. These reports were prepared on January 13, 2016.
Wellington Management Company LLP
Portfolio Manager:
W. Michael Reckmeyer, III, CFA, Senior Managing Director
U.S. economic performance was uneven toward the end of 2015, with weakness in the industrial complex and strength in consumer categories. Growth in consumer spending outpaced that of industrial spending in the fourth quarter, although consumption growth slowed because of unfavorable weather. U.S. dollar strength also hurt export demand and growth rates for industrial companies.
The inventory overhang carried into the new year. If low oil prices persist, consumer spending could improve from its fourth-quarter growth rate. We believe the energy market has a self-correcting pricing mechanism; however, normalization is taking longer to materialize than we had expected. Though favorable to consumers, this commodity price collapse has been a significant challenge to energy and materials companies. In addition, credit spreads have widened, which could be a sign of deteriorating credit conditions and broader market issues.
Europe and China also remain key areas of focus as we assess the global economy. Although European economies have held relatively steady, decelerating growth in China could continue to affect growth globally. Market participants seemed relieved by the Federal Reserve’s decision to raise short-term interest rates. We believe future changes in rates will be data-driven and unlikely to present a shock to equity markets.
Our relative performance was aided by stock selection, most notably in the consumer discretionary, consumer staples, and energy sectors. Our position in home improvement retailer Home Depot was the top relative contributor. We continue to hold a large position, as same-store sales are expected to keep accelerating, and we believe earnings power can increase as housing expenditures rise. Our holdings in Kraft Foods also aided relative performance. Shares moved up strongly on news that the company would merge with Heinz in a deal led by 3G Capital and Berkshire Hathaway. We continue to hold the stock based on our view that the combination will be more accretive to earnings than the market currently expects.
Selection was weaker and detracted in industrials, health care, and financials. Not owning Apple, which did not meet our yield requirements, hurt performance the most.
| | | |
| Total Returns | | | |
| | | Ten Years Ended |
| | | December 31, 2015 |
| | Year Ended | Average |
| December 31, 2015 | Annual Return |
| Vanguard Equity Income Portfolio | 0.85% | 7.87% |
| Spliced Equity Income Index1 | 0.39 | 7.66 |
| Variable Insurance Equity Income Funds Average2 | -4.02 | 5.48 |
The figures shown represent past performance, which is not a guarantee of future results. (Current performance may be lower or higher than the performance data cited. For performance data current to the most recent month-end, visit our website at vanguard.com/performance.) Note, too, that both investment returns and principal value can fluctuate widely, so an investor’s shares, when sold, could be worth more or less than their original cost.
| | |
| Expense Ratios3 | | |
| Your Portfolio Compared With Its Peer Group | | |
| Variable Insurance |
| Equity Income |
| Portfolio | Funds Average |
| Equity Income Portfolio | 0.32% | 0.86% |
1 Russell 1000 Value Index through July 31, 2007; FTSE High Dividend Yield Index thereafter.
2 Derived from data provided by Lipper, a Thomson Reuters Company.
3 The portfolio expense ratio shown is from the prospectus dated April 30, 2015, and represents estimated costs for the current fiscal year. For the fiscal year ended December 31, 2015, the Equity Income Portfolio’s expense ratio was 0.31%. The peer-group expense ratio is derived from data provided by Lipper, a Thomson Reuters Company, and captures information through year-end 2014.
58
Vanguard Equity Income Portfolio
Significant purchases for our portion of the portfolio included new positions in Dominion Resources, Union Pacific, Duke Energy, Honeywell International, Raytheon, and IBM. The utilities sector weakened midyear, creating an attractive relative valuation opportunity for us to close our underweighting and shift to a modest overweighting in the sector. We purchased shares of power and gas distributor Duke Energy and diversified energy provider Dominion Resources during the second half of the year. Dominion has a solid dividend yield supported by good growth from its pipeline projects, and we believe the valuation is compelling. We also purchased the stock of Union Pacific, one of the nation’s largest railroad operators, as it traded lower on weak volumes. The company enjoys strong pricing and cost control, and we anticipate improved volumes in 2016.
We sold our holdings in Unilever, WPP, Akzo Nobel, Eli Lilly, Anheuser-Busch, and DuPont because of valuation. We also sold Illinois Tool Works amid a weakening cycle, which made our outlook less favorable. We significantly trimmed our position in Analog Devices.
Sector positioning continues to be a product of our bottom-up stock selection process. We ended the period most overweighted in financials, industrials, and utilities. Consumer staples, telecommunication services, and materials were our largest underweightings relative to the benchmark.
As always, we remain focused on finding investment opportunities in quality dividend-paying companies with superior total return potential at discounted valuations.
Vanguard Quantitative Equity Group
Portfolio Managers:
James P. Stetler, Principal
James D. Troyer, CFA, Principal
Michael R. Roach, CFA
The broad U.S. equity market returned 0.48% in 2015. Large- and mid-capitalization stocks returned about 1%, while small-caps declined. Growth-oriented companies significantly outpaced their value-oriented counterparts. Globally, the U.S. equity market continued to outperform international markets, especially those in developing countries.
Real GDP in the United States in the third quarter grew 2.0%, compared with 3.9% in the previous quarter, decelerating mainly because of slowdowns in private inventory investment, exports, and capital spending. Corporate profits decreased 1.6% in the third quarter after rising 3.5% in the second—attractive compared with the rest of the world. A 30% decline in oil prices lifted consumer spending. The U.S. job market continued to improve: Nonfarm payroll employment rose by 292,000 in December, and the unemployment rate of 5.0% was unchanged from the month before. In December, the Federal Reserve raised interest rates for the first time in nearly a decade. Further gradual rate hikes are expected but will depend on economic data.
Foreign currencies continued to lose ground against the dollar, which has weighed on emerging markets, especially those with abundant dollar-denominated debt. Last August, volatility in Chinese markets spread to global stocks as well as commodities and recently returned amid poor economic data from the region. Meanwhile, the European Central Bank is expected to continue its stance of accommodative monetary policy as it aims to spur inflation.
Within the FTSE High Dividend Yield Index benchmark, which returned 0.39%, in line with the broad market, seven of the ten sectors generated positive returns. Results were best in information technology, consumer staples, and health care, while energy stocks were down more than 20% as oil prices continued their descent.
| | | |
| Vanguard Equity Income Portfolio Investment Advisors |
| |
| Portfolio Assets Managed | |
| Investment Advisor | % | $ Million | Investment Strategy |
| Wellington Management | 63 | 591 | Employs a fundamental approach to identify desirable |
| Company LLP | individual stocks, seeking those that typically offer |
| | | | above-average dividend yields, below-average |
| | | | valuations, and the potential for dividend increases |
| | | | in the future. |
| Vanguard Quantitative | 34 | 317 | Employs a quantitative fundamental management |
| Equity Group | approach, using models that assess valuation, growth |
| | | | prospects, management decisions, market sentiment, |
| | | | and earnings and balance-sheet quality of companies |
| | | | as compared with their peers. |
| Cash Investments | 3 | 32 | These short-term reserves are invested by Vanguard |
| | | | in equity index products to simulate investment in |
| | | | stocks. Each advisor may also maintain a modest |
| | | | cash position. |
59
Vanguard Equity Income Portfolio
Although we seek to understand the impact of macroeconomic factors on portfolio performance, our investment process is centered on specific stock fundamentals. We use a quantitative approach to systematically identify stocks in our investment universe that appear more likely to exhibit long-term outperformance. Our process focuses on valuation as well as on other factors that we believe contribute to fundamental growth, helping us to take advantage of inefficiencies in the market caused by persistent biases in investor behavior. Using the results of our model, we then construct our portfolio with the goal of maximizing expected return while minimizing exposure to risks relative to the benchmark (such as industry selection) that our research indicates do not improve returns.
Our growth and sentiment models helped performance, but our management decisions, quality, and valuation models did not perform as expected. Relative to the benchmark, we outperformed in five of the ten industry sectors, especially with our selections in energy, technology, and materials. Telecommunications was a disappointment.
In energy, PBF Energy, Delek US Holdings, and Nordic American Tankers were strong positive contributors to performance. Technology companies EarthLink, Leidos Holdings, and Broadridge Financial Solutions also lifted results, as did Avery Dennison, LyondellBasell Industries, and Dow Chemical in materials. In telecommunications, CenturyLink, Verizon, and AT&T detracted.
60
Vanguard Equity Income Portfolio
Portfolio Profile
As of December 31, 2015
| | | |
| Portfolio Characteristics | | |
| | Comparative | Broad |
| Portfolio | Index1 | Index2 |
| Number of Stocks | 145 | 431 | 3,960 |
| Median Market Cap | $114.5B | $114.5B | $51.4B |
| Price/Earnings Ratio | 18.8x | 19.4x | 21.9x |
| Price/Book Ratio | 2.5x | 2.5x | 2.7x |
| Yield3 | 2.8% | 3.4% | 2.1% |
| Return on Equity | 17.8% | 17.8% | 17.2% |
| Earnings Growth Rate | 5.5% | 3.4% | 9.5% |
| Foreign Holdings | 6.8% | 0.0% | 0.0% |
| Turnover Rate | 36% | — | — |
| Expense Ratio4 | 0.32% | — | — |
| Short-Term Reserves | 1.8% | — | — |
| | |
| Volatility Measures | |
| Portfolio Versus | Portfolio Versus |
| Comparative Index1 | Broad Index2 |
| R-Squared | 0.99 | 0.93 |
| Beta | 0.98 | 0.93 |
| | | |
| Sector Diversification (% of equity exposure) |
| | | Comparative | Broad |
| Portfolio | Index1 | Index2 |
| Consumer Discretionary | 6.6% | 6.6% | 13.4% |
| Consumer Staples | 11.3 | 14.7 | 8.8 |
| Energy | 10.3 | 10.1 | 5.9 |
| Financials | 16.8 | 14.4 | 18.3 |
| Health Care | 12.7 | 12.1 | 14.8 |
| Industrials | 12.3 | 11.3 | 10.6 |
| Information Technology | 14.2 | 14.4 | 19.8 |
| Materials | 2.7 | 3.3 | 3.1 |
| Telecommunication | | | |
| Services | 4.4 | 5.2 | 2.2 |
| Utilities | 8.7 | 7.9 | 3.1 |
| | |
| Ten Largest Holdings5 (% of total net assets) |
| |
| Microsoft Corp. | Systems Software | 4.8% |
| Wells Fargo & Co. | Diversified Banks | 3.9 |
| JPMorgan Chase & Co. | Diversified Banks | 3.3 |
| Johnson & Johnson | Pharmaceuticals | 3.2 |
| General Electric Co. | Industrial | |
| Conglomerates | 3.0 |
| Verizon | Integrated | |
| Communications Inc. | Telecommunication | |
| Services | 2.5 |
| Intel Corp. | Semiconductors | 2.5 |
| Exxon Mobil Corp. | Integrated Oil | |
| & Gas | 2.4 |
| Home Depot Inc. | Home Improvement | |
| Retail | 2.3 |
| Pfizer Inc. | Pharmaceuticals | 2.3 |
| Top Ten | 30.2% |
Investment Focus

30-Day SEC Yield. A portfolio’s 30-day SEC yield is derived using a formula specified by the U.S. Securities and Exchange Commission. Under the formula, data related to the portfolio’s security holdings in the previous 30 days are used to calculate the portfolio’s hypothetical net income for that period, which is then annualized and divided by the portfolio’s estimated average net assets over the calculation period. For the purposes of this calculation, a security’s income is based on its current market yield to maturity (for bonds), its actual income (for asset-backed securities), or its projected dividend yield (for stocks). Because the SEC yield represents hypothetical annualized income, it will differ—at times significantly—from the portfolio’s actual experience. As a result, the portfolio’s income distributions may be higher or lower than implied by the SEC yield.
Beta. A measure of the magnitude of a portfolio’s past share-price fluctuations in relation to the ups and downs of a given market index. The index is assigned a beta of 1.00. Compared with a given index, a portfolio with a beta of 1.20 typically would have seen its share price rise or fall by 12% when the index rose or fell by 10%. For this report, beta is based on returns over the past 36 months for both the portfolio and the index.
Equity Exposure. A measure that reflects a portfolio’s investments in stocks and stock futures. Any holdings in short-term reserves are excluded.
R-Squared. A measure of how much of a portfolio’s past returns can be explained by the returns from the market in general, as measured by a given index. If a portfolio’s total returns were precisely synchronized with an index’s returns, its R-squared would be 1.00. If the portfolio’s returns bore no relationship to the index’s returns, its R-squared would be 0. For this report, R-squared is based on returns over the past 36 months for both the portfolio and the index.
1 FTSE High Dividend Yield Index.
2 Dow Jones U.S. Total Stock Market Float Adjusted Index.
3 30-day SEC yield for the portfolio; annualized dividend yield for the index.
4 The expense ratio shown is from the prospectus dated April 30, 2015, and represents estimated costs for the current fiscal year. For the fiscal year ended December 31, 2015, the Equity Income Portfolio’s expense ratio was 0.31%.
5 The holdings listed exclude any temporary cash investments and equity index products.
61
Vanguard Equity Income Portfolio
Performance Summary
All of the returns in this report represent past performance, which is not a guarantee of future results that may be achieved by the portfolio. (Current performance may be lower or higher than the performance data cited. For performance data current to the most recent month-end, visit our website at vanguard.com/performance.) Note, too, that both investment returns and principal value can fluctuate widely, so an investor’s shares, when sold, could be worth more or less than their original cost. The returns shown do not reflect taxes that a shareholder would pay on portfolio distributions or on the sale of portfolio shares. Nor do the returns reflect fees and expenses associated with the annuity or life insurance program through which a shareholder invests. If these fees and expenses were included, the portfolio’s returns would be lower.
Cumulative Performance: December 31, 2005–December 31, 2015
Initial Investment of $10,000

| | | | |
| | | Average Annual Total Returns | Final Value |
| | Periods Ended December 31, 2015 | of a $10,000 |
| | One Year | Five Years | Ten Years | Investment |
| Equity Income Portfolio | 0.85% | 12.81% | 7.87% | $21,332 |
| Spliced Equity Income Index1 | 0.39 | 13.14 | 7.66 | 20,916 |
| Variable Insurance Equity Income | | | | |
| Funds Average2 | -4.02 | 9.27 | 5.48 | 17,056 |
| Dow Jones U.S. Total Stock Market | | | | |
| Float Adjusted Index | 0.44 | 12.14 | 7.48 | 20,563 |
Fiscal-Year Total Returns (%): December 31, 2005–December 31, 2015

|
| Equity Income Portfolio |
| Spliced Equity Income Index1 |
1 Russell 1000 Value Index through July 31, 2007; FTSE High Dividend Yield Index thereafter.
2 Derived from data provided by Lipper, a Thomson Reuters Company.
See Financial Highlights for dividend and capital gains information.
62
Vanguard Equity Income Portfolio
Financial Statements
Statement of Net Assets
As of December 31, 2015
The portfolio reports a complete list of its holdings in regulatory filings four times in each fiscal year, at the quarter-ends. For the second and fourth fiscal quarters, the lists appear in the portfolio’s semiannual and annual reports to shareholders. For the first and third fiscal quarters, the portfolio files the lists with the Securities and Exchange Commission on Form N-Q. Shareholders can look up the portfolio’s Forms N-Q on the SEC’s website at sec.gov. Forms N-Q may also be reviewed and copied at the SEC’s Public Reference Room (see the back cover of this report for further information).
| | | |
| Market |
| Value• |
| | | Shares | ($000) |
| Common Stocks (95.6%)1 | | |
| Consumer Discretionary (6.1%) | | |
| Home Depot Inc. | 166,500 | 22,019 |
| McDonald’s Corp. | 90,396 | 10,679 |
| Thomson Reuters Corp. | 125,800 | 4,761 |
| Target Corp. | 45,100 | 3,275 |
| Ford Motor Co. | 203,100 | 2,862 |
| Carnival Corp. | 47,100 | 2,566 |
| General Motors Co. | 68,300 | 2,323 |
| Omnicom Group Inc. | 25,800 | 1,952 |
| Darden Restaurants Inc. | 27,400 | 1,744 |
| Leggett & Platt Inc. | 39,100 | 1,643 |
| American Eagle Outfitters | | |
| | Inc. | 82,300 | 1,276 |
| Cracker Barrel Old Country | | |
| | Store Inc. | 9,000 | 1,141 |
| Gannett Co. Inc. | 38,000 | 619 |
| Time Warner Cable Inc. | 2,100 | 390 |
| International Game | | |
| | Technology plc | 11,500 | 186 |
| Bob Evans Farms Inc. | 2,900 | 113 |
| 57,549 |
| Consumer Staples (10.8%) | | |
| Coca-Cola Co. | 348,824 | 14,985 |
| Philip Morris International | | |
| | Inc. | 160,873 | 14,142 |
| Kraft Heinz Co. | 167,765 | 12,207 |
| Procter & Gamble Co. | 126,400 | 10,037 |
| Altria Group Inc. | 156,380 | 9,103 |
| Wal-Mart Stores Inc. | 142,785 | 8,753 |
| British American Tobacco | | |
| | plc | 151,812 | 8,431 |
| PepsiCo Inc. | 54,200 | 5,416 |
| Diageo plc ADR | 43,400 | 4,734 |
| Dr Pepper Snapple Group | | |
| | Inc. | 26,200 | 2,442 |
| Clorox Co. | 18,400 | 2,334 |
| Kimberly-Clark Corp. | 15,760 | 2,006 |
| Campbell Soup Co. | 36,600 | 1,923 |
| Ingredion Inc. | 19,400 | 1,859 |
| Universal Corp. | 29,400 | 1,649 |
| B&G Foods Inc. | 15,200 | 532 |
| ConAgra Foods Inc. | 11,900 | 502 |
| 101,055 |
| Energy (9.8%) | | |
| Exxon Mobil Corp. | 293,050 | 22,843 |
| Chevron Corp. | 204,900 | 18,433 |
| Suncor Energy Inc. | 446,200 | 11,512 |
| Phillips 66 | 112,600 | 9,211 |
| Occidental Petroleum Corp. | 120,950 | 8,177 |
| Enbridge Inc. | 144,500 | 4,796 |
| Marathon Oil Corp. | 243,500 | 3,066 |
| Valero Energy Corp. | 41,200 | 2,913 |
| | | |
| Market |
| Value• |
| | Shares | ($000) |
| ^ | Nordic American Tankers | | |
| | Ltd. | 105,400 | 1,638 |
| ^ | Ship Finance International | | |
| | Ltd. | 94,900 | 1,572 |
| Ensco plc Class A | 101,600 | 1,564 |
| Noble Corp. plc | 133,300 | 1,406 |
| Scorpio Tankers Inc. | 166,300 | 1,334 |
| CVR Energy Inc. | 32,900 | 1,295 |
| HollyFrontier Corp. | 29,500 | 1,177 |
| Western Refining Inc. | 23,100 | 823 |
| ConocoPhillips | 16,200 | 756 |
| 92,516 |
| Financials (16.0%) | | |
| Wells Fargo & Co. | 668,500 | 36,340 |
| JPMorgan Chase & Co. | 463,700 | 30,618 |
| Marsh & McLennan | | |
| | Cos. Inc. | 265,900 | 14,744 |
| PNC Financial Services | | |
| | Group Inc. | 127,200 | 12,123 |
| BlackRock Inc. | 29,600 | 10,079 |
| ACE Ltd. | 77,900 | 9,103 |
| MetLife Inc. | 159,900 | 7,709 |
| M&T Bank Corp. | 51,400 | 6,229 |
| US Bancorp | 115,700 | 4,937 |
| Travelers Cos. Inc. | 27,100 | 3,058 |
| Prudential Financial Inc. | 37,400 | 3,045 |
| Principal Financial Group Inc. | 67,000 | 3,014 |
| Aflac Inc. | 40,700 | 2,438 |
| Lazard Ltd. Class A | 39,400 | 1,773 |
| Navient Corp. | 147,800 | 1,692 |
| Maiden Holdings Ltd. | 107,900 | 1,609 |
| CME Group Inc. | 7,700 | 698 |
| United Fire Group Inc. | 12,700 | 486 |
| Washington Federal Inc. | 14,900 | 355 |
| Oritani Financial Corp. | 12,600 | 208 |
| Flushing Financial Corp. | 4,200 | 91 |
| Cincinnati Financial Corp. | 1,400 | 83 |
| 150,432 |
| Health Care (12.0%) | | |
| Johnson & Johnson | 297,186 | 30,527 |
| Pfizer Inc. | 663,199 | 21,408 |
| Merck & Co. Inc. | 403,074 | 21,290 |
| Bristol-Myers Squibb Co. | 177,060 | 12,180 |
| Roche Holding AG | 25,308 | 7,013 |
| AstraZeneca plc ADR | 173,800 | 5,901 |
| AbbVie Inc. | 88,000 | 5,213 |
| Eli Lilly & Co. | 57,420 | 4,838 |
| Novartis AG | 48,293 | 4,154 |
| 112,524 |
| Industrials (11.7%) | | |
| General Electric Co. | 915,652 | 28,523 |
| 3M Co. | 67,840 | 10,219 |
| Eaton Corp. plc | 194,200 | 10,106 |
| | | |
| Market |
| Value• |
| | Shares | ($000) |
| United Technologies Corp. | 97,600 | 9,376 |
| Raytheon Co. | 59,300 | 7,385 |
| United Parcel Service Inc. | | |
| | Class B | 75,900 | 7,304 |
| Honeywell International Inc. | 61,100 | 6,328 |
| Union Pacific Corp. | 74,200 | 5,803 |
| Boeing Co. | 34,900 | 5,046 |
| Caterpillar Inc. | 62,500 | 4,248 |
| Waste Management Inc. | 64,700 | 3,453 |
| Lockheed Martin Corp. | 14,800 | 3,214 |
| PACCAR Inc. | 41,000 | 1,943 |
| Pitney Bowes Inc. | 82,100 | 1,695 |
| General Cable Corp. | 116,400 | 1,563 |
| General Dynamics Corp. | 11,370 | 1,562 |
| West Corp. | 51,400 | 1,109 |
| National Preston Industries | | |
| | Inc. | 11,000 | 912 |
| Harsco Corp. | 47,000 | 370 |
| 110,159 |
| Information Technology (13.3%) | |
| Microsoft Corp. | 815,300 | 45,233 |
| Intel Corp. | 675,900 | 23,285 |
| Cisco Systems Inc. | 754,600 | 20,491 |
| International Business | | |
| | Machines Corp. | 69,400 | 9,551 |
| Maxim Integrated | | |
| | Products Inc. | 147,300 | 5,597 |
| Analog Devices Inc. | 96,400 | 5,333 |
| Texas Instruments Inc. | 91,400 | 5,009 |
| Western Union Co. | 102,000 | 1,827 |
| Leidos Holdings Inc. | 32,300 | 1,817 |
| Diebold Inc. | 51,500 | 1,550 |
| EarthLink Holdings Corp. | 207,500 | 1,542 |
| QUALCOMM Inc. | 27,400 | 1,369 |
| Apple Inc. | 9,100 | 958 |
| Computer Sciences Corp. | 28,000 | 915 |
| CSRA Inc. | 24,800 | 744 |
| 125,221 |
| Materials (2.5%) | | |
| Dow Chemical Co. | 187,000 | 9,627 |
| International Paper Co. | 110,110 | 4,151 |
| Nucor Corp. | 83,900 | 3,381 |
| LyondellBasell Industries NV | | |
| | Class A | 32,700 | 2,842 |
| Avery Dennison Corp. | 29,900 | 1,873 |
| EI du Pont de Nemours | | |
| | & Co. | 11,166 | 744 |
| Domtar Corp. | 19,700 | 728 |
| Schnitzer Steel | | |
| | Industries Inc. | 34,000 | 488 |
| 23,834 |
| Other (0.8%) | | |
| 2 | Vanguard High Dividend | | |
| | Yield ETF | 119,332 | 7,966 |
| |
| Telecommunication Services (4.2%) | |
| Verizon Communications | | |
| | Inc. | 514,217 | 23,767 |
| BCE Inc. | 184,700 | 7,136 |
| AT&T Inc. | 187,495 | 6,452 |
| CenturyLink Inc. | 81,900 | 2,060 |
| 39,415 |
63
Vanguard Equity Income Portfolio
| | | |
| Market |
| Value• |
| | Shares | ($000) |
| Utilities (8.4%) | | |
| NextEra Energy Inc. | 87,940 | 9,136 |
| Dominion Resources Inc. | 132,200 | 8,942 |
| Xcel Energy Inc. | 218,600 | 7,850 |
| UGI Corp. | 221,700 | 7,485 |
| Eversource Energy | 134,600 | 6,874 |
| Duke Energy Corp. | 88,000 | 6,282 |
| National Grid plc | 356,704 | 4,919 |
| Sempra Energy | 46,300 | 4,353 |
| CMS Energy Corp. | 113,900 | 4,109 |
| American Electric Power | | |
| | Co. Inc. | 47,800 | 2,785 |
| Exelon Corp. | 93,200 | 2,588 |
| PPL Corp. | 73,300 | 2,502 |
| Public Service Enterprise | | |
| | Group Inc. | 61,200 | 2,368 |
| Consolidated Edison Inc. | 34,600 | 2,224 |
| FirstEnergy Corp. | 68,200 | 2,164 |
| WGL Holdings Inc. | 30,100 | 1,896 |
| Southern Co. | 26,900 | 1,259 |
| ONE Gas Inc. | 17,000 | 853 |
| 78,589 |
| Total Common Stocks | | |
| (Cost $767,570) | 899,260 |
| | |
| Market |
| Value• |
| Shares | ($000) |
| Temporary Cash Investments (4.6%)1 | |
| Money Market Fund (2.8%) | | |
| 3,4 Vanguard Market Liquidity | | |
| Fund, 0.363% | 26,493,427 | 26,493 |
| |
| Face | |
| Amount | |
| ($000) | |
| Repurchase Agreement (1.6%) | |
| BNP Paribas Securities Corp. | |
| 0.300%, 1/4/16 (Dated | | |
| 12/31/15, Repurchase Value | |
| $15,201,000, collateralized | |
| by Federal National Mortgage | |
| Assn. 3.500%–6.500%, | | |
| 12/1/25–11/1/45, Government | |
| National Mortgage Assn. | | |
| 3.000%–4.500%, 9/15/40– | |
| 7/20/42, and U.S. Treasury | |
| Note/Bond 0.000%–2.000%, | |
| 1/7/16–2/15/22, with a value | |
| of $15,504,000) | 15,200 | 15,200 |
| |
| U.S. Government and Agency Obligations (0.2%) |
| 5,6 Federal Home Loan | | |
| Bank Discount Notes, | | |
| 0.115%, 1/14/16 | 1,000 | 1,000 |
| 5,6 Federal Home Loan | | |
| Bank Discount Notes, | | |
| 0.572%, 6/22/16 | 200 | 199 |
| 6,7 Freddie Mac Discount Notes, | |
| 0.220%, 4/15/16 | 100 | 100 |
| 6 United States Treasury Bill, | |
| 0.370%, 5/26/16 | 100 | 100 |
| 1,399 |
| Total Temporary Cash Investments | |
| (Cost $43,092) | 43,092 |
| Total Investments (100.2%) | | |
| (Cost $810,662) | 942,352 |
| |
| Amount |
| ($000) |
| Other Assets and Liabilities (-0.2%) | |
| Other Assets | |
| Investment in Vanguard | 83 |
| Receivables for Investment Securities Sold | 154 |
| Receivables for Accrued Income | 1,888 |
| Receivables for Capital Shares Issued | 178 |
| Other Assets | 29 |
| Total Other Assets | 2,332 |
| Liabilities | |
| Payables for Investment Securities Purchased (202) |
| Collateral for Securities on Loan | (1,321) |
| Payables to Investment Advisor | (124) |
| Payables for Capital Shares Redeemed | (1,143) |
| Payables to Vanguard | (1,361) |
| Other Liabilities | (251) |
| Total Liabilities | (4,402) |
| Net Assets (100%) | |
| Applicable to 44,304,651 outstanding | |
| $.001 par value shares of beneficial | |
| interest (unlimited authorization) | 940,282 |
| Net Asset Value Per Share | $21.22 |
| |
| |
| At December 31, 2015, net assets consisted of: |
| Amount |
| ($000) |
| Paid-in Capital | 718,020 |
| Undistributed Net Investment Income | 24,792 |
| Accumulated Net Realized Gains | 65,556 |
| Unrealized Appreciation (Depreciation) | |
| Investment Securities | 131,690 |
| Futures Contracts | 239 |
| Foreign Currencies | (15) |
| Net Assets | 940,282 |
• See Note A in Notes to Financial Statements.
^ Includes partial security positions on loan to broker-dealers. The total value of securities on loan is $1,283,000.
1 The portfolio invests a portion of its cash reserves in equity markets through the use of index futures contracts. After giving effect to futures investments, the portfolio’s effective common stock and temporary cash investment positions represent 98.3% and 1.9%, respectively, of net assets.
2 Considered an affiliated company of the portfolio as the issuer is another member of The Vanguard Group.
3 Affiliated money market fund available only to Vanguard funds and certain trusts and accounts managed by Vanguard. Rate shown is the 7-day yield.
4 Includes $1,321,000 of collateral received for securities on loan.
5 The issuer operates under a congressional charter; its securities are generally neither guaranteed by the U.S. Treasury nor backed by the full faith and credit of the U.S. government.
6 Securities with a value of $1,299,000 have been segregated as initial margin for open futures contracts.
7 The issuer was placed under federal conservatorship in September 2008; since that time, its daily operations have been managed by the Federal Housing Finance Agency and it receives capital from the U.S. Treasury, as needed to maintain a positive net worth, in exchange for senior preferred stock.
ADR—American Depositary Receipt.
See accompanying Notes, which are an integral part of the Financial Statements.
64
Vanguard Equity Income Portfolio
| | | |
| Statement of Operations |
| |
| Year Ended |
| December 31, 2015 |
| | ($000) |
| Investment Income | | |
| Income | | |
| Dividends1,2 | 29,022 |
| Interest1 | 39 |
| Securities Lending | 107 |
| Total Income | 29,168 |
| Expenses | | |
| Investment Advisory Fees—Note B | |
| Basic Fee | 882 |
| Performance Adjustment | (59) |
| The Vanguard Group—Note C | | |
| Management and Administrative | 1,897 |
| Marketing and Distribution | 126 |
| Custodian Fees | 35 |
| Auditing Fees | 35 |
| Shareholders’ Reports | 23 |
| Trustees’ Fees and Expenses | 2 |
| Total Expenses | 2,941 |
| Net Investment Income | 26,227 |
| Realized Net Gain (Loss) | | |
| Investment Securities Sold1 | 66,503 |
| Futures Contracts | (552) |
| Foreign Currencies | (19) |
| Realized Net Gain (Loss) | 65,932 |
| Change in Unrealized Appreciation | |
| (Depreciation) | | |
| Investment Securities | (83,804) |
| Futures Contracts | (58) |
| Foreign Currencies | — |
| Change in Unrealized Appreciation | |
| (Depreciation) | (83,862) |
| Net Increase (Decrease) in Net Assets | |
| Resulting from Operations | 8,297 |
1 Dividend income, interest income, and realized net gain (loss) from affiliated companies of the portfolio were $256,000, $27,000, and $0, respectively.
2 Dividends are net of foreign withholding taxes of $212,000.
| | |
| Statement of Changes in Net Assets | | |
| |
| Year Ended December 31, |
| 2015 | 2014 |
| ($000) | ($000) |
| Increase (Decrease) in Net Assets | | |
| Operations | | |
| Net Investment Income | 26,227 | 25,140 |
| Realized Net Gain (Loss) | 65,932 | 58,114 |
| Change in Unrealized Appreciation (Depreciation) | (83,862) | 17,734 |
| Net Increase (Decrease) in Net Assets Resulting from Operations | 8,297 | 100,988 |
| Distributions | | |
| Net Investment Income | (25,120) | (22,248) |
| Realized Capital Gain1 | (58,331) | (46,098) |
| Total Distributions | (83,451) | (68,346) |
| Capital Share Transactions | | |
| Issued | 81,848 | 63,402 |
| Issued in Lieu of Cash Distributions | 83,451 | 68,346 |
| Redeemed | (127,701) | (97,512) |
| Net Increase (Decrease) from Capital Share Transactions | 37,598 | 34,236 |
| Total Increase (Decrease) | (37,556) | 66,878 |
| Net Assets |
| Beginning of Period | 977,838 | 910,960 |
| End of Period2 | 940,282 | 977,838 |
1 Includes fiscal 2015 and 2014 short-term gain distributions totaling $5,563,000 and $0, respectively. Short-term gain distributions are treated as ordinary income dividends for tax purposes.
2 Net Assets—End of Period includes undistributed (overdistributed) net investment income of $24,792,000 and $23,668,000.
See accompanying Notes, which are an integral part of the Financial Statements.
65
| | | | | |
| Vanguard Equity Income Portfolio | | | | | |
| |
| |
| Financial Highlights | | | | | |
| |
| |
| For a Share Outstanding | | | Year Ended December 31, |
| Throughout Each Period | 2015 | 2014 | 2013 | 2012 | 2011 |
| Net Asset Value, Beginning of Period | $23.04 | $22.36 | $17.63 | $15.93 | $14.78 |
| Investment Operations | |
| Net Investment Income | .597 | .603 | .532 | .481 | .417 |
| Net Realized and Unrealized Gain (Loss) | | | | | |
| on Investments | (.437) | 1.782 | 4.681 | 1.632 | 1.088 |
| Total from Investment Operations | .160 | 2.385 | 5.213 | 2.113 | 1.505 |
| Distributions | | |
| Dividends from Net Investment Income | (.596) | (.555) | (.483) | (.413) | (.355) |
| Distributions from Realized Capital Gains | (1.384) | (1.150) | — | — | — |
| Total Distributions | (1.980) | (1.705) | (.483) | (.413) | (.355) |
| Net Asset Value, End of Period | $21.22 | $23.04 | $22.36 | $17.63 | $15.93 |
| |
| Total Return | 0.85% | 11.41% | 30.04% | 13.40% | 10.27% |
| |
| Ratios/Supplemental Data | | |
| Net Assets, End of Period (Millions) | $940 | $978 | $911 | $672 | $563 |
| Ratio of Total Expenses to Average Net Assets1 | 0.31% | 0.32% | 0.32% | 0.33% | 0.33% |
| Ratio of Net Investment Income to | | | | | |
| Average Net Assets | 2.76% | 2.69% | 2.71% | 2.99% | 2.92% |
| Portfolio Turnover Rate | 36% | 31% | 34% | 28% | 27% |
1 Includes performance-based investment advisory fee increases (decreases) of (0.01%), 0.00%, 0.00%, 0.00%, and 0.01%.
See accompanying Notes, which are an integral part of the Financial Statements.
66
Vanguard Equity Income Portfolio
Notes to Financial Statements
Vanguard Equity Income Portfolio, a portfolio of Vanguard Variable Insurance Funds, is registered under the Investment Company Act of 1940 as an open-end investment company. The portfolio’s shares are only available for purchase by separate accounts of insurance companies as investments for variable annuity plans, variable life insurance contracts, or other variable benefit insurance contracts.
A. The following significant accounting policies conform to generally accepted accounting principles for U.S. investment companies. The portfolio consistently follows such policies in preparing its financial statements.
1. Security Valuation: Securities are valued as of the close of trading on the New York Stock Exchange (generally 4 p.m., Eastern time) on the valuation date. Equity securities are valued at the latest quoted sales prices or official closing prices taken from the primary market in which each security trades; such securities not traded on the valuation date are valued at the mean of the latest quoted bid and asked prices. Securities for which market quotations are not readily available, or whose values have been affected by events occurring before the portfolio’s pricing time but after the close of the securities’ primary markets, are valued at their fair values calculated according to procedures adopted by the board of trustees. These procedures include obtaining quotations from an independent pricing service, monitoring news to identify significant market- or security-specific events, and evaluating changes in the values of foreign market proxies (for example, ADRs, futures contracts, or exchange-traded funds), between the time the foreign markets close and the portfolio’s pricing time. When fair-value pricing is employed, the prices of securities used by a portfolio to calculate its net asset value may differ from quoted or published prices for the same securities. Investments in Vanguard Market Liquidity Fund are valued at that fund’s net asset value. Temporary cash investments acquired over 60 days to maturity are valued using the latest bid prices or using valuations based on a matrix system (which considers such factors as security prices, yields, maturities, and ratings), both as furnished by independent pricing services. Other temporary cash investments are valued at amortized cost, which approximates market value.
2. Foreign Currency: Securities and other assets and liabilities denominated in foreign currencies are translated into U.S. dollars using exchange rates obtained from an independent third party as of the portfolio’s pricing time on the valuation date. Realized gains (losses) and unrealized appreciation (depreciation) on investment securities include the effects of changes in exchange rates since the securities were purchased, combined with the effects of changes in security prices. Fluctuations in the value of other assets and liabilities resulting from changes in exchange rates are recorded as unrealized foreign currency gains (losses) until the assets or liabilities are settled in cash, at which time they are recorded as realized foreign currency gains (losses).
3. Futures Contracts: The portfolio uses index futures contracts to a limited extent, with the objective of maintaining full exposure to the stock market while maintaining liquidity. The portfolio may purchase or sell futures contracts to achieve a desired level of investment, whether to accommodate portfolio turnover or cash flows from capital share transactions. The primary risks associated with the use of futures contracts are imperfect correlation between changes in market values of stocks held by the portfolio and the prices of futures contracts, and the possibility of an illiquid market. Counterparty risk involving futures is mitigated because a regulated clearinghouse is the counterparty instead of the clearing broker. To further mitigate counterparty risk, the portfolio trades futures contracts on an exchange, monitors the financial strength of its clearing brokers and clearinghouse, and has entered into clearing agreements with its clearing brokers. The clearinghouse imposes initial margin requirements to secure the portfolio’s performance and requires daily settlement of variation margin representing changes in the market value of each contract.
Futures contracts are valued at their quoted daily settlement prices. The aggregate settlement values of the contracts are not recorded in the Statement of Net Assets. Fluctuations in the value of the contracts are recorded in the Statement of Net Assets as an asset (liability) and in the Statement of Operations as unrealized appreciation (depreciation) until the contracts are closed, when they are recorded as realized futures gains (losses).
During the year ended December 31, 2015, the portfolio’s average investments in long and short futures contracts represented 2% and 0% of net assets, respectively, based on the average of aggregate settlement values at each quarter-end during the period.
67
Vanguard Equity Income Portfolio
4. Repurchase Agreements: The portfolio enters into repurchase agreements with institutional counterparties. Securities pledged as collateral to the portfolio under repurchase agreements are held by a custodian bank until the agreements mature. Each agreement requires that the market value of the collateral be sufficient to cover payments of interest and principal. The portfolio further mitigates its counterparty risk by entering into repurchase agreements only with a diverse group of prequalified counterparties, monitoring their financial strength, and entering into master repurchase agreements with its counterparties. The master repurchase agreements provide that, in the event of a counterparty’s default (including bankruptcy), the portfolio may terminate any repurchase agreements with that counterparty, determine the net amount owed, and sell or retain the collateral up to the net amount owed to the portfolio. Such action may be subject to legal proceedings, which may delay or limit the disposition of collateral.
5. Federal Income Taxes: The portfolio intends to continue to qualify as a regulated investment company and distribute all of its taxable income. Management has analyzed the portfolio’s tax positions taken for all open federal income tax years (December 31, 2012–2015), and has concluded that no provision for federal income tax is required in the portfolio’s financial statements.
6. Distributions: Distributions to shareholders are recorded on the ex-dividend date.
7. Securities Lending: To earn additional income, the portfolio lends its securities to qualified institutional borrowers. Security loans are subject to termination by the portfolio at any time and are required to be secured at all times by collateral in an amount at least equal to the market value of securities loaned. Daily market fluctuations could cause the value of loaned securities to be more or less than the value of the collateral received. When this occurs, the collateral is adjusted and settled on the next business day. The portfolio further mitigates its counterparty risk by entering into securities lending transactions only with a diverse group of prequalified counterparties, monitoring their financial strength, and entering into master securities lending agreements with its counterparties. The master securities lending agreements provide that, in the event of a counterparty’s default (including bankruptcy), the portfolio may terminate any loans with that borrower, determine the net amount owed, and sell or retain the collateral up to the net amount owed to the portfolio; however, such actions may be subject to legal proceedings. While collateral mitigates counterparty risk, in the absence of a default the portfolio may experience delays and costs in recovering the securities loaned. The portfolio invests cash collateral received in Vanguard Market Liquidity Fund, and records a liability in the Statement of Net Assets for the return of the collateral, during the period the securities are on loan. Securities lending income represents fees charged to borrowers plus income earned on invested cash collateral, less expenses associated with the loan.
8. Credit Facility: The portfolio and certain other funds managed by The Vanguard Group (“Vanguard”) participate in a $3 billion committed credit facility provided by a syndicate of lenders pursuant to a credit agreement that may be renewed annually; each fund is individually liable for its borrowings, if any, under the credit facility. Borrowings may be utilized for temporary and emergency purposes, and are subject to the portfolio’s regulatory and contractual borrowing restrictions. The participating funds are charged administrative fees and an annual commitment fee of 0.06% of the undrawn amount of the facility; these fees are allocated to the funds based on a method approved by the portfolio’s board of trustees and included in Management and Administrative expenses on the portfolio’s Statement of Operations. Any borrowings under this facility bear interest at a rate equal to the higher of the federal funds rate or LIBOR reference rate plus an agreed-upon spread.
The portfolio had no borrowings outstanding at December 31, 2015, or at any time during the period then ended.
9. Other: Dividend income is recorded on the ex-dividend date. Interest income includes income distributions received from Vanguard Market Liquidity Fund and is accrued daily. Premiums and discounts on debt securities purchased are amortized and accreted, respectively, to interest income over the lives of the respective securities. Security transactions are accounted for on the date securities are bought or sold. Costs used to determine realized gains (losses) on the sale of investment securities are those of the specific securities sold.
B. The investment advisory firm Wellington Management Company llp provides investment advisory services to a portion of the portfolio for a fee calculated at an annual percentage rate of average net assets managed by the advisor. The basic fee of Wellington Management Company llp is subject to quarterly adjustments based on performance relative to the FTSE High Dividend Yield Index for the preceding three years.
68
Vanguard Equity Income Portfolio
Vanguard provides investment advisory services to a portion of the portfolio as described below; the portfolio paid Vanguard advisory fees of $279,000 for the year ended December 31, 2015.
For the year ended December 31, 2015, the aggregate investment advisory fee paid to all advisors represented an effective annual basic rate of 0.09% of the portfolio’s average net assets, before a decrease of $59,000 (0.01%) based on performance.
C. In accordance with the terms of a Funds’ Service Agreement (the “FSA”) between Vanguard and the portfolio, Vanguard furnishes to the portfolio investment advisory, corporate management, administrative, marketing, and distribution services at Vanguard’s cost of operations (as defined by the FSA). These costs of operations are allocated to the portfolio based on methods and guidelines approved by the board of trustees. Vanguard does not require reimbursement in the current period for certain costs of operations (such as deferred compensation/benefits and risk/insurance costs); the portfolio’s liability for these costs of operations is included in Payables to Vanguard on the Statement of Net Assets.
Upon the request of Vanguard, the portfolio may invest up to 0.40% of its net assets as capital in Vanguard. At December 31, 2015, the portfolio had contributed to Vanguard capital in the amount of $83,000, representing 0.01% of the portfolio’s net assets and 0.03% of Vanguard’s capitalization.
D. Various inputs may be used to determine the value of the portfolio’s investments. These inputs are summarized in three broad levels for financial statement purposes. The inputs or methodologies used to value securities are not necessarily an indication of the risk associated with investing in those securities.
Level 1—Quoted prices in active markets for identical securities.
Level 2—Other significant observable inputs (including quoted prices for similar securities, interest rates, prepayment speeds, credit risk, etc.).
Level 3—Significant unobservable inputs (including the portfolio’s own assumptions used to determine the fair value of investments).
The following table summarizes the market value of the portfolio’s investments as of December 31, 2015, based on the inputs used to value them:
| | | |
| Level 1 | Level 2 | Level 3 |
| Investments | ($000) | ($000) | ($000) |
| Common Stocks | 874,743 | 24,517 | — |
| Temporary Cash Investments | 26,493 | 16,599 | — |
| Futures Contracts—Assets1 | 5 | — | — |
| Futures Contracts—Liabilities1 | (251) | — | — |
| Total | 900,990 | 41,116 | — |
| 1 Represents variation margin on the last day of the reporting period. | | | |
E. At December 31, 2015, the aggregate settlement value of open futures contracts and the related unrealized appreciation (depreciation) were:
| | | | |
| Aggregate |
| Number of | Settlement | Unrealized |
| Long (Short) | Value | Appreciation |
| Futures Contracts | Expiration | Contracts | Long (Short) | (Depreciation) |
| E-mini S&P 500 Index | March 2016 | 251 | 25,544 | 239 |
Unrealized appreciation (depreciation) on open futures contracts is required to be treated as realized gain (loss) for tax purposes.
F. Distributions are determined on a tax basis and may differ from net investment income and realized capital gains for financial reporting purposes. Differences may be permanent or temporary. Permanent differences are reclassified among capital accounts in the financial statements to reflect their tax character. Temporary differences arise when certain items of income, expense, gain, or loss are recognized in different periods for financial statement and tax purposes. These differences will reverse at some time in the future. Differences in classification may also result from the treatment of short-term gains as ordinary income for tax purposes.
69
Vanguard Equity Income Portfolio
During the year ended December 31, 2015, the portfolio realized net foreign currency losses of $19,000, which decreased distributable net income for tax purposes; accordingly, such losses have been reclassified from accumulated net realized gains to undistributed net investment income. Certain of the portfolio’s investments are in securities considered to be passive foreign investment companies, for which any unrealized appreciation and/or realized gains are required to be included in distributable net income for tax purposes. During the year ended December 31, 2015, the portfolio realized gains on the sale of passive foreign investment companies of $36,000, which have been included in current and prior periods’ taxable income; accordingly, such gains have been reclassified from accumulated net realized gains to undistributed net investment income.
For tax purposes, at December 31, 2015, the portfolio had $34,274,000 of ordinary income and $57,496,000 of long-term capital gains available for distribution.
At December 31, 2015, the cost of investment securities for tax purposes was $810,662,000. Net unrealized appreciation of investment securities for tax purposes was $131,690,000, consisting of unrealized gains of $168,519,000 on securities that had risen in value since their purchase and $36,829,000 in unrealized losses on securities that had fallen in value since their purchase.
G. During the year ended December 31, 2015, the portfolio purchased $332,327,000 of investment securities and sold $368,309,000 of investment securities, other than temporary cash investments.
H. Capital shares issued and redeemed were:
| | |
| Year Ended December 31, |
| 2015 | 2014 |
| Shares | Shares |
| (000) | (000) |
| Issued | 3,819 | 2,874 |
| Issued in Lieu of Cash Distributions | 4,004 | 3,255 |
| Redeemed | (5,960) | (4,434) |
| Net Increase (Decrease) in Shares Outstanding | 1,863 | 1,695 |
At December 31, 2015, one shareholder, an insurance company separate account whose holdings in the portfolio represent the indirect investment of Vanguard Variable Annuity contract holders, was the record or beneficial owner of 73% of the portfolio’s net assets. If the shareholder were to redeem its investment in the portfolio, the redemption might result in an increase in the portfolio’s expense ratio or cause the portfolio to incur higher transaction costs.
I. Management has determined that no material events or transactions occurred subsequent to December 31, 2015, that would require recognition or disclosure in these financial statements.
70
Vanguard Equity Income Portfolio
Report of Independent Registered Public Accounting Firm
To the Board of Trustees of Vanguard Variable Insurance Funds and the Shareholders of Equity Income Portfolio: In our opinion, the accompanying statement of net assets and the related statements of operations and of changes in net assets and the financial highlights present fairly, in all material respects, the financial position of Equity Income Portfolio (constituting a separate portfolio of Vanguard Variable Insurance Funds, hereafter referred to as the “Portfolio”) at December 31, 2015, the results of its operations for the year then ended, the changes in its net assets for each of the two years in the period then ended, and the financial highlights for each of the five years in the period then ended, in conformity with accounting principles generally accepted in the United States of America. These financial statements and financial highlights (hereafter referred to as “financial statements”) are the responsibility of the Portfolio’s management. Our responsibility is to express an opinion on these financial statements based on our audits. We conducted our audits of these financial statements in accordance with the standards of the Public Company Accounting Oversight Board (United States). Those standards require that we plan and perform the audit to obtain reasonable assurance about whether the financial statements are free of material misstatement. An audit includes examining, on a test basis, evidence supporting the amounts and disclosures in the financial statements, assessing the accounting principles used and significant estimates made by management, and evaluating the overall financial statement presentation. We believe that our audits, which included confirmation of securities at December 31, 2015 by correspondence with the custodian and brokers, by agreement to the underlying ownership records of the transfer agent and the application of alternative auditing procedures where securities purchased had not been received, provide a reasonable basis for our opinion.
/s/PricewaterhouseCoopers LLP
Philadelphia, Pennsylvania
February 11, 2016
| |
| |
| Special 2015 tax information (unaudited) for corporate shareholders only for Vanguard |
| Equity Income Portfolio, a portfolio of Vanguard Variable Insurance Funds |
| |
| This information for the fiscal year ended December 31, 2015, is included pursuant to provisions |
| of the Internal Revenue Code for corporate shareholders only. |
| |
| The portfolio distributed $52,768,000 as capital gain dividends (20% rate gain distributions) to |
| shareholders during the fiscal year. |
| |
| For corporate shareholders, 73.9% of investment income (dividend income plus short-term gains, |
| if any) qualifies for the dividends-received deduction. |
71
Vanguard Equity Income Portfolio
About Your Portfolio’s Expenses
As a shareholder of the portfolio, you incur ongoing costs, which include costs for portfolio management, administrative services, and shareholder reports (like this one), among others. Operating expenses, which are deducted from a portfolio’s gross income, directly reduce the investment return of the portfolio.
A portfolio’s expenses are expressed as a percentage of its average net assets. This figure is known as the expense ratio. The following examples are intended to help you understand the ongoing costs (in dollars) of investing in your portfolio and to compare these costs with those of other mutual funds. The examples are based on an investment of $1,000 made at the beginning of the period shown and held for the entire period.
The table below illustrates your portfolio’s costs in two ways:
• Based on actual portfolio return. This section helps you to estimate the actual expenses that you paid over the period. The “Ending Account Value” shown is derived from the portfolio’s actual return, and the third column shows the dollar amount that would have been paid by an investor who started with $1,000 in the portfolio. You may use the information here, together with the amount you invested, to estimate the expenses that you paid over the period.
To do so, simply divide your account value by $1,000 (for example, an $8,600 account value divided by $1,000 = 8.6), then multiply the result by the number given for your portfolio under the heading “Expenses Paid During Period.”
• Based on hypothetical 5% yearly return. This section is intended to help you compare your portfolio’s costs with those of other mutual funds. It assumes that the portfolio had a yearly return of 5% before expenses, but that the expense ratio is unchanged. In this case—because the return used is not the portfolio’s actual return—the results do not apply to your investment. The example is useful in making comparisons because the Securities and Exchange Commission requires all mutual funds to calculate expenses based on a 5% return. You can assess your portfolio’s costs by comparing this hypothetical example with the hypothetical examples that appear in shareholder reports of other funds.
Note that the expenses shown in the table are meant to highlight and help you compare ongoing costs only and do not reflect transaction costs incurred by the portfolio for buying and selling securities. The portfolio’s expense ratio does not reflect additional fees and expenses associated with the annuity or life insurance program through which you invest.
The calculations assume no shares were bought or sold during the period. Your actual costs may have been higher or lower, depending on the amount of your investment and the timing of any purchases or redemptions.
You can find more information about the portfolio’s expenses in the Financial Statements section. For additional information on operating expenses and other shareholder costs, please refer to the prospectus.
| | | |
| Six Months Ended December 31, 2015 | | | |
| Beginning | Ending | Expenses |
| Account Value | Account Value | Paid During |
| Equity Income Portfolio | 6/30/2015 | 12/31/2015 | Period1 |
| Based on Actual Portfolio Return | $1,000.00 | $1,012.89 | $1.62 |
| Based on Hypothetical 5% Yearly Return | 1,000.00 | 1,023.59 | 1.63 |
1 The calculations are based on expenses incurred in the most recent six-month period. The portfolio’s annualized six-month expense ratio for that period is 0.32%. The dollar amounts shown as “Expenses Paid” are equal to the annualized expense ratio multiplied by the average account value over the period, multiplied by the number of days in the most recent six-month period, then divided by the number of days in the most recent 12-month period (184/365).
72
Vanguard® Equity Index Portfolio
U.S. stocks registered a very small gain in 2015 as volatility affected markets worldwide. For the fiscal year ended December 31, 2015, Vanguard Equity Index Portfolio returned 1.27%, in line with its benchmark index and a bit more than the average return of peer funds.
The table below shows the returns of your portfolio and its comparative standards for the year. For additional perspective, we also present their annualized returns for the past ten years.
Please note that the portfolio returns in Vanguard Variable Insurance Fund are different from those in Vanguard Variable Annuity (and other plans that invest in the fund), which take into account insurance-related expenses.
Energy’s double-digit decline blunted gains in several sectors
The Equity Index Portfolio invests in 500 of the largest U.S. companies, which span many different industries and account for about three-fourths of the U.S. stock market’s value. Stocks of large-capitalization companies returned more than those of smaller companies, helping the portfolio to slightly outpace the broad market.
Most segments of the U.S. economy grew, buoyed by shoppers’ overall confidence and their willingness and ability to spend. This trend benefited the consumer discretionary and consumer staples sectors, which were among the market’s top performers. Internet retailers led the way in consumer discretionary; home improvement stores and restaurants also excelled. In the consumer goods sector, notable showings came from tobacco, beverage, and packaged food companies.
The information technology and health care sectors also helped performance, although their returns paled compared with those of some robust recent periods. In IT, gains from internet and software firms were partially offset by losses from technology hardware and communications equipment companies. Merger-and-acquisition activity, vibrant drug pipelines, and favorable long-term demographic and economic trends lifted health care despite stumbles in the health care technology subsector.
Much of the contribution made by these sectors was erased by a double-digit decline in energy. The lengthy and sharp slide of oil prices punished the sector. High production levels from some leading oil-producing countries and concerns about slower growth in China, the world’s largest oil importer, fueled the decline. Natural gas prices also dropped, though not as dramatically. Some integrated oil and gas firms held up better than others, but the majority of companies engaged in production and exploration suffered.
Stocks in the financial, industrials, materials, and utilities sectors also weighed on the portfolio’s performance.
The portfolio’s low costs have helped it beat peers
For the decade through December 2015, the Equity Index Portfolio recorded an average annual return of 7.20%. This result was quite close to that of the portfolio’s target, the S&P 500 Index, which has no transaction costs or operating expenses.
Vanguard Equity Investment Group, the advisor overseeing the portfolio, has a long record of successfully tracking indexes. This was no easy feat during the extreme market volatility that accompanied the financial crisis of 2008–2009. The advisor was helped by the portfolio’s low expenses, which are far below the average for its peer group. For the decade, the portfolio outperformed the 6.05% average annual result of its peers.
| | |
| Total Returns | | |
| | Ten Years Ended |
| | December 31, 2015 |
| Year Ended | Average |
| December 31, 2015 | Annual Return |
| Vanguard Equity Index Portfolio | 1.27% | 7.20% |
| S&P 500 Index | 1.38 | 7.31 |
| Variable Insurance Large-Cap Core Funds Average1 | -0.24 | 6.05 |
The figures shown represent past performance, which is not a guarantee of future results. (Current performance may be lower or higher than the performance data cited. For performance data current to the most recent month-end, visit our website at vanguard.com/performance.) Note, too, that both investment returns and principal value can fluctuate widely, so an investor’s shares, when sold, could be worth more or less than their original cost.
Expense Ratios2
Your Portfolio Compared With Its Peer Group
| | |
| Variable Insurance |
| Large-Cap Core |
| Portfolio | Funds Average |
| Equity Index Portfolio | 0.16% | 0.40% |
1 Derived from data provided by Lipper, a Thomson Reuters Company.
2 The portfolio expense ratio shown is from the prospectus dated April 30, 2015, and represents estimated costs for the current fiscal year. For the fiscal year ended December 31, 2015, the portfolio’s expense ratio was 0.15%. The peer-group expense ratio is derived from data provided by Lipper, a Thomson Reuters Company, and captures information through year-end 2014.
73
Vanguard Equity Index Portfolio
Portfolio Profile
As of December 31, 2015
| | | |
| Portfolio Characteristics | | |
| Target | Broad |
| Portfolio | Index1 | Index2 |
| Number of Stocks | 503 | 504 | 3,960 |
| Median Market Cap $81.0B | $81.0B | $51.4B |
| Price/Earnings Ratio | 20.5x | 20.5x | 21.9x |
| Price/Book Ratio | 2.8x | 2.8x | 2.7x |
| Yield3 | 2.0% | 2.2% | 2.1% |
| Return on Equity | 18.5% | 18.3% | 17.2% |
| Earnings Growth Rate | 9.2% | 9.2% | 9.5% |
| Foreign Holdings | 0.0% | 0.0% | 0.0% |
| Turnover Rate | 4% | — | — |
| Expense Ratio4 | 0.16% | — | — |
| Short-Term Reserves | 0.1% | — | — |
| | |
| Volatility Measures | |
| Portfolio Versus Portfolio Versus |
| Target Index1 | Broad Index2 |
| R-Squared | 1.00 | 0.99 |
| Beta | 1.00 | 0.98 |
| | | |
| Sector Diversification (% of equity exposure) |
| Target | Broad |
| Portfolio | Index1 | Index2 |
| Consumer Discretionary 12.9% | 12.9% | 13.4% |
| Consumer Staples | 10.1 | 10.1 | 8.8 |
| Energy | 6.5 | 6.5 | 5.9 |
| Financials | 16.5 | 16.5 | 18.3 |
| Health Care | 15.2 | 15.2 | 14.8 |
| Industrials | 10.1 | 10.1 | 10.6 |
| Information Technology 20.5 | 20.5 | 19.8 |
| Materials | 2.8 | 2.8 | 3.1 |
| Telecommunication | | | |
| Services | 2.4 | 2.4 | 2.2 |
| Utilities | 3.0 | 3.0 | 3.1 |
| | |
| Ten Largest Holdings5 (% of total net assets) |
| |
| Apple Inc. | Technology Hardware, |
| Storage & Peripherals | 3.3% |
| Alphabet Inc. | Internet Software | |
| & Services | 2.5 |
| Microsoft Corp. | Systems Software | 2.5 |
| Exxon Mobil Corp. | Integrated Oil & Gas | 1.8 |
| General Electric Co. | Industrial | |
| Conglomerates | 1.6 |
| Johnson & Johnson | Pharmaceuticals | 1.6 |
| Amazon.com Inc. | Internet Retail | 1.4 |
| Wells Fargo & Co. | Diversified Banks | 1.4 |
| Berkshire | | |
| Hathaway Inc. | Multi-Sector Holdings | 1.4 |
| JPMorgan Chase & Co. Diversified Banks | 1.4 |
| Top Ten | 18.9% |
Investment Focus

30-Day SEC Yield. A portfolio’s 30-day SEC yield is derived using a formula specified by the U.S. Securities and Exchange Commission. Under the formula, data related to the portfolio’s security holdings in the previous 30 days are used to calculate the portfolio’s hypothetical net income for that period, which is then annualized and divided by the portfolio’s estimated average net assets over the calculation period. For the purposes of this calculation, a security’s income is based on its current market yield to maturity (for bonds) its actual income (for asset-backed securities), or its projected dividend yield (for stocks). Because the SEC yield represents hypothetical annualized income, it will differ—at times significantly—from the portfolio’s actual experience. As a result, the portfolio’s income distributions may be higher or lower than implied by the SEC yield.
Beta. A measure of the magnitude of a portfolio’s past share-price fluctuations in relation to the ups and downs of a given market index. The index is assigned a beta of 1.00. Compared with a given index, a portfolio with a beta of 1.20 typically would have seen its share price rise or fall by 12% when the index rose or fell by 10%. For this report, beta is based on returns over the past 36 months for both the portfolio and the index.
Equity Exposure. A measure that reflects a portfolio’s investments in stocks and stock futures. Any holdings in short-term reserves are excluded.
R-Squared. A measure of how much of a portfolio’s past returns can be explained by the returns from the market in general, as measured by a given index. If a portfolio’s total returns were precisely synchronized with an index’s returns, its R-squared would be 1.00. If the portfolio’s returns bore no relationship to the index’s returns, its R-squared would be 0. For this report, R-squared is based on returns over the past 36 months for both the portfolio and the index.
1 S&P 500 Index.
2 Dow Jones U.S. Total Stock Market Float Adjusted Index.
3 30-day SEC yield for the portfolio; annualized dividend yield for the indexes.
4 The expense ratio shown is from the prospectus dated April 30, 2015, and represents estimated costs for the current fiscal year. For the fiscal year ended December 31, 2015, the expense ratio was 0.15%.
5 The holdings listed exclude any temporary cash investments and equity index products.
74
Vanguard Equity Index Portfolio
Performance Summary
All of the returns in this report represent past performance, which is not a guarantee of future results that may be achieved by the portfolio. (Current performance may be lower or higher than the performance data cited. For performance data current to the most recent month-end, visit our website at vanguard.com/performance.) Note, too, that both investment returns and principal value can fluctuate widely, so an investor’s shares, when sold, could be worth more or less than their original cost. The returns shown do not reflect taxes that a shareholder would pay on portfolio distributions or on the sale of portfolio shares. Nor do the returns reflect fees and expenses associated with the annuity or life insurance program through which a shareholder invests. If these fees and expenses were included, the portfolio’s returns would be lower.
Cumulative Performance: December 31, 2005–December 31, 2015
Initial Investment of $10,000

| | | | |
| | | Average Annual Total Returns | Final Value |
| | Periods Ended December 31, 2015 | of a $10,000 |
| | One Year | Five Years | Ten Years | Investment |
| Equity Index Portfolio | 1.27% | 12.40% | 7.20% | $20,048 |
| S&P 500 Index | 1.38 | 12.57 | 7.31 | 20,242 |
| Variable Insurance Large-Cap Core | | | | |
| Funds Average1 | -0.24 | 10.79 | 6.05 | 17,994 |
| Dow Jones U.S. Total Stock Market | | | | |
| Float Adjusted Index | 0.44 | 12.14 | 7.48 | 20,563 |
Fiscal Year Total Returns (%): December 31, 2005–December 31, 2015

| |
| Equity Index Portfolio |
| S&P 500 Index |
1 Derived from data provided by Lipper, a Thomson Reuters Company.
See Financial Highlights for dividend and capital gains information.
75
Vanguard Equity Index Portfolio
Financial Statements
Statement of Net Assets
As of December 31, 2015
The portfolio reports a complete list of its holdings in regulatory filings four times in each fiscal year, at the quarter-ends. For the second and fourth fiscal quarters, the lists appear in the portfolio’s semiannual and annual reports to shareholders. For the first and third fiscal quarters, the portfolio files the lists with the Securities and Exchange Commission on Form N-Q. Shareholders can look up the portfolio’s Forms N-Q on the SEC’s website at sec.gov. Forms N-Q may also be reviewed and copied at the SEC’s Public Reference Room (see the back cover of this report for further information).
| | | |
| Market |
| Value• |
| | Shares | ($000) |
| Common Stocks (99.8%)1 | | |
| Consumer Discretionary (12.9%) | |
| * | Amazon.com Inc. | 85,462 | 57,763 |
| Home Depot Inc. | 281,911 | 37,283 |
| Walt Disney Co. | 338,135 | 35,531 |
| Comcast Corp. Class A | 542,908 | 30,636 |
| McDonald’s Corp. | 204,191 | 24,123 |
| Starbucks Corp. | 330,102 | 19,816 |
| NIKE Inc. Class B | 300,078 | 18,755 |
| Lowe’s Cos. Inc. | 203,301 | 15,459 |
| * | Priceline Group Inc. | 11,069 | 14,112 |
| Ford Motor Co. | 866,581 | 12,210 |
| Time Warner Cable Inc. | 62,993 | 11,691 |
| Time Warner Inc. | 177,751 | 11,495 |
| * | Netflix Inc. | 95,041 | 10,871 |
| General Motors Co. | 314,827 | 10,707 |
| TJX Cos. Inc. | 148,525 | 10,532 |
| Target Corp. | 137,004 | 9,948 |
| Twenty-First Century | | |
| | Fox Inc. Class A | 356,230 | 9,675 |
| Yum! Brands Inc. | 95,945 | 7,009 |
| Johnson Controls Inc. | 143,625 | 5,672 |
| Carnival Corp. | 102,125 | 5,564 |
| * | O’Reilly Automotive Inc. | 21,897 | 5,549 |
| L Brands Inc. | 56,689 | 5,432 |
| Delphi Automotive plc | 62,619 | 5,368 |
| * | AutoZone Inc. | 6,803 | 5,047 |
| Ross Stores Inc. | 90,952 | 4,894 |
| VF Corp. | 75,840 | 4,721 |
| Dollar General Corp. | 65,088 | 4,678 |
| CBS Corp. Class B | 97,781 | 4,608 |
| Omnicom Group Inc. | 53,815 | 4,072 |
| * | Dollar Tree Inc. | 51,787 | 3,999 |
| Royal Caribbean Cruises Ltd. | 37,892 | 3,835 |
| * | Chipotle Mexican Grill Inc. | | |
| | Class A | 6,936 | 3,328 |
| Expedia Inc. | 26,117 | 3,246 |
| * | Under Armour Inc. Class A | 39,767 | 3,206 |
| Viacom Inc. Class B | 76,526 | 3,150 |
| Genuine Parts Co. | 33,318 | 2,862 |
| Marriott International Inc. | | |
| | Class A | 42,604 | 2,856 |
| * | Mohawk Industries Inc. | 14,078 | 2,666 |
| Newell Rubbermaid Inc. | 59,035 | 2,602 |
| Hanesbrands Inc. | 88,035 | 2,591 |
| Starwood Hotels & Resorts | | |
| | Worldwide Inc. | 37,347 | 2,587 |
| Tractor Supply Co. | 29,946 | 2,560 |
| Whirlpool Corp. | 17,315 | 2,543 |
| * | CarMax Inc. | 45,887 | 2,477 |
| Advance Auto Parts Inc. | 16,076 | 2,420 |
| Macy’s Inc. | 69,023 | 2,414 |
| DR Horton Inc. | 71,827 | 2,301 |
| Signet Jewelers Ltd. | 17,520 | 2,167 |
| BorgWarner Inc. | 49,850 | 2,155 |
| * | TripAdvisor Inc. | 25,217 | 2,150 |
| Interpublic Group of Cos. Inc. | 90,067 | 2,097 |
| Best Buy Co. Inc. | 67,691 | 2,061 |
| Kohl’s Corp. | 43,271 | 2,061 |
| | | |
| Market |
| Value• |
| | Shares | ($000) |
| Mattel Inc. | 75,458 | 2,050 |
| Coach Inc. | 60,961 | 1,995 |
| Lennar Corp. Class A | 39,845 | 1,949 |
| Goodyear Tire & Rubber Co. | 59,284 | 1,937 |
| Harley-Davidson Inc. | 42,136 | 1,913 |
| Wyndham Worldwide Corp. | 25,976 | 1,887 |
| Tiffany & Co. | 24,607 | 1,877 |
| * | Bed Bath & Beyond Inc. | 37,708 | 1,819 |
| H&R Block Inc. | 51,918 | 1,729 |
| * | Michael Kors Holdings Ltd. | 42,559 | 1,705 |
| Hasbro Inc. | 24,490 | 1,650 |
| Darden Restaurants Inc. | 25,649 | 1,632 |
| Cablevision Systems Corp. | | |
| | Class A | 49,523 | 1,580 |
| Nordstrom Inc. | 30,546 | 1,522 |
| Harman International | | |
| | Industries Inc. | 15,752 | 1,484 |
| Ralph Lauren Corp. Class A | 13,232 | 1,475 |
| News Corp. Class A | 109,223 | 1,459 |
| * | Discovery | | |
| | Communications Inc. | 57,418 | 1,448 |
| Staples Inc. | 141,351 | 1,339 |
| PVH Corp. | 18,105 | 1,333 |
| Gap Inc. | 52,409 | 1,295 |
| Leggett & Platt Inc. | 30,344 | 1,275 |
| PulteGroup Inc. | 71,425 | 1,273 |
| TEGNA Inc. | 49,632 | 1,267 |
| Wynn Resorts Ltd. | 17,755 | 1,229 |
| Scripps Networks | | |
| | Interactive Inc. Class A | 20,871 | 1,152 |
| * | AutoNation Inc. | 17,281 | 1,031 |
| Garmin Ltd. | 26,615 | 989 |
| * | Discovery Communications | | |
| | Inc. Class A | 32,818 | 876 |
| GameStop Corp. Class A | 23,709 | 665 |
| * | Urban Outfitters Inc. | 19,709 | 448 |
| * | Fossil Group Inc. | 9,459 | 346 |
| 513,184 |
| Consumer Staples (10.0%) | | |
| Procter & Gamble Co. | 604,824 | 48,029 |
| Coca-Cola Co. | 870,187 | 37,383 |
| PepsiCo Inc. | 323,900 | 32,364 |
| Philip Morris | | |
| | International Inc. | 344,500 | 30,285 |
| Altria Group Inc. | 435,975 | 25,378 |
| CVS Health Corp. | 246,261 | 24,077 |
| Wal-Mart Stores Inc. | 348,829 | 21,383 |
| Walgreens Boots | | |
| | Alliance Inc. | 193,735 | 16,498 |
| Mondelez International Inc. | | |
| | Class A | 353,355 | 15,844 |
| Costco Wholesale Corp. | 97,272 | 15,709 |
| Colgate-Palmolive Co. | 199,472 | 13,289 |
| Kimberly-Clark Corp. | 80,712 | 10,275 |
| Kraft Heinz Co. | 132,220 | 9,620 |
| Kroger Co. | 216,438 | 9,054 |
| Reynolds American Inc. | 184,356 | 8,508 |
| General Mills Inc. | 132,914 | 7,664 |
| | | |
| Market |
| Value• |
| | Shares | ($000) |
| Constellation Brands Inc. | | |
| | Class A | 38,505 | 5,485 |
| * | Monster Beverage Corp. | 33,622 | 5,008 |
| Archer-Daniels-Midland Co. | 134,112 | 4,919 |
| Sysco Corp. | 116,808 | 4,789 |
| Estee Lauder Cos. Inc. | | |
| | Class A | 49,768 | 4,383 |
| Kellogg Co. | 56,818 | 4,106 |
| ConAgra Foods Inc. | 96,271 | 4,059 |
| Dr Pepper Snapple | | |
| | Group Inc. | 41,942 | 3,909 |
| Clorox Co. | 28,787 | 3,651 |
| Tyson Foods Inc. Class A | 65,432 | 3,489 |
| Mead Johnson Nutrition Co. | 43,581 | 3,441 |
| Molson Coors Brewing Co. | | |
| | Class B | 34,960 | 3,283 |
| JM Smucker Co. | 26,395 | 3,256 |
| Hershey Co. | 32,190 | 2,874 |
| Whole Foods Market Inc. | 75,540 | 2,531 |
| Church & Dwight Co. Inc. | 28,994 | 2,461 |
| Keurig Green Mountain Inc. | 26,478 | 2,382 |
| Hormel Foods Corp. | 29,560 | 2,338 |
| Coca-Cola Enterprises Inc. | 46,865 | 2,308 |
| Brown-Forman Corp. Class B | 22,475 | 2,231 |
| McCormick & Co. Inc. | 25,565 | 2,187 |
| Campbell Soup Co. | 39,716 | 2,087 |
| 400,537 |
| Energy (6.5%) | | |
| Exxon Mobil Corp. | 925,527 | 72,145 |
| Chevron Corp. | 418,461 | 37,645 |
| Schlumberger Ltd. | 280,405 | 19,558 |
| ConocoPhillips | 274,487 | 12,816 |
| Occidental Petroleum Corp. | 169,845 | 11,483 |
| EOG Resources Inc. | 122,282 | 8,656 |
| Phillips 66 | 105,540 | 8,633 |
| Valero Energy Corp. | 106,535 | 7,533 |
| Halliburton Co. | 190,270 | 6,477 |
| Marathon Petroleum Corp. | 117,904 | 6,112 |
| Kinder Morgan Inc. | 405,084 | 6,044 |
| Anadarko Petroleum Corp. | 113,009 | 5,490 |
| Baker Hughes Inc. | 96,985 | 4,476 |
| Pioneer Natural | | |
| | Resources Co. | 33,247 | 4,169 |
| Williams Cos. Inc. | 151,231 | 3,887 |
| Apache Corp. | 84,089 | 3,739 |
| Spectra Energy Corp. | 149,333 | 3,575 |
| Noble Energy Inc. | 94,686 | 3,118 |
| Tesoro Corp. | 27,063 | 2,852 |
| National Oilwell Varco Inc. | 84,422 | 2,827 |
| Devon Energy Corp. | 85,023 | 2,721 |
| * | Cameron International Corp. | 42,157 | 2,664 |
| Hess Corp. | 52,986 | 2,569 |
| Marathon Oil Corp. | 149,083 | 1,877 |
| Cimarex Energy Co. | 20,806 | 1,860 |
| EQT Corp. | 33,557 | 1,749 |
| Columbia Pipeline Group Inc. | 85,651 | 1,713 |
| Cabot Oil & Gas Corp. | 90,724 | 1,605 |
| * | FMC Technologies Inc. | 50,610 | 1,468 |
| Helmerich & Payne Inc. | 23,728 | 1,271 |
76
Vanguard Equity Index Portfolio
| | | |
| Market |
| Value• |
| | Shares | ($000) |
| * | Newfield Exploration Co. | 35,438 | 1,154 |
| ONEOK Inc. | 45,612 | 1,125 |
| ^ | Transocean Ltd. | 75,158 | 930 |
| Range Resources Corp. | 37,281 | 917 |
| Murphy Oil Corp. | 36,637 | 823 |
| Ensco plc Class A | 52,129 | 802 |
| * | Southwestern Energy Co. | 85,575 | 608 |
| ^ | Chesapeake Energy Corp. | 114,143 | 514 |
| CONSOL Energy Inc. | 49,606 | 392 |
| Diamond Offshore | | |
| | Drilling Inc. | 14,976 | 316 |
| 258,313 |
| Financials (16.5%) | | |
| Wells Fargo & Co. | 1,033,360 | 56,174 |
| JPMorgan Chase & Co. | 818,432 | 54,041 |
| * | Berkshire Hathaway Inc. | | |
| | Class B | 385,063 | 50,844 |
| Bank of America Corp. | 2,314,846 | 38,959 |
| Citigroup Inc. | 662,327 | 34,275 |
| American International | | |
| | Group Inc. | 275,060 | 17,046 |
| Goldman Sachs Group Inc. | 88,266 | 15,908 |
| US Bancorp | 365,582 | 15,599 |
| Simon Property Group Inc. | 68,818 | 13,381 |
| American Express Co. | 185,990 | 12,936 |
| MetLife Inc. | 247,168 | 11,916 |
| PNC Financial Services | | |
| | Group Inc. | 112,996 | 10,770 |
| Morgan Stanley | 335,216 | 10,663 |
| Bank of New York Mellon | | |
| | Corp. | 243,768 | 10,048 |
| BlackRock Inc. | 28,078 | 9,561 |
| American Tower | | |
| | Corporation | 94,240 | 9,137 |
| Charles Schwab Corp. | 266,361 | 8,771 |
| Capital One Financial Corp. | 118,328 | 8,541 |
| ACE Ltd. | 72,093 | 8,424 |
| Prudential Financial Inc. | 99,865 | 8,130 |
| Public Storage | 32,729 | 8,107 |
| Travelers Cos. Inc. | 67,651 | 7,635 |
| CME Group Inc. | 75,235 | 6,816 |
| Intercontinental | | |
| | Exchange Inc. | 26,275 | 6,733 |
| Chubb Corp. | 50,573 | 6,708 |
| Equity Residential | 81,004 | 6,609 |
| BB&T Corp. | 173,490 | 6,560 |
| Marsh & McLennan | | |
| | Cos. Inc. | 116,671 | 6,469 |
| Crown Castle International | | |
| | Corp. | 74,229 | 6,417 |
| State Street Corp. | 89,700 | 5,953 |
| McGraw Hill Financial Inc. | 60,145 | 5,929 |
| Aflac Inc. | 94,664 | 5,670 |
| Aon plc | 61,486 | 5,670 |
| * | Synchrony Financial | 185,439 | 5,639 |
| AvalonBay Communities Inc. | 30,320 | 5,583 |
| Welltower Inc. | 78,731 | 5,356 |
| Allstate Corp. | 85,684 | 5,320 |
| Discover Financial Services | 95,843 | 5,139 |
| Prologis Inc. | 116,621 | 5,005 |
| SunTrust Banks Inc. | 114,031 | 4,885 |
| Boston Properties Inc. | 33,887 | 4,322 |
| M&T Bank Corp. | 35,659 | 4,321 |
| Ventas Inc. | 74,097 | 4,181 |
| Ameriprise Financial Inc. | 39,227 | 4,175 |
| * | Berkshire Hathaway Inc. | | |
| | Class A | 21 | 4,154 |
| Equinix Inc. | 13,724 | 4,150 |
| Progressive Corp. | 129,179 | 4,108 |
| T. Rowe Price Group Inc. | 56,439 | 4,035 |
| | | |
| Market |
| Value• |
| | Shares | ($000) |
| Hartford Financial Services | | |
| | Group Inc. | 91,264 | 3,966 |
| HCP Inc. | 103,431 | 3,955 |
| Vornado Realty Trust | 39,494 | 3,948 |
| Moody’s Corp. | 38,340 | 3,847 |
| Fifth Third Bancorp | 176,514 | 3,548 |
| Essex Property Trust Inc. | 14,687 | 3,516 |
| General Growth | | |
| | Properties Inc. | 128,782 | 3,504 |
| Northern Trust Corp. | 48,047 | 3,464 |
| Weyerhaeuser Co. | 114,055 | 3,419 |
| Invesco Ltd. | 94,254 | 3,156 |
| Franklin Resources Inc. | 85,424 | 3,145 |
| Realty Income Corp. | 54,909 | 2,835 |
| Regions Financial Corp. | 291,153 | 2,795 |
| Lincoln National Corp. | 55,350 | 2,782 |
| Principal Financial Group Inc. | 60,064 | 2,702 |
| XL Group plc Class A | 66,443 | 2,603 |
| Host Hotels & Resorts Inc. | 165,718 | 2,542 |
| SL Green Realty Corp. | 21,954 | 2,480 |
| KeyCorp | 185,882 | 2,452 |
| Loews Corp. | 63,127 | 2,424 |
| Kimco Realty Corp. | 91,022 | 2,408 |
| Macerich Co. | 29,577 | 2,387 |
| * | CBRE Group Inc. Class A | 63,816 | 2,207 |
| Huntington Bancshares Inc. 176,645 | 1,954 |
| * | E*TRADE Financial Corp. | 65,151 | 1,931 |
| * | Affiliated Managers | | |
| | Group Inc. | 12,008 | 1,918 |
| Cincinnati Financial Corp. | 32,315 | 1,912 |
| Plum Creek Timber Co. Inc. | 38,669 | 1,845 |
| Unum Group | 54,823 | 1,825 |
| Comerica Inc. | 39,028 | 1,633 |
| Nasdaq Inc. | 25,917 | 1,508 |
| Torchmark Corp. | 25,634 | 1,465 |
| Apartment Investment & | | |
| | Management Co. | 34,533 | 1,382 |
| Leucadia National Corp. | 74,414 | 1,294 |
| Zions Bancorporation | 44,595 | 1,217 |
| Assurant Inc. | 14,587 | 1,175 |
| Iron Mountain Inc. | 42,269 | 1,142 |
| People’s United | | |
| | Financial Inc. | 68,026 | 1,099 |
| Legg Mason Inc. | 24,224 | 950 |
| Navient Corp. | 82,235 | 942 |
| 656,050 |
| Health Care (15.1%) | | |
| Johnson & Johnson | 615,150 | 63,188 |
| Pfizer Inc. | 1,372,370 | 44,300 |
| Merck & Co. Inc. | 621,061 | 32,804 |
| Gilead Sciences Inc. | 320,438 | 32,425 |
| * | Allergan plc | 87,619 | 27,381 |
| Amgen Inc. | 167,746 | 27,230 |
| Bristol-Myers Squibb Co. | 370,896 | 25,514 |
| UnitedHealth Group Inc. | 211,900 | 24,928 |
| Medtronic plc | 312,647 | 24,049 |
| AbbVie Inc. | 363,474 | 21,532 |
| * | Celgene Corp. | 174,680 | 20,920 |
| Eli Lilly & Co. | 217,009 | 18,285 |
| * | Biogen Inc. | 49,558 | 15,182 |
| Abbott Laboratories | 331,630 | 14,893 |
| * | Express Scripts Holding Co. 150,410 | 13,147 |
| Thermo Fisher Scientific Inc. | 88,739 | 12,588 |
| McKesson Corp. | 51,174 | 10,093 |
| * | Alexion Pharmaceuticals Inc. | 50,103 | 9,557 |
| * | Regeneron | | |
| | Pharmaceuticals Inc. | 17,263 | 9,372 |
| Aetna Inc. | 77,586 | 8,389 |
| Cigna Corp. | 57,309 | 8,386 |
| Anthem Inc. | 58,058 | 8,096 |
| | | |
| Market |
| Value• |
| | Shares | ($000) |
| Becton Dickinson and Co. | 46,947 | 7,234 |
| * | Vertex Pharmaceuticals Inc. | 54,685 | 6,881 |
| Stryker Corp. | 70,288 | 6,533 |
| Cardinal Health Inc. | 73,169 | 6,532 |
| * | Illumina Inc. | 32,462 | 6,231 |
| Humana Inc. | 33,044 | 5,899 |
| * | Boston Scientific Corp. | 299,062 | 5,515 |
| * | Mylan NV | 91,832 | 4,965 |
| Zoetis Inc. | 101,171 | 4,848 |
| * | HCA Holdings Inc. | 70,580 | 4,773 |
| Baxalta Inc. | 120,693 | 4,711 |
| Perrigo Co. plc | 32,554 | 4,711 |
| Baxter International Inc. | 121,693 | 4,643 |
| * | Intuitive Surgical Inc. | 8,312 | 4,540 |
| AmerisourceBergen Corp. | | |
| | Class A | 43,206 | 4,481 |
| * | Cerner Corp. | 67,276 | 4,048 |
| Zimmer Biomet Holdings Inc. 38,108 | 3,909 |
| St. Jude Medical Inc. | 62,879 | 3,884 |
| * | Edwards Lifesciences Corp. | 48,022 | 3,793 |
| CR Bard Inc. | 16,264 | 3,081 |
| Agilent Technologies Inc. | 73,031 | 3,053 |
| * | Henry Schein Inc. | 18,350 | 2,903 |
| * | Endo International plc | 46,012 | 2,817 |
| * | Laboratory Corp. of | | |
| | America Holdings | 22,578 | 2,792 |
| * | DaVita HealthCare | | |
| | Partners Inc. | 37,604 | 2,621 |
| * | Waters Corp. | 18,107 | 2,437 |
| Universal Health Services | | |
| | Inc. Class B | 20,052 | 2,396 |
| Quest Diagnostics Inc. | 31,480 | 2,239 |
| * | Mallinckrodt plc | 25,761 | 1,923 |
| DENTSPLY International Inc. | 30,704 | 1,868 |
| * | Varian Medical Systems Inc. | 21,872 | 1,767 |
| PerkinElmer Inc. | 24,856 | 1,331 |
| Patterson Cos. Inc. | 19,000 | 859 |
| * | Tenet Healthcare Corp. | 21,694 | 657 |
| 603,134 |
| Industrials (10.0%) | | |
| General Electric Co. | 2,098,242 | 65,360 |
| 3M Co. | 136,937 | 20,628 |
| Boeing Co. | 140,056 | 20,251 |
| Honeywell International Inc. 171,423 | 17,754 |
| United Technologies Corp. | 183,438 | 17,623 |
| United Parcel Service Inc. | | |
| | Class B | 154,795 | 14,896 |
| Union Pacific Corp. | 189,966 | 14,855 |
| Lockheed Martin Corp. | 58,806 | 12,770 |
| Danaher Corp. | 132,592 | 12,315 |
| General Dynamics Corp. | 66,132 | 9,084 |
| Delta Air Lines Inc. | 175,332 | 8,888 |
| Caterpillar Inc. | 129,533 | 8,803 |
| FedEx Corp. | 58,455 | 8,709 |
| Raytheon Co. | 66,710 | 8,307 |
| Northrop Grumman Corp. | 40,347 | 7,618 |
| Precision Castparts Corp. | 30,590 | 7,097 |
| Emerson Electric Co. | 145,610 | 6,965 |
| Illinois Tool Works Inc. | 72,610 | 6,729 |
| Southwest Airlines Co. | 145,089 | 6,248 |
| American Airlines Group Inc. 140,208 | 5,938 |
| CSX Corp. | 216,649 | 5,622 |
| Norfolk Southern Corp. | 66,261 | 5,605 |
| Eaton Corp. plc | 102,577 | 5,338 |
| Deere & Co. | 69,391 | 5,292 |
| Waste Management Inc. | 92,535 | 4,939 |
| * | United Continental | | |
| | Holdings Inc. | 83,005 | 4,756 |
| Roper Technologies Inc. | 22,457 | 4,262 |
| Nielsen Holdings plc | 81,245 | 3,786 |
77
Vanguard Equity Index Portfolio
| | | |
| Market |
| Value• |
| | Shares | ($000) |
| PACCAR Inc. | 77,930 | 3,694 |
| Stanley Black & Decker Inc. | 33,127 | 3,536 |
| Ingersoll-Rand plc | 58,379 | 3,228 |
| Cummins Inc. | 36,484 | 3,211 |
| Rockwell Automation Inc. | 29,556 | 3,033 |
| Tyco International plc | 94,035 | 2,999 |
| Parker-Hannifin Corp. | 30,612 | 2,969 |
| Equifax Inc. | 26,020 | 2,898 |
| AMETEK Inc. | 53,004 | 2,840 |
| Rockwell Collins Inc. | 28,961 | 2,673 |
| * | Verisk Analytics Inc. Class A | 34,672 | 2,666 |
| Fastenal Co. | 64,068 | 2,615 |
| WW Grainger Inc. | 12,730 | 2,579 |
| Textron Inc. | 60,890 | 2,558 |
| Republic Services Inc. | | |
| | Class A | 53,202 | 2,340 |
| * | Stericycle Inc. | 18,712 | 2,257 |
| Snap-on Inc. | 12,736 | 2,183 |
| Masco Corp. | 75,955 | 2,150 |
| Dover Corp. | 34,354 | 2,106 |
| L-3 Communications | | |
| | Holdings Inc. | 17,581 | 2,101 |
| Pentair plc | 40,074 | 1,985 |
| CH Robinson Worldwide Inc. | 31,982 | 1,984 |
| Expeditors International of | | |
| | Washington Inc. | 41,858 | 1,888 |
| Kansas City Southern | 24,157 | 1,804 |
| Cintas Corp. | 19,650 | 1,789 |
| * | United Rentals Inc. | 21,258 | 1,542 |
| Fluor Corp. | 32,476 | 1,533 |
| JB Hunt Transport | | |
| | Services Inc. | 20,280 | 1,488 |
| Xylem Inc. | 40,048 | 1,462 |
| Robert Half International Inc. | 29,639 | 1,397 |
| Allegion plc | 21,093 | 1,390 |
| ADT Corp. | 37,878 | 1,249 |
| Flowserve Corp. | 29,644 | 1,247 |
| * | Jacobs Engineering | | |
| | Group Inc. | 27,772 | 1,165 |
| Pitney Bowes Inc. | 44,658 | 922 |
| Dun & Bradstreet Corp. | 8,067 | 838 |
| * | Quanta Services Inc. | 35,794 | 725 |
| Ryder System Inc. | 11,783 | 670 |
| 400,152 |
| Information Technology (20.6%) | |
| Apple Inc. | 1,239,459 | 130,465 |
| Microsoft Corp. | 1,775,844 | 98,524 |
| * | Facebook Inc. Class A | 504,788 | 52,831 |
| * | Alphabet Inc. Class A | 64,772 | 50,393 |
| * | Alphabet Inc. | 66,061 | 50,132 |
| Intel Corp. | 1,049,089 | 36,141 |
| Visa Inc. Class A | 432,758 | 33,560 |
| Cisco Systems Inc. | 1,128,543 | 30,646 |
| International Business | | |
| | Machines Corp. | 198,452 | 27,311 |
| Oracle Corp. | 711,777 | 26,001 |
| MasterCard Inc. Class A | 220,150 | 21,434 |
| QUALCOMM Inc. | 334,163 | 16,703 |
| Accenture plc Class A | 138,965 | 14,522 |
| Texas Instruments Inc. | 225,569 | 12,363 |
| EMC Corp. | 431,054 | 11,069 |
| * | salesforce.com inc | 138,820 | 10,883 |
| * | Adobe Systems Inc. | 110,979 | 10,425 |
| * | PayPal Holdings Inc. | 247,174 | 8,948 |
| Automatic Data | | |
| | Processing Inc. | 102,433 | 8,678 |
| Avago Technologies Ltd. | | |
| | Class A | 58,102 | 8,434 |
| * | Cognizant Technology | | |
| | Solutions Corp. Class A | 135,244 | 8,117 |
| | | |
| Market |
| Value• |
| | Shares | ($000) |
| Broadcom Corp. Class A | 124,768 | 7,214 |
| * | eBay Inc. | 247,174 | 6,792 |
| * | Yahoo! Inc. | 193,179 | 6,425 |
| Hewlett Packard | | |
| | Enterprise Co. | 399,840 | 6,078 |
| Intuit Inc. | 58,359 | 5,632 |
| TE Connectivity Ltd. | 85,479 | 5,523 |
| Corning Inc. | 261,788 | 4,785 |
| HP Inc. | 401,640 | 4,755 |
| * | Electronic Arts Inc. | 69,160 | 4,753 |
| Applied Materials Inc. | 254,304 | 4,748 |
| * | Fiserv Inc. | 50,530 | 4,621 |
| Activision Blizzard Inc. | 112,181 | 4,343 |
| Analog Devices Inc. | 69,103 | 3,823 |
| Fidelity National Information | | |
| | Services Inc. | 61,774 | 3,744 |
| Paychex Inc. | 70,699 | 3,739 |
| * | Alliance Data Systems Corp. | 13,509 | 3,736 |
| NVIDIA Corp. | 112,506 | 3,708 |
| Amphenol Corp. Class A | 68,000 | 3,552 |
| * | Micron Technology Inc. | 241,399 | 3,418 |
| SanDisk Corp. | 44,841 | 3,407 |
| * | Red Hat Inc. | 40,368 | 3,343 |
| Skyworks Solutions Inc. | 42,087 | 3,234 |
| Symantec Corp. | 150,552 | 3,162 |
| Western Digital Corp. | 50,895 | 3,056 |
| * | Autodesk Inc. | 49,971 | 3,045 |
| Lam Research Corp. | 35,225 | 2,798 |
| Xilinx Inc. | 56,876 | 2,671 |
| * | Citrix Systems Inc. | 33,996 | 2,572 |
| Seagate Technology plc | 66,550 | 2,440 |
| KLA-Tencor Corp. | 35,093 | 2,434 |
| Motorola Solutions Inc. | 35,363 | 2,421 |
| Harris Corp. | 27,659 | 2,404 |
| Linear Technology Corp. | 52,697 | 2,238 |
| Xerox Corp. | 209,117 | 2,223 |
| Juniper Networks Inc. | 77,971 | 2,152 |
| Microchip Technology Inc. | 46,007 | 2,141 |
| * | Akamai Technologies Inc. | 39,052 | 2,055 |
| Western Union Co. | 113,599 | 2,035 |
| CA Inc. | 69,547 | 1,986 |
| * | VeriSign Inc. | 21,950 | 1,918 |
| Total System Services Inc. | 37,248 | 1,855 |
| NetApp Inc. | 65,973 | 1,750 |
| * | Qorvo Inc. | 31,049 | 1,580 |
| * | F5 Networks Inc. | 15,806 | 1,533 |
| * | First Solar Inc. | 16,425 | 1,084 |
| CSRA Inc. | 30,114 | 903 |
| FLIR Systems Inc. | 30,963 | 869 |
| * | Teradata Corp. | 29,208 | 772 |
| 823,050 |
| Materials (2.8%) | | |
| EI du Pont de Nemours | | |
| | & Co. | 194,912 | 12,981 |
| Dow Chemical Co. | 250,048 | 12,873 |
| Monsanto Co. | 97,880 | 9,643 |
| LyondellBasell Industries | | |
| | NV Class A | 79,996 | 6,952 |
| Ecolab Inc. | 59,175 | 6,769 |
| Praxair Inc. | 63,334 | 6,485 |
| PPG Industries Inc. | 59,746 | 5,904 |
| Air Products & | | |
| | Chemicals Inc. | 43,135 | 5,612 |
| Sherwin-Williams Co. | 17,593 | 4,567 |
| International Paper Co. | 91,806 | 3,461 |
| Nucor Corp. | 71,060 | 2,864 |
| Alcoa Inc. | 288,779 | 2,850 |
| Vulcan Materials Co. | 29,677 | 2,818 |
| WestRock Co. | 57,640 | 2,630 |
| Eastman Chemical Co. | 32,806 | 2,215 |
| | | |
| Market |
| Value• |
| | Shares | ($000) |
| Ball Corp. | 30,372 | 2,209 |
| International Flavors & | | |
| | Fragrances Inc. | 17,742 | 2,123 |
| CF Industries Holdings Inc. | 51,465 | 2,100 |
| Newmont Mining Corp. | 115,581 | 2,079 |
| Airgas Inc. | 14,879 | 2,058 |
| Mosaic Co. | 74,343 | 2,051 |
| Martin Marietta | | |
| | Materials Inc. | 14,824 | 2,025 |
| Sealed Air Corp. | 45,196 | 2,016 |
| Freeport-McMoRan Inc. | 256,990 | 1,740 |
| Avery Dennison Corp. | 20,128 | 1,261 |
| FMC Corp. | 29,394 | 1,150 |
| * | Owens-Illinois Inc. | 35,769 | 623 |
| 110,059 |
| Telecommunication Services (2.4%) | |
| AT&T Inc. | 1,367,726 | 47,063 |
| Verizon | | |
| | Communications Inc. | 904,608 | 41,811 |
| * | Level 3 | | |
| | Communications Inc. | 64,165 | 3,488 |
| CenturyLink Inc. | 123,674 | 3,112 |
| Frontier Communications | | |
| | Corp. | 254,202 | 1,187 |
| 96,661 |
| Utilities (3.0%) | | |
| Duke Energy Corp. | 153,112 | 10,931 |
| NextEra Energy Inc. | 102,389 | 10,637 |
| Southern Co. | 202,092 | 9,456 |
| Dominion Resources Inc. | 131,868 | 8,920 |
| American Electric Power | | |
| | Co. Inc. | 109,163 | 6,361 |
| PG&E Corp. | 109,125 | 5,804 |
| Exelon Corp. | 204,523 | 5,680 |
| PPL Corp. | 149,369 | 5,098 |
| Sempra Energy | 52,511 | 4,937 |
| Public Service Enterprise | | |
| | Group Inc. | 112,487 | 4,352 |
| Edison International | 71,813 | 4,252 |
| Consolidated Edison Inc. | 65,267 | 4,195 |
| Xcel Energy Inc. | 112,840 | 4,052 |
| Eversource Energy | 70,534 | 3,602 |
| WEC Energy Group Inc. | 70,202 | 3,602 |
| DTE Energy Co. | 39,948 | 3,203 |
| FirstEnergy Corp. | 94,102 | 2,986 |
| Entergy Corp. | 39,293 | 2,686 |
| Ameren Corp. | 54,011 | 2,335 |
| CMS Energy Corp. | 60,860 | 2,196 |
| SCANA Corp. | 31,351 | 1,896 |
| CenterPoint Energy Inc. | 93,989 | 1,726 |
| AGL Resources Inc. | 26,404 | 1,685 |
| Pinnacle West Capital Corp. | 24,357 | 1,570 |
| Pepco Holdings Inc. | 55,476 | 1,443 |
| AES Corp. | 149,070 | 1,427 |
| TECO Energy Inc. | 51,849 | 1,382 |
| NiSource Inc. | 68,951 | 1,345 |
| NRG Energy Inc. | 72,774 | 856 |
| 118,615 |
| Total Common Stocks | | |
| (Cost $3,079,835) | 3,979,755 |
78
Vanguard Equity Index Portfolio
| | |
| Market |
| Value• |
| Shares | ($000) |
| Temporary Cash Investments (0.1%)1 | |
| Money Market Fund (0.1%) | | |
| 2,3 Vanguard Market Liquidity | | |
| Fund, 0.363% | 1,615,401 | 1,615 |
| | |
| Face | |
| Amount | |
| ($000) | |
| U.S. Government and Agency Obligations (0.0%) |
| 4,5 Federal Home Loan Bank | | |
| Discount Notes, | | |
| 0.245%, 3/2/16 | 500 | 500 |
| 4,5 Federal Home Loan Bank | | |
| Discount Notes, | | |
| 0.501%, 5/3/16 | 500 | 499 |
| 999 |
| Total Temporary Cash Investments | |
| (Cost $2,614) | 2,614 |
| Total Investments (99.9%) | | |
| (Cost $3,082,449) | 3,982,369 |
| | |
| Amount |
| ($000) |
| Other Assets and Liabilities (0.1%) | |
| Other Assets | | |
| Investment in Vanguard | 352 |
| Receivables for Accrued Income | 5,308 |
| Receivables for Capital Shares Issued | 22,401 |
| Total Other Assets | 28,061 |
| Liabilities | | |
| Payables for Investment | | |
| Securities Purchased | (19,345) |
| Collateral for Securities on Loan | (761) |
| Payables for Capital Shares Redeemed | (1,913) |
| Payables to Vanguard | (3,553) |
| Other Liabilities | (41) |
| Total Liabilities | (25,613) |
| Net Assets (100%) | | |
| Applicable to 119,839,050 outstanding | |
| $.001 par value shares of beneficial | |
| interest (unlimited authorization) | 3,984,817 |
| Net Asset Value Per Share | | $33.25 |
| | |
| |
| At December 31, 2015, net assets consisted of: |
| Amount |
| ($000) |
| Paid-in Capital | 2,923,330 |
| Undistributed Net Investment Income | 87,332 |
| Accumulated Net Realized Gains | 74,223 |
| Unrealized Appreciation (Depreciation) | |
| Investment Securities | 899,920 |
| Futures Contracts | 12 |
| Net Assets | 3,984,817 |
| |
• See Note A in Notes to Financial Statements.
* Non-income-producing security.
^ Includes partial security positions on loan to broker-dealers. The total value of securities on loan is $699,000.
1 The portfolio invests a portion of its cash reserves in equity markets through the use of index futures contracts. After giving effect to futures investments, the portfolio’s effective common stock and temporary cash investment positions represent 99.9% and 0.0%, respectively, of net assets.
2 Affiliated money market fund available only to Vanguard funds and certain trusts and accounts managed by Vanguard. Rate shown is the 7-day yield.
3 Includes $761,000 of collateral received for securities on loan.
4 The issuer operates under a congressional charter; its securities are generally neither guaranteed by the U.S. Treasury nor backed by the full faith and credit of the U.S. government.
5 Securities with a value of $399,000 have been segregated as initial margin for open futures contracts.
See accompanying Notes, which are an integral part of the Financial Statements.
79
| | | |
| Vanguard Equity Index Portfolio | |
| |
| |
| Statement of Operations |
| |
| Year Ended |
| December 31, 2015 |
| | ($000) |
| Investment Income | | |
| Income | | |
| Dividends | 97,126 |
| Interest1 | 35 |
| Securities Lending | 96 |
| Total Income | 97,257 |
| Expenses | | |
| The Vanguard Group—Note B | | |
| Investment Advisory Services | 621 |
| Management and Administrative | 4,337 |
| Marketing and Distribution | 758 |
| Custodian Fees | 69 |
| Auditing Fees | 64 |
| Shareholders’ Reports | 39 |
| Trustees’ Fees and Expenses | 2 |
| Total Expenses | 5,890 |
| Net Investment Income | 91,367 |
| Realized Net Gain (Loss) | | |
| Investment Securities Sold | 74,803 |
| Futures Contracts | 114 |
| Realized Net Gain (Loss) | 74,917 |
| Change in Unrealized Appreciation | |
| (Depreciation) | | |
| Investment Securities (119,458) |
| Futures Contracts | (458) |
| Change in Unrealized Appreciation | |
| (Depreciation) (119,916) |
| Net Increase (Decrease) in Net Assets | |
| Resulting from Operations | 46,368 |
| 1 Interest income from an affiliated company of the portfolio |
| | was $32,000. | | |
| | |
| Statement of Changes in Net Assets | | |
| |
| Year Ended December 31, |
| 2015 | 2014 |
| ($000) | ($000) |
| Increase (Decrease) in Net Assets | | |
| Operations | | |
| Net Investment Income | 91,367 | 63,178 |
| Realized Net Gain (Loss) | 74,917 | 118,137 |
| Change in Unrealized Appreciation (Depreciation) | (119,916) | 245,427 |
| Net Increase (Decrease) in Net Assets Resulting from Operations | 46,368 | 426,742 |
| Distributions | | |
| Net Investment Income | (63,303) | (55,364) |
| Realized Capital Gain1 | (115,925) | (61,250) |
| Total Distributions | (179,228) | (116,614) |
| Capital Share Transactions | | |
| Issued | 608,805 | 615,339 |
| Issued in Lieu of Cash Distributions | 179,228 | 116,614 |
| Redeemed | (454,226) | (457,588) |
| Net Increase (Decrease) from Capital Share Transactions | 333,807 | 274,365 |
| Total Increase (Decrease) | 200,947 | 584,493 |
| Net Assets |
| Beginning of Period | 3,783,870 | 3,199,377 |
| End of Period2 | 3,984,817 | 3,783,870 |
1 Includes fiscal 2015 and 2014 short-term gain distributions totaling $2,114,000 and $2,793,000, respectively. Short-term gain distributions are treated as ordinary income dividends for tax purposes.
2 Net Assets—End of Period includes undistributed (overdistributed) net investment income of $87,332,000 and $59,268,000.
See accompanying Notes, which are an integral part of the Financial Statements.
80
| | | | | |
| Vanguard Equity Index Portfolio | | | | | |
| |
| |
| Financial Highlights | | | | | |
| |
| |
| For a Share Outstanding | | | Year Ended December 31, |
| Throughout Each Period | 2015 | 2014 | 2013 | 2012 | 2011 |
| Net Asset Value, Beginning of Period | $34.44 | $31.50 | $24.93 | $22.85 | $23.51 |
| Investment Operations | |
| Net Investment Income | .7591 | .587 | .545 | .512 | .466 |
| Net Realized and Unrealized Gain (Loss) | | | | | |
| on Investments | (.338) | 3.522 | 7.235 | 3.062 | .034 |
| Total from Investment Operations | .421 | 4.109 | 7.780 | 3.574 | .500 |
| Distributions | | |
| Dividends from Net Investment Income | (.569) | (.555) | (.505) | (.474) | (.390) |
| Distributions from Realized Capital Gains | (1.042) | (.614) | (.705) | (1.020) | (.770) |
| Total Distributions | (1.611) | (1.169) | (1.210) | (1.494) | (1.160) |
| Net Asset Value, End of Period | $33.25 | $34.44 | $31.50 | $24.93 | $22.85 |
| |
| Total Return | 1.27% | 13.51% | 32.18% | 15.86% | 1.93% |
| |
| Ratios/Supplemental Data | | |
| Net Assets, End of Period (Millions) | $3,985 | $3,784 | $3,199 | $2,418 | $2,132 |
| Ratio of Total Expenses to Average Net Assets | 0.15% | 0.16% | 0.16% | 0.17% | 0.17% |
| Ratio of Net Investment Income to | | | | | |
| Average Net Assets | 2.31%1 | 1.88% | 1.96% | 2.13% | 1.92% |
| Portfolio Turnover Rate | 4% | 7% | 8% | 9% | 8% |
1 Net investment income per share and the ratio of net investment income to average net assets include $.13 and 0.35%, respectively, resulting from a special dividend from Medtronic plc in January 2015.
See accompanying Notes, which are an integral part of the Financial Statements.
81
Vanguard Equity Index Portfolio
Notes to Financial Statements
Vanguard Equity Index Portfolio, a portfolio of Vanguard Variable Insurance Funds, is registered under the Investment Company Act of 1940 as an open-end investment company. The portfolio’s shares are only available for purchase by separate accounts of insurance companies as investments for variable annuity plans, variable life insurance contracts, or other variable benefit insurance contracts.
A. The following significant accounting policies conform to generally accepted accounting principles for U.S. investment companies. The portfolio consistently follows such policies in preparing its financial statements.
1. Security Valuation: Securities are valued as of the close of trading on the New York Stock Exchange (generally 4 p.m., Eastern time) on the valuation date. Equity securities are valued at the latest quoted sales prices or official closing prices taken from the primary market in which each security trades; such securities not traded on the valuation date are valued at the mean of the latest quoted bid and asked prices. Securities for which market quotations are not readily available, or whose values have been materially affected by events occurring before the portfolio’s pricing time but after the close of the securities’ primary markets, are valued by methods deemed by the board of trustees to represent fair value. Investments in Vanguard Market Liquidity Fund are valued at that fund’s net asset value. Temporary cash investments acquired over 60 days to maturity are valued using the latest bid prices or using valuations based on a matrix system (which considers such factors as security prices, yields, maturities, and ratings), both as furnished by independent pricing services. Other temporary cash investments are valued at amortized cost, which approximates market value.
2. Futures Contracts: The portfolio uses index futures contracts to a limited extent, with the objectives of maintaining full exposure to the stock market, enhancing returns, maintaining liquidity, and minimizing transaction costs. The portfolio may purchase futures contracts to immediately invest incoming cash in the market, or sell futures in response to cash outflows, thereby simulating a fully invested position in the underlying index while maintaining a cash balance for liquidity. The portfolio may seek to enhance returns by using futures contracts instead of the underlying securities when futures are believed to be priced more attractively than the underlying securities. The primary risks associated with the use of futures contracts are imperfect correlation between changes in market values of stocks held by the portfolio and the prices of futures contracts, and the possibility of an illiquid market. Counterparty risk involving futures is mitigated because a regulated clearinghouse is the counterparty instead of the clearing broker. To further mitigate counterparty risk, the portfolio trades futures contracts on an exchange, monitors the financial strength of its clearing brokers and clearinghouse, and has entered into clearing agreements with its clearing brokers. The clearinghouse imposes initial margin requirements to secure the portfolio’s performance and requires daily settlement of variation margin representing changes in the market value of each contract.
Futures contracts are valued at their quoted daily settlement prices. The aggregate settlement values of the contracts are not recorded in the Statement of Net Assets. Fluctuations in the value of the contracts are recorded in the Statement of Net Assets as an asset (liability) and in the Statement of Operations as unrealized appreciation (depreciation) until the contracts are closed, when they are recorded as realized futures gains (losses).
During the year ended December 31, 2015, the portfolio’s average investments in long and short futures contracts represented less than 1% and 0% of net assets, respectively, based on the average of aggregate settlement values at each quarter-end during the period.
3. Federal Income Taxes: The portfolio intends to continue to qualify as a regulated investment company and distribute all of its taxable income. Management has analyzed the portfolio’s tax positions taken for all open federal income tax years (December 31, 2012–2015), and has concluded that no provision for federal income tax is required in the portfolio’s financial statements.
4. Distributions: Distributions to shareholders are recorded on the ex-dividend date.
5. Securities Lending: To earn additional income, the portfolio lends its securities to qualified institutional borrowers. Security loans are subject to termination by the portfolio at any time and are required to be secured at all times by collateral in an amount at least equal to the market value of securities loaned. Daily market fluctuations could cause the value of loaned securities to be more or less than the value of the collateral received. When this occurs, the collateral is adjusted and settled on the next business day. The portfolio further mitigates its counterparty risk by entering into securities lending transactions only with a diverse group of prequalified counterparties, monitoring their financial strength, and entering into master securities lending agreements with its counterparties. The master securities lending agreements provide that, in the event of a counterparty’s default (including bankruptcy), the portfolio may terminate any loans with that borrower, determine the net amount
82
Vanguard Equity Index Portfolio
owed, and sell or retain the collateral up to the net amount owed to the portfolio; however, such actions may be subject to legal proceedings. While collateral mitigates counterparty risk, in the absence of a default the portfolio may experience delays and costs in recovering the securities loaned. The portfolio invests cash collateral received in Vanguard Market Liquidity Fund, and records a liability in the Statement of Net Assets for the return of the collateral, during the period the securities are on loan. Securities lending income represents fees charged to borrowers plus income earned on invested cash collateral, less expenses associated with the loan.
6. Credit Facility: The portfolio and certain other funds managed by The Vanguard Group (“Vanguard”) participate in a $3 billion committed credit facility provided by a syndicate of lenders pursuant to a credit agreement that may be renewed annually; each fund is individually liable for its borrowings, if any, under the credit facility. Borrowings may be utilized for temporary and emergency purposes, and are subject to the portfolio’s regulatory and contractual borrowing restrictions. The participating funds are charged administrative fees and an annual commitment fee of 0.06% of the undrawn amount of the facility; these fees are allocated to the funds based on a method approved by the portfolio’s board of trustees and included in Management and Administrative expenses on the portfolio’s Statement of Operations. Any borrowings under this facility bear interest at a rate equal to the higher of the federal funds rate or LIBOR reference rate plus an agreed-upon spread.
The portfolio had no borrowings outstanding at December 31, 2015, or at any time during the period then ended.
7. Other: Dividend income is recorded on the ex-dividend date. Interest income includes income distributions received from Vanguard Market Liquidity Fund and is accrued daily. Premiums and discounts on debt securities purchased are amortized and accreted, respectively, to interest income over the lives of the respective securities. Security transactions are accounted for on the date securities are bought or sold. Costs used to determine realized gains (losses) on the sale of investment securities are those of the specific securities sold.
B. In accordance with the terms of a Funds’ Service Agreement (the “FSA”) between Vanguard and the portfolio, Vanguard furnishes to the portfolio investment advisory, corporate management, administrative, marketing, and distribution services at Vanguard’s cost of operations (as defined by the FSA). These costs of operations are allocated to the portfolio based on methods and guidelines approved by the board of trustees. Vanguard does not require reimbursement in the current period for certain costs of operations (such as deferred compensation/benefits and risk/insurance costs); the portfolio’s liability for these costs of operations is included in Payables to Vanguard on the Statement of Net Assets.
Upon the request of Vanguard, the portfolio may invest up to 0.40% of its net assets as capital in Vanguard. At December 31, 2015, the portfolio had contributed to Vanguard capital in the amount of $352,000, representing 0.01% of the portfolio’s net assets and 0.14% of Vanguard’s capitalization. The portfolio’s trustees and officers are also directors and employees, respectively, of Vanguard.
C. Various inputs may be used to determine the value of the portfolio’s investments. These inputs are summarized in three broad levels for financial statement purposes. The inputs or methodologies used to value securities are not necessarily an indication of the risk associated with investing in those securities.
Level 1—Quoted prices in active markets for identical securities.
Level 2—Other significant observable inputs (including quoted prices for similar securities, interest rates, prepayment speeds, credit risk, etc.).
Level 3—Significant unobservable inputs (including the portfolio’s own assumptions used to determine the fair value of investments).
The following table summarizes the market value of the portfolio’s investments as of December 31, 2015, based on the inputs used to value them:
| | | |
| Level 1 | Level 2 | Level 3 |
| Investments | ($000) | ($000) | ($000) |
| Common Stocks | 3,979,755 | — | — |
| Temporary Cash Investments | 1,615 | 999 | — |
| Futures Contracts—Liabilities1 | (40) | — | — |
| Total | 3,981,330 | 999 | — |
| 1 Represents variation margin on the last day of the reporting period. |
83
Vanguard Equity Index Portfolio
D. At December 31, 2015, the aggregate settlement value of open futures contracts and the related unrealized appreciation (depreciation) were:
| | | | |
| | | | ($000) |
| Aggregate |
| Number of | Settlement | Unrealized |
| Long (Short) | Value | Appreciation |
| Futures Contracts | Expiration | Contracts | Long (Short) | (Depreciation) |
| E-mini S&P 500 Index | March 2016 | 42 | 4,274 | 12 |
Unrealized appreciation (depreciation) on open futures contracts is required to be treated as realized gain (loss) for tax purposes.
E. Distributions are determined on a tax basis and may differ from net investment income and realized capital gains for financial reporting purposes. Differences may be permanent or temporary. Permanent differences are reclassified among capital accounts in the financial statements to reflect their tax character. Temporary differences arise when certain items of income, expense, gain, or loss are recognized in different periods for financial statement and tax purposes. These differences will reverse at some time in the future. Differences in classification may also result from the treatment of short-term gains as ordinary income for tax purposes.
For tax purposes, at December 31, 2015, the portfolio had $91,075,000 of ordinary income and $73,711,000 of long-term capital gains available for distribution.
At December 31, 2015, the cost of investment securities for tax purposes was $3,082,449,000. Net unrealized appreciation of investment securities for tax purposes was $899,920,000, consisting of unrealized gains of $1,147,303,000 on securities that had risen in value since their purchase and $247,383,000 in unrealized losses on securities that had fallen in value since their purchase.
F. During the year ended December 31, 2015, the portfolio purchased $395,028,000 of investment securities and sold $149,640,000 of investment securities, other than temporary cash investments.
G. Capital shares issued and redeemed were:
| | |
| Year Ended December 31, |
| 2015 | 2014 |
| Shares | Shares |
| (000) | (000) |
| Issued | 18,193 | 18,705 |
| Issued in Lieu of Cash Distributions | 5,441 | 3,807 |
| Redeemed | (13,658) | (14,225) |
| Net Increase (Decrease) in Shares Outstanding | 9,976 | 8,287 |
At December 31, 2015, two shareholders (an insurance company separate account whose holdings in the portfolio represent the indirect investment of Vanguard Variable Annunity contract holders and Vanguard Total Stock Market Index Portfolio), were each the record or beneficial owner of 30% or more of the portfolio’s net assets, with a combined ownership of 71%. If one of these shareholders were to redeem its investment in the portfolio, the redemption might result in an increase in the portfolio’s expense ratio or cause the portfolio to incur higher transaction costs.
H. Management has determined that no material events or transactions occurred subsequent to December 31, 2015, that would require recognition or disclosure in these financial statements.
84
Vanguard Equity Index Portfolio
Report of Independent Registered Public Accounting Firm
To the Board of Trustees of Vanguard Variable Insurance Funds and the Shareholders of Equity Index Portfolio: In our opinion, the accompanying statement of net assets and the related statements of operations and of changes in net assets and the financial highlights present fairly, in all material respects, the financial position of Equity Index Portfolio (constituting a separate portfolio of Vanguard Variable Insurance Funds, hereafter referred to as the “Portfolio”) at December 31, 2015, the results of its operations for the year then ended, the changes in its net assets for each of the two years in the period then ended, and the financial highlights for each of the five years in the period then ended, in conformity with accounting principles generally accepted in the United States of America. These financial statements and financial highlights (hereafter referred to as “financial statements”) are the responsibility of the Portfolio’s management. Our responsibility is to express an opinion on these financial statements based on our audits. We conducted our audits of these financial statements in accordance with the standards of the Public Company Accounting Oversight Board (United States). Those standards require that we plan and perform the audit to obtain reasonable assurance about whether the financial statements are free of material misstatement. An audit includes examining, on a test basis, evidence supporting the amounts and disclosures in the financial statements, assessing the accounting principles used and significant estimates made by management, and evaluating the overall financial statement presentation. We believe that our audits, which included confirmation of securities at December 31, 2015 by correspondence with the custodian and brokers, by agreement to the underlying ownership records of the transfer agent and the application of alternative auditing procedures where securities purchased had not been received, provide a reasonable basis for our opinion.
/s/PricewaterhouseCoopers LLP
Philadelphia, Pennsylvania
February 11, 2016
| |
| |
| Special 2015 tax information (unaudited) for corporate shareholders only for Vanguard Equity |
| Index Portfolio, a portfolio of Vanguard Variable Insurance Funds |
| |
| This information for the fiscal year ended December 31, 2015, is included pursuant to provisions |
| of the Internal Revenue Code for corporate shareholders only. |
| |
| The portfolio distributed $113,811,000 as capital gain dividends (20% rate gain distributions) to |
| shareholders during the fiscal year. |
| |
| For corporate shareholders, 84.3% of investment income (dividend income plus short-term gains, |
| if any) qualifies for the dividends-received deduction. |
85
Vanguard Equity Index Portfolio
About Your Portfolio’s Expenses
As a shareholder of the portfolio, you incur ongoing costs, which include costs for portfolio management, administrative services, and shareholder reports (like this one), among others. Operating expenses, which are deducted from a portfolio’s gross income, directly reduce the investment return of the portfolio.
A portfolio’s expenses are expressed as a percentage of its average net assets. This figure is known as the expense ratio. The following examples are intended to help you understand the ongoing costs (in dollars) of investing in your portfolio and to compare these costs with those of other mutual funds. The examples are based on an investment of $1,000 made at the beginning of the period shown and held for the entire period.
The accompanying table illustrates your portfolio’s costs in two ways:
• Based on actual portfolio return. This section helps you to estimate the actual expenses that you paid over the period. The “Ending Account Value” shown is derived from the portfolio’s actual return, and the third column shows the dollar amount that would have been paid by an investor who started with $1,000 in the portfolio. You may use the information here, together with the amount you invested, to estimate the expenses that you paid over the period.
To do so, simply divide your account value by $1,000 (for example, an $8,600 account value divided by $1,000 = 8.6), then multiply the result by the number given for your portfolio under the heading “Expenses Paid During Period.”
• Based on hypothetical 5% yearly return. This section is intended to help you compare your portfolio’s costs with those of other mutual funds. It assumes that the portfolio had a yearly return of 5% before expenses, but that the expense ratio is unchanged. In this case—because the return used is not the portfolio’s actual return—the results do not apply to your investment. The example is useful in making comparisons because the Securities and Exchange Commission requires all mutual funds to calculate expenses based on a 5% return. You can assess your portfolio’s costs by comparing this hypothetical example with the hypothetical examples that appear in shareholder reports of other funds.
Note that the expenses shown in the table are meant to highlight and help you compare ongoing costs only and do not reflect transaction costs incurred by the portfolio for buying and selling securities. The portfolio’s expense ratio does not reflect additional fees and expenses associated with the annuity or life insurance program through which you invest.
The calculations assume no shares were bought or sold during the period. Your actual costs may have been higher or lower, depending on the amount of your investment and the timing of any purchases or redemptions.
You can find more information about the portfolio’s expenses in the Financial Statements section. For additional information on operating expenses and other shareholder costs, please refer to the prospectus.
| | | |
| Six Months Ended December 31, 2015 | | | |
| Beginning | Ending | Expenses |
| Account Value | Account Value | Paid During |
| Equity Index Portfolio | 6/30/2015 | 12/31/2015 | Period1 |
| Based on Actual Portfolio Return | $1,000.00 | $1,000.90 | $0.81 |
| Based on Hypothetical 5% Yearly Return | 1,000.00 | 1,024.40 | 0.82 |
1 The calculations are based on expenses incurred in the most recent six-month period. The portfolio’s annualized six-month expense ratio for that period is 0.16%. The dollar amounts shown as “Expenses Paid” are equal to the annualized expense ratio multiplied by the average account value over the period, multiplied by the number of days in the most recent six-month period, then divided by the number of days in the most recent 12-month period (184/365).
86
Vanguard® Growth Portfolio
Advisors’ Report
Vanguard Growth Portfolio returned 7.98% in 2015, about 2 percentage points ahead of its comparative standards. Please note that the returns for Vanguard Variable Insurance Fund are different from those of Vanguard Variable Annuity (and other plans that invest in the fund), which take into account insurance-related expenses.
The portfolio is overseen by three independent advisors, a strategy that enhances its diversification by providing exposure to distinct yet complementary investment approaches. It is not uncommon for different advisors to have different views about individual securities or the broader investment environment.
The advisors, the amount and percentage of the portfolio’s assets each manages, and brief descriptions of their investment strategies are presented in the accompanying table. Each advisor has also prepared a discussion of the investment environment that existed during 2015 and of the effect it had on the portfolio’s positioning. These reports were prepared on January 13, 2016.
Please note that William Blair & Company, L.L.C., underwent an internal restructuring. As a result, the name of the firm managing a portion of the Growth Portfolio assets is now William Blair Investment Management, LLC.
Jackson Square Partners, LLC
Portfolio Managers:
Jeffrey S. Van Harte, CFA, Chairman and Chief Investment Officer
Christopher J. Bonavico, CFA
Christopher M. Ericksen, CFA
Daniel J. Prislin, CFA
Our largest relative contributor to performance was Equinix. Although Equinix reported somewhat mixed financial results, the stock experienced relative strength as the company continues to benefit from significant opportunities associated with cloud computing and its disruption in the IT supply chain. We believe its innovative product offerings allow the company to be well-positioned in a technology spending environment that is focused on addressing the needs of enterprises that are struggling to maintain the highest level of network performance and quality of service for global users.
Qualcomm detracted as its patent licensing business reported lingering negotiating issues with handset makers in China, as well as new concerns in South Korea. Although these issues continue to affect sentiment, we do not believe they materially threaten the company’s long-term business model. We also believe the company’s mobile chip business should rebound as it recovers from 2015 product cycle issues that are unlikely to recur. Further, we are encouraged by the aggressive steps management is taking to run the business more efficiently, which will have a positive impact not only free cash generation but also capital structure.
Looking ahead, despite positive absolute returns in the equity market during the past few years, we believe the relatively tepid market sentiment demonstrates that there are more than just fundamental factors affecting stock prices. A lack of significant bull market sentiment suggests to us that many investors appear to be struggling to accurately predict the pace of global economic recovery and are assessing factors that threaten economic fundamentals (for example, central bank actions and fiscal policy debates across the globe). We believe the lingering effects of the credit crisis could lead to moderate growth, at best, for the intermediate term. In such a tenuous environment, we believe the quality of a company’s business model, competitive position, and management may prove to be of utmost importance.
| | | |
| Total Returns | | | |
| | | Ten Years Ended |
| | | December 31, 2015 |
| | Year Ended | Average |
| December 31, 2015 | Annual Return |
| Vanguard Growth Portfolio | 7.98% | 7.51% |
| Russell 1000 Growth Index | 5.67 | 8.53 |
| Variable Insurance Large-Cap Growth Funds Average1 | 6.00 | 7.19 |
The figures shown represent past performance, which is not a guarantee of future results. (Current performance may be lower or higher than the performance data cited. For performance data current to the most recent month-end, visit our website at vanguard.com/performance.) Note, too, that both investment returns and principal value can fluctuate widely, so an investor’s shares, when sold, could be worth more or less than their original cost.
| | |
| Expense Ratios2 | | |
| Your Portfolio Compared With Its Peer Group | | |
| Variable Insurance |
| Large-Cap Growth |
| Portfolio | Funds Average |
| Growth Portfolio | 0.43% | 0.89% |
1 Derived from data provided by Lipper, a Thomson Reuters Company.
2 The portfolio expense ratio shown is from the prospectus dated April 30, 2015, and represents estimated costs for the current fiscal year. For the fiscal year ended December 31, 2015, the Growth Portfolio’s expense ratio was 0.44%. The peer-group expense ratio is derived from data provided by Lipper, a Thomson Reuters Company, and captures information through year-end 2014.
87
Vanguard Growth Portfolio
Regardless of the economic outcome, we remain consistent in our long-term investment philosophy: We want to own what we view as companies with strong long-term growth prospects, solid business models, and competitive positions that we believe can increase market share and have the potential to deliver shareholder value in a variety of market environments.
Wellington Management Company, LLP
Portfolio Manager:
Andrew J. Shilling, CFA, Senior Managing Director
Our portion of the portfolio seeks to outperform growth indexes and, in the longer term, the broader market. We employ proprietary fundamental research and a rigorous valuation discipline to invest in high-quality, large-capitalization companies with attractive growth characteristics. Our investment approach is based on identifying companies with a clear competitive advantage that we believe will enable them to sustain above-average growth.
U.S. equities, as measured by the Standard & Poor’s 500 Index, gained 1.38% in 2015. Growth stocks outperformed value stocks, and small-caps trailed their larger peers.
Strong stock selection in the industrial, consumer discretionary, health care, and information technology sectors drove relative performance. Sector allocation, an indirect result of our stock-specific decisions, also aided relative results—notably, underweights to industrials and energy and an overweight to consumer discretionary.
Top relative contributors included Amazon.com, Netflix, and Uber, the privately held transportation and ride-sharing company. We eliminated our position in Netflix based on valuation, taking profits and reallocating the capital to other high-conviction opportunities.
Relative detractors included motorcycle manufacturer Harley-Davidson and Wynn Resorts, an owner and operator of casinos. We eliminated our position in Microsoft early in the second quarter on concerns about the company’s legacy business and because we preferred to play the strong secular trend in cloud computing through top-positioned Amazon. Not owning the benchmark constituent during the second half of the year weighed on relative performance, as shares rose following strong third-quarter results.
As we begin 2016, our largest active exposures are in the consumer discretionary, health care, and information technology sectors, which we believe represent today’s best long-term growth opportunities. We have increased our industrial exposure from a large underweight to neutral. Our largest underweights are in consumer staples, materials, and telecommunication service.
We continually tap into Wellington Management’s vast research, resources, and specialized expertise. We believe this gives us an inherent advantage in identifying growth companies with high cash-flow returns on investment, strong balance sheets, experienced and proven management teams, and the ability to maintain above-average growth over three to five years. Based on our fundamental and qualitative analysis, we invest in those companies that meet our valuation criteria and, in our view, offer superior long-term appreciation potential for the portfolio’s shareholders.
William Blair Investment Management, LLC
Portfolio Managers:
James Golan, CFA, Partner
David Ricci, CFA, Partner
The market advanced modestly during 2015, with strength in the first half of the year supported by strong consumer confidence, improving labor market health, solid housing data, and strong mergers-and-acquisitions activity. However, market
| | | | |
| Vanguard Growth Portfolio Investment Advisors | |
| |
| Portfolio Assets Managed | |
| Investment Advisor | | % | $ Million | Investment Strategy |
| Jackson Square Partners, LLC | 39 | 195 | Uses a bottom-up approach, seeking companies that |
| | | | | have large end-market potential, dominant business |
| | | | | models, and strong free-cash-flow generation that is |
| | | | | attractively priced compared with the intrinsic value |
| | | | | of the securities. |
| Wellington Management | 38 | 193 | Employs proprietary fundamental research and a |
| Company LLP | rigorous valuation discipline in an effort to invest in |
| | | | | high-quality, large-capitalization, sustainable-growth |
| | | | | companies. The firm’s philosophy is based on the |
| | | | | belief that stock prices often overreact to short-term |
| | | | | trends and that bottom-up, intensive research focused |
| | | | | on longer-term fundamentals can be used to identify |
| | | | | stocks that will outperform the market over time. |
| William Blair Investment | 20 | 99 | Uses a fundamental investment approach in pursuit |
| Management, | LLC of superior, long-term investment results from growth- |
| | | | | oriented companies with leadership positions and |
| | | | | strong market presence. |
| Cash Investments | | 3 | 19 | These short-term reserves are invested by Vanguard |
| | | | | in equity index products to simulate investment in |
| | | | | stocks. Each advisor may also maintain a modest |
| | | | | cash position. |
88
Vanguard Growth Portfolio
volatility spiked late in the summer, and downdrafts in August and September—driven by concerns of slowing growth in China and potential spillover effects for global economic growth—weighed significantly on returns. The market rebounded strongly in October as investor fears were eased by better data out of China and continued solid U.S. economic data, particularly in the consumer segment. However, the manufacturing segment remained a concern; this, along with the Federal Reserve’s first move toward policy renormalization and growth challenges globally, caused investors to question the durability of U.S. economic growth and pressure markets in the final months.
The performance of our portion of the portfolio was driven by stock selection, particularly in consumer discretionary and information technology. Within consumer discretionary, top performers included Amazon.com, Home Depot, and O’Reilly Automotive. In IT, Alphabet was a standout. We also benefited from strong performance from our position in Equifax in industrials.
Conversely, stock selection in consumer staples, including positions in Keurig Green Mountain and Mead Johnson Nutrition, detracted. Other notable underperformers included Affiliated Managers Group (financials), Union Pacific (industrials), and Cerner (health care).
Amid increasing concerns about the sustainability of economic growth given that we have likely moved past the midpoint of the current cycle, investors gravitated toward more consistent growers and were less sensitive to valuation. As such, our overweight to higher-valuation stocks, an exposure driven by our typical bias toward less cyclical and more sustainable growers, was a modest benefit.
We expect the increased volatility we observed in the second half of 2015 to continue into 2016, supported by the Fed’s data-dependent policy stance, China’s uncertain economic trajectory, the U.S. presidential election, and a more challenging backdrop for corporate earnings growth. With the economy nearly seven years into a recovery and with profit margins near peak levels, we believe fundamentally driven earnings growth will be harder to come by. Given our bias toward less cyclical companies with durable long-term growth opportunities that trade at attractive valuations relative to those characteristics, we believe our style of investing is likely to be rewarded.
89
Vanguard Growth Portfolio
Portfolio Profile
As of December 31, 2015
| | | |
| Portfolio Characteristics | | |
| | Comparative | Broad |
| Portfolio | Index1 | Index2 |
| Number of Stocks | 119 | 644 | 3,960 |
| Median Market Cap $56.1B | $68.5B | $51.4B |
| Price/Earnings Ratio | 26.7x | 23.9x | 21.9x |
| Price/Book Ratio | 5.3x | 5.6x | 2.7x |
| Yield3 | 0.4% | 1.6% | 2.1% |
| Return on Equity | 22.3% | 23.3% | 17.2% |
| Earnings Growth Rate | 18.5% | 13.9% | 9.5% |
| Foreign Holdings | 2.6% | 0.0% | 0.0% |
| Turnover Rate | 38% | — | — |
| Expense Ratio4 | 0.43% | — | — |
| Short-Term Reserves | 1.4% | — | — |
| | |
| Volatility Measures | |
| Portfolio Versus | Portfolio Versus |
| Comparative Index1 | Broad Index2 |
| R-Squared | 0.95 | 0.89 |
| Beta | 1.02 | 1.00 |
| | | |
| Sector Diversification (% of equity exposure) |
| | Comparative | Broad |
| Portfolio | Index1 | Index2 |
| Consumer Discretionary 19.2% | 21.2% | 13.4% |
| Consumer Staples | 6.6 | 11.3 | 8.8 |
| Energy | 0.7 | 0.5 | 5.9 |
| Financials | 9.1 | 5.5 | 18.3 |
| Health Care | 20.2 | 17.1 | 14.8 |
| Industrials | 6.1 | 10.8 | 10.6 |
| Information Technology 34.7 | 28.0 | 19.8 |
| Materials | 1.1 | 3.4 | 3.1 |
| Other | 1.8 | 0.0 | 0.0 |
| Telecommunication | | | |
| Services | 0.4 | 2.1 | 2.2 |
| Utilities | 0.1 | 0.1 | 3.1 |
| | |
| Ten Largest Holdings5 (% of total net assets) |
| |
| Alphabet Inc. | Internet Software | |
| & Services | 5.9% |
| MasterCard Inc. | Data Processing | |
| & Outsourced | |
| Services | 3.3 |
| Visa Inc. | Data Processing | |
| & Outsourced | |
| Services | 3.0 |
| Allergan plc | Pharmaceuticals | 2.8 |
| Apple Inc. | Technology | |
| Hardware, Storage | |
| & Peripherals | 2.8 |
| Facebook Inc. | Internet Software | |
| & Services | 2.7 |
| Amazon.com Inc. | Internet Retail | 2.6 |
| Celgene Corp. | Biotechnology | 2.3 |
| Home Depot Inc. | Home Improvement | |
| Retail | 2.3 |
| Biogen Inc. | Biotechnology | 1.9 |
| Top Ten | 29.6% |
Investment Focus

30-Day SEC Yield. A portfolio’s 30-day SEC yield is derived using a formula specified by the U.S. Securities and Exchange Commission. Under the formula, data related to the portfolio’s security holdings in the previous 30 days are used to calculate the portfolio’s hypothetical net income for that period, which is then annualized and divided by the portfolio’s estimated average net assets over the calculation period. For the purposes of this calculation, a security’s income is based on its current market yield to maturity (for bonds), its actual income (for asset-backed securities), or its projected dividend yield (for stocks). Because the SEC yield represents hypothetical annualized income, it will differ—at times significantly—from the portfolio’s actual experience. As a result, the portfolio’s income distributions may be higher or lower than implied by the SEC yield.
Beta. A measure of the magnitude of a portfolio’s past share-price fluctuations in relation to the ups and downs of a given market index. The index is assigned a beta of 1.00. Compared with a given index, a portfolio with a beta of 1.20 typically would have seen its share price rise or fall by 12% when the index rose or fell by 10%. For this report, beta is based on returns over the past 36 months for both the portfolio and the index.
Equity Exposure. A measure that reflects a portfolio’s investments in stocks and stock futures. Any holdings in short-term reserves are excluded.
R-Squared. A measure of how much of a portfolio’s past returns can be explained by the returns from the market in general, as measured by a given index. If a portfolio’s total returns were precisely synchronized with an index’s returns, its R-squared would be 1.00. If the portfolio’s returns bore no relationship to the index’s returns, its R-squared would be 0. For this report, R-squared is based on returns over the past 36 months for both the portfolio and the index.
1 Russell 1000 Growth Index.
2 Dow Jones U.S. Total Stock Market Float Adjusted Index.
3 30-day SEC yield for the portfolio; annualized dividend yield for the indexes.
4 The expense ratio shown is from the prospectus dated April 30, 2015, and represents estimated costs for the current fiscal year. For the fiscal year ended December 31, 2015, the Growth Portfolio’s expense ratio was 0.44%.
5 The holdings listed exclude any temporary cash investments and equity index products.
90
Vanguard Growth Portfolio
Performance Summary
All of the returns in this report represent past performance, which is not a guarantee of future results that may be achieved by the portfolio. (Current performance may be lower or higher than the performance data cited. For performance data current to the most recent month-end, visit our website at vanguard.com/performance.) Note, too, that both investment returns and principal value can fluctuate widely, so an investor’s shares, when sold, could be worth more or less than their original cost. The returns shown do not reflect taxes that a shareholder would pay on portfolio distributions or on the sale of portfolio shares. Nor do the returns reflect fees and expenses associated with the annuity or life insurance program through which a shareholder invests. If these fees and expenses were included, the portfolio’s returns would be lower.
Cumulative Performance: December 31, 2005–December 31, 2015
Initial Investment of $10,000

| | | | |
| | | Average Annual Total Returns | Final Value |
| | Periods Ended December 31, 2015 | of a $10,000 |
| | One Year | Five Years | Ten Years | Investment |
| Growth Portfolio | 7.98% | 14.31% | 7.51% | $20,623 |
| Russell 1000 Growth Index | 5.67 | 13.53 | 8.53 | 22,681 |
| Variable Insurance Large-Cap Growth | | | | |
| Funds Average1 | 6.00 | 12.24 | 7.19 | 20,015 |
| Dow Jones U.S. Total Stock Market | | | | |
| Float Adjusted Index | 0.44 | 12.14 | 7.48 | 20,563 |
Fiscal-Year Total Returns (%): December 31, 2005–December 31, 2015
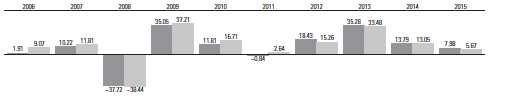
| |
| Growth Portfolio |
| Russell 1000 Growth Index |
1 Derived from data provided by Lipper, a Thomson Reuters Company.
See Financial Highlights for dividend and capital gains information.
91
Vanguard Growth Portfolio
Financial Statements
Statement of Net Assets
As of December 31, 2015
The portfolio reports a complete list of its holdings in regulatory filings four times in each fiscal year, at the quarter-ends. For the second and fourth fiscal quarters, the lists appear in the portfolio’s semiannual and annual reports to shareholders. For the first and third fiscal quarters, the portfolio files the lists with the Securities and Exchange Commission on Form N-Q. Shareholders can look up the portfolio’s Forms N-Q on the SEC’s website at sec.gov. Forms N-Q may also be reviewed and copied at the SEC’s Public Reference Room (see the back of the report for further information).
| | | |
| Market |
| Value• |
| | | Shares | ($000) |
| Common Stocks (93.5%)1 | | |
| Consumer Discretionary (18.5%) | |
| * | Amazon.com Inc. | 19,523 | 13,195 |
| Home Depot Inc. | 87,857 | 11,619 |
| * | Liberty Interactive Corp. | | |
| | QVC Group Class A | 316,660 | 8,651 |
| * | TripAdvisor Inc. | 68,346 | 5,826 |
| L Brands Inc. | 60,729 | 5,819 |
| Dollar General Corp. | 56,490 | 4,060 |
| Lowe’s Cos. Inc. | 50,889 | 3,870 |
| BorgWarner Inc. | 84,505 | 3,653 |
| DR Horton Inc. | 107,025 | 3,428 |
| * | AutoZone Inc. | 4,480 | 3,324 |
| Lennar Corp. Class A | 61,785 | 3,022 |
| Starbucks Corp. | 49,178 | 2,952 |
| * | O’Reilly Automotive Inc. | 11,380 | 2,884 |
| * | Priceline Group Inc. | 2,243 | 2,860 |
| * | Discovery Communications | | |
| | Inc. | 90,121 | 2,273 |
| Harman International | | |
| | Industries Inc. | 23,793 | 2,242 |
| Ross Stores Inc. | 37,461 | 2,016 |
| Dunkin’ Brands Group Inc. | 44,214 | 1,883 |
| Las Vegas Sands Corp. | 40,967 | 1,796 |
| Harley-Davidson Inc. | 39,565 | 1,796 |
| VF Corp. | 26,330 | 1,639 |
| * | Discovery Communications | | |
| | Inc. Class A | 49,952 | 1,333 |
| Wyndham Worldwide Corp. | 16,566 | 1,203 |
| * | Tesla Motors Inc. | 4,570 | 1,097 |
| NIKE Inc. Class B | 12,839 | 802 |
| Wynn Resorts Ltd. | 5,077 | 351 |
| 93,594 |
| Consumer Staples (6.2%) | | |
| Walgreens Boots Alliance | | |
| | Inc. | 101,101 | 8,609 |
| Estee Lauder Cos. Inc. | | |
| | Class A | 64,876 | 5,713 |
| * | Monster Beverage Corp. | 32,946 | 4,908 |
| Mondelez International Inc. | | |
| | Class A | 82,075 | 3,680 |
| CVS Health Corp. | 28,986 | 2,834 |
| Kroger Co. | 67,020 | 2,804 |
| PepsiCo Inc. | 26,171 | 2,615 |
| 31,163 |
| Energy (0.4%) | | |
| Schlumberger Ltd. | 25,610 | 1,786 |
| * | Cobalt International | | |
| | Energy Inc. | 49,915 | 270 |
| 2,056 |
| Financials (8.4%) | | |
| Equinix Inc. | 28,134 | 8,508 |
| Crown Castle International | | |
| | Corp. | 96,712 | 8,361 |
| Intercontinental | | |
| | Exchange Inc. | 31,530 | 8,080 |
| | | |
| Market |
| Value• |
| | Shares | ($000) |
| Citigroup Inc. | 58,860 | 3,046 |
| * | Affiliated Managers Group | | |
| | Inc. | 16,970 | 2,711 |
| American Tower Corporation | 27,576 | 2,673 |
| * | Markel Corp. | 2,655 | 2,345 |
| Moody’s Corp. | 20,540 | 2,061 |
| BlackRock Inc. | 5,832 | 1,986 |
| MSCI Inc. Class A | 18,180 | 1,311 |
| Marsh & McLennan | | |
| | Cos. Inc. | 22,607 | 1,254 |
| 42,336 |
| Health Care (19.4%) | | |
| * | Allergan plc | 45,127 | 14,102 |
| * | Celgene Corp. | 98,791 | 11,831 |
| * | Biogen Inc. | 31,720 | 9,717 |
| Bristol-Myers Squibb Co. | 123,487 | 8,495 |
| Novo Nordisk A/S ADR | 113,905 | 6,616 |
| * | Valeant Pharmaceuticals | | |
| | International Inc. | 62,294 | 6,332 |
| * | Cerner Corp. | 89,739 | 5,400 |
| UnitedHealth Group Inc. | 43,531 | 5,121 |
| Gilead Sciences Inc. | 36,151 | 3,658 |
| * | Edwards Lifesciences Corp. | 41,646 | 3,289 |
| * | Regeneron Pharmaceuticals | | |
| | Inc. | 5,657 | 3,071 |
| * | Illumina Inc. | 14,628 | 2,808 |
| Medtronic plc | 34,048 | 2,619 |
| * | IDEXX Laboratories Inc. | 35,120 | 2,561 |
| Zoetis Inc. | 51,080 | 2,448 |
| DENTSPLY International Inc. | 35,723 | 2,174 |
| * | Sirona Dental Systems Inc. | 19,556 | 2,143 |
| * | IMS Health Holdings Inc. | 69,943 | 1,781 |
| * | Vertex Pharmaceuticals Inc. | 13,329 | 1,677 |
| * | Medivation Inc. | 32,487 | 1,570 |
| McKesson Corp. | 4,360 | 860 |
| 98,273 |
| Industrials (5.6%) | | |
| * | Verisk Analytics Inc. | | |
| | Class A | 52,028 | 4,000 |
| Nielsen Holdings plc | 69,440 | 3,236 |
| Union Pacific Corp. | 39,620 | 3,098 |
| Fortune Brands Home | | |
| | & Security Inc. | 50,387 | 2,796 |
| Equifax Inc. | 24,040 | 2,677 |
| * | IHS Inc. Class A | 19,021 | 2,253 |
| * | TransDigm Group Inc. | 9,830 | 2,246 |
| AMETEK Inc. | 38,860 | 2,083 |
| * | Stericycle Inc. | 15,801 | 1,906 |
| Danaher Corp. | 13,590 | 1,262 |
| Kansas City Southern | 13,076 | 976 |
| * | TransUnion | 30,525 | 842 |
| JB Hunt Transport Services | | |
| | Inc. | 10,373 | 761 |
| Lockheed Martin Corp. | 867 | 188 |
| 28,324 |
| | | |
| Market |
| Value• |
| | Shares | ($000) |
| Information Technology (33.5%) | |
| * | Alphabet Inc. | 23,696 | 17,982 |
| MasterCard Inc. Class A | 169,781 | 16,530 |
| Visa Inc. Class A | 197,424 | 15,310 |
| Apple Inc. | 133,766 | 14,080 |
| * | Facebook Inc. Class A | 128,780 | 13,478 |
| * | Alphabet Inc. Class A | 14,989 | 11,662 |
| QUALCOMM Inc. | 189,376 | 9,466 |
| Microsoft Corp. | 152,981 | 8,487 |
| * | Electronic Arts Inc. | 105,699 | 7,264 |
| * | PayPal Holdings Inc. | 195,068 | 7,061 |
| * | eBay Inc. | 232,189 | 6,381 |
| * | Baidu Inc. ADR | 30,909 | 5,843 |
| * | Adobe Systems Inc. | 56,573 | 5,315 |
| Intuit Inc. | 38,469 | 3,712 |
| * | Red Hat Inc. | 40,490 | 3,353 |
| Texas Instruments Inc. | 59,720 | 3,273 |
| * | salesforce.com inc | 34,866 | 2,734 |
| * | Alliance Data Systems Corp. | 9,288 | 2,569 |
| CDW Corp. | 60,924 | 2,561 |
| * | Cognizant Technology | | |
| | Solutions Corp. Class A | 42,672 | 2,561 |
| * | FleetCor Technologies Inc. | 16,482 | 2,356 |
| * | ServiceNow Inc. | 23,757 | 2,056 |
| * | Alibaba Group Holding Ltd. | | |
| | ADR | 21,548 | 1,751 |
| * | Workday Inc. Class A | 19,534 | 1,557 |
| * | Yelp Inc. Class A | 36,471 | 1,050 |
| * | Zillow Group Inc. | 31,990 | 751 |
| *,^ Zillow Group Inc. Class A | 10,445 | 272 |
| 169,415 |
| Materials (1.0%) | | |
| Sherwin-Williams Co. | 11,324 | 2,939 |
| Eagle Materials Inc. | 20,632 | 1,247 |
| PPG Industries Inc. | 9,550 | 944 |
| 5,130 |
| Other (0.2%) | | |
| 2 | Vanguard Growth ETF | 8,500 | 904 |
| *,3 WeWork Class A PP | 4,015 | 167 |
| 1,071 |
| Telecommunication Services (0.3%) | |
| * | SBA Communications Corp. | | |
| | Class A | 13,120 | 1,378 |
| Total Common Stocks | | |
| (Cost $368,614) | 472,740 |
| Preferred Stocks (1.6%) | | |
| *,3 Uber Technologies PP | 104,984 | 5,120 |
| *,3 Pinterest Prf G PP | 24,865 | 893 |
| *,3 WeWork Pfd. D1 PP | 19,954 | 827 |
| *,3 WeWork Pfd. D2 PP | 15,678 | 650 |
| *,3 Cloudera, Inc. Pfd. | 21,972 | 564 |
| Total Preferred Stocks | | |
| (Cost $3,434) | 8,054 |
| Convertible Preferred Stocks (0.2%) | |
| *,3 Airbnb Inc. (Cost $928) | 9,972 | 999 |
92
Vanguard Growth Portfolio
| | |
| Market |
| Value• |
| Shares | ($000) |
| Temporary Cash Investments (4.6%)1 | |
| Money Market Fund (4.3%) | | |
| 4,5 Vanguard Market Liquidity | | |
| Fund, 0.363% | 21,753,904 | 21,754 |
| |
| Face | |
| Amount | |
| ($000) | |
| Repurchase Agreement (0.1%) | |
| Bank of America Securities, | |
| LLC 0.300%, 1/4/16 (Dated | |
| 12/31/15, Repurchase Value | |
| $500,000, collateralized | | |
| by Government National | | |
| Mortgage Assn., 3.500%, | |
| 3/20/45, with a value of | | |
| $510,000) | 500 | 500 |
| |
| U.S. Government and Agency Obligations (0.2%) |
| 6,7 Federal Home Loan | | |
| Bank Discount Notes, | | |
| 0.466%, 3/7/16 | 500 | 500 |
| 6,7 Federal Home Loan | | |
| Bank Discount Notes, | | |
| 0.290%, 4/29/16 | 500 | 499 |
| 7 United States Treasury | | |
| Bill, 0.536%, 6/9/16 | 200 | 199 |
| 1,198 |
| Total Temporary Cash Investments | |
| (Cost $23,453) | 23,452 |
| Total Investments (99.9%) | | |
| (Cost $396,429) | 505,245 |
| |
| Amount |
| ($000) |
| Other Assets and Liabilities (0.1%) | |
| Other Assets | |
| Investment in Vanguard | 44 |
| Receivables for Accrued Income | 181 |
| Receivables for Investment Securities Sold | 322 |
| Receivables for Capital Shares Issued | 1,736 |
| Other Assets | 62 |
| Total Other Assets | 2,345 |
| Liabilities | |
| Payables for Investment Securities Purchased (364) |
| Collateral for Securities on Loan | (221) |
| Payables to Investment Advisor | (207) |
| Payables for Capital Shares Redeemed | (131) |
| Payables to Vanguard | (899) |
| Other Liabilities | (158) |
| Total Liabilities | (1,980) |
| Net Assets (100%) | |
| Applicable to 22,395,113 outstanding | |
| $.001 par value shares of beneficial | |
| interest (unlimited authorization) | 505,610 |
| Net Asset Value Per Share | $22.58 |
| |
| At December 31, 2015, net assets consisted of: |
| Amount |
| ($000) |
| Paid-in Capital | 343,170 |
| Undistributed Net Investment Income | 1,795 |
| Accumulated Net Realized Gains | 51,605 |
| Unrealized Appreciation (Depreciation) | |
| Investment Securities | 108,816 |
| Futures Contracts | 224 |
| Net Assets | 505,610 |
• See Note A in Notes to Financial Statements.
* Non-income-producing security.
^ Includes partial security positions on loan to broker-dealers. The total value of securities on loan is $214,000.
1 The portfolio invests a portion of its cash reserves in equity markets through the use of index futures contracts. After giving effect to futures investments, the portfolio’s effective common stock and temporary cash investment positions represent 97.0% and 1.1%, respectively, of net assets.
2 Considered an affiliated company of the portfolio as the issuer is another member of The Vanguard Group.
3 Restricted securities totaling $9,220,000, representing 1.8% of net assets.
4 Affiliated money market fund available only to Vanguard funds and certain trusts and accounts managed by Vanguard. Rate shown is the 7-day yield.
5 Includes $221,000 of collateral received for securities on loan.
6 The issuer operates under a congressional charter; its securities are generally neither guaranteed by the U.S. Treasury nor backed by the full faith and credit of the U.S. government.
7 Securities with a value of $799,000 have been segregated as initial margin for open futures contracts.
ADR—American Depositary Receipt.
PP—Private Placement.
See accompanying Notes, which are an integral part of the Financial Statements.
93
| | | |
| Vanguard Growth Portfolio | | |
| |
| |
| Statement of Operations |
| |
| Year Ended |
| December 31, 2015 |
| | ($000) |
| Investment Income | | |
| Income | | |
| Dividends1,2 | 4,746 |
| Interest1 | 38 |
| Securities Lending | 29 |
| Total Income | 4,813 |
| Expenses | | |
| Investment Advisory Fees—Note B | |
| Basic Fee | 665 |
| Performance Adjustment | 134 |
| The Vanguard Group—Note C | | |
| Management and Administrative | 1,157 |
| Marketing and Distribution | 58 |
| Custodian Fees | 18 |
| Auditing Fees | 34 |
| Shareholders’ Reports | 18 |
| Trustees’ Fees and Expenses | 1 |
| Total Expenses | 2,085 |
| Expenses Paid Indirectly | (12) |
| Net Expenses | 2,073 |
| Net Investment Income | 2,740 |
| Realized Net Gain (Loss) | | |
| Investment Securities Sold1 | 52,183 |
| Futures Contracts | 23 |
| Realized Net Gain (Loss) | 52,206 |
| Change in Unrealized Appreciation | |
| (Depreciation) | | |
| Investment Securities | (18,255) |
| Futures Contracts | (340) |
| Change in Unrealized Appreciation | |
| (Depreciation) | (18,595) |
| Net Increase (Decrease) in Net Assets | |
| Resulting from Operations | 36,351 |
1 Dividend income, interest income, and realized net gain (loss) from affiliated companies of the portfolio were $12,000, $34,000, and $0, respectively.
2 Dividends are net of foreign withholding taxes of $17,000.
| | |
| Statement of Changes in Net Assets | | |
| |
| Year Ended December 31, |
| 2015 | 2014 |
| ($000) | ($000) |
| Increase (Decrease) in Net Assets | | |
| Operations | | |
| Net Investment Income | 2,740 | 2,715 |
| Realized Net Gain (Loss) | 52,206 | 44,073 |
| Change in Unrealized Appreciation (Depreciation) | (18,595) | 7,271 |
| Net Increase (Decrease) in Net Assets Resulting from Operations | 36,351 | 54,059 |
| Distributions | | |
| Net Investment Income | (2,749) | (1,795) |
| Realized Capital Gain1 | (44,406) | (2,114) |
| Total Distributions | (47,155) | (3,909) |
| Capital Share Transactions | | |
| Issued | 96,329 | 34,235 |
| Issued in Lieu of Cash Distributions | 47,155 | 3,909 |
| Redeemed | (73,499) | (52,828) |
| Net Increase (Decrease) from Capital Share Transactions | 69,985 | (14,684) |
| Total Increase (Decrease) | 59,181 | 35,466 |
| Net Assets |
| Beginning of Period | 446,429 | 410,963 |
| End of Period2 | 505,610 | 446,429 |
1 Includes fiscal 2015 and 2014 short-term gain distributions totaling $2,729,000 and $0, respectively. Short-term gain distributions are treated as ordinary income dividends for tax purposes.
2 Net Assets—End of Period includes undistributed (overdistributed) net investment income of $1,795,000 and $1,804,000.
See accompanying Notes, which are an integral part of the Financial Statements.
94
| | | | | |
| Vanguard Growth Portfolio | | | | | |
| |
| |
| Financial Highlights | | | | | |
| |
| |
| For a Share Outstanding | | | Year Ended December 31, |
| Throughout Each Period | 2015 | 2014 | 2013 | 2012 | 2011 |
| Net Asset Value, Beginning of Period | $23.24 | $20.62 | $15.32 | $12.99 | $13.18 |
| Investment Operations | |
| Net Investment Income | .127 | .140 | .089 | .082 | .072 |
| Net Realized and Unrealized Gain (Loss) | | | | | |
| on Investments | 1.632 | 2.676 | 5.296 | 2.312 | (.177) |
| Total from Investment Operations | 1.759 | 2.816 | 5.385 | 2.394 | (.105) |
| Distributions | | |
| Dividends from Net Investment Income | (.141) | (.090) | (.085) | (.064) | (.085) |
| Distributions from Realized Capital Gains | (2.278) | (.106) | — | — | — |
| Total Distributions | (2.419) | (.196) | (.085) | (.064) | (.085) |
| Net Asset Value, End of Period | $22.58 | $23.24 | $20.62 | $15.32 | $12.99 |
| |
| Total Return | 7.98% | 13.79% | 35.28% | 18.43% | -0.84% |
| |
| Ratios/Supplemental Data | | |
| Net Assets, End of Period (Millions) | $506 | $446 | $411 | $321 | $260 |
| Ratio of Total Expenses to Average Net Assets1 | 0.44% | 0.43% | 0.41% | 0.41% | 0.40% |
| Ratio of Net Investment Income to | | | | | |
| Average Net Assets | 0.57% | 0.65% | 0.50% | 0.58% | 0.54% |
| Portfolio Turnover Rate | 38% | 39% | 38% | 43% | 45% |
1 Includes performance-based investment advisory fee increases (decreases) of 0.03%, 0.01%, (0.01%), (0.01%), and (0.01%).
Notes to Financial Statements
Vanguard Growth Portfolio, a portfolio of Vanguard Variable Insurance Funds, is registered under the Investment Company Act of 1940 as an open-end investment company. The portfolio’s shares are only available for purchase by separate accounts of insurance companies as investments for variable annuity plans, variable life insurance contracts, or other variable benefit insurance contracts.
A. The following significant accounting policies conform to generally accepted accounting principles for U.S. investment companies. The portfolio consistently follows such policies in preparing its financial statements.
1. Security Valuation: Securities are valued as of the close of trading on the New York Stock Exchange (generally 4 p.m., Eastern time) on the valuation date. Equity securities are valued at the latest quoted sales prices or official closing prices taken from the primary market in which each security trades; such securities not traded on the valuation date are valued at the mean of the latest quoted bid and asked prices. Securities for which market quotations are not readily available, or whose values have been affected by events occurring before the portfolio’s pricing time but after the close of the securities’ primary markets, are valued at their fair values calculated according to procedures adopted by the board of trustees. These procedures include obtaining quotations from an independent pricing service, monitoring news to identify significant market- or security-specific events, and evaluating changes in the values of foreign market proxies (for example, ADRs, futures contracts, or exchange-traded funds), between the time the foreign markets close and the portfolio’s pricing time. When fair-value pricing is employed, the prices of securities used by a portfolio to calculate its net asset value may differ from quoted or published prices for the same securities. Investments in Vanguard Market Liquidity Fund are valued at that fund’s net asset value. Temporary cash investments acquired over 60 days to maturity are valued using the latest bid prices or using valuations based on a matrix system (which considers such factors as security prices, yields, maturities, and ratings), both as furnished by independent pricing services. Other temporary cash investments are valued at amortized cost, which approximates market value.
95
Vanguard Growth Portfolio
2. Foreign Currency: Securities and other assets and liabilities denominated in foreign currencies are translated into U.S. dollars using exchange rates obtained from an independent third party as of the portfolio’s pricing time on the valuation date. Realized gains (losses) and unrealized appreciation (depreciation) on investment securities include the effects of changes in exchange rates since the securities were purchased, combined with the effects of changes in security prices. Fluctuations in the value of other assets and liabilities resulting from changes in exchange rates are recorded as unrealized foreign currency gains (losses) until the assets or liabilities are settled in cash, at which time they are recorded as realized foreign currency gains (losses).
3. Futures Contracts: The portfolio uses index futures contracts to a limited extent, with the objective of maintaining full exposure to the stock market while maintaining liquidity. The portfolio may purchase or sell futures contracts to achieve a desired level of investment, whether to accommodate portfolio turnover or cash flows from capital share transactions. The primary risks associated with the use of futures contracts are imperfect correlation between changes in market values of stocks held by the portfolio and the prices of futures contracts, and the possibility of an illiquid market. Counterparty risk involving futures is mitigated because a regulated clearinghouse is the counterparty instead of the clearing broker. To further mitigate counterparty risk, the portfolio trades futures contracts on an exchange, monitors the financial strength of its clearing brokers and clearinghouse, and has entered into clearing agreements with its clearing brokers. The clearinghouse imposes initial margin requirements to secure the portfolio’s performance and requires daily settlement of variation margin representing changes in the market value of each contract.
Futures contracts are valued at their quoted daily settlement prices. The aggregate settlement values of the contracts are not recorded in the Statement of Net Assets. Fluctuations in the value of the contracts are recorded in the Statement of Net Assets as an asset (liability) and in the Statement of Operations as unrealized appreciation (depreciation) until the contracts are closed, when they are recorded as realized futures gains (losses).
During the year ended December 31, 2015, the portfolio’s average investments in long and short futures contracts represented 3% and 0% of net assets, respectively, based on the average of aggregate settlement values at each quarter-end during the period.
4. Repurchase Agreements: The portfolio enters into repurchase agreements with institutional counterparties. Securities pledged as collateral to the portfolio under repurchase agreements are held by a custodian bank until the agreements mature. Each agreement requires that the market value of the collateral be sufficient to cover payments of interest and principal. The portfolio further mitigates its counterparty risk by entering into repurchase agreements only with a diverse group of prequalified counterparties, monitoring their financial strength, and entering into master repurchase agreements with its counterparties. The master repurchase agreements provide that, in the event of a counterparty’s default (including bankruptcy), the portfolio may terminate any repurchase agreements with that counterparty, determine the net amount owed, and sell or retain the collateral up to the net amount owed to the portfolio. Such action may be subject to legal proceedings, which may delay or limit the disposition of collateral.
5. Federal Income Taxes: The portfolio intends to continue to qualify as a regulated investment company and distribute all of its taxable income. Management has analyzed the portfolio’s tax positions taken for all open federal income tax years (December 31, 2012–2015), and has concluded that no provision for federal income tax is required in the portfolio’s financial statements.
6. Distributions: Distributions to shareholders are recorded on the ex-dividend date.
7. Securities Lending: To earn additional income, the portfolio lends its securities to qualified institutional borrowers. Security loans are subject to termination by the portfolio at any time and are required to be secured at all times by collateral in an amount at least equal to the market value of securities loaned. Daily market fluctuations could cause the value of loaned securities to be more or less than the value of the collateral received. When this occurs, the collateral is adjusted and settled on the next business day. The portfolio further mitigates its counterparty risk by entering into securities lending transactions only with a diverse group of prequalified counterparties, monitoring their financial strength, and entering into master securities lending agreements with its counterparties. The master securities lending agreements provide that, in the event of a counterparty’s default (including bankruptcy), the portfolio may terminate any loans with that borrower, determine the net amount owed, and sell or retain the collateral up to the net amount owed to the portfolio; however, such actions may be subject to legal proceedings. While collateral mitigates counterparty risk, in the absence of a default the portfolio may experience delays and costs in recovering the securities loaned. The portfolio invests
96
Vanguard Growth Portfolio
cash collateral received in Vanguard Market Liquidity Fund, and records a liability in the Statement of Net Assets for the return of the collateral, during the period the securities are on loan. Securities lending income represents fees charged to borrowers plus income earned on invested cash collateral, less expenses associated with the loan.
8. Credit Facility: The portfolio and certain other funds managed by The Vanguard Group (“Vanguard”) participate in a $3 billion committed credit facility provided by a syndicate of lenders pursuant to a credit agreement that may be renewed annually; each fund is individually liable for its borrowings, if any, under the credit facility. Borrowings may be utilized for temporary and emergency purposes, and are subject to the portfolio’s regulatory and contractual borrowing restrictions. The participating funds are charged administrative fees and an annual commitment fee of 0.06% of the undrawn amount of the facility; these fees are allocated to the funds based on a method approved by the portfolio’s board of trustees and included in Management and Administrative expenses on the portfolio’s Statement of Operations. Any borrowings under this facility bear interest at a rate equal to the higher of the federal funds rate or LIBOR reference rate plus an agreed-upon spread.
The portfolio had no borrowings outstanding at December 31, 2015, or at any time during the period then ended.
9. Other: Dividend income is recorded on the ex-dividend date. Interest income includes income distributions received from Vanguard Market Liquidity Fund and is accrued daily. Premiums and discounts on debt securities purchased are amortized and accreted, respectively, to interest income over the lives of the respective securities. Security transactions are accounted for on the date securities are bought or sold. Costs used to determine realized gains (losses) on the sale of investment securities are those of the specific securities sold.
B. The investment advisory firms Jackson Square Partners, LLC, Wellington Management Company llp, and William Blair Investment Management, LLC, each provide investment advisory services to a portion of the portfolio for a fee calculated at an annual percentage rate of average net assets managed by the advisor. The basic fees of Jackson Square Partners, LLC, and Wellington Management Company llp are subject to quarterly adjustments based on performance relative to the Russell 1000 Growth Index for the preceding three years. The basic fee of William Blair Investment Management, LLC, is subject to quarterly adjustments based on performance relative to the Russell 1000 Growth Index for the preceding five years.
Vanguard manages the cash reserves of the portfolio as described below.
For the year ended December 31, 2015, the aggregate investment advisory fee represented an effective annual basic rate of 0.14% of the portfolio’s average net assets, before an increase of $134,000 (0.03%) based on performance.
C. In accordance with the terms of a Funds’ Service Agreement (the “FSA”) between Vanguard and the portfolio, Vanguard furnishes to the portfolio corporate management, administrative, marketing, distribution, and cash management services at Vanguard’s cost of operations (as defined by the FSA). These costs of operations are allocated to the portfolio based on methods and guidelines approved by the board of trustees. Vanguard does not require reimbursement in the current period for certain costs of operations (such as deferred compensation/benefits and risk/insurance costs); the portfolio’s liability for these costs of operations is included in Payables to Vanguard on the Statement of Net Assets.
Upon the request of Vanguard, the portfolio may invest up to 0.40% of its net assets as capital in Vanguard. At December 31, 2015, the portfolio had contributed to Vanguard capital in the amount of $44,000, representing 0.01% of the portfolio’s net assets and 0.02% of Vanguard’s capitalization. The portfolio’s trustees and officers are also directors and employees, respectively, of Vanguard.
D. The portfolio has asked its investment advisors to direct certain security trades, subject to obtaining the best price and execution, to brokers who have agreed to rebate to the portfolio part of the commissions generated. Such rebates are used solely to reduce the portfolio’s management and administrative expenses. For the year ended December 31, 2015, these arrangements reduced the portfolio’s expenses by $12,000 (an annual rate of 0.00% of average net assets).
E. Various inputs may be used to determine the value of the portfolio’s investments. These inputs are summarized in three broad levels for financial statement purposes. The inputs or methodologies used to value securities are not necessarily an indication of the risk associated with investing in those securities.
97
Vanguard Growth Portfolio
Level 1—Quoted prices in active markets for identical securities.
Level 2—Other significant observable inputs (including quoted prices for similar securities, interest rates, prepayment speeds, credit risk, etc.).
Level 3—Significant unobservable inputs (including the portfolio’s own assumptions used to determine the fair value of investments).
The following table summarizes the market value of the portfolio’s investments as of December 31, 2015, based on the inputs used to value them:
| | | |
| Level 1 | Level 2 | Level 3 |
| Investments | ($000) | ($000) | ($000) |
| Common Stocks | 472,573 | — | 167 |
| Preferred Stocks | — | — | 8,054 |
| Convertible Preferred Stocks | — | — | 999 |
| Temporary Cash Investments | 21,754 | 1,698 | — |
| Futures Contracts—Liabilities1 | (158) | — | — |
| Total | 494,169 | 1,698 | 9,220 |
| 1 Represents variation margin on the last day of the reporting period. |
The determination of Level 3 fair value measurements is governed by documented policies and procedures adopted by the board of trustees. The board has designated a pricing review committee, as an agent of the board, to ensure the timely analysis and valuation of Level 3 securities held by the fund in accordance with established policies and procedures. The pricing review committee employs various methods for calibrating valuation approaches, including a regular review of key inputs and assumptions, transactional back-testing or disposition analysis, and reviews of any related market activity. All valuation decisions made by the pricing review committee are reported to the board on a quarterly basis for review and ratification. The board reviews the adequacy of the fair value measurement policies and procedures in place on an annual basis.
The following table summarizes changes in investments valued based on Level 3 inputs during the year ended December 31, 2015. Transfers into or out of Level 3 are recognized based on values as of the date of transfer.
| |
| Investments in |
| Common Stocks, |
| Preferred Stocks, |
| and Convertible |
| Preferred Stocks |
| Amount Valued Based on Level 3 Inputs | ($000) |
| Balance as of December 31, 2014 | 4,883 |
| Purchases | 1,821 |
| Change in Unrealized Appreciation (Depreciation) | 2,516 |
| Balance as of December 31, 2015 | 9,220 |
| Net change in unrealized appreciation (depreciation) from investments still held as of December 31, 2015, was $2,516,000. |
The following table provides quantitative information about the significant unobservable inputs used in fair value measurement as of December 31, 2015:
| | | | |
| Fair Value | | | |
| Security Type | ($000) | Valuation Technique | Unobservable Input | Amount |
| Common Stocks | 167 | Market Approach | Target Event Price | $41.440 |
| Preferred Stocks | 8,054 | Market Approach | Recent Market Transaction | 48.772 |
| Target Event Price | 41.440 |
| Purchase Price | 35.895 |
| Comparable Company Approach | 25.690 |
| Convertible | | | | |
| Preferred Stocks | 999 | Market Approach | Comparable Company Approach | 100.130 |
Significant increases or decreases in the significant unobservable inputs used in the fair value measurement of the portfolio’s Level 3 securities, in isolation, could result in a significantly higher or lower fair value measurement.
98
Vanguard Growth Portfolio
F. At December 31, 2015, the aggregate settlement value of open futures contracts and the related unrealized appreciation (depreciation) were:
| | | | |
| | | | ($000) |
| Aggregate |
| Number of | Settlement | Unrealized |
| Long (Short) | Value | Appreciation |
| Futures Contracts | Expiration | Contracts | Long (Short) | (Depreciation) |
| E-mini S&P 500 Index | March 2016 | 177 | 18,013 | 224 |
Unrealized appreciation (depreciation) on open futures contracts is required to be treated as realized gain (loss) for tax purposes.
G. Distributions are determined on a tax basis and may differ from net investment income and realized capital gains for financial reporting purposes. Differences may be permanent or temporary. Permanent differences are reclassified among capital accounts in the financial statements to reflect their tax character. Temporary differences arise when certain items of income, expense, gain, or loss are recognized in different periods for financial statement and tax purposes. These differences will reverse at some time in the future. Differences in classification may also result from the treatment of short-term gains as ordinary income for tax purposes.
For tax purposes, at December 31, 2015, the portfolio had $2,616,000 of ordinary income and $51,843,000 of long-term capital gains available for distribution.
At December 31, 2015, the cost of investment securities for tax purposes was $396,435,000. Net unrealized appreciation of investment securities for tax purposes was $108,810,000 consisting of unrealized gains of $125,953,000 on securities that had risen in value since their purchase and $17,143,000 in unrealized losses on securities that had fallen in value since their purchase.
H. During the year ended December 31, 2015, the portfolio purchased $192,111,000 of investment securities and sold $172,560,000 of investment securities, other than temporary cash investments.
I. Capital shares issued and redeemed were:
| | |
| Year Ended December 31, |
| 2015 | 2014 |
| Shares | Shares |
| (000) | (000) |
| Issued | 4,266 | 1,585 |
| Issued in Lieu of Cash Distributions | 2,170 | 192 |
| Redeemed | (3,253) | (2,490) |
| Net Increase (Decrease) in Shares Outstanding | 3,183 | (713) |
At December 31, 2015, one shareholder, an insurance company separate account whose holdings in the portfolio represent the indirect investment of Vanguard Variable Annuity contract holders, was the record or beneficial owner of 78% of the portfolio’s net assets. If the shareholder were to redeem its investment in the portfolio, the redemption might result in an increase in the portfolio’s expense ratio or cause the portfolio to incur higher transaction costs.
J. Management has determined that no material events or transactions occurred subsequent to December 31, 2015, that would require recognition or disclosure in these financial statements.
99
Vanguard Growth Portfolio
Report of Independent Registered Public Accounting Firm
To the Board of Trustees of Vanguard Variable Insurance Funds and the Shareholders of Growth Portfolio:
In our opinion, the accompanying statement of net assets and the related statements of operations and of changes in net assets and the financial highlights present fairly, in all material respects, the financial position of Growth Portfolio (constituting a separate portfolio of Vanguard Variable Insurance Funds, hereafter referred to as the “Portfolio”) at December 31, 2015, the results of its operations for the year then ended, the changes in its net assets for each of the two years in the period then ended, and the financial highlights for each of the five years in the period then ended, in conformity with accounting principles generally accepted in the United States of America. These financial statements and financial highlights (hereafter referred to as “financial statements”) are the responsibility of the Portfolio’s management. Our responsibility is to express an opinion on these financial statements based on our audits. We conducted our audits of these financial statements in accordance with the standards of the Public Company Accounting Oversight Board (United States). Those standards require that we plan and perform the audit to obtain reasonable assurance about whether the financial statements are free of material misstatement. An audit includes examining, on a test basis, evidence supporting the amounts and disclosures in the financial statements, assessing the accounting principles used and significant estimates made by management, and evaluating the overall financial statement presentation. We believe that our audits, which included confirmation of securities at December 31, 2015 by correspondence with the custodian and brokers, by agreement to the underlying ownership records of the transfer agent and the application of alternative auditing procedures where securities purchased had not been received, provide a reasonable basis for our opinion.
/s/PricewaterhouseCoopers LLP
Philadelphia, Pennsylvania
February 11, 2016
| |
| |
| Special 2015 tax information (unaudited) for corporate shareholders only for Vanguard |
| Growth Portfolio, a portfolio of Vanguard Variable Insurance Funds |
| |
| This information for the fiscal year ended December 31, 2015, is included pursuant to provisions |
| of the Internal Revenue Code for corporate shareholders only. |
| |
| The portfolio distributed $41,677,000 as capital gain dividends (20% rate gain distributions) to |
| shareholders during the fiscal year. |
| |
| For corporate shareholders, 100% of investment income (dividend income plus short-term gains, |
| if any) qualifies for the dividends-received deduction. |
100
Vanguard Growth Portfolio
About Your Portfolio’s Expenses
As a shareholder of the portfolio, you incur ongoing costs, which include costs for portfolio management, administrative services, and shareholder reports (like this one), among others. Operating expenses, which are deducted from a portfolio’s gross income, directly reduce the investment return of the portfolio.
A portfolio’s expenses are expressed as a percentage of its average net assets. This figure is known as the expense ratio. The following examples are intended to help you understand the ongoing costs (in dollars) of investing in your portfolio and to compare these costs with those of other mutual funds. The examples are based on an investment of $1,000 made at the beginning of the period shown and held for the entire period.
The table below illustrates your portfolio’s costs in two ways:
• Based on actual portfolio return. This section helps you to estimate the actual expenses that you paid over the period. The “Ending Account Value” shown is derived from the portfolio’s actual return, and the third column shows the dollar amount that would have been paid by an investor who started with $1,000 in the portfolio. You may use the information here, together with the amount you invested, to estimate the expenses that you paid over the period.
To do so, simply divide your account value by $1,000 (for example, an $8,600 account value divided by $1,000 = 8.6), then multiply the result by the number given for your portfolio under the heading “Expenses Paid During Period.”
• Based on hypothetical 5% yearly return. This section is intended to help you compare your portfolio’s costs with those of other mutual funds. It assumes that the portfolio had a yearly return of 5% before expenses, but that the expense ratio is unchanged. In this case—because the return used is not the portfolio’s actual return—the results do not apply to your investment. The example is useful in making comparisons because the Securities and Exchange Commission requires all mutual funds to calculate expenses based on a 5% return. You can assess your portfolio’s costs by comparing this hypothetical example with the hypothetical examples that appear in shareholder reports of other funds.
Note that the expenses shown in the table are meant to highlight and help you compare ongoing costs only and do not reflect transaction costs incurred by the portfolio for buying and selling securities. The portfolio’s expense ratio does not reflect additional fees and expenses associated with the annuity or life insurance program through which you invest.
The calculations assume no shares were bought or sold during the period. Your actual costs may have been higher or lower, depending on the amount of your investment and the timing of any purchases or redemptions.
You can find more information about the portfolio’s expenses in the Financial Statements section. For additional information on operating expenses and other shareholder costs, please refer to the prospectus.
| | | |
| Six Months Ended December 31, 2015 | | | |
| Beginning | Ending | Expenses |
| Account Value | Account Value | Paid During |
| Growth Portfolio | 6/30/2015 | 12/31/2015 | Period1 |
| Based on Actual Portfolio Return | $1,000.00 | $1,020.80 | $2.29 |
| Based on Hypothetical 5% Yearly Return | 1,000.00 | 1,022.94 | 2.29 |
1 The calculations are based on expenses incurred in the most recent six-month period. The portfolio’s annualized six-month expense ratio for that period is 0.45%. The dollar amounts shown as “Expenses Paid” are equal to the annualized expense ratio multiplied by the average account value over the period, multiplied by the number of days in the most recent six-month period, then divided by the number of days in the most recent 12-month period (184/365).
101
Vanguard® High Yield Bond Portfolio
Advisor’s Report
For the year ended December 31, 2015, Vanguard High Yield Bond Portfolio returned –1.58%, compared with –2.53% for its benchmark index. Please note that the returns for Vanguard Variable Insurance Fund are different from those of Vanguard Variable Annuity (and other plans that invest in the fund), which take into account insurance-related expenses.
The market’s negative total return was primarily due to weakness in commodity prices, namely energy. Both the interest rate and credit environments also influenced returns in the high-yield market.
Monetary policy was accommodative for most of the year, but in December the Federal Reserve raised interest rates for the first time since 2006. U.S. Treasury yields across the maturity spectrum ended the year higher than they started; the 10-year yield, for example, ended 2015 at 2.30%, up from 2.19% at the end of 2014.
Because bond yields and prices move in opposite directions, bond prices declined modestly. The rise in Treasury yields most affected longer-duration and interest rate-sensitive fixed income assets.
Also, credit-sensitive sectors, including the high-yield market, generally underper-formed. Although economic data in the United States and Europe continued improving, China and emerging-market growth indicators weakened, and commodity prices declined significantly. This led corporate credit spreads to widen and resulted in negative performance that offset coupon income.
For the 12 months ended December 31, 2015, performance diverged notably by credit quality. The high-yield market favored relatively higher credit-quality bonds amid concerns that declining commodity prices could slow global growth. Higher-rated BB bonds performed best, returning –1.00%, as measured by Barclays High Yield Index data. Lower-rated Caa bonds experienced more severe spread-widening and returned –12.11%; B-rated bonds returned –4.77%.
The spread of the high-yield market widened to 660 basis points over Treasuries as of December 31, from 483 basis points a year earlier. (A basis point is one-hundredth of a percentage point.) The average dollar price of the high-yield market declined 10 points over the period, from $99 to $89.
Overall corporate fundamentals and debt levels at most companies remain stable. We expect U.S. gross domestic product (GDP) to maintain steady growth in 2016, and we believe that most high-yield companies can sustain solid credit profiles in that environment. Therefore, we see the economic backdrop for the high-yield market as generally favorable, but we continue to closely monitor factors that could spread commodity-related stress to the broader market. Those factors include the potential effects of a strengthening U.S. dollar on the industrial economy and the potential for contraction in credit availability, especially to the riskiest borrowers.
Although we expect default rates to increase through 2016, we think defaults are likely to stay concentrated in the energy and metals and mining sectors. Defaults so far have remained manageable. The Moody’s Investors Service trailing 12-month global speculative-grade default rate ended November at 2.9%, still below the long-term average of 3.9%. Given this outlook, we are seeking to take advantage of recent dislocations created by the sell-off in non-energy names, where wider spreads are attractive and the credits are bolstered by strong fundamentals.
| | |
| Total Returns | | |
| | Ten Years Ended |
| | December 31, 2015 |
| Year Ended | Average |
| December 31, 2015 | Annual Return |
| Vanguard High Yield Bond Portfolio | -1.58% | 5.80% |
| High-Yield Corporate Composite Index1 | -2.53 | 6.41 |
| Variable Insurance High Yield Funds Average2 | -3.32 | 5.03 |
The figures shown represent past performance, which is not a guarantee of future results. (Current performance may be lower or higher than the performance data cited. For performance data current to the most recent month-end, visit our website at vanguard.com/performance.) Note, too, that both investment returns and principal value can fluctuate widely, so an investor’s shares, when sold, could be worth more or less than their original cost.
| | |
| Expense Ratios3 | | |
| Your Portfolio Compared With Its Peer Group | | |
| Variable Insurance |
| High Yield |
| Portfolio | Funds Average |
| High Yield Bond Portfolio | 0.29% | 0.84% |
1 Consists of 95% Barclays U.S. High-Yield Ba/B 2% Issuer Capped Index and 5% Barclays U.S. 1–5 Year Treasury Bond Index.
2 Derived from data provided by Lipper, a Thomson Reuters Company.
3 The portfolio expense ratio shown is from the prospectus dated April 30, 2015, and represents estimated costs for the current fiscal year. For the fiscal year ended December 31, 2015, the portfolio’s expense ratio was 0.28%. The peer-group expense ratio is derived from data provided by Lipper, a Thomson Reuters Company, and captures information through year-end 2014.
102
Vanguard High Yield Bond Portfolio
The portfolio’s successes
The portfolio benefited from an underweight allocation to, and positive credit selection in, the energy sector as well as an overweight exposure to technology.
The portfolio’s shortfalls
Security selection within metals and mining and within utilities detracted from relative returns. An underweight allocation to the food and beverage sector also hurt relative performance. So did our underweighting of Treasury securities versus the composite benchmark, as the sector outperformed high-yield bonds over the year.
The portfolio’s positioning
The portfolio remains consistent in its investment objective and strategy and maintains a meaningful exposure to relatively higher-quality names within the high-yield market. We believe these credits have more consistent businesses and greater predictability of cash flows than those at the lower end of the quality spectrum. We prefer higher-quality credits in an effort to minimize defaults and provide stable income. We continue to diversify the portfolio’s holdings by issuer and industry and continue to deemphasize non-cash-paying securities, preferred stocks, and equity-linked securities such as convertibles because of their potential for volatility.
Michael L. Hong, CFA
Managing Director and Fixed Income Portfolio Manager
Wellington Management Company LLP
January 19, 2016
103
Vanguard High Yield Bond Portfolio
Portfolio Profile
As of December 31, 2015
| | | |
| Financial Attributes | | | |
| | Comparative | Broad |
| Portfolio | Index1 | Index2 |
| Number of Bonds | 405 | 1,873 | 2,208 |
| Yield3 | 6.2% | 7.0% | 8.7% |
| Yield to Maturity | 6.8%4 | 7.1% | 8.9% |
| Average Coupon | 5.8% | 6.1% | 6.7% |
| Average Effective | | | |
| Maturity | 5.7 years | 5.6 years | 5.6 years |
| Average Duration | 4.5 years | 4.4 years | 4.3 years |
| Expense Ratio5 | 0.29% | — | — |
| Short-Term Reserves | 5.2% | — | — |
| | |
| Volatility Measures | |
| Portfolio Versus | Portfolio Versus |
| Comparative Index1 | Broad Index2 |
| R-Squared | 0.97 | 0.93 |
| Beta | 0.96 | 0.86 |
| |
| Distribution by Effective Maturity (% of portfolio) |
| |
| Under 1 Year | 5.7% |
| 1–5 Years | 27.1 |
| 5–10 Years | 61.2 |
| 10–20 Years | 4.1 |
| 20–30 Years | 1.5 |
| Over 30 Years | 0.4 |
| |
| Sector Diversification6 (% of portfolio) | |
| |
| Basic Industry | 3.8% |
| Capital Goods | 7.4 |
| Communication | 26.5 |
| Consumer Cyclical | 7.2 |
| Consumer Non-Cyclical | 12.2 |
| Energy | 9.5 |
| Finance | 13.5 |
| Technology | 11.1 |
| Transportation | 1.8 |
| Treasury/Agency | 1.9 |
| Utilities | 4.5 |
| Other | 0.6 |
| |
| Distribution by Credit Quality (% of portfolio) |
| |
| U.S. Government | 1.9% |
| Aaa | 1.2 |
| Baa | 4.7 |
| Ba | 49.3 |
| B | 36.3 |
| Caa | 6.3 |
| C | 0.3 |
Investment Focus
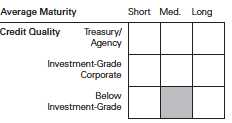
30-Day SEC Yield. A portfolio’s 30-day SEC yield is derived using a formula specified by the U.S. Securities and Exchange Commission. Under the formula, data related to the portfolio’s security holdings in the previous 30 days are used to calculate the portfolio’s hypothetical net income for that period, which is then annualized and divided by the portfolio’s estimated average net assets over the calculation period. For the purposes of this calculation, a security’s income is based on its current market yield to maturity (for bonds), its actual income (for asset-backed securities), or its projected dividend yield (for stocks). Because the SEC yield represents hypothetical annualized income, it will differ—at times significantly—from the portfolio’s actual experience. As a result, the portfolio’s income distributions may be higher or lower than implied by the SEC yield.
Beta. A measure of the magnitude of a portfolio’s past share-price fluctuations in relation to the ups and downs of a given market index. The index is assigned a beta of 1.00. Compared with a given index, a portfolio with a beta of 1.20 typically would have seen its share price rise or fall by 12% when the index rose or fell by 10%. For this report, beta is based on returns over the past 36 months for both the portfolio and the index.
Credit Quality. Credit-quality ratings are measured on a scale that generally ranges from AAA (highest) to D (lowest). U.S. Treasury, U.S. Agency, and U.S. Agency mortgage-backed securities appear under “U.S. Government.” Credit-quality ratings are obtained from Barclays and are from Moody’s, Fitch, and S&P. When ratings from all three agencies are used, the median rating is shown. When ratings from two of the agencies are used, the lower rating for each issue is shown. “Not Rated” is used to classify securities for which a rating is not available. Not rated securities include a fund’s investment in Vanguard Market Liquidity Fund or Vanguard Municipal Cash Management Fund, each of which invests in high-quality money market instruments and may serve as a cash management vehicle for the Vanguard funds, trusts, and accounts.
R-Squared. A measure of how much of a portfolio’s past returns can be explained by the returns from the market in general, as measured by a given index. If a portfolio’s total returns were precisely synchronized with an index’s returns, its R-squared would be 1.00. If the portfolio’s returns bore no relationship to the index’s returns, its R-squared would be 0. For this report, R-squared is based on returns over the past 36 months for both the portfolio and the index.
1 High-Yield Corporate Composite Index.
2 Barclays U.S. Corporate High Yield Bond Index.
3 30-day SEC yield for the portfolio; index yield assumes that all bonds are called or prepaid at the earliest possible dates.
4 Before expenses.
5 The portfolio expense ratio shown is from the prospectus dated April 30, 2015, and represents estimated costs for the current fiscal year. For the fiscal year ended December 31, 2015, the portfolio’s expense ratio was 0.28%.
6 The agency sector may include issues from government-sponsored enterprises; such issues are not backed by the full faith and credit of the U.S. government.
104
Vanguard High Yield Bond Portfolio
Performance Summary
All of the returns in this report represent past performance, which is not a guarantee of future results that may be achieved by the portfolio. (Current performance may be lower or higher than the performance data cited. For performance data current to the most recent month-end, visit our website at vanguard.com/performance.) Note, too, that both investment returns and principal value can fluctuate widely, so an investor’s shares, when sold, could be worth more or less than their original cost. The returns shown do not reflect taxes that a shareholder would pay on portfolio distributions or on the sale of portfolio shares. Nor do the returns reflect fees and expenses associated with the annuity or life insurance program through which a shareholder invests. If these fees and expenses were included, the portfolio’s returns would be lower.
Cumulative Performance: December 31, 2005–December 31, 2015
Initial Investment of $10,000
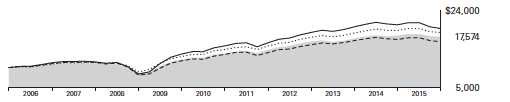
| | | | |
| | | Average Annual Total Returns | Final Value |
| | Periods Ended December 31, 2015 | of a $10,000 |
| | One Year | Five Years | Ten Years | Investment |
| High Yield Bond Portfolio | -1.58% | 5.56% | 5.80% | $17,574 |
| High-Yield Corporate Composite Index1 | -2.53 | 5.23 | 6.41 | 18,621 |
| Variable Insurance High Yield | | | | |
| Funds Average2 | -3.32 | 4.30 | 5.03 | 16,340 |
| Barclays U.S. Corporate High Yield | | | | |
| Bond Index | -4.47 | 5.04 | 6.96 | 19,594 |
Fiscal-Year Total Returns (%): December 31, 2005–December 31, 2015
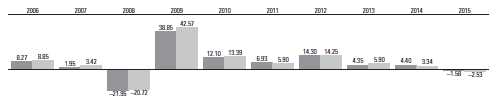
| |
| High Yield Bond Portfolio |
| High-Yield Corporate Composite Index1 |
1 Consists of 95% Barclays U.S. High-Yield Ba/B 2% Issuer Capped Index and 5% Barclays U.S. 1–5 Year Treasury Bond Index.
2 Derived from data provided by Lipper, a Thomson Reuters Company.
See Financial Highlights for dividend and capital gains information.
105
Vanguard High Yield Bond Portfolio
Financial Statements
Statement of Net Assets
As of December 31, 2015
The portfolio reports a complete list of its holdings in regulatory filings four times in each fiscal year, at the quarter-ends. For the second and fourth fiscal quarters, the lists appear in the portfolio’s semiannual and annual reports to shareholders. For the first and third fiscal quarters, the portfolio files the lists with the Securities and Exchange Commission on Form N-Q. Shareholders can look up the portfolio’s Forms N-Q on the SEC’s website at sec.gov. Forms N-Q may also be reviewed and copied at the SEC’s Public Reference Room (see the back of the report for further information).
| | | | | |
| Face | Market |
| Maturity Amount | Value • |
| | Coupon | Date | ($000) | ($000) |
| U.S. Government and Agency Obligations (1.8%) | | | |
| U.S. Government Securities (1.8%) | | | | |
| United States Treasury Note/Bond | 1.000% | 8/31/16 | 5,460 | 5,471 |
| 1 | United States Treasury Note/Bond | 0.875% | 11/30/16 | 4,060 | 4,063 |
| Total U.S. Government and Agency Obligations (Cost $9,556) | 9,534 |
| Asset-Backed/Commercial Mortgage-Backed Securities (0.4%) | | |
| 2 | Avis Budget Car Rental LLC / | | | | |
| | Avis Budget Finance Inc. | | | | |
| | (Cost $1,926) | 5.500% | 4/1/23 | 1,928 | 1,933 |
| Corporate Bonds (92.1%) | | | | |
| Finance (13.7%) | | | | |
| Banking (3.1%) | | | | |
| 2,3 Credit Suisse Group AG | 6.250% | 12/29/49 | 3,540 | 3,531 |
| 2 | HSBC Holdings plc | 5.625% | 12/29/49 | 1,150 | 1,142 |
| 2 | HSBC Holdings plc | 6.375% | 12/29/49 | 2,305 | 2,276 |
| Royal Bank of Scotland Group plc | 6.125% | 12/15/22 | 3,515 | 3,817 |
| Royal Bank of Scotland Group plc | 6.000% | 12/19/23 | 715 | 769 |
| Royal Bank of Scotland Group plc | 5.125% | 5/28/24 | 1,025 | 1,034 |
| 2 | Royal Bank of Scotland Group plc | 8.000% | 12/29/49 | 475 | 501 |
| 2,3 Societe Generale SA | 6.000% | 10/27/49 | 1,930 | 1,824 |
| UBS AG | 7.625% | 8/17/22 | 1,305 | 1,458 |
| |
| Finance Companies (8.1%) | | | | |
| AerCap Ireland Capital Ltd. / AerCap | | | | |
| | Global Aviation Trust | 3.750% | 5/15/19 | 1,480 | 1,478 |
| AerCap Ireland Capital Ltd. / AerCap | | | | |
| | Global Aviation Trust | 4.500% | 5/15/21 | 1,810 | 1,830 |
| AerCap Ireland Capital Ltd. / AerCap | | | | |
| | Global Aviation Trust | 5.000% | 10/1/21 | 755 | 782 |
| AerCap Ireland Capital Ltd. / AerCap | | | | |
| | Global Aviation Trust | 4.625% | 7/1/22 | 585 | 592 |
| Aircastle Ltd. | 6.250% | 12/1/19 | 345 | 371 |
| Aircastle Ltd. | 5.125% | 3/15/21 | 30 | 31 |
| Aircastle Ltd. | 5.500% | 2/15/22 | 830 | 851 |
| CIT Group Inc. | 5.250% | 3/15/18 | 3,045 | 3,152 |
| 3 | CIT Group Inc. | 6.625% | 4/1/18 | 2,555 | 2,708 |
| 3 | CIT Group Inc. | 5.500% | 2/15/19 | 2,270 | 2,369 |
| CIT Group Inc. | 3.875% | 2/19/19 | 1,100 | 1,095 |
| CIT Group Inc. | 5.375% | 5/15/20 | 3,415 | 3,577 |
| CIT Group Inc. | 5.000% | 8/15/22 | 3,200 | 3,256 |
| Homer City Generation LP | 8.734% | 10/1/26 | 3,664 | 2,931 |
| International Lease Finance Corp. | 3.875% | 4/15/18 | 1,220 | 1,228 |
| International Lease Finance Corp. | 5.875% | 4/1/19 | 1,420 | 1,505 |
| International Lease Finance Corp. | 6.250% | 5/15/19 | 2,042 | 2,188 |
| International Lease Finance Corp. | 8.250% | 12/15/20 | 1,511 | 1,787 |
| International Lease Finance Corp. | 4.625% | 4/15/21 | 970 | 992 |
| International Lease Finance Corp. | 8.625% | 1/15/22 | 900 | 1,089 |
| International Lease Finance Corp. | 5.875% | 8/15/22 | 90 | 97 |
| iStar Financial Inc. | 4.875% | 7/1/18 | 295 | 289 |
| iStar Financial Inc. | 5.000% | 7/1/19 | 1,290 | 1,264 |
| Navient Corp. | 8.450% | 6/15/18 | 1,100 | 1,155 |
| Navient Corp. | 5.500% | 1/15/19 | 2,445 | 2,298 |
| Navient Corp. | 8.000% | 3/25/20 | 2,000 | 1,985 |
| Navient Corp. | 7.250% | 1/25/22 | 615 | 569 |
| Navient Corp. | 5.500% | 1/25/23 | 825 | 664 |
| | | | | |
| Face | Market |
| Maturity Amount | Value • |
| | Coupon | Date | ($000) | ($000) |
| Insurance (1.5%) | | | | |
| 3 | Liberty Mutual Group Inc. | 7.800% | 3/15/37 | 1,560 | 1,778 |
| LifePoint Health Inc. | 5.875% | 12/1/23 | 860 | 875 |
| Unum Group | 7.375% | 6/15/32 | 175 | 206 |
| 2 | Voya Financial Inc. | 5.650% | 5/15/53 | 2,725 | 2,671 |
| WellCare Health Plans Inc. | 5.750% | 11/15/20 | 1,915 | 1,977 |
| |
| Other Finance (0.7%) | | | | |
| 3 | Argos Merger Sub Inc. | 7.125% | 3/15/23 | 2,710 | 2,679 |
| CNO Financial Group Inc. | 4.500% | 5/30/20 | 150 | 153 |
| CNO Financial Group Inc. | 5.250% | 5/30/25 | 665 | 677 |
| |
| Real Estate Investment Trusts (0.3%) | | | | |
| Felcor Lodging LP | 5.625% | 3/1/23 | 1,315 | 1,333 |
| Felcor Lodging LP | 6.000% | 6/1/25 | 360 | 365 |
| 71,199 |
| Industrial (74.7%) | | | | |
| Basic Industry (4.3%) | | | | |
| AK Steel Corp. | 7.625% | 10/1/21 | 2,540 | 978 |
| ArcelorMittal | 5.125% | 6/1/20 | 295 | 246 |
| ArcelorMittal | 6.250% | 8/5/20 | 1,035 | 824 |
| ArcelorMittal | 6.500% | 3/1/21 | 220 | 175 |
| ArcelorMittal | 7.250% | 2/25/22 | 560 | 454 |
| ArcelorMittal | 6.125% | 6/1/25 | 670 | 483 |
| 4,5 Arch Coal Inc. Bank Loan | 6.250% | 5/16/18 | 3,429 | 1,554 |
| Axiall Corp. | 4.875% | 5/15/23 | 230 | 207 |
| 3 | Cascades Inc. | 5.500% | 7/15/22 | 300 | 291 |
| Cloud Peak Energy Resources LLC / | | | | |
| | Cloud Peak Energy Finance Corp. | 8.500% | 12/15/19 | 180 | 89 |
| 3,6 Constellium NV | 4.625% | 5/15/21 | 125 | 105 |
| 3 | Constellium NV | 8.000% | 1/15/23 | 1,520 | 1,201 |
| 3 | Constellium NV | 5.750% | 5/15/24 | 500 | 340 |
| Eagle Spinco Inc. | 4.625% | 2/15/21 | 760 | 699 |
| 3 | FMG Resources August 2006 Pty Ltd. | 9.750% | 3/1/22 | 200 | 183 |
| Hexion US Finance Corp. | 6.625% | 4/15/20 | 1,545 | 1,201 |
| 3,6 INEOS Group Holdings SA | 5.750% | 2/15/19 | 790 | 859 |
| 3 | INEOS Group Holdings SA | 5.875% | 2/15/19 | 1,385 | 1,350 |
| Novelis Inc. | 8.375% | 12/15/17 | 1,008 | 980 |
| Novelis Inc. | 8.750% | 12/15/20 | 2,715 | 2,491 |
| Peabody Energy Corp. | 6.000% | 11/15/18 | 335 | 62 |
| Peabody Energy Corp. | 6.500% | 9/15/20 | 80 | 10 |
| Peabody Energy Corp. | 6.250% | 11/15/21 | 180 | 25 |
| 3 | Peabody Energy Corp. | 10.000% | 3/15/22 | 1,600 | 304 |
| Peabody Energy Corp. | 7.875% | 11/1/26 | 1,570 | 204 |
| Steel Dynamics Inc. | 5.125% | 10/1/21 | 1,320 | 1,223 |
| Steel Dynamics Inc. | 5.500% | 10/1/24 | 1,185 | 1,081 |
| United States Steel Corp. | 7.375% | 4/1/20 | 1,220 | 639 |
| United States Steel Corp. | 6.875% | 4/1/21 | 1,080 | 508 |
| United States Steel Corp. | 6.650% | 6/1/37 | 460 | 193 |
| 3,6 VWR Funding Inc. | 4.625% | 4/15/22 | 3,500 | 3,697 |
| |
| Capital Goods (7.0%) | | | | |
| 3 | Ardagh Packaging Finance plc | 9.125% | 10/15/20 | 880 | 902 |
| 3 | Ardagh Packaging Finance PLC / | | | | |
| | Ardagh Holdings USA Inc. | 9.125% | 10/15/20 | 755 | 772 |
| 3 | Ashtead Capital Inc. | 6.500% | 7/15/22 | 825 | 860 |
| Ball Corp. | 4.375% | 12/15/20 | 830 | 842 |
| 6 | Ball Corp. | 4.375% | 12/15/23 | 530 | 592 |
| Berry Plastics Corp. | 5.500% | 5/15/22 | 60 | 60 |
106
Vanguard High Yield Bond Portfolio
| | | | | |
| Face | Market |
| Maturity Amount | Value • |
| | Coupon | Date | ($000) | ($000) |
| Berry Plastics Corp. | 5.125% | 7/15/23 | 60 | 58 |
| 3 | Berry Plastics Escrow LLC/Berry | | | | |
| | Plastics Escrow Corp. | 6.000% | 10/15/22 | 750 | 764 |
| 3 | BlueLine Rental Finance Corp. | 7.000% | 2/1/19 | 950 | 834 |
| 3 | Building Materials Corp. of America | 5.375% | 11/15/24 | 1,085 | 1,082 |
| 3 | Building Materials Corp. of America | 6.000% | 10/15/25 | 4,295 | 4,424 |
| Case New Holland Inc. | 7.875% | 12/1/17 | 2,660 | 2,820 |
| 3 | Cemex Finance LLC | 6.000% | 4/1/24 | 290 | 250 |
| 3 | Cemex SAB de CV | 6.125% | 5/5/25 | 3,580 | 3,056 |
| Clean Harbors Inc. | 5.250% | 8/1/20 | 2,006 | 2,049 |
| Clean Harbors Inc. | 5.125% | 6/1/21 | 1,493 | 1,514 |
| CNH Industrial Capital LLC | 3.625% | 4/15/18 | 1,145 | 1,128 |
| CNH Industrial Capital LLC | 3.875% | 7/16/18 | 2,015 | 1,960 |
| CNH Industrial Capital LLC | 3.375% | 7/15/19 | 257 | 244 |
| CNH Industrial Capital LLC | 4.375% | 11/6/20 | 550 | 518 |
| HD Supply Inc. | 7.500% | 7/15/20 | 600 | 622 |
| 3 | HD Supply Inc. | 5.250% | 12/15/21 | 1,105 | 1,127 |
| 3 | Huntington Ingalls Industries Inc. | 5.000% | 11/15/25 | 385 | 391 |
| Masco Corp. | 7.750% | 8/1/29 | 480 | 533 |
| Masco Corp. | 6.500% | 8/15/32 | 120 | 122 |
| Owens Corning | 9.000% | 6/15/19 | 143 | 166 |
| 3 | Owens-Brockway Glass Container Inc. | 5.875% | 8/15/23 | 895 | 910 |
| 3 | Owens-Brockway Glass Container Inc. | 6.375% | 8/15/25 | 355 | 365 |
| Reynolds Group Issuer Inc. / Reynolds | | | | |
| | Group Issuer LLC / Reynolds Group | | | | |
| | Issuer Lu | 5.750% | 10/15/20 | 985 | 997 |
| Reynolds Group Issuer Inc. / Reynolds | | | | |
| | Group Issuer LLC / Reynolds Group | | | | |
| | Issuer Lu | 6.875% | 2/15/21 | 1,165 | 1,196 |
| Terex Corp. | 6.000% | 5/15/21 | 1,350 | 1,240 |
| United Rentals North America Inc. | 7.625% | 4/15/22 | 1,470 | 1,560 |
| United Rentals North America Inc. | 6.125% | 6/15/23 | 355 | 363 |
| United Rentals North America Inc. | 4.625% | 7/15/23 | 840 | 836 |
| United Rentals North America Inc. | 5.500% | 7/15/25 | 1,025 | 999 |
| 3 | USG Corp. | 5.500% | 3/1/25 | 263 | 267 |
| Vulcan Materials Co. | 7.150% | 11/30/37 | 220 | 232 |
| |
| Communication (24.1%) | | | | |
| 3 | Altice Financing SA | 6.625% | 2/15/23 | 615 | 607 |
| Belo Corp. | 7.250% | 9/15/27 | 461 | 468 |
| CCO Holdings LLC / CCO Holdings | | | | |
| | Capital Corp. | 5.250% | 3/15/21 | 250 | 259 |
| CCO Holdings LLC / CCO Holdings | | | | |
| | Capital Corp. | 6.500% | 4/30/21 | 75 | 78 |
| CCO Holdings LLC / CCO Holdings | | | | |
| | Capital Corp. | 5.250% | 9/30/22 | 365 | 368 |
| CCO Holdings LLC / CCO Holdings | | | | |
| | Capital Corp. | 5.125% | 2/15/23 | 400 | 400 |
| 3 | CCO Holdings LLC / CCO Holdings | | | | |
| | Capital Corp. | 5.125% | 5/1/23 | 2,990 | 2,990 |
| CCO Holdings LLC / CCO Holdings | | | | |
| | Capital Corp. | 5.750% | 9/1/23 | 1,150 | 1,182 |
| CCO Holdings LLC / CCO Holdings | | | | |
| | Capital Corp. | 5.750% | 1/15/24 | 145 | 149 |
| 3 | CCO Holdings LLC / CCO Holdings | | | | |
| | Capital Corp. | 5.375% | 5/1/25 | 2,441 | 2,435 |
| 3 | CCO Holdings LLC / CCO Holdings | | | | |
| | Capital Corp. | 5.875% | 5/1/27 | 745 | 741 |
| 3 | CCO Safari II LLC | 6.484% | 10/23/45 | 1,341 | 1,350 |
| 3 | CCOH Safari LLC | 5.750% | 2/15/26 | 1,450 | 1,454 |
| 3 | Cequel Communications Holdings I | | | | |
| | LLC / Cequel Capital Corp. | 5.125% | 12/15/21 | 1,935 | 1,727 |
| CSC Holdings LLC | 7.875% | 2/15/18 | 370 | 389 |
| CSC Holdings LLC | 7.625% | 7/15/18 | 790 | 830 |
| CSC Holdings LLC | 8.625% | 2/15/19 | 895 | 953 |
| CSC Holdings LLC | 6.750% | 11/15/21 | 390 | 374 |
| DISH DBS Corp. | 7.875% | 9/1/19 | 795 | 864 |
| DISH DBS Corp. | 6.750% | 6/1/21 | 3,830 | 3,868 |
| DISH DBS Corp. | 5.875% | 7/15/22 | 3,405 | 3,171 |
| DISH DBS Corp. | 5.000% | 3/15/23 | 525 | 455 |
| DISH DBS Corp. | 5.875% | 11/15/24 | 245 | 217 |
| | | | | |
| Face | Market |
| Maturity Amount | Value • |
| | Coupon | Date | ($000) | ($000) |
| Embarq Corp. | 7.995% | 6/1/36 | 720 | 740 |
| 3 | Frontier Communications Corp. | 11.000% | 9/15/25 | 2,030 | 2,017 |
| Gannett Co. Inc. | 5.125% | 7/15/20 | 1,995 | 2,070 |
| 3 | Gannett Co. Inc. | 4.875% | 9/15/21 | 410 | 412 |
| Gannett Co. Inc. | 6.375% | 10/15/23 | 2,300 | 2,409 |
| 3 | Gannett Co. Inc. | 5.500% | 9/15/24 | 65 | 65 |
| Hughes Satellite Systems Corp. | 6.500% | 6/15/19 | 2,769 | 2,984 |
| IAC/InterActiveCorp | 4.875% | 11/30/18 | 610 | 613 |
| 3 | Inmarsat Finance plc | 4.875% | 5/15/22 | 1,115 | 1,087 |
| Intelsat Jackson Holdings SA | 7.250% | 4/1/19 | 1,260 | 1,156 |
| Intelsat Jackson Holdings SA | 7.250% | 10/15/20 | 3,470 | 3,019 |
| Intelsat Jackson Holdings SA | 7.500% | 4/1/21 | 620 | 539 |
| Lamar Media Corp. | 5.875% | 2/1/22 | 585 | 614 |
| Lamar Media Corp. | 5.000% | 5/1/23 | 1,070 | 1,085 |
| Level 3 Escrow II Inc. | 5.375% | 8/15/22 | 2,515 | 2,553 |
| Level 3 Financing Inc. | 6.125% | 1/15/21 | 130 | 135 |
| Level 3 Financing Inc. | 5.625% | 2/1/23 | 870 | 885 |
| 3 | Level 3 Financing Inc. | 5.125% | 5/1/23 | 1,120 | 1,120 |
| 3 | Level 3 Financing Inc. | 5.375% | 1/15/24 | 450 | 452 |
| 3 | Level 3 Financing Inc. | 5.375% | 5/1/25 | 1,120 | 1,112 |
| Liberty Interactive LLC | 8.500% | 7/15/29 | 1,465 | 1,494 |
| Liberty Interactive LLC | 8.250% | 2/1/30 | 3,945 | 3,980 |
| MetroPCS Wireless Inc. | 6.625% | 11/15/20 | 2,035 | 2,099 |
| National CineMedia LLC | 6.000% | 4/15/22 | 1,095 | 1,136 |
| 3 | NBCUniversal Enterprise Inc. | 5.250% | 3/29/49 | 1,940 | 2,055 |
| 3 | Netflix Inc. | 5.875% | 2/15/25 | 2,245 | 2,301 |
| 3 | Nielsen Finance LLC / Nielsen | | | | |
| | Finance Co. | 5.000% | 4/15/22 | 4,155 | 4,098 |
| 3 | Numericable Group SA | 4.875% | 5/15/19 | 800 | 793 |
| 3 | Numericable Group SA | 6.000% | 5/15/22 | 1,275 | 1,237 |
| Quebecor Media Inc. | 5.750% | 1/15/23 | 2,385 | 2,373 |
| Qwest Corp. | 6.875% | 9/15/33 | 481 | 465 |
| SBA Communications Corp. | 5.625% | 10/1/19 | 1,295 | 1,352 |
| SBA Communications Corp. | 4.875% | 7/15/22 | 1,545 | 1,522 |
| SBA Telecommunications Inc. | 5.750% | 7/15/20 | 1,151 | 1,204 |
| 3 | Sirius XM Radio Inc. | 4.250% | 5/15/20 | 305 | 308 |
| 3 | Sirius XM Radio Inc. | 4.625% | 5/15/23 | 390 | 379 |
| 3 | Sirius XM Radio Inc. | 6.000% | 7/15/24 | 1,193 | 1,245 |
| 3 | Sirius XM Radio Inc. | 5.375% | 4/15/25 | 382 | 383 |
| 3 | Softbank Corp. | 4.500% | 4/15/20 | 5,125 | 5,099 |
| Sprint Corp. | 7.250% | 9/15/21 | 2,960 | 2,213 |
| Sprint Corp. | 7.875% | 9/15/23 | 2,095 | 1,566 |
| Sprint Corp. | 7.125% | 6/15/24 | 770 | 560 |
| Sprint Corp. | 7.625% | 2/15/25 | 835 | 616 |
| 3 | Sprint Nextel Corp. | 9.000% | 11/15/18 | 3,185 | 3,344 |
| 3 | Sprint Nextel Corp. | 7.000% | 3/1/20 | 3,820 | 3,839 |
| T-Mobile USA Inc. | 6.633% | 4/28/21 | 2,665 | 2,772 |
| T-Mobile USA Inc. | 6.125% | 1/15/22 | 330 | 339 |
| T-Mobile USA Inc. | 6.731% | 4/28/22 | 1,580 | 1,645 |
| T-Mobile USA Inc. | 6.836% | 4/28/23 | 90 | 93 |
| T-Mobile USA Inc. | 6.500% | 1/15/24 | 140 | 143 |
| Time Warner Cable Inc. | 5.500% | 9/1/41 | 1,500 | 1,357 |
| 4,5 Tribune Company Bank Loan | 3.750% | 12/27/20 | 1,908 | 1,882 |
| 3 | Tribune Media Co. | 5.875% | 7/15/22 | 2,300 | 2,294 |
| 3 | Unitymedia Hessen GmbH & Co. KG / | | | | |
| | Unitymedia NRW GmbH | 5.500% | 1/15/23 | 1,190 | 1,187 |
| 3 | Univision Communications Inc. | 5.125% | 5/15/23 | 550 | 531 |
| 3 | Univision Communications Inc. | 5.125% | 2/15/25 | 3,920 | 3,724 |
| 3 | UPCB Finance V Ltd. | 7.250% | 11/15/21 | 1,233 | 1,310 |
| 3 | UPCB Finance VI Ltd. | 6.875% | 1/15/22 | 991 | 1,045 |
| Videotron Ltd. | 5.000% | 7/15/22 | 3,053 | 3,045 |
| 3 | Videotron Ltd. | 5.375% | 6/15/24 | 260 | 261 |
| 3 | Virgin Media Secured Finance plc | 5.375% | 4/15/21 | 1,157 | 1,194 |
| 3 | Wind Acquisition Finance SA | 4.750% | 7/15/20 | 2,185 | 2,139 |
| Zayo Group LLC / Zayo Capital Inc. | 6.000% | 4/1/23 | 3,315 | 3,133 |
| Zayo Group LLC / Zayo Capital Inc. | 6.375% | 5/15/25 | 1,430 | 1,332 |
| |
| Consumer Cyclical (7.0%) | | | | |
| 3 | Activision Blizzard Inc. | 5.625% | 9/15/21 | 1,455 | 1,513 |
| 3 | Activision Blizzard Inc. | 6.125% | 9/15/23 | 1,555 | 1,648 |
| ADT Corp. | 5.250% | 3/15/20 | 300 | 315 |
107
Vanguard High Yield Bond Portfolio
| | | | | |
| Face | Market |
| Maturity Amount | Value • |
| | Coupon | Date | ($000) | ($000) |
| ADT Corp. | 6.250% | 10/15/21 | 2,285 | 2,399 |
| ADT Corp. | 4.125% | 6/15/23 | 90 | 84 |
| 3 | Carlson Travel Holdings Inc. | 7.500% | 8/15/19 | 525 | 517 |
| 3 | Carlson Wagonlit BV | 6.875% | 6/15/19 | 2,440 | 2,504 |
| 3 | Cedar Fair LP / Canada’s Wonderland | | | | |
| | Co. / MagnumManagement Corp. | 5.375% | 6/1/24 | 835 | 845 |
| Dana Holding Corp. | 5.375% | 9/15/21 | 557 | 554 |
| Dana Holding Corp. | 5.500% | 12/15/24 | 755 | 733 |
| 4,5 Delta Alpha Topco Bank Loan | 7.750% | 7/29/22 | 1,650 | 1,521 |
| Group 1 Automotive Inc. | 5.000% | 6/1/22 | 580 | 575 |
| 3 | Group 1 Automotive Inc. | 5.250% | 12/15/23 | 585 | 579 |
| 4,5 Ion Media Networks Bank Loan | 4.750% | 12/18/20 | 1,420 | 1,391 |
| KB Home | 4.750% | 5/15/19 | 830 | 807 |
| KB Home | 8.000% | 3/15/20 | 120 | 130 |
| KB Home | 7.000% | 12/15/21 | 150 | 148 |
| KB Home | 7.500% | 9/15/22 | 215 | 214 |
| KB Home | 7.625% | 5/15/23 | 1,300 | 1,287 |
| L Brands Inc. | 7.000% | 5/1/20 | 485 | 548 |
| L Brands Inc. | 6.625% | 4/1/21 | 1,430 | 1,580 |
| 4,5 La Quinta Intermediate Holdings LLC | | | | |
| | Bank Loan | 3.750% | 4/14/21 | 1,838 | 1,789 |
| Lennar Corp. | 4.875% | 12/15/23 | 625 | 621 |
| Neiman Marcus Group Inc. | 7.125% | 6/1/28 | 1,820 | 1,738 |
| 3 | Netflix Inc. | 5.500% | 2/15/22 | 950 | 974 |
| Penske Automotive Group Inc. | 5.750% | 10/1/22 | 387 | 398 |
| Penske Automotive Group Inc. | 5.375% | 12/1/24 | 694 | 702 |
| Sally Holdings LLC / Sally Capital Inc. | 5.750% | 6/1/22 | 605 | 627 |
| Sally Holdings LLC / Sally Capital Inc. | 5.625% | 12/1/25 | 650 | 663 |
| Service Corp. International | 8.000% | 11/15/21 | 1,225 | 1,441 |
| Service Corp. International | 5.375% | 1/15/22 | 905 | 928 |
| 3 | Shea Homes LP / Shea Homes | | | | |
| | Funding Corp. | 5.875% | 4/1/23 | 450 | 461 |
| 3 | Shea Homes LP / Shea Homes | | | | |
| | Funding Corp. | 6.125% | 4/1/25 | 450 | 463 |
| Sonic Automotive Inc. | 7.000% | 7/15/22 | 30 | 32 |
| Sonic Automotive Inc. | 5.000% | 5/15/23 | 265 | 252 |
| Toll Brothers Finance Corp. | 4.875% | 11/15/25 | 295 | 290 |
| Wynn Las Vegas LLC / Wynn Las | | | | |
| | Vegas Capital Corp. | 5.375% | 3/15/22 | 3,105 | 2,965 |
| 3 | ZF North America Capital Inc. | 4.500% | 4/29/22 | 470 | 461 |
| 3 | ZF North America Capital Inc. | 4.750% | 4/29/25 | 1,725 | 1,643 |
| |
| Consumer Noncyclical (11.8%) | | | | |
| 3 | Alere Inc. | 6.375% | 7/1/23 | 990 | 921 |
| Amsurg Corp. | 5.625% | 7/15/22 | 2,645 | 2,612 |
| 3 | Aramark Services Inc. | 5.125% | 1/15/24 | 395 | 402 |
| 3 | Capsugel SA | 7.000% | 5/15/19 | 1,495 | 1,461 |
| CHS/Community Health Systems Inc. | 7.125% | 7/15/20 | 1,060 | 1,055 |
| CHS/Community Health Systems Inc. | 5.125% | 8/1/21 | 525 | 522 |
| CHS/Community Health Systems Inc. | 6.875% | 2/1/22 | 4,720 | 4,466 |
| 3 | Endo Finance LLC / Endo Finco Inc. | 6.000% | 2/1/25 | 2,175 | 2,148 |
| 3 | Endo Finance LLC / Endo Ltd. / Endo | | | | |
| | Finco Inc. | 6.000% | 7/15/23 | 1,615 | 1,607 |
| 3 | Envision Healthcare Corp. | 5.125% | 7/1/22 | 2,806 | 2,750 |
| ExamWorks Group Inc. | 5.625% | 4/15/23 | 450 | 447 |
| 3 | Fresenius Medical Care US | | | | |
| | Finance Inc. | 5.750% | 2/15/21 | 720 | 770 |
| Grifols Worldwide Operations Ltd. | 5.250% | 4/1/22 | 510 | 513 |
| HCA Holdings Inc. | 6.250% | 2/15/21 | 1,020 | 1,074 |
| HCA Inc. | 6.500% | 2/15/20 | 3,875 | 4,224 |
| HCA Inc. | 5.875% | 3/15/22 | 1,850 | 1,956 |
| HCA Inc. | 4.750% | 5/1/23 | 2,100 | 2,079 |
| HCA Inc. | 5.875% | 5/1/23 | 300 | 306 |
| HCA Inc. | 5.375% | 2/1/25 | 505 | 497 |
| HCA Inc. | 5.250% | 4/15/25 | 1,500 | 1,511 |
| HCA Inc. | 7.690% | 6/15/25 | 130 | 141 |
| 3 | Hologic Inc. | 5.250% | 7/15/22 | 45 | 46 |
| 3 | Hypermarcas SA | 6.500% | 4/20/21 | 2,020 | 2,048 |
| 3 | IMS Health Inc. | 6.000% | 11/1/20 | 3,136 | 3,222 |
| Kinetic Concepts Inc / KCI USA Inc | 10.500% | 11/1/18 | 2,300 | 2,242 |
| 4,5 Lands’ End, Inc. Bank Loan | 4.250% | 3/12/21 | 3,124 | 2,655 |
| | | | | |
| Face | Market |
| Maturity Amount | Value • |
| | Coupon | Date | ($000) | ($000) |
| LifePoint Hospitals Inc. | 5.500% | 12/1/21 | 1,340 | 1,360 |
| 3 | MEDNAX Inc. | 5.250% | 12/1/23 | 580 | 584 |
| 3 | MPH Acquisition Holdings LLC | 6.625% | 4/1/22 | 1,345 | 1,348 |
| 4,5 MPH Acquisition Holdings LLC | | | | |
| | Bank Loan | 3.750% | 3/31/21 | 1,046 | 1,016 |
| 3 | Quintiles Transnational Holdings Inc. | 4.875% | 5/15/23 | 750 | 754 |
| 3 | Sterigenics-Nordion Holdings LLC | 6.500% | 5/15/23 | 1,500 | 1,442 |
| 3 | Tempur Sealy International Inc. | 5.625% | 10/15/23 | 375 | 381 |
| Tenet Healthcare Corp. | 6.250% | 11/1/18 | 1,500 | 1,579 |
| Tenet Healthcare Corp. | 5.000% | 3/1/19 | 1,560 | 1,435 |
| Tenet Healthcare Corp. | 5.500% | 3/1/19 | 785 | 740 |
| Tenet Healthcare Corp. | 4.750% | 6/1/20 | 835 | 839 |
| Tenet Healthcare Corp. | 4.500% | 4/1/21 | 932 | 909 |
| Tenet Healthcare Corp. | 4.375% | 10/1/21 | 3,520 | 3,397 |
| Tenet Healthcare Corp. | 8.125% | 4/1/22 | 1,550 | 1,535 |
| THC Escrow Corp. II | 6.750% | 6/15/23 | 375 | 344 |
| 3 | VRX Escrow Corp. | 6.125% | 4/15/25 | 2,669 | 2,389 |
| |
| Energy (9.1%) | | | | |
| AmeriGas Finance LLC / AmeriGas | | | | |
| | Finance Corp. | 6.750% | 5/20/20 | 1,190 | 1,154 |
| AmeriGas Finance LLC / AmeriGas | | | | |
| | Finance Corp. | 7.000% | 5/20/22 | 1,340 | 1,293 |
| Antero Resources Corp. | 5.375% | 11/1/21 | 715 | 572 |
| Antero Resources Corp. | 5.125% | 12/1/22 | 1,840 | 1,389 |
| 3 | Antero Resources Corp. | 5.625% | 6/1/23 | 460 | 357 |
| Concho Resources Inc. | 7.000% | 1/15/21 | 1,032 | 1,022 |
| Concho Resources Inc. | 6.500% | 1/15/22 | 745 | 708 |
| Concho Resources Inc. | 5.500% | 10/1/22 | 2,440 | 2,245 |
| Concho Resources Inc. | 5.500% | 4/1/23 | 850 | 780 |
| 3 | Crestwood Midstream Partners LP / | | | | |
| | Crestwood Midstream Finance Corp. | 6.250% | 4/1/23 | 1,170 | 813 |
| 3 | DCP Midstream LLC | 9.750% | 3/15/19 | 450 | 459 |
| 3 | DCP Midstream LLC | 5.350% | 3/15/20 | 335 | 287 |
| DCP Midstream Operating LP | 2.700% | 4/1/19 | 600 | 493 |
| DCP Midstream Operating LP | 4.950% | 4/1/22 | 1,436 | 1,146 |
| DCP Midstream Operating LP | 3.875% | 3/15/23 | 325 | 246 |
| DCP Midstream Operating LP | 5.600% | 4/1/44 | 875 | 532 |
| Energy Transfer Equity LP | 7.500% | 10/15/20 | 2,460 | 2,263 |
| Energy Transfer Equity LP | 5.500% | 6/1/27 | 2,430 | 1,822 |
| EP Energy LLC / Everest Acquisition | | | | |
| | Finance Inc. | 9.375% | 5/1/20 | 2,239 | 1,402 |
| EP Energy LLC / Everest Acquisition | | | | |
| | Finance Inc. | 6.375% | 6/15/23 | 700 | 352 |
| Ferrellgas LP / Ferrellgas Finance Corp. 6.500% | 5/1/21 | 2,303 | 1,958 |
| Harvest Operations Corp. | 6.875% | 10/1/17 | 2,500 | 1,837 |
| Kinder Morgan Inc. | 7.750% | 1/15/32 | 740 | 702 |
| Laredo Petroleum Inc. | 5.625% | 1/15/22 | 1,555 | 1,345 |
| Laredo Petroleum Inc. | 7.375% | 5/1/22 | 510 | 469 |
| Laredo Petroleum Inc. | 6.250% | 3/15/23 | 1,705 | 1,466 |
| Matador Resources Co. | 6.875% | 4/15/23 | 860 | 800 |
| 3 | MEG Energy Corp. | 6.500% | 3/15/21 | 496 | 352 |
| 3 | MEG Energy Corp. | 6.375% | 1/30/23 | 850 | 586 |
| 3 | MEG Energy Corp. | 7.000% | 3/31/24 | 1,439 | 1,022 |
| 3 | MPLX LP | 4.875% | 12/1/24 | 1,410 | 1,263 |
| 3 | MPLX LP | 4.875% | 6/1/25 | 2,685 | 2,394 |
| Newfield Exploration Co. | 5.625% | 7/1/24 | 600 | 498 |
| Noble Energy Inc. | 5.625% | 5/1/21 | 160 | 157 |
| Noble Energy Inc. | 5.875% | 6/1/22 | 1,615 | 1,520 |
| Noble Energy Inc. | 5.875% | 6/1/24 | 305 | 293 |
| 3 | Paragon Offshore plc | 6.750% | 7/15/22 | 845 | 110 |
| 3 | Paragon Offshore plc | 7.250% | 8/15/24 | 560 | 73 |
| QEP Resources Inc. | 6.800% | 3/1/20 | 220 | 200 |
| QEP Resources Inc. | 6.875% | 3/1/21 | 460 | 382 |
| QEP Resources Inc. | 5.375% | 10/1/22 | 235 | 168 |
| QEP Resources Inc. | 5.250% | 5/1/23 | 150 | 106 |
| Range Resources Corp. | 5.750% | 6/1/21 | 1,435 | 1,148 |
| Range Resources Corp. | 5.000% | 8/15/22 | 415 | 310 |
| 3 | Rice Energy Inc. | 7.250% | 5/1/23 | 740 | 536 |
| 3 | Seadrill Ltd. | 6.125% | 9/15/17 | 2,260 | 1,136 |
| SM Energy Co. | 6.125% | 11/15/22 | 725 | 537 |
108
Vanguard High Yield Bond Portfolio
| | | | | |
| Face | Market |
| Maturity Amount | Value • |
| | Coupon | Date | ($000) | ($000) |
| SM Energy Co. | 6.500% | 1/1/23 | 75 | 55 |
| SM Energy Co. | 5.000% | 1/15/24 | 319 | 212 |
| SM Energy Co. | 5.625% | 6/1/25 | 481 | 320 |
| 3 | Southern Star Central Corp. | 5.125% | 7/15/22 | 480 | 396 |
| Tesoro Corp. | 5.125% | 4/1/24 | 996 | 986 |
| 3 | Tesoro Logistics LP / Tesoro Logistics | | | | |
| | Finance Corp. | 5.500% | 10/15/19 | 165 | 160 |
| 3 | Tesoro Logistics LP / Tesoro Logistics | | | | |
| | Finance Corp. | 6.250% | 10/15/22 | 1,120 | 1,058 |
| Whiting Petroleum Corp. | 5.750% | 3/15/21 | 1,445 | 1,055 |
| Whiting Petroleum Corp. | 6.250% | 4/1/23 | 280 | 203 |
| WPX Energy Inc. | 6.000% | 1/15/22 | 956 | 681 |
| WPX Energy Inc. | 5.250% | 9/15/24 | 1,994 | 1,336 |
| |
| Technology (10.0%) | | | | |
| 3 | Alcatel-Lucent USA Inc. | 4.625% | 7/1/17 | 200 | 205 |
| 3 | Alcatel-Lucent USA Inc. | 6.750% | 11/15/20 | 900 | 949 |
| Alcatel-Lucent USA Inc. | 6.450% | 3/15/29 | 2,500 | 2,531 |
| 3 | Audatex North America Inc. | 6.000% | 6/15/21 | 2,605 | 2,624 |
| 3 | Audatex North America Inc. | 6.125% | 11/1/23 | 2,725 | 2,742 |
| CDW LLC / CDW Finance Corp. | 6.000% | 8/15/22 | 3,865 | 4,087 |
| CDW LLC / CDW Finance Corp. | 5.000% | 9/1/23 | 730 | 743 |
| CDW LLC / CDW Finance Corp. | 5.500% | 12/1/24 | 485 | 509 |
| Equinix Inc. | 5.375% | 4/1/23 | 680 | 694 |
| 3 | First Data Corp. | 6.750% | 11/1/20 | 255 | 269 |
| 3 | First Data Corp. | 5.375% | 8/15/23 | 2,265 | 2,279 |
| 3 | First Data Corp. | 7.000% | 12/1/23 | 4,825 | 4,837 |
| 3 | First Data Corp. | 5.000% | 1/15/24 | 1,500 | 1,492 |
| 3 | First Data Corp. | 5.750% | 1/15/24 | 3,751 | 3,709 |
| 4,5 First Data Corp. Bank Loan | 3.917% | 3/23/18 | 1,613 | 1,591 |
| 4,5 First Data Corp. Bank Loan | 4.168% | 7/8/22 | 1,190 | 1,173 |
| Flextronics International Ltd. | 4.625% | 2/15/20 | 585 | 605 |
| Flextronics International Ltd. | 5.000% | 2/15/23 | 665 | 672 |
| 3 | Freescale Semiconductor Inc. | 5.000% | 5/15/21 | 1,720 | 1,763 |
| 3 | Freescale Semiconductor Inc. | 6.000% | 1/15/22 | 725 | 758 |
| 3 | Infor Software Parent LLC | 7.125% | 5/1/21 | 445 | 323 |
| 3 | Infor US Inc. | 6.500% | 5/15/22 | 3,045 | 2,581 |
| 3,7 Iron Mountain Europe plc | 6.125% | 9/15/22 | 755 | 1,140 |
| Iron Mountain Inc. | 5.750% | 8/15/24 | 825 | 796 |
| 3 | MSCI Inc. | 5.250% | 11/15/24 | 150 | 152 |
| 3 | MSCI Inc. | 5.750% | 8/15/25 | 1,560 | 1,599 |
| NCR Corp. | 4.625% | 2/15/21 | 2,375 | 2,274 |
| Nokia Oyj | 6.625% | 5/15/39 | 1,500 | 1,535 |
| 3 | NXP BV / NXP Funding LLC | 3.750% | 6/1/18 | 1,190 | 1,196 |
| 3 | NXP BV / NXP Funding LLC | 4.125% | 6/15/20 | 545 | 545 |
| 3 | NXP BV / NXP Funding LLC | 4.625% | 6/15/22 | 650 | 639 |
| 3 | NXP BV / NXP Funding LLC | 5.750% | 3/15/23 | 255 | 263 |
| 3 | Open Text Corp. | 5.625% | 1/15/23 | 970 | 955 |
| 3 | Sensata Technologies BV | 5.625% | 11/1/24 | 70 | 71 |
| 3 | Sensata Technologies BV | 5.000% | 10/1/25 | 1,500 | 1,447 |
| 3 | Sensata Technologies UK Financing | | | | |
| | Co. plc | 6.250% | 2/15/26 | 1,520 | 1,581 |
| 3 | SS&C Technologies Holdings Inc. | 5.875% | 7/15/23 | 620 | 639 |
| |
| Transportation (1.4%) | | | | |
| 3 | Avis Budget Car Rental LLC / Avis | | | | |
| | Budget Finance Inc. | 5.125% | 6/1/22 | 1,370 | 1,353 |
| 2 | Continental Airlines 2007-1 Class B | | | | |
| | Pass Through Trust | 6.903% | 4/19/22 | 431 | 446 |
| Hertz Corp. | 4.250% | 4/1/18 | 390 | 393 |
| Hertz Corp. | 6.750% | 4/15/19 | 2,000 | 2,045 |
| Hertz Corp. | 5.875% | 10/15/20 | 660 | 682 |
| Hertz Corp. | 7.375% | 1/15/21 | 2,230 | 2,311 |
| 389,224 |
| | | | | |
| Face | Market |
| Maturity Amount | Value • |
| | Coupon | Date | ($000) | ($000) |
| Utilities (3.7%) | | | | |
| Electric (3.7%) | | | | |
| AES Corp. | 8.000% | 6/1/20 | 815 | 897 |
| AES Corp. | 4.875% | 5/15/23 | 600 | 522 |
| AES Corp. | 5.500% | 3/15/24 | 3,706 | 3,308 |
| 3 | Calpine Corp. | 6.000% | 1/15/22 | 500 | 514 |
| Calpine Corp. | 5.375% | 1/15/23 | 1,025 | 912 |
| 3 | Calpine Corp. | 5.875% | 1/15/24 | 285 | 292 |
| Calpine Corp. | 5.750% | 1/15/25 | 3,800 | 3,334 |
| Dynegy Inc. | 7.375% | 11/1/22 | 2,045 | 1,774 |
| Dynegy Inc. | 5.875% | 6/1/23 | 1,215 | 978 |
| Dynegy Inc. | 7.625% | 11/1/24 | 1,610 | 1,377 |
| GenOn Energy Inc. | 7.875% | 6/15/17 | 575 | 506 |
| GenOn Energy Inc. | 9.500% | 10/15/18 | 1,800 | 1,449 |
| GenOn Energy Inc. | 9.875% | 10/15/20 | 745 | 555 |
| NRG Energy Inc. | 7.875% | 5/15/21 | 190 | 179 |
| NRG Energy Inc. | 6.250% | 7/15/22 | 1,544 | 1,339 |
| NRG Energy Inc. | 6.625% | 3/15/23 | 300 | 261 |
| NRG Energy Inc. | 6.250% | 5/1/24 | 1,416 | 1,189 |
| 19,386 |
| Total Corporate Bonds (Cost $511,266) | 479,809 |
| | | | |
| Shares | |
| Preferred Stocks (0.5%) | | | | |
| Hartford Financial Services | | | | |
| | Group Inc. Pfd. (Cost $1,997) | 7.875% | 79,900 | 2,514 |
| Other (0.0%) | | | | |
| * | MediaNews Group Inc. | | | | |
| | Warrants Exp. 03/19/2017 | | | | |
| | (Cost $778) | 2,084 | 19 |
| Temporary Cash Investments (3.9%) | | | | |
| | | | |
| Face | |
| Amount | |
| ($000) | |
| Repurchase Agreement (2.7%) | | | | |
| Bank of America Securities, LLC | | | | |
| | (Dated 12/31/15, Repurchase Value | | | | |
| | $14,300,000, collateralized by | | | | |
| | Government National Mortgage | | | | |
| | Assn. 3.500%, 3/20/45, with a | | | | |
| | value of $14,586,000) | 0.300% | 1/4/16 | 14,300 | 14,300 |
| | | | |
| U.S. Government and Agency Obligations (1.2%) | | | |
| United States Treasury Bill | 0.085% | 1/7/16 | 6,000 | 6,000 |
| Total Temporary Cash Investments (Cost $20,300) | 20,300 |
| Total Investments (98.7%) (Cost $545,823) | 514,109 |
109
Vanguard High Yield Bond Portfolio
| |
| Amount |
| ($000) |
| Other Assets and Liabilities (1.3%) | |
| Other Assets | |
| Investment in Vanguard | 47 |
| Receivables for Investment Securities Sold | 4,079 |
| Receivables for Accrued Income | 7,544 |
| Receivables for Capital Shares Issued | 76 |
| Other Assets | 250 |
| Total Other Assets | 11,996 |
| Liabilities | |
| Payables for Investment Securities Purchased | (4,079) |
| Payables to Investment Advisor | (81) |
| Payables for Capital Shares Redeemed | (398) |
| Payables to Vanguard | (902) |
| Other Liabilities | (14) |
| Total Liabilities | (5,474) |
| Net Assets (100%) | |
| Applicable to 68,593,248 outstanding $.001 par value shares of | |
| beneficial interest (unlimited authorization) | 520,631 |
| Net Asset Value Per Share | $7.59 |
| |
| At December 31, 2015, net assets consisted of: | |
| Amount |
| ($000) |
| Paid-in Capital | 524,547 |
| Undistributed Net Investment Income | 28,155 |
| Accumulated Net Realized Losses | (369) |
| Unrealized Appreciation (Depreciation) | |
| Investment Securities | (31,714) |
| Swap Contracts | (51) |
| Forward Currency Contracts | 64 |
| Foreign Currencies | (1) |
| Net Assets | 520,631 |
| |
• See Note A in Notes to Financial Statements.
* Non-income-producing security.
1 Securities with a value of $423,000 have been segregated as initial margin for open cleared swap contracts.
2 The average or expected maturity is shorter than the final maturity shown because of the possibility of interim principal payments and prepayments or the possibility of the issue being called.
3 Security exempt from registration under Rule 144A of the Securities Act of 1933. Such securities may be sold in transactions exempt from registration, normally to qualified institutional buyers. At December 31, 2015, the aggregate value of these securities was $177,358,000, representing 34.1% of net assets.
4 Adjustable-rate security.
5 Security is a senior, secured, high-yield floating-rate loan. These loans are debt obligations issued by public and private companies and are comparable to high-yield bonds from a ratings and leverage perspective. At December 31, 2015, the aggregate value of these securities was $14,572,000, representing 2.8% of net assets.
6 Face amount denominated in euro.
7 Face amount denominated in British pounds.
See accompanying Notes, which are an integral part of the Financial Statements.
110
| | | |
| Vanguard High Yield Bond Portfolio | |
| |
| |
| Statement of Operations |
| |
| Year Ended |
| December 31, 2015 |
| | ($000) |
| Investment Income | | |
| Income | | |
| Dividends | 308 |
| Interest | 30,570 |
| Total Income | 30,878 |
| Expenses | | |
| Investment Advisory Fees—Note B | 326 |
| The Vanguard Group—Note C | | |
| Management and Administrative | 1,019 |
| Marketing and Distribution | 105 |
| Custodian Fees | 16 |
| Auditing Fees | 35 |
| Shareholders’ Reports | 14 |
| Trustees’ Fees and Expenses | 1 |
| Total Expenses | 1,516 |
| Net Investment Income | 29,362 |
| Realized Net Gain (Loss) | | |
| Investment Securities Sold | (265) |
| Swap Contracts | (4) |
| Foreign Currencies and | | |
| Forward Currency Contracts | 15 |
| Realized Net Gain (Loss) | (254) |
| Change in Unrealized Appreciation | |
| (Depreciation) | | |
| Investment Securities | (37,885) |
| Swap Contracts | (51) |
| Foreign Currencies and | | |
| Forward Currency Contracts | 11 |
| Change in Unrealized Appreciation | |
| (Depreciation) | (37,925) |
| Net Increase (Decrease) in Net Assets | |
| Resulting from Operations | (8,817) |
| | |
| Statement of Changes in Net Assets | | |
| |
| Year Ended December 31, |
| 2015 | 2014 |
| ($000) | ($000) |
| Increase (Decrease) in Net Assets | | |
| Operations | | |
| Net Investment Income | 29,362 | 28,464 |
| Realized Net Gain (Loss) | (254) | 9,170 |
| Change in Unrealized Appreciation (Depreciation) | (37,925) | (14,918) |
| Net Increase (Decrease) in Net Assets Resulting from Operations | (8,817) | 22,716 |
| Distributions | | |
| Net Investment Income | (27,866) | (29,274) |
| Realized Capital Gain1 | (856) | — |
| Total Distributions | (28,722) | (29,274) |
| Capital Share Transactions | | |
| Issued | 98,465 | 103,818 |
| Issued in Lieu of Cash Distributions | 28,722 | 29,274 |
| Redeemed | (102,606) | (101,695) |
| Net Increase (Decrease) from Capital Share Transactions | 24,581 | 31,397 |
| Total Increase (Decrease) | (12,958) | 24,839 |
| Net Assets |
| Beginning of Period | 533,589 | 508,750 |
| End of Period2 | 520,631 | 533,589 |
1 Includes fiscal 2015 short-term gain distributions totaling $0. Short-term gain distributions are treated as ordinary income dividends for tax purposes.
2 Net Assets—End of Period includes undistributed (overdistributed) net investment income of $28,155,000 and $26,701,000.
See accompanying Notes, which are an integral part of the Financial Statements.
111
| | | | | |
| Vanguard High Yield Bond Portfolio | | | | | |
| |
| |
| Financial Highlights | | | | | |
| |
| |
| For a Share Outstanding | | | Year Ended December 31, |
| Throughout Each Period | 2015 | 2014 | 2013 | 2012 | 2011 |
| Net Asset Value, Beginning of Period | $8.14 | $8.24 | $8.33 | $7.72 | $7.78 |
| Investment Operations | | |
| Net Investment Income | .427 | .416 | .458 | .420 | .516 |
| Net Realized and Unrealized Gain (Loss) | | | | | |
| on Investments | (.541) | (.061) | (.108) | .641 | .004 |
| Total from Investment Operations | (.114) | .355 | .350 | 1.061 | .520 |
| Distributions | | | |
| Dividends from Net Investment Income | (.423) | (.455) | (.440) | (.451) | (.580) |
| Distributions from Realized Capital Gains | (.013) | — | — | — | — |
| Total Distributions | (.436) | (.455) | (.440) | (.451) | (.580) |
| Net Asset Value, End of Period | $7.59 | $8.14 | $8.24 | $8.33 | $7.72 |
| |
| Total Return | -1.58% | 4.40% | 4.35% | 14.30% | 6.93% |
| |
| Ratios/Supplemental Data | | | |
| Net Assets, End of Period (Millions) | $521 | $534 | $509 | $546 | $397 |
| Ratio of Total Expenses to Average Net Assets | 0.28% | 0.29% | 0.29% | 0.29% | 0.29% |
| Ratio of Net Investment Income to | | | | | |
| Average Net Assets | 5.41% | 5.24% | 5.51% | 6.10% | 6.85% |
| Portfolio Turnover Rate | 38% | 35% | 37% | 29% | 37% |
Notes to Financial Statements
Vanguard High Yield Bond Portfolio, a portfolio of Vanguard Variable Insurance Funds, is registered under the Investment Company Act of 1940 as an open-end investment company. The portfolio’s shares are only available for purchase by separate accounts of insurance companies as investments for variable annuity plans, variable life insurance contracts, or other variable benefit insurance contracts. Certain of the portfolio’s investments are in corporate debt instruments; the issuers’ abilities to meet their obligations may be affected by economic developments in their respective industries.
A. The following significant accounting policies conform to generally accepted accounting principles for U.S. investment companies. The portfolio consistently follows such policies in preparing its financial statements.
1. Security Valuation: Securities are valued as of the close of trading on the New York Stock Exchange (generally 4 p.m., Eastern time) on the valuation date. Bonds, and temporary cash investments acquired over 60 days to maturity, are valued using the latest bid prices or using valuations based on a matrix system (which considers such factors as security prices, yields, maturities, and ratings), both as furnished by independent pricing services. Structured debt securities, including mortgages and asset-backed securities, are valued using the latest bid prices or using valuations based on a matrix system that considers such factors as issuer, tranche, nominal or option-adjusted spreads, weighted average coupon, weighted average maturity, credit enhancements, and collateral. Equity securities are valued at the latest quoted sales prices or official closing prices taken from the primary market in which each security trades; such securities not traded on the valuation date are valued at the mean of the latest quoted bid and asked prices. Other temporary cash investments are valued at amortized cost, which approximates market value. Securities for which market quotations are not readily available, or whose values have been affected by events occurring before the portfolio’s pricing time but after the close of the securities’ primary markets, are valued by methods deemed by the board of trustees to represent fair value.
2. Foreign Currency: Securities and other assets and liabilities denominated in foreign currencies are translated into U.S. dollars using exchange rates obtained from an independent third party as of the portfolio’s pricing time on the valuation date. Realized gains (losses) and unrealized appreciation (depreciation) on investment securities include the effects of changes in exchange rates since the securities were purchased, combined with the effects of changes in security prices. Fluctuations in
112
Vanguard High Yield Bond Portfolio
the value of other assets and liabilities resulting from changes in exchange rates are recorded as unrealized foreign currency gains (losses) until the assets or liabilities are settled in cash, at which time they are recorded as realized foreign currency gains (losses).
3. Forward Currency Contracts: The portfolio enters into forward currency contracts to protect the value of securities and related receivables and payables against changes in future foreign exchange rates. The portfolio’s risks in using these contracts include movement in the values of the foreign currencies relative to the U.S. dollar and the ability of the counterparties to fulfill their obligations under the contracts. The portfolio mitigates its counterparty risk by entering into forward currency contracts only with a diverse group of prequalified counterparties, monitoring their financial strength, entering into master netting arrangements with its counterparties, and requiring its counterparties to transfer collateral as security for their performance. The master netting arrangements provide that, in the event of a counterparty’s default (including bankruptcy), the portfolio may terminate the forward currency contracts, determine the net amount owed by either party in accordance with its master netting arrangements, and sell or retain any collateral held up to the net amount owed to the portfolio under the master netting arrangements. The forward currency contracts contain provisions whereby a counterparty may terminate open contracts if the portfolio’s net assets decline below a certain level, triggering a payment by the portfolio if the portfolio is in a net liability position at the time of the termination. The payment amount would be reduced by any collateral the portfolio has pledged. Any assets pledged as collateral for open contracts are noted in the Statement of Net Assets. The value of collateral received or pledged is compared daily to the value of the forward currency contracts exposure with each counterparty, and any difference, if in excess of a specified minimum transfer amount, is adjusted and settled within two business days.
Forward currency contracts are valued at their quoted daily prices obtained from an independent third party, adjusted for currency risk based on the expiration date of each contract. The notional amounts of the contracts are not recorded in the Statement of Net Assets. Fluctuations in the value of the contracts are recorded in the Statement of Net Assets as an asset (liability) and in the Statement of Operations as unrealized appreciation (depreciation) until the contracts are closed, when they are recorded as realized forward currency contract gains (losses).
During the year ended December 31, 2015, the portfolio’s average investment in forward currency contracts represented 1% of net assets, based on the average of notional amounts at each quarter-end during the period.
4. Swap Contracts: The portfolio invests in credit default swaps to adjust the overall credit risk of the portfolio or to actively overweight or underweight credit risk to a specific issuer or group of issuers. The portfolio may sell credit protection through credit default swaps to simulate investments in long positions that are either unavailable or considered to be less attractively priced in the bond market. The portfolio may purchase credit protection through credit default swaps to reduce credit exposure to a given issuer or issuers. Under the terms of the swaps, an up-front payment may be exchanged between the seller and buyer. In addition, the seller of the credit protection receives a periodic payment of premium from the buyer that is a fixed percentage applied to a notional amount. If, for example, the reference entity is subject to a credit event (such as bankruptcy, failure to pay, or obligation acceleration) during the term of the swap, the seller agrees to either physically settle or cash settle the swap contract. If the swap is physically settled, the seller agrees to pay the buyer an amount equal to the notional amount and take delivery of a debt instrument of the reference issuer with a par amount equal to such notional amount. If the swap is cash settled, the seller agrees to pay the buyer the difference between the notional amount and the final price for the relevant debt instrument, as determined either in a market auction or pursuant to a pre-agreed-upon valuation procedure.
The notional amounts of swap contracts are not recorded in the Statement of Net Assets. Swaps are valued daily based on market quotations received from independent pricing services or recognized dealers and the change in value is recorded in the Statement of Net Assets as an asset (liability) and in the Statement of Operations as unrealized appreciation (depreciation) until the seller of credit protection is required to take delivery (or, in a cash settled swap, pay the settlement amount determined) upon occurrence of a credit event, periodic payments are made, or the swap terminates, at which time realized gain (loss) is recorded. The net premium to be received or paid by the portfolio under swap contracts is accrued daily and recorded as realized gain (loss) over the life of the contract.
The primary risk associated with selling credit protection is that, upon the occurrence of a defined credit event, the market value of the debt instrument received by the portfolio (or, in a cash settled swap, the debt instruments used to determine the settlement payment by the portfolio) will be significantly less than the amount paid by the portfolio and, in a physically settled swap, the portfolio
113
Vanguard High Yield Bond Portfolio
may receive an illiquid debt instrument. A risk associated with all types of swaps is the possibility that a counterparty may default on its obligation to pay net amounts due to the portfolio. The portfolio’s maximum amount subject to counterparty risk is the unrealized appreciation on the swap contract. The portfolio mitigates its counterparty risk by entering into swaps only with a diverse group of prequalified counterparties, monitoring their financial strength, entering into master netting arrangements with its counterparties, and requiring its counterparties to transfer collateral as security for their performance. In the event of a counterparty’s default (including bankruptcy), the portfolio may terminate any swap contracts with that counterparty, determine the net amount owed by either party in accordance with its master netting arrangements, and sell or retain any collateral held up to the net amount owed to the portfolio under the master netting arrangements. The swap contracts contain provisions whereby a counterparty may terminate open contracts if the portfolio’s net assets decline below a certain level, triggering a payment by the portfolio if the portfolio is in a net liability position at the time of the termination. The payment amount would be reduced by any collateral the portfolio has pledged. Any securities pledged as collateral for open contracts are noted in the Statement of Net Assets. The value of collateral received or pledged is compared daily to the value of the swap contracts exposure with each counterparty, and any difference, if in excess of a specified minimum transfer amount, is adjusted and settled within two business days.
The portfolio enters into centrally cleared credit default swaps to achieve the same objectives specified with respect to the equivalent over-the-counter swaps but with less counterparty risk because a regulated clearinghouse is the counterparty instead of the clearing broker or executing broker. The clearinghouse imposes initial margin requirements to secure the portfolio’s performance, and requires daily settlement of variation margin representing changes in the market value of each contract. To further mitigate counterparty risk, the portfolio trades with a diverse group of prequalified executing brokers; monitors the financial strength of its clearing brokers, executing brokers, and clearinghouse; and has entered into agreements with its clearing brokers and executing brokers.
During the year ended December 31, 2015, the portfolio’s average amounts of investments in credit protection sold and credit protection purchased represented less than 1% and 0% of net assets, respectively, based on the average of notional amounts at each quarter-end during the period.
5. Repurchase Agreements: The portfolio enters into repurchase agreements with institutional counterparties. Securities pledged as collateral to the portfolio under repurchase agreements are held by a custodian bank until the agreements mature. Each agreement requires that the market value of the collateral be sufficient to cover payments of interest and principal. The portfolio further mitigates its counterparty risk by entering into repurchase agreements only with a diverse group of prequalified counterparties, monitoring their financial strength, and entering into master repurchase agreements with its counterparties. The master repurchase agreements provide that, in the event of a counter-party’s default (including bankruptcy), the portfolio may terminate any repurchase agreements with that counterparty, determine the net amount owed, and sell or retain the collateral up to the net amount owed to the portfolio. Such action may be subject to legal proceedings, which may delay or limit the disposition of collateral.
6. Federal Income Taxes: The portfolio intends to continue to qualify as a regulated investment company and distribute all of its taxable income. Management has analyzed the portfolio’s tax positions taken for all open federal income tax years (December 31, 2012–2015), and has concluded that no provision for federal income tax is required in the portfolio’s financial statements.
7. Distributions: Distributions to shareholders are recorded on the ex-dividend date.
8. Credit Facility: The portfolio and certain other funds managed by The Vanguard Group (“Vanguard”) participate in a $3 billion committed credit facility provided by a syndicate of lenders pursuant to a credit agreement that may be renewed annually; each fund is individually liable for its borrowings, if any, under the credit facility. Borrowings may be utilized for temporary and emergency purposes, and are subject to the portfolio’s regulatory and contractual borrowing restrictions. The participating funds are charged administrative fees and an annual commitment fee of 0.06% of the undrawn amount of the facility; these fees are allocated to the funds based on a method approved by the portfolio’s board of trustees and included in Management and Administrative expenses on the portfolio’s Statement of Operations. Any borrowings under this facility bear interest at a rate equal to the higher of the federal funds rate or LIBOR reference rate plus an agreed-upon spread.
The portfolio had no borrowings outstanding at December 31, 2015, or at any time during the period then ended.
114
Vanguard High Yield Bond Portfolio
9. Other: Dividend income is recorded on the ex-dividend date. Interest income is accrued daily. Premiums and discounts on debt securities purchased are amortized and accreted, respectively, to interest income over the lives of the respective securities. Security transactions are accounted for on the date securities are bought or sold. Costs used to determine realized gains (losses) on the sale of investment securities are those of the specific securities sold.
B. Wellington Management Company llp provides investment advisory services to the portfolio for a fee calculated at an annual percentage rate of average net assets. For the year ended December 31, 2015, the investment advisory fee represented an effective annual rate of 0.06% of the portfolio’s average net assets.
C. In accordance with the terms of a Funds’ Service Agreement (the “FSA”) between Vanguard and the portfolio, Vanguard furnishes to the portfolio corporate management, administrative, marketing, and distribution services at Vanguard’s cost of operations (as defined by the FSA). These costs of operations are allocated to the portfolio based on methods and guidelines approved by the board of trustees. Vanguard does not require reimbursement in the current period for certain costs of operations (such as deferred compensation/benefits and risk/insurance costs); the portfolio’s liability for these costs of operations is included in Payables to Vanguard on the Statement of Net Assets.
Upon the request of Vanguard, the portfolio may invest up to 0.40% of its net assets as capital in Vanguard. At December 31, 2015, the portfolio had contributed to Vanguard capital in the amount of $47,000, representing 0.01% of the portfolio’s net assets and 0.02% of Vanguard’s capitalization. The portfolio’s trustees and officers are also directors and employees, respectively, of Vanguard.
D. Various inputs may be used to determine the value of the portfolio’s investments. These inputs are summarized in three broad levels for financial statement purposes. The inputs or methodologies used to value securities are not necessarily an indication of the risk associated with investing in those securities.
Level 1—Quoted prices in active markets for identical securities.
Level 2—Other significant observable inputs (including quoted prices for similar securities, interest rates, prepayment speeds, credit risk, etc.).
Level 3—Significant unobservable inputs (including the portfolio’s own assumptions used to determine the fair value of investments).
The following table summarizes the market value of the portfolio’s investments as of December 31, 2015, based on the inputs used to value them:
| | | |
| Level 1 | Level 2 | Level 3 |
| Investments | ($000) | ($000) | ($000) |
| U.S. Government and Agency Obligations | — | 9,534 | — |
| Asset-Backed/Commercial Mortgage-Backed Securities | — | 1,933 | — |
| Corporate Bonds | — | 479,809 | — |
| Preferred Stocks | — | 2,514 | — |
| Other | — | — | 19 |
| Temporary Cash Investments | — | 20,300 | — |
| Swap Assets1 | 1 | — | — |
| Forward Currency Contracts—Assets | — | 64 | — |
| Total | 1 | 514,154 | 19 |
| 1 Represents variation margin on the last day of the reporting period. | |
E. At December 31, 2015, the fair values of derivatives were reflected in the Statement of Net Assets as follows:
| | | |
| Foreign | | |
| Exchange | Credit | |
| Contracts | Contracts | Total |
| Statement of Net Assets Caption | ($000) | ($000) | ($000) |
| Other Assets | 64 | 1 | 65 |
| Other Liabilities | — | — | — |
115
Vanguard High Yield Bond Portfolio
| | | |
| Foreign | | |
| Exchange | Credit | |
| Contracts | Contracts | Total |
| Realized Net Gain (Loss) on Derivatives | ($000) | ($000) | ($000) |
| Forward Currency Contracts | 10 | — | 10 |
| Swap Contracts | — | (4) | (4) |
| Realized Net Gain (Loss) on Derivatives | 10 | (4) | 6 |
| | | |
| Change in Unrealized Appreciation (Depreciation) on Derivatives |
| Forward Currency Contracts | 10 | — | 10 |
| Swap Contracts | — | (51) | (51) |
| Change in Unrealized Appreciation (Depreciation) on Derivatives | 10 | (51) | (41) |
At December 31, 2015, the fund had the following open swap contracts:
| | | | | | |
| Centrally Cleared Credit Default Swaps | | | | | |
| Remaining | | |
| Up-Front | Periodic | |
| Premium | Premium | Unrealized |
| Notional | Received | Received | Appreciation |
| Termination | Amount | (Paid) | (Paid) | (Depreciation) |
| Reference Entity | Date | Counterparty | ($000) | ($000) | (%) | ($000) |
| Credit Protection Sold | | | | | | |
| CDX-HYS-25-V1-5Y1 | 12/20/20 | CME | 3,220 | (87) | 5.000 | (51) |
| CME—Chicago Mercantile Exchange. |
| 1 High Yield Credit Default Swap Index—Version 25. |
At December 31, 2015, the portfolio had open forward currency contracts to receive and deliver currencies as follows. Unrealized appreciation (depreciation) on open forward currency contracts is treated as ordinary income for tax purposes.
| | | | | | |
| Unrealized |
| Contract | | | | | Appreciation |
| Settlement | | Contract Amount (000) | (Depreciation) |
| Counterparty | Date | | Receive | | Deliver | ($000) |
| Bank of America N.A. | 1/29/16 | USD | 5,519 | EUR | 5,028 | 51 |
| JP Morgan Chase Bank N.A. | 1/29/16 | USD | 1,149 | GBP | 771 | 13 |
| | | | | | 64 |
| EUR—Euro. | | | | | |
| GBP—British pound. | | | | | |
| USD—U.S. dollar. | | | | | |
F. Distributions are determined on a tax basis and may differ from net investment income and realized capital gains for financial reporting purposes. Differences may be permanent or temporary. Permanent differences are reclassified among capital accounts in the financial statements to reflect their tax character. Temporary differences arise when certain items of income, expense, gain, or loss are recognized in different periods for financial statement and tax purposes. These differences will reverse at some time in the future. Differences in classification may also result from the treatment of short-term gains as ordinary income for tax purposes.
During the year ended December 31, 2015, the portfolio realized net foreign currency losses of $71,000 (including gains and losses on forward currency contracts and the foreign currency component on sales of foreign currency denominated bonds), which decreased distributable net income for tax purposes; accordingly, such losses have been reclassified from accumulated net realized losses to undistributed net investment income.
Realized and unrealized gains (losses) on certain of the portfolio’s swap contracts are treated as ordinary income (loss) for tax purposes; the effect on the portfolio’s income dividends to shareholders is offset by a change in principal return. Realized gains of $29,000 on swap contracts have been reclassified from accumulated net realized losses to undistributed net investment income.
For tax purposes, at December 31, 2015, the portfolio had $28,858,000 of ordinary income available for distribution. The portfolio had available capital losses totaling $167,000 that may be carried forward indefinitely to offset future net capital gains.
116
Vanguard High Yield Bond Portfolio
At December 31, 2015, the cost of investment securities for tax purposes was $545,823,000. Net unrealized depreciation of investment securities for tax purposes was $31,714,000, consisting of unrealized gains of $6,388,000 on securities that had risen in value since their purchase and $38,102,000 in unrealized losses on securities that had fallen in value since their purchase.
G. During the year ended December 31, 2015, the portfolio purchased $199,792,000 of investment securities and sold $182,338,000 of investment securities, other than U.S. government securities and temporary cash investments. Purchases and sales of U.S. government securities were $0 and $8,153,000, respectively.
H. Capital shares issued and redeemed were:
| | |
| Year Ended December 31 |
| 2015 | 2014 |
| Shares | Shares |
| (000) | (000) |
| Issued | 12,410 | 12,663 |
| Issued in Lieu of Cash Distributions | 3,659 | 3,659 |
| Redeemed | (13,025) | (12,508) |
| Net Increase (Decrease) in Shares Outstanding | 3,044 | 3,814 |
At December 31, 2015, one shareholder, an insurance company separate account whose holdings in the portfolio represent the indirect investment of Vanguard Variable Annuity contract holders, was the record or beneficial owner of 58% of the portfolio’s net assets. If the shareholder were to redeem its investment in the portfolio, the redemption might result in an increase in the portfolio’s expense ratio or cause the portfolio to incur higher transaction costs.
I. Management has determined that no material events or transactions occurred subsequent to December 31, 2015, that would require recognition or disclosure in these financial statements.
117
Vanguard High Yield Bond Portfolio
Report of Independent Registered Public Accounting Firm
To the Board of Trustees of Vanguard Variable Insurance Funds and the Shareholders of High Yield Bond Portfolio: In our opinion, the accompanying statement of net assets and the related statements of operations and of changes in net assets and the financial highlights present fairly, in all material respects, the financial position of High Yield Bond Portfolio (constituting a separate portfolio of Vanguard Variable Insurance Funds, hereafter referred to as the “Portfolio”) at December 31, 2015, the results of its operations for the year then ended, the changes in its net assets for each of the two years in the period then ended, and the financial highlights for each of the five years in the period then ended, in conformity with accounting principles generally accepted in the United States of America. These financial statements and financial highlights (hereafter referred to as “financial statements”) are the responsibility of the Portfolio’s management. Our responsibility is to express an opinion on these financial statements based on our audits. We conducted our audits of these financial statements in accordance with the standards of the Public Company Accounting Oversight Board (United States). Those standards require that we plan and perform the audit to obtain reasonable assurance about whether the financial statements are free of material misstatement. An audit includes examining, on a test basis, evidence supporting the amounts and disclosures in the financial statements, assessing the accounting principles used and significant estimates made by management, and evaluating the overall financial statement presentation. We believe that our audits, which included confirmation of securities at December 31, 2015 by correspondence with the custodian and brokers and the application of alternative auditing procedures where securities purchased had not been received, provide a reasonable basis for our opinion.
/s/PricewaterhouseCoopers LLP
Philadelphia, Pennsylvania
February 11, 2016
| |
| |
| Special 2015 tax information (unaudited) for corporate shareholders only for Vanguard High |
| Yield Bond Portfolio, a portfolio of Vanguard Variable Insurance Funds |
| |
| This information for the fiscal year ended December 31, 2015, is included pursuant to provisions |
| of the Internal Revenue Code for corporate shareholders only. |
| |
| The portfolio distributed $856,000 as capital gain dividends (20% rate gain distributions) to |
| shareholders during the fiscal year. |
118
Vanguard High Yield Bond Portfolio
About Your Portfolio’s Expenses
As a shareholder of the portfolio, you incur ongoing costs, which include costs for portfolio management, administrative services, and shareholder reports (like this one), among others. Operating expenses, which are deducted from a portfolio’s gross income, directly reduce the investment return of the portfolio.
A portfolio’s expenses are expressed as a percentage of its average net assets. This figure is known as the expense ratio. The following examples are intended to help you understand the ongoing costs (in dollars) of investing in your portfolio and to compare these costs with those of other mutual funds. The examples are based on an investment of $1,000 made at the beginning of the period shown and held for the entire period.
The table below illustrates your portfolio’s costs in two ways:
• Based on actual portfolio return. This section helps you to estimate the actual expenses that you paid over the period. The “Ending Account Value” shown is derived from the portfolio’s actual return, and the third column shows the dollar amount that would have been paid by an investor who started with $1,000 in the portfolio. You may use the information here, together with the amount you invested, to estimate the expenses that you paid over the period.
To do so, simply divide your account value by $1,000 (for example, an $8,600 account value divided by $1,000 = 8.6), then multiply the result by the number given for your portfolio under the heading “Expenses Paid During Period.”
• Based on hypothetical 5% yearly return. This section is intended to help you compare your portfolio’s costs with those of other mutual funds. It assumes that the portfolio had a yearly return of 5% before expenses, but that the expense ratio is unchanged. In this case—because the return used is not the portfolio’s actual return—the results do not apply to your investment. The example is useful in making comparisons because the Securities and Exchange Commission requires all mutual funds to calculate expenses based on a 5% return. You can assess your portfolio’s costs by comparing this hypothetical example with the hypothetical examples that appear in shareholder reports of other funds.
Note that the expenses shown in the table are meant to highlight and help you compare ongoing costs only and do not reflect transaction costs incurred by the portfolio for buying and selling securities. The portfolio’s expense ratio does not reflect additional fees and expenses associated with the annuity or life insurance program through which you invest.
The calculations assume no shares were bought or sold during the period. Your actual costs may have been higher or lower, depending on the amount of your investment and the timing of any purchases or redemptions.
You can find more information about the portfolio’s expenses in the Financial Statements section. For additional information on operating expenses and other shareholder costs, please refer to the prospectus.
| | | |
| Six Months Ended December 31, 2015 | | | |
| Beginning | Ending | Expenses |
| Account Value | Account Value | Paid During |
| High Yield Bond Portfolio | 6/30/2015 | 12/31/2015 | Period1 |
| Based on Actual Portfolio Return | $1,000.00 | $965.65 | $1.44 |
| Based on Hypothetical 5% Yearly Return | 1,000.00 | 1,023.74 | 1.48 |
1 The calculations are based on expenses incurred in the most recent six-month period. The portfolio’s annualized six-month expense ratio for that period is 0.29%. The dollar amounts shown as “Expenses Paid” are equal to the annualized expense ratio multiplied by the average account value over the period, multiplied by the number of days in the most recent six-month period, then divided by the number of days in the most recent 12-month period (184/365).
119
Vanguard® International Portfolio
Advisors’ Report
For the year ended December 31, 2015, Vanguard International Portfolio returned –0.77%, ahead of the –5.66% return of its benchmark index and the –1.55% average return of peer funds. Please note that the returns for Vanguard Variable Insurance Fund are different from those of Vanguard Variable Annuity (and other plans that invest in the fund), which take into account insurance-related expenses.
The portfolio is managed by three independent advisors, a strategy that enhances diversification by providing exposure to distinct yet complementary investment approaches. It is not uncommon for different advisors to have different views about individual securities or the broader investment environment.
The advisors, the amount and percentage of the portfolio’s assets each manages, and brief descriptions of their investment strategies are presented in the accompanying table. Each advisor has also prepared a discussion of the investment environment that existed during 2015 and its effect on the portfolio’s positioning. These reports were prepared on January 14, 2016.
Baillie Gifford Overseas Ltd.
Portfolio Managers:
James K. Anderson, Head of Global Equities
Kave Sigaroudinia, Head of EAFE Alpha Research
As we reflect on 2015 and look ahead, we do so with optimism. The world is changing at a remarkable pace, driven by technological progress and innovation. We believe we own a lot of the companies that are well placed to prosper from these changes and have identified other research themes that we would like to explore in more depth. As growth investors with long time horizons, that excites us.
Such optimism has not been reflected in international equity returns over the past year. Market angst in the summer over Greece’s standoff with its creditors and a slowing of China’s growth led markets sharply lower, including many of our holdings. That many of these holdings have since recovered most of the ground lost has been less newsworthy, but it reminds us of the importance of patience when investing over the long term. While volatile markets can feel uncomfortable, they also offer opportunities, and we have been adding on weakness to holdings with appealing long-term growth characteristics.
Some of the dominant themes within our portion of the portfolio were well-represented in the leading contributors to performance over the year. Amazon and Tencent continue to drive forward the shift to internet-based commerce, while a relatively recent holding, Zalando, the German-based online fashion retailer, is rapidly developing its active, and increasingly mobile, customer base in Europe. Several of our health care holdings, such as Celltrion, Christian Hansen, Novo Nordisk, M3, and Genmab, a recent purchase, also appreciated strongly. The most significant weakness came from our European bank holdings and from Rolls-Royce, which has suffered a difficult year, with weakness in its marine, military, and civil aerospace divisions.
We have continued to invest in companies where change is driving growth. This has included several unlisted companies, such as music streaming service Spotify and Indian e-commerce site Flipkart, and two American growth companies we believe to be globally important, with no close parallels in international markets: Tesla and Illumina. We also took a new holding in Ctrip, a leader in the Chinese travel market. To fund these new investments we sold several holdings where our expectation of future growth is waning, including Sandvik, James Hardie, and Meggitt, and several of our banks with exposure to emerging markets: Credicorp and Garanti.
| | | |
| Total Returns | | | |
| | | Ten Years Ended |
| | | December 31, 2015 |
| | Year Ended | Average |
| December 31, 2015 | Annual Return |
| Vanguard International Portfolio | -0.77% | 4.92% |
| Spliced International Index1 | -5.66 | 1.79 |
| Variable Insurance International Funds Average2 | -1.55 | 3.18 |
The figures shown represent past performance, which is not a guarantee of future results. (Current performance may be lower or higher than the performance data cited. For performance data current to the most recent month-end, visit our website at vanguard.com/performance.) Note, too, that both investment returns and principal value can fluctuate widely, so an investor’s shares, when sold, could be worth more or less than their original cost.
| | |
| Expense Ratios3 | | |
| Your Portfolio Compared With Its Peer Group | | |
| Variable Insurance |
| International |
| Portfolio | Funds Average |
| International Portfolio | 0.46% | 0.96% |
1 MSCI EAFE Index through May 31, 2010; MSCI All Country World Index ex USA thereafter.
2 Derived from data provided by Lipper, a Thomson Reuters Company.
3 The portfolio expense ratio shown is from the prospectus dated April 30, 2015, and represents estimated costs for the current fiscal year. For the fiscal year ended December 31, 2015, the International Portfolio’s expense ratio was 0.40%. The peer-group expense ratio is derived from data provided by Lipper, a Thomson Reuters Company, and captures information through year-end 2014.
120
Vanguard International Portfolio
Schroder Investment Management North America Inc.
Portfolio Manager: Simon Webber, CFA
International equity markets struggled in a year characterized by concerns about global growth and downward revisions to corporate earnings. Stock selection was the main driver of returns in our portion of the portfolio, with sector and regional allocation also contributing positively.
The best-performing stocks of the last 12 months have been scarce organic growers with good cash-flow conversion. We benefited from several such holdings, including Check Point Software, Essilor, Lonza, Capita, SAP, AIA, Assa Abloy, and Reckitt Benckiser. All remain core holdings. When global prospects finally turn upward, this part of the market is likely to be a source of funds for companies that are more cyclical, but there is little tangible evidence of that inflection point so far.
Within cyclical areas of the market, we have had a strong preference for consumer and industrial holdings and have taken a much more cautious approach to energy and commodity stocks, where prices continue to decline. With the severe pressure on high-yield credit markets since August 2015, we expect to see a more rapid rationalization of capacity in energy and mining to the benefit of the stronger players, though the next few quarters are likely to be painful.
Hitachi weighed on our relative performance. We had expected management to continue proactive reform and restructuring of its cost base, but benefits from Abenomics (Prime Minister Shinzo Abe’s aggressive stimulus program) appear to have allowed a lack of management urgency to creep back in, and we sold our position.
We increased our holdings of Chinese online services companies such as JD.com, Tencent, and Alibaba, where growth is strong. These stocks will benefit further from the Chinese economy’s transition toward a more consumption-led growth model.
Looking forward, the backdrop for equities in aggregate remains challenging, and the macroeconomic environment is uncertain. It is therefore particularly relevant to take a selective approach to investing.
We are focused on finding opportunities where the market has either overlooked or underestimated companies’ potential to deliver earnings growth. For example, we are very focused on innovation as a driver of returns in 2016. Our emphasis here is on companies that are committed to finding new, interesting, and sustainable ways to grow their businesses.
M&G Investment Management Limited
Portfolio Manager: Charles Anniss, CFA
The past year was one of increasing uncertainty, volatility, and divergence. It started with a surge of investor ebullience following the introduction of a new quantitative-easing program by the European Central Bank (ECB), accommodative policy from other major central banks, and a stabilization of oil prices. But markets became overshadowed by the Greek debt crisis and, more drastically, the evident slowdown in China and extreme volatility in its stock markets. Reduced Chinese demand put extreme pressure on the materials sector, while a supply glut helped lead the price of oil to fresh lows.
Near year-end, the ECB cut deposit rates and extended its quantitative-easing program to March 2017; then the U.S. Federal Reserve raised interest rates for the first time in nearly a decade. While investors remained relatively sanguine following the Fed’s action, the ECB’s stimulus measures fell short of market expectations. This, combined with continued weakness in China, concerns over global growth, and ongoing feebleness in commodity prices, helped to drive further risk aversion and end 2015 on a sour note.
| | | |
| Vanguard International Portfolio Investment Advisors |
| |
| Portfolio Assets Managed | |
| Investment Advisor | % | $ Million | Investment Strategy |
| Baillie Gifford Overseas Ltd. | 59 | 1,327 Uses a bottom-up, stock-driven approach to select |
| | | | stocks that it believes have above-average growth |
| | | | rates and trade at reasonable prices. |
| Schroder Investment | 24 | 536 | Uses fundamental research to identify high-quality |
| Management | companies in developed and emerging markets that |
| North America Inc. | it believes have above-average growth potential. |
| M&G Investment | 14 | 324 | Uses a long-term, bottom-up investment approach |
| Management Limited that focuses on identifying the stocks of under |
| | | | appreciated, quality companies that it believes will |
| | | | deliver high returns and have the potential for growth. |
| Cash Investments | 3 | 66 These short-term reserves are invested by Vanguard |
| | | | in equity index products to simulate investment in |
| | | | stocks. Each advisor may also maintain a modest |
| | | | cash position. |
121
Vanguard International Portfolio
At a broad-market level, there were declines across sectors, except health care and consumer staples, where our overweight positions proved beneficial. However, our relative performance was largely driven by stock-picking in the consumer discretionary and industrial sectors. In industrials, two of our strongest performers were Airbus Group, the European aerospace giant, which we were pleased to see recovering from a period of weak performance in 2014, and MISUMI, an engineering components distributor that was aided by particularly buoyant markets in Japan. This positive sentiment was also reflected in the share price of another of our best performers, Japanese insurer Tokio Marine, whose agreement to acquire HCC Insurance Holdings in a move to build on its U.S. business was generally well-received.
Our top performer for the year was a consumer business, Germany-listed sportswear manufacturer adidas. It had a solid year of operational success, punctuated by robust top-line growth, with investor sentiment further boosted by a restructuring of its golf division and an increase in U.S. marketing activities.
On the downside, energy and materials were extremely weak, as were emerging markets, and this was reflected in our biggest laggards. These included metals and mining firm First Quantum Minerals and global pipeline coating company ShawCor, both Canadian businesses that suffered among the general malaise in their sectors.
In emerging markets, our bank holdings were particularly lackluster, namely Banco Bradesco in Brazil, one of the worst-performing countries for the year, and Kasikornbank in Thailand. Standard Chartered, a U.K.-listed company with the majority of its operations focused in Asia, also detracted.
We added three new positions: Japan Tobacco and ResMed, a global manufacturer of equipment to treat respiratory conditions, in the first half of the year, and AIA, a high-quality Hong Kong-listed pan-Asian life insurance company. We also closed several positions where we had lost confidence in the investment case, including Brazilian oil company Petroleo Brasileiro (Petrobras), Taiwanese chip maker Mediatek, Canadian miner Dominion Diamond, and Switzerland’s Zurich Insurance.
122
Vanguard International Portfolio
Portfolio Profile
As of December 31, 2015
| | |
| Portfolio Characteristics | | |
| Comparative |
| Portfolio | Index1 |
| Number of Stocks | 169 | 1,850 |
| Turnover Rate | 23% | — |
| Expense Ratio2 | 0.46% | — |
| Short-Term Reserves | 0.5% | — |
| |
| |
| Volatility Measures | | |
| Portfolio Versus |
| Comparative Index1 |
| R-Squared | | 0.93 |
| Beta | | 1.07 |
| | |
| Sector Diversification (% of equity exposure) |
| Comparative |
| Portfolio | Index1 |
| Consumer Discretionary | 22.8% | 12.1% |
| Consumer Staples | 6.6 | 10.8 |
| Energy | 2.0 | 5.9 |
| Financials | 20.7 | 27.1 |
| Health Care | 9.6 | 9.6 |
| Industrials | 10.2 | 11.2 |
| Information Technology | 18.2 | 8.2 |
| Materials | 4.2 | 6.4 |
| Other | 2.5 | 0.0 |
| Telecommunication Services | 3.1 | 5.2 |
| Utilities | 0.1 | 3.5 |
| | |
| Ten Largest Holdings3 (% of total net assets) |
| |
| Tencent Holdings Ltd. | Internet Software | |
| & Services | 3.7% |
| Industria de Diseno | | |
| Textil SA | Apparel Retail | 3.4 |
| AIA Group Ltd. | Life & Health | |
| Insurance | 3.4 |
| Baidu Inc. ADR | Internet Software | |
| & Services | 3.4 |
| Amazon.com Inc. | Internet Retail | 3.0 |
| Alibaba Group | Internet Software | |
| Holding Ltd. ADR | & Services | 2.8 |
| Fiat Chrysler | Automobile | |
| Automobiles NV | Manufacturers | 2.5 |
| SoftBank Group Corp. | Wireless | |
| Telecommunication | |
| Services | 2.0 |
| ARM Holdings plc | Semiconductors | 1.8 |
| Rolls-Royce Holdings plc | Aerospace | |
| & Defense | 1.7 |
| Top Ten | 27.7% |
Allocation by Region
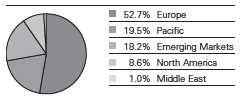
| | | |
| Market Diversification (% of equity exposure) |
| Comparative |
| Portfolio4 | Index1 |
| Europe | |
| United Kingdom | 13.6% | 14.3% |
| Germany | 8.0 | 6.7 |
| Spain | 5.6 | 2.3 |
| Sweden | 5.6 | 2.1 |
| France | 4.8 | 7.2 |
| Switzerland | 4.4 | 6.9 |
| Italy | 3.9 | 1.7 |
| Denmark | 2.1 | 1.4 |
| Netherlands | 1.4 | 2.1 |
| Norway | 1.3 | 0.4 |
| Ireland | 1.2 | 0.3 |
| Other European Markets | 0.8 | 2.1 |
| Subtotal | 52.7% | 47.5% |
| Pacific | |
| Japan | 11.2% | 17.1% |
| Hong Kong | 5.0 | 2.3 |
| South Korea | 2.2 | 3.2 |
| Other Pacific Markets | 1.1 | 6.1 |
| Subtotal | 19.5% | 28.7% |
| Emerging Markets | |
| China | 12.5% | 5.5% |
| India | 2.4 | 1.8 |
| Other Emerging Markets | 3.3 | 9.8 |
| Subtotal | 18.2% | 17.1% |
| North America | |
| United States | 7.2% | 0.0% |
| Canada | 1.4 | 5.9 |
| Subtotal | 8.6% | 5.9% |
| Middle East | |
| Israel | 1.0% | 0.6% |
| Other | 0.0% | 0.2% |
Beta. A measure of the magnitude of a portfolio’s past share-price fluctuations in relation to the ups and downs of a given market index. The index is assigned a beta of 1.00. Compared with a given index, a portfolio with a beta of 1.20 typically would have seen its share price rise or fall by 12% when the index rose or fell by 10%. For this report, beta is based on returns over the past 36 months for both the portfolio and the index.
Equity Exposure. A measure that reflects a portfolio’s investments in stocks and stock futures. Any holdings in short-term reserves are excluded.
R-Squared. A measure of how much of a portfolio’s past returns can be explained by the returns from the market in general, as measured by a given index. If a portfolio’s total returns were precisely synchronized with an index’s returns, its R-squared would be 1.00. If the portfolio’s returns bore no relationship to the index’s returns, its R-squared would be 0. For this report, R-squared is based on returns over the past 36 months for both the portfolio and the index.
1 MSCI All Country World Index ex USA.
2 The expense ratio shown is from the prospectus dated April 30, 2015, and represents estimated costs for the current fiscal year. For the fiscal year ended December 31, 2015, the International Portfolio’s expense ratio was 0.40%.
3 The holdings listed exclude any temporary cash investments and equity index products.
4 Market percentages exclude currency contracts held by the portfolio.
123
Vanguard International Portfolio
Performance Summary
All of the returns in this report represent past performance, which is not a guarantee of future results that may be achieved by the portfolio. (Current performance may be lower or higher than the performance data cited. For performance data current to the most recent month-end, visit our website at vanguard.com/performance.) Note, too, that both investment returns and principal value can fluctuate widely, so an investor’s shares, when sold, could be worth more or less than their original cost. The returns shown do not reflect taxes that a shareholder would pay on portfolio distributions or on the sale of portfolio shares. Nor do the returns reflect fees and expenses associated with the annuity or life insurance program through which a shareholder invests. If these fees and expenses were included, the portfolio’s returns would be lower.
Cumulative Performance: December 31, 2005–December 31, 2015
Initial Investment of $10,000

| | | | |
| | | Average Annual Total Returns | Final Value |
| | Periods Ended December 31, 2015 | of a $10,000 |
| | One Year | Five Years | Ten Years | Investment |
| International Portfolio | -0.77% | 3.60% | 4.92% | $16,167 |
| Spliced International Index1 | -5.66 | 1.06 | 1.79 | 11,945 |
| Variable Insurance International | | | | |
| Funds Average2 | -1.55 | 2.90 | 3.18 | 13,674 |
| MSCI All Country World Index ex USA | -5.66 | 1.06 | 2.92 | 13,338 |
Fiscal-Year Total Returns (%): December 31, 2005–December 31, 2015

| |
| International Portfolio |
| Spliced International Index1 |
1 MSCI EAFE Index through May 31, 2010; MSCI All Country World Index ex USA thereafter.
2 Derived from data provided by Lipper, a Thomson Reuters Company.
See Financial Highlights for dividend and capital gains information.
124
Vanguard International Portfolio
Financial Statements
Statement of Net Assets
As of December 31, 2015
The portfolio reports a complete list of its holdings in regulatory filings four times in each fiscal year, at the quarter-ends. For the second and fourth fiscal quarters, the lists appear in the portfolio’s semiannual and annual reports to shareholders. For the first and third fiscal quarters, the portfolio files the lists with the Securities and Exchange Commission on Form N-Q. Shareholders can look up the portfolio’s Forms N-Q on the SEC’s website at sec.gov. Forms N-Q may also be reviewed and copied at the SEC’s Public Reference Room (see the back cover of this report for further information).
| | | |
| Market |
| Value• |
| | Shares | ($000) |
| Common Stocks (96.9%)1 | | |
| Australia (0.6%) | | |
| Brambles Ltd. | 727,941 | 6,096 |
| Orica Ltd. | 434,103 | 4,864 |
| Amcor Ltd. | 269,655 | 2,620 |
| 13,580 |
| Brazil (0.4%) | | |
| Raia Drogasil SA | 439,586 | 3,934 |
| Banco Bradesco SA | | |
| | Preference Shares | 601,414 | 2,910 |
| BM&FBovespa SA - Bolsa | | |
| | de Valores Mercadorias | | |
| | e Futuros | 990,200 | 2,707 |
| * | Banco Bradesco SA | | |
| | Preference Shares Rights | | |
| | Exp. 02/05/2016 | 19,700 | 10 |
| 9,561 |
| Canada (1.4%) | | |
| Toronto-Dominion Bank | 421,953 | 16,540 |
| Bank of Nova Scotia | 124,822 | 5,049 |
| Suncor Energy Inc. | 156,060 | 4,029 |
| ShawCor Ltd. | 146,886 | 2,980 |
| First Quantum Minerals | | |
| | Ltd. | 631,761 | 2,365 |
| 30,963 |
| China (12.4%) | | |
| Tencent Holdings Ltd. | 4,274,900 | 83,702 |
| * | Baidu Inc. ADR | 403,200 | 76,221 |
| * | Alibaba Group Holding Ltd. | | |
| | ADR | 784,351 | 63,744 |
| New Oriental Education | | |
| | & Technology Group Inc. | | |
| | ADR | 557,300 | 17,483 |
| * | JD.com Inc. ADR | 371,234 | 11,978 |
| *,2 China Internet Plus | | |
| | Holdings Ltd. | 2,083,522 | 8,042 |
| China Pacific Insurance | | |
| | Group Co. Ltd. | 1,618,600 | 6,624 |
| Mindray Medical | | |
| | International Ltd. ADR | 183,450 | 4,975 |
| * | Ctrip.com International Ltd. | | |
| | ADR | 80,591 | 3,734 |
| CNOOC Ltd. | 3,506,000 | 3,649 |
| 280,152 |
| Denmark (2.1%) | | |
| Novozymes A/S | 354,441 | 16,970 |
| Chr Hansen Holding A/S | 163,100 | 10,202 |
| * | Genmab A/S | 73,621 | 9,789 |
| Novo Nordisk A/S Class B | 166,939 | 9,666 |
| 46,627 |
| Finland (0.3%) | | |
| Nokia Oyj | 1,008,820 | 7,137 |
| | | |
| Market |
| Value• |
| | Shares | ($000) |
| France (4.4%) | | |
| L’Oreal SA | 105,858 | 17,806 |
| Essilor International SA | 129,313 | 16,117 |
| Kering | 89,975 | 15,383 |
| Sanofi | 99,216 | 8,455 |
| Airbus Group SE | 119,807 | 8,073 |
| Societe Generale SA | 162,984 | 7,511 |
| Schneider Electric SE | 124,054 | 7,047 |
| ^ | Publicis Groupe SA | 98,302 | 6,537 |
| TOTAL SA | 127,648 | 5,723 |
| Accor SA | 118,371 | 5,127 |
| Safran SA | 34,481 | 2,369 |
| 100,148 |
| Germany (7.7%) | | |
| *,3 Zalando SE | 647,616 | 25,577 |
| SAP SE | 305,020 | 24,204 |
| Fresenius Medical Care | | |
| | AG & Co. KGaA | 189,422 | 15,918 |
| BASF SE | 183,791 | 14,001 |
| Bayerische Motoren | | |
| | Werke AG | 112,005 | 11,800 |
| Bayer AG | 78,248 | 9,773 |
| adidas AG | 91,865 | 8,916 |
| ^,*,3Rocket Internet SE | 278,557 | 8,486 |
| *,2 Home 24AG | 2,691 | 7,444 |
| HeidelbergCement AG | 89,614 | 7,303 |
| Continental AG | 29,916 | 7,237 |
| GEA Group AG | 169,070 | 6,831 |
| MTU Aero Engines AG | 69,000 | 6,725 |
| *,2 HelloFresh | 249,150 | 5,640 |
| Deutsche Bank AG | 177,891 | 4,320 |
| * | MorphoSys AG | 67,732 | 4,215 |
| *,2 CureVac GmbH | 1,452 | 3,369 |
| ^,* AIXTRON SE | 274,000 | 1,216 |
| Bayer AG (London Shares) | 889 | 111 |
| 173,086 |
| Hong Kong (5.0%) | | |
| AIA Group Ltd. | 12,849,800 | 76,779 |
| Hong Kong Exchanges | | |
| | and Clearing Ltd. | 503,560 | 12,828 |
| Jardine Matheson | | |
| | Holdings Ltd. | 227,251 | 11,005 |
| Techtronic Industries | | |
| | Co. Ltd. | 1,801,000 | 7,291 |
| Hang Lung Properties | | |
| | Ltd. | 1,822,000 | 4,128 |
| 112,031 |
| India (2.4%) | | |
| Housing Development | | |
| | Finance Corp. Ltd. | 863,800 | 16,429 |
| Idea Cellular Ltd. | 4,660,884 | 10,086 |
| HDFC Bank Ltd. | 457,216 | 7,467 |
| Zee Entertainment | | |
| | Enterprises Ltd. | 992,887 | 6,545 |
| | | |
| Market |
| Value• |
| | Shares | ($000) |
| *,2 ANI Technologies | 142 | 6,005 |
| *,2,3 Flipkart G Series | 37,575 | 5,143 |
| *,2,3 Flipkart H Series | 16,044 | 2,282 |
| 53,957 |
| Indonesia (0.2%) | | |
| Bank Mandiri Persero | | |
| | Tbk PT | 5,834,800 | 3,874 |
| |
| Ireland (1.2%) | | |
| Kerry Group plc Class A | 185,846 | 15,377 |
| * | Bank of Ireland | 32,956,683 | 12,068 |
| Kerry Group plc Class A | | |
| | (London Shares) | 2,735 | 228 |
| 27,673 |
| Israel (1.0%) | | |
| * | Check Point Software | | |
| | Technologies Ltd. | 174,247 | 14,180 |
| Teva Pharmaceutical | | |
| | Industries Ltd. ADR | 119,209 | 7,825 |
| 22,005 |
| Italy (3.8%) | | |
| * | Fiat Chrysler Automobiles | | |
| | NV | 4,048,246 | 56,222 |
| EXOR SPA | 331,840 | 15,061 |
| UniCredit SPA | 1,737,136 | 9,604 |
| Intesa Sanpaolo SPA | | |
| | (Registered) | 1,607,334 | 5,338 |
| 86,225 |
| Japan (10.3%) | | |
| SoftBank Group Corp. | 907,100 | 45,782 |
| SMC Corp. | 122,400 | 31,791 |
| Rakuten Inc. | 2,248,700 | 25,900 |
| M3 Inc. | 901,600 | 18,694 |
| Sumitomo Mitsui Financial | | |
| | Group Inc. | 376,300 | 14,202 |
| ^ | Bridgestone Corp. | 370,000 | 12,691 |
| Tokio Marine Holdings Inc. | 261,600 | 10,104 |
| Toyota Motor Corp. | 146,800 | 9,040 |
| ^ | Japan Tobacco Inc. | 233,800 | 8,584 |
| Sekisui Chemical Co. Ltd. | 615,000 | 8,030 |
| Kubota Corp. | 501,000 | 7,740 |
| Astellas Pharma Inc. | 530,500 | 7,552 |
| MISUMI Group Inc. | 513,000 | 7,086 |
| ORIX Corp. | 384,500 | 5,394 |
| SBI Holdings Inc. | 477,700 | 5,155 |
| Suzuki Motor Corp. | 164,200 | 4,989 |
| Keyence Corp. | 6,700 | 3,682 |
| FANUC Corp. | 20,400 | 3,515 |
| Suntory Beverage | | |
| | & Food Ltd. | 72,000 | 3,152 |
| 233,083 |
| Luxembourg (0.3%) | | |
| *,2 Spotify Technology SA | 2,961 | 6,599 |
| |
| Mexico (0.2%) | | |
| Grupo Financiero Banorte | | |
| | SAB de CV | 983,362 | 5,420 |
| |
| Netherlands (1.4%) | | |
| ASML Holding NV | 202,511 | 17,994 |
| ING Groep NV | 561,069 | 7,591 |
| Akzo Nobel NV | 75,830 | 5,067 |
| 30,652 |
125
Vanguard International Portfolio
| | | |
| Market |
| Value• |
| | Shares | ($000) |
| Norway (1.3%) | | |
| Statoil ASA | 760,633 | 10,608 |
| Schibsted ASA Class A | 214,063 | 7,038 |
| * | Schibsted ASA Class B | 214,063 | 6,813 |
| DNB ASA | 301,777 | 3,718 |
| 28,177 |
| Other (0.6%) | | |
| 4 | Vanguard FTSE All-World | | |
| | ex-US ETF | 298,796 | 12,971 |
| |
| Portugal (0.2%) | | |
| Jeronimo Martins SGPS SA | 343,323 | 4,467 |
| |
| Russia (0.6%) | | |
| Magnit PJSC GDR | 329,132 | 13,235 |
| |
| Singapore (0.2%) | | |
| DBS Group Holdings Ltd. | 465,311 | 5,453 |
| |
| South Africa (0.2%) | | |
| Sasol Ltd. | 145,368 | 3,925 |
| |
| South Korea (2.2%) | | |
| NAVER Corp. | 31,273 | 17,439 |
| ^,* Celltrion Inc. | 215,478 | 15,373 |
| Samsung Electronics Co. | | |
| | Ltd. | 6,493 | 6,925 |
| Hankook Tire Co. Ltd. | 148,777 | 5,934 |
| Hyundai Motor Co. | 22,888 | 2,887 |
| 48,558 |
| Spain (5.5%) | | |
| Industria de Diseno Textil | | |
| | SA | 2,261,342 | 77,687 |
| Banco Popular Espanol | | |
| | SA | 8,637,220 | 28,459 |
| Distribuidora Internacional | | |
| | de Alimentacion SA | 1,433,395 | 8,454 |
| Banco Bilbao Vizcaya | | |
| | Argentaria SA | 736,308 | 5,380 |
| Banco Santander SA | 728,564 | 3,584 |
| 123,564 |
| Sweden (5.5%) | | |
| * | Svenska Handelsbanken | | |
| | AB Class A | 2,703,555 | 35,907 |
| Investment AB Kinnevik | 1,100,606 | 33,900 |
| Atlas Copco AB Class A | 1,258,070 | 30,854 |
| * | Assa Abloy AB Class B | 440,319 | 9,217 |
| ^ | Elekta AB Class B | 920,856 | 7,824 |
| Alfa Laval AB | 393,219 | 7,179 |
| 124,881 |
| Switzerland (4.4%) | | |
| Nestle SA | 356,478 | 26,463 |
| Roche Holding AG | 85,659 | 23,737 |
| Syngenta AG | 35,879 | 14,043 |
| Cie Financiere Richemont | | |
| | SA | 190,704 | 13,649 |
| Novartis AG | 95,823 | 8,243 |
| LafargeHolcim Ltd. | 124,800 | 6,249 |
| Lonza Group AG | 38,176 | 6,209 |
| 98,593 |
| | | |
| Market |
| Value• |
| | Shares | ($000) |
| Taiwan (0.7%) | | |
| Taiwan Semiconductor | | |
| | Manufacturing Co. Ltd. | 3,703,000 | 15,976 |
| |
| Thailand (0.4%) | | |
| Kasikornbank PCL | 1,617,800 | 6,725 |
| Kasikornbank PCL | | |
| | (Foreign) | 778,500 | 3,231 |
| 9,956 |
| Turkey (0.6%) | | |
| BIM Birlesik Magazalar AS | 821,182 | 14,455 |
| |
| United Kingdom (12.5%) | | |
| ARM Holdings plc | 2,720,737 | 41,470 |
| Rolls-Royce Holdings plc | 4,563,908 | 38,658 |
| Prudential plc | 1,230,840 | 27,730 |
| HSBC Holdings plc | 1,983,398 | 15,657 |
| Carnival plc | 216,484 | 12,332 |
| Standard Chartered plc | 1,467,103 | 12,173 |
| Vodafone Group plc | 3,282,871 | 10,646 |
| Royal Dutch Shell plc | | |
| | Class A | 459,173 | 10,472 |
| Aggreko plc | 729,423 | 9,819 |
| Reckitt Benckiser Group | | |
| | plc | 90,821 | 8,403 |
| Unilever plc | 191,201 | 8,201 |
| Capita plc | 457,243 | 8,136 |
| Diageo plc | 293,677 | 8,020 |
| BHP Billiton plc | 655,830 | 7,314 |
| Lloyds Banking Group plc | 6,765,159 | 7,279 |
| Inchcape plc | 618,335 | 7,134 |
| Burberry Group plc | 374,315 | 6,586 |
| Ultra Electronics Holdings | | |
| | plc | 217,000 | 6,319 |
| ^,* Ocado Group plc | 1,403,300 | 6,270 |
| *,2 Skyscanner | 41,148 | 6,192 |
| G4S plc | 1,821,898 | 6,052 |
| Intertek Group plc | 147,843 | 6,048 |
| Spectris plc | 208,096 | 5,523 |
| WPP plc | 204,969 | 4,715 |
| 281,149 |
| United States (6.9%) | | |
| * | Amazon.com Inc. | 100,571 | 67,975 |
| * | Illumina Inc. | 144,375 | 27,712 |
| ^,* Tesla Motors Inc. | 114,445 | 27,468 |
| MercadoLibre Inc. | 151,400 | 17,311 |
| Samsonite International | | |
| | SA | 2,966,000 | 8,889 |
| ResMed Inc. | 118,794 | 6,378 |
| 155,733 |
| Total Common Stocks | | |
| (Cost $1,991,927) | 2,183,866 |
| | |
| Market |
| Value• |
| Shares | ($000) |
| Preferred Stocks (0.2%) | | |
| *,2 You & Mr. Jones | | |
| (Cost $5,200) | 5,200,000 | 5,200 |
| Temporary Cash Investments (4.9%)1 | |
| Money Market Fund (4.4%) | | |
| 5,6 Vanguard Market Liquidity | | |
| Fund, 0.363% | 98,834,493 | 98,834 |
| |
| Face | |
| Amount | |
| ($000) | |
| U.S. Government and Agency Obligations (0.5%) |
| 7,8 Federal Home Loan | | |
| Bank Discount Notes, | | |
| 0.225%, 2/12/16 | 2,000 | 1,999 |
| 7,8 Federal Home Loan | | |
| Bank Discount Notes, | | |
| 0.315%, 3/2/16 | 700 | 700 |
| 7 Federal Home Loan | | |
| Bank Discount Notes, | | |
| 0.245%, 4/20/16 | 4,000 | 3,995 |
| 7,8 Federal Home Loan | | |
| Bank Discount Notes, | | |
| 0.290%, 4/29/16 | 2,000 | 1,997 |
| United States Treasury Bill, | |
| 0.370%-0.386%, 5/26/16 | 1,800 | 1,797 |
| 10,488 |
| Total Temporary Cash Investments | |
| (Cost $109,326) | 109,322 |
| Total Investments (102.0%) | | |
| (Cost $2,106,453) | 2,298,388 |
126
Vanguard International Portfolio
| | |
| Amount |
| ($000) |
| Other Assets and Liabilities (-2.0%) | | |
| Other Assets | | |
| Investment in Vanguard | 204 |
| Receivables for Investment Securities Sold | 130 |
| Receivables for Accrued Income | 3,988 |
| Receivables for Capital Shares Issued | 256 |
| Other Assets | 812 |
| Total Other Assets | 5,390 |
| Liabilities | | |
| Payables for Investment Securities | | |
| Purchased | (347) |
| Collateral for Securities on Loan | (43,224) |
| Payables to Investment Advisor | (1,063) |
| Payables for Capital Shares Redeemed | (1,638) |
| Payables to Vanguard | (3,339) |
| Other Liabilities | (1,063) |
| Total Liabilities | (50,674) |
| Net Assets (100%) | | |
| Applicable to 113,766,819 outstanding | |
| $.001 par value shares of beneficial | | |
| interest (unlimited authorization) | 2,253,104 |
| Net Asset Value Per Share | $19.80 |
| |
| At December 31, 2015, net assets consisted of: |
| Amount |
| ($000) |
| Paid-in Capital | 1,997,192 |
| Undistributed Net Investment Income | 27,955 |
| Accumulated Net Realized Gains | 35,345 |
| Unrealized Appreciation (Depreciation) | |
| Investment Securities | 191,935 |
| Futures Contracts | 1,083 |
| Forward Currency Contracts | (105) |
| Foreign Currencies | (301) |
| Net Assets | 2,253,104 |
| |
• See Note A in Notes to Financial Statements.
* Non-income-producing security.
^ Includes partial security positions on loan to broker-dealers. The total value of securities on loan is $41,180,000.
1 The portfolio invests a portion of its cash reserves in equity markets through the use of index futures contracts. After giving effect to futures investments, the portfolio’s effective common stock and temporary cash investment positions represent 99.4% and 2.4%, respectively, of net assets.
2 Restricted securities totaling $55,916,000, representing 2.5% of net assets.
3 Security exempt from registration under Rule 144A of the Securities Act of 1933. Such securities may be sold in transactions exempt from registration, normally to qualified institutional buyers. At December 31, 2015, the aggregate value of these securities was $41,488,000, representing 1.8% of net assets.
4 Considered an affiliated company of the portfolio as the issuer is another member of The Vanguard Group.
5 Affiliated money market fund available only to Vanguard funds and certain trusts and accounts managed by Vanguard. Rate shown is the 7-day yield.
6 Includes $43,224,000 of collateral received for securities on loan.
7 The issuer operates under a congressional charter; its securities are generally neither guaranteed by the U.S. Treasury nor backed by the full faith and credit of the U.S. government.
8 Securities with a value of $3,696,000 have been segregated as initial margin for open futures contracts.
ADR—American Depositary Receipt.
GDR—Global Depositary Receipt.
See accompanying Notes, which are an integral part of the Financial Statements.
127
| | | |
| Vanguard International Portfolio | |
| |
| |
| Statement of Operations |
| |
| Year Ended |
| December 31, 2015 |
| | ($000) |
| Investment Income | | |
| Income | | |
| Dividends1,2 | 39,322 |
| Interest 2 | 150 |
| Securities Lending | 2,000 |
| Total Income | 41,472 |
| Expenses | | |
| Investment Advisory Fees—Note B | |
| | Basic Fee | 3,501 |
| | Performance Adjustment | 745 |
| The Vanguard Group—Note C | | |
| | Management and Administrative | 4,343 |
| | Marketing and Distribution | 354 |
| Custodian Fees | 369 |
| Auditing Fees | 44 |
| Shareholders’ Reports | 36 |
| Trustees’ Fees and Expenses | 3 |
| Total Expenses | 9,395 |
| Net Investment Income | 32,077 |
| Realized Net Gain (Loss) | | |
| Investment Securities Sold 2 | 41,603 |
| Futures Contracts | (1,474) |
| Foreign Currencies and Forward | | |
| Currency Contracts | (4,159) |
| Realized Net Gain (Loss) | 35,970 |
| Change in Unrealized Appreciation | |
| (Depreciation) | | |
| Investment Securities | (96,275) |
| Futures Contracts | (1,579) |
| Foreign Currencies and Forward | | |
| Currency Contracts | 999 |
| Change in Unrealized Appreciation | |
| (Depreciation) | (96,855) |
| Net Increase (Decrease) in Net Assets | |
| Resulting from Operations | (28,808) |
1 Dividends are net of foreign withholding taxes of $2,284,000.
2 Dividend income, interest income, and realized net gain (loss) from affiliated companies of the portfolio were $131,000, $137,000, and $0, respectively.
| | |
| Statement of Changes in Net Assets | | |
| |
| Year Ended December 31, |
| 2015 | 2014 |
| ($000) | ($000) |
| Increase (Decrease) in Net Assets | | |
| Operations | | |
| Net Investment Income | 32,077 | 42,606 |
| Realized Net Gain (Loss) | 35,970 | 106,981 |
| Change in Unrealized Appreciation (Depreciation) | (96,855) | (289,337) |
| Net Increase (Decrease) in Net Assets Resulting from Operations | (28,808) | (139,750) |
| Distributions | | |
| Net Investment Income | (42,431) | (32,280) |
| Realized Capital Gain | (34,854) | — |
| Total Distributions | (77,285) | (32,280) |
| Capital Share Transactions | | |
| Issued | 430,123 | 298,546 |
| Issued in Lieu of Cash Distributions | 77,285 | 32,280 |
| Redeemed | (350,922) | (240,402) |
| Net Increase (Decrease) from Capital Share Transactions | 156,486 | 90,424 |
| Total Increase (Decrease) | 50,393 | (81,606) |
| Net Assets |
| Beginning of Period | 2,202,711 | 2,284,317 |
| End of Period1 | 2,253,104 | 2,202,711 |
| 1 Net Assets—End of Period includes undistributed (overdistributed) net investment income of $27,955,000 and $38,962,000. |
See accompanying Notes, which are an integral part of the Financial Statements.
128
| | | | | |
| Vanguard International Portfolio | | | | | |
| |
| |
| Financial Highlights | | | | | |
| |
| |
| For a Share Outstanding | | | Year Ended December 31, |
| Throughout Each Period | 2015 | 2014 | 2013 | 2012 | 2011 |
| Net Asset Value, Beginning of Period | $20.63 | $22.28 | $18.35 | $15.58 | $18.29 |
| Investment Operations | |
| Net Investment Income | .278 | .4011 | .301 | .324 | .352 |
| Net Realized and Unrealized Gain (Loss) | | | | | |
| on Investments | (.394) | (1.736) | 3.909 | 2.792 | (2.782) |
| Total from Investment Operations | (.116) | (1.335) | 4.210 | 3.116 | (2.430) |
| Distributions | | |
| Dividends from Net Investment Income | (.392) | (.315) | (.280) | (.346) | (.280) |
| Distributions from Realized Capital Gains | (.322) | — | — | — | — |
| Total Distributions | (.714) | (.315) | (.280) | (.346) | (.280) |
| Net Asset Value, End of Period | $19.80 | $20.63 | $22.28 | $18.35 | $15.58 |
| |
| Total Return | -0.77% | -6.05% | 23.26% | 20.14% | -13.54% |
| |
| Ratios/Supplemental Data | | |
| Net Assets, End of Period (Millions) | $2,253 | $2,203 | $2,284 | $1,754 | $1,507 |
| Ratio of Total Expenses to Average Net Assets2 | 0.40% | 0.46% | 0.47% | 0.49% | 0.51% |
| Ratio of Net Investment Income to | | | | | |
| Average Net Assets | 1.37% | 1.89%1 | 1.63% | 1.89% | 1.97% |
| Portfolio Turnover Rate | 23% | 24% | 22% | 29% | 33% |
1 Net investment income per share and the ratio of net investment income to average net assets include $.061 and 0.28%, respectively, resulting from income received from Vodafone Group plc in the form of cash and shares in Verizon Communications Inc. in February 2014.
2 Includes performance-based investment advisory fee increases (decreases) of 0.03%, 0.03%, 0.03%, 0.04%, and 0.04%.
Notes to Financial Statements
Vanguard International Portfolio, a portfolio of Vanguard Variable Insurance Funds, is registered under the Investment Company Act of 1940 as an open-end investment company. The portfolio’s shares are only available for purchase by separate accounts of insurance companies as investments for variable annuity plans, variable life insurance contracts, or other variable benefit insurance contracts. The portfolio invests in securities of foreign issuers, which may subject it to investment risks not normally associated with investing in securities of U.S. corporations.
A. The following significant accounting policies conform to generally accepted accounting principles for U.S. investment companies. The portfolio consistently follows such policies in preparing its financial statements.
1. Security Valuation: Securities are valued as of the close of trading on the New York Stock Exchange (generally 4 p.m., Eastern time) on the valuation date. Equity securities are valued at the latest quoted sales prices or official closing prices taken from the primary market in which each security trades; such securities not traded on the valuation date are valued at the mean of the latest quoted bid and asked prices. Securities for which market quotations are not readily available, or whose values have been affected by events occurring before the portfolio’s pricing time but after the close of the securities’ primary markets, are valued at their fair values calculated according to procedures adopted by the board of trustees. These procedures include obtaining quotations from an independent pricing service, monitoring news to identify significant market- or security-specific events, and evaluating changes in the values of foreign market proxies (for example, ADRs, futures contracts, or exchange-traded funds), between the time the foreign markets close and the portfolio’s pricing time. When fair-value pricing is employed, the prices of securities used by a portfolio to calculate its net asset value may differ from quoted or published prices for the same securities. Investments in Vanguard Market Liquidity Fund are valued at that fund’s net asset value. Temporary cash investments acquired over 60 days to maturity are valued using the latest bid prices or using valuations based on a matrix
129
Vanguard International Portfolio
system (which considers such factors as security prices, yields, maturities, and ratings), both as furnished by independent pricing services. Other temporary cash investments are valued at amortized cost, which approximates market value.
2. Foreign Currency: Securities and other assets and liabilities denominated in foreign currencies are translated into U.S. dollars using exchange rates obtained from an independent third party as of the portfolio’s pricing time on the valuation date. Realized gains (losses) and unrealized appreciation (depreciation) on investment securities include the effects of changes in exchange rates since the securities were purchased, combined with the effects of changes in security prices. Fluctuations in the value of other assets and liabilities resulting from changes in exchange rates are recorded as unrealized foreign currency gains (losses) until the assets or liabilities are settled in cash, at which time they are recorded as realized foreign currency gains (losses).
3. Futures and Forward Currency Contracts: The portfolio uses index futures contracts to a limited extent, with the objective of maintaining full exposure to the stock market while maintaining liquidity. The portfolio may purchase or sell futures contracts to achieve a desired level of investment, whether to accommodate portfolio turnover or cash flows from capital share transactions. The primary risks associated with the use of futures contracts are imperfect correlation between changes in market values of stocks held by the portfolio and the prices of futures contracts, and the possibility of an illiquid market. Counterparty risk involving futures is mitigated because a regulated clearinghouse is the counterparty instead of the clearing broker. To further mitigate counterparty risk, the portfolio trades futures contracts on an exchange, monitors the financial strength of its clearing brokers and clearinghouse, and has entered into clearing agreements with its clearing brokers. The clearinghouse imposes initial margin requirements to secure the portfolio’s performance and requires daily settlement of variation margin representing changes in the market value of each contract.
The portfolio enters into forward currency contracts to provide the appropriate currency exposure related to any open futures contracts or to protect the value of securities and related receivables and payables against changes in foreign exchange rates. The portfolio’s risks in using these contracts include movement in the values of the foreign currencies relative to the U.S. dollar and the ability of the counterparties to fulfill their obligations under the contracts. The portfolio mitigates its counterparty risk by entering into forward currency contracts only with a diverse group of prequalified counterparties, monitoring their financial strength, entering into master netting arrangements with its counterparties, and requiring its counterparties to transfer collateral as security for their performance. The master netting arrangements provide that, in the event of a counterparty’s default (including bankruptcy), the portfolio may terminate the forward currency contracts, determine the net amount owed by either party in accordance with its master netting arrangements, and sell or retain any collateral held up to the net amount owed to the portfolio under the master netting arrangements. The forward currency contracts contain provisions whereby a counterparty may terminate open contracts if the portfolio’s net assets decline below a certain level, triggering a payment by the portfolio if the portfolio is in a net liability position at the time of the termination. The payment amount would be reduced by any collateral the portfolio has pledged. Any assets pledged as collateral for open contracts are noted in the Statement of Net Assets. The value of collateral received or pledged is compared daily to the value of the forward currency contracts exposure with each counterparty, and any difference, if in excess of a specified minimum transfer amount, is adjusted and settled within two business days.
Futures contracts are valued at their quoted daily settlement prices. Forward currency contracts are valued at their quoted daily prices obtained from an independent third party, adjusted for currency risk based on the expiration date of each contract. The aggregate settlement values and notional amounts of the contracts are not recorded in the Statement of Net Assets. Fluctuations in the value of the contracts are recorded in the Statement of Net Assets as an asset (liability) and in the Statement of Operations as unrealized appreciation (depreciation) until the contracts are closed, when they are recorded as realized gains (losses) on futures or forward currency contracts.
During the year ended December 31, 2015, the portfolio’s average investments in long and short futures contracts represented 3% and 0% of net assets, respectively, based on the average of aggregate settlement values at each quarter-end during the period. The portfolio’s average investment in forward currency contracts represented 4% of net assets, based on the average of notional amounts at each quarter-end during the period.
4. Federal Income Taxes: The portfolio intends to continue to qualify as a regulated investment company and distribute all of its taxable income. Management has analyzed the portfolio’s tax positions taken for all open federal income tax years (December 31, 2012–2015), and has concluded that no provision for federal income tax is required in the portfolio’s financial statements.
130
Vanguard International Portfolio
5. Distributions: Distributions to shareholders are recorded on the ex-dividend date.
6. Securities Lending: To earn additional income, the portfolio lends its securities to qualified institutional borrowers. Security loans are subject to termination by the portfolio at any time and are required to be secured at all times by collateral in an amount at least equal to the market value of securities loaned. Daily market fluctuations could cause the value of loaned securities to be more or less than the value of the collateral received. When this occurs, the collateral is adjusted and settled on the next business day. The portfolio further mitigates its counterparty risk by entering into securities lending transactions only with a diverse group of prequalified counterparties, monitoring their financial strength, and entering into master securities lending agreements with its counterparties. The master securities lending agreements provide that, in the event of a counterparty’s default (including bankruptcy), the portfolio may terminate any loans with that borrower, determine the net amount owed, and sell or retain the collateral up to the net amount owed to the portfolio; however, such actions may be subject to legal proceedings. While collateral mitigates counterparty risk, in the absence of a default the portfolio may experience delays and costs in recovering the securities loaned. The portfolio invests cash collateral received in Vanguard Market Liquidity Fund, and records a liability in the Statement of Net Assets for the return of the collateral, during the period the securities are on loan. Securities lending income represents fees charged to borrowers plus income earned on invested cash collateral, less expenses associated with the loan.
7. Credit Facility: The portfolio and certain other funds managed by The Vanguard Group (“Vanguard”) participate in a $3 billion committed credit facility provided by a syndicate of lenders pursuant to a credit agreement that may be renewed annually; each fund is individually liable for its borrowings, if any, under the credit facility. Borrowings may be utilized for temporary and emergency purposes, and are subject to the portfolio’s regulatory and contractual borrowing restrictions. The participating funds are charged administrative fees and an annual commitment fee of 0.06% of the undrawn amount of the facility; these fees are allocated to the funds based on a method approved by the portfolio’s board of trustees and included in Management and Administrative expenses on the portfolio’s Statement of Operations. Any borrowings under this facility bear interest at a rate equal to the higher of the federal funds rate or LIBOR reference rate plus an agreed-upon spread.
The portfolio had no borrowings outstanding at December 31, 2015, or at any time during the period then ended.
8. Other: Dividend income is recorded on the ex-dividend date. Interest income includes income distributions received from Vanguard Market Liquidity Fund and is accrued daily. Premiums and discounts on debt securities purchased are amortized and accreted, respectively, to interest income over the lives of the respective securities. Security transactions are accounted for on the date securities are bought or sold. Costs used to determine realized gains (losses) on the sale of investment securities are those of the specific securities sold.
B. The investment advisory firms Baillie Gifford Overseas Ltd., Schroder Investment Management North America Inc., and M&G Investment Management Limited each provide investment advisory services to a portion of the portfolio for a fee calculated at an annual percentage rate of average net assets managed by the advisor. The basic fees of Baillie Gifford Overseas Ltd., Schroder Investment Management North America Inc., and M&G Investment Management Limited are subject to quarterly adjustments based on performance relative to the MSCI All Country World Index ex USA for the preceding three years.
Vanguard manages the cash reserves of the portfolio as described below.
For the year ended December 31, 2015, the aggregate investment advisory fee represented an effective annual basic rate of 0.15% of the portfolio’s average net assets, before a net increase of $745,000 (0.03%) based on performance.
C. In accordance with the terms of a Funds’ Service Agreement (the “FSA”) between Vanguard and the portfolio, Vanguard furnishes to the portfolio corporate management, administrative, marketing, distribution, and cash management services at Vanguard’s cost of operations (as defined by the FSA). These costs of operations are allocated to the portfolio based on methods and guidelines approved by the board of trustees. Vanguard does not require reimbursement in the current period for certain costs of operations (such as deferred compensation/benefits and risk/insurance costs); the portfolio’s liability for these costs of operations is included in Payables to Vanguard on the Statement of Net Assets.
131
Vanguard International Portfolio
Upon the request of Vanguard, the portfolio may invest up to 0.40% of its net assets as capital in Vanguard. At December 31, 2015, the portfolio had contributed to Vanguard capital in the amount of $204,000, representing 0.01% of the portfolio’s net assets and 0.08% of Vanguard’s capitalization. The portfolio’s trustees and officers are also directors and employees, respectively, of Vanguard.
D. Various inputs may be used to determine the value of the portfolio’s investments. These inputs are summarized in three broad levels for financial statement purposes. The inputs or methodologies used to value securities are not necessarily an indication of the risk associated with investing in those securities.
Level 1—Quoted prices in active markets for identical securities.
Level 2—Other significant observable inputs (including quoted prices for similar securities, interest rates, prepayment speeds, credit risk, etc.).
Level 3—Significant unobservable inputs (including the portfolio’s own assumptions used to determine the fair value of investments).
The following table summarizes the market value of the portfolio’s investments as of December 31, 2015, based on the inputs used to value them:
| | | |
| Level 1 | Level 2 | Level 3 |
| Investments | ($000) | ($000) | ($000) |
| Common Stocks—North and South America | 183,227 | 18,450 | — |
| Common Stocks—Other | 213,111 | 1,718,362 | 50,716 |
| Preferred Stocks | — | — | 5,200 |
| Temporary Cash Investments | 98,834 | 10,488 | — |
| Futures Contracts—Liabilities1 | (113) | — | — |
| Forward Currency Contracts—Assets | — | 609 | — |
| Forward Currency Contracts—Liabilities | — | (714) | — |
| Total | 495,059 | 1,747,195 | 55,916 |
| 1 Represents variation margin on the last day of the reporting period. | | | |
The determination of Level 3 fair value measurements is governed by documented policies and procedures adopted by the board of trustees. The board has designated a pricing review committee, as an agent of the board, to ensure the timely analysis and valuation of Level 3 securities held by the portfolio in accordance with established policies and procedures. The pricing review committee employs various methods for calibrating valuation approaches, including a regular review of key inputs and assumptions, transactional back-testing or disposition analysis, and reviews of any related market activity. All valuation decisions made by the pricing review committee are reported to the board on a quarterly basis for review and ratification. The board reviews the adequacy of the fair value measurement policies and procedures in place on an annual basis.
The following table summarizes changes in investments valued based on Level 3 inputs during the year ended December 31, 2015. Transfers into or out of Level 3 are recognized based on values as of the date of transfer.
| | |
| | Investments in |
| Common Stocks and |
| | Preferred Stocks |
| Amount Valued Based on Level 3 Inputs | | ($000) |
| Balance as of December 31, 2014 | 4,500 |
| Purchases | 51,393 |
| Change in Unrealized Appreciation (Depreciation) | 23 |
| Balance as of December 31, 2015 | 55,916 |
| Net change in unrealized appreciation (depreciation) from investments still held as of December 31, 2015, was $23,000. | |
132
Vanguard International Portfolio
The following table provides quantitative information about the significant unobservable inputs used in fair value measurement as of December 31, 2015:
| | | | |
| Fair Value | | |
| Security Type | ($000) | Valuation Technique | Unobservable Input | Amount |
| Common Stocks | 50,716 | Market Approach | Purchase Price | $42,287.373 |
| Purchase Price | 2,766.369 |
| Purchase Price | 2,320.071 |
| Purchase Price | 2,228.610 |
| Purchase Price | 150.472 |
| Purchase Price | 142.240 |
| Recent Market Transaction | 136.870 |
| Purchase Price | 22.637 |
| Purchase Price | 3.860 |
| Preferred Stocks | 5,200 | Market Approach | Purchase Price | 1.000 |
Significant increases or decreases in the significant unobservable inputs used in the fair value measurement of the portfolio’s Level 3 securities, in isolation, could result in a significantly higher or lower fair value measurement.
E. At December 31, 2015, the fair values of derivatives were reflected in the Statement of Net Assets as follows:
| | | |
| Foreign | |
| Equity | Exchange | |
| Contracts | Contracts | Total |
| Statement of Net Assets Caption | ($000) | ($000) | ($000) |
| Other Assets | — | 609 | 609 |
| Other Liabilities | (113) | (714) | (827) |
Realized net gain (loss) and the change in unrealized appreciation (depreciation) on derivatives for the year ended December 31, 2015, were:
| | | |
| Foreign | |
| Equity | Exchange | |
| Contracts | Contracts | Total |
| Realized Net Gain (Loss) on Derivatives | ($000) | ($000) | ($000) |
| Futures Contracts | (1,474) | — | (1,474) |
| Forward Currency Contracts | — | (3,506) | (3,506) |
| Realized Net Gain (Loss) on Derivatives | (1,474) | (3,506) | (4,980) |
| |
| Change in Unrealized Appreciation (Depreciation) on Derivatives | | | |
| Futures Contracts | (1,579) | — | (1,579) |
| Forward Currency Contracts | — | 1,052 | 1,052 |
| Change in Unrealized Appreciation (Depreciation) on Derivatives | (1,579) | 1,052 | (527) |
At December 31, 2015, the aggregate settlement value of open futures contracts and the related unrealized appreciation (depreciation) were:
| | | | |
| | | | ($000) |
| Aggregate |
| Number of | Settlement | Unrealized |
| Long (Short) | Value | Appreciation |
| Futures Contracts | Expiration | Contracts | Long (Short) | (Depreciation) |
| Dow Jones EURO STOXX 50 Index | March 2016 | 553 | 19,716 | 383 |
| Topix Index | March 2016 | 124 | 15,952 | (423) |
| FTSE 100 Index | March 2016 | 148 | 13,520 | 633 |
| S&P ASX 200 Index | March 2016 | 73 | 6,980 | 490 |
| | | | 1,083 |
Unrealized appreciation (depreciation) on open Dow Jones EURO STOXX 50 Index and FTSE 100 Index futures contracts is required to be treated as realized gain (loss) for tax purposes.
133
Vanguard International Portfolio
At December 31, 2015, the portfolio had open forward currency contracts to receive and deliver currencies as follows. Unrealized appreciation (depreciation) on open forward currency contracts is treated as realized gain (loss) for tax purposes.
| | | | | | |
| Unrealized |
| Contract | Appreciation |
| Settlement | | Contract Amount (000) | (Depreciation) |
| Counterparty | Date | | Receive | | Deliver | ($000) |
| BNP Paribas | 3/23/16 | EUR | 17,807 | USD | 19,695 | (302) |
| Bank of America, N.A. | 3/15/16 | JPY | 2,394,096 | USD | 19,467 | 489 |
| Bank of America, N.A. | 3/23/16 | GBP | 8,745 | USD | 13,249 | (355) |
| Citibank, N.A. | 3/22/16 | AUD | 8,922 | USD | 6,372 | 103 |
| BNP Paribas | 3/15/16 | JPY | 84,364 | USD | 686 | 17 |
| BNP Paribas | 3/15/16 | USD | 4,050 | JPY | 492,640 | (57) |
| (105) |
| AUD—Australian dollar. | | | | | | |
| EUR—Euro. | | | | | | |
| GBP—British pound. | | | | | | |
| JPY—Japanese yen. | | | | | | |
| USD—U.S. dollar. | | | | | | |
F. Distributions are determined on a tax basis and may differ from net investment income and realized capital gains for financial reporting purposes. Differences may be permanent or temporary. Permanent differences are reclassified among capital accounts in the financial statements to reflect their tax character. Temporary differences arise when certain items of income, expense, gain, or loss are recognized in different periods for financial statement and tax purposes. These differences will reverse at some time in the future. Differences in classification may also result from the treatment of short-term gains as ordinary income for tax purposes.
During the year ended December 31, 2015, the portfolio realized net foreign currency losses of $653,000, which decreased distributable net income for tax purposes; accordingly, such losses have been reclassified from accumulated net realized gains to undistributed net investment income.
For tax purposes, at December 31, 2015, the portfolio had $30,898,000 of ordinary income and $36,399,000 of long-term capital gains available for distribution.
At December 31, 2015, the cost of investment securities for tax purposes was $2,106,453,000. Net unrealized appreciation of investment securities for tax purposes was $191,935,000, consisting of unrealized gains of $420,261,000 on securities that had risen in value since their purchase and $228,326,000 in unrealized losses on securities that had fallen in value since their purchase.
G. During the year ended December 31, 2015, the portfolio purchased $644,570,000 of investment securities and sold $503,196,000 of investment securities, other than temporary cash investments.
H. Capital shares issued and redeemed were:
| | |
| Year Ended December 31, |
| 2015 | 2014 |
| Shares | Shares |
| (000) | (000) |
| Issued | 20,336 | 13,861 |
| Issued in Lieu of Cash Distributions | 3,671 | 1,495 |
| Redeemed | (17,013) | (11,123) |
| Net Increase (Decrease) in Shares Outstanding | 6,994 | 4,233 |
At December 31, 2015, one shareholder, an insurance company separate account whose holdings in the portfolio represent the indirect investment of Vanguard Variable Annuity contract holders, was the record or beneficial owner of 38% of the portfolio’s net assets. If the shareholder were to redeem its investment in the portfolio, the redemption might result in an increase in the portfolio’s expense ratio or cause the portfolio to incur higher transaction costs.
I. Management has determined that no material events or transactions occurred subsequent to December 31, 2015, that would require recognition or disclosure in these financial statements.
134
Vanguard International Portfolio
Report of Independent Registered Public Accounting Firm
To the Board of Trustees of Vanguard Variable Insurance Funds and the Shareholders of International Portfolio:
In our opinion, the accompanying statement of net assets and the related statements of operations and of changes in net assets and the financial highlights present fairly, in all material respects, the financial position of International Portfolio (constituting a separate portfolio of Vanguard Variable Insurance Funds, hereafter referred to as the “Portfolio”) at December 31, 2015, the results of its operations for the year then ended, the changes in its net assets for each of the two years in the period then ended, and the financial highlights for each of the five years in the period then ended, in conformity with accounting principles generally accepted in the United States of America. These financial statements and financial highlights (hereafter referred to as “financial statements”) are the responsibility of the Portfolio’s management. Our responsibility is to express an opinion on these financial statements based on our audits. We conducted our audits of these financial statements in accordance with the standards of the Public Company Accounting Oversight Board (United States). Those standards require that we plan and perform the audit to obtain reasonable assurance about whether the financial statements are free of material misstatement. An audit includes examining, on a test basis, evidence supporting the amounts and disclosures in the financial statements, assessing the accounting principles used and significant estimates made by management, and evaluating the overall financial statement presentation. We believe that our audits, which included confirmation of securities at December 31, 2015 by correspondence with the custodian and brokers, by agreement to the underlying ownership records of the transfer agent and the application of alternative auditing procedures where securities purchased had not been received, provide a reasonable basis for our opinion.
/s/PricewaterhouseCoopers LLP
Philadelphia, Pennsylvania
February 11, 2016
| |
| |
| Special 2015 tax information (unaudited) for corporate shareholders only for Vanguard |
| International Portfolio, a portfolio of Vanguard Variable Insurance Funds |
| |
| This information for the fiscal year ended December 31, 2015, is included pursuant to provisions |
| of the Internal Revenue Code for corporate shareholders only. |
| |
| The portfolio distributed $34,854,000 as capital gain dividends (20% rate gain distributions) to |
| shareholders during the fiscal year. |
| |
| The portfolio designates to shareholders foreign source income of $33,556,000 and foreign taxes |
| paid of $2,354,000. |
135
Vanguard International Portfolio
About Your Portfolio’s Expenses
As a shareholder of the portfolio, you incur ongoing costs, which include costs for portfolio management, administrative services, and shareholder reports (like this one), among others. Operating expenses, which are deducted from a portfolio’s gross income, directly reduce the investment return of the portfolio.
A portfolio’s expenses are expressed as a percentage of its average net assets. This figure is known as the expense ratio. The following examples are intended to help you understand the ongoing costs (in dollars) of investing in your portfolio and to compare these costs with those of other mutual funds. The examples are based on an investment of $1,000 made at the beginning of the period shown and held for the entire period.
The table below illustrates your portfolio’s costs in two ways:
• Based on actual portfolio return. This section helps you to estimate the actual expenses that you paid over the period. The “Ending Account Value” shown is derived from the portfolio’s actual return, and the third column shows the dollar amount that would have been paid by an investor who started with $1,000 in the portfolio. You may use the information here, together with the amount you invested, to estimate the expenses that you paid over the period.
To do so, simply divide your account value by $1,000 (for example, an $8,600 account value divided by $1,000 = 8.6), then multiply the result by the number given for your portfolio under the heading “Expenses Paid During Period.”
• Based on hypothetical 5% yearly return. This section is intended to help you compare your portfolio’s costs with those of other mutual funds. It assumes that the portfolio had a yearly return of 5% before expenses, but that the expense ratio is unchanged. In this case—because the return used is not the portfolio’s actual return—the results do not apply to your investment. The example is useful in making comparisons because the Securities and Exchange Commission requires all mutual funds to calculate expenses based on a 5% return. You can assess your portfolio’s costs by comparing this hypothetical example with the hypothetical examples that appear in shareholder reports of other funds.
Note that the expenses shown in the table are meant to highlight and help you compare ongoing costs only and do not reflect transaction costs incurred by the portfolio for buying and selling securities. The portfolio’s expense ratio does not reflect additional fees and expenses associated with the annuity or life insurance program through which you invest.
The calculations assume no shares were bought or sold during the period. Your actual costs may have been higher or lower, depending on the amount of your investment and the timing of any purchases or redemptions.
You can find more information about the portfolio’s expenses in the Financial Statements section. For additional information on operating expenses and other shareholder costs, please refer to the prospectus.
| | | |
| Six Months Ended December 31, 2015 | | | |
| Beginning | Ending | Expenses |
| Account Value | Account Value | Paid During |
| International Portfolio | 6/30/2015 | 12/31/2015 | Period1 |
| Based on Actual Portfolio Return | $1,000.00 | $929.58 | $1.95 |
| Based on Hypothetical 5% Yearly Return | 1,000.00 | 1,023.19 | 2.04 |
1 The calculations are based on expenses incurred in the most recent six-month period. The portfolio’s annualized six-month expense ratio for that period is 0.40%. The dollar amounts shown as “Expenses Paid” are equal to the annualized expense ratio multiplied by the average account value over the period, multiplied by the number of days in the most recent six-month period, then divided by the number of days in the most recent 12-month period (184/365).
136
Vanguard® Mid-Cap Index Portfolio
U.S. stocks registered a very small gain in 2015 as volatility affected markets worldwide. Stocks of midsize and small companies didn’t keep pace with those of larger companies. Vanguard Mid-Cap Index Portfolio returned –1.43% for the fiscal year ended December 31, 2015, in line with its target index and 2 percentage points better than the average return of peers.
Please note that the portfolio returns in the table below shows the returns of your portfolio and its comparative standards for the past year. For additional perspective, we also present their annualized returns for the past ten years. Vanguard Variable Insurance Fund are different from those in Vanguard Variable Annuity (and other plans that invest in the fund), which take into account insurance-related expenses.
Energy stocks continued to decline; bright spots included health care
Vanguard Mid-Cap Index Portfolio offers investors broad exposure to the hundreds of mid-capitalization stocks in the U.S. equity market. The portfolio’s performance was notably hurt by oil and gas stocks, which returned about –29% over the period. High production levels from some leading oil-producing countries and concerns about slower growth in China, the world’s largest oil importer, fueled the decline. Natural gas prices also dropped, though not as dramatically. The vast majority of companies engaged in exploration, production, and services suffered.
The basic materials sector, which sank about –13%, detracted as commodity prices fell along with those of oil. Metals and mining firms posted the poorest results, but chemical companies, the largest subsector, also struggled. The industrials (–3%) and utilities (–9%) sectors also declined.
Consumer services stocks, which made up one of the largest sectors on average, returned –2% as some specialty retailers and media companies recorded modest losses.
There were bright spots. The consumer goods sector benefited from increased consumer spending, returning 15%. Strong showings came from beverage and household goods companies.
Health care stocks climbed about 10% as favorable long-term demographic and economic trends continued to lift the sector. Mid-cap biotechnology and health care equipment firms posted double-digit returns.
Financials, one of the portfolio’s largest sectors on average during the period, returned 3%. Strength in REITs (real estate investment trusts) and insurance companies more than compensated for sizable losses among consumer finance firms.
Technology returned about 2%. Gains in the computer services and semiconductors segments were partially offset by losses in computer hardware.
The portfolio’s long-term record reflects expertise and low costs
Vanguard Mid-Cap Index Portfolio generated an average annual return of 7.80% for the ten years ended December 31, 2015. The portfolio met its objective of closely tracking its benchmark index and exceeded the average returns of its peers by almost a full percentage point.
Vanguard Equity Investment Group, the advisor overseeing the portfolio, has a long record of successfully tracking indexes. This wasn’t easy to do during the extreme market volatility that accompanied the financial crisis of 2008–2009. The advisor was helped by the portfolio’s low expenses—a key factor in increasing any investor’s chance of success.
| | |
| Total Returns | | |
| | Ten Years Ended |
| | December 31, 2015 |
| Year Ended | Average |
| December 31, 2015 | Annual Return |
| Vanguard Mid-Cap Index Portfolio | -1.43% | 7.80% |
| Spliced Mid Cap Index1 | -1.28 | 7.94 |
| Variable Insurance Mid-Cap Core Funds Average2 | -3.44 | 6.94 |
The figures shown represent past performance, which is not a guarantee of future results. (Current performance may be lower or higher than the performance data cited. For performance data current to the most recent month-end, visit our website at vanguard.com/performance.) Note, too, that both investment returns and principal value can fluctuate widely, so an investor’s shares, when sold, could be worth more or less than their original cost.
Expense Ratios3
Your Portfolio Compared With Its Peer Group
| | |
| Variable Insurance |
| Mid-Cap Core |
| Portfolio | Funds Average |
| Mid-Cap Index Portfolio | 0.24% | 0.80% |
1 MSCI US Mid Cap 450 Index through January 30, 2013; CRSP US Mid Cap Index thereafter.
2 Derived from data provided by Lipper, a Thomson Reuters Company.
3 The portfolio expense ratio shown is from the prospectus dated April 30, 2015, and represents estimated costs for the current fiscal year. For the fiscal year ended December 31, 2015, the portfolio’s expense ratio was 0.19%. The peer-group expense ratio is derived from data provided by Lipper, a Thomson Reuters Company, and captures information through year-end 2014.
137
Vanguard Mid-Cap Index Portfolio
Portfolio Profile
As of December 31, 2015
Portfolio Characteristics
| | | |
| Target | Broad |
| Portfolio | Index1 | Index2 |
| Number of Stocks | 361 | 362 | 3,960 |
| Median Market Cap $10.8B | $10.8B | $51.4B |
| Price/Earnings Ratio | 26.1x | 25.8x | 21.9x |
| Price/Book Ratio | 2.6x | 2.6x | 2.7x |
| Yield3 | 1.3% | 1.6% | 2.1% |
| Return on Equity | 15.6% | 15.2% | 17.2% |
| Earnings Growth Rate | 11.6% | 11.6% | 9.5% |
| Foreign Holdings | 0.0% | 0.0% | 0.0% |
| Turnover Rate | 23% | — | — |
| Expense Ratio4 | 0.24% | — | — |
| Short-Term Reserves | 0.1% | — | — |
| | |
| Volatility Measures | |
| Portfolio Versus | Portfolio Versus |
| Spliced Target Index5 | Broad Index2 |
| R-Squared | 1.00 | 0.94 |
| Beta | 1.00 | 0.99 |
| | | |
| Sector Diversification (% of equity exposure) |
| Target | Broad |
| Portfolio | Index1 | Index2 |
| Basic Materials | 4.1% | 4.0% | 2.3% |
| Consumer Goods | 14.5 | 14.5 | 10.3 |
| Consumer Services | 13.9 | 13.9 | 14.2 |
| Financials | 19.5 | 19.6 | 19.5 |
| Health Care | 8.8 | 8.8 | 14.0 |
| Industrials | 16.8 | 16.8 | 12.2 |
| Oil & Gas | 4.9 | 4.9 | 5.9 |
| Technology | 11.5 | 11.5 | 16.4 |
| Telecommunications | 1.2 | 1.2 | 2.2 |
| Utilities | 4.8 | 4.8 | 3.0 |
| | |
| Ten Largest Holdings6 (% of total net assets) |
| |
| Ross Stores Inc. | Apparel Retailers | 0.7% |
| Fiserv Inc. | Financial | |
| Administration | 0.7 |
| Electronic Arts Inc. | Toys | 0.7 |
| Roper Technologies Inc. | Electronic | |
| Equipment | 0.6 |
| Equinix Inc. | Specialty REITs | 0.6 |
| Cerner Corp. | Software | 0.6 |
| ConAgra Foods Inc. | Food Products | 0.6 |
| Incyte Corp. | Biotechnology | 0.6 |
| Royal Caribbean Cruises | Recreational | |
| Ltd. | Services | 0.6 |
| Hartford Financial | | |
| Services Group Inc. | Full Line Insurance | 0.6 |
| Top Ten | 6.3% |
Investment Focus

30-Day SEC Yield. A portfolio’s 30-day SEC yield is derived using a formula specified by the U.S. Securities and Exchange Commission. Under the formula, data related to the portfolio’s security holdings in the previous 30 days are used to calculate the portfolio’s hypothetical net income for that period, which is then annualized and divided by the portfolio’s estimated average net assets over the calculation period. For the purposes of this calculation, a security’s income is based on its current market yield to maturity (for bonds), its actual income (for asset-backed securities), or its projected dividend yield (for stocks). Because the SEC yield represents hypothetical annualized income, it will differ—at times significantly—from the portfolio’s actual experience. As a result, the portfolio’s income distributions may be higher or lower than implied by the SEC yield.
Beta. A measure of the magnitude of a portfolio’s past share-price fluctuations in relation to the ups and downs of a given market index. The index is assigned a beta of 1.00. Compared with a given index, a portfolio with a beta of 1.20 typically would have seen its share price rise or fall by 12% when the index rose or fell by 10%. For this report, beta is based on returns over the past 36 months for both the portfolio and the index.
Equity Exposure. A measure that reflects a portfolio’s investments in stocks and stock futures. Any holdings in short-term reserves are excluded.
R-Squared. A measure of how much of a portfolio’s past returns can be explained by the returns from the market in general, as measured by a given index. If a portfolio’s total returns were precisely synchronized with an index’s returns, its R-squared would be 1.00. If the portfolio’s returns bore no relationship to the index’s returns, its R-squared would be 0. For this report, R-squared is based on returns over the past 36 months for both the portfolio and the index.
1 CRSP US Mid Cap Index.
2 Dow Jones U.S. Total Stock Market Float Adjusted Index.
3 30-day SEC yield for the portfolio; annualized dividend yield for the indexes.
4 The expense ratio shown is from the prospectus dated April 30, 2015, and represents estimated costs for the current fiscal year. For the fiscal year ended December 31, 2015, the Mid-Cap Index Portfolio’s expense ratio was 0.19%.
5 Spliced Mid-Cap Index: MSCI US Mid Cap 450 Index through January 30, 2013; CRSP US Mid Cap Index thereafter.
6 The holdings listed exclude any temporary cash investments and equity index products.
138
Vanguard Mid-Cap Index Portfolio
Performance Summary
All of the returns in this report represent past performance, which is not a guarantee of future results that may be achieved by the portfolio. (Current performance may be lower or higher than the performance data cited. For performance data current to the most recent month-end, visit our website at vanguard.com/performance.) Note, too, that both investment returns and principal value can fluctuate widely, so an investor’s shares, when sold, could be worth more or less than their original cost. The returns shown do not reflect taxes that a shareholder would pay on portfolio distributions or on the sale of portfolio shares. Nor do the returns reflect fees and expenses associated with the annuity or life insurance program through which a shareholder invests. If these fees and expenses were included, the portfolio’s returns would be lower.
Cumulative Performance: December 31, 2005–December 31, 2015
Initial Investment of $10,000
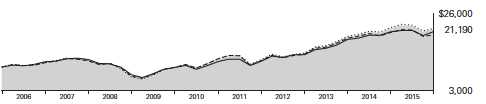
| | | | |
| | | Average Annual Total Returns | Final Value |
| | Periods Ended December 31, 2015 | of a $10,000 |
| | One Year | Five Years | Ten Years | Investment |
| Mid-Cap Index Portfolio | -1.43% | 11.38% | 7.80% | $21,190 |
| Spliced Mid-Cap Index1 | -1.28 | 11.58 | 7.94 | 21,467 |
| Variable Insurance Mid-Cap Core | | | | |
| Funds Average2 | -3.44 | 9.51 | 6.94 | 19,562 |
| Dow Jones U.S. Total Stock Market | | | | |
| Float Adjusted Index | 0.44 | 12.14 | 7.48 | 20,563 |
Fiscal Year Total Returns (%): December 31, 2005–December 31, 2015

| |
| Mid-Cap Index Portfolio |
| Spliced Mid-Cap Index1 |
1 MSCI US Mid Cap 450 Index through January 30, 2013; CRSP US Mid Cap Index thereafter.
2 Derived from data provided by Lipper, a Thomson Reuters Company.
See Financial Highlights for dividend and capital gains information.
139
Vanguard Mid-Cap Index Portfolio
Financial Statements
Statement of Net Assets
As of December 31, 2015
The portfolio reports a complete list of its holdings in regulatory filings four times in each fiscal year, at the quarter-ends. For the second and fourth fiscal quarters, the lists appear in the portfolio’s semiannual and annual reports to shareholders. For the first and third fiscal quarters, the portfolio files the lists with the Securities and Exchange Commission on Form N-Q. Shareholders can look up the portfolio’s Forms N-Q on the SEC’s website at sec.gov. Forms N-Q may also be reviewed and copied at the SEC’s Public Reference Room (see the back cover of this report for further information).
| | | |
| Market |
| Value• |
| | Shares | ($000) |
| Common Stocks (100.0%) | | |
| Basic Materials (4.0%) | | |
| Alcoa Inc. | 582,640 | 5,751 |
| Celanese Corp. Class A | 65,291 | 4,396 |
| International Flavors & | | |
| | Fragrances Inc. | 35,733 | 4,275 |
| Eastman Chemical Co. | 62,837 | 4,242 |
| Newmont Mining Corp. | 235,333 | 4,234 |
| CF Industries Holdings Inc. | 103,730 | 4,233 |
| Airgas Inc. | 28,877 | 3,994 |
| Freeport-McMoRan Inc. | 514,093 | 3,480 |
| * | WR Grace & Co. | 31,467 | 3,134 |
| Ashland Inc. | 29,789 | 3,059 |
| Albemarle Corp. | 49,664 | 2,782 |
| Avery Dennison Corp. | 40,512 | 2,538 |
| FMC Corp. | 59,112 | 2,313 |
| Mosaic Co. | 70,445 | 1,944 |
| Reliance Steel & | | |
| | Aluminum Co. | 30,056 | 1,741 |
| * | Axalta Coating Systems Ltd. | 63,145 | 1,683 |
| Westlake Chemical Corp. | 17,402 | 945 |
| Huntsman Corp. | 45,995 | 523 |
| 55,267 |
| Consumer Goods (14.5%) | | |
| * | Electronic Arts Inc. | 131,329 | 9,025 |
| ConAgra Foods Inc. | 192,514 | 8,116 |
| Dr Pepper Snapple | | |
| | Group Inc. | 84,066 | 7,835 |
| Clorox Co. | 57,447 | 7,286 |
| Tyson Foods Inc. Class A | 131,502 | 7,013 |
| JM Smucker Co. | 53,248 | 6,568 |
| * | Under Armour Inc. Class A | 80,120 | 6,459 |
| Molson Coors Brewing Co. | | |
| | Class B | 65,274 | 6,131 |
| Genuine Parts Co. | 63,752 | 5,476 |
| Delphi Automotive plc | 62,361 | 5,346 |
| * | Jarden Corp. | 93,115 | 5,319 |
| * | Mohawk Industries Inc. | 27,979 | 5,299 |
| Newell Rubbermaid Inc. | 118,807 | 5,237 |
| Hanesbrands Inc. | 174,252 | 5,128 |
| Whirlpool Corp. | 34,837 | 5,117 |
| DR Horton Inc. | 155,809 | 4,991 |
| Church & Dwight Co. Inc. | 58,351 | 4,953 |
| Hormel Foods Corp. | 58,917 | 4,659 |
| Keurig Green Mountain Inc. | 49,747 | 4,476 |
| Coca-Cola Enterprises Inc. | 90,856 | 4,474 |
| Snap-on Inc. | 25,871 | 4,435 |
| Bunge Ltd. | 63,420 | 4,330 |
| BorgWarner Inc. | 99,708 | 4,310 |
| McCormick & Co. Inc. | 49,210 | 4,210 |
| Mattel Inc. | 150,986 | 4,102 |
| Lear Corp. | 33,381 | 4,100 |
| Coach Inc. | 123,439 | 4,040 |
| Harley-Davidson Inc. | 85,345 | 3,874 |
| Lennar Corp. Class A | 79,048 | 3,866 |
| * | LKQ Corp. | 122,355 | 3,625 |
| Hasbro Inc. | 49,970 | 3,366 |
| * | Michael Kors Holdings Ltd. | 77,790 | 3,116 |
| | | |
| Market |
| Value• |
| | Shares | ($000) |
| Harman International | | |
| | Industries Inc. | 31,527 | 2,970 |
| Ralph Lauren Corp. Class A | 26,087 | 2,908 |
| PVH Corp. | 36,747 | 2,706 |
| * | NVR Inc. | 1,643 | 2,700 |
| Leucadia National Corp. | 144,125 | 2,506 |
| * | WABCO Holdings Inc. | 24,312 | 2,486 |
| PulteGroup Inc. | 138,823 | 2,474 |
| Polaris Industries Inc. | 27,506 | 2,364 |
| * | lululemon athletica Inc. | 43,628 | 2,289 |
| * | Edgewell Personal Care Co. | 27,476 | 2,153 |
| Goodyear Tire & Rubber Co. | 59,410 | 1,941 |
| * | WhiteWave Foods Co. | | |
| | Class A | 39,077 | 1,521 |
| *,^ Fitbit Inc. Class A | 26,045 | 771 |
| Pilgrim’s Pride Corp. | 28,122 | 621 |
| Coty Inc. Class A | 22,436 | 575 |
| Lennar Corp. Class B | 4,820 | 194 |
| 197,461 |
| Consumer Services (13.9%) | | |
| Ross Stores Inc. | 181,488 | 9,766 |
| Royal Caribbean Cruises Ltd. | 78,358 | 7,931 |
| * | Dollar Tree Inc. | 99,225 | 7,662 |
| Nielsen Holdings plc | 146,899 | 6,845 |
| * | Chipotle Mexican Grill Inc. | | |
| | Class A | 13,875 | 6,658 |
| Expedia Inc. | 51,819 | 6,441 |
| *,^ Charter Communications Inc. | | |
| | Class A | 32,453 | 5,942 |
| Tractor Supply Co. | 59,769 | 5,110 |
| * | Ulta Salon Cosmetics & | | |
| | Fragrance Inc. | 27,054 | 5,005 |
| Marriott International Inc. | | |
| | Class A | 74,388 | 4,987 |
| * | United Continental | | |
| | Holdings Inc. | 84,961 | 4,868 |
| * | CarMax Inc. | 90,199 | 4,868 |
| Advance Auto Parts Inc. | 30,994 | 4,665 |
| * | MGM Resorts International | 200,507 | 4,555 |
| Alaska Air Group Inc. | 56,175 | 4,523 |
| AmerisourceBergen Corp. | | |
| | Class A | 43,509 | 4,512 |
| Dollar General Corp. | 62,321 | 4,479 |
| Signet Jewelers Ltd. | 35,413 | 4,380 |
| * | TripAdvisor Inc. | 49,708 | 4,238 |
| Interpublic Group of | | |
| | Cos. Inc. | 180,750 | 4,208 |
| * | Norwegian Cruise Line | | |
| | Holdings Ltd. | 70,944 | 4,157 |
| Kohl’s Corp. | 86,581 | 4,124 |
| H&R Block Inc. | 122,935 | 4,095 |
| Foot Locker Inc. | 62,047 | 4,039 |
| Best Buy Co. Inc. | 130,309 | 3,968 |
| Wyndham Worldwide Corp. | 51,645 | 3,752 |
| Tiffany & Co. | 48,482 | 3,699 |
| * | IHS Inc. Class A | 30,359 | 3,595 |
| * | Bed Bath & Beyond Inc. | 70,578 | 3,405 |
| Darden Restaurants Inc. | 51,036 | 3,248 |
| | | |
| Market |
| Value• |
| | Shares | ($000) |
| Aramark | 100,687 | 3,247 |
| Nordstrom Inc. | 62,809 | 3,128 |
| News Corp. Class A | 221,653 | 2,961 |
| * | Discovery | | |
| | Communications Inc. | 116,053 | 2,927 |
| FactSet Research | | |
| | Systems Inc. | 17,555 | 2,854 |
| Staples Inc. | 286,329 | 2,712 |
| * | Liberty Interactive Corp. | | |
| | QVC Group Class A | 98,268 | 2,685 |
| Whole Foods Market Inc. | 75,396 | 2,526 |
| Wynn Resorts Ltd. | 35,992 | 2,490 |
| * | Hertz Global Holdings Inc. | 166,853 | 2,374 |
| Williams-Sonoma Inc. | 36,136 | 2,111 |
| * | AutoNation Inc. | 34,171 | 2,039 |
| Scripps Networks | | |
| | Interactive Inc. Class A | 33,487 | 1,849 |
| * | Rite Aid Corp. | 231,218 | 1,813 |
| * | Discovery Communications | | |
| | Inc. Class A | 66,129 | 1,764 |
| Gap Inc. | 49,424 | 1,221 |
| * | Hyatt Hotels Corp. Class A | 12,224 | 575 |
| 189,001 |
| Financials (19.6%) | | |
| Equinix Inc. | 27,382 | 8,280 |
| Hartford Financial Services | | |
| | Group Inc. | 182,167 | 7,917 |
| M&T Bank Corp. | 63,999 | 7,755 |
| Moody’s Corp. | 74,780 | 7,503 |
| Essex Property Trust Inc. | 29,373 | 7,032 |
| Citizens Financial Group Inc. | 234,714 | 6,147 |
| Equifax Inc. | 52,735 | 5,873 |
| Principal Financial Group Inc. | 130,256 | 5,859 |
| Realty Income Corp. | 111,007 | 5,731 |
| Macerich Co. | 70,471 | 5,686 |
| AvalonBay Communities Inc. | 30,477 | 5,612 |
| Regions Financial Corp. | 580,636 | 5,574 |
| Lincoln National Corp. | 110,146 | 5,536 |
| Welltower Inc. | 78,711 | 5,355 |
| * | Markel Corp. | 5,903 | 5,214 |
| XL Group plc Class A | 132,490 | 5,191 |
| SL Green Realty Corp. | 44,365 | 5,012 |
| Digital Realty Trust Inc. | 65,136 | 4,926 |
| KeyCorp | 371,532 | 4,901 |
| Kimco Realty Corp. | 174,677 | 4,622 |
| Extra Space Storage Inc. | 52,248 | 4,609 |
| Federal Realty Investment | | |
| | Trust | 30,758 | 4,494 |
| UDR Inc. | 116,608 | 4,381 |
| * | CBRE Group Inc. Class A | 126,411 | 4,371 |
| First Republic Bank | 64,487 | 4,260 |
| Cincinnati Financial Corp. | 69,127 | 4,090 |
| FNF Group | 117,033 | 4,058 |
| Western Union Co. | 224,809 | 4,026 |
| Annaly Capital | | |
| | Management Inc. | 421,570 | 3,954 |
| Huntington Bancshares Inc. | 354,372 | 3,919 |
| * | E*TRADE Financial Corp. | 130,333 | 3,863 |
140
Vanguard Mid-Cap Index Portfolio
| | | |
| Market |
| Value• |
| | Shares | ($000) |
| * | Affiliated Managers | | |
| | Group Inc. | 23,926 | 3,822 |
| Plum Creek Timber Co. Inc. | 77,218 | 3,685 |
| Unum Group | 108,285 | 3,605 |
| * | Arch Capital Group Ltd. | 51,643 | 3,602 |
| * | Ally Financial Inc. | 192,862 | 3,595 |
| CIT Group Inc. | 89,402 | 3,549 |
| Voya Financial Inc. | 95,791 | 3,536 |
| Willis Group Holdings plc | 72,154 | 3,505 |
| SEI Investments Co. | 65,834 | 3,450 |
| New York Community | | |
| | Bancorp Inc. | 204,965 | 3,345 |
| Raymond James | | |
| | Financial Inc. | 57,372 | 3,326 |
| Comerica Inc. | 78,187 | 3,271 |
| Jones Lang LaSalle Inc. | 20,118 | 3,216 |
| VEREIT Inc. | 402,528 | 3,188 |
| Torchmark Corp. | 52,153 | 2,981 |
| Nasdaq Inc. | 51,206 | 2,979 |
| MSCI Inc. Class A | 41,163 | 2,969 |
| Camden Property Trust | 38,419 | 2,949 |
| Alexandria Real Estate | | |
| | Equities Inc. | 32,066 | 2,897 |
| PartnerRe Ltd. | 19,216 | 2,685 |
| American Capital Agency | | |
| | Corp. | 154,143 | 2,673 |
| Everest Re Group Ltd. | 14,318 | 2,621 |
| Lazard Ltd. Class A | 57,453 | 2,586 |
| Reinsurance Group of | | |
| | America Inc. Class A | 29,267 | 2,504 |
| Zions Bancorporation | 90,393 | 2,468 |
| * | Realogy Holdings Corp. | 64,791 | 2,376 |
| Axis Capital Holdings Ltd. | 40,442 | 2,274 |
| Iron Mountain Inc. | 83,974 | 2,268 |
| WR Berkley Corp. | 41,221 | 2,257 |
| People’s United | | |
| | Financial Inc. | 138,017 | 2,229 |
| Brixmor Property Group Inc. | 85,747 | 2,214 |
| Legg Mason Inc. | 47,511 | 1,864 |
| Navient Corp. | 160,023 | 1,832 |
| * | Alleghany Corp. | 3,261 | 1,559 |
| * | LendingClub Corp. | 125,223 | 1,384 |
| Assurant Inc. | 14,464 | 1,165 |
| ^ | LPL Financial Holdings Inc. | 17,837 | 761 |
| * | Santander Consumer USA | | |
| | Holdings Inc. | 47,338 | 750 |
| 267,691 |
| Health Care (8.8%) | | |
| * | Incyte Corp. | 74,467 | 8,076 |
| * | Edwards Lifesciences Corp. | 95,938 | 7,577 |
| * | BioMarin Pharmaceutical Inc. | 71,736 | 7,515 |
| CR Bard Inc. | 32,933 | 6,239 |
| * | Endo International plc | 100,779 | 6,170 |
| * | Henry Schein Inc. | 36,888 | 5,835 |
| * | Laboratory Corp. of | | |
| | America Holdings | 45,050 | 5,570 |
| * | Boston Scientific Corp. | 299,140 | 5,516 |
| * | Alkermes plc | 66,742 | 5,298 |
| * | DaVita HealthCare | | |
| | Partners Inc. | 75,161 | 5,239 |
| Universal Health Services | | |
| | Inc. Class B | 40,626 | 4,854 |
| * | Waters Corp. | 34,367 | 4,625 |
| Quest Diagnostics Inc. | 63,851 | 4,542 |
| * | Hologic Inc. | 113,274 | 4,383 |
| * | Mallinckrodt plc | 51,663 | 3,856 |
| DENTSPLY International Inc. | 62,267 | 3,789 |
| * | Jazz Pharmaceuticals plc | 26,027 | 3,658 |
| * | Medivation Inc. | 72,442 | 3,502 |
| * | Varian Medical Systems Inc. | 43,125 | 3,485 |
| | | |
| Market |
| Value• |
| | Shares | ($000) |
| ResMed Inc. | 62,158 | 3,337 |
| * | Alnylam Pharmaceuticals Inc. | 31,907 | 3,004 |
| * | IDEXX Laboratories Inc. | 40,260 | 2,936 |
| Cooper Cos. Inc. | 21,633 | 2,903 |
| * | Quintiles Transnational | | |
| | Holdings Inc. | 35,686 | 2,450 |
| * | Envision Healthcare | | |
| | Holdings Inc. | 82,587 | 2,145 |
| Patterson Cos. Inc. | 38,708 | 1,750 |
| * | Centene Corp. | 25,043 | 1,648 |
| * | Intercept | | |
| | Pharmaceuticals Inc. | 3,475 | 519 |
| 120,421 |
| Industrials (16.8%) | | |
| * | Fiserv Inc. | 101,644 | 9,296 |
| Roper Technologies Inc. | 44,923 | 8,526 |
| Fidelity National Information | | |
| | Services Inc. | 125,530 | 7,607 |
| Amphenol Corp. Class A | 137,158 | 7,164 |
| * | Alliance Data Systems Corp. | 25,824 | 7,142 |
| AMETEK Inc. | 105,815 | 5,671 |
| Vulcan Materials Co. | 59,340 | 5,636 |
| * | FleetCor Technologies Inc. | 38,947 | 5,567 |
| Rockwell Collins Inc. | 58,490 | 5,399 |
| WestRock Co. | 116,461 | 5,313 |
| * | Verisk Analytics Inc. Class A | 67,869 | 5,218 |
| * | TransDigm Group Inc. | 22,691 | 5,184 |
| WW Grainger Inc. | 25,131 | 5,091 |
| Fastenal Co. | 122,417 | 4,997 |
| Textron Inc. | 109,550 | 4,602 |
| Xerox Corp. | 427,736 | 4,547 |
| * | Stericycle Inc. | 37,648 | 4,540 |
| Acuity Brands Inc. | 19,407 | 4,537 |
| Ball Corp. | 60,698 | 4,415 |
| Masco Corp. | 149,694 | 4,236 |
| Dover Corp. | 68,963 | 4,228 |
| * | Mettler-Toledo | | |
| | International Inc. | 12,176 | 4,129 |
| Martin Marietta | | |
| | Materials Inc. | 29,446 | 4,022 |
| Pentair plc | 80,256 | 3,975 |
| Towers Watson & Co. | | |
| | Class A | 30,919 | 3,972 |
| CH Robinson Worldwide Inc. | 63,970 | 3,967 |
| Fortune Brands Home & | | |
| | Security Inc. | 71,123 | 3,947 |
| Sealed Air Corp. | 87,857 | 3,918 |
| L-3 Communications | | |
| | Holdings Inc. | 31,422 | 3,755 |
| Expeditors International of | | |
| | Washington Inc. | 82,953 | 3,741 |
| Total System Services Inc. | 73,726 | 3,672 |
| Kansas City Southern | 48,581 | 3,628 |
| Cintas Corp. | 38,494 | 3,505 |
| * | Sensata Technologies | | |
| | Holding NV | 75,750 | 3,489 |
| * | Vantiv Inc. Class A | 69,551 | 3,298 |
| * | Crown Holdings Inc. | 61,669 | 3,127 |
| * | United Rentals Inc. | 41,365 | 3,001 |
| JB Hunt Transport | | |
| | Services Inc. | 40,842 | 2,996 |
| Fluor Corp. | 63,020 | 2,976 |
| Xylem Inc. | 79,840 | 2,914 |
| Wabtec Corp. | 40,554 | 2,884 |
| ManpowerGroup Inc. | 32,813 | 2,766 |
| Robert Half International Inc. | 56,145 | 2,647 |
| Avnet Inc. | 58,783 | 2,518 |
| Flowserve Corp. | 58,232 | 2,450 |
| ADT Corp. | 73,427 | 2,422 |
| * | Trimble Navigation Ltd. | 110,672 | 2,374 |
| | | |
| Market |
| Value• |
| | Shares | ($000) |
| * | Hubbell Inc. Class B | 23,258 | 2,350 |
| Owens Corning | 49,284 | 2,318 |
| Macquarie Infrastructure | | |
| | Corp. | 31,835 | 2,311 |
| * | Jacobs Engineering | | |
| | Group Inc. | 54,538 | 2,288 |
| * | Arrow Electronics Inc. | 42,084 | 2,280 |
| B/E Aerospace Inc. | 46,161 | 1,956 |
| Global Payments Inc. | 28,696 | 1,851 |
| Allison Transmission | | |
| | Holdings Inc. | 67,918 | 1,758 |
| FLIR Systems Inc. | 62,467 | 1,753 |
| Chicago Bridge & Iron | | |
| | Co. NV | 41,569 | 1,621 |
| * | First Data Corp. Class A | 79,531 | 1,274 |
| Donaldson Co. Inc. | 29,295 | 840 |
| AGCO Corp. | 15,931 | 723 |
| * | Quanta Services Inc. | 33,732 | 683 |
| * | Colfax Corp. | 19,174 | 448 |
| 229,463 |
| Oil & Gas (4.9%) | | |
| Tesoro Corp. | 53,547 | 5,642 |
| * | Cameron International Corp. | 84,971 | 5,370 |
| * | Concho Resources Inc. | 57,485 | 5,338 |
| Marathon Oil Corp. | 301,235 | 3,793 |
| Cimarex Energy Co. | 42,147 | 3,767 |
| EQT Corp. | 67,931 | 3,541 |
| Columbia Pipeline | | |
| | Group Inc. | 173,149 | 3,463 |
| * | Cheniere Energy Inc. | 89,324 | 3,327 |
| Cabot Oil & Gas Corp. | 184,151 | 3,258 |
| HollyFrontier Corp. | 81,405 | 3,247 |
| * | FMC Technologies Inc. | 101,474 | 2,944 |
| * | Weatherford | | |
| | International plc | 346,596 | 2,908 |
| * | Antero Resources Corp. | 116,366 | 2,537 |
| Helmerich & Payne Inc. | 45,279 | 2,425 |
| OGE Energy Corp. | 88,903 | 2,337 |
| Core Laboratories NV | 18,867 | 2,052 |
| Transocean Ltd. | 152,618 | 1,890 |
| Range Resources Corp. | 71,627 | 1,763 |
| Oceaneering | | |
| | International Inc. | 43,214 | 1,621 |
| Murphy Oil Corp. | 72,078 | 1,618 |
| Energen Corp. | 35,155 | 1,441 |
| Ensco plc Class A | 51,940 | 799 |
| * | Southwestern Energy Co. | 84,843 | 603 |
| ^ | Chesapeake Energy Corp. | 132,204 | 595 |
| 66,279 |
| Technology (11.5%) | | |
| * | Cerner Corp. | 136,963 | 8,241 |
| NVIDIA Corp. | 227,300 | 7,492 |
| SanDisk Corp. | 89,212 | 6,779 |
| * | Red Hat Inc. | 81,294 | 6,732 |
| Skyworks Solutions Inc. | 85,053 | 6,535 |
| * | Palo Alto Networks Inc. | 36,332 | 6,399 |
| * | Autodesk Inc. | 100,627 | 6,131 |
| * | ServiceNow Inc. | 67,186 | 5,816 |
| Lam Research Corp. | 70,488 | 5,598 |
| Xilinx Inc. | 114,367 | 5,372 |
| * | Citrix Systems Inc. | 64,992 | 4,917 |
| Seagate Technology plc | 133,013 | 4,876 |
| Harris Corp. | 55,426 | 4,816 |
| Maxim Integrated | | |
| | Products Inc. | 126,467 | 4,806 |
| KLA-Tencor Corp. | 69,286 | 4,805 |
| Linear Technology Corp. | 106,375 | 4,518 |
| Juniper Networks Inc. | 163,099 | 4,502 |
| Microchip Technology Inc. | 85,855 | 3,996 |
| * | Akamai Technologies Inc. | 75,207 | 3,958 |
141
Vanguard Mid-Cap Index Portfolio
| | | |
| Market |
| Value• |
| | Shares | ($000) |
| * | Workday Inc. Class A | 49,429 | 3,938 |
| * | VeriSign Inc. | 41,990 | 3,668 |
| * | ANSYS Inc. | 39,584 | 3,661 |
| NetApp Inc. | 131,230 | 3,482 |
| * | Splunk Inc. | 57,186 | 3,363 |
| * | Qorvo Inc. | 62,872 | 3,200 |
| * | Gartner Inc. | 35,107 | 3,184 |
| * | Synopsys Inc. | 69,437 | 3,167 |
| * | F5 Networks Inc. | 31,434 | 3,048 |
| Western Digital Corp. | 48,703 | 2,925 |
| * | Nuance | | |
| | Communications Inc. | 110,291 | 2,194 |
| Garmin Ltd. | 50,476 | 1,876 |
| CSRA Inc. | 60,479 | 1,814 |
| CDK Global Inc. | 35,267 | 1,674 |
| Marvell Technology | | |
| | Group Ltd. | 182,598 | 1,610 |
| * | NetSuite Inc. | 17,628 | 1,492 |
| * | IMS Health Holdings Inc. | 57,890 | 1,474 |
| * | Tableau Software Inc. | | |
| �� | Class A | 11,681 | 1,101 |
| Computer Sciences Corp. | 30,779 | 1,006 |
| * | Teradata Corp. | 29,366 | 776 |
| * | Premier Inc. Class A | 19,332 | 682 |
| * | FireEye Inc. | 31,855 | 661 |
| * | Rackspace Hosting Inc. | 25,195 | 638 |
| 156,923 |
| Telecommunications (1.2%) | | |
| * | Level 3 | | |
| | Communications Inc. | 126,793 | 6,892 |
| * | SBA Communications Corp. | | |
| | Class A | 56,101 | 5,895 |
| Frontier Communications | | |
| | Corp. | 519,709 | 2,427 |
| * | Zayo Group Holdings Inc. | 21,435 | 570 |
| 15,784 |
| Utilities (4.8%) | | |
| Eversource Energy | 141,107 | 7,206 |
| WEC Energy Group Inc. | 140,399 | 7,204 |
| DTE Energy Co. | 79,694 | 6,391 |
| American Water Works | | |
| | Co. Inc. | 79,846 | 4,771 |
| Ameren Corp. | 108,000 | 4,669 |
| CMS Energy Corp. | 123,605 | 4,460 |
| SCANA Corp. | 57,257 | 3,463 |
| CenterPoint Energy Inc. | 181,854 | 3,339 |
| Pinnacle West Capital Corp. | 49,069 | 3,164 |
| Alliant Energy Corp. | 50,473 | 3,152 |
| Pepco Holdings Inc. | 112,121 | 2,916 |
| AES Corp. | 299,302 | 2,864 |
| NiSource Inc. | 140,949 | 2,750 |
| Entergy Corp. | 39,495 | 2,700 |
| * | Calpine Corp. | 158,767 | 2,297 |
| ONEOK Inc. | 92,581 | 2,283 |
| NRG Energy Inc. | 69,356 | 816 |
| National Fuel Gas Co. | 17,724 | 758 |
| * | Avangrid Inc. | 13,617 | 523 |
| 65,726 |
| Total Common Stocks | | |
| (Cost $1,137,129) | 1,364,016 |
| | |
| Market |
| Value• |
| Shares | ($000) |
| Temporary Cash Investments (0.5%) | |
| Money Market Fund (0.5%) | | |
| 1,2 Vanguard Market Liquidity | | |
| Fund, 0.363% | 6,334,286 | 6,334 |
| |
| Face | |
| Amount | |
| ($000) | |
| U.S. Government and Agency Obligations (0.0%) |
| United States Treasury | | |
| Note/Bond, 0.375%, 5/31/16 200 | 200 |
| Total Temporary Cash Investments | |
| (Cost $6,534) | 6,534 |
| Total Investments (100.5%) | | |
| (Cost $1,143,663) | 1,370,550 |
| | |
| Amount |
| ($000) |
| Other Assets and Liabilities (-0.5%) | |
| Other Assets | | |
| Investment in Vanguard | 123 |
| Receivables for Accrued Income | 1,759 |
| Receivables for Capital Shares Issued | 664 |
| Total Other Assets | 2,546 |
| Liabilities | | |
| Payables for Investment Securities Purchased (21) |
| Collateral for Securities on Loan | (5,998) |
| Payables for Capital Shares Redeemed | (1,765) |
| Payables to Vanguard | (1,327) |
| Other Liabilities | (595) |
| Total Liabilities | (9,706) |
| Net Assets (100%) | | |
| Applicable to 65,664,190 outstanding | |
| $.001 par value shares of beneficial | |
| interest (unlimited authorization) | 1,363,390 |
| Net Asset Value Per Share $20.76 |
| |
| At December 31, 2015, net assets consisted of: |
| Amount |
| ($000) |
| Paid-in Capital | 1,024,602 |
| Undistributed Net Investment Income | 17,489 |
| Accumulated Net Realized Gains | 94,412 |
| Unrealized Appreciation (Depreciation) | 226,887 |
| Net Assets | 1,363,390 |
| |
• See Note A in Notes to Financial Statements.
* Non-income-producing security.
^ Includes partial security positions on loan to broker-dealers. The total value of securities on loan is $5,785,000.
1 Affiliated money market fund available only to Vanguard funds and certain trusts and accounts managed by Vanguard. Rate shown is the 7-day yield.
2 Includes $5,998,000 of collateral received for securities on loan.
See accompanying Notes, which are an integral part of the Financial Statements.
142
| | | |
| Vanguard Mid-Cap Index Portfolio | |
| |
| |
| Statement of Operations |
| |
| Year Ended |
| December 31, 2015 |
| | ($000) |
| Investment Income | | |
| Income | | |
| Dividends | 21,435 |
| Interest1 | 7 |
| Securities Lending | 310 |
| Total Income | 21,752 |
| Expenses | | |
| The Vanguard Group—Note B | | |
| Investment Advisory Services | 203 |
| Management and Administrative | 2,059 |
| Marketing and Distribution | 291 |
| Custodian Fees | 60 |
| Auditing Fees | 34 |
| Shareholders’ Reports | 31 |
| Trustees’ Fees and Expenses | 1 |
| Total Expenses | 2,679 |
| Net Investment Income | 19,073 |
| Realized Net Gain (Loss) | | |
| Investment Securities Sold | 94,450 |
| Futures Contracts | 58 |
| Realized Net Gain (Loss) | 94,508 |
| Change in Unrealized Appreciation | |
| (Depreciation) of Investment Securities (135,451) |
| Net Increase (Decrease) in Net Assets | |
| Resulting from Operations | (21,870) |
| 1 Interest income from an affiliated company of the portfolio was $7,000. |
| | | | |
| | |
| Statement of Changes in Net Assets | | |
| |
| Year Ended December 31, |
| 2015 | 2014 |
| ($000) | ($000) |
| Increase (Decrease) in Net Assets | | |
| Operations | | |
| Net Investment Income | 19,073 | 16,300 |
| Realized Net Gain (Loss) | 94,508 | 73,225 |
| Change in Unrealized Appreciation (Depreciation) | (135,451) | 72,025 |
| Net Increase (Decrease) in Net Assets Resulting from Operations | (21,870) | 161,550 |
| Distributions | | |
| Net Investment Income | (16,326) | (11,574) |
| Realized Capital Gain1 | (73,163) | (45,832) |
| Total Distributions | (89,489) | (57,406) |
| Capital Share Transactions | | |
| Issued | 225,446 | 223,561 |
| Issued in Lieu of Cash Distributions | 89,489 | 57,406 |
| Redeemed | (203,732) | (193,742) |
| Net Increase (Decrease) from Capital Share Transactions | 111,203 | 87,225 |
| Total Increase (Decrease) | (156) | 191,369 |
| Net Assets |
| Beginning of Period | 1,363,546 | 1,172,177 |
| End of Period2 | 1,363,390 | 1,363,546 |
1 Includes fiscal 2015 and 2014 short-term gain distributions totaling $2,315,000 and $17,071,000, respectively. Short-term gain distributions are treated as ordinary income for tax purposes.
2 Net Assets—End of Period includes undistributed (overdistributed) net investment income of $17,489,000 and $14,742,000.
See accompanying Notes, which are an integral part of the Financial Statements.
143
| | | | | |
| Vanguard Mid-Cap Index Portfolio | | | | | |
| |
| |
| Financial Highlights | | | | | |
| |
| |
| For a Share Outstanding | | | Year Ended December 31, |
| Throughout Each Period | 2015 | 2014 | 2013 | 2012 | 2011 |
| Net Asset Value, Beginning of Period | $22.49 | $20.77 | $16.13 | $14.49 | $14.93 |
| Investment Operations | |
| Net Investment Income | .291 | .266 | .203 | .205 | .172 |
| Net Realized and Unrealized Gain (Loss) | | | | | |
| on Investments | (.552) | 2.446 | 5.262 | 2.071 | (.462) |
| Total from Investment Operations | (.261) | 2.712 | 5.465 | 2.276 | (.290) |
| Distributions | | |
| Dividends from Net Investment Income | (.268) | (.200) | (.200) | (.178) | (.150) |
| Distributions from Realized Capital Gains | (1.201) | (.792) | (.625) | (.458) | — |
| Total Distributions | (1.469) | (.992) | (.825) | (.636) | (.150) |
| Net Asset Value, End of Period | $20.76 | $22.49 | $20.77 | $16.13 | $14.49 |
| |
| Total Return | -1.43% | 13.59% | 34.93% | 15.82% | -2.04% |
| |
| Ratios/Supplemental Data | | |
| Net Assets, End of Period (Millions) | $1,363 | $1,364 | $1,172 | $820 | $750 |
| Ratio of Total Expenses to Average Net Assets | 0.19% | 0.24% | 0.25% | 0.26% | 0.26% |
| Ratio of Net Investment Income to | | | | | |
| Average Net Assets | 1.35% | 1.29% | 1.15% | 1.30% | 1.11% |
| Portfolio Turnover Rate | 23% | 16% | 35% | 23% | 27% |
See accompanying Notes, which are an integral part of the Financial Statements.
144
Vanguard Mid-Cap Index Portfolio
Notes to Financial Statements
Vanguard Mid-Cap Index Portfolio, a portfolio of Vanguard Variable Insurance Funds, is registered under the Investment Company Act of 1940 as an open-end investment company. The portfolio’s shares are only available for purchase by separate accounts of insurance companies as investments for variable annuity plans, variable life insurance contracts, or other variable benefit insurance contracts.
A. The following significant accounting policies conform to generally accepted accounting principles for U.S. investment companies. The portfolio consistently follows such policies in preparing its financial statements.
1. Security Valuation: Securities are valued as of the close of trading on the New York Stock Exchange (generally 4 p.m., Eastern time) on the valuation date. Equity securities are valued at the latest quoted sales prices or official closing prices taken from the primary market in which each security trades; such securities not traded on the valuation date are valued at the mean of the latest quoted bid and asked prices. Securities for which market quotations are not readily available, or whose values have been materially affected by events occurring before the portfolio’s pricing time but after the close of the securities’ primary markets, are valued by methods deemed by the board of trustees to represent fair value. Investments in Vanguard Market Liquidity Fund are valued at that fund’s net asset value. Temporary cash investments acquired over 60 days to maturity are valued using the latest bid prices or using valuations based on a matrix system (which considers such factors as security prices, yields, maturities, and ratings), both as furnished by independent pricing services. Other temporary cash investments are valued at amortized cost, which approximates market value.
2. Futures Contracts: The portfolio uses index futures contracts to a limited extent, with the objectives of maintaining full exposure to the stock market, enhancing returns, maintaining liquidity, and minimizing transaction costs. The portfolio may purchase futures contracts to immediately invest incoming cash in the market, or sell futures in response to cash outflows, thereby simulating a fully invested position in the underlying index while maintaining a cash balance for liquidity. The portfolio may seek to enhance returns by using futures contracts instead of the underlying securities when futures are believed to be priced more attractively than the underlying securities. The primary risks associated with the use of futures contracts are imperfect correlation between changes in market values of stocks held by the portfolio and the prices of futures contracts, and the possibility of an illiquid market. Counterparty risk involving futures is mitigated because a regulated clearinghouse is the counterparty instead of the clearing broker. To further mitigate counterparty risk, the portfolio trades futures contracts on an exchange, monitors the financial strength of its clearing brokers and clearinghouse, and has entered into clearing agreements with its clearing brokers. The clearinghouse imposes initial margin requirements to secure the portfolio’s performance and requires daily settlement of variation margin representing changes in the market value of each contract.
Futures contracts are valued at their quoted daily settlement prices. The aggregate settlement values of the contracts are not recorded in the Statement of Net Assets. Fluctuations in the value of the contracts are recorded in the Statement of Net Assets as an asset (liability) and in the Statement of Operations as unrealized appreciation (depreciation) until the contracts are closed, when they are recorded as realized futures gains (losses).
During the year ended December 31, 2015, the portfolio’s average investments in long and short futures contracts represented less than 1% and 0% of net assets, respectively, based on the average of aggregate settlement values at each quarter-end during the period. The portfolio had no open futures contracts at December 31, 2015.
3. Federal Income Taxes: The portfolio intends to continue to qualify as a regulated investment company and distribute all of its taxable income. Management has analyzed the portfolio’s tax positions taken for all open federal income tax years (December 31, 2012–2015), and has concluded that no provision for federal income tax is required in the portfolio’s financial statements.
4. Distributions: Distributions to shareholders are recorded on the ex-dividend date.
5. Securities Lending: To earn additional income, the portfolio lends its securities to qualified institutional borrowers. Security loans are subject to termination by the portfolio at any time and are required to be secured at all times by collateral in an amount at least equal to the market value of securities loaned. Daily market fluctuations could cause the value of loaned securities to be more or less than the value of the collateral received. When this occurs, the collateral is adjusted and settled on the next business day. The portfolio further mitigates its counterparty risk by entering into securities lending transactions only with a diverse group of prequalified counterparties, monitoring
145
Vanguard Mid-Cap Index Portfolio
their financial strength, and entering into master securities lending agreements with its counterparties. The master securities lending agreements provide that, in the event of a counterparty’s default (including bankruptcy), the portfolio may terminate any loans with that borrower, determine the net amount owed, and sell or retain the collateral up to the net amount owed to the portfolio; however, such actions may be subject to legal proceedings. While collateral mitigates counterparty risk, in the absence of a default the portfolio may experience delays and costs in recovering the securities loaned. The portfolio invests cash collateral received in Vanguard Market Liquidity Fund, and records a liability in the Statement of Net Assets for the return of the collateral, during the period the securities are on loan. Securities lending income represents fees charged to borrowers plus income earned on invested cash collateral, less expenses associated with the loan.
6. Credit Facility: The portfolio and certain other funds managed by The Vanguard Group (“Vanguard”) participate in a $3 billion committed credit facility provided by a syndicate of lenders pursuant to a credit agreement that may be renewed annually; each fund is individually liable for its borrowings, if any, under the credit facility. Borrowings may be utilized for temporary and emergency purposes, and are subject to the portfolio’s regulatory and contractual borrowing restrictions. The participating funds are charged administrative fees and an annual commitment fee of 0.06% of the undrawn amount of the facility; these fees are allocated to the funds based on a method approved by the portfolio’s board of trustees and included in Management and Administrative expenses on the portfolio’s Statement of Operations. Any borrowings under this facility bear interest at a rate equal to the higher of the federal funds rate or LIBOR reference rate plus an agreed-upon spread.
The portfolio had no borrowings outstanding at December 31, 2015, or at any time during the period then ended.
7. Other: Dividend income is recorded on the ex-dividend date. Interest income includes income distributions received from Vanguard Market Liquidity Fund and is accrued daily. Premiums and discounts on debt securities purchased are amortized and accreted, respectively, to interest income over the lives of the respective securities. Security transactions are accounted for on the date securities are bought or sold. Costs used to determine realized gains (losses) on the sale of investment securities are those of the specific securities sold.
B. In accordance with the terms of a Funds’ Service Agreement (the “FSA”) between Vanguard and the portfolio, Vanguard furnishes to the portfolio investment advisory, corporate management, administrative, marketing, and distribution services at Vanguard’s cost of operations (as defined by the FSA). These costs of operations are allocated to the portfolio based on methods and guidelines approved by the board of trustees. Vanguard does not require reimbursement in the current period for certain costs of operations (such as deferred compensation/benefits and risk/insurance costs); the portfolio’s liability for these costs of operations is included in Payables to Vanguard on the Statement of Net Assets.
Upon the request of Vanguard, the portfolio may invest up to 0.40% of its net assets as capital in Vanguard. At December 31, 2015, the portfolio had contributed to Vanguard capital in the amount of $123,000, representing 0.01% of the portfolio’s net assets and 0.05% of Vanguard’s capitalization. The portfolio’s trustees and officers are also directors and employees, respectively, of Vanguard.
C. Various inputs may be used to determine the value of the portfolio’s investments. These inputs are summarized in three broad levels for financial statement purposes. The inputs or methodologies used to value securities are not necessarily an indication of the risk associated with investing in those securities.
Level 1—Quoted prices in active markets for identical securities.
Level 2—Other significant observable inputs (including quoted prices for similar securities, interest rates, prepayment speeds, credit risk, etc.).
Level 3—Significant unobservable inputs (including the portfolio’s own assumptions used to determine the fair value of investments).
The following table summarizes the market value of the portfolio’s investments as of December 31, 2015, based on the inputs used to value them:
| | | |
| Level 1 | Level 2 | Level 3 |
| Investments | ($000) | ($000) | ($000) |
| Common Stocks | 1,364,016 | — | — |
| Temporary Cash Investments | 6,334 | 200 | — |
| Total | 1,370,350 | 200 | — |
146
Vanguard Mid-Cap Index Portfolio
D. Distributions are determined on a tax basis and may differ from net investment income and realized capital gains for financial reporting purposes. Differences may be permanent or temporary. Permanent differences are reclassified among capital accounts in the financial statements to reflect their tax character. Temporary differences arise when certain items of income, expense, gain, or loss are recognized in different periods for financial statement and tax purposes. These differences will reverse at some time in the future. Differences in classification may also result from the treatment of short-term gains as ordinary income for tax purposes.
For tax purposes, at December 31, 2015, the portfolio had $18,678,000 of ordinary income and $94,417,000 of long-term capital gains available for distribution.
At December 31, 2015, the cost of investment securities for tax purposes was $1,143,663,000. Net unrealized appreciation of investment securities for tax purposes was $226,887,000, consisting of unrealized gains of $306,152,000 on securities that had risen in value since their purchase and $79,265,000 in unrealized losses on securities that had fallen in value since their purchase.
E. During the year ended December 31, 2015, the portfolio purchased $372,639,000 of investment securities and sold $328,727,000 of investment securities, other than temporary cash investments.
F. Capital shares issued and redeemed were:
| | |
| Year Ended December 31, |
| 2015 | 2014 |
| Shares | Shares |
| (000) | (000) |
| Issued | 10,312 | 10,549 |
| Issued in Lieu of Cash Distributions | 4,130 | 2,839 |
| Redeemed | (9,404) | (9,199) |
| Net Increase (Decrease) in Shares Outstanding | 5,038 | 4,189 |
At December 31, 2015, one shareholder, an insurance company separate account whose holdings in the portfolio represent the indirect investment of Vanguard Variable Annuity contract holders, was the record or beneficial owner of 49% of the portfolio’s net assets. If the shareholder were to redeem its investment in the portfolio, the redemption might result in an increase in the portfolio’s expense ratio or cause the portfolio to incur higher transaction costs.
G. Management has determined that no material events or transactions occurred subsequent to December 31, 2015, that would require recognition or disclosure in these financial statements.
147
Vanguard Mid-Cap Index Portfolio
Report of Independent Registered Public Accounting Firm
To the Board of Trustees of Vanguard Variable Insurance Funds and the Shareholders of Mid-Cap Index Portfolio: In our opinion, the accompanying statement of net assets and the related statements of operations and of changes in net assets and the financial highlights present fairly, in all material respects, the financial position of Mid-Cap Index Portfolio (constituting a separate portfolio of Vanguard Variable Insurance Funds, hereafter referred to as the “Portfolio”) at December 31, 2015, the results of its operations for the year then ended, the changes in its net assets for each of the two years in the period then ended, and the financial highlights for each of the five years in the period then ended, in conformity with accounting principles generally accepted in the United States of America. These financial statements and financial highlights (hereafter referred to as “financial statements”) are the responsibility of the Portfolio’s management. Our responsibility is to express an opinion on these financial statements based on our audits. We conducted our audits of these financial statements in accordance with the standards of the Public Company Accounting Oversight Board (United States). Those standards require that we plan and perform the audit to obtain reasonable assurance about whether the financial statements are free of material misstatement. An audit includes examining, on a test basis, evidence supporting the amounts and disclosures in the financial statements, assessing the accounting principles used and significant estimates made by management, and evaluating the overall financial statement presentation. We believe that our audits, which included confirmation of securities at December 31, 2015 by correspondence with the custodian and brokers, by agreement to the underlying ownership records of the transfer agent and the application of alternative auditing procedures where securities purchased had not been received, provide a reasonable basis for our opinion.
/s/PricewaterhouseCoopers LLP
Philadelphia, Pennsylvania
February 11, 2016
| |
| |
| Special 2015 tax information (unaudited) for corporate shareholders only for Vanguard |
| Mid-Cap Index Portfolio, a portfolio of Vanguard Variable Insurance Funds |
| |
| This information for the fiscal year ended December 31, 2015, is included pursuant to provisions |
| of the Internal Revenue Code for corporate shareholders only. |
| |
| The portfolio distributed $70,848,000 as capital gain dividends (20% rate gain distributions) to |
| shareholders during the fiscal year. |
| |
| For corporate shareholders, 87.7% of investment income (dividend income plus short-term gains, |
| if any) qualifies for the dividends-received deduction. |
148
Vanguard Mid-Cap Index Portfolio
About Your Portfolio’s Expenses
As a shareholder of the portfolio, you incur ongoing costs, which include costs for portfolio management, administrative services, and shareholder reports (like this one), among others. Operating expenses, which are deducted from a portfolio’s gross income, directly reduce the investment return of the portfolio.
A portfolio’s expenses are expressed as a percentage of its average net assets. This figure is known as the expense ratio. The following examples are intended to help you understand the ongoing costs (in dollars) of investing in your portfolio and to compare these costs with those of other mutual funds. The examples are based on an investment of $1,000 made at the beginning of the period shown and held for the entire period.
The accompanying table illustrates your portfolio’s costs in two ways:
• Based on actual portfolio return. This section helps you to estimate the actual expenses that you paid over the period. The “Ending Account Value” shown is derived from the portfolio’s actual return, and the third column shows the dollar amount that would have been paid by an investor who started with $1,000 in the portfolio. You may use the information here, together with the amount you invested, to estimate the expenses that you paid over the period.
To do so, simply divide your account value by $1,000 (for example, an $8,600 account value divided by $1,000 = 8.6), then multiply the result by the number given for your portfolio under the heading “Expenses Paid During Period.”
• Based on hypothetical 5% yearly return. This section is intended to help you compare your portfolio’s costs with those of other mutual funds. It assumes that the portfolio had a yearly return of 5% before expenses, but that the expense ratio is unchanged. In this case—because the return used is not the portfolio’s actual return—the results do not apply to your investment. The example is useful in making comparisons because the Securities and Exchange Commission requires all mutual funds to calculate expenses based on a 5% return. You can assess your portfolio’s costs by comparing this hypothetical example with the hypothetical examples that appear in shareholder reports of other funds.
Note that the expenses shown in the table are meant to highlight and help you compare ongoing costs only and do not reflect transaction costs incurred by the portfolio for buying and selling securities. The portfolio’s expense ratio does not reflect additional fees and expenses associated with the annuity or life insurance program through which you invest.
The calculations assume no shares were bought or sold during the period. Your actual costs may have been higher or lower, depending on the amount of your investment and the timing of any purchases or redemptions.
You can find more information about the portfolio’s expenses in the Financial Statements section. For additional information on operating expenses and other shareholder costs, please refer to the prospectus.
| | | |
| Six Months Ended December 31, 2015 | | | |
| Beginning | Ending | Expenses |
| Account Value | Account Value | Paid During |
| Mid-Cap Index Portfolio | 6/30/2015 | 12/31/2015 | Period1 |
| Based on Actual Portfolio Return | $1,000.00 | $956.68 | $0.94 |
| Based on Hypothetical 5% Yearly Return | 1,000.00 | 1,024.25 | 0.97 |
1 The calculations are based on expenses incurred in the most recent six-month period. The portfolio’s annualized six-month expense ratio for that period is 0.19%. The dollar amounts shown as “Expenses Paid” are equal to the annualized expense ratio multiplied by the average account value over the period, multiplied by the number of days in the most recent six-month period, then divided by the number of days in the most recent 12-month period (184/365).
149
Vanguard® Moderate Allocation Portfolio
Despite periods of volatility, U.S. stocks and bonds finished 2015 with positive returns. International stocks didn’t fare as well. For the fiscal year ended December 31, 2015, the Moderate Allocation Portfolio returned –0.16%, a bit lower than its composite benchmark index but better than the average return of its peers.
The table below shows the returns of your portfolio and its comparative standards for the past year. For additional perspective, we also present their annualized returns since the portfolio’s inception. Please note that the portfolio returns in Vanguard Variable Insurance Fund are different from those in Vanguard Variable Annuity (and other plans that invest in the fund), which take into account insurance-related expenses.
U.S. markets had a muted year; international stocks retreated
The Moderate Allocation Portfolio, as a “fund of funds,” seeks to capture the returns of its benchmark by investing in a combination of Vanguard Variable Insurance Fund (VVIF) portfolios and Vanguard index funds. Although the exact percentages may vary, the portfolio targets an asset allocation of approximately 60% stocks and 40% bonds. Its holdings consist of VVIF Equity Index Portfolio (34%), VVIF Total Bond Market Index Portfolio (32%), Vanguard Total International Stock Index Fund (18%), Vanguard Extended Market Index Fund (8%), and Vanguard Total International Bond Index Fund (8%).
In equity markets, U.S. large-capitalization stocks did better than smaller-caps during the 12 months, but overall returns were muted or negative. The Equity Index Portfolio returned 1.27%. The Extended Market Index Fund, which focuses on small-and mid-cap stocks, returned –3.39%.
Energy stocks retreated sharply, punished by the steep slide of oil prices. The U.S. materials sector, which sank about –10%, was another of the broad market’s weakest after commodity prices fell along with those of oil. Positive results came from health care and consumer-oriented companies.
International stocks generated mostly positive returns in local currency terms but returned about –4.37% in U.S. dollar terms as many foreign currencies continued to weaken against the dollar. Emerging markets fared the worst.
The Total Bond Market Index Portfolio, which encompasses most of the U.S. bond market, returned 0.33%. A decline in the prices of its holdings offset much of its earned income. After the Federal Reserve took the long-awaited step of raising its target for short-term rates, short-term yields finished the fiscal year higher than they had started it. The upward movement of intermediate- and long-term yields was more muted because of the fragile state of global growth and the subdued outlook for inflation.
Vanguard Total International Bond Index Fund, hedged against currency exposure, returned 1.04%. Without the hedging, returns would have been negative.
The portfolio’s long-term record reflects expertise and low costs
For the period since its inception on October 19, 2011, the Moderate Allocation Portfolio returned 8.46% on an average annual basis—very close to the result of its target benchmark. It beat the average return of its peers by about a full percentage point. This admirable performance is a testament to the skill of Vanguard’s equity and bond index managers, as well as the benefits of our consistently low costs.
| | |
| Total Returns | | |
| | October 19, 20111 |
| | through |
| | December 31, 2015 |
| Year Ended | Average |
| December 31, 2015 | Annual Return |
| Vanguard Moderate Allocation Portfolio | -0.16% | 8.46% |
| Moderate Allocation Composite Index 2 | 0.86 | 8.87 |
| Variable Insurance Mixed-Asset Target Allocation Moderate | | |
| Funds Average 3 | -1.43 | 7.38 |
The figures shown represent past performance, which is not a guarantee of future results. (Current performance may be lower or higher than the performance data cited. For performance data current to the most recent month-end, visit our website at vanguard.com/performance.) Note, too, that both investment returns and principal value can fluctuate widely, so an investor’s shares, when sold, could be worth more or less than their original cost.
Expense Ratios
Your Portfolio Compared With Its Peer Group
| | |
| Variable Insurance |
| Mixed-Asset |
| Target Allocation |
| Acquired Fund Fees | Moderate |
| and Expenses4 | Funds Average5 |
| Moderate Allocation Portfolio | 0.19% | 0.54% |
1 Portfolio inception.
2 Weighted 42% S&P Total Market Index, 32% Barclays U.S. Aggregate Float Adjusted Index, 18% FTSE Global All Cap ex US Index, and 8% Barclays Global Aggregate ex-USD Float Adjusted RIC Capped Index (USD Hedged) as of June 3, 2013. Previously, the composite was weighted 42% S&P Total Market Index, 40% Barclays U.S. Aggregate Float Adjusted Index, and 18% MSCI ACWI ex USA IMI Index.
3 Derived from data provided by Lipper, a Thomson Reuters Company.
4 This figure—drawn from the prospectus dated April 30, 2015—represents an estimate of the weighted average of the expense ratios and any transaction fees charged by the underlying mutual funds (the “acquired” funds) in which the Moderate Allocation Portfolio invests. The Moderate Allocation Portfolio does not charge any expenses or fees of its own. For the fiscal year ended December 31, 2015, the acquired fund fees and expenses were 0.16%.
5 The peer-group expense ratio is derived from data provided by Lipper, a Thomson Reuters Company, and captures information through year-end 2014.
150
Vanguard Moderate Allocation Portfolio
Portfolio Profile
As of December 31, 2015
| |
| Total Portfolio Characteristics | |
| |
| Yield1 | 2.1% |
| Acquired Fund Fees and Expenses2 | 0.19% |
| |
| Allocation to Underlying Funds | |
| |
| Vanguard Variable Insurance Fund | |
| Equity Index Portfolio | 34.1% |
| Vanguard Variable Insurance Fund | |
| Total Bond Market Index Portfolio | 32.0 |
| Vanguard Total International Stock | |
| Index Fund Investor Shares | 18.1 |
| Vanguard Total International Bond | |
| Index Fund Investor Shares | 8.0 |
| Vanguard Extended Market Index | |
| Fund Investor Shares | 7.8 |
Portfolio Asset Allocation
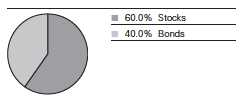
30-Day SEC Yield. A portfolio’s 30-day SEC yield is derived using a formula specified by the U.S. Securities and Exchange Commission. Under the formula, data related to the portfolio’s security holdings in the previous 30 days are used to calculate the portfolio’s hypothetical net income for that period, which is then annualized and divided by the portfolio’s estimated average net assets over the calculation period. For the purposes of this calculation, a security’s income is based on its current market yield to maturity (for bonds), its actual income (for asset-backed securities), or its projected dividend yield (for stocks). Because the SEC yield represents hypothetical annualized income, it will differ—at times significantly—from the portfolio’s actual experience. As a result, the portfolio’s income distributions may be higher or lower than implied by the SEC yield.
Acquired Fund Fees and Expenses. Portfolios that invest in other Vanguard funds incur no direct expenses, but they do bear proportionate shares of the operating, administrative, and advisory expenses of the underlying funds, and they must pay any fees charged by those funds. The figure for acquired fund fees and expenses represents a weighted average of these underlying costs. Acquired is a term that the Securities and Exchange Commission applies to any mutual fund whose shares are owned by another fund.
1 30-day SEC yield.
2 This figure—drawn from the prospectus dated April 30, 2015—represents an estimate of the weighted average of the expense ratios and any transaction fees charged by the underlying mutual funds (the “acquired”
funds) in which the Moderate Allocation Portfolio invests. The Moderate Allocation Portfolio does not charge any expenses or fees of its own. For the fiscal year ended December 31, 2015, the acquired fund fees and
expenses were 0.16%.
151
Vanguard Moderate Allocation Portfolio
Performance Summary
All of the returns in this report represent past performance, which is not a guarantee of future results that may be achieved by the portfolio. (Current performance may be lower or higher than the performance data cited. For performance data current to the most recent month-end, visit our website at vanguard.com/performance.) Note, too, that both investment returns and principal value can fluctuate widely, so an investor’s shares, when sold, could be worth more or less than their original cost. The returns shown do not reflect taxes that a shareholder would pay on portfolio distributions or on the sale of portfolio shares. Nor do the returns reflect fees and expenses associated with the annuity or life insurance program through which a shareholder invests. If these fees and expenses were included, the portfolio’s returns would be lower.
Cumulative Performance: October 19, 2011–December 31, 2015
Initial Investment of $10,000
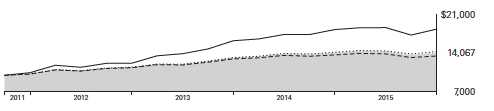
| | | |
| | Average Annual Total Returns | Final Value |
| Periods Ended December 31, 2015 | of a $10,000 |
| One Year | Since Inception1 | Investment |
| Moderate Allocation Portfolio | -0.16% | 8.46% | $14,067 |
| Moderate Allocation Composite Index2 | 0.86 | 8.87 | 14,289 |
| Variable Insurance Mixed-Asset Target | | | |
| Moderate Funds Average3 | -1.43 | 7.38 | 13,487 |
| Dow Jones U.S. Total Stock Market | | | |
| Float Adjusted Index | 0.44 | 15.56 | 18,359 |
Fiscal-Year Total Returns (%): October 19, 2011–December 31, 2015
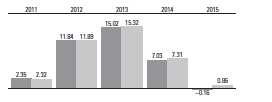
| |
| Moderate Allocation Portfolio |
| Moderate Allocation Composite Index2 |
1 October 19, 2011.
2 Weighted 42% S&P Total Market Index, 32% Barclays U.S. Aggregate Float Adjusted Index, 18% FTSE Global All Cap ex US Index, and 8% Barclays Global Aggregate ex-USD Float Adjusted RIC Capped Index (USD Hedged) as of June 3, 2013. Previously, the composite was weighted 42% S&P Total Market Index, 40% Barclays U.S. Aggregate Float Adjusted Index, and 18% MSCI ACWI ex USA IMI Index.
3 Derived from data provided by Lipper, a Thomson Reuters Company.
See Financial Highlights for dividend and capital gains information.
152
Vanguard Moderate Allocation Portfolio
Financial Statements
Statement of Net Assets
As of December 31, 2015
The portfolio reports a complete list of its holdings in regulatory filings four times in each fiscal year, at the quarter-ends. For the second and fourth fiscal quarters, the lists appear in the portfolio’s semiannual and annual reports to shareholders. For the first and third fiscal quarters, the portfolio files the lists with the Securities and Exchange Commission on Form N-Q. Shareholders can look up the portfolio’s Forms N-Q on the SEC’s website at sec.gov. Forms N-Q may also be reviewed and copied at the SEC’s Public Reference Room (see the back cover of this report for further information).
| | | |
| Market |
| Value• |
| Shares | ($000) |
| Investment Companies (100.0%) | | |
| U.S. Stock Funds (41.9%) | | |
| Vanguard Variable Insurance Fund—Equity Index Portfolio | 2,637,875 | 87,709 |
| Vanguard Extended Market Index Fund Investor Shares | 316,521 | 20,134 |
| 107,843 |
| International Stock Fund (18.1%) | | |
| Vanguard Total International Stock Index Fund Investor Shares | 3,208,481 | 46,491 |
| | |
| U.S. Bond Fund (32.0%) | | |
| Vanguard Variable Insurance Fund—Total Bond Market Index Portfolio | 6,980,106 | 82,296 |
| | |
| International Bond Fund (8.0%) | | |
| Vanguard Total International Bond Index Fund Investor Shares | 1,940,386 | 20,471 |
| Total Investments (Cost $253,275) | | 257,101 |
| | | |
| Amount |
| ($000) |
| Other Assets and Liabilities (0.0%) | | |
| Other Assets | | |
| Receivables for Capital Shares Issued | 391 |
| Liabilities | | |
| Payables for Investment Securities Purchased | (358) |
| Payables for Capital Shares Redeemed | (37) |
| Other Liabilities | (4) |
| Total Liabilities | | (399) |
| Net Assets (100%) | | |
| Applicable to 9,963,824 outstanding $.001 par value shares of | | |
| beneficial interest (unlimited authorization) | 257,093 |
| Net Asset Value Per Share | | $25.80 |
| |
| At December 31, 2015, net assets consisted of: | |
| Amount |
| ($000) |
| Paid-in Capital | 243,164 |
| Undistributed Net Investment Income | 4,385 |
| Accumulated Net Realized Gains | 5,718 |
| Unrealized Appreciation (Depreciation) | 3,826 |
| Net Assets | 257,093 |
• See Note A in Notes to Financial Statements.
See accompanying Notes, which are an integral part of the Financial Statements.
153
| | |
| Vanguard Moderate Allocation Portfolio | |
| |
| |
| Statement of Operations |
| |
| Year Ended |
| December 31, 2015 |
| | ($000) |
| Investment Income | | |
| Income | | |
| Income Distributions Received | 4,433 |
| Other Income | 9 |
| Net Investment Income—Note B | 4,442 |
| Realized Net Gain (Loss) | | |
| Capital Gain Distributions Received | 2,508 |
| Affiliated Investment Securities Sold | 3,233 |
| Realized Net Gain (Loss) | 5,741 |
| Change in Unrealized Appreciation | |
| (Depreciation) of Investment Securities | (11,680) |
| Net Increase (Decrease) in Net Assets | |
| Resulting from Operations | (1,497) |
| | |
| Statement of Changes in Net Assets | | |
| |
| Year Ended December 31, |
| 2015 | 2014 |
| ($000) | ($000) |
| Increase (Decrease) in Net Assets | | |
| Operations | | |
| Net Investment Income | 4,442 | 3,320 |
| Realized Net Gain (Loss) | 5,741 | 3,098 |
| Change in Unrealized Appreciation (Depreciation) | (11,680) | 4,621 |
| Net Increase (Decrease) in Net Assets Resulting from Operations | (1,497) | 11,039 |
| Distributions | | |
| Net Investment Income | (3,364) | (2,047) |
| Realized Capital Gain1 | (3,106) | (2,650) |
| Total Distributions | (6,470) | (4,697) |
| Capital Share Transactions | | |
| Issued | 87,645 | 68,329 |
| Issued in Lieu of Cash Distributions | 6,470 | 4,697 |
| Redeemed | (27,170) | (14,549) |
| Net Increase (Decrease) from Capital Share Transactions | 66,945 | 58,477 |
| Total Increase (Decrease) | 58,978 | 64,819 |
| Net Assets |
| Beginning of Period | 198,115 | 133,296 |
| End of Period2 | 257,093 | 198,115 |
1 Includes fiscal 2015 and 2014 short-term gain distributions totaling $169,000 and $360,000, respectively. Short-term gain distributions are treated as ordinary income dividends for tax purposes.
2 Net Assets—End of Period includes undistributed (overdistributed) net investment income of $4,385,000 and $3,307,000.
See accompanying Notes, which are an integral part of the Financial Statements.
154
| | | | | |
| Vanguard Moderate Allocation Portfolio | | | | | |
| |
| |
| Financial Highlights | | | | | |
| |
| |
| | Oct. 19, |
| 20111 to |
| For a Share Outstanding | | Year Ended December 31, | Dec. 31, |
| Throughout Each Period | 2015 | 2014 | 2013 | 2012 | 2011 |
| Net Asset Value, Beginning of Period | $26.63 | $25.72 | $22.82 | $20.47 | $20.00 |
| Investment Operations | | |
| Net Investment Income | . 499 2 | .5212 | .5052 | .4872 | .3002 |
| Capital Gain Distributions Received | . 282 2 | .1722 | . 263 2 | . 276 2 | — |
| Net Realized and Unrealized Gain (Loss) | | | | | |
| on Investments | (.809) | 1.066 | 2.612 | 1.657 | .170 |
| Total from Investment Operations | (.028) | 1.759 | 3.380 | 2.420 | .470 |
| Distributions | | |
| Dividends from Net Investment Income | (.417) | (.370) | (.245) | (.064) | — |
| Distributions from Realized Capital Gains | (.385) | (.479) | (.235) | (.006) | — |
| Total Distributions | (.802) | (.849) | (.480) | (.070) | — |
| Net Asset Value, End of Period | $25.80 | $26.63 | $25.72 | $22.82 | $20.47 |
| |
| Total Return | -0.16% | 7.03% | 15.02% | 11.84% | 2.35% |
| |
| Ratios/Supplemental Data | | |
| Net Assets, End of Period (Millions) | $257 | $198 | $133 | $63 | $13 |
| Ratio of Total Expenses to Average Net Assets | — | — | — | — | — |
| Acquired Fund Fees and Expenses | 0.16% | 0.19% | 0.19% | 0.20% | 0.20%3 |
| Ratio of Net Investment Income to | | | | | |
| Average Net Assets | 1.89% | 2.00% | 2.08% | 2.21% | 1.24%3 |
| Portfolio Turnover Rate | 12% | 9% | 21% | 12% | 2% |
| 1 Inception. | | | | | |
| 2 Calculated based on average shares outstanding. | | | | | |
| 3 Annualized. | | | | | |
See accompanying Notes, which are an integral part of the Financial Statements.
155
Vanguard Moderate Allocation Portfolio
Notes to Financial Statements
Vanguard Moderate Allocation Portfolio, a portfolio of Vanguard Variable Insurance Funds, is registered under the Investment Company Act of 1940 as an open-end investment company. The portfolio follows a balanced investment strategy by investing in selected Vanguard funds and portfolios to achieve its targeted allocation of assets to U.S. and international stocks, and U.S. and international bonds. Financial statements and other information about each underlying fund and portfolio are available on vanguard.com. The portfolio’s shares are only available for purchase by separate accounts of insurance companies as investments for variable annuity plans, variable life insurance contracts, or other variable benefit insurance contracts.
A. The following significant accounting policies conform to generally accepted accounting principles for U.S. investment companies. The portfolio consistently follows such policies in preparing its financial statements.
1. Security Valuation: Investments are valued at the net asset value of each underlying Vanguard fund determined as of the close of the New York Stock Exchange (generally 4 p.m., Eastern time) on the valuation date.
2. Federal Income Taxes: The portfolio intends to continue to qualify as a regulated investment company and distribute all of its taxable income. Management has analyzed the portfolio’s tax positions taken for all open federal income tax years (December 31, 2012–2015), and has concluded that no provision for federal income tax is required in the portfolio’s financial statements.
3. Distributions: Distributions to shareholders are recorded on the ex-dividend date.
4. Credit Facility: The portfolio and certain other funds managed by The Vanguard Group participate in a $3 billion committed credit facility provided by a syndicate of lenders pursuant to a credit agreement that may be renewed annually; each portfolio is individually liable for its borrowings, if any, under the credit facility. Borrowings may be utilized for temporary and emergency purposes, and are subject to the portfolio’s regulatory and contractual borrowing restrictions. The participating funds are charged administrative fees and an annual commitment fee of 0.06% of the undrawn amount of the facility; these fees are allocated to the funds based on a method approved by the fund’s board of trustees and borne by the funds in which the portfolio invests (see Note B). Any borrowings under this facility bear interest at a rate equal to the higher of the federal funds rate or LIBOR reference rate plus an agreed-upon spread.
The portfolio had no borrowings outstanding at December 31, 2015, or at any time during the period then ended.
5. Other: Income and capital gain distributions received are recorded on the ex-dividend date. Security transactions are accounted for on the date securities are bought or sold. Costs used to determine realized gains (losses) on the sale of investment securities are those of the specific securities sold.
B. In accordance with the terms of a Funds’ Service Agreement (the “FSA”) between Vanguard and the portfolio, Vanguard furnishes to the portfolio investment advisory, corporate management, administrative, marketing, and distribution services at Vanguard’s cost of operations (as defined by the FSA). These costs of operations are allocated to the portfolio based on methods and guidelines approved by the board of trustees. The FSA provides that expenses otherwise allocable to Vanguard funds-of-funds may be reduced or eliminated to the extent of savings realized by the underlying Vanguard funds by virtue of being part of a fund-of-funds. Accordingly, all expenses for services provided by Vanguard to the portfolio and all other expenses incurred by the portfolio during the period ended December 31, 2015, were borne by the underlying Vanguard funds in which the portfolio invests. The portfolio’s trustees and officers are also trustees and officers, respectively, of the underlying Vanguard funds, as well as directors and employees, respectively, of Vanguard.
C. Various inputs may be used to determine the value of the portfolio’s investments. These inputs are summarized in three broad levels for financial statement purposes. The inputs or methodologies used to value securities are not necessarily an indication of the risk associated with investing in those securities.
Level 1—Quoted prices in active markets for identical securities.
Level 2—Other significant observable inputs (including quoted prices for similar securities, interest rates, prepayment speeds, credit risk, etc.).
Level 3—Significant unobservable inputs (including the portfolio’s own assumptions used to determine the fair value of investments).
At December 31, 2015, 100% of the market value of the portfolio’s investments was determined based on Level 1 inputs.
156
Vanguard Moderate Allocation Portfolio
D. Distributions are determined on a tax basis and may differ from net investment income and realized capital gains for financial reporting purposes. Differences may be permanent or temporary. Permanent differences are reclassified among capital accounts in the financial statements to reflect their tax character. Temporary differences arise when certain items of income, expense, gain, or loss are recognized in different periods for financial statement and tax purposes. These differences will reverse at some time in the future. Differences in classification may also result from the treatment of short-term gains as ordinary income for tax purposes.
For tax purposes, at December 31, 2015, the portfolio had $4,687,000 of ordinary income and $5,416,000 of long-term capital gains available for distribution.
At December 31, 2015, the cost of investment securities for tax purposes was $253,275,000. Net unrealized appreciation of investment securities for tax purposes was $3,826,000, consisting of unrealized gains of $9,910,000 on securities that had risen in value since their purchase and $6,084,000 in unrealized losses on securities that had fallen in value since their purchase.
E. Capital shares issued and redeemed were:
| | |
| Year Ended December 31, |
| 2015 | 2014 |
| Shares | Shares |
| (000) | (000) |
| Issued | 3,314 | 2,629 |
| Issued in Lieu of Cash Distributions | 246 | 186 |
| Redeemed | (1,035) | (558) |
| Net Increase (Decrease) in Shares Outstanding | 2,525 | 2,257 |
F. Transactions during the period in affiliated underlying Vanguard funds were as follows:
| | | | | | |
| | | Current Period Transactions | |
| Dec. 31, | Proceeds | Dec. 31, |
| 2014 | from Capital Gain | 2015 |
| Market | Purchases | Securities | Dividend Distributions | Market |
| Value | at Cost | Sold | Income | Received | Value |
| ($000) | ($000) | ($000) | ($000) | ($000) | ($000) |
| Vanguard Extended Market | | | | | | |
| Index Fund | 16,257 | 6,306 | 1,465 | 230 | — | 20,134 |
| Vanguard Market Liquidity Fund | 117 | NA1 | NA1 | — | — | — |
| Vanguard Total International Bond | | | | | | |
| Index Fund | 15,680 | 5,516 | 612 | 301 | — | 20,471 |
| Vanguard Total International Stock | | | | | | |
| Index Fund | 35,509 | 17,262 | 2,882 | 1,130 | — | 46,491 |
| Vanguard Variable Insurance | | | | | | |
| Fund—Equity Index Portfolio | 66,383 | 31,070 | 7,497 | 1,209 | 2,215 | 87,709 |
| Vanguard Variable Insurance | | | | | | |
| Fund—Total Bond Market | | | | | | |
| Index Portfolio | 64,254 | 35,287 | 15,519 | 1,563 | 293 | 82,296 |
| Total | 198,200 | 95,441 | 27,975 | 4,433 | 2,508 | 257,101 |
| 1 Not applicable—purchases and sales are for temporary cash investment purposes. |
G. Management has determined that no material events or transactions occurred subsequent to December 31, 2015, that would require recognition or disclosure in these financial statements.
157
Vanguard Moderate Allocation Portfolio
Report of Independent Registered Public Accounting Firm
To the Board of Trustees of Vanguard Variable Insurance Funds and the Shareholders of Moderate Allocation Portfolio: In our opinion, the accompanying statement of net assets and the related statements of operations and of changes in net assets and the financial highlights present fairly, in all material respects, the financial position of Moderate Allocation Portfolio (constituting a separate portfolio of Vanguard Variable Insurance Funds, hereafter referred to as the “Portfolio”) at December 31, 2015, the results of its operations for the year then ended, the changes in its net assets for each of the two years in the period then ended, and the financial highlights for each of the periods indicated, in conformity with accounting principles generally accepted in the United States of America. These financial statements and financial highlights (hereafter referred to as “financial statements”) are the responsibility of the Portfolio’s management. Our responsibility is to express an opinion on these financial statements based on our audits. We conducted our audits of these financial statements in accordance with the standards of the Public Company Accounting Oversight Board (United States). Those standards require that we plan and perform the audit to obtain reasonable assurance about whether the financial statements are free of material misstatement. An audit includes examining, on a test basis, evidence supporting the amounts and disclosures in the financial statements, assessing the accounting principles used and significant estimates made by management, and evaluating the overall financial statement presentation. We believe that our audits, which included confirmation of securities at December 31, 2015 by agreement to the underlying ownership records of the transfer agent, provide a reasonable basis for our opinion.
/s/PricewaterhouseCoopers LLP
Philadelphia, Pennsylvania
February 11, 2016
| |
| |
| Special 2015 tax information (unaudited) for corporate shareholders only for Vanguard |
| Moderate Allocation Portfolio, a portfolio of Vanguard Variable Insurance Funds |
| |
| This information for the fiscal year ended December 31, 2015, is included pursuant to provisions |
| of the Internal Revenue Code for corporate shareholders only. |
| |
| The portfolio distributed $2,936,000 as capital gain dividends (20% rate gain distributions) to |
| shareholders during the fiscal year. |
| |
| For corporate shareholders, 25.4% of investment income (divided income plus short-term gains, |
| if any) qualifies for the dividends-received deduction. |
158
Vanguard Moderate Allocation Portfolio
About Your Portfolio’s Expenses
As a shareholder of the portfolio, you incur ongoing costs, which include costs for portfolio management, administrative services, and shareholder reports (like this one), among others. Operating expenses, which are deducted from a portfolio’s gross income, directly reduce the investment return of the portfolio.
A typical portfolio’s expenses are expressed as a percentage of its average net assets. The Moderate Allocation Portfolio has no direct expenses, but bears its proportionate share of the expenses of the underlying funds in which it invests. These indirect expenses make up the acquired fund fees and expenses, also expressed as a percentage of average net assets. The following examples are intended to help you understand the ongoing costs (in dollars) of investing in your portfolio and to compare these costs with those of other mutual funds. The examples are based on an investment of $1,000 made at the beginning of the period shown and held for the entire period. The costs were calculated using the acquired fund fees and expenses for the Moderate Allocation Portfolio.
The accompanying table illustrates your portfolio’s costs in two ways:
• Based on actual portfolio return. This section helps you to estimate the actual expenses that you paid over the period. The “Ending Account Value” shown is derived from the portfolio’s actual return, and the third column shows the dollar amount that would have been paid by an investor who started with $1,000 in the portfolio. You may use the information here, together with the amount you invested, to estimate the expenses that you paid over the period.
To do so, simply divide your account value by $1,000 (for example, an $8,600 account value divided by $1,000 = 8.6), then multiply the result by the number given for your portfolio under the heading “Expenses Paid During Period.”
• Based on hypothetical 5% yearly return. This section is intended to help you compare your portfolio’s costs with those of other mutual funds. It assumes that the portfolio had a yearly return of 5% before expenses, but that the expense ratio is unchanged. In this case—because the return used is not the portfolio’s actual return—the results do not apply to your investment. The example is useful in making comparisons because the Securities and Exchange Commission requires all mutual funds to calculate expenses based on a 5% return. You can assess your portfolio’s costs by comparing this hypothetical example with the hypothetical examples that appear in shareholder reports of other funds.
Note that the expenses shown in the table are meant to highlight and help you compare ongoing costs only. The portfolio’s expense figure does not reflect additional fees and expenses associated with the annuity or life insurance program through which you invest.
The calculations assume no shares were bought or sold during the period. Your actual costs may have been higher or lower, depending on the amount of your investment and the timing of any purchases or redemptions.
You can find more information about the portfolio’s expenses in the Financial Statements section. For additional information on operating expenses and other shareholder costs, please refer to the prospectus.
| | | |
| Six Months Ended December 31, 2015 | | | |
| Beginning | Ending | Expenses |
| Account Value | Account Value | Paid During |
| Moderate Allocation Portfolio | 6/30/2015 | 12/31/2015 | Period1 |
| Based on Actual Portfolio Return | $1,000.00 | $982.11 | $0.80 |
| Based on Hypothetical 5% Yearly Return | 1,000.00 | 1,024.40 | 0.82 |
1 The calculations are based on the Moderate Allocation Portfolio’s acquired fund fees and expenses for the most recent six-month period. The Moderate Allocation Portfolio’s annualized expense figure for that period is 0.16%. The dollar amounts shown as “Expenses Paid” are equal to the annualized average weighted expense ratio for the underlying funds, multiplied by the average account value over the period, multiplied by the number of days in the most recent six-month period, then divided by the number of days in the recent 12-month period (184/365).
159
Vanguard® Money Market Portfolio
Through most of the year ended December 31, 2015, the Federal Reserve’s target for short-term interest rates remained at 0%–0.25%—a historically low level that stifled returns for money market funds and savings accounts. Midway through the year’s final month, the Fed raised the target to 0.25%–0.5%, the first hike in almost a decade. Although the target is still uncommonly low, the rise marked a start to the process of normalizing monetary policy.
Vanguard Money Market Portfolio has been confined by these low rates. Nevertheless, the portfolio’s advisor, Vanguard Fixed Income Group, has effectively provided value while maintaining safety. For the 12 months, the portfolio returned 0.15%, slightly better than the 0.03% return of its benchmark and the 0.00% average return of its variable insurance money market peers. The portfolio maintained a net asset value of $1 per share during the period, as is expected but not guaranteed. On December 31, the portfolio’s 7-day SEC yield was 0.32%, up from 0.10% a year earlier.
Please note that the portfolio returns and yield of Vanguard Variable Insurance Fund Money Market Portfolio are different from those in Vanguard Variable Annuity (and other plans that invest in the portfolio), which take into account insurance-related expenses. Accordingly, given the low-rate environment, it is possible that while the portfolio maintains a $1 net asset value, the value of shares of the portfolio held indirectly through either Vanguard Variable Annuity or one of the other plans that invest in the portfolio could fall below $1.
Also, just a reminder that in 2014, the Securities and Exchange Commission adopted regulatory changes governing money market funds, which fund sponsors must adopt by October 2016. In June, we announced plans that preserve our money market funds as a cash management option with a stable price for both individual and institutional clients.
A conservative approach is the portfolio’s hallmark
One of the fallouts from the 2008–09 financial crisis was the record low short-term interest rates, which the Fed maintained and monitored since December 2008 as it worked to revive the economy. Investors have had just reason to be dissatisfied by negligible money market returns over the years since, especially if they’ve depended on such investments for income.
Although providing income is one of the Money Market Portfolio’s main objectives, that comes third behind safety and liquidity. Vanguard Fixed Income Group emphasizes caution and invests only in holdings from top-tier issuers (as determined by nationally recognized credit-rating services). Our experienced team of credit analysts scrutinizes each potential investment.
Yankee/foreign issues are the portfolio’s largest single holding. These securities, denominated in U.S. dollars to eliminate currency risk, are from highly rated foreign issuers and do not include financial paper from economically troubled countries in southern Europe. Over the 12 months, the Fixed Income Group, which has avoided any direct exposure to Greece in recent years, also ensured it had no indirect exposure.
Low expenses and advisor’s skill offered value over a tough decade
Over the ten years ended December 31, 2015, the Money Market Portfolio’s 1.44% average annual return exceeded that of its benchmark index (+1.16%) and peer group (+1.15%). Along with the portfolio’s low expenses, the advisor’s skill and experience have helped performance amid the exceptionally low rates that dominated most of the decade.
| | |
| Total Returns | | |
| | Ten Years Ended |
| | December 31, 2015 |
| Year Ended | Average |
| December 31, 2015 | Annual Return |
| Vanguard Money Market Portfolio (7-Day SEC Yield: 0.32%) | 0.15% | 1.44% |
| Variable Insurance Money Market Funds Average1 | 0.00 | 1.15 |
| Citigroup Three-Month U.S. Treasury Bill Index | 0.03 | 1.16 |
The figures shown represent past performance, which is not a guarantee of future results. (Current performance may be lower or higher than the performance data cited. For performance data current to the most recent month-end, visit our website at vanguard.com/performance.) Note, too, that both investment returns and principal value can fluctuate widely, so an investor’s shares, when sold, could be worth more or less than their original cost.
Expense Ratios2
Your Portfolio Compared With Its Peer Group
| | |
| Variable Insurance |
| Money Market |
| Portfolio | Funds Average1 |
| Money Market Portfolio | 0.16% | 0.22% |
1 Derived from data provided by Lipper, a Thomson Reuters Company.
2 The portfolio expense ratio shown is from the prospectus dated April 30, 2015, and represents estimated costs for the current fiscal year. The peer-group expense ratio is derived from data provided by Lipper, a Thomson Reuters Company, and captures information through year-end 2014. In most if not all cases, the expense ratios for funds in the peer group are based on net operating expenses after reimbursement and/or fee waivers by fund sponsors. In contrast, the expense ratio for Vanguard Money Market Portfolio shown in the table above does not reflect expense reductions. For the fiscal year ended December 31, 2015, the portfolio’s expense ratio was 0.06%, reflecting a temporary reduction in operating expenses (described in Note B of the Notes to Financial Statements). Before the reduction, the expense ratio was 0.16%.
160
Vanguard Money Market Portfolio
Portfolio Profile
As of December 31, 2015
| |
| Financial Attributes | |
| |
| Yield1 | 0.32% |
| Average Weighted Maturity | 54 days |
| Expense Ratio2 | 0.16% |
| |
| Sector Diversification3 (% of portfolio) | |
| |
| Certificates of Deposit | 7.2% |
| U.S. Commercial Paper | 6.3 |
| U.S. Government Obligations | 33.6 |
| U.S. Treasury Bills | 9.6 |
| Yankee/Foreign | 42.1 |
| Repurchase Agreements | 0.1 |
| Other | 1.1 |
| |
| Distribution by Credit Quality (% of portfolio) |
| First Tier | 100.0% |
7-Day SEC Yield. A money market portfolio’s 7-day SEC yield is calculated by annualizing its income distributions for the previous seven days, as required by the U.S. Securities and Exchange Commission.
Credit Quality. The Distribution by Credit Quality table includes tier ratings for consistency with SEC Rule 2a-7 under the Investment Company Act of 1940, which governs money market funds. A First Tier security is one that is eligible for money market funds and has been rated in the highest short-term rating category for debt obligations by nationally recognized statistical rating organizations. Credit-quality ratings are obtained from Moody’s, Fitch, and S&P. For securities rated by all three agencies, where two of them are in agreement and assign the highest rating category, the highest rating applies. If a security is only rated by two agencies, and their ratings are in different categories, the lower of the ratings applies. An unrated security is First Tier if it represents quality comparable to that of a rated security, as determined in accordance with SEC Rule 2a-7.
1 7-day SEC yield.
2 The portfolio expense ratio shown is from the prospectus dated April 30, 2015, and represents estimated costs for the current fiscal year. For the fiscal year ended December 31, 2015, the portfolio’s expense ratio was 0.06%, reflecting a temporary reduction in operating expenses (described in Note B of the Notes to Financial Statements). Before the reduction, expense ratio was 0.16%.
3 The agency sector may include issues from government-sponsored enterprises; such issues are not backed by the full faith and credit of the U.S. government.
161
Vanguard Money Market Portfolio
Performance Summary
Investment returns will fluctuate. All of the returns in this report represent past performance, which is not a guarantee of future results that may be achieved by the portfolio. (Current performance may be lower or higher than the performance data cited. For performance data current to the most recent month-end, visit our website at vanguard.com/performance.)
The returns shown do not reflect taxes that a shareholder would pay on portfolio distributions. An investment in a money market portfolio is not insured or guaranteed by the Federal Deposit Insurance Corporation or any other government agency. Although the portfolio seeks to preserve the value of your investment at $1 per share, it is possible to lose money by investing in the portfolio. The portfolio’s SEC 7-day annualized yield as of December 31, 2015, was 0.32%. This yield reflects the current earnings of the portfolio more closely than do the average annual returns. Note that the returns do not reflect fees and expenses associated with the annuity or life insurance program through which a shareholder invests. If these fees and expenses were included, the portfolio’s returns would be lower.
Cumulative Performance: December 31, 2005–December 31, 2015
Initial Investment of $10,000
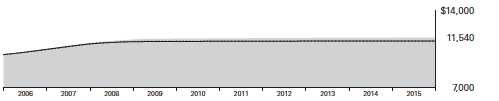
| | | | |
| | | Average Annual Total Returns | Final Value |
| | Periods Ended December 31, 2015 | of a $10,000 |
| | One Year | Five Years | Ten Years | Investment |
| Money Market Portfolio | 0.15% | 0.13% | 1.44% | $11,540 |
| Variable Insurance Money Market | | | | |
| Funds Average1 | 0.00 | -0.01 | 1.15 | 11,211 |
| Citigroup Three-Month U.S. | | | | |
| Treasury Bill Index | 0.03 | 0.04 | 1.16 | 11,233 |
Fiscal-Year Total Returns (%): December 31, 2005–December 31, 2015
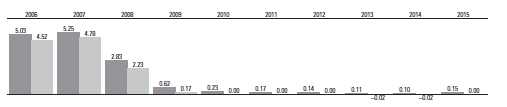
| |
| Money Market Portfolio |
| Variable Insurance Money Market Funds Average1 |
1 Derived from data provided by Lipper, a Thomson Reuters Company.
See Financial Highlights for dividend information.
162
Vanguard Money Market Portfolio
Financial Statements
Statement of Net Assets
As of December 31, 2015
The portfolio reports a complete list of its holdings in various monthly and quarterly regulatory filings. The portfolio publishes its holdings on a monthly basis at vanguard.com and files them with the Securities and Exchange Commission on Form N-MFP. The portfolio’s Form N-MFP filings become public 60 days after the relevant month-end, and may be viewed at sec.gov or via a link on the “Portfolio Holdings” page on vanguard.com. For the second and fourth fiscal quarters, the lists appear in the portfolio’s semiannual and annual reports to shareholders. For the first and third fiscal quarters, the portfolio files the lists with the SEC on Form N-Q. Shareholders can look up the portfolio’s Forms N-Q on the SEC’s website at sec.gov. Forms N-Q may also be reviewed and copied at the SEC’s Public Reference Room (see the back cover of this report for further information).
| | | | | |
| Face | Market |
| Maturity Amount | Value • |
| | Yield1 | Date | ($000) | ($000) |
| U.S. Government and Agency Obligations (42.5%) | | | |
| 2 | Fannie Mae Discount Notes | 0.180% | 1/14/16 | 5,974 | 5,974 |
| 2 | Fannie Mae Discount Notes | 0.120% | 1/20/16 | 1,500 | 1,500 |
| 2 | Fannie Mae Discount Notes | 0.400% | 1/25/16 | 96 | 96 |
| 2 | Fannie Mae Discount Notes | 0.300% | 2/2/16 | 1,800 | 1,799 |
| 2 | Fannie Mae Discount Notes | 0.310% | 3/2/16 | 2,750 | 2,749 |
| 2 | Fannie Mae Discount Notes | 0.430% | 3/9/16 | 2,418 | 2,416 |
| 2 | Fannie Mae Discount Notes | 0.551% | 4/13/16 | 2,500 | 2,496 |
| 3 | Federal Home Loan Bank | | | | |
| | Discount Notes | 0.110%–0.120% | 1/4/16 | 8,125 | 8,125 |
| 3 | Federal Home Loan Bank | | | | |
| | Discount Notes | 0.120%–0.130% | 1/6/16 | 5,013 | 5,013 |
| 3 | Federal Home Loan Bank | | | | |
| | Discount Notes | 0.295% | 1/15/16 | 1,150 | 1,150 |
| 3 | Federal Home Loan Bank | | | | |
| | Discount Notes | 0.298% | 1/21/16 | 1,300 | 1,300 |
| 3 | Federal Home Loan Bank | | | | |
| | Discount Notes | 0.130% | 1/22/16 | 1,500 | 1,500 |
| 3 | Federal Home Loan Bank | | | | |
| | Discount Notes | 0.300% | 1/25/16 | 5,500 | 5,499 |
| 3 | Federal Home Loan Bank | | | | |
| | Discount Notes | 0.250% | 1/26/16 | 2,200 | 2,200 |
| 3 | Federal Home Loan Bank | | | | |
| | Discount Notes | 0.300% | 1/29/16 | 1,177 | 1,177 |
| 3 | Federal Home Loan Bank | | | | |
| | Discount Notes | 0.210%–0.410% | 2/3/16 | 28,553 | 28,544 |
| 3 | Federal Home Loan Bank | | | | |
| | Discount Notes | 0.210% | 2/5/16 | 5,500 | 5,499 |
| 3 | Federal Home Loan Bank | | | | |
| | Discount Notes | 0.220% | 2/8/16 | 6,125 | 6,124 |
| 3 | Federal Home Loan Bank | | | | |
| | Discount Notes | 0.229% | 2/10/16 | 6,000 | 5,998 |
| 3 | Federal Home Loan Bank | | | | |
| | Discount Notes | 0.223%–0.225% | 2/12/16 | 29,145 | 29,137 |
| 3 | Federal Home Loan Bank | | | | |
| | Discount Notes | 0.250%–0.345% | 2/16/16 | 13,209 | 13,203 |
| 3 | Federal Home Loan Bank | | | | |
| | Discount Notes | 0.235%–0.300% | 2/17/16 | 45,750 | 45,734 |
| 3 | Federal Home Loan Bank | | | | |
| | Discount Notes | 0.234%–0.300% | 2/19/16 | 18,950 | 18,944 |
| 3 | Federal Home Loan Bank | | | | |
| | Discount Notes | 0.290% | 2/22/16 | 1,658 | 1,657 |
| 3 | Federal Home Loan Bank | | | | |
| | Discount Notes | 0.270% | 2/24/16 | 13,000 | 12,995 |
| 3 | Federal Home Loan Bank | | | | |
| | Discount Notes | 0.265%–0.300% | 2/26/16 | 15,386 | 15,379 |
| 3 | Federal Home Loan Bank | | | | |
| | Discount Notes | 0.315% | 3/2/16 | 500 | 500 |
| 3 | Federal Home Loan Bank | | | | |
| | Discount Notes | 0.379% | 4/8/16 | 286 | 286 |
| 3 | Federal Home Loan Bank | | | | |
| | Discount Notes | 0.561% | 5/16/16 | 5,599 | 5,587 |
| 2 | Freddie Mac Discount Notes | 0.150% | 1/5/16 | 1,895 | 1,895 |
| 2 | Freddie Mac Discount Notes | 0.170% | 1/8/16 | 2,900 | 2,900 |
| 2 | Freddie Mac Discount Notes | 0.140%–0.300% | 1/12/16 | 7,914 | 7,913 |
| | | | | | |
| Face | Market |
| Maturity Amount | Value • |
| | | Yield1 | Date | ($000) | ($000) |
| 2 | Freddie Mac Discount Notes | | 0.300% | 1/13/16 | 900 | 900 |
| 2 | Freddie Mac Discount Notes | 0.170%–0.190% | 1/15/16 | 3,767 | 3,767 |
| 2 | Freddie Mac Discount Notes | | 0.170% | 1/20/16 | 4,700 | 4,700 |
| 2 | Freddie Mac Discount Notes | | 0.180% | 1/21/16 | 2,171 | 2,171 |
| 2 | Freddie Mac Discount Notes | | 0.300% | 1/22/16 | 1,100 | 1,100 |
| 2 | Freddie Mac Discount Notes | | 0.130% | 1/27/16 | 2,800 | 2,800 |
| 2 | Freddie Mac Discount Notes | | 0.130% | 1/28/16 | 1,700 | 1,700 |
| 2 | Freddie Mac Discount Notes | | 0.250% | 1/29/16 | 2,185 | 2,185 |
| 2 | Freddie Mac Discount Notes | | 0.210% | 2/3/16 | 900 | 900 |
| 2 | Freddie Mac Discount Notes | | 0.130% | 2/5/16 | 5,500 | 5,499 |
| 2 | Freddie Mac Discount Notes | | 0.300% | 2/10/16 | 2,000 | 1,999 |
| 2 | Freddie Mac Discount Notes | | 0.260% | 2/17/16 | 694 | 694 |
| 2 | Freddie Mac Discount Notes | | 0.300% | 2/22/16 | 500 | 500 |
| 2 | Freddie Mac Discount Notes | | 0.360% | 2/29/16 | 1,192 | 1,191 |
| 2 | Freddie Mac Discount Notes | | 0.430% | 3/1/16 | 30,000 | 29,978 |
| 2 | Freddie Mac Discount Notes | | 0.280% | 3/11/16 | 10,000 | 9,995 |
| United States Treasury Bill | 0.200%–0.201% | 2/25/16 | 12,219 | 12,215 |
| United States Treasury Bill | | 0.270% | 3/3/16 | 13,000 | 12,994 |
| United States Treasury Bill | | 0.285% | 3/10/16 | 12,000 | 11,993 |
| United States Treasury Bill | | 0.280% | 5/5/16 | 35,000 | 34,966 |
| United States Treasury Bill | | 0.341% | 5/12/16 | 8,478 | 8,467 |
| United States Treasury Bill | | 0.416% | 6/2/16 | 15,000 | 14,974 |
| United States Treasury Bill | | 0.536% | 6/9/16 | 20,000 | 19,952 |
| United States Treasury Floating | | | | | |
| | Rate Note | | 0.305% | 1/31/16 | 3,000 | 3,000 |
| United States Treasury Floating | | | | | |
| | Rate Note | | 0.329% | 4/30/16 | 2,000 | 2,000 |
| United States Treasury Floating | | | | | |
| | Rate Note | | 0.313% | 10/31/16 | 14,500 | 14,493 |
| United States Treasury Floating | | | | | |
| | Rate Note | | 0.344% | 1/31/17 | 24,296 | 24,295 |
| United States Treasury Note/Bond | 0.375% | 1/15/16 | 3,000 | 3,000 |
| United States Treasury Note/Bond | 0.375% | 2/15/16 | 11,000 | 11,003 |
| United States Treasury Note/Bond | 2.375% | 3/31/16 | 10,000 | 10,053 |
| United States Treasury Note/Bond | 2.250% | 3/31/16 | 4,000 | 4,019 |
| United States Treasury Note/Bond | 5.125% | 5/15/16 | 7,500 | 7,636 |
| United States Treasury Note/Bond | 3.250% | 5/31/16 | 5,000 | 5,059 |
| United States Treasury Note/Bond | 0.500% | 6/15/16 | 2,298 | 2,299 |
| Total U.S. Government and Agency Obligations | | | |
| (Cost $517,786) | 517,786 |
| Commercial Paper (23.9%) | | | | | |
| Finance—Auto (1.6%) | | | | | |
| American Honda Finance Corp. | 0.230% | 1/6/16 | 3,000 | 3,000 |
| American Honda Finance Corp. | 0.200% | 1/8/16 | 500 | 500 |
| American Honda Finance Corp. | 0.200% | 1/11/16 | 500 | 500 |
| American Honda Finance Corp. | 0.220% | 1/13/16 | 3,000 | 2,999 |
| American Honda Finance Corp. | 0.220% | 1/21/16 | 500 | 500 |
| American Honda Finance Corp. | 0.220% | 1/25/16 | 250 | 250 |
| 4 | BMW US Capital LLC | | 0.330% | 1/4/16 | 500 | 500 |
| 4 | BMW US Capital LLC | | 0.220% | 1/11/16 | 500 | 500 |
| 4 | BMW US Capital LLC | | 0.390% | 2/1/16 | 500 | 500 |
| Toyota Motor Credit Corp. | | 0.321% | 1/5/16 | 2,000 | 2,000 |
| Toyota Motor Credit Corp. | | 0.311% | 1/12/16 | 250 | 250 |
| 5 | Toyota Motor Credit Corp. | | 0.331% | 4/15/16 | 4,000 | 4,000 |
163
Vanguard Money Market Portfolio
| | | | | | |
| Face | Market |
| Maturity Amount | Value • |
| | | Yield1 | Date | ($000) | ($000) |
| 5 | Toyota Motor Credit Corp. | 0.682% | 7/22/16 | 500 | 500 |
| 5 | Toyota Motor Credit Corp. | 0.682% | 7/22/16 | 1,000 | 1,000 |
| 5 | Toyota Motor Credit Corp. | 0.690% | 8/18/16 | 1,000 | 1,000 |
| 5 | Toyota Motor Credit Corp. | 0.690% | 8/19/16 | 1,000 | 1,000 |
| 5 | Toyota Motor Credit Corp. | 0.692% | 8/25/16 | 1,000 | 1,000 |
| 19,999 |
| Finance—Other (0.2%) | | | | | |
| 4 | Jupiter Securitization Co. LLC | 0.330% | 1/4/16 | 2,000 | 2,000 |
| | | | | |
| Foreign Banks (8.3%) | | | | | |
| 4,5 Australia & New Zealand Banking | | | | |
| | Group, Ltd. | | 0.440% | 1/15/16 | 1,000 | 1,000 |
| 4,5 Australia & New Zealand Banking | | | | |
| | Group, Ltd. | | 0.532% | 1/29/16 | 2,000 | 2,000 |
| 4,5 Australia & New Zealand Banking | | | | |
| | Group, Ltd. | | 0.532% | 1/29/16 | 3,000 | 3,000 |
| 4,5 Australia & New Zealand Banking | | | | |
| | Group, Ltd. | | 0.385% | 4/8/16 | 3,000 | 3,000 |
| 4 | Australia & New Zealand Banking | | | | |
| | Group, Ltd. | | 0.441% | 4/28/16 | 1,750 | 1,747 |
| 4,5 Australia & New Zealand Banking | | | | |
| | Group, Ltd. | | 0.640% | 5/23/16 | 3,000 | 3,000 |
| 4 | Australia & New Zealand Banking | | | | |
| | Group, Ltd. | | 0.672% | 6/2/16 | 1,000 | 997 |
| 4,5 Australia & New Zealand Banking | | | | |
| | Group, Ltd. | | 0.632% | 7/27/16 | 3,000 | 3,000 |
| 4,5 Australia & New Zealand Banking | | | | |
| | Group, Ltd. | | 0.454% | 8/3/16 | 1,000 | 1,000 |
| 4,5 Commonwealth Bank of Australia | 0.502% | 2/19/16 | 2,000 | 2,000 |
| 4,5 Commonwealth Bank of Australia | 0.587% | 2/24/16 | 2,000 | 2,000 |
| 4,5 Commonwealth Bank of Australia | 0.572% | 2/29/16 | 5,000 | 5,000 |
| 4,5 Commonwealth Bank of Australia | 0.421% | 3/4/16 | 10,000 | 10,000 |
| 4,5 Commonwealth Bank of Australia | 0.522% | 3/14/16 | 2,250 | 2,250 |
| 4,5 Commonwealth Bank of Australia | 0.534% | 3/31/16 | 1,500 | 1,500 |
| 4,5 Commonwealth Bank of Australia | 0.560% | 5/23/16 | 5,000 | 5,000 |
| 4,5 Commonwealth Bank of Australia | 0.593% | 6/22/16 | 2,250 | 2,250 |
| 4 | Commonwealth Bank of Australia | 0.844% | 6/23/16 | 5,000 | 4,980 |
| 4 | National Australia Bank Ltd. | 0.350% | 1/8/16 | 2,000 | 2,000 |
| 4,5 National Australia Bank Ltd. | 0.416% | 1/8/16 | 4,000 | 4,000 |
| 4,5 National Australia Bank Ltd. | 0.572% | 2/25/16 | 12,000 | 12,000 |
| 4 | Westpac Banking Corp. | | 0.270% | 1/15/16 | 2,000 | 2,000 |
| 4,5 Westpac Banking Corp. | | 0.425% | 2/8/16 | 4,000 | 4,000 |
| 4,5 Westpac Banking Corp. | | 0.523% | 2/22/16 | 3,500 | 3,500 |
| 4,5 Westpac Banking Corp. | | 0.582% | 2/26/16 | 5,500 | 5,500 |
| 4,5 Westpac Banking Corp. | | 0.582% | 2/29/16 | 1,500 | 1,500 |
| 4,5 Westpac Banking Corp. | | 0.371% | 4/4/16 | 5,000 | 5,000 |
| 4,5 Westpac Banking Corp. | | 0.572% | 5/27/16 | 3,000 | 3,000 |
| 4,5 Westpac Banking Corp. | | 0.393% | 6/2/16 | 5,000 | 5,000 |
| 101,224 |
| Foreign Governments (7.1%) | | | | | |
| Canada | | 0.200% | 1/26/16 | 1,000 | 1,000 |
| Canada | | 0.200% | 1/27/16 | 1,000 | 1,000 |
| Canada | | 0.200% | 1/28/16 | 1,000 | 1,000 |
| 4 | CDP Financial Inc. | | 0.260% | 1/22/16 | 12,000 | 11,998 |
| 4 | CDP Financial Inc. | | 0.300% | 2/10/16 | 1,000 | 1,000 |
| 4 | CDP Financial Inc. | | 0.340% | 2/16/16 | 500 | 500 |
| 4 | CDP Financial Inc. | 0.601%–0.630% | 3/15/16 | 1,000 | 999 |
| 4 | CDP Financial Inc. | | 0.601% | 3/16/16 | 1,000 | 999 |
| 4 | CDP Financial Inc. | | 0.451% | 5/2/16 | 250 | 249 |
| 6 | CPPIB Capital Inc. | | 0.250% | 1/11/16 | 2,000 | 2,000 |
| 6 | CPPIB Capital Inc. | | 0.300% | 1/13/16 | 2,500 | 2,500 |
| 6 | CPPIB Capital Inc. | | 0.300% | 1/15/16 | 2,000 | 2,000 |
| 6 | CPPIB Capital Inc. | | 0.300% | 1/19/16 | 1,000 | 1,000 |
| 6 | CPPIB Capital Inc. | | 0.265% | 1/20/16 | 1,000 | 1,000 |
| 6 | CPPIB Capital Inc. | | 0.310% | 2/2/16 | 5,000 | 4,999 |
| 6 | CPPIB Capital Inc. | | 0.300% | 2/3/16 | 1,000 | 1,000 |
| 6 | CPPIB Capital Inc. | | 0.250% | 2/11/16 | 2,250 | 2,249 |
| 6 | CPPIB Capital Inc. | | 0.250% | 2/12/16 | 750 | 750 |
| 6 | CPPIB Capital Inc. | | 0.371% | 3/14/16 | 1,000 | 999 |
| 6 | CPPIB Capital Inc. | | 0.551% | 3/16/16 | 250 | 250 |
| | | | | | |
| Face | Market |
| Maturity Amount | Value • |
| | | Yield1 | Date | ($000) | ($000) |
| 6 | CPPIB Capital Inc. | | 0.561% | 3/21/16 | 250 | 250 |
| 6 | CPPIB Capital Inc. | | 0.631% | 4/1/16 | 8,242 | 8,229 |
| 6 | CPPIB Capital Inc. | | 0.833% | 6/1/16 | 2,000 | 1,993 |
| 6 | CPPIB Capital Inc. | | 0.833% | 6/2/16 | 2,000 | 1,993 |
| 6 | CPPIB Capital Inc. | | 0.803% | 6/13/16 | 2,500 | 2,491 |
| 6 | CPPIB Capital Inc. | | 0.803% | 6/14/16 | 1,250 | 1,245 |
| Export Development Canada | 0.380% | 1/15/16 | 1,000 | 1,000 |
| Export Development Canada | 0.380% | 1/19/16 | 2,000 | 1,999 |
| Export Development Canada | 0.315% | 1/20/16 | 500 | 500 |
| Export Development Canada | 0.330% | 2/1/16 | 500 | 500 |
| Export Development Canada | 0.500% | 3/8/16 | 1,500 | 1,498 |
| Export Development Canada | 0.541% | 3/14/16 | 1,000 | 999 |
| Export Development Canada | 0.541% | 3/16/16 | 1,000 | 999 |
| Province of British Columbia | 0.551% | 3/9/16 | 2,761 | 2,758 |
| Province of British Columbia | 0.601% | 3/11/16 | 2,750 | 2,747 |
| Province of British Columbia | 0.601% | 4/20/16 | 4,600 | 4,591 |
| Province of Ontario | | 0.390% | 1/25/16 | 250 | 250 |
| Province of Ontario | | 0.200% | 1/29/16 | 1,354 | 1,354 |
| Province of Ontario | | 0.440% | 2/22/16 | 250 | 250 |
| Province of Ontario | | 0.450% | 2/26/16 | 250 | 250 |
| Province of Ontario | | 0.450% | 2/29/16 | 250 | 250 |
| 6 | PSP Capital Inc. | | 0.230% | 1/12/16 | 1,000 | 1,000 |
| 6 | PSP Capital Inc. | | 0.230% | 1/14/16 | 500 | 500 |
| 6 | PSP Capital Inc. | | 0.340% | 2/16/16 | 1,000 | 999 |
| 6 | PSP Capital Inc. | | 0.380% | 2/25/16 | 1,000 | 999 |
| 6 | PSP Capital Inc. | | 0.390% | 3/1/16 | 750 | 749 |
| 6 | PSP Capital Inc. | | 0.551% | 3/11/16 | 750 | 749 |
| 6 | PSP Capital Inc. | | 0.551% | 3/14/16 | 1,250 | 1,248 |
| 4 | Quebec | | 0.430% | 2/26/16 | 6,000 | 5,996 |
| 85,878 |
| Foreign Industrial (2.4%) | | | | | |
| 4 | BASF SE | | 0.571% | 3/29/16 | 1,750 | 1,748 |
| 4 | Nestle Capital Corp. | | 0.340% | 1/8/16 | 1,000 | 1,000 |
| 4 | Nestle Capital Corp. | | 0.340% | 1/12/16 | 1,000 | 1,000 |
| 4 | Nestle Capital Corp. | | 0.340% | 1/14/16 | 1,000 | 1,000 |
| Nestle Finance International Ltd. | 0.340% | 1/6/16 | 2,000 | 2,000 |
| Nestle Finance International Ltd. | 0.360% | 1/20/16 | 5,000 | 4,999 |
| Nestle Finance International Ltd. | 0.265% | 2/8/16 | 2,500 | 2,499 |
| 4 | Novartis Finance Corp. | | 0.300% | 1/4/16 | 500 | 500 |
| 4 | Reckitt Benckiser Treasury Services plc 0.260% | 1/11/16 | 500 | 500 |
| 4 | Siemens Capital Co. LLC | | 0.551% | 3/21/16 | 1,750 | 1,748 |
| 4 | Siemens Capital Co. LLC | | 0.551% | 3/23/16 | 3,500 | 3,496 |
| 4 | Siemens Capital Co. LLC | | 0.551% | 3/29/16 | 2,250 | 2,247 |
| 4 | Total Capital Canada Ltd. | | 0.350% | 1/14/16 | 500 | 500 |
| 4 | Total Capital Canada Ltd. | | 0.260% | 2/22/16 | 500 | 500 |
| 4 | Total Capital Canada Ltd. | | 0.260% | 2/25/16 | 1,250 | 1,250 |
| 4 | Total Capital Canada Ltd. | | 0.571% | 3/21/16 | 1,250 | 1,248 |
| Toyota Credit Canada Inc. | 0.461% | 4/5/16 | 500 | 499 |
| Toyota Credit Canada Inc. | 0.572% | 5/13/16 | 500 | 499 |
| Toyota Credit Canada Inc. | 0.562% | 6/1/16 | 250 | 249 |
| Toyota Credit Canada Inc. | 0.642% | 6/2/16 | 250 | 249 |
| 4 | Unilever Capital Corp. | | 0.280% | 1/4/16 | 500 | 500 |
| 4 | Unilever Capital Corp. | | 0.280% | 1/11/16 | 1,250 | 1,250 |
| 29,481 |
| Industrial (4.3%) | | | | | |
| Caterpillar Financial Services Corp. | 0.400% | 1/20/16 | 1,000 | 1,000 |
| Caterpillar Financial Services Corp. | 0.400% | 1/21/16 | 250 | 250 |
| 4 | Chevron Corp. | | 0.200% | 1/11/16 | 1,500 | 1,500 |
| 4 | Emerson Electric Co. | | 0.220% | 1/5/16 | 500 | 500 |
| 4 | Emerson Electric Co. | | 0.220% | 1/7/16 | 1,000 | 1,000 |
| 4 | Google Inc. | | 0.190% | 1/12/16 | 1,000 | 1,000 |
| 4 | Google Inc. | | 0.180% | 1/14/16 | 500 | 500 |
| 4 | Henkel of America Inc. | | 0.320% | 1/14/16 | 500 | 500 |
| 4 | Henkel of America Inc. | | 0.320% | 1/15/16 | 500 | 500 |
| 4 | Henkel of America Inc. | | 0.230% | 1/21/16 | 500 | 500 |
| 4 | John Deere Capital Corp. | | 0.520% | 2/17/16 | 2,250 | 2,248 |
| 4 | John Deere Capital Corp. | | 0.551% | 2/18/16 | 500 | 500 |
| 4 | John Deere Financial Inc. | | 0.520% | 2/17/16 | 1,000 | 999 |
| 4 | Microsoft Corp. | | 0.200% | 1/6/16 | 500 | 500 |
| 4 | Microsoft Corp. | 0.190%–0.200% | 1/13/16 | 4,500 | 4,500 |
164
Vanguard Money Market Portfolio
| | | | | | |
| Face | Market |
| Maturity Amount | Value • |
| | | Yield1 | Date | ($000) | ($000) |
| 4 | Microsoft Corp. | | 0.190% | 1/20/16 | 500 | 500 |
| 4 | Pfizer Inc | | 0.190% | 1/15/16 | 2,000 | 2,000 |
| 4 | Pfizer Inc | | 0.581% | 4/1/16 | 2,250 | 2,247 |
| 4 | The Coca-Cola Co. | | 0.381% | 1/13/16 | 8,950 | 8,949 |
| 4 | The Coca-Cola Co. | | 0.401% | 1/28/16 | 1,500 | 1,499 |
| 4 | The Coca-Cola Co. | 0.401%–0.420% | 1/29/16 | 1,000 | 1,000 |
| 4 | The Coca-Cola Co. | | 0.461% | 2/17/16 | 500 | 500 |
| 4 | The Coca-Cola Co. | | 0.461% | 2/18/16 | 1,000 | 999 |
| 4 | The Coca-Cola Co. | | 0.461% | 2/22/16 | 1,000 | 999 |
| 4 | The Coca-Cola Co. | | 0.501% | 3/16/16 | 6,000 | 5,994 |
| 4 | The Coca-Cola Co. | | 0.501% | 3/18/16 | 750 | 749 |
| 4 | The Coca-Cola Co. | | 0.421% | 3/22/16 | 3,000 | 2,997 |
| 4 | The Coca-Cola Co. | | 0.481% | 4/20/16 | 1,500 | 1,498 |
| 4 | The Coca-Cola Co. | | 0.481% | 4/21/16 | 500 | 499 |
| 4 | The Coca-Cola Co. | | 0.501% | 5/17/16 | 3,500 | 3,493 |
| 4 | The Walt Disney Co. | | 0.190% | 1/8/16 | 250 | 250 |
| 4 | The Walt Disney Co. | | 0.190% | 1/11/16 | 1,000 | 1,000 |
| 4 | The Walt Disney Co. | | 0.200% | 2/9/16 | 750 | 750 |
| 51,920 |
| Total Commercial Paper (Cost $290,502) | 290,502 |
| Certificates of Deposit (27.7%) | | | | |
| Domestic Banks (5.2%) | | | | | |
| Citibank NA | | 0.290% | 1/5/16 | 500 | 500 |
| Citibank NA | | 0.270% | 1/6/16 | 1,000 | 1,000 |
| Citibank NA | | 0.300% | 2/10/16 | 1,500 | 1,500 |
| Citibank NA | | 0.300% | 2/11/16 | 2,000 | 2,000 |
| Citibank NA | | 0.380% | 2/24/16 | 3,000 | 3,000 |
| Citibank NA | | 0.500% | 3/8/16 | 1,750 | 1,750 |
| 5 | State Street Bank & Trust Co. | 0.461% | 1/11/16 | 3,000 | 3,000 |
| 5 | State Street Bank & Trust Co. | 0.457% | 1/13/16 | 5,000 | 5,000 |
| 5 | State Street Bank & Trust Co. | 0.491% | 1/15/16 | 4,000 | 4,000 |
| 5 | State Street Bank & Trust Co. | 0.457% | 3/9/16 | 2,000 | 2,000 |
| 5 | State Street Bank & Trust Co. | 0.650% | 5/23/16 | 9,500 | 9,500 |
| 5 | Wells Fargo Bank NA | | 0.407% | 2/9/16 | 4,000 | 4,000 |
| 5 | Wells Fargo Bank NA | | 0.470% | 2/11/16 | 5,000 | 5,000 |
| 5 | Wells Fargo Bank NA | | 0.583% | 2/22/16 | 5,000 | 5,000 |
| 5 | Wells Fargo Bank NA | | 0.583% | 2/22/16 | 5,000 | 5,000 |
| 5 | Wells Fargo Bank NA | | 0.407% | 3/9/16 | 3,000 | 3,000 |
| 5 | Wells Fargo Bank NA | | 0.406% | 5/6/16 | 3,000 | 3,000 |
| 5 | Wells Fargo Bank NA | | 0.507% | 5/13/16 | 4,000 | 4,000 |
| 5 | Wells Fargo Bank NA | | 0.642% | 5/25/16 | 1,000 | 1,000 |
| 63,250 |
| Eurodollar Certificates of Deposit (1.3%) | | | | |
| Australia & New Zealand Banking | | | | |
| | Group, Ltd. | | 0.380% | 1/26/16 | 4,000 | 4,000 |
| Australia & New Zealand Banking | | | | |
| | Group, Ltd. | | 0.300% | 2/16/16 | 2,000 | 2,000 |
| National Australia Bank Ltd. | 0.800% | 6/15/16 | 10,000 | 10,000 |
| 16,000 |
| Yankee Certificates of Deposit (21.2%) | | | | |
| Australia & New Zealand Banking | | | | |
| | Group, Ltd. (New York Branch) | 0.550% | 3/22/16 | 1,500 | 1,500 |
| Australia & New Zealand Banking | | | | |
| | Group, Ltd. (New York Branch) | 0.600% | 4/29/16 | 1,250 | 1,250 |
| 5 | Bank of Montreal (Chicago Branch) | 0.425% | 1/8/16 | 2,000 | 2,000 |
| 5 | Bank of Montreal (Chicago Branch) | 0.404% | 3/1/16 | 2,000 | 2,000 |
| 5 | Bank of Montreal (Chicago Branch) | 0.404% | 3/1/16 | 3,000 | 3,000 |
| 5 | Bank of Montreal (Chicago Branch) | 0.457% | 3/9/16 | 2,000 | 2,000 |
| 5 | Bank of Montreal (Chicago Branch) | 0.463% | 3/10/16 | 1,500 | 1,500 |
| 5 | Bank of Montreal (Chicago Branch) | 0.572% | 3/21/16 | 5,000 | 5,000 |
| Bank of Montreal (Chicago Branch) | 0.630% | 3/23/16 | 3,000 | 3,000 |
| 5 | Bank of Montreal (Chicago Branch) | 0.602% | 3/29/16 | 1,000 | 1,000 |
| Bank of Montreal (Chicago Branch) | 0.680% | 6/2/16 | 5,000 | 5,000 |
| Bank of Montreal (Chicago Branch) | 0.810% | 6/21/16 | 5,000 | 5,000 |
| 5 | Bank of Nova Scotia (Houston Branch) | 0.419% | 1/7/16 | 6,000 | 6,000 |
| 5 | Bank of Nova Scotia (Houston Branch) | 0.563% | 2/22/16 | 4,000 | 4,000 |
| 5 | Bank of Nova Scotia (Houston Branch) | 0.582% | 2/25/16 | 5,000 | 5,000 |
| 5 | Bank of Nova Scotia (Houston Branch) | 0.582% | 2/26/16 | 3,500 | 3,500 |
| | | | | |
| Face | Market |
| Maturity Amount | Value • |
| | Yield1 | Date | ($000) | ($000) |
| 5 | Bank of Nova Scotia (Houston Branch) | 0.524% | 3/16/16 | 4,600 | 4,600 |
| 5 | Bank of Nova Scotia (Houston Branch) | 0.592% | 4/21/16 | 2,000 | 2,000 |
| 5 | Bank of Tokyo-Mitsubishi UFJ Ltd. | | | | |
| | (New York Branch) | 0.582% | 1/19/16 | 2,000 | 2,000 |
| 5 | Bank of Tokyo-Mitsubishi UFJ Ltd. | | | | |
| | (New York Branch) | 0.602% | 1/28/16 | 5,000 | 5,000 |
| Bank of Tokyo-Mitsubishi UFJ Ltd. | | | | |
| | (New York Branch) | 0.360% | 2/16/16 | 8,000 | 8,000 |
| Bank of Tokyo-Mitsubishi UFJ Ltd. | | | | |
| | (New York Branch) | 0.560% | 3/21/16 | 4,000 | 4,000 |
| Bank of Tokyo-Mitsubishi UFJ Ltd. | | | | |
| | (New York Branch) | 0.600% | 4/14/16 | 10,000 | 10,000 |
| Canadian Imperial Bank of Commerce | | | | |
| | (New York Branch) | 0.360% | 1/4/16 | 8,000 | 8,000 |
| Canadian Imperial Bank of Commerce | | | | |
| | (New York Branch) | 0.390% | 1/8/16 | 5,000 | 5,000 |
| Canadian Imperial Bank of Commerce | | | | |
| | (New York Branch) | 0.390% | 1/14/16 | 4,000 | 4,000 |
| Canadian Imperial Bank of Commerce | | | | |
| | (New York Branch) | 0.400% | 1/27/16 | 1,000 | 1,000 |
| 5 | Canadian Imperial Bank of Commerce | | | | |
| | (New York Branch) | 0.612% | 4/20/16 | 750 | 750 |
| 5 | Canadian Imperial Bank of Commerce | | | | |
| | (New York Branch) | 0.572% | 4/21/16 | 5,000 | 5,000 |
| 5 | Canadian Imperial Bank of Commerce | | | | |
| | (New York Branch) | 0.468% | 5/10/16 | 5,000 | 5,000 |
| Canadian Imperial Bank of Commerce | | | | |
| | (New York Branch) | 0.800% | 6/14/16 | 1,000 | 1,000 |
| 5 | Commonwealth Bank of Australia | | | | |
| | (New York Branch) | 0.518% | 2/24/16 | 500 | 500 |
| DNB Bank ASA (New York Branch) | 0.400% | 3/24/16 | 10,655 | 10,649 |
| Lloyds Bank plc (New York Branch) | 0.590% | 3/14/16 | 2,250 | 2,250 |
| Lloyds Bank plc (New York Branch) | 0.640% | 3/18/16 | 5,000 | 5,000 |
| National Australia Bank Ltd. | | | | |
| | (New York Branch) | 0.650% | 4/13/16 | 3,000 | 3,000 |
| National Australia Bank Ltd. | | | | |
| | (New York Branch) | 0.800% | 6/13/16 | 4,000 | 4,000 |
| Nordea Bank Finland plc | | | | |
| | (New York Branch) | 0.400% | 2/29/16 | 8,000 | 8,000 |
| Nordea Bank Finland plc | | | | |
| | (New York Branch) | 0.580% | 3/21/16 | 10,000 | 10,000 |
| Nordea Bank Finland plc | | | | |
| | (New York Branch) | 0.795% | 6/10/16 | 2,000 | 2,000 |
| Nordea Bank Finland plc | | | | |
| | (New York Branch) | 0.795% | 6/28/16 | 10,000 | 10,000 |
| 5 | Royal Bank of Canada | | | | |
| | (New York Branch) | 0.470% | 2/11/16 | 5,000 | 5,000 |
| 5 | Royal Bank of Canada | | | | |
| | (New York Branch) | 0.592% | 2/29/16 | 4,000 | 4,000 |
| 5 | Royal Bank of Canada | | | | |
| | (New York Branch) | 0.413% | 3/2/16 | 4,750 | 4,750 |
| 5 | Royal Bank of Canada | | | | |
| | (New York Branch) | 0.414% | 5/3/16 | 4,000 | 4,000 |
| 5 | Royal Bank of Canada | | | | |
| | (New York Branch) | 0.629% | 5/23/16 | 6,000 | 6,000 |
| 5 | Royal Bank of Canada | | | | |
| | (New York Branch) | 0.603% | 6/22/16 | 7,000 | 7,000 |
| Svenska HandelsBanken | | | | |
| | (New York Branch) | 0.550% | 3/14/16 | 10,000 | 10,000 |
| Svenska HandelsBanken | | | | |
| | (New York Branch) | 0.635% | 4/14/16 | 5,000 | 5,000 |
| Svenska HandelsBanken | | | | |
| | (New York Branch) | 0.790% | 6/14/16 | 10,000 | 10,000 |
| Toronto Dominion Bank | | | | |
| | (New York Branch) | 0.390% | 1/19/16 | 6,000 | 6,000 |
| 5 | Toronto Dominion Bank | | | | |
| | (New York Branch) | 0.578% | 2/24/16 | 5,000 | 5,000 |
| 5 | Toronto Dominion Bank | | | | |
| | (New York Branch) | 0.477% | 4/14/16 | 1,000 | 1,000 |
165
Vanguard Money Market Portfolio
| | | | | |
| Face | Market |
| Maturity Amount | Value • |
| | Yield1 | Date | ($000) ($000) |
| 5 | Toronto Dominion Bank | | | | |
| | (New York Branch) | 0.629% | 5/23/16 | 6,000 | 6,000 |
| Toronto Dominion Bank | | | | |
| | (New York Branch) | 0.760% | 6/8/16 | 7,000 | 7,000 |
| Westpac Banking Corp. | | | | |
| | (New York Branch) | 0.270% | 1/13/16 | 5,000 | 5,000 |
| 5 | Westpac Banking Corp. | | | | |
| | (New York Branch) | 0.394% | 6/3/16 | 1,000 | 1,000 |
| 258,249 |
| Total Certificates of Deposit (Cost $337,499) | 337,499 |
| Other Notes (1.9%) | | | | |
| Bank of America NA | 0.400% | 1/8/16 | 2,500 | 2,500 |
| Bank of America NA | 0.330% | 2/2/16 | 1,000 | 1,000 |
| Bank of America NA | 0.480% | 3/1/16 | 4,000 | 4,000 |
| Bank of America NA | 0.480% | 3/2/16 | 4,000 | 4,000 |
| 5 | Bank of America NA | 0.424% | 3/3/16 | 1,750 | 1,750 |
| Bank of America NA | 0.460% | 4/4/16 | 2,000 | 2,000 |
| Bank of America NA | 0.500% | 5/5/16 | 2,000 | 2,000 |
| 5 | Bank of America NA | 0.457% | 5/9/16 | 2,000 | 2,000 |
| 5 | Bank of America NA | 0.610% | 5/17/16 | 2,000 | 2,000 |
| 5 | Bank of America NA | 0.600% | 5/23/16 | 2,000 | 2,000 |
| Total Other Notes (Cost $23,250) | 23,250 |
| Repurchase Agreements (0.1%) | | | | |
| Bank of Montreal | | | | |
| | (Dated 12/31/15, Repurchase | | | | |
| | Value $1,000,000, collateralized | | | | |
| | by U.S. Treasury Note/Bond | | | | |
| | 1.500%–8.750%, 5/15/17–1/31/22, | | | | |
| | with a value of $1,020,000) | 0.280% | 1/4/16 | 1,000 | 1,000 |
| Corporate Bonds (1.4%) | | | | |
| Finance (0.3%) | | | | |
| Australia & New Zealand Banking | | | | |
| | Group Ltd. | 0.900% | 2/12/16 | 4,000 | 4,001 |
| | | | |
| Industrial (1.1%) | | | | |
| General Electric Capital Corp. | 5.000% | 1/8/16 | 1,887 | 1,889 |
| 5 | Toyota Motor Credit Corp. | 0.522% | 6/13/16 | 6,000 | 6,000 |
| 5 | Toyota Motor Credit Corp. | 0.527% | 10/7/16 | 5,000 | 5,000 |
| 12,889 |
| Total Corporate Bonds (Cost $16,890) | 16,890 |
| Taxable Municipal Bonds (1.3%) | | | | |
| Taxable Municipal Bonds (1.3%) | | | | |
| 6,7 BlackRock Municipal Bond Trust | | | | |
| | TOB VRDO | 0.370% | 1/4/16 | 285 | 285 |
| 6,7 BlackRock Municipal Income | | | | |
| | Investment Quality Trust TOB VRDO | 0.370% | 1/4/16 | 300 | 300 |
| 6,7 BlackRock Municipal Income Trust II | | | | |
| | TOB VRDO | 0.370% | 1/4/16 | 2,000 | 2,000 |
| | | | | |
| Face | Market |
| Maturity Amount | Value • |
| | Yield1 | Date | ($000) | ($000) |
| 6,7 BlackRock Municipal Income Trust | | | | |
| | TOB VRDO | 0.370% | 1/4/16 | 1,650 | 1,650 |
| 6,7 BlackRock MuniHoldings Fund II, Inc. | | | | |
| | TOB VRDO | 0.370% | 1/4/16 | 330 | 330 |
| 6,7 BlackRock MuniHoldings Fund, Inc. | | | | |
| | TOB VRDO | 0.370% | 1/4/16 | 195 | 195 |
| 6,7 BlackRock MuniHoldings Quality | | | | |
| | Fund II, Inc. TOB VRDO | 0.370% | 1/4/16 | 1,550 | 1,550 |
| 6,7 BlackRock MuniHoldings Quality | | | | |
| | Fund II, Inc. TOB VRDO | 0.370% | 1/4/16 | 390 | 390 |
| 6,7 BlackRock MuniVest Fund II, Inc. | | | | |
| | TOB VRDO | 0.370% | 1/4/16 | 1,150 | 1,150 |
| 6,7 BlackRock MuniVest Fund, Inc. | | | | |
| | TOB VRDO | 0.370% | 1/4/16 | 1,000 | 1,000 |
| 6,7 BlackRock MuniYield Investment | | | | |
| | Quality Fund TOB VRDO | 0.370% | 1/4/16 | 1,000 | 1,000 |
| 6,7 BlackRock MuniYield Investment | | | | |
| | Quality Fund TOB VRDO | 0.370% | 1/4/16 | 380 | 380 |
| 6,7 BlackRock Strategic Municipal Trust | | | | |
| | TOB VRDO | 0.370% | 1/4/16 | 200 | 200 |
| 6,7 Los Angeles CA Department of | | | | |
| | Water & Power Revenue TOB VRDO | 0.410% | 1/7/16 | 145 | 145 |
| 6 | Massachusetts Transportation Fund | | | | |
| | Revenue TOB VRDO | 0.410% | 1/7/16 | 100 | 100 |
| 7 | New Jersey Housing & Mortgage | | | | |
| | Finance Agency Multi-Family | | | | |
| | Housing Revenue | 0.380% | 1/7/16 | 4,650 | 4,650 |
| 6 | Seattle WA Municipal Light & Power | | | | |
| | Revenue TOB VRDO | 0.410% | 1/7/16 | 100 | 100 |
| Total Taxable Municipal Bonds (Cost $15,425) | 15,425 |
| Total Investments (98.8%) (Cost $1,202,352) 1,202,352 |
| | | | |
| Amount |
| ($000) |
| Other Assets and Liabilities (1.2%) | | | | |
| Other Assets | | | | |
| Investment in Vanguard | | | | 102 |
| Receivables for Accrued Income | | | | 439 |
| Receivables for Capital Shares Issued | | | | 18,819 |
| Other Assets | | | | 1 |
| Total Other Assets | 19,361 |
| Liabilities | | | | |
| Payables for Investment Securities Purchased | | | (3,994) |
| Payables for Capital Shares Redeemed | | | | (298) |
| Payables to Vanguard | | | | (42) |
| Total Liabilities | (4,334) |
| Net Assets (100%) | | | | |
| Applicable to 1,216,900,896 outstanding $.001 par value shares of | |
| beneficial interest (unlimited authorization) 1,217,379 |
| Net Asset Value per Share | $1.00 |
166
Vanguard Money Market Portfolio
| |
| At December 31, 2015, net assets consisted of: | |
| Amount |
| ($000) |
| Paid-in-Capital | 1,217,301 |
| Overdistributed Net Investment Income | (20) |
| Accumulated Net Realized Gains | 98 |
| Net Assets | 1,217,379 |
• See Note A in Notes to Financial Statements.
1 Represents annualized yield at date of purchase for discount securities, and coupon for coupon-bearing securities.
2 The issuer was placed under federal conservatorship in September 2008; since that time, its daily operations have been managed by the Federal Housing Finance Agency and it receives capital from the U.S. Treasury, as needed to maintain a positive net worth, in exchange for senior preferred stock.
3 The issuer operates under a congressional charter; its securities are generally neither guaranteed by the U.S. Treasury nor backed by the full faith and credit of the U.S. government.
4 Security exempt from registration under Section 4(2) of the Securities Act of 1933. Such securities may be sold in transactions exempt from registration only to dealers in that program or other “accredited investors.” At December 31, 2015, the aggregate value of these securities was $195,622,000, representing 16.1% of net assets.
5 Adjustable-rate security.
6 Security exempt from registration under Rule 144A of the Securities Act of 1933. Such securities may be sold in transactions exempt from registration, normally to qualified institutional buyers. At December 31, 2015, the aggregate value of these securities was $51,967,000, representing 4.3% of net assets.
7 Scheduled principal and interest payments are guaranteed by bank letter of credit.
TOB—Tender Option Bond.
VRDO—Variable Rate Demand Obligation.
See accompanying Notes, which are an integral part of the Financial Statements.
167
| | | |
| Vanguard Money Market Portfolio | |
| |
| |
| Statement of Operations |
| |
| Year Ended |
| December 31, 2015 |
| | ($000) |
| Investment Income | | |
| Income | | |
| Interest | 2,455 |
| Total Income | 2,455 |
| Expenses | | |
| The Vanguard Group—Note B | | |
| | Investment Advisory Services | 29 |
| | Management and Administrative | 1,446 |
| | Marketing and Distribution | 306 |
| Custodian Fees | 23 |
| Auditing Fees | 33 |
| Shareholders’ Reports | 16 |
| Trustees’ Fees and Expenses | 1 |
| Total Expenses | 1,854 |
| Expense Reduction—Note B | (1,147) |
| Net Expenses | 707 |
| Net Investment Income | 1,748 |
| Realized Net Gain (Loss) on | | |
| Investment Securities Sold | 10 |
| Net Increase (Decrease) in Net Assets | |
| Resulting from Operations | 1,758 |
| | |
| Statement of Changes in Net Assets | | |
| |
| Year Ended December 31, |
| 2015 | 2014 |
| ($000) | ($000) |
| Increase (Decrease) in Net Assets | | |
| Operations | | |
| Net Investment Income | 1,748 | 1,193 |
| Realized Net Gain (Loss) | 10 | 9 |
| Net Increase (Decrease) in Net Assets Resulting from Operations | 1,758 | 1,202 |
| Distributions | | |
| Net Investment Income | (1,768) | (1,193) |
| Realized Capital Gain | — | — |
| Total Distributions | (1,768) | (1,193) |
| Capital Share Transactions (at $1.00 per share) | | |
| Issued | 622,839 | 536,198 |
| Issued in Lieu of Cash Distributions | 1,768 | 1,193 |
| Redeemed | (604,587) | (647,755) |
| Net Increase (Decrease) from Capital Share Transactions | 20,020 | (110,364) |
| Total Increase (Decrease) | 20,010 | (110,355) |
| Net Assets |
| Beginning of Period | 1,197,369 | 1,307,724 |
| End of Period1 | 1,217,379 | 1,197,369 |
| 1 Net Assets—End of Period includes undistributed (overdistributed) net investment income of ($20,000) and $0. | |
See accompanying Notes, which are an integral part of the Financial Statements.
168
| | | | | |
| Vanguard Money Market Portfolio | | | | | |
| |
| |
| Financial Highlights | | | | | |
| |
| |
| For a Share Outstanding | | | Year Ended December 31, |
| Throughout Each Period | 2015 | 2014 | 2013 | 2012 | 2011 |
| Net Asset Value, Beginning of Period | $1.00 | $1.00 | $1.00 | $1.00 | $1.00 |
| Investment Operations | |
| Net Investment Income | .001 | .001 | .001 | .001 | .002 |
| Net Realized and Unrealized Gain (Loss) | | | | | |
| on Investments | — | — | — | — | — |
| Total from Investment Operations | .001 | .001 | .001 | .001 | .002 |
| Distributions | | |
| Dividends from Net Investment Income | (.001) | (.001) | (.001) | (.001) | (.002) |
| Distributions from Realized Capital Gains | — | — | — | — | — |
| Total Distributions | (.001) | (.001) | (.001) | (.001) | (.002) |
| Net Asset Value, End of Period | $1.00 | $1.00 | $1.00 | $1.00 | $1.00 |
| |
| Total Return | 0.15% | 0.10% | 0.11% | 0.14% | 0.17% |
| |
| Ratios/Supplemental Data | | |
| Net Assets, End of Period (Millions) | $1,217 | $1,197 | $1,308 | $1,108 | $1,218 |
| Ratio of Total Expenses to | | | | | |
| Average Net Assets1 | 0.06% | 0.06% | 0.06% | 0.06% | 0.06% |
| Ratio of Net Investment Income | | | | | |
| to Average Net Assets | 0.15% | 0.10% | 0.11% | 0.14% | 0.17% |
1 The ratios of total expenses to average net assets before an expense reduction were 0.16%, 0.16%, 0.16%, 0.16%, and 0.18%.
See Note B in the Notes to Financial Statements.
Notes to Financial Statements
Vanguard Money Market Portfolio, a portfolio of Vanguard Variable Insurance Funds, is registered under the Investment Company Act of 1940 as an open-end investment company. The portfolio’s shares are only available for purchase by separate accounts of insurance companies as investments for variable annuity plans, variable life insurance contracts, or other variable benefit insurance contracts. The portfolio invests in short-term debt instruments of companies primarily operating in specific industries, particularly financial services; the issuers’ abilities to meet their obligations may be affected by economic developments in such industries.
A. The following significant accounting policies conform to generally accepted accounting principles for U.S. investment companies. The portfolio consistently follows such policies in preparing its financial statements.
1. Security Valuation: Securities are valued as of the close of trading on the New York Stock Exchange (generally 4 p.m., Eastern time) on the valuation date. Securities are valued at amortized cost, which approximates market value.
2. Repurchase Agreements: The portfolio enters into repurchase agreements with institutional counterparties. Securities pledged as collateral to the portfolio under repurchase agreements are held by a custodian bank until the agreements mature. Each agreement requires that the market value of the collateral be sufficient to cover payments of interest and principal. The portfolio further mitigates its counterparty risk by entering into repurchase agreements only with a diverse group of prequalified counterparties, monitoring their financial strength, and entering into master repurchase agreements with its counterparties. The master repurchase agreements provide that, in the event of a counterparty’s default (including bankruptcy), the portfolio may terminate any repurchase agreements with that counterparty, determine the net amount owed, and sell or retain the collateral up to the net amount owed to the portfolio. Such action may be subject to legal proceedings, which may delay or limit the disposition of collateral.
3. Federal Income Taxes: The portfolio intends to continue to qualify as a regulated investment company and distribute all of its taxable income. Management has analyzed the portfolio’s tax positions taken for all open federal income tax years (December 31, 2012–2015), and has concluded that no provision for federal income tax is required in the portfolio’s financial statements.
169
Vanguard Money Market Portfolio
4. Distributions: Distributions from net investment income are declared daily and paid on the first business day of the following month.
5. Credit Facility: The portfolio and certain other funds managed by The Vanguard Group (“Vanguard”) participate in a $3 billion committed credit facility provided by a syndicate of lenders pursuant to a credit agreement that may be renewed annually; each fund is individually liable for its borrowings, if any, under the credit facility. Borrowings may be utilized for temporary and emergency purposes, and are subject to the portfolio’s regulatory and contractual borrowing restrictions. The participating funds are charged administrative fees and an annual commitment fee of 0.06% of the undrawn amount of the facility; these fees are allocated to the funds based on a method approved by the portfolio’s board of trustees and included in Management and Administrative expenses on the portfolio’s Statement of Operations. Any borrowings under this facility bear interest at a rate equal to the higher of the federal funds rate or LIBOR reference rate plus an agreed-upon spread.
The portfolio had no borrowings outstanding at December 31, 2015, or at any time during the period then ended.
6. Other: Interest income is accrued daily. Premiums and discounts on debt securities purchased are amortized and accreted, respectively, to interest income over the lives of the respective securities. Security transactions are accounted for on the date securities are bought or sold. Costs used to determine realized gains (losses) on the sale of investment securities are those of the specific securities sold.
B. In accordance with the terms of a Funds’ Service Agreement (the “FSA”) between Vanguard and the portfolio, Vanguard furnishes to the portfolio investment advisory, corporate management, administrative, marketing, and distribution services at Vanguard’s cost of operations (as defined by the FSA). These costs of operations are allocated to the portfolio based on methods and guidelines approved by the board of trustees. Vanguard does not require reimbursement in the current period for certain costs of operations (such as deferred compensation/benefits and risk/insurance costs); the portfolio’s liability for these costs of operations is included in Payables to Vanguard on the Statement of Net Assets.
Upon the request of Vanguard, the portfolio may invest up to 0.40% of its net assets as capital in Vanguard. At December 31, 2015, the portfolio had contributed to Vanguard capital in the amount of $102,000, representing 0.01% of the portfolio’s net assets and 0.04% of Vanguard’s capitalization. The portfolio’s trustees and officers are also directors and employees, respectively, of Vanguard.
Vanguard and the board of trustees have agreed to temporarily limit certain net operating expenses in excess of the portfolio’s daily yield in order to maintain a zero or positive yield for the portfolio. Vanguard and the board of trustees may terminate the temporary expense limitation at any time. For the year ended December 31, 2015, Vanguard’s expenses were reduced by $1,147,000 (an effective annual rate of 0.10% of the portfolio’s average net assets); the portfolio is not obligated to repay this amount to Vanguard.
C. Various inputs may be used to determine the value of the portfolio’s investments. These inputs are summarized in three broad levels for financial statement purposes. The inputs or methodologies used to value securities are not necessarily an indication of the risk associated with investing in those securities.
Level 1—Quoted prices in active markets for identical securities.
Level 2—Other significant observable inputs (including quoted prices for similar securities, interest rates, prepayment speeds, credit risk, etc.).
Level 3—Significant unobservable inputs (including the portfolio’s own assumptions used to determine the fair value of investments).
At December 31, 2015, 100% of the market value of the portfolio’s investments was determined using amortized cost, in accordance with rules under the Investment Company Act of 1940. Amortized cost approximates the current fair value of a security, but since the value is not obtained from a quoted price in an active market, securities valued at amortized cost are considered to be valued using Level 2 inputs.
D. At December 31, 2015, one shareholder, an insurance company separate account whose holdings in the portfolio represent the indirect investment of Vanguard Variable Annuity contract holders, was the record or beneficial owner of 65% of the portfolio’s net assets. If the shareholder were to redeem its investment in the portfolio, the redemption might result in an increase in the portfolio’s expense ratio or cause the portfolio to incur higher transaction costs.
E. Management has determined that no material events or transactions occurred subsequent to December 31, 2015, that would require recognition or disclosure in these financial statements.
170
Vanguard Money Market Portfolio
Report of Independent Registered Public Accounting Firm
To the Board of Trustees of Vanguard Variable Insurance Funds and the Shareholders of Money Market Portfolio: In our opinion, the accompanying statement of net assets and the related statements of operations and of changes in net assets and the financial highlights present fairly, in all material respects, the financial position of Money Market Portfolio (constituting a separate portfolio of Vanguard Variable Insurance Funds, hereafter referred to as the “Portfolio”) at December 31, 2015, the results of its operations for the year then ended, the changes in its net assets for each of the two years in the period then ended, and the financial highlights for each of the five years in the period then ended, in conformity with accounting principles generally accepted in the United States of America. These financial statements and financial highlights (hereafter referred to as “financial statements”) are the responsibility of the Portfolio’s management. Our responsibility is to express an opinion on these financial statements based on our audits. We conducted our audits of these financial statements in accordance with the standards of the Public Company Accounting Oversight Board (United States). Those standards require that we plan and perform the audit to obtain reasonable assurance about whether the financial statements are free of material misstatement. An audit includes examining, on a test basis, evidence supporting the amounts and disclosures in the financial statements, assessing the accounting principles used and significant estimates made by management, and evaluating the overall financial statement presentation. We believe that our audits, which included confirmation of securities at December 31, 2015 by correspondence with the custodian and brokers, by agreement to the underlying ownership records of the transfer agent and the application of alternative auditing procedures where securities purchased had not been received, provide a reasonable basis for our opinion.
/s/PricewaterhouseCoopers LLP
Philadelphia, Pennsylvania
February 11, 2016
171
Vanguard Money Market Portfolio
About Your Portfolio’s Expenses
As a shareholder of the portfolio, you incur ongoing costs, which include costs for portfolio management, administrative services, and shareholder reports (like this one), among others. Operating expenses, which are deducted from a portfolio’s gross income, directly reduce the investment return of the portfolio.
A portfolio’s expenses are expressed as a percentage of its average net assets. This figure is known as the expense ratio. The following examples are intended to help you understand the ongoing costs (in dollars) of investing in your portfolio and to compare these costs with those of other mutual funds. The examples are based on an investment of $1,000 made at the beginning of the period shown and held for the entire period.
The table below illustrates your portfolio’s costs in two ways:
• Based on actual portfolio return. This section helps you to estimate the actual expenses that you paid over the period. The “Ending Account Value” shown is derived from the portfolio’s actual return, and the third column shows the dollar amount that would have been paid by an investor who started with $1,000 in the portfolio. You may use the information here, together with the amount you invested, to estimate the expenses that you paid over the period.
To do so, simply divide your account value by $1,000 (for example, an $8,600 account value divided by $1,000 = 8.6), then multiply the result by the number given for your portfolio under the heading “Expenses Paid During Period.”
• Based on hypothetical 5% yearly return. This section is intended to help you compare your portfolio’s costs with those of other mutual funds. It assumes that the portfolio had a yearly return of 5% before expenses, but that the expense ratio is unchanged. In this case—because the return used is not the portfolio’s actual return—the results do not apply to your investment. The example is useful in making comparisons because the Securities and Exchange Commission requires all mutual funds to calculate expenses based on a 5% return. You can assess your portfolio’s costs by comparing this hypothetical example with the hypothetical examples that appear in shareholder reports of other funds.
Note that the expenses shown in the table are meant to highlight and help you compare ongoing costs only and do not reflect transaction costs incurred by the portfolio for buying and selling securities. The portfolio’s expense ratio does not reflect additional fees and expenses associated with the annuity or life insurance program through which you invest.
The calculations assume no shares were bought or sold during the period. Your actual costs may have been higher or lower, depending on the amount of your investment and the timing of any purchases or redemptions.
You can find more information about the portfolio’s expenses in the Financial Statements section. For additional information on operating expenses and other shareholder costs, please refer to the prospectus.
| | | |
| Six Months Ended December 31, 2015 | | | |
| Beginning | Ending | Expenses |
| Account Value | Account Value | Paid During |
| Money Market Portfolio | 6/30/2015 | 12/31/2015 | Period1 |
| Based on Actual Portfolio Return | $1,000.00 | $1,000.93 | $0.30 |
| Based on Hypothetical 5% Yearly Return | 1,000.00 | 1,024.90 | 0.31 |
1 The calculations are based on expenses incurred in the most recent six-month period. The portfolio’s annualized six-month expense ratio for that period is 0.06%. The dollar amounts shown as “Expenses Paid” are equal to the annualized expense ratio multiplied by the average account value over the period, multiplied by the number of days in the most recent six-month period, then divided by the number of days in the most recent 12-month period (184/365). If certain fees were not voluntarily waived by Vanguard during the period, the annualized expense ratio would have been 0.16% and the expenses paid in the actual and hypothetical examples above would have been $0.81 and $0.82, respectively.
172
Vanguard® REIT Index Portfolio
After a year of generous returns that far outpaced the broad U.S. stock market, real estate investment trusts more closely followed the rest of the market in 2015. For the 12 months ended December 31, 2015, they provided a very modest gain. Vanguard REIT Index Portfolio returned 2.22%, within range of its target index (2.52%) and slightly behind the average return of competing funds (2.44%).
The table below shows the returns of your portfolio and its comparative standards for the period. For additional perspective, we also present their annualized returns for the past ten years.
Please note that the portfolio returns in Vanguard Variable Insurance Fund are different from those in Vanguard Variable Annuity (and other plans that invest in the fund), which take into account insurance-related expenses.
Interest rates held fairly steady, so REITs ended with a small gain
After falling in 2014, bond yields fluctuated within a narrower range in 2015. The yield of the 10-year Treasury note ended the period at around 2.30%, just a tad higher than 12 months earlier. This more stable interest rate environment helped keep a lid on REITs’ performance. A year ago, declining rates supported their prospects because lower capital costs in a growing economy can aid REITs’ profit margins. Their yields also became more attractive as rates from fixed income assets fell.
However, as the Federal Reserve raised short-term rates for the first time in nearly a decade—a widely anticipated move—investors saw the possibility of higher rates in the future. That scenario would raise REITs’ debt financing costs, crimping profit margins. It could also make other income-generating investments that carry less risk more attractive. (REITs are required to pay out at least 90% of their income as dividends to investors.)
The muddled picture restrained REITs’ performance. Among the eight subsets of the market, four provided positive returns and four lost ground. The best results came from specialized REITs, which include storage facilities—they returned 22% thanks to strong demand.
Residential REITs also turned in an above-market performance, returning 16% as the rental market continued to benefit from rising apartment rents.
The largest subsector, retail REITs, returned about 5% as rising employment and falling energy prices propped up consumer spending and demand for retail properties.
The largest loser was the hotel and resort REIT subsector, which returned –27%. Despite a healthy tourism market, investors grew concerned about slowing growth and increasing competition from online home-sharing services. This subsector can be highly volatile; its income stream is not as stable as office or retail REITs. But its negative impact on the portfolio was muted by its relatively small size.
Meanwhile, health care and diversified REITs recorded returns of around –7%. Office REITs were nearly flat, and industrial REITs, the smallest subsector, returned about 3%.
Whether gains continue or not, focus on timeless principles
As shown in the table on the left, Vanguard REIT Index Portfolio’s ten-year average annual return is close to the return of its benchmark and exceeds that of its peers. The portfolio’s small gain in 2015 marked its seventh consecutive year of positive returns; four of those exceeded 17%. But the portfolio suffered steep losses in 2007 and 2008. Such volatility is not unusual for any investment that focuses on a specific industry. Interestingly, the portfolio’s ten-year average annual return was close to that of the overall U.S. stock market. This illustration of how the passage of time can smooth out year-to-year fluctuations underscores the value of keeping a long-term perspective.
| | |
| Total Returns | | |
| | Ten Years Ended |
| | December 31, 2015 |
| Year Ended | Average |
| December 31, 2015 | Annual Return |
| Vanguard REIT Index Portfolio | 2.22% | 7.32% |
| REIT Spliced Index1 | 2.52 | 7.53 |
| Variable Insurance Real Estate Funds Average2 | 2.44 | 6.10 |
The figures shown represent past performance, which is not a guarantee of future results. (Current performance may be lower or higher than the performance data cited. For performance data current to the most recent month-end, visit our website at vanguard.com/performance.) Note, too, that both investment returns and principal value can fluctuate widely, so an investor’s shares, when sold, could be worth more or less than their original cost.
Expense Ratios3
Your Portfolio Compared With Its Peer Group
| | |
| Variable Insurance |
| Real Estate |
| Portfolio | Funds Average |
| REIT Index Portfolio | 0.27% | 1.08% |

1 MSCI US REIT Index adjusted to include a 2% cash position (Lipper Money Market Average) through April 30, 2009; MSCI US REIT Index thereafter.
2 Derived from data provided by Lipper, a Thomson Reuters Company.
3 The portfolio expense ratio shown is from the prospectus dated April 30, 2015, and represents estimated costs for the current fiscal year. For the fiscal year ended December 31, 2015, the portfolio’s expense ratio was 0.27%. The peer-group expense ratio is derived from data provided by Lipper, a Thomson Reuters Company, and captures information through year-end 2014.
173
Vanguard REIT Index Portfolio
Portfolio Profile
As of December 31, 2015
| | | |
| Portfolio Characteristics | | |
| | Comparative | Broad |
| Portfolio | Index1 | Index2 |
| Number of Stocks | 151 | 151 | 3,960 |
| Median Market Cap $11.1B | $11.1B | $51.4B |
| Price/Earnings Ratio | 36.0x | 36.1x | 21.9x |
| Price/Book Ratio | 2.3x | 2.3x | 2.7x |
| Dividend Yield3 | 4.0% | 4.0% | 2.1% |
| Return on Equity | 6.8% | 6.8% | 17.2% |
| Earnings Growth Rate | 18.8% | 18.8% | 9.5% |
| Foreign Holdings | 0.0% | 0.0% | 0.0% |
| Turnover Rate | 21% | — | — |
| Expense Ratio4 | 0.27% | — | — |
| Short-Term Reserves | 0.0% | — | — |
| | |
| Volatility Measures | |
| Portfolio Versus | Portfolio Versus |
| Comparative Index1 | Broad Index2 |
| R-Squared | 1.00 | 0.11 |
| Beta | 1.00 | 0.45 |
| |
| Portfolio Allocation by REIT Type | |
| |
| Retail | 24.7% |
| Residential | 17.1 |
| Office | 13.7 |
| Specialized | 14.8 |
| Health Care | 12.3 |
| Hotel & Resort | 5.6 |
| Diversified | 7.3 |
| Industrial | 4.5 |
| | |
| Ten Largest Holdings5 (% of total net assets) |
| |
| Simon Property | | |
| Group Inc. | Retail REITs | 8.2% |
| Public Storage | Specialized REITs | 5.0 |
| Equity Residential | Residential REITs | 4.1 |
| AvalonBay | | |
| Communities Inc. | Residential REITs | 3.3 |
| Welltower Inc. | Health Care REITs | 3.3 |
| Prologis Inc. | Industrial REITs | 3.1 |
| Boston Properties Inc. | Office REITs | 2.7 |
| Ventas Inc. | Health Care REITs | 2.5 |
| Equinix Inc. | Specialized REITs | 2.4 |
| HCP Inc. | Health Care REITs | 2.4 |
| Top Ten | 37.0% |
Beta. A measure of the magnitude of a portfolio’s past share-price fluctuations in relation to the ups and downs of a given market index. The index is assigned a beta of 1.00. Compared with a given index, a portfolio with a beta of 1.20 typically would have seen its share price rise or fall by 12% when the index rose or fell by 10%. For this report, beta is based on returns over the past 36 months for both the portfolio and the index.
Dividend Yield. Dividend income earned by stocks, expressed as a percentage of the aggregate market value (or of net asset value, for a portfolio). The yield is determined by dividing the amount of the annual dividends by the aggregate value (or net asset value) at the end of the period. For a portfolio, the dividend yield is based solely on stock holdings and does not include any income produced by other investments.
R-Squared. A measure of how much of a portfolio’s past returns can be explained by the returns from the market in general, as measured by a given index. If a portfolio’s total returns were precisely synchronized with an index’s returns, its R-squared would be 1.00. If the portfolio’s returns bore no relationship to the index’s returns, its R-squared would be 0. For this report, R-squared is based on returns over the past 36 months for both the portfolio and the index.
1 MSCI US REIT Index.
2 Dow Jones U.S. Total Stock Market Float Adjusted Index.
3 This dividend yield may include some payments that represent a return of capital, capital gains distribution, or both by the underlying REITs. These amounts are determined by each REIT at the end of its fiscal year.
4 The expense ratio shown is from the prospectus dated April 30, 2015, and represents estimated costs for the current fiscal year. For the fiscal year ended December 31, 2015, the REIT Index Portfolio’s expense ratio was 0.27%.
5 The holdings listed exclude any temporary cash investments and equity index products.
174
Vanguard REIT Index Portfolio
Performance Summary
All of the returns in this report represent past performance, which is not a guarantee of future results that may be achieved by the portfolio. (Current performance may be lower or higher than the performance data cited. For performance data current to the most recent month-end, visit our website at vanguard.com/performance.) Note, too, that both investment returns and principal value can fluctuate widely, so an investor’s shares, when sold, could be worth more or less than their original cost. The returns shown do not reflect taxes that a shareholder would pay on portfolio distributions or on the sale of portfolio shares. Nor do the returns reflect fees and expenses associated with the annuity or life insurance program through which a shareholder invests. If these fees and expenses were included, the portfolio’s returns would be lower.
Cumulative Performance: December 31, 2005–December 31, 2015
Initial Investment of $10,000
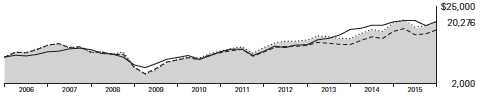
| | | | |
| | | Average Annual Total Returns | Final Value |
| | Periods Ended December 31, 2015 | of a $10,000 |
| | One Year | Five Years | Ten Years | Investment |
| REIT Index Portfolio | 2.22% | 11.63% | 7.32% | $20,276 |
| REIT Spliced Index1 | 2.52 | 11.88 | 7.53 | 20,665 |
| Variable Insurance Real Estate | | | | |
| Funds Average2 | 2.44 | 9.82 | 6.10 | 18,085 |
| Dow Jones U.S. Total Stock Market | | | | |
| Float Adjusted Index | 0.44 | 12.14 | 7.48 | 20,563 |
Fiscal Year Total Returns (%): December 31, 2005–December 31, 2015

| |
| REIT Index Portfolio |
| REIT Spliced Index1 |
1 MSCI US REIT Index adjusted to include a 2% cash position (Lipper Money Market Average) through April 30, 2009; MSCI US REIT Index thereafter.
2 Derived from data provided by Lipper, a Thomson Reuters Company.
See Financial Highlights for dividend and capital gains information.
175
Vanguard REIT Index Portfolio
Financial Statements
Statement of Net Assets
As of December 31, 2015
The portfolio reports a complete list of its holdings in regulatory filings four times in each fiscal year, at the quarter-ends. For the second and fourth fiscal quarters, the lists appear in the portfolio’s semiannual and annual reports to shareholders. For the first and third fiscal quarters, the portfolio files the lists with the Securities and Exchange Commission on Form N-Q. Shareholders can look up the portfolio’s Forms N-Q on the SEC’s website at sec.gov. Forms N-Q may also be reviewed and copied at the SEC’s Public Reference Room (see the back cover of this report for further information).
| | | | |
| Market |
| Value• |
| | | Shares | ($000) |
| Real Estate Investment Trusts (100.0%) | |
| Diversified REITs (7.3%) | | | |
| Duke Realty Corp. | | 466,980 | 9,816 |
| VEREIT Inc. | 1,223,721 | 9,692 |
| WP Carey Inc. | | 134,103 | 7,912 |
| Liberty Property Trust | 202,729 | 6,295 |
| Spirit Realty Capital Inc. | 597,113 | 5,983 |
| Gramercy Property Trust | 568,766 | 4,391 |
| NorthStar Realty Finance | | |
| | Corp. | | 246,537 | 4,198 |
| Empire State Realty | | | |
| | Trust Inc. | | 146,302 | 2,644 |
| Cousins Properties Inc. | 278,450 | 2,626 |
| Washington REIT | | 92,138 | 2,493 |
| PS Business Parks Inc. | 27,393 | 2,395 |
| Lexington Realty Trust | 287,856 | 2,303 |
| STORE Capital Corp. | | 95,378 | 2,213 |
| Global Net Lease Inc. | | 228,880 | 1,820 |
| Select Income REIT | | 90,418 | 1,792 |
| American Assets Trust Inc. | 45,438 | 1,742 |
| Investors Real Estate Trust | 169,331 | 1,177 |
| First Potomac Realty Trust | 79,604 | 907 |
| Winthrop Realty Trust | 41,935 | 544 |
| Whitestone REIT | | 36,076 | 433 |
| One Liberty Properties Inc. | 17,917 | 384 |
| RAIT Financial Trust | | 121,723 | 329 |
| 72,089 |
| Health Care REITs (12.3%) | | |
| Welltower Inc. | | 475,820 | 32,370 |
| Ventas Inc. | | 447,415 | 25,248 |
| HCP Inc. | | 625,422 | 23,916 |
| Omega Healthcare | | | |
| | Investors Inc. | | 250,167 | 8,751 |
| Senior Housing Properties | | |
| | Trust | | 321,133 | 4,766 |
| Healthcare Trust of | | | |
| | America Inc. Class A | 171,882 | 4,636 |
| Healthcare Realty Trust Inc. 135,896 | 3,849 |
| Medical Properties | | | |
| | Trust Inc. | | 316,424 | 3,642 |
| Care Capital Properties Inc. | 112,503 | 3,439 |
| National Health | | | |
| | Investors Inc. | | 48,186 | 2,933 |
| LTC Properties Inc. | | 46,900 | 2,023 |
| Physicians Realty Trust | 115,233 | 1,943 |
| Sabra Health Care REIT Inc. | 87,904 | 1,778 |
| New Senior Investment | | |
| | Group Inc. | | 117,158 | 1,155 |
| Universal Health Realty | | |
| | Income Trust | | 17,177 | 859 |
| CareTrust REIT Inc. | | 62,325 | 682 |
| 121,990 |
| Hotel & Resort REITs (5.6%) | | |
| Host Hotels & Resorts Inc. 1,015,649 | 15,580 |
| Hospitality Properties Trust | 204,902 | 5,358 |
| Apple Hospitality REIT Inc. | 209,665 | 4,187 |
| LaSalle Hotel Properties | 152,981 | 3,849 |
| RLJ Lodging Trust | | 177,000 | 3,829 |
| | | |
| Market |
| Value• |
| | Shares | ($000) |
| Sunstone Hotel | | |
| | Investors Inc. | 282,478 | 3,528 |
| Ryman Hospitality | | |
| | Properties Inc. | 62,474 | 3,226 |
| Pebblebrook Hotel Trust | 97,239 | 2,725 |
| DiamondRock | | |
| | Hospitality Co. | 271,546 | 2,620 |
| Xenia Hotels & Resorts Inc. | 143,653 | 2,202 |
| Chesapeake Lodging Trust | 80,780 | 2,033 |
| Summit Hotel Properties Inc. | 117,247 | 1,401 |
| FelCor Lodging Trust Inc. | 184,323 | 1,346 |
| Hersha Hospitality Trust | | |
| | Class A | 58,224 | 1,267 |
| Chatham Lodging Trust | 51,876 | 1,062 |
| Ashford Hospitality | | |
| | Trust Inc. | 129,195 | 815 |
| Ashford Hospitality | | |
| | Prime Inc. | 38,561 | 559 |
| 55,587 |
| Industrial REITs (4.5%) | | |
| Prologis Inc. | 708,701 | 30,417 |
| DCT Industrial Trust Inc. | 119,492 | 4,465 |
| First Industrial Realty | | |
| | Trust Inc. | 149,824 | 3,316 |
| EastGroup Properties Inc. | 43,680 | 2,429 |
| STAG Industrial Inc. | 92,198 | 1,701 |
| Terreno Realty Corp. | 35,506 | 803 |
| Monmouth Real Estate | | |
| | Investment Corp. | 74,280 | 777 |
| Rexford Industrial Realty Inc. | 45,637 | 747 |
| 44,655 |
| Office REITs (13.7%) | | |
| Boston Properties Inc. | 207,572 | 26,474 |
| Vornado Realty Trust | 229,342 | 22,925 |
| SL Green Realty Corp. | 134,743 | 15,223 |
| Alexandria Real Estate | | |
| | Equities Inc. | 97,766 | 8,834 |
| Kilroy Realty Corp. | 124,589 | 7,884 |
| BioMed Realty Trust Inc. | 275,325 | 6,523 |
| Douglas Emmett Inc. | 188,032 | 5,863 |
| Highwoods Properties Inc. | 127,298 | 5,550 |
| * | Equity Commonwealth | 166,719 | 4,623 |
| Paramount Group Inc. | 215,145 | 3,894 |
| Piedmont Office Realty | | |
| | Trust Inc. Class A | 204,545 | 3,862 |
| Columbia Property Trust Inc. | 160,777 | 3,775 |
| Brandywine Realty Trust | 243,326 | 3,324 |
| Hudson Pacific | | |
| | Properties Inc. | 102,892 | 2,895 |
| Corporate Office | | |
| | Properties Trust | 127,910 | 2,792 |
| Mack-Cali Realty Corp. | 114,546 | 2,675 |
| New York REIT Inc. | 220,006 | 2,530 |
| Parkway Properties Inc. | 112,896 | 1,765 |
| Government Properties | | |
| | Income Trust | 95,916 | 1,522 |
| Franklin Street Properties | | |
| | Corp. | 122,057 | 1,263 |
| | | |
| Market |
| Value• |
| | Shares | ($000) |
| NorthStar Realty Europe | | |
| | Corp. | 78,245 | 924 |
| Tier REIT Inc. | 37,616 | 555 |
| Easterly Government | | |
| | Properties Inc. | 19,443 | 334 |
| 136,009 |
| Residential REITs (17.1%) | | |
| Equity Residential | 492,221 | 40,160 |
| AvalonBay Communities Inc. | 179,683 | 33,085 |
| Essex Property Trust Inc. | 88,893 | 21,282 |
| UDR Inc. | 354,209 | 13,308 |
| Mid-America Apartment | | |
| | Communities Inc. | 101,947 | 9,258 |
| Camden Property Trust | 117,417 | 9,013 |
| Apartment Investment & | | |
| | Management Co. | 211,246 | 8,456 |
| Equity LifeStyle | | |
| | Properties Inc. | 108,172 | 7,212 |
| American Campus | | |
| | Communities Inc. | 151,910 | 6,280 |
| Sun Communities Inc. | 70,342 | 4,820 |
| Post Properties Inc. | 73,828 | 4,368 |
| American Homes 4 Rent | | |
| | Class A | 228,210 | 3,802 |
| Education Realty Trust Inc. | 74,944 | 2,839 |
| Monogram Residential | | |
| | Trust Inc. | 214,094 | 2,089 |
| Starwood Waypoint | | |
| | Residential Trust | 51,325 | 1,162 |
| American Residential | | |
| | Properties Inc. | 41,425 | 783 |
| Silver Bay Realty Trust Corp. | 46,467 | 728 |
| * | Campus Crest | | |
| | Communities Inc. | 87,676 | 596 |
| 169,241 |
| Retail REITs (24.7%) | | |
| Simon Property Group Inc. | 418,358 | 81,345 |
| General Growth | | |
| | Properties Inc. | 778,345 | 21,179 |
| Realty Income Corp. | 317,536 | 16,394 |
| Kimco Realty Corp. | 558,644 | 14,782 |
| Macerich Co. | 181,946 | 14,681 |
| Federal Realty Investment | | |
| | Trust | 93,402 | 13,646 |
| Regency Centers Corp. | 127,231 | 8,667 |
| National Retail | | |
| | Properties Inc. | 181,817 | 7,282 |
| DDR Corp. | 416,353 | 7,011 |
| Taubman Centers Inc. | 82,193 | 6,306 |
| Brixmor Property | | |
| | Group Inc. | 242,221 | 6,254 |
| Weingarten Realty Investors | 159,265 | 5,507 |
| Retail Properties of | | |
| | America Inc. | 320,850 | 4,739 |
| Tanger Factory Outlet | | |
| | Centers Inc. | 129,724 | 4,242 |
| Urban Edge Properties | 134,271 | 3,149 |
| Acadia Realty Trust | 93,145 | 3,088 |
176
Vanguard REIT Index Portfolio
| | | |
| Market |
| Value• |
| | Shares | ($000) |
| Kite Realty Group Trust | 112,787 | 2,924 |
| Equity One Inc. | 105,142 | 2,855 |
| CBL & Associates | | |
| | Properties Inc. | 230,627 | 2,853 |
| WP Glimcher Inc. | 250,681 | 2,660 |
| Retail Opportunity | | |
| | Investments Corp. | 133,689 | 2,393 |
| Pennsylvania REIT | 93,616 | 2,047 |
| Ramco-Gershenson | | |
| | Properties Trust | 107,162 | 1,780 |
| Seritage Growth Properties | | |
| | Class A | 33,264 | 1,338 |
| Inland Real Estate Corp. | 122,487 | 1,301 |
| Alexander’s Inc. | 3,099 | 1,190 |
| Agree Realty Corp. | 26,181 | 890 |
| Saul Centers Inc. | 17,258 | 885 |
| Rouse Properties Inc. | 54,986 | 800 |
| Cedar Realty Trust Inc. | 97,825 | 693 |
| Urstadt Biddle Properties | | |
| | Inc. Class A | 35,948 | 692 |
| Getty Realty Corp. | 36,214 | 621 |
| 244,194 |
| Specialized REITs (14.8%) | | |
| Public Storage | 198,806 | 49,244 |
| Equinix Inc. | 79,739 | 24,113 |
| Digital Realty Trust Inc. | 183,592 | 13,883 |
| Extra Space Storage Inc. | 156,591 | 13,813 |
| Iron Mountain Inc. | 270,917 | 7,318 |
| CubeSmart | 228,847 | 7,007 |
| Sovran Self Storage Inc. | 48,489 | 5,203 |
| EPR Properties | 78,198 | 4,571 |
| Corrections Corp. of | | |
| | America | 158,354 | 4,195 |
| Gaming and Leisure | | |
| | Properties Inc. | 123,906 | 3,445 |
| CyrusOne Inc. | 85,191 | 3,190 |
| GEO Group Inc. | 101,027 | 2,921 |
| DuPont Fabros | | |
| | Technology Inc. | 88,513 | 2,814 |
| QTS Realty Trust Inc. | | |
| | Class A | 52,764 | 2,380 |
| CoreSite Realty Corp. | 40,669 | 2,307 |
| 146,404 |
| Total Real Estate Investment Trusts | |
| (Cost $956,837) | 990,169 |
| | | |
| | Face | Market |
| | Amount | Value• |
| | ($000) | ($000) |
| Temporary Cash Investments (0.0%) | |
| U.S. Government and Agency Obligations (0.0%) |
| 1 | Federal Home Loan Bank | | |
| | Discount Notes, | | |
| | 0.315%, 3/2/16 | 100 | 100 |
| United States Treasury Bill, | | |
| | 0.386%, 5/26/16 | 100 | 100 |
| Total Temporary Cash Investments | |
| (Cost $200) | 200 |
| Total Investments (100.0%) | | |
| (Cost $957,037) | 990,369 |
| | |
| Amount |
| ($000) |
| Other Assets and Liabilities (0.0%) | |
| Other Assets | | |
| Investment in Vanguard | 85 |
| Receivables for Investment Securities Sold | 746 |
| Receivables for Accrued Income | 4,986 |
| Receivables for Capital Shares Issued | 263 |
| Total Other Assets | 6,080 |
| Liabilities | | |
| Payables for Investment Securities Purchased (3,368) |
| Payables for Capital Shares Redeemed | (662) |
| Payables to Vanguard | (884) |
| Other Liabilities | (1,119) |
| Total Liabilities | (6,033) |
| Net Assets (100%) | | |
| Applicable to 71,930,883 outstanding | |
| $.001 par value shares of beneficial | |
| interest (unlimited authorization) | 990,416 |
| Net Asset Value Per Share | $13.77 |
| |
| At December 31, 2015, net assets consisted of: |
| Amount |
| ($000) |
| Paid-in Capital | 862,944 |
| Undistributed Net Investment Income | 24,982 |
| Accumulated Net Realized Gains | 69,158 |
| Unrealized Appreciation (Depreciation) | 33,332 |
| Net Assets | 990,416 |
• See Note A in Notes to Financial Statements.
* Non-income-producing security.
1 The issuer operates under a congressional charter; its securities are generally neither guaranteed by the U.S. Treasury nor backed by the full faith and credit of the U.S. government.
REIT—Real Estate Investment Trust.
See accompanying Notes, which are an integral part of the Financial Statements.
177
| | | |
| Vanguard REIT Index Portfolio | | |
| |
| |
| Statement of Operations |
| |
| Year Ended |
| December 31, 2015 |
| | ($000) |
| Investment Income | | |
| Income | | |
| Dividends | 28,844 |
| Interest1 | 2 |
| Total Income | 28,846 |
| Expenses | | |
| The Vanguard Group—Note B | | |
| Investment Advisory Services | 153 |
| Management and Administrative | 2,210 |
| Marketing and Distribution | 229 |
| Custodian Fees | 55 |
| Auditing Fees | 36 |
| Shareholders’ Reports | 23 |
| Trustees’ Fees and Expenses | 1 |
| Total Expenses | 2,707 |
| Net Investment Income | 26,139 |
| Realized Net Gain (Loss) | | |
| Capital Gain Distributions Received | 7,337 |
| Investment Securities Sold | 61,773 |
| Futures Contracts | 114 |
| Realized Net Gain (Loss) | 69,224 |
| Change in Unrealized Appreciation | |
| (Depreciation) of Investment Securities | (76,645) |
| Net Increase (Decrease) in Net Assets | |
| Resulting from Operations | 18,718 |
| 1 Interest income from an affiliated company of the portfolio was $2,000. |
| | | | |
| | |
| Statement of Changes in Net Assets | | |
| |
| Year Ended December 31, |
| 2015 | 2014 |
| ($000) | ($000) |
| Increase (Decrease) in Net Assets | | |
| Operations | | |
| Net Investment Income | 26,139 | 21,720 |
| Realized Net Gain (Loss) | 69,224 | 34,480 |
| Change in Unrealized Appreciation (Depreciation) | (76,645) | 155,898 |
| Net Increase (Decrease) in Net Assets Resulting from Operations | 18,718 | 212,098 |
| Distributions | | |
| Net Investment Income | (18,254) | (21,192) |
| Realized Capital Gain1 | (34,545) | (40,415) |
| Total Distributions | (52,799) | (61,607) |
| Capital Share Transactions | | |
| Issued | 189,377 | 264,168 |
| Issued in Lieu of Cash Distributions | 52,799 | 61,607 |
| Redeemed | (227,024) | (121,670) |
| Net Increase (Decrease) from Capital Share Transactions | 15,152 | 204,105 |
| Total Increase (Decrease) | (18,929) | 354,596 |
| Net Assets |
| Beginning of Period | 1,009,345 | 654,749 |
| End of Period2 | 990,416 | 1,009,345 |
1 Includes fiscal 2015 and 2014 short-term gain distributions totaling $1,018,000 and $877,000, respectively. Short-term gain distributions are treated as ordinary income dividends for tax purposes.
2 Net Assets—End of Period includes undistributed (overdistributed) net investment income of $24,982,000 and $17,097,000.
See accompanying Notes, which are an integral part of the Financial Statements.
178
| | | | | |
| Vanguard REIT Index Portfolio | | | | | |
| |
| |
| Financial Highlights | | | | | |
| |
| |
| For a Share Outstanding | | | Year Ended December 31, |
| Throughout Each Period | 2015 | 2014 | 2013 | 2012 | 2011 |
| Net Asset Value, Beginning of Period | $14.17 | $11.87 | $12.12 | $10.90 | $10.35 |
| Investment Operations | |
| Net Investment Income | .358 | .307 | .308 | .264 | .231 |
| Net Realized and Unrealized Gain (Loss) | | | | | |
| on Investments | (.032) | 3.061 | .002 | 1.594 | .634 |
| Total from Investment Operations | .326 | 3.368 | .310 | 1.858 | .865 |
| Distributions | | |
| Dividends from Net Investment Income | (.251) | (.367) | (.255) | (.233) | (.185) |
| Distributions from Realized Capital Gains | (.475) | (.701) | (.305) | (.405) | (.130) |
| Total Distributions | (.726) | (1.068) | (.560) | (.638) | (.315) |
| Net Asset Value, End of Period | $13.77 | $14.17 | $11.87 | $12.12 | $10.90 |
| |
| Total Return | 2.22% | 30.11% | 2.33% | 17.46% | 8.44% |
| |
| Ratios/Supplemental Data | | |
| Net Assets, End of Period (Millions) | $990 | $1,009 | $655 | $644 | $516 |
| Ratio of Total Expenses to Average Net Assets | 0.27% | 0.27% | 0.27% | 0.28% | 0.28% |
| Ratio of Net Investment Income to | | | | | |
| Average Net Assets | 2.60% | 3.96% | 2.50% | 2.36% | 2.21% |
| Portfolio Turnover Rate | 21% | 11% | 19% | 8% | 13% |
See accompanying Notes, which are an integral part of the Financial Statements.
179
Vanguard REIT Index Portfolio
Notes to Financial Statements
Vanguard REIT Index Portfolio, a portfolio of Vanguard Variable Insurance Funds, is registered under the Investment Company Act of 1940 as an open-end investment company. The portfolio’s shares are only available for purchase by separate accounts of insurance companies as investments for variable annuity plans, variable life insurance contracts, or other variable benefit insurance contracts.
A. The following significant accounting policies conform to generally accepted accounting principles for U.S. investment companies. The portfolio consistently follows such policies in preparing its financial statements.
1. Security Valuation: Securities are valued as of the close of trading on the New York Stock Exchange (generally 4 p.m., Eastern time) on the valuation date. Equity securities are valued at the latest quoted sales prices or official closing prices taken from the primary market in which each security trades; such securities not traded on the valuation date are valued at the mean of the latest quoted bid and asked prices. Securities for which market quotations are not readily available, or whose values have been materially affected by events occurring before the portfolio’s pricing time but after the close of the securities’ primary markets, are valued by methods deemed by the board of trustees to represent fair value. Investments in Vanguard Market Liquidity Fund are valued at that fund’s net asset value. Temporary cash investments acquired over 60 days to maturity are valued using the latest bid prices or using valuations based on a matrix system (which considers such factors as security prices, yields, maturities, and ratings), both as furnished by independent pricing services. Other temporary cash investments are valued at amortized cost, which approximates market value.
2. Futures Contracts: The portfolio uses index futures contracts to a limited extent, with the objectives of maintaining full exposure to the stock market, enhancing returns, maintaining liquidity, and minimizing transaction costs. The portfolio may purchase futures contracts to immediately invest incoming cash in the market, or sell futures in response to cash outflows, thereby simulating a fully invested position in the underlying index while maintaining a cash balance for liquidity. The portfolio may seek to enhance returns by using futures contracts instead of the underlying securities when futures are believed to be priced more attractively than the underlying securities. The primary risks associated with the use of futures contracts are imperfect correlation between changes in market values of stocks held by the portfolio and the prices of futures contracts, and the possibility of an illiquid market. Counterparty risk involving futures is mitigated because a regulated clearinghouse is the counterparty instead of the clearing broker. To further mitigate counterparty risk, the portfolio trades futures contracts on an exchange, monitors the financial strength of its clearing brokers and clearinghouse, and has entered into clearing agreements with its clearing brokers. The clearinghouse imposes initial margin requirements to secure the portfolio’s performance and requires daily settlement of variation margin representing changes in the market value of each contract.
Futures contracts are valued at their quoted daily settlement prices. The aggregate settlement values of the contracts are not recorded in the Statement of Net Assets. Fluctuations in the value of the contracts are recorded in the Statement of Net Assets as an asset (liability) and in the Statement of Operations as unrealized appreciation (depreciation) until the contracts are closed, when they are recorded as realized futures gains (losses).
During the year ended December 31, 2015, the portfolio’s average investments in long and short futures contracts represented less than 1% and 0% of net assets, respectively, based on the average of aggregate settlement values at each quarter-end during the period. The fund had no open futures contracts at December 31, 2015.
3. Federal Income Taxes: The portfolio intends to continue to qualify as a regulated investment company and distribute all of its taxable income. Management has analyzed the portfolio’s tax positions taken for all open federal income tax years (December 31, 2012–2015), and has concluded that no provision for federal income tax is required in the portfolio’s financial statements.
4. Distributions: Distributions to shareholders are recorded on the ex-dividend date.
5. Credit Facility: The portfolio and certain other funds managed by The Vanguard Group (“Vanguard”) participate in a $3 billion committed credit facility provided by a syndicate of lenders pursuant to a credit agreement that may be renewed annually; each fund is individually liable for its borrowings, if any, under the credit facility. Borrowings may be utilized for temporary and emergency purposes, and are subject to the portfolio’s regulatory and contractual borrowing restrictions. The participating funds are charged administrative fees and an annual commitment fee of 0.06% of the undrawn amount of the facility; these fees are allocated to the funds based on a method approved by the portfolio’s board of trustees and included in Management and Administrative expenses on the portfolio’s Statement of Operations. Any borrowings under this facility bear interest at a rate equal to the higher of the federal funds rate or LIBOR reference rate plus an agreed-upon spread.
180
Vanguard REIT Index Portfolio
The portfolio had no borrowings outstanding at December 31, 2015, or at any time during the period then ended.
6. Other: Distributions received from REITs are recorded on the ex-dividend date. Each REIT reports annually the tax character of its distributions. Dividend income, capital gain distributions received, and unrealized appreciation (depreciation) reflect the amounts of taxable income, capital gain, and return of capital reported by the REITs, and management’s estimates of such amounts for REIT distributions for which actual information has not been reported. Interest income includes income distributions received from Vanguard Market Liquidity Fund and is accrued daily. Premiums and discounts on debt securities purchased are amortized and accreted, respectively, to interest income over the lives of the respective securities. Security transactions are accounted for on the date securities are bought or sold. Costs used to determine realized gains (losses) on the sale of investment securities are those of the specific securities sold.
B. In accordance with the terms of a Funds’ Service Agreement (the “FSA”) between Vanguard and the portfolio, Vanguard furnishes to the portfolio investment advisory, corporate management, administrative, marketing, and distribution services at Vanguard’s cost of operations (as defined by the FSA). These costs of operations are allocated to the portfolio based on methods and guidelines approved by the board of trustees. Vanguard does not require reimbursement in the current period for certain costs of operations (such as deferred compensation/benefits and risk/insurance costs); the portfolio’s liability for these costs of operations is included in Payables to Vanguard on the Statement of Net Assets.
Upon the request of Vanguard, the portfolio may invest up to 0.40% of its net assets as capital in Vanguard. At December 31, 2015, the portfolio had contributed to Vanguard capital in the amount of $85,000, representing 0.01% of the portfolio’s net assets and 0.03% of Vanguard’s capitalization. The portfolio’s trustees and officers are also directors and employees, respectively, of Vanguard.
C. Various inputs may be used to determine the value of the portfolio’s investments. These inputs are summarized in three broad levels for financial statement purposes. The inputs or methodologies used to value securities are not necessarily an indication of the risk associated with investing in those securities.
Level 1—Quoted prices in active markets for identical securities.
Level 2—Other significant observable inputs (including quoted prices for similar securities, interest rates, prepayment speeds, credit risk, etc.).
Level 3—Significant unobservable inputs (including the portfolio’s own assumptions used to determine the fair value of investments).
The following table summarizes the market value of the portfolio’s investments as of December 31, 2015, based on the inputs used to value them:
| | | |
| Level 1 | Level 2 | Level 3 |
| Investments | ($000) | ($000) | ($000) |
| Real Estate Investment Trusts | 990,169 | — | — |
| Temporary Cash Investments | — | 200 | — |
| Total | 990,169 | 200 | — |
D. Distributions are determined on a tax basis and may differ from net investment income and realized capital gains for financial reporting purposes. Differences may be permanent or temporary. Permanent differences are reclassified among capital accounts in the financial statements to reflect their tax character. Temporary differences arise when certain items of income, expense, gain, or loss are recognized in different periods for financial statement and tax purposes. These differences will reverse at some time in the future. Differences in classification may also result from the treatment of short-term gains as ordinary income for tax purposes.
For tax purposes, at December 31, 2015, the portfolio had $27,426,000 of ordinary income and $67,457,000 of long-term capital gains available for distribution.
At December 31, 2015, the cost of investment securities for tax purposes was $957,037,000. Net unrealized appreciation of investment securities for tax purposes was $33,332,000, consisting of unrealized gains of $131,362,000 on securities that had risen in value since their purchase and $98,030,000 in unrealized losses on securities that had fallen in value since their purchase.
E. During the year ended December 31, 2015, the portfolio purchased $210,403,000 of investment securities and sold $209,443,000 of investment securities, other than temporary cash investments.
181
Vanguard REIT Index Portfolio
F. Capital shares issued and redeemed were:
| | |
| Year Ended December 31, |
| 2015 | 2014 |
| Shares | Shares |
| (000) | (000) |
| Issued | 13,620 | 20,295 |
| Issued in Lieu of Cash Distributions | 3,777 | 5,186 |
| Redeemed | (16,709) | (9,411) |
| Net Increase (Decrease) in Shares Outstanding | 688 | 16,070 |
At December 31, 2015, one shareholder, an insurance company separate account whose holdings in the portfolio represent the indirect investment of Vanguard Variable Annuity contract holders, was the record or beneficial owner of 52% of the portfolio’s net assets. If the shareholder were to redeem its investment in the portfolio, the redemption might result in an increase in the portfolio’s expense ratio or cause the portfolio to incur higher transaction costs.
G. Management has determined that no material events or transactions occurred subsequent to December 31, 2015, that would require recognition or disclosure in these financial statements.
182
Vanguard REIT Index Portfolio
Report of Independent Registered Public Accounting Firm
To the Board of Trustees of Vanguard Variable Insurance Funds and the Shareholders of REIT Index Portfolio: In our opinion, the accompanying statement of net assets and the related statements of operations and of changes in net assets and the financial highlights present fairly, in all material respects, the financial position of REIT Index Portfolio (constituting a separate portfolio of Vanguard Variable Insurance Funds, hereafter referred to as the “Portfolio”) at December 31, 2015, the results of its operations for the year then ended, the changes in its net assets for each of the two years in the period then ended, and the financial highlights for each of the five years in the period then ended, in conformity with accounting principles generally accepted in the United States of America. These financial statements and financial highlights (hereafter referred to as “financial statements”) are the responsibility of the Portfolio’s management. Our responsibility is to express an opinion on these financial statements based on our audits. We conducted our audits of these financial statements in accordance with the standards of the Public Company Accounting Oversight Board (United States). Those standards require that we plan and perform the audit to obtain reasonable assurance about whether the financial statements are free of material misstatement. An audit includes examining, on a test basis, evidence supporting the amounts and disclosures in the financial statements, assessing the accounting principles used and significant estimates made by management, and evaluating the overall financial statement presentation. We believe that our audits, which included confirmation of securities at December 31, 2015 by correspondence with the custodian and brokers and the application of alternative auditing procedures where securities purchased had not been received, provide a reasonable basis for our opinion.
/s/PricewaterhouseCoopers LLP
Philadelphia, Pennsylvania
February 11, 2016
| |
| |
| Special 2015 tax information (unaudited) for corporate shareholders only for Vanguard REIT |
| Index Portfolio, a portfolio of Vanguard Variable Insurance Funds |
| |
| This information for the fiscal year ended December 31, 2015, is included pursuant to provisions |
| of the Internal Revenue Code for corporate shareholders only. |
| |
| The portfolio distributed $33,527,000 as capital gain dividends (from net long-term capital gains) to |
| shareholders during the fiscal year. The portfolio designates $31,533,000 of its capital gain dividends |
| as 20% rate gain distributions and $1,994,000 as unrecaptured section 1250 gain distributions (25% |
| rate gain). |
183
Vanguard REIT Index Portfolio
About Your Portfolio’s Expenses
As a shareholder of the portfolio, you incur ongoing costs, which include costs for portfolio management, administrative services, and shareholder reports (like this one), among others. Operating expenses, which are deducted from a portfolio’s gross income, directly reduce the investment return of the portfolio.
A portfolio’s expenses are expressed as a percentage of its average net assets. This figure is known as the expense ratio. The following examples are intended to help you understand the ongoing costs (in dollars) of investing in your portfolio and to compare these costs with those of other mutual funds. The examples are based on an investment of $1,000 made at the beginning of the period shown and held for the entire period.
The accompanying table illustrates your portfolio’s costs in two ways:
• Based on actual portfolio return. This section helps you to estimate the actual expenses that you paid over the period. The “Ending Account Value” shown is derived from the portfolio’s actual return, and the third column shows the dollar amount that would have been paid by an investor who started with $1,000 in the portfolio. You may use the information here, together with the amount you invested, to estimate the expenses that you paid over the period.
To do so, simply divide your account value by $1,000 (for example, an $8,600 account value divided by $1,000 = 8.6), then multiply the result by the number given for your portfolio under the heading “Expenses Paid During Period.”
• Based on hypothetical 5% yearly return. This section is intended to help you compare your portfolio’s costs with those of other mutual funds. It assumes that the portfolio had a yearly return of 5% before expenses, but that the expense ratio is unchanged. In this case—because the return used is not the portfolio’s actual return—the results do not apply to your investment. The example is useful in making comparisons because the Securities and Exchange Commission requires all mutual funds to calculate expenses based on a 5% return. You can assess your portfolio’s costs by comparing this hypothetical example with the hypothetical examples that appear in shareholder reports of other funds.
Note that the expenses shown in the table are meant to highlight and help you compare ongoing costs only and do not reflect transaction costs incurred by the portfolio for buying and selling securities. The portfolio’s expense ratio does not reflect additional fees and expenses associated with the annuity or life insurance program through which you invest.
The calculations assume no shares were bought or sold during the period. Your actual costs may have been higher or lower, depending on the amount of your investment and the timing of any purchases or redemptions.
You can find more information about the portfolio’s expenses in the Financial Statements section. For additional information on operating expenses and other shareholder costs, please refer to the prospectus.
| | | |
| Six Months Ended December 31, 2015 | | | |
| Beginning | Ending | Expenses |
| Account Value | Account Value | Paid During |
| REIT Index Portfolio | 6/30/2015 | 12/31/2015 | Period1 |
| Based on Actual Portfolio Return | $1,000.00 | $1,091.13 | $1.63 |
| Based on Hypothetical 5% Yearly Return | 1,000.00 | 1,023.24 | 1.58 |
1 The calculations are based on expenses incurred in the most recent six-month period. The portfolio’s annualized six-month expense ratio for that period is 0.31%. The dollar amounts shown as “Expenses Paid” are equal to the annualized expense ratio multiplied by the average account value over the period, multiplied by the number of days in the most recent six-month period, then divided by the number of days in the most recent 12-month period (184/365).
184
Vanguard® Short-Term Investment-Grade Portfolio
Toward the close of 2015, the Federal Reserve took the long-awaited step of raising its target for overnight interest rates, which had hovered near zero since the Great Recession. Its vote of confidence in the U.S. economy’s resiliency helped short-term bond yields finish higher than where they started for the fiscal year ended December 31, 2015. The upward movement of intermediate-and long-term yields, however, was more muted given the fragile state of global growth and the subdued outlook for inflation.
With yields rising, bond prices adjusted downward, as prices and yields move in opposite directions. Vanguard Short-Term Investment-Grade Portfolio nevertheless returned 1.12% for the fiscal year as the income earned by its holdings more than offset the decline in their prices.
The portfolio finished a step ahead of its expense-free benchmark, the Barclays U.S. 1–5 Year Credit Bond Index, which returned 1.06%. The portfolio also placed ahead of the average return of 0.00% for its peer group.
On December 31, the portfolio’s 30-day SEC yield stood at 2.07%, up from 1.67% a year earlier.
Please note that the portfolio returns in Vanguard Variable Insurance Fund are different from those in Vanguard Variable Annuity (and other plans that invest in the fund), which take into account insurance-related expenses.
Rising bond yields dampened the portfolio’s returns
As the Fed wound down its third round of bond-buying toward the end of 2014, speculation turned to when it might begin to raise short-term interest rates. The economy’s rebound from an early 2015 slowdown and further improvements in employment were favorable developments. On the other hand, inflation remained worryingly low as oil prices continued to fall. Greece’s debt crisis and slowing economic activity in China and other emerging markets may also have contributed to the Fed’s holding off on a rate increase until mid-December.
With interest rates rising across maturities, the portfolio’s slightly shorter duration helped it modestly outperform its benchmark. (Duration gauges a portfolio’s sensitivity to changes in rates.) The portfolio’s average duration as of December 31 was 2.6 years, compared with 2.7 years for the benchmark. Other contributors included an allocation to commercial mortgage-backed securities, which are not included in the benchmark, and a smaller-than-benchmark allocation to foreign-agency and government-related securities.
The portfolio’s advisor, Vanguard Fixed Income Group, also added value through astute security selection in the noncorporate segment.
On the other side of the ledger, the portfolio’s conservative positioning slightly dragged on performance. The advisor typically holds short-term U.S. Treasuries for liquidity purposes. These securities—roughly 10% of the portfolio’s assets at the end of the fiscal year—didn’t return quite as much as investment-grade securities as a whole.
Over ten years, the portfolio led its peer average but not its index
Over the decade ended December 31,
| | | |
| Total Returns | | | |
| | | Ten Years Ended |
| | | December 31, 2015 |
| | Year Ended | Average |
| December 31, 2015 | Annual Return |
| Vanguard Short-Term Investment-Grade Portfolio | | 1.12% | 3.60% |
| Barclays U.S. 1–5 Year Credit Bond Index | | 1.06 | 4.07 |
| Variable Insurance Short-Intermediate Investment Grade | | | |
| Debt Funds Average1 | | 0.00 | 2.43 |
The figures shown represent past performance, which is not a guarantee of future results. (Current performance may be lower or higher than the performance data cited. For performance data current to the most recent month-end, visit our website at vanguard.com/performance.) Note, too, that both investment returns and principal value can fluctuate widely, so an investor’s shares, when sold, could be worth more or less than their original cost.
Expense Ratios2
Your Portfolio Compared With Its Peer Group
| | |
| Variable Insurance |
| Short-Intermediate |
| Investment Grade |
| Portfolio | Debt Funds Average1 |
| Short-Term Investment-Grade Portfolio | 0.20% | 0.61% |
1 Derived from data provided by Lipper, a Thomson Reuters Company.
2 The portfolio expense ratio shown is from the prospectus dated April 30, 2015, and represents estimated costs for the current fiscal year. For the fiscal year ended December 31, 2015, the portfolio’s expense ratio was 0.16%. The peer-group expense ratio is derived from data provided by Lipper, a Thomson Reuters Company, and captures information through year-end 2014.
185
Vanguard Short-Term Investment-Grade Portfolio
Portfolio Profile
As of December 31, 2015
| | | |
| Financial Attributes | | | |
| | Comparative | Broad |
| Portfolio | Index1 | Index2 |
| Number of Bonds | 2,106 | 2,381 | 9,681 |
| Yield3 | 2.1% | 2.3% | 2.6% |
| Yield to Maturity | 2.3%4 | 2.3% | 2.6% |
| Average Coupon | 3.2% | 3.4% | 3.2% |
| Average Effective | | | |
| Maturity | 3.2 years | 2.9 years | 7.9 years |
| Average Duration | 2.6 years | 2.7 years | 5.7 years |
| Expense Ratio5 | 0.20% | — | — |
| Short-Term Reserves | 0.9% | — | — |
| | |
| Volatility Measures | |
| Portfolio Versus | Portfolio Versus |
| Comparative Index1 | Broad Index2 |
| R-Squared | 0.96 | 0.69 |
| Beta | 0.87 | 0.37 |
| |
| Distribution by Effective Maturity (% of portfolio) |
| |
| Under 1 Year | 11.5% |
| 1–3 Years | 45.2 |
| 3–5 Years | 29.3 |
| 5–7 Years | 5.1 |
| 7–10 Years | 8.5 |
| 10–20 Years | 0.1 |
| 20–30 Years | 0.2 |
| Over 30 Years | 0.1 |
| |
| Sector Diversification6 (% of portfolio) | |
| |
| Asset-Backed/Commercial Mortgage-Backed 20.3% |
| Finance | 27.4 |
| Foreign | 6.8 |
| Government Mortgage-Backed | 0.1 |
| Industrial | 28.0 |
| Treasury/Agency | 12.4 |
| Utilities | 4.3 |
| Other | 0.7 |
| |
| Distribution by Credit Quality (% of portfolio) |
| |
| U.S. Government | 10.6% |
| Aaa | 17.1 |
| Aa | 14.2 |
| A | 31.0 |
| Baa | 22.9 |
| Ba | 1.4 |
| Other | 0.1 |
| Not Rated | 2.7 |
Investment Focus

30-Day SEC Yield. A portfolio’s 30-day SEC yield is derived using a formula specified by the U.S. Securities and Exchange Commission. Under the formula, data related to the portfolio’s security holdings in the previous 30 days are used to calculate the portfolio’s hypothetical net income for that period, which is then annualized and divided by the portfolio’s estimated average net assets over the calculation period. For the purposes of this calculation, a security’s income is based on its current market yield to maturity (for bonds), its actual income (for asset-backed securities), or its projected dividend yield (for stocks). Because the SEC yield represents hypothetical annualized income, it will differ—at times significantly—from the portfolio’s actual experience. As a result, the portfolio’s income distributions may be higher or lower than implied by the SEC yield.
Beta. A measure of the magnitude of a portfolio’s past share-price fluctuations in relation to the ups and downs of a given market index. The index is assigned a beta of 1.00. Compared with a given index, a portfolio with a beta of 1.20 typically would have seen its share price rise or fall by 12% when the index rose or fell by 10%. For this report, beta is based on returns over the past 36 months for both the portfolio and the index.
Credit Quality. Credit-quality ratings are measured on a scale that generally ranges from AAA (highest) to D (lowest). U.S. Treasury, U.S. Agency, and U.S. Agency mortgage-backed securities appear under “U.S. Government.” Credit-quality ratings are obtained from Moody’s and S&P, and the higher rating for each issue is used.”Not Rated” is used to classify securities for which a rating is not available. Not rated securities include a fund’s investment in Vanguard Market Liquidity Fund or Vanguard Municipal Cash Management Fund, each of which invests in high-quality money market instruments and may serve as a cash management vehicle for the Vanguard funds, trusts, and accounts.
R-Squared. A measure of how much of a portfolio’s past returns can be explained by the returns from the market in general, as measured by a given index. If a portfolio’s total returns were precisely synchronized with an index’s returns, its R-squared would be 1.00. If the portfolio’s returns bore no relationship to the index’s returns, its R-squared would be 0. For this report, R-squared is based on returns over the past 36 months for both the portfolio and the index.
1 Barclays U.S. 1–5 Year Credit Bond Index.
2 Barclays U.S. Aggregate Bond Index.
3 30-day SEC yield for the portfolio; index yield assumes that all bonds are called or prepaid at the earliest possible dates.
4 Before expenses.
5 The portfolio expense ratio shown is from the prospectus dated April 30, 2015, and represents estimated costs for the current fiscal year. For the fiscal year ended December 31, 2015, the portfolio’s expense ratio was 0.16%.
6 The agency sector may include issues from government-sponsored enterprises; such issues are not backed by the full faith and credit of the U.S. government.
186
Vanguard Short-Term Investment-Grade Portfolio
Performance Summary
All of the returns in this report represent past performance, which is not a guarantee of future results that may be achieved by the portfolio. (Current performance may be lower or higher than the performance data cited. For performance data current to the most recent month-end, visit our website at vanguard.com/performance.) Note, too, that both investment returns and principal value can fluctuate widely, so an investor’s shares, when sold, could be worth more or less than their original cost. The returns shown do not reflect taxes that a shareholder would pay on portfolio distributions or on the sale of portfolio shares. Nor do the returns reflect fees and expenses associated with the annuity or life insurance program through which a shareholder invests. If these fees and expenses were included, the portfolio’s returns would be lower.
Cumulative Performance: December 31, 2005–December 31, 2015
Initial Investment of $10,000

| | | | |
| | | Average Annual Total Returns | Final Value |
| | Periods Ended December 31, 2015 | of a $10,000 |
| | One Year | Five Years | Ten Years | Investment |
| Short-Term Investment-Grade Portfolio | 1.12% | 2.07% | 3.60% | $14,242 |
| Barclays U.S. 1–5 Year Credit Bond Index | 1.06 | 2.55 | 4.07 | 14,906 |
| Variable Insurance Short-Intermediate | | | | |
| Investment Grade Debt Funds Average1 | 0.00 | 1.05 | 2.43 | 12,710 |
| Barclays U.S. Aggregate Bond Index | 0.55 | 3.25 | 4.51 | 15,552 |
Fiscal-Year Total Returns (%): December 31, 2005–December 31, 2015

| |
| Short-Term Investment-Grade Portfolio |
| Barclays U.S. 1–5 Year Credit Bond Index |
1 Derived from data provided by Lipper, a Thomson Reuters Company.
See Financial Highlights for dividend and capital gains information.
187
Vanguard Short-Term Investment-Grade Portfolio
Financial Statements
Statement of Net Assets
As of December 31, 2015
The portfolio reports a complete list of its holdings in regulatory filings four times in each fiscal year, at the quarter-ends. For the second and fourth fiscal quarters, the lists appear in the portfolio’s semiannual and annual reports to shareholders. For the first and third fiscal quarters, the portfolio files the lists with the Securities and Exchange Commission on Form N-Q. Shareholders can look up the portfolio’s Forms N-Q on the SEC’s website at sec.gov. Forms N-Q may also be reviewed and copied at the SEC’s Public Reference Room (see the back cover of this report for further information).
| | | | | |
| Face | Market |
| Maturity Amount | Value • |
| | Coupon | Date | ($000) | ($000) |
| U.S. Government and Agency Obligations (12.3%) | | | |
| U.S. Government Securities (12.2%) | | | | |
| United States Treasury Inflation | | | | |
| | Indexed Bonds | 0.375% | 7/15/25 | 17,933 | 17,404 |
| United States Treasury Note/Bond | 0.875% | 9/15/16 | 2,300 | 2,303 |
| United States Treasury Note/Bond | 0.500% | 9/30/16 | 50 | 50 |
| 1 | United States Treasury Note/Bond | 0.625% | 10/15/16 | 6,800 | 6,795 |
| United States Treasury Note/Bond | 0.375% | 10/31/16 | 3,850 | 3,838 |
| United States Treasury Note/Bond | 0.875% | 11/30/16 | 4,900 | 4,904 |
| United States Treasury Note/Bond | 0.500% | 1/31/17 | 8,000 | 7,971 |
| United States Treasury Note/Bond | 0.875% | 1/31/17 | 10,400 | 10,405 |
| United States Treasury Note/Bond | 0.875% | 2/28/17 | 2,200 | 2,201 |
| United States Treasury Note/Bond | 0.750% | 3/15/17 | 17,300 | 17,275 |
| United States Treasury Note/Bond | 0.500% | 3/31/17 | 5,765 | 5,740 |
| United States Treasury Note/Bond | 1.000% | 3/31/17 | 13,400 | 13,423 |
| United States Treasury Note/Bond | 0.875% | 4/15/17 | 7,750 | 7,749 |
| United States Treasury Note/Bond | 0.750% | 4/15/18 | 2,000 | 1,981 |
| 2 | United States Treasury Note/Bond | 0.875% | 7/15/18 | 8,100 | 8,029 |
| United States Treasury Note/Bond | 1.000% | 8/15/18 | 4,900 | 4,870 |
| United States Treasury Note/Bond | 1.000% | 9/15/18 | 3,650 | 3,625 |
| United States Treasury Note/Bond | 1.250% | 10/31/18 | 12,300 | 12,283 |
| 3 | United States Treasury Note/Bond | 1.250% | 11/15/18 | 18,050 | 18,022 |
| United States Treasury Note/Bond | 1.500% | 12/31/18 | 4,500 | 4,521 |
| United States Treasury Note/Bond | 1.250% | 1/31/19 | 6,000 | 5,981 |
| 159,370 |
| Conventional Mortgage-Backed Securities (0.0%) | | | |
| 4,5 Fannie Mae Pool | 6.000% | 12/1/16 | 6 | 6 |
| 4,5 Fannie Mae Pool | 6.500% | 9/1/16 | 4 | 5 |
| 4,5 Freddie Mac Gold Pool | 6.000% | 4/1/17 | 7 | 7 |
| 18 |
| Nonconventional Mortgage-Backed Securities (0.1%) | | |
| 4,5,6 Fannie Mae Pool | 2.319% | 12/1/32 | 10 | 11 |
| 4,5,6 Fannie Mae Pool | 2.360% | 2/1/37 | 35 | 37 |
| 4,5,6 Fannie Mae Pool | 2.375% | 6/1/33 | 78 | 82 |
| 4,5,6 Fannie Mae Pool | 2.435% | 7/1/32 | 9 | 9 |
| 4,5,6 Fannie Mae Pool | 2.460% | 5/1/33 | 70 | 74 |
| 4,5,6 Fannie Mae Pool | 2.465% | 9/1/32 | 1 | 1 |
| 4,5,6 Fannie Mae Pool | 2.500% | 9/1/32 | 6 | 6 |
| 4,5,6 Fannie Mae Pool | 2.535% | 8/1/33 | 115 | 120 |
| 4,5,6 Fannie Mae Pool | 2.550% | 7/1/33 | 164 | 169 |
| 4,5,6 Fannie Mae Pool | 2.581% | 8/1/37 | 14 | 15 |
| 4,5,6 Fannie Mae Pool | 2.610% | 5/1/33 | 17 | 18 |
| 4,5,6 Freddie Mac Non Gold Pool | 2.500% | 8/1/37 | 55 | 59 |
| 4,5,6 Freddie Mac Non Gold Pool | 2.504% | 9/1/32 | 3 | 3 |
| 4,5,6 Freddie Mac Non Gold Pool | 2.551% | 1/1/33 | 13 | 14 |
| 4,5,6 Freddie Mac Non Gold Pool | 2.586% | 2/1/33 | 15 | 15 |
| 4,5,6 Freddie Mac Non Gold Pool | 2.643% | 9/1/32 | 23 | 24 |
| 4,5,6 Freddie Mac Non Gold Pool | 2.711% | 8/1/33 | 24 | 25 |
| 4,5,6 Freddie Mac Non Gold Pool | 2.825% | 10/1/32 | 14 | 15 |
| 697 |
| Total U.S. Government and Agency Obligations | | | |
| (Cost $160,477) | 160,085 |
| Asset-Backed/Commercial Mortgage-Backed Securities (20.5%) | | |
| 4 | Ally Auto Receivables Trust 2015-1 | 1.390% | 9/16/19 | 245 | 244 |
| 4 | Ally Auto Receivables Trust 2015-1 | 1.750% | 5/15/20 | 280 | 278 |
| 4 | Ally Auto Receivables Trust 2015-1 | 2.260% | 10/15/20 | 100 | 99 |
| 4 | Ally Master Owner Trust Series 2012-5 | 1.540% | 9/15/19 | 2,050 | 2,038 |
| | | | | |
| Face | Market |
| Maturity Amount | Value • |
| | Coupon | Date | ($000) | ($000) |
| 4,6 Ally Master Owner Trust Series 2014-1 0.800% | 1/15/19 | 250 | 250 |
| 4 | Ally Master Owner Trust Series 2014-1 | 1.290% | 1/15/19 | 450 | 450 |
| 4 | Ally Master Owner Trust Series 2014-3 | 1.330% | 3/15/19 | 270 | 269 |
| 4,6 American Express Credit Account | | | | |
| | Secured Note Trust 2012-4 | 0.880% | 5/15/20 | 700 | 698 |
| 4,6,7 American Homes 4 Rent 2014-SFR1 | 1.351% | 6/17/31 | 127 | 125 |
| 4,6,7 American Homes 4 Rent 2014-SFR1 | 1.700% | 6/17/31 | 110 | 109 |
| 4,7 American Homes 4 Rent 2014-SFR2 | 3.786% | 10/17/36 | 294 | 296 |
| 4,7 American Homes 4 Rent 2014-SFR2 | 4.290% | 10/17/36 | 80 | 80 |
| 4,7 American Homes 4 Rent 2014-SFR3 | 3.678% | 12/17/36 | 432 | 431 |
| 4,7 American Homes 4 Rent 2015-SFR1 | 3.467% | 4/17/52 | 375 | 368 |
| 4,7 American Homes 4 Rent 2015-SFR2 | 3.732% | 10/17/45 | 179 | 179 |
| 4,7 American Homes 4 Rent 2015-SFR2 | 4.295% | 10/17/45 | 100 | 99 |
| 4,7 Americold 2010 LLC Trust Series | | | | |
| | 2010-ART | 4.954% | 1/14/29 | 455 | 501 |
| 4,7 Americold 2010 LLC Trust Series | | | | |
| | 2010-ART | 6.811% | 1/14/29 | 275 | 316 |
| 4 | AmeriCredit Automobile Receivables | | | | |
| | Trust 2013-1 | 1.570% | 1/8/19 | 80 | 80 |
| 4 | AmeriCredit Automobile Receivables | | | | |
| | Trust 2013-2 | 1.790% | 3/8/19 | 300 | 300 |
| 4 | AmeriCredit Automobile Receivables | | | | |
| | Trust 2013-3 | 2.380% | 6/10/19 | 400 | 402 |
| 4 | AmeriCredit Automobile Receivables | | | | |
| | Trust 2013-3 | 3.000% | 7/8/19 | 500 | 502 |
| 4 | AmeriCredit Automobile Receivables | | | | |
| | Trust 2013-4 | 2.720% | 9/9/19 | 80 | 81 |
| 4 | AmeriCredit Automobile Receivables | | | | |
| | Trust 2013-4 | 3.310% | 10/8/19 | 110 | 112 |
| 4 | AmeriCredit Automobile Receivables | | | | |
| | Trust 2013-5 | 2.290% | 11/8/19 | 155 | 155 |
| 4 | AmeriCredit Automobile Receivables | | | | |
| | Trust 2013-5 | 2.860% | 12/9/19 | 175 | 176 |
| 4 | AmeriCredit Automobile Receivables | | | | |
| | Trust 2014-1 | 2.150% | 3/9/20 | 100 | 100 |
| 4 | AmeriCredit Automobile Receivables | | | | |
| | Trust 2014-2 | 2.180% | 6/8/20 | 280 | 279 |
| 4 | AmeriCredit Automobile Receivables | | | | |
| | Trust 2015-3 | 1.540% | 3/9/20 | 650 | 646 |
| 4 | AmeriCredit Automobile Receivables | | | | |
| | Trust 2015-3 | 2.080% | 9/8/20 | 170 | 169 |
| 4 | AmeriCredit Automobile Receivables | | | | |
| | Trust 2015-3 | 2.730% | 3/8/21 | 290 | 289 |
| 4 | AmeriCredit Automobile Receivables | | | | |
| | Trust 2015-3 | 3.340% | 8/8/21 | 200 | 198 |
| 4,7 AOA 2015-1177 Mortgage Trust | 2.957% | 12/13/29 | 280 | 281 |
| 4,7 Applebee’s Funding LLC/ | | | | |
| | IHOP Funding LLC 2014-1 | 4.277% | 9/5/44 | 270 | 273 |
| 4,7 ARI Fleet Lease Trust 2015-A | 1.670% | 9/15/23 | 160 | 158 |
| 4,7 ARL Second LLC 2014-1A | 2.920% | 6/15/44 | 232 | 232 |
| 4,6,7 Arran Residential Mortgages Funding | | | | |
| | 2011-1 plc | 1.817% | 11/19/47 | 70 | 70 |
| 4,7 Aventura Mall Trust 2013-AVM | 3.743% | 12/5/32 | 480 | 500 |
| 4,7 Avis Budget Rental Car Funding | | | | |
| | AESOP LLC 2013-1A | 1.920% | 9/20/19 | 360 | 357 |
| 4,7 Avis Budget Rental Car Funding | | | | |
| | AESOP LLC 2013-2A | 2.970% | 2/20/20 | 500 | 509 |
| 4,7 Avis Budget Rental Car Funding | | | | |
| | AESOP LLC 2015-1A | 2.500% | 7/20/21 | 730 | 721 |
188
Vanguard Short-Term Investment-Grade Portfolio
| | | | | |
| Face | Market |
| Maturity Amount | Value • |
| | Coupon | Date | ($000) | ($000) |
| 4,7 Avis Budget Rental Car Funding | | | | |
| | AESOP LLC 2015-2A | 2.630% | 12/20/21 | 650 | 643 |
| 4,7 BAMLL Commercial Mortgage | | | | |
| | Securities Trust 2012-PARK | 2.959% | 12/10/30 | 125 | 124 |
| 4 | Banc of America Commercial Mortgage | | | | |
| | Trust 2006-5 | 5.415% | 9/10/47 | 498 | 506 |
| 4 | Banc of America Commercial Mortgage | | | | |
| | Trust 2006-6 | 5.347% | 10/10/45 | 516 | 526 |
| 4 | Banc of America Commercial Mortgage | | | | |
| | Trust 2007-2 | 5.568% | 4/10/49 | 790 | 815 |
| 4 | Banc of America Commercial Mortgage | | | | |
| | Trust 2008-1 | 6.171% | 2/10/51 | 1,369 | 1,450 |
| 4 | Banc of America Commercial Mortgage | | | | |
| | Trust 2008-1 | 6.215% | 2/10/51 | 130 | 138 |
| 4 | Banc of America Commercial Mortgage | | | | |
| | Trust 2015-UBS7 | 3.705% | 9/15/48 | 220 | 226 |
| 4 | Banc of America Commercial Mortgage | | | | |
| | Trust 2015-UBS7 | 4.367% | 9/15/48 | 65 | 68 |
| 4 | Banc of America Commercial Mortgage | | | | |
| | Trust 2015-UBS7 | 4.367% | 9/15/48 | 40 | 39 |
| 4,8 Banc of America Funding 2006-H Trust 2.871% | 9/20/46 | 442 | 362 |
| 4 | Bank of America Mortgage | | | | |
| | 2002-J Trust | 3.735% | 9/25/32 | 1 | 1 |
| 4,6,7 Bank of America Student Loan Trust | | | | |
| | 2010-1A | 1.120% | 2/25/43 | 564 | 556 |
| Bank of Nova Scotia | 1.850% | 4/14/20 | 460 | 452 |
| 4,7 Beacon Container Finance LLC | | | | |
| | 2012-1A | 3.720% | 9/20/27 | 304 | 303 |
| 4,8 Bear Stearns ARM Trust 2006-4 | 2.687% | 10/25/36 | 626 | 538 |
| 4,8 Bear Stearns ARM Trust 2007-3 | 2.802% | 5/25/47 | 518 | 440 |
| 4 | Bear Stearns Commercial Mortgage | | | | |
| | Securities Trust 2006-PWR13 | 5.533% | 9/11/41 | 491 | 499 |
| 4 | Bear Stearns Commercial Mortgage | | | | |
| | Securities Trust 2007-PWR16 | 5.722% | 6/11/40 | 438 | 452 |
| 4 | Bear Stearns Commercial Mortgage | | | | |
| | Securities Trust 2007-PWR17 | 5.650% | 6/11/50 | 1,954 | 2,050 |
| 4,6,7 BMW Floorplan Master Owner Trust | | | | |
| | 2015-1A | 0.830% | 7/15/20 | 1,145 | 1,137 |
| 4 | BMW Vehicle Owner Trust 2015-2 | 1.550% | 2/20/19 | 570 | 566 |
| 4,6 Brazos Higher Education Authority Inc. | | | | |
| | Series 2005-3 | 0.803% | 6/25/26 | 350 | 337 |
| 4,6 Brazos Higher Education Authority Inc. | | | | |
| | Series 2011-1 | 1.182% | 2/25/30 | 642 | 638 |
| 4 | Cabela’s Credit Card Master Note Trust | | | | |
| | 2015-1A | 2.260% | 3/15/23 | 220 | 219 |
| 4,6 Cabela’s Credit Card Master Note Trust | | | | |
| | 2015-2A | 1.001% | 7/17/23 | 600 | 598 |
| 4,7 CAL Funding II Ltd. Series 2012-1A | 3.470% | 10/25/27 | 137 | 135 |
| 4,7 CAL Funding II Ltd. Series 2013-1A | 3.350% | 3/27/28 | 254 | 247 |
| 4,7 California Republic Auto Receivables | | | | |
| | Trust 2015-4 | 2.580% | 6/15/21 | 400 | 399 |
| 7 | Canadian Imperial Bank of Commerce | 2.250% | 7/21/20 | 530 | 529 |
| 4 | Capital Auto Receivables Asset Trust | | | | |
| | 2013-1 | 1.290% | 4/20/18 | 150 | 150 |
| 4 | Capital Auto Receivables Asset Trust | | | | |
| | 2013-1 | 1.740% | 10/22/18 | 130 | 130 |
| 4 | Capital Auto Receivables Asset Trust | | | | |
| | 2013-3 | 3.690% | 2/20/19 | 315 | 320 |
| 4 | Capital Auto Receivables Asset Trust | | | | |
| | 2013-4 | 1.470% | 7/20/18 | 545 | 545 |
| 4 | Capital Auto Receivables Asset Trust | | | | |
| | 2013-4 | 2.060% | 10/22/18 | 370 | 371 |
| 4 | Capital Auto Receivables Asset Trust | | | | |
| | 2013-4 | 2.670% | 2/20/19 | 330 | 333 |
| 4 | Capital Auto Receivables Asset Trust | | | | |
| | 2013-4 | 3.220% | 5/20/19 | 290 | 295 |
| 4 | Capital Auto Receivables Asset Trust | | | | |
| | 2014-1 | 1.690% | 10/22/18 | 300 | 300 |
| 4 | Capital Auto Receivables Asset Trust | | | | |
| | 2014-1 | 2.220% | 1/22/19 | 150 | 150 |
| | | | | |
| Face | Market |
| Maturity Amount | Value • |
| | Coupon | Date | ($000) | ($000) |
| 4 | Capital Auto Receivables Asset Trust | | | | |
| | 2014-1 | 2.840% | 4/22/19 | 100 | 101 |
| 4 | Capital Auto Receivables Asset Trust | | | | |
| | 2014-1 | 3.390% | 7/22/19 | 100 | 101 |
| 4 | Capital Auto Receivables Asset Trust | | | | |
| | 2015-3 | 1.940% | 1/21/20 | 530 | 528 |
| 4 | Capital Auto Receivables Asset Trust | | | | |
| | 2015-3 | 2.130% | 5/20/20 | 520 | 518 |
| 4 | Capital Auto Receivables Asset Trust | | | | |
| | 2015-3 | 2.430% | 9/21/20 | 150 | 149 |
| 4 | Capital Auto Receivables Asset Trust | | | | |
| | 2015-3 | 2.900% | 12/21/20 | 170 | 170 |
| 4,6 Capital One Multi-Asset Execution | | | | |
| | Trust 2014-A3 | 0.710% | 1/18/22 | 935 | 932 |
| 4 | Capital One Multi-asset Execution | | | | |
| | Trust 2015-A4 | 2.750% | 5/15/25 | 1,450 | 1,463 |
| 4 | Capital One Multi-asset Execution | | | | |
| | Trust 2015-A8 | 2.050% | 8/15/23 | 2,120 | 2,091 |
| 4 | Carmax Auto Owner Trust 2013-3 | 1.910% | 3/15/19 | 140 | 140 |
| 4 | Carmax Auto Owner Trust 2013-3 | 2.850% | 2/18/20 | 85 | 86 |
| 4 | Carmax Auto Owner Trust 2014-1 | 1.690% | 8/15/19 | 50 | 50 |
| 4 | Carmax Auto Owner Trust 2014-1 | 1.930% | 11/15/19 | 100 | 99 |
| 4 | Carmax Auto Owner Trust 2015-1 | 1.830% | 7/15/20 | 70 | 70 |
| 4 | Carmax Auto Owner Trust 2015-2 | 3.040% | 11/15/21 | 140 | 139 |
| 4 | Carmax Auto Owner Trust 2015-3 | 1.980% | 2/16/21 | 280 | 278 |
| 4 | Carmax Auto Owner Trust 2015-3 | 2.280% | 4/15/21 | 107 | 106 |
| 4 | Carmax Auto Owner Trust 2015-3 | 2.680% | 6/15/21 | 150 | 149 |
| 4 | CenterPoint Energy Transition | | | | |
| | Bond Co. IV LLC 2012-1 | 2.161% | 10/15/21 | 700 | 704 |
| 4,7 CFCRE Commercial Mortgage Trust | | | | |
| | 2011-C1 | 5.870% | 4/15/44 | 36 | 40 |
| 4,7 CFCRE Commercial Mortgage Trust | | | | |
| | 2011-C2 | 5.574% | 12/15/47 | 390 | 449 |
| 4,6 Chase Issuance Trust 2007-C1 | 0.790% | 4/15/19 | 800 | 797 |
| 4 | CHL Mortgage Pass-Through Trust | | | | |
| | 2003-HYB3 | 2.669% | 11/19/33 | 30 | 28 |
| 4,8 CHL Mortgage Pass-Through Trust | | | | |
| | 2006-HYB1 | 2.526% | 3/20/36 | 319 | 277 |
| 4,8 CHL Mortgage Pass-Through Trust | | | | |
| | 2007-HYB2 | 2.703% | 2/25/47 | 349 | 304 |
| 4,7 Chrysler Capital Auto Receivables Trust | | | | |
| | 2013-AA | 1.830% | 3/15/19 | 100 | 100 |
| 4,7 Chrysler Capital Auto Receivables Trust | | | | |
| | 2013-AA | 2.280% | 7/15/19 | 115 | 115 |
| 4,7 Chrysler Capital Auto Receivables Trust | | | | |
| | 2013-AA | 2.930% | 8/17/20 | 125 | 123 |
| 4,7 Chrysler Capital Auto Receivables Trust | | | | |
| | 2014-AA | 2.280% | 11/15/19 | 240 | 238 |
| 4,7 Chrysler Capital Auto Receivables Trust | | | | |
| | 2015-BA | 2.260% | 10/15/20 | 500 | 498 |
| 4,7 Chrysler Capital Auto Receivables Trust | | | | |
| | 2015-BA | 2.700% | 12/15/20 | 160 | 159 |
| 4,7 Chrysler Capital Auto Receivables Trust | | | | |
| | 2015-BA | 3.260% | 4/15/21 | 245 | 245 |
| 4,7 Chrysler Capital Auto Receivables Trust | | | | |
| | 2015-BA | 4.170% | 1/16/23 | 375 | 374 |
| 4,7 Cit Equipment Collateral 2013-VT1 | 1.130% | 7/20/20 | 260 | 260 |
| 4,6 Citibank Credit Card Issuance Trust | | | | |
| | 2008-A7 | 1.777% | 5/20/20 | 1,220 | 1,248 |
| 4 | Citibank Credit Card Issuance Trust | | | | |
| | 2014-A1 | 2.880% | 1/23/23 | 200 | 204 |
| 4 | Citibank Credit Card Issuance Trust | | | | |
| | 2014-A6 | 2.150% | 7/15/21 | 2,240 | 2,251 |
| 4 | Citigroup Commercial Mortgage Trust | | | | |
| | 2012-GC8 | 3.024% | 9/10/45 | 150 | 151 |
| 4,7 Citigroup Commercial Mortgage Trust | | | | |
| | 2012-GC8 | 3.683% | 9/10/45 | 52 | 54 |
| 4 | Citigroup Commercial Mortgage Trust | | | | |
| | 2013-GC11 | 1.987% | 4/10/46 | 115 | 115 |
| 4 | Citigroup Commercial Mortgage Trust | | | | |
| | 2013-GC11 | 3.093% | 4/10/46 | 150 | 150 |
189
Vanguard Short-Term Investment-Grade Portfolio
| | | | | |
| Face | Market |
| Maturity Amount | Value • |
| | Coupon | Date | ($000) | ($000) |
| 4 | Citigroup Commercial Mortgage Trust | | | | |
| | 2013-GC15 | 3.161% | 9/10/46 | 565 | 580 |
| 4 | Citigroup Commercial Mortgage Trust | | | | |
| | 2013-GC15 | 3.942% | 9/10/46 | 200 | 212 |
| 4,6,7 Citigroup Commercial Mortgage Trust | | | | |
| | 2014-388G | 1.081% | 6/15/33 | 500 | 497 |
| 4 | Citigroup Commercial Mortgage Trust | | | | |
| | 2014-GC19 | 4.023% | 3/10/47 | 110 | 115 |
| 4 | Citigroup Commercial Mortgage Trust | | | | |
| | 2014-GC21 | 3.477% | 5/10/47 | 270 | 276 |
| 4 | Citigroup Commercial Mortgage Trust | | | | |
| | 2014-GC21 | 3.575% | 5/10/47 | 125 | 128 |
| 4 | Citigroup Commercial Mortgage Trust | | | | |
| | 2014-GC21 | 3.855% | 5/10/47 | 970 | 1,007 |
| 4 | Citigroup Commercial Mortgage Trust | | | | |
| | 2014-GC23 | 3.622% | 7/10/47 | 140 | 143 |
| 4 | Citigroup Commercial Mortgage Trust | | | | |
| | 2014-GC23 | 3.863% | 7/10/47 | 250 | 254 |
| 4 | Citigroup Commercial Mortgage Trust | | | | |
| | 2014-GC23 | 4.175% | 7/10/47 | 90 | 92 |
| 4 | Citigroup Commercial Mortgage Trust | | | | |
| | 2014-GC23 | 4.453% | 7/10/47 | 153 | 151 |
| 4 | Citigroup Commercial Mortgage Trust | | | | |
| | 2014-GC25 | 3.372% | 10/10/47 | 370 | 370 |
| 4 | Citigroup Commercial Mortgage Trust | | | | |
| | 2014-GC25 | 3.635% | 10/10/47 | 935 | 951 |
| 4 | Citigroup Commercial Mortgage Trust | | | | |
| | 2015-GC27 | 2.944% | 2/10/48 | 180 | 178 |
| 4 | Citigroup Commercial Mortgage Trust | | | | |
| | 2015-GC27 | 3.137% | 2/10/48 | 480 | 469 |
| 4 | Citigroup Commercial Mortgage Trust | | | | |
| | 2015-GC31 | 3.762% | 6/10/48 | 415 | 425 |
| 4 | Citigroup Commercial Mortgage Trust | | | | |
| | 2015-GC33 | 3.778% | 9/10/58 | 890 | 911 |
| 4 | Citigroup Commercial Mortgage Trust | | | | |
| | 2015-GC33 | 4.571% | 9/10/58 | 195 | 201 |
| 4 | Citigroup Commercial Mortgage Trust | | | | |
| | 2015-GC33 | 4.571% | 9/10/58 | 100 | 95 |
| 4,8 Citigroup Mortgage Loan Trust | | | | |
| | 2007-AR8 | 2.797% | 7/25/37 | 244 | 224 |
| 4,7 CKE Restaurant Holdings Inc. 2013-1A | 4.474% | 3/20/43 | 551 | 549 |
| 4,7 CLI Funding V LLC 2013-1A | 2.830% | 3/18/28 | 479 | 464 |
| 4 | COBALT CMBS Commercial Mortgage | | | | |
| | Trust 2007-C2 | 5.484% | 4/15/47 | 551 | 570 |
| 4,6,7 Colony American Homes 2014-1 | 1.400% | 5/17/31 | 288 | 284 |
| 4,6,7 Colony American Homes 2014-1 | 1.600% | 5/17/31 | 395 | 389 |
| 4,6,7 Colony American Homes 2015-1 | 1.550% | 7/17/32 | 270 | 267 |
| 4,6,7 Colony American Homes Single-Family | | | | |
| | Rental Pass-Through Certificates | | | | |
| | 2014-2 | 1.563% | 7/17/31 | 350 | 345 |
| 4 | COMM 15-CR22 Mortgage Trust | 3.309% | 3/10/48 | 685 | 680 |
| 4 | COMM 2006-C8 Mortgage Trust | 5.292% | 12/10/46 | 508 | 520 |
| 4 | COMM 2006-C8 Mortgage Trust | 5.306% | 12/10/46 | 832 | 847 |
| 4 | COMM 2007-C9 Mortgage Trust | 5.796% | 12/10/49 | 590 | 614 |
| 4 | COMM 2012-CCRE2 Mortgage Trust | 3.147% | 8/15/45 | 75 | 76 |
| 4 | COMM 2012-CCRE2 Mortgage Trust | 3.791% | 8/15/45 | 100 | 104 |
| 4 | COMM 2012-CCRE4 Mortgage Trust | 2.853% | 10/15/45 | 260 | 258 |
| 4 | COMM 2012-CCRE5 Mortgage Trust | 2.771% | 12/10/45 | 70 | 69 |
| 4 | COMM 2012-CR3 Mortgage Trust | 2.822% | 10/15/45 | 505 | 500 |
| 4 | COMM 2013-CCRE11 Mortgage Trust | 3.983% | 10/10/46 | 270 | 287 |
| 4 | COMM 2013-CCRE11 Mortgage Trust | 4.258% | 10/10/46 | 1,047 | 1,122 |
| 4 | COMM 2013-CCRE12 Mortgage Trust | 3.623% | 10/10/46 | 350 | 366 |
| 4 | COMM 2013-CCRE12 Mortgage Trust | 4.046% | 10/10/46 | 870 | 921 |
| 4 | COMM 2013-CCRE13 Mortgage Trust | 4.753% | 12/10/23 | 110 | 119 |
| 4 | COMM 2013-CCRE13 Mortgage Trust | 4.753% | 12/10/23 | 200 | 205 |
| 4 | COMM 2013-CCRE8 Mortgage Trust | 3.612% | 6/10/46 | 1,165 | 1,201 |
| 4 | COMM 2013-CCRE9 Mortgage Trust | 4.233% | 7/10/45 | 635 | 684 |
| 4,7 COMM 2013-CCRE9 Mortgage Trust | 4.257% | 7/10/45 | 250 | 266 |
| 4 | COMM 2013-CCRE9 Mortgage Trust | 2.972% | 8/10/46 | 550 | 558 |
| 4 | COMM 2013-CCRE9 Mortgage Trust | 3.795% | 8/10/46 | 250 | 264 |
| 4 | COMM 2013-CR13 Mortgage Trust | 4.194% | 11/10/23 | 650 | 693 |
| | | | | |
| Face | Market |
| Maturity Amount | Value • |
| | Coupon | Date | ($000) | ($000) |
| 4,7 COMM 2013-CR9 Mortgage Trust | 4.257% | 7/10/45 | 200 | 198 |
| 4 | COMM 2013-LC13 Mortgage Trust | 3.009% | 8/10/46 | 520 | 531 |
| 4,7 COMM 2013-LC13 Mortgage Trust | 3.774% | 8/10/46 | 250 | 263 |
| 4 | COMM 2013-LC13 Mortgage Trust | 4.205% | 8/10/46 | 315 | 337 |
| 4,7 COMM 2013-LC13 Mortgage Trust | 4.557% | 8/10/46 | 435 | 469 |
| 4 | COMM 2013-LC6 Mortgage Trust | 2.941% | 1/10/46 | 100 | 100 |
| 4,7 COMM 2013-SFS Mortgage Trust | 2.987% | 4/12/35 | 110 | 109 |
| 4,7 COMM 2014-277P Mortgage Trust | 3.611% | 8/10/49 | 910 | 927 |
| 4 | COMM 2014-CCRE14 Mortgage Trust | 3.743% | 2/10/47 | 130 | 136 |
| 4 | COMM 2014-CCRE15 Mortgage Trust | 2.928% | 2/10/47 | 300 | 304 |
| 4 | COMM 2014-CCRE15 Mortgage Trust | 4.074% | 2/10/47 | 390 | 412 |
| 4 | COMM 2014-CCRE15 Mortgage Trust | 4.426% | 2/10/47 | 250 | 269 |
| 4 | COMM 2014-CCRE15 Mortgage Trust | 4.715% | 2/10/47 | 150 | 163 |
| 4 | COMM 2014-CR14 Mortgage Trust | 4.236% | 2/10/47 | 240 | 257 |
| 4 | COMM 2014-CR17 Mortgage Trust | 3.977% | 5/10/47 | 1,070 | 1,120 |
| 4 | COMM 2014-CR17 Mortgage Trust | 4.174% | 5/10/47 | 650 | 685 |
| 4 | COMM 2014-CR17 Mortgage Trust | 4.735% | 5/10/47 | 80 | 82 |
| 4 | COMM 2014-CR18 Mortgage Trust | 3.452% | 7/15/47 | 300 | 312 |
| 4 | COMM 2014-CR18 Mortgage Trust | 3.828% | 7/15/47 | 715 | 742 |
| 4 | COMM 2014-CR20 Mortgage Trust | 3.590% | 11/10/47 | 795 | 807 |
| 4 | COMM 2014-LC17 Mortgage Trust | 3.917% | 10/10/47 | 465 | 484 |
| 4 | COMM 2014-LC19 Mortgage Trust | 3.040% | 2/10/48 | 90 | 91 |
| 4 | COMM 2015-CR24 Mortgage Trust | 3.445% | 8/10/55 | 200 | 207 |
| 4 | COMM 2015-CR24 Mortgage Trust | 3.696% | 8/10/55 | 415 | 424 |
| 4 | COMM 2015-CR25 Mortgage Trust | 3.759% | 8/10/48 | 970 | 993 |
| 4 | COMM 2015-CR26 Mortgage Trust | 3.630% | 10/10/48 | 970 | 981 |
| 4 | COMM 2015-CR27 Mortgage Trust | 3.612% | 10/10/48 | 570 | 576 |
| 4 | COMM 2015-CR27 Mortgage Trust | 4.472% | 10/10/48 | 210 | 204 |
| 4 | Commercial Mortgage Trust 2006-GG7 | 5.826% | 7/10/38 | 251 | 252 |
| 7 | Commonwealth Bank of Australia | 2.000% | 6/18/19 | 600 | 598 |
| 7 | Commonwealth Bank of Australia | 2.125% | 7/22/20 | 750 | 740 |
| 4,7 Core Industrial Trust 2015-TEXW | 3.077% | 2/10/34 | 1,040 | 1,033 |
| 4 | Credit Suisse Commercial Mortgage | | | | |
| | Trust Series 2006-C3 | 5.816% | 6/15/38 | 461 | 463 |
| 4 | Credit Suisse Commercial Mortgage | | | | |
| | Trust Series 2008-C1 | 6.067% | 2/15/41 | 788 | 840 |
| 4 | CSAIL Commercial Mortgage Trust | | | | |
| | 2015-C2 | 3.504% | 6/15/57 | 1,000 | 1,004 |
| 4 | CSAIL Commercial Mortgage Trust | | | | |
| | 2015-C3 | 3.718% | 8/15/48 | 1,040 | 1,061 |
| 4 | CSAIL Commercial Mortgage Trust | | | | |
| | 2015-C3 | 4.112% | 8/15/48 | 220 | 216 |
| 4 | CSAIL Commercial Mortgage Trust | | | | |
| | 2015-C3 | 4.362% | 8/15/48 | 240 | 221 |
| 4 | CSAIL Commercial Mortgage Trust | | | | |
| | 2015-C4 | 3.808% | 11/15/48 | 725 | 742 |
| 4,7 DB Master Finance LL 2015-1 | 3.262% | 2/20/45 | 216 | 214 |
| 4 | Discover Card Execution Note Trust | | | | |
| | 2012-A6 | 1.670% | 1/18/22 | 2,700 | 2,668 |
| 4,6 Discover Card Execution Note Trust | | | | |
| | 2013-A1 | 0.631% | 8/17/20 | 547 | 545 |
| 4 | Discover Card Execution Note Trust | | | | |
| | 2014-A4 | 2.120% | 12/15/21 | 1,400 | 1,403 |
| 4 | Discover Card Execution Note Trust | | | | |
| | 2015-A4 | 2.190% | 4/17/23 | 2,000 | 1,982 |
| 4,7 Drive Auto Receivables Trust 2015-A | 2.280% | 6/17/19 | 380 | 380 |
| 4,7 Drive Auto Receivables Trust 2015-A | 3.060% | 5/17/21 | 190 | 190 |
| 4,7 Drive Auto Receivables Trust 2015-A | 4.120% | 7/15/22 | 140 | 139 |
| 4,7 Drive Auto Receivables Trust 2015-B | 1.300% | 6/15/18 | 160 | 160 |
| 4,7 Drive Auto Receivables Trust 2015-BA | 2.120% | 6/17/19 | 180 | 179 |
| 4,7 Drive Auto Receivables Trust 2015-BA | 2.760% | 7/15/21 | 420 | 417 |
| 4,7 Drive Auto Receivables Trust 2015-BA | 3.840% | 7/15/21 | 250 | 246 |
| 4,7 Drive Auto Receivables Trust 2015-C | 2.230% | 9/16/19 | 345 | 344 |
| 4,7 Drive Auto Receivables Trust 2015-C | 3.010% | 5/17/21 | 515 | 509 |
| 4,7 Drive Auto Receivables Trust 2015-C | 4.200% | 9/15/21 | 380 | 376 |
| 4,7 Drive Auto Receivables Trust 2015-DA | 1.590% | 12/17/18 | 680 | 677 |
| 4,7 Drive Auto Receivables Trust 2015-DA | 2.590% | 12/16/19 | 750 | 747 |
| 4,7 Drive Auto Receivables Trust 2015-DA | 3.380% | 11/15/21 | 750 | 746 |
| 4,7 Drive Auto Receivables Trust 2015-DA | 4.590% | 1/17/23 | 750 | 747 |
| 4,6,7 Edsouth Indenture No 5 LLC 2015-1 | 1.222% | 10/25/56 | 816 | 803 |
190
Vanguard Short-Term Investment-Grade Portfolio
| | | | | |
| Face | Market |
| Maturity Amount | Value • |
| | Coupon | Date | ($000) | ($000) |
| 4,7 Enterprise Fleet Financing LLC Series | | | | |
| | 2012-2 | 0.930% | 4/20/18 | 132 | 132 |
| 4,7 Enterprise Fleet Financing LLC Series | | | | |
| | 2015-1 | 1.740% | 9/20/20 | 140 | 138 |
| 4,7 Enterprise Fleet Financing LLC Series | | | | |
| | 2015-2 | 2.090% | 2/22/21 | 600 | 591 |
| 4,6 Fannie Mae Connecticut Avenue | | | | |
| | Securities 2015-C01 | 1.922% | 2/25/25 | 82 | 82 |
| 4,6 Fannie Mae Connecticut Avenue | | | | |
| | Securities 2015-C01 | 1.922% | 2/25/25 | 53 | 53 |
| 4,6 Fannie Mae Connecticut Avenue | | | | |
| | Securities 2015-C02 | 1.572% | 5/25/25 | 135 | 134 |
| 4,6 Fannie Mae Connecticut Avenue | | | | |
| | Securities 2015-C02 | 1.622% | 5/25/25 | 252 | 251 |
| 4,6 Fannie Mae Connecticut Avenue | | | | |
| | Securities 2015-C03 | 1.922% | 7/25/25 | 335 | 335 |
| 4,6 Fannie Mae Connecticut Avenue | | | | |
| | Securities 2015-C03 | 1.922% | 7/25/25 | 425 | 425 |
| 4,6 Fannie Mae Connecticut Avenue | | | | |
| | Securities 2015-C04 | 2.022% | 4/25/28 | 484 | 484 |
| 4,6 Fannie Mae Connecticut Avenue | | | | |
| | Securities 2015-C04 | 2.122% | 4/25/28 | 237 | 237 |
| 4,8 First Horizon Mortgage Pass-Through | | | | |
| | Trust 2006-AR3 | 2.121% | 11/25/36 | 236 | 208 |
| 8 | First Horizon Mortgage Pass-Through | | | | |
| | Trust 2006-AR4 | 2.731% | 1/25/37 | 532 | 469 |
| 4 | Ford Credit Auto Lease Trust 2014-A | 1.160% | 8/15/17 | 540 | 539 |
| 4 | Ford Credit Auto Lease Trust 2015-A | 1.310% | 8/15/18 | 200 | 198 |
| 4 | Ford Credit Auto Lease Trust 2015-B | 1.540% | 2/15/19 | 420 | 417 |
| 4 | Ford Credit Auto Lease Trust 2015-B | 1.920% | 3/15/19 | 380 | 377 |
| 4 | Ford Credit Auto Owner Trust 2013-C | 1.680% | 11/15/18 | 100 | 100 |
| 4 | Ford Credit Auto Owner Trust 2013-D | 1.540% | 3/15/19 | 300 | 299 |
| 4 | Ford Credit Auto Owner Trust 2013-D | 1.720% | 7/15/19 | 310 | 309 |
| 4,7 Ford Credit Auto Owner Trust 2014-1 | 2.260% | 11/15/25 | 630 | 630 |
| 4,7 Ford Credit Auto Owner Trust 2014-1 | 2.410% | 11/15/25 | 160 | 159 |
| 4,7 Ford Credit Auto Owner Trust 2014-2 | 2.310% | 4/15/26 | 630 | 629 |
| 4,7 Ford Credit Auto Owner Trust 2014-2 | 2.510% | 4/15/26 | 140 | 139 |
| 4,7 Ford Credit Auto Owner Trust 2015-1 | 2.120% | 7/15/26 | 510 | 505 |
| 4,7 Ford Credit Auto Owner Trust 2015-2 | 2.440% | 1/15/27 | 1,500 | 1,494 |
| 4 | Ford Credit Auto Owner Trust 2015-B | 2.040% | 10/15/20 | 310 | 308 |
| 4 | Ford Credit Auto Owner Trust 2015-C | 2.010% | 3/15/21 | 295 | 293 |
| 4 | Ford Credit Auto Owner Trust 2015-C | 2.260% | 3/15/22 | 135 | 134 |
| 4 | Ford Credit Floorplan Master Owner | | | | |
| | Trust A Series 2012-2 | 1.920% | 1/15/19 | 700 | 704 |
| 4 | Ford Credit Floorplan Master Owner | | | | |
| | Trust A Series 2012-5 | 1.490% | 9/15/19 | 2,722 | 2,703 |
| 4 | Ford Credit Floorplan Master Owner | | | | |
| | Trust A Series 2012-5 | 1.690% | 9/15/19 | 200 | 199 |
| 4 | Ford Credit Floorplan Master Owner | | | | |
| | Trust A Series 2012-5 | 2.140% | 9/15/19 | 200 | 200 |
| 4 | Ford Credit Floorplan Master Owner | | | | |
| | Trust A Series 2013-1 | 1.370% | 1/15/18 | 640 | 640 |
| 4 | Ford Credit Floorplan Master Owner | | | | |
| | Trust A Series 2013-1 | 1.820% | 1/15/18 | 240 | 240 |
| 4 | Ford Credit Floorplan Master Owner | | | | |
| | Trust A Series 2013-4 | 2.100% | 6/15/20 | 150 | 150 |
| 4 | Ford Credit Floorplan Master Owner | | | | |
| | Trust A Series 2013-4 | 2.290% | 6/15/20 | 150 | 150 |
| 4 | Ford Credit Floorplan Master Owner | | | | |
| | Trust A Series 2013-4 | 2.790% | 6/15/20 | 60 | 60 |
| 4 | Ford Credit Floorplan Master Owner | | | | |
| | Trust A Series 2014-1 | 1.400% | 2/15/19 | 200 | 200 |
| 4 | Ford Credit Floorplan Master Owner | | | | |
| | Trust A Series 2014-1 | 2.310% | 2/15/21 | 100 | 100 |
| 4,6 Ford Credit Floorplan Master Owner | | | | |
| | Trust A Series 2014-2 | 0.830% | 2/15/21 | 130 | 130 |
| 4 | Ford Credit Floorplan Master Owner | | | | |
| | Trust A Series 2014-4 | 1.400% | 8/15/19 | 1,680 | 1,673 |
| 4 | Ford Credit Floorplan Master Owner | | | | |
| | Trust A Series 2015-2 | 1.980% | 1/15/22 | 273 | 270 |
| | | | | |
| Face | Market |
| Maturity Amount | Value • |
| | Coupon | Date | ($000) | ($000) |
| 4 | Ford Credit Floorplan Master Owner | | | | |
| | Trust A Series 2015-5 | 2.390% | 8/15/22 | 1,850 | 1,848 |
| 4,6 Freddie Mac Structured Agency Credit | | | | |
| | Risk Debt Notes 2015-HQA1 | 1.672% | 3/25/28 | 258 | 259 |
| 4,7 FRS I LLC 2013-1A | 1.800% | 4/15/43 | 99 | 98 |
| 4,7 FRS I LLC 2013-1A | 3.080% | 4/15/43 | 489 | 486 |
| 4,6 GE Capital Credit Card Master Note | | | | |
| | Trust Series 2011-2 | 1.330% | 5/15/19 | 1,200 | 1,200 |
| 4 | GE Capital Credit Card Master Note | | | | |
| | Trust Series 2012-2 | 2.220% | 1/15/22 | 2,000 | 2,006 |
| 4 | GE Capital Credit Card Master Note | | | | |
| | Trust Series 2012-6 | 1.360% | 8/17/20 | 1,560 | 1,550 |
| 4,6 GE Dealer Floorplan Master Note Trust | | | | |
| | Series 2012-2 | 1.152% | 4/22/19 | 900 | 901 |
| 4,6 GE Dealer Floorplan Master Note Trust | | | | |
| | Series 2015-2 | 1.052% | 1/20/22 | 500 | 489 |
| 4,7 GM Financial Leasing Trust 2014-1A | 1.760% | 5/21/18 | 300 | 300 |
| 4 | GM Financial Leasing Trust 2015-1 | 1.730% | 6/20/19 | 150 | 149 |
| 4 | GM Financial Leasing Trust 2015-2 | 2.420% | 7/22/19 | 140 | 140 |
| 4 | GM Financial Leasing Trust 2015-2 | 2.990% | 7/22/19 | 120 | 119 |
| 4 | GM Financial Leasing Trust 2015-3 | 1.690% | 3/20/19 | 670 | 665 |
| 4 | GM Financial Leasing Trust 2015-3 | 1.810% | 11/20/19 | 70 | 69 |
| 4 | GM Financial Leasing Trust 2015-3 | 2.320% | 11/20/19 | 90 | 89 |
| 4 | GM Financial Leasing Trust 2015-3 | 2.980% | 11/20/19 | 190 | 188 |
| 4 | GM Financial Leasing Trust 2015-3 | 3.480% | 8/20/20 | 190 | 188 |
| 4 | GMACM Mortgage Loan Trust | | | | |
| | 2005-AR6 | 3.036% | 11/19/35 | 94 | 88 |
| 4,7 GMF Floorplan Owner Revolving Trust | | | | |
| | 2015-1 | 1.650% | 5/15/20 | 1,450 | 1,432 |
| 4,7 GMF Floorplan Owner Revolving Trust | | | | |
| | 2015-1 | 1.970% | 5/15/20 | 150 | 149 |
| 4,7 Golden Credit Card Trust 2012-2A | 1.770% | 1/15/19 | 1,695 | 1,697 |
| 4,6,7 Golden Credit Card Trust 2015-1A | 0.771% | 2/15/20 | 1,200 | 1,197 |
| 4,7 Golden Credit Card Trust 2015-2A | 2.020% | 4/15/22 | 1,345 | 1,325 |
| 4,7 GRACE 2014-GRCE Mortgage Trust | 3.369% | 6/10/28 | 500 | 512 |
| 4,7 Great America Leasing Receivables | | | | |
| | 2013-1 | 1.160% | 5/15/18 | 281 | 280 |
| 4,7 Great America Leasing Receivables | | | | |
| | 2015-1 | 2.020% | 6/21/21 | 120 | 119 |
| 4,7 GS Mortgage Securities Trust 2010-C2 5.188% | 12/10/43 | 100 | 109 |
| 4,7 GS Mortgage Securities Trust | | | | |
| | 2011-GC3 | 5.642% | 3/10/44 | 70 | 77 |
| 4,7 GS Mortgage Securities Trust | | | | |
| | 2012-ALOHA | 3.551% | 4/10/34 | 790 | 813 |
| 4,7 GS Mortgage Securities Trust | | | | |
| | 2012-BWTR | 2.954% | 11/5/34 | 860 | 855 |
| 4,7 GS Mortgage Securities Trust | | | | |
| | 2012-GC6 | 4.948% | 1/10/45 | 25 | 28 |
| 4 | GS Mortgage Securities Trust | | | | |
| | 2013-GC13 | 4.036% | 7/10/46 | 525 | 560 |
| 4,7 GS Mortgage Securities Trust | | | | |
| | 2013-GC13 | 4.069% | 7/10/46 | 140 | 139 |
| 4 | GS Mortgage Securities Trust | | | | |
| | 2013-GC14 | 3.955% | 8/10/46 | 575 | 616 |
| 4 | GS Mortgage Securities Trust | | | | |
| | 2013-GCJ12 | 3.135% | 6/10/46 | 225 | 225 |
| 4 | GS Mortgage Securities Trust | | | | |
| | 2013-GCJ12 | 3.777% | 6/10/46 | 200 | 204 |
| 4 | GS Mortgage Securities Trust | | | | |
| | 2013-GCJ14 | 2.995% | 8/10/46 | 470 | 485 |
| 4 | GS Mortgage Securities Trust | | | | |
| | 2013-GCJ14 | 3.817% | 8/10/46 | 200 | 210 |
| 4 | GS Mortgage Securities Trust | | | | |
| | 2013-GCJ14 | 4.243% | 8/10/46 | 1,015 | 1,087 |
| 4 | GS Mortgage Securities Trust | | | | |
| | 2014-GC20 | 3.998% | 4/10/47 | 860 | 899 |
| 4 | GS Mortgage Securities Trust | | | | |
| | 2014-GC24 | 3.931% | 9/10/47 | 990 | 1,029 |
| 4 | GS Mortgage Securities Trust | | | | |
| | 2014-GC24 | 4.508% | 9/10/47 | 230 | 239 |
191
Vanguard Short-Term Investment-Grade Portfolio
| | | | | |
| Face | Market |
| Maturity Amount | Value • |
| | Coupon | Date | ($000) | ($000) |
| 4 | GS Mortgage Securities Trust | | | | |
| | 2014-GC24 | 4.529% | 9/10/47 | 330 | 326 |
| 4 | GS Mortgage Securities Trust | | | | |
| | 2014-GC26 | 3.629% | 11/10/47 | 350 | 359 |
| 4 | GS Mortgage Securities Trust | | | | |
| | 2015-GC28 | 3.396% | 2/10/48 | 170 | 169 |
| 4 | GS Mortgage Securities Trust | | | | |
| | 2015-GC30 | 3.382% | 5/10/50 | 530 | 527 |
| 4 | GS Mortgage Securities Trust | | | | |
| | 2015-GC32 | 3.764% | 7/10/48 | 370 | 379 |
| 4 | GS Mortgage Securities Trust | | | | |
| | 2015-GC32 | 4.402% | 7/10/48 | 155 | 161 |
| 4 | GS Mortgage Securities Trust | | | | |
| | 2015-GC32 | 4.412% | 7/10/48 | 70 | 68 |
| 4 | GS Mortgage Securities Trust | | | | |
| | 2015-GC34 | 3.506% | 10/10/48 | 940 | 942 |
| 4 | GS Mortgage Securities Trust | | | | |
| | 2015-GC34 | 4.466% | 10/10/48 | 310 | 317 |
| 4 | GS Mortgage Securities Trust | | | | |
| | 2015-GC34 | 4.655% | 10/10/48 | 310 | 299 |
| 7 | GTP Acquisition Partners I LLC | 3.482% | 6/16/25 | 630 | 609 |
| 4,7 Hertz Vehicle Financing LLC 2010-1A | 3.740% | 2/25/17 | 417 | 418 |
| 4,7 Hertz Vehicle Financing LLC 2011-1A | 3.290% | 3/25/18 | 1,330 | 1,346 |
| 4,7 Hertz Vehicle Financing LLC 2013-1A | 1.830% | 8/25/19 | 1,500 | 1,480 |
| 4,7 Hertz Vehicle Financing LLC 2015-3 | 2.670% | 9/25/21 | 400 | 396 |
| 4,7 Hilton USA Trust 2013-HLT | 2.662% | 11/5/30 | 380 | 380 |
| 4,7 Hilton USA Trust 2013-HLT | 3.367% | 11/5/30 | 395 | 394 |
| 4,7 Hilton USA Trust 2013-HLT | 3.714% | 11/5/30 | 180 | 180 |
| 4,7 Houston Galleria Mall Trust 2015-HGLR 3.087% | 3/5/37 | 770 | 749 |
| 4,7 Hudsons Bay Simon JV Trust 2015-HB7 3.914% | 8/5/34 | 500 | 512 |
| 4,7 Hyundai Auto Lease Securitization | | | | |
| | Trust 2014-A | 1.300% | 7/16/18 | 200 | 199 |
| 4,7 Hyundai Auto Lease Securitization | | | | |
| | Trust 2014-B | 1.540% | 12/17/18 | 250 | 249 |
| 4,7 Hyundai Auto Lease Securitization | | | | |
| | Trust 2015-A | 1.650% | 8/15/19 | 370 | 370 |
| 4,7 Hyundai Auto Lease Securitization | | | | |
| | Trust 2015-A | 2.070% | 11/15/19 | 500 | 499 |
| 4,7 Hyundai Auto Lease Securitization | | | | |
| | Trust 2015-B | 2.210% | 5/15/20 | 375 | 375 |
| 4 | Hyundai Auto Receivables Trust | | | | |
| | 2012-B | 1.950% | 10/15/18 | 200 | 200 |
| 4 | Hyundai Auto Receivables Trust | | | | |
| | 2013-B | 1.450% | 2/15/19 | 160 | 160 |
| 4 | Hyundai Auto Receivables Trust | | | | |
| | 2013-B | 2.480% | 9/16/19 | 250 | 252 |
| 4 | Hyundai Auto Receivables Trust | | | | |
| | 2013-C | 2.480% | 3/15/19 | 150 | 151 |
| 4 | Hyundai Auto Receivables Trust | | | | |
| | 2013-C | 3.090% | 1/15/20 | 130 | 132 |
| 4 | Hyundai Auto Receivables Trust | | | | |
| | 2014-A | 2.020% | 8/15/19 | 200 | 199 |
| 4 | Hyundai Auto Receivables Trust | | | | |
| | 2014-A | 2.530% | 7/15/20 | 140 | 141 |
| 4 | Hyundai Auto Receivables Trust | | | | |
| | 2014-B | 2.100% | 11/15/19 | 250 | 249 |
| 4 | Hyundai Auto Receivables Trust | | | | |
| | 2015-C | 2.150% | 11/15/21 | 90 | 90 |
| 4 | Hyundai Auto Receivables Trust | | | | |
| | 2015-C | 2.550% | 11/15/21 | 210 | 209 |
| 4,6,7 Hyundai Floorplan Master Owner Trust | | | | |
| | Series 2013-1 | 0.980% | 5/15/18 | 150 | 150 |
| 4,7 Icon Brands Holdings LLC 2012-1 | 4.229% | 1/25/43 | 403 | 372 |
| 6 | Illinois Student Assistance Commission | | | | |
| | Series 2010-1 | 1.370% | 4/25/22 | 334 | 334 |
| 4,6,7 Invitation Homes 2014-SFR1 Trust | 1.851% | 6/17/31 | 610 | 601 |
| 4,6,7 Invitation Homes 2014-SFR2 Trust | 1.451% | 9/17/31 | 290 | 286 |
| 4,6,7 Invitation Homes 2014-SFR2 Trust | 1.951% | 9/17/31 | 220 | 217 |
| 4,6,7 Invitation Homes 2015-SFR2 Trust | 1.700% | 6/17/32 | 196 | 194 |
| 4,7 Irvine Core Office Trust 2013-IRV | 3.173% | 5/15/48 | 350 | 348 |
| 4 | John Deere Owner Trust 2015-B | 1.780% | 6/15/22 | 90 | 90 |
| | | | | |
| Face | Market |
| Maturity Amount | Value • |
| | Coupon | Date | ($000) | ($000) |
| 4 | JP Morgan Chase Commercial | | | | |
| | Mortgage Securities Trust 2006-LDP6 5.471% | 4/15/43 | 526 | 527 |
| 4 | JP Morgan Chase Commercial | | | | |
| | Mortgage Securities Trust 2006-LDP7 5.909% | 4/15/45 | 444 | 448 |
| 4 | JP Morgan Chase Commercial | | | | |
| | Mortgage Securities Trust 2007-C1 | 5.716% | 2/15/51 | 118 | 122 |
| 4 | JP Morgan Chase Commercial | | | | |
| | Mortgage Securities Trust | | | | |
| | 2007-CIBC20 | 5.746% | 2/12/51 | 929 | 972 |
| 4 | JP Morgan Chase Commercial | | | | |
| | Mortgage Securities Trust 2007-LDP10 5.439% | 1/15/49 | 893 | 918 |
| 4 | JP Morgan Chase Commercial | | | | |
| | Mortgage Securities Trust 2007-LDP12 5.850% | 2/15/51 | 639 | 669 |
| 4,7 JP Morgan Chase Commercial | | | | |
| | Mortgage Securities Trust 2010-C1 | 4.608% | 6/15/43 | 120 | 124 |
| 4,7 JP Morgan Chase Commercial | | | | |
| | Mortgage Securities Trust 2010-C2 | 3.616% | 11/15/43 | 75 | 77 |
| 4,7 JP Morgan Chase Commercial | | | | |
| | Mortgage Securities Trust 2010-C2 | 4.070% | 11/15/43 | 70 | 74 |
| 4,7 JP Morgan Chase Commercial | | | | |
| | Mortgage Securities Trust 2010-C2 | 5.551% | 11/15/43 | 170 | 182 |
| 4,7 JP Morgan Chase Commercial | | | | |
| | Mortgage Securities Trust 2010-C2 | 5.551% | 11/15/43 | 150 | 161 |
| 4,7 JP Morgan Chase Commercial | | | | |
| | Mortgage Securities Trust 2011-C3 | 4.388% | 2/15/46 | 440 | 459 |
| 4,7 JP Morgan Chase Commercial | | | | |
| | Mortgage Securities Trust 2011-C3 | 4.717% | 2/15/46 | 625 | 680 |
| 4,7 JP Morgan Chase Commercial | | | | |
| | Mortgage Securities Trust 2011-C3 | 5.360% | 2/15/46 | 70 | 74 |
| 4,7 JP Morgan Chase Commercial | | | | |
| | Mortgage Securities Trust 2011-C5 | 5.323% | 8/15/46 | 100 | 113 |
| 4 | JP Morgan Chase Commercial | | | | |
| | Mortgage Securities Trust 2012-C6 | 3.507% | 5/15/45 | 420 | 434 |
| 4 | JP Morgan Chase Commercial | | | | |
| | Mortgage Securities Trust 2012-C8 | 2.829% | 10/15/45 | 440 | 437 |
| 4,7 JP Morgan Chase Commercial | | | | |
| | Mortgage Securities Trust 2012-C8 | 3.424% | 10/15/45 | 100 | 102 |
| 4 | JP Morgan Chase Commercial | | | | |
| | Mortgage Securities Trust 2012-CIBX | 4.271% | 6/15/45 | 650 | 694 |
| 4,7 JP Morgan Chase Commercial | | | | |
| | Mortgage Securities Trust 2012-HSBC 3.093% | 7/5/32 | 150 | 151 |
| 4 | JP Morgan Chase Commercial | | | | |
| | Mortgage Securities Trust 2012-LC9 | 2.840% | 12/15/47 | 950 | 946 |
| 4 | JP Morgan Chase Commercial | | | | |
| | Mortgage Securities Trust 2013-C13 | 3.994% | 1/15/46 | 340 | 360 |
| 4 | JP Morgan Chase Commercial | | | | |
| | Mortgage Securities Trust 2013-C16 | 3.674% | 12/15/46 | 280 | 292 |
| 4 | JP Morgan Chase Commercial | | | | |
| | Mortgage Securities Trust 2013-C16 | 3.881% | 12/15/46 | 30 | 32 |
| 4 | JP Morgan Chase Commercial | | | | |
| | Mortgage Securities Trust 2013-C16 | 4.166% | 12/15/46 | 300 | 319 |
| 4 | JP Morgan Chase Commercial | | | | |
| | Mortgage Securities Trust 2013-C16 | 4.517% | 12/15/46 | 400 | 430 |
| 4 | JP Morgan Chase Commercial | | | | |
| | Mortgage Securities Trust 2013-C16 | 4.944% | 12/15/46 | 550 | 593 |
| 4 | JP Morgan Chase Commercial | | | | |
| | Mortgage Securities Trust 2013-C16 | 5.009% | 12/15/46 | 270 | 278 |
| 4 | JP Morgan Chase Commercial | | | | |
| | Mortgage Securities Trust 2013-LC11 | 1.855% | 4/15/46 | 115 | 115 |
| 4 | JP Morgan Chase Commercial | | | | |
| | Mortgage Securities Trust 2013-LC11 | 2.960% | 4/15/46 | 345 | 343 |
| 4 | JPMBB Commercial Mortgage | | | | |
| | Securities Trust 2013-C12 | 3.664% | 7/15/45 | 420 | 436 |
| 4 | JPMBB Commercial Mortgage | | | | |
| | Securities Trust 2013-C12 | 4.025% | 7/15/45 | 180 | 189 |
| 4 | JPMBB Commercial Mortgage | | | | |
| | Securities Trust 2013-C14 | 3.761% | 8/15/46 | 360 | 378 |
| 4 | JPMBB Commercial Mortgage | | | | |
| | Securities Trust 2013-C14 | 4.133% | 8/15/46 | 230 | 245 |
| 4 | JPMBB Commercial Mortgage | | | | |
| | Securities Trust 2013-C15 | 2.977% | 11/15/45 | 350 | 358 |
192
Vanguard Short-Term Investment-Grade Portfolio
| | | | | |
| Face | Market |
| Maturity Amount | Value • |
| | Coupon | Date | ($000) | ($000) |
| 4 | JPMBB Commercial Mortgage | | | | |
| | Securities Trust 2013-C15 | 3.659% | 11/15/45 | 100 | 104 |
| 4 | JPMBB Commercial Mortgage | | | | |
| | Securities Trust 2013-C15 | 4.131% | 11/15/45 | 800 | 853 |
| 4 | JPMBB Commercial Mortgage | | | | |
| | Securities Trust 2013-C15 | 4.927% | 11/15/45 | 430 | 464 |
| 4 | JPMBB Commercial Mortgage | | | | |
| | Securities Trust 2013-C15 | 5.081% | 11/15/45 | 340 | 354 |
| 4 | JPMBB Commercial Mortgage | | | | |
| | Securities Trust 2013-C17 | 4.199% | 1/15/47 | 485 | 522 |
| 4 | JPMBB Commercial Mortgage | | | | |
| | Securities Trust 2014-C18 | 4.079% | 2/15/47 | 750 | 796 |
| 4 | JPMBB Commercial Mortgage | | | | |
| | Securities Trust 2014-C18 | 4.439% | 2/15/47 | 300 | 320 |
| 4 | JPMBB Commercial Mortgage | | | | |
| | Securities Trust 2014-C18 | 4.810% | 2/15/47 | 300 | 320 |
| 4 | JPMBB Commercial Mortgage | | | | |
| | Securities Trust 2014-C18 | 4.810% | 2/15/47 | 150 | 151 |
| 4 | JPMBB Commercial Mortgage | | | | |
| | Securities Trust 2014-C21 | 3.428% | 8/15/47 | 220 | 225 |
| 4 | JPMBB Commercial Mortgage | | | | |
| | Securities Trust 2014-C24 | 3.639% | 11/15/47 | 300 | 308 |
| 4 | JPMBB Commercial Mortgage | | | | |
| | Securities Trust 2014-C26 | 3.494% | 1/15/48 | 960 | 973 |
| 4 | JPMBB Commercial Mortgage | | | | |
| | Securities Trust 2015-C30 | 3.551% | 7/15/48 | 580 | 584 |
| 4 | JPMBB Commercial Mortgage | | | | |
| | Securities Trust 2015-C30 | 3.559% | 7/15/48 | 210 | 216 |
| 4 | JPMBB Commercial Mortgage | | | | |
| | Securities Trust 2015-C30 | 3.822% | 7/15/48 | 1,010 | 1,045 |
| 4 | JPMBB Commercial Mortgage | | | | |
| | Securities Trust 2015-C30 | 4.226% | 7/15/48 | 385 | 400 |
| 4 | JPMBB Commercial Mortgage | | | | |
| | Securities Trust 2015-C31 | 3.801% | 8/15/48 | 270 | 279 |
| 4 | JPMBB Commercial Mortgage | | | | |
| | Securities Trust 2015-C32 | 3.598% | 11/15/48 | 370 | 377 |
| 4 | JPMBB Commercial Mortgage | | | | |
| | Securities Trust 2015-C33 | 3.562% | 12/15/48 | 145 | 148 |
| 4 | JPMBB Commercial Mortgage | | | | |
| | Securities Trust 2015-C33 | 3.770% | 12/15/48 | 850 | 870 |
| 4,7 Ladder Capital Commercial Mortgage | | | | |
| | 2013-GCP Mortgage Trust | 3.388% | 5/15/31 | 450 | 464 |
| 4,6,7 Lanark Master Issuer plc 2012-2A | 1.778% | 12/22/54 | 463 | 464 |
| 4,6,7 Lanark Master Issuer plc 2013-1A | 0.878% | 12/22/54 | 279 | 278 |
| 4 | LB-UBS Commercial Mortgage Trust | | | | |
| | 2006-C3 | 5.641% | 3/15/39 | 1,043 | 1,043 |
| 4 | LB-UBS Commercial Mortgage Trust | | | | |
| | 2006-C4 | 5.820% | 6/15/38 | 223 | 225 |
| 4 | LB-UBS Commercial Mortgage Trust | | | | |
| | 2006-C6 | 5.342% | 9/15/39 | 507 | 516 |
| 4 | LB-UBS Commercial Mortgage Trust | | | | |
| | 2006-C7 | 5.347% | 11/15/38 | 235 | 240 |
| 4 | LB-UBS Commercial Mortgage Trust | | | | |
| | 2007-C2 | 5.387% | 2/15/40 | 577 | 597 |
| 4 | LB-UBS Commercial Mortgage Trust | | | | |
| | 2007-C7 | 5.866% | 9/15/45 | 737 | 784 |
| 4,7 Macquarie Equipment Funding Trust | | | | |
| | 2012-A | 0.850% | 10/22/18 | 33 | 33 |
| 4,7 Madison Avenue Trust 2013-650M | 3.843% | 10/12/32 | 295 | 312 |
| 4,7 Master Credit Card Trust 2013-3A | 2.280% | 1/22/18 | 100 | 100 |
| 4 | MASTR Adjustable Rate Mortgages | | | | |
| | Trust 2004-3 | 2.272% | 4/25/34 | 30 | 28 |
| 4,6 MBNA Credit Card Master Note Trust | | | | |
| | 2004-A3 | 0.591% | 8/16/21 | 2,205 | 2,189 |
| 4 | Mercedes-Benz Auto Lease Trust | | | | |
| | 2015-B | 1.530% | 5/17/21 | 950 | 943 |
| 4 | Mercedes-Benz Auto Receivables | | | | |
| | Trust 2015-1 | 1.750% | 12/15/21 | 520 | 516 |
| 4,6,7 Mercedes-Benz Master Owner Trust | | | | |
| | 2015-B | 0.710% | 4/15/20 | 250 | 249 |
| | | | | |
| Face | Market |
| Maturity Amount | Value • |
| | Coupon | Date | ($000) | ($000) |
| 4 | Merrill Lynch Mortgage Investors | | | | |
| | Trust MLMI Series 2003-A2 | 2.154% | 2/25/33 | 62 | 60 |
| 4 | Merrill Lynch Mortgage Investors | | | | |
| | Trust MLMI Series 2003-A4 | 2.726% | 7/25/33 | 18 | 17 |
| 4 | Merrill Lynch Mortgage Trust 2006-C2 | 5.739% | 8/12/43 | 218 | 220 |
| 4 | Merrill Lynch Mortgage Trust 2008-C1 | 5.690% | 2/12/51 | 192 | 200 |
| 4,7 Miramax LLC 2014-1A | 3.340% | 7/20/26 | 93 | 92 |
| 4 | ML-CFC Commercial Mortgage Trust | | | | |
| | 2006-2 | 5.880% | 6/12/46 | 195 | 197 |
| 4 | ML-CFC Commercial Mortgage Trust | | | | |
| | 2007-6 | 5.331% | 3/12/51 | 124 | 124 |
| 4,7 MMAF Equipment Finance LLC | | | | |
| | 2009-A | 3.510% | 1/15/30 | 8 | 8 |
| 4,7 MMAF Equipment Finance LLC | | | | |
| | 2011-A | 2.100% | 7/15/17 | 164 | 165 |
| 4,7 MMAF Equipment Finance LLC | | | | |
| | 2011-A | 3.040% | 8/15/28 | 700 | 710 |
| 4,7 MMAF Equipment Finance LLC | | | | |
| | 2012-A | 1.980% | 6/10/32 | 370 | 369 |
| 4,7 MMAF Equipment Finance LLC | | | | |
| | 2015-AA | 2.490% | 2/19/36 | 800 | 782 |
| 4 | Morgan Stanley Bank of America | | | | |
| | Merrill Lynch Trust 2012-C5 | 3.176% | 8/15/45 | 500 | 507 |
| 4 | Morgan Stanley Bank of America | | | | |
| | Merrill Lynch Trust 2012-C5 | 3.792% | 8/15/45 | 50 | 52 |
| 4 | Morgan Stanley Bank of America | | | | |
| | Merrill Lynch Trust 2012-C6 | 2.858% | 11/15/45 | 140 | 139 |
| 4,7 Morgan Stanley Bank of America | | | | |
| | Merrill Lynch Trust 2012-CKSV | 3.277% | 10/15/30 | 815 | 805 |
| 4 | Morgan Stanley Bank of America | | | | |
| | Merrill Lynch Trust 2013-C10 | 4.081% | 7/15/46 | 650 | 691 |
| 4 | Morgan Stanley Bank of America | | | | |
| | Merrill Lynch Trust 2013-C11 | 3.085% | 8/15/46 | 225 | 229 |
| 4 | Morgan Stanley Bank of America | | | | |
| | Merrill Lynch Trust 2013-C11 | 3.960% | 8/15/46 | 270 | 288 |
| 4 | Morgan Stanley Bank of America | | | | |
| | Merrill Lynch Trust 2013-C11 | 4.214% | 8/15/46 | 1,080 | 1,156 |
| 4 | Morgan Stanley Bank of America | | | | |
| | Merrill Lynch Trust 2013-C12 | 3.824% | 10/15/46 | 190 | 200 |
| 4 | Morgan Stanley Bank of America | | | | |
| | Merrill Lynch Trust 2013-C13 | 4.039% | 11/15/46 | 200 | 212 |
| 4 | Morgan Stanley Bank of America | | | | |
| | Merrill Lynch Trust 2013-C7 | 2.918% | 2/15/46 | 130 | 129 |
| 4 | Morgan Stanley Bank of America | | | | |
| | Merrill Lynch Trust 2013-C7 | 3.214% | 2/15/46 | 60 | 60 |
| 4 | Morgan Stanley Bank of America | | | | |
| | Merrill Lynch Trust 2013-C9 | 3.102% | 5/15/46 | 595 | 593 |
| 4 | Morgan Stanley Bank of America | | | | |
| | Merrill Lynch Trust 2014-C14 | 4.064% | 2/15/47 | 450 | 475 |
| 4 | Morgan Stanley Bank of America | | | | |
| | Merrill Lynch Trust 2014-C14 | 4.384% | 2/15/47 | 450 | 482 |
| 4 | Morgan Stanley Bank of America | | | | |
| | Merrill Lynch Trust 2014-C15 | 4.051% | 4/15/47 | 365 | 385 |
| 4 | Morgan Stanley Bank of America | | | | |
| | Merrill Lynch Trust 2014-C16 | 3.892% | 6/15/47 | 895 | 933 |
| 4 | Morgan Stanley Bank of America | | | | |
| | Merrill Lynch Trust 2014-C16 | 4.094% | 6/15/47 | 230 | 239 |
| 4 | Morgan Stanley Bank of America | | | | |
| | Merrill Lynch Trust 2014-C16 | 4.324% | 6/15/47 | 300 | 309 |
| 4 | Morgan Stanley Bank of America | | | | |
| | Merrill Lynch Trust 2014-C16 | 4.757% | 6/15/47 | 300 | 309 |
| 4 | Morgan Stanley Bank of America | | | | |
| | Merrill Lynch Trust 2014-C17 | 3.741% | 8/15/47 | 390 | 402 |
| 4 | Morgan Stanley Bank of America | | | | |
| | Merrill Lynch Trust 2014-C17 | 4.011% | 8/15/47 | 130 | 135 |
| 4 | Morgan Stanley Bank of America | | | | |
| | Merrill Lynch Trust 2014-C18 | 3.923% | 10/15/47 | 450 | 469 |
| 4 | Morgan Stanley Bank of America | | | | |
| | Merrill Lynch Trust 2014-C19 | 3.326% | 12/15/47 | 310 | 317 |
193
Vanguard Short-Term Investment-Grade Portfolio
| | | | | |
| Face | Market |
| Maturity Amount | Value • |
| | Coupon | Date | ($000) | ($000) |
| 4 | Morgan Stanley Bank of America | | | | |
| | Merrill Lynch Trust 2014-C19 | 3.526% | 12/15/47 | 140 | 142 |
| 4 | Morgan Stanley Bank of America | | | | |
| | Merrill Lynch Trust 2015-C20 | 3.069% | 2/15/48 | 175 | 176 |
| 4 | Morgan Stanley Bank of America | | | | |
| | Merrill Lynch Trust 2015-C20 | 3.249% | 2/15/48 | 295 | 291 |
| 4 | Morgan Stanley Bank of America | | | | |
| | Merrill Lynch Trust 2015-C22 | 3.306% | 4/15/48 | 575 | 568 |
| 4 | Morgan Stanley Bank of America | | | | |
| | Merrill Lynch Trust 2015-C23 | 3.719% | 7/15/50 | 880 | 899 |
| 4 | Morgan Stanley Bank of America | | | | |
| | Merrill Lynch Trust 2015-C24 | 3.479% | 5/15/48 | 420 | 426 |
| 4 | Morgan Stanley Bank of America | | | | |
| | Merrill Lynch Trust 2015-C24 | 3.732% | 5/15/48 | 915 | 934 |
| 4 | Morgan Stanley Bank of America | | | | |
| | Merrill Lynch Trust 2015-C25 | 3.383% | 10/15/48 | 410 | 417 |
| 4 | Morgan Stanley Bank of America | | | | |
| | Merrill Lynch Trust 2015-C25 | 3.635% | 10/15/48 | 735 | 743 |
| 4 | Morgan Stanley Capital I Trust | | | | |
| | 2006-HQ9 | 5.728% | 7/12/44 | 1,176 | 1,191 |
| 4 | Morgan Stanley Capital I Trust | | | | |
| | 2006-IQ12 | 5.319% | 12/15/43 | 256 | 262 |
| 4 | Morgan Stanley Capital I Trust | | | | |
| | 2007-IQ15 | 5.917% | 6/11/49 | 731 | 760 |
| 4 | Morgan Stanley Capital I Trust | | | | |
| | 2007-IQ16 | 5.688% | 12/12/49 | 1,059 | 1,108 |
| 4 | Morgan Stanley Capital I Trust | | | | |
| | 2012-C4 | 3.244% | 3/15/45 | 380 | 388 |
| 4 | Morgan Stanley Capital I Trust | | | | |
| | 2012-C4 | 3.773% | 3/15/45 | 60 | 62 |
| 4,7 Morgan Stanley Capital I Trust | | | | |
| | 2012-STAR | 3.201% | 8/5/34 | 405 | 408 |
| 4,7 Morgan Stanley Capital I Trust | | | | |
| | 2014-150E | 3.912% | 9/9/32 | 675 | 695 |
| 4,7 Morgan Stanley Capital I Trust | | | | |
| | 2014-CPT | 3.350% | 7/13/29 | 600 | 612 |
| 4,7 Morgan Stanley Capital I Trust | | | | |
| | 2015-420 | 3.727% | 10/11/50 | 760 | 771 |
| 4 | Morgan Stanley Capital I Trust | | | | |
| | 2015-UBS8 | 3.809% | 12/15/48 | 610 | 622 |
| 4 | Morgan Stanley Capital I Trust | | | | |
| | 2015-UBS8 | 4.745% | 12/15/48 | 350 | 333 |
| 4 | Morgan Stanley Mortgage Loan Trust | | | | |
| | 2006-8AR | 2.225% | 6/25/36 | 215 | 193 |
| 4,6 Navient Student Loan Trust 2015-3 | 1.072% | 6/26/56 | 560 | 550 |
| 4,6 New Mexico Educational Assistance | | | | |
| | Foundation 2013-1 | 0.944% | 1/2/25 | 426 | 411 |
| 4 | Nissan Auto Lease Trust 2015-A | 1.580% | 5/17/21 | 130 | 129 |
| 4 | Nissan Auto Receivables 2015-B | | | | |
| | Owner Trust | 1.790% | 1/17/22 | 190 | 189 |
| 4,6 Nissan Master Owner Trust | | | | |
| | Receivables Series 2013-A | 0.631% | 2/15/18 | 525 | 525 |
| 4 | Nissan Master Owner Trust | | | | |
| | Receivables Series 2015-A | 1.440% | 1/15/20 | 160 | 159 |
| 6 | North Carolina State Education | | | | |
| | Assistance Authority 2011-1 | 1.220% | 1/26/26 | 388 | 387 |
| 4,7 OBP Depositor LLC Trust 2010-OBP | 4.646% | 7/15/45 | 225 | 244 |
| 4,6,7 PFS Financing Corp. 2014-AA | 0.930% | 2/15/19 | 100 | 99 |
| 4,6,7 PFS Financing Corp. 2015-AA | 0.951% | 4/15/20 | 250 | 246 |
| 4,7 Porsche Innovative Lease Owner Trust | | | | |
| | 2015-1 | 1.430% | 5/21/21 | 340 | 337 |
| 4,7 Progress Residential 2015-SFR2 Trust | 2.740% | 6/12/32 | 180 | 176 |
| 4,7 Progress Residential 2015-SFR3 Trust | 3.067% | 11/12/32 | 620 | 611 |
| 4,7 Progress Residential 2015-SFR3 Trust | 3.733% | 11/12/32 | 230 | 227 |
| 4,6,7 Resimac MBS Trust 2014-1A | 1.202% | 12/12/45 | 478 | 477 |
| 4,8 RFMSI Series 2006-SA2 Trust | 3.630% | 8/25/36 | 502 | 446 |
| 4,8 RFMSI Series 2006-SA3 Trust | 3.850% | 9/25/36 | 152 | 129 |
| Royal Bank of Canada | 1.875% | 2/5/20 | 600 | 590 |
| 4 | Santander Drive Auto Receivables | | | | |
| | Trust 2013-2 | 1.950% | 3/15/19 | 600 | 600 |
| | | | | |
| Face | Market |
| Maturity Amount | Value • |
| | Coupon | Date | ($000) | ($000) |
| 4 | Santander Drive Auto Receivables | | | | |
| | Trust 2013-5 | 1.550% | 10/15/18 | 226 | 226 |
| 4 | Santander Drive Auto Receivables | | | | |
| | Trust 2015-3 | 1.490% | 6/17/19 | 365 | 364 |
| 4 | Santander Drive Auto Receivables | | | | |
| | Trust 2015-3 | 3.490% | 5/17/21 | 355 | 350 |
| 4 | Santander Drive Auto Receivables | | | | |
| | Trust 2015-4 | 1.580% | 9/16/19 | 520 | 517 |
| 4 | Santander Drive Auto Receivables | | | | |
| | Trust 2015-4 | 2.260% | 6/15/20 | 600 | 598 |
| 4 | Santander Drive Auto Receivables | | | | |
| | Trust 2015-4 | 2.970% | 3/15/21 | 600 | 599 |
| 7 | SBA Tower Trust | 3.156% | 10/15/20 | 450 | 443 |
| 4,6,7 Silver Bay Realty 2014-1 Trust | 1.351% | 9/17/31 | 256 | 252 |
| 4,6,7 Silver Bay Realty 2014-1 Trust | 1.801% | 9/17/31 | 160 | 158 |
| 4,6 SLM Student Loan Trust 2005-5 | 0.420% | 4/25/25 | 970 | 956 |
| 4,6 SLM Student Loan Trust 2005-9 | 0.440% | 1/27/25 | 430 | 429 |
| 4,6,7 SLM Student Loan Trust 2011-A | 1.330% | 10/15/24 | 69 | 69 |
| 4,7 SLM Student Loan Trust 2011-A | 4.370% | 4/17/28 | 300 | 311 |
| 4,7 SLM Student Loan Trust 2011-B | 3.740% | 2/15/29 | 1,400 | 1,433 |
| 4,6,7 SLM Student Loan Trust 2011-C | 1.730% | 12/15/23 | 9 | 9 |
| 4,7 SLM Student Loan Trust 2011-C | 4.540% | 10/17/44 | 637 | 665 |
| 4,7 SLM Student Loan Trust 2012-B | 3.480% | 10/15/30 | 433 | 439 |
| 4,6,7 SLM Student Loan Trust 2012-E | 1.081% | 10/16/23 | 173 | 173 |
| 4,6,7 SLM Student Loan Trust 2013-1 | 1.380% | 5/17/27 | 600 | 595 |
| 4,7 SLM Student Loan Trust 2013-1 | 2.500% | 3/15/47 | 200 | 190 |
| 4,7 SLM Student Loan Trust 2013-B | 1.850% | 6/17/30 | 250 | 244 |
| 4,7 SLM Student Loan Trust 2013-B | 3.000% | 5/16/44 | 300 | 285 |
| 4,7 SLM Student Loan Trust 2013-C | 3.500% | 6/15/44 | 140 | 138 |
| 4,7 SLM Student Loan Trust 2014-A | 2.590% | 1/15/26 | 100 | 99 |
| 4,7 SLM Student Loan Trust 2014-A | 3.500% | 11/15/44 | 100 | 96 |
| 4 | SMART ABS Series 2012-4US Trust | 0.970% | 3/14/17 | 90 | 89 |
| 4 | SMART ABS Series 2012-4US Trust | 1.250% | 8/14/18 | 200 | 199 |
| 4 | SMART ABS Series 2013-1US Trust | 1.050% | 10/14/18 | 382 | 380 |
| 4,7 Sonic Capital LLC 2011-1A | 5.438% | 5/20/41 | 307 | 314 |
| 4,7 SpareBank 1 Boligkreditt AS | 1.750% | 11/15/20 | 560 | 548 |
| 7 | Stadshypotek AB | 1.750% | 4/9/20 | 873 | 850 |
| 4,6,7 SWAY Residential 2014-1 Trust | 1.650% | 1/17/32 | 397 | 393 |
| 4 | Synchrony Credit Card Master Note | | | | |
| | Trust 2015-1 | 2.370% | 3/15/23 | 360 | 359 |
| 4 | Synchrony Credit Card Master Note | | | | |
| | Trust 2015-3 | 2.380% | 9/15/23 | 1,340 | 1,331 |
| 4,7 Tidewater Auto Receivables Trust | | | | |
| | 2014-AA | 1.400% | 7/15/18 | 69 | 69 |
| 4,7 TMSQ 2014-1500 Mortgage Trust | 3.680% | 10/10/36 | 540 | 547 |
| 7 | Toronto-Dominion Bank | 1.950% | 4/2/20 | 865 | 852 |
| 4,6,7 Trade MAPS 1 Ltd. 2013-1A | 0.993% | 12/10/18 | 950 | 945 |
| 4,6,7 Trade MAPS 1 Ltd. 2013-1A | 1.543% | 12/10/18 | 135 | 133 |
| 4,6,7 Trade MAPS 1 Ltd. 2013-1A | 2.543% | 12/10/18 | 75 | 74 |
| 4,6,7 Trafigura Securitisation Finance plc | | | | |
| | 2014-1A | 1.280% | 10/15/21 | 510 | 510 |
| 4 | UBS Commercial Mortgage Trust | | | | |
| | 2012-C1 | 4.171% | 5/10/45 | 30 | 32 |
| 4,7 UBS-BAMLL Trust 2012-WRM | 3.663% | 6/10/30 | 595 | 607 |
| 4 | UBS-Barclays Commercial Mortgage | | | | |
| | Trust 2012-C4 | 2.850% | 12/10/45 | 220 | 217 |
| 4,7 VNO 2012-6AVE Mortgage Trust | 2.996% | 11/15/30 | 290 | 286 |
| 4,7 VNO 2013-PENN Mortgage Trust | 3.808% | 12/13/29 | 270 | 281 |
| 4,7 VNO 2013-PENN Mortgage Trust | 3.947% | 12/13/29 | 80 | 84 |
| 4,7 VNO 2013-PENN Mortgage Trust | 3.947% | 12/13/29 | 60 | 62 |
| 4,7 Volkswagen Credit Auto Master | | | | |
| | Owner Trust 2014-1A | 1.400% | 7/22/19 | 1,000 | 987 |
| 4,7 Volvo Financial Equipment LLC Series | | | | |
| | 2015-1A | 1.910% | 1/15/20 | 220 | 220 |
| 4 | Wachovia Bank Commercial Mortgage | | | | |
| | Trust Series 2006-C27 | 5.765% | 7/15/45 | 190 | 192 |
| 4 | Wachovia Bank Commercial Mortgage | | | | |
| | Trust Series 2006-C28 | 5.572% | 10/15/48 | 933 | 950 |
| 4 | Wachovia Bank Commercial Mortgage | | | | |
| | Trust Series 2006-C29 | 5.297% | 11/15/48 | 773 | 790 |
194
Vanguard Short-Term Investment-Grade Portfolio
| | | | | |
| Face | Market |
| Maturity Amount | Value • |
| | Coupon | Date | ($000) | ($000) |
| 4 | WaMu Mortgage Pass-Through | | | | |
| | Certificates Series 2002-AR18 | 2.748% | 1/25/33 | 12 | 12 |
| 4 | WaMu Mortgage Pass-Through | | | | |
| | Certificates Series 2003-AR7 | 2.414% | 8/25/33 | 20 | 20 |
| 4 | WaMu Mortgage Pass-Through | | | | |
| | Certificates Series 2003-AR9 | 2.522% | 9/25/33 | 24 | 25 |
| 4 | Wells Fargo Commercial Mortgage | | | | |
| | Trust 2012-LC5 | 2.918% | 10/15/45 | 705 | 706 |
| 4 | Wells Fargo Commercial Mortgage | | | | |
| | Trust 2012-LC5 | 3.539% | 10/15/45 | 40 | 41 |
| 4 | Wells Fargo Commercial Mortgage | | | | |
| | Trust 2013-LC12 | 3.928% | 7/15/46 | 185 | 196 |
| 4 | Wells Fargo Commercial Mortgage | | | | |
| | Trust 2013-LC12 | 4.218% | 7/15/46 | 755 | 805 |
| 4 | Wells Fargo Commercial Mortgage | | | | |
| | Trust 2013-LC12 | 4.299% | 7/15/46 | 110 | 118 |
| 4 | Wells Fargo Commercial Mortgage | | | | |
| | Trust 2014-LC16 | 3.477% | 8/15/50 | 500 | 516 |
| 4 | Wells Fargo Commercial Mortgage | | | | |
| | Trust 2014-LC16 | 3.817% | 8/15/50 | 1,100 | 1,145 |
| 4 | Wells Fargo Commercial Mortgage | | | | |
| | Trust 2014-LC16 | 4.020% | 8/15/50 | 200 | 208 |
| Wells Fargo Commercial Mortgage | | | | |
| | Trust 2014-LC16 | 4.322% | 8/15/50 | 350 | 359 |
| Wells Fargo Commercial Mortgage | | | | |
| | Trust 2014-LC16 | 4.458% | 8/15/50 | 220 | 214 |
| 4 | Wells Fargo Commercial Mortgage | | | | |
| | Trust 2014-LC18 | 3.244% | 12/15/47 | 690 | 700 |
| 4 | Wells Fargo Commercial Mortgage | | | | |
| | Trust 2015-C26 | 2.991% | 2/15/48 | 290 | 290 |
| 4 | Wells Fargo Commercial Mortgage | | | | |
| | Trust 2015-C26 | 3.166% | 2/15/48 | 365 | 359 |
| 4 | Wells Fargo Commercial Mortgage | | | | |
| | Trust 2015-C27 | 3.190% | 2/15/48 | 180 | 176 |
| 4 | Wells Fargo Commercial Mortgage | | | | |
| | Trust 2015-C27 | 3.278% | 2/15/48 | 170 | 173 |
| 4 | Wells Fargo Commercial Mortgage | | | | |
| | Trust 2015-C27 | 3.451% | 2/15/48 | 670 | 670 |
| 4 | Wells Fargo Commercial Mortgage | | | | |
| | Trust 2015-C29 | 3.400% | 6/15/48 | 100 | 101 |
| 4 | Wells Fargo Commercial Mortgage | | | | |
| | Trust 2015-C29 | 3.637% | 6/15/48 | 830 | 843 |
| 4 | Wells Fargo Commercial Mortgage | | | | |
| | Trust 2015-C29 | 4.225% | 6/15/48 | 270 | 252 |
| 4 | Wells Fargo Commercial Mortgage | | | | |
| | Trust 2015-C30 | 3.411% | 9/15/58 | 750 | 746 |
| 4 | Wells Fargo Commercial Mortgage | | | | |
| | Trust 2015-C30 | 3.664% | 9/15/58 | 420 | 426 |
| 4 | Wells Fargo Commercial Mortgage | | | | |
| | Trust 2015-C30 | 4.067% | 9/15/58 | 350 | 360 |
| 4 | Wells Fargo Commercial Mortgage | | | | |
| | Trust 2015-C30 | 4.496% | 9/15/58 | 120 | 115 |
| 4 | Wells Fargo Commercial Mortgage | | | | |
| | Trust 2015-LC22 | 3.839% | 9/15/58 | 790 | 822 |
| 4 | Wells Fargo Commercial Mortgage | | | | |
| | Trust 2015-LC22 | 4.207% | 9/15/58 | 275 | 286 |
| 4 | Wells Fargo Commercial Mortgage | | | | |
| | Trust 2015-LC22 | 4.538% | 9/15/58 | 80 | 83 |
| 4 | Wells Fargo Commercial Mortgage | | | | |
| | Trust 2015-LC22 | 4.538% | 9/15/58 | 195 | 186 |
| 4 | Wells Fargo Commercial Mortgage | | | | |
| | Trust 2015-SG1 | 3.556% | 12/15/47 | 190 | 195 |
| 4 | Wells Fargo Commercial Mortgage | | | | |
| | Trust 2015-SG1 | 3.789% | 12/15/47 | 600 | 616 |
| 4,8 Wells Fargo Mortgage Backed | | | | |
| | Securities 2006-AR14 Trust | 2.723% | 10/25/36 | 414 | 390 |
| 4,7 Wendys Funding LLC 2015-1 | 4.080% | 6/15/45 | 399 | 396 |
| 7 | Westpac Banking Corp. | 2.000% | 3/3/20 | 500 | 493 |
| 7 | Westpac Banking Corp. | 2.250% | 11/9/20 | 615 | 607 |
| 4,7 WFLD 2014-MONT Mortgage Trust | 3.755% | 8/10/31 | 960 | 981 |
| | | | | |
| Face | Market |
| Maturity Amount | Value • |
| | Coupon | Date | ($000) | ($000) |
| 4,7 WFRBS Commercial Mortgage Trust | | | | |
| | 2011-C3 | 4.375% | 3/15/44 | 270 | 292 |
| 4 | WFRBS Commercial Mortgage Trust | | | | |
| | 2012-C10 | 2.875% | 12/15/45 | 265 | 262 |
| 4 | WFRBS Commercial Mortgage Trust | | | | |
| | 2012-C7 | 3.431% | 6/15/45 | 270 | 278 |
| 4 | WFRBS Commercial Mortgage Trust | | | | |
| | 2012-C7 | 4.090% | 6/15/45 | 135 | 143 |
| 4 | WFRBS Commercial Mortgage Trust | | | | |
| | 2012-C8 | 3.001% | 8/15/45 | 100 | 100 |
| 4 | WFRBS Commercial Mortgage Trust | | | | |
| | 2012-C9 | 2.870% | 11/15/45 | 570 | 566 |
| 4 | WFRBS Commercial Mortgage Trust | | | | |
| | 2012-C9 | 3.388% | 11/15/45 | 70 | 71 |
| 4 | WFRBS Commercial Mortgage Trust | | | | |
| | 2013-C13 | 3.345% | 5/15/45 | 50 | 50 |
| 4 | WFRBS Commercial Mortgage Trust | | | | |
| | 2013-C15 | 3.720% | 8/15/46 | 480 | 504 |
| 4 | WFRBS Commercial Mortgage Trust | | | | |
| | 2013-C15 | 4.153% | 8/15/46 | 65 | 70 |
| 4 | WFRBS Commercial Mortgage Trust | | | | |
| | 2013-C16 | 4.415% | 9/15/46 | 350 | 380 |
| 4 | WFRBS Commercial Mortgage Trust | | | | |
| | 2013-C17 | 3.558% | 12/15/46 | 85 | 89 |
| 4 | WFRBS Commercial Mortgage Trust | | | | |
| | 2013-C17 | 4.023% | 12/15/46 | 230 | 242 |
| 4 | WFRBS Commercial Mortgage Trust | | | | |
| | 2013-C18 | 3.676% | 12/15/46 | 160 | 168 |
| 4 | WFRBS Commercial Mortgage Trust | | | | |
| | 2013-C18 | 4.162% | 12/15/46 | 605 | 642 |
| 4 | WFRBS Commercial Mortgage Trust | | | | |
| | 2013-C18 | 4.669% | 12/15/46 | 140 | 149 |
| 4 | WFRBS Commercial Mortgage Trust | | | | |
| | 2014-C19 | 4.101% | 3/15/47 | 480 | 509 |
| 4 | WFRBS Commercial Mortgage Trust | | | | |
| | 2014-C20 | 3.638% | 5/15/47 | 503 | 520 |
| 4 | WFRBS Commercial Mortgage Trust | | | | |
| | 2014-C20 | 3.995% | 5/15/47 | 905 | 948 |
| 4 | WFRBS Commercial Mortgage Trust | | | | |
| | 2014-C20 | 4.378% | 5/15/47 | 280 | 292 |
| 4 | WFRBS Commercial Mortgage Trust | | | | |
| | 2014-C20 | 4.513% | 5/15/47 | 90 | 88 |
| 4 | WFRBS Commercial Mortgage Trust | | | | |
| | 2014-C21 | 3.678% | 8/15/47 | 735 | 752 |
| 4 | WFRBS Commercial Mortgage Trust | | | | |
| | 2014-C21 | 3.891% | 8/15/47 | 170 | 175 |
| 4 | WFRBS Commercial Mortgage Trust | | | | |
| | 2014-C21 | 4.234% | 8/15/47 | 300 | 287 |
| 4 | WFRBS Commercial Mortgage Trust | | | | |
| | 2014-C23 | 3.917% | 10/15/57 | 200 | 210 |
| 4 | WFRBS Commercial Mortgage Trust | | | | |
| | 2014-C24 | 3.607% | 11/15/47 | 345 | 352 |
| 4 | WFRBS Commercial Mortgage Trust | | | | |
| | 2014-LC14 | 3.522% | 3/15/47 | 35 | 36 |
| 4 | WFRBS Commercial Mortgage Trust | | | | |
| | 2014-LC14 | 4.045% | 3/15/47 | 600 | 637 |
| 4 | World Financial Network Credit Card | | | | |
| | Master Note Trust Series 2013-A | 1.610% | 12/15/21 | 470 | 468 |
| 4,6 World Financial Network Credit Card | | | | |
| | Master Note Trust Series 2015-A | 0.811% | 2/15/22 | 510 | 507 |
| 4 | World Omni Automobile Lease | | | | |
| | Securitization Trust 2015-A | 1.730% | 12/15/20 | 155 | 155 |
| Total Asset-Backed/Commercial Mortgage-Backed Securities | | |
| (Cost $269,414) | 267,598 |
| Corporate Bonds (59.2%) | | | | |
| Finance (27.1%) | | | | |
| Banking (22.1%) | | | | |
| Abbey National Treasury Services plc | 4.000% | 4/27/16 | 845 | 853 |
| Abbey National Treasury Services plc | 1.375% | 3/13/17 | 2,245 | 2,235 |
| Abbey National Treasury Services plc | 1.650% | 9/29/17 | 125 | 125 |
195
Vanguard Short-Term Investment-Grade Portfolio
| | | | | |
| Face | Market |
| Maturity Amount | Value • |
| | Coupon | Date | ($000) | ($000) |
| Abbey National Treasury Services plc | 3.050% | 8/23/18 | 1,130 | 1,159 |
| Abbey National Treasury Services plc | 2.000% | 8/24/18 | 683 | 682 |
| Abbey National Treasury Services plc | 2.350% | 9/10/19 | 215 | 215 |
| Abbey National Treasury Services plc | 2.375% | 3/16/20 | 1,127 | 1,122 |
| 7 | ABN AMRO Bank NV | 1.800% | 6/4/18 | 675 | 671 |
| 7 | ABN AMRO Bank NV | 2.450% | 6/4/20 | 550 | 546 |
| American Express Centurion Bank | 6.000% | 9/13/17 | 1,650 | 1,768 |
| American Express Co. | 6.150% | 8/28/17 | 490 | 525 |
| American Express Co. | 7.000% | 3/19/18 | 535 | 593 |
| American Express Credit Corp. | 2.800% | 9/19/16 | 1,480 | 1,499 |
| American Express Credit Corp. | 2.375% | 3/24/17 | 790 | 799 |
| American Express Credit Corp. | 1.550% | 9/22/17 | 280 | 280 |
| American Express Credit Corp. | 1.875% | 11/5/18 | 899 | 895 |
| American Express Credit Corp. | 2.125% | 3/18/19 | 236 | 236 |
| American Express Credit Corp. | 2.250% | 8/15/19 | 602 | 602 |
| American Express Credit Corp. | 2.375% | 5/26/20 | 800 | 793 |
| American Express Credit Corp. | 2.600% | 9/14/20 | 458 | 459 |
| 7 | ANZ New Zealand International Ltd. | 1.750% | 3/29/18 | 695 | 691 |
| 7 | Australia & New Zealand Banking | | | | |
| | Group Ltd. | 3.250% | 3/1/16 | 900 | 903 |
| Australia & New Zealand Banking | | | | |
| | Group Ltd. | 1.875% | 10/6/17 | 350 | 352 |
| Australia & New Zealand Banking | | | | |
| | Group Ltd. | 1.450% | 5/15/18 | 400 | 396 |
| Australia & New Zealand Banking | | | | |
| | Group Ltd. | 2.000% | 11/16/18 | 790 | 788 |
| Australia & New Zealand Banking | | | | |
| | Group Ltd. | 2.700% | 11/16/20 | 795 | 797 |
| 7 | Australia & New Zealand Banking | | | | |
| | Group Ltd. | 4.500% | 3/19/24 | 935 | 938 |
| Banco Bilbao Vizcaya Argentaria SA | 3.000% | 10/20/20 | 850 | 846 |
| 7 | Banco Votorantim SA | 5.250% | 2/11/16 | 280 | 280 |
| Bank of America Corp. | 3.625% | 3/17/16 | 725 | 729 |
| Bank of America Corp. | 6.050% | 5/16/16 | 810 | 824 |
| Bank of America Corp. | 6.500% | 8/1/16 | 1,790 | 1,842 |
| Bank of America Corp. | 5.420% | 3/15/17 | 485 | 504 |
| Bank of America Corp. | 5.700% | 5/2/17 | 162 | 169 |
| Bank of America Corp. | 6.400% | 8/28/17 | 391 | 419 |
| Bank of America Corp. | 6.000% | 9/1/17 | 1,040 | 1,107 |
| Bank of America Corp. | 5.750% | 12/1/17 | 961 | 1,029 |
| Bank of America Corp. | 2.000% | 1/11/18 | 783 | 782 |
| Bank of America Corp. | 6.875% | 4/25/18 | 1,077 | 1,188 |
| Bank of America Corp. | 5.650% | 5/1/18 | 391 | 420 |
| Bank of America Corp. | 1.950% | 5/12/18 | 700 | 696 |
| Bank of America Corp. | 1.750% | 6/5/18 | 1,160 | 1,153 |
| Bank of America Corp. | 6.500% | 7/15/18 | 200 | 221 |
| Bank of America Corp. | 2.600% | 1/15/19 | 3,335 | 3,345 |
| Bank of America NA | 1.125% | 11/14/16 | 1,900 | 1,896 |
| Bank of America NA | 1.250% | 2/14/17 | 500 | 499 |
| Bank of America NA | 5.300% | 3/15/17 | 240 | 250 |
| Bank of America NA | 6.100% | 6/15/17 | 160 | 169 |
| Bank of America NA | 1.650% | 3/26/18 | 1,685 | 1,673 |
| Bank of Montreal | 2.500% | 1/11/17 | 440 | 445 |
| Bank of Montreal | 1.300% | 7/14/17 | 450 | 449 |
| Bank of Montreal | 1.400% | 9/11/17 | 885 | 885 |
| Bank of Montreal | 1.450% | 4/9/18 | 250 | 248 |
| Bank of Montreal | 1.400% | 4/10/18 | 745 | 738 |
| Bank of Montreal | 1.800% | 7/31/18 | 875 | 874 |
| Bank of New York Mellon Corp. | 2.300% | 7/28/16 | 290 | 292 |
| Bank of New York Mellon Corp. | 2.400% | 1/17/17 | 710 | 717 |
| Bank of New York Mellon Corp. | 1.969% | 6/20/17 | 200 | 202 |
| Bank of New York Mellon Corp. | 2.100% | 1/15/19 | 81 | 81 |
| Bank of New York Mellon Corp. | 2.200% | 5/15/19 | 1,060 | 1,061 |
| Bank of New York Mellon Corp. | 2.300% | 9/11/19 | 710 | 712 |
| Bank of New York Mellon Corp. | 2.150% | 2/24/20 | 500 | 495 |
| Bank of New York Mellon Corp. | 2.600% | 8/17/20 | 461 | 463 |
| Bank of New York Mellon Corp. | 2.450% | 11/27/20 | 425 | 423 |
| Bank of Nova Scotia | 1.375% | 7/15/16 | 960 | 962 |
| Bank of Nova Scotia | 2.550% | 1/12/17 | 2,187 | 2,217 |
| Bank of Nova Scotia | 1.250% | 4/11/17 | 235 | 235 |
| Bank of Nova Scotia | 1.375% | 12/18/17 | 720 | 717 |
| | | | | |
| Face | Market |
| Maturity Amount | Value • |
| | Coupon | Date | ($000) | ($000) |
| Bank of Nova Scotia | 1.450% | 4/25/18 | 1,120 | 1,114 |
| Bank of Nova Scotia | 1.700% | 6/11/18 | 760 | 758 |
| Bank of Nova Scotia | 2.050% | 10/30/18 | 1,170 | 1,174 |
| Bank of Nova Scotia | 2.050% | 6/5/19 | 220 | 219 |
| Bank of Nova Scotia | 2.350% | 10/21/20 | 1,085 | 1,075 |
| Bank of Nova Scotia | 4.500% | 12/16/25 | 950 | 945 |
| 7 | Bank of Tokyo-Mitsubishi UFJ Ltd. | 2.150% | 9/14/18 | 800 | 798 |
| 7 | Bank of Tokyo-Mitsubishi UFJ Ltd. | 2.300% | 3/10/19 | 250 | 249 |
| 7 | Bank of Tokyo-Mitsubishi UFJ Ltd. | 2.300% | 3/5/20 | 925 | 912 |
| 7 | Bank of Tokyo-Mitsubishi UFJ Ltd. | 2.750% | 9/14/20 | 692 | 691 |
| 7 | Banque Federative du Credit Mutuel SA | 2.750% | 10/15/20 | 1,260 | 1,264 |
| Barclays Bank plc | 5.000% | 9/22/16 | 405 | 416 |
| Barclays Bank plc | 2.500% | 2/20/19 | 1,090 | 1,097 |
| Barclays plc | 2.750% | 11/8/19 | 685 | 683 |
| BB&T Corp. | 3.200% | 3/15/16 | 403 | 404 |
| BB&T Corp. | 2.150% | 3/22/17 | 1,590 | 1,603 |
| BB&T Corp. | 4.900% | 6/30/17 | 250 | 261 |
| BB&T Corp. | 1.600% | 8/15/17 | 180 | 180 |
| BB&T Corp. | 2.050% | 6/19/18 | 430 | 432 |
| BB&T Corp. | 2.450% | 1/15/20 | 585 | 587 |
| Bear Stearns Cos. LLC | 5.550% | 1/22/17 | 550 | 572 |
| Bear Stearns Cos. LLC | 6.400% | 10/2/17 | 945 | 1,018 |
| Bear Stearns Cos. LLC | 7.250% | 2/1/18 | 710 | 782 |
| BNP Paribas SA | 1.375% | 3/17/17 | 1,100 | 1,098 |
| BNP Paribas SA | 2.375% | 9/14/17 | 1,409 | 1,424 |
| BNP Paribas SA | 2.700% | 8/20/18 | 1,898 | 1,924 |
| BPCE SA | 1.625% | 2/10/17 | 987 | 988 |
| BPCE SA | 1.613% | 7/25/17 | 396 | 395 |
| 9 | BPCE SA | 4.500% | 4/17/18 | 200 | 149 |
| BPCE SA | 2.500% | 12/10/18 | 1,815 | 1,833 |
| 9 | BPCE SA | 3.500% | 4/24/20 | 600 | 430 |
| Branch Banking & Trust Co. | 5.625% | 9/15/16 | 240 | 247 |
| Branch Banking & Trust Co. | 1.000% | 4/3/17 | 600 | 596 |
| Branch Banking & Trust Co. | 1.350% | 10/1/17 | 720 | 719 |
| 7 | Caisse Centrale Desjardins | 1.750% | 1/29/18 | 1,630 | 1,616 |
| Canadian Imperial Bank of Commerce | 1.550% | 1/23/18 | 630 | 627 |
| Capital One Bank USA NA | 1.150% | 11/21/16 | 280 | 279 |
| Capital One Bank USA NA | 1.200% | 2/13/17 | 250 | 248 |
| Capital One Bank USA NA | 2.150% | 11/21/18 | 350 | 347 |
| Capital One Bank USA NA | 2.250% | 2/13/19 | 580 | 577 |
| Capital One Bank USA NA | 2.300% | 6/5/19 | 540 | 533 |
| Capital One Financial Corp. | 6.150% | 9/1/16 | 105 | 108 |
| Capital One Financial Corp. | 2.450% | 4/24/19 | 611 | 612 |
| Capital One NA | 1.500% | 9/5/17 | 430 | 427 |
| Capital One NA | 1.650% | 2/5/18 | 700 | 693 |
| Capital One NA | 1.500% | 3/22/18 | 1,405 | 1,382 |
| Citigroup Inc. | 1.350% | 3/10/17 | 384 | 383 |
| Citigroup Inc. | 1.850% | 11/24/17 | 1,450 | 1,448 |
| Citigroup Inc. | 1.800% | 2/5/18 | 860 | 856 |
| Citigroup Inc. | 1.700% | 4/27/18 | 1,990 | 1,971 |
| Citigroup Inc. | 1.750% | 5/1/18 | 1,302 | 1,290 |
| Citigroup Inc. | 2.150% | 7/30/18 | 118 | 118 |
| Citigroup Inc. | 2.500% | 9/26/18 | 1,420 | 1,431 |
| Citigroup Inc. | 2.550% | 4/8/19 | 1,414 | 1,423 |
| Citigroup Inc. | 2.500% | 7/29/19 | 540 | 539 |
| 4,7,10Colonial BancGroup Inc. | 7.114% | 5/29/49 | 560 | — |
| Comerica Bank | 5.750% | 11/21/16 | 425 | 440 |
| Comerica Bank | 5.200% | 8/22/17 | 175 | 184 |
| Commonwealth Bank of Australia | 1.125% | 3/13/17 | 250 | 249 |
| Commonwealth Bank of Australia | 1.400% | 9/8/17 | 1,300 | 1,300 |
| Commonwealth Bank of Australia | 1.900% | 9/18/17 | 470 | 472 |
| Commonwealth Bank of Australia | 1.625% | 3/12/18 | 555 | 553 |
| Commonwealth Bank of Australia | 2.500% | 9/20/18 | 1,495 | 1,518 |
| Commonwealth Bank of Australia | 1.750% | 11/2/18 | 546 | 542 |
| Commonwealth Bank of Australia | 2.250% | 3/13/19 | 1,385 | 1,389 |
| Commonwealth Bank of Australia | 2.300% | 9/6/19 | 800 | 798 |
| Commonwealth Bank of Australia | 2.300% | 3/12/20 | 510 | 506 |
| Commonwealth Bank of Australia | 2.400% | 11/2/20 | 680 | 673 |
| 7 | Commonwealth Bank of Australia | 4.500% | 12/9/25 | 995 | 984 |
| Cooperatieve Centrale | | | | |
| | Raiffeisen-Boerenleenbank BA | 3.375% | 1/19/17 | 995 | 1,015 |
196
Vanguard Short-Term Investment-Grade Portfolio
| | | | | |
| Face | Market |
| Maturity Amount | Value • |
| | Coupon | Date | ($000) | ($000) |
| Cooperatieve Centrale | | | | |
| | Raiffeisen-Boerenleenbank BA | 1.700% | 3/19/18 | 860 | 855 |
| 9 | Cooperatieve Centrale | | | | |
| | Raiffeisen-Boerenleenbank BA | 7.250% | 4/20/18 | 250 | 198 |
| Cooperatieve Centrale | | | | |
| | Raiffeisen-Boerenleenbank BA | 2.250% | 1/14/19 | 2,270 | 2,280 |
| Cooperatieve Centrale | | | | |
| | Raiffeisen-Boerenleenbank BA | 2.250% | 1/14/20 | 625 | 621 |
| Countrywide Financial Corp. | 6.250% | 5/15/16 | 945 | 960 |
| Credit Suisse | 1.375% | 5/26/17 | 1,205 | 1,199 |
| Credit Suisse | 1.750% | 1/29/18 | 965 | 962 |
| Credit Suisse | 1.700% | 4/27/18 | 1,405 | 1,394 |
| Credit Suisse | 2.300% | 5/28/19 | 1,685 | 1,687 |
| 7 | Credit Suisse Group Funding Guernsey | | | | |
| | Ltd. | 2.750% | 3/26/20 | 345 | 342 |
| 7 | Credit Suisse Group Funding Guernsey | | | | |
| | Ltd. | 3.125% | 12/10/20 | 585 | 583 |
| 7 | Danske Bank A/S | 3.875% | 4/14/16 | 825 | 830 |
| 7 | Danske Bank A/S | 2.750% | 9/17/20 | 1,323 | 1,335 |
| Deutsche Bank AG | 1.875% | 2/13/18 | 1,345 | 1,337 |
| Deutsche Bank AG | 2.500% | 2/13/19 | 515 | 518 |
| Deutsche Bank AG | 2.950% | 8/20/20 | 713 | 713 |
| Discover Bank | 2.600% | 11/13/18 | 588 | 588 |
| Discover Bank | 3.100% | 6/4/20 | 580 | 582 |
| Fifth Third Bank | 0.900% | 2/26/16 | 605 | 605 |
| Fifth Third Bank | 2.150% | 8/20/18 | 778 | 778 |
| Fifth Third Bank | 2.375% | 4/25/19 | 614 | 614 |
| First Republic Bank | 2.375% | 6/17/19 | 1,185 | 1,182 |
| Goldman Sachs Group Inc. | 5.625% | 1/15/17 | 885 | 919 |
| 11 | Goldman Sachs Group Inc. | 6.125% | 5/14/17 | 892 | 1,389 |
| Goldman Sachs Group Inc. | 6.250% | 9/1/17 | 1,813 | 1,941 |
| Goldman Sachs Group Inc. | 5.950% | 1/18/18 | 2,670 | 2,872 |
| Goldman Sachs Group Inc. | 2.375% | 1/22/18 | 2,020 | 2,037 |
| Goldman Sachs Group Inc. | 6.150% | 4/1/18 | 862 | 936 |
| Goldman Sachs Group Inc. | 2.900% | 7/19/18 | 1,960 | 1,998 |
| 9 | Goldman Sachs Group Inc. | 5.000% | 8/8/18 | 240 | 181 |
| Goldman Sachs Group Inc. | 2.625% | 1/31/19 | 1,550 | 1,562 |
| Goldman Sachs Group Inc. | 2.550% | 10/23/19 | 640 | 640 |
| Goldman Sachs Group Inc. | 5.375% | 3/15/20 | 501 | 551 |
| Goldman Sachs Group Inc. | 2.750% | 9/15/20 | 1,218 | 1,216 |
| 7 | HSBC Bank plc | 1.500% | 5/15/18 | 535 | 528 |
| HSBC Bank USA NA | 6.000% | 8/9/17 | 290 | 308 |
| HSBC USA Inc. | 1.500% | 11/13/17 | 190 | 189 |
| HSBC USA Inc. | 1.625% | 1/16/18 | 1,355 | 1,348 |
| HSBC USA Inc. | 2.625% | 9/24/18 | 865 | 877 |
| HSBC USA Inc. | 2.250% | 6/23/19 | 730 | 727 |
| HSBC USA Inc. | 2.375% | 11/13/19 | 1,170 | 1,166 |
| HSBC USA Inc. | 2.350% | 3/5/20 | 1,231 | 1,218 |
| HSBC USA Inc. | 2.750% | 8/7/20 | 1,021 | 1,022 |
| Huntington Bancshares Inc. | 2.600% | 8/2/18 | 810 | 811 |
| Huntington National Bank | 1.375% | 4/24/17 | 600 | 597 |
| Huntington National Bank | 2.000% | 6/30/18 | 1,280 | 1,272 |
| Huntington National Bank | 2.200% | 11/6/18 | 525 | 523 |
| Huntington National Bank | 2.875% | 8/20/20 | 819 | 813 |
| 7 | ING Bank NV | 3.750% | 3/7/17 | 1,600 | 1,638 |
| 7 | ING Bank NV | 1.800% | 3/16/18 | 203 | 203 |
| 7 | ING Bank NV | 2.050% | 8/17/18 | 590 | 590 |
| 7 | ING Bank NV | 2.450% | 3/16/20 | 925 | 923 |
| 7 | ING Bank NV | 2.700% | 8/17/20 | 93 | 93 |
| Intesa Sanpaolo SPA | 2.375% | 1/13/17 | 417 | 418 |
| Intesa Sanpaolo SPA | 3.875% | 1/16/18 | 556 | 569 |
| JPMorgan Chase & Co. | 1.350% | 2/15/17 | 295 | 294 |
| JPMorgan Chase & Co. | 2.000% | 8/15/17 | 635 | 638 |
| JPMorgan Chase & Co. | 6.000% | 1/15/18 | 1,696 | 1,829 |
| JPMorgan Chase & Co. | 1.800% | 1/25/18 | 470 | 469 |
| JPMorgan Chase & Co. | 1.700% | 3/1/18 | 1,437 | 1,430 |
| JPMorgan Chase & Co. | 1.625% | 5/15/18 | 63 | 63 |
| JPMorgan Chase & Co. | 2.350% | 1/28/19 | 2,050 | 2,054 |
| JPMorgan Chase & Co. | 6.300% | 4/23/19 | 1,720 | 1,926 |
| JPMorgan Chase & Co. | 2.200% | 10/22/19 | 2,634 | 2,615 |
| JPMorgan Chase & Co. | 2.250% | 1/23/20 | 1,460 | 1,443 |
| | | | | |
| Face | Market |
| Maturity Amount | Value • |
| | Coupon | Date | ($000) | ($000) |
| JPMorgan Chase & Co. | 2.750% | 6/23/20 | 2,140 | 2,145 |
| JPMorgan Chase & Co. | 4.250% | 10/15/20 | 139 | 147 |
| JPMorgan Chase & Co. | 2.550% | 10/29/20 | 1,402 | 1,389 |
| 4 | JPMorgan Chase & Co. | 5.300% | 12/29/49 | 340 | 339 |
| JPMorgan Chase Bank NA | 5.875% | 6/13/16 | 250 | 255 |
| 11 | JPMorgan Chase Bank NA | 5.375% | 9/28/16 | 350 | 531 |
| JPMorgan Chase Bank NA | 6.000% | 7/5/17 | 215 | 228 |
| JPMorgan Chase Bank NA | 6.000% | 10/1/17 | 775 | 829 |
| KeyBank NA | 1.650% | 2/1/18 | 136 | 135 |
| KeyBank NA | 1.700% | 6/1/18 | 250 | 248 |
| 4,7 LBG Capital No.1 plc | 8.000% | 12/29/49 | 340 | 353 |
| Lloyds Bank plc | 1.750% | 5/14/18 | 510 | 509 |
| Lloyds Bank plc | 2.000% | 8/17/18 | 895 | 892 |
| Lloyds Bank plc | 2.300% | 11/27/18 | 315 | 316 |
| Lloyds Bank plc | 2.350% | 9/5/19 | 430 | 430 |
| Lloyds Bank plc | 2.400% | 3/17/20 | 810 | 804 |
| Lloyds Bank plc | 2.700% | 8/17/20 | 670 | 673 |
| 7 | Macquarie Bank Ltd. | 1.600% | 10/27/17 | 1,400 | 1,389 |
| 7 | Macquarie Bank Ltd. | 2.400% | 1/21/20 | 865 | 855 |
| 7 | Macquarie Bank Ltd. | 4.875% | 6/10/25 | 500 | 493 |
| Manufacturers & Traders Trust Co. | 1.250% | 1/30/17 | 250 | 249 |
| Manufacturers & Traders Trust Co. | 6.625% | 12/4/17 | 925 | 1,004 |
| Manufacturers & Traders Trust Co. | 1.450% | 3/7/18 | 855 | 844 |
| Manufacturers & Traders Trust Co. | 2.300% | 1/30/19 | 970 | 971 |
| Manufacturers & Traders Trust Co. | 2.250% | 7/25/19 | 990 | 985 |
| Manufacturers & Traders Trust Co. | 2.100% | 2/6/20 | 470 | 462 |
| 4 | Manufacturers & Traders Trust Co. | 5.629% | 12/1/21 | 245 | 242 |
| 7 | Mitsubishi UFJ Trust & Banking Corp. | 1.600% | 10/16/17 | 710 | 705 |
| 7 | Mitsubishi UFJ Trust & Banking Corp. | 2.450% | 10/16/19 | 710 | 707 |
| 7 | Mitsubishi UFJ Trust & Banking Corp. | 2.650% | 10/19/20 | 760 | 757 |
| Morgan Stanley | 3.800% | 4/29/16 | 925 | 933 |
| Morgan Stanley | 5.750% | 10/18/16 | 1,690 | 1,749 |
| Morgan Stanley | 5.450% | 1/9/17 | 640 | 664 |
| Morgan Stanley | 5.550% | 4/27/17 | 455 | 477 |
| Morgan Stanley | 6.250% | 8/28/17 | 335 | 359 |
| Morgan Stanley | 5.950% | 12/28/17 | 1,179 | 1,268 |
| Morgan Stanley | 1.875% | 1/5/18 | 1,495 | 1,494 |
| Morgan Stanley | 6.625% | 4/1/18 | 650 | 712 |
| Morgan Stanley | 2.125% | 4/25/18 | 740 | 741 |
| Morgan Stanley | 2.500% | 1/24/19 | 850 | 853 |
| Morgan Stanley | 2.375% | 7/23/19 | 908 | 905 |
| Morgan Stanley | 5.625% | 9/23/19 | 182 | 201 |
| Morgan Stanley | 2.650% | 1/27/20 | 525 | 522 |
| Morgan Stanley | 2.800% | 6/16/20 | 800 | 803 |
| MUFG Americas Holdings Corp. | 1.625% | 2/9/18 | 300 | 297 |
| MUFG Americas Holdings Corp. | 2.250% | 2/10/20 | 700 | 690 |
| MUFG Union Bank NA | 5.950% | 5/11/16 | 1,360 | 1,382 |
| MUFG Union Bank NA | 3.000% | 6/6/16 | 1,410 | 1,422 |
| MUFG Union Bank NA | 1.500% | 9/26/16 | 954 | 957 |
| MUFG Union Bank NA | 2.125% | 6/16/17 | 610 | 614 |
| MUFG Union Bank NA | 2.625% | 9/26/18 | 945 | 954 |
| MUFG Union Bank NA | 2.250% | 5/6/19 | 580 | 580 |
| National Australia Bank Ltd. | 2.300% | 7/25/18 | 500 | 503 |
| National Bank of Canada | 2.100% | 12/14/18 | 675 | 674 |
| National City Bank | 5.250% | 12/15/16 | 250 | 259 |
| National City Bank | 5.800% | 6/7/17 | 375 | 396 |
| National City Corp. | 6.875% | 5/15/19 | 190 | 215 |
| 7 | Nationwide Building Society | 2.350% | 1/21/20 | 550 | 547 |
| 7 | Nordea Bank AB | 1.875% | 9/17/18 | 400 | 398 |
| 7 | Nordea Bank AB | 2.500% | 9/17/20 | 307 | 305 |
| PNC Bank NA | 5.250% | 1/15/17 | 665 | 689 |
| PNC Bank NA | 1.125% | 1/27/17 | 1,100 | 1,098 |
| PNC Bank NA | 4.875% | 9/21/17 | 565 | 591 |
| PNC Bank NA | 1.500% | 10/18/17 | 1,200 | 1,199 |
| PNC Bank NA | 6.000% | 12/7/17 | 115 | 123 |
| PNC Bank NA | 1.500% | 2/23/18 | 1,300 | 1,292 |
| PNC Bank NA | 6.875% | 4/1/18 | 100 | 110 |
| PNC Bank NA | 1.600% | 6/1/18 | 1,900 | 1,886 |
| PNC Bank NA | 1.850% | 7/20/18 | 740 | 739 |
| PNC Bank NA | 1.800% | 11/5/18 | 1,122 | 1,116 |
| PNC Bank NA | 2.200% | 1/28/19 | 1,185 | 1,188 |
197
Vanguard Short-Term Investment-Grade Portfolio
| | | | | |
| Face | Market |
| Maturity Amount | Value • |
| | Coupon | Date | ($000) | ($000) |
| PNC Bank NA | 2.250% | 7/2/19 | 1,010 | 1,013 |
| PNC Bank NA | 2.400% | 10/18/19 | 1,791 | 1,801 |
| PNC Bank NA | 2.300% | 6/1/20 | 364 | 360 |
| PNC Bank NA | 2.600% | 7/21/20 | 450 | 450 |
| PNC Bank NA | 2.450% | 11/5/20 | 439 | 436 |
| PNC Funding Corp. | 2.700% | 9/19/16 | 983 | 993 |
| PNC Funding Corp. | 5.625% | 2/1/17 | 105 | 109 |
| PNC Funding Corp. | 5.125% | 2/8/20 | 180 | 198 |
| Regions Bank | 7.500% | 5/15/18 | 250 | 278 |
| Regions Financial Corp. | 2.000% | 5/15/18 | 650 | 644 |
| Royal Bank of Canada | 2.875% | 4/19/16 | 1,700 | 1,710 |
| Royal Bank of Canada | 2.300% | 7/20/16 | 1,065 | 1,073 |
| Royal Bank of Canada | 1.250% | 6/16/17 | 480 | 479 |
| Royal Bank of Canada | 1.400% | 10/13/17 | 640 | 640 |
| Royal Bank of Canada | 1.500% | 1/16/18 | 95 | 95 |
| Royal Bank of Canada | 2.200% | 7/27/18 | 600 | 606 |
| Royal Bank of Canada | 1.800% | 7/30/18 | 439 | 438 |
| Royal Bank of Canada | 2.000% | 12/10/18 | 470 | 471 |
| Royal Bank of Canada | 2.100% | 10/14/20 | 950 | 935 |
| Royal Bank of Canada | 2.350% | 10/30/20 | 652 | 645 |
| Royal Bank of Scotland Group plc | 6.400% | 10/21/19 | 205 | 227 |
| Royal Bank of Scotland plc | 4.375% | 3/16/16 | 343 | 345 |
| Santander Bank NA | 8.750% | 5/30/18 | 795 | 898 |
| 7 | Skandinaviska Enskilda Banken AB | 2.450% | 5/27/20 | 292 | 291 |
| Societe Generale SA | 2.750% | 10/12/17 | 680 | 690 |
| 12 | SpareBank 1 SR-Bank ASA | 2.125% | 4/14/21 | 500 | 566 |
| State Street Corp. | 2.550% | 8/18/20 | 596 | 604 |
| 4 | State Street Corp. | 5.250% | 12/29/49 | 340 | 340 |
| Sumitomo Mitsui Banking Corp. | 1.350% | 7/11/17 | 380 | 377 |
| Sumitomo Mitsui Banking Corp. | 2.450% | 10/20/20 | 157 | 155 |
| SunTrust Banks Inc. | 3.500% | 1/20/17 | 295 | 301 |
| SunTrust Banks Inc. | 6.000% | 9/11/17 | 205 | 218 |
| Svenska Handelsbanken AB | 2.500% | 1/25/19 | 548 | 555 |
| Svenska Handelsbanken AB | 2.400% | 10/1/20 | 469 | 466 |
| Synchrony Financial | 3.000% | 8/15/19 | 2,109 | 2,108 |
| Synchrony Financial | 2.700% | 2/3/20 | 912 | 895 |
| Synchrony Financial | 3.750% | 8/15/21 | 240 | 240 |
| Toronto-Dominion Bank | 2.500% | 7/14/16 | 509 | 513 |
| Toronto-Dominion Bank | 1.625% | 3/13/18 | 1,140 | 1,139 |
| Toronto-Dominion Bank | 1.400% | 4/30/18 | 680 | 676 |
| Toronto-Dominion Bank | 1.750% | 7/23/18 | 1,230 | 1,230 |
| Toronto-Dominion Bank | 2.125% | 7/2/19 | 1,560 | 1,563 |
| Toronto-Dominion Bank | 2.250% | 11/5/19 | 1,415 | 1,415 |
| Toronto-Dominion Bank | 2.500% | 12/14/20 | 1,375 | 1,372 |
| UBS AG | 1.800% | 3/26/18 | 1,660 | 1,658 |
| UBS AG | 2.375% | 8/14/19 | 1,460 | 1,461 |
| 7 | UBS Group Funding Jersey Ltd. | 2.950% | 9/24/20 | 605 | 600 |
| US Bank NA | 1.100% | 1/30/17 | 183 | 183 |
| US Bank NA | 1.375% | 9/11/17 | 1,010 | 1,011 |
| US Bank NA | 1.350% | 1/26/18 | 502 | 500 |
| US Bank NA | 2.125% | 10/28/19 | 913 | 912 |
| Wachovia Bank NA | 5.600% | 3/15/16 | 405 | 409 |
| Wachovia Corp. | 5.625% | 10/15/16 | 920 | 950 |
| Wachovia Corp. | 5.750% | 6/15/17 | 900 | 953 |
| Wachovia Corp. | 5.750% | 2/1/18 | 1,316 | 1,422 |
| 10 | Washington Mutual Bank / Debt not | | | | |
| | acquired by JPMorgan | 6.875% | 6/15/11 | 517 | 1 |
| Wells Fargo & Co. | 3.676% | 6/15/16 | 1,230 | 1,245 |
| Wells Fargo & Co. | 1.150% | 6/2/17 | 190 | 189 |
| Wells Fargo & Co. | 1.400% | 9/8/17 | 887 | 884 |
| Wells Fargo & Co. | 5.625% | 12/11/17 | 480 | 515 |
| Wells Fargo & Co. | 1.500% | 1/16/18 | 980 | 976 |
| Wells Fargo & Co. | 2.150% | 1/15/19 | 856 | 861 |
| Wells Fargo & Co. | 2.125% | 4/22/19 | 1,983 | 1,985 |
| Wells Fargo & Co. | 2.150% | 1/30/20 | 1,815 | 1,801 |
| Wells Fargo & Co. | 2.600% | 7/22/20 | 1,475 | 1,475 |
| Wells Fargo & Co. | 2.550% | 12/7/20 | 1,328 | 1,317 |
| Wells Fargo Bank NA | 6.000% | 11/15/17 | 1,413 | 1,524 |
| Westpac Banking Corp. | 0.950% | 1/12/16 | 500 | 500 |
| Westpac Banking Corp. | 1.050% | 11/25/16 | 765 | 765 |
| Westpac Banking Corp. | 1.200% | 5/19/17 | 500 | 499 |
| | | | | |
| Face | Market |
| Maturity Amount | Value • |
| | Coupon | Date | ($000) | ($000) |
| Westpac Banking Corp. | 2.000% | 8/14/17 | 1,225 | 1,233 |
| Westpac Banking Corp. | 1.500% | 12/1/17 | 1,175 | 1,174 |
| Westpac Banking Corp. | 1.600% | 1/12/18 | 1,025 | 1,023 |
| Westpac Banking Corp. | 1.550% | 5/25/18 | 650 | 645 |
| Westpac Banking Corp. | 2.250% | 7/30/18 | 500 | 503 |
| Westpac Banking Corp. | 1.950% | 11/23/18 | 485 | 484 |
| Westpac Banking Corp. | 2.250% | 1/17/19 | 600 | 601 |
| Westpac Banking Corp. | 4.875% | 11/19/19 | 845 | 922 |
| Westpac Banking Corp. | 2.300% | 5/26/20 | 70 | 70 |
| Westpac Banking Corp. | 2.600% | 11/23/20 | 1,505 | 1,504 |
| |
| Brokerage (0.6%) | | | | |
| 4 | Ameriprise Financial Inc. | 7.518% | 6/1/66 | 155 | 151 |
| Charles Schwab Corp. | 6.375% | 9/1/17 | 140 | 151 |
| Charles Schwab Corp. | 1.500% | 3/10/18 | 465 | 463 |
| Franklin Resources Inc. | 1.375% | 9/15/17 | 380 | 379 |
| Jefferies Group LLC | 5.125% | 4/13/18 | 365 | 379 |
| Legg Mason Inc. | 2.700% | 7/15/19 | 140 | 139 |
| 10 | Lehman Brothers Holdings E-Capital | | | | |
| | Trust I | 3.589% | 8/19/65 | 210 | — |
| Nomura Holdings Inc. | 4.125% | 1/19/16 | 560 | 561 |
| Nomura Holdings Inc. | 2.000% | 9/13/16 | 2,230 | 2,237 |
| Nomura Holdings Inc. | 2.750% | 3/19/19 | 620 | 623 |
| NYSE Euronext | 2.000% | 10/5/17 | 980 | 984 |
| Stifel Financial Corp. | 3.500% | 12/1/20 | 700 | 690 |
| TD Ameritrade Holding Corp. | 2.950% | 4/1/22 | 415 | 411 |
| |
| Finance Companies (0.6%) | | | | |
| Air Lease Corp. | 5.625% | 4/1/17 | 1,993 | 2,068 |
| Air Lease Corp. | 3.375% | 1/15/19 | 845 | 850 |
| 7 | General Electric Capital Corp. | 2.342% | 11/15/20 | 2,724 | 2,702 |
| HSBC Finance Corp. | 5.500% | 1/19/16 | 1,507 | 1,510 |
| 6 | HSBC Finance Corp. | 0.844% | 6/1/16 | 425 | 424 |
| |
| Insurance (2.0%) | | | | |
| ACE INA Holdings Inc. | 2.300% | 11/3/20 | 317 | 313 |
| ACE INA Holdings Inc. | 2.875% | 11/3/22 | 390 | 387 |
| ACE INA Holdings Inc. | 3.350% | 5/3/26 | 384 | 382 |
| Aflac Inc. | 2.400% | 3/16/20 | 280 | 279 |
| Alleghany Corp. | 5.625% | 9/15/20 | 210 | 230 |
| Allied World Assurance Co. Ltd. | 7.500% | 8/1/16 | 1,395 | 1,441 |
| Allied World Assurance Co. Ltd. | 5.500% | 11/15/20 | 50 | 54 |
| Alterra Finance LLC | 6.250% | 9/30/20 | 235 | 264 |
| American Financial Group Inc. | 9.875% | 6/15/19 | 770 | 934 |
| American International Group Inc. | 2.300% | 7/16/19 | 262 | 260 |
| American International Group Inc. | 3.875% | 1/15/35 | 90 | 79 |
| Anthem Inc. | 1.875% | 1/15/18 | 465 | 463 |
| 4,12 Aquarius and Investments plc for Zurich | | | | |
| | Insurance Co. Ltd. | 4.250% | 10/2/43 | 200 | 237 |
| Aspen Insurance Holdings Ltd. | 6.000% | 12/15/20 | 625 | 683 |
| Assurant Inc. | 2.500% | 3/15/18 | 700 | 700 |
| 4,12 AXA SA | 3.875% | 5/20/49 | 100 | 107 |
| Axis Specialty Finance LLC | 5.875% | 6/1/20 | 300 | 332 |
| AXIS Specialty Finance plc | 2.650% | 4/1/19 | 350 | 348 |
| Berkshire Hathaway Finance Corp. | 5.400% | 5/15/18 | 600 | 651 |
| Berkshire Hathaway Inc. | 2.200% | 8/15/16 | 125 | 126 |
| Berkshire Hathaway Inc. | 2.100% | 8/14/19 | 125 | 126 |
| CNA Financial Corp. | 6.500% | 8/15/16 | 505 | 521 |
| CNA Financial Corp. | 7.350% | 11/15/19 | 100 | 115 |
| 4,11 CNP Assurances | 7.375% | 9/30/41 | 100 | 164 |
| 4,12 CNP Assurances | 4.000% | 11/29/49 | 100 | 103 |
| Marsh & McLennan Cos. Inc. | 2.550% | 10/15/18 | 125 | 126 |
| Marsh & McLennan Cos. Inc. | 2.350% | 3/6/20 | 340 | 337 |
| 7 | MassMutual Global Funding II | 2.000% | 4/5/17 | 200 | 202 |
| 7 | MassMutual Global Funding II | 2.100% | 8/2/18 | 300 | 302 |
| 7 | MassMutual Global Funding II | 2.500% | 10/17/22 | 365 | 349 |
| MetLife Inc. | 1.756% | 12/15/17 | 300 | 300 |
| MetLife Inc. | 6.817% | 8/15/18 | 315 | 355 |
| MetLife Inc. | 7.717% | 2/15/19 | 220 | 256 |
| 4 | MetLife Inc. | 5.250% | 12/29/49 | 165 | 166 |
| 7 | Metropolitan Life Global Funding I | 1.500% | 1/10/18 | 650 | 647 |
198
Vanguard Short-Term Investment-Grade Portfolio
| | | | | |
| Face | Market |
| Maturity Amount | Value • |
| | Coupon | Date | ($000) | ($000) |
| 9 | Metropolitan Life Global Funding I | 4.500% | 10/10/18 | 940 | 706 |
| 7 | Metropolitan Life Global Funding I | 2.300% | 4/10/19 | 275 | 275 |
| 7 | Metropolitan Life Global Funding I | 2.000% | 4/14/20 | 470 | 461 |
| 7 | New York Life Global Funding | 1.950% | 2/11/20 | 430 | 423 |
| PartnerRe Finance A LLC | 6.875% | 6/1/18 | 520 | 572 |
| 7 | Pricoa Global Funding I | 2.550% | 11/24/20 | 415 | 413 |
| Principal Financial Group Inc. | 1.850% | 11/15/17 | 400 | 401 |
| 7 | Principal Life Global Funding II | 2.250% | 10/15/18 | 275 | 277 |
| 7 | Principal Life Global Funding II | 2.200% | 4/8/20 | 685 | 675 |
| 4 | Progressive Corp. | 6.700% | 6/15/67 | 215 | 215 |
| 7 | Protective Life Global Funding | 2.700% | 11/25/20 | 415 | 414 |
| Prudential Financial Inc. | 3.000% | 5/12/16 | 275 | 277 |
| Prudential Financial Inc. | 7.375% | 6/15/19 | 255 | 296 |
| Prudential Financial Inc. | 2.350% | 8/15/19 | 260 | 259 |
| Prudential Financial Inc. | 4.500% | 11/16/21 | 460 | 496 |
| 4 | Prudential Financial Inc. | 5.375% | 5/15/45 | 290 | 290 |
| Reinsurance Group of America Inc. | 5.625% | 3/15/17 | 275 | 287 |
| Reinsurance Group of America Inc. | 6.450% | 11/15/19 | 505 | 568 |
| 7 | Reliance Standard Life Global Funding II | 2.150% | 10/15/18 | 680 | 675 |
| 7 | Reliance Standard Life Global Funding II | 2.500% | 1/15/20 | 1,255 | 1,243 |
| 7 | Reliance Standard Life Global Funding II | 2.375% | 5/4/20 | 430 | 421 |
| 7 | TIAA Asset Management Finance | | | | |
| | Co. LLC | 2.950% | 11/1/19 | 1,463 | 1,467 |
| Torchmark Corp. | 9.250% | 6/15/19 | 170 | 206 |
| Travelers Cos. Inc. | 5.800% | 5/15/18 | 55 | 60 |
| Travelers Cos. Inc. | 5.900% | 6/2/19 | 70 | 79 |
| Travelers Cos. Inc. | 3.900% | 11/1/20 | 105 | 112 |
| UnitedHealth Group Inc. | 1.450% | 7/17/17 | 660 | 660 |
| UnitedHealth Group Inc. | 1.400% | 12/15/17 | 290 | 289 |
| UnitedHealth Group Inc. | 1.900% | 7/16/18 | 720 | 723 |
| UnitedHealth Group Inc. | 2.300% | 12/15/19 | 235 | 236 |
| UnitedHealth Group Inc. | 2.700% | 7/15/20 | 350 | 354 |
| Unum Group | 7.125% | 9/30/16 | 325 | 337 |
| |
| Real Estate Investment Trusts (1.8%) | | | | |
| Alexandria Real Estate Equities Inc. | 2.750% | 1/15/20 | 715 | 705 |
| ARC Properties Operating Partnership | | | | |
| | LP/Clark Acquisition LLC | 2.000% | 2/6/17 | 2,740 | 2,686 |
| ARC Properties Operating Partnership | | | | |
| | LP/Clark Acquisition LLC | 3.000% | 2/6/19 | 505 | 484 |
| BioMed Realty LP | 3.850% | 4/15/16 | 385 | 386 |
| Boston Properties LP | 3.700% | 11/15/18 | 100 | 104 |
| Boston Properties LP | 5.875% | 10/15/19 | 781 | 867 |
| Brandywine Operating Partnership LP | 5.700% | 5/1/17 | 305 | 318 |
| Brandywine Operating Partnership LP | 4.950% | 4/15/18 | 475 | 497 |
| DDR Corp. | 9.625% | 3/15/16 | 205 | 208 |
| DDR Corp. | 4.750% | 4/15/18 | 725 | 758 |
| DDR Corp. | 7.875% | 9/1/20 | 170 | 204 |
| 7 | Digital Delta Holdings LLC | 3.400% | 10/1/20 | 706 | 707 |
| 7 | Digital Delta Holdings LLC | 4.750% | 10/1/25 | 165 | 167 |
| Digital Realty Trust LP | 5.875% | 2/1/20 | 470 | 519 |
| Digital Realty Trust LP | 3.950% | 7/1/22 | 840 | 833 |
| Duke Realty LP | 5.950% | 2/15/17 | 22 | 23 |
| Duke Realty LP | 6.500% | 1/15/18 | 75 | 81 |
| ERP Operating LP | 5.750% | 6/15/17 | 790 | 834 |
| ERP Operating LP | 2.375% | 7/1/19 | 125 | 125 |
| ERP Operating LP | 4.750% | 7/15/20 | 100 | 108 |
| Essex Portfolio LP | 3.500% | 4/1/25 | 356 | 343 |
| Federal Realty Investment Trust | 2.550% | 1/15/21 | 232 | 230 |
| HCP Inc. | 3.750% | 2/1/16 | 790 | 791 |
| HCP Inc. | 6.700% | 1/30/18 | 235 | 256 |
| HCP Inc. | 2.625% | 2/1/20 | 295 | 290 |
| HCP Inc. | 5.375% | 2/1/21 | 450 | 490 |
| HCP Inc. | 4.000% | 12/1/22 | 218 | 217 |
| Highwoods Realty LP | 5.850% | 3/15/17 | 105 | 109 |
| Kilroy Realty LP | 4.800% | 7/15/18 | 435 | 454 |
| Liberty Property LP | 5.500% | 12/15/16 | 655 | 676 |
| Liberty Property LP | 4.750% | 10/1/20 | 260 | 277 |
| Liberty Property LP | 3.750% | 4/1/25 | 85 | 82 |
| 7 | Omega Healthcare Investors Inc. | 5.250% | 1/15/26 | 775 | 791 |
| 12 | Prologis LP | 1.375% | 5/13/21 | 361 | 385 |
| | | | | |
| Face | Market |
| Maturity Amount | Value • |
| | Coupon | Date | ($000) | ($000) |
| Realty Income Corp. | 2.000% | 1/31/18 | 130 | 130 |
| Realty Income Corp. | 5.750% | 1/15/21 | 95 | 106 |
| Regency Centers LP | 5.875% | 6/15/17 | 253 | 267 |
| Senior Housing Properties Trust | 3.250% | 5/1/19 | 850 | 846 |
| Simon Property Group LP | 2.800% | 1/30/17 | 547 | 554 |
| Simon Property Group LP | 2.150% | 9/15/17 | 40 | 40 |
| Simon Property Group LP | 10.350% | 4/1/19 | 250 | 308 |
| Simon Property Group LP | 5.650% | 2/1/20 | 386 | 432 |
| Simon Property Group LP | 2.500% | 9/1/20 | 269 | 270 |
| Simon Property Group LP | 4.375% | 3/1/21 | 175 | 190 |
| Ventas Realty LP / Ventas Capital Corp. | 2.000% | 2/15/18 | 560 | 558 |
| Weingarten Realty Investors | 3.375% | 10/15/22 | 218 | 213 |
| Weingarten Realty Investors | 3.850% | 6/1/25 | 151 | 147 |
| Welltower Inc. | 3.625% | 3/15/16 | 1,032 | 1,036 |
| Welltower Inc. | 4.700% | 9/15/17 | 365 | 381 |
| Welltower Inc. | 2.250% | 3/15/18 | 385 | 384 |
| Welltower Inc. | 4.125% | 4/1/19 | 1,137 | 1,187 |
| Welltower Inc. | 6.125% | 4/15/20 | 350 | 392 |
| Welltower Inc. | 4.000% | 6/1/25 | 255 | 251 |
| 352,775 |
| Industrial (27.8%) | | | | |
| Basic Industry (1.7%) | | | | |
| Agrium Inc. | 6.750% | 1/15/19 | 922 | 1,029 |
| Air Products & Chemicals Inc. | 1.200% | 10/15/17 | 275 | 273 |
| Air Products & Chemicals Inc. | 4.375% | 8/21/19 | 170 | 183 |
| Airgas Inc. | 2.950% | 6/15/16 | 215 | 216 |
| Airgas Inc. | 1.650% | 2/15/18 | 555 | 550 |
| Airgas Inc. | 2.375% | 2/15/20 | 240 | 237 |
| Airgas Inc. | 3.050% | 8/1/20 | 300 | 302 |
| Albemarle Corp. | 3.000% | 12/1/19 | 120 | 118 |
| 12 | BHP Billiton Finance Ltd. | 6.375% | 4/4/16 | 325 | 359 |
| 9 | BHP Billiton Finance Ltd. | 3.750% | 10/18/17 | 340 | 248 |
| 9 | BHP Billiton Finance Ltd. | 3.000% | 3/30/20 | 340 | 237 |
| BHP Billiton Finance USA Ltd. | 1.875% | 11/21/16 | 86 | 86 |
| BHP Billiton Finance USA Ltd. | 1.625% | 2/24/17 | 1,720 | 1,710 |
| BHP Billiton Finance USA Ltd. | 5.400% | 3/29/17 | 768 | 798 |
| BHP Billiton Finance USA Ltd. | 2.050% | 9/30/18 | 335 | 329 |
| BHP Billiton Finance USA Ltd. | 6.500% | 4/1/19 | 878 | 967 |
| CF Industries Inc. | 6.875% | 5/1/18 | 935 | 1,012 |
| Dow Chemical Co. | 8.550% | 5/15/19 | 790 | 932 |
| Eastman Chemical Co. | 2.400% | 6/1/17 | 483 | 486 |
| Eastman Chemical Co. | 2.700% | 1/15/20 | 95 | 94 |
| Ecolab Inc. | 3.000% | 12/8/16 | 80 | 81 |
| EI du Pont de Nemours & Co. | 6.000% | 7/15/18 | 658 | 716 |
| EI du Pont de Nemours & Co. | 4.625% | 1/15/20 | 270 | 284 |
| Freeport-McMoRan Inc. | 2.375% | 3/15/18 | 195 | 155 |
| Goldcorp Inc. | 2.125% | 3/15/18 | 360 | 349 |
| LyondellBasell Industries NV | 5.000% | 4/15/19 | 995 | 1,058 |
| Monsanto Co. | 1.150% | 6/30/17 | 230 | 228 |
| Monsanto Co. | 5.125% | 4/15/18 | 535 | 572 |
| Monsanto Co. | 1.850% | 11/15/18 | 75 | 75 |
| Monsanto Co. | 2.125% | 7/15/19 | 950 | 948 |
| Monsanto Co. | 2.750% | 7/15/21 | 375 | 369 |
| Nucor Corp. | 5.850% | 6/1/18 | 550 | 589 |
| Potash Corp. of Saskatchewan Inc. | 3.250% | 12/1/17 | 693 | 709 |
| Potash Corp. of Saskatchewan Inc. | 6.500% | 5/15/19 | 120 | 135 |
| PPG Industries Inc. | 1.900% | 1/15/16 | 245 | 245 |
| PPG Industries Inc. | 2.300% | 11/15/19 | 715 | 710 |
| 12 | PPG Industries Inc. | 0.875% | 3/13/22 | 263 | 278 |
| Praxair Inc. | 4.500% | 8/15/19 | 510 | 551 |
| Rio Tinto Finance USA Ltd. | 6.500% | 7/15/18 | 650 | 704 |
| Rio Tinto Finance USA Ltd. | 9.000% | 5/1/19 | 120 | 140 |
| Rio Tinto Finance USA plc | 2.000% | 3/22/17 | 1,000 | 995 |
| Rio Tinto Finance USA plc | 1.625% | 8/21/17 | 1,200 | 1,180 |
| Vale Overseas Ltd. | 6.250% | 1/11/16 | 579 | 579 |
| |
| Capital Goods (2.9%) | | | | |
| 7 | ABB Treasury Center USA Inc. | 2.500% | 6/15/16 | 350 | 352 |
| Boeing Capital Corp. | 2.125% | 8/15/16 | 520 | 524 |
| Boeing Capital Corp. | 2.900% | 8/15/18 | 475 | 491 |
| Boeing Capital Corp. | 4.700% | 10/27/19 | 965 | 1,059 |
199
Vanguard Short-Term Investment-Grade Portfolio
| | | | | |
| Face | Market |
| Maturity Amount | Value • |
| | Coupon | Date | ($000) | ($000) |
| Boeing Co. | 6.000% | 3/15/19 | 315 | 353 |
| Boeing Co. | 1.650% | 10/30/20 | 325 | 318 |
| Caterpillar Financial Services Corp. | 5.450% | 4/15/18 | 1,095 | 1,184 |
| Caterpillar Financial Services Corp. | 7.050% | 10/1/18 | 145 | 164 |
| Caterpillar Financial Services Corp. | 7.150% | 2/15/19 | 1,010 | 1,157 |
| Caterpillar Inc. | 7.900% | 12/15/18 | 1,460 | 1,707 |
| Crane Co. | 2.750% | 12/15/18 | 385 | 384 |
| Danaher Corp. | 2.300% | 6/23/16 | 782 | 787 |
| Danaher Corp. | 1.650% | 9/15/18 | 400 | 400 |
| Danaher Corp. | 5.400% | 3/1/19 | 520 | 572 |
| Danaher Corp. | 2.400% | 9/15/20 | 480 | 480 |
| Danaher Corp. | 3.900% | 6/23/21 | 525 | 559 |
| 12 | DH Europe Finance SA | 1.700% | 1/4/22 | 636 | 709 |
| 12 | Dover Corp. | 2.125% | 12/1/20 | 240 | 272 |
| 7 | Embraer Overseas Ltd. | 5.696% | 9/16/23 | 263 | 256 |
| General Electric Capital Corp. | 5.000% | 1/8/16 | 595 | 595 |
| General Electric Capital Corp. | 2.950% | 5/9/16 | 438 | 441 |
| General Electric Capital Corp. | 2.900% | 1/9/17 | 145 | 147 |
| General Electric Capital Corp. | 2.450% | 3/15/17 | 105 | 107 |
| General Electric Capital Corp. | 5.625% | 5/1/18 | 145 | 158 |
| General Electric Capital Corp. | 6.000% | 8/7/19 | 141 | 159 |
| General Electric Capital Corp. | 2.200% | 1/9/20 | 301 | 301 |
| General Electric Capital Corp. | 5.550% | 5/4/20 | 287 | 325 |
| General Electric Capital Corp. | 5.300% | 2/11/21 | 48 | 54 |
| 4 | General Electric Capital Corp. | 6.375% | 11/15/67 | 165 | 172 |
| General Electric Co. | 5.250% | 12/6/17 | 3,115 | 3,328 |
| Harris Corp. | 1.999% | 4/27/18 | 470 | 465 |
| Harris Corp. | 2.700% | 4/27/20 | 170 | 167 |
| Honeywell International Inc. | 5.300% | 3/1/18 | 1,183 | 1,277 |
| Honeywell International Inc. | 5.000% | 2/15/19 | 1,368 | 1,499 |
| Ingersoll-Rand Global Holding Co. Ltd. | 6.875% | 8/15/18 | 235 | 260 |
| Ingersoll-Rand Global Holding Co. Ltd. | 2.875% | 1/15/19 | 810 | 817 |
| Ingersoll-Rand Luxembourg Finance SA | 2.625% | 5/1/20 | 240 | 236 |
| John Deere Capital Corp. | 5.350% | 4/3/18 | 655 | 707 |
| John Deere Capital Corp. | 5.750% | 9/10/18 | 680 | 748 |
| John Deere Capital Corp. | 2.050% | 3/10/20 | 175 | 173 |
| John Deere Capital Corp. | 2.375% | 7/14/20 | 1,245 | 1,242 |
| John Deere Capital Corp. | 2.450% | 9/11/20 | 1,075 | 1,073 |
| John Deere Capital Corp. | 2.800% | 3/4/21 | 815 | 821 |
| 9 | John Deere Financial Ltd. | 3.500% | 12/18/19 | 460 | 337 |
| L-3 Communications Corp. | 3.950% | 11/15/16 | 405 | 412 |
| L-3 Communications Corp. | 1.500% | 5/28/17 | 235 | 233 |
| L-3 Communications Corp. | 5.200% | 10/15/19 | 360 | 381 |
| Lockheed Martin Corp. | 1.850% | 11/23/18 | 365 | 364 |
| Lockheed Martin Corp. | 2.500% | 11/23/20 | 730 | 727 |
| Lockheed Martin Corp. | 3.350% | 9/15/21 | 730 | 746 |
| Mohawk Industries Inc. | 6.125% | 1/15/16 | 957 | 958 |
| 12 | Mohawk Industries Inc. | 2.000% | 1/14/22 | 288 | 316 |
| Raytheon Co. | 6.750% | 3/15/18 | 495 | 548 |
| Raytheon Co. | 6.400% | 12/15/18 | 720 | 811 |
| Raytheon Co. | 4.400% | 2/15/20 | 55 | 60 |
| Raytheon Co. | 3.125% | 10/15/20 | 180 | 185 |
| Rockwell Automation Inc. | 5.650% | 12/1/17 | 115 | 123 |
| Roper Technologies Inc. | 1.850% | 11/15/17 | 520 | 518 |
| Roper Technologies Inc. | 2.050% | 10/1/18 | 235 | 234 |
| 7 | Siemens Financieringsmaatschappij NV | 1.450% | 5/25/18 | 935 | 930 |
| United Rentals North America Inc. | 4.625% | 7/15/23 | 340 | 338 |
| United Technologies Corp. | 5.375% | 12/15/17 | 691 | 743 |
| United Technologies Corp. | 6.125% | 2/1/19 | 810 | 904 |
| Waste Management Inc. | 2.600% | 9/1/16 | 230 | 232 |
| Waste Management Inc. | 6.100% | 3/15/18 | 150 | 163 |
| |
| Communication (3.8%) | | | | |
| 21st Century Fox America Inc. | 7.250% | 5/18/18 | 175 | 195 |
| 21st Century Fox America Inc. | 6.900% | 3/1/19 | 160 | 182 |
| 21st Century Fox America Inc. | 4.500% | 2/15/21 | 250 | 269 |
| America Movil SAB de CV | 2.375% | 9/8/16 | 460 | 463 |
| America Movil SAB de CV | 5.625% | 11/15/17 | 555 | 590 |
| 12 | America Movil SAB de CV | 1.000% | 6/4/18 | 700 | 768 |
| America Movil SAB de CV | 5.000% | 10/16/19 | 400 | 431 |
| America Movil SAB de CV | 5.000% | 3/30/20 | 1,475 | 1,601 |
| | | | | |
| Face | Market |
| Maturity Amount | Value • |
| | Coupon | Date | ($000) | ($000) |
| American Tower Corp. | 4.500% | 1/15/18 | 710 | 741 |
| American Tower Corp. | 3.400% | 2/15/19 | 680 | 696 |
| American Tower Corp. | 2.800% | 6/1/20 | 700 | 692 |
| AT&T Inc. | 2.400% | 8/15/16 | 35 | 35 |
| AT&T Inc. | 1.600% | 2/15/17 | 470 | 471 |
| 11 | AT&T Inc. | 5.875% | 4/28/17 | 700 | 1,090 |
| AT&T Inc. | 1.700% | 6/1/17 | 275 | 276 |
| AT&T Inc. | 1.400% | 12/1/17 | 600 | 597 |
| AT&T Inc. | 5.500% | 2/1/18 | 709 | 758 |
| AT&T Inc. | 5.600% | 5/15/18 | 175 | 190 |
| AT&T Inc. | 5.800% | 2/15/19 | 1,080 | 1,192 |
| AT&T Inc. | 2.450% | 6/30/20 | 500 | 494 |
| British Telecommunications plc | 1.250% | 2/14/17 | 345 | 343 |
| British Telecommunications plc | 2.350% | 2/14/19 | 465 | 466 |
| CBS Corp. | 1.950% | 7/1/17 | 550 | 550 |
| CBS Corp. | 4.625% | 5/15/18 | 60 | 63 |
| CBS Corp. | 2.300% | 8/15/19 | 320 | 316 |
| Comcast Cable Communications LLC | 8.875% | 5/1/17 | 375 | 411 |
| Comcast Corp. | 6.500% | 1/15/17 | 750 | 790 |
| Comcast Corp. | 6.300% | 11/15/17 | 270 | 294 |
| Comcast Corp. | 5.875% | 2/15/18 | 410 | 446 |
| Comcast Corp. | 5.700% | 5/15/18 | 510 | 558 |
| Comcast Corp. | 5.700% | 7/1/19 | 1,275 | 1,429 |
| 7 | Deutsche Telekom International | | | | |
| | Finance BV | 3.125% | 4/11/16 | 490 | 492 |
| 7 | Deutsche Telekom International | | | | |
| | Finance BV | 2.250% | 3/6/17 | 200 | 201 |
| Deutsche Telekom International | | | | |
| | Finance BV | 6.750% | 8/20/18 | 275 | 308 |
| Deutsche Telekom International | | | | |
| | Finance BV | 6.000% | 7/8/19 | 350 | 388 |
| DIRECTV Holdings LLC / DIRECTV | | | | |
| | Financing Co. Inc. | 2.400% | 3/15/17 | 395 | 399 |
| DIRECTV Holdings LLC / DIRECTV | | | | |
| | Financing Co. Inc. | 1.750% | 1/15/18 | 835 | 832 |
| DIRECTV Holdings LLC / DIRECTV | | | | |
| | Financing Co. Inc. | 5.875% | 10/1/19 | 1,370 | 1,525 |
| DIRECTV Holdings LLC / DIRECTV | | | | |
| | Financing Co. Inc. | 5.200% | 3/15/20 | 895 | 969 |
| DIRECTV Holdings LLC / DIRECTV | | | | |
| | Financing Co. Inc. | 4.600% | 2/15/21 | 100 | 106 |
| Embarq Corp. | 7.082% | 6/1/16 | 450 | 457 |
| Interpublic Group of Cos. Inc. | 2.250% | 11/15/17 | 78 | 78 |
| 7 | KT Corp. | 1.750% | 4/22/17 | 815 | 813 |
| McGraw Hill Financial Inc. | 3.300% | 8/14/20 | 435 | 439 |
| McGraw Hill Financial Inc. | 4.000% | 6/15/25 | 340 | 341 |
| Moody’s Corp. | 2.750% | 7/15/19 | 1,400 | 1,414 |
| Moody’s Corp. | 5.500% | 9/1/20 | 150 | 165 |
| NBCUniversal Media LLC | 5.150% | 4/30/20 | 610 | 681 |
| Omnicom Group Inc. | 5.900% | 4/15/16 | 850 | 861 |
| Omnicom Group Inc. | 6.250% | 7/15/19 | 125 | 140 |
| Omnicom Group Inc. | 4.450% | 8/15/20 | 760 | 810 |
| Orange SA | 2.750% | 9/14/16 | 540 | 545 |
| Orange SA | 2.750% | 2/6/19 | 720 | 731 |
| Qwest Corp. | 6.500% | 6/1/17 | 185 | 196 |
| Rogers Communications Inc. | 6.800% | 8/15/18 | 413 | 462 |
| 7 | SES Global Americas Holdings GP | 2.500% | 3/25/19 | 1,295 | 1,277 |
| 7 | Sky plc | 2.625% | 9/16/19 | 300 | 298 |
| Telefonica Emisiones SAU | 3.992% | 2/16/16 | 1,105 | 1,108 |
| Telefonica Emisiones SAU | 6.421% | 6/20/16 | 305 | 312 |
| Telefonica Emisiones SAU | 6.221% | 7/3/17 | 380 | 403 |
| Telefonica Emisiones SAU | 3.192% | 4/27/18 | 640 | 652 |
| 9 | Telstra Corp. Ltd. | 4.500% | 11/13/18 | 590 | 445 |
| Thomson Reuters Corp. | 0.875% | 5/23/16 | 400 | 400 |
| Thomson Reuters Corp. | 1.300% | 2/23/17 | 520 | 517 |
| Thomson Reuters Corp. | 6.500% | 7/15/18 | 730 | 806 |
| Thomson Reuters Corp. | 4.700% | 10/15/19 | 480 | 515 |
| Time Warner Cable Inc. | 5.850% | 5/1/17 | 800 | 837 |
| Time Warner Cable Inc. | 6.750% | 7/1/18 | 1,705 | 1,867 |
| Time Warner Cable Inc. | 8.750% | 2/14/19 | 395 | 457 |
| Time Warner Cable Inc. | 8.250% | 4/1/19 | 555 | 638 |
200
Vanguard Short-Term Investment-Grade Portfolio
| | | | | |
| Face | Market |
| Maturity Amount | Value • |
| | Coupon | Date | ($000) | ($000) |
| Verizon Communications Inc. | 1.350% | 6/9/17 | 350 | 349 |
| Verizon Communications Inc. | 5.500% | 2/15/18 | 25 | 27 |
| Verizon Communications Inc. | 6.100% | 4/15/18 | 380 | 415 |
| Verizon Communications Inc. | 3.650% | 9/14/18 | 1,525 | 1,592 |
| Verizon Communications Inc. | 6.350% | 4/1/19 | 550 | 619 |
| Verizon Communications Inc. | 2.625% | 2/21/20 | 1,170 | 1,175 |
| Verizon Communications Inc. | 4.500% | 9/15/20 | 2,320 | 2,494 |
| Verizon Communications Inc. | 4.600% | 4/1/21 | 200 | 216 |
| Viacom Inc. | 6.250% | 4/30/16 | 110 | 112 |
| Viacom Inc. | 2.500% | 12/15/16 | 120 | 120 |
| Viacom Inc. | 6.125% | 10/5/17 | 255 | 271 |
| Viacom Inc. | 2.500% | 9/1/18 | 236 | 236 |
| Viacom Inc. | 5.625% | 9/15/19 | 75 | 81 |
| Vodafone Group plc | 1.250% | 9/26/17 | 305 | 302 |
| Vodafone Group plc | 5.450% | 6/10/19 | 100 | 110 |
| Vodafone Group plc | 2.950% | 2/19/23 | 400 | 379 |
| |
| Consumer Cyclical (4.7%) | | | | |
| Alibaba Group Holding Ltd. | 1.625% | 11/28/17 | 905 | 895 |
| Alibaba Group Holding Ltd. | 2.500% | 11/28/19 | 1,630 | 1,597 |
| Amazon.com Inc. | 2.600% | 12/5/19 | 465 | 472 |
| American Honda Finance Corp. | 1.125% | 10/7/16 | 470 | 471 |
| American Honda Finance Corp. | 0.950% | 5/5/17 | 380 | 378 |
| American Honda Finance Corp. | 1.600% | 7/13/18 | 255 | 254 |
| American Honda Finance Corp. | 2.125% | 10/10/18 | 1,005 | 1,012 |
| American Honda Finance Corp. | 2.250% | 8/15/19 | 1,000 | 1,005 |
| American Honda Finance Corp. | 2.450% | 9/24/20 | 415 | 416 |
| Automatic Data Processing Inc. | 2.250% | 9/15/20 | 505 | 507 |
| AutoNation Inc. | 3.350% | 1/15/21 | 125 | 125 |
| AutoZone Inc. | 7.125% | 8/1/18 | 720 | 807 |
| Block Financial LLC | 4.125% | 10/1/20 | 965 | 977 |
| Brinker International Inc. | 2.600% | 5/15/18 | 105 | 105 |
| Costco Wholesale Corp. | 5.500% | 3/15/17 | 140 | 147 |
| Costco Wholesale Corp. | 1.750% | 2/15/20 | 350 | 347 |
| CVS Health Corp. | 1.900% | 7/20/18 | 585 | 584 |
| CVS Health Corp. | 2.250% | 12/5/18 | 600 | 603 |
| CVS Health Corp. | 2.800% | 7/20/20 | 3,360 | 3,376 |
| 7 | Daimler Finance North America LLC | 2.950% | 1/11/17 | 405 | 410 |
| 7 | Daimler Finance North America LLC | 1.125% | 3/10/17 | 655 | 649 |
| 7 | Daimler Finance North America LLC | 2.400% | 4/10/17 | 260 | 262 |
| 7 | Daimler Finance North America LLC | 1.375% | 8/1/17 | 475 | 471 |
| 7 | Daimler Finance North America LLC | 1.650% | 3/2/18 | 335 | 331 |
| 7 | Daimler Finance North America LLC | 1.650% | 5/18/18 | 445 | 439 |
| 7 | Daimler Finance North America LLC | 2.375% | 8/1/18 | 215 | 216 |
| 7 | Daimler Finance North America LLC | 2.250% | 9/3/19 | 355 | 350 |
| 7 | Daimler Finance North America LLC | 2.250% | 3/2/20 | 335 | 326 |
| 7 | Daimler Finance North America LLC | 2.450% | 5/18/20 | 340 | 335 |
| Delphi Automotive plc | 3.150% | 11/19/20 | 365 | 364 |
| Dollar General Corp. | 4.125% | 7/15/17 | 305 | 314 |
| Dollar General Corp. | 1.875% | 4/15/18 | 235 | 233 |
| eBay Inc. | 2.200% | 8/1/19 | 480 | 474 |
| 7 | Experian Finance plc | 2.375% | 6/15/17 | 905 | 900 |
| Ford Motor Credit Co. LLC | 4.250% | 2/3/17 | 245 | 250 |
| Ford Motor Credit Co. LLC | 3.000% | 6/12/17 | 755 | 759 |
| Ford Motor Credit Co. LLC | 6.625% | 8/15/17 | 1,710 | 1,824 |
| Ford Motor Credit Co. LLC | 2.145% | 1/9/18 | 335 | 333 |
| Ford Motor Credit Co. LLC | 2.375% | 1/16/18 | 365 | 364 |
| Ford Motor Credit Co. LLC | 5.000% | 5/15/18 | 1,715 | 1,795 |
| Ford Motor Credit Co. LLC | 2.240% | 6/15/18 | 350 | 346 |
| 9 | Ford Motor Credit Co. LLC | 4.050% | 12/10/18 | 1,434 | 1,046 |
| Ford Motor Credit Co. LLC | 2.375% | 3/12/19 | 115 | 113 |
| Ford Motor Credit Co. LLC | 2.597% | 11/4/19 | 320 | 314 |
| Ford Motor Credit Co. LLC | 2.459% | 3/27/20 | 465 | 451 |
| Ford Motor Credit Co. LLC | 3.157% | 8/4/20 | 340 | 338 |
| Ford Motor Credit Co. LLC | 3.200% | 1/15/21 | 335 | 332 |
| General Motors Co. | 3.500% | 10/2/18 | 885 | 894 |
| General Motors Financial Co. Inc. | 2.625% | 7/10/17 | 475 | 476 |
| General Motors Financial Co. Inc. | 4.750% | 8/15/17 | 25 | 26 |
| General Motors Financial Co. Inc. | 3.250% | 5/15/18 | 1,535 | 1,545 |
| | | | | |
| Face | Market |
| Maturity Amount | Value • |
| | Coupon | Date | ($000) | ($000) |
| General Motors Financial Co. Inc. | 6.750% | 6/1/18 | 1,160 | 1,257 |
| General Motors Financial Co. Inc. | 3.500% | 7/10/19 | 560 | 561 |
| General Motors Financial Co. Inc. | 3.200% | 7/13/20 | 935 | 919 |
| General Motors Financial Co. Inc. | 3.700% | 11/24/20 | 580 | 580 |
| 7 | Harley-Davidson Financial Services Inc. 3.875% | 3/15/16 | 367 | 369 |
| 7 | Harley-Davidson Financial Services Inc. 2.700% | 3/15/17 | 415 | 421 |
| 7 | Harley-Davidson Financial Services Inc. 2.400% | 9/15/19 | 235 | 234 |
| 7 | Harley-Davidson Financial Services Inc. 2.150% | 2/26/20 | 255 | 250 |
| 7 | Harley-Davidson Funding Corp. | 6.800% | 6/15/18 | 90 | 100 |
| Home Depot Inc. | 2.000% | 6/15/19 | 475 | 478 |
| 7 | Hyundai Capital America | 4.000% | 6/8/17 | 193 | 198 |
| 7 | Hyundai Capital America | 2.400% | 10/30/18 | 815 | 812 |
| 7 | Hyundai Capital Services Inc. | 4.375% | 7/27/16 | 200 | 203 |
| 7 | Kia Motors Corp. | 3.625% | 6/14/16 | 731 | 737 |
| Lowe’s Cos. Inc. | 1.625% | 4/15/17 | 1,016 | 1,022 |
| Lowe’s Cos. Inc. | 6.100% | 9/15/17 | 300 | 323 |
| Lowe’s Cos. Inc. | 4.625% | 4/15/20 | 360 | 391 |
| Macy’s Retail Holdings Inc. | 5.900% | 12/1/16 | 282 | 293 |
| Macy’s Retail Holdings Inc. | 7.450% | 7/15/17 | 175 | 189 |
| Macy’s Retail Holdings Inc. | 3.450% | 1/15/21 | 485 | 483 |
| Marriott International Inc. | 6.375% | 6/15/17 | 255 | 272 |
| Marriott International Inc. | 3.000% | 3/1/19 | 240 | 243 |
| MasterCard Inc. | 2.000% | 4/1/19 | 300 | 301 |
| McDonald’s Corp. | 2.100% | 12/7/18 | 290 | 290 |
| McDonald’s Corp. | 2.750% | 12/9/20 | 485 | 485 |
| Nordstrom Inc. | 6.250% | 1/15/18 | 264 | 287 |
| PACCAR Financial Corp. | 1.600% | 3/15/17 | 160 | 160 |
| PACCAR Financial Corp. | 1.750% | 8/14/18 | 80 | 80 |
| PACCAR Financial Corp. | 2.200% | 9/15/19 | 450 | 448 |
| PACCAR Financial Corp. | 2.500% | 8/14/20 | 115 | 114 |
| QVC Inc. | 3.125% | 4/1/19 | 230 | 227 |
| Smithsonian Institute Washington | | | | |
| | DC GO | 3.434% | 9/1/23 | 150 | 155 |
| Staples Inc. | 2.750% | 1/12/18 | 80 | 80 |
| Starbucks Corp. | 0.875% | 12/5/16 | 100 | 100 |
| Target Corp. | 2.300% | 6/26/19 | 670 | 679 |
| TJX Cos. Inc. | 6.950% | 4/15/19 | 325 | 374 |
| TJX Cos. Inc. | 2.750% | 6/15/21 | 595 | 603 |
| Toyota Motor Credit Corp. | 2.000% | 9/15/16 | 86 | 87 |
| Toyota Motor Credit Corp. | 2.050% | 1/12/17 | 610 | 615 |
| Toyota Motor Credit Corp. | 1.450% | 1/12/18 | 650 | 649 |
| Toyota Motor Credit Corp. | 1.550% | 7/13/18 | 400 | 399 |
| Toyota Motor Credit Corp. | 2.000% | 10/24/18 | 490 | 493 |
| Toyota Motor Credit Corp. | 2.100% | 1/17/19 | 470 | 471 |
| Toyota Motor Credit Corp. | 2.125% | 7/18/19 | 985 | 985 |
| VF Corp. | 5.950% | 11/1/17 | 140 | 151 |
| Visa Inc. | 1.200% | 12/14/17 | 1,070 | 1,069 |
| Visa Inc. | 2.200% | 12/14/20 | 2,070 | 2,066 |
| 11 | Volkswagen Financial Services NV | 2.375% | 11/13/18 | 88 | 128 |
| 7 | Volkswagen Group of America Finance | | | | |
| | LLC | 1.250% | 5/23/17 | 815 | 796 |
| 7 | Volkswagen Group of America Finance | | | | |
| | LLC | 1.600% | 11/20/17 | 200 | 194 |
| 7 | Volkswagen Group of America Finance | | | | |
| | LLC | 1.650% | 5/22/18 | 200 | 192 |
| 7 | Volkswagen Group of America Finance | | | | |
| | LLC | 2.125% | 5/23/19 | 290 | 274 |
| Wal-Mart Stores Inc. | 0.600% | 4/11/16 | 695 | 695 |
| Wal-Mart Stores Inc. | 2.800% | 4/15/16 | 605 | 608 |
| Wal-Mart Stores Inc. | 5.375% | 4/5/17 | 489 | 515 |
| Wal-Mart Stores Inc. | 5.800% | 2/15/18 | 565 | 617 |
| Wal-Mart Stores Inc. | 1.125% | 4/11/18 | 560 | 557 |
| Wal-Mart Stores Inc. | 1.950% | 12/15/18 | 210 | 213 |
| Wal-Mart Stores Inc. | 3.625% | 7/8/20 | 715 | 765 |
| Wal-Mart Stores Inc. | 3.250% | 10/25/20 | 457 | 482 |
| 11 | Walgreens Boots Alliance Inc. | 2.875% | 11/20/20 | 281 | 411 |
| 7 | Wesfarmers Ltd. | 2.983% | 5/18/16 | 1,150 | 1,158 |
| 7 | Wesfarmers Ltd. | 1.874% | 3/20/18 | 425 | 422 |
201
Vanguard Short-Term Investment-Grade Portfolio
| | | | | |
| Face | Market |
| Maturity Amount | Value • |
| | Coupon | Date | ($000) | ($000) |
| Consumer Noncyclical (6.0%) | | | | |
| AbbVie Inc. | 1.800% | 5/14/18 | 3,140 | 3,128 |
| AbbVie Inc. | 2.500% | 5/14/20 | 2,270 | 2,245 |
| Actavis Funding SCS | 1.850% | 3/1/17 | 500 | 500 |
| Actavis Funding SCS | 2.350% | 3/12/18 | 1,000 | 1,003 |
| Actavis Funding SCS | 2.450% | 6/15/19 | 235 | 233 |
| Actavis Funding SCS | 3.000% | 3/12/20 | 2,575 | 2,571 |
| Actavis Inc. | 1.875% | 10/1/17 | 657 | 656 |
| Actavis Inc. | 6.125% | 8/15/19 | 235 | 261 |
| Agilent Technologies Inc. | 6.500% | 11/1/17 | 99 | 106 |
| Agilent Technologies Inc. | 5.000% | 7/15/20 | 565 | 606 |
| Allergan Inc. | 5.750% | 4/1/16 | 647 | 654 |
| Allergan Inc. | 1.350% | 3/15/18 | 200 | 196 |
| Altria Group Inc. | 9.250% | 8/6/19 | 1,714 | 2,100 |
| Altria Group Inc. | 4.750% | 5/5/21 | 465 | 505 |
| Amgen Inc. | 5.850% | 6/1/17 | 1,413 | 1,495 |
| Amgen Inc. | 5.700% | 2/1/19 | 185 | 204 |
| Anheuser-Busch Cos. LLC | 5.050% | 10/15/16 | 125 | 129 |
| Anheuser-Busch Cos. LLC | 5.600% | 3/1/17 | 100 | 105 |
| Anheuser-Busch Cos. LLC | 5.500% | 1/15/18 | 150 | 160 |
| Anheuser-Busch InBev Finance Inc. | 1.250% | 1/17/18 | 65 | 64 |
| Anheuser-Busch InBev Finance Inc. | 2.150% | 2/1/19 | 415 | 415 |
| Anheuser-Busch InBev Worldwide Inc. | 2.875% | 2/15/16 | 865 | 867 |
| Anheuser-Busch InBev Worldwide Inc. | 1.375% | 7/15/17 | 630 | 628 |
| Anheuser-Busch InBev Worldwide Inc. | 7.750% | 1/15/19 | 550 | 637 |
| Anheuser-Busch InBev Worldwide Inc. | 5.375% | 1/15/20 | 1,150 | 1,272 |
| AstraZeneca plc | 2.375% | 11/16/20 | 970 | 963 |
| 7 | Baxalta Inc. | 2.875% | 6/23/20 | 1,505 | 1,490 |
| Baxter International Inc. | 5.375% | 6/1/18 | 255 | 274 |
| 7 | Bayer US Finance LLC | 1.500% | 10/6/17 | 475 | 475 |
| 7 | Bayer US Finance LLC | 2.375% | 10/8/19 | 1,425 | 1,429 |
| Becton Dickinson & Co. | 2.675% | 12/15/19 | 185 | 186 |
| Biogen Inc. | 6.875% | 3/1/18 | 120 | 132 |
| Biogen Inc. | 2.900% | 9/15/20 | 2,785 | 2,775 |
| Boston Scientific Corp. | 2.650% | 10/1/18 | 540 | 543 |
| Boston Scientific Corp. | 2.850% | 5/15/20 | 400 | 398 |
| Bottling Group LLC | 5.500% | 4/1/16 | 301 | 305 |
| Bottling Group LLC | 5.125% | 1/15/19 | 100 | 110 |
| Cardinal Health Inc. | 1.900% | 6/15/17 | 170 | 170 |
| Cardinal Health Inc. | 1.700% | 3/15/18 | 495 | 493 |
| Cardinal Health Inc. | 1.950% | 6/15/18 | 700 | 699 |
| 7 | Cargill Inc. | 1.900% | 3/1/17 | 655 | 658 |
| 7 | Cargill Inc. | 6.000% | 11/27/17 | 300 | 322 |
| Catholic Health Initiatives Colorado GO | 2.600% | 8/1/18 | 100 | 100 |
| Clorox Co. | 5.950% | 10/15/17 | 120 | 129 |
| Coca-Cola Femsa SAB de CV | 2.375% | 11/26/18 | 450 | 451 |
| ConAgra Foods Inc. | 1.300% | 1/25/16 | 660 | 660 |
| ConAgra Foods Inc. | 5.819% | 6/15/17 | 74 | 78 |
| ConAgra Foods Inc. | 1.900% | 1/25/18 | 1,165 | 1,159 |
| ConAgra Foods Inc. | 2.100% | 3/15/18 | 68 | 68 |
| ConAgra Foods Inc. | 7.000% | 4/15/19 | 101 | 114 |
| ConAgra Foods Inc. | 4.950% | 8/15/20 | 325 | 348 |
| ConAgra Foods Inc. | 3.200% | 1/25/23 | 575 | 553 |
| Constellation Brands Inc. | 3.875% | 11/15/19 | 250 | 257 |
| Constellation Brands Inc. | 3.750% | 5/1/21 | 120 | 120 |
| Constellation Brands Inc. | 4.750% | 12/1/25 | 85 | 86 |
| Covidien International Finance SA | 6.000% | 10/15/17 | 1,218 | 1,312 |
| CR Bard Inc. | 1.375% | 1/15/18 | 345 | 340 |
| Diageo Capital plc | 1.125% | 4/29/18 | 170 | 167 |
| Edwards Lifesciences Corp. | 2.875% | 10/15/18 | 600 | 607 |
| Express Scripts Holding Co. | 2.650% | 2/15/17 | 1,222 | 1,234 |
| General Mills Inc. | 5.700% | 2/15/17 | 219 | 229 |
| General Mills Inc. | 5.650% | 2/15/19 | 300 | 329 |
| Gilead Sciences Inc. | 3.050% | 12/1/16 | 623 | 634 |
| Gilead Sciences Inc. | 2.550% | 9/1/20 | 1,205 | 1,205 |
| Gilead Sciences Inc. | 4.500% | 4/1/21 | 410 | 444 |
| Gilead Sciences Inc. | 4.400% | 12/1/21 | 820 | 884 |
| Hershey Co. | 1.600% | 8/21/18 | 560 | 562 |
| Ingredion Inc. | 1.800% | 9/25/17 | 144 | 143 |
| | | | | |
| Face | Market |
| Maturity Amount | Value • |
| | Coupon | Date | ($000) | ($000) |
| JM Smucker Co. | 1.750% | 3/15/18 | 600 | 597 |
| JM Smucker Co. | 2.500% | 3/15/20 | 330 | 328 |
| Kraft Foods Group Inc. | 2.250% | 6/5/17 | 228 | 230 |
| Kraft Foods Group Inc. | 6.125% | 8/23/18 | 291 | 320 |
| 7 | Kraft Heinz Foods Co. | 2.800% | 7/2/20 | 800 | 797 |
| Kroger Co. | 1.200% | 10/17/16 | 160 | 160 |
| Kroger Co. | 2.200% | 1/15/17 | 185 | 187 |
| Kroger Co. | 6.800% | 12/15/18 | 150 | 170 |
| Kroger Co. | 2.300% | 1/15/19 | 760 | 760 |
| Laboratory Corp. of America Holdings | 2.625% | 2/1/20 | 235 | 233 |
| McCormick & Co. Inc. | 3.900% | 7/15/21 | 100 | 107 |
| McKesson Corp. | 3.250% | 3/1/16 | 413 | 414 |
| McKesson Corp. | 5.700% | 3/1/17 | 150 | 157 |
| McKesson Corp. | 2.284% | 3/15/19 | 750 | 748 |
| Mead Johnson Nutrition Co. | 3.000% | 11/15/20 | 500 | 501 |
| Medco Health Solutions Inc. | 7.125% | 3/15/18 | 805 | 887 |
| Medtronic Inc. | 1.500% | 3/15/18 | 675 | 675 |
| Medtronic Inc. | 2.500% | 3/15/20 | 1,940 | 1,952 |
| Medtronic Inc. | 4.450% | 3/15/20 | 200 | 216 |
| Medtronic Inc. | 3.150% | 3/15/22 | 500 | 505 |
| Merck Sharp & Dohme Corp. | 5.000% | 6/30/19 | 180 | 198 |
| Mondelez International Inc. | 4.125% | 2/9/16 | 862 | 864 |
| Mondelez International Inc. | 2.250% | 2/1/19 | 1,080 | 1,079 |
| 12 | Mondelez International Inc. | 2.375% | 1/26/21 | 216 | 248 |
| 12 | Mondelez International Inc. | 1.000% | 3/7/22 | 224 | 238 |
| 7 | Mylan NV | 3.000% | 12/15/18 | 730 | 728 |
| Newell Rubbermaid Inc. | 2.050% | 12/1/17 | 315 | 312 |
| Newell Rubbermaid Inc. | 2.150% | 10/15/18 | 300 | 291 |
| Newell Rubbermaid Inc. | 2.875% | 12/1/19 | 225 | 217 |
| PepsiCo Inc. | 5.000% | 6/1/18 | 330 | 357 |
| PepsiCo Inc. | 7.900% | 11/1/18 | 320 | 375 |
| PepsiCo Inc. | 2.250% | 1/7/19 | 100 | 101 |
| PepsiCo Inc. | 4.500% | 1/15/20 | 400 | 434 |
| PepsiCo Inc. | 1.850% | 4/30/20 | 1,150 | 1,140 |
| PepsiCo Inc. | 2.150% | 10/14/20 | 2,200 | 2,187 |
| Perrigo Co. plc | 2.300% | 11/8/18 | 355 | 350 |
| Pfizer Inc. | 6.200% | 3/15/19 | 1,290 | 1,452 |
| Pharmacia Corp. | 6.500% | 12/1/18 | 200 | 225 |
| Philip Morris International Inc. | 2.500% | 5/16/16 | 515 | 518 |
| Philip Morris International Inc. | 1.125% | 8/21/17 | 125 | 125 |
| Philip Morris International Inc. | 5.650% | 5/16/18 | 510 | 557 |
| Quest Diagnostics Inc. | 2.700% | 4/1/19 | 465 | 464 |
| 7 | Reynolds American Inc. | 3.500% | 8/4/16 | 150 | 152 |
| Reynolds American Inc. | 3.500% | 8/4/16 | 185 | 187 |
| Reynolds American Inc. | 6.750% | 6/15/17 | 271 | 289 |
| Reynolds American Inc. | 8.125% | 6/23/19 | 1,216 | 1,429 |
| Reynolds American Inc. | 3.250% | 6/12/20 | 710 | 721 |
| 7 | Roche Holdings Inc. | 2.250% | 9/30/19 | 705 | 709 |
| Sanofi | 1.250% | 4/10/18 | 1,130 | 1,125 |
| St. Jude Medical Inc. | 2.500% | 1/15/16 | 495 | 495 |
| St. Jude Medical Inc. | 2.800% | 9/15/20 | 400 | 400 |
| Stryker Corp. | 1.300% | 4/1/18 | 282 | 280 |
| Teva Pharmaceutical Finance Co. BV | 2.400% | 11/10/16 | 870 | 875 |
| Thermo Fisher Scientific Inc. | 2.250% | 8/15/16 | 355 | 357 |
| Thermo Fisher Scientific Inc. | 2.150% | 12/14/18 | 400 | 400 |
| Tyson Foods Inc. | 6.600% | 4/1/16 | 978 | 991 |
| Tyson Foods Inc. | 2.650% | 8/15/19 | 1,755 | 1,754 |
| Tyson Foods Inc. | 4.500% | 6/15/22 | 250 | 266 |
| Whirlpool Corp. | 6.500% | 6/15/16 | 75 | 77 |
| Wyeth LLC | 5.450% | 4/1/17 | 80 | 84 |
| Zimmer Biomet Holdings Inc. | 2.000% | 4/1/18 | 465 | 462 |
| Zimmer Biomet Holdings Inc. | 2.700% | 4/1/20 | 580 | 574 |
| Zoetis Inc. | 1.875% | 2/1/18 | 35 | 35 |
| Zoetis Inc. | 3.450% | 11/13/20 | 290 | 290 |
| |
| Energy (4.4%) | | | | |
| Anadarko Petroleum Corp. | 5.950% | 9/15/16 | 865 | 886 |
| Anadarko Petroleum Corp. | 6.375% | 9/15/17 | 333 | 349 |
| BP Capital Markets plc | 3.200% | 3/11/16 | 1,050 | 1,055 |
202
Vanguard Short-Term Investment-Grade Portfolio
| | | | | |
| Face | Market |
| Maturity Amount | Value • |
| | Coupon | Date | ($000) | ($000) |
| BP Capital Markets plc | 2.248% | 11/1/16 | 735 | 741 |
| BP Capital Markets plc | 1.846% | 5/5/17 | 725 | 729 |
| BP Capital Markets plc | 1.375% | 11/6/17 | 550 | 546 |
| BP Capital Markets plc | 1.375% | 5/10/18 | 2,025 | 1,995 |
| BP Capital Markets plc | 2.241% | 9/26/18 | 705 | 705 |
| 9 | BP Capital Markets plc | 4.750% | 11/15/18 | 250 | 189 |
| BP Capital Markets plc | 4.750% | 3/10/19 | 730 | 782 |
| BP Capital Markets plc | 2.237% | 5/10/19 | 500 | 495 |
| BP Capital Markets plc | 2.315% | 2/13/20 | 1,350 | 1,333 |
| BP Capital Markets plc | 4.500% | 10/1/20 | 100 | 107 |
| Canadian Natural Resources Ltd. | 1.750% | 1/15/18 | 250 | 244 |
| Cenovus Energy Inc. | 5.700% | 10/15/19 | 579 | 608 |
| Chevron Corp. | 1.345% | 11/15/17 | 435 | 433 |
| Chevron Corp. | 1.104% | 12/5/17 | 300 | 298 |
| Chevron Corp. | 1.365% | 3/2/18 | 675 | 669 |
| Chevron Corp. | 1.718% | 6/24/18 | 900 | 895 |
| Chevron Corp. | 1.790% | 11/16/18 | 1,700 | 1,687 |
| Chevron Corp. | 2.193% | 11/15/19 | 100 | 100 |
| Chevron Corp. | 1.961% | 3/3/20 | 1,095 | 1,077 |
| Chevron Corp. | 2.427% | 6/24/20 | 600 | 599 |
| Chevron Corp. | 2.419% | 11/17/20 | 1,500 | 1,494 |
| ConocoPhillips Canada Funding Co. I | 5.625% | 10/15/16 | 780 | 805 |
| ConocoPhillips Co. | 2.200% | 5/15/20 | 700 | 677 |
| Dominion Gas Holdings LLC | 2.500% | 12/15/19 | 500 | 499 |
| Dominion Gas Holdings LLC | 2.800% | 11/15/20 | 300 | 301 |
| Dominion Gas Holdings LLC | 3.550% | 11/1/23 | 300 | 296 |
| El Paso Natural Gas Co. LLC | 5.950% | 4/15/17 | 250 | 254 |
| Enable Midstream Partners LP | 2.400% | 5/15/19 | 470 | 423 |
| Enbridge Energy Partners LP | 4.375% | 10/15/20 | 385 | 376 |
| 4 | Enbridge Energy Partners LP | 8.050% | 10/1/77 | 30 | 25 |
| Energy Transfer Partners LP | 6.125% | 2/15/17 | 515 | 526 |
| Energy Transfer Partners LP | 2.500% | 6/15/18 | 450 | 428 |
| Energy Transfer Partners LP | 6.700% | 7/1/18 | 990 | 1,042 |
| Energy Transfer Partners LP | 4.150% | 10/1/20 | 965 | 894 |
| Energy Transfer Partners LP | 5.200% | 2/1/22 | 195 | 181 |
| Ensco plc | 4.700% | 3/15/21 | 320 | 260 |
| Enterprise Products Operating LLC | 1.650% | 5/7/18 | 810 | 787 |
| Enterprise Products Operating LLC | 6.500% | 1/31/19 | 25 | 27 |
| Enterprise Products Operating LLC | 2.550% | 10/15/19 | 70 | 67 |
| Enterprise Products Operating LLC | 5.250% | 1/31/20 | 430 | 452 |
| Enterprise Products Operating LLC | 5.200% | 9/1/20 | 615 | 645 |
| EOG Resources Inc. | 5.875% | 9/15/17 | 50 | 53 |
| EOG Resources Inc. | 5.625% | 6/1/19 | 175 | 191 |
| EOG Resources Inc. | 4.400% | 6/1/20 | 800 | 849 |
| EOG Resources Inc. | 2.625% | 3/15/23 | 200 | 189 |
| Exxon Mobil Corp. | 1.912% | 3/6/20 | 800 | 798 |
| Halliburton Co. | 2.700% | 11/15/20 | 800 | 790 |
| Kinder Morgan Energy Partners LP | 6.000% | 2/1/17 | 395 | 403 |
| Kinder Morgan Energy Partners LP | 2.650% | 2/1/19 | 440 | 410 |
| Kinder Morgan Energy Partners LP | 6.500% | 4/1/20 | 425 | 434 |
| Kinder Morgan Energy Partners LP | 5.300% | 9/15/20 | 125 | 124 |
| Kinder Morgan Inc. | 7.000% | 6/15/17 | 570 | 587 |
| Kinder Morgan Inc. | 7.250% | 6/1/18 | 350 | 365 |
| Kinder Morgan Inc. | 3.050% | 12/1/19 | 200 | 185 |
| Marathon Oil Corp. | 5.900% | 3/15/18 | 315 | 318 |
| Marathon Oil Corp. | 2.700% | 6/1/20 | 800 | 703 |
| Nabors Industries Inc. | 2.350% | 9/15/16 | 400 | 396 |
| Nabors Industries Inc. | 6.150% | 2/15/18 | 460 | 471 |
| Noble Holding International Ltd. | 3.050% | 3/1/16 | 370 | 369 |
| Occidental Petroleum Corp. | 1.750% | 2/15/17 | 2,070 | 2,073 |
| Occidental Petroleum Corp. | 1.500% | 2/15/18 | 1,140 | 1,122 |
| ONEOK Partners LP | 3.200% | 9/15/18 | 280 | 266 |
| ONEOK Partners LP | 8.625% | 3/1/19 | 190 | 210 |
| Petro-Canada | 6.050% | 5/15/18 | 115 | 124 |
| Phillips 66 | 2.950% | 5/1/17 | 1,035 | 1,049 |
| Pioneer Natural Resources Co. | 6.650% | 3/15/17 | 120 | 124 |
| Pioneer Natural Resources Co. | 6.875% | 5/1/18 | 225 | 240 |
| Pioneer Natural Resources Co. | 3.450% | 1/15/21 | 600 | 554 |
| Pride International Inc. | 8.500% | 6/15/19 | 200 | 195 |
| | | | | |
| Face | Market |
| Maturity Amount | Value • |
| | Coupon | Date | ($000) | ($000) |
| Pride International Inc. | 6.875% | 8/15/20 | 385 | 358 |
| Shell International Finance BV | 5.200% | 3/22/17 | 375 | 385 |
| Shell International Finance BV | 1.125% | 8/21/17 | 100 | 99 |
| Shell International Finance BV | 1.900% | 8/10/18 | 100 | 100 |
| Shell International Finance BV | 1.625% | 11/10/18 | 500 | 495 |
| Shell International Finance BV | 2.000% | 11/15/18 | 325 | 324 |
| Shell International Finance BV | 4.300% | 9/22/19 | 750 | 800 |
| Shell International Finance BV | 2.125% | 5/11/20 | 1,300 | 1,275 |
| Shell International Finance BV | 2.250% | 11/10/20 | 1,250 | 1,231 |
| 7 | Southern Natural Gas Co. LLC | 5.900% | 4/1/17 | 270 | 275 |
| Southern Natural Gas Co. LLC / | | | | |
| | Southern Natural Issuing Corp. | 4.400% | 6/15/21 | 155 | 144 |
| Southwestern Energy Co. | 3.300% | 1/23/18 | 300 | 236 |
| Southwestern Energy Co. | 7.500% | 2/1/18 | 500 | 425 |
| Southwestern Energy Co. | 4.050% | 1/23/20 | 1,100 | 797 |
| Spectra Energy Partners LP | 2.950% | 9/25/18 | 230 | 226 |
| Suncor Energy Inc. | 6.100% | 6/1/18 | 80 | 86 |
| Sunoco Logistics Partners Operations | | | | |
| | LP | 4.400% | 4/1/21 | 2,160 | 2,093 |
| Total Capital Canada Ltd. | 1.450% | 1/15/18 | 1,045 | 1,040 |
| Total Capital International SA | 1.500% | 2/17/17 | 615 | 615 |
| Total Capital International SA | 1.550% | 6/28/17 | 485 | 485 |
| Total Capital International SA | 2.125% | 1/10/19 | 980 | 979 |
| Total Capital International SA | 2.100% | 6/19/19 | 400 | 403 |
| Total Capital SA | 2.125% | 8/10/18 | 275 | 276 |
| Transocean Inc. | 5.800% | 12/15/16 | 1,415 | 1,373 |
| Transocean Inc. | 3.000% | 10/15/17 | 1,555 | 1,384 |
| Weatherford International LLC | 6.350% | 6/15/17 | 360 | 351 |
| Weatherford International Ltd. | 5.500% | 2/15/16 | 240 | 239 |
| Weatherford International Ltd. | 6.000% | 3/15/18 | 225 | 206 |
| 7 | Woodside Finance Ltd. | 8.750% | 3/1/19 | 250 | 287 |
| |
| Other Industrial (0.2%) | | | | |
| 7 | Hutchison Whampoa Finance CI Ltd. | 7.450% | 8/1/17 | 255 | 277 |
| 7 | Hutchison Whampoa International 09 | | | | |
| | Ltd. | 7.625% | 4/9/19 | 1,115 | 1,293 |
| 7 | Hutchison Whampoa International 14 | | | | |
| | Ltd. | 1.625% | 10/31/17 | 970 | 963 |
| |
| Technology (2.8%) | | | | |
| Adobe Systems Inc. | 4.750% | 2/1/20 | 475 | 515 |
| Altera Corp. | 1.750% | 5/15/17 | 265 | 266 |
| Altera Corp. | 2.500% | 11/15/18 | 1,205 | 1,222 |
| Amphenol Corp. | 2.550% | 1/30/19 | 200 | 200 |
| Apple Inc. | 1.000% | 5/3/18 | 325 | 323 |
| Apple Inc. | 2.100% | 5/6/19 | 2,015 | 2,039 |
| 9 | Apple Inc. | 2.850% | 8/28/19 | 420 | 305 |
| Apple Inc. | 1.550% | 2/7/20 | 465 | 458 |
| Apple Inc. | 2.000% | 5/6/20 | 615 | 614 |
| Apple Inc. | 2.850% | 5/6/21 | 875 | 896 |
| Applied Materials Inc. | 2.625% | 10/1/20 | 580 | 580 |
| Autodesk Inc. | 3.125% | 6/15/20 | 280 | 278 |
| Baidu Inc. | 2.250% | 11/28/17 | 385 | 386 |
| Baidu Inc. | 3.250% | 8/6/18 | 825 | 836 |
| Baidu Inc. | 2.750% | 6/9/19 | 425 | 422 |
| CA Inc. | 3.600% | 8/1/20 | 255 | 261 |
| Cisco Systems Inc. | 1.650% | 6/15/18 | 460 | 462 |
| Cisco Systems Inc. | 4.950% | 2/15/19 | 1,030 | 1,126 |
| Cisco Systems Inc. | 2.125% | 3/1/19 | 815 | 822 |
| Cisco Systems Inc. | 4.450% | 1/15/20 | 650 | 708 |
| Cisco Systems Inc. | 2.450% | 6/15/20 | 215 | 217 |
| Computer Sciences Corp. | 6.500% | 3/15/18 | 280 | 302 |
| Corning Inc. | 6.625% | 5/15/19 | 135 | 151 |
| Corning Inc. | 4.250% | 8/15/20 | 70 | 73 |
| EMC Corp. | 1.875% | 6/1/18 | 490 | 457 |
| EMC Corp. | 2.650% | 6/1/20 | 290 | 257 |
| Equifax Inc. | 6.300% | 7/1/17 | 120 | 128 |
| Fidelity National Information | | | | |
| | Services Inc. | 1.450% | 6/5/17 | 270 | 267 |
203
Vanguard Short-Term Investment-Grade Portfolio
| | | | | |
| Face | Market |
| Maturity Amount | Value • |
| | Coupon | Date | ($000) | ($000) |
| Fidelity National Information | | | | |
| | Services Inc. | 2.000% | 4/15/18 | 70 | 69 |
| Fidelity National Information | | | | |
| | Services Inc. | 2.850% | 10/15/18 | 1,350 | 1,355 |
| Fidelity National Information Services | | | | |
| | Inc. | 3.625% | 10/15/20 | 1,500 | 1,520 |
| Fiserv Inc. | 2.700% | 6/1/20 | 295 | 295 |
| 7 | Hewlett Packard Enterprise Co. | 2.450% | 10/5/17 | 960 | 959 |
| 7 | Hewlett Packard Enterprise Co. | 2.850% | 10/5/18 | 1,125 | 1,124 |
| 7 | Hewlett Packard Enterprise Co. | 3.600% | 10/15/20 | 1,480 | 1,484 |
| Intel Corp. | 1.950% | 10/1/16 | 250 | 252 |
| Intel Corp. | 1.350% | 12/15/17 | 1,897 | 1,899 |
| Intel Corp. | 2.450% | 7/29/20 | 475 | 480 |
| Intel Corp. | 3.300% | 10/1/21 | 65 | 67 |
| International Business Machines Corp. | 1.250% | 2/6/17 | 400 | 401 |
| International Business Machines Corp. | 5.700% | 9/14/17 | 691 | 741 |
| International Business Machines Corp. | 1.250% | 2/8/18 | 300 | 299 |
| International Business Machines Corp. | 7.625% | 10/15/18 | 155 | 179 |
| International Business Machines Corp. | 1.950% | 2/12/19 | 635 | 638 |
| KLA-Tencor Corp. | 2.375% | 11/1/17 | 335 | 335 |
| KLA-Tencor Corp. | 3.375% | 11/1/19 | 90 | 91 |
| Lam Research Corp. | 2.750% | 3/15/20 | 580 | 561 |
| Microsoft Corp. | 1.300% | 11/3/18 | 340 | 339 |
| Microsoft Corp. | 2.000% | 11/3/20 | 510 | 510 |
| Oracle Corp. | 1.200% | 10/15/17 | 695 | 695 |
| Oracle Corp. | 5.750% | 4/15/18 | 400 | 437 |
| Oracle Corp. | 2.375% | 1/15/19 | 1,540 | 1,561 |
| Oracle Corp. | 5.000% | 7/8/19 | 330 | 363 |
| Oracle Corp. | 2.250% | 10/8/19 | 1,745 | 1,764 |
| Oracle Corp. | 2.800% | 7/8/21 | 770 | 780 |
| Pitney Bowes Inc. | 5.750% | 9/15/17 | 20 | 21 |
| Pitney Bowes Inc. | 5.600% | 3/15/18 | 120 | 128 |
| QUALCOMM Inc. | 1.400% | 5/18/18 | 425 | 421 |
| QUALCOMM Inc. | 2.250% | 5/20/20 | 210 | 208 |
| Seagate HDD Cayman | 3.750% | 11/15/18 | 340 | 337 |
| Tyco Electronics Group SA | 6.550% | 10/1/17 | 205 | 222 |
| Tyco Electronics Group SA | 2.375% | 12/17/18 | 350 | 350 |
| Tyco Electronics Group SA | 2.350% | 8/1/19 | 455 | 455 |
| Xilinx Inc. | 2.125% | 3/15/19 | 560 | 555 |
| |
| Transportation (1.3%) | | | | |
| 4,7 AA Aircraft Financing 2013-1 LLC | 6.500% | 11/1/17 | 425 | 431 |
| 4,7 American Airlines 2013-2 Class A Pass | | | | |
| | Through Trust | 3.596% | 11/1/19 | 635 | 635 |
| Canadian National Railway Co. | 5.850% | 11/15/17 | 370 | 398 |
| Canadian Pacific Railway Co. | 6.500% | 5/15/18 | 250 | 274 |
| Canadian Pacific Railway Co. | 7.250% | 5/15/19 | 211 | 241 |
| 4 | Continental Airlines 1997-4 Class A | | | | |
| | Pass Through Trust | 6.900% | 7/2/19 | 100 | 102 |
| 4 | Continental Airlines 1998-1 Class A | | | | |
| | Pass Through Trust | 6.648% | 3/15/19 | 27 | 28 |
| 4 | Continental Airlines 1998-1 Class B | | | | |
| | Pass Through Trust | 6.748% | 9/15/18 | 87 | 89 |
| 4 | Continental Airlines 1999-1 Class B | | | | |
| | Pass Through Trust | 6.795% | 2/2/20 | 20 | 21 |
| 4 | Continental Airlines 2000-1 Class A-1 | | | | |
| | Pass Through Trust | 8.048% | 11/1/20 | 110 | 123 |
| 4 | Continental Airlines 2005-ERJ1 Pass | | | | |
| | Through Trust | 9.798% | 10/1/22 | 309 | 339 |
| 4 | Continental Airlines 2012-2 Class B | | | | |
| | Pass Through Trust | 5.500% | 4/29/22 | 61 | 63 |
| Continental Airlines 2012-3 Class C | | | | |
| | Pass Thru Certificates | 6.125% | 4/29/18 | 1,235 | 1,269 |
| 4,13 Delta Air Lines 2002-1 Class G-1 Pass | | | | |
| | Through Trust | 6.718% | 7/2/24 | 406 | 460 |
| 4 | Delta Air Lines 2007-1 Class A Pass | | | | |
| | Through Trust | 6.821% | 2/10/24 | 837 | 960 |
| 4 | Delta Air Lines 2009-1 Class A Pass | | | | |
| | Through Trust | 7.750% | 6/17/21 | 625 | 700 |
| | | | | |
| Face | Market |
| Maturity Amount | Value • |
| | Coupon | Date | ($000) | ($000) |
| 4 | Delta Air Lines 2010-1 Class A Pass | | | | |
| | Through Trust | 6.200% | 1/2/20 | 334 | 356 |
| 4 | Delta Air Lines 2010-2 Class A Pass | | | | |
| | Through Trust | 4.950% | 11/23/20 | 116 | 123 |
| 4 | Delta Air Lines 2012-1 Class A Pass | | | | |
| | Through Trust | 4.750% | 11/7/21 | 63 | 66 |
| 7 | ERAC USA Finance LLC | 1.400% | 4/15/16 | 225 | 225 |
| 7 | ERAC USA Finance LLC | 6.375% | 10/15/17 | 795 | 853 |
| 7 | ERAC USA Finance LLC | 2.800% | 11/1/18 | 430 | 434 |
| 7 | ERAC USA Finance LLC | 2.350% | 10/15/19 | 285 | 281 |
| 7 | HPHT Finance 15 Ltd. | 2.250% | 3/17/18 | 695 | 691 |
| JB Hunt Transport Services Inc. | 2.400% | 3/15/19 | 120 | 120 |
| 4,6,13JetBlue Airways 2004-2 G-2 Pass | | | | |
| | Through Trust | 0.812% | 5/15/18 | 220 | 218 |
| 4 | Northwest Airlines 2007-1 Class B | | | | |
| | Pass Through Trust | 8.028% | 11/1/17 | 544 | 589 |
| 9 | Qantas Airways Ltd. | 7.500% | 6/11/21 | 600 | 480 |
| Ryder System Inc. | 2.350% | 2/26/19 | 180 | 180 |
| Ryder System Inc. | 2.550% | 6/1/19 | 160 | 159 |
| Ryder System Inc. | 2.650% | 3/2/20 | 500 | 491 |
| 4 | Southwest Airlines Co. 2007-1 Pass | | | | |
| | Through Trust | 6.150% | 2/1/24 | 126 | 141 |
| 4 | Spirit Airlines 2015-1 Pass Through | | | | |
| | Trust B | 4.450% | 10/1/25 | 350 | 342 |
| 4 | UAL 2007-1 Pass Through Trust | 6.636% | 7/2/22 | 451 | 478 |
| 4,7 UAL 2009-2B Pass Through Trust | 12.000% | 7/15/17 | 60 | 60 |
| Union Pacific Corp. | 5.750% | 11/15/17 | 225 | 242 |
| Union Pacific Corp. | 5.700% | 8/15/18 | 710 | 782 |
| Union Pacific Corp. | 2.250% | 2/15/19 | 385 | 388 |
| Union Pacific Corp. | 1.800% | 2/1/20 | 200 | 197 |
| Union Pacific Corp. | 2.250% | 6/19/20 | 575 | 575 |
| United Continental Holdings Inc. | 6.375% | 6/1/18 | 140 | 146 |
| United Parcel Service Inc. | 5.125% | 4/1/19 | 1,180 | 1,302 |
| United Parcel Service of America Inc. | 8.375% | 4/1/20 | 780 | 967 |
| 362,256 |
| Utilities (4.3%) | | | | |
| Electric (3.9%) | | | | |
| Ameren Illinois Co. | 6.125% | 11/15/17 | 190 | 205 |
| Ameren Illinois Co. | 6.250% | 4/1/18 | 110 | 120 |
| Appalachian Power Co. | 5.000% | 6/1/17 | 141 | 147 |
| Arizona Public Service Co. | 6.250% | 8/1/16 | 100 | 103 |
| Arizona Public Service Co. | 8.750% | 3/1/19 | 691 | 821 |
| Baltimore Gas & Electric Co. | 5.900% | 10/1/16 | 170 | 176 |
| Baltimore Gas & Electric Co. | 3.500% | 11/15/21 | 270 | 280 |
| Berkshire Hathaway Energy Co. | 5.750% | 4/1/18 | 1,070 | 1,156 |
| Berkshire Hathaway Energy Co. | 2.000% | 11/15/18 | 890 | 884 |
| Berkshire Hathaway Energy Co. | 2.400% | 2/1/20 | 400 | 396 |
| CenterPoint Energy Inc. | 5.950% | 2/1/17 | 510 | 531 |
| CenterPoint Energy Inc. | 6.500% | 5/1/18 | 170 | 185 |
| CMS Energy Corp. | 6.550% | 7/17/17 | 70 | 75 |
| CMS Energy Corp. | 5.050% | 2/15/18 | 1,105 | 1,168 |
| CMS Energy Corp. | 6.250% | 2/1/20 | 225 | 255 |
| Commonwealth Edison Co. | 5.950% | 8/15/16 | 255 | 263 |
| Commonwealth Edison Co. | 1.950% | 9/1/16 | 130 | 131 |
| Commonwealth Edison Co. | 6.150% | 9/15/17 | 705 | 757 |
| Commonwealth Edison Co. | 5.800% | 3/15/18 | 880 | 954 |
| Commonwealth Edison Co. | 2.150% | 1/15/19 | 160 | 159 |
| Commonwealth Edison Co. | 4.000% | 8/1/20 | 570 | 603 |
| Commonwealth Edison Co. | 3.400% | 9/1/21 | 210 | 218 |
| Connecticut Light & Power Co. | 5.500% | 2/1/19 | 285 | 313 |
| Consumers Energy Co. | 5.500% | 8/15/16 | 46 | 47 |
| Consumers Energy Co. | 5.150% | 2/15/17 | 360 | 374 |
| Consumers Energy Co. | 5.650% | 9/15/18 | 325 | 355 |
| Consumers Energy Co. | 6.125% | 3/15/19 | 595 | 667 |
| Consumers Energy Co. | 6.700% | 9/15/19 | 1,055 | 1,215 |
| DTE Electric Co. | 5.600% | 6/15/18 | 409 | 446 |
| DTE Electric Co. | 3.450% | 10/1/20 | 185 | 193 |
| Duke Energy Carolinas LLC | 5.250% | 1/15/18 | 25 | 27 |
| Duke Energy Carolinas LLC | 5.100% | 4/15/18 | 125 | 134 |
204
Vanguard Short-Term Investment-Grade Portfolio
| | | | | |
| Face | Market |
| Maturity Amount | Value • |
| | Coupon | Date | ($000) | ($000) |
| Duke Energy Carolinas LLC | 7.000% | 11/15/18 | 635 | 724 |
| Duke Energy Carolinas LLC | 4.300% | 6/15/20 | 300 | 325 |
| Duke Energy Carolinas LLC | 3.900% | 6/15/21 | 115 | 122 |
| Duke Energy Corp. | 2.100% | 6/15/18 | 225 | 225 |
| Duke Energy Corp. | 6.250% | 6/15/18 | 510 | 560 |
| Duke Energy Corp. | 5.050% | 9/15/19 | 300 | 326 |
| Duke Energy Florida LLC | 4.550% | 4/1/20 | 445 | 481 |
| Duke Energy Florida LLC | 5.650% | 6/15/18 | 950 | 1,037 |
| Duke Energy Indiana Inc. | 3.750% | 7/15/20 | 345 | 363 |
| Duke Energy Progress LLC | 3.000% | 9/15/21 | 620 | 632 |
| 7 | EDP Finance BV | 6.000% | 2/2/18 | 705 | 742 |
| 7 | EDP Finance BV | 4.900% | 10/1/19 | 940 | 968 |
| 7 | EDP Finance BV | 4.125% | 1/15/20 | 1,165 | 1,168 |
| Entergy Corp. | 4.700% | 1/15/17 | 305 | 313 |
| Entergy Gulf States Louisiana LLC | 6.000% | 5/1/18 | 30 | 33 |
| Entergy Louisiana LLC | 6.500% | 9/1/18 | 340 | 378 |
| Eversource Energy | 1.450% | 5/1/18 | 510 | 502 |
| Eversource Energy | 4.500% | 11/15/19 | 95 | 101 |
| Exelon Corp. | 1.550% | 6/9/17 | 600 | 598 |
| Exelon Corp. | 2.850% | 6/15/20 | 510 | 509 |
| 7 | Exelon Corp. | 3.950% | 6/15/25 | 240 | 240 |
| Exelon Generation Co. LLC | 6.200% | 10/1/17 | 390 | 416 |
| Exelon Generation Co. LLC | 2.950% | 1/15/20 | 440 | 438 |
| FirstEnergy Corp. | 2.750% | 3/15/18 | 555 | 559 |
| FirstEnergy Corp. | 4.250% | 3/15/23 | 630 | 641 |
| 7 | FirstEnergy Transmission LLC | 4.350% | 1/15/25 | 690 | 700 |
| 4,7 FPL Energy Marcus Hook LP | 7.590% | 7/10/18 | 391 | 416 |
| Georgia Power Co. | 5.400% | 6/1/18 | 185 | 201 |
| Georgia Power Co. | 1.950% | 12/1/18 | 800 | 798 |
| Kentucky Utilities Co. | 3.250% | 11/1/20 | 250 | 259 |
| LG&E & KU Energy LLC | 3.750% | 11/15/20 | 325 | 336 |
| MidAmerican Energy Co. | 5.950% | 7/15/17 | 340 | 360 |
| MidAmerican Energy Co. | 5.300% | 3/15/18 | 918 | 986 |
| National Rural Utilities Cooperative | | | | |
| | Finance Corp. | 3.050% | 3/1/16 | 200 | 201 |
| National Rural Utilities Cooperative | | | | |
| | Finance Corp. | 5.450% | 4/10/17 | 280 | 293 |
| National Rural Utilities Cooperative | | | | |
| | Finance Corp. | 5.450% | 2/1/18 | 750 | 803 |
| National Rural Utilities Cooperative | | | | |
| | Finance Corp. | 10.375% | 11/1/18 | 590 | 721 |
| National Rural Utilities Cooperative | | | | |
| | Finance Corp. | 2.150% | 2/1/19 | 640 | 641 |
| National Rural Utilities Cooperative | | | | |
| | Finance Corp. | 2.300% | 11/15/19 | 335 | 333 |
| National Rural Utilities Cooperative | | | | |
| | Finance Corp. | 2.000% | 1/27/20 | 500 | 491 |
| National Rural Utilities Cooperative | | | | |
| | Finance Corp. | 2.350% | 6/15/20 | 930 | 921 |
| National Rural Utilities Cooperative | | | | |
| | Finance Corp. | 2.300% | 11/1/20 | 990 | 981 |
| Nevada Power Co. | 6.500% | 5/15/18 | 771 | 859 |
| Nevada Power Co. | 6.500% | 8/1/18 | 225 | 250 |
| NextEra Energy Capital Holdings Inc. | 6.000% | 3/1/19 | 210 | 230 |
| NextEra Energy Capital Holdings Inc. | 2.400% | 9/15/19 | 370 | 365 |
| NextEra Energy Capital Holdings Inc. | 2.700% | 9/15/19 | 730 | 727 |
| NSTAR Electric Co. | 5.625% | 11/15/17 | 120 | 128 |
| NV Energy Inc. | 6.250% | 11/15/20 | 290 | 328 |
| Ohio Power Co. | 6.000% | 6/1/16 | 240 | 245 |
| Pacific Gas & Electric Co. | 5.625% | 11/30/17 | 1,220 | 1,304 |
| Pacific Gas & Electric Co. | 8.250% | 10/15/18 | 770 | 895 |
| Pacific Gas & Electric Co. | 3.500% | 10/1/20 | 800 | 832 |
| Pacific Gas & Electric Co. | 4.250% | 5/15/21 | 360 | 386 |
| Pacific Gas & Electric Co. | 3.250% | 9/15/21 | 100 | 102 |
| PacifiCorp | 5.650% | 7/15/18 | 490 | 534 |
| PacifiCorp | 5.500% | 1/15/19 | 114 | 125 |
| PacifiCorp | 3.850% | 6/15/21 | 100 | 105 |
| Pennsylvania Electric Co. | 6.050% | 9/1/17 | 140 | 149 |
| PPL Capital Funding Inc. | 1.900% | 6/1/18 | 310 | 307 |
| Public Service Electric & Gas Co. | 5.300% | 5/1/18 | 200 | 216 |
| | | | | |
| Face | Market |
| Maturity Amount | Value • |
| | Coupon | Date | ($000) | ($000) |
| Public Service Electric & Gas Co. | 2.300% | 9/15/18 | 510 | 516 |
| Puget Sound Energy Inc. | 4.300% | 5/20/45 | 60 | 61 |
| SCANA Corp. | 4.750% | 5/15/21 | 185 | 192 |
| Sierra Pacific Power Co. | 6.000% | 5/15/16 | 457 | 465 |
| South Carolina Electric & Gas Co. | 5.250% | 11/1/18 | 30 | 33 |
| South Carolina Electric & Gas Co. | 6.500% | 11/1/18 | 294 | 331 |
| Southern California Edison Co. | 1.125% | 5/1/17 | 160 | 159 |
| Southern California Edison Co. | 5.500% | 8/15/18 | 120 | 131 |
| Southern Co. | 2.750% | 6/15/20 | 870 | 860 |
| Southern Power Co. | 1.850% | 12/1/17 | 240 | 240 |
| Southwestern Electric Power Co. | 5.550% | 1/15/17 | 50 | 52 |
| Southwestern Electric Power Co. | 5.875% | 3/1/18 | 245 | 265 |
| Southwestern Electric Power Co. | 6.450% | 1/15/19 | 1,215 | 1,358 |
| Tampa Electric Co. | 6.100% | 5/15/18 | 525 | 572 |
| TECO Finance Inc. | 6.572% | 11/1/17 | 244 | 263 |
| Union Electric Co. | 6.400% | 6/15/17 | 380 | 406 |
| Union Electric Co. | 6.700% | 2/1/19 | 400 | 455 |
| Union Electric Co. | 5.100% | 10/1/19 | 175 | 191 |
| Virginia Electric & Power Co. | 5.400% | 4/30/18 | 145 | 157 |
| Xcel Energy Inc. | 1.200% | 6/1/17 | 345 | 343 |
| |
| Natural Gas (0.4%) | | | | |
| 12 | 2i Rete Gas SPA | 1.750% | 7/16/19 | 563 | 630 |
| Atmos Energy Corp. | 8.500% | 3/15/19 | 240 | 281 |
| Sempra Energy | 6.500% | 6/1/16 | 1,902 | 1,941 |
| Sempra Energy | 2.300% | 4/1/17 | 945 | 952 |
| Sempra Energy | 6.150% | 6/15/18 | 580 | 633 |
| Sempra Energy | 2.400% | 3/15/20 | 235 | 230 |
| Sempra Energy | 2.850% | 11/15/20 | 230 | 230 |
| |
| Other Utility (0.0%) | | | | |
| American Water Capital Corp. | 6.085% | 10/15/17 | 210 | 225 |
| 55,459 |
| Total Corporate Bonds (Cost $775,951) | 770,490 |
| Sovereign Bonds (U.S. Dollar-Denominated) (6.8%) | | | |
| Abu Dhabi National Energy Co. PJSC | 4.125% | 3/13/17 | 200 | 203 |
| 7 | Banco de Costa Rica | 5.250% | 8/12/18 | 200 | 199 |
| 7 | Banco del Estado de Chile | 2.000% | 11/9/17 | 200 | 198 |
| Banco Latinoamericano de Comercio | | | | |
| | Exterior SA | 3.750% | 4/4/17 | 800 | 811 |
| 7 | Banco Latinoamericano de Comercio | | | | |
| | Exterior SA | 3.750% | 4/4/17 | 250 | 253 |
| 7 | Banco Nacional de Desenvolvimento | | | | |
| | Economico e Social | 3.375% | 9/26/16 | 100 | 100 |
| Banco Nacional de Desenvolvimento | | | | |
| | Economico e Social | 6.369% | 6/16/18 | 170 | 168 |
| Banco Nacional de Desenvolvimento | | | | |
| | Economico e Social | 6.500% | 6/10/19 | 100 | 98 |
| 7 | Bank Nederlandse Gemeenten | 0.875% | 2/21/17 | 500 | 499 |
| 7 | Bank Nederlandse Gemeenten | 2.500% | 1/23/23 | 50 | 51 |
| 7 | Bermuda | 4.138% | 1/3/23 | 200 | 201 |
| 7 | Bermuda | 4.854% | 2/6/24 | 200 | 206 |
| 7 | Caisse d’Amortissement de la Dette | | | | |
| | Sociale | 1.375% | 1/29/18 | 125 | 125 |
| 7 | Caixa Economica Federal | 2.375% | 11/6/17 | 125 | 115 |
| 7 | CDP Financial Inc. | 3.150% | 7/24/24 | 670 | 674 |
| Centrais Eletricas Brasileiras SA | 5.750% | 10/27/21 | 400 | 313 |
| 7 | CNOOC Finance 2012 Ltd. | 3.875% | 5/2/22 | 200 | 203 |
| CNOOC Nexen Finance 2014 ULC | 1.625% | 4/30/17 | 825 | 821 |
| 7 | CNPC General Capital Ltd. | 2.750% | 4/19/17 | 125 | 126 |
| 7 | CNPC General Capital Ltd. | 2.750% | 5/14/19 | 235 | 235 |
| Corp. Andina de Fomento | 3.750% | 1/15/16 | 1,830 | 1,826 |
| Corp. Andina de Fomento | 5.750% | 1/12/17 | 100 | 104 |
| Corp. Andina de Fomento | 7.790% | 3/1/17 | 230 | 245 |
| Corp. Andina de Fomento | 1.500% | 8/8/17 | 210 | 209 |
| Corp. Andina de Fomento | 4.375% | 6/15/22 | 810 | 862 |
| 7 | Corp. Financiera de Desarrollo SA | 4.750% | 2/8/22 | 150 | 155 |
| Corp. Nacional del Cobre de Chile | 3.875% | 11/3/21 | 200 | 192 |
| 7 | Corp. Nacional del Cobre de Chile | 3.875% | 11/3/21 | 600 | 580 |
205
Vanguard Short-Term Investment-Grade Portfolio
| | | | | |
| Face | Market |
| Maturity Amount | Value • |
| | Coupon | Date | ($000) | ($000) |
| 7 | Corp. Nacional del Cobre de Chile | 3.000% | 7/17/22 | 525 | 471 |
| 7 | Corp. Nacional del Cobre de Chile | 4.500% | 8/13/23 | 200 | 194 |
| 7 | Democratic Socialist Republic of Sri | | | | |
| | Lanka | 5.125% | 4/11/19 | 200 | 191 |
| 14 | Development Bank of Japan Inc. | 2.750% | 3/15/16 | 100 | 100 |
| 14 | Development Bank of Japan Inc. | 5.125% | 2/1/17 | 200 | 208 |
| 7,15 Dexia Credit Local SA | 1.250% | 10/18/16 | 300 | 300 |
| Ecopetrol SA | 7.375% | 9/18/43 | 100 | 84 |
| Ecopetrol SA | 5.875% | 5/28/45 | 525 | 375 |
| 7 | Electricite de France SA | 1.150% | 1/20/17 | 1,390 | 1,385 |
| 7 | Electricite de France SA | 2.150% | 1/22/19 | 810 | 808 |
| 7 | Electricite de France SA | 6.000% | 1/22/14 | 60 | 60 |
| 9 | Emirates NBD PJSC | 5.750% | 5/8/19 | 300 | 228 |
| Eskom Holdings SOC Ltd. | 5.750% | 1/26/21 | 1,000 | 867 |
| 7 | Export-Import Bank of China/The via | | | | |
| | Avi Funding Co. Ltd. | 2.850% | 9/16/20 | 275 | 272 |
| Export-Import Bank of Korea | 3.750% | 10/20/16 | 705 | 718 |
| Export-Import Bank of Korea | 4.000% | 1/11/17 | 2,100 | 2,151 |
| Export-Import Bank of Korea | 2.875% | 9/17/18 | 300 | 306 |
| 7 | Federation of Malaysia | 2.991% | 7/6/16 | 125 | 126 |
| 4 | Federative Republic of Brazil | 8.000% | 1/15/18 | 488 | 503 |
| Federative Republic of Brazil | 4.875% | 1/22/21 | 1,705 | 1,577 |
| Federative Republic of Brazil | 2.625% | 1/5/23 | 645 | 492 |
| Federative Republic of Brazil | 5.000% | 1/27/45 | 200 | 133 |
| 7 | Fondo MIVIVIENDA SA | 3.375% | 4/2/19 | 500 | 497 |
| Fondo MIVIVIENDA SA | 3.375% | 4/2/19 | 150 | 149 |
| Gazprom OAO Via Gaz Capital SA | 9.250% | 4/23/19 | 265 | 295 |
| Hydro-Quebec | 2.000% | 6/30/16 | 550 | 553 |
| Industrial & Commercial Bank of | | | | |
| | China Ltd. | 2.351% | 11/13/17 | 355 | 356 |
| Industrial & Commercial Bank of | | | | |
| | China Ltd. | 3.231% | 11/13/19 | 400 | 408 |
| 14 | Japan Bank for International | | | | |
| | Cooperation | 2.500% | 1/21/16 | 500 | 500 |
| 14 | Japan Bank for International | | | | |
| | Cooperation | 2.500% | 5/18/16 | 1,000 | 1,005 |
| 14 | Japan Bank for International | | | | |
| | Cooperation | 2.250% | 7/13/16 | 910 | 916 |
| 14 | Japan Bank for International | | | | |
| | Cooperation | 1.750% | 7/31/18 | 700 | 698 |
| 14 | Japan Finance Organization for | | | | |
| | Municipalities | 4.000% | 1/13/21 | 250 | 269 |
| KazMunayGas National Co. JSC | 9.125% | 7/2/18 | 825 | 907 |
| 7 | Kingdom of Bahrain | 7.000% | 1/26/26 | 45 | 45 |
| 7,12 Kingdom of Spain | 5.850% | 1/31/22 | 335 | 468 |
| 7 | Kommunalbanken AS | 2.375% | 1/19/16 | 125 | 125 |
| 7 | Kommunalbanken AS | 0.875% | 10/3/16 | 225 | 225 |
| 7 | Kommunalbanken AS | 1.125% | 5/23/18 | 700 | 695 |
| Korea Development Bank | 1.000% | 1/22/16 | 200 | 200 |
| Korea Development Bank | 3.250% | 3/9/16 | 700 | 702 |
| Korea Development Bank | 4.000% | 9/9/16 | 200 | 204 |
| Korea Development Bank | 3.250% | 9/20/16 | 200 | 203 |
| Korea Development Bank | 3.875% | 5/4/17 | 675 | 694 |
| Korea Development Bank | 2.250% | 8/7/17 | 555 | 559 |
| Korea Development Bank | 3.500% | 8/22/17 | 575 | 591 |
| Korea Development Bank | 1.500% | 1/22/18 | 400 | 396 |
| 7 | Korea Expressway Corp. | 1.625% | 4/28/17 | 200 | 199 |
| Korea Expressway Corp. | 1.625% | 4/28/17 | 200 | 199 |
| Korea Expressway Corp. | 1.875% | 10/22/17 | 515 | 514 |
| Korea Gas Corp. | 2.875% | 7/29/18 | 200 | 203 |
| 7 | Korea National Oil Corp. | 4.000% | 10/27/16 | 525 | 535 |
| Korea National Oil Corp. | 2.750% | 1/23/19 | 350 | 353 |
| 7 | Korea Resources Corp. | 2.125% | 5/2/18 | 125 | 124 |
| 7 | Korea Western Power Co. Ltd. | 2.875% | 10/10/18 | 200 | 203 |
| Majapahit Holding BV | 8.000% | 8/7/19 | 400 | 449 |
| North American Development Bank | 2.300% | 10/10/18 | 150 | 151 |
| 7 | OCP SA | 5.625% | 4/25/24 | 200 | 203 |
| 16 | Oesterreichische Kontrollbank AG | 2.000% | 6/3/16 | 650 | 653 |
| | | | | |
| Face | Market |
| Maturity Amount | Value • |
| | Coupon | Date | ($000) | ($000) |
| 7 | Ooredoo International Finance Ltd. | 3.375% | 10/14/16 | 375 | 379 |
| 7 | Ooredoo International Finance Ltd. | 3.250% | 2/21/23 | 125 | 122 |
| 4 | Oriental Republic of Uruguay | 4.375% | 10/27/27 | 80 | 79 |
| 4 | Oriental Republic of Uruguay | 5.100% | 6/18/50 | 60 | 52 |
| 7 | Perusahaan Penerbit SBSN Indonesia II 4.000% | | 11/21/18 | 200 | 210 |
| 6 | Petrobras Global Finance BV | 1.990% | 5/20/16 | 425 | 418 |
| Petrobras Global Finance BV | 2.000% | 5/20/16 | 170 | 167 |
| 6 | Petrobras Global Finance BV | 2.460% | 1/15/19 | 300 | 226 |
| Petrobras Global Finance BV | 3.000% | 1/15/19 | 130 | 98 |
| Petrobras International Finance Co. SA | 3.875% | 1/27/16 | 1,411 | 1,407 |
| Petrobras International Finance Co. SA | 6.125% | 10/6/16 | 370 | 367 |
| Petrobras International Finance Co. SA | 5.875% | 3/1/18 | 700 | 625 |
| Petroleos Mexicanos | 5.750% | 3/1/18 | 5,370 | 5,624 |
| Petroleos Mexicanos | 3.500% | 7/18/18 | 255 | 253 |
| Petroleos Mexicanos | 8.000% | 5/3/19 | 2,785 | 3,072 |
| Petroleos Mexicanos | 5.500% | 1/21/21 | 930 | 941 |
| Province of British Columbia | 2.100% | 5/18/16 | 200 | 201 |
| Province of British Columbia | 1.200% | 4/25/17 | 225 | 225 |
| Province of Manitoba | 1.300% | 4/3/17 | 775 | 775 |
| Province of New Brunswick | 2.750% | 6/15/18 | 10 | 10 |
| Province of Ontario | 2.300% | 5/10/16 | 1,775 | 1,786 |
| Province of Ontario | 1.200% | 2/14/18 | 300 | 298 |
| Province of Ontario | 3.000% | 7/16/18 | 275 | 284 |
| Province of Ontario | 1.875% | 5/21/20 | 230 | 228 |
| Quebec | 5.000% | 3/1/16 | 250 | 252 |
| Quebec | 3.500% | 7/29/20 | 250 | 264 |
| Quebec | 2.750% | 8/25/21 | 715 | 724 |
| Quebec | 2.625% | 2/13/23 | 150 | 149 |
| 4 | Ras Laffan Liquefied Natural Gas | | | | |
| | Co. Ltd. II | 5.298% | 9/30/20 | 189 | 202 |
| 4,7 Ras Laffan Liquefied Natural Gas | | | | |
| | Co. Ltd. II | 5.298% | 9/30/20 | 105 | 112 |
| Republic of Colombia | 7.375% | 3/18/19 | 180 | 201 |
| Republic of Colombia | 4.375% | 7/12/21 | 2,120 | 2,125 |
| 4 | Republic of Colombia | 2.625% | 3/15/23 | 200 | 176 |
| 4 | Republic of Colombia | 4.500% | 1/28/26 | 200 | 192 |
| 4 | Republic of Colombia | 5.000% | 6/15/45 | 250 | 211 |
| Republic of Croatia | 6.250% | 4/27/17 | 1,360 | 1,408 |
| Republic of Hungary | 4.000% | 3/25/19 | 800 | 835 |
| Republic of Indonesia | 6.875% | 3/9/17 | 115 | 122 |
| Republic of Indonesia | 6.875% | 1/17/18 | 280 | 304 |
| Republic of Indonesia | 5.875% | 3/13/20 | 1,550 | 1,686 |
| Republic of Indonesia | 4.875% | 5/5/21 | 200 | 207 |
| 12 | Republic of Indonesia | 2.875% | 7/8/21 | 615 | 662 |
| Republic of Indonesia | 3.375% | 4/15/23 | 200 | 186 |
| 12 | Republic of Indonesia | 3.375% | 7/30/25 | 430 | 440 |
| Republic of Indonesia | 5.950% | 1/8/46 | 200 | 198 |
| Republic of Italy | 4.750% | 1/25/16 | 1,255 | 1,257 |
| Republic of Kazakhstan | 6.500% | 7/21/45 | 800 | 788 |
| Republic of Korea | 5.125% | 12/7/16 | 250 | 259 |
| Republic of Namibia | 5.500% | 11/3/21 | 100 | 101 |
| Republic of Poland | 6.375% | 7/15/19 | 1,580 | 1,805 |
| Republic of Poland | 5.125% | 4/21/21 | 350 | 389 |
| Republic of Poland | 5.000% | 3/23/22 | 835 | 926 |
| Republic of Poland | 4.000% | 1/22/24 | 200 | 210 |
| 7,12 Republic of Portugal | 2.875% | 10/15/25 | 255 | 285 |
| Republic of Romania | 4.375% | 8/22/23 | 200 | 208 |
| 12 | Republic of Romania | 2.750% | 10/29/25 | 365 | 402 |
| Republic of Serbia | 5.250% | 11/21/17 | 200 | 208 |
| 7 | Republic of Slovenia | 5.250% | 2/18/24 | 300 | 331 |
| Republic of Turkey | 7.000% | 9/26/16 | 2,135 | 2,211 |
| Republic of Turkey | 7.500% | 7/14/17 | 3,495 | 3,758 |
| Republic of Turkey | 6.750% | 4/3/18 | 2,315 | 2,489 |
| Republic of Turkey | 7.000% | 3/11/19 | 400 | 439 |
| Republic of Turkey | 3.250% | 3/23/23 | 400 | 366 |
| Republic of Turkey | 4.875% | 4/16/43 | 235 | 207 |
| 7 | Rio Oil Finance Trust Series 2014-3 | 9.750% | 1/6/27 | 340 | 245 |
| SABIC Capital II BV | 2.625% | 10/3/18 | 400 | 400 |
206
Vanguard Short-Term Investment-Grade Portfolio
| | | | | |
| Face | Market |
| Maturity Amount | Value • |
| | Coupon | Date | ($000) | ($000) |
| 7 | Saudi Electricity Global Sukuk Co. 3 | 4.000% | 4/8/24 | 180 | 178 |
| 7 | Sinopec Group Overseas | | | | |
| | Development 2013 Ltd. | 4.375% | 10/17/23 | 600 | 620 |
| State Bank of India | 4.125% | 8/1/17 | 800 | 823 |
| State of Israel | 5.500% | 11/9/16 | 125 | 130 |
| State of Israel | 4.000% | 6/30/22 | 200 | 215 |
| Statoil ASA | 1.800% | 11/23/16 | 100 | 100 |
| Statoil ASA | 3.125% | 8/17/17 | 175 | 179 |
| Statoil ASA | 1.200% | 1/17/18 | 1,225 | 1,212 |
| Statoil ASA | 2.250% | 11/8/19 | 500 | 499 |
| Svensk Exportkredit AB | 2.125% | 7/13/16 | 600 | 604 |
| Svensk Exportkredit AB | 1.750% | 5/30/17 | 100 | 101 |
| Svensk Exportkredit AB | 1.125% | 4/5/18 | 250 | 248 |
| 7 | Temasek Financial I Ltd. | 4.300% | 10/25/19 | 250 | 269 |
| 7 | Turkiye Halk Bankasi AS | 4.875% | 7/19/17 | 200 | 204 |
| United Mexican States | 5.625% | 1/15/17 | 285 | 296 |
| United Mexican States | 4.000% | 10/2/23 | 150 | 152 |
| United Mexican States | 5.750% | 10/12/10 | 130 | 121 |
| Vnesheconombank Via VEB Finance plc 5.450% | 11/22/17 | 100 | 100 |
| Total Sovereign Bonds (Cost $89,638) | 88,605 |
| Taxable Municipal Bonds (0.4%) | | | | |
| California Department of Water | | | | |
| | Resources Water System Revenue | | | | |
| | (Central Valley Project) | 1.871% | 12/1/19 | 200 | 201 |
| California GO | 5.950% | 3/1/18 | 650 | 707 |
| California GO | 6.200% | 10/1/19 | 350 | 402 |
| Colorado Housing & Finance Authority | | | | |
| | Employment Compensation Special | | | | |
| | Assessment Revenue | 1.600% | 5/15/16 | 400 | 402 |
| Florida Hurricane Catastrophe Fund | | | | |
| | Finance Corp. Revenue | 1.298% | 7/1/16 | 200 | 201 |
| Florida Hurricane Catastrophe Fund | | | | |
| | Finance Corp. Revenue | 2.107% | 7/1/18 | 150 | 151 |
| George Washington University District | | | | |
| | of Columbia GO | 3.485% | 9/15/22 | 200 | 203 |
| Harris County TX Toll Road Revenue | 1.361% | 8/15/17 | 250 | 249 |
| Illinois GO | 4.961% | 3/1/16 | 745 | 749 |
| Illinois GO | 5.365% | 3/1/17 | 220 | 228 |
| Illinois GO | 5.665% | 3/1/18 | 110 | 116 |
| JobsOhio Beverage System Statewide | | | | |
| | Liquor Profits Revenue | 2.217% | 1/1/19 | 150 | 152 |
| Louisiana Local Government | | | | |
| | Environmental Facilities & Community | | | | |
| | Development Authority Revenue | | | | |
| | 2010-EGSL | 3.220% | 2/1/21 | 750 | 767 |
| Louisiana Local Government | | | | |
| | Environmental Facilities & Community | | | | |
| | Development Authority Revenue | | | | |
| | 2010-ELL | 3.450% | 2/1/22 | 350 | 361 |
| 6 | Mississippi GO (Nissan North | | | | |
| | America, Inc. Project) | 0.944% | 11/1/17 | 300 | 301 |
| New York City NY Industrial | | | | |
| | Development Agency Special Facility | | | | |
| | Revenue (American Airlines Inc. | | | | |
| | John F. Kennedy International | | | | |
| | Airport Project) | 7.500% | 8/1/16 | 20 | 21 |
| University of California Revenue | 2.054% | 5/15/18 | 100 | 101 |
| University of California Revenue | 1.745% | 5/15/19 | 250 | 250 |
| Total Taxable Municipal Bonds (Cost $5,487) | 5,562 |
| | | | | |
| Market |
| Value• |
| | Coupon Shares | ($000) |
| Convertible Preferred Stocks (0.0%) | | | | |
| 10 | Lehman Brothers Holdings Inc. Pfd. | | | | |
| | (Cost $694) | 7.250% 700 | — |
| Temporary Cash Investment (2.0%) | | | | |
| Money Market Fund (2.0%) | | | | |
| 17 | Vanguard Market Liquidity Fund | | | | |
| | (Cost $26,736) | 0.363% | 26,736,469 26,736 |
| | | | | |
| | Expiration Date | Contracts | |
| Options on Futures Purchased (0.0%) | | | | |
| Put Options on 10-year U.S. | | | | |
| | Treasury Note Futures Contracts, | | | | |
| | Strike Price $124.00 (Cost $13) | 1/22/16 | 40 | 3 |
| Total Investments (101.2%) (Cost $1,328,410) | 1,319,079 |
| Liability for Options Written (0.0%) | | | | |
| Call Options on 10-year U.S. | | | | |
| | Treasury Note Futures Contracts, | | | | |
| | Strike Price $127.00 | 1/22/16 | 44 | (8) |
| Call Options on 10-year U.S. | | | | |
| | Treasury Note Futures Contracts, | | | | |
| | Strike Price $127.50 | 1/22/16 | 33 | (4) |
| Call Options on 10-year U.S. | | | | |
| | Treasury Note Futures Contracts, | | | | |
| | Strike Price $128.00 | 2/19/16 | 8 | (2) |
| Call Options on 10-year U.S. | | | | |
| | Treasury Note Futures Contracts, | | | | |
| | Strike Price $128.50 | 2/19/16 | 8 | (1) |
| Put Options on 10-year U.S. | | | | |
| | Treasury Note Futures Contracts, | | | | |
| | Strike Price $125.50 | 1/22/16 | 33 | (13) |
| Put Options on 10-year U.S. | | | | |
| | Treasury Note Futures Contracts, | | | | |
| | Strike Price $125.00 | 1/22/16 | 44 | (10) |
| Total Liability for Options Written (Premiums received $54) | | (38) |
| | | | | |
| Amount |
| ($000) |
| Other Assets and Liabilities (-1.2%) | | | | |
| Other Assets | | | | |
| Investment in Vanguard | | | | 115 |
| Receivables for Investment Securities Sold | | | | 839 |
| Receivables for Accrued Income | | | | 9,099 |
| Receivables for Capital Shares Issued | | | | 274 |
| Other Assets | | | | 2,393 |
| Total Other Assets | | 12,720 |
| Liabilities | | | | |
| Payables for Investment Securities Purchased | | | (12,068) |
| Payables for Capital Shares Redeemed | | | | (13,821) |
| Payables to Vanguard | | | | (1,155) |
| Other Liabilities | | | | (1,319) |
| Total Liabilities | | (28,363) |
| Net Assets (100%) | | | | |
| Applicable to 123,537,531 outstanding $.001 par value shares of | | |
| beneficial interest (unlimited authorization) | 1,303,398 |
| Net Asset Value Per Share | | $10.55 |
| | | | |
207
Vanguard Short-Term Investment-Grade Portfolio
| |
| At December 31, 2015, net assets consisted of: | |
| Amount |
| ($000) |
| Paid-in Capital | 1,290,031 |
| Undistributed Net Investment Income | 23,481 |
| Accumulated Net Realized Losses | (933) |
| Unrealized Appreciation (Depreciation) | |
| Investment Securities | (9,321) |
| Futures Contracts | (90) |
| Options on Futures Contracts | 6 |
| Swap Contracts | 371 |
| Forward Currency Contracts | (145) |
| Foreign Currencies | (2) |
| Net Assets | 1,303,398 |
| |
| |
| |
| |
| |
| |
• See Note A in Notes to Financial Statements.
1 Securities with a value of $519,000 have been segregated as collateral for open forward currency contracts and over-the-counter swap contracts.
2 Securities with a value of $991,000 have been segregated as initial margin for open futures contracts.
3 Securities with a value of $579,000 have been segregated as initial margin for open cleared swap contracts.
4 The average or expected maturity is shorter than the final maturity shown because of the possibility of interim principal payments and prepayments or the possibility of the issue being called.
5 The issuer was placed under federal conservatorship in September 2008; since that time, its daily operations have been managed by the Federal Housing Finance Agency and it receives capital from the U.S. Treasury, as needed to maintain a positive net worth, in exchange for senior preferred stock.
6 Adjustable-rate security.
7 Security exempt from registration under Rule 144A of the Securities Act of 1933. Such securities may be sold in transactions exempt from registration, normally to qualified institutional buyers. At December 31, 2015, the aggregate value of these securities was $167,577,000, representing 12.9% of net assets.
8 Security made only partial principal and/or interest payments during the period ended December 31, 2015.
9 Face amount denominated in Australian dollars.
10 Non-income-producing security—security in default.
11 Face amount denominated in British pounds.
12 Face amount denominated in Euro.
13 Scheduled principal and interest payments are guaranteed by Municipal Bond Insurance Association.
14 Guaranteed by the Government of Japan.
15 Guaranteed by multiple countries.
16 Guaranteed by the Republic of Austria.
17 Affiliated money market fund available only to Vanguard funds and certain trusts and accounts managed by Vanguard. Rate shown is the 7-day yield.
GO—General Obligation Bond.
See accompanying Notes, which are an integral part of the Financial Statements.
208
| | | |
| Vanguard Short-Term Investment-Grade Portfolio |
| |
| |
| Statement of Operations |
| |
| Year Ended |
| December 31, 2015 |
| | ($000) |
| Investment Income | | |
| Income | | |
| Interest1 | 26,900 |
| Total Income | 26,900 |
| Expenses | | |
| The Vanguard Group—Note B | | |
| Investment Advisory Services | 130 |
| Management and Administrative | 1,586 |
| Marketing and Distribution | 247 |
| Custodian Fees | 41 |
| Auditing Fees | 27 |
| Shareholders’ Reports | 19 |
| Trustees’ Fees and Expenses | 1 |
| Total Expenses | 2,051 |
| Net Investment Income | 24,849 |
| Realized Net Gain (Loss) | | |
| Investment Securities Sold | (1,269) |
| Futures Contracts | (835) |
| Options on Futures Contracts | 128 |
| Swap Contracts | 303 |
| Foreign Currencies and Forward | | |
| Currency Contracts | 1,069 |
| Realized Net Gain (Loss) | (604) |
| Change in Unrealized Appreciation | |
| (Depreciation) | | |
| Investment Securities | (9,720) |
| Futures Contracts | 306 |
| Options on Futures Contracts | 5 |
| Swap Contracts | (141) |
| Foreign Currencies and Forward | | |
| Currency Contracts | (159) |
| Change in Unrealized Appreciation | |
| (Depreciation) | (9,709) |
| Net Increase (Decrease) in Net Assets | |
| Resulting from Operations | 14,536 |
| 1 Interest income from an affiliated company of the portfolio was $25,000. |
| | | | |
| | |
| Statement of Changes in Net Assets | | |
| |
| Year Ended December 31, |
| 2015 | 2014 |
| ($000) | ($000) |
| Increase (Decrease) in Net Assets | | |
| Operations | | |
| Net Investment Income | 24,849 | 22,565 |
| Realized Net Gain (Loss) | (604) | 2,718 |
| Change in Unrealized Appreciation (Depreciation) | (9,709) | (5,200) |
| Net Increase (Decrease) in Net Assets Resulting from Operations | 14,536 | 20,083 |
| Distributions | | |
| Net Investment Income | (23,182) | (19,396) |
| Realized Capital Gain1 | (235) | (5,927) |
| Total Distributions | (23,417) | (25,323) |
| Capital Share Transactions | | |
| Issued | 260,055 | 287,191 |
| Issued in Lieu of Cash Distributions | 23,417 | 25,323 |
| Redeemed | (236,243) | (162,740) |
| Net Increase (Decrease) from Capital Share Transactions | 47,229 | 149,774 |
| Total Increase (Decrease) | 38,348 | 144,534 |
| Net Assets |
| Beginning of Period | 1,265,050 | 1,120,516 |
| End of Period2 | 1,303,398 | 1,265,050 |
1 Includes fiscal 2015 and 2014 short-term gain distributions totaling $235,000 and $1,078,000, respectively. Short-term gain distributions are treated as ordinary income dividends for tax purposes.
2 Net Assets—End of Period includes undistributed (overdistributed) net investment income of $23,481,000 and $20,965,000.
See accompanying Notes, which are an integral part of the Financial Statements.
209
| | | | | |
| Vanguard Short-Term Investment-Grade Portfolio | | | | | |
| |
| |
| Financial Highlights | | | | | |
| |
| |
| For a Share Outstanding | | | Year Ended December 31, |
| Throughout Each Period | 2015 | 2014 | 2013 | 2012 | 2011 |
| Net Asset Value, Beginning of Period | $10.63 | $10.68 | $10.89 | $10.71 | $10.97 |
| Investment Operations | | | | |
| Net Investment Income | .207 | .187 | .190 | .233 | .258 |
| Net Realized and Unrealized Gain (Loss) | | | | | |
| on Investments | (.088) | (.002) | (.075) | .232 | (.043) |
| Total from Investment Operations | .119 | .185 | .115 | .465 | .215 |
| Distributions | | | | | |
| Dividends from Net Investment Income | (.197) | (.180) | (.235) | (.285) | (.370) |
| Distributions from Realized Capital Gains | (.002) | (.055) | (.090) | — | (.105) |
| Total Distributions | (.199) | (.235) | (.325) | (.285) | (.475) |
| Net Asset Value, End of Period | $10.55 | $10.63 | $10.68 | $10.89 | $10.71 |
| |
| Total Return | 1.12% | 1.76% | 1.08% | 4.42% | 2.02% |
| |
| Ratios/Supplemental Data | | | | | |
| Net Assets, End of Period (Millions) | $1,303 | $1,265 | $1,121 | $1,059 | $991 |
| Ratio of Total Expenses to Average Net Assets | 0.16% | 0.20% | 0.20% | 0.20% | 0.20% |
| Ratio of Net Investment Income to | | | | | |
| Average Net Assets | 1.94% | 1.88% | 1.81% | 2.18% | 2.51% |
| Portfolio Turnover Rate | 74% | 83% | 112% | 79% | 50% |
Notes to Financial Statements
Vanguard Short-Term Investment-Grade Portfolio, a portfolio of Vanguard Variable Insurance Funds, is registered under the Investment Company Act of 1940 as an open-end investment company. The portfolio’s shares are only available for purchase by separate accounts of insurance companies as investments for variable annuity plans, variable life insurance contracts, or other variable benefit insurance contracts. Certain of the portfolio’s investments are in corporate debt instruments; the issuers’ abilities to meet their obligations may be affected by economic developments in their respective industries.
A. The following significant accounting policies conform to generally accepted accounting principles for U.S. investment companies. The portfolio consistently follows such policies in preparing its financial statements.
1. Security Valuation: Securities are valued as of the close of trading on the New York Stock Exchange (generally 4 p.m., Eastern time) on the valuation date. Equity securities are valued at the latest quoted sales prices or official closing prices taken from the primary market in which each security trades; such securities not traded on the valuation date are valued at the mean of the latest quoted bid and asked prices. Bonds, and temporary cash investments acquired over 60 days to maturity, are valued using the latest bid prices or using valuations based on a matrix system (which considers such factors as security prices, yields, maturities, and ratings), both as furnished by independent pricing services. Structured debt securities, including mortgages and asset-backed securities, are valued using the latest bid prices or using valuations based on a matrix system that considers such factors as issuer, tranche, nominal or option-adjusted spreads, weighted average coupon, weighted average maturity, credit enhancements, and collateral. Investments in Vanguard Market Liquidity Fund are valued at that fund’s net asset value. Other temporary cash investments are valued at amortized cost, which approximates market value. Securities for which market quotations are not readily available, or whose values have been affected by events occurring before the portfolio’s pricing time but after the close of the securities’ primary markets, are valued at their fair values calculated according to procedures adopted by the board of trustees. These procedures include obtaining quotations from an independent pricing service, monitoring news to identify significant market- or security-specific events, and evaluating changes in the values of foreign market proxies (for example, ADRs, futures contracts, or exchange-traded funds), between the time the foreign markets close and the portfolio’s pricing time. When fair-value pricing is employed, the prices of securities used by a portfolio to calculate its net asset value may differ from quoted or published prices for the same securities.
210
Vanguard Short-Term Investment-Grade Portfolio
2. Foreign Currency: Securities and other assets and liabilities denominated in foreign currencies are translated into U.S. dollars using exchange rates obtained from an independent third party as of the portfolio’s pricing time on the valuation date. Realized gains (losses) and unrealized appreciation (depreciation) on investment securities include the effects of changes in exchange rates since the securities were purchased, combined with the effects of changes in security prices. Fluctuations in the value of other assets and liabilities resulting from changes in exchange rates are recorded as unrealized foreign currency gains (losses) until the assets or liabilities are settled in cash, at which time they are recorded as realized foreign currency gains (losses).
3. Futures and Options: The portfolio uses futures contracts and options on futures contracts to invest in fixed income asset classes with greater efficiency and lower cost than is possible through direct investment, to add value when these instruments are attractively priced, or to adjust sensitivity to changes in interest rates. The primary risks associated with the use of futures contracts are imperfect correlation between changes in market values of bonds held by the portfolio and the prices of futures contracts, and the possibility of an illiquid market. The primary risk associated with purchasing options is that interest rates move in such a way that the option is out-of-the-money, the position is worthless at expiration, and the portfolio loses the premium paid. The primary risk associated with writing options is that interest rates move in such a way that the option is in-the-money, the counterparty exercises the option, and the portfolio loses an amount equal to the market value of the option written less the premium received. Counterparty risk involving futures and exchange-traded options is mitigated because a regulated clearinghouse is the counterparty instead of the clearing broker. To further mitigate counterparty risk, the portfolio trades futures and options on an exchange, monitors the financial strength of its clearing brokers and clearinghouse, and has entered into clearing agreements with its clearing brokers. The clearinghouse imposes initial margin requirements to secure the portfolio’s performance and requires daily settlement of variation margin representing changes in the market value of each contract.
Futures contracts are valued at their quoted daily settlement prices. The aggregate notional amounts of the contracts are not recorded in the Statement of Net Assets. Fluctuations in the value of the contracts are recorded in the Statement of Net Assets as an asset (liability) and in the Statement of Operations as unrealized appreciation (depreciation) until the contracts are closed, when they are recorded as realized futures gains (losses).
During the year ended December 31, 2015, the portfolio’s average investments in long and short futures contracts represented 4% and 3% of net assets, respectively, based on the average of aggregate settlement values at each quarter-end during the period.
Options on futures contracts are also valued at their quoted daily settlement prices. The premium paid for a purchased option is recorded in the Statement of Net Assets as an asset that is subsequently adjusted daily to the current market value of the option purchased. The premium received for a written option is recorded in the Statement of Net Assets as an asset with an equal liability that is subsequently adjusted daily to the current market value of the option written. Fluctuations in the value of the options are recorded in the Statement of Operations as unrealized appreciation (depreciation) until expired, closed, or exercised, at which time realized gains (losses) are recognized.
During the year ended December 31, 2015, the portfolio’s average value of options purchased and options written each represented less than 1% of net assets, based on the average market values at each quarter-end during the period.
4. Forward Currency Contracts: The portfolio enters into forward currency contracts to protect the value of securities and related receivables and payables against changes in future foreign exchange rates. The portfolio’s risks in using these contracts include movement in the values of the foreign currencies relative to the U.S. dollar and the ability of the counterparties to fulfill their obligations under the contracts. The portfolio mitigates its counterparty risk by entering into forward currency contracts only with a diverse group of prequalified counterparties, monitoring their financial strength, entering into master netting arrangements with its counterparties, and requiring its counterparties to transfer collateral as security for their performance. The master netting arrangements provide that, in the event of a counterparty’s default (including bankruptcy), the portfolio may terminate the forward currency contracts, determine the net amount owed by either party in accordance with its master netting arrangements, and sell or retain any collateral held up to the net amount owed to the portfolio under the master netting arrangements. The forward currency contracts contain provisions whereby a counterparty may terminate open contracts if the portfolio’s net assets decline below a certain level, triggering a payment by the portfolio if the portfolio is in a net liability position at the time of the termination. The payment amount would be reduced by any collateral the portfolio has pledged.
Any assets pledged as collateral for open contracts are noted in the Statement of Net Assets.
211
Vanguard Short-Term Investment-Grade Portfolio
The value of collateral received or pledged is compared daily to the value of the forward currency contracts exposure with each counterparty, and any difference, if in excess of a specified minimum transfer amount, is adjusted and settled within two business days.
Forward currency contracts are valued at their quoted daily prices obtained from an independent third party, adjusted for currency risk based on the expiration date of each contract. The notional amounts of the contracts are not recorded in the Statement of Net Assets. Fluctuations in the value of the contracts are recorded in the Statement of Net Assets as an asset (liability) and in the Statement of Operations as unrealized appreciation (depreciation) until the contracts are closed, when they are recorded as realized forward currency contract gains (losses).
During the year ended December 31, 2015, the portfolio’s average investment in forward currency contracts represented 2% of net assets, based on the average of notional amounts at each quarter-end during the period.
5. Swap Contracts: The portfolio invests in credit default swaps to adjust the overall credit risk of the portfolio or to actively overweight or underweight credit risk to a specific issuer or group of issuers. The portfolio may sell credit protection through credit default swaps to simulate investments in long positions that are either unavailable or considered to be less attractively priced in the bond market. The portfolio may purchase credit protection through credit default swaps to reduce credit exposure to a given issuer or issuers. Under the terms of the swaps, an up-front payment may be exchanged between the seller and buyer. In addition, the seller of the credit protection receives a periodic payment of premium from the buyer that is a fixed percentage applied to a notional amount. If, for example, the reference entity is subject to a credit event (such as bankruptcy, failure to pay, or obligation acceleration) during the term of the swap, the seller agrees to either physically settle or cash settle the swap contract. If the swap is physically settled, the seller agrees to pay the buyer an amount equal to the notional amount and take delivery of a debt instrument of the reference issuer with a par amount equal to such notional amount. If the swap is cash settled, the seller agrees to pay the buyer the difference between the notional amount and the final price for the relevant debt instrument, as determined either in a market auction or pursuant to a pre-agreed-upon valuation procedure.
The portfolio enters into interest rate swap transactions to adjust the portfolio’s sensitivity to changes in interest rates and maintain the ability to generate income at prevailing market rates. Under the terms of the swaps, one party pays the other an amount that is a fixed percentage rate applied to a notional amount. In return, the counterparty agrees to pay a floating rate, which is reset periodically based on short-term interest rates, applied to the same notional amount.
The portfolio invests in cross-currency swaps to hedge the currency risk associated with investing in foreign securities. Under the terms of the swaps, the parties exchange a series of payments calculated on the basis of a fixed rate applied to a notional amount, on specified dates and in a specified currency. Additionally, currency amounts are exchanged by the counterparties at the initiation of the contract, with an agreement to reverse the exchange of the currency amounts upon termination of the contract.
The notional amounts of swap contracts are not recorded in the Statement of Net Assets. Swaps are valued daily based on market quotations received from independent pricing services or recognized dealers and the change in value is recorded in the Statement of Net Assets as an asset (liability) and in the Statement of Operations as unrealized appreciation (depreciation) until the seller of credit protection is required to take delivery (or, in a cash settled swap, pay the settlement amount determined) upon occurrence of a credit event, periodic payments are made, or the swap terminates, at which time realized gain (loss) is recorded. The net premium to be received or paid by the portfolio under swap contracts is accrued daily and recorded as realized gain (loss) over the life of the contract.
The primary risk associated with selling credit protection is that, upon the occurrence of a defined credit event, the market value of the debt instrument received by the portfolio (or, in a cash settled swap, the debt instruments used to determine the settlement payment by the portfolio) will be significantly less than the amount paid by the portfolio and, in a physically settled swap, the portfolio may receive an illiquid debt instrument. A risk associated with all types of swaps is the possibility that a counterparty may default on its obligation to pay net amounts due to the portfolio. The portfolio’s maximum amount subject to counterparty risk is the unrealized appreciation on the swap contract. The portfolio mitigates its counterparty risk by entering into swaps only with a diverse group of prequalified counterparties, monitoring their financial strength, entering into master netting arrangements with its counterparties, and requiring its counterparties to transfer collateral as security for their performance. In the event of a counterparty’s default (including bankruptcy), the portfolio may terminate any swap contracts with that counterparty, determine the net amount owed by either party
212
Vanguard Short-Term Investment-Grade Portfolio
in accordance with its master netting arrangements, and sell or retain any collateral held up to the net amount owed to the portfolio under the master netting arrangements. The swap contracts contain provisions whereby a counterparty may terminate open contracts if the portfolio’s net assets decline below a certain level, triggering a payment by the portfolio if the portfolio is in a net liability position at the time of the termination. The payment amount would be reduced by any collateral the portfolio has pledged. Any securities pledged as collateral for open contracts are noted in the Statement of Net Assets. The value of collateral received or pledged is compared daily to the value of the swap contracts exposure with each counterparty, and any difference, if in excess of a specified minimum transfer amount, is adjusted and settled within two business days.
The portfolio enters into centrally cleared interest rate swaps to achieve the same objectives specified with respect to the equivalent over-the-counter swaps but with less counterparty risk because a regulated clearinghouse is the counterparty instead of the clearing broker or executing broker. The clearinghouse imposes initial margin requirements to secure the portfolio’s performance, and requires daily settlement of variation margin representing changes in the market value of each contract. To further mitigate counterparty risk, the portfolio trades with a diverse group of prequalified executing brokers; monitors the financial strength of its clearing brokers, executing brokers, and clearinghouse; and has entered into agreements with its clearing brokers and executing brokers.
During the year ended December 31, 2015, the portfolio’s average amounts of credit protection sold and credit protection purchased each represented 1% of net assets, based on the average of notional amounts at each quarter-end during the period. The average total amount of interest rate swaps represented 4% of net assets, based on the average of notional amounts at each quarter-end during the period. The average amount of cross currency swaps represented less than 1% of net assets, based on the average of notional amounts at each quarter-end during the period.
6. Federal Income Taxes: The portfolio intends to continue to qualify as a regulated investment company and distribute all of its taxable income. Management has analyzed the portfolio’s tax positions taken for all open federal income tax years (December 31, 2012–2015), and has concluded that no provision for federal income tax is required in the portfolio’s financial statements.
7. Distributions: Distributions to shareholders are recorded on the ex-dividend date.
8. Credit Facility: The portfolio and certain other funds managed by The Vanguard Group (“Vanguard”) participate in a $3 billion committed credit facility provided by a syndicate of lenders pursuant to a credit agreement that may be renewed annually; each fund is individually liable for its borrowings, if any, under the credit facility. Borrowings may be utilized for temporary and emergency purposes, and are subject to the portfolio’s regulatory and contractual borrowing restrictions. The participating funds are charged administrative fees and an annual commitment fee of 0.06% of the undrawn amount of the facility; these fees are allocated to the funds based on a method approved by the portfolio’s board of trustees and included in Management and Administrative expenses on the portfolio’s Statement of Operations. Any borrowings under this facility bear interest at a rate equal to the higher of the federal funds rate or LIBOR reference rate plus an agreed-upon spread.
The portfolio had no borrowings outstanding at December 31, 2015, or at any time during the period then ended.
9. Other: Dividend income is recorded on the ex-dividend date. Interest income includes income distributions received from Vanguard Market Liquidity Fund and is accrued daily. Premiums and discounts on debt securities purchased are amortized and accreted, respectively, to interest income over the lives of the respective securities. Security transactions are accounted for on the date securities are bought or sold. Costs used to determine realized gains (losses) on the sale of investment securities are those of the specific securities sold.
B. In accordance with the terms of a Funds’ Service Agreement (the “FSA”) between Vanguard and the portfolio, Vanguard furnishes to the portfolio investment advisory, corporate management, administrative, marketing, and distribution services at Vanguard’s cost of operations (as defined by the FSA). These costs of operations are allocated to the portfolio based on methods and guidelines approved by the board of trustees. Vanguard does not require reimbursement in the current period for certain costs of operations (such as deferred compensation/benefits and risk/insurance costs); the portfolio’s liability for these costs of operations is included in Payables to Vanguard on the Statement of Net Assets.
Upon the request of Vanguard, the portfolio may invest up to 0.40% of its net assets as capital in Vanguard. At December 31, 2015, the portfolio had contributed to Vanguard capital in the amount of $115,000, representing 0.01% of the portfolio’s net assets and 0.05% of Vanguard’s capitalization. The portfolio’s trustees and officers are also directors and employees, respectively, of Vanguard.
213
Vanguard Short-Term Investment-Grade Portfolio
C. Various inputs may be used to determine the value of the portfolio’s investments. These inputs are summarized in three broad levels for financial statement purposes. The inputs or methodologies used to value securities are not necessarily an indication of the risk associated with investing in those securities.
Level 1—Quoted prices in active markets for identical securities.
Level 2—Other significant observable inputs (including quoted prices for similar securities, interest rates, prepayment speeds, credit risk, etc.).
Level 3—Significant unobservable inputs (including the portfolio’s own assumptions used to determine the fair value of investments).
The following table summarizes the market value of the portfolio’s investments as of December 31, 2015, based on the inputs used to value them:
| | | |
| Level 1 | Level 2 | Level 3 |
| Investments | ($000) | ($000) | ($000) |
| U.S. Government and Agency Obligations | — | 160,085 | — |
| Asset-Backed/Commercial Mortgage-Backed Securities | — | 267,598 | — |
| Corporate Bonds | — | 770,490 | — |
| Sovereign Bonds | — | 88,605 | — |
| Taxable Municipal Bonds | — | 5,562 | — |
| Convertible Preferred Stocks | — | — | — |
| Temporary Cash Investments | 26,736 | — | — |
| Options on Futures Purchased | 3 | — | — |
| Liability for Options Written | (38) | — | — |
| Futures Contracts—Assets1 | 72 | — | — |
| Futures Contracts—Liabilities1 | (112) | — | — |
| Forward Currency Contracts—Assets | — | 226 | — |
| Forward Currency Contracts—Liabilities | — | (371) | — |
| Swap Contracts—Assets | 41 | 534 | — |
| Swap Contracts—Liabilities | (44)1 | (105) | — |
| Total | 26,621 | 1,292,624 | — |
| 1 Represents variation margin on the last day of the reporting period. |
D. At December 31, 2015, the fair values of derivatives were reflected in the Statement of Net Assets as follows:
| | | | |
| Interest Rate | Currency | Credit | |
| Contracts | Contracts | Contracts | Total |
| Statement of Net Assets Caption | ($000) | ($000) | ($000) | ($000) |
| Options on Futures Purchased | 3 | — | — | 3 |
| Other Assets | 76 | 614 | 146 | 836 |
| Liability for Options Written | (38) | — | — | (38) |
| Other Liabilities | (156) | (371) | (105) | (632) |
Realized net gain (loss) and the change in unrealized appreciation (depreciation) on derivatives for the year ended December 31, 2015, were:
| | | | |
| Interest Rate | Currency | Credit | |
| Contracts | Contracts | Contracts | Total |
| Realized Net Gain (Loss) on Derivatives | ($000) | ($000) | ($000) | ($000) |
| Futures Contracts | (835) | — | — | (835) |
| Options on Futures Contracts | 128 | — | — | 128 |
| Swap Contracts | (172) | 62 | 413 | 303 |
| Forward Currency Contracts | — | 715 | — | 715 |
| Realized Net Gain (Loss) on Derivatives | (879) | 777 | 413 | 311 |
214
| | | | |
| Vanguard Short-Term Investment-Grade Portfolio | | | |
| |
| |
| |
| |
| Interest Rate | Currency | Credit | |
| Change in Unrealized Appreciation | Contracts | Contracts | Contracts | Total |
| (Depreciation) on Derivatives | ($000) | ($000) | ($000) | ($000) |
| Futures Contracts | 306 | — | — | 306 |
| Options on Futures Contracts | 5 | — | — | 5 |
| Swap Contracts | (145) | (63) | 67 | (141) |
| Forward Currency Contracts | — | (166) | — | (166) |
| Change in Unrealized Appreciation | | | | |
| (Depreciation) on Derivatives | 166 | (229) | 67 | 4 |
At December 31, 2015, the aggregate settlement value of open futures contracts and the related unrealized appreciation (depreciation) were:
| | | | |
| | | | ($000) |
| Aggregate |
| Number of | Settlement | Unrealized |
| Long (Short) | Value | Appreciation |
| Futures Contracts | Expiration | Contracts | Long (Short) | (Depreciation) |
| 10-Year U.S. Treasury Note | March 2016 | (248) | (31,225) | 56 |
| 2-Year U.S. Treasury Note | March 2016 | 96 | 20,854 | (25) |
| 30-Year U.S. Treasury Bond | March 2016 | (66) | (10,148) | (2) |
| AUD 3-Year Treasury Bond | March 2016 | (71) | (7,914) | (15) |
| Ultra Long U.S. Treasury Bond | March 2016 | 47 | 7,458 | (117) |
| 5-Year U.S. Treasury Note | March 2016 | 41 | 4,851 | (1) |
| Euro-Bobl | March 2016 | (26) | (3,397) | 6 |
| Euro-Bund | March 2016 | (12) | (1,895) | 4 |
| Long Gilt | March 2016 | (4) | (467) | 4 |
| Euro-Schatz | March 2016 | 1 | 112 | — |
| (90) |
Unrealized appreciation (depreciation) on open futures contracts, except for AUD 3-Year Treasury Bond, is required to be treated as realized gain (loss) for tax purposes.
At December 31, 2015, the portfolio had open forward currency contracts to receive and deliver currencies as follows. Unrealized appreciation (depreciation) on open forward currency contracts is treated as ordinary income for tax purposes.
| | | | | | |
| Unrealized |
| Contract | Appreciation |
| Settlement | | Contract Amount (000) | (Depreciation) |
| Counterparty | Date | | Receive | | Deliver | ($000) |
| Goldman Sachs Bank AG | 1/5/16 | EUR | 6,919 | USD | 7,596 | (75) |
| Morgan Stanley Capital Services LLC | 1/5/16 | AUD | 7,376 | USD | 5,358 | 16 |
| Morgan Stanley Capital Services LLC | 1/5/16 | GBP | 1,442 | USD | 2,151 | (24) |
| Morgan Stanley Capital Services LLC | 1/5/16 | EUR | 595 | USD | 649 | (2) |
| Morgan Stanley Capital Services LLC | 1/5/16 | EUR | 547 | USD | 580 | 14 |
| Bank of America N.A. | 1/5/16 | EUR | 534 | USD | 571 | 10 |
| Goldman Sachs Bank AG | 2/2/16 | EUR | 450 | USD | 494 | (5) |
| BNP Paribas | 1/5/16 | EUR | 450 | USD | 480 | 9 |
| UBS AG | 1/5/16 | EUR | 382 | USD | 404 | 11 |
| BNP Paribas | 1/5/16 | USD | 9,242 | EUR | 8,671 | (183) |
| Goldman Sachs Bank AG | 2/2/16 | USD | 7,601 | EUR | 6,919 | 75 |
| Morgan Stanley Capital Services LLC | 2/2/16 | USD | 5,351 | AUD | 7,376 | (16) |
| Morgan Stanley Capital Services LLC | 1/5/16 | USD | 3,155 | AUD | 4,394 | (46) |
| BNP Paribas | 1/5/16 | USD | 2,186 | GBP | 1,442 | 59 |
| Morgan Stanley Capital Services LLC | 2/2/16 | USD | 2,151 | GBP | 1,442 | 24 |
| JPMorgan Chase Bank N.A. | 1/5/16 | USD | 950 | AUD | 1,300 | 3 |
| UBS AG | 1/5/16 | USD | 629 | AUD | 872 | (5) |
| Goldman Sachs Bank AG | 1/5/16 | USD | 494 | EUR | 450 | 5 |
215
Vanguard Short-Term Investment-Grade Portfolio
| | | | | | |
| Unrealized |
| Contract | Appreciation |
| Settlement | | Contract Amount (000) | (Depreciation) |
| Counterparty | Date | | Receive | | Deliver | ($000) |
| BNP Paribas | 1/5/16 | USD | 340 | AUD | 475 | (6) |
| Morgan Stanley Capital Services LLC | 1/5/16 | USD | 217 | EUR | 204 | (4) |
| JPMorgan Chase Bank N.A. | 1/5/16 | USD | 173 | AUD | 241 | (2) |
| JPMorgan Chase Bank N.A. | 1/5/16 | USD | 109 | EUR | 102 | (3) |
| Morgan Stanley Capital Services LLC | 1/5/16 | USD | 70 | AUD | 95 | — |
| (145) |
| AUD—Australian dollar. | | | | | | |
| EUR—Euro. | | | | | | |
| GBP—British pound. | | | | | | |
| USD—U.S. dollar. | | | | | | |
At December 31, 2015, the portfolio had the following open swap contracts:
| | | | | | |
| Over-the-Counter Credit Default Swaps | | | | | |
| Remaining | | |
| Up-Front | Periodic | |
| Premium | Premium | Unrealized |
| Notional | Received Received | Appreciation |
| Termination | Amount | (Paid) | (Paid) (Depreciation) |
| Reference Entity | Date | Counterparty | ($000) | ($000) | (%) | ($000) |
| Credit Protection Sold/Moody’s Rating | | | | | |
| Bank of America Corp./Baa1 | 12/20/17 | MSCS | 420 | 6 | 1.000 | 11 |
| Boeing Co./A2 | 9/20/18 | GSCM | 115 | (1) | 1.000 | 2 |
| Energy Transfer Partners LP/Baa3 | 6/20/17 | BOANA | 370 | 6 | 1.000 | 4 |
| Federation of Malaysia/A3 | 12/20/20 | BNPSW | 75 | 3 | 1.000 | — |
| Federation of Malaysia/A3 | 12/20/20 | BOANA | 810 | 40 | 1.000 | 9 |
| Federation of Malaysia/A3 | 12/20/20 | GSCM | 170 | 10 | 1.000 | 3 |
| Federation of Malaysia/A3 | 12/20/20 | GSCM | 270 | 11 | 1.000 | — |
| Federation of Malaysia/A3 | 12/20/20 | JPMC | 485 | 31 | 1.000 | 13 |
| Federation of Malaysia/A3 | 12/20/20 | JPMC | 230 | 10 | 1.000 | 1 |
| Federation of Malaysia/A3 | 12/20/20 | JPMC | 700 | 27 | 1.000 | — |
| General Electric Capital Corp./A1 | 12/20/19 | DBAG | 710 | (12) | 1.000 | 6 |
| Goldman Sachs Group Inc./A3 | 12/20/17 | MSCS | 240 | 4 | 1.000 | 7 |
| Goldman Sachs Group Inc./A3 | 3/20/20 | BOANA | 520 | (4) | 1.000 | 1 |
| Hartford Financial Services | | | | | | |
| Group Inc./Baa2 | 3/20/18 | GSCM | 250 | — | 1.000 | 5 |
| People’s Republic of China/Aa3 | 9/20/20 | BNPSW | 120 | 1 | 1.000 | 1 |
| People’s Republic of China/Aa3 | 9/20/20 | JPMC | 595 | (2) | 1.000 | (4) |
| People’s Republic of China/Aa3 | 12/20/20 | GSCM | 365 | 4 | 1.000 | 2 |
| People’s Republic of China/Aa3 | 12/20/20 | JPMC | 60 | — | 1.000 | — |
| People’s Republic of China/Aa3 | 12/20/20 | JPMC | 180 | 3 | 1.000 | 2 |
| Republic of Chile/Aa3 | 12/20/20 | BARC | 485 | 11 | 1.000 | 4 |
| Republic of Chile/Aa3 | 12/20/20 | BARC | 375 | 6 | 1.000 | — |
| Republic of Chile/Aa3 | 12/20/20 | BNPSW | 230 | 3 | 1.000 | — |
| Republic of Chile/Aa3 | 12/20/20 | BNPSW | 300 | 2 | 1.000 | (3) |
| Republic of Chile/Aa3 | 12/20/20 | BOANA | 235 | 5 | 1.000 | 2 |
| Republic of Chile/Aa3 | 12/20/20 | JPMC | 365 | 7 | 1.000 | 2 |
| Republic of Chile/Aa3 | 12/20/20 | JPMC | 240 | 2 | 1.000 | (1) |
| Republic of Columbia/Baa2 | 12/20/20 | BARC | 245 | 18 | 1.000 | 1 |
| Republic of Columbia/Baa2 | 12/20/20 | DBAG | 395 | 26 | 1.000 | (1) |
| Republic of Columbia/Baa2 | 12/20/20 | DBAG | 465 | 26 | 1.000 | (6) |
| Republic of Columbia/Baa2 | 12/20/20 | JPMC | 55 | 3 | 1.000 | (1) |
| Republic of Columbia/Baa2 | 12/20/20 | JPMC | 345 | 17 | 1.000 | (7) |
| Republic of Indonesia/Baa3 | 12/20/20 | BNPSW | 485 | 29 | 1.000 | — |
216
Vanguard Short-Term Investment-Grade Portfolio
| | | | | | |
| Over-the-Counter Credit Default Swaps (continued) | | | | |
| Remaining | | |
| Up-Front | Periodic | |
| Premium | Premium | Unrealized |
| Notional | Received Received | Appreciation |
| Termination | Amount | (Paid) | (Paid) (Depreciation) |
| Reference Entity | Date | Counterparty | ($000) | ($000) | (%) | ($000) |
| Republic of Indonesia/Baa3 | 12/20/20 | BNPSW | 195 | 10 | 1.000 | (2) |
| Republic of Indonesia/Baa3 | 12/20/20 | BOANA | 220 | 11 | 1.000 | (2) |
| Republic of Indonesia/Baa3 | 12/20/20 | JPMC | 370 | 25 | 1.000 | 3 |
| Republic of Indonesia/Baa3 | 12/20/20 | MSCS | 65 | 3 | 1.000 | (1) |
| Republic of Indonesia/Baa3 | 12/20/20 | MSCS | 540 | 30 | 1.000 | (3) |
| Republic of Peru/A3 | 12/20/20 | BNPSW | 960 | 28 | 1.000 | (12) |
| Republic of Peru/A3 | 12/20/20 | CSFBI | 120 | 5 | 1.000 | — |
| Republic of Peru/A3 | 12/20/20 | JPMC | 165 | 7 | 1.000 | — |
| Republic of Turkey/Baa3 | 12/20/16 | BNPSW | 260 | — | 1.000 | — |
| Republic of Turkey/Baa3 | 12/20/20 | BNPSW | 305 | 23 | 1.000 | (1) |
| Russian Federation/Ba1 | 6/20/17 | GSCM | 200 | 7 | 1.000 | 5 |
| Russian Federation/Ba1 | 6/20/17 | GSCM | 380 | 14 | 1.000 | 9 |
| Russian Federation/Ba1 | 6/20/17 | GSCM | 460 | 17 | 1.000 | 11 |
| Russian Federation/Ba1 | 12/20/20 | JPMC | 215 | 18 | 1.000 | (2) |
| United Mexican States/A3 | 12/20/20 | BARC | 180 | 6 | 1.000 | — |
| United Mexican States/A3 | 12/20/20 | JPMC | 465 | 16 | 1.000 | — |
| 16,005 | 58 |
| | | | | |
| Credit Protection Purchased | | | | |
| Aetna Inc. | 12/20/19 | CSFBI | 475 | 12 | (1.000) | (3) |
| Aetna Inc. | 6/20/20 | GSCM | 470 | 16 | (1.000) | — |
| American International Group Inc. | 6/20/20 | BOANA | 280 | 5 | (1.000) | (2) |
| American International Group Inc. | 6/20/20 | BOANA | 280 | 5 | (1.000) | (2) |
| Autozone Inc. | 12/20/20 | GSCM | 240 | 8 | (1.000) | — |
| Bank of America Corp. | 3/20/20 | GSCM | 520 | 7 | (1.000) | (1) |
| CMBX-NA-8-AAA | 10/17/57 | BARC | 500 | (23) | (0.500) | 2 |
| CMBX-NA-8-AAA | 10/17/57 | CSFBI | 500 | (23) | (0.500) | 2 |
| CMBX-NA-8-AAA | 10/17/57 | CSFBI | 2,000 | (104) | (0.500) | (5) |
| CMBX-NA-8-AAA | 10/17/57 | GSI | 500 | (20) | (0.500) | 4 |
| CMBX-NA-8-AAA | 10/17/57 | GSI | 2,015 | (105) | (0.500) | (5) |
| CVS Health Corp. | 12/20/20 | BOANA | 240 | 8 | (1.000) | — |
| EI du Pont de Nemours & Co. | 9/20/18 | BARC | 125 | 2 | (1.000) | (1) |
| EI du Pont de Nemours & Co. | 9/20/18 | BNPSW | 125 | 2 | (1.000) | (1) |
| EI du Pont de Nemours & Co. | 9/20/18 | CSFBI | 165 | 3 | (1.000) | (1) |
| EI du Pont de Nemours & Co. | 9/20/18 | DBAG | 125 | 2 | (1.000) | (1) |
| EI du Pont de Nemours & Co. | 9/20/18 | GSCM | 125 | 2 | (1.000) | (1) |
| Federal Express Corp. | 12/20/18 | GSCM | 520 | 5 | (1.000) | (7) |
| Federative Republic of Brazil | 12/20/20 | GSCM | 160 | (24) | (1.000) | 2 |
| Federative Republic of Brazil | 12/20/20 | JPMC | 365 | (58) | (1.000) | (1) |
| Federative Republic of Brazil | 12/20/20 | JPMC | 290 | (47) | (1.000) | (1) |
| Intesa Sanpaolo SpA | 6/20/19 | DBAG | 470 | 30 | (3.000) | (8) |
| Intesa Sanpaolo SpA | 12/20/19 | BARC | 355 | 3 | (1.000) | — |
| Intesa Sanpaolo SpA | 3/20/20 | BOANA | 430 | 2 | (1.000) | (2) |
| McKesson Corp. | 3/20/19 | JPMC | 430 | 10 | (1.000) | (2) |
| McKesson Corp. | 3/20/19 | JPMC | 430 | 10 | (1.000) | (2) |
| Petroleo Brasileiro SA | 6/20/16 | MSCS | 590 | (4) | (1.000) | 10 |
| PPG Industries Inc. | 3/20/18 | GSCM | 240 | 2 | (1.000) | (2) |
| Republic of Korea | 9/20/18 | JPMC | 200 | 1 | (1.000) | (3) |
| Republic of South Africa | 12/20/20 | BOANA | 550 | (43) | (1.000) | 11 |
| Republic of South Africa | 12/20/20 | JPMC | 550 | (43) | (1.000) | 11 |
217
Vanguard Short-Term Investment-Grade Portfolio
| | | | | | |
| Over-the-Counter Credit Default Swaps (continued) | | | | |
| Remaining | | |
| Up-Front | Periodic | |
| Premium | Premium | Unrealized |
| Notional | Received Received | Appreciation |
| Termination | Amount | (Paid) | (Paid) (Depreciation) |
| Reference Entity | Date | Counterparty | ($000) | ($000) | (%) | ($000) |
| United Mexican States | 12/20/18 | DBAG | 100 | (1) | (1.000) | — |
| UnitedHealth Group Inc. | 12/20/19 | CSFBI | 475 | 12 | (1.000) | (4) |
| UnitedHealth Group Inc. | 6/20/20 | CSFBI | 470 | 16 | (1.000) | (1) |
| Wells Fargo & Co. | 9/20/20 | BOANA | 620 | 12 | (1.000) | (3) |
| 15,930 | (17) |
| 41 |
The notional amount represents the maximum potential amount the portfolio could be required to pay as a seller of credit protection if the reference entity was subject to a credit event.
BARC—Barclays Bank plc.
BNPSW—BNP Paribas.
BOANA—Bank of America, N.A.
CSFBI—Credit Suisse First Boston International.
DBAG—Deutsche Bank AG.
GSCM—Goldman Sachs Bank USA.
GSI—Goldman Sachs International.
JPMC—JP Morgan Chase Bank.
MSCS—Morgan Stanley Capital Services LLC.
| | | | | |
| Centrally Cleared Interest Rate Swaps | | | | |
| Fixed | Floating | |
| Interest Rate | Interest Rate | Unrealized |
| Notional | Received | Received | Appreciation |
| Amount | (Paid) | (Paid) (Depreciation) |
| Termination Date | Clearinghouse | ($000) | (%) | (%) | ($000) |
| 3/16/17 | CME | 7,051 | (1.000) | 0.0001 | 5 |
| 5/15/17 | CME | 2,500 | 0.659 | (0.331)2 | (5) |
| 11/15/17 | LCH | 7,000 | 1.069 | (0.331)2 | 13 |
| 3/16/18 | CME | 14,104 | 1.500 | (0.000)1 | (27) |
| 1/15/19 | LCH | 7,000 | (1.400) | 0.3312 | (34) |
| 7/10/19 | CME | 1,500 | (1,686) | 0.2932 | (18) |
| 8/15/19 | LCH | 4,000 | (1.524) | 0.3312 | (25) |
| 8/15/20 | LCH | 8,500 | (1.486) | 0.3312 | 8 |
| 3/16/21 | CME | 6,033 | (2.000) | 0.0001 | 24 |
| 3/16/23 | CME | 3,018 | (2.250) | 0.0001 | 16 |
| 9/1/23 | LCH | 750 | (2.139) | 0.2442 | (15) |
| (58) |
1 Based on 3-month London InterBank Offered Rate (LIBOR) as of the most recent payment date.
2 Based on 1-month London InterBank Offered Rate (LIBOR) as of the most recent payment date.
CME—Chicago Mercantile Exchange.
LCH—London Clearing House.
218
| | | | | | |
| Vanguard Short-Term Investment-Grade Portfolio | | | | |
| |
| |
| |
| |
| Cross-Currency Swaps | | | | | |
| Notional | Notional | |
| Amount of | Amount of | Unrealized |
| Fixed Interest | Currency | Currency | Appreciation |
| Rate | Fixed Interest | Termination | Received | Delivered | (Depreciation) |
| Received | Rate Paid | Date | Counterparty | ($000) | (000) | ($000) |
| USD 4.684% | GBP 5.375% | 9/28/16 | MSCS | 599 | GBP 350 | 82 |
| USD 5.453% | GBP 5.875% | 4/28/17 | MSCS | 586 | GBP 350 | 70 |
| USD 6.653% | EUR 6.375% | 4/4/16 | MSCS | 447 | EUR 325 | 95 |
| USD 5.693% | GBP 6.125% | 5/14/17 | BARC | 381 | GBP 230 | 42 |
| USD 3.221% | EUR 2.125% | 12/1/20 | BARC | 329 | EUR 240 | 63 |
| USD 5.686% | GBP 6.125% | 5/14/17 | BARC | 317 | GBP 191 | 36 |
| 388 |
| BARC—Barclays Bank plc. | | | | | |
| MSCS—Morgan Stanley Capital Services LLC. | | | | | |
| EUR—Euro. | | | | | | |
| GBP—British pound. | | | | | | |
| USD—U.S. dollar. | | | | | | |
At December 31, 2015, counterparties had deposited in segregated accounts securities with a value of $161,000 in connection with open swap contracts and forward currency contracts.
E. Distributions are determined on a tax basis and may differ from net investment income and realized capital gains for financial reporting purposes. Differences may be permanent or temporary. Permanent differences are reclassified among capital accounts in the financial statements to reflect their tax character. Temporary differences arise when certain items of income, expense, gain, or loss are recognized in different periods for financial statement and tax purposes. These differences will reverse at some time in the future. Differences in classification may also result from the treatment of short-term gains as ordinary income for tax purposes.
During the year ended December 31, 2015, the portfolio recorded an adjustment as a result of permanent differences related to realized net foreign currency gains of $820,000 (including the foreign currency component on sales of foreign currency denominated bonds), which increased distributable net income for tax purposes; accordingly, such gains have been reclassified from accumulated net realized losses to undistributed net investment income.
Realized and unrealized gains (losses) on certain of the portfolio’s swap contracts are treated as ordinary income (loss) for tax purposes; the effect on the portfolio’s income dividends to shareholders is offset by a change in principal return. Realized gains of $29,000 on swap contracts have been reclassified from accumulated net realized losses to undistributed net investment income.
For tax purposes, at December 31, 2015, the portfolio had $24,536,000 of ordinary income available for distribution. The portfolio had available capital losses totaling $1,083,000 that may be carried forward indefinitely to offset future net capital gains.
At December 31, 2015, the cost of investment securities for tax purposes was $1,328,471,000. Net unrealized depreciation of investment securities for tax purposes was $9,395,000, consisting of unrealized gains of $3,656,000 on securities that had risen in value since their purchase and $13,051,000 in unrealized losses on securities that had fallen in value since their purchase.
F. During the year ended December 31, 2015, the portfolio purchased $561,990,000 of investment securities and sold $480,835,000 of investment securities, other than U.S. government securities and temporary cash investments. Purchases and sales of U.S. government securities were $419,650,000 and $450,664,000, respectively.
219
Vanguard Short-Term Investment-Grade Portfolio
The following table summarizes the portfolio’s options written during the year ended December 31, 2015:
| | |
| Premiums |
| Number of | Received |
| Options Written | Contracts | ($000) |
| Balance at December 31, 2014 | 542 | 179 |
| Options Written | 2,240 | 770 |
| Options Expired | (861) | (300) |
| Options Closed | (1,751) | (595) |
| Options Exercised | — | — |
| Balance at December 31, 2015 | 170 | 54 |
G. Capital shares issued and redeemed were:
| | |
| Year Ended December 31, |
| 2015 | 2014 |
| Shares | Shares |
| (000) | (000) |
| Issued | 24,591 | 26,996 |
| Issued in Lieu of Cash Distributions | 2,226 | 2,409 |
| Redeemed | (22,318) | (15,296) |
| Net Increase (Decrease) in Shares Outstanding | 4,499 | 14,109 |
At December 31, 2015, one shareholder, an insurance company separate account whose holdings in the portfolio represent the indirect investment of Vanguard Variable Annuity contract holders, was the record or beneficial owner of 70% of the portfolio’s net assets. If the shareholder were to redeem its investment in the portfolio, the redemption might result in an increase in the portfolio’s expense ratio or cause the portfolio to incur higher transaction costs.
H. Management has determined that no material events or transactions occurred subsequent to December 31, 2015, that would require recognition or disclosure in these financial statements.
220
Vanguard Short-Term Investment-Grade Portfolio
Report of Independent Registered Public Accounting Firm
To the Board of Trustees of Vanguard Variable Insurance Funds and the Shareholders of Short-Term Investment-Grade Portfolio: In our opinion, the accompanying statement of net assets and the related statements of operations and of changes in net assets and the financial highlights present fairly, in all material respects, the financial position of Short-Term Investment-Grade Portfolio (constituting a separate portfolio of Vanguard Variable Insurance Funds, hereafter referred to as the “Portfolio”) at December 31, 2015, the results of its operations for the year then ended, the changes in its net assets for each of the two years in the period then ended, and the financial highlights for each of the five years in the period then ended, in conformity with accounting principles generally accepted in the United States of America. These financial statements and financial highlights (hereafter referred to as “financial statements”) are the responsibility of the Portfolio’s management. Our responsibility is to express an opinion on these financial statements based on our audits. We conducted our audits of these financial statements in accordance with the standards of the Public Company Accounting Oversight Board (United States). Those standards require that we plan and perform the audit to obtain reasonable assurance about whether the financial statements are free of material misstatement. An audit includes examining, on a test basis, evidence supporting the amounts and disclosures in the financial statements, assessing the accounting principles used and significant estimates made by management, and evaluating the overall financial statement presentation. We believe that our audits, which included confirmation of securities at December 31, 2015 by correspondence with the custodian and brokers, by agreement to the underlying ownership records of the transfer agent and the application of alternative auditing procedures where securities purchased had not been received, provide a reasonable basis for our opinion.
/s/PricewaterhouseCoopers LLP
Philadelphia, Pennsylvania
February 11, 2016
221
Vanguard Short-Term Investment-Grade Portfolio
About Your Portfolio’s Expenses
As a shareholder of the portfolio, you incur ongoing costs, which include costs for portfolio management, administrative services, and shareholder reports (like this one), among others. Operating expenses, which are deducted from a portfolio’s gross income, directly reduce the investment return of the portfolio.
A portfolio’s expenses are expressed as a percentage of its average net assets. This figure is known as the expense ratio. The following examples are intended to help you understand the ongoing costs (in dollars) of investing in your portfolio and to compare these costs with those of other mutual funds. The examples are based on an investment of $1,000 made at the beginning of the period shown and held for the entire period.
The table below illustrates your portfolio’s costs in two ways:
• Based on actual portfolio return. This section helps you to estimate the actual expenses that you paid over the period. The “Ending Account Value” shown is derived from the portfolio’s actual return, and the third column shows the dollar amount that would have been paid by an investor who started with $1,000 in the portfolio. You may use the information here, together with the amount you invested, to estimate the expenses that you paid over the period.
To do so, simply divide your account value by $1,000 (for example, an $8,600 account value divided by $1,000 = 8.6), then multiply the result by the number given for your portfolio under the heading “Expenses Paid During Period.”
• Based on hypothetical 5% yearly return. This section is intended to help you compare your portfolio’s costs with those of other mutual funds. It assumes that the portfolio had a yearly return of 5% before expenses, but that the expense ratio is unchanged. In this case—because the return used is not the portfolio’s actual return—the results do not apply to your investment. The example is useful in making comparisons because the Securities and Exchange Commission requires all mutual funds to calculate expenses based on a 5% return. You can assess your portfolio’s costs by comparing this hypothetical example with the hypothetical examples that appear in shareholder reports of other funds.
Note that the expenses shown in the table are meant to highlight and help you compare ongoing costs only and do not reflect transaction costs incurred by the portfolio for buying and selling securities. The portfolio’s expense ratio does not reflect additional fees and expenses associated with the annuity or life insurance program through which you invest.
The calculations assume no shares were bought or sold during the period. Your actual costs may have been higher or lower, depending on the amount of your investment and the timing of any purchases or redemptions.
You can find more information about the portfolio’s expenses in the Financial Statements section. For additional information on operating expenses and other shareholder costs, please refer to the prospectus.
| | | |
| Six Months Ended December 31, 2015 | | | |
| Beginning | Ending | Expenses |
| Account Value | Account Value | Paid During |
| Short-Term Investment-Grade Portfolio | 6/30/2015 | 12/31/2015 | Period1 |
| Based on Actual Portfolio Return | $1,000.00 | $1,001.90 | $0.81 |
| Based on Hypothetical 5% Yearly Return | 1,000.00 | 1,024.40 | 0.82 |
1 The calculations are based on expenses incurred in the most recent six-month period. The portfolio’s annualized six-month expense ratio for that period is 0.16%. The dollar amounts shown as “Expenses Paid” are equal to the annualized expense ratio multiplied by the average account value over the period, multiplied by the number of days in the most recent six-month period, then divided by the number of days in the most recent 12-month period (184/365).
222
Vanguard® Small Company Growth Portfolio
Advisors’ Report
Vanguard Small Company Growth Portfolio returned –2.75% for the 12 months ended December 31, 2015, behind the –0.19% return of its benchmark, the Russell 2500 Growth Index, and the –1.96% average return of peer funds. Please note that the returns for Vanguard Variable Insurance Fund are different from those of Vanguard Variable Annuity (and other plans that invest in the fund), which take into account insurance-related expenses.
Through the fiscal year, the portfolio was managed by two independent advisors, a strategy that enhances diversification by providing exposure to distinct yet complementary investment approaches. It is not uncommon for different advisors to have different views about individual securities or the broader investment environment.
The advisors, the amount and percentage of the portfolio’s assets each manages, and brief descriptions of their investment strategies are presented in the accompanying table. Each advisor has also prepared a discussion of the investment environment that existed during the year and its effect on the portfolio’s positioning. (The Granahan discussion refers to
industry sectors as defined by Russell classifications, rather than by the Global Industry Classification Standard used elsewhere in this report.) These comments were prepared on January 25, 2016.
Please note that, as previously announced, Arrowpoint Partners was added as a third advisor to the portfolio effective January 25, 2016. It is expected that each of the advisors will manage approximately one-third of the portfolio’s assets.
Granahan Investment Management, Inc.
Portfolio Managers:
Gary C. Hatton, CFA, Co-Founder and Chief Investment Officer
Jane M. White, Co-Founder, President, and Chief Executive Officer
Jennifer M. Pawloski
John V. Schneider, CFA
The U.S. stock market indexes turned in disappointing performances in 2015, in part because of overall weak earnings growth. Although earnings growth in the portfolio was significantly stronger than that of larger companies, the companies represented in the portfolio (like their larger brethren) continued to battle lower commodity prices, slowing global economic activity, a stronger U.S. dollar, and geopolitical instability.
We maintained our disciplined investment approach, which includes bottom-up fundamental research and diversification by industry sector and company life cycle to mitigate risk. Our life-cycle categories are “core growth” (stocks of established companies with a record of earnings), “special situation” (companies with growth potential overlooked by the market), and “pioneer” (companies with unique technology or innovations).
We have been judiciously adding to the pioneer category, and the weighting is up 4 percentage points from the beginning of the year. We purchased several new names—2U, which provides SaaS (software as a service) to colleges; Demandware, an e-commerce management company; and Kornit Digital, which does fabric digital printing. We also eliminated some of our biotechnology pioneers.
Core growth reached 49% of our portfolio, up from 45% at the start of the year. Performance has been better in core growth than the other categories, and we have captured some profits and added names: Opus Bank; Fleetmatics, which provides SaaS for fleet management; and Abiomed, which makes heart pumps. Special situations are down from 37% to 27% of the portfolio. We made good sales in Sucampo Pharmaceuticals, MarineMax, and OM Group.
After a spike in the third quarter, our portfolio earnings growth has declined to a rate that is more in line with the past six quarters. Areas of particular earnings strength were health care, technology
| | | |
| Total Returns | | | |
| | | Ten Years Ended |
| | | December 31, 2015 |
| | Year Ended | Average |
| December 31, 2015 | Annual Return |
| Vanguard Small Company Growth Portfolio | -2.75% | 8.09% |
| Russell 2500 Growth Index | -0.19 | 8.49 |
| Variable Insurance Small-Cap Growth Funds Average1 | -1.96 | 7.09 |
The figures shown represent past performance, which is not a guarantee of future results. (Current performance may be lower or higher than the performance data cited. For performance data current to the most recent month-end, visit our website at vanguard.com/performance.) Note, too, that both investment returns and principal value can fluctuate widely, so an investor’s shares, when sold, could be worth more or less than their original cost.
| | |
| Expense Ratios2 | | |
| Your Portfolio Compared With Its Peer Group | | |
| Variable Insurance |
| Small-Cap Growth |
| Portfolio | Funds Average |
| Small Company Growth Portfolio | 0.40% | 1.04% |
1 Derived from data provided by Lipper, a Thomson Reuters Company.
2 The portfolio expense ratio shown is from the prospectus dated April 30, 2015, and represents estimated costs for the current fiscal year. For the fiscal year ended December 31, 2015, the Small Company Growth Portfolio’s expense ratio was 0.37%. The peer-group expense ratio is derived from data provided by Lipper, a Thomson Reuters Company, and captures information through year-end 2014.
223
Vanguard Small Company Growth Portfolio
and financials. Our earnings growth rate is significantly stronger than that of the Standard & Poor’s 500 Index, which is currently projected to be 7%. Valuations have risen from last quarter, perhaps because macroeconomic uncertainties tend to not penalize smaller companies as much as large companies. Many of our innovative companies’ products help enterprises reduce labor and increase productivity. We continue to look for companies that have differentiated business models, nimble managements, and strong long-term trends driving their growth, as these companies will grow despite the macroeconomic pressures.
Materials, energy, and technology firms were our strongest contributors. Materials & processing was the top performer, with strong stock selection led by Comfort Systems, a provider of commercial HVAC systems. Our underweighting in this sector, which performed poorly in the index, also helped, as did the fact that we did not own the commodity-driven companies that were hurt by plunging prices.
We were underweighted in the poorly performing energy sector. In the technology sector, where we are seeing
the strongest earnings growth in the portfolio, our overweight allocation helped, as did strong performance from Gigamon, Ultimate Software, and Inphi.
The volatility of the health care arena in 2015 made for a difficult investing environment. Although five of our top ten contributors for the year were health care holdings, too many of our health care pioneers hurt performance (notably Cardiovascular Systems, Tetraphase Pharmaceuticals, Spectranetics, and Esperion Therapeutics). In addition, we were underweighted in health care while it was one of the strongest-performing sectors for the index.
Producer durables also detracted; we were overweighted in this poorly performing sector, and stock selection was hurt by Power Solutions and Celadon Group. The financial sector impaired results, with Affiliated Managers Group, Stag Industrials, and Safeguard Scientifics all declining. The benefit from underweighting the consumer sector could not offset disappointing stock selection, including Pandora, Francesca’s, and Kona Grill.
Vanguard Quantitative Equity Group
Portfolio Managers:
James P. Stetler, Principal
James D. Troyer, CFA, Principal
Michael R. Roach, CFA
U.S. equities ended 2015 with mixed results. The broad market returned 0.48% (as measured by the Russell 3000 Index), large-cap stocks bettered smaller-caps, and growth-oriented companies significantly outpaced their value counterparts. The broad U.S. market fared better than international markets, both developed and emerging.
Real GDP in the United States in the third quarter grew 2.0% compared with 3.9% in the previous quarter, decelerating mainly because of slowdowns in private inventory investment, exports, and capital spending. Corporate profits decreased 1.6% in the third quarter after rising 3.5% in the second, attractive compared with the rest of the world. A 30% decline in oil prices lifted consumer spending. And the U.S. job market continued to improve: Nonfarm payroll employment rose by 292,000 in December, and the unemployment rate was unchanged from the month before at 5.0%. In December, the Federal Reserve raised interest rates for the first time in nearly a decade. Further gradual rate hikes are expected but will depend on economic data.
Foreign currencies continued to lose ground against the dollar, which has weighed on emerging markets, especially those with abundant dollar-denominated debt. Last August, volatility in Chinese markets spread to global stocks as well as commodities and recently returned amid poor economic data from the region. Meanwhile, the European Central Bank is expected to continue its stance of accommodative monetary policy as it aims to spur inflation.
| | | |
| Vanguard Small Company Growth Portfolio Investment Advisors |
| |
| Portfolio Assets Managed | |
| Investment Advisor | % | $ Million | Investment Strategy |
| Granahan Investment | 66 | 825 | Bases its investment process on the beliefs that |
| Management, Inc. | earnings drive stock prices and that small, dynamic |
| | | | companies with exceptional growth prospects have |
| | | | the greatest long-term potential. A bottom-up, |
| | | | fundamental approach places companies in one |
| | | | of three life-cycle categories: core growth, pioneer, |
| | | | and special situation. In each, the process looks |
| | | | for companies with strong earnings growth and |
| | | | leadership in their markets. |
| Vanguard Quantitative Equity | 30 | 383 | Employs a quantitative fundamental management |
| Group | approach, using models that assess valuation, growth |
| | | | prospects, management decisions, market sentiment, |
| | | | and earnings and balance-sheet quality of companies |
| | | | as compared with their peers. |
| Cash Investments | 4 | 48 | These short-term reserves are invested by Vanguard |
| | | | in equity index products to simulate investment in |
| | | | stocks. Each advisor may also maintain a modest |
| | | | cash position. |
224
Vanguard Small Company Growth Portfolio
The benchmark Russell 2500 Growth Index ended the year with a return of –0.19%, with six of ten sectors generating negative returns. Consumer discretionary, industrials, and energy were the worst performers. Health care, information technology, financials, and utilities produced positive returns.
Although we seek to understand the impact of macroeconomic factors on portfolio performance, our investment process is centered on specific stock fundamentals. We use a quantitative approach to systematically identify stocks in our investment universe that appear more likely to exhibit long-term outperformance. Our process focuses on valuation as well as other factors that we believe contribute to fundamental growth. Using the results of our model, we then construct our portfolio with the goal of maximizing expected return while minimizing exposure to risks relative to the benchmark (such as industry selection) that our research indicates do not improve returns.
Our models performed well for the year, producing results in seven sectors that exceeded those in the benchmark, with the strongest results in information technology, health care, and financials. However, our stock selection was disappointing in consumer discretionary, energy, and consumer staples.
In information technology, Manhattan Associates, Freescale Semiconductor, Heartland Payment Systems, and Blackbaud were the largest contributors to our relative performance. INC Research Holdings, Merge Healthcare, and PRA Health Sciences were strong contributors in health care, as were Credit Acceptance, Universal Insurance, and Walker & Dunlap in financials. Disappointments in consumer discretionary included Vince Holdings and Outerwall. In energy, Teekay Corporation, Pacific Ethanol, and Western Refining underperformed on a relative basis.
225
Vanguard Small Company Growth Portfolio
Portfolio Profile
As of December 31, 2015
| | | |
| Portfolio Characteristics | | |
| | Comparative | Broad |
| Portfolio | Index1 | Index2 |
| Number of Stocks | 461 | 1,505 | 3,960 |
| Median Market Cap | $1.5B | $3.9B | $51.4B |
| Price/Earnings Ratio | 41.2x | 32.7x | 21.9x |
| Price/Book Ratio | 3.3x | 4.4x | 2.7x |
| Yield3 | 0.2% | 0.9% | 2.1% |
| Return on Equity | 11.7% | 16.2% | 17.2% |
| Earnings Growth Rate | 11.4% | 15.5% | 9.5% |
| Foreign Holdings | 2.5% | 0.0% | 0.0% |
| Turnover Rate | 57% | — | — |
| Expense Ratio4 | 0.40% | — | — |
| Short-Term Reserves | 2.8% | — | — |
| | |
| Volatility Measures | |
| Portfolio Versus | Portfolio Versus |
| Comparative Index1 | Broad Index2 |
| R-Squared | 0.95 | 0.74 |
| Beta | 1.01 | 1.12 |
| | | |
| Sector Diversification (% of equity exposure) |
| | Comparative | Broad |
| Portfolio | Index1 | Index2 |
| Consumer Discretionary 12.3% | 19.9% | 13.4% |
| Consumer Staples | 2.1 | 3.4 | 8.8 |
| Energy | 0.7 | 0.7 | 5.9 |
| Financials | 8.5 | 10.4 | 18.3 |
| Health Care | 23.4 | 21.4 | 14.8 |
| Industrials | 15.1 | 15.8 | 10.6 |
| Information Technology 34.2 | 21.2 | 19.8 |
| Materials | 3.0 | 6.5 | 3.1 |
| Telecommunication | | | |
| Services | 0.6 | 0.5 | 2.2 |
| Utilities | 0.1 | 0.2 | 3.1 |
| | |
| Ten Largest Holdings5 (% of total net assets) |
| |
| Euronet Worldwide Inc. | Data Processing | |
| | & Outsourced | |
| | Services | 1.3% |
| SPS Commerce Inc. | Internet Software | |
| | & Services | 1.1 |
| Super Micro | Technology | |
| Computer Inc. | Hardware, Storage | |
| | & Peripherals | 1.1 |
| Ultimate Software | | |
| Group Inc. | Application Software 1.1 |
| Gigamon Inc. | Systems Software | 1.0 |
| Infoblox Inc. | Systems Software | 0.9 |
| Cynosure Inc. Class A | Health Care | |
| | Equipment | 0.9 |
| Advisory Board Co. | Research | |
| | & Consulting | |
| | Services | 0.9 |
| CoStar Group Inc. | Internet Software | |
| | & Services | 0.9 |
| Perficient Inc. | IT Consulting | |
| | & Other Services | 0.8 |
| Top Ten | 10.0% |
Investment Focus

30-Day SEC Yield. A portfolio’s 30-day SEC yield is derived using a formula specified by the U.S. Securities and Exchange Commission. Under the formula, data related to the portfolio’s security holdings in the previous 30 days are used to calculate the portfolio’s hypothetical net income for that period, which is then annualized and divided by the portfolio’s estimated average net assets over the calculation period. For the purposes of this calculation, a security’s income is based on its current market yield to maturity (for bonds), its actual income (for asset-backed securities), or its projected dividend yield (for stocks). Because the SEC yield represents hypothetical annualized income, it will differ—at times significantly—from the portfolio’s actual experience. As a result, the portfolio’s income distributions may be higher or lower than implied by the SEC yield.
Beta. A measure of the magnitude of a portfolio’s past share-price fluctuations in relation to the ups and downs of a given market index. The index is assigned a beta of 1.00. Compared with a given index, a portfolio with a beta of 1.20 typically would have seen its share price rise or fall by 12% when the index rose or fell by 10%. For this report, beta is based on returns over the past 36 months for both the portfolio and the index.
Equity Exposure. A measure that reflects a portfolio’s investments in stocks and stock futures. Any holdings in short-term reserves are excluded.
R-Squared. A measure of how much of a portfolio’s past returns can be explained by the returns from the market in general, as measured by a given index. If a portfolio’s total returns were precisely synchronized with an index’s returns, its R-squared would be 1.00. If the portfolio’s returns bore no relationship to the index’s returns, its R-squared would be 0. For this report, R-squared is based on returns over the past 36 months for both the portfolio and the index.
1 Russell 2500 Growth Index.
2 Dow Jones U.S. Total Stock Market Float Adjusted Index.
3 30-day SEC yield for the portfolio; annualized dividend yield for the indexes.
4 The expense ratio shown is from the prospectus dated April 30, 2015, and represents estimated costs for the current fiscal year. For the fiscal year ended December 31, 2015, the Small Company Growth Portfolio’s expense ratio was 0.37%.
5 The holdings listed exclude any temporary cash investments and equity index products.
226
Vanguard Small Company Growth Portfolio
Performance Summary
All of the returns in this report represent past performance, which is not a guarantee of future results that may be achieved by the portfolio. (Current performance may be lower or higher than the performance data cited. For performance data current to the most recent month-end, visit our website at vanguard.com/performance.) Note, too, that both investment returns and principal value can fluctuate widely, so an investor’s shares, when sold, could be worth more or less than their original cost. The returns shown do not reflect taxes that a shareholder would pay on portfolio distributions or on the sale of portfolio shares. Nor do the returns reflect fees and expenses associated with the annuity or life insurance program through which a shareholder invests. If these fees and expenses were included, the portfolio’s returns would be lower.
Cumulative Performance: December 31, 2005–December 31, 2015
Initial Investment of $10,000

| | | | |
| | | Average Annual Total Returns | Final Value |
| | Periods Ended December 31, 2015 | of a $10,000 |
| | One Year | Five Years | Ten Years | Investment |
| Small Company Growth Portfolio | -2.75% | 11.35% | 8.09% | $21,770 |
| Russell 2500 Growth Index | -0.19 | 11.43 | 8.49 | 22,588 |
| Variable Insurance Small-Cap Growth | | | | |
| Funds Average1 | -1.96 | 9.85 | 7.09 | 19,840 |
| Dow Jones U.S. Total Stock Market | | | | |
| Float Adjusted Index | 0.44 | 12.14 | 7.48 | 20,563 |
Fiscal-Year Total Returns (%): December 31, 2005–December 31, 2015

| |
| Small Company Growth Portfolio |
| Russell 2500 Growth Index |
1 Derived from data provided by Lipper, a Thomson Reuters Company.
See Financial Highlights for dividend and capital gains information.
227
Vanguard Small Company Growth Portfolio
Financial Statements
Statement of Net Assets
As of December 31, 2015
The portfolio reports a complete list of its holdings in regulatory filings four times in each fiscal year, at the quarter-ends. For the second and fourth fiscal quarters, the lists appear in the portfolio’s semiannual and annual reports to shareholders. For the first and third fiscal quarters, the portfolio files the lists with the Securities and Exchange Commission on Form N-Q. Shareholders can look up the portfolio’s Forms N-Q on the SEC’s website at sec.gov. Forms N-Q may also be reviewed and copied at the SEC’s Public Reference Room (see the back cover of this report for further information).
| | | |
| Market |
| Value• |
| | Shares | ($000) |
| Common Stocks (94.4%)1 | | |
| Consumer Discretionary (11.5%) | |
| * | 2U Inc. | 309,641 | 8,664 |
| * | IMAX Corp. | 218,203 | 7,755 |
| * | Modine Manufacturing Co. | 774,350 | 7,008 |
| * | Boyd Gaming Corp. | 352,360 | 7,001 |
| * | Buffalo Wild Wings Inc. | 27,480 | 4,387 |
| Foot Locker Inc. | 53,200 | 3,463 |
| * | Kona Grill Inc. | 216,200 | 3,429 |
| * | NVR Inc. | 2,060 | 3,385 |
| *,^ SodaStream International | | |
| | Ltd. | 205,310 | 3,349 |
| Leggett & Platt Inc. | 68,000 | 2,857 |
| * | Sportsman’s Warehouse | | |
| | Holdings Inc. | 188,100 | 2,426 |
| American Eagle | | |
| | Outfitters Inc. | 155,000 | 2,402 |
| Nexstar Broadcasting Group | | |
| | Inc. Class A | 40,900 | 2,401 |
| Interpublic Group of | | |
| | Cos. Inc. | 98,600 | 2,295 |
| * | Strayer Education Inc. | 37,400 | 2,248 |
| * | Express Inc. | 130,000 | 2,246 |
| Jack in the Box Inc. | 29,100 | 2,232 |
| Brinker International Inc. | 45,001 | 2,158 |
| ^ | World Wrestling | | |
| | Entertainment Inc. Class A | 120,600 | 2,152 |
| * | American Axle | | |
| | & Manufacturing | | |
| | Holdings Inc. | 111,200 | 2,106 |
| * | Pinnacle Entertainment Inc. | 66,100 | 2,057 |
| * | Skechers U.S.A. Inc. | | |
| | Class A | 67,800 | 2,048 |
| * | Michaels Cos. Inc. | 90,900 | 2,010 |
| ClubCorp Holdings Inc. | 108,200 | 1,977 |
| Big Lots Inc. | 50,800 | 1,958 |
| Harman International | | |
| | Industries Inc. | 20,600 | 1,941 |
| DR Horton Inc. | 60,400 | 1,935 |
| Cato Corp. Class A | 52,200 | 1,922 |
| Cooper Tire & Rubber Co. | 50,700 | 1,919 |
| ^ | Outerwall Inc. | 51,080 | 1,866 |
| Cracker Barrel Old Country | | |
| | Store Inc. | 13,700 | 1,738 |
| * | Penn National Gaming Inc. | 106,200 | 1,701 |
| Lithia Motors Inc. Class A | 14,700 | 1,568 |
| * | Isle of Capri Casinos Inc. | 111,700 | 1,556 |
| Brunswick Corp. | 29,400 | 1,485 |
| * | Skullcandy Inc. | 312,875 | 1,480 |
| * | Deckers Outdoor Corp. | 30,416 | 1,436 |
| * | Five Below Inc. | 43,984 | 1,412 |
| Churchill Downs Inc. | 9,944 | 1,407 |
| * | Francesca’s Holdings Corp. | 79,000 | 1,375 |
| Escalade Inc. | 98,302 | 1,303 |
| * | Performance Sports | | |
| | Group Ltd. | 133,386 | 1,285 |
| Domino’s Pizza Inc. | 11,110 | 1,236 |
| | | |
| Market |
| Value• |
| | Shares | ($000) |
| * | Del Frisco’s Restaurant | | |
| | Group Inc. | 76,500 | 1,226 |
| * | Fox Factory Holding Corp. | 73,761 | 1,219 |
| Oxford Industries Inc. | 18,960 | 1,210 |
| * | BJ’s Restaurants Inc. | 26,930 | 1,171 |
| Caleres Inc. | 43,200 | 1,159 |
| Callaway Golf Co. | 121,175 | 1,141 |
| * | Gray Television Inc. | 69,600 | 1,134 |
| * | Denny’s Corp. | 114,400 | 1,125 |
| * | Crocs Inc. | 107,680 | 1,103 |
| Bloomin’ Brands Inc. | 63,900 | 1,079 |
| Carter’s Inc. | 11,800 | 1,051 |
| * | MSG Networks Inc. | 45,300 | 942 |
| * | Fiesta Restaurant Group Inc. | 26,663 | 896 |
| Aaron’s Inc. | 39,600 | 887 |
| * | Ascena Retail Group Inc. | 88,650 | 873 |
| Williams-Sonoma Inc. | 14,900 | 870 |
| Nutrisystem Inc. | 38,400 | 831 |
| * | ZAGG Inc. | 74,700 | 817 |
| PetMed Express Inc. | 45,100 | 773 |
| * | ServiceMaster Global | | |
| | Holdings Inc. | 19,400 | 761 |
| * | Dave & Buster’s | | |
| | Entertainment Inc. | 16,500 | 689 |
| * | Cherokee Inc. | 38,620 | 666 |
| Dillard’s Inc. Class A | 10,100 | 664 |
| * | Gentherm Inc. | 13,204 | 626 |
| * | Diamond Resorts | | |
| | International Inc. | 23,800 | 607 |
| Culp Inc. | 23,700 | 604 |
| * | MCBC Holdings Inc. | 39,500 | 541 |
| * | Nautilus Inc. | 27,900 | 466 |
| Tupperware Brands Corp. | 8,327 | 463 |
| Tower International Inc. | 15,600 | 446 |
| Libbey Inc. | 19,200 | 409 |
| Vail Resorts Inc. | 3,000 | 384 |
| * | Madison Square Garden Co. | | |
| | Class A | 2,366 | 383 |
| Bassett Furniture Industries | | |
| | Inc. | 14,400 | 361 |
| Wolverine World Wide Inc. | 20,400 | 341 |
| * | Jamba Inc. | 24,300 | 328 |
| New York Times Co. | | |
| | Class A | 24,400 | 327 |
| * | Grand Canyon Education Inc. | 8,000 | 321 |
| * | Jarden Corp. | 5,300 | 303 |
| Polaris Industries Inc. | 3,500 | 301 |
| Sinclair Broadcast Group Inc. | | |
| | Class A | 9,200 | 299 |
| * | Select Comfort Corp. | 13,300 | 285 |
| * | Ulta Salon Cosmetics | | |
| | & Fragrance Inc. | 1,500 | 277 |
| * | Tenneco Inc. | 5,500 | 253 |
| * | Zoe’s Kitchen Inc. | 8,630 | 241 |
| MDC Partners Inc. Class A | 10,900 | 237 |
| Cablevision Systems Corp. | | |
| | Class A | 5,500 | 175 |
| | | |
| Market |
| Value• |
| | Shares | ($000) |
| AMC Entertainment | | |
| | Holdings Inc. | 7,200 | 173 |
| 144,017 |
| Consumer Staples (1.8%) | | |
| *,^ Freshpet Inc. | 265,160 | 2,251 |
| * | Herbalife Ltd. | 39,000 | 2,091 |
| ^ | Cal-Maine Foods Inc. | 44,800 | 2,076 |
| Dean Foods Co. | 119,800 | 2,055 |
| Pilgrim’s Pride Corp. | 90,452 | 1,998 |
| * | USANA Health Sciences Inc. | 13,800 | 1,763 |
| Ingles Markets Inc. Class A | 38,400 | 1,693 |
| * | Boulder Brands Inc. | 147,810 | 1,623 |
| Inter Parfums Inc. | 59,670 | 1,421 |
| PriceSmart Inc. | 17,125 | 1,421 |
| * | Landec Corp. | 107,194 | 1,268 |
| * | Natural Grocers by Vitamin | | |
| | Cottage Inc. | 51,517 | 1,049 |
| Casey’s General Stores Inc. | 8,400 | 1,012 |
| * | SUPERVALU Inc. | 119,400 | 810 |
| * | Blue Buffalo Pet | | |
| | Products Inc. | 4,700 | 88 |
| 22,619 |
| Energy (0.5%) | | |
| Western Refining Inc. | 55,200 | 1,966 |
| Core Laboratories NV | 16,800 | 1,827 |
| CVR Energy Inc. | 37,600 | 1,480 |
| Superior Energy Services | | |
| | Inc. | 38,009 | 512 |
| * | Enservco Corp. | 813,200 | 439 |
| Teekay Corp. | 36,000 | 355 |
| 6,579 |
| Financials (7.5%) | | |
| STAG Industrial Inc. | 441,400 | 8,144 |
| * | Affiliated Managers Group | | |
| | Inc. | 46,400 | 7,413 |
| Opus Bank | 194,369 | 7,186 |
| * | Safeguard Scientifics Inc. | 439,273 | 6,374 |
| MarketAxess Holdings Inc. | 36,400 | 4,062 |
| Extra Space Storage Inc. | 37,100 | 3,273 |
| QTS Realty Trust Inc. | | |
| | Class A | 69,780 | 3,148 |
| Lazard Ltd. Class A | 68,900 | 3,101 |
| MSCI Inc. Class A | 41,800 | 3,015 |
| * | Customers Bancorp Inc. | 102,500 | 2,790 |
| * | PRA Group Inc. | 79,965 | 2,774 |
| *,^ Credit Acceptance Corp. | 10,259 | 2,196 |
| * | Walker & Dunlop Inc. | 75,400 | 2,172 |
| Universal Insurance | | |
| | Holdings Inc. | 91,055 | 2,111 |
| * | MGIC Investment Corp. | 238,900 | 2,109 |
| Lamar Advertising Co. | | |
| | Class A | 34,200 | 2,051 |
| * | INTL. FCStone Inc. | 61,000 | 2,041 |
| Jones Lang LaSalle Inc. | 12,000 | 1,918 |
| BGC Partners Inc. Class A | 190,400 | 1,868 |
| Legg Mason Inc. | 43,700 | 1,714 |
| PrivateBancorp Inc. | 41,400 | 1,698 |
| * | Pacific Premier Bancorp Inc. | 72,800 | 1,547 |
| * | Harris & Harris Group Inc. | 668,250 | 1,470 |
| Ryman Hospitality | | |
| | Properties Inc. | 27,400 | 1,415 |
| * | LendingTree Inc. | 14,700 | 1,312 |
| CyrusOne Inc. | 34,200 | 1,281 |
| CoreSite Realty Corp. | 22,400 | 1,271 |
| Heritage Insurance Holdings | | |
| | Inc. | 57,800 | 1,261 |
| Financial Engines Inc. | 36,133 | 1,217 |
228
Vanguard Small Company Growth Portfolio
| | | |
| Market |
| Value• |
| | Shares | ($000) |
| Evercore Partners Inc. | | |
| | Class A | 20,900 | 1,130 |
| * | SVB Financial Group | 9,400 | 1,118 |
| Federal Realty Investment | | |
| | Trust | 6,900 | 1,008 |
| DuPont Fabros Technology | | |
| | Inc. | 31,000 | 985 |
| * | World Acceptance Corp. | 26,139 | 970 |
| Omega Healthcare | | |
| | Investors Inc. | 26,400 | 923 |
| OM Asset Management plc | 47,900 | 734 |
| * | Marcus & Millichap Inc. | 23,300 | 679 |
| Morningstar Inc. | 8,400 | 675 |
| *,^ Impac Mortgage Holdings | | |
| | Inc. | 36,600 | 659 |
| * | Texas Capital Bancshares | | |
| | Inc. | 11,500 | 568 |
| James River Group | | |
| | Holdings Ltd. | 16,700 | 560 |
| FactSet Research Systems | | |
| | Inc. | 3,350 | 545 |
| HCI Group Inc. | 10,500 | 366 |
| CubeSmart | 11,200 | 343 |
| Virtu Financial Inc. Class A | 12,500 | 283 |
| National Storage Affiliates | | |
| | Trust | 14,000 | 240 |
| Universal Health Realty | | |
| | Income Trust | 4,300 | 215 |
| * | Realogy Holdings Corp. | 4,600 | 169 |
| 94,102 |
| Health Care (22.2%) | | |
| * | Cynosure Inc. Class A | 249,499 | 11,145 |
| * | Nektar Therapeutics | 583,200 | 9,827 |
| West Pharmaceutical | | |
| | Services Inc. | 145,800 | 8,780 |
| * | Alkermes plc | 100,900 | 8,009 |
| * | Zeltiq Aesthetics Inc. | 273,824 | 7,812 |
| * | Ligand Pharmaceuticals | | |
| | Inc. | 67,786 | 7,349 |
| * | Acceleron Pharma Inc. | 150,000 | 7,314 |
| CONMED Corp. | 162,339 | 7,151 |
| * | ABIOMED Inc. | 78,330 | 7,072 |
| *,^ Rockwell Medical Inc. | 675,560 | 6,918 |
| * | NeoGenomics Inc. | 825,991 | 6,501 |
| *,^ Cempra Inc. | 199,900 | 6,223 |
| * | Cepheid | 167,200 | 6,108 |
| * | Bio-Rad Laboratories Inc. | | |
| | Class A | 43,244 | 5,996 |
| * | LDR Holding Corp. | 230,850 | 5,797 |
| * | AtriCure Inc. | 250,000 | 5,610 |
| * | Vascular Solutions Inc. | 156,636 | 5,387 |
| * | Sage Therapeutics Inc. | 92,158 | 5,373 |
| * | Spectranetics Corp. | 349,200 | 5,259 |
| * | Durect Corp. | 2,286,150 | 5,052 |
| * | Akorn Inc. | 122,060 | 4,554 |
| LeMaitre Vascular Inc. | 262,986 | 4,537 |
| * | Enanta Pharmaceuticals | | |
| | Inc. | 124,600 | 4,114 |
| * | Cardiovascular Systems | | |
| | Inc. | 267,900 | 4,051 |
| * | Mettler-Toledo | | |
| | International Inc. | 11,900 | 4,036 |
| * | Hologic Inc. | 101,500 | 3,927 |
| * | Centene Corp. | 58,200 | 3,830 |
| * | Syneron Medical Ltd. | 494,210 | 3,810 |
| * | Paratek Pharmaceuticals | | |
| | Inc. | 183,060 | 3,473 |
| * | United Therapeutics Corp. | 22,000 | 3,445 |
| | | |
| Market |
| Value• |
| | Shares | ($000) |
| * | AcelRx Pharmaceuticals | | |
| | Inc. | 825,530 | 3,178 |
| * | Cutera Inc. | 248,300 | 3,176 |
| ResMed Inc. | 57,100 | 3,066 |
| * | Charles River Laboratories | | |
| | International Inc. | 38,100 | 3,063 |
| * | Inogen Inc. | 73,663 | 2,953 |
| * | Quintiles Transnational | | |
| | Holdings Inc. | 41,100 | 2,822 |
| * | AMAG Pharmaceuticals Inc. | 92,300 | 2,787 |
| * | Acadia Healthcare Co. Inc. | 41,600 | 2,598 |
| * | ExamWorks Group Inc. | 97,600 | 2,596 |
| * | Prestige Brands Holdings | | |
| | Inc. | 48,400 | 2,492 |
| * | Evolent Health Inc. Class A | 205,190 | 2,485 |
| * | Molina Healthcare Inc. | 40,700 | 2,447 |
| * | Natus Medical Inc. | 50,300 | 2,417 |
| * | Intersect ENT Inc. | 105,712 | 2,379 |
| * | PRA Health Sciences Inc. | 50,600 | 2,291 |
| * | ICU Medical Inc. | 20,300 | 2,289 |
| * | INC Research Holdings Inc. | | |
| | Class A | 47,100 | 2,285 |
| * | AMN Healthcare Services | | |
| | Inc. | 69,575 | 2,160 |
| * | PAREXEL International Corp. | 31,300 | 2,132 |
| * | Amedisys Inc. | 54,100 | 2,127 |
| * | LifePoint Health Inc. | 28,700 | 2,107 |
| * | Harvard Bioscience Inc. | 595,200 | 2,065 |
| Quality Systems Inc. | 127,300 | 2,052 |
| *,^ Esperion Therapeutics Inc. | 91,300 | 2,032 |
| * | PTC Therapeutics Inc. | 62,150 | 2,014 |
| * | Amsurg Corp. | 26,400 | 2,006 |
| * | Align Technology Inc. | 30,300 | 1,995 |
| * | Emergent BioSolutions Inc. | 46,700 | 1,868 |
| * | Bruker Corp. | 73,700 | 1,789 |
| * | Affymetrix Inc. | 174,900 | 1,765 |
| * | Pacira Pharmaceuticals Inc. | 22,300 | 1,712 |
| * | Medidata Solutions Inc. | 31,157 | 1,536 |
| * | Merrimack Pharmaceuticals | | |
| | Inc. | 193,200 | 1,526 |
| DENTSPLY International Inc. | 24,500 | 1,491 |
| * | Lannett Co. Inc. | 36,000 | 1,444 |
| Chemed Corp. | 9,600 | 1,438 |
| * | Infinity Pharmaceuticals Inc. | 175,800 | 1,380 |
| * | Tetraphase Pharmaceuticals | | |
| | Inc. | 131,066 | 1,315 |
| * | Sucampo Pharmaceuticals | | |
| | Inc. Class A | 73,400 | 1,269 |
| * | Array BioPharma Inc. | 293,300 | 1,238 |
| * | VWR Corp. | 38,800 | 1,098 |
| * | Spectrum Pharmaceuticals | | |
| | Inc. | 181,300 | 1,093 |
| * | FibroGen Inc. | 32,500 | 990 |
| * | STAAR Surgical Co. | 136,340 | 973 |
| Phibro Animal Health Corp. | | |
| | Class A | 31,400 | 946 |
| * | IDEXX Laboratories Inc. | 12,300 | 897 |
| * | Masimo Corp. | 21,600 | 897 |
| * | Cross Country Healthcare | | |
| | Inc. | 50,600 | 829 |
| * | Depomed Inc. | 44,400 | 805 |
| * | Orexigen Therapeutics Inc. | 361,300 | 621 |
| * | Insys Therapeutics Inc. | 21,300 | 610 |
| * | Ionis Pharmaceuticals Inc. | 9,700 | 601 |
| * | Zafgen Inc. | 91,741 | 577 |
| * | LHC Group Inc. | 10,500 | 476 |
| * | Rigel Pharmaceuticals Inc. | 135,800 | 412 |
| * | NewLink Genetics Corp. | 10,700 | 389 |
| * | BioTelemetry Inc. | 31,300 | 366 |
| | | |
| Market |
| Value• |
| | Shares | ($000) |
| * | ImmunoGen Inc. | 25,600 | 347 |
| * | Halozyme Therapeutics Inc. | 16,300 | 283 |
| * | CTI BioPharma Corp. | 185,800 | 229 |
| * | Raptor Pharmaceutical | | |
| | Corp. | 36,800 | 191 |
| * | RTI Surgical Inc. | 37,100 | 147 |
| *,^ Northwest Biotherapeutics | | |
| | Inc. | 36,700 | 117 |
| * | Momenta Pharmaceuticals | | |
| | Inc. | 7,000 | 104 |
| 278,243 |
| Industrials (14.2%) | | |
| * | Advisory Board Co. | 217,777 | 10,804 |
| Douglas Dynamics Inc. | 464,424 | 9,785 |
| Kaman Corp. | 213,350 | 8,707 |
| Tennant Co. | 151,575 | 8,528 |
| John Bean Technologies | | |
| | Corp. | 157,000 | 7,823 |
| * | Hawaiian Holdings Inc. | 216,370 | 7,644 |
| * | RBC Bearings Inc. | 108,800 | 7,027 |
| Mobile Mini Inc. | 176,220 | 5,486 |
| *,^ Titan Machinery Inc. | 490,100 | 5,357 |
| * | Rush Enterprises Inc. | | |
| | Class A | 244,110 | 5,344 |
| Albany International Corp. | 137,232 | 5,016 |
| Celadon Group Inc. | 454,100 | 4,491 |
| Kennametal Inc. | 225,749 | 4,334 |
| Apogee Enterprises Inc. | 99,330 | 4,322 |
| *,^ Power Solutions | | |
| | International Inc. | 222,117 | 4,054 |
| Cintas Corp. | 40,400 | 3,678 |
| Alaska Air Group Inc. | 44,528 | 3,585 |
| * | Genesee & Wyoming Inc. | | |
| | Class A | 63,230 | 3,395 |
| Huntington Ingalls | | |
| | Industries Inc. | 26,200 | 3,324 |
| * | TASER International Inc. | 190,103 | 3,287 |
| * | Spirit AeroSystems | | |
| | Holdings Inc. Class A | 62,500 | 3,129 |
| AO Smith Corp. | 38,800 | 2,973 |
| * | Proto Labs Inc. | 43,200 | 2,751 |
| *,^ Kornit Digital Ltd. | 249,800 | 2,730 |
| Lennox International Inc. | 19,100 | 2,386 |
| * | JetBlue Airways Corp. | 102,400 | 2,319 |
| * | Wabash National Corp. | 192,600 | 2,278 |
| * | Echo Global Logistics Inc. | 109,600 | 2,235 |
| General Cable Corp. | 161,000 | 2,162 |
| BWX Technologies Inc. | 67,900 | 2,157 |
| * | American Woodmark Corp. | 26,900 | 2,151 |
| Exponent Inc. | 42,996 | 2,148 |
| Acuity Brands Inc. | 8,700 | 2,034 |
| *,^ Virgin America Inc. | 55,300 | 1,991 |
| Pitney Bowes Inc. | 96,300 | 1,989 |
| Aircastle Ltd. | 91,500 | 1,911 |
| Comfort Systems USA Inc. | 66,300 | 1,884 |
| Deluxe Corp. | 32,116 | 1,752 |
| Korn/Ferry International | 52,400 | 1,739 |
| Robert Half International | | |
| | Inc. | 36,200 | 1,706 |
| Global Brass & Copper | | |
| | Holdings Inc. | 79,400 | 1,691 |
| CEB Inc. | 27,000 | 1,658 |
| * | DXP Enterprises Inc. | 65,153 | 1,486 |
| * | United Rentals Inc. | 17,600 | 1,277 |
| Graco Inc. | 16,600 | 1,196 |
| * | Meritor Inc. | 142,800 | 1,192 |
| Lincoln Electric Holdings | | |
| | Inc. | 22,500 | 1,168 |
| * | WageWorks Inc. | 25,640 | 1,163 |
229
Vanguard Small Company Growth Portfolio
| | | |
| Market |
| Value• |
| | Shares | ($000) |
| Greenbrier Cos. Inc. | 28,500 | 930 |
| * | Aerojet Rocketdyne | | |
| | Holdings Inc. | 53,800 | 843 |
| Allison Transmission | | |
| | Holdings Inc. | 32,500 | 841 |
| * | Dycom Industries Inc. | 11,300 | 791 |
| IDEX Corp. | 10,000 | 766 |
| FreightCar America Inc. | 32,600 | 633 |
| Interface Inc. Class A | 25,400 | 486 |
| * | Avis Budget Group Inc. | 11,100 | 403 |
| * | PAM Transportation | | |
| | Services Inc. | 14,100 | 389 |
| Griffon Corp. | 21,700 | 386 |
| * | Spirit Airlines Inc. | 7,600 | 303 |
| * | Hudson Technologies Inc. | 89,367 | 265 |
| Heidrick & Struggles | | |
| | International Inc. | 6,800 | 185 |
| * | Trex Co. Inc. | 4,200 | 160 |
| West Corp. | 5,100 | 110 |
| * | YRC Worldwide Inc. | 5,900 | 84 |
| Primoris Services Corp. | 1,100 | 24 |
| 178,846 |
| Information Technology (32.4%) | |
| * | Euronet Worldwide Inc. | 225,512 | 16,334 |
| * | SPS Commerce Inc. | 204,957 | 14,390 |
| * | Super Micro Computer Inc. | 546,419 | 13,393 |
| * | Ultimate Software Group | | |
| | Inc. | 68,462 | 13,385 |
| * | Gigamon Inc. | 489,961 | 13,018 |
| * | Infoblox Inc. | 607,700 | 11,176 |
| * | CoStar Group Inc. | 52,212 | 10,792 |
| * | Perficient Inc. | 592,900 | 10,150 |
| * | Qualys Inc. | 274,200 | 9,073 |
| * | Ruckus Wireless Inc. | 799,000 | 8,557 |
| Brooks Automation Inc. | 742,243 | 7,927 |
| * | Radware Ltd. | 515,300 | 7,905 |
| * | Red Hat Inc. | 92,500 | 7,660 |
| * | Mellanox Technologies Ltd. | 175,800 | 7,408 |
| Teradyne Inc. | 357,530 | 7,390 |
| * | BroadSoft Inc. | 206,500 | 7,302 |
| * | Fleetmatics Group plc | 123,900 | 6,293 |
| * | PROS Holdings Inc. | 268,300 | 6,182 |
| * | Proofpoint Inc. | 93,886 | 6,103 |
| * | Imperva Inc. | 94,900 | 6,008 |
| * | Demandware Inc. | 110,920 | 5,986 |
| * | Virtusa Corp. | 133,677 | 5,526 |
| * | Tyler Technologies Inc. | 31,300 | 5,456 |
| * | CEVA Inc. | 231,000 | 5,396 |
| * | Qlik Technologies Inc. | 168,100 | 5,322 |
| * | Finisar Corp. | 347,500 | 5,053 |
| * | ShoreTel Inc. | 533,900 | 4,725 |
| * | Inphi Corp. | 170,245 | 4,600 |
| * | Pandora Media Inc. | 334,825 | 4,490 |
| * | Microsemi Corp. | 135,700 | 4,422 |
| * | PTC Inc. | 126,907 | 4,395 |
| * | Silicon Laboratories Inc. | 89,000 | 4,320 |
| *,^ Aerohive Networks Inc. | 832,593 | 4,255 |
| * | Constant Contact Inc. | 139,878 | 4,090 |
| * | Cadence Design Systems | | |
| | Inc. | 195,900 | 4,077 |
| * | GTT Communications Inc. | 234,300 | 3,997 |
| * | Rudolph Technologies Inc. | 280,500 | 3,989 |
| * | InvenSense Inc. | 373,600 | 3,822 |
| * | EPAM Systems Inc. | 48,000 | 3,774 |
| * | II-VI Inc. | 200,800 | 3,727 |
| Monolithic Power Systems | | |
| | Inc. | 56,500 | 3,600 |
| Intersil Corp. Class A | 280,200 | 3,575 |
| Ebix Inc. | 106,400 | 3,489 |
| | | |
| Market |
| Value• |
| | Shares | ($000) |
| * | OSI Systems Inc. | 39,000 | 3,458 |
| * | Synchronoss Technologies | | |
| | Inc. | 96,400 | 3,396 |
| FEI Co. | 41,300 | 3,295 |
| * | Guidewire Software Inc. | 54,156 | 3,258 |
| * | Paylocity Holding Corp. | 79,927 | 3,241 |
| Broadridge Financial | | |
| | Solutions Inc. | 60,300 | 3,240 |
| CDW Corp. | 75,200 | 3,161 |
| Jack Henry & Associates | | |
| | Inc. | 38,500 | 3,005 |
| * | Gartner Inc. | 31,568 | 2,863 |
| * | Manhattan Associates Inc. | 43,041 | 2,848 |
| Booz Allen Hamilton | | |
| | Holding Corp. Class A | 90,081 | 2,779 |
| * | LivePerson Inc. | 409,860 | 2,767 |
| * | IPG Photonics Corp. | 29,500 | 2,630 |
| DST Systems Inc. | 22,700 | 2,589 |
| MAXIMUS Inc. | 44,640 | 2,511 |
| * | WNS Holdings Ltd. ADR | 78,829 | 2,459 |
| * | Aspen Technology Inc. | 64,700 | 2,443 |
| * | TiVo Inc. | 274,149 | 2,366 |
| * | Ciena Corp. | 111,200 | 2,301 |
| *,^ Allot Communications Ltd. | 382,200 | 2,224 |
| * | ARRIS Group Inc. | 72,044 | 2,202 |
| * | MicroStrategy Inc. Class A | 12,000 | 2,151 |
| Leidos Holdings Inc. | 37,900 | 2,132 |
| * | Blackhawk Network | | |
| | Holdings Inc. | 48,200 | 2,131 |
| CSG Systems International | | |
| | Inc. | 58,900 | 2,119 |
| * | Sykes Enterprises Inc. | 66,800 | 2,056 |
| * | Advanced Micro Devices | | |
| | Inc. | 708,900 | 2,035 |
| Power Integrations Inc. | 41,500 | 2,018 |
| * | GoDaddy Inc. Class A | 62,700 | 2,010 |
| Avnet Inc. | 46,700 | 2,001 |
| EarthLink Holdings Corp. | 260,000 | 1,932 |
| *,^ Fitbit Inc. Class A | 56,000 | 1,657 |
| * | AVG Technologies NV | 77,340 | 1,551 |
| TeleTech Holdings Inc. | 54,300 | 1,515 |
| * | Integrated Device | | |
| | Technology Inc. | 55,600 | 1,465 |
| Global Payments Inc. | 21,000 | 1,355 |
| * | Cimpress NV | 16,400 | 1,331 |
| QAD Inc. Class A | 64,200 | 1,317 |
| * | Extreme Networks Inc. | 310,600 | 1,267 |
| * | Shopify Inc. | 48,900 | 1,262 |
| Hackett Group Inc. | 76,000 | 1,221 |
| * | Rubicon Project Inc. | 74,040 | 1,218 |
| Science Applications | | |
| | International Corp. | 26,300 | 1,204 |
| * | Nimble Storage Inc. | 127,000 | 1,168 |
| * | Cardtronics Inc. | 30,700 | 1,033 |
| Diebold Inc. | 33,600 | 1,011 |
| * | Synaptics Inc. | 12,200 | 980 |
| Monotype Imaging | | |
| | Holdings Inc. | 39,869 | 942 |
| * | Cirrus Logic Inc. | 30,700 | 907 |
| *,^ Digimarc Corp. | 23,975 | 875 |
| * | HubSpot Inc. | 14,700 | 828 |
| * | Advanced Energy | | |
| | Industries Inc. | 27,700 | 782 |
| * | Unisys Corp. | 64,800 | 716 |
| Heartland Payment | | |
| | Systems Inc. | 7,400 | 702 |
| * | Glu Mobile Inc. | 279,700 | 680 |
| * | Wix.com Ltd. | 29,000 | 660 |
| Jabil Circuit Inc. | 27,300 | 636 |
| | | |
| Market |
| Value• |
| | Shares | ($000) |
| * | Infinera Corp. | 30,500 | 553 |
| * | Angie’s List Inc. | 52,800 | 494 |
| * | Rackspace Hosting Inc. | 19,000 | 481 |
| *,^ Ambarella Inc. | 8,420 | 469 |
| * | ePlus Inc. | 4,600 | 429 |
| * | ON Semiconductor Corp. | 42,000 | 412 |
| * | Xcerra Corp. | 63,500 | 384 |
| Ingram Micro Inc. | 12,300 | 374 |
| *,^ VASCO Data Security | | |
| | International Inc. | 22,100 | 370 |
| * | Quantum Corp. | 345,140 | 321 |
| * | Callidus Software Inc. | 15,900 | 295 |
| *,^ Rapid7 Inc. | 17,500 | 265 |
| * | A10 Networks Inc. | 36,200 | 237 |
| * | Barracuda Networks Inc. | 12,000 | 224 |
| Pegasystems Inc. | 7,900 | 217 |
| * | Jive Software Inc. | 40,200 | 164 |
| * | Arista Networks Inc. | 1,600 | 125 |
| * | WebMD Health Corp. | 2,000 | 97 |
| * | Solium Capital Inc. | 6,700 | 34 |
| 406,381 |
| Materials (2.8%) | | |
| Quaker Chemical Corp. | 75,436 | 5,828 |
| Schweitzer-Mauduit | | |
| | International Inc. | 98,410 | 4,132 |
| Sealed Air Corp. | 80,700 | 3,599 |
| Avery Dennison Corp. | 49,600 | 3,108 |
| Graphic Packaging Holding | | |
| | Co. | 181,000 | 2,322 |
| * | Chemtura Corp. | 82,200 | 2,242 |
| *,^ Trinseo SA | 74,100 | 2,090 |
| Scotts Miracle-Gro Co. | | |
| | Class A | 29,831 | 1,924 |
| * | Berry Plastics Group Inc. | 52,600 | 1,903 |
| Valspar Corp. | 21,500 | 1,784 |
| * | AEP Industries Inc. | 18,100 | 1,396 |
| Ball Corp. | 17,800 | 1,295 |
| Steel Dynamics Inc. | 69,400 | 1,240 |
| International Flavors | | |
| | & Fragrances Inc. | 8,100 | 969 |
| * | Koppers Holdings Inc. | 48,400 | 883 |
| * | Ferro Corp. | 69,200 | 770 |
| 35,485 |
| Other (1.0%) | | |
| ^,2 Vanguard Small-Cap Growth | | |
| | ETF | 104,300 | 12,666 |
| * | NuPathe Inc. CVR | 345,900 | 208 |
| * | Prosensa Holding NV CVR | | |
| | Expire 2/15/17 | 189,490 | 188 |
| 13,062 |
| Telecommunication Services (0.5%) | |
| Cogent Communications | | |
| | Holdings Inc. | 97,462 | 3,381 |
| Inteliquent Inc. | 90,000 | 1,599 |
| * | Cincinnati Bell Inc. | 239,400 | 862 |
| * | FairPoint Communications | | |
| | Inc. | 38,400 | 617 |
| * | Vonage Holdings Corp. | 53,239 | 306 |
| 6,765 |
| Total Common Stocks | | |
| (Cost $1,121,007) | 1,186,099 |
230
Vanguard Small Company Growth Portfolio
| | |
| Market |
| Value• |
| Shares | ($000) |
| Temporary Cash Investments (6.2%)1 | |
| Money Market Fund (6.0%) | | |
| 3,4 Vanguard Market Liquidity | | |
| Fund, 0.363% | 75,472,470 | 75,472 |
| |
| Face | |
| Amount | |
| ($000) | |
| U.S. Government and Agency Obligations (0.2%) |
| 5 Federal Home Loan | | |
| Bank Discount Notes, | | |
| 0.115%, 1/14/16 | 1,000 | 1,000 |
| 5,6 Federal Home Loan | | |
| Bank Discount Notes, | | |
| 0.371%, 5/4/16 | 100 | 100 |
| 6,7 Freddie Mac | | |
| Discount Notes, | | |
| 0.220%, 4/15/16 | 1,100 | 1,099 |
| 2,199 |
| Total Temporary Cash Investments | |
| (Cost $77,672) | 77,671 |
| Total Investments (100.6%) | | |
| (Cost $1,198,679) | 1,263,770 |
| | |
| Amount |
| ($000) |
| Other Assets and Liabilities (-0.6%) | | |
| Other Assets | | |
| Investment in Vanguard | 114 |
| Receivables for Investment Securities Sold | 812 |
| Receivables for Accrued Income | 473 |
| Receivables for Capital Shares Issued | 13,399 |
| Other Assets | 45 |
| Total Other Assets | 14,843 |
| Liabilities | | |
| Collateral for Securities on Loan | (19,676) |
| Payables to Investment Advisor | (420) |
| Payables for Capital Shares Redeemed | (699) |
| Payables to Vanguard | (1,761) |
| Other Liabilities | (143) |
| Total Liabilities | (22,699) |
| Net Assets | (100%) |
| Applicable to 60,412,520 outstanding | |
| $.001 par value shares of beneficial | | |
| interest (unlimited authorization) | 1,255,914 |
| Net Asset Value Per Share | $20.79 |
| |
| At December 31, 2015, net assets consisted of: |
| Amount |
| ($000) |
| Paid-in Capital | 1,076,541 |
| Undistributed Net Investment Income | 2,485 |
| Accumulated Net Realized Gains | 111,540 |
| Unrealized Appreciation (Depreciation) | |
| Investment Securities | 65,091 |
| Futures Contracts | 257 |
| Net Assets | 1,255,914 |
• See Note A in Notes to Financial Statements.
* Non-income-producing security.
^ Includes partial security positions on loan to broker-dealers. The total value of securities on loan is $18,236,000.
1 The portfolio invests a portion of its cash reserves in equity markets through the use of index futures contracts. After giving effect to futures investments, the portfolio’s effective common stock and temporary cash investment positions represent 97.3% and 3.3%, respectively, of net assets.
2 Considered an affiliated company of the portfolio as the issuer is another member of The Vanguard Group.
3 Affiliated money market fund available only to Vanguard funds and certain trusts and accounts managed by Vanguard. Rate shown is the 7-day yield.
4 Includes $19,676,000 of collateral received for securities on loan.
5 The issuer operates under a congressional charter; its securities are generally neither guaranteed by the U.S. Treasury nor backed by the full faith and credit of the U.S. government.
6 Securities with a value of $1,199,000 have been segregated as initial margin for open futures contracts.
7 The issuer was placed under federal conservatorship in September 2008; since that time, its daily operations have been managed by the Federal Housing Finance Agency and it receives capital from the U.S. Treasury, as needed to maintain a positive net worth, in exchange for senior preferred stock.
ADR—American Depositary Receipt.
See accompanying Notes, which are an integral part of the Financial Statements.
231
| | | |
| Vanguard Small Company Growth Portfolio |
| |
| |
| Statement of Operations |
| |
| Year Ended |
| December 31, 2015 |
| | ($000) |
| Investment Income | | |
| Income | | |
| Dividends1 | 7,625 |
| Interest1 | 88 |
| Securities Lending | 1,472 |
| Total Income | 9,185 |
| Expenses | | |
| Investment Advisory Fees—Note B | |
| Basic Fee | 2,099 |
| Performance Adjustment | (97) |
| The Vanguard Group—Note C | | |
| Management and Administrative | 2,500 |
| Marketing and Distribution | 206 |
| Custodian Fees | 42 |
| Auditing Fees | 34 |
| Shareholders’ Reports | 39 |
| Trustees’ Fees and Expenses | 2 |
| Total Expenses | 4,825 |
| Net Investment Income | 4,360 |
| Realized Net Gain (Loss) | | |
| Investment Securities Sold1 | 113,424 |
| Futures Contracts | (1,181) |
| Realized Net Gain (Loss) | 112,243 |
| Change in Unrealized Appreciation | |
| (Depreciation) | | |
| Investment Securities (153,906) |
| Futures Contracts | (273) |
| Change in Unrealized Appreciation | |
| (Depreciation) (154,179) |
| Net Increase (Decrease) in Net Assets | |
| Resulting from Operations | (37,576) |
| 1 Dividend income, interest income, and realized net gain (loss) from affiliated companies of the portfolio were $124,000, $86,000, and $0, respectively. |
| | |
| | | | |
| | |
| Statement of Changes in Net Assets | | |
| |
| Year Ended December 31, |
| 2015 | 2014 |
| ($000) | ($000) |
| Increase (Decrease) in Net Assets | | |
| Operations | | |
| Net Investment Income | 4,360 | 4,556 |
| Realized Net Gain (Loss) | 112,243 | 148,384 |
| Change in Unrealized Appreciation (Depreciation) | (154,179) | (114,423) |
| Net Increase (Decrease) in Net Assets Resulting from Operations | (37,576) | 38,517 |
| Distributions | | |
| Net Investment Income | (4,640) | (3,910) |
| Realized Capital Gain1 | (147,415) | (176,221) |
| Total Distributions | (152,055) | (180,131) |
| Capital Share Transactions | | |
| Issued | 190,501 | 158,315 |
| Issued in Lieu of Cash Distributions | 152,055 | 180,131 |
| Redeemed | (226,311) | (273,783) |
| Net Increase (Decrease) from Capital Share Transactions | 116,245 | 64,663 |
| Total Increase (Decrease) | (73,386) | (76,951) |
| Net Assets |
| Beginning of Period | 1,329,300 | 1,406,251 |
| End of Period2 | 1,255,914 | 1,329,300 |
1 Includes fiscal 2015 and 2014 short-term gain distributions totaling $26,347,000 and $59,957,000, respectively. Short-term gain distributions are treated as ordinary income dividends for tax purposes.
2 Net Assets—End of Period includes undistributed (overdistributed) net investment income of $2,485,000 and $2,736,000.
See accompanying Notes, which are an integral part of the Financial Statements.
232
| | | | | |
| Vanguard Small Company Growth Portfolio | | | | | |
| |
| |
| Financial Highlights | | | | | |
| |
| |
| For a Share Outstanding | | | Year Ended December 31, |
| Throughout Each Period | 2015 | 2014 | 2013 | 2012 | 2011 |
| Net Asset Value, Beginning of Period | $24.14 | $26.90 | $20.08 | $17.89 | $17.68 |
| Investment Operations | |
| Net Investment Income | .078 | .085 | .073 | .155 | .039 |
| Net Realized and Unrealized Gain (Loss) | | | | | |
| on Investments | (.577) | .610 | 8.674 | 2.462 | .204 |
| Total from Investment Operations | (.499) | .695 | 8.747 | 2.617 | .243 |
| Distributions | | |
| Dividends from Net Investment Income | (.087) | (.075) | (.160) | (.045) | (.033) |
| Distributions from Realized Capital Gains | (2.764) | (3.380) | (1.767) | (.382) | — |
| Total Distributions | (2.851) | (3.455) | (1.927) | (.427) | (.033) |
| Net Asset Value, End of Period | $20.79 | $24.14 | $26.90 | $20.08 | $17.89 |
| |
| Total Return | -2.75% | 3.38% | 46.54% | 14.65% | 1.36% |
| |
| Ratios/Supplemental Data | | |
| Net Assets, End of Period (Millions) | $1,256 | $1,329 | $1,406 | $910 | $834 |
| Ratio of Total Expenses to Average Net Assets1 | 0.37% | 0.39% | 0.38% | 0.38% | 0.41% |
| Ratio of Net Investment Income to | | | | | |
| Average Net Assets | 0.33% | 0.34% | 0.32% | 0.78% | 0.23% |
| Portfolio Turnover Rate | 57% | 43% | 64% | 61% | 59% |
1 Includes performance-based investment advisory fee increases (decreases) of (0.01%), 0.01%, 0.01%, 0.02%, and 0.04%.
Notes to Financial Statements
Vanguard Small Company Growth Portfolio, a portfolio of Vanguard Variable Insurance Funds, is registered under the Investment Company Act of 1940 as an open-end investment company. The portfolio’s shares are only available for purchase by separate accounts of insurance companies as investments for variable annuity plans, variable life insurance contracts, or other variable benefit insurance contracts.
A. The following significant accounting policies conform to generally accepted accounting principles for U.S. investment companies. The portfolio consistently follows such policies in preparing its financial statements.
1. Security Valuation: Securities are valued as of the close of trading on the New York Stock Exchange (generally 4 p.m., Eastern time) on the valuation date. Equity securities are valued at the latest quoted sales prices or official closing prices taken from the primary market in which each security trades; such securities not traded on the valuation date are valued at the mean of the latest quoted bid and asked prices. Securities for which market quotations are not readily available, or whose values have been affected by events occurring before the portfolio’s pricing time but after the close of the securities’ primary markets, are valued at their fair values calculated according to procedures adopted by the board of trustees. These procedures include obtaining quotations from an independent pricing service, monitoring news to identify significant market- or security-specific events, and evaluating changes in the values of foreign market proxies (for example, ADRs, futures contracts, or exchange-traded funds), between the time the foreign markets close and the portfolio’s pricing time. When fair-value pricing is employed, the prices of securities used by a portfolio to calculate its net asset value may differ from quoted or published prices for the same securities. Investments in Vanguard Market Liquidity Fund are valued at that fund’s net asset value. Temporary cash investments acquired over 60 days to maturity are valued using the latest bid prices or using valuations based on a matrix system (which considers such factors as security prices, yields, maturities, and ratings), both as furnished by independent pricing services. Other temporary cash investments are valued at amortized cost, which approximates market value.
233
Vanguard Small Company Growth Portfolio
2. Futures Contracts: The portfolio uses index futures contracts to a limited extent, with the objective of maintaining full exposure to the stock market while maintaining liquidity. The portfolio may purchase or sell futures contracts to achieve a desired level of investment, whether to accommodate portfolio turnover or cash flows from capital share transactions. The primary risks associated with the use of futures contracts are imperfect correlation between changes in market values of stocks held by the portfolio and the prices of futures contracts, and the possibility of an illiquid market. Counterparty risk involving futures is mitigated because a regulated clearinghouse is the counterparty instead of the clearing broker. To further mitigate counterparty risk, the portfolio trades futures contracts on an exchange, monitors the financial strength of its clearing brokers and clearinghouse, and has entered into clearing agreements with its clearing brokers. The clearinghouse imposes initial margin requirements to secure the portfolio’s performance and requires daily settlement of variation margin representing changes in the market value of each contract.
Futures contracts are valued at their quoted daily settlement prices. The aggregate settlement values of the contracts are not recorded in the Statement of Net Assets. Fluctuations in the value of the contracts are recorded in the Statement of Net Assets as an asset (liability) and in the Statement of Operations as unrealized appreciation (depreciation) until the contracts are closed, when they are recorded as realized futures gains (losses).
During the year ended December 31, 2015, the portfolio’s average investments in long and short futures contracts represented 2% and 0% of net assets, respectively, based on the average of aggregate settlement values at each quarter-end during the period.
3. Federal Income Taxes: The portfolio intends to continue to qualify as a regulated investment company and distribute all of its taxable income. Management has analyzed the portfolio’s tax positions taken for all open federal income tax years (December 31, 2012–2015), and has concluded that no provision for federal income tax is required in the portfolio’s financial statements.
4. Distributions: Distributions to shareholders are recorded on the ex-dividend date.
5. Securities Lending: To earn additional income, the portfolio lends its securities to qualified institutional borrowers. Security loans are subject to termination by the portfolio at any time and are required to be secured at all times by collateral in an amount at least equal to the market value of securities loaned. Daily market fluctuations could cause the value of loaned securities to be more or less than the value of the collateral received. When this occurs, the collateral is adjusted and settled on the next business day. The portfolio further mitigates its counterparty risk by entering into securities lending transactions only with a diverse group of prequalified counterparties, monitoring their financial strength, and entering into master securities lending agreements with its counterparties. The master securities lending agreements provide that, in the event of a counterparty’s default (including bankruptcy), the portfolio may terminate any loans with that borrower, determine the net amount owed, and sell or retain the collateral up to the net amount owed to the portfolio; however, such actions may be subject to legal proceedings. While collateral mitigates counterparty risk, in the absence of a default the portfolio may experience delays and costs in recovering the securities loaned. The portfolio invests cash collateral received in Vanguard Market Liquidity Fund, and records a liability in the Statement of Net Assets for the return of the collateral, during the period the securities are on loan. Securities lending income represents fees charged to borrowers plus income earned on invested cash collateral, less expenses associated with the loan.
6. Credit Facility: The portfolio and certain other funds managed by The Vanguard Group (“Vanguard”) participate in a $3 billion committed credit facility provided by a syndicate of lenders pursuant to a credit agreement that may be renewed annually; each portfolio is individually liable for its borrowings, if any, under the credit facility. Borrowings may be utilized for temporary and emergency purposes, and are subject to the portfolio’s regulatory and contractual borrowing restrictions. The participating funds are charged administrative fees and an annual commitment fee of 0.06% of the undrawn amount of the facility; these fees are allocated to the funds based on a method approved by the fund’s board of trustees and borne by the funds in which the portfolio invests (see Note B). Any borrowings under this facility bear interest at a rate equal to the higher of the federal funds rate or LIBOR reference rate plus an agreed-upon spread.
The portfolio had no borrowings outstanding at December 31, 2015, or at any time during the period then ended.
234
Vanguard Small Company Growth Portfolio
7. Other: Dividend income is recorded on the ex-dividend date. Interest income includes income distributions received from Vanguard Market Liquidity Fund and is accrued daily. Premiums and discounts on debt securities purchased are amortized and accreted, respectively, to interest income over the lives of the respective securities. Security transactions are accounted for on the date securities are bought or sold. Costs used to determine realized gains (losses) on the sale of investment securities are those of the specific securities sold.
B. Granahan Investment Management, Inc., provides investment advisory services to a portion of the portfolio for a fee calculated at an annual percentage rate of average net assets managed by the advisor. The basic fee of Granahan Investment Management, Inc., is subject to quarterly adjustments based on performance relative to the Russell 2500 Growth Index for the preceding three years for periods prior to October 1, 2013, and to the current benchmark, Russell 2000 Index beginning October 1, 2013. The benchmark change will be fully phased in by September 2016.
Vanguard provides investment advisory services to a portion of the portfolio as described below; the portfolio paid Vanguard advisory fees of $321,000 for the year ended December 31, 2015.
For the year ended December 31, 2015, the aggregate investment advisory fee paid to all advisors represented an effective annual basic rate of 0.16% of the portfolio’s average net assets, before a decrease of $97,000 (0.01%) based on performance.
C. In accordance with the terms of a Funds’ Service Agreement (the “FSA”) between Vanguard and the portfolio, Vanguard furnishes to the portfolio investment advisory, corporate management, administrative, marketing, and distribution services at Vanguard’s cost of operations (as defined by the FSA). These costs of operations are allocated to the portfolio based on methods and guidelines approved by the board of trustees. Vanguard does not require reimbursement in the current period for certain costs of operations (such as deferred compensation/benefits and risk/insurance costs); the portfolio’s liability for these costs of operations is included in Payables to Vanguard on the Statement of Net Assets.
Upon the request of Vanguard, the portfolio may invest up to 0.40% of its net assets as capital in Vanguard. At December 31, 2015, the portfolio had contributed to Vanguard capital in the amount of $114,000, representing 0.01% of the portfolio’s net assets and 0.05% of Vanguard’s capitalization. The portfolio’s trustees and officers are also directors and employees, respectively, of Vanguard.
D. Various inputs may be used to determine the value of the portfolio’s investments. These inputs are summarized in three broad levels for financial statement purposes. The inputs or methodologies used to value securities are not necessarily an indication of the risk associated with investing in those securities.
Level 1—Quoted prices in active markets for identical securities.
Level 2—Other significant observable inputs (including quoted prices for similar securities, interest rates, prepayment speeds, credit risk, etc.).
Level 3—Significant unobservable inputs (including the portfolio’s own assumptions used to determine the fair value of investments).
The following table summarizes the market value of the portfolio’s investments as of December 31, 2015, based on the inputs used to value them:
| | | |
| Level 1 | Level 2 | Level 3 |
| Investments | ($000) | ($000) | ($000) |
| Common Stocks | 1,185,703 | — | 396 |
| Temporary Cash Investments | 75,472 | 2,199 | — |
| Futures Contracts—Assets1 | 11 | — | — |
| Futures Contracts—Liabilities1 | (142) | — | — |
| Total | 1,261,044 | 2,199 | 396 |
| 1 Represents variation margin on the last day of the reporting period. |
235
Vanguard Small Company Growth Portfolio
E. At December 31, 2015, the aggregate settlement value of open futures contracts and the related unrealized appreciation (depreciation) were:
| | | | |
| | | | ($000) |
| Aggregate |
| Number of | Settlement | Unrealized |
| Long (Short) | Value | Appreciation |
| Futures Contracts | Expiration | Contracts | Long (Short) | (Depreciation) |
| E-mini S&P 500 Index | March 2016 | 221 | 22,491 | 12 |
| E-mini Russell 2000 Index | March 2016 | 123 | 13,918 | 245 |
| 257 |
Unrealized appreciation (depreciation) on open futures contracts is required to be treated as realized gain (loss) for tax purposes.
F. Distributions are determined on a tax basis and may differ from net investment income and realized capital gains for financial reporting purposes. Differences may be permanent or temporary. Permanent differences are reclassified among capital accounts in the financial statements to reflect their tax character. Temporary differences arise when certain items of income, expense, gain, or loss are recognized in different periods for financial statement and tax purposes. These differences will reverse at some time in the future. Differences in classification may also result from the treatment of short-term gains as ordinary income for tax purposes.
Certain of the portfolio’s investments are in securities considered to be passive foreign investment companies, for which any unrealized appreciation and/or realized gains are required to be included in distributable net income for tax purposes. During the year ended December 31, 2015, the portfolio realized gains on the sale of passive foreign investment companies of $29,000, which have been included in current and prior periods’ taxable income; accordingly, such gains have been reclassified from accumulated net realized gains to undistributed net investment income.
For tax purposes, at December 31, 2015, the portfolio had $9,414,000 of ordinary income and $106,716,000 of long-term capital gains available for distribution.
At December 31, 2015, the cost of investment securities for tax purposes was $1,198,924,000. Net unrealized appreciation of investment securities for tax purposes was $64,846,000, consisting of unrealized gains of $212,046,000 on securities that had risen in value since their purchase and $147,200,000 in unrealized losses on securities that had fallen in value since their purchase.
G. During the year ended December 31, 2015, the portfolio purchased $716,562,000 of investment securities and sold $788,772,000 of investment securities, other than temporary cash investments.
H. Capital shares issued and redeemed were:
| | |
| Year Ended December 31, |
| 2015 | 2014 |
| Shares | Shares |
| (000) | (000) |
| Issued | 8,503 | 6,640 |
| Issued in Lieu of Cash Distributions | 6,890 | 7,925 |
| Redeemed | (10,036) | (11,778) |
| Net Increase (Decrease) in Shares Outstanding | 5,357 | 2,787 |
At December 31, 2015, one shareholder, an insurance company separate account whose holdings in the portfolio represent the indirect investment of Vanguard Variable Annuity contract holders, was the record or beneficial owner of 49% the portfolio’s net assets. If the shareholder were to redeem its investment in the portfolio, the redemption might result in an increase in the portfolio’s expense ratio or cause the portfolio to incur higher transaction costs.
I. Management has determined that no material events or transactions occurred subsequent to December 31, 2015, that would require recognition or disclosure in these financial statements.
236
Vanguard Small Company Growth Portfolio
Report of Independent Registered Public Accounting Firm
To the Board of Trustees of Vanguard Variable Insurance Funds and the Shareholders of Small Company Growth Portfolio: In our opinion, the accompanying statement of net assets and the related statements of operations and of changes in net assets and the financial highlights present fairly, in all material respects, the financial position of Small Company Growth Portfolio (constituting a separate portfolio of Vanguard Variable Insurance Funds, hereafter referred to as the “Portfolio”) at December 31, 2015, the results of its operations for the year then ended, the changes in its net assets for each of the two years in the period then ended, and the financial highlights for each of the five years in the period then ended, in conformity with accounting principles generally accepted in the United States of America. These financial statements and financial highlights (hereafter referred to as “financial statements”) are the responsibility of the Portfolio’s management. Our responsibility is to express an opinion on these financial statements based on our audits. We conducted our audits of these financial statements in accordance with the standards of the Public Company Accounting Oversight Board (United States). Those standards require that we plan and perform the audit to obtain reasonable assurance about whether the financial statements are free of material misstatement. An audit includes examining, on a test basis, evidence supporting the amounts and disclosures in the financial statements, assessing the accounting principles used and significant estimates made by management, and evaluating the overall financial statement presentation. We believe that our audits, which included confirmation of securities at December 31, 2015 by correspondence with the custodian and brokers, by agreement to the underlying ownership records of the transfer agent and the application of alternative auditing procedures where securities purchased had not been received, provide a reasonable basis for our opinion.
/s/PricewaterhouseCoopers LLP
Philadelphia, Pennsylvania
February 11, 2016
| |
| |
| Special 2015 tax information (unaudited) for corporate shareholders only for Vanguard |
| Small Company Growth Portfolio, a portfolio of Vanguard Variable Insurance Funds |
| |
| This information for the fiscal year ended December 31, 2015, is included pursuant to provisions |
| of the Internal Revenue Code for corporate shareholders only. |
| |
| The portfolio distributed $121,068,000 as capital gain dividends (20% rate gain distributions) to |
| shareholders during the fiscal year. |
| |
| For corporate shareholders, 64% of investment income (dividend income plus short-term gains, |
| if any) qualifies for the dividends-received deduction. |
237
Vanguard Small Company Growth Portfolio
About Your Portfolio’s Expenses
As a shareholder of the portfolio, you incur ongoing costs, which include costs for portfolio management, administrative services, and shareholder reports (like this one), among others. Operating expenses, which are deducted from a portfolio’s gross income, directly reduce the investment return of the portfolio.
A portfolio’s expenses are expressed as a percentage of its average net assets. This figure is known as the expense ratio. The following examples are intended to help you understand the ongoing costs (in dollars) of investing in your portfolio and to compare these costs with those of other mutual funds. The examples are based on an investment of $1,000 made at the beginning of the period shown and held for the entire period.
The table below illustrates your portfolio’s costs in two ways:
• Based on actual portfolio return. This section helps you to estimate the actual expenses that you paid over the period. The “Ending Account Value” shown is derived from the portfolio’s actual return, and the third column shows the dollar amount that would have been paid by an investor who started with $1,000 in the portfolio. You may use the information here, together with the amount you invested, to estimate the expenses that you paid over the period.
To do so, simply divide your account value by $1,000 (for example, an $8,600 account value divided by $1,000 = 8.6), then multiply the result by the number given for your portfolio under the heading “Expenses Paid During Period.”
• Based on hypothetical 5% yearly return. This section is intended to help you compare your portfolio’s costs with those of other mutual funds. It assumes that the portfolio had a yearly return of 5% before expenses, but that the expense ratio is unchanged. In this case—because the return used is not the portfolio’s actual return—the results do not apply to your investment. The example is useful in making comparisons because the Securities and Exchange Commission requires all mutual funds to calculate expenses based on a 5% return. You can assess your portfolio’s costs by comparing this hypothetical example with the hypothetical examples that appear in shareholder reports of other funds.
Note that the expenses shown in the table are meant to highlight and help you compare ongoing costs only and do not reflect transaction costs incurred by the portfolio for buying and selling securities. The portfolio’s expense ratio does not reflect additional fees and expenses associated with the annuity or life insurance program through which you invest.
The calculations assume no shares were bought or sold during the period. Your actual costs may have been higher or lower, depending on the amount of your investment and the timing of any purchases or redemptions.
You can find more information about the portfolio’s expenses in the Financial Statements section. For additional information on operating expenses and other shareholder costs, please refer to the prospectus.
| | | |
| Six Months Ended December 31, 2015 | | | |
| Beginning | Ending | Expenses |
| Account Value | Account Value | Paid During |
| Small Company Growth Portfolio | 6/30/2015 | 12/31/2015 | Period1 |
| Based on Actual Portfolio Return | $1,000.00 | $909.05 | $1.78 |
| Based on Hypothetical 5% Yearly Return | 1,000.00 | 1,023.34 | 1.89 |
1 The calculations are based on expenses incurred in the most recent six-month period. The portfolio’s annualized six-month expense ratio for that period is 0.37%. The dollar amounts shown as “Expenses Paid” are equal to the annualized expense ratio multiplied by the average account value over the period, multiplied by the number of days in the most recent six-month period, then divided by the number of days in the most recent 12-month period (184/365).
238
Vanguard® Total Bond Market Index Portfolio
Toward the close of 2015, the Federal Reserve took the long-awaited step of raising its target for overnight interest rates, which had hovered near zero since the Great Recession. Its vote of confidence in the U.S. economy’s resiliency helped short-term bond yields finish higher than where they started for the fiscal year ended December 31, 2015. The upward movement of intermediate-and long-term yields, however, was more muted given the fragile state of global growth and the subdued outlook for inflation.
With yields rising, bond prices adjusted downward, as prices and yields move in opposite directions. Vanguard Total Bond Market Index Portfolio returned 0.33% for the fiscal year as a decline in the prices of its bond holdings offset much of the income earned over the period.
The portfolio’s result was not far behind the 0.44% return of its expense-free benchmark and ahead of the average return of 0.10% for its peer group.
The portfolio’s 30-day SEC yield climbed to 2.30% on December 31, up from 1.96% a year earlier.
Please note that the portfolio returns in Vanguard Variable Insurance Fund are different from those in Vanguard Variable Annuity (and other plans that invest in the fund), which take into account insurance-related expenses.
Rising bond yields dampened the portfolio’s returns
As the Fed wound down its third round of bond-buying toward the end of 2014, speculation turned to when it might begin to raise short-term interest rates. The economy’s rebound from an early 2015 slowdown and further improvements in employment were favorable developments. On the other hand, inflation remained worryingly low as oil prices continued to fall. Greece’s debt crisis and slowing economic activity in China and other emerging markets may also have contributed to the Fed’s holding off on a rate increase until mid-December.
Even with prices declining, U.S. Treasuries returned close to 1% as a whole. By maturity, short- and intermediate-term Treasuries remained in the black, while their long-term counterparts returned roughly –1%.
Government mortgage-backed securities fared a little better than Treasuries. These high-quality securities benefited from continuing improvement in the housing market and from the attractiveness of their yield premium to Treasuries of similar maturities.
Corporate bonds, however, dipped into negative territory as the income they earned over the period did not fully offset price declines. The difference, or “spread,” in their yields versus Treasuries widened, notably in the industrial sector among bonds issued by metals and mining companies and by energy producers whose creditworthiness was hurt by falling commodity prices. The spread widened less for bonds issued by financial institutions, as regulatory changes have led to stronger balance sheets overall in that sector.
Over ten years, the portfolio closely tracked its index
Over the decade ended December 31, 2015, the indexing skills of the portfolio’s advisor, Vanguard Fixed Income Group, as well as a low expense ratio helped the portfolio post an average annual return of 4.41%. That was not far behind the 4.52% average annual return of its benchmark over the period and a few steps ahead of the 3.90% peer average.
| | | |
| Total Returns | | | |
| | | Ten Years Ended |
| | | December 31, 2015 |
| | Year Ended | Average |
| December 31, 2015 | Annual Return |
| Vanguard Total Bond Market Index Portfolio | | 0.33% | 4.41% |
| Spliced Barclays U.S. Aggregate Float Adjusted Index1 | | 0.44 | 4.52 |
| Spliced Variable Insurance Core Bond Funds Average2,3 | | 0.10 | 3.90 |
The figures shown represent past performance, which is not a guarantee of future results. (Current performance may be lower or higher than the performance data cited. For performance data current to the most recent month-end, visit our website at vanguard.com/performance.) Note, too, that both investment returns and principal value can fluctuate widely, so an investor’s shares, when sold, could be worth more or less than their original cost.
Expense Ratios4
Your Portfolio Compared With Its Peer Group
| | |
| Variable |
| Insurance |
| Core Bond |
| Portfolio | Funds Average3 |
| Total Bond Market Index Portfolio | 0.19% | 0.65% |
1 Barclays U.S. Aggregate Bond Index through December 31, 2009; Barclays U.S. Aggregate Float Adjusted Index thereafter.
2 Variable Insurance Intermediate Investment-Grade Debt Funds Average through August 31, 2013; Variable Insurance Core Bond Funds Average thereafter.
3 Derived from data provided by Lipper, a Thomson Reuters Company.
4 The portfolio expense ratio shown is from the prospectus dated April 30, 2015, and represents estimated costs for the current fiscal year. For the fiscal year ended December 31, 2015, the portfolio’s expense ratio was 0.15%. The peer-group expense ratio is derived from data provided by Lipper, a Thomson Reuters Company, and captures information through year-end 2014.
239
Vanguard Total Bond Market Index Portfolio
Portfolio Profile
As of December 31, 2015
| | |
| Financial Attributes | | |
| Target |
| Portfolio | Index1 |
| Number of Bonds | 5,801 | 9,681 |
| Yield 2 | 2.3% | 2.6% |
| Yield to Maturity | 2.6%3 | 2.6% |
| Average Coupon | 3.3% | 3.1% |
| Average Effective Maturity | 8.0 years | 7.9 years |
| Average Duration | 5.8 years | 5.8 years |
| Expense Ratio 4 | 0.19% | — |
| Short-Term Reserves | 0.9% | — |
| |
| Volatility Measures | |
| Portfolio Versus |
| Target Index1 |
| R-Squared | 0.99 |
| Beta | 1.03 |
| |
| Distribution by Effective Maturity (% of portfolio) |
| |
| Under 1 Year | 0.8% |
| 1–3 Years | 24.2 |
| 3–5 Years | 20.8 |
| 5–10 Years | 37.8 |
| 10–20 Years | 4.1 |
| 20–30 Years | 11.8 |
| Over 30 Years | 0.5 |
| |
| Sector Diversification5 (% of portfolio) | |
| |
| Asset-Backed/Commercial Mortgage-Backed | 2.8% |
| Finance | 8.5 |
| Foreign | 6.0 |
| Government Mortgage-Backed | 21.1 |
| Industrial | 16.5 |
| Treasury/Agency | 42.6 |
| Utilities | 2.1 |
| Other | 0.4 |
| |
| Distribution by Credit Quality (% of portfolio) |
| |
| U.S. Government | 63.7% |
| Aaa | 5.6 |
| Aa | 4.2 |
| A | 11.8 |
| Baa | 14.7 |
Investment Focus
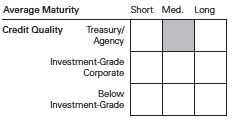
30-Day SEC Yield. A portfolio’s 30-day SEC yield is derived using a formula specified by the U.S. Securities and Exchange Commission. Under the formula, data related to the portfolio’s security holdings in the previous 30 days are used to calculate the portfolio’s hypothetical net income for that period, which is then annualized and divided by the portfolio’s estimated average net assets over the calculation period. For the purposes of this calculation, a security’s income is based on its current market yield to maturity (for bonds), its actual income (for asset-backed securities), or its projected dividend yield (for stocks). Because the SEC yield represents hypothetical annualized income, it will differ—at times significantly—from the portfolio’s actual experience. As a result, the portfolio’s income distributions may be higher or lower than implied by the SEC yield.
Beta. A measure of the magnitude of a portfolio’s past share-price fluctuations in relation to the ups and downs of a given market index. The index is assigned a beta of 1.00. Compared with a given index, a portfolio with a beta of 1.20 typically would have seen its share price rise or fall by 12% when the index rose or fell by 10%. For this report, beta is based on returns over the past 36 months for both the portfolio and the index.
Credit Quality. Credit-quality ratings are measured on a scale that generally ranges from AAA (highest) to D (lowest). U.S. Treasury, U.S. Agency, and U.S. Agency mortgage-backed securities appear under “U.S. Government.” Credit-quality ratings are obtained from Barclays and are from Moody’s, Fitch, and S&P. When ratings from all three agencies are used, the median rating is shown. When ratings from two of the agencies are used, the lower rating for each issue is shown. “Not Rated” is used to classify securities for which a rating is not available. Not rated securities include a fund’s investment in Vanguard Market Liquidity Fund or Vanguard Municipal Cash Management Fund, each of which invests in high-quality money market instruments and may serve as a cash management vehicle for the Vanguard funds, trusts, and accounts.
R-Squared. A measure of how much of a portfolio’s past returns can be explained by the returns from the market in general, as measured by a given index. If a portfolio’s total returns were precisely synchronized with an index’s returns, its R-squared would be 1.00. If the portfolio’s returns bore no relationship to the index’s returns, its R-squared would be 0. For this report, R-squared is based on returns over the past 36 months for both the portfolio and the index.
1 Barclays U.S. Aggregate Float Adjusted Index.
2 30-day SEC yield for the portfolio; index yield assumes that all bonds are called or prepaid at the earliest possible dates.
3 Before expenses.
4 The portfolio expense ratio shown is from the prospectus dated April 30, 2015, and represents estimated costs for the current fiscal year. For the fiscal year ended December 31, 2015, the portfolio’s expense ratio was 0.15%.
5 The agency sector may include issues from government-sponsored enterprises; such issues are not backed by the full faith and credit of the U.S. government.
240
Vanguard Total Bond Market Index Portfolio
Performance Summary
All of the returns in this report represent past performance, which is not a guarantee of future results that may be achieved by the portfolio. (Current performance may be lower or higher than the performance data cited. For performance data current to the most recent month-end, visit our website at vanguard.com/performance.) Note, too, that both investment returns and principal value can fluctuate widely, so an investor’s shares, when sold, could be worth more or less than their original cost. The returns shown do not reflect taxes that a shareholder would pay on portfolio distributions or on the sale of portfolio shares. Nor do the returns reflect fees and expenses associated with the annuity or life insurance program through which a shareholder invests. If these fees and expenses were included, the portfolio’s returns would be lower.
Cumulative Performance: December 31, 2005–December 31, 2015
Initial Investment of $10,000

| | | | |
| | | Average Annual Total Returns | Final Value |
| | Periods Ended December 31, 2015 | of a $10,000 |
| | One Year | Five Years | Ten Years | Investment |
| Total Bond Market Index Portfolio | 0.33% | 3.06% | 4.41% | $15,402 |
| Spliced Barclays U.S. Aggregate | | | | |
| Float Adjusted Index1 | 0.44 | 3.25 | 4.52 | 15,559 |
| Spliced Variable Insurance Core Bond | | | | |
| Funds Average2,3 | 0.10 | 3.08 | 3.90 | 14,666 |
Fiscal-Year Total Returns (%): December 31, 2005–December 31, 2015
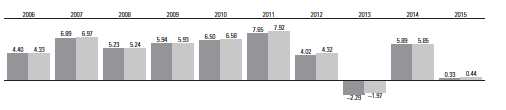
| |
| Total Bond Market Index Portfolio |
| Spliced Barclays U.S. Aggregate Float Adjusted Index1 |
1 Barclays U.S. Aggregate Bond Index through December 31, 2009; Barclays U.S. Aggregate Float Adjusted Index thereafter.
2 Variable Insurance Intermediate Investment-Grade Debt Funds Average through August 31, 2013; Variable Insurance Core Bond Funds Average thereafter.
3 Derived from data provided by Lipper, a Thomson Reuters Company.
See Financial Highlights for dividend and capital gains information.
241
Vanguard Total Bond Market Index Portfolio
Financial Statements
Statement of Net Assets
As of December 31, 2015
The portfolio reports a complete list of its holdings in regulatory filings four times in each fiscal year, at the quarter-ends. For the second and fourth fiscal quarters, the lists appear in the portfolio’s semiannual and annual reports to shareholders. For the first and third fiscal quarters, the portfolio files the lists with the Securities and Exchange Commission on Form N-Q. Shareholders can look up the portfolio’s Forms N-Q on the SEC’s website at sec.gov. Forms N-Q may also be reviewed and copied at the SEC’s Public Reference Room (see the back cover of this report for further information).
| | | | | |
| Face | Market |
| Maturity Amount | Value • |
| | Coupon | Date | ($000) | ($000) |
| U.S. Government and Agency Obligations (63.4%) | | | |
| U.S. Government Securities (39.4%) | | | | |
| United States Treasury Note/Bond | 4.625% | 11/15/16 | 250 | 258 |
| United States Treasury Note/Bond | 0.750% | 1/15/17 | 4,960 | 4,956 |
| United States Treasury Note/Bond | 0.875% | 1/31/17 | 550 | 550 |
| United States Treasury Note/Bond | 3.125% | 1/31/17 | 1,925 | 1,972 |
| United States Treasury Note/Bond | 0.625% | 2/15/17 | 10,396 | 10,372 |
| United States Treasury Note/Bond | 4.625% | 2/15/17 | 200 | 208 |
| United States Treasury Note/Bond | 0.875% | 2/28/17 | 1,696 | 1,697 |
| United States Treasury Note/Bond | 3.000% | 2/28/17 | 3,172 | 3,249 |
| United States Treasury Note/Bond | 0.750% | 3/15/17 | 3,220 | 3,215 |
| United States Treasury Note/Bond | 0.500% | 3/31/17 | 604 | 601 |
| United States Treasury Note/Bond | 1.000% | 3/31/17 | 155 | 155 |
| United States Treasury Note/Bond | 3.250% | 3/31/17 | 4,575 | 4,707 |
| United States Treasury Note/Bond | 0.875% | 4/15/17 | 6,450 | 6,449 |
| United States Treasury Note/Bond | 0.500% | 4/30/17 | 1,470 | 1,462 |
| United States Treasury Note/Bond | 0.875% | 5/15/17 | 12,900 | 12,894 |
| United States Treasury Note/Bond | 4.500% | 5/15/17 | 10,420 | 10,921 |
| United States Treasury Note/Bond | 8.750% | 5/15/17 | 5,125 | 5,667 |
| United States Treasury Note/Bond | 0.625% | 5/31/17 | 738 | 735 |
| United States Treasury Note/Bond | 2.750% | 5/31/17 | 1,662 | 1,704 |
| United States Treasury Note/Bond | 0.625% | 6/30/17 | 34 | 34 |
| United States Treasury Note/Bond | 0.500% | 7/31/17 | 700 | 695 |
| United States Treasury Note/Bond | 0.625% | 7/31/17 | 424 | 422 |
| United States Treasury Note/Bond | 2.375% | 7/31/17 | 5,886 | 6,011 |
| United States Treasury Note/Bond | 0.875% | 8/15/17 | 11,275 | 11,250 |
| United States Treasury Note/Bond | 4.750% | 8/15/17 | 2,175 | 2,306 |
| United States Treasury Note/Bond | 8.875% | 8/15/17 | 5,650 | 6,368 |
| United States Treasury Note/Bond | 0.625% | 8/31/17 | 693 | 689 |
| United States Treasury Note/Bond | 1.875% | 8/31/17 | 8,600 | 8,720 |
| United States Treasury Note/Bond | 1.000% | 9/15/17 | 3,000 | 2,999 |
| United States Treasury Note/Bond | 0.625% | 9/30/17 | 10,757 | 10,683 |
| United States Treasury Note/Bond | 1.875% | 9/30/17 | 7,000 | 7,100 |
| United States Treasury Note/Bond | 0.875% | 10/15/17 | 14,425 | 14,382 |
| United States Treasury Note/Bond | 0.750% | 10/31/17 | 4,335 | 4,312 |
| United States Treasury Note/Bond | 1.875% | 10/31/17 | 2,801 | 2,842 |
| United States Treasury Note/Bond | 0.875% | 11/15/17 | 10,276 | 10,242 |
| United States Treasury Note/Bond | 4.250% | 11/15/17 | 975 | 1,032 |
| United States Treasury Note/Bond | 0.625% | 11/30/17 | 3,625 | 3,596 |
| United States Treasury Note/Bond | 0.875% | 11/30/17 | 4,111 | 4,099 |
| United States Treasury Note/Bond | 2.250% | 11/30/17 | 10,000 | 10,222 |
| United States Treasury Note/Bond | 1.000% | 12/15/17 | 4,268 | 4,263 |
| United States Treasury Note/Bond | 0.750% | 12/31/17 | 2,305 | 2,290 |
| United States Treasury Note/Bond | 1.000% | 12/31/17 | 1,519 | 1,517 |
| United States Treasury Note/Bond | 0.875% | 1/15/18 | 8,475 | 8,437 |
| United States Treasury Note/Bond | 0.875% | 1/31/18 | 9,225 | 9,180 |
| United States Treasury Note/Bond | 2.625% | 1/31/18 | 2,478 | 2,555 |
| United States Treasury Note/Bond | 1.000% | 2/15/18 | 7,100 | 7,080 |
| United States Treasury Note/Bond | 0.750% | 2/28/18 | 5,675 | 5,627 |
| United States Treasury Note/Bond | 2.750% | 2/28/18 | 1,000 | 1,035 |
| United States Treasury Note/Bond | 1.000% | 3/15/18 | 11,191 | 11,154 |
| United States Treasury Note/Bond | 0.750% | 3/31/18 | 4,970 | 4,927 |
| United States Treasury Note/Bond | 2.875% | 3/31/18 | 2,465 | 2,559 |
| United States Treasury Note/Bond | 0.750% | 4/15/18 | 10,671 | 10,568 |
| United States Treasury Note/Bond | 0.625% | 4/30/18 | 4,507 | 4,449 |
| United States Treasury Note/Bond | 1.000% | 5/15/18 | 11,470 | 11,416 |
| United States Treasury Note/Bond | 9.125% | 5/15/18 | 50 | 59 |
| United States Treasury Note/Bond | 1.000% | 5/31/18 | 11,211 | 11,155 |
| United States Treasury Note/Bond | 2.375% | 5/31/18 | 2,350 | 2,416 |
| | | | |
| Face | Market |
| Maturity Amount | Value • |
| Coupon | Date | ($000) | ($000) |
| United States Treasury Note/Bond | 1.125% | 6/15/18 | 1,658 | 1,655 |
| United States Treasury Note/Bond | 2.375% | 6/30/18 | 3,415 | 3,515 |
| United States Treasury Note/Bond | 0.875% | 7/15/18 | 4,473 | 4,434 |
| United States Treasury Note/Bond | 1.375% | 7/31/18 | 9,131 | 9,167 |
| United States Treasury Note/Bond | 2.250% | 7/31/18 | 2,778 | 2,851 |
| United States Treasury Note/Bond | 1.000% | 8/15/18 | 1,755 | 1,744 |
| United States Treasury Note/Bond | 1.500% | 8/31/18 | 15,650 | 15,755 |
| United States Treasury Note/Bond | 1.000% | 9/15/18 | 5,355 | 5,318 |
| United States Treasury Note/Bond | 1.375% | 9/30/18 | 14,903 | 14,952 |
| United States Treasury Note/Bond | 0.875% | 10/15/18 | 2,415 | 2,389 |
| United States Treasury Note/Bond | 1.250% | 10/31/18 | 3,975 | 3,969 |
| United States Treasury Note/Bond | 1.750% | 10/31/18 | 7,700 | 7,800 |
| United States Treasury Note/Bond | 1.250% | 11/15/18 | 3,939 | 3,933 |
| United States Treasury Note/Bond | 3.750% | 11/15/18 | 4,395 | 4,701 |
| United States Treasury Note/Bond | 1.250% | 11/30/18 | 3,280 | 3,274 |
| United States Treasury Note/Bond | 1.375% | 11/30/18 | 3,030 | 3,037 |
| United States Treasury Note/Bond | 1.250% | 12/15/18 | 7,000 | 6,986 |
| United States Treasury Note/Bond | 1.375% | 12/31/18 | 9,000 | 9,007 |
| United States Treasury Note/Bond | 1.500% | 12/31/18 | 8,950 | 8,992 |
| United States Treasury Note/Bond | 1.500% | 1/31/19 | 14,525 | 14,577 |
| United States Treasury Note/Bond | 2.750% | 2/15/19 | 2,550 | 2,657 |
| United States Treasury Note/Bond | 8.875% | 2/15/19 | 110 | 135 |
| United States Treasury Note/Bond | 1.375% | 2/28/19 | 8,575 | 8,570 |
| United States Treasury Note/Bond | 1.500% | 2/28/19 | 2,000 | 2,006 |
| United States Treasury Note/Bond | 1.500% | 3/31/19 | 575 | 577 |
| United States Treasury Note/Bond | 1.625% | 3/31/19 | 2,100 | 2,114 |
| United States Treasury Note/Bond | 1.250% | 4/30/19 | 66 | 66 |
| United States Treasury Note/Bond | 1.625% | 4/30/19 | 6,543 | 6,582 |
| United States Treasury Note/Bond | 3.125% | 5/15/19 | 5,200 | 5,487 |
| United States Treasury Note/Bond | 1.125% | 5/31/19 | 5,650 | 5,586 |
| United States Treasury Note/Bond | 1.500% | 5/31/19 | 5,650 | 5,655 |
| United States Treasury Note/Bond | 1.000% | 6/30/19 | 441 | 434 |
| United States Treasury Note/Bond | 1.625% | 6/30/19 | 3,702 | 3,719 |
| United States Treasury Note/Bond | 0.875% | 7/31/19 | 1,898 | 1,855 |
| United States Treasury Note/Bond | 1.625% | 7/31/19 | 2,487 | 2,496 |
| United States Treasury Note/Bond | 3.625% | 8/15/19 | 1,800 | 1,932 |
| United States Treasury Note/Bond | 8.125% | 8/15/19 | 64 | 79 |
| United States Treasury Note/Bond | 1.000% | 8/31/19 | 175 | 172 |
| United States Treasury Note/Bond | 1.625% | 8/31/19 | 4,236 | 4,249 |
| United States Treasury Note/Bond | 1.000% | 9/30/19 | 575 | 563 |
| United States Treasury Note/Bond | 1.750% | 9/30/19 | 2,150 | 2,165 |
| United States Treasury Note/Bond | 1.250% | 10/31/19 | 625 | 618 |
| United States Treasury Note/Bond | 1.500% | 10/31/19 | 500 | 498 |
| United States Treasury Note/Bond | 3.375% | 11/15/19 | 8,485 | 9,060 |
| United States Treasury Note/Bond | 1.500% | 11/30/19 | 4,242 | 4,226 |
| United States Treasury Note/Bond | 1.125% | 12/31/19 | 500 | 491 |
| United States Treasury Note/Bond | 1.625% | 12/31/19 | 3,275 | 3,275 |
| United States Treasury Note/Bond | 1.250% | 1/31/20 | 499 | 491 |
| United States Treasury Note/Bond | 1.375% | 1/31/20 | 864 | 855 |
| United States Treasury Note/Bond | 3.625% | 2/15/20 | 22,275 | 24,029 |
| United States Treasury Note/Bond | 8.500% | 2/15/20 | 887 | 1,130 |
| United States Treasury Note/Bond | 1.250% | 2/29/20 | 2,143 | 2,108 |
| United States Treasury Note/Bond | 1.375% | 2/29/20 | 1,819 | 1,798 |
| United States Treasury Note/Bond | 1.125% | 3/31/20 | 5,900 | 5,767 |
| United States Treasury Note/Bond | 1.375% | 3/31/20 | 6,120 | 6,045 |
| United States Treasury Note/Bond | 1.125% | 4/30/20 | 16,925 | 16,539 |
| United States Treasury Note/Bond | 1.375% | 4/30/20 | 2,523 | 2,490 |
| United States Treasury Note/Bond | 3.500% | 5/15/20 | 3,515 | 3,779 |
| United States Treasury Note/Bond | 1.375% | 5/31/20 | 900 | 887 |
| United States Treasury Note/Bond | 1.500% | 5/31/20 | 4,508 | 4,471 |
242
Vanguard Total Bond Market Index Portfolio
| | | | |
| Face | Market |
| Maturity Amount | Value • |
| Coupon | Date | ($000) | ($000) |
| United States Treasury Note/Bond | 1.625% | 6/30/20 | 1,995 | 1,987 |
| United States Treasury Note/Bond | 1.875% | 6/30/20 | 9,825 | 9,894 |
| United States Treasury Note/Bond | 1.625% | 7/31/20 | 5,119 | 5,095 |
| United States Treasury Note/Bond | 2.000% | 7/31/20 | 2,419 | 2,447 |
| United States Treasury Note/Bond | 2.625% | 8/15/20 | 2,258 | 2,345 |
| United States Treasury Note/Bond | 8.750% | 8/15/20 | 8,425 | 11,034 |
| United States Treasury Note/Bond | 1.375% | 8/31/20 | 1,825 | 1,796 |
| United States Treasury Note/Bond | 2.125% | 8/31/20 | 967 | 983 |
| United States Treasury Note/Bond | 2.000% | 9/30/20 | 597 | 604 |
| United States Treasury Note/Bond | 1.375% | 10/31/20 | 2,685 | 2,638 |
| United States Treasury Note/Bond | 1.750% | 10/31/20 | 8,461 | 8,448 |
| United States Treasury Note/Bond | 2.625% | 11/15/20 | 4,305 | 4,473 |
| United States Treasury Note/Bond | 1.625% | 11/30/20 | 6,086 | 6,051 |
| United States Treasury Note/Bond | 2.000% | 11/30/20 | 8,575 | 8,662 |
| United States Treasury Note/Bond | 1.750% | 12/31/20 | 6,090 | 6,086 |
| United States Treasury Note/Bond | 2.375% | 12/31/20 | 8,150 | 8,379 |
| United States Treasury Note/Bond | 2.125% | 1/31/21 | 4,321 | 4,384 |
| United States Treasury Note/Bond | 3.625% | 2/15/21 | 6,933 | 7,536 |
| United States Treasury Note/Bond | 7.875% | 2/15/21 | 1,180 | 1,527 |
| United States Treasury Note/Bond | 2.000% | 2/28/21 | 4,550 | 4,587 |
| United States Treasury Note/Bond | 2.250% | 3/31/21 | 9,450 | 9,642 |
| United States Treasury Note/Bond | 2.250% | 4/30/21 | 5,375 | 5,481 |
| United States Treasury Note/Bond | 3.125% | 5/15/21 | 4,975 | 5,291 |
| United States Treasury Note/Bond | 2.000% | 5/31/21 | 9,483 | 9,547 |
| United States Treasury Note/Bond | 2.125% | 6/30/21 | 3,650 | 3,696 |
| United States Treasury Note/Bond | 2.250% | 7/31/21 | 6,425 | 6,545 |
| United States Treasury Note/Bond | 2.125% | 8/15/21 | 3,556 | 3,598 |
| United States Treasury Note/Bond | 2.000% | 8/31/21 | 7,800 | 7,833 |
| United States Treasury Note/Bond | 2.125% | 9/30/21 | 6,900 | 6,971 |
| United States Treasury Note/Bond | 2.000% | 10/31/21 | 10,205 | 10,232 |
| United States Treasury Note/Bond | 2.000% | 11/15/21 | 1,065 | 1,068 |
| United States Treasury Note/Bond | 8.000% | 11/15/21 | 2,570 | 3,432 |
| United States Treasury Note/Bond | 1.875% | 11/30/21 | 5,058 | 5,036 |
| United States Treasury Note/Bond | 2.125% | 12/31/21 | 5,953 | 6,005 |
| United States Treasury Note/Bond | 1.500% | 1/31/22 | 1,850 | 1,798 |
| United States Treasury Note/Bond | 2.000% | 2/15/22 | 235 | 235 |
| United States Treasury Note/Bond | 1.750% | 2/28/22 | 10,104 | 9,959 |
| United States Treasury Note/Bond | 1.750% | 3/31/22 | 10,649 | 10,481 |
| United States Treasury Note/Bond | 1.750% | 4/30/22 | 6,175 | 6,076 |
| United States Treasury Note/Bond | 1.875% | 5/31/22 | 5,650 | 5,594 |
| United States Treasury Note/Bond | 2.125% | 6/30/22 | 1,040 | 1,045 |
| United States Treasury Note/Bond | 2.000% | 7/31/22 | 6,975 | 6,956 |
| United States Treasury Note/Bond | 1.625% | 8/15/22 | 296 | 288 |
| United States Treasury Note/Bond | 7.250% | 8/15/22 | 100 | 132 |
| United States Treasury Note/Bond | 1.875% | 8/31/22 | 4,369 | 4,318 |
| United States Treasury Note/Bond | 1.750% | 9/30/22 | 10,287 | 10,080 |
| United States Treasury Note/Bond | 1.875% | 10/31/22 | 6,520 | 6,435 |
| United States Treasury Note/Bond | 1.625% | 11/15/22 | 6,025 | 5,852 |
| United States Treasury Note/Bond | 7.625% | 11/15/22 | 40 | 54 |
| United States Treasury Note/Bond | 2.000% | 11/30/22 | 8,350 | 8,302 |
| United States Treasury Note/Bond | 2.125% | 12/31/22 | 5,000 | 5,008 |
| United States Treasury Note/Bond | 2.000% | 2/15/23 | 123 | 122 |
| United States Treasury Note/Bond | 7.125% | 2/15/23 | 1,690 | 2,256 |
| United States Treasury Note/Bond | 1.750% | 5/15/23 | 12,970 | 12,632 |
| United States Treasury Note/Bond | 2.500% | 8/15/23 | 7,160 | 7,345 |
| United States Treasury Note/Bond | 6.250% | 8/15/23 | 6,565 | 8,473 |
| United States Treasury Note/Bond | 2.750% | 11/15/23 | 7,111 | 7,420 |
| United States Treasury Note/Bond | 2.750% | 2/15/24 | 9,410 | 9,798 |
| United States Treasury Note/Bond | 2.500% | 5/15/24 | 8,960 | 9,152 |
| United States Treasury Note/Bond | 2.375% | 8/15/24 | 11,564 | 11,680 |
| United States Treasury Note/Bond | 2.250% | 11/15/24 | 8,981 | 8,974 |
| United States Treasury Note/Bond | 7.500% | 11/15/24 | 25 | 36 |
| United States Treasury Note/Bond | 2.000% | 2/15/25 | 3,325 | 3,248 |
| United States Treasury Note/Bond | 2.125% | 5/15/25 | 9,810 | 9,677 |
| United States Treasury Note/Bond | 2.000% | 8/15/25 | 6,231 | 6,073 |
| United States Treasury Note/Bond | 6.875% | 8/15/25 | 1,957 | 2,739 |
| United States Treasury Note/Bond | 2.250% | 11/15/25 | 12,302 | 12,269 |
| United States Treasury Note/Bond | 6.000% | 2/15/26 | 4,160 | 5,550 |
| United States Treasury Note/Bond | 6.750% | 8/15/26 | 630 | 892 |
| United States Treasury Note/Bond | 6.500% | 11/15/26 | 765 | 1,070 |
| United States Treasury Note/Bond | 6.625% | 2/15/27 | 1,065 | 1,509 |
| | | | | |
| Face | Market |
| Maturity Amount | Value • |
| | Coupon | Date | ($000) | ($000) |
| United States Treasury Note/Bond | 6.375% | 8/15/27 | 185 | 260 |
| United States Treasury Note/Bond | 6.125% | 11/15/27 | 346 | 479 |
| United States Treasury Note/Bond | 5.500% | 8/15/28 | 955 | 1,270 |
| United States Treasury Note/Bond | 5.250% | 11/15/28 | 1,435 | 1,873 |
| United States Treasury Note/Bond | 5.250% | 2/15/29 | 2,183 | 2,857 |
| United States Treasury Note/Bond | 6.125% | 8/15/29 | 2,255 | 3,197 |
| United States Treasury Note/Bond | 6.250% | 5/15/30 | 1,600 | 2,318 |
| United States Treasury Note/Bond | 5.375% | 2/15/31 | 1,950 | 2,641 |
| United States Treasury Note/Bond | 4.500% | 2/15/36 | 2,175 | 2,783 |
| United States Treasury Note/Bond | 4.750% | 2/15/37 | 875 | 1,158 |
| United States Treasury Note/Bond | 4.375% | 2/15/38 | 1,900 | 2,394 |
| United States Treasury Note/Bond | 3.500% | 2/15/39 | 2,195 | 2,424 |
| United States Treasury Note/Bond | 4.250% | 5/15/39 | 3,232 | 3,987 |
| United States Treasury Note/Bond | 4.500% | 8/15/39 | 2,306 | 2,946 |
| United States Treasury Note/Bond | 4.375% | 11/15/39 | 2,817 | 3,538 |
| United States Treasury Note/Bond | 4.625% | 2/15/40 | 5,050 | 6,568 |
| United States Treasury Note/Bond | 4.375% | 5/15/40 | 3,085 | 3,877 |
| United States Treasury Note/Bond | 3.875% | 8/15/40 | 3,230 | 3,771 |
| United States Treasury Note/Bond | 4.250% | 11/15/40 | 5,125 | 6,328 |
| United States Treasury Note/Bond | 4.750% | 2/15/41 | 3,156 | 4,191 |
| United States Treasury Note/Bond | 3.125% | 11/15/41 | 20 | 21 |
| United States Treasury Note/Bond | 3.125% | 2/15/42 | 281 | 290 |
| United States Treasury Note/Bond | 3.000% | 5/15/42 | 5,050 | 5,074 |
| United States Treasury Note/Bond | 2.750% | 8/15/42 | 4,060 | 3,875 |
| United States Treasury Note/Bond | 2.750% | 11/15/42 | 16,946 | 16,138 |
| United States Treasury Note/Bond | 3.125% | 2/15/43 | 5,200 | 5,323 |
| United States Treasury Note/Bond | 2.875% | 5/15/43 | 4,150 | 4,041 |
| United States Treasury Note/Bond | 3.625% | 8/15/43 | 9,380 | 10,552 |
| United States Treasury Note/Bond | 3.750% | 11/15/43 | 4,617 | 5,312 |
| United States Treasury Note/Bond | 3.625% | 2/15/44 | 3,224 | 3,621 |
| United States Treasury Note/Bond | 3.375% | 5/15/44 | 6,129 | 6,569 |
| United States Treasury Note/Bond | 3.125% | 8/15/44 | 8,006 | 8,171 |
| United States Treasury Note/Bond | 3.000% | 11/15/44 | 10,140 | 10,088 |
| United States Treasury Note/Bond | 2.500% | 2/15/45 | 5,360 | 4,801 |
| United States Treasury Note/Bond | 3.000% | 5/15/45 | 4,867 | 4,837 |
| United States Treasury Note/Bond | 2.875% | 8/15/45 | 7,852 | 7,614 |
| United States Treasury Note/Bond | 3.000% | 11/15/45 | 7,425 | 7,391 |
| 1,103,614 |
| Agency Bonds and Notes (2.8%) | | | | |
| 1 | AID-Israel | 5.500% | 12/4/23 | 50 | 60 |
| 1 | AID-Israel | 5.500% | 4/26/24 | 475 | 576 |
| 1 | AID-Jordan | 1.945% | 6/23/19 | 200 | 202 |
| 1 | AID-Jordan | 2.503% | 10/30/20 | 225 | 230 |
| 1 | AID-Jordan | 2.578% | 6/30/22 | 200 | 203 |
| 1 | AID-Ukraine | 1.844% | 5/16/19 | 200 | 202 |
| 1 | AID-Ukraine | 1.847% | 5/29/20 | 200 | 199 |
| 2 | Federal Farm Credit Banks | 4.875% | 1/17/17 | 250 | 260 |
| 2 | Federal Farm Credit Banks | 1.125% | 9/22/17 | 100 | 100 |
| 2 | Federal Farm Credit Banks | 1.000% | 9/25/17 | 125 | 125 |
| 2 | Federal Farm Credit Banks | 1.125% | 12/18/17 | 250 | 250 |
| 2 | Federal Farm Credit Banks | 1.110% | 2/20/18 | 125 | 125 |
| 2 | Federal Farm Credit Banks | 1.100% | 6/1/18 | 100 | 100 |
| 2 | Federal Farm Credit Banks | 5.150% | 11/15/19 | 500 | 565 |
| 2 | Federal Farm Credit Banks | 3.500% | 12/20/23 | 75 | 81 |
| 2 | Federal Home Loan Banks | 0.875% | 3/10/17 | 75 | 75 |
| 2 | Federal Home Loan Banks | 4.875% | 5/17/17 | 550 | 579 |
| 2 | Federal Home Loan Banks | 0.875% | 5/24/17 | 500 | 499 |
| 2 | Federal Home Loan Banks | 0.625% | 5/30/17 | 1,500 | 1,492 |
| 2 | Federal Home Loan Banks | 1.000% | 6/21/17 | 400 | 400 |
| 2 | Federal Home Loan Banks | 0.860% | 8/1/17 | 250 | 249 |
| 2 | Federal Home Loan Banks | 0.750% | 8/28/17 | 500 | 497 |
| 2 | Federal Home Loan Banks | 0.625% | 10/26/17 | 1,400 | 1,388 |
| 2 | Federal Home Loan Banks | 5.000% | 11/17/17 | 225 | 241 |
| 2 | Federal Home Loan Banks | 1.000% | 12/19/17 | 1,000 | 997 |
| 2 | Federal Home Loan Banks | 1.375% | 3/9/18 | 600 | 602 |
| 2 | Federal Home Loan Banks | 1.125% | 4/25/18 | 550 | 549 |
| 2 | Federal Home Loan Banks | 5.375% | 8/15/18 | 150 | 166 |
| 2 | Federal Home Loan Banks | 1.875% | 3/13/20 | 75 | 76 |
| 2 | Federal Home Loan Banks | 4.125% | 3/13/20 | 300 | 329 |
| 2 | Federal Home Loan Banks | 5.250% | 12/11/20 | 425 | 493 |
| 2 | Federal Home Loan Banks | 5.625% | 6/11/21 | 35 | 42 |
243
Vanguard Total Bond Market Index Portfolio
| | | | | |
| Face | Market |
| Maturity Amount | Value • |
| | Coupon | Date | ($000) | ($000) |
| 2 | Federal Home Loan Banks | 2.125% | 3/10/23 | 1,325 | 1,311 |
| 2 | Federal Home Loan Banks | 5.500% | 7/15/36 | 1,400 | 1,826 |
| 3 | Federal Home Loan Mortgage Corp. | 0.500% | 1/27/17 | 750 | 747 |
| 3 | Federal Home Loan Mortgage Corp. | 0.875% | 2/22/17 | 600 | 600 |
| 3 | Federal Home Loan Mortgage Corp. | 1.000% | 3/8/17 | 1,000 | 1,001 |
| 3 | Federal Home Loan Mortgage Corp. | 1.250% | 5/12/17 | 5,000 | 5,016 |
| 3 | Federal Home Loan Mortgage Corp. | 1.000% | 6/29/17 | 440 | 440 |
| 3 | Federal Home Loan Mortgage Corp. | 0.750% | 7/14/17 | 600 | 597 |
| 3 | Federal Home Loan Mortgage Corp. | 1.000% | 7/28/17 | 679 | 678 |
| 3 | Federal Home Loan Mortgage Corp. | 1.000% | 9/29/17 | 700 | 699 |
| 3 | Federal Home Loan Mortgage Corp. | 5.125% | 11/17/17 | 200 | 215 |
| 3 | Federal Home Loan Mortgage Corp. | 1.000% | 12/15/17 | 700 | 698 |
| 3 | Federal Home Loan Mortgage Corp. | 0.750% | 1/12/18 | 700 | 694 |
| 3 | Federal Home Loan Mortgage Corp. | 0.875% | 3/7/18 | 1,000 | 993 |
| 3 | Federal Home Loan Mortgage Corp. | 4.875% | 6/13/18 | 550 | 597 |
| 3 | Federal Home Loan Mortgage Corp. | 3.750% | 3/27/19 | 625 | 669 |
| 3 | Federal Home Loan Mortgage Corp. | 1.750% | 5/30/19 | 1,150 | 1,158 |
| 3 | Federal Home Loan Mortgage Corp. | 1.250% | 8/1/19 | 700 | 692 |
| 3 | Federal Home Loan Mortgage Corp. | 1.250% | 10/2/19 | 1,150 | 1,134 |
| 3 | Federal Home Loan Mortgage Corp. | 1.375% | 5/1/20 | 1,300 | 1,281 |
| 3 | Federal Home Loan Mortgage Corp. | 2.375% | 1/13/22 | 800 | 811 |
| 3 | Federal Home Loan Mortgage Corp. | 6.750% | 9/15/29 | 127 | 180 |
| 3 | Federal Home Loan Mortgage Corp. | 6.750% | 3/15/31 | 1,525 | 2,186 |
| 3 | Federal Home Loan Mortgage Corp. | 6.250% | 7/15/32 | 502 | 696 |
| 3 | Federal National Mortgage Assn. | 1.250% | 1/30/17 | 1,000 | 1,004 |
| 3 | Federal National Mortgage Assn. | 5.000% | 2/13/17 | 1,925 | 2,013 |
| 3 | Federal National Mortgage Assn. | 0.750% | 4/20/17 | 300 | 299 |
| 3 | Federal National Mortgage Assn. | 1.125% | 4/27/17 | 2,950 | 2,955 |
| 3 | Federal National Mortgage Assn. | 5.000% | 5/11/17 | 2,000 | 2,107 |
| 3 | Federal National Mortgage Assn. | 5.375% | 6/12/17 | 1,000 | 1,062 |
| 3 | Federal National Mortgage Assn. | 0.875% | 8/28/17 | 175 | 174 |
| 3 | Federal National Mortgage Assn. | 1.000% | 9/27/17 | 550 | 549 |
| 3 | Federal National Mortgage Assn. | 0.875% | 10/26/17 | 900 | 896 |
| 3 | Federal National Mortgage Assn. | 0.875% | 12/20/17 | 1,500 | 1,492 |
| 3 | Federal National Mortgage Assn. | 0.875% | 2/8/18 | 2,500 | 2,484 |
| 3 | Federal National Mortgage Assn. | 0.875% | 5/21/18 | 510 | 505 |
| 3 | Federal National Mortgage Assn. | 1.125% | 7/20/18 | 1,500 | 1,494 |
| 3 | Federal National Mortgage Assn. | 1.875% | 9/18/18 | 1,825 | 1,851 |
| 3 | Federal National Mortgage Assn. | 1.125% | 10/19/18 | 700 | 696 |
| 3 | Federal National Mortgage Assn. | 1.625% | 11/27/18 | 1,330 | 1,340 |
| 3 | Federal National Mortgage Assn. | 1.125% | 12/14/18 | 1,000 | 992 |
| 3 | Federal National Mortgage Assn. | 1.875% | 2/19/19 | 500 | 507 |
| 3 | Federal National Mortgage Assn. | 1.750% | 6/20/19 | 1,000 | 1,007 |
| 3 | Federal National Mortgage Assn. | 1.750% | 9/12/19 | 2,000 | 2,009 |
| 3 | Federal National Mortgage Assn. | 0.000% | 10/9/19 | 275 | 255 |
| 3 | Federal National Mortgage Assn. | 1.750% | 11/26/19 | 1,000 | 1,004 |
| 3 | Federal National Mortgage Assn. | 1.625% | 1/21/20 | 1,000 | 997 |
| 3 | Federal National Mortgage Assn. | 1.500% | 6/22/20 | 1,000 | 988 |
| 3 | Federal National Mortgage Assn. | 1.500% | 11/30/20 | 1,000 | 983 |
| 3 | Federal National Mortgage Assn. | 1.875% | 12/28/20 | 1,000 | 1,001 |
| 3 | Federal National Mortgage Assn. | 2.625% | 9/6/24 | 500 | 505 |
| 3 | Federal National Mortgage Assn. | 6.250% | 5/15/29 | 175 | 238 |
| 3 | Federal National Mortgage Assn. | 7.125% | 1/15/30 | 925 | 1,354 |
| 3 | Federal National Mortgage Assn. | 7.250% | 5/15/30 | 300 | 445 |
| 3 | Federal National Mortgage Assn. | 6.625% | 11/15/30 | 300 | 426 |
| 3 | Federal National Mortgage Assn. | 5.625% | 7/15/37 | 275 | 366 |
| 2 | Financing Corp. | 9.650% | 11/2/18 | 225 | 276 |
| Private Export Funding Corp. | 1.375% | 2/15/17 | 25 | 25 |
| Private Export Funding Corp. | 2.250% | 12/15/17 | 125 | 127 |
| Private Export Funding Corp. | 1.875% | 7/15/18 | 100 | 101 |
| Private Export Funding Corp. | 4.375% | 3/15/19 | 200 | 216 |
| Private Export Funding Corp. | 1.450% | 8/15/19 | 125 | 123 |
| Private Export Funding Corp. | 2.250% | 3/15/20 | 150 | 151 |
| Private Export Funding Corp. | 2.300% | 9/15/20 | 50 | 50 |
| Private Export Funding Corp. | 4.300% | 12/15/21 | 100 | 110 |
| Private Export Funding Corp. | 2.800% | 5/15/22 | 125 | 127 |
| Private Export Funding Corp. | 2.050% | 11/15/22 | 1,075 | 1,038 |
| Private Export Funding Corp. | 3.550% | 1/15/24 | 100 | 106 |
| Private Export Funding Corp. | 2.450% | 7/15/24 | 100 | 97 |
| Private Export Funding Corp. | 3.250% | 6/15/25 | 50 | 51 |
| 2 | Tennessee Valley Authority | 5.500% | 7/18/17 | 275 | 293 |
| | | | | |
| Face | Market |
| Maturity Amount | Value • |
| | Coupon | Date | ($000) | ($000) |
| 2 | Tennessee Valley Authority | 4.500% | 4/1/18 | 175 | 187 |
| 2 | Tennessee Valley Authority | 1.750% | 10/15/18 | 150 | 151 |
| 2 | Tennessee Valley Authority | 3.875% | 2/15/21 | 250 | 273 |
| 2 | Tennessee Valley Authority | 1.875% | 8/15/22 | 175 | 170 |
| 2 | Tennessee Valley Authority | 2.875% | 9/15/24 | 191 | 191 |
| 2 | Tennessee Valley Authority | 6.750% | 11/1/25 | 134 | 177 |
| 2 | Tennessee Valley Authority | 7.125% | 5/1/30 | 1,000 | 1,428 |
| 2 | Tennessee Valley Authority | 4.650% | 6/15/35 | 175 | 196 |
| 2 | Tennessee Valley Authority | 5.880% | 4/1/36 | 250 | 319 |
| 2 | Tennessee Valley Authority | 5.500% | 6/15/38 | 100 | 123 |
| 2 | Tennessee Valley Authority | 5.250% | 9/15/39 | 225 | 272 |
| 2 | Tennessee Valley Authority | 3.500% | 12/15/42 | 200 | 183 |
| 2 | Tennessee Valley Authority | 4.875% | 1/15/48 | 100 | 112 |
| 2 | Tennessee Valley Authority | 5.375% | 4/1/56 | 50 | 59 |
| 2 | Tennessee Valley Authority | 4.625% | 9/15/60 | 180 | 189 |
| 2 | Tennessee Valley Authority | 4.250% | 9/15/65 | 200 | 193 |
| 77,983 |
| Conventional Mortgage-Backed Securities | (20.8%) | | | |
| 3,4 Fannie Mae Pool | 2.000% | 8/1/28– | | |
| | | 10/1/28 | 1,433 | 1,410 |
| 3,4 Fannie Mae Pool | 2.500% | 3/1/27– | | |
| | | 1/1/43 | 13,933 | 14,050 |
| 3,4,5 Fannie Mae Pool | 3.000% | 11/1/25– | | |
| | | 1/1/46 | 46,090 | 46,800 |
| 3,4,5 Fannie Mae Pool | 3.500% | 9/1/25– | | |
| | | 1/1/46 | 65,030 | 67,422 |
| 3,4,5 Fannie Mae Pool | 4.000% | 8/1/18– | | |
| | | 1/1/46 | 44,713 | 47,465 |
| 3,4 Fannie Mae Pool | 4.500% | 2/1/18– | | |
| | | 1/1/46 | 23,718 | 25,675 |
| 3,4 Fannie Mae Pool | 5.000% | 3/1/17– | | |
| | | 1/1/44 | 14,414 | 15,836 |
| 3,4 Fannie Mae Pool | 5.500% | 11/1/16– | | |
| | | 4/1/40 | 11,545 | 12,859 |
| 3,4 Fannie Mae Pool | 6.000% | 4/1/16– | | |
| | | 7/1/40 | 6,956 | 7,873 |
| 3,4 Fannie Mae Pool | 6.500% | 4/1/16– | | |
| | | 10/1/39 | 2,485 | 2,859 |
| 3,4 Fannie Mae Pool | 7.000% | 5/1/16– | | |
| | | 11/1/37 | 667 | 759 |
| 3,4 Fannie Mae Pool | 7.500% | 11/1/22– | | |
| | | 2/1/32 | 64 | 72 |
| 3,4 Fannie Mae Pool | 8.000% | 8/1/17– | | |
| | | 11/1/30 | 43 | 48 |
| 3,4 Fannie Mae Pool | 8.500% | 7/1/22– | | |
| | | 4/1/31 | 15 | 16 |
| 3,4 Fannie Mae Pool | 9.000% | 7/1/22– | | |
| | | 12/1/24 | 2 | 2 |
| 3,4 Fannie Mae Pool | 9.500% | 12/1/18– | | |
| | | 2/1/25 | 2 | 2 |
| 4 | Freddie Mac Gold Pool | 2.000% | 8/1/28– | | |
| | | 1/1/29 | 772 | 759 |
| 4 | Freddie Mac Gold Pool | 2.500% | 4/1/27– | | |
| | | 2/1/43 | 14,183 | 14,312 |
| 4,5 Freddie Mac Gold Pool | 3.000% | 10/1/26– | | |
| | | 1/1/46 | 29,447 | 29,860 |
| 4,5 Freddie Mac Gold Pool | 3.500% | 9/1/25– | | |
| | | 1/1/46 | 38,221 | 39,512 |
| 4,5 Freddie Mac Gold Pool | 4.000% | 7/1/18– | | |
| | | 1/1/46 | 28,571 | 30,249 |
| 4,5 Freddie Mac Gold Pool | 4.500% | 1/1/18– | | |
| | | 1/1/46 | 15,887 | 17,086 |
| 4,5 Freddie Mac Gold Pool | 5.000% | 10/1/17– | | |
| | | 1/1/46 | 8,634 | 9,399 |
| 4 | Freddie Mac Gold Pool | 5.500% | 8/1/16– | | |
| | | 6/1/41 | 6,806 | 7,534 |
| 4 | Freddie Mac Gold Pool | 6.000% | 4/1/16– | | |
| | | 3/1/39 | 4,450 | 5,004 |
| 4 | Freddie Mac Gold Pool | 6.500% | 1/1/16– | | |
| | | 4/1/39 | 1,422 | 1,644 |
244
Vanguard Total Bond Market Index Portfolio
| | | | | |
| Face | Market |
| Maturity Amount | Value • |
| | Coupon | Date | ($000) | ($000) |
| 4 | Freddie Mac Gold Pool | 7.000% | 4/1/23– | | |
| | | 2/1/37 | 465 | 539 |
| 4 | Freddie Mac Gold Pool | 7.500% | 11/1/19– | | |
| | | 4/1/28 | 36 | 41 |
| 4 | Freddie Mac Gold Pool | 8.000% | 1/1/22– | | |
| | | 7/1/30 | 32 | 39 |
| 4 | Freddie Mac Gold Pool | 8.500% | 4/1/23– | | |
| | | 11/1/30 | 23 | 27 |
| 4 | Freddie Mac Gold Pool | 9.000% | 5/1/27– | | |
| | | 5/1/30 | 5 | 6 |
| 4 | Ginnie Mae I Pool | 3.000% | 1/15/26– | | |
| | | 12/15/45 | 4,163 | 4,235 |
| 4,5 Ginnie Mae I Pool | 3.500% | 11/15/25– | | |
| | | 1/1/46 | 5,325 | 5,555 |
| 4,5 Ginnie Mae I Pool | 4.000% | 10/15/24– | | |
| | | 2/1/46 | 7,236 | 7,700 |
| 4 | Ginnie Mae I Pool | 4.500% | 8/15/18– | | |
| | | 1/1/46 | 8,538 | 9,273 |
| 4,5 Ginnie Mae I Pool | 5.000% | 1/15/18– | | |
| | | 1/1/46 | 5,167 | 5,694 |
| 4 | Ginnie Mae I Pool | 5.500% | 6/15/18– | | |
| | | 12/15/40 | 2,997 | 3,370 |
| 4 | Ginnie Mae I Pool | 6.000% | 2/15/17– | | |
| | | 3/15/40 | 2,155 | 2,441 |
| 4 | Ginnie Mae I Pool | 6.500% | 11/15/23– | | |
| | | 2/15/39 | 575 | 650 |
| 4 | Ginnie Mae I Pool | 7.000% | 5/15/23– | | |
| | | 10/15/31 | 137 | 156 |
| 4 | Ginnie Mae I Pool | 7.500% | 4/15/22– | | |
| | | 1/15/31 | 60 | 65 |
| 4 | Ginnie Mae I Pool | 8.000% | 2/15/22– | | |
| | | 10/15/30 | 39 | 41 |
| 4 | Ginnie Mae I Pool | 8.500% | 6/15/24– | | |
| | | 9/15/26 | 7 | 8 |
| 4 | Ginnie Mae I Pool | 9.000% | 9/15/16– | | |
| | | 7/15/30 | 9 | 9 |
| 4 | Ginnie Mae I Pool | 9.500% | 12/15/21 | 2 | 2 |
| 4 | Ginnie Mae II Pool | 2.500% | 2/20/28– | | |
| | | 6/20/28 | 656 | 667 |
| 4,5 Ginnie Mae II Pool | 3.000% | 2/20/27– | | |
| | | 1/1/46 | 27,522 | 27,981 |
| 4,5 Ginnie Mae II Pool | 3.500% | 9/20/25– | | |
| | | 1/1/46 | 52,069 | 54,391 |
| 4,5 Ginnie Mae II Pool | 4.000% | 9/20/25– | | |
| | | 1/1/46 | 30,002 | 31,978 |
| 4,5 Ginnie Mae II Pool | 4.500% | 2/20/39– | | |
| | | 1/1/46 | 15,467 | 16,695 |
| 4 | Ginnie Mae II Pool | 5.000% | 3/20/18– | | |
| | | 7/20/44 | 7,845 | 8,627 |
| 4 | Ginnie Mae II Pool | 5.500% | 6/20/34– | | |
| | | 9/20/41 | 2,290 | 2,548 |
| 4 | Ginnie Mae II Pool | 6.000% | 3/20/33– | | |
| | | 7/20/39 | 1,231 | 1,389 |
| 4 | Ginnie Mae II Pool | 6.500% | 12/20/35– | | |
| | | 11/20/39 | 410 | 471 |
| 4 | Ginnie Mae II Pool | 7.000% | 8/20/36– | | |
| | | 4/20/38 | 48 | 56 |
| 583,161 |
| Nonconventional Mortgage-Backed Securities (0.4%) | | |
| 3,4,6 Fannie Mae Pool | 1.591% | 4/1/37 | 31 | 32 |
| 3,4,6 Fannie Mae Pool | 2.040% | 12/1/41 | 102 | 105 |
| 3,4,6 Fannie Mae Pool | 2.052% | 9/1/37 | 69 | 74 |
| 3,4 Fannie Mae Pool | 2.118% | 3/1/43 | 230 | 233 |
| 3,4 Fannie Mae Pool | 2.187% | 6/1/43 | 186 | 189 |
| 3,4 Fannie Mae Pool | 2.213% | 9/1/42 | 172 | 180 |
| 3,4 Fannie Mae Pool | 2.240% | 10/1/42 | 123 | 125 |
| 3,4 Fannie Mae Pool | 2.265% | 7/1/43 | 239 | 239 |
| 3,4,6 Fannie Mae Pool | 2.266% | 2/1/36 | 21 | 21 |
| 3,4,6 Fannie Mae Pool | 2.288% | 8/1/37 | 54 | 57 |
| 3,4,6 Fannie Mae Pool | 2.341% | 8/1/35 | 129 | 137 |
| 3,4,6 Fannie Mae Pool | 2.359% | 5/1/40 | 33 | 35 |
| | | | |
| Face | Market |
| Maturity Amount | Value • |
| Coupon | Date | ($000) | ($000) |
| 3,4,6 Fannie Mae Pool | 2.360% | 6/1/37 | 34 | 36 |
| 3,4 Fannie Mae Pool | 2.393% | 7/1/42 | 186 | 190 |
| 3,4 Fannie Mae Pool | 2.398% | 5/1/42 | 252 | 262 |
| 3,4,6 Fannie Mae Pool | 2.410% | 9/1/40 | 69 | 73 |
| 3,4,6 Fannie Mae Pool | 2.415% | 6/1/36 | 1 | 1 |
| 3,4,6 Fannie Mae Pool | 2.418% | 1/1/37 | 60 | 64 |
| 3,4,6 Fannie Mae Pool | 2.422% | 1/1/40 | 44 | 46 |
| 3,4 Fannie Mae Pool | 2.429% | 5/1/43 | 382 | 386 |
| 3,4 Fannie Mae Pool | 2.441% | 10/1/42 | 153 | 156 |
| 3,4,6 Fannie Mae Pool | 2.443% | 12/1/33 | 17 | 18 |
| 3,4,6 Fannie Mae Pool | 2.445% | 7/1/39 | 13 | 13 |
| 3,4,6 Fannie Mae Pool | 2.447% | 1/1/35 | 100 | 107 |
| 3,4,6 Fannie Mae Pool | 2.450% | 7/1/37 | 14 | 14 |
| 3,4,6 Fannie Mae Pool | 2.452% | 8/1/40 | 87 | 91 |
| 3,4,6 Fannie Mae Pool | 2.465% | 11/1/36– | | |
| 9/1/43 | 109 | 114 |
| 3,4,6 Fannie Mae Pool | 2.488% | 9/1/34– | | |
| 7/1/38 | 30 | 32 |
| 3,4,6 Fannie Mae Pool | 2.492% | 7/1/42 | 49 | 52 |
| 3,4,6 Fannie Mae Pool | 2.520% | 5/1/42 | 42 | 44 |
| 3,4,6 Fannie Mae Pool | 2.524% | 5/1/40 | 21 | 23 |
| 3,4,6 Fannie Mae Pool | 2.535% | 10/1/39 | 26 | 27 |
| 3,4,6 Fannie Mae Pool | 2.546% | 10/1/40 | 104 | 110 |
| 3,4,6 Fannie Mae Pool | 2.561% | 12/1/40 | 83 | 88 |
| 3,4,6 Fannie Mae Pool | 2.574% | 11/1/39 | 17 | 18 |
| 3,4,6 Fannie Mae Pool | 2.576% | 7/1/36 | 16 | 16 |
| 3,4,6 Fannie Mae Pool | 2.596% | 11/1/34 | 24 | 25 |
| 3,4 Fannie Mae Pool | 2.601% | 12/1/41 | 103 | 108 |
| 3,4,6 Fannie Mae Pool | 2.609% | 12/1/35 | 70 | 74 |
| 3,4 Fannie Mae Pool | 2.620% | 11/1/41 | 102 | 108 |
| 3,4,6 Fannie Mae Pool | 2.671% | 11/1/40 | 31 | 33 |
| 3,4,6 Fannie Mae Pool | 2.676% | 10/1/40 | 52 | 54 |
| 3,4,6 Fannie Mae Pool | 2.685% | 11/1/33– | | |
| 11/1/39 | 60 | 63 |
| 3,4 Fannie Mae Pool | 2.697% | 1/1/42 | 99 | 104 |
| 3,4,6 Fannie Mae Pool | 2.750% | 3/1/41 | 72 | 77 |
| 3,4 Fannie Mae Pool | 2.751% | 3/1/42 | 155 | 161 |
| 3,4,6 Fannie Mae Pool | 2.775% | 12/1/40 | 59 | 62 |
| 3,4 Fannie Mae Pool | 2.784% | 1/1/42 | 109 | 114 |
| 3,4 Fannie Mae Pool | 2.805% | 11/1/41 | 101 | 107 |
| 3,4 Fannie Mae Pool | 2.887% | 12/1/40 | 49 | 51 |
| 3,4,6 Fannie Mae Pool | 2.914% | 3/1/42 | 96 | 100 |
| 3,4 Fannie Mae Pool | 2.957% | 9/1/43 | 197 | 205 |
| 3,4,6 Fannie Mae Pool | 3.022% | 3/1/41 | 109 | 115 |
| 3,4 Fannie Mae Pool | 3.052% | 2/1/41 | 49 | 51 |
| 3,4,6 Fannie Mae Pool | 3.077% | 2/1/41 | 40 | 41 |
| 3,4 Fannie Mae Pool | 3.137% | 2/1/41 | 51 | 53 |
| 3,4,6 Fannie Mae Pool | 3.200% | 12/1/40 | 58 | 61 |
| 3,4 Fannie Mae Pool | 3.207% | 5/1/41 | 64 | 68 |
| 3,4 Fannie Mae Pool | 3.353% | 8/1/42 | 142 | 145 |
| 3,4 Fannie Mae Pool | 3.553% | 7/1/41 | 170 | 180 |
| 3,4 Fannie Mae Pool | 3.558% | 4/1/41 | 93 | 97 |
| 3,4 Fannie Mae Pool | 3.580% | 8/1/39 | 34 | 36 |
| 3,4 Fannie Mae Pool | 3.594% | 6/1/41 | 23 | 25 |
| 3,4 Fannie Mae Pool | 3.745% | 6/1/41 | 90 | 96 |
| 3,4 Fannie Mae Pool | 3.827% | 9/1/40 | 130 | 137 |
| 3,4,6 Fannie Mae Pool | 4.038% | 8/1/39 | 80 | 82 |
| 3,4,6 Fannie Mae Pool | 4.277% | 11/1/39 | 32 | 33 |
| 3,4 Fannie Mae Pool | 4.293% | 12/1/39 | 77 | 78 |
| 3,4 Fannie Mae Pool | 4.917% | 3/1/38 | 27 | 28 |
| 3,4 Fannie Mae Pool | 5.387% | 5/1/36 | 4 | 4 |
| 3,4 Fannie Mae Pool | 5.508% | 4/1/37 | 35 | 37 |
| 3,4 Fannie Mae Pool | 5.598% | 10/1/37 | 50 | 52 |
| 3,4 Fannie Mae Pool | 5.760% | 12/1/37 | 56 | 60 |
| 3,4 Fannie Mae Pool | 6.076% | 10/1/37 | 55 | 56 |
| 4,6 Freddie Mac Non Gold Pool | 1.735% | 10/1/37 | 2 | 2 |
| 4,6 Freddie Mac Non Gold Pool | 1.855% | 6/1/37 | 43 | 45 |
| 4,6 Freddie Mac Non Gold Pool | 2.125% | 1/1/38 | 16 | 18 |
| 4,6 Freddie Mac Non Gold Pool | 2.250% | 1/1/35 | 7 | 8 |
| 4,6 Freddie Mac Non Gold Pool | 2.253% | 7/1/35 | 25 | 26 |
| 4,6 Freddie Mac Non Gold Pool | 2.271% | 2/1/37 | 12 | 13 |
245
Vanguard Total Bond Market Index Portfolio
| | | | | |
| Face | Market |
| Maturity Amount | Value • |
| | Coupon | Date | ($000) | ($000) |
| 4 | Freddie Mac Non Gold Pool | 2.332% | 5/1/42 | 24 | 25 |
| 4,6 Freddie Mac Non Gold Pool | 2.337% | 3/1/37 | 8 | 9 |
| 4,6 Freddie Mac Non Gold Pool | 2.375% | 5/1/38 | 5 | 5 |
| 4,6 Freddie Mac Non Gold Pool | 2.448% | 12/1/36 | 21 | 23 |
| 4,6 Freddie Mac Non Gold Pool | 2.462% | 12/1/35 | 33 | 35 |
| 4,6 Freddie Mac Non Gold Pool | 2.492% | 10/1/37 | 25 | 26 |
| 4,6 Freddie Mac Non Gold Pool | 2.500% | 5/1/36 | 20 | 21 |
| 4,6 Freddie Mac Non Gold Pool | 2.505% | 5/1/40 | 22 | 24 |
| 4,6 Freddie Mac Non Gold Pool | 2.574% | 5/1/40 | 21 | 23 |
| 4,6 Freddie Mac Non Gold Pool | 2.587% | 12/1/34 | 35 | 37 |
| 4 | Freddie Mac Non Gold Pool | 2.588% | 2/1/42 | 82 | 86 |
| 4,6 Freddie Mac Non Gold Pool | 2.607% | 12/1/36 | 61 | 65 |
| 4,6 Freddie Mac Non Gold Pool | 2.621% | 11/1/34 | 49 | 51 |
| 4,6 Freddie Mac Non Gold Pool | 2.630% | 6/1/40 | 39 | 40 |
| 4,6 Freddie Mac Non Gold Pool | 2.631% | 6/1/40 | 44 | 46 |
| 4 | Freddie Mac Non Gold Pool | 2.636% | 12/1/40 | 34 | 36 |
| 4 | Freddie Mac Non Gold Pool | 2.727% | 12/1/40 | 80 | 83 |
| 4 | Freddie Mac Non Gold Pool | 2.755% | 11/1/40 | 36 | 37 |
| 4 | Freddie Mac Non Gold Pool | 2.756% | 2/1/42 | 70 | 73 |
| 4,6 Freddie Mac Non Gold Pool | 2.758% | 10/1/36 | 27 | 29 |
| 4,6 Freddie Mac Non Gold Pool | 2.762% | 11/1/40 | 65 | 67 |
| 4 | Freddie Mac Non Gold Pool | 2.775% | 1/1/41 | 77 | 80 |
| 4 | Freddie Mac Non Gold Pool | 2.847% | 2/1/41 | 77 | 82 |
| 4 | Freddie Mac Non Gold Pool | 2.894% | 2/1/41 | 22 | 24 |
| 4 | Freddie Mac Non Gold Pool | 3.097% | 1/1/41 | 18 | 19 |
| 4 | Freddie Mac Non Gold Pool | 3.104% | 6/1/41 | 42 | 45 |
| 4 | Freddie Mac Non Gold Pool | 3.181% | 3/1/41 | 27 | 28 |
| 4 | Freddie Mac Non Gold Pool | 3.576% | 6/1/40 | 107 | 113 |
| 4 | Freddie Mac Non Gold Pool | 3.659% | 9/1/40 | 99 | 105 |
| 4 | Freddie Mac Non Gold Pool | 5.237% | 3/1/38 | 65 | 69 |
| 4 | Freddie Mac Non Gold Pool | 5.502% | 2/1/36 | 18 | 18 |
| 4 | Freddie Mac Non Gold Pool | 5.800% | 9/1/37 | 24 | 25 |
| 4 | Freddie Mac Non Gold Pool | 5.862% | 5/1/37 | 48 | 49 |
| 4 | Freddie Mac Non Gold Pool | 6.140% | 12/1/36 | 32 | 33 |
| 4,6 Ginnie Mae II Pool | 1.625% | 10/20/39 | 10 | 10 |
| 4,6 Ginnie Mae II Pool | 1.750% | 4/20/41 | 30 | 31 |
| 4,6 Ginnie Mae II Pool | 2.000% | 12/20/39– | | |
| | | 6/20/43 | 524 | 539 |
| 4,6 Ginnie Mae II Pool | 2.250% | 5/20/41 | 42 | 44 |
| 4 | Ginnie Mae II Pool | 2.500% | 1/20/41– | | |
| | | 1/20/42 | 248 | 252 |
| 4,6 Ginnie Mae II Pool | 3.000% | 7/20/38– | | |
| | | 11/20/41 | 380 | 394 |
| 4 | Ginnie Mae II Pool | 3.500% | 1/20/41– | | |
| | | 10/20/41 | 302 | 311 |
| 4 | Ginnie Mae II Pool | 4.000% | 4/20/41– | | |
| | | 10/20/41 | 125 | 130 |
| 9,743 |
| Total U.S. Government and Agency Obligations | | | |
| (Cost $1,749,765) 1,774,501 |
| Asset-Backed/Commercial Mortgage-Backed Securities (3.0%) | | |
| 4 | AEP Texas Central Transition | | | | |
| | Funding II LLC 2006-A | 5.170% | 1/1/18 | 87 | 91 |
| 4 | Ally Auto Receivables Trust 2013-2 | 0.790% | 1/15/18 | 26 | 26 |
| 4 | Ally Auto Receivables Trust 2013-2 | 1.240% | 11/15/18 | 25 | 25 |
| 4 | Ally Auto Receivables Trust 2014-1 | 0.970% | 10/15/18 | 75 | 75 |
| 4 | Ally Auto Receivables Trust 2014-1 | 1.530% | 4/15/19 | 25 | 25 |
| 4 | Ally Auto Receivables Trust 2014-3 | 1.280% | 6/17/19 | 100 | 100 |
| 4 | Ally Auto Receivables Trust 2014-3 | 1.720% | 3/16/20 | 55 | 55 |
| 4 | Ally Auto Receivables Trust 2014-SN1 | 0.750% | 2/21/17 | 67 | 67 |
| 4 | Ally Auto Receivables Trust 2014-SN1 | 0.950% | 6/20/18 | 50 | 50 |
| 4 | Ally Auto Receivables Trust 2014-SN2 | 1.030% | 9/20/17 | 75 | 75 |
| 4 | Ally Auto Receivables Trust 2014-SN2 | 1.210% | 2/20/19 | 75 | 75 |
| 4 | Ally Auto Receivables Trust 2015-1 | 1.390% | 9/16/19 | 25 | 25 |
| 4 | Ally Auto Receivables Trust 2015-1 | 1.750% | 5/15/20 | 50 | 50 |
| 4 | Ally Auto Receivables Trust 2015-2 | 1.490% | 11/15/19 | 100 | 99 |
| 4 | Ally Auto Receivables Trust 2015-2 | 1.840% | 6/15/20 | 50 | 50 |
| 4 | Ally Master Owner Trust Series 2014-4 | 1.430% | 6/17/19 | 100 | 100 |
| 4 | Ally Master Owner Trust Series 2015-3 | 1.630% | 5/15/20 | 150 | 148 |
| | | | | |
| Face | Market |
| Maturity Amount | Value • |
| | Coupon | Date | ($000) | ($000) |
| 4 | American Express Credit Account | | | | |
| | Secured Note Trust 2014-3 | 1.490% | 4/15/20 | 175 | 175 |
| 4 | American Express Credit Account | | | | |
| | Secured Note Trust 2014-4 | 1.430% | 6/15/20 | 100 | 100 |
| 4 | AmeriCredit Automobile Receivables | | | | |
| | Trust 2013-2 | 0.650% | 12/8/17 | 2 | 2 |
| 4 | AmeriCredit Automobile Receivables | | | | |
| | Trust 2013-3 | 0.920% | 4/9/18 | 21 | 21 |
| 4 | AmeriCredit Automobile Receivables | | | | |
| | Trust 2013-4 | 0.960% | 4/9/18 | 8 | 8 |
| 4 | AmeriCredit Automobile Receivables | | | | |
| | Trust 2014-1 | 0.900% | 2/8/19 | 21 | 21 |
| 4 | AmeriCredit Automobile Receivables | | | | |
| | Trust 2014-1 | 1.680% | 7/8/19 | 25 | 25 |
| 4 | AmeriCredit Automobile Receivables | | | | |
| | Trust 2014-3 | 1.150% | 6/10/19 | 50 | 50 |
| 4 | AmeriCredit Automobile Receivables | | | | |
| | Trust 2015-2 | 1.270% | 1/8/20 | 75 | 74 |
| 4 | Banc of America Commercial Mortgage | | | | |
| | Trust 2006-1 | 5.421% | 9/10/45 | 2 | 2 |
| 4 | Banc of America Commercial Mortgage | | | | |
| | Trust 2006-2 | 5.869% | 5/10/45 | 85 | 85 |
| 4 | Banc of America Commercial Mortgage | | | | |
| | Trust 2006-5 | 5.448% | 9/10/47 | 50 | 51 |
| 4 | Banc of America Commercial Mortgage | | | | |
| | Trust 2008-1 | 6.215% | 2/10/51 | 395 | 419 |
| 4 | Banc of America Commercial Mortgage | | | | |
| | Trust 2015-UBS7 | 3.429% | 9/15/48 | 50 | 51 |
| 4 | Banc of America Commercial Mortgage | | | | |
| | Trust 2015-UBS7 | 3.705% | 9/15/48 | 75 | 77 |
| Bank of Nova Scotia | 2.125% | 9/11/19 | 250 | 250 |
| Bank of Nova Scotia | 1.850% | 4/14/20 | 450 | 442 |
| 4 | Barclays Dryrock Issuance Trust 2015-2 1.560% | 3/15/21 | 100 | 99 |
| 4 | Bear Stearns Commercial Mortgage | | | | |
| | Securities Trust 2006-PWR13 | 5.582% | 9/11/41 | 95 | 97 |
| 4 | Bear Stearns Commercial Mortgage | | | | |
| | Securities Trust 2007-PWR16 | 5.722% | 6/11/40 | 150 | 157 |
| 4 | Bear Stearns Commercial Mortgage | | | | |
| | Securities Trust 2007-PWR17 | 5.694% | 6/11/50 | 220 | 229 |
| 4 | Bear Stearns Commercial Mortgage | | | | |
| | Securities Trust 2007-PWR17 | 5.882% | 6/11/50 | 235 | 248 |
| 4 | Bear Stearns Commercial Mortgage | | | | |
| | Securities Trust 2007-PWR18 | 5.700% | 6/11/50 | 575 | 600 |
| 4 | Bear Stearns Commercial Mortgage | | | | |
| | Securities Trust 2007-TOP26 | 5.471% | 1/12/45 | 66 | 68 |
| 4 | Bear Stearns Commercial Mortgage | | | | |
| | Securities Trust 2007-TOP26 | 5.513% | 1/12/45 | 190 | 196 |
| 4 | Bear Stearns Commercial Mortgage | | | | |
| | Securities Trust 2007-TOP28 | 5.742% | 9/11/42 | 806 | 845 |
| 4 | BMW Vehicle Owner Trust 2014-A | 0.970% | 11/26/18 | 100 | 100 |
| 4 | BMW Vehicle Owner Trust 2014-A | 1.500% | 2/25/21 | 75 | 75 |
| 4 | BMW Vehicle Owner Trust 2015-1 | 1.240% | 12/20/17 | 125 | 125 |
| 4 | BMW Vehicle Owner Trust 2015-2 | 1.400% | 2/20/19 | 100 | 99 |
| 4 | BMW Vehicle Owner Trust 2015-2 | 1.550% | 2/20/19 | 50 | 50 |
| 4 | Capital Auto Receivables Asset Trust | | | | |
| | 2013-1 | 0.790% | 6/20/17 | 6 | 6 |
| 4 | Capital Auto Receivables Asset Trust | | | | |
| | 2013-3 | 1.310% | 12/20/17 | 36 | 36 |
| 4 | Capital Auto Receivables Asset Trust | | | | |
| | 2013-3 | 1.680% | 4/20/18 | 30 | 30 |
| 4 | Capital Auto Receivables Asset Trust | | | | |
| | 2014-2 | 0.910% | 4/20/17 | 27 | 27 |
| 4 | Capital Auto Receivables Asset Trust | | | | |
| | 2014-2 | 1.260% | 5/21/18 | 25 | 25 |
| 4 | Capital Auto Receivables Asset Trust | | | | |
| | 2014-2 | 1.620% | 10/22/18 | 25 | 25 |
| 4 | Capital Auto Receivables Asset Trust | | | | |
| | 2014-3 | 1.480% | 11/20/18 | 50 | 50 |
| 4 | Capital Auto Receivables Asset Trust | | | | |
| | 2014-3 | 1.830% | 4/22/19 | 25 | 25 |
246
Vanguard Total Bond Market Index Portfolio
| | | | | |
| Face | Market |
| Maturity Amount | Value • |
| | Coupon | Date | ($000) | ($000) |
| 4 | Capital Auto Receivables Asset Trust | | | | |
| | 2015-1 | 1.610% | 6/20/19 | 200 | 199 |
| 4 | Capital Auto Receivables Asset Trust | | | | |
| | 2015-1 | 1.860% | 10/21/19 | 50 | 50 |
| 4 | Capital Auto Receivables Asset Trust | | | | |
| | 2015-2 | 1.730% | 9/20/19 | 125 | 124 |
| 4 | Capital Auto Receivables Asset Trust | | | | |
| | 2015-3 | 1.720% | 1/22/19 | 100 | 100 |
| 4 | Capital Auto Receivables Asset Trust | | | | |
| | 2015-3 | 1.940% | 1/21/20 | 100 | 100 |
| 4 | Capital Auto Receivables Asset Trust | | | | |
| | 2015-3 | 1.970% | 1/21/20 | 75 | 75 |
| 4 | Capital Auto Receivables Asset Trust | | | | |
| | 2015-3 | 2.130% | 5/20/20 | 75 | 75 |
| 4 | Capital Auto Receivables Asset Trust | | | | |
| | 2015-4 | 1.830% | 3/20/20 | 75 | 74 |
| 4 | Capital Auto Receivables Asset Trust | | | | |
| | 2015-4 | 2.010% | 7/20/20 | 75 | 74 |
| 4 | Capital One Multi-asset Execution | | | | |
| | Trust 2007-A7 | 5.750% | 7/15/20 | 225 | 241 |
| 4 | Capital One Multi-Asset Execution | | | | |
| | Trust 2014-A2 | 1.260% | 1/15/20 | 50 | 50 |
| 4 | Capital One Multi-Asset Execution | | | | |
| | Trust 2014-A5 | 1.480% | 7/15/20 | 150 | 150 |
| 4 | Capital One Multi-Asset Execution | | | | |
| | Trust 2015-A2 | 2.080% | 3/15/23 | 250 | 248 |
| 4 | Capital One Multi-asset Execution | | | | |
| | Trust 2015-A5 | 1.600% | 5/17/21 | 100 | 100 |
| 4 | Capital One Multi-asset Execution | | | | |
| | Trust 2015-A8 | 2.050% | 8/15/23 | 150 | 148 |
| 4 | CarMax Auto Owner Trust 2012-3 | 0.790% | 4/16/18 | 55 | 55 |
| 4 | CarMax Auto Owner Trust 2013-2 | 0.640% | 1/16/18 | 32 | 32 |
| 4 | Carmax Auto Owner Trust 2013-2 | 0.840% | 11/15/18 | 33 | 33 |
| 4 | Carmax Auto Owner Trust 2013-3 | 0.970% | 4/16/18 | 44 | 44 |
| 4 | Carmax Auto Owner Trust 2013-3 | 1.490% | 1/15/19 | 40 | 40 |
| 4 | Carmax Auto Owner Trust 2013-4 | 0.800% | 7/16/18 | 17 | 17 |
| 4 | Carmax Auto Owner Trust 2013-4 | 1.280% | 5/15/19 | 25 | 25 |
| 4 | Carmax Auto Owner Trust 2014-1 | 0.790% | 10/15/18 | 30 | 30 |
| 4 | Carmax Auto Owner Trust 2014-1 | 1.320% | 7/15/19 | 25 | 25 |
| 4 | Carmax Auto Owner Trust 2014-2 | 0.980% | 1/15/19 | 75 | 75 |
| 4 | Carmax Auto Owner Trust 2014-3 | 1.160% | 6/17/19 | 75 | 75 |
| 4 | Carmax Auto Owner Trust 2014-3 | 1.730% | 2/18/20 | 25 | 25 |
| 4 | Carmax Auto Owner Trust 2014-4 | 1.250% | 11/15/19 | 125 | 124 |
| 4 | Carmax Auto Owner Trust 2015-2 | 1.370% | 3/16/20 | 50 | 50 |
| 4 | Carmax Auto Owner Trust 2015-2 | 1.800% | 3/15/21 | 50 | 49 |
| 4 | Carmax Auto Owner Trust 2015-3 | 1.630% | 5/15/20 | 100 | 99 |
| 4 | Carmax Auto Owner Trust 2015-3 | 1.980% | 2/16/21 | 50 | 50 |
| 4 | Carmax Auto Owner Trust 2015-4 | 1.560% | 11/16/20 | 100 | 99 |
| 4 | Carmax Auto Owner Trust 2015-4 | 1.830% | 6/15/21 | 50 | 49 |
| 4 | CD 2007-CD5 Mortgage Trust | 5.886% | 11/15/44 | 370 | 389 |
| 4 | CenterPoint Energy Transition Bond | | | | |
| | Co. II LLC 2005-A | 5.170% | 8/1/19 | 25 | 25 |
| 4 | CenterPoint Energy Transition Bond | | | | |
| | Co. II LLC 2005-A | 5.302% | 8/1/20 | 26 | 28 |
| 4 | CenterPoint Energy Transition Bond | | | | |
| | Co. IV LLC 2012-1 | 3.028% | 10/15/25 | 350 | 355 |
| 4 | Chase Issuance Trust 2012-A4 | 1.580% | 8/16/21 | 150 | 148 |
| 4 | Chase Issuance Trust 2012-A7 | 2.160% | 9/16/24 | 313 | 303 |
| 4 | Chase Issuance Trust 2013-A1 | 1.300% | 2/18/20 | 275 | 273 |
| 4 | Chase Issuance Trust 2013-A8 | 1.010% | 10/15/18 | 225 | 224 |
| 4 | Chase Issuance Trust 2014-A1 | 1.150% | 1/15/19 | 125 | 125 |
| 4 | Chase Issuance Trust 2014-A2 | 2.770% | 3/15/23 | 225 | 229 |
| 4 | Chase Issuance Trust 2014-A6 | 1.260% | 7/15/19 | 300 | 299 |
| 4 | Chase Issuance Trust 2014-A7 | 1.380% | 11/15/19 | 225 | 224 |
| 4 | Chase Issuance Trust 2015-A2 | 1.590% | 2/18/20 | 597 | 597 |
| 4 | Chase Issuance Trust 2015-A4 | 1.840% | 4/15/22 | 150 | 148 |
| 4 | Chase Issuance Trust 2015-A5 | 1.360% | 4/15/20 | 325 | 323 |
| 4 | Citibank Credit Card Issuance Trust | | | | |
| | 2007-A8 | 5.650% | 9/20/19 | 250 | 267 |
| 4 | Citibank Credit Card Issuance Trust | | | | |
| | 2008-A1 | 5.350% | 2/7/20 | 245 | 263 |
| | | | | |
| Face | Market |
| Maturity Amount | Value • |
| | Coupon | Date | ($000) | ($000) |
| 4 | Citibank Credit Card Issuance Trust | | | | |
| | 2013-A10 | 0.730% | 2/7/18 | 100 | 100 |
| 4 | Citibank Credit Card Issuance Trust | | | | |
| | 2014-A1 | 2.880% | 1/23/23 | 100 | 102 |
| 4 | Citibank Credit Card Issuance Trust | | | | |
| | 2014-A4 | 1.230% | 4/24/19 | 425 | 424 |
| 4 | Citibank Credit Card Issuance Trust | | | | |
| | 2014-A5 | 2.680% | 6/7/23 | 200 | 203 |
| 4 | Citibank Credit Card Issuance Trust | | | | |
| | 2014-A6 | 2.150% | 7/15/21 | 500 | 502 |
| 4 | Citibank Credit Card Issuance Trust | | | | |
| | 2014-A8 | 1.730% | 4/9/20 | 325 | 326 |
| 4 | Citigroup Commercial Mortgage Trust | | | | |
| | 2006-C5 | 5.431% | 10/15/49 | 109 | 111 |
| 4 | Citigroup Commercial Mortgage Trust | | | | |
| | 2006-C5 | 5.462% | 10/15/49 | 100 | 102 |
| 4 | Citigroup Commercial Mortgage Trust | | | | |
| | 2007-C6 | 5.710% | 12/10/49 | 600 | 623 |
| 4 | Citigroup Commercial Mortgage Trust | | | | |
| | 2008-C7 | 6.137% | 12/10/49 | 459 | 481 |
| 4 | Citigroup Commercial Mortgage Trust | | | | |
| | 2012-GC8 | 3.024% | 9/10/45 | 75 | 75 |
| 4 | Citigroup Commercial Mortgage Trust | | | | |
| | 2013-GC11 | 3.093% | 4/10/46 | 100 | 100 |
| 4 | Citigroup Commercial Mortgage Trust | | | | |
| | 2013-GC15 | 3.161% | 9/10/46 | 75 | 77 |
| 4 | Citigroup Commercial Mortgage Trust | | | | |
| | 2013-GC15 | 4.371% | 9/10/46 | 50 | 54 |
| 4 | Citigroup Commercial Mortgage Trust | | | | |
| | 2013-GC15 | 4.649% | 9/10/46 | 75 | 82 |
| 4 | Citigroup Commercial Mortgage Trust | | | | |
| | 2014-GC19 | 2.790% | 3/10/47 | 37 | 38 |
| 4 | Citigroup Commercial Mortgage Trust | | | | |
| | 2014-GC19 | 3.552% | 3/10/47 | 25 | 26 |
| 4 | Citigroup Commercial Mortgage Trust | | | | |
| | 2014-GC19 | 4.023% | 3/10/47 | 25 | 26 |
| 4 | Citigroup Commercial Mortgage Trust | | | | |
| | 2014-GC19 | 4.345% | 3/10/47 | 25 | 27 |
| 4 | Citigroup Commercial Mortgage Trust | | | | |
| | 2014-GC21 | 3.855% | 5/10/47 | 50 | 52 |
| 4 | Citigroup Commercial Mortgage Trust | | | | |
| | 2014-GC21 | 4.328% | 5/10/47 | 50 | 51 |
| 4 | Citigroup Commercial Mortgage Trust | | | | |
| | 2014-GC23 | 3.622% | 7/10/47 | 100 | 102 |
| 4 | Citigroup Commercial Mortgage Trust | | | | |
| | 2014-GC25 | 3.635% | 10/10/47 | 175 | 178 |
| 4 | Citigroup Commercial Mortgage Trust | | | | |
| | 2015-GC27 | 3.137% | 2/10/48 | 225 | 220 |
| 4 | Citigroup Commercial Mortgage Trust | | | | |
| | 2015-GC27 | 3.571% | 2/10/48 | 100 | 98 |
| 4 | Citigroup Commercial Mortgage Trust | | | | |
| | 2015-GC29 | 2.674% | 4/10/48 | 50 | 50 |
| 4 | Citigroup Commercial Mortgage Trust | | | | |
| | 2015-GC29 | 3.192% | 4/10/48 | 175 | 172 |
| 4 | Citigroup Commercial Mortgage Trust | | | | |
| | 2015-GC29 | 3.758% | 4/10/48 | 84 | 81 |
| 4 | Citigroup Commercial Mortgage Trust | | | | |
| | 2015-GC31 | 3.762% | 6/10/48 | 100 | 102 |
| 4 | Citigroup Commercial Mortgage Trust | | | | |
| | 2015-GC33 | 3.778% | 9/10/58 | 100 | 102 |
| 4 | COBALT CMBS Commercial Mortgage | | | | |
| | Trust 2007-C3 | 5.766% | 5/15/46 | 256 | 267 |
| 4 | COMM 15-CR22 Mortgage Trust | 2.856% | 3/10/48 | 50 | 51 |
| 4 | COMM 15-CR22 Mortgage Trust | 3.309% | 3/10/48 | 150 | 149 |
| 4 | COMM 15-CR22 Mortgage Trust | 3.603% | 3/10/48 | 50 | 50 |
| 4 | COMM 15-CR23 Mortgage Trust | 3.257% | 5/10/48 | 75 | 77 |
| 4 | COMM 15-CR23 Mortgage Trust | 3.497% | 5/10/48 | 100 | 101 |
| 4 | COMM 15-CR23 Mortgage Trust | 3.801% | 5/10/48 | 50 | 50 |
| 4 | COMM 2006-C7 Mortgage Trust | 5.768% | 6/10/46 | 333 | 335 |
| 4 | COMM 2007-C9 Mortgage Trust | 5.796% | 12/10/49 | 577 | 601 |
| 4 | COMM 2012-CCRE2 Mortgage Trust | 3.147% | 8/15/45 | 58 | 59 |
247
Vanguard Total Bond Market Index Portfolio
| | | | | |
| Face | Market |
| Maturity Amount | Value • |
| | Coupon | Date | ($000) | ($000) |
| 4 | COMM 2012-CCRE2 Mortgage Trust | 3.791% | 8/15/45 | 65 | 68 |
| 4,7 COMM 2012-CCRE3 Mortgage Trust | 3.416% | 10/15/45 | 78 | 79 |
| 4 | COMM 2012-CCRE4 Mortgage Trust | 2.853% | 10/15/45 | 125 | 124 |
| 4 | COMM 2013-CCRE11 Mortgage Trust | 3.047% | 10/10/46 | 30 | 31 |
| 4 | COMM 2013-CCRE11 Mortgage Trust | 3.660% | 10/10/46 | 30 | 31 |
| 4 | COMM 2013-CCRE11 Mortgage Trust | 3.983% | 10/10/46 | 40 | 43 |
| 4 | COMM 2013-CCRE11 Mortgage Trust | 4.258% | 10/10/46 | 50 | 54 |
| 4 | COMM 2013-CCRE11 Mortgage Trust | 4.715% | 10/10/46 | 30 | 33 |
| 4 | COMM 2013-CCRE12 Mortgage Trust | 1.295% | 10/10/46 | 17 | 17 |
| 4 | COMM 2013-CCRE12 Mortgage Trust | 2.904% | 10/10/46 | 50 | 51 |
| 4 | COMM 2013-CCRE12 Mortgage Trust | 3.623% | 10/10/46 | 50 | 52 |
| 4 | COMM 2013-CCRE12 Mortgage Trust | 3.765% | 10/10/46 | 50 | 52 |
| 4 | COMM 2013-CCRE12 Mortgage Trust | 4.046% | 10/10/46 | 50 | 53 |
| 4 | COMM 2013-CCRE12 Mortgage Trust | 4.300% | 10/10/46 | 25 | 27 |
| 4 | COMM 2013-CCRE12 Mortgage Trust | 4.762% | 10/10/46 | 25 | 27 |
| 4 | COMM 2013-CCRE6 Mortgage Trust | 3.101% | 3/10/46 | 65 | 65 |
| 4 | COMM 2013-CCRE7 Mortgage Trust | 3.213% | 3/10/46 | 50 | 50 |
| 4 | COMM 2013-CCRE8 Mortgage Trust | 3.612% | 6/10/46 | 71 | 73 |
| 4 | COMM 2013-CCRE9 Mortgage Trust | 4.233% | 7/10/45 | 90 | 97 |
| 4 | COMM 2013-CCRE9 Mortgage Trust | 4.210% | 8/10/46 | 20 | 21 |
| 4 | COMM 2013-LC13 Mortgage Trust | 3.009% | 8/10/46 | 40 | 41 |
| 4 | COMM 2013-LC13 Mortgage Trust | 4.205% | 8/10/46 | 40 | 43 |
| 4 | COMM 2013-LC6 Mortgage Trust | 2.941% | 1/10/46 | 104 | 103 |
| 4 | COMM 2013-LC6 Mortgage Trust | 3.282% | 1/10/46 | 58 | 58 |
| 4 | COMM 2014-CCRE15 Mortgage Trust | 2.928% | 2/10/47 | 87 | 88 |
| 4 | COMM 2014-CCRE15 Mortgage Trust | 3.595% | 2/10/47 | 30 | 31 |
| 4 | COMM 2014-CCRE15 Mortgage Trust | 4.074% | 2/10/47 | 56 | 59 |
| 4 | COMM 2014-CCRE15 Mortgage Trust | 4.715% | 2/10/47 | 28 | 30 |
| 4 | COMM 2014-CCRE16 Mortgage Trust | 3.653% | 4/10/47 | 50 | 52 |
| 4 | COMM 2014-CCRE16 Mortgage Trust | 4.278% | 4/10/47 | 75 | 79 |
| 4 | COMM 2014-CCRE19 Mortgage Trust | 3.796% | 8/10/47 | 175 | 181 |
| 4 | COMM 2014-CCRE19 Mortgage Trust | 4.080% | 8/10/47 | 50 | 52 |
| 4 | COMM 2014-CCRE21 Mortgage Trust | 3.095% | 12/10/47 | 86 | 88 |
| 4 | COMM 2014-CCRE21 Mortgage Trust | 3.528% | 12/10/47 | 175 | 177 |
| 4 | COMM 2014-CR17 Mortgage Trust | 3.012% | 5/10/47 | 50 | 51 |
| 4 | COMM 2014-CR17 Mortgage Trust | 3.598% | 5/10/47 | 25 | 25 |
| 4 | COMM 2014-CR17 Mortgage Trust | 3.977% | 5/10/47 | 50 | 52 |
| 4 | COMM 2014-CR17 Mortgage Trust | 4.377% | 5/10/47 | 25 | 26 |
| 4 | COMM 2014-CR18 Mortgage Trust | 3.452% | 7/15/47 | 50 | 52 |
| 4 | COMM 2014-CR20 Mortgage Trust | 3.590% | 11/10/47 | 50 | 51 |
| 4 | COMM 2014-LC15 Mortgage Trust | 2.840% | 4/10/47 | 50 | 51 |
| 4 | COMM 2014-LC15 Mortgage Trust | 4.006% | 4/10/47 | 75 | 79 |
| 4 | COMM 2014-LC17 Mortgage Trust | 3.164% | 10/10/47 | 100 | 103 |
| 4 | COMM 2014-LC17 Mortgage Trust | 3.917% | 10/10/47 | 50 | 52 |
| 4 | COMM 2014-LC19 Mortgage Trust | 3.040% | 2/10/48 | 25 | 25 |
| 4 | COMM 2014-LC19 Mortgage Trust | 3.183% | 2/10/48 | 125 | 123 |
| 4 | COMM 2014-LC19 Mortgage Trust | 3.527% | 2/10/48 | 50 | 50 |
| 4 | COMM 2014-UBS2 Mortgage Trust | 2.820% | 3/10/47 | 24 | 24 |
| 4 | COMM 2014-UBS2 Mortgage Trust | 3.472% | 3/10/47 | 22 | 23 |
| 4 | COMM 2014-UBS2 Mortgage Trust | 3.961% | 3/10/47 | 54 | 56 |
| 4 | COMM 2014-UBS2 Mortgage Trust | 4.199% | 3/10/47 | 15 | 16 |
| 4 | COMM 2014-UBS2 Mortgage Trust | 4.701% | 3/10/47 | 10 | 11 |
| 4 | COMM 2014-UBS3 Mortgage Trust | 2.844% | 6/10/47 | 50 | 51 |
| 4 | COMM 2014-UBS3 Mortgage Trust | 3.819% | 6/10/47 | 100 | 103 |
| 4 | COMM 2014-UBS4 Mortgage Trust | 3.694% | 8/10/47 | 125 | 127 |
| 4 | COMM 2014-UBS4 Mortgage Trust | 3.968% | 8/10/47 | 44 | 45 |
| 4 | COMM 2014-UBS5 Mortgage Trust | 3.838% | 9/10/47 | 125 | 129 |
| 4 | COMM 2014-UBS6 Mortgage Trust | 2.935% | 12/10/47 | 125 | 128 |
| 4 | COMM 2014-UBS6 Mortgage Trust | 3.387% | 12/10/47 | 125 | 128 |
| 4 | COMM 2014-UBS6 Mortgage Trust | 3.644% | 12/10/47 | 225 | 228 |
| 4 | COMM 2014-UBS6 Mortgage Trust | 4.048% | 12/10/47 | 50 | 51 |
| 4 | COMM 2015-CR25 Mortgage Trust | 3.759% | 8/10/48 | 125 | 128 |
| 4 | COMM 2015-CR26 Mortgage Trust | 3.630% | 10/10/48 | 225 | 227 |
| 4 | COMM 2015-CR27 Mortgage Trust | 3.404% | 10/10/48 | 125 | 127 |
| 4 | COMM 2015-CR27 Mortgage Trust | 3.612% | 10/10/48 | 125 | 126 |
| 4 | Commercial Mortgage Trust 2006-GG7 | 5.826% | 7/10/38 | 179 | 180 |
| 4 | Credit Suisse Commercial Mortgage | | | | |
| | Trust Series 2006-C1 | 5.461% | 2/15/39 | 72 | 72 |
| 4 | Credit Suisse Commercial Mortgage | | | | |
| | Trust Series 2006-C4 | 5.509% | 9/15/39 | 50 | 51 |
| | | | | |
| Face | Market |
| Maturity Amount | Value • |
| | Coupon | Date | ($000) | ($000) |
| 4 | Credit Suisse Commercial Mortgage | | | | |
| | Trust Series 2006-C5 | 5.311% | 12/15/39 | 141 | 144 |
| 4 | Credit Suisse Commercial Mortgage | | | | |
| | Trust Series 2007-C1 | 5.383% | 2/15/40 | 136 | 139 |
| 4 | Credit Suisse Commercial Mortgage | | | | |
| | Trust Series 2007-C3 | 5.699% | 6/15/39 | 147 | 151 |
| 4 | CSAIL Commercial Mortgage Trust | | | | |
| | 2015-C1 | 3.505% | 4/15/50 | 100 | 101 |
| 4 | CSAIL Commercial Mortgage Trust | | | | |
| | 2015-C1 | 3.791% | 4/15/50 | 75 | 75 |
| 4 | CSAIL Commercial Mortgage Trust | | | | |
| | 2015-C1 | 4.044% | 4/15/50 | 50 | 50 |
| 4 | CSAIL Commercial Mortgage Trust | | | | |
| | 2015-C2 | 1.454% | 6/15/57 | 89 | 88 |
| 4 | CSAIL Commercial Mortgage Trust | | | | |
| | 2015-C2 | 3.504% | 6/15/57 | 150 | 151 |
| 4 | CSAIL Commercial Mortgage Trust | | | | |
| | 2015-C2 | 3.849% | 6/15/57 | 75 | 76 |
| 4 | CSAIL Commercial Mortgage Trust | | | | |
| | 2015-C3 | 3.448% | 8/15/48 | 85 | 86 |
| 4 | CSAIL Commercial Mortgage Trust | | | | |
| | 2015-C3 | 3.718% | 8/15/48 | 100 | 102 |
| 4 | CSAIL Commercial Mortgage Trust | | | | |
| | 2015-C3 | 4.112% | 8/15/48 | 50 | 49 |
| 4 | CSAIL Commercial Mortgage Trust | | | | |
| | 2015-C4 | 3.617% | 11/15/48 | 50 | 51 |
| 4 | CSAIL Commercial Mortgage Trust | | | | |
| | 2015-C4 | 3.808% | 11/15/48 | 75 | 77 |
| 4 | Discover Card Execution Note Trust | | | | |
| | 2007-A1 | 5.650% | 3/16/20 | 275 | 294 |
| 4 | Discover Card Execution Note Trust | | | | |
| | 2014-A3 | 1.220% | 10/15/19 | 200 | 199 |
| 4 | Discover Card Execution Note Trust | | | | |
| | 2014-A5 | 1.390% | 4/15/20 | 300 | 299 |
| 4 | Discover Card Execution Note Trust | | | | |
| | 2015-A2 | 1.900% | 10/17/22 | 275 | 271 |
| 4 | Discover Card Execution Note Trust | | | | |
| | 2015-A3 | 1.450% | 3/15/21 | 225 | 223 |
| 4 | Discover Card Execution Note Trust | | | | |
| | 2015-A4 | 2.190% | 4/17/23 | 225 | 223 |
| 3,4 Fannie Mae-Aces 2011-M2 | 3.764% | 4/25/21 | 150 | 161 |
| 3,4 Fannie Mae-Aces 2011-M4 | 3.726% | 6/25/21 | 275 | 294 |
| 3,4 Fannie Mae-Aces 2013-M12 | 2.393% | 3/25/23 | 285 | 282 |
| 3,4 Fannie Mae-Aces 2013-M14 | 2.505% | 4/25/23 | 328 | 330 |
| 3,4 Fannie Mae-Aces 2013-M14 | 3.329% | 10/25/23 | 350 | 363 |
| 3,4 Fannie Mae-Aces 2013-M4 | 2.608% | 3/25/22 | 25 | 25 |
| 3,4 Fannie Mae-Aces 2013-M7 | 2.280% | 12/27/22 | 100 | 99 |
| 3,4 Fannie Mae-Aces 2014-M1 | 2.323% | 11/25/18 | 440 | 447 |
| 3,4 Fannie Mae-Aces 2014-M1 | 3.311% | 7/25/23 | 450 | 473 |
| 3,4 Fannie Mae-Aces 2014-M10 | 2.171% | 9/25/19 | 200 | 202 |
| 3,4 Fannie Mae-Aces 2014-M12 | 2.614% | 10/25/21 | 350 | 355 |
| 3,4 Fannie Mae-Aces 2014-M13 | 1.637% | 11/25/17 | 45 | 45 |
| 3,4 Fannie Mae-Aces 2014-M13 | 2.566% | 8/25/24 | 48 | 49 |
| 3,4 Fannie Mae-Aces 2014-M13 | 3.021% | 8/25/24 | 125 | 127 |
| 3,4 Fannie Mae-Aces 2014-M15 | 2.509% | 7/25/22 | 150 | 151 |
| 3,4 Fannie Mae-Aces 2014-M2 | 1.916% | 6/25/21 | 110 | 110 |
| 3,4 Fannie Mae-Aces 2014-M2 | 3.513% | 12/25/23 | 346 | 364 |
| 3,4 Fannie Mae-Aces 2014-M3 | 2.613% | 1/25/24 | 136 | 139 |
| 3,4 Fannie Mae-Aces 2014-M3 | 3.475% | 1/25/24 | 175 | 183 |
| 3,4 Fannie Mae-Aces 2014-M4 | 3.346% | 3/25/24 | 175 | 182 |
| 3,4 Fannie Mae-Aces 2014-M6 | 2.679% | 5/25/21 | 325 | 330 |
| 3,4 Fannie Mae-Aces 2014-M7 | 3.249% | 6/25/24 | 345 | 364 |
| 3,4 Fannie Mae-Aces 2014-M8 | 2.346% | 6/25/24 | 45 | 46 |
| 3,4 Fannie Mae-Aces 2014-M8 | 3.056% | 6/25/24 | 175 | 181 |
| 3,4 Fannie Mae-Aces 2014-M9 | 1.462% | 4/25/17 | 215 | 216 |
| 3,4 Fannie Mae-Aces 2014-M9 | 3.103% | 7/25/24 | 200 | 208 |
| 3,4 Fannie Mae-Aces 2015-M1 | 1.626% | 2/25/18 | 75 | 75 |
| 3,4 Fannie Mae-Aces 2015-M1 | 2.532% | 9/25/24 | 300 | 298 |
| 3,4 Fannie Mae-Aces 2015-M10 | 3.092% | 4/25/27 | 100 | 103 |
| 3,4 Fannie Mae-Aces 2015-M12 | 2.792% | 5/25/25 | 225 | 222 |
| 3,4 Fannie Mae-Aces 2015-M15 | 2.923% | 10/25/25 | 275 | 274 |
248
Vanguard Total Bond Market Index Portfolio
| | | | |
| Face | Market |
| Maturity Amount | Value • |
| Coupon | Date | ($000) | ($000) |
| 3,4 Fannie Mae-Aces 2015-M2 | 2.620% | 12/25/24 | 219 | 219 |
| 3,4 Fannie Mae-Aces 2015-M3 | 2.723% | 10/25/24 | 100 | 101 |
| 3,4 Fannie Mae-Aces 2015-M7 | 1.550% | 4/25/18 | 50 | 50 |
| 3,4 Fannie Mae-Aces 2015-M7 | 2.590% | 12/25/24 | 200 | 200 |
| 3,4 Fannie Mae-Aces 2015-M8 | 2.344% | 1/25/25 | 121 | 122 |
| 3,4 Fannie Mae-Aces 2015-M8 | 2.900% | 1/25/25 | 100 | 101 |
| 3,4 FHLMC Multifamily Structured Pass | | | | |
| Through Certificates K005 | 3.484% | 4/25/19 | 210 | 215 |
| 3,4 FHLMC Multifamily Structured Pass | | | | |
| Through Certificates K006 | 3.398% | 7/25/19 | 157 | 162 |
| 3,4 FHLMC Multifamily Structured Pass | | | | |
| Through Certificates K007 | 3.342% | 12/25/19 | 119 | 122 |
| 3,4 FHLMC Multifamily Structured Pass | | | | |
| Through Certificates K009 | 2.757% | 5/25/20 | 200 | 204 |
| 3,4 FHLMC Multifamily Structured Pass | | | | |
| Through Certificates K010 | 2.412% | 8/25/18 | 75 | 76 |
| 3,4 FHLMC Multifamily Structured Pass | | | | |
| Through Certificates K010 | 3.320% | 7/25/20 | 198 | 203 |
| 3,4 FHLMC Multifamily Structured Pass | | | | |
| Through Certificates K011 | 4.084% | 11/25/20 | 250 | 271 |
| 3,4 FHLMC Multifamily Structured Pass | | | | |
| Through Certificates K014 | 3.871% | 4/25/21 | 133 | 143 |
| 3,4 FHLMC Multifamily Structured Pass | | | | |
| Through Certificates K017 | 2.873% | 12/25/21 | 350 | 359 |
| 3,4 FHLMC Multifamily Structured Pass | | | | |
| Through Certificates K019 | 2.272% | 3/25/22 | 150 | 149 |
| 3,4 FHLMC Multifamily Structured Pass | | | | |
| Through Certificates K020 | 2.373% | 5/25/22 | 350 | 348 |
| 3,4 FHLMC Multifamily Structured Pass | | | | |
| Through Certificates K021 | 2.396% | 6/25/22 | 225 | 224 |
| 3,4 FHLMC Multifamily Structured Pass | | | | |
| Through Certificates K026 | 2.510% | 11/25/22 | 325 | 323 |
| 3,4 FHLMC Multifamily Structured Pass | | | | |
| Through Certificates K027 | 2.637% | 1/25/23 | 325 | 327 |
| 3,4 FHLMC Multifamily Structured Pass | | | | |
| Through Certificates K028 | 3.111% | 2/25/23 | 475 | 488 |
| 3,4 FHLMC Multifamily Structured Pass | | | | |
| Through Certificates K029 | 3.320% | 2/25/23 | 325 | 338 |
| 3,4 FHLMC Multifamily Structured Pass | | | | |
| Through Certificates K030 | 2.779% | 9/25/22 | 291 | 300 |
| 3,4 FHLMC Multifamily Structured Pass | | | | |
| Through Certificates K030 | 3.250% | 4/25/23 | 325 | 339 |
| 3,4 FHLMC Multifamily Structured Pass | | | | |
| Through Certificates K031 | 3.300% | 4/25/23 | 340 | 353 |
| 3,4 FHLMC Multifamily Structured Pass | | | | |
| Through Certificates K032 | 3.016% | 2/25/23 | 304 | 315 |
| 3,4 FHLMC Multifamily Structured Pass | | | | |
| Through Certificates K032 | 3.310% | 5/25/23 | 340 | 355 |
| 3,4 FHLMC Multifamily Structured Pass | | | | |
| Through Certificates K033 | 2.871% | 2/25/23 | 306 | 316 |
| 3,4 FHLMC Multifamily Structured Pass | | | | |
| Through Certificates K033 | 3.060% | 7/25/23 | 325 | 334 |
| 3,4 FHLMC Multifamily Structured Pass | | | | |
| Through Certificates K034 | 3.531% | 7/25/23 | 288 | 305 |
| 3,4 FHLMC Multifamily Structured Pass | | | | |
| Through Certificates K035 | 3.458% | 8/25/23 | 400 | 421 |
| 3,4 FHLMC Multifamily Structured Pass | | | | |
| Through Certificates K036 | 3.527% | 10/25/23 | 325 | 344 |
| 3,4 FHLMC Multifamily Structured Pass | | | | |
| Through Certificates K038 | 2.604% | 10/25/23 | 115 | 118 |
| 3,4 FHLMC Multifamily Structured Pass | | | | |
| Through Certificates K038 | 3.389% | 3/25/24 | 400 | 420 |
| 3,4 FHLMC Multifamily Structured Pass | | | | |
| Through Certificates K039 | 2.683% | 12/25/23 | 70 | 71 |
| 3,4 FHLMC Multifamily Structured Pass | | | | |
| Through Certificates K039 | 3.303% | 7/25/24 | 225 | 235 |
| 3,4 FHLMC Multifamily Structured Pass | | | | |
| Through Certificates K040 | 2.768% | 4/25/24 | 96 | 98 |
| 3,4 FHLMC Multifamily Structured Pass | | | | |
| Through Certificates K040 | 3.241% | 9/25/24 | 275 | 281 |
| | | | | |
| Face | Market |
| Maturity Amount | Value • |
| | Coupon | Date | ($000) | ($000) |
| 3,4 FHLMC Multifamily Structured Pass | | | | |
| | Through Certificates K041 | 3.171% | 10/25/24 | 275 | 284 |
| 3,4 FHLMC Multifamily Structured Pass | | | | |
| | Through Certificates K042 | 2.267% | 6/25/24 | 48 | 48 |
| 3,4 FHLMC Multifamily Structured Pass | | | | |
| | Through Certificates K042 | 2.670% | 12/25/24 | 225 | 224 |
| 3,4 FHLMC Multifamily Structured Pass | | | | |
| | Through Certificates K043 | 2.532% | 10/25/23 | 49 | 49 |
| 3,4 FHLMC Multifamily Structured Pass | | | | |
| | Through Certificates K043 | 2.493% | 11/25/24 | 123 | 124 |
| 3,4 FHLMC Multifamily Structured Pass | | | | |
| | Through Certificates K043 | 3.062% | 12/25/24 | 150 | 153 |
| 3,4 FHLMC Multifamily Structured Pass | | | | |
| | Through Certificates K043 | 3.023% | 1/25/25 | 175 | 177 |
| 3,4 FHLMC Multifamily Structured Pass | | | | |
| | Through Certificates K046 | 3.205% | 3/25/25 | 175 | 181 |
| 3,4 FHLMC Multifamily Structured Pass | | | | |
| | Through Certificates K047 | 2.827% | 12/25/24 | 99 | 101 |
| 3,4 FHLMC Multifamily Structured Pass | | | | |
| | Through Certificates K047 | 3.329% | 5/25/25 | 175 | 182 |
| 3,4 FHLMC Multifamily Structured Pass | | | | |
| | Through Certificates K048 | 3.284% | 6/25/25 | 225 | 230 |
| 3,4 FHLMC Multifamily Structured Pass | | | | |
| | Through Certificates K049 | 3.010% | 7/25/25 | 125 | 125 |
| 3,4 FHLMC Multifamily Structured Pass | | | | |
| | Through Certificates K050 | 3.334% | 8/25/25 | 200 | 206 |
| 3,4 FHLMC Multifamily Structured Pass | | | | |
| | Through Certificates K503 | 1.384% | 1/25/19 | 161 | 159 |
| 3,4 FHLMC Multifamily Structured Pass | | | | |
| | Through Certificates K503 | 2.456% | 8/25/19 | 325 | 331 |
| 3,4 FHLMC Multifamily Structured Pass | | | | |
| | Through Certificates K702 | 3.154% | 2/25/18 | 544 | 560 |
| 3,4 FHLMC Multifamily Structured Pass | | | | |
| | Through Certificates K706 | 2.323% | 10/25/18 | 100 | 101 |
| 3,4 FHLMC Multifamily Structured Pass | | | | |
| | Through Certificates K707 | 2.220% | 12/25/18 | 150 | 152 |
| 3,4 FHLMC Multifamily Structured Pass | | | | |
| | Through Certificates K708 | 1.670% | 10/25/18 | 26 | 26 |
| 3,4 FHLMC Multifamily Structured Pass | | | | |
| | Through Certificates K710 | 1.883% | 5/25/19 | 25 | 25 |
| 3,4 FHLMC Multifamily Structured Pass | | | | |
| | Through Certificates K711 | 1.321% | 12/25/18 | 206 | 206 |
| 3,4 FHLMC Multifamily Structured Pass | | | | |
| | Through Certificates K711 | 1.730% | 7/25/19 | 425 | 423 |
| 3,4 FHLMC Multifamily Structured Pass | | | | |
| | Through Certificates K713 | 2.313% | 3/25/20 | 525 | 530 |
| 3,4 FHLMC Multifamily Structured Pass | | | | |
| | Through Certificates K714 | 3.034% | 10/25/20 | 400 | 413 |
| 3,4 FHLMC Multifamily Structured Pass | | | | |
| | Through Certificates K716 | 2.413% | 1/25/21 | 67 | 68 |
| 3,4 FHLMC Multifamily Structured Pass | | | | |
| | Through Certificates K716 | 3.130% | 6/25/21 | 370 | 384 |
| 3,4 FHLMC Multifamily Structured Pass | | | | |
| | Through Certificates K717 | 2.991% | 9/25/21 | 225 | 232 |
| 3,4 FHLMC Multifamily Structured Pass | | | | |
| | Through Certificates K718 | 2.375% | 9/25/21 | 220 | 223 |
| 3,4 FHLMC Multifamily Structured Pass | | | | |
| | Through Certificates K718 | 2.791% | 1/25/22 | 225 | 230 |
| 3,4 FHLMC Multifamily Structures Pass | | | | |
| | Through Certificates K715 | 2.856% | 1/25/21 | 125 | 129 |
| 3,4 FHLMC Multifamily Structures Pass | | | | |
| | Through Certificates K715 | 2.716% | 6/25/22 | 150 | 151 |
| 4 | Fifth Third Auto 2014-1 | 0.680% | 4/16/18 | 48 | 48 |
| 4 | Fifth Third Auto 2014-1 | 1.420% | 3/16/20 | 100 | 99 |
| 4 | Fifth Third Auto 2014-1 | 1.140% | 10/15/20 | 50 | 50 |
| 4 | Fifth Third Auto 2014-2 | 0.890% | 11/15/18 | 50 | 50 |
| 4 | Ford Credit Auto Lease Trust 2014-A | 0.680% | 4/15/17 | 28 | 28 |
| 4 | Ford Credit Auto Lease Trust 2014-A | 1.160% | 8/15/17 | 40 | 40 |
| 4 | Ford Credit Auto Lease Trust 2014-B | 0.890% | 9/15/17 | 50 | 50 |
| 4 | Ford Credit Auto Lease Trust 2015-A | 1.130% | 6/15/18 | 100 | 99 |
| 4 | Ford Credit Auto Lease Trust 2015-A | 1.310% | 8/15/18 | 50 | 50 |
249
Vanguard Total Bond Market Index Portfolio
| | | | | |
| Face | Market |
| Maturity Amount | Value • |
| | Coupon | Date | ($000) | ($000) |
| 4 | Ford Credit Auto Lease Trust 2015-B | 1.380% | 12/15/18 | 75 | 74 |
| 4 | Ford Credit Auto Lease Trust 2015-B | 1.540% | 2/15/19 | 75 | 74 |
| 4 | Ford Credit Auto Owner Trust 2012-A | 1.150% | 6/15/17 | 18 | 18 |
| 4 | Ford Credit Auto Owner Trust 2013-A | 0.550% | 7/15/17 | 12 | 12 |
| 4 | Ford Credit Auto Owner Trust 2013-B | 0.570% | 10/15/17 | 15 | 15 |
| 4 | Ford Credit Auto Owner Trust 2013-B | 0.760% | 8/15/18 | 30 | 30 |
| 4 | Ford Credit Auto Owner Trust 2013-C | 0.820% | 12/15/17 | 27 | 27 |
| 4 | Ford Credit Auto Owner Trust 2013-C | 1.250% | 10/15/18 | 26 | 26 |
| 4 | Ford Credit Auto Owner Trust 2014-B | 0.900% | 10/15/18 | 100 | 100 |
| 4 | Ford Credit Auto Owner Trust 2015-A | 1.280% | 9/15/19 | 50 | 50 |
| 4 | Ford Credit Auto Owner Trust 2015-A | 1.640% | 6/15/20 | 25 | 25 |
| 4 | Ford Credit Auto Owner Trust 2015-B | 1.160% | 11/15/19 | 75 | 75 |
| 4 | Ford Credit Auto Owner Trust 2015-B | 1.580% | 8/15/20 | 50 | 50 |
| 4 | Ford Credit Auto Owner Trust 2015-C | 1.410% | 2/15/20 | 50 | 50 |
| 4 | Ford Credit Auto Owner Trust 2015-C | 1.740% | 2/15/21 | 50 | 50 |
| 4 | Ford Credit Floorplan Master Owner | | | | |
| | Trust A Series 2013-5 | 1.500% | 9/15/18 | 100 | 100 |
| 4 | Ford Credit Floorplan Master Owner | | | | |
| | Trust A Series 2014-1 | 1.200% | 2/15/19 | 100 | 100 |
| 4 | Ford Credit Floorplan Master Owner | | | | |
| | Trust A Series 2014-4 | 1.400% | 8/15/19 | 225 | 224 |
| 4 | GE Capital Credit Card Master Note | | | | |
| | Trust Series 2012-7 | 1.760% | 9/15/22 | 148 | 145 |
| 4 | GE Commercial Mortgage Corp. Series | | | | |
| | 2006-C1 Trust | 5.459% | 3/10/44 | 175 | 175 |
| 4 | GE Commercial Mortgage Corp. Series | | | | |
| | 2007-C1 Trust | 5.543% | 12/10/49 | 275 | 282 |
| 4 | GM Financial Leasing Trust 2015-2 | 1.680% | 12/20/18 | 100 | 99 |
| 4 | GM Financial Leasing Trust 2015-2 | 1.850% | 7/22/19 | 50 | 50 |
| 4 | GM Financial Leasing Trust 2015-3 | 1.690% | 3/20/19 | 50 | 50 |
| 4 | GM Financial Leasing Trust 2015-3 | 1.810% | 11/20/19 | 50 | 50 |
| 4 | GS Mortgage Securities Trust | | | | |
| | 2006-GG6 | 5.622% | 4/10/38 | 2 | 2 |
| 4 | GS Mortgage Securities Trust | | | | |
| | 2011-GC5 | 3.707% | 8/10/44 | 80 | 84 |
| 4 | GS Mortgage Securities Trust | | | | |
| | 2012-GC6 | 3.482% | 1/10/45 | 300 | 311 |
| 4 | GS Mortgage Securities Trust | | | | |
| | 2012-GCJ7 | 3.377% | 5/10/45 | 175 | 179 |
| 4 | GS Mortgage Securities Trust | | | | |
| | 2012-GCJ9 | 2.773% | 11/10/45 | 125 | 123 |
| 4 | GS Mortgage Securities Trust | | | | |
| | 2013-GC10 | 2.943% | 2/10/46 | 92 | 91 |
| 4 | GS Mortgage Securities Trust | | | | |
| | 2013-GC10 | 3.279% | 2/10/46 | 35 | 35 |
| 4 | GS Mortgage Securities Trust | | | | |
| | 2013-GC13 | 4.036% | 7/10/46 | 20 | 21 |
| 4 | GS Mortgage Securities Trust | | | | |
| | 2013-GCJ12 | 3.135% | 6/10/46 | 90 | 90 |
| 4 | GS Mortgage Securities Trust | | | | |
| | 2013-GCJ12 | 3.375% | 6/10/46 | 39 | 39 |
| 4 | GS Mortgage Securities Trust | | | | |
| | 2013-GCJ14 | 2.995% | 8/10/46 | 45 | 46 |
| 4 | GS Mortgage Securities Trust | | | | |
| | 2013-GCJ14 | 3.817% | 8/10/46 | 30 | 32 |
| 4 | GS Mortgage Securities Trust | | | | |
| | 2013-GCJ14 | 4.243% | 8/10/46 | 150 | 161 |
| 4 | GS Mortgage Securities Trust | | | | |
| | 2014-GC18 | 3.467% | 6/10/47 | 50 | 51 |
| 4 | GS Mortgage Securities Trust | | | | |
| | 2014-GC18 | 3.862% | 6/10/47 | 50 | 52 |
| 4 | GS Mortgage Securities Trust | | | | |
| | 2014-GC24 | 3.931% | 9/10/47 | 125 | 130 |
| 4 | GS Mortgage Securities Trust | | | | |
| | 2014-GC24 | 4.508% | 9/10/47 | 25 | 26 |
| 4 | GS Mortgage Securities Trust | | | | |
| | 2014-GC26 | 2.902% | 11/10/47 | 50 | 51 |
| 4 | GS Mortgage Securities Trust | | | | |
| | 2014-GC26 | 3.365% | 11/10/47 | 75 | 76 |
| 4 | GS Mortgage Securities Trust | | | | |
| | 2014-GC26 | 3.629% | 11/10/47 | 225 | 231 |
| | | | | |
| Face | Market |
| Maturity Amount | Value • |
| | Coupon | Date | ($000) | ($000) |
| 4 | GS Mortgage Securities Trust | | | | |
| | 2014-GC26 | 3.964% | 11/10/47 | 50 | 52 |
| 4 | GS Mortgage Securities Trust | | | | |
| | 2014-GC26 | 4.215% | 11/10/47 | 50 | 51 |
| 4 | GS Mortgage Securities Trust | | | | |
| | 2015-GC28 | 3.396% | 2/10/48 | 150 | 149 |
| 4 | GS Mortgage Securities Trust | | | | |
| | 2015-GC30 | 2.726% | 5/10/50 | 100 | 101 |
| 4 | GS Mortgage Securities Trust | | | | |
| | 2015-GC30 | 3.382% | 5/10/50 | 150 | 149 |
| 4 | GS Mortgage Securities Trust | | | | |
| | 2015-GC32 | 3.513% | 7/10/48 | 125 | 127 |
| 4 | GS Mortgage Securities Trust | | | | |
| | 2015-GC32 | 3.764% | 7/10/48 | 50 | 51 |
| 4 | GS Mortgage Securities Trust | | | | |
| | 2015-GC34 | 3.278% | 10/10/48 | 125 | 125 |
| 4 | GS Mortgage Securities Trust | | | | |
| | 2015-GC34 | 3.506% | 10/10/48 | 100 | 100 |
| 4 | Honda Auto Receivables 2013-1 | | | | |
| | Owner Trust | 0.480% | 11/21/16 | 6 | 6 |
| 4 | Honda Auto Receivables 2013-1 | | | | |
| | Owner Trust | 0.620% | 3/21/19 | 109 | 109 |
| 4 | Honda Auto Receivables 2013-2 | | | | |
| | Owner Trust | 0.530% | 2/16/17 | 8 | 8 |
| 4 | Honda Auto Receivables 2013-2 | | | | |
| | Owner Trust | 0.660% | 6/17/19 | 38 | 38 |
| 4 | Honda Auto Receivables 2013-4 | | | | |
| | Owner Trust | 0.690% | 9/18/17 | 28 | 28 |
| 4 | Honda Auto Receivables 2013-4 | | | | |
| | Owner Trust | 1.040% | 2/18/20 | 50 | 50 |
| 4 | Honda Auto Receivables 2014-1 | | | | |
| | Owner Trust | 0.670% | 11/21/17 | 68 | 68 |
| 4 | Honda Auto Receivables 2014-1 | | | | |
| | Owner Trust | 1.040% | 2/21/20 | 36 | 36 |
| 4 | Honda Auto Receivables 2014-2 | | | | |
| | Owner Trust | 0.770% | 3/19/18 | 49 | 49 |
| 4 | Honda Auto Receivables 2014-3 | | | | |
| | Owner Trust | 0.880% | 6/15/18 | 100 | 100 |
| 4 | Honda Auto Receivables 2014-3 | | | | |
| | Owner Trust | 1.310% | 10/15/20 | 50 | 50 |
| 4 | Honda Auto Receivables 2015-1 | | | | |
| | Owner Trust | 1.050% | 10/15/18 | 100 | 100 |
| 4 | Honda Auto Receivables 2015-1 | | | | |
| | Owner Trust | 1.320% | 11/16/20 | 75 | 74 |
| 4 | Honda Auto Receivables 2015-2 | | | | |
| | Owner Trust | 1.040% | 2/21/19 | 75 | 74 |
| 4 | Honda Auto Receivables 2015-2 | | | | |
| | Owner Trust | 1.470% | 8/23/21 | 50 | 50 |
| 4 | Honda Auto Receivables 2015-3 | | | | |
| | Owner Trust | 1.270% | 4/18/19 | 100 | 100 |
| 4 | Honda Auto Receivables 2015-3 | | | | |
| | Owner Trust | 1.560% | 10/18/21 | 50 | 50 |
| 4 | Honda Auto Receivables 2015-4 | | | | |
| | Owner Trust | 1.230% | 9/23/19 | 125 | 124 |
| 4 | Huntington Auto Trust 2015-1 | 1.240% | 9/16/19 | 125 | 124 |
| 4 | Hyundai Auto Receivables Trust | | | | |
| | 2012-C | 0.730% | 6/15/18 | 65 | 64 |
| 4 | Hyundai Auto Receivables Trust | | | | |
| | 2013-A | 0.560% | 7/17/17 | 6 | 6 |
| 4 | Hyundai Auto Receivables Trust | | | | |
| | 2013-A | 0.750% | 9/17/18 | 115 | 115 |
| 4 | Hyundai Auto Receivables Trust | | | | |
| | 2013-B | 0.710% | 9/15/17 | 25 | 25 |
| 4 | Hyundai Auto Receivables Trust | | | | |
| | 2013-B | 1.010% | 2/15/19 | 50 | 50 |
| 4 | Hyundai Auto Receivables Trust | | | | |
| | 2013-C | 1.550% | 3/15/19 | 60 | 60 |
| 4 | Hyundai Auto Receivables Trust | | | | |
| | 2014-A | 0.790% | 7/16/18 | 44 | 44 |
| 4 | Hyundai Auto Receivables Trust 2014-B 0.900% | 12/17/18 | 97 | 97 |
| 4 | Hyundai Auto Receivables Trust 2015-A 1.370% | 7/15/20 | 50 | 49 |
250
Vanguard Total Bond Market Index Portfolio
| | | | | |
| Face | Market |
| Maturity Amount | Value • |
| | Coupon | Date | ($000) | ($000) |
| 4 | Hyundai Auto Receivables Trust 2015-C 1.460% | 2/18/20 | 50 | 50 |
| 4 | Hyundai Auto Receivables Trust 2015-C 1.780% | 11/15/21 | 50 | 50 |
| 4 | JP Morgan Chase Commercial | | | | |
| | Mortgage Securities Trust 2005-LDP5 5.476% | 12/15/44 | 10 | 10 |
| 4 | JP Morgan Chase Commercial | | | | |
| | Mortgage Securities Trust 2006-CIBC14 5.488% | 12/12/44 | 44 | 44 |
| 4 | JP Morgan Chase Commercial | | | | |
| | Mortgage Securities Trust 2006-LDP7 5.909% | 4/15/45 | 65 | 66 |
| 4 | JP Morgan Chase Commercial | | | | |
| | Mortgage Securities Trust 2006-LDP8 5.440% | 5/15/45 | 115 | 117 |
| 4 | JP Morgan Chase Commercial | | | | |
| | Mortgage Securities Trust 2007-CIBC20 5.794% | 2/12/51 | 464 | 485 |
| 4 | JP Morgan Chase Commercial | | | | |
| | Mortgage Securities Trust 2007-CIBC20 5.881% | 2/12/51 | 75 | 80 |
| 4 | JP Morgan Chase Commercial | | | | |
| | Mortgage Securities Trust 2007-LDP11 5.774% | 6/15/49 | 300 | 306 |
| 4 | JP Morgan Chase Commercial | | | | |
| | Mortgage Securities Trust 2012-C6 | 3.507% | 5/15/45 | 225 | 233 |
| 4 | JP Morgan Chase Commercial | | | | |
| | Mortgage Securities Trust 2012-C8 | 2.829% | 10/15/45 | 150 | 149 |
| 4 | JP Morgan Chase Commercial | | | | |
| | Mortgage Securities Trust 2012-CIBX | 3.483% | 6/15/45 | 176 | 184 |
| 4 | JP Morgan Chase Commercial | | | | |
| | Mortgage Securities Trust 2013-C10 | 3.143% | 12/15/47 | 52 | 52 |
| 4 | JP Morgan Chase Commercial | | | | |
| | Mortgage Securities Trust 2013-C10 | 3.372% | 12/15/47 | 39 | 39 |
| 4 | JP Morgan Chase Commercial | | | | |
| | Mortgage Securities Trust 2013-LC11 | 2.960% | 4/15/46 | 58 | 58 |
| 4 | JP Morgan Chase Commercial | | | | |
| | Mortgage Securities Trust 2014-C20 | 2.872% | 7/15/47 | 50 | 51 |
| 4 | JPMBB Commercial Mortgage | | | | |
| | Securities Trust 2013-C12 | 3.664% | 7/15/45 | 39 | 40 |
| 4 | JPMBB Commercial Mortgage | | | | |
| | Securities Trust 2013-C12 | 4.025% | 7/15/45 | 26 | 27 |
| 4 | JPMBB Commercial Mortgage | | | | |
| | Securities Trust 2013-C14 | 3.761% | 8/15/46 | 40 | 42 |
| 4 | JPMBB Commercial Mortgage | | | | |
| | Securities Trust 2013-C14 | 4.133% | 8/15/46 | 100 | 107 |
| 4 | JPMBB Commercial Mortgage | | | | |
| | Securities Trust 2013-C14 | 4.409% | 8/15/46 | 30 | 32 |
| 4 | JPMBB Commercial Mortgage | | | | |
| | Securities Trust 2013-C15 | 1.233% | 11/15/45 | 16 | 16 |
| 4 | JPMBB Commercial Mortgage | | | | |
| | Securities Trust 2013-C15 | 2.977% | 11/15/45 | 90 | 92 |
| 4 | JPMBB Commercial Mortgage | | | | |
| | Securities Trust 2013-C15 | 3.659% | 11/15/45 | 10 | 10 |
| 4 | JPMBB Commercial Mortgage | | | | |
| | Securities Trust 2013-C15 | 4.131% | 11/15/45 | 65 | 69 |
| 4 | JPMBB Commercial Mortgage | | | | |
| | Securities Trust 2013-C15 | 4.420% | 11/15/45 | 35 | 37 |
| 4 | JPMBB Commercial Mortgage | | | | |
| | Securities Trust 2014-C18 | 4.079% | 2/15/47 | 127 | 135 |
| 4 | JPMBB Commercial Mortgage | | | | |
| | Securities Trust 2014-C18 | 4.439% | 2/15/47 | 25 | 27 |
| 4 | JPMBB Commercial Mortgage | | | | |
| | Securities Trust 2014-C18 | 4.810% | 2/15/47 | 30 | 32 |
| 4 | JPMBB Commercial Mortgage | | | | |
| | Securities Trust 2014-C19 | 3.046% | 4/15/47 | 50 | 51 |
| 4 | JPMBB Commercial Mortgage | | | | |
| | Securities Trust 2014-C19 | 3.669% | 4/15/47 | 50 | 52 |
| 4 | JPMBB Commercial Mortgage | | | | |
| | Securities Trust 2014-C19 | 3.997% | 4/15/47 | 95 | 100 |
| 4 | JPMBB Commercial Mortgage | | | | |
| | Securities Trust 2014-C19 | 4.243% | 4/15/47 | 50 | 53 |
| 4 | JPMBB Commercial Mortgage | | | | |
| | Securities Trust 2014-C19 | 4.110% | 9/15/47 | 50 | 52 |
| 4 | JPMBB Commercial Mortgage | | | | |
| | Securities Trust 2014-C21 | 3.428% | 8/15/47 | 30 | 31 |
| 4 | JPMBB Commercial Mortgage | | | | |
| | Securities Trust 2014-C21 | 3.775% | 8/15/47 | 25 | 26 |
| | | | | |
| Face | Market |
| Maturity Amount | Value • |
| | Coupon | Date | ($000) | ($000) |
| 4 | JPMBB Commercial Mortgage | | | | |
| | Securities Trust 2014-C22 | 3.801% | 9/15/47 | 175 | 181 |
| 4 | JPMBB Commercial Mortgage | | | | |
| | Securities Trust 2014-C23 | 3.934% | 9/15/47 | 85 | 89 |
| 4 | JPMBB Commercial Mortgage | | | | |
| | Securities Trust 2014-C23 | 4.202% | 9/15/47 | 50 | 53 |
| 4 | JPMBB Commercial Mortgage | | | | |
| | Securities Trust 2014-C24 | 2.940% | 11/15/47 | 50 | 51 |
| 4 | JPMBB Commercial Mortgage | | | | |
| | Securities Trust 2014-C24 | 3.639% | 11/15/47 | 50 | 51 |
| 4 | JPMBB Commercial Mortgage | | | | |
| | Securities Trust 2014-C24 | 3.914% | 11/15/47 | 75 | 77 |
| 4 | JPMBB Commercial Mortgage | | | | |
| | Securities Trust 2014-C25 | 3.672% | 11/15/47 | 200 | 206 |
| 4 | JPMBB Commercial Mortgage | | | | |
| | Securities Trust 2014-C25 | 4.065% | 11/15/47 | 50 | 52 |
| 4 | JPMBB Commercial Mortgage | | | | |
| | Securities Trust 2014-C26 | 3.019% | 1/15/48 | 125 | 128 |
| 4 | JPMBB Commercial Mortgage | | | | |
| | Securities Trust 2014-C26 | 3.494% | 1/15/48 | 175 | 177 |
| 4 | JPMBB Commercial Mortgage | | | | |
| | Securities Trust 2014-C26 | 3.800% | 1/15/48 | 50 | 51 |
| 4 | JPMBB Commercial Mortgage | | | | |
| | Securities Trust 2014-C26 | 3.951% | 1/15/48 | 50 | 50 |
| 4 | JPMBB Commercial Mortgage | | | | |
| | Securities Trust 2015-C27 | 2.734% | 2/15/48 | 100 | 101 |
| 4 | JPMBB Commercial Mortgage | | | | |
| | Securities Trust 2015-C27 | 3.017% | 2/15/48 | 110 | 110 |
| 4 | JPMBB Commercial Mortgage | | | | |
| | Securities Trust 2015-C27 | 3.179% | 2/15/48 | 59 | 58 |
| 4 | JPMBB Commercial Mortgage | | | | |
| | Securities Trust 2015-C28 | 2.773% | 10/15/48 | 125 | 127 |
| 4 | JPMBB Commercial Mortgage | | | | |
| | Securities Trust 2015-C28 | 3.227% | 10/15/48 | 125 | 123 |
| 4 | JPMBB Commercial Mortgage | | | | |
| | Securities Trust 2015-C28 | 3.532% | 10/15/48 | 50 | 49 |
| 4 | JPMBB Commercial Mortgage | | | | |
| | Securities Trust 2015-C29 | 2.921% | 5/15/48 | 100 | 102 |
| 4 | JPMBB Commercial Mortgage | | | | |
| | Securities Trust 2015-C29 | 3.304% | 5/15/48 | 57 | 58 |
| 4 | JPMBB Commercial Mortgage | | | | |
| | Securities Trust 2015-C29 | 3.611% | 5/15/48 | 100 | 101 |
| 4 | JPMBB Commercial Mortgage | | | | |
| | Securities Trust 2015-C30 | 3.559% | 7/15/48 | 125 | 129 |
| 4 | JPMBB Commercial Mortgage | | | | |
| | Securities Trust 2015-C30 | 3.822% | 7/15/48 | 100 | 103 |
| 4 | JPMBB Commercial Mortgage | | | | |
| | Securities Trust 2015-C30 | 4.226% | 7/15/48 | 50 | 52 |
| 4 | JPMBB Commercial Mortgage | | | | |
| | Securities Trust 2015-C31 | 3.540% | 8/15/48 | 53 | 54 |
| 4 | JPMBB Commercial Mortgage | | | | |
| | Securities Trust 2015-C31 | 3.801% | 8/15/48 | 57 | 59 |
| 4 | JPMBB Commercial Mortgage | | | | |
| | Securities Trust 2015-C32 | 3.358% | 11/15/48 | 125 | 127 |
| 4 | JPMBB Commercial Mortgage | | | | |
| | Securities Trust 2015-C32 | 3.598% | 11/15/48 | 125 | 127 |
| 4 | JPMBB Commercial Mortgage | | | | |
| | Securities Trust 2015-C33 | 3.770% | 12/15/48 | 82 | 84 |
| 4 | JPMCC Commercial Mortgage | | | | |
| | Securities Trust 2015-JP1 | 3.914% | 1/15/49 | 75 | 77 |
| 4 | LB-UBS Commercial Mortgage Trust | | | | |
| | 2006-C1 | 5.217% | 2/15/31 | 69 | 69 |
| 4 | LB-UBS Commercial Mortgage Trust | | | | |
| | 2006-C6 | 5.372% | 9/15/39 | 81 | 82 |
| 4 | LB-UBS Commercial Mortgage Trust | | | | |
| | 2006-C6 | 5.413% | 9/15/39 | 60 | 61 |
| 4 | LB-UBS Commercial Mortgage Trust | | | | |
| | 2006-C7 | 5.378% | 11/15/38 | 75 | 77 |
| 4 | LB-UBS Commercial Mortgage Trust | | | | |
| | 2007-C1 | 5.424% | 2/15/40 | 616 | 633 |
251
Vanguard Total Bond Market Index Portfolio
| | | | | |
| Face | Market |
| Maturity Amount | Value • |
| | Coupon | Date | ($000) | ($000) |
| 4 | LB-UBS Commercial Mortgage Trust | | | | |
| | 2007-C2 | 5.430% | 2/15/40 | 264 | 271 |
| 4 | LB-UBS Commercial Mortgage Trust | | | | |
| | 2007-C7 | 5.866% | 9/15/45 | 516 | 549 |
| 4 | LB-UBS Commercial Mortgage Trust | | | | |
| | 2008-C1 | 6.087% | 4/15/41 | 178 | 190 |
| 4 | Mercedes-Benz Auto Lease Trust | | | | |
| | 2015-A | 1.210% | 10/15/20 | 175 | 174 |
| 4 | Mercedes-Benz Auto Lease Trust | | | | |
| | 2015-B | 1.340% | 7/16/18 | 50 | 50 |
| 4 | Mercedes-Benz Auto Lease Trust | | | | |
| | 2015-B | 1.530% | 5/17/21 | 50 | 50 |
| 4 | Mercedes-Benz Auto Receivables Trust | | | | |
| | 2013-1 | 0.780% | 8/15/17 | 8 | 8 |
| 4 | Mercedes-Benz Auto Receivables Trust | | | | |
| | 2013-1 | 1.130% | 11/15/19 | 26 | 26 |
| 4 | Mercedes-Benz Auto Receivables Trust | | | | |
| | 2014-1 | 0.870% | 10/15/18 | 50 | 50 |
| 4 | Mercedes-Benz Auto Receivables Trust | | | | |
| | 2015-1 | 1.340% | 12/16/19 | 50 | 50 |
| 4 | Mercedes-Benz Auto Receivables Trust | | | | |
| | 2015-1 | 1.750% | 12/15/21 | 25 | 25 |
| 4 | Merrill Lynch Mortgage Trust 2006-C1 | 5.666% | 5/12/39 | 50 | 50 |
| 4 | Merrill Lynch Mortgage Trust 2006-C2 | 5.782% | 8/12/43 | 125 | 127 |
| 4 | Merrill Lynch Mortgage Trust 2007-C1 | 5.836% | 6/12/50 | 750 | 774 |
| 4 | Merrill Lynch Mortgage Trust 2008-C1 | 5.690% | 2/12/51 | 355 | 371 |
| 4 | ML-CFC Commercial Mortgage Trust | | | | |
| | 2006-3 | 5.456% | 7/12/46 | 85 | 87 |
| 4 | ML-CFC Commercial Mortgage Trust | | | | |
| | 2006-4 | 5.204% | 12/12/49 | 50 | 51 |
| 4 | ML-CFC Commercial Mortgage Trust | | | | |
| | 2007-5 | 5.378% | 8/12/48 | 410 | 419 |
| 4 | ML-CFC Commercial Mortgage Trust | | | | |
| | 2007-7 | 5.743% | 6/12/50 | 137 | 142 |
| 4 | ML-CFC Commercial Mortgage Trust | | | | |
| | 2007-9 | 5.700% | 9/12/49 | 122 | 127 |
| 4 | Morgan Stanley Bank of America | | | | |
| | Merrill Lynch Trust 2012-C5 | 3.176% | 8/15/45 | 100 | 101 |
| 4 | Morgan Stanley Bank of America | | | | |
| | Merrill Lynch Trust 2013-C11 | 4.214% | 8/15/46 | 40 | 43 |
| 4 | Morgan Stanley Bank of America | | | | |
| | Merrill Lynch Trust 2013-C11 | 4.414% | 8/15/46 | 20 | 21 |
| 4 | Morgan Stanley Bank of America | | | | |
| | Merrill Lynch Trust 2013-C12 | 3.001% | 10/15/46 | 50 | 51 |
| 4 | Morgan Stanley Bank of America | | | | |
| | Merrill Lynch Trust 2013-C12 | 4.259% | 10/15/46 | 100 | 107 |
| 4 | Morgan Stanley Bank of America | | | | |
| | Merrill Lynch Trust 2013-C7 | 2.918% | 2/15/46 | 68 | 67 |
| 4 | Morgan Stanley Bank of America | | | | |
| | Merrill Lynch Trust 2013-C7 | 3.214% | 2/15/46 | 14 | 14 |
| 4 | Morgan Stanley Bank of America | | | | |
| | Merrill Lynch Trust 2013-C8 | 3.134% | 12/15/48 | 100 | 100 |
| 4 | Morgan Stanley Bank of America | | | | |
| | Merrill Lynch Trust 2013-C8 | 3.376% | 12/15/48 | 50 | 50 |
| 4 | Morgan Stanley Bank of America | | | | |
| | Merrill Lynch Trust 2013-C9 | 3.102% | 5/15/46 | 50 | 50 |
| 4 | Morgan Stanley Bank of America | | | | |
| | Merrill Lynch Trust 2013-C9 | 3.456% | 5/15/46 | 50 | 50 |
| 4 | Morgan Stanley Bank of America | | | | |
| | Merrill Lynch Trust 2014-C14 | 1.250% | 2/15/47 | 72 | 72 |
| 4 | Morgan Stanley Bank of America | | | | |
| | Merrill Lynch Trust 2014-C14 | 2.916% | 2/15/47 | 100 | 102 |
| 4 | Morgan Stanley Bank of America | | | | |
| | Merrill Lynch Trust 2014-C14 | 3.669% | 2/15/47 | 100 | 104 |
| 4 | Morgan Stanley Bank of America | | | | |
| | Merrill Lynch Trust 2014-C14 | 4.064% | 2/15/47 | 100 | 106 |
| 4 | Morgan Stanley Bank of America | | | | |
| | Merrill Lynch Trust 2014-C14 | 4.642% | 2/15/47 | 100 | 108 |
| 4 | Morgan Stanley Bank of America | | | | |
| | Merrill Lynch Trust 2014-C16 | 3.477% | 6/15/47 | 25 | 26 |
| | | | | |
| Face | Market |
| Maturity Amount | Value • |
| | Coupon | Date | ($000) | ($000) |
| 4 | Morgan Stanley Bank of America | | | | |
| | Merrill Lynch Trust 2014-C16 | 3.892% | 6/15/47 | 100 | 104 |
| 4 | Morgan Stanley Bank of America | | | | |
| | Merrill Lynch Trust 2014-C16 | 4.324% | 6/15/47 | 50 | 52 |
| 4 | Morgan Stanley Bank of America | | | | |
| | Merrill Lynch Trust 2014-C18 | 3.194% | 10/15/47 | 100 | 103 |
| 4 | Morgan Stanley Bank of America | | | | |
| | Merrill Lynch Trust 2014-C18 | 4.444% | 10/15/47 | 50 | 53 |
| 4 | Morgan Stanley Bank of America | | | | |
| | Merrill Lynch Trust 2014-C19 | 3.101% | 12/15/47 | 125 | 128 |
| 4 | Morgan Stanley Bank of America | | | | |
| | Merrill Lynch Trust 2014-C19 | 3.326% | 12/15/47 | 50 | 51 |
| 4 | Morgan Stanley Bank of America | | | | |
| | Merrill Lynch Trust 2014-C19 | 3.526% | 12/15/47 | 75 | 76 |
| 4 | Morgan Stanley Bank of America | | | | |
| | Merrill Lynch Trust 2015-C20 | 3.069% | 2/15/48 | 50 | 50 |
| 4 | Morgan Stanley Bank of America | | | | |
| | Merrill Lynch Trust 2015-C20 | 3.249% | 2/15/48 | 200 | 197 |
| 4 | Morgan Stanley Bank of America | | | | |
| | Merrill Lynch Trust 2015-C22 | 3.040% | 4/15/48 | 100 | 100 |
| 4 | Morgan Stanley Bank of America | | | | |
| | Merrill Lynch Trust 2015-C22 | 3.306% | 4/15/48 | 75 | 74 |
| 4 | Morgan Stanley Bank of America | | | | |
| | Merrill Lynch Trust 2015-C22 | 3.883% | 4/15/48 | 50 | 49 |
| 4 | Morgan Stanley Bank of America | | | | |
| | Merrill Lynch Trust 2015-C23 | 2.982% | 7/15/50 | 75 | 76 |
| 4 | Morgan Stanley Bank of America | | | | |
| | Merrill Lynch Trust 2015-C23 | 3.398% | 7/15/50 | 50 | 51 |
| 4 | Morgan Stanley Bank of America | | | | |
| | Merrill Lynch Trust 2015-C23 | 3.719% | 7/15/50 | 125 | 128 |
| 4 | Morgan Stanley Bank of America | | | | |
| | Merrill Lynch Trust 2015-C25 | 3.383% | 10/15/48 | 125 | 127 |
| 4 | Morgan Stanley Bank of America | | | | |
| | Merrill Lynch Trust 2015-C25 | 3.635% | 10/15/48 | 75 | 76 |
| 4 | Morgan Stanley Bank of America | | | | |
| | Merrill Lynch Trust 2015-C26 | 3.323% | 10/15/48 | 75 | 76 |
| 4 | Morgan Stanley Bank of America | | | | |
| | Merrill Lynch Trust 2015-C26 | 3.531% | 10/15/48 | 75 | 75 |
| 4 | Morgan Stanley Bank of America | | | | |
| | Merrill Lynch Trust 2015-C27 | 3.557% | 12/15/47 | 50 | 51 |
| 4 | Morgan Stanley Bank of America | | | | |
| | Merrill Lynch Trust 2015-C27 | 3.753% | 12/15/47 | 75 | 76 |
| 4 | Morgan Stanley Capital I Trust | | | | |
| | 2005-TOP19 | 4.985% | 6/12/47 | 6 | 6 |
| 4 | Morgan Stanley Capital I Trust | | | | |
| | 2006-HQ10 | 5.328% | 11/12/41 | 115 | 117 |
| 4 | Morgan Stanley Capital I Trust | | | | |
| | 2006-HQ8 | 5.480% | 3/12/44 | 85 | 85 |
| 4 | Morgan Stanley Capital I Trust | | | | |
| | 2006-HQ9 | 5.773% | 7/12/44 | 125 | 127 |
| 4 | Morgan Stanley Capital I Trust | | | | |
| | 2006-HQ9 | 5.793% | 7/12/44 | 115 | 117 |
| 4 | Morgan Stanley Capital I Trust | | | | |
| | 2006-IQ11 | 5.783% | 10/15/42 | 100 | 101 |
| 4 | Morgan Stanley Capital I Trust | | | | |
| | 2006-IQ11 | 5.783% | 10/15/42 | 20 | 20 |
| 4 | Morgan Stanley Capital I Trust | | | | |
| | 2006-IQ12 | 5.370% | 12/15/43 | 50 | 51 |
| 4 | Morgan Stanley Capital I Trust | | | | |
| | 2006-TOP23 | 5.847% | 8/12/41 | 50 | 51 |
| 4 | Morgan Stanley Capital I Trust | | | | |
| | 2007-IQ14 | 5.692% | 4/15/49 | 420 | 432 |
| 4 | Morgan Stanley Capital I Trust | | | | |
| | 2007-IQ15 | 5.917% | 6/11/49 | 230 | 239 |
| 4 | Morgan Stanley Capital I Trust | | | | |
| | 2007-IQ16 | 5.809% | 12/12/49 | 553 | 578 |
| 4 | Morgan Stanley Capital I Trust | | | | |
| | 2007-IQ16 | 6.054% | 12/12/49 | 125 | 131 |
| 4 | Morgan Stanley Capital I Trust | | | | |
| | 2007-TOP25 | 5.544% | 11/12/49 | 100 | 103 |
252
Vanguard Total Bond Market Index Portfolio
| | | | | |
| Face | Market |
| Maturity Amount | Value • |
| | Coupon | Date | ($000) | ($000) |
| 4 | Morgan Stanley Capital I Trust | | | | |
| | 2007-TOP27 | 5.645% | 6/11/42 | 295 | 308 |
| 4 | Morgan Stanley Capital I Trust | | | | |
| | 2007-TOP27 | 5.645% | 6/11/42 | 150 | 157 |
| 4 | Morgan Stanley Capital I Trust | | | | |
| | 2008-TOP29 | 6.268% | 1/11/43 | 420 | 449 |
| 4 | Morgan Stanley Capital I Trust | | | | |
| | 2012-C4 | 3.244% | 3/15/45 | 350 | 357 |
| 4 | Morgan Stanley Capital I Trust | | | | |
| | 2012-C4 | 3.773% | 3/15/45 | 75 | 78 |
| 4 | Morgan Stanley Capital I Trust | | | | |
| | 2015-UBS8 | 3.809% | 12/15/48 | 75 | 76 |
| 4 | Nissan Auto Lease Trust 2014-B | 1.120% | 9/15/17 | 50 | 50 |
| 4 | Nissan Auto Lease Trust 2015-B | 1.540% | 4/16/18 | 100 | 100 |
| 4 | Nissan Auto Lease Trust 2015-B | 1.700% | 4/15/21 | 50 | 50 |
| 4 | Nissan Auto Receivables 2013-A | | | | |
| | Owner Trust | 0.500% | 5/15/17 | 7 | 7 |
| 4 | Nissan Auto Receivables 2013-A | | | | |
| | Owner Trust | 0.750% | 7/15/19 | 275 | 274 |
| 4 | Nissan Auto Receivables 2013-B | | | | |
| | Owner Trust | 0.840% | 11/15/17 | 22 | 22 |
| 4 | Nissan Auto Receivables 2013-B | | | | |
| | Owner Trust | 1.310% | 10/15/19 | 40 | 40 |
| 4 | Nissan Auto Receivables 2013-C | | | | |
| | Owner Trust | 0.670% | 8/15/18 | 31 | 31 |
| 4 | Nissan Auto Receivables 2013-C | | | | |
| | Owner Trust | 1.300% | 6/15/20 | 25 | 25 |
| 4 | Nissan Auto Receivables 2014-A | | | | |
| | Owner Trust | 0.720% | 8/15/18 | 41 | 41 |
| 4 | Nissan Auto Receivables 2014-A | | | | |
| | Owner Trust | 1.340% | 8/17/20 | 75 | 75 |
| 4 | Nissan Auto Receivables 2014-B | | | | |
| | Owner Trust | 1.110% | 5/15/19 | 50 | 50 |
| 4 | Nissan Auto Receivables 2015-B | | | | |
| | Owner Trust | 1.050% | 10/15/19 | 100 | 99 |
| 4 | Nissan Auto Receivables 2015-B | | | | |
| | Owner Trust | 1.340% | 3/16/20 | 75 | 75 |
| 4 | Nissan Auto Receivables 2015-B | | | | |
| | Owner Trust | 1.790% | 1/17/22 | 50 | 50 |
| 4 | Nissan Auto Receivables 2015-C | | | | |
| | Owner Trust | 1.370% | 5/15/20 | 50 | 50 |
| 4 | Nissan Auto Receivables 2015-C | | | | |
| | Owner Trust | 1.670% | 2/15/22 | 75 | 74 |
| 4 | Royal Bank of Canada | 1.200% | 9/19/18 | 300 | 298 |
| 4 | Royal Bank of Canada | 2.000% | 10/1/19 | 400 | 401 |
| Royal Bank of Canada | 1.875% | 2/5/20 | 400 | 393 |
| Royal Bank of Canada | 2.100% | 10/14/20 | 800 | 787 |
| 4 | Santander Drive Auto Receivables | | | | |
| | Trust 2014-2 | 0.800% | 4/16/18 | 15 | 15 |
| 4 | Santander Drive Auto Receivables | | | | |
| | Trust 2014-4 | 1.080% | 9/17/18 | 50 | 50 |
| 4 | Synchrony Credit Card Master Note | | | | |
| | Trust 2014-1 | 1.610% | 11/15/20 | 100 | 100 |
| 4 | TIAA Seasoned Commercial Mortgage | | | | |
| | Trust 2007-C4 | 5.510% | 8/15/39 | 42 | 41 |
| 4 | Toyota Auto Receivables 2013-A | | | | |
| | Owner Trust | 0.550% | 1/17/17 | 4 | 4 |
| 4 | Toyota Auto Receivables 2013-A | | | | |
| | Owner Trust | 0.690% | 11/15/18 | 30 | 30 |
| 4 | Toyota Auto Receivables 2014-A | | | | |
| | Owner Trust | 1.180% | 6/17/19 | 25 | 25 |
| 4 | Toyota Auto Receivables 2014-B | | | | |
| | Owner Trust | 0.760% | 3/15/18 | 50 | 50 |
| 4 | Toyota Auto Receivables 2014-B | | | | |
| | Owner Trust | 1.310% | 9/16/19 | 25 | 25 |
| 4 | Toyota Auto Receivables 2015-B | | | | |
| | Owner Trust | 1.270% | 5/15/19 | 175 | 175 |
| 4 | Toyota Auto Receivables 2015-B | | | | |
| | Owner Trust | 1.740% | 9/15/20 | 125 | 125 |
| 4 | Toyota Auto Receivables 2015-C | | | | |
| | Owner Trust | 1.340% | 6/17/19 | 100 | 100 |
| | | | | |
| Face | Market |
| Maturity Amount | Value • |
| | Coupon | Date | ($000) | ($000) |
| 4 | Toyota Auto Receivables Owner Trust | | | | |
| | 2015-C | 1.690% | 12/15/20 | 75 | 75 |
| 4 | UBS-Barclays Commercial Mortgage | | | | |
| | Trust 2013-C5 | 3.185% | 3/10/46 | 104 | 106 |
| 4 | UBS-Barclays Commercial Mortgage | | | | |
| | Trust 2013-C6 | 3.244% | 4/10/46 | 75 | 76 |
| 4 | UBS-Barclays Commercial Mortgage | | | | |
| | Trust 2013-C6 | 3.469% | 4/10/46 | 25 | 25 |
| 4 | USAA Auto Owner Trust 2014-1 | 0.580% | 12/15/17 | 30 | 30 |
| 4 | USAA Auto Owner Trust 2014-1 | 0.940% | 5/15/19 | 25 | 25 |
| 4 | Volkswagen Auto Lease Trust 2014-A | 0.800% | 4/20/17 | 21 | 21 |
| 4 | Volkswagen Auto Lease Trust 2014-A | 0.990% | 7/20/18 | 25 | 25 |
| 4 | Volkswagen Auto Loan Enhanced Trust | | | | |
| | 2014-1 | 0.910% | 10/22/18 | 75 | 75 |
| 4 | Volkswagen Auto Loan Enhanced Trust | | | | |
| | 2014-1 | 1.450% | 9/21/20 | 50 | 49 |
| 4 | Volkswagen Auto Loan Enhanced Trust | | | | |
| | 2014-2 | 0.950% | 4/22/19 | 150 | 149 |
| 4 | Volkswagen Auto Loan Enhanced Trust | | | | |
| | 2014-2 | 1.390% | 5/20/21 | 75 | 73 |
| 4 | Wachovia Bank Commercial Mortgage | | | | |
| | Trust Series 2006-C26 | 5.962% | 6/15/45 | 34 | 34 |
| 4 | Wachovia Bank Commercial Mortgage | | | | |
| | Trust Series 2007-C30 | 5.342% | 12/15/43 | 150 | 155 |
| 4 | Wachovia Bank Commercial Mortgage | | | | |
| | Trust Series 2007-C33 | 5.952% | 2/15/51 | 124 | 128 |
| 4 | Wells Fargo Commercial Mortgage | | | | |
| | Trust 2012-LC5 | 2.918% | 10/15/45 | 70 | 70 |
| 4 | Wells Fargo Commercial Mortgage | | | | |
| | Trust 2014-LC16 | 2.819% | 8/15/50 | 50 | 51 |
| 4 | Wells Fargo Commercial Mortgage | | | | |
| | Trust 2014-LC16 | 3.817% | 8/15/50 | 75 | 78 |
| 4 | Wells Fargo Commercial Mortgage | | | | |
| | Trust 2014-LC18 | 2.954% | 12/15/47 | 100 | 102 |
| 4 | Wells Fargo Commercial Mortgage | | | | |
| | Trust 2014-LC18 | 3.271% | 12/15/47 | 75 | 76 |
| 4 | Wells Fargo Commercial Mortgage | | | | |
| | Trust 2014-LC18 | 3.405% | 12/15/47 | 125 | 126 |
| 4 | Wells Fargo Commercial Mortgage | | | | |
| | Trust 2014-LC18 | 3.808% | 12/15/47 | 75 | 76 |
| 4 | Wells Fargo Commercial Mortgage | | | | |
| | Trust 2015-C26 | 2.991% | 2/15/48 | 125 | 125 |
| 4 | Wells Fargo Commercial Mortgage | | | | |
| | Trust 2015-C26 | 3.166% | 2/15/48 | 75 | 74 |
| 4 | Wells Fargo Commercial Mortgage | | | | |
| | Trust 2015-C26 | 3.580% | 2/15/48 | 50 | 50 |
| 4 | Wells Fargo Commercial Mortgage | | | | |
| | Trust 2015-C27 | 3.190% | 2/15/48 | 275 | 269 |
| 4 | Wells Fargo Commercial Mortgage | | | | |
| | Trust 2015-C28 | 3.540% | 5/15/48 | 175 | 176 |
| 4 | Wells Fargo Commercial Mortgage | | | | |
| | Trust 2015-C28 | 3.872% | 5/15/48 | 31 | 31 |
| 4 | Wells Fargo Commercial Mortgage | | | | |
| | Trust 2015-C29 | 3.400% | 6/15/48 | 125 | 127 |
| 4 | Wells Fargo Commercial Mortgage | | | | |
| | Trust 2015-C29 | 3.637% | 6/15/48 | 175 | 178 |
| 4 | Wells Fargo Commercial Mortgage | | | | |
| | Trust 2015-LC20 | 2.978% | 4/15/50 | 29 | 29 |
| 4 | Wells Fargo Commercial Mortgage | | | | |
| | Trust 2015-LC20 | 3.184% | 4/15/50 | 225 | 221 |
| 4 | Wells Fargo Commercial Mortgage | | | | |
| | Trust 2015-LC20 | 3.719% | 4/15/50 | 50 | 48 |
| 4 | Wells Fargo Commercial Mortgage | | | | |
| | Trust 2015-LC22 | 3.571% | 9/15/58 | 50 | 52 |
| 4 | Wells Fargo Commercial Mortgage | | | | |
| | Trust 2015-LC22 | 3.839% | 9/15/58 | 75 | 78 |
| 4 | Wells Fargo Commercial Mortgage | | | | |
| | Trust 2015-LC22 | 4.207% | 9/15/58 | 75 | 78 |
| 4 | Wells Fargo Commercial Mortgage | | | | |
| | Trust 2015-NSX1 | 2.632% | 5/15/48 | 50 | 50 |
253
Vanguard Total Bond Market Index Portfolio
| | | | | |
| Face | Market |
| Maturity Amount | Value • |
| | Coupon | Date | ($000) | ($000) |
| 4 | Wells Fargo Commercial Mortgage | | | | |
| | Trust 2015-NSX1 | 2.934% | 5/15/48 | 50 | 50 |
| 4 | Wells Fargo Commercial Mortgage | | | | |
| | Trust 2015-NSX1 | 3.148% | 5/15/48 | 50 | 49 |
| 4 | Wells Fargo Commercial Mortgage | | | | |
| | Trust 2015-P2 | 3.656% | 12/15/48 | 100 | 103 |
| 4 | Wells Fargo Commercial Mortgage | | | | |
| | Trust 2015-P2 | 3.809% | 12/15/48 | 50 | 51 |
| 4 | Wells Fargo Commercial Mortgage | | | | |
| | Trust 2015-SG1 | 3.789% | 12/15/47 | 100 | 103 |
| 4 | WFRBS Commercial Mortgage Trust | | | | |
| | 2012-C6 | 3.440% | 4/15/45 | 175 | 181 |
| 4 | WFRBS Commercial Mortgage Trust | | | | |
| | 2012-C7 | 3.431% | 6/15/45 | 125 | 129 |
| 4 | WFRBS Commercial Mortgage Trust | | | | |
| | 2012-C7 | 4.090% | 6/15/45 | 100 | 106 |
| 4 | WFRBS Commercial Mortgage Trust | | | | |
| | 2012-C8 | 3.001% | 8/15/45 | 75 | 75 |
| 4 | WFRBS Commercial Mortgage Trust | | | | |
| | 2012-C9 | 2.870% | 11/15/45 | 140 | 139 |
| 4 | WFRBS Commercial Mortgage Trust | | | | |
| | 2013-C11 | 3.071% | 3/15/45 | 94 | 94 |
| 4 | WFRBS Commercial Mortgage Trust | | | | |
| | 2013-C12 | 3.198% | 3/15/48 | 39 | 39 |
| 4 | WFRBS Commercial Mortgage Trust | | | | |
| | 2013-C12 | 3.560% | 3/15/48 | 18 | 18 |
| 4 | WFRBS Commercial Mortgage Trust | | | | |
| | 2013-C13 | 3.001% | 5/15/45 | 76 | 76 |
| 4 | WFRBS Commercial Mortgage Trust | | | | |
| | 2013-C13 | 3.345% | 5/15/45 | 15 | 15 |
| 4 | WFRBS Commercial Mortgage Trust | | | | |
| | 2013-C14 | 3.337% | 6/15/46 | 150 | 152 |
| 4 | WFRBS Commercial Mortgage Trust | | | | |
| | 2013-C14 | 3.488% | 6/15/46 | 75 | 76 |
| 4 | WFRBS Commercial Mortgage Trust | | | | |
| | 2013-C15 | 3.720% | 8/15/46 | 20 | 21 |
| 4 | WFRBS Commercial Mortgage Trust | | | | |
| | 2013-C15 | 4.153% | 8/15/46 | 100 | 107 |
| 4 | WFRBS Commercial Mortgage Trust | | | | |
| | 2013-C15 | 4.358% | 8/15/46 | 20 | 21 |
| 4 | WFRBS Commercial Mortgage Trust | | | | |
| | 2013-C16 | 3.223% | 9/15/46 | 50 | 51 |
| 4 | WFRBS Commercial Mortgage Trust | | | | |
| | 2013-C16 | 3.963% | 9/15/46 | 30 | 32 |
| 4 | WFRBS Commercial Mortgage Trust | | | | |
| | 2013-C16 | 4.415% | 9/15/46 | 30 | 33 |
| 4 | WFRBS Commercial Mortgage Trust | | | | |
| | 2013-C16 | 4.668% | 9/15/46 | 50 | 55 |
| 4 | WFRBS Commercial Mortgage Trust | | | | |
| | 2013-C17 | 2.921% | 12/15/46 | 25 | 26 |
| 4 | WFRBS Commercial Mortgage Trust | | | | |
| | 2013-C17 | 3.558% | 12/15/46 | 25 | 26 |
| 4 | WFRBS Commercial Mortgage Trust | | | | |
| | 2013-C17 | 4.023% | 12/15/46 | 25 | 26 |
| 4 | WFRBS Commercial Mortgage Trust | | | | |
| | 2013-C17 | 4.255% | 12/15/46 | 25 | 27 |
| 4 | WFRBS Commercial Mortgage Trust | | | | |
| | 2013-C17 | 4.788% | 12/15/46 | 25 | 27 |
| 4 | WFRBS Commercial Mortgage Trust | | | | |
| | 2014-C19 | 1.233% | 3/15/47 | 18 | 17 |
| 4 | WFRBS Commercial Mortgage Trust | | | | |
| | 2014-C19 | 3.618% | 3/15/47 | 25 | 26 |
| 4 | WFRBS Commercial Mortgage Trust | | | | |
| | 2014-C19 | 3.660% | 3/15/47 | 25 | 26 |
| 4 | WFRBS Commercial Mortgage Trust | | | | |
| | 2014-C19 | 4.101% | 3/15/47 | 50 | 53 |
| 4 | WFRBS Commercial Mortgage Trust | | | | |
| | 2014-C19 | 4.723% | 3/15/47 | 25 | 27 |
| 4 | WFRBS Commercial Mortgage Trust | | | | |
| | 2014-C20 | 3.036% | 5/15/47 | 25 | 25 |
| | | | | |
| Face | Market |
| Maturity Amount | Value • |
| | Coupon | Date | ($000) | ($000) |
| 4 | WFRBS Commercial Mortgage Trust | | | | |
| | 2014-C20 | 3.638% | 5/15/47 | 25 | 26 |
| 4 | WFRBS Commercial Mortgage Trust | | | | |
| | 2014-C20 | 3.995% | 5/15/47 | 25 | 26 |
| 4 | WFRBS Commercial Mortgage Trust | | | | |
| | 2014-C20 | 4.176% | 5/15/47 | 25 | 26 |
| 4 | WFRBS Commercial Mortgage Trust | | | | |
| | 2014-C21 | 3.678% | 8/15/47 | 75 | 77 |
| 4 | WFRBS Commercial Mortgage Trust | | | | |
| | 2014-C22 | 3.752% | 9/15/57 | 150 | 154 |
| 4 | WFRBS Commercial Mortgage Trust | | | | |
| | 2014-C22 | 4.371% | 9/15/57 | 25 | 26 |
| 4 | WFRBS Commercial Mortgage Trust | | | | |
| | 2014-C23 | 3.636% | 10/15/57 | 76 | 79 |
| 4 | WFRBS Commercial Mortgage Trust | | | | |
| | 2014-C23 | 3.917% | 10/15/57 | 50 | 52 |
| 4 | WFRBS Commercial Mortgage Trust | | | | |
| | 2014-C24 | 3.428% | 11/15/47 | 65 | 67 |
| 4 | WFRBS Commercial Mortgage Trust | | | | |
| | 2014-C24 | 3.607% | 11/15/47 | 65 | 66 |
| 4 | WFRBS Commercial Mortgage Trust | | | | |
| | 2014-LC14 | 1.193% | 3/15/47 | 35 | 35 |
| 4 | WFRBS Commercial Mortgage Trust | | | | |
| | 2014-LC14 | 2.862% | 3/15/47 | 25 | 25 |
| 4 | WFRBS Commercial Mortgage Trust | | | | |
| | 2014-LC14 | 3.522% | 3/15/47 | 60 | 62 |
| 4 | WFRBS Commercial Mortgage Trust | | | | |
| | 2014-LC14 | 4.045% | 3/15/47 | 140 | 149 |
| 4 | WFRBS Commercial Mortgage Trust | | | | |
| | 2014-LC14 | 4.351% | 3/15/47 | 60 | 64 |
| 4 | World Omni Auto Receivables Trust | | | | |
| | 2012-B | 0.810% | 1/15/19 | 75 | 75 |
| 4 | World Omni Auto Receivables Trust | | | | |
| | 2013-B | 0.830% | 8/15/18 | 31 | 31 |
| 4 | World Omni Auto Receivables Trust | | | | |
| | 2013-B | 1.320% | 1/15/20 | 25 | 25 |
| 4 | World Omni Auto Receivables Trust | | | | |
| | 2014-A | 0.940% | 4/15/19 | 50 | 50 |
| 4 | World Omni Auto Receivables Trust | | | | |
| | 2014-A | 1.530% | 6/15/20 | 50 | 50 |
| 4 | World Omni Auto Receivables Trust | | | | |
| | 2014-B | 1.140% | 1/15/20 | 75 | 75 |
| 4 | World Omni Auto Receivables Trust | | | | |
| | 2015-B | 1.490% | 12/15/20 | 50 | 50 |
| 4 | World Omni Auto Receivables Trust | | | | |
| | 2015-B | 1.840% | 1/17/22 | 50 | 49 |
| 4 | World Omni Automobile Lease | | | | |
| | Securitization Trust 2013-A | 1.100% | 12/15/16 | 37 | 37 |
| 4 | World Omni Automobile Lease | | | | |
| | Securitization Trust 2014-A | 1.160% | 9/15/17 | 50 | 50 |
| 4 | World Omni Automobile Lease | | | | |
| | Securitization Trust 2014-A | 1.370% | 1/15/20 | 25 | 25 |
| 4 | World Omni Automobile Lease | | | | |
| | Securitization Trust 2015-A | 1.540% | 10/15/18 | 100 | 100 |
| Total Asset-Backed/Commercial Mortgage-Backed Securities | | |
| (Cost $83,424) | 84,255 |
| Corporate Bonds (26.9%) | | | | |
| Finance (8.5%) | | | | |
| Banking (5.9%) | | | | |
| Abbey National Treasury Services plc | 1.375% | 3/13/17 | 200 | 199 |
| Abbey National Treasury Services plc | 3.050% | 8/23/18 | 150 | 154 |
| Abbey National Treasury Services plc | 2.350% | 9/10/19 | 175 | 175 |
| Abbey National Treasury Services plc | 2.375% | 3/16/20 | 300 | 299 |
| Abbey National Treasury Services plc | 4.000% | 3/13/24 | 150 | 156 |
| American Express Centurion Bank | 5.950% | 6/12/17 | 50 | 53 |
| American Express Centurion Bank | 6.000% | 9/13/17 | 625 | 670 |
| American Express Co. | 6.150% | 8/28/17 | 261 | 279 |
| American Express Co. | 7.000% | 3/19/18 | 650 | 720 |
| American Express Co. | 3.625% | 12/5/24 | 150 | 148 |
| American Express Co. | 4.050% | 12/3/42 | 67 | 63 |
254
Vanguard Total Bond Market Index Portfolio
| | | | |
| Face | Market |
| Maturity Amount | Value • |
| Coupon | Date | ($000) | ($000) |
| American Express Credit Corp. | 2.375% | 3/24/17 | 250 | 253 |
| American Express Credit Corp. | 2.250% | 8/15/19 | 1,000 | 1,000 |
| American Express Credit Corp. | 2.375% | 5/26/20 | 300 | 297 |
| American Express Credit Corp. | 2.600% | 9/14/20 | 300 | 301 |
| Australia & New Zealand Banking | | | | |
| Group Ltd. | 0.900% | 2/12/16 | 275 | 275 |
| Australia & New Zealand Banking | | | | |
| Group Ltd. | 1.250% | 1/10/17 | 240 | 240 |
| Australia & New Zealand Banking | | | | |
| Group Ltd. | 2.000% | 11/16/18 | 300 | 299 |
| Australia & New Zealand Banking | | | | |
| Group Ltd. | 2.700% | 11/16/20 | 300 | 301 |
| Australia & New Zealand Banking | | | | |
| Group Ltd. | 3.700% | 11/16/25 | 250 | 256 |
| Banco Bilbao Vizcaya Argentaria SA | 3.000% | 10/20/20 | 250 | 249 |
| Bank of America Corp. | 5.420% | 3/15/17 | 125 | 130 |
| Bank of America Corp. | 5.700% | 5/2/17 | 300 | 313 |
| Bank of America Corp. | 6.400% | 8/28/17 | 400 | 429 |
| Bank of America Corp. | 6.000% | 9/1/17 | 371 | 395 |
| Bank of America Corp. | 5.750% | 12/1/17 | 285 | 305 |
| Bank of America Corp. | 2.000% | 1/11/18 | 475 | 474 |
| Bank of America Corp. | 6.875% | 4/25/18 | 1,875 | 2,068 |
| Bank of America Corp. | 5.650% | 5/1/18 | 900 | 968 |
| Bank of America Corp. | 6.500% | 7/15/18 | 75 | 83 |
| Bank of America Corp. | 2.600% | 1/15/19 | 1,225 | 1,229 |
| Bank of America Corp. | 2.650% | 4/1/19 | 400 | 401 |
| Bank of America Corp. | 7.625% | 6/1/19 | 300 | 347 |
| Bank of America Corp. | 2.250% | 4/21/20 | 500 | 489 |
| Bank of America Corp. | 5.625% | 7/1/20 | 350 | 388 |
| Bank of America Corp. | 2.625% | 10/19/20 | 500 | 494 |
| Bank of America Corp. | 5.700% | 1/24/22 | 125 | 141 |
| Bank of America Corp. | 3.300% | 1/11/23 | 650 | 641 |
| Bank of America Corp. | 4.100% | 7/24/23 | 300 | 310 |
| Bank of America Corp. | 4.125% | 1/22/24 | 325 | 335 |
| Bank of America Corp. | 4.000% | 4/1/24 | 725 | 742 |
| Bank of America Corp. | 4.200% | 8/26/24 | 475 | 476 |
| Bank of America Corp. | 4.000% | 1/22/25 | 425 | 416 |
| Bank of America Corp. | 3.950% | 4/21/25 | 500 | 487 |
| Bank of America Corp. | 3.875% | 8/1/25 | 800 | 812 |
| Bank of America Corp. | 4.250% | 10/22/26 | 350 | 346 |
| Bank of America Corp. | 6.110% | 1/29/37 | 435 | 494 |
| Bank of America Corp. | 7.750% | 5/14/38 | 240 | 325 |
| Bank of America Corp. | 5.875% | 2/7/42 | 225 | 263 |
| Bank of America Corp. | 5.000% | 1/21/44 | 600 | 626 |
| Bank of America Corp. | 4.875% | 4/1/44 | 300 | 310 |
| Bank of America Corp. | 4.750% | 4/21/45 | 100 | 96 |
| Bank of America NA | 5.300% | 3/15/17 | 625 | 650 |
| Bank of America NA | 6.100% | 6/15/17 | 500 | 529 |
| Bank of America NA | 1.750% | 6/5/18 | 300 | 298 |
| Bank of America NA | 2.050% | 12/7/18 | 250 | 249 |
| Bank of Montreal | 2.500% | 1/11/17 | 350 | 354 |
| Bank of Montreal | 1.300% | 7/14/17 | 100 | 100 |
| Bank of Montreal | 1.400% | 4/10/18 | 250 | 248 |
| Bank of Montreal | 1.800% | 7/31/18 | 250 | 250 |
| Bank of Montreal | 2.375% | 1/25/19 | 150 | 151 |
| Bank of Montreal | 2.550% | 11/6/22 | 150 | 148 |
| Bank of New York Mellon Corp. | 1.300% | 1/25/18 | 125 | 124 |
| Bank of New York Mellon Corp. | 2.100% | 1/15/19 | 250 | 251 |
| Bank of New York Mellon Corp. | 2.200% | 5/15/19 | 275 | 275 |
| Bank of New York Mellon Corp. | 5.450% | 5/15/19 | 200 | 220 |
| Bank of New York Mellon Corp. | 2.300% | 9/11/19 | 500 | 501 |
| Bank of New York Mellon Corp. | 2.600% | 8/17/20 | 175 | 176 |
| Bank of New York Mellon Corp. | 2.450% | 11/27/20 | 150 | 149 |
| Bank of New York Mellon Corp. | 3.550% | 9/23/21 | 300 | 314 |
| Bank of New York Mellon Corp. | 3.250% | 9/11/24 | 150 | 151 |
| Bank of New York Mellon Corp. | 3.000% | 2/24/25 | 250 | 246 |
| Bank of Nova Scotia | 2.550% | 1/12/17 | 150 | 152 |
| Bank of Nova Scotia | 1.250% | 4/11/17 | 170 | 170 |
| Bank of Nova Scotia | 1.300% | 7/21/17 | 100 | 100 |
| Bank of Nova Scotia | 1.375% | 12/18/17 | 100 | 100 |
| Bank of Nova Scotia | 1.700% | 6/11/18 | 200 | 199 |
| | | | | |
| Face | Market |
| Maturity Amount | Value • |
| | Coupon | Date | ($000) | ($000) |
| Bank of Nova Scotia | 2.050% | 10/30/18 | 450 | 452 |
| Bank of Nova Scotia | 2.350% | 10/21/20 | 1,000 | 991 |
| Bank of Nova Scotia | 2.800% | 7/21/21 | 450 | 456 |
| Bank of Nova Scotia | 4.500% | 12/16/25 | 600 | 597 |
| Barclays Bank plc | 2.500% | 2/20/19 | 950 | 956 |
| Barclays Bank plc | 3.750% | 5/15/24 | 350 | 356 |
| Barclays plc | 2.000% | 3/16/18 | 250 | 249 |
| Barclays plc | 2.750% | 11/8/19 | 100 | 100 |
| Barclays plc | 2.875% | 6/8/20 | 250 | 250 |
| Barclays plc | 4.375% | 9/11/24 | 200 | 196 |
| Barclays plc | 3.650% | 3/16/25 | 350 | 338 |
| Barclays plc | 5.250% | 8/17/45 | 250 | 254 |
| BB&T Corp. | 2.150% | 3/22/17 | 175 | 176 |
| BB&T Corp. | 4.900% | 6/30/17 | 75 | 78 |
| BB&T Corp. | 1.450% | 1/12/18 | 250 | 248 |
| BB&T Corp. | 6.850% | 4/30/19 | 400 | 456 |
| BB&T Corp. | 5.250% | 11/1/19 | 100 | 109 |
| BB&T Corp. | 2.450% | 1/15/20 | 130 | 130 |
| Bear Stearns Cos. LLC | 5.550% | 1/22/17 | 150 | 156 |
| Bear Stearns Cos. LLC | 6.400% | 10/2/17 | 400 | 431 |
| Bear Stearns Cos. LLC | 7.250% | 2/1/18 | 525 | 578 |
| BNP Paribas SA | 2.375% | 9/14/17 | 600 | 606 |
| BNP Paribas SA | 2.700% | 8/20/18 | 275 | 279 |
| BNP Paribas SA | 2.400% | 12/12/18 | 225 | 227 |
| BNP Paribas SA | 2.450% | 3/17/19 | 75 | 75 |
| BNP Paribas SA | 2.375% | 5/21/20 | 375 | 372 |
| BNP Paribas SA | 5.000% | 1/15/21 | 475 | 524 |
| BPCE SA | 1.625% | 2/10/17 | 200 | 200 |
| BPCE SA | 2.500% | 12/10/18 | 175 | 177 |
| BPCE SA | 2.500% | 7/15/19 | 250 | 251 |
| BPCE SA | 2.250% | 1/27/20 | 125 | 124 |
| BPCE SA | 4.000% | 4/15/24 | 325 | 337 |
| Branch Banking & Trust Co. | 1.350% | 10/1/17 | 100 | 100 |
| Branch Banking & Trust Co. | 3.625% | 9/16/25 | 500 | 505 |
| Capital One Bank USA NA | 1.150% | 11/21/16 | 300 | 299 |
| Capital One Bank USA NA | 1.300% | 6/5/17 | 250 | 248 |
| Capital One Bank USA NA | 2.150% | 11/21/18 | 100 | 99 |
| Capital One Bank USA NA | 2.300% | 6/5/19 | 400 | 395 |
| Capital One Bank USA NA | 8.800% | 7/15/19 | 350 | 417 |
| Capital One Bank USA NA | 3.375% | 2/15/23 | 235 | 230 |
| Capital One Financial Corp. | 5.250% | 2/21/17 | 50 | 52 |
| Capital One Financial Corp. | 6.750% | 9/15/17 | 50 | 54 |
| Capital One Financial Corp. | 2.450% | 4/24/19 | 200 | 200 |
| Capital One Financial Corp. | 4.750% | 7/15/21 | 50 | 54 |
| Capital One Financial Corp. | 3.500% | 6/15/23 | 27 | 27 |
| Capital One Financial Corp. | 3.750% | 4/24/24 | 175 | 176 |
| Capital One Financial Corp. | 4.200% | 10/29/25 | 175 | 173 |
| Capital One NA | 1.650% | 2/5/18 | 400 | 396 |
| Capital One NA | 2.400% | 9/5/19 | 100 | 99 |
| 4,7 Citicorp Lease Pass-Through Trust | | | | |
| | 1999-1 | 8.040% | 12/15/19 | 500 | 589 |
| Citigroup Inc. | 1.550% | 8/14/17 | 150 | 149 |
| Citigroup Inc. | 6.000% | 8/15/17 | 71 | 76 |
| Citigroup Inc. | 6.125% | 11/21/17 | 330 | 355 |
| Citigroup Inc. | 1.800% | 2/5/18 | 225 | 224 |
| Citigroup Inc. | 6.125% | 5/15/18 | 314 | 342 |
| Citigroup Inc. | 2.150% | 7/30/18 | 400 | 400 |
| Citigroup Inc. | 2.500% | 9/26/18 | 675 | 680 |
| Citigroup Inc. | 2.050% | 12/7/18 | 500 | 497 |
| Citigroup Inc. | 2.550% | 4/8/19 | 1,000 | 1,007 |
| Citigroup Inc. | 2.400% | 2/18/20 | 250 | 247 |
| Citigroup Inc. | 5.375% | 8/9/20 | 50 | 56 |
| Citigroup Inc. | 2.650% | 10/26/20 | 350 | 347 |
| Citigroup Inc. | 4.500% | 1/14/22 | 575 | 616 |
| Citigroup Inc. | 4.050% | 7/30/22 | 300 | 306 |
| Citigroup Inc. | 3.500% | 5/15/23 | 500 | 493 |
| Citigroup Inc. | 3.875% | 10/25/23 | 450 | 465 |
| Citigroup Inc. | 4.000% | 8/5/24 | 200 | 198 |
| Citigroup Inc. | 3.875% | 3/26/25 | 100 | 97 |
| Citigroup Inc. | 3.300% | 4/27/25 | 250 | 245 |
| Citigroup Inc. | 4.400% | 6/10/25 | 1,500 | 1,515 |
255
Vanguard Total Bond Market Index Portfolio
| | | | | |
| Face | Market |
| Maturity Amount | Value • |
| | Coupon | Date | ($000) | ($000) |
| Citigroup Inc. | 5.500% | 9/13/25 | 75 | 81 |
| Citigroup Inc. | 4.450% | 9/29/27 | 150 | 149 |
| Citigroup Inc. | 6.625% | 6/15/32 | 100 | 118 |
| Citigroup Inc. | 6.125% | 8/25/36 | 75 | 85 |
| Citigroup Inc. | 8.125% | 7/15/39 | 562 | 803 |
| Citigroup Inc. | 5.300% | 5/6/44 | 875 | 909 |
| Citigroup Inc. | 4.650% | 7/30/45 | 300 | 304 |
| Citizens Bank NA | 1.600% | 12/4/17 | 100 | 99 |
| Citizens Bank NA | 2.450% | 12/4/19 | 100 | 98 |
| Citizens Bank NA | 2.300% | 12/3/18 | 125 | 125 |
| Citizens Financial Group Inc. | 4.300% | 12/3/25 | 125 | 125 |
| Comerica Bank | 5.200% | 8/22/17 | 75 | 79 |
| Comerica Bank | 4.000% | 7/27/25 | 50 | 51 |
| Commonwealth Bank of Australia | 1.400% | 9/8/17 | 100 | 100 |
| Commonwealth Bank of Australia | 1.900% | 9/18/17 | 250 | 251 |
| Commonwealth Bank of Australia | 1.625% | 3/12/18 | 750 | 748 |
| Commonwealth Bank of Australia | 1.750% | 11/2/18 | 175 | 174 |
| Commonwealth Bank of Australia | 2.300% | 9/6/19 | 100 | 100 |
| Commonwealth Bank of Australia | 2.400% | 11/2/20 | 350 | 347 |
| 7 | Commonwealth Bank of Australia | 4.500% | 12/9/25 | 200 | 198 |
| Compass Bank | 1.850% | 9/29/17 | 100 | 99 |
| Compass Bank | 6.400% | 10/1/17 | 75 | 79 |
| Compass Bank | 2.750% | 9/29/19 | 100 | 99 |
| Cooperatieve Rabobank UA | 3.375% | 1/19/17 | 250 | 255 |
| Cooperatieve Rabobank UA | 1.700% | 3/19/18 | 325 | 323 |
| Cooperatieve Rabobank UA | 2.250% | 1/14/19 | 500 | 502 |
| Cooperatieve Rabobank UA | 2.250% | 1/14/20 | 750 | 745 |
| Cooperatieve Rabobank UA | 4.500% | 1/11/21 | 950 | 1,035 |
| Cooperatieve Rabobank UA | 3.875% | 2/8/22 | 525 | 552 |
| Cooperatieve Rabobank UA | 3.950% | 11/9/22 | 125 | 126 |
| Cooperatieve Rabobank UA | 4.625% | 12/1/23 | 175 | 182 |
| Cooperatieve Rabobank UA | 3.375% | 5/21/25 | 275 | 272 |
| Cooperatieve Rabobank UA | 4.375% | 8/4/25 | 100 | 101 |
| Cooperatieve Rabobank UA | 5.250% | 5/24/41 | 100 | 113 |
| Cooperatieve Rabobank UA | 5.750% | 12/1/43 | 250 | 277 |
| Cooperatieve Rabobank UA | 5.250% | 8/4/45 | 100 | 105 |
| Credit Suisse | 1.375% | 5/26/17 | 450 | 448 |
| Credit Suisse | 6.000% | 2/15/18 | 100 | 107 |
| Credit Suisse | 1.700% | 4/27/18 | 350 | 347 |
| Credit Suisse | 2.300% | 5/28/19 | 400 | 400 |
| Credit Suisse | 5.300% | 8/13/19 | 175 | 193 |
| Credit Suisse | 5.400% | 1/14/20 | 325 | 356 |
| Credit Suisse | 3.000% | 10/29/21 | 600 | 598 |
| Credit Suisse | 3.625% | 9/9/24 | 650 | 655 |
| 7 | Credit Suisse Group Funding Guernsey | | | | |
| | Ltd. | 2.750% | 3/26/20 | 250 | 248 |
| 7 | Credit Suisse Group Funding Guernsey | | | | |
| | Ltd. | 3.800% | 9/15/22 | 300 | 299 |
| 7 | Credit Suisse Group Funding Guernsey | | | | |
| | Ltd. | 3.750% | 3/26/25 | 250 | 244 |
| 7 | Credit Suisse Group Funding Guernsey | | | | |
| | Ltd. | 4.875% | 5/15/45 | 375 | 369 |
| Deutsche Bank AG | 1.400% | 2/13/17 | 275 | 273 |
| Deutsche Bank AG | 1.350% | 5/30/17 | 225 | 224 |
| Deutsche Bank AG | 6.000% | 9/1/17 | 800 | 848 |
| Deutsche Bank AG | 1.875% | 2/13/18 | 250 | 248 |
| Deutsche Bank AG | 2.500% | 2/13/19 | 150 | 151 |
| Deutsche Bank AG | 2.950% | 8/20/20 | 100 | 100 |
| Deutsche Bank AG | 3.700% | 5/30/24 | 225 | 224 |
| Discover Bank | 3.200% | 8/9/21 | 100 | 99 |
| Discover Bank | 4.200% | 8/8/23 | 300 | 305 |
| Discover Financial Services | 3.850% | 11/21/22 | 200 | 199 |
| Discover Financial Services | 3.950% | 11/6/24 | 375 | 369 |
| Discover Financial Services | 3.750% | 3/4/25 | 100 | 96 |
| Fifth Third Bancorp | 3.500% | 3/15/22 | 125 | 127 |
| Fifth Third Bancorp | 4.300% | 1/16/24 | 275 | 282 |
| Fifth Third Bancorp | 8.250% | 3/1/38 | 225 | 315 |
| Fifth Third Bank | 0.900% | 2/26/16 | 225 | 225 |
| Fifth Third Bank | 2.150% | 8/20/18 | 575 | 575 |
| First Horizon National Corp. | 3.500% | 12/15/20 | 100 | 99 |
| First Niagara Financial Group Inc. | 6.750% | 3/19/20 | 50 | 57 |
| | | | |
| Face | Market |
| Maturity Amount | Value • |
| Coupon | Date | ($000) | ($000) |
| FirstMerit Bank NA | 4.270% | 11/25/26 | 150 | 150 |
| FirstMerit Corp. | 4.350% | 2/4/23 | 50 | 51 |
| Goldman Sachs Capital I | 6.345% | 2/15/34 | 225 | 265 |
| Goldman Sachs Group Inc. | 5.625% | 1/15/17 | 450 | 467 |
| Goldman Sachs Group Inc. | 6.250% | 9/1/17 | 475 | 508 |
| Goldman Sachs Group Inc. | 5.950% | 1/18/18 | 825 | 887 |
| Goldman Sachs Group Inc. | 2.375% | 1/22/18 | 450 | 454 |
| Goldman Sachs Group Inc. | 6.150% | 4/1/18 | 200 | 217 |
| Goldman Sachs Group Inc. | 2.900% | 7/19/18 | 575 | 586 |
| Goldman Sachs Group Inc. | 2.625% | 1/31/19 | 850 | 857 |
| Goldman Sachs Group Inc. | 7.500% | 2/15/19 | 75 | 86 |
| Goldman Sachs Group Inc. | 2.550% | 10/23/19 | 1,200 | 1,199 |
| Goldman Sachs Group Inc. | 5.375% | 3/15/20 | 475 | 522 |
| Goldman Sachs Group Inc. | 2.600% | 4/23/20 | 300 | 299 |
| Goldman Sachs Group Inc. | 6.000% | 6/15/20 | 480 | 543 |
| Goldman Sachs Group Inc. | 2.750% | 9/15/20 | 275 | 275 |
| Goldman Sachs Group Inc. | 5.250% | 7/27/21 | 475 | 526 |
| Goldman Sachs Group Inc. | 5.750% | 1/24/22 | 1,175 | 1,336 |
| Goldman Sachs Group Inc. | 3.625% | 1/22/23 | 375 | 379 |
| Goldman Sachs Group Inc. | 4.000% | 3/3/24 | 575 | 590 |
| Goldman Sachs Group Inc. | 3.850% | 7/8/24 | 175 | 179 |
| Goldman Sachs Group Inc. | 3.500% | 1/23/25 | 450 | 441 |
| Goldman Sachs Group Inc. | 4.250% | 10/21/25 | 200 | 199 |
| Goldman Sachs Group Inc. | 5.950% | 1/15/27 | 400 | 443 |
| Goldman Sachs Group Inc. | 6.125% | 2/15/33 | 125 | 146 |
| Goldman Sachs Group Inc. | 6.450% | 5/1/36 | 225 | 254 |
| Goldman Sachs Group Inc. | 6.750% | 10/1/37 | 975 | 1,139 |
| Goldman Sachs Group Inc. | 6.250% | 2/1/41 | 675 | 806 |
| Goldman Sachs Group Inc. | 4.800% | 7/8/44 | 250 | 250 |
| Goldman Sachs Group Inc. | 5.150% | 5/22/45 | 850 | 825 |
| Goldman Sachs Group Inc. | 4.750% | 10/21/45 | 200 | 199 |
| HSBC Bank USA NA | 4.875% | 8/24/20 | 250 | 273 |
| HSBC Bank USA NA | 5.625% | 8/15/35 | 250 | 282 |
| HSBC Bank USA NA | 7.000% | 1/15/39 | 250 | 313 |
| HSBC Holdings plc | 5.100% | 4/5/21 | 625 | 694 |
| HSBC Holdings plc | 4.875% | 1/14/22 | 225 | 245 |
| HSBC Holdings plc | 4.000% | 3/30/22 | 225 | 236 |
| HSBC Holdings plc | 4.250% | 3/14/24 | 250 | 250 |
| HSBC Holdings plc | 4.250% | 8/18/25 | 150 | 150 |
| HSBC Holdings plc | 7.625% | 5/17/32 | 100 | 128 |
| HSBC Holdings plc | 7.350% | 11/27/32 | 100 | 124 |
| HSBC Holdings plc | 6.500% | 5/2/36 | 500 | 595 |
| HSBC Holdings plc | 6.500% | 9/15/37 | 550 | 658 |
| HSBC Holdings plc | 6.800% | 6/1/38 | 200 | 247 |
| HSBC Holdings plc | 5.250% | 3/14/44 | 250 | 258 |
| HSBC USA Inc. | 1.500% | 11/13/17 | 375 | 373 |
| HSBC USA Inc. | 1.625% | 1/16/18 | 455 | 453 |
| HSBC USA Inc. | 2.000% | 8/7/18 | 100 | 100 |
| HSBC USA Inc. | 2.625% | 9/24/18 | 50 | 51 |
| HSBC USA Inc. | 2.375% | 11/13/19 | 300 | 299 |
| HSBC USA Inc. | 2.350% | 3/5/20 | 275 | 272 |
| HSBC USA Inc. | 2.750% | 8/7/20 | 150 | 150 |
| HSBC USA Inc. | 5.000% | 9/27/20 | 300 | 327 |
| HSBC USA Inc. | 3.500% | 6/23/24 | 100 | 100 |
| Huntington Bancshares Inc. | 2.600% | 8/2/18 | 50 | 50 |
| Huntington Bancshares Inc. | 7.000% | 12/15/20 | 25 | 29 |
| Huntington National Bank | 1.375% | 4/24/17 | 200 | 199 |
| Huntington National Bank | 2.000% | 6/30/18 | 250 | 248 |
| Huntington National Bank | 2.200% | 11/6/18 | 175 | 174 |
| Huntington National Bank | 2.400% | 4/1/20 | 150 | 148 |
| Intesa Sanpaolo SPA | 2.375% | 1/13/17 | 175 | 176 |
| Intesa Sanpaolo SPA | 3.875% | 1/16/18 | 200 | 205 |
| Intesa Sanpaolo SPA | 3.875% | 1/15/19 | 185 | 190 |
| Intesa Sanpaolo SPA | 5.250% | 1/12/24 | 225 | 240 |
| JPMorgan Chase & Co. | 1.350% | 2/15/17 | 400 | 399 |
| JPMorgan Chase & Co. | 6.125% | 6/27/17 | 75 | 79 |
| JPMorgan Chase & Co. | 2.000% | 8/15/17 | 325 | 327 |
| JPMorgan Chase & Co. | 6.000% | 1/15/18 | 1,075 | 1,159 |
| JPMorgan Chase & Co. | 1.800% | 1/25/18 | 300 | 300 |
| JPMorgan Chase & Co. | 1.700% | 3/1/18 | 450 | 448 |
| JPMorgan Chase & Co. | 1.625% | 5/15/18 | 775 | 770 |
256
Vanguard Total Bond Market Index Portfolio
| | | | | |
| Face | Market |
| Maturity Amount | Value • |
| | Coupon | Date | ($000) | ($000) |
| JPMorgan Chase & Co. | 2.350% | 1/28/19 | 300 | 301 |
| JPMorgan Chase & Co. | 6.300% | 4/23/19 | 825 | 924 |
| JPMorgan Chase & Co. | 2.200% | 10/22/19 | 750 | 745 |
| JPMorgan Chase & Co. | 2.250% | 1/23/20 | 800 | 791 |
| JPMorgan Chase & Co. | 2.750% | 6/23/20 | 350 | 351 |
| JPMorgan Chase & Co. | 4.400% | 7/22/20 | 575 | 615 |
| JPMorgan Chase & Co. | 4.250% | 10/15/20 | 250 | 265 |
| JPMorgan Chase & Co. | 2.550% | 10/29/20 | 425 | 421 |
| JPMorgan Chase & Co. | 4.625% | 5/10/21 | 250 | 270 |
| JPMorgan Chase & Co. | 4.350% | 8/15/21 | 205 | 218 |
| JPMorgan Chase & Co. | 4.500% | 1/24/22 | 25 | 27 |
| JPMorgan Chase & Co. | 3.250% | 9/23/22 | 750 | 754 |
| JPMorgan Chase & Co. | 3.200% | 1/25/23 | 750 | 746 |
| JPMorgan Chase & Co. | 3.375% | 5/1/23 | 300 | 294 |
| JPMorgan Chase & Co. | 3.875% | 9/10/24 | 500 | 498 |
| JPMorgan Chase & Co. | 3.125% | 1/23/25 | 400 | 389 |
| JPMorgan Chase & Co. | 3.900% | 7/15/25 | 300 | 307 |
| JPMorgan Chase & Co. | 4.125% | 12/15/26 | 450 | 449 |
| JPMorgan Chase & Co. | 6.400% | 5/15/38 | 950 | 1,195 |
| JPMorgan Chase & Co. | 5.500% | 10/15/40 | 250 | 283 |
| JPMorgan Chase & Co. | 5.600% | 7/15/41 | 450 | 519 |
| JPMorgan Chase & Co. | 5.400% | 1/6/42 | 150 | 169 |
| JPMorgan Chase & Co. | 5.625% | 8/16/43 | 300 | 324 |
| JPMorgan Chase & Co. | 4.850% | 2/1/44 | 175 | 186 |
| JPMorgan Chase & Co. | 4.950% | 6/1/45 | 100 | 100 |
| JPMorgan Chase Bank NA | 6.000% | 10/1/17 | 1,075 | 1,150 |
| KeyBank NA | 5.450% | 3/3/16 | 150 | 151 |
| KeyBank NA | 1.650% | 2/1/18 | 75 | 75 |
| KeyBank NA | 1.700% | 6/1/18 | 250 | 248 |
| KeyBank NA | 2.500% | 12/15/19 | 100 | 100 |
| KeyBank NA | 2.250% | 3/16/20 | 250 | 247 |
| KeyBank NA | 3.300% | 6/1/25 | 125 | 124 |
| KeyCorp | 2.300% | 12/13/18 | 125 | 125 |
| KeyCorp | 5.100% | 3/24/21 | 25 | 27 |
| Lloyds Bank plc | 4.200% | 3/28/17 | 75 | 77 |
| Lloyds Bank plc | 1.750% | 3/16/18 | 75 | 75 |
| Lloyds Bank plc | 1.750% | 5/14/18 | 100 | 100 |
| Lloyds Bank plc | 2.300% | 11/27/18 | 225 | 226 |
| Lloyds Bank plc | 2.350% | 9/5/19 | 425 | 425 |
| Lloyds Bank plc | 2.400% | 3/17/20 | 50 | 50 |
| Lloyds Bank plc | 6.375% | 1/21/21 | 175 | 206 |
| Lloyds Bank plc | 3.500% | 5/14/25 | 225 | 226 |
| 7 | Lloyds Banking Group plc | 5.300% | 12/1/45 | 200 | 203 |
| Manufacturers & Traders Trust Co. | 6.625% | 12/4/17 | 200 | 217 |
| Manufacturers & Traders Trust Co. | 2.300% | 1/30/19 | 550 | 551 |
| Manufacturers & Traders Trust Co. | 2.250% | 7/25/19 | 100 | 100 |
| Manufacturers & Traders Trust Co. | 2.100% | 2/6/20 | 175 | 172 |
| 4,6 Manufacturers & Traders Trust Co. | 1.637% | 12/28/20 | 150 | 149 |
| Manufacturers & Traders Trust Co. | 2.900% | 2/6/25 | 425 | 411 |
| Morgan Stanley | 5.450% | 1/9/17 | 575 | 597 |
| Morgan Stanley | 4.750% | 3/22/17 | 255 | 264 |
| Morgan Stanley | 5.550% | 4/27/17 | 50 | 52 |
| Morgan Stanley | 5.950% | 12/28/17 | 375 | 403 |
| Morgan Stanley | 1.875% | 1/5/18 | 400 | 400 |
| Morgan Stanley | 6.625% | 4/1/18 | 450 | 493 |
| Morgan Stanley | 2.125% | 4/25/18 | 425 | 426 |
| Morgan Stanley | 2.200% | 12/7/18 | 250 | 250 |
| Morgan Stanley | 2.500% | 1/24/19 | 150 | 151 |
| Morgan Stanley | 7.300% | 5/13/19 | 525 | 603 |
| Morgan Stanley | 2.375% | 7/23/19 | 400 | 399 |
| Morgan Stanley | 5.625% | 9/23/19 | 800 | 882 |
| Morgan Stanley | 5.500% | 1/26/20 | 275 | 303 |
| Morgan Stanley | 2.650% | 1/27/20 | 250 | 249 |
| Morgan Stanley | 2.800% | 6/16/20 | 650 | 652 |
| Morgan Stanley | 5.500% | 7/24/20 | 175 | 195 |
| Morgan Stanley | 5.750% | 1/25/21 | 250 | 281 |
| Morgan Stanley | 5.500% | 7/28/21 | 75 | 84 |
| Morgan Stanley | 4.875% | 11/1/22 | 425 | 452 |
| Morgan Stanley | 3.750% | 2/25/23 | 675 | 692 |
| Morgan Stanley | 4.100% | 5/22/23 | 350 | 353 |
| Morgan Stanley | 3.875% | 4/29/24 | 595 | 607 |
| | | | |
| Face | Market |
| Maturity Amount | Value • |
| | Coupon | Date | ($000) | ($000) |
| Morgan Stanley | 3.700% | 10/23/24 | 650 | 650 |
| Morgan Stanley | 4.000% | 7/23/25 | 180 | 185 |
| Morgan Stanley | 5.000% | 11/24/25 | 300 | 318 |
| Morgan Stanley | 6.250% | 8/9/26 | 450 | 528 |
| Morgan Stanley | 4.350% | 9/8/26 | 225 | 224 |
| Morgan Stanley | 3.950% | 4/23/27 | 350 | 340 |
| Morgan Stanley | 7.250% | 4/1/32 | 150 | 197 |
| Morgan Stanley | 6.375% | 7/24/42 | 325 | 404 |
| Morgan Stanley | 4.300% | 1/27/45 | 500 | 474 |
| MUFG Americas Holdings Corp. | 1.625% | 2/9/18 | 200 | 198 |
| MUFG Americas Holdings Corp. | 2.250% | 2/10/20 | 200 | 197 |
| MUFG Americas Holdings Corp. | 3.500% | 6/18/22 | 175 | 178 |
| MUFG Americas Holdings Corp. | 3.000% | 2/10/25 | 100 | 95 |
| MUFG Union Bank NA | 5.950% | 5/11/16 | 100 | 102 |
| MUFG Union Bank NA | 2.125% | 6/16/17 | 50 | 50 |
| MUFG Union Bank NA | 2.625% | 9/26/18 | 125 | 126 |
| MUFG Union Bank NA | 2.250% | 5/6/19 | 300 | 300 |
| Murray Street Investment Trust I | 4.647% | 3/9/17 | 275 | 284 |
| National Australia Bank Ltd. | 2.750% | 3/9/17 | 175 | 178 |
| National Australia Bank Ltd. | 2.300% | 7/25/18 | 175 | 176 |
| National Australia Bank Ltd. | 3.000% | 1/20/23 | 250 | 248 |
| National Bank of Canada | 1.450% | 11/7/17 | 100 | 99 |
| National City Corp. | 6.875% | 5/15/19 | 100 | 113 |
| Northern Trust Corp. | 3.450% | 11/4/20 | 100 | 104 |
| Northern Trust Corp. | 3.375% | 8/23/21 | 100 | 104 |
| Northern Trust Corp. | 3.950% | 10/30/25 | 150 | 156 |
| People’s United Bank | 4.000% | 7/15/24 | 100 | 99 |
| People’s United Financial Inc. | 3.650% | 12/6/22 | 100 | 99 |
| PNC Bank NA | 4.875% | 9/21/17 | 775 | 810 |
| PNC Bank NA | 6.000% | 12/7/17 | 100 | 107 |
| PNC Bank NA | 1.500% | 2/23/18 | 100 | 99 |
| PNC Bank NA | 1.600% | 6/1/18 | 150 | 149 |
| PNC Bank NA | 1.800% | 11/5/18 | 200 | 199 |
| PNC Bank NA | 2.250% | 7/2/19 | 600 | 602 |
| PNC Bank NA | 2.400% | 10/18/19 | 75 | 75 |
| PNC Bank NA | 2.300% | 6/1/20 | 150 | 149 |
| PNC Bank NA | 2.450% | 11/5/20 | 100 | 99 |
| PNC Bank NA | 3.300% | 10/30/24 | 200 | 201 |
| PNC Bank NA | 2.950% | 2/23/25 | 150 | 145 |
| PNC Bank NA | 3.250% | 6/1/25 | 100 | 99 |
| PNC Financial Services Group Inc. | 3.900% | 4/29/24 | 625 | 640 |
| PNC Funding Corp. | 5.625% | 2/1/17 | 75 | 78 |
| PNC Funding Corp. | 6.700% | 6/10/19 | 25 | 29 |
| PNC Funding Corp. | 5.125% | 2/8/20 | 150 | 165 |
| PNC Funding Corp. | 4.375% | 8/11/20 | 475 | 512 |
| PNC Funding Corp. | 3.300% | 3/8/22 | 500 | 509 |
| Regions Bank | 6.450% | 6/26/37 | 250 | 296 |
| Regions Financial Corp. | 2.000% | 5/15/18 | 285 | 282 |
| Royal Bank of Canada | 1.200% | 1/23/17 | 285 | 285 |
| Royal Bank of Canada | 1.000% | 4/27/17 | 500 | 498 |
| Royal Bank of Canada | 1.250% | 6/16/17 | 150 | 150 |
| Royal Bank of Canada | 1.400% | 10/13/17 | 200 | 200 |
| Royal Bank of Canada | 2.200% | 7/27/18 | 375 | 379 |
| Royal Bank of Canada | 1.800% | 7/30/18 | 575 | 573 |
| Royal Bank of Canada | 2.000% | 12/10/18 | 175 | 175 |
| Royal Bank of Canada | 2.200% | 9/23/19 | 225 | 225 |
| Royal Bank of Scotland Group plc | 1.875% | 3/31/17 | 100 | 100 |
| Royal Bank of Scotland Group plc | 6.400% | 10/21/19 | 450 | 498 |
| Santander Bank NA | 2.000% | 1/12/18 | 250 | 248 |
| Santander Bank NA | 8.750% | 5/30/18 | 75 | 85 |
| Santander Holdings USA Inc. | 3.450% | 8/27/18 | 50 | 51 |
| Santander Holdings USA Inc. | 4.500% | 7/17/25 | 125 | 127 |
| Santander Issuances SAU | 5.179% | 11/19/25 | 450 | 439 |
| Santander UK Group Holdings plc | 2.875% | 10/16/20 | 300 | 298 |
| Societe Generale SA | 2.750% | 10/12/17 | 225 | 228 |
| Societe Generale SA | 2.625% | 10/1/18 | 125 | 126 |
| State Street Corp. | 4.956% | 3/15/18 | 275 | 288 |
| State Street Corp. | 1.350% | 5/15/18 | 275 | 273 |
| State Street Corp. | 3.100% | 5/15/23 | 150 | 148 |
| State Street Corp. | 3.700% | 11/20/23 | 83 | 86 |
| State Street Corp. | 3.550% | 8/18/25 | 225 | 232 |
257
| | | | |
| Face | Market |
| Maturity Amount | Value • |
| Coupon | Date | ($000) | ($000) |
| Sumitomo Mitsui Banking Corp. | 1.800% | 7/18/17 | 475 | 475 |
| Sumitomo Mitsui Banking Corp. | 1.950% | 7/23/18 | 250 | 249 |
| Sumitomo Mitsui Banking Corp. | 2.450% | 1/10/19 | 150 | 150 |
| Sumitomo Mitsui Banking Corp. | 2.250% | 7/11/19 | 250 | 248 |
| Sumitomo Mitsui Banking Corp. | 2.450% | 10/20/20 | 200 | 198 |
| Sumitomo Mitsui Banking Corp. | 3.200% | 7/18/22 | 250 | 251 |
| Sumitomo Mitsui Banking Corp. | 3.950% | 7/19/23 | 100 | 104 |
| Sumitomo Mitsui Banking Corp. | 3.950% | 1/10/24 | 250 | 259 |
| Sumitomo Mitsui Banking Corp. | 3.400% | 7/11/24 | 250 | 248 |
| SunTrust Bank | 7.250% | 3/15/18 | 75 | 83 |
| SunTrust Banks Inc. | 3.500% | 1/20/17 | 350 | 357 |
| SunTrust Banks Inc. | 6.000% | 9/11/17 | 50 | 53 |
| SunTrust Banks Inc. | 2.350% | 11/1/18 | 40 | 40 |
| SunTrust Banks Inc. | 2.500% | 5/1/19 | 300 | 301 |
| SVB Financial Group | 3.500% | 1/29/25 | 100 | 96 |
| Svenska Handelsbanken AB | 2.875% | 4/4/17 | 475 | 483 |
| Svenska Handelsbanken AB | 2.500% | 1/25/19 | 225 | 228 |
| Svenska Handelsbanken AB | 2.250% | 6/17/19 | 225 | 225 |
| Synchrony Financial | 2.600% | 1/15/19 | 175 | 174 |
| Synchrony Financial | 2.700% | 2/3/20 | 425 | 417 |
| Synchrony Financial | 4.250% | 8/15/24 | 250 | 247 |
| Synchrony Financial | 4.500% | 7/23/25 | 500 | 499 |
| Toronto-Dominion Bank | 1.125% | 5/2/17 | 150 | 150 |
| Toronto-Dominion Bank | 1.625% | 3/13/18 | 750 | 750 |
| Toronto-Dominion Bank | 1.400% | 4/30/18 | 250 | 248 |
| Toronto-Dominion Bank | 1.750% | 7/23/18 | 350 | 350 |
| Toronto-Dominion Bank | 2.625% | 9/10/18 | 300 | 307 |
| Toronto-Dominion Bank | 2.125% | 7/2/19 | 100 | 100 |
| Toronto-Dominion Bank | 2.250% | 11/5/19 | 500 | 500 |
| Toronto-Dominion Bank | 2.500% | 12/14/20 | 100 | 100 |
| UBS AG | 1.375% | 6/1/17 | 225 | 224 |
| UBS AG | 5.750% | 4/25/18 | 100 | 108 |
| UBS AG | 2.375% | 8/14/19 | 400 | 400 |
| UBS AG | 2.350% | 3/26/20 | 350 | 349 |
| UBS AG | 4.875% | 8/4/20 | 50 | 55 |
| US Bancorp | 1.950% | 11/15/18 | 325 | 327 |
| US Bancorp | 2.200% | 4/25/19 | 100 | 101 |
| US Bancorp | 4.125% | 5/24/21 | 250 | 270 |
| US Bancorp | 3.000% | 3/15/22 | 125 | 127 |
| US Bancorp | 2.950% | 7/15/22 | 400 | 398 |
| US Bancorp | 3.600% | 9/11/24 | 50 | 51 |
| US Bank NA | 1.375% | 9/11/17 | 175 | 175 |
| US Bank NA | 2.125% | 10/28/19 | 1,000 | 998 |
| US Bank NA | 2.800% | 1/27/25 | 500 | 487 |
| Vesey Street Investment Trust I | 4.404% | 9/1/16 | 25 | 25 |
| Wachovia Bank NA | 5.850% | 2/1/37 | 300 | 357 |
| Wachovia Corp. | 5.750% | 6/15/17 | 425 | 450 |
| Wachovia Corp. | 5.750% | 2/1/18 | 300 | 324 |
| Wachovia Corp. | 6.605% | 10/1/25 | 590 | 700 |
| Wells Fargo & Co. | 2.625% | 12/15/16 | 350 | 355 |
| Wells Fargo & Co. | 2.100% | 5/8/17 | 150 | 151 |
| Wells Fargo & Co. | 1.150% | 6/2/17 | 400 | 399 |
| Wells Fargo & Co. | 1.400% | 9/8/17 | 675 | 673 |
| Wells Fargo & Co. | 5.625% | 12/11/17 | 575 | 617 |
| Wells Fargo & Co. | 1.500% | 1/16/18 | 25 | 25 |
| Wells Fargo & Co. | 2.150% | 1/15/19 | 250 | 251 |
| Wells Fargo & Co. | 2.125% | 4/22/19 | 500 | 500 |
| Wells Fargo & Co. | 2.550% | 12/7/20 | 350 | 347 |
| Wells Fargo & Co. | 4.600% | 4/1/21 | 1,325 | 1,442 |
| Wells Fargo & Co. | 3.500% | 3/8/22 | 450 | 463 |
| Wells Fargo & Co. | 3.300% | 9/9/24 | 400 | 397 |
| Wells Fargo & Co. | 3.000% | 2/19/25 | 100 | 97 |
| Wells Fargo & Co. | 4.100% | 6/3/26 | 500 | 505 |
| Wells Fargo & Co. | 4.300% | 7/22/27 | 400 | 408 |
| Wells Fargo & Co. | 5.375% | 2/7/35 | 200 | 229 |
| Wells Fargo & Co. | 5.375% | 11/2/43 | 300 | 321 |
| Wells Fargo & Co. | 5.606% | 1/15/44 | 600 | 664 |
| Wells Fargo & Co. | 4.650% | 11/4/44 | 325 | 316 |
| Wells Fargo & Co. | 3.900% | 5/1/45 | 500 | 457 |
| Wells Fargo & Co. | 4.900% | 11/17/45 | 250 | 251 |
| Wells Fargo Bank NA | 6.000% | 11/15/17 | 200 | 216 |
Vanguard Total Bond Market Index Portfolio
| | | | |
| Face | Market |
| Maturity Amount | Value • |
| Coupon | Date | ($000) | ($000) |
| Wells Fargo Bank NA | 5.950% | 8/26/36 | 200 | 238 |
| Wells Fargo Bank NA | 6.600% | 1/15/38 | 225 | 291 |
| Westpac Banking Corp. | 1.200% | 5/19/17 | 600 | 598 |
| Westpac Banking Corp. | 1.500% | 12/1/17 | 200 | 200 |
| Westpac Banking Corp. | 1.600% | 1/12/18 | 200 | 200 |
| Westpac Banking Corp. | 2.250% | 7/30/18 | 325 | 327 |
| Westpac Banking Corp. | 1.950% | 11/23/18 | 200 | 200 |
| Westpac Banking Corp. | 2.250% | 1/17/19 | 225 | 225 |
| Westpac Banking Corp. | 4.875% | 11/19/19 | 250 | 273 |
| Westpac Banking Corp. | 2.600% | 11/23/20 | 250 | 250 |
| |
| Brokerage (0.2%) | | | | |
| Affiliated Managers Group Inc. | 4.250% | 2/15/24 | 100 | 101 |
| Affiliated Managers Group Inc. | 3.500% | 8/1/25 | 250 | 238 |
| Ameriprise Financial Inc. | 5.300% | 3/15/20 | 125 | 139 |
| Ameriprise Financial Inc. | 4.000% | 10/15/23 | 150 | 155 |
| Ameriprise Financial Inc. | 3.700% | 10/15/24 | 100 | 101 |
| Apollo Investment Corp. | 5.250% | 3/3/25 | 50 | 48 |
| BGC Partners Inc. | 5.375% | 12/9/19 | 50 | 51 |
| BlackRock Inc. | 6.250% | 9/15/17 | 100 | 108 |
| BlackRock Inc. | 5.000% | 12/10/19 | 160 | 177 |
| BlackRock Inc. | 4.250% | 5/24/21 | 125 | 135 |
| BlackRock Inc. | 3.375% | 6/1/22 | 125 | 129 |
| BlackRock Inc. | 3.500% | 3/18/24 | 225 | 230 |
| Brookfield Asset Management Inc. | 4.000% | 1/15/25 | 100 | 98 |
| Brookfield Asset Management Inc. | 7.375% | 3/1/33 | 50 | 59 |
| Charles Schwab Corp. | 3.225% | 9/1/22 | 300 | 305 |
| CME Group Inc. | 3.000% | 9/15/22 | 125 | 126 |
| CME Group Inc. | 3.000% | 3/15/25 | 125 | 123 |
| CME Group Inc. | 5.300% | 9/15/43 | 125 | 143 |
| Eaton Vance Corp. | 3.625% | 6/15/23 | 50 | 50 |
| Franklin Resources Inc. | 1.375% | 9/15/17 | 50 | 50 |
| Franklin Resources Inc. | 4.625% | 5/20/20 | 50 | 54 |
| Franklin Resources Inc. | 2.800% | 9/15/22 | 225 | 219 |
| Intercontinental Exchange Inc. | 2.500% | 10/15/18 | 25 | 25 |
| Intercontinental Exchange Inc. | 2.750% | 12/1/20 | 350 | 349 |
| Intercontinental Exchange Inc. | 4.000% | 10/15/23 | 150 | 155 |
| Intercontinental Exchange Inc. | 3.750% | 12/1/25 | 300 | 300 |
| Invesco Finance plc | 3.125% | 11/30/22 | 175 | 172 |
| Invesco Finance plc | 4.000% | 1/30/24 | 100 | 103 |
| Invesco Finance plc | 3.750% | 1/15/26 | 170 | 171 |
| Invesco Finance plc | 5.375% | 11/30/43 | 75 | 82 |
| Janus Capital Group Inc. | 4.875% | 8/1/25 | 75 | 77 |
| Jefferies Group LLC | 5.125% | 4/13/18 | 150 | 156 |
| Jefferies Group LLC | 8.500% | 7/15/19 | 25 | 29 |
| Jefferies Group LLC | 6.875% | 4/15/21 | 155 | 173 |
| Jefferies Group LLC | 5.125% | 1/20/23 | 100 | 100 |
| Jefferies Group LLC | 6.450% | 6/8/27 | 50 | 53 |
| Jefferies Group LLC | 6.250% | 1/15/36 | 75 | 69 |
| Jefferies Group LLC | 6.500% | 1/20/43 | 75 | 69 |
| Lazard Group LLC | 6.850% | 6/15/17 | 17 | 18 |
| Lazard Group LLC | 3.750% | 2/13/25 | 50 | 46 |
| Legg Mason Inc. | 2.700% | 7/15/19 | 50 | 50 |
| Legg Mason Inc. | 5.625% | 1/15/44 | 100 | 100 |
| Leucadia National Corp. | 5.500% | 10/18/23 | 150 | 147 |
| Leucadia National Corp. | 6.625% | 10/23/43 | 25 | 21 |
| Nasdaq Inc. | 5.550% | 1/15/20 | 175 | 193 |
| Nasdaq Inc. | 4.250% | 6/1/24 | 75 | 76 |
| Nomura Holdings Inc. | 2.750% | 3/19/19 | 250 | 251 |
| Nomura Holdings Inc. | 6.700% | 3/4/20 | 200 | 230 |
| Raymond James Financial Inc. | 4.250% | 4/15/16 | 50 | 50 |
| Stifel Financial Corp. | 3.500% | 12/1/20 | 50 | 49 |
| Stifel Financial Corp. | 4.250% | 7/18/24 | 50 | 49 |
| TD Ameritrade Holding Corp. | 5.600% | 12/1/19 | 50 | 56 |
| TD Ameritrade Holding Corp. | 2.950% | 4/1/22 | 150 | 149 |
| TD Ameritrade Holding Corp. | 3.625% | 4/1/25 | 100 | 101 |
| |
| Finance Companies (0.4%) | | | | |
| Air Lease Corp. | 5.625% | 4/1/17 | 175 | 182 |
| Air Lease Corp. | 2.125% | 1/15/18 | 75 | 74 |
| Air Lease Corp. | 2.625% | 9/4/18 | 100 | 99 |
258
Vanguard Total Bond Market Index Portfolio
| | | | | |
| Face | Market |
| Maturity Amount | Value • |
| | Coupon | Date | ($000) | ($000) |
| Air Lease Corp. | 3.375% | 1/15/19 | 125 | 126 |
| Air Lease Corp. | 4.750% | 3/1/20 | 75 | 79 |
| Air Lease Corp. | 3.875% | 4/1/21 | 75 | 75 |
| Air Lease Corp. | 3.750% | 2/1/22 | 125 | 122 |
| Air Lease Corp. | 4.250% | 9/15/24 | 75 | 74 |
| Ares Capital Corp. | 4.875% | 11/30/18 | 125 | 129 |
| Ares Capital Corp. | 3.875% | 1/15/20 | 100 | 102 |
| FS Investment Corp. | 4.000% | 7/15/19 | 75 | 75 |
| FS Investment Corp. | 4.750% | 5/15/22 | 50 | 49 |
| GATX Corp. | 3.500% | 7/15/16 | 50 | 50 |
| GATX Corp. | 1.250% | 3/4/17 | 50 | 49 |
| GATX Corp. | 2.375% | 7/30/18 | 40 | 40 |
| GATX Corp. | 2.500% | 7/30/19 | 50 | 49 |
| GATX Corp. | 4.750% | 6/15/22 | 100 | 106 |
| GATX Corp. | 3.250% | 3/30/25 | 125 | 116 |
| GATX Corp. | 4.500% | 3/30/45 | 50 | 43 |
| 7 | GE Capital International Funding Co | 0.964% | 4/15/16 | 2,293 | 2,294 |
| 7 | GE Capital International Funding Co | 2.342% | 11/15/20 | 3,162 | 3,136 |
| 7 | GE Capital International Funding Co | 3.373% | 11/15/25 | 558 | 564 |
| 7 | GE Capital International Funding Co | 4.418% | 11/15/35 | 2,768 | 2,822 |
| HSBC Finance Corp. | 6.676% | 1/15/21 | 465 | 533 |
| 7 | International Lease Finance Corp. | 7.125% | 9/1/18 | 200 | 219 |
| Prospect Capital Corp. | 5.000% | 7/15/19 | 50 | 50 |
| Prospect Capital Corp. | 5.875% | 3/15/23 | 40 | 39 |
| |
| Insurance (1.3%) | | | | |
| ACE Capital Trust II | 9.700% | 4/1/30 | 50 | 73 |
| ACE INA Holdings Inc. | 5.700% | 2/15/17 | 75 | 79 |
| ACE INA Holdings Inc. | 5.800% | 3/15/18 | 25 | 27 |
| ACE INA Holdings Inc. | 5.900% | 6/15/19 | 25 | 28 |
| ACE INA Holdings Inc. | 2.875% | 11/3/22 | 150 | 149 |
| ACE INA Holdings Inc. | 2.700% | 3/13/23 | 125 | 122 |
| ACE INA Holdings Inc. | 3.350% | 5/15/24 | 100 | 101 |
| ACE INA Holdings Inc. | 3.150% | 3/15/25 | 250 | 247 |
| ACE INA Holdings Inc. | 3.350% | 5/3/26 | 225 | 224 |
| ACE INA Holdings Inc. | 4.150% | 3/13/43 | 100 | 97 |
| ACE INA Holdings Inc. | 4.350% | 11/3/45 | 200 | 202 |
| AEGON Funding Co. LLC | 5.750% | 12/15/20 | 81 | 92 |
| Aetna Inc. | 1.750% | 5/15/17 | 50 | 50 |
| Aetna Inc. | 1.500% | 11/15/17 | 75 | 75 |
| Aetna Inc. | 2.200% | 3/15/19 | 60 | 60 |
| Aetna Inc. | 2.750% | 11/15/22 | 200 | 193 |
| Aetna Inc. | 3.500% | 11/15/24 | 125 | 125 |
| Aetna Inc. | 6.625% | 6/15/36 | 130 | 155 |
| Aetna Inc. | 6.750% | 12/15/37 | 100 | 125 |
| Aetna Inc. | 4.500% | 5/15/42 | 75 | 74 |
| Aetna Inc. | 4.125% | 11/15/42 | 75 | 70 |
| Aflac Inc. | 2.650% | 2/15/17 | 125 | 127 |
| Aflac Inc. | 2.400% | 3/16/20 | 100 | 100 |
| Aflac Inc. | 4.000% | 2/15/22 | 50 | 53 |
| Aflac Inc. | 3.625% | 6/15/23 | 125 | 129 |
| Aflac Inc. | 3.625% | 11/15/24 | 125 | 127 |
| Aflac Inc. | 3.250% | 3/17/25 | 75 | 74 |
| Aflac Inc. | 6.900% | 12/17/39 | 75 | 97 |
| Alleghany Corp. | 5.625% | 9/15/20 | 100 | 110 |
| Alleghany Corp. | 4.900% | 9/15/44 | 100 | 95 |
| Allied World Assurance Co. Holdings | | | | |
| | Ltd. | 4.350% | 10/29/25 | 450 | 446 |
| Allied World Assurance Co. Ltd. | 5.500% | 11/15/20 | 50 | 54 |
| Allstate Corp. | 3.150% | 6/15/23 | 350 | 350 |
| Allstate Corp. | 5.550% | 5/9/35 | 75 | 87 |
| Allstate Corp. | 4.500% | 6/15/43 | 50 | 51 |
| 4 | Allstate Corp. | 5.750% | 8/15/53 | 75 | 77 |
| 4 | Allstate Corp. | 6.125% | 5/15/67 | 125 | 125 |
| 4 | Allstate Corp. | 6.500% | 5/15/67 | 100 | 110 |
| Alterra Finance LLC | 6.250% | 9/30/20 | 55 | 62 |
| American Financial Group Inc. | 9.875% | 6/15/19 | 50 | 61 |
| American International Group Inc. | 5.850% | 1/16/18 | 200 | 215 |
| American International Group Inc. | 3.375% | 8/15/20 | 125 | 128 |
| American International Group Inc. | 6.400% | 12/15/20 | 385 | 444 |
| American International Group Inc. | 4.875% | 6/1/22 | 250 | 270 |
| | | | | |
| Face | Market |
| Maturity Amount | Value • |
| | Coupon | Date | ($000) | ($000) |
| American International Group Inc. | 4.125% | 2/15/24 | 170 | 174 |
| American International Group Inc. | 3.875% | 1/15/35 | 200 | 176 |
| American International Group Inc. | 4.700% | 7/10/35 | 75 | 75 |
| American International Group Inc. | 6.250% | 5/1/36 | 475 | 551 |
| American International Group Inc. | 4.500% | 7/16/44 | 375 | 347 |
| American International Group Inc. | 4.800% | 7/10/45 | 125 | 121 |
| American International Group Inc. | 4.375% | 1/15/55 | 125 | 107 |
| 4 | American International Group Inc. | 8.175% | 5/15/68 | 100 | 131 |
| 4 | American International Group Inc. | 6.250% | 3/15/87 | 100 | 108 |
| Anthem Inc. | 2.375% | 2/15/17 | 75 | 76 |
| Anthem Inc. | 5.875% | 6/15/17 | 25 | 26 |
| Anthem Inc. | 1.875% | 1/15/18 | 125 | 124 |
| Anthem Inc. | 2.250% | 8/15/19 | 150 | 149 |
| Anthem Inc. | 4.350% | 8/15/20 | 100 | 106 |
| Anthem Inc. | 3.700% | 8/15/21 | 125 | 127 |
| Anthem Inc. | 3.125% | 5/15/22 | 150 | 147 |
| Anthem Inc. | 3.300% | 1/15/23 | 175 | 170 |
| Anthem Inc. | 3.500% | 8/15/24 | 125 | 122 |
| Anthem Inc. | 5.950% | 12/15/34 | 75 | 84 |
| Anthem Inc. | 5.850% | 1/15/36 | 225 | 244 |
| Anthem Inc. | 6.375% | 6/15/37 | 110 | 130 |
| Anthem Inc. | 4.625% | 5/15/42 | 175 | 165 |
| Anthem Inc. | 4.650% | 1/15/43 | 175 | 166 |
| Anthem Inc. | 5.100% | 1/15/44 | 100 | 101 |
| Anthem Inc. | 4.650% | 8/15/44 | 125 | 119 |
| Anthem Inc. | 4.850% | 8/15/54 | 50 | 47 |
| Aon Corp. | 5.000% | 9/30/20 | 200 | 218 |
| Aon Corp. | 8.205% | 1/1/27 | 25 | 31 |
| Aon Corp. | 6.250% | 9/30/40 | 100 | 119 |
| Aon plc | 3.500% | 6/14/24 | 100 | 97 |
| Aon plc | 4.450% | 5/24/43 | 50 | 47 |
| Aon plc | 4.600% | 6/14/44 | 175 | 168 |
| Arch Capital Group Ltd. | 7.350% | 5/1/34 | 50 | 64 |
| Arch Capital Group US Inc. | 5.144% | 11/1/43 | 50 | 51 |
| Aspen Insurance Holdings Ltd. | 6.000% | 12/15/20 | 300 | 328 |
| Aspen Insurance Holdings Ltd. | 4.650% | 11/15/23 | 225 | 230 |
| Assurant Inc. | 4.000% | 3/15/23 | 100 | 100 |
| Assurant Inc. | 6.750% | 2/15/34 | 50 | 58 |
| AXA SA | 8.600% | 12/15/30 | 225 | 301 |
| Axis Specialty Finance LLC | 5.875% | 6/1/20 | 75 | 83 |
| AXIS Specialty Finance plc | 5.150% | 4/1/45 | 25 | 25 |
| Berkshire Hathaway Finance Corp. | 1.600% | 5/15/17 | 150 | 151 |
| Berkshire Hathaway Finance Corp. | 5.400% | 5/15/18 | 550 | 597 |
| Berkshire Hathaway Finance Corp. | 2.000% | 8/15/18 | 50 | 51 |
| Berkshire Hathaway Finance Corp. | 2.900% | 10/15/20 | 275 | 283 |
| Berkshire Hathaway Finance Corp. | 4.250% | 1/15/21 | 125 | 136 |
| Berkshire Hathaway Finance Corp. | 3.000% | 5/15/22 | 150 | 153 |
| Berkshire Hathaway Finance Corp. | 5.750% | 1/15/40 | 75 | 88 |
| Berkshire Hathaway Finance Corp. | 4.400% | 5/15/42 | 125 | 124 |
| Berkshire Hathaway Inc. | 1.900% | 1/31/17 | 175 | 177 |
| Berkshire Hathaway Inc. | 2.100% | 8/14/19 | 125 | 126 |
| Berkshire Hathaway Inc. | 3.000% | 2/11/23 | 225 | 229 |
| Berkshire Hathaway Inc. | 4.500% | 2/11/43 | 150 | 151 |
| Brown & Brown Inc. | 4.200% | 9/15/24 | 100 | 99 |
| Chubb Corp. | 5.750% | 5/15/18 | 50 | 54 |
| Chubb Corp. | 6.000% | 5/11/37 | 125 | 152 |
| Chubb Corp. | 6.500% | 5/15/38 | 50 | 65 |
| 4 | Chubb Corp. | 6.375% | 3/29/67 | 325 | 312 |
| Cigna Corp. | 5.125% | 6/15/20 | 50 | 54 |
| Cigna Corp. | 4.375% | 12/15/20 | 45 | 48 |
| Cigna Corp. | 4.500% | 3/15/21 | 50 | 53 |
| Cigna Corp. | 4.000% | 2/15/22 | 75 | 77 |
| Cigna Corp. | 3.250% | 4/15/25 | 150 | 147 |
| Cigna Corp. | 7.875% | 5/15/27 | 50 | 66 |
| Cigna Corp. | 6.150% | 11/15/36 | 75 | 86 |
| Cigna Corp. | 5.875% | 3/15/41 | 50 | 57 |
| Cigna Corp. | 5.375% | 2/15/42 | 75 | 82 |
| Cincinnati Financial Corp. | 6.125% | 11/1/34 | 150 | 171 |
| CNA Financial Corp. | 7.350% | 11/15/19 | 25 | 29 |
| CNA Financial Corp. | 5.875% | 8/15/20 | 75 | 83 |
| CNA Financial Corp. | 5.750% | 8/15/21 | 75 | 84 |
259
Vanguard Total Bond Market Index Portfolio
| | | | | |
| Face | Market |
| Maturity Amount | Value • |
| | Coupon | Date | ($000) | ($000) |
| Coventry Health Care Inc. | 5.950% | 3/15/17 | 60 | 63 |
| Coventry Health Care Inc. | 5.450% | 6/15/21 | 100 | 111 |
| Endurance Specialty Holdings Ltd. | 7.000% | 7/15/34 | 75 | 88 |
| Everest Reinsurance Holdings Inc. | 4.868% | 6/1/44 | 100 | 95 |
| First American Financial Corp. | 4.300% | 2/1/23 | 200 | 199 |
| First American Financial Corp. | 4.600% | 11/15/24 | 100 | 101 |
| Hartford Financial Services Group Inc. | 5.500% | 10/15/16 | 125 | 129 |
| Hartford Financial Services Group Inc. | 5.375% | 3/15/17 | 100 | 104 |
| Hartford Financial Services Group Inc. | 6.300% | 3/15/18 | 134 | 146 |
| Hartford Financial Services Group Inc. | 6.000% | 1/15/19 | 25 | 27 |
| Hartford Financial Services Group Inc. | 5.125% | 4/15/22 | 25 | 27 |
| Hartford Financial Services Group Inc. | 5.950% | 10/15/36 | 50 | 57 |
| Hartford Financial Services Group Inc. | 4.300% | 4/15/43 | 175 | 163 |
| Horace Mann Educators Corp. | 4.500% | 12/1/25 | 50 | 50 |
| Humana Inc. | 7.200% | 6/15/18 | 100 | 112 |
| Humana Inc. | 3.850% | 10/1/24 | 150 | 151 |
| Humana Inc. | 8.150% | 6/15/38 | 175 | 239 |
| Humana Inc. | 4.625% | 12/1/42 | 75 | 71 |
| Humana Inc. | 4.950% | 10/1/44 | 100 | 99 |
| Infinity Property & Casualty Corp. | 5.000% | 9/19/22 | 50 | 50 |
| Kemper Corp. | 4.350% | 2/15/25 | 125 | 123 |
| Lincoln National Corp. | 8.750% | 7/1/19 | 75 | 90 |
| Lincoln National Corp. | 6.250% | 2/15/20 | 25 | 28 |
| Lincoln National Corp. | 4.200% | 3/15/22 | 50 | 52 |
| Lincoln National Corp. | 4.000% | 9/1/23 | 50 | 51 |
| Lincoln National Corp. | 6.150% | 4/7/36 | 150 | 173 |
| Lincoln National Corp. | 7.000% | 6/15/40 | 160 | 201 |
| Loews Corp. | 2.625% | 5/15/23 | 75 | 71 |
| Loews Corp. | 6.000% | 2/1/35 | 50 | 58 |
| Loews Corp. | 4.125% | 5/15/43 | 175 | 156 |
| Manulife Financial Corp. | 4.900% | 9/17/20 | 275 | 299 |
| Markel Corp. | 7.125% | 9/30/19 | 50 | 57 |
| Markel Corp. | 4.900% | 7/1/22 | 125 | 134 |
| Markel Corp. | 5.000% | 3/30/43 | 50 | 50 |
| Marsh & McLennan Cos. Inc. | 2.350% | 3/6/20 | 500 | 495 |
| Marsh & McLennan Cos. Inc. | 4.800% | 7/15/21 | 295 | 321 |
| Marsh & McLennan Cos. Inc. | 3.500% | 6/3/24 | 100 | 99 |
| Marsh & McLennan Cos. Inc. | 3.500% | 3/10/25 | 100 | 98 |
| Marsh & McLennan Cos. Inc. | 3.750% | 3/14/26 | 100 | 100 |
| MetLife Inc. | 1.756% | 12/15/17 | 100 | 100 |
| MetLife Inc. | 1.903% | 12/15/17 | 90 | 90 |
| MetLife Inc. | 6.817% | 8/15/18 | 25 | 28 |
| MetLife Inc. | 7.717% | 2/15/19 | 50 | 58 |
| MetLife Inc. | 4.750% | 2/8/21 | 550 | 602 |
| MetLife Inc. | 3.048% | 12/15/22 | 225 | 224 |
| MetLife Inc. | 3.600% | 4/10/24 | 375 | 386 |
| MetLife Inc. | 3.000% | 3/1/25 | 250 | 241 |
| MetLife Inc. | 3.600% | 11/13/25 | 650 | 653 |
| MetLife Inc. | 6.500% | 12/15/32 | 175 | 215 |
| MetLife Inc. | 6.375% | 6/15/34 | 100 | 123 |
| MetLife Inc. | 5.700% | 6/15/35 | 200 | 231 |
| MetLife Inc. | 5.875% | 2/6/41 | 25 | 29 |
| MetLife Inc. | 4.125% | 8/13/42 | 125 | 118 |
| MetLife Inc. | 4.875% | 11/13/43 | 175 | 183 |
| MetLife Inc. | 4.721% | 12/15/44 | 63 | 64 |
| MetLife Inc. | 4.600% | 5/13/46 | 120 | 121 |
| 4 | MetLife Inc. | 6.400% | 12/15/66 | 220 | 240 |
| Old Republic International Corp. | 4.875% | 10/1/24 | 125 | 128 |
| OneBeacon US Holdings Inc. | 4.600% | 11/9/22 | 50 | 50 |
| PartnerRe Finance B LLC | 5.500% | 6/1/20 | 100 | 110 |
| Primerica Inc. | 4.750% | 7/15/22 | 25 | 27 |
| Principal Financial Group Inc. | 1.850% | 11/15/17 | 25 | 25 |
| Principal Financial Group Inc. | 8.875% | 5/15/19 | 75 | 90 |
| Principal Financial Group Inc. | 3.300% | 9/15/22 | 50 | 50 |
| Principal Financial Group Inc. | 3.125% | 5/15/23 | 100 | 97 |
| Principal Financial Group Inc. | 6.050% | 10/15/36 | 100 | 116 |
| Principal Financial Group Inc. | 4.625% | 9/15/42 | 50 | 49 |
| Principal Financial Group Inc. | 4.350% | 5/15/43 | 50 | 46 |
| 4 | Principal Financial Group Inc. | 4.700% | 5/15/55 | 100 | 100 |
| ProAssurance Corp. | 5.300% | 11/15/23 | 50 | 53 |
| Progressive Corp. | 3.750% | 8/23/21 | 75 | 79 |
| | | | | |
| Face | Market |
| Maturity Amount | Value • |
| | Coupon | Date | ($000) | ($000) |
| Progressive Corp. | 6.625% | 3/1/29 | 125 | 157 |
| Progressive Corp. | 4.350% | 4/25/44 | 50 | 51 |
| 4 | Progressive Corp. | 6.700% | 6/15/67 | 125 | 125 |
| Protective Life Corp. | 8.450% | 10/15/39 | 50 | 66 |
| Prudential Financial Inc. | 6.000% | 12/1/17 | 250 | 269 |
| Prudential Financial Inc. | 2.300% | 8/15/18 | 25 | 25 |
| Prudential Financial Inc. | 5.375% | 6/21/20 | 125 | 139 |
| Prudential Financial Inc. | 4.500% | 11/15/20 | 325 | 349 |
| Prudential Financial Inc. | 4.500% | 11/16/21 | 75 | 81 |
| Prudential Financial Inc. | 3.500% | 5/15/24 | 125 | 125 |
| Prudential Financial Inc. | 5.750% | 7/15/33 | 100 | 113 |
| Prudential Financial Inc. | 5.400% | 6/13/35 | 100 | 109 |
| Prudential Financial Inc. | 5.900% | 3/17/36 | 375 | 431 |
| Prudential Financial Inc. | 5.700% | 12/14/36 | 125 | 141 |
| Prudential Financial Inc. | 6.625% | 12/1/37 | 125 | 154 |
| Prudential Financial Inc. | 6.625% | 6/21/40 | 400 | 496 |
| 4 | Prudential Financial Inc. | 5.875% | 9/15/42 | 100 | 104 |
| 4 | Prudential Financial Inc. | 5.625% | 6/15/43 | 375 | 381 |
| Prudential Financial Inc. | 5.100% | 8/15/43 | 50 | 52 |
| 4 | Prudential Financial Inc. | 5.200% | 3/15/44 | 85 | 82 |
| Prudential Financial Inc. | 4.600% | 5/15/44 | 125 | 124 |
| 4 | Prudential Financial Inc. | 5.375% | 5/15/45 | 250 | 250 |
| Reinsurance Group of America Inc. | 6.450% | 11/15/19 | 75 | 84 |
| Reinsurance Group of America Inc. | 5.000% | 6/1/21 | 75 | 81 |
| Reinsurance Group of America Inc. | 4.700% | 9/15/23 | 75 | 79 |
| StanCorp Financial Group Inc. | 5.000% | 8/15/22 | 50 | 52 |
| Swiss Re Solutions Holding Corp. | 7.000% | 2/15/26 | 75 | 93 |
| Torchmark Corp. | 3.800% | 9/15/22 | 50 | 50 |
| Transatlantic Holdings Inc. | 8.000% | 11/30/39 | 175 | 225 |
| Travelers Cos. Inc. | 5.750% | 12/15/17 | 250 | 269 |
| Travelers Cos. Inc. | 5.900% | 6/2/19 | 300 | 338 |
| Travelers Cos. Inc. | 3.900% | 11/1/20 | 125 | 133 |
| Travelers Cos. Inc. | 6.250% | 6/15/37 | 150 | 189 |
| Travelers Cos. Inc. | 4.300% | 8/25/45 | 150 | 150 |
| Trinity Acquisition plc | 4.625% | 8/15/23 | 175 | 179 |
| Trinity Acquisition plc | 6.125% | 8/15/43 | 75 | 80 |
| UnitedHealth Group Inc. | 6.000% | 6/15/17 | 150 | 160 |
| UnitedHealth Group Inc. | 1.450% | 7/17/17 | 250 | 250 |
| UnitedHealth Group Inc. | 1.400% | 10/15/17 | 100 | 100 |
| UnitedHealth Group Inc. | 6.000% | 2/15/18 | 400 | 435 |
| UnitedHealth Group Inc. | 1.900% | 7/16/18 | 250 | 251 |
| UnitedHealth Group Inc. | 1.625% | 3/15/19 | 100 | 99 |
| UnitedHealth Group Inc. | 2.300% | 12/15/19 | 125 | 125 |
| UnitedHealth Group Inc. | 2.700% | 7/15/20 | 250 | 253 |
| UnitedHealth Group Inc. | 4.700% | 2/15/21 | 75 | 82 |
| UnitedHealth Group Inc. | 3.375% | 11/15/21 | 100 | 103 |
| UnitedHealth Group Inc. | 2.875% | 12/15/21 | 125 | 127 |
| UnitedHealth Group Inc. | 3.350% | 7/15/22 | 180 | 183 |
| UnitedHealth Group Inc. | 2.750% | 2/15/23 | 175 | 171 |
| UnitedHealth Group Inc. | 2.875% | 3/15/23 | 25 | 25 |
| UnitedHealth Group Inc. | 3.750% | 7/15/25 | 250 | 257 |
| UnitedHealth Group Inc. | 4.625% | 7/15/35 | 175 | 182 |
| UnitedHealth Group Inc. | 6.500% | 6/15/37 | 50 | 63 |
| UnitedHealth Group Inc. | 6.625% | 11/15/37 | 125 | 159 |
| UnitedHealth Group Inc. | 6.875% | 2/15/38 | 245 | 320 |
| UnitedHealth Group Inc. | 5.950% | 2/15/41 | 60 | 71 |
| UnitedHealth Group Inc. | 4.625% | 11/15/41 | 75 | 77 |
| UnitedHealth Group Inc. | 4.375% | 3/15/42 | 50 | 49 |
| UnitedHealth Group Inc. | 3.950% | 10/15/42 | 175 | 163 |
| UnitedHealth Group Inc. | 4.250% | 3/15/43 | 125 | 121 |
| UnitedHealth Group Inc. | 4.750% | 7/15/45 | 340 | 356 |
| Unum Group | 5.625% | 9/15/20 | 50 | 55 |
| Unum Group | 4.000% | 3/15/24 | 50 | 50 |
| Unum Group | 5.750% | 8/15/42 | 25 | 27 |
| Validus Holdings Ltd. | 8.875% | 1/26/40 | 75 | 94 |
| Voya Financial Inc. | 2.900% | 2/15/18 | 175 | 177 |
| Voya Financial Inc. | 5.500% | 7/15/22 | 25 | 28 |
| Voya Financial Inc. | 5.700% | 7/15/43 | 75 | 85 |
| WR Berkley Corp. | 5.375% | 9/15/20 | 175 | 191 |
| XLIT Ltd. | 5.750% | 10/1/21 | 105 | 117 |
| XLIT Ltd. | 4.450% | 3/31/25 | 100 | 98 |
260
Vanguard Total Bond Market Index Portfolio
| | | | | |
| Face | Market |
| Maturity Amount | Value • |
| | Coupon | Date | ($000) | ($000) |
| XLIT Ltd. | 6.250% | 5/15/27 | 125 | 144 |
| XLIT Ltd. | 5.500% | 3/31/45 | 100 | 93 |
| 4 | XLIT Ltd. | 6.500% | 10/29/49 | 200 | 145 |
| |
| Other Finance (0.0%) | | | | |
| XTRA Finance Corp. | 5.150% | 4/1/17 | 375 | 391 |
| |
| Real Estate Investment Trusts (0.7%) | | | | |
| Alexandria Real Estate Equities Inc. | 2.750% | 1/15/20 | 100 | 99 |
| Alexandria Real Estate Equities Inc. | 4.600% | 4/1/22 | 125 | 130 |
| Alexandria Real Estate Equities Inc. | 4.500% | 7/30/29 | 100 | 97 |
| American Campus Communities | | | | |
| | Operating Partnership LP | 3.350% | 10/1/20 | 50 | 50 |
| American Campus Communities | | | | |
| | Operating Partnership LP | 4.125% | 7/1/24 | 100 | 99 |
| AvalonBay Communities Inc. | 2.850% | 3/15/23 | 25 | 24 |
| AvalonBay Communities Inc. | 4.200% | 12/15/23 | 75 | 79 |
| AvalonBay Communities Inc. | 3.450% | 6/1/25 | 300 | 296 |
| BioMed Realty LP | 2.625% | 5/1/19 | 100 | 97 |
| BioMed Realty LP | 4.250% | 7/15/22 | 50 | 50 |
| Boston Properties LP | 5.625% | 11/15/20 | 325 | 362 |
| Boston Properties LP | 4.125% | 5/15/21 | 75 | 79 |
| Boston Properties LP | 3.850% | 2/1/23 | 225 | 230 |
| Boston Properties LP | 3.125% | 9/1/23 | 275 | 267 |
| Brandywine Operating Partnership LP | 4.950% | 4/15/18 | 250 | 262 |
| Brandywine Operating Partnership LP | 4.100% | 10/1/24 | 100 | 97 |
| Brandywine Operating Partnership LP | 4.550% | 10/1/29 | 100 | 96 |
| Brixmor Operating Partnership LP | 3.875% | 8/15/22 | 100 | 100 |
| Brixmor Operating Partnership LP | 3.850% | 2/1/25 | 350 | 340 |
| Camden Property Trust | 4.250% | 1/15/24 | 100 | 103 |
| CBL & Associates LP | 5.250% | 12/1/23 | 100 | 99 |
| CBL & Associates LP | 4.600% | 10/15/24 | 100 | 94 |
| Columbia Property Trust Operating | | | | |
| | Partnership LP | 4.150% | 4/1/25 | 100 | 99 |
| Corporate Office Properties LP | 3.600% | 5/15/23 | 150 | 138 |
| CubeSmart LP | 4.375% | 12/15/23 | 100 | 103 |
| CubeSmart LP | 4.000% | 11/15/25 | 50 | 50 |
| DCT Industrial Operating Partnership LP 4.500% | 10/15/23 | 50 | 50 |
| DDR Corp. | 4.750% | 4/15/18 | 25 | 26 |
| DDR Corp. | 3.500% | 1/15/21 | 75 | 75 |
| DDR Corp. | 4.625% | 7/15/22 | 200 | 207 |
| DDR Corp. | 3.375% | 5/15/23 | 275 | 260 |
| DDR Corp. | 3.625% | 2/1/25 | 200 | 189 |
| DDR Corp. | 4.250% | 2/1/26 | 70 | 68 |
| Digital Realty Trust LP | 5.250% | 3/15/21 | 75 | 81 |
| Digital Realty Trust LP | 3.950% | 7/1/22 | 250 | 248 |
| Digital Realty Trust LP | 3.625% | 10/1/22 | 575 | 550 |
| Duke Realty LP | 5.950% | 2/15/17 | 80 | 84 |
| EPR Properties | 5.750% | 8/15/22 | 25 | 26 |
| EPR Properties | 5.250% | 7/15/23 | 125 | 127 |
| EPR Properties | 4.500% | 4/1/25 | 50 | 48 |
| Equity Commonwealth | 5.875% | 9/15/20 | 100 | 108 |
| ERP Operating LP | 5.750% | 6/15/17 | 25 | 26 |
| ERP Operating LP | 4.750% | 7/15/20 | 50 | 54 |
| ERP Operating LP | 4.625% | 12/15/21 | 215 | 233 |
| ERP Operating LP | 3.000% | 4/15/23 | 125 | 123 |
| ERP Operating LP | 3.375% | 6/1/25 | 125 | 124 |
| ERP Operating LP | 4.500% | 7/1/44 | 150 | 150 |
| ERP Operating LP | 4.500% | 6/1/45 | 125 | 127 |
| Essex Portfolio LP | 5.500% | 3/15/17 | 75 | 78 |
| Essex Portfolio LP | 3.375% | 1/15/23 | 175 | 172 |
| Essex Portfolio LP | 3.250% | 5/1/23 | 25 | 24 |
| Essex Portfolio LP | 3.500% | 4/1/25 | 100 | 96 |
| Federal Realty Investment Trust | 3.000% | 8/1/22 | 75 | 74 |
| Federal Realty Investment Trust | 2.750% | 6/1/23 | 25 | 24 |
| Federal Realty Investment Trust | 4.500% | 12/1/44 | 300 | 304 |
| HCP Inc. | 6.700% | 1/30/18 | 50 | 54 |
| HCP Inc. | 3.750% | 2/1/19 | 50 | 52 |
| HCP Inc. | 2.625% | 2/1/20 | 375 | 369 |
| HCP Inc. | 5.375% | 2/1/21 | 25 | 27 |
| HCP Inc. | 3.150% | 8/1/22 | 75 | 72 |
| | | | | |
| Face | Market |
| Maturity Amount | Value • |
| | Coupon | Date | ($000) | ($000) |
| HCP Inc. | 4.000% | 12/1/22 | 500 | 497 |
| HCP Inc. | 4.250% | 11/15/23 | 150 | 150 |
| HCP Inc. | 3.400% | 2/1/25 | 75 | 70 |
| HCP Inc. | 6.750% | 2/1/41 | 100 | 121 |
| Healthcare Realty Trust Inc. | 3.750% | 4/15/23 | 50 | 49 |
| Healthcare Realty Trust Inc. | 3.875% | 5/1/25 | 125 | 121 |
| Healthcare Trust of America | | | | |
| | Holdings LP | 3.375% | 7/15/21 | 100 | 98 |
| Healthcare Trust of America | | | | |
| | Holdings LP | 3.700% | 4/15/23 | 25 | 24 |
| Highwoods Realty LP | 3.200% | 6/15/21 | 400 | 391 |
| Hospitality Properties Trust | 6.700% | 1/15/18 | 250 | 264 |
| Host Hotels & Resorts LP | 6.000% | 10/1/21 | 100 | 111 |
| Host Hotels & Resorts LP | 4.750% | 3/1/23 | 50 | 52 |
| Host Hotels & Resorts LP | 3.750% | 10/15/23 | 336 | 325 |
| Host Hotels & Resorts LP | 4.000% | 6/15/25 | 50 | 48 |
| Kilroy Realty LP | 4.800% | 7/15/18 | 125 | 131 |
| Kilroy Realty LP | 3.800% | 1/15/23 | 200 | 198 |
| Kimco Realty Corp. | 5.700% | 5/1/17 | 250 | 263 |
| Kimco Realty Corp. | 6.875% | 10/1/19 | 50 | 57 |
| Kimco Realty Corp. | 3.125% | 6/1/23 | 25 | 24 |
| Liberty Property LP | 3.375% | 6/15/23 | 50 | 47 |
| Liberty Property LP | 3.750% | 4/1/25 | 325 | 313 |
| Mack-Cali Realty LP | 7.750% | 8/15/19 | 100 | 111 |
| Mack-Cali Realty LP | 4.500% | 4/18/22 | 75 | 72 |
| Mid-America Apartments LP | 4.300% | 10/15/23 | 150 | 154 |
| Mid-America Apartments LP | 3.750% | 6/15/24 | 50 | 49 |
| National Retail Properties Inc. | 6.875% | 10/15/17 | 275 | 297 |
| National Retail Properties Inc. | 3.800% | 10/15/22 | 200 | 201 |
| Omega Healthcare Investors Inc. | 4.950% | 4/1/24 | 100 | 101 |
| Omega Healthcare Investors Inc. | 4.500% | 1/15/25 | 100 | 98 |
| 7 | Omega Healthcare Investors Inc. | 5.250% | 1/15/26 | 75 | 76 |
| Omega Healthcare Investors Inc. | 4.500% | 4/1/27 | 300 | 285 |
| Piedmont Operating Partnership LP | 3.400% | 6/1/23 | 50 | 47 |
| Post Apartment Homes LP | 3.375% | 12/1/22 | 50 | 48 |
| ProLogis LP | 2.750% | 2/15/19 | 150 | 151 |
| Realty Income Corp. | 2.000% | 1/31/18 | 50 | 50 |
| Realty Income Corp. | 6.750% | 8/15/19 | 200 | 227 |
| Realty Income Corp. | 5.750% | 1/15/21 | 200 | 223 |
| Realty Income Corp. | 3.250% | 10/15/22 | 50 | 48 |
| Realty Income Corp. | 3.875% | 7/15/24 | 50 | 49 |
| Regency Centers LP | 3.750% | 6/15/24 | 150 | 149 |
| Retail Opportunity Investments | | | | |
| | Partnership LP | 5.000% | 12/15/23 | 25 | 26 |
| Retail Properties of America Inc. | 4.000% | 3/15/25 | 125 | 118 |
| Select Income REIT | 2.850% | 2/1/18 | 50 | 50 |
| Select Income REIT | 4.150% | 2/1/22 | 100 | 96 |
| Select Income REIT | 4.500% | 2/1/25 | 50 | 46 |
| Senior Housing Properties Trust | 3.250% | 5/1/19 | 100 | 100 |
| Senior Housing Properties Trust | 4.750% | 5/1/24 | 100 | 98 |
| Simon Property Group LP | 5.250% | 12/1/16 | 250 | 256 |
| Simon Property Group LP | 2.150% | 9/15/17 | 75 | 76 |
| Simon Property Group LP | 2.200% | 2/1/19 | 575 | 578 |
| Simon Property Group LP | 5.650% | 2/1/20 | 75 | 84 |
| Simon Property Group LP | 4.375% | 3/1/21 | 125 | 135 |
| Simon Property Group LP | 4.125% | 12/1/21 | 250 | 268 |
| Simon Property Group LP | 3.375% | 3/15/22 | 100 | 103 |
| Simon Property Group LP | 2.750% | 2/1/23 | 25 | 24 |
| Simon Property Group LP | 3.750% | 2/1/24 | 150 | 156 |
| Simon Property Group LP | 3.500% | 9/1/25 | 100 | 101 |
| Simon Property Group LP | 4.750% | 3/15/42 | 75 | 80 |
| Tanger Properties LP | 3.875% | 12/1/23 | 25 | 25 |
| UDR Inc. | 4.250% | 6/1/18 | 125 | 131 |
| UDR Inc. | 3.700% | 10/1/20 | 25 | 26 |
| UDR Inc. | 4.625% | 1/10/22 | 50 | 53 |
| Ventas Realty LP | 3.750% | 5/1/24 | 200 | 196 |
| Ventas Realty LP | 5.700% | 9/30/43 | 75 | 83 |
| Ventas Realty LP / Ventas Capital Corp. | 2.000% | 2/15/18 | 100 | 100 |
| Ventas Realty LP / Ventas Capital Corp. | 4.000% | 4/30/19 | 150 | 156 |
| Ventas Realty LP / Ventas Capital Corp. | 4.750% | 6/1/21 | 125 | 133 |
| Ventas Realty LP / Ventas Capital Corp. | 3.250% | 8/15/22 | 200 | 195 |
261
Vanguard Total Bond Market Index Portfolio
| | | | |
| Face | Market |
| Maturity Amount | Value • |
| Coupon | Date | ($000) | ($000) |
| Washington Prime Group LP | 3.850% | 4/1/20 | 50 | 50 |
| Washington REIT | 4.950% | 10/1/20 | 25 | 27 |
| Washington REIT | 3.950% | 10/15/22 | 75 | 74 |
| Weingarten Realty Investors | 3.375% | 10/15/22 | 50 | 49 |
| Weingarten Realty Investors | 3.500% | 4/15/23 | 100 | 97 |
| Welltower Inc. | 4.700% | 9/15/17 | 25 | 26 |
| Welltower Inc. | 2.250% | 3/15/18 | 200 | 199 |
| Welltower Inc. | 4.125% | 4/1/19 | 200 | 209 |
| Welltower Inc. | 4.950% | 1/15/21 | 75 | 80 |
| Welltower Inc. | 5.250% | 1/15/22 | 100 | 108 |
| Welltower Inc. | 3.750% | 3/15/23 | 75 | 74 |
| Welltower Inc. | 4.000% | 6/1/25 | 325 | 320 |
| Welltower Inc. | 6.500% | 3/15/41 | 25 | 29 |
| Welltower Inc. | 5.125% | 3/15/43 | 75 | 75 |
| WP Carey Inc. | 4.600% | 4/1/24 | 75 | 75 |
| WP Carey Inc. | 4.000% | 2/1/25 | 50 | 48 |
| 238,139 |
| Industrial (16.3%) | | | | |
| Basic Industry (1.1%) | | | | |
| Agrium Inc. | 6.750% | 1/15/19 | 200 | 223 |
| Agrium Inc. | 3.500% | 6/1/23 | 299 | 285 |
| Agrium Inc. | 3.375% | 3/15/25 | 250 | 229 |
| Agrium Inc. | 4.125% | 3/15/35 | 500 | 430 |
| Agrium Inc. | 6.125% | 1/15/41 | 25 | 27 |
| Agrium Inc. | 4.900% | 6/1/43 | 50 | 45 |
| Agrium Inc. | 5.250% | 1/15/45 | 200 | 187 |
| Air Products & Chemicals Inc. | 1.200% | 10/15/17 | 100 | 99 |
| Air Products & Chemicals Inc. | 3.000% | 11/3/21 | 75 | 75 |
| Air Products & Chemicals Inc. | 2.750% | 2/3/23 | 50 | 49 |
| Air Products & Chemicals Inc. | 3.350% | 7/31/24 | 75 | 75 |
| Airgas Inc. | 3.050% | 8/1/20 | 100 | 101 |
| Airgas Inc. | 3.650% | 7/15/24 | 100 | 99 |
| Albemarle Corp. | 3.000% | 12/1/19 | 75 | 74 |
| Albemarle Corp. | 4.500% | 12/15/20 | 25 | 26 |
| Albemarle Corp. | 4.150% | 12/1/24 | 75 | 72 |
| Albemarle Corp. | 5.450% | 12/1/44 | 75 | 73 |
| Barrick Gold Corp. | 6.950% | 4/1/19 | 76 | 79 |
| Barrick Gold Corp. | 4.100% | 5/1/23 | 157 | 135 |
| Barrick North America Finance LLC | 6.800% | 9/15/18 | 175 | 187 |
| Barrick North America Finance LLC | 4.400% | 5/30/21 | 125 | 114 |
| Barrick North America Finance LLC | 5.700% | 5/30/41 | 450 | 314 |
| Barrick North America Finance LLC | 5.750% | 5/1/43 | 100 | 72 |
| BHP Billiton Finance USA Ltd. | 1.625% | 2/24/17 | 375 | 373 |
| BHP Billiton Finance USA Ltd. | 5.400% | 3/29/17 | 100 | 104 |
| BHP Billiton Finance USA Ltd. | 2.050% | 9/30/18 | 150 | 147 |
| BHP Billiton Finance USA Ltd. | 6.500% | 4/1/19 | 200 | 220 |
| BHP Billiton Finance USA Ltd. | 3.250% | 11/21/21 | 25 | 24 |
| BHP Billiton Finance USA Ltd. | 2.875% | 2/24/22 | 225 | 206 |
| BHP Billiton Finance USA Ltd. | 3.850% | 9/30/23 | 100 | 94 |
| BHP Billiton Finance USA Ltd. | 4.125% | 2/24/42 | 150 | 119 |
| BHP Billiton Finance USA Ltd. | 5.000% | 9/30/43 | 575 | 517 |
| Cabot Corp. | 2.550% | 1/15/18 | 150 | 152 |
| Carpenter Technology Corp. | 5.200% | 7/15/21 | 125 | 126 |
| Celulosa Arauco y Constitucion SA | 5.000% | 1/21/21 | 25 | 26 |
| Celulosa Arauco y Constitucion SA | 4.750% | 1/11/22 | 75 | 76 |
| CF Industries Inc. | 6.875% | 5/1/18 | 275 | 298 |
| CF Industries Inc. | 7.125% | 5/1/20 | 380 | 428 |
| CF Industries Inc. | 4.950% | 6/1/43 | 125 | 107 |
| Domtar Corp. | 6.250% | 9/1/42 | 25 | 24 |
| Domtar Corp. | 6.750% | 2/15/44 | 100 | 97 |
| Dow Chemical Co. | 8.550% | 5/15/19 | 325 | 383 |
| Dow Chemical Co. | 4.250% | 11/15/20 | 125 | 131 |
| Dow Chemical Co. | 4.125% | 11/15/21 | 100 | 104 |
| Dow Chemical Co. | 3.500% | 10/1/24 | 50 | 49 |
| Dow Chemical Co. | 7.375% | 11/1/29 | 25 | 31 |
| Dow Chemical Co. | 4.250% | 10/1/34 | 50 | 46 |
| Dow Chemical Co. | 9.400% | 5/15/39 | 350 | 505 |
| Dow Chemical Co. | 5.250% | 11/15/41 | 100 | 98 |
| Eastman Chemical Co. | 2.400% | 6/1/17 | 75 | 76 |
| Eastman Chemical Co. | 5.500% | 11/15/19 | 175 | 192 |
| Eastman Chemical Co. | 2.700% | 1/15/20 | 350 | 346 |
| | | | |
| Face | Market |
| Maturity Amount | Value • |
| Coupon | Date | ($000) | ($000) |
| Eastman Chemical Co. | 4.500% | 1/15/21 | 75 | 79 |
| Eastman Chemical Co. | 3.600% | 8/15/22 | 100 | 99 |
| Eastman Chemical Co. | 4.800% | 9/1/42 | 225 | 207 |
| Eastman Chemical Co. | 4.650% | 10/15/44 | 150 | 133 |
| Ecolab Inc. | 1.450% | 12/8/17 | 225 | 223 |
| Ecolab Inc. | 1.550% | 1/12/18 | 100 | 99 |
| Ecolab Inc. | 4.350% | 12/8/21 | 200 | 213 |
| Ecolab Inc. | 5.500% | 12/8/41 | 150 | 164 |
| EI du Pont de Nemours & Co. | 6.000% | 7/15/18 | 275 | 299 |
| EI du Pont de Nemours & Co. | 4.625% | 1/15/20 | 400 | 421 |
| EI du Pont de Nemours & Co. | 2.800% | 2/15/23 | 125 | 118 |
| EI du Pont de Nemours & Co. | 6.500% | 1/15/28 | 100 | 117 |
| EI du Pont de Nemours & Co. | 4.150% | 2/15/43 | 175 | 153 |
| Fibria Overseas Finance Ltd. | 5.250% | 5/12/24 | 100 | 94 |
| FMC Corp. | 3.950% | 2/1/22 | 50 | 50 |
| FMC Corp. | 4.100% | 2/1/24 | 250 | 248 |
| Freeport-McMoRan Inc. | 2.150% | 3/1/17 | 50 | 45 |
| Freeport-McMoRan Inc. | 2.375% | 3/15/18 | 165 | 131 |
| Freeport-McMoRan Inc. | 3.550% | 3/1/22 | 850 | 497 |
| Freeport-McMoRan Inc. | 3.875% | 3/15/23 | 210 | 119 |
| Freeport-McMoRan Inc. | 5.400% | 11/14/34 | 200 | 101 |
| Freeport-McMoRan Inc. | 5.450% | 3/15/43 | 225 | 115 |
| Georgia-Pacific LLC | 8.000% | 1/15/24 | 250 | 316 |
| Freeport-McMoran Oil & Gas LLC / | | | | |
| FCX Oil & Gas Inc | 6.500% | 11/15/20 | 75 | 48 |
| Freeport-McMoran Oil & Gas LLC / | | | | |
| FCX Oil & Gas Inc | 6.750% | 2/1/22 | 200 | 123 |
| Georgia-Pacific LLC | 7.375% | 12/1/25 | 100 | 124 |
| Georgia-Pacific LLC | 8.875% | 5/15/31 | 250 | 350 |
| Glencore Canada Corp. | 5.500% | 6/15/17 | 200 | 195 |
| Goldcorp Inc. | 2.125% | 3/15/18 | 200 | 194 |
| Goldcorp Inc. | 3.700% | 3/15/23 | 200 | 183 |
| Goldcorp Inc. | 5.450% | 6/9/44 | 100 | 81 |
| International Paper Co. | 7.500% | 8/15/21 | 450 | 533 |
| International Paper Co. | 3.650% | 6/15/24 | 100 | 98 |
| International Paper Co. | 3.800% | 1/15/26 | 75 | 74 |
| International Paper Co. | 5.000% | 9/15/35 | 100 | 99 |
| International Paper Co. | 7.300% | 11/15/39 | 100 | 114 |
| International Paper Co. | 4.800% | 6/15/44 | 200 | 181 |
| International Paper Co. | 5.150% | 5/15/46 | 200 | 190 |
| Kinross Gold Corp. | 5.125% | 9/1/21 | 75 | 51 |
| Kinross Gold Corp. | 5.950% | 3/15/24 | 100 | 69 |
| Kinross Gold Corp. | 6.875% | 9/1/41 | 50 | 29 |
| LyondellBasell Industries NV | 5.000% | 4/15/19 | 550 | 585 |
| LyondellBasell Industries NV | 6.000% | 11/15/21 | 175 | 196 |
| LyondellBasell Industries NV | 5.750% | 4/15/24 | 175 | 193 |
| LyondellBasell Industries NV | 4.625% | 2/26/55 | 425 | 344 |
| Meadwestvaco Corp. | 7.950% | 2/15/31 | 125 | 155 |
| Methanex Corp. | 3.250% | 12/15/19 | 200 | 191 |
| Monsanto Co. | 2.125% | 7/15/19 | 100 | 100 |
| Monsanto Co. | 2.750% | 7/15/21 | 200 | 197 |
| Monsanto Co. | 5.500% | 8/15/25 | 325 | 359 |
| Monsanto Co. | 4.200% | 7/15/34 | 100 | 86 |
| Monsanto Co. | 5.875% | 4/15/38 | 325 | 342 |
| Monsanto Co. | 4.400% | 7/15/44 | 250 | 207 |
| Monsanto Co. | 3.950% | 4/15/45 | 200 | 155 |
| Monsanto Co. | 4.700% | 7/15/64 | 300 | 229 |
| Mosaic Co. | 3.750% | 11/15/21 | 150 | 152 |
| Mosaic Co. | 4.250% | 11/15/23 | 450 | 446 |
| Mosaic Co. | 5.450% | 11/15/33 | 100 | 102 |
| Mosaic Co. | 5.625% | 11/15/43 | 100 | 96 |
| Newmont Mining Corp. | 3.500% | 3/15/22 | 300 | 268 |
| Newmont Mining Corp. | 5.875% | 4/1/35 | 100 | 81 |
| Newmont Mining Corp. | 4.875% | 3/15/42 | 250 | 177 |
| Nucor Corp. | 5.750% | 12/1/17 | 25 | 26 |
| Nucor Corp. | 5.850% | 6/1/18 | 150 | 161 |
| Nucor Corp. | 6.400% | 12/1/37 | 100 | 106 |
| Nucor Corp. | 5.200% | 8/1/43 | 200 | 187 |
| Packaging Corp. of America | 3.900% | 6/15/22 | 100 | 102 |
| Packaging Corp. of America | 4.500% | 11/1/23 | 350 | 366 |
| Placer Dome Inc. | 6.450% | 10/15/35 | 75 | 62 |
262
Vanguard Total Bond Market Index Portfolio
| | | | |
| Face | Market |
| Maturity Amount | Value • |
| Coupon | Date | ($000) | ($000) |
| Plum Creek Timberlands LP | 4.700% | 3/15/21 | 75 | 80 |
| Potash Corp. of Saskatchewan Inc. | 3.250% | 12/1/17 | 175 | 179 |
| Potash Corp. of Saskatchewan Inc. | 4.875% | 3/30/20 | 125 | 136 |
| Potash Corp. of Saskatchewan Inc. | 3.000% | 4/1/25 | 250 | 236 |
| Potash Corp. of Saskatchewan Inc. | 5.625% | 12/1/40 | 275 | 290 |
| PPG Industries Inc. | 2.300% | 11/15/19 | 400 | 397 |
| Praxair Inc. | 5.200% | 3/15/17 | 25 | 26 |
| Praxair Inc. | 4.500% | 8/15/19 | 50 | 54 |
| Praxair Inc. | 3.000% | 9/1/21 | 75 | 76 |
| Praxair Inc. | 2.450% | 2/15/22 | 450 | 440 |
| Praxair Inc. | 2.200% | 8/15/22 | 200 | 191 |
| Praxair Inc. | 3.550% | 11/7/42 | 50 | 44 |
| Rayonier Inc. | 3.750% | 4/1/22 | 50 | 49 |
| Reliance Steel & Aluminum Co. | 4.500% | 4/15/23 | 75 | 70 |
| Rio Tinto Alcan Inc. | 6.125% | 12/15/33 | 225 | 226 |
| Rio Tinto Finance USA Ltd. | 6.500% | 7/15/18 | 150 | 162 |
| Rio Tinto Finance USA Ltd. | 9.000% | 5/1/19 | 550 | 644 |
| Rio Tinto Finance USA Ltd. | 3.500% | 11/2/20 | 75 | 74 |
| Rio Tinto Finance USA Ltd. | 3.750% | 9/20/21 | 300 | 292 |
| Rio Tinto Finance USA Ltd. | 3.750% | 6/15/25 | 500 | 451 |
| Rio Tinto Finance USA Ltd. | 7.125% | 7/15/28 | 75 | 90 |
| Rio Tinto Finance USA Ltd. | 5.200% | 11/2/40 | 125 | 114 |
| Rio Tinto Finance USA plc | 2.000% | 3/22/17 | 125 | 124 |
| Rio Tinto Finance USA plc | 1.625% | 8/21/17 | 200 | 197 |
| Rio Tinto Finance USA plc | 2.250% | 12/14/18 | 75 | 73 |
| Rio Tinto Finance USA plc | 3.500% | 3/22/22 | 75 | 71 |
| Rio Tinto Finance USA plc | 2.875% | 8/21/22 | 75 | 68 |
| Rio Tinto Finance USA plc | 4.750% | 3/22/42 | 150 | 127 |
| Rio Tinto Finance USA plc | 4.125% | 8/21/42 | 200 | 156 |
| Rock-Tenn Co. | 3.500% | 3/1/20 | 150 | 152 |
| Rock-Tenn Co. | 4.900% | 3/1/22 | 100 | 106 |
| Rohm & Haas Co. | 7.850% | 7/15/29 | 250 | 322 |
| RPM International Inc. | 6.125% | 10/15/19 | 25 | 27 |
| RPM International Inc. | 3.450% | 11/15/22 | 100 | 96 |
| Sherwin-Williams Co. | 3.450% | 8/1/25 | 225 | 229 |
| Sherwin-Williams Co. | 4.550% | 8/1/45 | 90 | 93 |
| Southern Copper Corp. | 5.375% | 4/16/20 | 75 | 78 |
| Southern Copper Corp. | 3.875% | 4/23/25 | 50 | 44 |
| Southern Copper Corp. | 7.500% | 7/27/35 | 300 | 279 |
| Southern Copper Corp. | 6.750% | 4/16/40 | 125 | 107 |
| Southern Copper Corp. | 5.875% | 4/23/45 | 500 | 382 |
| Syngenta Finance NV | 3.125% | 3/28/22 | 100 | 97 |
| Syngenta Finance NV | 4.375% | 3/28/42 | 50 | 46 |
| Vale Overseas Ltd. | 6.250% | 1/23/17 | 50 | 50 |
| Vale Overseas Ltd. | 5.625% | 9/15/19 | 175 | 158 |
| Vale Overseas Ltd. | 4.625% | 9/15/20 | 275 | 229 |
| Vale Overseas Ltd. | 4.375% | 1/11/22 | 700 | 529 |
| Vale Overseas Ltd. | 8.250% | 1/17/34 | 50 | 40 |
| Vale Overseas Ltd. | 6.875% | 11/21/36 | 375 | 259 |
| Vale Overseas Ltd. | 6.875% | 11/10/39 | 450 | 313 |
| Valspar Corp. | 7.250% | 6/15/19 | 100 | 113 |
| Valspar Corp. | 3.950% | 1/15/26 | 200 | 199 |
| Westlake Chemical Corp. | 3.600% | 7/15/22 | 25 | 25 |
| Weyerhaeuser Co. | 7.375% | 10/1/19 | 250 | 289 |
| Weyerhaeuser Co. | 8.500% | 1/15/25 | 50 | 64 |
| Weyerhaeuser Co. | 7.375% | 3/15/32 | 200 | 238 |
| Weyerhaeuser Co. | 6.875% | 12/15/33 | 50 | 58 |
| Yamana Gold Inc. | 4.950% | 7/15/24 | 110 | 94 |
| |
| Capital Goods (1.5%) | | | | |
| 3M Co. | 1.375% | 8/7/18 | 100 | 100 |
| 3M Co. | 2.000% | 8/7/20 | 100 | 100 |
| 3M Co. | 3.000% | 8/7/25 | 100 | 102 |
| 3M Co. | 6.375% | 2/15/28 | 100 | 130 |
| 3M Co. | 5.700% | 3/15/37 | 125 | 154 |
| ABB Finance USA Inc. | 1.625% | 5/8/17 | 100 | 100 |
| ABB Finance USA Inc. | 4.375% | 5/8/42 | 25 | 25 |
| Acuity Brands Lighting Inc. | 6.000% | 12/15/19 | 50 | 54 |
| Boeing Co. | 6.000% | 3/15/19 | 400 | 449 |
| Boeing Co. | 4.875% | 2/15/20 | 75 | 84 |
| Boeing Co. | 1.650% | 10/30/20 | 100 | 98 |
| | | | | |
| Face | Market |
| Maturity Amount | Value • |
| | Coupon | Date | ($000) | ($000) |
| Boeing Co. | 2.200% | 10/30/22 | 100 | 97 |
| Boeing Co. | 2.500% | 3/1/25 | 500 | 482 |
| Boeing Co. | 6.625% | 2/15/38 | 50 | 67 |
| Boeing Co. | 6.875% | 3/15/39 | 75 | 103 |
| Boeing Co. | 5.875% | 2/15/40 | 275 | 348 |
| Carlisle Cos. Inc. | 3.750% | 11/15/22 | 75 | 74 |
| Caterpillar Financial Services Corp. | 1.800% | 11/13/18 | 550 | 551 |
| Caterpillar Financial Services Corp. | 7.150% | 2/15/19 | 525 | 601 |
| Caterpillar Financial Services Corp. | 2.250% | 12/1/19 | 550 | 550 |
| Caterpillar Financial Services Corp. | 2.000% | 3/5/20 | 250 | 248 |
| Caterpillar Financial Services Corp. | 2.500% | 11/13/20 | 200 | 200 |
| Caterpillar Financial Services Corp. | 2.750% | 8/20/21 | 100 | 99 |
| Caterpillar Financial Services Corp. | 3.300% | 6/9/24 | 250 | 249 |
| Caterpillar Inc. | 1.500% | 6/26/17 | 150 | 150 |
| Caterpillar Inc. | 3.900% | 5/27/21 | 75 | 80 |
| Caterpillar Inc. | 2.600% | 6/26/22 | 50 | 49 |
| Caterpillar Inc. | 3.400% | 5/15/24 | 250 | 252 |
| Caterpillar Inc. | 3.803% | 8/15/42 | 443 | 396 |
| Crane Co. | 2.750% | 12/15/18 | 50 | 50 |
| Crane Co. | 4.450% | 12/15/23 | 50 | 52 |
| CRH America Inc. | 8.125% | 7/15/18 | 100 | 114 |
| CRH America Inc. | 5.750% | 1/15/21 | 75 | 84 |
| Danaher Corp. | 2.300% | 6/23/16 | 50 | 50 |
| Danaher Corp. | 5.625% | 1/15/18 | 75 | 81 |
| Danaher Corp. | 1.650% | 9/15/18 | 100 | 100 |
| Danaher Corp. | 2.400% | 9/15/20 | 100 | 100 |
| Danaher Corp. | 3.900% | 6/23/21 | 250 | 266 |
| Danaher Corp. | 3.350% | 9/15/25 | 100 | 102 |
| Danaher Corp. | 4.375% | 9/15/45 | 250 | 259 |
| Deere & Co. | 4.375% | 10/16/19 | 175 | 189 |
| Deere & Co. | 2.600% | 6/8/22 | 325 | 320 |
| Deere & Co. | 5.375% | 10/16/29 | 125 | 146 |
| Deere & Co. | 7.125% | 3/3/31 | 100 | 130 |
| Deere & Co. | 3.900% | 6/9/42 | 75 | 72 |
| Dover Corp. | 5.450% | 3/15/18 | 200 | 216 |
| Dover Corp. | 3.150% | 11/15/25 | 200 | 197 |
| Dover Corp. | 6.600% | 3/15/38 | 75 | 97 |
| Eaton Corp. | 5.600% | 5/15/18 | 300 | 324 |
| Eaton Corp. | 2.750% | 11/2/22 | 200 | 193 |
| Eaton Corp. | 4.000% | 11/2/32 | 25 | 24 |
| Eaton Corp. | 4.150% | 11/2/42 | 50 | 46 |
| Eaton Electric Holdings LLC | 3.875% | 12/15/20 | 100 | 104 |
| Embraer Netherlands Finance BV | 5.050% | 6/15/25 | 150 | 136 |
| 7 | Embraer Overseas Ltd. | 5.696% | 9/16/23 | 451 | 440 |
| Emerson Electric Co. | 5.250% | 10/15/18 | 250 | 274 |
| Emerson Electric Co. | 4.875% | 10/15/19 | 25 | 27 |
| Emerson Electric Co. | 4.250% | 11/15/20 | 25 | 27 |
| Emerson Electric Co. | 2.625% | 12/1/21 | 150 | 149 |
| Emerson Electric Co. | 3.150% | 6/1/25 | 200 | 199 |
| Emerson Electric Co. | 6.000% | 8/15/32 | 275 | 329 |
| Exelis Inc. | 4.250% | 10/1/16 | 75 | 76 |
| Flowserve Corp. | 3.500% | 9/15/22 | 250 | 243 |
| Flowserve Corp. | 4.000% | 11/15/23 | 50 | 50 |
| Fortune Brands Home & Security Inc. | 3.000% | 6/15/20 | 75 | 75 |
| Fortune Brands Home & Security Inc. | 4.000% | 6/15/25 | 100 | 99 |
| 4 | GE Capital Trust I | 6.375% | 11/15/67 | 130 | 135 |
| General Dynamics Corp. | 1.000% | 11/15/17 | 275 | 274 |
| General Dynamics Corp. | 3.600% | 11/15/42 | 100 | 93 |
| General Electric Capital Corp. | 1.250% | 5/15/17 | 150 | 150 |
| General Electric Capital Corp. | 1.600% | 11/20/17 | 175 | 176 |
| General Electric Capital Corp. | 2.300% | 1/14/19 | 150 | 152 |
| General Electric Capital Corp. | 6.000% | 8/7/19 | 94 | 106 |
| General Electric Capital Corp. | 2.100% | 12/11/19 | 25 | 25 |
| General Electric Capital Corp. | 5.500% | 1/8/20 | 236 | 265 |
| General Electric Capital Corp. | 2.200% | 1/9/20 | 165 | 165 |
| General Electric Capital Corp. | 5.550% | 5/4/20 | 108 | 122 |
| General Electric Capital Corp. | 4.375% | 9/16/20 | 128 | 139 |
| General Electric Capital Corp. | 4.625% | 1/7/21 | 101 | 111 |
| General Electric Capital Corp. | 5.300% | 2/11/21 | 172 | 194 |
| General Electric Capital Corp. | 4.650% | 10/17/21 | 247 | 272 |
| General Electric Capital Corp. | 3.150% | 9/7/22 | 91 | 93 |
263
Vanguard Total Bond Market Index Portfolio
| | | | | |
| Face | Market |
| Maturity Amount | Value • |
| | Coupon | Date | ($000) | ($000) |
| General Electric Capital Corp. | 3.100% | 1/9/23 | 224 | 227 |
| General Electric Capital Corp. | 3.450% | 5/15/24 | 160 | 165 |
| General Electric Capital Corp. | 6.750% | 3/15/32 | 505 | 656 |
| General Electric Capital Corp. | 6.150% | 8/7/37 | 161 | 201 |
| General Electric Capital Corp. | 5.875% | 1/14/38 | 510 | 624 |
| General Electric Capital Corp. | 6.875% | 1/10/39 | 208 | 283 |
| 4 | General Electric Capital Corp. | 6.375% | 11/15/67 | 280 | 292 |
| General Electric Co. | 5.250% | 12/6/17 | 665 | 711 |
| General Electric Co. | 2.700% | 10/9/22 | 1,100 | 1,095 |
| General Electric Co. | 4.125% | 10/9/42 | 375 | 366 |
| General Electric Co. | 4.500% | 3/11/44 | 150 | 154 |
| Harris Corp. | 1.999% | 4/27/18 | 325 | 322 |
| Harris Corp. | 2.700% | 4/27/20 | 75 | 74 |
| Harris Corp. | 4.400% | 12/15/20 | 375 | 392 |
| Harris Corp. | 3.832% | 4/27/25 | 100 | 98 |
| Harris Corp. | 4.854% | 4/27/35 | 100 | 98 |
| Harris Corp. | 6.150% | 12/15/40 | 75 | 81 |
| Harris Corp. | 5.054% | 4/27/45 | 100 | 98 |
| Hexcel Corp. | 4.700% | 8/15/25 | 100 | 99 |
| Honeywell International Inc. | 5.300% | 3/15/17 | 200 | 210 |
| Honeywell International Inc. | 5.300% | 3/1/18 | 500 | 540 |
| Honeywell International Inc. | 4.250% | 3/1/21 | 450 | 492 |
| Honeywell International Inc. | 5.700% | 3/15/37 | 200 | 241 |
| Honeywell International Inc. | 5.375% | 3/1/41 | 250 | 297 |
| Illinois Tool Works Inc. | 6.250% | 4/1/19 | 100 | 113 |
| Illinois Tool Works Inc. | 3.375% | 9/15/21 | 100 | 103 |
| Illinois Tool Works Inc. | 4.875% | 9/15/41 | 75 | 82 |
| Illinois Tool Works Inc. | 3.900% | 9/1/42 | 75 | 71 |
| Ingersoll-Rand Global Holding Co. Ltd. | 6.875% | 8/15/18 | 500 | 552 |
| Ingersoll-Rand Global Holding Co. Ltd. | 2.875% | 1/15/19 | 50 | 50 |
| Ingersoll-Rand Global Holding Co. Ltd. | 4.250% | 6/15/23 | 75 | 78 |
| Ingersoll-Rand Global Holding Co. Ltd. | 5.750% | 6/15/43 | 25 | 28 |
| John Deere Capital Corp. | 2.000% | 1/13/17 | 150 | 152 |
| John Deere Capital Corp. | 2.800% | 9/18/17 | 275 | 281 |
| John Deere Capital Corp. | 1.200% | 10/10/17 | 200 | 199 |
| John Deere Capital Corp. | 1.350% | 1/16/18 | 400 | 398 |
| John Deere Capital Corp. | 1.300% | 3/12/18 | 125 | 124 |
| John Deere Capital Corp. | 1.750% | 8/10/18 | 75 | 75 |
| John Deere Capital Corp. | 5.750% | 9/10/18 | 275 | 303 |
| John Deere Capital Corp. | 1.700% | 1/15/20 | 125 | 122 |
| John Deere Capital Corp. | 2.050% | 3/10/20 | 250 | 247 |
| John Deere Capital Corp. | 2.450% | 9/11/20 | 75 | 75 |
| John Deere Capital Corp. | 2.800% | 3/4/21 | 100 | 101 |
| John Deere Capital Corp. | 3.900% | 7/12/21 | 100 | 106 |
| John Deere Capital Corp. | 3.150% | 10/15/21 | 25 | 25 |
| John Deere Capital Corp. | 2.800% | 1/27/23 | 50 | 49 |
| John Deere Capital Corp. | 3.400% | 9/11/25 | 75 | 76 |
| Kennametal Inc. | 2.650% | 11/1/19 | 75 | 74 |
| Kennametal Inc. | 3.875% | 2/15/22 | 50 | 49 |
| L-3 Communications Corp. | 1.500% | 5/28/17 | 200 | 198 |
| L-3 Communications Corp. | 5.200% | 10/15/19 | 100 | 106 |
| L-3 Communications Corp. | 4.750% | 7/15/20 | 75 | 78 |
| L-3 Communications Corp. | 4.950% | 2/15/21 | 75 | 77 |
| L-3 Communications Corp. | 3.950% | 5/28/24 | 103 | 98 |
| Lafarge SA | 7.125% | 7/15/36 | 100 | 118 |
| Leggett & Platt Inc. | 3.800% | 11/15/24 | 100 | 101 |
| Lockheed Martin Corp. | 1.850% | 11/23/18 | 75 | 75 |
| Lockheed Martin Corp. | 2.500% | 11/23/20 | 140 | 140 |
| Lockheed Martin Corp. | 3.350% | 9/15/21 | 250 | 255 |
| Lockheed Martin Corp. | 3.100% | 1/15/23 | 100 | 100 |
| Lockheed Martin Corp. | 3.550% | 1/15/26 | 330 | 332 |
| Lockheed Martin Corp. | 3.600% | 3/1/35 | 150 | 135 |
| Lockheed Martin Corp. | 4.500% | 5/15/36 | 100 | 101 |
| Lockheed Martin Corp. | 6.150% | 9/1/36 | 375 | 450 |
| Lockheed Martin Corp. | 5.500% | 11/15/39 | 25 | 28 |
| Lockheed Martin Corp. | 4.700% | 5/15/46 | 675 | 691 |
| Martin Marietta Materials Inc. | 6.600% | 4/15/18 | 150 | 162 |
| Mohawk Industries Inc. | 3.850% | 2/1/23 | 700 | 705 |
| Northrop Grumman Corp. | 1.750% | 6/1/18 | 275 | 273 |
| Northrop Grumman Corp. | 3.500% | 3/15/21 | 200 | 206 |
| Northrop Grumman Corp. | 3.250% | 8/1/23 | 150 | 150 |
| | | | |
| Face | Market |
| Maturity Amount | Value • |
| | Coupon | Date | ($000) | ($000) |
| Northrop Grumman Corp. | 5.050% | 11/15/40 | 50 | 52 |
| Northrop Grumman Corp. | 4.750% | 6/1/43 | 275 | 283 |
| Owens Corning | 4.200% | 12/15/22 | 150 | 150 |
| Parker Hannifin Corp. | 5.500% | 5/15/18 | 50 | 54 |
| Parker Hannifin Corp. | 3.500% | 9/15/22 | 100 | 103 |
| Parker Hannifin Corp. | 6.250% | 5/15/38 | 25 | 32 |
| Parker-Hannifin Corp. | 3.300% | 11/21/24 | 100 | 101 |
| Parker-Hannifin Corp. | 4.450% | 11/21/44 | 200 | 209 |
| Pentair Finance SA | 2.650% | 12/1/19 | 250 | 242 |
| Precision Castparts Corp. | 1.250% | 1/15/18 | 325 | 323 |
| Precision Castparts Corp. | 2.250% | 6/15/20 | 150 | 149 |
| Precision Castparts Corp. | 2.500% | 1/15/23 | 25 | 24 |
| Precision Castparts Corp. | 3.250% | 6/15/25 | 100 | 99 |
| Precision Castparts Corp. | 3.900% | 1/15/43 | 75 | 70 |
| Precision Castparts Corp. | 4.375% | 6/15/45 | 100 | 100 |
| Raytheon Co. | 6.750% | 3/15/18 | 125 | 138 |
| Raytheon Co. | 4.400% | 2/15/20 | 100 | 108 |
| Raytheon Co. | 3.125% | 10/15/20 | 25 | 26 |
| Raytheon Co. | 2.500% | 12/15/22 | 175 | 171 |
| Raytheon Co. | 7.200% | 8/15/27 | 25 | 33 |
| Raytheon Co. | 4.700% | 12/15/41 | 500 | 542 |
| Republic Services Inc. | 3.800% | 5/15/18 | 150 | 155 |
| Republic Services Inc. | 5.500% | 9/15/19 | 150 | 165 |
| Republic Services Inc. | 5.000% | 3/1/20 | 125 | 136 |
| Republic Services Inc. | 5.250% | 11/15/21 | 75 | 83 |
| Republic Services Inc. | 3.550% | 6/1/22 | 50 | 51 |
| Republic Services Inc. | 3.200% | 3/15/25 | 250 | 241 |
| Republic Services Inc. | 6.086% | 3/15/35 | 75 | 88 |
| Republic Services Inc. | 6.200% | 3/1/40 | 125 | 147 |
| Republic Services Inc. | 5.700% | 5/15/41 | 200 | 225 |
| Rockwell Automation Inc. | 5.650% | 12/1/17 | 25 | 27 |
| Rockwell Automation Inc. | 6.700% | 1/15/28 | 50 | 64 |
| Rockwell Automation Inc. | 6.250% | 12/1/37 | 100 | 124 |
| Rockwell Collins Inc. | 5.250% | 7/15/19 | 25 | 27 |
| Rockwell Collins Inc. | 3.100% | 11/15/21 | 50 | 51 |
| Rockwell Collins Inc. | 4.800% | 12/15/43 | 65 | 69 |
| Roper Technologies Inc. | 1.850% | 11/15/17 | 75 | 75 |
| Roper Technologies Inc. | 2.050% | 10/1/18 | 200 | 199 |
| Roper Technologies Inc. | 6.250% | 9/1/19 | 75 | 83 |
| Roper Technologies Inc. | 3.000% | 12/15/20 | 125 | 125 |
| Roper Technologies Inc. | 3.850% | 12/15/25 | 100 | 100 |
| Snap-on Inc. | 6.125% | 9/1/21 | 75 | 86 |
| Sonoco Products Co. | 4.375% | 11/1/21 | 25 | 26 |
| Sonoco Products Co. | 5.750% | 11/1/40 | 345 | 373 |
| Stanley Black & Decker Inc. | 3.400% | 12/1/21 | 150 | 153 |
| Stanley Black & Decker Inc. | 5.200% | 9/1/40 | 125 | 136 |
| Textron Inc. | 3.875% | 3/1/25 | 250 | 245 |
| United Technologies Corp. | 1.800% | 6/1/17 | 225 | 226 |
| United Technologies Corp. | 5.375% | 12/15/17 | 575 | 618 |
| United Technologies Corp. | 4.500% | 4/15/20 | 100 | 109 |
| United Technologies Corp. | 3.100% | 6/1/22 | 535 | 545 |
| United Technologies Corp. | 6.700% | 8/1/28 | 100 | 127 |
| United Technologies Corp. | 7.500% | 9/15/29 | 125 | 169 |
| United Technologies Corp. | 5.400% | 5/1/35 | 150 | 168 |
| United Technologies Corp. | 6.050% | 6/1/36 | 100 | 121 |
| United Technologies Corp. | 6.125% | 7/15/38 | 300 | 367 |
| United Technologies Corp. | 5.700% | 4/15/40 | 100 | 117 |
| United Technologies Corp. | 4.500% | 6/1/42 | 550 | 552 |
| United Technologies Corp. | 4.150% | 5/15/45 | 100 | 95 |
| Valmont Industries Inc. | 5.000% | 10/1/44 | 180 | 156 |
| Valmont Industries Inc. | 5.250% | 10/1/54 | 100 | 85 |
| Waste Management Inc. | 2.600% | 9/1/16 | 125 | 126 |
| Waste Management Inc. | 6.100% | 3/15/18 | 375 | 409 |
| Waste Management Inc. | 4.600% | 3/1/21 | 50 | 54 |
| Waste Management Inc. | 3.500% | 5/15/24 | 100 | 101 |
| Waste Management Inc. | 3.900% | 3/1/35 | 250 | 234 |
| WW Grainger Inc. | 4.600% | 6/15/45 | 250 | 261 |
| | | | |
| Communication (2.6%) | | | | |
| 21st Century Fox America Inc. | 4.500% | 2/15/21 | 200 | 215 |
| 21st Century Fox America Inc. | 3.000% | 9/15/22 | 150 | 148 |
264
Vanguard Total Bond Market Index Portfolio
| | | | | |
| Face | Market |
| Maturity Amount | Value • |
| | Coupon | Date | ($000) | ($000) |
| 7 | 21st Century Fox America Inc. | 3.700% | 10/15/25 | 100 | 100 |
| 21st Century Fox America Inc. | 6.550% | 3/15/33 | 300 | 344 |
| 21st Century Fox America Inc. | 6.200% | 12/15/34 | 350 | 396 |
| 21st Century Fox America Inc. | 6.400% | 12/15/35 | 365 | 420 |
| 21st Century Fox America Inc. | 8.150% | 10/17/36 | 175 | 232 |
| 21st Century Fox America Inc. | 6.150% | 3/1/37 | 100 | 111 |
| 21st Century Fox America Inc. | 6.900% | 8/15/39 | 100 | 118 |
| 21st Century Fox America Inc. | 6.150% | 2/15/41 | 250 | 281 |
| 21st Century Fox America Inc. | 4.750% | 9/15/44 | 100 | 96 |
| 21st Century Fox America Inc. | 7.750% | 12/1/45 | 100 | 130 |
| America Movil SAB de CV | 5.625% | 11/15/17 | 150 | 159 |
| America Movil SAB de CV | 5.000% | 10/16/19 | 400 | 431 |
| America Movil SAB de CV | 6.375% | 3/1/35 | 175 | 194 |
| America Movil SAB de CV | 6.125% | 11/15/37 | 150 | 165 |
| America Movil SAB de CV | 6.125% | 3/30/40 | 475 | 521 |
| America Movil SAB de CV | 4.375% | 7/16/42 | 250 | 224 |
| American Tower Corp. | 4.500% | 1/15/18 | 225 | 235 |
| American Tower Corp. | 2.800% | 6/1/20 | 75 | 74 |
| American Tower Corp. | 3.450% | 9/15/21 | 600 | 603 |
| American Tower Corp. | 5.900% | 11/1/21 | 500 | 557 |
| American Tower Corp. | 3.500% | 1/31/23 | 50 | 49 |
| American Tower Corp. | 4.000% | 6/1/25 | 100 | 98 |
| AT&T Inc. | 1.700% | 6/1/17 | 425 | 426 |
| AT&T Inc. | 1.400% | 12/1/17 | 200 | 199 |
| AT&T Inc. | 5.500% | 2/1/18 | 100 | 107 |
| AT&T Inc. | 5.600% | 5/15/18 | 450 | 489 |
| AT&T Inc. | 2.375% | 11/27/18 | 400 | 403 |
| AT&T Inc. | 5.800% | 2/15/19 | 250 | 276 |
| AT&T Inc. | 2.300% | 3/11/19 | 100 | 100 |
| AT&T Inc. | 2.450% | 6/30/20 | 500 | 494 |
| AT&T Inc. | 4.450% | 5/15/21 | 275 | 292 |
| AT&T Inc. | 3.875% | 8/15/21 | 250 | 259 |
| AT&T Inc. | 3.000% | 2/15/22 | 300 | 295 |
| AT&T Inc. | 3.000% | 6/30/22 | 500 | 486 |
| AT&T Inc. | 2.625% | 12/1/22 | 350 | 332 |
| AT&T Inc. | 3.400% | 5/15/25 | 975 | 937 |
| AT&T Inc. | 6.450% | 6/15/34 | 315 | 354 |
| AT&T Inc. | 4.500% | 5/15/35 | 200 | 186 |
| AT&T Inc. | 6.500% | 9/1/37 | 225 | 253 |
| AT&T Inc. | 6.300% | 1/15/38 | 350 | 383 |
| AT&T Inc. | 6.550% | 2/15/39 | 50 | 56 |
| AT&T Inc. | 5.350% | 9/1/40 | 881 | 871 |
| AT&T Inc. | 5.550% | 8/15/41 | 275 | 277 |
| AT&T Inc. | 4.300% | 12/15/42 | 271 | 232 |
| AT&T Inc. | 4.800% | 6/15/44 | 600 | 550 |
| AT&T Inc. | 4.350% | 6/15/45 | 374 | 322 |
| AT&T Inc. | 4.750% | 5/15/46 | 600 | 550 |
| AT&T Mobility LLC | 7.125% | 12/15/31 | 175 | 213 |
| Bellsouth Capital Funding Corp. | 7.875% | 2/15/30 | 103 | 123 |
| BellSouth LLC | 6.875% | 10/15/31 | 78 | 86 |
| BellSouth LLC | 6.550% | 6/15/34 | 79 | 84 |
| BellSouth LLC | 6.000% | 11/15/34 | 89 | 89 |
| BellSouth Telecommunications LLC | 6.375% | 6/1/28 | 45 | 49 |
| British Telecommunications plc | 5.950% | 1/15/18 | 300 | 324 |
| British Telecommunications plc | 9.625% | 12/15/30 | 440 | 642 |
| CBS Corp. | 5.750% | 4/15/20 | 115 | 127 |
| CBS Corp. | 4.300% | 2/15/21 | 275 | 286 |
| CBS Corp. | 3.500% | 1/15/25 | 300 | 286 |
| CBS Corp. | 4.000% | 1/15/26 | 150 | 146 |
| CBS Corp. | 5.900% | 10/15/40 | 275 | 286 |
| CBS Corp. | 4.600% | 1/15/45 | 125 | 108 |
| CC Holdings GS V LLC / Crown Castle | | | | |
| | GS III Corp. | 3.849% | 4/15/23 | 250 | 245 |
| 7 | CCO Safari II LLC | 3.579% | 7/23/20 | 475 | 472 |
| 7 | CCO Safari II LLC | 4.464% | 7/23/22 | 500 | 499 |
| 7 | CCO Safari II LLC | 4.908% | 7/23/25 | 750 | 748 |
| 7 | CCO Safari II LLC | 6.384% | 10/23/35 | 350 | 352 |
| 7 | CCO Safari II LLC | 6.484% | 10/23/45 | 600 | 604 |
| 7 | CCO Safari II LLC | 6.834% | 10/23/55 | 75 | 74 |
| Comcast Cable Communications | | | | |
| | Holdings Inc. | 9.455% | 11/15/22 | 139 | 193 |
| | | | |
| Face | Market |
| Maturity Amount | Value • |
| Coupon | Date | ($000) | ($000) |
| Comcast Cable Communications LLC | 8.875% | 5/1/17 | 500 | 548 |
| Comcast Corp. | 5.875% | 2/15/18 | 325 | 353 |
| Comcast Corp. | 5.700% | 5/15/18 | 175 | 191 |
| Comcast Corp. | 5.700% | 7/1/19 | 850 | 952 |
| Comcast Corp. | 5.150% | 3/1/20 | 325 | 363 |
| Comcast Corp. | 3.375% | 2/15/25 | 150 | 151 |
| Comcast Corp. | 3.375% | 8/15/25 | 250 | 253 |
| Comcast Corp. | 4.250% | 1/15/33 | 275 | 274 |
| Comcast Corp. | 4.200% | 8/15/34 | 175 | 173 |
| Comcast Corp. | 5.650% | 6/15/35 | 400 | 464 |
| Comcast Corp. | 4.400% | 8/15/35 | 200 | 202 |
| Comcast Corp. | 6.500% | 11/15/35 | 750 | 941 |
| Comcast Corp. | 6.450% | 3/15/37 | 75 | 93 |
| Comcast Corp. | 6.950% | 8/15/37 | 225 | 294 |
| Comcast Corp. | 4.650% | 7/15/42 | 535 | 541 |
| Comcast Corp. | 4.500% | 1/15/43 | 125 | 125 |
| Comcast Corp. | 4.600% | 8/15/45 | 350 | 354 |
| Deutsche Telekom International | | | | |
| Finance BV | 6.750% | 8/20/18 | 75 | 84 |
| Deutsche Telekom International | | | | |
| Finance BV | 6.000% | 7/8/19 | 150 | 166 |
| Deutsche Telekom International | | | | |
| Finance BV | 8.750% | 6/15/30 | 700 | 966 |
| DIRECTV Holdings LLC / DIRECTV | | | | |
| Financing Co. Inc. | 5.875% | 10/1/19 | 750 | 835 |
| DIRECTV Holdings LLC / DIRECTV | | | | |
| Financing Co. Inc. | 4.600% | 2/15/21 | 175 | 185 |
| DIRECTV Holdings LLC / DIRECTV | | | | |
| Financing Co. Inc. | 5.000% | 3/1/21 | 750 | 810 |
| DIRECTV Holdings LLC / DIRECTV | | | | |
| Financing Co. Inc. | 4.450% | 4/1/24 | 100 | 102 |
| DIRECTV Holdings LLC / DIRECTV | | | | |
| Financing Co. Inc. | 3.950% | 1/15/25 | 200 | 197 |
| DIRECTV Holdings LLC / DIRECTV | | | | |
| Financing Co. Inc. | 6.350% | 3/15/40 | 100 | 108 |
| DIRECTV Holdings LLC / DIRECTV | | | | |
| Financing Co. Inc. | 6.000% | 8/15/40 | 300 | 307 |
| DIRECTV Holdings LLC / DIRECTV | | | | |
| Financing Co. Inc. | 5.150% | 3/15/42 | 375 | 349 |
| Discovery Communications LLC | 5.050% | 6/1/20 | 350 | 373 |
| Discovery Communications LLC | 4.375% | 6/15/21 | 25 | 26 |
| Discovery Communications LLC | 3.300% | 5/15/22 | 125 | 118 |
| Discovery Communications LLC | 3.250% | 4/1/23 | 100 | 92 |
| Discovery Communications LLC | 3.450% | 3/15/25 | 150 | 136 |
| Discovery Communications LLC | 4.950% | 5/15/42 | 150 | 126 |
| Discovery Communications LLC | 4.875% | 4/1/43 | 125 | 103 |
| Embarq Corp. | 7.995% | 6/1/36 | 300 | 308 |
| Grupo Televisa SAB | 6.625% | 3/18/25 | 100 | 115 |
| Grupo Televisa SAB | 4.625% | 1/30/26 | 200 | 200 |
| Grupo Televisa SAB | 6.625% | 1/15/40 | 175 | 184 |
| Historic TW Inc. | 9.150% | 2/1/23 | 195 | 254 |
| Historic TW Inc. | 6.625% | 5/15/29 | 175 | 205 |
| Interpublic Group of Cos. Inc. | 3.750% | 2/15/23 | 300 | 289 |
| Interpublic Group of Cos. Inc. | 4.200% | 4/15/24 | 175 | 174 |
| Koninklijke KPN NV | 8.375% | 10/1/30 | 175 | 229 |
| McGraw Hill Financial Inc. | 2.500% | 8/15/18 | 100 | 101 |
| McGraw Hill Financial Inc. | 3.300% | 8/14/20 | 125 | 126 |
| McGraw Hill Financial Inc. | 4.000% | 6/15/25 | 125 | 125 |
| McGraw Hill Financial Inc. | 4.400% | 2/15/26 | 200 | 205 |
| McGraw Hill Financial Inc. | 6.550% | 11/15/37 | 150 | 171 |
| Moody’s Corp. | 4.500% | 9/1/22 | 175 | 186 |
| Moody’s Corp. | 4.875% | 2/15/24 | 250 | 267 |
| Moody’s Corp. | 5.250% | 7/15/44 | 250 | 257 |
| NBCUniversal Media LLC | 5.150% | 4/30/20 | 125 | 140 |
| NBCUniversal Media LLC | 4.375% | 4/1/21 | 175 | 190 |
| NBCUniversal Media LLC | 2.875% | 1/15/23 | 225 | 223 |
| NBCUniversal Media LLC | 6.400% | 4/30/40 | 300 | 373 |
| NBCUniversal Media LLC | 5.950% | 4/1/41 | 150 | 180 |
| NBCUniversal Media LLC | 4.450% | 1/15/43 | 225 | 220 |
| New Cingular Wireless Services Inc. | 8.750% | 3/1/31 | 75 | 103 |
| Nippon Telegraph & Telephone Corp. | 1.400% | 7/18/17 | 25 | 25 |
265
Vanguard Total Bond Market Index Portfolio
| | | | |
| Face | Market |
| Maturity Amount | Value • |
| Coupon | Date | ($000) | ($000) |
| Omnicom Group Inc. | 4.450% | 8/15/20 | 300 | 320 |
| Omnicom Group Inc. | 3.625% | 5/1/22 | 325 | 329 |
| Omnicom Group Inc. | 3.650% | 11/1/24 | 200 | 200 |
| Orange SA | 4.125% | 9/14/21 | 325 | 343 |
| Orange SA | 9.000% | 3/1/31 | 425 | 601 |
| Orange SA | 5.375% | 1/13/42 | 150 | 158 |
| Orange SA | 5.500% | 2/6/44 | 250 | 265 |
| Pacific Bell Telephone Co. | 7.125% | 3/15/26 | 50 | 61 |
| Qwest Corp. | 6.500% | 6/1/17 | 100 | 106 |
| Qwest Corp. | 6.750% | 12/1/21 | 200 | 209 |
| Qwest Corp. | 7.250% | 9/15/25 | 25 | 27 |
| Qwest Corp. | 6.875% | 9/15/33 | 446 | 431 |
| Qwest Corp. | 7.125% | 11/15/43 | 100 | 95 |
| RELX Capital Inc. | 3.125% | 10/15/22 | 282 | 273 |
| Rogers Communications Inc. | 6.800% | 8/15/18 | 150 | 168 |
| Rogers Communications Inc. | 3.000% | 3/15/23 | 205 | 200 |
| Rogers Communications Inc. | 4.100% | 10/1/23 | 175 | 183 |
| Rogers Communications Inc. | 4.500% | 3/15/43 | 65 | 61 |
| Rogers Communications Inc. | 5.000% | 3/15/44 | 240 | 243 |
| Scripps Networks Interactive Inc. | 2.750% | 11/15/19 | 150 | 148 |
| Scripps Networks Interactive Inc. | 2.800% | 6/15/20 | 100 | 98 |
| Scripps Networks Interactive Inc. | 3.900% | 11/15/24 | 50 | 48 |
| Telefonica Emisiones SAU | 3.192% | 4/27/18 | 325 | 331 |
| Telefonica Emisiones SAU | 5.877% | 7/15/19 | 100 | 111 |
| Telefonica Emisiones SAU | 5.134% | 4/27/20 | 225 | 246 |
| Telefonica Emisiones SAU | 5.462% | 2/16/21 | 225 | 251 |
| Telefonica Emisiones SAU | 4.570% | 4/27/23 | 500 | 523 |
| Telefonica Emisiones SAU | 7.045% | 6/20/36 | 425 | 514 |
| Thomson Reuters Corp. | 1.650% | 9/29/17 | 200 | 199 |
| Thomson Reuters Corp. | 4.700% | 10/15/19 | 300 | 322 |
| Thomson Reuters Corp. | 3.850% | 9/29/24 | 100 | 99 |
| Thomson Reuters Corp. | 5.500% | 8/15/35 | 75 | 76 |
| Thomson Reuters Corp. | 5.850% | 4/15/40 | 150 | 158 |
| Thomson Reuters Corp. | 5.650% | 11/23/43 | 225 | 234 |
| Time Warner Cable Inc. | 5.850% | 5/1/17 | 275 | 288 |
| Time Warner Cable Inc. | 6.750% | 7/1/18 | 850 | 931 |
| Time Warner Cable Inc. | 8.750% | 2/14/19 | 200 | 232 |
| Time Warner Cable Inc. | 8.250% | 4/1/19 | 225 | 259 |
| Time Warner Cable Inc. | 5.000% | 2/1/20 | 350 | 370 |
| Time Warner Cable Inc. | 6.550% | 5/1/37 | 200 | 202 |
| Time Warner Cable Inc. | 6.750% | 6/15/39 | 200 | 205 |
| Time Warner Cable Inc. | 5.875% | 11/15/40 | 600 | 567 |
| Time Warner Cable Inc. | 4.500% | 9/15/42 | 350 | 275 |
| Time Warner Entertainment Co. LP | 8.375% | 3/15/23 | 175 | 215 |
| Time Warner Entertainment Co. LP | 8.375% | 7/15/33 | 250 | 296 |
| Time Warner Inc. | 4.875% | 3/15/20 | 350 | 379 |
| Time Warner Inc. | 4.700% | 1/15/21 | 50 | 54 |
| Time Warner Inc. | 4.750% | 3/29/21 | 675 | 726 |
| Time Warner Inc. | 3.600% | 7/15/25 | 225 | 219 |
| Time Warner Inc. | 3.875% | 1/15/26 | 100 | 99 |
| Time Warner Inc. | 7.625% | 4/15/31 | 300 | 372 |
| Time Warner Inc. | 7.700% | 5/1/32 | 375 | 468 |
| Time Warner Inc. | 6.500% | 11/15/36 | 175 | 198 |
| Time Warner Inc. | 6.200% | 3/15/40 | 100 | 110 |
| Time Warner Inc. | 6.100% | 7/15/40 | 175 | 189 |
| Time Warner Inc. | 6.250% | 3/29/41 | 50 | 56 |
| Time Warner Inc. | 4.900% | 6/15/42 | 325 | 306 |
| Time Warner Inc. | 5.350% | 12/15/43 | 25 | 25 |
| Time Warner Inc. | 4.850% | 7/15/45 | 100 | 95 |
| Verizon Communications Inc. | 1.350% | 6/9/17 | 200 | 199 |
| Verizon Communications Inc. | 5.500% | 2/15/18 | 475 | 511 |
| Verizon Communications Inc. | 3.650% | 9/14/18 | 560 | 584 |
| Verizon Communications Inc. | 6.350% | 4/1/19 | 250 | 281 |
| Verizon Communications Inc. | 2.625% | 2/21/20 | 539 | 541 |
| Verizon Communications Inc. | 4.500% | 9/15/20 | 560 | 602 |
| Verizon Communications Inc. | 3.450% | 3/15/21 | 300 | 307 |
| Verizon Communications Inc. | 4.600% | 4/1/21 | 775 | 835 |
| Verizon Communications Inc. | 3.000% | 11/1/21 | 800 | 802 |
| Verizon Communications Inc. | 3.500% | 11/1/21 | 100 | 102 |
| Verizon Communications Inc. | 5.150% | 9/15/23 | 1,230 | 1,349 |
| Verizon Communications Inc. | 4.150% | 3/15/24 | 300 | 308 |
| | | | |
| Face | Market |
| Maturity Amount | Value • |
| | Coupon | Date | ($000) | ($000) |
| Verizon Communications Inc. | 3.500% | 11/1/24 | 100 | 99 |
| Verizon Communications Inc. | 7.750% | 12/1/30 | 300 | 383 |
| Verizon Communications Inc. | 6.400% | 9/15/33 | 454 | 519 |
| Verizon Communications Inc. | 5.050% | 3/15/34 | 225 | 225 |
| Verizon Communications Inc. | 4.400% | 11/1/34 | 250 | 234 |
| Verizon Communications Inc. | 5.850% | 9/15/35 | 425 | 456 |
| Verizon Communications Inc. | 4.272% | 1/15/36 | 888 | 802 |
| Verizon Communications Inc. | 6.250% | 4/1/37 | 60 | 67 |
| Verizon Communications Inc. | 6.400% | 2/15/38 | 375 | 427 |
| Verizon Communications Inc. | 6.900% | 4/15/38 | 165 | 198 |
| Verizon Communications Inc. | 4.750% | 11/1/41 | 200 | 184 |
| Verizon Communications Inc. | 6.550% | 9/15/43 | 1,312 | 1,553 |
| Verizon Communications Inc. | 4.862% | 8/21/46 | 581 | 548 |
| Verizon Communications Inc. | 4.522% | 9/15/48 | 1,088 | 974 |
| Verizon Communications Inc. | 5.012% | 8/21/54 | 574 | 526 |
| Verizon Communications Inc. | 4.672% | 3/15/55 | 888 | 770 |
| Verizon New York Inc. | 7.375% | 4/1/32 | 350 | 395 |
| Viacom Inc. | 2.500% | 12/15/16 | 175 | 175 |
| Viacom Inc. | 3.500% | 4/1/17 | 50 | 51 |
| Viacom Inc. | 6.125% | 10/5/17 | 75 | 80 |
| Viacom Inc. | 2.500% | 9/1/18 | 125 | 125 |
| Viacom Inc. | 2.200% | 4/1/19 | 300 | 293 |
| Viacom Inc. | 5.625% | 9/15/19 | 275 | 297 |
| Viacom Inc. | 3.875% | 12/15/21 | 25 | 25 |
| Viacom Inc. | 3.125% | 6/15/22 | 50 | 46 |
| Viacom Inc. | 4.250% | 9/1/23 | 75 | 72 |
| Viacom Inc. | 3.875% | 4/1/24 | 300 | 280 |
| Viacom Inc. | 6.875% | 4/30/36 | 375 | 368 |
| Viacom Inc. | 4.375% | 3/15/43 | 106 | 78 |
| Viacom Inc. | 5.850% | 9/1/43 | 75 | 67 |
| Viacom Inc. | 5.250% | 4/1/44 | 300 | 247 |
| Vodafone Group plc | 5.625% | 2/27/17 | 250 | 261 |
| Vodafone Group plc | 1.625% | 3/20/17 | 625 | 624 |
| Vodafone Group plc | 1.250% | 9/26/17 | 475 | 470 |
| Vodafone Group plc | 1.500% | 2/19/18 | 50 | 50 |
| Vodafone Group plc | 5.450% | 6/10/19 | 150 | 165 |
| Vodafone Group plc | 2.500% | 9/26/22 | 75 | 69 |
| Vodafone Group plc | 2.950% | 2/19/23 | 415 | 393 |
| Vodafone Group plc | 7.875% | 2/15/30 | 150 | 183 |
| Vodafone Group plc | 6.150% | 2/27/37 | 225 | 223 |
| Vodafone Group plc | 4.375% | 2/19/43 | 150 | 124 |
| Walt Disney Co. | 1.100% | 12/1/17 | 400 | 399 |
| Walt Disney Co. | 5.875% | 12/15/17 | 175 | 190 |
| Walt Disney Co. | 1.500% | 9/17/18 | 100 | 100 |
| Walt Disney Co. | 1.850% | 5/30/19 | 50 | 50 |
| Walt Disney Co. | 2.150% | 9/17/20 | 150 | 150 |
| Walt Disney Co. | 2.750% | 8/16/21 | 100 | 102 |
| Walt Disney Co. | 2.350% | 12/1/22 | 75 | 74 |
| Walt Disney Co. | 3.150% | 9/17/25 | 150 | 152 |
| Walt Disney Co. | 4.375% | 8/16/41 | 75 | 78 |
| Walt Disney Co. | 4.125% | 12/1/41 | 275 | 274 |
| Walt Disney Co. | 3.700% | 12/1/42 | 125 | 116 |
| Walt Disney Co. | 4.125% | 6/1/44 | 75 | 76 |
| WPP Finance 2010 | 4.750% | 11/21/21 | 208 | 224 |
| WPP Finance 2010 | 3.625% | 9/7/22 | 200 | 200 |
| WPP Finance 2010 | 3.750% | 9/19/24 | 100 | 99 |
| | | | |
| Consumer Cyclical (2.1%) | | | | |
| Advance Auto Parts Inc. | 5.750% | 5/1/20 | 425 | 463 |
| Alibaba Group Holding Ltd. | 1.625% | 11/28/17 | 275 | 272 |
| Alibaba Group Holding Ltd. | 2.500% | 11/28/19 | 360 | 353 |
| Alibaba Group Holding Ltd. | 3.125% | 11/28/21 | 300 | 292 |
| Alibaba Group Holding Ltd. | 3.600% | 11/28/24 | 400 | 385 |
| Alibaba Group Holding Ltd. | 4.500% | 11/28/34 | 80 | 76 |
| Amazon.com Inc. | 1.200% | 11/29/17 | 200 | 199 |
| Amazon.com Inc. | 2.600% | 12/5/19 | 375 | 381 |
| Amazon.com Inc. | 3.300% | 12/5/21 | 200 | 206 |
| Amazon.com Inc. | 2.500% | 11/29/22 | 150 | 145 |
| Amazon.com Inc. | 3.800% | 12/5/24 | 120 | 125 |
| Amazon.com Inc. | 4.800% | 12/5/34 | 200 | 210 |
| Amazon.com Inc. | 4.950% | 12/5/44 | 350 | 373 |
266
Vanguard Total Bond Market Index Portfolio
| | | | | |
| Face | Market |
| Maturity Amount | Value • |
| | Coupon | Date | ($000) | ($000) |
| American Honda Finance Corp. | 1.550% | 12/11/17 | 500 | 500 |
| American Honda Finance Corp. | 1.600% | 7/13/18 | 100 | 99 |
| American Honda Finance Corp. | 2.125% | 10/10/18 | 125 | 126 |
| American Honda Finance Corp. | 2.250% | 8/15/19 | 275 | 276 |
| American Honda Finance Corp. | 2.450% | 9/24/20 | 125 | 125 |
| Automatic Data Processing Inc. | 2.250% | 9/15/20 | 175 | 176 |
| Automatic Data Processing Inc. | 3.375% | 9/15/25 | 200 | 204 |
| AutoNation Inc. | 6.750% | 4/15/18 | 50 | 55 |
| AutoNation Inc. | 5.500% | 2/1/20 | 55 | 60 |
| AutoNation Inc. | 3.350% | 1/15/21 | 60 | 60 |
| AutoNation Inc. | 4.500% | 10/1/25 | 50 | 51 |
| AutoZone Inc. | 1.300% | 1/13/17 | 25 | 25 |
| AutoZone Inc. | 7.125% | 8/1/18 | 250 | 280 |
| AutoZone Inc. | 3.700% | 4/15/22 | 350 | 356 |
| AutoZone Inc. | 2.875% | 1/15/23 | 50 | 48 |
| AutoZone Inc. | 3.125% | 7/15/23 | 125 | 122 |
| Bed Bath & Beyond Inc. | 4.915% | 8/1/34 | 50 | 45 |
| Bed Bath & Beyond Inc. | 5.165% | 8/1/44 | 150 | 128 |
| Best Buy Co. Inc. | 5.500% | 3/15/21 | 25 | 26 |
| Block Financial LLC | 4.125% | 10/1/20 | 94 | 95 |
| Block Financial LLC | 5.500% | 11/1/22 | 75 | 79 |
| Block Financial LLC | 5.250% | 10/1/25 | 100 | 102 |
| BorgWarner Inc. | 4.625% | 9/15/20 | 25 | 27 |
| BorgWarner Inc. | 3.375% | 3/15/25 | 75 | 71 |
| BorgWarner Inc. | 4.375% | 3/15/45 | 100 | 89 |
| Brinker International Inc. | 2.600% | 5/15/18 | 25 | 25 |
| Brinker International Inc. | 3.875% | 5/15/23 | 25 | 24 |
| Carnival Corp. | 3.950% | 10/15/20 | 100 | 105 |
| Coach Inc. | 4.250% | 4/1/25 | 70 | 67 |
| Costco Wholesale Corp. | 5.500% | 3/15/17 | 200 | 210 |
| Costco Wholesale Corp. | 1.700% | 12/15/19 | 200 | 198 |
| Costco Wholesale Corp. | 1.750% | 2/15/20 | 200 | 198 |
| Costco Wholesale Corp. | 2.250% | 2/15/22 | 100 | 98 |
| Cummins Inc. | 7.125% | 3/1/28 | 100 | 131 |
| Cummins Inc. | 4.875% | 10/1/43 | 125 | 129 |
| CVS Health Corp. | 1.900% | 7/20/18 | 550 | 549 |
| CVS Health Corp. | 2.250% | 12/5/18 | 300 | 302 |
| CVS Health Corp. | 2.250% | 8/12/19 | 500 | 500 |
| CVS Health Corp. | 2.800% | 7/20/20 | 475 | 477 |
| CVS Health Corp. | 3.500% | 7/20/22 | 150 | 153 |
| CVS Health Corp. | 2.750% | 12/1/22 | 150 | 146 |
| 7 | CVS Health Corp. | 4.750% | 12/1/22 | 50 | 54 |
| CVS Health Corp. | 4.000% | 12/5/23 | 195 | 203 |
| CVS Health Corp. | 3.375% | 8/12/24 | 750 | 741 |
| 7 | CVS Health Corp. | 5.000% | 12/1/24 | 100 | 108 |
| CVS Health Corp. | 3.875% | 7/20/25 | 525 | 534 |
| CVS Health Corp. | 4.875% | 7/20/35 | 355 | 367 |
| CVS Health Corp. | 6.125% | 9/15/39 | 125 | 146 |
| CVS Health Corp. | 5.750% | 5/15/41 | 75 | 85 |
| CVS Health Corp. | 5.300% | 12/5/43 | 50 | 54 |
| CVS Health Corp. | 5.125% | 7/20/45 | 625 | 659 |
| Daimler Finance North America LLC | 8.500% | 1/18/31 | 250 | 363 |
| Delphi Automotive plc | 3.150% | 11/19/20 | 150 | 150 |
| Delphi Automotive plc | 4.250% | 1/15/26 | 350 | 351 |
| Delphi Corp. | 4.150% | 3/15/24 | 125 | 126 |
| Dollar General Corp. | 3.250% | 4/15/23 | 150 | 143 |
| Dollar General Corp. | 4.150% | 11/1/25 | 205 | 203 |
| eBay Inc. | 2.200% | 8/1/19 | 300 | 296 |
| eBay Inc. | 3.250% | 10/15/20 | 75 | 76 |
| eBay Inc. | 2.875% | 8/1/21 | 125 | 123 |
| eBay Inc. | 2.600% | 7/15/22 | 450 | 418 |
| eBay Inc. | 3.450% | 8/1/24 | 200 | 191 |
| eBay Inc. | 4.000% | 7/15/42 | 25 | 20 |
| Expedia Inc. | 5.950% | 8/15/20 | 75 | 82 |
| Expedia Inc. | 4.500% | 8/15/24 | 100 | 96 |
| 7 | Expedia Inc. | 5.000% | 2/15/26 | 275 | 270 |
| Ford Motor Co. | 6.625% | 10/1/28 | 425 | 489 |
| Ford Motor Co. | 6.375% | 2/1/29 | 100 | 112 |
| Ford Motor Co. | 7.450% | 7/16/31 | 375 | 460 |
| Ford Motor Co. | 7.400% | 11/1/46 | 100 | 122 |
| Ford Motor Credit Co. LLC | 4.250% | 2/3/17 | 100 | 102 |
| | | | |
| Face | Market |
| Maturity Amount | Value • |
| Coupon | Date | ($000) | ($000) |
| Ford Motor Credit Co. LLC | 6.625% | 8/15/17 | 325 | 347 |
| Ford Motor Credit Co. LLC | 1.724% | 12/6/17 | 200 | 197 |
| Ford Motor Credit Co. LLC | 2.145% | 1/9/18 | 500 | 497 |
| Ford Motor Credit Co. LLC | 5.000% | 5/15/18 | 650 | 680 |
| Ford Motor Credit Co. LLC | 2.375% | 3/12/19 | 550 | 542 |
| Ford Motor Credit Co. LLC | 2.597% | 11/4/19 | 550 | 540 |
| Ford Motor Credit Co. LLC | 8.125% | 1/15/20 | 250 | 295 |
| Ford Motor Credit Co. LLC | 3.157% | 8/4/20 | 200 | 199 |
| Ford Motor Credit Co. LLC | 3.200% | 1/15/21 | 450 | 446 |
| Ford Motor Credit Co. LLC | 5.750% | 2/1/21 | 250 | 277 |
| Ford Motor Credit Co. LLC | 5.875% | 8/2/21 | 325 | 363 |
| Ford Motor Credit Co. LLC | 4.375% | 8/6/23 | 225 | 231 |
| Ford Motor Credit Co. LLC | 3.664% | 9/8/24 | 200 | 195 |
| Ford Motor Credit Co. LLC | 4.134% | 8/4/25 | 300 | 298 |
| Gap Inc. | 5.950% | 4/12/21 | 275 | 291 |
| General Motors Co. | 3.500% | 10/2/18 | 100 | 101 |
| General Motors Co. | 4.875% | 10/2/23 | 250 | 255 |
| General Motors Co. | 4.000% | 4/1/25 | 100 | 95 |
| General Motors Co. | 5.000% | 4/1/35 | 165 | 154 |
| General Motors Co. | 6.250% | 10/2/43 | 210 | 222 |
| General Motors Co. | 5.200% | 4/1/45 | 250 | 235 |
| General Motors Financial Co. Inc. | 2.625% | 7/10/17 | 60 | 60 |
| General Motors Financial Co. Inc. | 4.750% | 8/15/17 | 75 | 78 |
| General Motors Financial Co. Inc. | 3.000% | 9/25/17 | 45 | 45 |
| General Motors Financial Co. Inc. | 3.250% | 5/15/18 | 90 | 91 |
| General Motors Financial Co. Inc. | 6.750% | 6/1/18 | 335 | 363 |
| General Motors Financial Co. Inc. | 3.100% | 1/15/19 | 275 | 276 |
| General Motors Financial Co. Inc. | 3.500% | 7/10/19 | 230 | 231 |
| General Motors Financial Co. Inc. | 3.150% | 1/15/20 | 65 | 64 |
| General Motors Financial Co. Inc. | 3.200% | 7/13/20 | 700 | 688 |
| General Motors Financial Co. Inc. | 3.700% | 11/24/20 | 275 | 275 |
| General Motors Financial Co. Inc. | 4.375% | 9/25/21 | 100 | 101 |
| General Motors Financial Co. Inc. | 3.450% | 4/10/22 | 205 | 196 |
| General Motors Financial Co. Inc. | 4.250% | 5/15/23 | 125 | 123 |
| General Motors Financial Co. Inc. | 4.000% | 1/15/25 | 175 | 166 |
| General Motors Financial Co. Inc. | 4.300% | 7/13/25 | 300 | 292 |
| Harley-Davidson Inc. | 3.500% | 7/28/25 | 100 | 100 |
| Harley-Davidson Inc. | 4.625% | 7/28/45 | 100 | 98 |
| Harman International Industries Inc. | 4.150% | 5/15/25 | 100 | 96 |
| Home Depot Inc. | 3.950% | 9/15/20 | 100 | 107 |
| Home Depot Inc. | 4.400% | 4/1/21 | 975 | 1,072 |
| Home Depot Inc. | 2.625% | 6/1/22 | 140 | 140 |
| Home Depot Inc. | 3.750% | 2/15/24 | 200 | 213 |
| Home Depot Inc. | 5.875% | 12/16/36 | 725 | 882 |
| Home Depot Inc. | 5.400% | 9/15/40 | 75 | 87 |
| Home Depot Inc. | 5.950% | 4/1/41 | 125 | 155 |
| Home Depot Inc. | 4.200% | 4/1/43 | 100 | 100 |
| Home Depot Inc. | 4.875% | 2/15/44 | 200 | 220 |
| Home Depot Inc. | 4.250% | 4/1/46 | 130 | 132 |
| Hyatt Hotels Corp. | 5.375% | 8/15/21 | 50 | 55 |
| Hyatt Hotels Corp. | 3.375% | 7/15/23 | 25 | 24 |
| Johnson Controls Inc. | 5.000% | 3/30/20 | 125 | 134 |
| Johnson Controls Inc. | 4.250% | 3/1/21 | 150 | 155 |
| Johnson Controls Inc. | 3.750% | 12/1/21 | 100 | 100 |
| Johnson Controls Inc. | 3.625% | 7/2/24 | 135 | 129 |
| Johnson Controls Inc. | 6.000% | 1/15/36 | 50 | 51 |
| Johnson Controls Inc. | 5.250% | 12/1/41 | 100 | 92 |
| Johnson Controls Inc. | 4.950% | 7/2/64 | 50 | 41 |
| Kohl’s Corp. | 4.000% | 11/1/21 | 200 | 205 |
| Kohl’s Corp. | 4.250% | 7/17/25 | 100 | 97 |
| Kohl’s Corp. | 5.550% | 7/17/45 | 75 | 70 |
| Lowe’s Cos. Inc. | 6.100% | 9/15/17 | 75 | 81 |
| Lowe’s Cos. Inc. | 3.750% | 4/15/21 | 500 | 527 |
| Lowe’s Cos. Inc. | 3.875% | 9/15/23 | 75 | 79 |
| Lowe’s Cos. Inc. | 3.125% | 9/15/24 | 100 | 100 |
| Lowe’s Cos. Inc. | 3.375% | 9/15/25 | 200 | 203 |
| Lowe’s Cos. Inc. | 6.875% | 2/15/28 | 25 | 32 |
| Lowe’s Cos. Inc. | 6.500% | 3/15/29 | 200 | 249 |
| Lowe’s Cos. Inc. | 5.800% | 10/15/36 | 175 | 207 |
| Lowe’s Cos. Inc. | 5.125% | 11/15/41 | 375 | 415 |
| Lowe’s Cos. Inc. | 5.000% | 9/15/43 | 50 | 55 |
267
Vanguard Total Bond Market Index Portfolio
| | | | |
| Face | Market |
| Maturity Amount | Value • |
| Coupon | Date | ($000) | ($000) |
| Lowe’s Cos. Inc. | 4.375% | 9/15/45 | 125 | 128 |
| Macy’s Retail Holdings Inc. | 7.450% | 7/15/17 | 325 | 350 |
| Macy’s Retail Holdings Inc. | 3.450% | 1/15/21 | 125 | 124 |
| Macy’s Retail Holdings Inc. | 3.625% | 6/1/24 | 100 | 93 |
| Macy’s Retail Holdings Inc. | 6.900% | 4/1/29 | 225 | 255 |
| Macy’s Retail Holdings Inc. | 4.500% | 12/15/34 | 100 | 83 |
| Macy’s Retail Holdings Inc. | 6.375% | 3/15/37 | 125 | 126 |
| Macy’s Retail Holdings Inc. | 5.125% | 1/15/42 | 175 | 153 |
| Magna International Inc. | 3.625% | 6/15/24 | 120 | 118 |
| Magna International Inc. | 4.150% | 10/1/25 | 100 | 102 |
| Marriott International Inc. | 6.375% | 6/15/17 | 50 | 53 |
| Marriott International Inc. | 3.000% | 3/1/19 | 50 | 51 |
| Marriott International Inc. | 3.375% | 10/15/20 | 225 | 229 |
| Marriott International Inc. | 2.875% | 3/1/21 | 75 | 74 |
| Marriott International Inc. | 3.125% | 10/15/21 | 50 | 50 |
| Marriott International Inc. | 3.750% | 10/1/25 | 100 | 98 |
| MasterCard Inc. | 2.000% | 4/1/19 | 75 | 75 |
| MasterCard Inc. | 3.375% | 4/1/24 | 150 | 153 |
| McDonald’s Corp. | 5.300% | 3/15/17 | 125 | 130 |
| McDonald’s Corp. | 5.800% | 10/15/17 | 325 | 347 |
| McDonald’s Corp. | 5.350% | 3/1/18 | 100 | 107 |
| McDonald’s Corp. | 5.000% | 2/1/19 | 100 | 108 |
| McDonald’s Corp. | 1.875% | 5/29/19 | 75 | 74 |
| McDonald’s Corp. | 2.750% | 12/9/20 | 75 | 75 |
| McDonald’s Corp. | 3.625% | 5/20/21 | 175 | 180 |
| McDonald’s Corp. | 3.375% | 5/26/25 | 175 | 172 |
| McDonald’s Corp. | 3.700% | 1/30/26 | 300 | 299 |
| McDonald’s Corp. | 4.700% | 12/9/35 | 125 | 124 |
| McDonald’s Corp. | 6.300% | 10/15/37 | 50 | 59 |
| McDonald’s Corp. | 5.700% | 2/1/39 | 100 | 109 |
| McDonald’s Corp. | 3.700% | 2/15/42 | 375 | 311 |
| McDonald’s Corp. | 3.625% | 5/1/43 | 25 | 21 |
| McDonald’s Corp. | 4.600% | 5/26/45 | 210 | 201 |
| McDonald’s Corp. | 4.875% | 12/9/45 | 300 | 301 |
| Metropolitan Museum of Art New York | | | | |
| Revenue | 3.400% | 7/1/45 | 75 | 68 |
| NIKE Inc. | 3.625% | 5/1/43 | 50 | 46 |
| NIKE Inc. | 3.875% | 11/1/45 | 325 | 314 |
| Nordstrom Inc. | 6.250% | 1/15/18 | 75 | 81 |
| Nordstrom Inc. | 4.750% | 5/1/20 | 250 | 270 |
| Nordstrom Inc. | 4.000% | 10/15/21 | 175 | 184 |
| Nordstrom Inc. | 5.000% | 1/15/44 | 115 | 119 |
| NVR Inc. | 3.950% | 9/15/22 | 100 | 100 |
| O’Reilly Automotive Inc. | 4.875% | 1/14/21 | 25 | 27 |
| O’Reilly Automotive Inc. | 3.850% | 6/15/23 | 50 | 51 |
| PACCAR Financial Corp. | 1.600% | 3/15/17 | 25 | 25 |
| PACCAR Financial Corp. | 1.400% | 11/17/17 | 85 | 85 |
| PACCAR Financial Corp. | 1.450% | 3/9/18 | 100 | 99 |
| PACCAR Financial Corp. | 1.750% | 8/14/18 | 50 | 50 |
| PACCAR Financial Corp. | 2.200% | 9/15/19 | 50 | 50 |
| PACCAR Financial Corp. | 2.500% | 8/14/20 | 75 | 74 |
| QVC Inc. | 3.125% | 4/1/19 | 125 | 124 |
| QVC Inc. | 5.125% | 7/2/22 | 25 | 25 |
| QVC Inc. | 4.850% | 4/1/24 | 125 | 119 |
| QVC Inc. | 5.950% | 3/15/43 | 125 | 106 |
| Ralph Lauren Corp. | 2.125% | 9/26/18 | 50 | 50 |
| Ralph Lauren Corp. | 2.625% | 8/18/20 | 50 | 50 |
| Ross Stores Inc. | 3.375% | 9/15/24 | 50 | 49 |
| Signet UK Finance plc | 4.700% | 6/15/24 | 75 | 74 |
| Staples Inc. | 4.375% | 1/12/23 | 100 | 96 |
| Starbucks Corp. | 2.700% | 6/15/22 | 75 | 75 |
| Starbucks Corp. | 3.850% | 10/1/23 | 250 | 266 |
| Starbucks Corp. | 4.300% | 6/15/45 | 50 | 52 |
| Starwood Hotels & Resorts Worldwide | | | | |
| Inc. | 3.125% | 2/15/23 | 100 | 98 |
| Starwood Hotels & Resorts Worldwide | | | | |
| Inc. | 3.750% | 3/15/25 | 175 | 171 |
| Starwood Hotels & Resorts Worldwide | | | | |
| Inc. | 4.500% | 10/1/34 | 50 | 44 |
| Target Corp. | 5.375% | 5/1/17 | 225 | 237 |
| Target Corp. | 6.000% | 1/15/18 | 200 | 218 |
| | | | |
| Face | Market |
| Maturity Amount | Value • |
| Coupon | Date | ($000) | ($000) |
| Target Corp. | 2.300% | 6/26/19 | 200 | 203 |
| Target Corp. | 2.900% | 1/15/22 | 175 | 178 |
| Target Corp. | 3.500% | 7/1/24 | 175 | 181 |
| Target Corp. | 6.350% | 11/1/32 | 175 | 219 |
| Target Corp. | 6.500% | 10/15/37 | 203 | 263 |
| Target Corp. | 7.000% | 1/15/38 | 125 | 171 |
| Target Corp. | 4.000% | 7/1/42 | 150 | 147 |
| Tiffany & Co. | 4.900% | 10/1/44 | 50 | 47 |
| TJX Cos. Inc. | 6.950% | 4/15/19 | 150 | 173 |
| TJX Cos. Inc. | 2.750% | 6/15/21 | 125 | 127 |
| TJX Cos. Inc. | 2.500% | 5/15/23 | 300 | 290 |
| Toyota Motor Credit Corp. | 2.050% | 1/12/17 | 450 | 454 |
| Toyota Motor Credit Corp. | 1.125% | 5/16/17 | 300 | 300 |
| Toyota Motor Credit Corp. | 1.250% | 10/5/17 | 175 | 174 |
| Toyota Motor Credit Corp. | 1.375% | 1/10/18 | 300 | 299 |
| Toyota Motor Credit Corp. | 1.450% | 1/12/18 | 100 | 100 |
| Toyota Motor Credit Corp. | 2.000% | 10/24/18 | 25 | 25 |
| Toyota Motor Credit Corp. | 2.125% | 7/18/19 | 500 | 500 |
| Toyota Motor Credit Corp. | 2.150% | 3/12/20 | 250 | 251 |
| Toyota Motor Credit Corp. | 4.250% | 1/11/21 | 125 | 135 |
| Toyota Motor Credit Corp. | 2.750% | 5/17/21 | 200 | 202 |
| Toyota Motor Credit Corp. | 3.400% | 9/15/21 | 75 | 78 |
| Toyota Motor Credit Corp. | 3.300% | 1/12/22 | 275 | 283 |
| Toyota Motor Credit Corp. | 2.800% | 7/13/22 | 100 | 100 |
| Toyota Motor Credit Corp. | 2.625% | 1/10/23 | 200 | 197 |
| VF Corp. | 5.950% | 11/1/17 | 75 | 81 |
| VF Corp. | 3.500% | 9/1/21 | 200 | 209 |
| VF Corp. | 6.450% | 11/1/37 | 50 | 64 |
| Visa Inc. | 1.200% | 12/14/17 | 800 | 799 |
| Visa Inc. | 2.200% | 12/14/20 | 600 | 599 |
| Visa Inc. | 2.800% | 12/14/22 | 250 | 251 |
| Visa Inc. | 3.150% | 12/14/25 | 975 | 977 |
| Visa Inc. | 4.150% | 12/14/35 | 275 | 278 |
| Visa Inc. | 4.300% | 12/14/45 | 600 | 608 |
| Wal-Mart Stores Inc. | 5.375% | 4/5/17 | 25 | 26 |
| Wal-Mart Stores Inc. | 5.800% | 2/15/18 | 425 | 464 |
| Wal-Mart Stores Inc. | 1.125% | 4/11/18 | 150 | 149 |
| Wal-Mart Stores Inc. | 1.950% | 12/15/18 | 75 | 76 |
| Wal-Mart Stores Inc. | 3.625% | 7/8/20 | 25 | 27 |
| Wal-Mart Stores Inc. | 3.250% | 10/25/20 | 325 | 343 |
| Wal-Mart Stores Inc. | 4.250% | 4/15/21 | 200 | 221 |
| Wal-Mart Stores Inc. | 2.550% | 4/11/23 | 150 | 148 |
| Wal-Mart Stores Inc. | 3.300% | 4/22/24 | 350 | 361 |
| Wal-Mart Stores Inc. | 5.875% | 4/5/27 | 725 | 886 |
| Wal-Mart Stores Inc. | 7.550% | 2/15/30 | 175 | 247 |
| Wal-Mart Stores Inc. | 5.250% | 9/1/35 | 150 | 171 |
| Wal-Mart Stores Inc. | 6.500% | 8/15/37 | 900 | 1,160 |
| Wal-Mart Stores Inc. | 6.200% | 4/15/38 | 300 | 377 |
| Wal-Mart Stores Inc. | 5.000% | 10/25/40 | 245 | 269 |
| Wal-Mart Stores Inc. | 5.625% | 4/15/41 | 435 | 516 |
| Wal-Mart Stores Inc. | 4.000% | 4/11/43 | 274 | 266 |
| Wal-Mart Stores Inc. | 4.300% | 4/22/44 | 175 | 178 |
| Walgreen Co. | 3.100% | 9/15/22 | 200 | 194 |
| Walgreen Co. | 4.400% | 9/15/42 | 75 | 64 |
| Walgreens Boots Alliance Inc. | 1.750% | 11/17/17 | 200 | 199 |
| Walgreens Boots Alliance Inc. | 2.700% | 11/18/19 | 350 | 350 |
| Walgreens Boots Alliance Inc. | 3.300% | 11/18/21 | 225 | 220 |
| Walgreens Boots Alliance Inc. | 3.800% | 11/18/24 | 275 | 268 |
| Walgreens Boots Alliance Inc. | 4.500% | 11/18/34 | 125 | 114 |
| Walgreens Boots Alliance Inc. | 4.800% | 11/18/44 | 250 | 227 |
| Western Union Co. | 5.253% | 4/1/20 | 133 | 143 |
| Western Union Co. | 6.200% | 11/17/36 | 75 | 73 |
| Western Union Co. | 6.200% | 6/21/40 | 50 | 47 |
| Wyndham Worldwide Corp. | 2.950% | 3/1/17 | 50 | 50 |
| Wyndham Worldwide Corp. | 2.500% | 3/1/18 | 50 | 50 |
| Wyndham Worldwide Corp. | 4.250% | 3/1/22 | 175 | 175 |
| Wyndham Worldwide Corp. | 3.900% | 3/1/23 | 50 | 48 |
| |
| Consumer Noncyclical (3.9%) | | | | |
| Abbott Laboratories | 5.125% | 4/1/19 | 350 | 385 |
| Abbott Laboratories | 2.000% | 3/15/20 | 200 | 199 |
268
Vanguard Total Bond Market Index Portfolio
| | | | | |
| Face | Market |
| Maturity Amount | Value • |
| | Coupon | Date | ($000) | ($000) |
| Abbott Laboratories | 4.125% | 5/27/20 | 25 | 27 |
| Abbott Laboratories | 2.550% | 3/15/22 | 250 | 248 |
| Abbott Laboratories | 2.950% | 3/15/25 | 175 | 173 |
| Abbott Laboratories | 6.150% | 11/30/37 | 175 | 218 |
| Abbott Laboratories | 6.000% | 4/1/39 | 25 | 31 |
| Abbott Laboratories | 5.300% | 5/27/40 | 100 | 112 |
| AbbVie Inc. | 1.750% | 11/6/17 | 600 | 599 |
| AbbVie Inc. | 1.800% | 5/14/18 | 600 | 598 |
| AbbVie Inc. | 2.000% | 11/6/18 | 225 | 224 |
| AbbVie Inc. | 2.500% | 5/14/20 | 650 | 643 |
| AbbVie Inc. | 2.900% | 11/6/22 | 800 | 773 |
| AbbVie Inc. | 3.200% | 11/6/22 | 175 | 172 |
| AbbVie Inc. | 3.600% | 5/14/25 | 575 | 567 |
| AbbVie Inc. | 4.500% | 5/14/35 | 475 | 465 |
| AbbVie Inc. | 4.400% | 11/6/42 | 301 | 280 |
| AbbVie Inc. | 4.700% | 5/14/45 | 552 | 540 |
| Actavis Funding SCS | 1.850% | 3/1/17 | 225 | 225 |
| Actavis Funding SCS | 1.300% | 6/15/17 | 300 | 297 |
| Actavis Funding SCS | 2.350% | 3/12/18 | 500 | 501 |
| Actavis Funding SCS | 3.000% | 3/12/20 | 599 | 598 |
| Actavis Funding SCS | 3.450% | 3/15/22 | 507 | 507 |
| Actavis Funding SCS | 3.850% | 6/15/24 | 200 | 200 |
| Actavis Funding SCS | 3.800% | 3/15/25 | 665 | 659 |
| Actavis Funding SCS | 4.550% | 3/15/35 | 450 | 439 |
| Actavis Funding SCS | 4.850% | 6/15/44 | 395 | 391 |
| Actavis Funding SCS | 4.750% | 3/15/45 | 350 | 340 |
| Actavis Inc. | 1.875% | 10/1/17 | 100 | 100 |
| Actavis Inc. | 3.250% | 10/1/22 | 675 | 664 |
| Actavis Inc. | 4.625% | 10/1/42 | 175 | 166 |
| Agilent Technologies Inc. | 5.000% | 7/15/20 | 100 | 107 |
| Agilent Technologies Inc. | 3.200% | 10/1/22 | 300 | 291 |
| Agilent Technologies Inc. | 3.875% | 7/15/23 | 100 | 100 |
| Allergan Inc. | 1.350% | 3/15/18 | 40 | 39 |
| Allergan Inc. | 2.800% | 3/15/23 | 100 | 94 |
| 4 | Allina Health System | 4.805% | 11/15/45 | 50 | 51 |
| Altria Group Inc. | 9.250% | 8/6/19 | 185 | 227 |
| Altria Group Inc. | 2.625% | 1/14/20 | 600 | 602 |
| Altria Group Inc. | 4.750% | 5/5/21 | 125 | 136 |
| Altria Group Inc. | 2.850% | 8/9/22 | 325 | 318 |
| Altria Group Inc. | 2.950% | 5/2/23 | 350 | 340 |
| Altria Group Inc. | 9.950% | 11/10/38 | 100 | 161 |
| Altria Group Inc. | 10.200% | 2/6/39 | 260 | 427 |
| Altria Group Inc. | 4.500% | 5/2/43 | 100 | 95 |
| Altria Group Inc. | 5.375% | 1/31/44 | 250 | 269 |
| AmerisourceBergen Corp. | 4.875% | 11/15/19 | 25 | 27 |
| AmerisourceBergen Corp. | 3.500% | 11/15/21 | 300 | 306 |
| AmerisourceBergen Corp. | 3.400% | 5/15/24 | 250 | 245 |
| AmerisourceBergen Corp. | 3.250% | 3/1/25 | 125 | 121 |
| AmerisourceBergen Corp. | 4.250% | 3/1/45 | 50 | 46 |
| Amgen Inc. | 2.125% | 5/15/17 | 525 | 528 |
| Amgen Inc. | 5.850% | 6/1/17 | 150 | 159 |
| Amgen Inc. | 5.700% | 2/1/19 | 75 | 83 |
| Amgen Inc. | 2.125% | 5/1/20 | 175 | 173 |
| Amgen Inc. | 3.450% | 10/1/20 | 225 | 232 |
| Amgen Inc. | 4.100% | 6/15/21 | 150 | 158 |
| Amgen Inc. | 3.875% | 11/15/21 | 200 | 208 |
| Amgen Inc. | 2.700% | 5/1/22 | 75 | 73 |
| Amgen Inc. | 3.625% | 5/15/22 | 225 | 232 |
| Amgen Inc. | 3.625% | 5/22/24 | 500 | 500 |
| Amgen Inc. | 3.125% | 5/1/25 | 325 | 309 |
| Amgen Inc. | 6.375% | 6/1/37 | 125 | 146 |
| Amgen Inc. | 6.900% | 6/1/38 | 400 | 497 |
| Amgen Inc. | 6.400% | 2/1/39 | 175 | 208 |
| Amgen Inc. | 5.750% | 3/15/40 | 16 | 17 |
| Amgen Inc. | 4.950% | 10/1/41 | 150 | 148 |
| Amgen Inc. | 5.150% | 11/15/41 | 180 | 183 |
| Amgen Inc. | 5.650% | 6/15/42 | 160 | 174 |
| Amgen Inc. | 5.375% | 5/15/43 | 75 | 80 |
| Amgen Inc. | 4.400% | 5/1/45 | 100 | 93 |
| Anheuser-Busch Cos. LLC | 5.500% | 1/15/18 | 75 | 80 |
| Anheuser-Busch Cos. LLC | 6.800% | 8/20/32 | 50 | 61 |
| | | | | |
| Face | Market |
| Maturity Amount | Value • |
| | Coupon | Date | ($000) | ($000) |
| Anheuser-Busch Cos. LLC | 5.750% | 4/1/36 | 115 | 126 |
| Anheuser-Busch Cos. LLC | 6.500% | 5/1/42 | 50 | 61 |
| Anheuser-Busch InBev Finance Inc. | 1.125% | 1/27/17 | 28 | 28 |
| Anheuser-Busch InBev Finance Inc. | 2.150% | 2/1/19 | 425 | 425 |
| Anheuser-Busch InBev Finance Inc. | 2.625% | 1/17/23 | 250 | 240 |
| Anheuser-Busch InBev Finance Inc. | 3.700% | 2/1/24 | 500 | 510 |
| Anheuser-Busch InBev Finance Inc. | 4.000% | 1/17/43 | 300 | 271 |
| Anheuser-Busch InBev Finance Inc. | 4.625% | 2/1/44 | 200 | 199 |
| Anheuser-Busch InBev Worldwide Inc. | 1.375% | 7/15/17 | 333 | 332 |
| Anheuser-Busch InBev Worldwide Inc. | 7.750% | 1/15/19 | 700 | 810 |
| Anheuser-Busch InBev Worldwide Inc. | 6.875% | 11/15/19 | 175 | 202 |
| Anheuser-Busch InBev Worldwide Inc. | 5.375% | 1/15/20 | 500 | 553 |
| Anheuser-Busch InBev Worldwide Inc. | 5.000% | 4/15/20 | 150 | 165 |
| Anheuser-Busch InBev Worldwide Inc. | 4.375% | 2/15/21 | 75 | 81 |
| Anheuser-Busch InBev Worldwide Inc. | 2.500% | 7/15/22 | 200 | 192 |
| Anheuser-Busch InBev Worldwide Inc. | 8.200% | 1/15/39 | 150 | 215 |
| Anheuser-Busch InBev Worldwide Inc. | 6.375% | 1/15/40 | 75 | 90 |
| Anheuser-Busch InBev Worldwide Inc. | 3.750% | 7/15/42 | 175 | 149 |
| Archer-Daniels-Midland Co. | 5.450% | 3/15/18 | 60 | 65 |
| Archer-Daniels-Midland Co. | 4.479% | 3/1/21 | 163 | 178 |
| Archer-Daniels-Midland Co. | 5.935% | 10/1/32 | 80 | 95 |
| Archer-Daniels-Midland Co. | 5.375% | 9/15/35 | 95 | 107 |
| Archer-Daniels-Midland Co. | 4.535% | 3/26/42 | 50 | 51 |
| Archer-Daniels-Midland Co. | 4.016% | 4/16/43 | 25 | 24 |
| 4 | Ascension Health | 4.847% | 11/15/53 | 200 | 216 |
| AstraZeneca plc | 5.900% | 9/15/17 | 550 | 590 |
| AstraZeneca plc | 1.750% | 11/16/18 | 200 | 199 |
| AstraZeneca plc | 1.950% | 9/18/19 | 25 | 25 |
| AstraZeneca plc | 2.375% | 11/16/20 | 350 | 348 |
| AstraZeneca plc | 3.375% | 11/16/25 | 250 | 247 |
| AstraZeneca plc | 6.450% | 9/15/37 | 450 | 561 |
| AstraZeneca plc | 4.000% | 9/18/42 | 150 | 140 |
| AstraZeneca plc | 4.375% | 11/16/45 | 250 | 248 |
| Baptist Health South Florida Obligated | | | | |
| | Group Revenue | 4.590% | 8/15/21 | 50 | 54 |
| 7 | Baxalta Inc. | 2.000% | 6/22/18 | 75 | 74 |
| 7 | Baxalta Inc. | 2.875% | 6/23/20 | 175 | 173 |
| 7 | Baxalta Inc. | 3.600% | 6/23/22 | 50 | 50 |
| 7 | Baxalta Inc. | 4.000% | 6/23/25 | 300 | 297 |
| 7 | Baxalta Inc. | 5.250% | 6/23/45 | 180 | 181 |
| Baxter International Inc. | 1.850% | 1/15/17 | 150 | 151 |
| Beam Suntory Inc. | 1.875% | 5/15/17 | 25 | 25 |
| Beam Suntory Inc. | 3.250% | 5/15/22 | 50 | 49 |
| Becton Dickinson & Co. | 1.450% | 5/15/17 | 50 | 50 |
| Becton Dickinson & Co. | 1.800% | 12/15/17 | 200 | 200 |
| Becton Dickinson & Co. | 5.000% | 5/15/19 | 50 | 54 |
| Becton Dickinson & Co. | 6.375% | 8/1/19 | 50 | 57 |
| Becton Dickinson & Co. | 2.675% | 12/15/19 | 200 | 201 |
| Becton Dickinson & Co. | 3.250% | 11/12/20 | 300 | 305 |
| Becton Dickinson & Co. | 3.125% | 11/8/21 | 65 | 66 |
| Becton Dickinson & Co. | 3.734% | 12/15/24 | 400 | 403 |
| Becton Dickinson & Co. | 4.685% | 12/15/44 | 200 | 203 |
| Becton Dickinson and Co. | 3.300% | 3/1/23 | 325 | 323 |
| Biogen Inc. | 6.875% | 3/1/18 | 100 | 110 |
| Biogen Inc. | 2.900% | 9/15/20 | 325 | 324 |
| Biogen Inc. | 3.625% | 9/15/22 | 175 | 177 |
| Biogen Inc. | 4.050% | 9/15/25 | 250 | 251 |
| Biogen Inc. | 5.200% | 9/15/45 | 310 | 310 |
| Boston Scientific Corp. | 2.650% | 10/1/18 | 285 | 287 |
| Boston Scientific Corp. | 6.000% | 1/15/20 | 200 | 222 |
| Boston Scientific Corp. | 2.850% | 5/15/20 | 100 | 99 |
| Boston Scientific Corp. | 3.375% | 5/15/22 | 50 | 49 |
| Boston Scientific Corp. | 3.850% | 5/15/25 | 150 | 148 |
| Boston Scientific Corp. | 7.000% | 11/15/35 | 50 | 59 |
| Boston Scientific Corp. | 7.375% | 1/15/40 | 50 | 61 |
| Bottling Group LLC | 5.125% | 1/15/19 | 100 | 109 |
| Bristol-Myers Squibb Co. | 2.000% | 8/1/22 | 275 | 267 |
| Bristol-Myers Squibb Co. | 7.150% | 6/15/23 | 200 | 254 |
| Bristol-Myers Squibb Co. | 5.875% | 11/15/36 | 62 | 76 |
| Bristol-Myers Squibb Co. | 6.125% | 5/1/38 | 20 | 25 |
| Bristol-Myers Squibb Co. | 3.250% | 8/1/42 | 100 | 87 |
269
Vanguard Total Bond Market Index Portfolio
| | | | | |
| Face | Market |
| Maturity Amount | Value • |
| | Coupon | Date | ($000) | ($000) |
| Bristol-Myers Squibb Co. | 4.500% | 3/1/44 | 50 | 54 |
| Brown-Forman Corp. | 1.000% | 1/15/18 | 150 | 148 |
| Brown-Forman Corp. | 2.250% | 1/15/23 | 50 | 48 |
| Brown-Forman Corp. | 3.750% | 1/15/43 | 25 | 23 |
| Brown-Forman Corp. | 4.500% | 7/15/45 | 100 | 103 |
| Bunge Ltd. Finance Corp. | 8.500% | 6/15/19 | 275 | 319 |
| Campbell Soup Co. | 3.050% | 7/15/17 | 25 | 26 |
| Campbell Soup Co. | 4.250% | 4/15/21 | 100 | 106 |
| Campbell Soup Co. | 3.300% | 3/19/25 | 125 | 124 |
| Campbell Soup Co. | 3.800% | 8/2/42 | 75 | 65 |
| Cardinal Health Inc. | 1.700% | 3/15/18 | 100 | 100 |
| Cardinal Health Inc. | 1.950% | 6/15/18 | 200 | 200 |
| Cardinal Health Inc. | 4.625% | 12/15/20 | 125 | 136 |
| Cardinal Health Inc. | 3.200% | 3/15/23 | 150 | 148 |
| Cardinal Health Inc. | 3.750% | 9/15/25 | 175 | 178 |
| Cardinal Health Inc. | 4.600% | 3/15/43 | 25 | 25 |
| Cardinal Health Inc. | 4.900% | 9/15/45 | 100 | 102 |
| 4 | Catholic Health Initiatives Colorado GO | 4.350% | 11/1/42 | 200 | 187 |
| Celgene Corp. | 1.900% | 8/15/17 | 75 | 75 |
| Celgene Corp. | 2.125% | 8/15/18 | 125 | 125 |
| Celgene Corp. | 2.300% | 8/15/18 | 100 | 100 |
| Celgene Corp. | 2.250% | 5/15/19 | 125 | 124 |
| Celgene Corp. | 2.875% | 8/15/20 | 125 | 124 |
| Celgene Corp. | 3.950% | 10/15/20 | 125 | 131 |
| Celgene Corp. | 3.250% | 8/15/22 | 175 | 173 |
| Celgene Corp. | 3.550% | 8/15/22 | 50 | 50 |
| Celgene Corp. | 4.000% | 8/15/23 | 125 | 128 |
| Celgene Corp. | 3.625% | 5/15/24 | 175 | 172 |
| Celgene Corp. | 3.875% | 8/15/25 | 425 | 423 |
| Celgene Corp. | 5.700% | 10/15/40 | 50 | 54 |
| Celgene Corp. | 5.250% | 8/15/43 | 425 | 434 |
| Celgene Corp. | 4.625% | 5/15/44 | 175 | 166 |
| Celgene Corp. | 5.000% | 8/15/45 | 125 | 126 |
| Children’s Hospital Medical Center | | | | |
| | Ohio GO | 4.268% | 5/15/44 | 50 | 49 |
| Church & Dwight Co. Inc. | 2.450% | 12/15/19 | 75 | 75 |
| Cleveland Clinic Foundation Ohio | | | | |
| | Revenue | 4.858% | 1/1/14 | 100 | 97 |
| Clorox Co. | 3.800% | 11/15/21 | 50 | 52 |
| Clorox Co. | 3.500% | 12/15/24 | 250 | 250 |
| Coca-Cola Bottling Co. Consolidated | 3.800% | 11/25/25 | 75 | 75 |
| Coca-Cola Co. | 1.150% | 4/1/18 | 336 | 335 |
| Coca-Cola Co. | 1.875% | 10/27/20 | 250 | 247 |
| Coca-Cola Co. | 2.450% | 11/1/20 | 750 | 762 |
| Coca-Cola Co. | 3.150% | 11/15/20 | 125 | 131 |
| Coca-Cola Co. | 3.300% | 9/1/21 | 250 | 261 |
| Coca-Cola Co. | 3.200% | 11/1/23 | 225 | 233 |
| Coca-Cola Co. | 2.875% | 10/27/25 | 300 | 295 |
| Coca-Cola Enterprises Inc. | 3.500% | 9/15/20 | 300 | 307 |
| Coca-Cola Femsa SAB de CV | 2.375% | 11/26/18 | 150 | 150 |
| Coca-Cola Femsa SAB de CV | 4.625% | 2/15/20 | 100 | 107 |
| Coca-Cola Femsa SAB de CV | 3.875% | 11/26/23 | 250 | 254 |
| Coca-Cola Femsa SAB de CV | 5.250% | 11/26/43 | 350 | 376 |
| Colgate-Palmolive Co. | 1.300% | 1/15/17 | 300 | 301 |
| Colgate-Palmolive Co. | 1.750% | 3/15/19 | 75 | 75 |
| Colgate-Palmolive Co. | 2.450% | 11/15/21 | 75 | 75 |
| Colgate-Palmolive Co. | 2.100% | 5/1/23 | 280 | 270 |
| Colgate-Palmolive Co. | 3.250% | 3/15/24 | 100 | 104 |
| Colgate-Palmolive Co. | 4.000% | 8/15/45 | 100 | 100 |
| ConAgra Foods Inc. | 1.900% | 1/25/18 | 75 | 75 |
| ConAgra Foods Inc. | 7.000% | 4/15/19 | 20 | 23 |
| ConAgra Foods Inc. | 3.250% | 9/15/22 | 125 | 120 |
| ConAgra Foods Inc. | 3.200% | 1/25/23 | 543 | 523 |
| ConAgra Foods Inc. | 7.125% | 10/1/26 | 150 | 179 |
| ConAgra Foods Inc. | 6.625% | 8/15/39 | 100 | 108 |
| ConAgra Foods Inc. | 4.650% | 1/25/43 | 66 | 59 |
| Covidien International Finance SA | 6.000% | 10/15/17 | 225 | 242 |
| Covidien International Finance SA | 3.200% | 6/15/22 | 200 | 200 |
| Covidien International Finance SA | 6.550% | 10/15/37 | 175 | 219 |
| CR Bard Inc. | 1.375% | 1/15/18 | 225 | 221 |
| CR Bard Inc. | 4.400% | 1/15/21 | 75 | 79 |
| | | | |
| Face | Market |
| Maturity Amount | Value • |
| Coupon | Date | ($000) | ($000) |
| Delhaize Group SA | 5.700% | 10/1/40 | 295 | 303 |
| Diageo Capital plc | 1.500% | 5/11/17 | 75 | 75 |
| Diageo Capital plc | 5.750% | 10/23/17 | 25 | 27 |
| Diageo Capital plc | 4.828% | 7/15/20 | 125 | 137 |
| Diageo Capital plc | 2.625% | 4/29/23 | 500 | 482 |
| Diageo Investment Corp. | 2.875% | 5/11/22 | 600 | 591 |
| Diageo Investment Corp. | 4.250% | 5/11/42 | 150 | 150 |
| Dignity Health California GO | 3.125% | 11/1/22 | 50 | 50 |
| Dignity Health California GO | 3.812% | 11/1/24 | 100 | 102 |
| Dignity Health California GO | 4.500% | 11/1/42 | 100 | 95 |
| Dignity Health California GO | 5.267% | 11/1/64 | 100 | 103 |
| Dr Pepper Snapple Group Inc. | 6.820% | 5/1/18 | 70 | 78 |
| Dr Pepper Snapple Group Inc. | 2.600% | 1/15/19 | 125 | 125 |
| Dr Pepper Snapple Group Inc. | 2.000% | 1/15/20 | 75 | 73 |
| Dr Pepper Snapple Group Inc. | 2.700% | 11/15/22 | 50 | 48 |
| Dr Pepper Snapple Group Inc. | 3.400% | 11/15/25 | 100 | 98 |
| Dr Pepper Snapple Group Inc. | 7.450% | 5/1/38 | 75 | 103 |
| Edwards Lifesciences Corp. | 2.875% | 10/15/18 | 50 | 51 |
| Eli Lilly & Co. | 5.200% | 3/15/17 | 110 | 115 |
| Eli Lilly & Co. | 1.250% | 3/1/18 | 200 | 200 |
| Eli Lilly & Co. | 1.950% | 3/15/19 | 125 | 126 |
| Eli Lilly & Co. | 2.750% | 6/1/25 | 150 | 149 |
| Eli Lilly & Co. | 5.550% | 3/15/37 | 60 | 72 |
| Eli Lilly & Co. | 3.700% | 3/1/45 | 160 | 150 |
| Estee Lauder Cos. Inc. | 2.350% | 8/15/22 | 75 | 73 |
| Estee Lauder Cos. Inc. | 6.000% | 5/15/37 | 75 | 91 |
| Estee Lauder Cos. Inc. | 3.700% | 8/15/42 | 25 | 22 |
| Estee Lauder Cos. Inc. | 4.375% | 6/15/45 | 50 | 50 |
| Express Scripts Holding Co. | 2.650% | 2/15/17 | 350 | 353 |
| Express Scripts Holding Co. | 7.250% | 6/15/19 | 50 | 58 |
| Express Scripts Holding Co. | 4.750% | 11/15/21 | 275 | 296 |
| Express Scripts Holding Co. | 3.900% | 2/15/22 | 200 | 206 |
| Express Scripts Holding Co. | 6.125% | 11/15/41 | 175 | 199 |
| Flowers Foods Inc. | 4.375% | 4/1/22 | 75 | 78 |
| Fomento Economico Mexicano SAB | | | | |
| de CV | 4.375% | 5/10/43 | 100 | 89 |
| General Mills Inc. | 5.700% | 2/15/17 | 150 | 157 |
| General Mills Inc. | 1.400% | 10/20/17 | 300 | 299 |
| General Mills Inc. | 5.650% | 2/15/19 | 275 | 302 |
| General Mills Inc. | 2.200% | 10/21/19 | 200 | 201 |
| General Mills Inc. | 3.150% | 12/15/21 | 25 | 25 |
| General Mills Inc. | 5.400% | 6/15/40 | 100 | 110 |
| Gilead Sciences Inc. | 1.850% | 9/4/18 | 125 | 125 |
| Gilead Sciences Inc. | 2.050% | 4/1/19 | 400 | 401 |
| Gilead Sciences Inc. | 2.350% | 2/1/20 | 105 | 105 |
| Gilead Sciences Inc. | 2.550% | 9/1/20 | 325 | 325 |
| Gilead Sciences Inc. | 4.500% | 4/1/21 | 150 | 162 |
| Gilead Sciences Inc. | 4.400% | 12/1/21 | 225 | 242 |
| Gilead Sciences Inc. | 3.250% | 9/1/22 | 175 | 176 |
| Gilead Sciences Inc. | 3.700% | 4/1/24 | 350 | 358 |
| Gilead Sciences Inc. | 3.500% | 2/1/25 | 225 | 226 |
| Gilead Sciences Inc. | 3.650% | 3/1/26 | 550 | 555 |
| Gilead Sciences Inc. | 4.600% | 9/1/35 | 150 | 152 |
| Gilead Sciences Inc. | 5.650% | 12/1/41 | 175 | 199 |
| Gilead Sciences Inc. | 4.800% | 4/1/44 | 300 | 300 |
| Gilead Sciences Inc. | 4.500% | 2/1/45 | 350 | 344 |
| Gilead Sciences Inc. | 4.750% | 3/1/46 | 435 | 438 |
| GlaxoSmithKline Capital Inc. | 5.650% | 5/15/18 | 675 | 736 |
| GlaxoSmithKline Capital Inc. | 2.800% | 3/18/23 | 50 | 50 |
| GlaxoSmithKline Capital Inc. | 6.375% | 5/15/38 | 550 | 701 |
| GlaxoSmithKline Capital Inc. | 4.200% | 3/18/43 | 100 | 101 |
| GlaxoSmithKline Capital plc | 1.500% | 5/8/17 | 525 | 527 |
| GlaxoSmithKline Capital plc | 2.850% | 5/8/22 | 100 | 101 |
| Hasbro Inc. | 6.300% | 9/15/17 | 175 | 187 |
| Hasbro Inc. | 6.350% | 3/15/40 | 125 | 137 |
| Hasbro Inc. | 5.100% | 5/15/44 | 50 | 47 |
| Hershey Co. | 1.600% | 8/21/18 | 75 | 75 |
| Hershey Co. | 4.125% | 12/1/20 | 75 | 81 |
| Hershey Co. | 2.625% | 5/1/23 | 100 | 98 |
| Hershey Co. | 3.200% | 8/21/25 | 65 | 66 |
| Hillshire Brands Co. | 4.100% | 9/15/20 | 50 | 51 |
270
Vanguard Total Bond Market Index Portfolio
| | | | | |
| Face | Market |
| Maturity Amount | Value • |
| | Coupon | Date | ($000) | ($000) |
| Hormel Foods Corp. | 4.125% | 4/15/21 | 25 | 27 |
| Ingredion Inc. | 4.625% | 11/1/20 | 25 | 26 |
| Ingredion Inc. | 6.625% | 4/15/37 | 25 | 30 |
| International Flavors & Fragrances Inc. | 3.200% | 5/1/23 | 25 | 24 |
| JM Smucker Co. | 1.750% | 3/15/18 | 75 | 75 |
| JM Smucker Co. | 2.500% | 3/15/20 | 75 | 75 |
| JM Smucker Co. | 3.500% | 10/15/21 | 125 | 129 |
| JM Smucker Co. | 3.000% | 3/15/22 | 100 | 99 |
| JM Smucker Co. | 3.500% | 3/15/25 | 150 | 149 |
| JM Smucker Co. | 4.250% | 3/15/35 | 150 | 146 |
| JM Smucker Co. | 4.375% | 3/15/45 | 100 | 97 |
| Johnson & Johnson | 5.550% | 8/15/17 | 500 | 535 |
| Johnson & Johnson | 5.150% | 7/15/18 | 150 | 164 |
| Johnson & Johnson | 2.950% | 9/1/20 | 100 | 105 |
| Johnson & Johnson | 3.375% | 12/5/23 | 200 | 212 |
| Johnson & Johnson | 6.950% | 9/1/29 | 25 | 36 |
| Johnson & Johnson | 4.950% | 5/15/33 | 150 | 175 |
| Johnson & Johnson | 4.375% | 12/5/33 | 100 | 110 |
| Johnson & Johnson | 5.950% | 8/15/37 | 375 | 484 |
| Johnson & Johnson | 4.500% | 9/1/40 | 150 | 164 |
| Kaiser Foundation Hospitals | 3.500% | 4/1/22 | 50 | 51 |
| Kaiser Foundation Hospitals | 4.875% | 4/1/42 | 100 | 103 |
| Kellogg Co. | 4.150% | 11/15/19 | 125 | 132 |
| Kellogg Co. | 4.000% | 12/15/20 | 647 | 680 |
| Kimberly-Clark Corp. | 6.125% | 8/1/17 | 275 | 296 |
| Kimberly-Clark Corp. | 6.250% | 7/15/18 | 50 | 56 |
| Kimberly-Clark Corp. | 3.625% | 8/1/20 | 140 | 148 |
| Kimberly-Clark Corp. | 2.150% | 8/15/20 | 50 | 50 |
| Kimberly-Clark Corp. | 2.650% | 3/1/25 | 125 | 121 |
| Kimberly-Clark Corp. | 3.050% | 8/15/25 | 50 | 50 |
| Kimberly-Clark Corp. | 6.625% | 8/1/37 | 250 | 333 |
| Koninklijke Philips NV | 5.750% | 3/11/18 | 100 | 107 |
| Koninklijke Philips NV | 3.750% | 3/15/22 | 200 | 205 |
| Koninklijke Philips NV | 6.875% | 3/11/38 | 80 | 93 |
| Koninklijke Philips NV | 5.000% | 3/15/42 | 50 | 48 |
| Kraft Foods Group Inc. | 2.250% | 6/5/17 | 150 | 151 |
| Kraft Foods Group Inc. | 6.125% | 8/23/18 | 75 | 83 |
| Kraft Foods Group Inc. | 5.375% | 2/10/20 | 138 | 151 |
| Kraft Foods Group Inc. | 3.500% | 6/6/22 | 150 | 152 |
| Kraft Foods Group Inc. | 6.875% | 1/26/39 | 425 | 505 |
| Kraft Foods Group Inc. | 5.000% | 6/4/42 | 410 | 413 |
| 7 | Kraft Heinz Foods Co. | 1.600% | 6/30/17 | 200 | 199 |
| 7 | Kraft Heinz Foods Co. | 2.000% | 7/2/18 | 200 | 199 |
| 7 | Kraft Heinz Foods Co. | 2.800% | 7/2/20 | 280 | 279 |
| 7 | Kraft Heinz Foods Co. | 3.500% | 7/15/22 | 200 | 201 |
| 7 | Kraft Heinz Foods Co. | 3.950% | 7/15/25 | 360 | 363 |
| 7 | Kraft Heinz Foods Co. | 5.000% | 7/15/35 | 170 | 174 |
| 7 | Kraft Heinz Foods Co. | 5.200% | 7/15/45 | 195 | 204 |
| Kroger Co. | 2.200% | 1/15/17 | 100 | 101 |
| Kroger Co. | 6.150% | 1/15/20 | 125 | 141 |
| Kroger Co. | 3.300% | 1/15/21 | 250 | 254 |
| Kroger Co. | 2.950% | 11/1/21 | 150 | 148 |
| Kroger Co. | 3.400% | 4/15/22 | 250 | 253 |
| Kroger Co. | 4.000% | 2/1/24 | 175 | 182 |
| Kroger Co. | 7.700% | 6/1/29 | 50 | 66 |
| Kroger Co. | 8.000% | 9/15/29 | 125 | 168 |
| Kroger Co. | 7.500% | 4/1/31 | 100 | 127 |
| Kroger Co. | 6.900% | 4/15/38 | 75 | 92 |
| Kroger Co. | 5.150% | 8/1/43 | 100 | 105 |
| Laboratory Corp. of America Holdings | 2.200% | 8/23/17 | 25 | 25 |
| Laboratory Corp. of America Holdings | 2.500% | 11/1/18 | 50 | 50 |
| Laboratory Corp. of America Holdings | 2.625% | 2/1/20 | 50 | 50 |
| Laboratory Corp. of America Holdings | 3.200% | 2/1/22 | 75 | 74 |
| Laboratory Corp. of America Holdings | 3.750% | 8/23/22 | 25 | 25 |
| Laboratory Corp. of America Holdings | 3.600% | 2/1/25 | 150 | 145 |
| Laboratory Corp. of America Holdings | 4.700% | 2/1/45 | 170 | 155 |
| Life Technologies Corp. | 6.000% | 3/1/20 | 125 | 139 |
| Life Technologies Corp. | 5.000% | 1/15/21 | 200 | 213 |
| Mattel Inc. | 1.700% | 3/15/18 | 50 | 49 |
| Mattel Inc. | 2.350% | 5/6/19 | 200 | 199 |
| Mattel Inc. | 3.150% | 3/15/23 | 25 | 24 |
| | | | | |
| Face | Market |
| Maturity Amount | Value • |
| | Coupon | Date | ($000) | ($000) |
| Mattel Inc. | 5.450% | 11/1/41 | 75 | 74 |
| 4 | Mayo Clinic | 3.774% | 11/15/43 | 75 | 70 |
| 4 | Mayo Clinic | 4.000% | 11/15/47 | 100 | 95 |
| McCormick & Co. Inc. | 3.900% | 7/15/21 | 50 | 53 |
| McKesson Corp. | 1.292% | 3/10/17 | 250 | 249 |
| McKesson Corp. | 7.500% | 2/15/19 | 250 | 286 |
| McKesson Corp. | 2.284% | 3/15/19 | 150 | 150 |
| McKesson Corp. | 4.750% | 3/1/21 | 25 | 27 |
| McKesson Corp. | 3.796% | 3/15/24 | 200 | 201 |
| McKesson Corp. | 6.000% | 3/1/41 | 200 | 231 |
| Mead Johnson Nutrition Co. | 4.900% | 11/1/19 | 100 | 108 |
| Mead Johnson Nutrition Co. | 3.000% | 11/15/20 | 100 | 100 |
| Mead Johnson Nutrition Co. | 4.125% | 11/15/25 | 125 | 126 |
| Mead Johnson Nutrition Co. | 5.900% | 11/1/39 | 100 | 109 |
| Medco Health Solutions Inc. | 7.125% | 3/15/18 | 250 | 276 |
| Medtronic Inc. | 1.500% | 3/15/18 | 150 | 150 |
| Medtronic Inc. | 5.600% | 3/15/19 | 25 | 28 |
| Medtronic Inc. | 2.500% | 3/15/20 | 400 | 402 |
| Medtronic Inc. | 4.450% | 3/15/20 | 125 | 135 |
| Medtronic Inc. | 3.125% | 3/15/22 | 260 | 262 |
| Medtronic Inc. | 3.150% | 3/15/22 | 650 | 656 |
| Medtronic Inc. | 2.750% | 4/1/23 | 275 | 268 |
| Medtronic Inc. | 3.625% | 3/15/24 | 50 | 51 |
| Medtronic Inc. | 3.500% | 3/15/25 | 850 | 860 |
| Medtronic Inc. | 4.375% | 3/15/35 | 500 | 505 |
| Medtronic Inc. | 6.500% | 3/15/39 | 25 | 32 |
| Medtronic Inc. | 5.550% | 3/15/40 | 350 | 403 |
| Medtronic Inc. | 4.500% | 3/15/42 | 21 | 21 |
| Medtronic Inc. | 4.000% | 4/1/43 | 100 | 93 |
| Medtronic Inc. | 4.625% | 3/15/44 | 55 | 56 |
| Medtronic Inc. | 4.625% | 3/15/45 | 625 | 645 |
| Memorial Sloan-Kettering Cancer | | | | |
| | Center | 4.200% | 7/1/55 | 25 | 24 |
| Memorial Sloan-Kettering Cancer | | | | |
| | Center New York GO | 5.000% | 7/1/42 | 50 | 54 |
| Memorial Sloan-Kettering Cancer | | | | |
| | Center New York GO | 4.125% | 7/1/52 | 150 | 139 |
| Merck & Co. Inc. | 1.100% | 1/31/18 | 50 | 50 |
| Merck & Co. Inc. | 1.850% | 2/10/20 | 200 | 200 |
| Merck & Co. Inc. | 3.875% | 1/15/21 | 250 | 268 |
| Merck & Co. Inc. | 2.350% | 2/10/22 | 225 | 221 |
| Merck & Co. Inc. | 2.400% | 9/15/22 | 250 | 244 |
| Merck & Co. Inc. | 2.750% | 2/10/25 | 200 | 194 |
| Merck & Co. Inc. | 6.500% | 12/1/33 | 75 | 96 |
| Merck & Co. Inc. | 6.550% | 9/15/37 | 125 | 164 |
| Merck & Co. Inc. | 3.600% | 9/15/42 | 75 | 68 |
| Merck & Co. Inc. | 4.150% | 5/18/43 | 300 | 297 |
| Merck & Co. Inc. | 3.700% | 2/10/45 | 675 | 621 |
| Merck Sharp & Dohme Corp. | 5.000% | 6/30/19 | 100 | 110 |
| Merck Sharp & Dohme Corp. | 5.750% | 11/15/36 | 150 | 180 |
| Molson Coors Brewing Co. | 2.000% | 5/1/17 | 25 | 25 |
| Molson Coors Brewing Co. | 3.500% | 5/1/22 | 25 | 25 |
| Molson Coors Brewing Co. | 5.000% | 5/1/42 | 100 | 97 |
| Mondelez International Inc. | 6.500% | 8/11/17 | 75 | 81 |
| Mondelez International Inc. | 6.125% | 2/1/18 | 125 | 136 |
| Mondelez International Inc. | 2.250% | 2/1/19 | 100 | 100 |
| Mondelez International Inc. | 5.375% | 2/10/20 | 460 | 509 |
| Mondelez International Inc. | 6.500% | 11/1/31 | 100 | 117 |
| Mondelez International Inc. | 6.500% | 2/9/40 | 100 | 123 |
| Mylan Inc. | 2.600% | 6/24/18 | 20 | 20 |
| Mylan Inc. | 2.550% | 3/28/19 | 275 | 271 |
| Mylan Inc. | 4.200% | 11/29/23 | 250 | 245 |
| Mylan Inc. | 5.400% | 11/29/43 | 75 | 70 |
| New York & Presbyterian Hospital | 4.024% | 8/1/45 | 100 | 94 |
| Newell Rubbermaid Inc. | 2.050% | 12/1/17 | 300 | 297 |
| Newell Rubbermaid Inc. | 2.150% | 10/15/18 | 50 | 49 |
| Newell Rubbermaid Inc. | 4.000% | 12/1/24 | 200 | 186 |
| Newell Rubbermaid Inc. | 3.900% | 11/1/25 | 50 | 46 |
| Novant Health Inc. | 5.850% | 11/1/19 | 150 | 168 |
| Novant Health Inc. | 4.371% | 11/1/43 | 150 | 144 |
| Novartis Capital Corp. | 2.400% | 9/21/22 | 75 | 74 |
271
Vanguard Total Bond Market Index Portfolio
| | | | | |
| Face | Market |
| Maturity Amount | Value • |
| | Coupon | Date | ($000) | ($000) |
| Novartis Capital Corp. | 3.400% | 5/6/24 | 400 | 413 |
| Novartis Capital Corp. | 3.000% | 11/20/25 | 300 | 296 |
| Novartis Capital Corp. | 3.700% | 9/21/42 | 75 | 71 |
| Novartis Capital Corp. | 4.400% | 5/6/44 | 350 | 364 |
| Novartis Capital Corp. | 4.000% | 11/20/45 | 250 | 245 |
| Novartis Securities Investment Ltd. | 5.125% | 2/10/19 | 650 | 713 |
| NYU Hospitals Center | 4.784% | 7/1/44 | 100 | 101 |
| Partners Healthcare System | | | | |
| | Massachusetts GO | 3.443% | 7/1/21 | 100 | 103 |
| PepsiAmericas Inc. | 5.000% | 5/15/17 | 100 | 105 |
| PepsiCo Inc. | 1.125% | 7/17/17 | 100 | 100 |
| PepsiCo Inc. | 1.250% | 8/13/17 | 200 | 200 |
| PepsiCo Inc. | 1.000% | 10/13/17 | 75 | 75 |
| PepsiCo Inc. | 1.250% | 4/30/18 | 325 | 324 |
| PepsiCo Inc. | 5.000% | 6/1/18 | 325 | 351 |
| PepsiCo Inc. | 7.900% | 11/1/18 | 275 | 322 |
| PepsiCo Inc. | 4.500% | 1/15/20 | 25 | 27 |
| PepsiCo Inc. | 1.850% | 4/30/20 | 675 | 669 |
| PepsiCo Inc. | 2.150% | 10/14/20 | 375 | 373 |
| PepsiCo Inc. | 3.000% | 8/25/21 | 150 | 154 |
| PepsiCo Inc. | 2.750% | 3/5/22 | 275 | 276 |
| PepsiCo Inc. | 2.750% | 4/30/25 | 450 | 440 |
| PepsiCo Inc. | 3.500% | 7/17/25 | 125 | 129 |
| PepsiCo Inc. | 5.500% | 1/15/40 | 250 | 292 |
| PepsiCo Inc. | 4.875% | 11/1/40 | 200 | 215 |
| PepsiCo Inc. | 4.000% | 3/5/42 | 175 | 169 |
| PepsiCo Inc. | 4.250% | 10/22/44 | 100 | 99 |
| PepsiCo Inc. | 4.450% | 4/14/46 | 125 | 129 |
| PerkinElmer Inc. | 5.000% | 11/15/21 | 100 | 105 |
| Perrigo Co. plc | 2.300% | 11/8/18 | 310 | 306 |
| Perrigo Co. plc | 5.300% | 11/15/43 | 150 | 144 |
| Perrigo Finance plc | 3.900% | 12/15/24 | 200 | 193 |
| Pfizer Inc. | 6.200% | 3/15/19 | 750 | 844 |
| Pfizer Inc. | 2.100% | 5/15/19 | 450 | 453 |
| Pfizer Inc. | 3.400% | 5/15/24 | 250 | 256 |
| Pfizer Inc. | 7.200% | 3/15/39 | 275 | 378 |
| Pfizer Inc. | 4.400% | 5/15/44 | 100 | 101 |
| Pharmacia Corp. | 6.600% | 12/1/28 | 75 | 96 |
| Philip Morris International Inc. | 1.625% | 3/20/17 | 50 | 50 |
| Philip Morris International Inc. | 1.250% | 8/11/17 | 325 | 325 |
| Philip Morris International Inc. | 1.125% | 8/21/17 | 75 | 75 |
| Philip Morris International Inc. | 1.250% | 11/9/17 | 125 | 125 |
| Philip Morris International Inc. | 5.650% | 5/16/18 | 325 | 355 |
| Philip Morris International Inc. | 2.625% | 3/6/23 | 100 | 98 |
| Philip Morris International Inc. | 3.250% | 11/10/24 | 225 | 227 |
| Philip Morris International Inc. | 3.375% | 8/11/25 | 400 | 405 |
| Philip Morris International Inc. | 6.375% | 5/16/38 | 200 | 251 |
| Philip Morris International Inc. | 4.375% | 11/15/41 | 425 | 423 |
| Philip Morris International Inc. | 4.500% | 3/20/42 | 100 | 100 |
| Philip Morris International Inc. | 3.875% | 8/21/42 | 25 | 23 |
| Philip Morris International Inc. | 4.125% | 3/4/43 | 125 | 118 |
| Philip Morris International Inc. | 4.875% | 11/15/43 | 150 | 158 |
| 4 | Procter & Gamble - Esop | 9.360% | 1/1/21 | 255 | 304 |
| Procter & Gamble Co. | 4.700% | 2/15/19 | 100 | 109 |
| Procter & Gamble Co. | 2.300% | 2/6/22 | 425 | 426 |
| Procter & Gamble Co. | 3.100% | 8/15/23 | 150 | 156 |
| Procter & Gamble Co. | 6.450% | 1/15/26 | 75 | 95 |
| Procter & Gamble Co. | 5.500% | 2/1/34 | 125 | 149 |
| Procter & Gamble Co. | 5.550% | 3/5/37 | 305 | 373 |
| Quest Diagnostics Inc. | 2.700% | 4/1/19 | 75 | 75 |
| Quest Diagnostics Inc. | 2.500% | 3/30/20 | 70 | 69 |
| Quest Diagnostics Inc. | 4.250% | 4/1/24 | 100 | 103 |
| Quest Diagnostics Inc. | 3.500% | 3/30/25 | 125 | 121 |
| Quest Diagnostics Inc. | 5.750% | 1/30/40 | 50 | 52 |
| Quest Diagnostics Inc. | 4.700% | 3/30/45 | 100 | 90 |
| Reynolds American Inc. | 6.750% | 6/15/17 | 150 | 160 |
| Reynolds American Inc. | 2.300% | 6/12/18 | 225 | 226 |
| Reynolds American Inc. | 8.125% | 6/23/19 | 175 | 206 |
| Reynolds American Inc. | 3.250% | 6/12/20 | 445 | 452 |
| Reynolds American Inc. | 4.000% | 6/12/22 | 175 | 182 |
| Reynolds American Inc. | 3.250% | 11/1/22 | 90 | 89 |
| | | | | |
| Face | Market |
| Maturity Amount | Value • |
| | Coupon | Date | ($000) | ($000) |
| Reynolds American Inc. | 3.750% | 5/20/23 | 100 | 100 |
| Reynolds American Inc. | 4.850% | 9/15/23 | 25 | 27 |
| Reynolds American Inc. | 4.450% | 6/12/25 | 475 | 497 |
| Reynolds American Inc. | 5.700% | 8/15/35 | 175 | 192 |
| Reynolds American Inc. | 7.250% | 6/15/37 | 125 | 154 |
| Reynolds American Inc. | 7.000% | 8/4/41 | 75 | 85 |
| Reynolds American Inc. | 4.750% | 11/1/42 | 75 | 72 |
| Reynolds American Inc. | 6.150% | 9/15/43 | 25 | 28 |
| Reynolds American Inc. | 5.850% | 8/15/45 | 380 | 421 |
| Sanofi | 1.250% | 4/10/18 | 275 | 274 |
| Sanofi | 4.000% | 3/29/21 | 350 | 374 |
| Southern Baptist Hospital of Florida Inc. | 4.857% | 7/15/45 | 25 | 26 |
| St. Jude Medical Inc. | 2.000% | 9/15/18 | 100 | 100 |
| St. Jude Medical Inc. | 2.800% | 9/15/20 | 100 | 100 |
| St. Jude Medical Inc. | 3.250% | 4/15/23 | 175 | 172 |
| St. Jude Medical Inc. | 3.875% | 9/15/25 | 75 | 76 |
| St. Jude Medical Inc. | 4.750% | 4/15/43 | 175 | 172 |
| Stryker Corp. | 4.375% | 1/15/20 | 50 | 54 |
| Stryker Corp. | 3.375% | 5/15/24 | 200 | 201 |
| Stryker Corp. | 3.375% | 11/1/25 | 100 | 99 |
| Stryker Corp. | 4.375% | 5/15/44 | 50 | 49 |
| Sysco Corp. | 5.250% | 2/12/18 | 250 | 267 |
| Sysco Corp. | 2.600% | 10/1/20 | 100 | 100 |
| Sysco Corp. | 3.750% | 10/1/25 | 100 | 101 |
| Sysco Corp. | 5.375% | 9/21/35 | 100 | 111 |
| Sysco Corp. | 4.850% | 10/1/45 | 50 | 52 |
| Teva Pharmaceutical Finance Co. BV | 3.650% | 11/10/21 | 300 | 305 |
| Teva Pharmaceutical Finance Co. BV | 2.950% | 12/18/22 | 422 | 404 |
| Teva Pharmaceutical Finance IV BV | 3.650% | 11/10/21 | 129 | 130 |
| 4 | Texas Health Resources | 4.330% | 11/15/55 | 25 | 24 |
| The Pepsi Bottling Group Inc. | 7.000% | 3/1/29 | 250 | 335 |
| Thermo Fisher Scientific Inc. | 2.150% | 12/14/18 | 75 | 75 |
| Thermo Fisher Scientific Inc. | 4.500% | 3/1/21 | 300 | 318 |
| Thermo Fisher Scientific Inc. | 3.300% | 2/15/22 | 200 | 200 |
| Thermo Fisher Scientific Inc. | 3.150% | 1/15/23 | 100 | 98 |
| Thermo Fisher Scientific Inc. | 3.650% | 12/15/25 | 500 | 497 |
| Trinity Health Corp. | 4.125% | 12/1/45 | 50 | 47 |
| Tupperware Brands Corp. | 4.750% | 6/1/21 | 50 | 51 |
| Tyson Foods Inc. | 4.500% | 6/15/22 | 275 | 292 |
| Tyson Foods Inc. | 3.950% | 8/15/24 | 100 | 103 |
| Tyson Foods Inc. | 4.875% | 8/15/34 | 250 | 255 |
| Tyson Foods Inc. | 5.150% | 8/15/44 | 100 | 105 |
| Unilever Capital Corp. | 2.200% | 3/6/19 | 200 | 203 |
| Unilever Capital Corp. | 2.100% | 7/30/20 | 350 | 349 |
| Unilever Capital Corp. | 4.250% | 2/10/21 | 200 | 218 |
| Unilever Capital Corp. | 3.100% | 7/30/25 | 225 | 228 |
| Unilever Capital Corp. | 5.900% | 11/15/32 | 50 | 63 |
| Whirlpool Corp. | 1.350% | 3/1/17 | 175 | 175 |
| Whirlpool Corp. | 1.650% | 11/1/17 | 100 | 100 |
| Whirlpool Corp. | 4.000% | 3/1/24 | 175 | 179 |
| Whirlpool Corp. | 3.700% | 5/1/25 | 75 | 74 |
| 7 | Whole Foods Market Inc. | 5.200% | 12/3/25 | 350 | 350 |
| Wyeth LLC | 5.450% | 4/1/17 | 50 | 53 |
| Wyeth LLC | 7.250% | 3/1/23 | 250 | 313 |
| Wyeth LLC | 6.450% | 2/1/24 | 100 | 122 |
| Wyeth LLC | 6.500% | 2/1/34 | 150 | 188 |
| Wyeth LLC | 6.000% | 2/15/36 | 85 | 101 |
| Wyeth LLC | 5.950% | 4/1/37 | 485 | 577 |
| Zeneca Wilmington Inc. | 7.000% | 11/15/23 | 25 | 31 |
| Zimmer Biomet Holdings Inc. | 1.450% | 4/1/17 | 125 | 124 |
| Zimmer Biomet Holdings Inc. | 2.000% | 4/1/18 | 200 | 199 |
| Zimmer Biomet Holdings Inc. | 4.625% | 11/30/19 | 50 | 54 |
| Zimmer Biomet Holdings Inc. | 2.700% | 4/1/20 | 200 | 198 |
| Zimmer Biomet Holdings Inc. | 3.375% | 11/30/21 | 100 | 100 |
| Zimmer Biomet Holdings Inc. | 3.150% | 4/1/22 | 175 | 172 |
| Zimmer Biomet Holdings Inc. | 3.550% | 4/1/25 | 250 | 243 |
| Zimmer Biomet Holdings Inc. | 4.250% | 8/15/35 | 200 | 187 |
| Zimmer Biomet Holdings Inc. | 5.750% | 11/30/39 | 50 | 55 |
| Zimmer Biomet Holdings Inc. | 4.450% | 8/15/45 | 250 | 231 |
| Zoetis Inc. | 1.150% | 2/1/16 | 25 | 25 |
| Zoetis Inc. | 1.875% | 2/1/18 | 25 | 25 |
272
Vanguard Total Bond Market Index Portfolio
| | | | | |
| Face | Market |
| Maturity Amount | Value • |
| | Coupon | Date | ($000) | ($000) |
| Zoetis Inc. | 3.450% | 11/13/20 | 75 | 75 |
| Zoetis Inc. | 3.250% | 2/1/23 | 300 | 286 |
| Zoetis Inc. | 4.500% | 11/13/25 | 100 | 101 |
| Zoetis Inc. | 4.700% | 2/1/43 | 200 | 175 |
| | | | |
| Energy (2.6%) | | | | |
| Alberta Energy Co. Ltd. | 7.375% | 11/1/31 | 125 | 120 |
| Anadarko Petroleum Corp. | 6.375% | 9/15/17 | 335 | 351 |
| Anadarko Petroleum Corp. | 6.450% | 9/15/36 | 200 | 191 |
| Anadarko Petroleum Corp. | 7.950% | 6/15/39 | 25 | 28 |
| Anadarko Petroleum Corp. | 6.200% | 3/15/40 | 275 | 258 |
| Anadarko Petroleum Corp. | 4.500% | 7/15/44 | 200 | 155 |
| Apache Corp. | 6.900% | 9/15/18 | 300 | 329 |
| Apache Corp. | 3.625% | 2/1/21 | 75 | 74 |
| Apache Corp. | 6.000% | 1/15/37 | 350 | 338 |
| Apache Corp. | 5.100% | 9/1/40 | 350 | 299 |
| Apache Corp. | 4.750% | 4/15/43 | 200 | 169 |
| Baker Hughes Inc. | 3.200% | 8/15/21 | 300 | 297 |
| Baker Hughes Inc. | 6.875% | 1/15/29 | 100 | 119 |
| Baker Hughes Inc. | 5.125% | 9/15/40 | 275 | 273 |
| Boardwalk Pipelines LP | 5.500% | 2/1/17 | 100 | 101 |
| Boardwalk Pipelines LP | 3.375% | 2/1/23 | 100 | 81 |
| Boardwalk Pipelines LP | 4.950% | 12/15/24 | 150 | 130 |
| BP Capital Markets plc | 1.846% | 5/5/17 | 225 | 226 |
| BP Capital Markets plc | 1.375% | 11/6/17 | 200 | 198 |
| BP Capital Markets plc | 1.674% | 2/13/18 | 300 | 300 |
| BP Capital Markets plc | 4.750% | 3/10/19 | 175 | 187 |
| BP Capital Markets plc | 2.237% | 5/10/19 | 425 | 421 |
| BP Capital Markets plc | 2.315% | 2/13/20 | 500 | 494 |
| BP Capital Markets plc | 4.500% | 10/1/20 | 425 | 455 |
| BP Capital Markets plc | 4.742% | 3/11/21 | 350 | 381 |
| BP Capital Markets plc | 3.062% | 3/17/22 | 25 | 24 |
| BP Capital Markets plc | 3.245% | 5/6/22 | 250 | 249 |
| BP Capital Markets plc | 2.500% | 11/6/22 | 75 | 72 |
| BP Capital Markets plc | 2.750% | 5/10/23 | 300 | 281 |
| BP Capital Markets plc | 3.994% | 9/26/23 | 200 | 203 |
| BP Capital Markets plc | 3.814% | 2/10/24 | 400 | 399 |
| BP Capital Markets plc | 3.506% | 3/17/25 | 200 | 195 |
| Buckeye Partners LP | 2.650% | 11/15/18 | 225 | 214 |
| Buckeye Partners LP | 4.150% | 7/1/23 | 75 | 65 |
| Buckeye Partners LP | 5.850% | 11/15/43 | 25 | 19 |
| Buckeye Partners LP | 5.600% | 10/15/44 | 75 | 56 |
| Burlington Resources Finance Co. | 7.400% | 12/1/31 | 175 | 209 |
| Cameron International Corp. | 6.375% | 7/15/18 | 150 | 163 |
| Cameron International Corp. | 4.000% | 12/15/23 | 250 | 251 |
| Cameron International Corp. | 3.700% | 6/15/24 | 100 | 98 |
| Cameron International Corp. | 7.000% | 7/15/38 | 100 | 120 |
| Canadian Natural Resources Ltd. | 5.700% | 5/15/17 | 225 | 230 |
| Canadian Natural Resources Ltd. | 7.200% | 1/15/32 | 225 | 233 |
| Canadian Natural Resources Ltd. | 6.450% | 6/30/33 | 125 | 121 |
| Canadian Natural Resources Ltd. | 6.500% | 2/15/37 | 150 | 141 |
| Cenovus Energy Inc. | 5.700% | 10/15/19 | 50 | 53 |
| Cenovus Energy Inc. | 6.750% | 11/15/39 | 375 | 357 |
| Cenovus Energy Inc. | 4.450% | 9/15/42 | 150 | 110 |
| Cenovus Energy Inc. | 5.200% | 9/15/43 | 100 | 79 |
| Chevron Corp. | 1.344% | 11/9/17 | 250 | 249 |
| Chevron Corp. | 1.345% | 11/15/17 | 450 | 448 |
| Chevron Corp. | 1.104% | 12/5/17 | 175 | 174 |
| Chevron Corp. | 1.365% | 3/2/18 | 175 | 174 |
| Chevron Corp. | 1.718% | 6/24/18 | 350 | 348 |
| Chevron Corp. | 1.790% | 11/16/18 | 300 | 298 |
| Chevron Corp. | 4.950% | 3/3/19 | 275 | 299 |
| Chevron Corp. | 2.193% | 11/15/19 | 300 | 299 |
| Chevron Corp. | 1.961% | 3/3/20 | 275 | 270 |
| Chevron Corp. | 2.419% | 11/17/20 | 200 | 199 |
| Chevron Corp. | 2.411% | 3/3/22 | 125 | 121 |
| Chevron Corp. | 2.355% | 12/5/22 | 325 | 310 |
| Chevron Corp. | 3.191% | 6/24/23 | 400 | 402 |
| Cimarex Energy Co. | 4.375% | 6/1/24 | 200 | 179 |
| 7 | Columbia Pipeline Group Inc. | 2.450% | 6/1/18 | 100 | 99 |
| 7 | Columbia Pipeline Group Inc. | 3.300% | 6/1/20 | 125 | 122 |
| | | | | |
| Face | Market |
| Maturity Amount | Value • |
| | Coupon | Date | ($000) | ($000) |
| 7 | Columbia Pipeline Group Inc. | 4.500% | 6/1/25 | 200 | 181 |
| ConocoPhillips | 5.750% | 2/1/19 | 875 | 947 |
| ConocoPhillips | 5.900% | 10/15/32 | 50 | 51 |
| ConocoPhillips | 5.900% | 5/15/38 | 150 | 147 |
| ConocoPhillips | 6.500% | 2/1/39 | 475 | 500 |
| ConocoPhillips Canada Funding Co. I | 5.950% | 10/15/36 | 200 | 206 |
| ConocoPhillips Co. | 2.400% | 12/15/22 | 250 | 227 |
| ConocoPhillips Co. | 3.350% | 11/15/24 | 250 | 232 |
| ConocoPhillips Co. | 4.150% | 11/15/34 | 100 | 87 |
| ConocoPhillips Co. | 4.300% | 11/15/44 | 125 | 103 |
| ConocoPhillips Holding Co. | 6.950% | 4/15/29 | 150 | 171 |
| Continental Resources Inc. | 5.000% | 9/15/22 | 350 | 257 |
| Continental Resources Inc. | 4.500% | 4/15/23 | 225 | 161 |
| Continental Resources Inc. | 3.800% | 6/1/24 | 600 | 421 |
| Devon Energy Corp. | 4.000% | 7/15/21 | 100 | 91 |
| Devon Energy Corp. | 3.250% | 5/15/22 | 125 | 106 |
| Devon Energy Corp. | 7.950% | 4/15/32 | 50 | 52 |
| Devon Energy Corp. | 5.600% | 7/15/41 | 250 | 189 |
| Devon Energy Corp. | 4.750% | 5/15/42 | 75 | 55 |
| Devon Financing Corp. LLC | 7.875% | 9/30/31 | 300 | 309 |
| Diamond Offshore Drilling Inc. | 5.875% | 5/1/19 | 75 | 76 |
| Diamond Offshore Drilling Inc. | 3.450% | 11/1/23 | 25 | 20 |
| Diamond Offshore Drilling Inc. | 5.700% | 10/15/39 | 100 | 68 |
| Diamond Offshore Drilling Inc. | 4.875% | 11/1/43 | 125 | 76 |
| Dominion Gas Holdings LLC | 2.800% | 11/15/20 | 200 | 201 |
| Dominion Gas Holdings LLC | 3.600% | 12/15/24 | 200 | 198 |
| Dominion Gas Holdings LLC | 4.600% | 12/15/44 | 400 | 372 |
| Enable Midstream Partners LP | 2.400% | 5/15/19 | 100 | 90 |
| Enable Midstream Partners LP | 3.900% | 5/15/24 | 100 | 78 |
| Enable Midstream Partners LP | 5.000% | 5/15/44 | 100 | 59 |
| Enbridge Energy Partners LP | 6.500% | 4/15/18 | 75 | 79 |
| Enbridge Energy Partners LP | 9.875% | 3/1/19 | 225 | 256 |
| Enbridge Energy Partners LP | 4.375% | 10/15/20 | 100 | 98 |
| Enbridge Energy Partners LP | 5.875% | 10/15/25 | 150 | 145 |
| Enbridge Energy Partners LP | 7.500% | 4/15/38 | 150 | 149 |
| Enbridge Inc. | 4.500% | 6/10/44 | 100 | 68 |
| Encana Corp. | 6.500% | 8/15/34 | 325 | 271 |
| Encana Corp. | 6.625% | 8/15/37 | 125 | 104 |
| Encana Corp. | 5.150% | 11/15/41 | 100 | 69 |
| Energy Transfer Partners LP | 6.125% | 2/15/17 | 50 | 51 |
| Energy Transfer Partners LP | 2.500% | 6/15/18 | 100 | 95 |
| Energy Transfer Partners LP | 9.000% | 4/15/19 | 229 | 252 |
| Energy Transfer Partners LP | 4.150% | 10/1/20 | 225 | 208 |
| Energy Transfer Partners LP | 4.650% | 6/1/21 | 280 | 263 |
| Energy Transfer Partners LP | 3.600% | 2/1/23 | 475 | 391 |
| Energy Transfer Partners LP | 4.050% | 3/15/25 | 1,000 | 829 |
| Energy Transfer Partners LP | 4.750% | 1/15/26 | 100 | 86 |
| Energy Transfer Partners LP | 6.625% | 10/15/36 | 150 | 128 |
| Energy Transfer Partners LP | 6.050% | 6/1/41 | 100 | 77 |
| Energy Transfer Partners LP | 6.500% | 2/1/42 | 175 | 143 |
| Energy Transfer Partners LP | 5.150% | 3/15/45 | 250 | 178 |
| EnLink Midstream Partners LP | 2.700% | 4/1/19 | 100 | 91 |
| EnLink Midstream Partners LP | 4.400% | 4/1/24 | 50 | 40 |
| EnLink Midstream Partners LP | 4.150% | 6/1/25 | 100 | 77 |
| EnLink Midstream Partners LP | 5.600% | 4/1/44 | 50 | 34 |
| Ensco plc | 4.700% | 3/15/21 | 300 | 244 |
| Ensco plc | 4.500% | 10/1/24 | 200 | 137 |
| Ensco plc | 5.200% | 3/15/25 | 150 | 106 |
| Enterprise Products Operating LLC | 6.300% | 9/15/17 | 125 | 132 |
| Enterprise Products Operating LLC | 6.650% | 4/15/18 | 75 | 81 |
| Enterprise Products Operating LLC | 1.650% | 5/7/18 | 50 | 49 |
| Enterprise Products Operating LLC | 6.500% | 1/31/19 | 50 | 55 |
| Enterprise Products Operating LLC | 2.550% | 10/15/19 | 225 | 216 |
| Enterprise Products Operating LLC | 5.200% | 9/1/20 | 300 | 315 |
| Enterprise Products Operating LLC | 3.350% | 3/15/23 | 200 | 181 |
| Enterprise Products Operating LLC | 3.900% | 2/15/24 | 475 | 443 |
| Enterprise Products Operating LLC | 3.750% | 2/15/25 | 150 | 137 |
| Enterprise Products Operating LLC | 3.700% | 2/15/26 | 100 | 89 |
| Enterprise Products Operating LLC | 6.875% | 3/1/33 | 175 | 183 |
| Enterprise Products Operating LLC | 7.550% | 4/15/38 | 250 | 267 |
| Enterprise Products Operating LLC | 6.125% | 10/15/39 | 150 | 136 |
273
Vanguard Total Bond Market Index Portfolio
| | | | | |
| Face | Market |
| Maturity Amount | Value • |
| | Coupon | Date | ($000) | ($000) |
| Enterprise Products Operating LLC | 5.950% | 2/1/41 | 175 | 158 |
| Enterprise Products Operating LLC | 4.450% | 2/15/43 | 50 | 38 |
| Enterprise Products Operating LLC | 4.850% | 3/15/44 | 300 | 243 |
| Enterprise Products Operating LLC | 5.100% | 2/15/45 | 350 | 291 |
| Enterprise Products Operating LLC | 4.900% | 5/15/46 | 200 | 162 |
| Enterprise Products Operating LLC | 4.950% | 10/15/54 | 100 | 78 |
| 4 | Enterprise Products Operating LLC | 7.000% | 6/1/67 | 100 | 80 |
| 4 | Enterprise Products Operating LLC | 7.034% | 1/15/68 | 225 | 229 |
| EOG Resources Inc. | 5.875% | 9/15/17 | 125 | 133 |
| EOG Resources Inc. | 4.400% | 6/1/20 | 100 | 106 |
| EOG Resources Inc. | 4.100% | 2/1/21 | 350 | 366 |
| EOG Resources Inc. | 2.625% | 3/15/23 | 450 | 425 |
| EOG Resources Inc. | 3.900% | 4/1/35 | 75 | 68 |
| EQT Corp. | 6.500% | 4/1/18 | 350 | 368 |
| EQT Corp. | 4.875% | 11/15/21 | 125 | 120 |
| Exxon Mobil Corp. | 1.305% | 3/6/18 | 400 | 399 |
| Exxon Mobil Corp. | 1.819% | 3/15/19 | 45 | 45 |
| Exxon Mobil Corp. | 1.912% | 3/6/20 | 265 | 264 |
| Exxon Mobil Corp. | 2.397% | 3/6/22 | 350 | 344 |
| Exxon Mobil Corp. | 2.709% | 3/6/25 | 300 | 294 |
| Exxon Mobil Corp. | 3.567% | 3/6/45 | 175 | 163 |
| FMC Technologies Inc. | 2.000% | 10/1/17 | 100 | 99 |
| FMC Technologies Inc. | 3.450% | 10/1/22 | 25 | 22 |
| Halliburton Co. | 2.000% | 8/1/18 | 125 | 124 |
| Halliburton Co. | 6.150% | 9/15/19 | 200 | 225 |
| Halliburton Co. | 2.700% | 11/15/20 | 200 | 198 |
| Halliburton Co. | 3.375% | 11/15/22 | 200 | 197 |
| Halliburton Co. | 3.500% | 8/1/23 | 225 | 219 |
| Halliburton Co. | 3.800% | 11/15/25 | 350 | 343 |
| Halliburton Co. | 4.850% | 11/15/35 | 200 | 197 |
| Halliburton Co. | 6.700% | 9/15/38 | 125 | 147 |
| Halliburton Co. | 7.450% | 9/15/39 | 200 | 255 |
| Halliburton Co. | 4.750% | 8/1/43 | 150 | 141 |
| Halliburton Co. | 5.000% | 11/15/45 | 300 | 296 |
| Hess Corp. | 3.500% | 7/15/24 | 100 | 87 |
| Hess Corp. | 7.875% | 10/1/29 | 350 | 381 |
| Hess Corp. | 7.125% | 3/15/33 | 100 | 98 |
| Hess Corp. | 6.000% | 1/15/40 | 150 | 132 |
| Hess Corp. | 5.600% | 2/15/41 | 300 | 251 |
| Husky Energy Inc. | 6.150% | 6/15/19 | 100 | 107 |
| Husky Energy Inc. | 4.000% | 4/15/24 | 150 | 138 |
| Husky Energy Inc. | 6.800% | 9/15/37 | 50 | 52 |
| Kerr-McGee Corp. | 6.950% | 7/1/24 | 250 | 269 |
| Kerr-McGee Corp. | 7.875% | 9/15/31 | 50 | 54 |
| Kinder Morgan Energy Partners LP | 5.950% | 2/15/18 | 300 | 308 |
| Kinder Morgan Energy Partners LP | 9.000% | 2/1/19 | 365 | 394 |
| Kinder Morgan Energy Partners LP | 6.850% | 2/15/20 | 850 | 881 |
| Kinder Morgan Energy Partners LP | 3.500% | 3/1/21 | 125 | 114 |
| Kinder Morgan Energy Partners LP | 5.000% | 10/1/21 | 150 | 141 |
| Kinder Morgan Energy Partners LP | 3.450% | 2/15/23 | 25 | 21 |
| Kinder Morgan Energy Partners LP | 3.500% | 9/1/23 | 125 | 104 |
| Kinder Morgan Energy Partners LP | 4.300% | 5/1/24 | 300 | 258 |
| Kinder Morgan Energy Partners LP | 4.250% | 9/1/24 | 100 | 85 |
| Kinder Morgan Energy Partners LP | 7.300% | 8/15/33 | 275 | 249 |
| Kinder Morgan Energy Partners LP | 5.800% | 3/15/35 | 50 | 40 |
| Kinder Morgan Energy Partners LP | 6.500% | 2/1/37 | 450 | 383 |
| Kinder Morgan Energy Partners LP | 6.950% | 1/15/38 | 50 | 44 |
| Kinder Morgan Energy Partners LP | 6.500% | 9/1/39 | 200 | 168 |
| Kinder Morgan Energy Partners LP | 6.550% | 9/15/40 | 250 | 213 |
| Kinder Morgan Energy Partners LP | 5.000% | 8/15/42 | 25 | 18 |
| Kinder Morgan Energy Partners LP | 4.700% | 11/1/42 | 375 | 265 |
| Kinder Morgan Energy Partners LP | 5.000% | 3/1/43 | 75 | 55 |
| Kinder Morgan Inc. | 7.000% | 6/15/17 | 150 | 155 |
| Kinder Morgan Inc. | 2.000% | 12/1/17 | 125 | 120 |
| Kinder Morgan Inc. | 7.800% | 8/1/31 | 90 | 84 |
| Kinder Morgan Inc. | 7.750% | 1/15/32 | 165 | 157 |
| Kinder Morgan Inc. | 5.300% | 12/1/34 | 175 | 137 |
| Kinder Morgan Inc. | 5.050% | 2/15/46 | 350 | 259 |
| Magellan Midstream Partners LP | 6.550% | 7/15/19 | 75 | 81 |
| Magellan Midstream Partners LP | 4.250% | 2/1/21 | 225 | 227 |
| Magellan Midstream Partners LP | 3.200% | 3/15/25 | 125 | 110 |
| | | | |
| Face | Market |
| Maturity Amount | Value • |
| Coupon | Date | ($000) | ($000) |
| Magellan Midstream Partners LP | 5.150% | 10/15/43 | 275 | 234 |
| Marathon Oil Corp. | 6.000% | 10/1/17 | 125 | 127 |
| Marathon Oil Corp. | 5.900% | 3/15/18 | 46 | 46 |
| Marathon Oil Corp. | 2.700% | 6/1/20 | 150 | 132 |
| Marathon Oil Corp. | 2.800% | 11/1/22 | 175 | 140 |
| Marathon Oil Corp. | 3.850% | 6/1/25 | 350 | 280 |
| Marathon Oil Corp. | 6.800% | 3/15/32 | 300 | 271 |
| Marathon Oil Corp. | 5.200% | 6/1/45 | 100 | 71 |
| Marathon Petroleum Corp. | 2.700% | 12/14/18 | 200 | 198 |
| Marathon Petroleum Corp. | 5.125% | 3/1/21 | 375 | 394 |
| Marathon Petroleum Corp. | 4.750% | 9/15/44 | 250 | 204 |
| Marathon Petroleum Corp. | 5.850% | 12/15/45 | 200 | 187 |
| Murphy Oil Corp. | 2.500% | 12/1/17 | 200 | 180 |
| Murphy Oil Corp. | 3.700% | 12/1/22 | 50 | 38 |
| Murphy Oil Corp. | 5.125% | 12/1/42 | 125 | 77 |
| Nabors Industries Inc. | 6.150% | 2/15/18 | 450 | 461 |
| Nabors Industries Inc. | 5.000% | 9/15/20 | 175 | 156 |
| National Fuel Gas Co. | 3.750% | 3/1/23 | 275 | 255 |
| National Oilwell Varco Inc. | 1.350% | 12/1/17 | 200 | 196 |
| National Oilwell Varco Inc. | 2.600% | 12/1/22 | 25 | 22 |
| National Oilwell Varco Inc. | 3.950% | 12/1/42 | 125 | 95 |
| Noble Energy Inc. | 8.250% | 3/1/19 | 475 | 531 |
| Noble Energy Inc. | 6.000% | 3/1/41 | 150 | 129 |
| Noble Energy Inc. | 5.250% | 11/15/43 | 375 | 296 |
| Noble Energy Inc. | 5.050% | 11/15/44 | 150 | 121 |
| Noble Holding International Ltd. | 2.500% | 3/15/17 | 100 | 94 |
| Noble Holding International Ltd. | 4.900% | 8/1/20 | 125 | 95 |
| Noble Holding International Ltd. | 3.950% | 3/15/22 | 50 | 33 |
| Noble Holding International Ltd. | 6.200% | 8/1/40 | 100 | 58 |
| Noble Holding International Ltd. | 6.050% | 3/1/41 | 150 | 90 |
| Noble Holding International Ltd. | 5.250% | 3/15/42 | 100 | 55 |
| Occidental Petroleum Corp. | 1.500% | 2/15/18 | 750 | 738 |
| Occidental Petroleum Corp. | 4.100% | 2/1/21 | 350 | 367 |
| Occidental Petroleum Corp. | 2.700% | 2/15/23 | 350 | 329 |
| Occidental Petroleum Corp. | 4.625% | 6/15/45 | 100 | 97 |
| Oceaneering International Inc. | 4.650% | 11/15/24 | 85 | 72 |
| ONEOK Partners LP | 2.000% | 10/1/17 | 175 | 168 |
| ONEOK Partners LP | 8.625% | 3/1/19 | 225 | 248 |
| ONEOK Partners LP | 3.375% | 10/1/22 | 100 | 80 |
| ONEOK Partners LP | 6.650% | 10/1/36 | 300 | 248 |
| ONEOK Partners LP | 6.125% | 2/1/41 | 150 | 115 |
| Panhandle Eastern Pipe Line Co. LP | 6.200% | 11/1/17 | 250 | 266 |
| Petro-Canada | 7.875% | 6/15/26 | 25 | 32 |
| Petro-Canada | 7.000% | 11/15/28 | 100 | 123 |
| Petro-Canada | 5.350% | 7/15/33 | 150 | 157 |
| Petro-Canada | 6.800% | 5/15/38 | 225 | 244 |
| Phillips 66 | 2.950% | 5/1/17 | 600 | 608 |
| Phillips 66 | 4.300% | 4/1/22 | 275 | 284 |
| Phillips 66 | 4.650% | 11/15/34 | 200 | 188 |
| Phillips 66 | 5.875% | 5/1/42 | 175 | 176 |
| Phillips 66 | 4.875% | 11/15/44 | 299 | 265 |
| Phillips 66 Partners LP | 2.646% | 2/15/20 | 35 | 33 |
| Phillips 66 Partners LP | 3.605% | 2/15/25 | 125 | 110 |
| Phillips 66 Partners LP | 4.680% | 2/15/45 | 50 | 37 |
| Pioneer Natural Resources Co. | 6.875% | 5/1/18 | 250 | 266 |
| Pioneer Natural Resources Co. | 3.950% | 7/15/22 | 200 | 183 |
| Pioneer Natural Resources Co. | 4.450% | 1/15/26 | 200 | 180 |
| Plains All American Pipeline LP / PAA | | | | |
| Finance Corp. | 6.500% | 5/1/18 | 25 | 26 |
| Plains All American Pipeline LP / PAA | | | | |
| Finance Corp. | 8.750% | 5/1/19 | 75 | 82 |
| Plains All American Pipeline LP / PAA | | | | |
| Finance Corp. | 5.000% | 2/1/21 | 550 | 526 |
| Plains All American Pipeline LP / PAA | | | | |
| Finance Corp. | 3.600% | 11/1/24 | 790 | 635 |
| Plains All American Pipeline LP / PAA | | | | |
| Finance Corp. | 4.300% | 1/31/43 | 325 | 213 |
| Plains All American Pipeline LP / PAA | | | | |
| Finance Corp. | 4.700% | 6/15/44 | 200 | 139 |
| Pride International Inc. | 8.500% | 6/15/19 | 450 | 438 |
| Pride International Inc. | 6.875% | 8/15/20 | 200 | 186 |
274
Vanguard Total Bond Market Index Portfolio
| | | | | |
| Face | Market |
| Maturity Amount | Value • |
| | Coupon | Date | ($000) | ($000) |
| Questar Corp. | 2.750% | 2/1/16 | 25 | 25 |
| Regency Energy Partners LP / | | | | |
| | Regency Energy Finance Corp. | 6.500% | 7/15/21 | 200 | 201 |
| Regency Energy Partners LP / | | | | |
| | Regency Energy Finance Corp. | 5.875% | 3/1/22 | 300 | 285 |
| Regency Energy Partners LP / | | | | |
| | Regency Energy Finance Corp. | 5.000% | 10/1/22 | 200 | 180 |
| Regency Energy Partners LP / | | | | |
| | Regency Energy Finance Corp. | 5.500% | 4/15/23 | 200 | 182 |
| Regency Energy Partners LP / | | | | |
| | Regency Energy Finance Corp. | 4.500% | 11/1/23 | 100 | 87 |
| Repsol Oil & Gas Canada Inc | 7.750% | 6/1/19 | 200 | 215 |
| Repsol Oil & Gas Canada Inc | 3.750% | 2/1/21 | 225 | 205 |
| Rowan Cos. Inc. | 5.000% | 9/1/17 | 175 | 174 |
| Rowan Cos. Inc. | 7.875% | 8/1/19 | 75 | 74 |
| Rowan Cos. Inc. | 4.750% | 1/15/24 | 50 | 36 |
| Rowan Cos. Inc. | 5.400% | 12/1/42 | 100 | 60 |
| Schlumberger Investment SA | 3.650% | 12/1/23 | 225 | 230 |
| SESI LLC | 7.125% | 12/15/21 | 125 | 111 |
| Shell International Finance BV | 1.250% | 11/10/17 | 200 | 199 |
| Shell International Finance BV | 1.900% | 8/10/18 | 575 | 574 |
| Shell International Finance BV | 2.000% | 11/15/18 | 800 | 798 |
| Shell International Finance BV | 4.300% | 9/22/19 | 550 | 586 |
| Shell International Finance BV | 4.375% | 3/25/20 | 325 | 348 |
| Shell International Finance BV | 2.125% | 5/11/20 | 450 | 441 |
| Shell International Finance BV | 2.250% | 11/10/20 | 100 | 98 |
| Shell International Finance BV | 3.400% | 8/12/23 | 75 | 75 |
| Shell International Finance BV | 3.250% | 5/11/25 | 200 | 193 |
| Shell International Finance BV | 4.125% | 5/11/35 | 200 | 190 |
| Shell International Finance BV | 6.375% | 12/15/38 | 475 | 566 |
| Shell International Finance BV | 5.500% | 3/25/40 | 125 | 135 |
| Shell International Finance BV | 4.550% | 8/12/43 | 400 | 380 |
| Shell International Finance BV | 4.375% | 5/11/45 | 400 | 378 |
| 7 | Southern Natural Gas Co. LLC | 5.900% | 4/1/17 | 200 | 203 |
| Southwestern Energy Co. | 7.500% | 2/1/18 | 800 | 680 |
| Southwestern Energy Co. | 4.100% | 3/15/22 | 125 | 79 |
| Spectra Energy Capital LLC | 6.200% | 4/15/18 | 300 | 318 |
| Spectra Energy Capital LLC | 6.750% | 2/15/32 | 50 | 50 |
| Spectra Energy Partners LP | 2.950% | 9/25/18 | 25 | 25 |
| Spectra Energy Partners LP | 4.750% | 3/15/24 | 400 | 390 |
| Spectra Energy Partners LP | 3.500% | 3/15/25 | 200 | 176 |
| Spectra Energy Partners LP | 4.500% | 3/15/45 | 250 | 192 |
| Suncor Energy Inc. | 6.100% | 6/1/18 | 25 | 27 |
| Suncor Energy Inc. | 5.950% | 12/1/34 | 75 | 75 |
| Suncor Energy Inc. | 6.500% | 6/15/38 | 525 | 575 |
| Sunoco Logistics Partners | | | | |
| | Operations LP | 4.400% | 4/1/21 | 500 | 485 |
| Sunoco Logistics Partners | | | | |
| | Operations LP | 3.450% | 1/15/23 | 50 | 42 |
| Sunoco Logistics Partners | | | | |
| | Operations LP | 4.250% | 4/1/24 | 75 | 65 |
| Sunoco Logistics Partners | | | | |
| | Operations LP | 4.950% | 1/15/43 | 175 | 124 |
| Sunoco Logistics Partners | | | | |
| | Operations LP | 5.300% | 4/1/44 | 325 | 242 |
| Tosco Corp. | 8.125% | 2/15/30 | 100 | 123 |
| Total Capital Canada Ltd. | 1.450% | 1/15/18 | 75 | 75 |
| Total Capital Canada Ltd. | 2.750% | 7/15/23 | 125 | 120 |
| Total Capital International SA | 1.000% | 8/12/16 | 100 | 100 |
| Total Capital International SA | 1.550% | 6/28/17 | 350 | 350 |
| Total Capital International SA | 2.125% | 1/10/19 | 350 | 350 |
| Total Capital International SA | 2.750% | 6/19/21 | 150 | 149 |
| Total Capital International SA | 2.875% | 2/17/22 | 300 | 297 |
| Total Capital International SA | 2.700% | 1/25/23 | 50 | 48 |
| Total Capital International SA | 3.700% | 1/15/24 | 775 | 785 |
| Total Capital SA | 2.125% | 8/10/18 | 250 | 251 |
| Total Capital SA | 4.450% | 6/24/20 | 375 | 402 |
| Total Capital SA | 4.125% | 1/28/21 | 125 | 133 |
| TransCanada PipeLines Ltd. | 1.625% | 11/9/17 | 650 | 647 |
| TransCanada PipeLines Ltd. | 6.500% | 8/15/18 | 150 | 164 |
| TransCanada PipeLines Ltd. | 3.800% | 10/1/20 | 175 | 179 |
| | | | | |
| Face | Market |
| Maturity Amount | Value • |
| | Coupon | Date | ($000) | ($000) |
| TransCanada PipeLines Ltd. | 4.625% | 3/1/34 | 350 | 330 |
| TransCanada PipeLines Ltd. | 5.600% | 3/31/34 | 150 | 152 |
| TransCanada PipeLines Ltd. | 5.850% | 3/15/36 | 300 | 308 |
| TransCanada PipeLines Ltd. | 6.200% | 10/15/37 | 475 | 500 |
| TransCanada PipeLines Ltd. | 5.000% | 10/16/43 | 150 | 138 |
| 4 | TransCanada PipeLines Ltd. | 6.350% | 5/15/67 | 275 | 208 |
| Transcontinental Gas Pipe Line Co. LLC 6.050% | 6/15/18 | 265 | 287 |
| Valero Energy Corp. | 9.375% | 3/15/19 | 100 | 118 |
| Valero Energy Corp. | 6.125% | 2/1/20 | 75 | 83 |
| Valero Energy Corp. | 7.500% | 4/15/32 | 725 | 789 |
| Western Gas Partners LP | 5.375% | 6/1/21 | 300 | 304 |
| Western Gas Partners LP | 5.450% | 4/1/44 | 150 | 119 |
| Williams Cos. Inc. | 7.500% | 1/15/31 | 116 | 80 |
| Williams Cos. Inc. | 7.750% | 6/15/31 | 185 | 136 |
| Williams Cos. Inc. | 5.750% | 6/24/44 | 200 | 117 |
| Williams Partners LP | 5.250% | 3/15/20 | 475 | 441 |
| Williams Partners LP | 4.125% | 11/15/20 | 275 | 239 |
| Williams Partners LP | 3.600% | 3/15/22 | 150 | 118 |
| Williams Partners LP | 3.350% | 8/15/22 | 125 | 97 |
| Williams Partners LP | 3.900% | 1/15/25 | 225 | 169 |
| Williams Partners LP | 6.300% | 4/15/40 | 100 | 77 |
| Williams Partners LP | 5.400% | 3/4/44 | 400 | 268 |
| Williams Partners LP | 5.100% | 9/15/45 | 150 | 99 |
| Williams Partners LP / ACMP Finance | | | | |
| | Corp. | 4.875% | 5/15/23 | 150 | 121 |
| Williams Partners LP / ACMP Finance | | | | |
| | Corp. | 4.875% | 3/15/24 | 200 | 160 |
| XTO Energy Inc. | 6.250% | 8/1/17 | 375 | 404 |
| |
| Other Industrial (0.1%) | | | | |
| California Institute of Technology GO | 4.321% | 8/1/45 | 200 | 208 |
| California Institute of Technology GO | 4.700% | 11/1/11 | 50 | 48 |
| CBRE Services Inc. | 5.000% | 3/15/23 | 150 | 150 |
| CBRE Services Inc. | 5.250% | 3/15/25 | 100 | 101 |
| Cintas Corp. No 2 | 6.125% | 12/1/17 | 150 | 162 |
| Cintas Corp. No 2 | 3.250% | 6/1/22 | 75 | 76 |
| Fluor Corp. | 3.375% | 9/15/21 | 75 | 77 |
| Fluor Corp. | 3.500% | 12/15/24 | 250 | 250 |
| Howard Hughes Medical Institute | | | | |
| | Revenue | 3.500% | 9/1/23 | 200 | 208 |
| 4 | Johns Hopkins University Maryland GO 4.083% | 7/1/53 | 75 | 74 |
| 4 | Massachusetts Institute of Technology | | | | |
| | GO | 3.959% | 7/1/38 | 125 | 129 |
| Massachusetts Institute of Technology | | | | |
| | GO | 5.600% | 7/1/11 | 200 | 245 |
| Massachusetts Institute of Technology | | | | |
| | GO | 4.678% | 7/1/14 | 75 | 78 |
| 4 | Northwestern University Illinois GO | 3.688% | 12/1/38 | 100 | 101 |
| 4 | Northwestern University Illinois GO | 4.643% | 12/1/44 | 75 | 85 |
| 4 | University of Notre Dame DU LAC | | | | |
| | Indiana GO | 3.438% | 2/15/45 | 100 | 94 |
| University of Pennsylvania GO | 4.674% | 9/1/12 | 100 | 100 |
| Yale University Connecticut GO | 2.086% | 4/15/19 | 50 | 50 |
| |
| Technology (1.8%) | | | | |
| Adobe Systems Inc. | 4.750% | 2/1/20 | 175 | 190 |
| Adobe Systems Inc. | 3.250% | 2/1/25 | 200 | 195 |
| Altera Corp. | 1.750% | 5/15/17 | 50 | 50 |
| Altera Corp. | 2.500% | 11/15/18 | 225 | 228 |
| Altera Corp. | 4.100% | 11/15/23 | 75 | 78 |
| Amphenol Corp. | 1.550% | 9/15/17 | 100 | 100 |
| Amphenol Corp. | 2.550% | 1/30/19 | 200 | 200 |
| Analog Devices Inc. | 2.875% | 6/1/23 | 150 | 144 |
| Apple Inc. | 1.050% | 5/5/17 | 275 | 275 |
| Apple Inc. | 0.900% | 5/12/17 | 150 | 150 |
| Apple Inc. | 1.000% | 5/3/18 | 450 | 447 |
| Apple Inc. | 2.100% | 5/6/19 | 425 | 430 |
| Apple Inc. | 1.550% | 2/7/20 | 225 | 222 |
| Apple Inc. | 2.850% | 5/6/21 | 1,425 | 1,460 |
| Apple Inc. | 2.150% | 2/9/22 | 325 | 317 |
| Apple Inc. | 2.700% | 5/13/22 | 500 | 501 |
275
Vanguard Total Bond Market Index Portfolio
| | | | | |
| Face | Market |
| Maturity Amount | Value • |
| | Coupon | Date | ($000) | ($000) |
| Apple Inc. | 2.400% | 5/3/23 | 725 | 706 |
| Apple Inc. | 3.450% | 5/6/24 | 450 | 466 |
| Apple Inc. | 2.500% | 2/9/25 | 100 | 96 |
| Apple Inc. | 3.200% | 5/13/25 | 350 | 354 |
| Apple Inc. | 3.850% | 5/4/43 | 450 | 415 |
| Apple Inc. | 4.450% | 5/6/44 | 175 | 177 |
| Apple Inc. | 3.450% | 2/9/45 | 225 | 193 |
| Apple Inc. | 4.375% | 5/13/45 | 350 | 350 |
| Applied Materials Inc. | 2.625% | 10/1/20 | 150 | 150 |
| Applied Materials Inc. | 4.300% | 6/15/21 | 150 | 160 |
| Applied Materials Inc. | 3.900% | 10/1/25 | 300 | 300 |
| Applied Materials Inc. | 5.100% | 10/1/35 | 100 | 101 |
| Applied Materials Inc. | 5.850% | 6/15/41 | 150 | 163 |
| Arrow Electronics Inc. | 3.000% | 3/1/18 | 50 | 50 |
| Arrow Electronics Inc. | 3.500% | 4/1/22 | 100 | 96 |
| Arrow Electronics Inc. | 4.500% | 3/1/23 | 50 | 51 |
| Arrow Electronics Inc. | 4.000% | 4/1/25 | 100 | 96 |
| Autodesk Inc. | 1.950% | 12/15/17 | 25 | 25 |
| Autodesk Inc. | 3.125% | 6/15/20 | 100 | 99 |
| Autodesk Inc. | 3.600% | 12/15/22 | 25 | 24 |
| Autodesk Inc. | 4.375% | 6/15/25 | 50 | 49 |
| Avnet Inc. | 5.875% | 6/15/20 | 200 | 217 |
| Baidu Inc. | 2.750% | 6/9/19 | 200 | 199 |
| Baidu Inc. | 3.500% | 11/28/22 | 500 | 493 |
| Broadcom Corp. | 2.700% | 11/1/18 | 50 | 51 |
| Broadcom Corp. | 2.500% | 8/15/22 | 325 | 323 |
| Broadridge Financial Solutions Inc. | 3.950% | 9/1/20 | 75 | 78 |
| CA Inc. | 5.375% | 12/1/19 | 175 | 190 |
| CA Inc. | 3.600% | 8/1/20 | 100 | 102 |
| CA Inc. | 4.500% | 8/15/23 | 75 | 76 |
| Cadence Design Systems Inc. | 4.375% | 10/15/24 | 100 | 99 |
| Cisco Systems Inc. | 1.100% | 3/3/17 | 100 | 100 |
| Cisco Systems Inc. | 3.150% | 3/14/17 | 50 | 51 |
| Cisco Systems Inc. | 4.950% | 2/15/19 | 475 | 519 |
| Cisco Systems Inc. | 2.125% | 3/1/19 | 600 | 605 |
| Cisco Systems Inc. | 4.450% | 1/15/20 | 825 | 898 |
| Cisco Systems Inc. | 2.900% | 3/4/21 | 75 | 77 |
| Cisco Systems Inc. | 3.625% | 3/4/24 | 125 | 131 |
| Cisco Systems Inc. | 5.900% | 2/15/39 | 200 | 245 |
| Cisco Systems Inc. | 5.500% | 1/15/40 | 275 | 329 |
| Computer Sciences Corp. | 6.500% | 3/15/18 | 50 | 54 |
| Corning Inc. | 1.500% | 5/8/18 | 250 | 246 |
| Corning Inc. | 6.625% | 5/15/19 | 25 | 28 |
| Corning Inc. | 2.900% | 5/15/22 | 175 | 168 |
| Corning Inc. | 3.700% | 11/15/23 | 200 | 197 |
| Corning Inc. | 4.700% | 3/15/37 | 50 | 48 |
| Corning Inc. | 5.750% | 8/15/40 | 75 | 80 |
| Dun & Bradstreet Corp. | 4.375% | 12/1/22 | 50 | 49 |
| EMC Corp. | 1.875% | 6/1/18 | 460 | 429 |
| EMC Corp. | 2.650% | 6/1/20 | 165 | 146 |
| EMC Corp. | 3.375% | 6/1/23 | 220 | 178 |
| Equifax Inc. | 6.300% | 7/1/17 | 25 | 27 |
| Fidelity National Information | | | | |
| | Services Inc. | 2.000% | 4/15/18 | 25 | 25 |
| Fidelity National Information | | | | |
| | Services Inc. | 2.850% | 10/15/18 | 150 | 151 |
| Fidelity National Information | | | | |
| | Services Inc. | 3.625% | 10/15/20 | 400 | 405 |
| Fidelity National Information | | | | |
| | Services Inc. | 5.000% | 3/15/22 | 50 | 52 |
| Fidelity National Information | | | | |
| | Services Inc. | 3.500% | 4/15/23 | 175 | 167 |
| Fidelity National Information | | | | |
| | Services Inc. | 5.000% | 10/15/25 | 75 | 77 |
| Fiserv Inc. | 2.700% | 6/1/20 | 125 | 125 |
| Fiserv Inc. | 3.500% | 10/1/22 | 150 | 150 |
| Fiserv Inc. | 3.850% | 6/1/25 | 300 | 300 |
| Flextronics International Ltd. | 4.625% | 2/15/20 | 85 | 88 |
| Google Inc. | 3.625% | 5/19/21 | 150 | 160 |
| 7 | Hewlett Packard Enterprise Co. | 2.450% | 10/5/17 | 400 | 400 |
| 7 | Hewlett Packard Enterprise Co. | 2.850% | 10/5/18 | 350 | 350 |
| | | | | |
| Face | Market |
| Maturity Amount | Value • |
| | Coupon | Date | ($000) | ($000) |
| 7 | Hewlett Packard Enterprise Co. | 3.600% | 10/15/20 | 425 | 426 |
| 7 | Hewlett Packard Enterprise Co. | 4.400% | 10/15/22 | 375 | 374 |
| 7 | Hewlett Packard Enterprise Co. | 4.900% | 10/15/25 | 500 | 491 |
| 7 | Hewlett Packard Enterprise Co. | 6.200% | 10/15/35 | 100 | 96 |
| 7 | Hewlett Packard Enterprise Co. | 6.350% | 10/15/45 | 400 | 381 |
| HP Inc. | 3.750% | 12/1/20 | 53 | 53 |
| HP Inc. | 4.300% | 6/1/21 | 850 | 846 |
| HP Inc. | 4.375% | 9/15/21 | 200 | 195 |
| HP Inc. | 4.650% | 12/9/21 | 350 | 349 |
| HP Inc. | 6.000% | 9/15/41 | 100 | 87 |
| Ingram Micro Inc. | 4.950% | 12/15/24 | 250 | 249 |
| Intel Corp. | 1.350% | 12/15/17 | 775 | 776 |
| Intel Corp. | 2.450% | 7/29/20 | 300 | 303 |
| Intel Corp. | 3.300% | 10/1/21 | 100 | 104 |
| Intel Corp. | 3.100% | 7/29/22 | 175 | 178 |
| Intel Corp. | 2.700% | 12/15/22 | 275 | 272 |
| Intel Corp. | 3.700% | 7/29/25 | 200 | 207 |
| Intel Corp. | 4.000% | 12/15/32 | 150 | 149 |
| Intel Corp. | 4.800% | 10/1/41 | 475 | 496 |
| Intel Corp. | 4.250% | 12/15/42 | 325 | 315 |
| Intel Corp. | 4.900% | 7/29/45 | 250 | 264 |
| International Business Machines Corp. | 5.700% | 9/14/17 | 2,150 | 2,306 |
| International Business Machines Corp. | 1.950% | 2/12/19 | 225 | 226 |
| International Business Machines Corp. | 1.625% | 5/15/20 | 25 | 24 |
| International Business Machines Corp. | 2.875% | 11/9/22 | 100 | 99 |
| International Business Machines Corp. | 3.625% | 2/12/24 | 450 | 461 |
| International Business Machines Corp. | 7.000% | 10/30/25 | 300 | 385 |
| International Business Machines Corp. | 6.220% | 8/1/27 | 75 | 93 |
| International Business Machines Corp. | 6.500% | 1/15/28 | 75 | 94 |
| International Business Machines Corp. | 5.600% | 11/30/39 | 98 | 114 |
| International Business Machines Corp. | 4.000% | 6/20/42 | 68 | 63 |
| Jabil Circuit Inc. | 5.625% | 12/15/20 | 100 | 105 |
| Juniper Networks Inc. | 3.300% | 6/15/20 | 200 | 200 |
| Juniper Networks Inc. | 4.600% | 3/15/21 | 50 | 52 |
| Juniper Networks Inc. | 4.350% | 6/15/25 | 50 | 49 |
| Juniper Networks Inc. | 5.950% | 3/15/41 | 25 | 23 |
| Keysight Technologies Inc. | 3.300% | 10/30/19 | 100 | 98 |
| Keysight Technologies Inc. | 4.550% | 10/30/24 | 100 | 96 |
| KLA-Tencor Corp. | 2.375% | 11/1/17 | 100 | 100 |
| KLA-Tencor Corp. | 4.125% | 11/1/21 | 300 | 301 |
| KLA-Tencor Corp. | 4.650% | 11/1/24 | 200 | 201 |
| Lam Research Corp. | 2.750% | 3/15/20 | 100 | 97 |
| Lam Research Corp. | 3.800% | 3/15/25 | 100 | 95 |
| Lender Processing Services Inc / | | | | |
| | Black Knight Lending Solutions Inc | 5.750% | 4/15/23 | 65 | 68 |
| Lexmark International Inc. | 6.650% | 6/1/18 | 150 | 162 |
| Maxim Integrated Products Inc. | 3.375% | 3/15/23 | 25 | 25 |
| Microsoft Corp. | 1.000% | 5/1/18 | 200 | 199 |
| Microsoft Corp. | 1.300% | 11/3/18 | 425 | 424 |
| Microsoft Corp. | 4.200% | 6/1/19 | 25 | 27 |
| Microsoft Corp. | 3.000% | 10/1/20 | 225 | 235 |
| Microsoft Corp. | 2.000% | 11/3/20 | 550 | 550 |
| Microsoft Corp. | 2.375% | 2/12/22 | 450 | 444 |
| Microsoft Corp. | 2.650% | 11/3/22 | 200 | 200 |
| Microsoft Corp. | 2.125% | 11/15/22 | 200 | 193 |
| Microsoft Corp. | 2.375% | 5/1/23 | 75 | 74 |
| Microsoft Corp. | 3.625% | 12/15/23 | 300 | 316 |
| Microsoft Corp. | 2.700% | 2/12/25 | 250 | 243 |
| Microsoft Corp. | 3.125% | 11/3/25 | 850 | 852 |
| Microsoft Corp. | 3.500% | 2/12/35 | 250 | 231 |
| Microsoft Corp. | 4.200% | 11/3/35 | 250 | 255 |
| Microsoft Corp. | 5.200% | 6/1/39 | 25 | 28 |
| Microsoft Corp. | 4.500% | 10/1/40 | 100 | 104 |
| Microsoft Corp. | 5.300% | 2/8/41 | 50 | 57 |
| Microsoft Corp. | 3.500% | 11/15/42 | 280 | 249 |
| Microsoft Corp. | 3.750% | 5/1/43 | 45 | 42 |
| Microsoft Corp. | 3.750% | 2/12/45 | 275 | 253 |
| Microsoft Corp. | 4.450% | 11/3/45 | 725 | 749 |
| Microsoft Corp. | 4.000% | 2/12/55 | 400 | 359 |
| Microsoft Corp. | 4.750% | 11/3/55 | 175 | 180 |
| Motorola Solutions Inc. | 3.750% | 5/15/22 | 250 | 228 |
276
Vanguard Total Bond Market Index Portfolio
| | | | | |
| Face | Market |
| Maturity Amount | Value • |
| | Coupon | Date | ($000) | ($000) |
| Motorola Solutions Inc. | 7.500% | 5/15/25 | 50 | 55 |
| Motorola Solutions Inc. | 5.500% | 9/1/44 | 100 | 77 |
| NetApp Inc. | 3.375% | 6/15/21 | 300 | 293 |
| Oracle Corp. | 1.200% | 10/15/17 | 325 | 325 |
| Oracle Corp. | 5.750% | 4/15/18 | 300 | 327 |
| Oracle Corp. | 2.375% | 1/15/19 | 225 | 228 |
| Oracle Corp. | 5.000% | 7/8/19 | 550 | 606 |
| Oracle Corp. | 2.250% | 10/8/19 | 225 | 227 |
| Oracle Corp. | 2.500% | 10/15/22 | 515 | 503 |
| Oracle Corp. | 3.400% | 7/8/24 | 450 | 456 |
| Oracle Corp. | 2.950% | 5/15/25 | 1,400 | 1,366 |
| Oracle Corp. | 3.250% | 5/15/30 | 100 | 94 |
| Oracle Corp. | 4.300% | 7/8/34 | 300 | 298 |
| Oracle Corp. | 3.900% | 5/15/35 | 75 | 71 |
| Oracle Corp. | 6.500% | 4/15/38 | 200 | 252 |
| Oracle Corp. | 6.125% | 7/8/39 | 150 | 182 |
| Oracle Corp. | 5.375% | 7/15/40 | 600 | 666 |
| Oracle Corp. | 4.500% | 7/8/44 | 200 | 200 |
| Oracle Corp. | 4.125% | 5/15/45 | 500 | 473 |
| Oracle Corp. | 4.375% | 5/15/55 | 150 | 139 |
| Pitney Bowes Inc. | 4.625% | 3/15/24 | 50 | 49 |
| QUALCOMM Inc. | 1.400% | 5/18/18 | 600 | 595 |
| QUALCOMM Inc. | 2.250% | 5/20/20 | 300 | 297 |
| QUALCOMM Inc. | 3.450% | 5/20/25 | 250 | 240 |
| QUALCOMM Inc. | 4.650% | 5/20/35 | 125 | 116 |
| QUALCOMM Inc. | 4.800% | 5/20/45 | 325 | 287 |
| Seagate HDD Cayman | 3.750% | 11/15/18 | 200 | 199 |
| Seagate HDD Cayman | 4.750% | 6/1/23 | 150 | 131 |
| Seagate HDD Cayman | 4.750% | 1/1/25 | 100 | 83 |
| 7 | Seagate HDD Cayman | 4.875% | 6/1/27 | 175 | 134 |
| 7 | Seagate HDD Cayman | 5.750% | 12/1/34 | 200 | 142 |
| Symantec Corp. | 2.750% | 6/15/17 | 175 | 175 |
| Symantec Corp. | 4.200% | 9/15/20 | 50 | 52 |
| Symantec Corp. | 3.950% | 6/15/22 | 175 | 174 |
| Telefonaktiebolaget LM Ericsson | 4.125% | 5/15/22 | 150 | 154 |
| Texas Instruments Inc. | 1.650% | 8/3/19 | 525 | 519 |
| Total System Services Inc. | 2.375% | 6/1/18 | 75 | 74 |
| Trimble Navigation Ltd. | 4.750% | 12/1/24 | 75 | 75 |
| Tyco Electronics Group SA | 6.550% | 10/1/17 | 75 | 81 |
| Tyco Electronics Group SA | 2.350% | 8/1/19 | 50 | 50 |
| Tyco Electronics Group SA | 3.500% | 2/3/22 | 100 | 102 |
| Tyco Electronics Group SA | 3.450% | 8/1/24 | 100 | 99 |
| Tyco Electronics Group SA | 7.125% | 10/1/37 | 200 | 255 |
| Verisk Analytics Inc. | 4.125% | 9/12/22 | 375 | 377 |
| Verisk Analytics Inc. | 5.500% | 6/15/45 | 50 | 48 |
| Xerox Corp. | 6.750% | 2/1/17 | 100 | 105 |
| Xerox Corp. | 2.950% | 3/15/17 | 500 | 504 |
| Xerox Corp. | 6.350% | 5/15/18 | 175 | 188 |
| Xerox Corp. | 5.625% | 12/15/19 | 25 | 27 |
| Xerox Corp. | 2.800% | 5/15/20 | 75 | 72 |
| Xerox Corp. | 3.800% | 5/15/24 | 50 | 47 |
| Xerox Corp. | 6.750% | 12/15/39 | 175 | 168 |
| Xilinx Inc. | 2.125% | 3/15/19 | 100 | 99 |
| Xilinx Inc. | 3.000% | 3/15/21 | 100 | 100 |
| |
| Transportation (0.6%) | | | | |
| 4 | American Airlines 2013-1 Class A Pass | | | | |
| | Through Trust | 4.000% | 1/15/27 | 27 | 27 |
| 4 | American Airlines 2013-2 Class A Pass | | | | |
| | Through Trust | 4.950% | 7/15/24 | 217 | 230 |
| 4 | American Airlines 2014-1 Class A Pass | | | | |
| | Through Trust | 3.700% | 4/1/28 | 118 | 118 |
| 4 | American Airlines 2015-1 Class A Pass | | | | |
| | Through Trust | 3.375% | 11/1/28 | 171 | 166 |
| 4 | American Airlines 2015-1 Class B Pass | | | | |
| | Through Trust | 3.700% | 11/1/24 | 48 | 46 |
| 4 | American Airlines 2015-2 Class AA Pass | | | | |
| | Through Trust | 3.600% | 9/22/27 | 55 | 56 |
| 4 | BNSF Funding Trust I | 6.613% | 12/15/55 | 75 | 84 |
| Burlington Northern Santa Fe LLC | 5.650% | 5/1/17 | 200 | 211 |
| Burlington Northern Santa Fe LLC | 5.750% | 3/15/18 | 100 | 108 |
| | | | | |
| Face | Market |
| Maturity Amount | Value • |
| | Coupon | Date | ($000) | ($000) |
| Burlington Northern Santa Fe LLC | 3.050% | 3/15/22 | 150 | 150 |
| Burlington Northern Santa Fe LLC | 3.050% | 9/1/22 | 150 | 150 |
| Burlington Northern Santa Fe LLC | 3.000% | 3/15/23 | 125 | 123 |
| Burlington Northern Santa Fe LLC | 3.850% | 9/1/23 | 125 | 130 |
| Burlington Northern Santa Fe LLC | 3.750% | 4/1/24 | 200 | 205 |
| Burlington Northern Santa Fe LLC | 3.400% | 9/1/24 | 150 | 149 |
| Burlington Northern Santa Fe LLC | 3.000% | 4/1/25 | 100 | 96 |
| Burlington Northern Santa Fe LLC | 3.650% | 9/1/25 | 75 | 76 |
| Burlington Northern Santa Fe LLC | 6.200% | 8/15/36 | 125 | 148 |
| Burlington Northern Santa Fe LLC | 5.050% | 3/1/41 | 125 | 129 |
| Burlington Northern Santa Fe LLC | 5.400% | 6/1/41 | 250 | 271 |
| Burlington Northern Santa Fe LLC | 4.400% | 3/15/42 | 250 | 238 |
| Burlington Northern Santa Fe LLC | 4.375% | 9/1/42 | 100 | 95 |
| Burlington Northern Santa Fe LLC | 4.450% | 3/15/43 | 75 | 72 |
| Burlington Northern Santa Fe LLC | 5.150% | 9/1/43 | 125 | 132 |
| Burlington Northern Santa Fe LLC | 4.900% | 4/1/44 | 100 | 103 |
| Burlington Northern Santa Fe LLC | 4.550% | 9/1/44 | 150 | 144 |
| Burlington Northern Santa Fe LLC | 4.150% | 4/1/45 | 75 | 68 |
| Burlington Northern Santa Fe LLC | 4.700% | 9/1/45 | 75 | 75 |
| Canadian National Railway Co. | 1.450% | 12/15/16 | 250 | 250 |
| Canadian National Railway Co. | 5.550% | 3/1/19 | 100 | 110 |
| Canadian National Railway Co. | 2.850% | 12/15/21 | 75 | 75 |
| Canadian National Railway Co. | 6.250% | 8/1/34 | 75 | 95 |
| Canadian National Railway Co. | 6.200% | 6/1/36 | 75 | 96 |
| Canadian National Railway Co. | 6.375% | 11/15/37 | 100 | 130 |
| Canadian National Railway Co. | 3.500% | 11/15/42 | 50 | 45 |
| Canadian Pacific Railway Co. | 7.250% | 5/15/19 | 150 | 171 |
| Canadian Pacific Railway Co. | 9.450% | 8/1/21 | 50 | 65 |
| Canadian Pacific Railway Co. | 4.450% | 3/15/23 | 225 | 240 |
| Canadian Pacific Railway Co. | 7.125% | 10/15/31 | 100 | 125 |
| Canadian Pacific Railway Co. | 5.950% | 5/15/37 | 450 | 506 |
| Canadian Pacific Railway Co. | 6.125% | 9/15/15 | 70 | 72 |
| Canadian Pacific Railway Ltd. | 5.750% | 1/15/42 | 115 | 125 |
| 4 | Continental Airlines 2007-1 Class A | | | | |
| | Pass Through Trust | 5.983% | 10/19/23 | 59 | 65 |
| 4 | Continental Airlines 2009-2 Class A | | | | |
| | Pass Through Trust | 7.250% | 5/10/21 | 108 | 122 |
| 4 | Continental Airlines 2012-1 Class A | | | | |
| | Pass Through Trust | 4.150% | 10/11/25 | 329 | 338 |
| 4 | Continental Airlines 2012-2 Class A | | | | |
| | Pass Through Trust | 4.000% | 4/29/26 | 90 | 91 |
| CSX Corp. | 5.600% | 5/1/17 | 180 | 189 |
| CSX Corp. | 6.250% | 3/15/18 | 375 | 408 |
| CSX Corp. | 7.375% | 2/1/19 | 100 | 115 |
| CSX Corp. | 3.350% | 11/1/25 | 150 | 146 |
| CSX Corp. | 6.220% | 4/30/40 | 152 | 180 |
| CSX Corp. | 5.500% | 4/15/41 | 225 | 248 |
| CSX Corp. | 4.750% | 5/30/42 | 210 | 210 |
| CSX Corp. | 4.100% | 3/15/44 | 150 | 136 |
| CSX Corp. | 3.950% | 5/1/50 | 125 | 106 |
| CSX Corp. | 4.500% | 8/1/54 | 25 | 23 |
| 4 | Delta Air Lines 2007-1 Class A Pass | | | | |
| | Through Trust | 6.821% | 2/10/24 | 145 | 167 |
| 4 | Delta Air Lines 2009-1 Class A Pass | | | | |
| | Through Trust | 7.750% | 6/17/21 | 59 | 66 |
| 4 | Delta Air Lines 2010-2 Class A Pass | | | | |
| | Through Trust | 4.950% | 11/23/20 | 44 | 46 |
| 4 | Delta Air Lines 2015-1 Class AA Pass | | | | |
| | Through Trust | 3.625% | 7/30/27 | 50 | 51 |
| FedEx Corp. | 8.000% | 1/15/19 | 100 | 116 |
| FedEx Corp. | 2.625% | 8/1/22 | 75 | 73 |
| FedEx Corp. | 4.000% | 1/15/24 | 125 | 130 |
| FedEx Corp. | 3.875% | 8/1/42 | 100 | 86 |
| FedEx Corp. | 4.100% | 4/15/43 | 75 | 66 |
| FedEx Corp. | 5.100% | 1/15/44 | 100 | 104 |
| FedEx Corp. | 4.750% | 11/15/45 | 150 | 148 |
| FedEx Corp. | 4.500% | 2/1/65 | 60 | 51 |
| 4 | Hawaiian Airlines 2013-1 Class A Pass | | | | |
| | Through Certificates | 3.900% | 1/15/26 | 252 | 243 |
| JB Hunt Transport Services Inc. | 3.300% | 8/15/22 | 100 | 99 |
| JB Hunt Transport Services Inc. | 3.850% | 3/15/24 | 50 | 51 |
277
Vanguard Total Bond Market Index Portfolio
| | | | | |
| Face | Market |
| Maturity Amount | Value • |
| | Coupon | Date | ($000) | ($000) |
| 7 | Kansas City Southern | 2.350% | 5/15/20 | 25 | 24 |
| 7 | Kansas City Southern | 3.000% | 5/15/23 | 75 | 71 |
| 7 | Kansas City Southern | 4.300% | 5/15/43 | 75 | 66 |
| 7 | Kansas City Southern | 4.950% | 8/15/45 | 125 | 122 |
| 4,7 Latam Airlines 2015-1 Pass Through | | | | |
| | Trust A | 4.200% | 11/15/27 | 125 | 115 |
| Norfolk Southern Corp. | 7.700% | 5/15/17 | 450 | 487 |
| Norfolk Southern Corp. | 5.900% | 6/15/19 | 175 | 195 |
| Norfolk Southern Corp. | 2.903% | 2/15/23 | 48 | 46 |
| Norfolk Southern Corp. | 5.590% | 5/17/25 | 50 | 57 |
| Norfolk Southern Corp. | 7.800% | 5/15/27 | 60 | 79 |
| Norfolk Southern Corp. | 4.837% | 10/1/41 | 313 | 305 |
| Norfolk Southern Corp. | 4.450% | 6/15/45 | 75 | 70 |
| Norfolk Southern Corp. | 7.900% | 5/15/97 | 70 | 96 |
| Norfolk Southern Corp. | 6.000% | 3/15/05 | 100 | 107 |
| Norfolk Southern Corp. | 6.000% | 5/23/11 | 240 | 252 |
| Ryder System Inc. | 2.450% | 11/15/18 | 250 | 250 |
| Ryder System Inc. | 2.350% | 2/26/19 | 250 | 250 |
| Ryder System Inc. | 2.550% | 6/1/19 | 300 | 299 |
| Ryder System Inc. | 2.500% | 5/11/20 | 50 | 49 |
| Southwest Airlines Co. | 2.750% | 11/6/19 | 50 | 50 |
| Southwest Airlines Co. | 2.650% | 11/5/20 | 125 | 124 |
| 4 | Southwest Airlines Co. 2007-1 Pass | | | | |
| | Through Trust | 6.150% | 2/1/24 | 35 | 39 |
| 4 | Spirit Airlines Class A Pass Through | | | | |
| | Certificates Series 2015-1 | 4.100% | 10/1/29 | 100 | 99 |
| Trinity Industries Inc. | 4.550% | 10/1/24 | 60 | 55 |
| Union Pacific Corp. | 2.250% | 6/19/20 | 225 | 225 |
| Union Pacific Corp. | 4.163% | 7/15/22 | 659 | 713 |
| Union Pacific Corp. | 3.250% | 1/15/25 | 100 | 101 |
| Union Pacific Corp. | 3.250% | 8/15/25 | 250 | 253 |
| Union Pacific Corp. | 3.375% | 2/1/35 | 100 | 91 |
| Union Pacific Corp. | 4.750% | 9/15/41 | 350 | 373 |
| Union Pacific Corp. | 4.750% | 12/15/43 | 100 | 107 |
| Union Pacific Corp. | 4.821% | 2/1/44 | 100 | 108 |
| Union Pacific Corp. | 4.050% | 11/15/45 | 150 | 146 |
| Union Pacific Corp. | 3.875% | 2/1/55 | 100 | 88 |
| Union Pacific Corp. | 4.375% | 11/15/65 | 135 | 125 |
| 4 | United Airlines 2013-1 Class A Pass | | | | |
| | Through Trust | 4.300% | 2/15/27 | 143 | 148 |
| 4 | United Airlines 2014-1 Class A Pass | | | | |
| | Through Trust | 4.000% | 10/11/27 | 194 | 198 |
| United Airlines 2015-1 Class A Pass | | | | |
| | Through Trust | 3.700% | 12/1/22 | 60 | 60 |
| 4 | United Airlines 2015-1 Class AA Pass | | | | |
| | Through Trust | 3.450% | 12/1/27 | 175 | 175 |
| United Parcel Service Inc. | 5.500% | 1/15/18 | 175 | 190 |
| United Parcel Service Inc. | 5.125% | 4/1/19 | 100 | 110 |
| United Parcel Service Inc. | 3.125% | 1/15/21 | 275 | 286 |
| United Parcel Service Inc. | 2.450% | 10/1/22 | 450 | 444 |
| United Parcel Service Inc. | 6.200% | 1/15/38 | 278 | 357 |
| United Parcel Service Inc. | 4.875% | 11/15/40 | 75 | 84 |
| United Parcel Service Inc. | 3.625% | 10/1/42 | 75 | 69 |
| 4 | US Airways 2013-1 Class A Pass | | | | |
| | Through Trust | 3.950% | 5/15/27 | 136 | 136 |
| 4 | US Airways Inc. 2012-2 Class A Pass | | | | |
| | Through Trust | 4.625% | 12/3/26 | 41 | 43 |
| 456,993 |
| Utilities (2.1%) | | | | |
| Electric (1.9%) | | | | |
| AEP Texas Central Co. | 6.650% | 2/15/33 | 200 | 244 |
| Alabama Power Co. | 5.500% | 10/15/17 | 230 | 244 |
| Alabama Power Co. | 6.125% | 5/15/38 | 50 | 61 |
| Alabama Power Co. | 5.500% | 3/15/41 | 50 | 57 |
| Alabama Power Co. | 5.200% | 6/1/41 | 175 | 191 |
| Alabama Power Co. | 3.850% | 12/1/42 | 25 | 23 |
| Alabama Power Co. | 4.150% | 8/15/44 | 75 | 72 |
| Alabama Power Co. | 3.750% | 3/1/45 | 150 | 135 |
| Ameren Corp. | 2.700% | 11/15/20 | 100 | 100 |
| Ameren Corp. | 3.650% | 2/15/26 | 80 | 80 |
| Ameren Illinois Co. | 6.125% | 11/15/17 | 25 | 27 |
| | | | | |
| Face | Market |
| Maturity Amount | Value • |
| | Coupon | Date | ($000) | ($000) |
| Ameren Illinois Co. | 2.700% | 9/1/22 | 500 | 492 |
| American Electric Power Co. Inc. | 1.650% | 12/15/17 | 150 | 149 |
| American Electric Power Co. Inc. | 2.950% | 12/15/22 | 25 | 25 |
| Appalachian Power Co. | 4.600% | 3/30/21 | 50 | 53 |
| Appalachian Power Co. | 6.700% | 8/15/37 | 250 | 299 |
| Arizona Public Service Co. | 8.750% | 3/1/19 | 200 | 238 |
| Arizona Public Service Co. | 3.350% | 6/15/24 | 50 | 51 |
| Arizona Public Service Co. | 3.150% | 5/15/25 | 200 | 199 |
| Arizona Public Service Co. | 4.500% | 4/1/42 | 25 | 26 |
| Arizona Public Service Co. | 4.700% | 1/15/44 | 100 | 106 |
| Arizona Public Service Co. | 4.350% | 11/15/45 | 125 | 126 |
| Atlantic City Electric Co. | 7.750% | 11/15/18 | 100 | 115 |
| Baltimore Gas & Electric Co. | 3.500% | 11/15/21 | 350 | 363 |
| Berkshire Hathaway Energy Co. | 5.750% | 4/1/18 | 575 | 621 |
| Berkshire Hathaway Energy Co. | 2.000% | 11/15/18 | 125 | 124 |
| Berkshire Hathaway Energy Co. | 3.750% | 11/15/23 | 100 | 103 |
| Berkshire Hathaway Energy Co. | 3.500% | 2/1/25 | 100 | 99 |
| Berkshire Hathaway Energy Co. | 5.950% | 5/15/37 | 225 | 257 |
| Berkshire Hathaway Energy Co. | 6.500% | 9/15/37 | 50 | 61 |
| Berkshire Hathaway Energy Co. | 5.150% | 11/15/43 | 150 | 158 |
| Berkshire Hathaway Energy Co. | 4.500% | 2/1/45 | 100 | 96 |
| CenterPoint Energy Houston Electric | | | | |
| | LLC | 6.950% | 3/15/33 | 50 | 66 |
| CenterPoint Energy Inc. | 6.500% | 5/1/18 | 200 | 218 |
| Cleco Power LLC | 6.000% | 12/1/40 | 100 | 112 |
| Cleveland Electric Illuminating Co. | 5.500% | 8/15/24 | 225 | 253 |
| CMS Energy Corp. | 8.750% | 6/15/19 | 200 | 239 |
| CMS Energy Corp. | 3.875% | 3/1/24 | 25 | 25 |
| CMS Energy Corp. | 3.600% | 11/15/25 | 175 | 174 |
| CMS Energy Corp. | 4.700% | 3/31/43 | 125 | 124 |
| Commonwealth Edison Co. | 6.150% | 9/15/17 | 325 | 349 |
| Commonwealth Edison Co. | 5.800% | 3/15/18 | 75 | 81 |
| Commonwealth Edison Co. | 4.000% | 8/1/20 | 25 | 26 |
| Commonwealth Edison Co. | 5.900% | 3/15/36 | 50 | 60 |
| Commonwealth Edison Co. | 6.450% | 1/15/38 | 175 | 223 |
| Commonwealth Edison Co. | 4.600% | 8/15/43 | 300 | 310 |
| Commonwealth Edison Co. | 4.700% | 1/15/44 | 175 | 184 |
| Commonwealth Edison Co. | 3.700% | 3/1/45 | 300 | 270 |
| Connecticut Light & Power Co. | 2.500% | 1/15/23 | 125 | 121 |
| Connecticut Light & Power Co. | 4.300% | 4/15/44 | 500 | 502 |
| Consolidated Edison Co. of | | | | |
| | New York Inc. | 6.650% | 4/1/19 | 550 | 624 |
| Consolidated Edison Co. of | | | | |
| | New York Inc. | 4.450% | 6/15/20 | 200 | 217 |
| Consolidated Edison Co. of | | | | |
| | New York Inc. | 5.300% | 3/1/35 | 200 | 223 |
| Consolidated Edison Co. of | | | | |
| | New York Inc. | 5.850% | 3/15/36 | 275 | 327 |
| Consolidated Edison Co. of | | | | |
| | New York Inc. | 6.200% | 6/15/36 | 75 | 91 |
| Consolidated Edison Co. of | | | | |
| | New York Inc. | 4.450% | 3/15/44 | 200 | 200 |
| Consolidated Edison Co. of | | | | |
| | New York Inc. | 4.500% | 12/1/45 | 375 | 378 |
| Constellation Energy Group Inc. | 5.150% | 12/1/20 | 200 | 217 |
| Consumers Energy Co. | 5.650% | 9/15/18 | 285 | 311 |
| Consumers Energy Co. | 3.375% | 8/15/23 | 275 | 281 |
| Consumers Energy Co. | 3.950% | 5/15/43 | 75 | 73 |
| Consumers Energy Co. | 4.100% | 11/15/45 | 50 | 50 |
| Consumers Energy Co. | 4.350% | 8/31/64 | 50 | 47 |
| Delmarva Power & Light Co. | 3.500% | 11/15/23 | 25 | 26 |
| Delmarva Power & Light Co. | 4.000% | 6/1/42 | 50 | 47 |
| Dominion Resources Inc. | 6.400% | 6/15/18 | 342 | 374 |
| Dominion Resources Inc. | 2.500% | 12/1/19 | 50 | 50 |
| Dominion Resources Inc. | 3.625% | 12/1/24 | 50 | 49 |
| Dominion Resources Inc. | 3.900% | 10/1/25 | 125 | 125 |
| Dominion Resources Inc. | 6.300% | 3/15/33 | 100 | 115 |
| Dominion Resources Inc. | 5.950% | 6/15/35 | 225 | 252 |
| Dominion Resources Inc. | 4.050% | 9/15/42 | 100 | 88 |
| Dominion Resources Inc. | 4.700% | 12/1/44 | 175 | 171 |
| 4 | Dominion Resources Inc. | 5.750% | 10/1/54 | 100 | 98 |
278
Vanguard Total Bond Market Index Portfolio
| | | | | |
| Face | Market |
| Maturity Amount | Value • |
| | Coupon | Date | ($000) | ($000) |
| DTE Electric Co. | 3.900% | 6/1/21 | 100 | 106 |
| DTE Electric Co. | 2.650% | 6/15/22 | 225 | 221 |
| DTE Electric Co. | 3.650% | 3/15/24 | 175 | 183 |
| DTE Electric Co. | 3.375% | 3/1/25 | 225 | 230 |
| DTE Electric Co. | 3.950% | 6/15/42 | 50 | 48 |
| DTE Electric Co. | 4.000% | 4/1/43 | 225 | 218 |
| DTE Energy Co. | 2.400% | 12/1/19 | 300 | 299 |
| Duke Energy Carolinas LLC | 4.300% | 6/15/20 | 325 | 352 |
| Duke Energy Carolinas LLC | 3.900% | 6/15/21 | 500 | 531 |
| Duke Energy Carolinas LLC | 6.000% | 12/1/28 | 125 | 150 |
| Duke Energy Carolinas LLC | 6.100% | 6/1/37 | 100 | 121 |
| Duke Energy Carolinas LLC | 6.000% | 1/15/38 | 25 | 31 |
| Duke Energy Carolinas LLC | 6.050% | 4/15/38 | 25 | 31 |
| Duke Energy Carolinas LLC | 5.300% | 2/15/40 | 100 | 115 |
| Duke Energy Carolinas LLC | 4.000% | 9/30/42 | 75 | 72 |
| Duke Energy Corp. | 2.100% | 6/15/18 | 75 | 75 |
| Duke Energy Corp. | 5.050% | 9/15/19 | 250 | 272 |
| Duke Energy Corp. | 3.050% | 8/15/22 | 75 | 74 |
| Duke Energy Corp. | 3.750% | 4/15/24 | 325 | 329 |
| Duke Energy Florida LLC | 5.650% | 6/15/18 | 75 | 82 |
| Duke Energy Florida LLC | 6.350% | 9/15/37 | 225 | 287 |
| Duke Energy Florida LLC | 6.400% | 6/15/38 | 200 | 256 |
| Duke Energy Florida LLC | 3.850% | 11/15/42 | 200 | 187 |
| Duke Energy Indiana Inc. | 3.750% | 7/15/20 | 25 | 26 |
| Duke Energy Indiana Inc. | 6.350% | 8/15/38 | 225 | 287 |
| Duke Energy Indiana Inc. | 4.200% | 3/15/42 | 400 | 392 |
| Duke Energy Progress Llc | 5.300% | 1/15/19 | 175 | 192 |
| Duke Energy Progress LLC | 4.375% | 3/30/44 | 550 | 558 |
| El Paso Electric Co. | 6.000% | 5/15/35 | 50 | 59 |
| Entergy Arkansas Inc. | 3.750% | 2/15/21 | 75 | 78 |
| Entergy Gulf States Louisiana LLC | 6.000% | 5/1/18 | 200 | 219 |
| Entergy Louisiana LLC | 5.400% | 11/1/24 | 475 | 543 |
| Entergy Louisiana LLC | 4.950% | 1/15/45 | 100 | 100 |
| Entergy Texas Inc. | 7.125% | 2/1/19 | 325 | 368 |
| Eversource Energy | 1.450% | 5/1/18 | 100 | 98 |
| Eversource Energy | 4.500% | 11/15/19 | 75 | 80 |
| Eversource Energy | 3.150% | 1/15/25 | 125 | 122 |
| Exelon Corp. | 2.850% | 6/15/20 | 75 | 75 |
| 7 | Exelon Corp. | 3.950% | 6/15/25 | 200 | 200 |
| 7 | Exelon Corp. | 4.950% | 6/15/35 | 225 | 226 |
| Exelon Corp. | 5.625% | 6/15/35 | 20 | 21 |
| 7 | Exelon Corp. | 5.100% | 6/15/45 | 250 | 250 |
| Exelon Generation Co. LLC | 6.200% | 10/1/17 | 125 | 133 |
| Exelon Generation Co. LLC | 2.950% | 1/15/20 | 400 | 399 |
| Exelon Generation Co. LLC | 4.000% | 10/1/20 | 225 | 232 |
| Exelon Generation Co. LLC | 5.600% | 6/15/42 | 205 | 191 |
| FirstEnergy Solutions Corp. | 6.800% | 8/15/39 | 125 | 118 |
| Florida Power & Light Co. | 5.550% | 11/1/17 | 75 | 80 |
| Florida Power & Light Co. | 5.625% | 4/1/34 | 25 | 30 |
| Florida Power & Light Co. | 5.650% | 2/1/37 | 96 | 115 |
| Florida Power & Light Co. | 5.960% | 4/1/39 | 475 | 593 |
| Florida Power & Light Co. | 3.800% | 12/15/42 | 150 | 142 |
| Georgia Power Co. | 1.950% | 12/1/18 | 140 | 140 |
| Georgia Power Co. | 5.650% | 3/1/37 | 50 | 54 |
| Georgia Power Co. | 5.400% | 6/1/40 | 300 | 316 |
| Georgia Power Co. | 4.300% | 3/15/43 | 100 | 92 |
| Iberdrola International BV | 6.750% | 7/15/36 | 75 | 92 |
| Indiana Michigan Power Co. | 7.000% | 3/15/19 | 100 | 113 |
| Indiana Michigan Power Co. | 6.050% | 3/15/37 | 200 | 227 |
| Interstate Power & Light Co. | 3.250% | 12/1/24 | 50 | 50 |
| Interstate Power & Light Co. | 6.250% | 7/15/39 | 50 | 63 |
| ITC Holdings Corp. | 4.050% | 7/1/23 | 75 | 77 |
| ITC Holdings Corp. | 5.300% | 7/1/43 | 175 | 179 |
| Jersey Central Power & Light Co. | 5.650% | 6/1/17 | 250 | 263 |
| 4 | John Sevier Combined Cycle | | | | |
| | Generation LLC | 4.626% | 1/15/42 | 71 | 78 |
| Kansas City Power & Light Co. | 6.050% | 11/15/35 | 50 | 60 |
| Kansas City Power & Light Co. | 5.300% | 10/1/41 | 100 | 109 |
| Kentucky Utilities Co. | 3.250% | 11/1/20 | 50 | 52 |
| Kentucky Utilities Co. | 5.125% | 11/1/40 | 125 | 140 |
| Kentucky Utilities Co. | 4.650% | 11/15/43 | 250 | 265 |
| | | | | |
| Face | Market |
| Maturity Amount | Value • |
| | Coupon | Date | ($000) | ($000) |
| Kentucky Utilities Co. | 4.375% | 10/1/45 | 25 | 26 |
| LG&E & KU Energy LLC | 3.750% | 11/15/20 | 100 | 103 |
| Louisville Gas & Electric Co. | 5.125% | 11/15/40 | 125 | 140 |
| Louisville Gas & Electric Co. | 4.650% | 11/15/43 | 25 | 26 |
| MidAmerican Energy Co. | 5.300% | 3/15/18 | 50 | 54 |
| MidAmerican Energy Co. | 6.750% | 12/30/31 | 125 | 160 |
| MidAmerican Energy Co. | 5.750% | 11/1/35 | 125 | 149 |
| Mississippi Power Co. | 4.250% | 3/15/42 | 150 | 115 |
| National Rural Utilities Cooperative | | | | |
| | Finance Corp. | 5.450% | 4/10/17 | 250 | 262 |
| National Rural Utilities Cooperative | | | | |
| | Finance Corp. | 0.950% | 4/24/17 | 100 | 100 |
| National Rural Utilities Cooperative | | | | |
| | Finance Corp. | 5.450% | 2/1/18 | 200 | 214 |
| National Rural Utilities Cooperative | | | | |
| | Finance Corp. | 2.300% | 11/15/19 | 175 | 174 |
| National Rural Utilities Cooperative | | | | |
| | Finance Corp. | 2.000% | 1/27/20 | 300 | 294 |
| National Rural Utilities Cooperative | | | | |
| | Finance Corp. | 2.350% | 6/15/20 | 375 | 371 |
| National Rural Utilities Cooperative | | | | |
| | Finance Corp. | 2.300% | 11/1/20 | 425 | 421 |
| National Rural Utilities Cooperative | | | | |
| | Finance Corp. | 4.023% | 11/1/32 | 204 | 200 |
| 4 | National Rural Utilities Cooperative | | | | |
| | Finance Corp. | 4.750% | 4/30/43 | 25 | 25 |
| Nevada Power Co. | 7.125% | 3/15/19 | 550 | 629 |
| NextEra Energy Capital Holdings Inc. | 2.400% | 9/15/19 | 425 | 419 |
| NextEra Energy Capital Holdings Inc. | 3.625% | 6/15/23 | 625 | 623 |
| 4 | NextEra Energy Capital Holdings Inc. | 6.650% | 6/15/67 | 75 | 57 |
| Northern States Power Co. | 5.250% | 3/1/18 | 175 | 188 |
| Northern States Power Co. | 2.200% | 8/15/20 | 50 | 50 |
| Northern States Power Co. | 6.250% | 6/1/36 | 75 | 95 |
| Northern States Power Co. | 6.200% | 7/1/37 | 50 | 63 |
| Northern States Power Co. | 5.350% | 11/1/39 | 175 | 202 |
| Northern States Power Co. | 4.000% | 8/15/45 | 50 | 49 |
| NorthWestern Corp. | 4.176% | 11/15/44 | 75 | 74 |
| NSTAR Electric Co. | 5.625% | 11/15/17 | 150 | 160 |
| NSTAR Electric Co. | 2.375% | 10/15/22 | 150 | 144 |
| NSTAR Electric Co. | 5.500% | 3/15/40 | 75 | 87 |
| Oglethorpe Power Corp. | 6.100% | 3/15/19 | 90 | 99 |
| Oglethorpe Power Corp. | 5.950% | 11/1/39 | 50 | 56 |
| Oglethorpe Power Corp. | 5.375% | 11/1/40 | 125 | 134 |
| Ohio Edison Co. | 8.250% | 10/15/38 | 100 | 139 |
| Oklahoma Gas & Electric Co. | 5.850% | 6/1/40 | 100 | 120 |
| Oklahoma Gas & Electric Co. | 3.900% | 5/1/43 | 50 | 46 |
| Oklahoma Gas & Electric Co. | 4.000% | 12/15/44 | 150 | 141 |
| Oncor Electric Delivery Co. LLC | 4.100% | 6/1/22 | 175 | 182 |
| Oncor Electric Delivery Co. LLC | 7.250% | 1/15/33 | 125 | 160 |
| Oncor Electric Delivery Co. LLC | 7.500% | 9/1/38 | 225 | 299 |
| Pacific Gas & Electric Co. | 5.625% | 11/30/17 | 150 | 160 |
| Pacific Gas & Electric Co. | 8.250% | 10/15/18 | 220 | 256 |
| Pacific Gas & Electric Co. | 3.250% | 6/15/23 | 300 | 301 |
| Pacific Gas & Electric Co. | 3.750% | 2/15/24 | 50 | 52 |
| Pacific Gas & Electric Co. | 3.400% | 8/15/24 | 50 | 50 |
| Pacific Gas & Electric Co. | 3.500% | 6/15/25 | 50 | 51 |
| Pacific Gas & Electric Co. | 6.050% | 3/1/34 | 625 | 743 |
| Pacific Gas & Electric Co. | 6.350% | 2/15/38 | 100 | 122 |
| Pacific Gas & Electric Co. | 5.400% | 1/15/40 | 250 | 282 |
| Pacific Gas & Electric Co. | 4.450% | 4/15/42 | 225 | 226 |
| Pacific Gas & Electric Co. | 4.600% | 6/15/43 | 375 | 382 |
| Pacific Gas & Electric Co. | 4.750% | 2/15/44 | 150 | 156 |
| Pacific Gas & Electric Co. | 4.250% | 3/15/46 | 175 | 170 |
| PacifiCorp | 5.650% | 7/15/18 | 100 | 109 |
| PacifiCorp | 3.600% | 4/1/24 | 125 | 129 |
| PacifiCorp | 7.700% | 11/15/31 | 600 | 826 |
| PacifiCorp | 5.250% | 6/15/35 | 100 | 112 |
| Peco Energy Co. | 5.350% | 3/1/18 | 50 | 54 |
| Peco Energy Co. | 2.375% | 9/15/22 | 75 | 73 |
| Pennsylvania Electric Co. | 6.050% | 9/1/17 | 85 | 90 |
| PG&E Corp. | 2.400% | 3/1/19 | 100 | 100 |
279
Vanguard Total Bond Market Index Portfolio
| | | | | |
| Face | Market |
| Maturity Amount | Value • |
| | Coupon | Date | ($000) | ($000) |
| Potomac Electric Power Co. | 6.500% | 11/15/37 | 100 | 129 |
| PPL Capital Funding Inc. | 1.900% | 6/1/18 | 50 | 50 |
| PPL Capital Funding Inc. | 3.500% | 12/1/22 | 115 | 116 |
| PPL Capital Funding Inc. | 3.400% | 6/1/23 | 100 | 99 |
| PPL Capital Funding Inc. | 3.950% | 3/15/24 | 50 | 51 |
| PPL Capital Funding Inc. | 4.700% | 6/1/43 | 25 | 25 |
| PPL Capital Funding Inc. | 5.000% | 3/15/44 | 350 | 361 |
| PPL Electric Utilities Corp. | 3.000% | 9/15/21 | 125 | 127 |
| PPL Electric Utilities Corp. | 4.125% | 6/15/44 | 50 | 49 |
| Progress Energy Inc. | 7.050% | 3/15/19 | 400 | 454 |
| Progress Energy Inc. | 3.150% | 4/1/22 | 40 | 40 |
| Progress Energy Inc. | 7.000% | 10/30/31 | 119 | 147 |
| Progress Energy Inc. | 6.000% | 12/1/39 | 25 | 29 |
| PSEG Power LLC | 8.625% | 4/15/31 | 381 | 474 |
| Public Service Co. of Colorado | 5.125% | 6/1/19 | 275 | 302 |
| Public Service Co. of Colorado | 3.200% | 11/15/20 | 25 | 26 |
| Public Service Co. of Colorado | 2.900% | 5/15/25 | 100 | 98 |
| Public Service Co. of Colorado | 4.750% | 8/15/41 | 75 | 81 |
| Public Service Co. of Colorado | 3.600% | 9/15/42 | 175 | 159 |
| Public Service Co. of New Hampshire | 3.500% | 11/1/23 | 50 | 51 |
| Public Service Co. of Oklahoma | 6.625% | 11/15/37 | 200 | 241 |
| Public Service Electric & Gas Co. | 5.300% | 5/1/18 | 85 | 92 |
| Public Service Electric & Gas Co. | 2.300% | 9/15/18 | 125 | 126 |
| Public Service Electric & Gas Co. | 1.800% | 6/1/19 | 50 | 49 |
| Public Service Electric & Gas Co. | 3.050% | 11/15/24 | 100 | 99 |
| Public Service Electric & Gas Co. | 3.000% | 5/15/25 | 80 | 79 |
| Public Service Electric & Gas Co. | 4.000% | 6/1/44 | 500 | 487 |
| Public Service Electric & Gas Co. | 4.050% | 5/1/45 | 100 | 98 |
| Public Service Electric & Gas Co. | 4.150% | 11/1/45 | 50 | 49 |
| Puget Energy Inc. | 6.500% | 12/15/20 | 75 | 86 |
| Puget Energy Inc. | 6.000% | 9/1/21 | 100 | 113 |
| 7 | Puget Energy Inc. | 3.650% | 5/15/25 | 400 | 388 |
| Puget Sound Energy Inc. | 5.483% | 6/1/35 | 25 | 29 |
| Puget Sound Energy Inc. | 6.274% | 3/15/37 | 125 | 158 |
| Puget Sound Energy Inc. | 5.757% | 10/1/39 | 75 | 91 |
| Puget Sound Energy Inc. | 5.764% | 7/15/40 | 100 | 121 |
| Puget Sound Energy Inc. | 4.434% | 11/15/41 | 150 | 154 |
| San Diego Gas & Electric Co. | 5.350% | 5/15/35 | 25 | 29 |
| San Diego Gas & Electric Co. | 5.350% | 5/15/40 | 50 | 58 |
| San Diego Gas & Electric Co. | 4.500% | 8/15/40 | 150 | 157 |
| San Diego Gas & Electric Co. | 3.950% | 11/15/41 | 175 | 169 |
| San Diego Gas & Electric Co. | 4.300% | 4/1/42 | 50 | 51 |
| SCANA Corp. | 4.750% | 5/15/21 | 125 | 130 |
| SCANA Corp. | 4.125% | 2/1/22 | 50 | 50 |
| Sierra Pacific Power Co. | 3.375% | 8/15/23 | 50 | 51 |
| Sierra Pacific Power Co. | 6.750% | 7/1/37 | 150 | 188 |
| South Carolina Electric & Gas Co. | 6.500% | 11/1/18 | 200 | 225 |
| South Carolina Electric & Gas Co. | 6.050% | 1/15/38 | 25 | 29 |
| South Carolina Electric & Gas Co. | 5.450% | 2/1/41 | 100 | 110 |
| South Carolina Electric & Gas Co. | 4.500% | 6/1/64 | 50 | 47 |
| South Carolina Electric & Gas Co. | 5.100% | 6/1/65 | 100 | 104 |
| Southern California Edison Co. | 1.125% | 5/1/17 | 50 | 50 |
| Southern California Edison Co. | 3.875% | 6/1/21 | 275 | 291 |
| 4 | Southern California Edison Co. | 1.845% | 2/1/22 | 93 | 92 |
| Southern California Edison Co. | 2.400% | 2/1/22 | 300 | 294 |
| Southern California Edison Co. | 3.500% | 10/1/23 | 175 | 181 |
| Southern California Edison Co. | 6.650% | 4/1/29 | 75 | 94 |
| Southern California Edison Co. | 6.000% | 1/15/34 | 50 | 61 |
| Southern California Edison Co. | 5.750% | 4/1/35 | 75 | 89 |
| Southern California Edison Co. | 5.350% | 7/15/35 | 100 | 113 |
| Southern California Edison Co. | 5.625% | 2/1/36 | 125 | 147 |
| Southern California Edison Co. | 5.950% | 2/1/38 | 200 | 245 |
| Southern California Edison Co. | 4.500% | 9/1/40 | 75 | 78 |
| Southern California Edison Co. | 4.050% | 3/15/42 | 125 | 122 |
| Southern California Edison Co. | 4.650% | 10/1/43 | 175 | 185 |
| Southern Co. | 1.300% | 8/15/17 | 75 | 74 |
| Southern Co. | 2.150% | 9/1/19 | 50 | 49 |
| Southern Co. | 2.750% | 6/15/20 | 250 | 247 |
| Southern Power Co. | 1.850% | 12/1/17 | 750 | 750 |
| Southern Power Co. | 4.150% | 12/1/25 | 200 | 200 |
| Southern Power Co. | 5.150% | 9/15/41 | 100 | 93 |
| | | | | |
| Face | Market |
| Maturity Amount | Value • |
| | Coupon | Date | ($000) | ($000) |
| Southern Power Co. | 5.250% | 7/15/43 | 50 | 48 |
| Southwestern Electric Power Co. | 6.450% | 1/15/19 | 100 | 112 |
| Southwestern Electric Power Co. | 3.550% | 2/15/22 | 25 | 25 |
| Southwestern Electric Power Co. | 6.200% | 3/15/40 | 50 | 59 |
| Southwestern Electric Power Co. | 3.900% | 4/1/45 | 100 | 87 |
| Southwestern Public Service Co. | 3.300% | 6/15/24 | 315 | 318 |
| Southwestern Public Service Co. | 4.500% | 8/15/41 | 100 | 103 |
| Tampa Electric Co. | 6.100% | 5/15/18 | 100 | 109 |
| Tampa Electric Co. | 2.600% | 9/15/22 | 75 | 73 |
| Tampa Electric Co. | 6.550% | 5/15/36 | 25 | 32 |
| Tampa Electric Co. | 4.100% | 6/15/42 | 50 | 48 |
| Tampa Electric Co. | 4.200% | 5/15/45 | 250 | 242 |
| TECO Finance Inc. | 5.150% | 3/15/20 | 50 | 54 |
| Toledo Edison Co. | 6.150% | 5/15/37 | 100 | 113 |
| TransAlta Corp. | 6.900% | 5/15/18 | 250 | 254 |
| TransAlta Corp. | 4.500% | 11/15/22 | 100 | 87 |
| Tri-State Generation & Transmission | | | | |
| | Association Inc. | 3.700% | 11/1/24 | 50 | 50 |
| Tri-State Generation & Transmission | | | | |
| | Association Inc. | 4.700% | 11/1/44 | 25 | 25 |
| Tucson Electric Power Co. | 5.150% | 11/15/21 | 50 | 55 |
| Tucson Electric Power Co. | 3.050% | 3/15/25 | 50 | 47 |
| UIL Holdings Corp. | 4.625% | 10/1/20 | 75 | 79 |
| Union Electric Co. | 3.500% | 4/15/24 | 225 | 232 |
| Union Electric Co. | 8.450% | 3/15/39 | 150 | 232 |
| Virginia Electric & Power Co. | 3.450% | 2/15/24 | 50 | 51 |
| Virginia Electric & Power Co. | 6.000% | 1/15/36 | 125 | 154 |
| Virginia Electric & Power Co. | 6.000% | 5/15/37 | 100 | 123 |
| Virginia Electric & Power Co. | 6.350% | 11/30/37 | 50 | 64 |
| Virginia Electric & Power Co. | 4.000% | 1/15/43 | 250 | 240 |
| Virginia Electric & Power Co. | 4.650% | 8/15/43 | 125 | 132 |
| Virginia Electric & Power Co. | 4.450% | 2/15/44 | 675 | 695 |
| WEC Energy Group Inc. | 1.650% | 6/15/18 | 50 | 50 |
| WEC Energy Group Inc. | 2.450% | 6/15/20 | 75 | 75 |
| WEC Energy Group Inc. | 3.550% | 6/15/25 | 200 | 201 |
| 4 | WEC Energy Group Inc. | 6.110% | 12/1/66 | 150 | 114 |
| 4 | WEC Energy Group Inc. | 6.250% | 5/15/67 | 150 | 112 |
| Westar Energy Inc. | 4.125% | 3/1/42 | 200 | 197 |
| Westar Energy Inc. | 4.100% | 4/1/43 | 50 | 49 |
| Westar Energy Inc. | 4.625% | 9/1/43 | 25 | 26 |
| Westar Energy Inc. | 4.250% | 12/1/45 | 25 | 25 |
| Western Massachusetts Electric Co. | 3.500% | 9/15/21 | 75 | 78 |
| Wisconsin Electric Power Co. | 4.250% | 6/1/44 | 100 | 101 |
| Wisconsin Power & Light Co. | 5.000% | 7/15/19 | 65 | 71 |
| Wisconsin Power & Light Co. | 2.250% | 11/15/22 | 75 | 72 |
| Wisconsin Power & Light Co. | 6.375% | 8/15/37 | 100 | 127 |
| Wisconsin Power & Light Co. | 4.100% | 10/15/44 | 75 | 73 |
| Xcel Energy Inc. | 5.613% | 4/1/17 | 78 | 82 |
| Xcel Energy Inc. | 1.200% | 6/1/17 | 100 | 99 |
| Xcel Energy Inc. | 4.700% | 5/15/20 | 100 | 107 |
| Xcel Energy Inc. | 3.300% | 6/1/25 | 100 | 98 |
| |
| Natural Gas (0.2%) | | | | |
| AGL Capital Corp. | 3.500% | 9/15/21 | 325 | 326 |
| AGL Capital Corp. | 5.875% | 3/15/41 | 75 | 83 |
| AGL Capital Corp. | 4.400% | 6/1/43 | 50 | 46 |
| Atmos Energy Corp. | 8.500% | 3/15/19 | 75 | 88 |
| Atmos Energy Corp. | 5.500% | 6/15/41 | 300 | 344 |
| British Transco Finance Inc. | 6.625% | 6/1/18 | 50 | 55 |
| CenterPoint Energy Resources Corp. | 4.500% | 1/15/21 | 50 | 52 |
| CenterPoint Energy Resources Corp. | 5.850% | 1/15/41 | 250 | 279 |
| KeySpan Corp. | 8.000% | 11/15/30 | 75 | 100 |
| Laclede Group Inc. | 4.700% | 8/15/44 | 100 | 99 |
| NiSource Finance Corp. | 6.400% | 3/15/18 | 30 | 33 |
| NiSource Finance Corp. | 6.800% | 1/15/19 | 75 | 84 |
| NiSource Finance Corp. | 5.450% | 9/15/20 | 225 | 247 |
| NiSource Finance Corp. | 6.125% | 3/1/22 | 75 | 86 |
| NiSource Finance Corp. | 6.250% | 12/15/40 | 150 | 177 |
| NiSource Finance Corp. | 5.800% | 2/1/42 | 150 | 170 |
| NiSource Finance Corp. | 4.800% | 2/15/44 | 125 | 127 |
| ONE Gas Inc. | 2.070% | 2/1/19 | 75 | 75 |
280
Vanguard Total Bond Market Index Portfolio
| | | | |
| Face | Market |
| Maturity Amount | Value • |
| Coupon | Date | ($000) | ($000) |
| ONE Gas Inc. | 4.658% | 2/1/44 | 25 | 26 |
| Piedmont Natural Gas Co. Inc. | 4.650% | 8/1/43 | 50 | 52 |
| Sempra Energy | 6.150% | 6/15/18 | 548 | 598 |
| Sempra Energy | 2.850% | 11/15/20 | 395 | 395 |
| Sempra Energy | 2.875% | 10/1/22 | 100 | 97 |
| Sempra Energy | 3.750% | 11/15/25 | 105 | 105 |
| Sempra Energy | 6.000% | 10/15/39 | 300 | 336 |
| Southern California Gas Co. | 3.750% | 9/15/42 | 25 | 23 |
| Southern California Gas Co. | 4.450% | 3/15/44 | 50 | 52 |
| |
| Other Utility (0.0%) | | | | |
| American Water Capital Corp. | 6.085% | 10/15/17 | 200 | 215 |
| American Water Capital Corp. | 3.400% | 3/1/25 | 75 | 76 |
| American Water Capital Corp. | 6.593% | 10/15/37 | 150 | 195 |
| American Water Capital Corp. | 4.300% | 9/1/45 | 100 | 101 |
| United Utilities plc | 5.375% | 2/1/19 | 325 | 349 |
| 57,799 |
| Total Corporate Bonds (Cost $747,928) | 752,931 |
| Sovereign Bonds (U.S. Dollar-Denominated) (5.0%) | | | |
| African Development Bank | 1.125% | 3/15/17 | 300 | 300 |
| African Development Bank | 0.875% | 3/15/18 | 150 | 149 |
| African Development Bank | 1.625% | 10/2/18 | 500 | 502 |
| African Development Bank | 2.375% | 9/23/21 | 650 | 659 |
| Agricultural Bank Of China | 2.000% | 5/21/18 | 250 | 249 |
| Asian Development Bank | 0.750% | 1/11/17 | 300 | 299 |
| Asian Development Bank | 1.125% | 3/15/17 | 600 | 601 |
| Asian Development Bank | 5.593% | 7/16/18 | 275 | 301 |
| Asian Development Bank | 1.750% | 9/11/18 | 225 | 227 |
| Asian Development Bank | 1.875% | 10/23/18 | 950 | 962 |
| Asian Development Bank | 1.750% | 3/21/19 | 25 | 25 |
| Asian Development Bank | 1.875% | 4/12/19 | 50 | 50 |
| Asian Development Bank | 1.500% | 1/22/20 | 700 | 692 |
| Asian Development Bank | 1.875% | 2/18/22 | 600 | 591 |
| Asian Development Bank | 2.000% | 1/22/25 | 300 | 290 |
| Banco do Brasil SA | 3.875% | 1/23/17 | 375 | 375 |
| Canada | 0.875% | 2/14/17 | 450 | 449 |
| Canada | 1.125% | 3/19/18 | 450 | 448 |
| CNOOC Finance 2013 Ltd. | 3.000% | 5/9/23 | 150 | 141 |
| CNOOC Finance 2015 Australia Pty Ltd. 2.625% | 5/5/20 | 300 | 293 |
| CNOOC Finance 2015 USA LLC | 3.500% | 5/5/25 | 500 | 476 |
| CNOOC Nexen Finance 2014 ULC | 1.625% | 4/30/17 | 700 | 696 |
| CNOOC Nexen Finance 2014 ULC | 4.250% | 4/30/24 | 300 | 305 |
| Corp. Andina de Fomento | 3.750% | 1/15/16 | 225 | 225 |
| Corp. Andina de Fomento | 8.125% | 6/4/19 | 300 | 353 |
| Corp. Andina de Fomento | 4.375% | 6/15/22 | 832 | 885 |
| Council Of Europe Development Bank | 1.500% | 2/22/17 | 300 | 302 |
| Council Of Europe Development Bank | 1.500% | 6/19/17 | 50 | 50 |
| Council Of Europe Development Bank | 1.000% | 3/7/18 | 275 | 273 |
| Council Of Europe Development Bank | 1.125% | 5/31/18 | 200 | 199 |
| Council Of Europe Development Bank | 1.625% | 3/10/20 | 300 | 297 |
| Ecopetrol SA | 4.250% | 9/18/18 | 100 | 100 |
| Ecopetrol SA | 5.875% | 9/18/23 | 325 | 296 |
| Ecopetrol SA | 4.125% | 1/16/25 | 650 | 519 |
| Ecopetrol SA | 5.375% | 6/26/26 | 250 | 212 |
| Ecopetrol SA | 7.375% | 9/18/43 | 300 | 252 |
| Ecopetrol SA | 5.875% | 5/28/45 | 200 | 143 |
| Emirates Telecommunications Group | | | | |
| Co PJSC | 3.500% | 6/18/24 | 200 | 203 |
| European Bank for Reconstruction | | | | |
| & Development | 2.500% | 3/15/16 | 175 | 176 |
| European Bank for Reconstruction | | | | |
| & Development | 1.375% | 10/20/16 | 100 | 100 |
| European Bank for Reconstruction | | | | |
| & Development | 0.750% | 9/1/17 | 700 | 696 |
| European Bank for Reconstruction | | | | |
| & Development | 1.000% | 9/17/18 | 150 | 148 |
| European Bank for Reconstruction | | | | |
| & Development | 1.625% | 11/15/18 | 200 | 201 |
| European Bank for Reconstruction | | | | |
| & Development | 1.750% | 6/14/19 | 275 | 276 |
| | | | | |
| Face | Market |
| Maturity Amount | Value • |
| | Coupon | Date | ($000) | ($000) |
| European Bank for Reconstruction | | | | |
| | & Development | 1.750% | 11/26/19 | 500 | 499 |
| European Bank for Reconstruction | | | | |
| | & Development | 1.500% | 3/16/20 | 350 | 345 |
| European Bank for Reconstruction | | | | |
| | & Development | 1.875% | 2/23/22 | 200 | 197 |
| European Investment Bank | 1.125% | 12/15/16 | 200 | 200 |
| European Investment Bank | 4.875% | 1/17/17 | 150 | 156 |
| European Investment Bank | 1.750% | 3/15/17 | 775 | 782 |
| European Investment Bank | 0.875% | 4/18/17 | 350 | 349 |
| European Investment Bank | 5.125% | 5/30/17 | 675 | 713 |
| European Investment Bank | 1.000% | 8/17/17 | 250 | 249 |
| European Investment Bank | 1.125% | 9/15/17 | 400 | 399 |
| European Investment Bank | 1.000% | 12/15/17 | 250 | 249 |
| European Investment Bank | 1.000% | 3/15/18 | 200 | 199 |
| European Investment Bank | 1.250% | 5/15/18 | 900 | 897 |
| European Investment Bank | 1.000% | 6/15/18 | 650 | 644 |
| European Investment Bank | 1.125% | 8/15/18 | 350 | 346 |
| European Investment Bank | 1.625% | 12/18/18 | 400 | 401 |
| European Investment Bank | 1.875% | 3/15/19 | 1,500 | 1,513 |
| European Investment Bank | 1.750% | 6/17/19 | 885 | 887 |
| European Investment Bank | 1.625% | 3/16/20 | 275 | 272 |
| European Investment Bank | 1.375% | 6/15/20 | 1,825 | 1,786 |
| European Investment Bank | 2.875% | 9/15/20 | 1,025 | 1,068 |
| European Investment Bank | 1.625% | 12/15/20 | 125 | 123 |
| European Investment Bank | 4.000% | 2/16/21 | 1,225 | 1,337 |
| European Investment Bank | 2.500% | 4/15/21 | 850 | 868 |
| European Investment Bank | 2.125% | 10/15/21 | 100 | 100 |
| European Investment Bank | 3.250% | 1/29/24 | 400 | 426 |
| European Investment Bank | 2.500% | 10/15/24 | 200 | 202 |
| European Investment Bank | 1.875% | 2/10/25 | 1,050 | 1,000 |
| Export Development Canada | 1.250% | 10/26/16 | 100 | 100 |
| 8 | Export Development Canada | 1.000% | 5/15/17 | 25 | 25 |
| Export Development Canada | 0.750% | 12/15/17 | 575 | 566 |
| Export Development Canada | 1.000% | 6/15/18 | 575 | 570 |
| 8 | Export Development Canada | 1.625% | 12/3/19 | 150 | 149 |
| Export-Import Bank of Korea | 4.000% | 1/11/17 | 325 | 333 |
| Export-Import Bank of Korea | 1.750% | 2/27/18 | 625 | 622 |
| Export-Import Bank of Korea | 2.875% | 9/17/18 | 200 | 204 |
| Export-Import Bank of Korea | 2.375% | 8/12/19 | 200 | 201 |
| Export-Import Bank of Korea | 2.500% | 5/10/21 | 300 | 297 |
| Export-Import Bank of Korea | 4.375% | 9/15/21 | 75 | 82 |
| Export-Import Bank of Korea | 5.000% | 4/11/22 | 275 | 309 |
| Export-Import Bank of Korea | 4.000% | 1/14/24 | 650 | 687 |
| Federative Republic of Brazil | 8.875% | 10/14/19 | 65 | 73 |
| Federative Republic of Brazil | 10.125% | 5/15/27 | 50 | 59 |
| FMS Wertmanagement AoeR | 0.625% | 1/30/17 | 500 | 497 |
| FMS Wertmanagement AoeR | 1.125% | 9/5/17 | 150 | 150 |
| FMS Wertmanagement AoeR | 1.000% | 11/21/17 | 200 | 199 |
| FMS Wertmanagement AoeR | 1.625% | 11/20/18 | 500 | 502 |
| FMS Wertmanagement AoeR | 1.750% | 3/17/20 | 150 | 149 |
| Hydro-Quebec | 8.400% | 1/15/22 | 775 | 999 |
| Hydro-Quebec | 8.050% | 7/7/24 | 200 | 271 |
| Industrial & Commercial Bank of | | | | |
| | China Ltd. | 2.351% | 11/13/17 | 250 | 251 |
| Industrial & Commercial Bank of | | | | |
| | China Ltd. | 3.231% | 11/13/19 | 250 | 255 |
| Inter-American Development Bank | 1.000% | 7/14/17 | 425 | 424 |
| Inter-American Development Bank | 2.375% | 8/15/17 | 100 | 102 |
| Inter-American Development Bank | 0.875% | 3/15/18 | 150 | 149 |
| Inter-American Development Bank | 1.750% | 8/24/18 | 275 | 278 |
| Inter-American Development Bank | 1.125% | 8/28/18 | 500 | 495 |
| Inter-American Development Bank | 4.250% | 9/10/18 | 1,050 | 1,128 |
| Inter-American Development Bank | 1.125% | 9/12/19 | 100 | 98 |
| Inter-American Development Bank | 3.875% | 9/17/19 | 1,550 | 1,668 |
| Inter-American Development Bank | 1.750% | 10/15/19 | 600 | 601 |
| Inter-American Development Bank | 3.875% | 2/14/20 | 50 | 54 |
| Inter-American Development Bank | 1.875% | 6/16/20 | 275 | 275 |
| Inter-American Development Bank | 1.750% | 4/14/22 | 800 | 781 |
| Inter-American Development Bank | 3.000% | 2/21/24 | 650 | 682 |
| Inter-American Development Bank | 2.125% | 1/15/25 | 400 | 391 |
281
Vanguard Total Bond Market Index Portfolio
| | | | | |
| Face | Market |
| Maturity Amount | Value • |
| | Coupon | Date | ($000) | ($000) |
| Inter-American Development Bank | 7.000% | 6/15/25 | 100 | 134 |
| International Bank for Reconstruction | | | | |
| | & Development | 0.625% | 10/14/16 | 550 | 549 |
| International Bank for Reconstruction | | | | |
| | & Development | 0.875% | 4/17/17 | 1,450 | 1,448 |
| International Bank for Reconstruction | | | | |
| | & Development | 1.000% | 11/15/17 | 200 | 199 |
| International Bank for Reconstruction | | | | |
| | & Development | 1.375% | 4/10/18 | 550 | 551 |
| International Bank for Reconstruction | | | | |
| | & Development | 1.000% | 6/15/18 | 1,000 | 991 |
| International Bank for Reconstruction | | | | |
| | & Development | 1.875% | 3/15/19 | 1,225 | 1,237 |
| International Bank for Reconstruction | | | | |
| | & Development | 1.875% | 10/7/19 | 600 | 604 |
| International Bank for Reconstruction | | | | |
| | & Development | 2.250% | 6/24/21 | 450 | 454 |
| International Bank for Reconstruction | | | | |
| | & Development | 1.625% | 2/10/22 | 1,025 | 994 |
| International Bank for Reconstruction | | | | |
| | & Development | 2.500% | 7/29/25 | 1,000 | 1,007 |
| International Bank for Reconstruction | | | | |
| | & Development | 4.750% | 2/15/35 | 400 | 487 |
| International Finance Corp. | 1.125% | 11/23/16 | 750 | 751 |
| International Finance Corp. | 0.625% | 12/21/17 | 250 | 246 |
| International Finance Corp. | 0.875% | 6/15/18 | 300 | 297 |
| International Finance Corp. | 1.250% | 7/16/18 | 150 | 150 |
| International Finance Corp. | 1.750% | 9/4/18 | 350 | 353 |
| International Finance Corp. | 1.750% | 9/16/19 | 300 | 300 |
| 9 | Japan Bank for International | | | | |
| | Cooperation | 1.125% | 7/19/17 | 950 | 944 |
| 9 | Japan Bank for International | | | | |
| | Cooperation | 1.750% | 7/31/18 | 150 | 150 |
| 9 | Japan Bank for International | | | | |
| | Cooperation | 1.750% | 11/13/18 | 400 | 398 |
| 9 | Japan Bank for International | | | | |
| | Cooperation | 3.375% | 7/31/23 | 100 | 105 |
| 9 | Japan Bank for International | | | | |
| | Cooperation | 3.000% | 5/29/24 | 500 | 512 |
| 9 | Japan Bank for International | | | | |
| | Cooperation | 2.125% | 2/10/25 | 200 | 190 |
| 9 | Japan Bank for International | | | | |
| | Cooperation | 2.500% | 5/28/25 | 200 | 194 |
| 9 | Japan Finance Organization for | | | | |
| | Municipalities | 5.000% | 5/16/17 | 100 | 104 |
| 9 | Japan Finance Organization for | | | | |
| | Municipalities | 4.000% | 1/13/21 | 300 | 323 |
| 10 | KFW | 1.250% | 2/15/17 | 1,700 | 1,705 |
| 10 | KFW | 0.750% | 3/17/17 | 900 | 896 |
| 10 | KFW | 0.875% | 9/5/17 | 250 | 249 |
| 10 | KFW | 0.875% | 12/15/17 | 700 | 693 |
| 10 | KFW | 1.000% | 1/26/18 | 300 | 297 |
| 10 | KFW | 4.375% | 3/15/18 | 250 | 267 |
| 10 | KFW | 1.000% | 6/11/18 | 300 | 297 |
| 10 | KFW | 1.125% | 8/6/18 | 600 | 594 |
| 10 | KFW | 1.875% | 4/1/19 | 775 | 782 |
| 10 | KFW | 4.875% | 6/17/19 | 1,350 | 1,496 |
| 10 | KFW | 1.750% | 10/15/19 | 200 | 199 |
| 10 | KFW | 4.000% | 1/27/20 | 50 | 54 |
| 10 | KFW | 1.500% | 4/20/20 | 625 | 614 |
| 10 | KFW | 1.875% | 6/30/20 | 1,100 | 1,096 |
| 10 | KFW | 2.750% | 9/8/20 | 3,200 | 3,316 |
| 10 | KFW | 2.750% | 10/1/20 | 200 | 207 |
| 10 | KFW | 2.000% | 10/4/22 | 650 | 640 |
| 10 | KFW | 2.125% | 1/17/23 | 1,025 | 1,013 |
| 10 | KFW | 2.500% | 11/20/24 | 800 | 804 |
| 10 | KFW | 2.000% | 5/2/25 | 300 | 289 |
| 10 | KFW | 0.000% | 4/18/36 | 400 | 210 |
| Korea Development Bank | 3.250% | 9/20/16 | 250 | 254 |
| Korea Development Bank | 2.250% | 8/7/17 | 25 | 25 |
| Korea Development Bank | 1.500% | 1/22/18 | 250 | 248 |
| | | | | |
| Face | Market |
| Maturity Amount | Value • |
| | Coupon | Date | ($000) | ($000) |
| Korea Development Bank | 3.000% | 3/17/19 | 200 | 203 |
| Korea Development Bank | 4.625% | 11/16/21 | 150 | 165 |
| Korea Development Bank | 3.000% | 9/14/22 | 750 | 755 |
| Korea Development Bank | 3.750% | 1/22/24 | 400 | 416 |
| 10 | Landwirtschaftliche Rentenbank | 0.875% | 9/12/17 | 725 | 720 |
| 10 | Landwirtschaftliche Rentenbank | 1.000% | 4/4/18 | 100 | 99 |
| 10 | Landwirtschaftliche Rentenbank | 1.875% | 9/17/18 | 150 | 151 |
| 10 | Landwirtschaftliche Rentenbank | 1.750% | 4/15/19 | 75 | 75 |
| 10 | Landwirtschaftliche Rentenbank | 1.375% | 10/23/19 | 50 | 49 |
| 10 | Landwirtschaftliche Rentenbank | 2.000% | 1/13/25 | 850 | 819 |
| 10 | Landwirtschaftliche Rentenbank | 2.375% | 6/10/25 | 475 | 467 |
| Nexen Energy ULC | 7.875% | 3/15/32 | 50 | 64 |
| Nexen Energy ULC | 6.400% | 5/15/37 | 450 | 508 |
| Nexen Energy ULC | 7.500% | 7/30/39 | 200 | 263 |
| Nordic Investment Bank | 1.125% | 3/19/18 | 200 | 199 |
| Nordic Investment Bank | 1.875% | 6/14/19 | 300 | 303 |
| Nordic Investment Bank | 1.500% | 9/29/20 | 500 | 493 |
| North American Development Bank | 4.375% | 2/11/20 | 100 | 108 |
| North American Development Bank | 2.400% | 10/26/22 | 150 | 146 |
| 11 | Oesterreichische Kontrollbank AG | 5.000% | 4/25/17 | 600 | 630 |
| 11 | Oesterreichische Kontrollbank AG | 1.375% | 2/10/20 | 700 | 685 |
| 11 | Oesterreichische Kontrollbank AG | 1.500% | 10/21/20 | 300 | 293 |
| 4 | Oriental Republic of Uruguay | 4.500% | 8/14/24 | 225 | 229 |
| 4 | Oriental Republic of Uruguay | 4.375% | 10/27/27 | 75 | 74 |
| 4 | Oriental Republic of Uruguay | 7.625% | 3/21/36 | 200 | 247 |
| 4 | Oriental Republic of Uruguay | 4.125% | 11/20/45 | 300 | 232 |
| 4 | Oriental Republic of Uruguay | 5.100% | 6/18/50 | 600 | 516 |
| Petroleos Mexicanos | 5.750% | 3/1/18 | 625 | 655 |
| Petroleos Mexicanos | 8.000% | 5/3/19 | 200 | 221 |
| Petroleos Mexicanos | 6.000% | 3/5/20 | 400 | 422 |
| 7 | Petroleos Mexicanos | 3.500% | 7/23/20 | 600 | 571 |
| Petroleos Mexicanos | 5.500% | 1/21/21 | 350 | 354 |
| Petroleos Mexicanos | 4.875% | 1/24/22 | 500 | 481 |
| Petroleos Mexicanos | 3.500% | 1/30/23 | 425 | 371 |
| Petroleos Mexicanos | 4.875% | 1/18/24 | 600 | 560 |
| 7 | Petroleos Mexicanos | 4.250% | 1/15/25 | 400 | 353 |
| Petroleos Mexicanos | 2.378% | 4/15/25 | 48 | 47 |
| 7 | Petroleos Mexicanos | 4.500% | 1/23/26 | 450 | 398 |
| Petroleos Mexicanos | 6.625% | 6/15/35 | 625 | 561 |
| Petroleos Mexicanos | 6.625% | 6/15/38 | 150 | 132 |
| Petroleos Mexicanos | 6.500% | 6/2/41 | 400 | 349 |
| Petroleos Mexicanos | 5.500% | 6/27/44 | 375 | 284 |
| 7 | Petroleos Mexicanos | 5.500% | 6/27/44 | 200 | 151 |
| 7 | Petroleos Mexicanos | 5.625% | 1/23/46 | 700 | 536 |
| Province of British Columbia | 1.200% | 4/25/17 | 100 | 100 |
| Province of British Columbia | 2.000% | 10/23/22 | 200 | 194 |
| Province of Manitoba | 1.300% | 4/3/17 | 75 | 75 |
| Province of Manitoba | 1.125% | 6/1/18 | 150 | 148 |
| Province of Manitoba | 1.750% | 5/30/19 | 175 | 174 |
| Province of Manitoba | 2.050% | 11/30/20 | 300 | 298 |
| Province of Manitoba | 2.100% | 9/6/22 | 150 | 145 |
| Province of Manitoba | 3.050% | 5/14/24 | 250 | 254 |
| Province of Ontario | 1.100% | 10/25/17 | 250 | 248 |
| Province of Ontario | 3.150% | 12/15/17 | 225 | 231 |
| Province of Ontario | 3.000% | 7/16/18 | 225 | 233 |
| Province of Ontario | 2.000% | 9/27/18 | 200 | 201 |
| Province of Ontario | 1.650% | 9/27/19 | 225 | 222 |
| Province of Ontario | 4.000% | 10/7/19 | 575 | 615 |
| Province of Ontario | 4.400% | 4/14/20 | 1,200 | 1,311 |
| Province of Ontario | 2.500% | 9/10/21 | 575 | 575 |
| Province of Ontario | 2.450% | 6/29/22 | 150 | 148 |
| Province of Ontario | 3.200% | 5/16/24 | 150 | 154 |
| Quebec | 4.625% | 5/14/18 | 575 | 614 |
| Quebec | 3.500% | 7/29/20 | 350 | 370 |
| Quebec | 2.750% | 8/25/21 | 325 | 329 |
| Quebec | 2.625% | 2/13/23 | 400 | 397 |
| Quebec | 7.500% | 9/15/29 | 325 | 465 |
| Republic of Chile | 3.875% | 8/5/20 | 50 | 53 |
| Republic of Chile | 2.250% | 10/30/22 | 175 | 168 |
| Republic of Chile | 3.125% | 3/27/25 | 465 | 464 |
| Republic of Chile | 3.625% | 10/30/42 | 75 | 65 |
282
Vanguard Total Bond Market Index Portfolio
| | | | | |
| Face | Market |
| Maturity Amount | Value • |
| | Coupon | Date | ($000) | ($000) |
| Republic of Colombia | 7.375% | 1/27/17 | 325 | 340 |
| Republic of Colombia | 7.375% | 3/18/19 | 400 | 447 |
| Republic of Colombia | 4.375% | 7/12/21 | 450 | 451 |
| Republic of Colombia | 4.000% | 2/26/24 | 200 | 191 |
| Republic of Colombia | 8.125% | 5/21/24 | 500 | 599 |
| 4 | Republic of Colombia | 4.500% | 1/28/26 | 950 | 914 |
| Republic of Colombia | 7.375% | 9/18/37 | 100 | 110 |
| Republic of Colombia | 6.125% | 1/18/41 | 575 | 557 |
| 4 | Republic of Colombia | 5.625% | 2/26/44 | 200 | 183 |
| 4 | Republic of Colombia | 5.000% | 6/15/45 | 600 | 505 |
| Republic of Italy | 5.375% | 6/12/17 | 500 | 526 |
| Republic of Italy | 6.875% | 9/27/23 | 975 | 1,201 |
| Republic of Italy | 5.375% | 6/15/33 | 175 | 196 |
| Republic of Korea | 7.125% | 4/16/19 | 475 | 550 |
| Republic of Korea | 3.875% | 9/11/23 | 700 | 757 |
| Republic of Korea | 5.625% | 11/3/25 | 100 | 123 |
| Republic of Panama | 5.200% | 1/30/20 | 200 | 217 |
| 4 | Republic of Panama | 4.000% | 9/22/24 | 200 | 200 |
| 4 | Republic of Panama | 3.750% | 3/16/25 | 200 | 196 |
| Republic of Panama | 7.125% | 1/29/26 | 600 | 747 |
| 4 | Republic of Panama | 6.700% | 1/26/36 | 292 | 347 |
| 4 | Republic of Panama | 4.300% | 4/29/53 | 200 | 171 |
| Republic of Peru | 7.125% | 3/30/19 | 150 | 172 |
| Republic of Peru | 7.350% | 7/21/25 | 425 | 533 |
| Republic of Peru | 4.125% | 8/25/27 | 200 | 197 |
| Republic of Peru | 8.750% | 11/21/33 | 142 | 201 |
| 4 | Republic of Peru | 6.550% | 3/14/37 | 225 | 261 |
| Republic of Peru | 5.625% | 11/18/50 | 600 | 613 |
| Republic of Poland | 6.375% | 7/15/19 | 961 | 1,098 |
| Republic of Poland | 5.125% | 4/21/21 | 250 | 278 |
| Republic of Poland | 5.000% | 3/23/22 | 425 | 471 |
| Republic of Poland | 3.000% | 3/17/23 | 525 | 520 |
| Republic of Poland | 4.000% | 1/22/24 | 150 | 158 |
| Republic of South Africa | 6.875% | 5/27/19 | 250 | 268 |
| Republic of South Africa | 5.500% | 3/9/20 | 500 | 512 |
| Republic of South Africa | 4.665% | 1/17/24 | 225 | 214 |
| Republic of South Africa | 5.875% | 9/16/25 | 300 | 307 |
| Republic of South Africa | 6.250% | 3/8/41 | 200 | 204 |
| Republic of the Philippines | 6.500% | 1/20/20 | 100 | 117 |
| Republic of the Philippines | 4.000% | 1/15/21 | 350 | 379 |
| Republic of the Philippines | 9.500% | 10/21/24 | 350 | 518 |
| Republic of the Philippines | 10.625% | 3/16/25 | 100 | 158 |
| Republic of the Philippines | 5.500% | 3/30/26 | 425 | 502 |
| Republic of the Philippines | 9.500% | 2/2/30 | 225 | 354 |
| Republic of the Philippines | 7.750% | 1/14/31 | 400 | 563 |
| Republic of the Philippines | 6.375% | 1/15/32 | 500 | 638 |
| Republic of the Philippines | 6.375% | 10/23/34 | 550 | 721 |
| Republic of the Philippines | 3.950% | 1/20/40 | 100 | 101 |
| Republic of Turkey | 7.500% | 7/14/17 | 625 | 672 |
| Republic of Turkey | 6.750% | 4/3/18 | 450 | 484 |
| Republic of Turkey | 7.000% | 3/11/19 | 425 | 466 |
| Republic of Turkey | 7.000% | 6/5/20 | 525 | 585 |
| Republic of Turkey | 5.625% | 3/30/21 | 300 | 318 |
| Republic of Turkey | 5.125% | 3/25/22 | 425 | 437 |
| Republic of Turkey | 6.250% | 9/26/22 | 400 | 436 |
| Republic of Turkey | 5.750% | 3/22/24 | 400 | 422 |
| Republic of Turkey | 7.375% | 2/5/25 | 650 | 760 |
| Republic of Turkey | 11.875% | 1/15/30 | 400 | 656 |
| Republic of Turkey | 8.000% | 2/14/34 | 50 | 63 |
| Republic of Turkey | 6.875% | 3/17/36 | 600 | 673 |
| Republic of Turkey | 6.750% | 5/30/40 | 500 | 557 |
| Republic of Turkey | 6.000% | 1/14/41 | 200 | 205 |
| Republic of Turkey | 4.875% | 4/16/43 | 1,120 | 987 |
| State of Israel | 5.500% | 11/9/16 | 175 | 182 |
| State of Israel | 5.125% | 3/26/19 | 550 | 605 |
| State of Israel | 3.150% | 6/30/23 | 400 | 406 |
| State of Israel | 4.500% | 1/30/43 | 200 | 201 |
| Statoil ASA | 3.125% | 8/17/17 | 400 | 410 |
| Statoil ASA | 1.250% | 11/9/17 | 200 | 199 |
| Statoil ASA | 1.200% | 1/17/18 | 125 | 124 |
| Statoil ASA | 5.250% | 4/15/19 | 25 | 27 |
| | | | |
| Face | Market |
| Maturity Amount | Value • |
| Coupon | Date | ($000) | ($000) |
| Statoil ASA | 2.250% | 11/8/19 | 250 | 249 |
| Statoil ASA | 2.750% | 11/10/21 | 300 | 295 |
| Statoil ASA | 3.150% | 1/23/22 | 150 | 149 |
| Statoil ASA | 2.450% | 1/17/23 | 150 | 142 |
| Statoil ASA | 2.650% | 1/15/24 | 100 | 95 |
| Statoil ASA | 3.250% | 11/10/24 | 150 | 146 |
| Statoil ASA | 7.250% | 9/23/27 | 400 | 519 |
| Statoil ASA | 5.100% | 8/17/40 | 125 | 134 |
| Statoil ASA | 4.250% | 11/23/41 | 175 | 166 |
| Statoil ASA | 3.950% | 5/15/43 | 125 | 113 |
| Statoil ASA | 4.800% | 11/8/43 | 175 | 181 |
| Svensk Exportkredit AB | 5.125% | 3/1/17 | 350 | 366 |
| Svensk Exportkredit AB | 1.750% | 5/30/17 | 200 | 202 |
| Svensk Exportkredit AB | 1.875% | 6/17/19 | 200 | 201 |
| Svensk Exportkredit AB | 1.875% | 6/23/20 | 200 | 199 |
| United Mexican States | 5.625% | 1/15/17 | 744 | 772 |
| United Mexican States | 5.950% | 3/19/19 | 150 | 167 |
| United Mexican States | 5.125% | 1/15/20 | 500 | 545 |
| United Mexican States | 3.500% | 1/21/21 | 100 | 101 |
| United Mexican States | 3.625% | 3/15/22 | 550 | 552 |
| United Mexican States | 4.000% | 10/2/23 | 1,466 | 1,485 |
| United Mexican States | 3.600% | 1/30/25 | 600 | 580 |
| United Mexican States | 8.300% | 8/15/31 | 100 | 148 |
| United Mexican States | 7.500% | 4/8/33 | 100 | 130 |
| United Mexican States | 6.750% | 9/27/34 | 433 | 519 |
| United Mexican States | 6.050% | 1/11/40 | 1,145 | 1,262 |
| United Mexican States | 4.750% | 3/8/44 | 527 | 483 |
| United Mexican States | 5.550% | 1/21/45 | 200 | 204 |
| United Mexican States | 4.600% | 1/23/46 | 600 | 534 |
| United Mexican States | 5.750% | 10/12/10 | 192 | 178 |
| Total Sovereign Bonds (Cost $139,703) | 139,670 |
| Taxable Municipal Bonds (0.9%) | | | | |
| American Municipal Power Ohio Inc. | | | | |
| Revenue (Prairie State Energy | | | | |
| Campus Project) | 5.939% | 2/15/47 | 150 | 173 |
| American Municipal Power Ohio Inc. | | | | |
| Revenue (Prairie State Energy | | | | |
| Campus Project) | 6.270% | 2/15/50 | 50 | 58 |
| American Municipal Power Ohio Inc. | | | | |
| Revenue (Prairie State Energy | | | | |
| Campus Project) | 7.499% | 2/15/50 | 50 | 67 |
| American Municipal Power Ohio Inc. | | | | |
| Revenue (Prairie State Energy | | | | |
| Campus Project) | 8.084% | 2/15/50 | 125 | 182 |
| Bay Area Toll Authority California | | | | |
| Toll Bridge Revenue (San Francisco | | | | |
| Bay Area) | 6.793% | 4/1/30 | 50 | 61 |
| Bay Area Toll Authority California | | | | |
| Toll Bridge Revenue (San Francisco | | | | |
| Bay Area) | 6.918% | 4/1/40 | 100 | 132 |
| Bay Area Toll Authority California | | | | |
| Toll Bridge Revenue (San Francisco | | | | |
| Bay Area) | 6.263% | 4/1/49 | 250 | 336 |
| Bay Area Toll Authority California | | | | |
| Toll Bridge Revenue (San Francisco | | | | |
| Bay Area) | 6.907% | 10/1/50 | 250 | 341 |
| California GO | 5.750% | 3/1/17 | 100 | 105 |
| California GO | 6.200% | 10/1/19 | 275 | 316 |
| California GO | 5.700% | 11/1/21 | 250 | 293 |
| California GO | 7.500% | 4/1/34 | 600 | 840 |
| California GO | 7.300% | 10/1/39 | 75 | 105 |
| California GO | 7.350% | 11/1/39 | 575 | 807 |
| California GO | 7.625% | 3/1/40 | 205 | 298 |
| California GO | 7.600% | 11/1/40 | 200 | 297 |
| Central Puget Sound WA Regional | | | | |
| Transit Authority Sales & Use Tax | | | | |
| Revenue | 5.491% | 11/1/39 | 50 | 61 |
| Chicago IL GO | 7.375% | 1/1/33 | 150 | 157 |
| Chicago IL GO | 7.781% | 1/1/35 | 50 | 54 |
283
Vanguard Total Bond Market Index Portfolio
| | | | |
| Face | Market |
| Maturity Amount | Value • |
| Coupon | Date | ($000) | ($000) |
| Chicago IL Metropolitan Water | | | | |
| Reclamation District GO | 5.720% | 12/1/38 | 100 | 115 |
| Chicago IL O’Hare International | | | | |
| Airport Revenue | 6.395% | 1/1/40 | 50 | 63 |
| Chicago IL Transit Authority Sales | | | | |
| Tax Receipts Revenue | 6.200% | 12/1/40 | 150 | 162 |
| Chicago IL Transit Authority Transfer | | | | |
| Tax Receipts Revenue | 6.899% | 12/1/40 | 125 | 144 |
| Chicago IL Wastewater Transmission | | | | |
| Revenue | 6.900% | 1/1/40 | 50 | 57 |
| Chicago IL Water Revenue | 6.742% | 11/1/40 | 275 | 313 |
| Clark County NV Airport System | | | | |
| Revenue | 6.881% | 7/1/42 | 100 | 112 |
| Clark County NV Airport System | | | | |
| Revenue | 6.820% | 7/1/45 | 100 | 138 |
| Commonwealth Financing Authority | | | | |
| Pennsylvania Revenue | 6.218% | 6/1/39 | 150 | 174 |
| Connecticut GO | 5.090% | 10/1/30 | 175 | 194 |
| Connecticut GO | 5.850% | 3/15/32 | 200 | 234 |
| Connecticut Special Tax Revenue | | | | |
| (Transportation Infrastructure) | 5.459% | 11/1/30 | 50 | 58 |
| Cook County IL GO | 6.229% | 11/15/34 | 50 | 53 |
| Curators of the University of Missouri | | | | |
| System Facilities Revenue | 5.792% | 11/1/41 | 50 | 64 |
| Dallas TX Area Rapid Transit Revenue | 4.922% | 12/1/41 | 50 | 57 |
| Dallas TX Area Rapid Transit Revenue | 5.999% | 12/1/44 | 100 | 131 |
| Dallas TX Area Rapid Transit Revenue | 5.022% | 12/1/48 | 50 | 58 |
| Dallas TX Independent School District | | | | |
| GO | 6.450% | 2/15/35 | 100 | 116 |
| Denver CO City & County School | | | | |
| District No. 1 COP | 7.017% | 12/15/37 | 50 | 66 |
| Denver CO City & County School | | | | |
| District No. 1 GO | 5.664% | 12/1/33 | 50 | 59 |
| District of Columbia Income Tax | | | | |
| Revenue | 5.591% | 12/1/34 | 50 | 60 |
| District of Columbia Income Tax | | | | |
| Revenue | 5.582% | 12/1/35 | 50 | 60 |
| District of Columbia Water & Sewer | | | | |
| Authority Public Utility Revenue | 4.814% | 10/1/14 | 250 | 248 |
| Energy Northwest Washington Electric | | | | |
| Revenue (Columbia Generating Station) | 2.197% | 7/1/19 | 100 | 101 |
| Florida Hurricane Catastrophe Fund | | | | |
| Finance Corp. Revenue | 2.107% | 7/1/18 | 125 | 126 |
| Florida Hurricane Catastrophe Fund | | | | |
| Finance Corp. Revenue | 2.995% | 7/1/20 | 250 | 254 |
| George Washington University District | | | | |
| of Columbia GO | 3.485% | 9/15/22 | 200 | 203 |
| Georgia GO | 4.503% | 11/1/25 | 150 | 167 |
| Georgia Municipal Electric Power | | | | |
| Authority Revenue | 6.637% | 4/1/57 | 300 | 357 |
| Georgia Municipal Electric Power | | | | |
| Authority Revenue | 6.655% | 4/1/57 | 150 | 177 |
| Georgia Municipal Electric Power | | | | |
| Authority Revenue | 7.055% | 4/1/57 | 75 | 82 |
| Houston TX Utility System Revenue | 3.828% | 5/15/28 | 75 | 78 |
| Illinois GO | 5.365% | 3/1/17 | 175 | 181 |
| Illinois GO | 5.877% | 3/1/19 | 250 | 268 |
| Illinois GO | 4.950% | 6/1/23 | 550 | 550 |
| Illinois GO | 5.100% | 6/1/33 | 1,100 | 1,041 |
| Illinois GO | 7.350% | 7/1/35 | 300 | 325 |
| Illinois Toll Highway Authority Revenue 5.851% | 12/1/34 | 50 | 60 |
| Indianapolis IN Local Public | | | | |
| Improvement Revenue | 6.116% | 1/15/40 | 250 | 311 |
| JobsOhio Beverage System Statewide | | | | |
| Liquor Profits Revenue | 3.985% | 1/1/29 | 150 | 156 |
| JobsOhio Beverage System Statewide | | | | |
| Liquor Profits Revenue | 4.532% | 1/1/35 | 100 | 106 |
| Kansas Development Finance | | | | |
| Authority Revenue | 4.727% | 4/15/37 | 200 | 200 |
| Los Angeles CA Community College | | | | |
| District GO | 6.600% | 8/1/42 | 150 | 205 |
| | | | | |
| Face | Market |
| Maturity Amount | Value • |
| | Coupon | Date | ($000) | ($000) |
| Los Angeles CA Department of | | | | |
| | Water & Power Revenue | 5.716% | 7/1/39 | 75 | 90 |
| Los Angeles CA Department of | | | | |
| | Water & Power Revenue | 6.008% | 7/1/39 | 150 | 183 |
| Los Angeles CA Department of | | | | |
| | Water & Power Revenue | 6.166% | 7/1/40 | 25 | 28 |
| Los Angeles CA Department of | | | | |
| | Water & Power Revenue | 6.574% | 7/1/45 | 100 | 136 |
| Los Angeles CA Department of | | | | |
| | Water & Power Revenue | 6.603% | 7/1/50 | 100 | 136 |
| Los Angeles CA Unified School District | | | | |
| | GO | 5.755% | 7/1/29 | 200 | 237 |
| Los Angeles CA Unified School District | | | | |
| | GO | 5.750% | 7/1/34 | 125 | 151 |
| Los Angeles CA Unified School District | | | | |
| | GO | 6.758% | 7/1/34 | 50 | 66 |
| Los Angeles County CA Metropolitan | | | | |
| | Transportation Authority Sales Tax | | | | |
| | Revenue | 5.735% | 6/1/39 | 75 | 91 |
| Los Angeles County CA Public Works | | | | |
| | Financing Authority Lease Revenue | 7.488% | 8/1/33 | 100 | 130 |
| Los Angeles County CA Public Works | | | | |
| | Financing Authority Lease Revenue | 7.618% | 8/1/40 | 50 | 70 |
| Maryland Transportation Authority | | | | |
| | Facilities Projects Revenue | 5.888% | 7/1/43 | 50 | 61 |
| Massachusetts GO | 4.200% | 12/1/21 | 125 | 136 |
| Massachusetts GO | 5.456% | 12/1/39 | 150 | 181 |
| Massachusetts School Building | | | | |
| | Authority Dedicated Sales Tax | | | | |
| | Revenue | 5.715% | 8/15/39 | 75 | 91 |
| Massachusetts Transportation Fund | | | | |
| | Revenue | 5.731% | 6/1/40 | 50 | 62 |
| Massachusetts Water Pollution | | | | |
| | Abatement Trust Revenue | 5.192% | 8/1/40 | 75 | 87 |
| Metropolitan Government of Nashville | | | | |
| | & Davidson County TN Convention | | | | |
| | Center Authority Tourism Tax Revenue 6.731% | 7/1/43 | 50 | 64 |
| Metropolitan Government of Nashville | | | | |
| | & Davidson County TN GO | 5.707% | 7/1/34 | 50 | 58 |
| Metropolitan Washington DC/VA | | | | |
| | Airports Authority Dulles Toll Road | | | | |
| | Revenue | 7.462% | 10/1/46 | 50 | 67 |
| Metropolitan Water District of Southern | | | | |
| | California Revenue | 6.947% | 7/1/40 | 50 | 58 |
| Mississippi GO | 5.245% | 11/1/34 | 50 | 57 |
| Missouri Highways & Transportation | | | | |
| | Commission Road Revenue | 5.445% | 5/1/33 | 50 | 58 |
| 12 | New Jersey Economic Development | | | | |
| | Authority Revenue (State Pension | | | | |
| | Funding) | 7.425% | 2/15/29 | 225 | 256 |
| New Jersey Transportation Trust Fund | | | | |
| | Authority Transportation System | | | | |
| | Revenue | 6.104% | 12/15/28 | 100 | 104 |
| New Jersey Transportation Trust Fund | | | | |
| | Authority Transportation System | | | | |
| | Revenue | 6.561% | 12/15/40 | 400 | 423 |
| 13 | New Jersey Turnpike Authority | | | | |
| | Revenue | 4.252% | 1/1/16 | 20 | 20 |
| New Jersey Turnpike Authority | | | | |
| | Revenue | 7.414% | 1/1/40 | 100 | 142 |
| New York City NY GO | 6.246% | 6/1/35 | 25 | 28 |
| New York City NY GO | 5.968% | 3/1/36 | 100 | 124 |
| New York City NY GO | 5.985% | 12/1/36 | 50 | 61 |
| New York City NY GO | 5.517% | 10/1/37 | 50 | 59 |
| New York City NY GO | 6.271% | 12/1/37 | 100 | 128 |
| New York City NY GO | 5.846% | 6/1/40 | 50 | 62 |
| New York City NY Municipal Water | | | | |
| | Finance Authority Water & Sewer | | | | |
| | System Revenue | 5.750% | 6/15/41 | 50 | 63 |
284
Vanguard Total Bond Market Index Portfolio
| | | | | |
| Face | Market |
| Maturity Amount | Value • |
| | Coupon | Date | ($000) | ($000) |
| New York City NY Municipal Water | | | | |
| | Finance Authority Water & Sewer | | | | |
| | System Revenue | 5.952% | 6/15/42 | 50 | 65 |
| New York City NY Municipal Water | | | | |
| | Finance Authority Water & Sewer | | | | |
| | System Revenue | 6.011% | 6/15/42 | 50 | 65 |
| New York City NY Municipal Water | | | | |
| | Finance Authority Water & Sewer | | | | |
| | System Revenue | 5.440% | 6/15/43 | 100 | 122 |
| New York City NY Municipal Water | | | | |
| | Finance Authority Water & Sewer | | | | |
| | System Revenue | 5.882% | 6/15/44 | 175 | 226 |
| New York City NY Transitional Finance | | | | |
| | Authority Building Aid Revenue | 6.828% | 7/15/40 | 150 | 198 |
| New York City NY Transitional Finance | | | | |
| | Authority Future Tax Revenue | 5.767% | 8/1/36 | 50 | 60 |
| New York City NY Transitional Finance | | | | |
| | Authority Future Tax Revenue | 5.508% | 8/1/37 | 100 | 120 |
| New York City NY Transitional Finance | | | | |
| | Authority Future Tax Revenue | 5.572% | 11/1/38 | 75 | 90 |
| New York Metropolitan Transportation | | | | |
| | Authority Revenue (Dedicated Tax | | | | |
| | Fund) | 7.336% | 11/15/39 | 450 | 656 |
| New York Metropolitan Transportation | | | | |
| | Authority Revenue (Transit Revenue) | 5.871% | 11/15/39 | 50 | 59 |
| New York Metropolitan Transportation | | | | |
| | Authority Revenue (Transit Revenue) | 6.648% | 11/15/39 | 100 | 130 |
| New York State Dormitory Authority | | | | |
| | Revenue (Personal Income Tax) | 5.500% | 3/15/30 | 125 | 149 |
| New York State Dormitory Authority | | | | |
| | Revenue (Personal Income Tax) | 5.289% | 3/15/33 | 100 | 117 |
| New York State Dormitory Authority | | | | |
| | Revenue (Personal Income Tax) | 5.628% | 3/15/39 | 100 | 120 |
| New York State Dormitory Authority | | | | |
| | Revenue (Personal Income Tax) | 5.389% | 3/15/40 | 75 | 89 |
| New York State Urban Development | | | | |
| | Corp. Revenue (Personal Income Tax) 5.770% | 3/15/39 | 150 | 182 |
| New York State Urban Development | | | | |
| | Corp. Revenue (Personal Income Tax) 5.838% | 3/15/40 | 50 | 61 |
| New York University Hospitals Center | | | | |
| | GO | 4.428% | 7/1/42 | 75 | 72 |
| New York University Hospitals Center | | | | |
| | Revenue | 5.750% | 7/1/43 | 100 | 115 |
| North Texas Tollway Authority System | | | | |
| | Revenue | 6.718% | 1/1/49 | 100 | 137 |
| Ohio State University General Receipts | | | | |
| | Revenue | 4.910% | 6/1/40 | 100 | 112 |
| Ohio State University General Receipts | | | | |
| | Revenue | 4.800% | 6/1/11 | 100 | 96 |
| Ohio State University General Receipts | | | | |
| | Revenue | 5.590% | 12/1/14 | 50 | 53 |
| Ohio Water Development Authority | | | | |
| | Water Pollution Control Loan Fund | | | | |
| | Revenue | 4.879% | 12/1/34 | 75 | 84 |
| Orange County CA Local Transportation | | | | |
| | Authority Sales Tax Revenue | 6.908% | 2/15/41 | 50 | 67 |
| Oregon Department of Transportation | | | | |
| | Highway User Tax Revenue | 5.834% | 11/15/34 | 50 | 63 |
| Oregon GO | 5.762% | 6/1/23 | 200 | 229 |
| Oregon GO | 5.892% | 6/1/27 | 75 | 90 |
| 13 | Oregon School Boards Association GO 4.759% | 6/30/28 | 75 | 82 |
| 14 | Oregon School Boards Association GO 5.528% | 6/30/28 | 50 | 57 |
| Pennsylvania GO | 4.650% | 2/15/26 | 50 | 54 |
| Pennsylvania GO | 5.350% | 5/1/30 | 200 | 220 |
| Pennsylvania Public School Building | | | | |
| | Authority Lease Revenue (School | | | | |
| | District of Philadelphia) | 5.000% | 9/15/27 | 50 | 54 |
| Pennsylvania Turnpike Commission | | | | |
| | Revenue | 5.511% | 12/1/45 | 50 | 58 |
| | | | |
| Face | Market |
| Maturity Amount | Value • |
| Coupon | Date | ($000) | ($000) |
| Pennsylvania Turnpike Commission | | | | |
| Revenue | 5.561% | 12/1/49 | 50 | 58 |
| Port Authority of New York & New | | | | |
| Jersey Revenue | 6.040% | 12/1/29 | 75 | 90 |
| Port Authority of New York & New | | | | |
| Jersey Revenue | 4.960% | 8/1/46 | 250 | 270 |
| Port Authority of New York & New | | | | |
| Jersey Revenue | 5.310% | 8/1/46 | 100 | 106 |
| Port Authority of New York & New | | | | |
| Jersey Revenue | 4.458% | 10/1/62 | 550 | 524 |
| President & Fellows of Harvard College | | | | |
| Massachusetts GO | 4.875% | 10/15/40 | 125 | 145 |
| Regional Transportation District of | | | | |
| Colorado Sales Tax Revenue | 5.844% | 11/1/50 | 100 | 128 |
| Rutgers State University New Jersey | | | | |
| Revenue | 5.665% | 5/1/40 | 50 | 59 |
| Sacramento CA Public Financing | | | | |
| Authority Lease Revenue | 5.637% | 4/1/50 | 50 | 53 |
| Salt River Project Arizona Agricultural | | | | |
| Improvement & Power District | | | | |
| Revenue | 4.839% | 1/1/41 | 50 | 57 |
| San Antonio TX Electric & Gas Systems | | | | |
| Revenue | 5.985% | 2/1/39 | 125 | 158 |
| San Antonio TX Electric & Gas Systems | | | | |
| Revenue | 5.718% | 2/1/41 | 50 | 62 |
| San Antonio TX Electric & Gas Systems | | | | |
| Revenue | 5.808% | 2/1/41 | 125 | 156 |
| San Antonio TX Electric & Gas Systems | | | | |
| Revenue | 4.427% | 2/1/42 | 75 | 79 |
| San Diego County CA Regional Airport | | | | |
| Authority Revenue | 5.594% | 7/1/43 | 75 | 81 |
| San Diego County CA Water Authority | | | | |
| Revenue | 6.138% | 5/1/49 | 250 | 324 |
| San Francisco CA City & County Public | | | | |
| Utilities Commission Water Revenue | 6.000% | 11/1/40 | 50 | 61 |
| San Francisco CA City & County Public | | | | |
| Utilities Commission Water Revenue | 6.950% | 11/1/50 | 100 | 140 |
| Santa Clara Valley CA Transportation | | | | |
| Authority Sales Tax Revenue | 5.876% | 4/1/32 | 200 | 240 |
| South Carolina Public Service Authority | | | | |
| Revenue | 6.454% | 1/1/50 | 200 | 250 |
| Texas Transportation Commission | | | | |
| Revenue | 5.028% | 4/1/26 | 50 | 57 |
| Texas Transportation Commission | | | | |
| Revenue | 5.178% | 4/1/30 | 175 | 206 |
| Texas Transportation Commission | | | | |
| Revenue | 4.631% | 4/1/33 | 350 | 384 |
| Texas Transportation Commission | | | | |
| Revenue | 4.681% | 4/1/40 | 50 | 56 |
| Tufts University Massachusetts GO | 5.017% | 4/15/12 | 200 | 206 |
| University of California Regents | | | | |
| Medical Center Revenue | 6.548% | 5/15/48 | 100 | 129 |
| University of California Regents | | | | |
| Medical Center Revenue | 6.583% | 5/15/49 | 50 | 64 |
| University of California Revenue | 6.270% | 5/15/31 | 500 | 558 |
| University of California Revenue | 4.765% | 5/15/44 | 100 | 102 |
| University of California Revenue | 5.946% | 5/15/45 | 175 | 214 |
| University of Massachusetts Building | | | | |
| Authority Revenue | 5.450% | 11/1/40 | 50 | 59 |
| University of Southern California GO | 5.250% | 10/1/11 | 100 | 113 |
| University of Texas System Revenue | | | | |
| Financing System Revenue | 5.262% | 7/1/39 | 50 | 60 |
| University of Texas System Revenue | | | | |
| Financing System Revenue | 6.276% | 8/15/41 | 25 | 28 |
| University of Texas System Revenue | | | | |
| Financing System Revenue | 5.134% | 8/15/42 | 100 | 117 |
| University of Texas System Revenue | | | | |
| Financing System Revenue | 4.794% | 8/15/46 | 75 | 85 |
| Utah GO | 4.554% | 7/1/24 | 50 | 56 |
285
Vanguard Total Bond Market Index Portfolio
| | | | | |
| Face | Market |
| Maturity | Amount | Value • |
| | | Coupon | Date | ($000) | ($000) |
| | Utah GO | 3.539% | 7/1/25 | 50 | 53 |
| | Washington GO | 5.090% | 8/1/33 | 250 | 285 |
| | Washington GO | 5.140% | 8/1/40 | 150 | 176 |
| 14 Wisconsin GO | 5.700% | 5/1/26 | 75 | 87 |
| Total Taxable Municipal Bonds (Cost $23,201) | 26,423 |
| | | | | |
| | Shares | |
| Temporary Cash Investment (3.2%) | | | | |
| Money Market Fund (3.2%) | | | | |
| 15 | Vanguard Market Liquidity Fund | | | | |
| | (Cost $89,808) | 0.363% | | 89,808,098 | 89,808 |
| Total Investments (102.4%) (Cost $2,833,829) 2,867,588 |
| | | | | |
| Amount |
| ($000) |
| Other Assets and Liabilities (-2.4%) | | | | |
| Other Assets | | | | |
| Investment in Vanguard | | | | 243 |
| Receivables for Investment Securities Sold | | | | 40,309 |
| Receivables for Accrued Income | | | | 19,400 |
| Receivables for Capital Shares Issued | | | | 1,259 |
| Other Assets | | | | 85 |
| Total Other Assets | 61,296 |
| Liabilities | | | | |
| Payables for Investment Securities Purchased | | | (122,457) |
| Payables for Capital Shares Redeemed | | | | (3,093) |
| Payables to Vanguard | | | | (2,612) |
| Other Liabilities | | | | (1,471) |
| Total Liabilities | (129,633) |
| Net Assets (100%) | | | | |
| Applicable to 237,523,555 outstanding $.001 par value shares of | |
| beneficial interest (unlimited authorization) 2,799,251 |
| Net Asset Value Per Share | $11.79 |
| |
| At December 31, 2015, net assets consisted of: | |
| Amount |
| ($000) |
| Paid-in Capital | 2,695,037 |
| Undistributed Net Investment Income | 63,033 |
| Accumulated Net Realized Gains | 7,422 |
| Unrealized Appreciation (Depreciation) | 33,759 |
| Net Assets | 2,799,251 |
| |
• See Note A in Notes to Financial Statements.
1 U.S. government-guaranteed.
2 The issuer operates under a congressional charter; its securities are generally neither guaranteed by the U.S. Treasury nor backed by the full faith and credit of the U.S. government.
3 The issuer was placed under federal conservatorship in September 2008; since that time, its daily operations have been managed by the Federal Housing Finance Agency and it receives capital from the U.S. Treasury, as needed to maintain a positive net worth, in exchange for senior preferred stock.
4 The average or expected maturity is shorter than the final maturity shown because of the possibility of interim principal payments and prepayments or the possibility of the issue being called.
5 Includes securities purchased on a when-issued or delayed-delivery basis for which the portfolio has not taken delivery as of December 31, 2015.
6 Adjustable-rate security.
7 Security exempt from registration under Rule 144A of the Securities Act of 1933. Such securities may be sold in transactions exempt from registration, normally to qualified institutional buyers. At December 31, 2015, the aggregate value of these securities was $24,675,000, representing 0.9% of net assets.
8 Guaranteed by the Government of Canada.
9 Guaranteed by the Government of Japan.
10 Guaranteed by the Federal Republic of Germany.
11 Guaranteed by the Republic of Austria.
12 Scheduled principal and interest payments are guaranteed by National Public Finance Guarantee Corp.
13 Scheduled principal and interest payments are guaranteed by AMBAC (Ambac Assurance Corporation).
14 Scheduled principal and interest payments are guaranteed by AGM (Assured Guaranty Municipal Corporation).
15 Affiliated money market fund available only to Vanguard funds and certain trusts and accounts managed by Vanguard. Rate shown is the 7-day yield.
COP—Certificate of Participation.
GO—General Obligation Bond.
REIT—Real Estate Investment Trust.
See accompanying Notes, which are an integral part of the Financial Statements.
286
| | | |
| Vanguard Total Bond Market Index Portfolio |
| |
| |
| Statement of Operations |
| |
| Year Ended |
| December 31, 2015 |
| | ($000) |
| Investment Income | | |
| Income | | |
| Interest1 | 70,796 |
| Total Income | 70,796 |
| Expenses | | |
| The Vanguard Group—Note B | | |
| Investment Advisory Services | 278 |
| Management and Administrative | 3,024 |
| Marketing and Distribution | 545 |
| Custodian Fees | 155 |
| Auditing Fees | 69 |
| Shareholders’ Reports | 38 |
| Trustees’ Fees and Expenses | 2 |
| Total Expenses | 4,111 |
| Net Investment Income | 66,685 |
| Realized Net Gain (Loss) on | | |
| Investment Securities Sold | 7,989 |
| Change in Unrealized Appreciation | |
| (Depreciation) of Investment Securities | (68,439) |
| Net Increase (Decrease) in Net Assets | |
| Resulting from Operations | 6,235 |
| 1 Interest income from an affiliated company of the portfolio |
| | was $265,000. | | |
| | |
| Statement of Changes in Net Assets | | |
| |
| Year Ended December 31, |
| 2015 | 2014 |
| ($000) | ($000) |
| Increase (Decrease) in Net Assets | | |
| Operations | | |
| Net Investment Income | 66,685 | 60,328 |
| Realized Net Gain (Loss) | 7,989 | 10,795 |
| Change in Unrealized Appreciation (Depreciation) | (68,439) | 66,416 |
| Net Increase (Decrease) in Net Assets Resulting from Operations | 6,235 | 137,539 |
| Distributions | | |
| Net Investment Income | (60,234) | (57,822) |
| Realized Capital Gain1 | (11,294) | (8,428) |
| Total Distributions | (71,528) | (66,250) |
| Capital Share Transactions | | |
| Issued | 559,680 | 528,626 |
| Issued in Lieu of Cash Distributions | 71,528 | 66,250 |
| Redeemed | (385,816) | (351,595) |
| Net Increase (Decrease) from Capital Share Transactions | 245,392 | 243,281 |
| Total Increase (Decrease) | 180,099 | 314,570 |
| Net Assets |
| Beginning of Period | 2,619,152 | 2,304,582 |
| End of Period2 | 2,799,251 | 2,619,152 |
1 Includes fiscal 2015 and 2014 short-term gain distributions totaling $6,644,000 and $0, respectively. Short-term gain distributions are treated as ordinary income dividends for tax purposes.
2 Net Assets—End of Period includes undistributed (overdistributed) net investment income of $63,033,000 and $56,582,000.
See accompanying Notes, which are an integral part of the Financial Statements.
287
| | | | | |
| Vanguard Total Bond Market Index Portfolio | | | | | |
| |
| |
| Financial Highlights | | | | | |
| |
| | | | | |
| For a Share Outstanding | | | Year Ended December 31, |
| Throughout Each Period | 2015 | 2014 | 2013 | 2012 | 2011 |
| Net Asset Value, Beginning of Period | $12.07 | $11.73 | $12.46 | $12.43 | $12.06 |
| Investment Operations | |
| Net Investment Income | .276 | .281 | .305 | .301 | .357 |
| Net Realized and Unrealized Gain (Loss) | | | | | |
| on Investments | (.233) | .397 | (.580) | .183 | .528 |
| Total from Investment Operations | .043 | .678 | (.275) | .484 | .885 |
| Distributions | | |
| Dividends from Net Investment Income | (.272) | (.295) | (.315) | (.341) | (.405) |
| Distributions from Realized Capital Gains | (.051) | (.043) | (.140) | (.113) | (.110) |
| Total Distributions | (.323) | (.338) | (.455) | (.454) | (.515) |
| Net Asset Value, End of Period | $11.79 | $12.07 | $11.73 | $12.46 | $12.43 |
| |
| Total Return | 0.33% | 5.89% | -2.29% | 4.02% | 7.65% |
| |
| Ratios/Supplemental Data | | |
| Net Assets, End of Period (Millions) | $2,799 | $2,619 | $2,305 | $2,666 | $2,488 |
| Ratio of Total Expenses to Average Net Assets | 0.15% | 0.19% | 0.19% | 0.20% | 0.21% |
| Ratio of Net Investment Income to | | | | | |
| Average Net Assets | 2.43% | 2.47% | 2.36% | 2.49% | 3.06% |
| Portfolio Turnover Rate1 | 149% | 118% | 106% | 105% | 113% |
| 1 Includes 61%, 61%, 69%, 66%, and 53% attributable to mortgage-dollar-roll activity. |
Notes to Financial Statements
Vanguard Total Bond Market Index Portfolio, a portfolio of Vanguard Variable Insurance Funds, is registered under the Investment Company Act of 1940 as an open-end investment company. The portfolio’s shares are only available for purchase by separate accounts of insurance companies as investments for variable annuity plans, variable life insurance contracts, or other variable benefit insurance contracts. Certain of the portfolio’s investments are in corporate debt instruments; the issuers’ abilities to meet their obligations may be affected by economic developments in their respective industries.
A. The following significant accounting policies conform to generally accepted accounting principles for U.S. investment companies. The portfolio consistently follows such policies in preparing its financial statements.
1. Security Valuation: Securities are valued as of the close of trading on the New York Stock Exchange (generally 4 p.m., Eastern time) on the valuation date. Bonds, and temporary cash investments acquired over 60 days to maturity, are valued using the latest bid prices or using valuations based on a matrix system (which considers such factors as security prices, yields, maturities, and ratings), both as furnished by independent pricing services. Structured debt securities, including mortgages and asset-backed securities, are valued using the latest bid prices or using valuations based on a matrix system that considers such factors as issuer, tranche, nominal or option-adjusted spreads, weighted average coupon, weighted average maturity, credit enhancements, and collateral. Investments in Vanguard Market Liquidity Fund are valued at that fund’s net asset value. Other temporary cash investments are valued at amortized cost, which approximates market value. Securities for which market quotations are not readily available, or whose values have been affected by events occurring before the portfolio’s pricing time but after the close of the securities’ primary markets, are valued by methods deemed by the board of trustees to represent fair value.
288
Vanguard Total Bond Market Index Portfolio
2. To Be Announced (TBA) Transactions: A TBA transaction is an agreement to buy or sell mortgage-backed securities with agreed-upon characteristics (face amount, coupon, maturity) for settlement at a future date. The portfolio may be a seller of TBA transactions to reduce its exposure to the mortgage-backed securities market or in order to sell mortgage-backed securities it owns under delayed-delivery arrangements. When the portfolio is a buyer of TBA transactions, it maintains cash or short-term investments in an amount sufficient to meet the purchase price at the settlement date of the TBA transaction. The primary risk associated with TBA transactions is that a counterparty may default on its obligations. The portfolio mitigates its counterparty risk by, among other things, performing a credit analysis of counterparties, allocating transactions among numerous counterpar-ties, and monitoring its exposure to each counterparty. The portfolio may also enter into a Master Securities Forward Transaction Agreement (MSFTA) with certain counterparties and require them to transfer collateral as security for their performance. Under an MSFTA, upon a counterparty default (including bankruptcy), the portfolio may terminate any TBA transactions with that counterparty, determine the net amount owed by either party in accordance with its master netting arrangements, and sell or retain any collateral held up to the net amount owed to the portfolio under the master netting arrangements.
3. Mortgage Dollar Rolls: The portfolio enters into mortgage-dollar-roll transactions, in which the portfolio sells mortgage-backed securities to a dealer and simultaneously agrees to purchase similar securities in the future at a predetermined price. The proceeds of the securities sold in mortgage-dollar-roll transactions are typically invested in high-quality short-term fixed income securities. The portfolio forgoes principal and interest paid on the securities sold, and is compensated by interest earned on the proceeds of the sale and by a lower price on the securities to be repurchased. The portfolio has also entered into mortgage-dollar-roll transactions in which the portfolio buys mortgage-backed securities from a dealer pursuant to a TBA transaction and simultaneously agrees to sell similar securities in the future at a predetermined price. The securities bought in mortgage-dollar-roll transactions are used to cover an open TBA sell position. The portfolio continues to earn interest on mortgage-backed security pools already held and receives a lower price on the securities to be sold in the future. The portfolio accounts for mortgage-dollar-roll transactions as purchases and sales; as such, these transactions may increase the portfolio’s portfolio turnover rate. Amounts to be received or paid in connection with open mortgage dollar rolls are included in Receivables for Investment Securities Sold (Other Assets) or Payables for Investment Securities Purchased (Liabilities) in the Statement of Net Assets.
4. Federal Income Taxes: The portfolio intends to continue to qualify as a regulated investment company and distribute all of its taxable income. Management has analyzed the portfolio’s tax positions taken for all open federal income tax years (December 31, 2012–2015), and has concluded that no provision for federal income tax is required in the portfolio’s financial statements.
5. Distributions: Distributions to shareholders are recorded on the ex-dividend date.
6. Credit Facility: The portfolio and certain other funds managed by The Vanguard Group (“Vanguard”) participate in a $3 billion committed credit facility provided by a syndicate of lenders pursuant to a credit agreement that may be renewed annually; each fund is individually liable for its borrowings, if any, under the credit facility. Borrowings may be utilized for temporary and emergency purposes, and are subject to the portfolio’s regulatory and contractual borrowing restrictions. The participating funds are charged administrative fees and an annual commitment fee of 0.06% of the undrawn amount of the facility; these fees are allocated to the funds based on a method approved by the portfolio’s board of trustees and included in Management and Administrative expenses on the portfolio’s Statement of Operations. Any borrowings under this facility bear interest at a rate equal to the higher of the federal funds rate or LIBOR reference rate plus an agreed-upon spread.
The portfolio had no borrowings outstanding at December 31, 2015, or at any time during the period then ended.
7. Other: Interest income includes income distributions received from Vanguard Market Liquidity Fund and is accrued daily. Premiums and discounts on debt securities purchased are amortized and accreted, respectively, to interest income over the lives of the respective securities. Security transactions are accounted for on the date securities are bought or sold. Costs used to determine realized gains (losses) on the sale of investment securities are those of the specific securities sold.
289
Vanguard Total Bond Market Index Portfolio
B. In accordance with the terms of a Funds’ Service Agreement (the “FSA”) between Vanguard and the portfolio, Vanguard furnishes to the portfolio investment advisory, corporate management, administrative, marketing, and distribution services at Vanguard’s cost of operations (as defined by the FSA). These costs of operations are allocated to the portfolio based on methods and guidelines approved by the board of trustees. Vanguard does not require reimbursement in the current period for certain costs of operations (such as deferred compensation/benefits and risk/insurance costs); the portfolio’s liability for these costs of operations is included in Payables to Vanguard on the Statement of Net Assets.
Upon the request of Vanguard, the portfolio may invest up to 0.40% of its net assets as capital in Vanguard. At December 31, 2015, the portfolio had contributed to Vanguard capital in the amount of $243,000, representing 0.01% of the portfolio’s net assets and 0.10% of Vanguard’s capitalization. The portfolio’s trustees and officers are also directors and employees, respectively, of Vanguard.
C. Various inputs may be used to determine the value of the portfolio’s investments. These inputs are summarized in three broad levels for financial statement purposes. The inputs or methodologies used to value securities are not necessarily an indication of the risk associated with investing in those securities.
Level 1—Quoted prices in active markets for identical securities.
Level 2—Other significant observable inputs (including quoted prices for similar securities, interest rates, prepayment speeds, credit risk, etc.).
Level 3—Significant unobservable inputs (including the portfolio’s own assumptions used to determine the fair value of investments).
The following table summarizes the market value of the portfolio’s investments as of December 31, 2015, based on the inputs used to value them:
| | | |
| Level 1 | Level 2 | Level 3 |
| Investments | ($000) | ($000) | ($000) |
| U.S. Government and Agency Obligations | — | 1,774,501 | — |
| Asset-Backed/Commercial Mortgage-Backed Securities | — | 84,255 | — |
| Corporate Bonds | — | 752,931 | — |
| Sovereign Bonds | — | 139,670 | — |
| Taxable Municipal Bonds | — | 26,423 | — |
| Temporary Cash Investments | 89,808 | — | — |
| Total | 89,808 | 2,777,780 | — |
D. Distributions are determined on a tax basis and may differ from net investment income and realized capital gains for financial reporting purposes. Differences may be permanent or temporary. Permanent differences are reclassified among capital accounts in the financial statements to reflect their tax character. Temporary differences arise when certain items of income, expense, gain, or loss are recognized in different periods for financial statement and tax purposes. These differences will reverse at some time in the future. Differences in classification may also result from the treatment of short-term gains as ordinary income for tax purposes.
For tax purposes, at December 31, 2015, the portfolio had $66,272,000 of ordinary income and $6,574,000 of long-term capital gains available for distribution.
At December 31, 2015, the cost of investment securities for tax purposes was $2,833,829,000. Net unrealized appreciation of investment securities for tax purposes was $33,759,000, consisting of unrealized gains of $62,625,000 on securities that had risen in value since their purchase and $28,866,000 in unrealized losses on securities that had fallen in value since their purchase.
E. During the year ended December 31, 2015, the portfolio purchased $324,556,000 of investment securities and sold $202,003,000 of investment securities, other than U.S. government securities and temporary cash investments. Purchases and sales of U.S. government securities were $3,969,378,000 and $3,860,519,000, respectively.
290
Vanguard Total Bond Market Index Portfolio
F. Capital shares issued and redeemed were:
| | |
| Year Ended December 31, |
| 2015 | 2014 |
| Shares | Shares |
| (000) | (000) |
| Issued | 46,908 | 44,488 |
| Issued in Lieu of Cash Distributions | 6,016 | 5,701 |
| Redeemed | (32,427) | (29,602) |
| Net Increase (Decrease) in Shares Outstanding | 20,497 | 20,587 |
At December 31, 2015, one shareholder, an insurance company separate account whose holdings in the portfolio represent the indirect investment of Vanguard Variable Annuity contract holders, was the record or beneficial owner of 49% of the portfolio’s net assets. If the shareholder were to redeem its investment in the portfolio, the redemption might result in an increase in the portfolio’s expense ratio or cause the portfolio to incur higher transaction costs.
G. Management has determined that no material events or transactions occurred subsequent to December 31, 2015, that would require recognition or disclosure in these financial statements.
291
Vanguard Total Bond Market Index Portfolio
Report of Independent Registered Public Accounting Firm
To the Board of Trustees of Vanguard Variable Insurance Funds and the Shareholders of Total Bond Market Index Portfolio: In our opinion, the accompanying statement of net assets and the related statements of operations and of changes in net assets and the financial highlights present fairly, in all material respects, the financial position of Total Bond Market Index Portfolio (constituting a separate portfolio of Vanguard Variable Insurance Funds, hereafter referred to as the “Portfolio”) at December 31, 2015, the results of its operations for the year then ended, the changes in its net assets for each of the two years in the period then ended, and the financial highlights for each of the five years in the period then ended, in conformity with accounting principles generally accepted in the United States of America. These financial statements and financial highlights (hereafter referred to as “financial statements”) are the responsibility of the Portfolio’s management. Our responsibility is to express an opinion on these financial statements based on our audits. We conducted our audits of these financial statements in accordance with the standards of the Public Company Accounting Oversight Board (United States). Those standards require that we plan and perform the audit to obtain reasonable assurance about whether the financial statements are free of material misstatement. An audit includes examining, on a test basis, evidence supporting the amounts and disclosures in the financial statements, assessing the accounting principles used and significant estimates made by management, and evaluating the overall financial statement presentation. We believe that our audits, which included confirmation of securities at December 31, 2015 by correspondence with the custodian and brokers, by agreement to the underlying ownership records of the transfer agent and the application of alternative auditing procedures where securities purchased had not been received, provide a reasonable basis for our opinion.
/s/PricewaterhouseCoopers LLP
Philadelphia, Pennsylvania
February 11, 2016
| |
| |
| Special 2015 tax information (unaudited) for corporate shareholders only for Vanguard |
| Total Bond Market Index Portfolio, a portfolio of Vanguard Variable Insurance Funds |
| |
| This information for the fiscal year ended December 31, 2015, is included pursuant to provisions |
| of the Internal Revenue Code for corporate shareholders only. |
| |
| The portfolio distributed $4,650,000 as capital gain dividends (20% rate gain distributions) |
| to shareholders during the fiscal year. |
292
Vanguard Total Bond Market Index Portfolio
About Your Portfolio’s Expenses
As a shareholder of the portfolio, you incur ongoing costs, which include costs for portfolio management, administrative services, and shareholder reports (like this one), among others. Operating expenses, which are deducted from a portfolio’s gross income, directly reduce the investment return of the portfolio.
A portfolio’s expenses are expressed as a percentage of its average net assets. This figure is known as the expense ratio. The following examples are intended to help you understand the ongoing costs (in dollars) of investing in your portfolio and to compare these costs with those of other mutual funds. The examples are based on an investment of $1,000 made at the beginning of the period shown and held for the entire period.
The table below illustrates your portfolio’s costs in two ways:
• Based on actual portfolio return. This section helps you to estimate the actual expenses that you paid over the period. The “Ending Account Value” shown is derived from the portfolio’s actual return, and the third column shows the dollar amount that would have been paid by an investor who started with $1,000 in the portfolio. You may use the information here, together with the amount you invested, to estimate the expenses that you paid over the period.
To do so, simply divide your account value by $1,000 (for example, an $8,600 account value divided by $1,000 = 8.6), then multiply the result by the number given for your portfolio under the heading “Expenses Paid During Period.”
• Based on hypothetical 5% yearly return. This section is intended to help you compare your portfolio’s costs with those of other mutual funds. It assumes that the portfolio had a yearly return of 5% before expenses, but that the expense ratio is unchanged. In this case—because the return used is not the portfolio’s actual return—the results do not apply to your investment. The example is useful in making comparisons because the Securities and Exchange Commission requires all mutual funds to calculate expenses based on a 5% return. You can assess your portfolio’s costs by comparing this hypothetical example with the hypothetical examples that appear in shareholder reports of other funds.
Note that the expenses shown in the table are meant to highlight and help you compare ongoing costs only and do not reflect transaction costs incurred by the portfolio for buying and selling securities. The portfolio’s expense ratio does not reflect additional fees and expenses associated with the annuity or life insurance program through which you invest.
The calculations assume no shares were bought or sold during the period. Your actual costs may have been higher or lower, depending on the amount of your investment and the timing of any purchases or redemptions.
You can find more information about the portfolio’s expenses in the Financial Statements section. For additional information on operating expenses and other shareholder costs, please refer to the prospectus.
| | | |
| Six Months Ended December 31, 2015 | | | |
| Beginning | Ending | Expenses |
| Account Value | Account Value | Paid During |
| Total Bond Market Index Portfolio | 6/30/2015 | 12/31/2015 | Period1 |
| Based on Actual Portfolio Return | $1,000.00 | $1,005.97 | $0.76 |
| Based on Hypothetical 5% Yearly Return | 1,000.00 | 1,024.45 | 0.77 |
1 The calculations are based on expenses incurred in the most recent six-month period. The portfolio’s annualized six-month expense ratio for that period is 0.15%. The dollar amounts shown as “Expenses Paid” are equal to the annualized expense ratio multiplied by the average account value over the period, multiplied by the number of days in the most recent six-month period, then divided by the number of days in the most recent 12-month period (184/365).
293
Vanguard Total Bond Market Index Portfolio
Vanguard Variable Insurance Fund Total Bond Market Index Portfolio is not sponsored, endorsed, issued, sold, or promoted by Barclays Capital Inc. or any of its affiliates (“Barclays”). Barclays makes no representation or warranty, express or implied, to the owners or purchasers of the portfolio or any member of the public regarding the advisability of investing in securities generally or in the portfolio particularly or the ability of the Barclays index to track general bond market performance. Barclays has not passed on the legality or suitability of the portfolio with respect to any person or entity. Barclays’ only relationship to Vanguard and the portfolio is the licensing of the Barclays index, which is determined, composed, and calculated by Barclays without regard to Vanguard or the portfolio or any owners or purchasers of the portfolio. Barclays has no obligation to take the needs of Vanguard, the portfolio, or the owners of the portfolio into consideration in determining, composing, or calculating the Barclays index. Barclays is not responsible for and has not participated in the determination of the timing of, prices at, or quantities of the portfolio to be issued. Barclays has no obligation or liability in connection with the administration, marketing, or trading of the portfolio.
Barclays shall have no liability to third parties for the quality, accuracy, and/or completeness of the index or any data included therein or for interruptions in the delivery of the index. Barclays makes no warranty, express or implied, as to results to be obtained by owners of the portfolio or any other person or entity from the use of the index or any data included therein in connection with the rights licensed hereunder or for any other use. Barclays reserves the right to change the methods of calculation or publication, or to cease the calculation or publication of the Barclays U.S. Aggregate Float Adjusted Index, and Barclays shall not be liable for any miscalculation of or any incorrect, delayed, or interrupted publication with respect to the index. Barclays makes no express or implied warranties, and hereby expressly disclaims all warranties of merchantability or fitness for a particular purpose or use with respect to the index or any data included therein. Barclays shall not be liable for any damages, including, without limitation, any indirect or consequential damages resulting from the use of the index or any data included therein.
294
Vanguard® Total Stock Market Index Portfolio
For the fiscal year ended December 31, 2015, Vanguard Total Stock Market Index Portfolio returned 0.37%, in line with its target index and several percentage points ahead of the average return of its peers.
The table below shows the returns of your portfolio and its comparative standards for the year. For additional perspective, we also present their annualized returns for the past ten years.
As a “fund of funds,” the Total Stock Market Index Portfolio seeks to capture the returns of its target benchmark by investing about 80% of its assets in the Equity Index Portfolio of Vanguard Variable Insurance Fund and about 20% in Vanguard Extended Market Index Fund. Because of the Equity Index Portfolio’s heavy weighting, you may wish to review that portfolio’s financial statements, which are included with this report.
Please note that the portfolio returns in Vanguard Variable Insurance Fund are different from those in Vanguard Variable Annuity (and other plans that invest in the fund), which take into account insurance-related expenses.
Energy stocks continued to decline; consumer sectors were bright spots
Vanguard Total Stock Market Index Portfolio offers investors exposure to every segment of the U.S. equity market, including stocks of all sizes, styles, and sectors. The portfolio’s overall performance was helped by its heavy exposure to the Equity Index Portfolio, which concentrates on large-capitalization stocks and outperformed smaller-company stocks during the year. The Equity Index Portfolio returned 1.27%, while the Extended Market Index Fund, which focuses on small- and mid-cap stocks, returned –3.39%.
Energy stocks, which returned about –23% for the period, had the largest effect on the portfolio’s overall results. The lengthy and sharp slide of oil prices punished these companies. Natural gas prices also dropped, though not as dramatically.
The materials sector, which returned about –10%, was also one of the broad market’s weakest, as commodity prices fell along with those of oil.
It wasn’t all grim. Most segments of the U.S. economy grew, boosted by shoppers’ overall confidence and their willingness and ability to spend. Consumer-related stocks returned about 6%. The internet retail area was especially productive, and several home improvement retailers also excelled. Notable showings also came from food, beverage, and tobacco companies.
Health care stocks did best, climbing about 7%, a fraction better than consumer services. Merger-and-acquisition activity, vibrant drug pipelines, and favorable long-term demographic and economic trends lifted results despite stumbles in the health care technology subsector.
Information technology, the largest sector, returned about 5%. Gains from internet and software firms were partially offset by poor returns from computer hardware and semiconductor companies.
The financial sector, the portfolio’s second-largest, retreated, returning a bit more than –1%. REITs (real estate investment trusts) and banks managed small returns, but asset managers and consumer finance companies declined.
The portfolio’s long-term record reflects expertise and low costs
For the decade through December 2015, the Total Stock Market Index Portfolio recorded an average annual return of 7.27%. This result was close to that of the portfolio’s target benchmark, the S&P Total Market Index, which has no transaction costs or operating expenses.
Vanguard Equity Investment Group, the advisor overseeing the portfolio, has a long track record of successfully tracking indexes. This wasn’t easy to do during the extreme market volatility that accompanied the financial crisis of 2008–2009. The advisor was helped by the portfolio’s low expenses, which are far below the average for its peer group. For the decade, the portfolio outperformed the 5.67% average annual result of its peers.
| | |
| Total Returns | | |
| | Ten Years Ended |
| | December 31, 2015 |
| Year Ended | Average |
| December 31, 2015 | Annual Return |
| Vanguard Total Stock Market Index Portfolio | 0.37% | 7.27% |
| S&P Total Market Index | 0.47 | 7.35 |
| Variable Insurance Multi-Cap Core Funds Average1 | -2.16 | 5.67 |
The figures shown represent past performance, which is not a guarantee of future results. (Current performance may be lower or higher than the performance data cited. For performance data current to the most recent month-end, visit our website at vanguard.com/performance.) Note, too, that both investment returns and principal value can fluctuate widely, so an investor’s shares, when sold, could be worth more or less than their original cost.
Expense Ratios2
Your Portfolio Compared With Its Peer Group
| | |
| Variable Insurance |
| Acquired Fund | Multi-Cap |
| Fees and | Core Funds |
| Expenses | Average |
| Total Stock Market Index Portfolio | 0.17% | 0.78% |
1 Derived from data provided by Lipper, a Thomson Reuters Company.
2 This figure—drawn from the prospectus dated April 30, 2015—represents an estimate of the weighted average of the annualized expense ratios and any transaction fees charged by the underlying mutual funds (the “acquired” funds) in which the Total Stock Market Index Portfolio invests. The Total Stock Market Index Portfolio does not charge any expenses or fees of its own. For the fiscal year ended December 31, 2015, the annualized acquired fund fees and expenses were 0.16%.
295
Vanguard Total Stock Market Index Portfolio
Portfolio Profile
As of December 31, 2015
| |
| Total Portfolio Characteristics | |
| |
| Yield1 | 1.5% |
| Acquired Fund Fees and Expenses2 | 0.17% |
| |
| Volatility Measures | |
| Portfolio Versus |
| Target Index3 |
| R-Squared | 1.00 |
| Beta | 1.00 |
| |
| Allocation to Underlying Funds | |
| |
| Vanguard Variable Insurance Fund | |
| Equity Index Portfolio | 81.4% |
| Vanguard Extended Market Index Fund | 18.6 |
Investment Focus
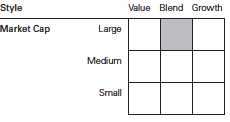
30-Day SEC Yield. A portfolio’s 30-day SEC yield is derived using a formula specified by the U.S. Securities and Exchange Commission. Under the formula, data related to the portfolio’s security holdings in the previous 30 days are used to calculate the portfolio’s hypothetical net income for that period, which is then annualized and divided by the portfolio’s estimated average net assets over the calculation period. For the purposes of this calculation, a security’s income is based on its current market yield to maturity (for bonds), its actual income (for asset-backed securities), or its projected dividend yield (for stocks). Because the SEC yield represents hypothetical annualized income, it will differ—at times significantly—from the portfolio’s actual experience. As a result, the portfolio’s income distributions may be higher or lower than implied by the SEC yield.
Acquired Fund Fees and Expenses. Portfolios that invest in other Vanguard funds incur no direct expenses, but they do bear proportionate shares of the operating, administrative, and advisory expenses of the underlying funds, and they must pay any fees charged by those funds. The figure for acquired fund fees and expenses represents a weighted average of these underlying costs. Acquired is a term that the Securities and Exchange Commission applies to any mutual fund whose shares are owned by another fund.
Beta. A measure of the magnitude of a portfolio’s past share-price fluctuations in relation to the ups and downs of a given market index. The index is assigned a beta of 1.00. Compared with a given index, a portfolio with a beta of 1.20 typically would have seen its share price rise or fall by 12% when the index rose or fell by 10%. For this report, beta is based on returns over the past 36 months for both the portfolio and the index.
R-Squared. A measure of how much of a portfolio’s past returns can be explained by the returns from the market in general, as measured by a given index. If a portfolio’s total returns were precisely synchronized with an index’s returns, its R-squared would be 1.00. If the portfolio’s returns bore no relationship to the index’s returns, its R-squared would be 0. For this report, R-squared is based on returns over the past 36 months for both the portfolio and the index.
1 30-day SEC yield.
2 This figure—drawn from the prospectus dated April 30, 2015—represents an estimate of the weighted average of the annualized expense ratios and any transaction fees charged by the underlying mutual funds (the “acquired” funds) in which the Total Stock Market Index Portfolio invests. The Total Stock Market Index Portfolio does not charge any expenses or fees of its own. For the fiscal year ended December 31, 2015, the annualized acquired fund fees and expenses were 0.16%.
3 S&P Total Market Index.
296
Vanguard Total Stock Market Index Portfolio
Performance Summary
All of the returns in this report represent past performance, which is not a guarantee of future results that may be achieved by the portfolio. (Current performance may be lower or higher than the performance data cited. For performance data current to the most recent month-end, visit our website at vanguard.com/performance.) Note, too, that both investment returns and principal value can fluctuate widely, so an investor’s shares, when sold, could be worth more or less than their original cost. The returns shown do not reflect taxes that a shareholder would pay on portfolio distributions or on the sale of portfolio shares. Nor do the returns reflect fees and expenses associated with the annuity or life insurance program through which a shareholder invests. If these fees and expenses were included, the portfolio’s returns would be lower.
Cumulative Performance: December 31, 2005–December 31, 2015
Initial Investment of $10,000

| | | | |
| | | Average Annual Total Returns | Final Value |
| | Periods Ended December 31, 2015 | of a $10,000 |
| | One Year | Five Years | Ten Years | Investment |
| Total Stock Market Index Portfolio | 0.37% | 12.00% | 7.27% | $20,165 |
| S&P Total Market Index | 0.47 | 12.11 | 7.35 | 20,321 |
| Variable Insurance Multi-Cap Core | | | | |
| Funds Average1 | -2.16 | 8.90 | 5.67 | 17,360 |
Fiscal Year Total Returns (%): December 31, 2005–December 31, 2015
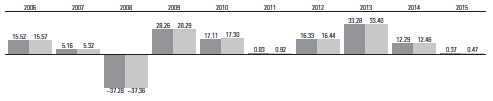
| |
| Total Stock Market Index Portfolio |
| S&P Total Market Index |
1 Derived from data provided by Lipper, a Thomson Reuters Company.
See Financial Highlights for dividend and capital gains information.
297
Vanguard Total Stock Market Index Portfolio
Financial Statements
Statement of Net Assets
As of December 31, 2015
The portfolio reports a complete list of its holdings in regulatory filings four times in each fiscal year, at the quarter-ends. For the second and fourth fiscal quarters, the lists appear in the portfolio’s semiannual and annual reports to shareholders. For the first and third fiscal quarters, the portfolio files the lists with the Securities and Exchange Commission on Form N-Q. Shareholders can look up the portfolio’s Forms N-Q on the SEC’s website at sec.gov. Forms N-Q may also be reviewed and copied at the SEC’s Public Reference Room (see the back cover of this report for further information).
| | | |
| Market |
| Value• |
| Shares | ($000) |
| Investment Companies (100.0%) | | |
| U.S. Stock Funds (100.0%) | | |
| Vanguard Variable Insurance Fund—Equity Index Portfolio | 41,593,606 | 1,382,988 |
| Vanguard Extended Market Index Fund Investor Shares | 4,965,840 | 315,877 |
| 1,698,865 |
| Total Investments (100.0%) (Cost $1,506,758) | 1,698,865 |
| | | |
| Amount |
| ($000) |
| Other Assets and Liabilities (0.0%) | | |
| Other Assets | | |
| Receivables for Investment Securities Sold | 502 |
| Receivables for Capital Shares Issued | 137 |
| Total Other Assets | | 639 |
| Liabilities | | |
| Payables for Capital Shares Redeemed | (316) |
| Other Liabilities | (321) |
| Total Liabilities | | (637) |
| Net Assets (100%) | | |
| Applicable to 52,985,412 outstanding $.001 par value shares of | | |
| beneficial interest (unlimited authorization) | 1,698,867 |
| Net Asset Value Per Share | | $32.06 |
| |
| At December 31, 2015, net assets consisted of: | |
| Amount |
| ($000) |
| Paid-in Capital | 1,414,614 |
| Undistributed Net Investment Income | 25,347 |
| Accumulated Net Realized Gains | 66,799 |
| Unrealized Appreciation (Depreciation) | 192,107 |
| Net Assets | 1,698,867 |
• See Note A in Notes to Financial Statements.
See accompanying Notes, which are an integral part of the Financial Statements.
298
| | |
| Vanguard Total Stock Market Index Portfolio |
| |
| |
| Statement of Operations |
| |
| Year Ended |
| December 31, 2015 |
| ($000) |
| Investment Income | | |
| Income | | |
| Income Distributions Received | 25,594 |
| Net Investment Income—Note B | 25,594 |
| Realized Net Gain (Loss) | | |
| Capital Gain Distributions Received | 40,095 |
| Affiliated Investment Securities Sold | 26,729 |
| Realized Net Gain (Loss) | 66,824 |
| Change in Unrealized Appreciation | |
| (Depreciation) of Investment Securities | (87,522) |
| Net Increase (Decrease) in Net Assets | |
| Resulting from Operations | 4,896 |
| | |
| Statement of Changes in Net Assets | | |
| |
| Year Ended December 31, |
| 2015 | 2014 |
| ($000) | ($000) |
| Increase (Decrease) in Net Assets | | |
| Operations | | |
| Net Investment Income | 25,594 | 21,095 |
| Realized Net Gain (Loss) | 66,824 | 53,985 |
| Change in Unrealized Appreciation (Depreciation) | (87,522) | 75,415 |
| Net Increase (Decrease) in Net Assets Resulting from Operations | 4,896 | 150,495 |
| Distributions | | |
| Net Investment Income | (21,231) | (17,329) |
| Realized Capital Gain1 | (53,936) | (68,740) |
| Total Distributions | (75,167) | (86,069) |
| Capital Share Transactions | | |
| Issued | 225,941 | 397,660 |
| Issued in Lieu of Cash Distributions | 75,167 | 86,069 |
| Redeemed | (160,713) | (128,564) |
| Net Increase (Decrease) from Capital Share Transactions | 140,395 | 355,165 |
| Total Increase (Decrease) | 70,124 | 419,591 |
| Net Assets |
| Beginning of Period | 1,628,743 | 1,209,152 |
| End of Period2 | 1,698,867 | 1,628,743 |
1 Includes fiscal 2015 and 2014 short-term gain distributions totaling $834,000 and $385,000, respectively. Short-term gain distributions are treated as ordinary income dividends for tax purposes.
2 Net Assets—End of Period includes undistributed (overdistributed) net investment income of $25,347,000 and $20,984,000.
See accompanying Notes, which are an integral part of the Financial Statements.
299
| | | | | |
| Vanguard Total Stock Market Index Portfolio | | | | | |
| |
| |
| Financial Highlights | | | | | |
| |
| |
| For a Share Outstanding | | | Year Ended December 31, |
| Throughout Each Period | 2015 | 2014 | 2013 | 2012 | 2011 |
| Net Asset Value, Beginning of Period | $33.46 | $32.01 | $25.32 | $23.63 | $24.44 |
| Investment Operations | | |
| Net Investment Income | .480 | .5061 | .454 | .442 | .3641 |
| Capital Gain Distributions Received | .672 | .4621 | .560 | .858 | .6491 |
| Net Realized and Unrealized Gain (Loss) | | | | | |
| on Investments | (1.019) | 2.717 | 7.116 | 2.488 | (.753) |
| Total from Investment Operations | .133 | 3.685 | 8.130 | 3.788 | .260 |
| Distributions | | |
| Dividends from Net Investment Income | (.433) | (.450) | (.435) | (.428) | (.340) |
| Distributions from Realized Capital Gains | (1.100) | (1.785) | (1.005) | (1.670) | (.730) |
| Total Distributions | (1.533) | (2.235) | (1.440) | (2.098) | (1.070) |
| Net Asset Value, End of Period | $32.06 | $33.46 | $32.01 | $25.32 | $23.63 |
| |
| Total Return | 0.37% | 12.29% | 33.28% | 16.33% | 0.83% |
| |
| Ratios/Supplemental Data | | |
| Net Assets, End of Period (Millions) | $1,699 | $1,629 | $1,209 | $903 | $786 |
| Ratio of Total Expenses to Average Net Assets | — | — | — | — | — |
| Acquired Fund Fees and Expenses | 0.16% | 0.17% | 0.18% | 0.18% | 0.18% |
| Ratio of Net Investment Income to | | | | | |
| Average Net Assets | 1.53% | 1.61% | 1.62% | 1.83% | 1.52% |
| Portfolio Turnover Rate | 5% | 9% | 17% | 8% | 12% |
| 1 Calculated based on average shares outstanding. | | | | | |
See accompanying Notes, which are an integral part of the Financial Statements.
300
Vanguard Total Stock Market Index Portfolio
Notes to Financial Statements
Vanguard Total Stock Market Index Portfolio, a portfolio of Vanguard Variable Insurance Funds, is registered under the Investment Company Act of 1940 as an open-end investment company. The portfolio seeks to match the return of its target index by investing in selected Vanguard funds and portfolios. Financial statements and other information about each underlying fund and portfolio are available on vanguard.com. The portfolio’s shares are only available for purchase by separate accounts of insurance companies as investments for variable annuity plans, variable life insurance contracts, or other variable benefit insurance contracts.
A. The following significant accounting policies conform to generally accepted accounting principles for U.S. investment companies. The portfolio consistently follows such policies in preparing its financial statements.
1. Security Valuation: Investments are valued at the net asset value of each underlying Vanguard fund determined as of the close of the New York Stock Exchange (generally 4 p.m., Eastern time) on the valuation date.
2. Federal Income Taxes: The portfolio intends to continue to qualify as a regulated investment company and distribute all of its taxable income. Management has analyzed the portfolio’s tax positions taken for all open federal income tax years (December 31, 2012–2015), and has concluded that no provision for federal income tax is required in the portfolio’s financial statements.
3. Distributions: Distributions to shareholders are recorded on the ex-dividend date.
4. Credit Facility: The portfolio and certain other funds managed by The Vanguard Group (“Vanguard”) participate in a $3 billion committed credit facility provided by a syndicate of lenders pursuant to a credit agreement that may be renewed annually; each portfolio is individually liable for its borrowings, if any, under the credit facility. Borrowings may be utilized for temporary and emergency purposes, and are subject to the portfolio’s regulatory and contractual borrowing restrictions. The participating funds are charged administrative fees and an annual commitment fee of 0.06% of the undrawn amount of the facility; these fees are allocated to the funds based on a method approved by the fund’s board of trustees and borne by the funds in which the portfolio invests (see Note B). Any borrowings under this facility bear interest at a rate equal to the higher of the federal funds rate or LIBOR reference rate plus an agreed-upon spread.
The portfolio had no borrowings outstanding at December 31, 2015, or at any time during the period then ended.
5. Other: Income and capital gain distributions received are recorded on the ex-dividend date. Security transactions are accounted for on the date securities are bought or sold. Costs used to determine realized gains (losses) on the sale of investment securities are those of the specific securities sold.
B. In accordance with the terms of a Funds’ Service Agreement (the “FSA”) between Vanguard and the portfolio, Vanguard furnishes to the portfolio investment advisory, corporate management, administrative, marketing, and distribution services at Vanguard’s cost of operations (as defined by the FSA). These costs of operations are allocated to the portfolio based on methods and guidelines approved by the board of trustees. The FSA provides that expenses otherwise allocable to Vanguard funds-of-funds may be reduced or eliminated to the extent of savings realized by the underlying Vanguard funds by virtue of being part of a fund-of-funds. Accordingly, all expenses for services provided by Vanguard to the portfolio and all other expenses incurred by the portfolio during the period ended December 31, 2015, were borne by the underlying Vanguard funds in which the portfolio invests. The portfolio’s trustees and officers are also trustees and officers, respectively, of the underlying Vanguard funds, as well as directors and employees, respectively, of Vanguard.
C. Various inputs may be used to determine the value of the portfolio’s investments. These inputs are summarized in three broad levels for financial statement purposes. The inputs or methodologies used to value securities are not necessarily an indication of the risk associated with investing in those securities.
Level 1—Quoted prices in active markets for identical securities.
Level 2—Other significant observable inputs (including quoted prices for similar securities, interest
rates, prepayment speeds, credit risk, etc.).
Level 3—Significant unobservable inputs (including the portfolio’s own assumptions used to
determine the fair value of investments).
At December 31, 2015, 100% of the market value of the portfolio’s investments was determined based on Level 1 inputs.
301
Vanguard Total Stock Market Index Portfolio
D. Distributions are determined on a tax basis and may differ from net investment income and realized capital gains for financial reporting purposes. Differences may be permanent or temporary. Permanent differences are reclassified among capital accounts in the financial statements to reflect their tax character. Temporary differences arise when certain items of income, expense, gain, or loss are recognized in different periods for financial statement and tax purposes. These differences will reverse at some time in the future. Differences in classification may also result from the treatment of short-term gains as ordinary income for tax purposes.
For tax purposes, at December 31, 2015, the portfolio had $26,065,000 of ordinary income and $66,080,000 of long-term capital gains available for distribution.
At December 31, 2015, the cost of investment securities for tax purposes was $1,506,758,000. Net unrealized appreciation of investment securities for tax purposes was $192,107,000, consisting entirely of unrealized gains on securities that had risen in value since their purchase.
E. Capital shares issued and redeemed were:
| | |
| Year Ended December 31, |
| 2015 | 2014 |
| Shares | Shares |
| (000) | (000) |
| Issued | 6,892 | 12,088 |
| Issued in Lieu of Cash Distributions | 2,330 | 2,860 |
| Redeemed | (4,912) | (4,045) |
| Net Increase (Decrease) in Shares Outstanding | 4,310 | 10,903 |
F. Transactions during the period in affiliated underlying Vanguard funds were as follows:
| | | | | | |
| | Current Period Transactions | |
| Dec. 31, | Proceeds | | | Dec. 31, |
| 2014 | from | | Capital Gain | 2015 |
| Market | Purchases | Securities | Dividend | Distributions | Market |
| Value | at Cost | Sold | Income | Received | Value |
| | ($000) | ($000) | ($000) | ($000) | ($000) | ($000) |
| Vanguard Extended Market | | | | | | |
| Index Fund | 318,948 | 45,604 | 34,041 | 3,699 | — | 315,877 |
| Vanguard Market Liquidity Fund | 213 | NA1 | NA1 | — | — | — |
| Vanguard Variable Insurance | | | | | | |
| Fund—Equity Index Portfolio | 1,309,738 | 167,419 | 48,010 | 21,895 | 40,095 | 1,382,988 |
| Total | 1,628,899 | 213,023 | 82,051 | 25,594 | 40,095 | 1,698,865 |
| 1 Not applicable—purchases and sales are for temporary cash investment purposes. | | | |
G. Management has determined that no material events or transactions occurred subsequent to December 31, 2015, that would require recognition or disclosure in these financial statements.
302
Vanguard Total Stock Market Index Portfolio
Report of Independent Registered Public Accounting Firm
To the Board of Trustees of Vanguard Variable Insurance Funds and the Shareholders of Total Stock Market Index Portfolio: In our opinion, the accompanying statement of net assets and the related statements of operations and of changes in net assets and the financial highlights present fairly, in all material respects, the financial position of Total Stock Market Index Portfolio (constituting a separate portfolio of Vanguard Variable Insurance Funds, hereafter referred to as the “Portfolio”) at December 31, 2015, the results of its operations for the year then ended, the changes in its net assets for each of the two years in the period then ended, and the financial highlights for each of the five years in the period then ended, in conformity with accounting principles generally accepted in the United States of America. These financial statements and financial highlights (hereafter referred to as “financial statements”) are the responsibility of the Portfolio’s management. Our responsibility is to express an opinion on these financial statements based on our audits. We conducted our audits of these financial statements in accordance with the standards of the Public Company Accounting Oversight Board (United States). Those standards require that we plan and perform the audit to obtain reasonable assurance about whether the financial statements are free of material misstatement. An audit includes examining, on a test basis, evidence supporting the amounts and disclosures in the financial statements, assessing the accounting principles used and significant estimates made by management, and evaluating the overall financial statement presentation. We believe that our audits, which included confirmation of securities at December 31, 2015 by agreement to the underlying ownership records of the transfer agent, provide a reasonable basis for our opinion.
/s/PricewaterhouseCoopers LLP
Philadelphia, Pennsylvania
February 11, 2016
| |
| |
| Special 2015 tax information (unaudited) for corporate shareholders only for Vanguard Total |
| Stock Market Index Portfolio, a portfolio of Vanguard Variable Insurance Funds |
| |
| This information for the fiscal year ended December 31, 2015, is included pursuant to provisions |
| of the Internal Revenue Code for corporate shareholders only. |
| |
| The portfolio distributed $53,102,000 as capital gain dividends (from net long-term capital gains) |
| to shareholders during the fiscal year. |
| |
| For corporate shareholders, 81.7% of investment income (dividend income plus short-term gains, |
| if any) qualifies for the dividends-received deduction. |
303
Vanguard Total Stock Market Index Portfolio
About Your Portfolio’s Expenses
As a shareholder of the portfolio, you incur ongoing costs, which include costs for portfolio management, administrative services, and shareholder reports (like this one), among others. Operating expenses, which are deducted from a portfolio’s gross income, directly reduce the investment return of the portfolio.
A typical portfolio’s expenses are expressed as a percentage of its average net assets. The Total Stock Market Index Portfolio has no direct expenses, but bears its proportionate share of the expenses of the underlying funds in which it invests. These indirect expenses make up the acquired fund fees and expenses, also expressed as a percentage of average net assets. The following examples are intended to help you understand the ongoing costs (in dollars) of investing in your portfolio and to compare these costs with those of other mutual funds. The examples are based on an investment of $1,000 made at the beginning of the period shown and held for the entire period. The costs were calculated using the acquired fund fees and expenses for the Total Stock Market Index Portfolio.
The accompanying table illustrates your portfolio’s costs in two ways:
• Based on actual portfolio return. This section helps you to estimate the actual expenses that you paid over the period. The “Ending Account Value” shown is derived from the portfolio’s actual return, and the third column shows the dollar amount that would have been paid by an investor who started with $1,000 in the portfolio. You may use the information here, together with the amount you invested, to estimate the expenses that you paid over the period.
To do so, simply divide your account value by $1,000 (for example, an $8,600 account value divided by $1,000 = 8.6), then multiply the result by the number given for your portfolio under the heading “Expenses Paid During Period.”
• Based on hypothetical 5% yearly return. This section is intended to help you compare your portfolio���s costs with those of other mutual funds. It assumes that the portfolio had a yearly return of 5% before expenses, but that the expense ratio is unchanged. In this case—because the return used is not the portfolio’s actual return—the results do not apply to your investment. The example is useful in making comparisons because the Securities and Exchange Commission requires all mutual funds to calculate expenses based on a 5% return. You can assess your portfolio’s costs by comparing this hypothetical example with the hypothetical examples that appear in shareholder reports of other funds.
Note that the expenses shown in the table are meant to highlight and help you compare ongoing costs only. The portfolio’s expense figure does not reflect additional fees and expenses associated with the annuity or life insurance program through which you invest.
The calculations assume no shares were bought or sold during the period. Your actual costs may have been higher or lower, depending on the amount of your investment and the timing of any purchases or redemptions.
You can find more information about the portfolio’s expenses in the Financial Statements section. For additional information on operating expenses and other shareholder costs, please refer to the prospectus.
| | | |
| Six Months Ended December 31, 2015 | | | |
| Beginning | Ending | Expenses |
| Account Value | Account Value | Paid During |
| Total Stock Market Index Portfolio | 6/30/2015 | 12/31/2015 | Period1 |
| Based on Actual Portfolio Return | $1,000.00 | $985.25 | $0.80 |
| Based on Hypothetical 5% Yearly Return | 1,000.00 | 1,024.40 | 0.82 |
1 The calculations are based on the Total Stock Market Index Portfolio’s acquired fund fees and expenses for the most recent six-month period. The Total Stock Market Index Portfolio’s annualized expense figure for that period is 0.16%. The dollar amounts shown as “Expenses Paid” are equal to the annualized average weighted expense ratio for the underlying funds, multiplied by the average account value over the period, multiplied by the number of days in the most recent six-month period, then divided by the number of days in the recent 12-month period (184/365).
304
Vanguard® Equity Index Portfolio
U.S. stocks registered a very small gain in 2015 as volatility affected markets worldwide. For the fiscal year ended December 31, 2015, Vanguard Equity Index Portfolio returned 1.27%, in line with its benchmark index and a bit more than the average return of peer funds.
The table below shows the returns of your portfolio and its comparative standards for the year. For additional perspective, we also present their annualized returns for the past ten years.
Please note that the portfolio returns in Vanguard Variable Insurance Fund are different from those in Vanguard Variable Annuity (and other plans that invest in the fund), which take into account insurance-related expenses.
Energy’s double-digit decline blunted gains in several sectors
The Equity Index Portfolio invests in 500 of the largest U.S. companies, which span many different industries and account for about three-fourths of the U.S. stock market’s value. Stocks of large-capitalization companies returned more than those of smaller companies, helping the portfolio to slightly outpace the broad market.
Most segments of the U.S. economy grew, buoyed by shoppers’ overall confidence and their willingness and ability to spend. This trend benefited the consumer discretionary and consumer staples sectors, which were among the market’s top performers. Internet retailers led the way in consumer discretionary; home improvement stores and restaurants also excelled. In the consumer goods sector, notable showings came from tobacco, beverage, and packaged food companies.
The information technology and health care sectors also helped performance, although their returns paled compared with those of some robust recent periods. In IT, gains from internet and software firms were partially offset by losses from technology hardware and communications equipment companies. Merger-and-acquisition activity, vibrant drug pipelines, and favorable long-term demographic and economic trends lifted health care despite stumbles in the health care technology subsector.
Much of the contribution made by these sectors was erased by a double-digit decline in energy. The lengthy and sharp slide of oil prices punished the sector. High production levels from some leading oil-producing countries and concerns about slower growth in China, the world’s largest oil importer, fueled the decline. Natural gas prices also dropped, though not as dramatically. Some integrated oil and gas firms held up better than others, but the majority of companies engaged in production and exploration suffered.
Stocks in the financial, industrials, materials, and utilities sectors also weighed on the portfolio’s performance.
The portfolio’s low costs have helped it beat peers
For the decade through December 2015, the Equity Index Portfolio recorded an average annual return of 7.20%. This result was quite close to that of the portfolio’s target, the S&P 500 Index, which has no transaction costs or operating expenses.
Vanguard Equity Investment Group, the advisor overseeing the portfolio, has a long record of successfully tracking indexes. This was no easy feat during the extreme market volatility that accompanied the financial crisis of 2008–2009. The advisor was helped by the portfolio’s low expenses, which are far below the average for its peer group. For the decade, the portfolio outperformed the 6.05% average annual result of its peers.
| | |
| Total Returns | | |
| | Ten Years Ended |
| | December 31, 2015 |
| Year Ended | Average |
| December 31, 2015 | Annual Return |
| Vanguard Equity Index Portfolio | 1.27% | 7.20% |
| S&P 500 Index | 1.38 | 7.31 |
| Variable Insurance Large-Cap Core Funds Average1 | -0.24 | 6.05 |
The figures shown represent past performance, which is not a guarantee of future results. (Current performance may be lower or higher than the performance data cited. For performance data current to the most recent month-end, visit our website at vanguard.com/performance.) Note, too, that both investment returns and principal value can fluctuate widely, so an investor’s shares, when sold, could be worth more or less than their original cost.
Expense Ratios2
Your Portfolio Compared With Its Peer Group
| | |
| Variable Insurance |
| Large-Cap Core |
| Portfolio | Funds Average |
| Equity Index Portfolio | 0.16% | 0.40% |
1 Derived from data provided by Lipper, a Thomson Reuters Company.
2 The portfolio expense ratio shown is from the prospectus dated April 30, 2015, and represents estimated costs for the current fiscal year. For the fiscal year ended December 31, 2015, the portfolio’s expense ratio was 0.15%. The peer-group expense ratio is derived from data provided by Lipper, a Thomson Reuters Company, and captures information through year-end 2014.
305
Vanguard Equity Index Portfolio
Portfolio Profile
As of December 31, 2015
Portfolio Characteristics
| | | |
| Target | Broad |
| Portfolio | Index1 | Index2 |
| Number of Stocks | 503 | 504 | 3,960 |
| Median Market Cap $81.0B | $81.0B | $51.4B |
| Price/Earnings Ratio | 20.5x | 20.5x | 21.9x |
| Price/Book Ratio | 2.8x | 2.8x | 2.7x |
| Yield3 | 2.0% | 2.2% | 2.1% |
| Return on Equity | 18.5% | 18.3% | 17.2% |
| Earnings Growth Rate | 9.2% | 9.2% | 9.5% |
| Foreign Holdings | 0.0% | 0.0% | 0.0% |
| Turnover Rate | 4% | — | — |
| Expense Ratio4 | 0.16% | — | — |
| Short-Term Reserves | 0.1% | — | — |
| | |
| Volatility Measures | |
| Portfolio Versus | Portfolio Versus |
| Target Index1 | Broad Index2 |
| R-Squared | 1.00 | 0.99 |
| Beta | 1.00 | 0.98 |
| | | |
| Sector Diversification (% of equity exposure) |
| Target | Broad |
| Portfolio | Index1 | Index2 |
| Consumer Discretionary 12.9% | 12.9% | 13.4% |
| Consumer Staples | 10.1 | 10.1 | 8.8 |
| Energy | 6.5 | 6.5 | 5.9 |
| Financials | 16.5 | 16.5 | 18.3 |
| Health Care | 15.2 | 15.2 | 14.8 |
| Industrials | 10.1 | 10.1 | 10.6 |
| Information Technology 20.5 | 20.5 | 19.8 |
| Materials | 2.8 | 2.8 | 3.1 |
| Telecommunication | | | |
| Services | 2.4 | 2.4 | 2.2 |
| Utilities | 3.0 | 3.0 | 3.1 |
| | |
| Ten Largest Holdings5 (% of total net assets) |
| |
| Apple Inc. | Technology Hardware, |
| Storage & Peripherals | 3.3% |
| Alphabet Inc. | Internet Software | |
| & Services | 2.5 |
| Microsoft Corp. | Systems Software | 2.5 |
| Exxon Mobil Corp. | Integrated Oil & Gas | 1.8 |
| General Electric Co. | Industrial | |
| Conglomerates | 1.6 |
| Johnson & Johnson | Pharmaceuticals | 1.6 |
| Amazon.com Inc. | Internet Retail | 1.4 |
| Wells Fargo & Co. | Diversified Banks | 1.4 |
| Berkshire | | |
| Hathaway Inc. | Multi-Sector Holdings | 1.4 |
| JPMorgan Chase & Co. Diversified Banks | 1.4 |
| Top Ten | 18.9% |
Investment Focus
30-Day SEC Yield. A portfolio’s 30-day SEC yield is derived using a formula specified by the U.S. Securities and Exchange Commission. Under the formula, data related to the portfolio’s security holdings in the previous 30 days are used to calculate the portfolio’s hypothetical net income for that period, which is then annualized and divided by the portfolio’s estimated average net assets over the calculation period. For the purposes of this calculation, a security’s income is based on its current market yield to maturity (for bonds) its actual income (for asset-backed securities), or its projected dividend yield (for stocks). Because the SEC yield represents hypothetical annualized income, it will differ—at times significantly—from the portfolio’s actual experience. As a result, the portfolio’s income distributions may be higher or lower than implied by the SEC yield.
Beta. A measure of the magnitude of a portfolio’s past share-price fluctuations in relation to the ups and downs of a given market index. The index is assigned a beta of 1.00. Compared with a given index, a portfolio with a beta of 1.20 typically would have seen its share price rise or fall by 12% when the index rose or fell by 10%. For this report, beta is based on returns over the past 36 months for both the portfolio and the index.
Equity Exposure. A measure that reflects a portfolio’s investments in stocks and stock futures. Any holdings in short-term reserves are excluded.
R-Squared. A measure of how much of a portfolio’s past returns can be explained by the returns from the market in general, as measured by a given index. If a portfolio’s total returns were precisely synchronized with an index’s returns, its R-squared would be 1.00. If the portfolio’s returns bore no relationship to the index’s returns, its R-squared would be 0. For this report, R-squared is based on returns over the past 36 months for both the portfolio and the index.
1 S&P 500 Index.
2 Dow Jones U.S. Total Stock Market Float Adjusted Index.
3 30-day SEC yield for the portfolio; annualized dividend yield for the indexes.
4 The expense ratio shown is from the prospectus dated April 30, 2015, and represents estimated costs for the current fiscal year. For the fiscal year ended December 31, 2015, the expense ratio was 0.15%.
5 The holdings listed exclude any temporary cash investments and equity index products.
306
Vanguard Equity Index Portfolio
Performance Summary
All of the returns in this report represent past performance, which is not a guarantee of future results that may be achieved by the portfolio. (Current performance may be lower or higher than the performance data cited. For performance data current to the most recent month-end, visit our website at vanguard.com/performance.) Note, too, that both investment returns and principal value can fluctuate widely, so an investor’s shares, when sold, could be worth more or less than their original cost. The returns shown do not reflect taxes that a shareholder would pay on portfolio distributions or on the sale of portfolio shares. Nor do the returns reflect fees and expenses associated with the annuity or life insurance program through which a shareholder invests. If these fees and expenses were included, the portfolio’s returns would be lower.
Cumulative Performance: December 31, 2005–December 31, 2015
Initial Investment of $10,000
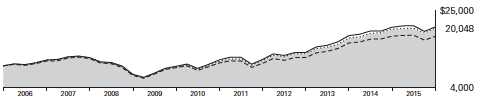
| | | | |
| | | Average Annual Total Returns | Final Value |
| | Periods Ended December 31, 2015 | of a $10,000 |
| | One Year | Five Years | Ten Years | Investment |
| Equity Index Portfolio | 1.27% | 12.40% | 7.20% | $20,048 |
| S&P 500 Index | 1.38 | 12.57 | 7.31 | 20,242 |
| Variable Insurance Large-Cap Core | | | | |
| Funds Average1 | -0.24 | 10.79 | 6.05 | 17,994 |
| Dow Jones U.S. Total Stock Market | | | | |
| Float Adjusted Index | 0.44 | 12.14 | 7.48 | 20,563 |
Fiscal Year Total Returns (%): December 31, 2005–December 31, 2015

| |
| Equity Index Portfolio |
| S&P 500 Index |
1 Derived from data provided by Lipper, a Thomson Reuters Company.
See Financial Highlights for dividend and capital gains information.
307
Vanguard Equity Index Portfolio
Financial Statements
Statement of Net Assets
As of December 31, 2015
The portfolio reports a complete list of its holdings in regulatory filings four times in each fiscal year, at the quarter-ends. For the second and fourth fiscal quarters, the lists appear in the portfolio’s semiannual and annual reports to shareholders. For the first and third fiscal quarters, the portfolio files the lists with the Securities and Exchange Commission on Form N-Q. Shareholders can look up the portfolio’s Forms N-Q on the SEC’s website at sec.gov. Forms N-Q may also be reviewed and copied at the SEC’s Public Reference Room (see the back cover of this report for further information).
| | | |
| Market |
| Value• |
| | Shares | ($000) |
| Common Stocks (99.8%)1 | | |
| Consumer Discretionary (12.9%) | |
| * | Amazon.com Inc. | 85,462 | 57,763 |
| Home Depot Inc. | 281,911 | 37,283 |
| Walt Disney Co. | 338,135 | 35,531 |
| Comcast Corp. Class A | 542,908 | 30,636 |
| McDonald’s Corp. | 204,191 | 24,123 |
| Starbucks Corp. | 330,102 | 19,816 |
| NIKE Inc. Class B | 300,078 | 18,755 |
| Lowe’s Cos. Inc. | 203,301 | 15,459 |
| * | Priceline Group Inc. | 11,069 | 14,112 |
| Ford Motor Co. | 866,581 | 12,210 |
| Time Warner Cable Inc. | 62,993 | 11,691 |
| Time Warner Inc. | 177,751 | 11,495 |
| * | Netflix Inc. | 95,041 | 10,871 |
| General Motors Co. | 314,827 | 10,707 |
| TJX Cos. Inc. | 148,525 | 10,532 |
| Target Corp. | 137,004 | 9,948 |
| Twenty-First Century | | |
| | Fox Inc. Class A | 356,230 | 9,675 |
| Yum! Brands Inc. | 95,945 | 7,009 |
| Johnson Controls Inc. | 143,625 | 5,672 |
| Carnival Corp. | 102,125 | 5,564 |
| * | O’Reilly Automotive Inc. | 21,897 | 5,549 |
| L Brands Inc. | 56,689 | 5,432 |
| Delphi Automotive plc | 62,619 | 5,368 |
| * | AutoZone Inc. | 6,803 | 5,047 |
| Ross Stores Inc. | 90,952 | 4,894 |
| VF Corp. | 75,840 | 4,721 |
| Dollar General Corp. | 65,088 | 4,678 |
| CBS Corp. Class B | 97,781 | 4,608 |
| Omnicom Group Inc. | 53,815 | 4,072 |
| * | Dollar Tree Inc. | 51,787 | 3,999 |
| Royal Caribbean Cruises Ltd. | 37,892 | 3,835 |
| * | Chipotle Mexican Grill Inc. | | |
| | Class A | 6,936 | 3,328 |
| Expedia Inc. | 26,117 | 3,246 |
| * | Under Armour Inc. Class A | 39,767 | 3,206 |
| Viacom Inc. Class B | 76,526 | 3,150 |
| Genuine Parts Co. | 33,318 | 2,862 |
| Marriott International Inc. | | |
| | Class A | 42,604 | 2,856 |
| * | Mohawk Industries Inc. | 14,078 | 2,666 |
| Newell Rubbermaid Inc. | 59,035 | 2,602 |
| Hanesbrands Inc. | 88,035 | 2,591 |
| Starwood Hotels & Resorts | | |
| | Worldwide Inc. | 37,347 | 2,587 |
| Tractor Supply Co. | 29,946 | 2,560 |
| Whirlpool Corp. | 17,315 | 2,543 |
| * | CarMax Inc. | 45,887 | 2,477 |
| Advance Auto Parts Inc. | 16,076 | 2,420 |
| Macy’s Inc. | 69,023 | 2,414 |
| DR Horton Inc. | 71,827 | 2,301 |
| Signet Jewelers Ltd. | 17,520 | 2,167 |
| BorgWarner Inc. | 49,850 | 2,155 |
| * | TripAdvisor Inc. | 25,217 | 2,150 |
| Interpublic Group of Cos. Inc. | 90,067 | 2,097 |
| Best Buy Co. Inc. | 67,691 | 2,061 |
| Kohl’s Corp. | 43,271 | 2,061 |
| | | |
| Market |
| Value• |
| | Shares | ($000) |
| Mattel Inc. | 75,458 | 2,050 |
| Coach Inc. | 60,961 | 1,995 |
| Lennar Corp. Class A | 39,845 | 1,949 |
| Goodyear Tire & Rubber Co. | 59,284 | 1,937 |
| Harley-Davidson Inc. | 42,136 | 1,913 |
| Wyndham Worldwide Corp. | 25,976 | 1,887 |
| Tiffany & Co. | 24,607 | 1,877 |
| * | Bed Bath & Beyond Inc. | 37,708 | 1,819 |
| H&R Block Inc. | 51,918 | 1,729 |
| * | Michael Kors Holdings Ltd. | 42,559 | 1,705 |
| Hasbro Inc. | 24,490 | 1,650 |
| Darden Restaurants Inc. | 25,649 | 1,632 |
| Cablevision Systems Corp. | | |
| | Class A | 49,523 | 1,580 |
| Nordstrom Inc. | 30,546 | 1,522 |
| Harman International | | |
| | Industries Inc. | 15,752 | 1,484 |
| Ralph Lauren Corp. Class A | 13,232 | 1,475 |
| News Corp. Class A | 109,223 | 1,459 |
| * | Discovery | | |
| | Communications Inc. | 57,418 | 1,448 |
| Staples Inc. | 141,351 | 1,339 |
| PVH Corp. | 18,105 | 1,333 |
| Gap Inc. | 52,409 | 1,295 |
| Leggett & Platt Inc. | 30,344 | 1,275 |
| PulteGroup Inc. | 71,425 | 1,273 |
| TEGNA Inc. | 49,632 | 1,267 |
| Wynn Resorts Ltd. | 17,755 | 1,229 |
| Scripps Networks | | |
| | Interactive Inc. Class A | 20,871 | 1,152 |
| * | AutoNation Inc. | 17,281 | 1,031 |
| Garmin Ltd. | 26,615 | 989 |
| * | Discovery Communications | | |
| | Inc. Class A | 32,818 | 876 |
| GameStop Corp. Class A | 23,709 | 665 |
| * | Urban Outfitters Inc. | 19,709 | 448 |
| * | Fossil Group Inc. | 9,459 | 346 |
| 513,184 |
| Consumer Staples (10.0%) | | |
| Procter & Gamble Co. | 604,824 | 48,029 |
| Coca-Cola Co. | 870,187 | 37,383 |
| PepsiCo Inc. | 323,900 | 32,364 |
| Philip Morris | | |
| | International Inc. | 344,500 | 30,285 |
| Altria Group Inc. | 435,975 | 25,378 |
| CVS Health Corp. | 246,261 | 24,077 |
| Wal-Mart Stores Inc. | 348,829 | 21,383 |
| Walgreens Boots | | |
| | Alliance Inc. | 193,735 | 16,498 |
| Mondelez International Inc. | | |
| | Class A | 353,355 | 15,844 |
| Costco Wholesale Corp. | 97,272 | 15,709 |
| Colgate-Palmolive Co. | 199,472 | 13,289 |
| Kimberly-Clark Corp. | 80,712 | 10,275 |
| Kraft Heinz Co. | 132,220 | 9,620 |
| Kroger Co. | 216,438 | 9,054 |
| Reynolds American Inc. | 184,356 | 8,508 |
| General Mills Inc. | 132,914 | 7,664 |
| | | |
| Market |
| Value• |
| | Shares | ($000) |
| Constellation Brands Inc. | | |
| | Class A | 38,505 | 5,485 |
| * | Monster Beverage Corp. | 33,622 | 5,008 |
| Archer-Daniels-Midland Co. | 134,112 | 4,919 |
| Sysco Corp. | 116,808 | 4,789 |
| Estee Lauder Cos. Inc. | | |
| | Class A | 49,768 | 4,383 |
| Kellogg Co. | 56,818 | 4,106 |
| ConAgra Foods Inc. | 96,271 | 4,059 |
| Dr Pepper Snapple | | |
| | Group Inc. | 41,942 | 3,909 |
| Clorox Co. | 28,787 | 3,651 |
| Tyson Foods Inc. Class A | 65,432 | 3,489 |
| Mead Johnson Nutrition Co. | 43,581 | 3,441 |
| Molson Coors Brewing Co. | | |
| | Class B | 34,960 | 3,283 |
| JM Smucker Co. | 26,395 | 3,256 |
| Hershey Co. | 32,190 | 2,874 |
| Whole Foods Market Inc. | 75,540 | 2,531 |
| Church & Dwight Co. Inc. | 28,994 | 2,461 |
| Keurig Green Mountain Inc. | 26,478 | 2,382 |
| Hormel Foods Corp. | 29,560 | 2,338 |
| Coca-Cola Enterprises Inc. | 46,865 | 2,308 |
| Brown-Forman Corp. Class B | 22,475 | 2,231 |
| McCormick & Co. Inc. | 25,565 | 2,187 |
| Campbell Soup Co. | 39,716 | 2,087 |
| 400,537 |
| Energy (6.5%) | | |
| Exxon Mobil Corp. | 925,527 | 72,145 |
| Chevron Corp. | 418,461 | 37,645 |
| Schlumberger Ltd. | 280,405 | 19,558 |
| ConocoPhillips | 274,487 | 12,816 |
| Occidental Petroleum Corp. | 169,845 | 11,483 |
| EOG Resources Inc. | 122,282 | 8,656 |
| Phillips 66 | 105,540 | 8,633 |
| Valero Energy Corp. | 106,535 | 7,533 |
| Halliburton Co. | 190,270 | 6,477 |
| Marathon Petroleum Corp. | 117,904 | 6,112 |
| Kinder Morgan Inc. | 405,084 | 6,044 |
| Anadarko Petroleum Corp. | 113,009 | 5,490 |
| Baker Hughes Inc. | 96,985 | 4,476 |
| Pioneer Natural | | |
| | Resources Co. | 33,247 | 4,169 |
| Williams Cos. Inc. | 151,231 | 3,887 |
| Apache Corp. | 84,089 | 3,739 |
| Spectra Energy Corp. | 149,333 | 3,575 |
| Noble Energy Inc. | 94,686 | 3,118 |
| Tesoro Corp. | 27,063 | 2,852 |
| National Oilwell Varco Inc. | 84,422 | 2,827 |
| Devon Energy Corp. | 85,023 | 2,721 |
| * | Cameron International Corp. | 42,157 | 2,664 |
| Hess Corp. | 52,986 | 2,569 |
| Marathon Oil Corp. | 149,083 | 1,877 |
| Cimarex Energy Co. | 20,806 | 1,860 |
| EQT Corp. | 33,557 | 1,749 |
| Columbia Pipeline Group Inc. | 85,651 | 1,713 |
| Cabot Oil & Gas Corp. | 90,724 | 1,605 |
| * | FMC Technologies Inc. | 50,610 | 1,468 |
| Helmerich & Payne Inc. | 23,728 | 1,271 |
308
Vanguard Equity Index Portfolio
| | | |
| Market |
| Value• |
| | Shares | ($000) |
| * | Newfield Exploration Co. | 35,438 | 1,154 |
| ONEOK Inc. | 45,612 | 1,125 |
| ^ | Transocean Ltd. | 75,158 | 930 |
| Range Resources Corp. | 37,281 | 917 |
| Murphy Oil Corp. | 36,637 | 823 |
| Ensco plc Class A | 52,129 | 802 |
| * | Southwestern Energy Co. | 85,575 | 608 |
| ^ | Chesapeake Energy Corp. | 114,143 | 514 |
| CONSOL Energy Inc. | 49,606 | 392 |
| Diamond Offshore | | |
| | Drilling Inc. | 14,976 | 316 |
| 258,313 |
| Financials (16.5%) | | |
| Wells Fargo & Co. | 1,033,360 | 56,174 |
| JPMorgan Chase & Co. | 818,432 | 54,041 |
| * | Berkshire Hathaway Inc. | | |
| | Class B | 385,063 | 50,844 |
| Bank of America Corp. | 2,314,846 | 38,959 |
| Citigroup Inc. | 662,327 | 34,275 |
| American International | | |
| | Group Inc. | 275,060 | 17,046 |
| Goldman Sachs Group Inc. | 88,266 | 15,908 |
| US Bancorp | 365,582 | 15,599 |
| Simon Property Group Inc. | 68,818 | 13,381 |
| American Express Co. | 185,990 | 12,936 |
| MetLife Inc. | 247,168 | 11,916 |
| PNC Financial Services | | |
| | Group Inc. | 112,996 | 10,770 |
| Morgan Stanley | 335,216 | 10,663 |
| Bank of New York Mellon | | |
| | Corp. | 243,768 | 10,048 |
| BlackRock Inc. | 28,078 | 9,561 |
| American Tower | | |
| | Corporation | 94,240 | 9,137 |
| Charles Schwab Corp. | 266,361 | 8,771 |
| Capital One Financial Corp. | 118,328 | 8,541 |
| ACE Ltd. | 72,093 | 8,424 |
| Prudential Financial Inc. | 99,865 | 8,130 |
| Public Storage | 32,729 | 8,107 |
| Travelers Cos. Inc. | 67,651 | 7,635 |
| CME Group Inc. | 75,235 | 6,816 |
| Intercontinental | | |
| | Exchange Inc. | 26,275 | 6,733 |
| Chubb Corp. | 50,573 | 6,708 |
| Equity Residential | 81,004 | 6,609 |
| BB&T Corp. | 173,490 | 6,560 |
| Marsh & McLennan | | |
| | Cos. Inc. | 116,671 | 6,469 |
| Crown Castle International | | |
| | Corp. | 74,229 | 6,417 |
| State Street Corp. | 89,700 | 5,953 |
| McGraw Hill Financial Inc. | 60,145 | 5,929 |
| Aflac Inc. | 94,664 | 5,670 |
| Aon plc | 61,486 | 5,670 |
| * | Synchrony Financial | 185,439 | 5,639 |
| AvalonBay Communities Inc. | 30,320 | 5,583 |
| Welltower Inc. | 78,731 | 5,356 |
| Allstate Corp. | 85,684 | 5,320 |
| Discover Financial Services | 95,843 | 5,139 |
| Prologis Inc. | 116,621 | 5,005 |
| SunTrust Banks Inc. | 114,031 | 4,885 |
| Boston Properties Inc. | 33,887 | 4,322 |
| M&T Bank Corp. | 35,659 | 4,321 |
| Ventas Inc. | 74,097 | 4,181 |
| Ameriprise Financial Inc. | 39,227 | 4,175 |
| * | Berkshire Hathaway Inc. | | |
| | Class A | 21 | 4,154 |
| Equinix Inc. | 13,724 | 4,150 |
| Progressive Corp. | 129,179 | 4,108 |
| T. Rowe Price Group Inc. | 56,439 | 4,035 |
| | | |
| Market |
| Value• |
| | Shares | ($000) |
| Hartford Financial Services | | |
| | Group Inc. | 91,264 | 3,966 |
| HCP Inc. | 103,431 | 3,955 |
| Vornado Realty Trust | 39,494 | 3,948 |
| Moody’s Corp. | 38,340 | 3,847 |
| Fifth Third Bancorp | 176,514 | 3,548 |
| Essex Property Trust Inc. | 14,687 | 3,516 |
| General Growth | | |
| | Properties Inc. | 128,782 | 3,504 |
| Northern Trust Corp. | 48,047 | 3,464 |
| Weyerhaeuser Co. | 114,055 | 3,419 |
| Invesco Ltd. | 94,254 | 3,156 |
| Franklin Resources Inc. | 85,424 | 3,145 |
| Realty Income Corp. | 54,909 | 2,835 |
| Regions Financial Corp. | 291,153 | 2,795 |
| Lincoln National Corp. | 55,350 | 2,782 |
| Principal Financial Group Inc. | 60,064 | 2,702 |
| XL Group plc Class A | 66,443 | 2,603 |
| Host Hotels & Resorts Inc. | 165,718 | 2,542 |
| SL Green Realty Corp. | 21,954 | 2,480 |
| KeyCorp | 185,882 | 2,452 |
| Loews Corp. | 63,127 | 2,424 |
| Kimco Realty Corp. | 91,022 | 2,408 |
| Macerich Co. | 29,577 | 2,387 |
| * | CBRE Group Inc. Class A | 63,816 | 2,207 |
| Huntington Bancshares Inc. 176,645 | 1,954 |
| * | E*TRADE Financial Corp. | 65,151 | 1,931 |
| * | Affiliated Managers | | |
| | Group Inc. | 12,008 | 1,918 |
| Cincinnati Financial Corp. | 32,315 | 1,912 |
| Plum Creek Timber Co. Inc. | 38,669 | 1,845 |
| Unum Group | 54,823 | 1,825 |
| Comerica Inc. | 39,028 | 1,633 |
| Nasdaq Inc. | 25,917 | 1,508 |
| Torchmark Corp. | 25,634 | 1,465 |
| Apartment Investment & | | |
| | Management Co. | 34,533 | 1,382 |
| Leucadia National Corp. | 74,414 | 1,294 |
| Zions Bancorporation | 44,595 | 1,217 |
| Assurant Inc. | 14,587 | 1,175 |
| Iron Mountain Inc. | 42,269 | 1,142 |
| People’s United | | |
| | Financial Inc. | 68,026 | 1,099 |
| Legg Mason Inc. | 24,224 | 950 |
| Navient Corp. | 82,235 | 942 |
| 656,050 |
| Health Care (15.1%) | | |
| Johnson & Johnson | 615,150 | 63,188 |
| Pfizer Inc. | 1,372,370 | 44,300 |
| Merck & Co. Inc. | 621,061 | 32,804 |
| Gilead Sciences Inc. | 320,438 | 32,425 |
| * | Allergan plc | 87,619 | 27,381 |
| Amgen Inc. | 167,746 | 27,230 |
| Bristol-Myers Squibb Co. | 370,896 | 25,514 |
| UnitedHealth Group Inc. | 211,900 | 24,928 |
| Medtronic plc | 312,647 | 24,049 |
| AbbVie Inc. | 363,474 | 21,532 |
| * | Celgene Corp. | 174,680 | 20,920 |
| Eli Lilly & Co. | 217,009 | 18,285 |
| * | Biogen Inc. | 49,558 | 15,182 |
| Abbott Laboratories | 331,630 | 14,893 |
| * | Express Scripts Holding Co. 150,410 | 13,147 |
| Thermo Fisher Scientific Inc. | 88,739 | 12,588 |
| McKesson Corp. | 51,174 | 10,093 |
| * | Alexion Pharmaceuticals Inc. | 50,103 | 9,557 |
| * | Regeneron | | |
| | Pharmaceuticals Inc. | 17,263 | 9,372 |
| Aetna Inc. | 77,586 | 8,389 |
| Cigna Corp. | 57,309 | 8,386 |
| Anthem Inc. | 58,058 | 8,096 |
| | | |
| Market |
| Value• |
| | Shares | ($000) |
| Becton Dickinson and Co. | 46,947 | 7,234 |
| * | Vertex Pharmaceuticals Inc. | 54,685 | 6,881 |
| Stryker Corp. | 70,288 | 6,533 |
| Cardinal Health Inc. | 73,169 | 6,532 |
| * | Illumina Inc. | 32,462 | 6,231 |
| Humana Inc. | 33,044 | 5,899 |
| * | Boston Scientific Corp. | 299,062 | 5,515 |
| * | Mylan NV | 91,832 | 4,965 |
| Zoetis Inc. | 101,171 | 4,848 |
| * | HCA Holdings Inc. | 70,580 | 4,773 |
| Baxalta Inc. | 120,693 | 4,711 |
| Perrigo Co. plc | 32,554 | 4,711 |
| Baxter International Inc. | 121,693 | 4,643 |
| * | Intuitive Surgical Inc. | 8,312 | 4,540 |
| AmerisourceBergen Corp. | | |
| | Class A | 43,206 | 4,481 |
| * | Cerner Corp. | 67,276 | 4,048 |
| Zimmer Biomet Holdings Inc. 38,108 | 3,909 |
| St. Jude Medical Inc. | 62,879 | 3,884 |
| * | Edwards Lifesciences Corp. | 48,022 | 3,793 |
| CR Bard Inc. | 16,264 | 3,081 |
| Agilent Technologies Inc. | 73,031 | 3,053 |
| * | Henry Schein Inc. | 18,350 | 2,903 |
| * | Endo International plc | 46,012 | 2,817 |
| * | Laboratory Corp. of | | |
| | America Holdings | 22,578 | 2,792 |
| * | DaVita HealthCare | | |
| | Partners Inc. | 37,604 | 2,621 |
| * | Waters Corp. | 18,107 | 2,437 |
| Universal Health Services | | |
| | Inc. Class B | 20,052 | 2,396 |
| Quest Diagnostics Inc. | 31,480 | 2,239 |
| * | Mallinckrodt plc | 25,761 | 1,923 |
| DENTSPLY International Inc. | 30,704 | 1,868 |
| * | Varian Medical Systems Inc. | 21,872 | 1,767 |
| PerkinElmer Inc. | 24,856 | 1,331 |
| Patterson Cos. Inc. | 19,000 | 859 |
| * | Tenet Healthcare Corp. | 21,694 | 657 |
| 603,134 |
| Industrials (10.0%) | | |
| General Electric Co. | 2,098,242 | 65,360 |
| 3M Co. | 136,937 | 20,628 |
| Boeing Co. | 140,056 | 20,251 |
| Honeywell International Inc. 171,423 | 17,754 |
| United Technologies Corp. | 183,438 | 17,623 |
| United Parcel Service Inc. | | |
| | Class B | 154,795 | 14,896 |
| Union Pacific Corp. | 189,966 | 14,855 |
| Lockheed Martin Corp. | 58,806 | 12,770 |
| Danaher Corp. | 132,592 | 12,315 |
| General Dynamics Corp. | 66,132 | 9,084 |
| Delta Air Lines Inc. | 175,332 | 8,888 |
| Caterpillar Inc. | 129,533 | 8,803 |
| FedEx Corp. | 58,455 | 8,709 |
| Raytheon Co. | 66,710 | 8,307 |
| Northrop Grumman Corp. | 40,347 | 7,618 |
| Precision Castparts Corp. | 30,590 | 7,097 |
| Emerson Electric Co. | 145,610 | 6,965 |
| Illinois Tool Works Inc. | 72,610 | 6,729 |
| Southwest Airlines Co. | 145,089 | 6,248 |
| American Airlines Group Inc. 140,208 | 5,938 |
| CSX Corp. | 216,649 | 5,622 |
| Norfolk Southern Corp. | 66,261 | 5,605 |
| Eaton Corp. plc | 102,577 | 5,338 |
| Deere & Co. | 69,391 | 5,292 |
| Waste Management Inc. | 92,535 | 4,939 |
| * | United Continental | | |
| | Holdings Inc. | 83,005 | 4,756 |
| Roper Technologies Inc. | 22,457 | 4,262 |
| Nielsen Holdings plc | 81,245 | 3,786 |
309
Vanguard Equity Index Portfolio
| | | |
| Market |
| Value• |
| | Shares | ($000) |
| PACCAR Inc. | 77,930 | 3,694 |
| Stanley Black & Decker Inc. | 33,127 | 3,536 |
| Ingersoll-Rand plc | 58,379 | 3,228 |
| Cummins Inc. | 36,484 | 3,211 |
| Rockwell Automation Inc. | 29,556 | 3,033 |
| Tyco International plc | 94,035 | 2,999 |
| Parker-Hannifin Corp. | 30,612 | 2,969 |
| Equifax Inc. | 26,020 | 2,898 |
| AMETEK Inc. | 53,004 | 2,840 |
| Rockwell Collins Inc. | 28,961 | 2,673 |
| * | Verisk Analytics Inc. Class A | 34,672 | 2,666 |
| Fastenal Co. | 64,068 | 2,615 |
| WW Grainger Inc. | 12,730 | 2,579 |
| Textron Inc. | 60,890 | 2,558 |
| Republic Services Inc. | | |
| | Class A | 53,202 | 2,340 |
| * | Stericycle Inc. | 18,712 | 2,257 |
| Snap-on Inc. | 12,736 | 2,183 |
| Masco Corp. | 75,955 | 2,150 |
| Dover Corp. | 34,354 | 2,106 |
| L-3 Communications | | |
| | Holdings Inc. | 17,581 | 2,101 |
| Pentair plc | 40,074 | 1,985 |
| CH Robinson Worldwide Inc. | 31,982 | 1,984 |
| Expeditors International of | | |
| | Washington Inc. | 41,858 | 1,888 |
| Kansas City Southern | 24,157 | 1,804 |
| Cintas Corp. | 19,650 | 1,789 |
| * | United Rentals Inc. | 21,258 | 1,542 |
| Fluor Corp. | 32,476 | 1,533 |
| JB Hunt Transport | | |
| | Services Inc. | 20,280 | 1,488 |
| Xylem Inc. | 40,048 | 1,462 |
| Robert Half International Inc. | 29,639 | 1,397 |
| Allegion plc | 21,093 | 1,390 |
| ADT Corp. | 37,878 | 1,249 |
| Flowserve Corp. | 29,644 | 1,247 |
| * | Jacobs Engineering | | |
| | Group Inc. | 27,772 | 1,165 |
| Pitney Bowes Inc. | 44,658 | 922 |
| Dun & Bradstreet Corp. | 8,067 | 838 |
| * | Quanta Services Inc. | 35,794 | 725 |
| Ryder System Inc. | 11,783 | 670 |
| 400,152 |
| Information Technology (20.6%) | |
| Apple Inc. | 1,239,459 | 130,465 |
| Microsoft Corp. | 1,775,844 | 98,524 |
| * | Facebook Inc. Class A | 504,788 | 52,831 |
| * | Alphabet Inc. Class A | 64,772 | 50,393 |
| * | Alphabet Inc. | 66,061 | 50,132 |
| Intel Corp. | 1,049,089 | 36,141 |
| Visa Inc. Class A | 432,758 | 33,560 |
| Cisco Systems Inc. | 1,128,543 | 30,646 |
| International Business | | |
| | Machines Corp. | 198,452 | 27,311 |
| Oracle Corp. | 711,777 | 26,001 |
| MasterCard Inc. Class A | 220,150 | 21,434 |
| QUALCOMM Inc. | 334,163 | 16,703 |
| Accenture plc Class A | 138,965 | 14,522 |
| Texas Instruments Inc. | 225,569 | 12,363 |
| EMC Corp. | 431,054 | 11,069 |
| * | salesforce.com inc | 138,820 | 10,883 |
| * | Adobe Systems Inc. | 110,979 | 10,425 |
| * | PayPal Holdings Inc. | 247,174 | 8,948 |
| Automatic Data | | |
| | Processing Inc. | 102,433 | 8,678 |
| Avago Technologies Ltd. | | |
| | Class A | 58,102 | 8,434 |
| * | Cognizant Technology | | |
| | Solutions Corp. Class A | 135,244 | 8,117 |
| | | |
| Market |
| Value• |
| | Shares | ($000) |
| Broadcom Corp. Class A | 124,768 | 7,214 |
| * | eBay Inc. | 247,174 | 6,792 |
| * | Yahoo! Inc. | 193,179 | 6,425 |
| Hewlett Packard | | |
| | Enterprise Co. | 399,840 | 6,078 |
| Intuit Inc. | 58,359 | 5,632 |
| TE Connectivity Ltd. | 85,479 | 5,523 |
| Corning Inc. | 261,788 | 4,785 |
| HP Inc. | 401,640 | 4,755 |
| * | Electronic Arts Inc. | 69,160 | 4,753 |
| Applied Materials Inc. | 254,304 | 4,748 |
| * | Fiserv Inc. | 50,530 | 4,621 |
| Activision Blizzard Inc. | 112,181 | 4,343 |
| Analog Devices Inc. | 69,103 | 3,823 |
| Fidelity National Information | | |
| | Services Inc. | 61,774 | 3,744 |
| Paychex Inc. | 70,699 | 3,739 |
| * | Alliance Data Systems Corp. | 13,509 | 3,736 |
| NVIDIA Corp. | 112,506 | 3,708 |
| Amphenol Corp. Class A | 68,000 | 3,552 |
| * | Micron Technology Inc. | 241,399 | 3,418 |
| SanDisk Corp. | 44,841 | 3,407 |
| * | Red Hat Inc. | 40,368 | 3,343 |
| Skyworks Solutions Inc. | 42,087 | 3,234 |
| Symantec Corp. | 150,552 | 3,162 |
| Western Digital Corp. | 50,895 | 3,056 |
| * | Autodesk Inc. | 49,971 | 3,045 |
| Lam Research Corp. | 35,225 | 2,798 |
| Xilinx Inc. | 56,876 | 2,671 |
| * | Citrix Systems Inc. | 33,996 | 2,572 |
| Seagate Technology plc | 66,550 | 2,440 |
| KLA-Tencor Corp. | 35,093 | 2,434 |
| Motorola Solutions Inc. | 35,363 | 2,421 |
| Harris Corp. | 27,659 | 2,404 |
| Linear Technology Corp. | 52,697 | 2,238 |
| Xerox Corp. | 209,117 | 2,223 |
| Juniper Networks Inc. | 77,971 | 2,152 |
| Microchip Technology Inc. | 46,007 | 2,141 |
| * | Akamai Technologies Inc. | 39,052 | 2,055 |
| Western Union Co. | 113,599 | 2,035 |
| CA Inc. | 69,547 | 1,986 |
| * | VeriSign Inc. | 21,950 | 1,918 |
| Total System Services Inc. | 37,248 | 1,855 |
| NetApp Inc. | 65,973 | 1,750 |
| * | Qorvo Inc. | 31,049 | 1,580 |
| * | F5 Networks Inc. | 15,806 | 1,533 |
| * | First Solar Inc. | 16,425 | 1,084 |
| CSRA Inc. | 30,114 | 903 |
| FLIR Systems Inc. | 30,963 | 869 |
| * | Teradata Corp. | 29,208 | 772 |
| 823,050 |
| Materials (2.8%) | | |
| EI du Pont de Nemours | | |
| | & Co. | 194,912 | 12,981 |
| Dow Chemical Co. | 250,048 | 12,873 |
| Monsanto Co. | 97,880 | 9,643 |
| LyondellBasell Industries | | |
| | NV Class A | 79,996 | 6,952 |
| Ecolab Inc. | 59,175 | 6,769 |
| Praxair Inc. | 63,334 | 6,485 |
| PPG Industries Inc. | 59,746 | 5,904 |
| Air Products & | | |
| | Chemicals Inc. | 43,135 | 5,612 |
| Sherwin-Williams Co. | 17,593 | 4,567 |
| International Paper Co. | 91,806 | 3,461 |
| Nucor Corp. | 71,060 | 2,864 |
| Alcoa Inc. | 288,779 | 2,850 |
| Vulcan Materials Co. | 29,677 | 2,818 |
| WestRock Co. | 57,640 | 2,630 |
| Eastman Chemical Co. | 32,806 | 2,215 |
| | | |
| Market |
| Value• |
| | Shares | ($000) |
| Ball Corp. | 30,372 | 2,209 |
| International Flavors & | | |
| | Fragrances Inc. | 17,742 | 2,123 |
| CF Industries Holdings Inc. | 51,465 | 2,100 |
| Newmont Mining Corp. | 115,581 | 2,079 |
| Airgas Inc. | 14,879 | 2,058 |
| Mosaic Co. | 74,343 | 2,051 |
| Martin Marietta | | |
| | Materials Inc. | 14,824 | 2,025 |
| Sealed Air Corp. | 45,196 | 2,016 |
| Freeport-McMoRan Inc. | 256,990 | 1,740 |
| Avery Dennison Corp. | 20,128 | 1,261 |
| FMC Corp. | 29,394 | 1,150 |
| * | Owens-Illinois Inc. | 35,769 | 623 |
| 110,059 |
| Telecommunication Services (2.4%) | |
| AT&T Inc. | 1,367,726 | 47,063 |
| Verizon | | |
| | Communications Inc. | 904,608 | 41,811 |
| * | Level 3 | | |
| | Communications Inc. | 64,165 | 3,488 |
| CenturyLink Inc. | 123,674 | 3,112 |
| Frontier Communications | | |
| | Corp. | 254,202 | 1,187 |
| 96,661 |
| Utilities (3.0%) | | |
| Duke Energy Corp. | 153,112 | 10,931 |
| NextEra Energy Inc. | 102,389 | 10,637 |
| Southern Co. | 202,092 | 9,456 |
| Dominion Resources Inc. | 131,868 | 8,920 |
| American Electric Power | | |
| | Co. Inc. | 109,163 | 6,361 |
| PG&E Corp. | 109,125 | 5,804 |
| Exelon Corp. | 204,523 | 5,680 |
| PPL Corp. | 149,369 | 5,098 |
| Sempra Energy | 52,511 | 4,937 |
| Public Service Enterprise | | |
| | Group Inc. | 112,487 | 4,352 |
| Edison International | 71,813 | 4,252 |
| Consolidated Edison Inc. | 65,267 | 4,195 |
| Xcel Energy Inc. | 112,840 | 4,052 |
| Eversource Energy | 70,534 | 3,602 |
| WEC Energy Group Inc. | 70,202 | 3,602 |
| DTE Energy Co. | 39,948 | 3,203 |
| FirstEnergy Corp. | 94,102 | 2,986 |
| Entergy Corp. | 39,293 | 2,686 |
| Ameren Corp. | 54,011 | 2,335 |
| CMS Energy Corp. | 60,860 | 2,196 |
| SCANA Corp. | 31,351 | 1,896 |
| CenterPoint Energy Inc. | 93,989 | 1,726 |
| AGL Resources Inc. | 26,404 | 1,685 |
| Pinnacle West Capital Corp. | 24,357 | 1,570 |
| Pepco Holdings Inc. | 55,476 | 1,443 |
| AES Corp. | 149,070 | 1,427 |
| TECO Energy Inc. | 51,849 | 1,382 |
| NiSource Inc. | 68,951 | 1,345 |
| NRG Energy Inc. | 72,774 | 856 |
| 118,615 |
| Total Common Stocks | | |
| (Cost $3,079,835) | 3,979,755 |
310
Vanguard Equity Index Portfolio
| | | |
| | | Market |
| | | Value• |
| | | Shares | ($000) |
| Temporary Cash Investments (0.1%)1 Money Market Fund (0.1%) 2,3 Vanguard Market Liquidity |
| | Fund, 0.363% | 1,615,401 | 1,615 |
| | | | |
| | | Face | |
| | | Amount | |
| | | ($000) | |
| U.S. Government and Agency Obligations (0.0%) 4,5 Federal Home Loan Bank Discount Notes, |
| | 0.245%, 3/2/16 | 500 | 500 |
| | 4,5 Federal Home Loan Bank Discount Notes, |
| | 0.501%, 5/3/16 | 500 | 499 |
| | | 999 |
| | Total Temporary Cash Investments | |
| | (Cost $2,614) | 2,614 |
| | Total Investments (99.9%) | | |
| | (Cost $3,082,449) | 3,982,369 |
| | | | |
| | | Amount |
| | | ($000) |
| | Other Assets and Liabilities (0.1%) Other Assets |
| | Investment in Vanguard | 352 |
| | Receivables for Accrued Income | 5,308 |
| | Receivables for Capital Shares Issued | 22,401 |
| | Total Other Assets | 28,061 |
| | Liabilities | | |
| | Payables for Investment | | |
| | Securities Purchased | (19,345) |
| | Collateral for Securities on Loan | (761) |
| | Payables for Capital Shares Redeemed | (1,913) |
| | Payables to Vanguard | (3,553) |
| | Other Liabilities | (41) |
| | Total Liabilities | (25,613) |
| Net Assets (100%) Applicable to 119,839,050 outstanding $.001 par value shares of beneficial |
| | interest (unlimited authorization) | 3,984,817 |
| | Net Asset Value Per Share | | $33.25 |
| | | | |
| |
| At December 31, 2015, net assets consisted of: |
| Amount |
| ($000) |
| Paid-in Capital | 2,923,330 |
| Undistributed Net Investment Income | 87,332 |
| Accumulated Net Realized Gains | 74,223 |
| Unrealized Appreciation (Depreciation) | |
| Investment Securities | 899,920 |
| Futures Contracts | 12 |
| Net Assets | 3,984,817 |
| |
• See Note A in Notes to Financial Statements.
* Non-income-producing security.
^ Includes partial security positions on loan to broker-dealers. The total value of securities on loan is $699,000.
1 The portfolio invests a portion of its cash reserves in equity markets through the use of index futures contracts. After giving effect to futures investments, the portfolio’s effective common stock and temporary cash investment positions represent 99.9% and 0.0%, respectively, of net assets.
2 Affiliated money market fund available only to Vanguard funds and certain trusts and accounts managed by Vanguard. Rate shown is the 7-day yield.
3 Includes $761,000 of collateral received for securities on loan.
4 The issuer operates under a congressional charter; its securities are generally neither guaranteed by the U.S. Treasury nor backed by the full faith and credit of the U.S. government.
5 Securities with a value of $399,000 have been segregated as initial margin for open futures contracts.
See accompanying Notes, which are an integral part of the Financial Statements.
311
| | | |
| Vanguard Equity Index Portfolio | |
| |
| |
| Statement of Operations |
| |
| Year Ended |
| December 31, 2015 |
| | ($000) |
| Investment Income | | |
| Income | | |
| Dividends | 97,126 |
| Interest1 | 35 |
| Securities Lending | 96 |
| Total Income | 97,257 |
| Expenses | | |
| The Vanguard Group—Note B | | |
| | Investment Advisory Services | 621 |
| | Management and Administrative | 4,337 |
| | Marketing and Distribution | 758 |
| Custodian Fees | 69 |
| Auditing Fees | 64 |
| Shareholders’ Reports | 39 |
| Trustees’ Fees and Expenses | 2 |
| Total Expenses | 5,890 |
| Net Investment Income | 91,367 |
| Realized Net Gain (Loss) | | |
| Investment Securities Sold | 74,803 |
| Futures Contracts | 114 |
| Realized Net Gain (Loss) | 74,917 |
| Change in Unrealized Appreciation | |
| (Depreciation) | | |
| Investment Securities (119,458) |
| Futures Contracts | (458) |
| Change in Unrealized Appreciation | |
| (Depreciation) (119,916) |
| Net Increase (Decrease) in Net Assets | |
| Resulting from Operations | 46,368 |
| 1 Interest income from an affiliated company of the portfolio was $32,000. |
| | | | |
| | |
| Statement of Changes in Net Assets | | |
| |
| Year Ended December 31, |
| 2015 | 2014 |
| ($000) | ($000) |
| Increase (Decrease) in Net Assets | | |
| Operations | | |
| Net Investment Income | 91,367 | 63,178 |
| Realized Net Gain (Loss) | 74,917 | 118,137 |
| Change in Unrealized Appreciation (Depreciation) | (119,916) | 245,427 |
| Net Increase (Decrease) in Net Assets Resulting from Operations | 46,368 | 426,742 |
| Distributions | | |
| Net Investment Income | (63,303) | (55,364) |
| Realized Capital Gain1 | (115,925) | (61,250) |
| Total Distributions | (179,228) | (116,614) |
| Capital Share Transactions | | |
| Issued | 608,805 | 615,339 |
| Issued in Lieu of Cash Distributions | 179,228 | 116,614 |
| Redeemed | (454,226) | (457,588) |
| Net Increase (Decrease) from Capital Share Transactions | 333,807 | 274,365 |
| Total Increase (Decrease) | 200,947 | 584,493 |
| Net Assets |
| Beginning of Period | 3,783,870 | 3,199,377 |
| End of Period2 | 3,984,817 | 3,783,870 |
1 Includes fiscal 2015 and 2014 short-term gain distributions totaling $2,114,000 and $2,793,000, respectively. Short-term gain distributions are treated as ordinary income dividends for tax purposes.
2 Net Assets—End of Period includes undistributed (overdistributed) net investment income of $87,332,000 and $59,268,000.
See accompanying Notes, which are an integral part of the Financial Statements.
312
| | | | | |
| Vanguard Equity Index Portfolio | | | | | |
| |
| |
| Financial Highlights | | | | | |
| |
| |
| For a Share Outstanding | | | Year Ended December 31, |
| Throughout Each Period | 2015 | 2014 | 2013 | 2012 | 2011 |
| Net Asset Value, Beginning of Period | $34.44 | $31.50 | $24.93 | $22.85 | $23.51 |
| Investment Operations | |
| Net Investment Income | .7591 | .587 | .545 | .512 | .466 |
| Net Realized and Unrealized Gain (Loss) | | | | | |
| on Investments | (.338) | 3.522 | 7.235 | 3.062 | .034 |
| Total from Investment Operations | .421 | 4.109 | 7.780 | 3.574 | .500 |
| Distributions | | |
| Dividends from Net Investment Income | (.569) | (.555) | (.505) | (.474) | (.390) |
| Distributions from Realized Capital Gains | (1.042) | (.614) | (.705) | (1.020) | (.770) |
| Total Distributions | (1.611) | (1.169) | (1.210) | (1.494) | (1.160) |
| Net Asset Value, End of Period | $33.25 | $34.44 | $31.50 | $24.93 | $22.85 |
| |
| Total Return | 1.27% | 13.51% | 32.18% | 15.86% | 1.93% |
| |
| Ratios/Supplemental Data | | |
| Net Assets, End of Period (Millions) | $3,985 | $3,784 | $3,199 | $2,418 | $2,132 |
| Ratio of Total Expenses to Average Net Assets | 0.15% | 0.16% | 0.16% | 0.17% | 0.17% |
| Ratio of Net Investment Income to | | | | | |
| Average Net Assets | 2.31%1 | 1.88% | 1.96% | 2.13% | 1.92% |
| Portfolio Turnover Rate | 4% | 7% | 8% | 9% | 8% |
1 Net investment income per share and the ratio of net investment income to average net assets include $.13 and 0.35%, respectively, resulting from a special dividend from Medtronic plc in January 2015.
See accompanying Notes, which are an integral part of the Financial Statements.
313
Vanguard Equity Index Portfolio
Notes to Financial Statements
Vanguard Equity Index Portfolio, a portfolio of Vanguard Variable Insurance Funds, is registered under the Investment Company Act of 1940 as an open-end investment company. The portfolio’s shares are only available for purchase by separate accounts of insurance companies as investments for variable annuity plans, variable life insurance contracts, or other variable benefit insurance contracts.
A. The following significant accounting policies conform to generally accepted accounting principles for U.S. investment companies. The portfolio consistently follows such policies in preparing its financial statements.
1. Security Valuation: Securities are valued as of the close of trading on the New York Stock Exchange (generally 4 p.m., Eastern time) on the valuation date. Equity securities are valued at the latest quoted sales prices or official closing prices taken from the primary market in which each security trades; such securities not traded on the valuation date are valued at the mean of the latest quoted bid and asked prices. Securities for which market quotations are not readily available, or whose values have been materially affected by events occurring before the portfolio’s pricing time but after the close of the securities’ primary markets, are valued by methods deemed by the board of trustees to represent fair value. Investments in Vanguard Market Liquidity Fund are valued at that fund’s net asset value. Temporary cash investments acquired over 60 days to maturity are valued using the latest bid prices or using valuations based on a matrix system (which considers such factors as security prices, yields, maturities, and ratings), both as furnished by independent pricing services. Other temporary cash investments are valued at amortized cost, which approximates market value.
2. Futures Contracts: The portfolio uses index futures contracts to a limited extent, with the objectives of maintaining full exposure to the stock market, enhancing returns, maintaining liquidity, and minimizing transaction costs. The portfolio may purchase futures contracts to immediately invest incoming cash in the market, or sell futures in response to cash outflows, thereby simulating a fully invested position in the underlying index while maintaining a cash balance for liquidity. The portfolio may seek to enhance returns by using futures contracts instead of the underlying securities when futures are believed to be priced more attractively than the underlying securities. The primary risks associated with the use of futures contracts are imperfect correlation between changes in market values of stocks held by the portfolio and the prices of futures contracts, and the possibility of an illiquid market. Counterparty risk involving futures is mitigated because a regulated clearinghouse is the counterparty instead of the clearing broker. To further mitigate counterparty risk, the portfolio trades futures contracts on an exchange, monitors the financial strength of its clearing brokers and clearinghouse, and has entered into clearing agreements with its clearing brokers. The clearinghouse imposes initial margin requirements to secure the portfolio’s performance and requires daily settlement of variation margin representing changes in the market value of each contract.
Futures contracts are valued at their quoted daily settlement prices. The aggregate settlement values of the contracts are not recorded in the Statement of Net Assets. Fluctuations in the value of the contracts are recorded in the Statement of Net Assets as an asset (liability) and in the Statement of Operations as unrealized appreciation (depreciation) until the contracts are closed, when they are recorded as realized futures gains (losses).
During the year ended December 31, 2015, the portfolio’s average investments in long and short futures contracts represented less than 1% and 0% of net assets, respectively, based on the average of aggregate settlement values at each quarter-end during the period.
3. Federal Income Taxes: The portfolio intends to continue to qualify as a regulated investment company and distribute all of its taxable income. Management has analyzed the portfolio’s tax positions taken for all open federal income tax years (December 31, 2012–2015), and has concluded that no provision for federal income tax is required in the portfolio’s financial statements.
4. Distributions: Distributions to shareholders are recorded on the ex-dividend date.
5. Securities Lending: To earn additional income, the portfolio lends its securities to qualified institutional borrowers. Security loans are subject to termination by the portfolio at any time and are required to be secured at all times by collateral in an amount at least equal to the market value of securities loaned. Daily market fluctuations could cause the value of loaned securities to be more or less than the value of the collateral received. When this occurs, the collateral is adjusted and settled on the next business day. The portfolio further mitigates its counterparty risk by entering into securities lending transactions only with a diverse group of prequalified counterparties, monitoring their financial strength, and entering into master securities lending agreements with its counterparties. The master securities lending agreements provide that, in the event of a counterparty’s default (including bankruptcy), the portfolio may terminate any loans with that borrower, determine the net amount
314
Vanguard Equity Index Portfolio
owed, and sell or retain the collateral up to the net amount owed to the portfolio; however, such actions may be subject to legal proceedings. While collateral mitigates counterparty risk, in the absence of a default the portfolio may experience delays and costs in recovering the securities loaned. The portfolio invests cash collateral received in Vanguard Market Liquidity Fund, and records a liability in the Statement of Net Assets for the return of the collateral, during the period the securities are on loan. Securities lending income represents fees charged to borrowers plus income earned on invested cash collateral, less expenses associated with the loan.
6. Credit Facility: The portfolio and certain other funds managed by The Vanguard Group (“Vanguard”) participate in a $3 billion committed credit facility provided by a syndicate of lenders pursuant to a credit agreement that may be renewed annually; each fund is individually liable for its borrowings, if any, under the credit facility. Borrowings may be utilized for temporary and emergency purposes, and are subject to the portfolio’s regulatory and contractual borrowing restrictions. The participating funds are charged administrative fees and an annual commitment fee of 0.06% of the undrawn amount of the facility; these fees are allocated to the funds based on a method approved by the portfolio’s board of trustees and included in Management and Administrative expenses on the portfolio’s Statement of Operations. Any borrowings under this facility bear interest at a rate equal to the higher of the federal funds rate or LIBOR reference rate plus an agreed-upon spread.
The portfolio had no borrowings outstanding at December 31, 2015, or at any time during the period then ended.
7. Other: Dividend income is recorded on the ex-dividend date. Interest income includes income distributions received from Vanguard Market Liquidity Fund and is accrued daily. Premiums and discounts on debt securities purchased are amortized and accreted, respectively, to interest income over the lives of the respective securities. Security transactions are accounted for on the date securities are bought or sold. Costs used to determine realized gains (losses) on the sale of investment securities are those of the specific securities sold.
B. In accordance with the terms of a Funds’ Service Agreement (the “FSA”) between Vanguard and the portfolio, Vanguard furnishes to the portfolio investment advisory, corporate management, administrative, marketing, and distribution services at Vanguard’s cost of operations (as defined by the FSA). These costs of operations are allocated to the portfolio based on methods and guidelines approved by the board of trustees. Vanguard does not require reimbursement in the current period for certain costs of operations (such as deferred compensation/benefits and risk/insurance costs); the portfolio’s liability for these costs of operations is included in Payables to Vanguard on the Statement of Net Assets.
Upon the request of Vanguard, the portfolio may invest up to 0.40% of its net assets as capital in Vanguard. At December 31, 2015, the portfolio had contributed to Vanguard capital in the amount of $352,000, representing 0.01% of the portfolio’s net assets and 0.14% of Vanguard’s capitalization. The portfolio’s trustees and officers are also directors and employees, respectively, of Vanguard.
C. Various inputs may be used to determine the value of the portfolio’s investments. These inputs are summarized in three broad levels for financial statement purposes. The inputs or methodologies used to value securities are not necessarily an indication of the risk associated with investing in those securities.
Level 1—Quoted prices in active markets for identical securities.
Level 2—Other significant observable inputs (including quoted prices for similar securities, interest rates, prepayment speeds, credit risk, etc.).
Level 3—Significant unobservable inputs (including the portfolio’s own assumptions used to determine the fair value of investments).
The following table summarizes the market value of the portfolio’s investments as of December 31, 2015, based on the inputs used to value them:
| | | |
| Level 1 | Level 2 | Level 3 |
| Investments | ($000) | ($000) | ($000) |
| Common Stocks | 3,979,755 | — | — |
| Temporary Cash Investments | 1,615 | 999 | — |
| Futures Contracts—Liabilities1 | (40) | — | — |
| Total | 3,981,330 | 999 | — |
| 1 Represents variation margin on the last day of the reporting period. | | | |
315
Vanguard Equity Index Portfolio
D. At December 31, 2015, the aggregate settlement value of open futures contracts and the related unrealized appreciation (depreciation) were:
| | | | |
| | | | ($000) |
| Aggregate |
| Number of | Settlement | Unrealized |
| Long (Short) | Value | Appreciation |
| Futures Contracts | Expiration | Contracts | Long (Short) | (Depreciation) |
| E-mini S&P 500 Index | March 2016 | 42 | 4,274 | 12 |
Unrealized appreciation (depreciation) on open futures contracts is required to be treated as realized gain (loss) for tax purposes.
E. Distributions are determined on a tax basis and may differ from net investment income and realized capital gains for financial reporting purposes. Differences may be permanent or temporary. Permanent differences are reclassified among capital accounts in the financial statements to reflect their tax character. Temporary differences arise when certain items of income, expense, gain, or loss are recognized in different periods for financial statement and tax purposes. These differences will reverse at some time in the future. Differences in classification may also result from the treatment of short-term gains as ordinary income for tax purposes.
For tax purposes, at December 31, 2015, the portfolio had $91,075,000 of ordinary income and $73,711,000 of long-term capital gains available for distribution.
At December 31, 2015, the cost of investment securities for tax purposes was $3,082,449,000. Net unrealized appreciation of investment securities for tax purposes was $899,920,000, consisting of unrealized gains of $1,147,303,000 on securities that had risen in value since their purchase and $247,383,000 in unrealized losses on securities that had fallen in value since their purchase.
F. During the year ended December 31, 2015, the portfolio purchased $395,028,000 of investment securities and sold $149,640,000 of investment securities, other than temporary cash investments.
G. Capital shares issued and redeemed were:
| | |
| Year Ended December 31, |
| 2015 | 2014 |
| Shares | Shares |
| (000) | (000) |
| Issued | 18,193 | 18,705 |
| Issued in Lieu of Cash Distributions | 5,441 | 3,807 |
| Redeemed | (13,658) | (14,225) |
| Net Increase (Decrease) in Shares Outstanding | 9,976 | 8,287 |
At December 31, 2015, two shareholders (an insurance company separate account whose holdings in the portfolio represent the indirect investment of Vanguard Variable Annunity contract holders and Vanguard Total Stock Market Index Portfolio), were each the record or beneficial owner of 30% or more of the portfolio’s net assets, with a combined ownership of 71%. If one of these shareholders were to redeem its investment in the portfolio, the redemption might result in an increase in the portfolio’s expense ratio or cause the portfolio to incur higher transaction costs.
H. Management has determined that no material events or transactions occurred subsequent to December 31, 2015, that would require recognition or disclosure in these financial statements.
316
Vanguard Equity Index Portfolio
Report of Independent Registered Public Accounting Firm
To the Board of Trustees of Vanguard Variable Insurance Funds and the Shareholders of Equity Index Portfolio: In our opinion, the accompanying statement of net assets and the related statements of operations and of changes in net assets and the financial highlights present fairly, in all material respects, the financial position of Equity Index Portfolio (constituting a separate portfolio of Vanguard Variable Insurance Funds, hereafter referred to as the “Portfolio”) at December 31, 2015, the results of its operations for the year then ended, the changes in its net assets for each of the two years in the period then ended, and the financial highlights for each of the five years in the period then ended, in conformity with accounting principles generally accepted in the United States of America. These financial statements and financial highlights (hereafter referred to as “financial statements”) are the responsibility of the Portfolio’s management. Our responsibility is to express an opinion on these financial statements based on our audits. We conducted our audits of these financial statements in accordance with the standards of the Public Company Accounting Oversight Board (United States). Those standards require that we plan and perform the audit to obtain reasonable assurance about whether the financial statements are free of material misstatement. An audit includes examining, on a test basis, evidence supporting the amounts and disclosures in the financial statements, assessing the accounting principles used and significant estimates made by management, and evaluating the overall financial statement presentation. We believe that our audits, which included confirmation of securities at December 31, 2015 by correspondence with the custodian and brokers, by agreement to the underlying ownership records of the transfer agent and the application of alternative auditing procedures where securities purchased had not been received, provide a reasonable basis for our opinion.
/s/PricewaterhouseCoopers LLP
Philadelphia, Pennsylvania
February 11, 2016
| |
| |
| Special 2015 tax information (unaudited) for corporate shareholders only for Vanguard Equity |
| Index Portfolio, a portfolio of Vanguard Variable Insurance Funds |
| |
| This information for the fiscal year ended December 31, 2015, is included pursuant to provisions |
| of the Internal Revenue Code for corporate shareholders only. |
| |
| The portfolio distributed $113,811,000 as capital gain dividends (20% rate gain distributions) to |
| shareholders during the fiscal year. |
| |
| For corporate shareholders, 84.3% of investment income (dividend income plus short-term gains, |
| if any) qualifies for the dividends-received deduction. |
317
Vanguard Equity Index Portfolio
About Your Portfolio’s Expenses
As a shareholder of the portfolio, you incur ongoing costs, which include costs for portfolio management, administrative services, and shareholder reports (like this one), among others. Operating expenses, which are deducted from a portfolio’s gross income, directly reduce the investment return of the portfolio.
A portfolio’s expenses are expressed as a percentage of its average net assets. This figure is known as the expense ratio. The following examples are intended to help you understand the ongoing costs (in dollars) of investing in your portfolio and to compare these costs with those of other mutual funds. The examples are based on an investment of $1,000 made at the beginning of the period shown and held for the entire period.
The accompanying table illustrates your portfolio’s costs in two ways:
• Based on actual portfolio return. This section helps you to estimate the actual expenses that you paid over the period. The “Ending Account Value” shown is derived from the portfolio’s actual return, and the third column shows the dollar amount that would have been paid by an investor who started with $1,000 in the portfolio. You may use the information here, together with the amount you invested, to estimate the expenses that you paid over the period.
To do so, simply divide your account value by $1,000 (for example, an $8,600 account value divided by $1,000 = 8.6), then multiply the result by the number given for your portfolio under the heading “Expenses Paid During Period.”
• Based on hypothetical 5% yearly return. This section is intended to help you compare your portfolio’s costs with those of other mutual funds. It assumes that the portfolio had a yearly return of 5% before expenses, but that the expense ratio is unchanged. In this case—because the return used is not the portfolio’s actual return—the results do not apply to your investment. The example is useful in making comparisons because the Securities and Exchange Commission requires all mutual funds to calculate expenses based on a 5% return. You can assess your portfolio’s costs by comparing this hypothetical example with the hypothetical examples that appear in shareholder reports of other funds.
Note that the expenses shown in the table are meant to highlight and help you compare ongoing costs only and do not reflect transaction costs incurred by the portfolio for buying and selling securities. The portfolio’s expense ratio does not reflect additional fees and expenses associated with the annuity or life insurance program through which you invest.
The calculations assume no shares were bought or sold during the period. Your actual costs may have been higher or lower, depending on the amount of your investment and the timing of any purchases or redemptions.
You can find more information about the portfolio’s expenses in the Financial Statements section. For additional information on operating expenses and other shareholder costs, please refer to the prospectus.
| | | |
| Six Months Ended December 31, 2015 | | | |
| Beginning | Ending | Expenses |
| Account Value | Account Value | Paid During |
| Equity Index Portfolio | 6/30/2015 | 12/31/2015 | Period1 |
| Based on Actual Portfolio Return | $1,000.00 | $1,000.90 | $0.81 |
| Based on Hypothetical 5% Yearly Return | 1,000.00 | 1,024.40 | 0.82 |
1 The calculations are based on expenses incurred in the most recent six-month period. The portfolio’s annualized six-month expense ratio for that period is 0.16%. The dollar amounts shown as “Expenses Paid” are equal to the annualized expense ratio multiplied by the average account value over the period, multiplied by the number of days in the most recent six-month period, then divided by the number of days in the most recent 12-month period (184/365).
318
This page intentionally left blank.
319
This page intentionally left blank.
320
The People Who Govern Your Fund
The trustees of your mutual fund are there to see that the fund is operated and managed in your best interests since, as a shareholder, you are a part owner of the fund. Your fund’s trustees also serve on the board of directors of The Vanguard Group, Inc., which is owned by the Vanguard funds and provides services to them on an at-cost basis.
A majority of Vanguard’s board members are independent, meaning that they have no affiliation with Vanguard or the funds they oversee, apart from the sizable personal investments they have made as private individuals. The
independent board members have distinguished backgrounds in business, academia, and public service. Each of the trustees and executive officers oversees 194 Vanguard funds.
The following table provides information for each trustee and executive officer of the fund. More information about the trustees is in the Statement of Additional Information, which can be obtained, without charge, by contacting Vanguard at 800-662-7447, or online at vanguard.com.
|
| InterestedTrustee1 |
| |
| F. William McNabb III |
| Born 1957. Trustee Since July 2009. Chairman of |
| the Board. Principal Occupation(s) During the Past |
| Five Years and Other Experience: Chairman of the |
| Board of The Vanguard Group, Inc., and of each of |
| the investment companies served by The Vanguard |
| Group, since January 2010; Director of The Vanguard |
| Group since 2008; Chief Executive Officer and |
| President of The Vanguard Group, and of each of |
| the investment companies served by The Vanguard |
| Group, since 2008; Director of Vanguard Marketing |
| Corporation; Managing Director of The Vanguard |
| Group (1995–2008). |
| |
| IndependentTrustees |
| |
| Emerson U. Fullwood |
| Born 1948. Trustee Since January 2008. Principal |
| Occupation(s) During the Past Five Years and |
| Other Experience: Executive Chief Staff and |
| Marketing Officer for North America and Corporate |
| Vice President (retired 2008) of Xerox Corporation |
| (document management products and services); |
| Executive in Residence and 2009–2010 Distinguished |
| Minett Professor at the Rochester Institute of |
| Technology; Director of SPX Corporation (multi-industry |
| manufacturing), the United Way of Rochester, the |
| University of Rochester Medical Center, Monroe |
| Community College Foundation, and North Carolina |
| A&T University. |
| |
| Rajiv L. Gupta |
| Born 1945. Trustee Since December 2001.2 Principal |
| Occupation(s) During the Past Five Years and Other |
| Experience: Chairman and Chief Executive Officer |
| (retired 2009) and President (2006–2008) of |
| Rohm and Haas Co. (chemicals); Director of Tyco |
| International PLC (diversified manufacturing and |
| services), Hewlett-Packard Co. (electronic computer |
| manufacturing), and Delphi Automotive PLC |
| (automotive components); Senior Advisor at New |
| Mountain Capital. |
| |
| Amy Gutmann |
| Born 1949. Trustee Since June 2006. Principal |
| Occupation(s) During the Past Five Years and |
| Other Experience: President of the University of |
| Pennsylvania; Christopher H. Browne Distinguished |
| Professor of Political Science, School of Arts and |
| Sciences, and Professor of Communication, Annenberg |
| School for Communication, with secondary faculty |
| appointments in the Department of Philosophy, School |
| of Arts and Sciences, and at the Graduate School of |
| Education, University of Pennsylvania; Trustee of the |
| National Constitution Center; Chair of the Presidential |
| Commission for the Study of Bioethical Issues. |
| |
| JoAnn Heffernan Heisen |
| Born 1950. Trustee Since July 1998. Principal |
| Occupation(s) During the Past Five Years and |
| Other Experience: Corporate Vice President and |
| Chief Global Diversity Officer (retired 2008) and |
| Member of the Executive Committee (1997–2008) |
| of Johnson & Johnson (pharmaceuticals/medical |
| devices/consumer products); Director of Skytop |
| Lodge Corporation (hotels) and the Robert Wood |
| Johnson Foundation; Member of the Advisory |
| Board of the Institute for Women’s Leadership |
| at Rutgers University. |
| |
| F. Joseph Loughrey |
| Born 1949. Trustee Since October 2009. Principal |
| Occupation(s) During the Past Five Years and Other |
| Experience: President and Chief Operating Officer |
| (retired 2009) of Cummins Inc. (industrial machinery); |
| Chairman of the Board of Hillenbrand, Inc. (specialized |
| consumer services), and of Oxfam America; Director |
| of SKF AB (industrial machinery), Hyster-Yale Materials |
| Handling, Inc. (forklift trucks), the Lumina Foundation |
| for Education, and the V Foundation for Cancer |
| Research; Member of the Advisory Council for the |
| College of Arts and Letters and of the Advisory Board |
| to the Kellogg Institute for International Studies, both |
| at the University of Notre Dame. |
| |
| Mark Loughridge |
| Born 1953. Trustee Since March 2012. Principal |
| Occupation(s) During the Past Five Years and Other |
| Experience: Senior Vice President and Chief Financial |
| Officer (retired 2013) at IBM (information technology |
| services); Fiduciary Member of IBM’s Retirement Plan |
| Committee (2004–2013); Director of the Dow Chemical |
| Company; Member of the Council on Chicago Booth. |
| |
| Scott C. Malpass |
| Born 1962. Trustee Since March 2012. Principal |
| Occupation(s) During the Past Five Years and Other |
| Experience: Chief Investment Officer and Vice |
| President at the University of Notre Dame; Assistant |
| Professor of Finance at the Mendoza College of |
| Business at Notre Dame; Member of the Notre Dame |
| 403(b) Investment Committee; Board Member of |
| TIFF Advisory Services, Inc., and Catholic Investment |
| Services, Inc. (investment advisors); Member of |
| the Investment Advisory Committee of Major |
| League Baseball. |
| |
| André F. Perold |
| Born 1952. Trustee Since December 2004. Principal |
| Occupation(s) During the Past Five Years and Other |
| Experience: George Gund Professor of Finance and |
| Banking, Emeritus at the Harvard Business School |
| (retired 2011); Chief Investment Officer and Managing |
| Partner of HighVista Strategies LLC (private investment |
| firm); Director of Rand Merchant Bank; Overseer of |
| the Museum of Fine Arts Boston. |
| |
| Peter F. Volanakis |
| Born 1955. Trustee Since July 2009. Principal |
| Occupation(s) During the Past Five Years and Other |
| Experience: President and Chief Operating Officer |
| (retired 2010) of Corning Incorporated (communications |
| equipment); Trustee of Colby-Sawyer College; |
| Member of the Advisory Board of the Norris Cotton |
| Cancer Center and of the Advisory Board of the |
| Parthenon Group (strategy consulting). |
| |
| Executive Officers |
| |
| Glenn Booraem |
| Born 1967. Treasurer Since May 2015. Principal |
| Occupation(s) During the Past Five Years and |
| Other Experience: Principal of The Vanguard Group, |
| Inc.; Treasurer of each of the investment companies |
| served by The Vanguard Group; Controller of each of |
| the investment companies served by The Vanguard |
| Group (2010–2015); Assistant Controller of each of |
| the investment companies served by The Vanguard |
| Group (2001–2010). |
| |
| Thomas J. Higgins |
| Born 1957. Chief Financial Officer Since September |
| 2008. Principal Occupation(s) During the Past Five |
| Years and Other Experience: Principal of The Vanguard |
| Group, Inc.; Chief Financial Officer of each of the |
| investment companies served by The Vanguard Group; |
| Treasurer of each of the investment companies served |
| by The Vanguard Group (1998–2008). |
| |
| Peter Mahoney |
| Born 1974. Controller Since May 2015. Principal |
| Occupation(s) During the Past Five Years and |
| Other Experience: Head of Global Fund Accounting |
| at The Vanguard Group, Inc.; Controller of each of the |
| investment companies served by The Vanguard Group; |
| Head of International Fund Services at The Vanguard |
| Group (2008–2014). |
| |
| Heidi Stam |
| Born 1956. Secretary Since July 2005. Principal |
| Occupation(s) During the Past Five Years and Other |
| Experience: Managing Director of The Vanguard |
| Group, Inc.; General Counsel of The Vanguard Group; |
| Secretary of The Vanguard Group and of each of the |
| investment companies served by The Vanguard Group; |
| Director and Senior Vice President of Vanguard |
| Marketing Corporation. |
| |
| Vanguard Senior ManagementTeam |
| |
| Mortimer J. Buckley | Chris D. McIsaac |
| Kathleen C. Gubanich | James M. Norris |
| Paul A. Heller | Thomas M. Rampulla |
| Martha G. King | Glenn W. Reed |
| John T. Marcante | Karin A. Risi |
| |
| Chairman Emeritus and Senior Advisor |
| John J. Brennan | |
| Chairman, 1996–2009 | |
| Chief Executive Officer and President, 1996–2008 |
| |
| Founder | |
| John C. Bogle | |
| Chairman and Chief Executive Officer, 1974–1996 |
1 Mr. McNabb is considered an “interested person,” as defined in the Investment Company Act of 1940, because he is an officer of the Vanguard funds.
2 December 2002 for Vanguard Equity Income Fund, the Vanguard Municipal Bond Funds, and the Vanguard State Tax-Exempt Funds.
|  |
| P.O. Box 2600 |
| Valley Forge, PA 19482-2600 |
Connect with Vanguard® > vanguard.com
|
| Fund Information > 800-662-7447 |
| |
| Annuity and Insurance Services > 800-522-5555 |
| |
| Institutional Investor Services > 800-523-1036 |
| |
| Text Telephone for People |
| Who Are Deaf or Hard of Hearing > 800-749-7273 |
| |
| |
| This material may be used in conjunction |
| with the offering of shares of any Vanguard |
| fund only if preceded or accompanied by |
| the fund’s current prospectus. |
| |
| You can obtain a free copy of Vanguard’s proxy voting |
| guidelines by visiting vanguard.com/proxyreporting or |
| by calling Vanguard at 800-662-2739. The guidelines |
| are also available from the SEC’s website, sec.gov. |
| In addition, you may obtain a free report on how your |
| fund voted the proxies for securities it owned during |
| the 12 months ended June 30. To get the report, visit |
| either vanguard.com/proxyreporting or sec.gov. |
| |
| All comparative mutual fund data are from Lipper, a | CFA® is a trademark owned by CFA Institute. |
| Thomson Reuters Company, or Morningstar, Inc., unless | |
| otherwise noted. | The S&P 500 Index is a product of S&P Dow Jones |
| | Indices LLC (“SPDJI”), and has been licensed for |
| You can review and copy information about your portfolio | use by Vanguard. Standard & Poor’s® and S&P® |
| at the SEC’s Public Reference Room in Washington, D.C. | are registered trademarks of Standard & Poor’s |
| To find out more about this public service, call the SEC | Financial Services LLC (“S&P”); Dow Jones® is |
| at 202-551-8090. Information about your portfolio is also | a registered trademark of Dow Jones Trademark |
| available on the SEC’s website, and you can receive copies | Holdings LLC (“Dow Jones”); S&P® and S&P 500® |
| of this information, for a fee, by sending a request in either | are trademarks of S&P; and these trademarks have |
| of two ways: via e-mail addressed to publicinfo@sec.gov | been licensed for use by SPDJI and sublicensed for |
| or via regular mail addressed to the Public Reference | certain purposes by Vanguard. Vanguard’s product(s) |
| Section, Securities and Exchange Commission, | are not sponsored, endorsed, sold or promoted by |
| Washington, DC 20549-1520. | SPDJI, Dow Jones, S&P, or their respective affiliates |
| | and none of such parties make any representation |
| The funds or securities referred to herein that are | regarding the advisability of investing in such |
| offered by The Vanguard Group and track an MSCI | product(s) nor do they have any liability for any |
| index are not sponsored, endorsed, or promoted by | errors, omissions, or interruptions of the |
| MSCI, and MSCI bears no liability with respect to any | S&P 500 Index. |
| such funds or securities. For such funds or securities, | |
| the prospectus or the Statement of Additional | |
| Information contains a more detailed description | © 2016 The Vanguard Group, Inc. |
| | All rights reserved. |
| of the limited relationship MSCI has with The | Vanguard Marketing Corporation, Distributor. |
| Vanguard Group. | |
| | Q690 022016 |
Item 2: Code of Ethics. The Registrant has adopted a code of ethics that applies to the Registrant’s principal executive officer, principal financial officer, principal accounting officer or controller or persons performing similar functions. The Code of Ethics was amended during the reporting period covered by this report to make certain technical, non-material changes.
Item 3: Audit Committee Financial Expert. The following members of the Audit Committee have been determined by the Registrant’s Board of Trustees to be Audit Committee Financial Experts serving on its Audit Committee, and to be independent: Rajiv L. Gupta, Amy Gutmann, JoAnn Heffernan Heisen, F. Joseph Loughrey, Mark Loughridge, Scott C. Malpass, and André F. Perold.
Item 4: Principal Accountant Fees and Services.
(a) Audit Fees.
Audit Fees of the Registrant
Fiscal Year Ended December 31, 2015: $539,000 Fiscal Year Ended December 31, 2014: $578,000
Aggregate Audit Fees of Registered Investment Companies in the Vanguard Group.
Fiscal Year Ended December 31, 2015: $7,000,200
Fiscal Year Ended December 31, 2014: $6,605,127
Includes fees billed in connection with audits of the Registrant, other registered investment companies in the Vanguard complex, The Vanguard Group, Inc. and Vanguard Marketing Corporation.
(b) Audit-Related Fees.
Fiscal Year Ended December 31, 2015: $2,899,096
Fiscal Year Ended December 31, 2014: $2,176,479
Includes fees billed in connection with assurance and related services provided to the Registrant, other registered investment companies in the Vanguard complex, The Vanguard Group, Inc., and Vanguard Marketing Corporation.
(c) Tax Fees.
Fiscal Year Ended December 31, 2015: $353,389
Fiscal Year Ended December 31, 2014: $316,869
Includes fees billed in connection with tax compliance, planning, and advice services provided to the Registrant, other registered investment companies in the Vanguard complex, The Vanguard Group, Inc., and Vanguard Marketing Corporation.
(d) All Other Fees.
Fiscal Year Ended December 31, 2015: $202,313
Fiscal Year Ended December 31, 2014: $198,163
Includes fees billed for services related to tax reported information provided to the Registrant, other registered investment companies in the Vanguard complex, The Vanguard Group, Inc., and Vanguard Marketing Corporation.
(e) (1) Pre-Approval Policies. The policy of the Registrant’s Audit Committee is to consider and, if appropriate, approve before the principal accountant is engaged for such services, all specific audit and non-audit services provided to: the Registrant, other registered investment companies in the Vanguard complex, The Vanguard Group, Inc., and entities controlled by The Vanguard Group, Inc. that provide ongoing services to the Registrant. In making a determination, the Audit Committee considers whether the services are consistent with maintaining the principal accountant’s independence.
In the event of a contingency situation in which the principal accountant is needed to provide services in between scheduled Audit Committee meetings, the Chairman of the Audit Committee would be called on to consider and, if appropriate, pre-approve audit or permitted non-audit services in an amount sufficient to complete services through the next Audit Committee meeting, and to determine if such services would be consistent with maintaining the accountant’s independence. At the next scheduled Audit Committee meeting, services and fees would be presented to the Audit Committee for formal consideration, and, if appropriate, approval by the entire Audit Committee. The Audit Committee would again consider whether such services and fees are consistent with maintaining the principal accountant’s independence.
The Registrant’s Audit Committee is informed at least annually of all audit and non-audit services provided by the principal accountant to the Vanguard complex, whether such services are provided to: the Registrant, other registered investment companies in the Vanguard complex, The Vanguard Group, Inc., or other entities controlled by The Vanguard Group, Inc. that provide ongoing services to the Registrant.
(2) No percentage of the principal accountant’s fees or services were approved pursuant to the waiver provision of paragraph (c)(7)(i)(C) of Rule 2-01 of Regulation S-X.
(f) For the most recent fiscal year, over 50% of the hours worked under the principal accountant’s engagement were not performed by persons other than full-time, permanent employees of the principal accountant.
(g) Aggregate Non-Audit Fees.
Fiscal Year Ended December 31, 2015: $555,702
Fiscal Year Ended December 31, 2014: $515,032
Includes fees billed for non-audit services provided to the Registrant, other registered investment companies in the Vanguard complex, The Vanguard Group, Inc., and Vanguard Marketing Corporation.
(h) For the most recent fiscal year, the Audit Committee has determined that the provision of all non-audit services was consistent with maintaining the principal accountant’s independence.
Item 5: Audit Committee of Listed Registrants.
Not Applicable.
Item 6: Investments.
Not Applicable.
Item 7: Disclosure of Proxy Voting Policies and Procedures for Closed-End Management Investment Companies.
Not Applicable.
Item 8: Portfolio Managers of Closed-End Management Investment Companies.
Not Applicable.
Item 9: Purchase of Equity Securities by Closed-End Management Investment Company and Affiliated Purchasers.
Not Applicable.
Item 10: Submission of Matters to a Vote of Security Holders.
Not Applicable.
Item 11: Controls and Procedures.
(a) Disclosure Controls and Procedures. The Principal Executive and Financial Officers concluded that the Registrant’s Disclosure Controls and Procedures are effective based on their evaluation of the Disclosure Controls and Procedures as of a date within 90 days of the filing date of this report.
(b) Internal Control Over Financial Reporting. There were no significant changes in Registrant’s Internal Control Over Financial Reporting or in other factors that could significantly affect this control subsequent to the date of the evaluation, including any corrective actions with regard to significant deficiencies and material weaknesses.
Item 12: Exhibits.
(a) Code of Ethics. (b) Certifications.
Pursuant to the requirements of the Securities Exchange Act of 1934 and the Investment Company Act of 1940, the registrant has duly caused this report to be signed on its behalf by the undersigned, thereunto duly authorized.
| |
| | VANGUARD VARIABLE INSURANCE FUNDS |
| |
| |
| BY: | /s/ F. WILLIAM MCNABB III* |
| | F. WILLIAM MCNABB III |
| | CHIEF EXECUTIVE OFFICER |
| |
| Date: | February 18, 2016 |
Pursuant to the requirements of the Securities Exchange Act of 1934 and the Investment Company Act of 1940, this report has been signed below by the following persons on behalf of the registrant and in the capacities and on the dates indicated.
| |
| | VANGUARD VARIABLE INSURANCE FUNDS |
| |
| |
| BY: | /s/ F. WILLIAM MCNABB III* |
| | F. WILLIAM MCNABB III |
| | CHIEF EXECUTIVE OFFICER |
| |
| Date: | February 18, 2016 |
| |
| | VANGUARD VARIABLE INSURANCE FUNDS |
| |
| |
| BY: | /s/ THOMAS J. HIGGINS* |
| | THOMAS J. HIGGINS |
| | CHIEF FINANCIAL OFFICER |
| |
| Date: | February 18, 2016 |
* By: /s/ Heidi Stam
Heidi Stam, pursuant to a Power of Attorney filed on April 22, 2014 see file Number 2-17620, Incorporated by Reference.