UNITED STATES
SECURITIES AND EXCHANGE COMMISSION
Washington, D.C. 20549
FORM N-CSR
CERTIFIED SHAREHOLDER REPORT OF REGISTERED
MANAGEMENT INVESTMENT COMPANIES
Investment Company Act file number811- 5968
John Hancock Municipal Securities Trust
(Exact name of registrant as specified in charter)
200 Berkeley Street, Boston, Massachusetts 02116
(Address of principal executive offices) (Zip code)
Salvatore Schiavone
Treasurer
200 Berkeley Street
Boston, Massachusetts 02116
(Name and address of agent for service)
Registrant's telephone number, including area code:617-663-4497
| Date of fiscal year end: | | May 31 |
| | | |
| Date of reporting period: | | November 30, 2019 |
ITEM 1. REPORTS TO STOCKHOLDERS.
John Hancock
High Yield Municipal Bond Fund
Semiannual report 11/30/19
Beginning on January 1, 2021, as permitted by regulations adopted by the Securities and Exchange Commission, paper copies of the fund's shareholder reports like this one will no longer be sent by mail, unless you specifically request paper copies of the reports from the fund or from your financial intermediary. Instead, the reports will be made available on a website, and you will be notified by mail each time a report is posted and provided with a website link to access the report.
If you already elected to receive shareholder reports electronically, you will not be affected by this change, and you do not need to take any action. You may elect to receive shareholder reports and other communications electronically by calling John Hancock Investment Management at 800-225-5291 (Class A, Class B and Class C shares) or 888-972-8696 (Class I and Class R6 shares) or by contacting your financial intermediary.
You may elect to receive all reports in paper, free of charge, at any time. You can inform John Hancock Investment Management or your financial intermediary that you wish to continue receiving paper copies of your shareholder reports by following the instructions listed above. Your election to receive reports in paper will apply to all funds held with John Hancock Investment Management or your financial intermediary.

A message to shareholders
Dear shareholder,
It was a volatile time for bond investors during the six months ended November 30, 2019, although most market segments delivered attractive absolute returns for the period. Uncertainty surrounding trade with China, the impeachment inquiry against President Trump, and the broader health of the global economy led to some dramatic swings in performance. The trend in longer-term yields was decidedly downward, leading to several periods where the U.S. Treasury yield curve was inverted. Three times in 2019—in July, September, and October—the U.S. Federal Reserve stepped in with reductions in short-term interest rates in an attempt to shore up the economy.
While the economic fundamentals in the United States appear fairly solid—with a strong labor market, low inflation and interest rates, and a confident consumer base—the outlook for the global economy is less certain. Subsequent to period end, President Trump was impeached by the House of Representatives; it remains to be seen how the Senate and financial markets will react. We feel confident in saying there are sure to be patches of market turbulence in the months ahead. As always, your best resource in unpredictable markets is your financial advisor, who can help position your portfolio so that it's sufficiently diversified to meet your long-term objectives and to withstand the inevitable bouts of market volatility along the way.
On behalf of everyone at John Hancock Investment Management, I'd like to take this opportunity to welcome new shareholders and thank existing shareholders for the continued trust you've placed in us.
Sincerely,
Andrew G. Arnott
President and CEO,
John Hancock Investment Management
Head of Wealth and Asset Management,
United States and Europe
This commentary reflects the CEO's views as of this report's period end and are subject to change at any time. Diversification does not guarantee investment returns and does not eliminate risk of loss. All investments entail risks, including the possible loss of principal. For more up-to-date information, you can visit our website at jhinvestments.com.
John Hancock
High Yield Municipal Bond Fund
Table of contents
| | | |
| 2 | | Your fund at a glance |
| 3 | | Portfolio summary |
| 5 | | A look at performance |
| 7 | | Your expenses |
| 9 | | Fund's investments |
| 18 | | Financial statements |
| 21 | | Financial highlights |
| 26 | | Notes to financial statements |
| 33 | | Continuation of investment advisory and subadvisory agreements |
| 40 | | More information |
SEMIANNUAL REPORT | JOHN HANCOCK HIGH YIELD MUNICIPAL BOND FUND 1
INVESTMENT OBJECTIVE
The fund seeks a high level of current income that is largely exempt from federal income tax, consistent with the preservation of capital.
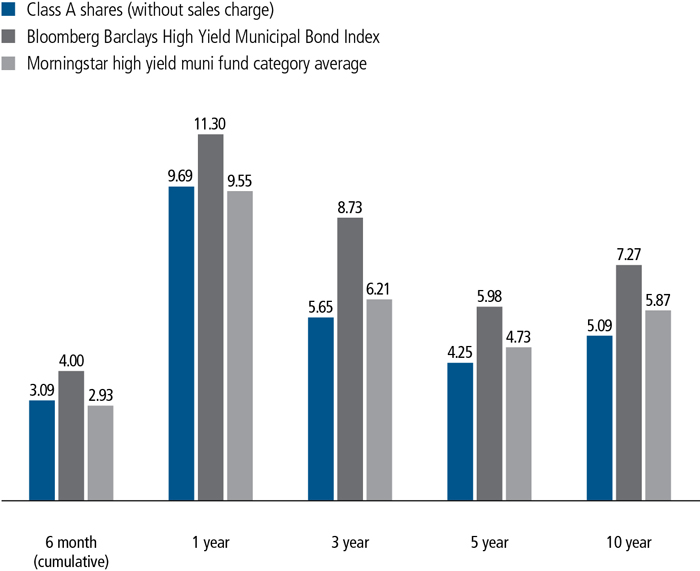
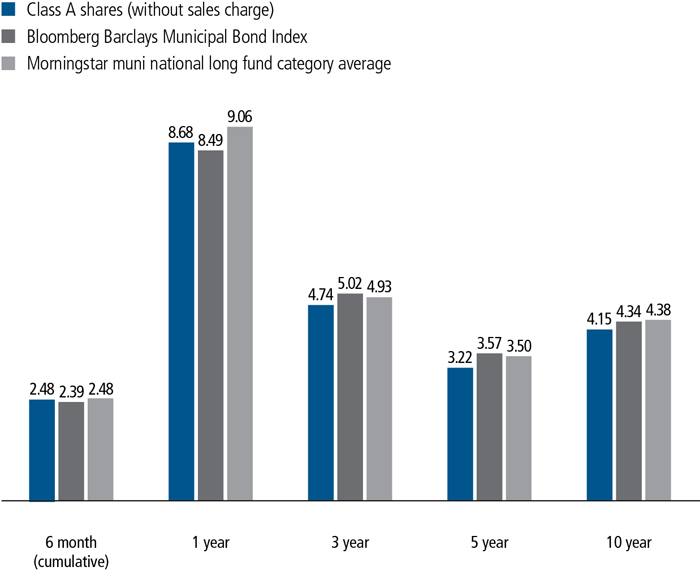
AVERAGE ANNUAL TOTAL RETURNS AS OF 11/30/19 (%)
The Bloomberg Barclays High Yield Municipal Bond Index is an unmanaged index of municipal bonds that are non-investment grade, unrated, or below BBB/Baa, according to S&P and Moody's, respectively.
It is not possible to invest directly in an index. Index figures do not reflect expenses or sales charges, which would result in lower returns.
Figures from Morningstar, Inc. include reinvested distributions and do not take into account sales charges. Actual load-adjusted performance is lower.
The past performance shown here reflects reinvested distributions and the beneficial effect of any expense reductions, and does not guarantee future results. Returns for periods shorter than one year are cumulative. Performance of the other share classes will vary based on the difference in the fees and expenses of those classes. Shares will fluctuate in value and, when redeemed, may be worth more or less than their original cost. Current month-end performance may be lower or higher than the performance cited, and can be found at jhinvestments.com or by calling 800-225-5291. For further information on the fund's objectives, risks, and strategy, see the fund's prospectus.
SEMIANNUAL REPORT | JOHN HANCOCK HIGH YIELD MUNICIPAL BOND FUND 2
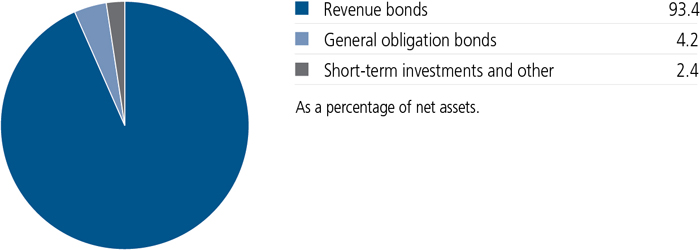
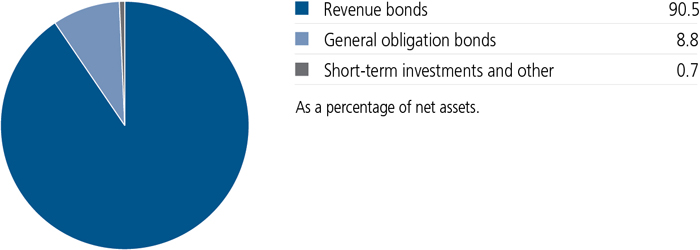
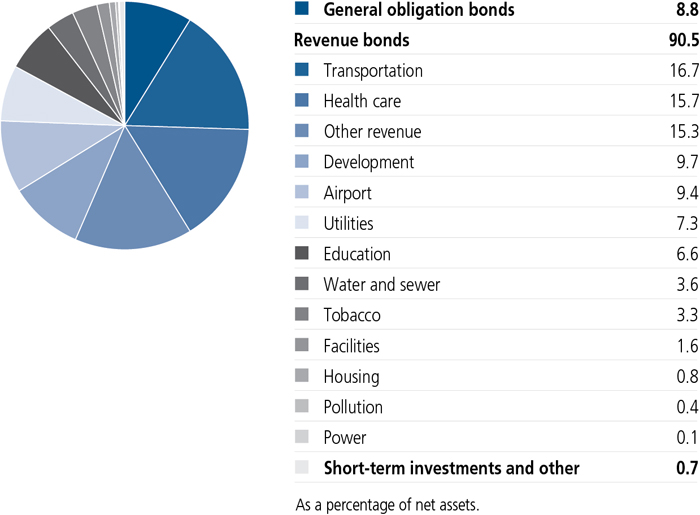
PORTFOLIO COMPOSITION AS OF 11/30/19 (%)
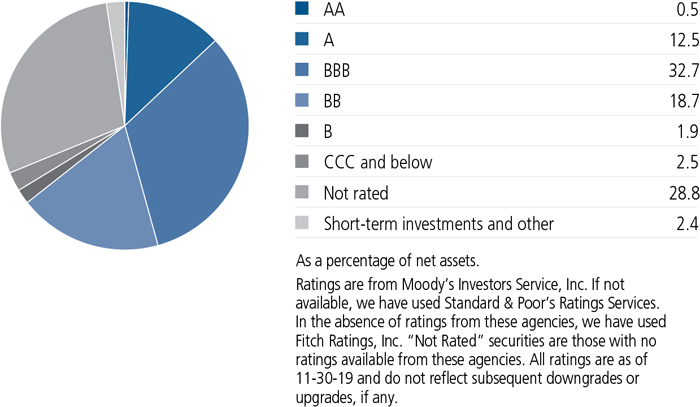
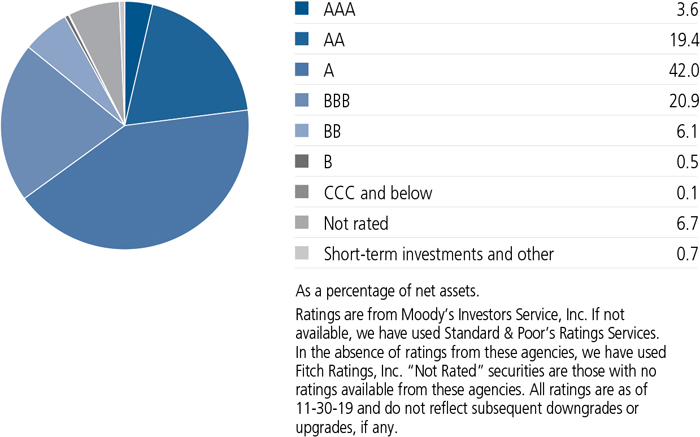
QUALITY COMPOSITION AS OF 11/30/19 (%)
A note about risks
The fund is subject to various risks as described in the fund's prospectus. For more information, please refer to the "Principal risks" section of the prospectus.
SEMIANNUAL REPORT | JOHN HANCOCK HIGH YIELD MUNICIPAL BOND FUND 3
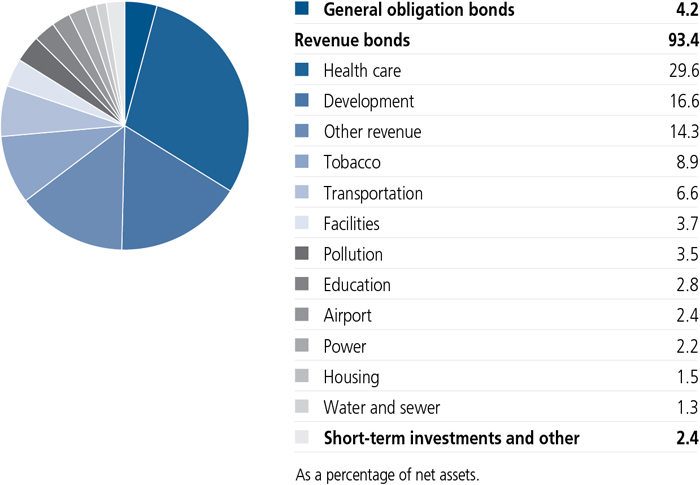
SECTOR COMPOSITION AS OF 11/30/19 (%)
SEMIANNUAL REPORT | JOHN HANCOCK HIGH YIELD MUNICIPAL BOND FUND 4
TOTAL RETURNS FOR THE PERIOD ENDED NOVEMBER 30, 2019
| | | | | | | | | | | | | | |
Average annual
total returns (%)
with maximum sales charge | | Cumulative
total returns (%)
with maximum sales charge | | SEC
30-day
yield (%)
subsidized | | SEC
30-day
yield (%)
unsubsidized1 | | Tax-
equivalent
subsidized
yield (%)2 |
| | 1-year | 5-year | 10-year | | 6-month | 5-year | 10-year | | as of
11-30-19 | | as of
11-30-19 | | as of
11-30-19 |
| Class A | 5.33 | 3.41 | 4.66 | | -1.09 | 18.25 | 57.64 | | 2.14 | | 2.02 | | 3.61 |
| Class B | 3.88 | 3.12 | 4.46 | | -2.30 | 16.62 | 54.75 | | 1.49 | | 1.37 | | 2.52 |
| Class C | 7.88 | 3.47 | 4.31 | | 1.70 | 18.59 | 52.47 | | 1.49 | | 1.37 | | 2.52 |
| Class I3,4 | 9.85 | 4.36 | 5.15 | | 3.16 | 23.76 | 65.17 | | 2.38 | | 2.36 | | 4.02 |
| Class R63,4 | 9.88 | 4.33 | 5.13 | | 3.05 | 23.61 | 64.96 | | 2.41 | | 2.39 | | 4.07 |
| Index 1† | 11.30 | 5.98 | 7.27 | | 4.00 | 33.67 | 101.68 | | — | | — | | — |
| Index 2† | 8.49 | 3.57 | 4.34 | | 2.39 | 19.17 | 53.00 | | — | | — | | — |
Performance figures assume all distributions have been reinvested. Figures reflect maximum sales charges on Class A shares of 4.0% and the applicable contingent deferred sales charge (CDSC) on Class B and Class C shares. The returns for Class A shares have been adjusted to reflect the reduction in the maximum sales charge from 4.5% to 4.0%, effective 2-3-14. The Class B shares' CDSC declines annually between years 1 to 6 according to the following schedule: 5%, 4%, 3%, 3%, 2%, 1%. No sales charge will be assessed after the sixth year. Class C shares sold within one year of purchase are subject to a 1% CDSC. Sales charges are not applicable to Class I and Class R6 shares.
The expense ratios of the fund, both net (including any fee waivers and/or expense limitations) and gross (excluding any fee waivers and/or expense limitations), are set forth according to the most recent publicly available prospectuses for the fund and may differ from those disclosed in the Financial highlights tables in this report.Net expenses reflect contractual expense limitations in effect until September 30, 2020 and are subject to change. Had the contractual fee waivers and expense limitations not been in place, gross expenses would apply. The expense ratios are as follows:
| | | | | | |
| | Class A | Class B | Class C | Class I | Class R6 |
| Gross (%) | 1.07 | 1.82 | 1.82 | 0.82 | 0.79 |
| Net (%) | 0.96 | 1.71 | 1.71 | 0.81 | 0.78 |
Please refer to the most recent prospectus and annual or semiannual report for more information on expenses and any expense limitation arrangements for each class.
The returns reflect past results and should not be considered indicative of future performance. The return and principal value of an investment will fluctuate so that shares, when redeemed, may be worth more or less than their original cost. Due to market volatility and other factors, the fund's current performance may be higher or lower than the performance shown. For current to the most recent month-end performance data, please call 800-225-5291 or visit the fund's website at jhinvestments.com.
The performance table above and the chart on the next page do not reflect the deduction of taxes that a shareholder would pay on fund distributions or the redemption of fund shares. The fund's performance results reflect any applicable fee waivers or expense reductions, without which the expenses would increase and results would have been less favorable.
| † | Index 1 is the Bloomberg Barclays High Yield Municipal Bond Index; Index 2 is the Bloomberg Barclays Municipal Bond Index. |
See the following page for footnotes.
SEMIANNUAL REPORT | JOHN HANCOCK HIGH YIELD MUNICIPAL BOND FUND 5
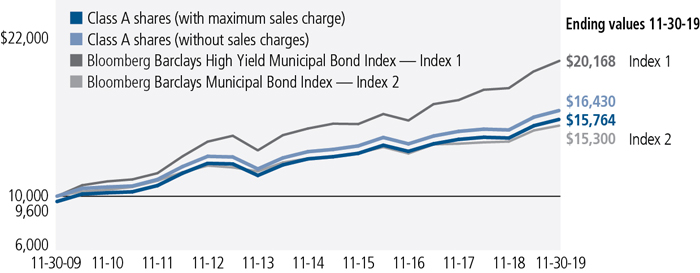
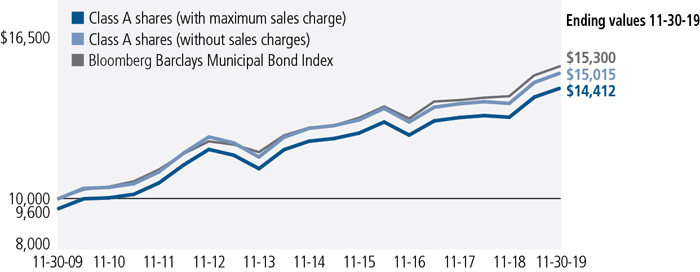
This chart and table show what happened to a hypothetical $10,000 investment in John Hancock High Yield Municipal Bond Fund for the share classes and periods indicated, assuming all distributions were reinvested. For comparison, we've shown the same investment in two separate indexes.
| | | | | | |
| | Start date | With maximum
sales charge ($) | Without
sales charge ($) | Index 1 ($) | Index 2 ($) |
| Class B5 | 11-30-09 | 15,475 | 15,475 | 20,168 | 15,300 |
| Class C5 | 11-30-09 | 15,247 | 15,247 | 20,168 | 15,300 |
| Class I3,4 | 11-30-09 | 16,517 | 16,517 | 20,168 | 15,300 |
| Class R63,4 | 11-30-09 | 16,496 | 16,496 | 20,168 | 15,300 |
The values shown in the chart for Class A shares with maximum sales charge have been adjusted to reflect the reduction in the Class A shares' maximum sales charge from 4.5% to 4.0%, which became effective on 2-3-14.
The Bloomberg Barclays High Yield Municipal Bond Index is an unmanaged index of municipal bonds that are non-investment grade, unrated, or below BBB/ Baa, according to S&P and Moody's, respectively.
The Bloomberg Barclays Municipal Bond Index is an unmanaged index representative of the tax-exempt bond market.
It is not possible to invest directly in an index. Index figures do not reflect expenses or sales charges, which would result in lower returns.
Footnotes related to performance pages
| 1 | Unsubsidized yield reflects what the yield would have been without the effect of reimbursements and waivers. |
| 2 | Tax-equivalent yield is based on the maximum federal income tax rate of 40.8%. |
| 3 | Class I shares and Class R6 shares were first offered on 2-13-17 and 8-30-17, respectively. Returns prior to these dates are those of Class A shares that have not been adjusted for class-specific expenses; otherwise, returns would vary. |
| 4 | For certain types of investors as described in the fund's prospectus. |
| 5 | The contingent deferred sales charge is not applicable. |
SEMIANNUAL REPORT | JOHN HANCOCK HIGH YIELD MUNICIPAL BOND FUND 6
These examples are intended to help you understand your ongoing operating expenses of investing in the fund so you can compare these costs with the ongoing costs of investing in other mutual funds.
Understanding fund expenses
As a shareholder of the fund, you incur two types of costs:
■Transaction costs,which include sales charges (loads) on purchases or redemptions (varies by share class), minimum account fee charge, etc.
■Ongoing operating expenses, including management fees, distribution and service fees (if applicable), and other fund expenses.
We are presenting only your ongoing operating expenses here.
Actual expenses/actual returns
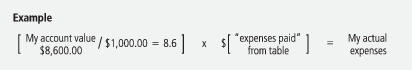
The first line of each share class in the table on the following page is intended to provide information about the fund’s actual ongoing operating expenses, and is based on the fund’s actual return. It assumes an account value of $1,000.00 on June 1, 2019, with the same investment held until November 30, 2019.
Together with the value of your account, you may use this information to estimate the operating expenses that you paid over the period. Simply divide your account value at November 30, 2019, by $1,000.00, then multiply it by the “expenses paid” for your share class from the table. For example, for an account value of $8,600.00, the operating expenses should be calculated as follows:
Hypothetical example for comparison purposes
The second line of each share class in the table on the following page allows you to compare the fund’s ongoing operating expenses with those of any other fund. It provides an example of the fund’s hypothetical account values and hypothetical expenses based on each class’s actual expense ratio and an assumed 5% annualized return before expenses (which is not the class’s actual return). It assumes an account value of $1,000.00 on June 1, 2019, with the same investment held until November 30, 2019. Look in any other fund shareholder report to find its hypothetical example and you will be able to compare these expenses. Please remember that these hypothetical account values and expenses may not be used to estimate the actual ending account balance or expenses you paid for the period.
| | SEMIANNUAL REPORT | JOHN HANCOCK HIGH YIELD MUNICIPAL BOND FUND | 7 |
Remember, these examples do not include any transaction costs, therefore, these examples will not help you to determine the relative total costs of owning different funds. If transaction costs were included, your expenses would have been higher. See the prospectus for details regarding transaction costs.
SHAREHOLDER EXPENSE EXAMPLE CHART
| | | Account
value on
6-1-2019 | Ending
value on
11-30-2019 | Expenses
paid during
period ended
11-30-20191 | Annualized
expense
ratio |
| Class A | Actual expenses/actual returns | $1,000.00 | $1,030.90 | $4.67 | 0.92% |
| | Hypothetical example | 1,000.00 | 1,020.40 | 4.65 | 0.92% |
| Class B | Actual expenses/actual returns | 1,000.00 | 1,027.00 | 8.46 | 1.67% |
| | Hypothetical example | 1,000.00 | 1,016.70 | 8.42 | 1.67% |
| Class C | Actual expenses/actual returns | 1,000.00 | 1,027.00 | 8.46 | 1.67% |
| | Hypothetical example | 1,000.00 | 1,016.70 | 8.42 | 1.67% |
| Class I | Actual expenses/actual returns | 1,000.00 | 1,031.60 | 3.91 | 0.77% |
| | Hypothetical example | 1,000.00 | 1,021.20 | 3.89 | 0.77% |
| Class R6 | Actual expenses/actual returns | 1,000.00 | 1,030.50 | 3.76 | 0.74% |
| | Hypothetical example | 1,000.00 | 1,021.30 | 3.74 | 0.74% |
| 1 | Expenses are equal to the annualized expense ratio, multiplied by the average account value over the period, multiplied by 183/366 (to reflect the one-half year period). |
| 8 | JOHN HANCOCK HIGH YIELD MUNICIPAL BOND FUND | SEMIANNUAL REPORT | |
AS OF 11-30-19 (unaudited)
| | Rate (%) | Maturity date | | Par value^ | Value |
| Municipal bonds 97.6% | | | | | $157,352,860 |
| (Cost $145,213,631) | | | | | |
| Alaska 1.2% | | | | | 2,004,600 |
Northern Tobacco Securitization Corp.
Series A | 5.000 | 06-01-46 | | 2,000,000 | 2,004,600 |
| California 10.3% | | | | | 16,672,234 |
California Community Housing Agency
Annadel Apartments, Series A (A) | 5.000 | 04-01-49 | | 1,000,000 | 1,110,060 |
California Pollution Control Financing Authority
Calplant I Project, AMT (A) | 7.500 | 07-01-32 | | 1,200,000 | 1,253,556 |
California Pollution Control Financing Authority
Waste Management, Inc., Series A1, AMT | 3.375 | 07-01-25 | | 1,000,000 | 1,083,080 |
California Pollution Control Financing Authority
Waste Management, Inc., Series A3, AMT | 4.300 | 07-01-40 | | 1,000,000 | 1,126,980 |
Foothill-Eastern Transportation Corridor Agency
Highway Revenue Tolls, Series A | 5.750 | 01-15-46 | | 1,000,000 | 1,152,340 |
Golden State Tobacco Securitization Corp.
Series A-1 | 3.500 | 06-01-36 | | 1,000,000 | 1,018,370 |
Golden State Tobacco Securitization Corp.
Series A2 | 5.300 | 06-01-37 | | 2,000,000 | 2,080,460 |
Golden State Tobacco Securitization Corp.
Series A-2 | 5.000 | 06-01-47 | | 1,000,000 | 1,028,430 |
Orange County Community Facilities District
Esencia Villagers, Series A | 5.000 | 08-15-41 | | 1,000,000 | 1,149,080 |
River Islands Public Financing Authority
Community Facilities District, Series 2003-1 | 5.000 | 09-01-48 | | 750,000 | 843,563 |
River Islands Public Financing Authority
Community Facilities District, Series 2003-1 | 5.500 | 09-01-45 | | 1,545,000 | 1,675,290 |
Southern California Public Power Authority
Natural Gas Project Revenue, Series A | 5.250 | 11-01-26 | | 1,500,000 | 1,815,225 |
Tobacco Securitization Authority of Northern California
Capital Appreciation 2nd Subordinated Asset Backed, Series C (B) | 8.091 | 06-01-45 | | 10,000,000 | 1,335,800 |
| Colorado 5.3% | | | | | 8,535,580 |
City & County of Denver
United Airlines, Inc., Project, AMT | 5.000 | 10-01-32 | | 1,000,000 | 1,091,330 |
Colorado Health Facilities Authority
Commonspirit Health, Series A1 | 4.000 | 08-01-44 | | 1,000,000 | 1,076,510 |
Public Authority for Colorado Energy
Natural Gas Revenue | 6.250 | 11-15-28 | | 2,500,000 | 3,191,775 |
Regional Transportation District
Denver Transit Partners | 6.000 | 01-15-41 | | 1,000,000 | 1,022,810 |
Sterling Ranch Community Authority Board
Series A | 5.000 | 12-01-47 | | 1,500,000 | 1,549,455 |
| SEE NOTES TO FINANCIAL STATEMENTS | SEMIANNUAL REPORT | JOHN HANCOCK HIGH YIELD MUNICIPAL BOND FUND | 9 |
| | Rate (%) | Maturity date | | Par value^ | Value |
| Colorado (continued) | | | | | |
Villages at Castle Rock Metropolitan District No. 6
Cobblestone Ranch Project, Series 2, GO (B) | 6.777 | 12-01-37 | | 2,000,000 | $603,700 |
| Connecticut 2.0% | | | | | 3,303,449 |
Town of Hamden
Whitney Center Project | 5.000 | 01-01-50 | | 1,000,000 | 1,072,320 |
Town of Hamden
Whitney Center Project, Series A | 7.625 | 01-01-30 | | 820,000 | 824,059 |
Town of Hamden
Whitney Center Project, Series A | 7.750 | 01-01-43 | | 1,400,000 | 1,407,070 |
| Delaware 1.0% | | | | | 1,540,935 |
Delaware State Economic Development Authority
Indian River Power Authority | 5.375 | 10-01-45 | | 1,500,000 | 1,540,935 |
| District of Columbia 4.1% | | | | | 6,583,910 |
District of Columbia
KIPP DC Project | 4.000 | 07-01-49 | | 1,000,000 | 1,074,620 |
Metropolitan Washington DC Airports Authority
Highway Revenue Tolls, Series C (C) | 6.500 | 10-01-41 | | 3,000,000 | 3,872,700 |
Metropolitan Washington DC Airports Authority
Metrorail, Series A (B) | 3.405 | 10-01-37 | | 3,000,000 | 1,636,590 |
| Florida 6.0% | | | | | 9,644,061 |
Alachua County Health Facilities Authority
Shands Teaching Hospital and Clinics | 4.000 | 12-01-49 | | 1,000,000 | 1,084,950 |
Celebration Pointe Community Development District
Alachua County (A) | 5.000 | 05-01-48 | | 1,000,000 | 1,057,640 |
Charlotte County Industrial Development Authority
Town and Country Utilities Project, AMT (A) | 5.000 | 10-01-49 | | 500,000 | 543,195 |
County of Lake
Imagine South Lake Charter School (A) | 5.000 | 01-15-54 | | 625,000 | 671,875 |
Florida Development Finance Corp.
Waste Pro USA, Inc., Project, AMT (A) | 5.000 | 05-01-29 | | 1,000,000 | 1,099,940 |
Lee County Industrial Development Authority
Cypress Cove Senior Living | 5.500 | 10-01-47 | | 1,000,000 | 1,087,350 |
Palm Beach County Health Facilities Authority
Retirement Life Communities, Inc. | 5.000 | 11-15-32 | | 1,000,000 | 1,170,490 |
Palm Beach County Health Facilities Authority
Sinai Residences Boca Raton Project, Series C | 7.500 | 06-01-49 | | 1,000,000 | 1,125,690 |
| Village Community Development District No. 12 (A) | 4.250 | 05-01-43 | | 995,000 | 1,059,864 |
Village Community Development District No. 8
Phase II | 6.125 | 05-01-39 | | 730,000 | 743,067 |
| 10 | JOHN HANCOCK HIGH YIELD MUNICIPAL BOND FUND | SEMIANNUAL REPORT | SEE NOTES TO FINANCIAL STATEMENTS |
| | Rate (%) | Maturity date | | Par value^ | Value |
| Georgia 2.1% | | | | | $3,431,200 |
Fulton County Residential Care Facilities for the Elderly Authority
Lenbrook Square Foundation, Inc. | 5.000 | 07-01-42 | | 840,000 | 914,080 |
Main Street Natural Gas, Inc.
Series A | 5.000 | 05-15-49 | | 1,000,000 | 1,359,600 |
Municipal Electric Authority of Georgia
Plant Vogtle Units 3&4 Project | 5.000 | 01-01-48 | | 1,000,000 | 1,157,520 |
| Illinois 8.1% | | | | | 13,000,001 |
Chicago Board of Education
Series A, GO | 7.000 | 12-01-44 | | 1,000,000 | 1,214,810 |
Chicago O'Hare International Airport
Customer Facility Charge | 5.750 | 01-01-43 | | 2,000,000 | 2,234,440 |
City of Chicago
Series A, GO | 5.250 | 01-01-35 | | 750,000 | 772,110 |
City of Chicago
Series A, GO | 6.000 | 01-01-38 | | 1,000,000 | 1,200,990 |
Illinois Finance Authority
Wesleyan University | 5.000 | 09-01-46 | | 1,000,000 | 1,134,330 |
Illinois Finance Authority
Westminster Village, Series A | 5.250 | 05-01-38 | | 1,000,000 | 1,088,050 |
Metropolitan Pier & Exposition Authority
McCormick Place Project, Series B | 4.250 | 06-15-42 | | 1,500,000 | 1,522,005 |
State of Illinois
Series D, GO | 5.000 | 11-01-21 | | 750,000 | 790,958 |
| State of Illinois, GO | 5.000 | 04-01-27 | | 2,000,000 | 2,199,660 |
The Illinois Sports Facilities Authority
State Tax Supported (C) | 5.250 | 06-15-32 | | 750,000 | 842,648 |
| Indiana 3.1% | | | | | 4,985,203 |
City of Crown Point
Wittenberg Village Project, Series A | 8.000 | 11-15-39 | | 1,250,000 | 1,251,263 |
Indiana Finance Authority
BHI Senior Living | 5.000 | 11-15-38 | | 1,000,000 | 1,138,200 |
Indiana Finance Authority
Green Bond Polyflow Industry Project, AMT (A) | 7.000 | 03-01-39 | | 1,500,000 | 1,512,960 |
Town of Chesterton
StoryPoint Chesterton Project, Series A-1 (A) | 6.125 | 01-15-34 | | 1,000,000 | 1,082,780 |
| Iowa 0.7% | | | | | 1,082,870 |
Iowa Finance Authority
Northcrest, Inc. Project, Series A | 5.000 | 03-01-48 | | 1,000,000 | 1,082,870 |
| Kentucky 0.5% | | | | | 796,703 |
Kentucky Municipal Power Agency
Prairie State Project, Series A | 4.000 | 09-01-45 | | 750,000 | 796,703 |
| SEE NOTES TO FINANCIAL STATEMENTS | SEMIANNUAL REPORT | JOHN HANCOCK HIGH YIELD MUNICIPAL BOND FUND | 11 |
| | Rate (%) | Maturity date | | Par value^ | Value |
| Louisiana 1.7% | | | | | $2,692,580 |
Calcasieu Parish Memorial Hospital Service District
Lake Charles Memorial Hospital | 5.000 | 12-01-39 | | 500,000 | 587,620 |
Louisiana Local Government Environmental Facilities & Community Development Authority
Westlake Chemical Corp. Projects | 3.500 | 11-01-32 | | 2,000,000 | 2,104,960 |
| Maryland 1.3% | | | | | 2,177,420 |
Anne Arundel County Consolidated Special Taxing District
Villages at 2 Rivers Project | 5.250 | 07-01-44 | | 1,000,000 | 1,034,060 |
Maryland Health & Higher Educational Facilities Authority
Meritus Medical Center | 5.000 | 07-01-40 | | 1,000,000 | 1,143,360 |
| Massachusetts 2.8% | | | | | 4,449,059 |
| Collegiate Charter School of Lowell (D) | 5.000 | 06-15-39 | | 500,000 | 536,810 |
Massachusetts Development Finance Agency
Green Bonds-Boston Medical Center, Series D | 5.000 | 07-01-44 | | 1,000,000 | 1,122,380 |
Massachusetts Development Finance Agency
NewBridge on the Charles, Inc. (A) | 5.000 | 10-01-47 | | 1,000,000 | 1,099,180 |
Massachusetts Development Finance Agency
NewBridge on the Charles, Inc. (A) | 5.000 | 10-01-57 | | 380,000 | 416,583 |
Massachusetts Development Finance Agency
Orchard Cove, Inc. | 5.000 | 10-01-49 | | 1,135,000 | 1,274,106 |
| Michigan 0.7% | | | | | 1,075,635 |
Michigan Finance Authority
Detroit Water & Sewer, Series C-2, AMT | 5.000 | 07-01-44 | | 500,000 | 534,155 |
Michigan Finance Authority
Local Government Loan Program, Series F1 | 4.500 | 10-01-29 | | 500,000 | 541,480 |
| Minnesota 3.5% | | | | | 5,640,953 |
City of Anoka
Homestead at Anoka, Inc. Project | 4.750 | 11-01-35 | | 500,000 | 536,360 |
City of Anoka
Homestead at Anoka, Inc. Project | 5.000 | 11-01-46 | | 1,000,000 | 1,069,310 |
City of Anoka
Homestead at Anoka, Inc. Project | 5.500 | 11-01-46 | | 500,000 | 550,920 |
Housing & Redevelopment Authority of The City of St. Paul
Carondelet Village Project, Series A | 5.000 | 12-01-47 | | 1,250,000 | 1,375,038 |
Woodbury Housing & Redevelopment Authority
St. Therese of Woodbury | 5.125 | 12-01-44 | | 1,000,000 | 1,051,854 |
Woodbury Housing & Redevelopment Authority
St. Therese of Woodbury | 5.250 | 12-01-49 | | 1,000,000 | 1,057,471 |
| 12 | JOHN HANCOCK HIGH YIELD MUNICIPAL BOND FUND | SEMIANNUAL REPORT | SEE NOTES TO FINANCIAL STATEMENTS |
| | Rate (%) | Maturity date | | Par value^ | Value |
| Missouri 2.1% | | | | | $3,318,200 |
Health & Educational Facilities Authority of the State of Missouri
Lutheran Senior Service Projects, Series A | 5.000 | 02-01-42 | | 1,000,000 | 1,122,680 |
Kirkwood Industrial Development Authority
Aberdeen Heights Project, Series A | 5.250 | 05-15-42 | | 1,000,000 | 1,122,230 |
Lees Summit Industrial Development Authority
John Knox Village Series A | 5.000 | 08-15-51 | | 1,000,000 | 1,073,290 |
| Nevada 0.6% | | | | | 1,020,190 |
City of Sparks
Sales Tax Revenue, Series A | 6.750 | 06-15-28 | | 1,000,000 | 1,020,190 |
| New Hampshire 0.7% | | | | | 1,055,980 |
New Hampshire Business Finance Authority
Covanta Project, AMT (A) | 4.875 | 11-01-42 | | 500,000 | 530,000 |
New Hampshire Health & Education Facilities Authority
Rivermead, Series A | 6.875 | 07-01-41 | | 500,000 | 525,980 |
| New Jersey 3.4% | | | | | 5,515,810 |
Casino Reinvestment Development Authority
Luxury Tax Revenue | 5.250 | 11-01-44 | | 1,000,000 | 1,081,470 |
New Jersey Economic Development Authority
Continental Airlines, Inc. Project, AMT | 5.250 | 09-15-29 | | 1,000,000 | 1,090,030 |
New Jersey Economic Development Authority
Port Newark Container Terminal LLC, AMT | 5.000 | 10-01-47 | | 1,000,000 | 1,140,130 |
New Jersey Economic Development Authority
Series WW | 5.000 | 06-15-37 | | 1,000,000 | 1,117,870 |
New Jersey Transportation Trust Fund Authority
Transportation Program, Series AA | 4.500 | 06-15-49 | | 1,000,000 | 1,086,310 |
| New York 5.1% | | | | | 8,197,074 |
Chautauqua County Industrial Development Agency
Dunkirk Power Project | 5.875 | 04-01-42 | | 2,950,000 | 2,968,585 |
Erie Tobacco Asset Securitization Corp.
Series A (B) | 9.518 | 06-01-60 | | 15,000,000 | 357,600 |
New York Liberty Development Corp.
World Trade Center, Class 1-3 (A) | 5.000 | 11-15-44 | | 1,850,000 | 2,042,289 |
New York State Dormitory Authority
Orange Regional Medical Center (A) | 5.000 | 12-01-45 | | 1,000,000 | 1,119,800 |
New York Transportation Development Corp.
Delta Airlines, Inc., Laguardia, AMT | 5.000 | 01-01-36 | | 1,000,000 | 1,180,900 |
Niagara Area Development Corp.
Covanta Project, Series A, AMT (A) | 4.750 | 11-01-42 | | 500,000 | 527,900 |
| Ohio 2.6% | | | | | 4,241,614 |
Buckeye Tobacco Settlement Financing Authority
Capital Appreciation Asset Senior Convertible A3 | 6.250 | 06-01-37 | | 1,550,000 | 1,585,309 |
| SEE NOTES TO FINANCIAL STATEMENTS | SEMIANNUAL REPORT | JOHN HANCOCK HIGH YIELD MUNICIPAL BOND FUND | 13 |
| | Rate (%) | Maturity date | | Par value^ | Value |
| Ohio (continued) | | | | | |
Ohio Air Quality Development Authority
Ohio Valley Electric Corporation Project | 3.250 | 09-01-29 | | 1,000,000 | $1,027,680 |
Ohio Air Quality Development Authority
Pratt Paper LLC Project, AMT (A) | 4.500 | 01-15-48 | | 500,000 | 539,815 |
Southeastern Ohio Port Authority
Marietta Memorial Hospital | 5.000 | 12-01-35 | | 1,000,000 | 1,088,810 |
| Oregon 0.7% | | | | | 1,144,620 |
Salem Hospital Facility Authority
Capital Manor Project | 5.000 | 05-15-48 | | 1,000,000 | 1,144,620 |
| Pennsylvania 3.2% | | | | | 5,103,613 |
Cumberland County Municipal Authority
Diakon Lutheran Ministries Project | 4.000 | 01-01-33 | | 750,000 | 782,453 |
Lancaster County Hospital Authority
Brethen Village Project | 5.125 | 07-01-37 | | 1,000,000 | 1,089,940 |
Pennsylvania Economic Development Financing Authority
Philadelphia Biosolids Facility | 6.250 | 01-01-32 | | 1,000,000 | 1,017,620 |
Pennsylvania Turnpike Commission
Series A (C) | 4.000 | 12-01-49 | | 2,000,000 | 2,213,600 |
| Puerto Rico 2.3% | | | | | 3,772,835 |
Children's Trust Fund
Series A (B) | 6.504 | 05-15-50 | | 8,000,000 | 1,141,520 |
Puerto Rico Electric Power Authority
Series TT-RSA-1 | 5.000 | 07-01-24 | | 765,000 | 585,225 |
Puerto Rico Sales Tax Financing Corp.
Series A-1 | 4.750 | 07-01-53 | | 1,000,000 | 1,032,350 |
Puerto Rico Sales Tax Financing Corp. Sales Tax Revenue
Series A-2 | 4.329 | 07-01-40 | | 1,000,000 | 1,013,740 |
| Rhode Island 2.3% | | | | | 3,783,155 |
Tobacco Settlement Financing Corp.
Series A | 5.000 | 06-01-35 | | 1,500,000 | 1,684,035 |
Tobacco Settlement Financing Corp.
Series A (B) | 6.311 | 06-01-52 | | 8,000,000 | 1,063,200 |
Tobacco Settlement Financing Corp.
Series B | 4.500 | 06-01-45 | | 1,000,000 | 1,035,920 |
| South Carolina 0.7% | | | | | 1,082,570 |
South Carolina Jobs-Economic Development Authority
Episcopal at Home Still | 5.000 | 04-01-48 | | 1,000,000 | 1,082,570 |
| Tennessee 2.9% | | | | | 4,759,968 |
Shelby County Health Educational & Housing Facilities Board
The Farms at Bailey Station Project | 5.750 | 10-01-59 | | 500,000 | 484,795 |
Tennessee Energy Acquisition Corp.
Natural Gas Revenue, Series C | 5.000 | 02-01-25 | | 3,720,000 | 4,275,173 |
| 14 | JOHN HANCOCK HIGH YIELD MUNICIPAL BOND FUND | SEMIANNUAL REPORT | SEE NOTES TO FINANCIAL STATEMENTS |
| | Rate (%) | Maturity date | | Par value^ | Value |
| Texas 10.3% | | | | | $16,550,284 |
Bexar County Health Facilities Development Corp.
Army Retirement Residence Foundation Project | 5.000 | 07-15-23 | | 175,000 | 193,907 |
Bexar County Health Facilities Development Corp.
Army Retirement Residence Foundation Project | 5.000 | 07-15-25 | | 115,000 | 131,635 |
Bexar County Health Facilities Development Corp.
Army Retirement Residence Foundation Project | 5.000 | 07-15-25 | | 200,000 | 229,642 |
Bexar County Health Facilities Development Corp.
Army Retirement Residence Foundation Project | 5.000 | 07-15-27 | | 200,000 | 228,548 |
Bexar County Health Facilities Development Corp.
Army Retirement Residence Foundation Project | 5.000 | 07-15-33 | | 830,000 | 938,373 |
Brazoria County Industrial Development Corp.
Gladieux Metals Recycling, AMT | 7.000 | 03-01-39 | | 1,000,000 | 1,072,240 |
City of Houston Airport System Revenue
Continental Airlines, Inc. Terminal Projects, AMT | 6.625 | 07-15-38 | | 1,000,000 | 1,066,120 |
City of Houston Airport System Revenue
United Airlines, Inc. Terminal E Project, AMT | 5.000 | 07-01-29 | | 3,000,000 | 3,343,140 |
City of Seguin Hospital
Hospital Mortgage Revenue | 5.000 | 12-01-45 | | 1,000,000 | 1,069,700 |
Mission Economic Development Corp.
Natgasoline Project, AMT (A) | 4.625 | 10-01-31 | | 1,500,000 | 1,623,660 |
New Hope Cultural Education Facilities Finance Corp.
Legacy Midtown Park Project, Series A | 5.500 | 07-01-54 | | 1,000,000 | 1,051,120 |
New Hope Cultural Education Facilities Finance Corp.
Retirement Facility Revenue Presbyterian Village North Project | 5.250 | 10-01-49 | | 1,000,000 | 1,099,750 |
Texas Municipal Gas Acquisition & Supply Corp.
Natural Gas Revenue, Series D | 6.250 | 12-15-26 | | 1,860,000 | 2,163,887 |
Texas Private Activity Bond Surface Transportation Corp.
Blueridge Transportation Group LLC, AMT | 5.000 | 12-31-55 | | 1,000,000 | 1,112,090 |
Texas Private Activity Bond Surface Transportation Corp.
NTE Mobility Partners Segments LLC, AMT | 7.000 | 12-31-38 | | 1,000,000 | 1,169,220 |
Travis County Health Facilities Development Corp.
Westminster Manor Project | 7.000 | 11-01-30 | | 55,000 | 57,252 |
| SEE NOTES TO FINANCIAL STATEMENTS | SEMIANNUAL REPORT | JOHN HANCOCK HIGH YIELD MUNICIPAL BOND FUND | 15 |
| | Rate (%) | Maturity date | | Par value^ | Value |
| Vermont 0.7% | | | | | $1,183,340 |
Vermont Economic Development Authority
Wake Robin Corp. Project | 5.400 | 05-01-33 | | 1,135,000 | 1,183,340 |
| Virginia 2.5% | | | | | 4,057,790 |
Alexandria Industrial Development Authority
Goodwin House | 5.000 | 10-01-45 | | 1,700,000 | 1,882,410 |
Norfolk Redevelopment & Housing Authority
Retirement Community | 5.000 | 01-01-49 | | 1,000,000 | 1,084,000 |
Norfolk Redevelopment & Housing Authority
Retirement Community | 5.250 | 01-01-54 | | 1,000,000 | 1,091,380 |
| Wisconsin 3.1% | | | | | 4,949,424 |
Public Finance Authority
Friends Homes (A) | 5.000 | 09-01-54 | | 1,000,000 | 1,091,500 |
Public Finance Authority
Retirement Facility Revenue Southminster (A) | 5.000 | 10-01-53 | | 1,150,000 | 1,266,426 |
Public Finance Authority
Rose Villa Project, Series A (A) | 5.750 | 11-15-44 | | 1,000,000 | 1,089,100 |
Public Finance Authority
Rose Villa Project, Series A (A) | 6.000 | 11-15-49 | | 1,000,000 | 1,097,930 |
Wisconsin Health & Educational Facilities Authority
St. Camillus Health Center System, Inc. | 5.000 | 11-01-46 | | 375,000 | 404,468 |
|
| | | Yield (%) | | Shares | Value |
| Short-term investments 1.6% | | | | $2,517,459 |
| (Cost $2,511,254) | | | | | |
| Short-term funds 1.6% | | | | | |
| John Hancock Collateral Trust (E) | | 1.7887(F) | | 251,587 | 2,517,459 |
|
| Total investments (Cost $147,724,885) 99.2% | | | $159,870,319 |
| Other assets and liabilities, net 0.8% | | | | | 1,321,428 |
| Total net assets 100.0% | | | | | $161,191,747 |
| The percentage shown for each investment category is the total value of the category as a percentage of the net assets of the fund. |
| ^All par values are denominated in U.S. dollars unless otherwise indicated. |
| Security Abbreviations and Legend |
| AMT | Interest earned from these securities may be considered a tax preference item for purpose of the Federal Alternative Minimum Tax. |
| GO | General Obligation |
| (A) | These securities are exempt from registration under Rule 144A of the Securities Act of 1933. Such securities may be resold, normally to qualified institutional buyers, in transactions exempt from registration. Rule 144A securities amounted to $21,836,053 or 13.5% of the fund's net assets as of 11-30-19. |
| (B) | Zero coupon bonds are issued at a discount from their principal amount in lieu of paying interest periodically. Rate shown is the effective yield at period end. |
| (C) | Bond is insured by one or more of the companies listed in the insurance coverage table below. |
| (D) | Security purchased or sold on a when-issued or delayed delivery basis. |
| (E) | Investment is an affiliate of the fund, the advisor and/or subadvisor. |
| (F) | The rate shown is the annualized seven-day yield as of 11-30-19. |
| 16 | JOHN HANCOCK HIGH YIELD MUNICIPAL BOND FUND | SEMIANNUAL REPORT | SEE NOTES TO FINANCIAL STATEMENTS |
At 11-30-19, the aggregate cost of investments for federal income tax purposes was $146,384,753. Net unrealized appreciation aggregated to $13,485,566, of which $13,620,762 related to gross unrealized appreciation and $135,196 related to gross unrealized depreciation.
| Insurance coverage | As a % of total
investments |
| Assured Guaranty Corp. | 2.4 |
| Assured Guaranty Municipal Corp. | 1.9 |
| SEE NOTES TO FINANCIAL STATEMENTS | SEMIANNUAL REPORT | JOHN HANCOCK HIGH YIELD MUNICIPAL BOND FUND | 17 |
STATEMENT OF ASSETS AND LIABILITIES 11-30-19 (unaudited)
| Assets | |
| Unaffiliated investments, at value (Cost $145,213,631) | $157,352,860 |
| Affiliated investments, at value (Cost $2,511,254) | 2,517,459 |
| Total investments, at value (Cost $147,724,885) | 159,870,319 |
| Interest receivable | 2,118,228 |
| Receivable for fund shares sold | 106,625 |
| Receivable from affiliates | 2,348 |
| Other assets | 50,347 |
| Total assets | 162,147,867 |
| Liabilities | |
| Distributions payable | 27,132 |
| Payable for delayed delivery securities purchased | 533,225 |
| Payable for fund shares repurchased | 299,465 |
| Payable to affiliates | |
| Accounting and legal services fees | 19,852 |
| Transfer agent fees | 5,403 |
| Distribution and service fees | 20,153 |
| Trustees' fees | 290 |
| Other liabilities and accrued expenses | 50,600 |
| Total liabilities | 956,120 |
| Net assets | $161,191,747 |
| Net assets consist of | |
| Paid-in capital | $144,596,953 |
| Total distributable earnings (loss) | 16,594,794 |
| Net assets | $161,191,747 |
| |
| Net asset value per share | |
| Based on net asset value and shares outstanding - the fund has an unlimited number of shares authorized with no par value | |
| Class A ($119,073,585 ÷ 14,631,684 shares)1 | $8.14 |
| Class B ($1,126,243 ÷ 138,386 shares)1 | $8.14 |
| Class C ($24,542,271 ÷ 3,015,752 shares)1 | $8.14 |
| Class I ($14,376,804 ÷ 1,763,866 shares) | $8.15 |
| Class R6 ($2,072,844 ÷ 254,232 shares) | $8.15 |
| Maximum offering price per share | |
| Class A (net asset value per share ÷ 96%)2 | $8.48 |
| 1 | Redemption price per share is equal to net asset value less any applicable contingent deferred sales charge. |
| 2 | On single retail sales of less than $100,000. On sales of $100,000 or more and on group sales the offering price is reduced. |
| 18 | JOHN HANCOCK High Yield Municipal Bond Fund | SEMIANNUAL REPORT | SEE NOTES TO FINANCIAL STATEMENTS |
STATEMENT OF OPERATIONSFor the six months ended 11-30-19 (unaudited)
| Investment income | |
| Interest | $3,691,298 |
| Income distributions received from affiliated investments | 10,122 |
| Total investment income | 3,701,420 |
| Expenses | |
| Investment management fees | 467,145 |
| Distribution and service fees | 282,559 |
| Accounting and legal services fees | 17,228 |
| Transfer agent fees | 32,511 |
| Trustees' fees | 1,479 |
| Custodian fees | 18,678 |
| State registration fees | 41,776 |
| Printing and postage | 21,325 |
| Professional fees | 26,691 |
| Other | 7,766 |
| Total expenses | 917,158 |
| Less expense reductions | (93,470) |
| Net expenses | 823,688 |
| Net investment income | 2,877,732 |
| Realized and unrealized gain (loss) | |
| Net realized gain (loss) on | |
| Unaffiliated investments | 1,845,644 |
| Affiliated investments | 7,338 |
| | 1,852,982 |
| Change in net unrealized appreciation (depreciation) of | |
| Unaffiliated investments | (105,537) |
| Affiliated investments | 6,205 |
| | (99,332) |
| Net realized and unrealized gain | 1,753,650 |
| Increase in net assets from operations | $4,631,382 |
| SEE NOTES TO FINANCIAL STATEMENTS | SEMIANNUAL REPORT | JOHN HANCOCK High Yield Municipal Bond Fund | 19 |
STATEMENTS OF CHANGES IN NET ASSETS
| | Six months ended
11-30-19
(unaudited) | Year ended
5-31-19 |
| Increase (decrease) in net assets | | |
| From operations | | |
| Net investment income | $2,877,732 | $6,155,754 |
| Net realized gain | 1,852,982 | 3,118,159 |
| Change in net unrealized appreciation (depreciation) | (99,332) | (558,866) |
| Increase in net assets resulting from operations | 4,631,382 | 8,715,047 |
| Distributions to shareholders | | |
| From earnings | | |
| Class A | (2,369,437) | (4,654,811) |
| Class B | (20,251) | (58,667) |
| Class C | (446,036) | (1,081,754) |
| Class I | (296,401) | (459,553) |
| Class R6 | (41,489) | (76,269) |
| Total distributions | (3,173,614) | (6,331,054) |
| From fund share transactions | 3,549,982 | (10,660,481) |
| Total increase (decrease) | 5,007,750 | (8,276,488) |
| Net assets | | |
| Beginning of period | 156,183,997 | 164,460,485 |
| End of period | $161,191,747 | $156,183,997 |
| 20 | JOHN HANCOCK High Yield Municipal Bond Fund | SEMIANNUAL REPORT | SEE NOTES TO FINANCIAL STATEMENTS |
| CLASS A SHARES Period ended | 11-30-191 | 5-31-19 | 5-31-18 | 5-31-17 | 5-31-16 | 5-31-15 |
| Per share operating performance | | | | | | |
| Net asset value, beginning of period | $8.06 | $7.93 | $8.01 | $8.33 | $8.18 | $8.17 |
| Net investment income2 | 0.15 | 0.32 | 0.34 | 0.34 | 0.35 | 0.37 |
| Net realized and unrealized gain (loss) on investments | 0.10 | 0.14 | (0.06) | (0.28) | 0.18 | 0.03 |
| Total from investment operations | 0.25 | 0.46 | 0.28 | 0.06 | 0.53 | 0.40 |
| Less distributions | | | | | | |
| From net investment income | (0.17) | (0.33) | (0.36) | (0.38) | (0.38) | (0.39) |
| Net asset value, end of period | $8.14 | $8.06 | $7.93 | $8.01 | $8.33 | $8.18 |
| Total return (%)3,4 | 3.095 | 5.99 | 3.55 | 0.76 | 6.65 | 4.94 |
| Ratios and supplemental data | | | | | | |
| Net assets, end of period (in millions) | $119 | $111 | $117 | $133 | $155 | $154 |
| Ratios (as a percentage of average net assets): | | | | | | |
| Expenses before reductions | 1.056 | 1.07 | 1.05 | 1.00 | 1.00 | 0.98 |
| Expenses including reductions | 0.926 | 0.93 | 0.91 | 0.89 | 0.90 | 0.87 |
| Net investment income | 3.746 | 4.10 | 4.31 | 4.24 | 4.24 | 4.47 |
| Portfolio turnover (%) | 14 | 41 | 8 | 27 | 22 | 30 |
| 1 | Six months ended 11-30-19. Unaudited. |
| 2 | Based on average daily shares outstanding. |
| 3 | Total returns would have been lower had certain expenses not been reduced during the applicable periods. |
| 4 | Does not reflect the effect of sales charges, if any. |
| 5 | Not annualized. |
| 6 | Annualized. |
| SEE NOTES TO FINANCIAL STATEMENTS | SEMIANNUAL REPORT | JOHN HANCOCK High Yield Municipal Bond Fund | 21 |
| CLASS B SHARES Period ended | 11-30-191 | 5-31-19 | 5-31-18 | 5-31-17 | 5-31-16 | 5-31-15 |
| Per share operating performance | | | | | | |
| Net asset value, beginning of period | $8.06 | $7.93 | $8.01 | $8.33 | $8.18 | $8.17 |
| Net investment income2 | 0.12 | 0.26 | 0.29 | 0.28 | 0.28 | 0.31 |
| Net realized and unrealized gain (loss) on investments | 0.10 | 0.14 | (0.07) | (0.28) | 0.19 | 0.03 |
| Total from investment operations | 0.22 | 0.40 | 0.22 | — | 0.47 | 0.34 |
| Less distributions | | | | | | |
| From net investment income | (0.14) | (0.27) | (0.30) | (0.32) | (0.32) | (0.33) |
| Net asset value, end of period | $8.14 | $8.06 | $7.93 | $8.01 | $8.33 | $8.18 |
| Total return (%)3,4 | 2.705 | 5.20 | 2.78 | 0.00 | 5.85 | 4.16 |
| Ratios and supplemental data | | | | | | |
| Net assets, end of period (in millions) | $1 | $1 | $2 | $4 | $6 | $7 |
| Ratios (as a percentage of average net assets): | | | | | | |
| Expenses before reductions | 1.806 | 1.82 | 1.80 | 1.75 | 1.75 | 1.73 |
| Expenses including reductions | 1.676 | 1.68 | 1.66 | 1.64 | 1.65 | 1.63 |
| Net investment income | 3.006 | 3.36 | 3.56 | 3.48 | 3.49 | 3.73 |
| Portfolio turnover (%) | 14 | 41 | 8 | 27 | 22 | 30 |
| 1 | Six months ended 11-30-19. Unaudited. |
| 2 | Based on average daily shares outstanding. |
| 3 | Total returns would have been lower had certain expenses not been reduced during the applicable periods. |
| 4 | Does not reflect the effect of sales charges, if any. |
| 5 | Not annualized. |
| 6 | Annualized. |
| 22 | JOHN HANCOCK High Yield Municipal Bond Fund | SEMIANNUAL REPORT | SEE NOTES TO FINANCIAL STATEMENTS |
| CLASS C SHARES Period ended | 11-30-191 | 5-31-19 | 5-31-18 | 5-31-17 | 5-31-16 | 5-31-15 |
| Per share operating performance | | | | | | |
| Net asset value, beginning of period | $8.06 | $7.93 | $8.01 | $8.33 | $8.18 | $8.17 |
| Net investment income2 | 0.12 | 0.26 | 0.29 | 0.28 | 0.29 | 0.31 |
| Net realized and unrealized gain (loss) on investments | 0.10 | 0.14 | (0.07) | (0.28) | 0.18 | 0.03 |
| Total from investment operations | 0.22 | 0.40 | 0.22 | — | 0.47 | 0.34 |
| Less distributions | | | | | | |
| From net investment income | (0.14) | (0.27) | (0.30) | (0.32) | (0.32) | (0.33) |
| Net asset value, end of period | $8.14 | $8.06 | $7.93 | $8.01 | $8.33 | $8.18 |
| Total return (%)3,4 | 2.705 | 5.20 | 2.78 | 0.00 | 5.85 | 4.16 |
| Ratios and supplemental data | | | | | | |
| Net assets, end of period (in millions) | $25 | $29 | $35 | $43 | $46 | $44 |
| Ratios (as a percentage of average net assets): | | | | | | |
| Expenses before reductions | 1.806 | 1.82 | 1.80 | 1.75 | 1.75 | 1.73 |
| Expenses including reductions | 1.676 | 1.68 | 1.66 | 1.64 | 1.65 | 1.63 |
| Net investment income | 3.006 | 3.35 | 3.56 | 3.50 | 3.49 | 3.73 |
| Portfolio turnover (%) | 14 | 41 | 8 | 27 | 22 | 30 |
| 1 | Six months ended 11-30-19. Unaudited. |
| 2 | Based on average daily shares outstanding. |
| 3 | Total returns would have been lower had certain expenses not been reduced during the applicable periods. |
| 4 | Does not reflect the effect of sales charges, if any. |
| 5 | Not annualized. |
| 6 | Annualized. |
| SEE NOTES TO FINANCIAL STATEMENTS | SEMIANNUAL REPORT | JOHN HANCOCK High Yield Municipal Bond Fund | 23 |
| CLASS I SHARES Period ended | 11-30-191 | 5-31-19 | 5-31-18 | 5-31-172 |
| Per share operating performance | | | | |
| Net asset value, beginning of period | $8.07 | $7.94 | $8.02 | $7.91 |
| Net investment income3 | 0.16 | 0.33 | 0.36 | 0.12 |
| Net realized and unrealized gain (loss) on investments | 0.09 | 0.14 | (0.07) | 0.10 |
| Total from investment operations | 0.25 | 0.47 | 0.29 | 0.22 |
| Less distributions | | | | |
| From net investment income | (0.17) | (0.34) | (0.37) | (0.11) |
| Net asset value, end of period | $8.15 | $8.07 | $7.94 | $8.02 |
| Total return (%)4 | 3.165 | 6.15 | 3.71 | 2.845 |
| Ratios and supplemental data | | | | |
| Net assets, end of period (in millions) | $14 | $13 | $9 | $8 |
| Ratios (as a percentage of average net assets): | | | | |
| Expenses before reductions | 0.806 | 0.82 | 0.80 | 0.736 |
| Expenses including reductions | 0.776 | 0.78 | 0.76 | 0.736 |
| Net investment income | 3.896 | 4.23 | 4.47 | 4.966 |
| Portfolio turnover (%) | 14 | 41 | 8 | 277 |
| 1 | Six months ended 11-30-19. Unaudited. |
| 2 | The inception date for Class I shares is 2-13-17. |
| 3 | Based on average daily shares outstanding. |
| 4 | Total returns would have been lower had certain expenses not been reduced during the applicable periods. |
| 5 | Not annualized. |
| 6 | Annualized. |
| 7 | Portfolio turnover is shown for the period from 6-1-16 to 5-31-17. |
| 24 | JOHN HANCOCK High Yield Municipal Bond Fund | SEMIANNUAL REPORT | SEE NOTES TO FINANCIAL STATEMENTS |
| CLASS R6 SHARES Period ended | 11-30-191 | 5-31-19 | 5-31-182 |
| Per share operating performance | | | |
| Net asset value, beginning of period | $8.08 | $7.94 | $8.08 |
| Net investment income3 | 0.16 | 0.33 | 0.28 |
| Net realized and unrealized gain (loss) on investments | 0.08 | 0.16 | (0.14) |
| Total from investment operations | 0.24 | 0.49 | 0.14 |
| Less distributions | | | |
| From net investment income | (0.17) | (0.35) | (0.28) |
| Net asset value, end of period | $8.15 | $8.08 | $7.94 |
| Total return (%)4 | 3.055 | 6.31 | 1.805 |
| Ratios and supplemental data | | | |
| Net assets, end of period (in millions) | $2 | $2 | $2 |
| Ratios (as a percentage of average net assets): | | | |
| Expenses before reductions | 0.776 | 0.79 | 0.776 |
| Expenses including reductions | 0.746 | 0.75 | 0.736 |
| Net investment income | 3.926 | 4.27 | 4.526 |
| Portfolio turnover (%) | 14 | 41 | 87 |
| 1 | Six months ended 11-30-19. Unaudited. |
| 2 | The inception date for Class R6 shares is 8-30-17. |
| 3 | Based on average daily shares outstanding. |
| 4 | Total returns would have been lower had certain expenses not been reduced during the applicable periods. |
| 5 | Not annualized. |
| 6 | Annualized. |
| 7 | Portfolio turnover is shown for the period from 6-1-17 to 5-31-18. |
| SEE NOTES TO FINANCIAL STATEMENTS | SEMIANNUAL REPORT | JOHN HANCOCK High Yield Municipal Bond Fund | 25 |
| Notes to financial statements (unaudited) | |
Note 1—Organization
John Hancock High Yield Municipal Bond Fund (the fund) is a series of John Hancock Municipal Securities Trust (the Trust), an open-end management investment company organized as a Massachusetts business trust and registered under the Investment Company Act of 1940, as amended (the 1940 Act). The investment objective of the fund is to seek a high level of current income that is largely exempt from federal income tax, consistent with the preservation of capital.
The fund may offer multiple classes of shares. The shares currently outstanding are detailed in the Statement of assets and liabilities. Class A and Class C shares are offered to all investors. Class B shares are closed to new investors. Class I shares are offered to institutions and certain investors. Class R6 shares are only available to certain retirement plans, institutions and other investors. Class B shares convert to Class A shares eight years after purchase. Class C shares convert to Class A shares ten years after purchase (certain exclusions may apply). Shareholders of each class have exclusive voting rights to matters that affect that class. The distribution and service fees, if any, and transfer agent fees for each class may differ.
Note 2—Significant accounting policies
The financial statements have been prepared in conformity with accounting principles generally accepted in the United States of America (US GAAP), which require management to make certain estimates and assumptions as of the date of the financial statements. Actual results could differ from those estimates and those differences could be significant. The fund qualifies as an investment company under Topic 946 of Accounting Standards Codification of US GAAP.
Events or transactions occurring after the end of the fiscal period through the date that the financial statements were issued have been evaluated in the preparation of the financial statements. The following summarizes the significant accounting policies of the fund:
Security valuation. Investments are stated at value as of the scheduled close of regular trading on the New York Stock Exchange (NYSE), normally at 4:00 P.M., Eastern Time. In case of emergency or other disruption resulting in the NYSE not opening for trading or the NYSE closing at a time other than the regularly scheduled close, the net asset value (NAV) may be determined as of the regularly scheduled close of the NYSE pursuant to the fund's Valuation Policies and Procedures.
In order to value the securities, the fund uses the following valuation techniques: Debt obligations are typically valued based on the evaluated prices provided by an independent pricing vendor. Independent pricing vendors utilize matrix pricing which takes into account factors such as institutional-size trading in similar groups of securities, yield, quality, coupon rate, maturity, type of issue, trading characteristics and other market data, as well as broker supplied prices. Investments by the fund in open-end mutual funds, including John Hancock Collateral Trust (JHCT), are valued at their respective NAVs each business day.
Other portfolio securities and assets, for which reliable market quotations are not readily available, are valued at fair value as determined in good faith by the fund's Pricing Committee following procedures established by the Board of Trustees. The frequency with which these fair valuation procedures are used cannot be predicted and fair value of securities may differ significantly from the value that would have been used had a ready market for such securities existed.
The fund uses a three-tier hierarchy to prioritize the pricing assumptions, referred to as inputs, used in valuation techniques to measure fair value. Level 1 includes securities valued using quoted prices in active markets for identical securities, including registered investment companies. Level 2 includes securities valued using other significant observable inputs. Observable inputs may include quoted prices for similar securities, interest rates,
| 26 | JOHN HANCOCK High Yield Municipal Bond Fund | SEMIANNUAL REPORT | |
prepayment speeds and credit risk. Prices for securities valued using these inputs are received from independent pricing vendors and brokers and are based on an evaluation of the inputs described. Level 3 includes securities valued using significant unobservable inputs when market prices are not readily available or reliable, including the fund's own assumptions in determining the fair value of investments. Factors used in determining value may include market or issuer specific events or trends, changes in interest rates and credit quality. The inputs or methodology used for valuing securities are not necessarily an indication of the risks associated with investing in those securities. Changes in valuation techniques and related inputs may result in transfers into or out of an assigned level within the disclosure hierarchy.
The following is a summary of the values by input classification of the fund's investments as of November 30, 2019, by major security category or type:
| | Total
value at
11-30-19 | Level 1
quoted
price | Level 2
significant
observable
inputs | Level 3
significant
unobservable
inputs |
| Investments in securities: | | | | |
| Assets | | | | |
| Municipal bonds | $157,352,860 | — | $157,352,860 | — |
| Short-term investments | 2,517,459 | $2,517,459 | — | — |
| Total investments in securities | $159,870,319 | $2,517,459 | $157,352,860 | — |
When-issued/delayed-delivery securities. The fund may purchase or sell debt securities on a when-issued or delayed-delivery basis, or in a “To Be Announced” (TBA) or “forward commitment” transaction, with delivery or payment to occur at a later date beyond the normal settlement period. TBA securities resulting from these transactions are included in the portfolio or in a schedule to the portfolio (Sale Commitments Outstanding). At the time a fund enters into a commitment to purchase or sell a security, the transaction is recorded and the value of the security is reflected in its NAV. The price of such security and the date that the security will be delivered and paid for are fixed at the time the transaction is negotiated. The value of the security may vary with market fluctuations. No interest accrues until settlement takes place. At the time that the fund enters into this type of transaction, the fund is required to have sufficient cash and/or liquid securities to cover its commitments.
Certain risks may arise upon entering into when-issued or delayed-delivery securities transactions, including the potential inability of counterparties to meet the terms of their contracts, and the issuer’s failure to issue the securities due to political, economic or other factors. Additionally, losses may arise due to declines in the value of the securities purchased or increase in the value of securities sold prior to settlement date.
Security transactions and related investment income. Investment security transactions are accounted for on a trade date plus one basis for daily NAV calculations. However, for financial reporting purposes, investment transactions are reported on trade date. Interest income is accrued as earned. Interest income includes coupon interest and amortization/accretion of premiums/discounts on debt securities. Debt obligations may be placed in a non-accrual status and related interest income may be reduced by stopping current accruals and writing off interest receivable when the collection of all or a portion of interest has become doubtful. Gains and losses on securities sold are determined on the basis of identified cost and may include proceeds from litigation.
Overdraft. The fund may have the ability to borrow from banks for temporary or emergency purposes, including meeting redemption requests that otherwise might require the untimely sale of securities. Pursuant to the fund's custodian agreement, the custodian may loan money to the fund to make properly authorized payments. The fund
| | SEMIANNUAL REPORT | JOHN HANCOCK High Yield Municipal Bond Fund | 27 |
is obligated to repay the custodian for any overdraft, including any related costs or expenses. The custodian may have a lien, security interest or security entitlement in any fund property that is not otherwise segregated or pledged, to the extent of any overdraft, and to the maximum extent permitted by law.
Line of credit. The fund and other affiliated funds have entered into a syndicated line of credit agreement with Citibank, N.A. as the administrative agent that enables them to participate in a $750 million unsecured committed line of credit. Excluding commitments designated for a certain fund and subject to the needs of all other affiliated funds, the fund can borrow up to an aggregate commitment amount of $500 million, subject to asset coverage and other limitations as specified in the agreement. A commitment fee payable at the end of each calendar quarter, based on the average daily unused portion of the line of credit, is charged to each participating fund based on a combination of fixed and asset based allocations and is reflected in Other expenses on the Statement of operations. For the six months ended November 30, 2019, the fund had no borrowings under the line of credit. Commitment fees for the six months ended November 30, 2019 were $1,223.
Expenses. Within the John Hancock group of funds complex, expenses that are directly attributable to an individual fund are allocated to such fund. Expenses that are not readily attributable to a specific fund are allocated among all funds in an equitable manner, taking into consideration, among other things, the nature and type of expense and the fund’s relative net assets. Expense estimates are accrued in the period to which they relate and adjustments are made when actual amounts are known.
Class allocations. Income, common expenses and realized and unrealized gains (losses) are determined at the fund level and allocated daily to each class of shares based on the net assets of the class. Class-specific expenses, such as distribution and service fees, if any, and transfer agent fees, for all classes, are charged daily at the class level based on the net assets of each class and the specific expense rates applicable to each class.
Change in accounting principle. Accounting Standards Update (ASU) 2017-08, Premium Amortization on Purchased Callable Debt Securities, shortens the premium amortization period for purchased non contingently callable debt securities and is effective for public companies with fiscal years beginning after December 15, 2018. Adoption of the ASU did not have a material impact to the fund.
Federal income taxes. The fund intends to continue to qualify as a regulated investment company by complying with the applicable provisions of the Internal Revenue Code and will not be subject to federal income tax on taxable income that is distributed to shareholders. Therefore, no federal income tax provision is required.
As of May 31, 2019, the fund had no uncertain tax positions that would require financial statement recognition, derecognition or disclosure. The fund's federal tax returns are subject to examination by the Internal Revenue Service for a period of three years.
Distribution of income and gains. Distributions to shareholders from net investment income and net realized gains, if any, are recorded on the ex-date. The fund generally declares dividends daily and pays them monthly. Capital gain distributions, if any, are typically distributed annually.
Distributions paid by the fund with respect to each class of shares are calculated in the same manner, at the same time and in the same amount, except for the effect of class level expenses that may be applied differently to each class.
Such distributions, on a tax basis, are determined in conformity with income tax regulations, which may differ from US GAAP. Distributions in excess of tax basis earnings and profits, if any, are reported in the fund's financial statements as a return of capital. The final determination of tax characteristics of the fund’s distribution will occur at the end of the year and will subsequently be reported to shareholders.
| 28 | JOHN HANCOCK High Yield Municipal Bond Fund | SEMIANNUAL REPORT | |
Capital accounts within the financial statements are adjusted for permanent book-tax differences. These adjustments have no impact on net assets or the results of operations. Temporary book-tax differences, if any, will reverse in a subsequent period. Book-tax differences are primarily attributable to characterization of distributions and accretion on debt securities.
Note 3—Guarantees and indemnifications
Under the Trust's organizational documents, its Officers and Trustees are indemnified against certain liabilities arising out of the performance of their duties to the Trust, including the fund. Additionally, in the normal course of business, the fund enters into contracts with service providers that contain general indemnification clauses. The fund's maximum exposure under these arrangements is unknown, as this would involve future claims that may be made against the fund that have not yet occurred. The risk of material loss from such claims is considered remote.
Note 4—Fees and transactions with affiliates
John Hancock Investment Management LLC (the Advisor) serves as investment advisor for the fund. John Hancock Investment Management Distributors LLC (the Distributor), an affiliate of the Advisor, serves as principal underwriter of the fund. The Advisor and the Distributor are indirect, wholly owned subsidiaries of Manulife Financial Corporation (MFC). Prior to June 28, 2019, the Advisor was known as John Hancock Advisers, LLC and the Distributor was known as John Hancock Funds, LLC.
Management fee. The fund has an investment management agreement with the Advisor under which the fund pays a daily management fee to the Advisor equivalent on an annual basis to the sum of: (a) 0.6250% of the first $75 million of the fund’s average daily net assets, (b) 0.5625% of the next $75 million of the fund’s average daily net assets, (c) 0.5000% of the next $1.85 billion of the fund’s average daily net assets, (d) 0.4800% of the next $2 billion of the fund’s average daily net assets; and (e) 0.4500% of the fund’s average daily net assets in excess of $4 billion. The Advisor has a subadvisory agreement with Manulife Investment Management (US) LLC, an indirectly owned subsidiary of MFC and an affiliate of the Advisor. The fund is not responsible for payment of the subadvisory fees.
The Advisor has contractually agreed to waive a portion of its management fee and/or reimburse expenses for certain funds of the John Hancock group of funds complex, including the fund (the participating portfolios). This waiver is based upon aggregate net assets of all the participating portfolios. The amount of the reimbursement is calculated daily and allocated among all the participating portfolios in proportion to the daily net assets of each fund. During the six months ended November 30, 2019, this waiver amounted to 0.01% of the fund’s average daily net assets on an annualized basis. This arrangement expires on July 31, 2021, unless renewed by mutual agreement of the fund and the Advisor based upon a determination that this is appropriate under the circumstances at that time.
The Advisor voluntarily agrees to reduce its management fee for the fund, or if necessary make payment to the fund, in an amount equal to the amount by which the other expenses of the fund exceed 0.15% of the average net assets of the fund. For purposes of this agreement, “other expenses of the fund” means all the expenses of the fund, excluding taxes, brokerage commissions, interest expense, litigation and indemnification expenses and other extraordinary expenses not incurred in the ordinary course of the fund’s business, Advisory fees, class-specific expenses, borrowing costs, prime brokerage fees, acquired fund fees and expenses paid indirectly, and short dividend expense. This agreement will continue in effect until terminated at any time by the Advisor on notice to the fund.
For the six months ended November 30, 2019, the expense reductions described above amounted to the following:
| | SEMIANNUAL REPORT | JOHN HANCOCK High Yield Municipal Bond Fund | 29 |
| Class | Expense reduction |
| Class A | $15,963 |
| Class B | 167 |
| Class C | 3,694 |
| Class | Expense reduction |
| Class I | $1,927 |
| Class R6 | 269 |
| Total | $22,020 |
Expenses waived or reimbursed in the current fiscal period are not subject to recapture in future fiscal periods.
The investment management fees, including the impact of the waivers and reimbursements as described above, incurred for the six months ended November 30, 2019, were equivalent to a net annual effective rate rate of 0.56% of the fund's average daily net assets.
Accounting and legal services. Pursuant to a service agreement, the fund reimburses the Advisor for all expenses associated with providing the administrative, financial, legal, compliance, accounting and recordkeeping services to the fund, including the preparation of all tax returns, periodic reports to shareholders and regulatory reports, among other services. These expenses are allocated to each share class based on its relative net assets at the time the expense was incurred. These accounting and legal services fees incurred for the six months ended November 30, 2019 amounted to an annual rate of 0.02% of the fund's average daily net assets.
Distribution and service plans. The fund has a distribution agreement with the Distributor. The fund has adopted distribution and service plans for certain classes as detailed below pursuant to Rule 12b-1 under the 1940 Act, to pay the Distributor for services provided as the distributor of shares of the fund. The fund may pay up to the following contractual rates of distribution and service fees under these arrangements, expressed as an annual percentage of average daily net assets for each class of the fund's shares:
| Class | Rule 12b-1 Fee |
| Class A | 0.25% |
| Class B | 1.00% |
| Class C | 1.00% |
The fund’s Distributor has contractually agreed to waive 0.10% of Rule12b-1 fees for Class A, Class B and Class C shares. The current waiver agreement expires on September 30, 2020, unless renewed by mutual agreement of the fund and the Distributor based upon a determination that this is appropriate under the circumstances at the time. This contractual waiver amounted to $57,591, $602 and $13,257 for Class A, Class B and Class C shares, respectively, for the six months ended November 30, 2019.
Sales charges. Class A shares are assessed up-front sales charges, which resulted in payments to the Distributor amounting to $96,955 for the six months ended November 30, 2019. Of this amount, $14,219 was retained and used for printing prospectuses, advertising, sales literature and other purposes and $82,736 was paid as sales commissions to broker-dealers.
Class A, Class B and Class C shares may be subject to contingent deferred sales charges (CDSCs). Certain Class A shares that are acquired through purchases of $1 million or more and are redeemed within one year of purchase are subject to a 1.00% sales charge. Class B shares that are redeemed within six years of purchase are subject to CDSCs, at declining rates, beginning at 5.00%. Class C shares that are redeemed within one year of purchase are subject to a 1.00% CDSC. CDSCs are applied to the lesser of the current market value at the time of redemption or the original purchase cost of the shares being redeemed. Proceeds from CDSCs are used to compensate the Distributor for providing distribution-related services in connection with the sale of these shares. During the six months ended November 30, 2019, CDSCs received by the Distributor amounted to $459 and $278 for Class A and Class C shares, respectively.
| 30 | JOHN HANCOCK High Yield Municipal Bond Fund | SEMIANNUAL REPORT | |
Transfer agent fees. The John Hancock group of funds has a complex-wide transfer agent agreement with John Hancock Signature Services, Inc. (Signature Services), an affiliate of the Advisor. The transfer agent fees paid to Signature Services are determined based on the cost to Signature Services (Signature Services Cost) of providing recordkeeping services. It also includes out-of-pocket expenses, including payments made to third-parties for recordkeeping services provided to their clients who invest in one or more John Hancock funds. In addition, Signature Services Cost may be reduced by certain fees that Signature Services receives in connection with retirement and small accounts. Signature Services Cost is calculated monthly and allocated, as applicable, to five categories of share classes: Retail Share and Institutional Share Classes of Non-Municipal Bond Funds, Class R6 Shares, Retirement Share Classes and Municipal Bond Share Classes. Within each of these categories, the applicable costs are allocated to the affected John Hancock affiliated funds and/or classes, based on the relative average daily net assets.
Class level expenses. Class level expenses for the six months ended November 30, 2019 were as follows:
| Class | Distribution and service fees | Transfer agent fees |
| Class A | $143,979 | $23,791 |
| Class B | 6,014 | 248 |
| Class C | 132,566 | 5,477 |
| Class I | — | 2,871 |
| Class R6 | — | 124 |
| Total | $282,559 | $32,511 |
Trustee expenses. The fund compensates each Trustee who is not an employee of the Advisor or its affiliates. The costs of paying Trustee compensation and expenses are allocated to the fund based on its net assets relative to other funds within the John Hancock group of funds complex.
Note 5—Fund share transactions
Transactions in fund shares for the six months ended November 30, 2019 and for the year ended May 31, 2019 were as follows:
| | Six Months Ended 11-30-19 | Year Ended 5-31-19 |
| | Shares | Amount | Shares | Amount |
| Class A shares | | | | |
| Sold | 2,166,107 | $17,628,997 | 3,254,554 | $25,579,095 |
| Distributions reinvested | 273,637 | 2,227,116 | 556,852 | 4,373,846 |
| Repurchased | (1,608,260) | (13,058,174) | (4,728,050) | (37,135,590) |
| Net increase (decrease) | 831,484 | $6,797,939 | (916,644) | $(7,182,649) |
| Class B shares | | | | |
| Sold | 3,438 | $27,715 | 1,630 | $12,858 |
| Distributions reinvested | 2,326 | 18,931 | 6,958 | 54,635 |
| Repurchased | (23,772) | (193,040) | (144,706) | (1,131,435) |
| Net decrease | (18,008) | $(146,394) | (136,118) | $(1,063,942) |
| | SEMIANNUAL REPORT | JOHN HANCOCK High Yield Municipal Bond Fund | 31 |
| | Six Months Ended 11-30-19 | Year Ended 5-31-19 |
| | Shares | Amount | Shares | Amount |
| Class C shares | | | | |
| Sold | 169,477 | $1,376,089 | 379,942 | $2,979,915 |
| Distributions reinvested | 52,212 | 424,855 | 130,908 | 1,027,866 |
| Repurchased | (749,017) | (6,088,248) | (1,426,494) | (11,169,635) |
| Net decrease | (527,328) | $(4,287,304) | (915,644) | $(7,161,854) |
| Class I shares | | | | |
| Sold | 256,199 | $2,087,531 | 954,114 | $7,523,759 |
| Distributions reinvested | 36,107 | 294,338 | 57,078 | 449,282 |
| Repurchased | (167,617) | (1,362,945) | (448,952) | (3,521,310) |
| Net increase | 124,689 | $1,018,924 | 562,240 | $4,451,731 |
| Class R6 shares | | | | |
| Sold | 36,213 | $294,399 | 170,229 | $1,342,159 |
| Distributions reinvested | 5,087 | 41,489 | 9,688 | 76,269 |
| Repurchased | (20,760) | (169,071) | (143,696) | (1,122,195) |
| Net increase | 20,540 | $166,817 | 36,221 | $296,233 |
| Total net increase (decrease) | 431,377 | $3,549,982 | (1,369,945) | $(10,660,481) |
Affiliates of the fund owned 5% of shares of Class R6 on November 30, 2019. Such concentration of shareholders’ capital could have a material effect on the fund if such shareholders redeem from the fund.
Note 6—Purchase and sale of securities
Purchases and sales of securities, other than short-term investments, amounted to $25,764,498 and $21,261,961, respectively, for the six months ended November 30, 2019.
Note 7—Investment in affiliated underlying funds
The fund may invest in affiliated underlying funds that are managed by the Advisor and its affiliates. Information regarding the fund's fiscal year to date purchases and sales of the affiliated underlying funds as well as income and capital gains earned by the fund, if any, is as follows:
| | | | | | | | Dividends and distributions |
| Affiliate | Ending
share
amount | Beginning
value | Cost of
purchases | Proceeds
from shares
sold | Realized
gain
(loss) | Change in
unrealized
appreciation
(depreciation) | Income
distributions
received | Capital gain
distributions
received | Ending
value |
| John Hancock Collateral Trust | 251,587 | — | $16,157,330 | $(13,653,414) | $7,338 | $6,205 | $10,122 | — | $2,517,459 |
| 32 | JOHN HANCOCK High Yield Municipal Bond Fund | SEMIANNUAL REPORT | |
CONTINUATION OF INVESTMENT ADVISORY AND SUBADVISORY AGREEMENTS
Evaluation of Advisory and Subadvisory Agreements by the Board of Trustees
This section describes the evaluation by the Board of Trustees (the Board) of John Hancock Municipal Securities Trust (the Trust) of the Advisory Agreement (the Advisory Agreement) with John Hancock Investment Management, LLC (the Advisor, formerly John Hancock Advisers, LLC)) and the Subadvisory Agreement (the Subadvisory Agreement) with Manulife Investment Management (US) LLC (the Subadvisor, formerly John Hancock Asset Management a division of Manulife Asset Management (US) LLC), for John Hancock High Yield Municipal Bond Fund (the fund). The Advisory Agreement and Subadvisory Agreement are collectively referred to as the Agreements. Prior to the June 23-26, 2019 in person meeting at which the Agreements were approved, the Board also discussed and considered information regarding the proposed continuation of the Agreements at an in-person meeting held on May 28-30, 2019.
Approval of Advisory and Subadvisory Agreements
At in-person meetings held on June 23-26, 2019, the Board, including the Trustees who are not parties to any Agreement or considered to be interested persons of the Trust under the Investment Company Act of 1940, as amended (the 1940 Act) (the Independent Trustees), reapproved for an annual period the continuation of the Advisory Agreement between the Trust and the Advisor and the Subadvisory Agreement between the Advisor and the Subadvisor with respect to the fund.
In considering the Advisory Agreement and the Subadvisory Agreement, the Board received in advance of the meetings a variety of materials relating to the fund, the Advisor and the Subadvisor, including comparative performance, fee and expense information for a peer group of similar funds prepared by an independent third-party provider of fund data, performance information for an applicable benchmark index; and, with respect to the Subadvisor, comparative performance information for comparably managed accounts, as applicable, and other information provided by the Advisor and the Subadvisor regarding the nature, extent and quality of services provided by the Advisor and the Subadvisor under their respective Agreements, as well as information regarding the Advisor's revenues and costs of providing services to the fund and any compensation paid to affiliates of the Advisor. At the meetings at which the renewal of the Advisory Agreement and Subadvisory Agreement are considered, particular focus is given to information concerning fund performance, comparability of fees and total expenses, and profitability. However, the Board noted that the evaluation process with respect to the Advisor and the Subadvisor is an ongoing one. In this regard, the Board also took into account discussions with management and information provided to the Board (including its various committees) at prior meetings with respect to the services provided by the Advisor and the Subadvisor to the fund, including quarterly performance reports prepared by management containing reviews of investment results and prior presentations from the Subadvisor with respect to the fund. The information received and considered by the Board in connection with the May and June meetings and throughout the year was both written and oral. The Board noted the affiliation of the Subadvisor with the Advisor, noting any potential conflicts of interest. The Board also considered the nature, quality, and extent of non-advisory services, if any, to be provided to the fund by the Advisor's affiliates, including distribution services. The Board considered the Advisory Agreement and the Subadvisory Agreement separately in the course of its review. In doing so, the Board noted the respective roles of the Advisor and Subadvisor in providing services to the fund.
Throughout the process, the Board asked questions of and requested additional information from management. The Board is assisted by counsel for the Trust and the Independent Trustees are also separately assisted by independent legal counsel throughout the process. The Independent Trustees also received a memorandum from their independent
SEMIANNUAL REPORT | JOHN HANCOCK HIGH YIELD MUNICIPAL BOND FUND 33
legal counsel discussing the legal standards for their consideration of the proposed continuation of the Agreements and discussed the proposed continuation of the Agreements in private sessions with their independent legal counsel at which no representatives of management were present.
Approval of Advisory Agreement
In approving the Advisory Agreement with respect to the fund, the Board, including the Independent Trustees, considered a variety of factors, including those discussed below. The Board also considered other factors (including conditions and trends prevailing generally in the economy, the securities markets, and the industry) and did not treat any single factor as determinative, and each Trustee may have attributed different weights to different factors. The Board's conclusions may be based in part on its consideration of the advisory and subadvisory arrangements in prior years and on the Board's ongoing regular review of fund performance and operations throughout the year.
Nature, extent, and quality of services. Among the information received by the Board from the Advisor relating to the nature, extent, and quality of services provided to the fund, the Board reviewed information provided by the Advisor relating to its operations and personnel, descriptions of its organizational and management structure, and information regarding the Advisor's compliance and regulatory history, including its Form ADV. The Board also noted that on a regular basis it receives and reviews information from the Trust's Chief Compliance Officer (CCO) regarding the fund's compliance policies and procedures established pursuant to Rule 38a-1 under the 1940 Act. The Board observed that the scope of services provided by the Advisor, and of the undertakings required of the Advisor in connection with those services, including maintaining and monitoring its own and the fund's compliance programs, risk management programs, liquidity management programs and cybersecurity programs, had expanded over time as a result of regulatory, market and other developments. The Board considered that the Advisor is responsible for the management of the day-to-day operations of the fund, including, but not limited to, general supervision of and coordination of the services provided by the Subadvisor, and is also responsible for monitoring and reviewing the activities of the Subadvisor and third-party service providers. The Board also considered the significant risks assumed by the Advisor in connection with the services provided to the fund including entrepreneurial risk in sponsoring new funds and ongoing risks including investment, operational, enterprise, litigation, regulatory and compliance risks with respect to all funds.
In considering the nature, extent, and quality of the services provided by the Advisor, the Trustees also took into account their knowledge of the Advisor's management and the quality of the performance of the Advisor's duties, through Board meetings, discussions and reports during the preceding year and through each Trustee's experience as a Trustee of the Trust and of the other trusts in the John Hancock group of funds complex (the John Hancock Fund Complex).
In the course of their deliberations regarding the Advisory Agreement, the Board considered, among other things:
| | | | | | | | | |
| | | | | (a) | | | the skills and competency with which the Advisor has in the past managed the Trust's affairs and its subadvisory relationship, the Advisor's oversight and monitoring of the Subadvisor's investment performance and compliance programs, such as the Subadvisor's compliance with fund policies and objectives, review of brokerage matters, including with respect to trade allocation and best execution and the Advisor's timeliness in responding to performance issues; | |
| | | | | (b) | | | the background, qualifications and skills of the Advisor's personnel; | |
| | | | | (c) | | | the Advisor's compliance policies and procedures and its responsiveness to regulatory changes and fund industry developments; | |
SEMIANNUAL REPORT | JOHN HANCOCK HIGH YIELD MUNICIPAL BOND FUND 34
| | | | | | | | | |
| | | | | (d) | | | the Advisor's administrative capabilities, including its ability to supervise the other service providers for the fund, as well as the Advisor's oversight of any securities lending activity, its monitoring of class action litigation and collection of class action settlements on behalf of the fund, and bringing loss recovery actions on behalf of the fund; | |
| | | | | (e) | | | the financial condition of the Advisor and whether it has the financial wherewithal to provide a high level and quality of services to the fund; | |
| | | | | (f) | | | the Advisor's initiatives intended to improve various aspects of the Trust's operations and investor experience with the fund; and | |
| | | | | (g) | | | the Advisor's reputation and experience in serving as an investment advisor to the Trust and the benefit to shareholders of investing in funds that are part of a family of funds offering a variety of investments. | |
The Board concluded that the Advisor may reasonably be expected to continue to provide a high quality of services under the Advisory Agreement with respect to the fund.
Investment performance. In considering the fund's performance, the Board noted that it reviews at its regularly scheduled meetings information about the fund's performance results. In connection with the consideration of the Advisory Agreement, the Board:
| | | |
| | (a) | reviewed information prepared by management regarding the fund's performance; |
| | (b) | considered the comparative performance of an applicable benchmark index; |
| | (c) | considered the performance of comparable funds, if any, as included in the report prepared by an independent third-party provider of fund data; and |
| | (d) | took into account the Advisor's analysis of the fund's performance and its plans and recommendations regarding the Trust's subadvisory arrangements generally. |
The Board noted that while it found the data provided by the independent third-party generally useful it recognized its limitations, including in particular that the data may vary depending on the end date selected and the results of the performance comparisons may vary depending on the selection of the peer group. The Board noted that the fund underperformed its benchmark index and its peer group average for the one-, three-, five- and ten-year periods ended December 31, 2018. The Board took into account management's discussion of the fund's performance, including management's discussion of the reasons for the fund's recent underperformance relative to the peer group. The Board concluded that the fund's performance is being monitored and reasonably addressed, where appropriate.
Fees and expenses. The Board reviewed comparative information prepared by an independent third-party provider of fund data, including, among other data, the fund's contractual and net management fees (and subadvisory fees, to the extent available) and total expenses as compared to similarly situated investment companies deemed to be comparable to the fund in light of the nature, extent and quality of the management and advisory and subadvisory services provided by the Advisor and the Subadvisor. The Board considered the fund's ranking within a smaller group of peer funds chosen by the independent third-party provider, as well as the fund's ranking within a broader group of funds. In comparing the fund's contractual and net management fees to those of comparable funds, the Board noted that such fees include both advisory and administrative costs. The Board noted that net management fees and net total expenses for the fund are higher than the peer group median.
The Board took into account management's discussion of the fund's expenses. The Board also took into account management's discussion with respect to the overall management fee and the fees of the Subadvisor, including the
SEMIANNUAL REPORT | JOHN HANCOCK HIGH YIELD MUNICIPAL BOND FUND 35
amount of the advisory fee retained by the Advisor after payment of the subadvisory fee, in each case in light of the services rendered for those amounts and the risks undertaken by the Advisor. The Board also noted that the Advisor pays the subadvisory fee. In addition, the Board took into account that management had agreed to implement an overall fee waiver across the complex, including the fund, which is discussed further below. The Board also noted actions taken over the past several years to reduce the fund's operating expenses. The Board also noted that, in addition, the Advisor is currently waiving fees and/or reimbursing expenses with respect to the fund and that the fund has breakpoints in its contractual management fee schedule that reduce management fees as assets increase. The Board also noted that the fund's distributor, an affiliate of the Advisor, has agreed to waive a portion of its Rule 12b-1 fee for a share class of the fund. The Board noted that the fund has a voluntary fee waiver and/or expense reimbursement, which reduces certain expenses of the fund. The Board reviewed information provided by the Advisor concerning the investment advisory fee charged by the Advisor or one of its advisory affiliates to other clients (including other funds in the John Hancock Fund Complex) having similar investment mandates, if any. The Board considered any differences between the Advisor's and Subadvisor's services to the fund and the services they provide to other comparable clients or funds. The Board concluded that the advisory fee paid with respect to the fund is reasonable in light of the nature, extent and quality of the services provided to the fund under the Advisory Agreement.
Profitability/Fall out benefits. In considering the costs of the services to be provided and the profits to be realized by the Advisor and its affiliates (including the Subadvisor) from the Advisor's relationship with the Trust, the Board:
| | | | | | | | | |
| | | | | (a) | | | reviewed financial information of the Advisor; | |
| | | | | (b) | | | reviewed and considered information presented by the Advisor regarding the net profitability to the Advisor and its affiliates with respect to the fund; | |
| | | | | (c) | | | received and reviewed profitability information with respect to the John Hancock Fund Complex as a whole and with respect to the fund; | |
| | | | | (d) | | | received information with respect to the Advisor's allocation methodologies used in preparing the profitability data and considered that the Advisor hired an independent third-party consultant to provide an analysis of the Advisor's allocation methodologies; | |
| | | | | (e) | | | considered that the John Hancock insurance companies that are affiliates of the Advisor, as shareholders of the Trust directly or through their separate accounts, receive certain tax credits or deductions relating to foreign taxes paid and dividends received by certain funds of the Trust and noted that these tax benefits, which are not available to participants in qualified retirement plans under applicable income tax law, are reflected in the profitability information reviewed by the Board; | |
| | | | | (f) | | | considered that the Advisor also provides administrative services to the fund on a cost basis pursuant to an administrative services agreement; | |
| | | | | (g) | | | noted that affiliates of the Advisor provide transfer agency services and distribution services to the fund, and that the fund's distributor also receives Rule 12b-1 payments to support distribution of the fund; | |
| | | | | (h) | | | noted that the fund's Subadvisor is an affiliate of the Advisor; | |
| | | | | (i) | | | noted that the Advisor also derives reputational and other indirect benefits from providing advisory services to the fund; | |
| | | | | (j) | | | noted that the subadvisory fee for the fund is paid by the Advisor; | |
SEMIANNUAL REPORT | JOHN HANCOCK HIGH YIELD MUNICIPAL BOND FUND 36
| | | | | | | | | |
| | | | | (k) | | | considered the Advisor's ongoing costs and expenditures necessary to improve services, meet new regulatory and compliance requirements, and adapt to other challenges impacting the fund industry; and | |
| | | | | (l) | | | considered that the Advisor should be entitled to earn a reasonable level of profits in exchange for the level of services it provides to the fund and the risks that it assumes as Advisor, including entrepreneurial, operational, reputational, litigation and regulatory risk. | |
Based upon its review, the Board concluded that the level of profitability, if any, of the Advisor and its affiliates (including the Subadvisor) from their relationship with the fund was reasonable and not excessive.
Economies of scale. In considering the extent to which economies of scale would be realized as the fund grows and whether fee levels reflect these economies of scale for the benefit of fund shareholders, the Board:
| | | |
| | (a) | considered that the Advisor has contractually agreed to waive a portion of its management fee for certain funds of the John Hancock Fund Complex, including the fund (the participating portfolios) or otherwise reimburse the expenses of the participating portfolios (the reimbursement). This waiver is based upon aggregate net assets of all the participating portfolios. The amount of the reimbursement is calculated daily and allocated among all the participating portfolios in proportion to the daily net assets of each fund; |
| | (b) | reviewed the fund's advisory fee structure and concluded that: (i) the fund's fee structure contains breakpoints at the subadvisory fee level and that such breakpoints are reflected as breakpoints in the advisory fees for the fund; and (ii) although economies of scale cannot be measured with precision, these arrangements permit shareholders of the fund to benefit from economies of scale if the fund grows. The Board also took into account management's discussion of the fund's advisory fee structure; and |
| | (c) | the Board also considered the effect of the fund's growth in size on its performance and fees. The Board also noted that if the fund's assets increase over time, the fund may realize other economies of scale. |
Approval of Subadvisory Agreement
In making its determination with respect to approval of the Subadvisory Agreement, the Board reviewed:
| | | |
| | (1) | information relating to the Subadvisor's business, including current subadvisory services to the Trust (and other funds in the John Hancock Fund Complex); |
| | (2) | the historical and current performance of the fund and comparative performance information relating to an applicable benchmark index and comparable funds; and |
| | (3) | the subadvisory fee for the fund, including any breakpoints, and to the extent available, comparable fee information prepared by an independent third-party provider of fund data. |
Nature, extent, and quality of services. With respect to the services provided by the Subadvisor, the Board received information provided to the Board by the Subadvisor, including the Subadvisor's Form ADV, as well as took into account information presented throughout the past year. The Board considered the Subadvisor's current level of staffing and its overall resources, as well as received information relating to the Subadvisor's compensation program. The Board reviewed the Subadvisor's history and investment experience, as well as information regarding the qualifications, background, and responsibilities of the Subadvisor's investment and compliance personnel who
SEMIANNUAL REPORT | JOHN HANCOCK HIGH YIELD MUNICIPAL BOND FUND 37
provide services to the fund. The Board also considered, among other things, the Subadvisor's compliance program and any disciplinary history. The Board also considered the Subadvisor's risk assessment and monitoring process. The Board reviewed the Subadvisor's regulatory history, including whether it was involved in any regulatory actions or investigations as well as material litigation, and any settlements and amelioratory actions undertaken, as appropriate. The Board noted that the Advisor conducts regular, periodic reviews of the Subadvisor and its operations, including regarding investment processes and organizational and staffing matters. The Board also noted that the Trust's CCO and his staff conduct regular, periodic compliance reviews with the Subadvisor and present reports to the Independent Trustees regarding the same, which includes evaluating the regulatory compliance systems of the Subadvisor and procedures reasonably designed to assure compliance with the federal securities laws. The Board also took into account the financial condition of the Subadvisor.
The Board considered the Subadvisor's investment process and philosophy. The Board took into account that the Subadvisor's responsibilities include the development and maintenance of an investment program for the fund that is consistent with the fund's investment objective, the selection of investment securities and the placement of orders for the purchase and sale of such securities, as well as the implementation of compliance controls related to performance of these services. The Board also received information with respect to the Subadvisor's brokerage policies and practices, including with respect to best execution and soft dollars.
Subadvisor compensation. In considering the cost of services to be provided by the Subadvisor and the profitability to the Subadvisor of its relationship with the fund, the Board noted that the fees under the Subadvisory Agreement are paid by the Advisor and not the fund. The Board also received information and took into account any other potential conflicts of interest the Advisor might have in connection with the Subadvisory Agreement.
In addition, the Board considered other potential indirect benefits that the Subadvisor and its affiliates may receive from the Subadvisor's relationship with the fund, such as the opportunity to provide advisory services to additional funds in the John Hancock Fund Complex and reputational benefits.
Subadvisory fees. The Board considered that the fund pays an advisory fee to the Advisor and that, in turn, the Advisor pays a subadvisory fee to the Subadvisor. As noted above, the Board also considered the fund's subadvisory fees as compared to similarly situated investment companies deemed to be comparable to the fund as included in the report prepared by the independent third-party provider of fund data, to the extent available. The Board also noted that the limited size of the Lipper peer group was not sufficient for comparative purposes. The Board also took into account the subadvisory fees paid by the Advisor to the Subadvisor with respect to the fund and compared them to fees charged by the Subadvisor to manage other subadvised portfolios and portfolios not subject to regulation under the 1940 Act, as applicable.
Subadvisor performance. As noted above, the Board considered the fund's performance as compared to the fund's peer group and the benchmark index and noted that the Board reviews information about the fund's performance results at its regularly scheduled meetings. The Board noted the Advisor's expertise and resources in monitoring the performance, investment style and risk-adjusted performance of the Subadvisor. The Board was mindful of the Advisor's focus on the Subadvisor's performance. The Board also noted the Subadvisor's long-term performance record for similar accounts, as applicable.
The Board's decision to approve the Subadvisory Agreement was based on a number of determinations, including the following:
| | | | | | | | | |
| | | | | (1) | | | the Subadvisor has extensive experience and demonstrated skills as a manager; | |
| | | | | (2) | | | the performance of the fund is being monitored and reasonably addressed, where appropriate; | |
SEMIANNUAL REPORT | JOHN HANCOCK HIGH YIELD MUNICIPAL BOND FUND 38
| | | | | | | | | |
| | | | | (3) | | | the subadvisory fee is reasonable in relation to the level and quality of services being provided under the Subadvisory Agreement; and | |
| | | | | (4) | | | noted that the subadvisory fees are paid by the Advisor not the fund and that the subadvisory fee breakpoints are reflected as breakpoints in the advisory fees for the fund in order to permit shareholders to benefit from economies of scale if the fund grows. | |
| | * * * | |
Based on the Board's evaluation of all factors that the Board deemed to be material, including those factors described above, the Board, including the Independent Trustees, concluded that renewal of the Advisory Agreement and the Subadvisory Agreement would be in the best interest of the fund and its shareholders. Accordingly, the Board, and the Independent Trustees voting separately, approved the Advisory Agreement and Subadvisory Agreement for an additional one-year period.
SEMIANNUAL REPORT | JOHN HANCOCK HIGH YIELD MUNICIPAL BOND FUND 39
| | |
Trustees
Hassell H. McClellan,Chairperson
Steven R. Pruchansky,Vice Chairperson
Andrew G. Arnott†
Charles L. Bardelis*
James R. Boyle
Peter S. Burgess*
William H. Cunningham
Grace K. Fey
Marianne Harrison†
Deborah C. Jackson
James M. Oates*
Gregory A. Russo
Officers
Andrew G. Arnott
President
Francis V. Knox, Jr.
Chief Compliance Officer
Charles A. Rizzo
Chief Financial Officer
Salvatore Schiavone
Treasurer
Christopher (Kit) Sechler
Secretary and Chief Legal Officer
| Investment advisor
John Hancock Investment Management LLC
Subadvisor
Manulife Investment Management (US) LLC
Portfolio Managers
Dennis DiCicco
Jeffrey N. Given, CFA
Principal distributor
John Hancock Investment Management Distributors LLC
Custodian
State Street Bank and Trust Company
Transfer agent
John Hancock Signature Services, Inc.
Legal counsel
K&L Gates LLP
|
* Member of the Audit Committee
† Non-Independent Trustee
The fund's proxy voting policies and procedures, as well as the fund proxy voting record for the most recent twelve-month period ended June 30, are available free of charge on the Securities and Exchange Commission (SEC) website at sec.gov or on our website.
All of the fund's holdings as of the end of the third month of every fiscal quarter are filed with the SEC on Form N-PORT within 60 days of the end of the fiscal quarter. The fund's Form N-PORT filings are available on our website and the SEC's website, sec.gov.
We make this information on your fund, as well asmonthly portfolio holdings, and other fund details available on our website at jhinvestments.com or by calling 800-225-5291.
| | | | |
| | You can also contact us: |
| | 800-225-5291
jhinvestments.com | Regular mail:
John Hancock Signature Services, Inc.
P.O. Box 55913
Boston, MA 02205-5913
| Express mail:
John Hancock Signature Services, Inc.
2000 Crown Colony Drive
Suite 55913
Quincy, MA 02169-0953
|
SEMIANNUAL REPORT | JOHN HANCOCK HIGH YIELD MUNICIPAL BOND FUND 40
John Hancock family of funds
| | | |
DOMESTIC EQUITY FUNDS
Blue Chip Growth
Classic Value
Disciplined Value
Disciplined Value Mid Cap
Equity Income
Financial Industries
Fundamental All Cap Core
Fundamental Large Cap Core
New Opportunities
Regional Bank
Small Cap Core
Small Cap Growth
Small Cap Value
U.S. Global Leaders Growth
U.S. Quality Growth
GLOBAL AND INTERNATIONAL EQUITY FUNDS
Disciplined Value International
Emerging Markets
Emerging Markets Equity
Fundamental Global Franchise
Global Equity
Global Shareholder Yield
Global Thematic Opportunities
International Dynamic Growth
International Growth
International Small Company
| | INCOME FUNDS
Bond
California Tax-Free Income
Emerging Markets Debt
Floating Rate Income
Government Income
High Yield
High Yield Municipal Bond
Income
Investment Grade Bond
Money Market
Short Duration Bond
Short Duration Credit Opportunities
Strategic Income Opportunities
Tax-Free Bond
ALTERNATIVE AND SPECIALTY FUNDS
Absolute Return Currency
Alternative Asset Allocation
Alternative Risk Premia
Disciplined Alternative Yield
Diversified Macro
Infrastructure
Multi-Asset Absolute Return
Seaport Long/Short
|
A fund's investment objectives, risks, charges, and expenses should be considered carefully before investing. The prospectus contains this and other important information about the fund. To obtain a prospectus, contact your financial professional, call John Hancock Investment Management at 800-225-5291, or visit our website at jhinvestments.com. Please read the prospectus carefully before investing or sending money.
| | | |
ASSET ALLOCATION
Balanced
Income Allocation
Multi-Index Lifetime Portfolios
Multi-Index Preservation Portfolios
Multimanager Lifestyle Portfolios
Multimanager Lifetime Portfolios
Retirement Income 2040
EXCHANGE-TRADED FUNDS
John Hancock Multifactor Consumer Discretionary ETF
John Hancock Multifactor Consumer Staples ETF
John Hancock Multifactor Developed International ETF
John Hancock Multifactor Emerging Markets ETF
John Hancock Multifactor Energy ETF
John Hancock Multifactor Financials ETF
John Hancock Multifactor Healthcare ETF
John Hancock Multifactor Industrials ETF
John Hancock Multifactor Large Cap ETF
John Hancock Multifactor Materials ETF
John Hancock Multifactor Media and
Communications ETF
John Hancock Multifactor Mid Cap ETF
John Hancock Multifactor Small Cap ETF
John Hancock Multifactor Technology ETF
John Hancock Multifactor Utilities ETF
| | ENVIRONMENTAL, SOCIAL, AND
GOVERNANCE FUNDS
ESG All Cap Core
ESG Core Bond
ESG International Equity
ESG Large Cap Core
CLOSED-END FUNDS
Financial Opportunities
Hedged Equity & Income
Income Securities Trust
Investors Trust
Preferred Income
Preferred Income II
Preferred Income III
Premium Dividend
Tax-Advantaged Dividend Income
Tax-Advantaged Global Shareholder Yield
|
John Hancock Multifactor ETF shares are bought and sold at market price (not NAV), and are not individually redeemed
from the fund. Brokerage commissions will reduce returns.
John Hancock ETFs are distributed by Foreside Fund Services, LLC, and are subadvised by Dimensional Fund Advisors LP.
Foreside is not affiliated with John Hancock Investment Management Distributors LLC or Dimensional Fund Advisors LP.
Dimensional Fund Advisors LP receives compensation from John Hancock in connection with licensing rights to the
John Hancock Dimensional indexes. Dimensional Fund Advisors LP does not sponsor, endorse, or sell, and makes no
representation as to the advisability of investing in, John Hancock Multifactor ETFs.
John Hancock Investment Management
A trusted brand
John Hancock Investment Management is a premier asset manager
representing one of America's most trusted brands, with a heritage of
financial stewardship dating back to 1862. Helping our shareholders
pursue their financial goals is at the core of everything we do. It's why
we support the role of professional financial advice and operate with
the highest standards of conduct and integrity.
A better way to invest
We serve investors globally through a unique multimanager approach:
We search the world to find proven portfolio teams with specialized
expertise for every strategy we offer, then we apply robust investment
oversight to ensure they continue to meet our uncompromising
standards and serve the best interests of our shareholders.
Results for investors
Our unique approach to asset management enables us to provide
a diverse set of investments backed by some of the world's best
managers, along with strong risk-adjusted returns across asset classes.
John Hancock Investment Management Distributors LLC n Member FINRA, SIPC
200 Berkeley Street n Boston, MA 02116-5010 n 800-225-5291 n jhinvestments.com
This report is for the information of the shareholders of John Hancock High Yield Municipal Bond Fund. It is not authorized for distribution to prospective investors unless preceded or accompanied by a prospectus.
John Hancock
Tax-Free Bond Fund
Semiannual report 11/30/19
Beginning on January 1, 2021, as permitted by regulations adopted by the Securities and Exchange Commission, paper copies of the fund's shareholder reports like this one will no longer be sent by mail, unless you specifically request paper copies of the reports from the fund or from your financial intermediary. Instead, the reports will be made available on a website, and you will be notified by mail each time a report is posted and provided with a website link to access the report.
If you already elected to receive shareholder reports electronically, you will not be affected by this change, and you do not need to take any action. You may elect to receive shareholder reports and other communications electronically by calling John Hancock Investment Management at 800-225-5291 (Class A, Class B and Class C shares) or 888-972-8696 (Class I and Class R6 shares) or by contacting your financial intermediary.
You may elect to receive all reports in paper, free of charge, at any time. You can inform John Hancock Investment Management or your financial intermediary that you wish to continue receiving paper copies of your shareholder reports by following the instructions listed above. Your election to receive reports in paper will apply to all funds held with John Hancock Investment Management or your financial intermediary.
A message to shareholders
Dear shareholder,
It was a volatile time for bond investors during the six months ended November 30, 2019, although most market segments delivered attractive absolute returns for the period. Uncertainty surrounding trade with China, the impeachment inquiry against President Trump, and the broader health of the global economy led to some dramatic swings in performance. The trend in longer-term yields was decidedly downward, leading to several periods where the U.S. Treasury yield curve was inverted. Three times in 2019—in July, September, and October—the U.S. Federal Reserve stepped in with reductions in short-term interest rates in an attempt to shore up the economy.
While the economic fundamentals in the United States appear fairly solid—with a strong labor market, low inflation and interest rates, and a confident consumer base—the outlook for the global economy is less certain. Subsequent to period end, President Trump was impeached by the House of Representatives; it remains to be seen how the Senate and financial markets will react. We feel confident in saying there are sure to be patches of market turbulence in the months ahead. As always, your best resource in unpredictable markets is your financial advisor, who can help position your portfolio so that it's sufficiently diversified to meet your long-term objectives and to withstand the inevitable bouts of market volatility along the way.
On behalf of everyone at John Hancock Investment Management, I'd like to take this opportunity to welcome new shareholders and thank existing shareholders for the continued trust you've placed in us.
Sincerely,
Andrew G. Arnott
President and CEO,
John Hancock Investment Management
Head of Wealth and Asset Management,
United States and Europe
This commentary reflects the CEO's views as of this report's period end and are subject to change at any time. Diversification does not guarantee investment returns and does not eliminate risk of loss. All investments entail risks, including the possible loss of principal. For more up-to-date information, you can visit our website at jhinvestments.com.
John Hancock
Tax-Free Bond Fund
Table of contents
| | | |
| 2 | | Your fund at a glance |
| 3 | | Portfolio summary |
| 5 | | A look at performance |
| 7 | | Your expenses |
| 9 | | Fund's investments |
| 21 | | Financial statements |
| 24 | | Financial highlights |
| 29 | | Notes to financial statements |
| 36 | | Continuation of investment advisory and subadvisory agreements |
| 43 | | More information |
SEMIANNUAL REPORT | JOHN HANCOCK TAX-FREE BOND FUND 1
INVESTMENT OBJECTIVE
The fund seeks as high a level of interest income exempt from federal income tax as is consistent with preservation of capital.
AVERAGE ANNUAL TOTAL RETURNS AS OF 11/30/19 (%)
The Bloomberg Barclays Municipal Bond Index is an unmanaged index representative of the tax-exempt bond market.
It is not possible to invest directly in an index. Index figures do not reflect expenses or sales charges, which would result in lower returns.
Figures from Morningstar, Inc. include reinvested distributions and do not take into account sales charges. Actual load-adjusted performance is lower.
The past performance shown here reflects reinvested distributions and the beneficial effect of any expense reductions, and does not guarantee future results. Returns for periods shorter than one year are cumulative. Performance of the other share classes will vary based on the difference in the fees and expenses of those classes. Shares will fluctuate in value and, when redeemed, may be worth more or less than their original cost. Current month-end performance may be lower or higher than the performance cited, and can be found at jhinvestments.com or by calling 800-225-5291. For further information on the fund's objectives, risks, and strategy, see the fund's prospectus.
SEMIANNUAL REPORT | JOHN HANCOCK TAX-FREE BOND FUND 2
PORTFOLIO COMPOSITION AS OF 11/30/19 (%)
QUALITY COMPOSITION AS OF 11/30/19 (%)
A note about risks
The fund is subject to various risks as described in the fund's prospectus. For more information, please refer to the "Principal risks" section of the prospectus.
SEMIANNUAL REPORT | JOHN HANCOCK TAX-FREE BOND FUND 3
SECTOR COMPOSITION AS OF 11/30/19 (%)
SEMIANNUAL REPORT | JOHN HANCOCK TAX-FREE BOND FUND 4
TOTAL RETURNS FOR THE PERIOD ENDED NOVEMBER 30, 2019
| | | | | | | | | | | | | | |
Average annual
total returns (%)
with maximum sales charge | | Cumulative
total returns (%)
with maximum sales charge | | SEC
30-day
yield (%)
subsidized | | SEC
30-day
yield (%)
unsubsidized1 | | Tax-
equivalent
subsidized
yield (%)2 |
| | 1-year | 5-year | 10-year | | 6-month | 5-year | 10-year | | as of
11-30-19 | | as of
11-30-19 | | as of
11-30-19 |
| Class A | 4.37 | 2.39 | 3.72 | | -1.63 | 12.52 | 44.12 | | 1.56 | | 1.45 | | 2.64 |
| Class B | 2.88 | 2.09 | 3.53 | | -2.91 | 10.92 | 41.42 | | 0.88 | | 0.77 | | 1.49 |
| Class C | 6.88 | 2.45 | 3.37 | | 1.09 | 12.87 | 39.33 | | 0.88 | | 0.77 | | 1.49 |
| Class I3,4 | 8.84 | 3.33 | 4.20 | | 2.55 | 17.77 | 50.92 | | 1.77 | | 1.76 | | 2.99 |
| Class R63,4 | 8.98 | 3.30 | 4.19 | | 2.56 | 17.65 | 50.76 | | 1.80 | | 1.79 | | 3.04 |
| Index† | 8.49 | 3.57 | 4.34 | | 2.39 | 19.17 | 53.00 | | — | | — | | — |
Performance figures assume all distributions have been reinvested. Figures reflect maximum sales charges on Class A shares of 4.0% and the applicable contingent deferred sales charge (CDSC) on Class B and Class C shares. The returns for Class A shares have been adjusted to reflect the reduction in the maximum sales charge from 4.5% to 4.0%, effective 2-3-14. The Class B shares' CDSC declines annually between years 1 to 6 according to the following schedule: 5%, 4%, 3%, 3%, 2%, 1%. No sales charge will be assessed after the sixth year. Class C shares sold within one year of purchase are subject to a 1% CDSC. Sales charges are not applicable to Class I and Class R6 shares.
The expense ratios of the fund, both net (including any fee waivers and/or expense limitations) and gross (excluding any fee waivers and/or expense limitations), are set forth according to the most recent publicly available prospectus for the fund and may differ from those disclosed in the Financial highlights tables in this report.Net expenses reflect contractual expense limitations in effect until September 30, 2020 and are subject to change. Had the contractual fee waivers and expense limitations not been in place, gross expenses would apply. The expense ratios are as follows:
| | | | | | |
| | Class A | Class B | Class C | Class I | Class R6 |
| Gross (%) | 0.93 | 1.68 | 1.68 | 0.68 | 0.65 |
| Net (%) | 0.82 | 1.57 | 1.57 | 0.67 | 0.64 |
Please refer to the most recent prospectus and annual or semiannual report for more information on expenses and any expense limitation arrangements for each class.
The returns reflect past results and should not be considered indicative of future performance. The return and principal value of an investment will fluctuate so that shares, when redeemed, may be worth more or less than their original cost. Due to market volatility and other factors, the fund's current performance may be higher or lower than the performance shown. For current to the most recent month-end performance data, please call 800-225-5291 or visit the fund's website at jhinvestments.com.
The performance table above and the chart on the next page do not reflect the deduction of taxes that a shareholder would pay on fund distributions or the redemption of fund shares. The fund's performance results reflect any applicable fee waivers or expense reductions, without which the expenses would increase and results would have been less favorable.
| † | Index is the Bloomberg Barclays Municipal Bond Index. |
See the following page for footnotes.
SEMIANNUAL REPORT | JOHN HANCOCK TAX-FREE BOND FUND 5
This chart and table show what happened to a hypothetical $10,000 investment in John Hancock Tax-Free Bond Fund for the share classes and periods indicated, assuming all distributions were reinvested. For comparison, we've shown the same investment in the Bloomberg Barclays Municipal Bond Index.
| | | | | |
| | Start date | With maximum
sales charge ($) | Without
sales charge ($) | Index ($) |
| Class B5 | 11-30-09 | 14,142 | 14,142 | 15,300 |
| Class C5 | 11-30-09 | 13,933 | 13,933 | 15,300 |
| Class I3,4 | 11-30-09 | 15,092 | 15,092 | 15,300 |
| Class R63,4 | 11-30-09 | 15,076 | 15,076 | 15,300 |
The values shown in the chart for Class A shares with maximum sales charge have been adjusted to reflect the reduction in the Class A shares' maximum sales charge from 4.5% to 4.0%, which became effective on 2-3-14.
The Bloomberg Barclays Municipal Bond Index is an unmanaged index representative of the tax-exempt bond market.
It is not possible to invest directly in an index. Index figures do not reflect expenses or sales charges, which would result in lower returns.
Footnotes related to performance pages
| 1 | Unsubsidized yield reflects what the yield would have been without the effect of reimbursements and waivers. |
| 2 | Tax-equivalent yield is based on the maximum federal income tax rate of 40.8%. |
| 3 | Class I shares and Class R6 shares were first offered on 2-13-17 and 8-30-17, respectively. Returns prior to these dates are those of Class A shares that have not been adjusted for class-specific expenses; otherwise, returns would vary. |
| 4 | For certain type of investors, as described in the fund's prospectus. |
| 5 | The contingent deferred sales charge is not applicable. |
SEMIANNUAL REPORT | JOHN HANCOCK TAX-FREE BOND FUND 6
These examples are intended to help you understand your ongoing operating expenses of investing in the fund so you can compare these costs with the ongoing costs of investing in other mutual funds.
Understanding fund expenses
As a shareholder of the fund, you incur two types of costs:
■Transaction costs,which include sales charges (loads) on purchases or redemptions (varies by share class), minimum account fee charge, etc.
■Ongoing operating expenses, including management fees, distribution and service fees (if applicable), and other fund expenses.
We are presenting only your ongoing operating expenses here.
Actual expenses/actual returns
The first line of each share class in the table on the following page is intended to provide information about the fund’s actual ongoing operating expenses, and is based on the fund’s actual return. It assumes an account value of $1,000.00 on June 1, 2019, with the same investment held until November 30, 2019.
Together with the value of your account, you may use this information to estimate the operating expenses that you paid over the period. Simply divide your account value at November 30, 2019, by $1,000.00, then multiply it by the “expenses paid” for your share class from the table. For example, for an account value of $8,600.00, the operating expenses should be calculated as follows:
Hypothetical example for comparison purposes
The second line of each share class in the table on the following page allows you to compare the fund’s ongoing operating expenses with those of any other fund. It provides an example of the fund’s hypothetical account values and hypothetical expenses based on each class’s actual expense ratio and an assumed 5% annualized return before expenses (which is not the class’s actual return). It assumes an account value of $1,000.00 on June 1, 2019, with the same investment held until November 30, 2019. Look in any other fund shareholder report to find its hypothetical example and you will be able to compare these expenses. Please remember that these hypothetical account values and expenses may not be used to estimate the actual ending account balance or expenses you paid for the period.
| | SEMIANNUAL REPORT | JOHN HANCOCK TAX-FREE BOND FUND | 7 |
Remember, these examples do not include any transaction costs, therefore, these examples will not help you to determine the relative total costs of owning different funds. If transaction costs were included, your expenses would have been higher. See the prospectus for details regarding transaction costs.
SHAREHOLDER EXPENSE EXAMPLE CHART
| | | Account
value on
6-1-2019 | Ending
value on
11-30-2019 | Expenses
paid during
period ended
11-30-20191 | Annualized
expense
ratio |
| Class A | Actual expenses/actual returns | $1,000.00 | $1,024.80 | $4.15 | 0.82% |
| | Hypothetical example | 1,000.00 | 1,020.90 | 4.14 | 0.82% |
| Class B | Actual expenses/actual returns | 1,000.00 | 1,020.90 | 7.93 | 1.57% |
| | Hypothetical example | 1,000.00 | 1,017.20 | 7.92 | 1.57% |
| Class C | Actual expenses/actual returns | 1,000.00 | 1,020.90 | 7.93 | 1.57% |
| | Hypothetical example | 1,000.00 | 1,017.20 | 7.92 | 1.57% |
| Class I | Actual expenses/actual returns | 1,000.00 | 1,025.50 | 3.39 | 0.67% |
| | Hypothetical example | 1,000.00 | 1,021.70 | 3.39 | 0.67% |
| Class R6 | Actual expenses/actual returns | 1,000.00 | 1,025.60 | 3.24 | 0.64% |
| | Hypothetical example | 1,000.00 | 1,021.80 | 3.23 | 0.64% |
| 1 | Expenses are equal to the annualized expense ratio, multiplied by the average account value over the period, multiplied by 183/366 (to reflect the one-half year period). |
| 8 | JOHN HANCOCK TAX-FREE BOND FUND | SEMIANNUAL REPORT | |
AS OF 11-30-19 (unaudited)
| | Rate (%) | Maturity date | | Par value^ | Value |
| Municipal bonds 99.3% | | | | | $500,237,020 |
| (Cost $465,033,912) | | | | | |
| Alaska 0.8% | | | | | 3,877,743 |
Alaska Municipal Bond Bank Authority
Series 4, AMT (A) | 5.000 | 12-01-34 | | 2,165,000 | 2,526,923 |
Alaska Municipal Bond Bank Authority
Series 4, AMT (A) | 5.000 | 12-01-35 | | 1,160,000 | 1,350,820 |
| Arizona 1.2% | | | | | 5,872,910 |
Arizona Industrial Development Authority
Equitable School Revolving Fund, Series A | 5.000 | 11-01-44 | | 1,000,000 | 1,194,840 |
City of Phoenix
Civic Plaza, Series B (A) | 5.500 | 07-01-28 | | 1,000,000 | 1,294,640 |
Glendale Industrial Development Authority
Senior Royal Oaks Life Care Community | 5.000 | 05-15-39 | | 3,000,000 | 3,383,430 |
| California 10.0% | | | | | 50,268,931 |
ABAG Finance Authority for Nonprofit Corps.
Sharp HealthCare, Series A | 5.000 | 08-01-43 | | 2,000,000 | 2,228,300 |
California County Tobacco Securitization Agency
Kern County Tobacco Funding Corp. | 5.000 | 06-01-40 | | 1,000,000 | 1,061,030 |
California Municipal Finance Authority
LINXS APM Project, AMT | 5.000 | 12-31-43 | | 1,000,000 | 1,170,990 |
California Municipal Finance Authority
LINXS APM Project, Series B, AMT | 5.000 | 06-01-48 | | 1,000,000 | 1,163,840 |
California Municipal Finance Authority
Paradise Valley Estates Project, Series A (A) | 5.000 | 01-01-49 | | 1,500,000 | 1,776,000 |
California Pollution Control Financing Authority
Waste Management, Inc., Series A1, AMT | 3.375 | 07-01-25 | | 2,000,000 | 2,166,160 |
California State Public Works Board
Lease Revenue, Series B | 5.000 | 10-01-39 | | 1,000,000 | 1,153,010 |
California State Public Works Board
Various Correctional Facilities, Series A | 5.000 | 09-01-39 | | 1,845,000 | 2,122,857 |
City of San Francisco Public Utilities Commission
Green Bonds, Series A | 5.000 | 11-01-45 | | 1,500,000 | 1,747,125 |
Foothill-Eastern Transportation Corridor Agency
Highway Revenue Tolls, Series A | 5.750 | 01-15-46 | | 3,000,000 | 3,457,020 |
Golden State Tobacco Securitization Corp.
Series A-2 | 5.000 | 06-01-47 | | 5,500,000 | 5,656,365 |
M-S-R Energy Authority
Natural Gas Revenue, Series B | 6.500 | 11-01-39 | | 1,000,000 | 1,547,870 |
M-S-R Energy Authority
Natural Gas Revenue, Series B | 7.000 | 11-01-34 | | 2,500,000 | 3,797,300 |
River Islands Public Financing Authority
Community Facilities District, Series 2003-1 | 5.500 | 09-01-45 | | 2,000,000 | 2,168,660 |
San Bernardino County
Medical Center Financing Project | 5.500 | 08-01-22 | | 2,500,000 | 2,727,225 |
San Diego Unified School District
Series I, GO (B) | 3.706 | 07-01-39 | | 1,250,000 | 606,550 |
| SEE NOTES TO FINANCIAL STATEMENTS | SEMIANNUAL REPORT | JOHN HANCOCK TAX-FREE BOND FUND | 9 |
| | Rate (%) | Maturity date | | Par value^ | Value |
| California (continued) | | | | | |
San Francisco City & County Airport Commission International Airport
Series A, AMT | 5.000 | 05-01-49 | | 3,000,000 | $3,619,500 |
San Joaquin Hills Transportation Corridor Agency
Highway Revenue Tolls, Series A | 5.000 | 01-15-44 | | 4,500,000 | 5,092,830 |
| State of California, GO | 5.000 | 02-01-38 | | 5,375,000 | 5,811,719 |
Stockton Public Financing Authority
Delta Water Supply Project, Series A | 6.250 | 10-01-40 | | 1,000,000 | 1,194,580 |
| Colorado 4.9% | | | | | 24,550,214 |
City & County of Denver
Series A | 4.000 | 08-01-46 | | 3,000,000 | 3,238,530 |
City & County of Denver
United Airlines, Inc., Project, AMT | 5.000 | 10-01-32 | | 3,500,000 | 3,819,655 |
Colorado Health Facilities Authority
Series A | 5.250 | 05-15-37 | | 500,000 | 572,805 |
Colorado Health Facilities Authority
Series A | 5.250 | 05-15-47 | | 1,125,000 | 1,263,296 |
Denver Convention Center Hotel Authority
Senior | 5.000 | 12-01-40 | | 2,500,000 | 2,836,325 |
Park Creek Metropolitan District
Senior Limited Property Tax Supported, Series A | 5.000 | 12-01-45 | | 4,265,000 | 4,796,248 |
Public Authority for Colorado Energy
Natural Gas Revenue | 6.250 | 11-15-28 | | 3,500,000 | 4,468,485 |
Regional Transportation District
Denver Transit Partners | 6.000 | 01-15-41 | | 2,000,000 | 2,045,620 |
Villages at Castle Rock Metropolitan District No. 6
Cobblestone Ranch Project, Series 2, GO (B) | 6.777 | 12-01-37 | | 5,000,000 | 1,509,250 |
| Connecticut 1.4% | | | | | 7,286,070 |
State of Connecticut Bradley International Airport CFC Revenue
Ground Transportation Center Project, AMT | 5.000 | 07-01-49 | | 1,500,000 | 1,795,920 |
State of Connecticut Special Tax Revenue
Series B | 5.000 | 10-01-36 | | 1,000,000 | 1,220,120 |
State of Connecticut Special Tax Revenue
Series B | 5.000 | 10-01-37 | | 1,000,000 | 1,214,720 |
University of Connecticut
Series A | 5.000 | 11-01-35 | | 1,000,000 | 1,224,050 |
University of Connecticut
Series A | 5.000 | 11-01-36 | | 1,500,000 | 1,831,260 |
| Delaware 0.3% | | | | | 1,435,650 |
Delaware State Economic Development Authority
Acts Retirement Communities | 5.000 | 11-15-48 | | 1,250,000 | 1,435,650 |
| District of Columbia 4.1% | | | | | 20,525,519 |
District of Columbia
KIPP DC Project | 4.000 | 07-01-39 | | 750,000 | 818,678 |
| 10 | JOHN HANCOCK TAX-FREE BOND FUND | SEMIANNUAL REPORT | SEE NOTES TO FINANCIAL STATEMENTS |
| | Rate (%) | Maturity date | | Par value^ | Value |
| District of Columbia (continued) | | | | | |
District of Columbia
KIPP DC Project | 4.000 | 07-01-44 | | 1,000,000 | $1,080,390 |
District of Columbia Tobacco Settlement Financing Corp.
Asset Backed Bonds | 6.500 | 05-15-33 | | 3,080,000 | 3,505,594 |
Metropolitan Washington DC Airports Authority
Highway Revenue Tolls, Series B (A)(B) | 2.860 | 10-01-33 | | 6,565,000 | 4,418,836 |
Metropolitan Washington DC Airports Authority
Highway Revenue Tolls, Series B (A)(B) | 2.949 | 10-01-35 | | 6,470,000 | 4,056,043 |
Metropolitan Washington DC Airports Authority
Highway Revenue Tolls, Series B (A)(B) | 2.984 | 10-01-36 | | 7,250,000 | 4,386,903 |
Metropolitan Washington DC Airports Authority
Highway Revenue Tolls, Series C (A) | 6.500 | 10-01-41 | | 1,750,000 | 2,259,075 |
| Florida 4.3% | | | | | 21,601,297 |
Alachua County Health Facilities Authority
Shands Teaching Hospital & Clinics | 5.000 | 12-01-44 | | 2,000,000 | 2,241,980 |
City of Atlantic Beach FL
Fleet Landing Project, Series A | 5.000 | 11-15-48 | | 1,000,000 | 1,133,080 |
City of Atlantic Beach FL
Fleet Landing Project, Series B-2 | 3.000 | 11-15-23 | | 1,250,000 | 1,256,250 |
Florida Development Finance Corp.
Waste Pro USA, Inc., Project, AMT (C) | 5.000 | 05-01-29 | | 1,015,000 | 1,116,439 |
Hillsborough County Aviation Authority
PFC Subordinated Tampa International Airport, AMT | 5.000 | 10-01-48 | | 2,000,000 | 2,372,420 |
Hillsborough County Aviation Authority
Tampa International Airport, Series A | 5.000 | 10-01-44 | | 1,250,000 | 1,411,525 |
Miami Beach Redevelopment Agency
City Center (A) | 5.000 | 02-01-44 | | 2,500,000 | 2,811,850 |
Miami-Dade County Health Facilities Authority
Nicklaus Children's Hospital | 5.000 | 08-01-47 | | 1,500,000 | 1,756,710 |
Orange County Health Facilities Authority
Presbyterian Retirement Communities | 5.000 | 08-01-41 | | 2,000,000 | 2,218,440 |
Orange County Health Facilities Authority
Presbyterian Retirement Communities | 5.000 | 08-01-47 | | 2,500,000 | 2,763,500 |
Palm Beach County Health Facilities Authority
Retirement Life Communities, Inc. | 5.000 | 11-15-32 | | 1,715,000 | 2,007,390 |
Village Community Development District No. 6
Special Assessment Revenue Refunding Bonds, Series 2017 (A) | 4.000 | 05-01-37 | | 475,000 | 511,713 |
| Georgia 3.1% | | | | | 15,813,933 |
Development Authority of Rockdale County
Pratt Paper LLC Project, AMT (C) | 4.000 | 01-01-38 | | 1,000,000 | 1,059,450 |
Fulton County Residential Care Facilities for the Elderly Authority
Lenbrook Square Foundation, Inc. | 5.000 | 07-01-42 | | 3,000,000 | 3,264,570 |
Main Street Natural Gas, Inc.
Series A | 5.000 | 05-15-38 | | 1,000,000 | 1,311,590 |
| SEE NOTES TO FINANCIAL STATEMENTS | SEMIANNUAL REPORT | JOHN HANCOCK TAX-FREE BOND FUND | 11 |
| | Rate (%) | Maturity date | | Par value^ | Value |
| Georgia (continued) | | | | | |
Main Street Natural Gas, Inc.
Series A | 5.000 | 05-15-43 | | 1,000,000 | $1,182,210 |
Municipal Electric Authority of Georgia
Electric, Power & Light Revenues, Series EE (A) | 7.250 | 01-01-24 | | 2,000,000 | 2,427,640 |
Municipal Electric Authority of Georgia
Power Revenue, Series HH | 5.000 | 01-01-29 | | 3,000,000 | 3,669,510 |
Municipal Electric Authority of Georgia
Power Revenue, Series HH | 5.000 | 01-01-39 | | 2,445,000 | 2,898,963 |
| Guam 0.2% | | | | | 1,156,350 |
Antonio B. Won Pat International Airport Authority
Series C, AMT (A) | 6.125 | 10-01-43 | | 1,000,000 | 1,156,350 |
| Illinois 9.8% | | | | | 49,363,626 |
Chicago Board of Education
Dedicated Capital Improvement | 5.000 | 04-01-42 | | 1,400,000 | 1,590,260 |
Chicago Board of Education
Dedicated Capital Improvement | 6.000 | 04-01-46 | | 3,500,000 | 4,172,245 |
Chicago O'Hare International Airport
Customer Facility Charge (A) | 5.500 | 01-01-43 | | 2,000,000 | 2,231,000 |
Chicago O'Hare International Airport
Series A | 5.750 | 01-01-39 | | 515,000 | 538,587 |
Chicago O'Hare International Airport
Series A, AMT | 5.000 | 01-01-48 | | 1,500,000 | 1,770,630 |
Chicago O'Hare International Airport
Series D | 5.250 | 01-01-42 | | 3,670,000 | 4,386,935 |
City of Chicago
Series 2007E-REMK, GO | 5.500 | 01-01-42 | | 1,000,000 | 1,118,920 |
City of Chicago
Series A, GO | 5.000 | 01-01-33 | | 540,000 | 566,417 |
City of Chicago
Series A, GO | 5.250 | 01-01-35 | | 1,750,000 | 1,801,590 |
City of Chicago
Wastewater Transmission Revenue, Series C | 5.000 | 01-01-39 | | 3,000,000 | 3,324,990 |
City of Chicago
Waterworks Revenue | 3.150 | 11-01-24 | | 500,000 | 534,805 |
Illinois Finance Authority
Advocate Health Care Network | 4.000 | 06-01-47 | | 1,895,000 | 2,023,083 |
Illinois Finance Authority
Advocate Health Care Network | 4.000 | 06-01-47 | | 1,105,000 | 1,137,874 |
Illinois State Toll Highway Authority
Series A | 4.000 | 01-01-39 | | 2,000,000 | 2,275,620 |
Illinois State Toll Highway Authority
Series B | 5.000 | 01-01-31 | | 2,000,000 | 2,540,240 |
Lake County Community Consolidated School District No. 24
Capital Appreciation Bonds, Series 2004, GO (A)(B) | 1.851 | 01-01-22 | | 2,440,000 | 2,346,987 |
Sales Tax Securitization Corp.
Series A | 5.000 | 01-01-32 | | 905,000 | 1,060,904 |
| 12 | JOHN HANCOCK TAX-FREE BOND FUND | SEMIANNUAL REPORT | SEE NOTES TO FINANCIAL STATEMENTS |
| | Rate (%) | Maturity date | | Par value^ | Value |
| Illinois (continued) | | | | | |
Sales Tax Securitization Corp.
Series A | 5.000 | 01-01-48 | | 4,000,000 | $4,543,600 |
State of Illinois
Series A, GO | 5.000 | 05-01-34 | | 2,000,000 | 2,274,400 |
State of Illinois
Series D, GO | 5.000 | 11-01-21 | | 1,250,000 | 1,318,263 |
| State of Illinois, GO (A) | 4.000 | 02-01-31 | | 1,000,000 | 1,093,890 |
| State of Illinois, GO | 4.000 | 06-01-35 | | 2,000,000 | 2,078,920 |
| State of Illinois, GO | 5.000 | 08-01-20 | | 1,310,000 | 1,337,916 |
| State of Illinois, GO | 5.000 | 02-01-26 | | 2,000,000 | 2,195,520 |
| State of Illinois, GO (A) | 5.500 | 07-01-38 | | 1,000,000 | 1,100,030 |
| Indiana 0.8% | | | | | 3,838,007 |
City of Whiting
Industry Environmental Facilities Revenue Various Refunding, AMT | 5.000 | 12-01-44 | | 3,240,000 | 3,838,007 |
| Iowa 0.2% | | | | | 1,000,170 |
Iowa Tobacco Settlement Authority
Asset Backed, Series C | 5.375 | 06-01-38 | | 1,000,000 | 1,000,170 |
| Kentucky 1.1% | | | | | 5,663,339 |
Kentucky Economic Development Finance Authority
Louisville Arena, Series A (A) | 5.000 | 12-01-45 | | 3,300,000 | 3,846,843 |
Kentucky Municipal Power Agency
Prairie State Project, Series A | 4.000 | 09-01-45 | | 500,000 | 531,135 |
Kentucky Turnpike Authority
Revitalization Projects, Series A | 5.000 | 07-01-21 | | 1,215,000 | 1,285,361 |
| Louisiana 2.6% | | | | | 13,054,935 |
City of Shreveport Water & Sewer Revenue
Water and Sewer Revenue and Refunding Bonds | 5.000 | 12-01-40 | | 1,000,000 | 1,137,550 |
Louisiana Local Government Environmental Facilities & Community Development Authority
Westlake Chemical Corp. Projects, Series A-1 | 6.500 | 11-01-35 | | 1,500,000 | 1,564,440 |
Louisiana Public Facilities Authority
Ochsner Clinic Foundation Project | 5.000 | 05-15-46 | | 2,500,000 | 2,866,900 |
New Orleans Aviation Board
Parking Facilities Corp. Consolidated Garage System (A) | 5.000 | 10-01-48 | | 1,000,000 | 1,186,210 |
New Orleans Aviation Board
Series B, AMT | 5.000 | 01-01-45 | | 2,000,000 | 2,226,360 |
New Orleans Aviation Board
Series B, AMT | 5.000 | 01-01-48 | | 500,000 | 572,200 |
Parish of St. John the Baptist
Marathon Oil Corp. Project | 2.000 | 06-01-37 | | 2,500,000 | 2,499,125 |
Parish of St. John the Baptist
Marathon Oil Corp. Project | 2.100 | 06-01-37 | | 1,000,000 | 1,002,150 |
| SEE NOTES TO FINANCIAL STATEMENTS | SEMIANNUAL REPORT | JOHN HANCOCK TAX-FREE BOND FUND | 13 |
| | Rate (%) | Maturity date | | Par value^ | Value |
| Maryland 0.8% | | | | | $4,265,285 |
Maryland Health & Higher Educational Facilities Authority
Broadmead Issue, Series A | 5.000 | 07-01-48 | | 1,000,000 | 1,141,410 |
Maryland State Transportation Authority
Passenger Facility Charge Revenue, AMT | 5.000 | 06-01-32 | | 2,500,000 | 3,123,875 |
| Massachusetts 7.6% | | | | | 38,109,932 |
Commonwealth of Massachusetts
Revenue Anticipation Notes, Series A, GO | 4.000 | 04-23-20 | | 5,000,000 | 5,055,650 |
Commonwealth of Massachusetts Transportation Fund Revenue
Rail Enhancement and Accelerated | 5.000 | 06-01-47 | | 3,180,000 | 3,792,691 |
Massachusetts Bay Transportation Authority
Sales Tax Revenue, Series A | 5.250 | 07-01-35 | | 1,310,000 | 1,885,562 |
Massachusetts Development Finance Agency
Dana-Farber Cancer Institute, Series N | 5.000 | 12-01-46 | | 3,000,000 | 3,504,690 |
Massachusetts Development Finance Agency
Emerson College, Series A | 5.000 | 01-01-40 | | 180,000 | 180,549 |
Massachusetts Development Finance Agency
Green Bonds-Boston Medical Center, Series D | 5.000 | 07-01-44 | | 2,500,000 | 2,805,950 |
Massachusetts Development Finance Agency
NewBridge on the Charles, Inc. (C) | 5.000 | 10-01-57 | | 3,000,000 | 3,288,810 |
Massachusetts Development Finance Agency
Suffolk University | 5.000 | 07-01-35 | | 870,000 | 1,054,823 |
Massachusetts Development Finance Agency
UMass Memorial Health Care, Series I | 5.000 | 07-01-46 | | 1,500,000 | 1,721,610 |
Massachusetts Development Finance Agency
Worcester Polytechnic Institute | 5.000 | 09-01-45 | | 1,745,000 | 2,061,369 |
Massachusetts Educational Financing Authority
Series B, AMT | 5.000 | 07-01-24 | | 350,000 | 400,652 |
Massachusetts Port Authority
BOSFuel Project, Series A, AMT | 5.000 | 07-01-39 | | 1,000,000 | 1,211,930 |
Massachusetts Port Authority
BOSFuel Project, Series A, AMT | 5.000 | 07-01-49 | | 1,000,000 | 1,191,690 |
Massachusetts Port Authority
ConRAC Project, Series A | 5.125 | 07-01-41 | | 1,500,000 | 1,580,760 |
Massachusetts School Building Authority
Series B | 5.000 | 11-15-36 | | 1,820,000 | 2,197,231 |
Massachusetts Transportation Trust Fund Metropolitan Highway System Revenue
Series A | 5.000 | 01-01-35 | | 2,000,000 | 2,487,600 |
Metropolitan Boston Transit Parking Corp.
Parking Revenue | 5.250 | 07-01-36 | | 3,475,000 | 3,688,365 |
| Michigan 2.8% | | | | | 14,040,305 |
Detroit City School District
School Building and Site Improvement, Series A, GO (A) | 5.250 | 05-01-32 | | 1,280,000 | 1,690,995 |
Detroit Downtown Development Authority
Catalyst Development Project, Series A (A) | 5.000 | 07-01-43 | | 1,000,000 | 1,109,500 |
| 14 | JOHN HANCOCK TAX-FREE BOND FUND | SEMIANNUAL REPORT | SEE NOTES TO FINANCIAL STATEMENTS |
| | Rate (%) | Maturity date | | Par value^ | Value |
| Michigan (continued) | | | | | |
Great Lakes Water Authority Sewage Disposal System Revenue
Series C | 5.000 | 07-01-35 | | 4,000,000 | $4,695,000 |
Michigan Finance Authority
Henry Ford Health System, Series A | 5.000 | 11-15-48 | | 1,000,000 | 1,208,070 |
Michigan Finance Authority
Local Government Loan Program (A) | 5.000 | 07-01-36 | | 250,000 | 282,778 |
Michigan Finance Authority
Local Government Loan Program, Series F1 | 4.500 | 10-01-29 | | 1,500,000 | 1,624,440 |
Michigan Finance Authority
McLaren Healthcare Hospital, Series A | 5.000 | 05-15-38 | | 1,460,000 | 1,674,372 |
Michigan Strategic Fund
Improvement Project, AMT | 5.000 | 06-30-48 | | 1,500,000 | 1,755,150 |
| Minnesota 0.3% | | | | | 1,493,641 |
Woodbury Housing & Redevelopment Authority
St. Therese of Woodbury | 5.125 | 12-01-44 | | 1,420,000 | 1,493,641 |
| Mississippi 0.2% | | | | | 1,227,990 |
State of Mississippi
Series A | 5.000 | 10-15-37 | | 1,000,000 | 1,227,990 |
| Nebraska 2.1% | | | | | 10,873,824 |
Central Plains Energy Project Revenue
Natural Gas Revenue, Series A | 5.250 | 12-01-20 | | 4,970,000 | 5,148,274 |
Omaha Public Power District
Separate Electric System Revenue Bonds, Series A | 5.000 | 02-01-49 | | 5,000,000 | 5,725,550 |
| New Hampshire 0.6% | | | | | 3,008,850 |
New Hampshire Business Finance Authority
Emerald Renewable Diesel, AMT (C) | 2.000 | 06-01-49 | | 3,000,000 | 3,008,850 |
| New Jersey 3.2% | | | | | 15,958,435 |
Casino Reinvestment Development Authority
Luxury Tax Revenue | 5.250 | 11-01-39 | | 2,520,000 | 2,729,286 |
New Jersey Economic Development Authority
Port Newark Container Terminal LLC, AMT | 5.000 | 10-01-47 | | 4,000,000 | 4,560,520 |
New Jersey Economic Development Authority
School Facilities Construction | 5.000 | 03-01-30 | | 1,500,000 | 1,638,330 |
New Jersey Economic Development Authority
Series DDD | 5.000 | 06-15-42 | | 1,000,000 | 1,118,940 |
New Jersey Higher Education Student Assistance Authority
Series 1A | 5.000 | 12-01-26 | | 445,000 | 445,307 |
New Jersey Transportation Trust Fund Authority
Transportation Program, Series AA | 5.000 | 06-15-44 | | 1,415,000 | 1,543,142 |
New Jersey Transportation Trust Fund Authority
Transportation Program, Series AA | 5.250 | 06-15-43 | | 1,000,000 | 1,162,710 |
Tobacco Settlement Financing Corp.
Series B | 5.000 | 06-01-46 | | 2,500,000 | 2,760,200 |
| SEE NOTES TO FINANCIAL STATEMENTS | SEMIANNUAL REPORT | JOHN HANCOCK TAX-FREE BOND FUND | 15 |
| | Rate (%) | Maturity date | | Par value^ | Value |
| New Mexico 0.6% | | | | | $3,179,730 |
New Mexico Educational Assistance Foundation
Education Loan, Series A1, AMT | 3.875 | 04-01-34 | | 3,000,000 | 3,179,730 |
| New York 7.6% | | | | | 38,426,854 |
Dutchess County Local Development Corp.
Nuvance Health, Series B | 4.000 | 07-01-49 | | 1,000,000 | 1,103,410 |
Hudson Yards Infrastructure Corp.
Series A | 5.750 | 02-15-47 | | 1,715,000 | 1,803,597 |
New York Liberty Development Corp.
1 World Trade Center Project | 5.000 | 12-15-41 | | 5,000,000 | 5,357,700 |
New York Liberty Development Corp.
4 World Trade Center Project | 5.000 | 11-15-31 | | 5,000,000 | 5,352,500 |
New York Liberty Development Corp.
7 World Trade Center, Class 2 | 5.000 | 09-15-43 | | 1,000,000 | 1,072,850 |
New York Liberty Development Corp.
Bank of America Tower, Class 2 | 5.625 | 07-15-47 | | 1,000,000 | 1,005,400 |
New York Liberty Development Corp.
World Trade Center, Class 1-3 (C) | 5.000 | 11-15-44 | | 2,500,000 | 2,759,850 |
New York State Dormitory Authority
General Purpose, Series E | 5.000 | 02-15-35 | | 20,000 | 20,148 |
New York State Dormitory Authority
Orange Regional Medical Center (C) | 5.000 | 12-01-40 | | 1,000,000 | 1,126,300 |
New York State Dormitory Authority
Rockefeller University, Series A | 5.000 | 07-01-41 | | 1,000,000 | 1,020,930 |
New York State Dormitory Authority
Series A | 5.000 | 03-15-43 | | 1,000,000 | 1,103,960 |
New York State Dormitory Authority
State University Dormitory Facilities, Series A | 5.000 | 07-01-35 | | 5,000,000 | 5,317,950 |
New York Transportation Development Corp.
Laguardia Airport Terminal B Redevelopment Project, AMT | 5.250 | 01-01-50 | | 2,500,000 | 2,781,825 |
Niagara Area Development Corp.
Covanta Project, Series A, AMT (C) | 4.750 | 11-01-42 | | 1,500,000 | 1,583,700 |
Port Authority of New York & New Jersey
JFK International Airport Terminal | 6.000 | 12-01-36 | | 1,000,000 | 1,048,190 |
Port Authority of New York & New Jersey
JFK International Airport Terminal | 6.000 | 12-01-42 | | 2,265,000 | 2,364,524 |
Port Authority of New York & New Jersey
Series 198 | 5.250 | 11-15-56 | | 3,000,000 | 3,604,020 |
| Ohio 3.0% | | | | | 15,028,455 |
County of Hamilton
Refunding and Improvement Life Enriching Community | 5.000 | 01-01-46 | | 1,000,000 | 1,110,340 |
County of Hamilton
Series A | 5.000 | 08-15-42 | | 4,000,000 | 4,679,880 |
Lancaster Port Authority
Series A | 5.000 | 08-01-49 | | 1,000,000 | 1,160,300 |
Northeast Ohio Regional Sewer District
Wastewater Improvement Revenue | 5.000 | 11-15-49 | | 5,000,000 | 5,716,500 |
| 16 | JOHN HANCOCK TAX-FREE BOND FUND | SEMIANNUAL REPORT | SEE NOTES TO FINANCIAL STATEMENTS |
| | Rate (%) | Maturity date | | Par value^ | Value |
| Ohio (continued) | | | | | |
Ohio Air Quality Development Authority
American Electric Power Company, AMT (D) | 2.100 | 04-01-28 | | 1,500,000 | $1,503,165 |
State of Ohio
Portsmouth Bypass Project, AMT (A) | 5.000 | 12-31-35 | | 750,000 | 858,270 |
| Oklahoma 0.9% | | | | | 4,839,414 |
Oklahoma Development Finance Authority
OU Medicine Project, Series B | 5.250 | 08-15-43 | | 2,150,000 | 2,565,294 |
Tulsa County Industrial Authority
Montereau, Inc., Project | 5.250 | 11-15-37 | | 1,000,000 | 1,143,820 |
Tulsa County Industrial Authority
Montereau, Inc., Project | 5.250 | 11-15-45 | | 1,000,000 | 1,130,300 |
| Oregon 0.8% | | | | | 4,111,840 |
Port of Portland OR Airport Revenue
Portland International Airport, AMT | 5.000 | 07-01-49 | | 1,000,000 | 1,200,090 |
Port of Portland OR Airport Revenue
Series 24B, AMT | 5.000 | 07-01-42 | | 2,500,000 | 2,911,750 |
| Pennsylvania 4.6% | | | | | 23,205,622 |
Berks County Industrial Development Authority
The Highlands at Wyomissing, Series C | 5.000 | 05-15-37 | | 750,000 | 840,203 |
City of Philadelphia
Series A, GO | 5.000 | 07-15-38 | | 2,000,000 | 2,215,280 |
Cumberland County Municipal Authority
Diakon Lutheran Ministries Project | 4.000 | 01-01-33 | | 1,465,000 | 1,528,391 |
Lancaster County Hospital Authority
Brethren Village Project | 5.250 | 07-01-41 | | 1,260,000 | 1,379,284 |
Pennsylvania Turnpike Commission
Highway Revenue Tolls, Series C | 5.000 | 12-01-44 | | 1,630,000 | 1,846,904 |
Pennsylvania Turnpike Commission
Series A | 5.000 | 12-01-38 | | 3,255,000 | 3,717,047 |
Pennsylvania Turnpike Commission
Series A | 5.000 | 12-01-44 | | 1,000,000 | 1,200,890 |
Pennsylvania Turnpike Commission
Series A | 5.250 | 12-01-44 | | 4,070,000 | 4,998,245 |
Philadelphia Gas Works Company
1998 General Ordinance Fifteenth | 5.000 | 08-01-47 | | 2,500,000 | 2,920,250 |
The School District of Philadelphia
Series E, GO | 5.250 | 09-01-22 | | 2,485,000 | 2,559,128 |
| Puerto Rico 1.0% | | | | | 5,105,920 |
Puerto Rico Sales Tax Financing Corp.
Series A-1 | 4.750 | 07-01-53 | | 2,000,000 | 2,064,700 |
Puerto Rico Sales Tax Financing Corp. Sales Tax Revenue
Series A-2 | 4.329 | 07-01-40 | | 3,000,000 | 3,041,220 |
| Rhode Island 0.5% | | | | | 2,403,334 |
Tobacco Settlement Financing Corp.
Series B | 4.500 | 06-01-45 | | 2,320,000 | 2,403,334 |
| SEE NOTES TO FINANCIAL STATEMENTS | SEMIANNUAL REPORT | JOHN HANCOCK TAX-FREE BOND FUND | 17 |
| | Rate (%) | Maturity date | | Par value^ | Value |
| Tennessee 0.6% | | | | | $2,844,366 |
Nashville & Davidson County Health & Educational Facility Board
Vanderbilt University Medical Center | 5.000 | 07-01-46 | | 2,050,000 | 2,359,571 |
Shelby County Health Educational & Housing Facilities Board
The Farms at Bailey Station Project | 5.750 | 10-01-59 | | 500,000 | 484,795 |
| Texas 11.5% | | | | | 57,818,133 |
Bexar County Health Facilities Development Corp.
Army Retirement Residence Foundation Project | 5.000 | 07-15-27 | | 530,000 | 605,652 |
Central Texas Regional Mobility Authority
Series A | 5.000 | 01-01-40 | | 500,000 | 572,420 |
Central Texas Regional Mobility Authority
Series A | 5.000 | 01-01-45 | | 500,000 | 568,725 |
Central Texas Turnpike System
Series C | 5.000 | 08-15-42 | | 2,000,000 | 2,259,780 |
City of Austin
Electric Utility Revenue (A) | 5.000 | 11-15-37 | | 5,000,000 | 5,482,600 |
City of El Paso Water & Sewer Revenue
Series B (D) | 5.000 | 03-01-29 | | 1,070,000 | 1,361,800 |
City of Houston Airport System Revenue
Series B2, AMT | 5.000 | 07-15-20 | | 1,200,000 | 1,223,868 |
City of Houston Airport System Revenue
United Airlines, Inc., AMT | 4.750 | 07-01-24 | | 2,000,000 | 2,171,000 |
City of San Antonio
Electric & Gas Revenue | 5.000 | 02-01-48 | | 5,000,000 | 5,555,850 |
Clifton Higher Education Finance Corp.
Idea Public Schools | 4.000 | 08-15-44 | | 3,775,000 | 4,260,390 |
Dallas/Fort Worth International Airport
Series D | 5.250 | 11-01-32 | | 5,000,000 | 5,694,400 |
Dallas/Fort Worth International Airport
Series D, AMT | 5.000 | 11-01-38 | | 2,500,000 | 2,647,300 |
Grand Parkway Transportation Corp.
Highway Revenue Tolls, Series B | 5.000 | 04-01-53 | | 4,000,000 | 4,434,840 |
Harris County Cultural Education Facilities Finance Corp.
Brazos Presbyterian | 5.000 | 01-01-48 | | 1,000,000 | 1,087,930 |
Harris County Cultural Education Facilities Finance Corp.
Memorial Herman Health System | 5.000 | 07-01-49 | | 1,000,000 | 1,105,670 |
Lower Colorado River Authority
LCRA Transmission Services Corp. | 5.000 | 05-15-44 | | 1,000,000 | 1,185,050 |
Lower Colorado River Authority
LCRA Transmission Services Corp., Series A | 5.000 | 05-15-41 | | 2,500,000 | 2,624,525 |
New Hope Cultural Education Facilities Finance Corp.
Westminster Manor Project | 4.000 | 11-01-36 | | 1,800,000 | 1,911,474 |
North Texas Tollway Authority
Revenue Refunding System, Series A | 4.000 | 01-01-44 | | 2,525,000 | 2,811,764 |
| 18 | JOHN HANCOCK TAX-FREE BOND FUND | SEMIANNUAL REPORT | SEE NOTES TO FINANCIAL STATEMENTS |
| | Rate (%) | Maturity date | | Par value^ | Value |
| Texas (continued) | | | | | |
Spring Independent School District
School Building, GO | 5.000 | 08-15-42 | | 1,500,000 | $1,778,355 |
Texas Municipal Power Agency
Transmission Revenue | 5.000 | 09-01-40 | | 6,000,000 | 6,152,700 |
Texas Private Activity Bond Surface Transportation Corp.
Segment 3C Project, AMT | 5.000 | 06-30-58 | | 2,000,000 | 2,322,040 |
| Utah 0.5% | | | | | 2,346,060 |
Salt Lake City Corp. Airport Revenue
Series A, AMT | 5.000 | 07-01-42 | | 2,000,000 | 2,346,060 |
| Virgin Islands 0.1% | | | | | 500,295 |
Virgin Islands Public Finance Authority
Series A-1 | 5.000 | 10-01-39 | | 500,000 | 500,295 |
| Virginia 1.4% | | | | | 6,957,365 |
Alexandria Industrial Development Authority
Goodwin House | 5.000 | 10-01-45 | | 1,000,000 | 1,107,300 |
Virginia Housing Development Authority
Rental Housing, Series D | 4.300 | 09-01-30 | | 2,000,000 | 2,012,360 |
Virginia Small Business Financing Authority
95 Express Lanes LLC Project, AMT | 5.000 | 07-01-49 | | 2,000,000 | 2,122,740 |
Virginia Small Business Financing Authority
Transform 66 P3 Project, AMT | 5.000 | 12-31-49 | | 1,500,000 | 1,714,965 |
| Washington 2.3% | | | | | 11,554,246 |
Port of Seattle
Revenue, AMT | 5.000 | 04-01-31 | | 3,000,000 | 3,729,810 |
Snohomish County Housing Authority
Carvel Apartments Project | 4.000 | 04-01-44 | | 2,000,000 | 2,147,740 |
State of Washington
Series R-2017A, GO | 5.000 | 08-01-20 | | 5,535,000 | 5,676,696 |
| West Virginia 0.2% | | | | | 1,037,450 |
West Virginia Economic Development Authority
Appalachian Power Company Amos Project, Series A | 2.550 | 03-01-40 | | 1,000,000 | 1,037,450 |
| Wisconsin 1.3% | | | | | 6,590,980 |
Public Finance Authority
Mary's Woods at Marylhurst (C) | 5.250 | 05-15-47 | | 1,000,000 | 1,114,320 |
Public Finance Authority
Rose Villa Project, Series A (C) | 5.000 | 11-15-24 | | 855,000 | 907,249 |
Public Finance Authority
Rose Villa Project, Series A (C) | 5.750 | 11-15-44 | | 1,000,000 | 1,089,100 |
Public Finance Authority
Waste Management, Inc. Project, Series A2, AMT | 2.875 | 05-01-27 | | 3,000,000 | 3,138,090 |
| SEE NOTES TO FINANCIAL STATEMENTS | SEMIANNUAL REPORT | JOHN HANCOCK TAX-FREE BOND FUND | 19 |
| | Rate (%) | Maturity date | | Par value^ | Value |
| Wisconsin (continued) | | | | | |
Wisconsin Health & Educational Facilities Authority
Rogers Memorial Hospital Incorporate, Series A | 5.000 | 07-01-49 | | 300,000 | $342,221 |
|
| | | Yield (%) | | Shares | Value |
| Short-term investments 0.6% | | | | $2,988,946 |
| (Cost $2,969,179) | | | | | |
| Short-term funds 0.6% | | | | | |
| John Hancock Collateral Trust (E) | | 1.7887(F) | | 298,706 | 2,988,946 |
|
| Total investments (Cost $468,003,091) 99.9% | | | $503,225,966 |
| Other assets and liabilities, net 0.1% | | | | | 395,167 |
| Total net assets 100.0% | | | | | $503,621,133 |
| The percentage shown for each investment category is the total value of the category as a percentage of the net assets of the fund. |
| ^All par values are denominated in U.S. dollars unless otherwise indicated. |
| Security Abbreviations and Legend |
| AMT | Interest earned from these securities may be considered a tax preference item for purpose of the Federal Alternative Minimum Tax. |
| GO | General Obligation |
| (A) | Bond is insured by one or more of the companies listed in the insurance coverage table below. |
| (B) | Zero coupon bonds are issued at a discount from their principal amount in lieu of paying interest periodically. Rate shown is the effective yield at period end. |
| (C) | These securities are exempt from registration under Rule 144A of the Securities Act of 1933. Such securities may be resold, normally to qualified institutional buyers, in transactions exempt from registration. |
| (D) | Security purchased or sold on a when-issued or delayed delivery basis. |
| (E) | Investment is an affiliate of the fund, the advisor and/or subadvisor. |
| (F) | The rate shown is the annualized seven-day yield as of 11-30-19. |
At 11-30-19, the aggregate cost of investments for federal income tax purposes was $464,890,384. Net unrealized appreciation aggregated to $38,335,582, of which $38,470,654 related to gross unrealized appreciation and $135,072 related to gross unrealized depreciation.
| Insurance Coverage | As a % of total
investments |
| Assured Guaranty Municipal Corp. | 4.5 |
| Assured Guaranty Corp. | 3.0 |
| National Public Finance Guarantee Corp. | 1.6 |
| Ambac Financial Group, Inc. | 0.5 |
| California Mortgage Insurance | 0.4 |
| Build America Mutual Assurance Company | 0.1 |
| TOTAL | 10.1 |
| | |
| 20 | JOHN HANCOCK TAX-FREE BOND FUND | SEMIANNUAL REPORT | SEE NOTES TO FINANCIAL STATEMENTS |
STATEMENT OF ASSETS AND LIABILITIES 11-30-19 (unaudited)
| Assets | |
| Unaffiliated investments, at value (Cost $465,033,912) | $500,237,020 |
| Affiliated investments, at value (Cost $2,969,179) | 2,988,946 |
| Total investments, at value (Cost $468,003,091) | 503,225,966 |
| Interest receivable | 6,172,357 |
| Receivable for fund shares sold | 731,911 |
| Receivable for investments sold | 2,938,155 |
| Receivable for delayed delivery securities sold | 3,609,420 |
| Receivable from affiliates | 2,490 |
| Other assets | 65,864 |
| Total assets | 516,746,163 |
| Liabilities | |
| Distributions payable | 119,173 |
| Payable for investments purchased | 5,947,154 |
| Payable for delayed delivery securities purchased | 6,459,899 |
| Payable for fund shares repurchased | 427,976 |
| Payable to affiliates | |
| Accounting and legal services fees | 62,891 |
| Transfer agent fees | 16,921 |
| Distribution and service fees | 24,896 |
| Trustees' fees | 583 |
| Other liabilities and accrued expenses | 65,537 |
| Total liabilities | 13,125,030 |
| Net assets | $503,621,133 |
| Net assets consist of | |
| Paid-in capital | $471,607,224 |
| Total distributable earnings (loss) | 32,013,909 |
| Net assets | $503,621,133 |
| |
| Net asset value per share | |
| Based on net asset value and shares outstanding - the fund has an unlimited number of shares authorized with no par value | |
| Class A ($448,823,762 ÷ 45,241,374 shares)1 | $9.92 |
| Class B ($1,726,087 ÷ 173,969 shares)1 | $9.92 |
| Class C ($30,316,133 ÷ 3,056,427 shares)1 | $9.92 |
| Class I ($13,629,595 ÷ 1,371,977 shares) | $9.93 |
| Class R6 ($9,125,556 ÷ 918,250 shares) | $9.94 |
| Maximum offering price per share | |
| Class A (net asset value per share ÷ 96%)2 | $10.33 |
| 1 | Redemption price per share is equal to net asset value less any applicable contingent deferred sales charge. |
| 2 | On single retail sales of less than $100,000. On sales of $100,000 or more and on group sales the offering price is reduced. |
| SEE NOTES TO FINANCIAL STATEMENTS | SEMIANNUAL REPORT | JOHN HANCOCK Tax-Free Bond Fund | 21 |
STATEMENT OF OPERATIONSFor the six months ended 11-30-19 (unaudited)
| Investment income | |
| Interest | $9,694,337 |
| Income distributions received from affiliated investments | 30,287 |
| Total investment income | 9,724,624 |
| Expenses | |
| Investment management fees | 1,383,420 |
| Distribution and service fees | 730,680 |
| Accounting and legal services fees | 54,801 |
| Transfer agent fees | 102,752 |
| Trustees' fees | 4,533 |
| Custodian fees | 37,397 |
| State registration fees | 46,685 |
| Printing and postage | 27,904 |
| Professional fees | 28,240 |
| Other | 11,465 |
| Total expenses | 2,427,877 |
| Less expense reductions | (260,153) |
| Net expenses | 2,167,724 |
| Net investment income | 7,556,900 |
| Realized and unrealized gain (loss) | |
| Net realized gain (loss) on | |
| Unaffiliated investments | 3,956,025 |
| Affiliated investments | 13,987 |
| | 3,970,012 |
| Change in net unrealized appreciation (depreciation) of | |
| Unaffiliated investments | 648,258 |
| Affiliated investments | 19,767 |
| | 668,025 |
| Net realized and unrealized gain | 4,638,037 |
| Increase in net assets from operations | $12,194,937 |
| 22 | JOHN HANCOCK Tax-Free Bond Fund | SEMIANNUAL REPORT | SEE NOTES TO FINANCIAL STATEMENTS |
STATEMENTS OF CHANGES IN NET ASSETS
| | Six months ended
11-30-19
(unaudited) | Year ended
5-31-19 |
| Increase (decrease) in net assets | | |
| From operations | | |
| Net investment income | $7,556,900 | $17,000,881 |
| Net realized gain | 3,970,012 | 4,335,779 |
| Change in net unrealized appreciation (depreciation) | 668,025 | 4,477,701 |
| Increase in net assets resulting from operations | 12,194,937 | 25,814,361 |
| Distributions to shareholders | | |
| From earnings | | |
| Class A | (6,870,872) | (15,465,396) |
| Class B | (24,026) | (80,640) |
| Class C | (375,792) | (990,385) |
| Class I | (214,923) | (422,587) |
| Class R6 | (139,233) | (270,227) |
| Total distributions | (7,624,846) | (17,229,235) |
| From fund share transactions | 3,212,403 | (30,677,962) |
| Total increase (decrease) | 7,782,494 | (22,092,836) |
| Net assets | | |
| Beginning of period | 495,838,639 | 517,931,475 |
| End of period | $503,621,133 | $495,838,639 |
| SEE NOTES TO FINANCIAL STATEMENTS | SEMIANNUAL REPORT | JOHN HANCOCK Tax-Free Bond Fund | 23 |
| CLASS A SHARES Period ended | 11-30-191 | 5-31-19 | 5-31-18 | 5-31-17 | 5-31-16 | 5-31-15 |
| Per share operating performance | | | | | | |
| Net asset value, beginning of period | $9.83 | $9.65 | $9.85 | $10.18 | $10.04 | $10.07 |
| Net investment income2 | 0.15 | 0.34 | 0.35 | 0.36 | 0.37 | 0.39 |
| Net realized and unrealized gain (loss) on investments | 0.09 | 0.18 | (0.19) | (0.33) | 0.15 | (0.02) |
| Total from investment operations | 0.24 | 0.52 | 0.16 | 0.03 | 0.52 | 0.37 |
| Less distributions | | | | | | |
| From net investment income | (0.15) | (0.34) | (0.36) | (0.36) | (0.38) | (0.40) |
| Net asset value, end of period | $9.92 | $9.83 | $9.65 | $9.85 | $10.18 | $10.04 |
| Total return (%)3,4 | 2.485 | 5.55 | 1.62 | 0.34 | 5.33 | 3.75 |
| Ratios and supplemental data | | | | | | |
| Net assets, end of period (in millions) | $449 | $439 | $460 | $505 | $551 | $520 |
| Ratios (as a percentage of average net assets): | | | | | | |
| Expenses before reductions | 0.926 | 0.93 | 0.92 | 0.92 | 0.92 | 0.93 |
| Expenses including reductions | 0.826 | 0.83 | 0.81 | 0.81 | 0.81 | 0.82 |
| Net investment income | 3.056 | 3.52 | 3.60 | 3.58 | 3.70 | 3.86 |
| Portfolio turnover (%) | 29 | 33 | 11 | 26 | 13 | 107 |
| 1 | Six months ended 11-30-19. Unaudited. |
| 2 | Based on average daily shares outstanding. |
| 3 | Total returns would have been lower had certain expenses not been reduced during the applicable periods. |
| 4 | Does not reflect the effect of sales charges, if any. |
| 5 | Not annualized. |
| 6 | Annualized. |
| 7 | Excludes merger activity. |
| 24 | JOHN HANCOCK Tax-Free Bond Fund | SEMIANNUAL REPORT | SEE NOTES TO FINANCIAL STATEMENTS |
| CLASS B SHARES Period ended | 11-30-191 | 5-31-19 | 5-31-18 | 5-31-17 | 5-31-16 | 5-31-15 |
| Per share operating performance | | | | | | |
| Net asset value, beginning of period | $9.83 | $9.65 | $9.85 | $10.18 | $10.04 | $10.07 |
| Net investment income2 | 0.11 | 0.27 | 0.28 | 0.28 | 0.30 | 0.32 |
| Net realized and unrealized gain (loss) on investments | 0.10 | 0.18 | (0.20) | (0.32) | 0.15 | (0.02) |
| Total from investment operations | 0.21 | 0.45 | 0.08 | (0.04) | 0.45 | 0.30 |
| Less distributions | | | | | | |
| From net investment income | (0.12) | (0.27) | (0.28) | (0.29) | (0.31) | (0.33) |
| Net asset value, end of period | $9.92 | $9.83 | $9.65 | $9.85 | $10.18 | $10.04 |
| Total return (%)3,4 | 2.095 | 4.76 | 0.86 | (0.41) | 4.55 | 2.98 |
| Ratios and supplemental data | | | | | | |
| Net assets, end of period (in millions) | $2 | $2 | $4 | $5 | $7 | $8 |
| Ratios (as a percentage of average net assets): | | | | | | |
| Expenses before reductions | 1.676 | 1.68 | 1.67 | 1.67 | 1.67 | 1.68 |
| Expenses including reductions | 1.576 | 1.58 | 1.56 | 1.56 | 1.56 | 1.57 |
| Net investment income | 2.316 | 2.77 | 2.85 | 2.82 | 2.95 | 3.11 |
| Portfolio turnover (%) | 29 | 33 | 11 | 26 | 13 | 107 |
| 1 | Six months ended 11-30-19. Unaudited. |
| 2 | Based on average daily shares outstanding. |
| 3 | Total returns would have been lower had certain expenses not been reduced during the applicable periods. |
| 4 | Does not reflect the effect of sales charges, if any. |
| 5 | Not annualized. |
| 6 | Annualized. |
| 7 | Excludes merger activity. |
| SEE NOTES TO FINANCIAL STATEMENTS | SEMIANNUAL REPORT | JOHN HANCOCK Tax-Free Bond Fund | 25 |
| CLASS C SHARES Period ended | 11-30-191 | 5-31-19 | 5-31-18 | 5-31-17 | 5-31-16 | 5-31-15 |
| Per share operating performance | | | | | | |
| Net asset value, beginning of period | $9.83 | $9.65 | $9.85 | $10.18 | $10.04 | $10.06 |
| Net investment income2 | 0.11 | 0.26 | 0.28 | 0.28 | 0.30 | 0.32 |
| Net realized and unrealized gain (loss) on investments | 0.10 | 0.19 | (0.20) | (0.32) | 0.15 | (0.01) |
| Total from investment operations | 0.21 | 0.45 | 0.08 | (0.04) | 0.45 | 0.31 |
| Less distributions | | | | | | |
| From net investment income | (0.12) | (0.27) | (0.28) | (0.29) | (0.31) | (0.33) |
| Net asset value, end of period | $9.92 | $9.83 | $9.65 | $9.85 | $10.18 | $10.04 |
| Total return (%)3,4 | 2.095 | 4.76 | 0.86 | (0.41) | 4.55 | 3.08 |
| Ratios and supplemental data | | | | | | |
| Net assets, end of period (in millions) | $30 | $33 | $39 | $52 | $60 | $57 |
| Ratios (as a percentage of average net assets): | | | | | | |
| Expenses before reductions | 1.676 | 1.68 | 1.67 | 1.67 | 1.67 | 1.68 |
| Expenses including reductions | 1.576 | 1.58 | 1.56 | 1.56 | 1.56 | 1.57 |
| Net investment income | 2.306 | 2.77 | 2.85 | 2.82 | 2.95 | 3.10 |
| Portfolio turnover (%) | 29 | 33 | 11 | 26 | 13 | 107 |
| 1 | Six months ended 11-30-19. Unaudited. |
| 2 | Based on average daily shares outstanding. |
| 3 | Total returns would have been lower had certain expenses not been reduced during the applicable periods. |
| 4 | Does not reflect the effect of sales charges, if any. |
| 5 | Not annualized. |
| 6 | Annualized. |
| 7 | Excludes merger activity. |
| 26 | JOHN HANCOCK Tax-Free Bond Fund | SEMIANNUAL REPORT | SEE NOTES TO FINANCIAL STATEMENTS |
| CLASS I SHARES Period ended | 11-30-191 | 5-31-19 | 5-31-18 | 5-31-172 |
| Per share operating performance | | | | |
| Net asset value, beginning of period | $9.84 | $9.66 | $9.86 | $9.70 |
| Net investment income3 | 0.16 | 0.35 | 0.37 | 0.12 |
| Net realized and unrealized gain (loss) on investments | 0.09 | 0.19 | (0.20) | 0.15 |
| Total from investment operations | 0.25 | 0.54 | 0.17 | 0.27 |
| Less distributions | | | | |
| From net investment income | (0.16) | (0.36) | (0.37) | (0.11) |
| Net asset value, end of period | $9.93 | $9.84 | $9.66 | $9.86 |
| Total return (%)4 | 2.555 | 5.71 | 1.77 | 2.815 |
| Ratios and supplemental data | | | | |
| Net assets, end of period (in millions) | $14 | $13 | $8 | $7 |
| Ratios (as a percentage of average net assets): | | | | |
| Expenses before reductions | 0.676 | 0.68 | 0.67 | 0.656 |
| Expenses including reductions | 0.676 | 0.68 | 0.66 | 0.656 |
| Net investment income | 3.206 | 3.66 | 3.74 | 4.056 |
| Portfolio turnover (%) | 29 | 33 | 11 | 267 |
| 1 | Six months ended 11-30-19. Unaudited. |
| 2 | The inception date for Class I shares is 2-13-17. |
| 3 | Based on average daily shares outstanding. |
| 4 | Total returns would have been lower had certain expenses not been reduced during the applicable periods. |
| 5 | Not annualized. |
| 6 | Annualized. |
| 7 | Portfolio turnover is shown for the period from 6-1-16 to 5-31-17. |
| SEE NOTES TO FINANCIAL STATEMENTS | SEMIANNUAL REPORT | JOHN HANCOCK Tax-Free Bond Fund | 27 |
| CLASS R6 SHARES Period ended | 11-30-191 | 5-31-19 | 5-31-182 |
| Per share operating performance | | | |
| Net asset value, beginning of period | $9.85 | $9.67 | $9.90 |
| Net investment income3 | 0.16 | 0.35 | 0.28 |
| Net realized and unrealized gain (loss) on investments | 0.09 | 0.19 | (0.23) |
| Total from investment operations | 0.25 | 0.54 | 0.05 |
| Less distributions | | | |
| From net investment income | (0.16) | (0.36) | (0.28) |
| Net asset value, end of period | $9.94 | $9.85 | $9.67 |
| Total return (%)4 | 2.565 | 5.74 | 0.555 |
| Ratios and supplemental data | | | |
| Net assets, end of period (in millions) | $9 | $8 | $7 |
| Ratios (as a percentage of average net assets): | | | |
| Expenses before reductions | 0.646 | 0.65 | 0.646 |
| Expenses including reductions | 0.646 | 0.64 | 0.636 |
| Net investment income | 3.226 | 3.69 | 3.816 |
| Portfolio turnover (%) | 29 | 33 | 117 |
| 1 | Six months ended 11-30-19. Unaudited. |
| 2 | The inception date for Class R6 shares is 8-30-17. |
| 3 | Based on average daily shares outstanding. |
| 4 | Total returns would have been lower had certain expenses not been reduced during the applicable periods. |
| 5 | Not annualized. |
| 6 | Annualized. |
| 7 | Portfolio turnover is shown for the period from 6-1-17 to 5-31-18. |
| 28 | JOHN HANCOCK Tax-Free Bond Fund | SEMIANNUAL REPORT | SEE NOTES TO FINANCIAL STATEMENTS |
| Notes to financial statements (unaudited) | |
Note 1—Organization
John Hancock Tax-Free Bond Fund (the fund) is a series of John Hancock Municipal Securities Trust (the Trust), an open-end management investment company organized as a Massachusetts business trust and registered under the Investment Company Act of 1940, as amended (the 1940 Act). The investment objective of the fund is to seek as high a level of interest income exempt from federal income tax as is consistent with preservation of capital.
The fund may offer multiple classes of shares. The shares currently outstanding are detailed in the Statement of assets and liabilities. Class A and Class C shares are offered to all investors. Class B shares are closed to new investors. Class I shares are offered to institutions and certain investors. Class R6 shares are only available to certain retirement plans, institutions and other investors. Class B shares convert to Class A shares eight years after purchase. Class C shares convert to Class A shares ten years after purchase (certain exclusions may apply). Shareholders of each class have exclusive voting rights to matters that affect that class. The distribution and service fees, if any, and transfer agent fees for each class may differ.
Note 2—Significant accounting policies
The financial statements have been prepared in conformity with accounting principles generally accepted in the United States of America (US GAAP), which require management to make certain estimates and assumptions as of the date of the financial statements. Actual results could differ from those estimates and those differences could be significant. The fund qualifies as an investment company under Topic 946 of Accounting Standards Codification of US GAAP.
Events or transactions occurring after the end of the fiscal period through the date that the financial statements were issued have been evaluated in the preparation of the financial statements. The following summarizes the significant accounting policies of the fund:
Security valuation. Investments are stated at value as of the scheduled close of regular trading on the New York Stock Exchange (NYSE), normally at 4:00 P.M., Eastern Time. In case of emergency or other disruption resulting in the NYSE not opening for trading or the NYSE closing at a time other than the regularly scheduled close, the net asset value (NAV) may be determined as of the regularly scheduled close of the NYSE pursuant to the fund's Valuation Policies and Procedures.
In order to value the securities, the fund uses the following valuation techniques: Debt obligations are typically valued based on the evaluated prices provided by an independent pricing vendor. Independent pricing vendors utilize matrix pricing which takes into account factors such as institutional-size trading in similar groups of securities, yield, quality, coupon rate, maturity, type of issue, trading characteristics and other market data, as well as broker supplied prices. Investments by the fund in open-end mutual funds, including John Hancock Collateral Trust (JHCT), are valued at their respective NAVs each business day.
Other portfolio securities and assets, for which reliable market quotations are not readily available, are valued at fair value as determined in good faith by the fund's Pricing Committee following procedures established by the Board of Trustees. The frequency with which these fair valuation procedures are used cannot be predicted and fair value of securities may differ significantly from the value that would have been used had a ready market for such securities existed.
The fund uses a three-tier hierarchy to prioritize the pricing assumptions, referred to as inputs, used in valuation techniques to measure fair value. Level 1 includes securities valued using quoted prices in active markets for identical securities, including registered investment companies. Level 2 includes securities valued using other significant observable inputs. Observable inputs may include quoted prices for similar securities, interest rates, prepayment speeds and credit risk. Prices for securities valued using these inputs are received from independent
| | SEMIANNUAL REPORT | JOHN HANCOCK Tax-Free Bond Fund | 29 |
pricing vendors and brokers and are based on an evaluation of the inputs described. Level 3 includes securities valued using significant unobservable inputs when market prices are not readily available or reliable, including the fund's own assumptions in determining the fair value of investments. Factors used in determining value may include market or issuer specific events or trends, changes in interest rates and credit quality. The inputs or methodology used for valuing securities are not necessarily an indication of the risks associated with investing in those securities. Changes in valuation techniques and related inputs may result in transfers into or out of an assigned level within the disclosure hierarchy.
The following is a summary of the values by input classification of the fund's investments as of November 30, 2019, by major security category or type:
| | Total
value at
11-30-19 | Level 1
quoted
price | Level 2
significant
observable
inputs | Level 3
significant
unobservable
inputs |
| Investments in securities: | | | | |
| Assets | | | | |
| Municipal bonds | $500,237,020 | — | $500,237,020 | — |
| Short-term investments | 2,988,946 | $2,988,946 | — | — |
| Total investments in securities | $503,225,966 | $2,988,946 | $500,237,020 | — |
When-issued/delayed-delivery securities. The fund may purchase or sell debt securities on a when-issued or delayed-delivery basis, or in a “To Be Announced” (TBA) or “forward commitment” transaction, with delivery or payment to occur at a later date beyond the normal settlement period. TBA securities resulting from these transactions are included in the portfolio or in a schedule to the portfolio (Sale Commitments Outstanding). At the time a fund enters into a commitment to purchase or sell a security, the transaction is recorded and the value of the security is reflected in its NAV. The price of such security and the date that the security will be delivered and paid for are fixed at the time the transaction is negotiated. The value of the security may vary with market fluctuations. No interest accrues until settlement takes place. At the time that the fund enters into this type of transaction, the fund is required to have sufficient cash and/or liquid securities to cover its commitments.
Certain risks may arise upon entering into when-issued or delayed-delivery securities transactions, including the potential inability of counterparties to meet the terms of their contracts, and the issuer’s failure to issue the securities due to political, economic or other factors. Additionally, losses may arise due to declines in the value of the securities purchased or increase in the value of securities sold prior to settlement date.
Security transactions and related investment income. Investment security transactions are accounted for on a trade date plus one basis for daily NAV calculations. However, for financial reporting purposes, investment transactions are reported on trade date. Interest income is accrued as earned. Interest income includes coupon interest and amortization/accretion of premiums/discounts on debt securities. Debt obligations may be placed in a non-accrual status and related interest income may be reduced by stopping current accruals and writing off interest receivable when the collection of all or a portion of interest has become doubtful. Gains and losses on securities sold are determined on the basis of identified cost and may include proceeds from litigation.
Overdraft. The fund may have the ability to borrow from banks for temporary or emergency purposes, including meeting redemption requests that otherwise might require the untimely sale of securities. Pursuant to the fund's custodian agreement, the custodian may loan money to the fund to make properly authorized payments. The fund
| 30 | JOHN HANCOCK Tax-Free Bond Fund | SEMIANNUAL REPORT | |
is obligated to repay the custodian for any overdraft, including any related costs or expenses. The custodian may have a lien, security interest or security entitlement in any fund property that is not otherwise segregated or pledged, to the extent of any overdraft, and to the maximum extent permitted by law.
Line of credit. The fund and other affiliated funds have entered into a syndicated line of credit agreement with Citibank, N.A. as the administrative agent that enables them to participate in a $750 million unsecured committed line of credit. Excluding commitments designated for a certain fund and subject to the needs of all other affiliated funds, the fund can borrow up to an aggregate commitment amount of $500 million, subject to asset coverage and other limitations as specified in the agreement. A commitment fee payable at the end of each calendar quarter, based on the average daily unused portion of the line of credit, is charged to each participating fund based on a combination of fixed and asset based allocations and is reflected in Other expenses on the Statement of operations. For the six months ended November 30, 2019, the fund had no borrowings under the line of credit. Commitment fees for the six months ended November 30, 2019 were $1,556.
Expenses. Within the John Hancock group of funds complex, expenses that are directly attributable to an individual fund are allocated to such fund. Expenses that are not readily attributable to a specific fund are allocated among all funds in an equitable manner, taking into consideration, among other things, the nature and type of expense and the fund’s relative net assets. Expense estimates are accrued in the period to which they relate and adjustments are made when actual amounts are known.
Class allocations. Income, common expenses and realized and unrealized gains (losses) are determined at the fund level and allocated daily to each class of shares based on the net assets of the class. Class-specific expenses, such as distribution and service fees, if any, and transfer agent fees, for all classes, are charged daily at the class level based on the net assets of each class and the specific expense rates applicable to each class.
Change in accounting principle. Accounting Standards Update (ASU) 2017-08, Premium Amortization on Purchased Callable Debt Securities, shortens the premium amortization period for purchased non contingently callable debt securities and is effective for public companies with fiscal years beginning after December 15, 2018. Adoption of the ASU did not have a material impact to the fund.
Federal income taxes. The fund intends to continue to qualify as a regulated investment company by complying with the applicable provisions of the Internal Revenue Code and will not be subject to federal income tax on taxable income that is distributed to shareholders. Therefore, no federal income tax provision is required.
For federal income tax purposes, as of May 31, 2019, the fund has a short-term capital loss carryforward of $8,200,311 and a long-term capital loss carryforward of $2,296,804 available to offset future net realized capital gains. These carryforwards do not expire.
As of May 31, 2019, the fund had no uncertain tax positions that would require financial statement recognition, derecognition or disclosure. The fund's federal tax returns are subject to examination by the Internal Revenue Service for a period of three years.
Distribution of income and gains. Distributions to shareholders from net investment income and net realized gains, if any, are recorded on the ex-date. The fund generally declares dividends daily and pays them monthly. Capital gain distributions, if any, are typically distributed annually.
Distributions paid by the fund with respect to each class of shares are calculated in the same manner, at the same time and in the same amount, except for the effect of class level expenses that may be applied differently to each class.
| | SEMIANNUAL REPORT | JOHN HANCOCK Tax-Free Bond Fund | 31 |
Such distributions, on a tax basis, are determined in conformity with income tax regulations, which may differ from US GAAP. Distributions in excess of tax basis earnings and profits, if any, are reported in the fund's financial statements as a return of capital. The final determination of tax characteristics of the fund’s distribution will occur at the end of the year and will subsequently be reported to shareholders.
Capital accounts within the financial statements are adjusted for permanent book-tax differences. These adjustments have no impact on net assets or the results of operations. Temporary book-tax differences, if any, will reverse in a subsequent period. Book-tax differences are primarily attributable to expiration of capital loss carryforwards and accretion on debt securities.
Note 3—Guarantees and indemnifications
Under the Trust's organizational documents, its Officers and Trustees are indemnified against certain liabilities arising out of the performance of their duties to the Trust, including the fund. Additionally, in the normal course of business, the fund enters into contracts with service providers that contain general indemnification clauses. The fund's maximum exposure under these arrangements is unknown, as this would involve future claims that may be made against the fund that have not yet occurred. The risk of material loss from such claims is considered remote.
Note 4—Fees and transactions with affiliates
John Hancock Investment Management LLC (the Advisor) serves as investment advisor for the fund. John Hancock Investment Management Distributors LLC (the Distributor), an affiliate of the Advisor, serves as principal underwriter of the fund. The Advisor and the Distributor are indirect, wholly owned subsidiaries of Manulife Financial Corporation (MFC). Prior to June 28, 2019, the Advisor was known as John Hancock Advisers, LLC and the Distributor was known as John Hancock Funds, LLC.
Management fee. The fund has an investment management agreement with the Advisor under which the fund pays a daily management fee to the Advisor equivalent on an annual basis to the sum of: (a) 0.550% of the first $500 million of the fund’s average daily net assets; (b) 0.500% of the next $500 million of the fund’s average daily net assets; (c) 0.450% of the next $2 billion of the fund’s average daily net assets; and (d) 0.425% of the fund’s average daily net assets in excess of $3 billion. The Advisor has a subadvisory agreement with Manulife Investment Management (US) LLC, an indirectly owned subsidiary of MFC and an affiliate of the Advisor. The fund is not responsible for payment of the subadvisory fees.
The Advisor has contractually agreed to waive a portion of its management fee and/or reimburse expenses for certain funds of the John Hancock group of funds complex, including the fund (the participating portfolios). This waiver is based upon aggregate net assets of all the participating portfolios. The amount of the reimbursement is calculated daily and allocated among all the participating portfolios in proportion to the daily net assets of each fund. During the six months ended November 30, 2019, this waiver amounted to 0.01% of the fund’s average daily net assets on an annualized basis. This arrangement expires on July 31, 2021, unless renewed by mutual agreement of the fund and the Advisor based upon a determination that this is appropriate under the circumstances at that time.
| 32 | JOHN HANCOCK Tax-Free Bond Fund | SEMIANNUAL REPORT | |
For the six months ended November 30, 2019, the expense reductions described above amounted to the following:
| Class | Expense reduction |
| Class A | $17,238 |
| Class B | 79 |
| Class C | 1,241 |
| Class | Expense reduction |
| Class I | $514 |
| Class R6 | 331 |
| Total | $19,403 |
Expenses waived or reimbursed in the current fiscal period are not subject to recapture in future fiscal periods.
The investment management fees, including the impact of the waivers and reimbursements as described above, incurred for the six months ended November 30, 2019, were equivalent to a net annual effective rate rate of 0.54% of the fund's average daily net assets.
Accounting and legal services. Pursuant to a service agreement, the fund reimburses the Advisor for all expenses associated with providing the administrative, financial, legal, compliance, accounting and recordkeeping services to the fund, including the preparation of all tax returns, periodic reports to shareholders and regulatory reports, among other services. These expenses are allocated to each share class based on its relative net assets at the time the expense was incurred. These accounting and legal services fees incurred for the six months ended November 30, 2019 amounted to an annual rate of 0.02% of the fund's average daily net assets.
Distribution and service plans. The fund has a distribution agreement with the Distributor. The fund has adopted distribution and service plans for certain classes as detailed below pursuant to Rule 12b-1 under the 1940 Act, to pay the Distributor for services provided as the distributor of shares of the fund. The fund may pay up to the following contractual rates of distribution and service fees under these arrangements, expressed as an annual percentage of average daily net assets for each class of the fund's shares:
| Class | Rule 12b-1 Fee |
| Class A | 0.25% |
| Class B | 1.00% |
| Class C | 1.00% |
The fund’s Distributor has contractually agreed to waive 0.10% of Rule12b-1 fees for Class A, Class B and Class C shares. The current waiver agreement expires on September 30, 2020, unless renewed by mutual agreement of the fund and the Distributor based upon a determination that this is appropriate under the circumstances at the time. This contractual waiver amounted to $223,576, $1,030 and $16,144 for Class A, Class B and Class C shares, respectively, for the six months ended November 30, 2019.
Sales charges. Class A shares are assessed up-front sales charges, which resulted in payments to the Distributor amounting to $189,703 for the six months ended November 30, 2019. Of this amount, $27,913 was retained and used for printing prospectuses, advertising, sales literature and other purposes and $161,790 was paid as sales commissions to broker-dealers.
Class A, Class B and Class C shares may be subject to contingent deferred sales charges (CDSCs). Certain Class A shares that are acquired through purchases of $1 million or more and are redeemed within one year of purchase are subject to a 1.00% sales charge. Class B shares that are redeemed within six years of purchase are subject to CDSCs, at declining rates, beginning at 5.00%. Class C shares that are redeemed within one year of purchase are subject to a 1.00% CDSC. CDSCs are applied to the lesser of the current market value at the time of redemption or the original purchase cost of the shares being redeemed. Proceeds from CDSCs are used to compensate the
| | SEMIANNUAL REPORT | JOHN HANCOCK Tax-Free Bond Fund | 33 |
Distributor for providing distribution-related services in connection with the sale of these shares. During the six months ended November 30, 2019, CDSCs received by the Distributor amounted to $619 and $335 for Class A and Class C shares, respectively.
Transfer agent fees. The John Hancock group of funds has a complex-wide transfer agent agreement with John Hancock Signature Services, Inc. (Signature Services), an affiliate of the Advisor. The transfer agent fees paid to Signature Services are determined based on the cost to Signature Services (Signature Services Cost) of providing recordkeeping services. It also includes out-of-pocket expenses, including payments made to third-parties for recordkeeping services provided to their clients who invest in one or more John Hancock funds. In addition, Signature Services Cost may be reduced by certain fees that Signature Services receives in connection with retirement and small accounts. Signature Services Cost is calculated monthly and allocated, as applicable, to five categories of share classes: Retail Share and Institutional Share Classes of Non-Municipal Bond Funds, Class R6 Shares, Retirement Share Classes and Municipal Bond Share Classes. Within each of these categories, the applicable costs are allocated to the affected John Hancock affiliated funds and/or classes, based on the relative average daily net assets.
Class level expenses. Class level expenses for the six months ended November 30, 2019 were as follows:
| Class | Distribution and service fees | Transfer agent fees |
| Class A | $558,939 | $92,355 |
| Class B | 10,301 | 426 |
| Class C | 161,440 | 6,669 |
| Class I | — | 2,754 |
| Class R6 | — | 548 |
| Total | $730,680 | $102,752 |
Trustee expenses. The fund compensates each Trustee who is not an employee of the Advisor or its affiliates. The costs of paying Trustee compensation and expenses are allocated to the fund based on its net assets relative to other funds within the John Hancock group of funds complex.
Note 5—Fund share transactions
Transactions in fund shares for the six months ended November 30, 2019 and for the year ended May 31, 2019 were as follows:
| | Six Months Ended 11-30-19 | Year Ended 5-31-19 |
| | Shares | Amount | Shares | Amount |
| Class A shares | | | | |
| Sold | 2,769,741 | $27,479,491 | 3,919,333 | $37,437,348 |
| Distributions reinvested | 614,455 | 6,102,900 | 1,425,541 | 13,649,058 |
| Repurchased | (2,769,357) | (27,469,380) | (8,349,566) | (79,692,434) |
| Net increase (decrease) | 614,839 | $6,113,011 | (3,004,692) | $(28,606,028) |
| 34 | JOHN HANCOCK Tax-Free Bond Fund | SEMIANNUAL REPORT | |
| | Six Months Ended 11-30-19 | Year Ended 5-31-19 |
| | Shares | Amount | Shares | Amount |
| Class B shares | | | | |
| Sold | 1,315 | $13,049 | 121 | $1,156 |
| Distributions reinvested | 2,141 | 21,262 | 7,585 | 72,582 |
| Repurchased | (73,614) | (729,601) | (133,879) | (1,277,368) |
| Net decrease | (70,158) | $(695,290) | (126,173) | $(1,203,630) |
| Class C shares | | | | |
| Sold | 153,328 | $1,525,180 | 339,757 | $3,237,126 |
| Distributions reinvested | 35,835 | 355,827 | 97,468 | 932,797 |
| Repurchased | (530,301) | (5,262,973) | (1,107,293) | (10,563,854) |
| Net decrease | (341,138) | $(3,381,966) | (670,068) | $(6,393,931) |
| Class I shares | | | | |
| Sold | 149,883 | $1,488,909 | 937,907 | $9,022,062 |
| Distributions reinvested | 21,218 | 211,024 | 42,927 | 411,592 |
| Repurchased | (120,595) | (1,200,411) | (523,575) | (5,002,275) |
| Net increase | 50,506 | $499,522 | 457,259 | $4,431,379 |
| Class R6 shares | | | | |
| Sold | 126,701 | $1,259,373 | 358,300 | $3,442,660 |
| Distributions reinvested | 13,994 | 139,233 | 28,166 | 270,227 |
| Repurchased | (72,768) | (721,480) | (274,446) | (2,618,639) |
| Net increase | 67,927 | $677,126 | 112,020 | $1,094,248 |
| Total net increase (decrease) | 321,976 | $3,212,403 | (3,231,654) | $(30,677,962) |
Note 6—Purchase and sale of securities
Purchases and sales of securities, other than short-term investments, amounted to $153,324,389 and $144,158,649, respectively, for the six months ended November 30, 2019.
Note 7—Investment in affiliated underlying funds
The fund may invest in affiliated underlying funds that are managed by the Advisor and its affiliates. Information regarding the fund's fiscal year to date purchases and sales of the affiliated underlying funds as well as income and capital gains earned by the fund, if any, is as follows:
| | | | | | | | Dividends and distributions |
| Affiliate | Ending
share
amount | Beginning
value | Cost of
purchases | Proceeds
from shares
sold | Realized
gain
(loss) | Change in
unrealized
appreciation
(depreciation) | Income
distributions
received | Capital gain
distributions
received | Ending
value |
| John Hancock Collateral Trust | 298,706 | — | $42,839,997 | $(39,884,805) | $13,987 | $19,767 | $30,287 | — | $2,988,946 |
| | SEMIANNUAL REPORT | JOHN HANCOCK Tax-Free Bond Fund | 35 |
CONTINUATION OF INVESTMENT ADVISORY AND SUBADVISORY AGREEMENTS
Evaluation of Advisory and Subadvisory Agreements by the Board of Trustees
This section describes the evaluation by the Board of Trustees (the Board) of John Hancock Municipal Securities Trust (the Trust) of the Advisory Agreement (the Advisory Agreement) with John Hancock Investment Management, LLC (the Advisor, formerly John Hancock Advisers, LLC) and the Subadvisory Agreement (the Subadvisory Agreement) with Manulife Investment Management (US) LLC (the Subadvisor, formerly John Hancock Asset Management a division of Manulife Asset Management (US) LLC), for John Hancock Tax-Free Bond Fund (the fund). The Advisory Agreement and Subadvisory Agreement are collectively referred to as the Agreements. Prior to the June 23-26, 2019 in-person meeting at which the Agreements were approved, the Board also discussed and considered information regarding the proposed continuation of the Agreements at an in-person meeting held on May 28-30, 2019.
Approval of Advisory and Subadvisory Agreements
At in-person meetings held on June 23-26, 2019, the Board, including the Trustees who are not parties to any Agreement or considered to be interested persons of the Trust under the Investment Company Act of 1940, as amended (the 1940 Act) (the Independent Trustees), reapproved for an annual period the continuation of the Advisory Agreement between the Trust and the Advisor and the Subadvisory Agreement between the Advisor and the Subadvisor with respect to the fund.
In considering the Advisory Agreement and the Subadvisory Agreement, the Board received in advance of the meetings a variety of materials relating to the fund, the Advisor and the Subadvisor, including comparative performance, fee and expense information for a peer group of similar funds prepared by an independent third-party provider of fund data, performance information for an applicable benchmark index; and, with respect to the Subadvisor, comparative performance information for comparably managed accounts, as applicable, and other information provided by the Advisor and the Subadvisor regarding the nature, extent and quality of services provided by the Advisor and the Subadvisor under their respective Agreements, as well as information regarding the Advisor's revenues and costs of providing services to the fund and any compensation paid to affiliates of the Advisor. At the meetings at which the renewal of the Advisory Agreement and Subadvisory Agreement are considered, particular focus is given to information concerning fund performance, comparability of fees and total expenses, and profitability. However, the Board noted that the evaluation process with respect to the Advisor and the Subadvisor is an ongoing one. In this regard, the Board also took into account discussions with management and information provided to the Board (including its various committees) at prior meetings with respect to the services provided by the Advisor and the Subadvisor to the fund, including quarterly performance reports prepared by management containing reviews of investment results and prior presentations from the Subadvisor with respect to the fund. The information received and considered by the Board in connection with the May and June meetings and throughout the year was both written and oral. The Board noted the affiliation of the Subadvisor with the Advisor, noting any potential conflicts of interest. The Board also considered the nature, quality, and extent of non-advisory services, if any, to be provided to the fund by the Advisor's affiliates, including distribution services. The Board considered the Advisory Agreement and the Subadvisory Agreement separately in the course of its review. In doing so, the Board noted the respective roles of the Advisor and Subadvisor in providing services to the fund.
Throughout the process, the Board asked questions of and requested additional information from management. The Board is assisted by counsel for the Trust and the Independent Trustees are also separately assisted by independent legal counsel throughout the process. The Independent Trustees also received a memorandum from their independent legal counsel discussing the legal standards for their consideration of the proposed continuation of the Agreements
SEMIANNUAL REPORT | JOHN HANCOCK TAX-FREE BOND FUND 36
and discussed the proposed continuation of the Agreements in private sessions with their independent legal counsel at which no representatives of management were present.
Approval of Advisory Agreement
In approving the Advisory Agreement with respect to the fund, the Board, including the Independent Trustees, considered a variety of factors, including those discussed below. The Board also considered other factors (including conditions and trends prevailing generally in the economy, the securities markets, and the industry) and did not treat any single factor as determinative, and each Trustee may have attributed different weights to different factors. The Board's conclusions may be based in part on its consideration of the advisory and subadvisory arrangements in prior years and on the Board's ongoing regular review of fund performance and operations throughout the year.
Nature, extent, and quality of services. Among the information received by the Board from the Advisor relating to the nature, extent, and quality of services provided to the fund, the Board reviewed information provided by the Advisor relating to its operations and personnel, descriptions of its organizational and management structure, and information regarding the Advisor's compliance and regulatory history, including its Form ADV. The Board also noted that on a regular basis it receives and reviews information from the Trust's Chief Compliance Officer (CCO) regarding the fund's compliance policies and procedures established pursuant to Rule 38a-1 under the 1940 Act. The Board observed that the scope of services provided by the Advisor, and of the undertakings required of the Advisor in connection with those services, including maintaining and monitoring its own and the fund's compliance programs, risk management programs, liquidity management programs and cybersecurity programs, had expanded over time as a result of regulatory, market and other developments. The Board considered that the Advisor is responsible for the management of the day-to-day operations of the fund, including, but not limited to, general supervision of and coordination of the services provided by the Subadvisor, and is also responsible for monitoring and reviewing the activities of the Subadvisor and third-party service providers. The Board also considered the significant risks assumed by the Advisor in connection with the services provided to the fund including entrepreneurial risk in sponsoring new funds and ongoing risks including investment, operational, enterprise, litigation, regulatory and compliance risks with respect to all funds.
In considering the nature, extent, and quality of the services provided by the Advisor, the Trustees also took into account their knowledge of the Advisor's management and the quality of the performance of the Advisor's duties, through Board meetings, discussions and reports during the preceding year and through each Trustee's experience as a Trustee of the Trust and of the other trusts in the John Hancock group of funds complex (the John Hancock Fund Complex).
In the course of their deliberations regarding the Advisory Agreement, the Board considered, among other things:
| | | | | | | | | |
| | | | | (a) | | | the skills and competency with which the Advisor has in the past managed the Trust's affairs and its subadvisory relationship, the Advisor's oversight and monitoring of the Subadvisor's investment performance and compliance programs, such as the Subadvisor's compliance with fund policies and objectives, review of brokerage matters, including with respect to trade allocation and best execution and the Advisor's timeliness in responding to performance issues; | |
| | | | | (b) | | | the background, qualifications and skills of the Advisor's personnel; | |
| | | | | (c) | | | the Advisor's compliance policies and procedures and its responsiveness to regulatory changes and fund industry developments; | |
SEMIANNUAL REPORT | JOHN HANCOCK TAX-FREE BOND FUND 37
| | | | | | | | | |
| | | | | (d) | | | the Advisor's administrative capabilities, including its ability to supervise the other service providers for the fund, as well as the Advisor's oversight of any securities lending activity, its monitoring of class action litigation and collection of class action settlements on behalf of the fund, and bringing loss recovery actions on behalf of the fund; | |
| | | | | (e) | | | the financial condition of the Advisor and whether it has the financial wherewithal to provide a high level and quality of services to the fund; | |
| | | | | (f) | | | the Advisor's initiatives intended to improve various aspects of the Trust's operations and investor experience with the fund; and | |
| | | | | (g) | | | the Advisor's reputation and experience in serving as an investment advisor to the Trust and the benefit to shareholders of investing in funds that are part of a family of funds offering a variety of investments. | |
The Board concluded that the Advisor may reasonably be expected to continue to provide a high quality of services under the Advisory Agreement with respect to the fund.
Investment performance. In considering the fund's performance, the Board noted that it reviews at its regularly scheduled meetings information about the fund's performance results. In connection with the consideration of the Advisory Agreement, the Board:
| | | |
| | (a) | reviewed information prepared by management regarding the fund's performance; |
| | (b) | considered the comparative performance of an applicable benchmark index; |
| | (c) | considered the performance of comparable funds, if any, as included in the report prepared by an independent third-party provider of fund data; and |
| | (d) | took into account the Advisor's analysis of the fund's performance and its plans and recommendations regarding the Trust's subadvisory arrangements generally. |
The Board noted that while it found the data provided by the independent third-party generally useful it recognized its limitations, including in particular that the data may vary depending on the end date selected and the results of the performance comparisons may vary depending on the selection of the peer group. The Board noted that the fund underperformed its benchmark index and its peer group average for the one-, three-, five- and ten-year periods ended December 31, 2018. The Board took into account management's discussion of the fund's performance, including management's discussion of the reasons for the fund's recent underperformance relative to the peer group. The Board concluded that the fund's performance is being monitored and reasonably addressed, where appropriate.
Fees and expenses. The Board reviewed comparative information prepared by an independent third-party provider of fund data, including, among other data, the fund's contractual and net management fees (and subadvisory fees, to the extent available) and total expenses as compared to similarly situated investment companies deemed to be comparable to the fund in light of the nature, extent and quality of the management and advisory and subadvisory services provided by the Advisor and the Subadvisor. The Board considered the fund's ranking within a smaller group of peer funds chosen by the independent third-party provider, as well as the fund's ranking within a broader group of funds. In comparing the fund's contractual and net management fees to those of comparable funds, the Board noted that such fees include both advisory and administrative costs. The Board noted that net management fees for the fund were higher than the peer group median and net total expenses for the fund are lower than the peer group median.
The Board took into account management's discussion of the fund's expenses. The Board also took into account management's discussion with respect to the overall management fee and the fees of the Subadvisor, including the
SEMIANNUAL REPORT | JOHN HANCOCK TAX-FREE BOND FUND 38
amount of the advisory fee retained by the Advisor after payment of the subadvisory fee, in each case in light of the services rendered for those amounts and the risks undertaken by the Advisor. The Board also noted that the Advisor pays the subadvisory fee. In addition, the Board took into account that management had agreed to implement an overall fee waiver across the complex, including the fund, which is discussed further below. The Board also noted actions taken over the past several years to reduce the fund's operating expenses. The Board also noted that, in addition, the Advisor is currently waiving fees and/or reimbursing expenses with respect to the fund and that the fund has breakpoints in its contractual management fee schedule that reduce management fees as assets increase. The Board also noted that the fund's distributor, an affiliate of the Advisor, has agreed to waive a portion of its Rule 12b-1 fee for a share class of the fund. The Board noted that the fund has a voluntary fee waiver and/or expense reimbursement, which reduces certain expenses of the fund. The Board reviewed information provided by the Advisor concerning the investment advisory fee charged by the Advisor or one of its advisory affiliates to other clients (including other funds in the John Hancock Fund Complex) having similar investment mandates, if any. The Board considered any differences between the Advisor's and Subadvisor's services to the fund and the services they provide to other comparable clients or funds. The Board concluded that the advisory fee paid with respect to the fund is reasonable in light of the nature, extent and quality of the services provided to the fund under the Advisory Agreement.
Profitability/Fall out benefits. In considering the costs of the services to be provided and the profits to be realized by the Advisor and its affiliates (including the Subadvisor) from the Advisor's relationship with the Trust, the Board:
| | | | | | | | | |
| | | | | (a) | | | reviewed financial information of the Advisor; | |
| | | | | (b) | | | reviewed and considered information presented by the Advisor regarding the net profitability to the Advisor and its affiliates with respect to the fund; | |
| | | | | (c) | | | received and reviewed profitability information with respect to the John Hancock Fund Complex as a whole and with respect to the fund; | |
| | | | | (d) | | | received information with respect to the Advisor's allocation methodologies used in preparing the profitability data and considered that the Advisor hired an independent third-party consultant to provide an analysis of the Advisor's allocation methodologies; | |
| | | | | (e) | | | considered that the John Hancock insurance companies that are affiliates of the Advisor, as shareholders of the Trust directly or through their separate accounts, receive certain tax credits or deductions relating to foreign taxes paid and dividends received by certain funds of the Trust and noted that these tax benefits, which are not available to participants in qualified retirement plans under applicable income tax law, are reflected in the profitability information reviewed by the Board; | |
| | | | | (f) | | | considered that the Advisor also provides administrative services to the fund on a cost basis pursuant to an administrative services agreement; | |
| | | | | (g) | | | noted that affiliates of the Advisor provide transfer agency services and distribution services to the fund, and that the fund's distributor also receives Rule 12b-1 payments to support distribution of the fund; | |
| | | | | (h) | | | noted that the fund's Subadvisor is an affiliate of the Advisor; | |
| | | | | (i) | | | noted that the Advisor also derives reputational and other indirect benefits from providing advisory services to the fund; | |
| | | | | (j) | | | noted that the subadvisory fee for the fund is paid by the Advisor; | |
SEMIANNUAL REPORT | JOHN HANCOCK TAX-FREE BOND FUND 39
| | | | | | | | | |
| | | | | (k) | | | considered the Advisor's ongoing costs and expenditures necessary to improve services, meet new regulatory and compliance requirements, and adapt to other challenges impacting the fund industry; and | |
| | | | | (l) | | | considered that the Advisor should be entitled to earn a reasonable level of profits in exchange for the level of services it provides to the fund and the risks that it assumes as Advisor, including entrepreneurial, operational, reputational, litigation and regulatory risk. | |
Based upon its review, the Board concluded that the level of profitability, if any, of the Advisor and its affiliates (including the Subadvisor) from their relationship with the fund was reasonable and not excessive.
Economies of scale. In considering the extent to which economies of scale would be realized as the fund grows and whether fee levels reflect these economies of scale for the benefit of fund shareholders, the Board:
| | | |
| | (a) | considered that the Advisor has contractually agreed to waive a portion of its management fee for certain funds of the John Hancock Fund Complex, including the fund (the participating portfolios) or otherwise reimburse the expenses of the participating portfolios (the reimbursement). This waiver is based upon aggregate net assets of all the participating portfolios. The amount of the reimbursement is calculated daily and allocated among all the participating portfolios in proportion to the daily net assets of each fund; |
| | (b) | reviewed the fund's advisory fee structure and concluded that: (i) the fund's fee structure contains breakpoints at the subadvisory fee level and that such breakpoints are reflected as breakpoints in the advisory fees for the fund; and (ii) although economies of scale cannot be measured with precision, these arrangements permit shareholders of the fund to benefit from economies of scale if the fund grows. The Board also took into account management's discussion of the fund's advisory fee structure; and |
| | (c) | the Board also considered the effect of the fund's growth in size on its performance and fees. The Board also noted that if the fund's assets increase over time, the fund may realize other economies of scale. |
Approval of Subadvisory Agreement
In making its determination with respect to approval of the Subadvisory Agreement, the Board reviewed:
| | | |
| | (1) | information relating to the Subadvisor's business, including current subadvisory services to the Trust (and other funds in the John Hancock Fund Complex); |
| | (2) | the historical and current performance of the fund and comparative performance information relating to an applicable benchmark index and comparable funds; and |
| | (3) | the subadvisory fee for the fund, including any breakpoints, and to the extent available, comparable fee information prepared by an independent third-party provider of fund data. |
Nature, extent, and quality of services. With respect to the services provided by the Subadvisor, the Board received information provided to the Board by the Subadvisor, including the Subadvisor's Form ADV, as well as took into account information presented throughout the past year. The Board considered the Subadvisor's current level of staffing and its overall resources, as well as received information relating to the Subadvisor's compensation program. The Board reviewed the Subadvisor's history and investment experience, as well as information regarding the qualifications, background, and responsibilities of the Subadvisor's investment and compliance personnel who
SEMIANNUAL REPORT | JOHN HANCOCK TAX-FREE BOND FUND 40
provide services to the fund. The Board also considered, among other things, the Subadvisor's compliance program and any disciplinary history. The Board also considered the Subadvisor's risk assessment and monitoring process. The Board reviewed the Subadvisor's regulatory history, including whether it was involved in any regulatory actions or investigations as well as material litigation, and any settlements and amelioratory actions undertaken, as appropriate. The Board noted that the Advisor conducts regular, periodic reviews of the Subadvisor and its operations, including regarding investment processes and organizational and staffing matters. The Board also noted that the Trust's CCO and his staff conduct regular, periodic compliance reviews with the Subadvisor and present reports to the Independent Trustees regarding the same, which includes evaluating the regulatory compliance systems of the Subadvisor and procedures reasonably designed to assure compliance with the federal securities laws. The Board also took into account the financial condition of the Subadvisor.
The Board considered the Subadvisor's investment process and philosophy. The Board took into account that the Subadvisor's responsibilities include the development and maintenance of an investment program for the fund that is consistent with the fund's investment objective, the selection of investment securities and the placement of orders for the purchase and sale of such securities, as well as the implementation of compliance controls related to performance of these services. The Board also received information with respect to the Subadvisor's brokerage policies and practices, including with respect to best execution and soft dollars.
Subadvisor compensation. In considering the cost of services to be provided by the Subadvisor and the profitability to the Subadvisor of its relationship with the fund, the Board noted that the fees under the Subadvisory Agreement are paid by the Advisor and not the fund. The Board also received information and took into account any other potential conflicts of interest the Advisor might have in connection with the Subadvisory Agreement.
In addition, the Board considered other potential indirect benefits that the Subadvisor and its affiliates may receive from the Subadvisor's relationship with the fund, such as the opportunity to provide advisory services to additional funds in the John Hancock Fund Complex and reputational benefits.
Subadvisory fees. The Board considered that the fund pays an advisory fee to the Advisor and that, in turn, the Advisor pays a subadvisory fee to the Subadvisor. As noted above, the Board also considered the fund's subadvisory fees as compared to similarly situated investment companies deemed to be comparable to the fund as included in the report prepared by the independent third-party provider of fund data, to the extent available. The Board also noted that the limited size of the Lipper peer group was not sufficient for comparative purposes. The Board also took into account the subadvisory fees paid by the Advisor to the Subadvisor with respect to the fund and compared them to fees charged by the Subadvisor to manage other subadvised portfolios and portfolios not subject to regulation under the 1940 Act, as applicable.
Subadvisor performance. As noted above, the Board considered the fund's performance as compared to the fund's peer group and the benchmark index and noted that the Board reviews information about the fund's performance results at its regularly scheduled meetings. The Board noted the Advisor's expertise and resources in monitoring the performance, investment style and risk-adjusted performance of the Subadvisor. The Board was mindful of the Advisor's focus on the Subadvisor's performance. The Board also noted the Subadvisor's long-term performance record for similar accounts, as applicable.
The Board's decision to approve the Subadvisory Agreement was based on a number of determinations, including the following:
| | | | | | | | | |
| | | | | (1) | | | the Subadvisor has extensive experience and demonstrated skills as a manager; | |
| | | | | (2) | | | the performance of the fund is being monitored and reasonably addressed, where appropriate; | |
SEMIANNUAL REPORT | JOHN HANCOCK TAX-FREE BOND FUND 41
| | | | | | | | | |
| | | | | (3) | | | the subadvisory fee is reasonable in relation to the level and quality of services being provided under the Subadvisory Agreement; and | |
| | | | | (4) | | | noted that the subadvisory fees are paid by the Advisor not the fund and that the subadvisory fee breakpoints are reflected as breakpoints in the advisory fees for the fund in order to permit shareholders to benefit from economies of scale if the fund grows. | |
| | * * * | |
Based on the Board's evaluation of all factors that the Board deemed to be material, including those factors described above, the Board, including the Independent Trustees, concluded that renewal of the Advisory Agreement and the Subadvisory Agreement would be in the best interest of the fund and its shareholders. Accordingly, the Board, and the Independent Trustees voting separately, approved the Advisory Agreement and Subadvisory Agreement for an additional one-year period.
SEMIANNUAL REPORT | JOHN HANCOCK TAX-FREE BOND FUND 42
| | |
Trustees
Hassell H. McClellan,Chairperson
Steven R. Pruchansky,Vice Chairperson
Andrew G. Arnott†
Charles L. Bardelis*
James R. Boyle
Peter S. Burgess*
William H. Cunningham
Grace K. Fey
Marianne Harrison†
Deborah C. Jackson
James M. Oates*
Gregory A. Russo
Officers
Andrew G. Arnott
President
Francis V. Knox, Jr.
Chief Compliance Officer
Charles A. Rizzo
Chief Financial Officer
Salvatore Schiavone
Treasurer
Christopher (Kit) Sechler
Secretary and Chief Legal Officer
| Investment advisor
John Hancock Investment Management LLC
Subadvisor
Manulife Investment Management (US) LLC
Portfolio Managers
Dennis DiCicco
Jeffrey N. Given, CFA
Principal distributor
John Hancock Investment Management Distributors LLC
Custodian
State Street Bank and Trust Company
Transfer agent
John Hancock Signature Services, Inc.
Legal counsel
K&L Gates LLP
|
* Member of the Audit Committee
† Non-Independent Trustee
The fund's proxy voting policies and procedures, as well as the fund proxy voting record for the most recent twelve-month period ended June 30, are available free of charge on the Securities and Exchange Commission (SEC) website at sec.gov or on our website.
All of the fund's holdings as of the end of the third month of every fiscal quarter are filed with the SEC on Form N-PORT within 60 days of the end of the fiscal quarter. The fund's Form N-PORT filings are available on our website and the SEC's website, sec.gov.
We make this information on your fund, as well asmonthly portfolio holdings, and other fund details available on our website at jhinvestments.com or by calling 800-225-5291.
| | | | |
| | You can also contact us: |
| | 800-225-5291
jhinvestments.com | Regular mail:
John Hancock Signature Services, Inc.
P.O. Box 55913
Boston, MA 02205-5913
| Express mail:
John Hancock Signature Services, Inc.
2000 Crown Colony Drive
Suite 55913
Quincy, MA 02169-0953
|
SEMIANNUAL REPORT | JOHN HANCOCK TAX-FREE BOND FUND 43
John Hancock family of funds
| | | |
DOMESTIC EQUITY FUNDS
Blue Chip Growth
Classic Value
Disciplined Value
Disciplined Value Mid Cap
Equity Income
Financial Industries
Fundamental All Cap Core
Fundamental Large Cap Core
New Opportunities
Regional Bank
Small Cap Core
Small Cap Growth
Small Cap Value
U.S. Global Leaders Growth
U.S. Quality Growth
GLOBAL AND INTERNATIONAL EQUITY FUNDS
Disciplined Value International
Emerging Markets
Emerging Markets Equity
Fundamental Global Franchise
Global Equity
Global Shareholder Yield
Global Thematic Opportunities
International Dynamic Growth
International Growth
International Small Company
| | INCOME FUNDS
Bond
California Tax-Free Income
Emerging Markets Debt
Floating Rate Income
Government Income
High Yield
High Yield Municipal Bond
Income
Investment Grade Bond
Money Market
Short Duration Bond
Short Duration Credit Opportunities
Strategic Income Opportunities
Tax-Free Bond
ALTERNATIVE AND SPECIALTY FUNDS
Absolute Return Currency
Alternative Asset Allocation
Alternative Risk Premia
Disciplined Alternative Yield
Diversified Macro
Infrastructure
Multi-Asset Absolute Return
Seaport Long/Short
|
A fund's investment objectives, risks, charges, and expenses should be considered carefully before investing. The prospectus contains this and other important information about the fund. To obtain a prospectus, contact your financial professional, call John Hancock Investment Management at 800-225-5291, or visit our website at jhinvestments.com. Please read the prospectus carefully before investing or sending money.
| | | |
ASSET ALLOCATION
Balanced
Income Allocation
Multi-Index Lifetime Portfolios
Multi-Index Preservation Portfolios
Multimanager Lifestyle Portfolios
Multimanager Lifetime Portfolios
Retirement Income 2040
EXCHANGE-TRADED FUNDS
John Hancock Multifactor Consumer Discretionary ETF
John Hancock Multifactor Consumer Staples ETF
John Hancock Multifactor Developed International ETF
John Hancock Multifactor Emerging Markets ETF
John Hancock Multifactor Energy ETF
John Hancock Multifactor Financials ETF
John Hancock Multifactor Healthcare ETF
John Hancock Multifactor Industrials ETF
John Hancock Multifactor Large Cap ETF
John Hancock Multifactor Materials ETF
John Hancock Multifactor Media and
Communications ETF
John Hancock Multifactor Mid Cap ETF
John Hancock Multifactor Small Cap ETF
John Hancock Multifactor Technology ETF
John Hancock Multifactor Utilities ETF
| | ENVIRONMENTAL, SOCIAL, AND
GOVERNANCE FUNDS
ESG All Cap Core
ESG Core Bond
ESG International Equity
ESG Large Cap Core
CLOSED-END FUNDS
Financial Opportunities
Hedged Equity & Income
Income Securities Trust
Investors Trust
Preferred Income
Preferred Income II
Preferred Income III
Premium Dividend
Tax-Advantaged Dividend Income
Tax-Advantaged Global Shareholder Yield
|
John Hancock Multifactor ETF shares are bought and sold at market price (not NAV), and are not individually redeemed
from the fund. Brokerage commissions will reduce returns.
John Hancock ETFs are distributed by Foreside Fund Services, LLC, and are subadvised by Dimensional Fund Advisors LP.
Foreside is not affiliated with John Hancock Investment Management Distributors LLC or Dimensional Fund Advisors LP.
Dimensional Fund Advisors LP receives compensation from John Hancock in connection with licensing rights to the
John Hancock Dimensional indexes. Dimensional Fund Advisors LP does not sponsor, endorse, or sell, and makes no
representation as to the advisability of investing in, John Hancock Multifactor ETFs.
John Hancock Investment Management
A trusted brand
John Hancock Investment Management is a premier asset manager
representing one of America's most trusted brands, with a heritage of
financial stewardship dating back to 1862. Helping our shareholders
pursue their financial goals is at the core of everything we do. It's why
we support the role of professional financial advice and operate with
the highest standards of conduct and integrity.
A better way to invest
We serve investors globally through a unique multimanager approach:
We search the world to find proven portfolio teams with specialized
expertise for every strategy we offer, then we apply robust investment
oversight to ensure they continue to meet our uncompromising
standards and serve the best interests of our shareholders.
Results for investors
Our unique approach to asset management enables us to provide
a diverse set of investments backed by some of the world's best
managers, along with strong risk-adjusted returns across asset classes.
John Hancock Investment Management Distributors LLC n Member FINRA, SIPC
200 Berkeley Street n Boston, MA 02116-5010 n 800-225-5291 n jhinvestments.com
This report is for the information of the shareholders of John Hancock Tax-Free Bond Fund. It is not authorized for distribution to prospective investors unless preceded or accompanied by a prospectus.
ITEM 2. CODE OF ETHICS.
Not applicable at this time.
ITEM 3. AUDIT COMMITTEE FINANCIAL EXPERT.
Not applicable at this time.
ITEM 4. PRINCIPAL ACCOUNTANT FEES AND SERVICES.
Not applicable at this time.
ITEM 5. AUDIT COMMITTEE OF LISTED REGISTRANTS.
Not applicable at this time.
ITEM 6. SCHEDULE OF INVESTMENTS.
Not applicable.
ITEM 7. DISCLOSURE OF PROXY VOTING POLICIES AND PROCEDURES FOR CLOSED-END MANAGEMENT INVESTMENT COMPANIES.
Not applicable.
ITEM 8. PORTFOLIO MANAGERS OF CLOSED-END MANAGEMENT INVESTMENT COMPANIES.
Not applicable.
ITEM 9. PURCHASES OF EQUITY SECURITIES BY CLOSED-END MANAGEMENT INVESTMENT COMPANY AND AFFILIATED PURCHASERS.
Not applicable.
ITEM 10. SUBMISSION OF MATTERS TO A VOTE OF SECURITY HOLDERS.
(a) The registrant has adopted procedures by which shareholders may recommend nominees to the registrant’s Board of Trustees. A copy of the procedures is filed as an exhibit to this Form NCSR. See attached “John Hancock Funds – Nominating and Governance Committee Charter”.
ITEM 11. CONTROLS AND PROCEDURES.
(a) EVALUATION OF DISCLOSURE CONTROLS AND PROCEDURES. The registrant maintains disclosure controls and procedures that are designed to ensure that information required to be disclosed in this Form N-CSR is recorded, processed, summarized and reported within the time periods specified in the rules and forms of the Securities and Exchange Commission. Such disclosure and procedures include controls and procedures designed to ensure that such information is accumulated and communicated to the registrant’s management, including its principal executive officer and principal financial officer, as appropriate, to allow timely decisions regarding required disclosure.
Within 90 days prior to the filing date of this Form N-CSR, the registrant had carried out an evaluation, under the supervision and with the participation of the registrant’s management, including the registrant’s principal executive officer and the registrant’s principal financial officer, of the effectiveness of the design and operation of the registrant’s disclosure controls and procedures relating to information required to be disclosed on Form N-CSR. Based on such evaluation, the registrant’s principal executive officer and principal financial officer concluded that the registrant’s disclosure controls and procedures are operating effectively to ensure that:
(i) information required to be disclosed in this Form N-CSR is recorded, processed, summarized and reported within the periods specified in the rules and forms of the Securities and Exchange Commission, and
(ii) information is accumulated and communicated to the registrant’s management, including its principal executive officer and principal financial officer, as appropriate, to allow timely decisions regarding required disclosure.
(b) CHANGE IN REGISTRANT’S INTERNAL CONTROL: Not applicable.
ITEM 12. DISCLOSURE OF SECURITIES LENDING ACTIVITIES FOR CLOSED-END MANAGEMENT INVESTMENT COMPANIES.
Not applicable.
ITEM 13. EXHIBITS.
(a)(1) Separate certifications for the registrant's principal executive officer and principal financial officer, as required by Section 302 of the Sarbanes-Oxley Act of 2002 and Rule 30a-2(a) under the Investment Company Act of 1940, are attached.
(b)(1) Separate certifications for the registrant's principal executive officer and principal financial officer, as required by 18 U.S.C. Section 1350, as adopted pursuant to Section 906 of the Sarbanes-Oxley Act of 2002, and Rule 30a-2(b) under the Investment Company Act of 1940, are attached. The certifications furnished pursuant to this paragraph are not deemed to be "filed" for purposes of Section 18 of the Securities Exchange Act of 1934, or otherwise subject to the liability of that section. Such certifications are not deemed to be incorporated by reference into any filing under the Securities Act of 1933 or the Securities Exchange Act of 1934, except to the extent that the Registrant specifically incorporates them by reference.
(c)(1) Submission of Matters to a Vote of Security Holders is attached. See attached “John Hancock Funds – Nominating and Governance Committee Charter”.
SIGNATURES
Pursuant to the requirements of the Securities Exchange Act of 1934 and the Investment Company Act of 1940, the registrant has duly caused this report to be signed on its behalf by the undersigned, thereunto duly authorized.
John Hancock Municipal Securities Trust
| By: | | /s/ Andrew Arnott |
| | Andrew Arnott |
| | President |
| | |
| Date: | | January 7, 2020 |
Pursuant to the requirements of the Securities Exchange Act of 1934 and the Investment Company Act of 1940, this report has been signed below by the following persons on behalf of the registrant and in the capacities and on the dates indicated.
| By: | | /s/ Andrew Arnott |
| | Andrew Arnott |
| | President |
| |
| Date: | | January 7, 2020 |
| |
| By: | | /s/ Charles A. Rizzo |
| | Charles A. Rizzo |
| | Chief Financial Officer |
| |
| Date: | | January 7, 2020 |