4Q INVESTOR PRESENTATION January 21, 2020 Member FDIC. © 2020 United Community Bank
Disclosures CAUTIONARY STATEMENT This Investor Presentation contains forward-looking statements, as defined by federal securities laws, including statements about United Community Banks, Inc. (“United”) and its financial outlook and business environment. These statements are based on current expectations and are provided to assist in the understanding of our operations and future financial performance. Our operations and such performance involves risks and uncertainties that may cause actual results to differ materially from those expressed or implied in any such statements. For a discussion of some of the risks and other factors that may cause such forward- looking statements to differ materially from actual results, please refer to United’s filings with the Securities and Exchange Commission, including its 2018 Annual Report on Form 10-K under the section entitled “Forward-Looking Statements.” Forward- looking statements speak only as of the date they are made, and we undertake no obligation to update or revise forward-looking statements. NON-GAAP MEASURES This Investor Presentation includes financial information determined by methods other than in accordance with generally accepted accounting principles (“GAAP”). This financial information includes certain operating performance measures, which exclude merger-related and other charges that are not considered part of recurring operations. Such measures include: “Earnings per share – operating,” “Diluted earnings per share – operating,” “Tangible book value per share,” “Return on common equity – operating,” “Return on tangible common equity – operating,” “Return on assets – operating,” “Efficiency ratio – operating,” “Expenses – operating,” and “Tangible common equity to tangible assets.” Management has included these non-GAAP measures because it believes these measures may provide useful supplemental information for evaluating United’s underlying performance trends. Further, management uses these measures in managing and evaluating United’s business and intends to refer to them in discussions about our operations and performance. Operating performance measures should be viewed in addition to, and not as an alternative to or substitute for, measures determined in accordance with GAAP, and are not necessarily comparable to non-GAAP measures that may be presented by other companies. To the extent applicable, reconciliations of these non-GAAP measures to the most directly comparable GAAP measures can be found in the ‘Non-GAAP Reconciliation Tables’ included in the exhibits to this Presentation. 2
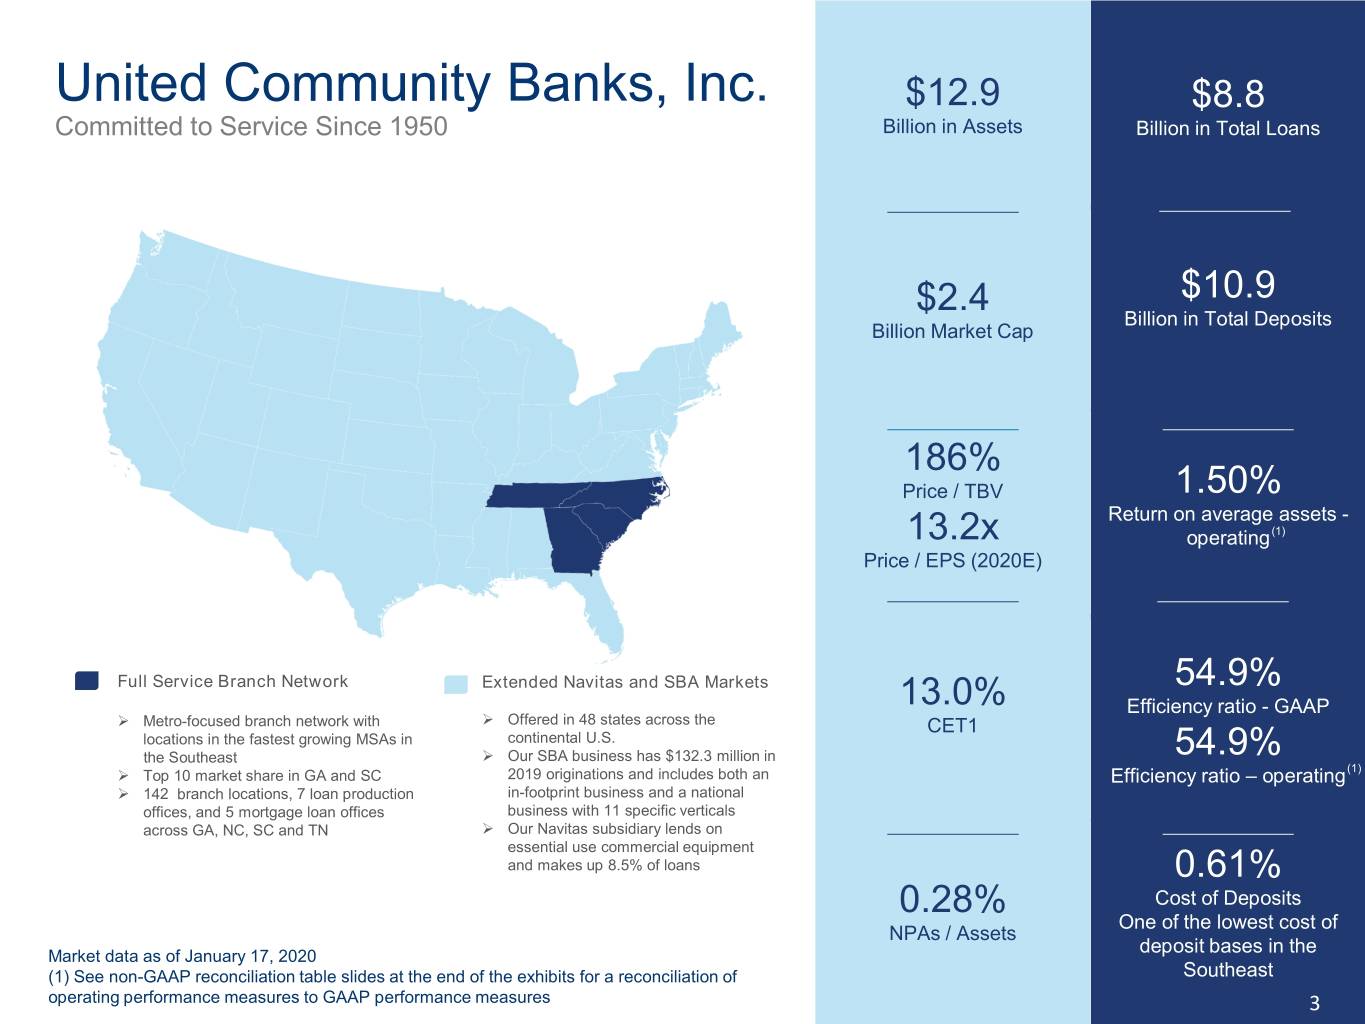
United Community Banks, Inc. $12.9 $8.8 Committed to Service Since 1950 Billion in Assets Billion in Total Loans $2.4 $10.9 Billion in Total Deposits Billion Market Cap 186% Price / TBV 1.50% Return on average assets - 13.2x operating(1) Price / EPS (2020E) Full Service Branch Network Extended Navitas and SBA Markets 54.9% 13.0% Efficiency ratio - GAAP Metro-focused branch network with Offered in 48 states across the CET1 locations in the fastest growing MSAs in continental U.S. the Southeast Our SBA business has $132.3 million in 54.9% Top 10 market share in GA and SC 2019 originations and includes both an Efficiency ratio – operating(1) 142 branch locations, 7 loan production in-footprint business and a national offices, and 5 mortgage loan offices business with 11 specific verticals across GA, NC, SC and TN Our Navitas subsidiary lends on essential use commercial equipment and makes up 8.5% of loans 0.61% 0.28% Cost of Deposits One of the lowest cost of NPAs / Assets deposit bases in the Market data as of January 17, 2020 (1) See non-GAAP reconciliation table slides at the end of the exhibits for a reconciliation of Southeast operating performance measures to GAAP performance measures 3
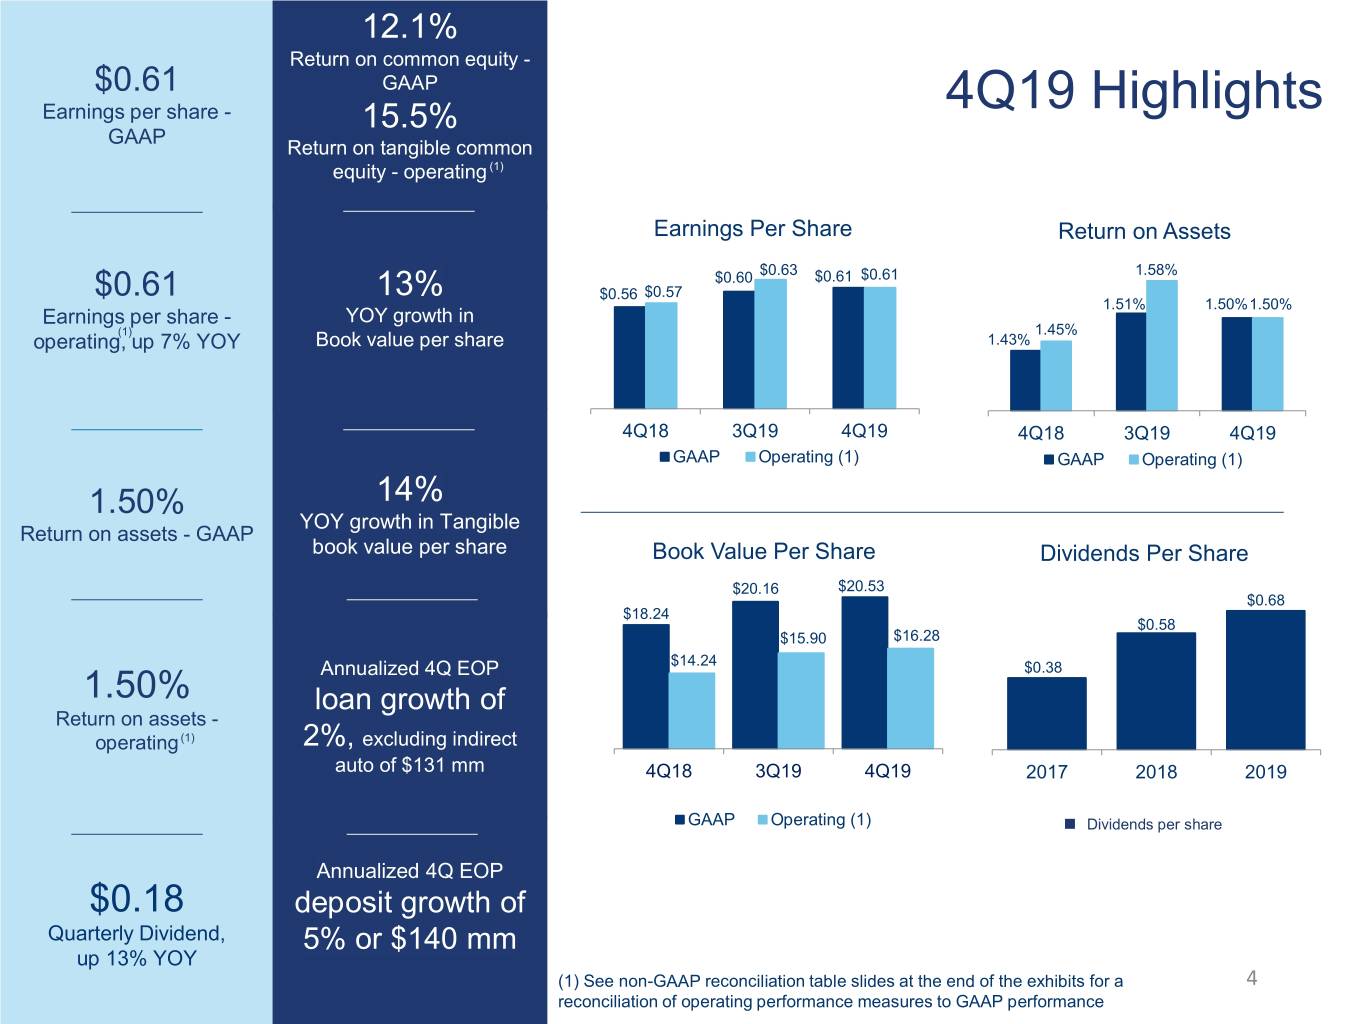
12.1% Return on common equity - $0.61 GAAP Earnings per share - 15.5% 4Q19 Highlights GAAP Return on tangible common equity - operating (1) Earnings Per Share Return on Assets $0.63 1.58% $0.60 $0.61 $0.61 $0.61 13% $0.56 $0.57 1.51% 1.50%1.50% Earnings per share - YOY growth in (1) 1.45% operating, up 7% YOY Book value per share 1.43% 4Q18 3Q19 4Q19 4Q18 3Q19 4Q19 GAAP Operating (1) GAAP Operating (1) 1.50% 14% YOY growth in Tangible Return on assets - GAAP book value per share Book Value Per Share Dividends Per Share $20.16 $20.53 $0.68 $18.24 $0.58 $15.90 $16.28 Annualized 4Q EOP $14.24 $0.38 1.50% loan growth of Return on assets - operating (1) 2%, excluding indirect auto of $131 mm 4Q18 3Q19 4Q19 2017 2018 2019 GAAP Operating (1) Dividends per share Annualized 4Q EOP $0.18 deposit growth of Quarterly Dividend, 5% or $140 mm up 13% YOY (1) See non-GAAP reconciliation table slides at the end of the exhibits for a 4 reconciliation of operating performance measures to GAAP performance
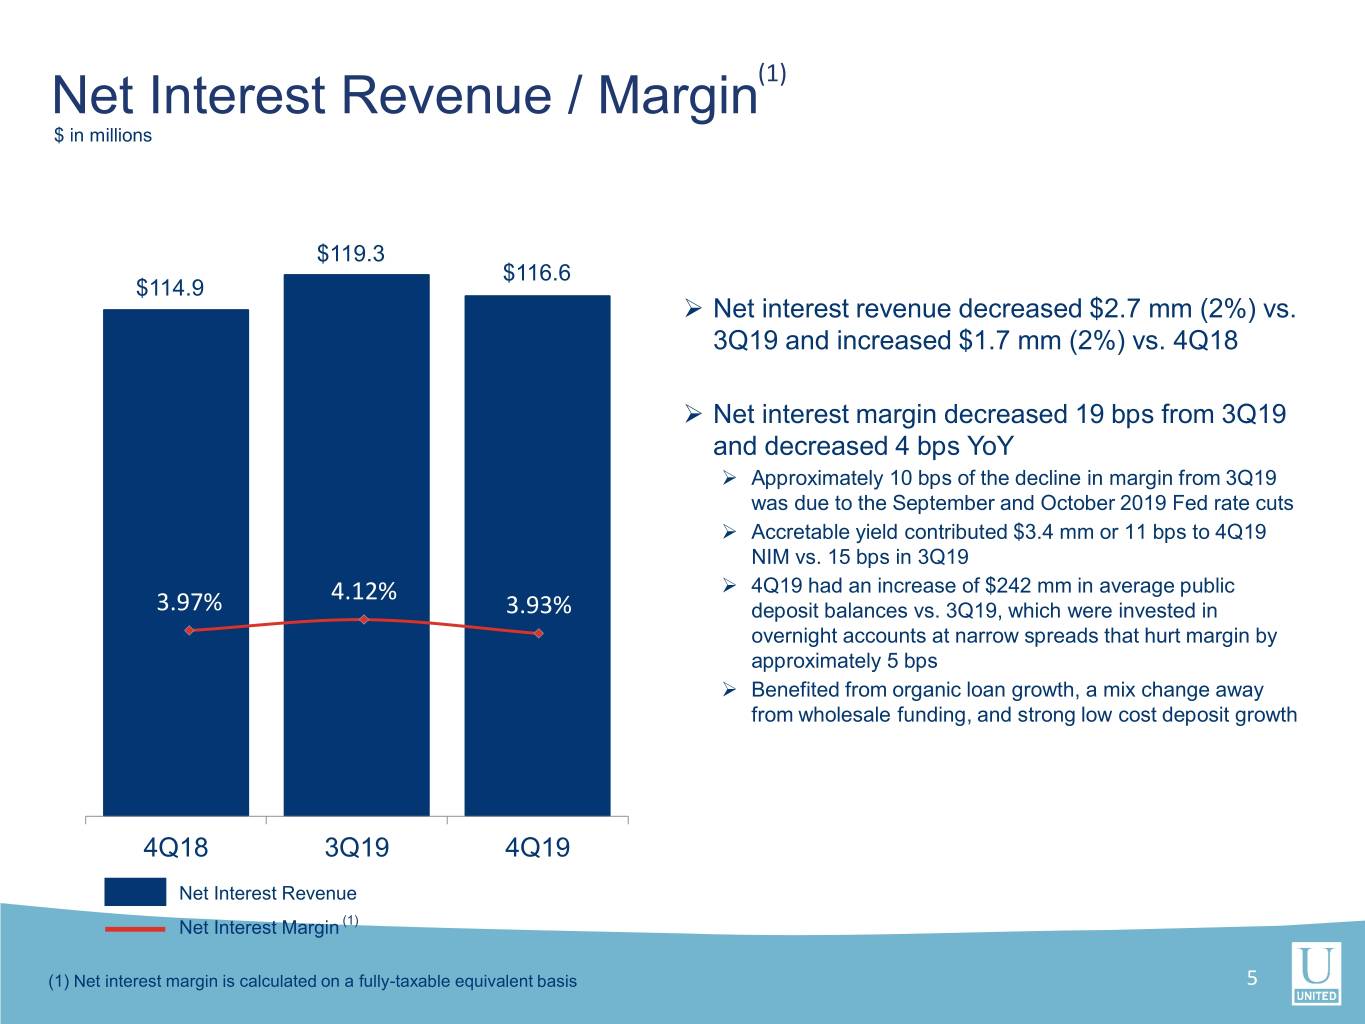
Net Interest Revenue / Margin(1) $ in millions $119.3 $116.6 $114.9 Net interest revenue decreased $2.7 mm (2%) vs. 3Q19 and increased $1.7 mm (2%) vs. 4Q18 Net interest margin decreased 19 bps from 3Q19 and decreased 4 bps YoY Approximately 10 bps of the decline in margin from 3Q19 was due to the September and October 2019 Fed rate cuts Accretable yield contributed $3.4 mm or 11 bps to 4Q19 NIM vs. 15 bps in 3Q19 4.12% 4Q19 had an increase of $242 mm in average public 3.97% 3.93% deposit balances vs. 3Q19, which were invested in overnight accounts at narrow spreads that hurt margin by approximately 5 bps Benefited from organic loan growth, a mix change away from wholesale funding, and strong low cost deposit growth 4Q18 3Q19 4Q19 Net Interest Revenue Net Interest Margin (1) (1) Net interest margin is calculated on a fully-taxable equivalent basis 5
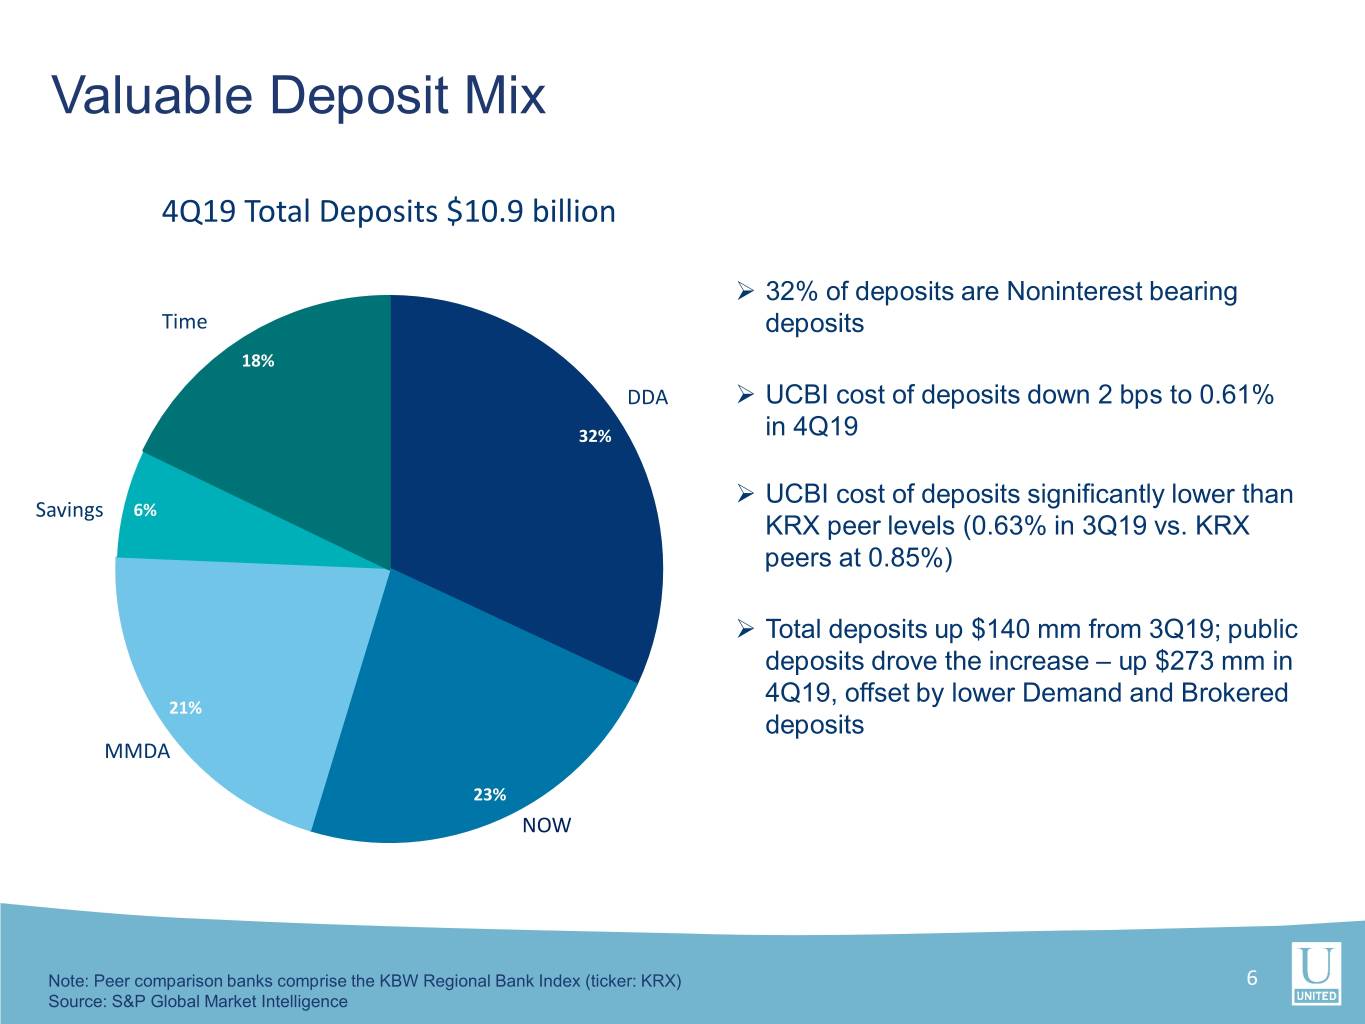
Valuable Deposit Mix 4Q19 Total Deposits $10.9 billion 32% of deposits are Noninterest bearing Time deposits 18% DDA UCBI cost of deposits down 2 bps to 0.61% 32% in 4Q19 UCBI cost of deposits significantly lower than Savings 6% KRX peer levels (0.63% in 3Q19 vs. KRX peers at 0.85%) Total deposits up $140 mm from 3Q19; public deposits drove the increase – up $273 mm in 4Q19, offset by lower Demand and Brokered 21% deposits MMDA 23% NOW Note: Peer comparison banks comprise the KBW Regional Bank Index (ticker: KRX) 6 Source: S&P Global Market Intelligence
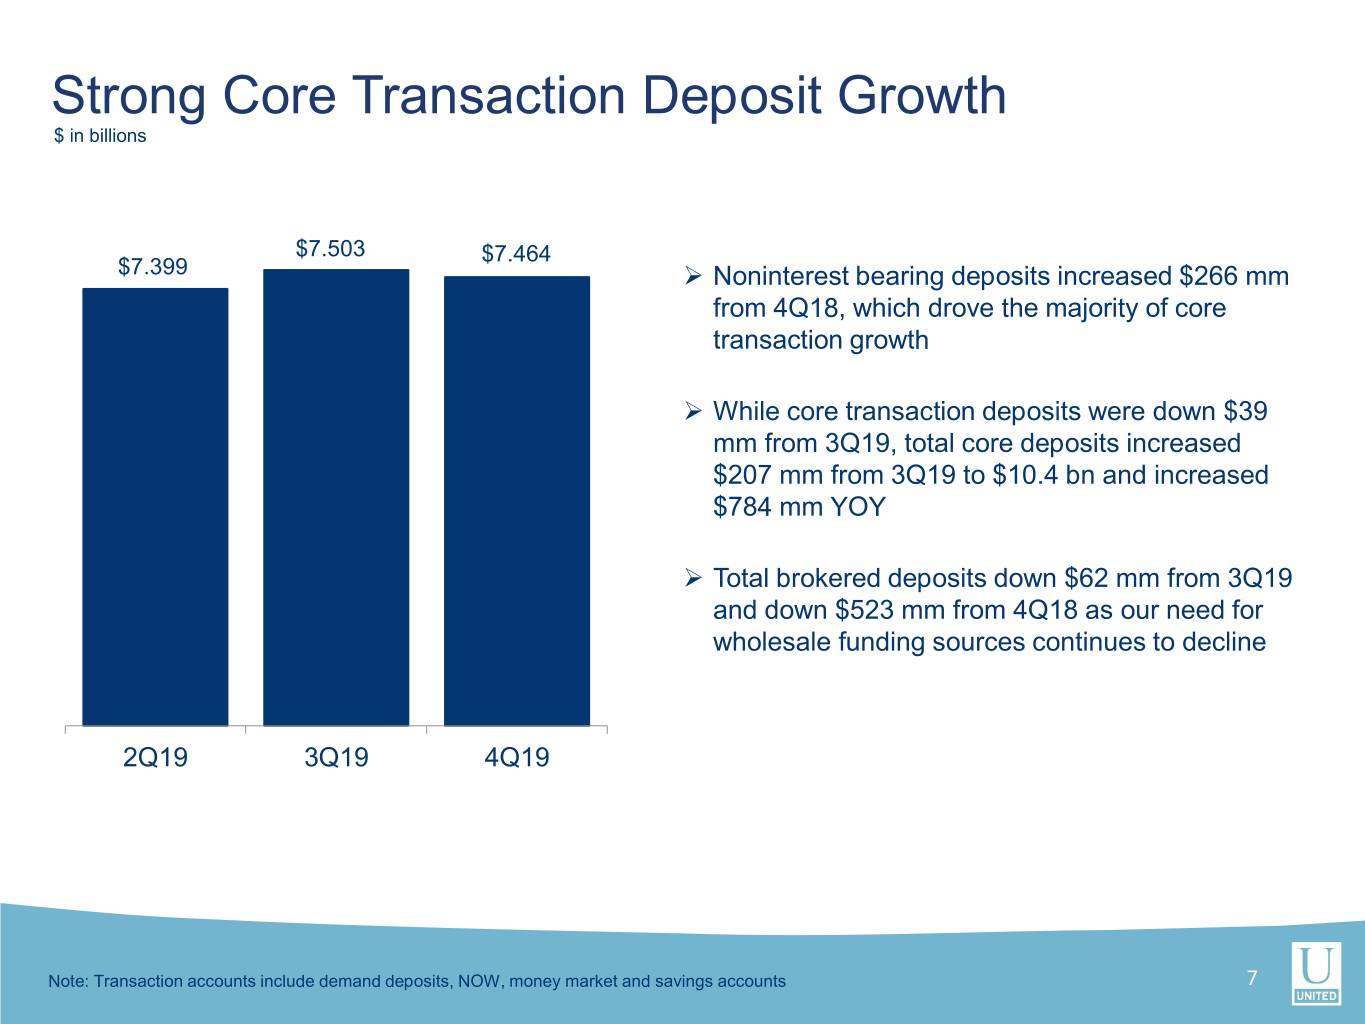
Strong Core Transaction Deposit Growth $ in billions $7.503 $7.464 $7.399 Noninterest bearing deposits increased $266 mm from 4Q18, which drove the majority of core transaction growth While core transaction deposits were down $39 mm from 3Q19, total core deposits increased $207 mm from 3Q19 to $10.4 bn and increased $784 mm YOY Total brokered deposits down $62 mm from 3Q19 and down $523 mm from 4Q18 as our need for wholesale funding sources continues to decline 2Q19 3Q19 4Q19 Note: Transaction accounts include demand deposits, NOW, money market and savings accounts 7
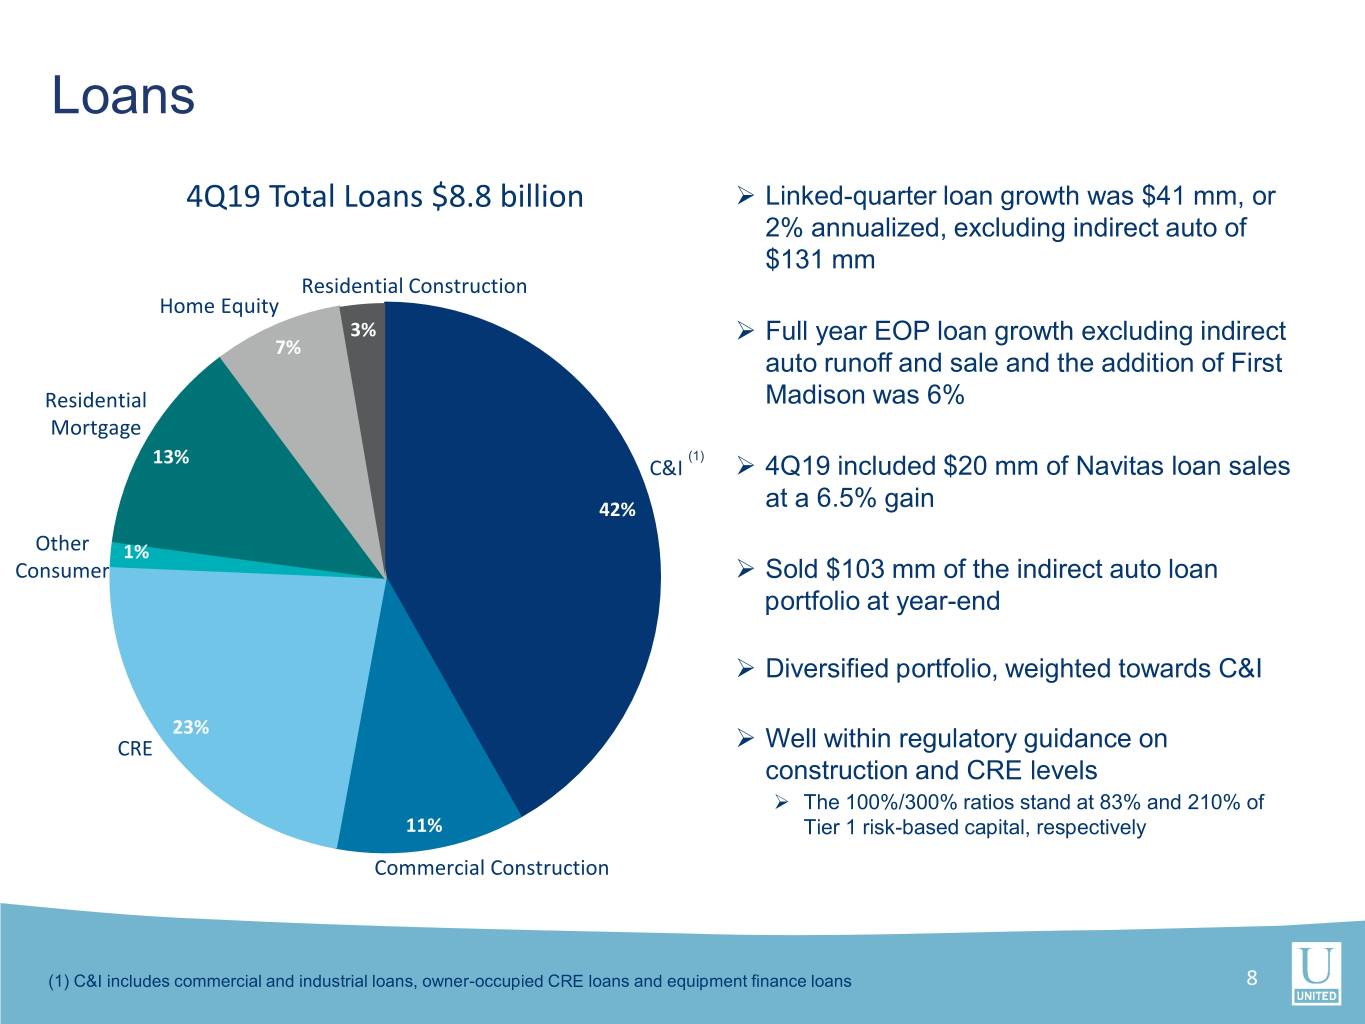
Loans 4Q19 Total Loans $8.8 billion Linked-quarter loan growth was $41 mm, or 2% annualized, excluding indirect auto of $131 mm Residential Construction Home Equity 3% Full year EOP loan growth excluding indirect 7% auto runoff and sale and the addition of First Residential Madison was 6% Mortgage (1) 13% C&I 4Q19 included $20 mm of Navitas loan sales 42% at a 6.5% gain Other 1% Consumer Sold $103 mm of the indirect auto loan portfolio at year-end Diversified portfolio, weighted towards C&I 23% CRE Well within regulatory guidance on construction and CRE levels The 100%/300% ratios stand at 83% and 210% of 11% Tier 1 risk-based capital, respectively Commercial Construction (1) C&I includes commercial and industrial loans, owner-occupied CRE loans and equipment finance loans 8

Noninterest Income $ in millions $30.2 $29.0 $2.5 $1.6 Linked Quarter Fees up $1.2 mm $23.0 Mortgage fees up $0.7 mm from 3Q19 as originations and $8.7 $9.4 loan sales continued at Q3’s pace despite weaker $2.5 seasonality and also benefitted from a $1.2 mm positive mark on the MSR asset $3.1 SBA fees up $0.20 mm or 12% from 3Q19 to $1.8 mm $1.7 $1.5 Sold $20.0 mm of equipment finance loans at a 6.5% gain $1.6 during 4Q19, which contributed $1.3 mm to noninterest income $7.1 $6.6 $7.4 4Q19 included three non-recurring items including a $1.6 mm BOLI gain, $0.9 mm of security losses and $0.7 mm loss on the sale of the indirect auto portfolio Year-over-Year $9.2 $9.9 $9.4 Fees up $7.2 mm Rate locks up 64% compared to last year ($411 mm in 4Q19 vs. $251 mm in 4Q18) 4Q19 SBA loan sales of $25.9 mm, down 25% from $34.7 4Q18 3Q19 4Q19 mm in 4Q18 due to strategic change to hold more production Service Charges Other Brokerage Mortgage SBA, USDA, Navitas 9
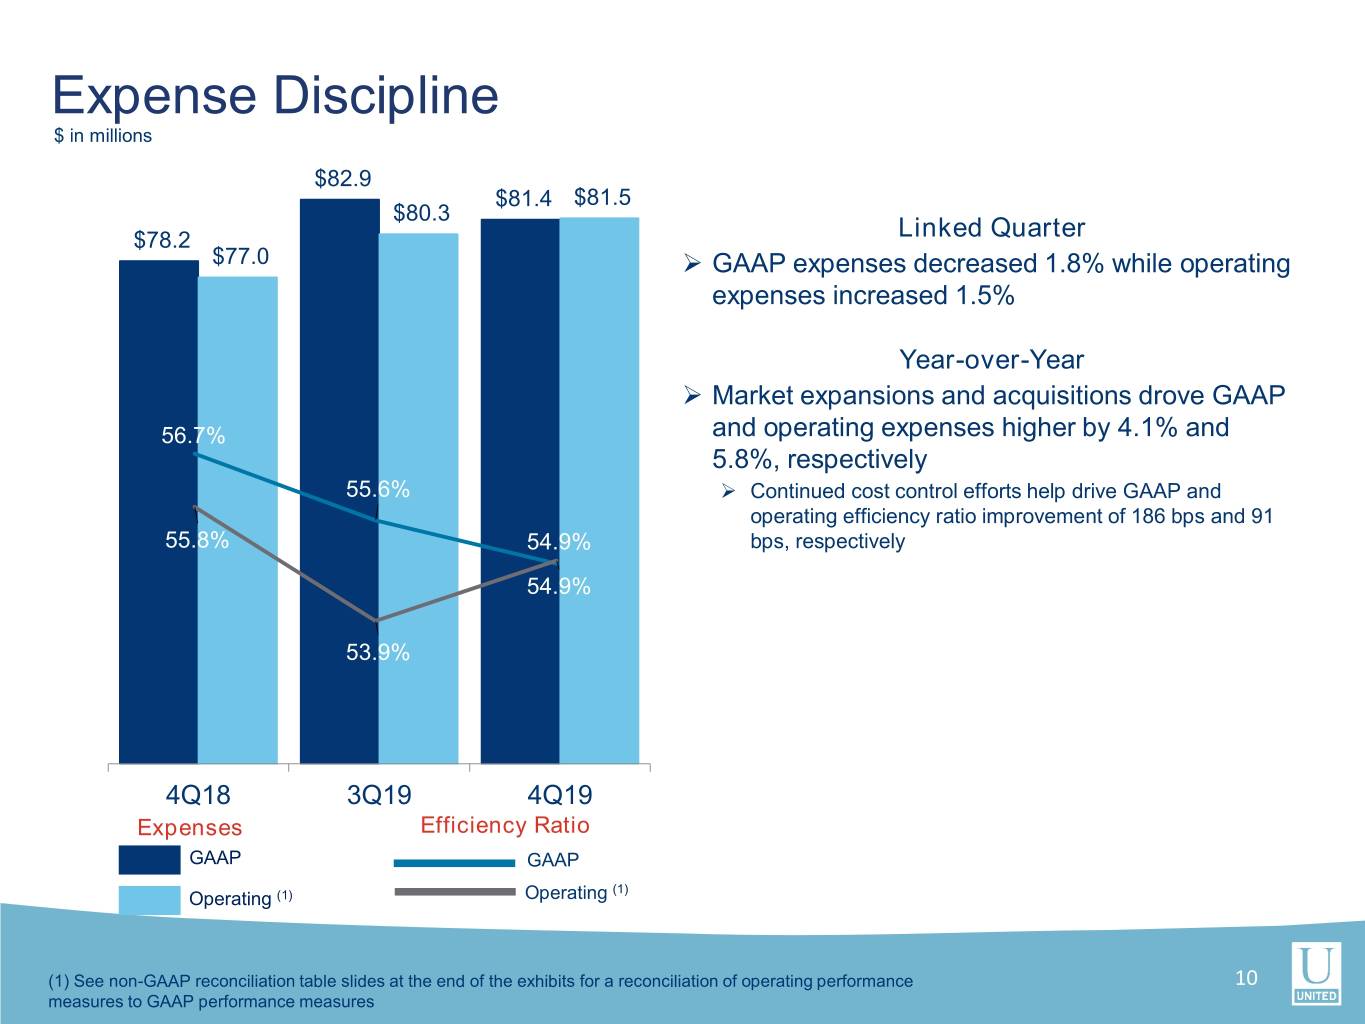
Expense Discipline $ in millions $82.9 $81.4 $81.5 $80.3 $78.2 Linked Quarter $77.0 GAAP expenses decreased 1.8% while operating expenses increased 1.5% Year-over-Year Market expansions and acquisitions drove GAAP 56.7% and operating expenses higher by 4.1% and 5.8%, respectively 55.6% Continued cost control efforts help drive GAAP and operating efficiency ratio improvement of 186 bps and 91 55.8% 54.9% bps, respectively 54.9% 53.9% 4Q18 3Q19 4Q19 Expenses Efficiency Ratio GAAP GAAP (1) Operating (1) Operating (1) See non-GAAP reconciliation table slides at the end of the exhibits for a reconciliation of operating performance 10 measures to GAAP performance measures
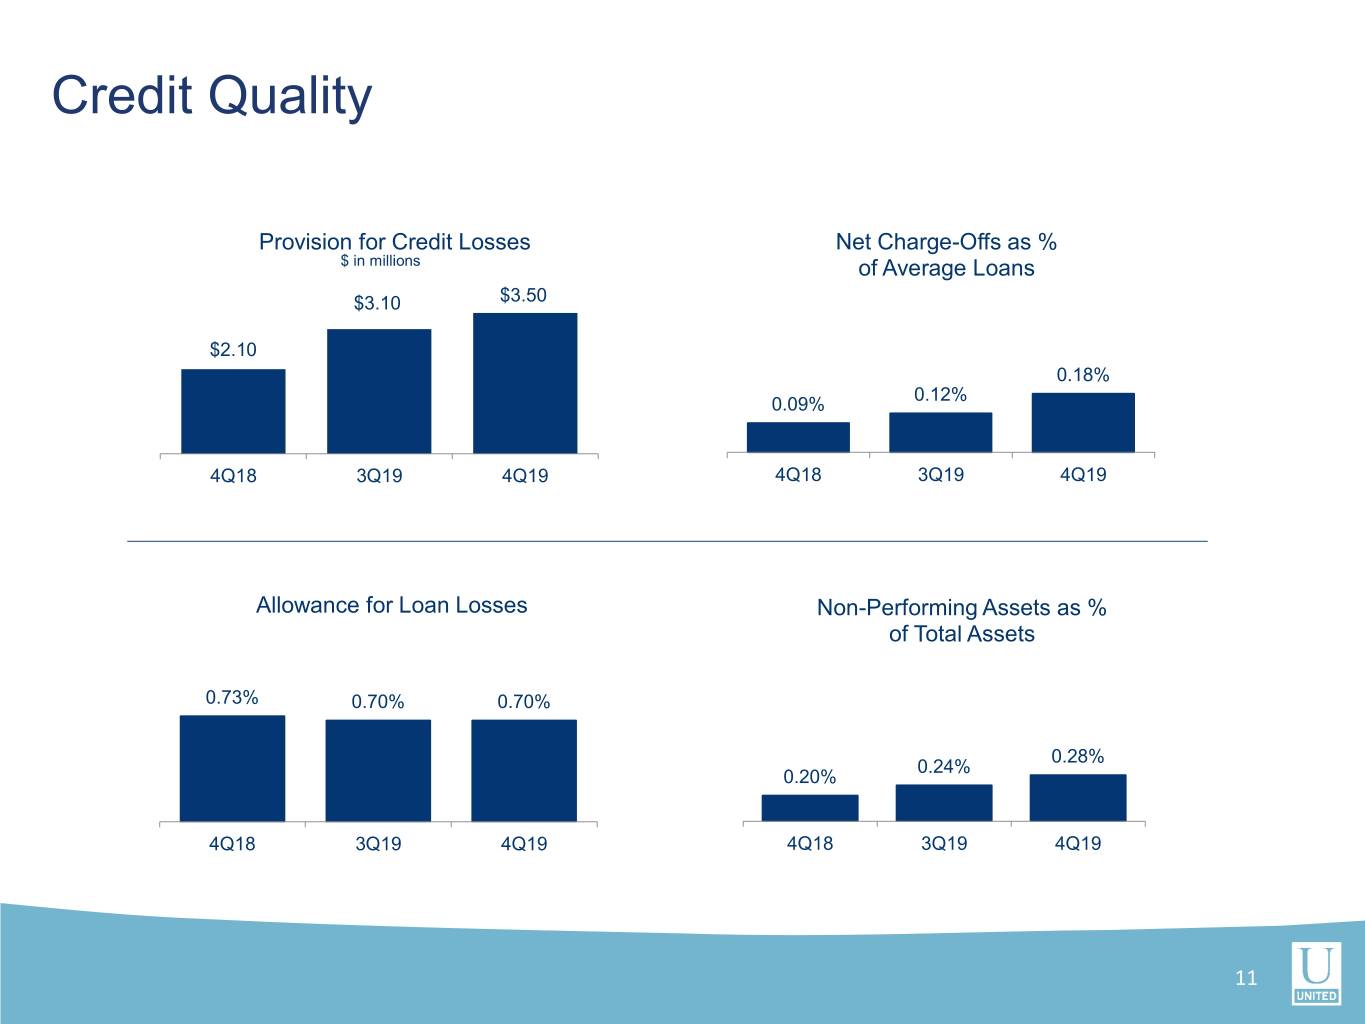
Credit Quality Provision for Credit Losses Net Charge-Offs as % $ in millions of Average Loans $3.10 $3.50 $2.10 0.18% 0.12% 0.09% 4Q18 3Q19 4Q19 4Q18 3Q19 4Q19 Allowance for Loan Losses Non-Performing Assets as % of Total Assets 0.73% 0.70% 0.70% 0.28% 0.24% 0.20% 4Q18 3Q19 4Q19 4Q18 3Q19 4Q19 11
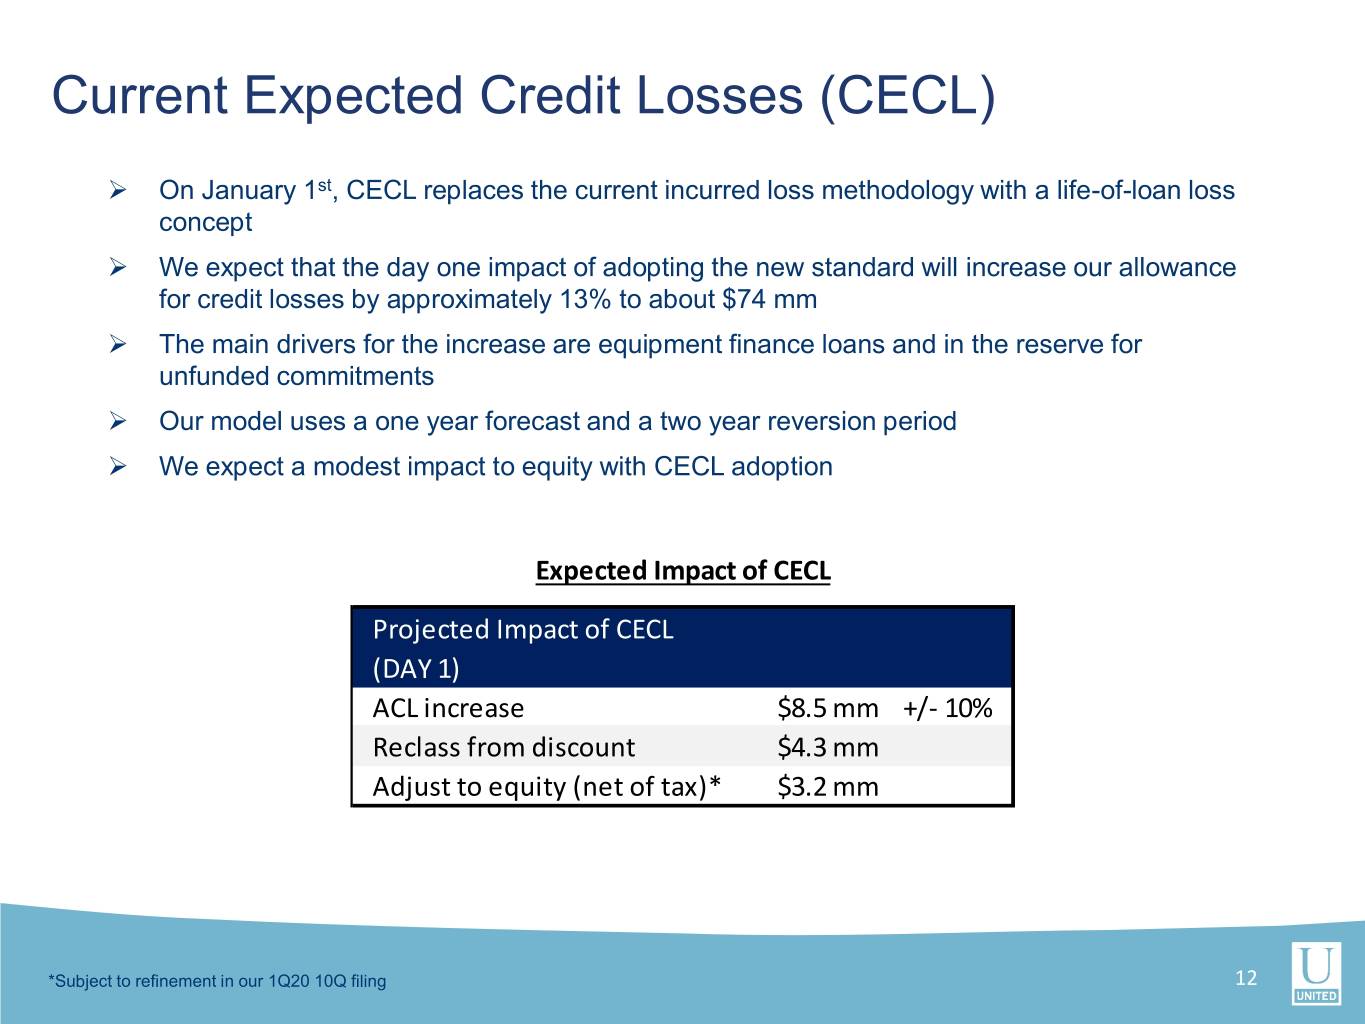
Current Expected Credit Losses (CECL) On January 1st, CECL replaces the current incurred loss methodology with a life-of-loan loss concept We expect that the day one impact of adopting the new standard will increase our allowance for credit losses by approximately 13% to about $74 mm The main drivers for the increase are equipment finance loans and in the reserve for unfunded commitments Our model uses a one year forecast and a two year reversion period We expect a modest impact to equity with CECL adoption Expected Impact of CECL Projected Impact of CECL (DAY 1) ACL increase $8.5 mm +/- 10% Reclass from discount $4.3 mm Adjust to equity (net of tax)* $3.2 mm *Subject to refinement in our 1Q20 10Q filing 12
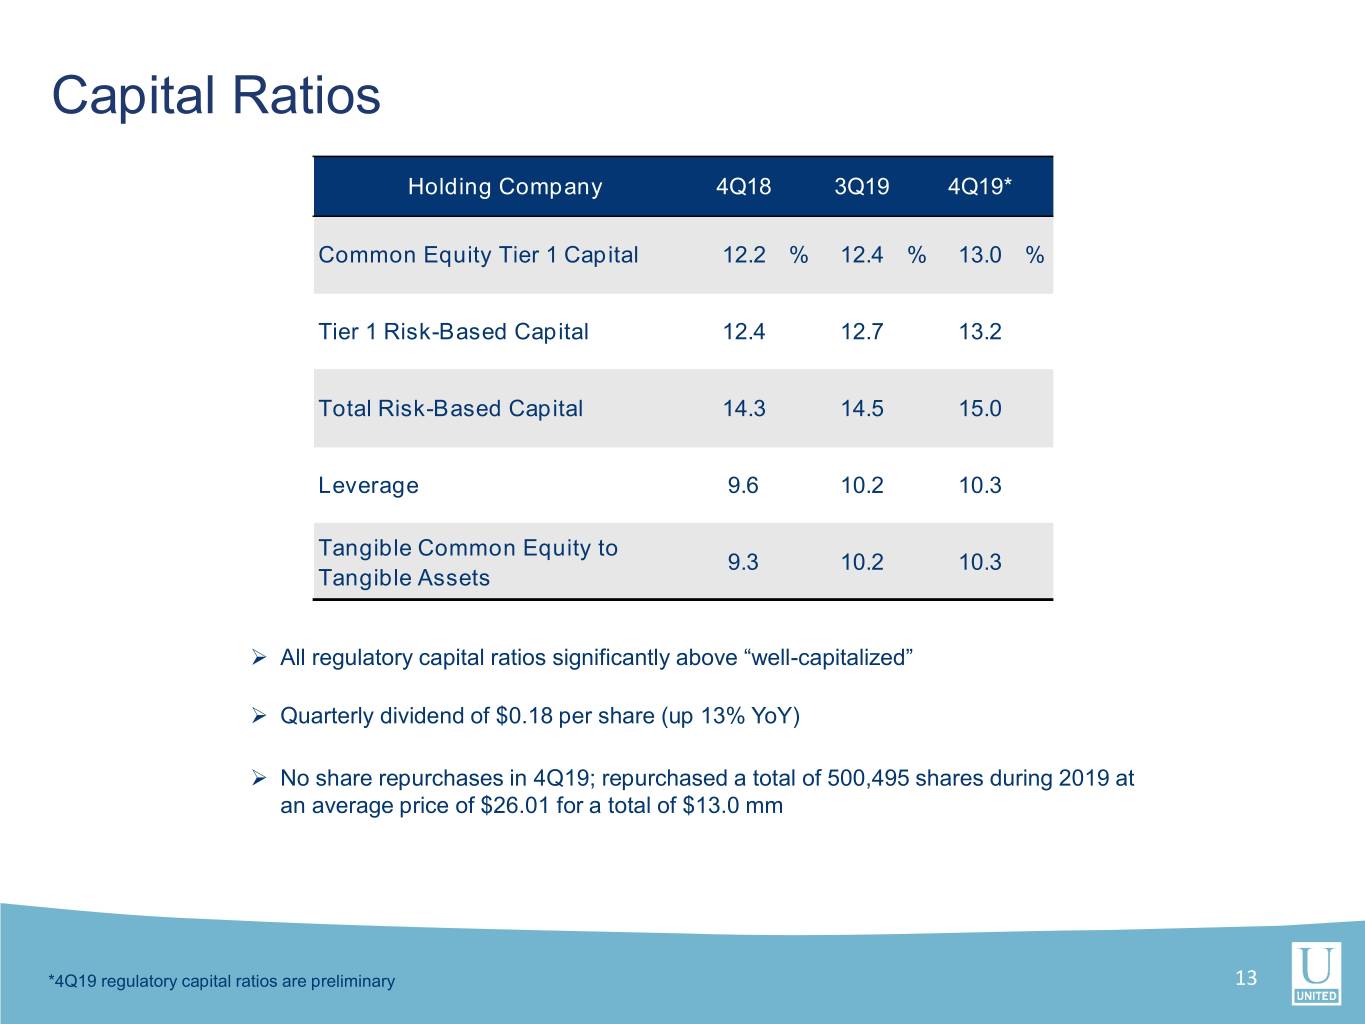
Capital Ratios Holding Company 4Q18 3Q19 4Q19* Common Equity Tier 1 Capital 12.2 % 12.4 % 13.0 % Tier 1 Risk-Based Capital 12.4 12.7 13.2 Total Risk-Based Capital 14.3 14.5 15.0 Leverage 9.6 10.2 10.3 Tangible Common Equity to 9.3 10.2 10.3 Tangible Assets All regulatory capital ratios significantly above “well-capitalized” Quarterly dividend of $0.18 per share (up 13% YoY) No share repurchases in 4Q19; repurchased a total of 500,495 shares during 2019 at an average price of $26.01 for a total of $13.0 mm *4Q19 regulatory capital ratios are preliminary 13

4Q INVESTOR PRESENTATION Exhibits Member FDIC. © 2020 United Community Bank
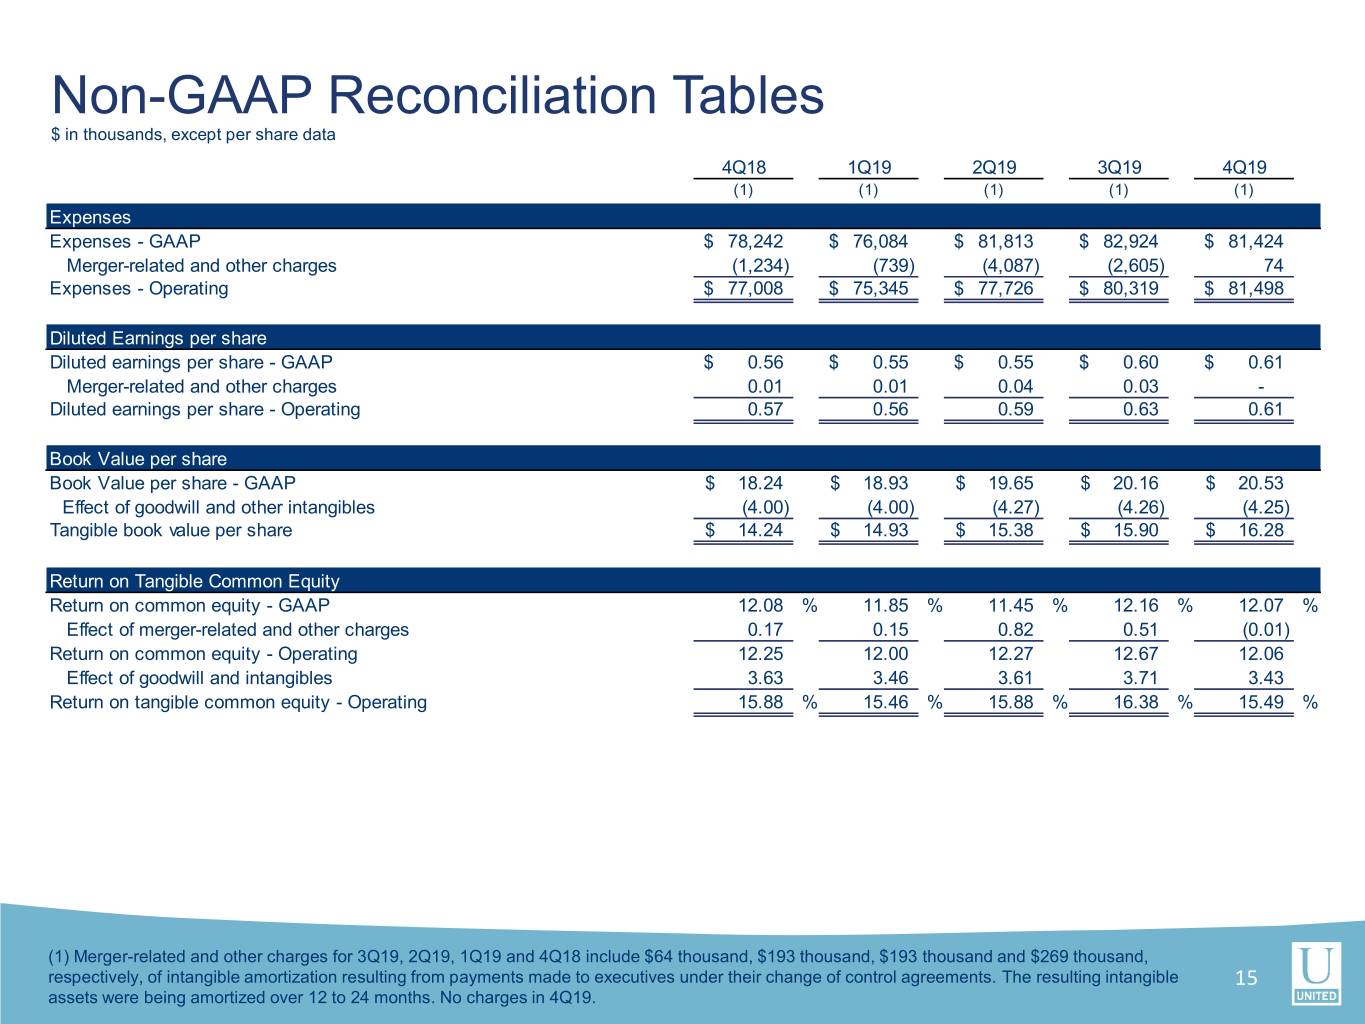
Non-GAAP Reconciliation Tables $ in thousands, except per share data 4Q18 1Q19 2Q19 3Q19 4Q19 (1) (1) (1) (1) (1) Expenses Expenses - GAAP $ 78,242 $ 76,084 $ 81,813 $ 82,924 $ 81,424 Merger-related and other charges (1,234) (739) (4,087) (2,605) 74 Expenses - Operating $ 77,008 $ 75,345 $ 77,726 $ 80,319 $ 81,498 Diluted Earnings per share Diluted earnings per share - GAAP $ 0.56 $ 0.55 $ 0.55 $ 0.60 $ 0.61 Merger-related and other charges 0.01 0.01 0.04 0.03 - Diluted earnings per share - Operating 0.57 0.56 0.59 0.63 0.61 Book Value per share Book Value per share - GAAP $ 18.24 $ 18.93 $ 19.65 $ 20.16 $ 20.53 Effect of goodwill and other intangibles (4.00) (4.00) (4.27) (4.26) (4.25) Tangible book value per share $ 14.24 $ 14.93 $ 15.38 $ 15.90 $ 16.28 Return on Tangible Common Equity Return on common equity - GAAP 12.08 % 11.85 % 11.45 % 12.16 % 12.07 % Effect of merger-related and other charges 0.17 0.15 0.82 0.51 (0.01) Return on common equity - Operating 12.25 12.00 12.27 12.67 12.06 Effect of goodwill and intangibles 3.63 3.46 3.61 3.71 3.43 Return on tangible common equity - Operating 15.88 % 15.46 % 15.88 % 16.38 % 15.49 % (1) Merger-related and other charges for 3Q19, 2Q19, 1Q19 and 4Q18 include $64 thousand, $193 thousand, $193 thousand and $269 thousand, respectively, of intangible amortization resulting from payments made to executives under their change of control agreements. The resulting intangible 15 assets were being amortized over 12 to 24 months. No charges in 4Q19.
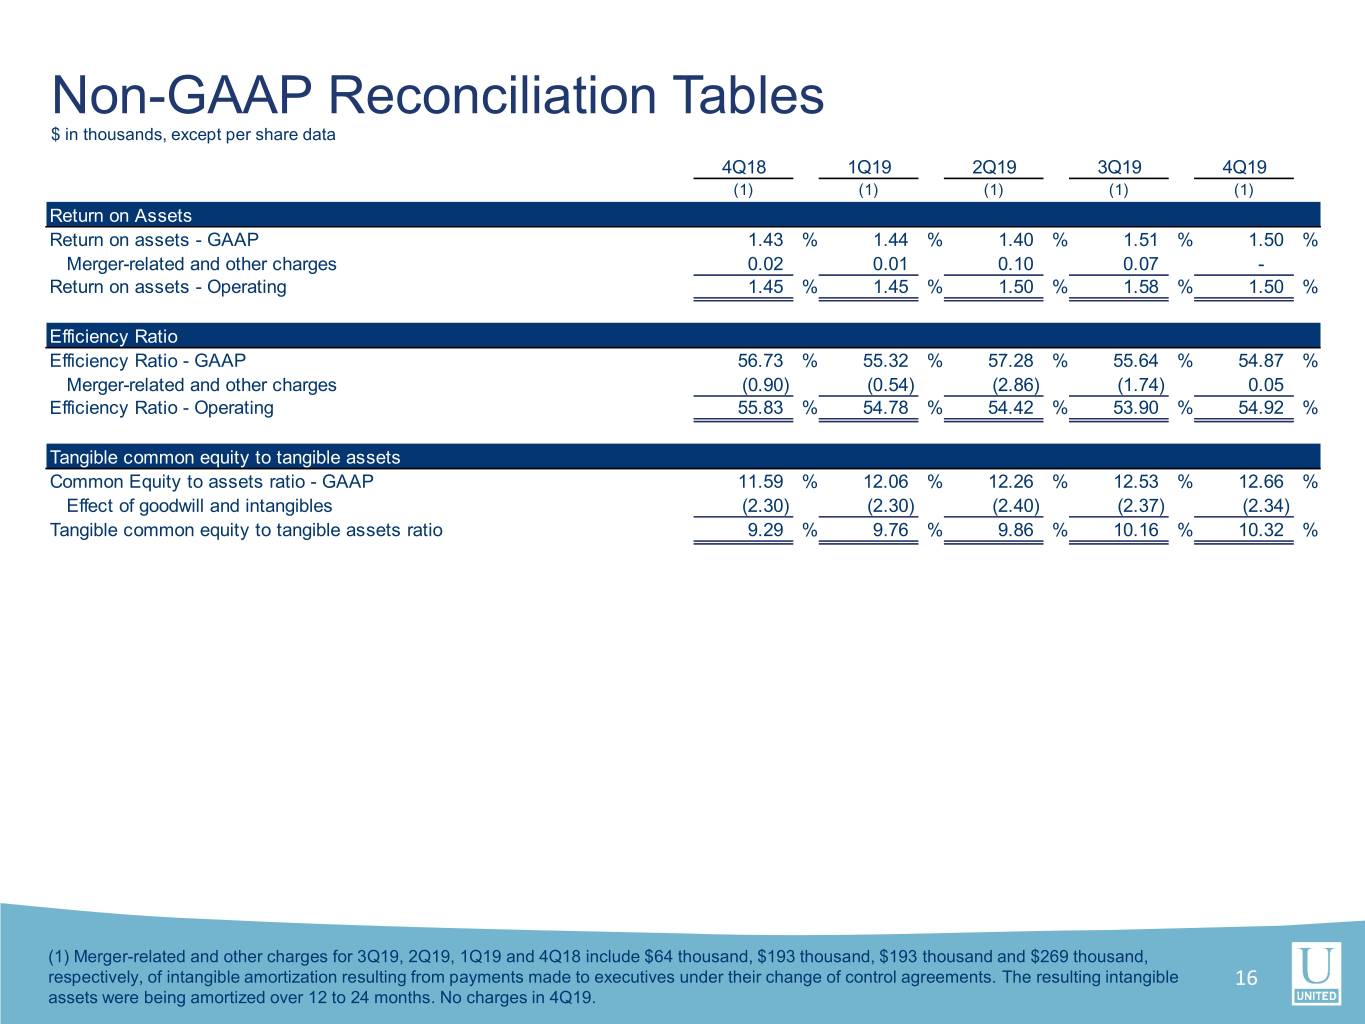
Non-GAAP Reconciliation Tables $ in thousands, except per share data 4Q18 1Q19 2Q19 3Q19 4Q19 (1) (1) (1) (1) (1) Return on Assets Return on assets - GAAP 1.43 % 1.44 % 1.40 % 1.51 % 1.50 % Merger-related and other charges 0.02 0.01 0.10 0.07 - Return on assets - Operating 1.45 % 1.45 % 1.50 % 1.58 % 1.50 % Efficiency Ratio Efficiency Ratio - GAAP 56.73 % 55.32 % 57.28 % 55.64 % 54.87 % Merger-related and other charges (0.90) (0.54) (2.86) (1.74) 0.05 Efficiency Ratio - Operating 55.83 % 54.78 % 54.42 % 53.90 % 54.92 % Tangible common equity to tangible assets Common Equity to assets ratio - GAAP 11.59 % 12.06 % 12.26 % 12.53 % 12.66 % Effect of goodwill and intangibles (2.30) (2.30) (2.40) (2.37) (2.34) Tangible common equity to tangible assets ratio 9.29 % 9.76 % 9.86 % 10.16 % 10.32 % (1) Merger-related and other charges for 3Q19, 2Q19, 1Q19 and 4Q18 include $64 thousand, $193 thousand, $193 thousand and $269 thousand, respectively, of intangible amortization resulting from payments made to executives under their change of control agreements. The resulting intangible 16 assets were being amortized over 12 to 24 months. No charges in 4Q19.


