Exhibit 99.2
| Investor Presentation Fourth Quarter 2009 David P. Shearrow Executive Vice President & CRO Rex S. Schuette Executive Vice President & CFO rex_schuette@ucbi.com (706) 781-2266 Jimmy C. Tallent President & CEO United Community Banks, Inc. |
| This presentation contains forward-looking statements, as defined by Federal Securities Laws, including statements about financial outlook and business environment. These statements are provided to assist in the understanding of future financial performance. Such performance involves risks and uncertainties that may cause actual results to differ materially from those in such statements. Any such statements are based on current expectations and involve a number of risks and uncertainties. For a discussion of factors that may cause such forward-looking statements to differ materially from actual results, please refer to United Community Banks, Inc. Annual Report filed on Form 10-K with the Securities and Exchange Commission. This presentation also contains non-GAAP financial measures, as defined by the Federal Securities Laws. For a presentation of the most directly comparable financial measures calculated and presented in accordance with GAAP and a reconciliation of the differences between those measures and the non-GAAP financial measures, please refer to "Selected Financial Data" in the United Community Banks, Inc. Annual Report filed on Form 10-K and Quarterly Reports filed on Form 10- Q with the Securities Exchange Commission, which may be found on the company's Web site, www.ucbi.com. Cautionary statement 2 |
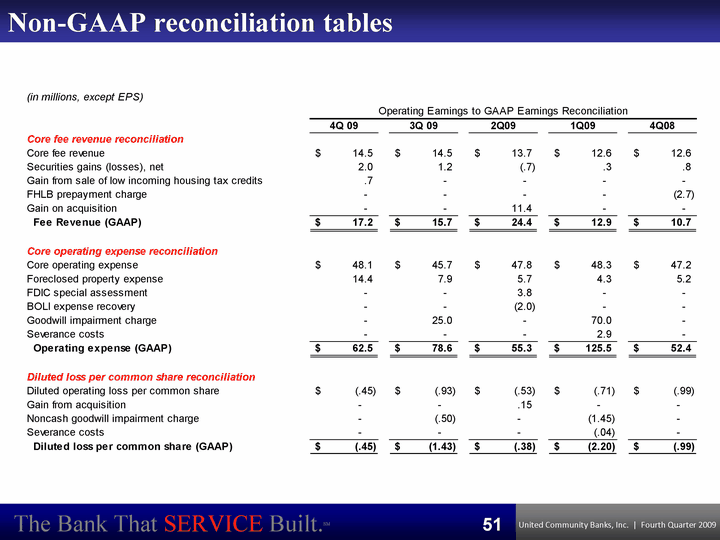
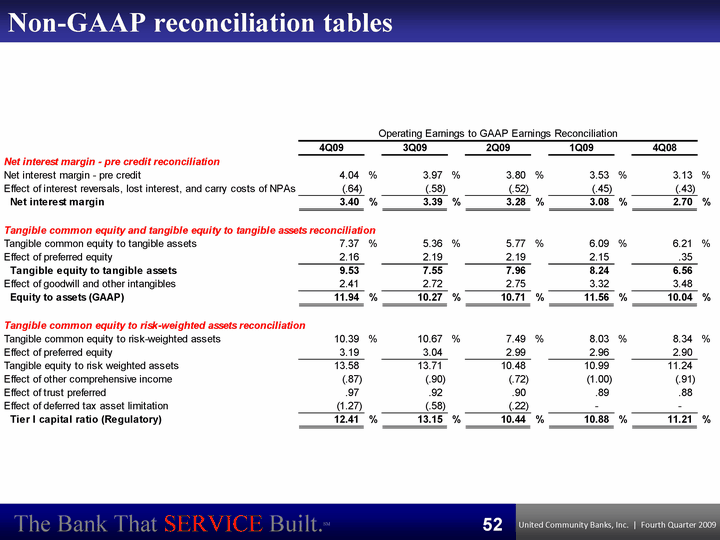
| Non-GAAP measures This presentation also contains non-GAAP financial measures determined by methods other than in accordance with generally accepted accounting principles ("GAAP"). Such non-GAAP financial measures include the following: net interest margin - pre credit, core fee revenue, core operating expense, core earnings, net operating (loss) income and net operating (loss) earnings per share, tangible common equity to tangible assets, tangible equity to tangible assets and tangible common equity to risk-weighted assets. The most comparable GAAP measures to these measures are: net interest margin, fee revenue, operating expense, net (loss) income, diluted (loss) earnings per share and equity to assets. Management uses these non-GAAP financial measures because we believe it is useful for evaluating our operations and performance over periods of time, as well as in managing and evaluating our business and in discussions about our operations and performance. Management believes these non-GAAP financial measures provide users of our financial information with a meaningful measure for assessing our financial results and credit trends, as well as comparison to financial results for prior periods. These non-GAAP financial measures should not be considered as a substitute for financial measures determined in accordance with GAAP and may not be comparable to other similarly titled financial measures used by other companies. For a reconciliation of the differences between our non-GAAP financial measures and the most comparable GAAP measures, please refer to the 'Non-GAAP Reconcilement Tables' at the end of the Appendix of this presentation. We have not reconciled tangible common equity to tangible assets and core earnings to the extent such numbers are presented on a forward-looking basis based on management's internal stress test or SCAP methodology. Estimates that would be required for such reconciliations cannot reliably be produced without unreasonable effort. 3 |
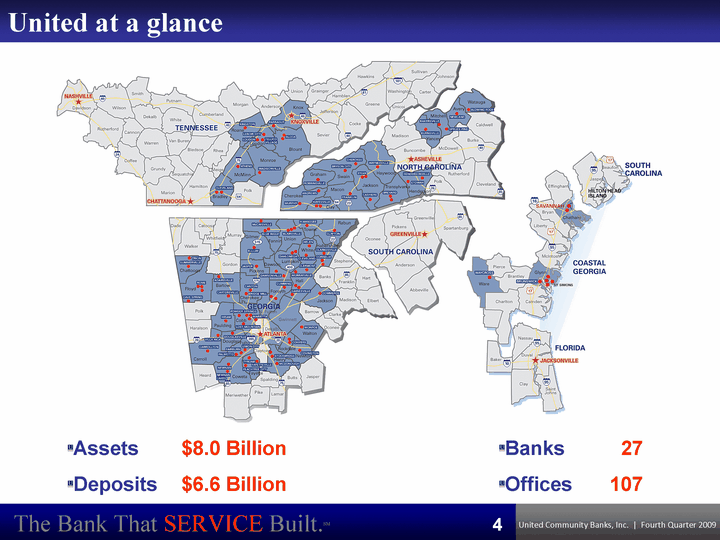
| United at a glance Assets $8.0 Billion Deposits $6.6 Billion Banks 27 Offices 107 4 |
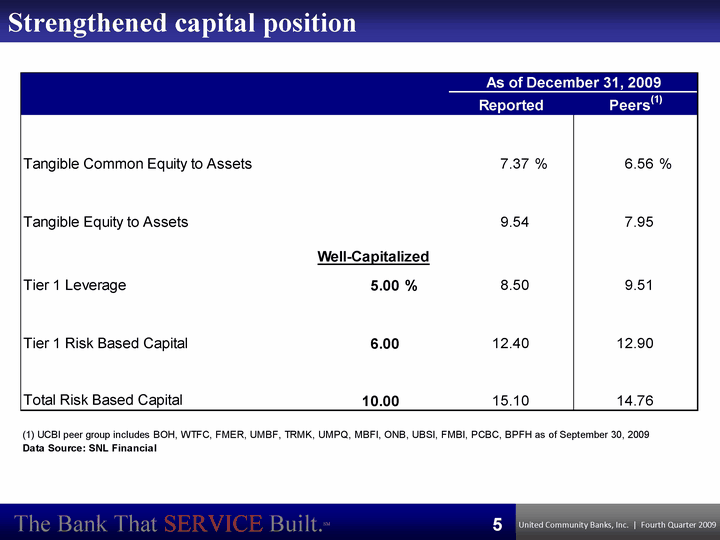
| Strengthened capital position 5 |
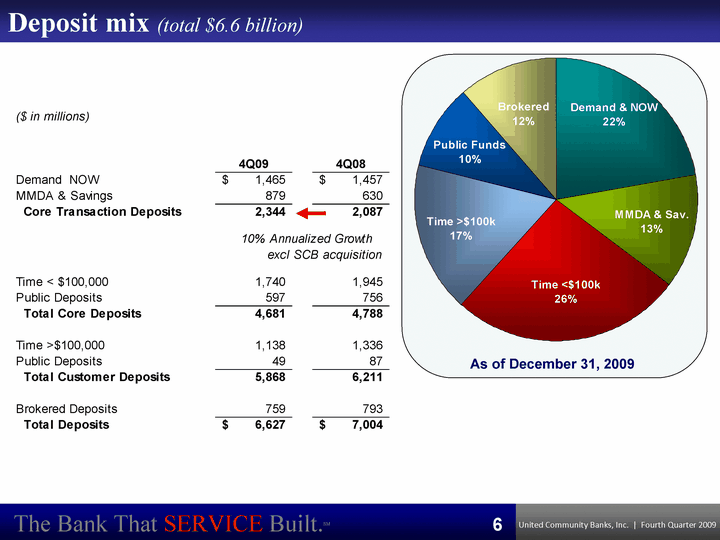
| Deposit mix (total $6.6 billion) As of December 31, 2009 Demand & NOW MMDA & Sav. Time <$100k Time >$100k Public Funds Brokered East 1465 879 1740 1138 646 759 6 |
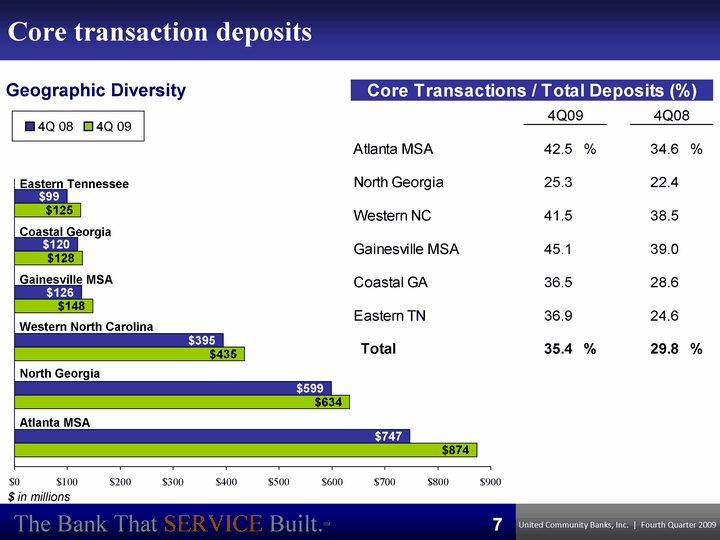
| Core transaction deposits $ in millions 4Q 08 4Q 09 Geographic Diversity 7 Core transaction deposits Atlanta MSA North Georgia Western North Carolina Gainesville MSA Coastal Georgia Eastern Tennessee 4Q09 874 634 435 148 128 125 4Q08 747 599 395 126 120 99 Atlanta MSA North Georgia Western North Carolina Gainesville MSA Coastal Georgia Eastern Tennessee |
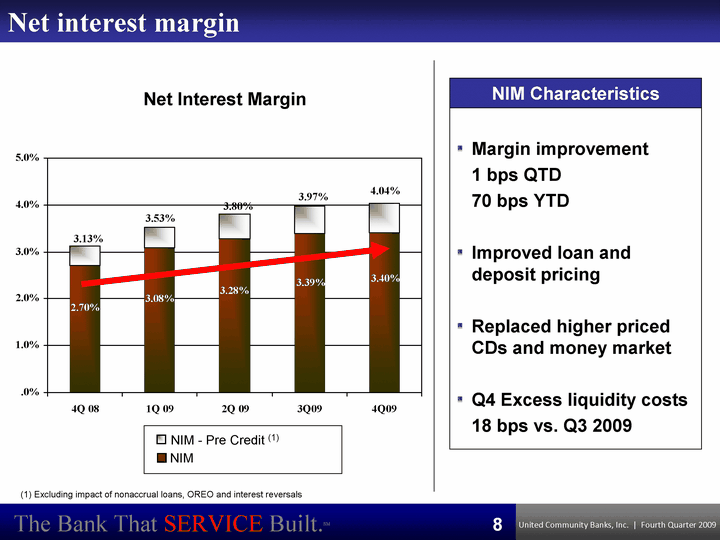
| Net interest margin 4Q 08 1Q 09 2Q 09 3Q09 4Q09 Net Interest Margin 0.027 0.0308 0.0328 0.0339 0.034 0.0043 0.0045 0.0052 0.0058 0.0064 Net Interest Margin Margin improvement 1 bps QTD 70 bps YTD Improved loan and deposit pricing Replaced higher priced CDs and money market Q4 Excess liquidity costs 18 bps vs. Q3 2009 NIM Characteristics 3.53% 3.80% 3.97% 4.04% NIM NIM - Pre Credit (1) (1) Excluding impact of nonaccrual loans, OREO and interest reversals 3.13% 8 |
| LOAN PORTFOLIO AND CREDIT QUALITY 9 |
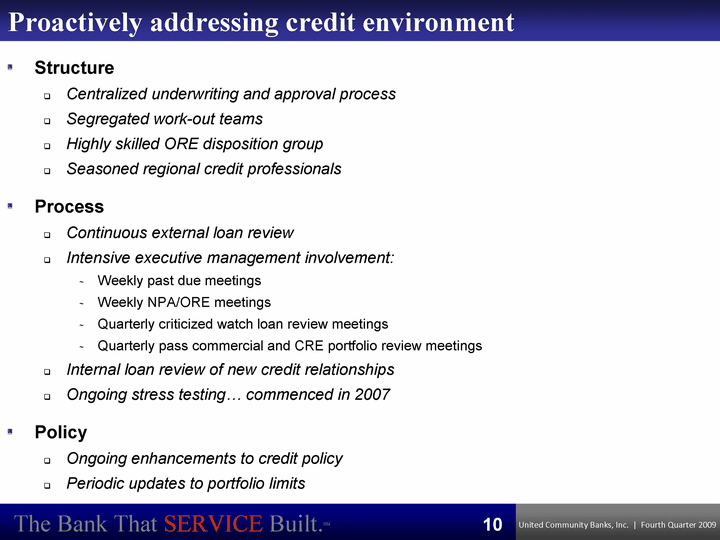
| Proactively addressing credit environment Structure Centralized underwriting and approval process Segregated work-out teams Highly skilled ORE disposition group Seasoned regional credit professionals Process Continuous external loan review Intensive executive management involvement: Weekly past due meetings Weekly NPA/ORE meetings Quarterly criticized watch loan review meetings Quarterly pass commercial and CRE portfolio review meetings Internal loan review of new credit relationships Ongoing stress testing... commenced in 2007 Policy Ongoing enhancements to credit policy Periodic updates to portfolio limits 10 |
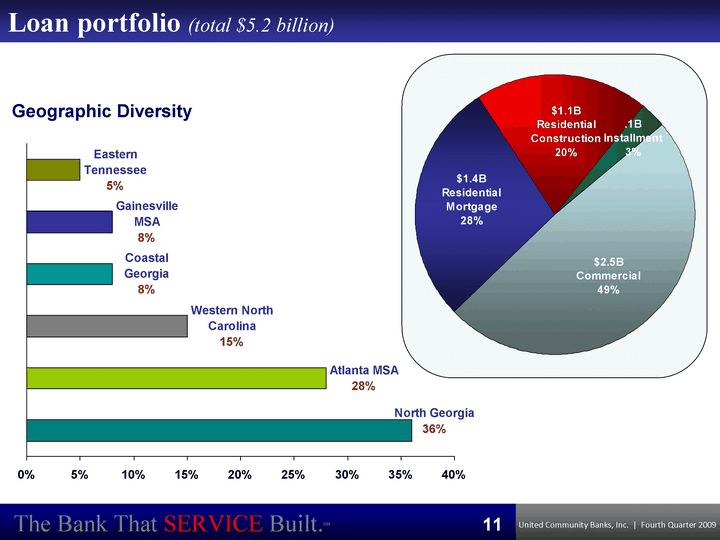
| North Georgia Atlanta MSA Western North Carolina Coastal Georgia Gainesville MSA Eastern Tennessee East 0.36 0.28 0.15 0.08 0.08 0.05 Loan portfolio (total $5.2 billion) Geographic Diversity 11 |
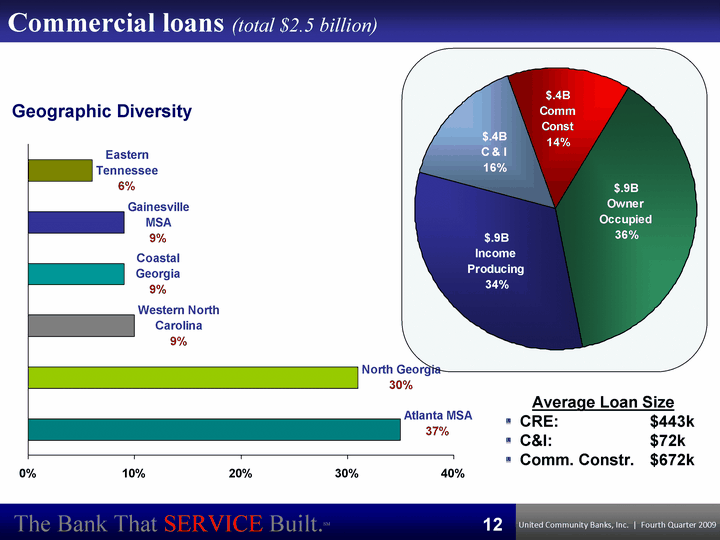
| Atlanta MSA North Georgia Western North Carolina Coastal Georgia Gainesville MSA Eastern Tennessee East 0.35 0.31 0.1 0.09 0.09 0.06 Commercial Construction Owner-Occupied Income Producing C & I East 14 38 32 15 Commercial loans (total $2.5 billion) Geographic Diversity Average Loan Size CRE: $443k C&I: $72k Comm. Constr. $672k 12 |
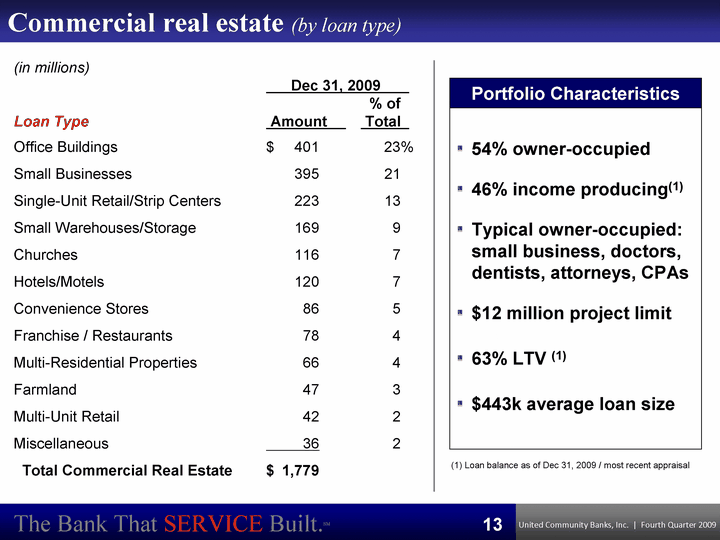
| Commercial real estate (by loan type) 54% owner-occupied 46% income producing(1) Typical owner-occupied: small business, doctors, dentists, attorneys, CPAs $12 million project limit 63% LTV (1) $443k average loan size Portfolio Characteristics (1) Loan balance as of Dec 31, 2009 / most recent appraisal 13 (in millions) Dec 31, 2009 % of Loan Type Amount Total Office Buildings $ 401 23 % Small Businesses 395 21 Single-Unit Retail/Strip Centers 223 13 Small Warehouses/Storage 169 9 Churches 116 7 Hotels/Motels 120 7 Convenience Stores 86 5 Franchise / Restaurants 78 4 Multi-Residential Properties 66 4 Farmland 47 3 Multi-Unit Retail 42 2 Miscellaneous 36 2 Total Commercial Real Estate $ 1,779 |
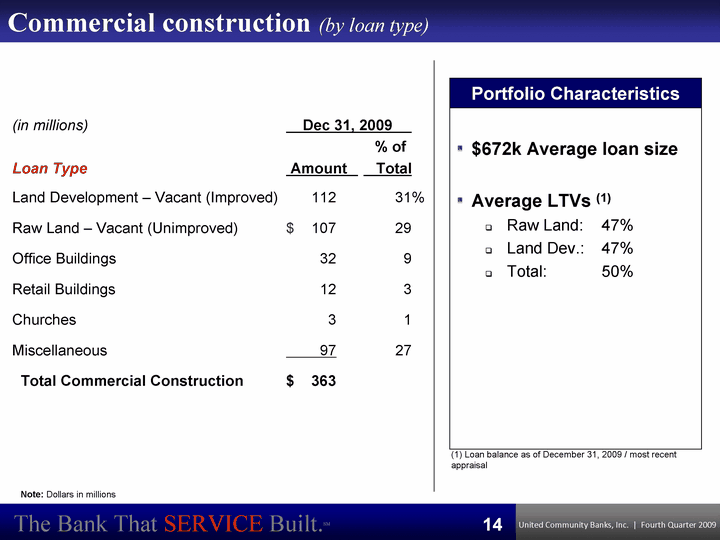
| Commercial construction (by loan type) Note: Dollars in millions $672k Average loan size Average LTVs (1) Raw Land: 47% Land Dev.: 47% Total: 50% Portfolio Characteristics (1) Loan balance as of December 31, 2009 / most recent appraisal 14 (in millions) Dec 31, 2009 % of Loan Type Amount Total Land Development - Vacant (Improved) 112 31 % Raw Land - Vacant (Unimproved) $ 107 29 Office Buildings 32 9 Retail Buildings 12 3 Churches 3 1 Miscellaneous 97 27 Total Commercial Construction $ 363 |
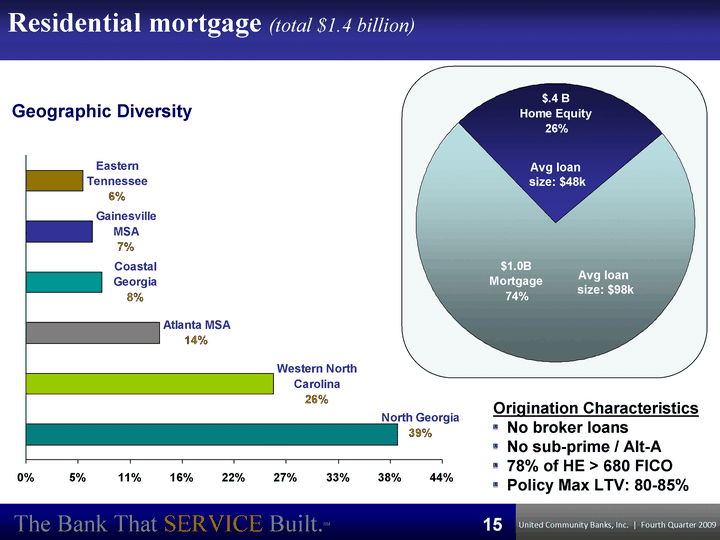
| North Georgia Western North Carolina Atlanta MSA Coastal Georgia Gainesville MSA Eastern Tennessee East 0.39 0.26 0.14 0.08 0.07 0.06 Mortgage Home Equity East 74 26 Residential mortgage (total $1.4 billion) Geographic Diversity Avg loan size: $48k Avg loan size: $98k 15 Origination Characteristics No broker loans No sub-prime / Alt-A 78% of HE > 680 FICO Policy Max LTV: 80-85% |
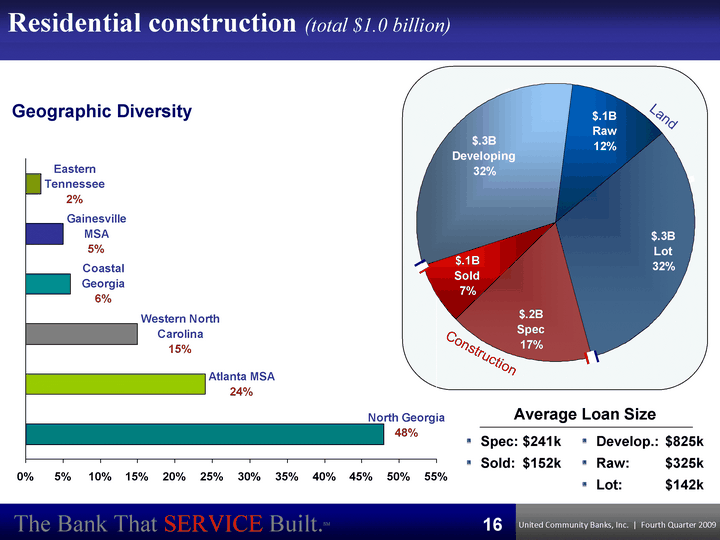
| North Georgia Atlanta MSA Western North Carolina Coastal Georgia Gainesville MSA Eastern Tennessee East 0.48 0.24 0.15 0.06 0.05 0.02 Residential construction (total $1.0 billion) Geographic Diversity Developing Spec: $241k Sold: $152k Develop.: $825k Raw: $325k Lot: $142k Average Loan Size 16 Lot Spec Sold Developing Raw East 0.32 0.17 0.07 0.32 0.12 Construction Land |
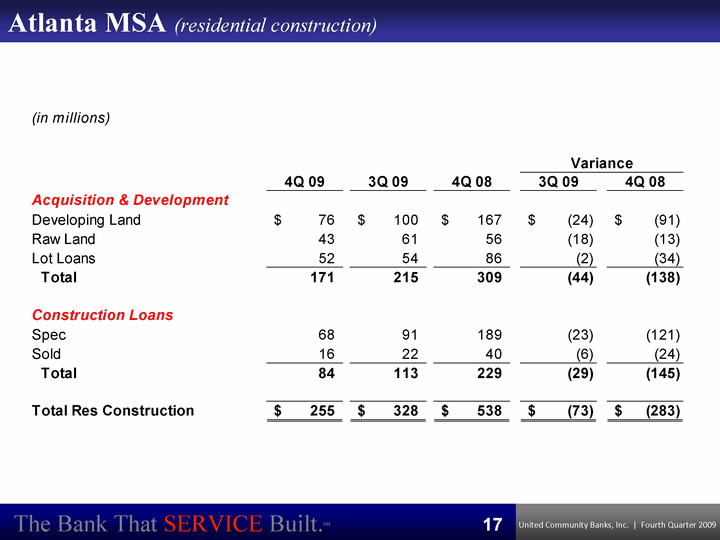
| Atlanta MSA (residential construction) 17 |
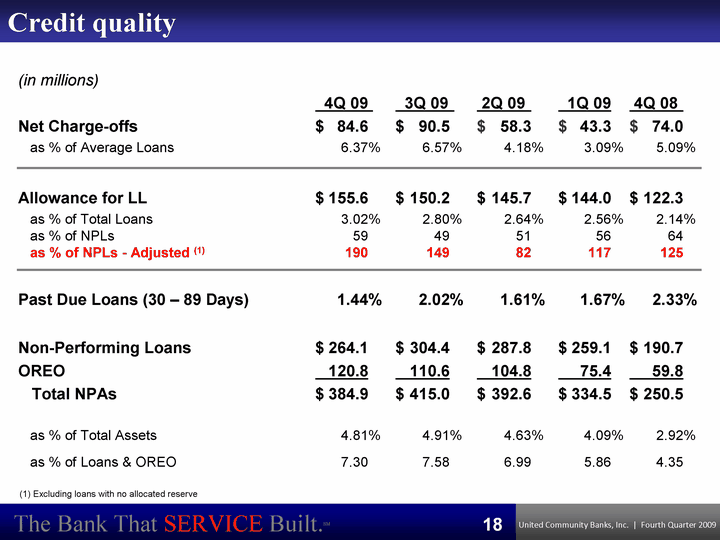
| Credit quality (in millions) 4Q 09 3Q 09 2Q 09 1Q 09 4Q 08 Net Charge-offs $ 84.6 $ 90.5 $ 58.3 $ 43.3 $ 74.0 as % of Average Loans 6.37 % 6.57 % 4.18 % 3.09 % 5.09 % Allowance for LL $ 155.6 $ 150.2 $ 145.7 $ 144.0 $ 122.3 as % of Total Loans 3.02 % 2.80 % 2.64 % 2.56 % 2.14 % as % of NPLs 59 49 51 56 64 as % of NPLs - Adjusted (1) 190 149 82 117 125 Past Due Loans (30 - 89 Days) 1.44 % 2.02 % 1.61 % 1.67 % 2.33 % Non-Performing Loans $ 264.1 $ 304.4 $ 287.8 $ 259.1 $ 190.7 OREO 120.8 110.6 104.8 75.4 59.8 Total NPAs $ 384.9 $ 415.0 $ 392.6 $ 334.5 $ 250.5 as % of Total Assets 4.81 % 4.91 % 4.63 % 4.09 % 2.92 % as % of Loans & OREO 7.30 7.58 6.99 5.86 4.35 (1) Excluding loans with no allocated reserve 18 |

| Net charge-offs by loan category (1) Based on simple average of the four quarters 19 |
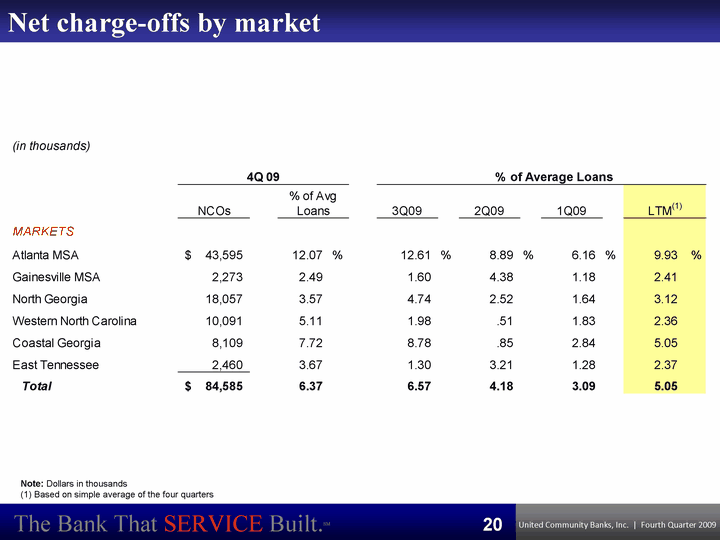
| Net charge-offs by market Note: Dollars in thousands (1) Based on simple average of the four quarters 20 |
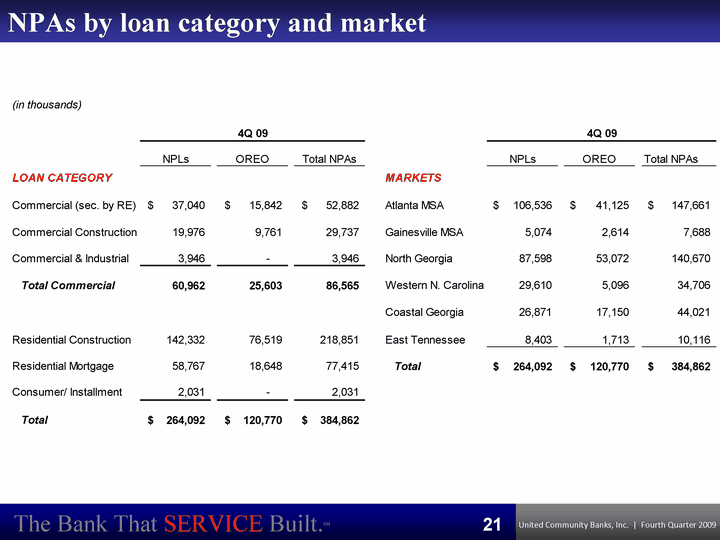
| NPAs by loan category and market 21 |
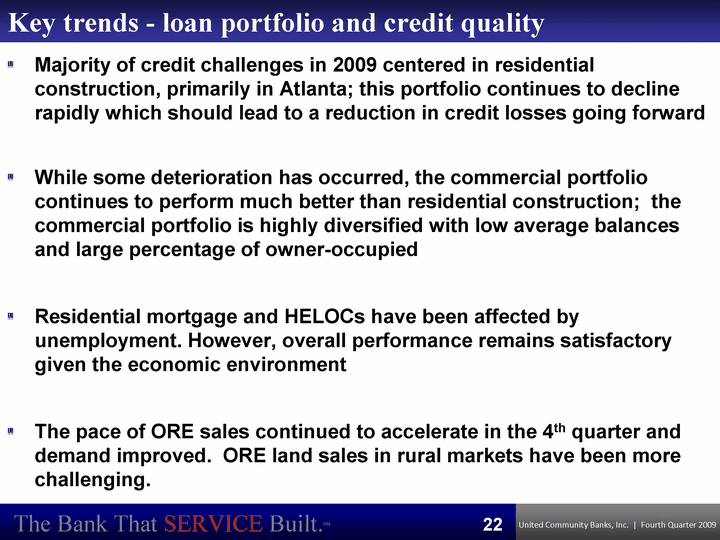
| Key trends - loan portfolio and credit quality Majority of credit challenges in 2009 centered in residential construction, primarily in Atlanta; this portfolio continues to decline rapidly which should lead to a reduction in credit losses going forward While some deterioration has occurred, the commercial portfolio continues to perform much better than residential construction; the commercial portfolio is highly diversified with low average balances and large percentage of owner-occupied Residential mortgage and HELOCs have been affected by unemployment. However, overall performance remains satisfactory given the economic environment The pace of ORE sales continued to accelerate in the 4th quarter and demand improved. ORE land sales in rural markets have been more challenging. 22 |
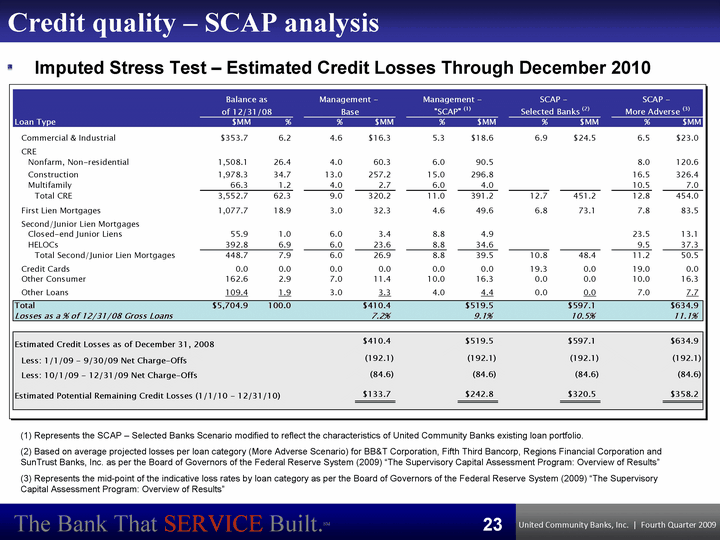
| Imputed Stress Test - Estimated Credit Losses Through December 2010 (1) Represents the SCAP - Selected Banks Scenario modified to reflect the characteristics of United Community Banks existing loan portfolio. (2) Based on average projected losses per loan category (More Adverse Scenario) for BB&T Corporation, Fifth Third Bancorp, Regions Financial Corporation and SunTrust Banks, Inc. as per the Board of Governors of the Federal Reserve System (2009) "The Supervisory Capital Assessment Program: Overview of Results" (3) Represents the mid-point of the indicative loss rates by loan category as per the Board of Governors of the Federal Reserve System (2009) "The Supervisory Capital Assessment Program: Overview of Results" Credit quality - SCAP analysis 23 |
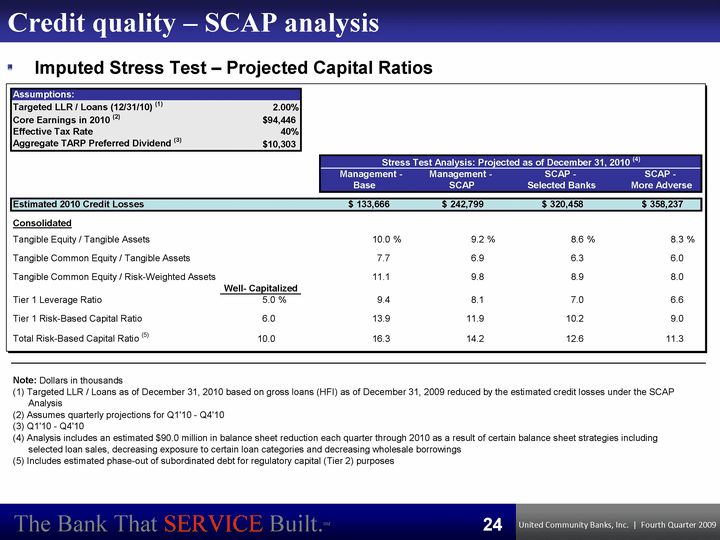
| Imputed Stress Test - Projected Capital Ratios Credit quality - SCAP analysis 24 |

| FINANCIAL RESULTS 25 |
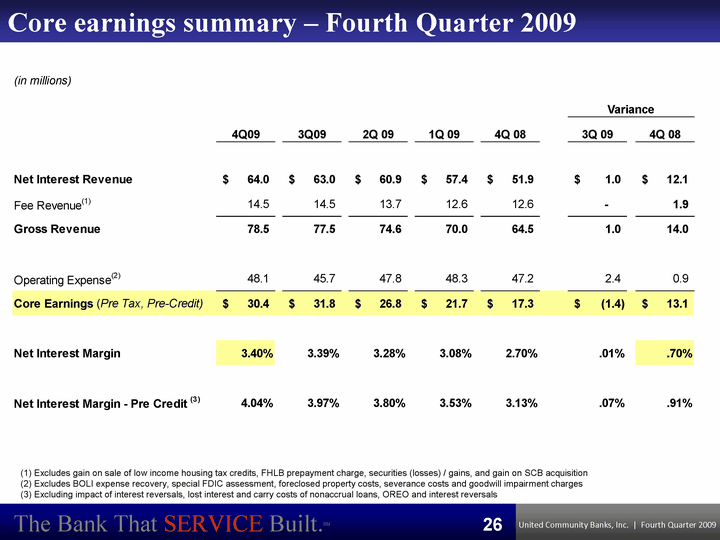
| Core earnings summary - Fourth Quarter 2009 (1) Excludes gain on sale of low income housing tax credits, FHLB prepayment charge, securities (losses) / gains, and gain on SCB acquisition (2) Excludes BOLI expense recovery, special FDIC assessment, foreclosed property costs, severance costs and goodwill impairment charges (3) Excluding impact of interest reversals, lost interest and carry costs of nonaccrual loans, OREO and interest reversals 26 |
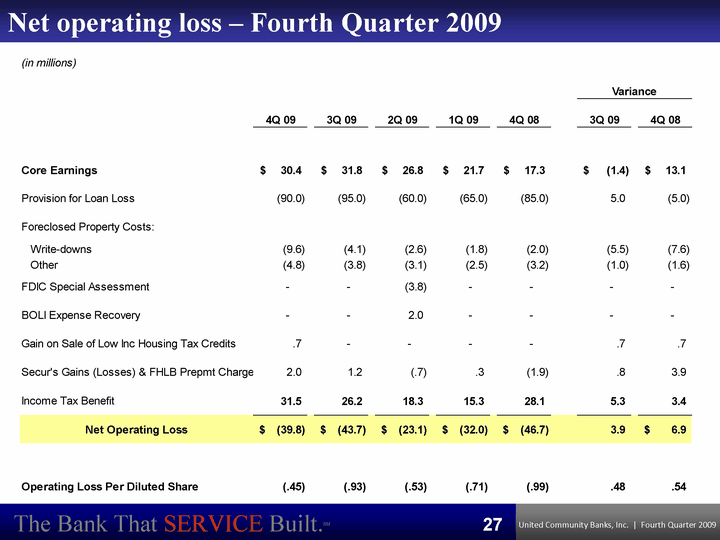
| Net operating loss - Fourth Quarter 2009 27 |
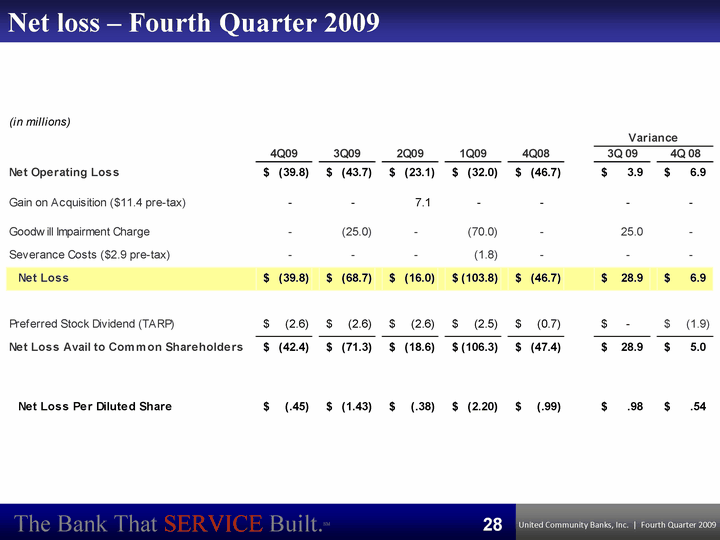
| Net loss - Fourth Quarter 2009 28 |
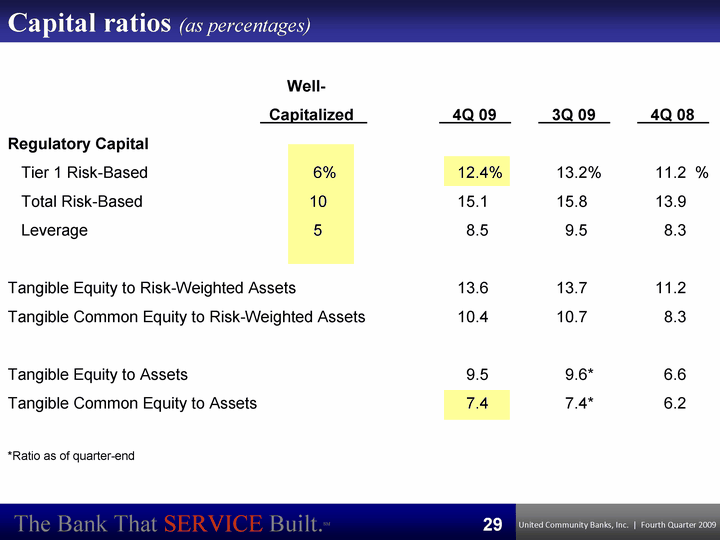
| Capital ratios (as percentages) Well- Capitalized 4Q 09 3Q 09 4Q 08 Regulatory Capital Tier 1 Risk-Based 6 % 12.4% 13.2% 11.2 % Total Risk-Based 10 15.1 15.8 13.9 Leverage 5 8.5 9.5 8.3 Tangible Equity to Risk-Weighted Assets 13.6 13.7 11.2 Tangible Common Equity to Risk-Weighted Assets 10.4 10.7 8.3 Tangible Equity to Assets 9.5 9.6* 6.6 Tangible Common Equity to Assets 7.4 7.4* 6.2 *Ratio as of quarter-end 29 |

| APPENDIX 30 |
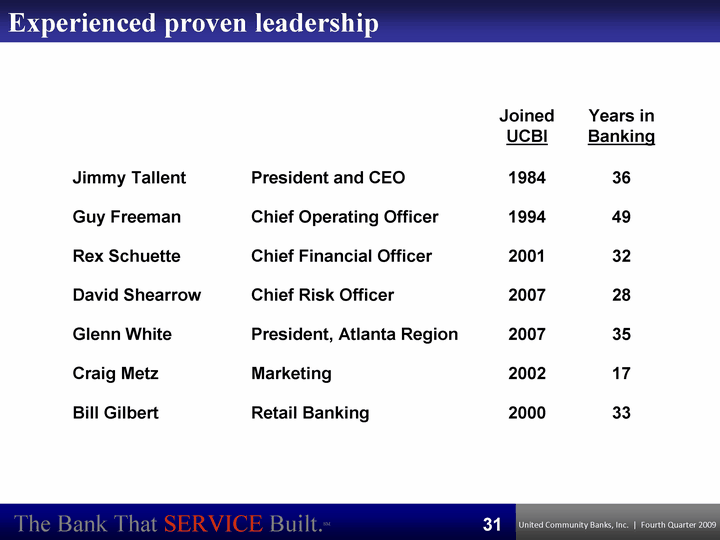
| Joined UCBI Years in Banking Jimmy Tallent President and CEO 1984 36 Guy Freeman Chief Operating Officer 1994 49 Rex Schuette Chief Financial Officer 2001 32 David Shearrow Chief Risk Officer 2007 28 Glenn White President, Atlanta Region 2007 35 Craig Metz Marketing 2002 17 Bill Gilbert Retail Banking 2000 33 Experienced proven leadership 31 |
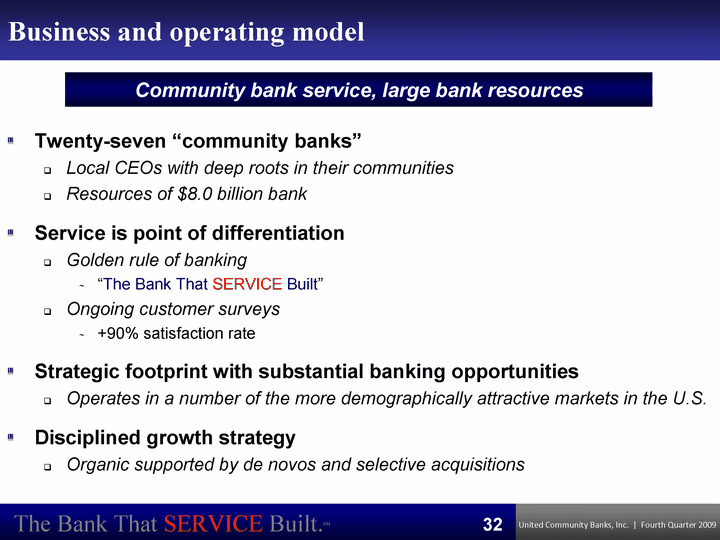
| Business and operating model Twenty-seven "community banks" Local CEOs with deep roots in their communities Resources of $8.0 billion bank Service is point of differentiation Golden rule of banking "The Bank That SERVICE Built" Ongoing customer surveys +90% satisfaction rate Strategic footprint with substantial banking opportunities Operates in a number of the more demographically attractive markets in the U.S. Disciplined growth strategy Organic supported by de novos and selective acquisitions Community bank service, large bank resources 32 |
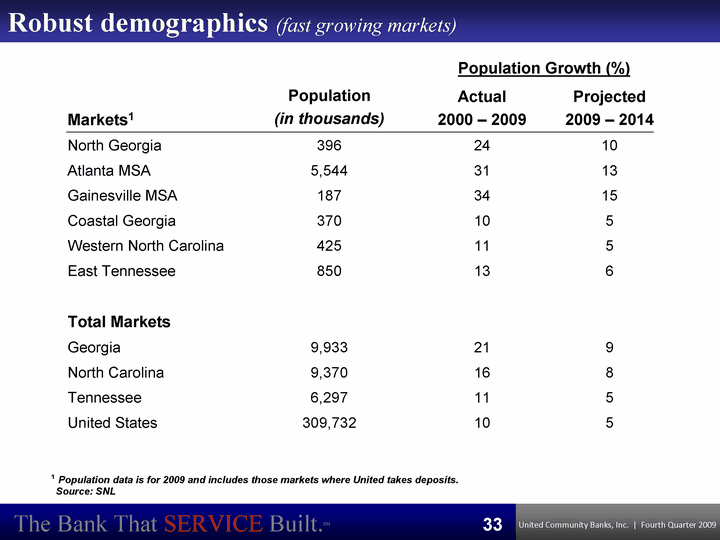
| Population Growth (%) Population Growth (%) Markets1 Population (in thousands) Actual 2000 - 2009 Projected 2009 - 2014 North Georgia 396 24 10 Atlanta MSA 5,544 31 13 Gainesville MSA 187 34 15 Coastal Georgia 370 10 5 Western North Carolina 425 11 5 East Tennessee 850 13 6 Total Markets Georgia 9,933 21 9 North Carolina 9,370 16 8 Tennessee 6,297 11 5 United States 309,732 10 5 1 Population data is for 2009 and includes those markets where United takes deposits. Source: SNL Robust demographics (fast growing markets) 33 |
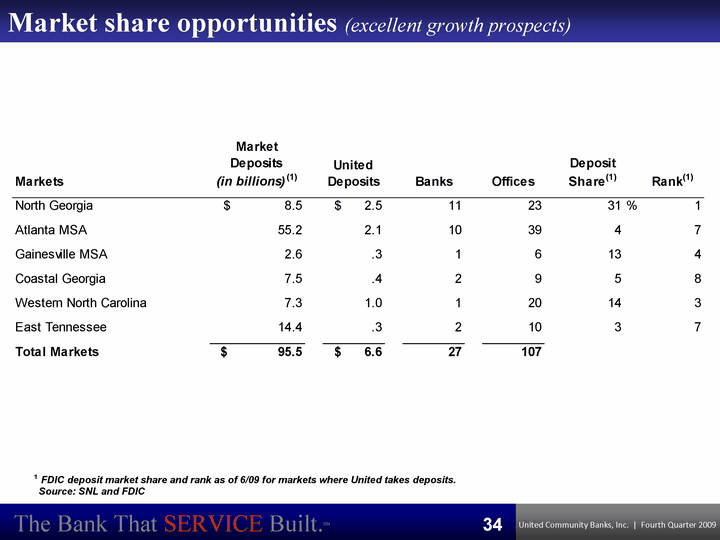
| 1 FDIC deposit market share and rank as of 6/09 for markets where United takes deposits. Source: SNL and FDIC Market share opportunities (excellent growth prospects) 34 |
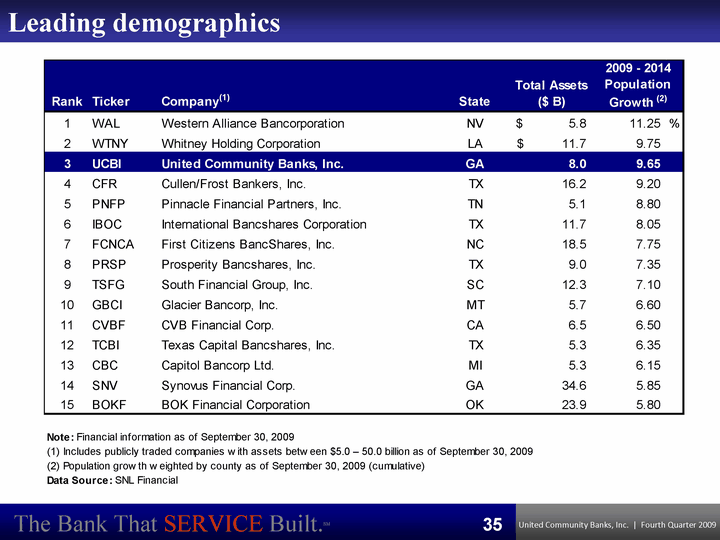
| Leading demographics 35 |
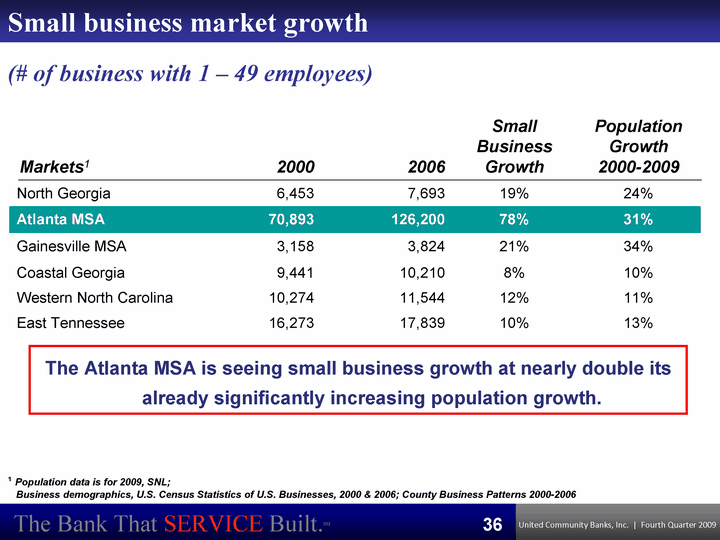
| Small business market growth 2000 2006 Small Business Growth Population Growth 2000-2009 North Georgia 6,453 7,693 19% 24% Atlanta MSA 70,893 126,200 78% 31% Gainesville MSA 3,158 3,824 21% 34% Coastal Georgia 9,441 10,210 8% 10% Western North Carolina 10,274 11,544 12% 11% East Tennessee 16,273 17,839 10% 13% 1 Population data is for 2009, SNL; Business demographics, U.S. Census Statistics of U.S. Businesses, 2000 & 2006; County Business Patterns 2000-2006 The Atlanta MSA is seeing small business growth at nearly double its already significantly increasing population growth. Markets1 (# of business with 1 - 49 employees) 36 |
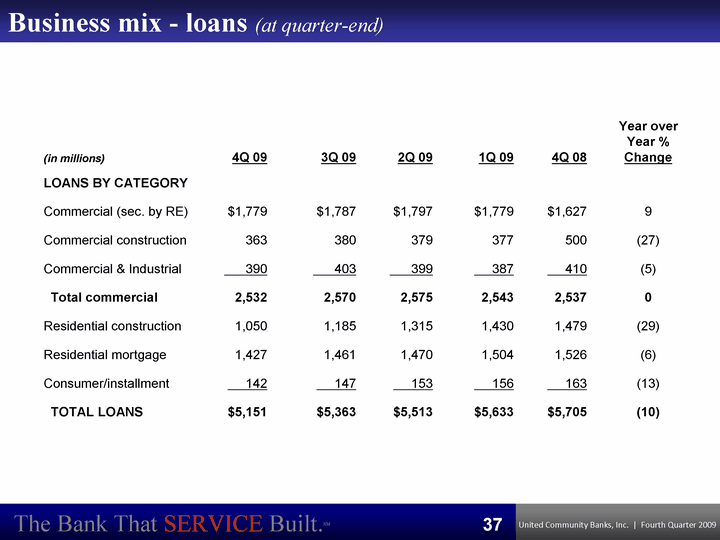
| (in millions) 4Q 09 3Q 09 2Q 09 1Q 09 4Q 08 Year over Year % Change LOANS BY CATEGORY Commercial (sec. by RE) $1,779 $1,787 $1,797 $1,779 $1,627 9 Commercial construction 363 380 379 377 500 (27) Commercial & Industrial 390 403 399 387 410 (5) Total commercial 2,532 2,570 2,575 2,543 2,537 0 Residential construction 1,050 1,185 1,315 1,430 1,479 (29) Residential mortgage 1,427 1,461 1,470 1,504 1,526 (6) Consumer/installment 142 147 153 156 163 (13) TOTAL LOANS $5,151 $5,363 $5,513 $5,633 $5,705 (10) Business mix - loans (at quarter-end) 37 |
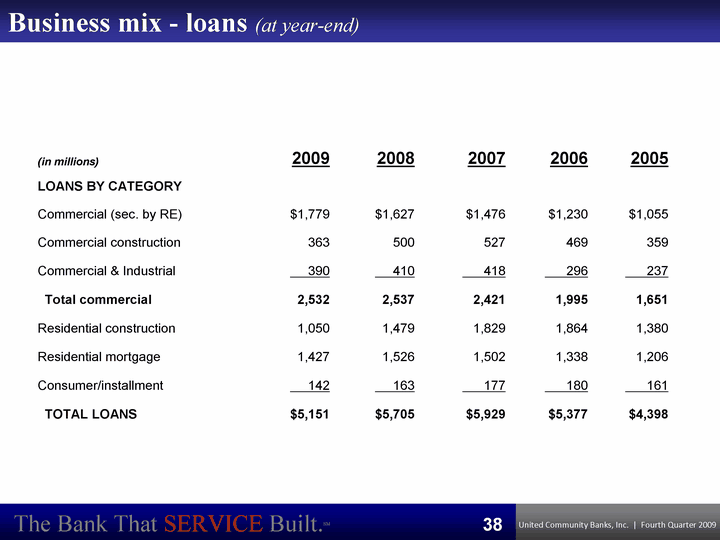
| (in millions) 2009 2008 2007 2006 2005 LOANS BY CATEGORY Commercial (sec. by RE) $1,779 $1,627 $1,476 $1,230 $1,055 Commercial construction 363 500 527 469 359 Commercial & Industrial 390 410 418 296 237 Total commercial 2,532 2,537 2,421 1,995 1,651 Residential construction 1,050 1,479 1,829 1,864 1,380 Residential mortgage 1,427 1,526 1,502 1,338 1,206 Consumer/installment 142 163 177 180 161 TOTAL LOANS $5,151 $5,705 $5,929 $5,377 $4,398 Business mix - loans (at year-end) 38 |

| (in millions) 4Q 09 3Q 09 2Q 09 1Q 09 4Q 08 Land Loans Developing Land $ 332 $ 380 $ 413 $ 445 $ 484 Raw Land 127 159 159 155 153 Lot Loans 336 336 369 390 358 Total 795 875 941 990 995 Construction Loans Spec 178 218 268 317 347 Sold 77 92 106 123 137 Total 255 310 374 440 484 Total Res Construction $1,050 $1,185 $1,315 $1,430 $1,479 Residential construction - total company 39 |
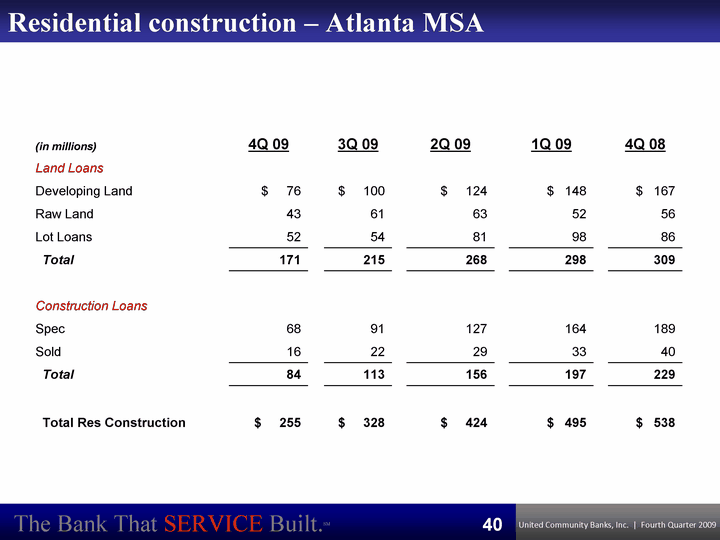
| (in millions) 4Q 09 3Q 09 2Q 09 1Q 09 4Q 08 Land Loans Developing Land $ 76 $ 100 $ 124 $ 148 $ 167 Raw Land 43 61 63 52 56 Lot Loans 52 54 81 98 86 Total 171 215 268 298 309 Construction Loans Spec 68 91 127 164 189 Sold 16 22 29 33 40 Total 84 113 156 197 229 Total Res Construction $ 255 $ 328 $ 424 $ 495 $ 538 Residential construction - Atlanta MSA 40 |
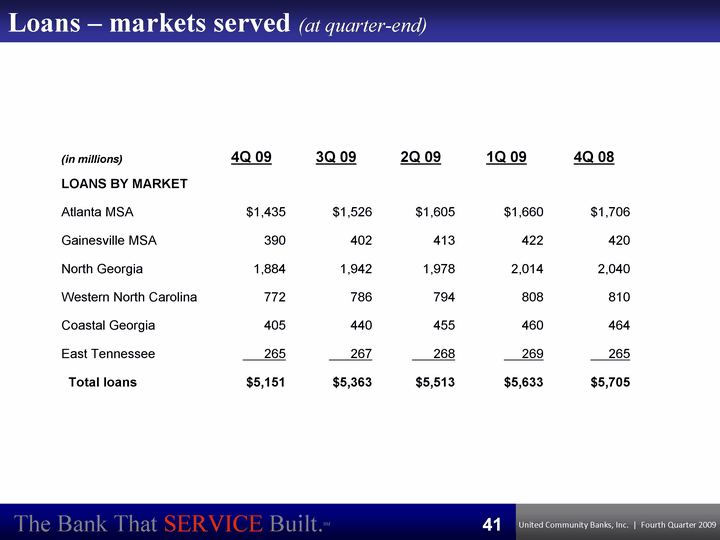
| (in millions) 4Q 09 3Q 09 2Q 09 1Q 09 4Q 08 LOANS BY MARKET Atlanta MSA $1,435 $1,526 $1,605 $1,660 $1,706 Gainesville MSA 390 402 413 422 420 North Georgia 1,884 1,942 1,978 2,014 2,040 Western North Carolina 772 786 794 808 810 Coastal Georgia 405 440 455 460 464 East Tennessee 265 267 268 269 265 Total loans $5,151 $5,363 $5,513 $5,633 $5,705 Loans - markets served (at quarter-end) 41 |
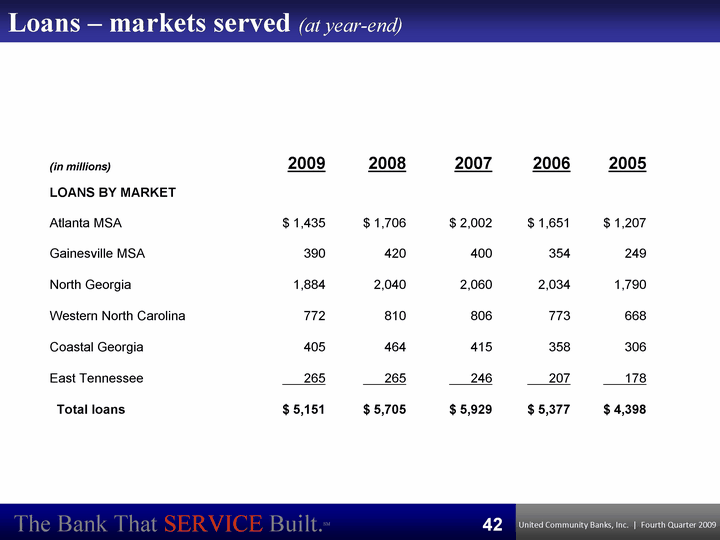
| (in millions) 2009 2008 2007 2006 2005 LOANS BY MARKET Atlanta MSA $ 1,435 $ 1,706 $ 2,002 $ 1,651 $ 1,207 Gainesville MSA 390 420 400 354 249 North Georgia 1,884 2,040 2,060 2,034 1,790 Western North Carolina 772 810 806 773 668 Coastal Georgia 405 464 415 358 306 East Tennessee 265 265 246 207 178 Total loans $ 5,151 $ 5,705 $ 5,929 $ 5,377 $ 4,398 Loans - markets served (at year-end) 42 |
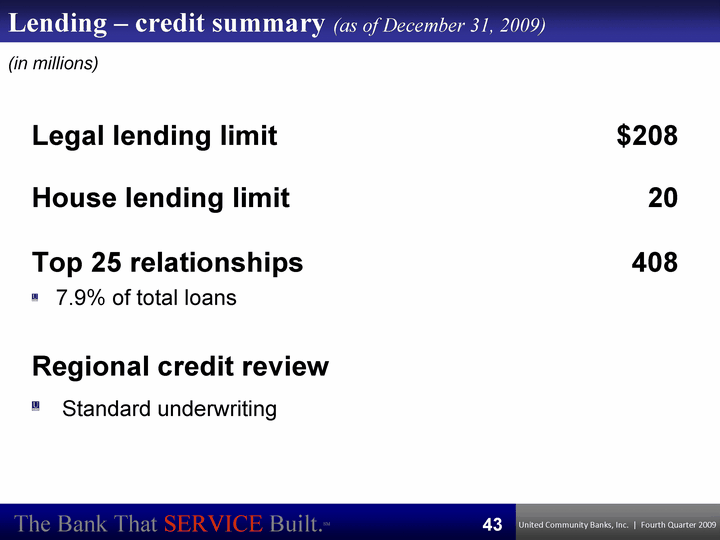
| Legal lending limit $208 House lending limit 20 Top 25 relationships 7.9% of total loans 408 Regional credit review Standard underwriting Lending - credit summary (as of December 31, 2009) 43 (in millions) |
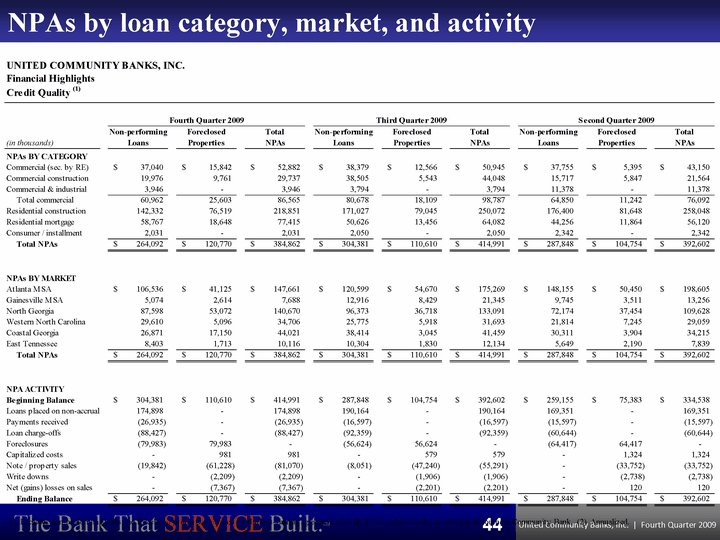
| NPAs by loan category, market, and activity 44 |
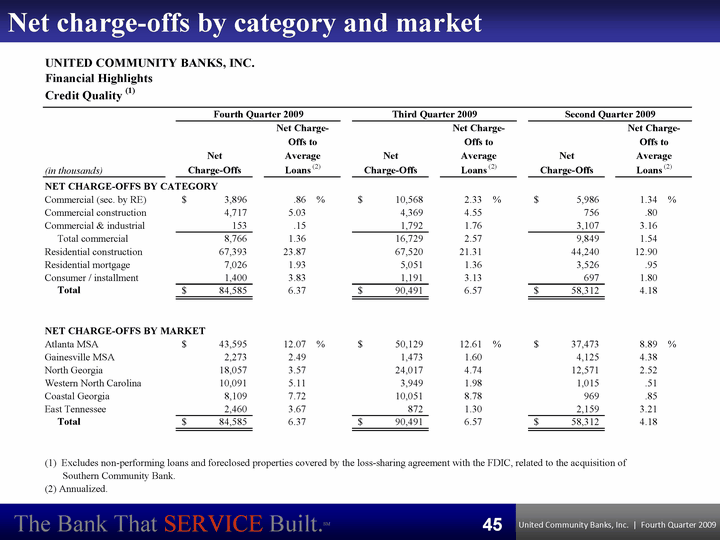
| Net charge-offs by category and market 45 |
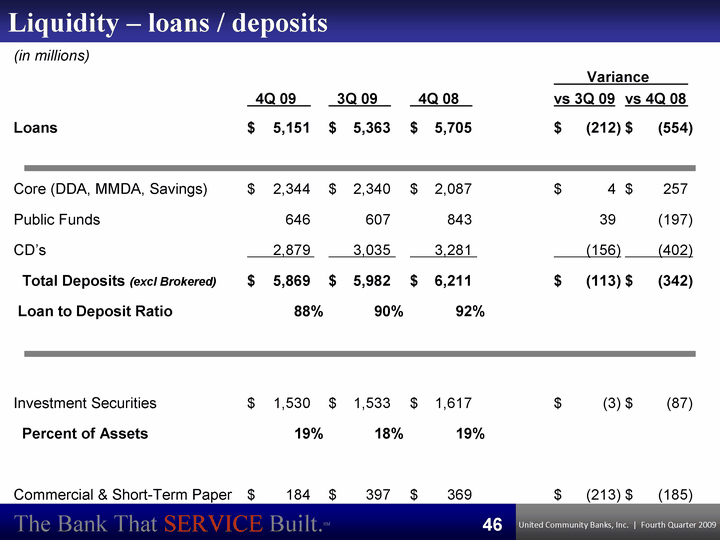
| Liquidity - loans / deposits (in millions) Variance 4Q 09 3Q 09 4Q 08 vs 3Q 09 vs 4Q 08 Loans $ 5,151 $ 5,363 $ 5,705 $ (212 ) $ (554 ) Core (DDA, MMDA, Savings) $ 2,344 $ 2,340 $ 2,087 $ 4 $ 257 Public Funds 646 607 843 39 (197 ) CD's 2,879 3,035 3,281 (156 ) (402 ) Total Deposits (excl Brokered) $ 5,869 $ 5,982 $ 6,211 $ (113 ) $ (342 ) Loan to Deposit Ratio 88 % 90 % 92 % Investment Securities $ 1,530 $ 1,533 $ 1,617 $ (3 ) $ (87 ) Percent of Assets 19 % 18 % 19 % Commercial & Short-Term Paper $ 184 $ 397 $ 369 $ (213 ) $ (185 ) 46 |
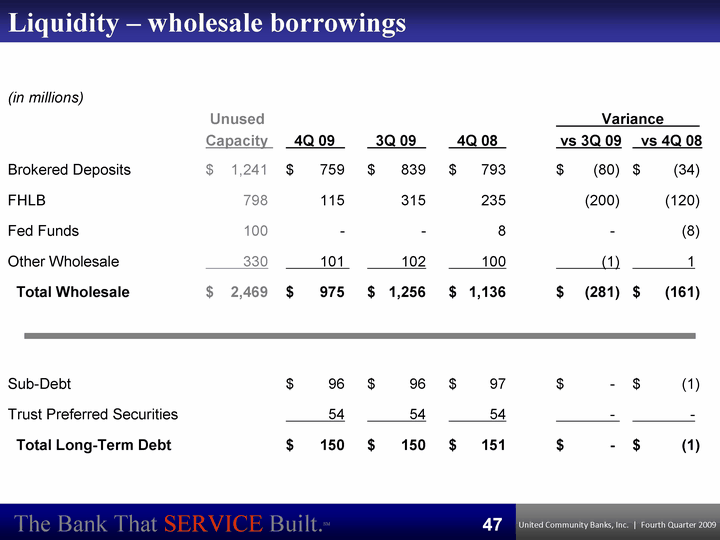
| Liquidity - wholesale borrowings (in millions) Unused Variance Capacity 4Q 09 3Q 09 4Q 08 vs 3Q 09 vs 4Q 08 Brokered Deposits $ 1,241 $ 759 $ 839 $ 793 $ (80 ) $ (34 ) FHLB 798 115 315 235 (200 ) (120 ) Fed Funds 100 - - 8 - (8 ) Other Wholesale 330 101 102 100 (1 ) 1 Total Wholesale $ 2,469 $ 975 $ 1,256 $ 1,136 $ (281 ) $ (161 ) Sub-Debt $ 96 $ 96 $ 97 $ - $ (1 ) Trust Preferred Securities 54 54 54 - - Total Long-Term Debt $ 150 $ 150 $ 151 $ - $ (1 ) 47 |
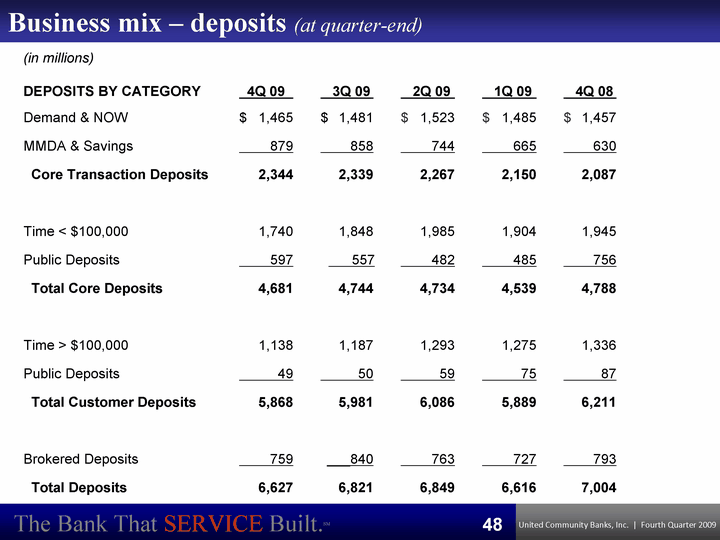
| Business mix - deposits (at quarter-end) (in millions) DEPOSITS BY CATEGORY 4Q 09 3Q 09 2Q 09 1Q 09 4Q 08 Demand & NOW $ 1,465 $ 1,481 $ 1,523 $ 1,485 $ 1,457 MMDA & Savings 879 858 744 665 630 Core Transaction Deposits 2,344 2,339 2,267 2,150 2,087 Time < $100,000 1,740 1,848 1,985 1,904 1,945 Public Deposits 597 557 482 485 756 Total Core Deposits 4,681 4,744 4,734 4,539 4,788 Time > $100,000 1,138 1,187 1,293 1,275 1,336 Public Deposits 49 50 59 75 87 Total Customer Deposits 5,868 5,981 6,086 5,889 6,211 Brokered Deposits 759 ___840 763 727 793 Total Deposits 6,627 6,821 6,849 6,616 7,004 48 |
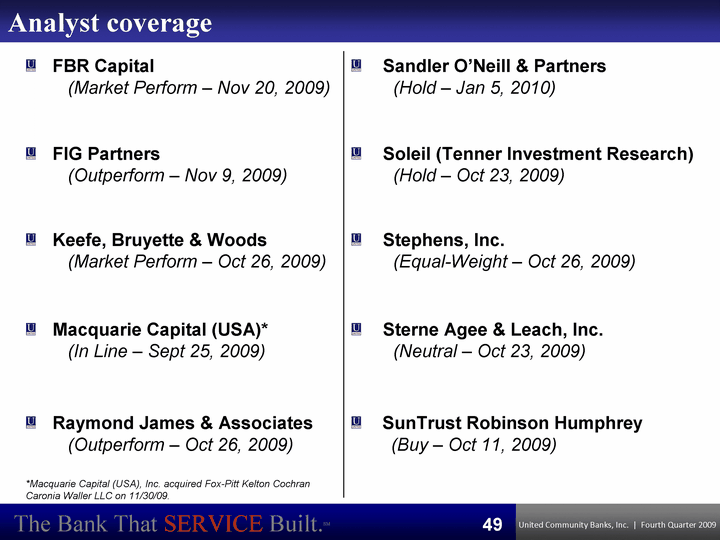
| Analyst coverage 49 FBR Capital (Market Perform - Nov 20, 2009) Sandler O'Neill & Partners (Hold - Jan 5, 2010) FIG Partners (Outperform - Nov 9, 2009) Soleil (Tenner Investment Research) (Hold - Oct 23, 2009) Keefe, Bruyette & Woods (Market Perform - Oct 26, 2009) Stephens, Inc. (Equal-Weight - Oct 26, 2009) Macquarie Capital (USA)* (In Line - Sept 25, 2009) Sterne Agee & Leach, Inc. (Neutral - Oct 23, 2009) Raymond James & Associates (Outperform - Oct 26, 2009) SunTrust Robinson Humphrey (Buy - Oct 11, 2009) *Macquarie Capital (USA), Inc. acquired Fox-Pitt Kelton Cochran Caronia Waller LLC on 11/30/09. |
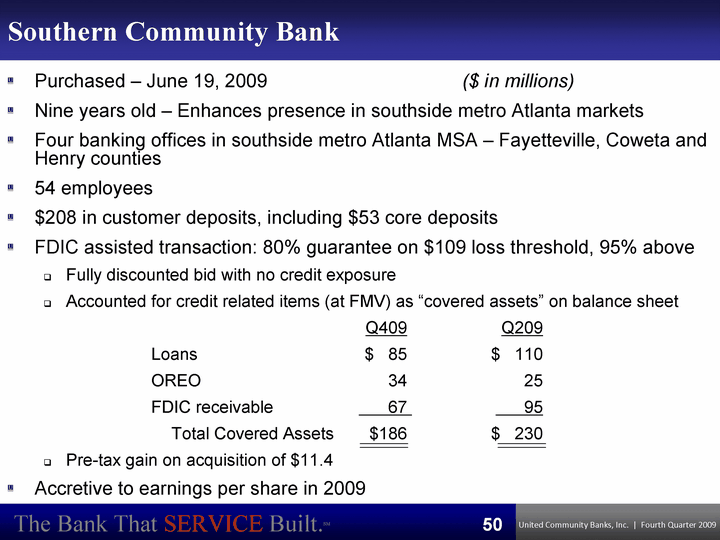
| Southern Community Bank Purchased - June 19, 2009 ($ in millions) Nine years old - Enhances presence in southside metro Atlanta markets Four banking offices in southside metro Atlanta MSA - Fayetteville, Coweta and Henry counties 54 employees $208 in customer deposits, including $53 core deposits FDIC assisted transaction: 80% guarantee on $109 loss threshold, 95% above Fully discounted bid with no credit exposure Accounted for credit related items (at FMV) as "covered assets" on balance sheet Q409 Q209 Loans $ 85 $ 110 OREO 34 25 FDIC receivable 67 95 Total Covered Assets $186 $ 230 Pre-tax gain on acquisition of $11.4 Accretive to earnings per share in 2009 50 |
| Non-GAAP reconciliation tables 51 |
| Non-GAAP reconciliation tables 52 |