Exhibit 99.2

Member FDIC. © 2023 United Community Bank | ucbi.com 2 Q23 Investor Presentation July 18, 2023
Disclosures 2 CAUTIONARY STATEMENT This communication contains “forward - looking statements” within the meaning of Section 27 A of the Securities Act of 1933 , as amended, and Section 21 E of the Securities Exchange Act of 1934 , as amended . In general, forward - looking statements usually may be identified through use of words such as “may,” “believe,” “expect,” “anticipate,” “intend,” “will,” “should,” “plan,” “estimate,” “predict,” “continue” and “potential” or the negative of these terms or other comparable terminology, and include statements related to potential benefits of the First Miami merger, and the strength of our pipelines and their ability to support business growth across our markets and our belief that our high - quality balance sheet and business mix will support strong performance regardless of future economic conditions . Forward - looking statements are not historical facts and represent management’s beliefs, based upon information available at the time the statements are made, with regard to the matters addressed; they are not guarantees of future performance . Actual results may prove to be materially different from the results expressed or implied by the forward - looking statements . Forward - looking statements are subject to numerous assumptions, risks and uncertainties that change over time and could cause actual results or financial condition to differ materially from those expressed in or implied by such statements . Factors that could cause or contribute to such differences include, but are not limited to ( 1 ) the risk that the cost savings from the merger may not be realized or take longer than anticipated to be realized, ( 2 ) disruption from the merger with customer, supplier, employee or other business partner relationships, ( 3 ) reputational risk and the reaction of each of the companies’ customers, suppliers, employees or other business partners to the merger, ( 4 ) the risks relating to the integration of FMIA’s operations into the operations of United, including the risk that such integration will be materially delayed or will be more costly or difficult than expected, ( 5 ) the risks associated with United’s pursuit of future acquisitions, ( 6 ) the risk associated with expansion into new geographic or product markets, ( 7 ) the dilution caused by United’s issuance of additional shares of its common stock in the merger, and ( 8 ) general competitive, economic, political and market conditions . Further information regarding additional factors which could affect the forward - looking statements can be found in the cautionary language included under the headings “Cautionary Note Regarding Forward - Looking Statements” and “Risk Factors” in United’s Annual Report on Form 10 - K for the year ended December 31 , 2022 , and other documents subsequently filed by United with the SEC . Many of these factors are beyond United’s ability to control or predict . If one or more events related to these or other risks or uncertainties materialize, or if the underlying assumptions prove to be incorrect, actual results may differ materially from the forward - looking statements . Accordingly, shareholders and investors should not place undue reliance on any such forward - looking statements . Any forward - looking statement speaks only as of the date of this communication, and United undertakes no obligation to update or revise any forward - looking statements, whether as a result of new information, future events or otherwise, except as required by law . New risks and uncertainties may emerge from time to time, and it is not possible for United to predict their occurrence or how they will affect United . United qualifies all forward - looking statements by these cautionary statements .

Disclosures 3 NON - GAAP MEASURES This Investor Presentation includes financial information determined by methods other than in accordance with generally accepted accounting principles (“GAAP”) . This financial information includes certain operating performance measures, which exclude merger - related and other charges that are not considered part of recurring operations . Such measures include : “Earnings per share – operating,” “Diluted earnings per share – operating,” “Tangible book value per share,” “Return on common equity – operating,” “Return on tangible common equity – operating,” “Return on assets – operating,” “Return on assets – pre - tax pre - provision, excluding merger - related and other charges,” “Efficiency ratio – operating,” “Expenses – operating,” and “Tangible common equity to tangible assets . ” Management has included these non - GAAP measures because it believes these measures may provide useful supplemental information for evaluating United’s underlying performance trends . Further, management uses these measures in managing and evaluating United’s business and intends to refer to them in discussions about United’s operations and performance . Operating performance measures should be viewed in addition to, and not as an alternative to or substitute for, measures determined in accordance with GAAP, and are not necessarily comparable to non - GAAP measures that may be presented by other companies . To the extent applicable, reconciliations of these non - GAAP measures to the most directly comparable GAAP measures can be found in the ‘Non - GAAP Reconciliation Tables’ included in the exhibits to this Presentation .
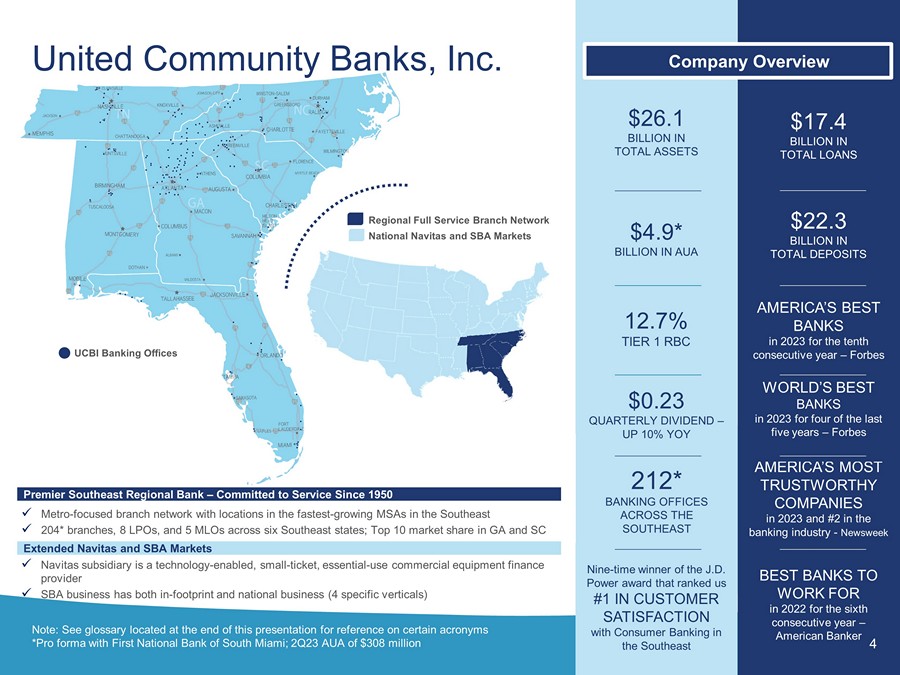
212* BANKING OFFICES ACROSS THE SOUTHEAST Nine - time winner of the J.D. Power award that ranked us #1 IN CUSTOMER SATISFACTION with Consumer Banking in the Southeast AMERICA’S MOST TRUSTWORTHY COMPANIES in 2023 and #2 in the banking industry - Newsweek $0.23 QUARTERLY DIVIDEND – UP 10% YOY WORLD’S BEST BANKS in 2023 f or four of the last five years – Forbes United Community Banks, Inc. $26.1 BILLION IN TOTAL ASSETS $4.9* BILLION IN AUA $22.3 BILLION IN TOTAL DEPOSITS BEST BANKS TO WORK FOR in 2022 for the sixth consecutive year – American Banker 4 Premier Southeast Regional Bank – Committed to Service Since 1950 x Metro - focused branch network with locations in the fastest - growing MSAs in the Southeast x 204* branches, 8 LPOs, and 5 MLOs across six Southeast states; Top 10 market share in GA and SC Extended Navitas and SBA Markets $17.4 BILLION IN TOTAL LOANS Company Overview 12.7% TIER 1 RBC AMERICA’S BEST BANKS in 2023 f or the tenth consecutive year – Forbes x Navitas subsidiary is a technology - enabled, small - ticket, essential - use commercial equipment finance provider x SBA business has both in - footprint and national business (4 specific verticals) UCBI Banking Offices Note: See glossary located at the end of this presentation for reference on certain acronyms *Pro forma with First National Bank of South Miami; 2Q23 AUA of $308 million Regional Full Service Branch Network National Navitas and SBA Markets
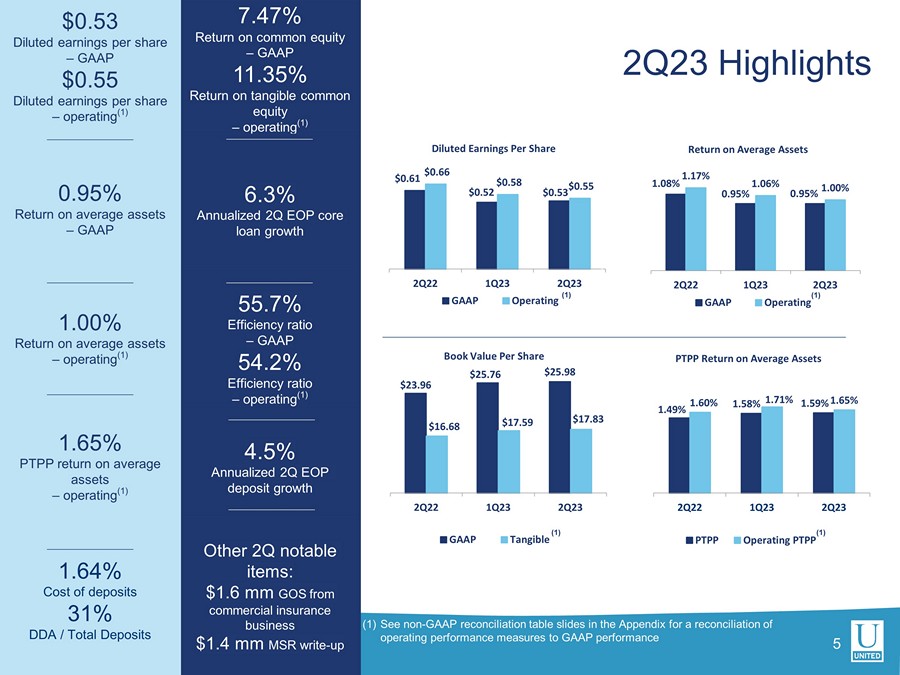
$23.96 $25.76 $25.98 $16.68 $17.59 $17.83 2Q22 1Q23 2Q23 Book Value Per Share GAAP Tangible 4.5% Annualized 2Q EOP deposit growth 7.47% Return on common equity – GAAP 11.35% Return on tangible common equity – operating (1) Other 2Q notable items: $1.6 mm GOS from commercial insurance business $1.4 mm MSR write - up $0.53 Diluted earnings per share – GAAP $0.55 Diluted earnings per share – operating (1) 0.95% Return on average assets – GAAP 1.00% Return on average assets – operating (1) 1.65% PTPP return on average assets – operating (1) 1.64% Cost of deposits 31% DDA / Total Deposits 2Q23 Highlights (1) See non - GAAP reconciliation table slides in the Appendix for a reconciliation of operating performance measures to GAAP performance $0.61 $0.52 $0.53 $0.66 $0.58 $0.55 2Q22 1Q23 2Q23 Diluted Earnings Per Share GAAP Operating (1) 1.08% 0.95% 0.95% 1.17% 1.06% 1.00% 2Q22 1Q23 2Q23 Return on Average Assets GAAP Operating 1.49% 1.58% 1.59% 1.60% 1.71% 1.65% 2Q22 1Q23 2Q23 PTPP Return on Average Assets PTPP Operating PTPP (1) (1) 6.3% Annualized 2Q EOP core loan growth 55.7% Efficiency ratio – GAAP 54.2% Efficiency ratio – operating (1) 5 (1)
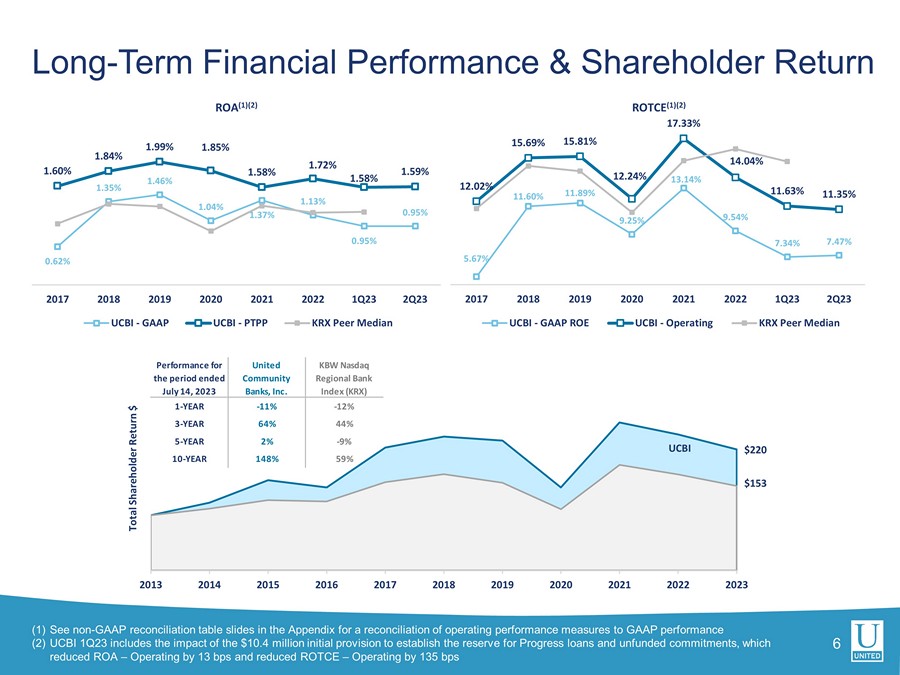
6 (1) See non - GAAP reconciliation table slides in the Appendix for a reconciliation of operating performance measures to GAAP performa nce (2) UCBI 1Q23 includes the impact of the $10.4 million initial provision to establish the reserve for Progress loans and unfunded co mmitments, which reduced ROA – Operating by 13 bps and reduced ROTCE – Operating by 135 bps Long - Term Financial Performance & Shareholder Return 0.62% 1.35% 1.46% 1.04% 1.37% 1.13% 0.95% 0.95% 1.60% 1.84% 1.99% 1.85% 1.58% 1.72% 1.58% 1.59% 2017 2018 2019 2020 2021 2022 1Q23 2Q23 ROA (1)(2) UCBI - GAAP UCBI - PTPP KRX Peer Median 5.67% 11.60% 11.89% 9.25% 13.14% 9.54% 7.34% 7.47% 12.02% 15.69% 15.81% 12.24% 17.33% 14.04% 11.63% 11.35% 2017 2018 2019 2020 2021 2022 1Q23 2Q23 ROTCE (1)(2) UCBI - GAAP ROE UCBI - Operating KRX Peer Median $220 $153 2013 2014 2015 2016 2017 2018 2019 2020 2021 2022 2023 Total Shareholder Return $ UCBI Performance for the period ended July 14, 2023 United Community Banks, Inc. KBW Nasdaq Regional Bank Index (KRX) 1-YEAR -11% -12% 3-YEAR 64% 44% 5-YEAR 2% -9% 10-YEAR 148% 59%
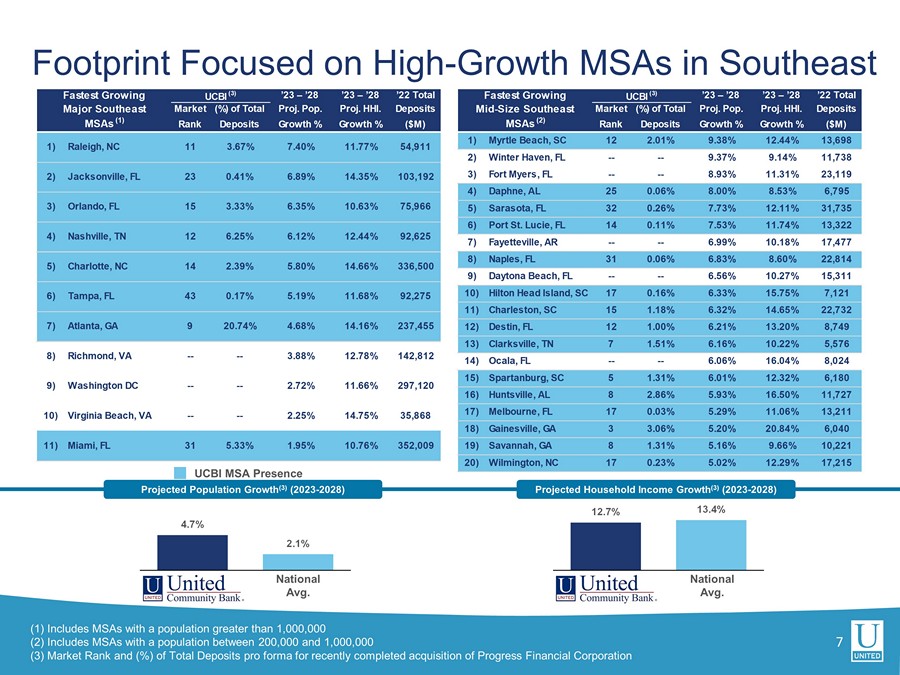
4.7% 2.1% 12.7% 13.4% 1 2 UCBI MSA Presence 7 (1) Includes MSAs with a population greater than 1,000,000 (2) Includes MSAs with a population between 200,000 and 1,000,000 (3) Market Rank and (%) of Total Deposits pro forma for recently completed acquisition of Progress Financial Corporation Projected Population Growth (3) (2023 - 2028) Projected Household Income Growth (3) (2023 - 2028) National Avg. National Avg. Footprint Focused on High - Growth MSAs in Southeast Fastest Growing UCBI (3) ’23 – ’28 ’23 – ’28 ’22 Total Major Southeast Market (%) of Total Proj. Pop. Proj. HHI. Deposits MSAs (1) Rank Deposits Growth % Growth % ($M) 1) Raleigh, NC 11 3.67% 7.40% 11.77% 54,911 2) Jacksonville, FL 23 0.41% 6.89% 14.35% 103,192 3) Orlando, FL 15 3.33% 6.35% 10.63% 75,966 4) Nashville, TN 12 6.25% 6.12% 12.44% 92,625 5) Charlotte, NC 14 2.39% 5.80% 14.66% 336,500 6) Tampa, FL 43 0.17% 5.19% 11.68% 92,275 7) Atlanta, GA 9 20.74% 4.68% 14.16% 237,455 8) Richmond, VA -- -- 3.88% 12.78% 142,812 9) Washington DC -- -- 2.72% 11.66% 297,120 10) Virginia Beach, VA -- -- 2.25% 14.75% 35,868 11) Miami, FL 31 5.33% 1.95% 10.76% 352,009 Fastest Growing UCBI (3) ’23 – ’28 ’23 – ’28 ’22 Total Mid-Size Southeast Market (%) of Total Proj. Pop. Proj. HHI. Deposits MSAs (2) Rank Deposits Growth % Growth % ($M) 1) Myrtle Beach, SC 12 2.01% 9.38% 12.44% 13,698 2) Winter Haven, FL -- -- 9.37% 9.14% 11,738 3) Fort Myers, FL -- -- 8.93% 11.31% 23,119 4) Daphne, AL 25 0.06% 8.00% 8.53% 6,795 5) Sarasota, FL 32 0.26% 7.73% 12.11% 31,735 6) Port St. Lucie, FL 14 0.11% 7.53% 11.74% 13,322 7) Fayetteville, AR -- -- 6.99% 10.18% 17,477 8) Naples, FL 31 0.06% 6.83% 8.60% 22,814 9) Daytona Beach, FL -- -- 6.56% 10.27% 15,311 10) Hilton Head Island, SC 17 0.16% 6.33% 15.75% 7,121 11) Charleston, SC 15 1.18% 6.32% 14.65% 22,732 12) Destin, FL 12 1.00% 6.21% 13.20% 8,749 13) Clarksville, TN 7 1.51% 6.16% 10.22% 5,576 14) Ocala, FL -- -- 6.06% 16.04% 8,024 15) Spartanburg, SC 5 1.31% 6.01% 12.32% 6,180 16) Huntsville, AL 8 2.86% 5.93% 16.50% 11,727 17) Melbourne, FL 17 0.03% 5.29% 11.06% 13,211 18) Gainesville, GA 3 3.06% 5.20% 20.84% 6,040 19) Savannah, GA 8 1.31% 5.16% 9.66% 10,221 20) Wilmington, NC 17 0.23% 5.02% 12.29% 17,215

Strong Deposit Growth x Total deposits were up $247 million in 2Q23, or 4.5% annualized from 1Q23 x YTD total deposits, excluding Progress, were up $1.0 billion, or 9.8% annualized x Total customer deposits were up $109 million in 2Q23, or 2.3% annualized from 1Q23 (excluding brokered deposits and public funds) x YTD total customer deposits, excluding Progress, were up $574 million, or 6.2% annualized Deposit Costs Below Peers, But Increased Due to Rates and Mix x 32% cumulative deposit beta since 4Q21, as cost of deposits moved to 1.64% from 1.10% in 1Q23 x DDA% moved to 31% of total deposits from 34% last quarter, as customers moved funds to CDs, which increased to 17% of total deposits from 14% last quarter 31% 23% 23% 6% 17% DDA MMDA Savings Time NOW Outstanding Deposit Franchise 8 2Q23 Total Deposits $22.3 billion Total Deposit Beta 3% 6% 12% 23% 32% 4% 10% 17% 23% 0.08% 0.19% 0.49% 1.10% 1.64% -0.10% 0.10% 0.30% 0.50% 0.70% 0.90% 1.10% 1.30% 1.50% 1.70% 0% 5% 10% 15% 20% 25% 30% 2Q22 3Q22 4Q22 1Q23 2Q23 UCBI Cumulative Deposit Beta KRX Peer Average Cumulative Deposit Beta UCBI Cost of Deposits
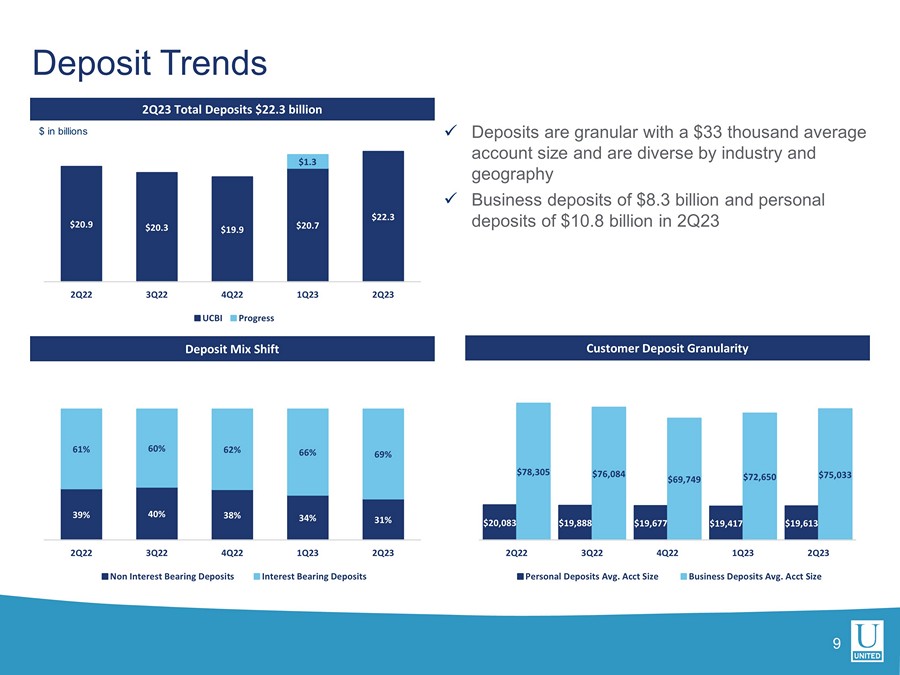
Deposit Trends 9 x Deposits are granular with a $33 thousand average account size and are diverse by industry and geography x Business deposits of $8.3 billion and personal deposits of $10.8 billion in 2Q23 2Q23 Total Deposits $22.3 billion Deposit Mix Shift Customer Deposit Granularity $20,083 $19,888 $19,677 $19,417 $19,613 $78,305 $76,084 $69,749 $72,650 $75,033 2Q22 3Q22 4Q22 1Q23 2Q23 Personal Deposits Avg. Acct Size Business Deposits Avg. Acct Size $ in billions 39% 40% 38% 34% 31% 61% 60% 62% 66% 69% 2Q22 3Q22 4Q22 1Q23 2Q23 Non Interest Bearing Deposits Interest Bearing Deposits $20.9 $20.3 $19.9 $20.7 $22.3 $1.3 2Q22 3Q22 4Q22 1Q23 2Q23 UCBI Progress
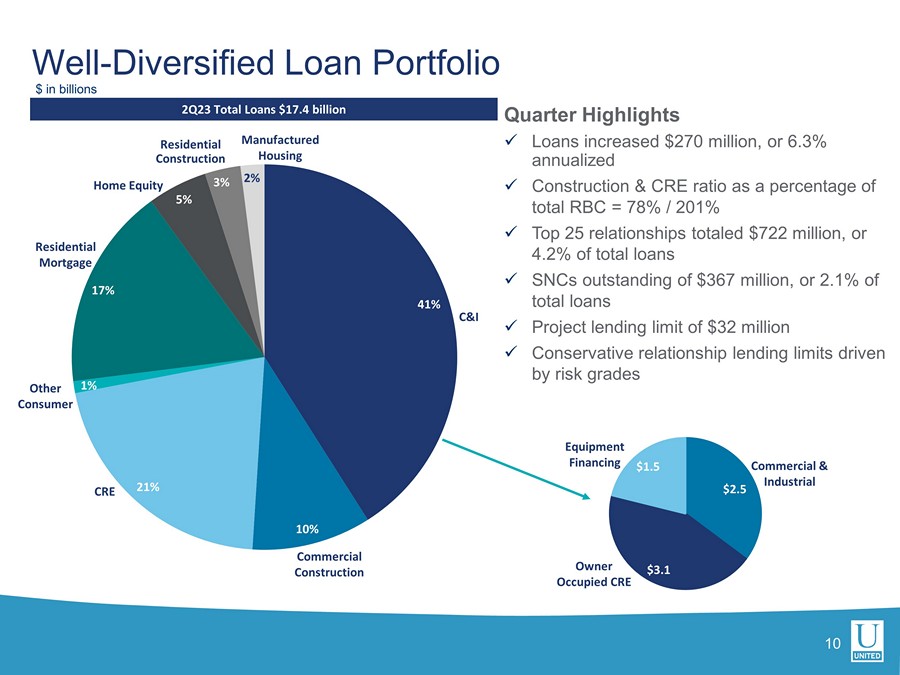
41% 10% 21% 1% 17% 5% 3% 2% Residential Mortgage Manufactured Housing 10 2Q23 Total Loans $17.4 billion Well - Diversified Loan Portfolio Quarter Highlights x Loans increased $270 million, or 6.3% annualized x Construction & CRE ratio as a percentage of total RBC = 78% / 201% x Top 25 relationships totaled $722 million, or 4.2% of total loans x SNCs outstanding of $367 million, or 2.1% of total loans x Project lending limit of $32 million x Conservative relationship lending limits driven by risk grades C&I Commercial Construction CRE Other Consumer Home Equity Residential Construction $2.5 $3.1 $1.5 Commercial & Industrial Owner Occupied CRE Equipment Financing $ in billions
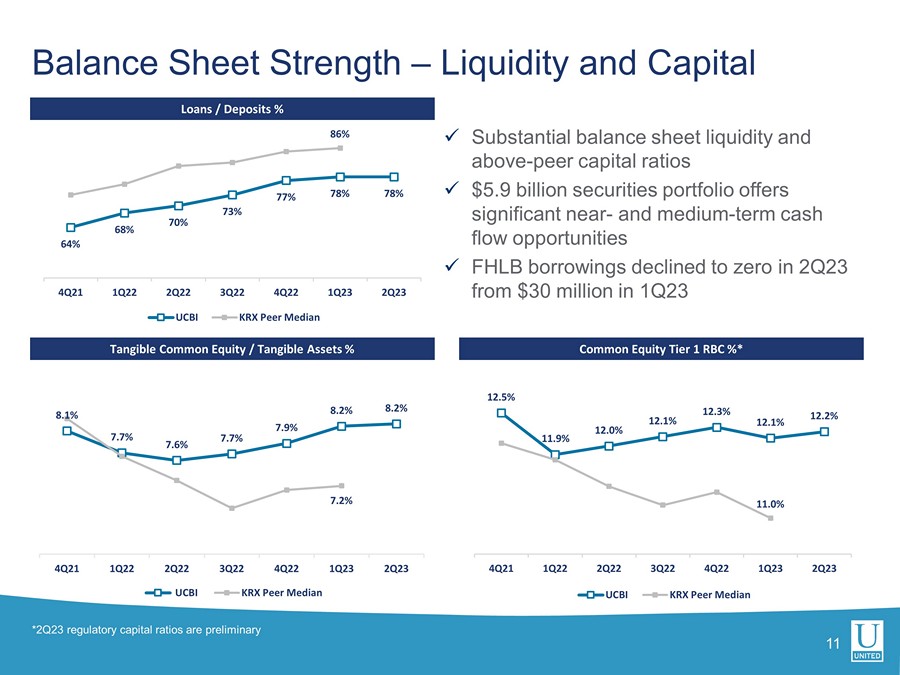
x Substantial balance sheet liquidity and above - peer capital ratios x $5.9 billion securities portfolio offers significant near - and medium - term cash flow opportunities x FHLB borrowings declined to zero in 2Q23 from $30 million in 1Q23 8.1% 7.7% 7.6% 7.7% 7.9% 8.2% 8.2% 7.2% 4Q21 1Q22 2Q22 3Q22 4Q22 1Q23 2Q23 UCBI KRX Peer Median 11 Loans / Deposits % Tangible Common Equity / Tangible Assets % Common Equity Tier 1 RBC %* 64% 68% 70% 73% 77% 78% 78% 86% 4Q21 1Q22 2Q22 3Q22 4Q22 1Q23 2Q23 UCBI KRX Peer Median 12.5% 11.9% 12.0% 12.1% 12.3% 12.1% 12.2% 11.0% 4Q21 1Q22 2Q22 3Q22 4Q22 1Q23 2Q23 UCBI KRX Peer Median Balance Sheet Strength – Liquidity and Capital *2Q23 regulatory capital ratios are preliminary
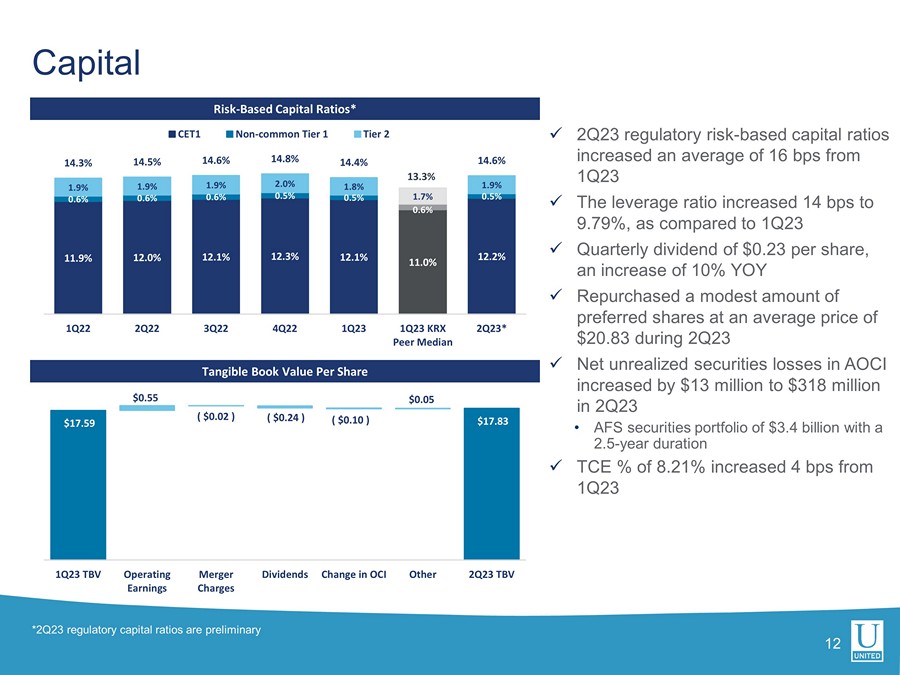
1 2 Risk - Based Capital Ratios* Tangible Book Value Per Share x 2Q23 regulatory risk - based capital ratios increased an average of 16 bps from 1Q23 x The leverage ratio increased 14 bps to 9.79%, as compared to 1Q23 x Quarterly dividend of $0.23 per share, an increase of 10% YOY x Repurchased a modest amount of preferred shares at an average price of $20.83 during 2Q23 x Net unrealized securities losses in AOCI increased by $13 million to $318 million in 2Q23 • AFS securities portfolio of $3.4 billion with a 2.5 - year duration x TCE % of 8.21% increased 4 bps from 1Q23 11.9% 12.0% 12.1% 12.3% 12.1% 11.0% 12.2% 0.6% 0.6% 0.6% 0.5% 0.5% 0.6% 0.5% 1.9% 1.9% 1.9% 2.0% 1.8% 1.7% 1.9% 14.3% 14.5% 14.6% 14.8% 14.4% 13.3% 14.6% 1Q22 2Q22 3Q22 4Q22 1Q23 1Q23 KRX Peer Median 2Q23* CET1 Non-common Tier 1 Tier 2 Total Capital *2Q23 regulatory capital ratios are preliminary $17.83 $17.59 $0.55 ( $0.02 ) ( $0.24 ) ( $0.10 ) $0.05 1Q23 TBV Operating Earnings Merger Charges Dividends Change in OCI Other 2Q23 TBV
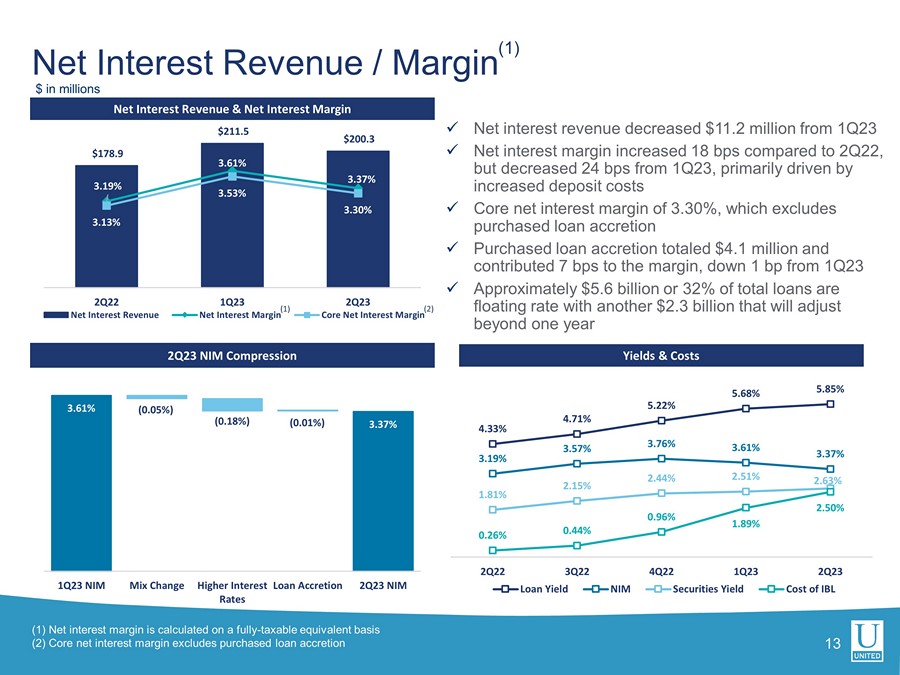
3.37% 3.61% ( 0.05% ) ( 0.18% ) ( 0.01% ) 1Q23 NIM Mix Change Higher Interest Rates Loan Accretion 2Q23 NIM 13 Net Interest Revenue & Net Interest Margin 2Q23 NIM Compression x Net interest revenue decreased $11.2 million from 1Q23 x Net interest margin increased 18 bps compared to 2Q22, but decreased 24 bps from 1Q23, primarily driven by increased deposit costs x Core net interest margin of 3.30%, which excludes purchased loan accretion x Purchased loan accretion totaled $4.1 million and contributed 7 bps to the margin, down 1 bp from 1Q23 x Approximately $5.6 billion or 32% of total loans are floating rate with another $2.3 billion that will adjust beyond one year Net Interest Revenue / Margin (1) Yields & Costs $ in millions 4.33% 4.71% 5.22% 5.68% 5.85% 3.19% 3.57% 3.76% 3.61% 3.37% 1.81% 2.15% 2.44% 2.51% 2.63% 0.26% 0.44% 0.96% 1.89% 2.50% 2Q22 3Q22 4Q22 1Q23 2Q23 Loan Yield NIM Securities Yield Cost of IBL (1) Net interest margin is calculated on a fully - taxable equivalent basis (2) Core net interest margin excludes purchased loan accretion (2) (1) $178.9 $211.5 $200.3 3.19% 3.61% 3.37% 3.13% 3.53% 3.30% $- $50.0 $100.0 $150.0 $200.0 2.00% 2.50% 3.00% 3.50% 4.00% 2Q22 1Q23 2Q23 Net Interest Revenue Net Interest Margin Core Net Interest Margin
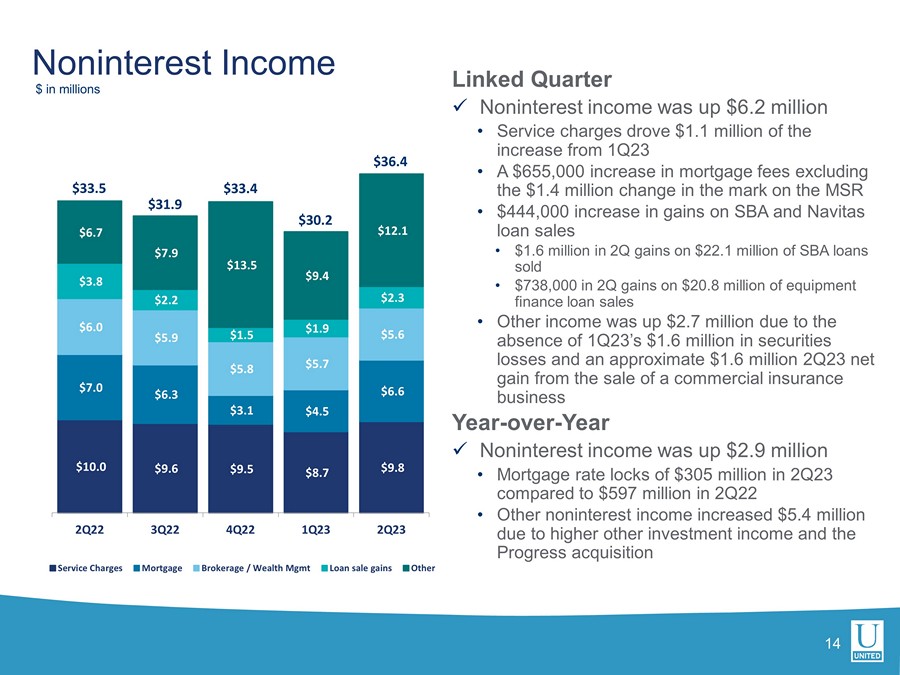
Noninterest Income $ in millions $10.0 $9.6 $9.5 $8.7 $9.8 $7.0 $6.3 $3.1 $4.5 $6.6 $6.0 $5.9 $5.8 $5.7 $5.6 $3.8 $2.2 $1.5 $1.9 $2.3 $6.7 $7.9 $13.5 $9.4 $12.1 2Q22 3Q22 4Q22 1Q23 2Q23 Service Charges Mortgage Brokerage / Wealth Mgmt Loan sale gains Other $36.4 $33.4 $30.2 Linked Quarter x Noninterest income was up $6.2 million • Service charges drove $1.1 million of the increase from 1Q23 • A $655,000 increase in mortgage fees excluding the $1.4 million change in the mark on the MSR • $444,000 increase in gains on SBA and Navitas loan sales • $1.6 million in 2Q gains on $22.1 million of SBA loans sold • $738,000 in 2Q gains on $20.8 million of equipment finance loan sales • Other income was up $2.7 million due to the absence of 1Q23’s $1.6 million in securities losses and an approximate $1.6 million 2Q23 net gain from the sale of a commercial insurance business Year - over - Year x Noninterest income was up $2.9 million • Mortgage rate locks of $305 million in 2Q23 compared to $597 million in 2Q22 • Other noninterest income increased $5.4 million due to higher other investment income and the Progress acquisition 14 $31.9 $33.5
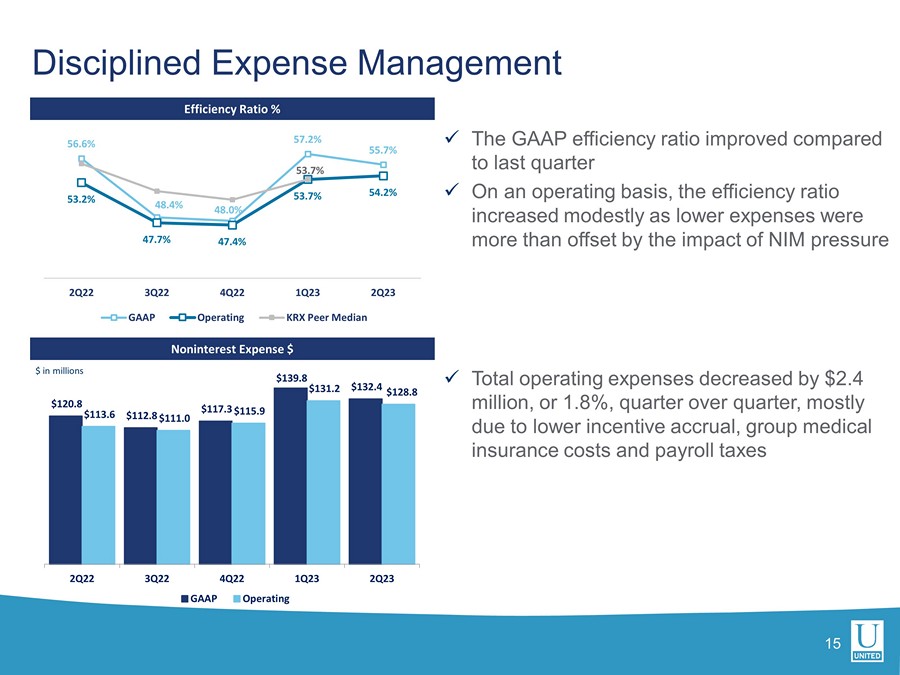
$120.8 $112.8 $117.3 $139.8 $132.4 $113.6 $111.0 $115.9 $131.2 $128.8 2Q22 3Q22 4Q22 1Q23 2Q23 GAAP Operating Disciplined Expense Management $ in millions x The GAAP efficiency ratio improved compared to last quarter x On an operating basis, the efficiency ratio increased modestly as lower expenses were more than offset by the impact of NIM pressure 15 Efficiency Ratio % Noninterest Expense $ 56.6% 48.4% 48.0% 57.2% 55.7% 53.2% 47.7% 47.4% 53.7% 54.2% 53.7% 2Q22 3Q22 4Q22 1Q23 2Q23 GAAP Operating KRX Peer Median x Total operating expenses decreased by $2.4 million, or 1.8%, quarter over quarter, mostly due to lower incentive accrual, group medical insurance costs and payroll taxes
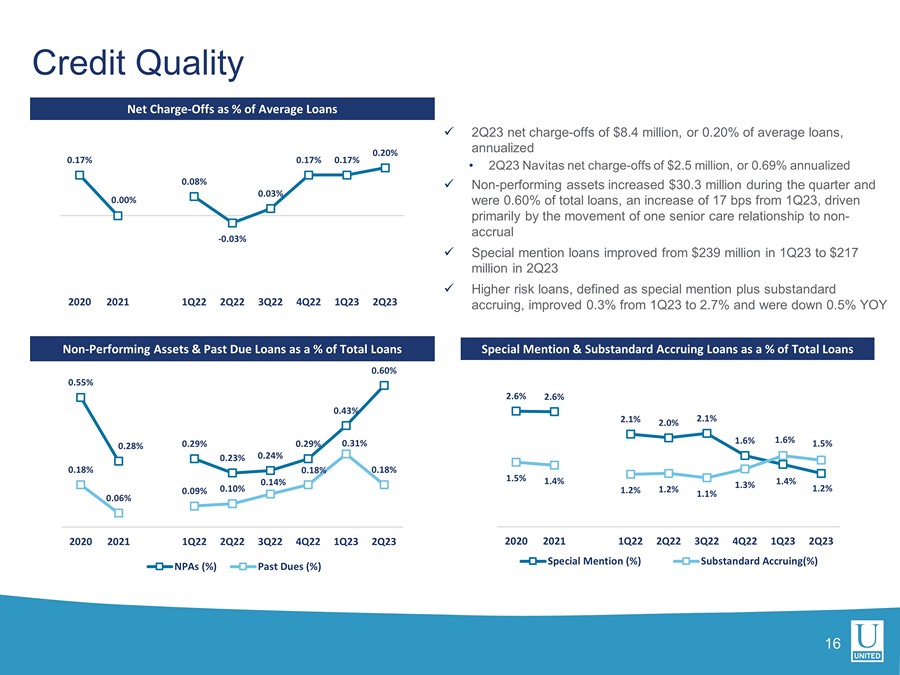
x 2Q23 net charge - offs of $8.4 million, or 0.20% of average loans, annualized • 2Q23 Navitas net charge - offs of $2.5 million, or 0.69% annualized x Non - performing assets increased $30.3 million during the quarter and were 0.60% of total loans, an increase of 17 bps from 1Q23, driven primarily by the movement of one senior care relationship to non - accrual x Special mention loans improved from $239 million in 1Q23 to $217 million in 2Q23 x Higher risk loans, defined as special mention plus substandard accruing, improved 0.3% from 1Q23 to 2.7% and were down 0.5% YOY Credit Quality Net Charge - Offs as % of Average Loans Non - Performing Assets & Past Due Loans as a % of Total Loans 16 0.55% 0.28% 0.29% 0.23% 0.24% 0.29% 0.43% 0.60% 0.18% 0.06% 0.09% 0.10% 0.14% 0.18% 0.31% 0.18% 2020 2021 1Q22 2Q22 3Q22 4Q22 1Q23 2Q23 NPAs (%) Past Dues (%) 2.6% 2.6% 2.1% 2.0% 2.1% 1.6% 1.4% 1.2% 1.5% 1.4% 1.2% 1.2% 1.1% 1.3% 1.6% 1.5% 2020 2021 1Q22 2Q22 3Q22 4Q22 1Q23 2Q23 Special Mention (%) Substandard Accruing(%) Special Mention & Substandard Accruing Loans as a % of Total Loans 0.17% 0.00% 0.08% - 0.03% 0.03% 0.17% 0.17% 0.20% 2020 2021 1Q22 2Q22 3Q22 4Q22 1Q23 2Q23
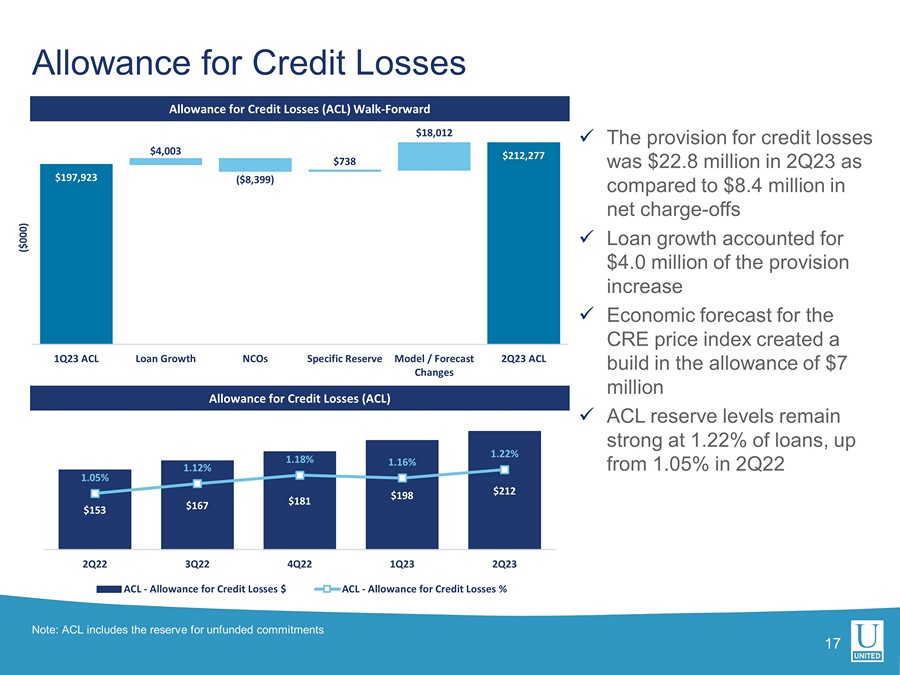
Allowance for Credit Losses Allowance for Credit Losses (ACL) Walk - Forward Allowance for Credit Losses (ACL) 17 Note: ACL includes the reserve for unfunded commitments x The provision for credit losses was $22.8 million in 2Q23 as compared to $8.4 million in net charge - offs x Loan growth accounted for $4.0 million of the provision increase x Economic forecast for the CRE price index created a build in the allowance of $7 million x ACL reserve levels remain strong at 1.22% of loans, up from 1.05% in 2Q22 $153 $167 $181 $198 $212 1.05% 1.12% 1.18% 1.16% 1.22% 0.65% 0.75% 0.85% 0.95% 1.05% 1.15% 1.25% 1.35% 1.45% 1.55% $30 $50 $70 $90 $110 $130 $150 $170 $190 $210 2Q22 3Q22 4Q22 1Q23 2Q23 ACL - Allowance for Credit Losses $ ACL - Allowance for Credit Losses % $197,923 $212,277 $4,003 ( $8,399 ) $738 $18,012 1Q23 ACL Loan Growth NCOs Specific Reserve Model / Forecast Changes 2Q23 ACL ($000)
Member FDIC. © 2023 United Community Bank | ucbi.com 2 Q23 INVESTOR PRESENTATION Exhibits
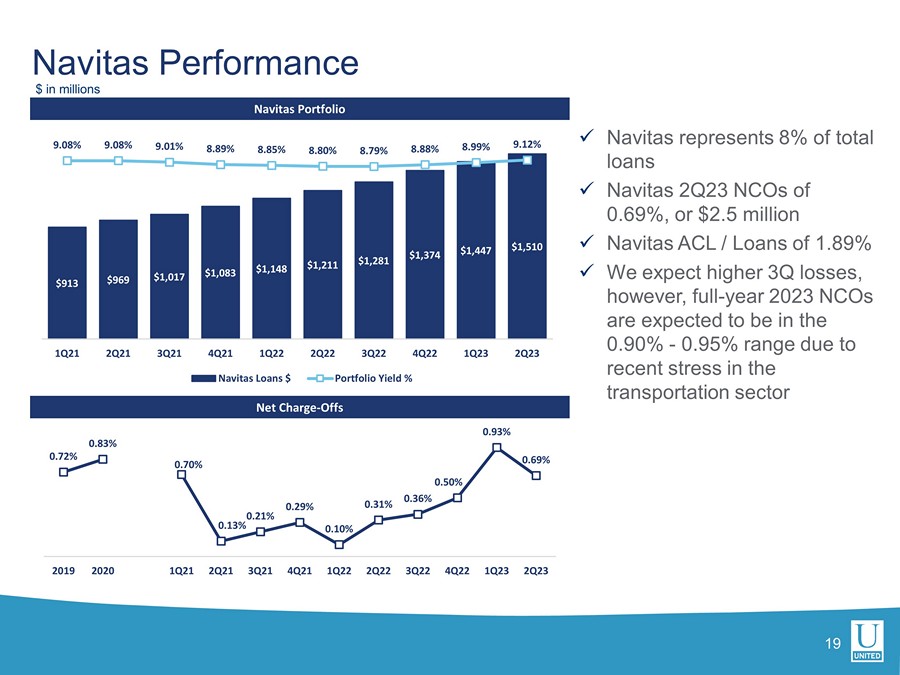
Navitas Portfolio Net Charge - Offs 19 x Navitas represents 8% of total loans x Navitas 2Q23 NCOs of 0.69%, or $2.5 million x Navitas ACL / Loans of 1.89% x We expect higher 3Q losses, however, full - year 2023 NCOs are expected to be in the 0.90% - 0.95% range due to recent stress in the transportation sector Navitas Performance $ in millions $913 $969 $1,017 $1,083 $1,148 $1,211 $1,281 $1,374 $1,447 $1,510 9.08% 9.08% 9.01% 8.89% 8.85% 8.80% 8.79% 8.88% 8.99% 9.12% 0.00% 1.00% 2.00% 3.00% 4.00% 5.00% 6.00% 7.00% 8.00% 9.00% 10.00% $0 $200 $400 $600 $800 $1,000 $1,200 $1,400 $1,600 1Q21 2Q21 3Q21 4Q21 1Q22 2Q22 3Q22 4Q22 1Q23 2Q23 Navitas Loans $ Portfolio Yield % 0.72% 0.83% 0.70% 0.13% 0.21% 0.29% 0.10% 0.31% 0.36% 0.50% 0.93% 0.69% 2019 2020 1Q21 2Q21 3Q21 4Q21 1Q22 2Q22 3Q22 4Q22 1Q23 2Q23

x Rate locks were $305 million compared to $335 million in 1Q23 x 22% of locked loans were variable rate mortgages in 2Q23, down from 27% in 1Q23 x Sold $131 million loans in 2Q23, up $52 million from $79 million sold in 1Q23 x Purchase / Refi mix shifted from 73% / 27% in 2Q22 to 86% / 14% in 2Q23 20 Mortgage Locks & Sales Mortgage Locks - Purchase vs. Refinance Mortgage Activity Shift to Saleable Production $597 $456 $364 $335 $305 $160 $93 $68 $79 $131 3.7% 3.1% 2.7% 2.9% 2.8% -0.5% 0.5% 1.5% 2.5% 3.5% 4.5% 5.5% $0 $100 $200 $300 $400 $500 $600 $700 2Q22 3Q22 4Q22 1Q23 2Q23 Mortgage locks $ Loans sold $ Gain on sale % 73% 71% 62% 87% 86% 27% 29% 38% 13% 14% 2Q22 3Q22 4Q22 1Q23 2Q23 Purchase Refinance $ in millions
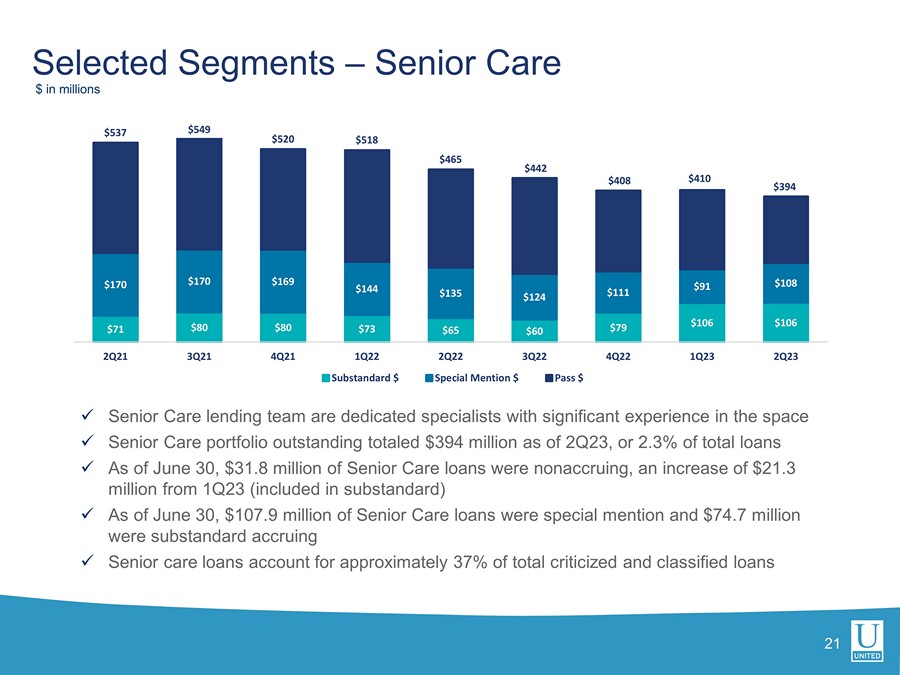
21 x Senior Care lending team are dedicated specialists with significant experience in the space x Senior Care portfolio outstanding totaled $394 million as of 2Q23, or 2.3% of total loans x As of June 30, $31.8 million of Senior Care loans were nonaccruing , an increase of $21.3 million from 1Q23 (included in substandard) x As of June 30, $107.9 million of Senior Care loans were special mention and $74.7 million were substandard accruing x Senior care loans account for approximately 37% of total criticized and classified loans 1% 20% 25% 49% 6% Selected Segments – Senior Care $ in millions $71 $80 $80 $73 $65 $60 $79 $106 $106 $170 $170 $169 $144 $135 $124 $111 $91 $108 $537 $549 $520 $518 $465 $442 $408 $410 $394 2Q21 3Q21 4Q21 1Q22 2Q22 3Q22 4Q22 1Q23 2Q23 Substandard $ Special Mention $ Pass $
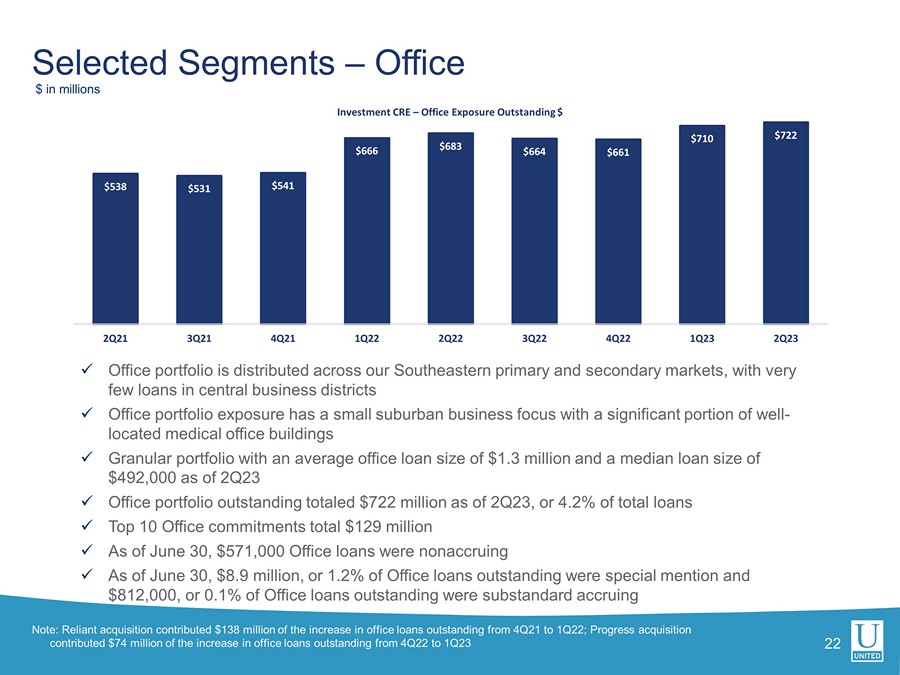
22 x Office portfolio is distributed across our Southeastern primary and secondary markets, with very few loans in central business districts x Office portfolio exposure has a small suburban business focus with a significant portion of well - located medical office buildings x Granular portfolio with an average office loan size of $1.3 million and a median loan size of $492,000 as of 2Q23 x Office portfolio outstanding totaled $722 million as of 2Q23, or 4.2% of total loans x Top 10 Office commitments total $129 million x As of June 30, $571,000 Office loans were nonaccruing x As of June 30, $8.9 million, or 1.2% of Office loans outstanding were special mention and $812,000, or 0.1% of Office loans outstanding were substandard accruing 1% 20% 25% 49% 6% Selected Segments – Office $ in millions $538 $531 $541 $666 $683 $664 $661 $710 $722 2Q21 3Q21 4Q21 1Q22 2Q22 3Q22 4Q22 1Q23 2Q23 Investment CRE – Office Exposure Outstanding $ Note: Reliant acquisition contributed $138 million of the increase in office loans outstanding from 4Q21 to 1Q22; Progress acquisition contributed $74 million of the increase in office loans outstanding from 4Q22 to 1Q23
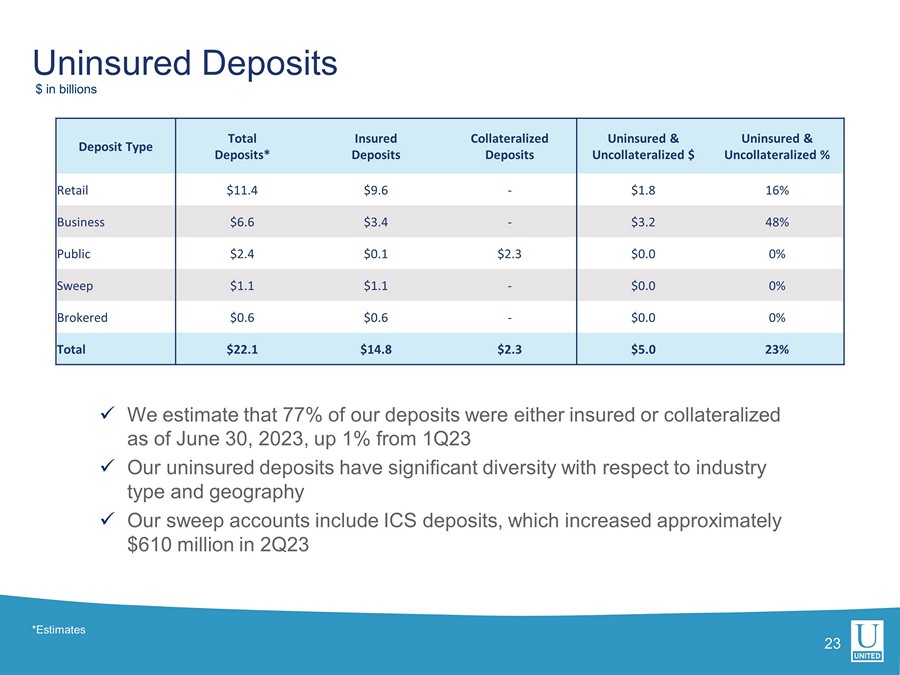
Uninsured Deposits 23 x We estimate that 77% of our deposits were either insured or collateralized as of June 30, 2023, up 1% from 1Q23 x Our uninsured deposits have significant diversity with respect to industry type and geography x Our sweep accounts include ICS deposits, which increased approximately $610 million in 2Q23 $ in billions Deposit Type Total Deposits* Insured Deposits Collateralized Deposits Uninsured & Uncollateralized $ Uninsured & Uncollateralized % Retail $11.4 $9.6 - $1.8 16% Business $6.6 $3.4 - $3.2 48% Public $2.4 $0.1 $2.3 $0.0 0% Sweep $1.1 $1.1 - $0.0 0% Brokered $0.6 $0.6 - $0.0 0% Total $22.1 $14.8 $2.3 $5.0 23% *Estimates
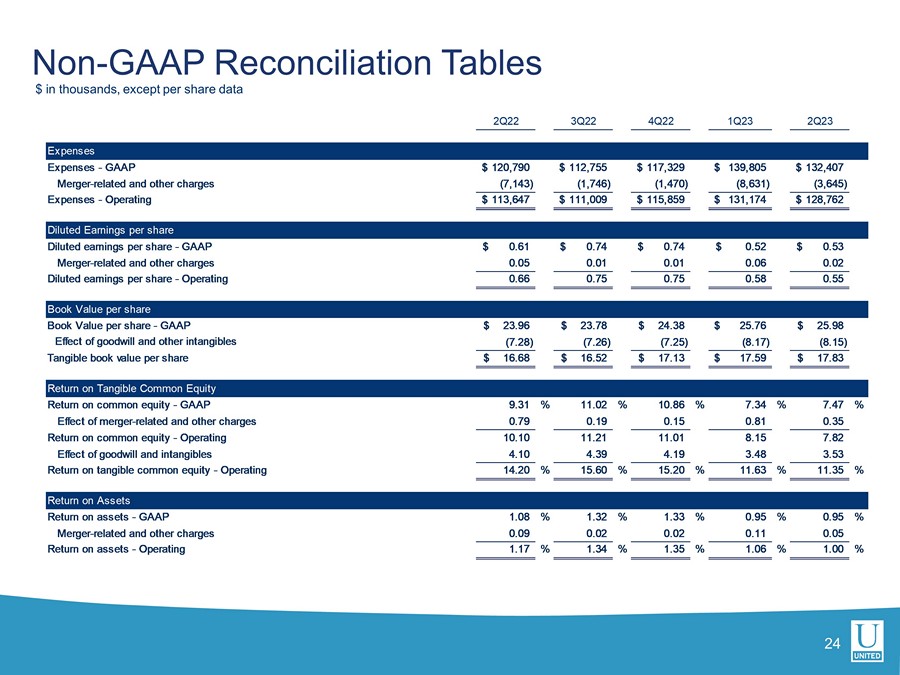
Non - GAAP Reconciliation Tables $ in thousands, except per share data 24 2Q22 3Q22 4Q22 1Q23 2Q23 Expenses Expenses - GAAP 120,790$ 112,755$ 117,329$ 139,805$ 132,407$ Merger-related and other charges (7,143) (1,746) (1,470) (8,631) (3,645) Expenses - Operating 113,647$ 111,009$ 115,859$ 131,174$ 128,762$ Diluted Earnings per share Diluted earnings per share - GAAP 0.61$ 0.74$ 0.74$ 0.52$ 0.53$ Merger-related and other charges 0.05 0.01 0.01 0.06 0.02 Diluted earnings per share - Operating 0.66 0.75 0.75 0.58 0.55 Book Value per share Book Value per share - GAAP 23.96$ 23.78$ 24.38$ 25.76$ 25.98$ Effect of goodwill and other intangibles (7.28) (7.26) (7.25) (8.17) (8.15) Tangible book value per share 16.68$ 16.52$ 17.13$ 17.59$ 17.83$ Return on Tangible Common Equity Return on common equity - GAAP 9.31 % 11.02 % 10.86 % 7.34 % 7.47 % Effect of merger-related and other charges 0.79 0.19 0.15 0.81 0.35 Return on common equity - Operating 10.10 11.21 11.01 8.15 7.82 Effect of goodwill and intangibles 4.10 4.39 4.19 3.48 3.53 Return on tangible common equity - Operating 14.20 % 15.60 % 15.20 % 11.63 % 11.35 % Return on Assets Return on assets - GAAP 1.08 % 1.32 % 1.33 % 0.95 % 0.95 % Merger-related and other charges 0.09 0.02 0.02 0.11 0.05 Return on assets - Operating 1.17 % 1.34 % 1.35 % 1.06 % 1.00 %

Non - GAAP Reconciliation Tables $ in thousands, except per share data 25 2Q22 3Q22 4Q22 1Q23 2Q23 Return on Assets to return on assets- pre-tax pre-provision Return on assets - GAAP 1.08 % 1.32 % 1.33 % 0.95 % 0.95 % Income tax expense 0.32 0.37 0.41 0.29 0.29 (Release of) provision for credit losses 0.09 0.25 0.33 0.34 0.35 Return on assets - pre-tax, pre-provision 1.49 1.94 2.07 1.58 1.59 Merger-related and other charges 0.11 0.03 0.02 0.13 0.06 Return on assets - pre-tax, pre-provision, excluding merger-related and other charges 1.60 % 1.97 % 2.09 % 1.71 % 1.65 % Efficiency Ratio Efficiency Ratio - GAAP 56.58 % 48.41 % 47.95 % 57.20 % 55.71 % Merger-related and other charges (3.35) (0.75) (0.60) (3.53) (1.54) Efficiency Ratio - Operating, excluding PPP fees and MSR marks 53.23 % 47.66 % 47.35 % 53.67 % 54.17 % Tangible common equity to tangible assets Equity to assets ratio - GAAP 10.95 % 11.12 % 11.25 % 11.90 % 11.89 % Effect of goodwill and other intangibles (2.96) (3.01) (2.97) (3.36) (3.31) Effect of preferred equity (0.40) (0.41) (0.40) (0.37) (0.37) Tangible common equity to tangible assets ratio 7.59 % 7.70 % 7.88 % 8.17 % 8.21 %
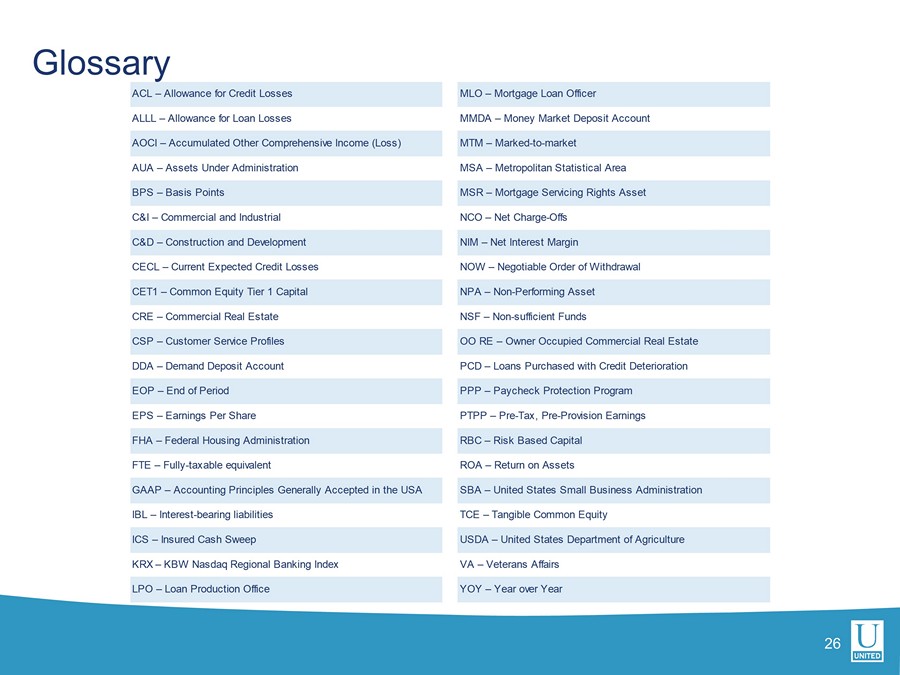
Glossary 26 ACL – Allowance for Credit Losses MLO – Mortgage Loan Officer ALLL – Allowance for Loan Losses MMDA – Money Market Deposit Account AOCI – Accumulated Other Comprehensive Income (Loss) MTM – Marked-to-market AUA – Assets Under Administration MSA – Metropolitan Statistical Area BPS – Basis Points MSR – Mortgage Servicing Rights Asset C&I – Commercial and Industrial NCO – Net Charge-Offs C&D – Construction and Development NIM – Net Interest Margin CECL – Current Expected Credit Losses NOW – Negotiable Order of Withdrawal CET1 – Common Equity Tier 1 Capital NPA – Non-Performing Asset CRE – Commercial Real Estate NSF – Non-sufficient Funds CSP – Customer Service Profiles OO RE – Owner Occupied Commercial Real Estate DDA – Demand Deposit Account PCD – Loans Purchased with Credit Deterioration EOP – End of Period PPP – Paycheck Protection Program EPS – Earnings Per Share PTPP – Pre-Tax, Pre-Provision Earnings FHA – Federal Housing Administration RBC – Risk Based Capital FTE – Fully-taxable equivalent ROA – Return on Assets GAAP – Accounting Principles Generally Accepted in the USA SBA – United States Small Business Administration IBL – Interest-bearing liabilities TCE – Tangible Common Equity ICS – Insured Cash Sweep USDA – United States Department of Agriculture KRX – KBW Nasdaq Regional Banking Index VA – Veterans Affairs LPO – Loan Production Office YOY – Year over Year