Exhibit 99.2
‹ � ����� 8QLWHG�&RPPXQLW\�%DQN��_�� XFEL�FRP 4Q24 Investor Presentation January 22, 2025
'LVFORVXUHV 2 CAUTIONARY STATEMENT This Investor Presentation contains “forward - looking statements” within the meaning of Section 27 A of the Securities Act of 1933 , as amended, and Section 21 E of the Securities Exchange Act of 1934 , as amended . In general, forward - looking statements usually may be identified through use of words such as “may,” “believe,” “expect,” “anticipate,” “intend,” “will,” “should,” “plan,” “estimate,” “predict,” “continue” and “potential,” or the negative of these terms or other comparable terminology, and include statements related to the expected benefits of the acquisition of ANB Holdings, Inc . (“ANB”) . Forward - looking statements are not historical facts and represent management’s beliefs, based upon information available at the time the statements are made, with regard to the matters addressed; they are not guarantees of future performance . Actual results may prove to be materially different from the results expressed or implied by the forward - looking statements . Forward - looking statements are subject to numerous assumptions, risks and uncertainties that change over time and could cause actual results or financial condition to differ materially from those expressed in or implied by such statements . Factors that could cause or contribute to such differences include, but are not limited to ( 1 ) the risk that the cost savings and any revenue synergies from the ANB acquisition may not be realized or take longer than anticipated to be realized, ( 2 ) disruption from the ANB acquisition of customer, supplier, employee or other business partner relationships, ( 3 ) the possibility that the costs, fees, expenses and charges related to the ANB acquisition may be greater than anticipated, ( 4 ) reputational risk and the reaction of each of the companies’ customers, suppliers, employees or other business partners to the ANB acquisition, ( 5 ) the failure of the ANB acquisition to close or any unexpected delay in closing the ANB acquisition, ( 6 ) the risks relating to the integration of ANB’s operations into the operations of United, including the risk that such integration will be materially delayed or will be more costly or difficult than expected, ( 7 ) the risks associated with United’s pursuit of future acquisitions, ( 8 ) the risk associated with expansion into new geographic or product markets, ( 9 ) the dilution caused by United’s issuance of additional shares of its common stock in the ANB acquisition, and ( 10 ) general competitive, economic, political, regulatory and market conditions . Further information regarding additional factors which could affect the forward - looking statements contained in this press release can be found in the cautionary language included under the headings “Cautionary Note Regarding Forward - Looking Statements” and “Risk Factors” in United’s Annual Report on Form 10 - K for the year ended December 31 , 2023 , and other documents subsequently filed by United with the United States Securities and Exchange Commission (“SEC”) . Many of these factors are beyond United’s ability to control or predict . If one or more events related to these or other risks or uncertainties materialize, or if the underlying assumptions prove to be incorrect, actual results may differ materially from the forward - looking statements . Accordingly, shareholders and investors should not place undue reliance on any such forward - looking statements . Any forward - looking statement speaks only as of the date of this communication, and United undertakes no obligation to update or revise any forward - looking statements, whether as a result of new information, future events or otherwise, except as required by law . New risks and uncertainties may emerge from time to time, and it is not possible for United to predict their occurrence or how they will affect United . United qualifies all forward - looking statements by these cautionary statements . NON - GAAP MEASURES This Investor Presentation includes financial information determined by methods other than in accordance with generally accepted accounting principles (“GAAP”) . This financial information includes certain operating performance measures, which exclude merger - related and other charges that are not considered part of recurring operations, such as "noninterest income – operating", “ noninterest expense – operating,” “operating net income,” “pre - tax, pre - provision income,” “operating net income per diluted common share,” “operating earnings per share,” “tangible book value per common share,” “operating return on common equity,” “operating return on tangible common equity,” “operating return on assets,” “return on assets - pre - tax pre - provision - operating,” “return on assets - pre - tax, pre - provision,” “operating efficiency ratio,” and “tangible common equity to tangible assets . ” These non - GAAP measures are included because United believes they may provide useful supplemental information for evaluating United’s underlying performance trends . Further, United’s management uses these measures in managing and evaluating United’s business and intends to refer to them in discussions about United’s operations and performance . These measures should be viewed in addition to, and not as an alternative to or substitute for, measures determined in accordance with GAAP, and are not necessarily comparable to non - GAAP measures that may be presented by other companies . To the extent applicable, reconciliations of these non - GAAP measures to the most directly comparable measures as reported in accordance with GAAP are included with the accompanying financial statement tables .
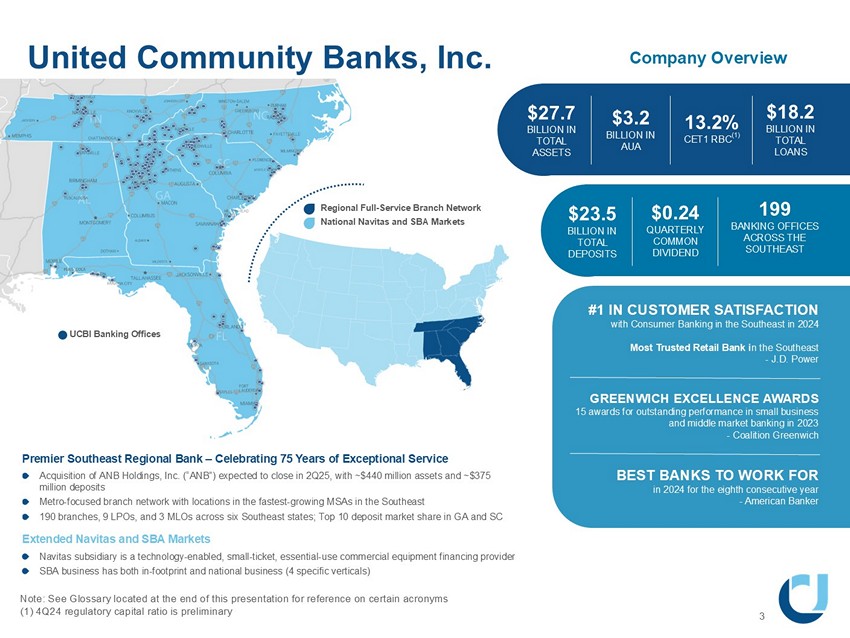
$27.7 BILLION IN TOTAL ASSETS United Community Banks, Inc. Note: See Glossary located at the end of this presentation for reference on certain acronyms (1) 4Q24 regulatory capital ratio is preliminary 3 8&%,�%DQNLQJ�2IILFHV���� Regional Full - Service Branch Network National Navitas and SBA Markets Company Overview $23.5 BILLION IN TOTAL DEPOSITS $3.2 BILLION IN AUA 13.2% CET1 RBC (1) $18.2 BILLION IN TOTAL LOANS $0.24 QUARTERLY COMMON DIVIDEND ��� %$1.,1*�2)),&(6� $&5266�7+(� 6287+($67 #1 IN CUSTOMER SATISFACTION with Consumer Banking in the Southeast in 2024 Most Trusted Retail Bank i n the Southeast - J.D. Power GREENWICH EXCELLENCE AWARDS 15 awards for outstanding performance in small business and middle market banking in 2023 - Coalition Greenwich BEST BANKS TO WORK FOR in 2024 for the eighth consecutive year - American Banker Premier Southeast Regional Bank – Celebrating 75 Years of Exceptional Service Acquisition of ANB Holdings, Inc. (“ANB”) expected to close in 2Q25, with ~$440 million assets and ~$375 million deposits Metro - focused branch network with locations in the fastest - growing MSAs in the Southeast 190 branches, 9 LPOs, and 3 MLOs across six Southeast states; Top 10 deposit market share in GA and SC Extended Navitas and SBA Markets Navitas subsidiary is a technology - enabled, small - ticket, essential - use commercial equipment financing provider SBA business has both in - footprint and national business (4 specific verticals)
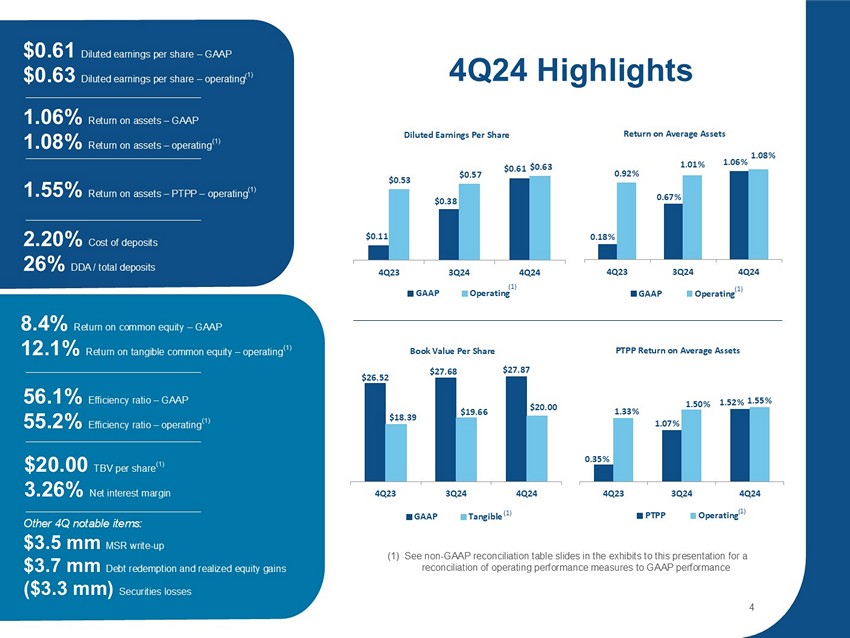
0.18% 0.67% 1.06% 0.92% 1.01% 1.08% 4Q23 3Q24 4Q24 ZĞƚƵƌŶ�ŽŶ��ǀĞƌĂŐĞ��ƐƐĞƚƐ GAAP Operating $0.11 $0.38 $0.61 $0.53 $0.57 $0.63 4Q23 3Q24 4Q24 Diluted Earnings Per Share GAAP Operating Ψ Ϯϲ͘ϱϮ $27.68 $27.87 $18.39 $19.66 $20.00 4Q23 3Q24 4Q24 Book Value Per Share GAAP Tangible 1.01% Return on assets – operating (1) � 4 ��� +LJKOLJKWV (1) See non - GAAP reconciliation table slides in the exhibits to this presentation for a reconciliation of operating performance measures to GAAP performance 0.35% 1.07% 1.52% 1.33% 1.50% 1.55% 4Q23 3Q24 4Q24 WdWW�ZĞƚƵƌŶ�ŽŶ��ǀĞƌĂŐĞ��ƐƐĞƚƐ PTPP Operating 4 (1) (1) (1) $0.61 Diluted earnings per share – GAAP $0.63 Diluted earnings per share – operating ( 1) 1.06% Return on assets – GAAP 1.08% Return on assets – operating (1) 1.55% Return on assets – PTPP – operating (1) ���� �� &RVW�RI�GHSRVLWV �� �� ''$���WRWDO�GHSRVLWV 8.4% Return on common equity – GAAP 12.1% Return on tangible common equity – operating (1) 56.1% Efficiency ratio – GAAP 55.2% Efficiency ratio – operating (1) $20.00 TBV per share (1) 3.26% Net interest margin Other 4Q notable items: $3.5 mm MSR write - up $3.7 mm Debt redemption and realized equity gains ($3.3 mm) Securities losses (1)
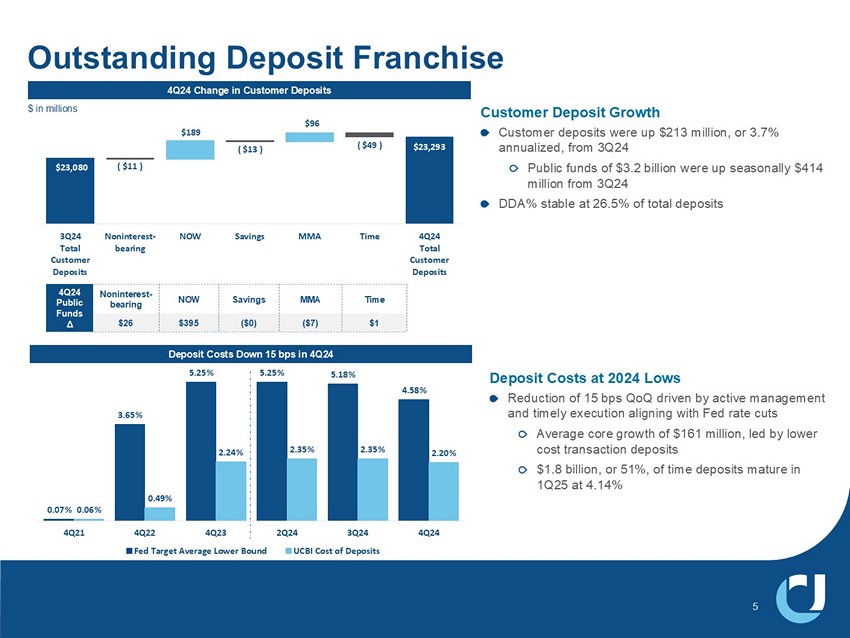
0.07% 3.65% 5.25% ϱ͘Ϯϱ й 5.18% 4.58% 0.06% 0.49% 2.24% 2.35% 2.35% Ϯ͘ϮϬ й 4Q21 4Q22 4Q23 2Q24 3Q24 4Q24 Fed Target Average Lower Bound UCBI Cost of Deposits Outstanding Deposit Franchise Deposit Costs Down 15 bps in 4Q24 5 Customer Deposit Growth Customer deposits were up $213 million, or 3.7% annualized, from 3Q24 Public funds of $3.2 billion were up seasonally $414 million from 3Q24 DDA% stable at 26.5% of total deposits 4Q24 Change in Customer Deposits $ 23,293 $23,080 ; � Ψ ϭϭ� Ϳ $189 ( $13 ) $96 ( $49 ) 3Q24 Total Customer Deposits Noninterest- bearing NOW Savings MMA Time 4Q24 Total Customer Deposits $ in millions Deposit Costs at 2024 Lows Reduction of 15 bps QoQ driven by active management and timely execution aligning with Fed rate cuts Average core growth of $161 million, led by lower cost transaction deposits $1.8 billion, or 51%, of time deposits mature in 1Q25 at 4.14% Time MMA Savings NOW Noninterest - bearing 4Q24 Public Funds Δ $1 ($7) ($0) $395 $26
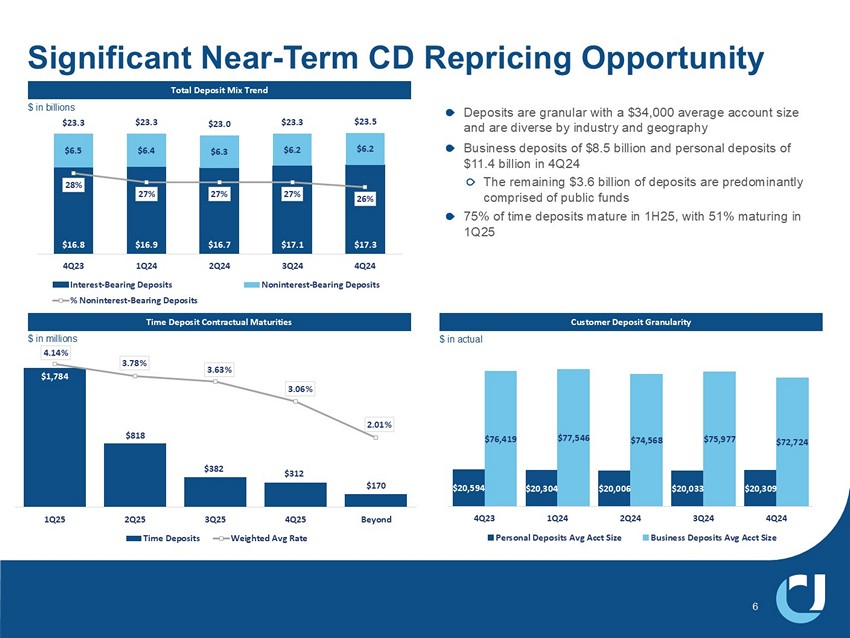
Significant Near - Term CD Repricing Opportunity Deposits are granular with a $34,000 average account size and are diverse by industry and geography Business deposits of $8.5 billion and personal deposits of $11.4 billion in 4Q24 The remaining $3.6 billion of deposits are predominantly comprised of public funds 75% of time deposits mature in 1H25, with 51% maturing in 1Q25 Time Deposit Contractual Maturities Customer Deposit Granularity $20,594 $20,304 $20,006 Ψ ϮϬ͕Ϭϯϯ $20,309 $76,419 $77,546 $74,568 $75,977 $72,724 4Q23 1Q24 2Q24 3Q24 4Q24 Personal Deposits Avg Acct Size Business Deposits Avg Acct Size $16.8 Ψ ϭϲ͘ϵ $16.7 $17.1 $17.3 $6.5 $6.4 $6.3 $6.2 Ψ ϲ͘Ϯ $23.3 $23.3 $23.0 $23.3 $23.5 28% 27% Ϯϳ й 27% 26% 4Q23 1Q24 2Q24 3Q24 4Q24 Interest-Bearing Deposits Noninterest-Bearing Deposits % Noninterest-Bearing Deposits 6 Total Deposit Mix Trend $ in billions $ in actual $ in millions Ψ ϭ͕ϳϴϰ $818 $382 $312 $170 4.14% 3.78% 3.63% ϯ͘Ϭϲ й 2.01% 1Q25 2Q25 3Q25 4Q25 Beyond Time Deposits Weighted Avg Rate
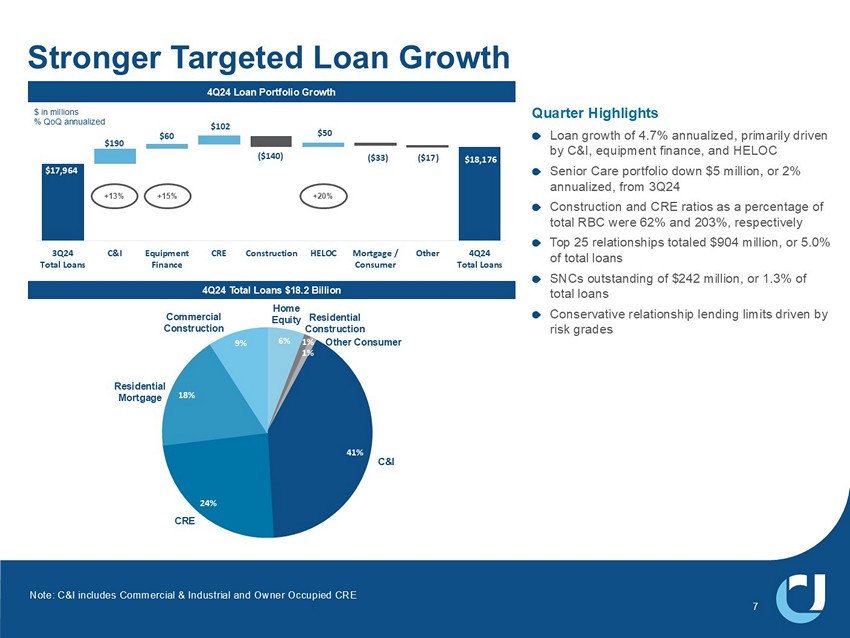
$18,176 Ψ ϭϳ͕ϵϲϰ $190 $60 $102 ( $140 ) $50 ( $33 ) ( $17 ) 3Q24 Total Loans C&I Equipment Finance CRE Construction HELOC Mortgage / Consumer Other 4Q24 Total Loans � 4 ��� /RDQ�3RUWIROLR�*URZWK Stronger Targeted Loan Growth Quarter Highlights Loan growth of 4.7% annualized, primarily driven by C&I, equipment finance, and HELOC Senior Care portfolio down $5 million, or 2% annualized, from 3Q24 Construction and CRE ratios as a percentage of total RBC were 62% and 203%, respectively Top 25 relationships totaled $904 million, or 5.0% of total loans SNCs outstanding of $242 million, or 1.3% of total loans Conservative relationship lending limits driven by risk grades 7 6% 1% 1% 41% Ϯϰ й 18% 9% 4Q24 Total Loans $18.2 Billion C&I Commercial Construction CRE Other Consumer 5HVLGHQWLDO� 0RUWJDJH Home Equity Residential Construction $ in millions % QoQ annualized Note: C&I includes Commercial & Industrial and Owner Occupied CRE +13% +15% +20%

ϳϵ й 79% 80% 78% 78% 91% 4Q23 1Q24 2Q24 3Q24 4Q24 United KRX Peer Median Substantial balance sheet liquidity and above - peer capital ratios $6.8 billion securities portfolio offers significant near - and medium - term cash flow opportunities Wholesale borrowings remained very low in 4Q24 0.7% of total deposits are brokered in 4Q24, compared to 3.0% for the KRX peer median 8.4% ϴ͘ϱ й 8.8% 8.9% 9.0% 8.2% 4Q23 1Q24 2Q24 3Q24 4Q24 United KRX Peer Median Loans / Core Deposits % Tangible Common Equity / Tangible Assets % Common Equity Tier 1 RBC %* ϭϮ͘Ϯ й 12.4% 12.8% 13.1% 13.2% 12.0% 4Q23 1Q24 2Q24 3Q24 4Q24 United KRX Peer Median Balance Sheet Strength – Liquidity and Capital 8 � 4 ��� UHJXODWRU\�FDSLWDO�UDWLR�LV�SUHOLPLQDU\
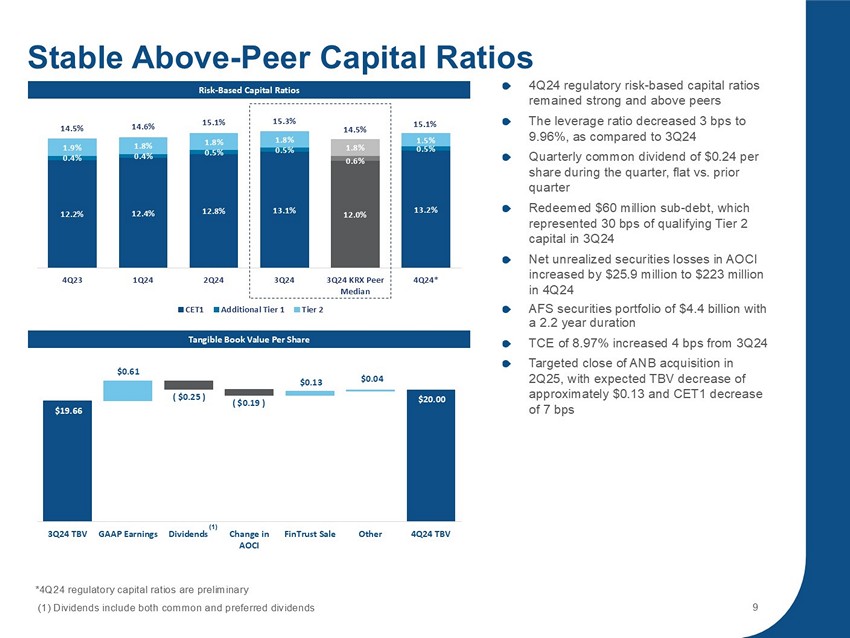
Risk - Based Capital Ratios Tangible Book Value Per Share 4Q24 regulatory risk - based capital ratios remained strong and above peers The leverage ratio decreased 3 bps to 9.96%, as compared to 3Q24 Quarterly common dividend of $0.24 per share during the quarter, flat vs. prior quarter Redeemed $60 million sub - debt, which represented 30 bps of qualifying Tier 2 capital in 3Q24 Net unrealized securities losses in AOCI increased by $25.9 million to $223 million in 4Q24 AFS securities portfolio of $4.4 billion with a 2.2 year duration TCE of 8.97% increased 4 bps from 3Q24 Targeted close of ANB acquisition in 2Q25, with expected TBV decrease of approximately $0.13 and CET1 decrease of 7 bps 12.2% 12.4% ϭϮ͘ϴ й 13.1% 12.0% 13.2% 0.4% 0.4% 0.5% 0.5% Ϭ͘ϲ й 0.5% 1.9% 1.8% 1.8% 1.8% 1.8% 1.5% ϭϰ͘ϱ й 14.6% 15.1% 15.3% 14.5% 15.1% 4Q23 1Q24 2Q24 3Q24 3Q24 KRX Peer Median 4Q24* CET1 Additional Tier 1 Tier 2 Stable Above - Peer Capital Ratios $20.00 � Ψ ϭϵ͘ϲϲ� $0.61 ( $0.25 ) ( $0.19 ) $0.13 $0.04 3Q24 TBV GAAP Earnings Dividends Change in AOCI FinTrust Sale Other 4Q24 TBV 9 *4Q24 regulatory capital ratios are preliminary � � �'LYLGHQGV�LQFOXGH�ERWK�FRPPRQ�DQG�SUHIHUUHG�GLYLGHQGV (1)
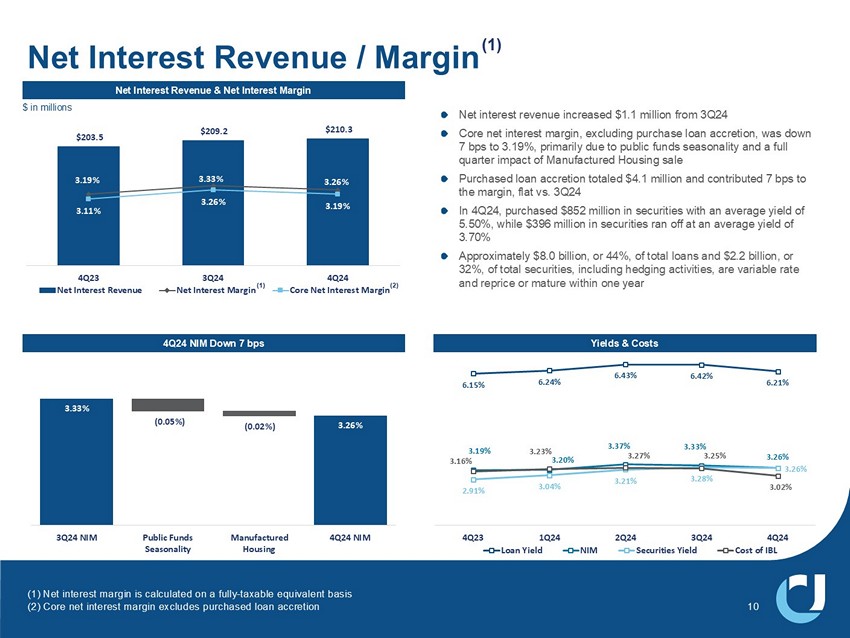
$203.5 $209.2 $210.3 ϯ͘ϭϵ й 3.33% 3.26% 3.11% 3.26% 3.19% $100.0 $120.0 $140.0 $160.0 $180.0 $200.0 2.00% 2.50% 3.00% 3.50% 4.00% 4Q23 3Q24 4Q24 Net Interest Revenue Net Interest Margin Core Net Interest Margin 3.26% 3.33% ; Ϭ͘Ϭϱ й Ϳ ( 0.02% ) 3Q24 NIM Public Funds Seasonality Manufactured Housing 4Q24 NIM Net Interest Revenue & Net Interest Margin 4Q24 NIM Down 7 bps Net interest revenue increased $1.1 million from 3Q24 Core net interest margin, excluding purchase loan accretion, was down 7 bps to 3.19%, primarily due to public funds seasonality and a full quarter impact of Manufactured Housing sale Purchased loan accretion totaled $4.1 million and contributed 7 bps to the margin, flat vs. 3Q24 In 4Q24, purchased $852 million in securities with an average yield of 5.50%, while $396 million in securities ran off at an average yield of 3.70% Approximately $8.0 billion , or 44%, of total loans and $2.2 billion, or 32%, of total securities, including hedging activities, are variable rate and reprice or mature within one year Net Interest Revenue / Margin (1) Yields & Costs ϲ͘ϭϱ й 6.24% 6.43% 6.42% 6.21% 3.19% 3.20% 3.37% ϯ͘ϯϯ й 3.26% 2.91% 3.04% 3.21% 3.28% 3.26% 3.16% ϯ͘Ϯϯ й 3.27% 3.25% 3.02% 4Q23 1Q24 2Q24 3Q24 4Q24 Loan Yield NIM Securities Yield Cost of IBL (1) Net interest margin is calculated on a fully - taxable equivalent basis (2) Core net interest margin excludes purchased loan accretion (2) (1) 10 ��LQ�PLOOLRQV
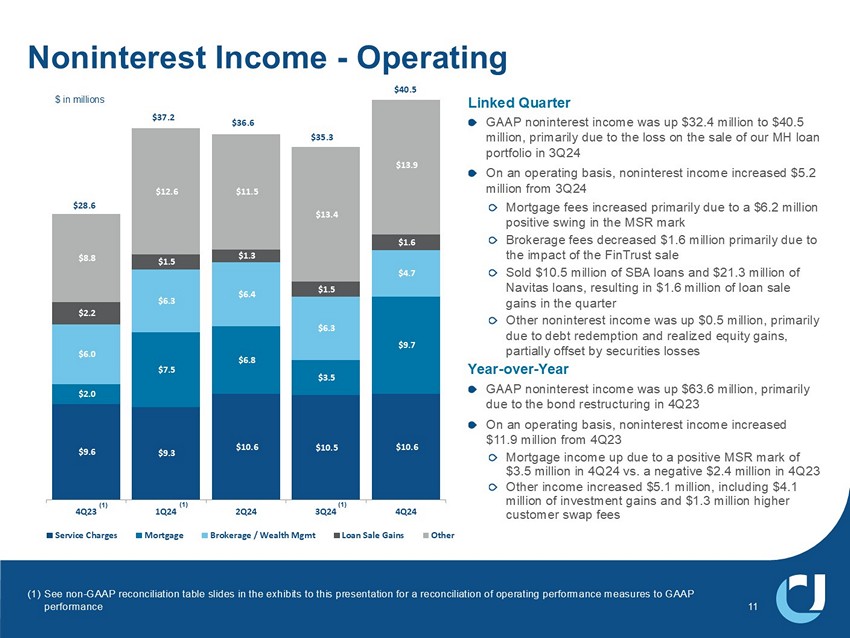
$9.6 $9.3 $10.6 $10.5 $10.6 $2.0 $7.5 � Ψ ϲ͘ϴ� $3.5 $9.7 $6.0 $6.3 $6.4 $6.3 $4.7 � Ψ Ϯ͘Ϯ� $1.5 $1.3 $1.5 $1.6 $8.8 $12.6 $11.5 � Ψ ϭϯ͘ϰ� $13.9 4Q23 1Q24 2Q24 3Q24 4Q24 Service Charges Mortgage Brokerage / Wealth Mgmt Loan Sale Gains Other $37.2 $36.6 Linked Quarter GAAP noninterest income was up $32.4 million to $40.5 million, primarily due to the loss on the sale of our MH loan portfolio in 3Q24 On an operating basis, noninterest income increased $5.2 million from 3Q24 Mortgage fees increased primarily due to a $6.2 million positive swing in the MSR mark Brokerage fees decreased $1.6 million primarily due to the impact of the FinTrust sale Sold $10.5 million of SBA loans and $21.3 million of Navitas loans, resulting in $1.6 million of loan sale gains in the quarter Other noninterest income was up $0.5 million, primarily due to debt redemption and realized equity gains, partially offset by securities losses Year - over - Year GAAP noninterest income was up $63.6 million, primarily due to the bond restructuring in 4Q23 On an operating basis, noninterest income increased $11.9 million from 4Q23 Mortgage income up due to a positive MSR mark of $3.5 million in 4Q24 vs. a negative $2.4 million in 4Q23 Other income increased $5.1 million, including $4.1 million of investment gains and $1.3 million higher customer swap fees $28.6 $35.3 11 1RQLQWHUHVW�,QFRPH� � � 2SHUDWLQJ (1) See non - GAAP reconciliation table slides in the exhibits to this presentation for a reconciliation of operating performance meas ures to GAAP performance $40.5 $ in millions (1) (1) (1)
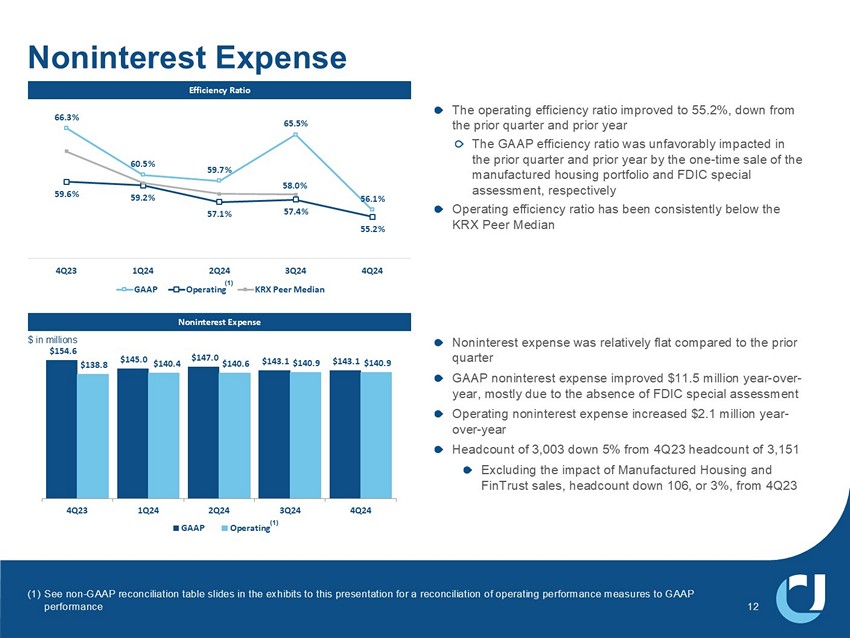
� Ψ ϭϱϰ͘ϲ� $145.0 $147.0 $143.1 $143.1 $138.8 $140.4 $140.6 � Ψ ϭϰϬ͘ϵ� $140.9 4Q23 1Q24 2Q24 3Q24 4Q24 GAAP Operating Noninterest Expense The operating efficiency ratio improved to 55.2%, down from the prior quarter and prior year The GAAP efficiency ratio was unfavorably impacted in the prior quarter and prior year by the one - time sale of the manufactured housing portfolio and FDIC special assessment, respectively Operating efficiency ratio has been consistently below the KRX Peer Median Efficiency Ratio Noninterest Expense 66.3% 60.5% ϱϵ͘ϳ й 65.5% 56.1% 59.6% 59.2% 57.1% 57.4% 55.2% ϱϴ͘Ϭ й 4Q23 1Q24 2Q24 3Q24 4Q24 GAAP Operating KRX Peer Median Noninterest expense was relatively flat compared to the prior quarter GAAP noninterest expense improved $11.5 million year - over - year, mostly due to the absence of FDIC special assessment Operating noninterest expense increased $2.1 million year - over - year Headcount of 3,003 down 5% from 4Q23 headcount of 3,151 Excluding the impact of Manufactured Housing and FinTrust sales, headcount down 106, or 3%, from 4Q23 12 (1) See non - GAAP reconciliation table slides in the exhibits to this presentation for a reconciliation of operating performance meas ures to GAAP performance (1) $ in millions (1)

4Q24 net charge - offs of $9.5 million, or 0.21% of loans annualized Navitas losses contributed 0.13% of the 0.21% Bank net charge - offs, excluding Navitas, were 0.08%; down $3.1 million from 3Q24 when excluding Manufactured Housing charge - offs Nonperforming assets increased $0.7 million during the quarter and were 0.64% of total loans, flat from 3Q24 Past due loans improved $2.3 million during the quarter and were 0.17% of total loans, a decrease of 2 bps from 3Q24 Higher risk loans, defined as special mention plus substandard accruing, increased 0.2% from 3Q24 to 3.2% Credit Quality Net Charge - Offs as % of Average Loans EŽŶƉĞƌĨŽƌŵŝŶŐ��ƐƐĞƚƐ�Θ�WĂƐƚ��ƵĞ�>ŽĂŶƐ�ĂƐ�Ă�й�ŽĨ�dŽƚĂů�>ŽĂŶƐ 0.55% 0.29% 0.43% 0.60% 0.50% 0.51% 0.58% Ϭ͘ϲϰ й 0.64% 0.64% 0.18% 0.06% 0.18% 0.31% 0.18% Ϭ͘Ϯϭ й 0.29% 0.28% 0.26% 0.19% 0.17% 2020 2021 2022 1Q23 2Q23 3Q23 4Q23 1Q24 2Q24 3Q24 4Q24 NPAs (%) Past Dues (%) 2.6% 2.6% ϭ͘ϲ й 1.4% 1.2% 1.4% 1.1% 1.6% 1.3% 1.3% ϭ͘ϰ й 1.5% 1.4% 1.3% 1.6% 1.5% 1.5% 1.6% ϭ͘ϯ й 1.5% 1.7% 1.8% 2020 2021 2022 1Q23 2Q23 3Q23 4Q23 1Q24 2Q24 3Q24 4Q24 Special Mention (%) Substandard Accruing (%) Special Mention & Substandard Accruing Loans as a % of Total Loans 13 0.17% 0.00% Ϭ͘Ϭϳ й 0.17% 0.20% 0.59% 0.22% 0.28% 0.26% 0.52% Ϭ͘Ϯϭ й 0.12% - 0.03% 0.04% 0.10% 0.15% 0.49% 0.05% Ϭ͘ϭϲ й 0.15% 0.45% 0.08% 2020 2021 2022 1Q23 2Q23 3Q23 4Q23 1Q24 2Q24 3Q24 4Q24 United United Excl. Navitas 0.28%

$OORZDQFH�IRU�&UHGLW�/RVVHV Allowance for Credit Losses (ACL) Walk - Forward Allowance for Credit Losses (ACL) Note: ACL includes the reserve for unfunded commitments Provision of $11.4 million covers charge - offs and loan growth for the quarter and the Allowance remains stable at 1.20% of the portfolio $27 million in total hurricane - related deferrals, $18 million of which were in the nine - county area covered by our $9.9 million special provision In the nine - county covered area, we have $13 million in total reserves, including the $9.9 million special reserve set aside last quarter We believe the $13 million in reserves is sufficient to cover expected losses $224 $224 $225 Ψ Ϯϭϲ $217 1.22% 1.22% 1.23% 1.20% 1.20% 0.65% 0.75% 0.85% 0.95% 1.05% 1.15% 1.25% 1.35% 1.45% 1.55% $30 $50 $70 $90 $110 $130 $150 $170 $190 $210 4Q23 1Q24 2Q24 3Q24 4Q24 ACL - Allowance for Credit Losses $ ACL - Allowance for Credit Losses / Loans % $215,517 Ψ Ϯϭϳ͕ϯϴϵ $ 3,279 $ 164 ($ 9,517 ) ($ 336 ) $ 8,282 3Q24 ACL Loan Growth/ Mix Changes Unfunded Commitments NCOs Specific Reserve Model Impact/ NCO Re-fill 4Q24 ACL 14 $ in millions ��LQ�WKRXVDQGV
4Q24 INVESTOR PRESENTATION Exhibits
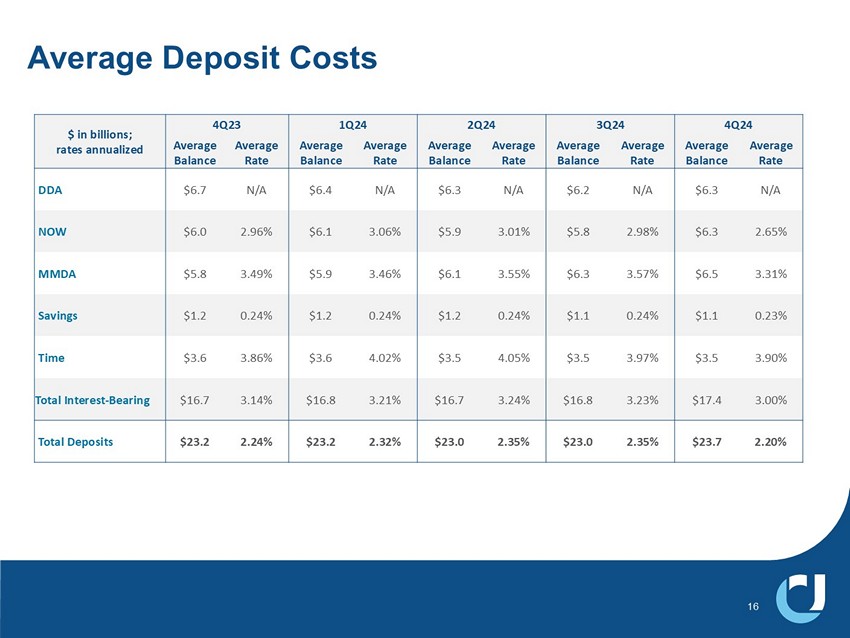
Average Deposit Costs 16 4Q24 3Q24 2Q24 1Q24 4Q23 $ in billions; rates annualized Average Rate Average Balance Average Rate Average Balance Average Rate Average Balance Average Rate Average Balance Average Rate Average Balance N/A $6.3 N/A $6.2 N/A $6.3 N/A $6.4 N/A $6.7 DDA 2.65% $6.3 2.98% $5.8 3.01% $5.9 3.06% $6.1 2.96% $6.0 NOW 3.31% $6.5 3.57% $6.3 3.55% $6.1 3.46% $5.9 3.49% $5.8 MMDA 0.23% $1.1 0.24% $1.1 0.24% $1.2 0.24% $1.2 0.24% $1.2 Savings 3.90% $3.5 3.97% $3.5 4.05% $3.5 4.02% $3.6 3.86% $3.6 Time 3.00% $17.4 3.23% $16.8 3.24% $16.7 3.21% $16.8 3.14% $16.7 Total Interest - Bearing 2.20% $23.7 2.35% $23.0 2.35% $23.0 2.32% $23.2 2.24% $23.2 Total Deposits
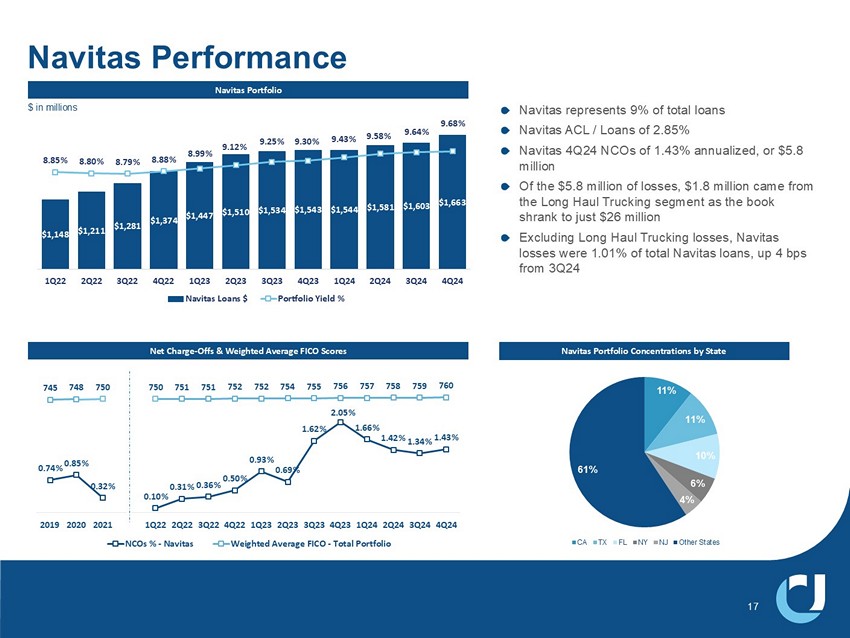
Navitas Portfolio Net Charge - Offs & Weighted Average FICO Scores 1DYLWDV�UHSUHVHQWV� � ��RI�WRWDO�ORDQV 1DYLWDV�$&/���/RDQV�RI� ���� � 1DYLWDV� � 4 ��� 1&2V�RI� ���� ��DQQXDOL]HG��RU�� ���� PLOOLRQ 2I�WKH�� ���� PLOOLRQ�RI�ORVVHV��� ���� PLOOLRQ�FDPH�IURP� WKH�/RQJ�+DXO�7UXFNLQJ�VHJPHQW�DV�WKH�ERRN� VKUDQN�WR�MXVW�� ��� PLOOLRQ ([FOXGLQJ�/RQJ�+DXO�7UXFNLQJ�ORVVHV��1DYLWDV� ORVVHV�ZHUH� ���� ��RI�WRWDO�1DYLWDV�ORDQV��XS� �� ESV� IURP� � 4 �� Navitas Performance $1,148 $1,211 $1,281 $1,374 $1,447 $1,510 Ψ ϭ͕ϱϯϰ $1,543 $1,544 $1,581 $1,603 $1,663 8.85% 8.80% ϴ͘ϳϵ й 8.88% 8.99% 9.12% 9.25% 9.30% 9.43% 9.58% ϵ͘ϲϰ й 9.68% 1Q22 2Q22 3Q22 4Q22 1Q23 2Q23 3Q23 4Q23 1Q24 2Q24 3Q24 4Q24 Navitas Loans $ Portfolio Yield % 17 0.74% 0.85% 0.32% 0.10% 0.31% Ϭ͘ϯϲ й 0.50% 0.93% 0.69% 1.62% 2.05% 1.66% 1.42% ϭ͘ϯϰ й 1.43% 745 748 750 750 751 751 ϳϱϮ 752 754 755 756 757 758 759 ϳϲϬ 2019 2020 2021 1Q22 2Q22 3Q22 4Q22 1Q23 2Q23 3Q23 4Q23 1Q24 2Q24 3Q24 4Q24 NCOs % - Navitas Weighted Average FICO - Total Portfolio $ in millions Navitas Portfolio Concentrations by State 11% 11% 10% 6% 4% �� � CA TX FL NY NJ Other States
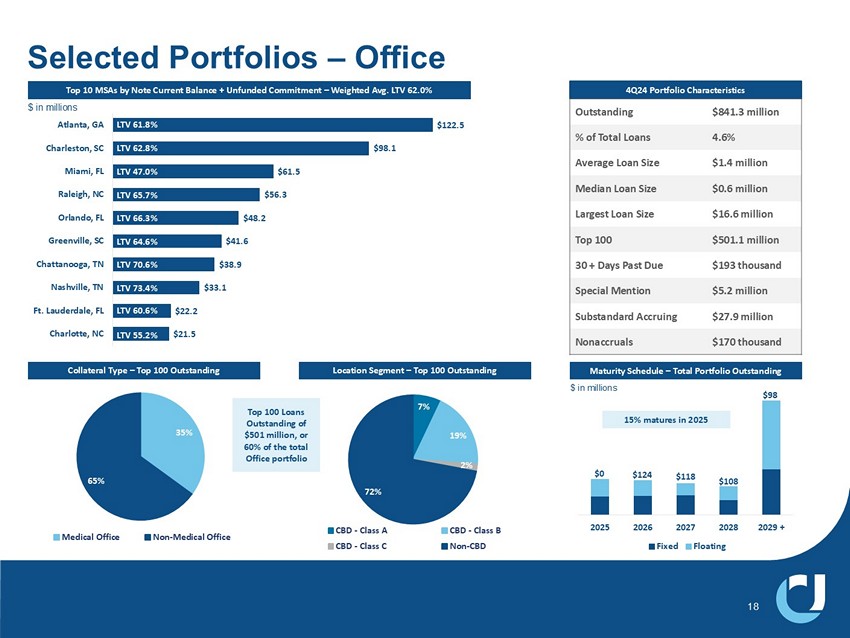
1% 20% 25% 49% 6% Selected Portfolios – Office 18 4Q24 Portfolio Characteristics Top 10 MSAs by Note Current Balance + Unfunded Commitment – Weighted Avg. LTV 62.0% $ in millions $ in millions $21.5 $22.2 $33.1 $38.9 $41.6 $48.2 $56.3 $61.5 $98.1 $122.5 Charlotte, NC Ft. Lauderdale, FL Nashville, TN Chattanooga, TN Greenville, SC Orlando, FL Raleigh, NC Miami, FL Charleston, SC Atlanta, GA LTV 61.8% LTV 62.8% LTV 47.0% LTV 65.7% LTV 66.3% LTV 64.6% LTV 70.6% LTV 73.4% LTV 55.2% Collateral Type – Top 100 Outstanding Location Segment – Top 100 Outstanding Maturity Schedule – Total Portfolio Outstanding $841.3 million �� KƵƚƐƚĂŶĚŝŶŐ 4.6% % of Total Loans $1.4 million Average Loan Size $0.6 million Median Loan Size $16.6 million Largest Loan Size $501.1 million Top 100 $193 thousand 30 + Days Past Due $5.2 million Special Mention $27.9 million Substandard Accruing $170 thousand Nonaccruals LTV 60.6% 35% 65% Medical Office Non-Medical Office 7% 19% 2% 72% CBD - Class A CBD - Class B CBD - Class C Non-CBD $0 $124 $118 $108 $98 2025 2026 2027 2028 2029 + Fixed Floating 15% matures in 2025 $ in millions Top 100 Loans Outstanding of $501 million, or 60% of the total Office portfolio
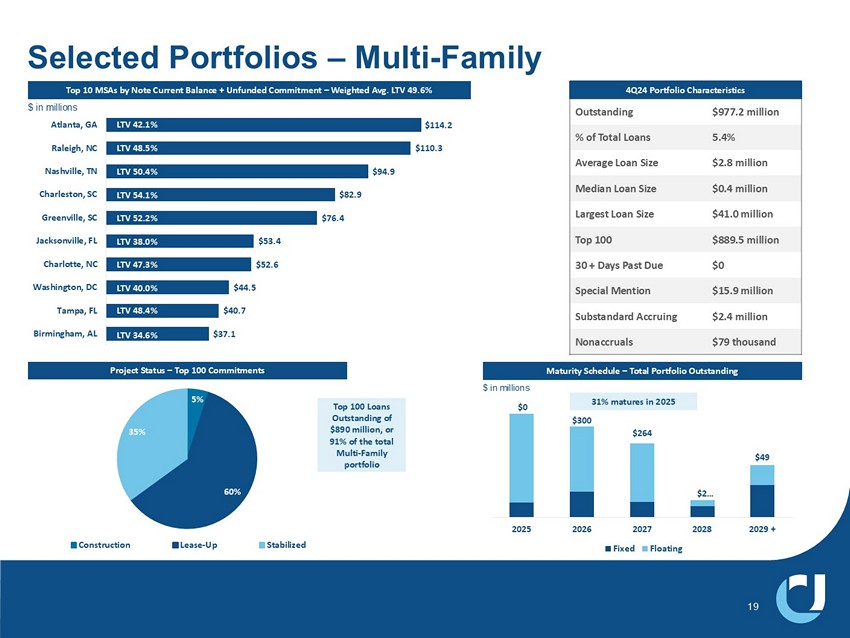
5% 60% 35% Construction Lease-Up Stabilized $37.1 $40.7 $44.5 $52.6 $53.4 $76.4 $82.9 $94.9 $110.3 $114.2 Birmingham, AL Tampa, FL Washington, DC Charlotte, NC Jacksonville, FL Greenville, SC Charleston, SC Nashville, TN Raleigh, NC Atlanta, GA 1% 20% 25% 49% 6% Selected Portfolios – Multi - Family 19 4Q24 Portfolio Characteristics $ in millions LTV 42.1% LTV 48.5% LTV 54.1% LTV 52.2% LTV 38.0% LTV 47.3% LTV 40.0% LTV 34.6% Project Status – Top 100 Commitments Maturity Schedule – Total Portfolio Outstanding $977.2 million Outstanding 5.4% % of Total Loans $2.8 million Average Loan Size $0.4 million Median Loan Size $41.0 million Largest Loan Size $889.5 million Top 100 $0 30 + Days Past Due $15.9 million Special Mention $2.4 million Substandard Accruing $79 thousand Nonaccruals LTV 48.4% $0 $300 $264 $2 … $49 2025 2026 2027 2028 2029 + Fixed Floating 31% matures in 2025 $ in millions Top 10 MSAs by Note Current Balance + Unfunded Commitment – Weighted Avg. LTV 49.6% Top 100 Loans Outstanding of $890 million, or 91% of the total Multi - Family portfolio LTV 50.4%
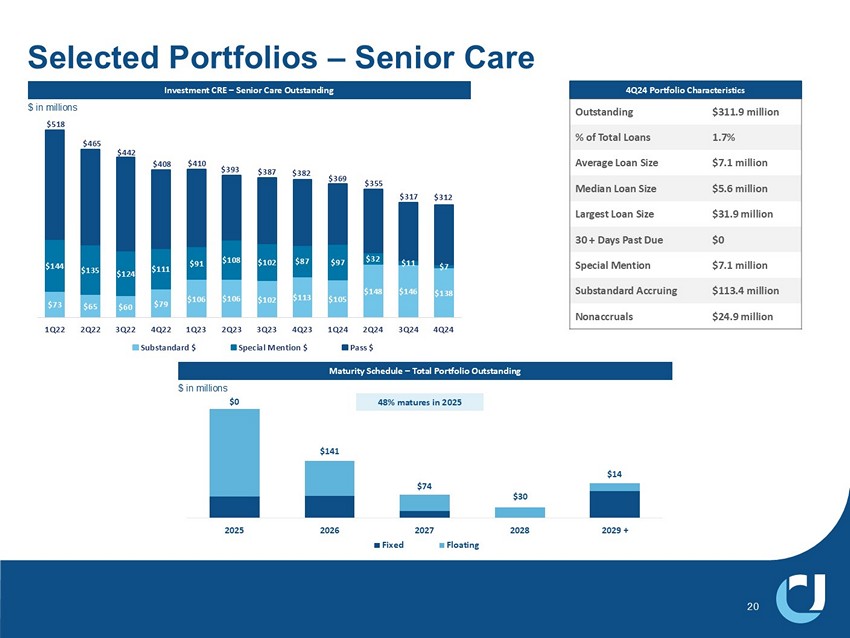
1% 20% 25% 49% 6% Selected Portfolios – Senior Care $73 $65 $60 $79 $106 $106 $102 $113 $105 $148 $146 $138 $144 $135 $124 $111 $91 $108 $102 $87 $97 $32 $11 $7 $518 $465 $442 $408 $410 $393 $387 $382 $369 $355 $317 $312 1Q22 2Q22 3Q22 4Q22 1Q23 2Q23 3Q23 4Q23 1Q24 2Q24 3Q24 4Q24 Substandard $ Special Mention $ Pass $ 20 $ in millions Investment CRE – Senior Care Outstanding Maturity Schedule – Total Portfolio Outstanding 4Q24 Portfolio Characteristics $311.9 million Outstanding 1.7% % of Total Loans $7.1 million Average Loan Size $5.6 million Median Loan Size $31.9 million Largest Loan Size $0 30 + Days Past Due $7.1 million Special Mention $113.4 million Substandard Accruing $24.9 million Nonaccruals $ in millions $0 $141 $74 $30 $14 2025 2026 2027 2028 2029 + Fixed Floating 48% matures in 2025
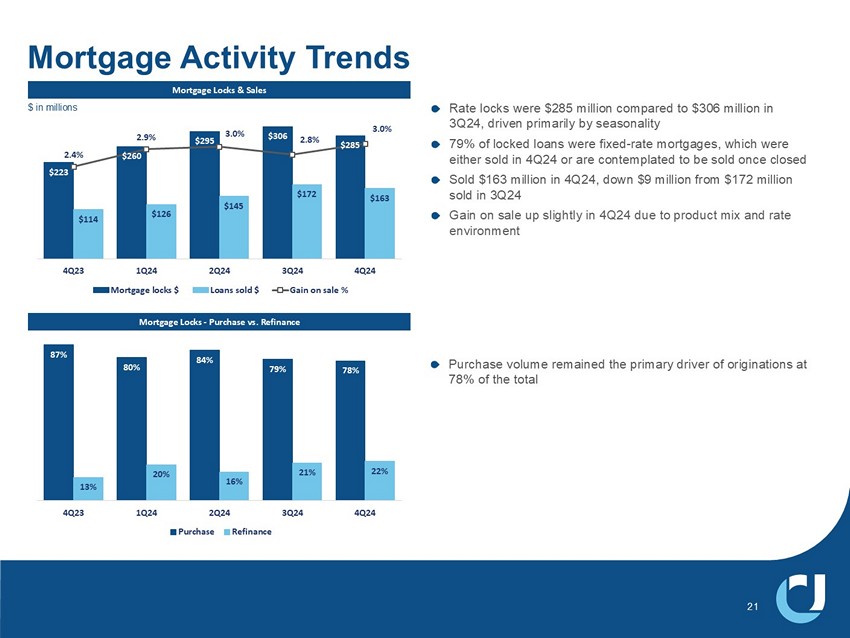
Rate locks were $285 million compared to $306 million in 3Q24, driven primarily by seasonality 79% of locked loans were fixed - rate mortgages, which were either sold in 4Q24 or are contemplated to be sold once closed Sold $163 million in 4Q24, down $9 million from $172 million sold in 3Q24 Gain on sale up slightly in 4Q24 due to product mix and rate environment Mortgage Locks & Sales Mortgage Locks - Purchase vs. Refinance Mortgage Activity Trends $223 $260 $295 $306 $285 $114 $126 $145 $172 $163 2.4% 2.9% 3.0% 2.8% 3.0% 4Q23 1Q24 2Q24 3Q24 4Q24 Mortgage locks $ Loans sold $ Gain on sale % 87% 80% 84% 79% 78% 13% 20% 16% 21% 22% 4Q23 1Q24 2Q24 3Q24 4Q24 Purchase Refinance 21 Purchase volume remained the primary driver of originations at 78% of the total $ in millions
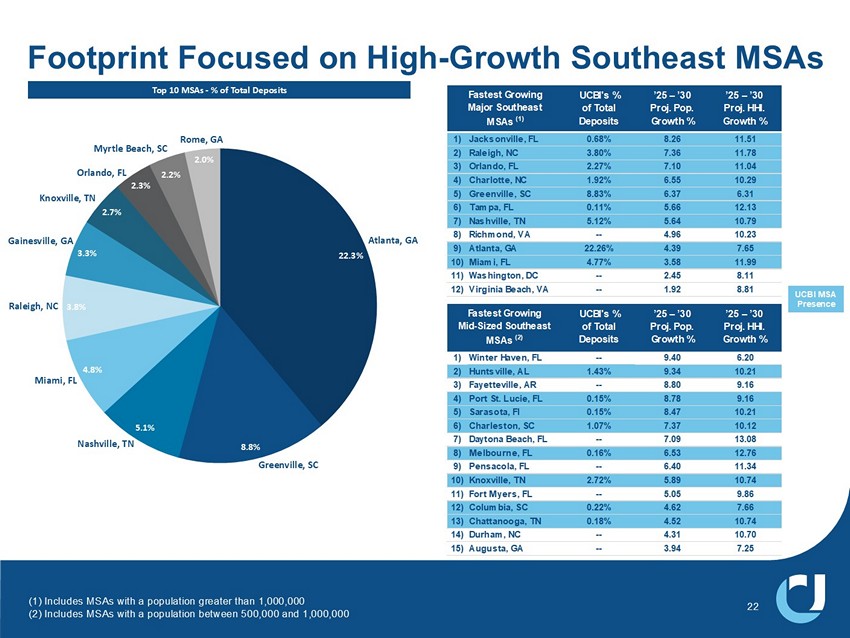
(1) Includes MSAs with a population greater than 1,000,000 (2) Includes MSAs with a population between 500,000 and 1,000,000 Footprint Focused on High - Growth Southeast MSAs 22 22.3% 8.8% 5.1% 4.8% 3.8% 3.3% 2.7% 2.3% 2.2% 2.0% Atlanta, GA Greenville, SC Nashville, TN Miami, FL Raleigh, NC Gainesville, GA Knoxville, TN Orlando, FL Rome, GA Myrtle Beach, SC Top 10 MSAs - % of Total Deposits UCBI's % of Total Deposits ’25 – ’30 Proj. Pop. Growth % ’25 – ’30 Proj. HHI. Growth % 1) Jacksonville, FL 0.68% 8.26 11.51 2) Raleigh, NC 3.80% 7.36 11.78 3) Orlando, FL 2.27% 7.10 11.04 4) Charlotte, NC 1.92% 6.55 10.29 5) Greenville, SC 8.83% 6.37 6.31 6) Tampa, FL 0.11% 5.66 12.13 7) Nashville, TN 5.12% 5.64 10.79 8) Richmond, VA -- 4.96 10.23 9) Atlanta, GA 22.26% 4.39 7.65 10) Miami, FL 4.77% 3.58 11.99 11) Washington, DC -- 2.45 8.11 12) Virginia Beach, VA -- 1.92 8.81 Fastest Growing Major Southeast MSAs (1) UCBI MSA Presence UCBI's % of Total Deposits ’25 – ’30 Proj. Pop. Growth % ’25 – ’30 Proj. HHI. Growth % 1) Winter Haven, FL -- 9.40 6.20 2) Huntsville, AL 1.43% 9.34 10.21 3) Fayetteville, AR -- 8.80 9.16 4) Port St. Lucie, FL 0.15% 8.78 9.16 5) Sarasota, Fl 0.15% 8.47 10.21 6) Charleston, SC 1.07% 7.37 10.12 7) Daytona Beach, FL -- 7.09 13.08 8) Melbourne, FL 0.16% 6.53 12.76 9) Pensacola, FL -- 6.40 11.34 10) Knoxville, TN 2.72% 5.89 10.74 11) Fort Myers, FL -- 5.05 9.86 12) Columbia, SC 0.22% 4.62 7.66 13) Chattanooga, TN 0.18% 4.52 10.74 14) Durham, NC -- 4.31 10.70 15) Augusta, GA -- 3.94 7.25 Fastest Growing Mid-Sized Southeast MSAs (2)
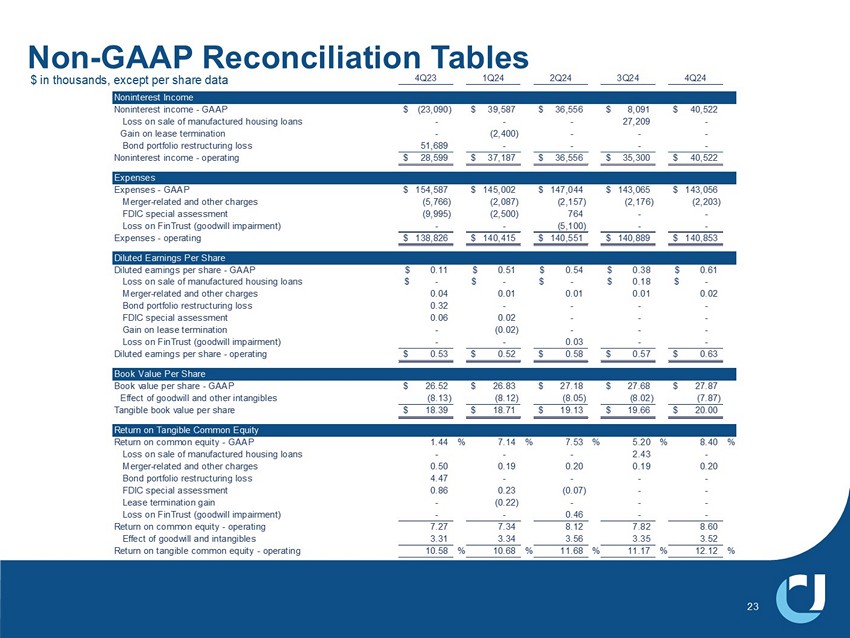
Non - GAAP Reconciliation Tables 23 4Q23 1Q24 2Q24 3Q24 4Q24 Noninterest Income Noninterest income - GAAP (23,090)$ 39,587$ 36,556$ 8,091$ 40,522$ Loss on sale of manufactured housing loans - - - 27,209 - Gain on lease termination - (2,400) - - - Bond portfolio restructuring loss 51,689 - - - - Noninterest income - operating 28,599$ 37,187$ 36,556$ 35,300$ 40,522$ Expenses Expenses - GAAP 154,587$ 145,002$ 147,044$ 143,065$ 143,056$ Merger-related and other charges (5,766) (2,087) (2,157) (2,176) (2,203) FDIC special assessment (9,995) (2,500) 764 - - Loss on FinTrust (goodwill impairment) - - (5,100) - - Expenses - operating 138,826$ 140,415$ 140,551$ 140,889$ 140,853$ Diluted Earnings Per Share Diluted earnings per share - GAAP 0.11$ 0.51$ 0.54$ 0.38$ 0.61$ Loss on sale of manufactured housing loans -$ -$ -$ 0.18$ -$ Merger-related and other charges 0.04 0.01 0.01 0.01 0.02 Bond portfolio restructuring loss 0.32 - - - - FDIC special assessment 0.06 0.02 - - - Gain on lease termination - (0.02) - - - Loss on FinTrust (goodwill impairment) - - 0.03 - - Diluted earnings per share - operating 0.53$ 0.52$ 0.58$ 0.57$ 0.63$ Book Value Per Share Book value per share - GAAP 26.52$ 26.83$ 27.18$ 27.68$ 27.87$ Effect of goodwill and other intangibles (8.13) (8.12) (8.05) (8.02) (7.87) Tangible book value per share 18.39$ 18.71$ 19.13$ 19.66$ 20.00$ Return on Tangible Common Equity Return on common equity - GAAP 1.44 % 7.14 % 7.53 % 5.20 % 8.40 % Loss on sale of manufactured housing loans - - - 2.43 - Merger-related and other charges 0.50 0.19 0.20 0.19 0.20 Bond portfolio restructuring loss 4.47 - - - - FDIC special assessment 0.86 0.23 (0.07) - - Lease termination gain - (0.22) - - - Loss on FinTrust (goodwill impairment) - - 0.46 - - Return on common equity - operating 7.27 7.34 8.12 7.82 8.60 Effect of goodwill and intangibles 3.31 3.34 3.56 3.35 3.52 Return on tangible common equity - operating 10.58 % 10.68 % 11.68 % 11.17 % 12.12 % $ in thousands, except per share data
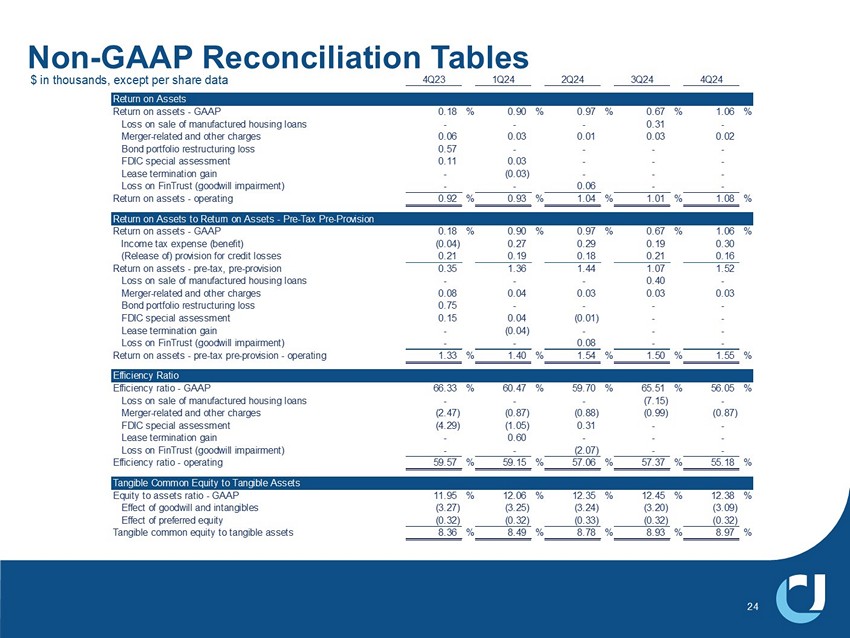
Non - GAAP Reconciliation Tables 24 4Q23 1Q24 2Q24 3Q24 4Q24 Return on Assets Return on assets - GAAP 0.18 % 0.90 % 0.97 % 0.67 % 1.06 % Loss on sale of manufactured housing loans - - - 0.31 - Merger-related and other charges 0.06 0.03 0.01 0.03 0.02 Bond portfolio restructuring loss 0.57 - - - - FDIC special assessment 0.11 0.03 - - - Lease termination gain - (0.03) - - - Loss on FinTrust (goodwill impairment) - - 0.06 - - Return on assets - operating 0.92 % 0.93 % 1.04 % 1.01 % 1.08 % Return on Assets to Return on Assets - Pre-Tax Pre-Provision Return on assets - GAAP 0.18 % 0.90 % 0.97 % 0.67 % 1.06 % Income tax expense (benefit) (0.04) 0.27 0.29 0.19 0.30 (Release of) provision for credit losses 0.21 0.19 0.18 0.21 0.16 Return on assets - pre-tax, pre-provision 0.35 1.36 1.44 1.07 1.52 Loss on sale of manufactured housing loans - - - 0.40 - Merger-related and other charges 0.08 0.04 0.03 0.03 0.03 Bond portfolio restructuring loss 0.75 - - - - FDIC special assessment 0.15 0.04 (0.01) - - Lease termination gain - (0.04) - - - Loss on FinTrust (goodwill impairment) - - 0.08 - - Return on assets - pre-tax pre-provision - operating 1.33 % 1.40 % 1.54 % 1.50 % 1.55 % Efficiency Ratio Efficiency ratio - GAAP 66.33 % 60.47 % 59.70 % 65.51 % 56.05 % Loss on sale of manufactured housing loans - - - (7.15) - Merger-related and other charges (2.47) (0.87) (0.88) (0.99) (0.87) FDIC special assessment (4.29) (1.05) 0.31 - - Lease termination gain - 0.60 - - - Loss on FinTrust (goodwill impairment) - - (2.07) - - Efficiency ratio - operating 59.57 % 59.15 % 57.06 % 57.37 % 55.18 % Tangible Common Equity to Tangible Assets Equity to assets ratio - GAAP 11.95 % 12.06 % 12.35 % 12.45 % 12.38 % Effect of goodwill and intangibles (3.27) (3.25) (3.24) (3.20) (3.09) Effect of preferred equity (0.32) (0.32) (0.33) (0.32) (0.32) Tangible common equity to tangible assets 8.36 % 8.49 % 8.78 % 8.93 % 8.97 % $ in thousands, except per share data

Glossary ACL – Allowance for Credit Losses MLO – Mortgage Loan Office ALLL – Allowance for Loan Losses MMDA – Money Market Deposit Account AOCI – Accumulated Other Comprehensive Income (Loss) MTM – Marked-to-Market AUA – Assets Under Administration MSA – Metropolitan Statistical Area BPS – Basis Points MSR – Mortgage Servicing Rights Asset C&I – Commercial and Industrial NCO – Net Charge-Offs C&D – Construction and Development NIM – Net Interest Margin CECL – Current Expected Credit Losses NOW – Negotiable Order of Withdrawal CET1 – Common Equity Tier 1 Capital NPA – Non-Performing Asset CRE – Commercial Real Estate NSF – Non-Sufficient Funds CSP – Customer Service Profiles OO CRE – Owner Occupied Commercial Real Estate DDA – Demand Deposit Account PCD – Loans Purchased with Credit Deterioration EOP – End of Period PPP – Paycheck Protection Program EPS – Earnings Per Share PTPP – Pre-Tax, Pre-Provision Earnings FHA – Federal Housing Administration RBC – Risk Based Capital FTE – Fully-Taxable Equivalent ROA – Return on Assets GAAP – Accounting Principles Generally Accepted in the USA SBA – United States Small Business Administration IBL – Interest-Bearing Liabilities TCE – Tangible Common Equity ICS – Insured Cash Sweep USDA – United States Department of Agriculture KRX – KBW Nasdaq Regional Banking Index VA – Veterans Affairs LPO – Loan Production Office YOY – Year over Year MH – Manufactured Housing 25