UNITED STATES
SECURITIES AND EXCHANGE COMMISSION
Washington, D.C. 20549
FORM 10-K
ANNUAL REPORT PURSUANT TO SECTION 13 OR 15(d) OF THE SECURITIES EXCHANGE ACT OF 1934
For the Fiscal Year Ended December 31, 2007
Commission File Number 0-21656
UNITED COMMUNITY BANKS, INC.
(Exact name of registrant as specified in its charter)
| | |
| (State or other jurisdiction of incorporation) | | (I.R.S. Employer Identification No.) |
| | | |
63 Highway 515, Blairsville, Georgia | | 30512 |
| (Address of principal executive offices) | | (Zip Code) |
Registrant’s telephone number, including area code: (706) 781-2265
Securities registered pursuant to Section 12(b) of the Act: None
Name of exchange on which registered: Nasdaq Global Select
Securities registered pursuant to Section 12(g) of the Act:
Common Stock, $1.00 par value
Indicate by check mark if the registrant is a well-known seasoned issuer, as defined in Rule 405 of the Securities Act.
Yes x No o
Indicate by check mark if the registrant is not required to file reports pursuant to Sections 13 or 15(d) of the Act.
Yes o No x
Indicate by check mark whether the registrant (1) has filed all reports required to be filed by Sections 13 or 15(d) of the Securities Exchange Act of 1934 during the preceding 12 months (or for such shorter period that the registrant was required to file such reports), and (2) has been subject to such filing requirements for the past 90 days. Yes x No o
Indicate by check mark if disclosure of delinquent filers pursuant to Item 405 of Regulation S-K is not contained herein and will not be contained, to the best of registrant’s knowledge, in definitive proxy or information statements incorporated by reference in Part III of this Form 10-K or any amendment to this Form 10-K. o
Indicate by check mark whether the registrant is a large accelerated filer, an accelerated filer, or a non-accelerated filer. See definition of “accelerated filer and large accelerated filer” in Rule 12b-2 of the Exchange Act. (check one):
Large accelerated filer x | Accelerated filer o | Non-accelerated filer o |
Indicate by check mark whether the registrant is a shell company (as defined in Rule 12b-2 of the Act).Yes o No x
State the aggregate market value of the voting common equity held by non-affiliates computed by reference to the price at which the common equity was last sold, or the average bid and asked price of such common equity, as of the last business day of the registrant’s most recently completed second fiscal quarter: $1,088,226,189 based on shares held by non-affiliates at $25.89 per share, the closing stock price on the Nasdaq stock market on June 29, 2007).
As of January 31, 2008, 49,965,766 shares of common stock were issued and outstanding, including presently exercisable options to acquire 1,694,064 shares and 84,627 shares issuable under United Community Banks, Inc.’s deferred compensation plan.
DOCUMENTS INCORPORATED BY REFERENCE
Portions of the registrant’s Proxy Statement for the Annual Meeting of Shareholders to be held on April 30, 2008 are incorporated herein into Part III by reference.
INDEX
| PART I | | |
| | | | |
| | Item 1. | Business | 3 |
| | Item 1A. | Risk Factors | 12 |
| | Item 1B. | Unresolved Staff Comments | 13 |
| | Item 2. | Properties | 13 |
| | Item 3. | Legal Proceedings | 13 |
| | Item 4. | Submission of Matters to a Vote of Security Holders | 14 |
| | | | |
| PART II | | |
| | | | |
| | Item 5. | Market for United’s Common Equity, Related Stockholder Matters and Issuer Purchases of Equity Securities | 14 |
| | Item 6. | Selected Financial Data | 17 |
| | Item 7. | Management’s Discussion and Analysis of Financial Condition and Results of Operations | 19 |
| | Item 7A. | Quantitative and Qualitative Disclosures About Market Risk | 37 |
| | Item 8. | Financial Statements and Supplementary Data | 41 |
| | Item 9. | Changes in and Disagreements with Accountants on Accounting and Financial Disclosure | 72 |
| | Item 9A. | Controls and Procedures | 72 |
| | Item 9B. | Other Information | 72 |
| | | | |
| PART III | | |
| | | | |
| | Item 10. | Directors, Executive Officers and Corporate Governance | 73 |
| | Item 11. | Executive Compensation | 73 |
| | Item 12. | Security Ownership of Certain Beneficial Owners and Management and Related Stockholder Matters | 73 |
| | Item 13. | Certain Relationships and Related Transactions, and Director Independence | 73 |
| | Item 14. | Principal Accounting Fees and Services | 73 |
| | | | |
| PART IV | | |
| | | | |
| | Item 15. | Exhibits, Financial Statement Schedules | 73 |
| | Signatures | | 77 |
PART I
ITEM 1. BUSINESS.
United Community Banks, Inc. (“United”), a bank holding company registered under the Bank Holding Company Act of 1956, was incorporated under the laws of Georgia in 1987 and commenced operations in 1988 by acquiring 100% of the outstanding shares of Union County Bank, Blairsville, Georgia, now known as United Community Bank, Blairsville, Georgia
United acquired United Community Bank, Brevard, North Carolina in 1990 and merged the bank into United Community Bank, Blairsville, Georgia effective February 1, 2008. Although United operated both the Georgia bank and north Carolina bank for the past five years, we will refer to the consolidated Georgia bank (“the Bank”) only through this report. Substantially all of United’s activities were conducted by the Bank.
Since the early 1990’s, United has actively expanded its market coverage through organic growth complemented by selective acquisitions, primarily of banks whose managements share United’s community banking and customer service philosophies. Although those acquisitions have directly contributed to United’s growth over the last ten years, their contribution has primarily been to provide United access to new markets with attractive growth potential. Organic growth in assets includes growth through existing offices as well as growth at de novo locations and post-acquisition growth at acquired banking offices. Organic growth will continue to be the principal focus of United’s balanced growth strategy to extend its reach in both new and existing markets.
To emphasize its commitment to community banking, United conducts substantially all of its operations through a community-focused operating model of 27 separate “community banks”, which as of December 31, 2007, operated at 111 locations in north Georgia, metro Atlanta and Gainesville (“Atlanta Region”), coastal Georgia, western North Carolina and east Tennessee. The community banks offer a full range of retail and corporate banking services, including checking, savings, and time deposit accounts, secured and unsecured loans, wire transfers, brokerage services, and other financial services, and are led by local bank presidents (referred to herein as the “Presidents”) and management with significant experience in, and ties to, their communities. Each of the community bank Presidents has authority, alone or with other local officers, to make most credit decisions.
In June 2007, United completed the acquisition of Gwinnett Commercial Group, Inc. and its wholly-owned subsidiary First Bank of the South. The acquisition of Gwinnett Commercial Group added assets and deposits of $809 million and $568 million, respectively, and five banking offices in Atlanta Region.
In December 2006, United completed the acquisition of Southern Bancorp, Inc. a Georgia bank holding company and its wholly-owned subsidiary Southern National Bank. Southern National Bank has two banking offices in Atlanta Region. United also acquired two branch locations in western North Carolina. Both transactions collectively added $430 million in assets and $360 million in deposits. In addition, United opened five de novo locations in 2007 and eight in 2006.
The Bank, through its full-service retail mortgage lending division, United Community Mortgage Services (“UCMS”), is approved as a seller/servicer for Federal National Mortgage Association and Federal Home Loan Mortgage Corporation and provides fixed and adjustable-rate home mortgages. During 2007, the Bank originated $410 million of residential mortgage loans throughout Georgia, North Carolina and Tennessee for the purchase of homes and to refinance existing mortgage debt. Substantially all of these mortgages were sold into the secondary market with no recourse to the Bank other than for breach of warranties.
Acquired in 2000, Brintech, Inc. (“Brintech”), a subsidiary of the Bank, is a consulting firm for the financial services industry. Brintech provides consulting, advisory, and implementation services in the areas of strategic planning, profitability improvement, technology, efficiency, security, risk management, network, Internet banking, marketing, core processing, and telecommunications.
United owns an insurance agency, United Community Insurance Services, Inc. (“UCIS”), known as United Community Advisory Services, that is a subsidiary of the Bank.
United provides retail brokerage services through an affiliation with a third party broker/dealer.
Forward-Looking Statements
This Form 10-K contains forward-looking statements regarding United, including, without limitation, statements relating to United’s expectations with respect to revenue, credit losses, levels of nonperforming assets, expenses, earnings and other measures of financial performance. Words such as “may”, “could”, “would”, “should”, “believes”, “expects”, “anticipates”, “estimates”, “intends”, “plans”, “targets” or similar expressions are intended to identify forward-looking statements. These forward-looking statements are not guarantees of future performance and involve certain risks and uncertainties that are subject to change based on various factors (many of which are beyond United’s control). The following factors, among others, could cause United’s financial performance to differ materially from the expectations expressed in such forward-looking statements:
| | ● | our past operating results may not be indicative of future operating results; |
| | | our business is subject to the success of the local economies in which we operate; |
| | ● | our concentration of construction and land development loans is subject to unique risks that could adversely affect our earnings; |
| | ● | we may face risks with respect to future expansion and acquisitions or mergers; |
| | ● | changes in prevailing interest rates may negatively affect our net income and the value of our assets; |
| | ● | if our allowance for loan losses is not sufficient to cover actual loan losses, earnings would decrease; |
| | ● | competition from financial institutions and other financial service providers may adversely affect our profitability; |
| | ● | business increases, productivity gains and other investments are lower than expected or do not occur as quickly as anticipated; |
| | ● | competitive pressures among financial services companies increase significantly; |
| | ● | the success of our business strategy; |
| | ● | the strength of the United States economy in general changes; |
| | ● | trade, monetary and fiscal policies and laws, including interest rate policies of the Board of Governors of the Federal Reserve System, change; |
| | ● | inflation or market conditions fluctuate; |
| | ● | conditions in the stock market, the public debt market and other capital markets deteriorate; |
| | ● | financial services laws and regulations change; |
| | ● | technology changes and United fails to adapt to those changes; |
| | ● | consumer spending and saving habits change; |
| | ● | unanticipated regulatory or judicial proceedings occur; and |
| | ● | United is unsuccessful at managing the risks involved in the foregoing. |
Additional information with respect to factors that may cause actual results to differ materially from those contemplated by such forward-looking statements may also be included in other reports that United files with the Securities and Exchange Commission. United cautions that the foregoing list of factors is not exclusive and not to place undue reliance on forward-looking statements. United does not intend to update any forward-looking statement, whether written or oral, relating to the matters discussed in this Form 10-K.
Monetary Policy And Economic Conditions
United’s profitability depends to a substantial extent on the difference between interest revenue received from loans, investments, and other earning assets, and the interest paid on deposits and other liabilities. These rates are highly sensitive to many factors that are beyond the control of United, including national and international economic conditions and the monetary policies of various governmental and regulatory authorities, particularly the Federal Reserve. The instruments of monetary policy employed by the Federal Reserve include open market operations in U.S. government securities, changes in the discount rate on bank borrowings and changes in reserve requirements against bank deposits.
Competition
The market for banking and bank-related services is highly competitive. United actively competes in their respective market areas, which include north Georgia, the Atlanta Region, coastal Georgia, western North Carolina and east Tennessee, with other providers of deposit and credit services. These competitors include other commercial banks, savings banks, savings and loan associations, credit unions, mortgage companies, and brokerage firms.
The following table displays the respective percentage of total bank and thrift deposits in each county where the Bank has operations. The table also indicates the ranking by deposit size in each county. All information in the table was obtained from the Federal Deposit Insurance Corporation Summary of Deposits as of June 30, 2007. The following information only shows market share in deposit gathering, which may not be indicative of market presence in other areas.
| Share of Local Deposit Markets by County - Banks and Savings Institutions | | | | | | | | |
| | | | | | | | | | | | | | | | | | | | | |
| | | Market | | | Rank in | | | | Market | | | Rank in | | | | Market | | | Rank in | |
| | | Share | | | Market | | | | Share | | | Market | | | | Share | | | Market | |
| | | | | | | | | | | | | | | | | | | | | |
| Atlanta Region | | | | | | | North Georgia | | | | | | | Coastal Georgia | | | | | | |
| Bartow | | 7% | | | 6 | | Chattooga | | 42% | | | 1 | | Chatham | | 1% | | | 12 | |
| Carroll | | 3 | | | 9 | | Fannin | | 50 | | | 1 | | Glynn | | 18 | | | 2 | |
| Cherokee | | 4 | | | 9 | | Floyd | | 15 | | | 3 | | Ware | | 7 | | | 5 | |
| Cobb | | 4 | | | 8 | | Gilmer | | 15 | | | 2 | | | | | | | | | |
| Coweta | | 1 | | | 12 | | Habersham | | 14 | | | 3 | | North Carolina | | | | | | | |
| Dawson | | 36 | | | 1 | | Jackson | | 2 | | | 11 | | Avery | | 13 | | | 4 | |
| DeKalb | | 1 | | | 18 | | Lumpkin | | 27 | | | 2 | | Cherokee | | 46 | | | 1 | |
| Douglas | | 2 | | | 11 | | Rabun | | 12 | | | 5 | | Clay | | 53 | | | 1 | |
| Fayette | | 1 | | | 12 | | Towns | | 32 | | | 2 | | Graham | | 75 | | | 1 | |
| Forsyth | | 3 | | | 11 | | Union | | 85 | | | 1 | | Haywood | | 11 | | | 5 | |
| Fulton | | 1 | | | 17 | | White | | 40 | | | 1 | | Henderson | | 3 | | | 11 | |
| Gwinnett | | 4 | | | 5 | | | | | | | | | | Jackson | | 23 | | | 2 | |
| Hall | | 9 | | | 5 | | Tennessee | | | | | | | | Macon | | 9 | | | 4 | |
| Henry | | 3 | | | 12 | | Blount | | 4 | | | 8 | | Mitchell | | 29 | | | 1 | |
| Newton | | 4 | | | 6 | | Bradley | | 4 | | | 7 | | Swain | | 31 | | | 2 | |
| Paulding | | 2 | | | 8 | | Knox | | 1 | | | 13 | | Transylvania | | 12 | | | 3 | |
| Pickens | | 2 | | | 7 | | Loudon | | 19 | | | 3 | | Watauga | | 1 | | | 13 | |
| Rockdale | | 12 | | | 4 | | McMinn | | 3 | | | 8 | | Yancey | | 12 | | | 5 | |
| Walton | | 1 | | | 13 | | Monroe | | 2 | | | 8 | | | | | | | | | |
| | | | | | | | | | Roane | | 9 | | | 4 | | | | | | | | | |
Loans
The Bank makes both secured and unsecured loans to individuals, firms, and corporations. Secured loans include first and second real estate mortgage loans. The Bank also makes direct installment loans to consumers on both a secured and unsecured basis. At December 31, 2007, commercial (commercial and industrial), commercial (secured by real estate), construction (residential and commercial), residential mortgage and consumer installment loans represented approximately 7%, 25%, 40%, 25% and 3%, respectively, of United’s total loan portfolio.
Specific risk elements associated with the Bank’s lending categories include, but are not limited to:
| Loan Type | Risk Elements |
| | |
| Commercial (commercial and industrial) | Industry concentrations; inability to monitor the condition of collateral (inventory, accounts receivable and vehicles); increased competition; use of specialized or obsolete equipment as collateral; insufficient cash flow from operations to service debt payments. |
| | |
| Commercial (secured by real estate) | Loan portfolio concentrations; declines in general economic conditions and occupancy rates; business failure and lack of a suitable alternative use for property; environmental contamination. |
| | |
| Construction (residential and commercial) | Loan portfolio concentrations; inadequate long-term financing arrangements; cost overruns, changes in market demand for property. |
| | |
| Residential mortgage | Changes in general economic conditions or in the local economy; loss of borrower’s employment; insufficient collateral value due to decline in property value. |
| | |
| Consumer installment | Loss of borrower’s employment; changes in local economy; the inability to monitor collateral (vehicles and boats). |
Lending Policy
The Bank makes loans primarily to persons or businesses that reside, work, own property, or operate in its primary market areas. Unsecured loans are generally made only to persons who qualify for such credit based on net worth and liquidity. Secured loans are made to persons who are well established and have net worth, collateral, and cash flow to support the loan. Exceptions to the Bank’s policies are permitted on a case-by-case basis and require the approving officer to document, in writing, the reason for the exception. Loans exceeding the approving officer’s credit limit must be approved through the credit approval process involving Regional Credit Managers. All loans to borrowers whose aggregate lending relationship exceeds $5 million must be reported to the Bank’s Board of Directors for ratification.
United’s Credit Administration department provides each lending officer with written guidelines for lending activities as approved by the Bank’s Board of Directors. Limited lending authority is delegated to lending officers by United’s Management Credit and Policy Committee as authorized by the Bank’s Board of Directors or the Committee’s designees in Credit Administration. Loans in excess of individual officer credit authority must be approved by a senior officer with sufficient approval authority delegated by the Management Credit and Policy Committee as authorized by the Bank’s Board of Directors. Loans to borrowers whose total aggregate loans exceed $15.0 million require the additional approval of two Bank directors.
Regional Credit Managers
United utilizes its Regional Credit Managers to provide credit administration support to the Bank as needed. The Regional Credit Managers have joint lending approval authority with the community bank Presidents within varying limits set by the Management Credit and Policy Committee based on characteristics of each market. The Regional Credit Managers also provide credit underwriting support as needed by the community banks they serve.
Loan Review and Non-performing Assets
The Loan Review Department of United reviews, or engages an independent third party to review, the Bank’s loan portfolio on an ongoing basis to identify any weaknesses in the portfolio and to assess the general quality of credit underwriting. The results of such reviews are presented to Executive Management, the community bank Presidents, Credit Administration management and the Audit Committee of the Board of Directors. If an individual loan or credit relationship has a material weakness identified during the review process, the risk rating of the loan, or all loans comprising that credit relationship, will be downgraded to the classification that most closely matches the current risk level. The review process also provides for the upgrade of loans that show improvement since the last review. Since each loan in a credit relationship may have a different credit structure, collateral, and other secondary source of repayment, different loans in a relationship can be assigned different risk ratings. Under United’s 10-tier loan grading system, grades 1 through 6 are considered “pass” (acceptable) credit risk, grade 7 is a “watch” rating, and grades 8 through 10 are “adversely classified” credits that require management’s attention. Both the pass and adversely classified ratings, and the entire 10-grade rating scale, provide for a higher numeric rating for increased risk. For example, a risk rating of 1 is the least risky of all credits and would be typical of a loan that is 100% secured by a deposit at the Bank. Risk ratings of 2 through 6 in the pass category each have incrementally more risk. The four watch list credit ratings and rating definitions are:
| | 7 (Watch) | Weaknesses exist that could cause future impairment, including the deterioration of financial ratios, past-due status and questionable management capabilities. Collateral values generally afford adequate coverage, but may not be immediately marketable. |
| | | |
| | 8 (Substandard) | Specific and well-defined weaknesses that may include poor liquidity and deterioration of financial ratios. Loan may be past-due and related deposit accounts experiencing overdrafts. Immediate corrective action is necessary. |
| | | |
| | 9 (Doubtful) | Specific weaknesses characterized as Substandard that are severe enough to make collection in full unlikely. No reliable secondary source of full repayment. |
| | | |
| | 10 (Loss) | Same characteristics as Doubtful, however, probability of loss is certain. Loans classified as such are generally charged-off. |
In addition, Credit Administration and Accounting jointly prepare a quarterly analysis to determine the adequacy of the Allowance for Loan Losses (“ALL”) for the Bank. The ALL analysis also provides the consolidated analysis for United. The ALL analysis starts with total loans and subtracting loans fully secured by deposit accounts at the Bank, which effectively have no risk of loss. Next, all loans with an adversely classified rating are subtracted, including loans considered impaired. The remaining loan balance for each major loan category is then multiplied by its respective loss factor that is derived from the average historical loss rate for the preceding two year period, adjusted to reflect current economic conditions, which provides a required minimum ALL for pass credits. Loss factors for these loans are determined based on historical loss experience by type of loan. Loans that are considered impaired are evaluated separately and are assigned specific reserves as necessary.
Asset/Liability Committees
United’s asset/liability committee (“ALCO”) is composed of executive officers and the Treasurer of United. The ALCO is charged with managing the assets and liabilities of United and the Bank. The ALCO attempts to manage asset growth, liquidity, and capital to maximize income and reduce interest rate risk, market risk and liquidity risk. The ALCO directs the Bank’s overall acquisition and allocation of funds. At periodic meetings, the committee reviews the monthly asset and liability funds budget in relation to the actual flow of funds; the ratio of the amount of rate sensitive assets to the amount of rate sensitive liabilities; the ratio of allowance for loan losses to outstanding and non-performing loans; and other variables, such as stress testing expected loan demand, investment opportunities, core deposit growth within specified categories, regulatory changes, monetary policy adjustments and the overall state of the economy. A more comprehensive discussion of United’s Asset/Liability Management and interest rate risk is contained in Management’s Discussion and Analysis (Part II, Item 7) and Quantitative and Qualitative Disclosures About Market Risk (Part II, Item 7A) sections of this report.
Investment Policy
United’s investment portfolio policy is to maximize income within liquidity, asset quality and regulatory constraints. The policy is reviewed from time to time by United’s ALCO and United’s Board of Directors. Individual transactions, portfolio composition, and performance are reviewed and approved periodically by United’s Board of Directors or a committee thereof. The Chief Financial Officer and Treasurer of United administer the policy and report information to the Board of Directors on a quarterly basis concerning sales, purchases, maturities and calls, resultant gains or losses, average maturity, federal taxable equivalent yields, and appreciation or depreciation by investment categories.
Employees
As of December 31, 2007, United and its subsidiaries had 1,944 full-time equivalent employees. Neither United nor any of its subsidiaries is a party to any collective bargaining agreement and management believes that employee relations are good.
Available Information
United’s Internet website address is ucbi.com. United makes available free of charge through its website Annual Reports on Form 10-K, Quarterly Reports on Form 10-Q and Current Reports on Form 8-K, and amendments to those reports, as soon as reasonably practicable after they are filed with, or furnished to, the Securities & Exchange Commission.
Supervision And Regulation
The following is an explanation of the supervision and regulation of United and the Bank as financial institutions. This explanation does not purport to describe state, federal or Nasdaq Stock Market supervision and regulation of general business corporations or Nasdaq listed companies.
General. United is a registered bank holding company subject to regulation by the Board of Governors of the Federal Reserve System (the “Federal Reserve”) under the Bank Holding Company Act of 1956, as amended (the “Act”). United is required to file annual and quarterly financial information with the Federal Reserve and is subject to periodic examination by the Federal Reserve.
The Act requires every bank holding company to obtain the Federal Reserve’s prior approval before (1) it may acquire direct or indirect ownership or control of more than 5% of the voting shares of any bank that it does not already control; (2) it or any of its non-bank subsidiaries may acquire all or substantially all of the assets of a bank; and (3) it may merge or consolidate with any other bank holding company. In addition, a bank holding company is generally prohibited from engaging in, or acquiring, direct or indirect control of the voting shares of any company engaged in non-banking activities. This prohibition does not apply to activities listed in the Act or found by the Federal Reserve, by order or regulation, to be closely related to banking or managing or controlling banks as to be a proper incident thereto. Some of the activities that the Federal Reserve has determined by regulation or order to be closely related to banking are:
| | ● | making or servicing loans and certain types of leases; |
| | ● | performing certain data processing services; |
| | ● | acting as fiduciary or investment or financial advisor; |
| | ● | providing brokerage services; |
| | ● | underwriting bank eligible securities; |
| | ● | underwriting debt and equity securities on a limited basis through separately capitalized subsidiaries; and |
| | ● | making investments in corporations or projects designed primarily to promote community welfare. |
Although the activities of bank holding companies have traditionally been limited to the business of banking and activities closely related or incidental to banking (as discussed above), the Gramm-Leach-Bliley Act (the “GLB Act”) relaxed the previous limitations and permitted bank holding companies to engage in a broader range of financial activities. Specifically, bank holding companies may elect to become financial holding companies which may affiliate with securities firms and insurance companies and engage in other activities that are financial in nature. Among the activities that are deemed “financial in nature” include:
| | ● | lending, exchanging, transferring, investing for others or safeguarding money or securities; |
| | ● | insuring, guaranteeing, or indemnifying against loss, harm, damage, illness, disability, or death, or providing and issuing annuities, and acting as principal, agent, or broker with respect thereto; |
| | ● | providing financial, investment, or economic advisory services, including advising an investment company; |
| | ● | issuing or selling instruments representing interests in pools of assets permissible for a bank to hold directly; and |
| | ● | underwriting, dealing in or making a market in securities |
.
A bank holding company may become a financial holding company under this statute only if each of its subsidiary banks is well-capitalized, is well managed and has at least a satisfactory rating under the Community Reinvestment Act. A bank holding company that falls out of compliance with such requirement may be required to cease engaging in certain activities. Any bank holding company that does not elect to become a financial holding company remains subject to the bank holding company restrictions of the Act.
Under this legislation, the Federal Reserve Board serves as the primary “umbrella” regulator of financial holding companies with supervisory authority over each parent company and limited authority over its subsidiaries. The primary regulator of each subsidiary of a financial holding company will depend on the type of activity conducted by the subsidiary. For example, broker-dealer subsidiaries will be regulated largely by securities regulators and insurance subsidiaries will be regulated largely by insurance authorities.
United has no current plans to register as a financial holding company.
United must also register with the Georgia Department of Banking and Finance (“DBF”) and file periodic information with the DBF. As part of such registration, the DBF requires information with respect to the financial condition, operations, management and intercompany relationship of United and the Bank and related matters. The DBF may also require such other information as is necessary to keep itself informed concerning compliance with Georgia law and the regulations and orders issued thereunder by the DBF, and the DBF may examine United and the Bank. Although the Bank operates branches in North Carolina and Tennessee, neither the North Carolina Banking Commission (“NCBC”), nor the Tennessee Department of Financial Institutions (“TDFI”) examines or directly regulates out-of-state holding companies.
United is an “affiliate” of the Bank under the Federal Reserve Act, which imposes certain restrictions on (1) loans by the Bank to United, (2) investments in the stock or securities of United by the Bank, (3) the Bank taking the stock or securities of an “affiliate” as collateral for loans by the Bank to a borrower, and (4) the purchase of assets from United by the Bank. Further, a bank holding company and its subsidiaries are prohibited from engaging in certain tie-in arrangements in connection with any extension of credit, lease or sale of property or furnishing of services.
The Bank and each of its subsidiaries are regularly examined by the Federal Deposit Insurance Corporation (the “FDIC”). The Bank, as a state banking association organized under Georgia law, is subject to the supervision of, and is regularly examined by, the DBF. The Bank’s North Carolina branches are subject to examination by the NCBC. The Bank’s Tennessee branches are subject to examination by the TDFI. Both the FDIC and the DBF must grant prior approval of any merger, consolidation or other corporation reorganization involving The Bank.
Payment of Dividends. United is a legal entity separate and distinct from the Bank. Most of the revenue of United results from dividends paid to it by the Bank. There are statutory and regulatory requirements applicable to the payment of dividends by the Bank, as well as by United to its shareholders.
Under the regulations of the DBF, dividends may not be declared out of the retained earnings of a state bank without first obtaining the written permission of the DBF, unless such bank meets all the following requirements:
| | (a) | total classified assets as of the most recent examination of the bank do not exceed 80% of equity capital (as defined by regulation); |
| | | |
| | (b) | the aggregate amount of dividends declared or anticipated to be declared in the calendar year does not exceed 50% of the net profits after taxes but before dividends for the previous calendar year; and |
| | | |
| | (c) | the ratio of equity capital to adjusted assets is not less than 6%. |
The payment of dividends by United and the Bank may also be affected or limited by other factors, such as the requirement to maintain adequate capital above regulatory guidelines. In addition, if, in the opinion of the applicable regulatory authority, a bank under its jurisdiction is engaged in or is about to engage in an unsafe or unsound practice (which, depending upon the financial condition of the bank, could include the payment of dividends), such authority may require, after notice and hearing, that such bank cease and desist from such practice. The FDIC has issued a policy statement providing that insured banks should generally only pay dividends out of current operating earnings. In addition to the formal statutes and regulations, regulatory authorities consider the adequacy of the Bank’s total capital in relation to its assets, deposits and other such items. Capital adequacy considerations could further limit the availability of dividends from the Bank. At February 1, 2008, net assets available from the Bank to pay dividends without prior approval from regulatory authorities totaled approximately $28 million. For 2007, United’s declared cash dividend payout to common stockholders was $16.8 million, or 28.57% of basic earnings per common share.
Capital Adequacy. The Federal Reserve and the FDIC have implemented substantially identical risk-based rules for assessing bank and bank holding company capital adequacy. These regulations establish minimum capital standards in relation to assets and off-balance sheet exposures as adjusted for credit risk. Banks and bank holding companies are required to have (1) a minimum level of Total Capital (as defined) to risk-weighted assets of eight percent (8%); and (2) a minimum Tier I Capital (as defined) to risk-weighted assets of four percent (4%). In addition, the Federal Reserve and the FDIC have established a minimum three percent (3%) leverage ratio of Tier I Capital to quarterly average total assets for the most highly-rated banks and bank holding companies. “Tier I Capital” generally consists of common equity excluding unrecognized gains and losses on available for sale securities, plus minority interests in equity accounts of consolidated subsidiaries and certain perpetual preferred stock less certain intangibles. The Federal Reserve and the FDIC will require a bank holding company and a bank, respectively, to maintain a leverage ratio greater than four percent (4%) if either is experiencing or anticipating significant growth or is operating with less than well-diversified risks in the opinion of the Federal Reserve. The Federal Reserve and the FDIC use the leverage ratio in tandem with the risk-based ratio to assess the capital adequacy of banks and bank holding companies. The FDIC, the Office of the Comptroller of the Currency (the “OCC”) and the Federal Reserve consider interest rate risk in the overall determination of a bank’s capital ratio, requiring banks with greater interest rate risk to maintain adequate capital for the risk.
In addition, Section 38 of the Federal Deposit Insurance Act implemented the prompt corrective action provisions that Congress enacted as a part of the Federal Deposit Insurance Corporation Improvement Act of 1991 (the “1991 Act”). The “prompt corrective action” provisions set forth five regulatory zones in which all banks are placed largely based on their capital positions. Regulators are permitted to take increasingly harsh action as a bank’s financial condition declines. Regulators are also empowered to place in receivership or require the sale of a bank to another depository institution when a bank’s capital leverage ratio reaches 2%. Better capitalized institutions are generally subject to less onerous regulation and supervision than banks with lesser amounts of capital.
The FDIC has adopted regulations implementing the prompt corrective action provisions of the 1991 Act, which place financial institutions in the following five categories based upon capitalization ratios: (1) a “well-capitalized” institution has a Total risk-based capital ratio of at least 10%, a Tier I risk-based ratio of at least 6% and a leverage ratio of at least 5%; (2) an “adequately capitalized” institution has a Total risk-based capital ratio of at least 8%, a Tier I risk-based ratio of at least 4% and a leverage ratio of at least 4%; (3) an “undercapitalized” institution has a Total risk-based capital ratio of under 8%, a Tier I risk-based ratio of under 4% or a leverage ratio of under 4%; (4) a “significantly undercapitalized” institution has a Total risk-based capital ratio of under 6%, a Tier I risk-based ratio of under 3% or a leverage ratio of under 3%; and (5) a “critically undercapitalized” institution has a leverage ratio of 2% or less. Institutions in any of the three undercapitalized categories would be prohibited from declaring dividends or making capital distributions. The FDIC regulations also establish procedures for “downgrading” an institution to a lower capital category based on supervisory factors other than capital.
To continue to conduct its business as currently conducted, United and the Bank will need to maintain capital well above the minimum levels. As of December 31, 2007 and 2006, the most recent notifications from the FDIC categorize the Bank as “well-capitalized” under current regulations.
Commercial Real Estate. In December, 2006 the federal banking agencies, including the FDIC, issued a final guidance on concentrations in commercial real estate lending, noting that recent increases in banks’ commercial real estate concentrations could create safety and soundness concerns in the event of a significant economic downturn. The guidance mandates certain minimal risk management practices and categorizes banks with defined levels of such concentrations as banks requiring elevated examiner scrutiny. The Bank has concentrations in commercial real estate loans in excess of those defined levels. Although management believes that United’s credit processes and procedures meet the risk management standards dictated by this guidance, regulatory outcomes could effectively limit increases in the real estate concentrations in the Bank’s loan portfolio and require additional credit administration and management costs associated with those portfolios.
Loans. Inter-agency guidelines adopted by federal bank regulators mandate that financial institutions establish real estate lending policies with maximum allowable real estate loan-to-value limits, subject to an allowable amount of non-conforming loans as a percentage of capital. The Bank adopted the federal guidelines in 2001.
Transactions with Affiliates. Under federal law, all transactions between and among a state nonmember bank and its affiliates, which include holding companies, are subject to Sections 23A and 23B of the Federal Reserve Act and Regulation W promulgated thereunder. Generally, these requirements limit these transactions to a percentage of the bank’s capital and require all of them to be on terms at least as favorable to the bank as transactions with non-affiliates. In addition, a bank may not lend to any affiliate engaged in non-banking activities not permissible for a bank holding company or acquire shares of any affiliate that is not a subsidiary. The FDIC is authorized to impose additional restrictions on transactions with affiliates if necessary to protect the safety and soundness of a bank. The regulations also set forth various reporting requirements relating to transactions with affiliates.
Financial Privacy. In accordance with the GLB Act, federal banking regulators adopted rules that limit the ability of banks and other financial institutions to disclose non-public information about consumers to nonaffiliated third parties. These limitations require disclosure of privacy policies to consumers and, in some circumstances, allow consumers to prevent disclosure of certain personal information to a nonaffiliated third party. The privacy provisions of the GLB Act affect how consumer information is transmitted through diversified financial companies and conveyed to outside vendors.
Anti-Money Laundering Initiatives and the USA Patriot Act. A major focus of governmental policy on financial institutions in recent years has been aimed at combating terrorist financing. This has generally been accomplished by amending existing anti-money laundering laws and regulations. The USA Patriot Act of 2001 (the “USA Patriot Act”) has imposed significant new compliance and due diligence obligations, creating new crimes and penalties. The United States Treasury Department has issued a number of implementing regulations which apply to various requirements of the USA Patriot Act to United and the Bank. These regulations impose obligations on financial institutions to maintain appropriate policies, procedures and controls to detect, prevent and report money laundering and terrorist financing and to verify the identity of their customers. Failure of a financial institution to maintain and implement adequate programs to combat terrorist financing, or to comply with all of the relevant laws or regulations, could have serious legal and reputational consequences for the institution.
Executive Officers Of United
Senior executives of United are elected by the Board of Directors annually and serve at the pleasure of the Board of Directors.
The senior executives officers of United, and their ages, positions with United, past five year employment history and terms of office as of February 1, 2008, are as follows:
| Name (age) | Position with United | Officer of United Since |
| | | |
Jimmy C. Tallent (55) | President, Chief Executive Officer and Director | 1988 |
| | | |
Guy W. Freeman (71) | Executive Vice President, Chief Operating Officer and Director | 1995 |
| | | |
Rex S. Schuette (58) | Executive Vice President and Chief Financial Officer | 2001 |
| | | |
David Shearrow (48) | Executive Vice President and Chief Risk Officer since April 2007; prior to joining United, he served as Executive Vice President and Senior Credit Officer of SunTrust Banks. | 2007 |
| | | |
Craig Metz (52) | Executive Vice President of Marketing | 2002 |
| | | |
Bill M. Gilbert (55) | Senior Vice President of Retail Banking since June 2003; previously, he was President of United Community Bank - Summerville | 2003 |
None of the above officers are related and there are no arrangements or understandings between them and any other person pursuant to which any of them was elected as an officer, other than arrangements or understandings with directors or officers of United acting solely in their capacities as such. Thomas C. Gilliland, former Executive Vice President, Secretary, and General Counsel, retired effective January 31, 2008.
ITEM 1A. RISK FACTORS.
An investment in United’s common stock involves risk. Investors should carefully consider the risks described below and all other information contained in this Annual Report on Form 10-K and the documents incorporated by reference before deciding to purchase common stock. It is possible that risks and uncertainties not listed below may arise or become material in the future and affect United’s business.
Past operating results may not be indicative of future operating results.
United may not be able to sustain its growth. Various factors, such as increased size, economic conditions, regulatory and legislative considerations, competition and the ability to find and retain people that can make United’s community-focused operating model successful, may impede its ability to expand its market presence. If United experiences a significant decrease in its growth rate, its results of operations and financial condition may be adversely affected.
United’s business is subject to the success of the local economies and real estate markets in which it operates.
United’s success significantly depends on the growth in population, income levels, loans and deposits and on the continued stability in real estate values in its markets. If the communities in which it operates do not grow or if prevailing economic conditions locally or nationally are unfavorable, United’s business may be adversely affected. Adverse economic conditions in United’s specific market areas, specifically decreases in real estate property values due to the nature of United’s loan portfolio, approximately 90% of which is secured by real estate, could reduce United’s growth rate, affect the ability of customers to repay their loans and generally affect United’s financial condition and results of operations. United is less able than a larger institution to spread the risks of unfavorable local economic conditions across a large number of more diverse economies.
United’s concentration of residential construction loans is subject to unique risks that could adversely affect earnings.
United’s residential construction loan portfolio was $1.8 billion at December 31, 2007, comprising 31% of total loans. Residential construction loans are often riskier than home equity loans or residential mortgage loans to individuals. In the event of a general economic slowdown like the one we are currently experiencing, these loans sometimes represent higher risk due to slower sales and reduced cash flow that could affect the borrowers’ ability to repay on a timely basis.
In addition, although regulations and regulatory policies affecting banks and financial services companies undergo continuous change and we cannot predict when changes will occur or the ultimate effect of any changes, there has been recent regulatory focus on construction, development and other commercial real estate lending. Recent changes in the federal policies applicable to construction, development or other commercial real estate loans make us subject us to substantial limitations with respect to making such loans, increase the costs of making such loans, and require us to have a greater amount of capital to support this kind of lending, all of which could have a material adverse effect on our profitability or financial condition.
United may face risks with respect to future expansion and acquisitions.
United regularly engages in de novo branch expansion. Also, when a business opportunity becomes available in the right market with the right management team, United may seek to acquire other financial institutions or parts of those institutions. These involve a number of risks, including:
| | · | the potential inaccuracy of the estimates and judgments used to evaluate credit, operations, management and market risks with respect to an acquired branch or institution,a new branch office or a new market; |
| | · | the time and costs of evaluating new markets, hiring or retaining experienced local management and opening new offices and the time lags between these activities and the generation of sufficient assets and deposits to support the costs of the expansion; |
| | · | the incurrence and possible impairment of goodwill associated with an acquisition and possible adverse effects on results of operations; and |
| | · | the risk of loss of key employees and customers of an acquired branch or institution. |
Changes in prevailing interest rates may negatively affect net income and the value of United’s assets.
Changes in prevailing interest rates may negatively affect the level of net interest revenue, the primary component of net income. In a period of changing interest rates, interest expense may increase at different rates than the interest earned on assets. Accordingly, changes in interest rates could decrease net interest revenue. At December 31, 2007, our simulation model indicated that a 200 basis point increase in rates over the next twelve months would cause an approximate 1.3% increase in net interest revenue and a 200 basis point decrease in rates over the next twelve months would cause an approximate 1.5% decrease in net interest revenue.
Changes in the level of interest rates may also negatively affect the value of United’s assets and its ability to realize gains or avoid losses from the sale of those assets, all of which ultimately affect earnings. In addition, an increase in interest rates may decrease the demand for loans.
If United’s allowance for loan losses is not sufficient to cover actual loan losses, earnings would decrease.
United’s loan customers may not repay their loans according to their terms and the collateral securing the payment of these loans may be insufficient to assure repayment. United may experience significant loan losses which would have a material adverse effect on operating results. Management makes various assumptions and judgments about the collectibility of the loan portfolio, including the creditworthiness of borrowers and the value of the real estate and other assets serving as collateral for the repayment of loans. United maintains an allowance for loan losses in an attempt to cover any loan losses inherent in the portfolio. In determining the size of the allowance, management relies on an analysis of the loan portfolio based on historical loss experience, volume and types of loans, trends in classification, volume and trends in delinquencies and non-accruals, national and local economic conditions and other pertinent information. If those assumptions are incorrect, the allowance may not be sufficient to cover future loan losses and adjustments may be necessary to allow for different economic conditions or adverse developments in the loan portfolio.
United may be subject to losses due to fraudulent and negligent conduct of our loan customers, third party service providers and employees.
When we make loans to individuals or entities, we rely upon information supplied by borrowers and other third parties, including information contained in the applicant’s loan application, property appraisal reports, title information and the borrower’s net worth, liquidity and cash flow information. While we attempt to verify information provided through available sources, we cannot be certain all such information is correct or complete. Our reliance on incorrect or incomplete information could have a material adverse effect on our profitability or financial condition.
Competition from financial institutions and other financial service providers may adversely affect United’s profitability.
The banking business is highly competitive, and United experiences competition in each of its markets from many other financial institutions. United competes with commercial banks, credit unions, savings and loan associations, mortgage banking firms, securities brokerage firms, insurance companies, money market funds and other mutual funds, as well as community, super-regional, national and international financial institutions that operate offices in its market areas and elsewhere. United competes with these institutions both in attracting deposits and in making loans. Many of United’s competitors are well-established, larger financial institutions that are able to operate profitably with a narrower net interest margin and have a more diverse revenue base. United may face a competitive disadvantage as a result of its smaller size, more limited geographic diversification and inability to spread costs across broader markets. Although United competes by concentrating marketing efforts in primary markets with local advertisements, personal contacts and greater flexibility and responsiveness in working with local customers, there can be no assurance that this strategy will continue to be successful.
ITEM 1B. UNRESOLVED STAFF COMMENTS.
There are no unresolved comments from the Securities and Exchange Commission staff regarding United’s periodic or current reports under the Exchange Act.
ITEM 2. PROPERTIES.
The executive offices of United are located at 63 Highway 515, Blairsville, Georgia. United owns this property. The Bank conducts business from facilities primarily owned by the Bank, all of which are in a good state of repair and appropriately designed for use as banking facilities. The Bank, Brintech and UCIS provide services or perform operational functions at 130 locations, of which 99 are owned and 31 are leased under operating leases. Note 7 to United’s Consolidated Financial Statements includes additional information regarding amounts invested in premises and equipment.
ITEM 3. LEGAL PROCEEDINGS.
In the ordinary course of operations, United and the Bank are defendants in various legal proceedings incidental to its business. In the opinion of management, there is no pending or threatened proceeding in which an adverse decision will result in a material adverse change in the consolidated financial condition or results of operations of United. No material proceedings terminated in the fourth quarter of 2007.
ITEM 4. SUBMISSION OF MATTERS TO A VOTE OF SECURITY HOLDERS.
No matters were submitted to a vote of the security holders of United during the fourth quarter of 2007.
PART II
ITEM 5. MARKET FOR UNITED’S COMMON EQUITY, RELATED STOCKHOLDER MATTERS AND ISSUER PURCHASES OF EQUITY SECURITIES.
Stock. United’s common stock trades on the Nasdaq Global Select Market under the symbol “UCBI”. The closing price for the period ended December 31, 2007 was $15.80. Below is a schedule of high, low and closing stock prices and average daily volume for all quarters in 2007 and 2006.
Stock Price Information
| | | 2007 | | | 2006 | |
| | | High | | | Low | | | Close | | | Avg Daily Volume | | | High | | | Low | | | Close | | | Avg Daily Volume | |
| | | | | | | | | | | | | | | | | | | | | | | | | |
| First quarter | | $ | 34.98 | | | $ | 30.81 | | | $ | 32.79 | | | | 232,269 | | | $ | 29.64 | | | $ | 26.02 | | | $ | 28.15 | | | | 59,252 | |
| Second quarter | | | 33.03 | | | | 25.80 | | | | 25.89 | | | | 266,682 | | | | 31.26 | | | | 27.02 | | | | 30.44 | | | | 92,937 | |
| Third quarter | | | 27.50 | | | | 22.16 | | | | 24.52 | | | | 346,596 | | | | 33.10 | | | | 27.51 | | | | 30.05 | | | | 86,495 | |
| Fourth quarter | | | 25.73 | | | | 15.13 | | | | 15.80 | | | | 421,910 | | | | 33.37 | | | | 29.03 | | | | 32.32 | | | | 87,626 | |
At January 31, 2008, there were approximately 6,435 record shareholders and 15,200 beneficial shareholders of United’s common stock.
Dividends. United declared cash dividends of $.36, $.32 and $.28 per common share in 2007, 2006 and 2005, respectively. Federal and state laws and regulations impose restrictions on the ability of United and the Bank to pay dividends. Additional information regarding this item is included in Note 16 to the Consolidated Financial Statements and under the heading of “Supervision and Regulation” in Part I of this report.
Share Repurchases. United has in place a board approved repurchase authorization for up to 3,000,000 shares of United’s common stock. The share repurchase program was initially authorized for 1,000,000 shares expiring December 31, 2007 and was announced in our Form 10-Q for the period ended March 31, 2006, filed May 8, 2006. In July 2007, the authorization was increased by the Board of Directors to 2,000,000 shares as announced in our Form 10-Q for the period ended June 30, 2007, filed August 8, 2007. In October 2007, the Board of Directors further increased the authorization to 3,000,000 shares and extended the expiration date to December 31, 2008. This amendment was announced in our third quarter 2007 earnings announcement dated October 23, 2007. At December 31, 2007, 2,000,000 shares had been purchased under the authorization and 1,000,000 shares remain available under the authorization. Stock repurchases may be made in the open market or in private transactions at time and in amounts we deem appropriate. However, there is no guarantee as to the exact number of additional shares that may be repurchased and we may terminate or limit the stock repurchase program at any time. We will hold the repurchased shares as treasury shares.
Additionally, United’s Amended and Restated 2000 Key Employee Stock Option Plan allows option holders to exercise stock options by delivering previously acquired shares having a fair market value equal to the exercise price provided that the shares delivered must have been held by the option holder for at least six months. During 2007 and 2006, optionees delivered 1,755 and 17,576 shares, respectively, to exercise stock options.
The following table sets forth information regarding purchases of our common stock by us or any affiliated purchaser, by quarter, during 2007. There were no purchases of stock during the first and second quarters of 2007 and there were no purchases, other than shares delivered by optionees, during 2006.
| Period | | Total number of shares purchased | | | Average price paid per share | | | Total number of shares purchased as part of publicly announced plans or programs | | | Maximum number of shares that may yet be purchased under the publicly announced plans or programs | |
| | | | | | | | | | | | | |
| July 2007 | | | 62,000 | | | $ | 23.91 | | | | 62,000 | | | | 2,938,000 | |
| August 2007 | | | 602,775 | | | | 24.08 | | | | 602,775 | | | | 2,335,225 | |
| September 2007 | | | 640,000 | | | | 24.81 | | | | 640,000 | | | | 1,695,225 | |
| Total third quarter | | | 1,304,775 | | | | 24.43 | | | | 1,304,775 | | | | | |
| | | | | | | | | | | | | | | | | |
| October 2007 | | | 94,600 | | | $ | 22.02 | | | | 94,600 | | | | 1,600,625 | |
| November 2007 | | | 495,000 | | | | 20.42 | | | | 495,000 | | | | 1,105,625 | |
| December 2007 | | | 105,625 | | | | 18.85 | | | | 105,625 | | | | 1,000,000 | |
| Total fourth quarter | | | 695,225 | | | | 20.40 | | | | 695,225 | | | | | |
| | | | | | | | | | | | | | | | | |
Sales of Unregistered Securities. United has not sold any unregistered securities in the past three years other than 7,500 shares sold to one employee in one transaction for $15.37 per share on August 4, 2005 and 189 shares sold to one employee in one transaction for $7.55 on July 13, 2005. Both of these transactions were pursuant to the exercise of options granted by companies that were acquired by United, exempt under Section 4(2) of the Securities Act because of the small number of purchasers and shares involved, the knowledge and sophistication of the purchases and the nature of the transactions.
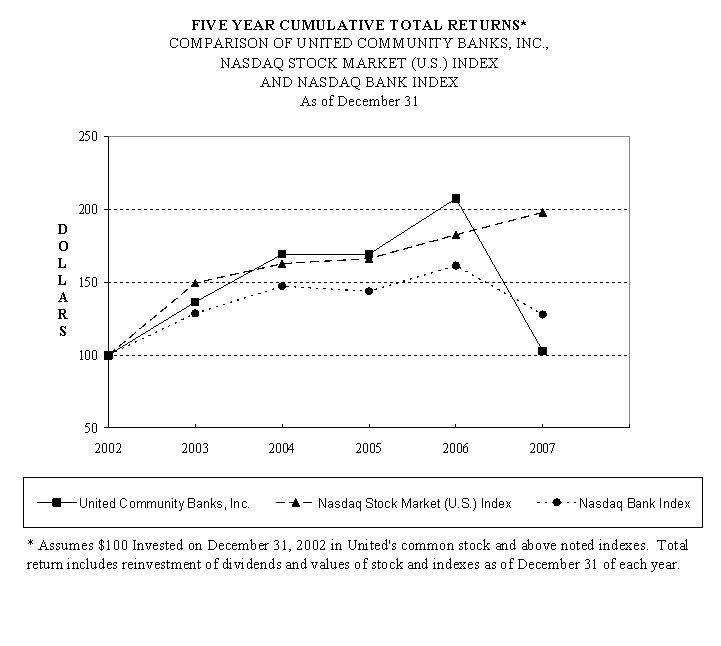
Performance Graph. Set forth below is a line graph comparing the yearly percentage change in the cumulative total shareholder return on United’s common stock against the cumulative total return on the Nasdaq Stock Market (U.S. Companies) Index and the Nasdaq Bank Stocks Index for the five-year period commencing December 31, 2002 and ending on December 31, 2007.
| | | Cumulative Total Return | |
| | | 2002 | | | 2003 | | | 2004 | | | 2005 | | | 2006 | | | 2007 | |
| United Community Banks, Inc. | | $ | 100 | | | $ | 136 | | | $ | 169 | | | $ | 169 | | | $ | 207 | | | $ | 103 | |
| Nasdaq Stock Market (U.S.) Index | | | 100 | | | | 150 | | | | 163 | | | | 166 | | | | 183 | | | | 198 | |
| Nasdaq Bank Index | | | 100 | | | | 129 | | | | 147 | | | | 144 | | | | 161 | | | | 128 | |
| ITEM 6. SELECTED FINANCIAL DATA. | | | | | | | | | | | | | | | | | | |
| UNITED COMMUNITY BANKS, INC. | | | | | | | | | | | | | | | | | | |
| Selected Financial Information | | | | | | | | | | | | | | | | | | |
| For the Years Ended December 31, | | | | | | | | | | | | | | | | | | |
| | |
| (in thousands, except per share data; | | | | | | | | | | | | | | | | | | 5 Year | |
| taxable equivalent) | | 2007 | | | 2006 | | | 2005 | | | 2004 | | | 2003 | | | 2002 | | | CAGR (4) | |
| INCOME SUMMARY | | | | | | | | | | | | | | | | | | | | | |
| Interest revenue | | $ | 550,917 | | | $ | 446,695 | | | $ | 324,225 | | | $ | 227,792 | | | $ | 198,689 | | | $ | 185,498 | | | | |
| Interest expense | | | 276,434 | | | | 208,815 | | | | 127,426 | | | | 74,794 | | | | 70,600 | | | | 76,357 | | | | |
| Net interest revenue | | | 274,483 | | | | 237,880 | | | | 196,799 | | | | 152,998 | | | | 128,089 | | | | 109,141 | | | 20% | |
Provision for loan losses (1) | | | 37,600 | | | | 14,600 | | | | 12,100 | | | | 7,600 | | | | 6,300 | | | | 6,900 | | | | |
| Fee revenue | | | 62,651 | | | | 49,095 | | | | 46,148 | | | | 39,539 | | | | 38,184 | | | | 30,734 | | | 15 | |
| Total revenue | | | 299,534 | | | | 272,375 | | | | 230,847 | | | | 184,937 | | | | 159,973 | | | | 132,975 | | | 18 | |
Operating expenses (1) | | | 190,061 | | | | 162,070 | | | | 140,808 | | | | 110,974 | | | | 97,251 | | | | 80,690 | | | 19 | |
| Income before taxes | | | 109,473 | | | | 110,305 | | | | 90,039 | | | | 73,963 | | | | 62,722 | | | | 52,285 | | | 16 | |
| Income taxes | | | 40,482 | | | | 41,490 | | | | 33,297 | | | | 26,807 | | | | 23,247 | | | | 19,505 | | | | |
| Net operating income | | | 68,991 | | | | 68,815 | | | | 56,742 | | | | 47,156 | | | | 39,475 | | | | 32,780 | | | 16 | |
| Fraud loss provision, net of tax | | | 10,998 | | | | - | | | | - | | | | - | | | | - | | | | - | | | | |
| Merger-related charges, net of tax | | | - | | | | - | | | | - | | | | 565 | | | | 1,357 | | | | - | | | | |
| Net income | | $ | 57,993 | | | $ | 68,815 | | | $ | 56,742 | | | $ | 46,591 | | | $ | 38,118 | | | $ | 32,780 | | | 12 | |
| | | | | | | | | | | | | | | | | | | | | | | | | | | | |
OPERATING PERFORMANCE (1) | | | | | | | | | | | | | | | | | | | | | | | | |
| Earnings per common share: | | | | | | | | | | | | | | | | | | | | | | | | | | | |
| Basic | | $ | 1.50 | | | $ | 1.70 | | | $ | 1.47 | | | $ | 1.31 | | | $ | 1.15 | | | $ | 1.02 | | | 8 | |
| Diluted | | | 1.48 | | | | 1.66 | | | | 1.43 | | | | 1.27 | | | | 1.12 | | | | .99 | | | 8 | |
Return on tangible equity (2)(3) | | | 14.23 | % | | | 17.52 | % | | | 18.99 | % | | | 19.74 | % | | | 19.24 | % | | | 17.88 | % | | | |
| Return on assets | | | .89 | | | | 1.09 | | | | 1.04 | | | | 1.07 | | | | 1.06 | | | | 1.11 | | | | |
| Efficiency ratio | | | 56.53 | | | | 56.35 | | | | 57.77 | | | | 57.65 | | | | 58.39 | | | | 57.72 | | | | |
| Dividend payout ratio | | | 24.00 | | | | 18.82 | | | | 19.05 | | | | 18.32 | | | | 17.39 | | | | 16.34 | | | | |
| | | | | | | | | | | | | | | | | | | | | | | | | | | | |
| GAAP PERFORMANCE | | | | | | | | | | | | | | | | | | | | | | | | | | | |
| Per common share: | | | | | | | | | | | | | | | | | | | | | | | | | | | |
| Basic earnings | | $ | 1.26 | | | $ | 1.70 | | | $ | 1.47 | | | $ | 1.29 | | | $ | 1.11 | | | $ | 1.02 | | | 4 | |
| Diluted earnings | | | 1.24 | | | | 1.66 | | | | 1.43 | | | | 1.25 | | | | 1.08 | | | | .99 | | | 5 | |
| Cash dividends declared (rounded) | .36 | | | | .32 | | | | .28 | | | | .24 | | | | .20 | | | | .17 | | | 17 | |
| Book value | | | 17.73 | | | | 14.37 | | | | 11.80 | | | | 10.39 | | | | 8.47 | | | | 6.89 | | | 21 | |
Tangible book value (3) | | | 10.94 | | | | 10.57 | | | | 8.94 | | | | 7.34 | | | | 6.52 | | | | 6.49 | | | 11 | |
| | | | | | | | | | | | | | | | | | | | | | | | | | | | |
| Key performance ratios: | | | | | | | | | | | | | | | | | | | | | | | | | | | |
Return on equity (2) | | | 7.79 | % | | | 13.28 | % | | | 13.46 | % | | | 14.39 | % | | | 14.79 | % | | | 16.54 | % | | | |
| Return on assets | | | .75 | | | | 1.09 | | | | 1.04 | | | | 1.05 | | | | 1.02 | | | | 1.11 | | | | |
| Net interest margin | | | 3.88 | | | | 4.05 | | | | 3.85 | | | | 3.71 | | | | 3.68 | | | | 3.95 | | | | |
| Dividend payout ratio | | | 28.57 | | | | 18.82 | | | | 19.05 | | | | 18.60 | | | | 18.02 | | | | 16.34 | | | | |
| Equity to assets | | | 9.61 | | | | 8.06 | | | | 7.63 | | | | 7.45 | | | | 7.21 | | | | 7.01 | | | | |
Tangible equity to assets (3) | | | 6.63 | | | | 6.32 | | | | 5.64 | | | | 5.78 | | | | 6.02 | | | | 6.60 | | | | |
| | | | | | | | | | | | | | | | | | | | | | | | | | | | |
| ASSET QUALITY | | | | | | | | | | | | | | | | | | | | | | | | | | | |
| Allowance for loan losses | | $ | 89,423 | | | $ | 66,566 | | | $ | 53,595 | | | $ | 47,196 | | | $ | 38,655 | | | $ | 30,914 | | | | |
| Non-performing assets | | | 46,258 | | | | 13,654 | | | | 12,995 | | | | 8,725 | | | | 7,589 | | | | 8,019 | | | | |
| Net charge-offs | | | 39,834 | | | | 5,524 | | | | 5,701 | | | | 3,617 | | | | 4,097 | | | | 3,111 | | | | |
| Allowance for loan losses to loans | | | 1.51 | % | | | 1.24 | % | | | 1.22 | % | | | 1.26 | % | | | 1.28 | % | | | 1.30 | % | | | |
| Non-performing assets to total assets | | | .56 | | | | .19 | | | | .22 | | | | .17 | | | | .19 | | | | .25 | | | | |
| Net charge-offs to average loans | | | .69 | | | | .12 | | | | .14 | | | | .11 | | | | .15 | | | | .14 | | | | |
| | | | | | | | | | | | | | | | | | | | | | | | | | | | |
| AVERAGE BALANCES | | | | | | | | | | | | | | | | | | | | | | | | | | | |
| Loans | | $ | 5,734,608 | | | $ | 4,800,981 | | | $ | 4,061,091 | | | $ | 3,322,916 | | | $ | 2,753,451 | | | $ | 2,239,875 | | | 21 | |
| Investment securities | | | 1,277,935 | | | | 1,041,897 | | | | 989,201 | | | | 734,577 | | | | 667,211 | | | | 464,468 | | | 22 | |
| Earning assets | | | 7,070,900 | | | | 5,877,483 | | | | 5,109,053 | | | | 4,119,327 | | | | 3,476,030 | | | | 2,761,265 | | | 21 | |
| Total assets | | | 7,730,530 | | | | 6,287,148 | | | | 5,472,200 | | | | 4,416,835 | | | | 3,721,284 | | | | 2,959,295 | | | 21 | |
| Deposits | | | 6,028,625 | | | | 5,017,435 | | | | 4,003,084 | | | | 3,247,612 | | | | 2,743,087 | | | | 2,311,717 | | | 21 | |
| Shareholders’ equity | | | 742,771 | | | | 506,946 | | | | 417,309 | | | | 329,225 | | | | 268,446 | | | | 207,312 | | | 29 | |
| Common shares - Basic | | | 45,893 | | | | 40,393 | | | | 38,477 | | | | 36,071 | | | | 34,132 | | | | 32,062 | | | | |
| Common shares - Diluted | | | 46,593 | | | | 41,575 | | | | 39,721 | | | | 37,273 | | | | 35,252 | | | | 33,241 | | | | |
| | | | | | | | | | | | | | | | | | | | | | | | | | | | |
| AT YEAR END | | | | | | | | | | | | | | | | | | | | | | | | | | | |
| Loans | | $ | 5,929,263 | | | $ | 5,376,538 | | | $ | 4,398,286 | | | $ | 3,734,905 | | | $ | 3,015,997 | | | $ | 2,381,798 | | | 20 | |
| Investment securities | | | 1,356,846 | | | | 1,107,153 | | | | 990,687 | | | | 879,978 | | | | 659,891 | | | | 559,390 | | | 19 | |
| Total assets | | | 8,207,302 | | | | 7,101,249 | | | | 5,865,756 | | | | 5,087,702 | | | | 4,068,834 | | | | 3,211,344 | | | 21 | |
| Deposits | | | 6,075,951 | | | | 5,772,886 | | | | 4,477,600 | | | | 3,680,516 | | | | 2,857,449 | | | | 2,385,239 | | | 21 | |
| Shareholders’ equity | | | 831,902 | | | | 616,767 | | | | 472,686 | | | | 397,088 | | | | 299,373 | | | | 221,579 | | | 30 | |
| Common shares outstanding | | | 46,903 | | | | 42,891 | | | | 40,020 | | | | 38,168 | | | | 35,289 | | | | 31,895 | | | 8 | |
| (1) | | Excludes pre-tax provision for fraud losses of $18 million, or $.24 per diluted common share, recorded in 2007 and pre-tax merger-related charges totaling $.9 million, or $.02 per diluted common share, recorded in 2004 and $2.1 million, or $.04 per diluted share, recorded in 2003. |
| (2) | | Net income available to common shareholders, which excludes preferred stock dividends, divided by average realized common equity which excludes accumulated other comprehensive income (loss). |
| (3) | | Excludes effect of acquisition related intangibles and associated amortization. | | | | | | | | | |
| (4) | | Compound annual growth rate. | | | | | | | | | | | | | | |
| UNITED COMMUNITY BANKS, INC. | | | | | | | | | | | | | | | | | | | | | |
| Selected Financial Information (continued) | | | | | | | | | | | | | | | | | | | | | |
| | |
| | | | | | | | | | | | | | | | | | | | | | | | | |
| | | 2007 | | | 2006 | |
| (in thousands, except per share | | Fourth | | | Third | | | Second | | | First | | | Fourth | | | Third | | | Second | | | First | |
| data; taxable equivalent) | | Quarter | | | Quarter | | | Quarter | | | Quarter | | | Quarter | | | Quarter | | | Quarter | | | Quarter | |
| INCOME SUMMARY | | | | | | | | | | | | | | | | | | | | | | | | |
| Interest revenue | | $ | 140,768 | | | $ | 144,884 | | | $ | 136,237 | | | $ | 129,028 | | | $ | 123,463 | | | $ | 116,304 | | | $ | 107,890 | | | $ | 99,038 | |
| Interest expense | | | 71,038 | | | | 73,203 | | | | 68,270 | | | | 63,923 | | | | 60,912 | | | | 55,431 | | | | 49,407 | | | | 43,065 | |
| Net interest revenue | | | 69,730 | | | | 71,681 | | | | 67,967 | | | | 65,105 | | | | 62,551 | | | | 60,873 | | | | 58,483 | | | | 55,973 | |
Provision for loan losses (1) | | | 26,500 | | | | 3,700 | | | | 3,700 | | | | 3,700 | | | | 3,700 | | | | 3,700 | | | | 3,700 | | | | 3,500 | |
| Fee revenue | | | 16,100 | | | | 15,615 | | | | 16,554 | | | | 14,382 | | | | 13,215 | | | | 12,146 | | | | 11,976 | | | | 11,758 | |
| Total revenue | | | 59,330 | | | | 83,596 | | | | 80,821 | | | | 75,787 | | | | 72,066 | | | | 69,319 | | | | 66,759 | | | | 64,231 | |
| Operating expenses | | | 49,336 | | | | 48,182 | | | | 47,702 | | | | 44,841 | | | | 42,521 | | | | 41,441 | | | | 39,645 | | | | 38,463 | |
| Income before taxes | | | 9,994 | | | | 35,414 | | | | 33,119 | | | | 30,946 | | | | 29,545 | | | | 27,878 | | | | 27,114 | | | | 25,768 | |
| Income taxes | | | 3,960 | | | | 12,878 | | | | 12,043 | | | | 11,601 | | | | 11,111 | | | | 10,465 | | | | 10,185 | | | | 9,729 | |
| Net operating income | | | 6,034 | | | | 22,536 | | | | 21,076 | | | | 19,345 | | | | 18,434 | | | | 17,413 | | | | 16,929 | | | | 16,039 | |
| Fraud loss provision, net of tax | | | 1,833 | | | | - | | | | 9,165 | | | | - | | | | - | | | | - | | | | - | | | | - | |
| Net income | | $ | 4,201 | | | $ | 22,536 | | | $ | 11,911 | | | $ | 19,345 | | | $ | 18,434 | | | $ | 17,413 | | | $ | 16,929 | | | $ | 16,039 | |
| | | | | | | | | | | | | | | | | | | | | | | | | | | | | | | | | |
OPERATING PERFORMANCE (1) | | | | | | | | | | | | | | | | | | | | | | | | | | | | | | | | |
| Per common share: | | | | | | | | | | | | | | | | | | | | | | | | | | | | | | | | |
| Basic earnings | | $ | .13 | | | $ | .47 | | | $ | .47 | | | $ | .45 | | | $ | .45 | | | $ | .43 | | | $ | .42 | | | $ | .40 | |
| Diluted earnings | | | .13 | | | | .46 | | | | .46 | | | | .44 | | | | .44 | | | | .42 | | | | .41 | | | | .39 | |
Return on tangible equity (2)(3)(4) | | | 5.06 | % | | | 17.54 | % | | | 17.52 | % | | | 17.18 | % | | | 17.49 | % | | | 17.29 | % | | | 17.68 | % | | | 17.66 | % |
Return on assets (4) | | | .29 | | | | 1.11 | | | | 1.12 | | | | 1.11 | | | | 1.10 | | | | 1.09 | | | | 1.10 | | | | 1.09 | |
| Dividend payout ratio | | | 69.23 | | | | 19.15 | | | | 19.15 | | | | 20.00 | | | | 17.78 | | | | 18.60 | | | | 19.05 | | | | 20.00 | |
| | | | | | | | | | | | | | | | | | | | | | | | | | | | | | | | | |
| GAAP PERFORMANCE MEASURES | | | | | | | | | | | | | | | | | | | | | | | | | | | | | |
| Per common share: | | | | | | | | | | | | | | | | | | | | | | | | | | | | | | | | |
| Basic earnings | | $ | .09 | | | $ | .47 | | | $ | .26 | | | $ | .45 | | | $ | .45 | | | $ | .43 | | | $ | .42 | | | $ | .40 | |
| Diluted earnings | | | .09 | | | | .46 | | | | .26 | | | | .44 | | | | .44 | | | | .42 | | | | .41 | | | | .39 | |
| Cash dividends declared | | | .09 | | | | .09 | | | | .09 | | | | .09 | | | | .08 | | | | .08 | | | | .08 | | | | .08 | |
| Book value | | | 17.73 | | | | 17.53 | | | | 16.98 | | | | 14.83 | | | | 14.37 | | | | 13.07 | | | | 12.34 | | | | 12.09 | |
Tangible book value (3) | | | 10.94 | | | | 10.82 | | | | 10.44 | | | | 11.06 | | | | 10.57 | | | | 10.16 | | | | 9.50 | | | | 9.25 | |
| | | | | | | | | | | | | | | | | | | | | | | | | | | | | | | | | |
| Key performance ratios: | | | | | | | | | | | | | | | | | | | | | | | | | | | | | | | | |
Return on equity (2)(4) | | | 2.01 | % | | | 10.66 | % | | | 7.05 | % | | | 12.47 | % | | | 13.26 | % | | | 13.22 | % | | | 13.41 | % | | | 13.25 | % |
Return on assets (4) | | | .20 | | | | 1.11 | | | | .64 | | | | 1.11 | | | | 1.10 | | | | 1.09 | | | | 1.10 | | | | 1.09 | |
Net interest margin (4) | | | 3.73 | | | | 3.89 | | | | 3.94 | | | | 3.99 | | | | 3.99 | | | | 4.07 | | | | 4.07 | | | | 4.06 | |
| Efficiency ratio | | | 57.67 | | | | 55.34 | | | | 56.59 | | | | 56.56 | | | | 55.93 | | | | 56.46 | | | | 56.27 | | | | 56.79 | |
| Dividend payout ratio | | | 100.00 | | | | 19.15 | | | | 34.62 | | | | 20.00 | | | | 17.78 | | | | 18.60 | | | | 19.05 | | | | 20.00 | |
| Equity to assets | | | 10.20 | | | | 10.32 | | | | 8.94 | | | | 8.80 | | | | 8.21 | | | | 8.04 | | | | 7.95 | | | | 8.04 | |
Tangible equity to assets (3) | | | 6.58 | | | | 6.65 | | | | 6.65 | | | | 6.66 | | | | 6.46 | | | | 6.35 | | | | 6.22 | | | | 6.24 | |
| | | | | | | | | | | | | | | | | | | | | | | | | | | | | | | | | |
| ASSET QUALITY | | | | | | | | | | | | | | | | | | | | | | | | | | | | | | | | |
| Allowance for loan losses | | $ | 89,423 | | | $ | 90,935 | | | $ | 92,471 | | | $ | 68,804 | | | $ | 66,566 | | | $ | 60,901 | | | $ | 58,508 | | | $ | 55,850 | |
| Non-performing assets | | | 46,258 | | | | 63,337 | | | | 43,601 | | | | 14,290 | | | | 13,654 | | | | 9,347 | | | | 8,805 | | | | 8,367 | |
| Net charge-offs | | | 31,012 | | | | 5,236 | | | | 2,124 | | | | 1,462 | | | | 1,930 | | | | 1,307 | | | | 1,042 | | | | 1,245 | |
| Allowance for loan losses to loans | | | 1.51 | % | | | 1.53 | % | | | 1.54 | % | | | 1.27 | % | | | 1.24 | % | | | 1.23 | % | | | 1.22 | % | | | 1.22 | % |
| Non-performing assets to total assets | | | .56 | | | | .77 | | | | .54 | | | | .20 | | | | .19 | | | | .14 | | | | .14 | | | | .14 | |
Net charge-offs to average loans (4) | | | 2.07 | | | | .35 | | | | .15 | | | | .11 | | | | .15 | | | | .11 | | | | .09 | | | | .11 | |
| | | | | | | | | | | | | | | | | | | | | | | | | | | | | | | | | |
| AVERAGE BALANCES | | | | | | | | | | | | | | | | | | | | | | | | | | | | | | | | |
| Loans | | $ | 5,940,230 | | | $ | 5,966,933 | | | $ | 5,619,950 | | | $ | 5,402,860 | | | $ | 5,134,721 | | | $ | 4,865,886 | | | $ | 4,690,196 | | | $ | 4,505,494 | |
| Investment securities | | | 1,404,796 | | | | 1,308,192 | | | | 1,242,448 | | | | 1,153,208 | | | | 1,059,125 | | | | 1,029,981 | | | | 1,039,707 | | | | 1,038,683 | |
| Earning assets | | | 7,424,992 | | | | 7,332,492 | | | | 5,915,134 | | | | 6,599,035 | | | | 6,225,943 | | | | 5,942,710 | | | | 5,758,697 | | | | 5,574,712 | |
| Total assets | | | 8,210,120 | | | | 8,083,739 | | | | 7,519,392 | | | | 7,092,710 | | | | 6,669,950 | | | | 6,350,205 | | | | 6,159,152 | | | | 5,960,801 | |
| Deposits | | | 6,151,476 | | | | 6,246,319 | | | | 5,945,633 | | | | 5,764,426 | | | | 5,517,696 | | | | 5,085,168 | | | | 4,842,389 | | | | 4,613,810 | |
| Stockholders’ equity | | | 837,195 | | | | 834,094 | | | | 672,348 | | | | 624,100 | | | | 547,419 | | | | 510,791 | | | | 489,821 | | | | 478,960 | |
| Common Shares - Basic | | | 47,203 | | | | 48,348 | | | | 44,949 | | | | 43,000 | | | | 41,096 | | | | 40,223 | | | | 40,156 | | | | 40,088 | |
| Common Shares - Diluted | | | 47,652 | | | | 48,977 | | | | 45,761 | | | | 43,912 | | | | 42,311 | | | | 41,460 | | | | 41,328 | | | | 41,190 | |
| | | | | | | | | | | | | | | | | | | | | | | | | | | | | | | | | |
| AT PERIOD END | | | | | | | | | | | | | | | | | | | | | | | | | | | | | | | | |
| Loans | | $ | 5,929,263 | | | $ | 5,952,749 | | | $ | 5,999,093 | | | $ | 5,402,198 | | | $ | 5,376,538 | | | $ | 4,965,365 | | | $ | 4,810,277 | | | $ | 4,584,155 | |
| Investment securities | | | 1,356,846 | | | | 1,296,826 | | | | 1,213,659 | | | | 1,150,424 | | | | 1,107,153 | | | | 980,273 | | | | 974,524 | | | | 983,846 | |
| Total assets | | | 8,207,302 | | | | 8,180,600 | | | | 8,087,667 | | | | 7,186,602 | | | | 7,101,249 | | | | 6,455,290 | | | | 6,331,136 | | | | 6,070,596 | |
| Deposits | | | 6,075,951 | | | | 6,154,308 | | | | 6,361,269 | | | | 5,841,687 | | | | 5,772,886 | | | | 5,309,219 | | | | 4,976,650 | | | | 4,748,438 | |
| Stockholders’ equity | | | 831,902 | | | | 833,761 | | | | 828,731 | | | | 638,456 | | | | 616,767 | | | | 526,734 | | | | 496,297 | | | | 485,414 | |
| Common shares outstanding | | | 46,903 | | | | 47,542 | | | | 48,781 | | | | 43,038 | | | | 42,891 | | | | 40,269 | | | | 40,179 | | | | 40,119 | |
| | | | | | | | | | | | | | | | | | | | | | | | | | | | | | | | | |
| (1) | Excludes effect of special $15 million fraud related loan loss provision recorded in the second quarter of 2007 and an additional $3 million in the fourth quarter of 2007. |
| (2) | Net income available to common shareholders, which excludes preferred stock dividends, divided by average realized common equity which excludes accumulated other comprehensive income (loss). |
| (3) | Excludes effect of acquisition related intangibles and associated amortization. |
| (4) | Annualized. |
ITEM 7. MANAGEMENT’S DISCUSSION AND ANALYSIS OF FINANCIAL CONDITION AND RESULTS OF OPERATIONS.
Overview
The following discussion is intended to provide insight into the financial condition and results of operations of United and its subsidiaries and should be read in conjunction with the consolidated financial statements and accompanying notes.
Net income was $58.0 million in 2007, a decrease of 16% from the $68.8 million earned in 2006. Diluted earnings per common share was $1.24 for 2007, compared with $1.66 for 2006, a decrease of 25%. The decrease from 2006 was primarily due to a more challenging economic environment that resulted in a higher provision for loan losses, a decline in the net interest margin and a special fraud-related provision for loan losses resulting from the failed real estate developments near Spruce Pine, North Carolina. Because the special provision for fraud-related losses was considered by management to be an isolated and nonrecurring event, management’s discussion will primarily refer to operating earnings and performance measures which exclude those fraud-related losses. Management believes that the presentation of operating earnings provides a meaningful basis for analyzing underlying performance trends. A reconciliation of operating earnings measures to earnings measures prepared using accounting principles generally accepted in the United States (GAAP) is shown in Table 1 on page 22 of this report.
Net operating income was $69.0 million in 2007 and was level with the $68.8 million earned in 2006. Diluted operating earnings per common share was $1.48 for 2007, compared with $1.66 for 2006, a decrease of 11%. Operating return on tangible equity for 2007 was 14.23%, compared with 17.52% for 2006. Operating return on assets for 2007 was .89% as compared to 1.09% in 2006.
Earnings for 2007 were influenced by a sharp decline in loan demand, particularly in the residential construction and housing markets. This began with problems in sub-prime lending early in the year. Although United does not participate in sub-prime lending, the slowdown in the housing market resulted in a buildup of finished home inventory as well as a surplus of finished lot inventory, particularly in the Atlanta Region market. This put stress on many residential real estate builders and developers who depend on an active housing market to sell their inventories. As a result, loan demand was down significantly in 2007 and United saw a sharp increase in credit losses. The soft housing market also affected deposit pricing as large mortgage banks , and local community banks, needing liquidity, aggressively competed for certificates of deposit, driving rates significantly above wholesale borrowings with similar terms. Competitive deposit pricing and the carrying cost of a larger base of nonperforming assets compressed the net interest margin 17 basis points to 3.88%, further affecting 2007 earnings.
The economic environment in 2006 was in sharp contrast to 2007. Earnings for 2006 were influenced by strong loan and deposit growth and rising interest rates that allowed us to engage in significant de novo branch expansion. The net interest margin increased 20 basis points to 4.05%, as rising interest rates had a positive effect on United’s slightly asset sensitive balance sheet. The local economies in United’s markets were strong, contributing to the strong loan growth.
For 2007, taxable equivalent net interest revenue of $274.5 million was up $36.6 million, or 15%, from 2006, primarily due to the acquisitions of Gwinnett Commercial Group and Southern Bancorp and strong loan growth during 2006. In 2007, loan growth slowed substantially leaving loans, absent the Gwinnett Commercial Group acquisition, only slightly above the level at December 31, 2006.
As a result of the soft housing market, credit quality measures showed deterioration in 2007. Net charge offs, excluding $18 million fraud-related Spruce Pine lot loans, were $21.8 million compared with $5.5 million in 2006. The weakening credit conditions resulted in a provision for loan losses of $37.6 million, excluding the $18 million provision related to the Spruce Pine lot loans, compared with $14.6 million in 2006. At December 31, 2007, the allowance for loan losses as a percentage of loans was 1.51% compared with 1.24% at the end of 2006. Nonperforming assets, which includes nonaccrual loans, loans past due more than 90 days and foreclosed real estate but excluding nonperforming assets related to Spruce Pine, were up $32.6 million from 2006 while loans increased $553 million over the same period, primarily due to the acquisition of Gwinnett Commercial Group. At December 31, 2007, such nonperforming assets represented .50% of total assets compared with .19% at the end of 2006. Net charge offs as a percentage of average loans were ..38%, excluding $18 million related to the Spruce Pine lot loans, compared with ..12% for 2006.
Despite the challenging economic environment, fee revenue showed strong growth in 2007. Fee revenue in 2007 increased $13.6 million, or 28%, from 2006. Although securities gains, net of losses from the prepayment of borrowings contributed to the increase, these balance sheet management activities represented only $2.2 million of the increase. Increases occurred in every category with consulting fees and brokerage fees both achieving record levels. Also contributing to the increase in fee revenue was a $50 million investment in bank owned life insurance (“BOLI”) in April 2007 that added $2.1 million to other fee revenue.
Operating expenses of $190.1 million were up $28.0 million, or 17%, from 2006. The increase resulted primarily from the acquisitions of Gwinnett Commercial Group in June 2007 and Southern Bancorp in December 2006, continued de novo expansion, higher write-downs and losses on other real estate and the new FDIC insurance assessments. Of the total $28.0 million increase in operating expenses, the two acquisitions accounted for approximately $9.0 million, higher losses on other real estate accounted for approximately $4.0 million and the new FDIC assessments were responsible for $1.7 million of the increase. In 2007, 2006 and 2005, United opened five, eight, and seven locations, respectively, resulting in higher staff, occupancy and equipment costs.
In June 2007, United completed the acquisition of Gwinnett Commercial Group, Inc., and its wholly-owned subsidiary, First Bank of the South. The company exchanged 5,691,948 shares of its common stock with a value of approximately $191.4 million and $31.5 million in cash for all of the outstanding shares of Gwinnett Commercial Group. The assets of First Bank of the South, including purchase accounting adjustments, totaled $809.2 million, and were included in United’s consolidated financial statements from the date of acquisition.
Critical Accounting Policies
The accounting and reporting policies of United and its subsidiaries are in accordance with accounting principles generally accepted in the United States and conform to general practices within the banking industry. Application of these principles requires management to make estimates or judgments that affect the amounts reported in the financial statements and the accompanying notes. These estimates are based on information available as of the date of the financial statements; accordingly, as this information changes, the financial statements could reflect different estimates or judgments. Certain policies inherently have a greater reliance on the use of estimates, and as such have a greater possibility of producing results that could be materially different than originally reported.
Estimates or judgments are necessary when assets and liabilities are required to be recorded at fair value, when a decline in the value of an asset not carried on the financial statements at fair value warrants an impairment write-down or valuation reserve to be established, or when an asset or liability needs to be recorded contingent upon future events. Carrying assets and liabilities at fair value results in more financial statement volatility. The fair values and the information used to record the valuation adjustments for certain assets and liabilities are based either on quoted market prices or are provided by other third-party sources, when available. When third-party information is not available, valuation adjustments are estimated in good faith by management primarily through the use of internal cash flow modeling techniques.
The most significant accounting policies for United are presented in Note 1 to the consolidated financial statements. These policies, along with the disclosures presented in the other financial statement notes and in this financial review, provide information on how significant assets and liabilities are valued in the financial statements and how those values are determined. Management views critical accounting policies to be those that are highly dependent on subjective or complex judgments, estimates and assumptions, and where changes in those estimates and assumptions could have a significant effect on the financial statements. Management considers the accounting policies related to the allowance for loan losses and intangible assets to be critical accounting policies.
Allowance for Loan Losses
The allowance for loan losses represents management’s estimate of probable credit losses inherent in the loan portfolio. Estimating the amount of the allowance for loan losses requires significant judgment and the use of estimates related to the amount and timing of expected future cash flows on impaired loans, estimated losses on non-impaired loans based on historical loss experience, management’s evaluation of the current loan portfolio, and consideration of current economic trends and conditions. The loan portfolio also represents the largest asset type on the consolidated balance sheet. Loan losses are charged against the allowance, while recoveries of amounts previously charged off are credited to the allowance. A provision for loan losses is charged to operations based on management’s periodic evaluation of the factors previously mentioned, as well as other pertinent factors.
The allowance for loan losses consists of an allocated component and an unallocated component. The components of the allowance for loan losses represent an estimate pursuant to either Statement of Financial Accounting Standards (SFAS) No. 5, Accounting for Contingencies, or SFAS 114, Accounting by Creditors for Impairment of a Loan. The allocated component of the allowance for loan losses reflects expected losses resulting from analyses developed through specific credit allocations for individual loans and historical loss experience for each loan category. The specific credit allocations are based on regular analyses of all loans over $500,000 where the internal credit rating is at or below a grade seven and on the “Watch List”. These analyses involve judgment in estimating the amount of loss associated with specific loans, including estimating the amount and timing of future cash flows and collateral values. The historical loss element is determined using the average of actual losses incurred over the prior two years for each type of loan. The historical loss experience is adjusted for known changes in economic conditions and credit quality trends such as changes in the amount of past due and nonperforming loans. The resulting loss allocation factors are applied to the balance of each type of loan after removing the balance of impaired loans and other specifically allocated loans from each category. The loss allocation factors are updated annually. The allocated component of the allowance for loan losses also includes consideration of concentrations of credit and changes in portfolio mix.
The unallocated portion of the allowance reflects management’s estimate of probable inherent but undetected losses within the portfolio due to uncertainties in economic conditions, delays in obtaining information, including unfavorable information about a borrower’s financial condition, the difficulty in identifying triggering events that correlate to subsequent loss rates, and risk factors that have not yet manifested themselves in loss allocation factors. In addition, the unallocated allowance includes a component that accounts for the inherent imprecision in loan loss estimation based on historical loss experience as a result of United’s growth through acquisitions, which have expanded the geographic footprint in which it operates, and changed its portfolio mix in recent years. Also, loss data representing a complete economic cycle is not available for all sectors. Uncertainty surrounding the strength and timing of economic cycles also affects estimates of loss. The historical losses used in developing loss allocation factors may not be representative of actual unrealized losses inherent in the portfolio.
There are many factors affecting the allowance for loan losses; some are quantitative while others require qualitative judgment. Although management believes its processes for determining the allowance adequately consider all the potential factors that could potentially result in credit losses, the process includes subjective elements and may be susceptible to significant change. To the extent actual outcomes differ from management estimates, additional provision for loan losses could be required that could adversely affect earnings or financial position in future periods.
Additional information on United’s loan portfolio and allowance for loan losses can be found in the sections of Management’s Discussion and Analysis titled “Asset Quality and Risk Elements” and “Nonperforming Assets” and in the sections of Part I, Item 1 titled “Lending Policy” and “Loan Review and Non-performing Assets”. Note 1 to the Consolidated Financial Statements includes additional information on United’s accounting policies related to the allowance for loan losses.
Intangible Assets
United’s intangible assets consist primarily of excess of cost over the fair value of net assets of acquired businesses (goodwill) and other identifiable intangible assets (primarily core deposit intangibles). United’s goodwill is tested for impairment annually, or more often if events or circumstances indicate impairment may exist. Adverse changes in the economic environment, declining operations of acquired business units, or other factors could result in a decline in implied fair value of excess purchase price. If the implied fair value is less than the carrying amount, a loss would be recognized to reduce the carrying amount to implied fair value. These changes or factors, when they occur, could be material to United’s operating results for any particular reporting period; the potential effect cannot be reasonably estimated.
Other identifiable intangible assets, primarily core deposit intangibles, are reviewed at least annually for events or circumstances which could affect the recoverability of the intangible asset, such as loss of core deposits, increased competition or adverse changes in the economy. To the extent an “other identifiable intangible asset” is deemed unrecoverable, an impairment loss would be recorded to reduce the carrying amount to the fair value. These events or circumstances, when they occur, could be material to United’s operating results for any particular reporting period; the potential effect cannot be reasonably estimated.
Mergers and Acquisitions
As part of its balanced growth strategy, United selectively engages in evaluation of strategic partnerships. Mergers and acquisitions present opportunities to enter new markets with an established presence and a capable management team already in place. United employs certain criteria to ensure that any merger or acquisition candidate meets strategic growth and earnings objectives that will build future franchise value for shareholders. Additionally, the criteria include ensuring that management of a potential partner shares United’s community banking philosophy of premium service quality and operates in attractive, high-growth markets with excellent opportunities for further organic growth. As part of this strategy, United completed one bank merger in 2007 and one bank merger and two branch acquisitions in 2006. United will continue to evaluate potential transactions as they are presented.
On June 1, 2007, United completed the acquisition of Gwinnett Commercial Group, Inc. (“Gwinnett”), a bank holding company headquartered in Lawrenceville, Georgia, and its wholly-owned subsidiary First Bank of the South. On June 1, 2007, Gwinnett had assets totaling $809 million, including purchase accounting related intangibles. United exchanged 5,691,948 shares of its common stock valued at $191.4 million and $31.5 million in cash for all of the outstanding shares. First Bank of the South was merged into The Bank and operates as a separate community bank, United Community Bank – Gwinnett.
On December 1, 2006, United completed the acquisition of Southern Bancorp, Inc. (“Southern”), a bank holding company headquartered in Marietta, Georgia, and its wholly owned subsidiary Southern National Bank. On December 1, 2006, Southern had assets totaling $416 million, including purchase accounting related intangibles. United exchanged 2,180,118 shares of its common stock valued at $67.8 million for all of the outstanding shares. Southern National Bank was merged into the Bank. The Cobb County location is now included with United Community Bank – Metro, and the Cherokee County location operates as a separate community bank, United Community Bank – Cherokee.
On September 22, 2006, United completed the acquisition of two western North Carolina banking locations in Sylva and Bryson City. These offices were acquired from another financial institution, and had $8 million in loans and $38 million in deposits on the date they were acquired. United paid a premium for these branches of approximately 8% of deposits. Both of these offices are located in markets where United has a presence and are natural extensions of its existing franchise.
Operating Results
Much of the discussion contained in this report is presented on an operating basis. The presentation of operating earnings excludes an $18 million fraud loss provision recorded in 2007 and merger-related charges in 2003 and 2004 that are considered non-recurring. The presentation of operating earnings is therefore not consistent with generally accepted accounting principles (“GAAP”).
In June 2007, the North Carolina Attorney General obtained a receiver to take custody of the assets of the developers of two failed real estate developments near Spruce Pine, North Carolina, citing possible fraud on the part of the developers. United had loans to 83 individual borrowers totaling $23.6 million secured by undeveloped lots in these developments. United was one of twelve banks that had loaned money to borrowers to finance the purchase of lots. The loans were made to appropriately qualified borrowers in accordance with our standard underwriting procedures. At the time the loans were made, we were not aware that most of the borrowers were simultaneously obtaining loans for additional lots at other banks and thereby taking on debt possibly beyond their repayment ability. We were also unaware that the borrowers’ down payments were not paid in cash as indicated on the closing documents, but were financed by a second mortgage from the developer and that the developer agreed to service the borrowers’ debts. We also subsequently learned that the appraisals relied upon in the underwriting process had been inflated by using comparable sales that were not at arms length to persons related to the developer and that many of the lots were subdivided into parcels that are too small to be used for their intended purpose. United recognized a provision for fraud-related loan losses of $18 million in 2007 related to these loans and charged-off an equal amount of loans. The special provision reduced net income by $11 million and reduced diluted earnings per share by $.24 in 2007.
Merger-related charges in 2007 and 2006 related to the acquisitions of Gwinnett, Southern and the two North Carolina branches were insignificant and are therefore not shown separately. Pre-tax merger-related charges of $.9 million and $2.1 million were incurred in 2004 and 2003, respectively. These charges decreased net income by $.6 million and $1.4 million and diluted earnings per share by $.02 and $.04, respectively, for 2004 and 2003.
Management included non-GAAP net operating income because it believes it is useful for evaluating United’s operations and performance over periods of time, as well as in managing and evaluating United’s business and in discussions about United’s operations and performance. Net operating income excludes the pre-tax effect of the special $18 million fraud-related provision for loan losses in 2007 and the merger-related charges in 2003 and 2004 because management believes that the circumstances leading to the provision and such charges were isolated, non-recurring events and do not reflect overall trends in United’s earnings and financial performance. Management believes this non-GAAP net operating income provides users of United’s financial information with a meaningful measure for assessing United’s financial results and credit trends, as well as comparison to financial results for prior periods.
The following is a reconciliation of net operating income to GAAP net income. There were no charges incurred in 2006, 2005 or 2002 that were excluded from the presentation of operating earnings.
| Table 1 - Operating Earnings to GAAP Earnings Reconciliation | | | | | | | | | | | | | |
| (in thousands, except per share data) | | | | | | | | | | | | | | | | | | |
| | |
| | | Fourth | | | Third | | | Second | | | | |
| | | Quarter | | | Quarter | | | Quarter | | | Years Ended December 31, | |
| | | 2007 | | | 2007 | | | 2007 | | | 2007 | | | 2004 | | | 2003 | |
| | | | | | | | | | | | | | | | | | | |
| Special provision for fraud related loan losses | | $ | 3,000 | | | $ | - | | | $ | 15,000 | | | $ | 18,000 | | | $ | - | | | $ | - | |
| | | | | | | | | | | | | | | | | | | | | | | | | |
| Merger-related charges included in expenses: | | | | | | | | | | | | | | | | | | | | | | | | |
| Salaries and employee benefits - severance and related costs | | | - | | | | - | | | | - | | | | - | | | | 203 | | | | 135 | |
| Professional fees | | | - | | | | - | | | | - | | | | - | | | | 407 | | | | 885 | |
| Contract termination costs | | | - | | | | - | | | | - | | | | - | | | | 119 | | | | 566 | |
| Other merger-related expenses | | | - | | | | - | | | | - | | | | - | | | | 141 | | | | 502 | |
| Total merger-related charges | | | - | | | | - | | | | - | | | | - | | | | 870 | | | | 2,088 | |
| Pre-tax earnings impact of non-operating charges | | | 3,000 | | | | - | | | | 15,000 | | | | 18,000 | | | | 870 | | | | 2,088 | |
| Income tax effect of special provision | | | 1,167 | | | | - | | | | 5,835 | | | | 7,002 | | | | 305 | | | | 731 | |
| After-tax effect of special provision | | $ | 1,833 | | | $ | - | | | $ | 9,165 | | | $ | 10,998 | | | $ | 565 | | | $ | 1,357 | |
| | | | | | | | | | | | | | | | | | | | | | | | | |
| Net Income Reconciliation | | | | | | | | | | | | | | | | | | | | | | | | |
| Operating net income | | $ | 6,034 | | | $ | 22,536 | | | $ | 21,076 | | | $ | 68,991 | | | $ | 47,156 | | | $ | 39,475 | |
| After-tax effect of special provision and merger-related charges | | | (1,833 | ) | | | - | | | | (9,165 | ) | | | (10,998 | ) | | | (565 | ) | | | (1,357 | ) |
| Net income (GAAP) | | $ | 4,201 | | | $ | 22,536 | | | $ | 11,911 | | | $ | 57,993 | | | $ | 46,591 | | | $ | 38,118 | |
| | | | | | | | | | | | | | | | | | | | | | | | | |
| Basic Earnings Per Share Reconciliation | | | | | | | | | | | | | | | | | | | | | | | | |
| Basic operating earnings per share | | $ | .13 | | | $ | .47 | | | $ | .47 | | | $ | 1.50 | | | $ | 1.31 | | | $ | 1.15 | |
| Per share effect of special provision and merger-related charges | | | (.04 | ) | | | - | | | | (.21 | ) | | | (.24 | ) | | | (.02 | ) | | | (.04 | ) |
| Basic earnings per share (GAAP) | | $ | .09 | | | $ | .47 | | | $ | .26 | | | $ | 1.26 | | | $ | 1.29 | | | $ | 1.11 | |
| | | | | | | | | | | | | | | | | | | | | | | | | |
| Diluted Earnings Per Share Reconciliation | | | | | | | | | | | | | | | | | | | | | | | | |
| Diluted operating earnings per share | | $ | .13 | | | $ | .46 | | | $ | .46 | | | $ | 1.48 | | | $ | 1.27 | | | $ | 1.12 | |
| Per share effect of special provision and merger-related charges | | | (.04 | ) | | | - | | | | (.20 | ) | | | (.24 | ) | | | (.02 | ) | | | (.04 | ) |
| Diluted earnings per share (GAAP) | | $ | .09 | | | $ | .46 | | | $ | .26 | | | $ | 1.24 | | | $ | 1.25 | | | $ | 1.08 | |
| | | | | | | | | | | | | | | | | | | | | | | | | |
| Provision for Loan Losses Reconciliation | | | | | | | | | | | | | | | | | | | | | | | | |
| Operating provision for loan losses | | $ | 26,500 | | | $ | 3,700 | | | $ | 3,700 | | | $ | 37,600 | | | $ | 7,600 | | | $ | 6,300 | |
| Special provision for fraud related loan losses | | | 3,000 | | | | - | | | | 15,000 | | | | 18,000 | | | | - | | | | - | |
| Provision for loan losses (GAAP) | | $ | 29,500 | | | $ | 3,700 | | | $ | 18,700 | | | $ | 55,600 | | | $ | 7,600 | | | $ | 6,300 | |
| | | | | | | | | | | | | | | | | | | | | | | | | |
| Nonperforming Assets Reconciliation | | | | | | | | | | | | | | | | | | | | | | | | |
| Nonperforming assets excluding fraud-related assets | | $ | 40,956 | | | $ | 39,761 | | | $ | 19,968 | | | $ | 40,956 | | | $ | 8,725 | | | $ | 7,589 | |
| Fraud-related loans and OREO included in nonperforming assets | | | 5,302 | | | | 23,576 | | | | 23,633 | | | | 5,302 | | | | - | | | | - | |
| Nonperforming assets (GAAP) | | $ | 46,258 | | | $ | 63,337 | | | $ | 43,601 | | | $ | 46,258 | | | $ | 8,725 | | | $ | 7,589 | |
| | | | | | | | | | | | | | | | | | | | | | | | | |
| Allowance for Loan Losses Reconciliation | | | | | | | | | | | | | | | | | | | | | | | | |
| Allowance for loan losses excluding special fraud-related allowance | | $ | 89,423 | | | $ | 75,935 | | | $ | 77,471 | | | $ | 89,423 | | | $ | 47,196 | | | $ | 38,655 | |
| Fraud-related allowance for loan losses | | | - | | | | 15,000 | | | | 15,000 | | | | - | | | | - | | | | - | |
| Allowance for loan losses (GAAP) | | $ | 89,423 | | | $ | 90,935 | | | $ | 92,471 | | | $ | 89,423 | | | $ | 47,196 | | | $ | 38,655 | |
| | | | | | | | | | | | | | | | | | | | | | | | | |
| Net Charge Offs Reconciliation | | | | | | | | | | | | | | | | | | | | | | | | |
| Net charge offs excluding charge off of fraud-related loans | | $ | 13,012 | | | $ | 5,236 | | | $ | 2,124 | | | $ | 21,834 | | | $ | 3,617 | | | $ | 4,097 | |
| Fraud-related loans charged off | | | 18,000 | | | | - | | | | - | | | | 18,000 | | | | - | | | | - | |
| Net charge offs (GAAP) | | $ | 31,012 | | | $ | 5,236 | | | $ | 2,124 | | | $ | 39,834 | | | $ | 3,617 | | | $ | 4,097 | |
| | | | | | | | | | | | | | | | | | | | | | | | | |
| Allowance for Loan Losses to Loans Ratio Reconciliation | | | | | | | | | | | | | | | | | | | | | |
| Allowance for loan losses to loans ratio excluding fraud-related allowance | | | 1.51 | % | | | 1.28 | % | | | 1.29 | % | | | 1.51 | % | | | 1.26 | % | | | 1.28 | % |
| Portion of allowance assigned to fraud-related loans | | | - | | | | .25 | | | | .25 | | | | - | | | | - | | | | - | |
| Allowance for loan losses to loans ratio (GAAP) | | | 1.51 | % | | | 1.53 | % | | | 1.54 | % | | | 1.51 | % | | | 1.26 | % | | | 1.28 | % |
| | | | | | | | | | | | | | | | | | | | | | | | | |
| Nonperforming Assets to Total Assets Ratio Reconciliation | | | | | | | | | | | | | | | | | | | | | |
| Nonperforming assets to total assets ratio excluding fraud-related assets | | | .50 | % | | | .49 | % | | | .25 | % | | | .50 | % | | | .17 | % | | | .19 | % |
| Fraud-related nonperforming assets | | | .06 | | | | .28 | | | | .29 | | | | .06 | | | | - | | | | - | |
| Nonperforming assets to total assets ratio (GAAP) | | | .56 | % | | | .77 | % | | | .54 | % | | | .56 | % | | | .17 | % | | | .19 | % |
| | | | | | | | | | | | | | | | | | | | | | | | | |
| Net Charge Offs to Average Loans Ratio Reconciliation | | | | | | | | | | | | | | | | | | | | | |
| Net charge offs to average loans ratio excluding fraud-related loans | | | .87 | % | | | .35 | % | | | .15 | % | | | .38 | % | | | .11 | % | | | .15 | % |
| Charge offs of fraud-related loans | | | 1.20 | | | | - | | | | - | | | | .31 | | | | - | | | | - | |
| Net charge offs to average loans ratio (GAAP) | | | 2.07 | % | | | .35 | % | | | .15 | % | | | .69 | % | | | .11 | % | | | .15 | % |
| | | | | | | | | | | | | | | | | | | | | | | | | |
| Operating Expenses Reconciliation | | | | | | | | | | | | | | | | | | | | | | | | |
| Operating expenses (operating basis) | | $ | 49,336 | | | $ | 47,702 | | | $ | 47,702 | | | $ | 190,061 | | | $ | 110,974 | | | $ | 97,251 | |
| Merger-related charges | | | - | | | | - | | | | - | | | | - | | | | 870 | | | | 2,088 | |
| Operating expenses (GAAP) | | $ | 49,336 | | | $ | 47,702 | | | $ | 47,702 | | | $ | 190,061 | | | $ | 111,844 | | | $ | 99,339 | |
Results of Operations
The remainder of this financial discussion focuses on operating earnings, which exclude the fraud-related provision in 2007 and merger-related charges in 2003 and 2004, except for the discussion of income taxes. Operating and GAAP earnings were the same in 2006, 2005 and 2002. For additional information on operating earnings measures, refer to the preceding section on “Operating Results”.
Net Interest Revenue (Taxable Equivalent)
Net interest revenue (the difference between the interest earned on assets and the interest paid on deposits and other liabilities) is the single largest component of United’s revenue. United actively manages this revenue source to provide an optimal level of revenue while balancing interest rate, credit, and liquidity risks. Net interest revenue totaled $274.5 million in 2007, an increase of $36.6 million, or 15%, from the level recorded in 2006. Net interest revenue for 2006 increased $41.1 million, or 21%, over the 2005 level.
The main drivers of the increase in net interest revenue for 2007 were loan growth due to the acquisition of Gwinnett in June, 2007, the acquisition of Southern National in December 2006 and core loan growth during 2006. Average loans increased $934 million, or 19%, from last year. The average yield on loans increased 18 basis points reflecting the rising prime lending rate through June, 2006, on United’s predominantly prime-based loan portfolio. Year-end loan balances increased $553 million from 2006, resulting in a 10% growth rate. This growth includes $534 million from the acquisition of Gwinnett. Core loan growth slowed substantially in 2007 reflecting weakness in the housing market, particularly in the Atlanta Region. Aside from the Atlanta Region, loan growth continued in our other markets, although at a slower pace than in prior years. Excluding the acquisition of Gwinnett, loan volume in the Atlanta Region was down $137 million from 2006. In our other markets of North Georgia, western North Carolina, east Tennessee and coastal Georgia, loans were up $26 million, $33 million, $39 million and $58 million, respectively.
Average interest-earning assets for the year increased $1.2 billion, or 20%, over 2006. The increase reflects the acquisitions and core loan growth in 2006, as well as a 23% increase in the investment securities portfolio. The majority of the increase in interest-earning assets was funded by interest-bearing sources, as the increase in average interest-bearing liabilities for the year was $1.1 billion over 2006. The average yield on interest-earning assets for 2007 was 7.79% up from 7.60% in 2006 reflecting the effect of higher short-term interest rates on United’s prime-based loans.
The banking industry uses two key ratios to measure relative profitability of net interest revenue, which are the interest rate spread and the net interest margin. The interest rate spread measures the difference between the average yield on interest earning assets and the average rate paid on interest bearing liabilities. The interest rate spread eliminates the effect of non-interest-bearing deposits and other non-interest bearing funding sources and gives a direct perspective on the effect of market interest rate movements. The net interest margin is an indication of the profitability of a company’s investments, and is defined as net interest revenue as a percentage of total average interest earning assets which includes the positive effect of funding a portion of interest earning assets with customers’ non-interest bearing deposits and with stockholders’ equity.
For 2007, 2006 and 2005, United’s net interest spread was 3.34%, 3.50% and 3.47%, respectively, while the net interest margin was 3.88%, 4.05% and 3.85%, respectively. Both the net interest margin and net interest spread fell in 2007 due to the increase in nonperforming assets, aggressive competitive pricing for deposits and the effect of the Federal Reserve’s action in lowering short-term rates in the second half of 2007 on United’s slightly asset-sensitive balance sheet. During most of the second half of 2007, there was an imbalance between LIBOR and retail certificate of deposit (“CD”) rates, which did not allow us to lower CD rates proportionately with the Fed Rate movements. This contributed to our margin compression in 2007. In 2006, United was able to significantly increase its liquidity by gathering CDs at rates below comparable wholesale borrowings. Because United entered into 2007 with excess liquidity, we were able to avoid some of the aggressive CD pricing, and related margin compression, by allowing higher priced, non-relationship CDs to leave the bank in favor of lower priced wholesale borrowings.
The average rate on interest-bearing liabilities for 2007 was 4.45%, up from 4.10%, reflecting the effect of rising rates on United’s floating rate liabilities, higher deposit pricing and a changing deposit mix with a higher portion of our overall funding coming from interest-bearing sources.
The following table shows the relationship between interest revenue and interest expense and the average balances of interest-earning assets and interest-bearing liabilities.
| Table 2 - Average Consolidated Balance Sheet and Net Interest Margin Analysis | | | | | | | | | | |
| For the Years Ended December 31, | | | | | | | | | | | | | | | | | | | | |
| (In thousands, taxable equivalent) | | | | | | | | | | | | | | | | | | | | |
| | | 2007 | | | 2006 | | | 2005 | |
| | | Average | | | | | | Avg. | | | Average | | | | | | Avg. | | | Average | | | | | | Avg. | |
| | | Balance | | | Interest | | | Rate | | | Balance | | | Interest | | | Rate | | | Balance | | | Interest | | | Rate | |
| Assets: | | | | | | | | | | | | | | | | | | | | | | | | | | | |
| Interest-earning assets: | | | | | | | | | | | | | | | | | | | | | | | | | | | |
Loans (1)(2) | | $ | 5,734,608 | | | $ | 481,590 | | | 8.40% | | | $ | 4,800,981 | | | $ | 394,439 | | | 8.22% | | | $ | 4,061,091 | | | $ | 278,158 | | | 6.85% | |
Taxable securities (3) | | | 1,236,595 | | | | 64,377 | | | 5.21 | | | | 995,172 | | | | 47,149 | | | 4.74 | | | | 940,411 | | | | 40,195 | | | 4.27 | |
Tax-exempt securities (1)(3) | | | 41,340 | | | | 2,826 | | | 6.84 | | | | 46,725 | | | | 3,240 | | | 6.93 | | | | 48,790 | | | | 3,433 | | | 7.04 | |
| Federal funds sold and other | | | | | | | | | | | | | | | | | | | | | | | | | | | | | | | | | | | |
| interest-earning assets | | | 58,357 | | | | 2,124 | | | 3.64 | | | | 34,605 | | | | 1,867 | | | 5.40 | | | | 58,761 | | | | 2,439 | | | 4.15 | |
| Total interest-earning assets | | | 7,070,900 | | | | 550,917 | | | 7.79 | | | | 5,877,483 | | | | 446,695 | | | 7.60 | | | | 5,109,053 | | | | 324,225 | | | 6.35 | |
| Non-interest-earning assets: | | | | | | | | | | | | | | | | | | | | | | | | | | | | | | | | | | | |
| Allowance for loan losses | | | (81,378 | ) | | | | | | | | | | | (59,376 | ) | | | | | | | | | | | (50,710 | ) | | | | | | | |
| Cash and due from banks | | | 135,021 | | | | | | | | | | | | 122,268 | | | | | | | | | | | | 105,488 | | | | | | | | |
| Premises and equipment | | | 164,153 | | | | | | | | | | | | 123,865 | | | | | | | | | | | | 105,433 | | | | | | | | |
Other assets (3) | | | 441,834 | | | | | | | | | | | | 222,908 | | | | | | | | | | | | 202,936 | | | | | | | | |
| Total assets | | $ | 7,730,530 | | | | | | | | | | | $ | 6,287,148 | | | | | | | | | | | $ | 5,472,200 | | | | | | | | |
| | | | | | | | | | | | | | | | | | | | | | | | | | | | | | | | | | | | |
| Liabilities and Shareholders' Equity: | | | | | | | | | | | | | | | | | | | | | | | | | | | | | | | | | | | |
| Interest-bearing liabilities: | | | | | | | | | | | | | | | | | | | | | | | | | | | | | | | | | | | |
| Interest-bearing deposits: | | | | | | | | | | | | | | | | | | | | | | | | | | | | | | | | | | | |
| NOW | | $ | 1,406,655 | | | $ | 45,142 | | | 3.21 | | | $ | 1,115,434 | | | $ | 30,549 | | | 2.74 | | | $ | 978,046 | | | $ | 16,390 | | | 1.68 | |
| Money market | | | 399,838 | | | | 15,396 | | | 3.85 | | | | 202,477 | | | | 7,496 | | | 3.70 | | | | 162,848 | | | | 2,804 | | | 1.72 | |
| Savings deposits | | | 188,560 | | | | 1,653 | | | .88 | | | | 172,698 | | | | 928 | | | .54 | | | | 175,648 | | | | 791 | | | .45 | |
| Time deposits less than $100,000 | | | 1,619,279 | | | | 79,333 | | | 4.90 | | | | 1,410,869 | | | | 61,676 | | | 4.37 | | | | 1,066,734 | | | | 32,334 | | | 3.03 | |
| Time deposits greater than $100,000 | | | 1,377,915 | | | | 71,467 | | | 5.19 | | | | 1,134,414 | | | | 54,304 | | | 4.79 | | | | 708,081 | | | | 25,083 | | | 3.54 | |
| Brokered deposits | | | 337,376 | | | | 16,600 | | | 4.92 | | | | 334,243 | | | | 14,344 | | | 4.29 | | | | 319,372 | | | | 9,551 | | | 2.99 | |
| Total interest-bearing deposits | | | 5,329,623 | | | | 229,591 | | | 4.31 | | | | 4,370,135 | | | | 169,297 | | | 3.87 | | | | 3,410,729 | | | | 86,953 | | | 2.55 | |
| Federal funds purchased, | | | | | | | | | | | | | | | | | | | | | | | | | | | | | | | | | | | |
| repurchase agreeements, | | | | | | | | | | | | | | | | | | | | | | | | | | | | | | | | | | | |
| & other short-term borrowings | | | 308,372 | | | | 16,236 | | | 5.27 | | | | 140,544 | | | | 7,319 | | | 5.21 | | | | 157,137 | | | | 5,304 | | | 3.38 | |
| Federal Home Loan Bank advances | | | 455,620 | | | | 22,013 | | | 4.83 | | | | 465,820 | | | | 23,514 | | | 5.05 | | | | 750,841 | | | | 26,633 | | | 3.55 | |
| Long-term debt | | | 122,555 | | | | 8,594 | | | 7.01 | | | | 112,135 | | | | 8,685 | | | 7.75 | | | | 111,869 | | | | 8,536 | | | 7.63 | |
| Total borrowed funds | | | 886,547 | | | | 46,843 | | | 5.28 | | | | 718,499 | | | | 39,518 | | | 5.50 | | | | 1,019,847 | | | | 40,473 | | | 3.97 | |
| Total interest-bearing liabilities | | | 6,216,170 | | | | 276,434 | | | 4.45 | | | | 5,088,634 | | | | 208,815 | | | 4.10 | | | | 4,430,576 | | | | 127,426 | | | 2.88 | |
| Non-interest-bearing liabilities: | | | | | | | | | | | | | | | | | | | | | | | | | | | | | | | | | | | |
| Non-interest-bearing deposits | | | 699,002 | | | | | | | | | | | | 647,300 | | | | | | | | | | | | 592,355 | | | | | | | | |
| Other liabilities | | | 72,587 | | | | | | | | | | | | 44,268 | | | | | | | | | | | | 31,960 | | | | | | | | |
| Total liabilities | | | 6,987,759 | | | | | | | | | | | | 5,780,202 | | | | | | | | | | | | 5,054,891 | | | | | | | | |
| Shareholders' equity | | | 742,771 | | | | | | | | | | | | 506,946 | | | | | | | | | | | | 417,309 | | | | | | | | |
| Total liabilities | | | | | | | | | | | | | | | | | | | | | | | | | | | | | | | | | | | |
| and shareholders' equity | | $ | 7,730,530 | | | | | | | | | | | $ | 6,287,148 | | | | | | | | | | | $ | 5,472,200 | | | | | | | | |
| Net interest revenue | | | | | | $ | 274,483 | | | | | | | | | | | $ | 237,880 | | | | | | | | | | | $ | 196,799 | | | | |
| Net interest-rate spread | | | | | | | | | | 3.34% | | | | | | | | | | | 3.50% | | | | | | | | | | | 3.47% | |
Net interest margin (4) | | | | | | | | | | 3.88% | | | | | | | | | | | 4.05% | | | | | | | | | | | 3.85% | |
| | | | | | | | | | | | | | | | | | | | | | | | | | | | | | | | | | | | |
| | | | | | | | | | | | | | | | | | | | | | | | | | | | | | | | | | | | |
| (1) Interest revenue on tax-exempt securities and loans has been increased to reflect comparable interest on taxable securities and loans. | | | |
| The rate used was 39%, reflecting the statutory federal rate and the federal tax adjusted state tax rate. | | | | | | | | |
| (2) Included in the average balance of loans outstanding are loans where the accrual of interest has been discontinued. | | | | | |
| (3) Securities available for sale are shown at amortized cost. Pretax unrealized losses of $8.1 million, $17.5 million and $2.7 million in 2007, 2006 and | |
| 2005, respectively, are included in other assets for purposes of this presentation. | | | | | | | | | | | | |
| (4) Net interest margin is taxable equivalent net-interest revenue divided by average interest-earning assets. | | | | | | | | |
The following table shows the relative effect on net interest revenue of changes in the average outstanding balances (volume) of earning assets and interest bearing liabilities and the rates earned and paid by United on such assets and liabilities.
| Table 3 - Change in Interest Revenue and Interest Expense | | | | | | | | | | | | | |
| (in thousands, taxable equivalent) | | | | | | | | | | | | | | | | | | |
| | | | | | | | | | | | | | | | | | | |
| | | 2007 Compared to 2006 | | | 2006 Compared to 2005 | |
| | | Increase (decrease) | | | Increase (decrease) | |
| | | due to changes in | | | due to changes in | |
| | | Volume | | | Rate | | | Total | | | Volume | | | Rate | | | Total | |
| Interest-earning assets: | | | | | | | | | | | | | | | | | | |
| Loans | | $ | 78,233 | | | $ | 8,918 | | | $ | 87,151 | | | $ | 55,504 | | | $ | 60,777 | | | $ | 116,281 | |
| Taxable securities | | | 12,241 | | | | 4,987 | | | | 17,228 | | | | 2,429 | | | | 4,525 | | | | 6,954 | |
| Tax-exempt securities | | | (370 | ) | | | (44 | ) | | | (414 | ) | | | (143 | ) | | | (50 | ) | | | (193 | ) |
| Federal funds sold and other | | | | | | | | | | | | | | | | | | | | | | | | |
| interest-earning assets | | | 999 | | | | (742 | ) | | | 257 | | | | (1,177 | ) | | | 605 | | | | (572 | ) |
| Total interest-earning assets | | | 91,103 | | | | 13,119 | | | | 104,222 | | | | 56,613 | | | | 65,857 | | | | 122,470 | |
| | | | | | | | | | | | | | | | | | | | | | | | | |
| Interest-bearing liabilities: | | | | | | | | | | | | | | | | | | | | | | | | |
| Interest-bearing deposits: | | | | | | | | | | | | | | | | | | | | | | | | |
| NOW | | | 8,802 | | | | 5,791 | | | | 14,593 | | | | 2,567 | | | | 11,592 | | | | 14,159 | |
| Money Market | | | 7,588 | | | | 312 | | | | 7,900 | | | | 819 | | | | 3,873 | | | | 4,692 | |
| Savings deposits | | | 92 | | | | 633 | | | | 725 | | | | (13 | ) | | | 150 | | | | 137 | |
| Time deposits less than $100,000 | | | 9,716 | | | | 7,941 | | | | 17,657 | | | | 12,377 | | | | 16,965 | | | | 29,342 | |
| Time deposits greater than $100,000 | | | 12,357 | | | | 4,806 | | | | 17,163 | | | | 18,453 | | | | 10,768 | | | | 29,221 | |
| Brokered deposits | | | 136 | | | | 2,120 | | | | 2,256 | | | | 463 | | | | 4,330 | | | | 4,793 | |
| Total interest-bearing deposits | | | 38,691 | | | | 21,603 | | | | 60,294 | | | | 34,666 | | | | 47,678 | | | | 82,344 | |
| Federal funds purchased, repurchase agreements | | | | | | | | | | | | | | | | | | | | | |
| & other short-term borrowings | | | 8,798 | | | | 119 | | | | 8,917 | | | | (610 | ) | | | 2,625 | | | | 2,015 | |
| Federal Home Loan Bank advances | | | (507 | ) | | | (994 | ) | | | (1,501 | ) | | | (12,133 | ) | | | 9,014 | | | | (3,119 | ) |
| Long-term debt | | | 769 | | | | (860 | ) | | | (91 | ) | | | 20 | | | | 129 | | | | 149 | |
| Total borrowed funds | | | 9,060 | | | | (1,735 | ) | | | 7,325 | | | | (12,723 | ) | | | 11,768 | | | | (955 | ) |
| Total interest-bearing liabilities | | | 47,751 | | | | 19,868 | | | | 67,619 | | | | 21,943 | | | | 59,446 | | | | 81,389 | |
| | | | | | | | | | | | | | | | | | | | | | | | | |
| Increase in net interest revenue | | $ | 43,352 | | | $ | (6,749 | ) | | $ | 36,603 | | | $ | 34,670 | | | $ | 6,411 | | | $ | 41,081 | |
| | | | | | | | | | | | | | | | | | | | | | | | | |
Any variance attributable jointly to volume and rate changes is allocated to the volume and rate variance in proportion to the relationship of the absolute dollar amount of the change in each.
Provision for Loan Losses
Excluding the $18 million special provision for fraud-related loan losses, the provision for loan losses was $37.6 million in 2007, compared with $14.6 million in 2006 and $12.1 million in 2005. As a percentage of average outstanding loans, the provision was ..66%, .30% and .30%, respectively, in 2007, 2006 and 2005. The ratio of net loan charge-offs to average outstanding loans for 2007, excluding the $18 million in fraud-related charge-offs, was .38%, compared with .12% for 2006 and ..14% for 2005. The provision for loan losses for each year is the amount management believes is necessary to position the allowance for loan losses at an amount adequate to absorb losses inherent in the loan portfolio as of the balance sheet date. The increase in the provision for loan losses in 2007 reflects the weak housing market and its effect on United’s residential construction portfolio, primarily in the Atlanta Region market.
The provision for loan losses is based on management’s evaluation of inherent risks in the loan portfolio and the corresponding analysis of the allowance for loan losses. Additional discussions on loan quality and the allowance for loan losses are included in the Asset Quality section of this report, Note 1 to the Consolidated Financial Statements, and above in the Critical Accounting Policies section of this report.
Fee Revenue
Fee revenue for 2007 was $62.7 million, compared with $49.1 million in 2006 and $46.1 million in 2005. The following table presents the components of fee revenue.
| Table 4 - Fee Revenue | | | | | | | | | | | | | |
| For the Years Ended December 31, | | | | | | | | | | | | | |
| (in thousands) | | | | | | | | | | | | | |
| | | | | | | | | | | | Change | | |
| | | 2007 | | | 2006 | | | 2005 | | | 2007-2006 | | |
| Service charges and fees | | $ | 31,433 | | | $ | 27,159 | | | $ | 25,137 | | | 16% | | |
| Mortgage loan and related fees | | | 8,537 | | | | 7,303 | | | | 7,330 | | | 17 | | |
| Consulting fees | | | 8,946 | | | | 7,291 | | | | 6,609 | | | 23 | | |
| Brokerage fees | | | 4,095 | | | | 3,083 | | | | 2,570 | | | 33 | | |
| Securities gains (losses), net | | | 3,182 | | | | (643 | ) | | | (809 | ) | | | | | |
| Losses on prepayment of borrowings | | | (2,242 | ) | | | (636 | ) | | | - | | | | | | |
| Other | | | 8,700 | | | | 5,538 | | | | 5,311 | | | 57 | | |
| Total fee revenue | | $ | 62,651 | | | $ | 49,095 | | | $ | 46,148 | | | 28 | | |
| | | | | | | | | | | | | | | | | | |
Comparability between current and prior years is affected by the acquisitions completed over the last 36 months. Earnings for acquired companies are included in consolidated earnings after their respective acquisition dates.
Service charges and fees of $31.4 million were up $4.3 million, or 16%, from 2006. This increase was primarily due to growth in transactions and new accounts from our core deposit programs, growth in fees on deposit accounts, and cross-selling of other products and services. The growth in the number of accounts and higher transaction activity was reflected in the increase in ATM and debit card revenue that was up $1.5 million, or 26% from 2006. With the growth in the customer base, service charges and fees on deposit accounts for 2006 increased 8% from 2005.
Mortgage loan and related fees of $8.6 million were up $1.2 million, or 17%, from 2006. In 2007, United closed 2,234 mortgage loans totaling $410 million compared with 2,117 loans totaling $365 million in 2006. Substantially all these originated residential mortgages were sold into the secondary market, including the right to service the loans.
Consulting fees of $8.9 million were up $1.6 million, or 23%, from 2006. The increase was primarily due to the continued growth in risk management and strategic bank assessment services practices at our Brintech subsidiary.
Brokerage fees increased $1.0 million, or 33% from 2006. The increase in brokerage fees for each year was due to strong market activity and growth in customers, particularly from 401(k) rollovers.
United incurred net securities gains of $3.2 million during 2007, which resulted from balance sheet management activities. The 2007 securities gains allowed us to reduce our long-term borrowing costs by prepaying a Federal Home Loan Bank advance. In 2006, similar balance sheet management activities resulted in $643,000 in net securities losses, and $636,000 in losses from the prepayment of Federal Home Loan Bank advances.
Other fee revenue of $8.7 million increased $3.2 million, or 57%, from 2006. The increase was primarily due to an additional investment in BOLI. In April 2007, United purchased $50 million in BOLI which added $2.1 million to other fee revenue in 2007.
Operating Expense
Operating expenses were $190.1 million in 2007 as compared to $162.1 million in 2006 and $140.8 million in 2005. The following table presents the components of operating expenses.
| Table 5 - Operating Expenses | | | | | | | | | | | | |
| For the Years Ended December 31, | | | | | | | | | | | | |
| (in thousands) | | | | | | | | | | | Change | |
| | | 2007 | | | 2006 | | | 2005 | | | 2007-2006 | |
| Salaries and employee benefits | | $ | 115,153 | | | $ | 100,964 | | | $ | 84,854 | | | 14% | |
| Communications and equipment | | | 15,483 | | | | 15,071 | | | | 13,157 | | | 3 | |
| Occupancy | | | 13,613 | | | | 11,632 | | | | 10,835 | | | 17 | |
| Advertising and public relations | | | 7,524 | | | | 7,623 | | | | 6,733 | | | (1) | |
| Postage, printing and supplies | | | 6,365 | | | | 5,748 | | | | 5,501 | | | 11 | |
| Professional fees | | | 7,218 | | | | 4,442 | | | | 4,306 | | | 62 | |
| Amortization of intangibles | | | 2,739 | | | | 2,032 | | | | 2,012 | | | 35 | |
| Other | | | 21,966 | | | | 14,558 | | | | 13,410 | | | 51 | |
| Total operating expenses | | $ | 190,061 | | | $ | 162,070 | | | $ | 140,808 | | | 17 | |
| | | | | | | | | | | | | | | | |
Acquisitions affect expense comparisons between periods since the operating expenses of acquired companies prior to the acquisition date are not included in United’s consolidated financial statements. This affects year over year expense comparisons in the year an acquisition is completed and the year immediately following the acquisition. In order to assist in understanding the core expense growth trends, operating expense explanations in this section include an estimate for the amount of the increase related to acquisitions where it is possible to reasonably quantify the amount.
Salaries and employee benefits expense for 2007 was $115.2 million, an increase of $14.2 million, or 14%, from 2006. Acquisitions accounted for approximately 45% of the increase, or $6.5 million. The balance of the increase was due to an increase in staff to support de novo business growth and related hiring costs, higher brokerage and mortgage incentives and higher health care costs. At December 31, 2007, total staff was 2,027, an increase of 90 from 2006. Acquisitions account for 74 staff members, and de novo expansion accounts for 16 additional staff members.
Communication and equipment expense for 2007 was $15.5 million, an increase of $412,000, or 3%, from 2006. The increase was primarily due to higher maintenance and depreciation costs resulting from United’s purchase of Southern in December, 2006 and Gwinnett in June 2007, and a continued commitment to technology and telecommunications equipment to enhance customer service and support business growth.
Occupancy expense for 2007 was $13.6 million, an increase of $2.0 million, or 17%, from 2006. The majority of this increase was the result of higher facilities costs and maintenance expenses resulting from additional banking offices added through the acquisitions of Southern and Gwinnett and further de novo expansion.
Advertising and public relations expense for 2007 was $7.5 million, a decrease of $99,000, or 1%, from 2006 due to efforts to control discretionary spending.
Postage, printing and supplies expense for 2007 was $6.4 million, an increase of $617,000, or 11%, from 2006. Most of this increase was due to additional postage and courier expenses resulting from business growth, including new customers and locations which were the result of the acquisitions of Southern and Gwinnett.
Professional fees were $7.2 million for 2007, an increase of $2.8 million, or 62% from 2006 primarily due to higher legal costs associated with loan workouts and corporate initiatives. Higher costs of outsourced services also contributed to the increase.
Other expenses were $22.0 million for 2007, an increase of $7.4 million, or 51%, from 2006. Losses and expenses on foreclosed properties accounted for approximately $4 million of the increase and the new FDIC insurance assessments accounted for approximately $1.7 million of the increase.
The efficiency ratio measures total operating expenses (excluding merger-related charges), as a percentage of total revenue (excluding the provision for loan losses and net securities gains or losses). Based on operating income, United’s efficiency ratio for 2007 was 56.53%, compared with 56.35% for 2006 and 57.77% for 2005. The slight increase in 2007 was the result of compression in our net interest margin. However, the increase was kept in line by United’s continued discipline in managing expenses.
Income Taxes
Income tax expense, including tax benefits relating to merger charges, was $31.6 million in 2007, compared to $39.6 million in 2006 and $31.7 million in 2005. The effective tax rates (as a percentage of pre-tax net income) were 35.3%, 36.5% and 35.8% for 2007, 2006 and 2005, respectively. The effective tax rate has increased over the years as tax-exempt interest revenue on securities and loans has declined as a percentage of pre-tax earnings. In 2007, pre-tax earnings were down from 2006, resulting in a lower effective tax rate. Additional information regarding income taxes, including a reconciliation of the differences between the recorded income tax provision and the amount of income tax computed by applying the statutory federal income tax rate to income before income taxes, can be found in Note 14 to the Consolidated Financial Statements.
Fourth Quarter Discussion
Taxable equivalent net interest revenue for the fourth quarter of 2007 rose $7.2 million, or 11%, to $69.7 million from the same period a year ago with loan and deposit growth from acquisitions accounting for most of the increase. Year over year loan growth, excluding acquisitions, has been relatively flat with loans at December 31, 2007 up $19 million from 2006. The net interest margin decreased 26 basis points from the fourth quarter of 2006 to 3.73% for the fourth quarter of 2007. Several factors led to the margin compression including the higher balance of nonperforming assets and competitive pricing pressures on deposits.
The 2007 fourth quarter provision for loan losses, excluding $3 million related to the Spruce Pine lot loans, was $26.5 million, up $22.8 million from a year earlier. Non-performing assets totaled $46.3 million, up $32.6 million from a year ago. Non-performing assets as a percentage of total assets were .56% at December 31, 2007, compared with .19% at December 31, 2006.
Fee revenue of $16.1 million grew $2.9 million, or 22%, from $13.2 million for the fourth quarter of 2006. Service charges and fees on deposit accounts increased $1.3 million, or 18%, to $8.4 million, primarily due to higher ATM and debit card usage fees and growth in transactions and new accounts from core deposit programs. Mortgage fees decreased $434,000, or 20%, to $1.7 million due to decreased demand during the fourth quarter reflecting the continued softness in the housing market. United closed $78 million in mortgage loans in the fourth quarter of 2007 compared with $103 million for the fourth quarter of 2006. Consulting fees were up $482,000, or 23 percent, to $2.6 million from a year ago reflecting strong growth in the risk management and advisory services practices. United recognized securities gains of $1.4 million in the fourth quarter 2007, up $1.6 million from the loss recognized in the fourth quarter 2006. The 2007 gain was offset by a loss of $1.1 million from the prepayment of Federal Home Loan Bank advances. The two transactions were part of the same balance sheet management initiative to reduce funding costs.
Operating expenses increased $6.8 million to $49.3 million, a 16% increase from the fourth quarter of 2006. The acquisitions of Southern and Gwinnett added approximately $2.4 million to fourth quarter 2007 expenses. Salaries and employee benefit costs of $27.1 million increased $592,000, or 2%, from the fourth quarter of 2006. This increase resulted from increases in staff to support our de novo expansion activities as well as higher health care costs. The two acquisitions added approximately $1.5 million in staff costs. These costs were offset by an adjustment to bonus and profit sharing expense that reduced fourth quarter 2007 staff costs $3.2 million. Communications and equipment expenses decreased $211,000 to $3.9 million. Occupancy expense increased $650,000 to $3.5 million reflecting the increase in cost to operate additional banking offices. Postage, printing and supplies expense decreased $18,000 to $1.5 million. Professional fees increased $535,000 to $1.8 million reflecting higher legal expenses associated with loan workouts and the cost of various corporate initiatives. Other operating expense increased $5.0 million to $8.8 million primarily due to approximately $3.7 million in write downs and expenses on foreclosed properties and $927,000 resulting from the new FDIC insurance assessments.
Balance Sheet Review
Total assets at December 31, 2007 were $8.2 billion, an increase of $1.1 billion, or 16% from December 31, 2006. On an average basis, total assets increased $1.4 billion, or 23% from 2006 to 2007. Average interest earning assets for 2007 were $7.1 billion, compared with $5.9 billion for 2006, an increase of 20%.
Loans
Total loans averaged $5.7 billion in 2007, compared with $4.8 billion in 2006, an increase of 19%. At December 31, 2007, total loans were $5.9 billion, an increase of $553 million, or 10%, from December 31, 2006. Excluding the acquisitions of 2006 and 2007, United grew the total loan portfolio by $19 million. In 2006, United experienced strong loan growth in all markets, with particular strength in loans secured by real estate, both residential and non-residential. In 2007, the softening housing market resulted in a much more challenging lending environment and fewer acceptable lending opportunities. The weak housing market mostly affected our residential construction portfolio, which was down $205 million from the end of 2006, when acquisitions are excluded. Most of the loan balance attrition occurred in the Atlanta region where a buildup of finished lot inventory halted new land development projects. While residential construction lending was weak throughout 2007, residential mortgages grew $137 million, or 12%, excluding acquisitions. Commercial loans, excluding commercial construction, grew $57 million, or 10%, excluding acquisitions.
| Table 6 - Loans Outstanding | | | | | | | | | | | | | | | |
| As of December 31, | | | | | | | | | | | | | | | |
| (in thousands) | | | | | | | | | | | | | | | |
| | | | | | | | | | | | | | | | |
| Loans by Category | | 2007 | | | 2006 | | | 2005 | | | 2004 | | | 2003 | |
| Commercial (secured by real estate) | | $ | 1,475,930 | | | $ | 1,229,910 | | | $ | 1,055,191 | | | $ | 966,558 | | | $ | 776,591 | |
| Commercial (commercial and industrial) | | | 417,715 | | | | 295,698 | | | | 236,882 | | | | 211,850 | | | | 190,189 | |
| Commercial construction | | | 527,123 | | | | 469,432 | | | | 359,450 | | | | 249,667 | | | | 151,783 | |
| Total commercial | | | 2,420,768 | | | | 1,995,040 | | | | 1,651,523 | | | | 1,428,075 | | | | 1,118,563 | |
| Residential construction | | | 1,829,506 | | | | 1,864,153 | | | | 1,379,540 | | | | 1,054,859 | | | | 775,304 | |
| Residential mortgage | | | 1,501,916 | | | | 1,337,728 | | | | 1,205,685 | | | | 1,101,653 | | | | 981,961 | |
| Installment | | | 177,073 | | | | 179,617 | | | | 161,538 | | | | 150,318 | | | | 140,169 | |
| Total loans | | $ | 5,929,263 | | | $ | 5,376,538 | | | $ | 4,398,286 | | | $ | 3,734,905 | | | $ | 3,015,997 | |
| | | | | | | | | | | | | | | | | | | | | |
| | | | | | | | | | | | | | | | | | | | | |
| Loans by Market | | 2007 | | | 2006 | | | 2005 | | | 2004 | | | 2003 | |
| Atlanta Region | | $ | 2,401,649 | | | $ | 2,005,024 | | | $ | 1,455,795 | | | $ | 1,061,436 | | | $ | 662,418 | |
| North Georgia | | | 2,060,224 | | | | 2,033,553 | | | | 1,789,757 | | | | 1,626,567 | | | | 1,480,891 | |
| North Carolina | | | 805,999 | | | | 773,301 | | | | 668,560 | | | | 633,314 | | | | 547,676 | |
| East Tennessee | | | 245,769 | | | | 207,001 | | | | 177,728 | | | | 140,040 | | | | 102,606 | |
| Coastal Georgia | | | 415,622 | | | | 357,659 | | | | 306,446 | | | | 273,548 | | | | 222,406 | |
| Total loans | | $ | 5,929,263 | | | $ | 5,376,538 | | | $ | 4,398,286 | | | $ | 3,734,905 | | | $ | 3,015,997 | |
| | | | | | | | | | | | | | | | | | | | | |
Substantially all loans are to customers (including customers who have a seasonal residence in United’s market areas) located in Georgia, North Carolina and Tennessee, the immediate market areas of United, and 90% of the loans are secured by real estate.
As of December 31, 2007, United’s 25 largest credit relationships consisted of loans and loan commitments ranging from $15 million to $61 million, with an aggregate total credit exposure of $513 million, including $83 million in unfunded commitments, and $430 million in balances outstanding. All of the loans to these customers were underwritten in accordance with United’s credit quality standards and structured to minimize potential exposure to loss.
The following table sets forth the maturity distribution of commercial and construction loans, including the interest rate sensitivity for loans maturing after one year.
| Table 7 - Loan Portfolio Maturity | | | | | | | | | | | | | | | | | | |
| As of December 31, 2007 | | | | | | | | | | | | | | | | | | |
| (in thousands) | | | | | | | | | | | | | | | | | | |
| | | | | | | | | | | | | | | | | | | |
| | | | | | | | | | | | | | | Rate Structure for Loans | |
| | | Maturity | | | Maturing Over One Year | |
| | | One Year | | | One through | | | Over Five | | | | | | Fixed | | | Floating | |
| | | or Less | | | Five Years | | | Years | | | Total | | | Rate | | | Rate | |
| Commercial (commercial and industrial) | | $ | 301,758 | | | $ | 89,679 | | | $ | 26,278 | | | $ | 417,715 | | | $ | 114,885 | | | $ | 1,072 | |
| Construction (secured by real estate) | | | 2,225,325 | | | | 95,285 | | | | 36,019 | | | | 2,356,629 | | | | 106,379 | | | | 24,925 | |
| Total | | $ | 2,527,083 | | | $ | 184,964 | | | $ | 62,297 | | | $ | 2,774,344 | | | $ | 221,264 | | | $ | 25,997 | |
| | | | | | | | | | | | | | | | | | | | | | | | | |
Asset Quality and Risk Elements
United manages asset quality and controls credit risk through diversification of the loan portfolio and the application of policies designed to promote sound underwriting and loan monitoring practices. United’s credit administration function is charged with monitoring asset quality, establishing credit policies and procedures and managing the consistent application of these policies and procedures at all of United. Additional information on United’s loan administration function is included in Item 1 under the heading Loan Review and Non-performing Assets.
The provision for loan losses is based on management’s judgment of the amount necessary to maintain the allowance for losses at a level adequate to absorb probable losses. The amount each year is dependent upon many factors including loan growth, net charge-offs, changes in the composition of the loan portfolio, delinquencies and other credit quality trends, management’s assessment of loan portfolio quality, the value of collateral, and economic factors and trends. The evaluation of these factors is performed by United’s credit administration through analysis of the adequacy of the allowance for loan losses.
Reviews of non-performing loans, past due loans and larger credits are designed to identify potential charges to the allowance for loan losses, as well as to determine the adequacy of the allowance and are conducted on a regular basis during the year. These reviews are performed by the responsible lending officers, a separate loan review function or the special assets department with consideration of such factors as the customer’s financial position, prevailing and anticipated economic conditions and other pertinent factors.
The following table presents a summary of changes in the allowance for loan losses for each of the past five years.
| Table 8 - Allowance for Loan Losses | | | | | | | | | | | | | | | |
| Years Ended December 31, | | | | | | | | | | | | | | | |
| (in thousands) | | | | | | | | | | | | | | | |
| | | | | | | | | | | | | | | | |
| | | 2007 | | | 2006 | | | 2005 | | | 2004 | | | 2003 | |
| Balance beginning of period | | $ | 66,566 | | | $ | 53,595 | | | $ | 47,196 | | �� | $ | 38,655 | | | $ | 30,914 | |
| Provision for loan losses | | | 55,600 | | | | 14,600 | | | | 12,100 | | | | 7,600 | | | | 6,300 | |
| Allowance for loan losses acquired from | | | | | | | | | | | | | | | | | |
| subsidiaries at merger date | | | 7,091 | | | | 3,895 | | | | - | | | | 4,558 | | | | 5,538 | |
| Charge-offs: | | | | | | | | | | | | | | | | | | | | |
| Commercial (commercial and industrial) | | | 1,188 | | | | 1,157 | | | | 1,266 | | | | 515 | | | | 1,183 | |
| Commercial (secured by real estate) | | | 688 | | | | 1,138 | | | | 877 | | | | 1,859 | | | | 538 | |
| Commercial construction | | | 245 | | | | 11 | | | | 3 | | | | 5 | | | | 181 | |
| Residential construction | | | 30,351 | | | | 179 | | | | 1,198 | | | | 122 | | | | 188 | |
| Residential mortgage | | | 7,022 | | | | 2,111 | | | | 1,653 | | | | 1,271 | | | | 1,367 | |
| Installment | | | 2,200 | | | | 3,027 | | | | 2,217 | | | | 1,716 | | | | 1,812 | |
| Total loans charged-off | | | 41,694 | | | | 7,623 | | | | 7,214 | | | | 5,488 | | | | 5,269 | |
| Recoveries: | | | | | | | | | | | | | | | | | | | | |
| Commercial (commercial and industrial) | | | 187 | | | | 177 | | | | 309 | | | | 293 | | | | 259 | |
| Commercial (secured by real estate) | | | 97 | | | | 123 | | | | 289 | | | | 140 | | | | 92 | |
| Commercial construction | | | 1 | | | | - | | | | 1 | | | | 181 | | | | - | |
| Residential construction | | | 117 | | | | 949 | | | | 11 | | | | 351 | | | | 36 | |
| Residential mortgage | | | 486 | | | | 113 | | | | 252 | | | | 370 | | | | 283 | |
| Installment | | | 972 | | | | 737 | | | | 651 | | | | 536 | | | | 502 | |
| Total recoveries | | | 1,860 | | | | 2,099 | | | | 1,513 | | | | 1,871 | | | | 1,172 | |
| Net charge-offs | | | 39,834 | | | | 5,524 | | | | 5,701 | | | | 3,617 | | | | 4,097 | |
| | | | | | | | | | | | | | | | | | | | | |
| Balance end of period | | $ | 89,423 | | | $ | 66,566 | | | $ | 53,595 | | | $ | 47,196 | | | $ | 38,655 | |
| | | | | | | | | | | | | | | | | | | | | |
| Total loans: | | | | | | | | | | | | | | | | | | | | |
| At year-end | | $ | 5,929,263 | | | $ | 5,376,538 | | | $ | 4,398,286 | | | $ | 3,734,905 | | | $ | 3,015,997 | |
| Average | | | 5,734,608 | | | | 4,800,981 | | | | 4,061,091 | | | | 3,322,916 | | | | 2,753,451 | |
| | | | | | | | | | | | | | | | | | | | | |
| Allowance as a percentage of year-end loans | | | 1.51 | % | | | 1.24 | % | | | 1.22 | % | | | 1.26 | % | | | 1.28 | % |
| | | | | | | | | | | | | | | | | | | | | |
| As a percentage of average loans: | | | | | | | | | | | | | | | | | | | | |
| Net charge-offs | | | .69 | | | | .12 | | | | .14 | | | | .11 | | | | .15 | |
| Provision for loan losses | | | .97 | | | | .30 | | | | .30 | | | | .23 | | | | .23 | |
| | | | | | | | | | | | | | | | | | | | | |
| Allowance as a percentage of | | | | | | | | | | | | | | | | | | | | |
| non-performing loans | | | 317 | | | | 534 | | | | 447 | | | | 588 | | | | 583 | |
| | | | | | | | | | | | | | | | | | | | | |
Management believes that the allowance for loan losses at December 31, 2007 is adequate and appropriate to absorb losses inherent in the loan portfolio. This assessment involves uncertainty and judgment; therefore, the adequacy of the allowance for loan losses cannot be determined with precision and may be subject to change in future periods. In addition, bank regulatory authorities, as part of their periodic examination of United, may require additional charges to the provision for loan losses in future periods if the results of their review warrant such additions. See the “Critical Accounting Policies” section for additional information on the allowance for loan losses.
The allocation of the allowance for loan losses is based on historical data, subjective judgment and estimates and, therefore, is not necessarily indicative of the specific amounts or loan categories in which charge-offs may ultimately occur. Due to the imprecise nature of the loan loss estimation process and the effects of changing conditions, these risk attributes may not be adequately captured in the data related to the formula-based loan loss components used to determine allocations in United’s analysis of the adequacy of the allowance for loan losses. Consequently, management believes that the unallocated allowance appropriately reflects probable inherent but undetected losses in the loan portfolio. The following table summarizes the allocation of the allowance for loan losses for each of the past five years.
| Table 9 - Allocation of Allowance for Loan Losses | | | | | | | | | | | | | | | | | | | | | | | | | | | | |
| As of December 31, | | | | | | | | | | | | | | | | | | | | | | | | | | | | | | |
| (in thousands) | | | | | | | | | | | | | | | | | | | | | | | | | | | | | | |
| | | 2007 | | | 2006 | | | 2005 | | | 2004 | | | 2003 | |
| | | Amount | | | %* | | | Amount | | | %* | | | Amount | | | %* | | | Amount | | | %* | | | Amount | | | %* | |
| | | | | | | | | | | | | | | | | | | | | | | | | | | | | | | | | | | | |
| Commercial (commercial and industrial) | | $ | 7,902 | | | | 7 | | | $ | 5,758 | | | | 6 | | | $ | 4,492 | | | | 5 | | | $ | 3,728 | | | | 6 | | | $ | 3,921 | | | | 6 | |
| Commercial (secured by real estate) | | | 9,520 | | | | 25 | | | | 14,716 | | | | 23 | | | | 12,401 | | | | 24 | | | | 14,107 | | | | 26 | | | | 8,936 | | | | 26 | |
| Total commercial | | | 17,422 | | | | 32 | | | | 20,474 | | | | 29 | | | | 16,893 | | | | 29 | | | | 17,835 | | | | 32 | | | | 12,857 | | | | 32 | |
| Construction | | | 38,183 | | | | 40 | | | | 25,181 | | | | 43 | | | | 20,787 | | | | 40 | | | | 10,695 | | | | 35 | | | | 8,994 | | | | 31 | |
| Residential mortgage | | | 19,611 | | | | 25 | | | | 11,323 | | | | 25 | | | | 9,049 | | | | 27 | | | | 11,511 | | | | 29 | | | | 10,026 | | | | 32 | |
| Installment | | | 3,823 | | | | 3 | | | | 3,245 | | | | 3 | | | | 2,088 | | | | 4 | | | | 2,798 | | | | 4 | | | | 3,390 | | | | 5 | |
| Unallocated | | | 10,384 | | | | | | | | 6,343 | | | | | | | | 4,778 | | | | | | | | 4,357 | | | | | | | | 3,388 | | | | | |
| Total allowance for loan losses | | $ | 89,423 | | | | 100 | | | $ | 66,566 | | | | 100 | | | $ | 53,595 | | | | 100 | | | $ | 47,196 | | | | 100 | | | $ | 38,655 | | | | 100 | |
| | | | | | | | | | | | | | | | | | | | | | | | | | | | | | | | | | | | | | | | | |
| * Loan balance in each category, expressed as a percentage of total loans | | | | | | | | | | | | | | | | | | | | | | | | | |
Non-performing Assets
Non-performing loans, which include non-accrual loans and accruing loans past due over 90 days, totaled $28.2 million at year-end 2007, compared with $12.5 million at December 31, 2006. At December 31, 2007, the majority of non-performing loans were residential construction loans within the Atlanta Region. At December 31, 2007 and 2006, the ratio of non-performing loans to total loans was .48% and ..23%, respectively. Non-performing assets, which include non-performing loans and foreclosed real estate, totaled $46.3 million at December 31, 2007, compared with $13.7 million at year-end 2006.
United’s policy is to place loans on non-accrual status when, in the opinion of management, the principal and interest on a loan is not likely to be repaid in accordance with the loan terms or when the loan becomes 90 days past due and is not both well secured and in the process of collection. When a loan is placed on non-accrual status, interest previously accrued but not collected is reversed against current interest revenue. Generally, interest revenue on a non-accrual loan is recognized on a cash basis as payments are received if the collateral value sufficiently covers the loan balance.
There were no commitments to lend additional funds to customers whose loans were on non-accrual status at December 31, 2007. The table below summarizes non-performing assets at year-end for the last five years.
| Table 10 - Non-Performing Assets | | | | | | | | | | | | | | | |
| As of December 31, | | | | | | | | | | | | | | | |
| (in thousands) | | | | | | | | | | | | | | | |
| | | 2007 | | | 2006 | | | 2005 | | | 2004 | | | 2003 | |
| Non-accrual loans | | $ | 28,219 | | | $ | 12,458 | | | $ | 11,997 | | | $ | 8,031 | | | $ | 6,627 | |
| Loans past due 90 days or more and still accruing | | | - | | | | - | | | | - | | | | - | | | | - | |
| Total non-performing loans | | | 28,219 | | | | 12,458 | | | | 11,997 | | | | 8,031 | | | | 6,627 | |
| Other real estate owned | | | 18,039 | | | | 1,196 | | | | 998 | | | | 694 | | | | 962 | |
| Total non-performing assets | | $ | 46,258 | | | $ | 13,654 | | | $ | 12,995 | | | $ | 8,725 | | | $ | 7,589 | |
| | | | | | | | | | | | | | | | | | | | | |
| Total non-performing loans as a percentage of total loans | | | .48 | % | | | .23 | % | | | .27 | % | | | .22 | % | | | .22 | % |
| | | | | | | | | | | | | | | | | | | | | |
| Total non-performing assets as a percentage of total assets | | | .56 | | | | .19 | | | | .22 | | | | .17 | | | | .19 | |
| | | | | | | | | | | | | | | | | | | | | |
At December 31, 2007 and 2006, there were $78.4 million and $5.9 million, respectively, of loans classified as impaired under the definition outlined in SFAS No. 114. Specific reserves allocated to these impaired loans totaled $13.5 million on December 31, 2007 and $1.0 million on December 31, 2006. The average recorded investment in impaired loans for the years ended December 31, 2007 and 2006 was $51.3 million and $6.2 million, respectively. United’s policy is to discontinue the recognition of interest revenue for loans classified as impaired under SFAS No. 114 when the loan meets the criteria for nonaccrual status.
Investment Securities
The composition of the investment securities portfolio reflects United’s investment strategy of maintaining an appropriate level of liquidity while providing a relatively stable source of revenue. The securities portfolio also provides a balance to interest rate risk in other categories of the balance sheet while providing a vehicle for the investment of available funds, furnishing liquidity, and supplying securities to pledge as required collateral for certain deposits.
Total securities available for sale increased $250 million from the end of 2006. United continued to purchase securities through 2007 as part of a continuing program to help stabilize the interest rate sensitivity of the balance sheet, to increase net interest revenue and to replace maturing securities. At December 31, 2007 and 2006, securities available for sale represented 17% and 16%, respectively, of total assets. At December 31, 2007, the effective duration of the investment portfolio based on expected maturities was 3.05 years compared with 2.69 years at December 31, 2006. The following table shows the carrying value of United’s securities.
| Table 11 - Carrying Value of Investment Securities | | | | |
| As of December 31, | | | | | | |
| (in thousands) | | | | | | |
| | | | | | | |
| | | 2007 | | | 2006 | |
| Securities available for sale: | | | | | | |
| U.S. Government agencies | | | 295,160 | | | | 466,488 | |
| State and political subdivisions | | | 41,314 | | | | 48,203 | |
| Mortgage-backed securities | | | 1,015,043 | | | | 585,973 | |
| Other | | | 5,329 | | | | 6,489 | |
| Total securities available for sale | | $ | 1,356,846 | | | $ | 1,107,153 | |
| | | | | | | | | |
The investment securities portfolio consists of U.S. Government agency securities, municipal securities, and mortgage-backed securities which are primarily U.S. Government agency sponsored. A mortgage-backed security relies on the underlying pools of mortgage loans to provide a cash flow of principal and interest. The actual maturities of these securities will differ from the contractual maturities because the loans underlying the security may prepay without prepayment penalties. Decreases in long-term interest rates will generally cause an acceleration of prepayment levels. In a declining interest rate environment, proceeds may not be able to be reinvested in assets that have comparable yields.
At December 31, 2007, United had 75% of its total investment securities portfolio in mortgage backed securities, compared with 53% at December 31, 2006. During 2007, United began purchasing U.S. Government agency mortgage backed securities to replace callable U.S. Government agency bonds that were expected to be called. United did not have securities of any issuer in excess of 10% of equity at year-end 2007 or 2006, excluding U.S. Government issues. Only .2% of the securities portfolio is rated below “A” and 95.4% is rated “Aaa”. See Note 5 to the Consolidated Financial Statements for further discussion of investment portfolio and related fair value and maturity information.
Deposits
Total average deposits for 2007 were $6.0 billion, an increase of $1.0 billion, or 17% from 2006. Average non-interest bearing demand deposit accounts increased $52 million, or 8%, and average NOW accounts increased $292 million, or 26%, from 2006. Average time deposits for 2007 were $3.3 billion, up from $2.9 billion in 2006. At December 31, 2007, total deposits were $6.1 billion compared with $5.8 billion at the end of 2006, an increase of $303 million, or 5%. Throughout most of 2006, pricing advantages with CDs made them a relatively more attractive funding source than wholesale borrowings with similar maturities. Toward the end of 2006, competitive CD pricing in the Bank’s markets eliminated most of the pricing advantage that existed earlier in the year. In 2007, aggressive pricing competition for CDs made them a less attractive funding source so the Bank allowed attrition of higher-priced CDs where no other customer relationship existed.
Time deposits of $100,000 and greater totaled $1.4 billion at both December 31, 2007 and 2006. Total interest expense on time deposits of $100,000 and greater during 2007 was approximately $71 million. United utilizes “brokered” time deposits, issued in certificates of less than $100,000, as an alternative source of cost-effective funding. Average brokered time deposits outstanding in 2007, 2006 and 2005 were $337 million, $334 million and $319 million, respectively. The average rate paid on brokered time deposits in 2007, 2006 and 2005 was 4.92%, 4.29% and 2.99%, respectively.
The following table sets forth the scheduled maturities of time deposits of $100,000 and greater and brokered time deposits.
| Table 12 - Maturities of Time Deposits of $100,000 and Greater and Brokered Deposits |
| As of December 31, 2007 | | | | |
| (in thousands) | | | | |
| | | | | |
| $100,000 and greater: | | | | |
| Three months or less | | $ | 443,677 | |
| Three to six months | | | 351,590 | |
| Six to twelve months | | | 410,058 | |
| Over one year | | | 159,438 | |
| Total | | $ | 1,364,763 | |
| | | | | |
| Brokered deposits: | | | | |
| Three months or less | | $ | 41,138 | |
| Three to six months | | | 56,367 | |
| Six to twelve months | | | 48,989 | |
| Over one year | | | 176,022 | |
| Total | | $ | 322,516 | |
| | | | | |
Wholesale Funding
The Bank is a shareholder in the Federal Home Loan Bank (FHLB) of Atlanta. Through this affiliation, secured advances totaling $520 million were outstanding at rates competitive with time deposits of like maturities. The Bank anticipates continued utilization of this short and long-term source of funds to minimize interest rate risk and to meet liquidity needs. The FHLB advances outstanding at December 31, 2007 had both fixed and floating interest rates ranging from 2.85% to 5.82%. Approximately 45% of the FHLB advances mature prior to December 31, 2008. Additional information regarding FHLB advances, including scheduled maturities, is provided in Note 10 to the Consolidated Financial Statements.
Liquidity Management
The primary objective of liquidity management is to ensure that sufficient funding is available, at reasonable cost, to meet ongoing operational cash needs. While the desired level of liquidity will vary depending on a number of factors, it is the primary goal of United to maintain a sufficient level of liquidity in reasonably foreseeable economic environments. Liquidity is defined as the ability of a bank to convert assets into cash or cash equivalents without significant loss and to raise additional funds by increasing liabilities. Liquidity management involves maintaining United’s ability to meet the daily cash flow requirements of the Bank’s customers, both depositors and borrowers.
The primary objectives of asset/liability management are to provide for adequate liquidity in order to meet the needs of customers and to maintain an optimal balance between interest-sensitive assets and interest-sensitive liabilities, so that United can also meet the investment objectives of its shareholders as market interest rates change. Daily monitoring of the sources and uses of funds is necessary to maintain a position that meets both goals.
The asset portion of the balance sheet provides liquidity primarily through loan principal repayments and the maturities and sales of securities. Mortgage loans held for sale totaled $28.0 million at December 31, 2007, and typically turn over every 45 days as closed loans are sold to investors in the secondary market. Construction and commercial loans that mature in one year or less amounted to $2.5 billion, or 43%, of the loan portfolio at December 31, 2007.
The liability section of the balance sheet provides liquidity through depositors’ interest-bearing and non-interest-bearing accounts. Federal funds purchased, FHLB advances and securities sold under agreements to repurchase are additional sources of liquidity and represent United’s incremental borrowing capacity. These sources of liquidity are short-term in nature and are used as necessary to fund asset growth and meet other short-term liquidity needs. The table below presents a summary of United’s short-term borrowings over the last three years.
| Table 13 - Short-Term Borrowings | | | | | | | | | | | | | |
| As of December 31, | | | | | | | | | | | | | | | |
| (in thousands) | | | | | | | | | | | | | | | |
| December 31, 2007 | | Period-end balance | | | Period end weighted- average interest rate | | | Maximum outstanding at any month- end | | | Average amounts outstanding during the year | | | Weighted- average rate for the year | |
| Federal funds purchased | | $ | 343,834 | | | | 4.29 | % | | $ | 366,447 | | | $ | 186,795 | | | | 5.05 | % |
| Line of credit | | | 42,000 | | | | 7.24 | | | | 149,070 | | | | 10,142 | | | | 7.26 | |
| Repurchase agreements | | | 102,628 | | | | 3.01 | | | | 42,000 | | | | 111,435 | | | | 4.96 | |
| Other | | | 150,000 | | | | 4.23 | | | | 150,000 | | | | 11,904 | | | | 4.52 | |
| | | $ | 638,462 | | | | | | | | | | | $ | 320,276 | | | | | |
| December 31, 2006 | | | | | | | | | | | | | | | | | | | | |
| Federal funds purchased | | $ | 65,884 | | | | 5.29 | | | $ | 249,552 | | | $ | 139,823 | | | | 5.20 | |
| Commercial paper | | | - | | | | - | | | | 1,300 | | | | 632 | | | | 4.75 | |
| Line of credit | | | - | | | | - | | | | 2,000 | | | | 101 | | | | 5.80 | |
| | | $ | 65,884 | | | | | | | | | | | $ | 140,556 | | | | 5.21 | |
| December 31, 2005 | | | | | | | | | | | | | | | | | | | | |
| Federal funds purchased | | $ | 121,581 | | | | 4.37 | | | $ | 205,291 | | | $ | 143,080 | | | | 3.35 | |
| Commercial paper | | | 1,300 | | | | 4.75 | | | | 1,524 | | | | 1,367 | | | | 4.06 | |
| Line of credit | | | - | | | | - | | | | 8,000 | | | | 3,649 | | | | 5.82 | |
| Repurchase agreements | | | - | | | | - | | | | 25,000 | | | | 9,041 | | | | 2.72 | |
| | | $ | 122,881 | | | | | | | | | | | $ | 157,137 | | | | 3.38 | |
| | | | | | | | | | | | | | | | | | | | | |
At December 31, 2007, United had available lines of credit at its holding company with other financial institutions totaling $75 million that can be drawn on if a material adverse effect on the business prospects or financial condition or any other event of default thereunder has not occurred. At December 31, 2007, there was $42 million outstanding on those lines, leaving $33 million available. United had sufficient qualifying collateral to increase FHLB advances by $609 million. United’s internal policy limits brokered deposits to 25% of total non-brokered deposits. At December 31, 2007, United had the capacity to increase brokered deposits by $1.1 billion and still remain within this limit. In addition to these wholesale sources, United has the ability to attract retail deposits at any time by competing more aggressively on pricing. The following table shows United’s contractual obligations and other commitments.
| Table 14 - Contractual Obligations and Other Commitments | | | | | | | | | | | | | |
| As of December 31, 2007 | | | | | | | | | | | | | | | |
| (in thousands) | | | | | | | | | | | | | | | |
| | | Maturity By Years | |
| | | Total | | | 1 or Less | | | 1 to 3 | | | 3 to 5 | | | Over 5 | |
| Contractual Cash Obligations | | | | | | | | | | | | | | | |
| FHLB advances | | $ | 519,782 | | | $ | 234,012 | | | $ | 205,645 | | | $ | 50,000 | | | $ | 30,125 | |
| Long-term debt | | | 107,996 | | | | - | | | | - | | | | 31,500 | | | | 76,496 | |
| Operating leases | | | 11,618 | | | | 3,532 | | | | 2,461 | | | | 1,743 | | | | 3,882 | |
| Total contractual cash obligations | | $ | 639,396 | | | $ | 237,544 | | | $ | 208,106 | | | $ | 83,243 | | | $ | 110,503 | |
| | | | | | | | | | | | | | | | | | | | | |
| Other Commitments | | | | | | | | | | | | | | | | | | | | |
| Lines of credit | | $ | 917,113 | | | $ | 540,390 | | | $ | 154,468 | | | $ | 31,859 | | | $ | 190,396 | |
| Commercial letters of credit | | | 28,324 | | | | 24,934 | | | | 3,363 | | | | 27 | | | | - | |
| Uncertain tax positions | | | 5,339 | | | | 3,117 | | | | 979 | | | | 958 | | | | 285 | |
| Total other commitments | | $ | 950,776 | | | $ | 568,441 | | | $ | 158,810 | | | $ | 32,844 | | | $ | 190,681 | |
| | | | | | | | | | | | | | | | | | | | | |
As disclosed in United’s consolidated statement of cash flows, net cash provided by operating activities was $105 million during 2007. The major source of cash provided by operating activities was net income plus noncash expenses of depreciation, amortization and accretion, provision for loan losses and stock-based compensation which totaled $131 million. Uses of cash from operating activities include an increase in deferred income taxes of $14.2 million and a net decrease in accrued expenses and other liabilities of $35.6 million. Net cash used in investing activities of $358 million consisted primarily an increase in loans of $113 million, the purchase of BOLI of $50 million, the purchase of premises and equipment of $34 million and the purchase of $904 million of available for sale securities, offset by the maturity of $597 million of available for sale securities and $128 million from the sale of available for sale securities. Net cash provided by financing activities provided the remainder of funding sources for 2007. The $301 million of net cash provided by financing activities consisted primarily of a net increase in short-term borrowings of $567 million. The increases were partially offset by a net decrease in deposits of $265 million. The purchases of treasury stock of $46 million were partially funded by the $42 million increase in borrowings. In the opinion of management, United’s liquidity position at December 31, 2007 is sufficient to meet its expected cash flow requirements.
Off-Balance Sheet Arrangements
United is a party to financial instruments with off-balance sheet risk in the normal course of business to meet the financing needs of customers. These financial instruments include commitments to extend credit, letters of credit and financial guarantees.
A commitment to extend credit is an agreement to lend to a customer as long as there is no violation of any condition established in the contract. Commitments generally have fixed expiration dates or other termination clauses and may require payment of a fee. Letters of credit and financial guarantees are conditional commitments issued to guarantee a customer’s performance to a third party and have essentially the same credit risk as extending loan facilities to customers. Those commitments are primarily issued to local businesses.
The exposure to credit loss in the event of nonperformance by the other party to the commitments to extend credit, letters of credit and financial guarantees is represented by the contractual amount of these instruments. United uses the same credit underwriting procedures for making commitments, letters of credit and financial guarantees as for on-balance sheet instruments. United evaluates each customer’s creditworthiness on a case-by-case basis and the amount of the collateral, if deemed necessary, is based on the credit evaluation. Collateral held varies, but may include unimproved and improved real estate, certificates of deposit, personal property or other acceptable collateral.
All of these instruments involve, to varying degrees, elements of credit risk in excess of the amount recognized in the balance sheet. The total amount of these instruments does not necessarily represent future cash requirements because a significant portion of these instruments expire without being used.
United is not involved in off-balance sheet contractual relationships, other than those disclosed in this report, that could result in liquidity needs or other commitments, or that could significantly affect earnings. See Notes 2 and 17 to the Consolidated Financial Statements for additional information on off-balance sheet arrangements.
Capital Resources and Dividends
Shareholders’ equity at December 31, 2007 was $831.9 million, an increase of $215.1 million, or 35%, from December 31, 2006. Accumulated other comprehensive income (loss), which includes unrealized gains and losses on securities available for sale and the unrealized gains and losses on derivatives qualifying as cash flow hedges, is excluded in the calculation of regulatory capital ratios. Excluding the increase in the accumulated other comprehensive income, shareholders’ equity increased $196.9 million, or 32%. The increase includes $191.3 million of equity issued in connection with the acquisition of Gwinnett Commercial Group, Inc. Dividends of $16.8 million, or $.36 per share, were declared on common stock in 2007, an increase of 13% per share from the amount declared in 2006. The dividend payout ratios based on basic earnings per share for 2007 and 2006 were 28.57% and 18.82%, respectively. United has historically retained earnings in order to provide capital for continued growth and expansion. However, in recognition that cash dividends are an important component of shareholder return, management has targeted a long-term payout ratio between 18 and 20% when earnings and capital levels permit.
In 2005, United completed a public offering of its common stock to raise additional capital to support its balanced growth strategy. Through the offering, United issued 1,552,500 shares of its common stock and raised $40.5 million in capital. In addition to the common stock offering, United has a number of ongoing sources of equity capital to support its growth needs including a Dividend Reinvestment and Stock Purchase Plan that allows existing shareholders to automatically reinvest all or a portion of their dividends in United’s common stock or purchase additional shares directly from United without commissions or fees.
The Federal Reserve has issued guidelines for the implementation of risk-based capital requirements by U.S. banks and bank holding companies. These risk-based capital guidelines take into consideration risk factors, as defined by regulators, associated with various categories of assets, both on and off balance sheet. Under the guidelines, capital strength is measured in two tiers which are used in conjunction with risk adjusted assets to determine the risk based capital ratios. The guidelines require an 8% Total risk-based capital ratio, of which 4% must be Tier I capital.
Tier I capital consists of shareholders’ equity, excluding accumulated other comprehensive income and intangible assets (goodwill and deposit-based intangibles), plus qualifying capital securities. United’s Tier I capital totaled $539.4 million at December 31, 2007. Tier II capital components include supplemental capital such as the qualifying portion of the allowance for loan losses and qualifying subordinated debt. Tier I capital plus Tier II capital is referred to as Total Risk-based Capital and was $683.9 million at December 31, 2007. The ratios, as calculated under the guidelines, were 8.63% and 10.95% for Tier I and Total risk-based capital, respectively, at December 31, 2007.
United has outstanding junior subordinated debentures commonly referred to as Trust Preferred Securities totaling $41.5 million at December 31, 2007. The Trust Preferred Securities qualify as Tier I capital under risk-based capital guidelines provided that total Trust Preferred Securities do not exceed certain quantitative limits. At December 31, 2007, all of United’s Trust Preferred Securities qualified as Tier I capital. Further information on United’s Trust Preferred Securities is provided in Note 12 to the Consolidated Financial Statements.
In 2002, United issued $31.5 million in 6.75% subordinated notes due November 26, 2012. Proceeds from the issuance were used for general business purposes. The notes qualify as Tier II capital under risk-based capital guidelines.
In 2003, United issued $35 million in subordinated step-up notes due September 30, 2015. The subordinated notes qualify as Tier II capital under risk-based capital guidelines. The notes bear interest at a fixed rate of 6.25% through September 30, 2010, and at a rate of 7.50% thereafter until maturity or earlier redemption. The notes are callable at par on September 30, 2010, and September 30 of each year thereafter until maturity. The proceeds were used for general corporate purposes.
A minimum leverage ratio is required in addition to the risk-based capital standards and is defined as Tier I capital divided by quarterly average assets reduced by the amount of goodwill and deposit-based intangibles. A minimum leverage ratio of 3% is required for the highest-rated bank holding companies which are not undertaking significant expansion programs, but the Federal Reserve Board requires a bank holding company to maintain a leverage ratio greater than 4% if it is experiencing or anticipating significant growth or is operating with less diversified risks in the opinion of the Federal Reserve Board. The Federal Reserve Board uses the leverage and risk-based capital ratios to assess capital adequacy of banks and bank holding companies. Management believes that United’s capital must be well above the minimum capital requirements to maintain its business plan. United’s leverage ratio at December 31, 2007 was 6.84%.
United monitors these capital ratios to ensure that United and the Bank remain within regulatory guidelines. Further information regarding the actual and required capital ratios of United and United is provided in Note 16 to the Consolidated Financial Statements.
Effect of Inflation and Changing Prices
A bank’s asset and liability structure is substantially different from that of a general business corporation in that primarily all assets and liabilities of a bank are monetary in nature, with relatively little investment in fixed assets or inventories. Inflation has an important effect on the growth of total assets and the resulting need to increase equity capital at higher than nominal rates in order to maintain an appropriate equity to assets ratio.
United’s management believes the effect of inflation on financial results depends on United’s ability to react to changes in interest rates and, by such reaction, reduce the inflationary effect on performance. United has an asset/liability management program to monitor and manage United’s interest rate sensitivity position. In addition, periodic reviews of banking services and products are conducted to adjust pricing in view of current and expected costs.
ITEM 7A. QUANTITATIVE AND QUALITATIVE DISCLOSURES ABOUT MARKET RISK.
Interest Rate Sensitivity Management
The absolute level and volatility of interest rates can have a significant effect on United’s profitability. The objective of interest rate risk management is to identify and manage the sensitivity of net interest revenue to changing interest rates, in order to achieve United’s overall financial goals. Based on economic conditions, asset quality and various other considerations, management establishes tolerance ranges for interest rate sensitivity and manages within these ranges.
United’s net interest revenue, and the fair value of its financial instruments, are influenced by changes in the level of interest rates. United manages its exposure to fluctuations in interest rates through policies established by the ALCO. The ALCO meets periodically and has responsibility for approving asset/liability management policies, formulating and implementing strategies to improve balance sheet positioning and/or earnings and reviewing United’s interest rate sensitivity.
One of the tools management uses to estimate the sensitivity of net interest revenue to changes in interest rates is an interest rate simulation model. Such estimates are based upon a number of assumptions for each scenario, including the level of balance sheet growth, deposit repricing characteristics and the rate of prepayments. The simulation model measures the potential change in net interest revenue over a twelve-month period under multiple interest rate scenarios. The base scenario assumes rates remain flat over the next twelve months and is the scenario that all others are compared to in order to measure the change in net interest revenue. The second scenario is a most likely scenario that projects the most likely change in rates over the next twelve months based on the slope of the yield curve. United models ramp scenarios that assume gradual increases and decreases of up to 200 basis points each over the next twelve months. United has a policy for net interest revenue simulation based on rate movements of up 200 basis points ramp over twelve months and down 200 basis points ramp over twelve months from the flat rate scenario. The policy limits the change in net interest revenue to a 10% increase or decrease in either scenario. At December 31, 2007, United’s simulation model indicated that a 200 basis point increase in rates over the next twelve months would cause an approximate 1.3% increase in net interest revenue and a 200 basis point decrease in rates over the next twelve months would cause an approximate 1.5% decrease in net interest revenue. At December 31, 2006, United’s simulation model indicated that a 200 basis point increase in rates over the next twelve months would cause an approximate 1.9% increase in net interest revenue and a 200 basis point decrease in rates over the next twelve months would cause an approximate .7% decrease in net interest revenue.
The following table shows interest sensitivity gaps for specified intervals.
| Table 15 - Interest Rate Gap Sensitivity | | | | | | | | | | | | | | | | | | |
| As of December 31, 2007 | | | | | | | | | | | | | | | | | | |
| (in thousands) | | | | | | | | | | | | | | | | | | |
| | | | | | | | | | | | | | | | | | | |
| | | Interest Sensitivity Periods in Months | |
| | | Immediate | | | 1 to 3 | | | 4 to 12 | | | 13 to 60 | | | Over 60 | | | Total | |
| Interest earning assets: | | | | | | | | | | | | | | | | | | |
| Interest bearing deposits with banks | | $ | 62,074 | | | $ | - | | | $ | - | | | $ | - | | | $ | - | | | $ | 62,074 | |
| Investment securities | | | 87,607 | | | | 36,396 | | | | 197,321 | | | | 627,349 | | | | 408,173 | | | | 1,356,846 | |
| Mortgage loans held for sale | | | - | | | | 28,004 | | | | - | | | | - | | | | - | | | | 28,004 | |
| Loans | | | 3,515,827 | | | | 236,700 | | | | 893,362 | | | | 1,081,649 | | | | 201,725 | | | | 5,929,263 | |
| Other interest-earning assets | | | - | | | | - | | | | - | | | | - | | | | 37,360 | | | | 37,360 | |
| Total interest-earning assets | | | 3,665,508 | | | | 301,100 | | | | 1,090,683 | | | | 1,708,998 | | | | 647,258 | | | | 7,413,547 | |
| | | | | | | | | | | | | | | | | | | | | | | | | |
| Interest bearing liabilities: | | | | | | | | | | | | | | | | | | | | | | | | |
| NOW deposits | | | 1,474,818 | | | | - | | | | - | | | | - | | | | - | | | | 1,474,818 | |
| Money market deposits | | | 452,917 | | | | - | | | | - | | | | - | | | | - | | | | 452,917 | |
| Savings deposits | | | 186,392 | | | | - | | | | - | | | | - | | | | - | | | | 186,392 | |
| Time deposits | | | 357,654 | | | | 653,493 | | | | 1,714,975 | | | | 519,684 | | | | 15,077 | | | | 3,260,883 | |
| Fed funds purchased, repurchase | | | | | | | | | | | | | | | | | | | | | | | | |
| agreements & other short- | | | | | | | | | | | | | | | | | | | | | | | | |
| term borrowings | | | 638,462 | | | | - | | | | - | | | | - | | | | - | | | | 638,462 | |
| FHLB advances | | | 250,000 | | | | 55,012 | | | | 4,000 | | | | 180,645 | | | | 30,125 | | | | 519,782 | |
| Other borrowings | | | - | | | | - | | | | 4,382 | | | | 35,000 | | | | 68,614 | | | | 107,996 | |
| Total interest-bearing liabilities | | | 3,360,243 | | | | 708,505 | | | | 1,723,357 | | | | 735,329 | | | | 113,816 | | | | 6,641,250 | |
| Interest rate swaps, net | | | 1,285,000 | | | | - | | | | - | | | | - | | | | - | | | | 1,285,000 | |
| Non-interest bearing sources of funds | | | - | | | | - | | | | - | | | | - | | | | 700,941 | | | | 700,941 | |
| Interest sensitivity gap | | | (979,735 | ) | | | (407,405 | ) | | | (632,674 | ) | | | 973,669 | | | | (167,499 | ) | | | | |
| Cumulative sensitivity gap | | $ | (979,735 | ) | | $ | (1,387,140 | ) | | $ | (2,019,814 | ) | | $ | (1,046,145 | ) | | $ | (1,213,644 | ) | | | | |
| Cumulative gap percent(1) | | | -13 | % | | | -19 | % | | | -27 | % | | | -14 | % | | | -16 | % | | | | |
| | | | | | | | | | | | | | | | | | | | | | | | | |
| (1) Cumulative interest rate sensitivity position as a percent of total interest-earning assets. | | | | | | | | | |
Interest rate sensitivity is a function of the repricing characteristics of the portfolio of assets and liabilities. These repricing characteristics are the time frames within which the interest-earning assets and interest-bearing liabilities are subject to change in interest rates either at replacement, repricing or maturity during the life of the instruments. Interest rate sensitivity management focuses on the maturity structure of assets and liabilities and their repricing characteristics during periods of changes in market interest rates. Effective interest rate sensitivity management seeks to ensure that both assets and liabilities respond to changes in interest rates within an acceptable timeframe, thereby minimizing the effect of interest rate changes on net interest revenue. Interest rate sensitivity is measured as the difference between the volumes of assets and liabilities in United’s current portfolio that are subject to repricing at various time horizons: immediate; one to three months; four to twelve months; one to five years; over five years, and on a cumulative basis. The differences are known as interest sensitivity gaps.
As demonstrated in the preceding table, 87% of interest-bearing liabilities will reprice within twelve months compared with 68% of interest-earning assets, however such changes may not be proportionate with changes in market rates within each balance sheet category. In addition, United may have some discretion in the extent and timing of deposit repricing depending upon the competitive pressures in the markets in which it operates. Changes in the mix of earning assets or supporting liabilities can either increase or decrease the net interest margin without affecting interest rate sensitivity. The interest rate spread between an asset and its supporting liability can vary significantly even when the timing of repricing for both the asset and the liability remains the same, due to the two instruments repricing according to different indices.
Varying interest rate environments can create unexpected changes in prepayment levels of assets and liabilities that are not reflected in the interest rate sensitivity gap analysis. These prepayments may have significant effect on the net interest margin. Because of these limitations, an interest sensitivity gap analysis alone generally does not provide an accurate assessment of exposure to changes in interest rates.
The following table presents the contractual maturity of investment securities by maturity date and average yields based on amortized cost (for all obligations on a fully taxable basis). The composition and maturity/repricing distribution of the securities portfolio is subject to change depending on rate sensitivity, capital and liquidity needs.
| Table 16 - Expected Maturity of Available for Sale Investment Securities | | | | | | | | | | |
| As of December 31, 2007 | | | | | | | | | | | | | | | |
| (in thousands) | | | | | | | | | | | | | | | |
| | | | | Maturity By Years | |
| | | | | 1 or Less | | | 1 to 5 | | | 5 to 10 | | | Over 10 | | | Total | |
| | | U.S. Government agencies | | | 24,288 | | | | 56,020 | | | | 214,852 | | | | - | | | | 295,160 | |
| | | State and political subdivisions | | | 6,006 | | | | 20,613 | | | | 9,345 | | | | 5,350 | | | | 41,314 | |
| | | Other securities (1) | | | 21,905 | | | | 502,305 | | | | 361,102 | | | | 135,060 | | | | 1,020,372 | |
| | | Total securities available for sale | | $ | 52,199 | | | $ | 578,938 | | | $ | 585,299 | | | $ | 140,410 | | | $ | 1,356,846 | |
| | | | | | | | | | | | | | | | | | | | | | | |
| | | Weighted average yield (2) | | | 5.42 | % | | | 5.05 | % | | | 5.61 | % | | | 5.73 | % | | | 5.37 | % |
| | | | | | | | | | | | | | | | | | | | | | | |
| (1 | ) | Includes mortgage-backed securities | | | | | | | | | | | | | | | | | | | | |
| (2 | ) | Based on amortized cost, taxable equivalent basis | | | | | | | | | | | | | | | | | |
| | | | | | | | | | | | | | | | | | | | | | | |
In order to assist in achieving a desired level of interest rate sensitivity, United has entered into off-balance sheet contracts that are considered derivative financial instruments. Derivative financial instruments can be a cost-effective and capital-effective means of modifying the repricing characteristics of on-balance sheet assets and liabilities. These contracts consist of interest rate swaps under which United pays a variable rate and receives a fixed rate and interest rate floor contracts in which United pays a premium to a counterparty who agrees to pay United the difference between a variable rate and a strike rate if the variable rate falls below the strike rate.
United’s derivative financial instruments are classified as either cash flow or fair value hedges. The changes in fair value of derivative instruments classified as cash flow hedges are recognized in other comprehensive income from which amounts are reclassified into interest income over time as the hedged forecasted transactions affect earnings. Fair value hedges recognize currently in earnings both the effect of change in the fair value of the derivative financial instrument and the offsetting effect of the change in fair value of the hedged asset or liability. At December 31, 2007 United had interest rate swap contracts with a total notional amount of $680 million that were designated as cash flow hedges of prime based loans. United had interest rate floor contracts with a total notional amount of $500 million that were also designated as cash flow hedges of prime based loans. At December 31, 2007, United had receive fixed, pay LIBOR swap contracts with a total notional amount of $105 million that were accounted for as fair value hedges of fixed rate liabilities.
The following table presents United’s interest rate derivative contracts outstanding.
| Table 17 - Derivative Financial Instruments | | | | | | | | | | | | |
| As of December 31, 2007 | | | | | | | | | | | | |
| (dollars in thousands) | | | | | | | | | | | | |
| | | | | | | | | | | | | |
| Type/Maturity | | Notional Amount | | | Rate Received / Floor Rate | | | Rate Paid | | | Fair Value (8) | |
| Fair Value Hedges: | | | | | | | | | | | | |
| LIBOR Swaps (Brokered CDs) | | | | | | | | | | | | |
June 18, 2008 (3) | | $ | 20,000 | | | | 5.15 | % | | | 4.65 | % | | $ | 79 | |
September 29, 2008 (1) | | | 10,000 | | | | 5.25 | | | | 4.80 | | | | 76 | |
November 3, 2008 (2) | | | 10,000 | | | | 5.00 | | | | 4.95 | | | | 95 | |
| April 13, 2017 | | | 15,000 | | | | 5.20 | | | | 4.92 | | | | (12 | ) |
| Total: | | | 55,000 | | | | 5.15 | | | | 4.81 | | | | 238 | |
| | | | | | | | | | | | | | | | | |
| LIBOR Swaps (FHLB Advances) | | | | | | | | | | | | | | | | |
January 5, 2009 (4) | | | 25,000 | | | | 5.06 | | | | 5.12 | | | | 299 | |
March 2, 2009 (5) | | | 25,000 | | | | 4.90 | | | | 5.10 | | | | 347 | |
| Total: | | | 50,000 | | | | 4.98 | | | | 5.11 | | | | 646 | |
| Total Fair Value Hedges | | | 105,000 | | | | 5.07 | | | | 4.95 | | | | 884 | |
| Cash Flow Hedges: | | | | | | | | | | | | | | | | |
Prime Swaps (Prime Loans) (6) | | | | | | | | | | | | | | | | |
| February 1, 2008 | | | 50,000 | | | | 8.40 | | | | 7.25 | | | | 30 | |
| April 17, 2008 | | | 50,000 | | | | 8.25 | | | | 7.25 | | | | 114 | |
| April 17, 2008 | | | 50,000 | | | | 8.25 | | | | 7.25 | | | | 114 | |
| May 1, 2008 | | | 50,000 | | | | 8.33 | | | | 7.25 | | | | 162 | |
| May 1, 2008 | | | 50,000 | | | | 8.34 | | | | 7.25 | | | | 164 | |
| August 4, 2008 | | | 50,000 | | | | 8.32 | | | | 7.25 | | | | 345 | |
| November 4, 2008 | | | 100,000 | | | | 8.32 | | | | 7.25 | | | | 1,142 | |
| February 1, 2009 | | | 25,000 | | | | 8.31 | | | | 7.25 | | | | 404 | |
| May 4, 2009 | | | 30,000 | | | | 8.29 | | | | 7.25 | | | | 639 | |
| June 11, 2010 | | | 25,000 | | | | 8.26 | | | | 7.25 | | | | 1,046 | |
| June 13, 2011 | | | 25,000 | | | | 6.72 | | | | 7.25 | | | | 150 | |
| December 12, 2011 | | | 25,000 | | | | 6.86 | | | | 7.25 | | | | 159 | |
| March 12, 2012 | | | 50,000 | | | | 6.87 | | | | 7.25 | | | | 376 | |
| March 27, 2012 | | | 50,000 | | | | 6.76 | | | | 7.25 | | | | 172 | |
| March 27, 2012 | | | 50,000 | | | | 6.72 | | | | 7.25 | | | | 107 | |
| Total: | | | 680,000 | | | | 7.86 | | | | 7.25 | | | | 5,124 | |
Prime Floors (Prime Loans) (7) | | | | | | | | | | | | | | | | |
| February 1, 2009 | | | 25,000 | | | | 8.75 | | | | | | | | 576 | |
| May 1, 2009 | | | 25,000 | | | | 8.75 | | | | | | | | 729 | |
| August 1, 2009 | | | 75,000 | | | | 8.75 | | | | | | | | 2,640 | |
| November 1, 2009 | | | 75,000 | | | | 8.75 | | | | | | | | 3,075 | |
| February 4, 2010 | | | 100,000 | | | | 8.75 | | | | | | | | 4,672 | |
| May 4, 2010 | | | 100,000 | | | | 8.75 | | | | | | | | 5,147 | |
| August 1, 2010 | | | 50,000 | | | | 8.75 | | | | | | | | 2,804 | |
| August 4, 2010 | | | 50,000 | | | | 8.75 | | | | | | | | 2,811 | |
| Total: | | | 500,000 | | | | | | | | | | | | 22,454 | |
| Total Cash Flow Hedges: | | | 1,180,000 | | | | | | | | | | | | 27,578 | |
| Total Derivative Contracts | | $ | 1,285,000 | | | | | | | | | | | $ | 28,462 | |
| | | | | | | | | | | | | | | | | |
| (1) Rate Paid equals 1-Month LIBOR minus .0075 | | | | | | | | | | | | | |
| (2) Rate Paid equals 1-Month LIBOR minus .2725 | | | | | | | | | | | | | |
| (3) Rate Paid equals 1-Month LIBOR minus .3435 | | | | | | | | | | | | | |
| (4) Rate Paid equals 1-Month LIBOR minus .1101 | | | | | | | | | | | | | |
| (5) Rate Paid equals 1-Month LIBOR minus .1280 | | | | | | | | | | | | | |
| (6) Rate Paid equals Prime rate as of December 31, 2007 | | | | | | | | | | | | | |
| (7) Floor contracts receive cash payments equal to the floor rate less the prime rate. | | | | | | | | | |
| (8) Excludes accrued interest | | | | | | | | | | | | | | | | |
ITEM 8. FINANCIAL STATEMENTS AND SUPPLEMENTARY DATA.
The consolidated financial statements of the registrant and report of independent registered public accounting firm are included herein as follows:

MANAGEMENT’S REPORT ON INTERNAL CONTROLS OVER FINANCIAL REPORTING
The management of United Community Banks, Inc. is responsible for establishing and maintaining adequate internal control over financial reporting. Internal control over financial reporting is defined in Rule 13a-15(f) promulgated under the Securities Exchange Act of 1934 as a process designed by, or under the supervision of the company’s principal executive and principal financial officers and effected by the company’s board of directors, management and other personnel, to provide reasonable assurance regarding the reliability of financial reporting and the preparation of financial statements for external purposes in accordance with accounting principles generally accepted in the United States of America and includes those policies and procedures that:
| | · | Pertain to the maintenance of records that in reasonable detail accurately and fairly reflect the transactions and dispositions of the assets of the company; |
| | | |
| | · | Provide reasonable assurance that transactions are recorded as necessary to permit preparation of financial statements in accordance with accounting principles generally accepted in the United States of America, and that receipts and expenditures of the company are being made only in accordance with authorizations of management and directors of the company; and |
| | | |
| | · | Provide reasonable assurance regarding prevention or timely detection of unauthorized acquisition, use or disposition of the company’s assets that could have a material effect on the financial statements. |
Because of its inherent limitations, internal control over financial reporting may not prevent or detect misstatements. Projections of any evaluation of effectiveness to future periods are subject to the risk that controls may become inadequate because of changes in conditions, or that the degree of compliance with the policies or procedures may deteriorate.
We assessed the effectiveness of the internal control over financial reporting as of December 31, 2007. In making this assessment, we used the criteria established in Internal Control – Integrated Framework issued by the Committee of Sponsoring Organizations of the Treadway Commission (COSO).
Based on our assessment, we believe that as of December 31, 2007, United Community Banks, Inc.’s internal control over financial reporting is effective based on those criteria.
Our independent registered public accountants have issued an audit report on our assessment of the company’s internal control over financial reporting. This report appears on page 43.
 | |  | |
| Jimmy C. Tallent | | Rex S. Schuette | |
| President and Chief Executive Officer | | Executive Vice President and | |
| | | Chief Financial Officer | |

Porter Keadle Moore, LLP
REPORT OF INDEPENDENT REGISTERED PUBLIC ACCOUNTING FIRM
To the Board of Directors and shareholders
United Community Banks, Inc.
Blairsville, Georgia
We have audited the accompanying consolidated balance sheets of United Community Banks, Inc. and subsidiaries (the “Company”) as of December 31, 2007 and 2006, and the related consolidated statements of income, changes in shareholders’ equity, and cash flows for each of the years in the three-year period ended December 31, 2007. We have also audited the Company’s internal controls over financial reporting as of December 31, 2007, based on the criteria established in Internal Control – Integrated Framework issued by the Committee of Sponsoring Organizations of the Treadway Commission (COSO). The Company’s management is responsible for these financial statements, for maintaining effective control over financial reporting and for its assessment of the effectiveness internal control over financial reporting included in the accompanying Management’s Report on Internal Controls Over Financial Reporting. Our responsibility is to express an opinion on these financial statements and an opinion on the Company’s internal control over financial reporting based on our audits.
We conducted our audits in accordance with the auditing standards of the Public Company Accounting Oversight Board (United States). Those standards require that we plan and perform the audits to obtain reasonable assurance about whether the financial statements are free of material misstatement and whether effective internal control over financial reporting was maintained in all material respects. Our audits of the financial statements include examining, on a test basis, evidence supporting the amounts and disclosures in the financial statements. Our audits also included assessing the accounting principles used and significant estimates made by management, as well as evaluating the overall financial statement presentation. Our audit of internal control over financial reporting included obtaining an understanding of internal control over financial reporting, assessing the risk that a material weakness exists, and testing and evaluating the design and operating effectiveness of internal control based on the assessed risk. Our audits also included performing such other procedures as we considered necessary in the circumstances. We believe that our audits provide a reasonable basis for our opinions.
A company’s internal control over financial reporting is a process designed to provide reasonable assurance regarding the reliability of financial reporting and the preparation of the financial statements for external purposes in accordance with generally accepted accounting principles. A company’s internal control over financial reporting includes those policies and procedures that (1) pertain to the maintenance of records that, in reasonable detail, accurately and fairly reflect the transactions and dispositions of the assets of the company; (2) provide reasonable assurance that transactions are recorded as necessary to permit preparation of financial statements in accordance with generally accepted accounting principles, and that receipts and expenditures of the company are being made only in accordance with authorizations of management and directors of the company; and (3) provide reasonable assurance regarding prevention or timely detection of unauthorized acquisition, use, or disposition of the Company’s assets that could have a material effect on the financial statements.
Because of its inherent limitations, internal control over financial reporting may not prevent or detect misstatements. Also, projections of any evaluation of effectiveness to future periods are subject to the risk that controls may become inadequate because of changes in conditions, or that the degree of compliance with the policies or procedures may deteriorate.
Certified Public Accountants
Suite 1800 Ÿ 235 Peachtree Street NE Ÿ Atlanta, Georgia 30303 Ÿ Phone 404-588-4200 Ÿ Fax 404-588-4222 Ÿ www.pkm.com
In our opinion, the consolidated financial statements referred to above present fairly, in all material respects, the financial position of United Community Banks, Inc. and subsidiaries as of December 31, 2007 and 2006, and the results of their operations and their cash flows for each of the years in the three-year period ended December 31, 2007, in conformity with generally accepted accounting principles. Also, in our opinion, United Community Banks, Inc. maintained, in all material respects, effective internal control over financial reporting as of December 31, 2007, based on criteria established in Internal Control – Integrated Framework issued by the Committee of Sponsoring Organizations of the Treadway Commission (COSO).
Atlanta, Georgia
February 26, 2008
| UNITED COMMUNITY BANKS, INC. AND SUBSIDIARIES | |
| | | | | | | | | | |
| Consolidated Statement of Income |
| | | | | | | | | | |
| For the Years Ended December 31, 2007, 2006 and 2005 | |
| | | | | | | | | | |
| (in thousands, except per share data) | |
| | | | | | | | | | |
| | | 2007 | | | 2006 | | | 2005 | |
| | | | | | | | | | |
| Interest revenue: | | | | | | | | | |
| Loans, including fees | | $ | 482,333 | | | $ | 394,907 | | | $ | 279,397 | |
| Investment securities: | | | | | | | | | | | | |
| Taxable | | | 64,377 | | | | 47,149 | | | | 40,195 | |
| Tax exempt | | | 1,718 | | | | 1,969 | | | | 2,086 | |
| Federal funds sold and deposits in banks | | | 608 | | | | 802 | | | | 911 | |
| Total interest revenue | | | 549,036 | | | | 444,827 | | | | 322,589 | |
| Interest expense: | | | | | | | | | | | | |
| Deposits: | | | | | | | | | | | | |
| NOW | | | 45,142 | | | | 30,549 | | | | 16,390 | |
| Money market | | | 15,396 | | | | 7,496 | | | | 2,804 | |
| Savings | | | 1,653 | | | | 928 | | | | 791 | |
| Time | | | 167,400 | | | | 130,324 | | | | 66,968 | |
| Total deposit interest expense | | | 229,591 | | | | 169,297 | | | | 86,953 | |
| Federal funds purchased, repurchase agreements and other short-term borrowings | | | 16,236 | | | | 7,319 | | | | 5,304 | |
| Federal Home Loan Bank advances | | | 22,013 | | | | 23,514 | | | | 26,633 | |
| Long-term debt | | | 8,594 | | | | 8,685 | | | | 8,536 | |
| Total interest expense | | | 276,434 | | | | 208,815 | | | | 127,426 | |
| Net interest revenue | | | 272,602 | | | | 236,012 | | | | 195,163 | |
| Provision for loan losses | | | 55,600 | | | | 14,600 | | | | 12,100 | |
| Net interest revenue after provision for loan losses | | | 217,002 | | | | 221,412 | | | | 183,063 | |
| Fee revenue: | | | | | | | | | | | | |
| Service charges and fees | | | 31,433 | | | | 27,159 | | | | 25,137 | |
| Mortgage loan and other related fees | | | 8,537 | | | | 7,303 | | | | 7,330 | |
| Consulting fees | | | 8,946 | | | | 7,291 | | | | 6,609 | |
| Brokerage fees | | | 4,095 | | | | 3,083 | | | | 2,570 | |
| Securities gains (losses), net | | | 3,182 | | | | (643 | ) | | | (809 | ) |
| Losses on prepayment of borrowings | | | (2,242 | ) | | | (636 | ) | | | - | |
| Other | | | 8,700 | | | | 5,538 | | | | 5,311 | |
| Total fee revenue | | | 62,651 | | | | 49,095 | | | | 46,148 | |
| Total revenue | | | 279,653 | | | | 270,507 | | | | 229,211 | |
| | | | | | | | | | | | | |
| Operating expenses: | | | | | | | | | | | | |
| Salaries and employee benefits | | | 115,153 | | | | 100,964 | | | | 84,854 | |
| Communications and equipment | | | 15,483 | | | | 15,071 | | | | 13,157 | |
| Occupancy | | | 13,613 | | | | 11,632 | | | | 10,835 | |
| Advertising and public relations | | | 7,524 | | | | 7,623 | | | | 6,733 | |
| Postage, printing and supplies | | | 6,365 | | | | 5,748 | | | | 5,501 | |
| Professional fees | | | 7,218 | | | | 4,442 | | | | 4,306 | |
| Amortization of intangibles | | | 2,739 | | | | 2,032 | | | | 2,012 | |
| Other | | | 21,966 | | | | 14,558 | | | | 13,410 | |
| Total operating expenses | | | 190,061 | | | | 162,070 | | | | 140,808 | |
| Income before income taxes | | | 89,592 | | | | 108,437 | | | | 88,403 | |
| Income taxes | | | 31,599 | | | | 39,622 | | | | 31,661 | |
| Net income | | $ | 57,993 | | | $ | 68,815 | | | $ | 56,742 | |
| | | | | | | | | | | | | |
| Net income available to common shareholders | | $ | 57,975 | | | $ | 68,796 | | | $ | 56,719 | |
| Earnings per common share: | | | | | | | | | | | | |
| Basic | | $ | 1.26 | | | $ | 1.70 | | | $ | 1.47 | |
| Diluted | | | 1.24 | | | | 1.66 | | | | 1.43 | |
| Dividends per common share | | | .36 | | | | .32 | | | | .28 | |
| Weighted average common shares outstanding: | | | | | | | | | | | | |
| Basic | | | 45,893 | | | | 40,393 | | | | 38,477 | |
| Diluted | | | 46,593 | | | | 41,575 | | | | 39,721 | |
| | | | | | | | | | | | | |
| See accompanying notes to consolidated financial statements | | | | | | | | | | | | |
| UNITED COMMUNITY BANKS, INC. AND SUBSIDIARIES | |
| | | | | | | |
| Consolidated Balance Sheet | |
| | | | | | | |
| As of December 31, 2007 and 2006 | |
| | | | | | | |
| (in thousands, except share data) | |
| | | | | | | |
| Assets | |
| | | 2007 | | | 2006 | |
| | | | | | | |
| Cash and due from banks | | $ | 157,549 | | | $ | 158,348 | |
| Interest-bearing deposits in banks | | | 62,074 | | | | 12,936 | |
| | | | | | | | | |
| Cash and cash equivalents | | | 219,623 | | | | 171,284 | |
| | | | | | | | | |
| Securities available for sale | | | 1,356,846 | | | | 1,107,153 | |
| Mortgage loans held for sale | | | 28,004 | | | | 35,325 | |
| Loans, net of unearned income | | | 5,929,263 | | | | 5,376,538 | |
| Less allowance for loan losses | | | 89,423 | | | | 66,566 | |
| Loans, net | | | 5,839,840 | | | | 5,309,972 | |
| Premises and equipment, net | | | 180,088 | | | | 139,716 | |
| Accrued interest receivable | | | 62,828 | | | | 58,291 | |
| Goodwill and other intangible assets | | | 325,305 | | | | 167,058 | |
| Other assets | | | 194,768 | | | | 112,450 | |
| | | | | | | | | |
| Total assets | | $ | 8,207,302 | | | $ | 7,101,249 | |
| | | | | | | | | |
| Liabilities and Shareholders’ Equity | |
| | | | | | | | | |
| Liabilities: | | | | | | | | |
| Deposits: | | | | | | | | |
| Demand | | $ | 700,941 | | | $ | 659,892 | |
| NOW | | | 1,474,818 | | | | 1,307,654 | |
| Money market | | | 452,917 | | | | 255,862 | |
| Savings | | | 186,392 | | | | 175,631 | |
| Time: | | | | | | | | |
| Less than $100,000 | | | 1,573,604 | | | | 1,650,906 | |
| Greater than $100,000 | | | 1,364,763 | | | | 1,397,245 | |
| Brokered | | | 322,516 | | | | 325,696 | |
| Total deposits | | | 6,075,951 | | | | 5,772,886 | |
| | | | | | | | | |
| Federal funds purchased, repurchase agreements and other short-term borrowings | | | 638,462 | | | | 65,884 | |
| Federal Home Loan Bank advances | | | 519,782 | | | | 489,084 | |
| Long-term debt | | | 107,996 | | | | 113,151 | |
| Accrued expenses and other liabilities | | | 33,209 | | | | 43,477 | |
| | | | | | | | | |
| Total liabilities | | | 7,375,400 | | | | 6,484,482 | |
| | | | | | | | | |
| Commitments and contingencies | | | | | | | | |
| | | | | | | | | |
| Shareholders' equity: | | | | | | | | |
| Preferred stock, $1 par value; $10 stated value; 10,000,000 shares authorized; | | | | | |
| 25,800 and 32,200 shares issued and outstanding | | | 258 | | | | 322 | |
| Common stock, $1 par value; 100,000,000 shares authorized; | | | | | | | | |
| 48,809,301 and 42,890,863 shares issued | | | 48,809 | | | | 42,891 | |
| Common stock issuable; 73,250 and 29,821 shares | | | 2,100 | | | | 862 | |
| Capital surplus | | | 462,881 | | | | 270,383 | |
| Retained earnings | | | 347,391 | | | | 306,261 | |
| Treasury stock; 1,905,921 shares, at cost | | | (43,798 | ) | | | - | |
| Accumulated other comprehensive income (loss) | | | 14,261 | | | | (3,952 | ) |
| | | | | | | | | |
| Total shareholders’ equity | | | 831,902 | | | | 616,767 | |
| | | | | | | | | |
| Total liabilities and shareholders’ equity | | $ | 8,207,302 | | | $ | 7,101,249 | |
| | | | | | | | | |
| See accompanying notes to consolidated financial statements | | | | | | | | |
| UNITED COMMUNITY BANKS, INC. AND SUBSIDIARIES | |
| Consolidated Statement of Changes in Shareholders’ Equity | |
| For the Years Ended December 31, 2007, 2006 and 2005 | |
| (in thousands, except share and per share data) | |
| | | | | | | | | | | | | | | | | | | | | | | | | |
| | | | | | | | | | | | | | | | | | | | | Accumulated | | | | |
| | | | | | | | | Common | | | | | | | | | | | | Other | | | | |
| | | Preferred | | | Common | | | Stock | | | Capital | | | Retained | | | Treasury | | | Comprehensive | | | | |
| | | Stock | | | Stock | | | Issuable | | | Surplus | | | Earnings | | | Stock | | | Income (Loss) | | | Total | |
| Balance, December 31, 2004 | | $ | 448 | | | $ | 38,408 | | | $ | - | | | $ | 155,076 | | | $ | 204,709 | | | $ | (4,413 | ) | | $ | 2,860 | | | $ | 397,088 | |
| Comprehensive income: | | | | | | | | | | | | | | | | | | | | | | | | | | | | | | | | |
| Net income | | | - | | | | - | | | | - | | | | - | | | | 56,742 | | | | - | | | | - | | | | 56,742 | |
| Other comprehensive loss: | | | | | | | | | | | | | | | | | | | | | | | | | | | | | | | | |
| Unrealized holding losses on available for sale securities (net of deferred tax benefit of $7,706) | | | - | | | | - | | | | - | | | | - | | | | - | | | | - | | | | (13,043 | ) | | | (13,043 | ) |
| Reclassification adjustment for losses on securities available for sale included in fee revenue (net of tax benefit of $315) | | | - | | | | - | | | | - | | | | - | | | | - | | | | - | | | | 494 | | | | 494 | |
| Unrealized losses on derivative financial instruments qualifying as cash flow hedges (net of deferred tax benefit of $1,373) | | | - | | | | - | | | | - | | | | - | | | | - | | | | - | | | | (2,156 | ) | | | (2,156 | ) |
| Comprehensive income | | | | | | | | | | | | | | | | | | | 56,742 | | | | | | | | (14,705 | ) | | | 42,037 | |
| Retirement of preferred stock (12,600 shares) | | | (126 | ) | | | - | | | | - | | | | - | | | | - | | | | - | | | | - | | | | (126 | ) |
| Cash dividends declared on common stock ($.28 per share) | | | - | | | | - | | | | - | | | | - | | | | (10,865 | ) | | | - | | | | - | | | | (10,865 | ) |
| Common stock issued in secondary offering (1,552,500 shares) | | | - | | | | 1,553 | | | | - | | | | 38,945 | | | | - | | | | - | | | | - | | | | 40,498 | |
| Exercise of stock options, net of shares exchanged (254,304 shares) | | | - | | | | 46 | | | | - | | | | (1,833 | ) | | | - | | | | 3,612 | | | | - | | | | 1,825 | |
| Common stock issued to Dividend Reinvestment Plan and employee benefit plans (40,709 shares) | | | - | | | | 13 | | | | - | | | | 393 | | | | - | | | | 737 | | | | - | | | | 1,143 | |
| Amortization of restricted stock awards | | | - | | | | - | | | | - | | | | 595 | | | | - | | | | - | | | | - | | | | 595 | |
| Vesting of restricted stock awards (4,812 shares) | | | - | | | | - | | | | - | | | | (64 | ) | | | - | | | | 64 | | | | - | | | | - | |
| Deferred compensation plan, net, including dividend equivalents | | | - | | | | - | | | | 271 | | | | - | | | | - | | | | - | | | | - | | | | 271 | |
| Tax benefit from options exercised | | | - | | | | - | | | | - | | | | 243 | | | | - | | | | - | | | | - | | | | 243 | |
| Cash dividends declared on preferred stock ($.60 per share) | | | - | | | | - | | | | - | | | | - | | | | (23 | ) | | | - | | | | - | | | | (23 | ) |
| Balance, December 31, 2005 | | | 322 | | | | 40,020 | | | | 271 | | | | 193,355 | | | | 250,563 | | | | - | | | | (11,845 | ) | | | 472,686 | |
| Comprehensive income: | | | | | | | | | | | | | | | | | | | | | | | | | | | | | | | | |
| Net income | | | - | | | | - | | | | - | | | | - | | | | 68,815 | | | | - | | | | - | | | | 68,815 | |
| Other comprehensive loss: | | | | | | | | | | | | | | | | | | | | | | | | | | | | | | | | |
| Unrealized holding gains on available for sale securities (net of deferred tax expense of $2,113) | | | - | | | | - | | | | - | | | | - | | | | - | | | | - | | | | 3,436 | | | | 3,436 | |
| Reclassification adjustment for losses on securities available for sale included in fee revenue (net of tax benefit of $250) | | | - | | | | - | | | | - | | | | - | | | | - | | | | - | | | | 393 | | | | 393 | |
| Unrealized gains on derivative financial instruments qualifying as cash flow hedges (net of deferred tax expense of $1,211) | | | - | | | | - | | | | - | | | | - | | | | - | | | | - | | | | 1,903 | | | | 1,903 | |
| Reclassification adjustment for losses on terminated swap positions (net of tax benefit of $1,376) | | | - | | | | - | | | | - | | | | - | | | | - | | | | - | | | | 2,161 | | | | 2,161 | |
| Comprehensive income | | | | | | | | | | | | | | | | | | | 68,815 | | | | | | | | 7,893 | | | | 76,708 | |
| Cash dividends declared on common stock ($.32 per share) | | | - | | | | - | | | | - | | | | - | | | | (13,098 | ) | | | - | | | | - | | | | (13,098 | ) |
| Common stock issued for acquisition (2,180,118 shares) | | | - | | | | 2,180 | | | | - | | | | 65,609 | | | | - | | | | - | | | | - | | | | 67,789 | |
| Exercise of stock options, net of shares exchanged (120,441 shares) | | | - | | | | 121 | | | | - | | | | 722 | | | | - | | | | - | | | | - | | | | 843 | |
| Common stock issued to Dividend Reinvestment Plan and employee benefit plans (172,004 shares) | | | - | | | | 172 | | | | - | | | | 4,888 | | | | - | | | | - | | | | - | | | | 5,060 | |
| Amortization of stock options and restricted stock | | | - | | | | - | | | | - | | | | 3,107 | | | | - | | | | - | | | | - | | | | 3,107 | |
| Common stock issued for conversion of debt (372,000 shares) | | | - | | | | 372 | | | | - | | | | 2,728 | | | | - | | | | - | | | | - | | | | 3,100 | |
| Vesting of restricted stock awards (26,447 shares) | | | - | | | | 26 | | | | - | | | | (26 | ) | | | - | | | | - | | | | - | | | | - | |
| Deferred compensation plan, net, including dividend equivalents | | | - | | | | - | | | | 591 | | | | - | | | | - | | | | - | | | | - | | | | 591 | |
| Cash dividends declared on preferred stock ($.60 per share) | | | - | | | | - | | | | - | | | | - | | | | (19 | ) | | | - | | | | - | | | | (19 | ) |
| Balance, December 31, 2006 | | | 322 | | | | 42,891 | | | | 862 | | | | 270,383 | | | | 306,261 | | | | - | | | | (3,952 | ) | | | 616,767 | |
| Comprehensive income: | | | | | | | | | | | | | | | | | | | | | | | | | | | | | | | | |
| Net income | | | - | | | | - | | | | - | | | | - | | | | 57,993 | | | | - | | | | - | | | | 57,993 | |
| Other comprehensive income: | | | | | | | | | | | | | | | | | | | | | | | | | | | | | | | | |
| Unrealized holding gains on available for sale securities (net of deferred tax expense of $6,163) | | | - | | | | - | | | | - | | | | - | | | | - | | | | - | | | | 10,267 | | | | 10,267 | |
| Reclassification adjustment for gains on securities available for sale included in fee revenue (net of tax expense of $1,237) | | | - | | | | - | | | | - | | | | - | | | | - | | | | - | | | | (1,945 | ) | | | (1,945 | ) |
| Unrealized gains on derivative financial instruments qualifying as cash flow hedges (net of deferred tax expense of $6,297) | | | - | | | | - | | | | - | | | | - | | | | - | | | | - | | | | 9,891 | | | | 9,891 | |
| Comprehensive income | | | | | | | | | | | | | | | | | | | 57,993 | | | | | | | | 18,213 | | | | 76,206 | |
| Retirement of preferred stock (6,400 shares) | | | (64 | ) | | | - | | | | - | | | | - | | | | - | | | | - | | | | - | | | | (64 | ) |
| Cash dividends declared on common stock ($.36 per share) | | | - | | | | - | | | | - | | | | - | | | | (16,845 | ) | | | - | | | | - | | | | (16,845 | ) |
| Common stock issued for acquisition (5,691,948 shares) | | | - | | | | 5,692 | | | | - | | | | 185,649 | | | | - | | | | - | | | | - | | | | 191,341 | |
| Exercise of stock options, net of shares exchanged (150,078 shares) | | | - | | | | 86 | | | | - | | | | 71 | | | | - | | | | 1,543 | | | | - | | | | 1,700 | |
| Common stock issued to Dividend Reinvestment Plan and employee benefit plans (134,664 shares) | | | - | | | | 110 | | | | - | | | | 3,217 | | | | - | | | | 615 | | | | - | | | | 3,942 | |
| Amortization of stock options and restricted stock | | | - | | | | - | | | | - | | | | 3,580 | | | | - | | | | - | | | | - | | | | 3,580 | |
| Vesting of restricted stock awards (34,277 shares issued, 3,125 shares deferred) | | | - | | | | 30 | | | | 93 | | | | (219 | ) | | | - | | | | 96 | | | | - | | | | - | |
| Purchases of treasury stock (2,000,000 shares) | | | - | | | | - | | | | - | | | | - | | | | - | | | | (46,056 | ) | | | | | | | (46,056 | ) |
| Deferred compensation plan, net, including dividend equivalents | | | - | | | | - | | | | 1,187 | | | | - | | | | - | | | | - | | | | - | | | | 1,187 | |
| Shares issued from deferred compensation plan (1,550 shares) | | | - | | | | - | | | | (42 | ) | | | 38 | | | | - | | | | 4 | | | | - | | | | - | |
| Tax benefit from options exercised | | | - | | | | - | | | | - | | | | 162 | | | | - | | | | - | | | | - | | | | 162 | |
| Cash dividends declared on preferred stock ($.60 per share) | | | - | | | | - | | | | - | | | | - | | | | (18 | ) | | | - | | | | - | | | | (18 | ) |
| Balance, December 31, 2007 | | $ | 258 | | | $ | 48,809 | | | $ | 2,100 | | | $ | 462,881 | | | $ | 347,391 | | | $ | (43,798 | ) | | $ | 14,261 | | | $ | 831,902 | |
| | | | | | | | | | | | | | | | | | | | | | | | | | | | | | | | | |
| See accompanying notes to consolidated financial statements | | | | | | | | | | | | | | | | | | | | | | | | | | | | | | | | |
| UNITED COMMUNITY BANKS, INC. AND SUBSIDIARIES | |
| | | | | | | | | | |
| Consolidated Statement of Cash Flows | |
| | | | | | | | | | |
| For the Years Ended December 31, 2007, 2006 and 2005 | |
| | | | | | | | | | |
| (in thousands) | |
| | | | | | | | | | |
| | | 2007 | | | 2006 | | | 2005 | |
| Operating activities: | | | | | | | | | |
| Net income | | $ | 57,993 | | | $ | 68,815 | | | $ | 56,742 | |
| Adjustments to reconcile net income to net cash provided | | | | | | | | | | | | |
| by operating activities: | | | | | | | | | | | | |
| Depreciation, amortization and accretion | | | 13,946 | | | | 14,817 | | | | 15,804 | |
| Provision for loan losses | | | 55,600 | | | | 14,600 | | | | 12,100 | |
| Stock based compensation | | | 3,580 | | | | 3,107 | | | | 595 | |
| Deferred income tax benefit | | | (14,228 | ) | | | (3,510 | ) | | | (3,064 | ) |
| Securities (gains) losses, net | | | (3,182 | ) | | | 643 | | | | 809 | |
| Gain on sale of other assets | | | (214 | ) | | | (780 | ) | | | (715 | ) |
| Loss on prepayment of borrowings | | | 2,242 | | | | 636 | | | | - | |
| Change in assets and liabilities, net of effects | | | | | | | | | | | | |
| of business combinations: | | | | | | | | | | | | |
| Other assets and accrued interest receivable | | | 17,929 | | | | (28,532 | ) | | | (9,851 | ) |
| Accrued expenses and other liabilities | | | (35,574 | ) | | | (5,523 | ) | | | 17,166 | |
| Mortgage loans held for sale | | | 7,321 | | | | (12,990 | ) | | | 14,759 | |
| Net cash provided by operating activities | | | 105,413 | | | | 51,283 | | | | 104,345 | |
| | | | | | | | | | | | | |
| Investing activities, net of effects of business combinations: | | | | | | | | | | | | |
| Proceeds from sales of securities available for sale | | | 128,214 | | | | 128,392 | | | | 19,392 | |
| Proceeds from maturities and calls of securities available for sale | | | 597,215 | | | | 173,015 | | | | 237,149 | |
| Purchases of securities available for sale | | | (904,158 | ) | | | (367,083 | ) | | | (382,751 | ) |
| Net increase in loans | | | (113,206 | ) | | | (715,140 | ) | | | (673,473 | ) |
| Purchase of Bank Owned Life Insurance (BOLI) | | | (50,000 | ) | | | - | | | | - | |
| Purchases of premises and equipment | | | (34,062 | ) | | | (29,784 | ) | | | (17,431 | ) |
| Net cash (paid for) received from business combinations | | | (4,346 | ) | | | 73,749 | | | | - | |
| Proceeds from sales of other real estate | | | 22,483 | | | | 3,902 | | | | 3,108 | |
| Net cash used in investing activities | | | (357,860 | ) | | | (732,949 | ) | | | (814,006 | ) |
| | | | | | | | | | | | | |
| Financing activities, net of effects of business combinations: | | | | | | | | | | | | |
| Net change in deposits | | | (264,780 | ) | | | 935,064 | | | | 797,084 | |
| Net change in federal funds purchased, repurchase agreements | | | | | | | | | |
| and other short-term borrowings | | | 567,233 | | | | (68,392 | ) | | | (10,050 | ) |
| Proceeds from line of credit | | | 42,000 | | | | - | | | | - | |
| Retirement of trust preferred securities | | | (5,000 | ) | | | - | | | | - | |
| Proceeds from FHLB advances | | | 1,200,000 | | | | 949,452 | | | | 1,668,600 | |
| Repayments of FHLB advances | | | (1,182,142 | ) | | | (1,099,136 | ) | | | (1,770,700 | ) |
| Proceeds from issuance of common stock | | | 3,942 | | | | 5,060 | | | | 41,641 | |
| Proceeds from exercise of stock options | | | 1,700 | | | | 843 | | | | 1,825 | |
| Retirement of preferred stock | | | (64 | ) | | | - | | | | (126 | ) |
| Purchase of treasury stock | | | (46,056 | ) | | | - | | | | - | |
| Cash dividends on common stock | | | (16,029 | ) | | | (12,492 | ) | | | (10,860 | ) |
| Cash dividends on preferred stock | | | (18 | ) | | | (19 | ) | | | (23 | ) |
| Net cash provided by financing activities | | | 300,786 | | | | 710,380 | | | | 717,391 | |
| | | | | | | | | | | | | |
| Net change in cash and cash equivalents | | | 48,339 | | | | 28,714 | | | | 7,730 | |
| | | | | | | | | | | | | |
| Cash and cash equivalents at beginning of year | | | 171,284 | | | | 142,570 | | | | 134,840 | |
| | | | | | | | | | | | | |
| Cash and cash equivalents at end of year | | $ | 219,623 | | | $ | 171,284 | | | $ | 142,570 | |
| | | | | | | | | | | | | |
| See accompanying notes to consolidated financial statements | | | | | | | | | | | | |
UNITED COMMUNITY BANKS, INC. AND SUBSIDIARIES
Notes to Consolidated Financial Statements
| (1) | Summary of Significant Accounting Policies |
| | The accounting principles followed by United Community Banks, Inc. (“United”) and its subsidiaries and the methods of applying these principles conform with accounting principles generally accepted in the United States of America (“GAAP”) and with general practices within the banking industry. The following is a description of the more significant of those policies. |
| | |
| | Organization and Basis of Presentation |
| | At Decmeber 31, 2007, United was a multi-bank holding company whose business was conducted by its wholly-owned bank subsidiaries. United is subject to regulation under the Bank Holding Company Act of 1956. The consolidated financial statements include the accounts of United Community Banks, Inc. and its wholly-owned commercial bank subsidiaries in Georgia and North Carolina (collectively, the “Banks”), and Brintech, Inc., a financial services consulting subsidiary based in Florida. Although effective February 1, 2008, United’s North Carolina banking subsidiary was merged into its Georgia banking subsidiary, the consolidated financial statements and notes thereto reflect the separate banks as they existed on December 31, 2007. All significant intercompany accounts and transactions have been eliminated in consolidation. |
| | |
| | The Banks are commercial banks that serve markets throughout north Georgia, coastal Georgia, metropolitan Atlanta, western North Carolina and east Tennessee and provide a full range of banking services. The Banks are insured and subject to the regulation of the Federal Deposit Insurance Corporation (“FDIC”) and are also subject to the regulation of state regulatory authorities. |
| | |
| | In preparing the financial statements, management is required to make estimates and assumptions that affect the reported amounts of assets and liabilities as of the dates of the balance sheet and revenue and expenses for the years then ended. Actual results could differ significantly from those estimates. Material estimates that are particularly susceptible to significant change are the determination of the allowance for loan losses, the valuation of real estate acquired in connection with foreclosures or in satisfaction of loans and the valuation of goodwill and separately identifiable intangible assets associated with mergers and acquisitions. |
| | |
| | Operating Segments |
| | Operating segments are components of a business about which separate financial information is available and evaluated regularly by the chief operating decision maker in deciding how to allocate resources and assessing performance. Public companies are required to report certain financial information about operating segments in interim and annual financial statements. Although United’s operations are divided among 27 community banks, those banks have similar economic characteristics and are therefore aggregated into one operating segment for purposes of segment reporting. Because United has only one operating segment, segment information is not provided separate from the Consolidated Financial Statements. |
| | |
| | Cash and Cash Equivalents |
| | Cash equivalents include amounts due from banks, interest-bearing deposits in banks, and federal funds sold. Federal funds are generally sold for one-day periods and interest-bearing deposits in banks mature within a period of less than 90 days. |
| | |
| | Investment Securities |
| | United classifies its securities in one of three categories: held to maturity, available for sale, or trading. Trading securities are bought and held principally for the purpose of selling them in the near term. Held to maturity securities are those securities for which United has the ability and intent to hold until maturity. All other securities are classified as available for sale. At December 31, 2007 and 2006, all securities were classified as available for sale. |
| | |
| | Held to maturity securities are recorded at cost, adjusted for the amortization or accretion of premiums or discounts. Available for sale securities are recorded at fair value. Unrealized holding gains and losses, net of the related tax effect, on available for sale securities are excluded from net income and are reported in other comprehensive income as a separate component of shareholders’ equity until realized. Transfers of securities between categories are recorded at fair value at the date of transfer. Unrealized holding gains or losses associated with transfers of securities from held to maturity to available for sale are recorded as a separate component of shareholders’ equity. These unrealized holding gains or losses are amortized into income over the remaining life of the security as an adjustment to the yield in a manner consistent with the amortization or accretion of the original purchase premium or discount on the associated security. |
UNITED COMMUNITY BANKS, INC. AND SUBSIDIARIES
Notes to Consolidated Financial Statements, continued
| (1) | Summary of Significant Accounting Policies, continued |
| | Investment Securities, continued |
| | A decline in the fair value of available for sale and held to maturity securities below cost that is deemed other than temporary is charged to earnings and establishes a new cost basis for the security. Premiums and discounts are amortized or accreted over the life of the related security as an adjustment to the yield. Realized gains and losses for securities classified as available for sale and held to maturity are included in net income and derived using the specific identification method for determining the cost of the securities sold. |
| | |
| | Federal Home Loan Bank (“FHLB”) stock is included in other assets at its original cost basis, as cost approximates fair value and there is no ready market for such investments. |
| | |
| | Mortgage Loans Held for Sale |
| | Mortgage loans held for sale are carried at the lower of aggregate cost or market value. The amount by which cost exceeds market value is accounted for as a valuation allowance. Changes in the valuation allowance are included in the determination of net income for the period in which the change occurs. No market valuation allowances were required at December 31, 2007 or 2006 since loans are pre-sold before they are funded, and those loans not presold have market values that approximated the recorded basis. |
| | |
| | Loans and Allowance for Loan Losses |
| | With the exception of purchased loans that are recorded at fair value on the date of acquisition, loans are stated at principal amount outstanding, net of any unearned revenue and net of any deferred loan fees and costs. Interest on loans is primarily calculated by using the simple interest method on daily balances of the principal amount outstanding. |
| | |
| | The accrual of interest is discontinued when a loan becomes 90 days past due and is not both well collateralized and in the process of collection, or when management believes, after considering economic and business conditions and collection efforts, that the principal or interest will not be collectible in the normal course of business. When a loan is placed on nonaccrual status, previously accrued and uncollected interest is charged against interest revenue on loans. Interest income is recognized on a cash basis or applied to the principal balance on nonaccrual loans. |
| | |
| | A loan is considered impaired when, based on current information and events, it is probable that all amounts due, according to the contractual terms of the loan, will not be collected. Impaired loans are measured based on the present value of expected future cash flows, discounted at the loan’s effective interest rate, or at the loan’s observable market price, or the fair value of the collateral if the loan is collateral dependent. Interest revenue on impaired loans is discontinued when the loans meet the criteria for nonaccrual status described above. |
| | |
| | The allowance for loan losses is established through a provision for loan losses charged to income. Loans are charged against the allowance for loan losses when available information confirms that the collectibility of the principal is unlikely. The allowance represents an amount, which, in management’s judgment, is adequate to absorb probable losses on existing loans as of the date of the balance sheet. |
| | |
| | The allowance is composed of general reserves and specific reserves. General reserves are determined by applying loss percentages to the portfolio that are based on historical loss experience and management’s evaluation and “risk grading” of the commercial loan portfolio. Additionally, the general economic and business conditions affecting key lending areas, credit quality trends, collateral values, loan volumes and concentrations, seasoning of the loan portfolio, the findings of internal credit reviews and results from external bank regulatory examinations are included in this evaluation. The need for specific reserves is evaluated on commercial loans that are classified in the Watch, Substandard or Doubtful risk grades, when necessary. The specific reserves are determined on a loan-by-loan basis based on management’s evaluation of United’s exposure for each credit, given the current payment status of the loan and the value of any underlying collateral. Loans for which specific reserves are provided are excluded from the calculation of general reserves. |
| | |
| | Management prepares a quarterly analysis of the allowance for loan losses and material deficiencies are adjusted by increasing the provision for loan losses. Management has an internal loan review department that is independent of the lending function to challenge and corroborate the loan grading system and provide additional analysis in determining the adequacy of the allowance for loan losses. Management also outsources loan review on a rotating basis to ensure objectivity in the loan review process. |
UNITED COMMUNITY BANKS, INC. AND SUBSIDIARIES
Notes to Consolidated Financial Statements, continued
| (1) | Summary of Significant Accounting Policies, continued |
| | Loans and Allowance for Loan Losses, continued |
| | Management believes the allowance for loan losses is adequate at December 31, 2007. While management uses available information to recognize losses on loans, future additions to the allowance may be necessary based on changes in economic conditions. In addition, various regulatory agencies, as an integral part of their examination process, periodically review United’s allowance for loan losses. Such agencies may require United to recognize additions or deductions to the allowance based on their judgment and information available to them at the time of their examination. |
| | |
| | Premises and Equipment |
| | Premises and equipment are stated at cost less accumulated depreciation. Depreciation is computed primarily using the straight-line method over the estimated useful lives of the related assets. Costs incurred for maintenance and repairs are expensed as incurred. The range of estimated useful lives for buildings and improvements is 15 to 40 years, for land improvements, 10 to 35 years, and for furniture and equipment, 3 to 10 years. |
| | |
| | Goodwill and Other Intangible Assets |
| | Goodwill represents the excess of the purchase price over the fair value of the net identifiable assets acquired in a business combination. Goodwill and other intangible assets deemed to have an indefinite useful life are not amortized but instead are subject to an annual review for impairment. |
| | |
| | Also in connection with business combinations involving banks and branch locations, United generally records core deposit intangibles representing the value of the acquired core deposit base. Core deposit intangibles are amortized over the estimated useful life of the deposit base, generally on a straight-line or accelerated basis not exceeding 15 years. The remaining useful lives of core deposit intangibles are evaluated periodically to determine whether events and circumstances warrant a revision to the remaining period of amortization. |
| | |
| | Income Taxes |
| | Deferred tax assets and liabilities are recorded for the future tax consequences attributable to differences between the financial statement carrying amounts of existing assets and liabilities and their respective tax bases. Future tax benefits are recognized to the extent that realization of such benefits is more likely than not. Deferred tax assets and liabilities are measured using enacted tax rates expected to apply to taxable income in the years in which the assets and liabilities are expected to be recovered or settled. The effect of a change in tax rates on deferred tax assets and liabilities is recognized in income taxes during the period that includes the enactment date. |
| | |
| | In the event the future tax consequences of differences between the financial reporting bases and the tax bases of United’s assets and liabilities results in deferred tax assets, an evaluation of the probability of being able to realize the future benefits indicated by such asset is required. A valuation allowance is provided for the portion of the deferred tax asset when it is more likely than not that some or all of the deferred tax asset will not be realized. In assessing the realizability of the deferred tax assets, management considers the scheduled reversals of deferred tax liabilities, projected future taxable earnings and tax planning strategies. |
| | |
| | Income tax expense is the total of the current year income tax due or refundable and the change in deferred tax assets and liabilities. |
| | |
| | The Company adopted FASB Interpretation No. 48, Accounting for Uncertainty in Income Taxes, an Interpretation of FASB Statement 109 (“FIN 48”), as of January 1, 2007. A tax position is recognized as a benefit only if it is “more likely than not” that the tax position would be sustained in a tax examination, with a tax examination being presumed to occur. The amount recognized is the largest amount of tax benefit that is greater than 50 percent likely of being realized on examination. For tax positions not meeting the “more likely than not” test, no tax benefit is recorded. The adoption had no affect on the Company’s financial statements. |
| | |
| | The Company recognizes interest and / or penalties related to income tax matters in income tax expense. |
| | |
| | Stock-Based Compensation |
| | Effective January 1, 2006, United adopted the fair value method of recognizing expense for stock based compensation prescribed by Statement of Financial Accounting Standards (“SFAS”) No. 123(R), Share-Based Payment. United applied the modified prospective approach to adoption in which expense is recognized prospectively for previously granted but unvested options and new option grants. Under this transition method, periods prior to adoption continue to be reported under the intrinsic value method of expense recognition prescribed by Accounting Principles Board (“APB”) Opinion No. 25, Accounting for Stock Issued to Employees, and related |
UNITED COMMUNITY BANKS, INC. AND SUBSIDIARIES
Notes to Consolidated Financial Statements, continued
| (1) | Summary of Significant Accounting Policies, continued |
| | Stock-Based Compensation, continued |
| | interpretations. Under the intrinsic value method of APB No. 25, compensation expense for employee stock options was not recognized if the exercise price of the option equals or exceeds the fair value of the stock on the date of grant. The following table illustrates the effect on net income available to common stockholders and earnings per share if United had applied the fair value recognition provisions of SFAS No. 123, Accounting for Stock-Based Compensation, to stock-based compensation for all reported periods (in thousands, except per share data): |
| | | 2007 | | | 2006 | | | 2005 | |
| | | | | | | | | | |
| Net income available to common stockholders: | | | | | | | | | |
| As reported | | $ | 57,975 | | | $ | 68,796 | | | $ | 56,719 | |
| Pro forma | | | 57,975 | | | | 68,796 | | | | 55,129 | |
| | | | | | | | | | | | | |
| Basic earnings per common share: | | | | | | | | | | | | |
| As reported | | | 1.26 | | | | 1.70 | | | | 1.47 | |
| Pro forma | | | 1.26 | | | | 1.70 | | | | 1.43 | |
| | | | | | | | | | | | | |
| Diluted earnings per common share: | | | | | | | | | | | | |
| As reported | | | 1.24 | | | | 1.66 | | | | 1.43 | |
| Pro forma | | | 1.24 | | | | 1.66 | | | | 1.39 | |
| | | | | | | | | | | | | |
| | Additional information on stock based compensation, including assumptions underlying the determination of fair value of option grants, is included in Note 19 to the consolidated financial statements. |
| | |
| | Derivative Instruments and Hedging Activities |
| | United’s interest rate risk management strategy incorporates the use of derivative instruments to minimize fluctuations in net income that are caused by interest rate volatility. United’s goal is to manage interest rate sensitivity by modifying the repricing or maturity characteristics of certain balance sheet assets and liabilities so that the net interest margin is not, on a material basis, adversely affected by movements in interest rates. United views this strategy as a prudent management of interest rate risk, such that net income is not exposed to undue risk presented by changes in interest rates. |
| | |
| | In carrying out this part of its interest rate risk management strategy, United uses interest rate derivative contracts. The two primary types of derivative contracts used by United to manage interest rate risk are interest rate swaps and interest rate floors. Interest rate swaps generally involve the exchange of fixed- and variable-rate interest payments between two parties, based on a common notional principal amount and maturity date. |
| | |
| | Interest rate floors are options that entitle the purchaser to receive payments from the counterparty equal to the difference between the rate in an underlying index (i.e. LIBOR, Prime) and a strike rate when the index falls below the strike rate. Similar to swaps, interest rate floors are based on a common notional principal amount and maturity date. The premium paid to the counterparty to purchase the floor is amortized into earnings over the life of the contract. United’s hedging strategies involving interest rate derivatives are classified as either Fair Value Hedges or Cash Flow Hedges, depending on the rate characteristics of the hedged item. |
| | |
| | Fair Value Hedge: As a result of interest rate fluctuations, fixed-rate assets and liabilities will appreciate or depreciate in fair value. When effectively hedged, this appreciation or depreciation will generally be offset by fluctuations in the fair value of the derivative instruments that are linked to the hedged assets and liabilities. This strategy is referred to as a fair value hedge. |
| | |
| | Cash Flow Hedge: Cash flows related to floating-rate assets and liabilities will fluctuate with changes in an underlying rate index. When effectively hedged, the increases or decreases in cash flows related to the floating rate asset or liability will generally be offset by changes in cash flows of the derivative instrument designated as a hedge. This strategy is referred to as a cash flow hedge. |
| | |
| | By using derivative instruments, United is exposed to credit and market risk. If the counterparty fails to perform, credit risk is equal to the fair value gain in a derivative. When the fair value of a derivative contract is positive, this situation generally indicates that the counterparty is obligated to pay United, and, therefore, creates a repayment risk for United. When the fair value of a derivative contract is negative, United is obligated to pay the counterparty and, therefore, has no repayment risk. United minimizes the credit risk in derivative instruments by entering into transactions with high-quality counterparties that are reviewed periodically by United. From time to time, United may require the counterparties to pledge securities as collateral to cover the net exposure. |
UNITED COMMUNITY BANKS, INC. AND SUBSIDIARIES
Notes to Consolidated Financial Statements, continued
| (1) | Summary of Significant Accounting Policies, continued |
| | Derivative Instruments and Hedging Activities, continued |
| | United’s derivative activities are monitored by its asset/liability management committee as part of that committee’s oversight of United’s asset/liability and treasury functions. United’s asset/liability committee is responsible for implementing various hedging strategies that are developed through its analysis of data from financial simulation models and other internal and industry sources. The resulting hedging strategies are then incorporated into the overall interest-rate risk management process. |
| | |
| | United recognizes the fair value of derivatives as assets or liabilities in the financial statements. The accounting for the changes in the fair value of a derivative depends on the intended use of the derivative instrument at inception. The change in fair value of instruments used as fair value hedges is accounted for in the net income of the period simultaneous with accounting for the fair value change of the item being hedged. The change in fair value of the effective portion of cash flow hedges is accounted for in other comprehensive income rather than net income. Changes in fair value of derivative instruments that are not intended as a hedge are accounted for in the net income of the period of the change. |
| | |
| | As of December 31, 2007, United had prime based interest rate floors that were being accounted as cash flow hedges with a total notional amount of $500 million for the purpose of protecting cash flows from prime based loans in the event that the prime rate should fall. United also had prime based interest rate swaps with a total notional amount of $680 million that were being accounted for as cash flow hedges of prime based loans for the purpose of converting floating rate assets to a fixed rate. No hedge ineffectiveness from cash flow hedges was recognized in the statement of income in 2007. |
| | |
| | Amounts reported in accumulated other comprehensive income related to derivatives will be reclassified to interest revenue as interest payments are received on the Company’s prime-based loans. During 2008, the Company estimates that an additional $9.3 million will be reclassified to interest revenue. |
| | |
| | As of December 31, 2007, United had interest rate swap contracts with a total notional amount of $55 million that were being accounted for as fair value hedges of brokered certificates of deposit. United recognized expense of $5,000 in other operating expense in the 2007 statement of income due to ineffectiveness of these swap contracts. Although some ineffectiveness was recognized, the fair value hedges remain highly effective. |
| | |
| | As of December 31, 2007, United had interest rate swap contracts with a total notional amount of $50 million that were being accounted for as fair value hedges of fixed-rate Federal Home Loan Bank advances. No ineffectiveness has been recognized on these swap contracts as they are being accounted for using the short-cut method of accounting which allows the fair value adjustment for the hedged item to be equal to the fair value adjustment of the swap if all of the terms of each instrument match. |
| | |
| | As of December 31, 2006, United had prime based interest rate floors that were being accounted as cash flow hedges with a total notional amount of $500 million for the purpose of protecting cash flows from prime based loans in the event that the prime rate should fall. United also had prime based interest rate swaps with a total notional amount of $505 million that were being accounted for as cash flow hedges of prime based loans for the purpose of converting floating rate assets to fixed rate. No hedge ineffectiveness from cash flow hedges was recognized in the statement of income in 2006. |
| | |
| | As of December 31, 2006, United had interest rate swap contracts with a total notional amount of $20 million that were being accounted for as fair value hedges of brokered certificates of deposit. United recognized expense of $8,000 in other operating expense in the 2006 statement of income due to ineffectiveness of these swap contracts. Although some ineffectiveness was recognized, the fair value hedges remain highly effective. All components of each derivative’s gain or loss for 2007 and 2006 are included in the assessment of hedge effectiveness. |
| | |
| | At December 31, 2007 and 2006, United recorded in other assets an asset of approximately $28.5 million and $14.6 million, respectively, for the fair value of these instruments. |
| | |
| | Reclassifications |
| | Certain 2006 and 2005 amounts have been reclassified to conform to the 2007 presentation. |
UNITED COMMUNITY BANKS, INC. AND SUBSIDIARIES
Notes to Consolidated Financial Statements, continued
| (1) | Summary of Significant Accounting Policies, continued |
| | Accumulated Other Comprehensive Income |
| | GAAP normally require that recognized revenues, expenses, gains and losses be included in net income. Although certain changes in assets and liabilities, such as unrealized gains and losses on available for sale securities, are reported as a separate component of the equity section of the consolidated balance sheets, such items with net income, are components of comprehensive income. United presents comprehensive income as a component of the statement of changes in shareholders’ equity. |
| | |
| (2) | Recent Accounting Pronouncements |
| | Fair Value Measurements |
| | In September 2006, the FASB issued SFAS No. 157, Fair Value Measurements. SFAS No. 157 does not require any new fair value measurements, but rather, it provides enhanced guidance to other pronouncements that require or permit assets or liabilities to be measured at fair value. However, the application of this statement may change how fair value is determined. The statement is effective for financial statements issued for fiscal years beginning after November 15, 2007 and interim periods within those fiscal years. The effect is not expected to be material to United’s financial position, results of operations or disclosures. |
| | |
| | Fair Value Option |
| | In February 2007, the FASB issued SFAS No. 159, The Fair Value Option for Financial Assets and Liabilities. The statement allows an entity to elect to measure certain financial assets and liabilities at fair value with changes in fair value recognized in the income statement each period. The statement also requires additional disclosures to identify the effects of an entity’s fair value election on its earnings. SFAS No. 159 is effective for United beginning January 1, 2008. United did not elect to apply SFAS No. 159 to any assets or liabilities on the balance sheet at that time. Thus, the effect is not material to United’s financial position, results of operations, or disclosures. |
| | |
| | Accounting for Income Tax Benefits of Dividends on Share-Based Payment Awards |
| | In June 2007, the FASB ratified the consensus reached in EITF 06-11, Accounting for Income Tax Benefits of Dividends on Share-Based Payment Awards. EITF 06-11 applies to entities that have share-based payment arrangements that entitle employees to receive dividends or dividend equivalents on equity-classified nonvested shares when those dividends or dividend equivalents are charged to retained earnings and result in an income tax deduction. Entities that have share-based payment arrangements that fall within the scope of EITF 06-11 will be required to increase capital surplus for any realized income tax benefit associated with dividends or dividend equivalents paid to employees for equity-classified nonvested equity awards. Any increase recorded to capital surplus is required to be included in an entity’s pool of excess tax benefits that are available to absorb potential future tax deficiencies on share-based payment awards. The effect of adoption is not expected to have a material effect on United’s financial condition, results of operations, or liquidity. |
| | |
| | Business Combinations |
| | In December 2007, the FASB issued SFAS 141(R), Business Combinations. SFAS 141(R) will significantly change how entities apply the acquisition method to business combinations. The most significant changes affecting how the Corporation will account for business combinations under this Statement include: the acquisition date will be date the acquirer obtains control; all (and only) identifiable assets acquired, liabilities assumed, and noncontrolling interests in the acquiree will be stated at fair value on the acquisition date; assets or liabilities arising from noncontractual contingencies will be measured at their acquisition date fair value only if it is more likely than not that they meet the definition of an asset or liability on the acquisition date; adjustments subsequently made to the provisional amounts recorded on the acquisition date will be made retroactively during a measurement period not to exceed one year; acquisition-related restructuring costs that do not meet the criteria in SFAS 146, Accounting for Costs Associated with Exit or Disposal Activities, will be expensed as incurred; transaction costs will be expensed as incurred; reversals of deferred income tax valuation allowances and income tax contingencies will be recognized in earnings subsequent to the measurement period; and the allowance for loan losses of an acquiree will not be permitted to be recognized by the acquirer. Additionally, SFAS 141(R) will require new and modified disclosures surrounding subsequent changes to acquisition-related contingencies, contingent consideration, noncontrolling interests, acquisition-related transaction costs, fair values and cash flows not expected to be collected for acquired loans, and an enhanced goodwill rollforward. |
| | |
| | The Company will be required to apply SFAS No. 141(R) prospectively to all business combinations completed after January 1, 2009. Management is currently evaluating the effect the statement will have on financial condition, results of operations, and liquidity. |
UNITED COMMUNITY BANKS, INC. AND SUBSIDIARIES
Notes to Consolidated Financial Statements, continued
| (3) | Mergers and Acquisitions |
| | On June 1, 2007, United acquired 100 percent of the outstanding common shares of Gwinnett Commercial Group, Inc. (“Gwinnett”), a community bank holding company headquartered in Lawrenceville, Georgia. Gwinnett’s results of operations are included in consolidated financial results from the acquisition date. Gwinnett was the parent company of First Bank of the South, a community bank with five full service banking offices serving the north metro Atlanta counties of Gwinnett, DeKalb, and north Fulton and a commercial loan office in Walton County. United has continued to expand its presence in metropolitan Atlanta and the acquisition of Gwinnett accomplishes a long-standing strategic goal of encircling metro Atlanta. The aggregate purchase price was approximately $222.9 million, including 5,691,948 shares of United’s common stock and $31.5 million in cash that was exchanged for all of the outstanding common shares and options to purchase common shares of Gwinnett. The value of the common stock issued of $33.62 per share was determined based on the average of the closing market price of United’s common shares over the period beginning two days before and ending two days after the terms of the acquisition were agreed to and announced. |
| | |
| | On December 1, 2006, United acquired 100 percent of the outstanding common shares of Southern Bancorp, Inc. (“Southern”), a community bank holding company headquartered in Marietta, Georgia. Southern’s results of operations are included in consolidated financial results from the acquisition date. Southern was the parent company of Southern National Bank, a community bank with two full service banking offices serving the northwest side of metropolitan Atlanta. United has continued to expand its presence in metropolitan Atlanta. The aggregate purchase price was approximately $67.8 million, including 2,180,118 shares of United’s common stock that was exchanged for all of the outstanding common shares and options to purchase common shares of Southern. The value of the common stock issued of $31.09 per share was determined based on the average of the closing market price of United’s common shares over the period beginning two days before and ending two days after the terms of the acquisition were agreed to and announced. |
| | |
| | On September 22, 2006, United completed the acquisition of two branch locations in the western North Carolina counties of Jackson and Swain. The two acquired branch locations were in markets where United already had a presence and added approximately $8 million in new loans, approximately $38 million in deposits and $3 million in intangibles. Results of operations of the acquired branches are included in United’s consolidated results beginning on the acquisition date. |
| | |
| | Core deposit intangibles related to the acquisitions are being amortized over a period of 10 years. Goodwill resulting from the acquisitions of Gwinnett in 2007 and Southern in 2006 will not be amortized nor deductible for tax purposes. Goodwill resulting from the North Carolina branch acquisitions will not be amortized but will be deductible for tax purposes. |
| | |
| | The following table summarizes the estimated fair values of assets acquired and liabilities assumed at the date of the acquisition in 2007 (in thousands): |
| | | Gwinnett | |
| | | Commercial | |
| | | Group | |
| Assets Acquired: | | | |
| Cash and cash equivalents | | $ | 16,472 | |
| Federal funds sold | | | 36,655 | |
| Investment securities | | | 48,157 | |
| Loans, net | | | 526,629 | |
| Premises and equipment | | | 16,690 | |
| Core deposit intangible | | | 6,874 | |
| Goodwill | | | 154,504 | |
| Other assets | | | 3,170 | |
| Total assets acquired | | | 809,151 | |
| | | | | |
| Liabilities Assumed: | | | | |
| Deposits | | | 567,845 | |
| Other borrowed funds | | | 10,000 | |
| Other liabilities | | | 17,648 | |
| Total liabilities assumed | | | 595,493 | |
| Net assets acquired | | $ | 213,658 | |
| | | | | |
UNITED COMMUNITY BANKS, INC. AND SUBSIDIARIES
Notes to Consolidated Financial Statements, continued
| (3) | Mergers and Acquisitions, continued |
| | A reconciliation of the accrued merger costs is presented below (in thousands): |
| 2007 | | Beginning Balance | | | Purchase Adjustments | | | Amounts Charged to Earnings | | | Amounts Paid | | | Ending Balance | |
| Severance and related costs | | $ | 577 | | | $ | 2,348 | | | $ | 71 | | | $ | (515 | ) | | $ | 2,481 | |
| Professional fees | | | 47 | | | | 705 | | | | - | | | | (748 | ) | | | 4 | |
| Contract termination costs | | | 804 | | | | (785 | ) | | | - | | | | (19 | ) | | | - | |
| | | | | | | | | | | | | | | | | | | | | |
| Totals | | $ | 1,428 | | | $ | 2,268 | | | $ | 71 | | | $ | (1,282 | ) | | $ | 2,485 | |
| | | | | | | | | | | | | | | | | | | | | |
| 2006 | | | | | | | | | | | | | | | | | | | | |
| | | | | | | | | | | | | | | | | | | | | |
| Severance and related costs | | $ | 336 | | | $ | 266 | | | $ | - | | | $ | (25 | ) | | $ | 577 | |
| Professional fees | | | 81 | | | | 32 | | | | - | | | | (66 | ) | | | 47 | |
| Contract termination costs | | | 816 | | | | - | | | | - | | | | (12 | ) | | | 804 | |
| Other merger-related expenses | | | 85 | | | | - | | | | - | | | | (85 | ) | | | - | |
| | | | | | | | | | | | | | | | | | | | | |
| Totals | | $ | 1,318 | | | $ | 298 | | | $ | - | | | $ | (188 | ) | | $ | 1,428 | |
| | | | | | | | | | | | | | | | | | | | | |
| 2005 | | | | | | | | | | | | | | | | | | | | |
| | | | | | | | | | | | | | | | | | | | | |
| Severance and related costs | | $ | 764 | | | $ | - | | | $ | - | | | $ | (428 | ) | | $ | 336 | |
| Professional fees | | | 754 | | | | (29 | ) | | | - | | | | (644 | ) | | | 81 | |
| Contract termination costs | | | 3,854 | | | | (594 | ) | | | - | | | | (2,444 | ) | | | 816 | |
| Other merger-related expenses | | | 247 | | | | 78 | | | | - | | | | (240 | ) | | | 85 | |
| | | | | | | | | | | | | | | | | | | | | |
| Totals | | $ | 5,619 | | | $ | (545 | ) | | $ | - | | | $ | (3,756 | ) | | $ | 1,318 | |
| | | | | | | | | | | | | | | | | | | | | |
| | At December 31, 2007, accrued merger costs of $2.5 million remained unpaid relating to acquisitions. In January of 2008, $2.0 million of the severance and related costs were paid, leaving a balance of $525,000 which is primarily comprised of change in control payments that had been deferred. At December 31, 2006, $804,000 in contract termination costs remained unpaid primarily relating to one contract termination charge that is in dispute. The dispute was settled in United’s favor, resulting in a decrease in goodwill. |
| | |
| | The financial information below presents the pro forma earnings of United assuming that the results of operations of Gwinnett and Southern were included in consolidated earnings for the full years of 2007, 2006 and 2005. |
| | | 2007 | | | 2006 | | | 2005 | |
| Total revenue | | $ | 290,901 | | | $ | 313,191 | | | $ | 260,585 | |
| Net income | | | 62,251 | | | | 84,633 | | | | 67,126 | |
| | | | | | | | | | | | | |
| Diluted earnings per common share | | | 1.27 | | | | 1.72 | | | | 1.41 | |
| (4) | Cash Flows |
| | United paid approximately $276 million, $200 million and $123 million in interest on deposits and other borrowings during 2007, 2006 and 2005, respectively. In connection with United’s 2007 acquisition of Gwinnett, assets having a fair value of approximately $809 million were acquired and liabilities totaling approximately $595 million were assumed. In connection with United’s 2006 acquisitions of Southern and two branches in western North Carolina, assets having a fair value of approximately $428 million were acquired and liabilities totaling approximately $387 million were assumed. |
| | |
| | During 2007, 2006 and 2005, loans having a carrying value of $62.7 million, $8.3 million and $9.5 million, respectively, were transferred to other real estate. Also, during 2007, 2006 and 2005, United financed the sale of other real estate properties with loans totaling $8.3 million, $2.3 million and 5.1 million, respectively. Loans made by United to finance the sale of other real estate were made on terms substantially the same as other loans made by United. |
UNITED COMMUNITY BANKS, INC. AND SUBSIDIARIES
Notes to Consolidated Financial Statements, continued
| (5) | Securities Available for Sale |
| | The cost basis, unrealized gains and losses, and fair value of securities available for sale at December 31, 2007 and 2006 are listed below (in thousands): |
| | | | | | Gross | | | Gross | | | | |
| | | Amortized | | | Unrealized | | | Unrealized | | | Fair | |
| As of December 31, 2007 | | Cost | | | Gains | | | Losses | | | Value | |
| | | | | | | | | | | | | |
| U.S. Government agencies | | $ | 292,912 | | | $ | 2,270 | | | $ | 22 | | | $ | 295,160 | |
| State and political subdivisions | | | 40,651 | | | | 708 | | | | 45 | | | | 41,314 | |
| Mortgage-backed securities | | | 1,013,228 | | | | 6,035 | | | | 4,220 | | | | 1,015,043 | |
| Other | | | 5,405 | | | | 12 | | | | 88 | | | | 5,329 | |
| | | | | | | | | | | | | | | | | |
| Total | | $ | 1,352,196 | | | $ | 9,025 | | | $ | 4,375 | | | $ | 1,356,846 | |
| | | | | | | | | | | | | | | | | |
| As of December 31, 2006 | | | | | | | | | | | | | | | | |
| | | | | | | | | | | | | | | | | |
| U.S. Government agencies | | $ | 467,983 | | | $ | 598 | | | $ | 2,093 | | | $ | 466,488 | |
| State and political subdivisions | | | 47,542 | | | | 793 | | | | 132 | | | | 48,203 | |
| Mortgage-backed securities | | | 593,702 | | | | 1,266 | | | | 8,995 | | | | 585,973 | |
| Other | | | 6,488 | | | | 1 | | | | - | | | | 6,489 | |
| | | | | | | | | | | | | | | | | |
| Total | | $ | 1,115,715 | | | $ | 2,658 | | | $ | 11,220 | | | $ | 1,107,153 | |
| | | | | | | | | | | | | | | | | |
| | At December 31, 2007 and 2006, securities with a carrying value of $1.3 billion and $981 million, respectively, were pledged to secure public deposits and FHLB advances. |
| | |
| | The amortized cost and fair value of the investment securities at December 31, 2007, by contractual maturity, are presented in the following table (in thousands). Expected maturities may differ from contractual maturities because borrowers have the right to call or prepay obligations with or without call or prepayment penalties. |
| | | Amortized Cost | | | Fair Value | |
| | | | | | | |
| U.S. Government agencies: | | | | | | |
| Within 1 year | | $ | 24,301 | | | $ | 24,288 | |
| 1 to 5 years | | | 55,797 | | | | 56,020 | |
| 5 to 10 years | | | 212,814 | | | | 214,852 | |
| | | | 292,912 | | | | 295,160 | |
| | | | | | | | | |
| State and political subdivisions: | | | | | | | | |
| Within 1 year | | | 5,995 | | | | 6,006 | |
| 1 to 5 years | | | 20,218 | | | | 20,613 | |
| 5 to 10 years | | | 9,166 | | | | 9,345 | |
| More than 10 years | | | 5,272 | | | | 5,350 | |
| | | | 40,651 | | | | 41,314 | |
| | | | | | | | | |
| Other: | | | | | | | | |
| 1 to 5 years | | | 525 | | | | 527 | |
| 5 to 10 years | | | 1,460 | | | | 1,373 | |
| More than 10 years | | | 3,420 | | | | 3,429 | |
| | | | 5,405 | | | | 5,329 | |
| | | | | | | | | |
| Total securities other than mortgage-backed securities: | | | | | | | | |
| Within 1 year | | | 30,296 | | | | 30,294 | |
| 1 to 5 years | | | 76,540 | | | | 77,160 | |
| 5 to 10 years | | | 223,440 | | | | 225,570 | |
| More than 10 years | | | 8,692 | | | | 8,779 | |
| | | | | | | | | |
| Mortgage-backed securities | | | 1,013,228 | | | | 1,015,043 | |
| | | | | | | | | |
| | | $ | 1,352,196 | | | $ | 1,356,846 | |
| | | | | | | | | |
UNITED COMMUNITY BANKS, INC. AND SUBSIDIARIES
Notes to Consolidated Financial Statements, continued
| (5) | Securities Available for Sale, continued |
| | The following summarizes securities in an unrealized loss position as of December 31, 2007 and 2006 (in thousands) |
| | | Less than 12 Months | | | 12 Months or More | | | Total | |
| As of December 31, 2007 | | Fair Value | | | Unrealized Loss | | | Fair Value | | | Unrealized Loss | | | Fair Value | | | Unrealized Loss | |
| | | | | | | | | | | | | | | | | | | |
| U.S. Government agencies | | $ | - | | | $ | - | | | $ | 9,978 | | | $ | 22 | | | $ | 9,978 | | | $ | 22 | |
| State and political subdivisions | | | - | | | | - | | | | 3,547 | | | | 45 | | | | 3,547 | | | | 45 | |
| Mortgage-backed securities | | | 32,513 | | | | 172 | | | | 339,550 | | | | 4,048 | | | | 372,063 | | | | 4,220 | |
| Other | | | 373 | | | | 88 | | | | - | | | | - | | | | 373 | | | | 88 | |
| Total unrealized loss position | | $ | 32,886 | | | $ | 260 | | | $ | 353,075 | | | $ | 4,115 | | | $ | 385,961 | | | $ | 4,375 | |
| | | | | | | | | | | | | | | | | | | | | | | | | |
| | | | | | | | | | | | | | | | | | | | | | | | | |
| As of December 31, 2006 | | | | | | | | | | | | | | | | | | | | | | | | |
| | | | | | | | | | | | | | | | | | | | | | | | | |
| U.S. Government agencies | | $ | 79,510 | | | $ | 132 | | | $ | 197,888 | | | $ | 1,961 | | | $ | 277,398 | | | $ | 2,093 | |
| State and political subdivisions | | | 2,721 | | | | 8 | | | | 7,636 | | | | 124 | | | | 10,357 | | | | 132 | |
| Mortgage-backed securities | | | 73,789 | | | | 250 | | | | 412,855 | | | | 8,745 | | | | 486,644 | | | | 8,995 | |
| Total unrealized loss position | | $ | 156,020 | | | $ | 390 | | | $ | 618,379 | | | $ | 10,830 | | | $ | 774,399 | | | $ | 11,220 | |
| | | | | | | | | | | | | | | | | | | | | | | | | |
| | During 2005, United recognized a loss of $500,000 on FHLMC preferred securities which was included in other investments. These losses were considered to be “other-than-temporary impairment”. The securities were sold in 2006 with an additional loss of $13,000. Management believes that there were no unrealized losses as of December 31, 2007 and 2006 that represent an other-than-temporary impairment. Unrealized losses at December 31, 2007 and 2006 were primarily attributable to changes in interest rates, and United has both the intent and ability to hold the securities for a time necessary to recover the amortized cost. |
| | |
| | The following summarizes securities sales activities for the years ended December 31, 2007, 2006 and 2005 (in thousands): |
| | | 2007 | | | 2006 | | | 2005 | |
| | | | | | | | | | |
| Proceeds from sales | | $ | 128,214 | | | $ | 128,392 | | | $ | 19,392 | |
| | | | | | | | | | | | | |
| Gross gains on sales | | $ | 3,511 | | | $ | 375 | | | $ | - | |
| Gross losses on sales | | | 329 | | | | 1,018 | | | | 809 | |
| | | | | | | | | | | | | |
| Net gains (losses) on sales of securities | | $ | 3,182 | | | $ | (643 | ) | | $ | (809 | ) |
| | | | | | | | | | | | | |
| Income tax expense (benefit) attributable to sales | | $ | 1,238 | | | $ | (250 | ) | | $ | (315 | ) |
| | | | | | | | | | | | | |
| (6) | Loans and Allowance for Loan Losses |
| | Major classifications of loans at December 31, 2007 and 2006, are summarized as follows (in thousands): |
| | | 2007 | | | 2006 | |
| | | | | | | |
| Commercial (secured by real estate) | | $ | 1,475,930 | | | $ | 1,229,910 | |
| Commercial (commercial and industrial) | | | 417,715 | | | | 295,698 | |
| Commercial construction | | | 527,123 | | | | 469,432 | |
| Total commercial | | | 2,420,768 | | | | 1,995,040 | |
| Residential construction | | | 1,829,506 | | | | 1,864,153 | |
| Residential mortgage | | | 1,501,916 | | | | 1,337,728 | |
| Installment | | | 177,073 | | | | 179,617 | |
| | | | | | | | | |
| Total loans | | | 5,929,263 | | | | 5,376,538 | |
| | | | | | | | | |
| Less - allowance for loan losses | | | 89,423 | | | | 66,566 | |
| | | | | | | | | |
| Loans, net | | $ | 5,839,840 | | | $ | 5,309,972 | |
| | | | | | | | | |
UNITED COMMUNITY BANKS, INC. AND SUBSIDIARIES
Notes to Consolidated Financial Statements, continued
| (6) | Loans and Allowance for Loan Losses, continued |
| | The Bank grants loans and extensions of credit to individuals and a variety of firms and corporations located primarily in counties in north Georgia, metropolitan Atlanta, coastal Georgia, western North Carolina and east Tennessee. Although the Bank has a diversified loan portfolio, a substantial portion of the loan portfolio is collateralized by improved and unimproved real estate and is dependent upon the real estate market. |
| | |
| | United had $78.4 million in loans classified as impaired at December 31, 2007. Of that amount, $61.1 million had specific reserves of $13.5 million allocated and the remaining $17.3 million did not require specific reserves. At December 31, 2006, United had $5.9 million of loans classified as impaired for which specific reserves of $994,000 had been allocated. United’s policy is to discontinue recognition of interest revenue for loans classified as impaired when those loans meet the criteria for nonaccrual status. The average investment in impaired loans for 2007 was $51.3 million. Interest income recognized on impaired loans in 2007 was $3.7 million. |
| | |
| | Changes in the allowance for loan losses are summarized as follows (in thousands): |
| | | 2007 | | | 2006 | | | 2005 | |
| | | | | | | | | | |
| Balance at beginning of year | | $ | 66,566 | | | $ | 53,595 | | | $ | 47,196 | |
| Provision for loan losses | | | 55,600 | | | | 14,600 | | | | 12,100 | |
| Charge-offs | | | (41,694 | ) | | | (7,623 | ) | | | (7,214 | ) |
| Recoveries | | | 1,860 | | | | 2,099 | | | | 1,513 | |
| Allowance acquired through acquisitions | | | 7,091 | | | | 3,895 | | | | - | |
| | | | | | | | | | | | | |
| Balance at end of year | | $ | 89,423 | | | $ | 66,566 | | | $ | 53,595 | |
| | | | | | | | | | | | | |
| | In the ordinary course of business, the Bank grants loans to executive officers, certain key employees, and directors of the holding company and the Bank, including their immediate families and companies with which they are associated. Management believes that such loans are made substantially on the same terms, including interest rate and collateral, as those prevailing at the time for comparable transactions with other customers. The following is a summary of such loans outstanding and the activity in these loans for the year ended December 31, 2007 (in thousands): |
| Balances at December 31, 2006 | | $ | 36,186 | |
| New loans | | | 56,643 | |
| Repayments | | | (8,976 | ) |
| Renewals | | | (27,930 | ) |
| Adjustment for changes in executive officers and directors | | | (1,466 | ) |
| | | | | |
| Balances at December 31, 2007 | | $ | 54,457 | |
| | | | | |
| | At December 31, 2007, loans with a carrying value of $1.7 billion were pledged as collateral to secure FHLB advances and other contingent funding sources. |
| | |
| (7) | Premises and Equipment |
| | Premises and equipment at December 31, 2007 and 2006 are summarized as follows, (in thousands): |
| | | 2007 | | | 2006 | |
| | | | | | | |
| Land and land improvements | | $ | 75,776 | | | $ | 53,692 | |
| Buildings and improvements | | | 89,570 | | | | 72,271 | |
| Furniture and equipment | | | 71,174 | | | | 62,235 | |
| Construction in progress | | | 10,745 | | | | 9,177 | |
| | | | | | | | | |
| | | | 247,265 | | | | 197,375 | |
| | | | | | | | | |
| Less - accumulated depreciation | | | 67,177 | | | | 57,659 | |
| | | | | | | | | |
| Premises and equipment, net | | $ | 180,088 | | | $ | 139,716 | |
| | | | | | | | | |
Depreciation expense was approximately $10.6 million, $9.9 million and $8.9 million for 2007, 2006 and 2005, respectively.
UNITED COMMUNITY BANKS, INC. AND SUBSIDIARIES
Notes to Consolidated Financial Statements, continued
| (8) | Goodwill and Other Intangible Assets |
| | A summary of changes in goodwill for the years ended December 31, 2007 and 2006, (in thousands): |
| | | 2007 | | | 2006 | |
| | | | | | | |
| Beginning balance | | $ | 151,974 | | | $ | 104,001 | |
| Goodwill acquired | | | 154,504 | | | | 47,973 | |
| Purchase adjustments | | | (392 | ) | | | - | |
| | | | | | | | | |
| Ending balance | | $ | 306,086 | | | $ | 151,974 | |
| | | | | | | | | |
| | United has finite-lived intangible assets capitalized on its balance sheet in the form of core deposit intangibles. These intangible assets are amortized over their estimated useful lives of no more than 15 years. |
| | |
| | A summary of core deposit intangible assets as of December 31, 2007 and 2006, (in thousands): |
| | | 2007 | | | 2006 | |
| | | | | | | |
| Gross carrying amount | | $ | 31,152 | | | $ | 24,278 | |
| Less - accumulated amortization | | | 11,933 | | | | 9,194 | |
| | | | | | | | | |
| Net carrying amount | | $ | 19,219 | | | $ | 15,084 | |
| | Amortization expense on finite-lived intangible assets was $2,739,000 in 2007, $2,032,000 for 2006 and $2,012,000 for 2005. Amortization expense for each of the years 2008 through 2012 is estimated below (in thousands): |
| 2008 | | $ | 3,010 | |
| 2009 | | | 2,955 | |
| 2010 | | | 2,891 | |
| 2011 | | | 2,779 | |
| 2012 | | | 2,708 | |
| (9) | Deposits |
| | At December 31, 2007, the contractual maturities of time deposits are summarized as follows (in thousands): |
| Maturing In: | | | |
| | | | |
| 2008 | | $ | 2,723,982 | |
| 2009 | | | 295,038 | |
| 2010 | | | 135,010 | |
| 2011 | | | 57,947 | |
| 2012 | | | 33,829 | |
| thereafter | | | 15,077 | |
| | | | | |
| | | $ | 3,260,883 | |
| | | | | |
| | At December 31, 2007, United held $323 million in certificates of deposit obtained through the efforts of third party brokers. At December 31, 2006, United had $326 million of such certificates of deposit. The daily average balance of these brokered deposits totaled $337 million and $334 million in 2007 and 2006, respectively. The weighted average rates paid during 2007 and 2006 were 4.92% and 4.29%, respectively, and the weighted average rate as of December 31, 2007 was 4.79%. These deposits generally have maturity dates ranging from 1 week to 5 years. |
| | |
| | At December 31, 2007 and 2006, $1,765,000 and $3,356,000 in overdrawn deposit accounts were reclassified as loans. No specific allowance for loan losses was deemed necessary for these accounts at December 31, 2007 and 2006. |
UNITED COMMUNITY BANKS, INC. AND SUBSIDIARIES
Notes to Consolidated Financial Statements, continued
| (10) | Federal Home Loan Bank Advances |
| | At December 31, 2007, the Banks had advances totaling $520 million from the FHLB of which $111 million are fixed rate advances and the remaining $409 million are variable. At December 31, 2006, the Banks had advances totaling $489 million. Interest payments and principal payments are due at various maturity dates and interest rates range from 2.85% to 5.82% at December 31, 2007. At December 31, 2007, the weighted average interest rate on FHLB advances was 4.49%. The FHLB advances are collateralized by commercial (secured by real estate) and residential mortgage loans, investment securities and FHLB stock. |
| | |
| | At December 31, 2007, the maturities and current rates of outstanding advances were as follows (in thousands): |
| | | | Amount | | | | | | | | | | |
| | Maturing In: | | Maturing | | | Current Rate Range | |
| | | | | | | | | | | | | | |
| | 2008 | | $ | 234,012 | | | 3.47% | | | - | | | 5.51% | |
| | 2009 | | | 155,645 | | | 3.26% | | | - | | | 5.82% | |
| | 2010 | | | 50,000 | | | 4.69% | | | - | | | 4.69% | |
| | 2011 | | | - | | | | | | | | | | |
| | 2012 | | | 50,000 | | | 4.05% | | | - | | | 4.39% | |
| | thereafter | | | 30,125 | | | 2.85% | | | - | | | 4.49% | |
| | | | | | | | | | | | | | | |
| | | | $ | 519,782 | | | | | | | | | | |
| | | | | | | | | | | | | | | |
| | Timing of principal payments may differ from the maturity schedule shown above as some advances include call options that allow the FHLB to require repayment prior to the maturity date. |
| | |
| (11) | Short-term Borrowings |
| | United uses a number of sources of short-term borrowings to meet its liquidity needs including federal funds purchased, repurchase agreements, commercial paper and holding company lines of credit. The table below shows the amounts of short-term borrowings outstanding by type at December 31, 2007 and 2006 (in thousands). |
| | | | 2007 | | | 2006 | |
| | | | | | | | |
| | Federal funds purchased | | $ | 343,834 | | | $ | 65,884 | |
| | Repurchase agreements | | | 102,628 | | | | - | |
| | Lines of credit | | | 42,000 | | | | - | |
| | Term Investment Option | | | 150,000 | | | | - | |
| | | | | | | | | | |
| | Total short-term borrowings | | $ | 638,462 | | | $ | 65,884 | |
| | | | | | | | | | |
| | Lines of Credit |
| | United maintains a line of credit agreement with a financial institution to borrow up to $30 million with an interest rate indexed to the prime rate. The agreement is renewable each year. United has pledged the stock of its North Carolina bank subsidiary as collateral securing any amounts outstanding on the line of credit. There were no borrowings outstanding under this agreement as of December 31, 2007 or 2006. |
| | |
| | At December 31, 2007 and 2006, United maintained a line of credit agreement with a financial institution to borrow up to $45 million with interest indexed to LIBOR, adjusted monthly. United had pledged the common stock of its Georgia bank subsidiary as collateral securing any amounts outstanding on the line of credit. At December 31, 2007, there was $42 million outstanding on this line of credit. There were no borrowings outstanding under this agreement as of December 31, 2006. In January 2008, the balance was repaid and the line of credit was terminated. Simultaneously, United entered into a line of credit agreement with another financial institution to borrow up to $50 million with interest indexed to LIBOR, adjusted monthly. United had pledged the common stock of its Georgia bank subsidiary as collateral securing any amounts outstanding on the line of credit. |
| | |
| | Term Investment Option |
| | United periodically obtains funds from the Federal Reserve through its Term Investment Option (TIO) program. The funds are obtained through a bid process through the Federal Reserve’s treasury department. United’s TIO funds are collateralized by commercial loans with maturities ranging from overnight to two weeks. Interest on TIO funds is comparable to the targeted federal funds rate. |
UNITED COMMUNITY BANKS, INC. AND SUBSIDIARIES
Notes to Consolidated Financial Statements, continued
| (12) | Long-term Debt |
| | Long-term debt at December 31, 2007 and 2006 consisted of the following (in thousands): |
| | | 2007 | | | 2006 | | Issue Date | | Stated Maturity Date | | Earliest Call Date | | Interest Rate | |
| | | | | | | | | | | | | | | |
| 2002 subordinated debentures | | $ | 31,500 | | | $ | 31,500 | | 2002 | | 2012 | | 2012 | | | 6.750 | % |
| 2003 subordinated debentures | | | 35,000 | | | | 35,000 | | 2003 | | 2015 | | 2010 | | | 6.250 | |
| Total subordinated debentures | | | 66,500 | | | | 66,500 | | | | | | | | | | |
| United Community Statutory Trust I | | | 5,155 | | | | 5,155 | | 2000 | | 2030 | | 2010 | | | 10.600 | |
| United Community Capital Trust II | | | 10,309 | | | | 10,309 | | 2000 | | 2030 | | 2010 | | | 11.295 | |
| United Community Capital Trust | | | 21,650 | | | | 21,650 | | 1998 | | 2028 | | 2008 | | | 8.125 | |
| Fairbanco Capital Trust I | | | - | | | | 5,155 | | 2002 | | 2032 | | 2007 | | LIBOR + 3.65 | |
| Southern Bancorp Capital Trust I | | | 4,382 | | | | 4,382 | | 2004 | | 2034 | | 2009 | | Prime + 1.00 | |
| Total trust preferred securities | | | 41,496 | | | | 46,651 | | | | | | | | | | |
| Total long-term debt | | $ | 107,996 | | | $ | 113,151 | | | | | | | | | | |
| | | | | | | | | | | | | | | | | | |
| | Interest is paid semiannually for all subordinated debentures and trust preferred securities. |
| | |
| | Subordinated Debentures |
| | Subordinated debentures qualify as Tier II capital under risk based capital guidelines. The 2003 subordinated debentures are callable at par on September 30, 2010 and September 30 of each year thereafter. If not called, the interest rate increases to 7.50% and remains at that rate until maturity or until it is called. |
| | |
| | Trust Preferred Securities |
| | Trust preferred securities qualify as Tier I capital under risk based capital guidelines subject to certain limitations. The trust preferred securities are mandatorily redeemable upon maturity, or upon earlier redemption at a premium as provided in the indentures. |
| | |
| (13) | Earnings Per Share |
| | United is required to report on the face of the statement of income, earnings per common share with and without the dilutive effects of potential common stock issuances from instruments such as options, convertible securities and warrants. Basic earnings per common share is based on the weighted average number of common shares outstanding during the period while the effects of potential common shares outstanding during the period are included in diluted earnings per common share. During 2007, 2006 and 2005, United paid dividends to Series A preferred stockholders totaling $18,000, $19,000 and $23,000, respectively. |
| | |
| | The following table sets forth the computation of basic and diluted earnings per common share for the years ended December 31, 2007, 2006 and 2005 (in thousands, except per share data): |
| | | 2007 | | | 2006 | | | 2005 | |
| | | | | | | | | | |
| Net income available to common stockholders | | $ | 57,975 | | | $ | 68,796 | | | $ | 56,719 | |
| Effects of convertible debentures | | | - | | | | 160 | | | | 130 | |
| | | | | | | | | | | | | |
| Diluted net earnings | | $ | 57,975 | | | $ | 68,956 | | | $ | 56,849 | |
| | | | | | | | | | | | | |
| Earnings per common share: | | | | | | | | | | | | |
| Basic | | $ | 1.26 | | | $ | 1.70 | | | $ | 1.47 | |
| Diluted | | | 1.24 | | | | 1.66 | | | | 1.43 | |
| | | | | | | | | | | | | |
| Weighted average common shares: | | | | | | | | | | | | |
| Basic | | | 45,893 | | | | 40,393 | | | | 38,477 | |
| | | | | | | | | | | | | |
| Effect of dilutive securities: | | | | | | | | | | | | |
| Stock options | | | 645 | | | | 804 | | | | 872 | |
| Convertible debentures | | | - | | | | 358 | | | | 372 | |
| Common stock issuable under deferred compensation plan | | | 55 | | | | 20 | | | | - | |
| | | | | | | | | | | | | |
| Diluted | | | 46,593 | | | | 41,575 | | | | 39,721 | |
| | | | | | | | | | | | | |
UNITED COMMUNITY BANKS, INC. AND SUBSIDIARIES
Notes to Consolidated Financial Statements, continued
| (14) | Income Taxes |
| | Income tax expense (benefit) for the years ended December 31, 2007, 2006 and 2005 is as follows (in thousands): |
| | | 2007 | | | 2006 | | | 2005 | |
| | | | | | | | | | |
| Current | | $ | 45,827 | | | $ | 43,132 | | | $ | 34,725 | |
| Deferred | | | (14,228 | ) | | | (3,510 | ) | | | (3,064 | ) |
| | | | | | | | | | | | | |
| Total income tax expense | | $ | 31,599 | | | $ | 39,622 | | | $ | 31,661 | |
| | The differences between the provision for income taxes and the amount computed by applying the statutory federal income tax rate (of 35%) to income before income taxes are as follows (in thousands): |
| | | 2007 | | | 2006 | | | 2005 | |
| | | | | | | | | | |
| Pretax earnings at statutory rates | | $ | 31,357 | | | $ | 37,953 | | | $ | 30,941 | |
| Add (deduct): | | | | | | | | | | | | |
| State taxes, net of federal benefit | | | 696 | | | | 2,470 | | | | 2,027 | |
| Bank owned life insurance earnings | | | (1,001 | ) | | | (265 | ) | | | (244 | ) |
| Adjustment to reserve for uncertain tax positions | | | 1,684 | | | | - | | | | - | |
| Tax-exempt interest revenue | | | (986 | ) | | | (980 | ) | | | (848 | ) |
| Nondeductible interest expense | | | 159 | | | | 148 | | | | 95 | |
| Tax credits | | | (482 | ) | | | (373 | ) | | | (335 | ) |
| Incentive stock option expense | | | 315 | | | | 457 | | | | - | |
| Other | | | (143 | ) | | | 212 | | | | 25 | |
| | | | | | | | | | | | | |
| | | $ | 31,599 | | | $ | 39,622 | | | $ | 31,661 | |
| | The following summarizes the sources and expected tax consequences of future taxable deductions (revenue) which comprise the net deferred tax asset at December 31, 2007 and 2006, which is included in other assets (in thousands): |
| | | 2007 | | | 2006 | |
| Deferred tax assets: | | | | | | |
| Allowances for loan losses | | $ | 41,306 | | | $ | 25,785 | |
| Deferred compensation | | | 4,714 | | | | 2,819 | |
| Nonqualified share based compensation | | | 1,325 | | | | 624 | |
| Interest on nonperforming loans | | | 1,013 | | | | 335 | |
| Accrued expenses | | | 986 | | | | 621 | |
| Reserve for losses on foreclosed properties | | | 876 | | | | 332 | |
| Unrealized losses on securities available for sale | | | - | | | | 3,149 | |
| | | | | | | | | |
| Total deferred tax assets | | | 50,220 | | | | 33,665 | |
| | | | | | | | | |
| Deferred tax liabilities: | | | | | | | | |
| Acquired intangible assets | | | 6,685 | | | | 5,030 | |
| Premises and equipment | | | 5,552 | | | | 2,974 | |
| Loan origination costs | | | 2,369 | | | | - | |
| Unrealized gains on cash flow hedges | | | 7,255 | | | | 958 | |
| Unrealized gains on securities available for sale | | | 1,777 | | | | - | |
| Other | | | 633 | | | | 719 | |
| | | | | | | | | |
| Total deferred tax liabilities | | | 24,271 | | | | 9,681 | |
| | | | | | | | | |
| Net deferred tax asset | | $ | 25,949 | | | $ | 23,984 | |
| | | | | | | | | |
| | During 2007, 2006 and 2005, United made income tax payments of approximately $50.4 million, $53.5 million and $22.7 million, respectively. |
| | At December 31, 2007, United had state tax loss carryforwards of approximately $880,000 that begin to expire in 2020, if not previously utilized. |
UNITED COMMUNITY BANKS, INC. AND SUBSIDIARIES
Notes to Consolidated Financial Statements, continued
| (14) | Income Taxes, continued |
| | United adopted FIN 48 on January 1, 2007. The adoption of FIN 48 had no affect on United’s financial statements. |
| | |
| | The amount of unrecognized tax benefits as of January 1, 2007 and December 31, 2007 are $2.4 million and $4.7 million, respectively. |
| | |
| | A reconciliation of the beginning and ending unrecognized tax benefit is as follows (in thousands): |
| Balance at January 1, 2007 | | $ | 2,361 | |
| Additions based on tax positions related to prior years | | | 1,089 | |
| Decreases based on tax positions related to prior years | | | (84 | ) |
| Additions based on tax positions related to the current year | | | 1,363 | |
| | | | | |
| Balance at December 31, 2007 | | $ | 4,729 | |
| | | | | |
| | Approximately $3.1 million of this amount would increase income from continuing operations, and thus affect United’s effective tax rate, if ultimately recognized into income. |
| | |
| | It is the United’s policy to recognize interest and penalties accrued relative to unrecognized tax benefits in their respective federal or state income taxes accounts. The total amount of interest and penalties recorded in the income statement for the year ended December 31, 2007 was $207,000, and the amount accrued for interest and penalties at December 31, 2007 was $610,000. |
| | |
| | United is currently under examination by certain taxing authorities. Based on the outcome of these examinations, or as a result of the expiration of statute of limitations for specific jurisdictions, it is reasonably possible that the related unrecognized tax benefits for tax positions taken regarding previously filed tax returns will materially change from those recorded as liabilities for uncertain tax positions in the financial statements. United anticipates that these audits may be finalized in the next 12 months. However, based on the status of these examinations and the protocol of finalizing audits by the relevant tax authorities, which could include formal legal proceedings, at this time it is not possible to estimate the effect of such changes, if any, to previously recorded uncertain tax positions. |
| | |
| | United and its subsidiaries file a consolidated U.S. federal income tax return, as well as filing various returns in the states where its banking offices are located. United’s Georgia and North Carolina-filed state income tax returns are no longer subject to examination by taxing authorities for years before 2003. The federal and remaining state filed income tax returns are no longer subject to examination by taxing authorities for years before 2004. |
| | |
| (15) | Employee Benefit Plans |
| | United offers a defined contribution 401(k) and Profit Sharing Plan (“Plan”) that covers substantially all employees meeting certain minimum service requirements. The Plan allows employees to make pre-tax contributions to the Plan and United matches these employee contributions dollar-for-dollar up to 5% of eligible compensation, subject to Plan and regulatory limits. United also makes discretionary profit sharing contributions of up to 3.5% of eligible compensation based on earnings performance. Employees begin to receive matching contributions after completing one year of service and benefits vest after three years of service. United’s Plan is administered in accordance with applicable laws and regulations. Compensation expense related to the Plan totaled $3.3 million, $5.0 million and $4.2 million in 2007, 2006 and 2005, respectively. The Plan allows employees to choose to invest among a number of investment options, including United’s common stock. During 2007, 2006 and 2005, the Plan purchased 71,577, 111,485 and 24,857 shares, respectively, directly from United at the average of the high and low stock price on the date of purchase. |
| | |
| | United provides defined post-retirement benefits to certain executive officers and other key employees. Expenses incurred for these post-retirement benefits were approximately $860,000, $818,000 and $1.0 million for 2007, 2006 and 2005, respectively. |
UNITED COMMUNITY BANKS, INC. AND SUBSIDIARIES
Notes to Consolidated Financial Statements, continued
| (15) | Employee Benefit Plans, continued |
| | United sponsors a non-qualified deferred compensation plan for its executive officers, certain other key employees and members of its, and its community banks’ Boards of Directors. The deferred compensation plan provides for the pre-tax deferral of compensation, fees and other specified benefits. The deferred compensation plan permits each participant to elect to defer a portion of his or her base salary or bonus and permits each director participant to elect to defer all or a portion of his or her director’s fees. Further, the deferred compensation plan allows for additional contributions by an employee, with matching contributions by United, for amounts that exceed the allowable amounts under the tax-qualified 401(k) plan. During 2007, 2006 and 2005, United recognized $147,000, $204,000 and $151,000, respectively, in matching contributions for this provision of the deferred compensation plan. The Board of Directors may elect to make a discretionary contribution to any or all participants. |
| | |
| (16) | Regulatory Matters |
| | Capital Requirements |
| | United and the Banks are subject to various regulatory capital requirements administered by the federal banking agencies. Failure to meet minimum capital requirements can initiate certain mandatory and possibly additional discretionary action by regulators that, if undertaken, could have a direct material effect on the financial statements. Under capital adequacy guidelines and the regulatory framework for prompt corrective action, United and the Banks must meet specific capital guidelines that involve quantitative measures of the Banks’ assets, liabilities, and certain off-balance sheet items as calculated under regulatory accounting practices. The capital amounts and classification are also subject to qualitative judgments by the regulators about components, risk weightings, and other factors. |
| | |
| | Quantitative measures (as defined) established by regulation to ensure capital adequacy require United and the Banks to maintain minimum amounts and ratios of Total capital and Tier I capital to risk-weighted assets, and of Tier I capital to average assets. |
| | |
| | As of December 31, 2007 and 2006, the Banks were categorized as well-capitalized under the regulatory framework for prompt corrective action. To be categorized as well-capitalized, the Banks must exceed the well-capitalized guideline ratios, as set forth in the table, and meet certain other requirements. Management believes that the Banks exceed all well-capitalized requirements, and there have been no conditions or events since year-end that would change the status of well-capitalized. The regulatory designation of “well-capitalized” under prompt corrective action regulations is not applicable to United (a bank holding company). However, Regulation Y defines “well-capitalized” for a bank holding company for the purpose of determining eligibility for a streamlined review process for acquisition proposals. For such purposes, “well-capitalized” requires United to maintain a minimum Tier I risk-based capital ratio of 6% and a minimum Total risk-based capital ratio of 10%. |
| | |
| | Minimum amounts required for capital adequacy purposes and to be well-capitalized under prompt corrective action provisions are presented below for United and its significant subsidiaries (dollars in thousands). |
| | | Regulatory | | | United | | | | | | | | | North | |
| | | Guidelines | | | (consolidated) | | | Georgia | | | Carolina | |
| | | | | | | | | | | | | | | | | | | | | | | | | |
| | | | | | Well | | | | | | | | | | | | | | | | | | | |
| | | Minimum | | | Capitalized | | | 2007 | | | 2006 | | | 2007 | | | 2006 | | | 2007 | | | 2006 | |
| | | | | | | | | | | | | | | | | | | | | | | | | |
| Risk-based ratios: | | | | | | | | | | | | | | | | | | | | | | | | |
| Tier I capital | | 4.0% | | | 6.0% | % | | | 8.6 | % | | | 9.0 | % | | | 9.0 | % | | | 8.4 | % | | | 9.0 | % | | | 9.9 | % |
| Total capital | | 8.0 | | | 10.0 | | | | 11.0 | | | | 11.3 | | | | 11.5 | | | | 10.9 | | | | 11.1 | | | | 12.0 | |
| Leverage ratio | | 3.0 | | | 5.0 | | | | 6.8 | | | | 7.7 | | | | 7.1 | | | | 7.3 | | | | 6.8 | | | | 7.4 | |
| | | | | | | | | | | | | | | | | | | | | | | | | | | | | | | |
| Tier I capital | | | | | | | | $ | 539,184 | | | $ | 505,335 | | | $ | 487,988 | | | $ | 403,076 | | | $ | 77,740 | | | $ | 79,962 | |
| Total capital | | | | | | | | | 683,919 | | | | 638,401 | | | | 620,653 | | | | 525,659 | | | | 95,505 | | | | 96,945 | |
| | | | | | | | | | | | | | | | | | | | | | | | | | | | | | | |
| | Cash, Dividend, Loan and Other Restrictions |
| | At December 31, 2007 and 2006, the Banks were required by the Federal Reserve Bank to maintain reserve cash balances of $74 million and $54 million, respectively. Federal and state banking regulations place certain restrictions on dividends paid by the Banks to United. At December 31, 2007, the Banks had approximately $102 million of retained earnings available for distribution to United in the form of dividends without requesting regulatory approval. Effective February 1, 2008, United merged its North Carolina bank into its Georgia bank. Prior to the merger, the North Carolina bank paid a $50 million dividend to United. Immediately following the merger, the combined bank had approximately $28 million available to pay dividends without regulatory approval. |
UNITED COMMUNITY BANKS, INC. AND SUBSIDIARIES
Notes to Consolidated Financial Statements, continued
| (16) | Regulatory Matters, continued |
| | The Federal Reserve Act requires that extensions of credit by the Banks to certain affiliates, including United, be secured by specific collateral, that the extension of credit to any one affiliate be limited to 10% of capital and surplus (as defined), and that extensions of credit to all such affiliates be limited to 20% of capital and surplus. |
| | |
| (17) | Commitments and Contingencies |
| | United and the Bank are parties to financial instruments with off-balance-sheet risk in the normal course of business to meet the financing needs of their customers. These financial instruments include commitments to extend credit and letters of credit. These instruments involve, to varying degrees, elements of credit risk in excess of the amount recognized in the balance sheet. The contract amounts of these instruments reflect the extent of involvement the Bank has in particular classes of financial instruments. |
| | |
| | The exposure to credit loss in the event of nonperformance by the other party to the financial instrument for commitments to extend credit and letters of credit written is represented by the contractual amount of these instruments. United uses the same credit policies in making commitments and conditional obligations as for on-balance-sheet instruments. In most cases, collateral or other security is required to support financial instruments with credit risk. |
| | |
| | The following table summarizes, as of December 31, 2007 and 2006, the contract amount of off-balance sheet instruments (in thousands): |
| | | 2007 | | | 2006 | |
| | | | | | | |
| Financial instruments whose contract amounts represent credit risk: | | | | | | |
| Commitments to extend credit | | $ | 917,113 | | | $ | 1,014,267 | |
| Commercial letters of credit | | | 28,324 | | | | 23,534 | |
| | | | | | | | | |
| | Commitments to extend credit are agreements to lend to a customer as long as there is no violation of any condition established in the contract. Commitments generally have fixed expiration dates or other termination clauses and may require payment of a fee. Since many of the commitments may expire without being drawn on, the total commitment amounts do not necessarily represent future cash requirements. United evaluates each customer’s creditworthiness on a case-by-case basis. The amount of collateral obtained, if deemed necessary, upon extension of credit is based on management’s credit evaluation. Collateral held varies, but may include unimproved and improved real estate, certificates of deposit, personal property or other acceptable collateral. |
| | |
| | Commercial letters of credit are issued to facilitate commerce and typically result in the commitment being drawn on when the underlying transaction is consummated between the customer and the third party. Those guarantees are primarily issued to local businesses. The credit risk involved in issuing letters of credit is essentially the same as that involved in extending loan facilities to customers. The Bank holds real estate, certificates of deposit, and other acceptable collateral as security supporting those commitments for which collateral is deemed necessary. The extent of collateral held for those commitments varies. |
| | |
| | United, in the normal course of business, is subject to various pending and threatened lawsuits in which claims for monetary damages are asserted. Although it is not possible to predict the outcome of these lawsuits, or the range of any possible loss, management, after consultation with legal counsel, does not anticipate that the ultimate aggregate liability, if any, arising from these lawsuits will have a material adverse effect on United’s financial position or results of operations. |
| | |
| (18) | Preferred Stock |
| | United may issue preferred stock in one or more series, up to a maximum of 10,000,000 shares. Each series shall include the number of shares issued, preferences, special rights and limitations as determined by the Board of Directors. At December 31, 2007 and 2006, there were 25,800 and 32,200 preferred shares, respectively, issued and outstanding, which were issued as Series A non-cumulative preferred stock. The dividend rate of the preferred stock is 6% per annum, provided a dividend has been declared for the common shares. The holders of the preferred stock maintain a liquidation preference to the common stockholder. The preferred stock has no voting rights and United may redeem the preferred stock for an amount equal to the stated value plus the accrued dividend. |
UNITED COMMUNITY BANKS, INC. AND SUBSIDIARIES
Notes to Consolidated Financial Statements, continued
| (19) | Shareholders’ Equity |
| | United’s Board of Directors has authorized the repurchase of United’s outstanding common stock for general corporate purposes. During 2007, United purchased 2,000,000 shares at an average price of $23.03. At December 31, 2007, 1,000,000 shares remain available to be repurchased under the current authorization of 3,000,000 shares through December 31, 2008. |
| | |
| | In 2005, United issued 1,552,500 shares of common stock in a public offering. The new shares were issued at a price of $27.75 per share. The total net proceeds from the offering were $40.5 million, net of $2.6 million in issuance costs, and the proceeds were used to support growth opportunities and for general corporate purposes. Also in 2005, United formed a Dividend Reinvestment and Stock Purchase Plan that allows participants who already own United’s common stock to purchase additional shares directly from the company. The Plan also allows participants to automatically reinvest their quarterly dividends in additional shares of common stock without a commission. During 2007, 2006 and 2005, 40,419, 43,565 and 15,852 shares, respectively, were issued in connection with the Dividend Reinvestment and Stock Purchase Plan. |
| | |
| | In 2005, United began offering its common stock as an investment option in its deferred compensation plan. The common stock component is accounted for as an equity instrument and is reflected in the consolidated balance sheet as common stock issuable. The deferred compensation plan does not allow for diversification once an election is made to invest in Company stock and settlement must be accomplished in shares at the time the deferral period is completed. At December 31, 2007 and 2006, United had 73,250 and 29,821 shares, respectively, of its common stock that was issuable under the deferred compensation plan. |
| | |
| | In 2007, the shareholders approved the Amended and Restated 2000 Key Employee Stock Option Plan (“2000 Plan”). Under the terms of the 2000 Plan, awards of 2,500,000 options, restricted stock awards, stock awards, performance share awards or stock appreciation rights could be granted for shares of United’s common stock. Options granted under the 2000 Plan can have an exercise price no less than the fair market value at the date of grant. The general terms of the 2000 Plan include a vesting period (usually four years) with an exercisable period not to exceed ten years. Certain option and restricted stock grants provide for accelerated vesting if there is a change in control of the Company or certain other conditions are met (as defined in the plan). As of December 31, 2007, approximately 1,924,000 awards could be granted under the 2000 Plan. |
| | |
| | Certain acquired companies had stock option plans for their key employees with provisions similar to United’s plan. Options under acquired plans were converted at the exchange ratio effective for common shares. No options are available for grant under any of the acquired plans. |
| | |
| | Restricted stock and options outstanding and activity for the years ended December 31, 2007, 2006 and 2005 consisted of the following: |
| | | Restricted Stock | | | Options | |
| | | | | | Weighted | | | | | | Weighted | | | Weighted | | | | |
| | | | | | Average | | | | | | Average | | | Average | | | Aggregate | |
| | | | | | Grant Date | | | | | | Exercise | | | Remaining | | | Intrinsic | |
| | | Shares | | | Fair Value | | | Shares | | | Price | | | Term (Yrs.) | | | Value (000's) | |
| December 31, 2004 | | | 20,300 | | | $ | 24.66 | | | | 2,118,666 | | | $ | 14.28 | | | | | | | |
| Granted | | | 55,024 | | | | 22.82 | | | | 442,950 | | | | 22.76 | | | | | | | |
| Exercised | | | (4,812 | ) | | | 24.70 | | | | (306,888 | ) | | | 10.81 | | | | | | | |
| Cancelled | | | - | | | | - | | | | (34,388 | ) | | | 20.51 | | | | | | | |
| December 31, 2005 | | | 70,512 | | | | 23.22 | | | | 2,220,340 | | | | 16.36 | | | | | | | |
| Granted | | | 35,125 | | | | 29.11 | | | | 491,900 | | | | 29.00 | | | | | | | |
| Exercised | | | (26,447 | ) | | | 23.08 | | | | (138,017 | ) | | | 10.08 | | | | | | | |
| Cancelled | | | (750 | ) | | | 29.50 | | | | (24,400 | ) | | | 24.78 | | | | | | | |
| December 31, 2006 | | | 78,440 | | | | 25.85 | | | | 2,549,823 | | | | 19.05 | | | | | | | |
| Granted | | | 48,400 | | | | 30.96 | | | | 605,700 | | | | 30.56 | | | | | | | |
| Exercised | | | (37,402 | ) | | | 24.34 | | | | (150,078 | ) | | | 11.33 | | | | | | | |
| Cancelled | | | (5,025 | ) | | | 29.07 | | | | (92,888 | ) | | | 27.41 | | | | | | | |
| December 31, 2007 | | | 84,413 | | | $ | 29.26 | | | | 2,912,557 | | | $ | 21.57 | | | | 6.26 | | | $ | 2,973 | |
| | | | | | | | | | | | | | | | | | | | | | | | | |
| Exerciseable at December 31, 2007 | | | | | | | | 1,731,440 | | | $ | 16.90 | | | | 4.69 | | | $ | 2,973 | |
| | | | | | | | | | | | | | | | | | | | | | | | | |
UNITED COMMUNITY BANKS, INC. AND SUBSIDIARIES
Notes to Consolidated Financial Statements, continued
| (19) | Shareholders’ Equity, continued |
| | The following is a summary of stock options outstanding at December 31, 2007: |
| Options Outstanding | | Options Exercisable | |
| | | | | | | Weighted | | Average | | | | | Weighted | |
| Shares | | | Range | | | Average Price | | Remaining Life | | Shares | | | Average Price | |
| | | | | | | | | | | | | | | |
| | 283,576 | | | $ | 5.00 - 12.50 | | | $ | 10.51 | | 3.1 years | | | 283,576 | | | $ | 10.51 | |
| | 517,995 | | | | 12.51 - 15.00 | | | | 12.96 | | 3.1 years | | | 517,995 | | | | 12.96 | |
| | 393,786 | | | | 15.01 - 17.50 | | | | 16.43 | | 5.0 years | | | 390,786 | | | | 16.42 | |
| | 273,825 | | | | 17.51 - 22.50 | | | | 22.00 | | 7.1 years | | | 147,950 | | | | 21.75 | |
| | 393,350 | | | | 22.51 - 25.00 | | | | 23.63 | | 6.6 years | | | 260,911 | | | | 23.71 | |
| | 456,625 | | | | 25.01 - 30.00 | | | | 28.73 | | 8.2 years | | | 125,097 | | | | 28.64 | |
| | 593,400 | | | | 30.01 - 33.50 | | | | 30.73 | | 9.3 years | | | 5,125 | | | | 31.53 | |
| | | | | | | | | | | | | | | | | | | | |
| | 2,912,557 | | | | 5.00 - 33.50 | | | | 21.57 | | 6.3 years | | | 1,731,440 | | | | 16.90 | |
| | | | | | | | | | | | | | | | | | | | |
| | The weighted average fair value of options granted in 2007, 2006 and 2005 was $8.25, $8.68 and $5.74, respectively. The fair value of each option granted was estimated on the date of grant using the Black-Scholes model. The key assumptions used to determine the fair value of options are presented in the table below: |
| | | 2007 | | | 2006 | | | 2005 | |
| | | | | | | | | | |
| Expected volatility | | | 20 | % | | | 22 | % | | | 20 | % |
| Expected dividend yield | | 1.1% to 2.1% | | | 1.0% to 1.2% | | | 1.0% to 1.3% | |
| Expected life (in years) | | 6.25 to 6.50 | | | | 6.25 | | | | 6.25 | |
| Risk free rate | | 3.9% to 4.9% | | | 4.3% to 5.2% | | | 3.8% to 4.5% | |
| | United’s stock trading history began in March of 2002 when United listed on the Nasdaq Global Select Market. For 2007, 2006 and 2005, expected volatility was determined using United’s historical monthly volatility over the period beginning in March of 2002 through the end of the last completed year. Compensation expense relating to options of $2.1 million and $1.9 million, respectively, net of deferred tax benefit of $713,000 and $377,000, respectively, was included in earnings in 2007 and 2006. In 2005, compensation expense relating to options of $1.6 million net of deferred tax benefit of $150,000 was not included in earnings but has been included in the pro forma results provided in Note 1 to the consolidated financial statements for comparative purposes. The amount of compensation expense for all periods was determined based on the fair value of options at the time of grant, multiplied by the number of options granted that were expected to vest, which was then amortized, net of any applicable tax benefit, over the vesting period. The forfeiture rate for options is estimated to be approximately 3% per year. The total intrinsic value of options exercised during 2007, 2006 and 2005, was $2.4 million, $2.8 million and $4.9 million, respectively. |
| | |
| | Compensation expense for restricted stock is based on the fair value of restricted stock awards at the time of grant, which is equal to the value of United’s common stock on the date of grant. The value of restricted stock grants that are expected to vest is amortized into expense over the vesting period. Compensation expense recognized in the consolidated statement of income for restricted stock in 2007, 2006 and 2005 was $757,000, $831,000, and $595,000, respectively. The total intrinsic value of restricted stock at December 31, 2007 was $1.3 million. |
| | |
| | As of December 31, 2007, there was $8.7 million of unrecognized compensation cost related to nonvested stock options and restricted stock granted under the 2000 Plan. The cost is expected to be recognized over a weighted-average period of 1.5 years. The aggregate grant date fair value of options and restricted stock that vested during 2007 was $3.4 million. |
| | |
| | The table below shows the components of accumulated other comprehensive income at December 31, 2007 and 2006 (in thousands): |
| | | 2007 | | | 2006 | |
| | | | | | | |
| Unrealized gains (losses) on securities available for sale, net of tax | | $ | 2,865 | | | $ | (5,457 | ) |
| Unrealized gains on derivative financial instruments | | | | | | | | |
| qualifying as cash flow hedges, net of tax | | | 11,396 | | | | 1,505 | |
| Accumulated other comprehensive loss | | $ | 14,261 | | | $ | (3,952 | ) |
| | | | | | | | | |
UNITED COMMUNITY BANKS, INC. AND SUBSIDIARIES
Notes to Consolidated Financial Statements, continued
| (20) | Fair Value of Financial Instruments |
| | United uses the following methods to estimate the fair value of financial instruments: |
| | |
| | For financial instruments that have quoted market prices, those quotes are used to determine fair value. Financial instruments that have no defined maturity, have a remaining maturity of 180 days or less, or reprice frequently to a market rate, are assumed to have a fair value that approximates reported book value, after taking into consideration any applicable credit risk. If no market quotes are available, financial instruments are valued by discounting the expected cash flows using an estimated current market interest rate for the financial instrument. For off-balance sheet derivative instruments, fair value is estimated as the amount that United would receive or pay to terminate the contracts at the reporting date, taking into account the current unrealized gains or losses on open contracts. |
| | |
| | The short maturity of United’s assets and liabilities results in having a significant number of financial instruments whose fair value equals or closely approximates carrying value. Such financial instruments are reported in the following balance sheet captions: cash and cash equivalents, mortgage loans held for sale, federal funds purchased and repurchase agreements. Fair value of securities available for sale equals the balance sheet value. As of December 31, 2007 and 2006, the fair value of interest rate contracts used for balance sheet management was an asset of approximately $28.5 million and $14.6 million, respectively. |
| | |
| | Fair value estimates are made at a specific point in time, based on relevant market information and information about the financial instrument. These estimates do not reflect the premium or discount on any particular financial instrument that could result from the sale of United’s entire holdings. Because no ready market exists for a significant portion of United’s financial instruments, fair value estimates are based on many judgments. These estimates are subjective in nature and involve uncertainties and matters of significant judgment and therefore cannot be determined with precision. Changes in assumptions could significantly affect the estimates. |
| | |
| | Fair value estimates are based on existing on and off-balance sheet financial instruments without attempting to estimate the value of anticipated future business and the value of assets and liabilities that are not considered financial instruments. Significant assets and liabilities that are not considered financial instruments include the mortgage banking operation, brokerage network, deferred income taxes, premises and equipment and goodwill. In addition, the tax ramifications related to the realization of the unrealized gains and losses can have a significant effect on fair value estimates and have not been considered in the estimates. |
| | |
| | Off-balance sheet instruments (commitments to extend credit and standby letters of credit) are generally short-term and at variable rates. Therefore, both the carrying amount and the estimated fair value associated with these instruments are immaterial. |
| | |
| | The carrying amount and fair values for other financial instruments included in United’s balance sheet at December 31, 2007 and 2006 are as follows (in thousands): |
| | | 2007 | | | 2006 | |
| | | Carrying | | | | | | Carrying | | | | |
| | Amount | | | Fair Value | | | Amount | | | Fair Value | |
| Assets: | | | | | | | | | | | | | | | | |
| Loans, net | | $ | 5,839,840 | | | $ | 5,862,033 | | | $ | 5,309,972 | | | $ | 5,309,497 | |
| | | | | | | | | | | | | | | | | |
| Liabilities: | | | | | | | | | | | | | | | | |
| Deposits | | | 6,075,951 | | | | 6,094,973 | | | | 5,772,886 | | | | 5,758,924 | |
| Federal Home Loan Bank advances | | | 519,782 | | | | 515,582 | | | | 489,084 | | | | 488,088 | |
| Long-term debt | | | 107,996 | | | | 107,834 | | | | 113,151 | | | | 115,775 | |
| | | | | | | | | | | | | | | | | |
UNITED COMMUNITY BANKS, INC. AND SUBSIDIARIES
Notes to Consolidated Financial Statements, continued
| (21) | Condensed Financial Statements of United Community Banks, Inc. (Parent Only), |
| Statement of Income | |
| For the Years Ended December 31, 2007, 2006 and 2005 | |
| | | | | | | | | | |
| (in thousands) | |
| | | | | | | | | | |
| | | 2007 | | | 2006 | | | 2005 | |
| | | | | | | | | | |
| Dividends from subsidiaries | | $ | 42,500 | | | $ | 10,000 | | | $ | 26,500 | |
| Other | | | 12,254 | | | | 9,232 | | | | 5,861 | |
| | | | | | | | | | | | | |
| Total income | | | 54,754 | | | | 19,232 | | | | 32,361 | |
| | | | | | | | | | | | | |
| Interest | | | 9,332 | | | | 8,721 | | | | 8,795 | |
| Other | | | 10,147 | | | | 9,522 | | | | 6,461 | |
| | | | | | | | | | | | | |
| Total expenses | | | 19,479 | | | | 18,243 | | | | 15,256 | |
| Income tax benefit | | | 2,553 | | | | 3,240 | | | | 3,365 | |
| | | | | | | | | | | | | |
| Income before equity in undistributed income of subsidiaries | | | 37,828 | | | | 4,229 | | | | 20,470 | |
| | | | | | | | | | | | | |
| Equity in undistributed income of subsidiaries | | | 20,165 | | | | 64,586 | | | | 36,272 | |
| | | | | | | | | | | | | |
| Net income | | $ | 57,993 | | | $ | 68,815 | | | $ | 56,742 | |
| | | | | | | | | | | | | |
| | | | | | | | | | | | | |
| Balance Sheet | |
| As of December 31, 2007 and 2006 | |
| | | | | | | | | | | | | |
| (in thousands) | |
| | | | | | | | | | | | | |
| Assets | |
| | | | | | | | | | | | | |
| | | 2007 | | | 2006 | | | | | |
| | | | | | | | | | | | | |
| Cash | | $ | 1,630 | | | $ | 7,647 | | | | | |
| Investment in subsidiaries | | | 901,062 | | | | 642,773 | | | | | |
| Investment in subordinated notes issued by subsidiaries | | | 73,000 | | | | 73,000 | | | | | |
| Other assets | | | 28,611 | | | | 14,152 | | | | | |
| | | | | | | | | | | | | |
| Total assets | | $ | 1,004,303 | | | $ | 737,572 | | | | | |
| | | | | | | | | | | | | |
| Liabilities and Stockholders' Equity | |
| | | | | | | | | | | | | |
| Subordinated debentures | | $ | 107,996 | | | $ | 113,151 | | | | | |
| Lines of credit | | | 42,000 | | | | - | | | | | |
| Other liabilities | | | 22,405 | | | | 7,654 | | | | | |
| | | | | | | | | | | | | |
| Total liabilities | | | 172,401 | | | | 120,805 | | | | | |
| | | | | | | | | | | | | |
| Stockholders' equity | | | 831,902 | | | | 616,767 | | | | | |
| | | | | | | | | | | | | |
| Total liabilities and stockholders' equity | | $ | 1,004,303 | | | $ | 737,572 | | | | | |
| | | | | | | | | | | | | |
UNITED COMMUNITY BANKS, INC. AND SUBSIDIARIES
Notes to Consolidated Financial Statements, continued
| (21) | Condensed Financial Statements of United Community Banks, Inc. (Parent Only), continued |
| Statement of Cash Flows | |
| For the Years Ended December 31, 2007, 2006 and 2005 | |
| | | | | | | | | | |
| (in thousands) | |
| | | | | | | | | | |
| | | 2007 | | | 2006 | | | 2005 | |
| | | | | | | | | | |
| Operating activities: | | | | | | | | | |
| Net income | | $ | 57,993 | | | $ | 68,815 | | | $ | 56,742 | |
| Adjustments to reconcile net income to net cash provided | | | | | | | | | | | | |
| by operating activities: | | | | | | | | | | | | |
| Equity in undistributed income of the subsidiaries | | | (20,165 | ) | | | (64,586 | ) | | | (36,272 | ) |
| Depreciation, amortization and accretion | | | 565 | | | | 677 | | | | 718 | |
| Employee stock compensation | | | 3,580 | | | | 3,107 | | | | 595 | |
| Change in assets and liabilities, net of effects | | | | | | | | | | | | |
| of business combinations: | | | | | | | | | | | | |
| Other assets | | | (15,434 | ) | | | 11,922 | | | | (12,151 | ) |
| Other liabilities | | | 15,457 | | | | (10,324 | ) | | | 12,330 | |
| | | | | | | | | | | | | |
| Net cash provided by operating activities | | | 41,996 | | | | 9,611 | | | | 21,962 | |
| | | | | | | | | | | | | |
| Investing activities, net of effects of purchase acquisitions: | | | | | | | | | | | | |
| Purchases of premises and equipment | | | (76 | ) | | | (25 | ) | | | (48 | ) |
| Investment in subsidiaries | | | (6,000 | ) | | | (250 | ) | | | (3,500 | ) |
| Purchases of subordinated notes issued by subsidiaries | | | - | | | | - | | | | (50,000 | ) |
| Net cash (paid for) received from acquisitions | | | (22,287 | ) | | | 1,914 | | | | - | |
| Purchases of securities available for sale | | | (125 | ) | | | (500 | ) | | | - | |
| | | | | | | | | | | | | |
| Net cash (used) provided by investing activities | | | (28,488 | ) | | | 1,139 | | | | (53,548 | ) |
| | | | | | | | | | | | | |
| Financing activities, net of effects of business combinations: | | | | | | | | | | | | |
| Net change in short-term borrowings | | | 42,000 | | | | (1,300 | ) | | | (3,210 | ) |
| Retirement of trust preferred securities | | | (5,000 | ) | | | - | | | | - | |
| Proceeds from exercise of stock options | | | 1,700 | | | | 843 | | | | 1,825 | |
| Proceeds from issuance of common stock | | | 3,942 | | | | 5,060 | | | | 41,641 | |
| Retirement of preferred stock | | | (64 | ) | | | - | | | | (126 | ) |
| Purchases of treasury stock | | | (46,056 | ) | | | - | | | | - | |
| Cash dividends on common stock | | | (16,029 | ) | | | (12,492 | ) | | | (10,860 | ) |
| Cash dividends on preferred stock | | | (18 | ) | | | (19 | ) | | | (23 | ) |
| | | | | | | | | | | | | |
| Net cash (used) provided by financing activities | | | (19,525 | ) | | | (7,908 | ) | | | 29,247 | |
| | | | | | | | | | | | | |
| Net change in cash | | | (6,017 | ) | | | 2,842 | | | | (2,339 | ) |
| | | | | | | | | | | | | |
| Cash at beginning of year | | | 7,647 | | | | 4,805 | | | | 7,144 | |
| | | | | | | | | | | | | |
| Cash at end of year | | $ | 1,630 | | | $ | 7,647 | | | $ | 4,805 | |
| | | | | | | | | | | | | |
ITEM 9. CHANGES IN AND DISAGREEMENTS WITH ACCOUNTANTS ON ACCOUNTING AND FINANCIAL DISCLOSURE.
During the past two years, United did not change accountants nor have any disagreements with its accountants on any matters of accounting principles or practices or financial statement disclosure.
ITEM 9A. CONTROLS AND PROCEDURES.
Evaluation of Disclosure Controls and Procedures
United’s management, including the Chief Executive Officer and Chief Financial Officer, supervised and participated in an evaluation of the company’s disclosure controls and procedures as of December 31, 2007.
Based on that evaluation, the Chief Executive Officer and Chief Financial Officer have concluded that the disclosure controls and procedures were effective in accumulating and communicating information to management, including the Chief Executive Officer and Chief Financial Officer, as appropriate to allow timely decisions regarding disclosures of that information under the Securities and Exchange Commission’s rules and forms and that the disclosure controls and procedures are designed to ensure that the information required to be disclosed in reports that are filed or submitted under the Act is recorded, processed, summarized and reported within the time periods specified.
Changes in Internal Control Over Financial Reporting
No changes were made to United’s internal control over financial reporting during the fourth quarter of 2007 that materially affected, or are reasonably likely to materially affect, United’s internal control over financial reporting.
Management’s Report on Internal Control Over Financial Reporting
United’s management is responsible for establishing and maintaining adequate internal control over financial reporting. Management’s assessment of the effectiveness of United’s internal control over financial reporting as of December 31, 2007 is included in Item 8 of this Report under the heading “Management’s Report on Internal Controls Over Financial Reporting”.
ITEM 9B. OTHER INFORMATION.
There were no items required to be reported on Form 8-K during the fourth quarter of 2007 that were not reported on Form 8-K.
PART III
ITEM 10. DIRECTORS, EXECUTIVE OFFICERS AND CORPORATE GOVERNANCE.
The information contained under the headings “Information Regarding Nominees and Other Directors”, “Corporate Governance” and “Section 16(a) Beneficial Ownership Reporting Compliance” in the Proxy Statement to be used in connection with the solicitation of proxies for United’s 2008 Annual Meeting of Shareholders, to be filed with the SEC, is incorporated herein by reference. Pursuant to instruction 3 to paragraph (b) of Item 401 of Regulation S-K, information relating to the executive officers of United is included in Item 1 of this Report.
ITEM 11. EXECUTIVE COMPENSATION.
The information contained under the heading “Compensation of Executive Officers and Directors” in the Proxy Statement to be used in connection with the solicitation of proxies for United��s 2008 Annual Meeting of Shareholders, to be filed with the SEC, is incorporated herein by reference.
ITEM 12. SECURITY OWNERSHIP OF CERTAIN BENEFICIAL OWNERS AND MANAGEMENT AND RELATEDSTOCKHOLDER MATTERS.
The information contained under the heading “Principal and Management Shareholders” and the “Equity Compensation Plan Information” table in the Proxy Statement to be used in connection with the solicitation of proxies for United’s 2008 Annual Meeting of Shareholders, to be filed with the SEC, is incorporated herein by reference. For purposes of determining the aggregate market value of United’s voting stock held by nonaffiliates, shares held by all directors and executive officers of United have been excluded. The exclusion of such shares is not intended to, and shall not, constitute a determination as to which persons or entities may be “Affiliates” of United as defined by the Commission.
ITEM 13. CERTAIN RELATIONSHIPS AND RELATED TRANSACTIONS, AND DIRECTOR INDEPENDENCE.
The information contained under the heading “Corporate Governance – Certain Relationships and Related Transactions” in the Proxy Statement to be used in connection with the solicitation of proxies for United’s 2008 Annual Meeting of Shareholders, to be filed with the SEC, is incorporated herein by reference.
ITEM 14. PRINCIPAL ACCOUNTANTING FEES AND SERVICES.
The information contained under the heading “Other Matters – Independent Registered Public Accounting Firm” in the Proxy Statement to be used in connection with the solicitation of proxies for United’s 2008 Annual Meeting of Shareholders, to be filed with the SEC, is incorporated herein by reference.
PART IV
ITEM 15. EXHIBITS, FINANCIAL STATEMENT SCHEDULES.
| (a) | 1. | Financial Statements. |
| | | |
| | | The following consolidated financial statements are located in Item 8 of this Report: |
| | | |
| | | Report of Independent Registered Public Accounting Firm |
| | | Consolidated Statement of Income - Years ended December 31, 2007, 2006, and 2005 |
| | | Consolidated Balance Sheet - December 31, 2007 and 2006 |
| | | Consolidated Statement of Changes in Shareholders’ Equity - Years ended December 31, 2007, 2006, and 2005 |
| | | Consolidated Statement of Cash Flows - Years ended December 31, 2007, 2006, and 2005 |
| | | Notes to Consolidated Financial Statements |
| | 2. | Financial Statement Schedules. |
| | | | |
| | | Schedules to the consolidated financial statements are omitted, as the required information is not applicable. |
| | | | |
| | 3. | Exhibits. |
| | | | |
| | | The following exhibits are required to be filed with this Report on Form 10-K by Item 601 of Regulation S-K: |
| | Exhibit No. | Exhibit |
| | | |
| | 3.1 | Restated Articles of Incorporation of United Community Banks, Inc., (incorporated herein by reference to Exhibit 3.1 to United Community Banks, Inc.’s Quarterly Report on Form 10-Q for the quarter ended June 30, 2001, File No. 0-21656, filed with the Commission on August 14, 2001). |
| | | |
| | 3.2 | Amendment to the Restated Articles of Incorporation of United Community Banks, Inc. (incorporated herein by reference to Exhibit 3.3 to United Community Banks, Inc.’s Registration Statement on Form S-4, File No. 333-118893, filed with the Commission on September 9, 2004). |
| | | |
| | 3.3 | Amended and Restated Bylaws of United Community Banks, Inc., dated September 12, 1997 (incorporated herein by reference to Exhibit 3.1 to United Community Banks, Inc.’s Annual Report on Form 10-K, for the year ended December 31, 1997, File No. 0-21656, filed with the Commission on March 27, 1998). |
| | | |
| | 4.1 | See Exhibits 3.1, 3.2 and 3.3 for provisions of the Restated Articles of Incorporation, as amended, and Amended and Restated Bylaws, which define the rights of the Shareholders. |
| | | |
| | 10.1 | United Community Banks, Inc.’s 1995 Key Employee Stock Option Plan (incorporated herein by reference to Exhibit 10.3 to United Community Banks, Inc.’s Annual Report on Form 10-K for the year ended December 31, 1994, File No. 0-21656).* |
| | | |
| | 10.2 | United Community Banks, Inc.’s Profit Sharing Plan, dated as of March 9, 2001 (incorporated herein by reference to Exhibit 4.3 to United Community Banks, Inc.’s Registration Statement on Form S-8, File No. 333-86876, filed with the Commission on April 24, 2002).* |
| | | |
| | 10.3 | Amendment No. 1 to United Community Banks, Inc.’s Profit Sharing Plan, dated as of March 15, 2002 (incorporated herein by reference to Exhibit 4.4 to United Community Banks, Inc.’s Registration Statement on Form S-8, File No. 333-86876, filed with the Commission on April 24, 2002).* |
| | | |
| | 10.4 | United Community Banks, Inc.’s 2000 Key Employee Stock Option Plan (incorporated herein by reference to Exhibit 4.3 to United Community Banks, Inc.’s Registration Statement on Form S-8, File No. 333-99849, filed with the Commission on September 19, 2002).* |
| | | |
| | 10.5 | Amendment to United Community Banks, Inc. 2000 Key Employee Stock Option Plan, dated March 5, 2004 (incorporated herein by reference to United Community Banks, Inc.’s Registration Statement on Form S-4, filed on September 9, 2004).* |
| | Exhibit No. | Exhibit |
| | | |
| | 10.6 | Loan and Stock Pledge Agreement dated June 27, 2003, as amended and restated as of October 30, 2003, by and between United Community Banks, Inc. and The Bankers Bank (incorporated herein by reference to Exhibit 10.5 to United Community Banks, Inc.’s Annual Report on Form 10-K for the year ended December 31, 2003, File No. 0-21656, filed with the Commission on March 8, 2004). |
| | | |
| | 10.7 | Split-Dollar Agreement between United and Jimmy C. Tallent dated June 1, 1994 (incorporated herein by reference to Exhibit 10.11 to United Community Banks, Inc.’s Annual Report on Form 10-K for the year ended December 31, 1994, File No. 0-21656).* |
| | | |
| | 10.8 | Form of Change of Control Severance Agreement by and between United Community Banks, Inc. and Jimmy C. Tallent, Thomas C. Gilliland, Ray K. Williams and David Shearrow (incorporated herein by reference to Exhibit 10.1 to United Community Banks, Inc.’s Quarterly Report on Form 10-Q for the quarter ended June 30, 2001, File No. 0-21656, filed with the Commission on August 14, 2001).* |
| | | |
| | 10.9 | Change of Control Severance Agreement by and between United Community Banks, Inc. and Guy W. Freeman (incorporated herein by reference to Exhibit 10.10 to United Community Banks, Inc.’s Annual Report on Form 10-K for the year ended December 31, 2005, File No. 0-21656, filed with the Commission on March 1, 2006).* |
| | | |
| | 10.10 | Change of Control Severance Agreement by and between United Community Banks, Inc. and Rex S. Schuette (incorporated herein by reference to Exhibit 10.11 to United Community Banks, Inc.’s Annual Report on Form 10-K for the year ended December 31, 2001, File No. 0-21656, filed with the Commission on March 15, 2002).* |
| | | |
| | 10.11 | Credit Agreement dated August 28, 2003, by and between United Community Banks, Inc., Marshall & Ilsley Bank and Compass Bank (incorporated herein by reference to Exhibit 10.25 to United Community Banks, Inc.’s Annual Report on Form 10-K for the year ended December 31, 2003, File No. 0-21656, filed with the Commission on March 8, 2004). |
| | | |
| | 10.12 | First Amendment to Credit Agreement date August 28, 2003, by and between United Community Banks, Inc., Marshall & Ilsley Bank and Compass Bank. (incorporated here in by reference to Exhibit 10.12 to United Community Banks, Inc.’s Annual Report on Form 10-K for the year ended December 31, 2004, File No. 0-21656, filed with the commission on March 1, 2005). |
| | | |
| | 10.13 | Second Amendment to Credit Agreement date August 28, 2003, by and between United Community Banks, Inc., Marshall & Ilsley Bank and Compass Bank. (incorporated herein by reference to Exhibit 10.13 to United Community Banks, Inc.’s Annual Report on Form 10-K for the year ended December 31, 2004, File No. 0-21656, filed with the commission on March 1, 2005). |
| | | |
| | 10.14 | United Community Bank Modified Retirement Plan, effective as of January 1, 2004 (incorporated herein by reference to Exhibit 10.1 to United Community Banks, Inc.’s Quarterly Report on Form 10-Q for the quarter ended September 30, 2004, File No. 0-21656, filed with the Commission on November 9, 2004).* |
| | Exhibit No. | Exhibit |
| | | |
| | 10.15 | United Community Bank Deferred Compensation Plan, effective as of October 21, 2004 (incorporated herein by reference to Exhibit 10.2 to United Community Banks, Inc.’s Quarterly Report on Form 10-Q for the quarter ended September 30, 2004, File No. 0-21656, filed with the Commission on November 9, 2004).* |
| | | |
| | 10.16 | United Community Banks, Inc. Dividend Reinvestment and Share Purchase Plan (incorporated) herein by reference to Exhibit Y to United Community Banks, Inc.’s Registration Statement on Form S-3D, File No. 333-127477, filed with the Commission on August 12, 2005). |
| | | |
| | 10.17 | United Community Banks, Inc., Employee Stock Purchase Plan, effective as of December 20, 2005 (incorporated herein by reference to Exhibit 4 to United Community Banks, Inc.’s Registration Statement on Form S-8, File No. 333-130489, filed with the commission on December 20, 2005). |
| | | |
| | 10.18 | Amendment Number 2 to United Community Banks, Inc. 2000 Key Employee Stock Option Plan, dated April 26, 2006 (incorporated herein by reference to Exhibit 10.1 to United Community Banks, Inc.’s Quarterly Report on Form 10-Q for the quarter ended June 30, 2006, File No. 0-21656, filed with the Commission on August 8, 2006).* |
| | | |
| | 10.19 | United Community Banks, Inc.’s Amended and Restated 2000 Key Employee Stock Option Plan (incorporated herein by reference to Exhibit 10.1 to United Community Banks, Inc.’s Current Report on Form 8-K, filed with the Commission on May 1, 2007).* |
| | | |
| | 10.20 | Form of Incentive Stock Option Agreement (incorporated herein by reference to Exhibit 10.2 to United Community Banks, Inc.’s Current Report on Form 8-K, filed with the Commission on May 1, 2007).* |
| | | |
| | 10.21 | Form of Nonqualified Stock Option Agreement (incorporated herein by reference to Exhibit 10.3 to United Community Banks, Inc.’s Current Report on Form 8-K, filed with the Commission on May 1, 2007).* |
| | | |
| | 10.22 | Form of Restricted Stock Unit Award Agreement (incorporated herein by reference to Exhibit 10.4 to United Community Banks, Inc.’s Current Report on Form 8-K, filed with the Commission on May 1, 2007).* |
| | | |
| | 10.23 | United Community Banks, Inc.’s Management Incentive Plan (incorporated herein by reference to Exhibit 10.5 to United Community Banks, Inc.’s Current Report on Form 8-K, filed with the Commission on May 1, 2007).* |
| | | |
| | 10.24 | Amendment No. 1 to United Community Banks, Inc.’s Amended and Restated 2000 Key Employee Stock Option Plan (incorporated herein by reference to Exhibit 10.1 to United Community Banks, Inc.’s Current Report on Form 8-K, filed with the Commission on April 13, 2007).* |
| | | |
| | 14 | Code of Ethical Conduct (incorporated herein by reference to Exhibit 14 to United Community Banks, Inc.’s Annual Report on Form 10-K for the year ended December 31, 2003, File No. 0-21656, filed with the Commission on March 8, 2004.). |
| | | |
| | 21 | Subsidiaries of United |
| | | |
| | 23 | Consent of Independent Registered Public Accounting Firm |
| | Exhibit No. | Exhibit |
| | | |
| | 24 | Power of Attorney of certain officers and directors of United (included on Signature Page) |
| | | |
| | 31.1 | Certification by Jimmy C. Tallent, President and Chief Executive Officer of United Community Banks, Inc., as adopted pursuant to Section 302 of the Sarbanes-Oxley Act of 2002. |
| | | |
| | 31.2 | Certification by Rex S. Schuette, Executive Vice President and Chief Financial Officer of United Community Banks, Inc., as adopted pursuant to Section 302 of the Sarbanes-Oxley Act of 2002. |
| | | |
| | 32 | Certification pursuant to 18 U.S.C. Section 1350, as adopted pursuant to Section 906 of the Sarbanes-Oxley Act of 2002. |
| | | |
| | | |
| | | |
________________________
| * | Management contract or compensatory plan or arrangement required to be filed as an Exhibit to this Annual Report on Form 10-K pursuant to Item 15(c) of Form 10-K. |
SIGNATURES
Pursuant to the requirements of Section 13 or 15(a) of the Securities Exchange Act of 1934, United has duly caused this Report on Form 10-K to be signed on its behalf by the undersigned, thereunto duly authorized, in the City of Blairsville, State of Georgia, on the 29th day of February, 2008.
| | UNITED COMMUNITY BANKS, INC. | |
| | | (Registrant) | |
| | | | |
| | | | |
| | By: | /s/ Jimmy C. Tallent | |
| | | Jimmy C. Tallent | |
| | | President and Chief Executive Officer |
| | | (Principal Executive Officer) | |
| | | | |
| | By: | /s/ Rex S. Schuette | |
| | | Rex S. Schuette | |
| | | Executive Vice President and Chief Financial Officer |
| | | (Principal Financial Officer) | |
| | | | |
| | By: | /s/ Alan H. Kumler | |
| | | Alan H. Kumler | |
| | | Senior Vice President, Controller and Chief Accounting Officer |
| | | (Principal Accounting Officer) | |
POWER OF ATTORNEY AND SIGNATURES
Know all men by these presents, that each person whose signature appears below constitutes and appoints Jimmy C. Tallent and Robert L. Head, or either of them, as attorney-in-fact, with each having the power of substitution, for him in any and all capacities, to sign any amendments to this Report on Form 10-K and to file the same, with exhibits thereto, and other documents in connection therewith, with the Securities and Exchange Commission, hereby ratifying and confirming all that each of said attorneys-in-fact, or his substitute or substitutes, may do or cause to be done by virtue hereof.
Pursuant to the requirements of the Securities Exchange Act of 1934, this Report has been signed below by the following persons on behalf of United in the capacities set forth and on the 29th day of February, 2008.
| /s/ Jimmy C. Tallent | |
| Jimmy C. Tallent | |
| President, Chief Executive Officer and Director |
| | |
| /s/ Robert L. Head, Jr. | |
| Robert L. Head, Jr. | |
| Chairman of the Board | |
| | |
| /s/ W. C. Nelson, Jr. | |
| W. C. Nelson, Jr. | |
| Vice Chairman of the Board | |
| | |
| /s/ A. William Bennett | |
| A. William Bennett | |
| Director | |
| | |
| /s/ Robert Blalock | |
| Robert Blalock | |
| Director | |
| | |
| /s/ Guy W. Freeman | |
| Guy W. Freeman | |
| Director | |
| | |
| /s/ Thomas C. Gilliland | |
| Thomas C. Gilliland | |
| Director | |
| | |
| /s/ Charles E. Hill | |
| Charles E. Hill | |
| Director | |
| | |
| /s/ Hoyt O. Holloway | |
| Hoyt O. Holloway | |
| Director | |
| | |
| /s/ Clarence W. Mason, Sr. | |
| Clarence W. Mason, Sr. | |
| Director | |
| | |
| /s/ John D. Stephens | |
| John D. Stephens | |
| Director | |
| | |
| /s/ Tim Wallis | |
| Tim Wallis | |
| Director | |
EXHIBIT INDEX
| Exhibit No. | | Description |
| | | |
| 21 | | Subsidiaries of United |
| | | |
| 23 | | Consent of Independent Registered Public Accounting Firm |
| | | |
| 31.1 | | Certification by Jimmy C. Tallent, President and Chief Executive Officer of United Community Banks, Inc., as adopted pursuant to Section 302 of the Sarbanes-Oxley Act of 2002. |
| | | |
| 31.2 | | Certification by Rex S. Schuette, Executive Vice President and Chief Financial Officer of United Community Banks, Inc., as adopted pursuant to Section 302 of the Sarbanes-Oxley Act of 2002. |
| | | |
| 32 | | Certification Pursuant to 18 U.S.C. Section 1350, as Adopted Pursuant to Section 906 of the Sarbanes-Oxley Act of 2002 |