Investor Presentation Third Quarter 2009 United Community Banks, Inc.Jimmy C. TallentPresident & CEO Rex S. Schuette David P. Shearrow Executive Vice President & CFO Executive Vice President & CRO rex_schuette@ucbi.com (706) 781-2266 The Bank That SERVICE Built.SM United Community Banks, Inc. | Third Quarter 2009
Cautionary statement This presentation contains forward-looking statements, as defined by Federal Securities Laws, including statements about financial outlook and business environment. These statements are provided to assist in the understanding of future financial performance. Such performance involves risks and uncertainties that may cause actual results to differ materially from those in such statements. Any such statements are based on current expectations and involve a number of risks and uncertainties. For a discussion of factors that may cause such forward-looking statements to differ materially from actual results, please refer to United Community Banks, Inc. Annual Report filed on Form 10-K with the Securities and Exchange Commission. This presentation also contains non-GAAP financial measures, as defined by the Federal Securities Laws. For a presentation of the most directly comparable financial measures calculated and presented in accordance with GAAP and a reconciliation of the differences between those measures and the non-GAAP financial measures, please refer to “Selected Financial Data” in the United Community Banks, Inc. Annual Report filed on Form 10-K and Quarterly Reports filed on Form 10Q with the Securities Exchange Commission, which may be found on the company’s Web site, www.ucbi.com. The Bank That SERVICE Built.SM UnitedCommunityBanks,Inc.|ThirdQuarter20092
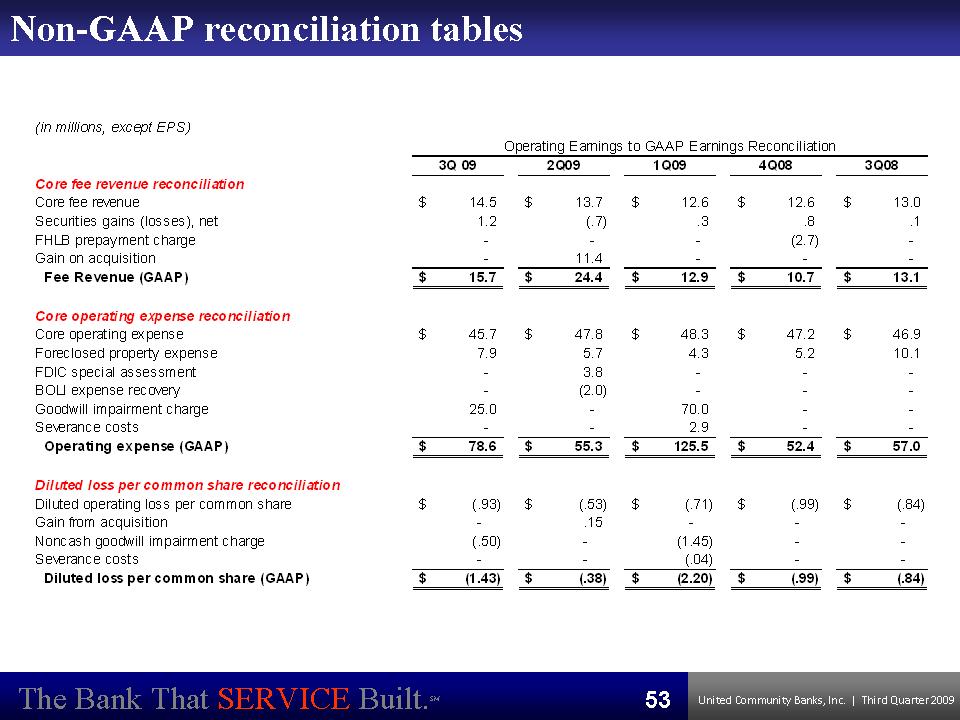
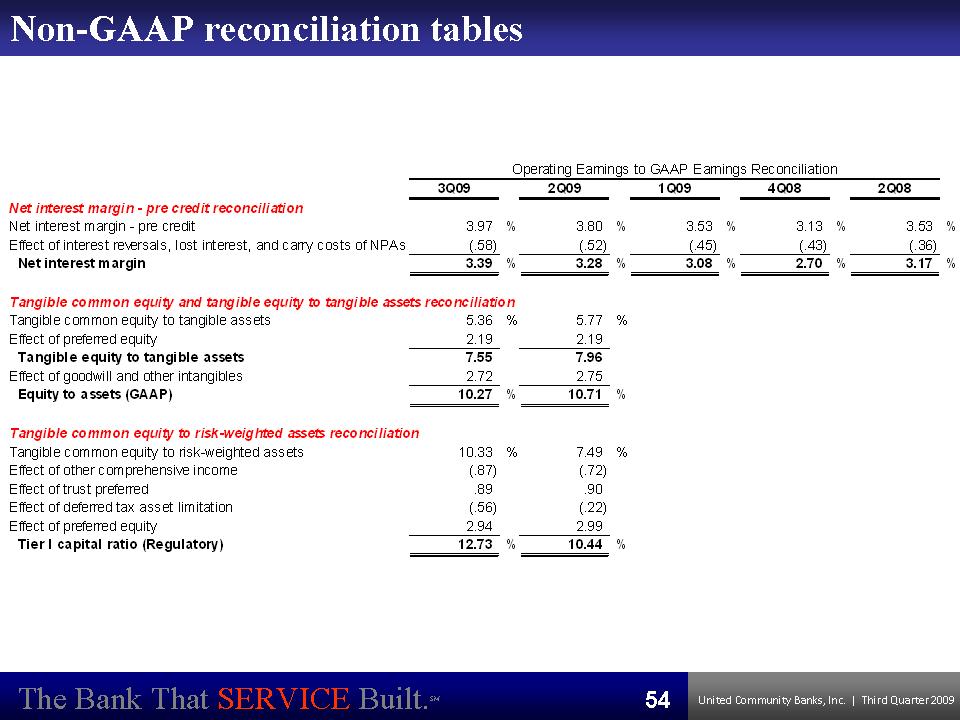
Non-GAAP measures This presentation also contains non-GAAP financial measures determined by methods other than in accordance with generally accepted accounting principles (“GAAP”). Such non-GAAP financial measures include the following: net interest margin – pre credit, core fee revenue, core operating expense, core earnings, net operating (loss) income and net operating (loss) earnings per share, tangible common equity to tangible assets, tangible equity to tangible assets and tangible common equity to risk-weighted assets. The most comparable GAAP measures to these measures are: net interest margin, fee revenue, operating expense, net (loss) income, diluted (loss) earnings per share and equity to assets. Management uses these non-GAAP financial measures because we believe it is useful for evaluating our operations and performance over periods of time, as well as in managing and evaluating our business and in discussions about our operations and performance. Management believes these non-GAAP financial measures provide users of our financial information with a meaningful measure for assessing our financial results and credit trends, as well as comparison to financial results for prior periods. These non-GAAP financial measures should not be considered as a substitute for financial measures determined in accordance with GAAP and may not be comparable to other similarly titled financial measures used by other companies. For a reconciliation of the differences between our non-GAAP financial measures and the most comparable GAAP measures, please refer to the ‘Non-GAAP Reconcilement Tables’ at the end of the Appendix of this presentation. We have not reconciled tangible common equity to tangible assets and core earnings to the extent such numbers are presented on a forward-looking basis based on management’s internal stress test or SCAP methodology. Estimates that would be required for such reconciliations cannot reliably be produced without unreasonable effort. The Bank That SERVICE Built.SM UnitedCommunityBanks,Inc.|ThirdQuarter20093
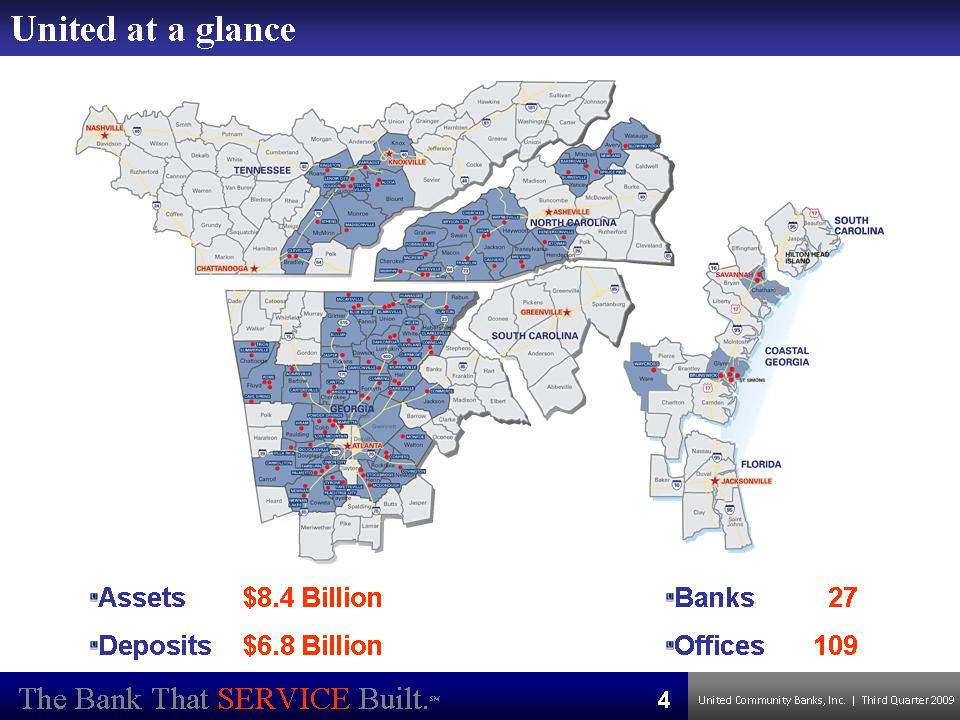
United at a glance Assets $8.4 Billion Banks 27 Deposits $6.8 Billion Offices 109 The Bank That SERVICE Built.SM UnitedCommunityBanks,Inc.|ThirdQuarter20094
Current environment Working through credit challenges Strengthened capital Core earnings improvement The Bank That SERVICE Built.SM UnitedCommunityBanks,Inc.|ThirdQuarter20095
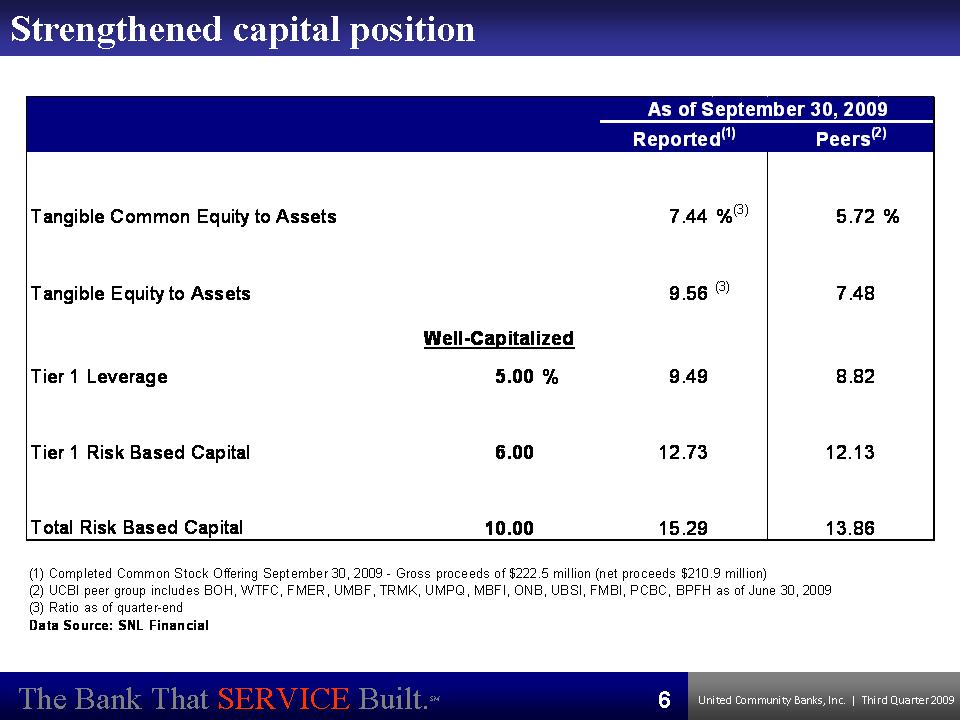
Strengthened capital position Tangible Common Equity to Assets 7.44 %(3) 5.72 % Tangible Equity to Assets 9.56 (3) 7.48 Tier 1 Leverage 5.00 % 9.49 8.82 Tier 1 Risk Based Capital 6.00 12.73 12.13 Total Risk Based Capital 10.00 15.29 13.86 As of September 30, 2009 Well-Capitalized Reported(1) Peers(2) (1) Completed Common Stock Offering September 30, 2009 - Gross proceeds of $222.5 million (net proceeds $210.9 million) (2) UCBI peer group includes BOH, WTFC, FMER, UMBF, TRMK, UMPQ, MBFI, ONB, UBSI, FMBI, PCBC, BPFH as of June 30, 2009 (3) Ratio as of quarter-end Data Source: SNL Financial The Bank That SERVICE Built.SM UnitedCommunityBanks,Inc.|ThirdQuarter20096
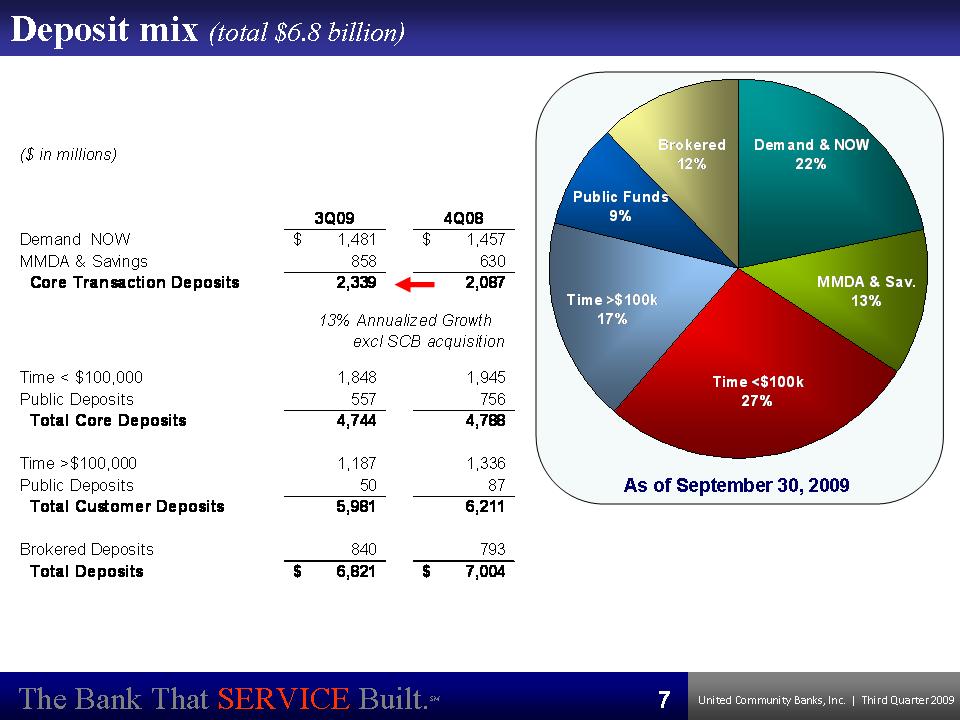
The Bank That SERVICE Built.SM United Community Banks, Inc. | Third Quarter 2009 Deposit mix (total $6.8 billion) As of September 30, 2009 MMDA & Sav. Time >$100k 13% 17% Time <$100k 27% Public Funds 9% Brokered 12% Demand & NOW 22% 7 ($ in millions) 3Q09 4Q08 Demand NOW $ 1 ,481 $ 1,457 MMDA & Savings 858 630 Core Transaction Deposits 2,339 2,087 13% Annualized Growth excl SCB acquisition Time < $100,000 1,848 1,945 Public Deposits 557 756 Total Core Deposits 4,744 4,788 Time >$100,000 1,187 1,336 Public Deposits 50 87 Total Customer Deposits 5,981 6,211 Brokered Deposits 840 793 Total Deposits $ 6 ,821 $ 7,004
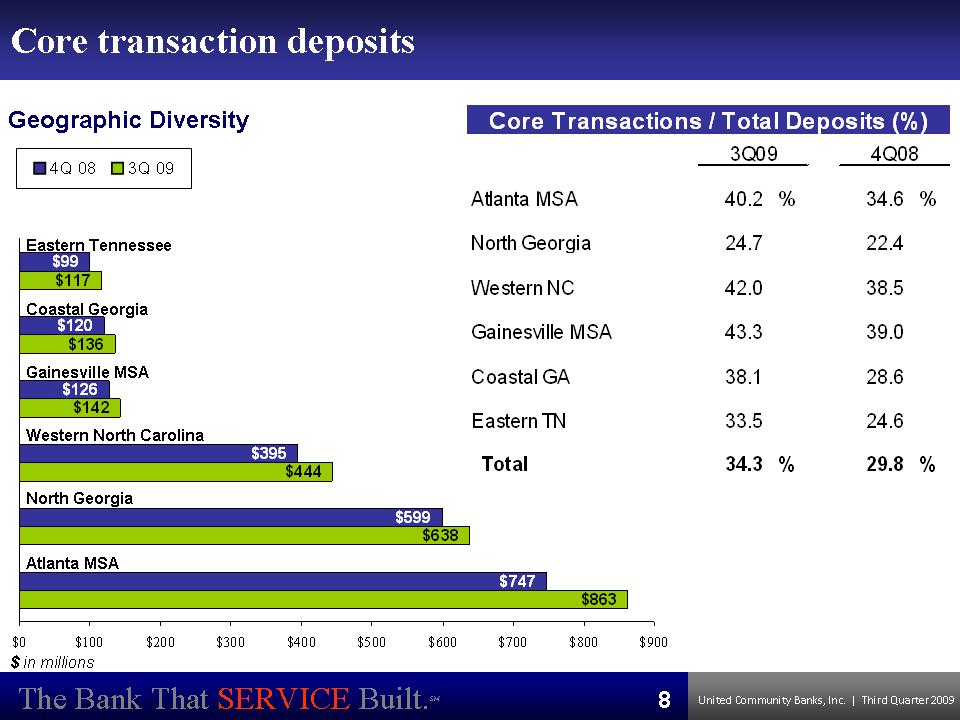
Core transaction deposits Geographic Diversity4Q 08 3Q 09 Core Transactions / Total Deposits (%) 3Q09 4Q08 40.2 % 34.6 % 24.7 22.4 42.0 38.5 43.3 39.0 38.1 28.6 33.5 24.634.3 % 29.8 % Atlanta MSA$863 $638 $444 $142 $136 $117 $747 $599 $395 $126 $120 $99 Atlanta MSA North Georgia Western North Carolina Gainesville MSA Coastal Georgia Eastern Tennessee North Georgia Western NC Gainesville MSA Coastal GA Eastern TN Total $0 $100 $200 $300 $400 $500 $600 $700 $800 $900 $ in millions The Bank That SERVICE Built.SM 8 UnitedCommunityBanks,Inc.|ThirdQuarter2009
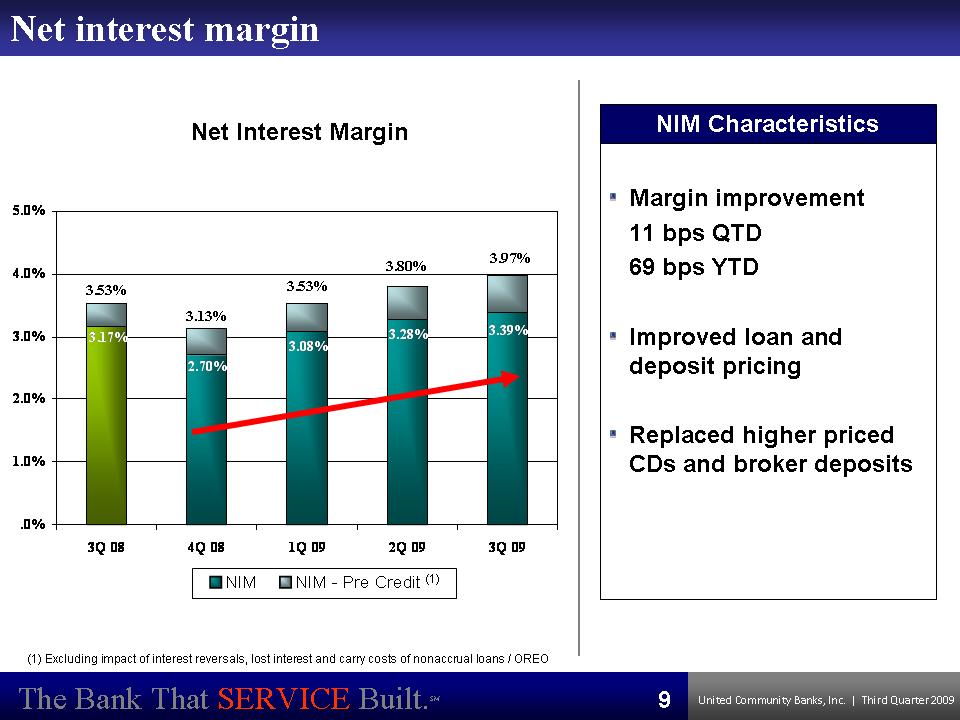
Net interest margin Net Interest Margin 5.0%4.0% 3.0% 2.0% 1.0% .0% 3.39% 3.28% 3.08% 2.70% 3.17% 3.80% 3.53% 3.13% 3.53% 3.97% 3Q08 4Q 08 1Q 09 2Q 09 3Q 09NIM NIM -Pre Credit (1) Margin improvement 11 bps QTD 69 bps YTD Improved loan and deposit pricing Replaced higher priced CDs and broker deposits NIM Characteristics (1) Excluding impact of interest reversals, lost interest and carry costs of nonaccrual loans / OREO The Bank That SERVICE Built.SM UnitedCommunityBanks,Inc.|ThirdQuarter20099
WHITES

LOAN PORTFOLIO AND CREDIT QUALITY The Bank That SERVICE Built.SM UnitedCommunityBanks,Inc.|ThirdQuarter200910
Proactively addressing credit environment Structure . Centralized underwriting and approval process. Segregated work-out teams. Highly skilled ORE disposition group. Seasoned regional credit professionalsProcess . Continuous external loan review . Intensive executive management involvement:~ Weekly past due meetings~ Weekly NPA/ORE meetings~ Quarterly criticized watch loan review meetings~ Quarterly pass commercial and CRE portfolio review meetings. Internal loan review of new credit relationships. Ongoing stress testing… commenced in 2007Policy . Ongoing enhancements to credit policy . Periodic updates to portfolio limitsThe Bank That SERVICE Built.SM UnitedCommunityBanks,Inc.|ThirdQuarter200911
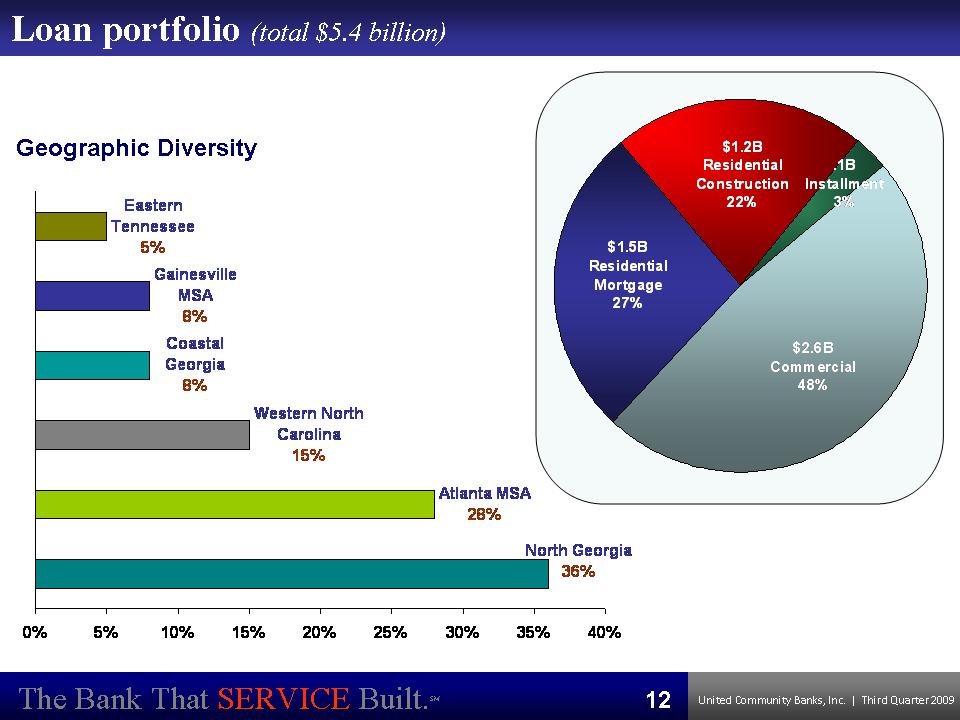
The Bank That SERVICE Built.SM United Community Banks, Inc. | Third Quarter 2009 Atlanta MSA 28% Western North Carolina 15% Coastal Georgia 8% Gainesville MSA 8% Eastern Tennessee 5% North Georgia 36% 0% 5% 10% 15% 20% 25% 30% 35% 40% Loan portfolio (total $5.4 billion) Geographic Diversity .1B Installment 3% $1.2B Residential Construction 22% $2.6B Commercial 48% $1.5B Residential Mortgage 27%12

The Bank That SERVICE Built.SM United Community Banks, Inc. | Third Quarter 2009 North Georgia 30 Western North Carolina 9% Coastal Georgia 9% Gainesville MSA 9% Eastern Tennessee 6% Atlanta MSA 37% 0% 7% 15% 22% 29% 37% 44% $.4B Comm Const 15% $1.0B Owner Occupied 38% $.4B C & I 16% $.8B Income Producing 31% Commercial loans (total $2.6 billion) Geographic Diversity Average Loan Size CRE: $443k C&I: $73k Comm. Constr. $660k 13
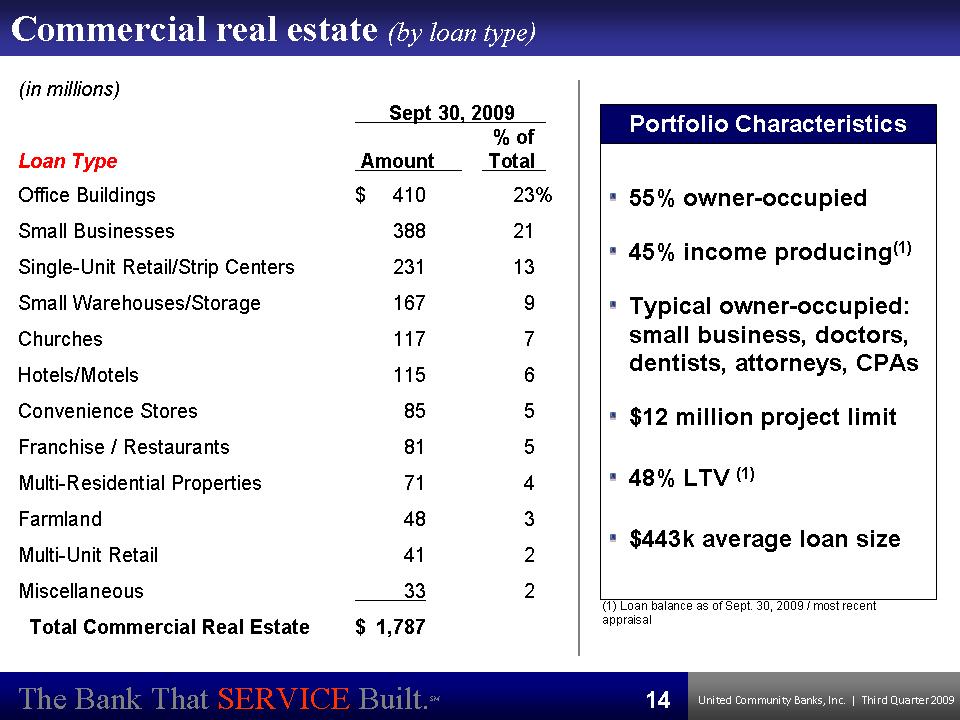
Commercial real estate (by loan type) (in millions) Loan Type Office Buildings Small Businesses Single-Unit Retail/Strip Centers Small Warehouses/Storage Churches Hotels/Motels Convenience Stores Franchise / Restaurants Multi-Residential Properties Farmland Multi-Unit Retail Miscellaneous Total Commercial Real Estate Sept 30, 2009Amount $ 410 388 231 167 117 115 85 81 71 48 41 33 % ofTotal23% 21 13 9 7 6 5 5 4 3 2 2 55% owner-occupied 45% income producing(1) Typical owner-occupied: small business, doctors, dentists, attorneys, CPAs $12 million project limit 48% LTV (1) $443k average loan size Portfolio Characteristics (1) Loan balance as of Sept. 30, 2009 / most recent appraisal $ 1,787The Bank That SERVICE Built.SM UnitedCommunityBanks,Inc.|ThirdQuarter200914
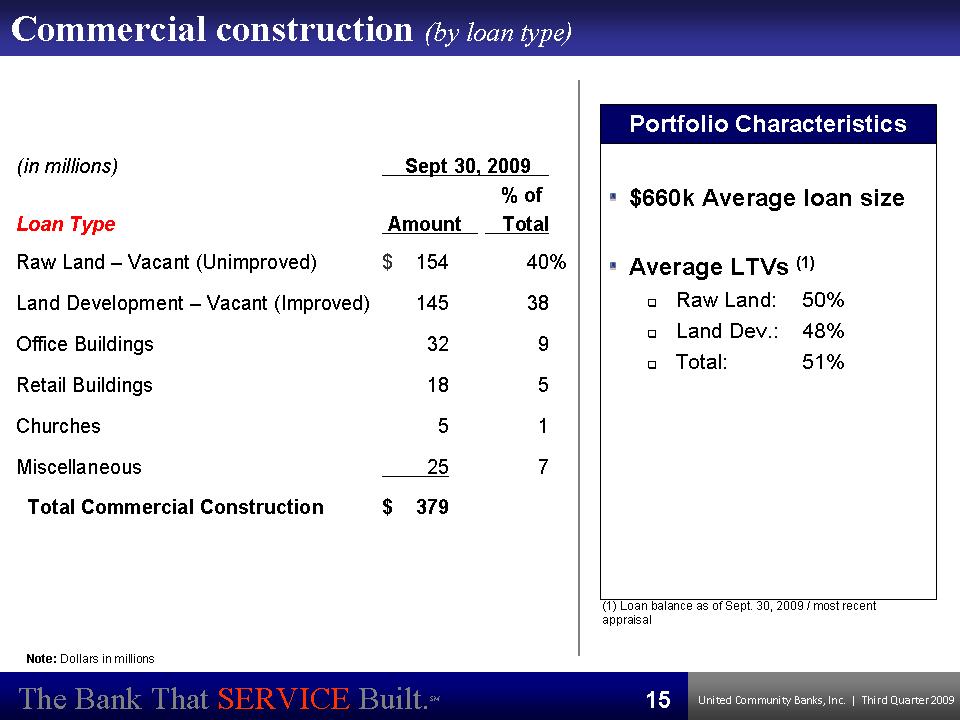
Commercial construction (by loan type) (in millions) Loan Type Sept 30, 2009 % of Amount Total Raw Land – Vacant (Unimproved) $ 154 40% Land Development – Vacant (Improved) 145 38Office Buildings 32 9 Retail Buildings 18 5 Churches 5 1 Miscellaneous 25 7 Total Commercial Construction $ 379 Note: Dollars in millions $660k Average loan size Average LTVs (1) ..Raw Land: 50% ..Land Dev.: 48% ..Total: 51% Portfolio Characteristics (1) Loan balance as of Sept. 30, 2009 / most recent appraisal The Bank That SERVICE Built.SM UnitedCommunityBanks,Inc.|ThirdQuarter200915
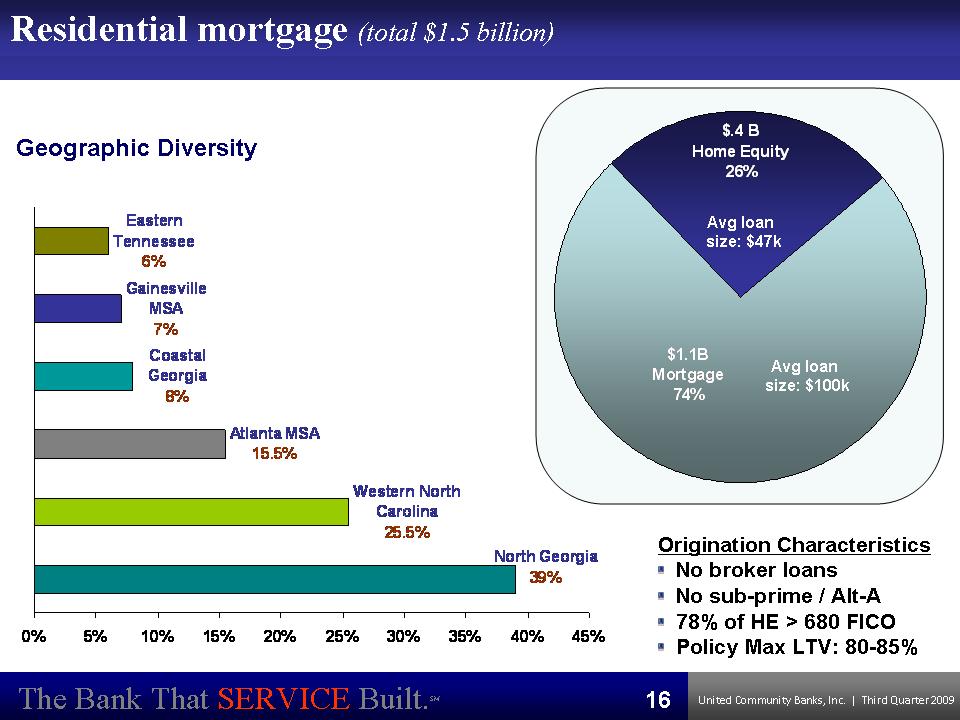
The Bank That SERVICE Built.SM United Community Banks, Inc. | Third Quarter 2009 Western North Carolina 25.5% Atlanta MSA 15.5% Coastal Georgia 8% Gainesville MSA 7% Eastern Tennessee 6% North Georgia 39% 0% 5% 10% 15% 20% 25% 30% 35% 40% 45% $.4 B Home Equity 26% $1.1B Mortgage 74% Residential mortgage (total $1.5 billion) Geographic Diversity Avg loan size: $47kAvg loan size: $100k 16Origination Characteristics No broker loans No sub-prime / Alt-A 78% of HE > 680 FICO Policy Max LTV: 80-85%
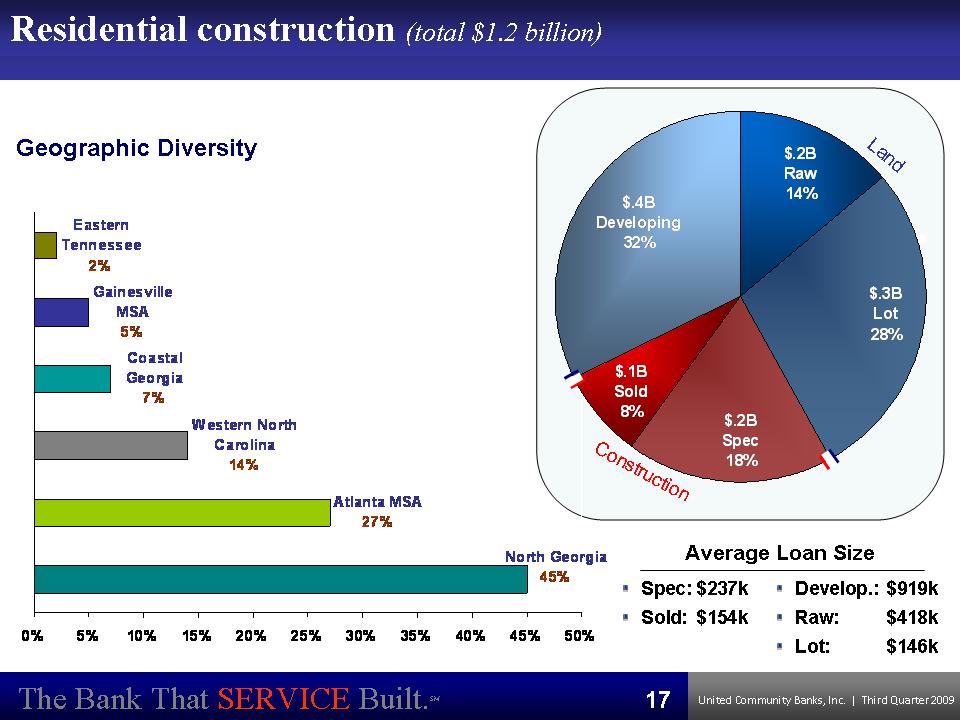
The Bank That SERVICE Built.SM United Community Banks, Inc. | Third Quarter 2009 Atlanta MSA 27% Western North Carolina 14% Coastal Georgia 7% Gainesville MSA 5% Eastern Tennessee 2% North Georgia 45% 0% 5% 10% 15% 20% 25% 30% 35% 40% 45% 50% Residential construction (total $1.2 billion) Geographic Diversity Developing Spec: $237k Sold: $154k Develop.: $919k Raw: $418k Lot: $146k Average Loan Size 17 $.1B Sold 8% $.2B Spec 18% $.3B Lot 28% $.2B Raw $.4B 14% Developing 32% Construction Land
The Bank That SERVICE Built.SM United Community Banks, Inc. | Third Quarter 2009 Atlanta MSA 27% Western North Carolina 14% Coastal Georgia 7% Gainesville MSA 5% Eastern Tennessee 2% North Georgia 45% 0% 5% 10% 15% 20% 25% 30% 35% 40% 45% 50% Residential construction (total $1.2 billion) Geographic Diversity Developing Spec: $237k Sold: $154k Develop.: $919k Raw: $418k Lot: $146k Average Loan Size 17 $.1B Sold 8% $.2B Spec 18% $.3B Lot 28% $.2B Raw $.4B 14% Developing 32% Construction Land
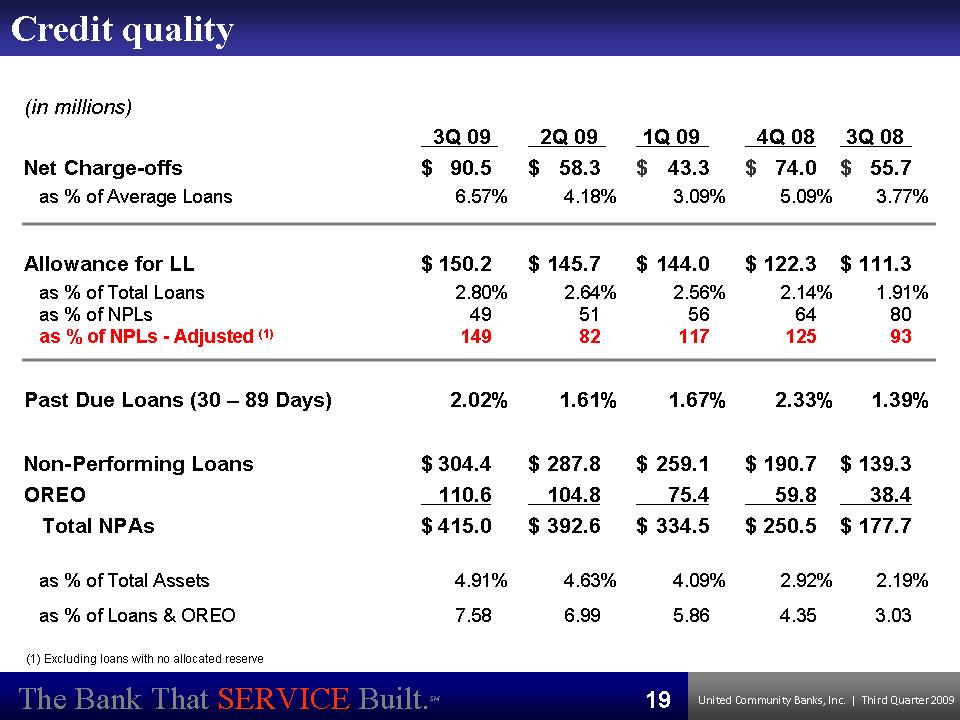
Credit quality The Bank That SERVICE Built.SM UnitedCommunityBanks,Inc.|ThirdQuarter200919
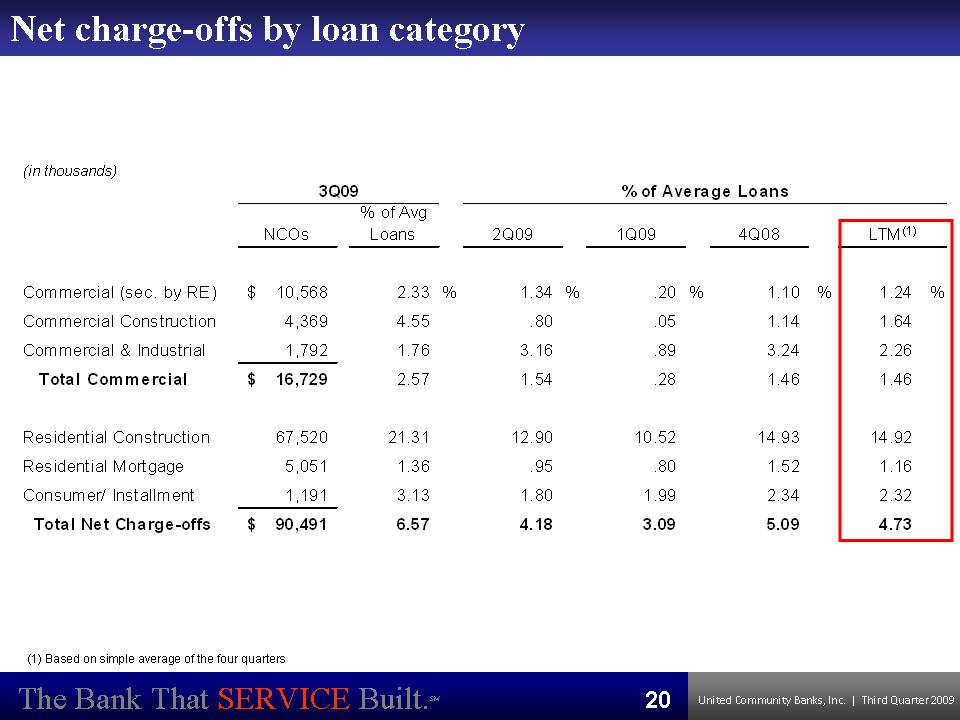
Net charge-offs by loan category (in thousands) 3Q09 % of Average Loans % of Avg NCOs Loans 2Q09 1Q09 4Q08 LTM(1) Commercial (sec. by RE) $ 10,568 2.33 % 1.34 % .20 % 1.10 % 1.24 % Commercial Construction 4,369 4.55 .80 .05 1.14 1.64 Commercial & Industrial 1,792 1.76 3.16 .89 3.24 2.26 Total Commercial $ 16,729 2.57 1.54 .28 1.46 1.46 Residential Construction 67,520 21.31 12.90 10.52 14.93 14.92 Residential Mortgage 5,051 1.36 .95 .80 1.52 1.16 Consumer/ Installment 1,191 3.13 1.80 1.99 2.34 2.32 Total Net Charge-offs $ 90,491 6.57 4.18 3.09 5.09 4.73 (1) Based on simple average of the four quarters The Bank That SERVICE Built.SM UnitedCommunityBanks,Inc.|ThirdQuarter200920

Net charge-offs by market (in thousands) NCOs 3Q 09 % of Avg Loans 2Q09 1Q09 4Q08 % of Average Loans MARKETS Atlanta MSA $ 50,129 12.61 % 8.89 % 6.16 % 10.80 % Gainesville MSA 1,473 1.60 4.38 1.18 8.60 North Georgia 24,017 4.74 2.52 1.64 1.91 Western North Carolina 3,949 1.98 0.51 1.83 1.16 Coastal Georgia 10,051 8.78 0.85 2.84 2.70 East Tennessee 872 1.30 3.21 1.28 2.02 Total $ 90,491 6.57 4.18 3.09 5.09 LTM(1) 9.62 % 3.94 2.70 1.37 3.79 1.95 4.73 Note: Dollars in thousands (1) Based on simple average of the four quarters The Bank That SERVICE Built.SM UnitedCommunityBanks,Inc.|ThirdQuarter200921
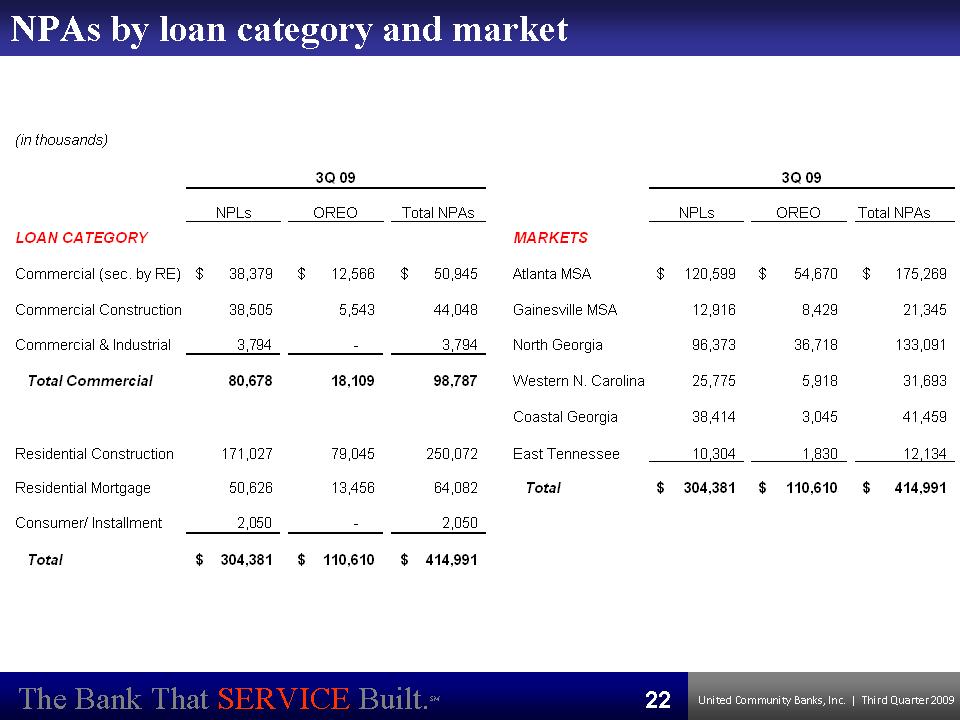
NPAs by loan category and market (in thousands) 3Q 09 3Q 09NPLs OREO Total NPAs LOAN CATEGORY Commercial (sec. by RE) $ 38,379 $ 12,566 $ 50,945 Commercial Construction 38,505 5,543 44,048 Commercial & Industrial 3,794 -3,794 Total Commercial 80,678 18,109 98,787 Residential Construction 171,027 79,045 250,072 Residential Mortgage 50,626 13,456 64,082 Consumer/ Installment 2,050 -2,050 Total $ 304,381 $ 110,610 $ 414,991 NPLs OREO MARKETS Atlanta MSA $ 120,599 $ 54,670 Gainesville MSA 12,916 8,429 North Georgia 96,373 36,718 Western N. Carolina 25,775 5,918 Coastal Georgia 38,414 3,045 East Tennessee 10,304 1,830 Total $ 304,381 $ 110,610 Total NPAs $ 175,269 21,345 133,091 31,693 41,459 12,134 $ 414,991The Bank That SERVICE Built.SM UnitedCommunityBanks,Inc.|ThirdQuarter200922
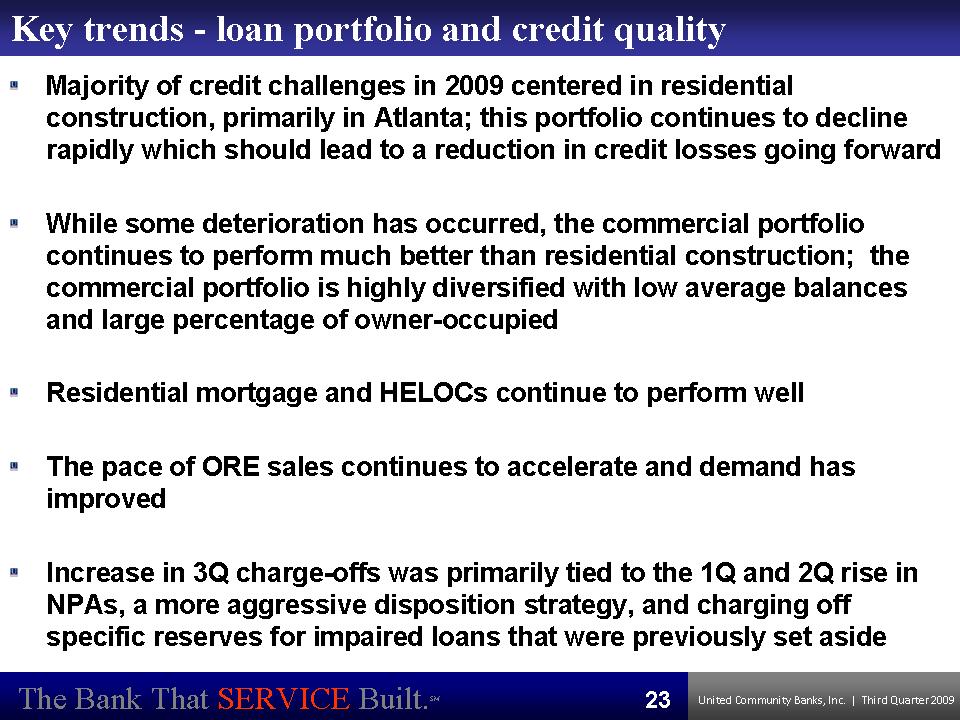
Key trends -loan portfolio and credit quality Majority of credit challenges in 2009 centered in residential construction, primarily in Atlanta; this portfolio continues to decline rapidly which should lead to a reduction in credit losses going forward While some deterioration has occurred, the commercial portfolio continues to perform much better than residential construction; the commercial portfolio is highly diversified with low average balances and large percentage of owner-occupied Residential mortgage and HELOCs continue to perform well The pace of ORE sales continues to accelerate and demand has improvedIncrease in 3Q charge-offs was primarily tied to the 1Q and 2Q rise in NPAs, a more aggressive disposition strategy, and charging off specific reserves for impaired loans that were previously set aside The Bank That SERVICE Built.SM UnitedCommunityBanks,Inc.|ThirdQuarter200923
 • Tenant move-outs
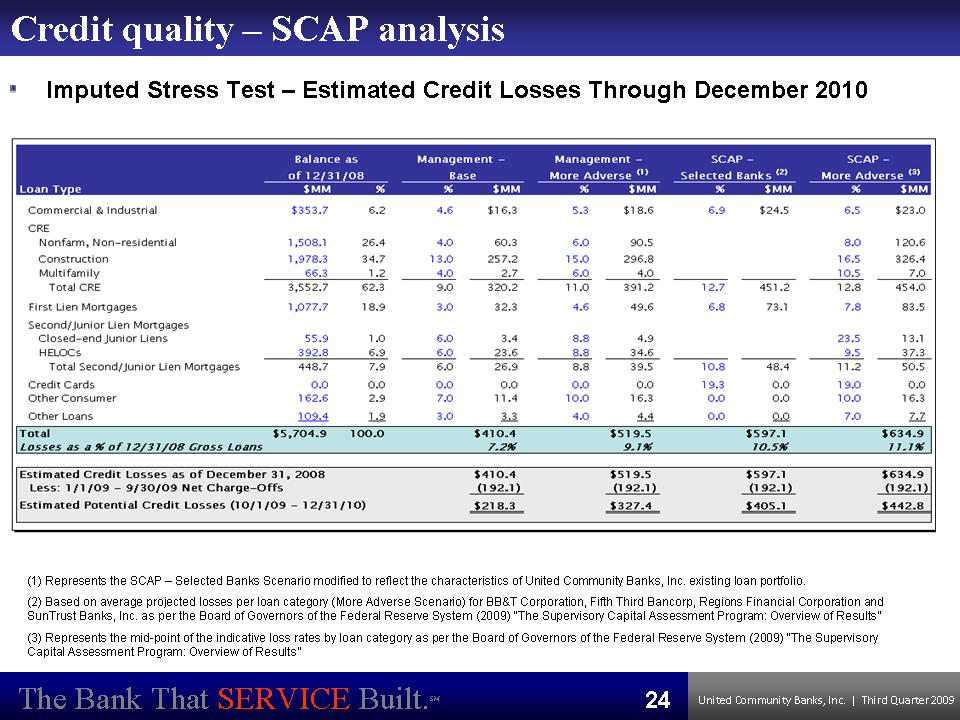
Credit quality – SCAP analysis Imputed Stress Test – Estimated Credit Losses Through December 2010(1) Represents the SCAP – Selected Banks Scenario modified to reflect the characteristics of United Community Banks, Inc. existing loan portfolio. (2) Based on average projected losses per loan category (More Adverse Scenario) for BB&T Corporation, Fifth Third Bancorp, Regions Financial Corporation and SunTrust Banks, Inc. as per the Board of Governors of the Federal Reserve System (2009) “The Supervisory Capital Assessment Program: Overview of Results”(3) Represents the mid-point of the indicative loss rates by loan category as per the Board of Governors of the Federal Reserve System (2009) “The SupervisoryCapital Assessment Program: Overview of Results”The Bank That SERVICE Built.SM UnitedCommunityBanks,Inc.|ThirdQuarter200924
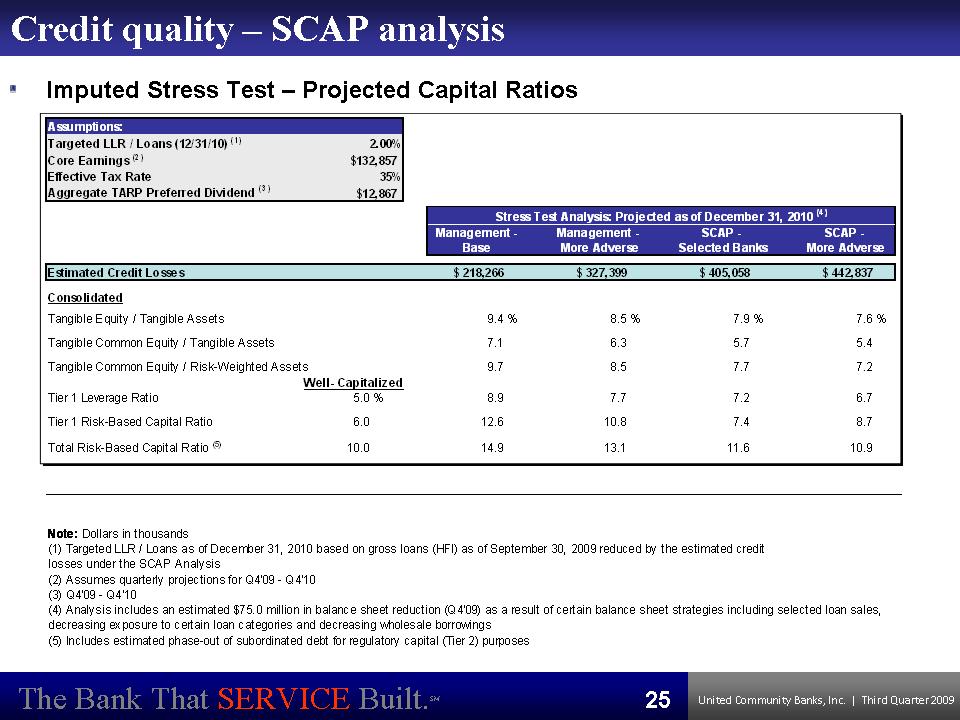
Credit quality – SCAP analysis Imputed Stress Test – Projected Capital RatiosAssumptions: Targeted LLR / Loans (12/31/10) (1) 2.00% Core Earnings (2) $132,857 Effective Tax Rate 35% Aggregate TARP Preferred Dividend (3) $12,867 Stress Test Analysis: Projected as of December 31, 2010 (4) Management Management SCAP SCAP Base More Adverse Selected Banks More Adverse Estimated Credit Losses $ 218,266 $ 327,399 $ 405,058 $ 442,837 Consolidated Tangible Equity / Tangible Assets 9.4 % 8.5 % 7.9 % 7.6 % Tangible Common Equity / Tangible Assets 7.1 6.3 5.7 5.4 Tangible Common Equity / Risk-Weighted Assets 9.7 8.5 7.7 7.2 Well- Capitalized Tier 1 Leverage Ratio 5.0 % 8.9 7.7 7.2 6.7 Tier 1 Risk-Based Capital Ratio 6.0 12.6 10.8 7.4 8.7 Total Risk-Based Capital Ratio (5) 10.0 14.9 13.1 11.6 10.9 Note: Dollars in thousands (1) Targeted LLR / Loans as of December 31, 2010 based on gross loans (HFI) as of September 30, 2009 reduced by the estimated credit losses under the SCAP Analysis (2) Assumes quarterly projections for Q4'09 - Q4'10 (3) Q4'09 - Q4'10 (4) Analysis includes an estimated $75.0 million in balance sheet reduction (Q4'09) as a result of certain balance sheet strategies including selected loan sales, decreasing exposure to certain loan categories and decreasing wholesale borrowings (5) Includes estimated phase-out of subordinated debt for regulatory capital (Tier 2) purposes The Bank That SERVICE Built.SM UnitedCommunityBanks,Inc.|ThirdQuarter200925

FINANCIAL RESULTS The Bank That SERVICE Built.SM UnitedCommunityBanks,Inc.|ThirdQuarter200926
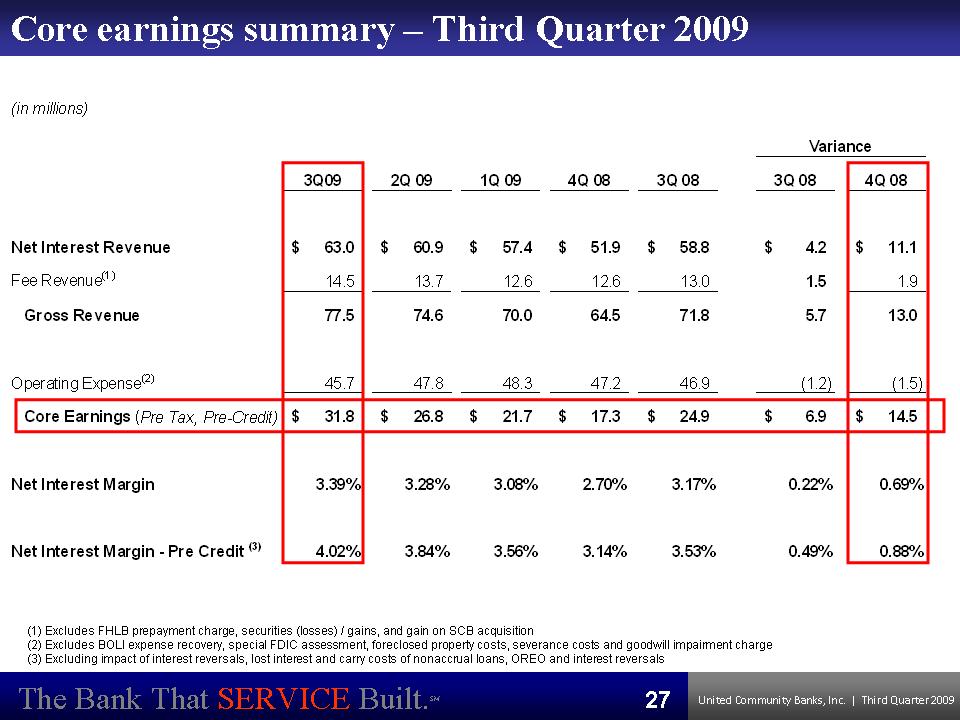
Core earnings summary – Third Quarter 2009 (in millions) Variance 3Q09 63.0 $ 14.5 77.5 45.7 3.39% 4.02% 2Q 09 1Q 09 4Q 08 3Q 08 3Q08 Net Interest Revenue $ 60.9 $ 57.4 $ 51.9 $ 58.8 $ 4.2 Fee Revenue(1) 13.7 12.6 12.6 13.0 1.5 Gross Revenue 74.6 70.0 64.5 71.8 5.7 Operating Expense(2) 47.8 48.3 47.2 46.9 (1.2) 4Q 08 11.1 $ 1.9 13.0 (1.5) 14.5 $ 0.69% 0.88% Core Earnings (Pre Tax, Pre-Credit) 31.8 $ 26.8 $ 21.7 $ 17.3 $ 24.9 $ 6.9 $ Net Interest Margin 3.28% 3.08% 2.70% 3.17% 0.22% Net Interest Margin - Pre Credit (3) 3.84% 3.56% 3.14% 3.53% 0.49% (1) Excludes FHLB prepayment charge, securities (losses) / gains, and gain on SCB acquisition (2) Excludes BOLI expense recovery, special FDIC assessment, foreclosed property costs, severance costs and goodwill impairment charge (3) Excluding impact of interest reversals, lost interest and carry costs of nonaccrual loans, OREO and interest reversals The Bank That SERVICE Built.SM UnitedCommunityBanks,Inc.|ThirdQuarter200927
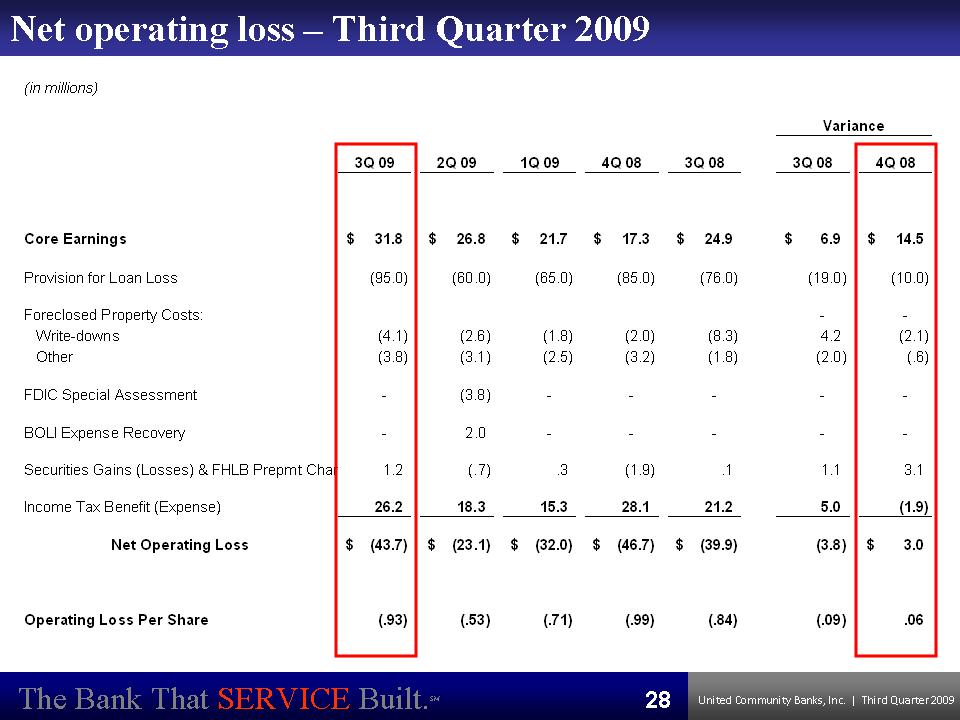
Net operating loss – Third Quarter 2009 (in millions) Variance 2Q09 1Q 09 4Q 08 3Q08 3Q08 4Q 08 Core Earnings $ 26.8 $ 21.7 $ 17.3 $ 24.9 $ 6.9 $ 14.5 Provision for Loan Loss (60.0) (65.0) (85.0) (76.0) (19.0) (10.0) Foreclosed Property Costs: Write-downs (2.6) (1.8) (2.0) (8.3) 4.2 (2.1) Other (3.1) (2.5) (3.2) (1.8) (2.0) (.6) FDIC Special Assessment (3.8) ----BOLI Expense Recovery 2.0 ----Securities Gains (Losses) & FHLB Prepmt Char 3Q 09 31.8 $ (95.0) (4.1) (3.8) --1.2 26.2 (43.7) $ (.93) (.7) .3 (1.9) .1 1.1 3.1 Income Tax Benefit (Expense) 18.3 15.3 28.1 21.2 5.0 (1.9) Net Operating Loss $ (23.1) $ (32.0) $ (46.7) $ (39.9) (3.8) $ 3.0 Operating Loss Per Share (.53) (.71) (.99) (.84) (.09) .06 The Bank That SERVICE Built.SM UnitedCommunityBanks,Inc.|ThirdQuarter200928
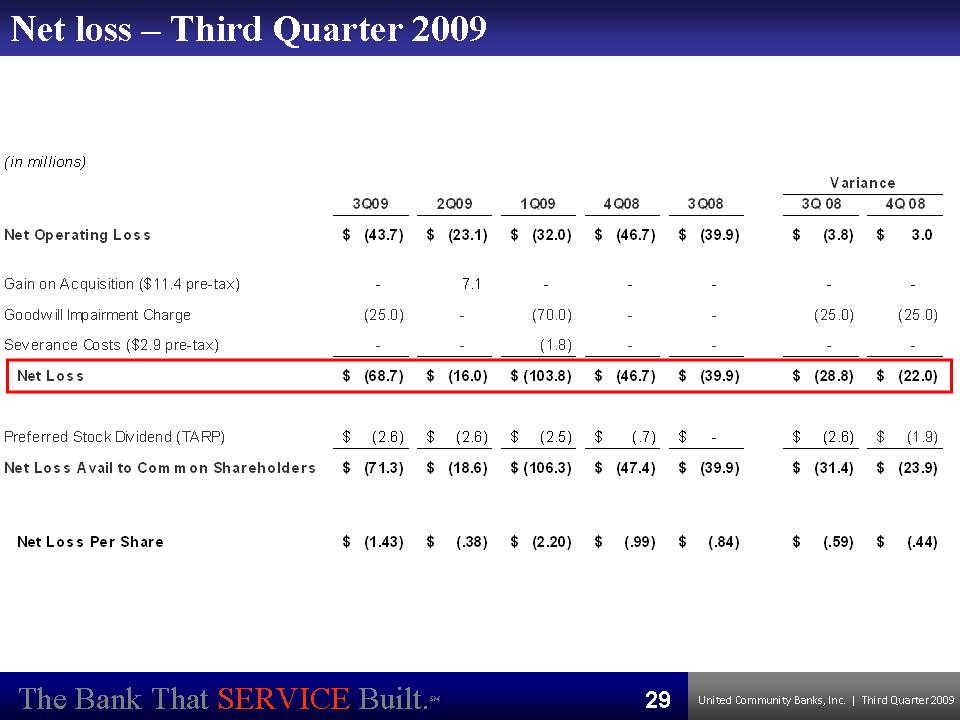
Net loss – Third Quarter 2009 (in millions) Net Operating Loss Gain on Acquisition ($11.4 pre-tax) Goodw ill Impairment Charge Severance Costs ($2.9 pre-tax) 3Q09 $ (43.7) -(25.0) 2Q09 $ (23.1) 7.1 -1Q09 $ (32.0) -(70.0) (1.8) 4Q08 $ (46.7) -3Q08 $ (39.9) -Variance 3Q 08 4Q 08 $ (3.8) $ 3.0 --(25.0) (25.0) -------- Net Loss $ (68.7) $ (16.0) $ (103.8) $ (46.7) $ (39.9) $ (28.8) $ (22.0) Preferred Stock Dividend (TARP) $ (2.6) $ (2.6) $ (2.5) $ (.7) $ $ (2.6) $ (1.9) Net Loss Avail to Common Shareholders $ (71.3) $ (18.6) $ (106.3) $ (47.4) $ (39.9) $ (31.4) $ (23.9) Net Loss Per Share $ (1.43) $ (.38) $ (2.20) $ (.99) $ (.84) $ (.59) $ (.44) The Bank That SERVICE Built.SM UnitedCommunityBanks,Inc.|ThirdQuarter200929
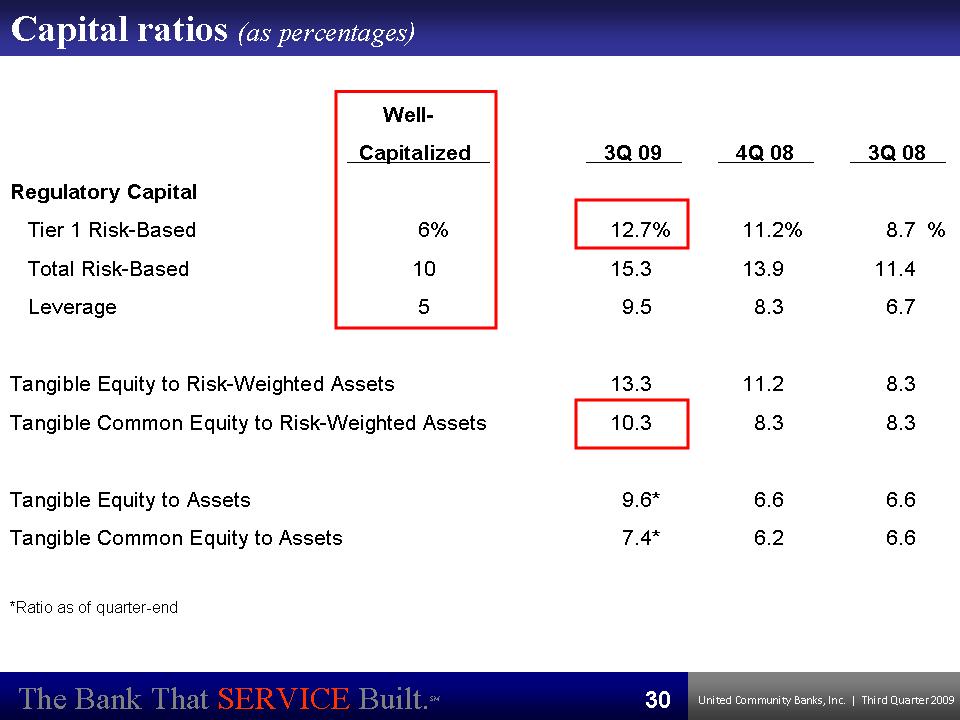
Capital ratios (as percentages) Well-Capitalized Regulatory Capital Tier 1 Risk-Based 6%Total Risk-Based 10Leverage 5Tangible Equity to Risk-Weighted Assets Tangible Common Equity to Risk-Weighted Assets Tangible Equity to Assets Tangible Common Equity to Assets *Ratio as of quarter-end The Bank That SERVICE Built.SM UnitedCommunityBanks,Inc.|ThirdQuarter200930 3Q 09 12.7% 15.3 9.5 13.3 10.39.6*7.4*4Q 08 11.2% 13.9 8.3 11.2 8.3 6.6 6.2 3Q 08 8.7 % 11.4 6.7 8.3 8.3 6.6 6.6

REASONS TO INVEST IN UNITED The Bank That SERVICE Built.SM UnitedCommunityBanks,Inc.|ThirdQuarter200931
Closing Comments Capital strength Core earnings Business model – franchise Significant strategic opportunities The Bank That SERVICE Built.SM UnitedCommunityBanks,Inc.|ThirdQuarter200932
APPENDIX The Bank That SERVICE Built.SM UnitedCommunityBanks,Inc.|ThirdQuarter200933
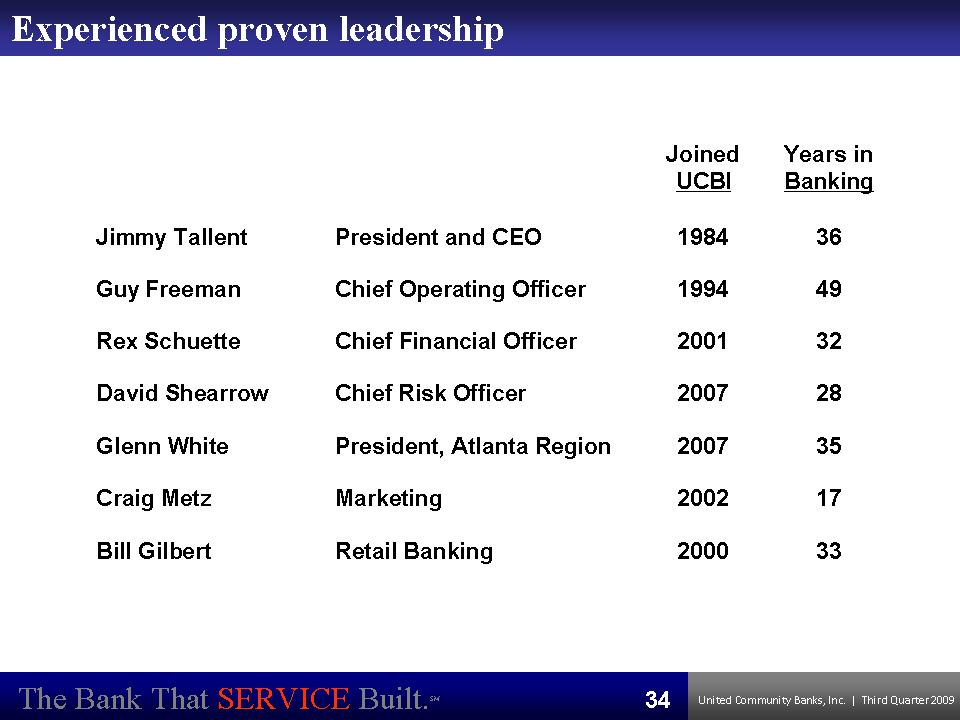
Experienced proven leadership Jimmy Tallent President and CEO Guy Freeman Chief Operating Officer Rex Schuette Chief Financial Officer David Shearrow Chief Risk Officer Glenn White President, Atlanta Region Craig Metz Marketing Bill Gilbert Retail Banking Joined UCBI 1984 1994 2001 2007 2007 2002 2000 Years in Banking36493228351733The Bank That SERVICE Built.SM UnitedCommunityBanks,Inc.|ThirdQuarter200934
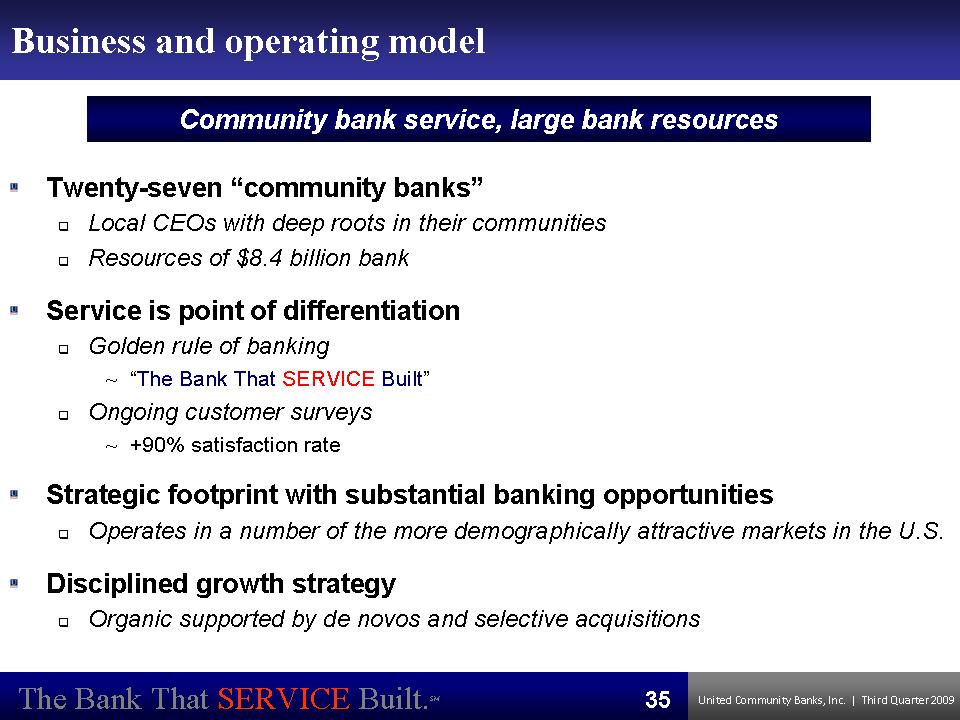
Business and operating model Community bank service, large bank resources Twenty-seven “community banks” . Local CEOs with deep roots in their communities . Resources of $8.4 billion bank Service is point of differentiation . Golden rule of banking ~ “The Bank That SERVICE Built” . Ongoing customer surveys ~ +90% satisfaction rate Strategic footprint with substantial banking opportunities . Operates in a number of the more demographically attractive markets in the U.S. Disciplined growth strategy . Organic supported by de novos and selective acquisitions The Bank That SERVICE Built.SM UnitedCommunityBanks,Inc.|ThirdQuarter200935
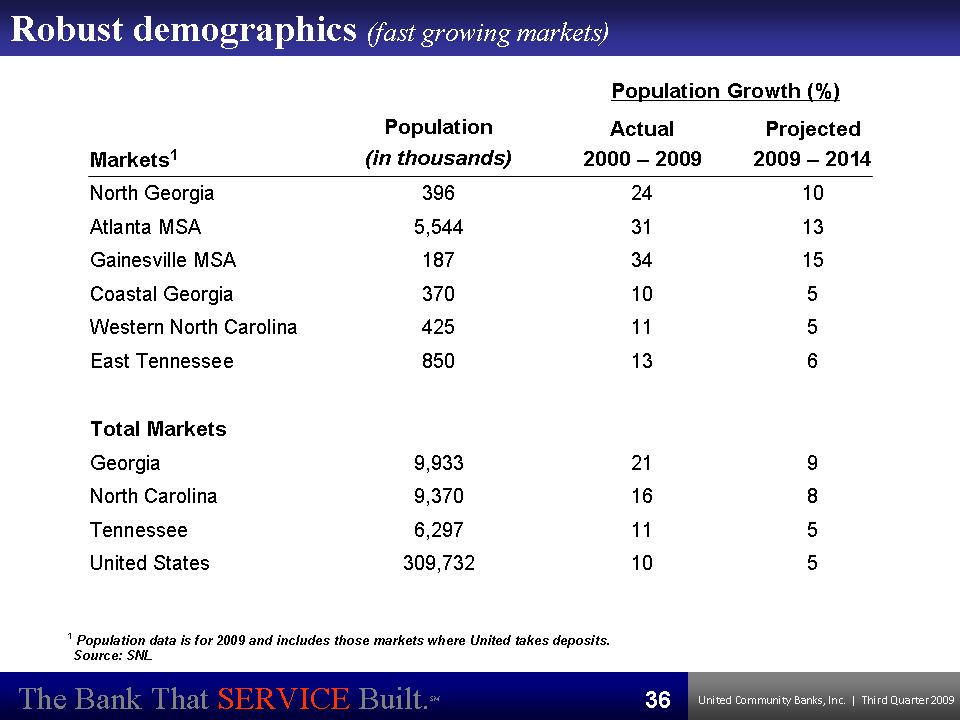
Robust demographics (fast growing markets) Population Growth (%) Population Actual Projected Markets1 (in thousands) 2000 – 2009 2009 – 2014 North Georgia 396Atlanta MSA 5,544Gainesville MSA 187Coastal Georgia 370Western North Carolina 425East Tennessee 850 Total Markets Georgia 9,933 North Carolina 9,370 Tennessee 6,297 United States 309,732 24 10 31 13 34 15 10 5 11 5 13 6 21 9 16 8 11 5 10 5 ¹ Population data is for 2009 and includes those markets where United takes deposits. Source: SNL The Bank That SERVICE Built.SM UnitedCommunityBanks,Inc.|ThirdQuarter200936
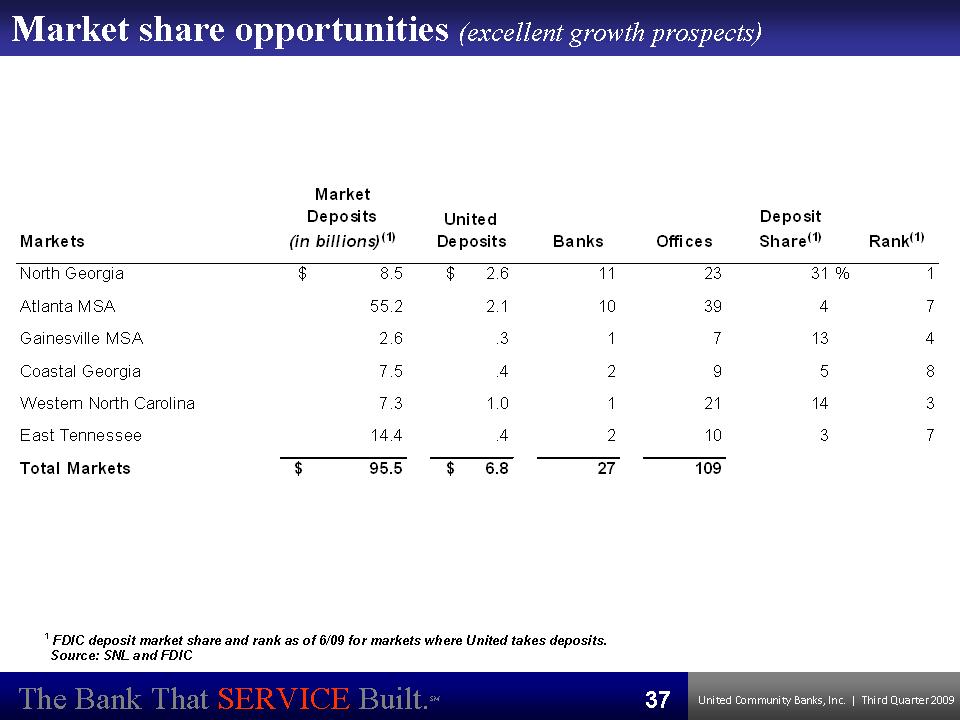
Market share opportunities (excellent growth prospects) Market Deposits United Deposit Markets (in billions) (1) Deposits Banks Offices Share(1) Rank(1) North Georgia $ 8.5 $ 2.6 Atlanta MSA 55.2 2.1 Gainesville MSA 2.6 .3 Coastal Georgia 7.5 .4 Western North Carolina 7.3 1.0 East Tennessee 14.4 .4 Total Markets $ 95.5 $ 6.8 11 23 31% 1 10 39 4 7 1 713 4 2958 121 14 3 210 3 7 27 109 ¹ FDIC deposit market share and rank as of 6/09 for markets where United takes deposits. Source: SNL and FDIC The Bank That SERVICE Built.SM UnitedCommunityBanks,Inc.|ThirdQuarter200937
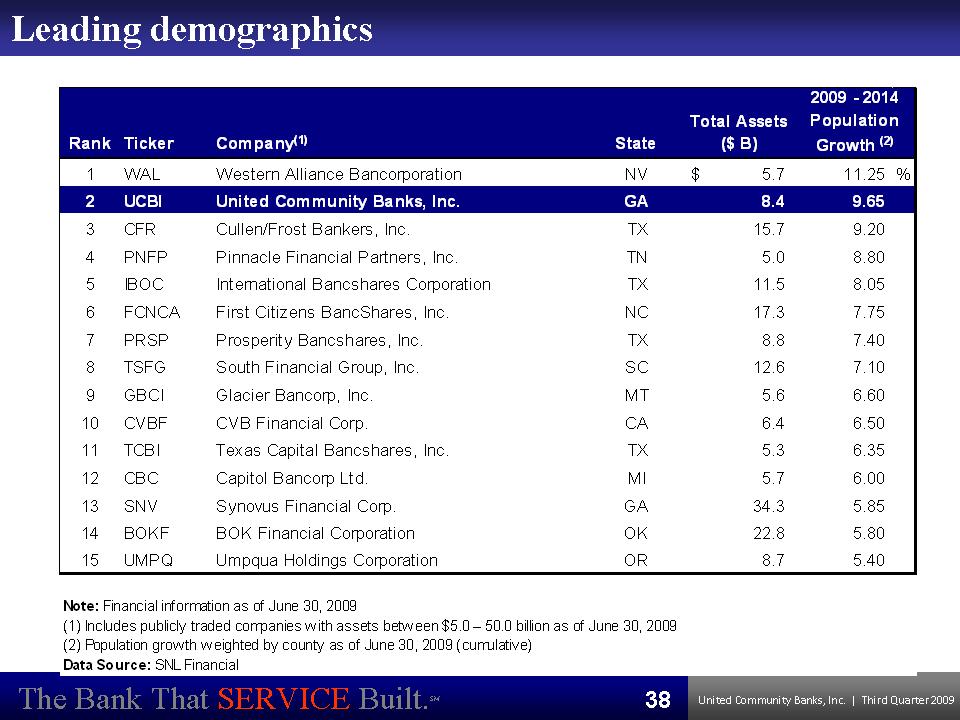
Leading demographics Rank Ticker Company(1) State Total Assets ($ B) 2009 - 2014 Population Growth 1 WAL Western Alliance Bancorporation NV 5.7 $ 2.25 % 2 UCBI United Community Banks, Inc. GA 8.4 1.93 3 CFR Cullen/Frost Bankers, Inc. TX 15.7 1.84 4 PNFP Pinnacle Financial Partners, Inc. TN 5.0 1.76 5 IBOC International Bancshares Corporation TX 11.5 1.61 6 FCNCA First Citizens BancShares, Inc. NC 17.3 1.55 7 PRSP Prosperity Bancshares, Inc. TX 8.8 1.48 8 TSFG South Financial Group, Inc. SC 12.6 1.42 9 GBCI Glacier Bancorp, Inc. MT 5.6 1.32 10 CVBF CVB Financial Corp. CA 6.4 1.30 11 TCBI Texas Capital Bancshares, Inc. TX 5.3 1.27 12 CBC Capitol Bancorp Ltd. MI 5.7 1.20 13 SNV Synovus Financial Corp. GA 34.3 1.17 14 BOKF BOK Financial Corporation OK 22.8 1.16 15 UMPQ Umpqua Holdings Corporation OR 8.7 1.08 Note: Financial information as of June 30, 2009 (1) Includes publicly traded companies w ith assets betw een $5.0 – 50.0 billion as of June 30, 2009 (2) Population grow th w eighted by county as of June 30, 2009 Data Source: SNL FinancialThe Bank That SERVICE Built.SM UnitedCommunityBanks,Inc.|ThirdQuarter200938

Small business market growth (# of business with 1 – 49 employees) Markets1 North Georgia 2000 6,453 2006 7,693 Small Business Growth 19% Population Growth 2000-2009 24% 70,893 31% 78% 126,200Atlanta MSA Gainesville MSA 3,158 3,824 21% 34% Coastal Georgia 9,441 10,210 8% 10% Western North Carolina 10,274 11,544 12% 11% East Tennessee 16,273 17,839 10% 13% The Atlanta MSA is seeing small business growth at nearly double its already significantly increasing population growth. ¹ Population data is for 2009, SNL;Business demographics, U.S. Census Statistics of U.S. Businesses, 2000 & 2006; County Business Patterns 2000-2006The Bank That SERVICE Built.SM UnitedCommunityBanks,Inc.|ThirdQuarter200939
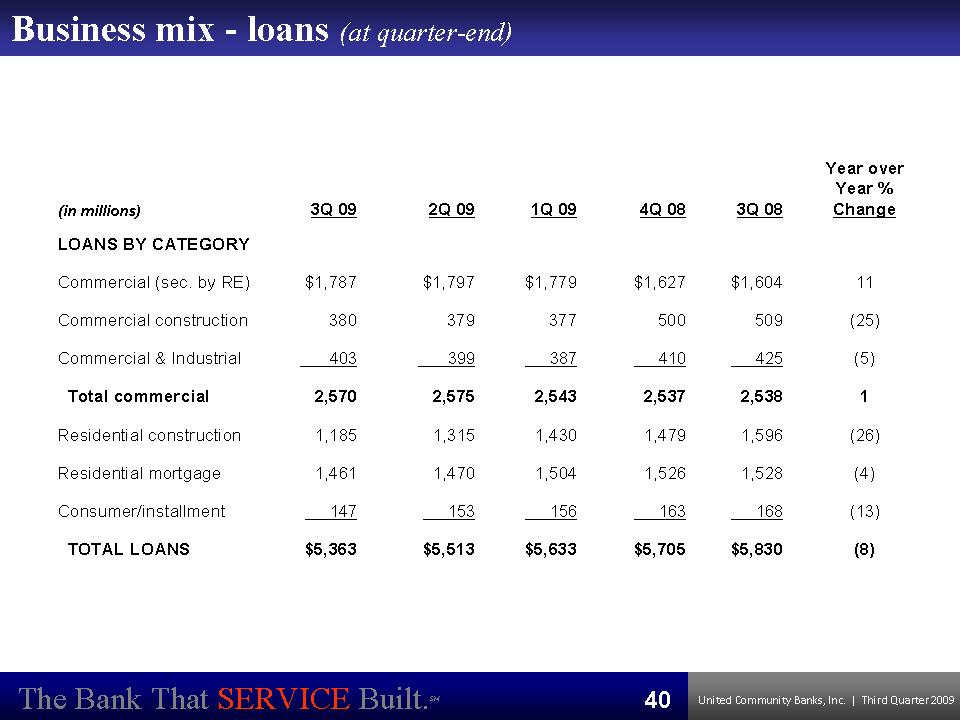
Business mix -loans (at quarter-end) Year over Year % (in millions) 3Q 09 2Q 09 1Q 09 4Q 08 3Q 08 Change LOANS BY CATEGORY Commercial (sec. by RE) $1,787 $1,797 $1,779 $1,627 $1,604 11 Commercial construction 380 379 377 500 509 (25) Commercial & Industrial 403 399 387 410 425 (5) Total commercial 2,570 2,575 2,543 2,537 2,538 1 Residential construction 1,185 1,315 1,430 1,479 1,596 (26) Residential mortgage 1,461 1,470 1,504 1,526 1,528 (4) Consumer/installment 147 153 156 163 168 (13) TOTAL LOANS $5,363 $5,513 $5,633 $5,705 $5,830 (8) The Bank That SERVICE Built.SM UnitedCommunityBanks,Inc.|ThirdQuarter200940

Business mix -loans (at year-end) (in millions) 2008 2007 2006 2005 2004 LOANS BY CATEGORY Commercial (sec. by RE) $1,627 $1,476 $1,230 $1,055 $ 966 Commercial construction 500 527 470 359 250 Commercial & Industrial 410 418 296 237 212 Total commercial 2,537 2,421 1,996 1,651 1,428 Residential construction 1,479 1,829 1,864 1,380 1,055 Residential mortgage 1,526 1,502 1,338 1,206 1,102 Consumer/installment 163 177 179 161 150 TOTAL LOANS $5,705 $5,929 $5,377 $4,398 $3,735 The Bank That SERVICE Built.SM UnitedCommunityBanks,Inc.|ThirdQuarter200941
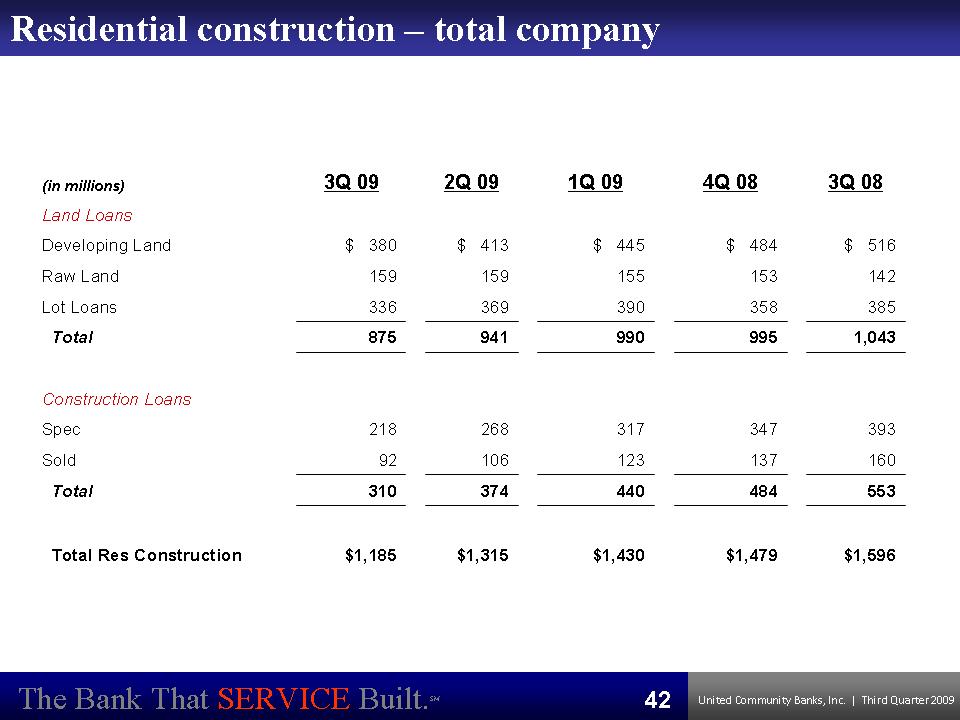
Residential construction – total company (in millions) 3Q 09 2Q 09 1Q 09 4Q 08 3Q 08 Land Loans Developing Land $ 380 $ 413 $ 445 $ 484 $ 516 Raw Land 159 159 155 153 142 Lot Loans 336 369 390 358 385 Total 875 941 990 995 1,043 Construction Loans Spec 218 268 317 347 393 Sold 92 106 123 137 160 Total 310 374 440 484 553 Total Res Construction $1,185 $1,315 $1,430 $1,479 $1,596 The Bank That SERVICE Built.SM UnitedCommunityBanks,Inc.|ThirdQuarter200942
Liabilities
• Total liabilities increase by $4.3 million
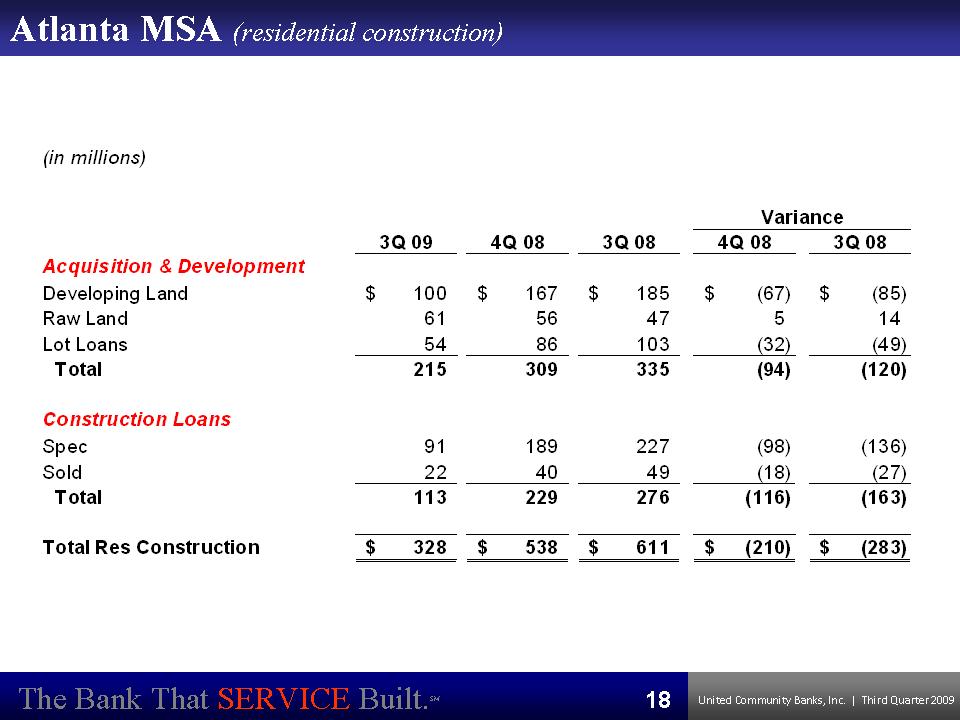
Residential construction – Atlanta MSA (in millions) 3Q 09 2Q 09 1Q 09 4Q 08 3Q 08 Land Loans Developing Land $ 100 $ 124 $ 148 $ 167 $ 185 Raw Land 61 63 52 56 47 Lot Loans 54 81 98 86 103 Total 215 268 298 309 335 Construction Loans Spec 91 127 164 189 227 Sold 22 29 33 40 49 Total 113 156 197 229 276 Total Res Construction $ 328 $ 424 $ 495 $ 538 $ 611 The Bank That SERVICE Built.SM UnitedCommunityBanks,Inc.|ThirdQuarter200943
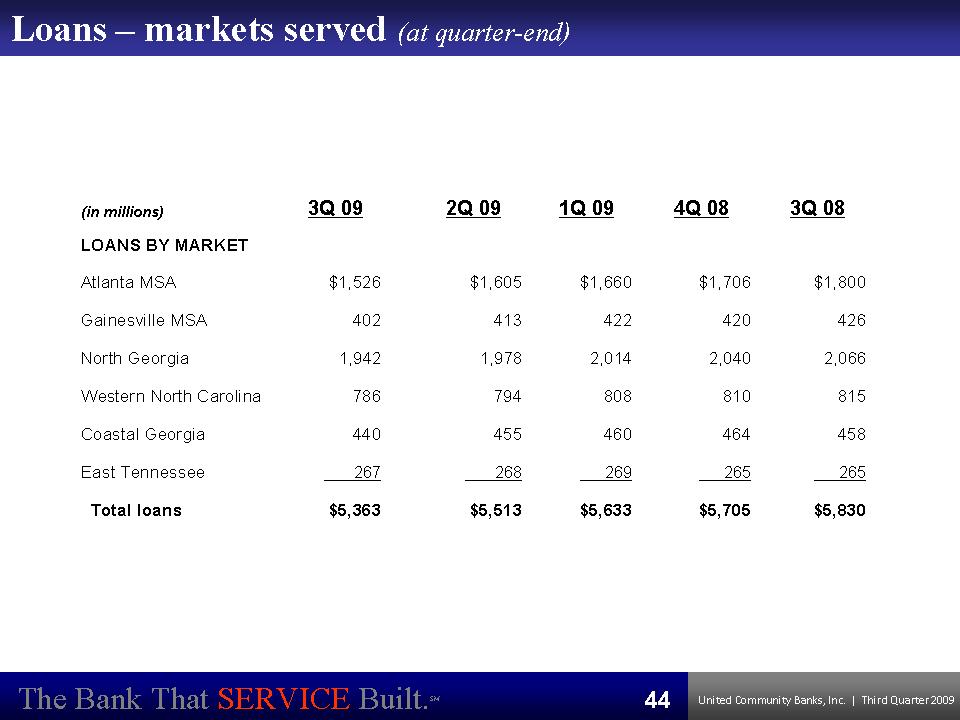
Loans – markets served (at quarter-end) (in millions) 3Q 09 2Q 09 1Q 09 4Q 08 3Q 08 LOANS BY MARKET Atlanta MSA $1,526 $1,605 $1,660 $1,706 $1,800 Gainesville MSA 402 413 422 420 426 North Georgia 1,942 1,978 2,014 2,040 2,066 Western North Carolina 786 794 808 810 815 Coastal Georgia 440 455 460 464 458 East Tennessee 267 268 269 265 265 Total loans $5,363 $5,513 $5,633 $5,705 $5,830 The Bank That SERVICE Built.SM UnitedCommunityBanks,Inc.|ThirdQuarter200944
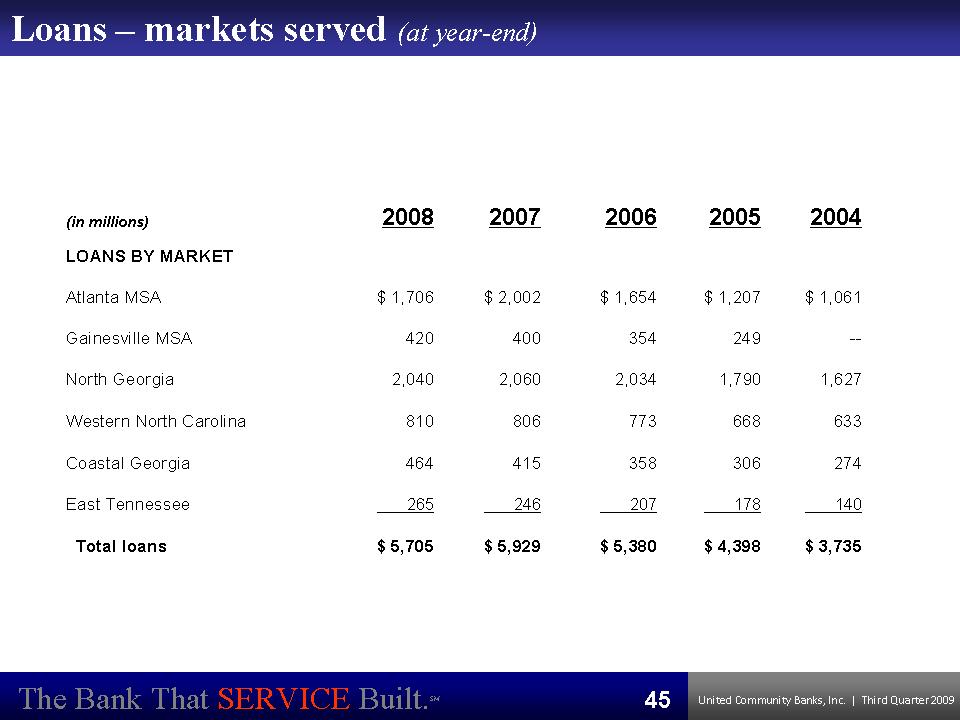
Loans – markets served (at year-end) (in millions) 2008 2007 2006 2005 2004 LOANS BY MARKET Atlanta MSA $ 1,706 $ 2,002 $ 1,654 $ 1,207 $ 1,061 Gainesville MSA 420 400 354 249 -North Georgia 2,040 2,060 2,034 1,790 1,627 Western North Carolina 810 806 773 668 633 Coastal Georgia 464 415 358 306 274 East Tennessee 265 246 207 178 140 Total loans $ 5,705 $ 5,929 $ 5,380 $ 4,398 $ 3,735 The Bank That SERVICE Built.SM UnitedCommunityBanks,Inc.|ThirdQuarter200945
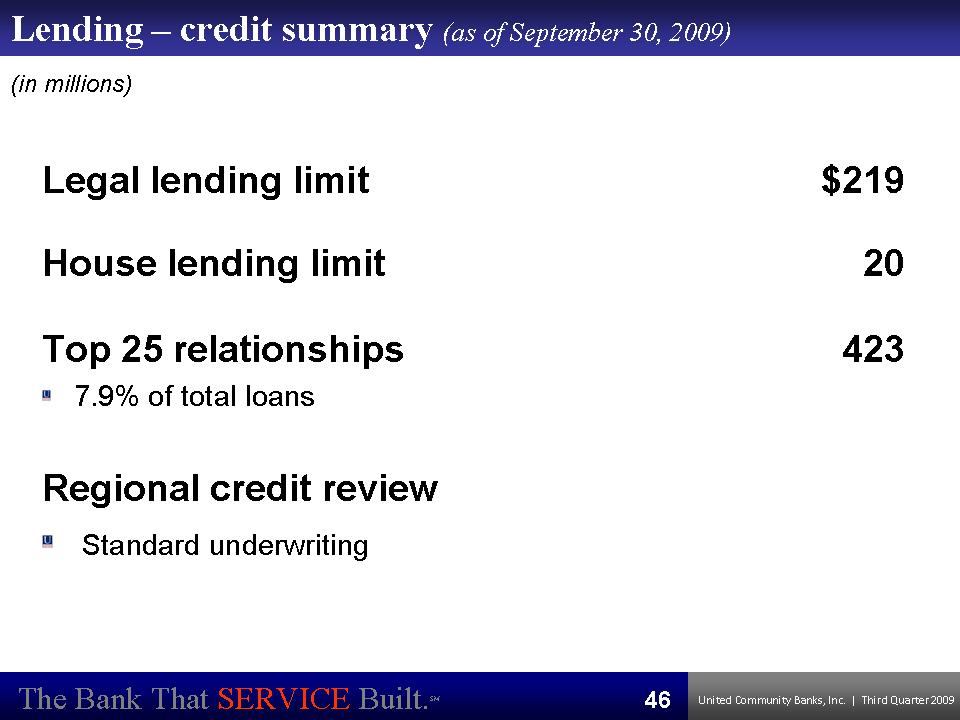
Lending – credit summary (as of September 30, 2009) (in millions) Legal lending limit $219House lending limit 20Top 25 relationships 4237.9% of total loans Regional credit review Standard underwriting The Bank That SERVICE Built.SM UnitedCommunityBanks,Inc.|ThirdQuarter200946
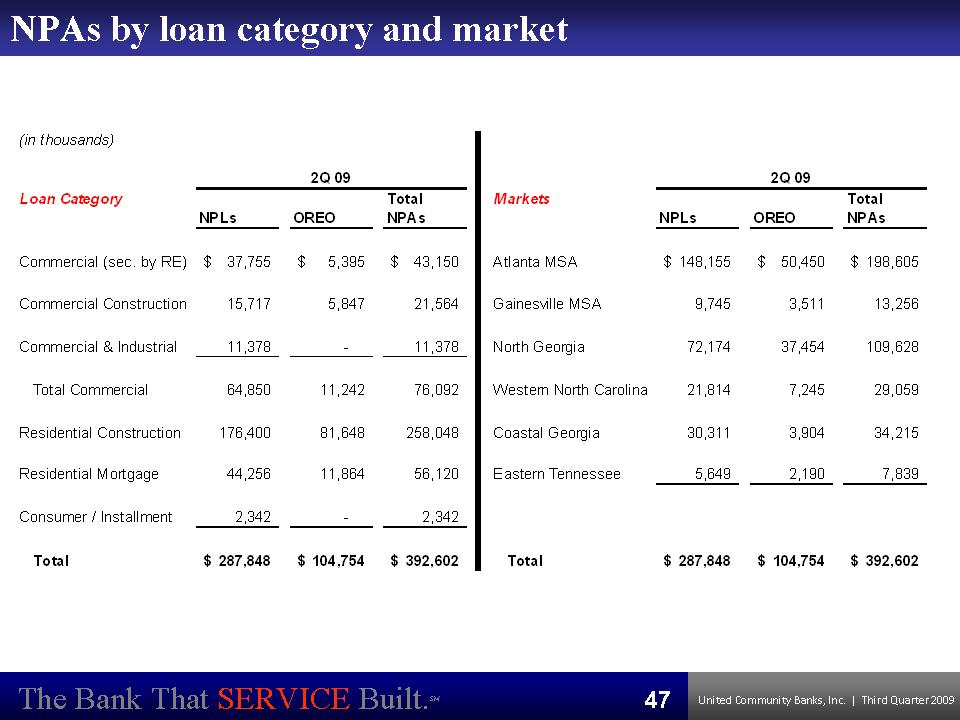
NPAs by loan category and market (in thousands) Loan Category Commercial (sec. by RE) Commercial Construction Commercial & Industrial Total Commercial Residential Construction Residential Mortgage Consumer / Installment Total NPLs $ 37,755 15,717 11,378 64,850 176,400 44,256 2,342 $ 287,8482Q 092Q 09Total Markets OREO NPAs $ 5,395 43,150 $ Atlanta MSA 5,847 21,564 Gainesville MSA -11,378 North Georgia 11,242 76,092 Western North Carolina 81,648 258,048 Coastal Georgia 11,864 56,120 Eastern Tennessee -2,342$ 104,754 $ 392,602 Total NPLs $ 148,155 9,745 72,174 21,814 30,311 5,649 $ 287,848OREO$ 50,450 3,511 37,454 7,245 3,904 2,190 $ 104,754TotalNPAs$ 198,605 13,256 109,62829,059 34,215 7,839 $ 392,602The Bank That SERVICE Built.SM UnitedCommunityBanks,Inc.|ThirdQuarter200947
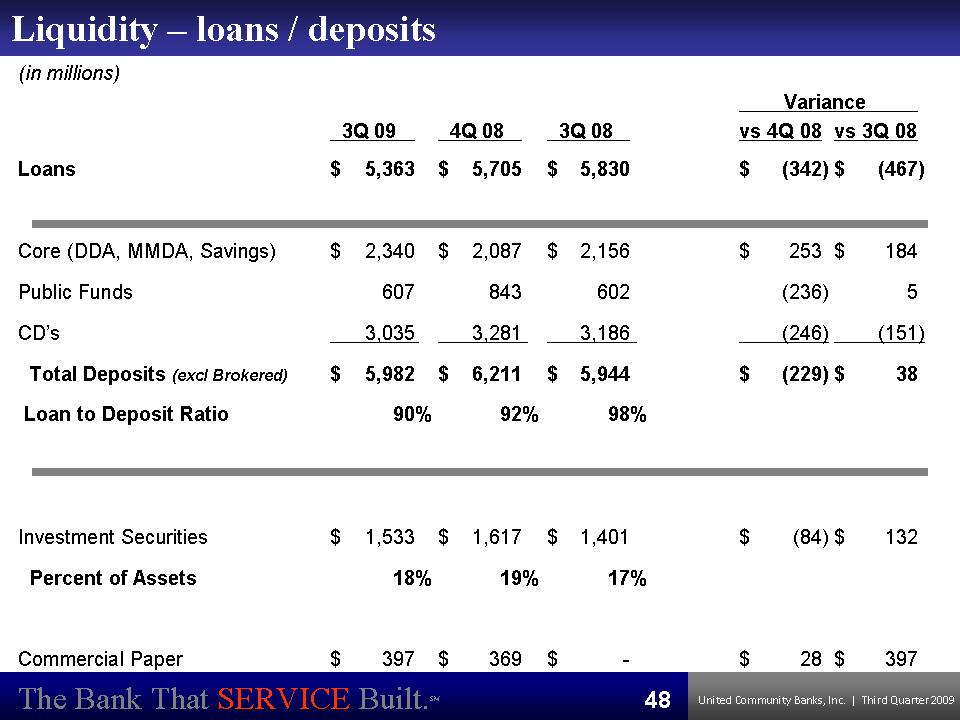
Liquidity – loans / deposits (in millions) Variance 3Q 09 4Q 08 3Q 08 vs 4Q 08 vs 3Q 08 Loans $ 5,363 $ 5,705 $ 5,830 $ (342) $ (467) Core (DDA, MMDA, Savings) $ 2,340 $ 2,087 $ 2,156 $ 253 $ 184 Public Funds 607 843 602 (236) 5 CD’s 3,035 3,281 3,186 (246) (151) Total Deposits (excl Brokered) $ 5,982 $ 6,211 $ 5,944 $ (229) $ 38 Loan to Deposit Ratio 90% 92% 98% Investment Securities $ 1,533 $ 1,617 $ 1,401 $ (84) $ 132 Percent of Assets 18% 19% 17% The Bank That SERVICE Built.SM UnitedCommunityBanks,Inc.|ThirdQuarter2009Commercial Paper $ 397 $ 369 $ -$ 28 $ 397 48
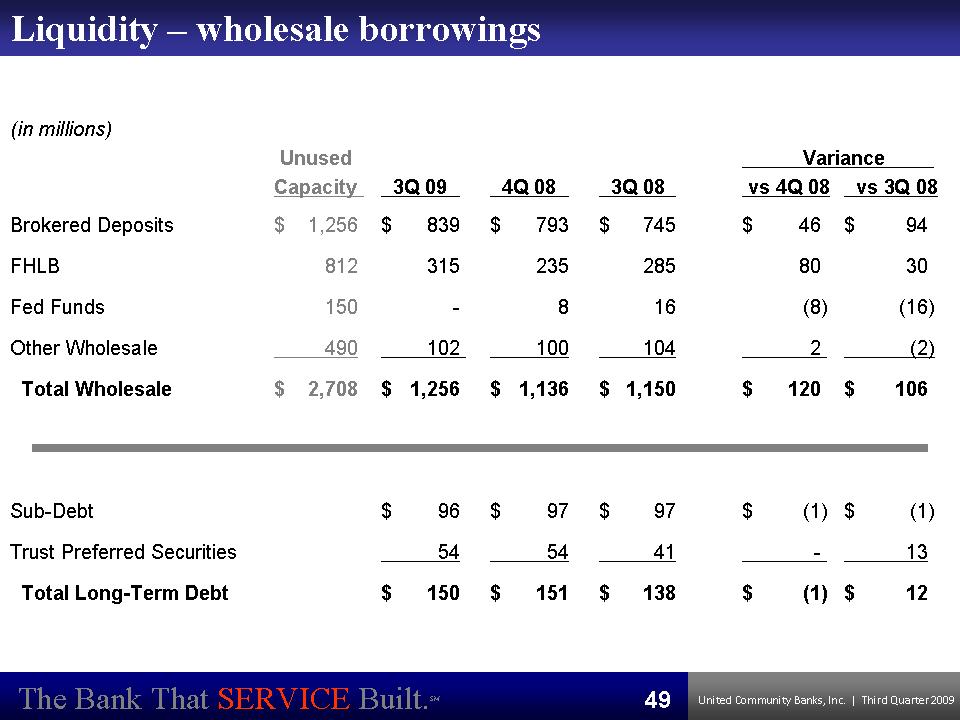
Liquidity – wholesale borrowings (in millions) Unused Variance Capacity 3Q 09 4Q 08 3Q 08 vs 4Q 08 vs 3Q 08 Brokered Deposits $1,256 $ 839 $ 793 $ 745 $ 46 $ 94 FHLB 812 315 235 285 80 30 Fed Funds 150 -8 16 (8) (16) Other Wholesale 490 102 100 104 2 (2) Total Wholesale $2,708 $ 1,256 $ 1,136 $ 1,150 $ 120 $ 106 Sub-Debt $ 96 $ 97 $ 97 $ (1) $ (1) Trust Preferred Securities 54 54 41 -13 Total Long-Term Debt $ 150 $ 151 $ 138 $ (1) $ 12 The Bank That SERVICE Built.SM UnitedCommunityBanks,Inc.|ThirdQuarter200949
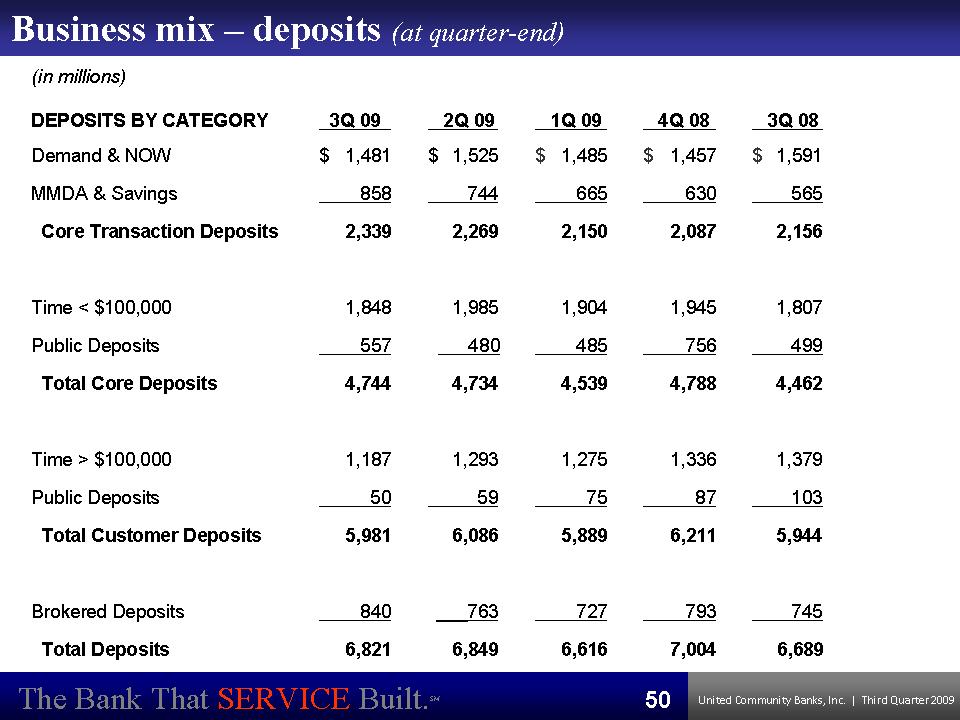
Business mix – deposits (at quarter-end) The Bank That SERVICE Built.SM UnitedCommunityBanks,Inc.|ThirdQuarter2009Total Deposits 6,821 6,849 6,616 7,004 6,689 50
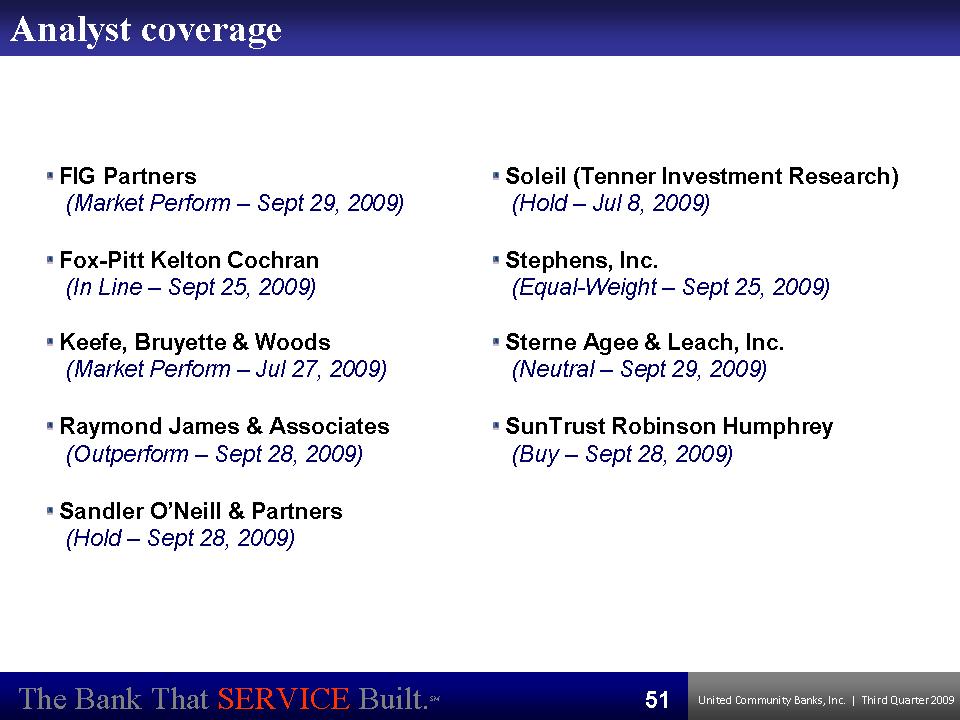
Analyst coverage FIG Partners (Market Perform – Sept 29, 2009) Fox-Pitt Kelton Cochran (In Line – Sept 25, 2009) Keefe, Bruyette & Woods (Market Perform – Jul 27, 2009) Raymond James & Associates (Outperform – Sept 28, 2009) Sandler O’Neill & Partners (Hold – Sept 28, 2009) Soleil (Tenner Investment Research) (Hold – Jul 8, 2009) Stephens, Inc. (Equal-Weight ��� Sept 25, 2009) Sterne Agee & Leach, Inc. (Neutral – Sept 29, 2009) SunTrust Robinson Humphrey (Buy – Sept 28, 2009) The Bank That SERVICE Built.SM UnitedCommunityBanks,Inc.|ThirdQuarter200951