Exhibit 99.2
 | United Community Banks, Inc. Investor Presentation Fourth Quarter 2011 Jimmy C. Tallent Rex S. Schuette David P. Shearrow President & CEO EVP & CFO EVP & CRO rex_schuette@ucbi.com (706) 781-2266 |
1
 | Cautionary Statement 2 This presentation contains forward-looking statements, as defined by Federal Securities Laws, including statements about financial outlook and business environment. These statements are provided to assist in the understanding of future financial performance. Such performance involves risks and uncertainties that may cause actual results to differ materially from those in such statements. Any such statements are based on current expectations and involve a number of risks and uncertainties. For a discussion of factors that may cause such forward-looking statements to differ materially from actual results, please refer to United Community Banks, Inc.’s Annual Report filed on Form 10-K with the Securities and Exchange Commission. |
2
 | Non-GAAP Measures 3 This presentation also contains non-GAAP financial measures determined by methods other than in accordance with generally accepted accounting principles (“GAAP”). Such non-GAAP financial measures include the following: net interest margin – pre credit, core net interest margin, core net interest revenue, core fee revenue, core operating expense, core earnings, net operating (loss) income and net operating (loss) earnings per share, tangible common equity to tangible assets, tangible equity to tangible assets and tangible common equity to risk-weighted assets. The most comparable GAAP measures to these measures are: net interest margin, net interest revenue, fee revenue, operating expense, net (loss) income, diluted (loss) earnings per share and equity to assets. Management uses these non-GAAP financial measures because we believe it is useful for evaluating our operations and performance over periods of time, as well as in managing and evaluating our business and in discussions about our operations and performance. Management believes these non-GAAP financial measures provide users of our financial information with a meaningful measure for assessing our financial results and credit trends, as well as comparison to financial results for prior periods. These non-GAAP financial measures should not be considered as a substitute for financial measures determined in accordance with GAAP and may not be comparable to other similarly titled financial measures used by other companies. For a reconciliation of the differences between our non-GAAP financial measures and the most comparable GAAP measures, please refer to the ‘Non-GAAP Reconcilement Tables’ at the end of the Appendix of this presentation. |
3
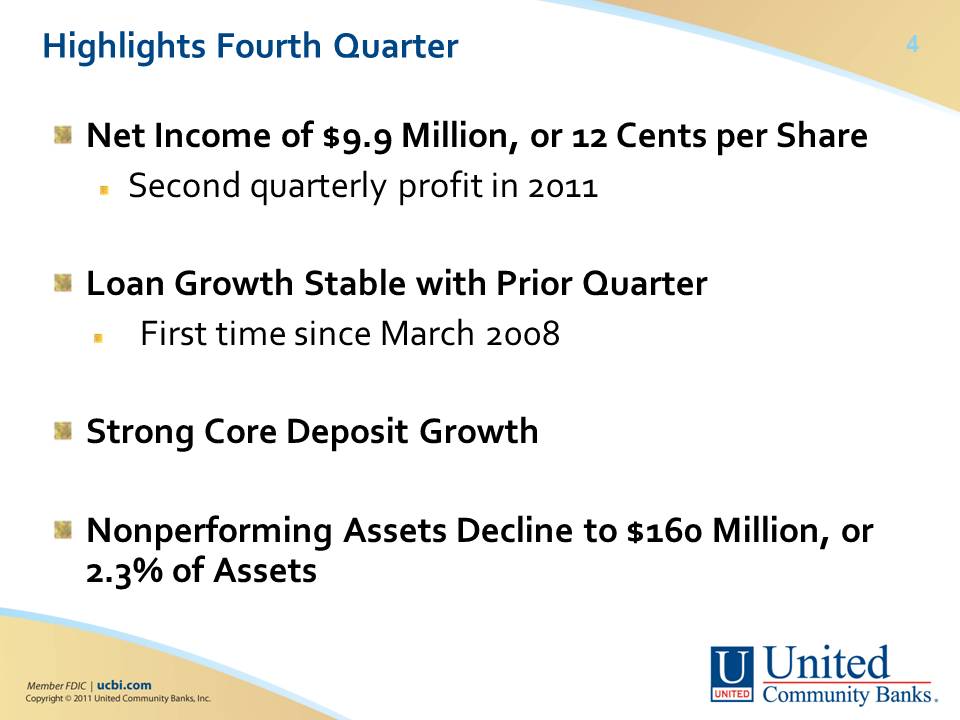 | Highlights Fourth Quarter 4 Net Income of $9.9 Million, or 12 Cents per Share Second quarterly profit in 2011 Loan Growth Flat First time since March 2008 Strong Core Deposit Growth Nonperforming Assets Decline to $160 Million, or 2.3% of Assets |
4
 | LOAN PORTFOLIO & CREDIT 5 QUALITY |
5
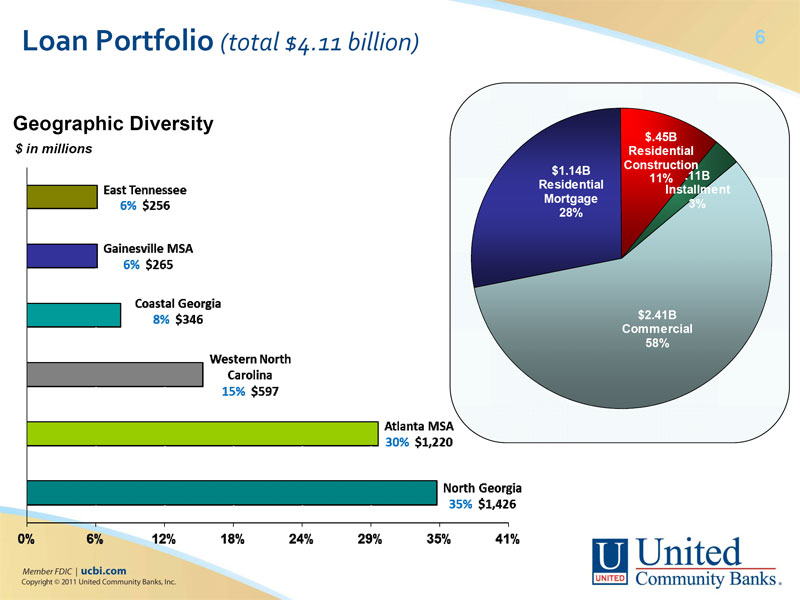 | Loan Portfolio (total $4.11 billion) 6 Geographic Diversity $.45B $ in millions Residential Construction $1.14B .11B 11% Residential Installment Mortgage 3% 28% $2.41B Commercial 58% |
6
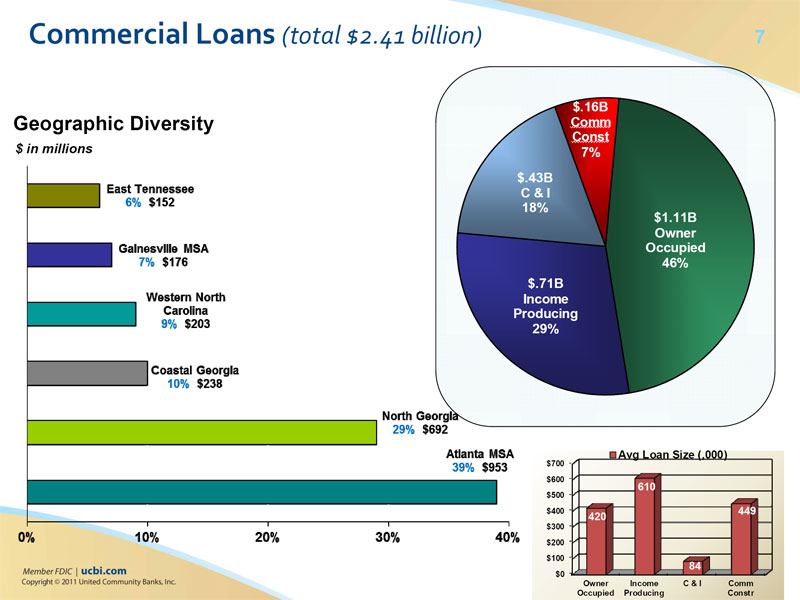 | Commercial Loans (total $2.41 billion) 7 $.16B Geographic Diversity Comm Const $ in millions 7% $.43B C & I 18% $1.11B Owner Occupied 46% $.71B Income Producing 29% Avg Loan Size (,000) $700 $600 610 $500 $400 449 420 $300 $200 $100 84 $0 Owner Income C & I Comm Occupied Producing Constr |
7
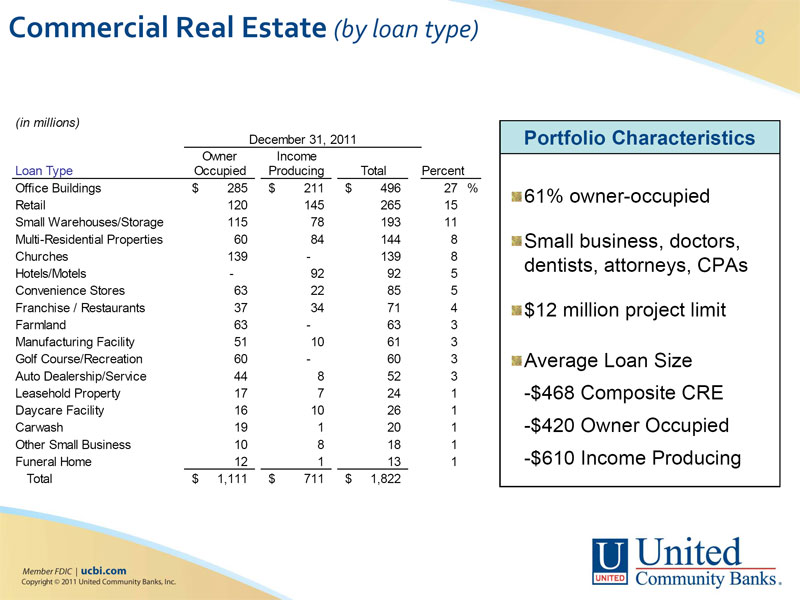 | Commercial Real Estate (by loan type) 8 (in millions) December 31, 2011 Portfolio Characteristics Owner Income Loan Type Occupied Producing Total Percent Office Buildings $ 285 $ 211 $ 496 27 % 61% owner-occupied Retail 120 145 265 15 Small Warehouses/Storage 115 78 193 11 Multi-Residential Properties 60 84 144 8Small business, doctors, Churches 139 - 139 8dentists, attorneys, CPAs Hotels/Motels - 92 92 5 Convenience Stores 63 22 85 5 Franchise / Restaurants 37 34 71 4$12 million project limit Farmland 63 - 63 3 Manufacturing Facility 51 10 61 3 Golf Course/Recreation�� 60 - 60 3Average Loan Size Auto Dealership/Service 44 8 52 3 Leasehold Property 17 7 24 1-$468 Composite CRE Daycare Facility 16 10 26 1 Carwash 19 1 20 1-$420 Owner Occupied Other Small Business 10 8 18 1 Funeral Home 12 1 13 1-$610 Income Producing Total$ 1,111 $ 711 $ 1,822 |
8
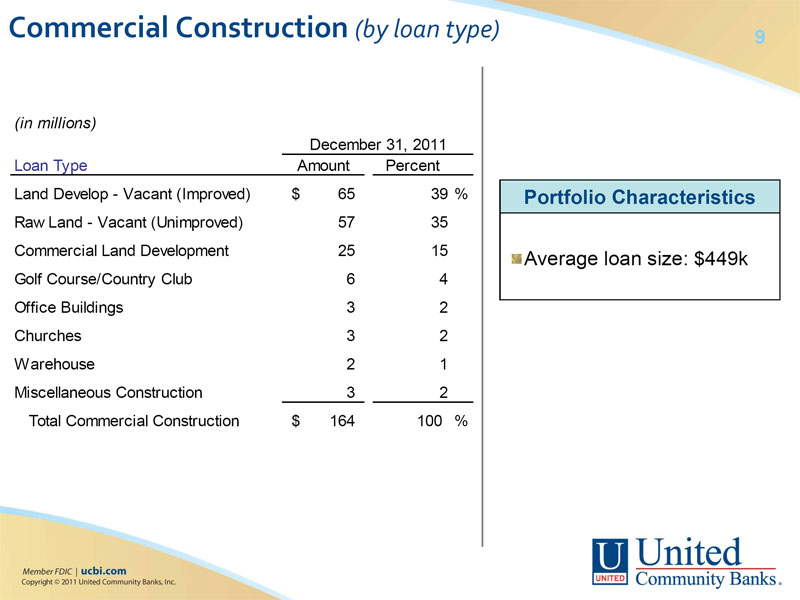 | Commercial Construction (by loan type) 9 (in millions) December 31, 2011 Loan Type Amount Percent Land Develop - Vacant (Improved) $ 65 39 % Portfolio Characteristics Raw Land - Vacant (Unimproved) 5735 Commercial Land Development 2515Average loan size: $449k Golf Course/Country Club 64 Office Buildings 32 Churches 32 Warehouse 21 Miscellaneous Construction 32 Total Commercial Construction$ 164 100 % |
9
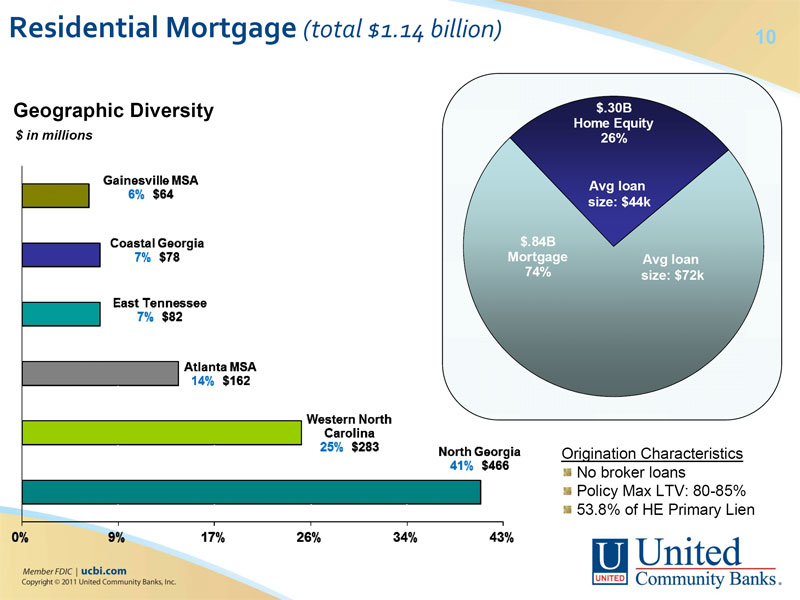 | Residential Mortgage (total $1.14 billion) 10 Geographic Diversity $.30B Home Equity $ in millions 26% Avg loan size: $44k $.84B Mortgage Avg loan 74% size: $72k Origination Characteristics No broker loans Policy Max LTV: 80-85% 53.8% of HE Primary Lien |
10
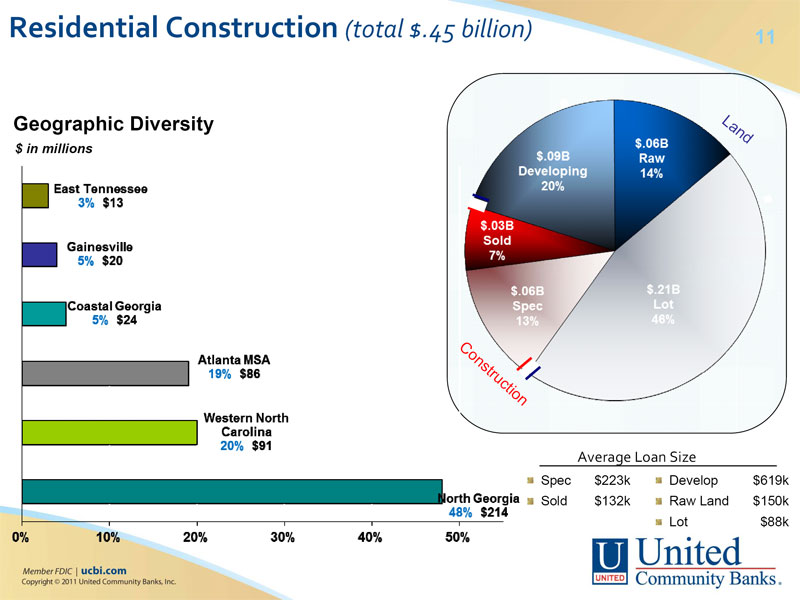 | Residential Construction (total $.45 billion) 11 Geographic Diversity a L d n $ in millions Developing o C s n r u t t i c n o Average Loan Size Spec $223k Develop $619k Sold $132k Raw Land $150k Lot $88k |
11
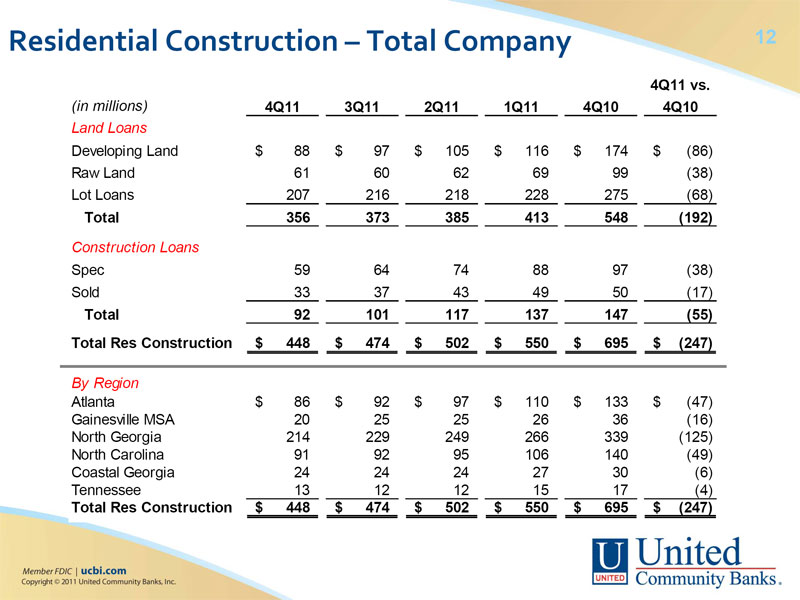 | Residential Construction – Total Company 12 4Q11 vs. (in millions) 4Q11 3Q11 2Q11 1Q11 4Q10 4Q10 Land Loans Developing Land $ 88 $ 97 $ 105 $ 116 $ 174 $ (86) Raw Land 61 60 62 69 99 (38) Lot Loans 207 216 218 228 275 (68) Total 356 373 385 413 548 (192) Construction Loans Spec 59 64 74 88 97 (38) Sold 33 37 43 49 50 (17) Total 92 101 117 137 147 (55) Total Res Construction$ 448$ 474$ 502 $ 550$ 695$ (247) By Region Atlanta $ 86 $ 92 $ 97 $ 110 $ 133 $ (47) Gainesville MSA 20 25 25 26 36 (16) North Georgia 214 229 249 266 339 (125) North Carolina 91 92 95 106 140 (49) Coastal Georgia 24 24 24 27 30 (6) Tennessee 13 12 12 15 17 (4) Total Res Construction $ 448 $ 474 $ 502 $ 550 $ 695 $ (247) |
12
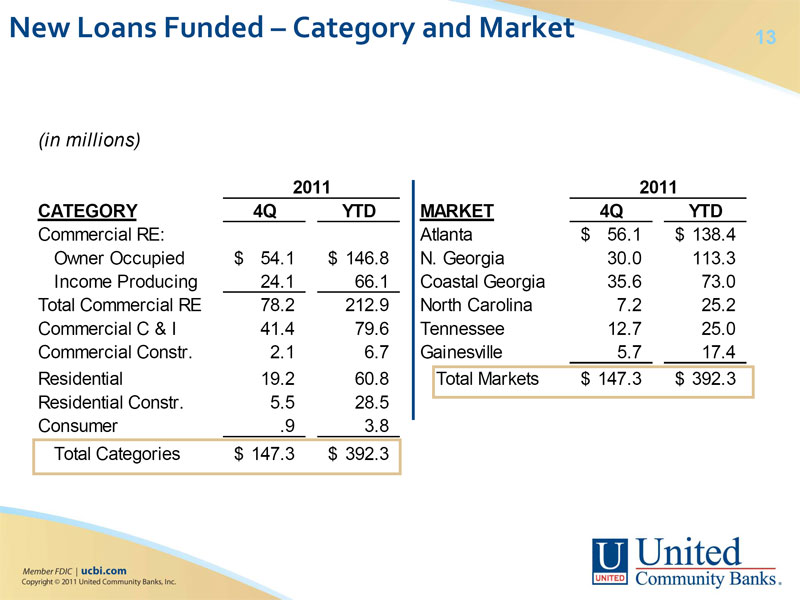 | New Loans Funded – Category and Market 13 (in millions) 2011 2011 CATEGORY 4Q YTD MARKET 4Q YTD Commercial RE: Atlanta $ 56.1 $ 138.4 Owner Occupied $ 54.1 $ 146.8 N. Georgia 30.0 113.3 Income Producing 24.1 66.1Coastal Georgia 35.6 73.0 Total Commercial RE 78.2 212.9North Carolina 7.2 25.2 Commercial C & I 41.4 79.6Tennessee 12.7 25.0 Commercial Constr. 2.1 6.7Gainesville 5.7 17.4 Residential 19.2 60.8 Total Markets$ 147.3$ 392.3 Residential Constr. 5.5 28.5 Consumer .9 3.8 Total Categories$ 147.3$ 392.3 |
13
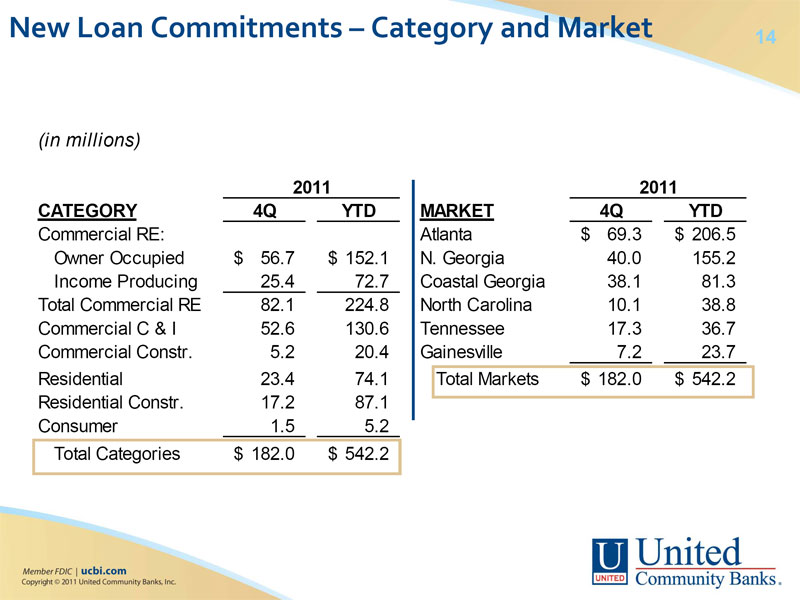 | New Loan Commitments – Category and Market 14 (in millions) 2011 2011 CATEGORY 4Q YTD MARKET 4Q YTD Commercial RE: Atlanta $ 69.3 $ 206.5 Owner Occupied $ 56.7 $ 152.1 N. Georgia 40.0 155.2 Income Producing 25.4 72.7Coastal Georgia 38.1 81.3 Total Commercial RE 82.1 224.8North Carolina 10.1 38.8 Commercial C & I 52.6 130.6Tennessee 17.3 36.7 Commercial Constr. 5.2 20.4Gainesville 7.2 23.7 Residential 23.4 74.1 Total Markets$ 182.0$ 542.2 Residential Constr. 17.2 87.1 Consumer 1.5 5.2 Total Categories$ 182.0$ 542.2 |
14
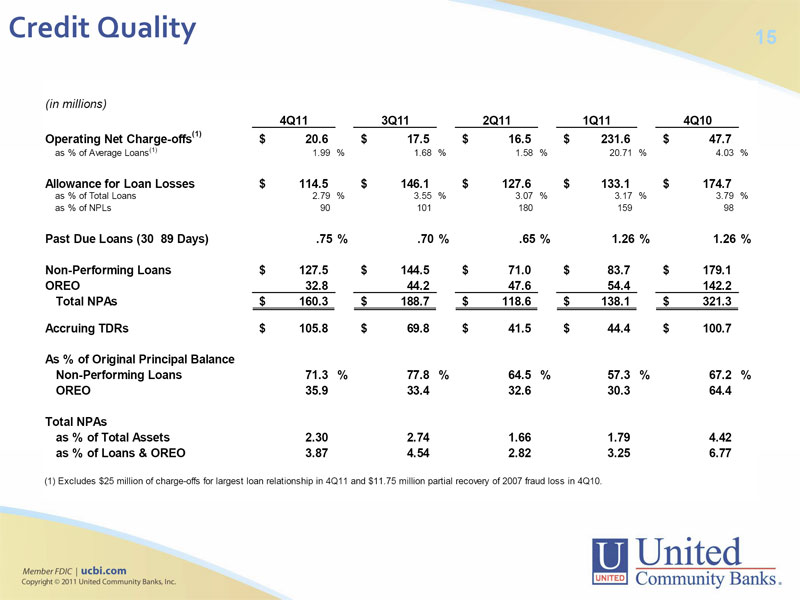 | Credit Quality 15 (in millions)4Q11 3Q11 2Q11 1Q11 4Q10 Operating Net Charge-offs(1) $ 20.6 $ 17.5 $ 16.5 $ 231.6 $ 47.7a % of Average Loans(1) 1.99 % 1.68 % 1.58 % 20.71 % 4.03 % Allowance for Loan Losses $ 114.5 $ 146.1 $ 127.6 $ 133.1 $ 174.7 as % of Total Loans 2.79 % 3.55 % 3.07 % 3.17 % 3.79 % as % of NPLs 90 101 180 159 98 Past Due Loans (30 89 Days) .75 % .70 % .65 % 1.26 % 1.26 % Non-Performing Loans $ 127.5 $ 144.5 $ 71.0 $ 83.7 $ 179.1 OREO 32.8 44.2 47.6 54.4 142.2 Total NPAs $ 160.3 $ 188.7 $ 118.6 $ 138.1 $ 321.3 Accruing TDRs $ 105.8 $ 69.8 $ 41.5 $ 44.4 $ 100.7 As % of Original Principal Balance Non-Performing Loans 71.3 % 77.8 % 64.5 % 57.3 % 67.2 % OREO 35.9 33.4 32.6 30.3 64.4 Total NPAs as % of Total Assets 2.30 2.74 1.66 1.79 4.42 as % of Loans & OREO 3.87 4.54 2.82 3.25 6.77 (1) Excludes $25 million of charge-offs for largest loan relationship in 4Q11 and $11.75 million partial recovery of 2007 fraud loss in 4Q10. |
15
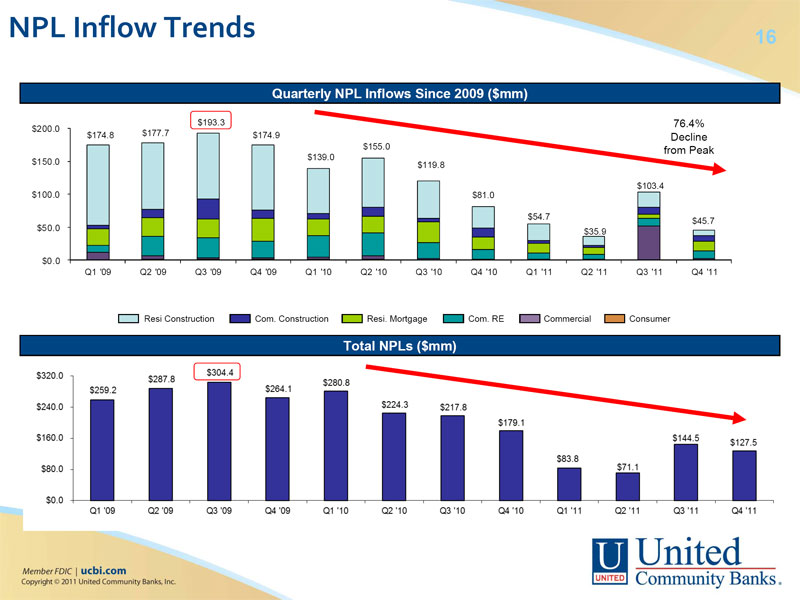 | NPL Inflow Trends 16 Quarterly NPL Inflows Since 2009 ($mm) $193.3 76.4% $200.0 $174.8 $177.7 $174.9 Decline $155.0 from Peak $139.0 $150.0$119.8 $103.4 $100.0$81.0 $54.7 $45.7 $50.0 $35.9 $0.0 Q1 '09 Q2 '09 Q3 '09 Q4 '09 Q1 '10 Q2 '10 Q3 '10 Q4 '10 Q1 '11 Q2 '11 Q3 '11 Q4 '11 Resi Construction Com. Construction Resi. Mortgage Com. RE Commercial Consumer Total NPLs ($mm) |
16
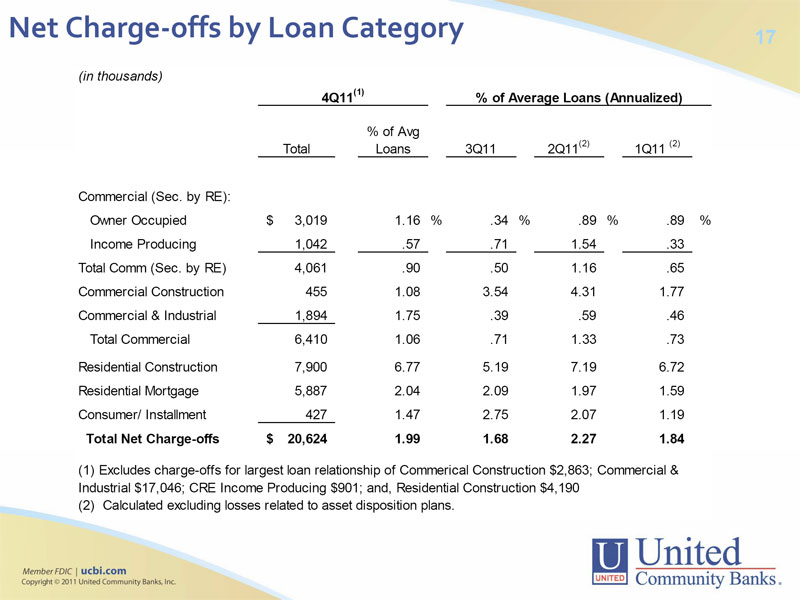 | Net Charge‐offs by Loan Category 17 (in thousands) 4Q11(1) % of Average Loans (Annualized) % of Avg Total Loans 3Q11 2Q11(2) 1Q11 (2) Commercial (Sec. by RE): Owner Occupied $ 3,019 1.16 % .34 % .89 % .89 % Income Producing 1,042 .57 .71 1.54 .33 Total Comm (Sec. by RE) 4,061 .90 .50 1.16 .65 Commercial Construction 455 1.08 3.54 4.31 1.77 Commercial & Industrial 1,894 1.75 .39 .59 .46 Total Commercial 6,410 1.06 .71 1.33 .73 Residential Construction 7,900 6.77 5.19 7.19 6.72 Residential Mortgage 5,887 2.04 2.09 1.97 1.59 Consumer/ Installment 427 1.47 2.75 2.07 1.19 Total Net Charge-offs $ 20,624 1.99 1.68 2.27 1.84 (1) Excludes charge-offs for largest loan relationship of Commerical Construction $2,863; Commercial & Industrial $17,046; CRE Income Producing $901; and, Residential Construction $4,190 (2) Calculated excluding losses related to asset disposition plans. |
17
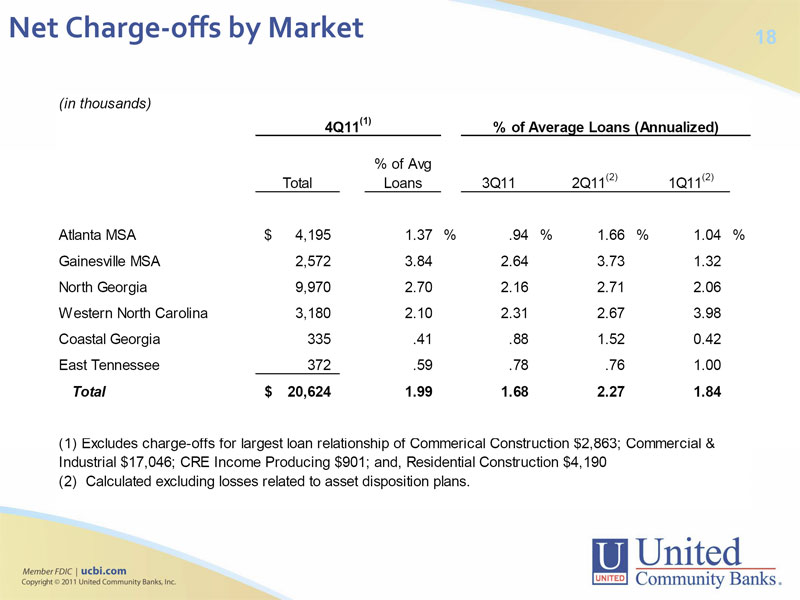 | Net Charge‐offs by Market 18 (in thousands) 4Q11(1) % of Average Loans (Annualized) % of Avg Total Loans 3Q11 2Q11(2) 1Q11(2) Atlanta MSA $ 4,195 1.37 % .94 % 1.66 % 1.04 % Gainesville MSA 2,572 3.84 2.64 3.73 1.32 North Georgia 9,970 2.70 2.16 2.71 2.06 Western North Carolina 3,180 2.10 2.31 2.67 3.98 Coastal Georgia 335 .41 .88 1.52 0.42 East Tennessee 372 .59 .78 .76 1.00 Total $ 20,624 1.99 1.68 2.27 1.84 (1) Excludes charge-offs for largest loan relationship of Commerical Construction $2,863; Commercial & Industrial $17,046; CRE Income Producing $901; and, Residential Construction $4,190 (2) Calculated excluding losses related to asset disposition plans. |
18
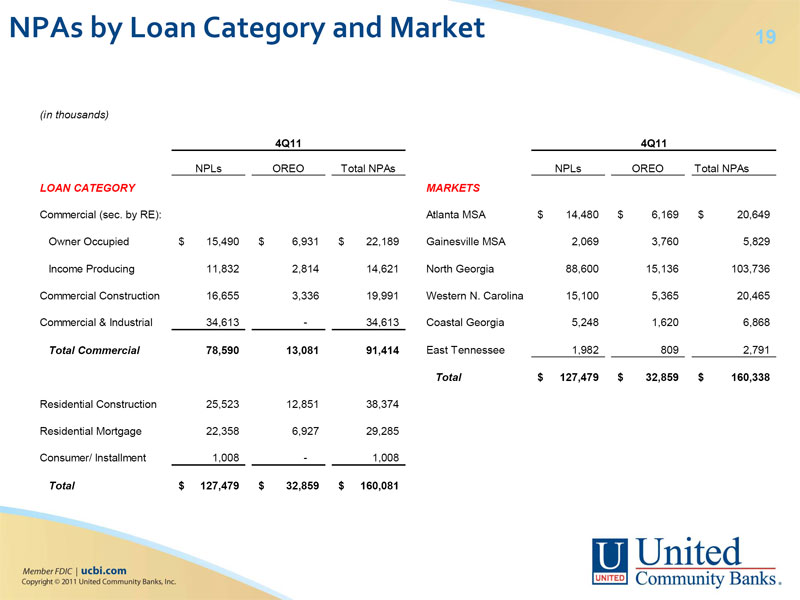 | NPAs by Loan Category and Market 19 (in thousands) 4Q11 4Q11 NPLs OREO Total NPAs NPLs OREO Total NPAs LOAN CATEGORY MARKETS Commercial (sec. by RE): Atlanta MSA $ 14,480 $ 6,169 $ 20,649 Owner Occupied $ 15,490 $ 6,931 $ 22,189 Gainesville MSA 2,069 3,760 5,829 Income Producing 11,832 2,814 14,621 North Georgia 88,600 15,136 103,736 Commercial Construction 16,655 3,336 19,991 Western N. Carolina 15,100 5,365 20,465 Commercial & Industrial 34,613 - 34,613 Coastal Georgia 5,248 1,620 6,868 Total Commercial 78,590 13,081 91,414 East Tennessee 1,982 809 2,791 Total $ 127,479 $ 32,859 $ 160,338 Residential Construction 25,523 12,851 38,374 Residential Mortgage 22,358 6,927 29,285 Consumer/ Installment 1,008 - 1,008 Total $ 127,479 $ 32,859 $ 160,081 |
19
 | Financial Review 20 |
20
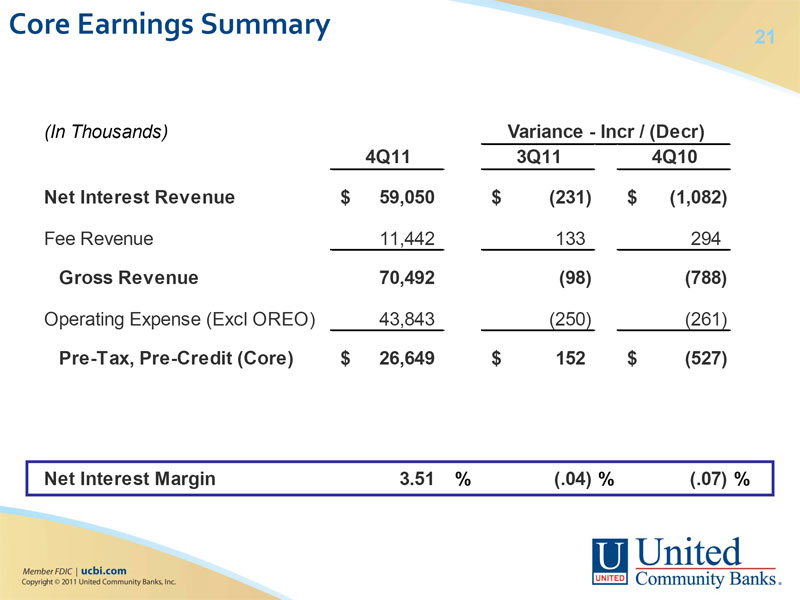 | Core Earnings Summary 21 (In Thousands) Variance - Incr / (Decr) 4Q11 3Q11 4Q10 Net Interest Revenue $ 59,050 $ (231) $ (1,082) Fee Revenue 11,442 133 294 Gross Revenue 70,492 (98) (788) Operating Expense (Excl OREO) 43,843 (250) (261) Pre-Tax, Pre-Credit (Core) $ 26,649 $ 152 $ (527) Net Interest Margin 3.51 % (.04) % (.07) % |
21
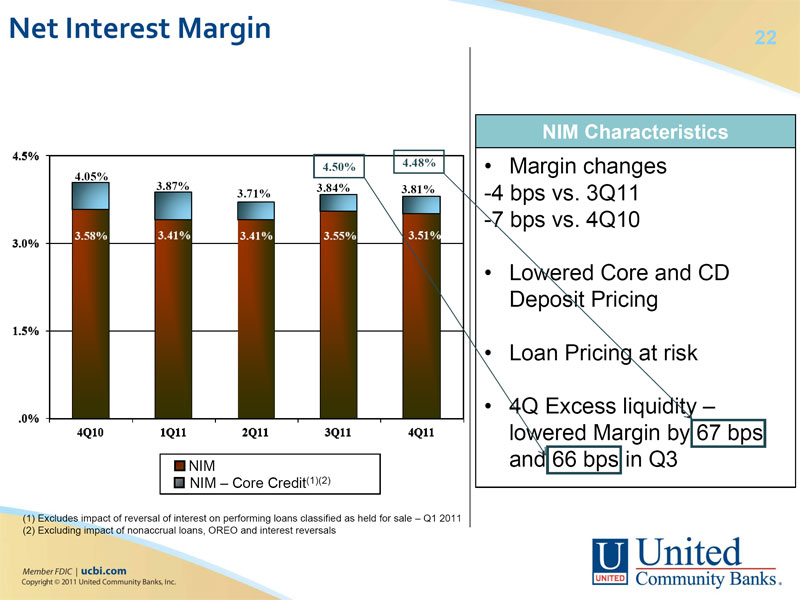 | Net Interest Margin 22 NIM Characteristics 4.50% 4.48% • Margin changes 4.05% 3.87% 3.84% 3.81% 3.71% -4 bps vs. 3Q11 -7 bps vs. 4Q10 • Lowered Core and CD Deposit Pricing • Loan Pricing at risk • 4Q Excess liquidity –lowered Margin by 67 bps NIM and 66 bps in Q3 NIM – Core Credit(1)(2) (1) Excludes impact of reversal of interest on performing loans classified as held for sale – Q1 2011 (2) Excluding impact of nonaccrual loans, OREO and interest reversals |
22
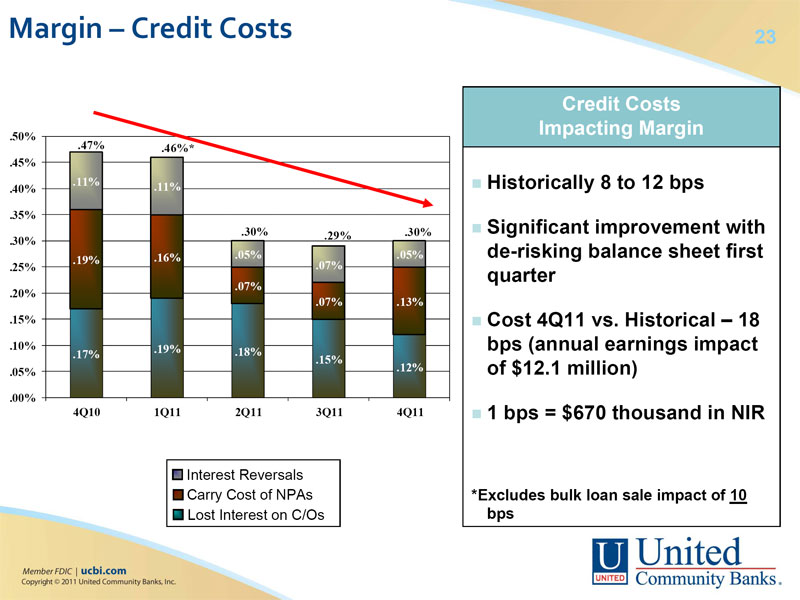 | Margin – Credit Costs 23 Credit Costs Impacting Margin .50% .47% .46%* .45% .11% .11% Historically 8 to 12 bps .40% .35% .30% .30% Significant improvement with .29% .30% de-risking balance sheet first .19% .16% .05% .05% .25% .07% quarter .07% .20% .07% .13% .15% Cost 4Q11 vs. Historical – 18 .10% .19% bps (annual earnings impact .17% .18% .15% .05% .12% of $12.1 million) .00% 4Q10 1Q11 2Q11 3Q11 4Q11 1 bps = $670 thousand in NIR Interest Reversals Carry Cost of NPAs *Excludes bulk loan sale impact of 10 Lost Interest on C/Os bps |
23
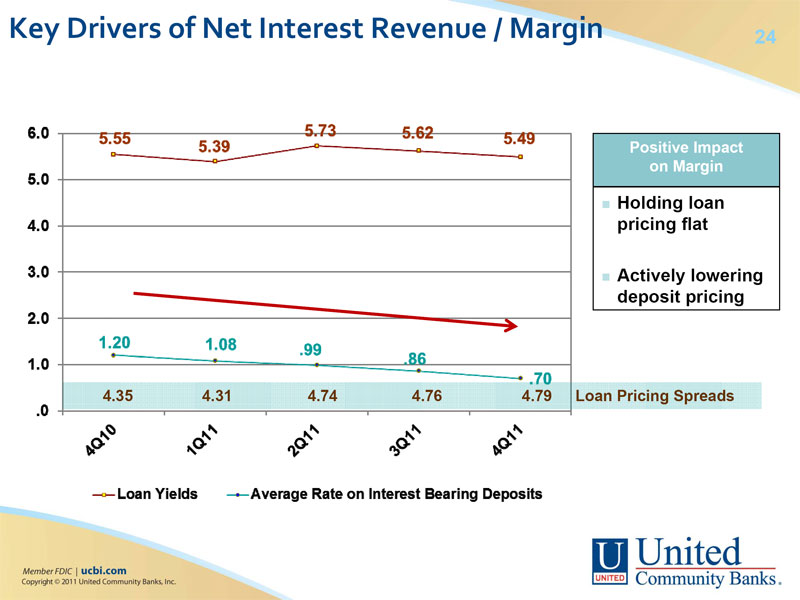 | Key Drivers of Net Interest Revenue / Margin 24 Positive Impact on Margin Holding loan pricing flat Actively lowering deposit pricing 4.35 4.31 4.74 4.76 4.79 Loan Pricing Spreads |
24
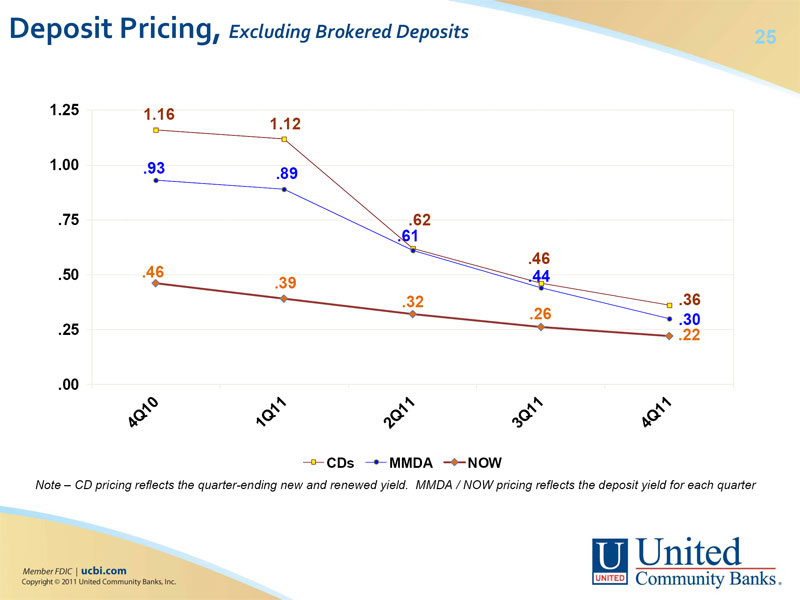 | Deposit Pricing, Excluding Brokered Deposits 25 1.25 1.16 1.12 1.00 .93 .89 .75 .62 .61 .46 .50 .46 .44 .39 .32 .36 .26 .30 .25 .22 .00 CDs MMDA NOW Note – CD pricing reflects the quarter-ending new and renewed yield. MMDA / NOW pricing reflects the deposit yield for each quarter |
25
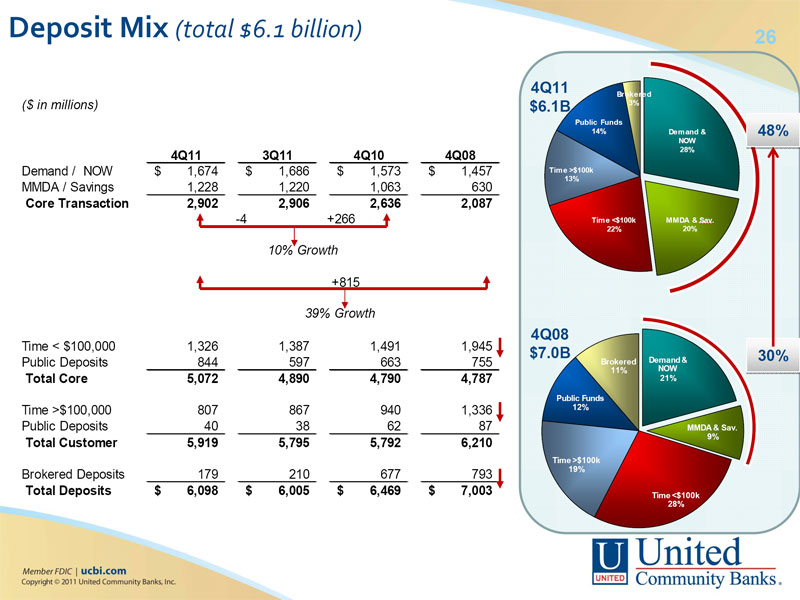 | Deposit Mix (total $6.1 billion) 26 4Q11 Brokered ($ in millions) $6.1B 3% Public Funds 14% Demand & 48% NOW 4Q11 3Q11 4Q10 4Q08 28% Demand / NOW $ 1,674 $ 1,686 $ 1,573 $ 1,457 Time >$100k 13% MMDA / Savings 1,228 1,220 1,063 ��630 Core Transaction 2,902 2,906 2,636 2,087 -4 +266 Time <$100k MMDA & Sav. 22% 20% 10% Growth +815 39% Growth 4Q08 Time < $100,000 1,326 1,387 1,491 1,945 $7.0B Demand & 30% Public Deposits 844 597 663 755 Brokered 11% NOW Total Core 5,072 4,890 4,790 4,787 21% Public Funds Time >$100,000 807 867 940 1,336 12% Public Deposits 40 38 62 87 MMDA & Sav. Total Customer 5,919 5,795 5,792 6,210 9% Time >$100k Brokered Deposits 179 210 677 793 19% Total Deposits $ 6,098 $ 6,005 $ 6,469 $ 7,003 Time <$100k 28% |
26
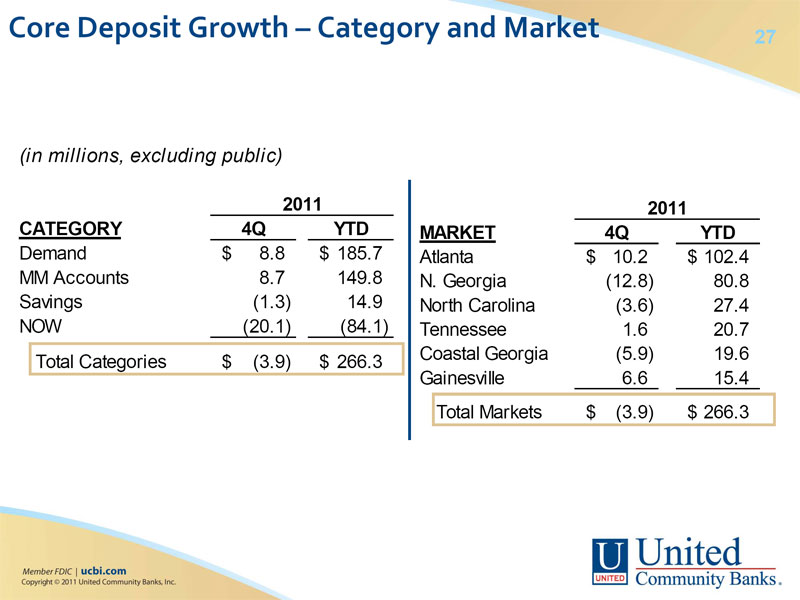 | Core Deposit Growth – Category and Market 27 (in millions, excluding public) 2011 2011 CATEGORY 4Q YTD MARKET 4Q YTD Demand $ 8.8 $ 185.7 Atlanta $ 10.2 $ 102.4 MM Accounts 8.7 149.8 N. Georgia (12.8) 80.8 Savings (1.3) 14.9 North Carolina (3.6) 27.4 NOW (20.1) (84.1) Tennessee 1.6 20.7 Total Categories $ (3.9) $ 266.3 Coastal Georgia (5.9) 19.6 Gainesville 6.6 15.4 Total Markets $ (3.9) $ 266.3 |
27
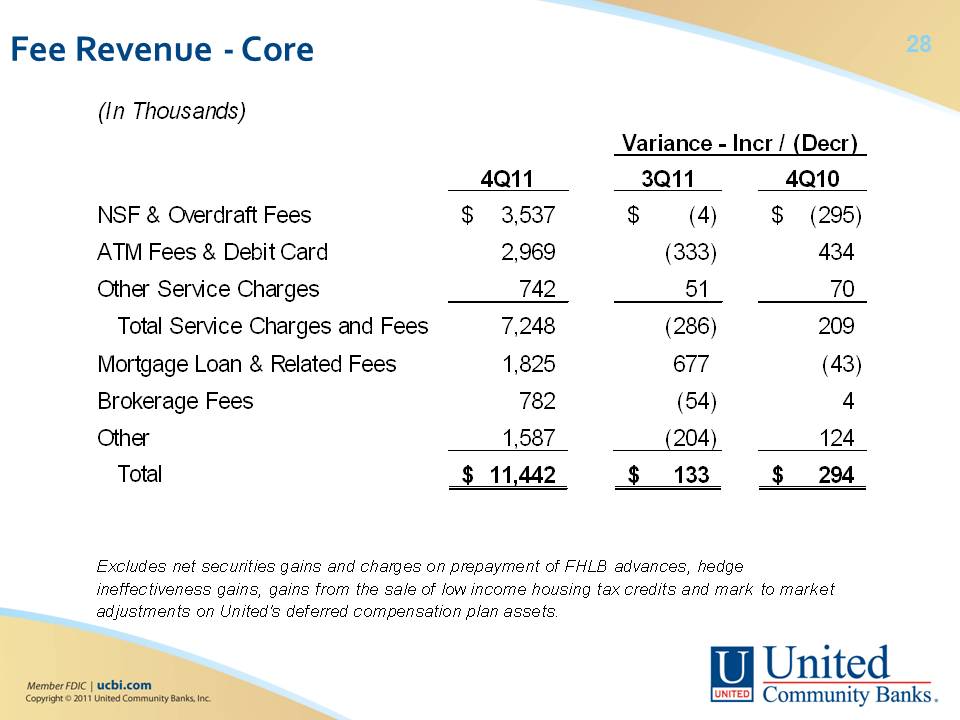 | Fee Revenue - Core 28 (In Thousands) Variance - Incr / (Decr) 4Q11 3Q11 4Q10 NSF & Overdraft Fees $ 3,537 $ (4) $ (295) ATM Fees 2,969 (333) 434 Other Service Charges 742 51 70 Total Service Charges and Fees 7,248 (286) 209 M ortgage Loan & Related Fees 1,825 677 (43) Brokerage Fees 782 (54) 4 Other 1,587 (204) 124 Total$ 11,442$ 133$ 294 Excludes net securities gains and charges on prepayment of FHLB advances, hedge ineffectiveness gains, gains from the sale of low income housing tax credits and mark to market adjustments on United's deferred compensation plan assets. |
28
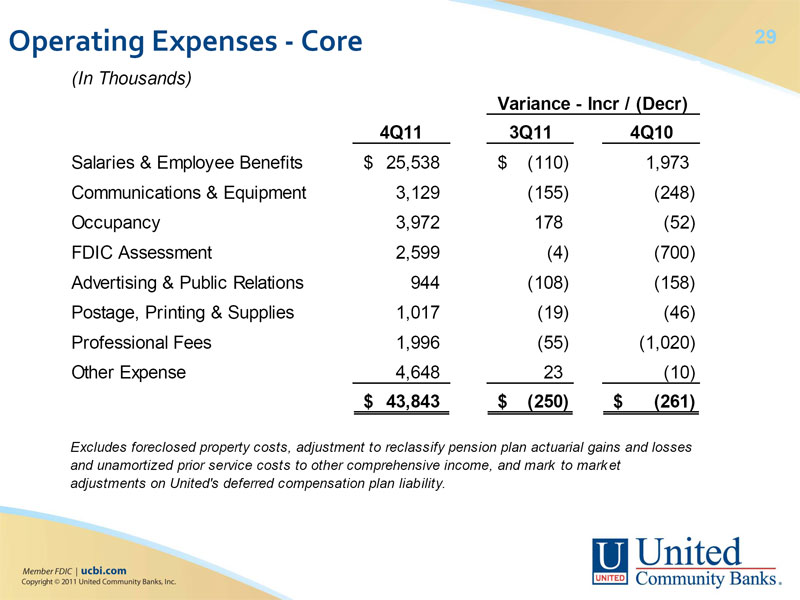 | Operating Expenses - Core 29 (In Thousands) Variance - Incr / (Decr) 4Q11 3Q11 4Q10 Salaries & Employee Benefits $ 25,538 $ (110) 1,973 Communications & Equipment 3,129 (155) (248) Occupancy 3,972 178 (52) FDIC Assessment 2,599 (4) (700) Advertising & Public Relations 944 (108) (158) Postage, Printing & Supplies 1,017 (19) (46) Professional Fees 1,996 (55) (1,020) Other Expense 4,648 23 (10) $ 43,843 $ (250) $ (261) Excludes foreclosed property costs, adjustment to reclassify pension plan actuarial gains and losses and unamortized prior service costs to other comprehensive income, and mark to market adjustments on United's deferred compensation plan liability. |
29
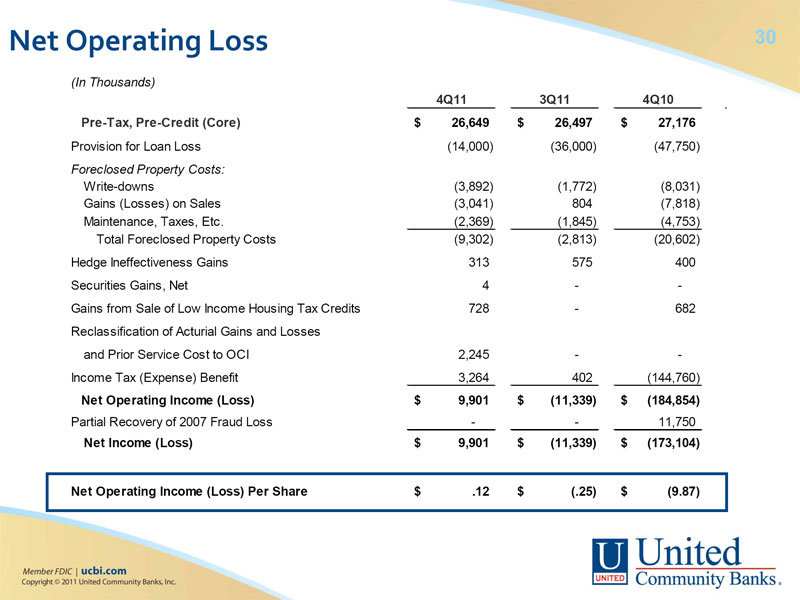 | Net Operating Loss 30 (In Thousands) 4Q11 3Q11 4Q10 Pre-Tax, Pre-Credit (Core) $ 26,649 $ 26,497 $ 27,176 Provision for Loan Loss (14,000) (36,000) (47,750) Foreclosed Property Costs: Write-downs (3,892) (1,772) (8,031) Gains (Losses) on Sales (3,041) 804 (7,818) Maintenance, Taxes, Etc. (2,369) (1,845) (4,753) Total Foreclosed Property Costs (9,302) (2,813) (20,602) Hedge Ineffectiveness Gains 313 575 400 Securities Gains, Net 4 - -Gains from Sale of Low Income Housing Tax Credits 728 - 682 Reclassification of Acturial Gains and Losses and Prior Service Cost to OCI 2,245 - -Income Tax (Expense) Benefit 3,264 402 (144,760) Net Operating Income (Loss) $ 9,901 $ (11,339) $ (184,854) Partial Recovery of 2007 Fraud Loss - - 11,750 Net Income (Loss) $ 9,901 $ (11,339) $ (173,104) Net Operating Income (Loss) Per Share $ .12 $ (.25) $ (9.87) |
30
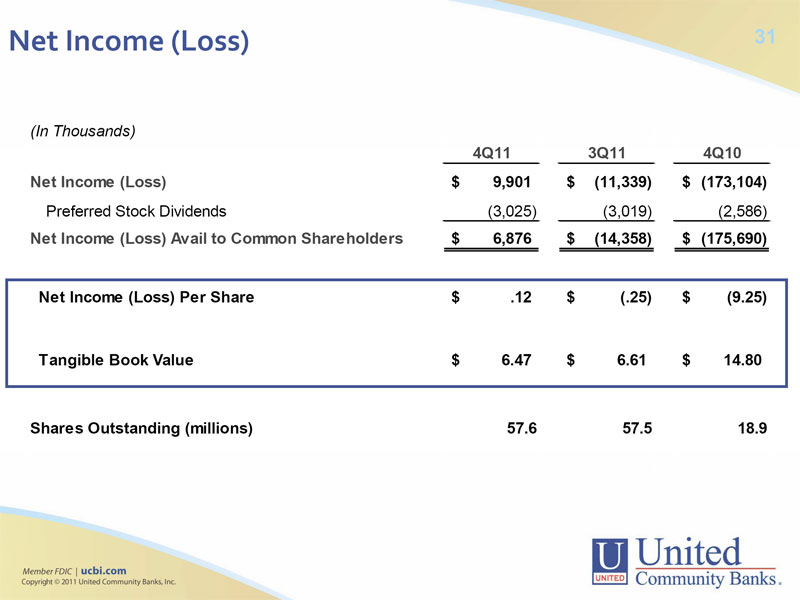 | Net Income (Loss) 31 (In Thousands) 4Q11 3Q11 4Q10 Net Income (Loss) $ 9,901 $ (11,339) $ (173,104) Preferred Stock Dividends (3,025) (3,019) (2,586) Net Income (Loss) Avail to Common Shareholders $ 6,876 $ (14,358) $ (175,690) Net Income (Loss) Per Share$ .12$ (.25)$ (9.25) Tangible Book Value $ 6.47$ 6.61$ 14.80 Shares Outstanding (millions) 57.6 57.5 18.9 |
31
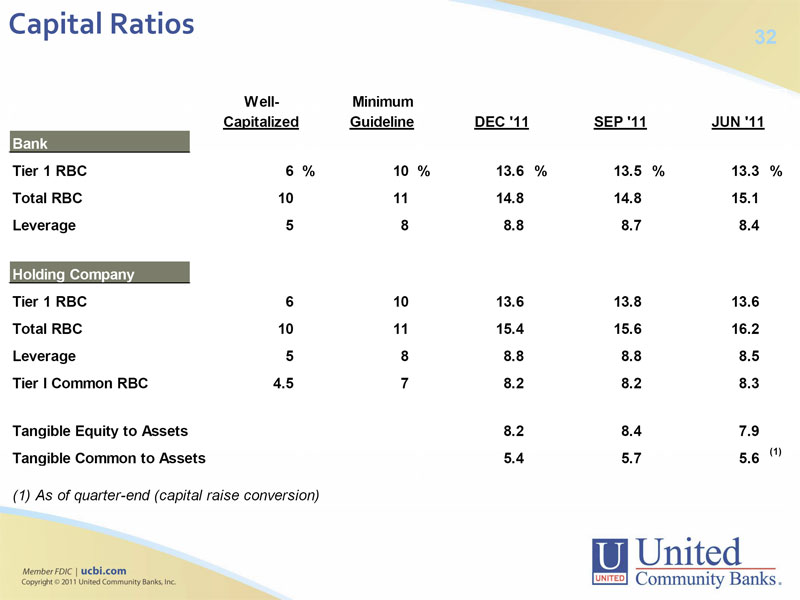 | Capital Ratios 32 Well- Minimum Capitalized Guideline DEC '11 SEP '11 JUN '11 Bank Tier 1 RBC 6 % 10 % 13.6 % 13.5 % 13.3 % Total RBC 10 11 14.8 14.8 15.1 Leverage 5 8 8.8 8.7 8.4 Holding Company Tier 1 RBC 6 10 13.6 13.8 13.6 Total RBC 10 11 15.4 15.6 16.2 Leverage 5 8 8.8 8.8 8.5 Tier I Common RBC 4.5 7 8.2 8.2 8.3 Tangible Equity to Assets 8.2 8.4 7.9 Tangible Common to Assets 5.4 5.7 5.6 (1) (1) As of quarter-end (capital raise conversion) |
32
 | 33 |
33
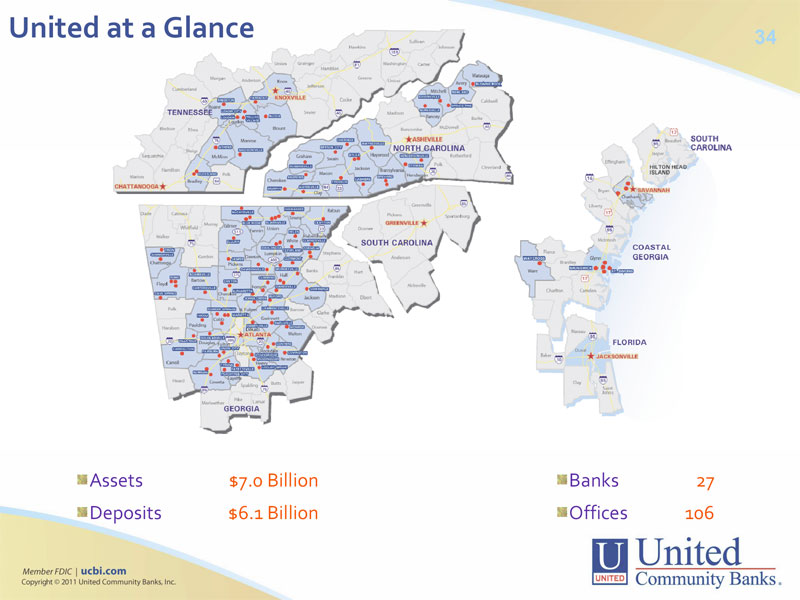 | United at a Glance 34 Assets $7.0 Billion Banks 27 Deposits $6.1 Billion Offices 106 |
34
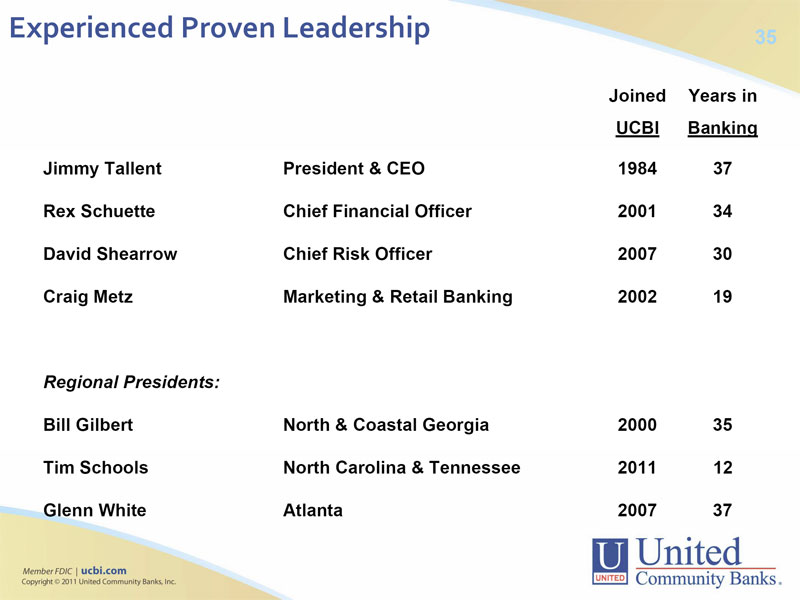 | Experienced Proven Leadership 35 Joined Years in UCBI Banking Jimmy Tallent President & CEO 1984 37 Rex Schuette Chief Financial Officer 2001 34 David ShearrowChief Risk Officer200730 Craig MetzMarketing & Retail Banking200219 Regional Presidents: Bill Gilbert North & Coastal Georgia 2000 35 Tim Schools North Carolina & Tennessee 201112 Glenn WhiteAtlanta200737 |
35
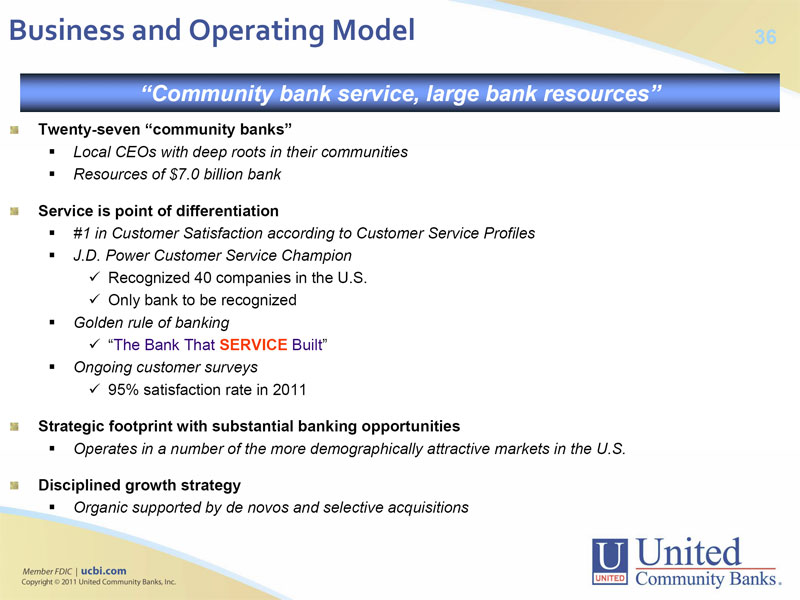 | Business and Operating Model 36 “Community bank service, large bank resources” Twenty-seven “community banks” Local CEOs with deep roots in their communities Resources of $7.0 billion bank Service is point of differentiation #1 in Customer Satisfaction according to Customer Service Profiles J.D. Power Customer Service Champion Recognized 40 companies in the U.S. Only bank to be recognized Golden rule of banking “The Bank That SERVICE Built” Ongoing customer surveys 95% satisfaction rate in 2011 Strategic footprint with substantial banking opportunities Operates in a number of the more demographically attractive markets in the U.S. Disciplined growth strategy Organic supported by de novos and selective acquisitions |
36
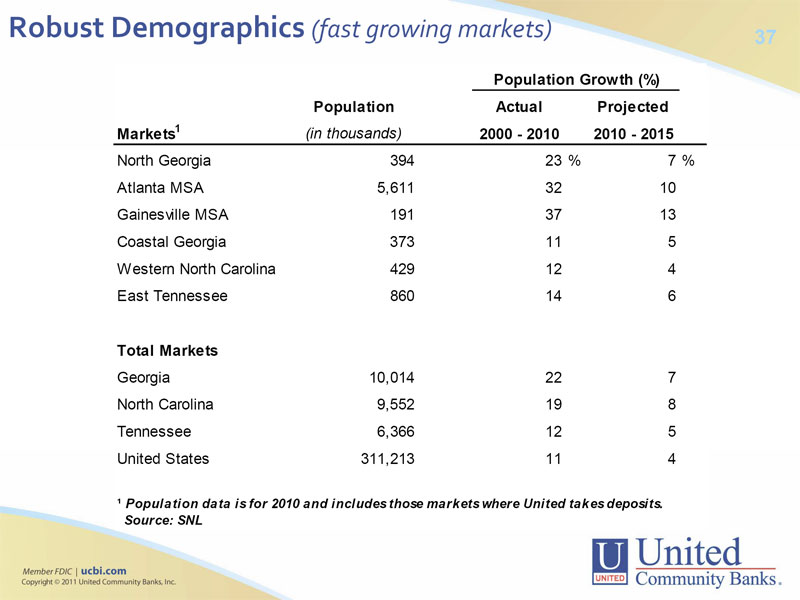 | Robust Demographics (fast growing markets) 37 Population Growth (%) Population Actual Projected Markets1 (in thousands) 2000 - 20102010 - 2015 North Georgia 394 23 % 7 % Atlanta MSA 5,611 32 10 Gainesville MSA 1913713 Coastal Georgia 373115 Western North Carolina 429124 East Tennessee 860146 Total Markets Georgia 10,014 22 7 North Carolina 9,552 19 8 Tennessee 6,366125 United States 311,213114 ¹ Population data is for 2010 and includes those markets where United takes deposits. Source: SNL |
37
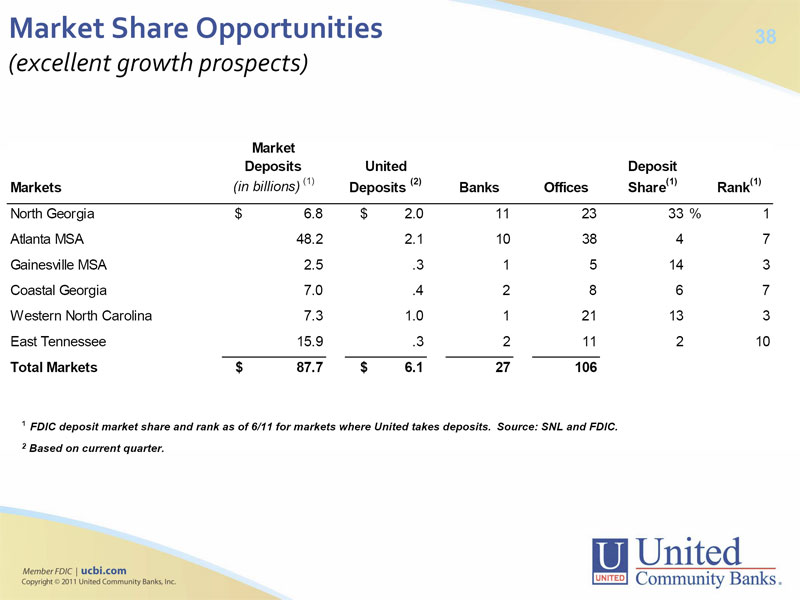 | Market Share Opportunities 38 (excellent growth prospects) Market Deposits United Deposit Markets (in billions) (1) Deposits (2) Banks Offices Share(1) Rank(1) North Georgia $ 6.8 $ 2.0 11 23 33 % 1 Atlanta MSA 48.2 2.1103847 Gainesville MSA 2.5 .315143 Coastal Georgia 7.0 .42867 Western North Carolina 7.3 1.0 121133 East Tennessee 15.9 .3 211210 Total Markets $ 87.7 $ 6.1 27 106 ¹ FDIC deposit market share and rank as of 6/11 for markets where United takes deposits. Source: SNL and FDIC. 2 Based on current quarter. |
38
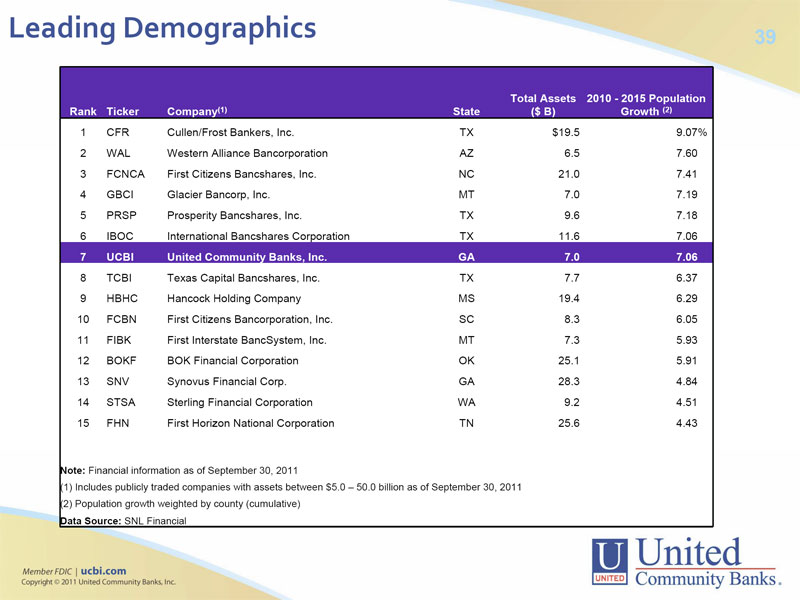 | Leading Demographics 39 Total Assets 2010 - 2015 Population Rank Ticker Company(1) State ($ B) Growth (2) 1 CFR Cullen/Frost Bankers, Inc. TX $19.5 9.07% 2 WAL Western Alliance Bancorporation AZ 6.5 7.60 3 FCNCA First Citizens Bancshares, Inc. NC 21.0 7.41 4 GBCI Glacier Bancorp, Inc. MT 7.0 7.19 5 PRSP Prosperity Bancshares, Inc. TX 9.6 7.18 6 IBOC International Bancshares Corporation TX 11.6 7.06 7 UCBI United Community Banks, Inc. GA 7.0 7.06 8 TCBI Texas Capital Bancshares, Inc. TX 7.7 6.37 9 HBHC Hancock Holding Company MS 19.4 6.29 10 FCBN First Citizens Bancorporation, Inc. SC 8.3 6.05 11 FIBK First Interstate BancSystem, Inc. MT 7.3 5.93 12 BOKF BOK Financial Corporation OK 25.1 5.91 13 SNV Synovus Financial Corp. GA 28.3 4.84 14 STSA Sterling Financial Corporation WA 9.2 4.51 15 FHN First Horizon National Corporation TN 25.6 4.43 Note: Financial information as of September 30, 2011 (1) Includes publicly traded companies with assets between $5.0 – 50.0 billion as of September 30, 2011 (2) Population growth weighted by county (cumulative) Data Source: SNL Financial |
39
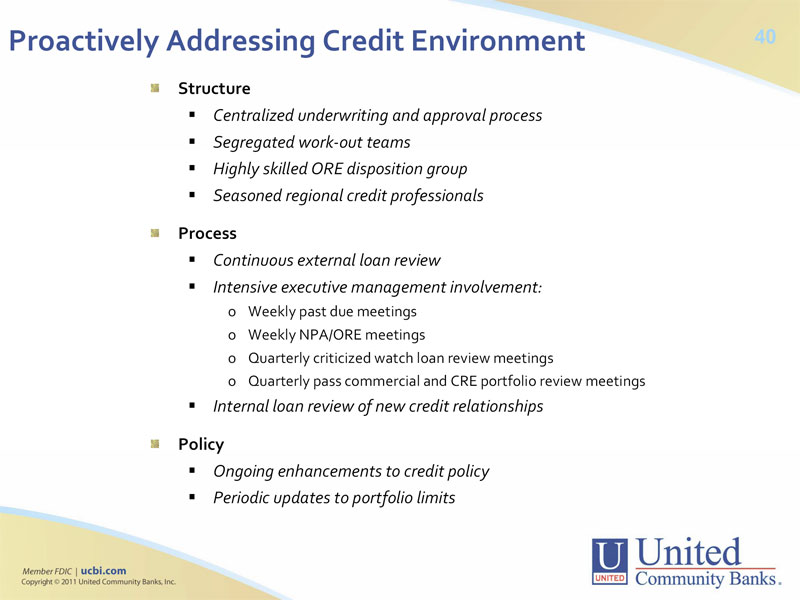 | Proactively Addressing Credit Environment 40 Structure Centralized underwriting and approval process Segregated work-out teams Highly skilled ORE disposition group Seasoned regional credit professionals Process Continuous external loan review Intensive executive management involvement: o Weekly past due meetings o Weekly NPA/ORE meetings o Quarterly criticized watch loan review meetings o Quarterly pass commercial and CRE portfolio review meetings Internal loan review of new credit relationships Policy Ongoing enhancements to credit policy Periodic updates to portfolio limits |
40
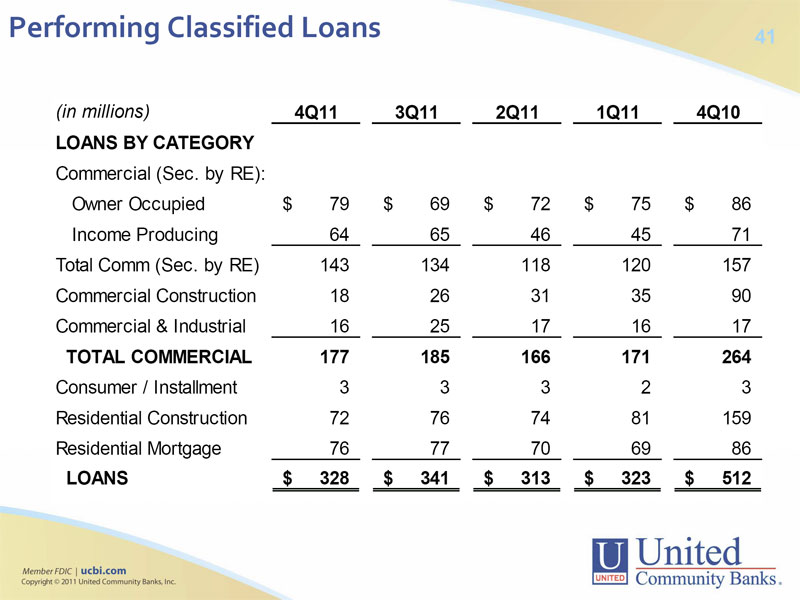 | Performing Classified Loans 41 (in millions) 4Q11 3Q11 2Q11 1Q11 4Q10 LOANS BY CATEGORY Commercial (Sec. by RE): Owner Occupied $ 79 $ 69 $ 72 $ 75 $ 86 Income Producing 64 65 46 45 71 Total Comm (Sec. by RE) 143 134 118 120 157 Commercial Construction 18 26 31 35 90 Commercial & Industrial 16 25 17 16 17 TOTAL COMMERCIAL 177 185 166 171 264 Consumer / Installment 3 3 3 2 3 Residential Construction 72 76 74 81 159 Residential Mortgage 76 77 70 69 86 LOANS$ 328$ 341$ 313$ 323$ 512 |
41
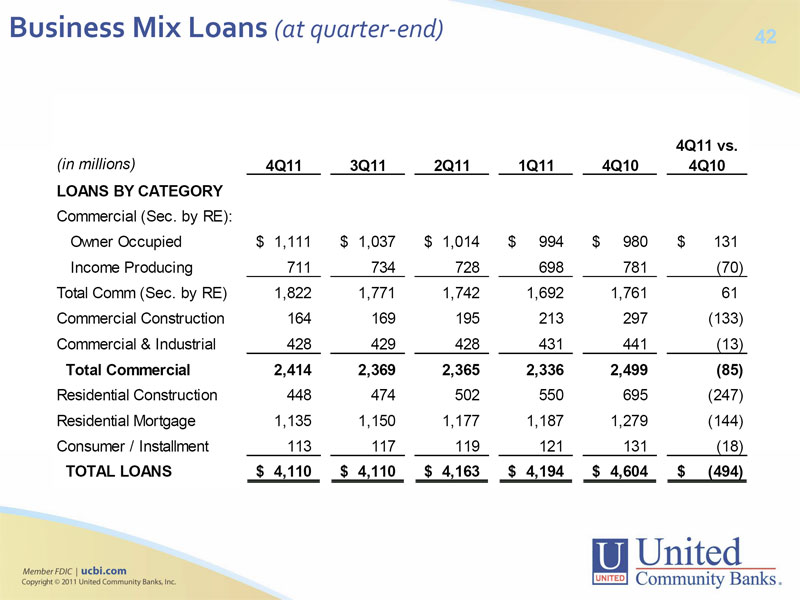 | Business Mix Loans (at quarter-end) 42 4Q11 vs. (in millions) 4Q11 3Q11 2Q11 1Q11 4Q10 4Q10 LOANS BY CATEGORY Commercial (Sec. by RE): Owner Occupied $ 1,111 $ 1,037 $ 1,014 $ 994 $ 980 $ 131 Income Producing 711 734 728 698 781 (70) Total Comm (Sec. by RE) 1,822 1,771 1,742 1,692 1,761 61 Commercial Construction 164 169 195 213 297 (133) Commercial & Industrial 428 429 428 431 441 (13) Total Commercial 2,414 2,369 2,365 2,336 2,499 (85) Residential Construction 448 474 502 550 695 (247) Residential Mortgage 1,135 1,150 1,177 1,187 1,279 (144) Consumer / Installment 113 117 119 121 131 (18) TOTAL LOANS$ 4,110$ 4,110$ 4,163$ 4,194$ 4,604$ (494) |
42
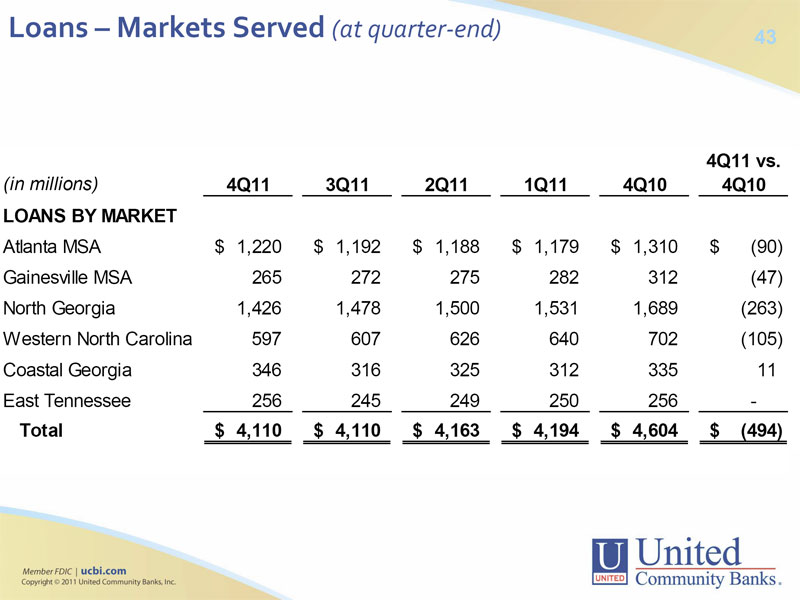 | Loans – Markets Served (at quarter-end) 43 4Q11 vs. (in millions) 4Q11 3Q11 2Q11 1Q11 4Q10 4Q10 LOANS BY MARKET Atlanta MSA $ 1,220 $ 1,192 $ 1,188 $ 1,179 $ 1,310 $ (90) Gainesville MSA 265 272 275 282 312 (47) North Georgia 1,426 1,478 1,500 1,531 1,689 (263) Western North Carolina 597 607 626 640 702 (105) Coastal Georgia 346 316 325 312 335 11 East Tennessee 256 245 249 250 256 - Total $ 4,110 $ 4,110 $ 4,163 $ 4,194 $ 4,604 $ (494) |
43
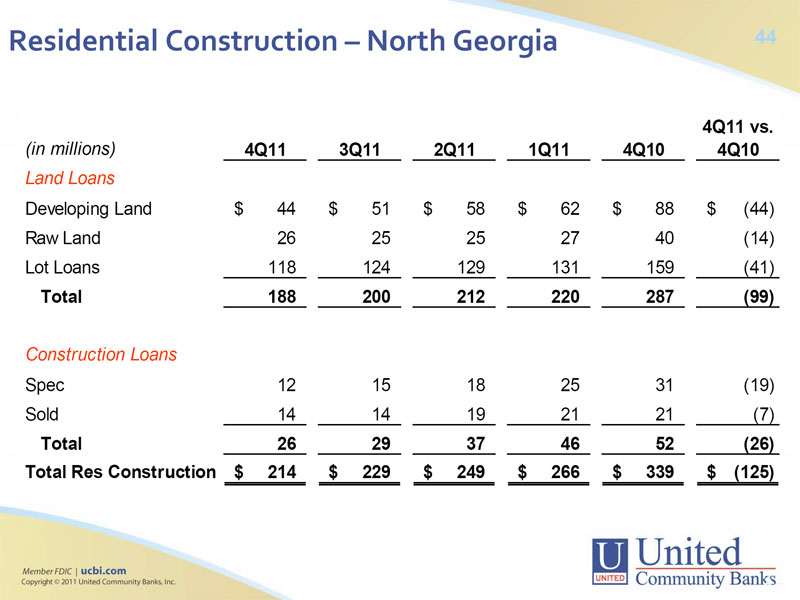 | Residential Construction – North Georgia 44 4Q11 vs. (in millions) �� 4Q11 3Q11 2Q11 1Q11 4Q10 4Q10 Land Loans Developing Land $ 44 $ 51 $ 58 $ 62 $ 88 $ (44) Raw Land 26 25 25 27 40 (14) Lot Loans 118 124 129 131 159 (41) Total 188 200 212 220 287 (99) Construction Loans Spec 12 15 18 25 31 (19) Sold 14 14 19 21 21 (7) Total 26 29 37 46 52 (26) Total Res Construction $ 214$ 229$ 249$ 266$ 339$ (125) 44 |
44
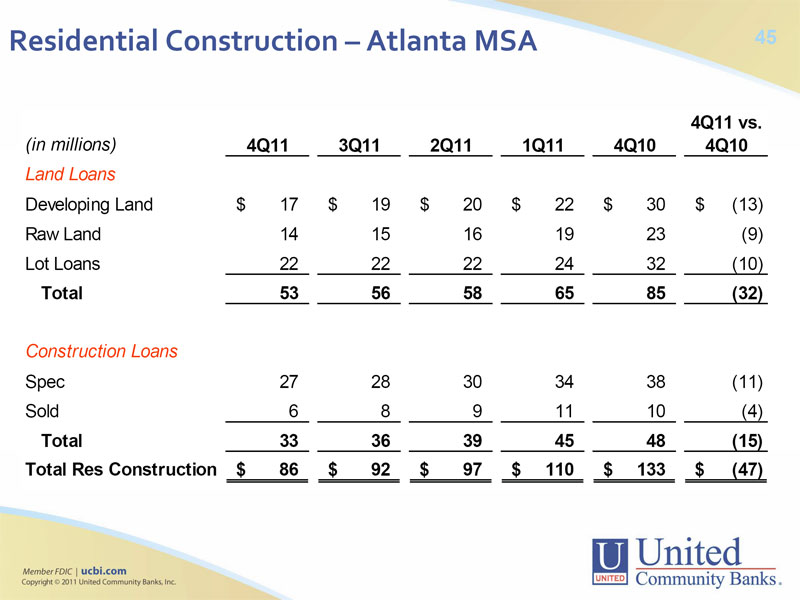 | Residential Construction – Atlanta MSA 45 4Q11 vs. (in millions) 4Q11 3Q11 2Q11 1Q11 4Q10 4Q10 Land Loans Developing Land $ 17 $ 19 $ 20 $ 22 $ 30 $ (13) Raw Land 14 15 16 19 23 (9) Lot Loans 22 22 22 24 32 (10) Total 53 56 58 65 85 (32) Construction Loans Spec 27 28 30 34 38 (11) Sold 6 8 9 11 10 (4) Total 33 36 39 45 48 (15) Total Res Construction $ 86$ 92$ 97$ 110$ 133$ (47) |
45
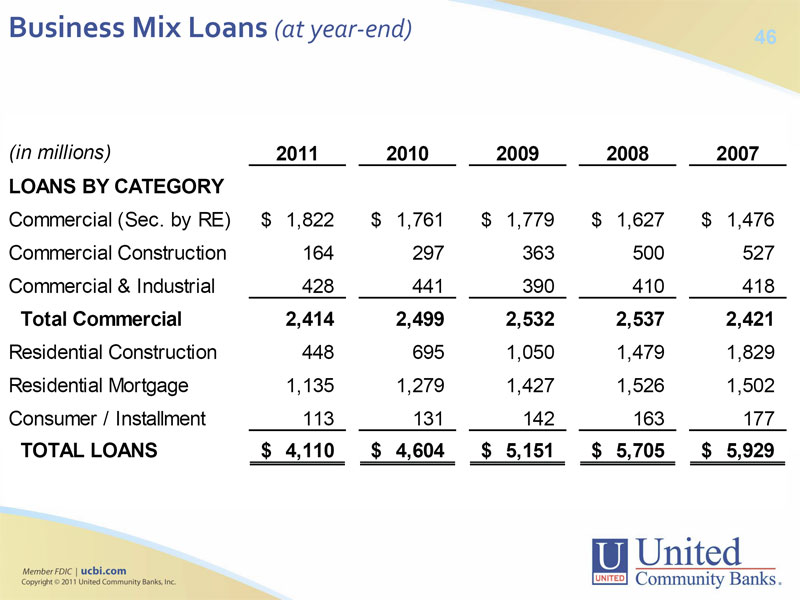 | Business Mix Loans (at year-end) 46 (in millions) 2011 2010 2009 2008 2007 LOANS BY CATEGORY Commercial (Sec. by RE) $ 1,822 $ 1,761 $ 1,779 $ 1,627 $ 1,476 Commercial Construction 164 297 363 500 527 Commercial & Industrial 428 441 390 410 418 Total Commercial 2,414 2,499 2,532 2,537 2,421 Residential Construction 448 695 1,050 1,479 1,829 Residential Mortgage 1,135 1,279 1,427 1,526 1,502 Consumer / Installment 113 131 142 163 177 TOTAL LOANS$ 4,110$ 4,604$ 5,151$ 5,705$ 5,929 |
46
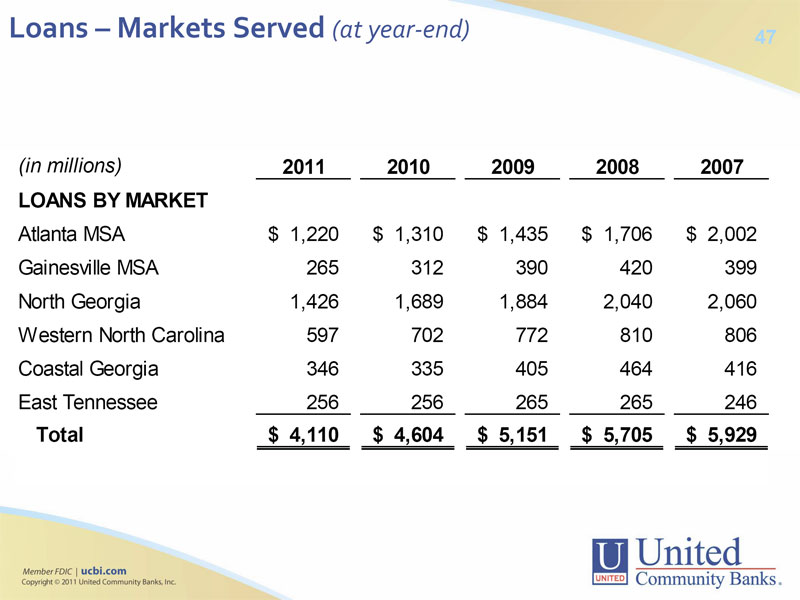 | Loans – Markets Served (at year-end) 47 (in millions) 2011 2010 2009 2008 2007 LOANS BY MARKET Atlanta MSA $ 1,220 $ 1,310 $ 1,435 $ 1,706 $ 2,002 Gainesville MSA 265 312 390 420 399 North Georgia 1,426 1,689 1,884 2,040 2,060 Western North Carolina 597 702 772 810 806 Coastal Georgia 346 335 405 464 416 East Tennessee 256 256 265 265 246 Total $ 4,110 $ 4,604 $ 5,151 $ 5,705 $ 5,929 |
47
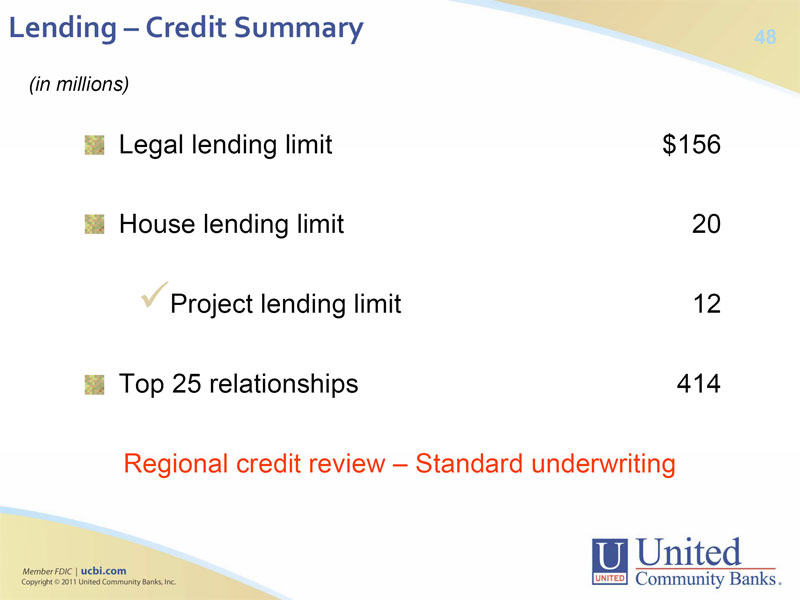 | Lending – Credit Summary 48 (in millions) Legal lending limit $156 House lending limit 20 Project lending limit 12 Top 25 relationships 414 Regional credit review – Standard underwriting |
48
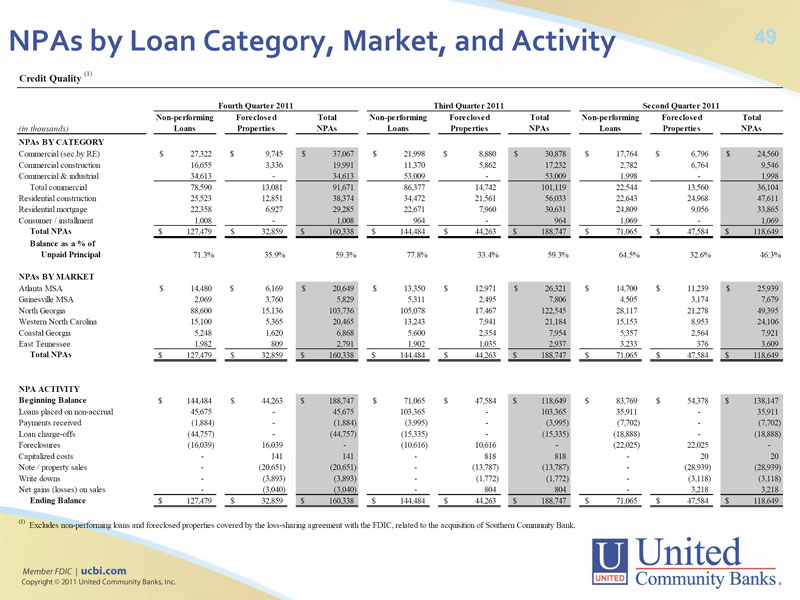 | NPAs by Loan Category, Market, and Activity 49 Credit Quality (1) Fourth Quarter 2011 Third Quarter 2011 Second Quarter 2011 Non-performing Foreclosed Total Non-performing Foreclosed Total Non-performing ForeclosedTotal (in thousands) Loans Properties NPAs Loans Properties NPAs Loans Properties NPAs NPAs BY CATEGORY Commercial (sec.by RE) $ 27,322 $ 9,745 $ 37,067 $ 21,998 $ 8,880 $ 30,878 $ 17,764 $ 6,796 $ 24,560 Commercial construction 16,655 3,336 19,991 11,370 5,862 17,232 2,782 6,764 9,546 Commercial & industrial 34,613 - 34,613 53,009 - 53,009 1,998 - 1,998 Total commercial 78,590 13,081 91,671 86,377 14,742 101,119 22,544 13,560 36,104 Residential construction 25,523 12,851 38,374 34,472 21,561 56,033 22,643 24,968 47,611 Residential mortgage 22,358 6,927 29,285 22,671 7,960 30,631 24,809 9,056 33,865 Consumer / installment 1,008 - 1,008 964 - 964 1,069 - 1,069 Total NPAs$ 127,479 $ 32,859 $ 160,338 $ 144,484 $ 44,263 $ 188,747 $ 71,065 $ 47,584 $ 118,649 Balance as a % of Unpaid Principal 71.3% 35.9% 59.3% 77.8% 33.4% 59.3% 64.5% 32.6% 46.3% NPAs BY MARKET Atlanta MSA $ 14,480 $ 6,169 $ 20,649 $ 13,350 $ 12,971 $ 26,321 $ 14,700 $ 11,239 $ 25,939 Gainesville MSA 2,069 3,760 5,829 5,311 2,495 7,806 4,505 3,174 7,679 North Georgia 88,600 15,136 103,736 105,078 17,467 122,545 28,117 21,278 49,395 Western North Carolina 15,100 5,365 20,465 13,243 7,941 21,184 15,153 8,953 24,106 Coastal Georgia 5,248 1,620 6,868 5,600 2,354 7,954 5,357 2,564 7,921 East Tennessee 1,982 809 2,791 1,902 1,035 2,937 3,233 376 3,609 Total NPAs$ 127,479 $ 32,859 $ 160,338 $ 144,484 $ 44,263 $ 188,747 $ 71,065 $ 47,584 $ 118,649 NPA ACTIVITY Beginning Balance $ 144,484 $ 44,263 $ 188,747 $ 71,065 $ 47,584 $ 118,649 $ 83,769 $ 54,378 $ 138,147 Loans placed on non-accrual 45,675 - 45,675 103,365 - 103,365 35,911 - 35,911 Payments received (1,884) - (1,884) (3,995) - (3,995) (7,702) - (7,702) Loan charge-offs (44,757) - (44,757) (15,335) - (15,335) (18,888) - (18,888) Foreclosures (16,039) 16,039 - (10,616) 10,616 - (22,025) 22,025 -Capitalized costs - 141 141 - 818 818 - 20 20 Note / property sales - (20,651) (20,651) - (13,787) (13,787) - (28,939) (28,939) Write downs - (3,893) (3,893) - (1,772) (1,772) - (3,118) (3,118) Net gains (losses) on sales - (3,040) (3,040) - 804 804 - 3,218 3,218 Ending Balance$ 127,479 $ 32,859 $ 160,338 $ 144,484 $ 44,263 $ 188,747 $ 71,065 $ 47,584 $ 118,649 (1) Excludes non-performing loans and foreclosed properties covered by the loss-sharing agreement with the FDIC, related to the acquisition of Southern Community Bank. |
49
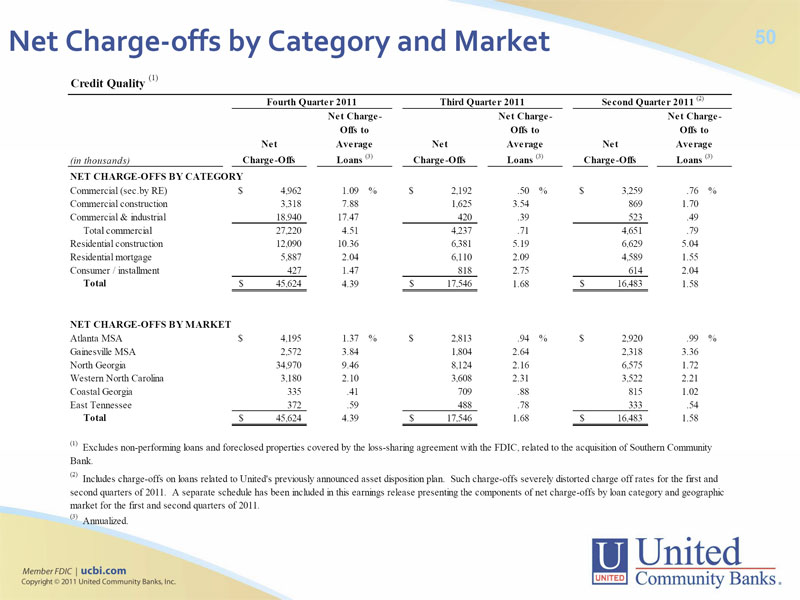 | Net Charge-offs by Category and Market 50 Credit Quality (1) Fourth Quarter 2011 Third Quarter 2011 Second Quarter 2011 (2) Net Charge- Net Charge- Net Charge-Offs toOffs toOffs to NetAverageNetAverageNetAverage (in thousands) Charge-Offs Loans (3) Charge-Offs Loans (3) Charge-Offs Loans (3) NET CHARGE-OFFS BY CATEGORY Commercial (sec.by RE) $ 4,962 1.09 % $ 2,192 .50 % $ 3,259 .76 % Commercial construction 3,318 7.88 1,625 3.54 869 1.70 Commercial & industrial 18,940 17.47 420 .39 523 .49 Total commercial 27,220 4.51 4,237 .71 4,651 .79 Residential construction 12,090 10.36 6,381 5.19 6,629 5.04 Residential mortgage 5,887 2.04 6,110 2.09 4,589 1.55 Consumer / installment 427 1.47 818 2.75 614 2.04 Total$ 45,624 4.39$ 17,546 1.68$ 16,483 1.58 NET CHARGE-OFFS BY MARKET Atlanta MSA $ 4,195 1.37 % $ 2,813 .94 % $ 2,920 .99 % Gainesville MSA 2,572 3.84 1,804 2.64 2,318 3.36 North Georgia 34,970 9.46 8,124 2.16 6,575 1.72 Western North Carolina 3,180 2.10 3,608 2.31 3,522 2.21 Coastal Georgia 335 .41 709 .88 815 1.02 East Tennessee 372 .59 488 .78 333 .54 Total$ 45,624 4.39$ 17,546 1.68$ 16,483 1.58 (1) Excludes non-performing loans and foreclosed properties covered by the loss-sharing agreement with the FDIC, related to the acquisition of Southern Community Bank. (2) Includes charge-offs on loans related to United's previously announced asset disposition plan. Such charge-offs severely distorted charge off rates for the first and second quarters of 2011. A separate schedule has been included in this earnings release presenting the components of net charge-offs by loan category and geographic market for the first and second quarters of 2011. (3) Annualized. |
50
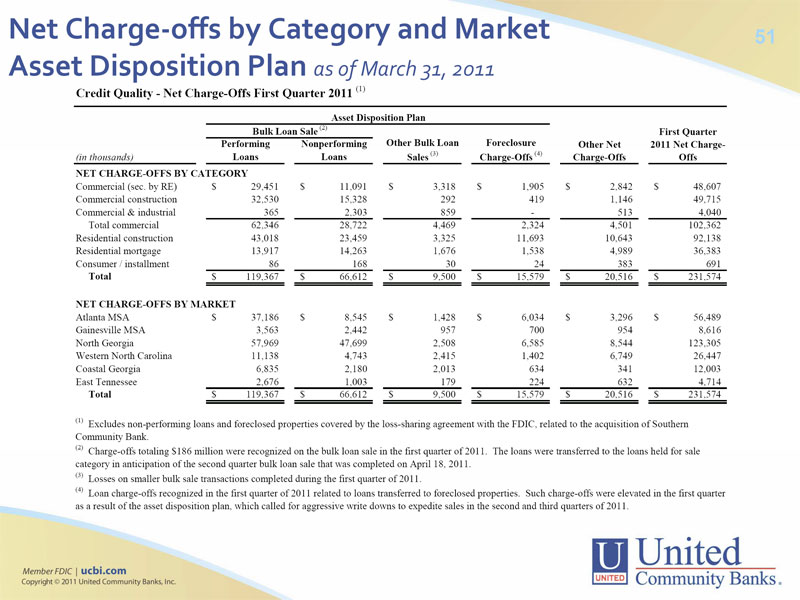 | Net Charge-offs by Category and Market 51 Asset Disposition Plan as of March 31, 2011 Credit Quality - Net Charge-Offs First Quarter 2011 (1) Asset Disposition Plan Bulk Loan Sale (2) First Quarter Performing Nonperforming Other Bulk Loan Foreclosure Other Net2011 Net Charge-(in thousands) Loans Loans Sales (3) Charge-Offs (4) Charge-Offs Offs NET CHARGE-OFFS BY CATEGORY Commercial (sec. by RE) $ 29,451 $ 11,091 $ 3,318 $ 1,905 $ 2,842 $ 48,607 Commercial construction 32,530 15,328 292 419 1,146 49,715 Commercial & industrial 365 2,303 859 - 513 4,040 Total commercial 62,346 28,722 4,469 2,324 4,501 102,362 Residential construction 43,018 23,459 3,325 11,693 10,643 92,138 Residential mortgage 13,917 14,263 1,676 1,538 4,989 36,383 Consumer / installment 86 168 30 24 383 691 Total$ 119,367 $ 66,612 $ 9,500 $ 15,579 $ 20,516 $ 231,574 NET CHARGE-OFFS BY MARKET Atlanta MSA $ 37,186 $ 8,545 $ 1,428 $ 6,034 $ 3,296 $ 56,489 Gainesville MSA 3,563 2,442 957 700 954 8,616 North Georgia 57,969 47,699 2,508 6,585 8,544 123,305 Western North Carolina 11,138 4,743 2,415 1,402 6,749 26,447 Coastal Georgia 6,835 2,180 2,013 634 341 12,003 East Tennessee 2,676 1,003 179 224 632 4,714 Total$ 119,367 $ 66,612 $ 9,500 $ 15,579 $ 20,516 $ 231,574 (1) Excludes non-performing loans and foreclosed properties covered by the loss-sharing agreement with the FDIC, related to the acquisition of Southern Community Bank. (2) Charge-offs totaling $186 million were recognized on the bulk loan sale in the first quarter of 2011. The loans were transferred to the loans held for sale category in anticipation of the second quarter bulk loan sale that was completed on April 18, 2011. (3) Losses on smaller bulk sale transactions completed during the first quarter of 2011. (4) Loan charge-offs recognized in the first quarter of 2011 related to loans transferred to foreclosed properties. Such charge-offs were elevated in the first quarter as a result of the asset disposition plan, which called for aggressive write downs to expedite sales in the second and third quarters of 2011. |
51
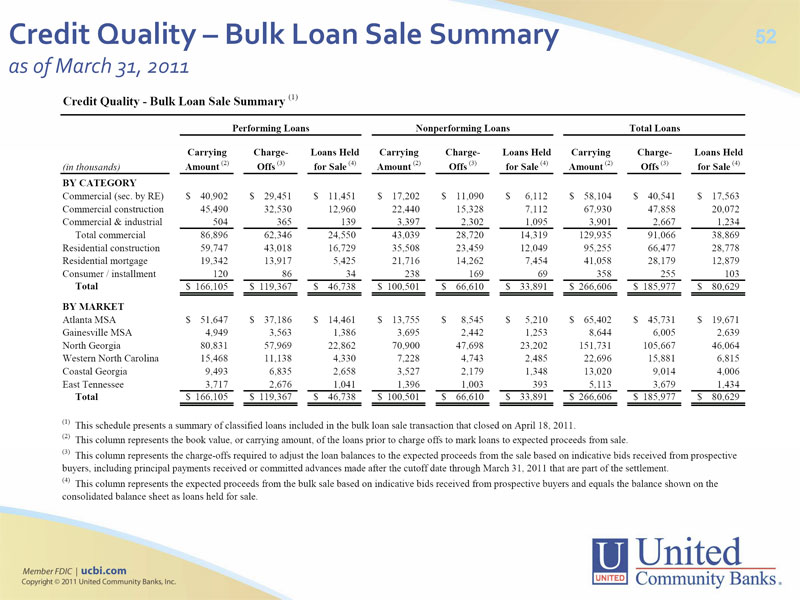 | Credit Quality – Bulk Loan Sale Summary 52 as of March 31, 2011 Credit Quality - Bulk Loan Sale Summary (1) Performing Loans Nonperforming Loans Total Loans Carrying Charge- Loans Held Carrying Charge- Loans Held Carrying Charge- Loans Held (in thousands) Amount (2) Offs (3) for Sale (4) Amount (2) Offs (3) for Sale (4) Amount (2) Offs (3) for Sale (4) BY CATEGORY Commercial (sec. by RE) $ 40,902 $ 29,451 $ 11,451 $ 17,202 $ 11,090 $ 6,112 $ 58,104 $ 40,541 $ 17,563 Commercial construction 45,490 32,530 12,960 22,440 15,328 7,112 67,930 47,858 20,072 Commercial & industrial 504 365 139 3,397 2,302 1,095 3,901 2,667 1,234 Total commercial 86,896 62,346 24,550 43,039 28,720 14,319 129,935 91,066 38,869 Residential construction 59,747 43,018 16,729 35,508 23,459 12,049 95,255 66,477 28,778 Residential mortgage 19,342 13,917 5,425 21,716 14,262 7,454 41,058 28,179 12,879 Consumer / installment 120 86 34 238 169 69 358 255 103 Total$ 166,105 $ 119,367 $ 46,738 $ 100,501 $ 66,610 $ 33,891 $ 266,606 $ 185,977 $ 80,629 BY MARKET Atlanta MSA $ 51,647 $ 37,186 $ 14,461 $ 13,755 $ 8,545 $ 5,210 $ 65,402 $ 45,731 $ 19,671 Gainesville MSA 4,949 3,563 1,386 3,695 2,442 1,253 8,644 6,005 2,639 North Georgia 80,831 57,969 22,862 70,900 47,698 23,202 151,731 105,667 46,064 Western North Carolina 15,468 11,138 4,330 7,228 4,743 2,485 22,696 15,881 6,815 Coastal Georgia 9,493 6,835 2,658 3,527 2,179 1,348 13,020 9,014 4,006 East Tennessee 3,717 2,676 1,041 1,396 1,003 393 5,113 3,679 1,434 Total$ 166,105 $ 119,367 $ 46,738 $ 100,501 $ 66,610 $ 33,891 $ 266,606 $ 185,977 $ 80,629 (1) This schedule presents a summary of classified loans included in the bulk loan sale transaction that closed on April 18, 2011. (2) This column represents the book value, or carrying amount, of the loans prior to charge offs to mark loans to expected proceeds from sale. (3) This column represents the charge-offs required to adjust the loan balances to the expected proceeds from the sale based on indicative bids received from prospective buyers, including principal payments received or committed advances made after the cutoff date through March 31, 2011 that are part of the settlement. (4) This column represents the expected proceeds from the bulk sale based on indicative bids received from prospective buyers and equals the balance shown on the consolidated balance sheet as loans held for sale. |
52
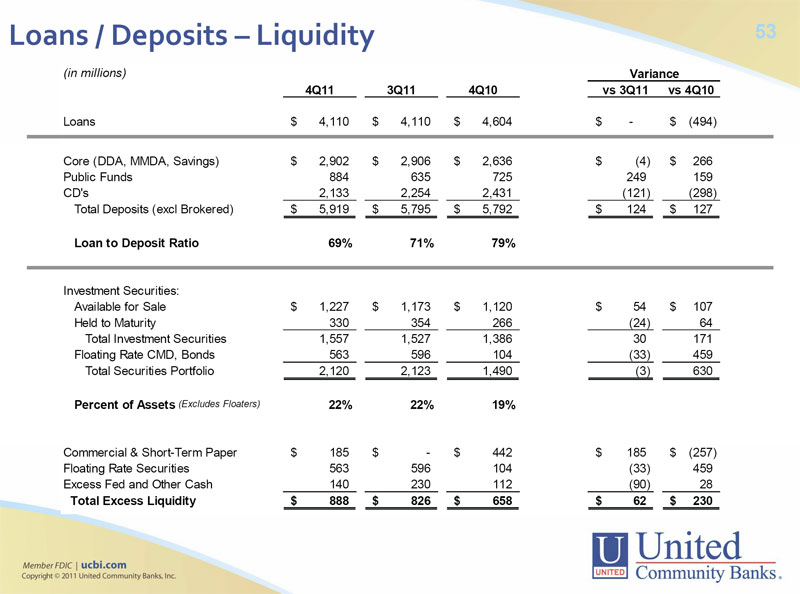 | Loans / Deposits – Liquidity 53 (in millions) Variance 4Q11 3Q11 4Q10 vs 3Q11 vs 4Q10 Loans $ 4,110 $ 4,110 $ 4,604 $ - $ (494) Core (DDA, MMDA, Savings) $ 2,902 $ 2,906 $ 2,636 $ (4) $ 266 Public Funds 884 635 725 249 159 CD's 2,133 2,254 2,431 (121) (298) Total Deposits (excl Brokered)$ 5,919$ 5,795$ 5,792$ 124$ 127 Loan to Deposit Ratio 69% 71% 79% Investment Securities: Available for Sale $ 1,227 $ 1,173 $ 1,120 $ 54 $ 107 Held to Maturity 330 354 266 (24) 64 Total Investment Securities 1,557 1,527 1,386 30 171 Floating Rate CMD, Bonds 563 596 104 (33) 459 Total Securities Portfolio 2,120 2,123 1,490 (3) 630 Percent of Assets (Excludes Floaters) 22% 22% 19% Commercial & Short-Term Paper $ 185 $ - $ 442 $ 185 $ (257) Floating Rate Securities 563 596 104 (33) 459 Excess Fed and Other Cash 140 230 112 (90) 28 Total Excess Liquidity$ 888$ 826$ 658$ 62$ 230 |
53
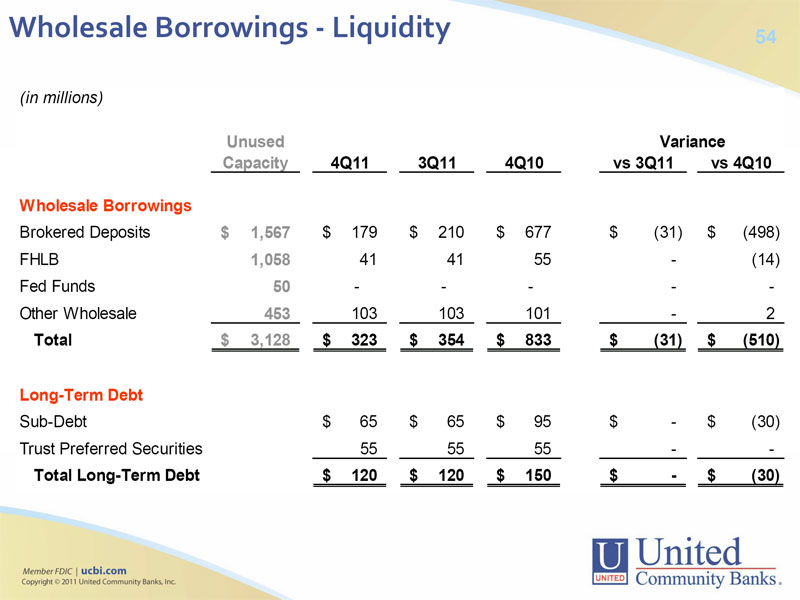 | Wholesale Borrowings - Liquidity 54 (in millions) Unused Variance Capacity 4Q11 3Q11 4Q10 vs 3Q11 vs 4Q10 Wholesale Borrowings Brokered Deposits $ 1,567 $ 179 $ 210 $ 677 $ (31) $ (498) FHLB 1,058 41 41 55 - (14) Fed Funds 50 - - - - -Other Wholesale 453 103 103 101 - 2 Total $ 3,128 $ 323 $ 354 $ 833 $ (31) $ (510) Long-Term Debt Sub-Debt $ 65 $ 65 $ 95 $ - $ (30) Trust Preferred Securities 55 55 55 - - Total Long-Term Debt $ 120 $ 120 $ 150 $ - $ (30) |
54
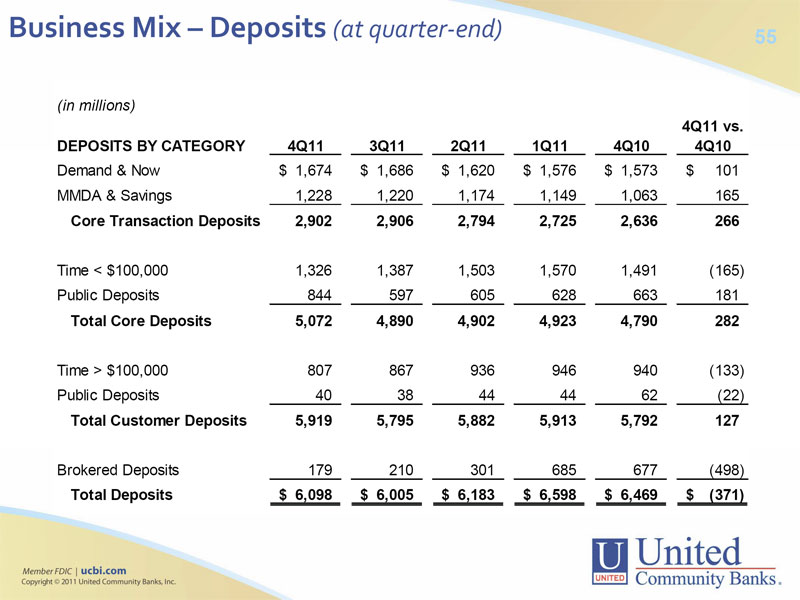 | Business Mix – Deposits (at quarter-end) 55 (in millions) 4Q11 vs. DEPOSITS BY CATEGORY 4Q11 3Q11 2Q11 1Q11 4Q10 4Q10 Demand & Now $ 1,674 $ 1,686 $ 1,620 $ 1,576 $ 1,573 $ 101 MMDA & Savings 1,228 1,220 1,174 1,149 1,063 165 Core Transaction Deposits 2,902 2,906 2,794 2,725 2,636 266 Time < $100,000 1,326 1,387 1,503 1,570 1,491 (165) Public Deposits 844 597 605 628 663 181 Total Core Deposits 5,072 4,890 4,902 4,923 4,790 282 Time > $100,000 807 867 936 946 940 (133) Public Deposits 40 38 44 44 62 (22) Total Customer Deposits 5,919 5,795 5,882 5,913 5,792 127 Brokered Deposits 179 210 301 685 677 (498) Total Deposits $ 6,098 $ 6,005 $ 6,183 $ 6,598 $ 6,469 $ (371) |
55
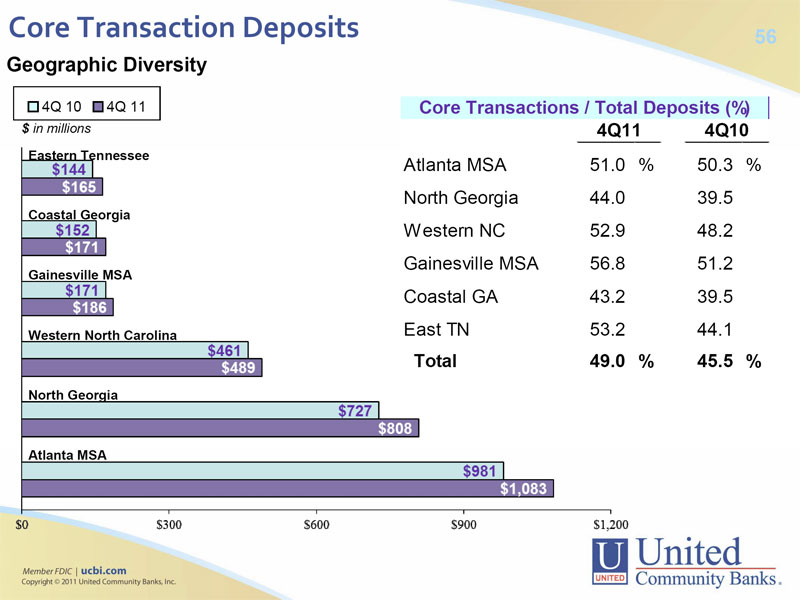 | Core Transaction Deposits 56 Geographic Diversity 4Q 10 4Q 11 Core Transactions / Total Deposits (%) $ in millions 4Q11 4Q10 Eastern Tennessee Atlanta MSA 51.0 % 50.3 % North Georgia 44.0 39.5 Coastal Georgia Western NC 52.9 48.2 Gainesville MSA 56.8 51.2 Gainesville MSA Coastal GA 43.2 39.5 Western North Carolina East TN 53.2 44.1 Total 49.0 % 45.5 % North Georgia Atlanta MSA |
56
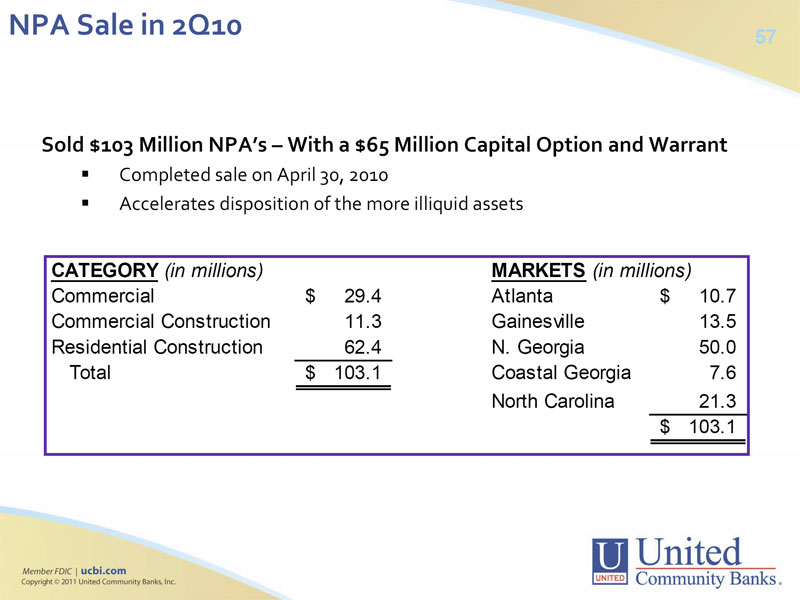 | NPA Sale in 2Q10 57 Sold $103 Million NPA’s – With a $65 Million Capital Option and Warrant Completed sale on April 30, 2010 Accelerates disposition of the more illiquid assets CATEGORY (in millions) MARKETS (in millions) Commercial $ 29.4 Atlanta $ 10.7 Commercial Construction 11.3 Gainesville 13.5 Residential Construction 62.4N. Georgia 50.0 Total$ 103.1Coastal Georgia 7.6 North Carolina 21.3 $ 103.1 |
57
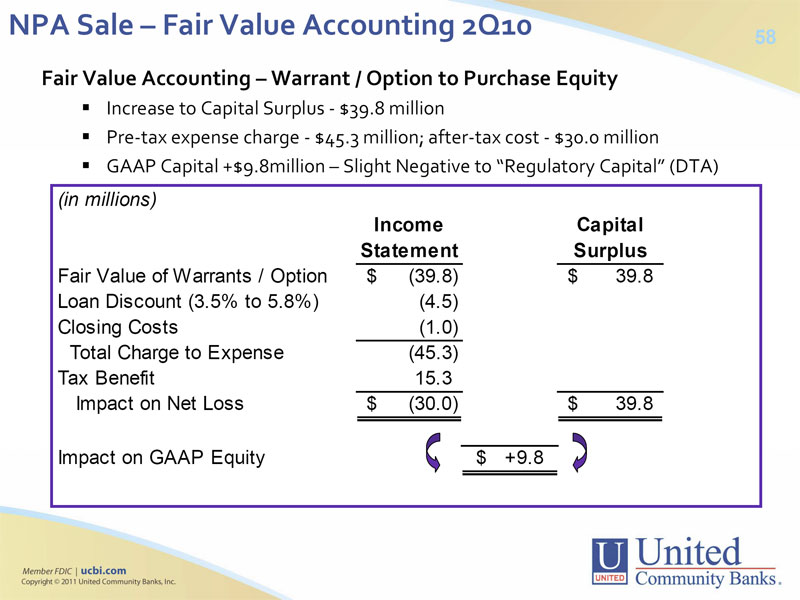 | NPA Sale – Fair Value Accounting 2Q10 58 Fair Value Accounting – Warrant / Option to Purchase Equity Increase to Capital Surplus - $39.8 million Pre-tax expense charge - $45.3 million; after-tax cost - $30.0 million GAAP Capital +$9.8million – Slight Negative to “Regulatory Capital” (DTA) (in millions) Income Capital Statement Surplus Fair Value of Warrants / Option $ (39.8) $ 39.8 Loan Discount (3.5% to 5.8%) (4.5) Closing Costs (1.0) Total Charge to Expense (45.3) Tax Benefit 15.3 Impact on Net Loss$ (30.0)$ 39.8 Impact on GAAP Equity $ +9.8 |
58
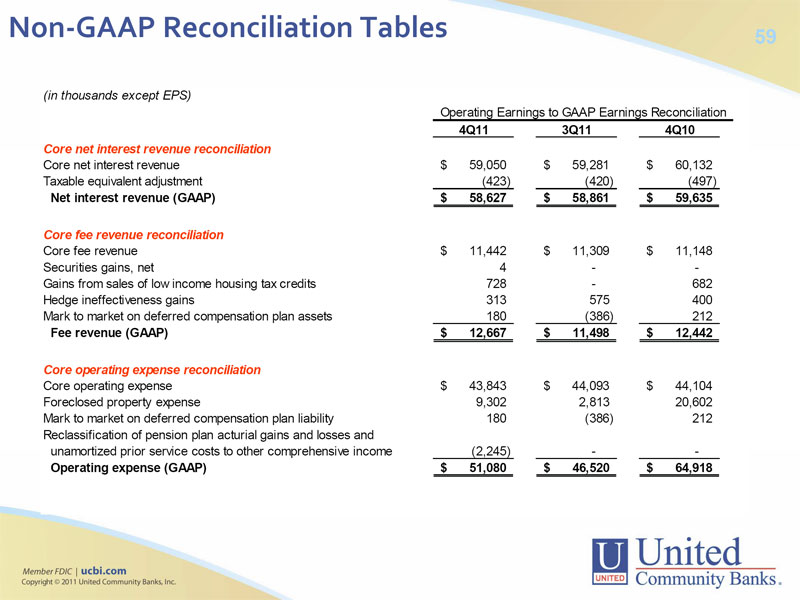 | Non-GAAP Reconciliation Tables 59 (in thousands except EPS) Operating Earnings to GAAP Earnings Reconciliation 4Q11 3Q11 4Q10 Core net interest revenue reconciliation Core net interest revenue $ 59,050 $ 59,281 $ 60,132 Taxable equivalent adjustment (423) (420) (497) Net interest revenue (GAAP)$ 58,627$ 58,861$ 59,635 Core fee revenue reconciliation Core fee revenue $ 11,442 $ 11,309 $ 11,148 Securities gains, net 4 - -Gains from sales of low income housing tax credits 728 - 682 Hedge ineffectiveness gains 313 575 400 Mark to market on deferred compensation plan assets 180 (386) 212 Fee revenue (GAAP)$ 12,667$ 11,498$ 12,442 Core operating expense reconciliation Core operating expense $ 43,843 $ 44,093 $ 44,104 Foreclosed property expense 9,302 2,813 20,602 Mark to market on deferred compensation plan liability 180 (386) 212 Reclassification of pension plan acturial gains and losses and unamortized prior service costs to other comprehensive income (2,245) - - Operating expense (GAAP)$ 51,080$ 46,520$ 64,918 |
59
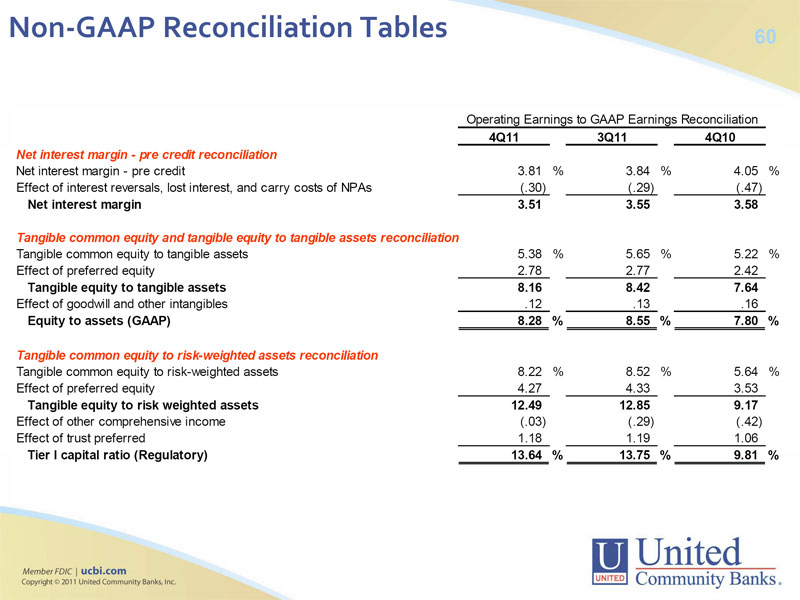 | Non-GAAP Reconciliation Tables 60 Operating Earnings to GAAP Earnings Reconciliation 4Q11 3Q11 4Q10 Net interest margin - pre credit reconciliation Net interest margin - pre credit 3.81 % 3.84 % 4.05 % Effect of interest reversals, lost interest, and carry costs of NPAs (.30) (.29) (.47) Net interest margin 3.51 3.55 3.58 Tangible common equity and tangible equity to tangible assets reconciliation Tangible common equity to tangible assets 5.38 % 5.65 % 5.22 % Effect of preferred equity 2.78 2.77 2.42 Tangible equity to tangible assets 8.16 8.42 7.64 Effect of goodwill and other intangibles .12 .13 .16 Equity to assets (GAAP) 8.28 % 8.55 % 7.80 % Tangible common equity to risk-weighted assets reconciliation Tangible common equity to risk-weighted assets 8.22 % 8.52 % 5.64 % Effect of preferred equity 4.27 4.33 3.53 Tangible equity to risk weighted assets 12.49 12.85 9.17 Effect of other comprehensive income (.03) (.29) (.42) Effect of trust preferred 1.18 1.19 1.06 Tier I capital ratio (Regulatory) 13.64 % 13.75 % 9.81 % |
60
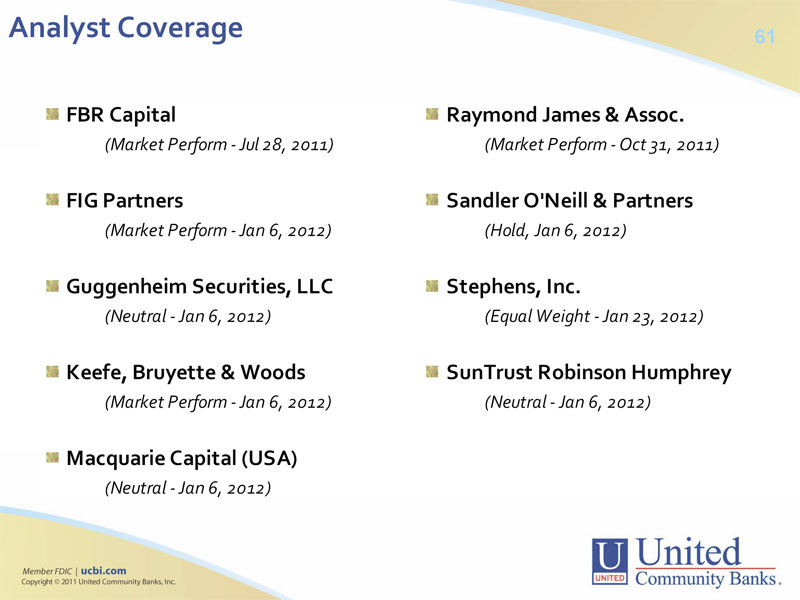 | Analyst Coverage 61 FBR Capital Raymond James & Assoc. (Market Perform - Jul 28, 2011) (Market Perform - Oct 31, 2011) FIG Partners Sandler O'Neill & Partners (Market Perform - Jan 6, 2012) (Hold, Jan 6, 2012) Guggenheim Securities, LLC Stephens, Inc. (Neutral - Jan 6, 2012) (Equal Weight - Jan 23, 2012) Keefe, Bruyette & Woods SunTrust Robinson Humphrey (Market Perform - Jan 6, 2012) (Neutral - Jan 6, 2012) Macquarie Capital (USA) (Neutral - Jan 6, 2012) |
61
 | 62 United Community Banks, Inc. Investor Presentation Fourth Quarter 2011 Copyright 2012 United Community Banks, Inc. All rights reserved. |