Exhibit 99.2
Jimmy C. Tallent President & CEO Rex S. Schuette EVP & CFO rex_schuette@ucbi.com (706) 781-2266 David P. Shearrow EVP & CRO United Community Banks, Inc. Second Quarter 2012 Investor Presentation July 26, 2012 |
2 Cautionary Statement This news release contains forward‐looking statements, as defined by federal securities laws, including statements about United’s financial outlook and business environment. These statements are based on current expectations and are provided to assist in the understanding of future financial performance. Such performance involves risks and uncertainties that may cause actual results to differ materially from those expressed or implied in any such statements. For a discussion of some of the risks and other factors that may cause such forward‐looking statements to differ materially from actual results, please refer to United Community Banks, Inc.’s filings with the Securities and Exchange Commission including its 2011 Annual Report on Form 10‐K under the sections entitled “Forward‐Looking Statements”. Forward‐looking statements speak only as of the date they are made, and we undertake no obligation to update or revise forward‐looking statements. |
3 Non-GAAP Measures This presentation also contains financial measures determined by methods other than in accordance with generally accepted accounting principles (“GAAP”). Such non‐GAAP financial measures include the following: net interest margin – pre credit, core net interest margin, core net interest revenue, core fee revenue, core operating expense, core earnings, net operating (loss) income and net operating (loss) earnings per share, tangible common equity to tangible assets, tangible equity to tangible assets and tangible common equity to risk‐weighted assets. The most comparable GAAP measures to these measures are: net interest margin, net interest revenue, fee revenue, operating expense, net (loss) income, diluted (loss) earnings per share and equity to assets. Management uses these non‐GAAP financial measures because we believe it is useful for evaluating our operations and performance over periods of time, as well as in managing and evaluating our business and in discussions about our operations and performance. Management believes these non‐GAAP financial measures provide users of our financial information with a meaningful measure for assessing our financial results and credit trends, as well as for comparison to financial results for prior periods. These non‐GAAP financial measures should not be considered as a substitute for financial measures determined in accordance with GAAP and may not be comparable to other similarly titled financial measures used by other companies. For a reconciliation of the differences between our non‐GAAP financial measures and the most comparable GAAP measures, please refer to the ‘Non‐GAAP Reconcilement Tables’ at the end of the Appendix to this presentation. |
4 United at a Glance Founded in 1950 Third‐largest bank holding company in Georgia Headquartered in Blairsville, Georgia with 104 locations throughout north Georgia, metro Atlanta, coastal Georgia, western North Carolina and east Tennessee 1,651 employees 27 Banks and 104 Offices Deposit Market Share(1) Market Banks Offices Deposit Share Rank North Georgia 11 22 33% 1 Atlanta MSA 10 38 4 7 Gainesville MSA 1 5 14 3 Coastal Georgia 2 8 6 7 Western North Carolina 1 20 13 3 East Tennessee 2 11 2 10 Key Statistics as of 6/30/12 (billions) Total assets $6.74 Total deposits $5.82 Loans $4.12 ¹ FDIC deposit market share and rank as of 6/11 for markets where United takes deposits. Source: SNL and FDIC. |
5 Highlights Second Quarter Improving Quarterly Results Net Income of $6.5 million, or 6 cents per share Fourth quarterly profit in past five quarters Core earnings (pre-tax, pre-credit) of $28.3 million Strong Core Transaction Deposit Growth Year-to-date up 11% annualized Building customer deposit base Represents 55% of total customer deposits compared to 34% three years ago Non Performing Assets Declining |
6 LOAN PORTFOLIO & CREDIT QUALITY |
7 Loan Portfolio (total $4.12 billion) |
8 Commercial Loans (total $2.46 billion) |
9 9 Commercial Real Estate (by loan type) June 30, 2012 Owner Income (in millions) Occupied Producing Total Percent Office Buildings $ 299 $ 205 $ 504 28% Retail 118 138 256 15 Small Warehouses/Storage 116 74 190 10 Multi-Residential/Other Properties 62 90 152 8 Churches 141 - 141 8 Convenience Stores 74 24 98 5 Hotels/Motels - 87 87 5 Franchise / Restaurants 38 34 72 4 Farmland 61 - 61 3 Manufacturing Facility 45 8 53 3 Auto Dealership/Service 45 8 53 3 Golf Course/Recreation 49 - 49 3 Leasehold Property 17 10 27 1 Daycare Facility 17 9 26 1 Carwash 17 1 18 1 Movie TheaterBowling/Recreation 16 - 16 1 Funeral Home 12 1 13 1 Marina 10 - 10 1 Mobile Home Parks - 8 8 1 Other Small Business 3 - 3 1 Total $ 1,140 $ 697 $ 1,837 Portfolio Characteristics 58.7% owner-occupied Small business, doctors, dentists, attorneys, CPAs $12 million project limit Average Loan Size o $469 Composite CRE o $425 Owner Occupied o $606 Income Producing |
10 10 Commercial Construction (by loan type) June 30, 2012 (in millions) Amount Percent Land Develop - Vacant (Improved) $ 64 38 % Raw Land - Vacant (Unimproved) 59 35 Commercial Land Development 25 15 Office Buildings 5 3 Churches 5 3 Warehouse 2 1 Carwash 1 1 Restaurants/Fast Food/Other Franchise 1 1 Retail Building 1 1 Hotels/Motels 1 0 Mobile Home Parks 1 0 Miscellaneous Construction 4 2 Total Commercial Construction $ 169 100 % Portfolio Characteristics Average loan size: $455k |
11 Residential Mortgage (total $1.13 billion) Origination Characteristics No broker loans Policy Max LTV: 80-85% 55% of HE Primary Lien |
12 Residential Construction (total $0.41 billion) Average Loan Size (in thousands) Spec $ 231k Sold 119k Develop 604k Raw Land 111k 12% Raw $.05B 49% 20% Lot Developing $.20B $.08B |
13 Residential Construction – Total Company 2Q12 vs. (in millions) 2Q12 1Q12 4Q113Q112Q112Q11 Land Loans Developing Land $ 78 $ 86 $ 88$97$105$(27) Raw Land 45 57 616062(17) Lot Loans 203 204 207216218(15) Total 326 347 356373385(59) Construction Loans Spec 49 57 596474(25) Sold 34 32 333743(9) Total 83 89 92101117(34) Total Res Construction $ 409 $ 436 $ 448$474$502$(93) By Region Atlanta $ 76 $ 86 $ 86$92$97$(21) Gainesville MSA 19 20 202525(6) North Georgia 193 206 214229249(56) North Carolina 87 88 919295(8) Coastal Georgia 22 23 242424(2) Tennessee 12 13 131212- Total Res Construction $ 409 $ 436 $ 448$474$502$(93) |
14 New Loans Funded – Category and Market (in millions) CATEGORY 2Q12 1Q12 Commercial RE: Owner Occupied $ 25.5 $ 55.0 Income Producing 7.1 15.3 Total Commercial RE 32.6 70.3 Commercial C & I 15.3 26.0 Commercial Constr. 4.6 2.9 Residential 25.1 24.7 Residential Constr. 7.9 6.4 Consumer 1.0 1.1 Total Categories $ 86.5 $ 131.4 MARKET 2Q12 1Q12 Atlanta $ 35.5 $ 54.2 Coastal Georgia 9.8 25.4 N. Georgia 21.9 25.1 Tennessee 9.9 14.1 North Carolina 5.7 7.9 Gainesville 3.7 4.7 Total Markets $ 86.5 $ 131.4 |
15 New Loan Commitments – Category and Market15 (in millions) CATEGORY 2Q12 1Q12 Commercial RE: Owner Occupied $ 28.0 $ 55.7 Income Producing 7.7 16.7 Total Commercial RE 35.7 72.4 Commercial C & I 23.7 39.0 Commercial Constr. 7.5 6.1 Residential 32.1 29.0 Residential Constr. 32.2 20.9 Consumer 1.2 1.2 Total Categories $ 132.4 $ 168.6 MARKET 2Q12 1Q12 Atlanta $ 54.7 $ 70.9 N. Georgia 35.0 36.3 Coastal Georgia 11.4 28.0 Tennessee 14.8 18.7 North Carolina 12.5 9.8 Gainesville 4.0 4.9 Total Markets $ 132.4 $ 168.6 |
16 Credit Quality16 (in millions) 2Q12 1Q124Q113Q112Q11 Operating Net Charge-offs(1) $ 18.9 $ 15.9$20.6$17.5$16.5 as % of Average Loans(1) 1.85 % 1.55 %1.99%1.68%1.58% Allowance for Loan Losses $ 112.7 $ 113.6$114.5$146.1$127.6 as % of Total Loans 2.74 % 2.75 %2.79%3.55%3.07% as % of NPLs 98 8890101180 Past Due Loans (30 89 Days) .65 % .86 %.75%.70%0.65% Non-Performing Loans $ 115.4 $ 129.7$127.5$144.5$71.0 OREO 30.4 31.932.844.247.6 Total NPAs $ 145.8 $ 161.6$160.3$188.7$118.6 Accruing TDRs (see page 49) $ 141.6 $ 125.8$105.8$69.8$41.5 As % of Original Principal Balance Non-Performing Loans 68.8 % 70.6 %71.3%77.8%64.5% OREO 39.3 36.135.933.432.6 Total NPAs as % of Total Assets 2.16 2.252.302.741.66 as % of Loans & OREO 3.51 3.883.874.542.82 (1) Excludes $25 million of charge-offs for largest loan relationship in 4Q11. |
17 NPL Inflow Trends 17 Quarterly NPL Inflows Since 2009 ($mm) 84.8% $193.3 $200.0 $177.7 Decline $174.8 $174.9 $155.0 from Peak $139.0 $150.0 $119.8 $103.4 $100.0$81.0 $54.7 $45.7 $50.0$35.9 $32.4$29.4 $0.0 Q1 ‘09 Q2 ‘09 Q3 ‘09 Q4 ‘09 Q1 ‘10 Q2 ‘10 Q3 ‘10 Q4 ‘10Q1 ‘11Q2 ‘11Q3 ‘11Q4 ‘11Q1 ‘12Q2 ‘12 Resi Construction Com. Construction Resi. Mortgage Com. RE Commercial Consumer ($50,000) Total NPLs ($mm) 304.4 $320.0 287.8 280.8 259.2 264.1 224.3 217.8 $240.0 179.1 144.5 $160.0 127.5 129.7 115.4 83.8 71.1 $80.0 $- Q1 ‘09 Q2 ‘09 Q3 ‘09 Q4 ‘09 Q1 ‘10 Q2 ‘10 Q3 ‘10 Q4 ‘10Q1 ‘11Q2 ‘11Q3 ‘11Q4 ‘11Q1 ‘12Q2 ‘12 |
Net Charge-offs by Loan Category18 (in thousands) 2Q12% of Average Loans (Annualized) % of Avg Total Loans1Q124Q12(1) 3Q11 Commercial (Sec. by RE): Owner Occupied $ 1,305 .46 %.87%1.16%.34% Income Producing 3,044 1.75.70.57.71 Total Comm (Sec. by RE) 4,349 .95.81.90.50 Commercial & Industrial 775 .70.621.083.54 Commercial Construction 88 .21.811.75.39 Total Commercial 5,212 .86.781.06.71 Residential Mortgage 3,862 1.381.912.042.09 Residential Construction 9,563 9.144.846.775.19 Consumer/ Installment 259 .881.721.472.75 Total Net Charge-offs $ 18,896 1.851.551.991.68 (1) Excludes charge-offs for largest loan relationship of Commerical Construction $2,863; Commercial & Industrial $17,046; CRE Income Producing $901; and, Residential Construction $4,190 |
19 Net Charge-offs by Market19 (in millions) 2Q12% of Average Loans (Annualized) % of Avg Total Loans1Q124Q11(1) 3Q11 North Georgia $ 12,474 3.58 %2.56%2.70%2.16% Atlanta MSA 2,307 .75.891.37.94 North Carolina 3,634 2.521.142.102.31 Coastal Georgia 211 .231.53.41.88 Gainesville MSA (187) (.29)1.353.842.64 East Tennessee 457 .68.34.59.78 Total $ 18,896 1.851.551.991.68 (1) Excludes charge-offs for largest loan relationship of in North Georgia of $25,000 |
20 NPAs by Loan Category and Market20 (in thousands) 2Q12 NPLs OREO Total NPAs LOAN CATEGORY Commercial (sec. by RE): Owner Occupied $ 9,399 $ 7,914 $ 17,313 Income Producing 9,716 2,672 12,388 Commercial & Industrial 34,982 - 34,982 Commercial Construction 18,175 2,732 20,907 Total Commercial 72,272 13,318 85,590 Residential Mortgage 16,631 5,591 22,222 Residential Construction 25,530 11,512 37,042 Consumer/ Installment 907 - 907 Total $ 115,340 $ 30,421 $ 145,761 2Q12 NPLs OREO Total NPAs MARKETS North Georgia $ 77,332 $ 13,546 $ 90,878 Atlanta MSA 17,593 8,651 26,244 North Carolina 10,657 3,287 13,944 Coastal Georgia 5,822 785 6,607 Gainesville MSA 991 2,998 3,989 East Tennessee 2,945 1,154 4,099 Total $ 115,340 $ 30,421 $ 145,761 |
21 FINANCIAL REVIEW |
22 Core Earnings Summary22 (in thousands) Variance - Incr / (Decr) 2Q121Q124Q111Q11 Net Interest Revenue $ 56,836$(2,028)$(2,214)$(2,110) Fee Revenue 12,764(327)1,3221,668 Gross Revenue 69,600(2,355)(892)(442) Operating Expense (Excl OREO) 41,312(1,358)(2,531)(4,368) Pre-Tax, Pre-Credit (Core) $ 28,288$(997)$1,639$3,926 Net Interest Margin 3.43 %(.10) %(.08) %.02 |
23 Net Interest Margin23 3.79% 3.77% 3.76% 3.67% 3.62% NIM NIM – Core Credit(1) (1) Excluding impact of nonaccrual loans, OREO and interest reversals NIM Characteristics Margin -10 bps vs. 1Q12 +2 bps vs. 2Q11 Lowered Core and CD Deposit Pricing Loan Pricing Pressure 2Q Excess Liquidity –Lowered Margin by 44 bps and 53 bps in Q1 |
24 Margin – Credit Costs 24 .26% .26% .24% .23% .19% Credit Costs Impacting Margin Historically 8 to 12 bps Significant improvement after de-risking balance sheet 1Q11 Cost 2Q12 vs. Historical – 7 bps (annual earnings impact of $4.7 million) 1 bps = $667 thousand in NIR Margin |
. 25 Key Drivers of Net Interest Revenue / Margin 25 Offsetting Impacts on Margin Loan pricing under pressure Deposit rates continue to decline 4.74 4.76 4.79 4.79 4.72 Loan Spreads |
26 Deposit Pricing, Excluding Brokered Deposits 26 Note – CD pricing reflects the quarter-ending new and renewed yield. MMDA / NOW pricing reflects the deposit yield for each quarter |
27 Deposit Mix 27 (in millions) 2Q12 55% $5.6B Public Funds 2Q12 1Q12 2Q11 4Q08 12% Demand & Demand / NOW $ 1,735 $ 1,722 $ 1,620 $ 1,457 Time NOW >$100k MMDA / Savings 1,330 1,331 1,174 630 31% 13% Core Transaction 3,065 3,053 2,794 2,087 Time <$100k 20% MMDA & 10% Growth - $271 Million Sav. 24% +978 47% Growth Customer Time < $100,000 1,159 1,201 1,503 1,945 Public Deposits 623 782 605 755 4Q08 Total Core 4,847 5,036 4,902 4,787 $6.2B Public Funds Demand & 34% Time >$100,000 728 759 936 1,336 14% NOW 23% Public Deposits 36 38 44 87 Total Customer 5,611 5,833 5,882 6,210 Time >$100k 22% MMDA & Sav. Brokered Deposits 211 168 301 793 10% Total Deposits $ 5,822 $ 6,001 $ 6,183 $ 7,003 Time <$100k 31% 31% |
Core Deposit Growth – Category and Market 28 (in millions, excluding public) Growth YTD CATEGORY 2Q12 2Q12 Last 12 Mo Demand $ 35.9 $ 143.7 $ 222.6 MM Accounts (6.2) 81.9 134.9 Savings 5.4 20.7 21.7 NOW (22.6) (82.8) (107.6) Total Categories $ 12.5 $ 163.5 $ 271.6 Percent Growth (Annualized) 2 % 11 % 10 % MARKET Atlanta $ 2.9 $ 65.1 $ 130.2 North Carolina 12.8 43.3 55.3 Coastal Georgia 0.1 25.5 25.7 N. Georgia (3.5) 17.8 38.2 Tennessee (1.8) 7.5 12.7 Gainesville 2.0 4.3 9.5 Total Markets $ 12.5 $ 163.5 $ 271.6 |
Fee Revenue - Core 29 (in millions) Variance - Incr / (Decr) 2Q12 1Q12 4Q11 2Q11 NSF & Overdraft Fees $ 3,232 $ (13) $ (305) $ (426) Debit Card Fees 3,242 140 273 (37) Other Service Charges 1,342 (94) 600 671 Total Service Charges and Fees 7,816 33 568 208 Mortgage Loan & Related Fees 2,322 223 497 1,370 Brokerage Fees 809 (4) 27 118 Other 1,817 (579) 230 (28) Total $ 12,764 $ (327) $ 1,322 $ 1,668 Excludes net securities gains and charges on prepayment of FHLB advances, hedge ineffectiveness gains, gains from the sale of low income housing tax credits, interest on Federal income tax refund and mark to market adjustments on United’s deferred compensation plan assets. |
Investment Conclusions 30 Operating Expenses - Core 30 (in thousands) Variance - Incr / (Decr) 2Q12 1Q12 4Q11 2Q11 Salaries & Employee Benefits $ 23,150 $ (1,615) $ (2,388) $ (2,129) Communications & Equipment 3,211 56 82 (167) Occupancy 3,539 (232) (433) (266) FDIC Assessment 2,545 35 144 (1,099) Advertising & Public Relations 1,088 242 (101) (229) Postage, Printing & Supplies 916 (63) (44) (169) Professional Fees 1,952 (23) (54) (398) Other Expense 4,911 242 263 89 $ 41,312 $ (1,358) $ (2,531) $ (4,368) Excludes foreclosed property costs, adjustment to reclassify pension plan actuarial gains and losses and unamortized prior service costs to other comprehensive income, severance costs and mark to market adjustments on United’s deferred compensation plan liability. |
31 Net Operating Income 31 (in thousands) 2Q12 1Q12 4Q11 2Q11 Pre-Tax, Pre-Credit (Core) $ 28,288 $ 29,285 $ 26,649 $ 24,362 Provision for Loan Loss (18,000) (15,000) (14,000) (11,000) Foreclosed Property Costs: Write-downs (1,008) (2,111) (3,892) (3,118) Losses on Sales 269 (93) (3,041) 3,218 Maintenance, Taxes, Etc. (1,112) (1,621) (2,369) (1,991) Total Foreclosed Property Costs (1,851) (3,825) (9,302) (1,891) Hedge Ineffectiveness Gains (Losses) (180) 115 313 2,810 Securities Gains, Net 6,490 557 4 783 Losses from Prepayment of Borrowings (6,199) (482) - (791) Gains from Sale of Low Income Housing Tax Credits - 728 728 - Interest on Federal Income Tax Refund - 1,100 - - Reclassification of Pension Acturial Gains and Losses and Prior Service Costs to OCI - - 2,245 - Severance (1,155) (190) - (1,150) Income Tax Expense (894) (760) 3,264 (1,095) Net Income $ 6,499 $ 11,528 $ 9,901 $ 12,028 Net Income Per Share $ .06 $ .15 $ .12 $ .16 |
32 Net Income 32 (in thousands) 2Q12 1Q12 4Q11 2Q11 Net Income $ 6,499 $ 11,528 $ 9,901 $ 12,028 Preferred Stock Dividends (3,032) (3,030) (3,025) (3,016) Net Income Avail to Common Shareholders $ 3,467 $ 8,498 $ 6,876 $ 9,012 Net Income Per Share $ .06 $ .15 $ .12 $ .16 Tangible Book Value $ 6.48 $ 6.54 $ 6.47 $ 6.94 Shares Outstanding (millions) 57.8 57.8 57.6 57.5 |
26 33 Capital Ratios 33 Well- Minimum Capitalized Guideline JUN ‘12 MAR ‘12 JUN ‘11 Bank Tier 1 RBC 6 % 10 % 14.3 % 13.7 % 13.3 % Total RBC 10 11 15.6 15.0 15.1 Leverage 5 8 9.2 9.0 8.3 Holding Company Tier 1 RBC 6 10 14.2 13.7 13.6 Total RBC 10 11 15.9 15.4 16.2 Leverage 5 8 9.1 8.9 8.5 Tier I Common RBC 4.5 7 8.7 8.3 8.3 Tangible Equity to Assets 8.2 8.1 7.9 34 APPENDIX |
34 APPENDIX |
35 Experienced Proven Leadership 35 Joined Years in UCBI Banking Jimmy Tallent President & CEO 1984 38 Rex Schuette Chief Financial Officer 2001 35 David Shearrow Chief Risk Officer 2007 31 Craig Metz Marketing & Retail Banking 2002 20 Regional Presidents: Bill Gilbert North & Coastal Georgia 2000 36 Tim Schools North Carolina & Tennessee 2011 12 Glenn White Atlanta 2007 38 |
36 Business and Operating Model 36 Twenty-seven “community banks” Local CEOs with deep roots in their communities Resources of $6.7 billion bank Service is point of differentiation #1 in Customer Satisfaction according to Customer Service Profiles J.D. Power Customer Service Champion 9 Recognized 40 companies in the U.S. 9 Only bank to be recognized Golden rule of banking 9 “The Bank That SERVICE Built” Ongoing customer surveys 9 95% satisfaction rate Strategic footprint with substantial banking opportunities Operates in a number of the more demographically attractive markets in the U.S. Disciplined growth strategy Organic supported by de novos and selective acquisitions “Community bank service, large bank resources” |
37 37 Robust Demographics (fast growing markets) Population Growth (%) Population Actual Projected Markets1(in thousands) 2000 - 2011 2011 - 2016 North Georgia 386 21 % 4 % Atlanta MSA 5,321 25 5 Gainesville MSA 181 30 4 Coastal Georgia 385 15 5 Western North Carolina 441 15 5 East Tennessee 862 14 5 Total Markets Georgia 9,775 19 5 North Carolina 9,659 20 7 Tennessee 6,402 13 4 United States 310,704 10 3 ¹ Population data is for 2011 and includes those markets where United takes deposits. Source: SNL |
38 Market Share Opportunities 38 Excellent growth prospects Market Deposits United Deposit Markets (in billions) (1) Deposits (2) Banks Offices Share(1) Rank(1) North Georgia $ 6.8 $ 2.0 11 22 33 % 1 Atlanta MSA 48.2 2.0 10 38 4 7 Gainesville MSA 2.5 .3 1 5 14 3 Coastal Georgia 7.0 .3 2 8 6 7 Western North Carolina 7.3 .9 1 20 13 3 East Tennessee 15.9 .3 2 11 2 10 Total Markets $ 87.7 $ 5.8 27 104 ¹ FDIC deposit market share and rank as of 6/11 for markets where United takes deposits. Source: SNL and FDIC. 2 Based on current quarter. |
39 Leading Demographics 39 2011 ‐ 2016 Total Assets Population Rank Ticker Company(1) State ($B) Growth(2) 1 CFR Cullen/Frost Bankers, Inc. TX 20.4 8.38 2 IBOC International Bancshares Corporation TX 11.8 6.99 3 HBHC Hancock Holding Company MS 19.3 6.38 4 PB Prosperity Bancshares, Inc. TX 10.9 6.23 5 FCNCA First Citizens BancShares, Inc. NC21.16.10 6 GBCI Glacier Bancorp, Inc. MT 7.2 5.63 7 FIBK First Interstate BancSystem, Inc. MT 7.4 5.43 8 TCBI Texas Capital Bancshares, Inc. TX 8.6 5.37 9 FCBN First Citizens Bancorporation, Inc. SC 8.3 4.87 10 UCBI United Community Banks, Inc. GA 6.7 4.85 11 BOKF BOK Financial Corporation OK 25.9 4.77 12 WAL Western Alliance Bancorporation AZ 6.9 4.56 13 IBKC IBERIABANK Corporation LA 11.8 4.42 14 STSA Sterling Financial Corporation WA 9.5 4.20 15 UMPQ Umpqua Holdings Corporation OR 11.5 3.98 NOTE: Financial information as of March 31, 2012 (1) Includes publicly traded companies with assets between $5.0 ‐ $50.0 billion as of March 31, 2012 (2) Population growth weighted by county (cumulative) Data Source: SNL Financial |
Investment Conclusions 40 Proactively Addressing Credit Environment 40 Structure Centralized underwriting and approval process Segregated work‐out teams Highly skilled ORE disposition group Seasoned regional credit professionals Process Continuous external loan review Intensive executive management involvement: o Weekly past due meetings o Weekly NPA/ORE meetings o Quarterly criticized watch loan review meetings o Quarterly pass commercial and CRE portfolio review meetings Internal loan review of new credit relationships Policy Ongoing enhancements to credit policy Periodic updates to portfolio limits |
41 Lending – Credit Summary 41 (in millions) Legal lending limit $158 House lending limit 20 Project lending limit 12 Top 25 relationships 404 Regional credit review – Standard underwriting |
42 Performing Classified Loans 42 (in millions) LOANS BY CATEGORY 2Q12 1Q12 4Q11 3Q11 2Q11 Commercial (Sec. by RE): Owner Occupied $ 54 $ 78 $ 79 $ 69 $ 72 Income Producing 94 56 64 65 46 Total Comm (Sec. by RE) 148 134 143 134 118 Commercial & Industrial 16 17 16 25 17 Commercial Construction 38 23 18 26 31 Total Commercial 202 174 177 185 166 Residential Mortgage 73 76 76 77 70 Residential Construction 46 64 72 76 74 Consumer / Installment 3 3 3 3 3 Total Classified Loans $ 324 $ 317 $ 328 $ 341 $ 313 26 |
43 Business Mix Loans 43 (at quarter-end) (in millions) 2Q12 vs. LOANS BY CATEGORY 2Q12 1Q12 4Q11 3Q11 2Q11 2Q11 Commercial (Sec. by RE): Owner Occupied $ 1,140 $ 1,137 $ 1,111 $ 1,037 $ 1,014 $ 126 Income Producing 697 706 711 734 728 (31) Total Comm (Sec. by RE) 1,837 1,843 1,822 1,771 1,742 95 Commercial & Industrial 450 440 428 429 428 22 Commercial Construction 169 167 164 169 195 (26) Total Commercial 2,456 2,450 2,414 2,369 2,365 91 Residential Mortgage 1,128 1,131 1,135 1,150 1,177 (49) Residential Construction 409 436 448 474 502 (93) Consumer / Installment 126 111 113 117 119 7 Total Loans $ 4,119 $ 4,128 $ 4,110 $ 4,110 $ 4,163 $ (44) |
44 44 Loans – Markets Served (at quarter-end) (in millions) 2Q12 vs. LOANS BY MARKET 2Q12 1Q12 4Q11 3Q11 2Q11 2Q11 North Georgia $ 1,387 $ 1,408 $ 1,426 $ 1,478 $ 1,500 $ (113) Atlanta MSA 1,252 1,239 1,220 1,192 1,188 64 North Carolina 576 588 597 607 626 (50) Coastal Georgia 369 366 346 316 325 44 Gainesville MSA 259 262 265 272 275 (16) East Tennessee 276 265 256 245 249 27 Total Loans $ 4,119 $ 4,128 $ 4,110 $ 4,110 $ 4,163 $ (44) |
45 Residential Construction – North Georgia 45 (in millions) 2Q12 vs. 2Q12 1Q12 4Q11 3Q11 2Q11 2Q11 Land Loans Developing Land $ 39 $ 44 $ 44 $ 51 $ 58 $ (19) Raw Land 18 26 26 25 25 (7) Lot Loans 113 113 118 124 129 (16) Total 170 183 188 200 212 (42) Construction Loans Spec 9 12 12 15 18 (9) Sold 14 11 14 14 19 (5) Total 23 23 26 29 37 (14) Total Res Construction $ 193 $ 206 $ 214 $ 229 $ 249 $ (56) |
46 Residential Construction – Atlanta MSA 46 (in millions) 2Q12 vs. 2Q12 1Q12 4Q11 3Q11 2Q11 2Q11 Land Loans Developing Land $ 14 $ 17 $ 17 $ 19 $ 20 $ (6) Raw Land 9 13 14 15 16 (7) Lot Loans 22 22 22 22 22 - Total 45 52 53 56 58 (13) Construction Loans Spec 24 27 27 28 30 (6) Sold 7 7 6 8 9 (2) Total 31 34 33 36 39 (8) Total Res Construction $ 76 $ 86 $ 86 $ 92 $ 97 $ (21) |
47 47 Business Mix Loans (at year-end) (in millions) 2011 2010 2009 2008 2007 LOANS BY CATEGORY Commercial (Sec. by RE) $ 1,822 $ 1,761 $ 1,779 $ 1,627 $ 1,476 Commercial & Industrial 428 441 390 410 418 Commercial Construction 164 297 363 500 527 Total Commercial 2,414 2,499 2,532 2,537 2,421 Residential Mortgage 1,135 1,279 1,427 1,526 1,502 Residential Construction 448 695 1,050 1,479 1,829 Consumer / Installment 113 131 142 163 177 Total Loans $ 4,110 $ 4,604 $ 5,151 $ 5,705 $ 5,929 |
48 Markets Served 48 Loans – (at year-end) (in millions) LOANS BY MARKET 2011 2010 2009 2008 2007 North Georgia $ 1,426 $ 1,689 $ 1,884 $ 2,040 $ 2,060 Atlanta MSA 1,220 1,310 1,435 1,706 2,002 North Carolina 597 702 772 810 806 Coastal Georgia 346 335 405 464 416 Gainesville MSA 265 312 390 420 399 East Tennessee 256 256 265 265 246 Total Loans $ 4,110 $ 4,604 $ 5,151 $ 5,705 $ 5,929 |
49 TDRs by Loan Type (in millions) LOAN TYPE Accruing(1) Non-Accruing Total TDRs As of June 30, 2012 Commercial (Sec by RE) $ 75,901 $ 6,424 $ 82,325 Commercial & Industrial 3,713 259 3,972 Commercial Construction 30,727 10,950 41,677 Total Commercial 110,341 17,633 127,974 Residential Mortgage 14,485 2,465 16,950 Residential Construction 16,450 5,728 22,178 Consumer Installment 366 145 511 Total $ 141,642 $ 25,971 $ 167,613 (1) 78 percent of accruing TDR loans have an interest rate of 4 percent of greater. As of March 31, 2012 Commercial (Sec by RE) $ 70,293 $ 9,551 $ 79,844 Commercial & Industrial 3,288 199 3,487 Commercial Construction 17,891 16,175 34,066 Total Commercial 91,472 25,925 117,397 Residential Mortgage 12,479 2,353 14,832 Residential Construction 21,652 4,296 25,948 Consumer Installment 193 137 330 Total $ 125,796 $ 32,711 $ 158,507 |
50 NPAs by Loan Category, Market, and Activity 50
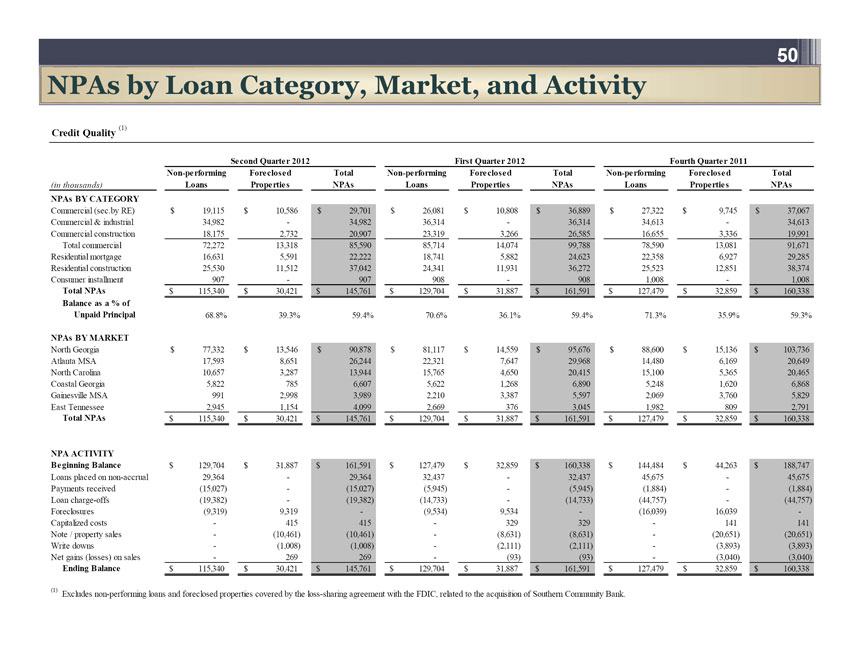
 Credit Quality (1) Second Quarter 2012 First Quarter 2012Fourth Quarter 2011 Non-performing Foreclosed Total Non-performing Foreclosed TotalNon-performingForeclosedTotal (in thousands) Loans Properties NPAs Loans Properties NPAsLoansPropertiesNPAs
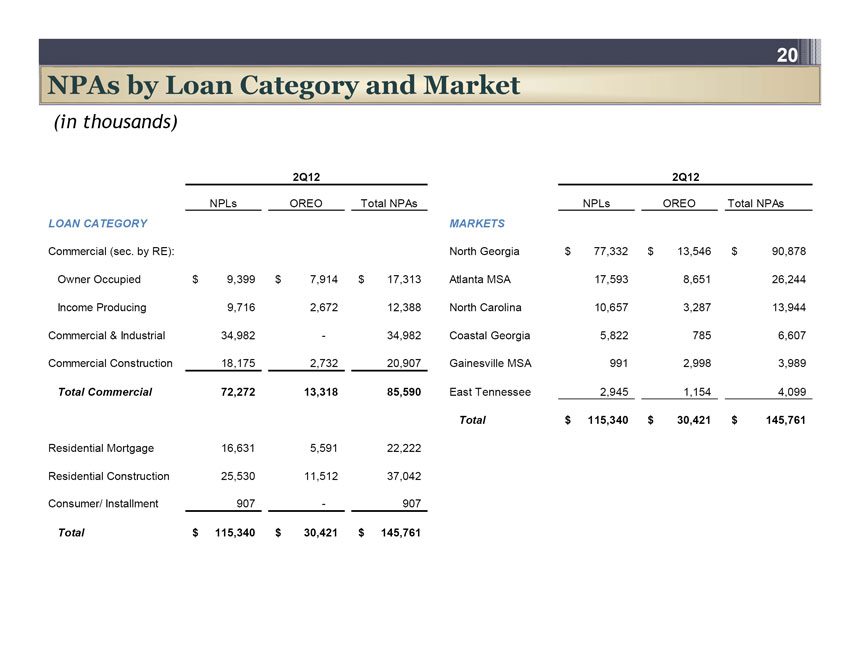
 NPAs BY CATEGORY Commercial (sec.by RE) $ 19,115 $ 10,586 $ 29,701 $ 26,081 $ 10,808 $ 36,889$27,322$9,745$37,067 Commercial & industrial 34,982 - 34,982 36,314 - 36,314 34,613-34,613 Commercial construction 18,175 2,732 20,907 23,319 3,266 26,585 16,6553,33619,991 Total commercial 72,272 13,318 85,590 85,714 14,074 99,788 78,59013,08191,671 Residential mortgage 16,631 5,591 22,222 18,741 5,882 24,623 22,3586,92729,285 Residential construction 25,530 11,512 37,042 24,341 11,931 36,272 25,52312,85138,374 Consumer installment 907 - 907 908 - 908 1,008 - 1,008 Total NPAs $ 115,340 $ 30,421 $ 145,761 $ 129,704 $ 31,887 $ 161,591 $ 127,479$32,859$160,338 Balance as a % of Unpaid Principal 68.8% 39.3% 59.4% 70.6% 36.1% 59.4% 71.3%35.9%59.3% NPAs BY MARKET North Georgia $ 77,332 $ 13,546 $ 90,878 $ 81,117 $ 14,559 $ 95,676 $ 88,600$15,136$103,736 Atlanta MSA 17,593 8,651 26,244 22,321 7,647 29,968 14,4806,16920,649 North Carolina 10,657 3,287 13,944 15,765 4,650 20,415 15,1005,36520,465 Coastal Georgia 5,822 785 6,607 5,622 1,268 6,890 5,248 1,6206,868 Gainesville MSA 991 2,998 3,989 2,210 3,387 5,597 2,069 3,7605,829 East Tennessee 2,945 1,154 4,099 2,669 376 3,045 1,982 809 2,791 Total NPAs $ 115,340 $ 30,421 $ 145,761 $ 129,704 $ 31,887 $ 161,591 $ 127,479$32,859$160,338 NPA ACTIVITY Beginning Balance $ 129,704 $ 31,887 $ 161,591 $ 127,479 $ 32,859 $ 160,338 $ 144,484$44,263$188,747 Loans placed on non-accrual 29,364 - 29,364 32,437 - 32,43745,675-45,675 Payments received (15,027) - (15,027) (5,945) - (5,945) (1,884)-(1,884) Loan charge-offs (19,382) - (19,382) (14,733) - (14,733) (44,757)-(44,757) Foreclosures (9,319) 9,319 - (9,534) 9,534 - (16,039)16,039- Capitalized costs - 415 415 - 329 329 - 141 141 Note / property sales - (10,461) (10,461) - (8,631) (8,631) -(20,651)(20,651) Write downs - (1,008) (1,008) - (2,111) (2,111) - (3,893)(3,893) Net gains (losses) on sales - 269 269 - (93) (93) - (3,040)(3,040) Ending Balance $ 115,340 $ 30,421 $ 145,761 $ 129,704 $ 31,887 $ 161,591 $ 127,479$32,859$160,338 (1) Excludes non-performing loans and foreclosed properties covered by the loss-sharing agreement with the FDIC, related to the acquisition of Southern Community Bank.26 |
51 Net Charge-offs by Category and Market 51 Credit Quality (1) Second Quarter 2012 First Quarter 2012 Fourth Quarter 2011 Net Charge- Net Charge- Net Charge- Offs to Offs to Offs to Net Average Net Average Net Average (in thousands) Charge-Offs Loans (2) Charge-Offs Loans (2) Charge-OffsLoans(2) NET CHARGE-OFFS BY CATEGORY Commercial (sec.by RE) $ 4,349 .95 % $ 3,697 .81 % $ 4,962 1.09 % Commercial & industrial 775 .70 669 .62 18,940 17.47 Commercial construction 88 .21 334 .81 3,318 7.88 Total commercial 5,212 .86 4,700 .78 27,220 4.51 Residential mortgage 3,862 1.38 5,375 1.91 5,887 2.04 Residential construction 9,563 9.14 5,314 4.84 12,090 10.36 Consumer installment 259 .88 478 1.72 427 1.47 Total $ 18,896 1.85 $ 15,867 1.55 $ 45,624 4.39 NET CHARGE-OFFS BY MARKET North Georgia $ 12,474 3.58 % $ 9,022 2.56 % $ 34,970 9.46 % Atlanta MSA 2,307 .75 2,729 .89 4,195 1.37 North Carolina 3,634 2.52 1,679 1.14 3,180 2.10 Coastal Georgia 211 .23 1,329 1.53 335 .41 Gainesville MSA (187) (.29) 883 1.35 2,572 3.84 East Tennessee 457 .68 225 .34 372 .59 Total $ 18,896 1.85 $ 15,867 1.55 $ 45,624 4.39 (1) Excludes non-performing loans and foreclosed properties covered by the loss-sharing agreement with the FDIC, related to the acquisition of Southern Community Bank. (2) Annualized. |
52 Net Charge-offs by Category and Market 52 Asset Disposition Plan as of March 31, 2011 Credit Quality - Net Charge-Offs First Quarter 2011 (1) Asset Disposition Plan Bulk Loan Sale (2) First Quarter Performing Nonperforming Other Bulk LoanForeclosureOther Net2011 Net Charge- (in thousands) Loans Loans Sales (3) Charge-Offs (4) Charge-OffsOffs NET CHARGE-OFFS BY CATEGORY Commercial (sec. by RE) $ 29,451 $ 11,091 $ 3,318 $ 1,905 $ 2,842$48,607 Commercial construction 32,530 15,328 292 419 1,14649,715 Commercial & industrial 365 2,303 859 - 5134,040 Total commercial 62,346 28,722 4,469 2,324 4,501 102,362 Residential construction 43,018 23,459 3,325 11,693 10,64392,138 Residential mortgage 13,917 14,263 1,676 1,538 4,989 36,383 Consumer / installment 86 168 30 24 383 691 Total $ 119,367 $ 66,612 $ 9,500 $ 15,579 $ 20,516$231,574 NET CHARGE-OFFS BY MARKET Atlanta MSA $ 37,186 $ 8,545 $ 1,428 $ 6,034 $ 3,296 $ 56,489 Gainesville MSA 3,563 2,442 957 700 954 8,616 North Georgia 57,969 47,699 2,508 6,585 8,544 123,305 Western North Carolina 11,138 4,743 2,415 1,402 6,74926,447 Coastal Georgia 6,835 2,180 2,013 634 341 12,003 East Tennessee 2,676 1,003 179 224 632 4,714 Total $ 119,367 $ 66,612 $ 9,500 $ 15,579 $ 20,516$231,574 (1) Excludes non-performing loans and foreclosed properties covered by the loss-sharing agreement with the FDIC, related to the acquisition of Southern Community Bank. (2) Charge-offs totaling $186 million were recognized on the bulk loan sale in the first quarter of 2011. The loans were transferred to the loans held for sale category in anticipation of the second quarter bulk loan sale that was completed on April 18, 2011. (3) Losses on smaller bulk sale transactions completed during the first quarter of 2011. (4) Loan charge-offs recognized in the first quarter of 2011 related to loans transferred to foreclosed properties. Such charge-offs were elevated in the first quarter as a result of the asset disposition plan, which called for aggressive write downs to expedite sales in the second and third quarters of 2011. 26 |
53 53 Credit Quality – Bulk Loan Sale Summary as of March 31, 2011 Credit Quality - Bulk Loan Sale Summary (1) Performing Loans Nonperforming LoansTotal Loans Carrying Charge- Loans Held Carrying Charge- Loans HeldCarryingCharge-Loans Held (in thousands) Amount (2) Offs (3) for Sale (4) Amount (2)Offs (3)for Sale (4)Amount (2)Offs (3)for Sale (4) BY CATEGORY Commercial (sec. by RE) $ 40,902 $ 29,451 $ 11,451 $ 17,202 $ 11,090 $6,112$58,104$40,541$17,563 Commercial construction 45,490 32,530 12,960 22,440 15,3287,11267,93047,85820,072 Commercial & industrial 504 365 139 3,397 2,302 1,095 3,901 2,6671,234 Total commercial 86,896 62,346 24,550 43,039 28,720 14,319129,93591,06638,869 Residential construction 59,747 43,018 16,729 35,508 23,45912,04995,25566,47728,778 Residential mortgage 19,342 13,917 5,425 21,716 14,262 7,45441,05828,17912,879 Consumer / installment 120 86 34 238 169 69 358 255103 Total $ 166,105 $ 119,367 $ 46,738 $ 100,501 $ 66,610 $ 33,891$266,606$185,977$80,629 BY MARKET Atlanta MSA $ 51,647 $ 37,186 $ 14,461 $ 13,755 $ 8,545 $ 5,210 $ 65,402$45,731$19,671 Gainesville MSA 4,949 3,563 1,386 3,695 2,442 1,253 8,644 6,0052,639 North Georgia 80,831 57,969 22,862 70,900 47,698 23,202151,731105,66746,064 Western North Carolina 15,468 11,138 4,330 7,228 4,743 2,485 22,69615,8816,815 Coastal Georgia 9,493 6,835 2,658 3,527 2,179 1,348 13,0209,0144,006 East Tennessee 3,717 2,676 1,041 1,396 1,003 393 5,113 3,6791,434 Total $ 166,105 $ 119,367 $ 46,738 $ 100,501 $ 66,610 $ 33,891$266,606$185,977$80,629 (1) This schedule presents a summary of classified loans included in the bulk loan sale transaction that closed on April 18, 2011. (2) This column represents the book value, or carrying amount, of the loans prior to charge offs to mark loans to expected proceeds from sale. (3) This column represents the charge-offs required to adjust the loan balances to the expected proceeds from the sale based on indicative bids received from prospective buyers, including principal payments received or committed advances made after the cutoff date through March 31, 2011 that are part of the settlement. (4) This column represents the expected proceeds from the bulk sale based on indicative bids received from prospective buyers and equals the balance shown on the consolidated balance sheet as loans held for sale. |
54 Loans / Deposits - Liquidity 54 (in millions) Variance 2Q12 1Q12 2Q11 vs 1Q12 vs 2Q11 Loans $ 4,119 $ 4,128 $ 4,163 $ (9) $ (44) Core (DDA, MMDA, Savings) $ 3,065 $ 3,053 $ 2,794 $ 12 $ 271 Public Funds 659 820 649 (161) 10 CD’s 1,887 1,960 2,439 (73) (552) Total Deposits (excl Brokered) $ 5,611 $ 5,833 $ 5,882 $ (222) $ (271) Loan to Deposit Ratio 73% 71% 71% Investment Securities: Available for Sale $ 1,259 $ 1,359 $ 1,194 $ (100) $ 65 Held to Maturity 283 304 371 (21) (88) Total Investment Securities 1,542 1,663 1,565 (121) (23) Floating Rate CMD, Bonds 442 540 623 (98) (181) Total Securities Portfolio 1,984 2,203 2,188 (219) (204) Percent of Assets (Excludes Floating) 19% 23% 22% Commercial Paper & Reverse Repo $ 120 $ 235 $ 175 $ (115) $ (55) Floating Rate Securities 442 540 623 (98) (181) Excess Reserves 94 103 42 (9) 52 Total Excess Liquidity $ 656 $ 878 $ 840 $ (222) $ (184) |
55 Wholesale Borrowings - Liquidity 55 (in millions) Unused Variance Capacity 2Q12 1Q12 2Q11 vs 1Q12 vs 2Q11 Wholesale Borrowings (1) Brokered Deposits $ 1,474 $ 211 $ 168 $ 301 $ 43 $ (90) FHLB 629 125 215 41 (90) 84 Fed Funds 125 - - - - - Other Wholesale 478 54 102 104 (48) (50) Total $ 2,706 $ 390 $ 485 $ 446 $ (95) $ (56) Long-Term Debt Sub-Debt $ 65 $ 65 $ 95 $ - $ (30) Trust Preferred Securities 55 55 55 - - Total Long-Term Debt $ 120 $ 120 $ 150 $ - $ (30) (1) Estimated Brokered Deposit Total Capacity at 25% of Assets |
56 Deposits 56 Business Mix – at quarter-end (in millions) 2Q12 vs. DEPOSITS BY CATEGORY 2Q12 1Q12 4Q11 3Q11 2Q11 2Q11 Demand & Now $ 1,735 $ 1,722 $ 1,674 $ 1,686 $ 1,620 $ 115 MMDA & Savings 1,330 1,331 1,228 1,220 1,174 156 Core Transaction Deposits 3,065 3,053 2,902 2,906 2,794 271 Time < $100,000 1,159 1,201 1,326 1,387 1,503 (344) Public Deposits 623 782 844 597 605 18 Total Core Deposits 4,847 5,036 5,072 4,890 4,902 (55) Time > $100,000 728 759 807 867 936 (208) Public Deposits 36 38 40 38 44 (8) Total Customer Deposits 5,611 5,833 5,919 5,795 5,882 (271) Brokered Deposits 211 168 179 210 301 (90) Total Deposits $ 5,822 $ 6,001 $ 6,098 $ 6,005 $ 6,183 $ (361) |
57 Core Transaction Deposits 57 Geographic Diversity Core Transactions / Total Deposits (%) 2Q12 2Q11 2Q 11 2Q 12 $ in millions Coastal GA 64.0 % 42.4 % Eastern Tennessee Gainesville MSA 59.4 53.1 North Carolina 57.9 50.3 Gainesville MSA Atlanta MSA 57.0 50.4 East TN 56.5 48.5 Coastal Georgia North Georgia 51.2 51.1 North Carolina Total 54.3 % 47.5 % North Georgia Atlanta MSA |
58 Non GAAP Reconciliation Tables 58 (in thousands except EPS) Operating Earnings to GAAP Earnings Reconciliation 2Q12 1Q12 2Q11 Core net interest revenue reconciliation Core net interest revenue $ 56,836 $ 58,864 $ 58,946 Taxable equivalent adjustment (444) (446) (429) Net interest revenue (GAAP) $ 56,392 $ 58,418 $ 58,517 Core fee revenue reconciliation Core fee revenue $ 12,764 $ 13,091 $ 11,096 Securities gains, net 6,490 557 783 Loss on prepayment of borrowings (6,199) (482) (791) Gains from sales of low income housing tax credits - 728 - Hedge ineffectiveness (losses) gains (180) 115 2,810 Interest on Federal tax refund - 1,100 - Mark to market on deferred compensation plan assets (8) 270 7 Fee revenue (GAAP) $ 12,867 $ 15,379 $ 13,905 Core operating expense reconciliation Core operating expense $ 41,312 $ 42,670 $ 45,680 Foreclosed property expense 1,851 3,825 1,891 Severance 1,155 190 1,150 Mark to market on deferred compensation plan liability (8) 270 7 Operating expense (GAAP) $ 44,310 $ 46,955 $ 48,728 |
59 Non GAAP Reconciliation Tables 59 Operating Earnings to GAAP Earnings Reconciliation 2Q12 1Q12 2Q11 Net interest margin - pre credit reconciliation Net interest margin - pre credit 3.62 % 3.76 % 3.67 % Effect of interest reversals, lost interest, and carry costs of NPAs (.19) (.23) (.26) Net interest margin 3.43 3.53 3.41 Tangible common equity and tangible equity to tangible assets reconciliation Tangible common equity to tangible assets 5.45 % 5.33 % 1.37 % Effect of preferred equity 2.79 2.75 6.56 Tangible equity to tangible assets 8.24 8.08 7.93 Effect of goodwill and other intangibles .09 .11 .13 Equity to assets (GAAP) 8.33 % 8.19 % 8.06 % Tangible common equity to risk-weighted assets reconciliation Tangible common equity to risk-weighted assets 8.38 % 8.21 % 8.69 % Effect of preferred equity 4.36 4.23 4.20 Tangible equity to risk weighted assets 12.74 12.44 12.89 Effect of other comprehensive income .28 .10 (.42) Effect of trust preferred 1.19 1.15 1.15 Tier I capital ratio (Regulatory) 14.21 % 13.69 % 13.62 % |
Analyst Coverage 26 |
61 United Community Banks, Inc. Investor Presentation Second Quarter 2012 Copyright 2012 United Community Banks, Inc. All rights reserved. |