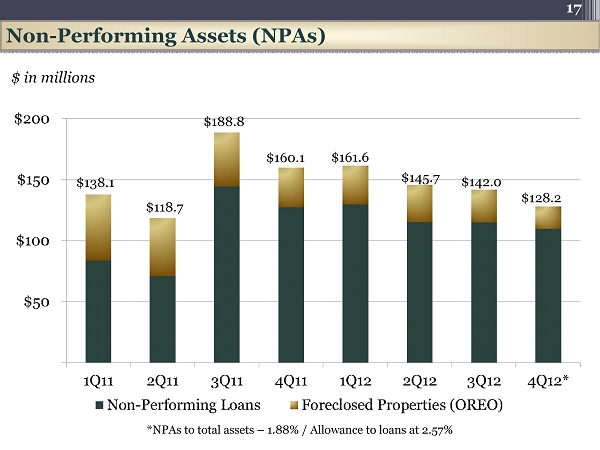
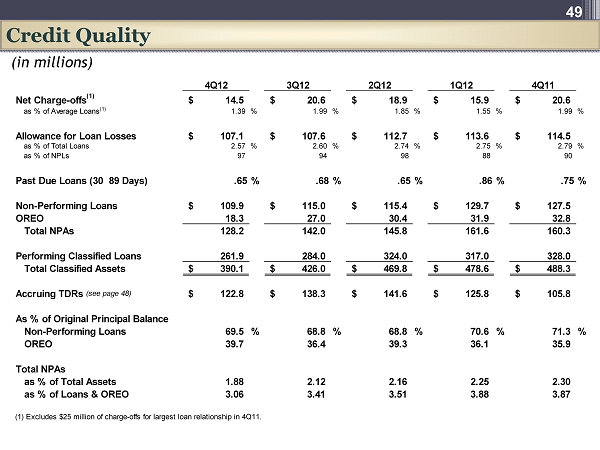
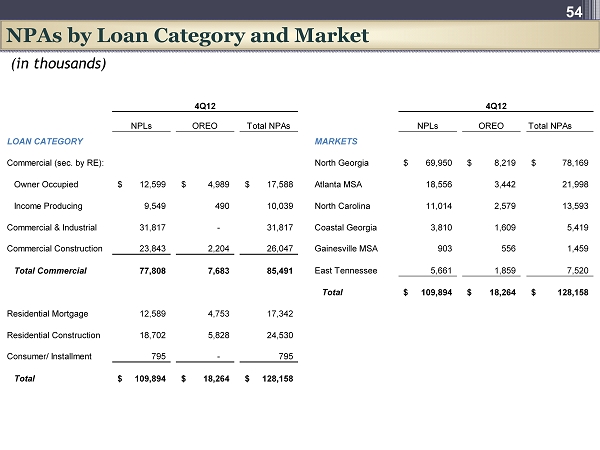
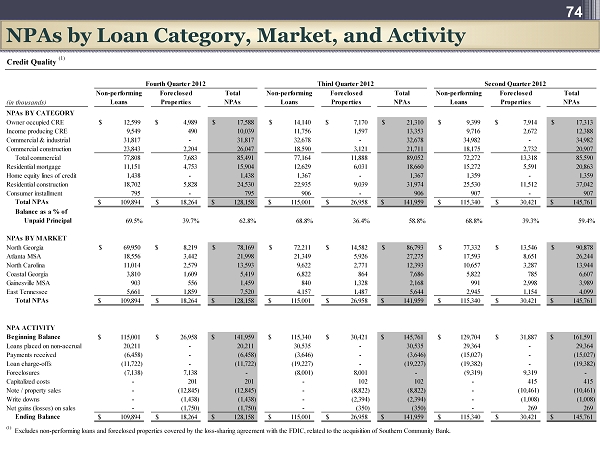
| 74 NPAs by Loan Category, Market, and Activity 74 Credit Quality (1) Fourth Quarter 2012 Third Quarter 2012 Second Quarter 2012 Non-performing Foreclosed Total Non-performing Foreclosed Total Non-performing Foreclosed Total (in thousands) Loans Properties NPAs Loans Properties NPAs Loans Properties NPAs NPAs BY CATEGORY Owner occupied CRE $ 12,599 $ 4,989 $ 17,588 $ 14,140 $ 7,170 $ 21,310 $ 9,399 $ 7,914 $ 17,313 Income producing CRE 9,549 490 10,039 11,756 1,597 13,353 9,716 2,672 12,388 Commercial & industrial 31,817 - 31,817 32,678 - 32,678 34,982 - 34,982 Commercial construction 23,843 2,204 26,047 18,590 3,121 21,711 18,175 2,732 20,907 Total commercial 77,808 7,683 85,491 77,164 11,888 89,052 72,272 13,318 85,590 Residential mortgage 11,151 4,753 15,904 12,629 6,031 18,660 15,272 5,591 20,863 Home equity lines of credit 1,438 - 1,438 1,367 - 1,367 1,359 - 1,359 Residential construction 18,702 5,828 24,530 22,935 9,039 31,974 25,530 11,512 37,042 Consumer installment 795 - 795 906 - 906 907 - 907 Total NPAs $ 109,894 $ 18,264 $ 128,158 $ 115,001 $ 26,958 $ 141,959 $ 115,340 $ 30,421 $ 145,761 Balance as a % of Unpaid Principal 69.5% 39.7% 62.8% 68.8% 36.4% 58.8% 68.8% 39.3% 59.4% NPAs BY MARKET North Georgia $ 69,950 $ 8,219 $ 78,169 $ 72,211 $ 14,582 $ 86,793 $ 77,332 $ 13,546 $ 90,878 Atlanta MSA 18,556 3,442 21,998 21,349 5,926 27,275 17,593 8,651 26,244 North Carolina 11,014 2,579 13,593 9,622 2,771 12,393 10,657 3,287 13,944 Coastal Georgia 3,810 1,609 5,419 6,822 864 7,686 5,822 785 6,607 Gainesville MSA 903 556 1,459 840 1,328 2,168 991 2,998 3,989 East Tennessee 5,661 1,859 7,520 4,157 1,487 5,644 2,945 1,154 4,099 Total NPAs $ 109,894 $ 18,264 $ 128,158 $ 115,001 $ 26,958 $ 141,959 $ 115,340 $ 30,421 $ 145,761 NPA ACTIVITY Beginning Balance $ 115,001 $ 26,958 $ 141,959 $ 115,340 $ 30,421 $ 145,761 $ 129,704 $ 31,887 $ 161,591 Loans placed on non-accrual 20,211 - 20,211 30,535 - 30,535 29,364 - 29,364 Payments received (6,458) - (6,458) (3,646) - (3,646) (15,027) - (15,027) Loan charge-offs (11,722) - (11,722) (19,227) - (19,227) (19,382) - (19,382) Foreclosures (7,138) 7,138 - (8,001) 8,001 - (9,319) 9,319 -Capitalized costs - 201 201 - 102 102 - 415 415 Note / property sales - (12,845) (12,845) - (8,822) (8,822) - (10,461) (10,461) Write downs - (1,438) (1,438) - (2,394) (2,394) - (1,008) (1,008) Net gains (losses) on sales - (1,750) (1,750) - (350) (350) - 269 269 Ending Balance $ 109,894 $ 18,264 $ 128,158 $ 115,001 $ 26,958 $ 141,959 $ 115,340 $ 30,421 $ 145,761 (1) Excludes non-performing loans and foreclosed properties covered by the loss-sharing agreement with the FDIC, related to the acquisition of Southern Community Bank |