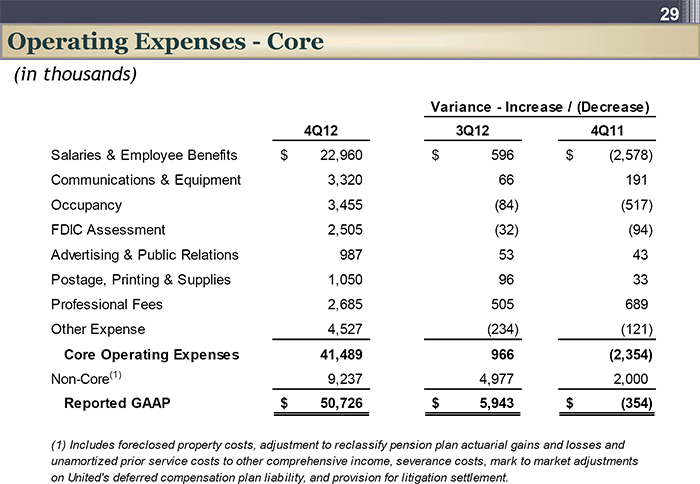
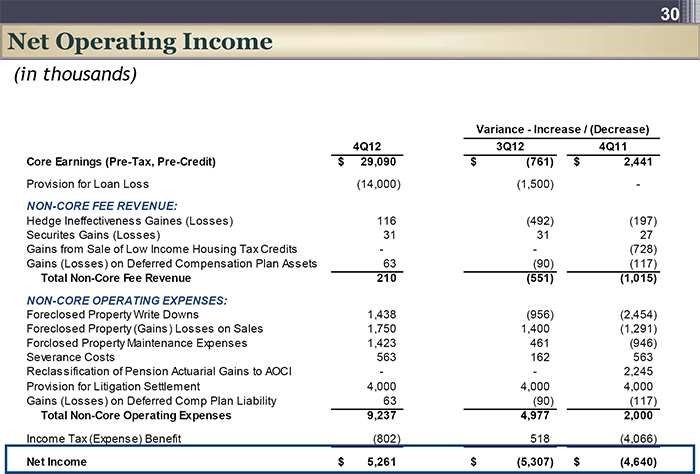
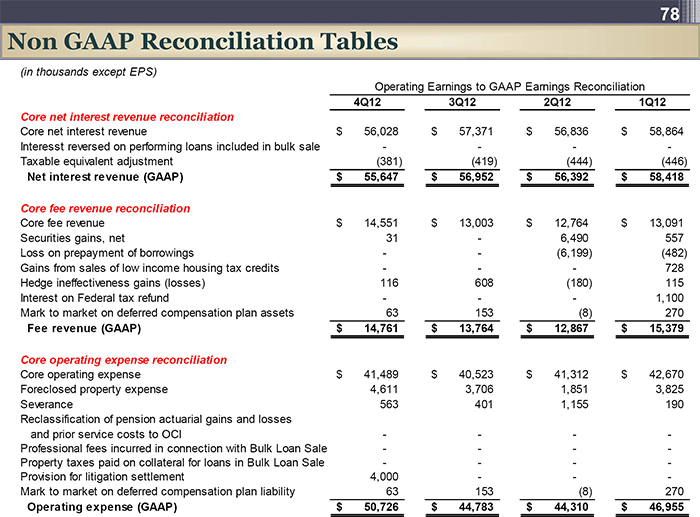
| 78 Non GAAP Reconciliation Tables12 (in thousands except EPS) Operating Earnings to GAAP Earnings Reconciliation 4Q12 3Q122Q121Q12 Core net interest revenue reconciliation Core net interest revenue $ 56,028 $ 57,371 $ 56,836$ 58,864 Interesst reversed on performing loans included in bulk sale - - - - Taxable equivalent adjustment (381) (419) (444) (446) Net interest revenue (GAAP)$ 55,647$ 56,952$ 56,392$ 58,418 Core fee revenue reconciliation Core fee revenue $ 14,551 $ 13,003 $ 12,764$ 13,091 Securities gains, net 31 - 6,490 557 Loss on prepayment of borrowings - - (6,199) (482) Gains from sales of low income housing tax credits - - - 728 Hedge ineffectiveness gains (losses) 116 608 (180) 115 Interest on Federal tax refund - - - 1,100 Mark to market on deferred compensation plan assets 63 153 (8) 270 Fee revenue (GAAP)$ 14,761$ 13,764$ 12,867$ 15,379 Core operating expense reconciliation Core operating expense $ 41,489 $ 40,523 $ 41,312$ 42,670 Foreclosed property expense 4,611 3,706 1,851 3,825 Severance 563 401 1,155 190 Reclassification of pension actuarial gains and losses and prior service costs to OCI - - - - Professional fees incurred in connection with Bulk Loan Sale - - - - Property taxes paid on collateral for loans in Bulk Loan Sale - - - - Provision for litigation settlement 4,000 - - - Mark to market on deferred compensation plan liability 63 153 (8) 270 Operating expense (GAAP) $ 50,726$ 44,783$ 44,310$ 46,955 |