Exhbit 99.2
 | Jimmy C. Tallent President & CEO H. Lynn Harton Chief Operating Officer Rex S. Schuette EVP & Chief Financial Officer rex_schuette@ucbi.com (706) 781-2266 David P. Shearrow EVP & Chief Risk Officer Updated as of February 22, 2013 |
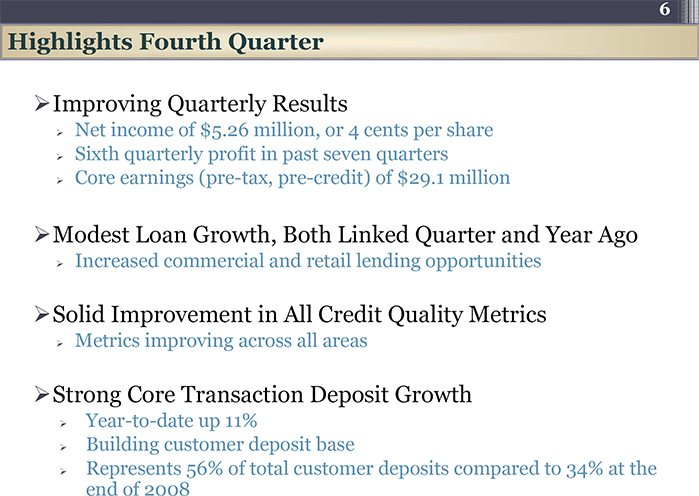 | 6 Highlights Fourth Quarter Improving Quarterly Results Net income of $5.26 million, or 4 cents per share Sixth quarterly profit in past seven quarters Core earnings (pre-tax, pre-credit) of $29.1 million Modest Loan Growth, Both Linked Quarter and Year Ago Increased commercial and retail lending opportunities Solid Improvement in All Credit Quality Metrics Metrics improving across all areas Strong Core Transaction Deposit Growth Year-to-date up 11% Building customer deposit base Represents 56% of total customer deposits compared to 34% at the end of 2008 |
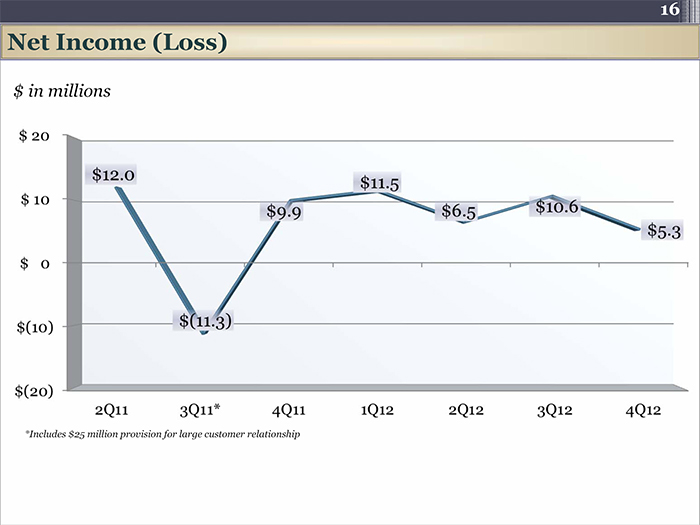 | 16 Net Income (Loss) $ in millions *Includes $25 million provision for large customer relationship |
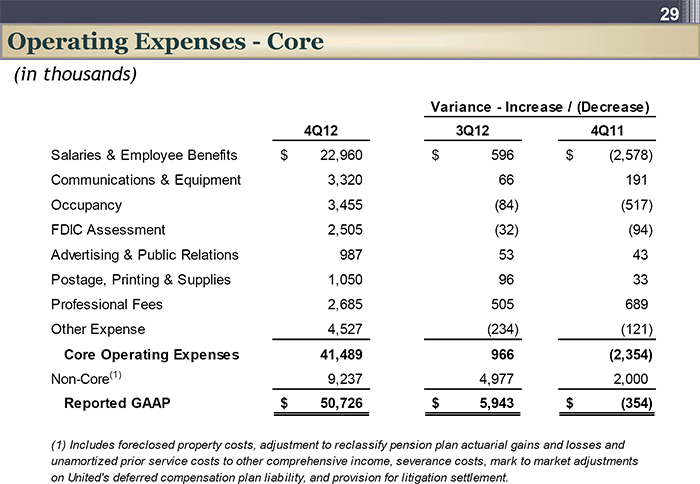 | 29 Operating Expenses - Core4 (in thousands) Variance - Increase / (Decrease) 4Q12 3Q124Q11 Salaries & Employee Benefits $ 22,960 $ 596 $ (2,578) Communications & Equipment 3,320 66 191 Occupancy 3,455 (84) (517) FDIC Assessment 2,505 (32) (94) Advertising & Public Relations 987 53 43 Postage, Printing & Supplies 1,050 96 33 Professional Fees 2,685 505 689 Other Expense 4,527 (234) (121) Core Operating Expenses 41,489 966 (2,354) Non-Core(1) 9,237 4,977 2,000 Reported GAAP $ 50,726 $ 5,943$ (354) (1) Includes foreclosed property costs, adjustment to reclassify pension plan actuarial gains and losses and unamortized prior service costs to other comprehensive income, severance costs, mark to market adjustments on United’s deferred compensation plan liability, and provision for litigation settlement. |
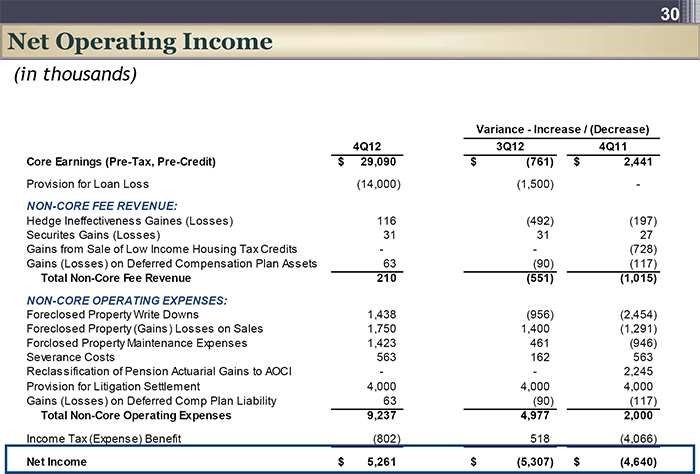 | 30 Net Operating Income 5 (in thousands) Variance - Increase / (Decrease) 4Q12 3Q12 4Q11 Core Earnings (Pre-Tax, Pre-Credit)$ 29,090$ (761) $ 2,441 Provision for Loan Loss (14,000) (1,500) - NON-CORE FEE REVENUE: Hedge Ineffectiveness Gaines (Losses) 116 (492) (197) Securites Gains (Losses) 31 31 27 Gains from Sale of Low Income Housing Tax Credits - - (728) Gains (Losses) on Deferred Compensation Plan Assets 63 (90) (117) Total Non-Core Fee Revenue 210 (551) (1,015) NON-CORE OPERATING EXPENSES: Foreclosed Property Write Downs 1,438 (956) (2,454) Foreclosed Property (Gains) Losses on Sales 1,750 1,400 (1,291) Forclosed Property Maintenance Expenses 1,423 461 (946) Severance Costs 563 162 563 Reclassification of Pension Actuarial Gains to AOCI - - 2,245 Provision for Litigation Settlement 4,000 4,000 4,000 Gains (Losses) on Deferred Comp Plan Liability 63 (90) (117) Total Non-Core Operating Expenses 9,237 4,977 2,000 Income Tax (Expense) Benefit (802) 518 (4,066) Net Income $ 5,261 $ (5,307)$ (4,640) |
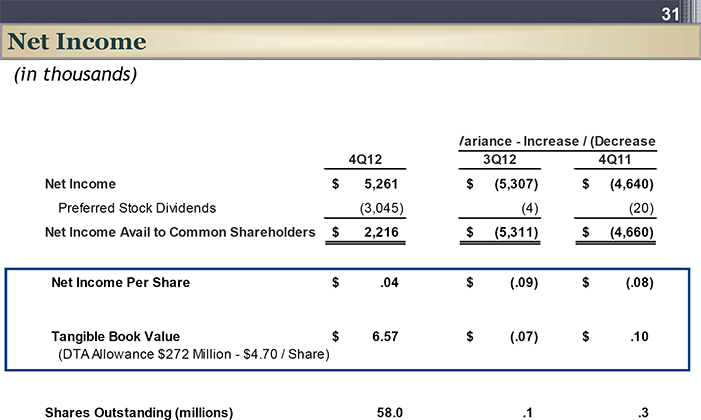 | 31 Net Income6 (in thousands) ariance - Increase / (Decrease 4Q12 3Q12 4Q11 Net Income$ 5,261$ (5,307)$ (4,640) Preferred Stock Dividends (3,045) (4) (20) Net Income Avail to Common Shareholders $ 2,216 $ (5,311)$ (4,660) Net Income Per Share $ .04 $ (.09)$ (.08) Tangible Book Value $ 6.57 $ (.07)$ .10 (DTA Allowance $272 Million - $4.70 / Share) Shares Outstanding (millions) 58.0 .1 .3 |
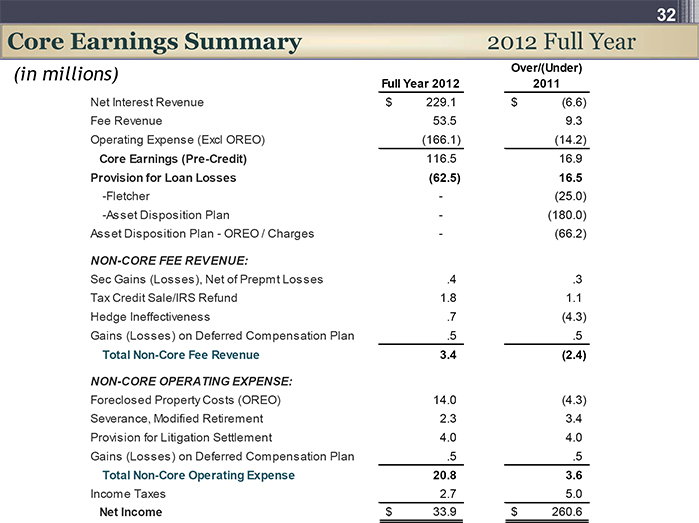 | 32 Core Earnings Summary 2012 Full Year (in millions)Over/(Under) Full Year 20122011 Net Interest Revenue $ 229.1 $ (6.6) Fee Revenue 53.5 9.3 Operating Expense (Excl OREO) (166.1) (14.2) Core Earnings (Pre-Credit) 116.5 16.9 Provision for Loan Losses (62.5) 16.5 - Fletcher - (25.0) - Asset Disposition Plan - (180.0) Asset Disposition Plan - OREO / Charges - (66.2) NON-CORE FEE REVENUE: Sec Gains (Losses), Net of Prepmt Losses .4 .3 Tax Credit Sale/IRS Refund 1.8 1.1 Hedge Ineffectiveness .7 (4.3) Gains (Losses) on Deferred Compensation Plan .5 .5 Total Non-Core Fee Revenue 3.4 (2.4) NON-CORE OPERATING EXPENSE: Foreclosed Property Costs (OREO) 14.0 (4.3) Severance, Modified Retirement 2.3 3.4 Provision for Litigation Settlement 4.0 4.0 Gains (Losses) on Deferred Compensation Plan .5 .5 Total Non-Core Operating Expense 20.8 3.6 Income Taxes 2.7 5.0 Net Income $ 33.9 $ 260.6 |
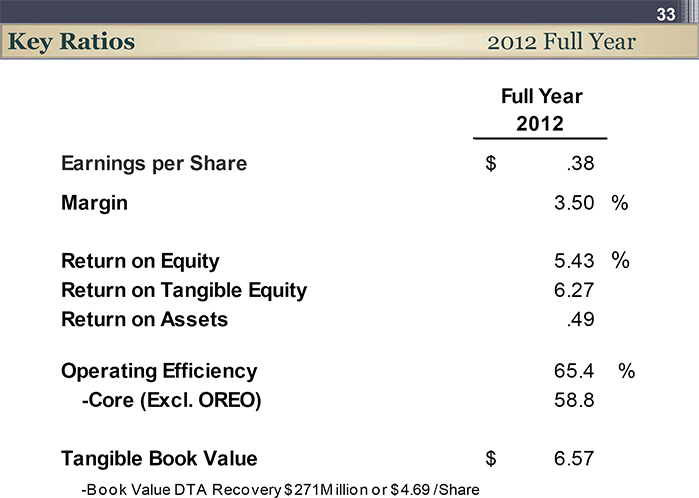 | 33 Key Ratios 2012 Full Year Full Year 2012 Earnings per Share $ .38 Margin 3.50 % Return on Equity 5.43 % Return on Tangible Equity 6.27 Return on Assets .49 Operating Efficiency 65.4% -Core (Excl. OREO) 58.8 Tangible Book Value $ 6.57 -Book Value DTA Recovery $271 M illion or $4.69 /Share |
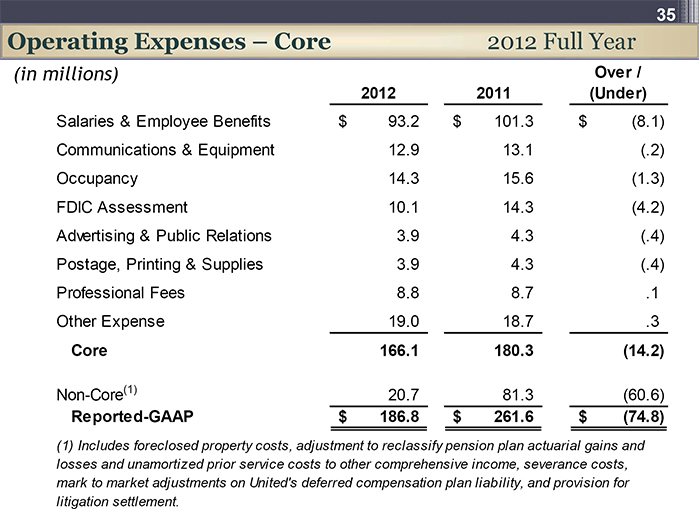 | 35 Operating Expenses – Core 2012 Full Year (in millions) Over / 2012 2011 (Under) Salaries & Employee Benefits $ 93.2 $ 101.3$ (8.1) Communications & Equipment 12.9 13.1 (.2) Occupancy 14.3 15.6 (1.3) FDIC Assessment 10.1 14.3 (4.2) Advertising & Public Relations 3.9 4.3 (.4) Postage, Printing & Supplies 3.9 4.3 (.4) Professional Fees 8.8 8.7 .1 Other Expense 19.0 18.7 .3 Core 166.1 180.3 (14.2) Non-Core(1) 20.7 81.3 (60.6) Reported-GAAP $ 186.8 $ 261.6$ (74.8) (1) Includes foreclosed property costs, adjustment to reclassify pension plan actuarial gains and losses and unamortized prior service costs to other comprehensive income, severance costs, mark to market adjustments on United’s deferred compensation plan liability, and provision for litigation settlement. |
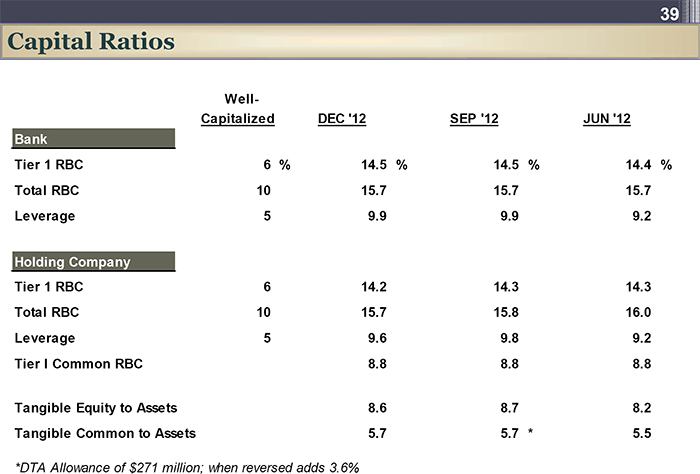 | 39 Capital Ratios10 Well-Capitalized DEC ’12 SEP ’12 JUN ’12 Bank Tier 1 RBC 6 % 14.5 % 14.5 % 14.4 % Total RBC 10 15.7 15.7 15.7 Leverage 5 9.9 9.9 9.2 Holding Company Tier 1 RBC 6 14.2 14.3 14.3 Total RBC 10 15.7 15.8 16.0 Leverage 5 9.6 9.8 9.2 Tier I Common RBC 8.8 8.8 8.8 Tangible Equity to Assets 8.6 8.7 8.2 Tangible Common to Assets 5.7 5.7 * 5.5 *DTA Allowance of $271 million; when reversed adds 3.6% |
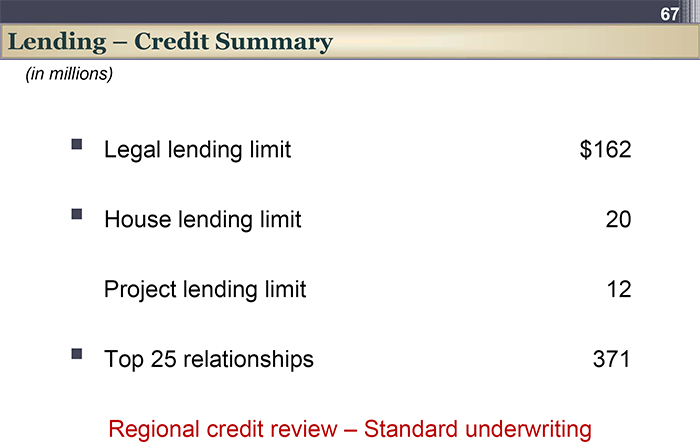 | 67 Lending – Credit Summary11 (in millions) Legal lending limit$162 House lending limit20 Project lending limit12 Top 25 relationships371 Regional credit review – Standard underwriting |
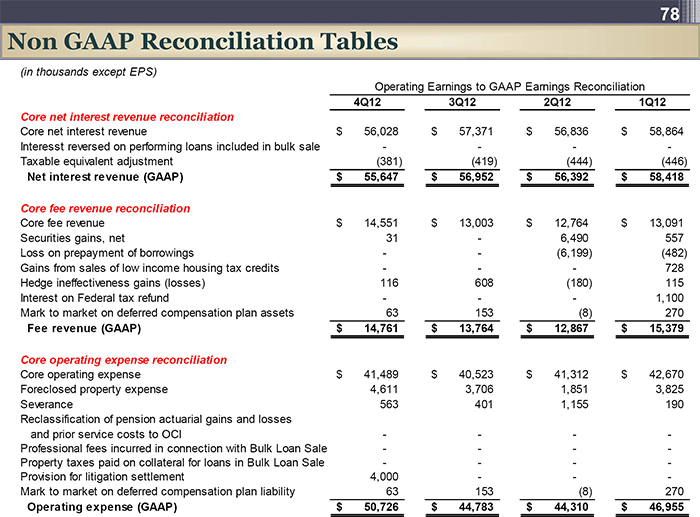 | 78 Non GAAP Reconciliation Tables12 (in thousands except EPS) Operating Earnings to GAAP Earnings Reconciliation 4Q12 3Q122Q121Q12 Core net interest revenue reconciliation Core net interest revenue $ 56,028 $ 57,371 $ 56,836$ 58,864 Interesst reversed on performing loans included in bulk sale - - - - Taxable equivalent adjustment (381) (419) (444) (446) Net interest revenue (GAAP)$ 55,647$ 56,952$ 56,392$ 58,418 Core fee revenue reconciliation Core fee revenue $ 14,551 $ 13,003 $ 12,764$ 13,091 Securities gains, net 31 - 6,490 557 Loss on prepayment of borrowings - - (6,199) (482) Gains from sales of low income housing tax credits - - - 728 Hedge ineffectiveness gains (losses) 116 608 (180) 115 Interest on Federal tax refund - - - 1,100 Mark to market on deferred compensation plan assets 63 153 (8) 270 Fee revenue (GAAP)$ 14,761$ 13,764$ 12,867$ 15,379 Core operating expense reconciliation Core operating expense $ 41,489 $ 40,523 $ 41,312$ 42,670 Foreclosed property expense 4,611 3,706 1,851 3,825 Severance 563 401 1,155 190 Reclassification of pension actuarial gains and losses and prior service costs to OCI - - - - Professional fees incurred in connection with Bulk Loan Sale - - - - Property taxes paid on collateral for loans in Bulk Loan Sale - - - - Provision for litigation settlement 4,000 - - - Mark to market on deferred compensation plan liability 63 153 (8) 270 Operating expense (GAAP) $ 50,726$ 44,783$ 44,310$ 46,955 |
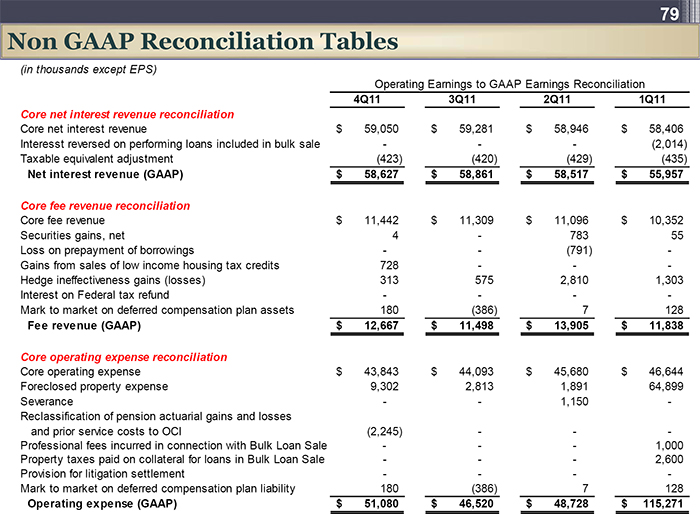 | 79 Non GAAP Reconciliation Tables13 (in thousands except EPS) Operating Earnings to GAAP Earnings Reconciliation 4Q11 3Q112Q111Q11 Core net interest revenue reconciliation Core net interest revenue $ 59,050 $ 59,281 $ 58,946$ 58,406 Interesst reversed on performing loans included in bulk sale - - - (2,014) Taxable equivalent adjustment (423) (420) (429) (435) Net interest revenue (GAAP)$ 58,627$ 58,861$ 58,517$ 55,957 Core fee revenue reconciliation Core fee revenue $ 11,442 $ 11,309 $ 11,096$ 10,352 Securities gains, net 4 - 783 55 Loss on prepayment of borrowings - - (791) - Gains from sales of low income housing tax credits 728 - - - Hedge ineffectiveness gains (losses) 313 575 2,810 1,303 Interest on Federal tax refund - - - - Mark to market on deferred compensation plan assets 180 (386) 7 128 Fee revenue (GAAP)$ 12,667$ 11,498$ 13,905$ 11,838 Core operating expense reconciliation Core operating expense $ 43,843 $ 44,093 $ 45,680$ 46,644 Foreclosed property expense 9,302 2,813 1,891 64,899 Severance - - 1,150 - Reclassification of pension actuarial gains and losses and prior service costs to OCI (2,245) - - - Professional fees incurred in connection with Bulk Loan Sale - - - 1,000 Property taxes paid on collateral for loans in Bulk Loan Sale - - - 2,600 Provision for litigation settlement - - - - Mark to market on deferred compensation plan liability 180 (386) 7 128 Operating expense (GAAP)$ 51,080$ 46,520$ 48,728$ 115,271 |
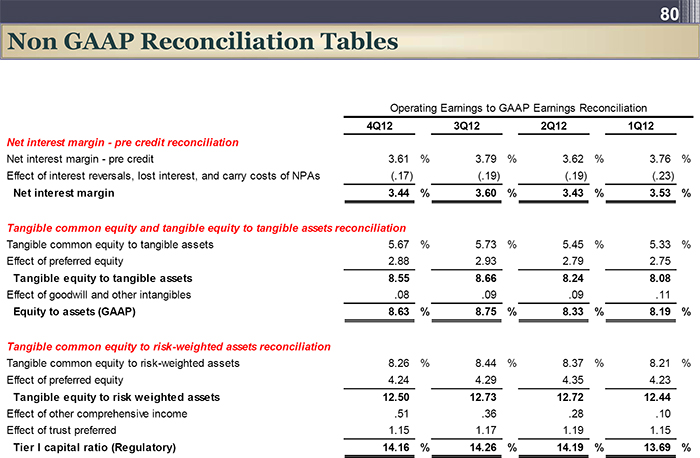 | 80 Non GAAP Reconciliation Tables14 Operating Earnings to GAAP Earnings Reconciliation 4Q12 3Q122Q121Q12 Net interest margin - pre credit reconciliation Net interest margin - pre credit 3.61 % 3.79 % 3.62 % 3.76 % Effect of interest reversals, lost interest, and carry costs of NPAs (.17) (.19) (.19) (.23) Net interest margin 3.44 % 3.60 % 3.43 % 3.53 % Tangible common equity and tangible equity to tangible assets reconciliation Tangible common equity to tangible assets 5.67 % 5.73 % 5.45 % 5.33 % Effect of preferred equity 2.88 2.93 2.79 2.75 Tangible equity to tangible assets 8.55 8.66 8.24 8.08 Effect of goodwill and other intangibles .08 .09 .09 .11 Equity to assets (GAAP) 8.63 % 8.75 % 8.33 % 8.19 % Tangible common equity to risk-weighted assets reconciliation Tangible common equity to risk-weighted assets 8.26 % 8.44 % 8.37 % 8.21 % Effect of preferred equity 4.24 4.29 4.35 4.23 Tangible equity to risk weighted assets 12.50 12.73 12.72 12.44 Effect of other comprehensive income .51 .36 .28 .10 Effect of trust preferred 1.15 1.17 1.19 1.15 Tier I capital ratio (Regulatory) 14.16 % 14.26 % 14.19 % 13.69 % |