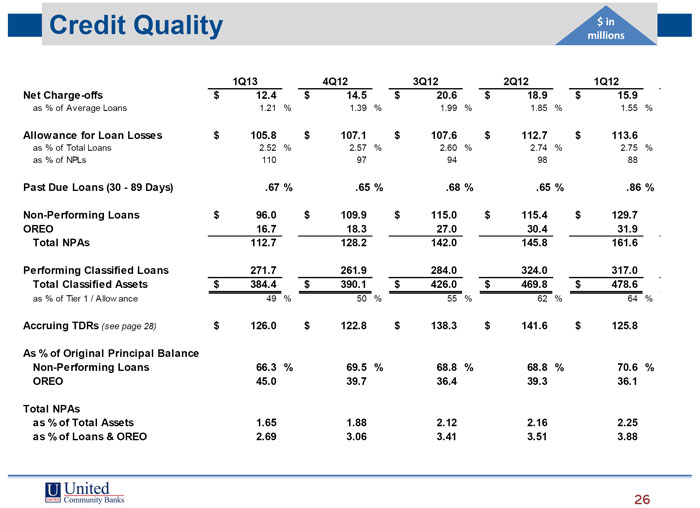
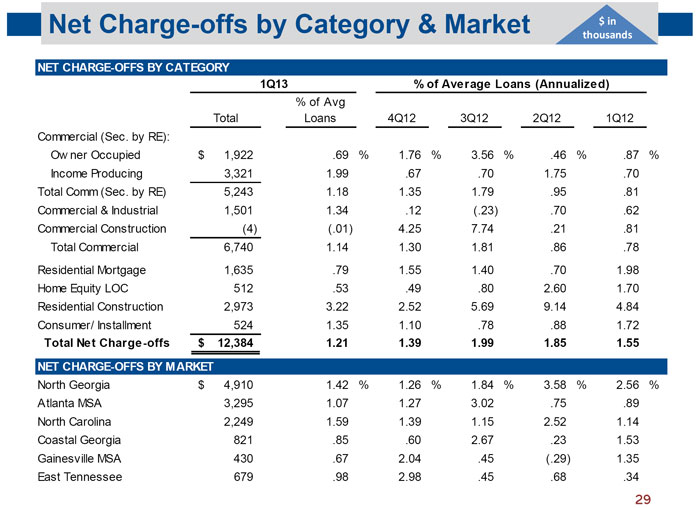
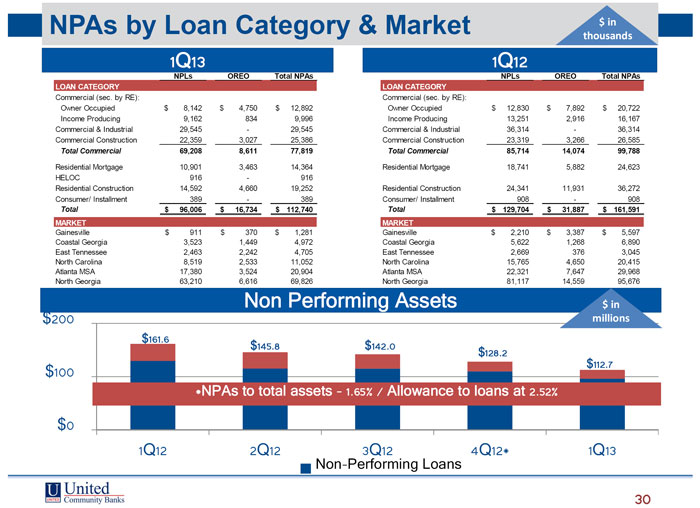
 | NPAs by Loan Category & Market $ in thousands 1Q13 1Q12 NPLs OREO Total NPAs NPLs OREO Total NPAs LOAN CATEGORY LOAN CATEGORY Commercial (sec. by RE): Commercial (sec. by RE): Owner Occupied $ 8,142 $ 4,750 $ 12,892 Owner Occupied $ 12,830 $ 7,892 $ 20,722 Income Producing 9,162 834 9,996 Income Producing 13,251 2,916 16,167 Commercial & Industrial 29,545 - 29,545 Commercial & Industrial 36,314 - 36,314 Commercial Construction 22,359 3,027 25,386 Commercial Construction 23,319 3,266 26,585 Total Commercial 69,208 8,611 77,819 Total Commercial 85,714 14,074 99,788 Residential Mortgage 10,901 3,463 14,364 Residential Mortgage 18,741 5,882 24,623 HELOC 916 - 916 Residential Construction 14,592 4,660 19,252 Residential Construction 24,341 11,931 36,272 Consumer/ Installment 389 - 389 Consumer/ Installment 908 - 908 Total $ 96,006 $ 16,734 $ 112,740 Total $ 129,704 $ 31,887 $ 161,591 MARKET MARKET Gainesville $ 911 $ 370 $ 1,281 Gainesville $ 2,210 $ 3,387 $ 5,597 Coastal Georgia 3,523 1,449 4,972 Coastal Georgia 5,622 1,268 6,890 East Tennessee 2,463 2,242 4,705 East Tennessee 2,669 376 3,045 North Carolina 8,519 2,533 11,052 North Carolina 15,765 4,650 20,415 Atlanta MSA 17,380 3,524 20,904 Atlanta MSA 22,321 7,647 29,968 North Georgia 63,210 6,616 69,826 North Georgia 81,117 14,559 95,676 Non Performing Assets $ in $ 200 millions $ 161.6 $ 145.8 $142.0 $ 128.2 $ 100 $112.7 *NPAs to total assets Ð 1.65% / Allowance to loans at 2.52% $ 0 1Q12 2Q12 3Q12 4Q12* 1Q13 Non-Performing Loans 30 |