Exhibit 99.2
 | First Quarter 2013 Investor Presentation Jimmy C. Tallent President & Chief Executive Officer H. Lynn Harton Chief Operating Officer Rex S. Schuette Executive Vice President & Chief Financial Officer rex_schuette@ucbi.com (706) 781-2266 David P. Shearrow Executive Vice President & Chief Risk Officer United Community Banks, Inc. |
 | Cautionary Statement This investor presentation may contain forward-looking statements, as defined by federal securities laws, including statements about United’s financial outlook and business environment. These statements are based on current expectations and are provided to assist in the understanding of future financial performance. Such performance involves risks and uncertainties that may cause actual results to differ materially from those expressed or implied in any such statements. For a discussion of some of the risks and other factors that may cause such forward-looking statements to differ materially from actual results, please refer to United Community Banks, Inc.’s filings with the Securities and Exchange Commission including its 2012 Annual Report on Form 10-K under the sections entitled “Forward-Looking Statements”. Forward-looking statements speak only as of the date they are made, and we undertake no Non-GAAP Measures This presentation also contains financial measures determined by methods other than in accordance with generally accepted accounting principles (“GAAP”). Such non-GAAP financial measures include the following: core fee revenue, core operating expense, core earnings, tangible common equity to tangible assets, tangible equity to tangible assets and tangible common equity to risk-weighted assets. The most comparable GAAP measures to these measures are: fee revenue, operating expense, net income (loss), and equity to assets. Management uses these non-GAAP financial measures because we believe it is useful for evaluating our operations and performance over periods of time, as well as in managing and evaluating our business and in discussions about our operations and performance. Management believes these non-GAAP financial measures provide users of our financial information with a meaningful measure for assessing our financial results and credit trends, as well as for comparison to financial results for prior periods. These non-GAAP financial measures should not be considered as a substitute for financial measures determined in accordance with GAAP and may not be comparable to other similarly titled financial measures used by other companies. For a reconciliation of the differences between our non-GAAP financial measures and the most comparable GAAP measures, please refer to the ‘Non-GAAP Reconcilement Tables’ at the end of the Appendix to this presentation. 2 |
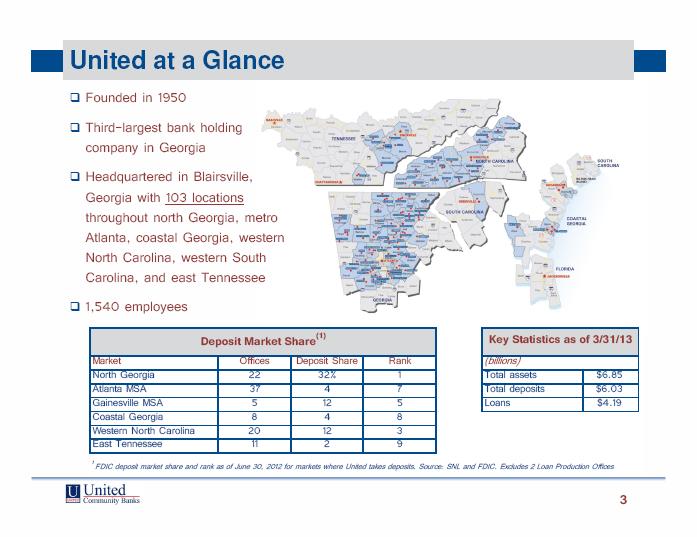 | United at a Glance Founded in 1950 Third-largest bank holding company in Georgia Headquartered in Blairsville, Georgia with 103 locations throughout north Georgia, metro Atlanta, coastal Georgia, western North Carolina, western South Carolina, and east Tennessee Deposit Market Share(1) Key Statistics as of 3/31/13 Market Offices Deposit Share Rank (billions) North Georgia 22 32% Total assets $6.85 Atlanta MSA 37 4 7 Total deposits $6.03 Gainesville MSA 5 12 5 Loans $4.19 Coastal Georgia 8 4 8 Western North Carolina 20 12 3 East Tennessee 1 2 9 1FDIC deposit market share and rank as of June 30, 2012 for markets where United takes deposits. Source: SNL and FDIC. Excludes 2 Loan Production Offices 3 |
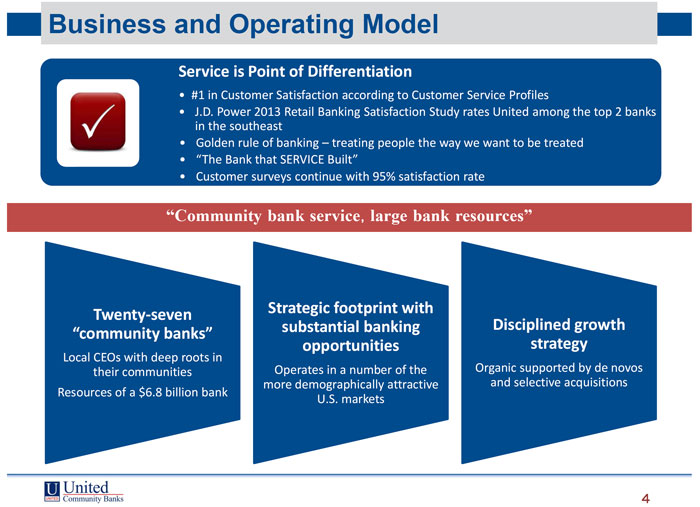 | Business and Operating Model Service is Point of Differentiation • #1 in Customer Satisfaction according to Customer Service Profiles • J.D. Power 2013 Retail Banking Satisfaction Study rates United among the top 2 banks in the southeast • Golden rule of banking – treating people the way we want to be treated • “The Bank that SERVICE Built” • Customer surveys continue with 95% satisfaction rate “Community bank service, large bank resources” Strategic footprint with Twenty-seven substantial banking Disciplined growth “community banks” opportunities strategy Local CEOs with deep roots in their communities Operates in a number of the Organic supported by de novos more demographically attractive and selective acquisitions Resources of a $6.8 billion bank U.S. markets 4 |
 | United Community Banks, Inc. PERFORMANCE - TRENDS 5 |
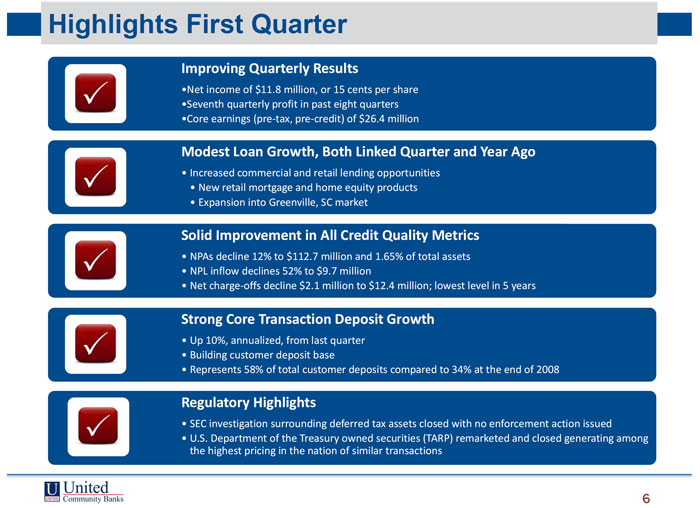 | Highlights First Quarter Improving Quarterly Results •Net income of $11.8 million, or 15 cents per share •Seventh quarterly profit in past eight quarters •Core earnings (pre-tax, pre-credit) of $26.4 million Modest Loan Growth, Both Linked Quarter and Year Ago • Increased commercial and retail lending opportunities • New retail mortgage and home equity products • Expansion into Greenville, SC market Solid Improvement in All Credit Quality Metrics • NPAs decline 12% to $112.7 million and 1.65% of total assets • NPL inflow declines 52% to $9.7 million • Net charge-offs decline $2.1 million to $12.4 million; lowest level in 5 years Strong Core Transaction Deposit Growth • Up 10%, annualized, from last quarter • Building customer deposit base • Represents 58% of total customer deposits compared to 34% at the end of 2008 Regulatory Highlights • SEC investigation surrounding deferred tax assets closed with no enforcement action issued • U.S. Department of the Treasury owned securities (TARP) remarketed and closed generating among the highest pricing in the nation of similar transactions 6 |
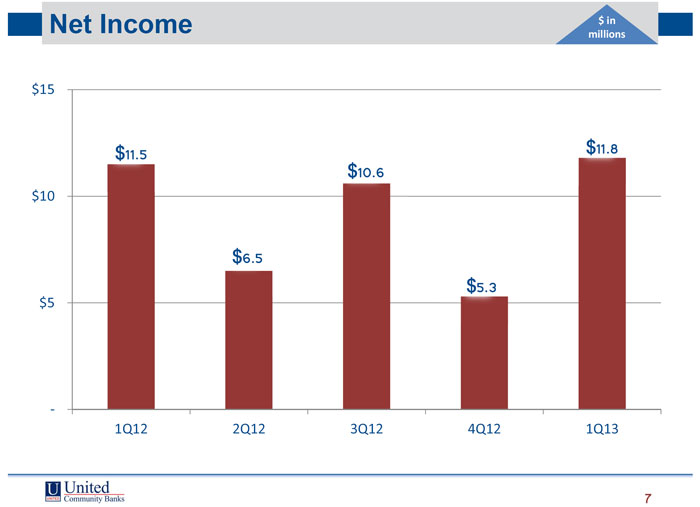 | Net Income $ in millions $15 $ 11.5 $11.8 $10.6 $10 $ 6.5 $5.3 $5 - 1Q12 2Q12 3Q12 4Q12 1Q13 7 |
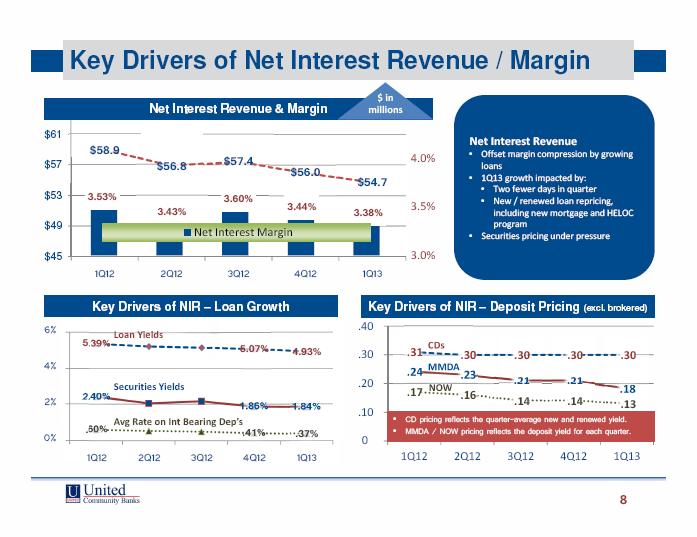 | Key Drivers of Net Interest Revenue / Margin $ in Net Interest Revenue & Margin millions $61 $ 58.9 Net Interest Revenue $ 57.4 4.0% • Offset margin compression by growing $57 $56.8 $56.0 loans $ 54.7 • 1Q13 growth impacted by: • Two fewer days in quarter $53 3.53% 3.60% • New / renewed loan repricing, 3.43% 3.44% 3.5% 3.38% including new mortgage and HELOC $49 program Net Interest Margin • Securities pricing under pressure $45 3.0% 1Q12 2Q12 3Q12 4Q12 1Q13 Key Drivers of NIR – Loan Growth Key Drivers of NIR – Deposit Pricing (excl. brokered) 6% .40 5 Loan Yields 5.07% 4.93% .30 .30 .30 .30 4% .20 .21 .21 Securities Yields NOW 2% 2 .14 .14 .13 • CD pricing reflects the quarter-average new and .10 Avg Rate on Int Bearing Dep’s renewed yield. . .37% • MMDA / NOW pricing reflects the deposit yield for 0% 0 each quarter. 1Q12 2Q12 3Q12 4Q12 1Q13 1Q12 2Q12 3Q12 4Q12 1Q13 8 |
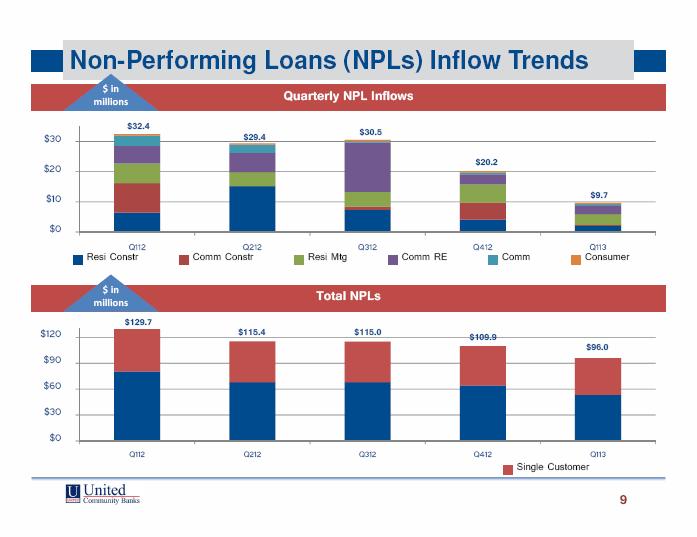 | Non-Performing Loans (NPLs) Inflow Trends $ in Quarterly NPL Inflows millions $ 32.4 $ 30 $29.4 $30.5 $ 20 $20.2 $ 10 $9.7 $ 0 Q112 Q212 Q312 Q412 Q113 Resi Constr Comm Constr Resi Mtg Comm RE Comm Consumer $ in Total NPLs millions $ 129.7 $ 120 $115.4 $115.0 $ 109.9 $ 99.0 $ 90 $ 60 $ 30 $ 0 Q112 Q212 Q312 Q412 Q113 Single Customer 9 |
 | United Community Banks, Inc. OUTLOOK 10 |
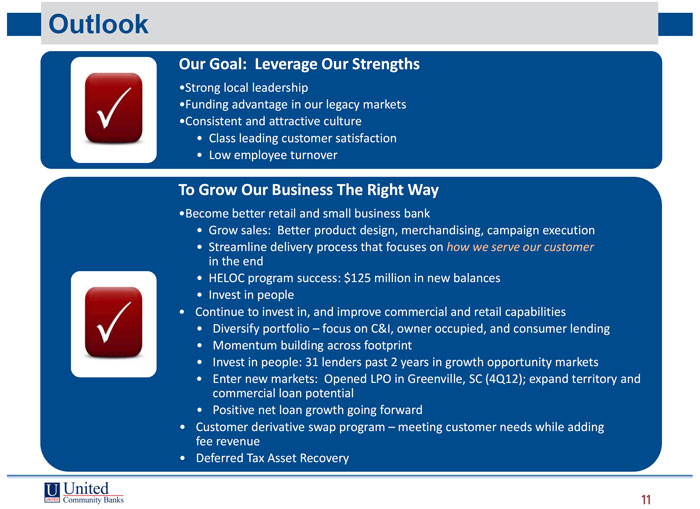 | Outlook Our Goal: Leverage Our Strengths •Strong local leadership •Funding advantage in our legacy markets •Consistent and attractive culture • Class leading customer satisfaction • Low employee turnover To Grow Our Business The Right Way •Become better retail and small business bank • Grow sales: Better product design, merchandising, campaign execution • Streamline delivery process that focuses on how we serve our customer in the end • HELOC program success: $125 million in new balances • Invest in people • Continue to invest in, and improve commercial and retail capabilities • Diversify portfolio – focus on C&I, owner occupied, and consumer lending • Momentum building across footprint • Invest in people: 31 lenders past 2 years in growth opportunity markets • Enter new markets: Opened LPO in Greenville, SC (4Q12); expand territory and commercial loan potential • Positive net loan growth going forward • Customer derivative swap program – meeting customer needs while adding fee revenue • Deferred Tax Asset Recovery 11 |
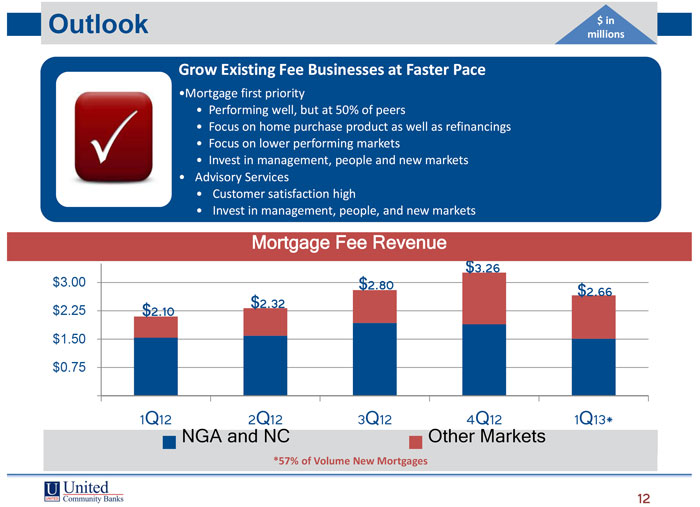 | Outlook $ in millions Grow Existing Fee Businesses at Faster Pace •Mortgage first priority • Performing well, but at 50% of peers • Focus on home purchase product as well as refinancings • Focus on lower performing markets • Invest in management, people and new markets • Advisory Services • Customer satisfaction high • Invest in management, people, and new markets Mortgage Fee Revenue $ 3.26 $3.00 $2.80 $ 2.66 $ 2.32 $2.25 $2.10 $1.50 $0.75 1Q12 2Q12 3Q12 4Q12 1Q13* NGA and NC Other Markets *57% of Volume New Mortgages 12 |
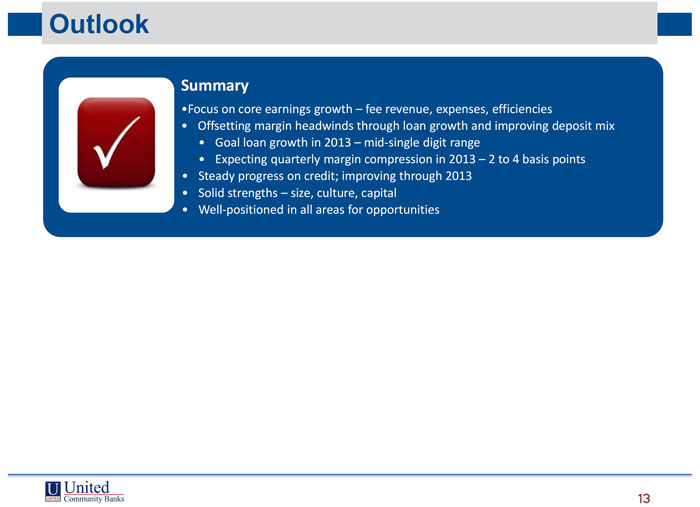 | Outlook Summary •Focus on core earnings growth – fee revenue, expenses, efficiencies • Offsetting margin headwinds through loan growth and improving deposit mix • Goal loan growth in 2013 – mid-single digit range • Expecting quarterly margin compression in 2013 – 2 to 4 basis points • Steady progress on credit; improving through 2013 • Solid strengths – size, culture, capital • Well-positioned in all areas for opportunities 13 |
 | United Community Banks, Inc. FINANCIAL REVIEW 14 |
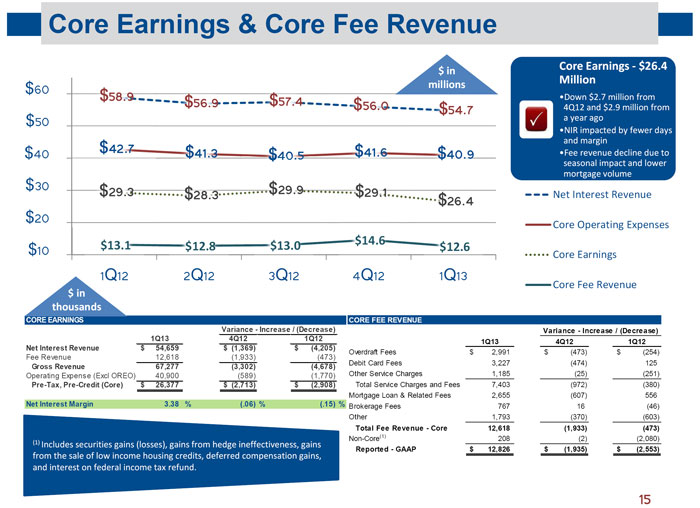 | Core Earnings & Core Fee Revenue Core Earnings -$26.4 $ in Million $ 60 millions $ 58.9 $56.9 $57.4 $56.0 •Down $2.7 million from $ 54.7 4Q12 and $2.9 million from $ 50 a year ago •NIR impacted by fewer days $ 42.7 and margin $ 40 $41.3 $40.5 $41.6 $40.9 •Fee revenue decline due to seasonal impact and lower mortgage volume $ 30 $29.3 $29.9 $29.1 $ 28.3 $26.4 Net Interest Revenue $ 20 Core Operating Expenses $13.1 $14.6 $ 10 $12.8 $13.0 $12.6 Core Earnings 1Q12 2Q12 3Q12 4Q12 1Q13 Core Fee Revenue $ in thousands CORE EARNINGS CORE FEE REVENUE Variance - Increase / (Decrease) Variance - Increase / (Decrease) 1Q13 4Q12 1Q12 1Q13 4Q12 1Q12 Net Interest Revenue $ 54,659 $ (1,369) $ (4,205) Overdraft Fees $ 2,991 $ (473) $ (254) Fee Revenue 12,618 (1,933) (473) Debit Card Fees 3,227 (474) 125 Gross Revenue 67,277 (3,302) (4,678) Operating Expense (Excl OREO) 40,900 (589) (1,770) Other Service Charges 1,185 (25) (251) Pre-Tax, Pre-Credit (Core) $ 26,377 $ (2,713) $ (2,908) Total Service Charges and Fees 7,403 (972) (380) Mortgage Loan & Related Fees 2,655 (607) 556 Net Interest Margin 3.38 % (.06) % (.15) % Brokerage Fees 767 16 (46) Other 1,793 (370) (603) Total Fee Revenue - Core 12,618 (1,933) (473) Non-Core(1) 208 (2) (2,080) (1) Includes securities gains (losses), gains from hedge ineffectiveness, gains Reported - GAAP $ 12,826 $ (1,935) $ (2,553) from the sale of low income housing credits, deferred compensation gains, and interest on federal income tax refund. 15 |
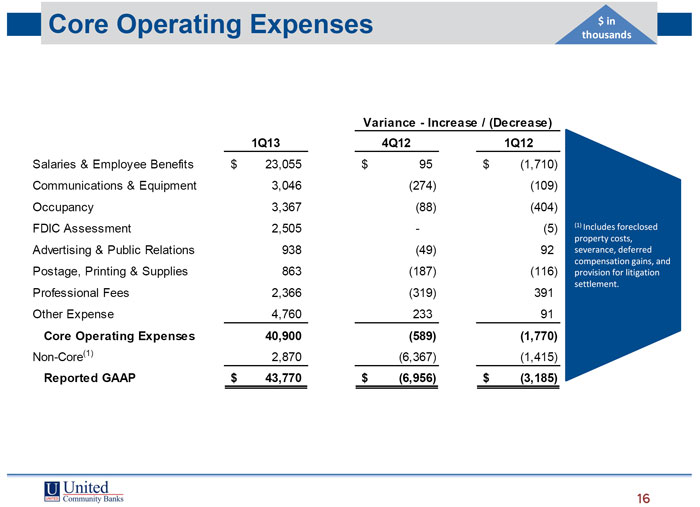 | Core Operating Expenses $ in thousands Variance - Increase / (Decrease) 1Q13 4Q12 1Q12 Salaries & Employee Benefits $ 23,055 $ 95 $ (1,710) Communications & Equipment 3,046 (274) (109) Occupancy 3,367 (88) (404) FDIC Assessment 2,505 - (5) (1) Includes foreclosed property costs, Advertising & Public Relations 938 (49) 92 severance, deferred compensation gains, and Postage, Printing & Supplies 863 (187) (116) provision for litigation settlement. Professional Fees 2,366 (319) 391 Other Expense 4,760 233 91 Core Operating Expenses 40,900 (589) (1,770) Non-Core(1) 2,870 (6,367) (1,415) Reported GAAP $ 43,770 $ (6,956) $ (3,185) 16 |
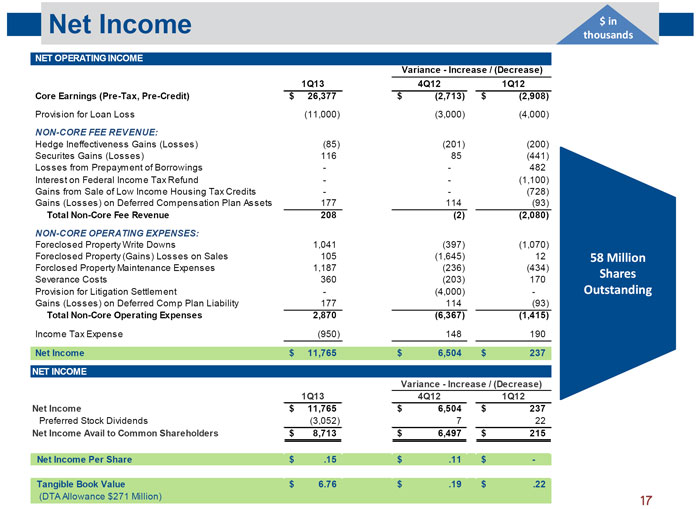 | Net Income $ in thousands NET OPERATING INCOME Variance - Increase / (Decrease) 1Q13 4Q12 1Q12 Core Earnings (Pre-Tax, Pre-Credit) $ 26,377 $ (2,713) $ (2,908) Provision for Loan Loss (11,000) (3,000) (4,000) NON-CORE FEE REVENUE: Hedge Ineffectiveness Gains (Losses) (85) (201) (200) Securites Gains (Losses) 116 85 (441) Losses from Prepayment of Borrowings - - 482 Interest on Federal Income Tax Refund - - (1,100) Gains from Sale of Low Income Housing Tax Credits - - (728) Gains (Losses) on Deferred Compensation Plan Assets 177 114 (93) Total Non-Core Fee Revenue 208 (2) (2,080) NON-CORE OPERATING EXPENSES: Foreclosed Property Write Downs 1,041 (397) (1,070) Foreclosed Property (Gains) Losses on Sales 105 (1,645) 12 58 Million Forclosed Property Maintenance Expenses 1,187 (236) (434) Shares Severance Costs 360 (203) 170 Provision for Litigation Settlement - (4,000) - Outstanding Gains (Losses) on Deferred Comp Plan Liability 177 114 (93) Total Non-Core Operating Expenses 2,870 (6,367) (1,415) Income Tax Expense (950) 148 190 Net Income $ 11,765 $ 6,504 $ 237 NET INCOME Variance - Increase / (Decrease) 1Q13 4Q12 1Q12 Net Income $ 11,765 $ 6,504 $ 237 Preferred Stock Dividends (3,052) 7 22 Net Income Avail to Common Shareholders $ 8,713 $ 6,497 $ 215 Net Income Per Share $ .15 $ .11 $ - Tangible Book Value $ 6.76 $ .19 $ .22 (DTA Allowance $271 Million) 17 |
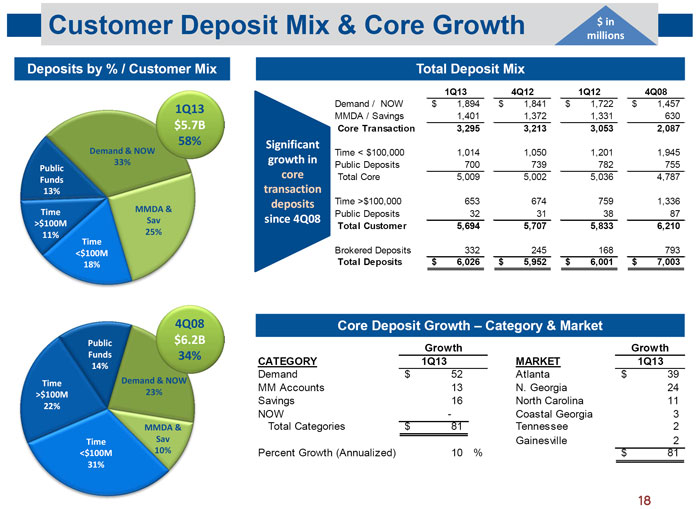 | Customer Deposit Mix & Core Growth $ in millions Deposits by % / Customer Mix Total Deposit Mix 1Q13 4Q12 1Q12 4Q08 Demand / NOW $ 1,894 $ 1,841 $ 1,722 $ 1,457 1Q13 MMDA / Savings 1,401 1,372 1,331 630 $5.7B Core Transaction 3,295 3,213 3,053 2,087 58% Significant Demand & NOW Time < $100,000 1,014 1,050 1,201 1,945 33% growth in Public Public Deposits 700 739 782 755 core Total Core 5,009 5,002 5,036 4,787 Funds 13% transaction deposits Time >$100,000 653 674 759 1,336 Time MMDA & Public Deposits 32 31 38 87 Sav since 4Q08 >$100M Total Customer 5,694 5,707 5,833 6,210 11% 25% Time <$100M Brokered Deposits 332 245 168 793 18% Total Deposits $ 6,026 $ 5,952 $ 6,001 $ 7,003 4Q08 Core Deposit Growth – Category & Market Public $6.2B Growth Growth Funds 34% CATEGORY 1Q13 MARKET 1Q13 14% Demand $ 52 Atlanta $ 39 Time Demand & NOW MM Accounts 13 N. Georgia 24 >$100M 23% Savings 16 North Carolina 11 22% NOW - Coastal Georgia 3 MMDA & Total Categories $ 81 Tennessee 2 Time Sav Gainesville 2 <$100M 10% Percent Growth (Annualized) 10 % $ 81 31% 18 |
 | Capital Ratios 15% 14.30% 14.30% 14.20% 14.30% 13.70% 10% 8.80% 8.80% 8.80% 8.90% 8.30% 5.50% 5.70% 5.70% 5.70% 5% 5.30% 1Q12 2Q12 3Q12 4Q12 1Q13 Total RBC Tier 1 RBC Leverage Tier 1 Common RBC Tangible Common to Assets* *DTA Allowance of $271 million, when reversed, adds 3.6% to 1Q13 Tangible Common to Assets Well- Capitalized MAR ‘13 DEC ‘12 MAR ‘12 Bank Tier 1 RBC 6 % 14.7 % 14.5 % 13.7 % Total RBC 10 16.0 15.7 15.0 Leverage 5 10.0 9.9 9.0 Holding Company Tangible Equity to Assets 8.5 8.6 8.1 19 |
 | United Community Banks, Inc. LOAN PORTFOLIO & CREDIT QUALITY 20 |
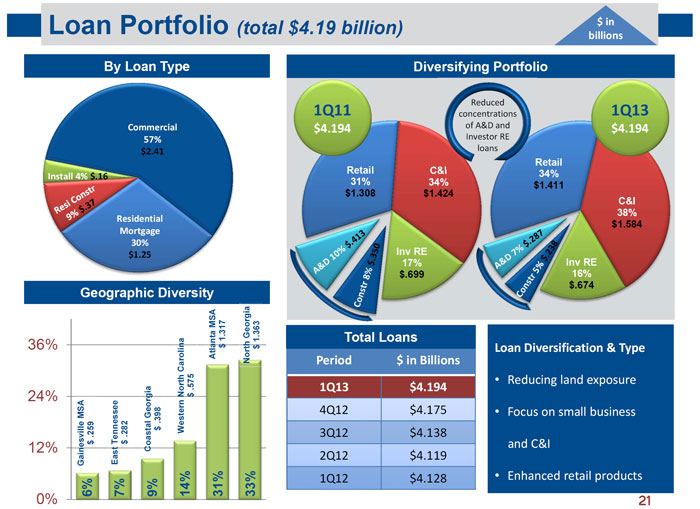 | Loan Portfolio (total $4.19 billion) $ in billions By Loan Type Diversifying Portfolio Reduced 1Q11 concentrations 1Q13 Commercial $4.194 of A&D and $4.194 57% Investor RE $2.41 loans Retail Retail C&I 34% Install 4% $.16 31% 34% $1.411 $1.308 $1.424 C&I 38% Residential $1.584 Mortgage 30% $1.25 Inv RE 17% Inv RE $.699 16% $.674 Geographic Diversity $ 1.317 $ 1.363 Total Loans 36% Atlanta MSA North Georgia Loan Diversification & Type Period $ in Billions • Reducing land exposure $ .575 1Q13 $4.194 24% $ .398 Western North Carolina 4Q12 $4.175 • Focus on small business $ .259 $ .282 3Q12 $4.138 12% Coastal Georgia and C&I Gainesville MSA East Tennessee 2Q12 $4.119 33% 1Q12 $4.128 • Enhanced retail products 6% 7% 9% 14% 31% 0% 21 |
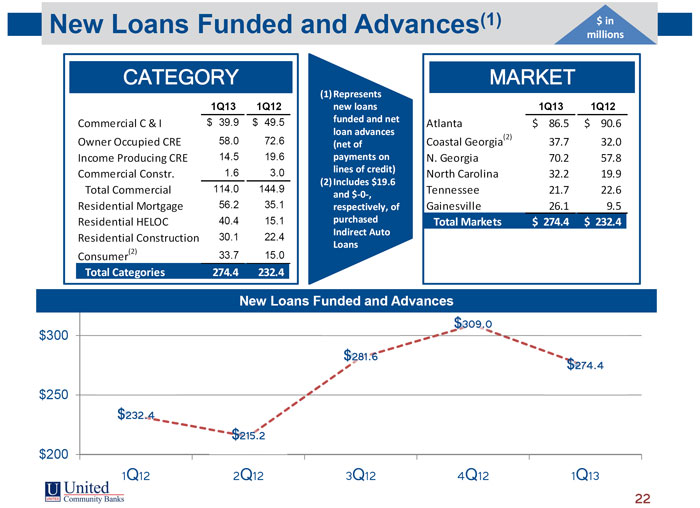 | New Loans Funded and Advances(1) $ in millions CATEGORY MARKET (1)Represents 1Q13 1Q12 new loans 1Q13 1Q12 Commercial C & I $ 39.9 $ 49.5 funded and net Atlanta $ 86.5 $ 90.6 loan advances Owner Occupied CRE 58.0 72.6 (net of Coastal Georgia(2) 37.7 32.0 Income Producing CRE 14.5 19.6 payments on N. Georgia 70.2 57.8 1.6 3.0 lines of credit) Commercial Constr. North Carolina 32.2 19.9 (2)Includes $19.6 Total Commercial 114.0 144.9 Tennessee 21.7 22.6 and $-0-, Residential Mortgage 56.2 35.1 respectively, of Gainesville 26.1 9.5 Residential HELOC 40.4 15.1 purchased Total Markets $ 274.4 $ 232.4 30.1 22.4 Indirect Auto Residential Construction Loans Consumer(2) 33.7 15.0 Total Categories 274.4 232.4 New Loans Funded and Advances $309.0 $300 $ 281.6 $ 274.4 $250 $ 232.4 $215.2 $200 1Q12 2Q12 3Q12 4Q12 1Q13 22 |
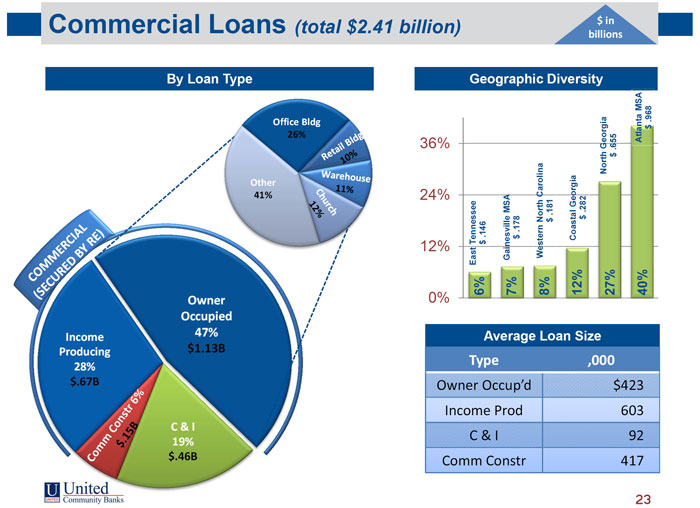 | Commercial Loans (total $2.41 billion) $ in billions By Loan Type Geographic Diversity Office Bldg $ .968 26% Atlanta MSA 36% North Georgia $ .655 Other 41% 24% $ .181 $ .282 $ .146 $ .178 Coastal Georgia 12% East Tennessee Gainesville MSA Western North Carolina 6% 7% 8% 12% 27% 40% Owner 0% Occupied Income 47% Average Loan Size Producing $1.13B Type ,000 28% $.67B Owner Occup’d $423 Income Prod 603 C & I C & I 92 19% $.46B Comm Constr 417 23 |
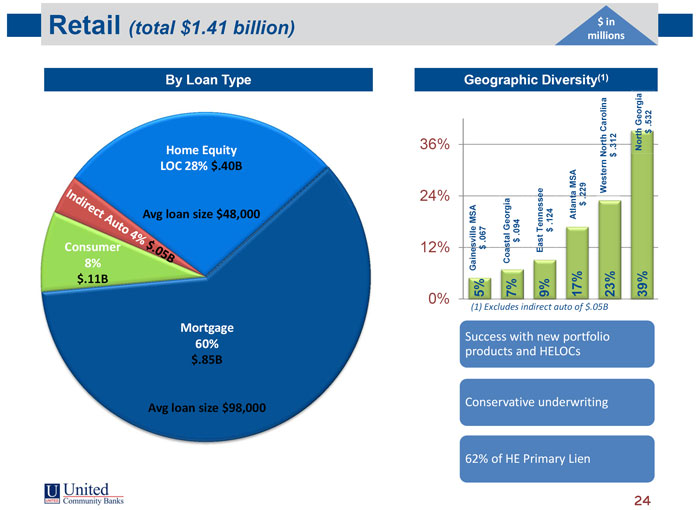 | Retail (total $1.41 billion) $ in millions By Loan Type Geographic Diversity(1) $ .532 Home Equity 36% $ .312 North Georgia LOC 28% $.40B Western North Carolina 24% $ .229 Avg loan size $48,000 $ .124 Atlanta MSA $ .067 $ .094 Consumer 12% Coastal Georgia East Tennessee 8% Gainesville MSA $.11B 5% 7% 9% 17% 23% 39% 0% (1) Excludes indirect auto of $.05B Mortgage Success with new portfolio 60% products and HELOCs $.85B Conservative underwriting Avg loan size $98,000 62% of HE Primary Lien 24 |
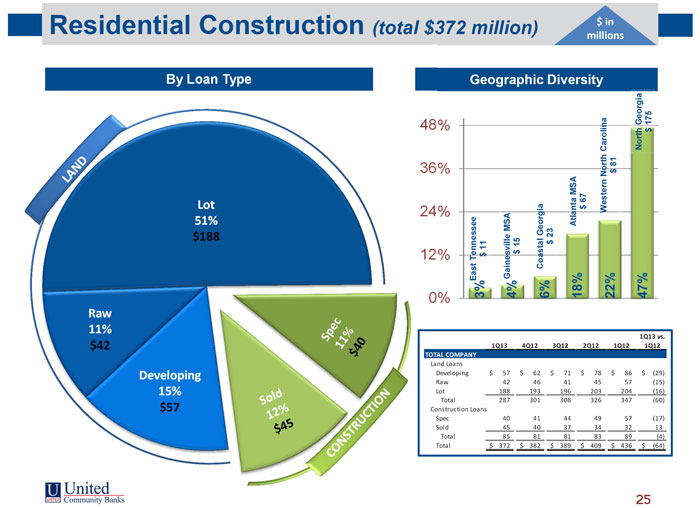 | Residential Construction (total $372 million) $ in millions Geographic Diversity North Georgia $ 175 $ 81 Atlanta MSA $ 67 Western North Carolina $ 23 East Tennessee $ 11 Gainesville MSA $ 15 Coastal Georgia 0% 3% 4% 6% 18% 22% 47% 1Q13 vs. 1Q13 4Q12 3Q12 2Q12 1Q12 1Q12 TOTAL COMPANY Land Loans Developing $ 57 $ 62 $ 71 $ 78 $ 86 $ (29) Raw 42 46 41 45 57 (15) Lot 188 193 196 203 204 (16) Total 287 301 308 326 347 (60) Construction Loans Spec 40 41 44 49 57 (17) Sold 45 40 37 34 32 13 Total 85 81 81 83 89 (4) Total $ 372 $ 382 $ 389 $ 409 $ 436 $ (64) 25 |
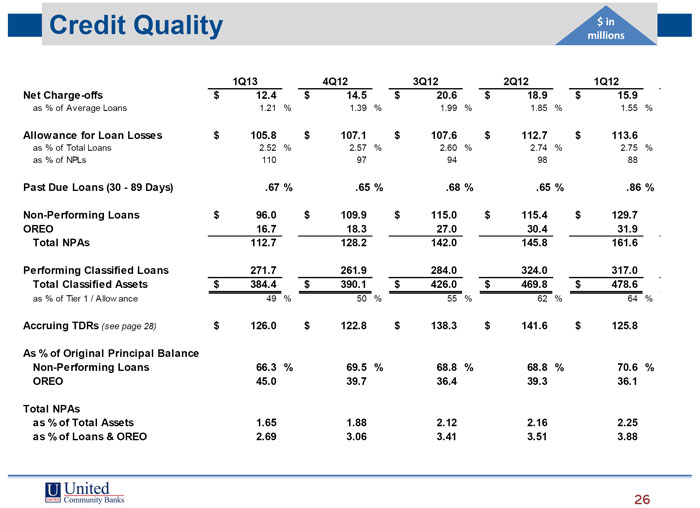 | Credit Quality $ in millions 1Q13 4Q12 3Q12 2Q12 1Q12 Net Charge-offs $ 12.4 $ 14.5 $ 20.6 $ 18.9 $ 15.9 as % of Average Loans 1.21 % 1.39 % 1.99 % 1.85 % 1.55 % Allowance for Loan Losses $ 105.8 $ 107.1 $ 107.6 $ 112.7 $ 113.6 as % of Total Loans 2.52 % 2.57 % 2.60 % 2.74 % 2.75 % as % of NPLs 110 97 94 98 88 Past Due Loans (30 - 89 Days) .67 % .65 % .68 % .65 % .86 % Non-Performing Loans $ 96.0 $ 109.9 $ 115.0 $ 115.4 $ 129.7 OREO 16.7 18.3 27.0 30.4 31.9 Total NPAs 112.7 128.2 142.0 145.8 161.6 Performing Classified Loans 271.7 261.9 284.0 324.0 317.0 Total Classified Assets $ 384.4 $ 390.1 $ 426.0 $ 469.8 $ 478.6 as % of Tier 1 / Allow ance 49 % 50 % 55 % 62 % 64 % Accruing TDRs (see page 28) $ 126.0 $ 122.8 $ 138.3 $ 141.6 $ 125.8 As % of Original Principal Balance Non-Performing Loans 66.3 % 69.5 % 68.8 % 68.8 % 70.6 % OREO 45.0 39.7 36.4 39.3 36.1 Total NPAs as % of Total Assets 1.65 1.88 2.12 2.16 2.25 as % of Loans & OREO 2.69 3.06 3.41 3.51 3.88 26 |
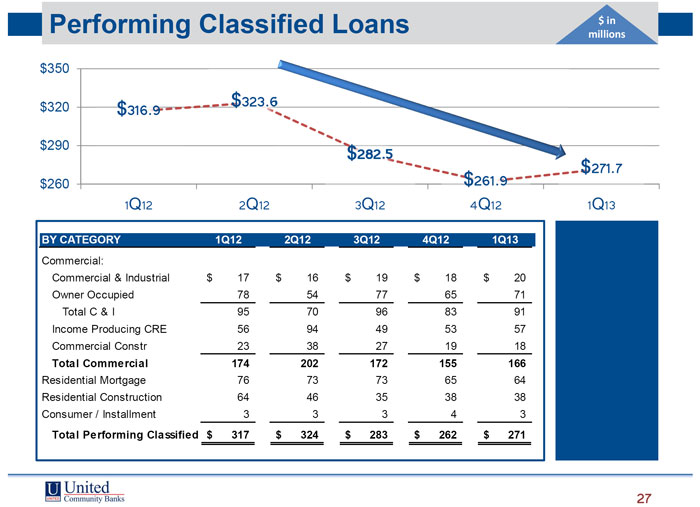 | Performing Classified Loans $ in millions $350 $320 $323.6 $ 316.9 $290 $271.7 $260 $261.9 1Q12 2Q12 3Q12 4Q12 1Q13 BY CATEGORY 1Q12 2Q12 3Q12 4Q12 1Q13 Commercial: Commercial & Industrial $ 17 $ 16 $ 19 $ 18 $ 20 Owner Occupied 78 54 77 65 71 Total C & I 95 70 96 83 91 Income Producing CRE 56 94 49 53 57 Commercial Constr 23 38 27 19 18 Total Commercial 174 202 172 155 166 Residential Mortgage 76 73 73 65 64 Residential Construction 64 46 35 38 38 Consumer / Installment 3 3 3 4 3 Total Performing Classified $ 317 $ 324 $ 283 $ 262 $ 271 27 |
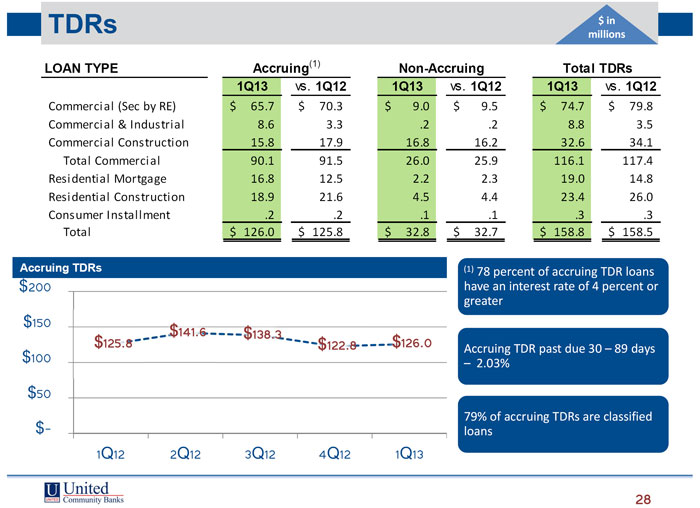 | TDRs $ in millions LOAN TYPE Accruing(1) Non-Accruing Total TDRs 1Q13 vs. 1Q12 1Q13 vs. 1Q12 1Q13 vs. 1Q12 Commercial (Sec by RE) $ 65.7 $ 70.3 $ 9.0 $ 9.5 $ 74.7 $ 79.8 Commercial & Industrial 8.6 3.3 .2 .2 8.8 3.5 Commercial Construction 15.8 17.9 16.8 16.2 32.6 34.1 Total Commercial 90.1 91.5 26.0 25.9 116.1 117.4 Residential Mortgage 16.8 12.5 2.2 2.3 19.0 14.8 Residential Construction 18.9 21.6 4.5 4.4 23.4 26.0 Consumer Installment .2 .2 .1 .1 .3 .3 Total $ 126.0 $ 125.8 $ 32.8 $ 32.7 $ 158.8 $ 158.5 Accruing TDRs (1) 78 percent of accruing TDR loans $ 200 have an interest rate of 4 percent or greater $ 150 $ 141.6 $138.3 $ 125.8 $122.8 $126.0 $ 100 Accruing TDR past due 30 – 89 days – 2.03% $ 50 79% of accruing TDRs are classified $ - loans 1Q12 2Q12 3Q12 4Q12 1Q13 28 |
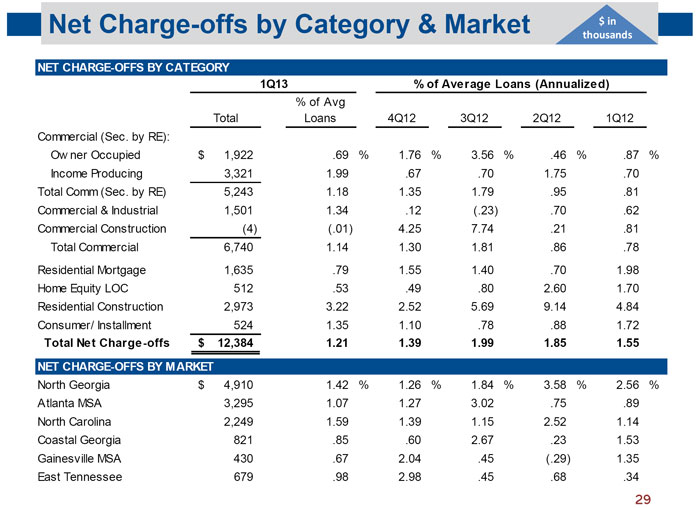 | Net Charge-offs by Category & Market $ in thousands NET CHARGE-OFFS BY CATEGORY 1Q13 % of Average Loans (Annualized) % of Avg Total Loans 4Q12 3Q12 2Q12 1Q12 Commercial (Sec. by RE): Ow ner Occupied $ 1,922 .69 % 1.76 % 3.56 % .46 % .87 % Income Producing 3,321 1.99 .67 .70 1.75 .70 Total Comm (Sec. by RE) 5,243 1.18 1.35 1.79 .95 .81 Commercial & Industrial 1,501 1.34 .12 (.23) .70 .62 Commercial Construction (4) (.01) 4.25 7.74 .21 .81 Total Commercial 6,740 1.14 1.30 1.81 .86 .78 Residential Mortgage 1,635 .79 1.55 1.40 .70 1.98 Home Equity LOC 512 .53 .49 .80 2.60 1.70 Residential Construction 2,973 3.22 2.52 5.69 9.14 4.84 Consumer/ Installment 524 1.35 1.10 .78 .88 1.72 Total Net Charge-offs $ 12,384 1.21 1.39 1.99 1.85 1.55 NET CHARGE-OFFS BY MARKET North Georgia $ 4,910 1.42 % 1.26 % 1.84 % 3.58 % 2.56 % Atlanta MSA 3,295 1.07 1.27 3.02 .75 .89 North Carolina 2,249 1.59 1.39 1.15 2.52 1.14 Coastal Georgia 821 .85 .60 2.67 .23 1.53 Gainesville MSA 430 .67 2.04 .45 (.29) 1.35 East Tennessee 679 .98 2.98 .45 .68 .34 29 |
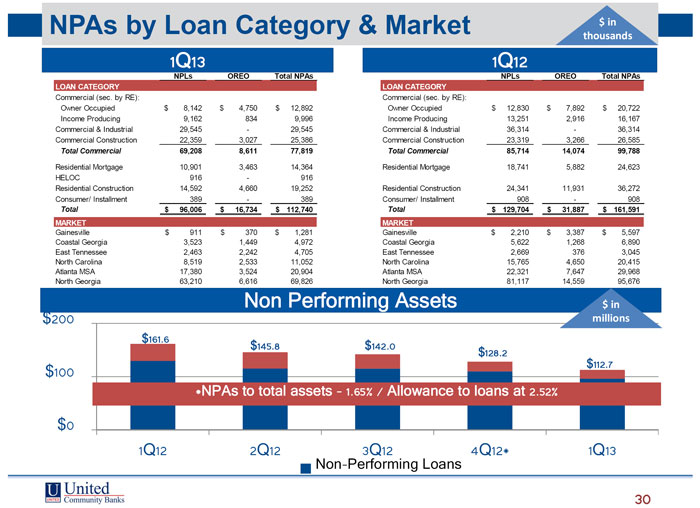 | NPAs by Loan Category & Market $ in thousands 1Q13 1Q12 NPLs OREO Total NPAs NPLs OREO Total NPAs LOAN CATEGORY LOAN CATEGORY Commercial (sec. by RE): Commercial (sec. by RE): Owner Occupied $ 8,142 $ 4,750 $ 12,892 Owner Occupied $ 12,830 $ 7,892 $ 20,722 Income Producing 9,162 834 9,996 Income Producing 13,251 2,916 16,167 Commercial & Industrial 29,545 - 29,545 Commercial & Industrial 36,314 - 36,314 Commercial Construction 22,359 3,027 25,386 Commercial Construction 23,319 3,266 26,585 Total Commercial 69,208 8,611 77,819 Total Commercial 85,714 14,074 99,788 Residential Mortgage 10,901 3,463 14,364 Residential Mortgage 18,741 5,882 24,623 HELOC 916 - 916 Residential Construction 14,592 4,660 19,252 Residential Construction 24,341 11,931 36,272 Consumer/ Installment 389 - 389 Consumer/ Installment 908 - 908 Total $ 96,006 $ 16,734 $ 112,740 Total $ 129,704 $ 31,887 $ 161,591 MARKET MARKET Gainesville $ 911 $ 370 $ 1,281 Gainesville $ 2,210 $ 3,387 $ 5,597 Coastal Georgia 3,523 1,449 4,972 Coastal Georgia 5,622 1,268 6,890 East Tennessee 2,463 2,242 4,705 East Tennessee 2,669 376 3,045 North Carolina 8,519 2,533 11,052 North Carolina 15,765 4,650 20,415 Atlanta MSA 17,380 3,524 20,904 Atlanta MSA 22,321 7,647 29,968 North Georgia 63,210 6,616 69,826 North Georgia 81,117 14,559 95,676 Non Performing Assets $ in $ 200 millions $ 161.6 $ 145.8 $142.0 $ 128.2 $ 100 $112.7 *NPAs to total assets Ð 1.65% / Allowance to loans at 2.52% $ 0 1Q12 2Q12 3Q12 4Q12* 1Q13 Non-Performing Loans 30 |
 | United Community Banks, Inc. APPENDIX 31 |
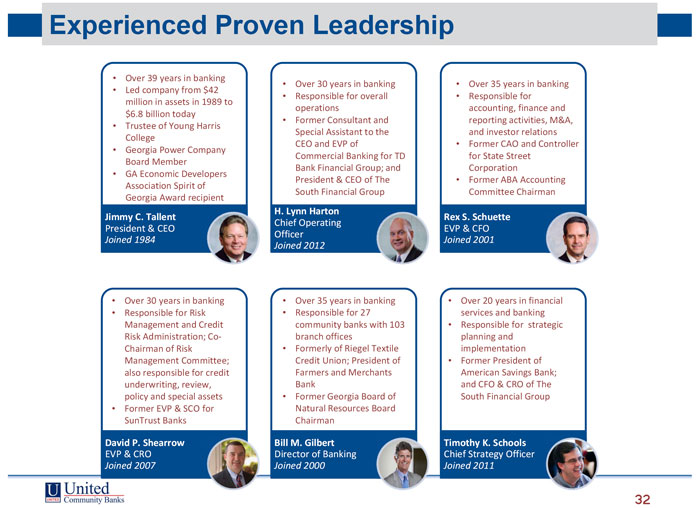 | Experienced Proven Leadership • Over 39 years in banking • Over 30 years in banking • Over 35 years in banking • Led company from $42 • Responsible for overall • Responsible for million in assets in 1989 to operations accounting, finance and $6.8 billion today • Former Consultant and reporting activities, M&A, • Trustee of Young Harris Special Assistant to the and investor relations College CEO and EVP of • Former CAO and Controller • Georgia Power Company Commercial Banking for TD for State Street Board Member Bank Financial Group; and Corporation • GA Economic Developers President & CEO of The • Former ABA Accounting Association Spirit of South Financial Group Committee Chairman Georgia Award recipient H. Lynn Harton Jimmy C. Tallent Rex S. Schuette Chief Operating President & CEO EVP & CFO Officer Joined 1984 Joined 2001 Joined 2012 • Over 30 years in banking • Over 35 years in banking • Over 20 years in financial • Responsible for Risk • Responsible for 27 services and banking Management and Credit community banks with 103 • Responsible for strategic Risk Administration; Co- branch offices planning and Chairman of Risk • Formerly of Riegel Textile implementation Management Committee; Credit Union; President of • Former President of also responsible for credit Farmers and Merchants American Savings Bank; underwriting, review, Bank and CFO & CRO of The policy and special assets • Former Georgia Board of South Financial Group • Former EVP & SCO for Natural Resources Board SunTrust Banks Chairman David P. Shearrow Bill M. Gilbert Timothy K. Schools EVP & CRO Director of Banking Chief Strategy Officer Joined 2007 Joined 2000 Joined 2011 32 |
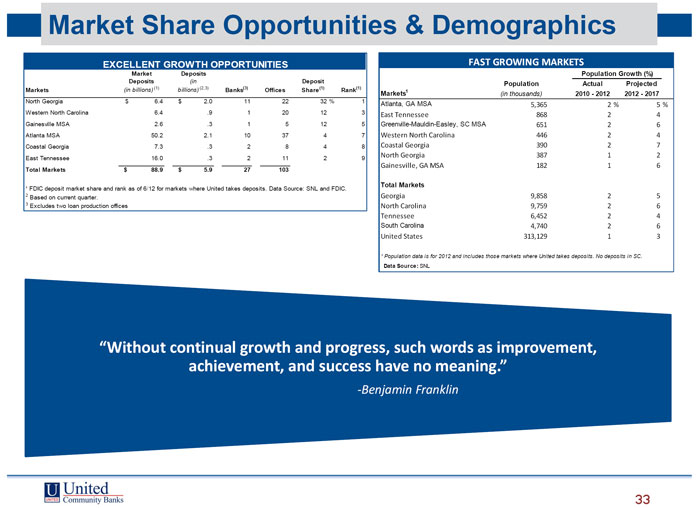 | Market Share Opportunities & Demographics EXCELLENT GROWTH OPPORTUNITIES FAST GROWING MARKETS Market Deposits Population Growth (%) Deposits (in Deposit Population Actual Projected Markets (in billions)(1) billions)(2,3) Banks(3) Offices Share(1) Rank(1) Markets1 (in thousands) 2010 - 2012 2012 - 2017 North Georgia $ 6.4 $ 2.0 11 22 32 % 1 Atlanta, GA MSA 5,365 2 % 5 % Western North Carolina 6.4 .9 1 20 12 3 East Tennessee 868 2 4 Gainesville MSA 2.6 .3 1 5 12 5 Greenville-Mauldin-Easley, SC MSA 651 2 6 Atlanta MSA 50.2 2.1 10 37 4 7 Western North Carolina 446 2 4 Coastal Georgia 7.3 .3 2 8 4 8 Coastal Georgia 390 2 7 East Tennessee 16.0 .3 2 11 2 9 North Georgia 387 1 2 Gainesville, GA MSA 182 1 6 Total Markets $ 88.9 $ 5.9 27 103 Total Markets ¹ FDIC deposit market share and rank as of 6/12 for markets where United takes deposits. Data Source: SNL and FDIC. 2 Based on current quarter. Georgia 9,858 2 5 3 Excludes two loan production offices North Carolina 9,759 2 6 Tennessee 6,452 2 4 South Carolina 4,740 2 6 United States 313,129 1 3 ¹ Population data is for 2012 and includes those markets where United takes deposits. No deposits in SC. Data Source: SNL “Without continual growth and progress, such words as improvement, achievement, and success have no meaning.” -Benjamin Franklin 33 |
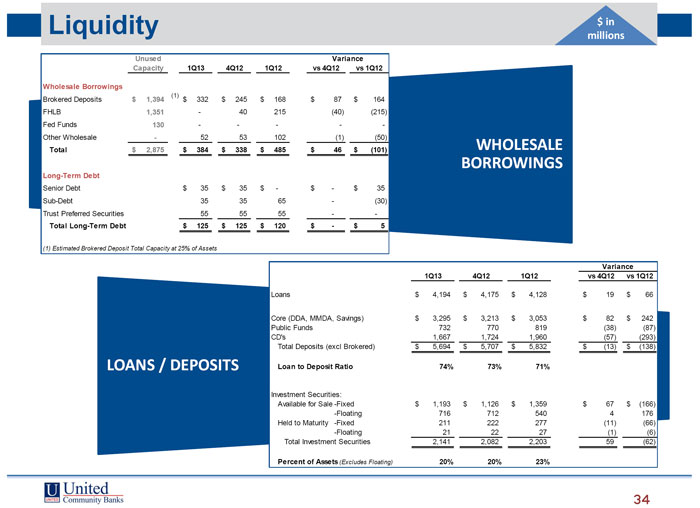 | Liquidity $ in millions Unused Variance Capacity 1Q13 4Q12 1Q12 vs 4Q12 vs 1Q12 Wholesale Borrowings (1) Brokered Deposits $ 1,394 $ 332 $ 245 $ 168 $ 87 $ 164 FHLB 1,351 - 40 215 (40) (215) Fed Funds 130 - - - - -Other Wholesale - 52 53 102 (1) (50) Total $ 2,875 $ 384 $ 338 $ 485 $ 46 $ (101) WHOLESALE BORROWINGS Long-Term Debt Senior Debt $ 35 $ 35 $ - $ - $ 35 Sub-Debt 35 35 65 - (30) Trust Preferred Securities 55 55 55 - - Total Long-Term Debt $ 125 $ 125 $ 120 $ - $ 5 (1) Estimated Brokered Deposit Total Capacity at 25% of Assets Variance 1Q13 4Q12 1Q12 vs 4Q12 vs 1Q12 Loans $ 4,194 $ 4,175 $ 4,128 $ 19 $ 66 Core (DDA, MMDA, Savings) $ 3,295 $ 3,213 $ 3,053 $ 82 $ 242 Public Funds 732 770 819 (38) (87) CD’s 1,667 1,724 1,960 (57) (293) Total Deposits (excl Brokered) $ 5,694 $ 5,707 $ 5,832 $ (13) $ (138) LOANS / DEPOSITS Loan to Deposit Ratio 74% 73% 71% Investment Securities: Available for Sale -Fixed $ 1,193 $ 1,126 $ 1,359 $ 67 $ (166) -Floating 716 712 540 4 176 Held to Maturity -Fixed 211 222 277 (11) (66) -Floating 21 22 27 (1) (6) Total Investment Securities 2,141 2,082 2,203 59 (62) Percent of Assets (Excludes Floating) 20% 20% 23% 34 |
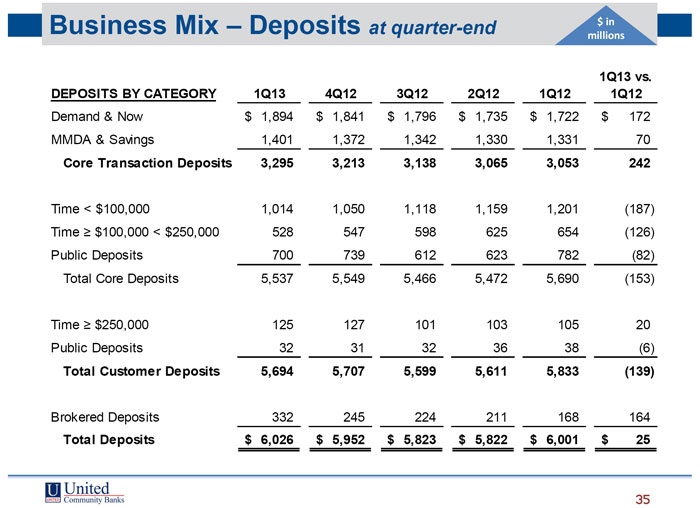 | Business Mix – Deposits at quarter-end $ in millions 1Q13 vs. DEPOSITS BY CATEGORY 1Q13 4Q12 3Q12 2Q12 1Q12 1Q12 Demand & Now $ 1,894 $ 1,841 $ 1,796 $ 1,735 $ 1,722 $ 172 MMDA & Savings 1,401 1,372 1,342 1,330 1,331 70 Core Transaction Deposits 3,295 3,213 3,138 3,065 3,053 242 Time < $100,000 1,014 1,050 1,118 1,159 1,201 (187) Time $100,000 < $250,000 528 547 598 625 654 (126) Public Deposits 700 739 612 623 782 (82) Total Core Deposits 5,537 5,549 5,466 5,472 5,690 (153) Time $250,000 125 127 101 103 105 20 Public Deposits 32 31 32 36 38 (6) Total Customer Deposits 5,694 5,707 5,599 5,611 5,833 (139) Brokered Deposits 332 245 224 211 168 164 Total Deposits $ 6,026 $ 5,952 $ 5,823 $ 5,822 $ 6,001 $ 25 35 |
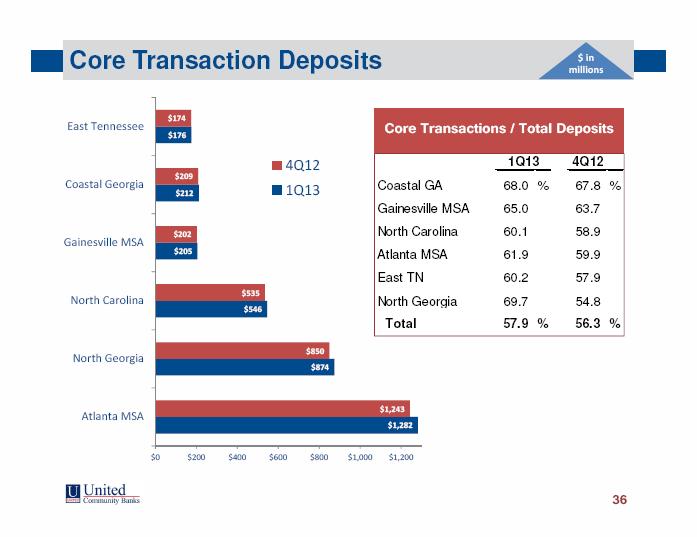 | Core Transaction Deposits $ in millions $174 East Tennessee Core Transactions / Total $176 4Q12 1Q13 4Q12 $209 Coastal Georgia 1Q13 Coastal GA 68.0 % 67.8 % $212 Gainesville MSA 65.0 63.7 $202 North Carolina 60.1 58.9 Gainesville MSA $205 Atlanta MSA 61.9 59.9 East TN 60.2 57.9 $535 North Carolina North Georgia 69.7 54.8 $546 Total 57.9 % 56.3 % $850 North Georgia $874 $1,243 Atlanta MSA $1,282 $0 $200 $400 $600 $800 $1,000 $1,200 36 |
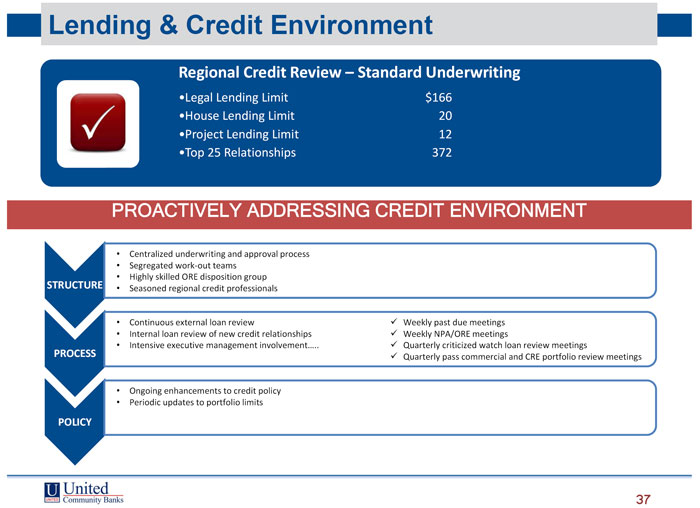 | Lending & Credit Environment Regional Credit Review – Standard Underwriting •Legal Lending Limit $166 •House Lending Limit 20 •Project Lending Limit 12 •Top 25 Relationships 372 PROACTIVELY ADDRESSING CREDIT ENVIRONMENT • Centralized underwriting and approval process • Segregated work-out teams • Highly skilled ORE disposition group STRUCTURE • Seasoned regional credit professionals • Continuous external loan review Weekly past due meetings • Internal loan review of new credit relationships Weekly NPA/ORE meetings • Intensive executive management involvement….. Quarterly criticized watch loan review meetings PROCESS Quarterly pass commercial and CRE portfolio review meetings • Ongoing enhancements to credit policy • Periodic updates to portfolio limits POLICY 37 |
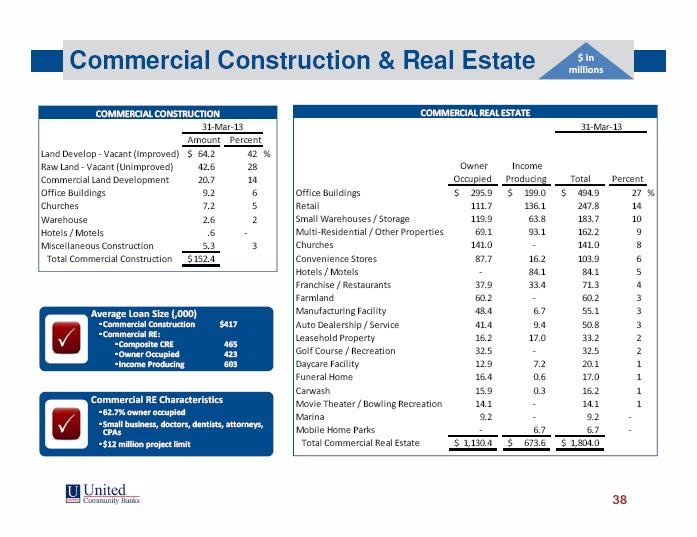 | Commercial Construction & Real Estate $ in millions COMMERCIAL CONSTRUCTION COMMERCIAL REAL ESTATE 31-Mar-13 31-Mar-13 Amount Percent Land Develop - Vacant (Improved) $ 64.2 42 % Raw Land - Vacant (Unimproved) 42.6 28 Owner Income Commercial Land Development 20.7 14 Occupied Producing Total Percent Office Buildings 9.2 6 Office Buildings $ 295.9 $ 199.0 $ 494.9 27 % Churches 7.2 5 Retail 111.7 136.1 247.8 14 Warehouse 2.6 2 Small Warehouses / Storage 119.9 63.8 183.7 10 Hotels / Motels .6 - Multi-Residential / Other Properties 69.1 93.1 162.2 9 Miscellaneous Construction 5.3 3 Churches 141.0 - 141.0 8 Total Commercial Construction $ 152.4 Convenience Stores 87.7 16.2 103.9 6 Hotels / Motels - 84.1 84.1 5 Franchise / Restaurants 37.9 33.4 71.3 4 Farmland 60.2 - 60.2 3 Average Loan Size (,000) Manufacturing Facility 48.4 6.7 55.1 3 •Commercial Construction $417 Auto Dealership / Service 41.4 9.4 50.8 3 •Commercial RE: Leasehold Property 16.2 17.0 33.2 2 •Composite CRE 465 •Owner Occupied 423 Golf Course / Recreation 32.5 - 32.5 2 •Income Producing 603 Daycare Facility 12.9 7.2 20.1 1 Funeral Home 16.4 0.6 17.0 1 Carwash 15.9 0.3 16.2 1 Commercial RE Characteristics Movie Theater / Bowling Recreation 14.1 - 14.1 1 •62.7% owner occupied Marina 9.2 - 9.2 - •Small business, doctors, dentists, attorneys, CPAs Mobile Home Parks - 6.7 6.7 - •$12 million project limit Total Commercial Real Estate $ 1,130.4 $ 673.6 $ 1,804.0 38 |
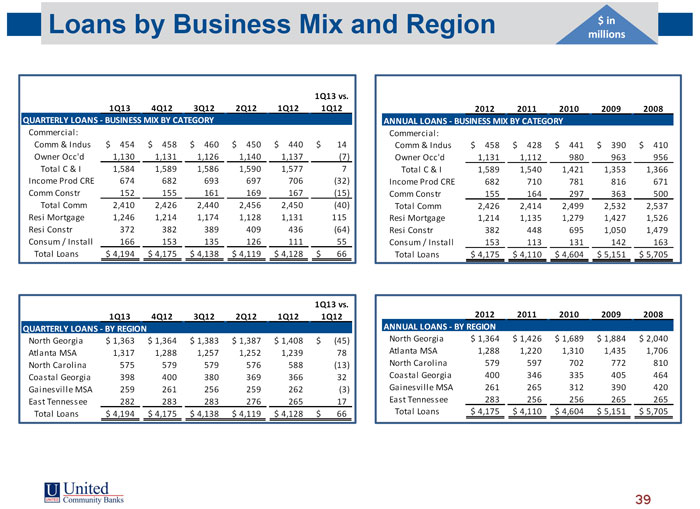 | Loans by Business Mix and Region $ in millions 1Q13 vs. 1Q13 4Q12 3Q12 2Q12 1Q12 1Q12 2012 2011 2010 2009 2008 QUARTERLY LOANS - BUSINESS MIX BY CATEGORY ANNUAL LOANS - BUSINESS MIX BY CATEGORY Commercial: Commercial: Comm & Indus $ 454 $ 458 $ 460 $ 450 $ 440 $ 14 Comm & Indus $ 458 $ 428 $ 441 $ 390 $ 410 Owner Occ’d 1,130 1,131 1,126 1,140 1,137 (7) Owner Occ’d 1,131 1,112 980 963 956 Total C & I 1,584 1,589 1,586 1,590 1,577 7 Total C & I 1,589 1,540 1,421 1,353 1,366 Income Prod CRE 674 682 693 697 706 (32) Income Prod CRE 682 710 781 816 671 Comm Constr 152 155 161 169 167 (15) Comm Constr 155 164 297 363 500 Total Comm 2,410 2,426 2,440 2,456 2,450 (40) Total Comm 2,426 2,414 2,499 2,532 2,537 Resi Mortgage 1,246 1,214 1,174 1,128 1,131 115 Resi Mortgage 1,214 1,135 1,279 1,427 1,526 Resi Constr 372 382 389 409 436 (64) Resi Constr 382 448 695 1,050 1,479 Consum / Install 166 153 135 126 111 55 Consum / Install 153 113 131 142 163 Total Loans $ 4,194 $ 4,175 $ 4,138 $ 4,119 $ 4,128 $ 66 Total Loans $ 4,175 $ 4,110 $ 4,604 $ 5,151 $ 5,705 1Q13 vs. 1Q13 4Q12 3Q12 2Q12 1Q12 1Q12 2012 2011 2010 2009 2008 QUARTERLY LOANS - BY REGION ANNUAL LOANS - BY REGION North Georgia $ 1,363 $ 1,364 $ 1,383 $ 1,387 $ 1,408 $ (45) North Georgia $ 1,364 $ 1,426 $ 1,689 $ 1,884 $ 2,040 Atlanta MSA 1,317 1,288 1,257 1,252 1,239 78 Atlanta MSA 1,288 1,220 1,310 1,435 1,706 North Carolina 575 579 579 576 588 (13) North Carolina 579 597 702 772 810 Coastal Georgia 398 400 380 369 366 32 Coastal Georgia 400 346 335 405 464 Gainesville MSA 259 261 256 259 262 (3) Gainesville MSA 261 265 312 390 420 East Tennessee 282 283 283 276 265 17 East Tennessee 283 256 256 265 265 Total Loans $ 4,194 $ 4,175 $ 4,138 $ 4,119 $ 4,128 $ 66 Total Loans $ 4,175 $ 4,110 $ 4,604 $ 5,151 $ 5,705 39 |
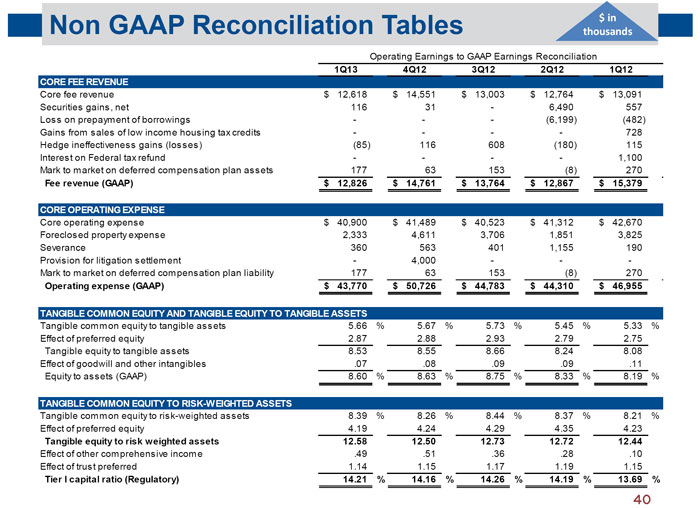 | Non GAAP Reconciliation Tables $ in thousands Operating Earnings to GAAP Earnings Reconciliation 1Q13 4Q12 3Q12 2Q12 1Q12 CORE FEE REVENUE Core fee revenue $ 12,618 $ 14,551 $ 13,003 $ 12,764 $ 13,091 Securities gains, net 116 31 - 6,490 557 Loss on prepayment of borrowings - - - (6,199) (482) Gains from sales of low income housing tax credits - - - - 728 Hedge ineffectiveness gains (losses) (85) 116 608 (180) 115 Interest on Federal tax refund - - - - 1,100 Mark to market on deferred compensation plan assets 177 63 153 (8) 270 Fee revenue (GAAP) $ 12,826 $ 14,761 $ 13,764 $ 12,867 $ 15,379 CORE OPERATING EXPENSE Core operating expense $ 40,900 $ 41,489 $ 40,523 $ 41,312 $ 42,670 Foreclosed property expense 2,333 4,611 3,706 1,851 3,825 Severance 360 563 401 1,155 190 Provision for litigation settlement - 4,000 - - -Mark to market on deferred compensation plan liability 177 63 153 (8) 270 Operating expense (GAAP) $ 43,770 $ 50,726 $ 44,783 $ 44,310 $ 46,955 TANGIBLE COMMON EQUITY AND TANGIBLE EQUITY TO TANGIBLE ASSETS Tangible common equity to tangible assets 5.66 % 5.67 % 5.73 % 5.45 % 5.33 % Effect of preferred equity 2.87 2.88 2.93 2.79 2.75 Tangible equity to tangible assets 8.53 8.55 8.66 8.24 8.08 Effect of goodwill and other intangibles .07 .08 .09 .09 .11 Equity to assets (GAAP) 8.60 % 8.63 % 8.75 % 8.33 % 8.19 % TANGIBLE COMMON EQUITY TO RISK-WEIGHTED ASSETS Tangible common equity to risk-weighted assets 8.39 % 8.26 % 8.44 % 8.37 % 8.21 % Effect of preferred equity 4.19 4.24 4.29 4.35 4.23 Tangible equity to risk weighted assets 12.58 12.50 12.73 12.72 12.44 Effect of other comprehensive income .49 .51 .36 .28 .10 Effect of trust preferred 1.14 1.15 1.17 1.19 1.15 Tier I capital ratio (Regulatory) 14.21 % 14.16 % 14.26 % 14.19 % 13.69 % 40 |