Georgia | 58-1807304 | |
(State or other jurisdiction of incorporation or organization) | (I.R.S. Employer Identification No.) | |
125 Highway 515 East, Blairsville, Georgia | 30512 | |
| (Address of principal executive offices) | (Zip Code) |
| Large accelerated filer | x | Accelerated filer | o | |
| Non-accelerated filer | o | Smaller Reporting Company | o |
| INDEX | ||||
| 3 | ||||
| 16 | ||||
| 22 | ||||
| 22 | ||||
| 22 | ||||
| 22 | ||||
| 23 | ||||
| 25 | ||||
| 27 | ||||
| 54 | ||||
| 56 | ||||
| 113 | ||||
| 113 | ||||
| 113 | ||||
| 114 | ||||
| 114 | ||||
| 114 | ||||
| 114 | ||||
| 114 | ||||
| 115 | ||||
| 119 | ||||
| 2 |
| ITEM 1. | BUSINESS. |
| 3 |
● | our ability to maintain profitability; |
● | our ability to fully realize our deferred tax asset balances, including net operating loss carry-forwards; |
● | the condition of the banking system and financial markets; |
● | our ability to raise capital as may be necessary; |
● | our ability to maintain liquidity or access other sources of funding; |
● | changes in the cost and availability of funding; |
● | the success of the local economies in which we operate; |
● | our concentrations of residential and commercial construction and development loans and commercial real estate loans are subject to unique risks that could adversely affect our earnings; |
● | changes in prevailing interest rates may negatively affect our net income and the value of our assets; |
● | the accounting and reporting policies of United; |
● | if our allowance for loan losses is not sufficient to cover actual loan losses; |
● | losses due to fraudulent and negligent conduct of our loan customers, third party service providers or employees; |
● | competition from financial institutions and other financial service providers; |
● | risks with respect to future expansion and acquisitions; |
● | if the conditions in the stock market, the public debt market and other capital markets deteriorate; |
● | the impact of the Dodd-Frank Wall Street Reform and Consumer Protection Act of 2010 (the “Dodd-Frank Act”) and related regulations and other changes in financial services laws and regulations; |
● | the costs and effects of litigation, examinations, investigations, or similar matters, or adverse facts and developments related thereto, including possible dilution; |
● | regulatory or judicial proceedings, board resolutions, informal memorandums of understanding or formal enforcement actions imposed by regulators that may occur; |
● | the risk that we may be required to increase the valuation allowance on our deferred tax asset in future periods; |
● | the risk that we could have an “ownership change” under Section 382 of the Internal Revenue Code, which could impair our ability to timely and fully realize our deferred tax asset balance; and |
● | the risk that we could be subject to changes in tax laws, regulations and interpretations or challenges to our income tax provision. |
| 4 |
| 5 |
| Share of Local Deposit Markets by County - Banks and Savings Institutions | ||||||||||||||||||||||||||||||||||||||||
| Market Share | Rank in Market | |||||||||||||||||||||||||||||||||||||||
| 2013 | 2012 | 2011 | 2010 | 2009 | 2013 | 2012 | 2011 | 2010 | 2009 | |||||||||||||||||||||||||||||||
| Atlanta, Georgia MSA | ||||||||||||||||||||||||||||||||||||||||
| Bartow | 11 | % | 9 | % | 12 | % | 9 | % | 8 | % | 3 | 4 | 3 | 4 | 5 | |||||||||||||||||||||||||
| Carroll | 7 | 6 | 6 | 5 | 4 | 5 | 6 | 6 | 7 | 7 | ||||||||||||||||||||||||||||||
| Cherokee | 4 | 5 | 4 | 4 | 4 | 9 | 9 | 9 | 9 | 9 | ||||||||||||||||||||||||||||||
| Cobb | 3 | 3 | 3 | 3 | 3 | 11 | 10 | 10 | 10 | 7 | ||||||||||||||||||||||||||||||
| Coweta | 2 | 2 | 2 | 2 | 3 | 11 | 10 | 10 | 10 | 10 | ||||||||||||||||||||||||||||||
| Dawson | 36 | 36 | 36 | 30 | 29 | 1 | 1 | 1 | 1 | 1 | ||||||||||||||||||||||||||||||
| DeKalb | 1 | 1 | 1 | 1 | 1 | 18 | 18 | 21 | 21 | 18 | ||||||||||||||||||||||||||||||
| Douglas | 2 | 2 | 2 | 1 | 1 | 12 | 12 | 11 | 13 | 13 | ||||||||||||||||||||||||||||||
| Fayette | 7 | 7 | 8 | 9 | 11 | 5 | 6 | 5 | 4 | 4 | ||||||||||||||||||||||||||||||
| Forsyth | 7 | 6 | 3 | 2 | 3 | 6 | 7 | 11 | 13 | 11 | ||||||||||||||||||||||||||||||
| Fulton | 1 | 1 | 1 | 1 | 1 | 20 | 20 | 20 | 18 | 20 | ||||||||||||||||||||||||||||||
| Gwinnett | 3 | 3 | 3 | 3 | 3 | 7 | 8 | 7 | 8 | 7 | ||||||||||||||||||||||||||||||
| Henry | 6 | 5 | 4 | 4 | 4 | 6 | 7 | 7 | 9 | 8 | ||||||||||||||||||||||||||||||
| Newton | 3 | 3 | 3 | 3 | 3 | 8 | 8 | 8 | 8 | 9 | ||||||||||||||||||||||||||||||
| Paulding | 4 | 5 | 5 | 3 | 2 | 9 | 6 | 7 | 8 | 12 | ||||||||||||||||||||||||||||||
| Pickens | 6 | 4 | 3 | 2 | 2 | 5 | 6 | 7 | 7 | 7 | ||||||||||||||||||||||||||||||
| Rockdale | 12 | 12 | 12 | 12 | 12 | 4 | 4 | 4 | 4 | 3 | ||||||||||||||||||||||||||||||
| Walton | 2 | 1 | 2 | 1 | 1 | 10 | 10 | 10 | 10 | 10 | ||||||||||||||||||||||||||||||
| Gainesville, Georgia MSA | ||||||||||||||||||||||||||||||||||||||||
| Hall | 12 | 12 | 14 | 14 | 13 | 4 | 5 | 3 | 3 | 4 | ||||||||||||||||||||||||||||||
| North Georgia | ||||||||||||||||||||||||||||||||||||||||
| Chattooga | 43 | 40 | 40 | 39 | 40 | 1 | 1 | 1 | 1 | 1 | ||||||||||||||||||||||||||||||
| Fannin | 50 | 49 | 52 | 49 | 50 | 1 | 1 | 1 | 1 | 1 | ||||||||||||||||||||||||||||||
| Floyd | 15 | 16 | 16 | 14 | 13 | 4 | 2 | 1 | 3 | 3 | ||||||||||||||||||||||||||||||
| Gilmer | 26 | 25 | 25 | 15 | 14 | 2 | 2 | 2 | 2 | 2 | ||||||||||||||||||||||||||||||
| Habersham | 23 | 22 | 20 | 16 | 14 | 2 | 2 | 2 | 3 | 3 | ||||||||||||||||||||||||||||||
| Jackson | 7 | 6 | 6 | 5 | 4 | 7 | 6 | 7 | 8 | 8 | ||||||||||||||||||||||||||||||
| Lumpkin | 29 | 29 | 29 | 28 | 29 | 2 | 2 | 2 | 2 | 1 | ||||||||||||||||||||||||||||||
| Rabun | 14 | 13 | 12 | 11 | 10 | 3 | 3 | 5 | 5 | 5 | ||||||||||||||||||||||||||||||
| Towns | 50 | 48 | 41 | 37 | 27 | 1 | 2 | 2 | 2 | 2 | ||||||||||||||||||||||||||||||
| Union | 84 | 83 | 84 | 86 | 88 | 1 | 1 | 1 | 1 | 1 | ||||||||||||||||||||||||||||||
| White | 48 | 44 | 46 | 43 | 39 | 1 | 1 | 1 | 1 | 1 | ||||||||||||||||||||||||||||||
| Tennessee | ||||||||||||||||||||||||||||||||||||||||
| Blount | 1 | 1 | 2 | 2 | 3 | 12 | 11 | 11 | 11 | 11 | ||||||||||||||||||||||||||||||
| Bradley | 5 | 5 | 5 | 5 | 5 | 7 | 7 | 7 | 7 | 7 | ||||||||||||||||||||||||||||||
| Knox | 1 | 1 | 1 | 1 | 1 | 30 | 26 | 23 | 25 | 16 | ||||||||||||||||||||||||||||||
| Loudon | 15 | 13 | 14 | 14 | 16 | 3 | 3 | 3 | 3 | 3 | ||||||||||||||||||||||||||||||
| McMinn | — | 3 | 2 | 2 | 3 | — | 9 | 9 | 9 | 9 | ||||||||||||||||||||||||||||||
| Monroe | 3 | 4 | 4 | 3 | 4 | 8 | 7 | 7 | 8 | 7 | ||||||||||||||||||||||||||||||
| Roane | 9 | 8 | 8 | 8 | 10 | 5 | 6 | 6 | 6 | 4 | ||||||||||||||||||||||||||||||
| Coastal Georgia | ||||||||||||||||||||||||||||||||||||||||
| Chatham | 2 | 1 | 1 | 1 | 1 | 9 | 10 | 10 | 10 | 11 | ||||||||||||||||||||||||||||||
| Glynn | 12 | 12 | 18 | 15 | 13 | 2 | 3 | 2 | 3 | 3 | ||||||||||||||||||||||||||||||
| Ware | 3 | 3 | 4 | 4 | 7 | 9 | 9 | 9 | 8 | 7 | ||||||||||||||||||||||||||||||
| North Carolina | ||||||||||||||||||||||||||||||||||||||||
| Avery | 16 | 16 | 18 | 17 | 15 | 4 | 2 | 1 | 1 | 4 | ||||||||||||||||||||||||||||||
| Cherokee | 35 | 35 | 29 | 29 | 34 | 1 | 1 | 1 | 1 | 1 | ||||||||||||||||||||||||||||||
| Clay | 44 | 45 | 48 | 49 | 51 | 1 | 1 | 1 | 1 | 1 | ||||||||||||||||||||||||||||||
| Graham | 71 | 71 | 72 | 72 | 74 | 1 | 1 | 1 | 1 | 1 | ||||||||||||||||||||||||||||||
| Haywood | 11 | 10 | 10 | 11 | 12 | 6 | 5 | 5 | 5 | 4 | ||||||||||||||||||||||||||||||
| Henderson | 3 | 3 | 3 | 3 | 3 | 10 | 11 | 11 | 11 | 11 | ||||||||||||||||||||||||||||||
| Jackson | 28 | 25 | 25 | 25 | 24 | 1 | 1 | 1 | 1 | 1 | ||||||||||||||||||||||||||||||
| Macon | 7 | 8 | 8 | 8 | 9 | 5 | 5 | 6 | 5 | 4 | ||||||||||||||||||||||||||||||
| Mitchell | 34 | 36 | 37 | 34 | 32 | 1 | 1 | 1 | 1 | 1 | ||||||||||||||||||||||||||||||
| Swain | 17 | 21 | 25 | 30 | 28 | 2 | 2 | 2 | 2 | 2 | ||||||||||||||||||||||||||||||
| Transylvania | 14 | 15 | 14 | 13 | 14 | 3 | 3 | 3 | 4 | 3 | ||||||||||||||||||||||||||||||
| Watauga | 2 | 2 | 1 | 1 | 2 | 11 | 12 | 12 | 11 | 11 | ||||||||||||||||||||||||||||||
| Yancey | 20 | 18 | 20 | 19 | 17 | 2 | 2 | 2 | 2 | 4 | ||||||||||||||||||||||||||||||
| 6 |
Loan Type | Risk Elements | ||
| Commercial (secured by real estate) | Loan portfolio concentrations; declines in general economic conditions and occupancy rates; business failure and lack of a suitable alternative use for property; environmental contamination. | ||
| Commercial (commercial and industrial) | Industry concentrations; inability to monitor the condition of collateral (inventory, accounts receivable and other non-real estate assets); use of specialized or obsolete equipment as collateral; insufficient cash flow from operations to service debt payments; declines in general economic conditions. | ||
| Commercial construction | Inadequate long-term financing arrangements; inventory levels; cost overruns, changes in market demand for property. | ||
| Residential mortgage | Loan portfolio concentrations; changes in general economic conditions or in the local economy; loss of borrower’s employment; insufficient collateral value due to decline in property value. | ||
| Residential construction | Inadequate long-term financing arrangements; inventory levels; cost overruns, changes in market demand for property; rising interest rates. | ||
| Consumer installment | Loss of borrower’s employment; changes in local economy; the inability to monitor collateral. | ||
| 7 |
| 7 (Watch) | Loans in this category are presently protected from apparent loss; however weaknesses exist that could cause future impairment, including the deterioration of financial ratios, past due status and questionable management capabilities. These loans require more than the ordinary amount of supervision. Collateral values generally afford adequate coverage, but may not be immediately marketable. |
| 8 (Substandard) | These loans are inadequately protected by the current net worth and paying capacity of the obligor or by the collateral pledged. Specific and well-defined weaknesses exist that may include poor liquidity and deterioration of financial ratios. The loan may be past due and related deposit accounts experiencing overdrafts. There is the distinct possibility that United will sustain some loss if deficiencies are not corrected. If possible, immediate corrective action is taken. |
| 9 (Doubtful) | Specific weaknesses characterized as Substandard that are severe enough to make collection in full highly questionable and improbable. There is no reliable secondary source of full repayment. |
| 10 (Loss) | Loans categorized as Loss have the same characteristics as Doubtful, however, probability of loss is certain. Loans classified as Loss are charged-off. |
| 8 |
● | making or servicing loans and certain types of leases; |
● | performing certain data processing services; |
● | acting as fiduciary or investment or financial advisor; |
● | providing brokerage services; |
● | underwriting bank eligible securities; |
● | underwriting debt and equity securities on a limited basis through separately capitalized subsidiaries; and |
● | making investments in corporations or projects designed primarily to promote community welfare. |
● | lending, exchanging, transferring, investing for others or safeguarding money or securities; |
● | insuring, guaranteeing, or indemnifying against loss, harm, damage, illness, disability, or death, or providing and issuing annuities, and acting as principal, agent, or broker with respect thereto; |
● | providing financial, investment, or economic advisory services, including advising an investment company; |
● | issuing or selling instruments representing interests in pools of assets permissible for a bank to hold directly; and |
● | underwriting, dealing in or making a market in securities. |
| 9 |
| (a) | total classified assets as of the most recent examination of the bank do not exceed 80% of equity capital (as defined by regulation); |
| (b) | the aggregate amount of dividends declared or anticipated to be declared in the calendar year does not exceed 50% of the net profits after taxes but before dividends for the previous calendar year; and |
| (c) | the ratio of equity capital to adjusted assets is not less than 6%. |
| 10 |
● | define the components of capital and address other issues affecting the numerator in banking institutions’ regulatory capital ratios; |
● | address risk weights and other issues affecting the denominator in banking institutions’ regulatory capital ratios and replace the existing risk-weighting approach, which was derived from the Basel I capital accords of the Basel Committee, with a more risk-sensitive approach based, in part, on the standardized approach in the Basel Committee’s 2004 “Basel II” capital accords; |
● | introduce a new capital measure called “common equity Tier 1” (“CET1”); |
● | specify that Tier 1 capital consists of CET1 and “additional Tier 1 capital” instruments meeting specified requirements; and |
● | implement the requirements of Section 939A of the Dodd-Frank Act to remove references to credit ratings from the federal banking agencies’ rules. |
| 11 |
● | a minimum ratio of CET1 to risk-weighted assets of at least 4.5%, plus a 2.5% “capital conservation buffer” (which is added to the 4.5% CET1 ratio as that buffer is phased in, effectively resulting in a minimum ratio of CET1 to risk-weighted assets of at least 7% upon full implementation); |
● | a minimum ratio of Tier 1 capital to risk-weighted assets of at least 6.0%, plus the capital conservation buffer (which is added to the 6.0% Tier 1 capital ratio as that buffer is phased in, effectively resulting in a minimum Tier 1 capital ratio of 8.5% upon full implementation); |
● | a minimum ratio of total capital (that is, Tier 1 plus Tier 2) to risk-weighted assets of at least 8.0%, plus the capital conservation buffer (which is added to the 8.0% total capital ratio as that buffer is phased in, effectively resulting in a minimum total capital ratio of 10.5% upon full implementation); and |
● | a minimum leverage ratio of 4%, calculated as the ratio of Tier 1 capital to average assets (as compared to a current minimum leverage ratio of 3% for banking organizations that either have the highest supervisory rating or have implemented the appropriate federal regulatory authority’s risk-adjusted measure for market risk). |
| 12 |
● | risks to consumers and compliance with the federal consumer financial laws |
● | the markets in which firms operate and risks to consumers posed by activities in those markets; |
● | depository institutions that offer a wide variety of consumer financial products and services; |
● | depository institutions with a more specialized focus; and |
● | non-depository companies that offer one or more consumer financial products or services. |
| 13 |
● | provide incentives that do not encourage risk-taking beyond the organization’s ability to effectively identify and manage risks, |
● | be compatible with effective internal controls and risk management, and |
● | be supported by strong corporate governance, including active and effective oversight by the organization’s board of directors and appropriate policies, procedures and monitoring. |
| 14 |
| Name (age) | Position with United and Employment History | Officer of United Since | |||
| Jimmy C. Tallent (61) | President, Chief Executive Officer and Director | 1988 | |||
| H. Lynn Harton (52) | Executive Vice President and Chief Operating Officer; prior to joining United was Executive Vice President and Special Assistant to the Chief Executive Officer of Toronto-Dominion Bank (2010 - 2012); President and Chief Executive Officer of South Financial Group (2009 - 2010); Chief Risk and Chief Credit Officer of South Financial Group (2007 - 2009); | 2012 | |||
| Rex S. Schuette (64) | Executive Vice President and Chief Financial Officer | 2001 | |||
| David Shearrow (54) | Executive Vice President and Chief Risk Officer | 2007 | |||
| Bill M. Gilbert (61) | Director of Banking; Regional President of North Georgia and Coastal Georgia (2011 - 2013); Senior Vice President of Retail Banking (2003 - 2011) | 2003 | |||
| Tim Schools (44) | Chief Strategy Officer; Regional President of North Carolina and Tennessee (November 2011 through 2012); prior to joining United was President (2008 - 2010) and Chief Operating Officer (2007 – 2008) of American Savings Bank, F.S.B. | 2011 | |||
| 15 |
● | a decrease in the demand for loans and other products and services offered by us; |
● | a decrease in the value of our loans secured by residential or commercial real estate; |
● | a permanent impairment of our assets, such as our deferred tax assets; or |
● | an increase in the number of customers or other counterparties who default on their loans or other obligations to us, which could result in a higher level of nonperforming assets, net charge-offs and provision for loan losses. |
| 16 |
| 17 |
| 18 |
● | the potential inaccuracy of the estimates and judgments used to evaluate credit, operations, management and market risks with respect to an acquired branch or institution, a new branch office or a new market; |
● | the time and costs of evaluating new markets, hiring or retaining experienced local management and opening new offices and the time lags between these activities and the generation of sufficient assets and deposits to support the costs of the expansion; |
● | the incurrence and possible impairment of goodwill associated with an acquisition and possible adverse effects on results of operations; |
● | the loss of key employees and customers of an acquired branch or institution; |
● | the difficulty or failure to successfully integrate the acquired financial institution or portion of the institution; and |
● | the temporary disruption of our business or the business of the acquired institution. |
| 19 |
| 20 |
| 21 |
| 22 |
| 2013 | 2012 | |||||||||||||||||||||||||||||||
| High | Low | Close | Avg Daily Volume | High | Low | Close | Avg Daily Volume | |||||||||||||||||||||||||
| First quarter | $ | 11.57 | $ | 9.59 | $ | 11.34 | 195,803 | $ | 10.30 | $ | 6.37 | $ | 9.75 | 142,987 | ||||||||||||||||||
| Second quarter | 12.94 | 10.15 | 12.42 | 184,922 | 9.77 | 7.76 | 8.57 | 145,132 | ||||||||||||||||||||||||
| Third quarter | 16.04 | 12.15 | 14.99 | 341,270 | 8.82 | 6.12 | 8.39 | 329,475 | ||||||||||||||||||||||||
| Fourth quarter | 18.56 | 14.82 | 17.75 | 421,948 | 9.49 | 8.01 | 9.44 | 202,871 | ||||||||||||||||||||||||
| 23 |
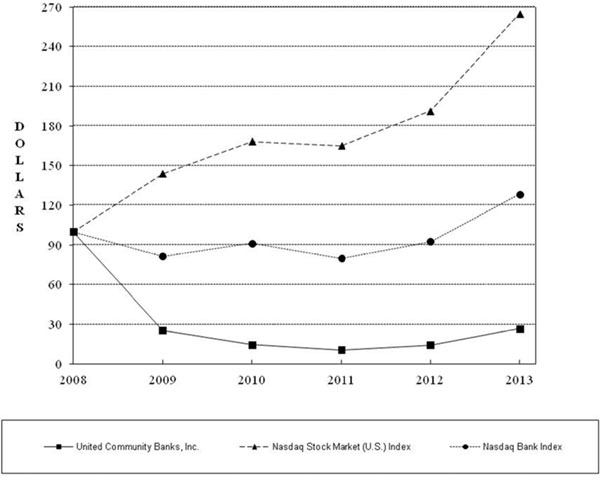
| Cumulative Total Return * | ||||||||||||||||||||||||
| 2008 | 2009 | 2010 | 2011 | 2012 | 2013 | |||||||||||||||||||
| United Community Banks, Inc. | $ | 100 | $ | 25 | $ | 15 | $ | 10 | $ | 14 | $ | 27 | ||||||||||||
| Nasdaq Stock Market (U.S.) Index | 100 | 144 | 168 | 165 | 191 | 265 | ||||||||||||||||||
| Nasdaq Bank Index | 100 | 81 | 91 | 80 | 92 | 128 | ||||||||||||||||||
| 24 |
(in thousands, except per share data; | ||||||||||||||||||||
| taxable equivalent) | 2013 | 2012 | 2011 | 2010 | 2009 | |||||||||||||||
| INCOME SUMMARY | ||||||||||||||||||||
Net interest revenue(1) | $ | 219,641 | $ | 229,758 | $ | 238,670 | $ | 244,637 | $ | 244,834 | ||||||||||
Operating provision for credit losses (2) | 65,500 | 62,500 | 251,000 | 234,750 | 310,000 | |||||||||||||||
Operating fee revenue (1)(3) | 56,598 | 56,112 | 44,907 | 46,963 | 51,357 | |||||||||||||||
Total operating revenue (2)(3) | 210,739 | 223,370 | 32,577 | 56,850 | (13,809 | ) | ||||||||||||||
Operating expenses (4) | 174,304 | 186,774 | 261,599 | 242,952 | 217,050 | |||||||||||||||
| Loss on sale of nonperforming assets | — | — | — | 45,349 | — | |||||||||||||||
| Operating income (loss) from continuing operations before taxes | 36,435 | 36,596 | (229,022 | ) | (231,451 | ) | (230,859 | ) | ||||||||||||
| Operating income taxes | (236,705 | ) | 2,740 | (2,276 | ) | 73,218 | (91,754 | ) | ||||||||||||
| Net operating income (loss) from continuing operations | 273,140 | 33,856 | (226,746 | ) | (304,669 | ) | (139,105 | ) | ||||||||||||
| Gain from acquisition, net of tax | — | — | — | — | 7,062 | |||||||||||||||
| Noncash goodwill impairment charges | — | — | — | (210,590 | ) | (95,000 | ) | |||||||||||||
| Severance cost, net of tax benefit | — | — | — | — | (1,797 | ) | ||||||||||||||
| Fraud loss provision and subsequent recovery, net of tax benefit | — | — | — | 11,750 | — | |||||||||||||||
| Net income (loss) from discontinued operations | — | — | — | (101 | ) | 513 | ||||||||||||||
| Gain from sale of subsidiary, net of income taxes and selling costs | — | — | — | 1,266 | — | |||||||||||||||
| Net income (loss) | 273,140 | 33,856 | (226,746 | ) | (502,344 | ) | (228,327 | ) | ||||||||||||
| Preferred dividends and discount accretion | 12,078 | 12,148 | 11,838 | 10,316 | 10,242 | |||||||||||||||
| Net income (loss) available to common shareholders | $ | 261,062 | $ | 21,708 | $ | (238,584 | ) | $ | (512,660 | ) | $ | (238,569 | ) | |||||||
| PERFORMANCE MEASURES | ||||||||||||||||||||
| Per common share: | ||||||||||||||||||||
Diluted operating earnings (loss) from continuing operations (2)(3)(4) | $ | 4.44 | $ | .38 | $ | (5.97 | ) | $ | (16.64 | ) | $ | (12.37 | ) | |||||||
| Diluted earnings (loss) from continuing operations | 4.44 | .38 | (5.97 | ) | (27.15 | ) | (19.80 | ) | ||||||||||||
| Diluted earnings (loss) | 4.44 | .38 | (5.97 | ) | (27.09 | ) | (19.76 | ) | ||||||||||||
| Book value | 11.30 | 6.67 | 6.62 | 15.40 | 41.78 | |||||||||||||||
Tangible book value (6) | 11.26 | 6.57 | 6.47 | 14.80 | 30.09 | |||||||||||||||
| Key performance ratios: | ||||||||||||||||||||
Return on common equity (5) | 46.72 | 5.43 | (93.57 | ) % | (85.08 | ) % | (34.40 | ) % | ||||||||||||
| Return on assets | 3.86 | .49 | (3.15 | ) | (6.61 | ) | (2.76 | ) | ||||||||||||
| Net interest margin | 3.30 | 3.51 | 3.52 | 3.59 | 3.29 | |||||||||||||||
Operating efficiency ratio from continuing operations (3)(4) | 63.14 | 65.43 | 92.27 | 98.98 | 73.97 | |||||||||||||||
| Equity to assets | 10.35 | 8.47 | 7.75 | 10.77 | 11.12 | |||||||||||||||
Tangible equity to assets (6) | 10.31 | 8.38 | 7.62 | 8.88 | 8.33 | |||||||||||||||
Tangible common equity to assets (6) | 7.55 | 5.54 | 3.74 | 6.52 | 6.15 | |||||||||||||||
Tangible common equity to risk-weighted assets (6) | 13.17 | 8.26 | 8.25 | 5.64 | 10.39 | |||||||||||||||
| ASSET QUALITY * | ||||||||||||||||||||
| Non-performing loans | $ | 26,819 | $ | 109,894 | $ | 127,479 | $ | 179,094 | $ | 264,092 | ||||||||||
| Foreclosed properties | 4,221 | 18,264 | 32,859 | 142,208 | 120,770 | |||||||||||||||
| Total non-performing assets (NPAs) | 31,040 | 128,158 | 160,338 | 321,302 | 384,862 | |||||||||||||||
| Allowance for loan losses | 76,762 | 107,137 | 114,468 | 174,695 | 155,602 | |||||||||||||||
Operating net charge-offs (2) | 93,710 | 69,831 | 311,227 | 215,657 | 276,669 | |||||||||||||||
| Allowance for loan losses to loans | 1.77 | 2.57 | % | 2.79 | % | 3.79 | % | 3.02 | % | |||||||||||
Operating net charge-offs to average loans (2) | 2.22 | 1.69 | 7.33 | 4.42 | 5.03 | |||||||||||||||
| NPAs to loans and foreclosed properties | .72 | 3.06 | 3.87 | 6.77 | 7.30 | |||||||||||||||
| NPAs to total assets | .42 | 1.88 | 2.30 | 4.42 | 4.81 | |||||||||||||||
AVERAGE BALANCES ($ in millions) | ||||||||||||||||||||
| Loans | $ | 4,254 | $ | 4,166 | $ | 4,307 | $ | 4,961 | $ | 5,548 | ||||||||||
| Investment securities | 2,190 | 2,089 | 1,999 | 1,453 | 1,656 | |||||||||||||||
| Earning assets | 6,649 | 6,547 | 6,785 | 6,822 | 7,465 | |||||||||||||||
| Total assets | 7,074 | 6,865 | 7,189 | 7,605 | 8,269 | |||||||||||||||
| Deposits | 6,027 | 5,885 | 6,275 | 6,373 | 6,713 | |||||||||||||||
| Shareholders’ equity | 732 | 582 | 557 | 819 | 920 | |||||||||||||||
Common shares - Basic (thousands) | 58,787 | 57,857 | 39,943 | 18,925 | 12,075 | |||||||||||||||
Common shares - Diluted (thousands) | 58,845 | 57,857 | 39,943 | 18,925 | 12,075 | |||||||||||||||
| �� | ||||||||||||||||||||
AT YEAR END ($ in millions) | ||||||||||||||||||||
| Loans * | $ | 4,329 | $ | 4,175 | $ | 4,110 | $ | 4,604 | $ | 5,151 | ||||||||||
| Investment securities | 2,312 | 2,079 | 2,120 | 1,490 | 1,530 | |||||||||||||||
| Total assets | 7,425 | 6,802 | 6,983 | 7,276 | 8,000 | |||||||||||||||
| Deposits | 6,202 | 5,952 | 6,098 | 6,469 | 6,628 | |||||||||||||||
| Shareholders’ equity | 796 | 581 | 575 | 469 | 962 | |||||||||||||||
Common shares outstanding (thousands) | 59,432 | 57,741 | 57,561 | 18,937 | 18,809 | |||||||||||||||
| 25 |
| Selected Financial Data (Continued) | ||||||||||||||||||||||||||||||||
| 2013 | 2012 | |||||||||||||||||||||||||||||||
| (in thousands, except per share | Fourth | Third | Second | First | Fourth | Third | Second | First | ||||||||||||||||||||||||
| data; taxable equivalent) | Quarter | Quarter | Quarter | Quarter | Quarter | Quarter | Quarter | Quarter | ||||||||||||||||||||||||
| INCOME SUMMARY | ||||||||||||||||||||||||||||||||
Interest revenue(1) | $ | 61,695 | $ | 61,426 | $ | 62,088 | $ | 62,114 | $ | 64,450 | $ | 66,092 | $ | 66,823 | $ | 70,302 | ||||||||||||||||
Interest expense(1) | 5,816 | 7,169 | 7,157 | 7,540 | 8,306 | 8,113 | 10,167 | 11,323 | ||||||||||||||||||||||||
| Net interest revenue | 55,879 | 54,257 | 54,931 | 54,574 | 56,144 | 57,979 | 56,656 | 58,979 | ||||||||||||||||||||||||
| Provision for credit losses | 3,000 | 3,000 | 48,500 | 11,000 | 14,000 | 15,500 | 18,000 | 15,000 | ||||||||||||||||||||||||
Fee revenue(1) | 13,519 | 14,225 | 15,943 | 12,911 | 14,645 | 13,156 | 13,047 | 15,264 | ||||||||||||||||||||||||
| Total revenue | 66,398 | 65,482 | 22,374 | 56,485 | 56,789 | 55,635 | 51,703 | 59,243 | ||||||||||||||||||||||||
| Operating expenses | 41,614 | 40,097 | 48,823 | 43,770 | 50,726 | 44,783 | 44,310 | 46,955 | ||||||||||||||||||||||||
| Income (loss) before income taxes | 24,784 | 25,385 | (26,449 | ) | 12,715 | 6,063 | 10,852 | 7,393 | 12,288 | |||||||||||||||||||||||
| Income tax expense (benefit) | 8,873 | 9,885 | (256,413 | ) | 950 | 802 | 284 | 894 | 760 | |||||||||||||||||||||||
| Net income | 15,911 | 15,500 | 229,964 | 11,765 | 5,261 | 10,568 | 6,499 | 11,528 | ||||||||||||||||||||||||
| Preferred dividends and discount accretion | 2,912 | 3,059 | 3,055 | 3,052 | 3,045 | 3,041 | 3,032 | 3,030 | ||||||||||||||||||||||||
| Net income available to common shareholders | $ | 12,999 | $ | 12,441 | $ | 226,909 | $ | 8,713 | $ | 2,216 | $ | 7,527 | $ | 3,467 | $ | 8,498 | ||||||||||||||||
| PERFORMANCE MEASURES | ||||||||||||||||||||||||||||||||
| Per common share: | ||||||||||||||||||||||||||||||||
| Diluted income | $ | .22 | $ | .21 | $ | 3.90 | $ | .15 | $ | .04 | $ | .13 | $ | .06 | $ | .15 | ||||||||||||||||
| Book value | 11.30 | 10.99 | 10.90 | 6.85 | 6.67 | 6.75 | 6.61 | 6.68 | ||||||||||||||||||||||||
Tangible book value (2) | 11.26 | 10.95 | 10.82 | 6.76 | 6.57 | 6.64 | 6.48 | 6.54 | ||||||||||||||||||||||||
| Key performance ratios: | ||||||||||||||||||||||||||||||||
Return on common equity (3)(4) | 7.52 | % | 7.38 | % | 197.22 | % | 8.51 | % | 2.15 | % | 7.43 | % | 3.51 | % | 8.78 | % | ||||||||||||||||
Return on assets (4) | .86 | .86 | 13.34 | .70 | .31 | .63 | .37 | .66 | ||||||||||||||||||||||||
Net interest margin (4) | 3.26 | 3.26 | 3.33 | 3.37 | 3.45 | 3.64 | 3.42 | 3.54 | ||||||||||||||||||||||||
| Efficiency ratio | 60.02 | 58.55 | 68.89 | 64.97 | 71.69 | 62.95 | 63.84 | 63.31 | ||||||||||||||||||||||||
| Equity to assets | 11.62 | 11.80 | 11.57 | (5) | 8.60 | 8.63 | 8.75 | 8.33 | 8.19 | |||||||||||||||||||||||
Tangible equity to assets (2) | 11.59 | 11.76 | 11.53 | (5) | 8.53 | 8.55 | 8.66 | 8.24 | 8.08 | |||||||||||||||||||||||
Tangible common equity to assets (2) | 8.99 | 9.02 | 8.79 | (5) | 5.66 | 5.67 | 5.73 | 5.45 | 5.33 | |||||||||||||||||||||||
Tangible common equity to risk- weighted assets (2) | 13.17 | 13.34 | 13.16 | 8.45 | 8.26 | 8.44 | 8.37 | 8.21 | ||||||||||||||||||||||||
| ASSET QUALITY * | ||||||||||||||||||||||||||||||||
| Non-performing loans | $ | 26,819 | $ | 26,088 | $ | 27,864 | $ | 96,006 | $ | 109,894 | $ | 115,001 | $ | 115,340 | $ | 129,704 | ||||||||||||||||
| Foreclosed properties | 4,221 | 4,467 | 3,936 | 16,734 | 18,264 | 26,958 | 30,421 | 31,887 | ||||||||||||||||||||||||
| Total non-performing assets (NPAs) | 31,040 | 30,555 | 31,800 | 112,740 | 128,158 | 141,959 | 145,761 | 161,591 | ||||||||||||||||||||||||
| Allowance for loan losses | 76,762 | 80,372 | 81,845 | 105,753 | 107,137 | 107,642 | 112,705 | 113,601 | ||||||||||||||||||||||||
| Net charge-offs | 4,445 | 4,473 | 72,408 | 12,384 | 14,505 | 20,563 | 18,896 | 15,867 | ||||||||||||||||||||||||
| Allowance for loan losses to loans | 1.77 | % | 1.88 | % | 1.95 | % | 2.52 | % | 2.57 | % | 2.60 | % | 2.74 | % | 2.75 | % | ||||||||||||||||
Net charge-offs to average loans (4) | .41 | .42 | 6.87 | 1.21 | 1.39 | 1.99 | 1.85 | 1.55 | ||||||||||||||||||||||||
| NPAs to loans and foreclosed properties | .72 | .72 | .76 | 2.68 | 3.06 | 3.41 | 3.51 | 3.88 | ||||||||||||||||||||||||
| NPAs to total assets | .42 | .42 | .44 | 1.65 | 1.88 | 2.12 | 2.16 | 2.25 | ||||||||||||||||||||||||
AVERAGE BALANCES ($ in millions) | ||||||||||||||||||||||||||||||||
| Loans | $ | 4,315 | $ | 4,250 | $ | 4,253 | $ | 4,197 | $ | 4,191 | $ | 4,147 | $ | 4,156 | $ | 4,168 | ||||||||||||||||
| Investment securities | 2,280 | 2,178 | 2,161 | 2,141 | 2,088 | 1,971 | 2,145 | 2,153 | ||||||||||||||||||||||||
| Earning assets | 6,823 | 6,615 | 6,608 | 6,547 | 6,482 | 6,346 | 6,665 | 6,700 | ||||||||||||||||||||||||
| Total assets | 7,370 | 7,170 | 6,915 | 6,834 | 6,778 | 6,648 | 6,993 | 7,045 | ||||||||||||||||||||||||
| Deposits | 6,190 | 5,987 | 5,983 | 5,946 | 5,873 | 5,789 | 5,853 | 6,028 | ||||||||||||||||||||||||
| Shareholders’ equity | 856 | 846 | 636 | 588 | 585 | 582 | 583 | 577 | ||||||||||||||||||||||||
Common shares - basic (thousands) | 59,923 | 59,100 | 58,141 | 58,081 | 57,971 | 57,880 | 57,840 | 57,764 | ||||||||||||||||||||||||
Common shares - diluted (thousands) | 59,925 | 59,202 | 58,141 | 58,081 | 57,971 | 57,880 | 57,840 | 57,764 | ||||||||||||||||||||||||
AT PERIOD END ($ in millions) | ||||||||||||||||||||||||||||||||
| Loans * | $ | 4,329 | $ | 4,267 | $ | 4,189 | $ | 4,194 | $ | 4,175 | $ | 4,138 | $ | 4,119 | $ | 4,128 | ||||||||||||||||
| Investment securities | 2,312 | 2,169 | 2,152 | 2,141 | 2,079 | 2,025 | 1,984 | 2,202 | ||||||||||||||||||||||||
| Total assets | 7,425 | 7,243 | 7,163 | 6,849 | 6,802 | 6,699 | 6,737 | 7,174 | ||||||||||||||||||||||||
| Deposits | 6,202 | 6,113 | 6,012 | 6,026 | 5,952 | 5,823 | 5,822 | 6,001 | ||||||||||||||||||||||||
| Shareholders’ equity | 796 | 852 | 829 | 592 | 581 | 585 | 576 | 580 | ||||||||||||||||||||||||
Common shares outstanding (thousands) | 59,432 | 59,412 | 57,831 | 57,767 | 57,741 | 57,710 | 57,641 | 57,603 | ||||||||||||||||||||||||
| 26 |
| 27 |
| 28 |
| 29 |
| 30 |
For the Years Ended December 31, | ||||||||||||||||||||
| (in thousands, except per share | ||||||||||||||||||||
| data; taxable equivalent) | 2013 | 2012 | 2011 | 2010 | 2009 | |||||||||||||||
| Interest revenue reconciliation | ||||||||||||||||||||
| Interest revenue - taxable equivalent | $ | 247,323 | $ | 267,667 | $ | 304,308 | $ | 344,493 | $ | 404,961 | ||||||||||
| Taxable equivalent adjustment | (1,483 | ) | (1,690 | ) | (1,707 | ) | (2,001 | ) | (2,132 | ) | ||||||||||
| Interest revenue (GAAP) | $ | 245,840 | $ | 265,977 | $ | 302,601 | $ | 342,492 | $ | 402,829 | ||||||||||
| Net interest revenue reconciliation | ||||||||||||||||||||
| Net interest revenue - taxable equivalent | $ | 219,641 | $ | 229,758 | $ | 238,670 | $ | 244,637 | $ | 244,834 | ||||||||||
| Taxable equivalent adjustment | (1,483 | ) | (1,690 | ) | (1,707 | ) | (2,001 | ) | (2,132 | ) | ||||||||||
| Net interest revenue (GAAP) | $ | 218,158 | $ | 228,068 | $ | 236,963 | $ | 242,636 | $ | 242,702 | ||||||||||
| Provision for credit losses reconciliation | ||||||||||||||||||||
| Operating provision for credit losses | $ | 65,500 | $ | 62,500 | $ | 251,000 | $ | 234,750 | $ | 310,000 | ||||||||||
| Partial recovery of special fraud-related loan loss | — | — | — | (11,750 | ) | — | ||||||||||||||
| Provision for credit losses (GAAP) | $ | 65,500 | $ | 62,500 | $ | 251,000 | $ | 223,000 | $ | 310,000 | ||||||||||
| Fee revenue reconciliation | ||||||||||||||||||||
| Operating fee revenue | $ | 56,598 | $ | 56,112 | $ | 44,907 | $ | 46,963 | $ | 51,357 | ||||||||||
| Gain from acquisition | — | — | — | — | 11,390 | |||||||||||||||
| Fee revenue (GAAP) | $ | 56,598 | $ | 56,112 | $ | 44,907 | $ | 46,963 | $ | 62,747 | ||||||||||
| Total revenue reconciliation | ||||||||||||||||||||
| Total operating revenue | $ | 210,739 | $ | 223,370 | $ | 32,577 | $ | 56,850 | $ | (13,809 | ) | |||||||||
| Taxable equivalent adjustment | (1,483 | ) | (1,690 | ) | (1,707 | ) | (2,001 | ) | (2,132 | ) | ||||||||||
| Gain from acquisition | — | — | — | — | 11,390 | |||||||||||||||
| Partial recovery of special fraud-related loan loss | — | — | — | 11,750 | — | |||||||||||||||
| Total revenue (GAAP) | $ | 209,256 | $ | 221,680 | $ | 30,870 | $ | 66,599 | $ | (4,551 | ) | |||||||||
| Expense reconciliation | ||||||||||||||||||||
| Operating expense | $ | 174,304 | $ | 186,774 | $ | 261,599 | $ | 288,301 | $ | 217,050 | ||||||||||
| Noncash goodwill impairment charge | — | — | — | 210,590 | 95,000 | |||||||||||||||
| Severance costs | — | — | — | — | 2,898 | |||||||||||||||
| Operating expense (GAAP) | $ | 174,304 | $ | 186,774 | $ | 261,599 | $ | 498,891 | $ | 314,948 | ||||||||||
| Income (loss) before taxes reconciliation | ||||||||||||||||||||
| Income (loss) before taxes | $ | 36,435 | $ | 36,596 | $ | (229,022 | ) | $ | (231,451 | ) | $ | (230,859 | ) | |||||||
| Taxable equivalent adjustment | (1,483 | ) | (1,690 | ) | (1,707 | ) | (2,001 | ) | (2,132 | ) | ||||||||||
| Gain from acquisition | — | — | — | — | 11,390 | |||||||||||||||
| Noncash goodwill impairment charge | — | — | — | (210,590 | ) | (95,000 | ) | |||||||||||||
| Severance costs | — | — | — | — | (2,898 | ) | ||||||||||||||
| Partial recovery of special fraud-related loan loss | — | — | — | 11,750 | — | |||||||||||||||
| Income (loss) before taxes (GAAP) | $ | 34,952 | $ | 34,906 | $ | (230,729 | ) | $ | (432,292 | ) | $ | (319,499 | ) | |||||||
| Income tax expense (benefit) reconciliation | ||||||||||||||||||||
| Income tax expense (benefit) | $ | (236,705 | ) | $ | 2,740 | $ | (2,276 | ) | $ | 73,218 | $ | (91,754 | ) | |||||||
| Taxable equivalent adjustment | (1,483 | ) | (1,690 | ) | (1,707 | ) | (2,001 | ) | (2,132 | ) | ||||||||||
| Gain from acquisition, tax expense | — | — | — | — | 4,328 | |||||||||||||||
| Severance costs, tax benefit | — | — | — | — | (1,101 | ) | ||||||||||||||
| Income tax expense (benefit) (GAAP) | $ | (238,188 | ) | $ | 1,050 | $ | (3,983 | ) | $ | 71,217 | $ | (90,659 | ) | |||||||
| 31 |
For the Years Ended December 31, | ||||||||||||||||||||
| (in thousands, except per share | ||||||||||||||||||||
| data; taxable equivalent) | 2013 | 2012 | 2011 | 2010 | 2009 | |||||||||||||||
| Diluted earnings (loss) from continuing operations per common share reconciliation | ||||||||||||||||||||
| Diluted operating earnings (loss) from continuing operations per common share | $ | 4.44 | $ | .38 | $ | (5.97 | ) | $ | (16.64 | ) | $ | (12.37 | ) | |||||||
| Gain from acquisition | — | — | — | — | .58 | |||||||||||||||
| Noncash goodwill impairment charge | — | — | — | (11.13 | ) | (7.86 | ) | |||||||||||||
| Severance costs | — | — | — | — | (.15 | ) | ||||||||||||||
| Partial recovery of special fraud-related loan loss | — | — | — | .62 | — | |||||||||||||||
| Diluted earnings (loss) from continuing operations per common share (GAAP) | $ | 4.44 | $ | .38 | $ | (5.97 | ) | $ | (27.15 | ) | $ | (19.80 | ) | |||||||
| Book value per common share reconciliation | ||||||||||||||||||||
| Tangible book value per common share | $ | 11.26 | $ | 6.57 | $ | 6.47 | $ | 14.80 | $ | 30.09 | ||||||||||
| Effect of goodwill and other intangibles | .04 | .10 | .15 | .60 | 11.69 | |||||||||||||||
| Book value per common share (GAAP) | $ | 11.30 | $ | 6.67 | $ | 6.62 | $ | 15.40 | $ | 41.78 | ||||||||||
| Efficiency ratio from continuing operations reconciliation | ||||||||||||||||||||
| Operating efficiency ratio from continuing operations | 63.14 | % | 65.43 | % | 92.27 | % | 98.98 | % | 73.97 | % | ||||||||||
| Gain from acquisition | — | — | — | — | (2.77 | ) | ||||||||||||||
| Noncash goodwill impairment charge | — | — | — | 72.29 | 31.17 | |||||||||||||||
| Severance costs | — | — | — | — | .95 | |||||||||||||||
| Efficiency ratio from continuing operations (GAAP) | 63.14 | % | 65.43 | % | 92.27 | % | 171.27 | % | 103.32 | % | ||||||||||
| Average equity to assets reconciliation | ||||||||||||||||||||
| Tangible common equity to assets | 7.55 | % | 5.54 | % | 3.74 | % | 6.52 | % | 6.15 | % | ||||||||||
| Effect of preferred equity | 2.76 | 2.84 | 3.88 | 2.36 | 2.18 | |||||||||||||||
| Tangible equity to assets | 10.31 | 8.38 | 7.62 | 8.88 | 8.33 | |||||||||||||||
| Effect of goodwill and other intangibles | .04 | .09 | .13 | 1.89 | 2.79 | |||||||||||||||
| Equity to assets (GAAP) | 10.35 | % | 8.47 | % | 7.75 | % | 10.77 | % | 11.12 | % | ||||||||||
| Tangible common equity to risk-weighted assets reconciliation | ||||||||||||||||||||
| Tangible common equity to risk-weighted assets | 13.17 | % | 8.26 | % | 8.25 | % | 5.64 | % | 10.39 | % | ||||||||||
| Effect of other comprehensive income | .39 | .51 | (.03 | ) | (.42 | ) | (.87 | ) | ||||||||||||
| Effect of deferred tax limitation | (4.25 | ) | — | — | — | (1.27 | ) | |||||||||||||
| Effect of trust preferred | 1.04 | 1.15 | 1.18 | 1.06 | .97 | |||||||||||||||
| Effect of preferred equity | 2.38 | 4.24 | 4.29 | 3.53 | 3.19 | |||||||||||||||
| Tier I capital ratio (Regulatory) | 12.73 | % | 14.16 | % | 13.69 | % | 9.81 | % | 12.41 | % | ||||||||||
| Net charge-offs reconciliation | ||||||||||||||||||||
| Operating net charge-offs | $ | 93,710 | $ | 69,831 | $ | 311,227 | $ | 215,657 | $ | 276,669 | ||||||||||
| Subsequent partial recovery of fraud-related charge-off | — | — | — | (11,750 | ) | — | ||||||||||||||
| Net charge-offs (GAAP) | $ | 93,710 | $ | 69,831 | $ | 311,227 | $ | 203,907 | $ | 276,669 | ||||||||||
| Net charge-offs to average loans reconciliation | ||||||||||||||||||||
| Operating net charge-offs to average loans | 2.22 | % | 1.69 | % | 7.33 | % | 4.42 | % | 5.03 | |||||||||||
| Subsequent partial recovery of fraud-related charge-off | — | — | — | (.25 | ) | — | ||||||||||||||
| Net charge-offs to average loans (GAAP) | 2.22 | % | 1.69 | % | 7.33 | % | 4.17 | % | 5.03 | |||||||||||
| 32 |
Table 1 (Continued) - Operating Earnings to GAAP Earnings Reconciliation - Quarterly Selected Financial Information | ||||||||||||||||||||||||||||||||
| 2013 | 2012 | |||||||||||||||||||||||||||||||
| (in thousands, except per share | Fourth | Third | Second | First | Fourth | Third | Second | First | ||||||||||||||||||||||||
| data; taxable equivalent) | Quarter | Quarter | Quarter | Quarter | Quarter | Quarter | Quarter | Quarter | ||||||||||||||||||||||||
| Interest revenue reconciliation | ||||||||||||||||||||||||||||||||
| Interest revenue - taxable equivalent | $ | 61,695 | $ | 61,426 | $ | 62,088 | $ | 62,114 | $ | 64,450 | $ | 66,092 | $ | 66,823 | $ | 70,302 | ||||||||||||||||
| Taxable equivalent adjustment | (380 | ) | (370 | ) | (368 | ) | (365 | ) | (381 | ) | (419 | ) | (444 | ) | (446 | ) | ||||||||||||||||
| Interest revenue (GAAP) | $ | 61,315 | $ | 61,056 | $ | 61,720 | $ | 61,749 | $ | 64,069 | $ | 65,673 | $ | 66,379 | $ | 69,856 | ||||||||||||||||
| Net interest revenue reconciliation | ||||||||||||||||||||||||||||||||
| Net interest revenue - taxable equivalent | $ | 55,879 | $ | 54,257 | $ | 54,931 | $ | 54,574 | $ | 56,144 | $ | 57,979 | $ | 56,656 | $ | 58,979 | ||||||||||||||||
| Taxable equivalent adjustment | (380 | ) | (370 | ) | (368 | ) | (365 | ) | (381 | ) | (419 | ) | (444 | ) | (446 | ) | ||||||||||||||||
| Net interest revenue (GAAP) | $ | 55,499 | $ | 53,887 | $ | 54,563 | $ | 54,209 | $ | 55,763 | $ | 57,560 | $ | 56,212 | $ | 58,533 | ||||||||||||||||
| Total revenue reconciliation | ||||||||||||||||||||||||||||||||
| Total operating revenue | $ | 66,398 | $ | 65,482 | $ | 22,374 | $ | 56,485 | $ | 56,789 | $ | 55,635 | $ | 51,703 | $ | 59,243 | ||||||||||||||||
| Taxable equivalent adjustment | (380 | ) | (370 | ) | (368 | ) | (365 | ) | (381 | ) | (419 | ) | (444 | ) | (446 | ) | ||||||||||||||||
| Total revenue (GAAP) | $ | 66,018 | $ | 65,112 | $ | 22,006 | $ | 56,120 | $ | 56,408 | $ | 55,216 | $ | 51,259 | $ | 58,797 | ||||||||||||||||
| Income (loss) before taxes reconciliation | ||||||||||||||||||||||||||||||||
| Income (loss) before taxes | $ | 24,784 | $ | 25,385 | $ | (26,449 | ) | $ | 12,715 | $ | 6,063 | $ | 10,852 | $ | 7,393 | $ | 12,288 | |||||||||||||||
| Taxable equivalent adjustment | (380 | ) | (370 | ) | (368 | ) | (365 | ) | (381 | ) | (419 | ) | (444 | ) | (446 | ) | ||||||||||||||||
| Income (loss) before taxes (GAAP) | $ | 24,404 | $ | 25,015 | $ | (26,817 | ) | $ | 12,350 | $ | 5,682 | $ | 10,433 | $ | 6,949 | $ | 11,842 | |||||||||||||||
| Income tax expense (benefit) reconciliation | ||||||||||||||||||||||||||||||||
| Income tax expense (benefit) | $ | 8,873 | $ | 9,885 | $ | (256,413 | ) | $ | 950 | $ | 802 | $ | 284 | $ | 894 | $ | 760 | |||||||||||||||
| Taxable equivalent adjustment | (380 | ) | (370 | ) | (368 | ) | (365 | ) | (381 | ) | (419 | ) | (444 | ) | (446 | ) | ||||||||||||||||
| Income tax expense (benefit) (GAAP) | $ | 8,493 | $ | 9,515 | $ | (256,781 | ) | $ | 585 | $ | 421 | $ | (135 | ) | $ | 450 | $ | 314 | ||||||||||||||
| Book value per common share reconciliation | ||||||||||||||||||||||||||||||||
| Tangible book value per common share | $ | 11.26 | $ | 10.95 | $ | 10.82 | $ | 6.76 | $ | 6.57 | $ | 6.64 | $ | 6.48 | $ | 6.54 | ||||||||||||||||
| Effect of goodwill and other intangibles | .04 | .04 | .08 | .09 | .10 | .11 | .13 | .14 | ||||||||||||||||||||||||
| Book value per common share (GAAP) | $ | 11.30 | $ | 10.99 | $ | 10.90 | $ | 6.85 | $ | 6.67 | $ | 6.75 | $ | 6.61 | $ | 6.68 | ||||||||||||||||
| Average equity to assets reconciliation | ||||||||||||||||||||||||||||||||
| Tangible common equity to assets | 8.99 | % | 9.02 | % | 8.79 | % | 5.66 | % | 5.67 | % | 5.73 | % | 5.45 | % | 5.33 | % | ||||||||||||||||
| Effect of preferred equity | 2.60 | 2.74 | 2.74 | 2.87 | 2.88 | 2.93 | 2.79 | 2.75 | ||||||||||||||||||||||||
| Tangible equity to assets | 11.59 | 11.76 | 11.53 | 8.53 | 8.55 | 8.66 | 8.24 | 8.08 | ||||||||||||||||||||||||
| Effect of goodwill and other intangibles | .03 | .04 | .04 | .07 | .08 | .09 | .09 | .11 | ||||||||||||||||||||||||
| Equity to assets (GAAP) | 11.62 | % | 11.80 | % | 11.57 | % | 8.60 | % | 8.63 | % | 8.75 | % | 8.33 | % | 8.19 | % | ||||||||||||||||
| Tangible common equity to risk-weighted assets reconciliation | ||||||||||||||||||||||||||||||||
| Tangible common equity to risk-weighted assets | 13.17 | % | 13.34 | % | 13.16 | % | 8.45 | % | 8.26 | % | 8.44 | % | 8.37 | % | 8.21 | % | ||||||||||||||||
| Effect of other comprehensive income | .39 | .49 | .29 | .49 | .51 | .36 | .28 | .10 | ||||||||||||||||||||||||
| Effect of deferred tax limitation | (4.25 | ) | (4.72 | ) | (4.99 | ) | — | — | — | — | — | |||||||||||||||||||||
| Effect of trust preferred | 1.04 | 1.09 | 1.11 | 1.15 | 1.15 | 1.17 | 1.19 | 1.15 | ||||||||||||||||||||||||
| Effect of preferred equity | 2.38 | 4.01 | 4.11 | 4.22 | 4.24 | 4.29 | 4.35 | 4.23 | ||||||||||||||||||||||||
| Tier I capital ratio (Regulatory) | 12.73 | % | 14.21 | % | 13.68 | % | 14.31 | % | 14.16 | % | 14.26 | % | 14.19 | % | 13.69 | % | ||||||||||||||||
| 33 |
| 34 |
| 2013 | 2012 | 2011 | ||||||||||||||||||||||||||||||||||
| Average | Avg. | Average | Avg. | Average | Avg. | |||||||||||||||||||||||||||||||
| Balance | Interest | Rate | Balance | Interest | Rate | Balance | Interest | Rate | ||||||||||||||||||||||||||||
| Assets: | ||||||||||||||||||||||||||||||||||||
| Interest-earning assets: | ||||||||||||||||||||||||||||||||||||
Loans (1)(2) | $ | 4,254,159 | $ | 201,278 | 4.73 | % | $ | 4,165,520 | $ | 217,705 | 5.23 | % | $ | 4,307,111 | $ | 244,159 | 5.67 | % | ||||||||||||||||||
Taxable securities (3) | 2,169,024 | 40,331 | 1.86 | 2,065,162 | 43,657 | 2.11 | 1,973,678 | 55,251 | 2.80 | |||||||||||||||||||||||||||
Tax-exempt securities (1)(3) | 21,228 | 1,354 | 6.38 | 23,759 | 1,565 | 6.59 | 25,693 | 1,651 | 6.43 | |||||||||||||||||||||||||||
Federal funds sold and other interest-earning assets | 204,303 | 4,360 | 2.13 | 292,857 | 4,740 | 1.62 | 478,403 | 3,247 | .68 | |||||||||||||||||||||||||||
| Total interest-earning assets | 6,648,714 | 247,323 | 3.72 | 6,547,298 | 267,667 | 4.09 | 6,784,885 | 304,308 | 4.49 | |||||||||||||||||||||||||||
| Non-interest-earning assets: | ||||||||||||||||||||||||||||||||||||
| Allowance for loan losses | (95,411 | ) | (114,647 | ) | (145,656 | ) | ||||||||||||||||||||||||||||||
| Cash and due from banks | 63,174 | 53,247 | 90,212 | |||||||||||||||||||||||||||||||||
| Premises and equipment | 167,424 | 172,544 | 178,061 | |||||||||||||||||||||||||||||||||
Other assets (3) | 290,098 | 206,609 | 281,233 | |||||||||||||||||||||||||||||||||
| Total assets | $ | 7,073,999 | $ | 6,865,051 | $ | 7,188,735 | ||||||||||||||||||||||||||||||
Liabilities and Shareholders’ Equity: | ||||||||||||||||||||||||||||||||||||
| Interest-bearing liabilities: | ||||||||||||||||||||||||||||||||||||
| Interest-bearing deposits: | ||||||||||||||||||||||||||||||||||||
| NOW | $ | 1,285,842 | $ | 1,759 | .14 | $ | 1,293,510 | $ | 2,049 | .16 | $ | 1,348,493 | $ | 3,998 | .30 | |||||||||||||||||||||
| Money market | 1,315,385 | 2,210 | .17 | 1,140,354 | 2,518 | .22 | 993,871 | 5,456 | .55 | |||||||||||||||||||||||||||
| Savings deposits | 244,725 | 133 | .05 | 216,880 | 150 | .07 | 195,468 | 234 | .12 | |||||||||||||||||||||||||||
| Time deposits less than $100,000 | 974,470 | 5,850 | .60 | 1,170,202 | 9,788 | .84 | 1,471,596 | 18,648 | 1.27 | |||||||||||||||||||||||||||
| Time deposits greater than $100,000 | 654,102 | 5,115 | .78 | 766,411 | 8,027 | 1.05 | 948,659 | 14,347 | 1.51 | |||||||||||||||||||||||||||
| Brokered deposits | 219,215 | (501 | ) | (.23 | ) | 155,902 | 1,282 | .82 | 401,393 | 6,119 | 1.52 | |||||||||||||||||||||||||
| Total interest-bearing deposits | 4,693,739 | 14,566 | .31 | 4,743,259 | 23,814 | .50 | 5,359,480 | 48,802 | .91 | |||||||||||||||||||||||||||
Federal funds purchased, repurchase agreeements, and other short-term borrowings | 66,561 | 2,071 | 3.11 | 80,593 | 2,987 | 3.71 | 102,727 | 4,250 | 4.14 | |||||||||||||||||||||||||||
| Federal Home Loan Bank advances | 32,604 | 68 | .21 | 124,771 | 907 | .73 | 47,220 | 2,042 | 4.32 | |||||||||||||||||||||||||||
| Long-term debt | 131,081 | 10,977 | 8.37 | 127,623 | 10,201 | 7.99 | 139,666 | 10,544 | 7.55 | |||||||||||||||||||||||||||
| Total borrowed funds | 230,246 | 13,116 | 5.70 | 332,987 | 14,095 | 4.23 | 289,613 | 16,836 | 5.81 | |||||||||||||||||||||||||||
| Total interest-bearing liabilities | 4,923,985 | 27,682 | .56 | 5,076,246 | 37,909 | .75 | 5,649,093 | 65,638 | 1.16 | |||||||||||||||||||||||||||
| Non-interest-bearing liabilities: | ||||||||||||||||||||||||||||||||||||
| Non-interest-bearing deposits | 1,333,199 | 1,142,236 | 915,649 | |||||||||||||||||||||||||||||||||
| Other liabilities | 84,506 | 64,986 | 66,809 | |||||||||||||||||||||||||||||||||
| Total liabilities | 6,341,690 | 6,283,468 | 6,631,551 | |||||||||||||||||||||||||||||||||
Shareholders’ equity | 732,309 | 581,583 | 557,184 | |||||||||||||||||||||||||||||||||
| Total liabilities | ||||||||||||||||||||||||||||||||||||
and shareholders’ equity | $ | 7,073,999 | $ | 6,865,051 | $ | 7,188,735 | ||||||||||||||||||||||||||||||
| Net interest revenue | $ | 219,641 | $ | 229,758 | $ | 238,670 | ||||||||||||||||||||||||||||||
| Net interest-rate spread | 3.16 | % | 3.34 | % | 3.33 | % | ||||||||||||||||||||||||||||||
Net interest margin (4) | 3.30 | % | 3.51 | % | 3.52 | % | ||||||||||||||||||||||||||||||
| 35 |
| Table 3 - Change in Interest Revenue and Interest Expense | ||||||||||||||||||||||||
| (in thousands, taxable equivalent) | ||||||||||||||||||||||||
| 2013 Compared to 2012 | 2012 Compared to 2011 | |||||||||||||||||||||||
| Increase (decrease) | Increase (decrease) | |||||||||||||||||||||||
| due to changes in | due to changes in | |||||||||||||||||||||||
| Volume | Rate | Total | Volume | Rate | Total | |||||||||||||||||||
| Interest-earning assets: | ||||||||||||||||||||||||
| Loans | $ | 4,552 | $ | (20,979 | ) | $ | (16,427 | ) | $ | (7,696 | ) | $ | (18,758 | ) | $ | (26,454 | ) | |||||||
| Taxable securities | 2,118 | (5,444 | ) | (3,326 | ) | 2,461 | (14,055 | ) | (11,594 | ) | ||||||||||||||
| Tax-exempt securities | (163 | ) | (48 | ) | (211 | ) | (127 | ) | 41 | (86 | ) | |||||||||||||
Federal funds sold and other interest-earning assets | (1,656 | ) | 1,276 | (380 | ) | (1,641 | ) | 3,134 | 1,493 | |||||||||||||||
| Total interest-earning assets | 4,851 | (25,195 | ) | (20,344 | ) | (7,003 | ) | (29,638 | ) | (36,641 | ) | |||||||||||||
| Interest-bearing liabilities: | ||||||||||||||||||||||||
| Interest-bearing deposits: | ||||||||||||||||||||||||
| NOW | (12 | ) | (278 | ) | (290 | ) | (157 | ) | (1,792 | ) | (1,949 | ) | ||||||||||||
| Money Market | 350 | (658 | ) | (308 | ) | 709 | (3,647 | ) | (2,938 | ) | ||||||||||||||
| Savings deposits | 18 | (35 | ) | (17 | ) | 23 | (107 | ) | (84 | ) | ||||||||||||||
| Time deposits less than $100,000 | (1,465 | ) | (2,473 | ) | (3,938 | ) | (3,331 | ) | (5,529 | ) | (8,860 | ) | ||||||||||||
| Time deposits greater than $100,000 | (1,067 | ) | (1,845 | ) | (2,912 | ) | (2,430 | ) | (3,890 | ) | (6,320 | ) | ||||||||||||
| Brokered deposits | 360 | (2,143 | ) | (1,783 | ) | (3,028 | ) | (1,809 | ) | (4,837 | ) | |||||||||||||
| Total interest-bearing deposits | (1,816 | ) | (7,432 | ) | (9,248 | ) | (8,214 | ) | (16,774 | ) | (24,988 | ) | ||||||||||||
Federal funds purchased, repurchase agreements & other short-term borrowings | (477 | ) | (439 | ) | (916 | ) | (851 | ) | (412 | ) | (1,263 | ) | ||||||||||||
| Federal Home Loan Bank advances | (427 | ) | (412 | ) | (839 | ) | 1,502 | (2,637 | ) | (1,135 | ) | |||||||||||||
| Long-term debt | 281 | 495 | 776 | (941 | ) | 598 | (343 | ) | ||||||||||||||||
| Total borrowed funds | (623 | ) | (356 | ) | (979 | ) | (290 | ) | (2,451 | ) | (2,741 | ) | ||||||||||||
| Total interest-bearing liabilities | (2,439 | ) | (7,788 | ) | (10,227 | ) | (8,504 | ) | (19,225 | ) | (27,729 | ) | ||||||||||||
| Decrease in net interest revenue | $ | 7,290 | $ | (17,407 | ) | $ | (10,117 | ) | $ | 1,501 | $ | (10,413 | ) | $ | (8,912 | ) | ||||||||
| 36 |
| Table 4 - Fee Revenue | ||||||||||||||||
| For the Years Ended December 31, | ||||||||||||||||
| (in thousands) | ||||||||||||||||
| Change | ||||||||||||||||
| 2013 | 2012 | 2011 | 2013-2012 | |||||||||||||
| Overdraft fees | $ | 12,425 | $ | 13,302 | $ | 14,246 | (7 | )% | ||||||||
| ATM and debit card fees | 14,509 | 13,108 | 12,079 | 11 | ||||||||||||
| Other service charges and fees | 5,063 | 5,260 | 2,785 | (4 | ) | |||||||||||
| Service charges and fees | 31,997 | 31,670 | 29,110 | 1 | ||||||||||||
| Mortgage loan and related fees | 9,925 | 10,483 | 5,419 | (5 | ) | |||||||||||
| Brokerage fees | 4,465 | 3,082 | 2,986 | 45 | ||||||||||||
| Customer derivatives | 1,599 | 524 | — | 205 | ||||||||||||
| Securities gains, net | 186 | 7,078 | 842 | |||||||||||||
| Losses on prepayment of borrowings | — | (6,681 | ) | (791 | ) | |||||||||||
| Other | 8,426 | 9,956 | 7,341 | (15 | ) | |||||||||||
| Total fee revenue | $ | 56,598 | $ | 56,112 | $ | 44,907 | 1 | |||||||||
| 37 |
| Table 5 - Operating Expenses |
| For the Years Ended December 31, |
| (in thousands) |
| Change | ||||||||||||||||
| 2013 | 2012 | 2011 | 2013-2012 | |||||||||||||
| Salaries and employee benefits | $ | 96,233 | $ | 96,026 | $ | 100,095 | — | % | ||||||||
| Communications and equipment | 13,233 | 12,940 | 13,135 | 2 | ||||||||||||
| Occupancy | 13,930 | 14,304 | 15,645 | (3 | ) | |||||||||||
| Advertising and public relations | 3,718 | 3,855 | 4,291 | (4 | ) | |||||||||||
| Postage, printing and supplies | 3,283 | 3,899 | 4,256 | (16 | ) | |||||||||||
| Professional fees | 9,617 | 8,792 | 9,727 | 9 | ||||||||||||
| Foreclosed property - foreclosure and carrying costs | 3,163 | 5,118 | 10,499 | (38 | ) | |||||||||||
| Foreclosed property - writedowns and losses from sales | 4,706 | 8,875 | 68,406 | (47 | ) | |||||||||||
| FDIC assessments and other regulatory charges | 9,219 | 10,097 | 14,259 | (9 | ) | |||||||||||
| Amortization of intangibles | 2,031 | 2,917 | 3,016 | (30 | ) | |||||||||||
| Other | 15,171 | 19,951 | 18,270 | (24 | ) | |||||||||||
| Total operating expenses | $ | 174,304 | $ | 186,774 | $ | 261,599 | (7 | ) | ||||||||
| 38 |
| 39 |
| Three Months Ended | ||||||||||||
| December 31, | ||||||||||||
| 2013 | 2012 | Change | ||||||||||
| Overdraft fees | $ | 3,199 | $ | 3,464 | (8 | )% | ||||||
| ATM and debit card fees | 3,691 | 3,701 | — | |||||||||
| Other service charges and fees | 1,276 | 1,210 | 5 | |||||||||
| Service charges and fees | 8,166 | 8,375 | (2 | ) | ||||||||
| Mortgage loan and related fees | 1,713 | 3,262 | (47 | ) | ||||||||
| Brokerage fees | 1,361 | 751 | 81 | |||||||||
| Securities gains, net | 70 | 31 | 126 | |||||||||
| Other | 2,209 | 2,226 | (1 | ) | ||||||||
| Total operating fee revenue | $ | 13,519 | $ | 14,645 | (8 | ) | ||||||
| 40 |
| Three Months Ended | ||||||||||||
| December 31, | ||||||||||||
| 2013 | 2012 | Change | ||||||||||
| Salaries and employee benefits | $ | 24,817 | $ | 23,586 | 5 | |||||||
| Communications and equipment | 3,414 | 3,320 | 3 | |||||||||
| Occupancy | 3,735 | 3,455 | 8 | |||||||||
| Advertising and public relations | 781 | 987 | (21 | ) | ||||||||
| Postage, printing and supplies | 882 | 1,050 | (16 | ) | ||||||||
| Professional fees | 2,102 | 2,685 | (22 | ) | ||||||||
| Foreclosed property - foreclosure and carrying costs | 626 | 1,423 | (56 | ) | ||||||||
| Foreclosed property - writedowns, (gains) losses from sales, net | (435 | ) | 3,188 | (114 | ) | |||||||
| FDIC assessments and other regulatory charges | 1,804 | 2,505 | (28 | ) | ||||||||
| Amortization of intangibles | 408 | 727 | (44 | ) | ||||||||
| Other | 3,480 | 7,800 | (55 | ) | ||||||||
| Total operating expenses | $ | 41,614 | $ | 50,726 | (18 | ) | ||||||
| 41 |
| Table 8 - Loans Outstanding | ||||||||||||||||||||
| As of December 31, | ||||||||||||||||||||
| (in thousands) | ||||||||||||||||||||
| 2013 | 2012 | 2011 | 2010 | 2009 | ||||||||||||||||
| Loans by Category | ||||||||||||||||||||
| Commercial (secured by real estate) | $ | 1,756,710 | $ | 1,813,365 | $ | 1,821,414 | $ | 1,761,424 | $ | 1,779,398 | ||||||||||
| Commercial & industrial | 471,961 | 458,246 | 428,249 | 441,518 | 390,520 | |||||||||||||||
| Commercial construction | 148,903 | 154,769 | 164,155 | 296,582 | 362,566 | |||||||||||||||
| Total commercial | 2,377,574 | 2,426,380 | 2,413,818 | 2,499,524 | 2,532,484 | |||||||||||||||
| Residential mortgage | 1,315,964 | 1,214,203 | 1,134,902 | 1,278,780 | 1,427,198 | |||||||||||||||
| Residential construction | 328,579 | 381,677 | 448,391 | 695,166 | 1,050,065 | |||||||||||||||
| Consumer installment | 307,149 | 152,748 | 112,503 | 130,656 | 141,729 | |||||||||||||||
| Total loans | $ | 4,329,266 | $ | 4,175,008 | $ | 4,109,614 | $ | 4,604,126 | $ | 5,151,476 | ||||||||||
| 2013 | 2012 | 2011 | 2010 | 2009 | ||||||||||||||||
| Loans by Market | ||||||||||||||||||||
| North Georgia | $ | 1,240,234 | $ | 1,363,723 | $ | 1,425,811 | $ | 1,688,586 | $ | 1,883,880 | ||||||||||
| Atlanta MSA | 1,275,139 | 1,249,470 | 1,219,652 | 1,310,222 | 1,435,223 | |||||||||||||||
| North Carolina | 571,971 | 579,085 | 597,446 | 701,798 | 771,709 | |||||||||||||||
| Coastal Georgia | 423,045 | 400,022 | 346,189 | 335,020 | 405,689 | |||||||||||||||
| Gainesville MSA | 254,655 | 261,406 | 264,567 | 312,049 | 389,766 | |||||||||||||||
| East Tennessee | 279,587 | 282,863 | 255,949 | 256,451 | 265,209 | |||||||||||||||
| South Carolina | 88,531 | — | — | — | — | |||||||||||||||
| Other (Indirect Auto) | 196,104 | 38,439 | — | — | — | |||||||||||||||
| Total loans | $ | 4,329,266 | $ | 4,175,008 | $ | 4,109,614 | $ | 4,604,126 | $ | 5,151,476 |
| Table 9 - Loan Portfolio Maturity | ||||||||||||||||||||||||
| As of December 31, 2013 | ||||||||||||||||||||||||
| (in thousands) | ||||||||||||||||||||||||
| Rate Structure for Loans | ||||||||||||||||||||||||
| Maturity | Maturing Over One Year | |||||||||||||||||||||||
| One Year | One through | Over Five | Fixed | Floating | ||||||||||||||||||||
| or Less | Five Years | Years | Total | Rate | Rate | |||||||||||||||||||
| Commercial (commercial and industrial) | $ | 161,045 | $ | 220,526 | $ | 90,390 | $ | 471,961 | $ | 208,821 | $ | 102,095 | ||||||||||||
| Construction (commercial and residential) | 207,253 | 194,541 | 75,688 | 477,482 | 185,220 | 85,009 | ||||||||||||||||||
| Total | $ | 368,298 | $ | 415,067 | $ | 166,078 | $ | 949,443 | $ | 394,041 | $ | 187,104 | ||||||||||||
| 42 |
| Table 10 - Performing Substandard Loans | ||||||||||||||||||||
| (dollars in thousands) | ||||||||||||||||||||
| December 31, | December 31, | December 31, | December 31, | December 31, | ||||||||||||||||
| 2013 | 2012 | 2011 | 2010 | 2009 | ||||||||||||||||
| By Category | ||||||||||||||||||||
| Commercial (secured by real estate) | $ | 77,725 | $ | 117,543 | $ | 143,058 | $ | 156,765 | $ | 123,740 | ||||||||||
| Commercial & industrial | 9,589 | 18,477 | 15,753 | 16,767 | 33,974 | |||||||||||||||
| Commercial construction | 16,758 | 19,285 | 18,510 | 90,745 | 51,696 | |||||||||||||||
| Total commercial | 104,072 | 155,305 | 177,321 | 264,277 | 209,410 | |||||||||||||||
| Residential mortgage | 51,989 | 65,179 | 76,442 | 86,143 | 79,741 | |||||||||||||||
| Residential construction | 14,104 | 37,804 | 71,955 | 158,770 | 196,908 | |||||||||||||||
| Consumer installment | 2,538 | 3,653 | 2,751 | 2,957 | 3,553 | |||||||||||||||
| Total | $ | 172,703 | $ | 261,941 | $ | 328,469 | $ | 512,147 | $ | 489,612 | ||||||||||
| By Market | ||||||||||||||||||||
| North Georgia | $ | 69,510 | $ | 105,851 | $ | 134,945 | $ | 212,992 | $ | 256,178 | ||||||||||
| Atlanta MSA | 43,171 | 77,630 | 99,453 | 185,327 | 141,205 | |||||||||||||||
| North Carolina | 18,954 | 28,657 | 40,302 | 42,335 | 17,524 | |||||||||||||||
| Coastal Georgia | 18,561 | 17,421 | 24,985 | 29,223 | 40,930 | |||||||||||||||
| Gainesville MSA | 14,916 | 19,251 | 17,338 | 33,962 | 26,969 | |||||||||||||||
| East Tennessee | 7,591 | 13,131 | 11,446 | 8,308 | 6,806 | |||||||||||||||
| South Carolina | — | — | — | — | — | |||||||||||||||
| Total loans | $ | 172,703 | $ | 261,941 | $ | 328,469 | $ | 512,147 | $ | 489,612 | ||||||||||
| 43 |
| Table 11 - Allocation of Allowance for Credit Losses | ||||||||||||||||||||||||||||||||||||||||
| As of December 31, | ||||||||||||||||||||||||||||||||||||||||
| (in thousands) | ||||||||||||||||||||||||||||||||||||||||
| 2013 | 2012 | 2011 | 2010 | 2009 | ||||||||||||||||||||||||||||||||||||
| Amount | %* | Amount | %* | Amount | %* | Amount | %* | Amount | %* | |||||||||||||||||||||||||||||||
| Commercial (secured by real estate) | $ | 24,338 | 41 | $ | 27,847 | 43 | $ | 31,644 | 44 | $ | 31,191 | 38 | $ | 19,208 | 34 | |||||||||||||||||||||||||
| Commercial & industrial | 6,573 | 11 | 5,537 | 11 | 5,681 | 10 | 7,580 | 10 | 6,892 | 8 | ||||||||||||||||||||||||||||||
| Total commercial | 30,911 | 52 | 33,384 | 54 | 37,325 | 54 | 38,771 | 48 | 26,100 | 42 | ||||||||||||||||||||||||||||||
| Construction | 16,155 | 11 | 35,051 | 13 | 36,476 | 15 | 99,351 | 21 | 99,446 | 27 | ||||||||||||||||||||||||||||||
| Residential mortgage | 20,974 | 30 | 26,642 | 29 | 29,076 | 28 | 22,305 | 28 | 17,266 | 28 | ||||||||||||||||||||||||||||||
| Consumer installment | 2,479 | 7 | 2,747 | 4 | 2,124 | 3 | 3,030 | 3 | 2,545 | 3 | ||||||||||||||||||||||||||||||
| Unallocated | 6,243 | 9,313 | 9,467 | 11,238 | 10,245 | |||||||||||||||||||||||||||||||||||
| Total allowance for loan losses | 76,762 | 100 | 107,137 | 100 | 114,468 | 100 | 174,695 | 100 | 155,602 | 100 | ||||||||||||||||||||||||||||||
| Allowance for unfunded commitments | 2,165 | — | — | �� | — | — | ||||||||||||||||||||||||||||||||||
| Total allowance for credit losses | $ | 78,927 | $ | 107,137 | $ | 114,468 | $ | 174,695 | $ | 155,602 | ||||||||||||||||||||||||||||||
| * Loan balance in each category, expressed as a percentage of total loans. | ||||||||||||||||||||||||||||||||||||||||
| Table 12 - Allowance for Credit Losses | ||||||||||||||||||||
| Years Ended December 31, | ||||||||||||||||||||
| (in thousands) | ||||||||||||||||||||
| 2013 | 2012 | 2011 | 2010 | 2009 | ||||||||||||||||
| Balance beginning of period | $ | 107,137 | $ | 114,468 | $ | 174,695 | $ | 155,602 | $ | 122,271 | ||||||||||
| Charge-offs: | ||||||||||||||||||||
| Commercial (secured by real estate) | 36,470 | 23,062 | 59,468 | 33,593 | 21,796 | |||||||||||||||
| Commercial & industrial | 18,914 | 2,424 | 24,890 | 10,837 | 11,322 | |||||||||||||||
| Commercial construction | 6,483 | 5,411 | 55,730 | 9,993 | 9,908 | |||||||||||||||
| Residential mortgage | 12,277 | 17,262 | 53,707 | 28,806 | 18,997 | |||||||||||||||
| Residential construction | 23,049 | 24,260 | 118,916 | 136,666 | 219,168 | |||||||||||||||
| Consumer installment | 2,461 | 2,214 | 3,594 | 4,828 | 5,115 | |||||||||||||||
| Total loans charged-off | 99,654 | 74,633 | 316,305 | 224,723 | 286,306 | |||||||||||||||
| Recoveries: | ||||||||||||||||||||
| Commercial (secured by real estate) | 1,945 | 692 | 448 | 1,167 | 520 | |||||||||||||||
| Commercial & industrial | 1,888 | 1,104 | 967 | 1,762 | 5,397 | |||||||||||||||
| Commercial construction | 69 | 111 | 203 | 431 | 12 | |||||||||||||||
| Residential mortgage | 715 | 799 | 738 | 867 | 411 | |||||||||||||||
| Residential construction | 173 | 1,272 | 1,678 | 15,370 | 2,253 | |||||||||||||||
| Consumer installment | 1,154 | 824 | 1,044 | 1,219 | 1,044 | |||||||||||||||
| Total recoveries | 5,944 | 4,802 | 5,078 | 20,816 | 9,637 | |||||||||||||||
| Net charge-offs | 93,710 | 69,831 | 311,227 | 203,907 | 276,669 | |||||||||||||||
| Provision for loan losses | 63,335 | 62,500 | 251,000 | 223,000 | 310,000 | |||||||||||||||
| Allowance for loan losses at end of period | 76,762 | 107,137 | 114,468 | 174,695 | 155,602 | |||||||||||||||
| Allowance for unfunded commitments at beginning of period | — | — | — | — | — | |||||||||||||||
| Provision for unfunded commitments | 2,165 | — | — | — | — | |||||||||||||||
| Allowance for unfunded commitments at end of period | 2,165 | — | — | — | — | |||||||||||||||
| Allowance for credit losses | $ | 78,927 | $ | 107,137 | $ | 114,468 | $ | 174,695 | $ | 155,602 | ||||||||||
Total loans (1): | ||||||||||||||||||||
| At year-end | $ | 4,329,266 | $ | 4,175,008 | $ | 4,109,614 | $ | 4,604,126 | $ | 5,151,476 | ||||||||||
| Average | 4,228,235 | 4,123,530 | 4,244,305 | 4,884,330 | 5,501,165 | |||||||||||||||
Allowance for loan losses as a percentage of year-end loans | 1.77 | % | 2.57 | % | 2.79 | % | 3.79 | % | 3.02 | % | ||||||||||
| As a percentage of average loans: | ||||||||||||||||||||
| Net charge-offs | 2.22 | 1.69 | 7.33 | 4.17 | 5.03 | |||||||||||||||
| Provision for loan losses | 1.50 | 1.52 | 5.91 | 4.57 | 5.64 | |||||||||||||||
| Allowance for loan losses as a percentage of nonperforming loans | 286 | 97 | 90 | 98 | 59 | |||||||||||||||
(1) Excludes loans acquired through the FDIC assisted acquisition of Southern Community Bank that are covered by loss sharing agreements. | ||||||||||||||||||||
| 44 |
| Table 13 - Nonperforming Assets | ||||||||||||||||||||
| As of December 31, | ||||||||||||||||||||
| (in thousands) | ||||||||||||||||||||
| 2013 | 2012 | 2011 | 2010 | 2009 | ||||||||||||||||
| Nonaccrual loans (NPLs) | $ | 26,819 | $ | 109,894 | $ | 127,479 | $ | 179,094 | $ | 264,092 | ||||||||||
| Foreclosed properties | 4,221 | 18,264 | 32,859 | 142,208 | 120,770 | |||||||||||||||
| Total nonperforming assets (NPAs) | $ | 31,040 | $ | 128,158 | $ | 160,338 | $ | 321,302 | $ | 384,862 | ||||||||||
| NPLs as a percentage of total loans | .62 | % | 2.63 | % | 3.10 | % | 3.89 | % | 5.13 | % | ||||||||||
| NPAs as a percentage of loans and foreclosed properties | .72 | 3.06 | 3.87 | 6.77 | 7.30 | |||||||||||||||
| NPAs as a percentage of total assets | .42 | 1.88 | 2.30 | 4.42 | 4.81 | |||||||||||||||
| 45 |
| Table 14 - Nonperforming Assets by Quarter | ||||||||||||||||||||||||||||||||||||||||||||||||
| (in thousands) | ||||||||||||||||||||||||||||||||||||||||||||||||
December 31, 2013 (1) | September 30, 2013 (1) | June 30, 2013 (1) | March 31, 2013 (1) | |||||||||||||||||||||||||||||||||||||||||||||
| Nonaccrual | Foreclosed | Total | Nonaccrual | Foreclosed | Total | Nonaccrual | Foreclosed | Total | Nonaccrual | Foreclosed | Total | |||||||||||||||||||||||||||||||||||||
| Loans | Properties | NPAs | Loans | Properties | NPAs | Loans | Properties | NPAs | Loans | Properties | NPAs | |||||||||||||||||||||||||||||||||||||
| BY CATEGORY | ||||||||||||||||||||||||||||||||||||||||||||||||
| Commercial (sec. by RE) | $ | 8,340 | $ | 832 | $ | 9,172 | $ | 8,015 | $ | 730 | $ | 8,745 | $ | 7,237 | $ | 547 | $ | 7,784 | $ | 17,304 | $ | 5,584 | $ | 22,888 | ||||||||||||||||||||||||
| Commercial & industrial | 427 | — | 427 | 609 | — | 609 | 548 | — | 548 | 29,545 | — | 29,545 | ||||||||||||||||||||||||||||||||||||
| Commercial construction | 361 | — | 361 | 343 | 376 | 719 | 504 | 376 | 880 | 22,359 | 3,027 | 25,386 | ||||||||||||||||||||||||||||||||||||
| Total commercial | 9,128 | 832 | 9,960 | 8,967 | 1,106 | 10,073 | 8,289 | 923 | 9,212 | 69,208 | 8,611 | 77,819 | ||||||||||||||||||||||||||||||||||||
| Residential mortgage | 13,178 | 3,073 | 16,251 | 12,504 | 2,154 | 14,658 | 14,338 | 1,443 | 15,781 | 11,817 | 3,463 | 15,280 | ||||||||||||||||||||||||||||||||||||
| Residential construction | 4,264 | 316 | 4,580 | 4,097 | 1,207 | 5,304 | 4,838 | 1,570 | 6,408 | 14,592 | 4,660 | 19,252 | ||||||||||||||||||||||||||||||||||||
| Consumer installment | 249 | — | 249 | 520 | — | 520 | 399 | — | 399 | 389 | — | 389 | ||||||||||||||||||||||||||||||||||||
| Total NPAs | $ | 26,819 | $ | 4,221 | $ | 31,040 | $ | 26,088 | $ | 4,467 | $ | 30,555 | $ | 27,864 | $ | 3,936 | $ | 31,800 | $ | 96,006 | $ | 16,734 | $ | 112,740 | ||||||||||||||||||||||||
Balance as a % of Unpaid Principal | 65.3 | % | 44.5 | % | 61.4 | % | 61.6 | % | 41.5 | % | 57.6 | % | 62.6 | % | 31.6 | % | 55.8 | % | 66.3 | % | 45.0 | % | 62.0 | % | ||||||||||||||||||||||||
| BY MARKET | ||||||||||||||||||||||||||||||||||||||||||||||||
| North Georgia | $ | 12,352 | $ | 2,494 | $ | 14,846 | $ | 13,652 | $ | 1,726 | $ | 15,378 | $ | 12,830 | $ | 1,617 | $ | 14,447 | $ | 63,210 | $ | 6,616 | $ | 69,826 | ||||||||||||||||||||||||
| Atlanta MSA | 2,830 | 684 | 3,514 | 3,096 | 1,026 | 4,122 | 3,803 | 1,197 | 5,000 | 17,380 | 3,524 | 20,904 | ||||||||||||||||||||||||||||||||||||
| North Carolina | 6,567 | 683 | 7,250 | 5,680 | 762 | 6,442 | 6,512 | 295 | 6,807 | 8,519 | 2,533 | 11,052 | ||||||||||||||||||||||||||||||||||||
| Coastal Georgia | 2,342 | 173 | 2,515 | 995 | 928 | 1,923 | 2,588 | 627 | 3,215 | 3,523 | 1,449 | 4,972 | ||||||||||||||||||||||||||||||||||||
| Gainesville MSA | 928 | — | 928 | 1,036 | — | 1,036 | 1,008 | — | 1,008 | 911 | 370 | 1,281 | ||||||||||||||||||||||||||||||||||||
| East Tennessee | 1,800 | 187 | 1,987 | 1,629 | 25 | 1,654 | 1,123 | 200 | 1,323 | 2,463 | 2,242 | 4,705 | ||||||||||||||||||||||||||||||||||||
| South Carolina | — | — | — | — | — | — | — | — | — | — | — | — | ||||||||||||||||||||||||||||||||||||
| Total NPAs | $ | 26,819 | $ | 4,221 | $ | 31,040 | $ | 26,088 | $ | 4,467 | $ | 30,555 | $ | 27,864 | $ | 3,936 | $ | 31,800 | $ | 96,006 | $ | 16,734 | $ | 112,740 | ||||||||||||||||||||||||
December 31, 2012 (1) | September 30, 2012 (1) | June 30, 2012 (1) | March 31, 2012 (1) | |||||||||||||||||||||||||||||||||||||||||||||
| Nonaccrual | Foreclosed | Total | Nonaccrual | Foreclosed | Total | Nonaccrual | Foreclosed | Total | Nonaccrual | Foreclosed | Total | |||||||||||||||||||||||||||||||||||||
| Loans | Properties | NPAs | Loans | Properties | NPAs | Loans | Properties | NPAs | Loans | Properties | NPAs | |||||||||||||||||||||||||||||||||||||
| BY CATEGORY | ||||||||||||||||||||||||||||||||||||||||||||||||
| Commercial (sec. by RE) | $ | 22,148 | $ | 5,479 | $ | 27,627 | $ | 25,896 | $ | 8,767 | $ | 34,663 | $ | 19,115 | $ | 10,586 | $ | 29,701 | $ | 26,081 | $ | 10,808 | $ | 36,889 | ||||||||||||||||||||||||
| Commercial & industrial | 31,817 | — | 31,817 | 32,678 | — | 32,678 | 34,982 | — | 34,982 | 36,314 | — | 36,314 | ||||||||||||||||||||||||||||||||||||
| Commercial construction | 23,843 | 2,204 | 26,047 | 18,590 | 3,121 | 21,711 | 18,175 | 2,732 | 20,907 | 23,319 | 3,266 | 26,585 | ||||||||||||||||||||||||||||||||||||
| Total commercial | 77,808 | 7,683 | 85,491 | 77,164 | 11,888 | 89,052 | 72,272 | 13,318 | 85,590 | 85,714 | 14,074 | 99,788 | ||||||||||||||||||||||||||||||||||||
| Residential mortgage | 12,589 | 4,753 | 17,342 | 13,996 | 6,031 | 20,027 | 16,631 | 5,591 | 22,222 | 18,741 | 5,882 | 24,623 | ||||||||||||||||||||||||||||||||||||
| Residential construction | 18,702 | 5,828 | 24,530 | 22,935 | 9,039 | 31,974 | 25,530 | 11,512 | 37,042 | 24,341 | 11,931 | 36,272 | ||||||||||||||||||||||||||||||||||||
| Consumer installment | 795 | — | 795 | 906 | — | 906 | 907 | — | 907 | 908 | — | 908 | ||||||||||||||||||||||||||||||||||||
| Total NPAs | $ | 109,894 | $ | 18,264 | $ | 128,158 | $ | 115,001 | $ | 26,958 | $ | 141,959 | $ | 115,340 | $ | 30,421 | $ | 145,761 | $ | 129,704 | $ | 31,887 | $ | 161,591 | ||||||||||||||||||||||||
Balance as a percentage of unpaid principal | 69.5 | % | 39.7 | % | 62.8 | % | 68.8 | % | 36.4 | % | 58.8 | % | 68.8 | % | 39.3 | % | 59.4 | % | 70.6 | % | 36.1 | % | 59.4 | % | ||||||||||||||||||||||||
| BY MARKET | ||||||||||||||||||||||||||||||||||||||||||||||||
| North Georgia | $ | 69,950 | $ | 8,219 | $ | 78,169 | $ | 72,211 | $ | 14,582 | $ | 86,793 | $ | 77,332 | $ | 13,546 | $ | 90,878 | $ | 81,117 | $ | 14,559 | $ | 95,676 | ||||||||||||||||||||||||
| Atlanta MSA | 18,556 | 3,442 | 21,998 | 21,349 | 5,926 | 27,275 | 17,593 | 8,651 | 26,244 | 22,321 | 7,647 | 29,968 | ||||||||||||||||||||||||||||||||||||
| North Carolina | 11,014 | 2,579 | 13,593 | 9,622 | 2,771 | 12,393 | 10,657 | 3,287 | 13,944 | 15,765 | 4,650 | 20,415 | ||||||||||||||||||||||||||||||||||||
| Coastal Georgia | 3,810 | 1,609 | 5,419 | 6,822 | 864 | 7,686 | 5,822 | 785 | 6,607 | 5,622 | 1,268 | 6,890 | ||||||||||||||||||||||||||||||||||||
| Gainesville MSA | 903 | 556 | 1,459 | 840 | 1,328 | 2,168 | 991 | 2,998 | 3,989 | 2,210 | 3,387 | 5,597 | ||||||||||||||||||||||||||||||||||||
| East Tennessee | 5,661 | 1,859 | 7,520 | 4,157 | 1,487 | 5,644 | 2,945 | 1,154 | 4,099 | 2,669 | 376 | 3,045 | ||||||||||||||||||||||||||||||||||||
| Total NPAs | $ | 109,894 | $ | 18,264 | $ | 128,158 | $ | 115,001 | $ | 26,958 | $ | 141,959 | $ | 115,340 | $ | 30,421 | $ | 145,761 | $ | 129,704 | $ | 31,887 | $ | 161,591 | ||||||||||||||||||||||||
(1) Excludes non-performing loans and foreclosed properties covered by the loss-sharing agreement with the FDIC, related to the acquisition of Southern Community Bank. | ||||||||||||||||||||||||||||||||||||||||||||||||
| 46 |
2013 (1) | 2012 (1) | 2011 (1)(3) | ||||||||||||||||||||||||||||||||||
| Nonaccrual | Foreclosed | Total | Nonaccrual | Foreclosed | Total | Nonaccrual | Foreclosed | Total | ||||||||||||||||||||||||||||
| Loans | Properties | NPAs | Loans | Properties | NPAs | Loans | Properties | NPAs | ||||||||||||||||||||||||||||
| Beginning Balance | $ | 109,894 | $ | 18,264 | $ | 128,158 | $ | 127,479 | $ | 32,859 | $ | 160,338 | $ | 179,094 | $ | 142,208 | $ | 321,302 | ||||||||||||||||||
Loans placed on non-accrual (2) | 43,867 | — | 43,867 | 112,547 | — | 112,547 | 239,681 | — | 239,681 | |||||||||||||||||||||||||||
| Payments received | (60,035 | ) | — | (60,035 | ) | (31,076 | ) | — | (31,076 | ) | (17,131 | ) | — | (17,131 | ) | |||||||||||||||||||||
| Loan charge-offs | (44,444 | ) | — | (44,444 | ) | (65,064 | ) | — | (65,064 | ) | (122,949 | ) | — | (122,949 | ) | |||||||||||||||||||||
| Foreclosures | (22,463 | ) | 22,463 | — | (33,992 | ) | 33,992 | — | (65,732 | ) | 65,732 | — | ||||||||||||||||||||||||
| Capitalized costs | — | 116 | 116 | — | 1,047 | 1,047 | — | 1,249 | 1,249 | |||||||||||||||||||||||||||
| Property sales | — | (31,916 | ) | (31,916 | ) | — | (40,759 | ) | (40,759 | ) | (11,400 | ) | (107,924 | ) | (119,324 | ) | ||||||||||||||||||||
| Loans transferred to held for sale | — | — | — | — | — | — | (74,084 | ) | — | (74,084 | ) | |||||||||||||||||||||||||
| Write downs | — | (3,065 | ) | (3,065 | ) | — | (6,951 | ) | (6,951 | ) | — | (57,368 | ) | (57,368 | ) | |||||||||||||||||||||
| Net losses on sales | — | (1,641 | ) | (1,641 | ) | — | (1,924 | ) | (1,924 | ) | — | (11,038 | ) | (11,038 | ) | |||||||||||||||||||||
| Ending Balance | $ | 26,819 | $ | 4,221 | $ | 31,040 | $ | 109,894 | $ | 18,264 | $ | 128,158 | $ | 127,479 | $ | 32,859 | $ | 160,338 | ||||||||||||||||||
(1) Excludes non-performing loans and foreclosed properties covered by the loss-sharing agreement with the FDIC, related to the acquisition of SCB. | ||||||||||||||||||
(2) Includes $76.6 million from United’s largest loan relationship that was placed on nonaccrual in the third quarter of 2011. | ||||||||||||||||||
(3) The NPA activity shown for 2011 is presented with all activity related to loans transferred to the held for sale classification on one line as if those loans were transferred to held for sale at the beginning of the period. During the first quarter of 2011, $27.1 million in loans transferred to held for sale were placed on nonaccrual, $1.1 million in payments were received on nonaccrual loans transferred to held for sale and $66.6 million in charge-offs were recorded on nonaccrual loans transferred to held for sale to write them down to the expected proceeds from the sale. |
The gross additional interest income that would have been earned if the loans classified as nonaccrual had performed in accordance with the original terms was approximately $2.11 million, $6.81 million and $13.6 million in 2013, 2012 and 2011, respectively. The gross additional interest income that would have been earned in 2013, 2012 and 2011 had performing TDRs performed in accordance with the original terms is immaterial.
| 47 |
| December 31, 2013 | ||||||||||||
| Available-for-Sale | Held-to-Maturity | Total Securities | ||||||||||
| State and political subdivisions | $ | 23,242 | $ | 51,733 | $ | 74,975 | ||||||
| Mortgage-backed securities | 1,145,347 | 428,009 | 1,573,356 | |||||||||
| Corporate bonds | 250,296 | — | 250,296 | |||||||||
| Asset-backed securities | 410,633 | — | 410,633 | |||||||||
| Other | 2,699 | — | 2,699 | |||||||||
| Total securities | $ | 1,832,217 | $ | 479,742 | $ | 2,311,959 | ||||||
| December 31, 2012 | ||||||||||||
| Available-for-Sale | Held-to-Maturity | Total Securities | ||||||||||
| State and political subdivisions | $ | 29,052 | $ | 51,780 | $ | 80,832 | ||||||
| Mortgage-backed securities | 1,428,502 | 192,404 | 1,620,906 | |||||||||
| Corporate bonds | 163,662 | — | 163,662 | |||||||||
| Asset-backed securities | 210,556 | — | 210,556 | |||||||||
| Other | 2,821 | — | 2,821 | |||||||||
| Total securities | $ | 1,834,593 | $ | 244,184 | $ | 2,078,777 | ||||||
| 48 |
| 2013 | 2012 | |||||||
| $100,000 and greater: | ||||||||
| Three months or less | $ | 116,875 | $ | 141,911 | ||||
| Three to six months | 100,425 | 121,059 | ||||||
| Six to twelve months | 195,064 | 251,620 | ||||||
| Over one year | 176,325 | 190,968 | ||||||
| Total | $ | 588,689 | $ | 705,558 | ||||
| Brokered time deposits: | ||||||||
| Three months or less | $ | — | $ | 248 | ||||
| Three to six months | — | — | ||||||
| Six to twelve months | — | — | ||||||
| Over one year | 273,166 | 154,641 | ||||||
| Total | $ | 273,166 | $ | 154,889 | ||||
| 49 |
| Period-end balance | Period end weighted- average interest rate | Maximum outstanding at any month-end | Average amounts outstanding during the year | Weighted- average rate for the year | ||||||||||||||||
December 31, 2013 | ||||||||||||||||||||
| Federal funds purchased | $ | — | — | % | $ | 70,000 | $ | 13,327 | .33 | % | ||||||||||
| Repurchase agreements | 53,241 | 4.00 | 54,164 | 53,234 | 3.81 | |||||||||||||||
| $ | 53,241 | $ | 66,561 | |||||||||||||||||
| December 31, 2012 | ||||||||||||||||||||
| Federal funds purchased | $ | — | — | % | $ | — | $ | 5,000 | .33 | % | ||||||||||
| Repurchase agreements | 52,574 | 4.00 | 103,551 | 75,593 | 3.93 | |||||||||||||||
| $ | 52,574 | $ | 80,593 | |||||||||||||||||
| December 31, 2011 | ||||||||||||||||||||
| Federal funds purchased | $ | — | — | % | $ | — | $ | 137 | .39 | % | ||||||||||
| Repurchase agreements | 102,577 | 4.12 | 103,666 | 102,590 | 4.14 | |||||||||||||||
| $ | 102,577 | $ | 102,727 | |||||||||||||||||
| 50 |
| Maturity By Years | ||||||||||||||||||||
| Total | 1 or Less | 1 to 3 | 3 to 5 | Over 5 | ||||||||||||||||
| Contractual Cash Obligations | ||||||||||||||||||||
| FHLB advances | $ | 120,125 | $ | 120,000 | $ | 125 | $ | — | $ | — | ||||||||||
| Long-term debt | 129,865 | — | — | 75,000 | 54,865 | |||||||||||||||
| Operating leases | 6,310 | 1,852 | 1,956 | 936 | 1,566 | |||||||||||||||
| Total contractual cash obligations | $ | 256,300 | $ | 121,852 | $ | 2,081 | $ | 75,936 | $ | 56,431 | ||||||||||
| Other Commitments | ||||||||||||||||||||
| Lines of credit | $ | 747,170 | $ | 239,861 | $ | 161,924 | $ | 83,669 | $ | 261,716 | ||||||||||
| Commercial letters of credit | 19,846 | 18,553 | 1,283 | 10 | — | |||||||||||||||
| Uncertain tax positions | 4,503 | 682 | 1,074 | 351 | 2,396 | |||||||||||||||
| Total other commitments | $ | 771,519 | $ | 259,096 | $ | 164,281 | $ | 84,030 | $ | 264,112 | ||||||||||
| Maturity By Years | ||||||||||||||||||||
| 1 or Less | 1 to 5 | 5 to 10 | Over 10 | Total | ||||||||||||||||
| Available for Sale | ||||||||||||||||||||
| State and political subdivisions | $ | 2,869 | $ | 16,881 | $ | 2,607 | $ | 885 | $ | 23,242 | ||||||||||
| Corporate bonds | — | 38,520 | 201,504 | 10,272 | 250,296 | |||||||||||||||
| Asset-backed securities | — | 89,438 | 271,418 | 49,777 | 410,633 | |||||||||||||||
Other securities (1) | 5,462 | 662,269 | 238,934 | 241,381 | 1,148,046 | |||||||||||||||
| Total securities available for sale | $ | 8,331 | $ | 807,108 | $ | 714,463 | $ | 302,315 | $ | 1,832,217 | ||||||||||
Weighted average yield (2) | 3.97 | % | 2.02 | % | 1.99 | % | 3.60 | % | 2.28 | % | ||||||||||
| Held to Maturity | ||||||||||||||||||||
| State and political subdivisions | $ | — | $ | 12,463 | $ | 26,062 | $ | 13,208 | $ | 51,733 | ||||||||||
Other securities (1) | 639 | 212,792 | 204,302 | 10,276 | 428,009 | |||||||||||||||
| Total securities available for sale | $ | 639 | $ | 225,255 | $ | 230,364 | $ | 23,484 | $ | 479,742 | ||||||||||
Weighted average yield (2) | 4.75 | % | 3.14 | % | 2.88 | % | 4.73 | % | 3.09 | % | ||||||||||
| Combined Portfolio | ||||||||||||||||||||
| State and political subdivisions | $ | 2,869 | $ | 29,344 | $ | 28,669 | $ | 14,093 | $ | 74,975 | ||||||||||
| Corporate bonds | — | 38,520 | 201,504 | 10,272 | 250,296 | |||||||||||||||
| Asset-backed securities | — | 89,438 | 271,418 | 49,777 | 410,633 | |||||||||||||||
Other securities (1) | 6,101 | 875,061 | 443,236 | 251,657 | 1,576,055 | |||||||||||||||
| Total securities available for sale | $ | 8,970 | $ | 1,032,363 | $ | 944,827 | $ | 325,799 | $ | 2,311,959 | ||||||||||
Weighted average yield (2) | 4.03 | % | 2.27 | % | 2.21 | % | 3.68 | % | 2.45 | % | ||||||||||
| 51 |
| 52 |
| Regulatory Guidelines | United Community Banks, Inc. (Consolidated) | United Community Bank | ||||||||||||||||||||||
| Well | As of December 31, | As of December 31, | ||||||||||||||||||||||
| Minimum | Capitalized | 2013 | 2012 | 2013 | 2012 | |||||||||||||||||||
| Risk-based ratios: | ||||||||||||||||||||||||
| Tier 1 capital | 4.0 | % | 6.0 | % | 12.74 | % | 14.16 | % | 13.55 | % | 14.48 | % | ||||||||||||
| Total capital | 8.0 | 10.0 | 13.99 | 15.73 | 14.80 | 15.74 | ||||||||||||||||||
| Leverage ratio | 3.0 | 5.0 | 9.08 | 9.64 | 9.61 | 9.86 | ||||||||||||||||||
| Tier 1 capital | $ | 649,162 | $ | 652,692 | $ | 686,687 | $ | 666,585 | ||||||||||||||||
| Total capital | 713,063 | 724,915 | 750,216 | 724,738 | ||||||||||||||||||||
| 53 |
Increase (Decrease) in Net Interest Revenue from Base Scenario at December 31, | ||||||||||||||||
| 2013 | 2012 | |||||||||||||||
| Change in Rates | Shock | Ramp | Shock | Ramp | ||||||||||||
| 200 basis point increase | 4.4 | % | 5.4 | % | 6.7 | % | 3.6 | % | ||||||||
| 25 basis point decrease | (2.7 | ) | (2.7 | ) | 1.2 | 1.2 | ||||||||||
| 54 |
| Number of Contracts | Notional | Purpose | Fair Value (F) | ||||||||||||||
| Type of Instrument | Asset | Liability | |||||||||||||||
| Fair value hedges of fixed rate brokered deposit (accounting hedge) | |||||||||||||||||
Receive fixed cancellable swaps (1) | 16 | $ | 199,000 | Low cost funding | $ | — | $ | 19,970 | |||||||||
| Fair value hedges of fixed rate corporate bonds (accounting hedge) | |||||||||||||||||
Pay fixed swaps (2) | 8 | 86,000 | Protection from rising interest rates | 3,939 | 2,308 | ||||||||||||
| Cash flow hedges of floating rate borrowings (accounting hedge) | |||||||||||||||||
Pay fixed swaps (3) | 3 | 200,000 | Protection from rising interest rates | — | 3,368 | ||||||||||||
| Cash flow hedges of LIBOR indexed money market deposits (accounting hedge) | |||||||||||||||||
Pay fixed swaps (4) | 3 | 375,000 | Protection from rising interest rates | 4,782 | — | ||||||||||||
| Customer swap positions | |||||||||||||||||
Receive fixed swaps (5) | 53 | 170,647 | Provide customer with fixed rate loan | 898 | 1,347 | ||||||||||||
| Dealer offset to customer swap positions | |||||||||||||||||
Pay fixed swaps (5) | 53 | 170,647 | Protection from rising interest rates | 1,347 | 915 | ||||||||||||
| Bifurcated derivatives embedded in hybrid host instruments | |||||||||||||||||
Pay steepener rate cancellable swap (6) | 3 | 99,509 | Low cost funding | 12,867 | — | ||||||||||||
| Interest rate swaps not designated as accounting hedges | |||||||||||||||||
Receive steepener rate cancellable swap (6) | 3 | 101,500 | Low cost funding | — | 18,324 | ||||||||||||
| $ | 1,402,303 | $ | 23,833 | $ | 46,232 | ||||||||||||
(1) United uses these swaps as part of a program to provide a low cost non-collateralized source of funds. The swaps hedge fixed rate brokered deposits with step up rates that increase over time that are mirrored in the receive rate of the swaps. The variable pay rates on these swaps are based on three-month LIBOR at spreads of minus 20 to minus 65 basis points. The counterparties have the right to call the instruments at any time generally after six months to one year following inception. United has a similar option in the hedged brokered deposit. |
(2) These swaps convert fixed rate corporate bonds to three-month LIBOR and are used for protection against rising interest rates. The pay rates match the fixed rates of the hedged corporate bonds. |
(3) These swaps are forward starting and become effective in the first and second quarters of 2014. They convert three month LIBOR-based floating rate borrowings to fixed rates for a three-year term. They are used for protection against rising interest rates. |
(4) These swaps are forward starting and become effective in the second and third quarters of 2014 and the second quarter of 2015. They convert one month LIBOR-based money market deposits to fixed rates for terms of three to eight years. They are used for protection against rising interest rates. |
(5) United offers interest rate swaps to customers seeking fixed rate loans under a back to back swap program. United enters into offsetting swap positions with qualified dealers simultaneously with the customer swap. Customer swaps and the offsetting dealer swap positions are marked to market through other fee revenue. |
(6) United offers market linked certificates of deposit through broker dealers. The rate paid on these hybrid instruments is based on a formula derived from the spread betweeen the long and short ends of the constant maturity swap (“CMS”) rate curve. This type of instrument is referred to as a steepener since it derives its value from the slope of the CMS curve. United has determined that these hybrid instruments contain an embedded swap contract which has been bifurcated from the host contract. United enters into a swap with a swap dealer simultaneously where the receive rate on the swap mirrors the pay rate on the brokered deposit. The bifurcated derivative and the stand alone swap are both marked to market through other fee revenue. Although these instruments are not treated as an accounting hedge, the swap acts as an effective economic hedge of the steepener index in the brokered deposit. |
| 55 |
| 56 |

● | Pertain to the maintenance of records that in reasonable detail accurately and fairly reflect the transactions and dispositions of the assets of the company; |
● | Provide reasonable assurance that transactions are recorded as necessary to permit preparation of financial statements in accordance with accounting principles generally accepted in the United States of America, and that receipts and expenditures of the company are being made only in accordance with authorizations of management and directors of the company; and |
● | Provide reasonable assurance regarding prevention or timely detection of unauthorized acquisition, use or disposition of the company’s assets that could have a material effect on the financial statements. |
 |  | |
| Jimmy C. Tallent | Rex S. Schuette | |
| President and Chief Executive Officer | Executive Vice President and | |
| Chief Financial Officer |
| 57 |

To the Board of Directors and Shareholders
of United Community Banks, Inc.
In our opinion, the accompanying consolidated balance sheet as of December 31, 2013 and the related consolidated statements of operations, of comprehensive income (loss), of changes in shareholders’ equity and of cash flows for the year then ended present fairly, in all material respects, the financial position of United Community Banks, Inc. and its subsidiaries at December 31, 2013, and the results of their operations and their cash flows for the year then ended in conformity with accounting principles generally accepted in the United States of America. Also in our opinion, the Company maintained, in all material respects, effective internal control over financial reporting as of December 31, 2013, based on criteria established inInternal Control - Integrated Framework (1992)issued by the Committee of Sponsoring Organizations of the Treadway Commission (COSO). The Company's management is responsible for these financial statements, for maintaining effective internal control over financial reporting and for its assessment of the effectiveness of internal control over financial reporting, included in the accompanying Management's Report on Internal Control over Financial Reporting. Our responsibility is to express opinions on these financial statements and on the Company's internal control over financial reporting based on our integrated audit. We conducted our audit in accordance with the standards of the Public Company Accounting Oversight Board (United States). Those standards require that we plan and perform the audit to obtain reasonable assurance about whether the financial statements are free of material misstatement and whether effective internal control over financial reporting was maintained in all material respects. Our audit of the financial statements included examining, on a test basis, evidence supporting the amounts and disclosures in the financial statements, assessing the accounting principles used and significant estimates made by management, and evaluating the overall financial statement presentation. Our audit of internal control over financial reporting included obtaining an understanding of internal control over financial reporting, assessing the risk that a material weakness exists, and testing and evaluating the design and operating effectiveness of internal control based on the assessed risk. Our audit also included performing such other procedures as we considered necessary in the circumstances. We believe that our audit provides a reasonable basis for our opinions.
A company’s internal control over financial reporting is a process designed to provide reasonable assurance regarding the reliability of financial reporting and the preparation of financial statements for external purposes in accordance with generally accepted accounting principles. A company’s internal control over financial reporting includes those policies and procedures that (i) pertain to the maintenance of records that, in reasonable detail, accurately and fairly reflect the transactions and dispositions of the assets of the company; (ii) provide reasonable assurance that transactions are recorded as necessary to permit preparation of financial statements in accordance with generally accepted accounting principles, and that receipts and expenditures of the company are being made only in accordance with authorizations of management and directors of the company; and (iii) provide reasonable assurance regarding prevention or timely detection of unauthorized acquisition, use, or disposition of the company’s assets that could have a material effect on the financial statements.
Because of its inherent limitations, internal control over financial reporting may not prevent or detect misstatements. Also, projections of any evaluation of effectiveness to future periods are subject to the risk that controls may become inadequate because of changes in conditions, or that the degree of compliance with the policies or procedures may deteriorate.

| 58 |


| 59 |
| UNITED COMMUNITY BANKS, INC. AND SUBSIDIARIES | |||||
| Consolidated Statement of Operations | |||||
| For the Years Ended December 31, 2013, 2012 and 2011 | |||||
| (in thousands, except per share data) |
| 2013 | 2012 | 2011 | ||||||||||
| Interest revenue: | ||||||||||||
| Loans, including fees | $ | 200,893 | $ | 217,378 | $ | 244,020 | ||||||
| Investment securities: | ||||||||||||
| Taxable | 40,331 | 43,657 | 55,251 | |||||||||
| Tax exempt | 827 | 956 | 1,009 | |||||||||
| Deposits in banks and short-term investments | 3,789 | 3,986 | 2,321 | |||||||||
| Total interest revenue | 245,840 | 265,977 | 302,601 | |||||||||
| Interest expense: | ||||||||||||
| Deposits: | ||||||||||||
| NOW | 1,759 | 2,049 | 3,998 | |||||||||
| Money market | 2,210 | 2,518 | 5,456 | |||||||||
| Savings | 133 | 150 | 234 | |||||||||
| Time | 10,464 | 19,097 | 39,114 | |||||||||
| Total deposit interest expense | 14,566 | 23,814 | 48,802 | |||||||||
| Short-term borrowings | 2,071 | 2,987 | 4,250 | |||||||||
| Federal Home Loan Bank advances | 68 | 907 | 2,042 | |||||||||
| Long-term debt | 10,977 | 10,201 | 10,544 | |||||||||
| Total interest expense | 27,682 | 37,909 | 65,638 | |||||||||
| Net interest revenue | 218,158 | 228,068 | 236,963 | |||||||||
| Provision for credit losses | 65,500 | 62,500 | 251,000 | |||||||||
| Net interest revenue after provision for credit losses | 152,658 | 165,568 | (14,037 | ) | ||||||||
| Fee revenue: | ||||||||||||
| Service charges and fees | 31,997 | 31,670 | 29,110 | |||||||||
| Mortgage loan and other related fees | 9,925 | 10,483 | 5,419 | |||||||||
| Brokerage fees | 4,465 | 3,082 | 2,986 | |||||||||
| Securities gains, net | 186 | 7,078 | 842 | |||||||||
| Losses on prepayment of borrowings | — | (6,681 | ) | (791 | ) | |||||||
| Other | 10,025 | 10,480 | 7,341 | |||||||||
| Total fee revenue | 56,598 | 56,112 | 44,907 | |||||||||
| Total revenue | 209,256 | 221,680 | 30,870 | |||||||||
| Operating expenses: | ||||||||||||
| Salaries and employee benefits | 96,233 | 96,026 | 100,095 | |||||||||
| Occupancy | 13,930 | 14,304 | 15,645 | |||||||||
| Communications and equipment | 13,233 | 12,940 | 13,135 | |||||||||
| FDIC assessments and other regulatory charges | 9,219 | 10,097 | 14,259 | |||||||||
| Professional fees | 9,617 | 8,792 | 9,727 | |||||||||
| Postage, printing and supplies | 3,283 | 3,899 | 4,256 | |||||||||
| Advertising and public relations | 3,718 | 3,855 | 4,291 | |||||||||
| Amortization of intangibles | 2,031 | 2,917 | 3,016 | |||||||||
| Foreclosed property | 7,869 | 13,993 | 78,905 | |||||||||
| Other | 15,171 | 19,951 | 18,270 | |||||||||
| Total operating expenses | 174,304 | 186,774 | 261,599 | |||||||||
| Income (loss) before income taxes | 34,952 | 34,906 | (230,729 | ) | ||||||||
| Income tax expense (benefit) | (238,188 | ) | 1,050 | (3,983 | ) | |||||||
| Net income (loss) | 273,140 | 33,856 | (226,746 | ) | ||||||||
| Preferred stock dividends | 12,078 | 12,148 | 11,838 | |||||||||
| Net income (loss) available to common shareholders | $ | 261,062 | $ | 21,708 | $ | (238,584 | ) | |||||
| Income (loss) per common share: | ||||||||||||
| Basic | $ | 4.44 | $ | .38 | $ | (5.97 | ) | |||||
| Diluted | 4.44 | .38 | (5.97 | ) | ||||||||
| Weighted average common shares outstanding: | ||||||||||||
| Basic | 58,787 | 57,857 | 39,943 | |||||||||
| Diluted | 58,845 | 57,857 | 39,943 | |||||||||
| 60 |
| UNITED COMMUNITY BANKS, INC. AND SUBSIDIARIES | |||||||||||||||||
| Consolidated Statement of Comprehensive Income (Loss) | |||||||||||||||||
| For the Years Ended December 31, 2013, 2012 and 2011 | |||||||||||||||||
| (in thousands, except per share data) |
| 2013 | 2012 | 2011 | ||||||||||||||||||||||||||||||||||
| Before-tax Amount | Tax (Expense) Benefit | Net of Tax Amount | Before-tax Amount | Tax (Expense) Benefit | Net of Tax Amount | Before-tax Amount | Tax (Expense) Benefit | Net of Tax Amount | ||||||||||||||||||||||||||||
| Net income (loss) | $ | 34,952 | $ | 238,188 | $ | 273,140 | $ | 34,906 | $ | (1,050 | ) | $ | 33,856 | $ | (230,729 | ) | $ | 3,983 | $ | (226,746 | ) | |||||||||||||||
| Other comprehensive income (loss): | ||||||||||||||||||||||||||||||||||||
| Unrealized (losses) gains on available-for-sale securities: | ||||||||||||||||||||||||||||||||||||
| Unrealized holding gains (losses) arising during period | (22,421 | ) | 8,475 | (13,946 | ) | 748 | (273 | ) | 475 | (1,275 | ) | 361 | (914 | ) | ||||||||||||||||||||||
| Reclassification of securities from available-for-sale to held-to-maturity | 8,306 | (3,119 | ) | 5,187 | — | — | — | — | — | — | ||||||||||||||||||||||||||
| Reclassification adjustment for gains included in net income (loss) | (186 | ) | 72 | (114 | ) | (7,078 | ) | 2,753 | (4,325 | ) | (842 | ) | 328 | (514 | ) | |||||||||||||||||||||
| Adjustment of valuation allowance for the change in deferred taxes arising from unrealized gains and losses on available-for-sale securities and release of valuation allowance | (2,963 | ) | (2,963 | ) | — | (2,480 | ) | (2,480 | ) | — | (689 | ) | (689 | ) | ||||||||||||||||||||||
| Net unrealized losses | (14,301 | ) | 2,465 | (11,836 | ) | (6,330 | ) | — | (6,330 | ) | (2,117 | ) | — | (2,117 | ) | |||||||||||||||||||||
| Amortization of gains included in net income (loss) on available-for-sale securities transferred to held to maturity | (731 | ) | 282 | (449 | ) | (1,988 | ) | 773 | (1,215 | ) | (2,177 | ) | 846 | (1,331 | ) | |||||||||||||||||||||
| Reclassification of securities from available-for-sale to held-to-maturity | (8,306 | ) | 3,119 | (5,187 | ) | — | — | — | — | — | — | |||||||||||||||||||||||||
| Adjustment of valuation allowance for the change in deferred taxes arising from the amortization of gains included in net income (loss) on available-for-sale securities transferred to held-to-maturity and release of valuation allowance | — | 1,293 | 1,293 | — | (773 | ) | (773 | ) | — | (846 | ) | (846 | ) | |||||||||||||||||||||||
| Net unrealized losses | (9,037 | ) | 4,694 | (4,343 | ) | (1,988 | ) | — | (1,988 | ) | (2,177 | ) | — | (2,177 | ) | |||||||||||||||||||||
| Amounts reclassified into net income on cash flow hedges | (904 | ) | 352 | (552 | ) | (3,712 | ) | 1,444 | (2,268 | ) | (15,116 | ) | 5,880 | (9,236 | ) | |||||||||||||||||||||
| Unrealized losses on derivative financial instruments accounted for as cash flow hedges | 10,084 | (3,923 | ) | 6,161 | (8,739 | ) | 3,400 | (5,339 | ) | — | — | — | ||||||||||||||||||||||||
| Adjustment of valuation allowance for the change in deferred taxes arising from unrealized gains and losses and amortization of gains included in net income (loss) on cash flow hedges and release of valuation allowance | 13,698 | 13,698 | — | (4,844 | ) | (4,844 | ) | — | (5,880 | ) | (5,880 | ) | ||||||||||||||||||||||||
| Net unrealized gains (losses) | 9,180 | 10,127 | 19,307 | (12,451 | ) | — | (12,451 | ) | (15,116 | ) | — | (15,116 | ) | |||||||||||||||||||||||
| Reclassification of unamortized prior service cost and actuarial losses | — | — | — | — | — | — | (4,750 | ) | 1,848 | (2,902 | ) | |||||||||||||||||||||||||
| Net actuarial gain (loss) on defined benefit pension plan | 561 | (218 | ) | 343 | (177 | ) | 69 | (108 | ) | — | — | — | ||||||||||||||||||||||||
| Amortization of prior service cost and actuarial losses included in net periodic pension cost for defined benefit pension plan | 532 | (207 | ) | 325 | 615 | (240 | ) | 375 | — | — | — | |||||||||||||||||||||||||
| Adjustment of valuation allowance for the change in deferred taxes arising from reclassification of unamortized prior service cost and actuarial losses and amortization of prior service cost and actuarial losses and release of valuation allowance | — | — | — | — | 171 | 171 | — | (1,848 | ) | (1,848 | ) | |||||||||||||||||||||||||
| Net defined benefit pension plan activity | 1,093 | (425 | ) | 668 | 438 | — | 438 | (4,750 | ) | — | (4,750 | ) | ||||||||||||||||||||||||
| Total other comprehensive income (loss) | (13,065 | ) | 16,861 | 3,796 | (20,331 | ) | — | (20,331 | ) | (24,160 | ) | — | (24,160 | ) | ||||||||||||||||||||||
| Comprehensive income (loss) | $ | 21,887 | $ | 255,049 | $ | 276,936 | $ | 14,575 | $ | (1,050 | ) | $ | 13,525 | $ | (254,889 | ) | $ | 3,983 | $ | (250,906 | ) | |||||||||||||||
| 61 |
| UNITED COMMUNITY BANKS, INC. AND SUBSIDIARIES | |||
| Consolidated Balance Sheet | |||
| As of December 31, 2013 and 2012 | |||
| (in thousands, except share data) |
| Assets | ||||||||
| 2013 | 2012 | |||||||
| Cash and due from banks | $ | 71,230 | $ | 66,536 | ||||
| Interest-bearing deposits in banks | 119,669 | 124,613 | ||||||
| Short-term investments | 37,999 | 60,000 | ||||||
| Cash and cash equivalents | 228,898 | 251,149 | ||||||
| Securities available-for-sale | 1,832,217 | 1,834,593 | ||||||
| Securities held-to-maturity (fair value $485,585 and $261,131) | 479,742 | 244,184 | ||||||
| Mortgage loans held for sale | 10,319 | 28,821 | ||||||
| Loans, net of unearned income | 4,329,266 | 4,175,008 | ||||||
| Less allowance for loan losses | (76,762 | ) | (107,137 | ) | ||||
| Loans, net | 4,252,504 | 4,067,871 | ||||||
| Assets covered by loss sharing agreements with the FDIC | 22,882 | 47,467 | ||||||
| Premises and equipment, net | 163,589 | 168,920 | ||||||
| Bank owned life insurance | 80,670 | 81,867 | ||||||
| Accrued interest receivable | 19,598 | 18,659 | ||||||
| Intangible assets | 3,480 | 5,510 | ||||||
| Foreclosed property | 4,221 | 18,264 | ||||||
| Net deferred tax asset | 258,518 | — | ||||||
| Derivative financial instruments | 23,833 | 658 | ||||||
| Other assets | 44,948 | 34,296 | ||||||
Total assets | $ | 7,425,419 | $ | 6,802,259 | ||||
| Liabilities and Shareholders’ Equity | ||||||||
| Liabilities: | ||||||||
| Deposits: | ||||||||
| Demand | $ | 1,388,512 | $ | 1,252,605 | ||||
| NOW | 1,427,939 | 1,316,453 | ||||||
| Money market | 1,227,575 | 1,149,912 | ||||||
| Savings | 251,125 | 227,308 | ||||||
| Time: | ||||||||
| Less than $100,000 | 892,961 | 1,055,271 | ||||||
| Greater than $100,000 | 588,689 | 705,558 | ||||||
| Brokered | 424,704 | 245,033 | ||||||
| Total deposits | 6,201,505 | 5,952,140 | ||||||
| Short-term borrowings | 53,241 | 52,574 | ||||||
| Federal Home Loan Bank advances | 120,125 | 40,125 | ||||||
| Long-term debt | 129,865 | 124,805 | ||||||
| Derivative financial instruments | 46,232 | 12,543 | ||||||
| Unsettled securities purchases | 29,562 | — | ||||||
| Accrued expenses and other liabilities | 49,174 | 38,667 | ||||||
Total liabilities | 6,629,704 | 6,220,854 | ||||||
| Commitments and contingencies | ||||||||
Shareholders’ equity: | ||||||||
| Preferred stock, $1 par value; 10,000,000 shares authorized; | ||||||||
| Series A, $10 stated value; 0 and 21,700 shares issued and outstanding | — | 217 | ||||||
| Series B, $1,000 stated value; 105,000 and 180,000 shares issued and outstanding | 105,000 | 178,557 | ||||||
| Series D, $1,000 stated value; 16,613 shares issued and outstanding | 16,613 | 16,613 | ||||||
| Common stock, $1 par value; 100,000,000 shares authorized; | ||||||||
| 46,243,345 and 42,423,870 shares issued and outstanding | 46,243 | 42,424 | ||||||
| Common stock, non-voting $1 par value; 30,000,000 shares authorized; | ||||||||
| 13,188,206 and 15,316,794 shares issued and outstanding | 13,188 | 15,317 | ||||||
| Common stock issuable; 241,832 and 133,238 shares | 3,930 | 3,119 | ||||||
| Capital surplus | 1,078,676 | 1,057,951 | ||||||
| Accumulated deficit | (448,091 | ) | (709,153 | ) | ||||
| Accumulated other comprehensive loss | (19,844 | ) | (23,640 | ) | ||||
Total shareholders’ equity | 795,715 | 581,405 | ||||||
Total liabilities and shareholders’ equity | $ | 7,425,419 | $ | 6,802,259 | ||||
| 62 |
| UNITED COMMUNITY BANKS, INC. AND SUBSIDIARIES | ||||||||||||||||||||||||
| Consolidated Statement of Changes in Shareholders’ Equity | ||||||||||||||||||||||||
| For the Years Ended December 31, 2013, 2012 and 2011 |
| Retained | Accumulated | |||||||||||||||||||||||||||||||||||||||||||||||
| Non-Voting | Common | Earnings | Other | |||||||||||||||||||||||||||||||||||||||||||||
| Preferred Stock | Common | Common | Stock | Capital | (Accumulated | Comprehensive | ||||||||||||||||||||||||||||||||||||||||||
| Series A | Series B | Series D | Series F | Series G | Stock | Stock | Issuable | Surplus | Deficit) | (Loss) Income | Total | |||||||||||||||||||||||||||||||||||||
| Balance, December 31, 2010 | $ | 217 | $ | 175,711 | $ | — | $ | — | $ | — | $ | 18,937 | $ | — | $ | 3,894 | $ | 741,244 | $ | (492,276 | ) | $ | 20,851 | $ | 468,578 | |||||||||||||||||||||||
| Net loss | (226,746 | ) | (226,746 | ) | ||||||||||||||||||||||||||||||||||||||||||||
| Other comprehensive loss | (24,160 | ) | (24,160 | ) | ||||||||||||||||||||||||||||||||||||||||||||
| Penalty received on incomplete private equity transaction | 3,250 | 3,250 | ||||||||||||||||||||||||||||||||||||||||||||||
| Preferred for common equity exchange related to tax benefits preservation plan (1,551,126 common shares) | 16,613 | (1,551 | ) | (15,062 | ) | — | ||||||||||||||||||||||||||||||||||||||||||
| Common and preferred stock issued (3,467,699 common shares) | 195,872 | 151,185 | 3,468 | 11,035 | 361,560 | |||||||||||||||||||||||||||||||||||||||||||
| Conversion of Series F and Series G preferred stock (20,618,156 voting and 15,914,209 non-voting common shares) | (195,872 | ) | (151,185 | ) | 20,618 | 15,914 | 310,525 | — | ||||||||||||||||||||||||||||||||||||||||
| Common stock issued to Dividend Reinvestment Plan and employee benefit plans (156,816 common shares) | 156 | 1,297 | 1,453 | |||||||||||||||||||||||||||||||||||||||||||||
| Amortization of stock options and restricted stock | 2,144 | 2,144 | ||||||||||||||||||||||||||||||||||||||||||||||
| Vesting of restricted stock awards (12,239 common shares issued, 6,382 common shares deferred) | 13 | 54 | (67 | ) | — | |||||||||||||||||||||||||||||||||||||||||||
| Deferred compensation plan, net | 241 | 241 | ||||||||||||||||||||||||||||||||||||||||||||||
| Shares issued from deferred compensation plan (6,266 common shares) | 6 | (956 | ) | 950 | — | |||||||||||||||||||||||||||||||||||||||||||
| Tax on option exercise and restricted stock vesting | (376 | ) | (376 | ) | ||||||||||||||||||||||||||||||||||||||||||||
| Preferred stock dividends: | ||||||||||||||||||||||||||||||||||||||||||||||||
| Series A | (13 | ) | (13 | ) | ||||||||||||||||||||||||||||||||||||||||||||
| Series B, including accretion | 1,381 | (10,401 | ) | (9,020 | ) | |||||||||||||||||||||||||||||||||||||||||||
| Series D | (1,425 | ) | (1,425 | ) | ||||||||||||||||||||||||||||||||||||||||||||
| Balance, December 31, 2011 | 217 | 177,092 | 16,613 | — | — | 41,647 | 15,914 | 3,233 | 1,054,940 | (730,861 | ) | (3,309 | ) | 575,486 | ||||||||||||||||||||||||||||||||||
| Net income | 33,856 | 33,856 | ||||||||||||||||||||||||||||||||||||||||||||||
| Other comprehensive loss | (20,331 | ) | (20,331 | ) | ||||||||||||||||||||||||||||||||||||||||||||
| Common stock issued to Dividend Reinvestment Plan and employee benefit plans (109,905 common shares) | 110 | 790 | 900 | |||||||||||||||||||||||||||||||||||||||||||||
| Conversion of non-voting common stock to voting common stock (597,415 shares) | 597 | (597 | ) | — | ||||||||||||||||||||||||||||||||||||||||||||
| Amortization of stock options and restricted stock | 1,976 | 1,976 | ||||||||||||||||||||||||||||||||||||||||||||||
| Vesting of restricted stock awards (64,839 common shares issued, 36,673 common shares deferred) | 65 | 155 | (220 | ) | — | |||||||||||||||||||||||||||||||||||||||||||
| Deferred compensation plan, net | 201 | 201 | ||||||||||||||||||||||||||||||||||||||||||||||
| Shares issued from deferred compensation plan (4,611 common shares) | 5 | (470 | ) | 465 | — | |||||||||||||||||||||||||||||||||||||||||||
| Preferred stock dividends: | ||||||||||||||||||||||||||||||||||||||||||||||||
| Series A | (12 | ) | (12 | ) | ||||||||||||||||||||||||||||||||||||||||||||
| Series B, including accretion | 1,465 | (10,465 | ) | (9,000 | ) | |||||||||||||||||||||||||||||||||||||||||||
| Series D | (1,671 | ) | (1,671 | ) | ||||||||||||||||||||||||||||||||||||||||||||
| Balance, December 31, 2012 | 217 | 178,557 | 16,613 | — | — | 42,424 | 15,317 | 3,119 | 1,057,951 | (709,153 | ) | (23,640 | ) | 581,405 | ||||||||||||||||||||||||||||||||||
| Net income | 273,140 | 273,140 | ||||||||||||||||||||||||||||||||||||||||||||||
| Other comprehensive loss | 3,796 | 3,796 | ||||||||||||||||||||||||||||||||||||||||||||||
| Retirement of Series A preferred stock (21,700 shares) | (217 | ) | (217 | ) | ||||||||||||||||||||||||||||||||||||||||||||
| Retirement of Series B preferred stock (75,000 shares) | (75,000 | ) | (75,000 | ) | ||||||||||||||||||||||||||||||||||||||||||||
| Common stock issued to Dividend Reinvestment Plan and employee benefit plans (62,978 common shares) | 63 | 733 | 796 | |||||||||||||||||||||||||||||||||||||||||||||
| Conversion of non-voting common stock to voting common stock (2,128,588 shares) | 2,129 | (2,129 | ) | |||||||||||||||||||||||||||||||||||||||||||||
| Warrant exercise (1,551,126 shares) | 1,551 | 17,838 | 19,389 | |||||||||||||||||||||||||||||||||||||||||||||
| Amortization of stock options and restricted stock | 3,045 | 3,045 | ||||||||||||||||||||||||||||||||||||||||||||||
| Vesting of restricted stock awards, net of shares surrendered to cover payroll taxes (55,328 common shares issued, 115,664 common shares deferred) | 55 | 1,693 | (1,929 | ) | (181 | ) | ||||||||||||||||||||||||||||||||||||||||||
| Deferred compensation plan, net | 177 | 177 | ||||||||||||||||||||||||||||||||||||||||||||||
| Shares issued from deferred compensation plan (21,455 common shares) | 21 | (1,059 | ) | 1,038 | — | |||||||||||||||||||||||||||||||||||||||||||
| Preferred stock dividends: | ||||||||||||||||||||||||||||||||||||||||||||||||
| Series A | (12 | ) | (12 | ) | ||||||||||||||||||||||||||||||||||||||||||||
| Series B, including accretion | 1,443 | (10,401 | ) | (8,958 | ) | |||||||||||||||||||||||||||||||||||||||||||
| Series D | (1,665 | ) | (1,665 | ) | ||||||||||||||||||||||||||||||||||||||||||||
| Balance, December 31, 2013 | $ | — | $ | 105,000 | $ | 16,613 | $ | — | $ | — | $ | 46,243 | $ | 13,188 | $ | 3,930 | $ | 1,078,676 | $ | (448,091 | ) | $ | (19,844 | ) | $ | 795,715 | ||||||||||||||||||||||
See accompanying notes to consolidated financial statements. | ||||||||||||||||||||||||||||||||||||||||||||||||
| 63 |
| UNITED COMMUNITY BANKS, INC. AND SUBSIDIARIES | |||||
| Consolidated Statement of Cash Flows | |||||
| For the Years Ended December 31, 2013, 2012 and 2011 | |||||
| (in thousands) |
| 2013 | 2012 | 2011 | ||||||||||
| Operating activities: | ||||||||||||
| Net income (loss) | $ | 273,140 | $ | 33,856 | $ | (226,746 | ) | |||||
| Adjustments to reconcile net income (loss) to net cash provided by operating activities: | ||||||||||||
| Depreciation, amortization and accretion | 26,388 | 32,562 | 21,084 | |||||||||
| Provision for credit losses | 65,500 | 62,500 | 251,000 | |||||||||
| Stock based compensation | 3,045 | 1,976 | 2,144 | |||||||||
| Deferred income tax benefit | (241,655 | ) | — | — | ||||||||
| Securities gains, net | (186 | ) | (7,078 | ) | (842 | ) | ||||||
| Losses on prepayment of borrowings | — | 6,681 | 791 | |||||||||
| Losses and write downs on sales of other real estate owned | 4,706 | 8,875 | 68,406 | |||||||||
| Change in assets and liabilities: | ||||||||||||
| (Increase) decrease in other assets and accrued interest receivable | (293 | ) | 43,738 | 27,188 | ||||||||
| Increase (decrease) in accrued expenses and other liabilities | 42,505 | 4,908 | (3,171 | ) | ||||||||
| Decrease (increase) in mortgage loans held for sale | 18,502 | (4,940 | ) | 12,027 | ||||||||
| Net cash provided by operating activities | 191,652 | 183,078 | 151,881 | |||||||||
| Investing activities: | ||||||||||||
| Investment securities held-to-maturity: | ||||||||||||
| Proceeds from maturities and calls | 63,985 | 82,801 | 76,764 | |||||||||
| Purchases | (8,481 | ) | — | (144,506 | ) | |||||||
| Investment securities available-for-sale: | ||||||||||||
| Proceeds from sales | 39,731 | 469,167 | 128,217 | |||||||||
| Proceeds from maturities and calls | 477,060 | 629,896 | 493,276 | |||||||||
| Purchases | (818,256 | ) | (1,166,653 | ) | (1,184,013 | ) | ||||||
| Net (increase) decrease in loans | (358,858 | ) | (159,814 | ) | 53,104 | |||||||
| Proceeds from loan sales | 91,913 | — | 99,298 | |||||||||
| Proceeds collected from FDIC under loss sharing agreements | 5,882 | 14,292 | 33,572 | |||||||||
| Purchases of premises and equipment | (8,143 | ) | (4,117 | ) | (7,210 | ) | ||||||
| Proceeds from sales of premises and equipment | 3,946 | 1,059 | 737 | |||||||||
| Proceeds from sale of other real estate owned | 28,430 | 31,356 | 86,789 | |||||||||
| Net cash (used in) investing activities | (482,791 | ) | (102,013 | ) | (363,972 | ) | ||||||
| Financing activities: | ||||||||||||
| Net increase (decrease) in deposits | 249,365 | (145,843 | ) | (371,189 | ) | |||||||
| Net increase (decrease) in short-term borrowings | 667 | (54,483 | ) | 1,510 | ||||||||
| Proceeds from Federal Home Loan Bank advances | 770,000 | 1,789,000 | — | |||||||||
| Repayment of Federal Home Loan Bank advances | (690,000 | ) | (1,791,701 | ) | (15,291 | ) | ||||||
| Repayment of long-term debt | (35,000 | ) | (30,500 | ) | (30,000 | ) | ||||||
| Proceeds from issuance of long-term debt | 40,000 | 35,000 | — | |||||||||
| Proceeds from issuance of common stock for dividend reinvestment and employee benefit plans | 796 | 894 | 1,453 | |||||||||
| Proceeds from issuance of common and preferred stock, net of offering costs | — | — | 361,560 | |||||||||
| Proceeds from warrant exercise | 19,389 | |||||||||||
| Retirement of preferred stock | (75,217 | ) | — | — | ||||||||
| Proceeds from penalty on incomplete private equity transaction | — | — | 3,250 | |||||||||
| Cash dividends on Series A preferred stock | (15 | ) | (12 | ) | (13 | ) | ||||||
| Cash dividends on Series B preferred stock | (9,440 | ) | (9,000 | ) | (9,020 | ) | ||||||
| Cash dividends on Series D preferred stock | (1,657 | ) | (1,687 | ) | (1,210 | ) | ||||||
| Net cash provided by (used in) financing activities | 268,888 | (208,332 | ) | (58,950 | ) | |||||||
| Net change in cash and cash equivalents | (22,251 | ) | (127,267 | ) | (271,041 | ) | ||||||
| Cash and cash equivalents at beginning of year | 251,149 | 378,416 | 649,457 | |||||||||
| Cash and cash equivalents at end of year | $ | 228,898 | $ | 251,149 | $ | 378,416 | ||||||
| Supplemental disclosures of cash flow information: | ||||||||||||
| Cash paid during the period for: | ||||||||||||
| Interest | $ | 26,139 | $ | 42,107 | $ | 68,068 | ||||||
| Income taxes paid (refunds received) | 2,362 | (26,164 | ) | 138 | ||||||||
| 64 |
| (1) | Summary of Significant Accounting Policies |
| 65 |
| (1) | Summary of Significant Accounting Policies, continued |
| 66 |
| (1) | Summary of Significant Accounting Policies, continued |
| 67 |
| (1) | Summary of Significant Accounting Policies, continued |
| 68 |
| (1) | Summary of Significant Accounting Policies, continued |
| 69 |
| (1) | Summary of Significant Accounting Policies, continued |
| 70 |
| (1) | Summary of Significant Accounting Policies, continued |
| (2) | Accounting Standards Updates |
| 71 |
| (2) | Accounting Standards Updates, continued |
| (3) | Mergers and Acquisitions |
| 72 |
Purchased Impaired Loans | Other Purchased Loans | Other | Total | |||||||||||||
December 31, 2013 | ||||||||||||||||
| Commercial (secured by real estate) | $ | — | $ | 12,342 | $ | — | $ | 12,342 | ||||||||
| Commercial & industrial | — | 600 | — | 600 | ||||||||||||
| Construction and land development | — | 2,731 | — | 2,731 | ||||||||||||
| Residential mortgage | — | 4,633 | — | 4,633 | ||||||||||||
| Consumer installment | — | 24 | — | 24 | ||||||||||||
| Total covered loans | — | 20,330 | — | 20,330 | ||||||||||||
| Covered foreclosed property | — | — | 1,211 | 1,211 | ||||||||||||
| Estimated loss reimbursement from the FDIC | — | — | 1,341 | 1,341 | ||||||||||||
| Total covered assets | $ | — | $ | 20,330 | $ | 2,552 | $ | 22,882 | ||||||||
| December 31, 2012 | ||||||||||||||||
| Commercial (secured by real estate) | $ | — | $ | 22,823 | $ | — | $ | 22,823 | ||||||||
| Commercial & industrial | — | 959 | — | 959 | ||||||||||||
| Construction and land development | 405 | 3,712 | — | 4,117 | ||||||||||||
| Residential mortgage | 116 | 5,302 | — | 5,418 | ||||||||||||
| Consumer installment | — | 99 | — | 99 | ||||||||||||
| Total covered loans | 521 | 32,895 | — | 33,416 | ||||||||||||
| Covered foreclosed property | — | — | 7,278 | 7,278 | ||||||||||||
| Estimated loss reimbursement from the FDIC | — | — | 6,773 | 6,773 | ||||||||||||
| Total covered assets | $ | 521 | $ | 32,895 | $ | 14,051 | $ | 47,467 | ||||||||
| (4) | Cash Flows |
| 73 |
Notes to Consolidated Financial Statements
| (5) | Balance Sheet Offsetting |
| Gross Amounts of Recognized Assets | Gross Amounts Offset on the Balance Sheet | Gross Amounts not Offset in the Balance Sheet | ||||||||||||||||||||||
| Net Asset Balance | Financial Instruments | Collateral Received | Net Amount | |||||||||||||||||||||
| December 31, 2013 | ||||||||||||||||||||||||
| Repurchase agreements / reverse repurchase agreements | $ | 385,000 | $ | (350,000 | ) | $ | 35,000 | $ | — | $ | (38,982 | ) | $ | (3,982 | ) | |||||||||
| Derivatives | 23,833 | — | 23,833 | (4,378 | ) | (2,912 | ) | 16,543 | ||||||||||||||||
| Total | $ | 408,833 | $ | (350,000 | ) | $ | 58,833 | $ | (4,378 | ) | $ | (41,894 | ) | $ | 12,561 | |||||||||
| Weighted average interest rate of reverse repurchase agreements | 1.09 | % | ||||||||||||||||||||||
| Gross Amounts of Recognized Liabilities | Gross Amounts Offset on the Balance Sheet | Net Liability Balance | Gross Amounts not Offset in the Balance Sheet | |||||||||||||||||||||
| Financial Instruments | Collateral Pledged | Net Amount | ||||||||||||||||||||||
| Repurchase agreements / reverse repurchase agreements | $ | 350,000 | $ | (350,000 | ) | $ | — | $ | — | $ | — | $ | — | |||||||||||
| Derivatives | 46,232 | 46,232 | (4,378 | ) | (38,145 | ) | 3,709 | |||||||||||||||||
| Total | $ | 396,232 | $ | (350,000 | ) | $ | 46,232 | $ | (4,378 | ) | $ | (38,145 | ) | $ | 3,709 | |||||||||
| Weighted average interest rate of repurchase agreements | .27 | % | ||||||||||||||||||||||
| Gross Amounts of Recognized Assets | Gross Amounts Offset on the Balance Sheet | Net Asset Balance | Gross Amounts not Offset in the Balance Sheet | |||||||||||||||||||||
| Financial Instruments | Collateral Received | Net Amount | ||||||||||||||||||||||
December 31, 2012 | ||||||||||||||||||||||||
| Repurchase agreements / reverse repurchase agreements | $ | 325,000 | $ | (265,000 | ) | $ | 60,000 | $ | — | (64,443 | ) | $ | (4,443 | ) | ||||||||||
| Securities lending transactions | 50,000 | (50,000 | ) | — | — | — | — | |||||||||||||||||
| Derivatives | 658 | — | 658 | (23 | ) | — | 635 | |||||||||||||||||
| Total | $ | 375,658 | $ | (315,000 | ) | $ | 60,658 | $ | (23 | ) | $ | (64,443 | ) | $ | (3,808 | ) | ||||||||
| Weighted average interest rate of reverse repurchase agreements | 1.18 | % | ||||||||||||||||||||||
| Gross Amounts of Recognized Liabilities | Gross Amounts Offset on the Balance Sheet | Net Liability Balance | Gross Amounts not Offset in the Balance Sheet | |||||||||||||||||||||
| Financial Instruments | Collateral Pledged | Net Amount | ||||||||||||||||||||||
| Repurchase agreements / reverse repurchase agreements | $ | 265,000 | $ | (265,000 | ) | $ | — | $ | — | $ | — | $ | — | |||||||||||
| Securities lending transactions | 50,000 | (50,000 | ) | — | — | — | — | |||||||||||||||||
| Derivatives | 12,543 | — | 12,543 | (23 | ) | (11,493 | ) | 1,027 | ||||||||||||||||
| Total | $ | 327,543 | $ | (315,000 | ) | $ | 12,543 | $ | (23 | ) | $ | (11,493 | ) | $ | 1,027 | |||||||||
| Weighted average interest rate of repurchase agreements | .43 | % | ||||||||||||||||||||||
| (6) | Investment Securities |
| 74 |
Notes to Consolidated Financial Statements
| (6) | Investment Securities, continued |
| Gross | Gross | |||||||||||||||
| Amortized | Unrealized | Unrealized | Fair | |||||||||||||
| Cost | Gains | Losses | Value | |||||||||||||
| As of December 31, 2013 | ||||||||||||||||
| State and political subdivisions | $ | 51,733 | $ | 2,718 | $ | 42 | $ | 54,409 | ||||||||
Mortgage-backed securities (1) | 428,009 | 6,690 | 3,523 | 431,176 | ||||||||||||
| Total | $ | 479,742 | $ | 9,408 | $ | 3,565 | $ | 485,585 | ||||||||
| As of December 31, 2012 | ||||||||||||||||
| State and political subdivisions | $ | 51,780 | $ | 5,486 | $ | — | $ | 57,266 | ||||||||
Mortgage-backed securities (1) | 192,404 | 11,461 | — | 203,865 | ||||||||||||
| Total | $ | 244,184 | $ | 16,947 | $ | — | $ | 261,131 | ||||||||
(1) All are residential type mortgage-backed securities | ||||||||||||||||
| Gross | Gross | |||||||||||||||
| Amortized | Unrealized | Unrealized | Fair | |||||||||||||
| Cost | Gains | Losses | Value | |||||||||||||
As of December 31, 2013 | ||||||||||||||||
| State and political subdivisions | $ | 22,558 | $ | 823 | $ | 139 | $ | 23,242 | ||||||||
Mortgage-backed securities (1) | 1,145,800 | 13,296 | 13,749 | 1,145,347 | ||||||||||||
| Corporate bonds | 255,316 | 1,304 | 6,324 | 250,296 | ||||||||||||
| Asset-backed securities | 409,086 | 2,535 | 988 | 410,633 | ||||||||||||
| Other | 2,699 | — | — | 2,699 | ||||||||||||
| Total | $ | 1,835,459 | $ | 17,958 | $ | 21,200 | $ | 1,832,217 | ||||||||
| As of December 31, 2012 | ||||||||||||||||
| State and political subdivisions | $ | 27,717 | $ | 1,354 | $ | 19 | $ | 29,052 | ||||||||
Mortgage-backed securities (1) | 1,408,042 | 22,552 | 2,092 | 1,428,502 | ||||||||||||
| Corporate bonds | 169,783 | 1,052 | 7,173 | 163,662 | ||||||||||||
| Asset-backed securities | 209,411 | 1,894 | 749 | 210,556 | ||||||||||||
| Other | 2,821 | — | — | 2,821 | ||||||||||||
| Total | $ | 1,817,774 | $ | 26,852 | $ | 10,033 | $ | 1,834,593 | ||||||||
(1) All are residential type mortgage-backed securities | ||||||||||||||||
| 75 |
| (6) | Investment Securities, continued |
| Less than 12 Months | 12 Months or More | Total | ||||||||||||||||||||||
| Fair Value | Unrealized Loss | Fair Value | Unrealized Loss | Fair Value | Unrealized Loss | |||||||||||||||||||
As of December 31, 2013 | ||||||||||||||||||||||||
| State and political subdivisions | $ | 1,595 | $ | 42 | $ | — | $ | — | $ | 1,595 | $ | 42 | ||||||||||||
| Mortgage-backed securities | 259,870 | 3,523 | — | — | 259,870 | 3,523 | ||||||||||||||||||
| Total unrealized loss position | $ | 261,465 | $ | 3,565 | $ | — | $ | — | $ | 261,465 | $ | 3,565 | ||||||||||||
| Less than 12 Months | 12 Months or More | Total | ||||||||||||||||||||||
| Fair Value | Unrealized Loss | Fair Value | Unrealized Loss | Fair Value | Unrealized Loss | |||||||||||||||||||
As of December 31, 2013 | ||||||||||||||||||||||||
| State and political subdivisions | $ | 4,539 | $ | 139 | $ | — | $ | — | $ | 4,539 | $ | 139 | ||||||||||||
| Mortgage-backed securities | 334,996 | 6,480 | 175,865 | 7,269 | 510,861 | 13,749 | ||||||||||||||||||
| Corporate bonds | 137,318 | 4,494 | 54,130 | 1,830 | 191,448 | 6,324 | ||||||||||||||||||
| Asset-backed securities | 164,933 | 722 | 22,370 | 266 | 187,303 | 988 | ||||||||||||||||||
| Total unrealized loss position | $ | 641,786 | $ | 11,835 | $ | 252,365 | $ | 9,365 | $ | 894,151 | $ | 21,200 | ||||||||||||
| As of December 31, 2012 | ||||||||||||||||||||||||
| State and political subdivisions | $ | 3,674 | $ | 17 | $ | 10 | $ | 2 | $ | 3,684 | $ | 19 | ||||||||||||
| Mortgage-backed securities | 326,485 | 2,092 | — | — | 326,485 | 2,092 | ||||||||||||||||||
| Corporate bonds | 21,248 | 136 | 93,903 | 7,037 | 115,151 | 7,173 | ||||||||||||||||||
| Asset-backed securities | 82,188 | 749 | — | — | 82,188 | 749 | ||||||||||||||||||
| Total unrealized loss position | $ | 433,595 | $ | 2,994 | $ | 93,913 | $ | 7,039 | $ | 527,508 | $ | 10,033 | ||||||||||||
| 76 |
| (6) | Investment Securities, continued |
| 2013 | 2012 | 2011 | ||||||||||
| Proceeds from sales | $ | 39,731 | $ | 469,167 | $ | 128,217 | ||||||
| Gross gains on sales | $ | 264 | $ | 7,364 | $ | 1,173 | ||||||
| Gross losses on sales | (78 | ) | (286 | ) | (331 | ) | ||||||
| Net gains on sales of securities | $ | 186 | $ | 7,078 | $ | 842 | ||||||
| Income tax expense attributable to sales | $ | 72 | $ | 2,753 | $ | 328 | ||||||
| Available-for-Sale | Held-to-Maturity | |||||||||||||||
| Amortized Cost | Fair Value | Amortized Cost | Fair Value | |||||||||||||
| State and political subdivisions: | ||||||||||||||||
| Within 1 year | $ | 2,840 | $ | 2,869 | $ | — | $ | — | ||||||||
| 1 to 5 years | 16,257 | 16,881 | 12,463 | 13,234 | ||||||||||||
| 5 to 10 years | 2,613 | 2,607 | 26,062 | 27,408 | ||||||||||||
| More than 10 years | 848 | 885 | 13,208 | 13,767 | ||||||||||||
| 22,558 | 23,242 | 51,733 | 54,409 | |||||||||||||
| Corporate bonds: | ||||||||||||||||
| 1 to 5 years | 38,305 | 38,520 | — | — | ||||||||||||
| 5 to 10 years | 206,237 | 201,504 | — | — | ||||||||||||
| More than 10 years | 10,774 | 10,272 | — | — | ||||||||||||
| 255,316 | 250,296 | — | — | |||||||||||||
| Asset-backed securities: | ||||||||||||||||
| 1 to 5 years | 89,770 | 89,438 | — | — | ||||||||||||
| 5 to 10 years | 269,337 | 271,418 | — | — | ||||||||||||
| More than 10 years | 49,979 | 49,777 | — | — | ||||||||||||
| 409,086 | 410,633 | — | — | |||||||||||||
| Other: | ||||||||||||||||
| More than 10 years | 2,699 | 2,699 | — | — | ||||||||||||
| 2,699 | 2,699 | — | — | |||||||||||||
| Total securities other than mortgage-backed securities: | ||||||||||||||||
| Within 1 year | 2,840 | 2,869 | — | — | ||||||||||||
| 1 to 5 years | 144,332 | 144,839 | 12,463 | 13,234 | ||||||||||||
| 5 to 10 years | 478,187 | 475,529 | 26,062 | 27,408 | ||||||||||||
| More than 10 years | 64,300 | 63,633 | 13,208 | 13,767 | ||||||||||||
| Mortgage-backed securities | 1,145,800 | 1,145,347 | 428,009 | 431,176 | ||||||||||||
| $ | 1,835,459 | $ | 1,832,217 | $ | 479,742 | $ | 485,585 | |||||||||
| 77 |
| (7) | Loans and Allowance for Credit Losses |
| 2013 | 2012 | |||||||
| Commercial (secured by real estate) | $ | 1,756,710 | $ | 1,813,365 | ||||
| Commercial & industrial | 471,961 | 458,246 | ||||||
| Commercial construction | 148,903 | 154,769 | ||||||
| Total commercial | 2,377,574 | 2,426,380 | ||||||
| Residential mortgage | 1,315,964 | 1,214,203 | ||||||
| Residential construction | 328,579 | 381,677 | ||||||
| Consumer installment | 307,149 | 152,748 | ||||||
| Total loans | 4,329,266 | 4,175,008 | ||||||
| Less allowance for loan losses | (76,762 | ) | (107,137 | ) | ||||
| Loans, net | $ | 4,252,504 | $ | 4,067,871 | ||||
| Recorded Investment | Net Sales Proceeds | Net Charge-Off | ||||||||||
| Loans considered impaired | $ | 96,829 | $ | 56,298 | $ | (40,531 | ) | |||||
| Loans not considered impaired | 25,687 | 15,227 | (10,460 | ) | ||||||||
| Foreclosed properties | 8,398 | 5,933 | (2,465 | ) | ||||||||
| Total assets sold | $ | 130,914 | $ | 77,458 | $ | (53,456 | ) | |||||
| 78 |
| (7) | Loans and Allowance for Credit Losses, continued |
Beginning Balance | Charge- Offs | Recoveries | Provision | Ending Balance | ||||||||||||||||
| Year Ended December 31, 2013 | ||||||||||||||||||||
| Commercial (secured by real estate) | $ | 27,847 | $ | (36,470 | ) | $ | 1,945 | $ | 31,016 | $ | 24,338 | |||||||||
| Commercial & industrial | 5,537 | (18,914 | ) | 1,888 | 18,016 | 6,527 | ||||||||||||||
| Commercial construction | 8,389 | (6,483 | ) | 69 | 1,694 | 3,669 | ||||||||||||||
| Residential mortgage | 26,642 | (12,277 | ) | 715 | 5,894 | 20,974 | ||||||||||||||
| Residential construction | 26,662 | (23,049 | ) | 173 | 8,746 | 12,532 | ||||||||||||||
| Consumer installment | 2,747 | (2,461 | ) | 1,154 | 1,039 | 2,479 | ||||||||||||||
| Unallocated | 9,313 | — | — | (3,070 | ) | 6,243 | ||||||||||||||
| Total allowance for loan losses | 107,137 | (99,654 | ) | 5,944 | 63,335 | 76,762 | ||||||||||||||
| Allowance for unfunded commitments | — | — | — | 2,165 | 2,165 | |||||||||||||||
| Total allowance for credit losses | $ | 107,137 | $ | (99,654 | ) | $ | 5,944 | $ | 65,500 | $ | 78,927 | |||||||||
Beginning Balance | Charge- Offs | Recoveries | Provision | Ending Balance | ||||||||||||||||
| Year Ended December 31, 2012 | ||||||||||||||||||||
| Commercial (secured by real estate) | $ | 31,644 | $ | (23,062 | ) | $ | 692 | $ | 18,573 | $ | 27,847 | |||||||||
| Commercial & industrial | 5,681 | (2,424 | ) | 1,104 | 1,176 | 5,537 | ||||||||||||||
| Commercial construction | 6,097 | (5,411 | ) | 111 | 7,592 | 8,389 | ||||||||||||||
| Residential mortgage | 29,076 | (17,262 | ) | 799 | 14,029 | 26,642 | ||||||||||||||
| Residential construction | 30,379 | (24,260 | ) | 1,272 | 19,271 | 26,662 | ||||||||||||||
| Consumer installment | 2,124 | (2,214 | ) | 824 | 2,013 | 2,747 | ||||||||||||||
| Unallocated | 9,467 | — | — | (154 | ) | 9,313 | ||||||||||||||
| Total allowance for loan losses | 114,468 | (74,633 | ) | 4,802 | 62,500 | 107,137 | ||||||||||||||
| Allowance for unfunded commitments | — | — | — | — | — | |||||||||||||||
| Total allowance for credit losses | $ | 114,468 | $ | (74,633 | ) | $ | 4,802 | $ | 62,500 | $ | 107,137 | |||||||||
Beginning Balance | Charge- Offs | Recoveries | Provision | Ending Balance | ||||||||||||||||
| Year Ended December 31, 2011 | ||||||||||||||||||||
| Commercial (secured by real estate) | $ | 31,191 | $ | (59,468 | ) | $ | 448 | $ | 59,473 | $ | 31,644 | |||||||||
| Commercial & industrial | 7,580 | (24,890 | ) | 967 | 22,024 | 5,681 | ||||||||||||||
| Commercial construction | 6,780 | (55,730 | ) | 203 | 54,844 | 6,097 | ||||||||||||||
| Residential mortgage | 22,305 | (53,707 | ) | 738 | 59,740 | 29,076 | ||||||||||||||
| Residential construction | 92,571 | (118,916 | ) | 1,678 | 55,046 | 30,379 | ||||||||||||||
| Consumer installment | 3,030 | (3,594 | ) | 1,044 | 1,644 | 2,124 | ||||||||||||||
| Unallocated | 11,238 | — | — | (1,771 | ) | 9,467 | ||||||||||||||
| Total allowance for loan losses | 174,695 | (316,305 | ) | 5,078 | 251,000 | 114,468 | ||||||||||||||
| Allowance for unfunded commitments | — | — | — | — | — | |||||||||||||||
| Total allowance for credit losses | $ | 174,695 | $ | (316,305 | ) | $ | 5,078 | $ | 251,000 | $ | 114,468 | |||||||||
| 79 |
| (7) | Loans and Allowance for Credit Losses, continued |
| Allowance for Loan Losses | ||||||||||||||||||||||||
| December 31, 2013 | December 31, 2012 | |||||||||||||||||||||||
| Individually evaluated for impairment | Collectively evaluated for impairment | Ending Balance | Individually evaluated for impairment | Collectively evaluated for impairment | Ending Balance | |||||||||||||||||||
| Commercial (secured by real estate) | $ | 2,013 | $ | 22,325 | $ | 24,338 | $ | 6,106 | $ | 21,741 | $ | 27,847 | ||||||||||||
| Commercial & industrial | 66 | 6,461 | 6,527 | 490 | 5,047 | 5,537 | ||||||||||||||||||
| Commercial construction | 112 | 3,557 | 3,669 | 2,239 | 6,150 | 8,389 | ||||||||||||||||||
| Residential mortgage | 2,919 | 18,055 | 20,974 | 2,165 | 24,477 | 26,642 | ||||||||||||||||||
| Residential construction | 688 | 11,844 | 12,532 | 625 | 26,037 | 26,662 | ||||||||||||||||||
| Consumer installment | 224 | 2,255 | 2,479 | 19 | 2,728 | 2,747 | ||||||||||||||||||
| Unallocated | — | 6,243 | 6,243 | — | 9,313 | 9,313 | ||||||||||||||||||
| Total allowance for loan losses | 6,022 | 70,740 | 76,762 | 11,644 | 95,493 | 107,137 | ||||||||||||||||||
| Allowance for unfunded commitments | — | 2,165 | 2,165 | — | — | — | ||||||||||||||||||
| Total allowance for credit losses | $ | 6,022 | $ | 72,905 | $ | 78,927 | $ | 11,644 | $ | 95,493 | $ | 107,137 | ||||||||||||
| Loans Outstanding | ||||||||||||||||||||||||
| December 31, 2013 | December 31, 2012 | |||||||||||||||||||||||
| Individually evaluated for impairment | Collectively evaluated for impairment | Ending Balance | Individually evaluated for impairment | Collectively evaluated for impairment | Ending Balance | |||||||||||||||||||
| Commercial (secured by real estate) | $ | 60,208 | $ | 1,696,502 | $ | 1,756,710 | $ | 104,409 | $ | 1,708,956 | $ | 1,813,365 | ||||||||||||
| Commercial & industrial | 4,217 | 467,744 | 471,961 | 51,501 | 406,745 | 458,246 | ||||||||||||||||||
| Commercial construction | 13,715 | 135,188 | 148,903 | 40,168 | 114,601 | 154,769 | ||||||||||||||||||
| Residential mortgage | 20,672 | 1,295,292 | 1,315,964 | 22,247 | 1,191,956 | 1,214,203 | ||||||||||||||||||
| Residential construction | 14,808 | 313,771 | 328,579 | 34,055 | 347,622 | 381,677 | ||||||||||||||||||
| Consumer installment | 999 | 306,150 | 307,149 | 430 | 152,318 | 152,748 | ||||||||||||||||||
| Unallocated | — | — | — | — | — | — | ||||||||||||||||||
| Total loans | $ | 114,619 | $ | 4,214,647 | $ | 4,329,266 | $ | 252,810 | $ | 3,922,198 | $ | 4,175,008 | ||||||||||||
| 80 |
| (7) | Loans and Allowance for Credit Losses, continued |
| 81 |
| (7) | Loans and Allowance for Credit Losses, continued |
| Balances at December 31, 2012 | $ | 6,610 | ||
| New loans and advances | 1,470 | |||
| Repayments | (1,606 | ) | ||
| Adjustment for changes in executive officers and directors | (3,576 | ) | ||
| Balances at December 31, 2013 | $ | 2,898 | ||
| 2013 | 2012 | 2011 | ||||||||||||||||||||||||||||||||||
| Average Balance | Interest Revenue Recognized During Impairment | Cash Basis Interest Revenue Received | Average Balance | Interest Revenue Recognized During Impairment | Cash Basis Interest Revenue Received | Average Balance | Interest Revenue Recognized During Impairment | Cash Basis Interest Revenue Received | ||||||||||||||||||||||||||||
| Commercial (secured by real estate) | $ | 59,724 | $ | 3,553 | $ | 3,807 | $ | 114,556 | $ | 4,994 | $ | 5,270 | $ | 48,712 | $ | 1,588 | $ | 1,506 | ||||||||||||||||||
| Commercial & industrial | 4,609 | 401 | 865 | 45,233 | 1,051 | 2,523 | 24,329 | 153 | 704 | |||||||||||||||||||||||||||
| Commercial construction | 13,946 | 633 | 720 | 45,489 | 875 | 1,268 | 13,126 | 94 | 317 | |||||||||||||||||||||||||||
| Total commercial | 78,279 | 4,587 | 5,392 | 205,278 | 6,920 | 9,061 | 86,167 | 1,835 | 2,527 | |||||||||||||||||||||||||||
| Residential mortgage | 21,413 | 1,114 | 1,088 | 23,926 | 1,058 | 1,190 | 9,575 | 217 | 222 | |||||||||||||||||||||||||||
| Residential construction | 14,558 | 993 | 1,023 | 46,410 | 1,527 | 2,054 | 30,797 | 604 | 728 | |||||||||||||||||||||||||||
| Consumer installment | 383 | 21 | 21 | 564 | 26 | 27 | 101 | 6 | 6 | |||||||||||||||||||||||||||
| Total | $ | 114,633 | $ | 6,715 | $ | 7,524 | $ | 276,178 | $ | 9,531 | $ | 12,332 | $ | 126,640 | $ | 2,662 | $ | 3,483 | ||||||||||||||||||
| December 31, 2013 | December 31, 2012 | |||||||||||||||||||||||
| Unpaid Principal Balance | Recorded Investment | Allowance for Loan Losses Allocated | Unpaid Principal Balance | Recorded Investment | Allowance for Loan Losses Allocated | |||||||||||||||||||
| With no related allowance recorded: | ||||||||||||||||||||||||
| Commercial (secured by real estate) | $ | 30,361 | $ | 24,205 | $ | — | $ | 74,066 | $ | 62,609 | $ | — | ||||||||||||
| Commercial & industrial | 2,252 | 2,252 | — | 74,572 | 49,572 | — | ||||||||||||||||||
| Commercial construction | 974 | 974 | — | 23,938 | 17,305 | — | ||||||||||||||||||
| Total commercial | 33,587 | 27,431 | — | 172,576 | 129,486 | — | ||||||||||||||||||
| Residential mortgage | 4,496 | 3,634 | — | 10,336 | 8,383 | — | ||||||||||||||||||
| Residential construction | 9,462 | 7,807 | — | 35,439 | 19,093 | — | ||||||||||||||||||
| Consumer installment | — | — | — | — | — | — | ||||||||||||||||||
| Total with no related allowance recorded | 47,545 | 38,872 | — | 218,351 | 156,962 | — | ||||||||||||||||||
| With an allowance recorded: | ||||||||||||||||||||||||
| Commercial (secured by real estate) | 36,085 | 36,003 | 2,013 | 44,395 | 41,800 | 6,106 | ||||||||||||||||||
| Commercial & industrial | 2,248 | 1,965 | 66 | 2,170 | 1,929 | 490 | ||||||||||||||||||
| Commercial construction | 12,821 | 12,741 | 112 | 23,746 | 22,863 | 2,239 | ||||||||||||||||||
| Total commercial | 51,154 | 50,709 | 2,191 | 70,311 | 66,592 | 8,835 | ||||||||||||||||||
| Residential mortgage | 17,624 | 17,038 | 2,919 | 14,267 | 13,864 | 2,165 | ||||||||||||||||||
| Residential construction | 8,469 | 7,001 | 688 | 15,412 | 14,962 | 625 | ||||||||||||||||||
| Consumer installment | 999 | 999 | 224 | 441 | 430 | 19 | ||||||||||||||||||
| Total with an allowance recorded | 78,246 | 75,747 | 6,022 | 100,431 | 95,848 | 11,644 | ||||||||||||||||||
| Total | $ | 125,791 | $ | 114,619 | $ | 6,022 | $ | 318,782 | $ | 252,810 | $ | 11,644 | ||||||||||||
| 82 |
| (7) | Loans and Allowance for Credit Losses, continued |
| 2013 | 2012 | |||||||
| Commercial (secured by real estate) | $ | 8,340 | $ | 22,148 | ||||
| Commercial & industrial | 427 | 31,817 | ||||||
| Commercial construction | 361 | 23,843 | ||||||
| Total commercial | 9,128 | 77,808 | ||||||
| Residential mortgage | 13,178 | 12,589 | ||||||
| Residential construction | 4,264 | 18,702 | ||||||
| Consumer installment | 249 | 795 | ||||||
| Total | $ | 26,819 | $ | 109,894 | ||||
| Loans Past Due | Loans Not | |||||||||||||||||||||||
| As of December 31, 2013 | 30 - 59 Days | 60 - 89 Days | > 90 Days | Total | Past Due | Total | ||||||||||||||||||
| Commercial (secured by real estate) | $ | 5,724 | $ | 2,797 | $ | 2,547 | $ | 11,068 | $ | 1,745,642 | $ | 1,756,710 | ||||||||||||
| Commercial & industrial | 2,349 | 223 | 88 | 2,660 | 469,301 | 471,961 | ||||||||||||||||||
| Commercial construction | 94 | 190 | 235 | 519 | 148,384 | 148,903 | ||||||||||||||||||
| Total commercial | 8,167 | 3,210 | 2,870 | 14,247 | 2,363,327 | 2,377,574 | ||||||||||||||||||
| Residential mortgage | 11,067 | 3,262 | 5,081 | 19,410 | 1,296,554 | 1,315,964 | ||||||||||||||||||
| Residential construction | 1,335 | 588 | 1,375 | 3,298 | 325,281 | 328,579 | ||||||||||||||||||
| Consumer installment | 1,243 | 423 | 66 | 1,732 | 305,417 | 307,149 | ||||||||||||||||||
| Total loans | $ | 21,812 | $ | 7,483 | $ | 9,392 | $ | 38,687 | $ | 4,290,579 | $ | 4,329,266 | ||||||||||||
| As of December 31, 2012 | ||||||||||||||||||||||||
| Commercial (secured by real estate) | $ | 8,106 | $ | 3,232 | $ | 7,476 | $ | 18,814 | $ | 1,794,551 | $ | 1,813,365 | ||||||||||||
| Commercial & industrial | 1,565 | 429 | 867 | 2,861 | 455,385 | 458,246 | ||||||||||||||||||
| Commercial construction | 2,216 | — | 4,490 | 6,706 | 148,063 | 154,769 | ||||||||||||||||||
| Total commercial | 11,887 | 3,661 | 12,833 | 28,381 | 2,397,999 | 2,426,380 | ||||||||||||||||||
| Residential mortgage | 12,292 | 2,426 | 4,848 | 19,566 | 1,194,637 | 1,214,203 | ||||||||||||||||||
| Residential construction | 2,233 | 1,934 | 5,159 | 9,326 | 372,351 | 381,677 | ||||||||||||||||||
| Consumer installment | 1,320 | 245 | 289 | 1,854 | 150,894 | 152,748 | ||||||||||||||||||
| Total loans | $ | 27,732 | $ | 8,266 | $ | 23,129 | $ | 59,127 | $ | 4,115,881 | $ | 4,175,008 | ||||||||||||
| 83 |
| (7) | Loans and Allowance for Credit Losses, continued |
| Pre- Modification Outstanding Recorded Investment | Post- Modification Outstanding Recorded Investment | Troubled Debt Restructurings That Have Subsequently Defaulted Within the Previous Twelve Months | ||||||||||||||||||
| Troubled Debt Restructurings for the Year ended December 31, 2013 | Number of Contracts | Number of Contracts | Recorded Investment | |||||||||||||||||
| Commercial (secured by real estate) | 20 | $ | 12,483 | $ | 11,384 | 3 | $ | 670 | ||||||||||||
| Commercial & industrial | 14 | 1,464 | 1,208 | 1 | 35 | |||||||||||||||
| Commercial construction | 1 | 416 | 416 | 2 | 1,454 | |||||||||||||||
| Total commercial | 35 | 14,363 | 13,008 | 6 | 2,159 | |||||||||||||||
| Residential mortgage | 49 | 7,098 | 6,573 | 3 | 641 | |||||||||||||||
| Residential construction | 15 | 2,160 | 2,015 | 3 | 531 | |||||||||||||||
| Consumer installment | 11 | 80 | 80 | 5 | 29 | |||||||||||||||
| Total loans | 110 | $ | 23,701 | $ | 21,676 | 17 | $ | 3,360 | ||||||||||||
| Year ended December 31, 2012 | ||||||||||||||||||||
| Commercial (secured by real estate) | 54 | $ | 34,450 | $ | 32,928 | 7 | $ | 3,287 | ||||||||||||
| Commercial & industrial | 22 | 3,619 | 3,616 | 3 | 71 | |||||||||||||||
| Commercial construction | 20 | 34,014 | 33,934 | 3 | 4,224 | |||||||||||||||
| Total commercial | 96 | 72,083 | 70,478 | 13 | 7,582 | |||||||||||||||
| Residential mortgage | 67 | 15,132 | 14,303 | 10 | 650 | |||||||||||||||
| Residential construction | 49 | 19,909 | 17,400 | 16 | 5,728 | |||||||||||||||
| Consumer installment | 25 | 334 | 328 | 4 | 39 | |||||||||||||||
| Total loans | 237 | $ | 107,458 | $ | 102,509 | 43 | $ | 13,999 | ||||||||||||
| Year ended December 31, 2011 | ||||||||||||||||||||
| Commercial (secured by real estate) | 57 | $ | 56,981 | $ | 56,031 | 4 | $ | 1,447 | ||||||||||||
| Commercial & industrial | 15 | 767 | 767 | 2 | 52 | |||||||||||||||
| Commercial construction | 9 | 16,243 | 16,243 | — | — | |||||||||||||||
| Total commercial | 81 | 73,991 | 73,041 | 6 | 1,499 | |||||||||||||||
| Residential mortgage | 75 | 11,008 | 10,444 | 9 | 718 | |||||||||||||||
| Residential construction | 44 | 22,584 | 21,821 | 9 | 1,289 | |||||||||||||||
| Consumer installment | 31 | 205 | 200 | 13 | 68 | |||||||||||||||
| Total loans | 231 | $ | 107,788 | $ | 105,506 | 37 | $ | 3,574 | ||||||||||||
| 84 |
| (7) | Loans and Allowance for Credit Losses, continued |
| December 31, 2013 | December 31, 2012 | |||||||||||||||||||||||
Number of Contracts | Pre- Modification Outstanding Recorded Investment | Post- Modification Outstanding Recorded Investment | Number of Contracts | Pre- Modification Outstanding Recorded Investment | Post- Modification Outstanding Recorded Investment | |||||||||||||||||||
| Commercial (secured by real estate) | 77 | $ | 44,964 | $ | 40,667 | 96 | $ | 80,261 | $ | 75,340 | ||||||||||||||
| Commercial & industrial | 36 | 3,527 | 3,245 | 32 | 7,492 | 7,250 | ||||||||||||||||||
| Commercial construction | 13 | 13,122 | 13,042 | 25 | 37,537 | 33,809 | ||||||||||||||||||
| Total commercial | 126 | 61,613 | 56,954 | 153 | 125,290 | 116,399 | ||||||||||||||||||
| Residential mortgage | 136 | 20,622 | 19,357 | 117 | 20,323 | 19,296 | ||||||||||||||||||
| Residential construction | 57 | 12,459 | 10,452 | 67 | 25,822 | 23,786 | ||||||||||||||||||
| Consumer installment | 26 | 203 | 203 | 51 | 1,292 | 1,282 | ||||||||||||||||||
| Total loans | 345 | $ | 94,897 | $ | 86,966 | 388 | $ | 172,727 | $ | 160,763 | ||||||||||||||
| 85 |
| (7) | Loans and Allowance for Credit Losses, continued |
| Substandard | Doubtful / | |||||||||||||||||||||||
| Pass | Watch | Performing | Nonaccrual | Loss | Total | |||||||||||||||||||
As of December 31, 2013 | ||||||||||||||||||||||||
| Commercial (secured by real estate) | $ | 1,630,521 | $ | 40,124 | $ | 77,725 | $ | 8,340 | $ | — | $ | 1,756,710 | ||||||||||||
| Commercial & industrial | 456,563 | 5,382 | 9,589 | 427 | — | 471,961 | ||||||||||||||||||
| Commercial construction | 120,852 | 10,932 | 16,758 | 361 | — | 148,903 | ||||||||||||||||||
| Total commercial | 2,207,936 | 56,438 | 104,072 | 9,128 | — | 2,377,574 | ||||||||||||||||||
| Residential mortgage | 1,219,433 | 31,364 | 51,989 | 13,178 | — | 1,315,964 | ||||||||||||||||||
| Residential construction | 298,685 | 11,526 | 14,104 | 4,264 | — | 328,579 | ||||||||||||||||||
| Consumer installment | 303,133 | 1,229 | 2,538 | 249 | — | 307,149 | ||||||||||||||||||
| Total loans | $ | 4,029,187 | $ | 100,557 | $ | 172,703 | $ | 26,819 | $ | — | $ | 4,329,266 | ||||||||||||
| As of December 31, 2012 | ||||||||||||||||||||||||
| Commercial (secured by real estate) | $ | 1,592,677 | $ | 80,997 | $ | 117,543 | $ | 22,148 | $ | — | $ | 1,813,365 | ||||||||||||
| Commercial & industrial | 402,548 | 5,404 | 18,477 | 31,817 | — | 458,246 | ||||||||||||||||||
| Commercial construction | 104,296 | 7,345 | 19,285 | 23,843 | — | 154,769 | ||||||||||||||||||
| Total commercial | 2,099,521 | 93,746 | 155,305 | 77,808 | — | 2,426,380 | ||||||||||||||||||
| Residential mortgage | 1,102,746 | 33,689 | 65,179 | 12,589 | — | 1,214,203 | ||||||||||||||||||
| Residential construction | 292,264 | 32,907 | 37,804 | 18,702 | — | 381,677 | ||||||||||||||||||
| Consumer installment | 147,214 | 1,086 | 3,653 | 795 | — | 152,748 | ||||||||||||||||||
| Total loans | $ | 3,641,745 | $ | 161,428 | $ | 261,941 | $ | 109,894 | $ | — | $ | 4,175,008 | ||||||||||||
(8) | Foreclosed Property |
2013 | 2012 | |||||||
| Commercial real estate | $ | 1,287 | $ | 6,368 | ||||
| Commercial construction | — | 2,204 | ||||||
| Total commercial | 1,287 | 8,572 | ||||||
| Residential mortgage | 3,380 | 5,192 | ||||||
| Residential construction | 736 | 11,454 | ||||||
| Total foreclosed property | 5,403 | 25,218 | ||||||
| Less valuation allowance | (1,182 | ) | (6,954 | ) | ||||
| Foreclosed property, net | $ | 4,221 | $ | 18,264 | ||||
| Balance as a percentage of original loan unpaid principal | 44.5 | % | 39.7 | % |
2013 | 2012 | 2011 | ||||||||||
| Balance at beginning of year | $ | 6,954 | $ | 18,982 | $ | 16,565 | ||||||
| Additions charged to expense | 3,065 | 6,951 | 57,368 | |||||||||
| Charge-offs upon disposition | (8,837 | ) | (18,979 | ) | (54,951 | ) | ||||||
| Balance at end of year | $ | 1,182 | $ | 6,954 | $ | 18,982 |
| 86 |
| (8) | Foreclosed Property, continued |
2013 | 2012 | 2011 | ||||||||||
| Net loss on sales | $ | 1,641 | $ | 1,924 | $ | 11,038 | ||||||
| Provision for unrealized losses | 3,065 | 6,951 | 57,368 | |||||||||
| Operating expenses, net of rental income | 3,163 | 5,118 | 10,499 | |||||||||
| Total foreclosed property expense | $ | 7,869 | $ | 13,993 | $ | 78,905 |
| (9) | Premises and Equipment |
2013 | 2012 | |||||||
| Land and land improvements | $ | 80,845 | $ | 81,272 | ||||
| Buildings and improvements | 114,048 | 114,127 | ||||||
| Furniture and equipment | 63,015 | 66,565 | ||||||
| Construction in progress | 510 | 1,181 | ||||||
| 258,418 | 263,145 | |||||||
| Less accumulated depreciation | (94,829 | ) | (94,225 | ) | ||||
| Premises and equipment, net | $ | 163,589 | $ | 168,920 | ||||
| 2014 | $ | 1,852 | ||
| 2015 | 1,393 | |||
| 2016 | 563 | |||
| 2017 | 537 | |||
| 2018 | 399 | |||
| Thereafter | 1,566 | |||
| Total | $ | 6,310 |
| (10) | Intangible Assets |
2013 | 2012 | |||||||
| Gross carrying amount | $ | 32,652 | $ | 32,652 | ||||
| Less accumulated amortization | 29,172 | 27,142 | ||||||
| Net carrying amount | $ | 3,480 | $ | 5,510 |
| 87 |
| (10) | Intangible Assets, continued |
| 2014 | $ | 1,349 | ||
| 2015 | 956 | |||
| 2016 | 879 | |||
| 2017 | 263 | |||
| 2018 | 31 |
| (11) | Deposits |
| Maturing In: | ||||
| 2014 | $ | 1,098,425 | ||
| 2015 | 232,625 | |||
| 2016 | 118,261 | |||
| 2017 | 15,353 | |||
| 2018 | 21,191 | |||
| thereafter | 268,960 | |||
| $ | 1,754,815 |
| (12) | Federal Home Loan Bank Advances |
Amount | ||||||||||||||||
| Maturing In: | Maturing | Current Rate Range | ||||||||||||||
| 2014 | $ | 120,000 | 0.17% - 0.20% | |||||||||||||
| 2016 | 125 | |||||||||||||||
| $ | 120,125 | |||||||||||||||
| 88 |
| (13) | Short-term Borrowings |
| (14) | Long-term Debt |
2013 | 2012 | Issue Date | Stated Maturity Date | Earliest Call Date | Interest Rate | |||||||||||||||||||
| 2013 senior debentures | $ | 40,000 | $ | — | 2013 | 2018 | 2015 | 6.000 | % | |||||||||||||||
| 2012 senior debentures | 35,000 | 35,000 | 2012 | 2017 | 2017 | 9.000 | ||||||||||||||||||
| Total senior debentures | 75,000 | 35,000 | ||||||||||||||||||||||
| 2003 subordinated debentures | — | 35,000 | 2003 | 2015 | 2010 | 7.500 | ||||||||||||||||||
| Total subordinated debentures | — | 35,000 | ||||||||||||||||||||||
| United Community Capital Trust | 21,650 | 21,650 | 1998 | 2028 | 2008 | 8.125 | ||||||||||||||||||
| United Community Statutory Trust I | 5,155 | 5,155 | 2000 | 2030 | 2010 | 10.600 | ||||||||||||||||||
| United Community Capital Trust II | 10,309 | 10,309 | 2000 | 2030 | 2010 | 11.295 | ||||||||||||||||||
| Southern Bancorp Capital Trust I | 4,382 | 4,382 | 2004 | 2034 | 2009 | Prime + 1.00 | ||||||||||||||||||
| United Community Statutory Trust II | 12,131 | 12,077 | 2008 | 2038 | 2013 | 9.000 | ||||||||||||||||||
| United Community Statutory Trust III | 1,238 | 1,232 | 2008 | 2038 | 2013 | Prime + 3.00 | ||||||||||||||||||
| Total trust preferred securities | 54,865 | 54,805 | ||||||||||||||||||||||
| Total long-term debt | $ | 129,865 | $ | 124,805 | ||||||||||||||||||||
| 89 |
| (15) | Reclassifications Out of Accumulated Other Comprehensive Income |
| Details about Accumulated Other | Amounts Reclassified from Accumulated Other Comprehensive Income For the Years Ended December 31, | Affected Line Item in the Statement | |||||||||||
| Comprehensive Income Components | 2013 | 2012 | 2011 | Where Net Income is Presented | |||||||||
| Unrealized (losses) gains on available-for-sale securities: | |||||||||||||
| $ | 186 | $ | 7,078 | $ | 842 | Securities gains, net | |||||||
| (72 | ) | (2,753 | ) | (328 | ) | Tax (expense) or benefit | |||||||
| $ | 114 | $ | 4,325 | $ | 514 | Net of tax | |||||||
| Amortization of gains included in net income on available-for-sale securities transferred to held to maturity: | |||||||||||||
| $ | 731 | $ | 1,988 | $ | 2,177 | Investment securities interest revenue | |||||||
| (282 | ) | (773 | ) | (846 | ) | Tax (expense) or benefit | |||||||
| $ | 449 | $ | 1,215 | $ | 1,331 | Net of tax | |||||||
| Gains included in net income on derivative financial instruments accounted for as cash flow hedges: | |||||||||||||
| Effective portion of interest rate contracts | $ | 852 | $ | 3,475 | $ | 10,152 | Loan interest revenue | ||||||
| Ineffective portion of interest rate contracts | 52 | 237 | 4,964 | Loan interest revenue | |||||||||
| 904 | 3,712 | 15,116 | Total before tax | ||||||||||
| (352 | ) | (1,444 | ) | (5,880 | ) | Tax (expense) or benefit | |||||||
| $ | 552 | $ | 2,268 | $ | 9,236 | Net of tax | |||||||
| Amortization of prior service cost and actuarial losses included in net periodic pension cost for defined benefit pension plan | |||||||||||||
| Prior service cost | $ | (365 | ) | $ | (365 | ) | $ | — | Salaries and employee benefits expense | ||||
| Actuarial losses | (167 | ) | (250 | ) | — | Salaries and employee benefits expense | |||||||
Reclassification of unamortized prior service cost and actuarial gains and losses | — | — | 4,750 | Salaries and employee benefits expense | |||||||||
| (532 | ) | (615 | ) | 4,750 | Total before tax | ||||||||
| 207 | 240 | (1,848 | ) | Tax (expense) or benefit | |||||||||
| $ | (325 | ) | $ | (375 | ) | $ | 2,902 | Net of tax | |||||
| Total reclassifications for the period | $ | 790 | $ | 7,433 | $ | 13,983 | Net of tax | ||||||
| Amounts shown above in parentheses reduce earnings | |||||||||||||
| (16) | Earnings Per Share |
| 2013 | 2012 | 2011 | ||||||||||
Series A - 6% fixed (1) | $ | 12 | $ | 12 | $ | 13 | ||||||
Series B - 5% fixed until December 6, 2013, 9% thereafter (1)(2) | 10,401 | 10,465 | 10,401 | |||||||||
Series D - LIBOR plus 9.6875%, resets quarterly (1) | 1,665 | 1,671 | 1,425 | |||||||||
| Total preferred stock dividends | $ | 12,078 | $ | 12,148 | $ | 11,839 | ||||||
| (1) | All preferred stock dividends are payable quarterly. |
| (2) | Series B preferred stock was issued at a discount. Dividend amounts shown include discount accretion for each period. |
| 90 |
| (16) | Earnings Per Share, continued |
| 2013 | 2012 | 2011 | ||||||||||
| Net income (loss) available to common stockholders | $ | 261,062 | $ | 21,708 | $ | (238,584 | ) | |||||
| Income (loss) per common share: | ||||||||||||
| Basic | 4.44 | .38 | $ | (5.97 | ) | |||||||
| Diluted | 4.44 | .38 | (5.97 | ) | ||||||||
| Weighted average common shares: | ||||||||||||
| Basic | 58,787 | 57,857 | 39,943 | |||||||||
| Effect of dilutive securities: | ||||||||||||
| Stock options | 1 | — | — | |||||||||
| Warrants | 57 | — | — | |||||||||
| Diluted | 58,845 | 57,857 | 39,943 | |||||||||
| 91 |
| (16) | Earnings Per Share, continued |
| (17) | Income Taxes |
| 2013 | 2012 | 2011 | ||||||||||
| Current | $ | 3,467 | $ | 1,050 | $ | (3,983 | ) | |||||
| Deferred | 23,785 | 9,446 | (94,808 | ) | ||||||||
| Increase (decrease) in valuation allowance | (265,440 | ) | (9,446 | ) | 94,808 | |||||||
| Total income tax expense (benefit) | $ | (238,188 | ) | $ | 1,050 | $ | (3,983 | ) | ||||
| 2013 | 2012 | 2011 | ||||||||||
| Pretax loss at statutory rates | $ | 12,234 | $ | 12,217 | $ | (80,755 | ) | |||||
| Add (deduct): | ||||||||||||
| State taxes, net of federal benefit | 895 | 577 | (9,210 | ) | ||||||||
| Bank owned life insurance earnings | (704 | ) | (444 | ) | (556 | ) | ||||||
| Adjustment to reserve for uncertain tax positions | (426 | ) | (577 | ) | (4,593 | ) | ||||||
| Tax-exempt interest revenue | (714 | ) | (816 | ) | (836 | ) | ||||||
| Nondeductible interest expense | 10 | 18 | 34 | |||||||||
| Equity compensation | 676 | 255 | 489 | |||||||||
| Tax credits | (438 | ) | (460 | ) | (350 | ) | ||||||
| Change in state statutory tax rate | 1,003 | — | — | |||||||||
| Disproportionate tax effects | 12,174 | — | — | |||||||||
| (Decrease) increase in valuation allowance | (265,440 | ) | (9,446 | ) | 94,808 | |||||||
| Other | 2,542 | (274 | ) | (3,014 | ) | |||||||
| Total income tax expense (benefit) | $ | (238,188 | ) | $ | 1,050 | $ | (3,983 | ) | ||||
| 92 |
| (17) | Income Taxes, continued |
| 2013 | 2012 | |||||||
| Deferred tax assets: | ||||||||
| Allowances for loan losses | $ | 29,672 | $ | 41,521 | ||||
| Net operating loss carryforwards | 219,863 | 221,335 | ||||||
| Deferred compensation | 6,299 | 5,526 | ||||||
| Reserve for losses on foreclosed properties | 678 | 3,702 | ||||||
| Nonqualified share based compensation | 3,710 | 4,424 | ||||||
| Accrued expenses | 2,663 | 1,960 | ||||||
| Investment in low income housing tax credit partnerships | 1,335 | 1,443 | ||||||
| Unamortized pension actuarial losses and prior service cost | 1,252 | 1,677 | ||||||
| Acquired intangible assets | 326 | 890 | ||||||
| Unrealized losses on securities available-for-sale | 2,056 | — | ||||||
| Unrealized losses on cash flow hedges | — | 3,048 | ||||||
| Other | 3,985 | 3,919 | ||||||
| Total deferred tax assets | 271,839 | 289,445 | ||||||
| Deferred tax liabilities: | ||||||||
| Unrealized gains on securities available-for-sale | — | 6,629 | ||||||
| Unrealized gains on cash flow hedges | 523 | — | ||||||
| Premises and equipment | 2,812 | 3,414 | ||||||
| Loan origination costs | 4,234 | 3,876 | ||||||
| Gain from acquisition of Southern Community Bank | 816 | 4,021 | ||||||
| Prepaid expenses | 836 | 1,082 | ||||||
| Total deferred tax liabilities | 9,221 | 19,022 | ||||||
| Less valuation allowance | 4,100 | 270,423 | ||||||
| Net deferred tax asset | $ | 258,518 | $ | — | ||||
| 93 |
| (17) | Income Taxes, continued |
| 2013 | 2012 | 2011 | ||||||||||
| Balance at beginning of year | $ | 5,069 | $ | 5,985 | $ | 11,133 | ||||||
| Additions based on tax positions related to prior years | — | 130 | — | |||||||||
| Decreases based on tax positions related to prior years | — | — | (3,369 | ) | ||||||||
| Additions based on tax positions related to the current year | 352 | 500 | 585 | |||||||||
| Decreases resulting from a lapse in the applicable statute of limitations | (918 | ) | (957 | ) | (1,362 | ) | ||||||
| Decreases based on settlements with taxing authorities | — | (589 | ) | (1,002 | ) | |||||||
| Balance at end of year | $ | 4,503 | $ | 5,069 | $ | 5,985 | ||||||
| 94 |
| (18) | Pension and Employee Benefit Plans |
| 2013 | 2012 | |||||||
| Discount rate for disclosures | �� | 4.50 | % | 4.00 | % | |||
| Discount rate for net periodic benefit cost | 4.00 | % | 4.50 | % | ||||
| Rate of compensation increase | NA | NA | ||||||
| Measurement date | 12/31/2013 | 12/31/2012 | ||||||
| 95 |
| (18) | Pension and Employee Benefit Plans, continued |
| 2013 | 2012 | |||||||
| Accumulated benefit obligation: | ||||||||
| Accumulated benefit obligation - beginning of year | $ | 13,155 | $ | 12,064 | ||||
| Service cost | 465 | 597 | ||||||
| Interest cost | 533 | 537 | ||||||
| Actuarial (gains) losses | (561 | ) | 177 | |||||
| Benefits paid | (272 | ) | (220 | ) | ||||
| Accumulated benefit obligation - end of year | 13,320 | 13,155 | ||||||
| Change in plan assets, at fair value: | ||||||||
| Employer contribution | 272 | 220 | ||||||
| Benefits paid | (272 | ) | (220 | ) | ||||
| Plan assets - end of year | — | — | ||||||
| Funded status - end of year (plan assets less benefit obligations) | $ | (13,320 | ) | $ | (13,155 | ) | ||
| 2013 | 2012 | |||||||
| Net actuarial losses | $ | 1,424 | $ | 2,152 | ||||
| Prior service cost | 1,794 | 2,159 | ||||||
| $ | 3,218 | $ | 4,311 | |||||
| 2013 | 2012 | 2011 | ||||||||||
| Service cost | $ | 465 | $ | 597 | $ | 477 | ||||||
| Interest cost | 533 | 537 | 489 | |||||||||
| Amortization of prior service cost | 365 | 365 | 279 | |||||||||
| Amortization of net losses | 167 | 250 | 27 | |||||||||
| Net periodic benefit cost | 1,530 | 1,749 | 1,272 | |||||||||
| Net actuarial (gain) loss | $ | (561 | ) | $ | 177 | $ | 1,026 | |||||
| Amortization of net losses | (167 | ) | (250 | ) | (27 | ) | ||||||
| Prior service cost | — | — | 1,540 | |||||||||
| Amortization of prior service cost | (365 | ) | (365 | ) | (279 | ) | ||||||
| Total recognized in other comprehensive income | (1,093 | ) | (438 | ) | 2,260 | |||||||
Total net periodic benefit cost and accumulated other comprehensive income | $ | 437 | $ | 1,311 | $ | 3,532 | ||||||
| 96 |
| (18) | Pension and Employee Benefit Plans, continued |
| 2014 | $ | 323 | ||
| 2015 | 697 | |||
| 2016 | 764 | |||
| 2017 | 787 | |||
| 2018 | 980 | |||
| Following five years | 4,694 |
| (19) | Derivatives and Hedging Activities |
| Fair Value | ||||||||||
| Interest Rate | December 31, | December 31, | ||||||||
| Products | Balance Sheet Location | 2013 | 2012 | |||||||
| Cash flow hedge of money market deposits | Other assets | $ | 4,782 | $ | — | |||||
Fair value hedge of brokered CD’s | Other assets | — | 23 | |||||||
| Fair value hedge of corporate bonds | Other assets | 3,939 | — | |||||||
| $ | 8,721 | $ | 23 | |||||||
| Cash flow hedge of short-term debt | Other liabilities | $ | 3,368 | $ | 4,574 | |||||
| Cash flow hedge of money market deposits | Other liabilities | — | 4,165 | |||||||
Fair value hedge of brokered CD’s | Other liabilities | 19,970 | 3,161 | |||||||
| Fair value hedge of corporate bonds | Other liabilities | 2,308 | — | |||||||
| $ | 25,646 | $ | 11,900 | |||||||
| 97 |
| (19) | Derivatives and Hedging Activities, continued |
| Fair Value | ||||||||||
| Interest Rate | December 31, | December 31, | ||||||||
| Products | Balance Sheet Location | 2013 | 2012 | |||||||
| Customer swap positions | Other assets | $ | 898 | $ | 635 | |||||
| Dealer offsets to customer swap positions | Other assets | 1,347 | — | |||||||
| Bifurcated embedded derivatives | Other assets | 12,867 | — | |||||||
| $ | 15,112 | $ | 635 | |||||||
| Customer swap positions | Other liabilities | $ | 1,347 | $ | — | |||||
| Dealer offsets to customer swap positions | Other liabilities | 915 | 643 | |||||||
| Dealer offsets to bifurcated embedded derivatives | Other liabilities | 18,324 | — | |||||||
| $ | 20,586 | $ | 643 | |||||||
| 98 |
| (19) | Derivatives and Hedging Activities, continued |
| Location of Gain (Loss) | Amount of Gain (Loss) Recognized in | Amount of Gain (Loss) Recognized in | ||||||||||||||||||||||||
| Recognized in Income | Income on Derivative | Income on Hedged Item | ||||||||||||||||||||||||
| on Derivative | 2013 | 2012 | 2011 | 2013 | 2012 | 2011 | ||||||||||||||||||||
Fair value hedges of brokered CD’s | Interest expense | $ | (16,433 | ) | $ | 540 | $ | 328 | $ | 16,981 | $ | 330 | $ | (291 | ) | |||||||||||
| Fair value hedges of corporate bonds | Interest revenue | 6,285 | — | — | (5,765 | ) | — | — | ||||||||||||||||||
| $ | (10,148 | ) | $ | 540 | $ | 328 | $ | 11,216 | $ | 330 | $ | (291 | ) | |||||||||||||
| Amount of Gain (Loss) Recognized in | ||||||||||||||||||||||||||||||||||||||
| Other Comprehensive Income on | Gain (Loss) Reclassified from Accumulated Other | Gain (Loss) Recognized in Income on Derivative | ||||||||||||||||||||||||||||||||||||
| Derivative (Effective Portion) | Comprehensive Income into Income (Effective Portion) | (Ineffective Portion) | ||||||||||||||||||||||||||||||||||||
| 2013 | 2012 | 2011 | Location | 2013 | 2012 | 2011 | Location | 2013 | 2012 | 2011 | ||||||||||||||||||||||||||||
| Interest rate swaps | $ | 10,084 | $ | (8,739 | ) | $ | — | Interest revenue | $ | 904 | $ | 3,712 | $ | 15,120 | Interest expense | $ | 70 | $ | — | $ | — | |||||||||||||||||
| 99 |
| (19) | Derivatives and Hedging Activities, continued |
| (20) | Regulatory Matters |
| 100 |
| (20) | Regulatory Matters, continued |
| Regulatory | United Community Banks, Inc. | |||||||||||||||||||||||
| Guidelines | (consolidated) | United Community Bank | ||||||||||||||||||||||
| Well | ||||||||||||||||||||||||
| Minimum | Capitalized | 2013 | 2012 | 2013 | 2012 | |||||||||||||||||||
| Risk-based ratios: | ||||||||||||||||||||||||
| Tier 1 capital | 4.0 | % | 6.0 | % | 12.74 | % | 14.16 | % | 13.55 | % | 14.48 | % | ||||||||||||
| Total capital | 8.0 | 10.0 | 13.99 | 15.73 | 14.80 | 15.74 | ||||||||||||||||||
| Leverage ratio | 3.0 | 9.08 | 9.64 | 9.61 | 9.86 | |||||||||||||||||||
| Tier 1 capital | $ | 649,162 | $ | 652,692 | $ | 686,687 | $ | 666,585 | ||||||||||||||||
| Total capital | 713,063 | 724,915 | 750,216 | 724,738 | ||||||||||||||||||||
| 101 |
| (21) | Commitments and Contingencies |
| 2013 | 2012 | |||||||
| Financial instruments whose contract amounts represent credit risk: | ||||||||
| Commitments to extend credit | $ | 747,170 | $ | 534,928 | ||||
| Letters of credit | 19,846 | 13,683 | ||||||
| Minimum Lease Payments | 6,310 | 6,716 | ||||||
| 102 |
| (22) | Preferred Stock |
| (23) | Shareholders’ Equity |
| 103 |
| (23) | Shareholders’ Equity, continued |
| Restricted Stock | Options | |||||||||||||||||||||||
| Weighted | Weighted | Weighted | ||||||||||||||||||||||
| Average | Average | Average | Aggregate | |||||||||||||||||||||
| Grant Date | Exercise | Remaining | Intrinsic | |||||||||||||||||||||
| Shares | Fair Value | Shares | Price | Term (Yrs.) | Value (000’s) | |||||||||||||||||||
| December 31, 2010 | 23,214 | 59.67 | 678,313 | 93.00 | ||||||||||||||||||||
| Granted | 410,051 | 10.15 | 10,000 | 11.20 | ||||||||||||||||||||
| Exercised | (18,621 | ) | 26.77 | — | — | |||||||||||||||||||
| Cancelled | — | — | (104,666 | ) | 76.87 | |||||||||||||||||||
| December 31, 2011 | 414,644 | 12.19 | 583,647 | 94.48 | ||||||||||||||||||||
| Granted | 200,612 | 8.73 | — | — | ||||||||||||||||||||
| Exercised | (114,673 | ) | 14.77 | — | — | |||||||||||||||||||
| Cancelled | (14,999 | ) | 10.25 | (101,119 | ) | 78.98 | ||||||||||||||||||
| December 31, 2012 | 485,584 | 10.72 | 482,528 | 97.73 | ||||||||||||||||||||
| Granted | 876,583 | 14.74 | 5,000 | 15.09 | ||||||||||||||||||||
| Exercised | (195,366 | ) | 13.16 | — | — | |||||||||||||||||||
| Cancelled | (93,125 | ) | 8.78 | (136,756 | ) | 94.37 | ||||||||||||||||||
| December 31, 2013 | 1,073,676 | 13.73 | 350,772 | 97.87 | 3.30 | $ | 79 | |||||||||||||||||
Vested / Exercisable at December 31, 2013 | 22,462 | 10.11 | 340,572 | 100.40 | 3.14 | 33 | ||||||||||||||||||
| Options Outstanding | Options Exercisable | ||||||||||||||||||||
| Weighted | Average | Weighted | |||||||||||||||||||
| Shares | Range | Average Price | Remaining Life | Shares | Average Price | ||||||||||||||||
| 16,823 | $ | 10.00 - 30.00 | $ | 13.92 | 7.98 | 6,623 | $ | 14.88 | |||||||||||||
| 47,398 | 30.01 - 50.00 | 31.66 | 5.32 | 47,398 | 31.66 | ||||||||||||||||
| 75,561 | 50.01 - 70.00 | 66.31 | 4.27 | 75,561 | 66.31 | ||||||||||||||||
| 2,595 | 70.01 - 90.00 | 77.22 | 3.41 | 2,595 | 77.22 | ||||||||||||||||
| 29,781 | 90.01 - 110.00 | 107.28 | 1.32 | 29,781 | 107.28 | ||||||||||||||||
| 51,597 | 110.01 - 130.00 | 114.19 | 0.75 | 51,597 | 114.19 | ||||||||||||||||
| 121,614 | 130.01 - 150.00 | 143.69 | 2.82 | 121,614 | 143.69 | ||||||||||||||||
| 5,403 | 150.01 - 170.00 | 152.10 | 3.21 | 5,403 | 152.10 | ||||||||||||||||
| 350,772 | 10.00 - 170.00 | 97.87 | 3.30 | 340,572 | 100.40 | ||||||||||||||||
| 104 |
| (23) | Shareholders’ Equity, continued |
| 2013 | 2012 | 2011 | |||||
| Expected volatility | 30 | % | NA | 33 | % | ||
| Expected dividend yield | 0.0 | % | NA | 0.0 | % | ||
| Expected life (in years) | 6.25 | NA | 5.00 | ||||
| Risk free rate | 2.0 | % | NA | 2.1 | % |
| 105 |
| (24) | Assets and Liabilities Measured at Fair Value |
Level 1 Valuation is based upon quoted prices (unadjusted) in active markets for identical assets or liabilities that United has the ability to access. |
Level 2 Valuation is based upon quoted prices for similar assets and liabilities in active markets, as well as inputs that are observable for the asset or liability (other than quoted prices), such as interest rates, foreign exchange rates, and yield curves that are observable at commonly quoted intervals. |
Level 3 Valuation is generated from model-based techniques that use at least one significant assumption based on unobservable inputs for the asset or liability, which are typically based on an entity’s own assumptions, as there is little, if any, related market activity. In instances where the determination of the fair value measurement is based on inputs from different levels of the fair value hierarchy, the level in the fair value hierarchy within which the entire fair value measurement falls is based on the lowest level input that is significant to the fair value measurement in its entirety. United’s assessment of the significance of a particular input to the fair value measurement in its entirety requires judgment, and considers factors specific to the asset or liability. |
| 106 |
| (24) | Assets and Liabilities Measured at Fair Value, continued |
| 107 |
| (24) | Assets and Liabilities Measured at Fair Value, continued |
| December 31, 2013 | Level 1 | Level 2 | Level 3 | Total | |||||||||||||
| Assets: | |||||||||||||||||
| Securities available-for-sale | |||||||||||||||||
| State and political subdivisions | $ | — | $ | 23,242 | $ | — | $ | 23,242 | |||||||||
| Mortgage-backed securities | — | 1,145,347 | — | 1,145,347 | |||||||||||||
| Corporate bonds | — | 249,946 | 350 | 250,296 | |||||||||||||
| Asset-backed securities | — | 410,633 | — | 410,633 | |||||||||||||
| Other | — | 2,699 | — | 2,699 | |||||||||||||
| Deferred compensation plan assets | 3,496 | — | — | 3,496 | |||||||||||||
| Derivative financial instruments | — | 23,833 | — | 23,833 | |||||||||||||
| Total assets | $ | 3,496 | $ | 1,855,700 | $ | 350 | $ | 1,859,546 | |||||||||
| Liabilities: | |||||||||||||||||
| Deferred compensation plan liability | $ | 3,496 | $ | — | $ | — | $ | 3,496 | |||||||||
| Brokered certificates of deposit | — | 173,657 | — | 173,657 | |||||||||||||
| Derivative financial instruments | — | 46,233 | — | 46,233 | |||||||||||||
| Total liabilities | $ | 3,496 | $ | 219,890 | $ | — | $ | 223,386 | |||||||||
| December 31, 2012 | Level 1 | Level 2 | Level 3 | Total | |||||||||||||
| Assets: | |||||||||||||||||
| Securities available-for-sale | |||||||||||||||||
| State and political subdivisions | $ | — | $ | 29,052 | $ | — | $ | 29,052 | |||||||||
| Mortgage-backed securities | — | 1,428,502 | — | 1,428,502 | |||||||||||||
| Corporate bonds | — | 163,312 | 350 | 163,662 | |||||||||||||
| Asset-backed securities | — | 210,556 | — | 210,556 | |||||||||||||
| Other | — | 2,821 | — | 2,821 | |||||||||||||
| Deferred compensation plan assets | 3,101 | — | — | 3,101 | |||||||||||||
| Derivative financial instruments | — | 658 | — | 658 | |||||||||||||
| Total assets | $ | 3,101 | $ | 1,834,901 | $ | 350 | $ | 1,838,352 | |||||||||
| Liabilities: | |||||||||||||||||
| Deferred compensation plan liability | $ | 3,101 | $ | — | $ | — | $ | 3,101 | |||||||||
| Brokered certificates of deposit | — | 154,641 | — | 154,641 | |||||||||||||
| Derivative financial instruments | — | 12,543 | — | 12,543 | |||||||||||||
| Total liabilities | $ | 3,101 | $ | 167,184 | $ | — | $ | 170,285 | |||||||||
| 108 |
| (24) | Assets and Liabilities Measured at Fair Value, continued |
| Securities Available-for-Sale | ||||||||||||
| 2013 | 2012 | 2011 | ||||||||||
| Balance at beginning of period | $ | 350 | $ | 350 | $ | 5,284 | ||||||
| Amounts included in earnings | — | — | (19 | ) | ||||||||
| Paydowns | — | — | (1,119 | ) | ||||||||
| Transfers between valuation levels, net | — | — | (3,796 | ) | ||||||||
| Balance at end of period | $ | 350 | $ | 350 | $ | 350 | ||||||
| December 31, 2013 | Level 1 | Level 2 | Level 3 | Total | |||||||||||||
| Assets: | |||||||||||||||||
| Loans | $ | — | $ | — | $ | 82,798 | $ | 82,798 | |||||||||
| Foreclosed properties | — | — | 3,747 | 3,747 | |||||||||||||
| Total assets | $ | — | $ | — | $ | 86,545 | $ | 86,545 | |||||||||
| December 31, 2012 | Level 1 | Level 2 | Level 3 | Total | |||||||||||||
| Assets: | |||||||||||||||||
| Loans | $ | — | $ | — | $ | 165,751 | $ | 165,751 | |||||||||
| Foreclosed properties | — | — | 14,788 | 14,788 | |||||||||||||
| Total assets | $ | — | $ | — | $ | 180,539 | $ | 180,539 | |||||||||
| 109 |
| (24) | Assets and Liabilities Measured at Fair Value, continued |
| Carrying | Fair Value Level | ||||||||||||||||||||
| December 31, 2013 | Amount | Level 1 | Level 2 | Level 3 | Total | ||||||||||||||||
| Assets: | |||||||||||||||||||||
| Securities held-to-maturity | $ | 479,742 | $ | — | $ | 485,585 | $ | — | $ | 485,585 | |||||||||||
| Loans, net | 4,252,504 | — | — | 4,165,591 | 4,165,591 | ||||||||||||||||
| Mortgage loans held for sale | 10,319 | — | 10,529 | — | 10,529 | ||||||||||||||||
| Liabilities: | |||||||||||||||||||||
| Deposits | 6,201,505 | — | 6,204,815 | — | 6,204,815 | ||||||||||||||||
| Federal Home Loan Bank advances | 120,125 | — | 120,125 | — | 120,125 | ||||||||||||||||
| Long-term debt | 129,865 | — | — | 130,262 | 130,262 | ||||||||||||||||
| December 31, 2012 | |||||||||||||||||||||
| Assets: | |||||||||||||||||||||
| Securities held-to-maturity | $ | 244,184 | $ | — | $ | 261,131 | $ | — | $ | 261,131 | |||||||||||
| Loans, net | 4,067,871 | — | — | 3,957,669 | 3,957,669 | ||||||||||||||||
| Mortgage loans held for sale | 28,821 | — | 29,693 | — | 29,693 | ||||||||||||||||
| Liabilities: | |||||||||||||||||||||
| Deposits | 5,952,140 | — | 5,988,743 | — | 5,988,743 | ||||||||||||||||
| Federal Home Loan Bank advances | 40,125 | — | 40,125 | — | 40,125 | ||||||||||||||||
| Long-term debt | 124,805 | — | — | 118,626 | 118,626 | ||||||||||||||||
| 110 |
| (25) | Condensed Financial Statements of United Community Banks, Inc. (Parent Only) |
| Statement of Operations | ||||||||||||
| For the Years Ended December 31, 2013, 2012 and 2011 | ||||||||||||
| (in thousands) | ||||||||||||
| 2013 | 2012 | 2011 | ||||||||||
| Dividends from bank subsidiary | $ | 50,000 | $ | — | $ | — | ||||||
| Shared service fees from subsidiaries | 6,764 | 6,714 | 7,646 | |||||||||
| Other | 1,217 | 1,169 | 609 | |||||||||
| Total income | 57,981 | 7,883 | 8,255 | |||||||||
| Interest expense | 10,977 | 10,201 | 9,587 | |||||||||
| Other expense | 8,658 | 8,717 | 9,367 | |||||||||
| Total expenses | 19,635 | 18,918 | 18,954 | |||||||||
| Income tax benefit (expense) | 24,862 | 398 | (1,272 | ) | ||||||||
| Income (loss) before equity in undistributed loss of subsidiaries | 63,208 | (10,637 | ) | (11,971 | ) | |||||||
| Equity in undistributed earnings (loss) of subsidiaries | 209,932 | 44,493 | (214,775 | ) | ||||||||
| Net income (loss) | $ | 273,140 | $ | 33,856 | $ | (226,746 | ) | |||||
| Balance Sheet | ||||||||
| As of December 31, 2013 and 2012 | ||||||||
| (in thousands) | ||||||||
| 2013 | 2012 | |||||||
Assets | ||||||||
| Cash | $ | 36,338 | $ | 54,047 | ||||
| Investment in subsidiaries | 869,665 | 655,934 | ||||||
| Other assets | 34,972 | 6,708 | ||||||
| Total assets | $ | 940,975 | $ | 716,689 | ||||
| Liabilities and Shareholders’ Equity | ||||||||
| Long-term debt | $ | 129,865 | $ | 124,805 | ||||
| Other liabilities | 15,395 | 10,479 | ||||||
| Total liabilities | 145,260 | 135,284 | ||||||
| Shareholders’ equity | 795,715 | 581,405 | ||||||
| Total liabilities and shareholders’ equity | $ | 940,975 | $ | 716,689 | ||||
| 111 |
| (25) | Condensed Financial Statements of United Community Banks, Inc. (Parent Only), continued |
| Statement of Cash Flows | ||||||||||||
| For the Years Ended December 31, 2013, 2012 and 2011 | ||||||||||||
| (in thousands) | ||||||||||||
| 2013 | 2012 | 2011 | ||||||||||
| Operating activities: | ||||||||||||
| Net income (loss) | $ | 273,140 | $ | 33,856 | $ | (226,746 | ) | |||||
Adjustments to reconcile net income (loss) to net cash used in operating activities: | ||||||||||||
| Equity in undistributed (earnings) loss of the subsidiaries | (209,932 | ) | (44,493 | ) | 214,775 | |||||||
| Depreciation, amortization and accretion | 82 | 142 | 122 | |||||||||
| Stock-based compensation | 3,045 | 1,976 | 2,144 | |||||||||
| Change in assets and liabilities: | ||||||||||||
| Other assets | (29,168 | ) | 21,722 | (3,604 | ) | |||||||
| Other liabilities | 5,682 | (20,483 | ) | 6,590 | ||||||||
| Net cash provided by (used) in operating activities | 42,849 | (7,280 | ) | (6,719 | ) | |||||||
| Investing activities: | ||||||||||||
| Investment in subsidiaries | — | — | (292,000 | ) | ||||||||
| Sales and paydowns of securities available for sale | 586 | — | — | |||||||||
| Net cash provided by (used in) investing activities | 586 | — | (292,000 | ) | ||||||||
| Financing activities: | ||||||||||||
| Repayment of subordinated notes | (35,000 | ) | (30,500 | ) | — | |||||||
| Proceeds from issuance of senior notes | 40,000 | 35,000 | — | |||||||||
Proceeds from issuance of common stock for dividend reinvestment and employee benefit plans | 796 | 894 | 1,453 | |||||||||
| Proceeds from issuance of common and preferred stock, net of offering costs | — | — | 361,560 | |||||||||
| Proceeds from penalty on incomplete private equity transaction | — | — | 3,250 | |||||||||
| Proceeds from exercise of warrant | 19,389 | — | — | |||||||||
| Retirement of preferred stock | (75,217 | ) | — | — | ||||||||
| Cash dividends on Series A preferred stock | (15 | ) | (12 | ) | (13 | ) | ||||||
| Cash dividends on Series B preferred stock | (9,440 | ) | (9,000 | ) | (9,020 | ) | ||||||
| Cash dividends on Series D preferred stock | (1,657 | ) | (1,687 | ) | (1,210 | ) | ||||||
| Net cash (used in) provided by financing activities | (61,144 | ) | (5,305 | ) | 356,020 | |||||||
| Net change in cash | (17,709 | ) | (12,585 | ) | 57,301 | |||||||
| Cash at beginning of year | 54,047 | 66,632 | 9,331 | |||||||||
| Cash at end of year | $ | 36,338 | $ | 54,047 | $ | 66,632 | ||||||
| (26) | Subsequent Events |
| 112 |
| ITEM 9. | CHANGES IN AND DISAGREEMENTS WITH ACCOUNTANTS ON ACCOUNTING AND FINANCIAL DISCLOSURE. |
| ITEM 9A. |
| ITEM 9B. |
| 113 |
| 114 |
| Consolidated Statement of Operations - Years ended December 31, 2013, 2012, and 2011 |
| Consolidated Balance Sheet - December 31, 2013 and 2012 |
| Consolidated Statement of Changes in Shareholders’ Equity - Years ended December 31, 2013, 2012, and 2011 |
| Consolidated Statement of Cash Flows - Years ended December 31, 2013, 2012, and 2011 |
| Notes to Consolidated Financial Statements |
| Exhibit No. | Exhibit | ||
| 3.1 | Restated Articles of Incorporation of United Community Banks, Inc., as amended (incorporated herein by reference to Exhibit 3.1 to United Community Banks, Inc.’s Quarterly Report on Form 10-Q for the period ended June 30, 2011, filed with the SEC on August 9, 2011). | ||
| 3.2 | Amended and Restated Bylaws of United Community Banks, Inc., as amended (incorporated herein by reference to Exhibit 3.2 to United Community Banks, Inc.’s Quarterly Report on Form 10-Q for the period ended March 31, 2011, filed with the SEC on May 4, 2011). | ||
| 4.1 | See Exhibits 3.1 and 3.2 for provisions of the Restated Articles of Incorporation of United Community Banks, Inc., as amended, and the Amended and Restated Bylaws, as amended, of United Community Banks, Inc., which define the rights of security holders. | ||
| 4.2 | Form of Warrants to Purchase Shares of Common Stock of United Community Banks, Inc. (incorporated herein by reference to Exhibit 1.3 to United Community Banks, Inc.’s Current Report on Form 8-K, filed with the SEC on April 1, 2010), as amended by Amendment to Warrants to Purchase Shares of Common Stock of United Community Banks, Inc., dated as of June 11, 2010 (incorporated herein by reference to Exhibit 1.2 to United Community Banks, Inc.’s Current Report on Form 8-K, filed with the SEC on June 14, 2010). | ||
| 115 |
Exhibit No. | Exhibit | ||
| 4.3 | Tax Benefits Preservation Plan, dated as of February 22, 2011, by and between United Community Banks, Inc. and Illinois Stock Transfer Company (incorporated herein by reference to Exhibit 4.1 to United Community Banks, Inc.’s Current Report on Form 8-K, filed with the SEC on February 24, 2011), as amended by Amendment to Tax Benefits Preservation Plan, dated as of March 29, 2011 (incorporated herein by reference to Exhibit 4.1 to United Community Banks, Inc.’s Current Report on Form 8-K, filed with the SEC on March 31, 2011) and as amended by Second Amendment to Tax Benefits Preservation Plan, dated as of June 17, 2011 (incorporated herein by reference to Exhibit 10.1 to United Community Banks, Inc.’s Current Report on Form 8-K, filed with the SEC on June 21, 2011). | ||
| 4.4 | Form of Summary of Rights for Tax Benefits Preservation Plan, dated as of February 22, 2011, by and between United Community Banks, Inc. and Illinois Stock Transfer Company (incorporated herein by reference to Exhibit 4.2 to United Community Banks, Inc.’s Current Report on Form 8-K, filed with the SEC on February 24, 2011). | ||
| 10.1 | United Community Banks, Inc.’s Profit Sharing Plan, amended and restated as of January 1, 2001 (incorporated herein by reference to Exhibit 4.3 to United Community Banks, Inc.’s Registration Statement on Form S-8, File No. 333-86876, filed with the SEC on April 24, 2002).* | ||
| 10.2 | Amendment No. 1 to United Community Banks, Inc.’s Profit Sharing Plan, dated as of March 15, 2002 (incorporated herein by reference to Exhibit 4.4 to United Community Banks, Inc.’s Registration Statement on Form S-8, File No. 333-86876, filed with the SEC on April 24, 2002).* | ||
| 10.3 | United Community Banks, Inc.’s 2000 Key Employee Stock Option Plan (incorporated herein by reference to Exhibit 10 to United Community Banks, Inc.’s Registration Statement on Form S-8, File No. 333-99849, filed with the SEC on September 19, 2002).* | ||
| 10.4 | Amendment to United Community Banks, Inc.’s 2000 Key Employee Stock Option Plan, dated March 5, 2004 (incorporated herein by reference to Exhibit 10.1 to United Community Banks, Inc.’s Registration Statement on Form S-4, File No. 333-118893, filed with the SEC on September 9, 2004).* | ||
| 10.5 | Split-Dollar Agreement between United Community Banks, Inc. and Jimmy C. Tallent dated June 1, 1994 (incorporated herein by reference to Exhibit 10.11 to United Community Banks, Inc.’s Annual Report on Form 10-K for the year ended December 31, 1994, File No. 0-21656).* | ||
| 10.6 | Amendment Number 2 to United Community Banks, Inc. 2000 Key Employee Stock Option Plan, dated April 26, 2006 (incorporated herein by reference to Exhibit 10.1 to United Community Banks, Inc.’s Quarterly Report on Form 10-Q for the quarter ended June 30, 2006, File No. 000-21656, filed with the SEC on August 4, 2006).* | ||
| 10.7 | United Community Banks, Inc.’s Amended and Restated 2000 Key Employee Stock Option Plan (incorporated herein by reference to Exhibit 10.1 to United Community Banks, Inc.’s Current Report on Form 8-K, File No. 000-21656, filed with the SEC on May 1, 2007).* | ||
| 10.8 | Form of Senior Executive Officer Incentive Stock Option Agreement (incorporated herein by reference to Exhibit 10.3 to United Community Banks, Inc.'s Quarterly Report on Form 10-Q for the quarter ended June 30, 2009, File No. 000-21656, filed with the SEC on August 7, 2009).* | ||
| 116 |
Exhibit No. | Exhibit | ||
| 10.9 | Form of Amended and Restated Change of Control Severance Agreement by and between United Community Banks, Inc. and Jimmy C. Tallent, H. Lynn Harton, Rex S. Schuette, David Shearrow, and Bill Gilbert (incorporated herein by reference to Exhibit 10.8 to United Community Banks, Inc.’s Annual Report on Form 10-K for the year ended December 31, 2008, File No. 000-21656, filed with the SEC on February 27, 2009).* | ||
| 10.10 | United Community Banks, Inc.’s Amended and Restated Modified Retirement Plan, effective as of January 1, 2005 (incorporated herein by reference to Exhibit 10.10 to United Community Banks, Inc.’s Annual Report on Form 10-K for the year ended December 31, 2008, File No. 000-21656, filed with the SEC on February 27, 2009).* | ||
| 10.11 | United Community Banks, Inc.’s Amended and Restated Deferred Compensation Plan, effective as of January 1, 2005 (incorporated herein by reference to Exhibit 10.11 to United Community Banks, Inc.’s Annual Report on Form 10-K for the year ended December 31, 2008, File No. 000-21656, filed with the SEC on February 27, 2009).* | ||
| 10.12 | United Community Banks, Inc. Dividend Reinvestment and Share Purchase Plan (incorporated herein by reference to Exhibit 4 to United Community Banks, Inc.’s Registration Statement on Form S-3D, File No. 333-127477, filed with the SEC on August 12, 2005).* | ||
| 10.13 | United Community Banks, Inc. Employee Stock Purchase Plan, effective as of December 20, 2005 (incorporated herein by reference to Exhibit 4 to United Community Banks, Inc.’s Registration Statement on Form S-8, File No. 333-130489, filed with the SEC on December 20, 2005).* | ||
| 10.14 | Form of Senior Executive Officer Nonqualified Stock Option Agreement (incorporated herein by reference to Exhibit 10.1 to United Community Banks, Inc.'s Quarterly Report on Form 10-Q for the quarter ended June 30, 2009, File No. 000-21656, filed with the SEC on August 7, 2009).* | ||
| 10.15 | Form of Executive Officer Restricted Stock Unit Award Agreement (incorporated herein by reference to Exhibit 10.2 to United Community Banks, Inc.'s Quarterly Report on Form 10-Q for the quarter ended June 30, 2009, File No. 000-21656, filed with the SEC on August 7, 2009).* | ||
| 10.16 | United Community Banks, Inc.’s Management Incentive Plan, effective as of January 1, 2007 (incorporated herein by reference to Exhibit 10.5 to United Community Banks, Inc.’s Current Report on Form 8-K, File No. 000-21656, filed with the SEC on May 1, 2007).* | ||
| 10.17 | Amendment No. 1 to United Community Banks, Inc.’s Amended and Restated 2000 Key Employee Stock Option Plan dated April 13, 2007 (incorporated herein by reference to Exhibit 10.1 to United Community Banks, Inc.’s Current Report on Form 8-K, File No. 000-21656, filed with the SEC on April 13, 2007).* | ||
| 10.18 | Investment Agreement, dated as of March 16, 2011, between United Community Banks, Inc. and Corsair Georgia, L.P. (incorporated herein by reference to Exhibit 10.1 to United Community Banks, Inc.’s Current Report on Form 8-K, File No. 001-35095, filed with the SEC on March 17, 2011).* | ||
| 10.19 | Form of Subscription Agreement, dated as of March 16, 2011, between United Community Banks, Inc. and each Additional Investor (incorporated herein by reference to Exhibit 10.2 to United Community Banks, Inc.’s Current Report on Form 8-K, File No. 001-35095, filed with the SEC on March 17, 2011).* | ||
| 10.20 | Employment Agreement, dated as of September 14, 2012, between United Community Bank and H. Lynn Harton (incorporated herein by reference to Exhibit 10.1 to United Community Banks, Inc.’s Current Report on Form 8-K, File No. 001-35095, filed with the SEC on September 19, 2012).* | ||
| 117 |
Exhibit No. | Exhibit | ||
| 10.21 | Credit Agreement dated as of January 7, 2014, between United Community Banks, Inc. and Synovus Bank. | ||
| 14 | Code of Ethical Conduct (incorporated herein by reference to Exhibit 14 to United Community Banks, Inc.’s Annual Report on Form 10-K for the year ended December 31, 2003, File No. 000-21656, filed with the SEC on March 8, 2004). | ||
| 21 | Subsidiaries of United. | ||
| 23.1 | Consent of Independent Registered Public Accounting Firm | ||
| 23.2 | Consent of Independent Registered Public Accounting Firm | ||
| 24 | Power of Attorney of certain officers and directors of United (included on Signature Page) | ||
| 31.1 | Certification by Jimmy C. Tallent, President and Chief Executive Officer of United Community Banks, Inc., as adopted pursuant to Section 302 of the Sarbanes-Oxley Act of 2002. | ||
| 31.2 | Certification by Rex S. Schuette, Executive Vice President and Chief Financial Officer of United Community Banks, Inc., as adopted pursuant to Section 302 of the Sarbanes-Oxley Act of 2002. | ||
| 32 | Certification pursuant to 18 U.S.C. Section 1350, as adopted pursuant to Section 906 of the Sarbanes-Oxley Act of 2002. | ||
| 99 | TARP Compliance Certification pursuant to 31 C.F.R. Section 30.15. | ||
| 101.INS** | XBRL Report Instance Document | ||
| 101.SCH** | XBRL Taxonomy Extension Schema Document | ||
| 101.CAL** | XBRL Taxonomy Calculation Linkbase Document | ||
| 101.LAB** | XBRL Taxonomy Label Linkbase Document | ||
| 101.PRE** | XBRL Presentation Linkbase Document | ||
| 101.DEF** | XBRL Taxonomy Extension Definition Linkbase Document | ||
* | Management contract or compensatory plan or arrangement required to be filed as an Exhibit to this Annual Report on Form 10-K pursuant to Item 15(b) of Form 10-K. |
** | Indicates furnished herewith. |
| 118 |
| /s/ Jimmy C. Tallent | /s/ Rex S. Schuette | |
Jimmy C. Tallent | Rex S. Schuette | |
President, Chief Executive Officer and Director | Executive Vice President and Chief Financial Officer | |
(Principal Executive Officer) | (Principal Financial Officer) | |
/s/ Alan H. Kumler | ||
Alan H. Kumler | ||
Senior Vice President, Controller and Chief Accounting | ||
| Officer | ||
(Principal Accounting Officer) |
/s/ Jimmy C. Tallent | /s/ Robert Blalock | |
Jimmy C. Tallent | Robert Blalock | |
President, Chief Executive Officer and Director | Director | |
| (Principal Executive Officer) | ||
/s/ L. Cathy Cox | ||
/s/ Rex S. Schuette | L. Cathy Cox | |
Rex S. Schuette | Director | |
Executive Vice President and Chief Financial Officer | ||
(Principal Financial Officer) | /s/ Steven J. Goldstein | |
Steven J. Goldstein | ||
/s/ Alan H. Kumler | Director | |
Alan H. Kumler | ||
Senior Vice President, Controller and Chief Accounting | /s/ Thomas A. Richlovsky | |
| Officer | Thomas A. Richlovsky | |
(Principal Accounting Officer) | Director | |
/s/ W.C. Nelson, Jr. | /s/ Tim Wallis | |
W. C. Nelson, Jr. | Tim Wallis | |
Chairman of the Board | Director | |
/s/ Clifford V. Brokaw | ||
| Clifford V. Brokaw | ||
| Director |
| 119 |
| Exhibit No. | Description | ||
| 10.21 | Credit Agreement dated as of January 7, 2014, between United Community Banks, Inc. and Synovus Bank. | ||
| 21 | Subsidiaries of United. | ||
| 23.1 | Consent of Independent Registered Public Accounting Firm. | ||
| 23.2 | Consent of Independent Registered Public Accounting Firm. | ||
| 24 | Power of Attorney of certain officers and directors of United (included on Signature Page). | ||
| 31.1 | Certification by Jimmy C. Tallent, President and Chief Executive Officer of United Community Banks, Inc., as adopted pursuant to Section 302 of the Sarbanes-Oxley Act of 2002. | ||
| 31.2 | Certification by Rex S. Schuette, Executive Vice President and Chief Financial Officer of United Community Banks, Inc., as adopted pursuant to Section 302 of the Sarbanes-Oxley Act of 2002. | ||
| 32 | Certification pursuant to 18 U.S.C. Section 1350, as Adopted Pursuant to Section 906 of the Sarbanes-Oxley Act of 2002. | ||
| 99 | TARP Compliance Certification pursuant to 31 C.F.R. Section 30.15. | ||
| 120 |