Exhibit 99.2

2017 INVESTOR PRESENTATION SECOND QUARTER 2017 JULY 26, 2017
ucbi.com | 2 Disclosures CAUTIONARY STATEMENT This investor presentation may contain forward - looking statements, as defined by federal securities laws, including statements about United and its financial outlook and business environment . These statements are based on current expectations and are provided to assist in the understanding of our operations and future financial performance . Our operations and such performance involves risks and uncertainties that may cause actual results to differ materially from those expressed or implied in any such statements . For a discussion of some of the risks and other factors that may cause such forward - looking statements to differ materially from actual results, please refer to United Community Banks, Inc . ’s filings with the Securities and Exchange Commission, including its 2016 Annual Report on Form 10 - K under the section entitled “Forward - Looking Statements . ” Forward - looking statements speak only as of the date they are made, and we undertake no obligation to update or revise forward - looking statements . NON - GAAP MEASURES This presentation includes financial information determined by methods other than in accordance with generally accepted accounting principles (“GAAP”) . This financial information includes certain operating performance measures, which exclude merger - related and other charges that are not considered part of recurring operations . Such measures include : “Net income – operating ,” “ Net income available to common shareholders – operating,” “Earnings per share – operating,” “Diluted earnings per share – operating,” “Tangible book value per share,” “Return on common equity – operating,” “Return on tangible common equity – operating,” “Return on assets – operating,” “Efficiency ratio – operating,” “Expenses – operating,” “Tangible common equity to risk - weighted assets,” and “Average tangible equity to average assets . ” This presentation also includes “pre - tax, pre - credit earnings,” which excludes the provision for credit losses, income taxes and merger - related and other charges . Management has included these non - GAAP measures because we believe they may provide useful supplemental information for evaluating our underlying performance trends . Further, management uses these measures in managing and evaluating our business and intends to refer to them in discussions about our operations and performance . Operating performance measures should be viewed in addition to, and not as an alternative to or substitute for, measures determined in accordance with GAAP, and are not necessarily comparable to non - GAAP measures that may be presented by other companies . To the extent applicable, reconciliations of these non - GAAP measures to the most directly comparable GAAP measures can be found in the ‘Non - GAAP Reconciliation Tables’ included in the exhibits to this presentation . ucbi.com | 2

ucbi.com | 3 Snapshot of United Community Banks, Inc . ucbi.com | 3 Established: 1950 Four State Regional Community Bank: GA , NC, SC, TN Headquarters : Blairsville, GA Regional Headquarters: Greenville, SC Employees: 1,966 LOCATION LEGEND United Community Bank 134 locations (includes 7 Loan Production Offices) 4 Mortgage Loan Offices Four Oaks 14 locations ( includes 2 Loan Production Offices ) Horry 8 locations
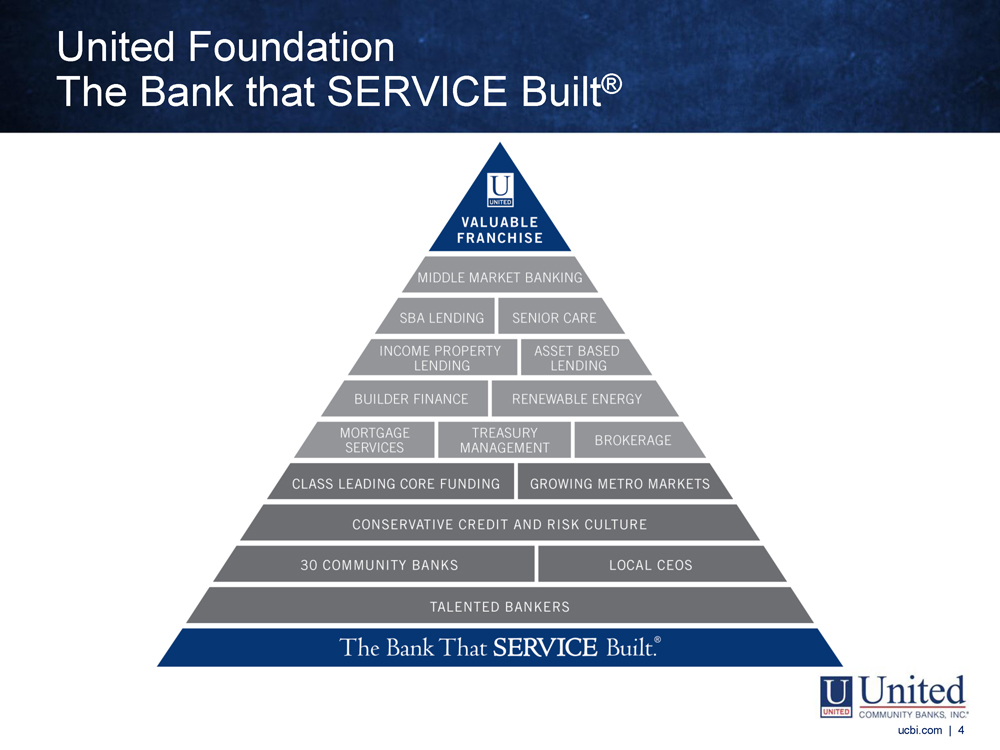
ucbi.com | 4 United Foundation The Bank that SERVICE Built ® ucbi.com | 4
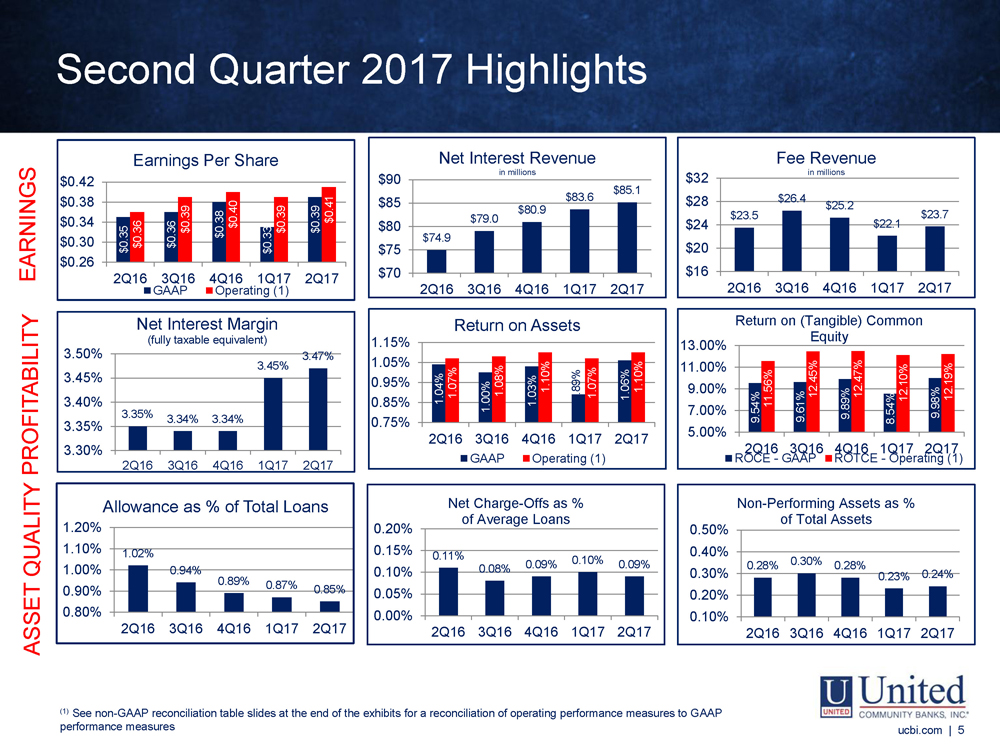
Second Quarter 2017 Highlights ucbi.com | 5 $23.5 $26.4 $25.2 $22.1 $23.7 $16 $20 $24 $28 $32 2Q16 3Q16 4Q16 1Q17 2Q17 Fee Revenue in millions 9.54% 9.61% 9.89% 8.54% 9.98% 11.56% 12.45% 12.47% 12.10% 12.19% 5.00% 7.00% 9.00% 11.00% 13.00% 2Q16 3Q16 4Q16 1Q17 2Q17 Return on (Tangible) Common Equity ROCE - GAAP ROTCE - Operating (1) $74.9 $79.0 $80.9 $83.6 $85.1 $70 $75 $80 $85 $90 2Q16 3Q16 4Q16 1Q17 2Q17 Net Interest Revenue in millions $0.35 $0.36 $0.38 $0.33 $0.39 $0.36 $0.39 $0.40 $0.39 $0.41 $0.26 $0.30 $0.34 $0.38 $0.42 2Q16 3Q16 4Q16 1Q17 2Q17 Earnings Per Share GAAP Operating (1) 1.04% 1.00% 1.03% .89% 1.06% 1.07% 1.08% 1.10% 1.07% 1.10% 0.75% 0.85% 0.95% 1.05% 1.15% 2Q16 3Q16 4Q16 1Q17 2Q17 Return on Assets GAAP Operating (1) 3.35% 3.34% 3.34% 3.45% 3.47% 3.30% 3.35% 3.40% 3.45% 3.50% 2Q16 3Q16 4Q16 1Q17 2Q17 Net Interest Margin (fully taxable equivalent) 1.02% 0.94% 0.89% 0.87% 0.85% 0.80% 0.90% 1.00% 1.10% 1.20% 2Q16 3Q16 4Q16 1Q17 2Q17 Allowance as % of Total Loans 0.28% 0.30% 0.28% 0.23% 0.24% 0.10% 0.20% 0.30% 0.40% 0.50% 2Q16 3Q16 4Q16 1Q17 2Q17 Non - Performing Assets as % of Total Assets 0.11% 0.08% 0.09% 0.10% 0.09% 0.00% 0.05% 0.10% 0.15% 0.20% 2Q16 3Q16 4Q16 1Q17 2Q17 Net Charge - Offs as % of Average Loans EARNINGS PROFITABILITY ASSET QUALITY (1) See non - GAAP reconciliation table slides at the end of the exhibits for a reconciliation of operating performance measures to G AAP performance measures ucbi.com | 5 (1) See non - GAAP reconciliation table slides at the end of the exhibits for a reconciliation of operating performance measures to G AAP performance measures
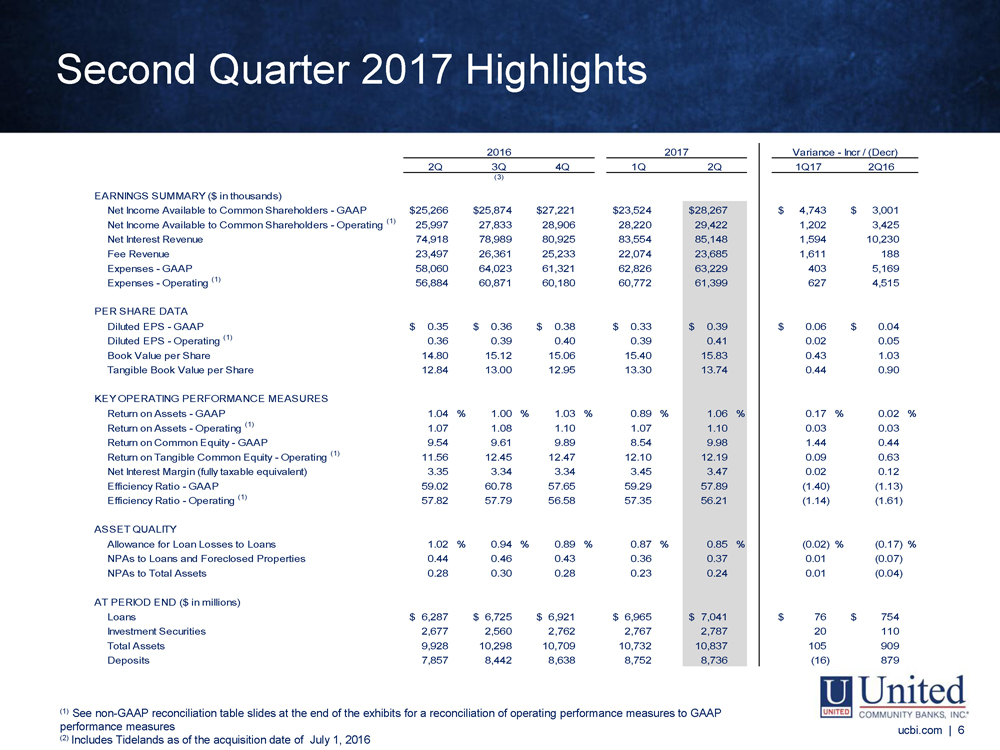
(1) See non - GAAP reconciliation table slides at the end of the exhibits ( 2 ) Includes Tidelands as of the acquisition date of July 1, 2016 ucbi.com | 6 EARNINGS SUMMARY ($ in thousands) Net Income Available to Common Shareholders - GAAP 25,266$ 25,874$ 27,221$ 23,524$ 28,267$ 4,743$ 3,001$ Net Income Available to Common Shareholders - Operating (1) 25,997 27,833 28,906 28,220 29,422 1,202 3,425 Net Interest Revenue 74,918 78,989 80,925 83,554 85,148 1,594 10,230 Fee Revenue 23,497 26,361 25,233 22,074 23,685 1,611 188 Expenses - GAAP 58,060 64,023 61,321 62,826 63,229 403 5,169 Expenses - Operating (1) 56,884 60,871 60,180 60,772 61,399 627 4,515 PER SHARE DATA Diluted EPS - GAAP 0.35$ 0.36$ 0.38$ 0.33$ 0.39$ 0.06$ 0.04$ Diluted EPS - Operating (1) 0.36 0.39 0.40 0.39 0.41 0.02 0.05 Book Value per Share 14.80 15.12 15.06 15.40 15.83 0.43 1.03 Tangible Book Value per Share 12.84 13.00 12.95 13.30 13.74 0.44 0.90 KEY OPERATING PERFORMANCE MEASURES Return on Assets - GAAP 1.04 % 1.00 % 1.03 % 0.89 % 1.06 % 0.17 % 0.02 % Return on Assets - Operating (1) 1.07 1.08 1.10 1.07 1.10 0.03 0.03 Return on Common Equity - GAAP 9.54 9.61 9.89 8.54 9.98 1.44 0.44 Return on Tangible Common Equity - Operating (1) 11.56 12.45 12.47 12.10 12.19 0.09 0.63 Net Interest Margin (fully taxable equivalent) 3.35 3.34 3.34 3.45 3.47 0.02 0.12 Efficiency Ratio - GAAP 59.02 60.78 57.65 59.29 57.89 (1.40) (1.13) Efficiency Ratio - Operating (1) 57.82 57.79 56.58 57.35 56.21 (1.14) (1.61) ASSET QUALITY Allowance for Loan Losses to Loans 1.02 % 0.94 % 0.89 % 0.87 % 0.85 % (0.02) % (0.17) % NPAs to Loans and Foreclosed Properties 0.44 0.46 0.43 0.36 0.37 0.01 (0.07) NPAs to Total Assets 0.28 0.30 0.28 0.23 0.24 0.01 (0.04) AT PERIOD END ($ in millions) Loans 6,287$ 6,725$ 6,921$ 6,965$ 7,041$ 76$ 754$ Investment Securities 2,677 2,560 2,762 2,767 2,787 20 110 Total Assets 9,928 10,298 10,709 10,732 10,837 105 909 Deposits 7,857 8,442 8,638 8,752 8,736 (16) 879 (3) 4Q 2016 1Q17 2Q16 Variance - Incr / (Decr) 3Q2Q 1Q 2017 2Q Second Quarter 2017 Highlights ucbi.com | 6 (1) See non - GAAP reconciliation table slides at the end of the exhibits for a reconciliation of operating performance measures to GAAP performance measures (2) Includes Tidelands as of the acquisition date of July 1, 2016
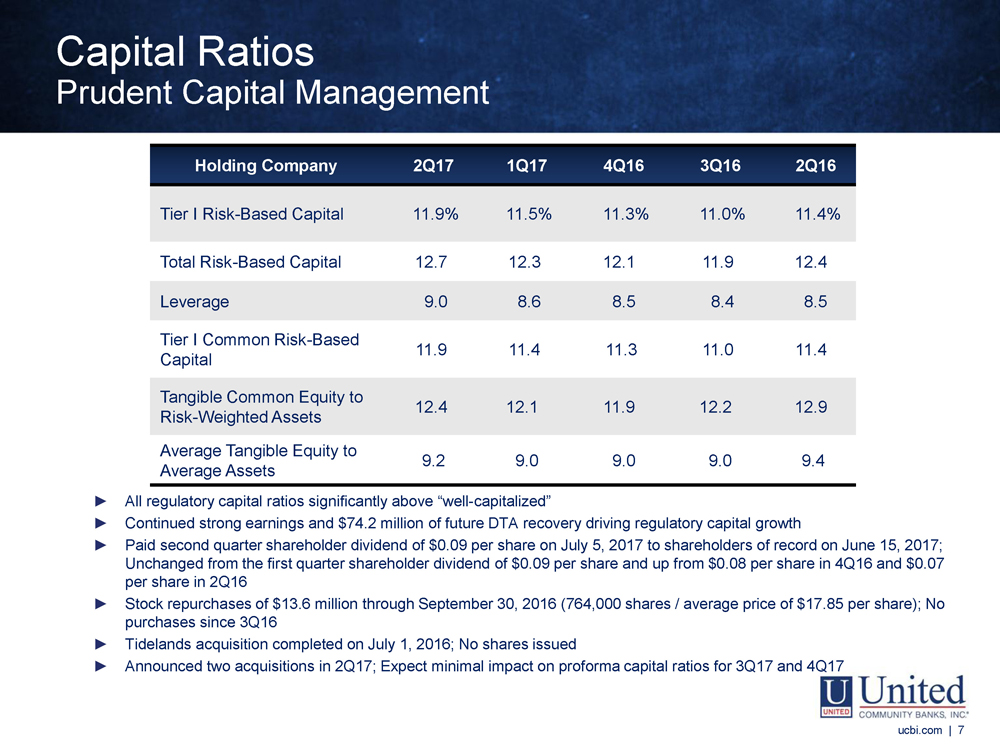
ucbi.com | 7 Holding Company 2Q17 1Q17 4Q16 3Q16 2Q16 Tier I Risk - Based Capital 11.9% 11.5% 11.3% 11.0% 11.4% Total Risk - Based Capital 12.7 12.3 12.1 11.9 12.4 Leverage 9.0 8.6 8.5 8.4 8.5 Tier I Common Risk - Based Capital 11.9 11.4 11.3 11.0 11.4 Tangible Common Equity to Risk - Weighted Assets 12.4 12.1 11.9 12.2 12.9 Average Tangible Equity to Average Assets 9.2 9.0 9.0 9.0 9.4 ► All regulatory capital ratios significantly above “well - capitalized” ► Continued strong earnings and $74.2 million of future DTA recovery driving regulatory capital growth ► Paid second quarter shareholder dividend of $0.09 per share on July 5, 2017 to shareholders of record on June 15, 2017; Unchanged from the first quarter shareholder dividend of $0.09 per share and up from $0.08 per share in 4Q16 and $0.07 per share in 2Q16 ► Stock repurchases of $13.6 million through September 30, 2016 (764,000 shares / average price of $17.85 per share); No purchases since 3Q16 ► Tidelands acquisition completed on July 1, 2016; No shares issued ► Announced two acquisitions in 2Q17; Expect minimal impact on proforma capital ratios for 3Q17 and 4Q17 Capital Ratios Prudent Capital Management ucbi.com | 7
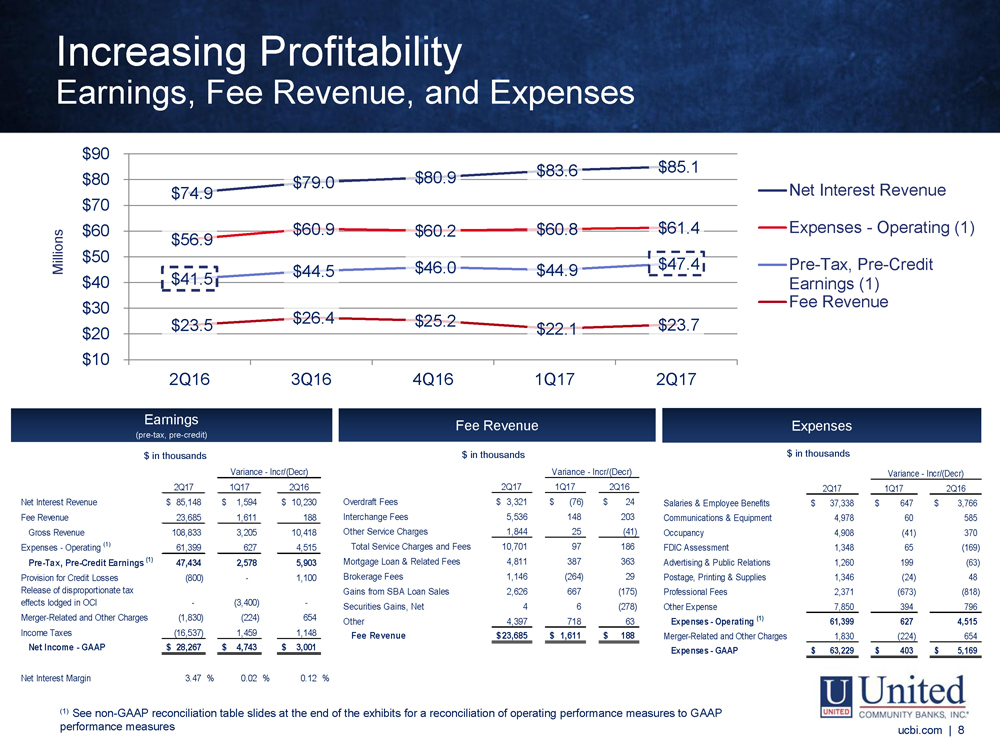
$74.9 $79.0 $80.9 $83.6 $85.1 $56.9 $60.9 $60.2 $60.8 $61.4 $41.5 $44.5 $46.0 $44.9 $47.4 $23.5 $26.4 $25.2 $22.1 $23.7 $10 $20 $30 $40 $50 $60 $70 $80 $90 2Q16 3Q16 4Q16 1Q17 2Q17 Net Interest Revenue Expenses - Operating (1) Pre-Tax, Pre-Credit Earnings (1) Fee Revenue ucbi.com | 8 2Q17 1Q17 2Q16 Salaries & Employee Benefits 37,338$ 647$ 3,766$ Communications & Equipment 4,978 60 585 Occupancy 4,908 (41) 370 FDIC Assessment 1,348 65 (169) Advertising & Public Relations 1,260 199 (63) Postage, Printing & Supplies 1,346 (24) 48 Professional Fees 2,371 (673) (818) Other Expense 7,850 394 796 Expenses - Operating (1) 61,399 627 4,515 Merger-Related and Other Charges 1,830 (224) 654 Expenses - GAAP 63,229$ 403$ 5,169$ Variance - Incr/(Decr) 2Q17 1Q17 2Q16 Overdraft Fees 3,321$ (76)$ 24$ Interchange Fees 5,536 148 203 Other Service Charges 1,844 25 (41) Total Service Charges and Fees 10,701 97 186 Mortgage Loan & Related Fees 4,811 387 363 Brokerage Fees 1,146 (264) 29 Gains from SBA Loan Sales 2,626 667 (175) Securities Gains, Net 4 6 (278) Other 4,397 718 63 Fee Revenue 23,685$ 1,611$ 188$ Variance - Incr/(Decr) 2Q17 1Q17 2Q16 Net Interest Revenue 85,148$ 1,594$ 10,230$ Fee Revenue 23,685 1,611 188 Gross Revenue 108,833 3,205 10,418 Expenses - Operating (1) 61,399 627 4,515 Pre-Tax, Pre-Credit Earnings (1) 47,434 2,578 5,903 Provision for Credit Losses (800) - 1,100 Release of disproportionate tax effects lodged in OCI - (3,400) - Merger-Related and Other Charges (1,830) (224) 654 Income Taxes (16,537) 1,459 1,148 Net Income - GAAP 28,267$ 4,743$ 3,001$ Net Interest Margin 3.47 % 0.02 % 0.12 % Variance - Incr/(Decr) $ in t housands $ in thousands $ in thousands Expenses Earnings (pre - tax, pre - credit) Fee Revenue M illions (1 ) See non - GAAP reconciliation table slides at the end of the exhibits for a reconciliation of operating performance measures to GA AP performance measures Increasing Profitability Earnings, Fee Revenue, and Expenses ucbi.com | 8 (1) See non - GAAP reconciliation table slides at the end of the exhibits for a reconciliation of operating performance measures to G AAP performance measures
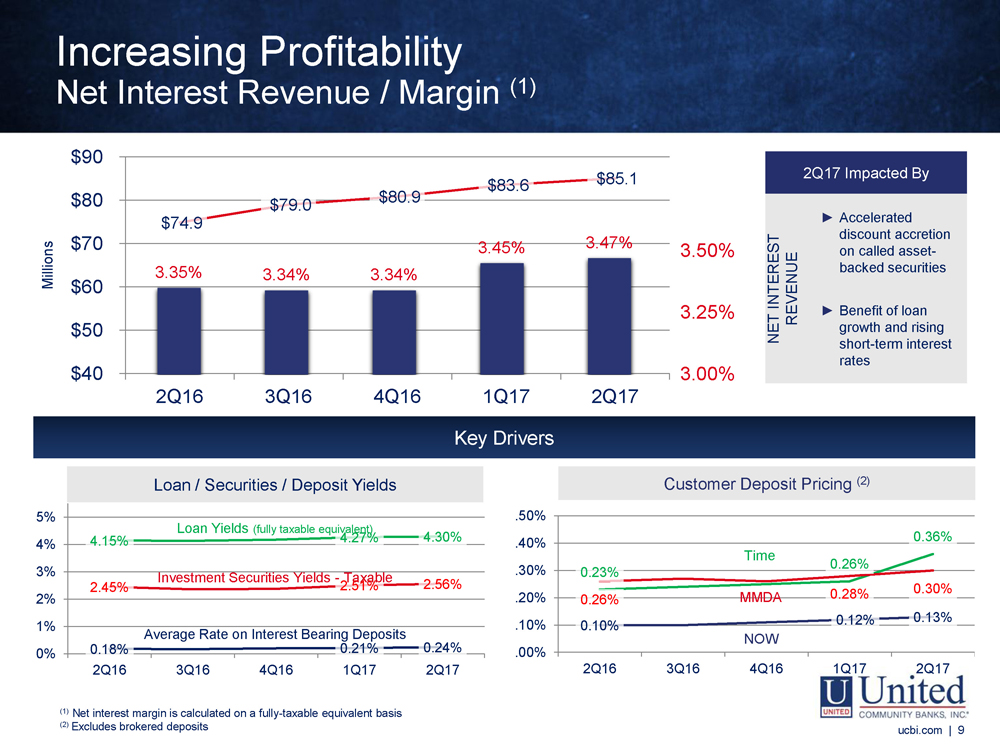
$74.9 $79.0 $80.9 $83.6 $85.1 $40 $50 $60 $70 $80 $90 2Q16 3Q16 4Q16 1Q17 2Q17 4.15% 4.27% 4.30% 2.45% 2.51% 2.56% 0.18% 0.21% 0.24% 0% 1% 2% 3% 4% 5% 2Q16 3Q16 4Q16 1Q17 2Q17 0.23% 0.26% 0.36% 0.26% 0.28% 0.30% 0.10% 0.12% 0.13% .00% .10% .20% .30% .40% .50% 2Q16 3Q16 4Q16 1Q17 2Q17 3.35% 3.34% 3.34% 3.45% 3.47% 3.00% 3.25% 3.50% ucbi.com | 9 Key Drivers 2Q17 Impacted By NET INTEREST REVENUE ► Accelerated discount accretion on called asset - backed securities ► Benefit of loan growth and rising short - term interest rates Millions Loan / Securities / Deposit Yields Customer Deposit Pricing (2) Loan Yields (fully taxable equivalent) Investment Securities Yields - Taxable Average Rate on Interest Bearing Deposits (1) Net interest margin is calculated on a fully taxable equivalent basis (2) E xcludes brokered deposits Time MMDA NOW Increasing Profitability Net Interest Revenue / Margin (1) ucbi.com | 9 (1) Net interest margin is calculated on a fully - taxable equivalent basis (2) Excludes brokered deposits
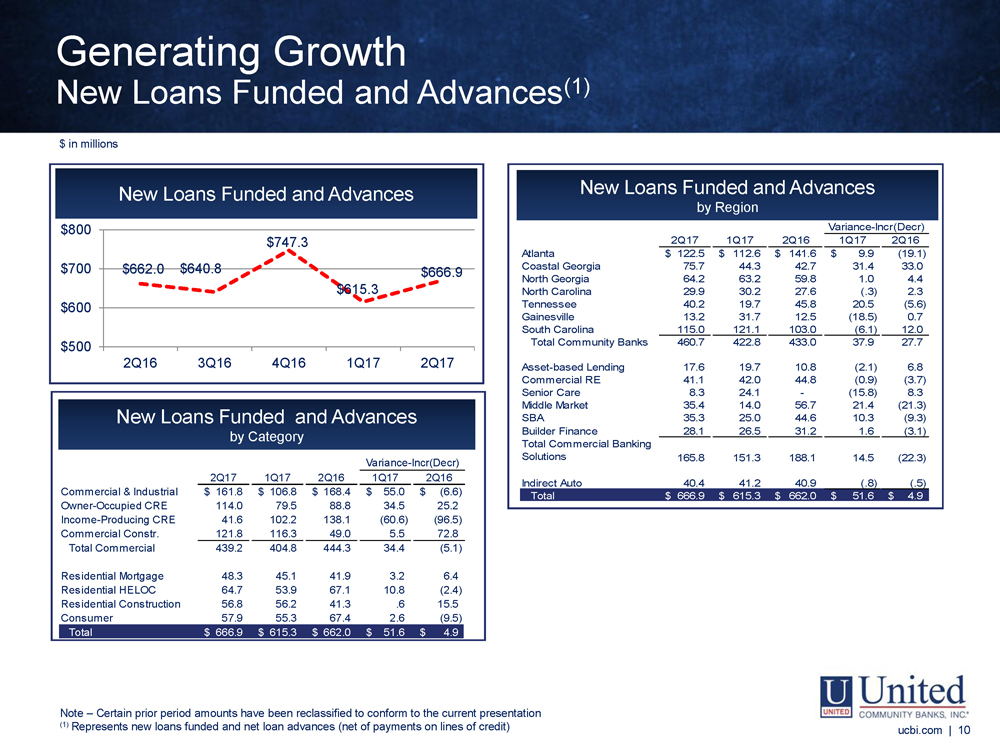
ucbi.com | 10 2Q17 1Q17 2Q16 1Q17 2Q16 Commercial & Industrial 161.8$ 106.8$ 168.4$ 55.0$ (6.6)$ Owner-Occupied CRE 114.0 79.5 88.8 34.5 25.2 Income-Producing CRE 41.6 102.2 138.1 (60.6) (96.5) Commercial Constr. 121.8 116.3 49.0 5.5 72.8 Total Commercial 439.2 404.8 444.3 34.4 (5.1) Residential Mortgage 48.3 45.1 41.9 3.2 6.4 Residential HELOC 64.7 53.9 67.1 10.8 (2.4) Residential Construction 56.8 56.2 41.3 .6 15.5 Consumer 57.9 55.3 67.4 2.6 (9.5) Total 666.9$ 615.3$ 662.0$ 51.6$ 4.9$ Variance-Incr(Decr) NOTE - Certain prior period amounts have been reclassified to conform to the current presentation (1) Represents new loans funded and net loan advances (net of payments on lines of credit) New Loans Funded and Advances $662.0 $640.8 $747.3 $615.3 $666.9 $500 $600 $700 $800 2Q16 3Q16 4Q16 1Q17 2Q17 New Loans Funded and Advances by Region New Loans Funded and Advances by Category 2Q17 1Q17 2Q16 1Q17 2Q16 Atlanta 122.5$ 112.6$ 141.6$ 9.9$ (19.1) Coastal Georgia 75.7 44.3 42.7 31.4 33.0 North Georgia 64.2 63.2 59.8 1.0 4.4 North Carolina 29.9 30.2 27.6 (.3) 2.3 Tennessee 40.2 19.7 45.8 20.5 (5.6) Gainesville 13.2 31.7 12.5 (18.5) 0.7 South Carolina 115.0 121.1 103.0 (6.1) 12.0 Total Community Banks 460.7 422.8 433.0 37.9 27.7 Asset-based Lending 17.6 19.7 10.8 (2.1) 6.8 Commercial RE 41.1 42.0 44.8 (0.9) (3.7) Senior Care 8.3 24.1 - (15.8) 8.3 Middle Market 35.4 14.0 56.7 21.4 (21.3) SBA 35.3 25.0 44.6 10.3 (9.3) Builder Finance 28.1 26.5 31.2 1.6 (3.1) 165.8 151.3 188.1 14.5 (22.3) Indirect Auto 40.4 41.2 40.9 (.8) (.5) Total 666.9$ 615.3$ 662.0$ 51.6$ 4.9$ Variance-Incr(Decr) Total Commercial Banking Solutions Generating Growth New Loans Funded and Advances (1) ucbi.com | 10 Note – Certain prior period amounts have been reclassified to conform to the current presentation (1) Represents new loans funded and net loan advances (net of payments on lines of credit) $ in millions
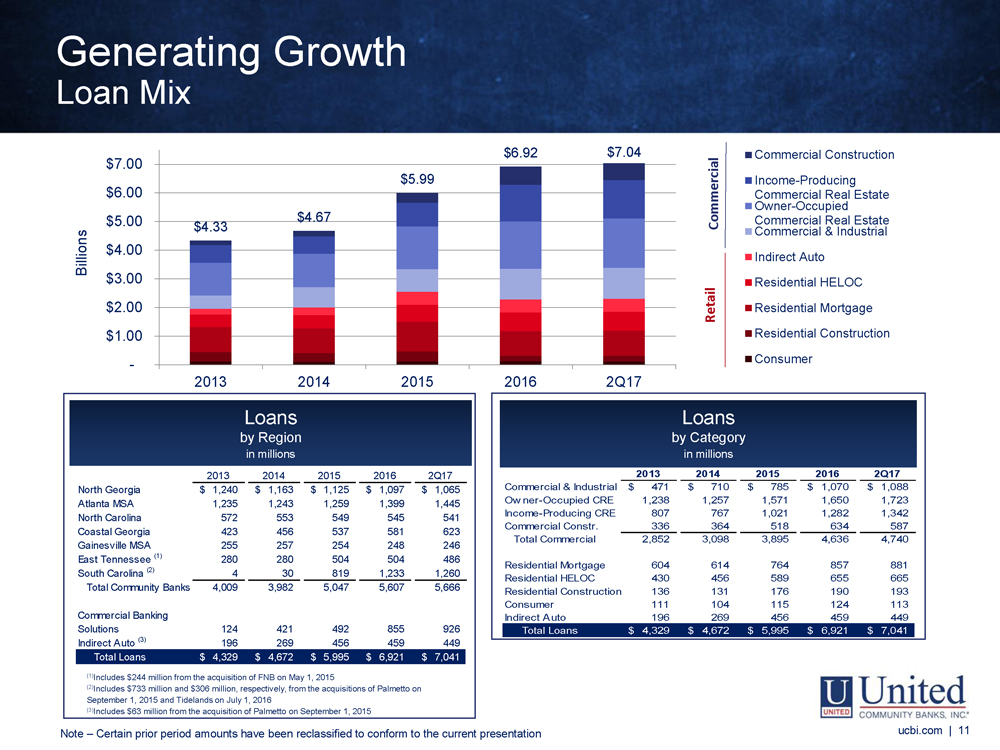
2013 2014 2015 2016 2Q17 North Georgia 1,240$ 1,163$ 1,125$ 1,097$ 1,065$ Atlanta MSA 1,235 1,243 1,259 1,399 1,445 North Carolina 572 553 549 545 541 Coastal Georgia 423 456 537 581 623 Gainesville MSA 255 257 254 248 246 East Tennessee (1) 280 280 504 504 486 South Carolina (2) 4 30 819 1,233 1,260 Total Community Banks 4,009 3,982 5,047 5,607 5,666 124 421 492 855 926 Indirect Auto (3) 196 269 456 459 449 Total Loans 4,329$ 4,672$ 5,995$ 6,921$ 7,041$ Commercial Banking Solutions $4.33 $4.67 $5.99 $6.92 $7.04 - $1.00 $2.00 $3.00 $4.00 $5.00 $6.00 $7.00 2013 2014 2015 2016 2Q17 Billions Commercial Construction Income-Producing Commercial Real Estate Owner-Occupied Commercial Real Estate Commercial & Industrial Indirect Auto Residential HELOC Residential Mortgage Residential Construction Consumer Commercial Retail 2013 2014 2015 2016 2Q17 Commercial & Industrial 471$ 710$ 785$ 1,070$ 1,088$ Owner-Occupied CRE 1,238 1,257 1,571 1,650 1,723 Income-Producing CRE 807 767 1,021 1,282 1,342 Commercial Constr. 336 364 518 634 587 Total Commercial 2,852 3,098 3,895 4,636 4,740 Residential Mortgage 604 614 764 857 881 Residential HELOC 430 456 589 655 665 Residential Construction 136 131 176 190 193 Consumer 111 104 115 124 113 Indirect Auto 196 269 456 459 449 Total Loans 4,329$ 4,672$ 5,995$ 6,921$ 7,041$ ucbi.com | 11 (1) Includes $244 million from the acquisition of FNB on May 1, 2015 (2) Includes $733 million and $306 million, respectively, from the acquisitions of Palmetto on September 1, 2015 and Tidelands on July 1, 2016 (3) Includes $63 million from the acquisition of Palmetto on September 1, 2015 Loans by Category i n millions Loans by Region i n millions NOTE - Certain prior period amounts in the loans by category table have been reclassified to conform to the current presentation Generating Growth Loan Mix ucbi.com | 11 Note – Certain prior period amounts have been reclassified to conform to the current presentation
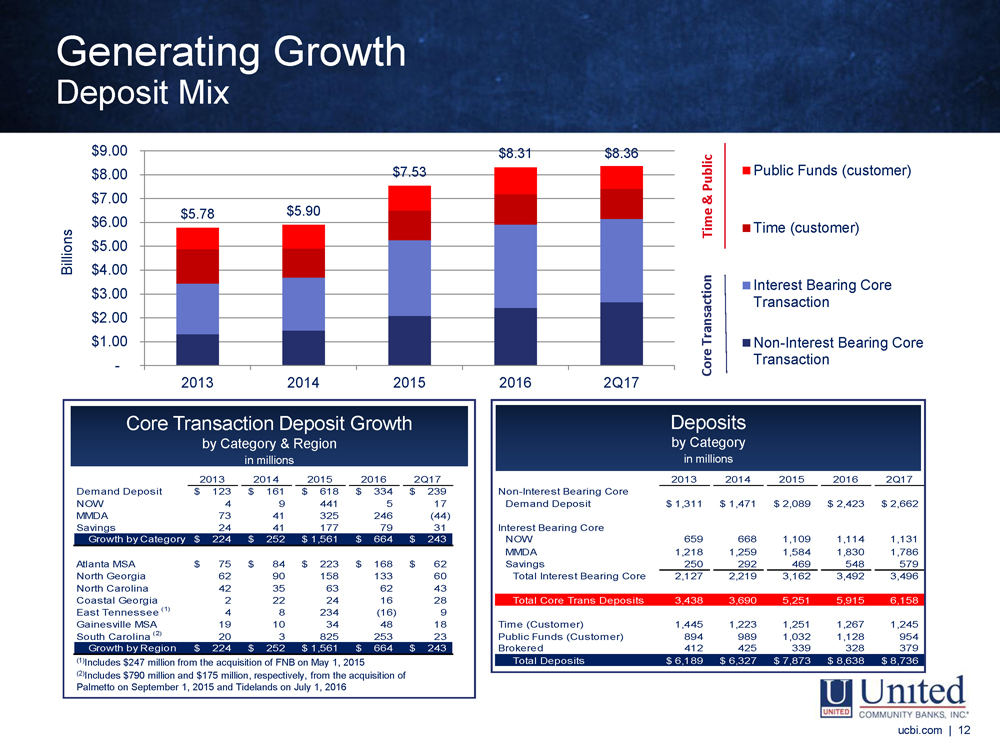
2013 2014 2015 2016 2Q17 2013 2014 2015 2016 2Q17 Demand Deposit 123$ 161$ 618$ 334$ 239$ Non-Interest Bearing Core NOW 4 9 441 5 17 Demand Deposit 1,311$ 1,471$ 2,089$ 2,423$ 2,662$ MMDA 73 41 325 246 (44) Savings 24 41 177 79 31 Interest Bearing Core Growth by Category 224$ 252$ 1,561$ 664$ 243$ Total CommercialNOW 659 668 1,109 1,114 1,131 MMDA 1,218 1,259 1,584 1,830 1,786 Atlanta MSA 75$ 84$ 223$ 168$ 62$ Savings 250 292 469 548 579 North Georgia 62 90 158 133 60 Total Interest Bearing Core 2,127 2,219 3,162 3,492 3,496 North Carolina 42 35 63 62 43 Coastal Georgia 2 22 24 16 28 Total Core Trans Deposits 3,438 3,690 5,251 5,915 6,158 East Tennessee (1) 4 8 234 (16) 9 Gainesville MSA 19 10 34 48 18 Time (Customer) 1,445 1,223 1,251 1,267 1,245 South Carolina (2) 20 3 825 253 23 Public Funds (Customer) 894 989 1,032 1,128 954 Growth by Region 224$ 252$ 1,561$ 664$ 243$ Brokered 412 425 339 328 379 Total LoansTotal Deposits 6,189$ 6,327$ 7,873$ 8,638$ 8,736$ ucbi.com | 12 NOTE - Certain prior period amounts in the loans by category table have been reclassified to conform to the current presentation Generating Growth Deposit Mix $5.78 $5.90 $7.53 $8.31 $8.36 - $1.00 $2.00 $3.00 $4.00 $5.00 $6.00 $7.00 $8.00 $9.00 2013 2014 2015 2016 2Q17 Billions Public Funds (customer) Time (customer) Interest Bearing Core Transaction Non-Interest Bearing Core Transaction Time & Public Core Transaction Core Transaction Deposit Growth by Category & Region i n millions Deposits by Category i n millions (1) Includes $ 247 million from the acquisition of FNB on May 1, 2015 (2) Includes $790 million and $175 million, respectively, from the acquisition of Palmetto on September 1, 2015 and Tidelands on July 1, 2016 ucbi.com | 12
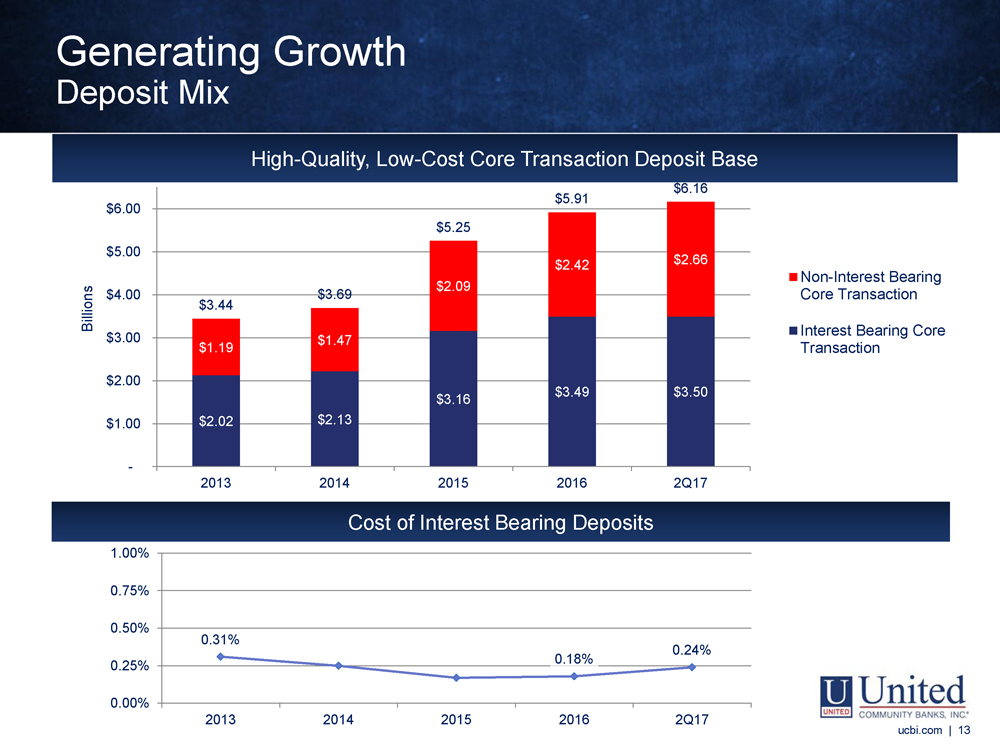
$ 2.02 $ 2.13 $3.16 $3.49 $3.50 $1.19 $1.47 $2.09 $2.42 $2.66 $3.44 $3.69 $5.25 $5.91 $6.16 - $1.00 $2.00 $3.00 $4.00 $5.00 $6.00 2013 2014 2015 2016 2Q17 Billions Non-Interest Bearing Core Transaction Interest Bearing Core Transaction ucbi.com | 13 High - Quality, Low - Cost Core Transaction Deposit Base 0.31% 0.18% 0.24% 0.00% 0.25% 0.50% 0.75% 1.00% 2013 2014 2015 2016 2Q17 Cost of Interest Bearing Deposits Generating Growth Deposit Mix ucbi.com | 13
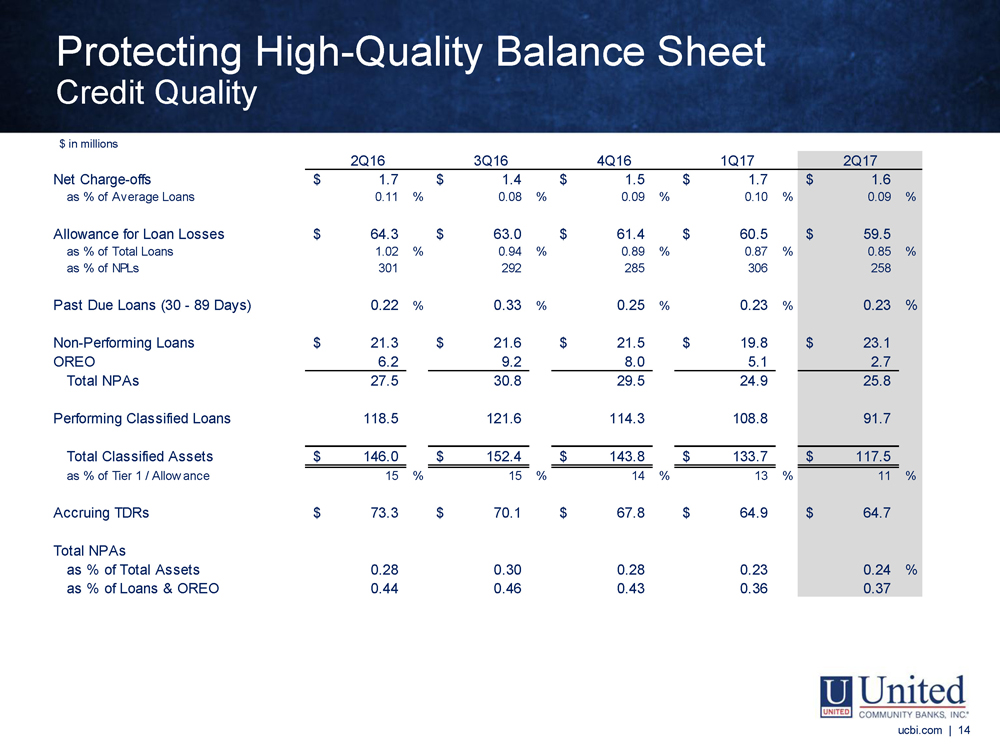
Net Charge-offs 1.7$ 1.4$ 1.5$ 1.7$ 1.6$ as % of Average Loans 0.11 % 0.08 % 0.09 % 0.10 % 0.09 % Allowance for Loan Losses 64.3$ 63.0$ 61.4$ 60.5$ 59.5$ as % of Total Loans 1.02 % 0.94 % 0.89 % 0.87 % 0.85 % as % of NPLs 301 292 285 306 258 Past Due Loans (30 - 89 Days) 0.22 % 0.33 % 0.25 % 0.23 % 0.23 % Non-Performing Loans 21.3$ 21.6$ 21.5$ 19.8$ 23.1$ OREO 6.2 9.2 8.0 5.1 2.7 Total NPAs 27.5 30.8 29.5 24.9 25.8 Performing Classified Loans 118.5 121.6 114.3 108.8 91.7 Total Classified Assets 146.0$ 152.4$ 143.8$ 133.7$ 117.5$ as % of Tier 1 / Allowance 15 % 15 % 14 % 13 % 11 % Accruing TDRs 73.3$ 70.1$ 67.8$ 64.9$ 64.7$ Total NPAs as % of Total Assets 0.28 0.30 0.28 0.23 0.24 % as % of Loans & OREO 0.44 0.46 0.43 0.36 0.37 2Q16 3Q16 4Q16 1Q17 2Q17 $ in millions ucbi.com | 14 Protecting High - Quality Balance Sheet Credit Quality ucbi.com | 14
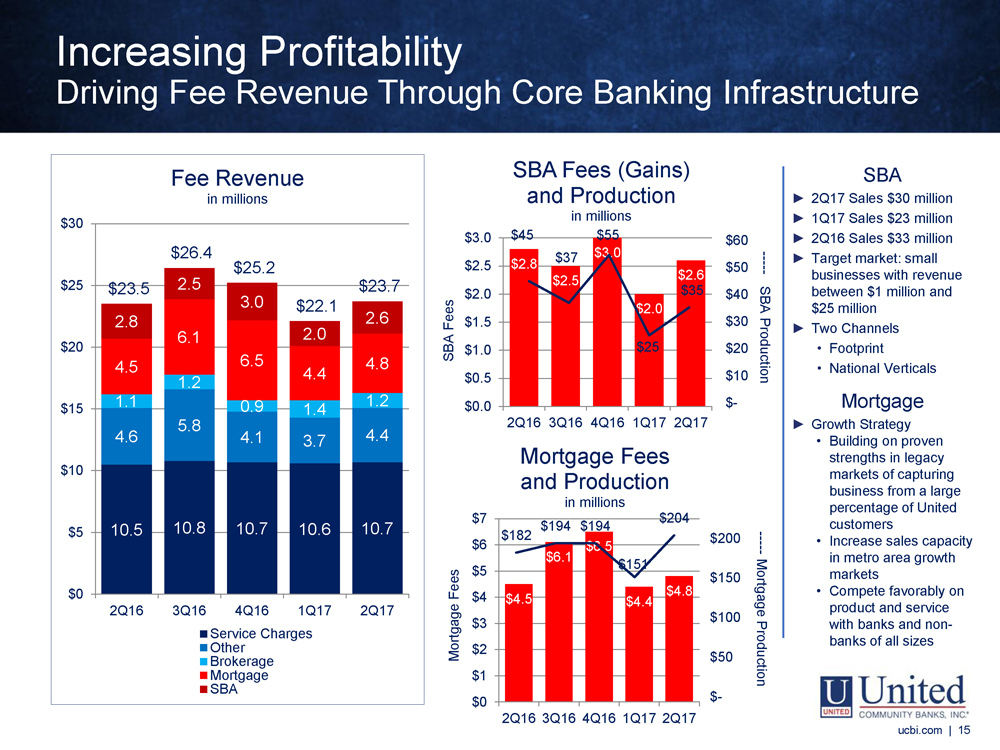
ucbi.com | 15 10.5 10.8 10.7 10.6 10.7 4.6 5.8 4.1 3.7 4.4 1.1 1.2 0.9 1.4 1.2 4.5 6.1 6.5 4.4 4.8 2.8 2.5 3.0 2.0 2.6 $23.5 $26.4 $25.2 $22.1 $23.7 $0 $5 $10 $15 $20 $25 $30 2Q16 3Q16 4Q16 1Q17 2Q17 Fee Revenue in millions Service Charges Other Brokerage Mortgage SBA $4.5 $6.1 $6.5 $4.4 $4.8 $0 $1 $2 $3 $4 $5 $6 $7 2Q16 3Q16 4Q16 1Q17 2Q17 Mortgage Fees and Production in millions $182 $194 $194 $151 $204 $- $50 $100 $150 $200 SBA ► 2Q17 Sales $30 million ► 1Q17 Sales $23 million ► 2Q16 Sales $33 million ► Target market: small businesses with revenue between $ 1 million and $ 25 million ► Two Channels • Footprint • National Verticals Mortgage ► Growth Strategy • Building on proven strengths in legacy markets of capturing business from a large percentage of United customers • Increase sales capacity in metro area growth markets • Compete favorably on product and service with banks and non - banks of all sizes $2.8 $2.5 $3.0 $2.0 $2.6 $0.0 $0.5 $1.0 $1.5 $2.0 $2.5 $3.0 2Q16 3Q16 4Q16 1Q17 2Q17 SBA Fees (Gains ) and Production in millions $45 $37 $55 $25 $35 $- $10 $20 $30 $40 $50 $60 Mortgage Fees SBA Fees ----- SBA Production ----- Mortgage Production Increasing Profitability Driving Fee Revenue Through Core Banking Infrastructure ucbi.com | 15
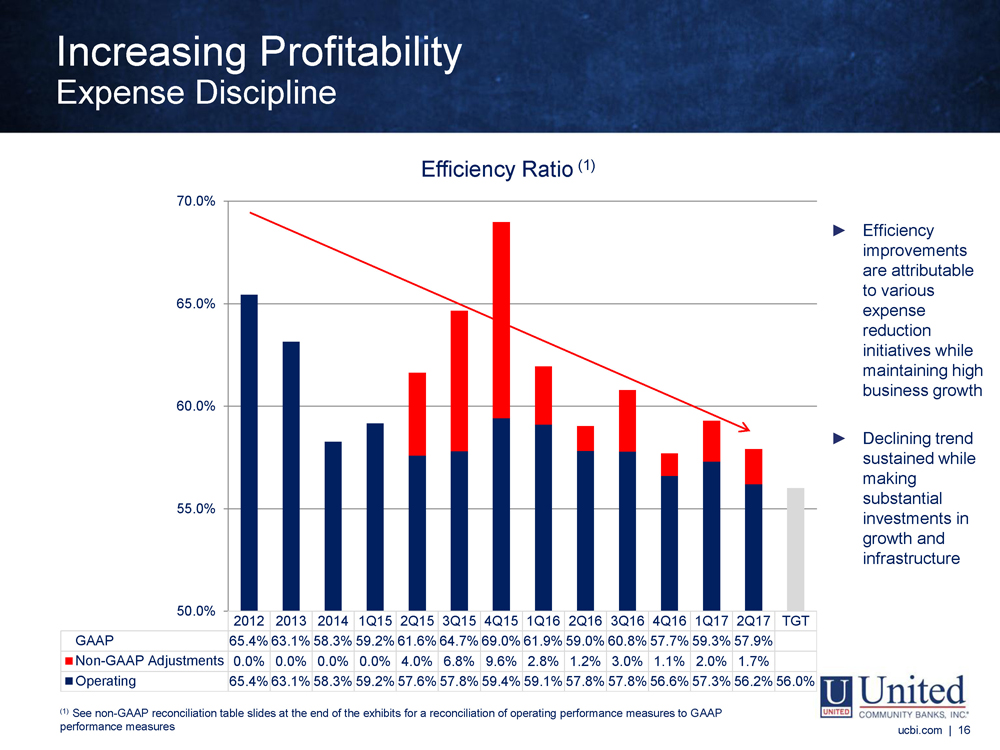
ucbi.com | 16 ► Efficiency improvements are attributable to various expense reduction initiatives while maintaining high business growth ► Declining trend sustained while making substantial investments in growth and infrastructure 2012 2013 2014 1Q15 2Q15 3Q15 4Q15 1Q16 2Q16 3Q16 4Q16 1Q17 2Q17 TGT GAAP 65.4% 63.1% 58.3% 59.2% 61.6% 64.7% 69.0% 61.9% 59.0% 60.8% 57.7% 59.3% 57.9% Non-GAAP Adjustments 0.0% 0.0% 0.0% 0.0% 4.0% 6.8% 9.6% 2.8% 1.2% 3.0% 1.1% 2.0% 1.7% Operating 65.4% 63.1% 58.3% 59.2% 57.6% 57.8% 59.4% 59.1% 57.8% 57.8% 56.6% 57.3% 56.2% 56.0% 50.0% 55.0% 60.0% 65.0% 70.0% Efficiency Ratio (1) (1) See non - GAAP reconciliation table slides at the end of the exhibits for a reconciliation of operating performance measures to G AAP performance measures Increasing Profitability Expense Discipline ucbi.com | 16 (1) See non - GAAP reconciliation table slides at the end of the exhibits for a reconciliation of operating performance measures to G AAP performance measures
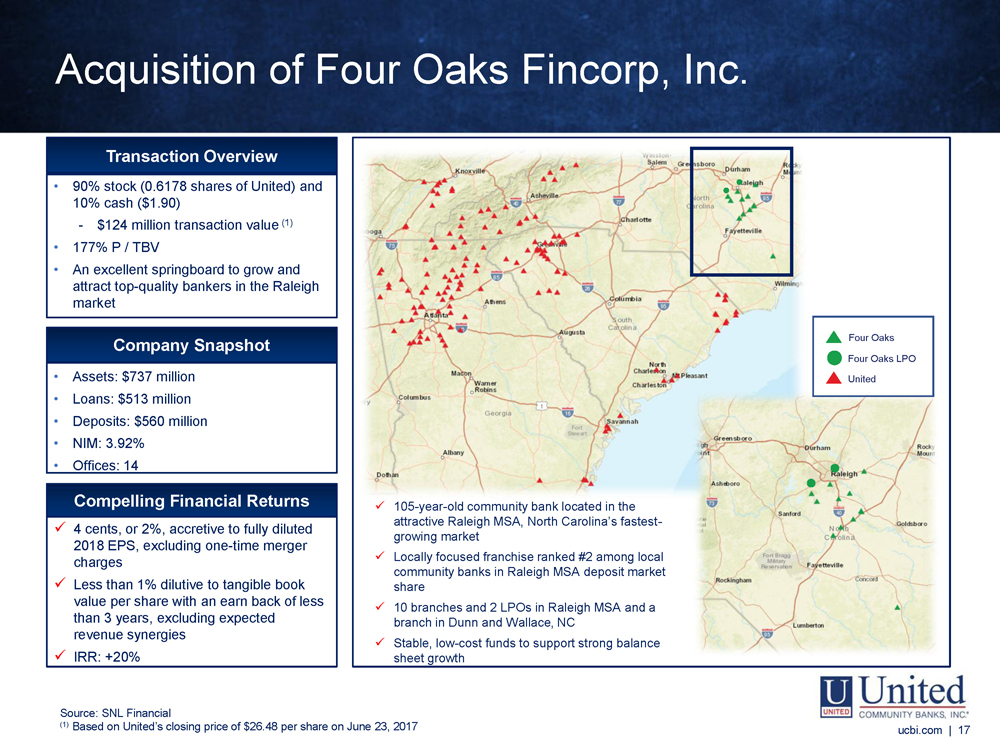
Transaction Overview • 90% stock (0.6178 shares of United) and 10% cash ($1.90) - $ 124 million transaction value (1) • 177% P / TBV • An excellent springboard to grow and attract top - quality bankers in the Raleigh market Company Snapshot • Assets: $737 million • Loans: $513 million • Deposits: $560 million • NIM: 3.92% • Offices: 14 Compelling Financial Returns Acquisition of Four Oaks Fincorp , Inc . Source: SNL Financial (1) Based on United’s closing price of $26.48 per share on June 23, 2017 ucbi.com | 17 x 4 cents, or 2%, accretive to fully diluted 2018 EPS, excluding one - time merger charges x Less than 1% dilutive to tangible book value per share with an earn back of less than 3 years, excluding expected revenue synergies x IRR: +20% x 105 - year - old community bank located in the attractive Raleigh MSA, North Carolina’s fastest - growing market x Locally focused franchise ranked #2 among local community banks in Raleigh MSA deposit market share x 10 branches and 2 LPOs in Raleigh MSA and a branch in Dunn and Wallace, NC x Stable, low - cost funds to support strong balance sheet growth Four Oaks Four Oaks LPO United
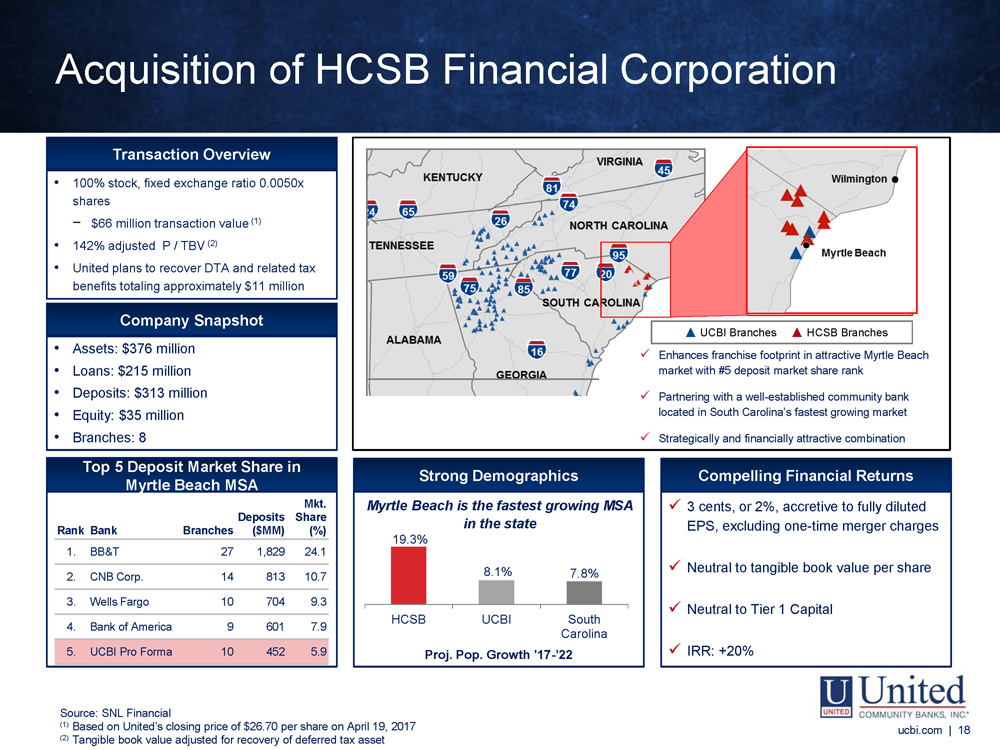
19.3% 8.1% 7.8% HCSB UCBI South Carolina Rank Bank Branches Deposits ($MM) Mkt. Share (%) 1. BB&T 27 1,829 24.1 2. CNB Corp. 14 813 10.7 3. Wells Fargo 10 704 9.3 4. Bank of America 9 601 7.9 5. UCBI Pro Forma 10 452 5.9 Strong Demographics Myrtle Beach is the fastest growing MSA in the state Compelling Financial Returns x 3 cents, or 2%, accretive to fully diluted EPS , excluding one - time merger charges x Neutral to tangible book value per share x Neutral to Tier 1 Capital x IRR: +20% Transaction Overview • 100% stock, fixed exchange ratio 0.0050x shares − $66 million transaction value (1) • 142% adjusted P / TBV (2) • United plans to recover DTA and related tax benefits totaling approximately $11 million Company Snapshot • Assets: $376 million • Loans: $215 million • Deposits: $313 million • Equity: $35 million • Branches: 8 Proj. Pop. Growth ’17 - ’22 Top 5 Deposit Market Share in Myrtle Beach MSA 95 26 20 74 40 Charleston North Charleston Mount Pleasant Summerville Myrtle Beach Florence 95 Sumter Wilmington HCSB Branches UCBI Branches x Enhances franchise footprint in attractive Myrtle Beach market with #5 deposit market share rank x Partnering with a well - established community bank located in South Carolina’s fastest growing market x Strategically and financially attractive combination Acquisition of HCSB Financial Corporation Source: SNL Financial (1) Based on United’s closing price of $26.70 per share on April 19, 2017 (2) Tangible book value adjusted for recovery of deferred tax asset ucbi.com | 18
2017 INVESTOR PRESENTATION Exhibits SECOND QUARTER 2017 JULY 26, 2017
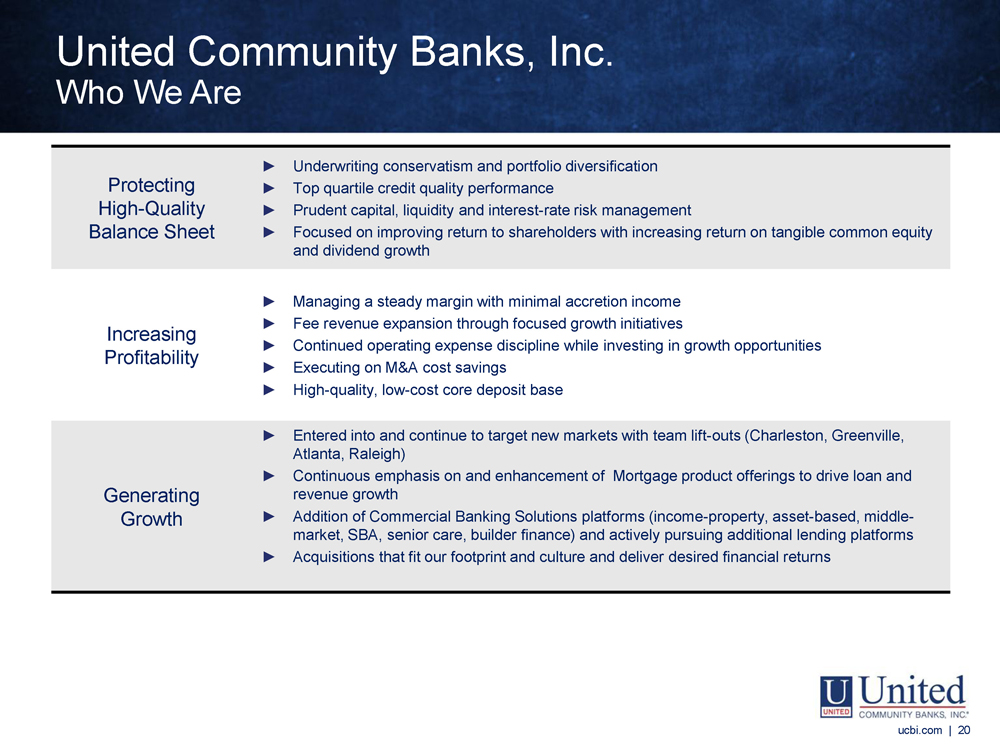
ucbi.com | 20 Protecting High - Quality Balance Sheet ► Underwriting conservatism and portfolio diversification ► Top quartile credit quality performance ► Prudent capital, liquidity and interest - rate risk management ► Focused on improving return to shareholders with increasing return on tangible common equity and dividend growth Increasing Profitability ► Managing a steady margin with minimal accretion income ► Fee revenue expansion through focused growth initiatives ► Continued operating expense discipline while investing in growth opportunities ► Executing on M&A cost savings ► High - quality, low - cost core deposit base Generating Growth ► Entered into and continue to target new markets with team lift - outs (Charleston, Greenville, Atlanta, Raleigh) ► Continuous emphasis on and enhancement of Mortgage product offerings to drive loan and revenue growth ► Addition of Commercial Banking Solutions platforms (income - property, asset - based, middle - market, SBA, senior care, builder finance) and actively pursuing additional lending platforms ► Acquisitions that fit our footprint and culture and deliver desired financial returns United Community Banks, Inc . Who We Are ucbi.com | 20
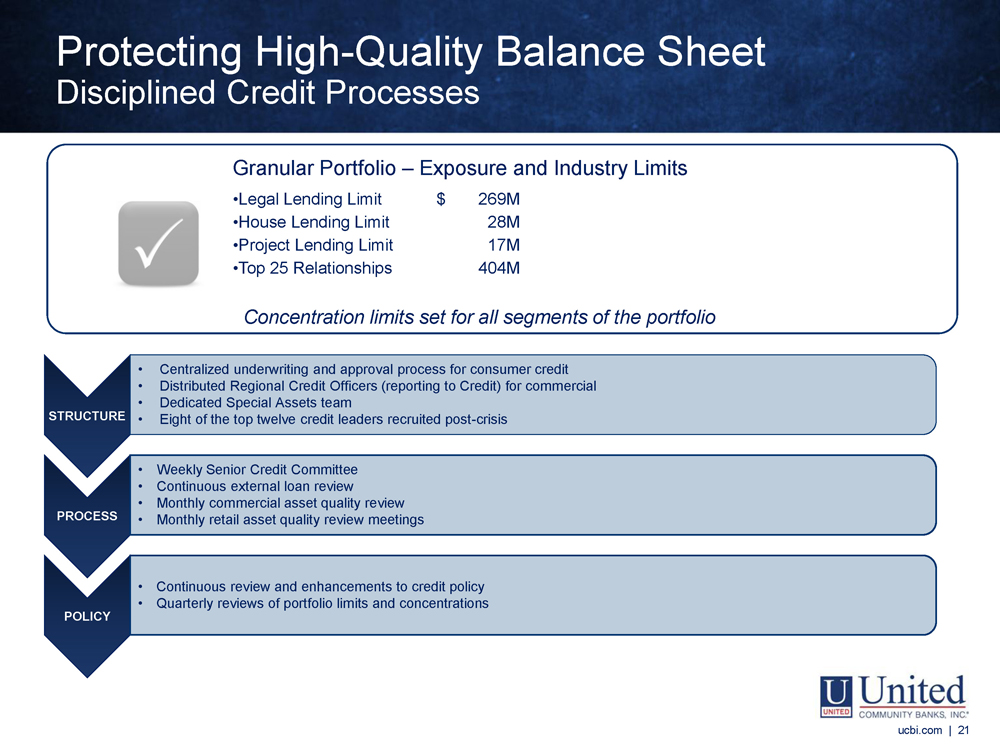
ucbi.com | 21 Granular Portfolio – Exposure and Industry Limits • Legal Lending Limit $ 269M • House Lending Limit 28M • Project Lending Limit 17M • Top 25 Relationships 404M Concentration limits set for all segments of the portfolio Protecting High - Quality Balance Sheet Disciplined Credit Processes ucbi.com | 21 STRUCTURE • Centralized underwriting and approval process for consumer credit • Distributed Regional Credit Officers (reporting to Credit) for commercial • Dedicated Special Assets team • Eight of the top twelve credit leaders recruited post - crisis PROCESS • Weekly Senior Credit Committee • Continuous external loan review • Monthly commercial asset quality review • Monthly retail asset quality review meetings POLICY • Continuous review and enhancements to credit policy • Quarterly reviews of portfolio limits and concentrations
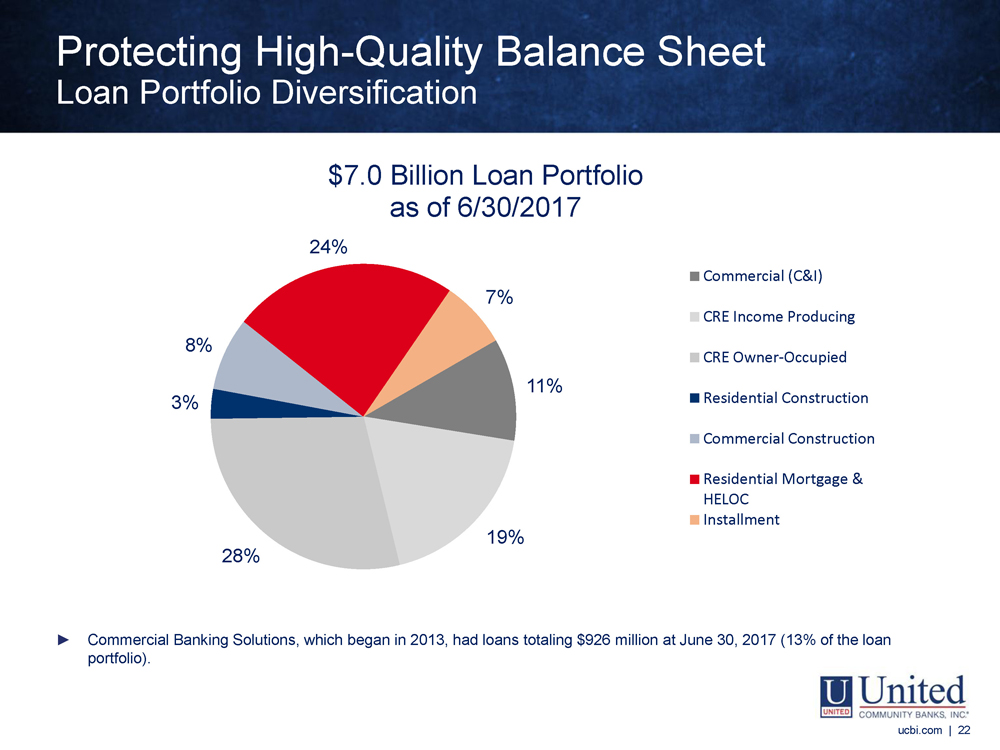
ucbi.com | 22 11% 19% 28% 3% 8% 24% 7% $7.0 Billion Loan Portfolio as of 6/30/2017 Commercial (C&I) CRE Income Producing CRE Owner-Occupied Residential Construction Commercial Construction Residential Mortgage & HELOC Installment ► Commercial Banking Solutions, which began in 2013, had loans totaling $926 million at June 30, 2017 (13% of the loan portfolio). NOTE – Certain prior period amounts have been reclassified to conform to the current presentation Protecting High - Quality Balance Sheet Loan Portfolio Diversification ucbi.com | 22
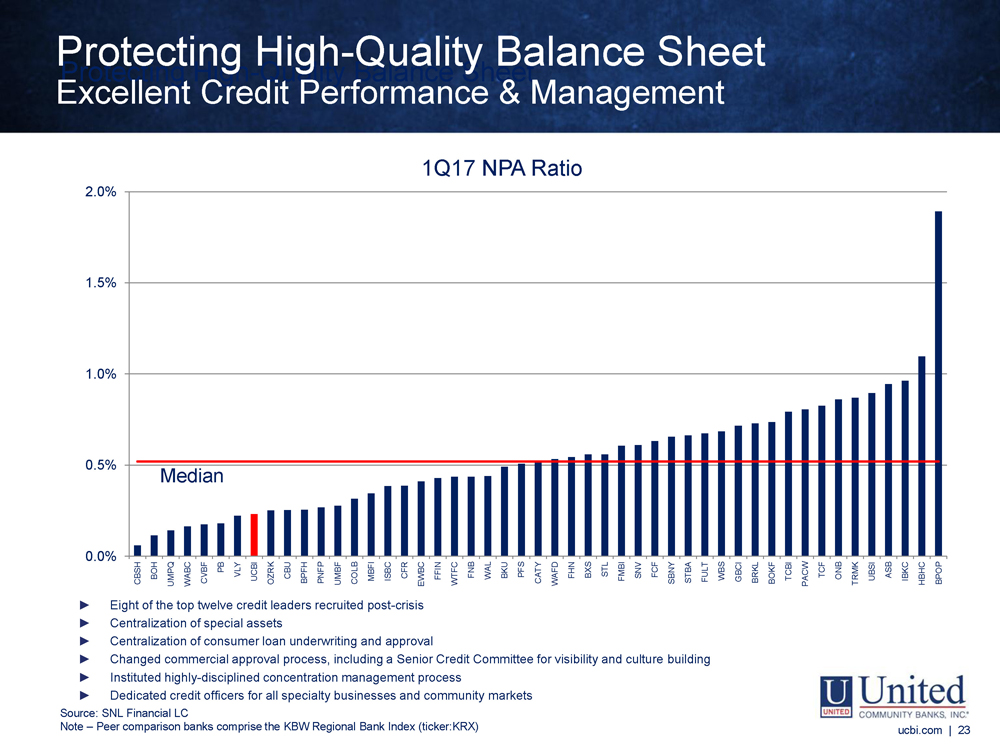
Note: Peer comparison banks comprise the KBW Regional Bank Index (ticker: KRX) Protecting High - Quality Balance Sheet ucbi.com | 23 0.0% 0.5% 1.0% 1.5% 2.0% CBSH BOH UMPQ WABC CVBF PB VLY UCBI OZRK CBU BPFH PNFP UMBF COLB MBFI ISBC CFR EWBC FFIN WTFC FNB WAL BKU PFS CATY WAFD FHN BXS STL FMBI SNV FCF SBNY STBA FULT WBS GBCI BRKL BOKF TCBI PACW TCF ONB TRMK UBSI ASB IBKC HBHC BPOP 1Q17 NPA Ratio Median ► Eight of the top twelve credit leaders recruited post - crisis ► Centralization of special assets ► Centralization of consumer loan underwriting and approval ► Changed commercial approval process, including a Senior Credit Committee for visibility and culture building ► Instituted highly - disciplined concentration management process ► Dedicated credit officers for all specialty businesses and community markets Protecting High - Quality Balance Sheet Excellent Credit Performance & Management ucbi.com | 23 Source: SNL Financial LC Note – Peer comparison banks comprise the KBW Regional Bank Index ( ticker:KRX )
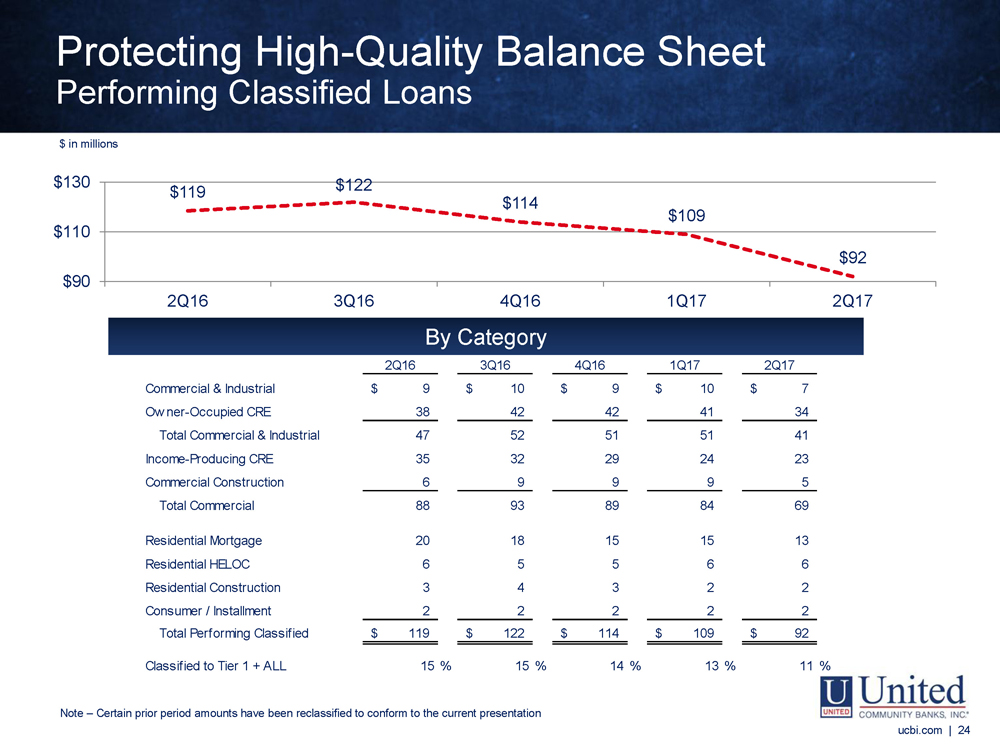
ucbi.com | 24 By Category 2Q16 3Q16 4Q16 1Q17 2Q17 Commercial & Industrial 9$ 10$ 9$ 10$ 7$ Owner-Occupied CRE 38 42 42 41 34 Total Commercial & Industrial 47 52 51 51 41 Income-Producing CRE 35 32 29 24 23 Commercial Construction 6 9 9 9 5 Total Commercial 88 93 89 84 69 Residential Mortgage 20 18 15 15 13 Residential HELOC 6 5 5 6 6 Residential Construction 3 4 3 2 2 Consumer / Installment 2 2 2 2 2 Total Performing Classified 119$ 122$ 114$ 109$ 92$ Classified to Tier 1 + ALL 15% 15% 14% 13% 11% $119 $122 $114 $109 $92 $90 $110 $130 2Q16 3Q16 4Q16 1Q17 2Q17 NOTE - Certain prior period amounts have been reclassified to conform to the current presentation Protecting High - Quality Balance Sheet Performing Classified Loans ucbi.com | 24 Note – Certain prior period amounts have been reclassified to conform to the current presentation $ in millions
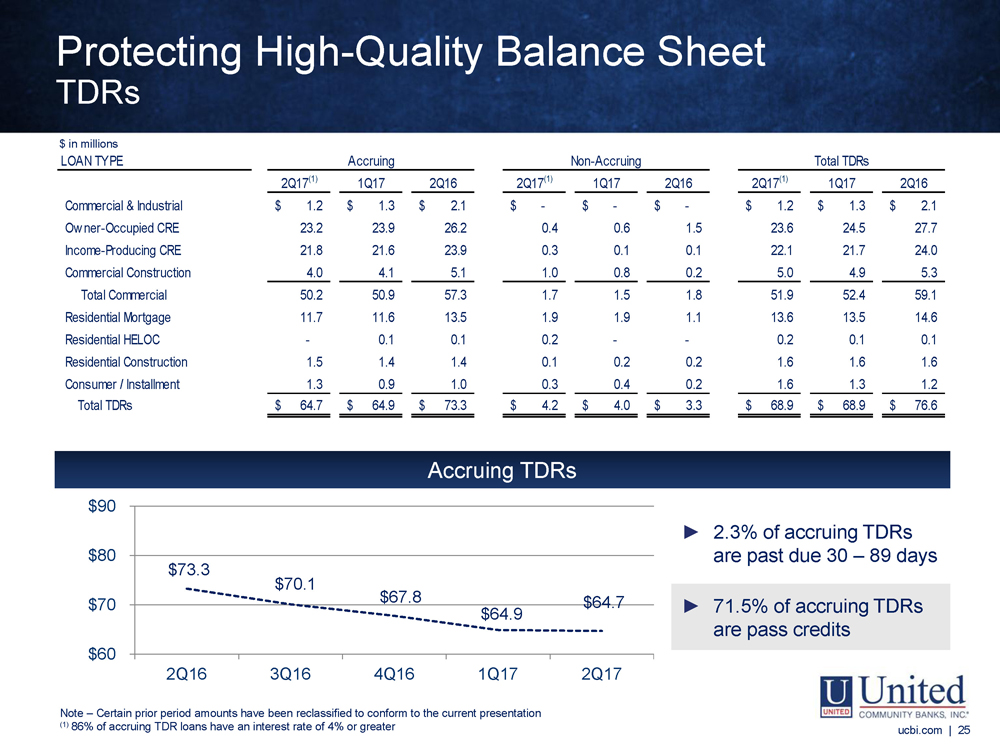
$73.3 $70.1 $67.8 $64.9 $64.7 $60 $70 $80 $90 2Q16 3Q16 4Q16 1Q17 2Q17 ucbi.com | 25 LOAN TYPE 2Q17(1) 1Q17 2Q16 2Q17(1) 1Q17 2Q16 2Q17(1) 1Q17 2Q16 Commercial & Industrial 1.2$ 1.3$ 2.1$ -$ -$ -$ 1.2$ 1.3$ 2.1$ Owner-Occupied CRE 23.2 23.9 26.2 0.4 0.6 1.5 23.6 24.5 27.7 Income-Producing CRE 21.8 21.6 23.9 0.3 0.1 0.1 22.1 21.7 24.0 Commercial Construction 4.0 4.1 5.1 1.0 0.8 0.2 5.0 4.9 5.3 Total Commercial 50.2 50.9 57.3 1.7 1.5 1.8 51.9 52.4 59.1 Residential Mortgage 11.7 11.6 13.5 1.9 1.9 1.1 13.6 13.5 14.6 Residential HELOC - 0.1 0.1 0.2 - - 0.2 0.1 0.1 Residential Construction 1.5 1.4 1.4 0.1 0.2 0.2 1.6 1.6 1.6 Consumer / Installment 1.3 0.9 1.0 0.3 0.4 0.2 1.6 1.3 1.2 Total TDRs 64.7$ 64.9$ 73.3$ 4.2$ 4.0$ 3.3$ 68.9$ 68.9$ 76.6$ Accruing Non-Accruing Total TDRs Accruing TDRs ► 2.3% of accruing TDRs are past due 30 – 89 days ► 71.5% of accruing TDRs are pass credits NOTE - Certain prior period amounts have been reclassified to conform to the current presentation (1) 87% of accruing TDR loans have an interest rate of 4% or greater Protecting High - Quality Balance Sheet TDRs ucbi.com | 25 Note – Certain prior period amounts have been reclassified to conform to the current presentation (1) 86% of accruing TDR loans have an interest rate of 4% or greater $ in millions
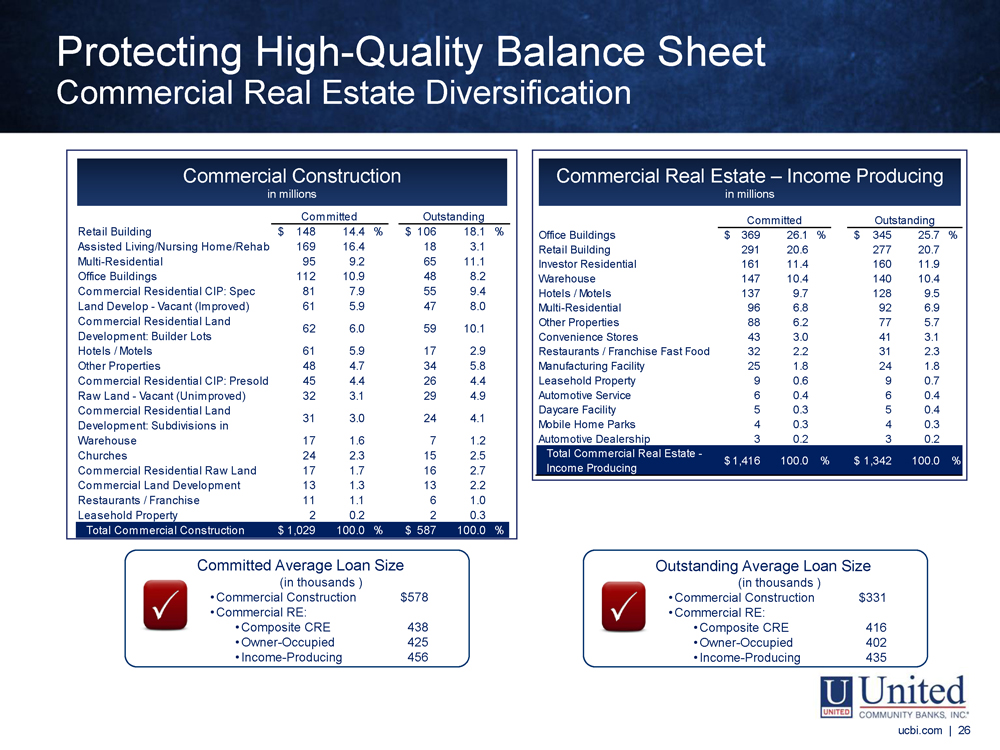
Protecting High - Quality Balance Sheet Commercial Real Estate Diversification ucbi.com | 26 Retail Building 148$ 14.4 % 106$ 18.1 % Assisted Living/Nursing Home/Rehab 169 16.4 18 3.1 Multi-Residential 95 9.2 65 11.1 Office Buildings 112 10.9 48 8.2 Commercial Residential CIP: Spec 81 7.9 55 9.4 Land Develop - Vacant (Improved) 61 5.9 47 8.0 Commercial Residential Land Development: Builder Lots 62 6.0 59 10.1 Hotels / Motels 61 5.9 17 2.9 Other Properties 48 4.7 34 5.8 Commercial Residential CIP: Presold 45 4.4 26 4.4 Raw Land - Vacant (Unimproved) 32 3.1 29 4.9 Commercial Residential Land Development: Subdivisions in 31 3.0 24 4.1 Warehouse 17 1.6 7 1.2 Churches 24 2.3 15 2.5 Commercial Residential Raw Land 17 1.7 16 2.7 Commercial Land Development 13 1.3 13 2.2 Restaurants / Franchise 11 1.1 6 1.0 Leasehold Property 2 0.2 2 0.3 Total Commercial Construction 1,029$ 100.0 % 587$ 100.0 % OutstandingCommitted Commercial Real Estate – Income Producing in millions Commercial Construction in millions Office Buildings 369$ 26.1 % 345$ 25.7 % Retail Building 291 20.6 277 20.7 Investor Residential 161 11.4 160 11.9 Warehouse 147 10.4 140 10.4 Hotels / Motels 137 9.7 128 9.5 Multi-Residential 96 6.8 92 6.9 Other Properties 88 6.2 77 5.7 Convenience Stores 43 3.0 41 3.1 Restaurants / Franchise Fast Food 32 2.2 31 2.3 Manufacturing Facility 25 1.8 24 1.8 Leasehold Property 9 0.6 9 0.7 Automotive Service 6 0.4 6 0.4 Daycare Facility 5 0.3 5 0.4 Mobile Home Parks 4 0.3 4 0.3 Automotive Dealership 3 0.2 3 0.2 Total Commercial Real Estate - Income Producing 1,416$ 100.0 % 1,342$ 100.0 % Committed Outstanding Outstanding Average Loan Size (in thousands ) • Commercial Construction $331 • Commercial RE: • Composite CRE 416 • Owner - Occupied 402 • Income - Producing 435 Committed Average Loan Size (in thousands ) • Commercial Construction $578 • Commercial RE: • Composite CRE 438 • Owner - Occupied 425 • Income - Producing 456 ucbi.com | 26
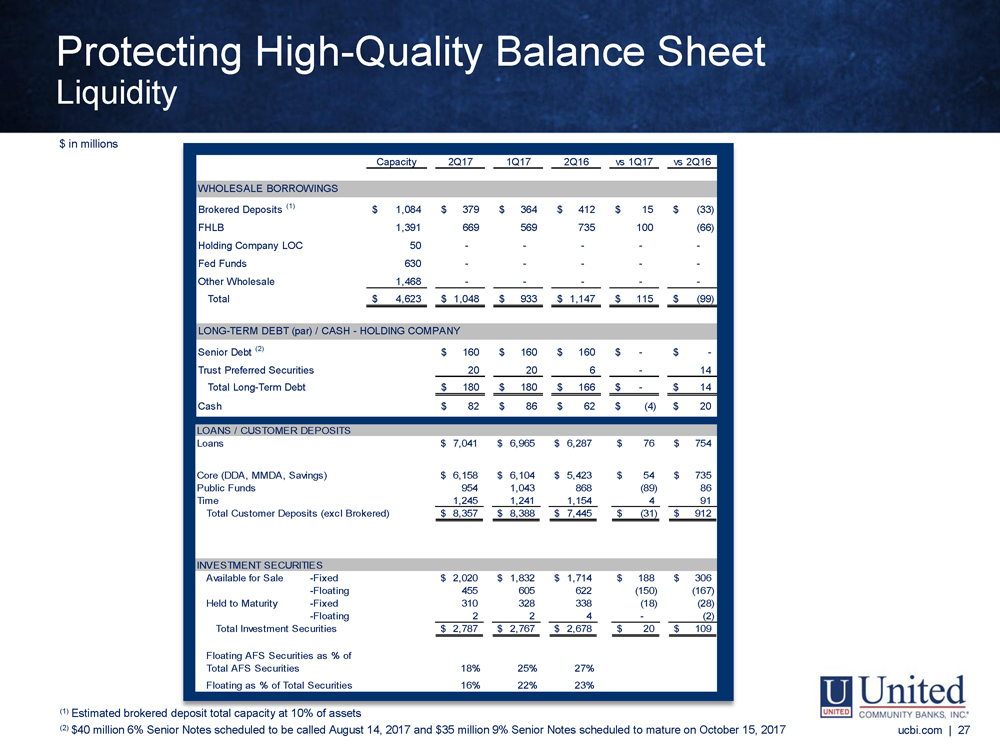
ucbi.com | 27 Capacity 2Q17 1Q17 2Q16 vs 1Q17 vs 2Q16 WHOLESALE BORROWINGS Brokered Deposits (1) 1,084$ 379$ 364$ 412$ 15$ (33)$ FHLB 1,391 669 569 735 100 (66) Holding Company LOC 50 - - - - - Fed Funds 630 - - - - - Other Wholesale 1,468 - - - - - Total 4,623$ 1,048$ 933$ 1,147$ 115$ (99)$ LONG-TERM DEBT (par) / CASH - HOLDING COMPANY Senior Debt (2) 160$ 160$ 160$ -$ -$ Trust Preferred Securities 20 20 6 - 14 Total Long-Term Debt 180$ 180$ 166$ -$ 14$ Cash 82$ 86$ 62$ (4)$ 20$ LOANS / CUSTOMER DEPOSITS Loans 7,041$ 6,965$ 6,287$ 76$ 754$ Core (DDA, MMDA, Savings) 6,158$ 6,104$ 5,423$ 54$ 735$ Public Funds 954 1,043 868 (89) 86 Time 1,245 1,241 1,154 4 91 Total Customer Deposits (excl Brokered) 8,357$ 8,388$ 7,445$ (31)$ 912$ INVESTMENT SECURITIES Available for Sale -Fixed 2,020$ 1,832$ 1,714$ 188$ 306$ -Floating 455 605 622 (150) (167) Held to Maturity -Fixed 310 328 338 (18) (28) -Floating 2 2 4 - (2) Total Investment Securities 2,787$ 2,767$ 2,678$ 20$ 109$ 18% 25% 27% Floating as % of Total Securities 16% 22% 23% Floating AFS Securities as % of Total AFS Securities (1) Estimated brokered deposit total capacity at 10% of assets Protecting High - Quality Balance Sheet Liquidity ucbi.com | 27 (1) Estimated brokered deposit total capacity at 10% of assets $ in millions (2) $40 million 6% Senior Notes scheduled to be called August 14, 2017 and $35 million 9% Senior Notes scheduled to mature on Oct obe r 15, 2017
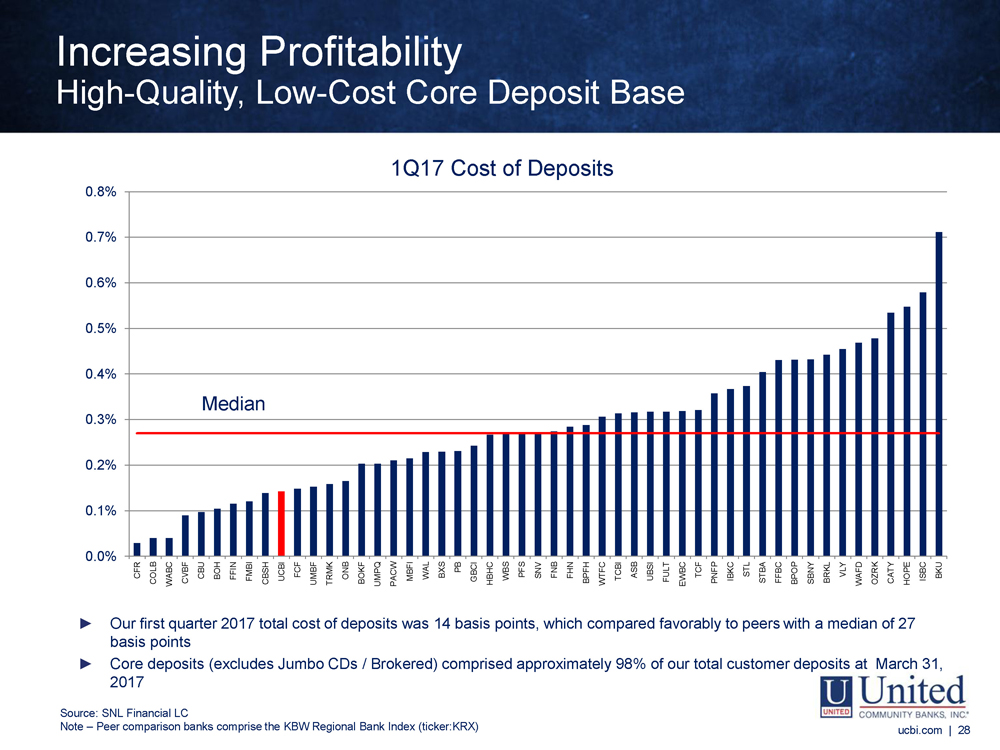
Note: Peer comparison banks comprise the KBW Regional Bank Index (ticker: KRX) ucbi.com | 28 0.0% 0.1% 0.2% 0.3% 0.4% 0.5% 0.6% 0.7% 0.8% CFR COLB WABC CVBF CBU BOH FFIN FMBI CBSH UCBI FCF UMBF TRMK ONB BOKF UMPQ PACW MBFI WAL BXS PB GBCI HBHC WBS PFS SNV FNB FHN BPFH WTFC TCBI ASB UBSI FULT EWBC TCF PNFP IBKC STL STBA FFBC BPOP SBNY BRKL VLY WAFD OZRK CATY HOPE ISBC BKU 1Q17 Cost of Deposits Median ► Our first quarter 2017 total cost of deposits was 14 basis points, which compared favorably to peers with a median of 27 basis points ► Core deposits (excludes Jumbo CDs / Brokered) comprised approximately 98% of our total customer deposits at March 31, 2017 Increasing Profitability High - Quality, Low - Cost Core Deposit Base ucbi.com | 28 Source: SNL Financial LC Note – Peer comparison banks comprise the KBW Regional Bank Index ( ticker:KRX )
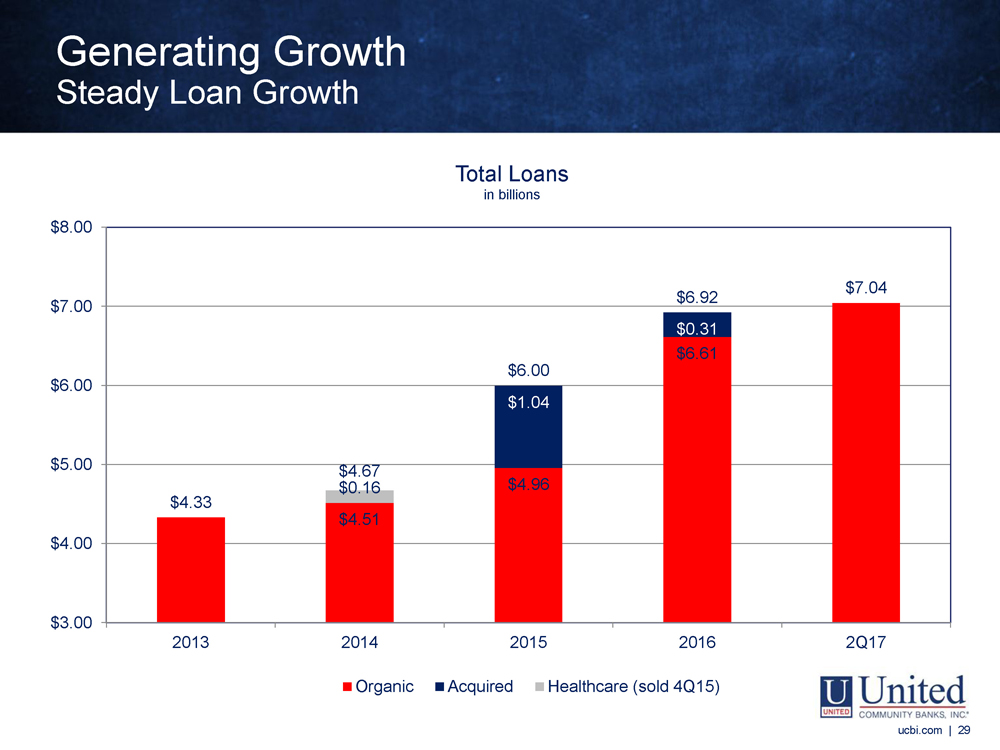
Generating Growth Steady Loan Growth ucbi.com | 29 $4.51 $4.96 $6.61 $1.04 $0.31 $0.16 $4.33 $4.67 $6.00 $6.92 $7.04 $3.00 $4.00 $5.00 $6.00 $7.00 $8.00 2013 2014 2015 2016 2Q17 Millions Total Loans in billions Organic Acquired Healthcare (sold 4Q15) ucbi.com | 29
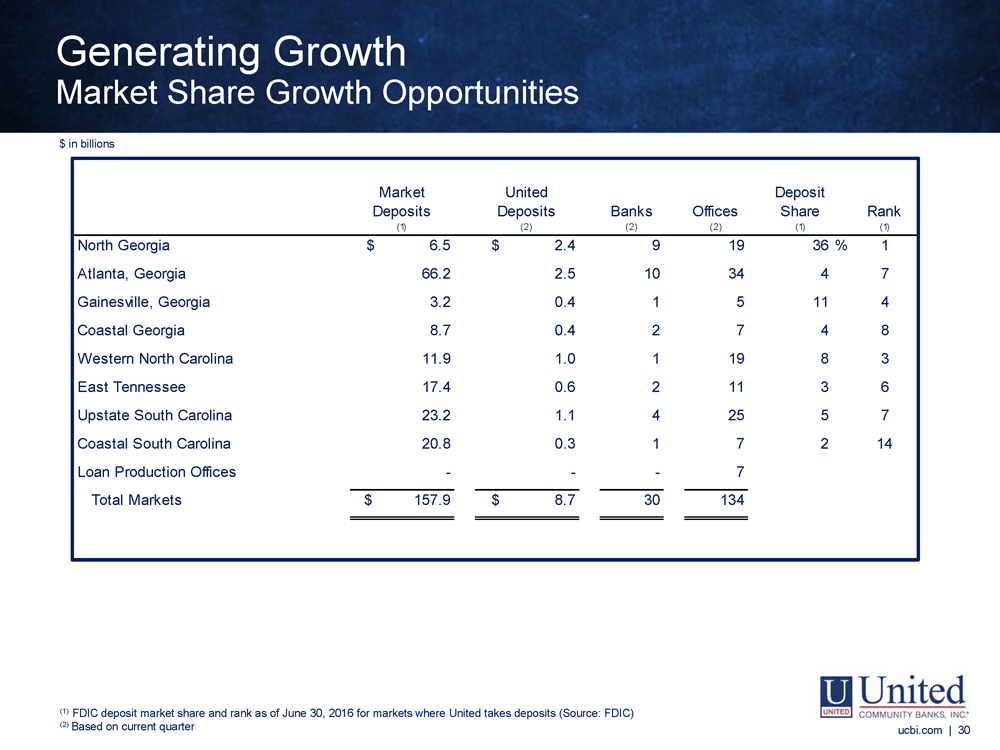
ucbi.com | 30 (1) (2) (2) (2) (1) (1) North Georgia $ 6.5 $ 2.4 9 19 36% 1 Atlanta, Georgia 66.2 2.5 10 34 4 7 Gainesville, Georgia 3.2 0.4 1 5 11 4 Coastal Georgia 8.7 0.4 2 7 4 8 Western North Carolina 11.9 1.0 1 19 8 3 East Tennessee 17.4 0.6 2 11 3 6 Upstate South Carolina 23.2 1.1 4 25 5 7 Coastal South Carolina 20.8 0.3 1 7 2 14 Loan Production Offices - - - 7 Total Markets $ 157.9 $ 8.7 30 134 Banks Offices Rank Market Deposits United Deposits Deposit Share Generating Growth Market Share Growth Opportunities ucbi.com | 30 (1) FDIC deposit market share and rank as of June 30, 2016 for markets where United takes deposits (Source: FDIC) (2) Based on current quarter $ in billions
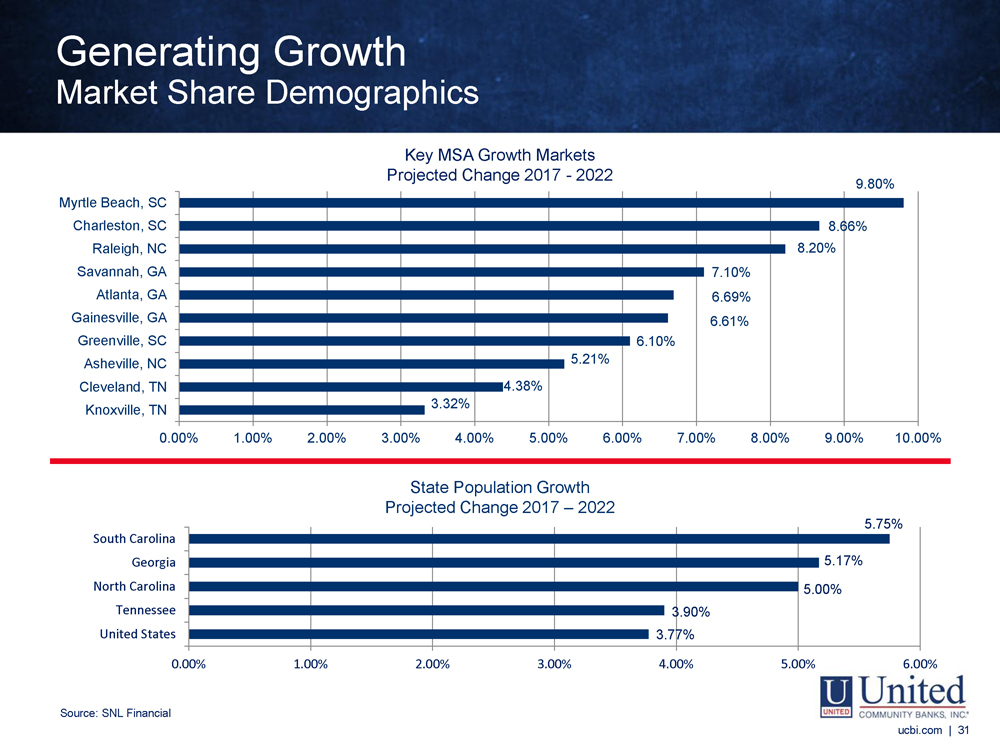
ucbi.com | 31 3.32% 4.38% 5.21% 6.10% 6.61% 6.69% 7.10% 8.20% 8.66% 9.80% 0.00% 1.00% 2.00% 3.00% 4.00% 5.00% 6.00% 7.00% 8.00% 9.00% 10.00% Knoxville, TN Cleveland, TN Asheville, NC Greenville, SC Gainesville, GA Atlanta, GA Savannah, GA Raleigh, NC Charleston, SC Myrtle Beach, SC Key MSA Growth Markets Projected Change 2017 - 2022 3.77% 3.90% 5.00% 5.17% 5.75% 0.00% 1.00% 2.00% 3.00% 4.00% 5.00% 6.00% United States Tennessee North Carolina Georgia South Carolina State Population Growth Projected Change 2017 – 2022 Generating Growth Market Share Demographics ucbi.com | 31 Source: SNL Financial
► M&A accelerates our growth strategy in new and existing markets and can be accomplished more efficiently than with a de novo plan ; we seek to pair M&A with organic growth opportunities, including adding teams of local bankers to quickly increase growth . ► We are interested in pursuing transactions in our target markets including : • Coastal South Carolina – Charleston, Myrtle Beach, Hilton Head ; • East Tennessee – Knoxville to Chattanooga and Cleveland ; • Atlanta – Northern region ; and • North Carolina – Western (Asheville area) to Eastern (Raleigh/Cary area) . ► While larger transformational deals are not out of the question, we have decided to focus on roll - up targets, as we believe there are more actionable opportunities with a shorter time to complete and less risk . ► We carefully evaluate and price potential acquisitions with specific financial return targets in mind, including : • Year one EPS accretion, not including transaction expenses ; • TBV dilution threshold in the low single digits and earnback within three years ; and • IRR of 20 %+. ucbi.com | 32 Generating Growth Mergers & Acquisitions Strategy ucbi.com | 32
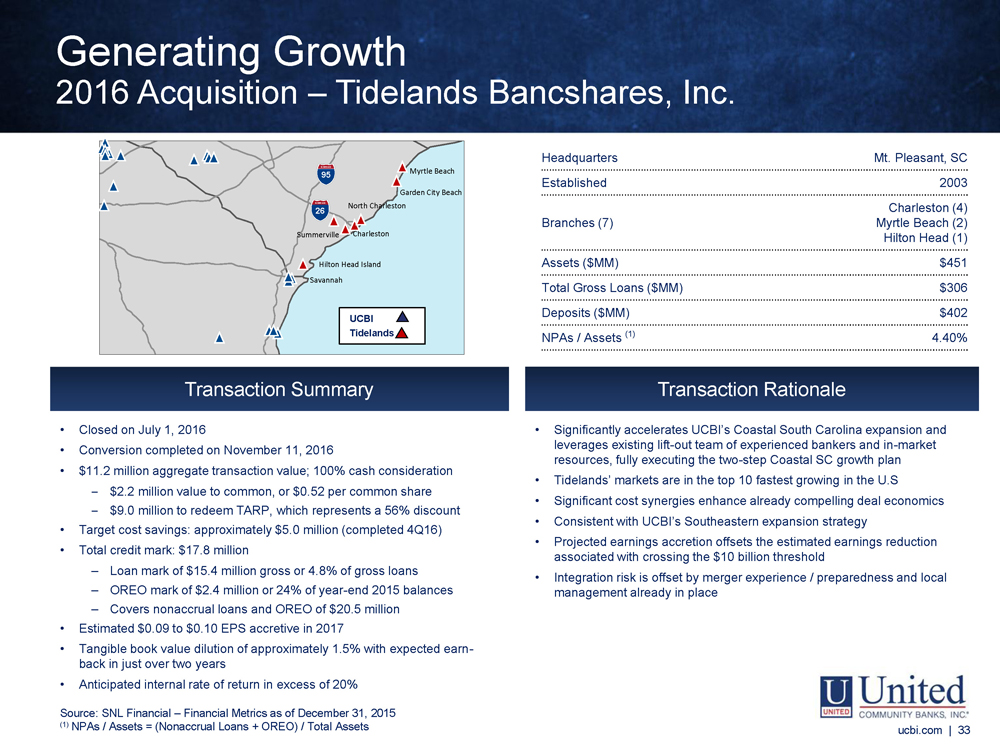
ucbi.com | 33 INTERSTATE 26 INTERSTATE 95 Myrtle Beach Garden City Beach North Charleston Summerville Charleston Hilton Head Island Savannah Transaction Summary Headquarters Mt. Pleasant, SC Established 2003 Branches (7) Charleston (4) Myrtle Beach (2) Hilton Head (1) Assets ($MM) $451 Total Gross Loans ($MM) $306 Deposits ($MM) $402 NPAs / Assets (1) 4.40% • Closed on July 1, 2016 • Conversion completed on November 11, 2016 • $11.2 million aggregate transaction value; 100% cash consideration ‒ $2.2 million value to common, or $0.52 per common share ‒ $9.0 million to redeem TARP, which represents a 56% discount • Target cost savings: approximately $5.0 million (completed 4Q16) • Total credit mark: $17.8 million ‒ Loan mark of $15.4 million gross or 4.8% of gross loans ‒ OREO mark of $2.4 million or 24% of year - end 2015 balances ‒ Covers nonaccrual loans and OREO of $ 20.5 million • Estimated $0.09 to $0.10 EPS accretive in 2017 • Tangible book value dilution of approximately 1.5% with expected earn - back in just over two years • Anticipated internal rate of return in excess of 20% Transaction Rationale • Significantly accelerates UCBI’s Coastal South Carolina expansion and leverages existing lift - out team of experienced bankers and in - market resources, fully executing the two - step Coastal SC growth plan • Tidelands’ markets are in the top 10 fastest growing in the U.S • Significant cost synergies enhance already compelling deal economics • Consistent with UCBI’s Southeastern expansion strategy • Projected e arnings accretion offsets the estimated earnings reduction associated with crossing the $10 billion threshold • Integration risk is offset by merger experience / preparedness and local management already in place (1) NPAs / Assets = (Nonaccrual L oans + OREO) / Total A ssets Generating Growth 2016 Acquisition – Tidelands Bancshares, Inc. UCBI Tidelands ucbi.com | 33 Source: SNL Financial – Financial Metrics as of December 31, 2015 (1) NPAs / Assets = (Nonaccrual Loans + OREO) / Total Assets
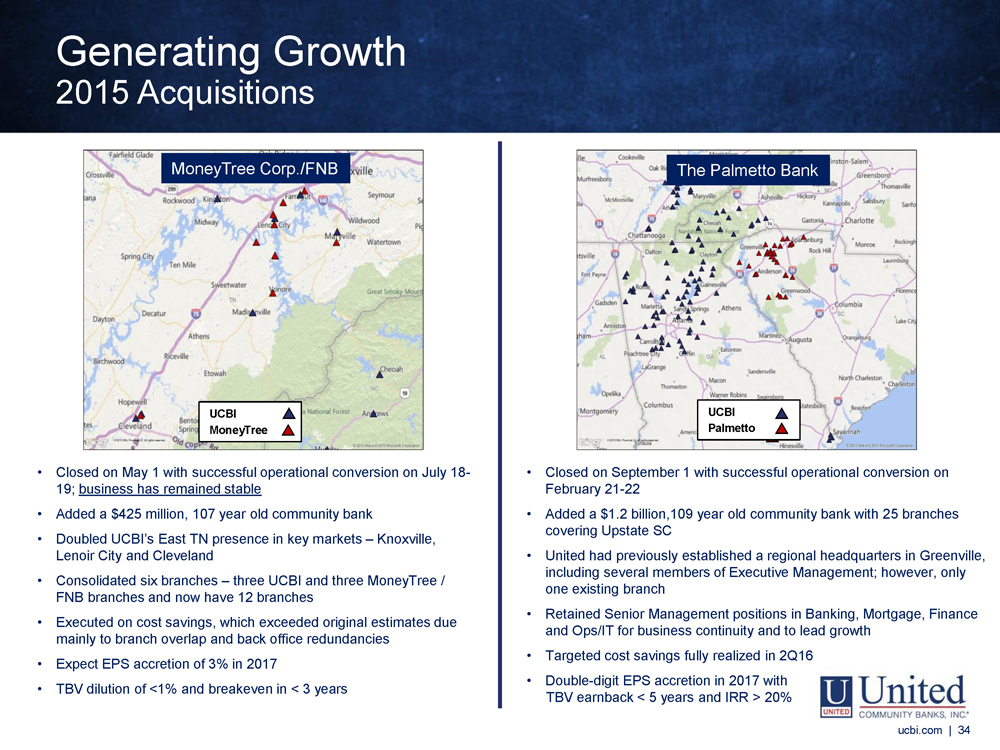
UCBI MoneyTree • Closed on May 1 with successful operational conversion on July 18 - 19; business has remained stable • Added a $425 million, 107 year old community bank • Doubled UCBI’s East TN presence in key markets – Knoxville, Lenoir City and Cleveland • Consolidated six branches – three UCBI and three MoneyTree / FNB branches and now have 12 branches • Executed on cost savings, which exceeded original estimates due mainly to branch overlap and back office redundancies • Expect EPS accretion of 3% in 2017 • TBV dilution of <1% and breakeven in < 3 years • Closed on September 1 with successful operational conversion on February 21 - 22 • Added a $1.2 billion,109 year old community bank with 25 branches covering Upstate SC • United had previously established a regional headquarters in Greenville, including several members of Executive Management; however, only one existing branch • Retained Senior Management positions in Banking, Mortgage, Finance and Ops/IT for business continuity and to lead growth • Targeted cost savings fully realized in 2Q16 • Double - digit EPS accretion in 2017 with TBV earnback < 5 years and IRR > 20% UCBI Palmetto ucbi.com | 34 MoneyTree Corp./FNB The Palmetto Bank Generating Growth 2015 Acquisitions ucbi.com | 34
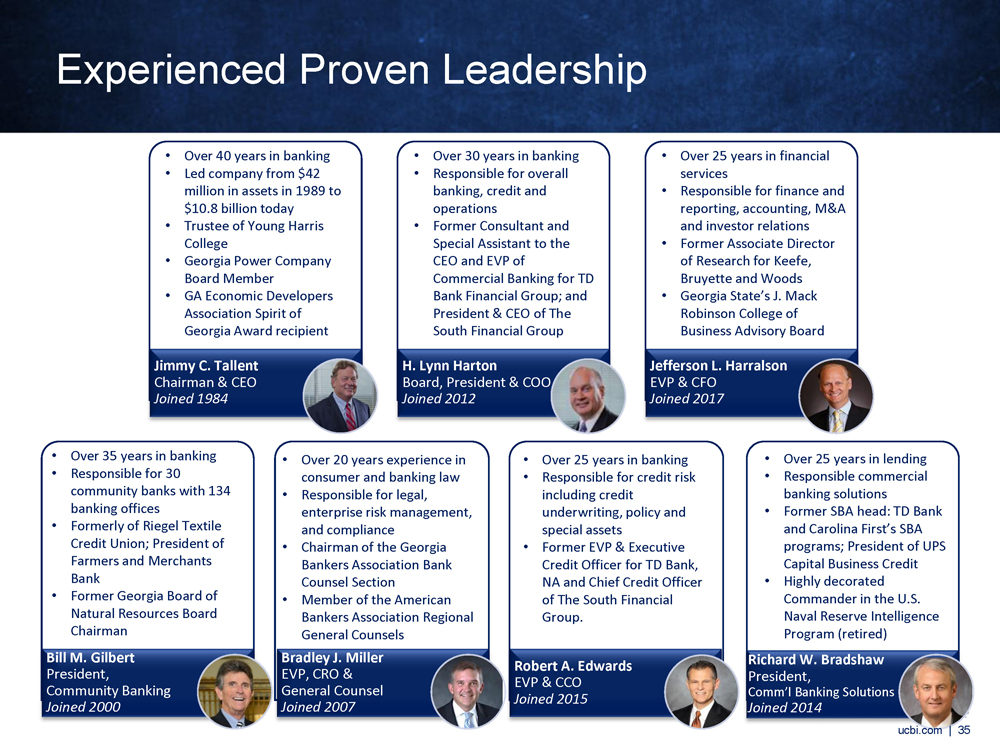
Jimmy C. Tallent Chairman & CEO Joined 1984 H. Lynn Harton Board, President & COO Joined 2012 Bill M. Gilbert President, Community Banking Joined 2000 Bradley J. Miller EVP, CRO & General Counsel Joined 2007 • Over 40 years in banking • Led company from $42 million in assets in 1989 to $10.8 billion today • Trustee of Young Harris College • Georgia Power Company Board Member • GA Economic Developers Association Spirit of Georgia Award recipient • Over 30 years in banking • Responsible for overall banking, credit and operations • Former Consultant and Special Assistant to the CEO and EVP of Commercial Banking for TD Bank Financial Group; and President & CEO of The South Financial Group • Over 25 years in financial services • Responsible for finance and reporting, accounting, M&A and investor relations • Former Associate Director of Research for Keefe, Bruyette and Woods • Georgia State’s J. Mack Robinson College of Business Advisory Board • Over 35 years in banking • Responsible for 30 community banks with 134 banking offices • Formerly of Riegel Textile Credit Union; President of Farmers and Merchants Bank • Former Georgia Board of Natural Resources Board Chairman • Over 20 years experience in consumer and banking law • Responsible for legal , enterprise r isk m anagement , and compliance • Chairman of the Georgia Bankers Association Bank Counsel Section • Member of the American Bankers Association Regional General Counsels Robert A. Edwards EVP & CCO Joined 2015 Richard W. Bradshaw President, Comm’l Banking Solutions Joined 2014 • Over 25 years in lending • Responsible commercial banking solutions • Former SBA head: TD Bank and Carolina First’s SBA programs; President of UPS Capital Business Credit • Highly decorated Commander in the U.S. Naval Reserve Intelligence Program (retired) • Over 25 years in banking • Responsible for credit risk including credit underwriting, policy and special assets • Former EVP & Executive Credit Officer for TD Bank, NA and Chief Credit Officer of The South Financial Group. ucbi.com | 35 Jefferson L. Harralson EVP & CFO Joined 2017 Experienced Proven Leadership ucbi.com | 35
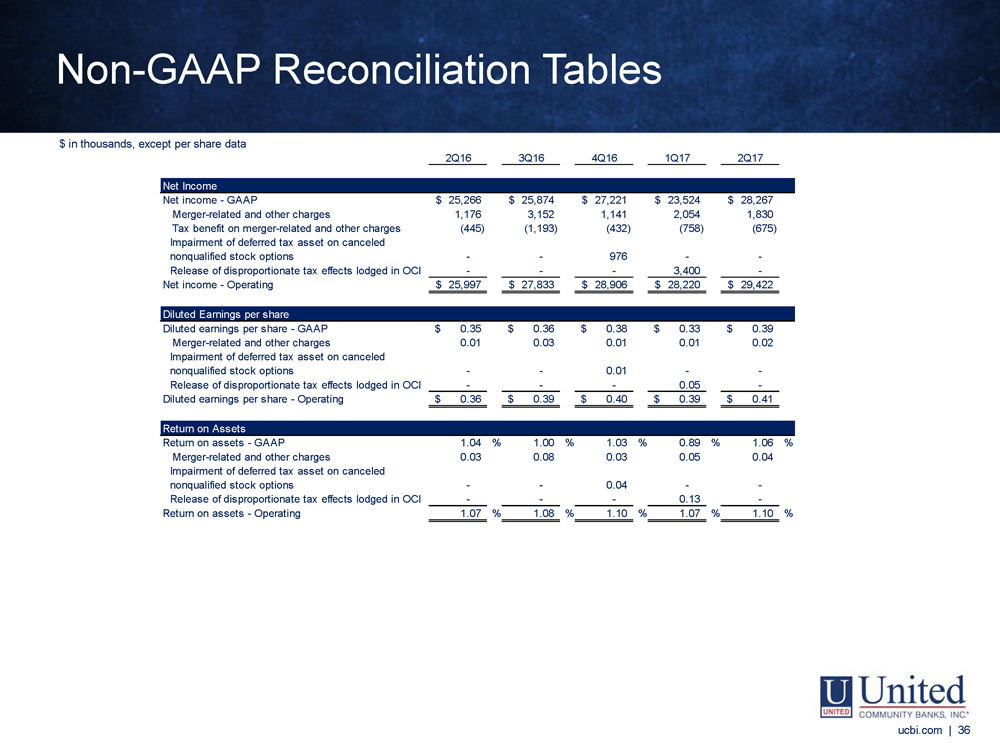
2Q16 3Q16 4Q16 1Q17 2Q17 Net Income Net income - GAAP 25,266$ 25,874$ 27,221$ 23,524$ 28,267$ Merger-related and other charges 1,176 3,152 1,141 2,054 1,830 Tax benefit on merger-related and other charges (445) (1,193) (432) (758) (675) Impairment of deferred tax asset on canceled nonqualified stock options - - 976 - - Release of disproportionate tax effects lodged in OCI - - - 3,400 - Net income - Operating 25,997$ 27,833$ 28,906$ 28,220$ 29,422$ Diluted Earnings per share Diluted earnings per share - GAAP 0.35$ 0.36$ 0.38$ 0.33$ 0.39$ Merger-related and other charges 0.01 0.03 0.01 0.01 0.02 Impairment of deferred tax asset on canceled nonqualified stock options - - 0.01 - - Release of disproportionate tax effects lodged in OCI - - - 0.05 - Diluted earnings per share - Operating 0.36$ 0.39$ 0.40$ 0.39$ 0.41$ Return on Assets Return on assets - GAAP 1.04 % 1.00 % 1.03 % 0.89 % 1.06 % Merger-related and other charges 0.03 0.08 0.03 0.05 0.04 Impairment of deferred tax asset on canceled nonqualified stock options - - 0.04 - - Release of disproportionate tax effects lodged in OCI - - - 0.13 - Return on assets - Operating 1.07 % 1.08 % 1.10 % 1.07 % 1.10 % ucbi.com | 36 Non - GAAP Reconciliation Tables ucbi.com | 36 $ in thousands, except per share data
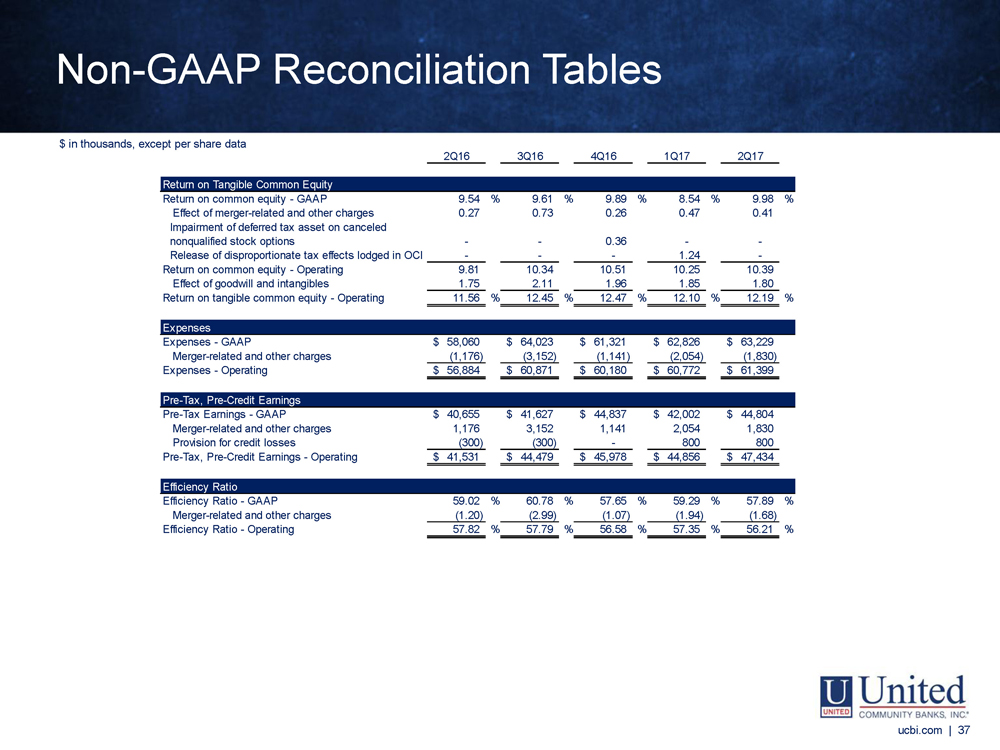
2Q16 3Q16 4Q16 1Q17 2Q17 Return on Tangible Common Equity Return on common equity - GAAP 9.54 % 9.61 % 9.89 % 8.54 % 9.98 % Effect of merger-related and other charges 0.27 0.73 0.26 0.47 0.41 Impairment of deferred tax asset on canceled nonqualified stock options - - 0.36 - - Release of disproportionate tax effects lodged in OCI - - - 1.24 - Return on common equity - Operating 9.81 10.34 10.51 10.25 10.39 Effect of goodwill and intangibles 1.75 2.11 1.96 1.85 1.80 Return on tangible common equity - Operating 11.56 % 12.45 % 12.47 % 12.10 % 12.19 % Expenses Expenses - GAAP 58,060$ 64,023$ 61,321$ 62,826$ 63,229$ Merger-related and other charges (1,176) (3,152) (1,141) (2,054) (1,830) Expenses - Operating 56,884$ 60,871$ 60,180$ 60,772$ 61,399$ Pre-Tax, Pre-Credit Earnings Pre-Tax Earnings - GAAP 40,655$ 41,627$ 44,837$ 42,002$ 44,804$ Merger-related and other charges 1,176 3,152 1,141 2,054 1,830 Provision for credit losses (300) (300) - 800 800 Pre-Tax, Pre-Credit Earnings - Operating 41,531$ 44,479$ 45,978$ 44,856$ 47,434$ Efficiency Ratio Efficiency Ratio - GAAP 59.02 % 60.78 % 57.65 % 59.29 % 57.89 % Merger-related and other charges (1.20) (2.99) (1.07) (1.94) (1.68) Efficiency Ratio - Operating 57.82 % 57.79 % 56.58 % 57.35 % 56.21 % ucbi.com | 37 Non - GAAP Reconciliation Tables ucbi.com | 37 $ in thousands, except per share data