This report must be preceded or accompanied by a prospectus. To obtain a summary prospectus, if available, or prospectus for any of our funds, visit www.dws-investments.com. We advise you to consider a fund's objectives, risks, charges and expenses carefully before investing. The summary prospectus and prospectus contain this and other important information about each fund. Please read the prospectus carefully before you invest.
NOT FDIC/NCUA INSURED NO BANK GUARANTEE MAY LOSE VALUE NOT A DEPOSIT NOT INSURED BY ANY FEDERAL GOVERNMENT AGENCY
All performance information below is historical and does not guarantee future results. Investment return and principal fluctuate, so your shares may be worth more or less when redeemed. Current performance may differ from performance data shown. Please visit www.dws-investments.com for the funds' most recent month-end performance. The 7-day current yield refers to the income paid by the funds over a 7-day period expressed as an annual percentage rate of each fund's shares outstanding. Yields fluctuate and are not guaranteed.
At the beginning of the funds' most recent fiscal year ended April 30, 2013, we saw another dramatic "flight to quality," as worries concerning Greece's upcoming elections and continuingly worsening conditions for Spanish and Italian banks led global and domestic investors to abandon risky assets. Late in 2012, any negative economic data was overshadowed by investor anticipation of more substantial central bank actions. The European Central Bank (ECB) lowered its interest rate for bank reserves. Then, the head of the ECB, Mario Draghi, stated that the central bank would do "whatever it takes" to preserve the euro. In December 2012, the U.S. Federal Reserve Board (the Fed) altered its guidance regarding rate levels, stating that it would maintain short-term interest rates near zero until U.S. unemployment dropped below 6.5%, and as long as inflation levels did not exceed 2.5%. In the first quarter of 2013, the European situation remained quiescent until the banking crisis in Cyprus reached a boiling point; the crisis was finally resolved after it was agreed that large uninsured depositors in Cyprus' banks would suffer substantial losses. In addition, the U.S. economy was boosted by higher housing prices and some gains in employment levels. In the money market area, we saw a continued supply/demand imbalance as well as a reduction in short-term money market supply due to ongoing quantitative easing by the Fed. In the continued search for yield, money market investors looked to a variety of financial instruments issued in countries around the world.
We were able to maintain a yield that is in line with other similar money market funds during the period ended April 30, 2013.
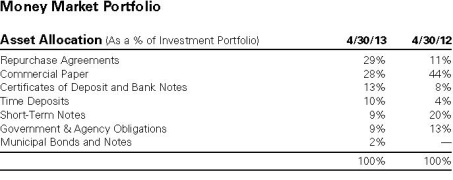
For the Money Market Portfolio, we continued to hold a large percentage of fund assets in short-maturity instruments for liquidity purposes. We also maintained a relatively conservative average maturity, with fund assets broadly diversified among a number of sectors and geographical areas for money market investment, such as Scandinavia, the United States, China and Singapore. Because we believe that overnight money market yields are beginning to decline due to heavy investor demand, we permitted the fund's weighted average maturity to lengthen somewhat to seek additional yield for the fund.
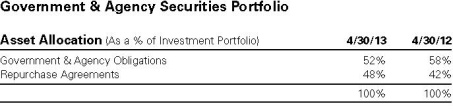
In the case of the Government & Agency Securities Portfolio, with short-maturity yields trading in a narrow range throughout most of the period, we pursued a "barbell" strategy for the fund: we held a large percentage of portfolio assets in overnight Treasury and agency repurchase agreements for relative yield, flexibility and liquidity purposes. At the same time, we purchased six-month to one-year Treasury and agency securities to take advantage of more attractive rates within that portion of the yield curve.
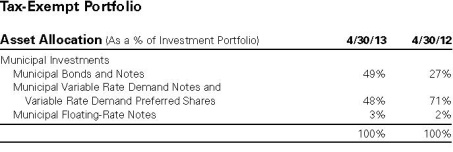
For the Tax-Exempt Portfolio, we sought to preserve a balance of liquidity and high quality by maintaining a strong position in variable-rate securities during the period. (The interest rate of variable-rate securities adjusts periodically based on indices such as the Securities Industry and Financial Market Association Index of Variable Rate Demand Notes. Because the interest rates of these instruments adjust as market conditions change, they provide flexibility in an uncertain interest rate environment.) In addition, we took advantage of higher yields along the yield curve by investing in tax-exempt commercial paper, three-month to nine-month municipal "put" bonds, and one-year fixed-rate municipal note issues. We have also maintained broad diversification for the fund by investing in a number of states and municipalities.
Performance is historical and does not guarantee future results. Current performance may be lower or higher than the performance data quoted.
An investment in these funds is not insured or guaranteed by the Federal Deposit Insurance Corporation (FDIC) or by any other government agency. Although the funds seek to preserve the value of your investment at $1.00 per share, it is possible to lose money by investing in the funds.
For all three funds, the types of securities that we invested in tended to have lower yields than issues carrying more risk. We preferred to be cautious during a time of market uncertainty. In the end this may have cost the funds some yield, but we believe that this represented a prudent approach to preserving principal.
We anticipate limited growth for the U.S. economy over the remainder of this year, due to steady but unspectacular employment gains and the automatic budget cuts dictated by congressional sequestration. In turn, we think that restrained growth will mean that the Fed will continue its extremely accommodative monetary policy through early 2014. We look for money market rates to continue to be low based on decreases in supply on a number of fronts and strong investor demand.
We continue our insistence on the highest credit quality within the funds. We also plan to maintain our conservative investment strategies and standards under the current market conditions. We continue to apply a careful approach to investing on behalf of the funds and to seek competitive yield for our shareholders.
A group of investment professionals is responsible for the day-to-day management of each fund. These investment professionals have a broad range of experience managing money market funds.
The views expressed reflect those of the portfolio management team only through the end of the period of the report as stated on the cover. The management team's views are subject to change at any time based on market and other conditions and should not be construed as a recommendation. Past performance is no guarantee of future results. Current and future portfolio holdings are subject to risk.
* Floating rate securities' yields vary with a designated market index or market rate, such as the coupon-equivalent of the U.S. Treasury Bill rate. These securities are shown at their current rate as of April 30, 2013.
** Annualized yield at time of purchase; not a coupon rate.
*** Variable rate demand notes are securities whose interest rates are reset periodically at market levels. These securities are payable on demand and are shown at their current rates as of April 30, 2013.
(a) Government-backed debt issued by financial companies or government sponsored enterprises.
(b) Collateralized by $26,276,294 Federal National Mortgage Association, maturing on 10/9/2019 with a value of $23,460,001.
(d) Collateralized by $23,116,800 U.S. Treasury Inflation-Indexed Notes, with the various coupon rates from 0.125-2.0%, with various maturity dates of 1/15/2016-1/15/2023 with a value of $26,520,744.
(e) Collateralized by $139,236,797 Federal National Mortgage Association — Interest Only, with the various coupon rates from 3.0-6.5%, with various maturity dates of 8/25/2026-10/25/2040 with a value of $15,300,362.
(f) Collateralized by $8,176,760 Ally Auto Receivables Trust, 1.06%, maturing on 5/15/2017 with a value of $8,241,343.
(h) Collateralized by $2,836,200 U.S. Treasury Note, 0.25%, maturing on 11/30/2014 with a value of $2,841,802.
(i) Collateralized by $13,936,100 U.S. Treasury Bond, 6.0%, maturing on 2/15/2026 with a value of $20,400,014.
(j) Collateralized by $153,412,926 Federal National Mortgage Association, with the various coupon rates from 2.47-4.0%, with various maturity dates of 9/1/2027-3/1/2043 with a value of $163,200,001.
(k) Collateralized by $34,311,775 Federal National Mortgage Association, with the various coupon rates from 4.0-5.0%, with various maturity dates of 5/1/2035-12/1/2042 with a value of $37,230,000.
(l) Collateralized by $20,269,900 U.S. Treasury Notes, with the various coupon rates from 0.25-4.125%, with various maturity dates of 6/15/2014-5/15/2015 with a value of $20,400,014.
144A: Security exempt from registration under Rule 144A of the Securities Act of 1933. These securities may be resold in transactions exempt from registration, normally to qualified institutional buyers.
Interest Only: Interest Only (IO) bonds represent the "interest only" portion of payments on a pool of underlying mortgages or mortgage-backed securities. IO securities are subject to prepayment risk of the pool of underlying mortgages.
Principal Only: Principal Only (PO) bonds represent the "principal only" portion of payments on a pool of underlying mortgages or mortgage-backed securities.
Various inputs are used in determining the value of the Fund's investments. These inputs are summarized in three broad levels. Level 1 includes quoted prices in active markets for identical securities. Level 2 includes other significant observable inputs (including quoted prices for similar securities, interest rates, prepayment speeds and credit risk). Level 3 includes significant unobservable inputs (including the Fund's own assumptions in determining the fair value of investments). The inputs or methodology used for valuing securities are not necessarily an indication of the risk associated with investing in those securities. Securities held by the Fund are reflected as Level 2 because the securities are valued at amortized cost (which approximates fair value) and, accordingly, the inputs used to determine value are not quoted prices in an active market.
The following is a summary of the inputs used as of April 30, 2013 in valuing the Fund's investments. For information on the Fund's policy regarding the valuation of investments, please refer to the Security Valuation section of Note 1 in the accompanying Notes to Financial Statements.
There have been no transfers between fair value measurement levels during the year ended April 30, 2013.
The accompanying notes are an integral part of the financial statements.
The accompanying notes are an integral part of the financial statements.
The accompanying notes are an integral part of the financial statements.
The accompanying notes are an integral part of the financial statements.
The accompanying notes are an integral part of the financial statements.
* Annualized yield at time of purchase; not a coupon rate.
** Floating rate securities' yields vary with a designated market index or market rate, such as the coupon-equivalent of the U.S. Treasury Bill rate. These securities are shown at their current rate as of April 30, 2013.
(a) Collateralized by $126,575,000 Federal Home Loan Bank, with the various coupon rates from 2.13-2.65%, with various maturity dates of 11/5/2024-2/15/2028 with a value of $127,500,282.
(b) Collateralized by $50,645,400 U.S. Treasury Inflation-Indexed Notes, with the various coupon rates from 2.0-2.5%, with various maturity dates of 1/15/2016-7/15/2016 with a value of $66,300,001.
(c) Collateralized by $40,258,000 U.S. Federal Home Loan Mortgage Corp., with the various coupon rates from 0.45-3.01%, with various maturity dates of 1/9/2014-7/9/2027 with a value of $40,800,030.
(i) Collateralized by $26,210,800 U.S. Treasury Bond, 4.625%, maturing on 2/15/2040 with a value of $35,804,331.
(j) Collateralized by $91,947,100 U.S. Treasury Note, 11.25%, maturing on 2/15/2015 with a value of $112,200,034.
(k) Collateralized by $401,096,407 Federal Home Loan Mortgage Corp., with the various coupon rates from 3.0-5.0%, with various maturity dates of 2/1/2026-4/1/2043 with a value of $432,480,000.
(l) Collateralized by $134,311,400 U.S. Treasury Notes, with the various coupon rates from 3.125-4.0%, with various maturity dates of 8/31/2013-2/15/2014 with a value of $137,705,131.
144A: Security exempt from registration under Rule 144A of the Securities Act of 1933. These securities may be resold in transactions exempt from registration, normally to qualified institutional buyers.
Interest Only: Interest Only (IO) bonds represent the "interest only" portion of payments on a pool of underlying mortgages or mortgage-backed securities. IO securities are subject to prepayment risk of the pool of underlying mortgages.
Various inputs are used in determining the value of the Fund's investments. These inputs are summarized in three broad levels. Level 1 includes quoted prices in active markets for identical securities. Level 2 includes other significant observable inputs (including quoted prices for similar securities, interest rates, prepayment speeds and credit risk). Level 3 includes significant unobservable inputs (including the Fund's own assumptions in determining the fair value of investments). The inputs or methodology used for valuing securities are not necessarily an indication of the risk associated with investing in those securities. Securities held by the Fund are reflected as Level 2 because the securities are valued at amortized cost (which approximates fair value) and, accordingly, the inputs used to determine value are not quoted prices in an active market.
The following is a summary of the inputs used as of April 30, 2013 in valuing the Fund's investments. For information on the Fund's policy regarding the valuation of investments, please refer to the Security Valuation section of Note 1 in the accompanying Notes to Financial Statements.
There have been no transfers between fair value measurement levels during the year ended April 30, 2013.
(o) See Investment Portfolio for additional detailed categorizations.
The accompanying notes are an integral part of the financial statements.
The accompanying notes are an integral part of the financial statements.
The accompanying notes are an integral part of the financial statements.
The accompanying notes are an integral part of the financial statements.
The accompanying notes are an integral part of the financial statements.
* Variable rate demand notes and variable rate demand preferred shares are securities whose interest rates are reset periodically at market levels. These securities are payable on demand and are shown at their current rates as of April 30, 2013.
** Floating rate securities' yields vary with a designated market index or market rate, such as the coupon-equivalent of the U.S. Treasury Bill rate. These securities are shown at their current rate as of April 30, 2013.
144A: Security exempt from registration under Rule 144A of the Securities Act of 1933. These securities may be resold in transactions exempt from registration, normally to qualified institutional buyers.
AMBAC: Ambac Financial Group, Inc.
AMT: Subject to alternative minimum tax.
Prerefunded: Bonds which are prerefunded are collateralized usually by U.S. Treasury securities which are held in escrow and used to pay principal and interest on tax-exempt issues and to retire the bonds in full at the earliest refunding date.
Various inputs are used in determining the value of the Fund's investments. These inputs are summarized in three broad levels. Level 1 includes quoted prices in active markets for identical securities. Level 2 includes other significant observable inputs (including quoted prices for similar securities, interest rates, prepayment speeds and credit risk). Level 3 includes significant unobservable inputs (including the Fund's own assumptions in determining the fair value of investments). The inputs or methodology used for valuing securities are not necessarily an indication of the risk associated with investing in those securities. Securities held by the Fund are reflected as Level 2 because the securities are valued at amortized cost (which approximates fair value) and, accordingly, the inputs used to determine value are not quoted prices in an active market.
The following is a summary of the inputs used as of April 30, 2013 in valuing the Fund's investments. For information on the Fund's policy regarding the valuation of investments, please refer to the Security Valuation section of Note 1 in the accompanying Notes to Financial Statements.
There have been no transfers between fair value measurement levels during the period ended April 30, 2013.
(a) See Investment Portfolio for additional detailed categorizations.
The accompanying notes are an integral part of the financial statements.
The accompanying notes are an integral part of the financial statements.
The accompanying notes are an integral part of the financial statements.
The accompanying notes are an integral part of the financial statements.
The accompanying notes are an integral part of the financial statements.
1. Organization and Significant Accounting Policies
Cash Account Trust (the "Trust") is registered under the Investment Company Act of 1940, as amended (the "1940 Act"), as an open-end investment management company organized as a Massachusetts business trust.
The Trust offers three funds: Money Market Portfolio, Government & Agency Securities Portfolio and Tax-Exempt Portfolio (each a "Fund" and together, the "Funds").
Money Market Portfolio offers six classes of shares: Capital Assets Funds Shares, Capital Assets Funds Preferred Shares, Davidson Cash Equivalent Shares, Davidson Cash Equivalent Plus Shares, Premium Reserve Money Market Shares and Service Shares.
Government & Agency Securities Portfolio offers seven classes of shares: Capital Assets Funds Shares, Davidson Cash Equivalent Shares, Davidson Cash Equivalent Plus Shares, DWS Government & Agency Money Fund, DWS Government Cash Institutional Shares, Government Cash Managed Shares and Service Shares.
Tax-Exempt Portfolio offers eight classes of shares: Capital Assets Funds Shares, Davidson Cash Equivalent Shares, DWS Tax-Exempt Cash Institutional Shares, DWS Tax-Exempt Money Fund, DWS Tax-Free Money Fund Class S, Service Shares, Tax-Exempt Cash Managed Shares and Tax-Free Investment Class.
The financial highlights for all classes of shares, other than Service Shares, are provided separately and are available upon request.
Each Fund's investment income, realized gains and losses, and certain Fund-level expenses and expense reductions, if any, are borne pro rata on the basis of relative net assets by the holders of all classes of shares of that Fund, except that each class bears certain expenses unique to that class such as distribution and service fees, services to shareholders and certain other class-specific expenses. Differences in class-level expenses may result in payment of different per share dividends by class. All shares of the Trust have equal rights with respect to voting subject to class-specific arrangements.
Each Fund's financial statements are prepared in accordance with accounting principles generally accepted in the United States of America which require the use of management estimates. Actual results could differ from those estimates. The policies described below are followed consistently by the Funds in the preparation of their financial statements.
The Funds value all securities utilizing the amortized cost method permitted in accordance with Rule 2a-7 under the 1940 Act and certain conditions therein. Under this method, which does not take into account unrealized capital gains or losses on securities, an instrument is initially valued at its cost and thereafter assumes a constant accretion/amortization rate to maturity of any discount or premium. Securities held by the Fund are reflected as Level 2 because the securities are valued at amortized cost (which approximates fair value) and, accordingly, the inputs used to determine value are not quoted prices in an active market.
Disclosure about the classification of fair value measurements is included in a table following each Fund's Investment Portfolio.
Under the Regulated Investment Company Modernization Act of 2010, net capital losses incurred post-enactment may be carried forward indefinitely, and their character is retained as short-term and/or long-term losses. Previously, net capital losses were carried forward for eight years and treated as short-term losses. As a transition rule, the Act requires that post-enactment net capital losses be used before pre-enactment net capital losses.
At April 30, 2013, DWS Money Market Portfolio had a net tax basis capital loss carryforward of approximately $14,000 of post-enactment short-term losses, which may be applied against realized net taxable capital gains indefinitely.
At April 30, 2013, DWS Government & Agency Securities Portfolio had a net tax basis capital loss carryforward of approximately $436,000 of pre-enactment losses, which may be applied against any realized net taxable capital gains of each succeeding year until fully utilized or until April 30, 2019 (the expiration date), whichever occurs first.
The Funds have reviewed the tax positions for the open tax years as of April 30, 2013 and have determined that no provision for income tax is required in the Funds' financial statements. The Funds' federal tax returns for the prior three fiscal years remain open subject to examination by the Internal Revenue Service.
Permanent book and tax basis differences relating to shareholder distributions will result in reclassifications to paid in capital. Temporary book and tax basis differences will reverse in a subsequent period. There were no significant book-to-tax differences for the Funds.
At April 30, 2013, the Funds' components of distributable earnings on a tax basis are as follows:
In addition, the tax character of distributions paid to shareholders by each Fund is summarized as follows:
* For tax purposes, short-term capital gain distributions are considered ordinary income distributions.
2. Related Parties
The Money Market Portfolio pays a monthly management fee based on the combined average daily net assets of the three Funds in the Trust and allocated to Money Market Portfolio based on its relative net assets, computed and accrued daily and payable monthly, at 1/12 of the following annual rates:
For the year ended April 30, 2013, the Fund incurred a management fee equivalent to the following annual effective rate of the Fund's average daily net assets:
The Advisor has agreed to voluntarily waive expenses. The voluntary waiver may be changed or terminated at any time without notice. Under these arrangements, the Advisor waived certain expenses on Services Shares of Money Market Portfolio.
In addition, the Advisor has agreed to maintain expenses of certain other classes of the Trust. These rates are disclosed in the respective share classes' annual reports that are provided separately and are available upon request.
The Government & Agency Securities Portfolio and Tax-Exempt Portfolio pay a monthly management fee based on the combined average daily net assets of the three Funds in the Trust and allocated to Government & Agency Securities Portfolio and Tax-Exempt Portfolio, respectively, based on their relative net assets, computed and accrued daily and payable monthly, at the following annual rates:
The Advisor has agreed to contractually reduce its management fee for the Government & Agency Securities Portfolio such that the annual effective rate is limited to 0.05% of the Government & Agency Securities Portfolio's average daily net assets.
In addition, the Advisor has agreed to voluntarily waive additional expenses. The voluntary waiver may be changed or terminated at any time without notice. Under these arrangements, the Advisor waived certain expenses on Services Shares of Government & Agency Securities Portfolio and Tax-Exempt Portfolio.
Accordingly, for the year ended April 30, 2013, the Advisor earned a management fee on the Government & Agency Securities Portfolio aggregating $1,898,580, of which $1,332,763 was waived, resulting in an annual effective rate of 0.02% of the Fund's average daily net assets.
Accordingly, for the year ended April 30, 2013, the Advisor earned a management fee on the Tax-Exempt Portfolio aggregating $1,326,518, of which $309,712 was waived, resulting in an annual effective rate of 0.05% of the Fund's average daily net assets.
The Advisor has also agreed to maintain expenses of certain other classes of the Trust. These rates are disclosed in the respective share classes' annual reports that are provided separately and are available upon request.
Pursuant to a fund accounting agreement between DIMA and Money Market Portfolio, DIMA is responsible for computing the daily net asset value per share and maintaining the portfolio and general accounting records of Money Market Portfolio. DIMA has delegated certain fund accounting and record-keeping services to State Street Bank and Trust Company. The costs and expenses of such delegation are paid by DIMA. Money Market Portfolio paid no fee to DIMA for fund accounting and record-keeping services provided under the fund accounting agreement during the period.
In addition, DIDI provides information and administrative services for a fee ("Service Fee") for the shares listed in the following table. A portion of these fees may be paid pursuant to a Rule 12b-1 plan.
3. Concentration of Ownership
From time to time, the Funds may have a concentration of several shareholder accounts holding a significant percentage of shares outstanding. Investment activities of these shareholders could have a material impact on the Funds.
At April 30, 2013, two shareholder accounts held approximately 82% and 11% of the outstanding shares of the Money Market Portfolio; one shareholder account held approximately 13% of the outstanding shares of the Government & Agency Securities Portfolio; and three shareholder accounts held approximately 33%, 17% and 12% of the outstanding shares of the Tax-Exempt Portfolio.
4. Line of Credit
The Funds and other affiliated funds (the "Participants") share in a $375 million revolving credit facility provided by a syndication of banks. Each Fund may borrow for temporary or emergency purposes, including the meeting of redemption requests that otherwise might require the untimely disposition of securities. The Participants are charged an annual commitment fee which is allocated based on net assets, among each of the Participants. Interest is calculated at a rate per annum equal to the sum of the Federal Funds Rate plus 1.25 percent plus, if LIBOR exceeds the Federal Funds Rate, the amount of such excess. Each Fund may borrow up to a maximum of 33 percent of its net assets under the agreement. The Fund had no outstanding loans at April 30, 2013.
5. Share Transactions
We have audited the accompanying statements of assets and liabilities of Money Market Portfolio, Government & Agency Securities Portfolio and Tax-Exempt Portfolio (the "Funds") (the three Funds comprising Cash Account Trust), including the investment portfolios, as of April 30, 2013, and the related statements of operations for the year then ended, the statements of changes in net assets for each of the two years in the period then ended, and the financial highlights for each of the five years in the period then ended. These financial statements and financial highlights are the responsibility of the Funds' management. Our responsibility is to express an opinion on these financial statements and financial highlights based on our audits.
We conducted our audits in accordance with the standards of the Public Company Accounting Oversight Board (United States). Those standards require that we plan and perform the audit to obtain reasonable assurance about whether the financial statements and financial highlights are free of material misstatement. We were not engaged to perform an audit of the Funds' internal control over financial reporting. Our audits included consideration of internal control over financial reporting as a basis for designing audit procedures that are appropriate in the circumstances, but not for the purpose of expressing an opinion on the effectiveness of the Funds' internal control over financial reporting. Accordingly, we express no such opinion. An audit also includes examining, on a test basis, evidence supporting the amounts and disclosures in the financial statements and financial highlights, assessing the accounting principles used and significant estimates made by management, and evaluating the overall financial statement presentation. Our procedures included confirmation of securities owned as of April 30, 2013, by correspondence with the custodian and brokers. We believe that our audits provide a reasonable basis for our opinion.
In our opinion, the financial statements and financial highlights referred to above present fairly, in all material respects, the financial position of Money Market Portfolio, Government & Agency Securities Portfolio and Tax-Exempt Portfolio at April 30, 2013, the results of their operations for the year then ended, the changes in their net assets for each of the two years in the period then ended, and the financial highlights for each of the five years in the period then ended, in conformity with U.S. generally accepted accounting principles.
As an investor of a Fund, you incur two types of costs: ongoing expenses and transaction costs. Ongoing expenses include management fees, distribution and service (12b-1) fees and other Fund expenses. Examples of transaction costs include account maintenance fees, which are not shown in this section. The following tables are intended to help you understand your ongoing expenses (in dollars) of investing in each Fund and to help you compare these expenses with the ongoing expenses of investing in other mutual funds. In the most recent six-month period, each Fund limited these expenses; had they not done so, expenses would have been higher for the Service Shares. The example in the table is based on an investment of $1,000 invested at the beginning of the six-month period and held for the entire period (November 1, 2012 to April 30, 2013).
Please note that the expenses shown in these tables are meant to highlight your ongoing expenses only and do not reflect any transaction costs. The "Expenses Paid per $1,000" line of the tables is useful in comparing ongoing expenses only and will not help you determine the relative total expense of owning different funds. If these transaction costs had been included, your costs would have been higher.
For the Money Market Portfolio, a total of 5% of the dividends distributed during the fiscal year was derived from interest on U.S. government securities, which is generally exempt from state income tax.
For the Government & Agency Securities Portfolio, a total of 31% of the dividends distributed during the fiscal year was derived from interest on U.S. government securities, which is generally exempt from state income tax.
For the Tax-Exempt Portfolio, of the dividends paid from net investment income for the taxable year ended April 30, 2013, 100% are designated as exempt interest dividends for federal income tax purposes.
Please consult a tax advisor if you have questions about federal or state income tax laws, or on how to prepare your tax returns. If you have specific questions about your account, please call (800) 728-3337.
The Fund's policies and procedures for voting proxies for portfolio securities and information about how the Fund voted proxies related to its portfolio securities during the 12-month period ended June 30 are available on our Web site — www.dws-investments.com (click on "proxy voting" at the bottom of the page) — or on the SEC's Web site — www.sec.gov. To obtain a written copy of the Fund's policies and procedures without charge, upon request, call us toll free at (800) 728-3337.
Following the Fund's fiscal first and third quarter-end, a complete portfolio holdings listing is filed with the SEC on Form N-Q. In addition, each month, information about the Fund and its portfolio holdings is filed with the SEC on Form N-MFP. The SEC delays the public availability of the information filed on Form N-MFP for 60 days after the end of the reporting period included in the filing. These forms will be available on the SEC's Web site at www.sec.gov, and they may also be reviewed and copied at the SEC's Public Reference Room in Washington, D.C. Information on the operation of the SEC's Public Reference Room may be obtained by calling (800) SEC-0330. The Fund's portfolio holdings are also posted on www.dws-investments.com from time to time. Please see the Fund's current prospectus for more information.
In 2010, the Securities and Exchange Commission adopted amendments to then-existing money market fund regulations, imposing new liquidity, credit quality and maturity requirements on all money market funds. In November 2012, the Financial Stability Oversight Council (FSOC), a board of U.S. regulators established by the Dodd-Frank Act, proposed recommendations for money market fund reform. If the SEC were to adopt one or more of the FSOC proposed recommendations in the future, or if FSOC were to take other steps to establish similar regulations of money market funds in the future, such regulatory action may affect the Fund's operations and/or return potential.
Pursuant to an Order entered into by Deutsche Investment Management Americas and affiliates (collectively, "DeAM") with the Attorney General of New York, I, Thomas H. Mack, have been appointed the Independent Fee Consultant for the DWS Funds (formerly the DWS Scudder Funds). My duties include preparing an annual written evaluation of the management fees DeAM charges the Funds, considering among other factors the management fees charged by other mutual fund companies for like services, management fees DeAM charges other clients for like services, DeAM's costs of supplying services under the management agreements and related profit margins, possible economies of scale if a Fund grows larger, and the nature and quality of DeAM's services, including fund performance. This report summarizes my evaluation for 2012, including my qualifications, the evaluation process for each of the DWS Funds, consideration of certain complex-level factors, and my conclusions. I served in substantially the same capacity in 2007, 2008, 2009, 2010 and 2011.
For more than 35 years I have served in various professional capacities within the investment management business. I have held investment analysis and advisory positions, including securities analyst, portfolio strategist and director of investment policy with a large investment firm. I have also performed business management functions, including business development, financial management and marketing research and analysis.
Since 1991, I have been an independent consultant within the asset management industry. I have provided services to over 125 client organizations, including investment managers, mutual fund boards, product distributors and related organizations. Over the past ten years I have completed a number of assignments for mutual fund boards, specifically including assisting boards with management contract renewal.
I hold a Master of Business Administration degree, with highest honors, from Harvard University and Master of Science and Bachelor of Science (highest honors) degrees from the University of California at Berkeley. I am an independent director and audit committee financial expert for two closed-end mutual funds and have served in various leadership and financial oversight capacities with non-profit organizations.
My work focused primarily on evaluating, fund-by-fund, the fees charged to each of the 103 mutual fund portfolios in the DWS Fund family. For each Fund, I considered each of the key factors mentioned above, as well as any other relevant information. In doing so I worked closely with the Funds' Independent Directors in their annual contract renewal process, as well as in their approval of contracts for several new funds (documented separately).
In evaluating each Fund's fees, I reviewed comprehensive materials provided by or on behalf of DeAM, including expense information prepared by Lipper Analytical, comparative performance information, profitability data, manager histories, and other materials. I also accessed certain additional information from the Lipper and Morningstar databases and drew on my industry knowledge and experience.
To facilitate evaluating this considerable body of information, I prepared for each Fund a document summarizing the key data elements in each area as well as additional analytics discussed below. This made it possible to consider each key data element in the context of the others.
In the course of contract renewal, DeAM agreed to implement a number of fee and expense adjustments requested by the Independent Directors which will favorably impact future fees and expenses, and my evaluation includes the effects of these changes.
The competitive fee and expense evaluation for each fund focused on two primary comparisons:
The Fund's contractual management fee (the advisory fee plus the administration fee where applicable) compared with those of a group of typically 12-15 funds in the same Lipper investment category (e.g. Large Capitalization Growth) having similar distribution arrangements and being of similar size.
The Fund's total expenses compared with a broader universe of funds from the same Lipper investment category and having similar distribution arrangements.
These two comparisons provide a view of not only the level of the fee compared with funds of similar scale but also the total expense the Fund bears for all the services it receives, in comparison with the investment choices available in the Fund's investment category and distribution channel. The principal figure-of-merit used in these comparisons was the subject Fund's percentile ranking against peers.
DeAM provided management fee schedules for all of its US domiciled fund and non-fund investment management accounts in any of the investment categories where there is a DWS Fund. These similar products included the other DWS Funds, non-fund pooled accounts, institutional accounts and sub-advisory accounts. Using this information, I calculated for each Fund the fee that would be charged to each similar product, at the subject Fund's asset level.
Evaluating information regarding non-fund products is difficult because there are varying levels of services required for different types of accounts, with mutual funds generally requiring considerably more regulatory and administrative types of service as well as having more frequent cash flows than other types of accounts. Also, while mutual fund fees for similar fund products can be expected to be similar, there will be some differences due to different pricing conditions in different distribution channels (e.g. retail funds versus those used in variable insurance products), differences in underlying investment processes and other factors.
DeAM provided a detailed profitability analysis for each Fund. After making some adjustments so that the presentation would be more comparable to the available industry figures, I reviewed profit margins from investment management alone, from investment management plus other fund services (excluding distribution) provided to the Funds by DeAM (principally shareholder services), and DeAM profits from all sources, including distribution. A later section comments on overall profitability.
Economies of scale — an expected decline in management cost per dollar of fund assets as fund assets grow — are very rarely quantified and documented because of inherent difficulties in collecting and analyzing relevant data. However, in virtually every investment category that I reviewed, larger funds tend to have lower fees and lower total expenses than smaller funds. To see how each DWS Fund compares with this industry observation, I reviewed:
The trend in Fund assets over the last five years and the accompanying trend in total expenses. This shows if the Fund has grown and, if so, whether total expense (management fees as well as other expenses) have declined as a percent of assets.
Whether the Fund has break-points in its management fee schedule, the extent of the fee reduction built into the schedule and the asset levels where the breaks take effect, and in the case of a sub-advised Fund how the Fund's break-points compare with those of the sub-advisory fee schedule.
How the Fund's contractual fee schedule compares with trends in the industry data. To accomplish this, I constructed a chart showing how actual latest-fiscal-year contractual fees of the Fund and of other similar funds relate to average fund assets, with the subject Fund's contractual fee schedule superimposed.
The quality-of-service evaluation focused on investment performance, which is the principal result of the investment management service. Each Fund's performance was reviewed over the past 1, 3, 5 and 10 years, as applicable, and compared with that of other funds in the same investment category and with a suitable market index.
In addition, I calculated and reviewed risk-adjusted returns relative to an index of similar mutual funds' returns and a suitable market index. The risk-adjusted returns analysis provides a way of determining the extent to which the Fund's return comparisons are mainly the product of investment value-added (or lack thereof) or alternatively taking considerably more or less risk than is typical in its investment category.
I also received and considered the history of portfolio manager changes for each Fund, as this provided an important context for evaluating the performance results.
While this evaluation was conducted mainly at the individual fund level, there are some issues relating to the reasonableness of fees that can alternatively be considered across the whole fund complex:
I reviewed DeAM's profitability analysis for all DWS Funds, with a view toward determining if the allocation procedures used were reasonable and how profit levels compared with public data for other investment managers.
I considered whether DeAM and affiliates receive any significant ancillary or "fallout" benefits that should be considered in interpreting the direct profitability results. These would be situations where serving as the investment manager of the Funds is beneficial to another part of the Deutsche Bank organization.
I considered how aggregated DWS Fund expenses had varied over the years, by asset class and in the context of trends in asset levels.
I considered how aggregated DWS Fund performance measures relative to appropriate peers had varied by asset class and over time.
I reviewed the structure of the DeAM organization, trends in staffing levels, and information on compensation of investment management and other professionals compared with industry data.
Based on the process and analysis discussed above, which included reviewing a wide range of information from management and external data sources and considering among other factors the fees DeAM charges other clients, the fees charged by other fund managers, DeAM's costs and profits associated with managing the Funds, economies of scale, possible fall-out benefits, and the nature and quality of services provided, in my opinion the management fees charged the DWS Funds are reasonable.
Thomas H. Mack
President, Thomas H. Mack & Co., Inc.
The following table presents certain information regarding the Board Members and Officers of the fund. Each Board Member's year of birth is set forth in parentheses after his or her name. Unless otherwise noted, (i) each Board Member has engaged in the principal occupation(s) noted in the table for at least the most recent five years, although not necessarily in the same capacity; and (ii) the address of each Independent Board Member is c/o Kenneth C. Froewiss, Chairman, DWS Mutual Funds, P.O. Box 78, Short Hills, NJ 07078. Except as otherwise noted below, the term of office for each Board Member is until the election and qualification of a successor, or until such Board Member sooner dies, resigns, is removed or as otherwise provided in the governing documents of the fund. Because the fund does not hold an annual meeting of shareholders, each Board Member will hold office for an indeterminate period. The Board Members may also serve in similar capacities with other funds in the fund complex.
The fund's Statement of Additional Information ("SAI") includes additional information about the Board Members. The SAI is available, without charge, upon request. If you would like to request a copy of the SAI, you may do so by calling the following toll-free number: (800) 728-3337.
ANNUAL REPORT TO SHAREHOLDERS
Capital Assets Funds Shares
Money Market Portfolio
Government & Agency Securities Portfolio
Tax-Exempt Portfolio
Capital Assets Funds Preferred Shares
Money Market Portfolio
April 30, 2013
Contents
4 Portfolio Management Review Money Market Portfolio 15 Statement of Assets and Liabilities 17 Statement of Operations 18 Statement of Changes in Net Assets Government & Agency Securities Portfolio 27 Statement of Assets and Liabilities 29 Statement of Operations 30 Statement of Changes in Net Assets Tax-Exempt Portfolio 40 Statement of Assets and Liabilities 42 Statement of Operations 43 Statement of Changes in Net Assets 45 Notes to Financial Statements 61 Report of Independent Registered Public Accounting Firm 62 Information About Each Fund's Expenses 67 Summary of Management Fee Evaluation by Independent Fee Consultant 71 Board Members and Officers |
This report must be preceded or accompanied by a prospectus. To obtain a summary prospectus, if available, or prospectus for any of our funds, visit www.dws-investments.com. We advise you to consider a fund's objectives, risks, charges and expenses carefully before investing. The summary prospectus and prospectus contain this and other important information about each fund. Please read the prospectus carefully before you invest.
An investment in these funds is not insured or guaranteed by the Federal Deposit Insurance Corporation (FDIC) or by any other government agency. Although the funds seek to preserve the value of your investment at $1.00 per share, it is possible to lose money by investing in the funds. The share price of money market funds can fall below the $1.00 share price. You should not rely on or expect the Advisor to enter into support agreements or take other actions to maintain a fund's $1.00 share price. The credit quality of the fund's holdings can change rapidly in certain markets, and the default of a single holding could have an adverse impact on a fund's share price. The fund's share price can also be negatively affected during periods of high redemption pressures and/or illiquid markets. The actions of a few large investors in one class of shares in a fund may have a significant adverse effect on the share prices of all classes of shares within that fund. See the prospectus for specific details regarding each fund's risk profile.
NOT FDIC/NCUA INSURED NO BANK GUARANTEE MAY LOSE VALUE NOT A DEPOSIT NOT INSURED BY ANY FEDERAL GOVERNMENT AGENCY
Portfolio Management Review (Unaudited)
Market Overview
All performance information below is historical and does not guarantee future results. Investment return and principal fluctuate, so your shares may be worth more or less when redeemed. Current performance may differ from performance data shown. Please visit www.dws-investments.com for the funds' most recent month-end performance. The 7-day current yield refers to the income paid by the funds over a 7-day period expressed as an annual percentage rate of each fund's shares outstanding. Yields fluctuate and are not guaranteed.
At the beginning of the funds' most recent fiscal year ended April 30, 2013, we saw another dramatic "flight to quality," as worries concerning Greece's upcoming elections and continuingly worsening conditions for Spanish and Italian banks led global and domestic investors to abandon risky assets. Late in 2012, any negative economic data was overshadowed by investor anticipation of more substantial central bank actions. The European Central Bank (ECB) lowered its interest rate for bank reserves. Then, the head of the ECB, Mario Draghi, stated that the central bank would do "whatever it takes" to preserve the euro. In December 2012, the U.S. Federal Reserve Board (the Fed) altered its guidance regarding rate levels, stating that it would maintain short-term interest rates near zero until U.S. unemployment dropped below 6.5%, and as long as inflation levels did not exceed 2.5%. In the first quarter of 2013, the European situation remained quiescent until the banking crisis in Cyprus reached a boiling point; the crisis was finally resolved after it was agreed that large uninsured depositors in Cyprus' banks would suffer substantial losses. In addition, the U.S. economy was boosted by higher housing prices and some gains in employment levels. In the money market area, we saw a continued supply/demand imbalance as well as a reduction in short-term money market supply due to ongoing quantitative easing by the Fed. In the continued search for yield, money market investors looked to a variety of financial instruments issued in countries around the world.
Positive Contributors to Fund Performance
We were able to maintain a yield that is in line with other similar money market funds during the period ended April 30, 2013.
| Money Market Portfolio seeks to provide maximum current income consistent with stability of capital. |
For the Money Market Portfolio, we continued to hold a large percentage of fund assets in short-maturity instruments for liquidity purposes. We also maintained a relatively conservative average maturity, with fund assets broadly diversified among a number of sectors and geographical areas for money market investment, such as Scandinavia, the United States, China and Singapore. Because we believe that overnight money market yields are beginning to decline due to heavy investor demand, we permitted the fund's weighted average maturity to lengthen somewhat to seek additional yield for the fund.
| Government & Agency Securities Portfolio seeks to provide maximum current income consistent with stability of capital. |
In the case of the Government & Agency Securities Portfolio, with short-maturity yields trading in a narrow range throughout most of the period, we pursued a "barbell" strategy for the fund: we held a large percentage of portfolio assets in overnight Treasury and agency repurchase agreements for relative yield, flexibility and liquidity purposes. At the same time, we purchased six-month to one-year Treasury and agency securities to take advantage of more attractive rates within that portion of the yield curve.
| Tax-Exempt Portfolio seeks to provide maximum current income that is exempt from federal income taxes to the extent consistent with stability of capital. |
For the Tax-Exempt Portfolio, we sought to preserve a balance of liquidity and high quality by maintaining a strong position in variable-rate securities during the period. (The interest rate of variable-rate securities adjusts periodically based on indices such as the Securities Industry and Financial Market Association Index of Variable Rate Demand Notes. Because the interest rates of these instruments adjust as market conditions change, they provide flexibility in an uncertain interest rate environment.) In addition, we took advantage of higher yields along the yield curve by investing in tax-exempt commercial paper, three-month to nine-month municipal "put" bonds, and one-year fixed-rate municipal note issues. We have also maintained broad diversification for the fund by investing in a number of states and municipalities.
Fund Performance (as of April 30, 2013)
Performance is historical and does not guarantee future results. Current performance may be lower or higher than the performance data quoted.
An investment in these funds is not insured or guaranteed by the Federal Deposit Insurance Corporation (FDIC) or by any other government agency. Although the funds seek to preserve the value of your investment at $1.00 per share, it is possible to lose money by investing in the funds.
| | | 7-Day Current Yield | |
| Money Market Portfolio — Capital Assets Funds Shares | | | .02 | %* |
| Government & Agency Securities Portfolio — Capital Assets Funds Shares | | | .01 | %* |
| Tax-Exempt Portfolio — Capital Assets Funds Shares | | | .01 | %* |
| Equivalent Taxable Yield | | | .02 | %** |
| Money Market Portfolio — Capital Assets Funds Preferred Shares | | | .05 | %* |
Yields are historical, will fluctuate and do not guarantee future performance. The 7-day current yield refers to the income paid by the funds over a 7-day period expressed as an annual percentage rate of the funds' shares outstanding. For the most current yield information, call (888) 466-4250. * The investment advisor has agreed to voluntarily waive fees/reimburse expenses. This waiver may be changed or terminated at any time without notice. ** The equivalent taxable yield allows you to compare with the performance of taxable money market funds. For the Tax-Exempt Portfolio, the equivalent taxable yield is based upon the marginal income tax rate of 35%. Income may be subject to local taxes and, for some investors, the alternative minimum tax. | |
Negative Contributors to Fund Performance
For all three funds, the types of securities that we invested in tended to have lower yields than issues carrying more risk. We preferred to be cautious during a time of market uncertainty. In the end this may have cost the funds some yield, but we believe that this represented a prudent approach to preserving principal.
Outlook and Positioning
We anticipate limited growth for the U.S. economy over the remainder of this year, due to steady but unspectacular employment gains and the automatic budget cuts dictated by congressional sequestration. In turn, we think that restrained growth will mean that the Fed will continue its extremely accommodative monetary policy through early 2014. We look for money market rates to continue to be low based on decreases in supply on a number of fronts and strong investor demand.
We continue our insistence on the highest credit quality within the funds. We also plan to maintain our conservative investment strategies and standards under the current market conditions. We continue to apply a careful approach to investing on behalf of the funds and to seek competitive yield for our shareholders.
Portfolio Management Team
A group of investment professionals is responsible for the day-to-day management of each fund. These investment professionals have a broad range of experience managing money market funds.
The views expressed reflect those of the portfolio management team only through the end of the period of the report as stated on the cover. The management team's views are subject to change at any time based on market and other conditions and should not be construed as a recommendation. Past performance is no guarantee of future results. Current and future portfolio holdings are subject to risk.
Terms to Know
Quantitative easing is a government monetary policy often used when interest rates are at or near zero. With this policy government or other securities are purchased from the market, causing the price of the securities purchased to rise and the yield or interest rates on the securities purchased to fall. For the companies whose bonds the central banks are willing to purchase, it means having to pay lower interest rates on new bonds issued to replace existing bonds that have matured. With lower borrowing costs, the central banks hope that consumers will be encouraged to spend more, thus helping the overall economy and improving the balance sheets of the companies providing the goods and services on which consumers are spending their money.
The yield curve is a graphical representation of how yields on bonds of different maturities compare. Normally, yield curves slant up, as bonds with longer maturities typically offer higher yields than short-term bonds.
A repurchase agreement, or "overnight repo," is an agreement between a seller and a buyer, usually of government securities, where the seller agrees to repurchase the securities at a given price and usually at a stated time. Repos are widely used money market instruments that serve as an interest-bearing, short-term "parking place" for large sums of money.
The Securities Industry and Financial Market Association Index of Variable Rate Demand Notes is a weekly high-grade market index consisting of seven-day, tax-exempt, variable-rate demand notes produced by Municipal Market Data Group. Actual issues are selected from Municipal Market Data's database of more than 10,000 active issues. Index returns do not reflect fees or expenses and it is not possible to invest directly into an index.
A "put" bond allows an investor to require the issuer to repurchase the bond at a specified date before its maturity.
Portfolio Summary (Unaudited)
Investment Portfolio as of April 30, 2013
Money Market Portfolio
| | | Principal Amount ($) | | | Value ($) | |
| | | | |
| Certificates of Deposit and Bank Notes 12.6% | |
| Banco del Estado de Chile, 0.24%, 5/14/2013 | | | 4,000,000 | | | | 4,000,000 | |
| Bank of Montreal, 0.13%, 5/3/2013 | | | 50,000,000 | | | | 50,000,000 | |
| Caisse d'Amortissement de la Dette Sociale, 1.375%, 7/29/2013 | | | 6,000,000 | | | | 6,016,628 | |
| Caisse des Depots et Consignations, 1.25%, 9/20/2013 | | | 8,000,000 | | | | 8,029,846 | |
| China Construction Bank Corp., 0.32%, 5/28/2013 | | | 10,000,000 | | | | 10,000,000 | |
| DnB Bank ASA, 0.22%, 6/4/2013 | | | 12,000,000 | | | | 12,000,000 | |
| DZ Bank AG: | |
| 0.22%, 5/10/2013 | | | 8,000,000 | | | | 8,000,000 | |
| 0.22%, 6/5/2013 | | | 15,000,000 | | | | 15,000,000 | |
| Industrial & Commercial Bank of China: | |
| 0.29%, 5/28/2013 | | | 29,000,000 | | | | 29,000,000 | |
| 0.29%, 6/4/2013 | | | 8,000,000 | | | | 8,000,000 | |
| Kreditanstalt Fuer Wiederaufbau, 0.22%, 4/11/2014 | | | 10,000,000 | | | | 9,996,488 | |
| Nordea Bank Finland PLC: | |
| 0.25%, 9/9/2013 | | | 10,000,000 | | | | 10,000,000 | |
| 0.3%, 6/14/2013 | | | 3,000,000 | | | | 3,000,000 | |
| Rabobank Nederland NV, 0.27%, 9/9/2013 | | | 5,000,000 | | | | 5,000,000 | |
| Svenska Handelsbanken AB: | |
| 0.225%, 7/12/2013 | | | 10,000,000 | | | | 10,000,100 | |
| 0.28%, 7/23/2013 | | | 10,000,000 | | | | 10,000,115 | |
Total Certificates of Deposit and Bank Notes (Cost $198,043,177) | | | | 198,043,177 | |
| | |
| Commercial Paper 28.1% | |
| Issued at Discount** 25.7% | |
| Bedford Row Funding Corp.: | |
| 144A, 0.32%, 7/15/2013 | | | 3,500,000 | | | | 3,497,667 | |
| 144A, 0.39%, 10/21/2013 | | | 3,500,000 | | | | 3,493,440 | |
| 144A, 0.42%, 1/3/2014 | | | 3,500,000 | | | | 3,489,914 | |
| BHP Billiton Finance (U.S.A.) Ltd., 144A, 0.15%, 5/16/2013 | | | 50,000,000 | | | | 49,996,875 | |
| Carnival Corp., 0.28%, 5/6/2013 | | | 2,500,000 | | | | 2,499,903 | |
| Collateralized Commercial Paper II Co., LLC: | |
| 144A, 0.25%, 7/9/2013 | | | 6,000,000 | | | | 5,997,125 | |
| 144A, 0.3%, 6/3/2013 | | | 10,000,000 | | | | 9,997,250 | |
| 144A, 0.32%, 5/14/2013 | | | 9,000,000 | | | | 8,998,960 | |
| 144A, 0.33%, 5/15/2013 | | | 9,000,000 | | | | 8,998,845 | |
| DnB Bank ASA, 0.24%, 5/13/2013 | | | 9,000,000 | | | | 8,999,280 | |
| Erste Abwicklungsanstalt: | |
| 0.21%, 5/10/2013 | | | 14,000,000 | | | | 13,999,265 | |
| 0.21%, 6/3/2013 | | | 3,500,000 | | | | 3,499,326 | |
| 0.24%, 8/1/2013 | | | 3,000,000 | | | | 2,998,160 | |
| 0.39%, 7/22/2013 | | | 8,500,000 | | | | 8,492,449 | |
| 0.425%, 7/8/2013 | | | 12,000,000 | | | | 11,990,367 | |
| 0.43%, 7/19/2013 | | | 8,500,000 | | | | 8,491,979 | |
| 0.43%, 8/13/2013 | | | 5,000,000 | | | | 4,993,789 | |
| 0.48%, 5/2/2013 | | | 5,000,000 | | | | 4,999,933 | |
| General Electric Capital Corp., 0.25%, 5/1/2013 | | | 12,000,000 | | | | 12,000,000 | |
| Google, Inc., 0.15%, 5/2/2013 | | | 2,000,000 | | | | 1,999,992 | |
| Gotham Funding Corp., 144A, 0.19%, 5/8/2013 | | | 15,000,000 | | | | 14,999,446 | |
| Kells Funding LLC: | |
| 144A, 0.25%, 9/17/2013 | | | 5,000,000 | | | | 4,995,174 | |
| 144A, 0.25%, 9/20/2013 | | | 5,000,000 | | | | 4,995,069 | |
| 144A, 0.26%, 8/19/2013 | | | 8,000,000 | | | | 7,993,644 | |
| 144A, 0.26%, 8/27/2013 | | | 5,000,000 | | | | 4,995,739 | |
| 144A, 0.34%, 5/28/2013 | | | 5,000,000 | | | | 4,998,725 | |
| Kreditanstalt Fuer Wiederaufbau, 144A, 0.19%, 5/2/2013 | | | 10,000,000 | | | | 9,999,947 | |
| Matchpoint Master Trust, 0.2%, 5/16/2013 | | | 6,000,000 | | | | 5,999,500 | |
| Nestle Finance International Ltd., 0.27%, 5/7/2013 | | | 7,500,000 | | | | 7,499,663 | |
| Nieuw Amsterdam Receivables Corp., 144A, 0.23%, 5/8/2013 | | | 5,358,000 | | | | 5,357,760 | |
| Nordea North America, Inc.: | |
| 0.26%, 8/26/2013 | | | 8,000,000 | | | | 7,993,240 | |
| 0.275%, 7/16/2013 | | | 10,500,000 | | | | 10,493,904 | |
| Oversea-Chinese Banking Corp., Ltd., 0.2%, 5/28/2013 | | | 16,000,000 | | | | 15,997,600 | |
| Queensland Treasury Corp., 0.15%, 5/21/2013 | | | 35,000,000 | | | | 34,997,083 | |
| Scaldis Capital LLC: | |
| 0.18%, 5/13/2013 | | | 15,000,000 | | | | 14,999,100 | |
| 0.19%, 5/23/2013 | | | 23,000,000 | | | | 22,997,330 | |
| Skandinaviska Enskilda Banken AB, 0.225%, 5/6/2013 | | | 10,000,000 | | | | 9,999,688 | |
| Standard Chartered Bank, 0.27%, 7/11/2013 | | | 18,000,000 | | | | 17,990,415 | |
| UOB Funding LLC, 0.25%, 8/26/2013 | | | 10,000,000 | | | | 9,991,875 | |
| Victory Receivables Corp., 144A, 0.21%, 5/13/2013 | | | 6,000,000 | | | | 5,999,580 | |
| Working Capital Management Co., 144A, 0.21%, 5/10/2013 | | | 4,000,000 | | | | 3,999,790 | |
| | | | | 406,728,791 | |
| Issued at Par* 2.4% | |
| ASB Finance Ltd., 144A, 0.414%, 9/4/2013 | | | 8,500,000 | | | | 8,500,000 | |
| Australia & New Zealand Banking Group Ltd., 144A, 0.35%, 12/6/2013 | | | 4,000,000 | | | | 4,000,000 | |
| BNZ International Funding Ltd., 144A, 0.356%, 10/23/2013 | | | 4,000,000 | | | | 4,000,000 | |
| Kells Funding LLC, 144A, 0.299%, 10/21/2013 | | | 3,000,000 | | | | 3,000,012 | |
| Westpac Banking Corp.: | |
| 144A, 0.293%, 9/3/2013 | | | 5,000,000 | | | | 5,000,000 | |
| 144A, 0.35%, 11/29/2013 | | | 13,250,000 | | | | 13,250,000 | |
| | | | | 37,750,012 | |
Total Commercial Paper (Cost $444,478,803) | | | | 444,478,803 | |
| Short-Term Notes* 9.2% | |
| Bank of Nova Scotia: | |
| 0.25%, 8/9/2013 | | | 9,000,000 | | | | 9,000,000 | |
| 0.29%, 1/10/2014 | | | 8,000,000 | | | | 8,000,000 | |
| 0.3%, 1/10/2014 | | | 8,000,000 | | | | 8,000,000 | |
| HSBC Bank PLC, 144A, 0.72%, 5/15/2013 | | | 7,500,000 | | | | 7,501,292 | |
| JPMorgan Chase Bank NA, 0.347%, 6/18/2013 | | | 3,000,000 | | | | 3,000,691 | |
| Kommunalbanken AS, 144A, 0.2%, 2/26/2014 | | | 7,500,000 | | | | 7,500,000 | |
| National Australia Bank Ltd., 0.28%, 8/13/2013 | | | 8,500,000 | | | | 8,500,000 | |
| Rabobank Nederland NV: | |
| 0.345%, 1/27/2014 | | | 10,000,000 | | | | 10,000,000 | |
| 0.383%, 6/27/2013 | | | 5,000,000 | | | | 5,000,000 | |
| 0.448%, 5/7/2013 | | | 10,000,000 | | | | 10,000,000 | |
| 144A, 0.5%, 8/16/2014 | | | 12,000,000 | | | | 12,000,000 | |
| Royal Bank of Canada: | |
| 0.35%, 2/28/2014 | | | 8,000,000 | | | | 8,000,000 | |
| 0.53%, 6/4/2013 | | | 4,500,000 | | | | 4,500,000 | |
| Svensk Exportkredit AB, 144A, 0.42%, 5/22/2013 | | | 4,000,000 | | | | 4,000,000 | |
| Wells Fargo Bank NA, 0.189%, 11/22/2013 | | | 10,000,000 | | | | 10,000,000 | |
| Westpac Banking Corp.: | |
| 0.35%, 11/15/2013 | | | 10,000,000 | | | | 10,000,000 | |
| 0.373%, 5/3/2013 | | | 12,000,000 | | | | 12,000,058 | |
| 0.459%, 8/9/2013 | | | 9,000,000 | | | | 9,000,000 | |
Total Short-Term Notes (Cost $146,002,041) | | | | 146,002,041 | |
| | |
| Government & Agency Obligations 9.2% | |
| Other Government Related 0.5% | |
| European Investment Bank, 1.875%, 6/17/2013 (a) | | | 8,500,000 | | | | 8,518,792 | |
| U.S. Government Sponsored Agencies 6.9% | |
| Federal Farm Credit Bank, 0.22%*, 10/29/2014 | | | 4,000,000 | | | | 4,000,918 | |
| Federal Home Loan Bank: | |
| 0.17%, 7/5/2013 | | | 7,000,000 | | | | 6,999,788 | |
| 0.18%, 3/7/2014 | | | 5,000,000 | | | | 4,999,788 | |
| 0.21%*, 11/8/2013 | | | 3,500,000 | | | | 3,499,271 | |
| 0.36%, 5/16/2013 | | | 4,000,000 | | | | 4,000,184 | |
| 0.5%, 8/28/2013 | | | 7,000,000 | | | | 7,006,798 | |
| Federal Home Loan Mortgage Corp.: | |
| 0.119%**, 8/26/2013 | | | 12,000,000 | | | | 11,995,320 | |
| 0.139%**, 8/13/2013 | | | 12,500,000 | | | | 12,494,944 | |
| 0.165%**, 5/29/2013 | | | 10,000,000 | | | | 9,998,678 | |
| Federal National Mortgage Association: | |
| 0.139%**, 7/19/2013 | | | 12,500,000 | | | | 12,496,160 | |
| 0.149%**, 9/3/2013 | | | 25,000,000 | | | | 24,986,979 | |
| 0.149%**, 9/16/2013 | | | 6,000,000 | | | | 5,996,550 | |
| | | | | 108,475,378 | |
| U.S. Treasury Obligations 1.8% | |
| U.S. Treasury Notes: | |
| 0.5%, 5/31/2013 | | | 13,500,000 | | | | 13,503,886 | |
| 0.5%, 10/15/2013 | | | 6,800,000 | | | | 6,809,813 | |
| 0.5%, 11/15/2013 | | | 8,000,000 | | | | 8,015,018 | |
| | | | | 28,328,717 | |
Total Government & Agency Obligations (Cost $145,322,887) | | | | 145,322,887 | |
| | |
| Time Deposits 9.7% | |
| BNP Paribas, 0.11%, 5/1/2013 | | | 41,000,000 | | | | 41,000,000 | |
| Citibank NA, 0.15%, 5/1/2013 | | | 47,000,000 | | | | 47,000,000 | |
| National Australia Bank Ltd., 0.1%, 5/1/2013 | | | 65,000,000 | | | | 65,000,000 | |
Total Time Deposits (Cost $153,000,000) | | | | 153,000,000 | |
| | |
| Municipal Bonds and Notes 2.1% | |
| Texas, JPMorgan Chase Putters/Drivers Trust, Various States, Series 4264, 144A, 0.18%***, 8/30/2013, LIQ: JPMorgan Chase Bank NA | | | 20,000,000 | | | | 20,000,000 | |
| Texas, State Transportation Revenue, 2.5%, 8/30/2013 | | | 13,000,000 | | | | 13,098,035 | |
Total Municipal Bonds and Notes (Cost $33,098,035) | | | | 33,098,035 | |
| | |
| Repurchase Agreements 29.1% | |
| Barclays Capital PLC, 0.1%, dated 4/25/2013, to be repurchased at $23,000,447 on 5/2/2013 (b) | | | 23,000,000 | | | | 23,000,000 | |
| Citigroup Global Markets, Inc., 0.09%, dated 4/24/2013, to be repurchased at $64,001,120 on 5/1/2013 (c) | | | 64,000,000 | | | | 64,000,000 | |
| HSBC Securities, Inc., 0.14%, dated 4/30/2013, to be repurchased at $26,000,101 on 5/1/2013 (d) | | | 26,000,000 | | | | 26,000,000 | |
| JPMorgan Securities, Inc., 0.17%, dated 4/30/2013, to be repurchased at $15,000,071 on 5/1/2013 (e) | | | 15,000,000 | | | | 15,000,000 | |
| JPMorgan Securities, Inc., 0.403%, dated 3/18/2013, to be repurchased at $8,032,688 on 3/18/2014 (f) | | | 8,000,000 | | | | 8,000,000 | |
| Merrill Lynch & Co., Inc., 0.09%, dated 4/26/2013, to be repurchased at $85,001,488 on 5/3/2013 (g) | | | 85,000,000 | | | | 85,000,000 | |
| Merrill Lynch & Co., Inc., 0.14%, dated 4/30/2013, to be repurchased at $2,786,057 on 5/1/2013 (h) | | | 2,786,046 | | | | 2,786,046 | |
| Merrill Lynch & Co., Inc., 0.17%, dated 3/1/2013, to be repurchased at $20,017,567 on 9/3/2013 (i) | | | 20,000,000 | | | | 20,000,000 | |
| Morgan Stanley & Co., Inc., 0.17%, dated 4/30/2013, to be repurchased at $160,000,756 on 5/1/2013 (j) | | | 160,000,000 | | | | 160,000,000 | |
| The Goldman Sachs & Co., 0.16%, dated 4/30/2013, to be repurchased at $36,500,162 on 5/1/2013 (k) | | | 36,500,000 | | | | 36,500,000 | |
| The Toronto-Dominion Bank, 0.1%, dated 4/24/2013, to be repurchased at $20,000,389 on 5/1/2013 (l) | | | 20,000,000 | | | | 20,000,000 | |
Total Repurchase Agreements (Cost $460,286,046) | | | | 460,286,046 | |
| | | % of Net Assets | | | Value ($) | |
| | | | |
Total Investment Portfolio (Cost $1,580,230,989)† | | | 100.0 | | | | 1,580,230,989 | |
| Other Assets and Liabilities, Net | | | 0.0 | | | | 150,395 | |
| Net Assets | | | 100.0 | | | | 1,580,381,384 | |
* Floating rate securities' yields vary with a designated market index or market rate, such as the coupon-equivalent of the U.S. Treasury Bill rate. These securities are shown at their current rate as of April 30, 2013.
** Annualized yield at time of purchase; not a coupon rate.
*** Variable rate demand notes are securities whose interest rates are reset periodically at market levels. These securities are payable on demand and are shown at their current rates as of April 30, 2013.
† The cost for federal income tax purposes was $1,580,230,989.
(a) Government-backed debt issued by financial companies or government sponsored enterprises.
(b) Collateralized by $26,276,294 Federal National Mortgage Association, maturing on 10/9/2019 with a value of $23,460,001.
(c) Collateralized by:
| Principal Amount ($) | | Security | | Rate (%) | | Maturity Date | | Collateral Value ($) | |
| | 2,477,802 | | Federal Home Loan Mortgage Corp. | | | 1.299 | | 11/15/2036 | | | 2,296,019 | |
| | 64,828,528 | | Federal Home Loan Mortgage Corp. — Interest Only | | | 5.801-5.881 | | 4/15/2037- 10/15/2041 | | | 9,185,069 | |
| | 95,122,638 | | Federal National Mortgage Association — Interest Only | | | 5.8-6.35 | | 6/25/2040- 7/25/2042 | | | 16,811,622 | |
| | 3,628,588 | | Government National Mortgage Association | | | 19.442 | | 1/20/2038 | | | 4,867,796 | |
| | 204,115,863 | | Government National Mortgage Association — Interest Only | | | 5.85-6.45 | | 10/20/2038- 11/16/2041 | | | 31,515,411 | |
| | 975,257 | | Government National Mortgage Association — Principal Only | | Zero Coupon | | 3/20/2040 | | | 878,770 | |
| Total Collateral Value | | | 65,554,687 | |
(d) Collateralized by $23,116,800 U.S. Treasury Inflation-Indexed Notes, with the various coupon rates from 0.125-2.0%, with various maturity dates of 1/15/2016-1/15/2023 with a value of $26,520,744.
(e) Collateralized by $139,236,797 Federal National Mortgage Association — Interest Only, with the various coupon rates from 3.0-6.5%, with various maturity dates of 8/25/2026-10/25/2040 with a value of $15,300,362.
(f) Collateralized by $8,176,760 Ally Auto Receivables Trust, 1.06%, maturing on 5/15/2017 with a value of $8,241,343.
(g) Collateralized by:
| Principal Amount ($) | | Security | | Rate (%) | | Maturity Date | | Collateral Value ($) | |
| | 20,999,000 | | Federal Farm Credit Bank | | | 1.5-2.11 | | 4/1/2020- 11/15/2023 | | | 21,125,904 | |
| | 19,000,000 | | Federal Home Loan Bank | | | 2.35 | | 8/8/2022 | | | 18,221,532 | |
| | 38,000,000 | | Federal Home Loan Mortgage Corp. | | | 0.875-5.63 | | 3/7/2018- 3/12/2027 | | | 38,886,044 | |
| | 9,803,000 | | Federal Home Loan Mortgage Corp. STRIPS | | Zero Coupon | | 1/15/2022 | | | 8,012,384 | |
| | 455,000 | | Federal National Mortgage Association | | | 0.375 | | 10/29/2015 | | | 455,032 | |
| Total Collateral Value | | | 86,700,896 | |
(h) Collateralized by $2,836,200 U.S. Treasury Note, 0.25%, maturing on 11/30/2014 with a value of $2,841,802.
(i) Collateralized by $13,936,100 U.S. Treasury Bond, 6.0%, maturing on 2/15/2026 with a value of $20,400,014.
(j) Collateralized by $153,412,926 Federal National Mortgage Association, with the various coupon rates from 2.47-4.0%, with various maturity dates of 9/1/2027-3/1/2043 with a value of $163,200,001.
(k) Collateralized by $34,311,775 Federal National Mortgage Association, with the various coupon rates from 4.0-5.0%, with various maturity dates of 5/1/2035-12/1/2042 with a value of $37,230,000.
(l) Collateralized by $20,269,900 U.S. Treasury Notes, with the various coupon rates from 0.25-4.125%, with various maturity dates of 6/15/2014-5/15/2015 with a value of $20,400,014.
144A: Security exempt from registration under Rule 144A of the Securities Act of 1933. These securities may be resold in transactions exempt from registration, normally to qualified institutional buyers.
Interest Only: Interest Only (IO) bonds represent the "interest only" portion of payments on a pool of underlying mortgages or mortgage-backed securities. IO securities are subject to prepayment risk of the pool of underlying mortgages.
LIQ: Liquidity Facility
Principal Only: Principal Only (PO) bonds represent the "principal only" portion of payments on a pool of underlying mortgages or mortgage-backed securities.
STRIPS: Separate Trading of Registered Interest and Principal Securities
Fair Value Measurements
Various inputs are used in determining the value of the Fund's investments. These inputs are summarized in three broad levels. Level 1 includes quoted prices in active markets for identical securities. Level 2 includes other significant observable inputs (including quoted prices for similar securities, interest rates, prepayment speeds and credit risk). Level 3 includes significant unobservable inputs (including the Fund's own assumptions in determining the fair value of investments). The inputs or methodology used for valuing securities are not necessarily an indication of the risk associated with investing in those securities. Securities held by the Fund are reflected as Level 2 because the securities are valued at amortized cost (which approximates fair value) and, accordingly, the inputs used to determine value are not quoted prices in an active market.
The following is a summary of the inputs used as of April 30, 2013 in valuing the Fund's investments. For information on the Fund's policy regarding the valuation of investments, please refer to the Security Valuation section of Note 1 in the accompanying Notes to Financial Statements.
| Assets | | Level 1 | | | Level 2 | | | Level 3 | | | Total | |
| | |
| Investments in Securities (m) | | $ | — | | | $ | 1,119,944,943 | | | $ | — | | | $ | 1,119,944,943 | |
| Repurchase Agreements | | | — | | | | 460,286,046 | | | | — | | | | 460,286,046 | |
| Total | | $ | — | | | $ | 1,580,230,989 | | | $ | — | | | $ | 1,580,230,989 | |
There have been no transfers between fair value measurement levels during the year ended April 30, 2013.
(m) See Investment Portfolio for additional categorizations.
The accompanying notes are an integral part of the financial statements.
Statement of Assets and Liabilities | as of April 30, 2013 | |
| Assets | | Money Market Portfolio | |
Investments: Investments in non-affiliated securities, valued at amortized cost | | $ | 1,119,944,943 | |
| Repurchase agreements, valued at amortized cost | | | 460,286,046 | |
| Total investments in securities, valued at amortized cost | | | 1,580,230,989 | |
| Receivable for Fund shares sold | | | 2,321 | |
| Interest receivable | | | 656,881 | |
| Due from Advisor | | | 193 | |
| Other assets | | | 66,922 | |
| Total assets | | | 1,580,957,306 | |
| Liabilities | |
| Payable for Fund shares redeemed | | | 8,146 | |
| Accrued management fee | | | 214,424 | |
| Accrued Trustees' fees | | | 15,584 | |
| Other accrued expenses and payables | | | 337,768 | |
| Total liabilities | | | 575,922 | |
| Net assets, at value | | $ | 1,580,381,384 | |
| Net Assets Consist of | |
| Undistributed net investment income | | | 26,943 | |
| Accumulated net realized gain (loss) | | | (13,851 | ) |
| Paid-in capital | | | 1,580,368,292 | |
| Net assets, at value | | $ | 1,580,381,384 | |
The accompanying notes are an integral part of the financial statements.
Statement of Assets and Liabilities as of April 30, 2013 (continued) | |
| Net Asset Value | | Money Market Portfolio | |
Capital Assets Funds Shares Net Asset Value, offering and redemption price per share ($582,909,923 ÷ 582,576,498 outstanding shares of beneficial interest, no par value, unlimited number of shares authorized) | | $ | 1.00 | |
Capital Assets Funds Preferred Shares Net Asset Value, offering and redemption price per share ($1,696,111 ÷ 1,695,141 outstanding shares of beneficial interest, no par value, unlimited number of shares authorized) | | $ | 1.00 | |
Davidson Cash Equivalent Shares Net Asset Value, offering and redemption price per share ($7,608,926 ÷ 7,604,572 outstanding shares of beneficial interest, no par value, unlimited number of shares authorized) | | $ | 1.00 | |
Davidson Cash Equivalent Plus Shares Net Asset Value, offering and redemption price per share ($583,590 ÷ 583,256 outstanding shares of beneficial interest, no par value, unlimited number of shares authorized) | | $ | 1.00 | |
Premium Reserve Money Market Shares Net Asset Value, offering and redemption price per share ($56,973,559 ÷ 56,940,968 outstanding shares of beneficial interest, no par value, unlimited number of shares authorized) | | $ | 1.00 | |
Service Shares Net Asset Value, offering and redemption price per share ($930,609,275 ÷ 930,076,962 outstanding shares of beneficial interest, no par value, unlimited number of shares authorized) | | $ | 1.00 | |
The accompanying notes are an integral part of the financial statements.
| for the year ended April 30, 2013 | |
| Investment Income | | Money Market Portfolio | |
Income: Interest | | $ | 5,066,039 | |
Expenses: Management fee | | | 2,833,999 | |
| Services to shareholders | | | 4,315,409 | |
| Distribution and service fees | | | 10,046,458 | |
| Custodian fee | | | 50,971 | |
| Professional fees | | | 122,043 | |
| Reports to shareholders | | | 297,324 | |
| Registration fees | | | 130,640 | |
| Trustees' fees and expenses | | | 73,535 | |
| Other | | | 57,895 | |
| Total expenses before expense reductions | | | 17,928,274 | |
| Expense reductions | | | (13,103,841 | ) |
| Total expenses after expense reductions | | | 4,824,433 | |
| Net investment income | | | 241,606 | |
| Net realized gain (loss) from investments | | | 9,230 | |
| Net increase (decrease) in net assets resulting from operations | | $ | 250,836 | |
The accompanying notes are an integral part of the financial statements.
Statement of Changes in Net Assets | | | Money Market Portfolio | |
| Increase (Decrease) in Net Assets | | Years Ended April 30, | |
| | 2013 | | | 2012 | |
Operations: Net investment income | | $ | 241,606 | | | $ | 287,114 | |
| Net realized gain (loss) | | | 9,230 | | | | (23,081 | ) |
| Net increase in net assets resulting from operations | | | 250,836 | | | | 264,033 | |
Distributions to shareholders from: Net investment income: Capital Assets Funds Shares | | | (135,785 | ) | | | (151,966 | ) |
| Capital Assets Funds Preferred Shares | | | (1,152 | ) | | | (1,683 | ) |
| Davidson Cash Equivalent Shares | | | (895 | ) | | | (1,139 | ) |
| Davidson Cash Equivalent Plus Shares | | | (69 | ) | | | (101 | ) |
| Premium Reserve Money Market Shares | | | (5,207 | ) | | | (5,559 | ) |
| Service Shares | | | (98,502 | ) | | | (126,660 | ) |
Net realized gains: Capital Assets Funds Shares | | | (4,805 | ) | | | — | |
| Capital Assets Funds Preferred Shares | | | (18 | ) | | | — | |
| Davidson Cash Equivalent Shares | | | (64 | ) | | | — | |
| Davidson Cash Equivalent Plus Shares | | | (6 | ) | | | — | |
| Premium Reserve Money Market Shares | | | (447 | ) | | | — | |
| Service Shares | | | (6,802 | ) | | | — | |
| Total distributions | | | (253,752 | ) | | | (287,108 | ) |
Fund share transactions: Proceeds from shares sold | | | 1,530,799,135 | | | | 2,195,076,399 | |
| Reinvestment of distributions | | | 251,713 | | | | 284,155 | |
| Cost of shares redeemed | | | (1,744,126,197 | ) | | | (2,987,807,342 | ) |
| Net increase (decrease) in net assets from Fund share transactions | | | (213,075,349 | ) | | | (792,446,788 | ) |
| Increase (decrease) in net assets | | | (213,078,265 | ) | | | (792,469,863 | ) |
| Net assets at beginning of period | | | 1,793,459,649 | | | | 2,585,929,512 | |
| Net assets at end of period (including undistributed net investment income of $26,943 and $39,089, respectively) | | $ | 1,580,381,384 | | | $ | 1,793,459,649 | |
The accompanying notes are an integral part of the financial statements.
Money Market Portfolio Capital Assets Funds Shares | |
| | | Years Ended April 30, | |
| | 2013 | | | 2012 | | | 2011 | | | 2010 | | | 2009 | |
| Selected Per Share Data | |
| Net asset value, beginning of period | | $ | 1.00 | | | $ | 1.00 | | | $ | 1.00 | | | $ | 1.00 | | | $ | 1.00 | |
Income (loss) from investment operations: Net investment income | | | .000 | * | | | .000 | * | | | .000 | * | | | .001 | | | | .012 | |
| Net realized gain (loss) | | | .000 | * | | | (.000 | )* | | | .000 | * | | | .000 | * | | | .000 | * |
| Total from investment operations | | | .000 | * | | | .000 | * | | | .000 | * | | | .001 | | | | .012 | |
Less distributions from: Net investment income | | | (.000 | )* | | | (.000 | )* | | | (.000 | )* | | | (.001 | ) | | | (.012 | ) |
| Net realized gain | | | (.000 | )* | | | — | | | | — | | | | (.000 | )* | | | — | |
| Total distributions | | | (.000 | )* | | | (.000 | )* | | | (.000 | )* | | | (.001 | ) | | | (.012 | ) |
| Net asset value, end of period | | $ | 1.00 | | | $ | 1.00 | | | $ | 1.00 | | | $ | 1.00 | | | $ | 1.00 | |
Total Return (%)a | | | .02 | | | | .02 | | | | .02 | | | | .06 | | | | 1.21 | |
| Ratios to Average Net Assets and Supplemental Data | |
| Net assets, end of period ($ millions) | | | 583 | | | | 734 | | | | 846 | | | | 897 | | | | 919 | |
| Ratio of expenses before expense reductions (%) | | | 1.04 | | | | 1.04 | | | | 1.03 | | | | 1.03 | | | | 1.04 | |
| Ratio of expenses after expense reductions (%) | | | .27 | | | | .25 | | | | .34 | | | | .42 | | | | 1.00 | |
| Ratio of net investment income (%) | | | .02 | | | | .02 | | | | .02 | | | | .04 | | | | 1.16 | |
a Total return would have been lower had certain expenses not been reduced. * Amount is less than $.0005. | |
Money Market Portfolio Capital Assets Funds Preferred Shares | |
| | | Years Ended April 30, | |
| | 2013 | | | 2012 | | | 2011 | | | 2010 | | | 2009 | |
| Selected Per Share Data | |
| Net asset value, beginning of period | | $ | 1.00 | | | $ | 1.00 | | | $ | 1.00 | | | $ | 1.00 | | | $ | 1.00 | |
Income (loss) from investment operations: Net investment income | | | .001 | | | | .001 | | | | .001 | | | | .001 | | | | .016 | |
| Net realized gain (loss) | | | .000 | * | | | (.000 | )* | | | .000 | * | | | .000 | * | | | .000 | * |
| Total from investment operations | | | .001 | | | | .001 | | | | .001 | | | | .001 | | | | .016 | |
Less distributions from: Net investment income | | | (.001 | ) | | | (.001 | ) | | | (.001 | ) | | | (.001 | ) | | | (.016 | ) |
| Net realized gain | | | (.000 | )* | | | — | | | | — | | | | (.000 | )* | | | — | |
| Total distributions | | | (.001 | ) | | | (.001 | ) | | | (.001 | ) | | | (.001 | ) | | | (.016 | ) |
| Net asset value, end of period | | $ | 1.00 | | | $ | 1.00 | | | $ | 1.00 | | | $ | 1.00 | | | $ | 1.00 | |
Total Return (%)a | | | .05 | | | | .05 | | | | .05 | | | | .06 | | | | 1.60 | |
| Ratios to Average Net Assets and Supplemental Data | |
| Net assets, end of period ($ millions) | | | 2 | | | | 3 | | | | 5 | | | | 53 | | | | 49 | |
| Ratio of expenses before expense reductions (%) | | | .66 | | | | .66 | | | | .65 | | | | .65 | | | | .65 | |
| Ratio of expenses after expense reductions (%) | | | .24 | | | | .22 | | | | .33 | | | | .41 | | | | .61 | |
| Ratio of net investment income (%) | | | .05 | | | | .05 | | | | .05 | | | | .04 | | | | 1.55 | |
a Total return would have been lower had certain expenses not been reduced. * Amount is less than $.0005. | |
Portfolio Summary (Unaudited)
Investment Portfolio as of April 30, 2013
Government & Agency Securities Portfolio
| | | Principal Amount ($) | | | Value ($) | |
| | | | |
| Government & Agency Obligations 51.8% | |
| U.S. Government Sponsored Agencies 45.6% | |
| Federal Farm Credit Bank: | |
| 0.15%**, 2/6/2014 | | | 75,000,000 | | | | 75,000,000 | |
| 0.19%, 12/13/2013 | | | 15,000,000 | | | | 15,000,000 | |
| 0.211%*, 5/23/2013 | | | 10,000,000 | | | | 9,998,656 | |
| Federal Home Loan Bank: | |
| 0.117%*, 6/3/2013 | | | 35,000,000 | | | | 34,996,150 | |
| 0.12%, 10/3/2013 | | | 50,000,000 | | | | 49,997,423 | |
| 0.125%, 3/27/2014 | | | 15,000,000 | | | | 14,992,270 | |
| 0.15%, 10/15/2013 | | | 38,000,000 | | | | 37,998,836 | |
| 0.16%, 6/5/2013 | | | 25,000,000 | | | | 24,999,760 | |
| 0.16%, 12/19/2013 | | | 15,000,000 | | | | 14,999,389 | |
| 0.17%, 7/5/2013 | | | 30,000,000 | | | | 29,999,090 | |
| 0.17%, 3/25/2014 | | | 15,000,000 | | | | 14,998,374 | |
| 0.171%*, 6/5/2013 | | | 50,000,000 | | | | 49,991,493 | |
| 0.18%**, 7/25/2013 | | | 25,000,000 | | | | 24,999,703 | |
| 0.18%**, 7/26/2013 | | | 15,000,000 | | | | 14,999,647 | |
| 0.18%, 3/7/2014 | | | 22,500,000 | | | | 22,498,775 | |
| 0.21%**, 11/8/2013 | | | 27,000,000 | | | | 26,994,378 | |
| 0.22%**, 11/15/2013 | | | 12,500,000 | | | | 12,497,259 | |
| 0.235%**, 11/4/2013 | | | 49,000,000 | | | | 48,993,658 | |
| 0.28%, 11/14/2013 | | | 10,000,000 | | | | 10,006,609 | |
| 0.31%, 5/16/2013 | | | 20,755,000 | | | | 20,755,569 | |
| 0.31%**, 5/17/2013 | | | 38,000,000 | | | | 38,000,000 | |
| 0.36%, 5/16/2013 | | | 27,500,000 | | | | 27,501,263 | |
| 0.5%, 8/28/2013 | | | 24,000,000 | | | | 24,023,308 | |
| 0.875%, 12/27/2013 | | | 12,000,000 | | | | 12,055,109 | |
| 2.375%, 3/14/2014 | | | 10,000,000 | | | | 10,190,020 | |
| Federal Home Loan Mortgage Corp.: | |
| 0.11%*, 11/19/2013 | | | 17,000,000 | | | | 16,989,507 | |
| 0.119%*, 8/26/2013 | | | 50,000,000 | | | | 49,980,500 | |
| 0.128%*, 7/15/2013 | | | 25,000,000 | | | | 24,993,229 | |
| 0.138%*, 7/9/2013 | | | 38,000,000 | | | | 37,989,803 | |
| 0.139%**, 9/13/2013 | | | 75,000,000 | | | | 74,998,762 | |
| 0.139%*, 8/13/2013 | | | 12,500,000 | | | | 12,494,944 | |
| 0.147%*, 6/12/2013 | | | 25,000,000 | | | | 24,995,625 | |
| 0.149%*, 9/4/2013 | | | 35,000,000 | | | | 34,981,625 | |
| 0.15%*, 5/6/2013 | | | 20,000,000 | | | | 19,999,514 | |
| 0.158%*, 6/25/2013 | | | 35,000,000 | | | | 34,991,444 | |
| 0.165%*, 5/29/2013 | | | 20,000,000 | | | | 19,997,355 | |
| 0.166%*, 5/13/2013 | | | 18,000,000 | | | | 17,998,920 | |
| 1.375%, 2/25/2014 | | | 15,000,000 | | | | 15,151,525 | |
| 3.5%, 5/29/2013 | | | 10,500,000 | | | | 10,526,336 | |
| Federal National Mortgage Association: | |
| 0.09%*, 5/8/2013 | | | 25,000,000 | | | | 24,999,514 | |
| 0.109%*, 7/2/2013 | | | 22,000,000 | | | | 21,995,832 | |
| 0.129%*, 10/1/2013 | | | 38,000,000 | | | | 37,979,005 | |
| 0.139%*, 7/19/2013 | | | 20,000,000 | | | | 19,993,856 | |
| 0.149%*, 9/16/2013 | | | 68,500,000 | | | | 68,460,612 | |
| 0.16%*, 5/1/2013 | | | 10,000,000 | | | | 10,000,000 | |
| 0.169%*, 5/22/2013 | | | 25,000,000 | | | | 24,997,448 | |
| 1.5%, 6/26/2013 | | | 10,000,000 | | | | 10,019,950 | |
| 2.75%, 3/13/2014 | | | 58,000,000 | | | | 59,304,625 | |
| | | | | 1,340,326,670 | |
| U.S. Treasury Obligations 5.2% | |
| U.S. Treasury Notes: | |
| 0.25%, 10/31/2013 | | | 10,000,000 | | | | 10,001,916 | |
| 0.25%, 11/30/2013 | | | 15,000,000 | | | | 15,008,089 | |
| 0.5%, 5/31/2013 | | | 28,500,000 | | | | 28,507,950 | |
| 0.5%, 10/15/2013 | | | 32,500,000 | | | | 32,544,533 | |
| 0.5%, 11/15/2013 | | | 32,500,000 | | | | 32,559,305 | |
| 0.75%, 12/15/2013 | | | 35,000,000 | | | | 35,127,814 | |
| | | | | 153,749,607 | |
| Other Government Related 1.0% | |
| Straight-A Funding LLC, 144A, 0.17%, 6/18/2013 | | | 30,000,000 | | | | 29,993,200 | |
Total Government & Agency Obligations (Cost $1,524,069,477) | | | | 1,524,069,477 | |
| | |
| Repurchase Agreements 48.2% | |
| Barclays Capital, 0.1%, dated 4/25/2013, to be repurchased at $125,002,431 on 5/2/2013 (a) | | | 125,000,000 | | | | 125,000,000 | |
| BNP Paribas, 0.14%, dated 4/30/2013, to be repurchased at $65,000,253 on 5/1/2013 (b) | | | 65,000,000 | | | | 65,000,000 | |
| BNP Paribas, 0.15%, dated 4/30/2013, to be repurchased at $40,000,167 on 5/1/2013 (c) | | | 40,000,000 | | | | 40,000,000 | |
| Citigroup Global Markets, Inc., 0.09%, dated 4/24/2013, to be repurchased at $13,000,228 on 5/1/2013 (d) | | | 13,000,000 | | | | 13,000,000 | |
| Citigroup Global Markets, Inc., 0.14%, dated 4/30/2013, to be repurchased at $42,000,163 on 5/1/2013 (e) | | | 42,000,000 | | | | 42,000,000 | |
| HSBC Securities, Inc., 0.17%, dated 4/30/2013, to be repurchased at $54,000,255 on 5/1/2013 (f) | | | 54,000,000 | | | | 54,000,000 | |
| JPMorgan Securities, Inc., 0.17%, dated 4/30/2013, to be repurchased at $113,000,534 on 5/1/2013 (g) | | | 113,000,000 | | | | 113,000,000 | |
| Merrill Lynch & Co., Inc., 0.09%, dated 4/26/2013, to be repurchased at $85,001,488 on 5/3/2013 (h) | | | 85,000,000 | | | | 85,000,000 | |
| Merrill Lynch & Co., Inc., 0.14%, dated 4/30/2013, to be repurchased at $35,102,349 on 5/1/2013 (i) | | | 35,102,212 | | | | 35,102,212 | |
| Merrill Lynch & Co., Inc., 0.14%, dated 4/5/2013, to be repurchased at $110,014,117 on 5/8/2013 (j) | | | 110,000,000 | | | | 110,000,000 | |
| Morgan Stanley & Co., Inc., 0.17%, dated 4/30/2013, to be repurchased at $424,002,002 on 5/1/2013 (k) | | | 424,000,000 | | | | 424,000,000 | |
| RBS Securities, Inc., 0.14%, dated 4/30/2013, to be repurchased at $135,000,525 on 5/1/2013 (l) | | | 135,000,000 | | | | 135,000,000 | |
| The Goldman Sachs & Co., 0.16%, dated 4/30/2013, to be repurchased at $100,000,444 on 5/1/2013 (m) | | | 100,000,000 | | | | 100,000,000 | |
| The Toronto-Dominion Bank, 0.1%, dated 4/24/2013, to be repurchased at $75,001,458 on 5/1/2013 (n) | | | 75,000,000 | | | | 75,000,000 | |
Total Repurchase Agreements (Cost $1,416,102,212) | | | | 1,416,102,212 | |
| | | % of Net Assets | | | Value ($) | |
| | | | |
Total Investment Portfolio (Cost $2,940,171,689)† | | | 100.0 | | | | 2,940,171,689 | |
| Other Assets and Liabilities, Net | | | 0.0 | | | | 185,473 | |
| Net Assets | | | 100.0 | | | | 2,940,357,162 | |
* Annualized yield at time of purchase; not a coupon rate.
** Floating rate securities' yields vary with a designated market index or market rate, such as the coupon-equivalent of the U.S. Treasury Bill rate. These securities are shown at their current rate as of April 30, 2013.
† The cost for federal income tax purposes was $2,940,171,689.
(a) Collateralized by $126,575,000 Federal Home Loan Bank, with the various coupon rates from 2.13-2.65%, with various maturity dates of 11/5/2024-2/15/2028 with a value of $127,500,282.
(b) Collateralized by $50,645,400 U.S. Treasury Inflation-Indexed Notes, with the various coupon rates from 2.0-2.5%, with various maturity dates of 1/15/2016-7/15/2016 with a value of $66,300,001.
(c) Collateralized by $40,258,000 U.S. Federal Home Loan Mortgage Corp., with the various coupon rates from 0.45-3.01%, with various maturity dates of 1/9/2014-7/9/2027 with a value of $40,800,030.
(d) Collateralized by:
| Principal Amount ($) | | Security | | Rate (%) | | Maturity Date | | Collateral Value ($) | |
| | 2,986,985 | | Federal Home Loan Mortgage Corp. | | | 1.299 | | 11/15/2036 | | | 2,767,845 | |
| | 25,652,820 | | Federal National Mortgage Association — Interest Only | | | 7.05 | | 12/25/2042 | | | 4,912,647 | |
| | 36,197,656 | | Government National Mortgage Association — Interest Only | | | 5.85-6.317 | | 1/20/2038- 11/16/2041 | | | 5,742,486 | |
| Total Collateral Value | | | 13,422,978 | |
(e) Collateralized by:
| Principal Amount ($) | | Security | | Rate (%) | | Maturity Date | | Collateral Value ($) | |
| | 13,766,000 | | U.S. Treasury Inflation-Indexed Note | | | 1.125 | | 1/15/2021 | | | 17,248,540 | |
| | 25,503,800 | | U.S. Treasury Note | | | 0.75 | | 9/15/2013 | | | 25,591,469 | |
| Total Collateral Value | | | 42,840,009 | |
(f) Collateralized by:
| Principal Amount ($) | | Security | | Rate (%) | | Maturity Date | | Collateral Value ($) | |
| | 47,691,333 | | Government National Mortgage Association | | | 3.5-6.0 | | 8/15/2032- 2/20/2043 | | | 52,685,764 | |
| | 2,395,000 | | U.S. Treasury Bill | | | — | | 7/5/2013 | | | 2,394,856 | |
| Total Collateral Value | | | 55,080,620 | |
(g) Collateralized by:
| Principal Amount ($) | | Security | | Rate (%) | | Maturity Date | | Collateral Value ($) | |
| | 1,075,267,081 | | Federal Home Loan Mortgage Corp. — Interest Only | | | 2.5-6.0 | | 9/15/2015- 2/15/2043 | | | 100,729,795 | |
| | 2,288,334 | | Federal National Mortgage Association | | | 3.0 | | 3/25/2033 | | | 2,323,084 | |
| | 106,602,739 | | Federal National Mortgage Association — Interest Only | | | 3.0-6.5 | | 6/25/2020- 8/25/2042 | | | 12,207,334 | |
| Total Collateral Value | | | 115,260,213 | |
(h) Collateralized by:
| Principal Amount ($) | | Security | | Rate (%) | | Maturity Date | | Collateral Value ($) | |
| | 17,990,000 | | Federal Farm Credit Bank | | | 1.5 | | 4/1/2020 | | | 18,185,341 | |
| | 20,650,000 | | Federal Home Loan Mortgage Corp. | | | 1.375 | | 5/1/2020 | | | 20,730,185 | |
| | 46,940,000 | | Federal National Mortgage Association | | | 1.05-6.08 | | 11/15/2017- 10/23/2036 | | | 47,785,043 | |
| Total Collateral Value | | | 86,700,569 | |
(i) Collateralized by $26,210,800 U.S. Treasury Bond, 4.625%, maturing on 2/15/2040 with a value of $35,804,331.
(j) Collateralized by $91,947,100 U.S. Treasury Note, 11.25%, maturing on 2/15/2015 with a value of $112,200,034.
(k) Collateralized by $401,096,407 Federal Home Loan Mortgage Corp., with the various coupon rates from 3.0-5.0%, with various maturity dates of 2/1/2026-4/1/2043 with a value of $432,480,000.
(l) Collateralized by $134,311,400 U.S. Treasury Notes, with the various coupon rates from 3.125-4.0%, with various maturity dates of 8/31/2013-2/15/2014 with a value of $137,705,131.
(m) Collateralized by:
| Principal Amount ($) | | Security | | Rate (%) | | Maturity Date | | Collateral Value ($) | |
| | 660 | | Federal Home Loan Mortgage Corp. | | | 9.5 | | 11/15/2021 | | | 13,281 | |
| | 94,546,134 | | Federal National Mortgage Association | | Zero Coupon-4.0 | | 10/1/2027- 4/1/2043 | | | 101,986,720 | |
| Total Collateral Value | | | 102,000,001 | |
(n) Collateralized by:
| Principal Amount ($) | | Security | | Rate (%) | | Maturity Date | | Collateral Value ($) | |
| | 21,837,000 | | U.S. Treasury Bonds | | | 4.5-6.0 | | 2/15/2026- 5/15/2038 | | | 30,623,017 | |
| | 45,084,400 | | U.S. Treasury Notes | | | 0.125-1.875 | | 12/31/2013- 9/30/2019 | | | 45,877,044 | |
| Total Collateral Value | | | 76,500,061 | |
144A: Security exempt from registration under Rule 144A of the Securities Act of 1933. These securities may be resold in transactions exempt from registration, normally to qualified institutional buyers.
Interest Only: Interest Only (IO) bonds represent the "interest only" portion of payments on a pool of underlying mortgages or mortgage-backed securities. IO securities are subject to prepayment risk of the pool of underlying mortgages.
Fair Value Measurements
Various inputs are used in determining the value of the Fund's investments. These inputs are summarized in three broad levels. Level 1 includes quoted prices in active markets for identical securities. Level 2 includes other significant observable inputs (including quoted prices for similar securities, interest rates, prepayment speeds and credit risk). Level 3 includes significant unobservable inputs (including the Fund's own assumptions in determining the fair value of investments). The inputs or methodology used for valuing securities are not necessarily an indication of the risk associated with investing in those securities. Securities held by the Fund are reflected as Level 2 because the securities are valued at amortized cost (which approximates fair value) and, accordingly, the inputs used to determine value are not quoted prices in an active market.
The following is a summary of the inputs used as of April 30, 2013 in valuing the Fund's investments. For information on the Fund's policy regarding the valuation of investments, please refer to the Security Valuation section of Note 1 in the accompanying Notes to Financial Statements.
| Assets | | Level 1 | | | Level 2 | | | Level 3 | | | Total | |
| | |
| Investments in Securities (o) | | $ | — | | | $ | 1,524,069,477 | | | $ | — | | | $ | 1,524,069,477 | |
| Repurchase Agreements | | | — | | | | 1,416,102,212 | | | | — | | | | 1,416,102,212 | |
| Total | | $ | — | | | $ | 2,940,171,689 | | | $ | — | | | $ | 2,940,171,689 | |
There have been no transfers between fair value measurement levels during the year ended April 30, 2013.
(o) See Investment Portfolio for additional detailed categorizations.
The accompanying notes are an integral part of the financial statements.
Statement of Assets and Liabilities | as of April 30, 2013 | |
| Assets | | Government & Agency Securities Portfolio | |
Investments: Investments in non-affiliated securities, valued at amortized cost | | $ | 1,524,069,477 | |
| Repurchase agreements, valued at amortized cost | | | 1,416,102,212 | |
| Total investments in securities, valued at amortized cost | | | 2,940,171,689 | |
| Receivable for Fund shares sold | | | 200,399 | |
| Interest receivable | | | 1,067,727 | |
| Due from Advisor | | | 27,126 | |
| Other assets | | | 71,710 | |
| Total assets | | | 2,941,538,651 | |
| Liabilities | |
| Payable for Fund shares redeemed | | | 794,880 | |
| Distributions payable | | | 25,829 | |
| Accrued Trustees' fees | | | 28,311 | |
| Other accrued expenses and payables | | | 332,469 | |
| Total liabilities | | | 1,181,489 | |
| Net assets, at value | | $ | 2,940,357,162 | |
| Net Assets Consist of | |
| Undistributed net investment income | | | 201,505 | |
| Accumulated net realized gain (loss) | | | (435,501 | ) |
| Paid-in capital | | | 2,940,591,158 | |
| Net assets, at value | | $ | 2,940,357,162 | |
The accompanying notes are an integral part of the financial statements.
Statement of Assets and Liabilities as of April 30, 2013 (continued) | |
| Net Asset Value | | Government & Agency Securities Portfolio | |
Capital Assets Funds Shares Net Asset Value, offering and redemption price per share ($137,808,041 ÷ 137,818,174 outstanding shares of beneficial interest, no par value, unlimited number of shares authorized) | | $ | 1.00 | |
Davidson Cash Equivalent Shares Net Asset Value, offering and redemption price per share ($20,267,423 ÷ 20,268,915 outstanding shares of beneficial interest, no par value, unlimited number of shares authorized) | | $ | 1.00 | |
Davidson Cash Equivalent Plus Shares Net Asset Value, offering and redemption price per share ($108,250,027 ÷ 108,257,988 outstanding shares of beneficial interest, no par value, unlimited number of shares authorized) | | $ | 1.00 | |
DWS Government & Agency Money Fund Net Asset Value, offering and redemption price per share ($117,365,297 ÷ 117,373,968 outstanding shares of beneficial interest, no par value, unlimited number of shares authorized) | | $ | 1.00 | |
DWS Government Cash Institutional Shares Net Asset Value, offering and redemption price per share ($2,256,081,997 ÷ 2,256,247,886 outstanding shares of beneficial interest, no par value, unlimited number of shares authorized) | | $ | 1.00 | |
Government Cash Managed Shares Net Asset Value, offering and redemption price per share ($222,242,097 ÷ 222,258,439 outstanding shares of beneficial interest, no par value, unlimited number of shares authorized) | | $ | 1.00 | |
Service Shares Net Asset Value, offering and redemption price per share ($78,342,280 ÷ 78,348,040 outstanding shares of beneficial interest, no par value, unlimited number of shares authorized) | | $ | 1.00 | |
The accompanying notes are an integral part of the financial statements.
| for the year ended April 30, 2013 | |
| Investment Income | | Government & Agency Securities Portfolio | |
Income: Interest | | $ | 5,237,165 | |
Expenses: Management fee | | | 1,898,580 | |
| Administration fee | | | 2,969,292 | |
| Services to shareholders | | | 1,499,291 | |
| Distribution and service fees | | | 2,540,744 | |
| Custodian fee | | | 55,371 | |
| Professional fees | | | 135,387 | |
| Reports to shareholders | | | 139,606 | |
| Registration fees | | | 135,888 | |
| Trustees' fees and expenses | | | 135,253 | |
| Other | | | 134,035 | |
| Total expenses before expense reductions | | | 9,643,447 | |
| Expense reductions | | | (5,144,848 | ) |
| Total expenses after expense reductions | | | 4,498,599 | |
| Net investment income | | | 738,566 | |
| Net realized gain (loss) from investments | | | 11,278 | |
| Net increase (decrease) in net assets resulting from operations | | $ | 749,844 | |
The accompanying notes are an integral part of the financial statements.
Statement of Changes in Net Assets | | | Government & Agency Securities Portfolio | |
| Increase (Decrease) in Net Assets | | Years Ended April 30, | |
| | 2013 | | | 2012 | |
Operations: Net investment income | | $ | 738,566 | | | $ | 1,255,673 | |
| Net realized gain (loss) | | | 11,278 | | | | 155,718 | |
| Net increase in net assets resulting from operations | | | 749,844 | | | | 1,411,391 | |
Distributions to shareholders from: Net investment income: Capital Assets Funds Shares | | | (17,994 | ) | | | (24,512 | ) |
| Davidson Cash Equivalent Shares | | | (2,284 | ) | | | (2,348 | ) |
| Davidson Cash Equivalent Plus Shares | | | (9,941 | ) | | | (7,569 | ) |
| DWS Government & Agency Money Fund | | | (12,034 | ) | | | (14,615 | ) |
| DWS Government Cash Institutional Shares | | | (662,372 | ) | | | (1,165,027 | ) |
| Government Cash Managed Shares | | | (24,703 | ) | | | (24,030 | ) |
| Service Shares | | | (9,225 | ) | | | (17,564 | ) |
| Total distributions | | | (738,553 | ) | | | (1,255,665 | ) |
Fund share transactions: Proceeds from shares sold | | | 17,983,371,115 | | | | 33,927,293,511 | |
| Reinvestment of distributions | | | 400,224 | | | | 717,672 | |
| Cost of shares redeemed | | | (18,573,676,534 | ) | | | (35,969,779,735 | ) |
| Net increase (decrease) in net assets from Fund share transactions | | | (589,905,195 | ) | | | (2,041,768,552 | ) |
| Increase (decrease) in net assets | | | (589,893,904 | ) | | | (2,041,612,826 | ) |
| Net assets at beginning of period | | | 3,530,251,066 | | | | 5,571,863,892 | |
| Net assets at end of period (including undistributed net investment income of $201,505 and $201,492, respectively) | | $ | 2,940,357,162 | | | $ | 3,530,251,066 | |
The accompanying notes are an integral part of the financial statements.
Government & Agency Securities Portfolio Capital Assets Funds Shares | |
| | | Years Ended April 30, | |
| | 2013 | | | 2012 | | | 2011 | | | 2010 | | | 2009 | |
| Selected Per Share Data | |
| Net asset value, beginning of period | | $ | 1.00 | | | $ | 1.00 | | | $ | 1.00 | | | $ | 1.00 | | | $ | 1.00 | |
Income (loss) from investment operations: Net investment income | | | .000 | * | | | .000 | * | | | .000 | * | | | .000 | * | | | .007 | |
| Net realized gain (loss) | | | .000 | * | | | .000 | * | | | (.000 | )* | | | .000 | * | | | .000 | * |
| Total from investment operations | | | .000 | * | | | .000 | * | | | .000 | * | | | .000 | * | | | .007 | |
Less distributions from: Net investment income | | | (.000 | )* | | | (.000 | )* | | | (.000 | )* | | | (.000 | )* | | | (.007 | ) |
| Net realized gain | | | — | | | | — | | | | — | | | | (.000 | )* | | | — | |
| Total distributions | | | (.000 | )* | | | (.000 | )* | | | (.000 | )* | | | (.000 | )* | | | (.007 | ) |
| Net asset value, end of period | | $ | 1.00 | | | $ | 1.00 | | | $ | 1.00 | | | $ | 1.00 | | | $ | 1.00 | |
Total Return (%)a | | | .01 | | | | .01 | | | | .01 | | | | .02 | | | | .75 | |
| Ratios to Average Net Assets and Supplemental Data | |
| Net assets, end of period ($ millions) | | | 138 | | | | 237 | | | | 284 | | | | 304 | | | | 280 | |
| Ratio of expenses before expense reductions (%) | | | 1.02 | | | | 1.01 | | | | 1.01 | | | | 1.03 | | | | 1.03 | |
| Ratio of expenses after expense reductions (%) | | | .17 | | | | .11 | | | | .22 | | | | .30 | | | | .92 | |
| Ratio of net investment income (%) | | | .01 | | | | .01 | | | | .01 | | | | .01 | | | | .60 | b |
a Total return would have been lower had certain expenses not been reduced. b Due to the timing of the subscriptions and redemptions, the amount shown does not correspond to the total return during the period. * Amount is less than $.0005. | |
Portfolio Summary (Unaudited)
Investment Portfolio as of April 30, 2013
Tax-Exempt Portfolio
| | | Principal Amount ($) | | | Value ($) | |
| | | | |
| Municipal Investments 98.7% | |
| Alaska 3.1% | |
| Anchorage, AK: | |
| Tax Anticipation Notes, 2.0%, 9/17/2013 | | | 25,000,000 | | | | 25,174,489 | |
| TECP, 0.19%, 10/3/2013, LOC: Wells Fargo | | | 25,000,000 | | | | 25,000,000 | |
| TECP, 0.23%, 6/5/2013, LOC: Wells Fargo | | | 8,300,000 | | | | 8,300,000 | |
| | | | | 58,474,489 | |
| California 14.5% | |
| California, Golden State Tobacco Securitization Corp., Tobacco Settlement: | | | | | | | | |
| Series B, Prerefunded 6/1/2013 @ 100, 5.5%, 6/1/2043 | | | 24,415,000 | | | | 24,523,306 | |
| Series B, Prerefunded 6/1/2013 @ 100, 5.625%, 6/1/2038 | | | 31,610,000 | | | | 31,753,010 | |
| Series 2003-A-1, Prerefunded 6/1/2013 @ 100, 6.25%, 6/1/2033 | | | 43,745,000 | | | | 43,966,499 | |
| Series 2003-A-1, Prerefunded 6/1/2013 @ 100, 6.75%, 6/1/2039 | | | 38,470,000 | | | | 38,683,616 | |
| California, Nuveen Dividend Advantage Municipal Fund, Series 1-1362, 144A, AMT, 0.4%*, 6/1/2041, LIQ: Morgan Stanley Bank | | | 5,000,000 | | | | 5,000,000 | |
| California, RBC Municipal Products, Inc. Trust: | |
| Series E-21, 144A, 0.26%*, Mandatory Put 9/3/2013 @ 100, 10/1/2013, LIQ: Royal Bank of Canada, LOC: Royal Bank of Canada | | | 25,000,000 | | | | 25,000,000 | |
| Series E-24, 144A, 0.26%*, Mandatory Put 8/1/2013 @ 100, 7/1/2031, LIQ: Royal Bank of Canada, LOC: Royal Bank of Canada | | | 16,865,000 | | | | 16,865,000 | |
| California, State Department of Water Resources, Supply Revenue: | | | | | | | | |
| Series N, 5.0%, 5/1/2013 | | | 10,000,000 | | | | 10,000,000 | |
| Series M, 5.0%, 5/1/2014 | | | 7,500,000 | | | | 7,859,716 | |
| California, State General Obligation: | |
| Prerefunded 4/1/2014 @ 100, 5.0%, 4/1/2031, INS: AMBAC | | | 10,325,000 | | | | 10,778,410 | |
| Prerefunded 4/1/2014 @ 100, 5.25%, 4/1/2034 | | | 6,035,000 | | | | 6,313,855 | |
| California, Statewide Communities Development Authority, Multi-Family Housing Revenue: | | | | | | | | |
| Series 2680, 144A, 0.29%*, 5/15/2018, LOC: JPMorgan Chase Bank NA | | | 14,700,000 | | | | 14,700,000 | |
| Series 2681, 144A, AMT, 0.36%*, 5/15/2018, LOC: JPMorgan Chase Bank NA | | | 12,250,000 | | | | 12,250,000 | |
| California, Wells Fargo Stage Trust: | |
| Series 74C, 144A, 0.19%*, 11/15/2040, GTY: Wells Fargo Bank NA, LIQ: Wells Fargo Bank NA | | | 5,810,000 | | | | 5,810,000 | |
| Series 31C, 144A, AMT, 0.25%*, Mandatory Put 8/15/2013 @ 100, 1/1/2022, GTY: Wells Fargo Bank NA, LIQ: Wells Fargo Bank NA | | | 5,995,000 | | | | 5,995,000 | |
| San Diego County, CA, School District Note Participations, Series A, 2.0%, 6/28/2013 | | | 10,000,000 | | | | 10,029,016 | |
| | | | | 269,527,428 | |
| Colorado 3.8% | |
| Colorado, State Education Loan Program, Series C, 144A, 2.5%, 6/27/2013 | | | 60,000,000 | | | | 60,221,714 | |
| Colorado, Wells Fargo Stage Trust, Series 42C, 144A, AMT, 0.19%*, 11/15/2023, GTY: Wells Fargo Bank NA, LIQ: Wells Fargo Bank NA | | | 9,835,000 | | | | 9,835,000 | |
| | | | | 70,056,714 | |
| District of Columbia 0.8% | |
| District of Columbia, Wells Fargo Stage Trust, Series 57C, 144A, AMT, 0.25%*, Mandatory Put 12/26/2013 @ 100, 10/1/2032, GTY: Wells Fargo Bank NA, LIQ: Wells Fargo Bank NA | | | 13,965,000 | | | | 13,965,000 | |
| Georgia 0.7% | |
| Burke County, GA, Development Authority Revenue, Georgia Power Co. Plant, 144A, 0.21%*, 5/1/2022 | | | 5,555,000 | | | | 5,555,000 | |
| Georgia, Private Colleges & Universities Authority Revenue, Mercer University Project, Series C, 0.24%*, 10/1/2031, LOC: Branch Banking & Trust | | | 8,335,000 | | | | 8,335,000 | |
| | | | | 13,890,000 | |
| Hawaii 0.5% | |
| Hawaii, Wells Fargo State Trust, Series 6C, 144A, 0.19%*, 7/1/2040, GTY: Wells Fargo Bank NA, LIQ: Wells Fargo Bank NA | | | 8,820,000 | | | | 8,820,000 | |
| Idaho 2.5% | |
| Idaho, State General Obligation, 2.0%, 6/28/2013 | | | 47,000,000 | | | | 47,134,110 | |
| Illinois 13.3% | |
| Chicago, IL, Loyola University: | |
| TECP, 0.14%, 5/21/2013 | | | 25,000,000 | | | | 25,000,000 | |
| TECP, 0.15%, 6/3/2013 | | | 25,040,000 | | | | 25,040,000 | |
| Chicago, IL, O'Hare International Airport Revenue, 0.18%, 5/7/2013 | | | 5,000,000 | | | | 5,000,000 | |
| Illinois, BB&T Municipal Trust, Series 5001, 144A, 0.31%*, 6/1/2020, LIQ: Rabobank Nederland, LOC: Rabobank International | | | 23,460,000 | | | | 23,460,000 | |
| Illinois, Educational Facilities Authority Revenue, University of Chicago, Series B-3, 0.24%*, Mandatory Put 3/13/2014 @ 100, 7/1/2036 | | | 18,000,000 | | | | 18,000,000 | |
| Illinois, Educational Facilities Authority Revenues: | |
| TECP, 0.15%, 6/3/2013, LOC: Northern Trust Co. | | | 20,000,000 | | | | 20,000,000 | |
| TECP, 0.16%, 6/3/2013, LOC: Northern Trust Co. | | | 30,000,000 | | | | 30,000,000 | |
| TECP, 0.16%, 7/1/2013, LOC: Northern Trust Co. | | | 16,200,000 | | | | 16,200,000 | |
| TECP, 0.16%, 7/2/2013, LOC: Northern Trust Co. | | | 30,000,000 | | | | 30,000,000 | |
| Illinois, Wells Fargo Stage Trust, Series 27C, 144A, 0.26%*, Mandatory Put 10/24/2013 @ 100, 8/1/2025, GTY: Wells Fargo Bank NA, LIQ: Wells Fargo Bank NA, | | | 38,405,000 | | | | 38,405,000 | |
| Mundelein, IL, Industrial Development Revenue, MacLean Fogg Co. Project, 144A, AMT, 0.38%*, 1/1/2015, LOC: Northern Trust Co. | | | 6,500,000 | | | | 6,500,000 | |
| Woodstock, IL, Multi-Family Housing Revenue, Willow Brooke Apartments, AMT, 0.24%*, 4/1/2042, LOC: Wells Fargo Bank NA | | | 10,000,000 | | | | 10,000,000 | |
| | | | | 247,605,000 | |
| Indiana 3.6% | |
| Indiana, State Finance Authority, Industrial Revenue, Midwest Fertilizer Corp. Project, 0.2%, Mandatory Put 7/1/2013 @ 100, 7/1/2046 | | | 60,000,000 | | | | 60,000,000 | |
| Indiana, Wells Fargo State Trust, Series 100C, 144A, 0.19%*, 8/1/2021, GTY: Wells Fargo Bank NA, LIQ: Wells Fargo Bank NA | | | 7,495,000 | | | | 7,495,000 | |
| | | | | 67,495,000 | |
| Iowa 4.1% | |
| Iowa, State Finance Authority Midwestern Disaster Area Revenue, Fertilizer Co. Project, 0.17%*, Mandatory Put 5/31/2013 @ 100, 12/1/2050 | | | 70,000,000 | | | | 70,000,000 | |
| Iowa, State Finance Authority, Wellness Facilities Revenue, Community Marshalltown Project, 0.26%*, 1/1/2031, LOC: Northern Trust Co. | | | 6,015,000 | | | | 6,015,000 | |
| | | | | 76,015,000 | |
| Kansas 0.8% | |
| Kansas, State Development Finance Authority, Multi-Family Revenue, Oak Ridge Park II Project, Series X, AMT, 0.29%*, 12/1/2036, LOC: U.S. Bank NA | | | 3,650,000 | | | | 3,650,000 | |
| Olathe, KS, General Obligation, Series A, 1.5%, 7/1/2013 | | | 11,280,000 | | | | 11,304,457 | |
| | | | | 14,954,457 | |
| Kentucky 1.9% | |
| Kentucky, State Economic Development Finance Authority, Catholic Health Initiatives: | | | | | | | | |
| Series B, 0.32%**, 2/1/2046 | | | 10,680,000 | | | | 10,680,000 | |
| Series B-2, 0.32%**, 2/1/2046 | | | 12,000,000 | | | | 12,000,000 | |
| Series B-3, 0.32%**, 2/1/2046 | | | 12,415,000 | | | | 12,415,000 | |
| | | | | 35,095,000 | |
| Maryland 1.6% | |
| Maryland, State Health & Higher Educational Facilities Authority Revenue, Pooled Loan Program, Series D, 144A, 0.27%*, 1/1/2029, LOC: Bank of America NA | | | 12,580,000 | | | | 12,580,000 | |
| Montgomery County, MD, TECP, 0.17%, 6/4/2013, LOC: State Street Bank & Trust Co. | | | 17,000,000 | | | | 17,000,000 | |
| | | | | 29,580,000 | |
| Michigan 6.6% | |
| Michigan, RBC Municipal Products, Inc. Trust: | |
| Series L-23, 144A, AMT, 0.26%*, 3/1/2028, INS: AMBAC, LIQ: Royal Bank of Canada, LOC: Royal Bank of Canada | | | 44,995,000 | | | | 44,995,000 | |
| Series L-27, 144A, AMT, 0.26%*, 3/1/2031, LIQ: Royal Bank of Canada, LOC: Royal Bank of Canada | | | 40,000,000 | | | | 40,000,000 | |
| Michigan, State Finance Authority Revenue, Unemployment Obligation Assessment, Series A, 2.0%, 7/1/2013 | | | 11,100,000 | | | | 11,133,708 | |
| Michigan, State Hospital Finance Authority Revenue, Ascension Health Senior Credit Group: | | | | | | | | |
| Series F-7, 0.31%*, 11/15/2047 | | | 11,200,000 | | | | 11,200,000 | |
| Series F-6, 0.31%**, 11/15/2049 | | | 8,660,000 | | | | 8,660,000 | |
| Series F-8, 0.31%**, 11/15/2049 | | | 7,100,000 | | | | 7,100,000 | |
| | | | | 123,088,708 | |
| Minnesota 1.3% | |
| Cohasset, MN, State Power & Light Co. Project, Series A, 0.27%*, 6/1/2020, LOC: JPMorgan Chase Bank NA | | | 24,630,000 | | | | 24,630,000 | |
| Mississippi 0.5% | |
| Mississippi, Redstone Partners Floaters/Residuals Trust, Series C, 144A, AMT, 0.41%*, 12/1/2047, LOC: Wachovia Bank NA | | | 9,220,000 | | | | 9,220,000 | |
| Missouri 5.0% | |
| Missouri, State Health & Educational Facilities: | |
| TECP, 0.12%, 5/21/2013 | | | 28,000,000 | | | | 28,000,000 | |
| TECP, 0.14%, 5/16/2013 | | | 22,000,000 | | | | 22,000,000 | |
| Missouri, University of Curators, TECP, 0.14%, 5/7/2013 | | | 23,000,000 | | | | 23,000,000 | |
| North Kansas City, MO, Hospital Revenue, 0.22%*, 11/1/2033, LOC: Bank of America NA | | | 20,660,000 | | | | 20,660,000 | |
| | | | | 93,660,000 | |
| New York 4.2% | |
| BlackRock New York Municipal Income Quality Trust, Series W-7-40, 144A, AMT, 0.32%*, 10/1/2041, LIQ: Barclays Bank PLC | | | 5,000,000 | | | | 5,000,000 | |
| BlackRock New York Municipal Intermediate Duration Fund, Inc., Series W-7-296, 144A, AMT, 0.32%*, 10/1/2041, LIQ: Barclays Bank PLC | | | 13,500,000 | | | | 13,500,000 | |
| New York, RIB Floater Trust, Series 1WE, 144A, 0.29%*, 9/30/2013, LIQ: Barclays Bank PLC | | | 60,000,000 | | | | 60,000,000 | |
| | | | | 78,500,000 | |
| North Carolina 1.9% | |
| North Carolina, BB&T Municipal Trust: | |
| Series 1008, 144A, 0.31%*, 3/1/2024, LIQ: Branch Banking & Trust, LOC: Branch Banking & Trust | | | 5,515,000 | | | | 5,515,000 | |
| Series 1009, 144A, 0.31%*, 6/1/2024, LIQ: Branch Banking & Trust, LOC: Branch Banking & Trust | | | 15,675,000 | | | | 15,675,000 | |
| North Carolina, Capital Facilities Finance Agency, TECP, 0.15%, 6/5/2013 | | | 13,860,000 | | | | 13,860,000 | |
| | | | | 35,050,000 | |
| Ohio 1.6% | |
| Ohio, Puttable Floating Option Tax-Exempt Receipts, Series 808, 144A, AMT, 0.42%*, 12/1/2041, GTY: Bank of America NA, INS: AMBAC, LIQ: Bank of America NA | | | 30,000,000 | | | | 30,000,000 | |
| Oklahoma 0.5% | |
| Tulsa, OK, Airports Improvement Trust, Special Facilities Revenue, Lufthansa/Bizjet International, Inc., 144A, AMT, 0.26%*, 8/1/2018, LOC: Landesbank Hessen-Thuringen | | | 10,120,000 | | | | 10,120,000 | |
| Other Territories 6.2% | |
| BB&T Municipal Trust, Series 1010, 144A, 0.26%*, 1/15/2019, LIQ: Branch Banking & Trust, LOC: Branch Banking & Trust | | | 5,980,000 | | | | 5,980,000 | |
| BB&T Municipal Trust, Series 5000, 144A, 0.31%*, 10/1/2028, LIQ: Rabobank Nederland, LOC: Rabobank International | | | 6,755,000 | | | | 6,755,000 | |
| BlackRock Muni Holdings Investment Quality Fund, Series W-7-2746, 144A, AMT, 0.43%*, 7/1/2041, LIQ: Bank of America NA | | | 28,100,000 | | | | 28,100,000 | |
| BlackRock Municipal Bond Investment Trust, Series W-7-178, 144A, AMT, 0.32%*, 10/1/2041, LIQ: Barclays Bank PLC | | | 9,300,000 | | | | 9,300,000 | |
| Eagle Tax- Exempt Trust, 144A, AMT, 0.27%*, 4/15/2049, LIQ: Federal Home Loan Bank | | | 14,615,000 | | | | 14,615,000 | |
| Nuveen Premier Income Municipal Fund 2, Inc., Series 1-4895, 144A, AMT, 0.32%*, 5/1/2041, LIQ: Barclays Bank PLC | | | 52,000,000 | | | | 52,000,000 | |
| | | | | 116,750,000 | |
| Pennsylvania 2.7% | |
| Pennsylvania, State Economic Development Financing Authority, IESI PA Corp., 0.26%*, 11/1/2028, GTY: IESI Corp., LOC: Bank of America NA | | | 34,000,000 | | | | 34,000,000 | |
| University of Pittsburgh, PA, The Commonwealth Systems of Higher Education, Pittsburgh Assessment Notes, 2.0%, 7/2/2013 | | | 17,000,000 | | | | 17,051,605 | |
| | | | | 51,051,605 | |
| Puerto Rico 2.6% | |
| Puerto Rico, RIB Floater Trust, Series 8WE, 144A, 0.27%, 9/30/2014, LOC: Barclays Bank PLC | | | 47,500,000 | | | | 47,500,000 | |
| Tennessee 3.5% | |
| Metropolitan Government Nashville & Davidson County, TN: | |
| TECP, 0.2%, 10/3/2013 | | | 10,000,000 | | | | 10,000,000 | |
| TECP, 0.23%, 9/3/2013 | | | 17,000,000 | | | | 17,000,000 | |
| Tennessee, Tennergy Corp., Gas Revenue, Stars Certificates, Series 2006-001, 144A, 0.27%*, 5/1/2016, LOC: BNP Paribas | | | 39,000,000 | | | | 39,000,000 | |
| | | | | 66,000,000 | |
| Texas 9.5% | |
| Harris County, TX, Cultural Education, TECP, 0.23%, 7/9/2013 | | | 40,000,000 | | | | 40,000,000 | |
| Lamar, TX, Consolidated Independent School District, Series R-12266, 144A, 0.25%*, 8/1/2015, SPA: Citibank NA | | | 20,485,000 | | | | 20,485,000 | |
| North Texas, Tollway Authority Revenue, TECP, 0.16%, 6/7/2013, LOC: JPMorgan Chase Bank NA | | | 15,400,000 | | | | 15,400,000 | |
| Texas, JPMorgan Chase Putters/Drivers Trust, Series 4263, 144A, 0.18%*, 8/30/2013, LIQ: JPMorgan Chase Bank NA | | | 30,000,000 | | | | 30,000,000 | |
| Texas, Municipal Power Agency Revenue, TECP, 0.21%, 5/17/2013, LOC: Barclays Bank PLC | | | 15,500,000 | | | | 15,500,000 | |
| Texas, State Transportation Revenue, 2.5%, 8/30/2013 | | | 45,000,000 | | | | 45,339,981 | |
| Texas City, TX, Industrial Development Corp. Revenue, Del Papa Realty Holdings, 0.26%*, 1/1/2051, LOC: Bank of America NA | | | 9,500,000 | | | | 9,500,000 | |
| | | | | 176,224,981 | |
| Washington 0.7% | |
| Washington, Wells Fargo Stage Trust, Series 93C, 144A, 0.29%, Mandatory Put 6/13/2013 @ 100, 8/15/2046, GTY: Wells Fargo Bank NA, LIQ: Wells Fargo Bank NA | | | 13,675,000 | | | | 13,675,000 | |
| West Virginia 0.7% | |
| West Virginia, Economic Development Authority Revenue, Morgantown Energy, AMT, 0.26%*, 4/1/2027, LOC: Union Bank NA | | | 12,210,000 | | | | 12,210,000 | |
| | | % of Net Assets | | | Value ($) | |
| | | | |
Total Investment Portfolio (Cost $1,840,292,492)† | | | 98.7 | | | | 1,840,292,492 | |
| Other Assets and Liabilities, Net | | | 1.3 | | | | 24,009,682 | |
| Net Assets | | | 100.0 | | | | 1,864,302,174 | |
* Variable rate demand notes and variable rate demand preferred shares are securities whose interest rates are reset periodically at market levels. These securities are payable on demand and are shown at their current rates as of April 30, 2013.
** Floating rate securities' yields vary with a designated market index or market rate, such as the coupon-equivalent of the U.S. Treasury Bill rate. These securities are shown at their current rate as of April 30, 2013.
† The cost for federal income tax purposes was $1,840,292,492.
144A: Security exempt from registration under Rule 144A of the Securities Act of 1933. These securities may be resold in transactions exempt from registration, normally to qualified institutional buyers.
AMBAC: Ambac Financial Group, Inc.
AMT: Subject to alternative minimum tax.
GTY: Guaranty Agreement
INS: Insured
LIQ: Liquidity Facility
LOC: Letter of Credit
Prerefunded: Bonds which are prerefunded are collateralized usually by U.S. Treasury securities which are held in escrow and used to pay principal and interest on tax-exempt issues and to retire the bonds in full at the earliest refunding date.
SPA: Standby Bond Purchase Agreement
TECP: Tax Exempt Commercial Paper
Fair Value Measurements
Various inputs are used in determining the value of the Fund's investments. These inputs are summarized in three broad levels. Level 1 includes quoted prices in active markets for identical securities. Level 2 includes other significant observable inputs (including quoted prices for similar securities, interest rates, prepayment speeds and credit risk). Level 3 includes significant unobservable inputs (including the Fund's own assumptions in determining the fair value of investments). The inputs or methodology used for valuing securities are not necessarily an indication of the risk associated with investing in those securities. Securities held by the Fund are reflected as Level 2 because the securities are valued at amortized cost (which approximates fair value) and, accordingly, the inputs used to determine value are not quoted prices in an active market.
The following is a summary of the inputs used as of April 30, 2013 in valuing the Fund's investments. For information on the Fund's policy regarding the valuation of investments, please refer to the Security Valuation section of Note 1 in the accompanying Notes to Financial Statements.
| Assets | | Level 1 | | | Level 2 | | | Level 3 | | | Total | |
| | |
| Municipal Investments (a) | | $ | — | | | $ | 1,840,292,492 | | | $ | — | | | $ | 1,840,292,492 | |
| Total | | $ | — | | | $ | 1,840,292,492 | | | $ | — | | | $ | 1,840,292,492 | |
There have been no transfers between fair value measurement levels during the period ended April 30, 2013.
(a) See Investment Portfolio for additional detailed categorizations.
The accompanying notes are an integral part of the financial statements.
Statement of Assets and Liabilities | as of April 30, 2013 | |
| Assets | | Tax-Exempt Portfolio | |
Investments: Investments in non-affiliated securities, valued at amortized cost | | $ | 1,840,292,492 | |
| Receivable for investments sold | | | 17,580,000 | |
| Receivable for Fund shares sold | | | 298,158 | |
| Interest receivable | | | 7,109,732 | |
| Due from Advisor | | | 3,699 | |
| Other assets | | | 77,001 | |
| Total assets | | | 1,865,361,082 | |
| Liabilities | |
| Cash overdraft | | | 391,974 | |
| Payable for Fund shares redeemed | | | 169,016 | |
| Distributions payable | | | 6,227 | |
| Accrued management fee | | | 110,040 | |
| Accrued Trustees' fees | | | 18,385 | |
| Other accrued expenses and payables | | | 363,266 | |
| Total liabilities | | | 1,058,908 | |
| Net assets, at value | | $ | 1,864,302,174 | |
| Net Assets Consist of | |
| Undistributed net investment income | | | 212,651 | |
| Paid-in capital | | | 1,864,089,523 | |
| Net assets, at value | | $ | 1,864,302,174 | |
The accompanying notes are an integral part of the financial statements.
Statement of Assets and Liabilities as of April 30, 2013 (continued) | |
| Net Asset Value | | Tax-Exempt Portfolio | |
Capital Assets Funds Shares Net Asset Value, offering and redemption price per share ($10,059,102 ÷ 10,056,881 outstanding shares of beneficial interest, no par value, unlimited number of shares authorized) | | $ | 1.00 | |
Davidson Cash Equivalent Shares Net Asset Value, offering and redemption price per share ($70,393,545 ÷ 70,377,984 outstanding shares of beneficial interest, no par value, unlimited number of shares authorized) | | $ | 1.00 | |
DWS Tax-Exempt Cash Institutional Shares Net Asset Value, offering and redemption price per share ($970,451,993 ÷ 970,237,656 outstanding shares of beneficial interest, no par value, unlimited number of shares authorized) | | $ | 1.00 | |
DWS Tax-Exempt Money Fund Net Asset Value, offering and redemption price per share ($241,992,881 ÷ 241,939,471 outstanding shares of beneficial interest, no par value, unlimited number of shares authorized) | | $ | 1.00 | |
DWS Tax-Free Money Fund Class S Net Asset Value, offering and redemption price per share ($99,900,985 ÷ 99,878,925 outstanding shares of beneficial interest, no par value, unlimited number of shares authorized) | | $ | 1.00 | |
Service Shares Net Asset Value, offering and redemption price per share ($44,904,689 ÷ 44,894,771 outstanding shares of beneficial interest, no par value, unlimited number of shares authorized) | | $ | 1.00 | |
Tax-Exempt Cash Managed Shares Net Asset Value, offering and redemption price per share ($115,086,280 ÷ 115,060,862 outstanding shares of beneficial interest, no par value, unlimited number of shares authorized) | | $ | 1.00 | |
Tax-Free Investment Class Net Asset Value, offering and redemption price per share ($311,512,699 ÷ 311,443,897 outstanding shares of beneficial interest, no par value, unlimited number of shares authorized) | | $ | 1.00 | |
The accompanying notes are an integral part of the financial statements.
| for the year ended April 30, 2013 | |
| Investment Income | | Tax-Exempt Portfolio | |
Income: Interest | | $ | 4,226,122 | |
Expenses: Management fee | | | 1,326,518 | |
| Administration fee | | | 2,073,476 | |
| Services to shareholders | | | 1,150,669 | |
| Distribution and service fees | | | 2,113,579 | |
| Custodian fee | | | 27,586 | |
| Professional fees | | | 126,547 | |
| Reports to shareholders | | | 149,965 | |
| Registration fees | | | 153,018 | |
| Trustees' fees and expenses | | | 87,355 | |
| Other | | | 101,842 | |
| Total expenses before expense reductions | | | 7,310,555 | |
| Expense reductions | | | (3,397,143 | ) |
| Total expenses after expense reductions | | | 3,913,412 | |
| Net investment income | | | 312,710 | |
| Net realized gain (loss) from investments | | | 119,059 | |
| Net increase (decrease) in net assets resulting from operations | | $ | 431,769 | |
The accompanying notes are an integral part of the financial statements.
Statement of Changes in Net Assets | | | Tax-Exempt Portfolio | |
| Increase (Decrease) in Net Assets | | Years Ended April 30, | |
| | 2013 | | | 2012 | |
Operations: Net investment income | | $ | 312,710 | | | $ | 659,723 | |
| Net realized gain (loss) | | | 119,059 | | | | 21,137 | |
| Net increase in net assets resulting from operations | | | 431,769 | | | | 680,860 | |
Distributions to shareholders from: Net investment income: Capital Assets Funds Shares | | | (2,578 | ) | | | (2,580 | ) |
| Davidson Cash Equivalent Shares | | | (16,635 | ) | | | (13,672 | ) |
| DWS Tax-Exempt Cash Institutional Shares | | | (347,411 | ) | | | (598,543 | ) |
| DWS Tax-Exempt Money Fund | | | (63,056 | ) | | | (115,000 | ) |
| DWS Tax-Free Money Fund Class S | | | (22,814 | ) | | | (28,531 | ) |
| Service Shares | | | (12,350 | ) | | | (16,307 | ) |
| Tax-Exempt Cash Managed Shares | | | (36,504 | ) | | | (35,814 | ) |
| Tax-Free Investment Class | | | (80,485 | ) | | | (64,866 | ) |
Net realized gain: Capital Assets Funds Shares | | | (686 | ) | | | — | |
| Davidson Cash Equivalent Shares | | | (4,358 | ) | | | — | |
| DWS Tax-Exempt Cash Institutional Shares | | | (58,793 | ) | | | — | |
| DWS Tax-Exempt Money Fund | | | (15,872 | ) | | | — | |
| DWS Tax-Free Money Fund Class S | | | (5,799 | ) | | | — | |
| Service Shares | | | (2,541 | ) | | | — | |
| Tax-Exempt Cash Managed Shares | | | (9,837 | ) | | | — | |
| Tax-Free Investment Class | | | (21,062 | ) | | | — | |
| Total distributions | | | (700,781 | ) | | | (875,313 | ) |
Fund share transactions: Proceeds from shares sold | | | 3,574,503,665 | | | | 5,483,352,307 | |
| Reinvestment of distributions | | | 409,744 | | | | 544,506 | |
| Cost of shares redeemed | | | (3,871,064,788 | ) | | | (5,984,187,987 | ) |
| Net increase (decrease) in net assets from Fund share transactions | | | (296,151,379 | ) | | | (500,291,174 | ) |
| Increase (decrease) in net assets | | | (296,420,391 | ) | | | (500,485,627 | ) |
| Net assets at beginning of period | | | 2,160,722,565 | | | | 2,661,208,192 | |
| Net assets at end of period (including undistributed net investment income of $212,651 and $481,663, respectively) | | $ | 1,864,302,174 | | | $ | 2,160,722,565 | |
The accompanying notes are an integral part of the financial statements.
Tax-Exempt Portfolio Capital Assets Funds Shares | |
| | | Years Ended April 30, | |
| | | 2013 | | | 2012 | | | 2011 | | | 2010 | | | 2009 | |
| Selected Per Share Data | |
| Net asset value, beginning of period | | $ | 1.00 | | | $ | 1.00 | | | $ | 1.00 | | | $ | 1.00 | | | $ | 1.00 | |
Income (loss) from investment operations: Net investment income | | | .000 | * | | | .000 | * | | | .000 | * | | | .000 | * | | | .008 | |
| Net realized gain (loss) | | | .000 | * | | | .000 | * | | | .000 | * | | | .000 | * | | | .000 | * |
| Total from investment operations | | | .000 | * | | | .000 | * | | | .000 | * | | | .000 | * | | | .008 | |
Less distributions from: Net investment income | | | (.000 | )* | | | (.000 | )* | | | (.000 | )* | | | (.000 | )* | | | (.008 | ) |
| Net realized gain | | | (.000 | )* | | | — | | | | — | | | | (.000 | )* | | | — | |
| Total distributions | | | (.000 | )* | | | (.000 | )* | | | (.000 | )* | | | (.000 | )* | | | (.008 | ) |
| Net asset value, end of period | | $ | 1.00 | | | $ | 1.00 | | | $ | 1.00 | | | $ | 1.00 | | | $ | 1.00 | |
Total Return (%)a | | | .03 | | | | .02 | | | | .01 | | | | .01 | | | | .83 | |
| Ratios to Average Net Assets and Supplemental Data | |
| Net assets, end of period ($ millions) | | | 10 | | | | 12 | | | | 11 | | | | 18 | | | | 26 | |
| Ratio of expenses before expense reductions (%) | | | 1.03 | | | | 1.02 | | | | 1.02 | | | | 1.03 | | | | 1.03 | |
| Ratio of expenses after expense reductions (%) | | | .20 | | | | .22 | | | | .35 | | | | .46 | | | | .96 | |
| Ratio of net investment income (%) | | | .01 | | | | .01 | | | | .01 | | | | .01 | | | | .82 | |
a Total return would have been lower had certain expenses not been reduced. * Amount is less than $.0005. | |
Notes to Financial Statements
1. Organization and Significant Accounting Policies
Cash Account Trust (the "Trust") is registered under the Investment Company Act of 1940, as amended (the "1940 Act"), as an open-end investment management company organized as a Massachusetts business trust.
The Trust offers three funds: Money Market Portfolio, Government & Agency Securities Portfolio and Tax-Exempt Portfolio (each a "Fund" and together, the "Funds").
Money Market Portfolio offers six classes of shares: Capital Assets Funds Shares, Capital Assets Funds Preferred Shares, Davidson Cash Equivalent Shares, Davidson Cash Equivalent Plus Shares, Premium Reserve Money Market Shares and Service Shares.
Government & Agency Securities Portfolio offers seven classes of shares: Capital Assets Funds Shares, Davidson Cash Equivalent Shares, Davidson Cash Equivalent Plus Shares, DWS Government & Agency Money Fund, DWS Government Cash Institutional Shares, Government Cash Managed Shares and Service Shares.
Tax-Exempt Portfolio offers eight classes of shares: Capital Assets Funds Shares, Davidson Cash Equivalent Shares, DWS Tax-Exempt Cash Institutional Shares, DWS Tax-Exempt Money Fund, DWS Tax-Free Money Fund Class S, Service Shares, Tax-Exempt Cash Managed Shares and Tax-Free Investment Class.
The financial highlights for all classes of shares, other than Capital Assets Funds Shares and Capital Assets Funds Preferred Shares, are provided separately and are available upon request.
Each Fund's investment income, realized gains and losses, and certain Fund-level expenses and expense reductions, if any, are borne pro rata on the basis of relative net assets by the holders of all classes of shares of that Fund, except that each class bears certain expenses unique to that class such as distribution and service fees, services to shareholders and certain other class-specific expenses. Differences in class-level expenses may result in payment of different per share dividends by class. All shares of the Trust have equal rights with respect to voting subject to class-specific arrangements.
Each Fund's financial statements are prepared in accordance with accounting principles generally accepted in the United States of America which require the use of management estimates. Actual results could differ from those estimates. The policies described below are followed consistently by the Funds in the preparation of their financial statements.
Security Valuation. Various inputs are used in determining the value of each Fund's investments. These inputs are summarized in three broad levels. Level 1 includes quoted prices in active markets for identical securities. Level 2 includes other significant observable inputs (including quoted prices for similar securities, interest rates, prepayment speeds, and credit risk). Level 3 includes significant unobservable inputs (including each Fund's own assumptions in determining the fair value of investments). The inputs or methodology used for valuing securities are not necessarily an indication of the risk associated with investing in those securities.
The Funds value all securities utilizing the amortized cost method permitted in accordance with Rule 2a-7 under the 1940 Act and certain conditions therein. Under this method, which does not take into account unrealized capital gains or losses on securities, an instrument is initially valued at its cost and thereafter assumes a constant accretion/amortization rate to maturity of any discount or premium. Securities held by the Fund are reflected as Level 2 because the securities are valued at amortized cost (which approximates fair value) and, accordingly, the inputs used to determine value are not quoted prices in an active market.
Disclosure about the classification of fair value measurements is included in a table following each Fund's Investment Portfolio.
New Accounting Pronouncement. In January 2013, Accounting Standard Update 2013-01 (ASU 2013-01), Clarifying the Scope of Disclosures about Offsetting Assets and Liabilities, replaced Accounting Standards Update 2011-11 (ASU 2011-11), Disclosures about Offsetting Assets and Liabilities. ASU 2013-01 is effective for fiscal years beginning on or after January 1, 2013, and interim periods within those annual periods. ASU 2011-11 was intended to enhance disclosure requirements on the offsetting of financial assets and liabilities. The ASU 2013-01 limits the scope of the new balance sheet offsetting disclosures to derivatives, repurchase agreements, and securities lending transactions to the extent that they are (1) offset in the financial statements or (2) subject to an enforceable master netting arrangement or similar agreement. Management is currently evaluating the application of ASU 2013-01 and its impact, if any, on the Fund's financial statements.
Repurchase Agreements. Each Fund may enter into repurchase agreements with certain banks and broker/dealers whereby each Fund, through its custodian or a sub-custodian bank, receives delivery of the underlying securities, the amount of which at the time of purchase and each subsequent business day is required to be maintained at such a level that the market value is equal to at least the principal amount of the repurchase price plus accrued interest. The custodial bank or another designated subcustodian holds the collateral in a separate account until the agreement matures. If the value of the securities falls below the principal amount of the repurchase agreement plus accrued interest, the financial institution deposits additional collateral by the following business day. If the financial institution either fails to deposit the required additional collateral or fails to repurchase the securities as agreed, the Funds have the right to sell the securities and recover any resulting loss from the financial institution. If the financial institution enters into bankruptcy, the Funds' claims on the collateral may be subject to legal proceedings.
Federal Income Taxes. Each of the Funds' policies is to comply with the requirements of the Internal Revenue Code, as amended, which are applicable to regulated investment companies and to distribute all of its taxable and tax-exempt income to its shareholders.
Under the Regulated Investment Company Modernization Act of 2010, net capital losses incurred post-enactment may be carried forward indefinitely, and their character is retained as short-term and/or long-term losses. Previously, net capital losses were carried forward for eight years and treated as short-term losses. As a transition rule, the Act requires that post-enactment net capital losses be used before pre-enactment net capital losses.
At April 30, 2013, DWS Money Market Portfolio had a net tax basis capital loss carryforward of approximately $14,000 of post-enactment short-term losses, which may be applied against realized net taxable capital gains indefinitely.
At April 30, 2013, DWS Government & Agency Securities Portfolio had a net tax basis capital loss carryforward of approximately $436,000 of pre-enactment losses, which may be applied against any realized net taxable capital gains of each succeeding year until fully utilized or until April 30, 2019 (the expiration date), whichever occurs first.
The Funds have reviewed the tax positions for the open tax years as of April 30, 2013 and have determined that no provision for income tax is required in the Funds' financial statements. The Funds' federal tax returns for the prior three fiscal years remain open subject to examination by the Internal Revenue Service.
Distribution of Income. Net investment income of each Fund is declared as a daily dividend and is distributed to shareholders monthly. Each Fund may take into account capital gains and losses in its daily dividend declarations. Each Fund may also make additional distributions for tax purposes if necessary.
Permanent book and tax basis differences relating to shareholder distributions will result in reclassifications to paid in capital. Temporary book and tax basis differences will reverse in a subsequent period. There were no significant book-to-tax differences for the Funds.
At April 30, 2013, the Funds' components of distributable earnings on a tax basis are as follows:
Money Market Portfolio: Undistributed ordinary income* | | $ | 26,943 | |
| Capital loss carryforwards | | $ | (14,000 | ) |
Government & Agency Securities Portfolio: Undistributed ordinary income* | | $ | 227,334 | |
| Capital loss carryforwards | | $ | (436,000 | ) |
Tax-Exempt Portfolio: Undistributed tax-exempt income* | | $ | 218,878 | |
In addition, the tax character of distributions paid to shareholders by each Fund is summarized as follows:
| | | Years Ended April 30, | |
| Portfolio | | 2013 | | | 2012 | |
Money Market Portfolio: Distributions from ordinary income* | | $ | 253,752 | | | $ | 287,108 | |
Government & Agency Securities Portfolio: Distributions from ordinary income* | | $ | 738,553 | | | $ | 1,255,665 | |
Tax-Exempt Portfolio: Distributions from tax-exempt income | | $ | 581,722 | | | $ | 854,176 | |
| Distributions from ordinary income* | | $ | 119,059 | | | $ | 21,137 | |
* For tax purposes, short-term capital gain distributions are considered ordinary income distributions.
Expenses. Expenses of the Trust arising in connection with a specific Fund are allocated to that Fund. Other Trust expenses which cannot be directly attributed to a Fund are apportioned pro rata on the basis of relative net assets among the Funds in the Trust based upon the relative net assets or other appropriate measures.
Contingencies. In the normal course of business, the Funds may enter into contracts with service providers that contain general indemnification clauses. The Funds' maximum exposure under these arrangements is unknown as this would involve future claims that may be made against the Funds that have not yet been made. However, based on experience, the Funds expect the risk of loss to be remote.
Other. Investment transactions are accounted for on trade date. Interest income is recorded on the accrual basis. Realized gains and losses from investment transactions are recorded on an identified cost basis and may include proceeds from litigation. All discounts and premiums are accreted/amortized for both tax and financial reporting purposes.
2. Related Parties
Management Agreement for Money Market Portfolio. Under an Investment Management Agreement with Deutsche Investment Management Americas Inc. ("DIMA" or the "Advisor"), an indirect, wholly owned subsidiary of Deutsche Bank AG, the Advisor directs the investments of Money Market Portfolio in accordance with its investment objectives, policies and restrictions. The Advisor determines the securities, instruments and other contracts relating to investments to be purchased, sold or entered into by the Fund. In addition to portfolio management services, the Advisor provides certain administrative services in accordance with the Investment Management Agreement to the Money Market Portfolio.
The Money Market Portfolio pays a monthly management fee based on the combined average daily net assets of the three Funds in the Trust and allocated to Money Market Portfolio based on its relative net assets, computed and accrued daily and payable monthly, at 1/12 of the following annual rates:
| First $500 million of the Funds' combined average daily net assets | | | .220 | % |
| Next $500 million of such net assets | | | .200 | % |
| Next $1 billion of such net assets | | | .175 | % |
| Next $1 billion of such net assets | | | .160 | % |
| Over $3 billion of such net assets | | | .150 | % |
For the year ended April 30, 2013, the Fund incurred a management fee equivalent to the following annual effective rate of the Fund's average daily net assets:
| Fund | | Annual Effective Rate | |
| Money Market Portfolio | | | .16 | % |
For the period from May 1, 2012 through April 30, 2013, the Advisor has agreed to voluntarily waive its fees and/or reimburse certain operating expenses of the Capital Assets Funds Preferred Shares of the Money Market Portfolio to the extent necessary to maintain the operating expenses (excluding certain expenses such as extraordinary expenses, taxes, brokerage and interest) at 0.60%.
The Advisor and Penson Financial Services, Inc., the sole sub-distributor, have agreed to voluntarily waive additional expenses. These voluntary waivers may be changed or terminated at any time without notice. Under these arrangements, the Advisor waived certain expenses on Capital Assets Funds Shares and Capital Assets Funds Preferred Shares of Money Market Portfolio.
In addition, the Advisor has agreed to maintain expenses of certain other classes of the Trust. These rates are disclosed in the respective share classes' annual reports that are provided separately and are available upon request.
Management Agreement for Government & Agency Securities Portfolio and Tax-Exempt Portfolio. Under an Amended and Restated Investment Management Agreement with the Advisor, the Advisor directs the investments of Government & Agency Securities Portfolio and Tax-Exempt Portfolio in accordance with their respective investment objectives, policies and restrictions. The Advisor determines the securities, instruments and other contracts relating to investments to be purchased, sold or entered into by each Fund.
The Government & Agency Securities Portfolio and Tax-Exempt Portfolio pay a monthly management fee based on the combined average daily net assets of the three Funds in the Trust and allocated to Government & Agency Securities Portfolio and Tax-Exempt Portfolio, respectively, based on their relative net assets, computed and accrued daily and payable monthly, at the following annual rates:
| First $500 million of the Funds' combined average daily net assets | | | .120 | % |
| Next $500 million of such net assets | | | .100 | % |
| Next $1 billion of such net assets | | | .075 | % |
| Next $1 billion of such net assets | | | .060 | % |
| Over $3 billion of such net assets | | | .050 | % |
The Advisor has agreed to contractually reduce its management fee for the Government & Agency Securities Portfolio such that the annual effective rate is limited to 0.05% of the Government & Agency Securities Portfolio's average daily net assets.
For the period from May 1, 2012 through April 30, 2013, the Advisor has agreed to voluntarily waive its fees and/or reimburse certain operating expenses of the Capital Assets Funds Shares of the Tax-Exempt Portfolio to the extent necessary to maintain the operating expenses (excluding certain expenses such as extraordinary expenses, taxes, brokerage and interest) at 1.03%.
In addition, the Advisor and Penson Financial Services, Inc., the sole sub-distributor, have agreed to voluntarily waive additional expenses. These voluntary waivers may be changed or terminated at any time without notice. Under these arrangements, the Advisor waived certain expenses on Capital Assets Funds Shares of Government & Agency Securities Portfolio and Tax-Exempt Portfolio.
Accordingly, for the year ended April 30, 2013, the Advisor earned a management fee on the Government & Agency Securities Portfolio aggregating $1,898,580, of which $1,332,763 was waived, resulting in an annual effective rate of 0.02% of the Fund's average daily net assets.
Accordingly, for the year ended April 30, 2013, the Advisor earned a management fee on the Tax-Exempt Portfolio aggregating $1,326,518, of which $309,712 was waived, resulting in an annual effective rate of 0.05% of the Fund's average daily net assets.
The Advisor has also agreed to maintain expenses of certain other classes of the Trust. These rates are disclosed in the respective share classes' annual reports that are provided separately and are available upon request.
Administration Fee. Pursuant to an Administrative Services Agreement, DIMA provides most administrative services to the Government & Agency Securities Portfolio and Tax-Exempt Portfolio. For all services provided under the Administrative Services Agreement, each of these two Funds pays the Advisor an annual fee ("Administration Fee") of 0.10% of each of these two Funds' average daily net assets, computed and accrued daily and payable monthly. For the year ended April 30, 2013, the Administration Fee from the Government & Agency Securities Portfolio and the Tax-Exempt Portfolio was as follows:
| Fund | | Administration Fee | | | Unpaid at April 30, 2013 | |
| Government & Agency Securities Portfolio | | $ | 2,969,292 | | | $ | 237,874 | |
| Tax-Exempt Portfolio | | $ | 2,073,476 | | | $ | 161,841 | |
Service Provider Fees. DWS Investments Service Company ("DISC"), an affiliate of the Advisor, is the transfer agent, dividend-paying agent and shareholder service agent for the Funds. Pursuant to a sub-transfer agency agreement between DISC and DST Systems, Inc. ("DST"), DISC has delegated certain transfer agent, dividend-paying agent and shareholder service agent functions to DST. DISC compensates DST out of the shareholder servicing fee it receives from the Funds. For the year ended April 30, 2013, the amounts charged to the Funds by DISC were as follows:
| Money Market Portfolio: | | Total Aggregated | | | Waived | | | Unpaid at April 30, 2013 | |
| Capital Assets Funds Shares | | $ | 1,698,073 | | | $ | 1,257,408 | | | $ | 22,820 | |
| Capital Assets Funds Preferred Shares | | | 3,458 | | | | 2,722 | | | | — | |
| Davidson Cash Equivalent Shares | | | 23,907 | | | | 17,214 | | | | 649 | |
| Davidson Cash Equivalent Plus Shares | | | 1,785 | | | | 1,264 | | | | 93 | |
| Premium Reserve Money Market Shares | | | 81,513 | | | | 43,002 | | | | 5,163 | |
| Service Shares | | | 2,463,999 | | | | 1,735,773 | | | | 51,257 | |
| | | $ | 4,272,735 | | | $ | 3,057,383 | | | $ | 79,982 | |
| Government & Agency Securities Portfolio: | | Total Aggregated | | | Waived | | | Unpaid at April 30, 2013 | |
| Capital Assets Funds Shares | | $ | 446,473 | | | $ | 407,085 | | | $ | 21,372 | |
| Davidson Cash Equivalent Shares | | | 57,088 | | | | 52,121 | | | | 618 | |
| Davidson Cash Equivalent Plus Shares | | | 198,754 | | | | 177,388 | | | | 6,098 | |
| DWS Government & Agency Money Fund | | | 108,301 | | | | 82,446 | | | | 9,591 | |
| DWS Government Cash Institutional Shares | | | 194,797 | | | | 194,797 | | | | — | |
| Government Cash Managed Shares | | | 197,828 | | | | 145,451 | | | | 10,765 | |
| Service Shares | | | 230,680 | | | | 212,053 | | | | 3,333 | |
| | | $ | 1,433,921 | | | $ | 1,271,341 | | | $ | 51,777 | |
| Tax-Exempt Portfolio: | | Total Aggregated | | | Waived | | | Unpaid at April 30, 2013 | |
| Capital Assets Funds Shares | | $ | 30,095 | | | $ | 28,537 | | | $ | — | |
| Davidson Cash Equivalent Shares | | | 101,958 | | | | 96,636 | | | | 286 | |
| DWS Tax-Exempt Cash Institutional Shares | | | 159,779 | | | | 159,779 | | | | — | |
| DWS Tax-Exempt Money Fund | | | 90,009 | | | | 64,368 | | | | 6,013 | |
| DWS Tax-Free Money Fund Class S | | | 62,942 | | | | 51,694 | | | | 3,125 | |
| Service Shares | | | 156,558 | | | | 147,666 | | | | 5,419 | |
| Tax-Exempt Cash Managed Shares | | | 102,865 | | | | 86,626 | | | | 431 | |
| Tax-Free Investment Class | | | 368,933 | | | | 338,546 | | | | — | |
| | | $ | 1,073,139 | | | $ | 973,852 | | | $ | 15,274 | |
Pursuant to a fund accounting agreement between DIMA and Money Market Portfolio, DIMA is responsible for computing the daily net asset value per share and maintaining the portfolio and general accounting records of Money Market Portfolio. DIMA has delegated certain fund accounting and record-keeping services to State Street Bank and Trust Company. The costs and expenses of such delegation are paid by DIMA. Money Market Portfolio paid no fee to DIMA for fund accounting and record-keeping services provided under the fund accounting agreement during the period.
Distribution Service Agreement. Under the Distribution Service Agreement, in accordance with Rule 12b-1 under the 1940 Act, DWS Investments Distributors, Inc. ("DIDI"), an affiliate of the Advisor, receives a fee ("Distribution Fee"), calculated as a percentage of average daily net assets for the shares listed in the following table.
For the year ended April 30, 2013, the Distribution Fee was as follows:
| Money Market Portfolio: | | Distribution Fee | | | Waived | | | Annual Effective Rate | | | Contractual Rate (Up To) | |
| Capital Assets Funds Shares | | $ | 2,241,456 | | | $ | 2,241,456 | | | | .00 | % | | | .33 | % |
| Capital Assets Funds Preferred Shares | | | 4,611 | | | | 4,611 | | | | .00 | % | | | .20 | % |
| Davidson Cash Equivalent Shares | | | 26,860 | | | | 26,860 | | | | .00 | % | | | .30 | % |
| Davidson Cash Equivalent Plus Shares | | | 1,723 | | | | 1,723 | | | | .00 | % | | | .25 | % |
| Service Shares | | | 5,913,598 | | | | 5,913,598 | | | | .00 | % | | | .60 | % |
| | | $ | 8,188,248 | | | $ | 8,188,248 | | | | | | | | | |
| Government & Agency Securities Portfolio: | | Distribution Fee | | | Waived | | | Annual Effective Rate | | | Contractual Rate (Up To) | |
| Capital Assets Funds Shares | | $ | 593,656 | | | $ | 593,656 | | | | .00 | % | | | .33 | % |
| Davidson Cash Equivalent Shares | | | 68,505 | | | | 68,505 | | | | .00 | % | | | .30 | % |
| Davidson Cash Equivalent Plus Shares | | | 248,443 | | | | 248,443 | | | | .00 | % | | | .25 | % |
| Service Shares | | | 553,631 | | | | 553,631 | | | | .00 | % | | | .60 | % |
| | | $ | 1,464,235 | | | $ | 1,464,235 | | | | | | | | | |
| Tax-Exempt Portfolio: | | Distribution Fee | | | Waived | | | Annual Effective Rate | | | Contractual Rate (Up To) | |
| Capital Assets Funds Shares | | $ | 39,725 | | | $ | 39,725 | | | | .00 | % | | | .33 | % |
| Davidson Cash Equivalent Shares | | | 203,917 | | | | 203,917 | | | | .00 | % | | | .30 | % |
| Service Shares | | | 375,740 | | | | 375,740 | | | | .00 | % | | | .60 | % |
| Tax-Free Investment Class | | | 836,286 | | | | 836,286 | | | | .00 | % | | | .25 | % |
| | | $ | 1,455,668 | | | $ | 1,455,668 | | | | | | | | | |
In addition, DIDI provides information and administrative services for a fee ("Service Fee") for the shares listed in the following table. A portion of these fees may be paid pursuant to a Rule 12b-1 plan.
For the year ended April 30, 2013, the Service Fee was as follows:
| Money Market Portfolio: | | Service Fee | | | Waived | | | Annual Effective Rate | | | Contractual Rate (Up To) | |
| Capital Assets Funds Shares | | $ | 1,698,073 | | | $ | 1,698,073 | | | | .00 | % | | | .25 | % |
| Capital Assets Funds Preferred Shares | | | 2,305 | | | | 2,305 | | | | .00 | % | | | .10 | % |
| Davidson Cash Equivalent Shares | | | 22,384 | | | | 22,384 | | | | .00 | % | | | .25 | % |
| Davidson Cash Equivalent Plus Shares | | | 1,379 | | | | 1,379 | | | | .00 | % | | | .20 | % |
| Premium Reserve Money Market Shares | | | 134,069 | | | | 134,069 | | | | .00 | % | | | .25 | % |
| | | $ | 1,858,210 | | | $ | 1,858,210 | | | | | | | | | |
| Government & Agency Securities Portfolio: | | Service Fee | | | Waived | | | Annual Effective Rate | | | Contractual Rate (Up To) | |
| Capital Assets Funds Shares | | $ | 449,739 | | | $ | 449,739 | | | | .00 | % | | | .25 | % |
| Davidson Cash Equivalent Shares | | | 57,088 | | | | 57,088 | | | | .00 | % | | | .25 | % |
| Davidson Cash Equivalent Plus Shares | | | 198,754 | | | | 198,754 | | | | .00 | % | | | .20 | % |
| Government Cash Managed Shares | | | 370,928 | | | | 370,928 | | | | .00 | % | | | .15 | % |
| | | $ | 1,076,509 | | | $ | 1,076,509 | | | | | | | | | |
| Tax-Exempt Portfolio: | | Service Fee | | | Waived | | | Annual Effective Rate | | | Contractual Rate (Up To) | |
| Capital Assets Funds Shares | | $ | 30,095 | | | $ | 30,095 | | | | .00 | % | | | .25 | % |
| Davidson Cash Equivalent Shares | | | 169,930 | | | | 169,930 | | | | .00 | % | | | .25 | % |
| Tax-Exempt Cash Managed Shares | | | 223,726 | | | | 223,726 | | | | .00 | % | | | .15 | % |
| Tax-Free Investment Class | | | 234,160 | | | | 234,160 | | | | .00 | % | | | .07 | % |
| | | $ | 657,911 | | | $ | 657,911 | | | | | | | | | |
Typesetting and Filing Service Fees. Under an agreement with DIMA, DIMA is compensated for providing typesetting and certain regulatory filing services to the Funds. For the year ended April 30, 2013, the amounts charged to the Funds by DIMA included in the Statement of Operations under "reports to shareholders" were as follows:
| Fund | | Total Aggregated | | | Unpaid at April 30, 2013 | |
| Money Market Portfolio | | $ | 43,232 | | | $ | 14,410 | |
| Government & Agency Securities Portfolio | | $ | 56,466 | | | $ | 19,054 | |
| Tax-Exempt Portfolio | | $ | 85,990 | | | $ | 31,227 | |
Trustees' Fees and Expenses. The Funds paid retainer fees to each Trustee not affiliated with the Advisor, plus specified amounts to the Board Chairperson and Vice Chairperson and to each committee Chairperson.
3. Concentration of Ownership
From time to time, the Funds may have a concentration of several shareholder accounts holding a significant percentage of shares outstanding. Investment activities of these shareholders could have a material impact on the Funds.
At April 30, 2013, two shareholder accounts held approximately 82% and 11% of the outstanding shares of the Money Market Portfolio; one shareholder account held approximately 13% of the outstanding shares of the Government & Agency Securities Portfolio; and three shareholder accounts held approximately 33%, 17% and 12% of the outstanding shares of the Tax-Exempt Portfolio.
4. Line of Credit
The Funds and other affiliated funds (the "Participants") share in a $375 million revolving credit facility provided by a syndication of banks. Each Fund may borrow for temporary or emergency purposes, including the meeting of redemption requests that otherwise might require the untimely disposition of securities. The Participants are charged an annual commitment fee which is allocated based on net assets, among each of the Participants. Interest is calculated at a rate per annum equal to the sum of the Federal Funds Rate plus 1.25 percent plus, if LIBOR exceeds the Federal Funds Rate, the amount of such excess. Each Fund may borrow up to a maximum of 33 percent of its net assets under the agreement. The Fund had no outstanding loans at April 30, 2013.
5. Share Transactions
The following table summarizes share and dollar activity in the Funds:
Money Market Portfolio
| | | Year Ended April 30, 2013 | | | Year Ended April 30, 2012 | |
| | | Shares | | | Dollars | | | Shares | | | Dollars | |
| Shares sold | |
| Capital Assets Funds Shares | | | 629,975,145 | | | $ | 629,975,145 | | | | 740,327,726 | | | $ | 740,327,726 | |
| Capital Assets Funds Preferred Shares | | | 15,876,680 | | | | 15,876,680 | | | | 15,237,717 | | | | 15,237,717 | |
| Davidson Cash Equivalent Shares | | | 4,424,439 | | | | 4,424,439 | | | | 5,888,909 | | | | 5,888,909 | |
| Davidson Cash Equivalent Plus Shares | | | 667,261 | | | | 667,261 | | | | 303,684 | | | | 303,684 | |
| Premium Reserve Money Market Shares | | | 119,393,312 | | | | 119,393,312 | | | | 90,937,663 | | | | 90,937,663 | |
| Service Shares | | | 760,462,298 | | | | 760,462,298 | | | | 1,342,380,700 | | | | 1,342,380,700 | |
| | | | | | | $ | 1,530,799,135 | | | | | | | $ | 2,195,076,399 | |
| Shares issued to shareholders in reinvestment of distributions | |
| Capital Assets Funds Shares | | | 140,590 | | | $ | 140,590 | | | | 151,503 | | | $ | 151,503 | |
| Capital Assets Funds Preferred Shares | | | 1,170 | | | | 1,170 | | | | 1,677 | | | | 1,677 | |
| Davidson Cash Equivalent Shares | | | 959 | | | | 959 | | | | 1,136 | | | | 1,136 | |
| Davidson Cash Equivalent Plus Shares | | | 75 | | | | 75 | | | | 101 | | | | 101 | |
| Premium Reserve Money Market Shares | | | 3,797 | | | | 3,797 | | | | 3,793 | | | | 3,793 | |
| Service Shares | | | 105,122 | | | | 105,122 | | | | 125,945 | | | | 125,945 | |
| | | | | | | $ | 251,713 | | | | | | | $ | 284,155 | |
| Shares redeemed | |
| Capital Assets Funds Shares | | | (780,874,399 | ) | | $ | (780,874,399 | ) | | | (852,717,812 | ) | | $ | (852,717,812 | ) |
| Capital Assets Funds Preferred Shares | | | (16,735,077 | ) | | | (16,735,077 | ) | | | (17,403,287 | ) | | | (17,403,287 | ) |
| Davidson Cash Equivalent Shares | | | (6,174,353 | ) | | | (6,174,353 | ) | | | (9,655,583 | ) | | | (9,655,583 | ) |
| Davidson Cash Equivalent Plus Shares | | | (791,706 | ) | | | (791,706 | ) | | | (906,966 | ) | | | (906,966 | ) |
| Premium Reserve Money Market Shares | | | (116,890,479 | ) | | | (116,890,479 | ) | | | (98,084,584 | ) | | | (98,084,584 | ) |
| Service Shares | | | (822,660,183 | ) | | | (822,660,183 | ) | | | (2,009,039,110 | ) | | | (2,009,039,110 | ) |
| | | | | | | $ | (1,744,126,197 | ) | | | | | | $ | (2,987,807,342 | ) |
| Net increase (decrease) | |
| Capital Assets Funds Shares | | | (150,758,664 | ) | | $ | (150,758,664 | ) | | | (112,238,583 | ) | | $ | (112,238,583 | ) |
| Capital Assets Funds Preferred Shares | | | (857,227 | ) | | | (857,227 | ) | | | (2,163,893 | ) | | | (2,163,893 | ) |
| Davidson Cash Equivalent Shares | | | (1,748,955 | ) | | | (1,748,955 | ) | | | (3,765,538 | ) | | | (3,765,538 | ) |
| Davidson Cash Equivalent Plus Shares | | | (124,370 | ) | | | (124,370 | ) | | | (603,181 | ) | | | (603,181 | ) |
| Premium Reserve Money Market Shares | | | 2,506,630 | | | | 2,506,630 | | | | (7,143,128 | ) | | | (7,143,128 | ) |
| Service Shares | | | (62,092,763 | ) | | | (62,092,763 | ) | | | (666,532,465 | ) | | | (666,532,465 | ) |
| | | | | | | $ | (213,075,349 | ) | | | | | | $ | (792,446,788 | ) |
Government & Agency Securities Portfolio
| | | Year Ended April 30, 2013 | | | Year Ended April 30, 2012 | |
| | | Shares | | | Dollars | | | Shares | | | Dollars | |
| Shares sold | |
| Capital Assets Funds Shares | | | 106,697,232 | | | $ | 106,697,232 | | | | 447,922,936 | | | $ | 447,922,936 | |
| Davidson Cash Equivalent Shares | | | 31,099,071 | | | | 31,099,071 | | | | 41,768,083 | | | | 41,768,083 | |
| Davidson Cash Equivalent Plus Shares | | | 222,327,364 | | | | 222,327,364 | | | | 213,635,877 | | | | 213,635,877 | |
| DWS Government & Agency Money Fund | | | 53,121,349 | | | | 53,121,349 | | | | 61,520,170 | | | | 61,520,170 | |
| DWS Government Cash Institutional Shares | | | 15,315,065,657 | | | | 15,315,065,657 | | | | 30,092,618,931 | | | | 30,092,618,931 | |
| Government Cash Managed Shares | | | 1,990,326,289 | | | | 1,990,326,289 | | | | 2,673,520,482 | | | | 2,673,520,482 | |
| Service Shares | | | 264,734,153 | | | | 264,734,153 | | | | 396,307,032 | | | | 396,307,032 | |
| | | | | | | $ | 17,983,371,115 | | | | | | | $ | 33,927,293,511 | |
| Shares issued to shareholders in reinvestment of distributions | |
| Capital Assets Funds Shares | | | 17,994 | | | $ | 17,994 | | | | 24,434 | | | $ | 24,434 | |
| Davidson Cash Equivalent Shares | | | 2,284 | | | | 2,284 | | | | 2,343 | | | | 2,343 | |
| Davidson Cash Equivalent Plus Shares | | | 9,940 | | | | 9,940 | | | | 7,560 | | | | 7,560 | |
| DWS Government & Agency Money Fund | | | 11,818 | | | | 11,818 | | | | 13,959 | | | | 13,959 | |
| DWS Government Cash Institutional Shares | | | 341,515 | | | | 341,515 | | | | 644,365 | | | | 644,365 | |
| Government Cash Managed Shares | | | 7,714 | | | | 7,714 | | | | 7,755 | | | | 7,755 | |
| Service Shares | | | 8,959 | | | | 8,959 | | | | 17,256 | | | | 17,256 | |
| | | | | | | $ | 400,224 | | | | | | | $ | 717,672 | |
| Shares redeemed | |
| Capital Assets Funds Shares | | | (205,489,534 | ) | | $ | (205,489,534 | ) | | | (495,723,357 | ) | | $ | (495,723,357 | ) |
| Davidson Cash Equivalent Shares | | | (35,645,815 | ) | | | (35,645,815 | ) | | | (36,015,591 | ) | | | (36,015,591 | ) |
| Davidson Cash Equivalent Plus Shares | | | (207,586,537 | ) | | | (207,586,537 | ) | | | (153,400,457 | ) | | | (153,400,457 | ) |
| DWS Government & Agency Money Fund | | | (75,265,565 | ) | | | (75,265,565 | ) | | | (92,132,646 | ) | | | (92,132,646 | ) |
| DWS Government Cash Institutional Shares | | | (15,771,839,065 | ) | | | (15,771,839,065 | ) | | | (32,152,791,854 | ) | | | (32,152,791,854 | ) |
| Government Cash Managed Shares | | | (1,983,483,875 | ) | | | (1,983,483,875 | ) | | | (2,637,952,274 | ) | | | (2,637,952,274 | ) |
| Service Shares | | | (294,366,143 | ) | | | (294,366,143 | ) | | | (401,763,556 | ) | | | (401,763,556 | ) |
| | | | | | | $ | (18,573,676,534 | ) | | | | | | $ | (35,969,779,735 | ) |
| Net increase (decrease) | |
| Capital Assets Funds Shares | | | (98,774,308 | ) | | $ | (98,774,308 | ) | | | (47,775,987 | ) | | $ | (47,775,987 | ) |
| Davidson Cash Equivalent Shares | | | (4,544,460 | ) | | | (4,544,460 | ) | | | 5,754,835 | | | | 5,754,835 | |
| Davidson Cash Equivalent Plus Shares | | | 14,750,767 | | | | 14,750,767 | | | | 60,242,980 | | | | 60,242,980 | |
| DWS Government & Agency Money Fund | | | (22,132,398 | ) | | | (22,132,398 | ) | | | (30,598,517 | ) | | | (30,598,517 | ) |
| DWS Government Cash Institutional Shares | | | (456,431,893 | ) | | | (456,431,893 | ) | | | (2,059,528,558 | ) | | | (2,059,528,558 | ) |
| Government Cash Managed Shares | | | 6,850,128 | | | | 6,850,128 | | | | 35,575,963 | | | | 35,575,963 | |
| Service Shares | | | (29,623,031 | ) | | | (29,623,031 | ) | | | (5,439,268 | ) | | | (5,439,268 | ) |
| | | | | | | $ | (589,905,195 | ) | | | | | | $ | (2,041,768,552 | ) |
Tax-Exempt Portfolio
| | | Year Ended April 30, 2013 | | | Year Ended April 30, 2012 | |
| | | Shares | | | Dollars | | | Shares | | | Dollars | |
| Shares sold | |
| Capital Assets Funds Shares | | | 33,780,270 | | | $ | 33,780,270 | | | | 32,054,021 | | | $ | 32,054,021 | |
| Davidson Cash Equivalent Shares | | | 115,063,476 | | | | 115,063,476 | | | | 121,475,389 | | | | 121,475,389 | |
| DWS Tax-Exempt Cash Institutional Shares | | | 2,372,880,502 | | | | 2,372,880,502 | | | | 4,080,690,854 | | | | 4,080,690,854 | |
| DWS Tax-Exempt Money Fund | | | 251,306,829 | | | | 251,306,829 | | | | 325,873,832 | | | | 325,873,832 | |
| DWS Tax-Free Money Fund Class S | | | 28,082,317 | | | | 28,082,317 | | | | 31,868,351 | | | | 31,868,351 | |
| Service Shares | | | 138,095,905 | | | | 138,095,905 | | | | 173,964,295 | | | | 173,964,295 | |
| Tax-Exempt Cash Managed Shares | | | 238,693,476 | | | | 238,693,476 | | | | 387,004,796 | | | | 387,004,796 | |
| Tax-Free Investment Class | | | 396,600,890 | | | | 396,600,890 | | | | 330,420,769 | | | | 330,420,769 | |
| | | | | | | $ | 3,574,503,665 | | | | | | | $ | 5,483,352,307 | |
| Shares issued to shareholders in reinvestment of distributions | |
| Capital Assets Funds Shares | | | 3,264 | | | $ | 3,264 | | | | 2,578 | | | $ | 2,578 | |
| Davidson Cash Equivalent Shares | | | 20,992 | | | | 20,992 | | | | 13,652 | | | | 13,652 | |
| DWS Tax-Exempt Cash Institutional Shares | | | 163,290 | | | | 163,290 | | | | 307,257 | | | | 307,257 | |
| DWS Tax-Exempt Money Fund | | | 76,913 | | | | 76,913 | | | | 112,297 | | | | 112,297 | |
| DWS Tax-Free Money Fund Class S | | | 27,387 | | | | 27,387 | | | | 27,195 | | | | 27,195 | |
| Service Shares | | | 14,768 | | | | 14,768 | | | | 16,265 | | | | 16,265 | |
| Tax-Exempt Cash Managed Shares | | | 2,584 | | | | 2,584 | | | | 1,546 | | | | 1,546 | |
| Tax-Free Investment Class | | | 100,546 | | | | 100,546 | | | | 63,716 | | | | 63,716 | |
| | | | | | | $ | 409,744 | | | | | | | $ | 544,506 | |
| Shares redeemed | |
| Capital Assets Funds Shares | | | (35,324,040 | ) | | $ | (35,324,040 | ) | | | (31,054,695 | ) | | $ | (31,054,695 | ) |
| Davidson Cash Equivalent Shares | | | (106,210,991 | ) | | | (106,210,991 | ) | | | (135,004,695 | ) | | | (135,004,695 | ) |
| DWS Tax-Exempt Cash Institutional Shares | | | (2,508,359,723 | ) | | | (2,508,359,723 | ) | | | (4,467,264,493 | ) | | | (4,467,264,493 | ) |
| DWS Tax-Exempt Money Fund | | | (322,145,746 | ) | | | (322,145,746 | ) | | | (379,194,651 | ) | | | (379,194,651 | ) |
| DWS Tax-Free Money Fund Class S | | | (38,170,621 | ) | | | (38,170,621 | ) | | | (46,678,340 | ) | | | (46,678,340 | ) |
| Service Shares | | | (171,243,303 | ) | | | (171,243,303 | ) | | | (177,914,611 | ) | | | (177,914,611 | ) |
| Tax-Exempt Cash Managed Shares | | | (290,012,104 | ) | | | (290,012,104 | ) | | | (348,035,830 | ) | | | (348,035,830 | ) |
| Tax-Free Investment Class | | | (399,598,260 | ) | | | (399,598,260 | ) | | | (399,040,672 | ) | | | (399,040,672 | ) |
| | | | | | | $ | (3,871,064,788 | ) | | | | | | $ | (5,984,187,987 | ) |
| Net increase (decrease) | |
| Capital Assets Funds Shares | | | (1,540,506 | ) | | $ | (1,540,506 | ) | | | 1,001,904 | | | $ | 1,001,904 | |
| Davidson Cash Equivalent Shares | | | 8,873,477 | | | | 8,873,477 | | | | (13,515,654 | ) | | | (13,515,654 | ) |
| DWS Tax-Exempt Cash Institutional Shares | | | (135,315,931 | ) | | | (135,315,931 | ) | | | (386,266,382 | ) | | | (386,266,382 | ) |
| DWS Tax-Exempt Money Fund | | | (70,762,004 | ) | | | (70,762,004 | ) | | | (53,208,522 | ) | | | (53,208,522 | ) |
| DWS Tax-Free Money Fund Class S | | | (10,060,917 | ) | | | (10,060,917 | ) | | | (14,782,794 | ) | | | (14,782,794 | ) |
| Service Shares | | | (33,132,630 | ) | | | (33,132,630 | ) | | | (3,934,051 | ) | | | (3,934,051 | ) |
| Tax-Exempt Cash Managed Shares | | | (51,316,044 | ) | | | (51,316,044 | ) | | | 38,970,512 | | | | 38,970,512 | |
| Tax-Free Investment Class | | | (2,896,824 | ) | | | (2,896,824 | ) | | | (68,556,187 | ) | | | (68,556,187 | ) |
| | | | | | | $ | (296,151,379 | ) | | | | | | $ | (500,291,174 | ) |
Report of Independent Registered Public Accounting Firm
To the Shareholders and Board of Trustees of Cash Account Trust:
We have audited the accompanying statements of assets and liabilities of Money Market Portfolio, Government & Agency Securities Portfolio and Tax-Exempt Portfolio (the "Funds") (the three Funds comprising Cash Account Trust), including the investment portfolios, as of April 30, 2013, and the related statements of operations for the year then ended, the statements of changes in net assets for each of the two years in the period then ended, and the financial highlights for each of the five years in the period then ended. These financial statements and financial highlights are the responsibility of the Funds' management. Our responsibility is to express an opinion on these financial statements and financial highlights based on our audits.
We conducted our audits in accordance with the standards of the Public Company Accounting Oversight Board (United States). Those standards require that we plan and perform the audit to obtain reasonable assurance about whether the financial statements and financial highlights are free of material misstatement. We were not engaged to perform an audit of the Funds' internal control over financial reporting. Our audits included consideration of internal control over financial reporting as a basis for designing audit procedures that are appropriate in the circumstances, but not for the purpose of expressing an opinion on the effectiveness of the Funds' internal control over financial reporting. Accordingly, we express no such opinion. An audit also includes examining, on a test basis, evidence supporting the amounts and disclosures in the financial statements and financial highlights, assessing the accounting principles used and significant estimates made by management, and evaluating the overall financial statement presentation. Our procedures included confirmation of securities owned as of April 30, 2013, by correspondence with the custodian and brokers. We believe that our audits provide a reasonable basis for our opinion.
In our opinion, the financial statements and financial highlights referred to above present fairly, in all material respects, the financial position of Money Market Portfolio, Government & Agency Securities Portfolio and Tax-Exempt Portfolio at April 30, 2013, the results of their operations for the year then ended, the changes in their net assets for each of the two years in the period then ended, and the financial highlights for each of the five years in the period then ended, in conformity with U.S. generally accepted accounting principles.
| | | |
Boston, Massachusetts June 19, 2013 | | |
Information About Each Fund's Expenses
As an investor of a Fund, you incur two types of costs: ongoing expenses and transaction costs. Ongoing expenses include management fees, distribution and service (12b-1) fees and other Fund expenses. Examples of transaction costs include account maintenance fees, which are not shown in this section. The following tables are intended to help you understand your ongoing expenses (in dollars) of investing in each Fund and to help you compare these expenses with the ongoing expenses of investing in other mutual funds. In the most recent six-month period, the Funds limited these expenses; had they not done so, expenses would have been higher for the Capital Assets Funds Shares and the Capital Assets Funds Preferred Shares. The example in the table is based on an investment of $1,000 invested at the beginning of the six-month period and held for the entire period (November 1, 2012 to April 30, 2013).
The tables illustrate your Fund's expenses in two ways:
•Actual Fund Return. This helps you estimate the actual dollar amount of ongoing expenses (but not transaction costs) paid on a $1,000 investment in the Fund using the Fund's actual return during the period. To estimate the expenses you paid over the period, simply divide your account value by $1,000 (for example, an $8,600 account value divided by $1,000 = 8.6), then multiply the result by the number in the "Expenses Paid per $1,000" line under the share class you hold.
• Hypothetical 5% Portfolio Return. This helps you to compare your Fund's ongoing expenses (but not transaction costs) with those of other mutual funds using the Fund's actual expense ratio and a hypothetical rate of return of 5% per year before expenses. Examples using a 5% hypothetical fund return may be found in the shareholder reports of other mutual funds. The hypothetical account values and expenses may not be used to estimate the actual ending account balance or expenses you paid for the period.
Please note that the expenses shown in these tables are meant to highlight your ongoing expenses only and do not reflect any transaction costs. The "Expenses Paid per $1,000" line of the tables is useful in comparing ongoing expenses only and will not help you determine the relative total expense of owning different funds. If these transaction costs had been included, your costs would have been higher.
Capital Assets Funds Shares Expenses and Value of a $1,000 Investment for the six months ended April 30, 2013 (Unaudited) | |
| Actual Fund Return | | Money Market Portfolio | | | Government & Agency Securities Portfolio | | | Tax-Exempt Portfolio | |
| Beginning Account Value 11/1/12 | | $ | 1,000.00 | | | $ | 1,000.00 | | | $ | 1,000.00 | |
| Ending Account Value 4/30/13 | | $ | 1,000.11 | | | $ | 1,000.05 | | | $ | 1,000.23 | |
| Expenses Paid per $1,000* | | $ | 1.19 | | | $ | .84 | | | $ | .89 | |
| Hypothetical 5% Fund Return | | | | | | | | | | | | |
| Beginning Account Value 11/1/12 | | $ | 1,000.00 | | | $ | 1,000.00 | | | $ | 1,000.00 | |
| Ending Account Value 4/30/13 | | $ | 1,023.60 | | | $ | 1,023.95 | | | $ | 1,023.90 | |
| Expenses Paid per $1,000* | | $ | 1.20 | | | $ | .85 | | | $ | .90 | |
| * Expenses are equal to the Fund's annualized expense ratio for each share class, multiplied by the average account value over the period, multiplied by 181 (the number of days in the most recent six-month period), then divided by 365. | |
| Annualized Expense Ratios | | Money Market Portfolio | | | Government & Agency Securities Portfolio | | | Tax-Exempt Portfolio | |
| Capital Assets Funds Shares | | | .24 | % | | | .17 | % | | | .18 | % |
For more information, please refer to each Fund's prospectus. For an analysis of the fees associated with an investment in the Fund or similar funds, please refer to http://apps.finra.org/fundanalyzer/1/fa.aspx. | |
Capital Assets Funds Preferred Shares Expenses and Value of a $1,000 Investment for the six months ended April 30, 2013 (Unaudited) | |
| Actual Fund Return | | Money Market Portfolio | |
| Beginning Account Value 11/1/12 | | $ | 1,000.00 | |
| Ending Account Value 4/30/13 | | $ | 1,000.26 | |
| Expenses Paid per $1,000* | | $ | 1.09 | |
| Hypothetical 5% Fund Return | | | | |
| Beginning Account Value 11/1/12 | | $ | 1,000.00 | |
| Ending Account Value 4/30/13 | | $ | 1,023.70 | |
| Expenses Paid per $1,000* | | $ | 1.10 | |
| * Expenses are equal to the Fund's annualized expense ratio for each share class, multiplied by the average account value over the period, multiplied by 181 (the number of days in the most recent six-month period), then divided by 365. | |
| Annualized Expense Ratio | | Money Market Portfolio | |
| Capital Assets Funds Preferred Shares | | | .22 | % |
For more information, please refer to the Fund's prospectus. For an analysis of the fees associated with an investment in the Fund or similar funds, please refer to http://apps.finra.org/fundanalyzer/1/fa.aspx. | |
Tax Information (Unaudited)
For the Money Market Portfolio, a total of 5% of the dividends distributed during the fiscal year was derived from interest on U.S. government securities, which is generally exempt from state income tax.
For the Government & Agency Securities Portfolio, a total of 31% of the dividends distributed during the fiscal year was derived from interest on U.S. government securities, which is generally exempt from state income tax.
For the Tax-Exempt Portfolio, of the dividends paid from net investment income for the taxable year ended April 30, 2013, 100% are designated as exempt interest dividends for federal income tax purposes.
Please consult a tax advisor if you have questions about federal or state income tax laws, or on how to prepare your tax returns. If you have specific questions about your account, please call (800) 728-3337.
Proxy Voting
The Fund's policies and procedures for voting proxies for portfolio securities and information about how the Fund voted proxies related to its portfolio securities during the 12-month period ended June 30 are available on our Web site — www.dws-investments.com (click on "proxy voting" at the bottom of the page) — or on the SEC's Web site — www.sec.gov. To obtain a written copy of the Fund's policies and procedures without charge, upon request, call us toll free at (800) 728-3337.
Portfolio Holdings
Following the Fund's fiscal first and third quarter-end, a complete portfolio holdings listing is filed with the SEC on Form N-Q. In addition, each month, information about the Fund and its portfolio holdings is filed with the SEC on Form N-MFP. The SEC delays the public availability of the information filed on Form N-MFP for 60 days after the end of the reporting period included in the filing. These forms will be available on the SEC's Web site at www.sec.gov, and they may also be reviewed and copied at the SEC's Public Reference Room in Washington, D.C. Information on the operation of the SEC's Public Reference Room may be obtained by calling (800) SEC-0330. The Fund's portfolio holdings are also posted on www.dws-investments.com from time to time. Please see the Fund's current prospectus for more information.
Money Market Fund Reform
In 2010, the Securities and Exchange Commission adopted amendments to then-existing money market fund regulations, imposing new liquidity, credit quality and maturity requirements on all money market funds. In November 2012, the Financial Stability Oversight Council (FSOC), a board of U.S. regulators established by the Dodd-Frank Act, proposed recommendations for money market fund reform. If the SEC were to adopt one or more of the FSOC proposed recommendations in the future, or if FSOC were to take other steps to establish similar regulations of money market funds in the future, such regulatory action may affect the Fund's operations and/or return potential.
Summary of Management Fee Evaluation by Independent Fee Consultant
September 17, 2012
Pursuant to an Order entered into by Deutsche Investment Management Americas and affiliates (collectively, "DeAM") with the Attorney General of New York, I, Thomas H. Mack, have been appointed the Independent Fee Consultant for the DWS Funds (formerly the DWS Scudder Funds). My duties include preparing an annual written evaluation of the management fees DeAM charges the Funds, considering among other factors the management fees charged by other mutual fund companies for like services, management fees DeAM charges other clients for like services, DeAM's costs of supplying services under the management agreements and related profit margins, possible economies of scale if a Fund grows larger, and the nature and quality of DeAM's services, including fund performance. This report summarizes my evaluation for 2012, including my qualifications, the evaluation process for each of the DWS Funds, consideration of certain complex-level factors, and my conclusions. I served in substantially the same capacity in 2007, 2008, 2009, 2010 and 2011.
Qualifications
For more than 35 years I have served in various professional capacities within the investment management business. I have held investment analysis and advisory positions, including securities analyst, portfolio strategist and director of investment policy with a large investment firm. I have also performed business management functions, including business development, financial management and marketing research and analysis.
Since 1991, I have been an independent consultant within the asset management industry. I have provided services to over 125 client organizations, including investment managers, mutual fund boards, product distributors and related organizations. Over the past ten years I have completed a number of assignments for mutual fund boards, specifically including assisting boards with management contract renewal.
I hold a Master of Business Administration degree, with highest honors, from Harvard University and Master of Science and Bachelor of Science (highest honors) degrees from the University of California at Berkeley. I am an independent director and audit committee financial expert for two closed-end mutual funds and have served in various leadership and financial oversight capacities with non-profit organizations.
Evaluation of Fees for each DWS Fund
My work focused primarily on evaluating, fund-by-fund, the fees charged to each of the 103 mutual fund portfolios in the DWS Fund family. For each Fund, I considered each of the key factors mentioned above, as well as any other relevant information. In doing so I worked closely with the Funds' Independent Directors in their annual contract renewal process, as well as in their approval of contracts for several new funds (documented separately).
In evaluating each Fund's fees, I reviewed comprehensive materials provided by or on behalf of DeAM, including expense information prepared by Lipper Analytical, comparative performance information, profitability data, manager histories, and other materials. I also accessed certain additional information from the Lipper and Morningstar databases and drew on my industry knowledge and experience.
To facilitate evaluating this considerable body of information, I prepared for each Fund a document summarizing the key data elements in each area as well as additional analytics discussed below. This made it possible to consider each key data element in the context of the others.
In the course of contract renewal, DeAM agreed to implement a number of fee and expense adjustments requested by the Independent Directors which will favorably impact future fees and expenses, and my evaluation includes the effects of these changes.
Fees and Expenses Compared with Other Funds
The competitive fee and expense evaluation for each fund focused on two primary comparisons:
The Fund's contractual management fee (the advisory fee plus the administration fee where applicable) compared with those of a group of typically 12-15 funds in the same Lipper investment category (e.g. Large Capitalization Growth) having similar distribution arrangements and being of similar size.
The Fund's total expenses compared with a broader universe of funds from the same Lipper investment category and having similar distribution arrangements.
These two comparisons provide a view of not only the level of the fee compared with funds of similar scale but also the total expense the Fund bears for all the services it receives, in comparison with the investment choices available in the Fund's investment category and distribution channel. The principal figure-of-merit used in these comparisons was the subject Fund's percentile ranking against peers.
DeAM's Fees for Similar Services to Others
DeAM provided management fee schedules for all of its US domiciled fund and non-fund investment management accounts in any of the investment categories where there is a DWS Fund. These similar products included the other DWS Funds, non-fund pooled accounts, institutional accounts and sub-advisory accounts. Using this information, I calculated for each Fund the fee that would be charged to each similar product, at the subject Fund's asset level.
Evaluating information regarding non-fund products is difficult because there are varying levels of services required for different types of accounts, with mutual funds generally requiring considerably more regulatory and administrative types of service as well as having more frequent cash flows than other types of accounts. Also, while mutual fund fees for similar fund products can be expected to be similar, there will be some differences due to different pricing conditions in different distribution channels (e.g. retail funds versus those used in variable insurance products), differences in underlying investment processes and other factors.
Costs and Profit Margins
DeAM provided a detailed profitability analysis for each Fund. After making some adjustments so that the presentation would be more comparable to the available industry figures, I reviewed profit margins from investment management alone, from investment management plus other fund services (excluding distribution) provided to the Funds by DeAM (principally shareholder services), and DeAM profits from all sources, including distribution. A later section comments on overall profitability.
Economies of Scale
Economies of scale — an expected decline in management cost per dollar of fund assets as fund assets grow — are very rarely quantified and documented because of inherent difficulties in collecting and analyzing relevant data. However, in virtually every investment category that I reviewed, larger funds tend to have lower fees and lower total expenses than smaller funds. To see how each DWS Fund compares with this industry observation, I reviewed:
The trend in Fund assets over the last five years and the accompanying trend in total expenses. This shows if the Fund has grown and, if so, whether total expense (management fees as well as other expenses) have declined as a percent of assets.
Whether the Fund has break-points in its management fee schedule, the extent of the fee reduction built into the schedule and the asset levels where the breaks take effect, and in the case of a sub-advised Fund how the Fund's break-points compare with those of the sub-advisory fee schedule.
How the Fund's contractual fee schedule compares with trends in the industry data. To accomplish this, I constructed a chart showing how actual latest-fiscal-year contractual fees of the Fund and of other similar funds relate to average fund assets, with the subject Fund's contractual fee schedule superimposed.
Quality of Service — Performance
The quality-of-service evaluation focused on investment performance, which is the principal result of the investment management service. Each Fund's performance was reviewed over the past 1, 3, 5 and 10 years, as applicable, and compared with that of other funds in the same investment category and with a suitable market index.
In addition, I calculated and reviewed risk-adjusted returns relative to an index of similar mutual funds' returns and a suitable market index. The risk-adjusted returns analysis provides a way of determining the extent to which the Fund's return comparisons are mainly the product of investment value-added (or lack thereof) or alternatively taking considerably more or less risk than is typical in its investment category.
I also received and considered the history of portfolio manager changes for each Fund, as this provided an important context for evaluating the performance results.
Complex-Level Considerations
While this evaluation was conducted mainly at the individual fund level, there are some issues relating to the reasonableness of fees that can alternatively be considered across the whole fund complex:
I reviewed DeAM's profitability analysis for all DWS Funds, with a view toward determining if the allocation procedures used were reasonable and how profit levels compared with public data for other investment managers.
I considered whether DeAM and affiliates receive any significant ancillary or "fallout" benefits that should be considered in interpreting the direct profitability results. These would be situations where serving as the investment manager of the Funds is beneficial to another part of the Deutsche Bank organization.
I considered how aggregated DWS Fund expenses had varied over the years, by asset class and in the context of trends in asset levels.
I considered how aggregated DWS Fund performance measures relative to appropriate peers had varied by asset class and over time.
I reviewed the structure of the DeAM organization, trends in staffing levels, and information on compensation of investment management and other professionals compared with industry data.
Findings
Based on the process and analysis discussed above, which included reviewing a wide range of information from management and external data sources and considering among other factors the fees DeAM charges other clients, the fees charged by other fund managers, DeAM's costs and profits associated with managing the Funds, economies of scale, possible fall-out benefits, and the nature and quality of services provided, in my opinion the management fees charged the DWS Funds are reasonable.
Thomas H. Mack
President, Thomas H. Mack & Co., Inc.
Board Members and Officers
The following table presents certain information regarding the Board Members and Officers of the fund. Each Board Member's year of birth is set forth in parentheses after his or her name. Unless otherwise noted, (i) each Board Member has engaged in the principal occupation(s) noted in the table for at least the most recent five years, although not necessarily in the same capacity; and (ii) the address of each Independent Board Member is c/o Kenneth C. Froewiss, Chairman, DWS Mutual Funds, P.O. Box 78, Short Hills, NJ 07078. Except as otherwise noted below, the term of office for each Board Member is until the election and qualification of a successor, or until such Board Member sooner dies, resigns, is removed or as otherwise provided in the governing documents of the fund. Because the fund does not hold an annual meeting of shareholders, each Board Member will hold office for an indeterminate period. The Board Members may also serve in similar capacities with other funds in the fund complex.
| Independent Board Members |
Name, Year of Birth, Position with the Fund and Length of Time Served1 | | Business Experience and Directorships During the Past Five Years | Number of Funds in DWS Fund Complex Overseen |
Other Directorships Held by Board Member |
Kenneth C. Froewiss (1945) Chairperson since 2013,9 and Board Member since 2001 | | Adjunct Professor of Finance, NYU Stern School of Business (September 2009-present; Clinical Professor from 1997-September 2009); Member, Finance Committee, Association for Asian Studies (2002-present); Director, Mitsui Sumitomo Insurance Group (US) (2004-present); prior thereto, Managing Director, J.P. Morgan (investment banking firm) (until 1996) | 102 | — |
William McClayton (1944) Vice Chairperson since 2013,9 and Board Member since 2004 | | Private equity investor (since October 2009); previously, Managing Director, Diamond Management & Technology Consultants, Inc. (global consulting firm) (2001-2009); Directorship: Board of Managers, YMCA of Metropolitan Chicago; formerly: Senior Partner, Arthur Andersen LLP (accounting) (1966-2001); Trustee, Ravinia Festival | 102 | — |
John W. Ballantine (1946) Board Member since 1999 | | Retired; formerly, Executive Vice President and Chief Risk Management Officer, First Chicago NBD Corporation/The First National Bank of Chicago (1996-1998); Executive Vice President and Head of International Banking (1995-1996); former Directorships: Stockwell Capital Investments PLC (private equity); First Oak Brook Bancshares, Inc. and Oak Brook Bank; Prisma Energy International | 102 | Chairman of the Board, Healthways, Inc.2 (provider of disease and care management services) (2003- present); Portland General Electric2 (utility company) (2003- present) |
Henry P. Becton, Jr. (1943) Board Member since 1990 | | Vice Chair and former President, WGBH Educational Foundation. Directorships: Public Radio International; Public Radio Exchange (PRX); The PBS Foundation; North Bennett Street School (Boston); former Directorships: Association of Public Television Stations; Boston Museum of Science; American Public Television; Concord Academy; New England Aquarium; Mass. Corporation for Educational Telecommunications; Committee for Economic Development; Public Broadcasting Service; Connecticut College | 102 | Lead Director, Becton Dickinson and Company2 (medical technology company); Lead Director, Belo Corporation2 (media company) |
Dawn-Marie Driscoll (1946) Board Member since 1987 | | President, Driscoll Associates (consulting firm); Emeritus Executive Fellow, Center for Business Ethics, Bentley University; formerly, Partner, Palmer & Dodge (1988-1990); Vice President of Corporate Affairs and General Counsel, Filene's (1978-1988). Directorships: Director of ICI Mutual Insurance Company (since 2007); Advisory Board, Center for Business Ethics, Bentley University; Chairman of the Board of Trustees, Southwest Florida Community Foundation (charitable organization); former Directorships: Sun Capital Advisers Trust (mutual funds) (2007-2012), Investment Company Institute (audit, executive, nominating committees) and Independent Directors Council (governance, executive committees) | 102 | — |
Keith R. Fox, CFA (1954) Board Member since 1996 | | Managing General Partner, Exeter Capital Partners (a series of private investment funds) (since 1986). Directorships: Progressive International Corporation (kitchen goods importer and distributor); The Kennel Shop (retailer); former Chairman, National Association of Small Business Investment Companies; former Directorships: BoxTop Media Inc. (advertising); Sun Capital Advisers Trust (mutual funds) (2011-2012) | 102 | — |
Paul K. Freeman (1950) Board Member since 1993, and Chairperson (2009-Jan. 8, 2013) | | Consultant, World Bank/Inter-American Development Bank; Executive and Governing Council of the Independent Directors Council (Chairman of Education Committee); formerly: Project Leader, International Institute for Applied Systems Analysis (1998-2001); Chief Executive Officer, The Eric Group, Inc. (environmental insurance) (1986-1998); Directorships: Denver Zoo Foundation (December 2012-present); former Directorships: Prisma Energy International | 102 | — |
Richard J. Herring (1946) Board Member since 1990 | | Jacob Safra Professor of International Banking and Professor, Finance Department, The Wharton School, University of Pennsylvania (since July 1972); Co-Director, Wharton Financial Institutions Center (since July 2000); Co-Chair, U.S. Shadow Financial Regulatory Committee; Executive Director, Financial Economists Roundtable; formerly: Vice Dean and Director, Wharton Undergraduate Division (July 1995-June 2000); Director, Lauder Institute of International Management Studies (July 2000-June 2006) | 102 | Director, Japan Equity Fund, Inc. (since September 2007), Thai Capital Fund, Inc. (since 2007), Singapore Fund, Inc. (since September 2007), Independent Director of Barclays Bank Delaware (since September 2010) |
Rebecca W. Rimel (1951) Board Member since 1995 | | President and Chief Executive Officer, The Pew Charitable Trusts (charitable organization) (1994 to present); formerly: Executive Vice President, The Glenmede Trust Company (investment trust and wealth management) (1983-2004); Board Member, Investor Education (charitable organization) (2004-2005); Trustee, Executive Committee, Philadelphia Chamber of Commerce (2001-2007); Director, Viasys Health Care2 (January 2007-June 2007); Trustee, Thomas Jefferson Foundation (charitable organization) (1994-2012) | 102 | Director, Becton Dickinson and Company2 (medical technology company) (2012- present); Director, CardioNet, Inc.2 (health care) (2009- present) |
William N. Searcy, Jr. (1946) Board Member since 1993 | | Private investor since October 2003; formerly: Pension & Savings Trust Officer, Sprint Corporation2 (telecommunications) (November 1989-September 2003); Trustee, Sun Capital Advisers Trust (mutual funds) (1998-2012) | 102 | — |
Jean Gleason Stromberg (1943) Board Member since 1997 | | Retired. Formerly, Consultant (1997-2001); Director, Financial Markets U.S. Government Accountability Office (1996-1997); Partner, Fulbright & Jaworski, L.L.P. (law firm) (1978-1996). Directorships: The William and Flora Hewlett Foundation; former Directorships: Service Source, Inc., Mutual Fund Directors Forum (2002-2004), American Bar Retirement Association (funding vehicle for retirement plans) (1987-1990 and 1994-1996) | 102 | — |
Robert H. Wadsworth (1940) Board Member since 1999 | | President, Robert H. Wadsworth & Associates, Inc. (consulting firm) (1983 to present); Director, National Horizon, Inc. (non-profit organization); Director and Treasurer, The Phoenix Boys Choir Association | 105 | — |
Interested Board Member and Officer4 |
Name, Year of Birth, Position with the Fund and Length of Time Served1,6 | | Business Experience and Directorships During the Past Five Years | Number of Funds in DWS Fund Complex Overseen |
Other Directorships Held by Board Member |
Michael J. Woods5 (1967) Board Member since 2013,9 and Executive Vice President since 20139 | | Managing Director,3 Deutsche Asset & Wealth Management (2009-present); Head of the Americas Asset Management Business for Deutsche Bank, Member of the Asset and Wealth Management ("AWM") Extended Executive Committee, AWM Global Client Group Executive Committee and the AWM Active Asset Management Executive Committee; CEO and US Regional Head of DWS Investments; formerly: Sr. VP, Head of the Financial Intermediaries and Investments Group of Evergreen Investments (2007-2009), CEO and Vice Chairman of Board of Directors of XTF Global Asset Management (2006-2007), Managing Director — US Head of Sub-Advisory and Investment Only Business at Citigroup Asset Management (2000-2006). Mr. Woods is currently a board member of The Children's Village, The Big Brothers Big Sisters Organization, and The Mutual Fund Education Alliance. | 38 | — |
Officers4 |
Name, Year of Birth, Position with the Fund and Length of Time Served6 | | Business Experience and Directorships During the Past Five Years |
W. Douglas Beck, CFA7 (1967) President, 2011-present | | Managing Director,3 Deutsche Asset & Wealth Management (2006-present); President of DWS family of funds and Head of Product Management, U.S. for DWS Investments; formerly: Executive Director, Head of Product Management (2002-2006) and President (2005-2006) of the UBS Funds at UBS Global Asset Management; Co-Head of Manager Research/Managed Solutions Group, Merrill Lynch (1998-2002) |
John Millette8 (1962) Vice President and Secretary, 1999-present | | Director,3 Deutsche Asset & Wealth Management |
Paul H. Schubert7 (1963) Chief Financial Officer, 2004-present Treasurer, 2005-present | | Managing Director,3 Deutsche Asset & Wealth Management (since July 2004); formerly: Executive Director, Head of Mutual Fund Services and Treasurer for UBS Family of Funds (1998-2004); Vice President and Director of Mutual Fund Finance at UBS Global Asset Management (1994-1998) |
Caroline Pearson8 (1962) Chief Legal Officer, 2010-present | | Managing Director,3 Deutsche Asset & Wealth Management; formerly: Assistant Secretary for DWS family of funds (1997-2010) |
Melinda Morrow7 (1970) Vice President, 2012-present | | Director,3 Deutsche Asset & Wealth Management |
Hepsen Uzcan8 (1974) Assistant Secretary, since 20139 | | Vice President, Deutsche Asset & Wealth Management |
Paul Antosca8 (1957) Assistant Treasurer, 2007-present | | Director,3 Deutsche Asset & Wealth Management |
Jack Clark8 (1967) Assistant Treasurer, 2007-present | | Director,3 Deutsche Asset & Wealth Management |
Diane Kenneally8 (1966) Assistant Treasurer, 2007-present | | Director,3 Deutsche Asset & Wealth Management |
John Caruso7 (1965) Anti-Money Laundering Compliance Officer, 2010-present | | Managing Director,3 Deutsche Asset & Wealth Management |
Robert Kloby7 (1962) Chief Compliance Officer, 2006-present | | Managing Director,3 Deutsche Asset & Wealth Management |
1 The length of time served represents the year in which the Board Member joined the board of one or more DWS funds currently overseen by the Board.
2 A publicly held company with securities registered pursuant to Section 12 of the Securities Exchange Act of 1934.
3 Executive title, not a board directorship.
4 As a result of their respective positions held with the Advisor, these individuals are considered "interested persons" of the Advisor within the meaning of the 1940 Act. Interested persons receive no compensation from the fund.
5 The mailing address of Mr. Woods is 60 Wall Street, New York, New York 10005. Mr. Woods is an interested Board Member by virtue of his positions with Deutsche Asset & Wealth Management. As an interested person, Mr. Woods receives no compensation from the fund. Mr. Woods is a board member of the following trusts and corporations: Cash Account Trust, DWS Market Trust, DWS Money Funds, DWS State Tax-Free Income Series, DWS Target Fund, DWS Value Series, Inc., DWS Variable Series II, Investors Cash Trust, Tax-Exempt California Money Market Fund, DWS Global High Income Fund, Inc., DWS High Income Opportunities Fund, Inc., DWS High Income Trust, DWS Multi-Market Income Trust, DWS Municipal Income Trust, DWS Strategic Income Trust and DWS Strategic Municipal Income Trust.
6 The length of time served represents the year in which the officer was first elected in such capacity for one or more DWS funds.
7 Address: 60 Wall Street, New York, NY 10005.
8 Address: One Beacon Street, Boston, MA 02108.
9 Effective as of January 9, 2013.
The fund's Statement of Additional Information ("SAI") includes additional information about the Board Members. The SAI is available, without charge, upon request. If you would like to request a copy of the SAI, you may do so by calling the following toll-free number: (800) 728-3337.
Notes
Notes
Notes

ANNUAL REPORT TO SHAREHOLDERS
Davidson Cash Equivalent Shares
Money Market Portfolio
Government & Agency Securities Portfolio
Tax-Exempt Portfolio
Davidson Cash Equivalent Plus Shares
Money Market Portfolio
Government & Agency Securities Portfolio
April 30, 2013
Contents
4 Portfolio Management Review Money Market Portfolio 15 Statement of Assets and Liabilities 17 Statement of Operations 18 Statement of Changes in Net Assets Government & Agency Securities Portfolio 27 Statement of Assets and Liabilities 29 Statement of Operations 30 Statement of Changes in Net Assets Tax-Exempt Portfolio 41 Statement of Assets and Liabilities 43 Statement of Operations 44 Statement of Changes in Net Assets 46 Notes to Financial Statements 62 Report of Independent Registered Public Accounting Firm 63 Information About Each Fund's Expenses 68 Summary of Management Fee Evaluation by Independent Fee Consultant 72 Board Members and Officers |
This report must be preceded or accompanied by a prospectus. To obtain a summary prospectus, if available, or prospectus for any of our funds, visit www.dws-investments.com. We advise you to consider a fund's objectives, risks, charges and expenses carefully before investing. The summary prospectus and prospectus contain this and other important information about each fund. Please read the prospectus carefully before you invest.
An investment in these funds is not insured or guaranteed by the Federal Deposit Insurance Corporation (FDIC) or by any other government agency. Although the funds seek to preserve the value of your investment at $1.00 per share, it is possible to lose money by investing in the funds. The share price of money market funds can fall below the $1.00 share price. You should not rely on or expect the Advisor to enter into support agreements or take other actions to maintain a fund's $1.00 share price. The credit quality of the fund's holdings can change rapidly in certain markets, and the default of a single holding could have an adverse impact on a fund's share price. The fund's share price can also be negatively affected during periods of high redemption pressures and/or illiquid markets. The actions of a few large investors in one class of shares in a fund may have a significant adverse effect on the share prices of all classes of shares within that fund. See the prospectus for specific details regarding each fund's risk profile.
NOT FDIC/NCUA INSURED NO BANK GUARANTEE MAY LOSE VALUE NOT A DEPOSIT NOT INSURED BY ANY FEDERAL GOVERNMENT AGENCY
Portfolio Management Review (Unaudited)
Market Overview
All performance information below is historical and does not guarantee future results. Investment return and principal fluctuate, so your shares may be worth more or less when redeemed. Current performance may differ from performance data shown. Please visit www.dws-investments.com for the funds' most recent month-end performance. The 7-day current yield refers to the income paid by the funds over a 7-day period expressed as an annual percentage rate of each fund's shares outstanding. Yields fluctuate and are not guaranteed.
At the beginning of the funds' most recent fiscal year ended April 30, 2013, we saw another dramatic "flight to quality," as worries concerning Greece's upcoming elections and continuingly worsening conditions for Spanish and Italian banks led global and domestic investors to abandon risky assets. Late in 2012, any negative economic data was overshadowed by investor anticipation of more substantial central bank actions. The European Central Bank (ECB) lowered its interest rate for bank reserves. Then, the head of the ECB, Mario Draghi, stated that the central bank would do "whatever it takes" to preserve the euro. In December 2012, the U.S. Federal Reserve Board (the Fed) altered its guidance regarding rate levels, stating that it would maintain short-term interest rates near zero until U.S. unemployment dropped below 6.5%, and as long as inflation levels did not exceed 2.5%. In the first quarter of 2013, the European situation remained quiescent until the banking crisis in Cyprus reached a boiling point; the crisis was finally resolved after it was agreed that large uninsured depositors in Cyprus' banks would suffer substantial losses. In addition, the U.S. economy was boosted by higher housing prices and some gains in employment levels. In the money market area, we saw a continued supply/demand imbalance as well as a reduction in short-term money market supply due to ongoing quantitative easing by the Fed. In the continued search for yield, money market investors looked to a variety of financial instruments issued in countries around the world.
Positive Contributors to Fund Performance
We were able to maintain a yield that is in line with other similar money market funds during the period ended April 30, 2013.
| Money Market Portfolio seeks to provide maximum current income consistent with stability of capital. |
For the Money Market Portfolio, we continued to hold a large percentage of fund assets in short-maturity instruments for liquidity purposes. We also maintained a relatively conservative average maturity, with fund assets broadly diversified among a number of sectors and geographical areas for money market investment, such as Scandinavia, the United States, China and Singapore. Because we believe that overnight money market yields are beginning to decline due to heavy investor demand, we permitted the fund's weighted average maturity to lengthen somewhat to seek additional yield for the fund.
| Government & Agency Securities Portfolio seeks to provide maximum current income consistent with stability of capital. |
In the case of the Government & Agency Securities Portfolio, with short-maturity yields trading in a narrow range throughout most of the period, we pursued a "barbell" strategy for the fund: we held a large percentage of portfolio assets in overnight Treasury and agency repurchase agreements for relative yield, flexibility and liquidity purposes. At the same time, we purchased six-month to one-year Treasury and agency securities to take advantage of more attractive rates within that portion of the yield curve.
| Tax-Exempt Portfolio seeks to provide maximum current income that is exempt from federal income taxes to the extent consistent with stability of capital. |
For the Tax-Exempt Portfolio, we sought to preserve a balance of liquidity and high quality by maintaining a strong position in variable-rate securities during the period. (The interest rate of variable-rate securities adjusts periodically based on indices such as the Securities Industry and Financial Market Association Index of Variable Rate Demand Notes. Because the interest rates of these instruments adjust as market conditions change, they provide flexibility in an uncertain interest rate environment.) In addition, we took advantage of higher yields along the yield curve by investing in tax-exempt commercial paper, three-month to nine-month municipal "put" bonds, and one-year fixed-rate municipal note issues. We have also maintained broad diversification for the fund by investing in a number of states and municipalities.
Fund Performance (as of April 30, 2013)
Performance is historical and does not guarantee future results. Current performance may be lower or higher than the performance data quoted.
An investment in these funds is not insured or guaranteed by the Federal Deposit Insurance Corporation (FDIC) or by any other government agency. Although the funds seek to preserve the value of your investment at $1.00 per share, it is possible to lose money by investing in the funds.
| | | 7-Day Current Yield | |
| Money Market Portfolio — Davidson Cash Equivalent Shares | | | .01 | %* |
| Government & Agency Securities Portfolio — Davidson Cash Equivalent Shares | | | .01 | %* |
| Tax-Exempt Portfolio — Davidson Cash Equivalent Shares | | | .01 | %* |
| Equivalent Taxable Yield | | | .02 | %** |
| Money Market Portfolio — Davidson Cash Equivalent Plus Shares | | | .01 | %* |
| Government & Agency Securities Portfolio — Davidson Cash Equivalent Plus Shares | | | .01 | %* |
Yields are historical, will fluctuate and do not guarantee future performance. The 7-day current yield refers to the income paid by the funds over a 7-day period expressed as an annual percentage rate of the funds' shares outstanding. For the most current yield information, call (800) 332-5915. * The investment advisor has agreed to voluntarily waive fees/reimburse expenses. This waiver may be changed or terminated at any time without notice. ** The equivalent taxable yield allows you to compare with the performance of taxable money market funds. For the Tax-Exempt Portfolio, the equivalent taxable yield is based upon the marginal income tax rate of 35%. Income may be subject to local taxes and, for some investors, the alternative minimum tax. | |
Negative Contributors to Fund Performance
For all three funds, the types of securities that we invested in tended to have lower yields than issues carrying more risk. We preferred to be cautious during a time of market uncertainty. In the end this may have cost the funds some yield, but we believe that this represented a prudent approach to preserving principal.
Outlook and Positioning
We anticipate limited growth for the U.S. economy over the remainder of this year, due to steady but unspectacular employment gains and the automatic budget cuts dictated by congressional sequestration. In turn, we think that restrained growth will mean that the Fed will continue its extremely accommodative monetary policy through early 2014. We look for money market rates to continue to be low based on decreases in supply on a number of fronts and strong investor demand.
We continue our insistence on the highest credit quality within the funds. We also plan to maintain our conservative investment strategies and standards under the current market conditions. We continue to apply a careful approach to investing on behalf of the funds and to seek competitive yield for our shareholders.
Portfolio Management Team
A group of investment professionals is responsible for the day-to-day management of each fund. These investment professionals have a broad range of experience managing money market funds.
The views expressed reflect those of the portfolio management team only through the end of the period of the report as stated on the cover. The management team's views are subject to change at any time based on market and other conditions and should not be construed as a recommendation. Past performance is no guarantee of future results. Current and future portfolio holdings are subject to risk.
Terms to Know
Quantitative easing is a government monetary policy often used when interest rates are at or near zero. With this policy government or other securities are purchased from the market, causing the price of the securities purchased to rise and the yield or interest rates on the securities purchased to fall. For the companies whose bonds the central banks are willing to purchase, it means having to pay lower interest rates on new bonds issued to replace existing bonds that have matured. With lower borrowing costs, the central banks hope that consumers will be encouraged to spend more, thus helping the overall economy and improving the balance sheets of the companies providing the goods and services on which consumers are spending their money.
The yield curve is a graphical representation of how yields on bonds of different maturities compare. Normally, yield curves slant up, as bonds with longer maturities typically offer higher yields than short-term bonds.
A repurchase agreement, or "overnight repo," is an agreement between a seller and a buyer, usually of government securities, where the seller agrees to repurchase the securities at a given price and usually at a stated time. Repos are widely used money market instruments that serve as an interest-bearing, short-term "parking place" for large sums of money.
The Securities Industry and Financial Market Association Index of Variable Rate Demand Notes is a weekly high-grade market index consisting of seven-day, tax-exempt, variable-rate demand notes produced by Municipal Market Data Group. Actual issues are selected from Municipal Market Data's database of more than 10,000 active issues. Index returns do not reflect fees or expenses and it is not possible to invest directly into an index.
A "put" bond allows an investor to require the issuer to repurchase the bond at a specified date before its maturity.
Portfolio Summary (Unaudited)
Investment Portfolio as of April 30, 2013
Money Market Portfolio
| | | Principal Amount ($) | | | Value ($) | |
| | | | |
| Certificates of Deposit and Bank Notes 12.6% | |
| Banco del Estado de Chile, 0.24%, 5/14/2013 | | | 4,000,000 | | | | 4,000,000 | |
| Bank of Montreal, 0.13%, 5/3/2013 | | | 50,000,000 | | | | 50,000,000 | |
| Caisse d'Amortissement de la Dette Sociale, 1.375%, 7/29/2013 | | | 6,000,000 | | | | 6,016,628 | |
| Caisse des Depots et Consignations, 1.25%, 9/20/2013 | | | 8,000,000 | | | | 8,029,846 | |
| China Construction Bank Corp., 0.32%, 5/28/2013 | | | 10,000,000 | | | | 10,000,000 | |
| DnB Bank ASA, 0.22%, 6/4/2013 | | | 12,000,000 | | | | 12,000,000 | |
| DZ Bank AG: | |
| 0.22%, 5/10/2013 | | | 8,000,000 | | | | 8,000,000 | |
| 0.22%, 6/5/2013 | | | 15,000,000 | | | | 15,000,000 | |
| Industrial & Commercial Bank of China: | |
| 0.29%, 5/28/2013 | | | 29,000,000 | | | | 29,000,000 | |
| 0.29%, 6/4/2013 | | | 8,000,000 | | | | 8,000,000 | |
| Kreditanstalt Fuer Wiederaufbau, 0.22%, 4/11/2014 | | | 10,000,000 | | | | 9,996,488 | |
| Nordea Bank Finland PLC: | |
| 0.25%, 9/9/2013 | | | 10,000,000 | | | | 10,000,000 | |
| 0.3%, 6/14/2013 | | | 3,000,000 | | | | 3,000,000 | |
| Rabobank Nederland NV, 0.27%, 9/9/2013 | | | 5,000,000 | | | | 5,000,000 | |
| Svenska Handelsbanken AB: | |
| 0.225%, 7/12/2013 | | | 10,000,000 | | | | 10,000,100 | |
| 0.28%, 7/23/2013 | | | 10,000,000 | | | | 10,000,115 | |
Total Certificates of Deposit and Bank Notes (Cost $198,043,177) | | | | 198,043,177 | |
| | |
| Commercial Paper 28.1% | |
| Issued at Discount** 25.7% | |
| Bedford Row Funding Corp.: | |
| 144A, 0.32%, 7/15/2013 | | | 3,500,000 | | | | 3,497,667 | |
| 144A, 0.39%, 10/21/2013 | | | 3,500,000 | | | | 3,493,440 | |
| 144A, 0.42%, 1/3/2014 | | | 3,500,000 | | | | 3,489,914 | |
| BHP Billiton Finance (U.S.A.) Ltd., 144A, 0.15%, 5/16/2013 | | | 50,000,000 | | | | 49,996,875 | |
| Carnival Corp., 0.28%, 5/6/2013 | | | 2,500,000 | | | | 2,499,903 | |
| Collateralized Commercial Paper II Co., LLC: | |
| 144A, 0.25%, 7/9/2013 | | | 6,000,000 | | | | 5,997,125 | |
| 144A, 0.3%, 6/3/2013 | | | 10,000,000 | | | | 9,997,250 | |
| 144A, 0.32%, 5/14/2013 | | | 9,000,000 | | | | 8,998,960 | |
| 144A, 0.33%, 5/15/2013 | | | 9,000,000 | | | | 8,998,845 | |
| DnB Bank ASA, 0.24%, 5/13/2013 | | | 9,000,000 | | | | 8,999,280 | |
| Erste Abwicklungsanstalt: | |
| 0.21%, 5/10/2013 | | | 14,000,000 | | | | 13,999,265 | |
| 0.21%, 6/3/2013 | | | 3,500,000 | | | | 3,499,326 | |
| 0.24%, 8/1/2013 | | | 3,000,000 | | | | 2,998,160 | |
| 0.39%, 7/22/2013 | | | 8,500,000 | | | | 8,492,449 | |
| 0.425%, 7/8/2013 | | | 12,000,000 | | | | 11,990,367 | |
| 0.43%, 7/19/2013 | | | 8,500,000 | | | | 8,491,979 | |
| 0.43%, 8/13/2013 | | | 5,000,000 | | | | 4,993,789 | |
| 0.48%, 5/2/2013 | | | 5,000,000 | | | | 4,999,933 | |
| General Electric Capital Corp., 0.25%, 5/1/2013 | | | 12,000,000 | | | | 12,000,000 | |
| Google, Inc., 0.15%, 5/2/2013 | | | 2,000,000 | | | | 1,999,992 | |
| Gotham Funding Corp., 144A, 0.19%, 5/8/2013 | | | 15,000,000 | | | | 14,999,446 | |
| Kells Funding LLC: | |
| 144A, 0.25%, 9/17/2013 | | | 5,000,000 | | | | 4,995,174 | |
| 144A, 0.25%, 9/20/2013 | | | 5,000,000 | | | | 4,995,069 | |
| 144A, 0.26%, 8/19/2013 | | | 8,000,000 | | | | 7,993,644 | |
| 144A, 0.26%, 8/27/2013 | | | 5,000,000 | | | | 4,995,739 | |
| 144A, 0.34%, 5/28/2013 | | | 5,000,000 | | | | 4,998,725 | |
| Kreditanstalt Fuer Wiederaufbau, 144A, 0.19%, 5/2/2013 | | | 10,000,000 | | | | 9,999,947 | |
| Matchpoint Master Trust, 0.2%, 5/16/2013 | | | 6,000,000 | | | | 5,999,500 | |
| Nestle Finance International Ltd., 0.27%, 5/7/2013 | | | 7,500,000 | | | | 7,499,663 | |
| Nieuw Amsterdam Receivables Corp., 144A, 0.23%, 5/8/2013 | | | 5,358,000 | | | | 5,357,760 | |
| Nordea North America, Inc.: | |
| 0.26%, 8/26/2013 | | | 8,000,000 | | | | 7,993,240 | |
| 0.275%, 7/16/2013 | | | 10,500,000 | | | | 10,493,904 | |
| Oversea-Chinese Banking Corp., Ltd., 0.2%, 5/28/2013 | | | 16,000,000 | | | | 15,997,600 | |
| Queensland Treasury Corp., 0.15%, 5/21/2013 | | | 35,000,000 | | | | 34,997,083 | |
| Scaldis Capital LLC: | |
| 0.18%, 5/13/2013 | | | 15,000,000 | | | | 14,999,100 | |
| 0.19%, 5/23/2013 | | | 23,000,000 | | | | 22,997,330 | |
| Skandinaviska Enskilda Banken AB, 0.225%, 5/6/2013 | | | 10,000,000 | | | | 9,999,688 | |
| Standard Chartered Bank, 0.27%, 7/11/2013 | | | 18,000,000 | | | | 17,990,415 | |
| UOB Funding LLC, 0.25%, 8/26/2013 | | | 10,000,000 | | | | 9,991,875 | |
| Victory Receivables Corp., 144A, 0.21%, 5/13/2013 | | | 6,000,000 | | | | 5,999,580 | |
| Working Capital Management Co., 144A, 0.21%, 5/10/2013 | | | 4,000,000 | | | | 3,999,790 | |
| | | | | 406,728,791 | |
| Issued at Par* 2.4% | |
| ASB Finance Ltd., 144A, 0.414%, 9/4/2013 | | | 8,500,000 | | | | 8,500,000 | |
| Australia & New Zealand Banking Group Ltd., 144A, 0.35%, 12/6/2013 | | | 4,000,000 | | | | 4,000,000 | |
| BNZ International Funding Ltd., 144A, 0.356%, 10/23/2013 | | | 4,000,000 | | | | 4,000,000 | |
| Kells Funding LLC, 144A, 0.299%, 10/21/2013 | | | 3,000,000 | | | | 3,000,012 | |
| Westpac Banking Corp.: | |
| 144A, 0.293%, 9/3/2013 | | | 5,000,000 | | | | 5,000,000 | |
| 144A, 0.35%, 11/29/2013 | | | 13,250,000 | | | | 13,250,000 | |
| | | | | 37,750,012 | |
Total Commercial Paper (Cost $444,478,803) | | | | 444,478,803 | |
| Short-Term Notes* 9.2% | |
| Bank of Nova Scotia: | |
| 0.25%, 8/9/2013 | | | 9,000,000 | | | | 9,000,000 | |
| 0.29%, 1/10/2014 | | | 8,000,000 | | | | 8,000,000 | |
| 0.3%, 1/10/2014 | | | 8,000,000 | | | | 8,000,000 | |
| HSBC Bank PLC, 144A, 0.72%, 5/15/2013 | | | 7,500,000 | | | | 7,501,292 | |
| JPMorgan Chase Bank NA, 0.347%, 6/18/2013 | | | 3,000,000 | | | | 3,000,691 | |
| Kommunalbanken AS, 144A, 0.2%, 2/26/2014 | | | 7,500,000 | | | | 7,500,000 | |
| National Australia Bank Ltd., 0.28%, 8/13/2013 | | | 8,500,000 | | | | 8,500,000 | |
| Rabobank Nederland NV: | |
| 0.345%, 1/27/2014 | | | 10,000,000 | | | | 10,000,000 | |
| 0.383%, 6/27/2013 | | | 5,000,000 | | | | 5,000,000 | |
| 0.448%, 5/7/2013 | | | 10,000,000 | | | | 10,000,000 | |
| 144A, 0.5%, 8/16/2014 | | | 12,000,000 | | | | 12,000,000 | |
| Royal Bank of Canada: | |
| 0.35%, 2/28/2014 | | | 8,000,000 | | | | 8,000,000 | |
| 0.53%, 6/4/2013 | | | 4,500,000 | | | | 4,500,000 | |
| Svensk Exportkredit AB, 144A, 0.42%, 5/22/2013 | | | 4,000,000 | | | | 4,000,000 | |
| Wells Fargo Bank NA, 0.189%, 11/22/2013 | | | 10,000,000 | | | | 10,000,000 | |
| Westpac Banking Corp.: | |
| 0.35%, 11/15/2013 | | | 10,000,000 | | | | 10,000,000 | |
| 0.373%, 5/3/2013 | | | 12,000,000 | | | | 12,000,058 | |
| 0.459%, 8/9/2013 | | | 9,000,000 | | | | 9,000,000 | |
Total Short-Term Notes (Cost $146,002,041) | | | | 146,002,041 | |
| | |
| Government & Agency Obligations 9.2% | |
| Other Government Related 0.5% | |
| European Investment Bank, 1.875%, 6/17/2013 (a) | | | 8,500,000 | | | | 8,518,792 | |
| U.S. Government Sponsored Agencies 6.9% | |
| Federal Farm Credit Bank, 0.22%*, 10/29/2014 | | | 4,000,000 | | | | 4,000,918 | |
| Federal Home Loan Bank: | |
| 0.17%, 7/5/2013 | | | 7,000,000 | | | | 6,999,788 | |
| 0.18%, 3/7/2014 | | | 5,000,000 | | | | 4,999,788 | |
| 0.21%*, 11/8/2013 | | | 3,500,000 | | | | 3,499,271 | |
| 0.36%, 5/16/2013 | | | 4,000,000 | | | | 4,000,184 | |
| 0.5%, 8/28/2013 | | | 7,000,000 | | | | 7,006,798 | |
| Federal Home Loan Mortgage Corp.: | |
| 0.119%**, 8/26/2013 | | | 12,000,000 | | | | 11,995,320 | |
| 0.139%**, 8/13/2013 | | | 12,500,000 | | | | 12,494,944 | |
| 0.165%**, 5/29/2013 | | | 10,000,000 | | | | 9,998,678 | |
| Federal National Mortgage Association: | |
| 0.139%**, 7/19/2013 | | | 12,500,000 | | | | 12,496,160 | |
| 0.149%**, 9/3/2013 | | | 25,000,000 | | | | 24,986,979 | |
| 0.149%**, 9/16/2013 | | | 6,000,000 | | | | 5,996,550 | |
| | | | | 108,475,378 | |
| U.S. Treasury Obligations 1.8% | |
| U.S. Treasury Notes: | |
| 0.5%, 5/31/2013 | | | 13,500,000 | | | | 13,503,886 | |
| 0.5%, 10/15/2013 | | | 6,800,000 | | | | 6,809,813 | |
| 0.5%, 11/15/2013 | | | 8,000,000 | | | | 8,015,018 | |
| | | | | 28,328,717 | |
Total Government & Agency Obligations (Cost $145,322,887) | | | | 145,322,887 | |
| | |
| Time Deposits 9.7% | |
| BNP Paribas, 0.11%, 5/1/2013 | | | 41,000,000 | | | | 41,000,000 | |
| Citibank NA, 0.15%, 5/1/2013 | | | 47,000,000 | | | | 47,000,000 | |
| National Australia Bank Ltd., 0.1%, 5/1/2013 | | | 65,000,000 | | | | 65,000,000 | |
Total Time Deposits (Cost $153,000,000) | | | | 153,000,000 | |
| | |
| Municipal Bonds and Notes 2.1% | |
| Texas, JPMorgan Chase Putters/Drivers Trust, Various States, Series 4264, 144A, 0.18%***, 8/30/2013, LIQ: JPMorgan Chase Bank NA | | | 20,000,000 | | | | 20,000,000 | |
| Texas, State Transportation Revenue, 2.5%, 8/30/2013 | | | 13,000,000 | | | | 13,098,035 | |
Total Municipal Bonds and Notes (Cost $33,098,035) | | | | 33,098,035 | |
| | |
| Repurchase Agreements 29.1% | |
| Barclays Capital PLC, 0.1%, dated 4/25/2013, to be repurchased at $23,000,447 on 5/2/2013 (b) | | | 23,000,000 | | | | 23,000,000 | |
| Citigroup Global Markets, Inc., 0.09%, dated 4/24/2013, to be repurchased at $64,001,120 on 5/1/2013 (c) | | | 64,000,000 | | | | 64,000,000 | |
| HSBC Securities, Inc., 0.14%, dated 4/30/2013, to be repurchased at $26,000,101 on 5/1/2013 (d) | | | 26,000,000 | | | | 26,000,000 | |
| JPMorgan Securities, Inc., 0.17%, dated 4/30/2013, to be repurchased at $15,000,071 on 5/1/2013 (e) | | | 15,000,000 | | | | 15,000,000 | |
| JPMorgan Securities, Inc., 0.403%, dated 3/18/2013, to be repurchased at $8,032,688 on 3/18/2014 (f) | | | 8,000,000 | | | | 8,000,000 | |
| Merrill Lynch & Co., Inc., 0.09%, dated 4/26/2013, to be repurchased at $85,001,488 on 5/3/2013 (g) | | | 85,000,000 | | | | 85,000,000 | |
| Merrill Lynch & Co., Inc., 0.14%, dated 4/30/2013, to be repurchased at $2,786,057 on 5/1/2013 (h) | | | 2,786,046 | | | | 2,786,046 | |
| Merrill Lynch & Co., Inc., 0.17%, dated 3/1/2013, to be repurchased at $20,017,567 on 9/3/2013 (i) | | | 20,000,000 | | | | 20,000,000 | |
| Morgan Stanley & Co., Inc., 0.17%, dated 4/30/2013, to be repurchased at $160,000,756 on 5/1/2013 (j) | | | 160,000,000 | | | | 160,000,000 | |
| The Goldman Sachs & Co., 0.16%, dated 4/30/2013, to be repurchased at $36,500,162 on 5/1/2013 (k) | | | 36,500,000 | | | | 36,500,000 | |
| The Toronto-Dominion Bank, 0.1%, dated 4/24/2013, to be repurchased at $20,000,389 on 5/1/2013 (l) | | | 20,000,000 | | | | 20,000,000 | |
Total Repurchase Agreements (Cost $460,286,046) | | | | 460,286,046 | |
| | | % of Net Assets | | | Value ($) | |
| | | | |
Total Investment Portfolio (Cost $1,580,230,989)† | | | 100.0 | | | | 1,580,230,989 | |
| Other Assets and Liabilities, Net | | | 0.0 | | | | 150,395 | |
| Net Assets | | | 100.0 | | | | 1,580,381,384 | |
* Floating rate securities' yields vary with a designated market index or market rate, such as the coupon-equivalent of the U.S. Treasury Bill rate. These securities are shown at their current rate as of April 30, 2013.
** Annualized yield at time of purchase; not a coupon rate.
*** Variable rate demand notes are securities whose interest rates are reset periodically at market levels. These securities are payable on demand and are shown at their current rates as of April 30, 2013.
† The cost for federal income tax purposes was $1,580,230,989.
(a) Government-backed debt issued by financial companies or government sponsored enterprises.
(b) Collateralized by $26,276,294 Federal National Mortgage Association, maturing on 10/9/2019 with a value of $23,460,001.
(c) Collateralized by:
| Principal Amount ($) | | Security | | Rate (%) | | Maturity Date | | Collateral Value ($) | |
| | 2,477,802 | | Federal Home Loan Mortgage Corp. | | | 1.299 | | 11/15/2036 | | | 2,296,019 | |
| | 64,828,528 | | Federal Home Loan Mortgage Corp. — Interest Only | | | 5.801-5.881 | | 4/15/2037- 10/15/2041 | | | 9,185,069 | |
| | 95,122,638 | | Federal National Mortgage Association — Interest Only | | | 5.8-6.35 | | 6/25/2040- 7/25/2042 | | | 16,811,622 | |
| | 3,628,588 | | Government National Mortgage Association | | | 19.442 | | 1/20/2038 | | | 4,867,796 | |
| | 204,115,863 | | Government National Mortgage Association — Interest Only | | | 5.85-6.45 | | 10/20/2038- 11/16/2041 | | | 31,515,411 | |
| | 975,257 | | Government National Mortgage Association — Principal Only | | Zero Coupon | | 3/20/2040 | | | 878,770 | |
| Total Collateral Value | | | 65,554,687 | |
(d) Collateralized by $23,116,800 U.S. Treasury Inflation-Indexed Notes, with the various coupon rates from 0.125-2.0%, with various maturity dates of 1/15/2016-1/15/2023 with a value of $26,520,744.
(e) Collateralized by $139,236,797 Federal National Mortgage Association — Interest Only, with the various coupon rates from 3.0-6.5%, with various maturity dates of 8/25/2026-10/25/2040 with a value of $15,300,362.
(f) Collateralized by $8,176,760 Ally Auto Receivables Trust, 1.06%, maturing on 5/15/2017 with a value of $8,241,343.
(g) Collateralized by:
| Principal Amount ($) | | Security | | Rate (%) | | Maturity Date | | Collateral Value ($) | |
| | 20,999,000 | | Federal Farm Credit Bank | | | 1.5-2.11 | | 4/1/2020- 11/15/2023 | | | 21,125,904 | |
| | 19,000,000 | | Federal Home Loan Bank | | | 2.35 | | 8/8/2022 | | | 18,221,532 | |
| | 38,000,000 | | Federal Home Loan Mortgage Corp. | | | 0.875-5.63 | | 3/7/2018- 3/12/2027 | | | 38,886,044 | |
| | 9,803,000 | | Federal Home Loan Mortgage Corp. STRIPS | | Zero Coupon | | 1/15/2022 | | | 8,012,384 | |
| | 455,000 | | Federal National Mortgage Association | | | 0.375 | | 10/29/2015 | | | 455,032 | |
| Total Collateral Value | | | 86,700,896 | |
(h) Collateralized by $2,836,200 U.S. Treasury Note, 0.25%, maturing on 11/30/2014 with a value of $2,841,802.
(i) Collateralized by $13,936,100 U.S. Treasury Bond, 6.0%, maturing on 2/15/2026 with a value of $20,400,014.
(j) Collateralized by $153,412,926 Federal National Mortgage Association, with the various coupon rates from 2.47-4.0%, with various maturity dates of 9/1/2027-3/1/2043 with a value of $163,200,001.
(k) Collateralized by $34,311,775 Federal National Mortgage Association, with the various coupon rates from 4.0-5.0%, with various maturity dates of 5/1/2035-12/1/2042 with a value of $37,230,000.
(l) Collateralized by $20,269,900 U.S. Treasury Notes, with the various coupon rates from 0.25-4.125%, with various maturity dates of 6/15/2014-5/15/2015 with a value of $20,400,014.
144A: Security exempt from registration under Rule 144A of the Securities Act of 1933. These securities may be resold in transactions exempt from registration, normally to qualified institutional buyers.
Interest Only: Interest Only (IO) bonds represent the "interest only" portion of payments on a pool of underlying mortgages or mortgage-backed securities. IO securities are subject to prepayment risk of the pool of underlying mortgages.
LIQ: Liquidity Facility
Principal Only: Principal Only (PO) bonds represent the "principal only" portion of payments on a pool of underlying mortgages or mortgage-backed securities.
STRIPS: Separate Trading of Registered Interest and Principal Securities
Fair Value Measurements
Various inputs are used in determining the value of the Fund's investments. These inputs are summarized in three broad levels. Level 1 includes quoted prices in active markets for identical securities. Level 2 includes other significant observable inputs (including quoted prices for similar securities, interest rates, prepayment speeds and credit risk). Level 3 includes significant unobservable inputs (including the Fund's own assumptions in determining the fair value of investments). The inputs or methodology used for valuing securities are not necessarily an indication of the risk associated with investing in those securities. Securities held by the Fund are reflected as Level 2 because the securities are valued at amortized cost (which approximates fair value) and, accordingly, the inputs used to determine value are not quoted prices in an active market.
The following is a summary of the inputs used as of April 30, 2013 in valuing the Fund's investments. For information on the Fund's policy regarding the valuation of investments, please refer to the Security Valuation section of Note 1 in the accompanying Notes to Financial Statements.
| Assets | | Level 1 | | | Level 2 | | | Level 3 | | | Total | |
| | |
| Investments in Securities (m) | | $ | — | | | $ | 1,119,944,943 | | | $ | — | | | $ | 1,119,944,943 | |
| Repurchase Agreements | | | — | | | | 460,286,046 | | | | — | | | | 460,286,046 | |
| Total | | $ | — | | | $ | 1,580,230,989 | | | $ | — | | | $ | 1,580,230,989 | |
There have been no transfers between fair value measurement levels during the year ended April 30, 2013.
(m) See Investment Portfolio for additional categorizations.
The accompanying notes are an integral part of the financial statements.
Statement of Assets and Liabilities | as of April 30, 2013 | |
| Assets | | Money Market Portfolio | |
Investments: Investments in non-affiliated securities, valued at amortized cost | | $ | 1,119,944,943 | |
| Repurchase agreements, valued at amortized cost | | | 460,286,046 | |
| Total investments in securities, valued at amortized cost | | | 1,580,230,989 | |
| Receivable for Fund shares sold | | | 2,321 | |
| Interest receivable | | | 656,881 | |
| Due from Advisor | | | 193 | |
| Other assets | | | 66,922 | |
| Total assets | | | 1,580,957,306 | |
| Liabilities | |
| Payable for Fund shares redeemed | | | 8,146 | |
| Accrued management fee | | | 214,424 | |
| Accrued Trustees' fees | | | 15,584 | |
| Other accrued expenses and payables | | | 337,768 | |
| Total liabilities | | | 575,922 | |
| Net assets, at value | | $ | 1,580,381,384 | |
| Net Assets Consist of | |
| Undistributed net investment income | | | 26,943 | |
| Accumulated net realized gain (loss) | | | (13,851 | ) |
| Paid-in capital | | | 1,580,368,292 | |
| Net assets, at value | | $ | 1,580,381,384 | |
The accompanying notes are an integral part of the financial statements.
Statement of Assets and Liabilities as of April 30, 2013 (continued) | |
| Net Asset Value | | Money Market Portfolio | |
Capital Assets Funds Shares Net Asset Value, offering and redemption price per share ($582,909,923 ÷ 582,576,498 outstanding shares of beneficial interest, no par value, unlimited number of shares authorized) | | $ | 1.00 | |
Capital Assets Funds Preferred Shares Net Asset Value, offering and redemption price per share ($1,696,111 ÷ 1,695,141 outstanding shares of beneficial interest, no par value, unlimited number of shares authorized) | | $ | 1.00 | |
Davidson Cash Equivalent Shares Net Asset Value, offering and redemption price per share ($7,608,926 ÷ 7,604,572 outstanding shares of beneficial interest, no par value, unlimited number of shares authorized) | | $ | 1.00 | |
Davidson Cash Equivalent Plus Shares Net Asset Value, offering and redemption price per share ($583,590 ÷ 583,256 outstanding shares of beneficial interest, no par value, unlimited number of shares authorized) | | $ | 1.00 | |
Premium Reserve Money Market Shares Net Asset Value, offering and redemption price per share ($56,973,559 ÷ 56,940,968 outstanding shares of beneficial interest, no par value, unlimited number of shares authorized) | | $ | 1.00 | |
Service Shares Net Asset Value, offering and redemption price per share ($930,609,275 ÷ 930,076,962 outstanding shares of beneficial interest, no par value, unlimited number of shares authorized) | | $ | 1.00 | |
The accompanying notes are an integral part of the financial statements.
| for the year ended April 30, 2013 | |
| Investment Income | | Money Market Portfolio | |
Income: Interest | | $ | 5,066,039 | |
Expenses: Management fee | | | 2,833,999 | |
| Services to shareholders | | | 4,315,409 | |
| Distribution and service fees | | | 10,046,458 | |
| Custodian fee | | | 50,971 | |
| Professional fees | | | 122,043 | |
| Reports to shareholders | | | 297,324 | |
| Registration fees | | | 130,640 | |
| Trustees' fees and expenses | | | 73,535 | |
| Other | | | 57,895 | |
| Total expenses before expense reductions | | | 17,928,274 | |
| Expense reductions | | | (13,103,841 | ) |
| Total expenses after expense reductions | | | 4,824,433 | |
| Net investment income | | | 241,606 | |
| Net realized gain (loss) from investments | | | 9,230 | |
| Net increase (decrease) in net assets resulting from operations | | $ | 250,836 | |
The accompanying notes are an integral part of the financial statements.
Statement of Changes in Net Assets | | | Money Market Portfolio | |
| Increase (Decrease) in Net Assets | | Years Ended April 30, | |
| | 2013 | | | 2012 | |
Operations: Net investment income | | $ | 241,606 | | | $ | 287,114 | |
| Net realized gain (loss) | | | 9,230 | | | | (23,081 | ) |
| Net increase in net assets resulting from operations | | | 250,836 | | | | 264,033 | |
Distributions to shareholders from: Net investment income: Capital Assets Funds Shares | | | (135,785 | ) | | | (151,966 | ) |
| Capital Assets Funds Preferred Shares | | | (1,152 | ) | | | (1,683 | ) |
| Davidson Cash Equivalent Shares | | | (895 | ) | | | (1,139 | ) |
| Davidson Cash Equivalent Plus Shares | | | (69 | ) | | | (101 | ) |
| Premium Reserve Money Market Shares | | | (5,207 | ) | | | (5,559 | ) |
| Service Shares | | | (98,502 | ) | | | (126,660 | ) |
Net realized gains: Capital Assets Funds Shares | | | (4,805 | ) | | | — | |
| Capital Assets Funds Preferred Shares | | | (18 | ) | | | — | |
| Davidson Cash Equivalent Shares | | | (64 | ) | | | — | |
| Davidson Cash Equivalent Plus Shares | | | (6 | ) | | | — | |
| Premium Reserve Money Market Shares | | | (447 | ) | | | — | |
| Service Shares | | | (6,802 | ) | | | — | |
| Total distributions | | | (253,752 | ) | | | (287,108 | ) |
Fund share transactions: Proceeds from shares sold | | | 1,530,799,135 | | | | 2,195,076,399 | |
| Reinvestment of distributions | | | 251,713 | | | | 284,155 | |
| Cost of shares redeemed | | | (1,744,126,197 | ) | | | (2,987,807,342 | ) |
| Net increase (decrease) in net assets from Fund share transactions | | | (213,075,349 | ) | | | (792,446,788 | ) |
| Increase (decrease) in net assets | | | (213,078,265 | ) | | | (792,469,863 | ) |
| Net assets at beginning of period | | | 1,793,459,649 | | | | 2,585,929,512 | |
| Net assets at end of period (including undistributed net investment income of $26,943 and $39,089, respectively) | | $ | 1,580,381,384 | | | $ | 1,793,459,649 | |
The accompanying notes are an integral part of the financial statements.
Money Market Portfolio Davidson Cash Equivalent Shares | |
| | | Years Ended April 30, | |
| | 2013 | | | 2012 | | | 2011 | | | 2010 | | | 2009 | |
| Selected Per Share Data | |
| Net asset value, beginning of period | | $ | 1.00 | | | $ | 1.00 | | | $ | 1.00 | | | $ | 1.00 | | | $ | 1.00 | |
Income (loss) from investment operations: Net investment income | | | .000 | * | | | .000 | * | | | .000 | * | | | .000 | * | | | .012 | |
| Net realized gain (loss) | | | .000 | * | | | (.000 | )* | | | .000 | * | | | .000 | * | | | .000 | * |
| Total from investment operations | | | .000 | * | | | .000 | * | | | .000 | * | | | .000 | * | | | .012 | |
Less distributions from: Net investment income | | | (.000 | )* | | | (.000 | )* | | | (.000 | )* | | | (.000 | )* | | | (.012 | ) |
| Net realized gains | | | (.000 | )* | | | — | | | | — | | | | (.000 | )* | | | — | |
| Total distributions | | | (.000 | )* | | | (.000 | )* | | | (.000 | )* | | | (.000 | )* | | | (.012 | ) |
| Net asset value, end of period | | $ | 1.00 | | | $ | 1.00 | | | $ | 1.00 | | | $ | 1.00 | | | $ | 1.00 | |
Total Return (%)a | | | .01 | | | | .01 | | | | .01 | | | | .03 | | | | 1.25 | |
| Ratios to Average Net Assets and Supplemental Data | |
| Net assets, end of period ($ millions) | | | 8 | | | | 9 | | | | 13 | | | | 18 | | | | 30 | |
| Ratio of expenses before expense reductions (%) | | | 1.03 | | | | 1.03 | | | | 1.01 | | | | .94 | | | | .98 | |
| Ratio of expenses after expense reductions (%) | | | .28 | | | | .26 | | | | .35 | | | | .46 | | | | .97 | |
| Ratio of net investment income (%) | | | .01 | | | | .01 | | | | .01 | | | | .01 | | | | 1.19 | |
a Total return would have been lower had certain expenses not been reduced. * Amount is less than $.0005. | |
Money Market Portfolio Davidson Cash Equivalent Plus Shares | |
| | | Years Ended April 30, | |
| | 2013 | | | 2012 | | | 2011 | | | 2010 | | | 2009 | |
| Selected Per Share Data | |
| Net asset value, beginning of period | | $ | 1.00 | | | $ | 1.00 | | | $ | 1.00 | | | $ | 1.00 | | | $ | 1.00 | |
Income (loss) from investment operations: Net investment income | | | .000 | * | | | .000 | * | | | .000 | * | | | .000 | * | | | .013 | |
| Net realized gain (loss) | | | .000 | * | | | (.000 | )* | | | .000 | * | | | .000 | * | | | .000 | * |
| Total from investment operations | | | .000 | * | | | .000 | * | | | .000 | * | | | .000 | * | | | .013 | |
Less distributions from: Net investment income | | | (.000 | )* | | | (.000 | )* | | | (.000 | )* | | | (.000 | )* | | | (.013 | ) |
| Net realized gains | | | (.000 | )* | | | — | | | | — | | | | (.000 | )* | | | — | |
| Total distributions | | | (.000 | )* | | | (.000 | )* | | | (.000 | )* | | | (.000 | )* | | | (.013 | ) |
| Net asset value, end of period | | $ | 1.00 | | | $ | 1.00 | | | $ | 1.00 | | | $ | 1.00 | | | $ | 1.00 | |
Total Return (%)a | | | .01 | | | | .01 | | | | .01 | | | | .03 | | | | 1.35 | |
| Ratios to Average Net Assets and Supplemental Data | |
| Net assets, end of period ($ millions) | | | 1 | | | | 1 | | | | 1 | | | | 2 | | | | 5 | |
| Ratio of expenses before expense reductions (%) | | | .92 | | | | .90 | | | | .88 | | | | .86 | | | | .86 | |
| Ratio of expenses after expense reductions (%) | | | .28 | | | | .26 | | | | .35 | | | | .46 | | | | .86 | |
| Ratio of net investment income (%) | | | .01 | | | | .01 | | | | .01 | | | | .01 | | | | 1.30 | |
a Total return would have been lower had certain expenses not been reduced. * Amount is less than $.0005. | |
Portfolio Summary (Unaudited)
Investment Portfolio as of April 30, 2013
Government & Agency Securities Portfolio
| | | Principal Amount ($) | | | Value ($) | |
| | | | |
| Government & Agency Obligations 51.8% | |
| U.S. Government Sponsored Agencies 45.6% | |
| Federal Farm Credit Bank: | |
| 0.15%**, 2/6/2014 | | | 75,000,000 | | | | 75,000,000 | |
| 0.19%, 12/13/2013 | | | 15,000,000 | | | | 15,000,000 | |
| 0.211%*, 5/23/2013 | | | 10,000,000 | | | | 9,998,656 | |
| Federal Home Loan Bank: | |
| 0.117%*, 6/3/2013 | | | 35,000,000 | | | | 34,996,150 | |
| 0.12%, 10/3/2013 | | | 50,000,000 | | | | 49,997,423 | |
| 0.125%, 3/27/2014 | | | 15,000,000 | | | | 14,992,270 | |
| 0.15%, 10/15/2013 | | | 38,000,000 | | | | 37,998,836 | |
| 0.16%, 6/5/2013 | | | 25,000,000 | | | | 24,999,760 | |
| 0.16%, 12/19/2013 | | | 15,000,000 | | | | 14,999,389 | |
| 0.17%, 7/5/2013 | | | 30,000,000 | | | | 29,999,090 | |
| 0.17%, 3/25/2014 | | | 15,000,000 | | | | 14,998,374 | |
| 0.171%*, 6/5/2013 | | | 50,000,000 | | | | 49,991,493 | |
| 0.18%**, 7/25/2013 | | | 25,000,000 | | | | 24,999,703 | |
| 0.18%**, 7/26/2013 | | | 15,000,000 | | | | 14,999,647 | |
| 0.18%, 3/7/2014 | | | 22,500,000 | | | | 22,498,775 | |
| 0.21%**, 11/8/2013 | | | 27,000,000 | | | | 26,994,378 | |
| 0.22%**, 11/15/2013 | | | 12,500,000 | | | | 12,497,259 | |
| 0.235%**, 11/4/2013 | | | 49,000,000 | | | | 48,993,658 | |
| 0.28%, 11/14/2013 | | | 10,000,000 | | | | 10,006,609 | |
| 0.31%, 5/16/2013 | | | 20,755,000 | | | | 20,755,569 | |
| 0.31%**, 5/17/2013 | | | 38,000,000 | | | | 38,000,000 | |
| 0.36%, 5/16/2013 | | | 27,500,000 | | | | 27,501,263 | |
| 0.5%, 8/28/2013 | | | 24,000,000 | | | | 24,023,308 | |
| 0.875%, 12/27/2013 | | | 12,000,000 | | | | 12,055,109 | |
| 2.375%, 3/14/2014 | | | 10,000,000 | | | | 10,190,020 | |
| Federal Home Loan Mortgage Corp.: | |
| 0.11%*, 11/19/2013 | | | 17,000,000 | | | | 16,989,507 | |
| 0.119%*, 8/26/2013 | | | 50,000,000 | | | | 49,980,500 | |
| 0.128%*, 7/15/2013 | | | 25,000,000 | | | | 24,993,229 | |
| 0.138%*, 7/9/2013 | | | 38,000,000 | | | | 37,989,803 | |
| 0.139%**, 9/13/2013 | | | 75,000,000 | | | | 74,998,762 | |
| 0.139%*, 8/13/2013 | | | 12,500,000 | | | | 12,494,944 | |
| 0.147%*, 6/12/2013 | | | 25,000,000 | | | | 24,995,625 | |
| 0.149%*, 9/4/2013 | | | 35,000,000 | | | | 34,981,625 | |
| 0.15%*, 5/6/2013 | | | 20,000,000 | | | | 19,999,514 | |
| 0.158%*, 6/25/2013 | | | 35,000,000 | | | | 34,991,444 | |
| 0.165%*, 5/29/2013 | | | 20,000,000 | | | | 19,997,355 | |
| 0.166%*, 5/13/2013 | | | 18,000,000 | | | | 17,998,920 | |
| 1.375%, 2/25/2014 | | | 15,000,000 | | | | 15,151,525 | |
| 3.5%, 5/29/2013 | | | 10,500,000 | | | | 10,526,336 | |
| Federal National Mortgage Association: | |
| 0.09%*, 5/8/2013 | | | 25,000,000 | | | | 24,999,514 | |
| 0.109%*, 7/2/2013 | | | 22,000,000 | | | | 21,995,832 | |
| 0.129%*, 10/1/2013 | | | 38,000,000 | | | | 37,979,005 | |
| 0.139%*, 7/19/2013 | | | 20,000,000 | | | | 19,993,856 | |
| 0.149%*, 9/16/2013 | | | 68,500,000 | | | | 68,460,612 | |
| 0.16%*, 5/1/2013 | | | 10,000,000 | | | | 10,000,000 | |
| 0.169%*, 5/22/2013 | | | 25,000,000 | | | | 24,997,448 | |
| 1.5%, 6/26/2013 | | | 10,000,000 | | | | 10,019,950 | |
| 2.75%, 3/13/2014 | | | 58,000,000 | | | | 59,304,625 | |
| | | | | 1,340,326,670 | |
| U.S. Treasury Obligations 5.2% | |
| U.S. Treasury Notes: | |
| 0.25%, 10/31/2013 | | | 10,000,000 | | | | 10,001,916 | |
| 0.25%, 11/30/2013 | | | 15,000,000 | | | | 15,008,089 | |
| 0.5%, 5/31/2013 | | | 28,500,000 | | | | 28,507,950 | |
| 0.5%, 10/15/2013 | | | 32,500,000 | | | | 32,544,533 | |
| 0.5%, 11/15/2013 | | | 32,500,000 | | | | 32,559,305 | |
| 0.75%, 12/15/2013 | | | 35,000,000 | | | | 35,127,814 | |
| | | | | 153,749,607 | |
| Other Government Related 1.0% | |
| Straight-A Funding LLC, 144A, 0.17%, 6/18/2013 | | | 30,000,000 | | | | 29,993,200 | |
Total Government & Agency Obligations (Cost $1,524,069,477) | | | | 1,524,069,477 | |
| | |
| Repurchase Agreements 48.2% | |
| Barclays Capital, 0.1%, dated 4/25/2013, to be repurchased at $125,002,431 on 5/2/2013 (a) | | | 125,000,000 | | | | 125,000,000 | |
| BNP Paribas, 0.14%, dated 4/30/2013, to be repurchased at $65,000,253 on 5/1/2013 (b) | | | 65,000,000 | | | | 65,000,000 | |
| BNP Paribas, 0.15%, dated 4/30/2013, to be repurchased at $40,000,167 on 5/1/2013 (c) | | | 40,000,000 | | | | 40,000,000 | |
| Citigroup Global Markets, Inc., 0.09%, dated 4/24/2013, to be repurchased at $13,000,228 on 5/1/2013 (d) | | | 13,000,000 | | | | 13,000,000 | |
| Citigroup Global Markets, Inc., 0.14%, dated 4/30/2013, to be repurchased at $42,000,163 on 5/1/2013 (e) | | | 42,000,000 | | | | 42,000,000 | |
| HSBC Securities, Inc., 0.17%, dated 4/30/2013, to be repurchased at $54,000,255 on 5/1/2013 (f) | | | 54,000,000 | | | | 54,000,000 | |
| JPMorgan Securities, Inc., 0.17%, dated 4/30/2013, to be repurchased at $113,000,534 on 5/1/2013 (g) | | | 113,000,000 | | | | 113,000,000 | |
| Merrill Lynch & Co., Inc., 0.09%, dated 4/26/2013, to be repurchased at $85,001,488 on 5/3/2013 (h) | | | 85,000,000 | | | | 85,000,000 | |
| Merrill Lynch & Co., Inc., 0.14%, dated 4/30/2013, to be repurchased at $35,102,349 on 5/1/2013 (i) | | | 35,102,212 | | | | 35,102,212 | |
| Merrill Lynch & Co., Inc., 0.14%, dated 4/5/2013, to be repurchased at $110,014,117 on 5/8/2013 (j) | | | 110,000,000 | | | | 110,000,000 | |
| Morgan Stanley & Co., Inc., 0.17%, dated 4/30/2013, to be repurchased at $424,002,002 on 5/1/2013 (k) | | | 424,000,000 | | | | 424,000,000 | |
| RBS Securities, Inc., 0.14%, dated 4/30/2013, to be repurchased at $135,000,525 on 5/1/2013 (l) | | | 135,000,000 | | | | 135,000,000 | |
| The Goldman Sachs & Co., 0.16%, dated 4/30/2013, to be repurchased at $100,000,444 on 5/1/2013 (m) | | | 100,000,000 | | | | 100,000,000 | |
| The Toronto-Dominion Bank, 0.1%, dated 4/24/2013, to be repurchased at $75,001,458 on 5/1/2013 (n) | | | 75,000,000 | | | | 75,000,000 | |
Total Repurchase Agreements (Cost $1,416,102,212) | | | | 1,416,102,212 | |
| | | % of Net Assets | | | Value ($) | |
| | | | |
Total Investment Portfolio (Cost $2,940,171,689)† | | | 100.0 | | | | 2,940,171,689 | |
| Other Assets and Liabilities, Net | | | 0.0 | | | | 185,473 | |
| Net Assets | | | 100.0 | | | | 2,940,357,162 | |
* Annualized yield at time of purchase; not a coupon rate.
** Floating rate securities' yields vary with a designated market index or market rate, such as the coupon-equivalent of the U.S. Treasury Bill rate. These securities are shown at their current rate as of April 30, 2013.
† The cost for federal income tax purposes was $2,940,171,689.
(a) Collateralized by $126,575,000 Federal Home Loan Bank, with the various coupon rates from 2.13-2.65%, with various maturity dates of 11/5/2024-2/15/2028 with a value of $127,500,282.
(b) Collateralized by $50,645,400 U.S. Treasury Inflation-Indexed Notes, with the various coupon rates from 2.0-2.5%, with various maturity dates of 1/15/2016-7/15/2016 with a value of $66,300,001.
(c) Collateralized by $40,258,000 U.S. Federal Home Loan Mortgage Corp., with the various coupon rates from 0.45-3.01%, with various maturity dates of 1/9/2014-7/9/2027 with a value of $40,800,030.
(d) Collateralized by:
| Principal Amount ($) | | Security | | Rate (%) | | Maturity Date | | Collateral Value ($) | |
| | 2,986,985 | | Federal Home Loan Mortgage Corp. | | | 1.299 | | 11/15/2036 | | | 2,767,845 | |
| | 25,652,820 | | Federal National Mortgage Association — Interest Only | | | 7.05 | | 12/25/2042 | | | 4,912,647 | |
| | 36,197,656 | | Government National Mortgage Association — Interest Only | | | 5.85-6.317 | | 1/20/2038- 11/16/2041 | | | 5,742,486 | |
| Total Collateral Value | | | 13,422,978 | |
(e) Collateralized by:
| Principal Amount ($) | | Security | | Rate (%) | | Maturity Date | | Collateral Value ($) | |
| | 13,766,000 | | U.S. Treasury Inflation-Indexed Note | | | 1.125 | | 1/15/2021 | | | 17,248,540 | |
| | 25,503,800 | | U.S. Treasury Note | | | 0.75 | | 9/15/2013 | | | 25,591,469 | |
| Total Collateral Value | | | 42,840,009 | |
(f) Collateralized by:
| Principal Amount ($) | | Security | | Rate (%) | | Maturity Date | | Collateral Value ($) | |
| | 47,691,333 | | Government National Mortgage Association | | | 3.5-6.0 | | 8/15/2032- 2/20/2043 | | | 52,685,764 | |
| | 2,395,000 | | U.S. Treasury Bill | | | — | | 7/5/2013 | | | 2,394,856 | |
| Total Collateral Value | | | 55,080,620 | |
(g) Collateralized by:
| Principal Amount ($) | | Security | | Rate (%) | | Maturity Date | | Collateral Value ($) | |
| | 1,075,267,081 | | Federal Home Loan Mortgage Corp. — Interest Only | | | 2.5-6.0 | | 9/15/2015- 2/15/2043 | | | 100,729,795 | |
| | 2,288,334 | | Federal National Mortgage Association | | | 3.0 | | 3/25/2033 | | | 2,323,084 | |
| | 106,602,739 | | Federal National Mortgage Association — Interest Only | | | 3.0-6.5 | | 6/25/2020- 8/25/2042 | | | 12,207,334 | |
| Total Collateral Value | | | 115,260,213 | |
(h) Collateralized by:
| Principal Amount ($) | | Security | | Rate (%) | | Maturity Date | | Collateral Value ($) | |
| | 17,990,000 | | Federal Farm Credit Bank | | | 1.5 | | 4/1/2020 | | | 18,185,341 | |
| | 20,650,000 | | Federal Home Loan Mortgage Corp. | | | 1.375 | | 5/1/2020 | | | 20,730,185 | |
| | 46,940,000 | | Federal National Mortgage Association | | | 1.05-6.08 | | 11/15/2017- 10/23/2036 | | | 47,785,043 | |
| Total Collateral Value | | | 86,700,569 | |
(i) Collateralized by $26,210,800 U.S. Treasury Bond, 4.625%, maturing on 2/15/2040 with a value of $35,804,331.
(j) Collateralized by $91,947,100 U.S. Treasury Note, 11.25%, maturing on 2/15/2015 with a value of $112,200,034.
(k) Collateralized by $401,096,407 Federal Home Loan Mortgage Corp., with the various coupon rates from 3.0-5.0%, with various maturity dates of 2/1/2026-4/1/2043 with a value of $432,480,000.
(l) Collateralized by $134,311,400 U.S. Treasury Notes, with the various coupon rates from 3.125-4.0%, with various maturity dates of 8/31/2013-2/15/2014 with a value of $137,705,131.
(m) Collateralized by:
| Principal Amount ($) | | Security | | Rate (%) | | Maturity Date | | Collateral Value ($) | |
| | 660 | | Federal Home Loan Mortgage Corp. | | | 9.5 | | 11/15/2021 | | | 13,281 | |
| | 94,546,134 | | Federal National Mortgage Association | | Zero Coupon-4.0 | | 10/1/2027- 4/1/2043 | | | 101,986,720 | |
| Total Collateral Value | | | 102,000,001 | |
(n) Collateralized by:
| Principal Amount ($) | | Security | | Rate (%) | | Maturity Date | | Collateral Value ($) | |
| | 21,837,000 | | U.S. Treasury Bonds | | | 4.5-6.0 | | 2/15/2026- 5/15/2038 | | | 30,623,017 | |
| | 45,084,400 | | U.S. Treasury Notes | | | 0.125-1.875 | | 12/31/2013- 9/30/2019 | | | 45,877,044 | |
| Total Collateral Value | | | 76,500,061 | |
144A: Security exempt from registration under Rule 144A of the Securities Act of 1933. These securities may be resold in transactions exempt from registration, normally to qualified institutional buyers.
Interest Only: Interest Only (IO) bonds represent the "interest only" portion of payments on a pool of underlying mortgages or mortgage-backed securities. IO securities are subject to prepayment risk of the pool of underlying mortgages.
Fair Value Measurements
Various inputs are used in determining the value of the Fund's investments. These inputs are summarized in three broad levels. Level 1 includes quoted prices in active markets for identical securities. Level 2 includes other significant observable inputs (including quoted prices for similar securities, interest rates, prepayment speeds and credit risk). Level 3 includes significant unobservable inputs (including the Fund's own assumptions in determining the fair value of investments). The inputs or methodology used for valuing securities are not necessarily an indication of the risk associated with investing in those securities. Securities held by the Fund are reflected as Level 2 because the securities are valued at amortized cost (which approximates fair value) and, accordingly, the inputs used to determine value are not quoted prices in an active market.
The following is a summary of the inputs used as of April 30, 2013 in valuing the Fund's investments. For information on the Fund's policy regarding the valuation of investments, please refer to the Security Valuation section of Note 1 in the accompanying Notes to Financial Statements.
| Assets | | Level 1 | | | Level 2 | | | Level 3 | | | Total | |
| | |
| Investments in Securities (o) | | $ | — | | | $ | 1,524,069,477 | | | $ | — | | | $ | 1,524,069,477 | |
| Repurchase Agreements | | | — | | | | 1,416,102,212 | | | | — | | | | 1,416,102,212 | |
| Total | | $ | — | | | $ | 2,940,171,689 | | | $ | — | | | $ | 2,940,171,689 | |
There have been no transfers between fair value measurement levels during the year ended April 30, 2013.
(o) See Investment Portfolio for additional detailed categorizations.
The accompanying notes are an integral part of the financial statements.
Statement of Assets and Liabilities | as of April 30, 2013 | |
| Assets | | Government & Agency Securities Portfolio | |
Investments: Investments in non-affiliated securities, valued at amortized cost | | $ | 1,524,069,477 | |
| Repurchase agreements, valued at amortized cost | | | 1,416,102,212 | |
| Total investments in securities, valued at amortized cost | | | 2,940,171,689 | |
| Receivable for Fund shares sold | | | 200,399 | |
| Interest receivable | | | 1,067,727 | |
| Due from Advisor | | | 27,126 | |
| Other assets | | | 71,710 | |
| Total assets | | | 2,941,538,651 | |
| Liabilities | |
| Payable for Fund shares redeemed | | | 794,880 | |
| Distributions payable | | | 25,829 | |
| Accrued Trustees' fees | | | 28,311 | |
| Other accrued expenses and payables | | | 332,469 | |
| Total liabilities | | | 1,181,489 | |
| Net assets, at value | | $ | 2,940,357,162 | |
| Net Assets Consist of | |
| Undistributed net investment income | | | 201,505 | |
| Accumulated net realized gain (loss) | | | (435,501 | ) |
| Paid-in capital | | | 2,940,591,158 | |
| Net assets, at value | | $ | 2,940,357,162 | |
The accompanying notes are an integral part of the financial statements.
Statement of Assets and Liabilities as of April 30, 2013 (continued) | |
| Net Asset Value | | Government & Agency Securities Portfolio | |
Capital Assets Funds Shares Net Asset Value, offering and redemption price per share ($137,808,041 ÷ 137,818,174 outstanding shares of beneficial interest, no par value, unlimited number of shares authorized) | | $ | 1.00 | |
Davidson Cash Equivalent Shares Net Asset Value, offering and redemption price per share ($20,267,423 ÷ 20,268,915 outstanding shares of beneficial interest, no par value, unlimited number of shares authorized) | | $ | 1.00 | |
Davidson Cash Equivalent Plus Shares Net Asset Value, offering and redemption price per share ($108,250,027 ÷ 108,257,988 outstanding shares of beneficial interest, no par value, unlimited number of shares authorized) | | $ | 1.00 | |
DWS Government & Agency Money Fund Net Asset Value, offering and redemption price per share ($117,365,297 ÷ 117,373,968 outstanding shares of beneficial interest, no par value, unlimited number of shares authorized) | | $ | 1.00 | |
DWS Government Cash Institutional Shares Net Asset Value, offering and redemption price per share ($2,256,081,997 ÷ 2,256,247,886 outstanding shares of beneficial interest, no par value, unlimited number of shares authorized) | | $ | 1.00 | |
Government Cash Managed Shares Net Asset Value, offering and redemption price per share ($222,242,097 ÷ 222,258,439 outstanding shares of beneficial interest, no par value, unlimited number of shares authorized) | | $ | 1.00 | |
Service Shares Net Asset Value, offering and redemption price per share ($78,342,280 ÷ 78,348,040 outstanding shares of beneficial interest, no par value, unlimited number of shares authorized) | | $ | 1.00 | |
The accompanying notes are an integral part of the financial statements.
| for the year ended April 30, 2013 | |
| Investment Income | | Government & Agency Securities Portfolio | |
Income: Interest | | $ | 5,237,165 | |
Expenses: Management fee | | | 1,898,580 | |
| Administration fee | | | 2,969,292 | |
| Services to shareholders | | | 1,499,291 | |
| Distribution and service fees | | | 2,540,744 | |
| Custodian fee | | | 55,371 | |
| Professional fees | | | 135,387 | |
| Reports to shareholders | | | 139,606 | |
| Registration fees | | | 135,888 | |
| Trustees' fees and expenses | | | 135,253 | |
| Other | | | 134,035 | |
| Total expenses before expense reductions | | | 9,643,447 | |
| Expense reductions | | | (5,144,848 | ) |
| Total expenses after expense reductions | | | 4,498,599 | |
| Net investment income | | | 738,566 | |
| Net realized gain (loss) from investments | | | 11,278 | |
| Net increase (decrease) in net assets resulting from operations | | $ | 749,844 | |
The accompanying notes are an integral part of the financial statements.
Statement of Changes in Net Assets | | | Government & Agency Securities Portfolio | |
| Increase (Decrease) in Net Assets | | Years Ended April 30, | |
| | 2013 | | | 2012 | |
Operations: Net investment income | | $ | 738,566 | | | $ | 1,255,673 | |
| Net realized gain (loss) | | | 11,278 | | | | 155,718 | |
| Net increase in net assets resulting from operations | | | 749,844 | | | | 1,411,391 | |
Distributions to shareholders from: Net investment income: Capital Assets Funds Shares | | | (17,994 | ) | | | (24,512 | ) |
| Davidson Cash Equivalent Shares | | | (2,284 | ) | | | (2,348 | ) |
| Davidson Cash Equivalent Plus Shares | | | (9,941 | ) | | | (7,569 | ) |
| DWS Government & Agency Money Fund | | | (12,034 | ) | | | (14,615 | ) |
| DWS Government Cash Institutional Shares | | | (662,372 | ) | | | (1,165,027 | ) |
| Government Cash Managed Shares | | | (24,703 | ) | | | (24,030 | ) |
| Service Shares | | | (9,225 | ) | | | (17,564 | ) |
| Total distributions | | | (738,553 | ) | | | (1,255,665 | ) |
Fund share transactions: Proceeds from shares sold | | | 17,983,371,115 | | | | 33,927,293,511 | |
| Reinvestment of distributions | | | 400,224 | | | | 717,672 | |
| Cost of shares redeemed | | | (18,573,676,534 | ) | | | (35,969,779,735 | ) |
| Net increase (decrease) in net assets from Fund share transactions | | | (589,905,195 | ) | | | (2,041,768,552 | ) |
| Increase (decrease) in net assets | | | (589,893,904 | ) | | | (2,041,612,826 | ) |
| Net assets at beginning of period | | | 3,530,251,066 | | | | 5,571,863,892 | |
| Net assets at end of period (including undistributed net investment income of $201,505 and $201,492, respectively) | | $ | 2,940,357,162 | | | $ | 3,530,251,066 | |
The accompanying notes are an integral part of the financial statements.
Government & Agency Securities Portfolio Davidson Cash Equivalent Shares | |
| | | Years Ended April 30, | |
| | 2013 | | | 2012 | | | 2011 | | | 2010 | | | 2009 | |
| Selected Per Share Data | |
| Net asset value, beginning of period | | $ | 1.00 | | | $ | 1.00 | | | $ | 1.00 | | | $ | 1.00 | | | $ | 1.00 | |
Income (loss) from investment operations: Net investment income | | | .000 | * | | | .000 | * | | | .000 | * | | | .000 | * | | | .008 | |
| Net realized gain (loss) | | | .000 | * | | | .000 | * | | | (.000 | )* | | | .000 | * | | | .000 | * |
| Total from investment operations | | | .000 | * | | | .000 | * | | | .000 | * | | | .000 | * | | | .008 | |
Less distributions from: Net investment income | | | (.000 | )* | | | (.000 | )* | | | (.000 | )* | | | (.000 | )* | | | (.008 | ) |
| Net realized gains | | | — | | | | — | | | | — | | | | (.000 | )* | | | — | |
| Total distributions | | | (.000 | )* | | | (.000 | )* | | | (.000 | )* | | | (.000 | )* | | | (.008 | ) |
| Net asset value, end of period | | $ | 1.00 | | | $ | 1.00 | | | $ | 1.00 | | | $ | 1.00 | | | $ | 1.00 | |
Total Return (%)a | | | .01 | | | | .01 | | | | .01 | | | | .02 | | | | .76 | |
| Ratios to Average Net Assets and Supplemental Data | |
| Net assets, end of period ($ millions) | | | 20 | | | | 25 | | | | 19 | | | | 20 | | | | 29 | |
| Ratio of expenses before expense reductions (%) | | | .99 | | | | .99 | | | | .99 | | | | .96 | | | | .99 | |
| Ratio of expenses after expense reductions (%) | | | .17 | | | | .11 | | | | .22 | | | | .31 | | | | .90 | |
| Ratio of net investment income (%) | | | .01 | | | | .01 | | | | .01 | | | | .01 | | | | .82 | b |
a Total return would have been lower had certain expenses not been reduced. b Due to the timing of the subscriptions and redemptions, the amount shown does not correspond to the total return during the period. * Amount is less than $.0005. | |
Government & Agency Securities Portfolio Davidson Cash Equivalent Plus Shares | |
| | | Years Ended April 30, | |
| | 2013 | | | 2012 | | | 2011 | | | 2010 | | | 2009 | |
| Selected Per Share Data | |
| Net asset value, beginning of period | | $ | 1.00 | | | $ | 1.00 | | | $ | 1.00 | | | $ | 1.00 | | | $ | 1.00 | |
Income (loss) from investment operations: Net investment income | | | .000 | * | | | .000 | * | | | .000 | * | | | .000 | * | | | .009 | |
| Net realized gain (loss) | | | .000 | * | | | .000 | * | | | (.000 | )* | | | .000 | * | | | .000 | * |
| Total from investment operations | | | .000 | * | | | .000 | * | | | .000 | * | | | .000 | * | | | .009 | |
Less distributions from: Net investment income | | | (.000 | )* | | | (.000 | )* | | | (.000 | )* | | | (.000 | )* | | | (.009 | ) |
| Net realized gains | | | — | | | | — | | | | — | | | | (.000 | )* | | | — | |
| Total distributions | | | (.000 | )* | | | (.000 | )* | | | (.000 | )* | | | (.000 | )* | | | (.009 | ) |
| Net asset value, end of period | | $ | 1.00 | | | $ | 1.00 | | | $ | 1.00 | | | $ | 1.00 | | | $ | 1.00 | |
Total Return (%)a | | | .01 | | | | .01 | | | | .01 | | | | .02 | | | | .89 | |
| Ratios to Average Net Assets and Supplemental Data | |
| Net assets, end of period ($ millions) | | | 108 | | | | 94 | | | | 33 | | | | 50 | | | | 24 | |
| Ratio of expenses before expense reductions (%) | | | .84 | | | | .83 | | | | .84 | | | | .85 | | | | .83 | |
| Ratio of expenses after expense reductions (%) | | | .17 | | | | .11 | | | | .23 | | | | .29 | | | | .78 | |
| Ratio of net investment income (%) | | | .01 | | | | .01 | | | | .01 | | | | .01 | | | | .96 | b |
a Total return would have been lower had certain expenses not been reduced. b Due to the timing of the subscriptions and redemptions, the amount shown does not correspond to the total return during the period. * Amount is less than $.0005. | |
Portfolio Summary (Unaudited)
Investment Portfolio as of April 30, 2013
Tax-Exempt Portfolio
| | | Principal Amount ($) | | | Value ($) | |
| | | | |
| Municipal Investments 98.7% | |
| Alaska 3.1% | |
| Anchorage, AK: | |
| Tax Anticipation Notes, 2.0%, 9/17/2013 | | | 25,000,000 | | | | 25,174,489 | |
| TECP, 0.19%, 10/3/2013, LOC: Wells Fargo | | | 25,000,000 | | | | 25,000,000 | |
| TECP, 0.23%, 6/5/2013, LOC: Wells Fargo | | | 8,300,000 | | | | 8,300,000 | |
| | | | | 58,474,489 | |
| California 14.5% | |
| California, Golden State Tobacco Securitization Corp., Tobacco Settlement: | | | | | | | | |
| Series B, Prerefunded 6/1/2013 @ 100, 5.5%, 6/1/2043 | | | 24,415,000 | | | | 24,523,306 | |
| Series B, Prerefunded 6/1/2013 @ 100, 5.625%, 6/1/2038 | | | 31,610,000 | | | | 31,753,010 | |
| Series 2003-A-1, Prerefunded 6/1/2013 @ 100, 6.25%, 6/1/2033 | | | 43,745,000 | | | | 43,966,499 | |
| Series 2003-A-1, Prerefunded 6/1/2013 @ 100, 6.75%, 6/1/2039 | | | 38,470,000 | | | | 38,683,616 | |
| California, Nuveen Dividend Advantage Municipal Fund, Series 1-1362, 144A, AMT, 0.4%*, 6/1/2041, LIQ: Morgan Stanley Bank | | | 5,000,000 | | | | 5,000,000 | |
| California, RBC Municipal Products, Inc. Trust: | |
| Series E-21, 144A, 0.26%*, Mandatory Put 9/3/2013 @ 100, 10/1/2013, LIQ: Royal Bank of Canada, LOC: Royal Bank of Canada | | | 25,000,000 | | | | 25,000,000 | |
| Series E-24, 144A, 0.26%*, Mandatory Put 8/1/2013 @ 100, 7/1/2031, LIQ: Royal Bank of Canada, LOC: Royal Bank of Canada | | | 16,865,000 | | | | 16,865,000 | |
| California, State Department of Water Resources, Supply Revenue: | | | | | | | | |
| Series N, 5.0%, 5/1/2013 | | | 10,000,000 | | | | 10,000,000 | |
| Series M, 5.0%, 5/1/2014 | | | 7,500,000 | | | | 7,859,716 | |
| California, State General Obligation: | |
| Prerefunded 4/1/2014 @ 100, 5.0%, 4/1/2031, INS: AMBAC | | | 10,325,000 | | | | 10,778,410 | |
| Prerefunded 4/1/2014 @ 100, 5.25%, 4/1/2034 | | | 6,035,000 | | | | 6,313,855 | |
| California, Statewide Communities Development Authority, Multi-Family Housing Revenue: | | | | | | | | |
| Series 2680, 144A, 0.29%*, 5/15/2018, LOC: JPMorgan Chase Bank NA | | | 14,700,000 | | | | 14,700,000 | |
| Series 2681, 144A, AMT, 0.36%*, 5/15/2018, LOC: JPMorgan Chase Bank NA | | | 12,250,000 | | | | 12,250,000 | |
| California, Wells Fargo Stage Trust: | |
| Series 74C, 144A, 0.19%*, 11/15/2040, GTY: Wells Fargo Bank NA, LIQ: Wells Fargo Bank NA | | | 5,810,000 | | | | 5,810,000 | |
| Series 31C, 144A, AMT, 0.25%*, Mandatory Put 8/15/2013 @ 100, 1/1/2022, GTY: Wells Fargo Bank NA, LIQ: Wells Fargo Bank NA | | | 5,995,000 | | | | 5,995,000 | |
| San Diego County, CA, School District Note Participations, Series A, 2.0%, 6/28/2013 | | | 10,000,000 | | | | 10,029,016 | |
| | | | | 269,527,428 | |
| Colorado 3.8% | |
| Colorado, State Education Loan Program, Series C, 144A, 2.5%, 6/27/2013 | | | 60,000,000 | | | | 60,221,714 | |
| Colorado, Wells Fargo Stage Trust, Series 42C, 144A, AMT, 0.19%*, 11/15/2023, GTY: Wells Fargo Bank NA, LIQ: Wells Fargo Bank NA | | | 9,835,000 | | | | 9,835,000 | |
| | | | | 70,056,714 | |
| District of Columbia 0.8% | |
| District of Columbia, Wells Fargo Stage Trust, Series 57C, 144A, AMT, 0.25%*, Mandatory Put 12/26/2013 @ 100, 10/1/2032, GTY: Wells Fargo Bank NA, LIQ: Wells Fargo Bank NA | | | 13,965,000 | | | | 13,965,000 | |
| Georgia 0.7% | |
| Burke County, GA, Development Authority Revenue, Georgia Power Co. Plant, 144A, 0.21%*, 5/1/2022 | | | 5,555,000 | | | | 5,555,000 | |
| Georgia, Private Colleges & Universities Authority Revenue, Mercer University Project, Series C, 0.24%*, 10/1/2031, LOC: Branch Banking & Trust | | | 8,335,000 | | | | 8,335,000 | |
| | | | | 13,890,000 | |
| Hawaii 0.5% | |
| Hawaii, Wells Fargo State Trust, Series 6C, 144A, 0.19%*, 7/1/2040, GTY: Wells Fargo Bank NA, LIQ: Wells Fargo Bank NA | | | 8,820,000 | | | | 8,820,000 | |
| Idaho 2.5% | |
| Idaho, State General Obligation, 2.0%, 6/28/2013 | | | 47,000,000 | | | | 47,134,110 | |
| Illinois 13.3% | |
| Chicago, IL, Loyola University: | |
| TECP, 0.14%, 5/21/2013 | | | 25,000,000 | | | | 25,000,000 | |
| TECP, 0.15%, 6/3/2013 | | | 25,040,000 | | | | 25,040,000 | |
| Chicago, IL, O'Hare International Airport Revenue, 0.18%, 5/7/2013 | | | 5,000,000 | | | | 5,000,000 | |
| Illinois, BB&T Municipal Trust, Series 5001, 144A, 0.31%*, 6/1/2020, LIQ: Rabobank Nederland, LOC: Rabobank International | | | 23,460,000 | | | | 23,460,000 | |
| Illinois, Educational Facilities Authority Revenue, University of Chicago, Series B-3, 0.24%*, Mandatory Put 3/13/2014 @ 100, 7/1/2036 | | | 18,000,000 | | | | 18,000,000 | |
| Illinois, Educational Facilities Authority Revenues: | |
| TECP, 0.15%, 6/3/2013, LOC: Northern Trust Co. | | | 20,000,000 | | | | 20,000,000 | |
| TECP, 0.16%, 6/3/2013, LOC: Northern Trust Co. | | | 30,000,000 | | | | 30,000,000 | |
| TECP, 0.16%, 7/1/2013, LOC: Northern Trust Co. | | | 16,200,000 | | | | 16,200,000 | |
| TECP, 0.16%, 7/2/2013, LOC: Northern Trust Co. | | | 30,000,000 | | | | 30,000,000 | |
| Illinois, Wells Fargo Stage Trust, Series 27C, 144A, 0.26%*, Mandatory Put 10/24/2013 @ 100, 8/1/2025, GTY: Wells Fargo Bank NA, LIQ: Wells Fargo Bank NA, | | | 38,405,000 | | | | 38,405,000 | |
| Mundelein, IL, Industrial Development Revenue, MacLean Fogg Co. Project, 144A, AMT, 0.38%*, 1/1/2015, LOC: Northern Trust Co. | | | 6,500,000 | | | | 6,500,000 | |
| Woodstock, IL, Multi-Family Housing Revenue, Willow Brooke Apartments, AMT, 0.24%*, 4/1/2042, LOC: Wells Fargo Bank NA | | | 10,000,000 | | | | 10,000,000 | |
| | | | | 247,605,000 | |
| Indiana 3.6% | |
| Indiana, State Finance Authority, Industrial Revenue, Midwest Fertilizer Corp. Project, 0.2%, Mandatory Put 7/1/2013 @ 100, 7/1/2046 | | | 60,000,000 | | | | 60,000,000 | |
| Indiana, Wells Fargo State Trust, Series 100C, 144A, 0.19%*, 8/1/2021, GTY: Wells Fargo Bank NA, LIQ: Wells Fargo Bank NA | | | 7,495,000 | | | | 7,495,000 | |
| | | | | 67,495,000 | |
| Iowa 4.1% | |
| Iowa, State Finance Authority Midwestern Disaster Area Revenue, Fertilizer Co. Project, 0.17%*, Mandatory Put 5/31/2013 @ 100, 12/1/2050 | | | 70,000,000 | | | | 70,000,000 | |
| Iowa, State Finance Authority, Wellness Facilities Revenue, Community Marshalltown Project, 0.26%*, 1/1/2031, LOC: Northern Trust Co. | | | 6,015,000 | | | | 6,015,000 | |
| | | | | 76,015,000 | |
| Kansas 0.8% | |
| Kansas, State Development Finance Authority, Multi-Family Revenue, Oak Ridge Park II Project, Series X, AMT, 0.29%*, 12/1/2036, LOC: U.S. Bank NA | | | 3,650,000 | | | | 3,650,000 | |
| Olathe, KS, General Obligation, Series A, 1.5%, 7/1/2013 | | | 11,280,000 | | | | 11,304,457 | |
| | | | | 14,954,457 | |
| Kentucky 1.9% | |
| Kentucky, State Economic Development Finance Authority, Catholic Health Initiatives: | | | | | | | | |
| Series B, 0.32%**, 2/1/2046 | | | 10,680,000 | | | | 10,680,000 | |
| Series B-2, 0.32%**, 2/1/2046 | | | 12,000,000 | | | | 12,000,000 | |
| Series B-3, 0.32%**, 2/1/2046 | | | 12,415,000 | | | | 12,415,000 | |
| | | | | 35,095,000 | |
| Maryland 1.6% | |
| Maryland, State Health & Higher Educational Facilities Authority Revenue, Pooled Loan Program, Series D, 144A, 0.27%*, 1/1/2029, LOC: Bank of America NA | | | 12,580,000 | | | | 12,580,000 | |
| Montgomery County, MD, TECP, 0.17%, 6/4/2013, LOC: State Street Bank & Trust Co. | | | 17,000,000 | | | | 17,000,000 | |
| | | | | 29,580,000 | |
| Michigan 6.6% | |
| Michigan, RBC Municipal Products, Inc. Trust: | |
| Series L-23, 144A, AMT, 0.26%*, 3/1/2028, INS: AMBAC, LIQ: Royal Bank of Canada, LOC: Royal Bank of Canada | | | 44,995,000 | | | | 44,995,000 | |
| Series L-27, 144A, AMT, 0.26%*, 3/1/2031, LIQ: Royal Bank of Canada, LOC: Royal Bank of Canada | | | 40,000,000 | | | | 40,000,000 | |
| Michigan, State Finance Authority Revenue, Unemployment Obligation Assessment, Series A, 2.0%, 7/1/2013 | | | 11,100,000 | | | | 11,133,708 | |
| Michigan, State Hospital Finance Authority Revenue, Ascension Health Senior Credit Group: | | | | | | | | |
| Series F-7, 0.31%*, 11/15/2047 | | | 11,200,000 | | | | 11,200,000 | |
| Series F-6, 0.31%**, 11/15/2049 | | | 8,660,000 | | | | 8,660,000 | |
| Series F-8, 0.31%**, 11/15/2049 | | | 7,100,000 | | | | 7,100,000 | |
| | | | | 123,088,708 | |
| Minnesota 1.3% | |
| Cohasset, MN, State Power & Light Co. Project, Series A, 0.27%*, 6/1/2020, LOC: JPMorgan Chase Bank NA | | | 24,630,000 | | | | 24,630,000 | |
| Mississippi 0.5% | |
| Mississippi, Redstone Partners Floaters/Residuals Trust, Series C, 144A, AMT, 0.41%*, 12/1/2047, LOC: Wachovia Bank NA | | | 9,220,000 | | | | 9,220,000 | |
| Missouri 5.0% | |
| Missouri, State Health & Educational Facilities: | |
| TECP, 0.12%, 5/21/2013 | | | 28,000,000 | | | | 28,000,000 | |
| TECP, 0.14%, 5/16/2013 | | | 22,000,000 | | | | 22,000,000 | |
| Missouri, University of Curators, TECP, 0.14%, 5/7/2013 | | | 23,000,000 | | | | 23,000,000 | |
| North Kansas City, MO, Hospital Revenue, 0.22%*, 11/1/2033, LOC: Bank of America NA | | | 20,660,000 | | | | 20,660,000 | |
| | | | | 93,660,000 | |
| New York 4.2% | |
| BlackRock New York Municipal Income Quality Trust, Series W-7-40, 144A, AMT, 0.32%*, 10/1/2041, LIQ: Barclays Bank PLC | | | 5,000,000 | | | | 5,000,000 | |
| BlackRock New York Municipal Intermediate Duration Fund, Inc., Series W-7-296, 144A, AMT, 0.32%*, 10/1/2041, LIQ: Barclays Bank PLC | | | 13,500,000 | | | | 13,500,000 | |
| New York, RIB Floater Trust, Series 1WE, 144A, 0.29%*, 9/30/2013, LIQ: Barclays Bank PLC | | | 60,000,000 | | | | 60,000,000 | |
| | | | | 78,500,000 | |
| North Carolina 1.9% | |
| North Carolina, BB&T Municipal Trust: | |
| Series 1008, 144A, 0.31%*, 3/1/2024, LIQ: Branch Banking & Trust, LOC: Branch Banking & Trust | | | 5,515,000 | | | | 5,515,000 | |
| Series 1009, 144A, 0.31%*, 6/1/2024, LIQ: Branch Banking & Trust, LOC: Branch Banking & Trust | | | 15,675,000 | | | | 15,675,000 | |
| North Carolina, Capital Facilities Finance Agency, TECP, 0.15%, 6/5/2013 | | | 13,860,000 | | | | 13,860,000 | |
| | | | | 35,050,000 | |
| Ohio 1.6% | |
| Ohio, Puttable Floating Option Tax-Exempt Receipts, Series 808, 144A, AMT, 0.42%*, 12/1/2041, GTY: Bank of America NA, INS: AMBAC, LIQ: Bank of America NA | | | 30,000,000 | | | | 30,000,000 | |
| Oklahoma 0.5% | |
| Tulsa, OK, Airports Improvement Trust, Special Facilities Revenue, Lufthansa/Bizjet International, Inc., 144A, AMT, 0.26%*, 8/1/2018, LOC: Landesbank Hessen-Thuringen | | | 10,120,000 | | | | 10,120,000 | |
| Other Territories 6.2% | |
| BB&T Municipal Trust, Series 1010, 144A, 0.26%*, 1/15/2019, LIQ: Branch Banking & Trust, LOC: Branch Banking & Trust | | | 5,980,000 | | | | 5,980,000 | |
| BB&T Municipal Trust, Series 5000, 144A, 0.31%*, 10/1/2028, LIQ: Rabobank Nederland, LOC: Rabobank International | | | 6,755,000 | | | | 6,755,000 | |
| BlackRock Muni Holdings Investment Quality Fund, Series W-7-2746, 144A, AMT, 0.43%*, 7/1/2041, LIQ: Bank of America NA | | | 28,100,000 | | | | 28,100,000 | |
| BlackRock Municipal Bond Investment Trust, Series W-7-178, 144A, AMT, 0.32%*, 10/1/2041, LIQ: Barclays Bank PLC | | | 9,300,000 | | | | 9,300,000 | |
| Eagle Tax- Exempt Trust, 144A, AMT, 0.27%*, 4/15/2049, LIQ: Federal Home Loan Bank | | | 14,615,000 | | | | 14,615,000 | |
| Nuveen Premier Income Municipal Fund 2, Inc., Series 1-4895, 144A, AMT, 0.32%*, 5/1/2041, LIQ: Barclays Bank PLC | | | 52,000,000 | | | | 52,000,000 | |
| | | | | 116,750,000 | |
| Pennsylvania 2.7% | |
| Pennsylvania, State Economic Development Financing Authority, IESI PA Corp., 0.26%*, 11/1/2028, GTY: IESI Corp., LOC: Bank of America NA | | | 34,000,000 | | | | 34,000,000 | |
| University of Pittsburgh, PA, The Commonwealth Systems of Higher Education, Pittsburgh Assessment Notes, 2.0%, 7/2/2013 | | | 17,000,000 | | | | 17,051,605 | |
| | | | | 51,051,605 | |
| Puerto Rico 2.6% | |
| Puerto Rico, RIB Floater Trust, Series 8WE, 144A, 0.27%, 9/30/2014, LOC: Barclays Bank PLC | | | 47,500,000 | | | | 47,500,000 | |
| Tennessee 3.5% | |
| Metropolitan Government Nashville & Davidson County, TN: | |
| TECP, 0.2%, 10/3/2013 | | | 10,000,000 | | | | 10,000,000 | |
| TECP, 0.23%, 9/3/2013 | | | 17,000,000 | | | | 17,000,000 | |
| Tennessee, Tennergy Corp., Gas Revenue, Stars Certificates, Series 2006-001, 144A, 0.27%*, 5/1/2016, LOC: BNP Paribas | | | 39,000,000 | | | | 39,000,000 | |
| | | | | 66,000,000 | |
| Texas 9.5% | |
| Harris County, TX, Cultural Education, TECP, 0.23%, 7/9/2013 | | | 40,000,000 | | | | 40,000,000 | |
| Lamar, TX, Consolidated Independent School District, Series R-12266, 144A, 0.25%*, 8/1/2015, SPA: Citibank NA | | | 20,485,000 | | | | 20,485,000 | |
| North Texas, Tollway Authority Revenue, TECP, 0.16%, 6/7/2013, LOC: JPMorgan Chase Bank NA | | | 15,400,000 | | | | 15,400,000 | |
| Texas, JPMorgan Chase Putters/Drivers Trust, Series 4263, 144A, 0.18%*, 8/30/2013, LIQ: JPMorgan Chase Bank NA | | | 30,000,000 | | | | 30,000,000 | |
| Texas, Municipal Power Agency Revenue, TECP, 0.21%, 5/17/2013, LOC: Barclays Bank PLC | | | 15,500,000 | | | | 15,500,000 | |
| Texas, State Transportation Revenue, 2.5%, 8/30/2013 | | | 45,000,000 | | | | 45,339,981 | |
| Texas City, TX, Industrial Development Corp. Revenue, Del Papa Realty Holdings, 0.26%*, 1/1/2051, LOC: Bank of America NA | | | 9,500,000 | | | | 9,500,000 | |
| | | | | 176,224,981 | |
| Washington 0.7% | |
| Washington, Wells Fargo Stage Trust, Series 93C, 144A, 0.29%, Mandatory Put 6/13/2013 @ 100, 8/15/2046, GTY: Wells Fargo Bank NA, LIQ: Wells Fargo Bank NA | | | 13,675,000 | | | | 13,675,000 | |
| West Virginia 0.7% | |
| West Virginia, Economic Development Authority Revenue, Morgantown Energy, AMT, 0.26%*, 4/1/2027, LOC: Union Bank NA | | | 12,210,000 | | | | 12,210,000 | |
| | | % of Net Assets | | | Value ($) | |
| | | | |
Total Investment Portfolio (Cost $1,840,292,492)† | | | 98.7 | | | | 1,840,292,492 | |
| Other Assets and Liabilities, Net | | | 1.3 | | | | 24,009,682 | |
| Net Assets | | | 100.0 | | | | 1,864,302,174 | |
* Variable rate demand notes and variable rate demand preferred shares are securities whose interest rates are reset periodically at market levels. These securities are payable on demand and are shown at their current rates as of April 30, 2013.
** Floating rate securities' yields vary with a designated market index or market rate, such as the coupon-equivalent of the U.S. Treasury Bill rate. These securities are shown at their current rate as of April 30, 2013.
† The cost for federal income tax purposes was $1,840,292,492.
144A: Security exempt from registration under Rule 144A of the Securities Act of 1933. These securities may be resold in transactions exempt from registration, normally to qualified institutional buyers.
AMBAC: Ambac Financial Group, Inc.
AMT: Subject to alternative minimum tax.
GTY: Guaranty Agreement
INS: Insured
LIQ: Liquidity Facility
LOC: Letter of Credit
Prerefunded: Bonds which are prerefunded are collateralized usually by U.S. Treasury securities which are held in escrow and used to pay principal and interest on tax-exempt issues and to retire the bonds in full at the earliest refunding date.
SPA: Standby Bond Purchase Agreement
TECP: Tax Exempt Commercial Paper
Fair Value Measurements
Various inputs are used in determining the value of the Fund's investments. These inputs are summarized in three broad levels. Level 1 includes quoted prices in active markets for identical securities. Level 2 includes other significant observable inputs (including quoted prices for similar securities, interest rates, prepayment speeds and credit risk). Level 3 includes significant unobservable inputs (including the Fund's own assumptions in determining the fair value of investments). The inputs or methodology used for valuing securities are not necessarily an indication of the risk associated with investing in those securities. Securities held by the Fund are reflected as Level 2 because the securities are valued at amortized cost (which approximates fair value) and, accordingly, the inputs used to determine value are not quoted prices in an active market.
The following is a summary of the inputs used as of April 30, 2013 in valuing the Fund's investments. For information on the Fund's policy regarding the valuation of investments, please refer to the Security Valuation section of Note 1 in the accompanying Notes to Financial Statements.
| Assets | | Level 1 | | | Level 2 | | | Level 3 | | | Total | |
| | |
| Municipal Investments (a) | | $ | — | | | $ | 1,840,292,492 | | | $ | — | | | $ | 1,840,292,492 | |
| Total | | $ | — | | | $ | 1,840,292,492 | | | $ | — | | | $ | 1,840,292,492 | |
There have been no transfers between fair value measurement levels during the period ended April 30, 2013.
(a) See Investment Portfolio for additional detailed categorizations.
The accompanying notes are an integral part of the financial statements.
Statement of Assets and Liabilities | as of April 30, 2013 | |
| Assets | | Tax-Exempt Portfolio | |
Investments: Investments in non-affiliated securities, valued at amortized cost | | $ | 1,840,292,492 | |
| Receivable for investments sold | | | 17,580,000 | |
| Receivable for Fund shares sold | | | 298,158 | |
| Interest receivable | | | 7,109,732 | |
| Due from Advisor | | | 3,699 | |
| Other assets | | | 77,001 | |
| Total assets | | | 1,865,361,082 | |
| Liabilities | |
| Cash overdraft | | | 391,974 | |
| Payable for Fund shares redeemed | | | 169,016 | |
| Distributions payable | | | 6,227 | |
| Accrued management fee | | | 110,040 | |
| Accrued Trustees' fees | | | 18,385 | |
| Other accrued expenses and payables | | | 363,266 | |
| Total liabilities | | | 1,058,908 | |
| Net assets, at value | | $ | 1,864,302,174 | |
| Net Assets Consist of | |
| Undistributed net investment income | | | 212,651 | |
| Paid-in capital | | | 1,864,089,523 | |
| Net assets, at value | | $ | 1,864,302,174 | |
The accompanying notes are an integral part of the financial statements.
Statement of Assets and Liabilities as of April 30, 2013 (continued) | |
| Net Asset Value | | Tax-Exempt Portfolio | |
Capital Assets Funds Shares Net Asset Value, offering and redemption price per share ($10,059,102 ÷ 10,056,881 outstanding shares of beneficial interest, no par value, unlimited number of shares authorized) | | $ | 1.00 | |
Davidson Cash Equivalent Shares Net Asset Value, offering and redemption price per share ($70,393,545 ÷ 70,377,984 outstanding shares of beneficial interest, no par value, unlimited number of shares authorized) | | $ | 1.00 | |
DWS Tax-Exempt Cash Institutional Shares Net Asset Value, offering and redemption price per share ($970,451,993 ÷ 970,237,656 outstanding shares of beneficial interest, no par value, unlimited number of shares authorized) | | $ | 1.00 | |
DWS Tax-Exempt Money Fund Net Asset Value, offering and redemption price per share ($241,992,881 ÷ 241,939,471 outstanding shares of beneficial interest, no par value, unlimited number of shares authorized) | | $ | 1.00 | |
DWS Tax-Free Money Fund Class S Net Asset Value, offering and redemption price per share ($99,900,985 ÷ 99,878,925 outstanding shares of beneficial interest, no par value, unlimited number of shares authorized) | | $ | 1.00 | |
Service Shares Net Asset Value, offering and redemption price per share ($44,904,689 ÷ 44,894,771 outstanding shares of beneficial interest, no par value, unlimited number of shares authorized) | | $ | 1.00 | |
Tax-Exempt Cash Managed Shares Net Asset Value, offering and redemption price per share ($115,086,280 ÷ 115,060,862 outstanding shares of beneficial interest, no par value, unlimited number of shares authorized) | | $ | 1.00 | |
Tax-Free Investment Class Net Asset Value, offering and redemption price per share ($311,512,699 ÷ 311,443,897 outstanding shares of beneficial interest, no par value, unlimited number of shares authorized) | | $ | 1.00 | |
The accompanying notes are an integral part of the financial statements.
| for the year ended April 30, 2013 | |
| Investment Income | | Tax-Exempt Portfolio | |
Income: Interest | | $ | 4,226,122 | |
Expenses: Management fee | | | 1,326,518 | |
| Administration fee | | | 2,073,476 | |
| Services to shareholders | | | 1,150,669 | |
| Distribution and service fees | | | 2,113,579 | |
| Custodian fee | | | 27,586 | |
| Professional fees | | | 126,547 | |
| Reports to shareholders | | | 149,965 | |
| Registration fees | | | 153,018 | |
| Trustees' fees and expenses | | | 87,355 | |
| Other | | | 101,842 | |
| Total expenses before expense reductions | | | 7,310,555 | |
| Expense reductions | | | (3,397,143 | ) |
| Total expenses after expense reductions | | | 3,913,412 | |
| Net investment income | | | 312,710 | |
| Net realized gain (loss) from investments | | | 119,059 | |
| Net increase (decrease) in net assets resulting from operations | | $ | 431,769 | |
The accompanying notes are an integral part of the financial statements.
Statement of Changes in Net Assets | | | Tax-Exempt Portfolio | |
| Increase (Decrease) in Net Assets | | Years Ended April 30, | |
| | 2013 | | | 2012 | |
Operations: Net investment income | | $ | 312,710 | | | $ | 659,723 | |
| Net realized gain (loss) | | | 119,059 | | | | 21,137 | |
| Net increase in net assets resulting from operations | | | 431,769 | | | | 680,860 | |
Distributions to shareholders from: Net investment income: Capital Assets Funds Shares | | | (2,578 | ) | | | (2,580 | ) |
| Davidson Cash Equivalent Shares | | | (16,635 | ) | | | (13,672 | ) |
| DWS Tax-Exempt Cash Institutional Shares | | | (347,411 | ) | | | (598,543 | ) |
| DWS Tax-Exempt Money Fund | | | (63,056 | ) | | | (115,000 | ) |
| DWS Tax-Free Money Fund Class S | | | (22,814 | ) | | | (28,531 | ) |
| Service Shares | | | (12,350 | ) | | | (16,307 | ) |
| Tax-Exempt Cash Managed Shares | | | (36,504 | ) | | | (35,814 | ) |
| Tax-Free Investment Class | | | (80,485 | ) | | | (64,866 | ) |
Net realized gain: Capital Assets Funds Shares | | | (686 | ) | | | — | |
| Davidson Cash Equivalent Shares | | | (4,358 | ) | | | — | |
| DWS Tax-Exempt Cash Institutional Shares | | | (58,793 | ) | | | — | |
| DWS Tax-Exempt Money Fund | | | (15,872 | ) | | | — | |
| DWS Tax-Free Money Fund Class S | | | (5,799 | ) | | | — | |
| Service Shares | | | (2,541 | ) | | | — | |
| Tax-Exempt Cash Managed Shares | | | (9,837 | ) | | | — | |
| Tax-Free Investment Class | | | (21,062 | ) | | | — | |
| Total distributions | | | (700,781 | ) | | | (875,313 | ) |
Fund share transactions: Proceeds from shares sold | | | 3,574,503,665 | | | | 5,483,352,307 | |
| Reinvestment of distributions | | | 409,744 | | | | 544,506 | |
| Cost of shares redeemed | | | (3,871,064,788 | ) | | | (5,984,187,987 | ) |
| Net increase (decrease) in net assets from Fund share transactions | | | (296,151,379 | ) | | | (500,291,174 | ) |
| Increase (decrease) in net assets | | | (296,420,391 | ) | | | (500,485,627 | ) |
| Net assets at beginning of period | | | 2,160,722,565 | | | | 2,661,208,192 | |
| Net assets at end of period (including undistributed net investment income of $212,651 and $481,663, respectively) | | $ | 1,864,302,174 | | | $ | 2,160,722,565 | |
The accompanying notes are an integral part of the financial statements.
Tax-Exempt Portfolio Davidson Cash Equivalent Shares | |
| | | Years Ended April 30, | |
| | | 2013 | | | 2012 | | | 2011 | | | 2010 | | | 2009 | |
| Selected Per Share Data | |
| Net asset value, beginning of period | | $ | 1.00 | | | $ | 1.00 | | | $ | 1.00 | | | $ | 1.00 | | | $ | 1.00 | |
Income (loss) from investment operations: Net investment income | | | .000 | * | | | .000 | * | | | .000 | * | | | .000 | * | | | .009 | |
| Net realized gain (loss) | | | .000 | * | | | .000 | * | | | .000 | * | | | .000 | * | | | .000 | * |
| Total from investment operations | | | .000 | * | | | .000 | * | | | .000 | * | | | .000 | * | | | .009 | |
Less distributions from: Net investment income | | | (.000 | )* | | | (.000 | )* | | | (.000 | )* | | | (.000 | )* | | | (.009 | ) |
| Net realized gains | | | (.000 | )* | | | — | | | | — | | | | (.000 | )* | | | — | |
| Total distributions | | | (.000 | )* | | | (.000 | )* | | | (.000 | )* | | | (.000 | )* | | | (.009 | ) |
| Net asset value, end of period | | $ | 1.00 | | | $ | 1.00 | | | $ | 1.00 | | | $ | 1.00 | | | $ | 1.00 | |
Total Return (%)a | | | .03 | | | | .02 | | | | .01 | | | | .01 | | | | .94 | |
| Ratios to Average Net Assets and Supplemental Data | |
| Net assets, end of period ($ millions) | | | 70 | | | | 62 | | | | 75 | | | | 80 | | | | 67 | |
| Ratio of expenses before expense reductions (%) | | | .90 | | | | .89 | | | | .89 | | | | .90 | | | | .91 | |
| Ratio of expenses after expense reductions (%) | | | .19 | | | | .22 | | | | .35 | | | | .43 | | | | .86 | |
| Ratio of net investment income (%) | | | .01 | | | | .01 | | | | .01 | | | | .01 | | | | .92 | |
a Total return would have been lower had certain expenses not been reduced. * Amount is less than $.0005. | |
Notes to Financial Statements
1. Organization and Significant Accounting Policies
Cash Account Trust (the "Trust") is registered under the Investment Company Act of 1940, as amended (the "1940 Act"), as an open-end investment management company organized as a Massachusetts business trust.
The Trust offers three funds: Money Market Portfolio, Government & Agency Securities Portfolio and Tax-Exempt Portfolio (each a "Fund" and together, the "Funds").
Money Market Portfolio offers six classes of shares: Capital Assets Funds Shares, Capital Assets Funds Preferred Shares, Davidson Cash Equivalent Shares, Davidson Cash Equivalent Plus Shares, Premium Reserve Money Market Shares and Service Shares.
Government & Agency Securities Portfolio offers seven classes of shares: Capital Assets Funds Shares, Davidson Cash Equivalent Shares, Davidson Cash Equivalent Plus Shares, DWS Government & Agency Money Fund, DWS Government Cash Institutional Shares, Government Cash Managed Shares and Service Shares.
Tax-Exempt Portfolio offers eight classes of shares: Capital Assets Funds Shares, Davidson Cash Equivalent Shares, DWS Tax-Exempt Cash Institutional Shares, DWS Tax-Exempt Money Fund, DWS Tax-Free Money Fund Class S, Service Shares, Tax-Exempt Cash Managed Shares and Tax-Free Investment Class.
The financial highlights for all classes of shares, other than Davidson Cash Equivalent Shares and Davidson Cash Equivalent Plus Shares, are provided separately and are available upon request.
Each Fund's investment income, realized gains and losses, and certain Fund-level expenses and expense reductions, if any, are borne pro rata on the basis of relative net assets by the holders of all classes of shares of that Fund, except that each class bears certain expenses unique to that class such as distribution and service fees, services to shareholders and certain other class-specific expenses. Differences in class-level expenses may result in payment of different per share dividends by class. All shares of the Trust have equal rights with respect to voting subject to class-specific arrangements.
Each Fund's financial statements are prepared in accordance with accounting principles generally accepted in the United States of America which require the use of management estimates. Actual results could differ from those estimates. The policies described below are followed consistently by the Funds in the preparation of their financial statements.
Security Valuation. Various inputs are used in determining the value of each Fund's investments. These inputs are summarized in three broad levels. Level 1 includes quoted prices in active markets for identical securities. Level 2 includes other significant observable inputs (including quoted prices for similar securities, interest rates, prepayment speeds, and credit risk). Level 3 includes significant unobservable inputs (including each Fund's own assumptions in determining the fair value of investments). The inputs or methodology used for valuing securities are not necessarily an indication of the risk associated with investing in those securities.
The Funds value all securities utilizing the amortized cost method permitted in accordance with Rule 2a-7 under the 1940 Act and certain conditions therein. Under this method, which does not take into account unrealized capital gains or losses on securities, an instrument is initially valued at its cost and thereafter assumes a constant accretion/amortization rate to maturity of any discount or premium. Securities held by the Fund are reflected as Level 2 because the securities are valued at amortized cost (which approximates fair value) and, accordingly, the inputs used to determine value are not quoted prices in an active market.
Disclosure about the classification of fair value measurements is included in a table following each Fund's Investment Portfolio.
New Accounting Pronouncement. In January 2013, Accounting Standard Update 2013-01 (ASU 2013-01), Clarifying the Scope of Disclosures about Offsetting Assets and Liabilities, replaced Accounting Standards Update 2011-11 (ASU 2011-11), Disclosures about Offsetting Assets and Liabilities. ASU 2013-01 is effective for fiscal years beginning on or after January 1, 2013, and interim periods within those annual periods. ASU 2011-11 was intended to enhance disclosure requirements on the offsetting of financial assets and liabilities. The ASU 2013-01 limits the scope of the new balance sheet offsetting disclosures to derivatives, repurchase agreements, and securities lending transactions to the extent that they are (1) offset in the financial statements or (2) subject to an enforceable master netting arrangement or similar agreement. Management is currently evaluating the application of ASU 2013-01 and its impact, if any, on the Fund's financial statements.
Repurchase Agreements. Each Fund may enter into repurchase agreements with certain banks and broker/dealers whereby each Fund, through its custodian or a sub-custodian bank, receives delivery of the underlying securities, the amount of which at the time of purchase and each subsequent business day is required to be maintained at such a level that the market value is equal to at least the principal amount of the repurchase price plus accrued interest. The custodial bank or another designated subcustodian holds the collateral in a separate account until the agreement matures. If the value of the securities falls below the principal amount of the repurchase agreement plus accrued interest, the financial institution deposits additional collateral by the following business day. If the financial institution either fails to deposit the required additional collateral or fails to repurchase the securities as agreed, the Funds have the right to sell the securities and recover any resulting loss from the financial institution. If the financial institution enters into bankruptcy, the Funds' claims on the collateral may be subject to legal proceedings.
Federal Income Taxes. Each of the Funds' policies is to comply with the requirements of the Internal Revenue Code, as amended, which are applicable to regulated investment companies and to distribute all of its taxable and tax-exempt income to its shareholders.
Under the Regulated Investment Company Modernization Act of 2010, net capital losses incurred post-enactment may be carried forward indefinitely, and their character is retained as short-term and/or long-term losses. Previously, net capital losses were carried forward for eight years and treated as short-term losses. As a transition rule, the Act requires that post-enactment net capital losses be used before pre-enactment net capital losses.
At April 30, 2013, DWS Money Market Portfolio had a net tax basis capital loss carryforward of approximately $14,000 of post-enactment short-term losses, which may be applied against realized net taxable capital gains indefinitely.
At April 30, 2013, DWS Government & Agency Securities Portfolio had a net tax basis capital loss carryforward of approximately $436,000 of pre-enactment losses, which may be applied against any realized net taxable capital gains of each succeeding year until fully utilized or until April 30, 2019 (the expiration date), whichever occurs first.
The Funds have reviewed the tax positions for the open tax years as of April 30, 2013 and have determined that no provision for income tax is required in the Funds' financial statements. The Funds' federal tax returns for the prior three fiscal years remain open subject to examination by the Internal Revenue Service.
Distribution of Income. Net investment income of each Fund is declared as a daily dividend and is distributed to shareholders monthly. Each Fund may take into account capital gains and losses in its daily dividend declarations. Each Fund may also make additional distributions for tax purposes if necessary.
Permanent book and tax basis differences relating to shareholder distributions will result in reclassifications to paid in capital. Temporary book and tax basis differences will reverse in a subsequent period. There were no significant book-to-tax differences for the Funds.
At April 30, 2013, the Funds' components of distributable earnings on a tax basis are as follows:
Money Market Portfolio: Undistributed ordinary income* | | $ | 26,943 | |
| Capital loss carryforwards | | $ | (14,000 | ) |
Government & Agency Securities Portfolio: Undistributed ordinary income* | | $ | 227,334 | |
| Capital loss carryforwards | | $ | (436,000 | ) |
Tax-Exempt Portfolio: Undistributed tax-exempt income* | | $ | 218,878 | |
In addition, the tax character of distributions paid to shareholders by each Fund is summarized as follows:
| | | Years Ended April 30, | |
| Portfolio | | 2013 | | | 2012 | |
Money Market Portfolio: Distributions from ordinary income* | | $ | 253,752 | | | $ | 287,108 | |
Government & Agency Securities Portfolio: Distributions from ordinary income* | | $ | 738,553 | | | $ | 1,255,665 | |
Tax-Exempt Portfolio: Distributions from tax-exempt income | | $ | 581,722 | | | $ | 854,176 | |
| Distributions from ordinary income* | | $ | 119,059 | | | $ | 21,137 | |
* For tax purposes, short-term capital gain distributions are considered ordinary income distributions.
Expenses. Expenses of the Trust arising in connection with a specific Fund are allocated to that Fund. Other Trust expenses which cannot be directly attributed to a Fund are apportioned pro rata on the basis of relative net assets among the Funds in the Trust based upon the relative net assets or other appropriate measures.
Contingencies. In the normal course of business, the Funds may enter into contracts with service providers that contain general indemnification clauses. The Funds' maximum exposure under these arrangements is unknown as this would involve future claims that may be made against the Funds that have not yet been made. However, based on experience, the Funds expect the risk of loss to be remote.
Other. Investment transactions are accounted for on trade date. Interest income is recorded on the accrual basis. Realized gains and losses from investment transactions are recorded on an identified cost basis and may include proceeds from litigation. All discounts and premiums are accreted/amortized for both tax and financial reporting purposes.
2. Related Parties
Management Agreement for Money Market Portfolio. Under an Investment Management Agreement with Deutsche Investment Management Americas Inc. ("DIMA" or the "Advisor"), an indirect, wholly owned subsidiary of Deutsche Bank AG, the Advisor directs the investments of Money Market Portfolio in accordance with its investment objectives, policies and restrictions. The Advisor determines the securities, instruments and other contracts relating to investments to be purchased, sold or entered into by the Fund. In addition to portfolio management services, the Advisor provides certain administrative services in accordance with the Investment Management Agreement to the Money Market Portfolio.
The Money Market Portfolio pays a monthly management fee based on the combined average daily net assets of the three Funds in the Trust and allocated to Money Market Portfolio based on its relative net assets, computed and accrued daily and payable monthly, at 1/12 of the following annual rates:
| First $500 million of the Funds' combined average daily net assets | | | .220 | % |
| Next $500 million of such net assets | | | .200 | % |
| Next $1 billion of such net assets | | | .175 | % |
| Next $1 billion of such net assets | | | .160 | % |
| Over $3 billion of such net assets | | | .150 | % |
For the year ended April 30, 2013, the Fund incurred a management fee equivalent to the following annual effective rate of the Fund's average daily net assets:
| Fund | | Annual Effective Rate | |
| Money Market Portfolio | | | .16 | % |
For the period from May 1, 2012 through April 30, 2013, the Advisor has agreed to voluntarily waive its fees and/or reimburse certain operating expenses of Davidson Cash Equivalent Shares and Davidson Cash Equivalent Plus Shares of the Money Market Portfolio to the extent necessary to maintain the operating expenses (excluding certain expenses such as extraordinary expenses, taxes, brokerage and interest) at 1.00% and 0.85%, respectively.
The Advisor and D.A. Davidson & Co., the sole sub-distributor, have agreed to voluntarily waive additional expenses. These voluntary waivers may be changed or terminated at any time without notice. Under these arrangements, the Advisor waived certain expenses on Davidson Cash Equivalent Shares and Davidson Cash Equivalent Plus Shares of the Money Market Portfolio.
In addition, the Advisor has agreed to maintain expenses of certain other classes of the Trust. These rates are disclosed in the respective share classes' annual reports that are provided separately and are available upon request.
Management Agreement for Government & Agency Securities Portfolio and Tax-Exempt Portfolio. Under an Amended and Restated Investment Management Agreement with the Advisor, the Advisor directs the investments of Government & Agency Securities Portfolio and Tax-Exempt Portfolio in accordance with their respective investment objectives, policies and restrictions. The Advisor determines the securities, instruments and other contracts relating to investments to be purchased, sold or entered into by each Fund.
The Government & Agency Securities Portfolio and Tax-Exempt Portfolio pay a monthly management fee based on the combined average daily net assets of the three Funds in the Trust and allocated to Government & Agency Securities Portfolio and Tax-Exempt Portfolio, respectively, based on their relative net assets, computed and accrued daily and payable monthly, at the following annual rates:
| First $500 million of the Funds' combined average daily net assets | | | .120 | % |
| Next $500 million of such net assets | | | .100 | % |
| Next $1 billion of such net assets | | | .075 | % |
| Next $1 billion of such net assets | | | .060 | % |
| Over $3 billion of such net assets | | | .050 | % |
The Advisor has agreed to contractually reduce its management fee for the Government & Agency Securities Portfolio such that the annual effective rate is limited to 0.05% of the Government & Agency Securities Portfolio's average daily net assets.
For the period from May 1, 2012 through April 30, 2013, the Advisor has agreed to voluntarily waive its fees and/or reimburse certain operating expenses of the Davidson Cash Equivalent Shares of the Government & Agency Securities Portfolio and Tax-Exempt Portfolio and Davidson Cash Equivalent Plus Shares of the Government & Agency Securities Portfolio to the extent necessary to maintain the operating expenses (excluding certain expenses such as extraordinary expenses, taxes, brokerage and interest) at 1.00%, 0.85% and 0.85%, respectively.
The Advisor and D.A. Davidson & Co., the sole sub-distributor, have agreed to voluntarily waive additional expenses. These voluntary waivers may be changed or terminated at any time without notice. Under these arrangements, the Advisor waived certain expenses on Davidson Cash Equivalent Shares of the Government & Agency Securities Portfolio and Tax-Exempt Portfolio and Davidson Cash Equivalent Plus Shares of the Government & Agency Securities Portfolio.
Accordingly, for the year ended April 30, 2013, the Advisor earned a management fee on the Government & Agency Securities Portfolio aggregating $1,898,580, of which $1,332,763 was waived, resulting in an annual effective rate of 0.02% of the Fund's average daily net assets.
Accordingly, for the year ended April 30, 2013, the Advisor earned a management fee on the Tax-Exempt Portfolio aggregating $1,326,518, of which $309,712 was waived, resulting in an annual effective rate of 0.05% of the Fund's average daily net assets.
The Advisor has also agreed to maintain expenses of certain other classes of the Trust. These rates are disclosed in the respective share classes' annual reports that are provided separately and are available upon request.
Administration Fee. Pursuant to an Administrative Services Agreement, DIMA provides most administrative services to the Government & Agency Securities Portfolio and Tax-Exempt Portfolio. For all services provided under the Administrative Services Agreement, each of these two Funds pays the Advisor an annual fee ("Administration Fee") of 0.10% of each of these two Funds' average daily net assets, computed and accrued daily and payable monthly. For the year ended April 30, 2013, the Administration Fee from the Government & Agency Securities Portfolio and the Tax-Exempt Portfolio was as follows:
| Fund | | Administration Fee | | | Unpaid at April 30, 2013 | |
| Government & Agency Securities Portfolio | | $ | 2,969,292 | | | $ | 237,874 | |
| Tax-Exempt Portfolio | | $ | 2,073,476 | | | $ | 161,841 | |
Service Provider Fees. DWS Investments Service Company ("DISC"), an affiliate of the Advisor, is the transfer agent, dividend-paying agent and shareholder service agent for the Funds. Pursuant to a sub-transfer agency agreement between DISC and DST Systems, Inc. ("DST"), DISC has delegated certain transfer agent, dividend-paying agent and shareholder service agent functions to DST. DISC compensates DST out of the shareholder servicing fee it receives from the Funds. For the year ended April 30, 2013, the amounts charged to the Funds by DISC were as follows:
| Money Market Portfolio: | | Total Aggregated | | | Waived | | | Unpaid at April 30, 2013 | |
| Capital Assets Funds Shares | | $ | 1,698,073 | | | $ | 1,257,408 | | | $ | 22,820 | |
| Capital Assets Funds Preferred Shares | | | 3,458 | | | | 2,722 | | | | — | |
| Davidson Cash Equivalent Shares | | | 23,907 | | | | 17,214 | | | | 649 | |
| Davidson Cash Equivalent Plus Shares | | | 1,785 | | | | 1,264 | | | | 93 | |
| Premium Reserve Money Market Shares | | | 81,513 | | | | 43,002 | | | | 5,163 | |
| Service Shares | | | 2,463,999 | | | | 1,735,773 | | | | 51,257 | |
| | | $ | 4,272,735 | | | $ | 3,057,383 | | | $ | 79,982 | |
| Government & Agency Securities Portfolio: | | Total Aggregated | | | Waived | | | Unpaid at April 30, 2013 | |
| Capital Assets Funds Shares | | $ | 446,473 | | | $ | 407,085 | | | $ | 21,372 | |
| Davidson Cash Equivalent Shares | | | 57,088 | | | | 52,121 | | | | 618 | |
| Davidson Cash Equivalent Plus Shares | | | 198,754 | | | | 177,388 | | | | 6,098 | |
| DWS Government & Agency Money Fund | | | 108,301 | | | | 82,446 | | | | 9,591 | |
| DWS Government Cash Institutional Shares | | | 194,797 | | | | 194,797 | | | | — | |
| Government Cash Managed Shares | | | 197,828 | | | | 145,451 | | | | 10,765 | |
| Service Shares | | | 230,680 | | | | 212,053 | | | | 3,333 | |
| | | $ | 1,433,921 | | | $ | 1,271,341 | | | $ | 51,777 | |
| Tax-Exempt Portfolio: | | Total Aggregated | | | Waived | | | Unpaid at April 30, 2013 | |
| Capital Assets Funds Shares | | $ | 30,095 | | | $ | 28,537 | | | $ | — | |
| Davidson Cash Equivalent Shares | | | 101,958 | | | | 96,636 | | | | 286 | |
| DWS Tax-Exempt Cash Institutional Shares | | | 159,779 | | | | 159,779 | | | | — | |
| DWS Tax-Exempt Money Fund | | | 90,009 | | | | 64,368 | | | | 6,013 | |
| DWS Tax-Free Money Fund Class S | | | 62,942 | | | | 51,694 | | | | 3,125 | |
| Service Shares | | | 156,558 | | | | 147,666 | | | | 5,419 | |
| Tax-Exempt Cash Managed Shares | | | 102,865 | | | | 86,626 | | | | 431 | |
| Tax-Free Investment Class | | | 368,933 | | | | 338,546 | | | | — | |
| | | $ | 1,073,139 | | | $ | 973,852 | | | $ | 15,274 | |
Pursuant to a fund accounting agreement between DIMA and Money Market Portfolio, DIMA is responsible for computing the daily net asset value per share and maintaining the portfolio and general accounting records of Money Market Portfolio. DIMA has delegated certain fund accounting and record-keeping services to State Street Bank and Trust Company. The costs and expenses of such delegation are paid by DIMA. Money Market Portfolio paid no fee to DIMA for fund accounting and record-keeping services provided under the fund accounting agreement during the period.
Distribution Service Agreement. Under the Distribution Service Agreement, in accordance with Rule 12b-1 under the 1940 Act, DWS Investments Distributors, Inc. ("DIDI"), an affiliate of the Advisor, receives a fee ("Distribution Fee"), calculated as a percentage of average daily net assets for the shares listed in the following table.
For the year ended April 30, 2013, the Distribution Fee was as follows:
| Money Market Portfolio: | | Distribution Fee | | | Waived | | | Annual Effective Rate | | | Contractual Rate (Up To) | |
| Capital Assets Funds Shares | | $ | 2,241,456 | | | $ | 2,241,456 | | | | .00 | % | | | .33 | % |
| Capital Assets Funds Preferred Shares | | | 4,611 | | | | 4,611 | | | | .00 | % | | | .20 | % |
| Davidson Cash Equivalent Shares | | | 26,860 | | | | 26,860 | | | | .00 | % | | | .30 | % |
| Davidson Cash Equivalent Plus Shares | | | 1,723 | | | | 1,723 | | | | .00 | % | | | .25 | % |
| Service Shares | | | 5,913,598 | | | | 5,913,598 | | | | .00 | % | | | .60 | % |
| | | $ | 8,188,248 | | | $ | 8,188,248 | | | | | | | | | |
| Government & Agency Securities Portfolio: | | Distribution Fee | | | Waived | | | Annual Effective Rate | | | Contractual Rate (Up To) | |
| Capital Assets Funds Shares | | $ | 593,656 | | | $ | 593,656 | | | | .00 | % | | | .33 | % |
| Davidson Cash Equivalent Shares | | | 68,505 | | | | 68,505 | | | | .00 | % | | | .30 | % |
| Davidson Cash Equivalent Plus Shares | | | 248,443 | | | | 248,443 | | | | .00 | % | | | .25 | % |
| Service Shares | | | 553,631 | | | | 553,631 | | | | .00 | % | | | .60 | % |
| | | $ | 1,464,235 | | | $ | 1,464,235 | | | | | | | | | |
| Tax-Exempt Portfolio: | | Distribution Fee | | | Waived | | | Annual Effective Rate | | | Contractual Rate (Up To) | |
| Capital Assets Funds Shares | | $ | 39,725 | | | $ | 39,725 | | | | .00 | % | | | .33 | % |
| Davidson Cash Equivalent Shares | | | 203,917 | | | | 203,917 | | | | .00 | % | | | .30 | % |
| Service Shares | | | 375,740 | | | | 375,740 | | | | .00 | % | | | .60 | % |
| Tax-Free Investment Class | | | 836,286 | | | | 836,286 | | | | .00 | % | | | .25 | % |
| | | $ | 1,455,668 | | | $ | 1,455,668 | | | | | | | | | |
In addition, DIDI provides information and administrative services for a fee ("Service Fee") for the shares listed in the following table. A portion of these fees may be paid pursuant to a Rule 12b-1 plan.
For the year ended April 30, 2013, the Service Fee was as follows:
| Money Market Portfolio: | | Service Fee | | | Waived | | | Annual Effective Rate | | | Contractual Rate (Up To) | |
| Capital Assets Funds Shares | | $ | 1,698,073 | | | $ | 1,698,073 | | | | .00 | % | | | .25 | % |
| Capital Assets Funds Preferred Shares | | | 2,305 | | | | 2,305 | | | | .00 | % | | | .10 | % |
| Davidson Cash Equivalent Shares | | | 22,384 | | | | 22,384 | | | | .00 | % | | | .25 | % |
| Davidson Cash Equivalent Plus Shares | | | 1,379 | | | | 1,379 | | | | .00 | % | | | .20 | % |
| Premium Reserve Money Market Shares | | | 134,069 | | | | 134,069 | | | | .00 | % | | | .25 | % |
| | | $ | 1,858,210 | | | $ | 1,858,210 | | | | | | | | | |
| Government & Agency Securities Portfolio: | | Service Fee | | | Waived | | | Annual Effective Rate | | | Contractual Rate (Up To) | |
| Capital Assets Funds Shares | | $ | 449,739 | | | $ | 449,739 | | | | .00 | % | | | .25 | % |
| Davidson Cash Equivalent Shares | | | 57,088 | | | | 57,088 | | | | .00 | % | | | .25 | % |
| Davidson Cash Equivalent Plus Shares | | | 198,754 | | | | 198,754 | | | | .00 | % | | | .20 | % |
| Government Cash Managed Shares | | | 370,928 | | | | 370,928 | | | | .00 | % | | | .15 | % |
| | | $ | 1,076,509 | | | $ | 1,076,509 | | | | | | | | | |
| Tax-Exempt Portfolio: | | Service Fee | | | Waived | | | Annual Effective Rate | | | Contractual Rate (Up To) | |
| Capital Assets Funds Shares | | $ | 30,095 | | | $ | 30,095 | | | | .00 | % | | | .25 | % |
| Davidson Cash Equivalent Shares | | | 169,930 | | | | 169,930 | | | | .00 | % | | | .25 | % |
| Tax-Exempt Cash Managed Shares | | | 223,726 | | | | 223,726 | | | | .00 | % | | | .15 | % |
| Tax-Free Investment Class | | | 234,160 | | | | 234,160 | | | | .00 | % | | | .07 | % |
| | | $ | 657,911 | | | $ | 657,911 | | | | | | | | | |
Typesetting and Filing Service Fees. Under an agreement with DIMA, DIMA is compensated for providing typesetting and certain regulatory filing services to the Funds. For the year ended April 30, 2013, the amounts charged to the Funds by DIMA included in the Statement of Operations under "reports to shareholders" were as follows:
| Fund | | Total Aggregated | | | Unpaid at April 30, 2013 | |
| Money Market Portfolio | | $ | 43,232 | | | $ | 14,410 | |
| Government & Agency Securities Portfolio | | $ | 56,466 | | | $ | 19,054 | |
| Tax-Exempt Portfolio | | $ | 85,990 | | | $ | 31,227 | |
Trustees' Fees and Expenses. The Funds paid retainer fees to each Trustee not affiliated with the Advisor, plus specified amounts to the Board Chairperson and Vice Chairperson and to each committee Chairperson.
3. Concentration of Ownership
From time to time, the Funds may have a concentration of several shareholder accounts holding a significant percentage of shares outstanding. Investment activities of these shareholders could have a material impact on the Funds.
At April 30, 2013, two shareholder accounts held approximately 82% and 11% of the outstanding shares of the Money Market Portfolio; one shareholder account held approximately 13% of the outstanding shares of the Government & Agency Securities Portfolio; and three shareholder accounts held approximately 33%, 17% and 12% of the outstanding shares of the Tax-Exempt Portfolio.
4. Line of Credit
The Funds and other affiliated funds (the "Participants") share in a $375 million revolving credit facility provided by a syndication of banks. Each Fund may borrow for temporary or emergency purposes, including the meeting of redemption requests that otherwise might require the untimely disposition of securities. The Participants are charged an annual commitment fee which is allocated based on net assets, among each of the Participants. Interest is calculated at a rate per annum equal to the sum of the Federal Funds Rate plus 1.25 percent plus, if LIBOR exceeds the Federal Funds Rate, the amount of such excess. Each Fund may borrow up to a maximum of 33 percent of its net assets under the agreement. The Fund had no outstanding loans at April 30, 2013.
5. Share Transactions
The following table summarizes share and dollar activity in the Funds:
Money Market Portfolio
| | | Year Ended April 30, 2013 | | | Year Ended April 30, 2012 | |
| | | Shares | | | Dollars | | | Shares | | | Dollars | |
| Shares sold | |
| Capital Assets Funds Shares | | | 629,975,145 | | | $ | 629,975,145 | | | | 740,327,726 | | | $ | 740,327,726 | |
| Capital Assets Funds Preferred Shares | | | 15,876,680 | | | | 15,876,680 | | | | 15,237,717 | | | | 15,237,717 | |
| Davidson Cash Equivalent Shares | | | 4,424,439 | | | | 4,424,439 | | | | 5,888,909 | | | | 5,888,909 | |
| Davidson Cash Equivalent Plus Shares | | | 667,261 | | | | 667,261 | | | | 303,684 | | | | 303,684 | |
| Premium Reserve Money Market Shares | | | 119,393,312 | | | | 119,393,312 | | | | 90,937,663 | | | | 90,937,663 | |
| Service Shares | | | 760,462,298 | | | | 760,462,298 | | | | 1,342,380,700 | | | | 1,342,380,700 | |
| | | | | | | $ | 1,530,799,135 | | | | | | | $ | 2,195,076,399 | |
| Shares issued to shareholders in reinvestment of distributions | |
| Capital Assets Funds Shares | | | 140,590 | | | $ | 140,590 | | | | 151,503 | | | $ | 151,503 | |
| Capital Assets Funds Preferred Shares | | | 1,170 | | | | 1,170 | | | | 1,677 | | | | 1,677 | |
| Davidson Cash Equivalent Shares | | | 959 | | | | 959 | | | | 1,136 | | | | 1,136 | |
| Davidson Cash Equivalent Plus Shares | | | 75 | | | | 75 | | | | 101 | | | | 101 | |
| Premium Reserve Money Market Shares | | | 3,797 | | | | 3,797 | | | | 3,793 | | | | 3,793 | |
| Service Shares | | | 105,122 | | | | 105,122 | | | | 125,945 | | | | 125,945 | |
| | | | | | | $ | 251,713 | | | | | | | $ | 284,155 | |
| Shares redeemed | |
| Capital Assets Funds Shares | | | (780,874,399 | ) | | $ | (780,874,399 | ) | | | (852,717,812 | ) | | $ | (852,717,812 | ) |
| Capital Assets Funds Preferred Shares | | | (16,735,077 | ) | | | (16,735,077 | ) | | | (17,403,287 | ) | | | (17,403,287 | ) |
| Davidson Cash Equivalent Shares | | | (6,174,353 | ) | | | (6,174,353 | ) | | | (9,655,583 | ) | | | (9,655,583 | ) |
| Davidson Cash Equivalent Plus Shares | | | (791,706 | ) | | | (791,706 | ) | | | (906,966 | ) | | | (906,966 | ) |
| Premium Reserve Money Market Shares | | | (116,890,479 | ) | | | (116,890,479 | ) | | | (98,084,584 | ) | | | (98,084,584 | ) |
| Service Shares | | | (822,660,183 | ) | | | (822,660,183 | ) | | | (2,009,039,110 | ) | | | (2,009,039,110 | ) |
| | | | | | | $ | (1,744,126,197 | ) | | | | | | $ | (2,987,807,342 | ) |
| Net increase (decrease) | |
| Capital Assets Funds Shares | | | (150,758,664 | ) | | $ | (150,758,664 | ) | | | (112,238,583 | ) | | $ | (112,238,583 | ) |
| Capital Assets Funds Preferred Shares | | | (857,227 | ) | | | (857,227 | ) | | | (2,163,893 | ) | | | (2,163,893 | ) |
| Davidson Cash Equivalent Shares | | | (1,748,955 | ) | | | (1,748,955 | ) | | | (3,765,538 | ) | | | (3,765,538 | ) |
| Davidson Cash Equivalent Plus Shares | | | (124,370 | ) | | | (124,370 | ) | | | (603,181 | ) | | | (603,181 | ) |
| Premium Reserve Money Market Shares | | | 2,506,630 | | | | 2,506,630 | | | | (7,143,128 | ) | | | (7,143,128 | ) |
| Service Shares | | | (62,092,763 | ) | | | (62,092,763 | ) | | | (666,532,465 | ) | | | (666,532,465 | ) |
| | | | | | | $ | (213,075,349 | ) | | | | | | $ | (792,446,788 | ) |
Government & Agency Securities Portfolio
| | | Year Ended April 30, 2013 | | | Year Ended April 30, 2012 | |
| | | Shares | | | Dollars | | | Shares | | | Dollars | |
| Shares sold | |
| Capital Assets Funds Shares | | | 106,697,232 | | | $ | 106,697,232 | | | | 447,922,936 | | | $ | 447,922,936 | |
| Davidson Cash Equivalent Shares | | | 31,099,071 | | | | 31,099,071 | | | | 41,768,083 | | | | 41,768,083 | |
| Davidson Cash Equivalent Plus Shares | | | 222,327,364 | | | | 222,327,364 | | | | 213,635,877 | | | | 213,635,877 | |
| DWS Government & Agency Money Fund | | | 53,121,349 | | | | 53,121,349 | | | | 61,520,170 | | | | 61,520,170 | |
| DWS Government Cash Institutional Shares | | | 15,315,065,657 | | | | 15,315,065,657 | | | | 30,092,618,931 | | | | 30,092,618,931 | |
| Government Cash Managed Shares | | | 1,990,326,289 | | | | 1,990,326,289 | | | | 2,673,520,482 | | | | 2,673,520,482 | |
| Service Shares | | | 264,734,153 | | | | 264,734,153 | | | | 396,307,032 | | | | 396,307,032 | |
| | | | | | | $ | 17,983,371,115 | | | | | | | $ | 33,927,293,511 | |
| Shares issued to shareholders in reinvestment of distributions | |
| Capital Assets Funds Shares | | | 17,994 | | | $ | 17,994 | | | | 24,434 | | | $ | 24,434 | |
| Davidson Cash Equivalent Shares | | | 2,284 | | | | 2,284 | | | | 2,343 | | | | 2,343 | |
| Davidson Cash Equivalent Plus Shares | | | 9,940 | | | | 9,940 | | | | 7,560 | | | | 7,560 | |
| DWS Government & Agency Money Fund | | | 11,818 | | | | 11,818 | | | | 13,959 | | | | 13,959 | |
| DWS Government Cash Institutional Shares | | | 341,515 | | | | 341,515 | | | | 644,365 | | | | 644,365 | |
| Government Cash Managed Shares | | | 7,714 | | | | 7,714 | | | | 7,755 | | | | 7,755 | |
| Service Shares | | | 8,959 | | | | 8,959 | | | | 17,256 | | | | 17,256 | |
| | | | | | | $ | 400,224 | | | | | | | $ | 717,672 | |
| Shares redeemed | |
| Capital Assets Funds Shares | | | (205,489,534 | ) | | $ | (205,489,534 | ) | | | (495,723,357 | ) | | $ | (495,723,357 | ) |
| Davidson Cash Equivalent Shares | | | (35,645,815 | ) | | | (35,645,815 | ) | | | (36,015,591 | ) | | | (36,015,591 | ) |
| Davidson Cash Equivalent Plus Shares | | | (207,586,537 | ) | | | (207,586,537 | ) | | | (153,400,457 | ) | | | (153,400,457 | ) |
| DWS Government & Agency Money Fund | | | (75,265,565 | ) | | | (75,265,565 | ) | | | (92,132,646 | ) | | | (92,132,646 | ) |
| DWS Government Cash Institutional Shares | | | (15,771,839,065 | ) | | | (15,771,839,065 | ) | | | (32,152,791,854 | ) | | | (32,152,791,854 | ) |
| Government Cash Managed Shares | | | (1,983,483,875 | ) | | | (1,983,483,875 | ) | | | (2,637,952,274 | ) | | | (2,637,952,274 | ) |
| Service Shares | | | (294,366,143 | ) | | | (294,366,143 | ) | | | (401,763,556 | ) | | | (401,763,556 | ) |
| | | | | | | $ | (18,573,676,534 | ) | | | | | | $ | (35,969,779,735 | ) |
| Net increase (decrease) | |
| Capital Assets Funds Shares | | | (98,774,308 | ) | | $ | (98,774,308 | ) | | | (47,775,987 | ) | | $ | (47,775,987 | ) |
| Davidson Cash Equivalent Shares | | | (4,544,460 | ) | | | (4,544,460 | ) | | | 5,754,835 | | | | 5,754,835 | |
| Davidson Cash Equivalent Plus Shares | | | 14,750,767 | | | | 14,750,767 | | | | 60,242,980 | | | | 60,242,980 | |
| DWS Government & Agency Money Fund | | | (22,132,398 | ) | | | (22,132,398 | ) | | | (30,598,517 | ) | | | (30,598,517 | ) |
| DWS Government Cash Institutional Shares | | | (456,431,893 | ) | | | (456,431,893 | ) | | | (2,059,528,558 | ) | | | (2,059,528,558 | ) |
| Government Cash Managed Shares | | | 6,850,128 | | | | 6,850,128 | | | | 35,575,963 | | | | 35,575,963 | |
| Service Shares | | | (29,623,031 | ) | | | (29,623,031 | ) | | | (5,439,268 | ) | | | (5,439,268 | ) |
| | | | | | | $ | (589,905,195 | ) | | | | | | $ | (2,041,768,552 | ) |
Tax-Exempt Portfolio
| | | Year Ended April 30, 2013 | | | Year Ended April 30, 2012 | |
| | | Shares | | | Dollars | | | Shares | | | Dollars | |
| Shares sold | |
| Capital Assets Funds Shares | | | 33,780,270 | | | $ | 33,780,270 | | | | 32,054,021 | | | $ | 32,054,021 | |
| Davidson Cash Equivalent Shares | | | 115,063,476 | | | | 115,063,476 | | | | 121,475,389 | | | | 121,475,389 | |
| DWS Tax-Exempt Cash Institutional Shares | | | 2,372,880,502 | | | | 2,372,880,502 | | | | 4,080,690,854 | | | | 4,080,690,854 | |
| DWS Tax-Exempt Money Fund | | | 251,306,829 | | | | 251,306,829 | | | | 325,873,832 | | | | 325,873,832 | |
| DWS Tax-Free Money Fund Class S | | | 28,082,317 | | | | 28,082,317 | | | | 31,868,351 | | | | 31,868,351 | |
| Service Shares | | | 138,095,905 | | | | 138,095,905 | | | | 173,964,295 | | | | 173,964,295 | |
| Tax-Exempt Cash Managed Shares | | | 238,693,476 | | | | 238,693,476 | | | | 387,004,796 | | | | 387,004,796 | |
| Tax-Free Investment Class | | | 396,600,890 | | | | 396,600,890 | | | | 330,420,769 | | | | 330,420,769 | |
| | | | | | | $ | 3,574,503,665 | | | | | | | $ | 5,483,352,307 | |
| Shares issued to shareholders in reinvestment of distributions | |
| Capital Assets Funds Shares | | | 3,264 | | | $ | 3,264 | | | | 2,578 | | | $ | 2,578 | |
| Davidson Cash Equivalent Shares | | | 20,992 | | | | 20,992 | | | | 13,652 | | | | 13,652 | |
| DWS Tax-Exempt Cash Institutional Shares | | | 163,290 | | | | 163,290 | | | | 307,257 | | | | 307,257 | |
| DWS Tax-Exempt Money Fund | | | 76,913 | | | | 76,913 | | | | 112,297 | | | | 112,297 | |
| DWS Tax-Free Money Fund Class S | | | 27,387 | | | | 27,387 | | | | 27,195 | | | | 27,195 | |
| Service Shares | | | 14,768 | | | | 14,768 | | | | 16,265 | | | | 16,265 | |
| Tax-Exempt Cash Managed Shares | | | 2,584 | | | | 2,584 | | | | 1,546 | | | | 1,546 | |
| Tax-Free Investment Class | | | 100,546 | | | | 100,546 | | | | 63,716 | | | | 63,716 | |
| | | | | | | $ | 409,744 | | | | | | | $ | 544,506 | |
| Shares redeemed | |
| Capital Assets Funds Shares | | | (35,324,040 | ) | | $ | (35,324,040 | ) | | | (31,054,695 | ) | | $ | (31,054,695 | ) |
| Davidson Cash Equivalent Shares | | | (106,210,991 | ) | | | (106,210,991 | ) | | | (135,004,695 | ) | | | (135,004,695 | ) |
| DWS Tax-Exempt Cash Institutional Shares | | | (2,508,359,723 | ) | | | (2,508,359,723 | ) | | | (4,467,264,493 | ) | | | (4,467,264,493 | ) |
| DWS Tax-Exempt Money Fund | | | (322,145,746 | ) | | | (322,145,746 | ) | | | (379,194,651 | ) | | | (379,194,651 | ) |
| DWS Tax-Free Money Fund Class S | | | (38,170,621 | ) | | | (38,170,621 | ) | | | (46,678,340 | ) | | | (46,678,340 | ) |
| Service Shares | | | (171,243,303 | ) | | | (171,243,303 | ) | | | (177,914,611 | ) | | | (177,914,611 | ) |
| Tax-Exempt Cash Managed Shares | | | (290,012,104 | ) | | | (290,012,104 | ) | | | (348,035,830 | ) | | | (348,035,830 | ) |
| Tax-Free Investment Class | | | (399,598,260 | ) | | | (399,598,260 | ) | | | (399,040,672 | ) | | | (399,040,672 | ) |
| | | | | | | $ | (3,871,064,788 | ) | | | | | | $ | (5,984,187,987 | ) |
| Net increase (decrease) | |
| Capital Assets Funds Shares | | | (1,540,506 | ) | | $ | (1,540,506 | ) | | | 1,001,904 | | | $ | 1,001,904 | |
| Davidson Cash Equivalent Shares | | | 8,873,477 | | | | 8,873,477 | | | | (13,515,654 | ) | | | (13,515,654 | ) |
| DWS Tax-Exempt Cash Institutional Shares | | | (135,315,931 | ) | | | (135,315,931 | ) | | | (386,266,382 | ) | | | (386,266,382 | ) |
| DWS Tax-Exempt Money Fund | | | (70,762,004 | ) | | | (70,762,004 | ) | | | (53,208,522 | ) | | | (53,208,522 | ) |
| DWS Tax-Free Money Fund Class S | | | (10,060,917 | ) | | | (10,060,917 | ) | | | (14,782,794 | ) | | | (14,782,794 | ) |
| Service Shares | | | (33,132,630 | ) | | | (33,132,630 | ) | | | (3,934,051 | ) | | | (3,934,051 | ) |
| Tax-Exempt Cash Managed Shares | | | (51,316,044 | ) | | | (51,316,044 | ) | | | 38,970,512 | | | | 38,970,512 | |
| Tax-Free Investment Class | | | (2,896,824 | ) | | | (2,896,824 | ) | | | (68,556,187 | ) | | | (68,556,187 | ) |
| | | | | | | $ | (296,151,379 | ) | | | | | | $ | (500,291,174 | ) |
Report of Independent Registered Public Accounting Firm
To the Shareholders and Board of Trustees of Cash Account Trust:
We have audited the accompanying statements of assets and liabilities of Money Market Portfolio, Government & Agency Securities Portfolio and Tax-Exempt Portfolio (the "Funds") (the three Funds comprising Cash Account Trust), including the investment portfolios, as of April 30, 2013, and the related statements of operations for the year then ended, the statements of changes in net assets for each of the two years in the period then ended, and the financial highlights for each of the five years in the period then ended. These financial statements and financial highlights are the responsibility of the Funds' management. Our responsibility is to express an opinion on these financial statements and financial highlights based on our audits.
We conducted our audits in accordance with the standards of the Public Company Accounting Oversight Board (United States). Those standards require that we plan and perform the audit to obtain reasonable assurance about whether the financial statements and financial highlights are free of material misstatement. We were not engaged to perform an audit of the Funds' internal control over financial reporting. Our audits included consideration of internal control over financial reporting as a basis for designing audit procedures that are appropriate in the circumstances, but not for the purpose of expressing an opinion on the effectiveness of the Funds' internal control over financial reporting. Accordingly, we express no such opinion. An audit also includes examining, on a test basis, evidence supporting the amounts and disclosures in the financial statements and financial highlights, assessing the accounting principles used and significant estimates made by management, and evaluating the overall financial statement presentation. Our procedures included confirmation of securities owned as of April 30, 2013, by correspondence with the custodian and brokers. We believe that our audits provide a reasonable basis for our opinion.
In our opinion, the financial statements and financial highlights referred to above present fairly, in all material respects, the financial position of Money Market Portfolio, Government & Agency Securities Portfolio and Tax-Exempt Portfolio at April 30, 2013, the results of their operations for the year then ended, the changes in their net assets for each of the two years in the period then ended, and the financial highlights for each of the five years in the period then ended, in conformity with U.S. generally accepted accounting principles.
| | | |
Boston, Massachusetts June 19, 2013 | | |
Information About Each Fund's Expenses
As an investor of a Fund, you incur two types of costs: ongoing expenses and transaction costs. Ongoing expenses include management fees, distribution and service (12b-1) fees and other Fund expenses. Examples of transaction costs include account maintenance fees, which are not shown in this section. The following tables are intended to help you understand your ongoing expenses (in dollars) of investing in each Fund and to help you compare these expenses with the ongoing expenses of investing in other mutual funds. In the most recent six-month period, the Funds limited these expenses; had they not done so, expenses would have been higher for the Davidson Cash Equivalent Shares and the Davidson Cash Equivalent Plus Shares. The example in the table is based on an investment of $1,000 invested at the beginning of the six-month period and held for the entire period (November 1, 2012 to April 30, 2013).
The tables illustrate your Fund's expenses in two ways:
•Actual Fund Return. This helps you estimate the actual dollar amount of ongoing expenses (but not transaction costs) paid on a $1,000 investment in the Fund using the Fund's actual return during the period. To estimate the expenses you paid over the period, simply divide your account value by $1,000 (for example, an $8,600 account value divided by $1,000 = 8.6), then multiply the result by the number in the "Expenses Paid per $1,000" line under the share class you hold.
• Hypothetical 5% Portfolio Return. This helps you to compare your Fund's ongoing expenses (but not transaction costs) with those of other mutual funds using the Fund's actual expense ratio and a hypothetical rate of return of 5% per year before expenses. Examples using a 5% hypothetical fund return may be found in the shareholder reports of other mutual funds. The hypothetical account values and expenses may not be used to estimate the actual ending account balance or expenses you paid for the period.
Please note that the expenses shown in these tables are meant to highlight your ongoing expenses only and do not reflect any transaction costs. The "Expenses Paid per $1,000" line of the tables is useful in comparing ongoing expenses only and will not help you determine the relative total expense of owning different funds. If these transaction costs had been included, your costs would have been higher.
Davidson Cash Equivalent Shares Expenses and Value of a $1,000 Investment for the six months ended April 30, 2013 (Unaudited) | |
| Actual Fund Return | | Money Market Portfolio | | | Government & Agency Securities Portfolio | | | Tax-Exempt Portfolio | |
| Beginning Account Value 11/1/12 | | $ | 1,000.00 | | | $ | 1,000.00 | | | $ | 1,000.00 | |
| Ending Account Value 4/30/13 | | $ | 1,000.06 | | | $ | 1,000.05 | | | $ | 1,000.23 | |
| Expenses Paid per $1,000* | | $ | 1.24 | | | $ | .79 | | | $ | .84 | |
| Hypothetical 5% Fund Return | | | | | | | | | | | | |
| Beginning Account Value 11/1/12 | | $ | 1,000.00 | | | $ | 1,000.00 | | | $ | 1,000.00 | |
| Ending Account Value 4/30/13 | | $ | 1,023.55 | | | $ | 1,024.00 | | | $ | 1,023.95 | |
| Expenses Paid per $1,000* | | $ | 1.25 | | | $ | .80 | | | $ | .85 | |
| * Expenses are equal to the Fund's annualized expense ratio for each share class, multiplied by the average account value over the period, multiplied by 181 (the number of days in the most recent six-month period), then divided by 365. | |
| Annualized Expense Ratios | | Money Market Portfolio | | | Government & Agency Securities Portfolio | | | Tax-Exempt Portfolio | |
| Davidson Cash Equivalent Shares | | | .25 | % | | | .16 | % | | | .17 | % |
For more information, please refer to each Fund's prospectus. For an analysis of the fees associated with an investment in the Fund or similar funds, please refer to http://apps.finra.org/fundanalyzer/1/fa.aspx. | |
Davidson Cash Equivalent Plus Shares Expenses and Value of a $1,000 Investment for the six months ended April 30, 2013 (Unaudited) | |
| Actual Fund Return | | Money Market Portfolio | | | Government & Agency Securities Portfolio | |
| Beginning Account Value 11/1/12 | | $ | 1,000.00 | | | $ | 1,000.00 | |
| Ending Account Value 4/30/13 | | $ | 1,000.06 | | | $ | 1,000.05 | |
| Expenses Paid per $1,000* | | $ | 1.24 | | | $ | .79 | |
| Hypothetical 5% Fund Return | | | | | | | | |
| Beginning Account Value 11/1/12 | | $ | 1,000.00 | | | $ | 1,000.00 | |
| Ending Account Value 4/30/13 | | $ | 1,023.55 | | | $ | 1,024.00 | |
| Expenses Paid per $1,000* | | $ | 1.25 | | | $ | .80 | |
| * Expenses are equal to the Fund's annualized expense ratio for each share class, multiplied by the average account value over the period, multiplied by 181 (the number of days in the most recent six-month period), then divided by 365. | |
| Annualized Expense Ratios | | Money Market Portfolio | | | Government & Agency Securities Portfolio | |
| Davidson Cash Equivalent Plus Shares | | | .25 | % | | | .16 | % |
For more information, please refer to each Fund's prospectus. For an analysis of the fees associated with an investment in the Fund or similar funds, please refer to http://apps.finra.org/fundanalyzer/1/fa.aspx. | |
Tax Information (Unaudited)
For the Money Market Portfolio, a total of 5% of the dividends distributed during the fiscal year was derived from interest on U.S. government securities, which is generally exempt from state income tax.
For the Government & Agency Securities Portfolio, a total of 31% of the dividends distributed during the fiscal year was derived from interest on U.S. government securities, which is generally exempt from state income tax.
For the Tax-Exempt Portfolio, of the dividends paid from net investment income for the taxable year ended April 30, 2013, 100% are designated as exempt interest dividends for federal income tax purposes.
Please consult a tax advisor if you have questions about federal or state income tax laws, or on how to prepare your tax returns. If you have specific questions about your account, please call (800) 728-3337.
Proxy Voting
The Fund's policies and procedures for voting proxies for portfolio securities and information about how the Fund voted proxies related to its portfolio securities during the 12-month period ended June 30 are available on our Web site — www.dws-investments.com (click on "proxy voting" at the bottom of the page) — or on the SEC's Web site — www.sec.gov. To obtain a written copy of the Fund's policies and procedures without charge, upon request, call us toll free at (800) 728-3337.
Portfolio Holdings
Following the Fund's fiscal first and third quarter-end, a complete portfolio holdings listing is filed with the SEC on Form N-Q. In addition, each month, information about the Fund and its portfolio holdings is filed with the SEC on Form N-MFP. The SEC delays the public availability of the information filed on Form N-MFP for 60 days after the end of the reporting period included in the filing. These forms will be available on the SEC's Web site at www.sec.gov, and they may also be reviewed and copied at the SEC's Public Reference Room in Washington, D.C. Information on the operation of the SEC's Public Reference Room may be obtained by calling (800) SEC-0330. The Fund's portfolio holdings are also posted on www.dws-investments.com from time to time. Please see the Fund's current prospectus for more information.
Money Market Fund Reform
In 2010, the Securities and Exchange Commission adopted amendments to then-existing money market fund regulations, imposing new liquidity, credit quality and maturity requirements on all money market funds. In November 2012, the Financial Stability Oversight Council (FSOC), a board of U.S. regulators established by the Dodd-Frank Act, proposed recommendations for money market fund reform. If the SEC were to adopt one or more of the FSOC proposed recommendations in the future, or if FSOC were to take other steps to establish similar regulations of money market funds in the future, such regulatory action may affect the Fund's operations and/or return potential.
Summary of Management Fee Evaluation by Independent Fee Consultant
September 17, 2012
Pursuant to an Order entered into by Deutsche Investment Management Americas and affiliates (collectively, "DeAM") with the Attorney General of New York, I, Thomas H. Mack, have been appointed the Independent Fee Consultant for the DWS Funds (formerly the DWS Scudder Funds). My duties include preparing an annual written evaluation of the management fees DeAM charges the Funds, considering among other factors the management fees charged by other mutual fund companies for like services, management fees DeAM charges other clients for like services, DeAM's costs of supplying services under the management agreements and related profit margins, possible economies of scale if a Fund grows larger, and the nature and quality of DeAM's services, including fund performance. This report summarizes my evaluation for 2012, including my qualifications, the evaluation process for each of the DWS Funds, consideration of certain complex-level factors, and my conclusions. I served in substantially the same capacity in 2007, 2008, 2009, 2010 and 2011.
Qualifications
For more than 35 years I have served in various professional capacities within the investment management business. I have held investment analysis and advisory positions, including securities analyst, portfolio strategist and director of investment policy with a large investment firm. I have also performed business management functions, including business development, financial management and marketing research and analysis.
Since 1991, I have been an independent consultant within the asset management industry. I have provided services to over 125 client organizations, including investment managers, mutual fund boards, product distributors and related organizations. Over the past ten years I have completed a number of assignments for mutual fund boards, specifically including assisting boards with management contract renewal.
I hold a Master of Business Administration degree, with highest honors, from Harvard University and Master of Science and Bachelor of Science (highest honors) degrees from the University of California at Berkeley. I am an independent director and audit committee financial expert for two closed-end mutual funds and have served in various leadership and financial oversight capacities with non-profit organizations.
Evaluation of Fees for each DWS Fund
My work focused primarily on evaluating, fund-by-fund, the fees charged to each of the 103 mutual fund portfolios in the DWS Fund family. For each Fund, I considered each of the key factors mentioned above, as well as any other relevant information. In doing so I worked closely with the Funds' Independent Directors in their annual contract renewal process, as well as in their approval of contracts for several new funds (documented separately).
In evaluating each Fund's fees, I reviewed comprehensive materials provided by or on behalf of DeAM, including expense information prepared by Lipper Analytical, comparative performance information, profitability data, manager histories, and other materials. I also accessed certain additional information from the Lipper and Morningstar databases and drew on my industry knowledge and experience.
To facilitate evaluating this considerable body of information, I prepared for each Fund a document summarizing the key data elements in each area as well as additional analytics discussed below. This made it possible to consider each key data element in the context of the others.
In the course of contract renewal, DeAM agreed to implement a number of fee and expense adjustments requested by the Independent Directors which will favorably impact future fees and expenses, and my evaluation includes the effects of these changes.
Fees and Expenses Compared with Other Funds
The competitive fee and expense evaluation for each fund focused on two primary comparisons:
The Fund's contractual management fee (the advisory fee plus the administration fee where applicable) compared with those of a group of typically 12-15 funds in the same Lipper investment category (e.g. Large Capitalization Growth) having similar distribution arrangements and being of similar size.
The Fund's total expenses compared with a broader universe of funds from the same Lipper investment category and having similar distribution arrangements.
These two comparisons provide a view of not only the level of the fee compared with funds of similar scale but also the total expense the Fund bears for all the services it receives, in comparison with the investment choices available in the Fund's investment category and distribution channel. The principal figure-of-merit used in these comparisons was the subject Fund's percentile ranking against peers.
DeAM's Fees for Similar Services to Others
DeAM provided management fee schedules for all of its US domiciled fund and non-fund investment management accounts in any of the investment categories where there is a DWS Fund. These similar products included the other DWS Funds, non-fund pooled accounts, institutional accounts and sub-advisory accounts. Using this information, I calculated for each Fund the fee that would be charged to each similar product, at the subject Fund's asset level.
Evaluating information regarding non-fund products is difficult because there are varying levels of services required for different types of accounts, with mutual funds generally requiring considerably more regulatory and administrative types of service as well as having more frequent cash flows than other types of accounts. Also, while mutual fund fees for similar fund products can be expected to be similar, there will be some differences due to different pricing conditions in different distribution channels (e.g. retail funds versus those used in variable insurance products), differences in underlying investment processes and other factors.
Costs and Profit Margins
DeAM provided a detailed profitability analysis for each Fund. After making some adjustments so that the presentation would be more comparable to the available industry figures, I reviewed profit margins from investment management alone, from investment management plus other fund services (excluding distribution) provided to the Funds by DeAM (principally shareholder services), and DeAM profits from all sources, including distribution. A later section comments on overall profitability.
Economies of Scale
Economies of scale — an expected decline in management cost per dollar of fund assets as fund assets grow — are very rarely quantified and documented because of inherent difficulties in collecting and analyzing relevant data. However, in virtually every investment category that I reviewed, larger funds tend to have lower fees and lower total expenses than smaller funds. To see how each DWS Fund compares with this industry observation, I reviewed:
The trend in Fund assets over the last five years and the accompanying trend in total expenses. This shows if the Fund has grown and, if so, whether total expense (management fees as well as other expenses) have declined as a percent of assets.
Whether the Fund has break-points in its management fee schedule, the extent of the fee reduction built into the schedule and the asset levels where the breaks take effect, and in the case of a sub-advised Fund how the Fund's break-points compare with those of the sub-advisory fee schedule.
How the Fund's contractual fee schedule compares with trends in the industry data. To accomplish this, I constructed a chart showing how actual latest-fiscal-year contractual fees of the Fund and of other similar funds relate to average fund assets, with the subject Fund's contractual fee schedule superimposed.
Quality of Service — Performance
The quality-of-service evaluation focused on investment performance, which is the principal result of the investment management service. Each Fund's performance was reviewed over the past 1, 3, 5 and 10 years, as applicable, and compared with that of other funds in the same investment category and with a suitable market index.
In addition, I calculated and reviewed risk-adjusted returns relative to an index of similar mutual funds' returns and a suitable market index. The risk-adjusted returns analysis provides a way of determining the extent to which the Fund's return comparisons are mainly the product of investment value-added (or lack thereof) or alternatively taking considerably more or less risk than is typical in its investment category.
I also received and considered the history of portfolio manager changes for each Fund, as this provided an important context for evaluating the performance results.
Complex-Level Considerations
While this evaluation was conducted mainly at the individual fund level, there are some issues relating to the reasonableness of fees that can alternatively be considered across the whole fund complex:
I reviewed DeAM's profitability analysis for all DWS Funds, with a view toward determining if the allocation procedures used were reasonable and how profit levels compared with public data for other investment managers.
I considered whether DeAM and affiliates receive any significant ancillary or "fallout" benefits that should be considered in interpreting the direct profitability results. These would be situations where serving as the investment manager of the Funds is beneficial to another part of the Deutsche Bank organization.
I considered how aggregated DWS Fund expenses had varied over the years, by asset class and in the context of trends in asset levels.
I considered how aggregated DWS Fund performance measures relative to appropriate peers had varied by asset class and over time.
I reviewed the structure of the DeAM organization, trends in staffing levels, and information on compensation of investment management and other professionals compared with industry data.
Findings
Based on the process and analysis discussed above, which included reviewing a wide range of information from management and external data sources and considering among other factors the fees DeAM charges other clients, the fees charged by other fund managers, DeAM's costs and profits associated with managing the Funds, economies of scale, possible fall-out benefits, and the nature and quality of services provided, in my opinion the management fees charged the DWS Funds are reasonable.
Thomas H. Mack
President, Thomas H. Mack & Co., Inc.
Board Members and Officers
The following table presents certain information regarding the Board Members and Officers of the fund. Each Board Member's year of birth is set forth in parentheses after his or her name. Unless otherwise noted, (i) each Board Member has engaged in the principal occupation(s) noted in the table for at least the most recent five years, although not necessarily in the same capacity; and (ii) the address of each Independent Board Member is c/o Kenneth C. Froewiss, Chairman, DWS Mutual Funds, P.O. Box 78, Short Hills, NJ 07078. Except as otherwise noted below, the term of office for each Board Member is until the election and qualification of a successor, or until such Board Member sooner dies, resigns, is removed or as otherwise provided in the governing documents of the fund. Because the fund does not hold an annual meeting of shareholders, each Board Member will hold office for an indeterminate period. The Board Members may also serve in similar capacities with other funds in the fund complex.
| Independent Board Members |
Name, Year of Birth, Position with the Fund and Length of Time Served1 | | Business Experience and Directorships During the Past Five Years | Number of Funds in DWS Fund Complex Overseen |
Other Directorships Held by Board Member |
Kenneth C. Froewiss (1945) Chairperson since 2013,9 and Board Member since 2001 | | Adjunct Professor of Finance, NYU Stern School of Business (September 2009-present; Clinical Professor from 1997-September 2009); Member, Finance Committee, Association for Asian Studies (2002-present); Director, Mitsui Sumitomo Insurance Group (US) (2004-present); prior thereto, Managing Director, J.P. Morgan (investment banking firm) (until 1996) | 102 | — |
William McClayton (1944) Vice Chairperson since 2013,9 and Board Member since 2004 | | Private equity investor (since October 2009); previously, Managing Director, Diamond Management & Technology Consultants, Inc. (global consulting firm) (2001-2009); Directorship: Board of Managers, YMCA of Metropolitan Chicago; formerly: Senior Partner, Arthur Andersen LLP (accounting) (1966-2001); Trustee, Ravinia Festival | 102 | — |
John W. Ballantine (1946) Board Member since 1999 | | Retired; formerly, Executive Vice President and Chief Risk Management Officer, First Chicago NBD Corporation/The First National Bank of Chicago (1996-1998); Executive Vice President and Head of International Banking (1995-1996); former Directorships: Stockwell Capital Investments PLC (private equity); First Oak Brook Bancshares, Inc. and Oak Brook Bank; Prisma Energy International | 102 | Chairman of the Board, Healthways, Inc.2 (provider of disease and care management services) (2003- present); Portland General Electric2 (utility company) (2003- present) |
Henry P. Becton, Jr. (1943) Board Member since 1990 | | Vice Chair and former President, WGBH Educational Foundation. Directorships: Public Radio International; Public Radio Exchange (PRX); The PBS Foundation; North Bennett Street School (Boston); former Directorships: Association of Public Television Stations; Boston Museum of Science; American Public Television; Concord Academy; New England Aquarium; Mass. Corporation for Educational Telecommunications; Committee for Economic Development; Public Broadcasting Service; Connecticut College | 102 | Lead Director, Becton Dickinson and Company2 (medical technology company); Lead Director, Belo Corporation2 (media company) |
Dawn-Marie Driscoll (1946) Board Member since 1987 | | President, Driscoll Associates (consulting firm); Emeritus Executive Fellow, Center for Business Ethics, Bentley University; formerly, Partner, Palmer & Dodge (1988-1990); Vice President of Corporate Affairs and General Counsel, Filene's (1978-1988). Directorships: Director of ICI Mutual Insurance Company (since 2007); Advisory Board, Center for Business Ethics, Bentley University; Chairman of the Board of Trustees, Southwest Florida Community Foundation (charitable organization); former Directorships: Sun Capital Advisers Trust (mutual funds) (2007-2012), Investment Company Institute (audit, executive, nominating committees) and Independent Directors Council (governance, executive committees) | 102 | — |
Keith R. Fox, CFA (1954) Board Member since 1996 | | Managing General Partner, Exeter Capital Partners (a series of private investment funds) (since 1986). Directorships: Progressive International Corporation (kitchen goods importer and distributor); The Kennel Shop (retailer); former Chairman, National Association of Small Business Investment Companies; former Directorships: BoxTop Media Inc. (advertising); Sun Capital Advisers Trust (mutual funds) (2011-2012) | 102 | — |
Paul K. Freeman (1950) Board Member since 1993, and Chairperson (2009-Jan. 8, 2013) | | Consultant, World Bank/Inter-American Development Bank; Executive and Governing Council of the Independent Directors Council (Chairman of Education Committee); formerly: Project Leader, International Institute for Applied Systems Analysis (1998-2001); Chief Executive Officer, The Eric Group, Inc. (environmental insurance) (1986-1998); Directorships: Denver Zoo Foundation (December 2012-present); former Directorships: Prisma Energy International | 102 | — |
Richard J. Herring (1946) Board Member since 1990 | | Jacob Safra Professor of International Banking and Professor, Finance Department, The Wharton School, University of Pennsylvania (since July 1972); Co-Director, Wharton Financial Institutions Center (since July 2000); Co-Chair, U.S. Shadow Financial Regulatory Committee; Executive Director, Financial Economists Roundtable; formerly: Vice Dean and Director, Wharton Undergraduate Division (July 1995-June 2000); Director, Lauder Institute of International Management Studies (July 2000-June 2006) | 102 | Director, Japan Equity Fund, Inc. (since September 2007), Thai Capital Fund, Inc. (since 2007), Singapore Fund, Inc. (since September 2007), Independent Director of Barclays Bank Delaware (since September 2010) |
Rebecca W. Rimel (1951) Board Member since 1995 | | President and Chief Executive Officer, The Pew Charitable Trusts (charitable organization) (1994 to present); formerly: Executive Vice President, The Glenmede Trust Company (investment trust and wealth management) (1983-2004); Board Member, Investor Education (charitable organization) (2004-2005); Trustee, Executive Committee, Philadelphia Chamber of Commerce (2001-2007); Director, Viasys Health Care2 (January 2007-June 2007); Trustee, Thomas Jefferson Foundation (charitable organization) (1994-2012) | 102 | Director, Becton Dickinson and Company2 (medical technology company) (2012- present); Director, CardioNet, Inc.2 (health care) (2009- present) |
William N. Searcy, Jr. (1946) Board Member since 1993 | | Private investor since October 2003; formerly: Pension & Savings Trust Officer, Sprint Corporation2 (telecommunications) (November 1989-September 2003); Trustee, Sun Capital Advisers Trust (mutual funds) (1998-2012) | 102 | — |
Jean Gleason Stromberg (1943) Board Member since 1997 | | Retired. Formerly, Consultant (1997-2001); Director, Financial Markets U.S. Government Accountability Office (1996-1997); Partner, Fulbright & Jaworski, L.L.P. (law firm) (1978-1996). Directorships: The William and Flora Hewlett Foundation; former Directorships: Service Source, Inc., Mutual Fund Directors Forum (2002-2004), American Bar Retirement Association (funding vehicle for retirement plans) (1987-1990 and 1994-1996) | 102 | — |
Robert H. Wadsworth (1940) Board Member since 1999 | | President, Robert H. Wadsworth & Associates, Inc. (consulting firm) (1983 to present); Director, National Horizon, Inc. (non-profit organization); Director and Treasurer, The Phoenix Boys Choir Association | 105 | — |
Interested Board Member and Officer4 |
Name, Year of Birth, Position with the Fund and Length of Time Served1,6 | | Business Experience and Directorships During the Past Five Years | Number of Funds in DWS Fund Complex Overseen |
Other Directorships Held by Board Member |
Michael J. Woods5 (1967) Board Member since 2013,9 and Executive Vice President since 20139 | | Managing Director,3 Deutsche Asset & Wealth Management (2009-present); Head of the Americas Asset Management Business for Deutsche Bank, Member of the Asset and Wealth Management ("AWM") Extended Executive Committee, AWM Global Client Group Executive Committee and the AWM Active Asset Management Executive Committee; CEO and US Regional Head of DWS Investments; formerly: Sr. VP, Head of the Financial Intermediaries and Investments Group of Evergreen Investments (2007-2009), CEO and Vice Chairman of Board of Directors of XTF Global Asset Management (2006-2007), Managing Director — US Head of Sub-Advisory and Investment Only Business at Citigroup Asset Management (2000-2006). Mr. Woods is currently a board member of The Children's Village, The Big Brothers Big Sisters Organization, and The Mutual Fund Education Alliance. | 38 | — |
Officers4 |
Name, Year of Birth, Position with the Fund and Length of Time Served6 | | Business Experience and Directorships During the Past Five Years |
W. Douglas Beck, CFA7 (1967) President, 2011-present | | Managing Director,3 Deutsche Asset & Wealth Management (2006-present); President of DWS family of funds and Head of Product Management, U.S. for DWS Investments; formerly: Executive Director, Head of Product Management (2002-2006) and President (2005-2006) of the UBS Funds at UBS Global Asset Management; Co-Head of Manager Research/Managed Solutions Group, Merrill Lynch (1998-2002) |
John Millette8 (1962) Vice President and Secretary, 1999-present | | Director,3 Deutsche Asset & Wealth Management |
Paul H. Schubert7 (1963) Chief Financial Officer, 2004-present Treasurer, 2005-present | | Managing Director,3 Deutsche Asset & Wealth Management (since July 2004); formerly: Executive Director, Head of Mutual Fund Services and Treasurer for UBS Family of Funds (1998-2004); Vice President and Director of Mutual Fund Finance at UBS Global Asset Management (1994-1998) |
Caroline Pearson8 (1962) Chief Legal Officer, 2010-present | | Managing Director,3 Deutsche Asset & Wealth Management; formerly: Assistant Secretary for DWS family of funds (1997-2010) |
Melinda Morrow7 (1970) Vice President, 2012-present | | Director,3 Deutsche Asset & Wealth Management |
Hepsen Uzcan8 (1974) Assistant Secretary, since 20139 | | Vice President, Deutsche Asset & Wealth Management |
Paul Antosca8 (1957) Assistant Treasurer, 2007-present | | Director,3 Deutsche Asset & Wealth Management |
Jack Clark8 (1967) Assistant Treasurer, 2007-present | | Director,3 Deutsche Asset & Wealth Management |
Diane Kenneally8 (1966) Assistant Treasurer, 2007-present | | Director,3 Deutsche Asset & Wealth Management |
John Caruso7 (1965) Anti-Money Laundering Compliance Officer, 2010-present | | Managing Director,3 Deutsche Asset & Wealth Management |
Robert Kloby7 (1962) Chief Compliance Officer, 2006-present | | Managing Director,3 Deutsche Asset & Wealth Management |
1 The length of time served represents the year in which the Board Member joined the board of one or more DWS funds currently overseen by the Board.
2 A publicly held company with securities registered pursuant to Section 12 of the Securities Exchange Act of 1934.
3 Executive title, not a board directorship.
4 As a result of their respective positions held with the Advisor, these individuals are considered "interested persons" of the Advisor within the meaning of the 1940 Act. Interested persons receive no compensation from the fund.
5 The mailing address of Mr. Woods is 60 Wall Street, New York, New York 10005. Mr. Woods is an interested Board Member by virtue of his positions with Deutsche Asset & Wealth Management. As an interested person, Mr. Woods receives no compensation from the fund. Mr. Woods is a board member of the following trusts and corporations: Cash Account Trust, DWS Market Trust, DWS Money Funds, DWS State Tax-Free Income Series, DWS Target Fund, DWS Value Series, Inc., DWS Variable Series II, Investors Cash Trust, Tax-Exempt California Money Market Fund, DWS Global High Income Fund, Inc., DWS High Income Opportunities Fund, Inc., DWS High Income Trust, DWS Multi-Market Income Trust, DWS Municipal Income Trust, DWS Strategic Income Trust and DWS Strategic Municipal Income Trust.
6 The length of time served represents the year in which the officer was first elected in such capacity for one or more DWS funds.
7 Address: 60 Wall Street, New York, NY 10005.
8 Address: One Beacon Street, Boston, MA 02108.
9 Effective as of January 9, 2013.
The fund's Statement of Additional Information ("SAI") includes additional information about the Board Members. The SAI is available, without charge, upon request. If you would like to request a copy of the SAI, you may do so by calling the following toll-free number: (800) 728-3337.
Notes
Notes

ANNUAL REPORT TO SHAREHOLDERS
Premium Reserve Money Market Shares Fund #97
Money Market Portfolio
April 30, 2013
Contents
4 Portfolio Management Review 15 Statement of Assets and Liabilities 17 Statement of Operations 18 Statement of Changes in Net Assets 20 Notes to Financial Statements 28 Report of Independent Registered Public Accounting Firm 29 Information About Your Fund's Expenses 32 Summary of Management Fee Evaluation by Independent Fee Consultant 36 Board Members and Officers |
This report must be preceded or accompanied by a prospectus. To obtain a summary prospectus, if available, or prospectus for any of our funds, visit www.dws-investments.com. We advise you to consider the fund's objectives, risks, charges and expenses carefully before investing. The summary prospectus and prospectus contain this and other important information about the fund. Please read the prospectus carefully before you invest.
An investment in this fund is not insured or guaranteed by the Federal Deposit Insurance Corporation (FDIC) or by any other government agency. Although the fund seeks to preserve the value of your investment at $1.00 per share, it is possible to lose money by investing in the fund. The share price of money market funds can fall below the $1.00 share price. You should not rely on or expect the Advisor to enter into support agreements or take other actions to maintain the fund's $1.00 share price. The credit quality of the fund's holdings can change rapidly in certain markets, and the default of a single holding could have an adverse impact on the fund's share price. The fund's share price can also be negatively affected during periods of high redemption pressures and/or illiquid markets. The actions of a few large investors in one class of shares of the fund may have a significant adverse effect on the share prices of all classes of shares of the fund. See the prospectus for specific details regarding the fund's risk profile.
NOT FDIC/NCUA INSURED NO BANK GUARANTEE MAY LOSE VALUE NOT A DEPOSIT NOT INSURED BY ANY FEDERAL GOVERNMENT AGENCY
Portfolio Management Review (Unaudited)
Market Overview
All performance information below is historical and does not guarantee future results. Investment return and principal fluctuate, so your shares may be worth more or less when redeemed. Current performance may differ from performance data shown. Please visit www.dws-investments.com for the fund's most recent month-end performance. The 7-day current yield refers to the income paid by the fund over a 7-day period expressed as an annual percentage rate of the fund's shares outstanding. Yields fluctuate and are not guaranteed.
At the beginning of the fund's most recent fiscal year ended April 30, 2013, we saw another dramatic "flight to quality," as worries concerning Greece's upcoming elections and continuingly worsening conditions for Spanish and Italian banks led global and domestic investors to abandon risky assets. Late in 2012, any negative economic data was overshadowed by investor anticipation of more substantial central bank actions. The European Central Bank (ECB) lowered its interest rate for bank reserves. Then, the head of the ECB, Mario Draghi, stated that the central bank would do "whatever it takes" to preserve the euro. In December 2012, the U.S. Federal Reserve Board (the Fed) altered its guidance regarding rate levels, stating that it would maintain short-term interest rates near zero until U.S. unemployment dropped below 6.5%, and as long as inflation levels did not exceed 2.5%. In the first quarter of 2013, the European situation remained quiescent until the banking crisis in Cyprus reached a boiling point; the crisis was finally resolved after it was agreed that large uninsured depositors in Cyprus' banks would suffer substantial losses. In addition, the U.S. economy was boosted by higher housing prices and some gains in employment levels. In the money market area, we saw a continued supply/demand imbalance as well as a reduction in short-term money market supply due to ongoing quantitative easing by the Fed. In the continued search for yield, money market investors looked to a variety of financial instruments issued in countries around the world.
Positive Contributors to Fund Performance
We were able to maintain a yield that is in line with other similar money market funds during the period ended April 30, 2013.
| Money Market Portfolio seeks to provide maximum current income consistent with stability of capital. |
We continued to hold a large percentage of fund assets in short-maturity instruments for liquidity purposes. We also maintained a relatively conservative average maturity, with fund assets broadly diversified among a number of sectors and geographical areas for money market investment, such as Scandinavia, the United States, China and Singapore. Because we believe that overnight money market yields are beginning to decline due to heavy investor demand, we permitted the fund's weighted average maturity to lengthen somewhat to seek additional yield for the fund.
Fund Performance (as of April 30, 2013)
Performance is historical and does not guarantee future results. Current performance may be lower or higher than the performance data quoted.
An investment in the fund is not insured or guaranteed by the Federal Deposit Insurance Corporation (FDIC) or by any other government agency. Although the fund seeks to preserve the value of your investment at $1.00 per share, it is possible to lose money by investing in the fund.
| | | 7-Day Current Yield | |
| Premium Reserve Money Market Shares | | | .01 | %* |
Yields are historical, will fluctuate and do not guarantee future performance. The 7-day current yield refers to the income paid by the fund over a 7-day period expressed as an annual percentage rate of the fund's shares outstanding. For the most current yield information, visit our Web site at www.dws-investments.com. * The investment advisor has agreed to voluntarily waive fees/reimburse expenses. This waiver may be changed or terminated at any time without notice. | |
Negative Contributors to Fund Performance
The types of securities that we invested in tended to have lower yields than issues carrying more risk. We preferred to be cautious during a time of market uncertainty. In the end this may have cost the fund some yield, but we believe that this represented a prudent approach to preserving principal.
Outlook and Positioning
We anticipate limited growth for the U.S. economy over the remainder of this year, due to steady but unspectacular employment gains and the automatic budget cuts dictated by congressional sequestration. In turn, we think that restrained growth will mean that the Fed will continue its extremely accommodative monetary policy through early 2014. We look for money market rates to continue to be low based on decreases in supply on a number of fronts and strong investor demand.
We continue our insistence on the highest credit quality within the fund. We also plan to maintain our conservative investment strategies and standards under the current market conditions. We continue to apply a careful approach to investing on behalf of the fund and to seek competitive yield for our shareholders.
Portfolio Management Team
A group of investment professionals is responsible for the day-to-day management of the fund. These investment professionals have a broad range of experience managing money market funds.
The views expressed reflect those of the portfolio management team only through the end of the period of the report as stated on the cover. The management team's views are subject to change at any time based on market and other conditions and should not be construed as a recommendation. Past performance is no guarantee of future results. Current and future portfolio holdings are subject to risk.
Terms to Know
Quantitative easing is a government monetary policy often used when interest rates are at or near zero. With this policy government or other securities are purchased from the market, causing the price of the securities purchased to rise and the yield or interest rates on the securities purchased to fall. For the companies whose bonds the central banks are willing to purchase, it means having to pay lower interest rates on new bonds issued to replace existing bonds that have matured. With lower borrowing costs, the central banks hope that consumers will be encouraged to spend more, thus helping the overall economy and improving the balance sheets of the companies providing the goods and services on which consumers are spending their money.
The yield curve is a graphical representation of how yields on bonds of different maturities compare. Normally, yield curves slant up, as bonds with longer maturities typically offer higher yields than short-term bonds.
A repurchase agreement, or "overnight repo," is an agreement between a seller and a buyer, usually of government securities, where the seller agrees to repurchase the securities at a given price and usually at a stated time. Repos are widely used money market instruments that serve as an interest-bearing, short-term "parking place" for large sums of money.
The Securities Industry and Financial Market Association Index of Variable Rate Demand Notes is a weekly high-grade market index consisting of seven-day, tax-exempt, variable-rate demand notes produced by Municipal Market Data Group. Actual issues are selected from Municipal Market Data's database of more than 10,000 active issues. Index returns do not reflect fees or expenses and it is not possible to invest directly into an index.
A "put" bond allows an investor to require the issuer to repurchase the bond at a specified date before its maturity.
Portfolio Summary (Unaudited)
Investment Portfolio as of April 30, 2013
Money Market Portfolio
| | | Principal Amount ($) | | | Value ($) | |
| | | | |
| Certificates of Deposit and Bank Notes 12.6% | |
| Banco del Estado de Chile, 0.24%, 5/14/2013 | | | 4,000,000 | | | | 4,000,000 | |
| Bank of Montreal, 0.13%, 5/3/2013 | | | 50,000,000 | | | | 50,000,000 | |
| Caisse d'Amortissement de la Dette Sociale, 1.375%, 7/29/2013 | | | 6,000,000 | | | | 6,016,628 | |
| Caisse des Depots et Consignations, 1.25%, 9/20/2013 | | | 8,000,000 | | | | 8,029,846 | |
| China Construction Bank Corp., 0.32%, 5/28/2013 | | | 10,000,000 | | | | 10,000,000 | |
| DnB Bank ASA, 0.22%, 6/4/2013 | | | 12,000,000 | | | | 12,000,000 | |
| DZ Bank AG: | |
| 0.22%, 5/10/2013 | | | 8,000,000 | | | | 8,000,000 | |
| 0.22%, 6/5/2013 | | | 15,000,000 | | | | 15,000,000 | |
| Industrial & Commercial Bank of China: | |
| 0.29%, 5/28/2013 | | | 29,000,000 | | | | 29,000,000 | |
| 0.29%, 6/4/2013 | | | 8,000,000 | | | | 8,000,000 | |
| Kreditanstalt Fuer Wiederaufbau, 0.22%, 4/11/2014 | | | 10,000,000 | | | | 9,996,488 | |
| Nordea Bank Finland PLC: | |
| 0.25%, 9/9/2013 | | | 10,000,000 | | | | 10,000,000 | |
| 0.3%, 6/14/2013 | | | 3,000,000 | | | | 3,000,000 | |
| Rabobank Nederland NV, 0.27%, 9/9/2013 | | | 5,000,000 | | | | 5,000,000 | |
| Svenska Handelsbanken AB: | |
| 0.225%, 7/12/2013 | | | 10,000,000 | | | | 10,000,100 | |
| 0.28%, 7/23/2013 | | | 10,000,000 | | | | 10,000,115 | |
Total Certificates of Deposit and Bank Notes (Cost $198,043,177) | | | | 198,043,177 | |
| | |
| Commercial Paper 28.1% | |
| Issued at Discount** 25.7% | |
| Bedford Row Funding Corp.: | |
| 144A, 0.32%, 7/15/2013 | | | 3,500,000 | | | | 3,497,667 | |
| 144A, 0.39%, 10/21/2013 | | | 3,500,000 | | | | 3,493,440 | |
| 144A, 0.42%, 1/3/2014 | | | 3,500,000 | | | | 3,489,914 | |
| BHP Billiton Finance (U.S.A.) Ltd., 144A, 0.15%, 5/16/2013 | | | 50,000,000 | | | | 49,996,875 | |
| Carnival Corp., 0.28%, 5/6/2013 | | | 2,500,000 | | | | 2,499,903 | |
| Collateralized Commercial Paper II Co., LLC: | |
| 144A, 0.25%, 7/9/2013 | | | 6,000,000 | | | | 5,997,125 | |
| 144A, 0.3%, 6/3/2013 | | | 10,000,000 | | | | 9,997,250 | |
| 144A, 0.32%, 5/14/2013 | | | 9,000,000 | | | | 8,998,960 | |
| 144A, 0.33%, 5/15/2013 | | | 9,000,000 | | | | 8,998,845 | |
| DnB Bank ASA, 0.24%, 5/13/2013 | | | 9,000,000 | | | | 8,999,280 | |
| Erste Abwicklungsanstalt: | |
| 0.21%, 5/10/2013 | | | 14,000,000 | | | | 13,999,265 | |
| 0.21%, 6/3/2013 | | | 3,500,000 | | | | 3,499,326 | |
| 0.24%, 8/1/2013 | | | 3,000,000 | | | | 2,998,160 | |
| 0.39%, 7/22/2013 | | | 8,500,000 | | | | 8,492,449 | |
| 0.425%, 7/8/2013 | | | 12,000,000 | | | | 11,990,367 | |
| 0.43%, 7/19/2013 | | | 8,500,000 | | | | 8,491,979 | |
| 0.43%, 8/13/2013 | | | 5,000,000 | | | | 4,993,789 | |
| 0.48%, 5/2/2013 | | | 5,000,000 | | | | 4,999,933 | |
| General Electric Capital Corp., 0.25%, 5/1/2013 | | | 12,000,000 | | | | 12,000,000 | |
| Google, Inc., 0.15%, 5/2/2013 | | | 2,000,000 | | | | 1,999,992 | |
| Gotham Funding Corp., 144A, 0.19%, 5/8/2013 | | | 15,000,000 | | | | 14,999,446 | |
| Kells Funding LLC: | |
| 144A, 0.25%, 9/17/2013 | | | 5,000,000 | | | | 4,995,174 | |
| 144A, 0.25%, 9/20/2013 | | | 5,000,000 | | | | 4,995,069 | |
| 144A, 0.26%, 8/19/2013 | | | 8,000,000 | | | | 7,993,644 | |
| 144A, 0.26%, 8/27/2013 | | | 5,000,000 | | | | 4,995,739 | |
| 144A, 0.34%, 5/28/2013 | | | 5,000,000 | | | | 4,998,725 | |
| Kreditanstalt Fuer Wiederaufbau, 144A, 0.19%, 5/2/2013 | | | 10,000,000 | | | | 9,999,947 | |
| Matchpoint Master Trust, 0.2%, 5/16/2013 | | | 6,000,000 | | | | 5,999,500 | |
| Nestle Finance International Ltd., 0.27%, 5/7/2013 | | | 7,500,000 | | | | 7,499,663 | |
| Nieuw Amsterdam Receivables Corp., 144A, 0.23%, 5/8/2013 | | | 5,358,000 | | | | 5,357,760 | |
| Nordea North America, Inc.: | |
| 0.26%, 8/26/2013 | | | 8,000,000 | | | | 7,993,240 | |
| 0.275%, 7/16/2013 | | | 10,500,000 | | | | 10,493,904 | |
| Oversea-Chinese Banking Corp., Ltd., 0.2%, 5/28/2013 | | | 16,000,000 | | | | 15,997,600 | |
| Queensland Treasury Corp., 0.15%, 5/21/2013 | | | 35,000,000 | | | | 34,997,083 | |
| Scaldis Capital LLC: | |
| 0.18%, 5/13/2013 | | | 15,000,000 | | | | 14,999,100 | |
| 0.19%, 5/23/2013 | | | 23,000,000 | | | | 22,997,330 | |
| Skandinaviska Enskilda Banken AB, 0.225%, 5/6/2013 | | | 10,000,000 | | | | 9,999,688 | |
| Standard Chartered Bank, 0.27%, 7/11/2013 | | | 18,000,000 | | | | 17,990,415 | |
| UOB Funding LLC, 0.25%, 8/26/2013 | | | 10,000,000 | | | | 9,991,875 | |
| Victory Receivables Corp., 144A, 0.21%, 5/13/2013 | | | 6,000,000 | | | | 5,999,580 | |
| Working Capital Management Co., 144A, 0.21%, 5/10/2013 | | | 4,000,000 | | | | 3,999,790 | |
| | | | | 406,728,791 | |
| Issued at Par* 2.4% | |
| ASB Finance Ltd., 144A, 0.414%, 9/4/2013 | | | 8,500,000 | | | | 8,500,000 | |
| Australia & New Zealand Banking Group Ltd., 144A, 0.35%, 12/6/2013 | | | 4,000,000 | | | | 4,000,000 | |
| BNZ International Funding Ltd., 144A, 0.356%, 10/23/2013 | | | 4,000,000 | | | | 4,000,000 | |
| Kells Funding LLC, 144A, 0.299%, 10/21/2013 | | | 3,000,000 | | | | 3,000,012 | |
| Westpac Banking Corp.: | |
| 144A, 0.293%, 9/3/2013 | | | 5,000,000 | | | | 5,000,000 | |
| 144A, 0.35%, 11/29/2013 | | | 13,250,000 | | | | 13,250,000 | |
| | | | | 37,750,012 | |
Total Commercial Paper (Cost $444,478,803) | | | | 444,478,803 | |
| Short-Term Notes* 9.2% | |
| Bank of Nova Scotia: | |
| 0.25%, 8/9/2013 | | | 9,000,000 | | | | 9,000,000 | |
| 0.29%, 1/10/2014 | | | 8,000,000 | | | | 8,000,000 | |
| 0.3%, 1/10/2014 | | | 8,000,000 | | | | 8,000,000 | |
| HSBC Bank PLC, 144A, 0.72%, 5/15/2013 | | | 7,500,000 | | | | 7,501,292 | |
| JPMorgan Chase Bank NA, 0.347%, 6/18/2013 | | | 3,000,000 | | | | 3,000,691 | |
| Kommunalbanken AS, 144A, 0.2%, 2/26/2014 | | | 7,500,000 | | | | 7,500,000 | |
| National Australia Bank Ltd., 0.28%, 8/13/2013 | | | 8,500,000 | | | | 8,500,000 | |
| Rabobank Nederland NV: | |
| 0.345%, 1/27/2014 | | | 10,000,000 | | | | 10,000,000 | |
| 0.383%, 6/27/2013 | | | 5,000,000 | | | | 5,000,000 | |
| 0.448%, 5/7/2013 | | | 10,000,000 | | | | 10,000,000 | |
| 144A, 0.5%, 8/16/2014 | | | 12,000,000 | | | | 12,000,000 | |
| Royal Bank of Canada: | |
| 0.35%, 2/28/2014 | | | 8,000,000 | | | | 8,000,000 | |
| 0.53%, 6/4/2013 | | | 4,500,000 | | | | 4,500,000 | |
| Svensk Exportkredit AB, 144A, 0.42%, 5/22/2013 | | | 4,000,000 | | | | 4,000,000 | |
| Wells Fargo Bank NA, 0.189%, 11/22/2013 | | | 10,000,000 | | | | 10,000,000 | |
| Westpac Banking Corp.: | |
| 0.35%, 11/15/2013 | | | 10,000,000 | | | | 10,000,000 | |
| 0.373%, 5/3/2013 | | | 12,000,000 | | | | 12,000,058 | |
| 0.459%, 8/9/2013 | | | 9,000,000 | | | | 9,000,000 | |
Total Short-Term Notes (Cost $146,002,041) | | | | 146,002,041 | |
| | |
| Government & Agency Obligations 9.2% | |
| Other Government Related 0.5% | |
| European Investment Bank, 1.875%, 6/17/2013 (a) | | | 8,500,000 | | | | 8,518,792 | |
| U.S. Government Sponsored Agencies 6.9% | |
| Federal Farm Credit Bank, 0.22%*, 10/29/2014 | | | 4,000,000 | | | | 4,000,918 | |
| Federal Home Loan Bank: | |
| 0.17%, 7/5/2013 | | | 7,000,000 | | | | 6,999,788 | |
| 0.18%, 3/7/2014 | | | 5,000,000 | | | | 4,999,788 | |
| 0.21%*, 11/8/2013 | | | 3,500,000 | | | | 3,499,271 | |
| 0.36%, 5/16/2013 | | | 4,000,000 | | | | 4,000,184 | |
| 0.5%, 8/28/2013 | | | 7,000,000 | | | | 7,006,798 | |
| Federal Home Loan Mortgage Corp.: | |
| 0.119%**, 8/26/2013 | | | 12,000,000 | | | | 11,995,320 | |
| 0.139%**, 8/13/2013 | | | 12,500,000 | | | | 12,494,944 | |
| 0.165%**, 5/29/2013 | | | 10,000,000 | | | | 9,998,678 | |
| Federal National Mortgage Association: | |
| 0.139%**, 7/19/2013 | | | 12,500,000 | | | | 12,496,160 | |
| 0.149%**, 9/3/2013 | | | 25,000,000 | | | | 24,986,979 | |
| 0.149%**, 9/16/2013 | | | 6,000,000 | | | | 5,996,550 | |
| | | | | 108,475,378 | |
| U.S. Treasury Obligations 1.8% | |
| U.S. Treasury Notes: | |
| 0.5%, 5/31/2013 | | | 13,500,000 | | | | 13,503,886 | |
| 0.5%, 10/15/2013 | | | 6,800,000 | | | | 6,809,813 | |
| 0.5%, 11/15/2013 | | | 8,000,000 | | | | 8,015,018 | |
| | | | | 28,328,717 | |
Total Government & Agency Obligations (Cost $145,322,887) | | | | 145,322,887 | |
| | |
| Time Deposits 9.7% | |
| BNP Paribas, 0.11%, 5/1/2013 | | | 41,000,000 | | | | 41,000,000 | |
| Citibank NA, 0.15%, 5/1/2013 | | | 47,000,000 | | | | 47,000,000 | |
| National Australia Bank Ltd., 0.1%, 5/1/2013 | | | 65,000,000 | | | | 65,000,000 | |
Total Time Deposits (Cost $153,000,000) | | | | 153,000,000 | |
| | |
| Municipal Bonds and Notes 2.1% | |
| Texas, JPMorgan Chase Putters/Drivers Trust, Various States, Series 4264, 144A, 0.18%***, 8/30/2013, LIQ: JPMorgan Chase Bank NA | | | 20,000,000 | | | | 20,000,000 | |
| Texas, State Transportation Revenue, 2.5%, 8/30/2013 | | | 13,000,000 | | | | 13,098,035 | |
Total Municipal Bonds and Notes (Cost $33,098,035) | | | | 33,098,035 | |
| | |
| Repurchase Agreements 29.1% | |
| Barclays Capital PLC, 0.1%, dated 4/25/2013, to be repurchased at $23,000,447 on 5/2/2013 (b) | | | 23,000,000 | | | | 23,000,000 | |
| Citigroup Global Markets, Inc., 0.09%, dated 4/24/2013, to be repurchased at $64,001,120 on 5/1/2013 (c) | | | 64,000,000 | | | | 64,000,000 | |
| HSBC Securities, Inc., 0.14%, dated 4/30/2013, to be repurchased at $26,000,101 on 5/1/2013 (d) | | | 26,000,000 | | | | 26,000,000 | |
| JPMorgan Securities, Inc., 0.17%, dated 4/30/2013, to be repurchased at $15,000,071 on 5/1/2013 (e) | | | 15,000,000 | | | | 15,000,000 | |
| JPMorgan Securities, Inc., 0.403%, dated 3/18/2013, to be repurchased at $8,032,688 on 3/18/2014 (f) | | | 8,000,000 | | | | 8,000,000 | |
| Merrill Lynch & Co., Inc., 0.09%, dated 4/26/2013, to be repurchased at $85,001,488 on 5/3/2013 (g) | | | 85,000,000 | | | | 85,000,000 | |
| Merrill Lynch & Co., Inc., 0.14%, dated 4/30/2013, to be repurchased at $2,786,057 on 5/1/2013 (h) | | | 2,786,046 | | | | 2,786,046 | |
| Merrill Lynch & Co., Inc., 0.17%, dated 3/1/2013, to be repurchased at $20,017,567 on 9/3/2013 (i) | | | 20,000,000 | | | | 20,000,000 | |
| Morgan Stanley & Co., Inc., 0.17%, dated 4/30/2013, to be repurchased at $160,000,756 on 5/1/2013 (j) | | | 160,000,000 | | | | 160,000,000 | |
| The Goldman Sachs & Co., 0.16%, dated 4/30/2013, to be repurchased at $36,500,162 on 5/1/2013 (k) | | | 36,500,000 | | | | 36,500,000 | |
| The Toronto-Dominion Bank, 0.1%, dated 4/24/2013, to be repurchased at $20,000,389 on 5/1/2013 (l) | | | 20,000,000 | | | | 20,000,000 | |
Total Repurchase Agreements (Cost $460,286,046) | | | | 460,286,046 | |
| | | % of Net Assets | | | Value ($) | |
| | | | |
Total Investment Portfolio (Cost $1,580,230,989)† | | | 100.0 | | | | 1,580,230,989 | |
| Other Assets and Liabilities, Net | | | 0.0 | | | | 150,395 | |
| Net Assets | | | 100.0 | | | | 1,580,381,384 | |
* Floating rate securities' yields vary with a designated market index or market rate, such as the coupon-equivalent of the U.S. Treasury Bill rate. These securities are shown at their current rate as of April 30, 2013.
** Annualized yield at time of purchase; not a coupon rate.
*** Variable rate demand notes are securities whose interest rates are reset periodically at market levels. These securities are payable on demand and are shown at their current rates as of April 30, 2013.
† The cost for federal income tax purposes was $1,580,230,989.
(a) Government-backed debt issued by financial companies or government sponsored enterprises.
(b) Collateralized by $26,276,294 Federal National Mortgage Association, maturing on 10/9/2019 with a value of $23,460,001.
(c) Collateralized by:
| Principal Amount ($) | | Security | | Rate (%) | | Maturity Date | | Collateral Value ($) | |
| | 2,477,802 | | Federal Home Loan Mortgage Corp. | | | 1.299 | | 11/15/2036 | | | 2,296,019 | |
| | 64,828,528 | | Federal Home Loan Mortgage Corp. — Interest Only | | | 5.801-5.881 | | 4/15/2037- 10/15/2041 | | | 9,185,069 | |
| | 95,122,638 | | Federal National Mortgage Association — Interest Only | | | 5.8-6.35 | | 6/25/2040- 7/25/2042 | | | 16,811,622 | |
| | 3,628,588 | | Government National Mortgage Association | | | 19.442 | | 1/20/2038 | | | 4,867,796 | |
| | 204,115,863 | | Government National Mortgage Association — Interest Only | | | 5.85-6.45 | | 10/20/2038- 11/16/2041 | | | 31,515,411 | |
| | 975,257 | | Government National Mortgage Association — Principal Only | | Zero Coupon | | 3/20/2040 | | | 878,770 | |
| Total Collateral Value | | | 65,554,687 | |
(d) Collateralized by $23,116,800 U.S. Treasury Inflation-Indexed Notes, with the various coupon rates from 0.125-2.0%, with various maturity dates of 1/15/2016-1/15/2023 with a value of $26,520,744.
(e) Collateralized by $139,236,797 Federal National Mortgage Association — Interest Only, with the various coupon rates from 3.0-6.5%, with various maturity dates of 8/25/2026-10/25/2040 with a value of $15,300,362.
(f) Collateralized by $8,176,760 Ally Auto Receivables Trust, 1.06%, maturing on 5/15/2017 with a value of $8,241,343.
(g) Collateralized by:
| Principal Amount ($) | | Security | | Rate (%) | | Maturity Date | | Collateral Value ($) | |
| | 20,999,000 | | Federal Farm Credit Bank | | | 1.5-2.11 | | 4/1/2020- 11/15/2023 | | | 21,125,904 | |
| | 19,000,000 | | Federal Home Loan Bank | | | 2.35 | | 8/8/2022 | | | 18,221,532 | |
| | 38,000,000 | | Federal Home Loan Mortgage Corp. | | | 0.875-5.63 | | 3/7/2018- 3/12/2027 | | | 38,886,044 | |
| | 9,803,000 | | Federal Home Loan Mortgage Corp. STRIPS | | Zero Coupon | | 1/15/2022 | | | 8,012,384 | |
| | 455,000 | | Federal National Mortgage Association | | | 0.375 | | 10/29/2015 | | | 455,032 | |
| Total Collateral Value | | | 86,700,896 | |
(h) Collateralized by $2,836,200 U.S. Treasury Note, 0.25%, maturing on 11/30/2014 with a value of $2,841,802.
(i) Collateralized by $13,936,100 U.S. Treasury Bond, 6.0%, maturing on 2/15/2026 with a value of $20,400,014.
(j) Collateralized by $153,412,926 Federal National Mortgage Association, with the various coupon rates from 2.47-4.0%, with various maturity dates of 9/1/2027-3/1/2043 with a value of $163,200,001.
(k) Collateralized by $34,311,775 Federal National Mortgage Association, with the various coupon rates from 4.0-5.0%, with various maturity dates of 5/1/2035-12/1/2042 with a value of $37,230,000.
(l) Collateralized by $20,269,900 U.S. Treasury Notes, with the various coupon rates from 0.25-4.125%, with various maturity dates of 6/15/2014-5/15/2015 with a value of $20,400,014.
144A: Security exempt from registration under Rule 144A of the Securities Act of 1933. These securities may be resold in transactions exempt from registration, normally to qualified institutional buyers.
Interest Only: Interest Only (IO) bonds represent the "interest only" portion of payments on a pool of underlying mortgages or mortgage-backed securities. IO securities are subject to prepayment risk of the pool of underlying mortgages.
LIQ: Liquidity Facility
Principal Only: Principal Only (PO) bonds represent the "principal only" portion of payments on a pool of underlying mortgages or mortgage-backed securities.
STRIPS: Separate Trading of Registered Interest and Principal Securities
Fair Value Measurements
Various inputs are used in determining the value of the Fund's investments. These inputs are summarized in three broad levels. Level 1 includes quoted prices in active markets for identical securities. Level 2 includes other significant observable inputs (including quoted prices for similar securities, interest rates, prepayment speeds and credit risk). Level 3 includes significant unobservable inputs (including the Fund's own assumptions in determining the fair value of investments). The inputs or methodology used for valuing securities are not necessarily an indication of the risk associated with investing in those securities. Securities held by the Fund are reflected as Level 2 because the securities are valued at amortized cost (which approximates fair value) and, accordingly, the inputs used to determine value are not quoted prices in an active market.
The following is a summary of the inputs used as of April 30, 2013 in valuing the Fund's investments. For information on the Fund's policy regarding the valuation of investments, please refer to the Security Valuation section of Note 1 in the accompanying Notes to Financial Statements.
| Assets | | Level 1 | | | Level 2 | | | Level 3 | | | Total | |
| | |
| Investments in Securities (m) | | $ | — | | | $ | 1,119,944,943 | | | $ | — | | | $ | 1,119,944,943 | |
| Repurchase Agreements | | | — | | | | 460,286,046 | | | | — | | | | 460,286,046 | |
| Total | | $ | — | | | $ | 1,580,230,989 | | | $ | — | | | $ | 1,580,230,989 | |
There have been no transfers between fair value measurement levels during the year ended April 30, 2013.
(m) See Investment Portfolio for additional categorizations.
The accompanying notes are an integral part of the financial statements.
Statement of Assets and Liabilities | as of April 30, 2013 | |
| Assets | | Money Market Portfolio | |
Investments: Investments in non-affiliated securities, valued at amortized cost | | $ | 1,119,944,943 | |
| Repurchase agreements, valued at amortized cost | | | 460,286,046 | |
| Total investments in securities, valued at amortized cost | | | 1,580,230,989 | |
| Receivable for Fund shares sold | | | 2,321 | |
| Interest receivable | | | 656,881 | |
| Due from Advisor | | | 193 | |
| Other assets | | | 66,922 | |
| Total assets | | | 1,580,957,306 | |
| Liabilities | |
| Payable for Fund shares redeemed | | | 8,146 | |
| Accrued management fee | | | 214,424 | |
| Accrued Trustees' fees | | | 15,584 | |
| Other accrued expenses and payables | | | 337,768 | |
| Total liabilities | | | 575,922 | |
| Net assets, at value | | $ | 1,580,381,384 | |
| Net Assets Consist of | |
| Undistributed net investment income | | | 26,943 | |
| Accumulated net realized gain (loss) | | | (13,851 | ) |
| Paid-in capital | | | 1,580,368,292 | |
| Net assets, at value | | $ | 1,580,381,384 | |
The accompanying notes are an integral part of the financial statements.
Statement of Assets and Liabilities as of April 30, 2013 (continued) | |
| Net Asset Value | | Money Market Portfolio | |
Capital Assets Funds Shares Net Asset Value, offering and redemption price per share ($582,909,923 ÷ 582,576,498 outstanding shares of beneficial interest, no par value, unlimited number of shares authorized) | | $ | 1.00 | |
Capital Assets Funds Preferred Shares Net Asset Value, offering and redemption price per share ($1,696,111 ÷ 1,695,141 outstanding shares of beneficial interest, no par value, unlimited number of shares authorized) | | $ | 1.00 | |
Davidson Cash Equivalent Shares Net Asset Value, offering and redemption price per share ($7,608,926 ÷ 7,604,572 outstanding shares of beneficial interest, no par value, unlimited number of shares authorized) | | $ | 1.00 | |
Davidson Cash Equivalent Plus Shares Net Asset Value, offering and redemption price per share ($583,590 ÷ 583,256 outstanding shares of beneficial interest, no par value, unlimited number of shares authorized) | | $ | 1.00 | |
Premium Reserve Money Market Shares Net Asset Value, offering and redemption price per share ($56,973,559 ÷ 56,940,968 outstanding shares of beneficial interest, no par value, unlimited number of shares authorized) | | $ | 1.00 | |
Service Shares Net Asset Value, offering and redemption price per share ($930,609,275 ÷ 930,076,962 outstanding shares of beneficial interest, no par value, unlimited number of shares authorized) | | $ | 1.00 | |
The accompanying notes are an integral part of the financial statements.
| for the year ended April 30, 2013 | |
| Investment Income | | Money Market Portfolio | |
Income: Interest | | $ | 5,066,039 | |
Expenses: Management fee | | | 2,833,999 | |
| Services to shareholders | | | 4,315,409 | |
| Distribution and service fees | | | 10,046,458 | |
| Custodian fee | | | 50,971 | |
| Professional fees | | | 122,043 | |
| Reports to shareholders | | | 297,324 | |
| Registration fees | | | 130,640 | |
| Trustees' fees and expenses | | | 73,535 | |
| Other | | | 57,895 | |
| Total expenses before expense reductions | | | 17,928,274 | |
| Expense reductions | | | (13,103,841 | ) |
| Total expenses after expense reductions | | | 4,824,433 | |
| Net investment income | | | 241,606 | |
| Net realized gain (loss) from investments | | | 9,230 | |
| Net increase (decrease) in net assets resulting from operations | | $ | 250,836 | |
The accompanying notes are an integral part of the financial statements.
Statement of Changes in Net Assets | | | Money Market Portfolio | |
| Increase (Decrease) in Net Assets | | Years Ended April 30, | |
| | 2013 | | | 2012 | |
Operations: Net investment income | | $ | 241,606 | | | $ | 287,114 | |
| Net realized gain (loss) | | | 9,230 | | | | (23,081 | ) |
| Net increase in net assets resulting from operations | | | 250,836 | | | | 264,033 | |
Distributions to shareholders from: Net investment income: Capital Assets Funds Shares | | | (135,785 | ) | | | (151,966 | ) |
| Capital Assets Funds Preferred Shares | | | (1,152 | ) | | | (1,683 | ) |
| Davidson Cash Equivalent Shares | | | (895 | ) | | | (1,139 | ) |
| Davidson Cash Equivalent Plus Shares | | | (69 | ) | | | (101 | ) |
| Premium Reserve Money Market Shares | | | (5,207 | ) | | | (5,559 | ) |
| Service Shares | | | (98,502 | ) | | | (126,660 | ) |
Net realized gains: Capital Assets Funds Shares | | | (4,805 | ) | | | — | |
| Capital Assets Funds Preferred Shares | | | (18 | ) | | | — | |
| Davidson Cash Equivalent Shares | | | (64 | ) | | | — | |
| Davidson Cash Equivalent Plus Shares | | | (6 | ) | | | — | |
| Premium Reserve Money Market Shares | | | (447 | ) | | | — | |
| Service Shares | | | (6,802 | ) | | | — | |
| Total distributions | | | (253,752 | ) | | | (287,108 | ) |
Fund share transactions: Proceeds from shares sold | | | 1,530,799,135 | | | | 2,195,076,399 | |
| Reinvestment of distributions | | | 251,713 | | | | 284,155 | |
| Cost of shares redeemed | | | (1,744,126,197 | ) | | | (2,987,807,342 | ) |
| Net increase (decrease) in net assets from Fund share transactions | | | (213,075,349 | ) | | | (792,446,788 | ) |
| Increase (decrease) in net assets | | | (213,078,265 | ) | | | (792,469,863 | ) |
| Net assets at beginning of period | | | 1,793,459,649 | | | | 2,585,929,512 | |
| Net assets at end of period (including undistributed net investment income of $26,943 and $39,089, respectively) | | $ | 1,580,381,384 | | | $ | 1,793,459,649 | |
The accompanying notes are an integral part of the financial statements.
Money Market Portfolio Premium Reserve Money Market Shares | |
| | | Years Ended April 30, | |
| | 2013 | | | 2012 | | | 2011 | | | 2010 | | | 2009 | |
| Selected Per Share Data | |
| Net asset value, beginning of period | | $ | 1.00 | | | $ | 1.00 | | | $ | 1.00 | | | $ | 1.00 | | | $ | 1.00 | |
Income (loss) from investment operations: Net investment income | | | .000 | * | | | .000 | * | | | .000 | * | | | .001 | | | | .016 | |
| Net realized gain (loss) | | | .000 | * | | | (.000 | )* | | | .000 | * | | | .000 | * | | | .000 | * |
| Total from investment operations | | | .000 | * | | | .000 | * | | | .000 | * | | | .001 | | | | .016 | |
Less distributions from: Net investment income | | | (.000 | )* | | | (.000 | )* | | | (.000 | )* | | | (.001 | ) | | | (.016 | ) |
| Net realized gains | | | (.000 | )* | | | — | | | | — | | | | (.000 | )* | | | — | |
| Total distributions | | | (.000 | )* | | | (.000 | )* | | | (.000 | )* | | | (.001 | ) | | | (.016 | ) |
| Net asset value, end of period | | $ | 1.00 | | | $ | 1.00 | | | $ | 1.00 | | | $ | 1.00 | | | $ | 1.00 | |
| Total Return (%) | | | .01 | a | | | .01 | a | | | .01 | a | | | .06 | a | | | 1.65 | |
| Ratios to Average Net Assets and Supplemental Data | |
| Net assets, end of period ($ millions) | | | 57 | | | | 54 | | | | 62 | | | | 70 | | | | 411 | |
| Ratio of expenses before expense reductions (%) | | | .61 | | | | .61 | | | | .58 | | | | .56 | | | | .56 | |
| Ratio of expenses after expense reductions (%) | | | .28 | | | | .26 | | | | .35 | | | | .46 | | | | .56 | |
| Ratio of net investment income (%) | | | .01 | | | | .01 | | | | .01 | | | | .05 | | | | 1.60 | |
a Total return would have been lower had certain expenses not been reduced. * Amount is less than $.0005. | |
Notes to Financial Statements
1. Organization and Significant Accounting Policies
Cash Account Trust (the "Trust") is registered under the Investment Company Act of 1940, as amended (the "1940 Act"), as an open-end investment management company organized as a Massachusetts business trust.
The Trust offers three funds: Money Market Portfolio, Government & Agency Securities Portfolio and Tax-Exempt Portfolio. These financial statements report on Money Market Portfolio (the "Fund").
Money Market Portfolio offers six classes of shares: Capital Assets Funds Shares, Capital Assets Funds Preferred Shares, Davidson Cash Equivalent Shares, Davidson Cash Equivalent Plus Shares, Premium Reserve Money Market Shares and Service Shares.
The financial highlights for all classes of shares, other than Premium Reserve Money Market Shares, are provided separately and are available upon request.
The Fund's investment income, realized gains and losses, and certain Fund-level expenses and expense reductions, if any, are borne pro rata on the basis of relative net assets by the holders of all classes of shares of the Fund, except that each class bears certain expenses unique to that class such as distribution and service fees, services to shareholders and certain other class-specific expenses. Differences in class-level expenses may result in payment of different per share dividends by class. All shares of the Trust have equal rights with respect to voting subject to class-specific arrangements.
The Fund's financial statements are prepared in accordance with accounting principles generally accepted in the United States of America which require the use of management estimates. Actual results could differ from those estimates. The policies described below are followed consistently by the Fund in the preparation of its financial statements.
Security Valuation. Various inputs are used in determining the value of the Fund's investments. These inputs are summarized in three broad levels. Level 1 includes quoted prices in active markets for identical securities. Level 2 includes other significant observable inputs (including quoted prices for similar securities, interest rates, prepayment speeds, and credit risk). Level 3 includes significant unobservable inputs (including the Fund's own assumptions in determining the fair value of investments). The inputs or methodology used for valuing securities are not necessarily an indication of the risk associated with investing in those securities.
The Fund values all securities utilizing the amortized cost method permitted in accordance with Rule 2a-7 under the 1940 Act and certain conditions therein. Under this method, which does not take into account unrealized capital gains or losses on securities, an instrument is initially valued at its cost and thereafter assumes a constant accretion/amortization rate to maturity of any discount or premium. Securities held by the Fund are reflected as Level 2 because the securities are valued at amortized cost (which approximates fair value) and, accordingly, the inputs used to determine value are not quoted prices in an active market.
Disclosure about the classification of fair value measurements is included in a table following the Fund's Investment Portfolio.
New Accounting Pronouncement. In January 2013, Accounting Standard Update 2013-01 (ASU 2013-01), Clarifying the Scope of Disclosures about Offsetting Assets and Liabilities, replaced Accounting Standards Update 2011-11 (ASU 2011-11), Disclosures about Offsetting Assets and Liabilities. ASU 2013-01 is effective for fiscal years beginning on or after January 1, 2013, and interim periods within those annual periods. ASU 2011-11 was intended to enhance disclosure requirements on the offsetting of financial assets and liabilities. The ASU 2013-01 limits the scope of the new balance sheet offsetting disclosures to derivatives, repurchase agreements, and securities lending transactions to the extent that they are (1) offset in the financial statements or (2) subject to an enforceable master netting arrangement or similar agreement. Management is currently evaluating the application of ASU 2013-01 and its impact, if any, on the Fund's financial statements.
Repurchase Agreements. The Fund may enter into repurchase agreements with certain banks and broker/dealers whereby the Fund, through its custodian or a sub-custodian bank, receives delivery of the underlying securities, the amount of which at the time of purchase and each subsequent business day is required to be maintained at such a level that the market value is equal to at least the principal amount of the repurchase price plus accrued interest. The custodial bank or another designated subcustodian holds the collateral in a separate account until the agreement matures. If the value of the securities falls below the principal amount of the repurchase agreement plus accrued interest, the financial institution deposits additional collateral by the following business day. If the financial institution either fails to deposit the required additional collateral or fails to repurchase the securities as agreed, the Fund has the right to sell the securities and recover any resulting loss from the financial institution. If the financial institution enters into bankruptcy, the Fund's claims on the collateral may be subject to legal proceedings.
Federal Income Taxes. The Fund's policy is to comply with the requirements of the Internal Revenue Code, as amended, which are applicable to regulated investment companies and to distribute all of its taxable and tax-exempt income to its shareholders.
At April 30, 2013, the Fund had a net tax basis capital loss carryforward of approximately $14,000 of post-enactment short-term losses, which may be applied against realized net taxable capital gains indefinitely.
The Fund has reviewed the tax positions for the open tax years as of April 30, 2013 and has determined that no provision for income tax is required in the Fund's financial statements. The Fund's federal tax returns for the prior three fiscal years remain open subject to examination by the Internal Revenue Service.
Distribution of Income. Net investment income of the Fund is declared as a daily dividend and is distributed to shareholders monthly. The Fund may take into account capital gains and losses in its daily dividend declarations. The Fund may also make additional distributions for tax purposes if necessary.
Permanent book and tax basis differences relating to shareholder distributions will result in reclassifications to paid in capital. Temporary book and tax basis differences will reverse in a subsequent period. There were no significant book-to-tax differences for the Fund.
At April 30, 2013, the Fund's components of distributable earnings on a tax basis are as follows:
| Undistributed ordinary income* | | $ | 26,943 | |
| Capital loss carryforwards | | $ | (14,000 | ) |
In addition,the tax character of distributions paid to shareholders by the Fund is summarized as follows:
| | | Years Ended April 30, | |
| Portfolio | | 2013 | | | 2012 | |
| Distributions from ordinary income* | | $ | 253,752 | | | $ | 287,108 | |
* For tax purposes, short-term capital gain distributions are considered ordinary income distributions.
Expenses. Expenses of the Trust arising in connection with a specific Fund are allocated to that Fund. Other Trust expenses which cannot be directly attributed to a Fund are apportioned pro rata on the basis of relative net assets among the funds in the Trust based upon the relative net assets or other appropriate measures.
Contingencies. In the normal course of business, the Fund may enter into contracts with service providers that contain general indemnification clauses. The Fund's maximum exposure under these arrangements is unknown as this would involve future claims that may be made against the Fund that have not yet been made. However, based on experience, the Fund expects the risk of loss to be remote.
Other. Investment transactions are accounted for on trade date. Interest income is recorded on the accrual basis. Realized gains and losses from investment transactions are recorded on an identified cost basis and may include proceeds from litigation. All discounts and premiums are accreted/amortized for both tax and financial reporting purposes.
2. Related Parties
Management Agreement. Under an Investment Management Agreement with Deutsche Investment Management Americas Inc. ("DIMA" or the "Advisor"), an indirect, wholly owned subsidiary of Deutsche Bank AG, the Advisor directs the investments of the Fund in accordance with its investment objectives, policies and restrictions. The Advisor determines the securities, instruments and other contracts relating to investments to be purchased, sold or entered into by the Fund. In addition to portfolio management services, the Advisor provides certain administrative services in accordance with the Investment Management Agreement to the Fund.
The Fund pays a monthly management fee based on the combined average daily net assets of the three funds in the Trust and allocated to Money Market Portfolio based on its relative net assets, accrued daily and payable monthly, at 1/12 of the following annual rates:
| First $500 million of the Funds' combined average daily net assets | | | .220 | % |
| Next $500 million of such net assets | | | .200 | % |
| Next $1 billion of such net assets | | | .175 | % |
| Next $1 billion of such net assets | | | .160 | % |
| Over $3 billion of such net assets | | | .150 | % |
For the year ended April 30, 2013, the Fund incurred a management fee equivalent to the following annual effective rate of the Fund's average daily net assets:
| Fund | Annual Effective Rate |
| Money Market Portfolio | .16% |
The Advisor has agreed to voluntarily waive expenses. The voluntary waiver may be changed or terminated at any time without notice. Under these arrangements, the Advisor waived certain expenses on Premium Reserve Money Market Shares.
In addition, the Advisor has agreed to maintain expenses of certain other classes of the Trust. These rates are disclosed in the respective share classes' annual reports that are provided separately and are available upon request.
Service Provider Fees. DWS Investments Service Company ("DISC"), an affiliate of the Advisor, is the transfer agent, dividend-paying agent and shareholder service agent for the Fund. Pursuant to a sub-transfer agency agreement between DISC and DST Systems, Inc. ("DST"), DISC has delegated certain transfer agent, dividend-paying agent and shareholder service agent functions to DST. DISC compensates DST out of the shareholder servicing fee it receives from the Fund. For the year ended April 30, 2013, the amounts charged to the Fund by DISC were as follows:
| Money Market Portfolio: | | Total Aggregated | | | Waived | | | Unpaid at April 30, 2013 | |
| Capital Assets Funds Shares | | $ | 1,698,073 | | | $ | 1,257,408 | | | $ | 22,820 | |
| Capital Assets Funds Preferred Shares | | | 3,458 | | | | 2,722 | | | | — | |
| Davidson Cash Equivalent Shares | | | 23,907 | | | | 17,214 | | | | 649 | |
| Davidson Cash Equivalent Plus Shares | | | 1,785 | | | | 1,264 | | | | 93 | |
| Premium Reserve Money Market Shares | | | 81,513 | | | | 43,002 | | | | 5,163 | |
| Service Shares | | | 2,463,999 | | | | 1,735,773 | | | | 51,257 | |
| | | $ | 4,272,735 | | | $ | 3,057,383 | | | $ | 79,982 | |
Pursuant to a fund accounting agreement between DIMA and the Fund, DIMA is responsible for computing the daily net asset value per share and maintaining the portfolio and general accounting records of the Fund. DIMA has delegated certain fund accounting and record-keeping services to State Street Bank and Trust Company. The costs and expenses of such delegation are paid by DIMA. The Fund paid no fee to DIMA for fund accounting and record-keeping services provided under the fund accounting agreement during the period.
Distribution Service Agreement. Under the Distribution Service Agreement, in accordance with Rule 12b-1 under the 1940 Act, DWS Investments Distributors, Inc. ("DIDI"), an affiliate of the Advisor, receives a fee ("Distribution Fee"), calculated as a percentage of average daily net assets for the shares listed in the following table.
For the year ended April 30, 2013, the Distribution Fee was as follows:
| Money Market Portfolio: | | Distribution Fee | | | Waived | | | Annual Effective Rate | | | Contractual Rate (Up To) | |
| Capital Assets Funds Shares | | $ | 2,241,456 | | | $ | 2,241,456 | | | | .00 | % | | | .33 | % |
| Capital Assets Funds Preferred Shares | | | 4,611 | | | | 4,611 | | | | .00 | % | | | .20 | % |
| Davidson Cash Equivalent Shares | | | 26,860 | | | | 26,860 | | | | .00 | % | | | .30 | % |
| Davidson Cash Equivalent Plus Shares | | | 1,723 | | | | 1,723 | | | | .00 | % | | | .25 | % |
| Service Shares | | | 5,913,598 | | | | 5,913,598 | | | | .00 | % | | | .60 | % |
| | | $ | 8,188,248 | | | $ | 8,188,248 | | | | | | | | | |
In addition, DIDI provides information and administrative services for a fee ("Service Fee") for the shares listed in the following table. A portion of these fees may be paid pursuant to a Rule 12b-1 plan.
For the year ended April 30, 2013, the Service Fee was as follows:
| Money Market Portfolio: | | Service Fee | | | Waived | | | Annual Effective Rate | | | Contractual Rate (Up To) | |
| Capital Assets Funds Shares | | $ | 1,698,073 | | | $ | 1,698,073 | | | | .00 | % | | | .25 | % |
| Capital Assets Funds Preferred Shares | | | 2,305 | | | | 2,305 | | | | .00 | % | | | .10 | % |
| Davidson Cash Equivalent Shares | | | 22,384 | | | | 22,384 | | | | .00 | % | | | .25 | % |
| Davidson Cash Equivalent Plus Shares | | | 1,379 | | | | 1,379 | | | | .00 | % | | | .20 | % |
| Premium Reserve Money Market Shares | | | 134,069 | | | | 134,069 | | | | .00 | % | | | .25 | % |
| | | $ | 1,858,210 | | | $ | 1,858,210 | | | | | | | | | |
Typesetting and Filing Service Fees. Under an agreement with DIMA, DIMA is compensated for providing typesetting and certain regulatory filing services to the Fund. For the year ended April 30, 2013, the amount charged to the Fund by DIMA included in the Statement of Operations under "reports to shareholders" was as follows:
| Fund | | Total Aggregated | | | Unpaid at April 30, 2013 | |
| Money Market Portfolio | | $ | 43,232 | | | $ | 14,410 | |
Trustees' Fees and Expenses. The Fund paid retainer fees to each Trustee not affiliated with the Advisor, plus specified amounts to the Board Chairperson and Vice Chairperson and to each committee Chairperson.
3. Concentration of Ownership
From time to time, the Fund may have a concentration of several shareholder accounts holding a significant percentage of shares outstanding. Investment activities of these shareholders could have a material impact on the Fund.
At April 30, 2013, two shareholders account held approximately 82% and 11% of the outstanding shares of the Fund.
4. Line of Credit
The Fund and other affiliated funds (the "Participants") share in a $375 million revolving credit facility provided by a syndication of banks. The Fund may borrow for temporary or emergency purposes, including the meeting of redemption requests that otherwise might require the untimely disposition of securities. The Participants are charged an annual commitment fee which is allocated based on net assets, among each of the Participants. Interest is calculated at a rate per annum equal to the sum of the Federal Funds Rate plus 1.25 percent plus, if LIBOR exceeds the Federal Funds Rate, the amount of such excess. The Fund may borrow up to a maximum of 33 percent of its net assets under the agreement. The Fund had no outstanding loans at April 30, 2013.
5. Share Transactions
The following table summarizes share and dollar activity in the Fund:
Money Market Portfolio
| | | Year Ended April 30, 2013 | | | Year Ended April 30, 2012 | |
| | | Shares | | | Dollars | | | Shares | | | Dollars | |
| Shares sold | |
| Capital Assets Funds Shares | | | 629,975,145 | | | $ | 629,975,145 | | | | 740,327,726 | | | $ | 740,327,726 | |
| Capital Assets Funds Preferred Shares | | | 15,876,680 | | | | 15,876,680 | | | | 15,237,717 | | | | 15,237,717 | |
| Davidson Cash Equivalent Shares | | | 4,424,439 | | | | 4,424,439 | | | | 5,888,909 | | | | 5,888,909 | |
| Davidson Cash Equivalent Plus Shares | | | 667,261 | | | | 667,261 | | | | 303,684 | | | | 303,684 | |
| Premium Reserve Money Market Shares | | | 119,393,312 | | | | 119,393,312 | | | | 90,937,663 | | | | 90,937,663 | |
| Service Shares | | | 760,462,298 | | | | 760,462,298 | | | | 1,342,380,700 | | | | 1,342,380,700 | |
| | | | | | | $ | 1,530,799,135 | | | | | | | $ | 2,195,076,399 | |
| Shares issued to shareholders in reinvestment of distributions | |
| Capital Assets Funds Shares | | | 140,590 | | | $ | 140,590 | | | | 151,503 | | | $ | 151,503 | |
| Capital Assets Funds Preferred Shares | | | 1,170 | | | | 1,170 | | | | 1,677 | | | | 1,677 | |
| Davidson Cash Equivalent Shares | | | 959 | | | | 959 | | | | 1,136 | | | | 1,136 | |
| Davidson Cash Equivalent Plus Shares | | | 75 | | | | 75 | | | | 101 | | | | 101 | |
| Premium Reserve Money Market Shares | | | 3,797 | | | | 3,797 | | | | 3,793 | | | | 3,793 | |
| Service Shares | | | 105,122 | | | | 105,122 | | | | 125,945 | | | | 125,945 | |
| | | | | | | $ | 251,713 | | | | | | | $ | 284,155 | |
| Shares redeemed | |
| Capital Assets Funds Shares | | | (780,874,399 | ) | | $ | (780,874,399 | ) | | | (852,717,812 | ) | | $ | (852,717,812 | ) |
| Capital Assets Funds Preferred Shares | | | (16,735,077 | ) | | | (16,735,077 | ) | | | (17,403,287 | ) | | | (17,403,287 | ) |
| Davidson Cash Equivalent Shares | | | (6,174,353 | ) | | | (6,174,353 | ) | | | (9,655,583 | ) | | | (9,655,583 | ) |
| Davidson Cash Equivalent Plus Shares | | | (791,706 | ) | | | (791,706 | ) | | | (906,966 | ) | | | (906,966 | ) |
| Premium Reserve Money Market Shares | | | (116,890,479 | ) | | | (116,890,479 | ) | | | (98,084,584 | ) | | | (98,084,584 | ) |
| Service Shares | | | (822,660,183 | ) | | | (822,660,183 | ) | | | (2,009,039,110 | ) | | | (2,009,039,110 | ) |
| | | | | | | $ | (1,744,126,197 | ) | | | | | | $ | (2,987,807,342 | ) |
| Net increase (decrease) | |
| Capital Assets Funds Shares | | | (150,758,664 | ) | | $ | (150,758,664 | ) | | | (112,238,583 | ) | | $ | (112,238,583 | ) |
| Capital Assets Funds Preferred Shares | | | (857,227 | ) | | | (857,227 | ) | | | (2,163,893 | ) | | | (2,163,893 | ) |
| Davidson Cash Equivalent Shares | | | (1,748,955 | ) | | | (1,748,955 | ) | | | (3,765,538 | ) | | | (3,765,538 | ) |
| Davidson Cash Equivalent Plus Shares | | | (124,370 | ) | | | (124,370 | ) | | | (603,181 | ) | | | (603,181 | ) |
| Premium Reserve Money Market Shares | | | 2,506,630 | | | | 2,506,630 | | | | (7,143,128 | ) | | | (7,143,128 | ) |
| Service Shares | | | (62,092,763 | ) | | | (62,092,763 | ) | | | (666,532,465 | ) | | | (666,532,465 | ) |
| | | | | | | $ | (213,075,349 | ) | | | | | | $ | (792,446,788 | ) |
Report of Independent Registered Public Accounting Firm
To the Shareholders and Board of Trustees of Cash Account Trust:
We have audited the accompanying statement of assets and liabilities of Money Market Portfolio (the "Fund") (one of the Funds comprising Cash Account Trust), including the investment portfolio, as of April 30, 2013, and the related statement of operations for the year then ended, the statement of changes in net assets for each of the two years in the period then ended, and the financial highlights for each of the five years in the period then ended. These financial statements and financial highlights are the responsibility of the Fund's management. Our responsibility is to express an opinion on these financial statements and financial highlights based on our audits.
We conducted our audits in accordance with the standards of the Public Company Accounting Oversight Board (United States). Those standards require that we plan and perform the audit to obtain reasonable assurance about whether the financial statements and financial highlights are free of material misstatement. We were not engaged to perform an audit of the Fund's internal control over financial reporting. Our audits included consideration of internal control over financial reporting as a basis for designing audit procedures that are appropriate in the circumstances, but not for the purpose of expressing an opinion on the effectiveness of the Fund's internal control over financial reporting. Accordingly, we express no such opinion. An audit also includes examining, on a test basis, evidence supporting the amounts and disclosures in the financial statements and financial highlights, assessing the accounting principles used and significant estimates made by management, and evaluating the overall financial statement presentation. Our procedures included confirmation of securities owned as of April 30, 2013, by correspondence with the custodian and brokers. We believe that our audits provide a reasonable basis for our opinion.
In our opinion, the financial statements and financial highlights referred to above present fairly, in all material respects, the financial position of Money Market Portfolio at April 30, 2013, the results of its operations for the year then ended, the changes in its net assets for each of the two years in the period then ended, and the financial highlights for each of the five years in the period then ended, in conformity with U.S. generally accepted accounting principles.
| | | |
Boston, Massachusetts June 19, 2013 | | |
Information About Your Fund's Expenses
As an investor of the Fund, you incur two types of costs: ongoing expenses and transaction costs. Ongoing expenses include management fees, distribution and service (12b-1) fees and other Fund expenses. Examples of transaction costs include account maintenance fees, which are not shown in this section. The following tables are intended to help you understand your ongoing expenses (in dollars) of investing in the Fund and to help you compare these expenses with the ongoing expenses of investing in other mutual funds. In the most recent six-month period, the Fund limited these expenses; had it not done so, expenses would have been higher for the Premium Reserve Money Market Shares. The example in the table is based on an investment of $1,000 invested at the beginning of the six-month period and held for the entire period (November 1, 2012 to April 30, 2013).
The tables illustrate your Fund's expenses in two ways:
•Actual Fund Return. This helps you estimate the actual dollar amount of ongoing expenses (but not transaction costs) paid on a $1,000 investment in the Fund using the Fund's actual return during the period. To estimate the expenses you paid over the period, simply divide your account value by $1,000 (for example, an $8,600 account value divided by $1,000 = 8.6), then multiply the result by the number in the "Expenses Paid per $1,000" line under the share class you hold.
• Hypothetical 5% Fund Return. This helps you to compare your Fund's ongoing expenses (but not transaction costs) with those of other mutual funds using the Fund's actual expense ratio and a hypothetical rate of return of 5% per year before expenses. Examples using a 5% hypothetical fund return may be found in the shareholder reports of other mutual funds. The hypothetical account values and expenses may not be used to estimate the actual ending account balance or expenses you paid for the period.
Please note that the expenses shown in these tables are meant to highlight your ongoing expenses only and do not reflect any transaction costs. The "Expenses Paid per $1,000" line of the tables is useful in comparing ongoing expenses only and will not help you determine the relative total expense of owning different funds. If these transaction costs had been included, your costs would have been higher.
Expenses and Value of a $1,000 Investment for the six months ended April 30, 2013 (Unaudited) | |
| Actual Fund Return | | Premium Reserve Money Market Shares | |
| Beginning Account Value 11/1/12 | | $ | 1,000.00 | |
| Ending Account Value 4/30/13 | | $ | 1,000.06 | |
| Expenses Paid per $1,000* | | $ | 1.24 | |
| Hypothetical 5% Fund Return | | | | |
| Beginning Account Value 11/1/12 | | $ | 1,000.00 | |
| Ending Account Value 4/30/13 | | $ | 1,023.55 | |
| Expenses Paid per $1,000* | | $ | 1.25 | |
| * Expenses are equal to the Fund's annualized expense ratio for each share class, multiplied by the average account value over the period, multiplied by 181 (the number of days in the most recent six-month period), then divided by 365. | |
| Annualized Expense Ratios | | | | |
| Premium Reserve Money Market Shares | | | .25 | % |
For more information, please refer to the Fund's prospectus. For an analysis of the fees associated with an investment in the Fund or similar funds, please refer to http://apps.finra.org/fundanalyzer/1/fa.aspx. | |
Tax Information (Unaudited)
A total of 5% of the dividends distributed during the fiscal year was derived from interest on U.S. government securities, which is generally exempt from state income tax.
Please consult a tax advisor if you have questions about federal or state income tax laws, or on how to prepare your tax returns. If you have specific questions about your account, please call (800) 728-3337.
Proxy Voting
The Fund's policies and procedures for voting proxies for portfolio securities and information about how the Fund voted proxies related to its portfolio securities during the 12-month period ended June 30 are available on our Web site — www.dws-investments.com (click on "proxy voting" at the bottom of the page) — or on the SEC's Web site — www.sec.gov. To obtain a written copy of the Fund's policies and procedures without charge, upon request, call us toll free at (800) 728-3337.
Portfolio Holdings
Following the Fund's fiscal first and third quarter-end, a complete portfolio holdings listing is filed with the SEC on Form N-Q. In addition, each month, information about the Fund and its portfolio holdings is filed with the SEC on Form N-MFP. The SEC delays the public availability of the information filed on Form N-MFP for 60 days after the end of the reporting period included in the filing. These forms will be available on the SEC's Web site at www.sec.gov, and they may also be reviewed and copied at the SEC's Public Reference Room in Washington, D.C. Information on the operation of the SEC's Public Reference Room may be obtained by calling (800) SEC-0330. The Fund's portfolio holdings are also posted on www.dws-investments.com from time to time. Please see the Fund's current prospectus for more information.
Money Market Fund Reform
In 2010, the Securities and Exchange Commission adopted amendments to then-existing money market fund regulations, imposing new liquidity, credit quality and maturity requirements on all money market funds. In November 2012, the Financial Stability Oversight Council (FSOC), a board of U.S. regulators established by the Dodd-Frank Act, proposed recommendations for money market fund reform. If the SEC were to adopt one or more of the FSOC proposed recommendations in the future, or if FSOC were to take other steps to establish similar regulations of money market funds in the future, such regulatory action may affect the Fund's operations and/or return potential.
Summary of Management Fee Evaluation by Independent Fee Consultant
September 17, 2012
Pursuant to an Order entered into by Deutsche Investment Management Americas and affiliates (collectively, "DeAM") with the Attorney General of New York, I, Thomas H. Mack, have been appointed the Independent Fee Consultant for the DWS Funds (formerly the DWS Scudder Funds). My duties include preparing an annual written evaluation of the management fees DeAM charges the Funds, considering among other factors the management fees charged by other mutual fund companies for like services, management fees DeAM charges other clients for like services, DeAM's costs of supplying services under the management agreements and related profit margins, possible economies of scale if a Fund grows larger, and the nature and quality of DeAM's services, including fund performance. This report summarizes my evaluation for 2012, including my qualifications, the evaluation process for each of the DWS Funds, consideration of certain complex-level factors, and my conclusions. I served in substantially the same capacity in 2007, 2008, 2009, 2010 and 2011.
Qualifications
For more than 35 years I have served in various professional capacities within the investment management business. I have held investment analysis and advisory positions, including securities analyst, portfolio strategist and director of investment policy with a large investment firm. I have also performed business management functions, including business development, financial management and marketing research and analysis.
Since 1991, I have been an independent consultant within the asset management industry. I have provided services to over 125 client organizations, including investment managers, mutual fund boards, product distributors and related organizations. Over the past ten years I have completed a number of assignments for mutual fund boards, specifically including assisting boards with management contract renewal.
I hold a Master of Business Administration degree, with highest honors, from Harvard University and Master of Science and Bachelor of Science (highest honors) degrees from the University of California at Berkeley. I am an independent director and audit committee financial expert for two closed-end mutual funds and have served in various leadership and financial oversight capacities with non-profit organizations.
Evaluation of Fees for each DWS Fund
My work focused primarily on evaluating, fund-by-fund, the fees charged to each of the 103 mutual fund portfolios in the DWS Fund family. For each Fund, I considered each of the key factors mentioned above, as well as any other relevant information. In doing so I worked closely with the Funds' Independent Directors in their annual contract renewal process, as well as in their approval of contracts for several new funds (documented separately).
In evaluating each Fund's fees, I reviewed comprehensive materials provided by or on behalf of DeAM, including expense information prepared by Lipper Analytical, comparative performance information, profitability data, manager histories, and other materials. I also accessed certain additional information from the Lipper and Morningstar databases and drew on my industry knowledge and experience.
To facilitate evaluating this considerable body of information, I prepared for each Fund a document summarizing the key data elements in each area as well as additional analytics discussed below. This made it possible to consider each key data element in the context of the others.
In the course of contract renewal, DeAM agreed to implement a number of fee and expense adjustments requested by the Independent Directors which will favorably impact future fees and expenses, and my evaluation includes the effects of these changes.
Fees and Expenses Compared with Other Funds
The competitive fee and expense evaluation for each fund focused on two primary comparisons:
The Fund's contractual management fee (the advisory fee plus the administration fee where applicable) compared with those of a group of typically 12-15 funds in the same Lipper investment category (e.g. Large Capitalization Growth) having similar distribution arrangements and being of similar size.
The Fund's total expenses compared with a broader universe of funds from the same Lipper investment category and having similar distribution arrangements.
These two comparisons provide a view of not only the level of the fee compared with funds of similar scale but also the total expense the Fund bears for all the services it receives, in comparison with the investment choices available in the Fund's investment category and distribution channel. The principal figure-of-merit used in these comparisons was the subject Fund's percentile ranking against peers.
DeAM's Fees for Similar Services to Others
DeAM provided management fee schedules for all of its US domiciled fund and non-fund investment management accounts in any of the investment categories where there is a DWS Fund. These similar products included the other DWS Funds, non-fund pooled accounts, institutional accounts and sub-advisory accounts. Using this information, I calculated for each Fund the fee that would be charged to each similar product, at the subject Fund's asset level.
Evaluating information regarding non-fund products is difficult because there are varying levels of services required for different types of accounts, with mutual funds generally requiring considerably more regulatory and administrative types of service as well as having more frequent cash flows than other types of accounts. Also, while mutual fund fees for similar fund products can be expected to be similar, there will be some differences due to different pricing conditions in different distribution channels (e.g. retail funds versus those used in variable insurance products), differences in underlying investment processes and other factors.
Costs and Profit Margins
DeAM provided a detailed profitability analysis for each Fund. After making some adjustments so that the presentation would be more comparable to the available industry figures, I reviewed profit margins from investment management alone, from investment management plus other fund services (excluding distribution) provided to the Funds by DeAM (principally shareholder services), and DeAM profits from all sources, including distribution. A later section comments on overall profitability.
Economies of Scale
Economies of scale — an expected decline in management cost per dollar of fund assets as fund assets grow — are very rarely quantified and documented because of inherent difficulties in collecting and analyzing relevant data. However, in virtually every investment category that I reviewed, larger funds tend to have lower fees and lower total expenses than smaller funds. To see how each DWS Fund compares with this industry observation, I reviewed:
The trend in Fund assets over the last five years and the accompanying trend in total expenses. This shows if the Fund has grown and, if so, whether total expense (management fees as well as other expenses) have declined as a percent of assets.
Whether the Fund has break-points in its management fee schedule, the extent of the fee reduction built into the schedule and the asset levels where the breaks take effect, and in the case of a sub-advised Fund how the Fund's break-points compare with those of the sub-advisory fee schedule.
How the Fund's contractual fee schedule compares with trends in the industry data. To accomplish this, I constructed a chart showing how actual latest-fiscal-year contractual fees of the Fund and of other similar funds relate to average fund assets, with the subject Fund's contractual fee schedule superimposed.
Quality of Service — Performance
The quality-of-service evaluation focused on investment performance, which is the principal result of the investment management service. Each Fund's performance was reviewed over the past 1, 3, 5 and 10 years, as applicable, and compared with that of other funds in the same investment category and with a suitable market index.
In addition, I calculated and reviewed risk-adjusted returns relative to an index of similar mutual funds' returns and a suitable market index. The risk-adjusted returns analysis provides a way of determining the extent to which the Fund's return comparisons are mainly the product of investment value-added (or lack thereof) or alternatively taking considerably more or less risk than is typical in its investment category.
I also received and considered the history of portfolio manager changes for each Fund, as this provided an important context for evaluating the performance results.
Complex-Level Considerations
While this evaluation was conducted mainly at the individual fund level, there are some issues relating to the reasonableness of fees that can alternatively be considered across the whole fund complex:
I reviewed DeAM's profitability analysis for all DWS Funds, with a view toward determining if the allocation procedures used were reasonable and how profit levels compared with public data for other investment managers.
I considered whether DeAM and affiliates receive any significant ancillary or "fallout" benefits that should be considered in interpreting the direct profitability results. These would be situations where serving as the investment manager of the Funds is beneficial to another part of the Deutsche Bank organization.
I considered how aggregated DWS Fund expenses had varied over the years, by asset class and in the context of trends in asset levels.
I considered how aggregated DWS Fund performance measures relative to appropriate peers had varied by asset class and over time.
I reviewed the structure of the DeAM organization, trends in staffing levels, and information on compensation of investment management and other professionals compared with industry data.
Findings
Based on the process and analysis discussed above, which included reviewing a wide range of information from management and external data sources and considering among other factors the fees DeAM charges other clients, the fees charged by other fund managers, DeAM's costs and profits associated with managing the Funds, economies of scale, possible fall-out benefits, and the nature and quality of services provided, in my opinion the management fees charged the DWS Funds are reasonable.
Thomas H. Mack
President, Thomas H. Mack & Co., Inc.
Board Members and Officers
The following table presents certain information regarding the Board Members and Officers of the fund. Each Board Member's year of birth is set forth in parentheses after his or her name. Unless otherwise noted, (i) each Board Member has engaged in the principal occupation(s) noted in the table for at least the most recent five years, although not necessarily in the same capacity; and (ii) the address of each Independent Board Member is c/o Kenneth C. Froewiss, Chairman, DWS Mutual Funds, P.O. Box 78, Short Hills, NJ 07078. Except as otherwise noted below, the term of office for each Board Member is until the election and qualification of a successor, or until such Board Member sooner dies, resigns, is removed or as otherwise provided in the governing documents of the fund. Because the fund does not hold an annual meeting of shareholders, each Board Member will hold office for an indeterminate period. The Board Members may also serve in similar capacities with other funds in the fund complex.
| Independent Board Members |
Name, Year of Birth, Position with the Fund and Length of Time Served1 | | Business Experience and Directorships During the Past Five Years | Number of Funds in DWS Fund Complex Overseen |
Other Directorships Held by Board Member |
Kenneth C. Froewiss (1945) Chairperson since 2013,9 and Board Member since 2001 | | Adjunct Professor of Finance, NYU Stern School of Business (September 2009-present; Clinical Professor from 1997-September 2009); Member, Finance Committee, Association for Asian Studies (2002-present); Director, Mitsui Sumitomo Insurance Group (US) (2004-present); prior thereto, Managing Director, J.P. Morgan (investment banking firm) (until 1996) | 102 | — |
William McClayton (1944) Vice Chairperson since 2013,9 and Board Member since 2004 | | Private equity investor (since October 2009); previously, Managing Director, Diamond Management & Technology Consultants, Inc. (global consulting firm) (2001-2009); Directorship: Board of Managers, YMCA of Metropolitan Chicago; formerly: Senior Partner, Arthur Andersen LLP (accounting) (1966-2001); Trustee, Ravinia Festival | 102 | — |
John W. Ballantine (1946) Board Member since 1999 | | Retired; formerly, Executive Vice President and Chief Risk Management Officer, First Chicago NBD Corporation/The First National Bank of Chicago (1996-1998); Executive Vice President and Head of International Banking (1995-1996); former Directorships: Stockwell Capital Investments PLC (private equity); First Oak Brook Bancshares, Inc. and Oak Brook Bank; Prisma Energy International | 102 | Chairman of the Board, Healthways, Inc.2 (provider of disease and care management services) (2003- present); Portland General Electric2 (utility company) (2003- present) |
Henry P. Becton, Jr. (1943) Board Member since 1990 | | Vice Chair and former President, WGBH Educational Foundation. Directorships: Public Radio International; Public Radio Exchange (PRX); The PBS Foundation; North Bennett Street School (Boston); former Directorships: Association of Public Television Stations; Boston Museum of Science; American Public Television; Concord Academy; New England Aquarium; Mass. Corporation for Educational Telecommunications; Committee for Economic Development; Public Broadcasting Service; Connecticut College | 102 | Lead Director, Becton Dickinson and Company2 (medical technology company); Lead Director, Belo Corporation2 (media company) |
Dawn-Marie Driscoll (1946) Board Member since 1987 | | President, Driscoll Associates (consulting firm); Emeritus Executive Fellow, Center for Business Ethics, Bentley University; formerly, Partner, Palmer & Dodge (1988-1990); Vice President of Corporate Affairs and General Counsel, Filene's (1978-1988). Directorships: Director of ICI Mutual Insurance Company (since 2007); Advisory Board, Center for Business Ethics, Bentley University; Chairman of the Board of Trustees, Southwest Florida Community Foundation (charitable organization); former Directorships: Sun Capital Advisers Trust (mutual funds) (2007-2012), Investment Company Institute (audit, executive, nominating committees) and Independent Directors Council (governance, executive committees) | 102 | — |
Keith R. Fox, CFA (1954) Board Member since 1996 | | Managing General Partner, Exeter Capital Partners (a series of private investment funds) (since 1986). Directorships: Progressive International Corporation (kitchen goods importer and distributor); The Kennel Shop (retailer); former Chairman, National Association of Small Business Investment Companies; former Directorships: BoxTop Media Inc. (advertising); Sun Capital Advisers Trust (mutual funds) (2011-2012) | 102 | — |
Paul K. Freeman (1950) Board Member since 1993, and Chairperson (2009-Jan. 8, 2013) | | Consultant, World Bank/Inter-American Development Bank; Executive and Governing Council of the Independent Directors Council (Chairman of Education Committee); formerly: Project Leader, International Institute for Applied Systems Analysis (1998-2001); Chief Executive Officer, The Eric Group, Inc. (environmental insurance) (1986-1998); Directorships: Denver Zoo Foundation (December 2012-present); former Directorships: Prisma Energy International | 102 | — |
Richard J. Herring (1946) Board Member since 1990 | | Jacob Safra Professor of International Banking and Professor, Finance Department, The Wharton School, University of Pennsylvania (since July 1972); Co-Director, Wharton Financial Institutions Center (since July 2000); Co-Chair, U.S. Shadow Financial Regulatory Committee; Executive Director, Financial Economists Roundtable; formerly: Vice Dean and Director, Wharton Undergraduate Division (July 1995-June 2000); Director, Lauder Institute of International Management Studies (July 2000-June 2006) | 102 | Director, Japan Equity Fund, Inc. (since September 2007), Thai Capital Fund, Inc. (since 2007), Singapore Fund, Inc. (since September 2007), Independent Director of Barclays Bank Delaware (since September 2010) |
Rebecca W. Rimel (1951) Board Member since 1995 | | President and Chief Executive Officer, The Pew Charitable Trusts (charitable organization) (1994 to present); formerly: Executive Vice President, The Glenmede Trust Company (investment trust and wealth management) (1983-2004); Board Member, Investor Education (charitable organization) (2004-2005); Trustee, Executive Committee, Philadelphia Chamber of Commerce (2001-2007); Director, Viasys Health Care2 (January 2007-June 2007); Trustee, Thomas Jefferson Foundation (charitable organization) (1994-2012) | 102 | Director, Becton Dickinson and Company2 (medical technology company) (2012- present); Director, CardioNet, Inc.2 (health care) (2009- present) |
William N. Searcy, Jr. (1946) Board Member since 1993 | | Private investor since October 2003; formerly: Pension & Savings Trust Officer, Sprint Corporation2 (telecommunications) (November 1989-September 2003); Trustee, Sun Capital Advisers Trust (mutual funds) (1998-2012) | 102 | — |
Jean Gleason Stromberg (1943) Board Member since 1997 | | Retired. Formerly, Consultant (1997-2001); Director, Financial Markets U.S. Government Accountability Office (1996-1997); Partner, Fulbright & Jaworski, L.L.P. (law firm) (1978-1996). Directorships: The William and Flora Hewlett Foundation; former Directorships: Service Source, Inc., Mutual Fund Directors Forum (2002-2004), American Bar Retirement Association (funding vehicle for retirement plans) (1987-1990 and 1994-1996) | 102 | — |
Robert H. Wadsworth (1940) Board Member since 1999 | | President, Robert H. Wadsworth & Associates, Inc. (consulting firm) (1983 to present); Director, National Horizon, Inc. (non-profit organization); Director and Treasurer, The Phoenix Boys Choir Association | 105 | — |
Interested Board Member and Officer4 |
Name, Year of Birth, Position with the Fund and Length of Time Served1,6 | | Business Experience and Directorships During the Past Five Years | Number of Funds in DWS Fund Complex Overseen |
Other Directorships Held by Board Member |
Michael J. Woods5 (1967) Board Member since 2013,9 and Executive Vice President since 20139 | | Managing Director,3 Deutsche Asset & Wealth Management (2009-present); Head of the Americas Asset Management Business for Deutsche Bank, Member of the Asset and Wealth Management ("AWM") Extended Executive Committee, AWM Global Client Group Executive Committee and the AWM Active Asset Management Executive Committee; CEO and US Regional Head of DWS Investments; formerly: Sr. VP, Head of the Financial Intermediaries and Investments Group of Evergreen Investments (2007-2009), CEO and Vice Chairman of Board of Directors of XTF Global Asset Management (2006-2007), Managing Director — US Head of Sub-Advisory and Investment Only Business at Citigroup Asset Management (2000-2006). Mr. Woods is currently a board member of The Children's Village, The Big Brothers Big Sisters Organization, and The Mutual Fund Education Alliance. | 38 | — |
Officers4 |
Name, Year of Birth, Position with the Fund and Length of Time Served6 | | Business Experience and Directorships During the Past Five Years |
W. Douglas Beck, CFA7 (1967) President, 2011-present | | Managing Director,3 Deutsche Asset & Wealth Management (2006-present); President of DWS family of funds and Head of Product Management, U.S. for DWS Investments; formerly: Executive Director, Head of Product Management (2002-2006) and President (2005-2006) of the UBS Funds at UBS Global Asset Management; Co-Head of Manager Research/Managed Solutions Group, Merrill Lynch (1998-2002) |
John Millette8 (1962) Vice President and Secretary, 1999-present | | Director,3 Deutsche Asset & Wealth Management |
Paul H. Schubert7 (1963) Chief Financial Officer, 2004-present Treasurer, 2005-present | | Managing Director,3 Deutsche Asset & Wealth Management (since July 2004); formerly: Executive Director, Head of Mutual Fund Services and Treasurer for UBS Family of Funds (1998-2004); Vice President and Director of Mutual Fund Finance at UBS Global Asset Management (1994-1998) |
Caroline Pearson8 (1962) Chief Legal Officer, 2010-present | | Managing Director,3 Deutsche Asset & Wealth Management; formerly: Assistant Secretary for DWS family of funds (1997-2010) |
Melinda Morrow7 (1970) Vice President, 2012-present | | Director,3 Deutsche Asset & Wealth Management |
Hepsen Uzcan8 (1974) Assistant Secretary, since 20139 | | Vice President, Deutsche Asset & Wealth Management |
Paul Antosca8 (1957) Assistant Treasurer, 2007-present | | Director,3 Deutsche Asset & Wealth Management |
Jack Clark8 (1967) Assistant Treasurer, 2007-present | | Director,3 Deutsche Asset & Wealth Management |
Diane Kenneally8 (1966) Assistant Treasurer, 2007-present | | Director,3 Deutsche Asset & Wealth Management |
John Caruso7 (1965) Anti-Money Laundering Compliance Officer, 2010-present | | Managing Director,3 Deutsche Asset & Wealth Management |
Robert Kloby7 (1962) Chief Compliance Officer, 2006-present | | Managing Director,3 Deutsche Asset & Wealth Management |
1 The length of time served represents the year in which the Board Member joined the board of one or more DWS funds currently overseen by the Board.
2 A publicly held company with securities registered pursuant to Section 12 of the Securities Exchange Act of 1934.
3 Executive title, not a board directorship.
4 As a result of their respective positions held with the Advisor, these individuals are considered "interested persons" of the Advisor within the meaning of the 1940 Act. Interested persons receive no compensation from the fund.
5 The mailing address of Mr. Woods is 60 Wall Street, New York, New York 10005. Mr. Woods is an interested Board Member by virtue of his positions with Deutsche Asset & Wealth Management. As an interested person, Mr. Woods receives no compensation from the fund. Mr. Woods is a board member of the following trusts and corporations: Cash Account Trust, DWS Market Trust, DWS Money Funds, DWS State Tax-Free Income Series, DWS Target Fund, DWS Value Series, Inc., DWS Variable Series II, Investors Cash Trust, Tax-Exempt California Money Market Fund, DWS Global High Income Fund, Inc., DWS High Income Opportunities Fund, Inc., DWS High Income Trust, DWS Multi-Market Income Trust, DWS Municipal Income Trust, DWS Strategic Income Trust and DWS Strategic Municipal Income Trust.
6 The length of time served represents the year in which the officer was first elected in such capacity for one or more DWS funds.
7 Address: 60 Wall Street, New York, NY 10005.
8 Address: One Beacon Street, Boston, MA 02108.
9 Effective as of January 9, 2013.
The fund's Statement of Additional Information ("SAI") includes additional information about the Board Members. The SAI is available, without charge, upon request. If you would like to request a copy of the SAI, you may do so by calling the following toll-free number: (800) 728-3337.

APRIL 30, 2013 Annual Report to Shareholders |
| |
Government & Agency Securities Portfolio DWS Government Cash Institutional Shares Fund #250 Government Cash Managed Shares Fund #254 |
|
Contents
3 Portfolio Management Review 12 Statement of Assets and Liabilities 14 Statement of Operations 15 Statement of Changes in Net Assets 18 Notes to Financial Statements 26 Report of Independent Registered Public Accounting Firm 27 Information About Your Fund's Expenses 30 Summary of Management Fee Evaluation by Independent Fee Consultant 34 Board Members and Officers |
This report must be preceded or accompanied by a prospectus. To obtain a summary prospectus, if available, or prospectus for any of our funds, visit www.dws-investments.com. We advise you to consider the fund's objectives, risks, charges and expenses carefully before investing. The summary prospectus and prospectus contain this and other important information about the fund. Please read the prospectus carefully before you invest.
An investment in this fund is not insured or guaranteed by the Federal Deposit Insurance Corporation (FDIC) or by any other government agency. Although the fund seeks to preserve the value of your investment at $1.00 per share, it is possible to lose money by investing in the fund. The share price of money market funds can fall below the $1.00 share price. You should not rely on or expect the Advisor to enter into support agreements or take other actions to maintain the fund's $1.00 share price. The credit quality of the fund's holdings can change rapidly in certain markets, and the default of a single holding could have an adverse impact on the fund's share price. The fund's share price can also be negatively affected during periods of high redemption pressures and/or illiquid markets. The actions of a few large investors in one class of shares of the fund may have a significant adverse effect on the share prices of all classes of shares of the fund. See the prospectus for specific details regarding the fund's risk profile.
DWS Investments is part of the Deutsche Asset & Wealth Management division of Deutsche Bank AG.
NOT FDIC/NCUA INSURED NO BANK GUARANTEE MAY LOSE VALUE NOT A DEPOSIT NOT INSURED BY ANY FEDERAL GOVERNMENT AGENCY
Portfolio Management Review (Unaudited)
Market Overview
All performance information below is historical and does not guarantee future results. Investment return and principal fluctuate, so your shares may be worth more or less when redeemed. Current performance may differ from performance data shown. Please visit www.dws-investments.com for the fund's most recent month-end performance. The 7-day current yield refers to the income paid by the fund over a 7-day period expressed as an annual percentage rate of the fund's shares outstanding. Yields fluctuate and are not guaranteed.
At the beginning of the fund's most recent fiscal year ended April 30, 2013, we saw another dramatic "flight to quality," as worries concerning Greece's upcoming elections and continuingly worsening conditions for Spanish and Italian banks led global and domestic investors to abandon risky assets. Late in 2012, any negative economic data was overshadowed by investor anticipation of more substantial central bank actions. The European Central Bank (ECB) lowered its interest rate for bank reserves. Then, the head of the ECB, Mario Draghi, stated that the central bank would do "whatever it takes" to preserve the euro. In December 2012, the U.S. Federal Reserve Board (the Fed) altered its guidance regarding rate levels, stating that it would maintain short-term interest rates near zero until U.S. unemployment dropped below 6.5%, and as long as inflation levels did not exceed 2.5%. In the first quarter of 2013, the European situation remained quiescent until the banking crisis in Cyprus reached a boiling point; the crisis was finally resolved after it was agreed that large uninsured depositors in Cyprus' banks would suffer substantial losses. In addition, the U.S. economy was boosted by higher housing prices and some gains in employment levels. In the money market area, we saw a continued supply/demand imbalance as well as a reduction in short-term money market supply due to ongoing quantitative easing by the Fed. In the continued search for yield, money market investors looked to a variety of financial instruments issued in countries around the world.
Positive Contributors to Fund Performance
We were able to maintain a yield that is in line with other similar money market funds during the period ended April 30, 2013.
| Government & Agency Securities Portfolio seeks to provide maximum current income consistent with stability of capital. |
With short-maturity yields trading in a narrow range throughout most of the period, we pursued a "barbell" strategy for the fund: we held a large percentage of portfolio assets in overnight Treasury and agency repurchase agreements for relative yield, flexibility and liquidity purposes. At the same time, we purchased six-month to one-year Treasury and agency securities to take advantage of more attractive rates within that portion of the yield curve.
Fund Performance (as of April 30, 2013)
Performance is historical and does not guarantee future results. Current performance may be lower or higher than the performance data quoted.
An investment in the fund is not insured or guaranteed by the Federal Deposit Insurance Corporation (FDIC) or by any other government agency. Although the fund seeks to preserve the value of your investment at $1.00 per share, it is possible to lose money by investing in the fund.
| | | 7-Day Current Yield | |
| DWS Government Cash Institutional Shares | | | .03 | %* |
| Government Cash Managed Shares | | | .01 | %* |
Yields are historical, will fluctuate and do not guarantee future performance. The 7-day current yield refers to the income paid by the fund over a 7-day period expressed as an annual percentage rate of the fund's shares outstanding. For the most current yield information, visit our Web site at www.dws-investments.com. * The investment advisor has agreed to voluntarily waive fees/reimburse expenses. This waiver may be changed or terminated at any time without notice. | |
Negative Contributors to Fund Performance
The types of securities that we invested in tended to have lower yields than issues carrying more risk. We preferred to be cautious during a time of market uncertainty. In the end this may have cost the fund some yield, but we believe that this represented a prudent approach to preserving principal.
Outlook and Positioning
We anticipate limited growth for the U.S. economy over the remainder of this year, due to steady but unspectacular employment gains and the automatic budget cuts dictated by congressional sequestration. In turn, we think that restrained growth will mean that the Fed will continue its extremely accommodative monetary policy through early 2014. We look for money market rates to continue to be low based on decreases in supply on a number of fronts and strong investor demand.
We continue our insistence on the highest credit quality within the fund. We also plan to maintain our conservative investment strategies and standards under the current market conditions. We continue to apply a careful approach to investing on behalf of the fund and to seek competitive yield for our shareholders.
Portfolio Management Team
A group of investment professionals is responsible for the day-to-day management of the fund. These investment professionals have a broad range of experience managing money market funds.
The views expressed reflect those of the portfolio management team only through the end of the period of the report as stated on the cover. The management team's views are subject to change at any time based on market and other conditions and should not be construed as a recommendation. Past performance is no guarantee of future results. Current and future portfolio holdings are subject to risk.
Terms to Know
Quantitative easing is a government monetary policy often used when interest rates are at or near zero. With this policy government or other securities are purchased from the market, causing the price of the securities purchased to rise and the yield or interest rates on the securities purchased to fall. For the companies whose bonds the central banks are willing to purchase, it means having to pay lower interest rates on new bonds issued to replace existing bonds that have matured. With lower borrowing costs, the central banks hope that consumers will be encouraged to spend more, thus helping the overall economy and improving the balance sheets of the companies providing the goods and services on which consumers are spending their money.
The yield curve is a graphical representation of how yields on bonds of different maturities compare. Normally, yield curves slant up, as bonds with longer maturities typically offer higher yields than short-term bonds.
A repurchase agreement, or "overnight repo," is an agreement between a seller and a buyer, usually of government securities, where the seller agrees to repurchase the securities at a given price and usually at a stated time. Repos are widely used money market instruments that serve as an interest-bearing, short-term "parking place" for large sums of money.
The Securities Industry and Financial Market Association Index of Variable Rate Demand Notes is a weekly high-grade market index consisting of seven-day, tax-exempt, variable-rate demand notes produced by Municipal Market Data Group. Actual issues are selected from Municipal Market Data's database of more than 10,000 active issues. Index returns do not reflect fees or expenses and it is not possible to invest directly into an index.
A "put" bond allows an investor to require the issuer to repurchase the bond at a specified date before its maturity.
Portfolio Summary (Unaudited)
Investment Portfolio as of April 30, 2013
Government & Agency Securities Portfolio
| | | Principal Amount ($) | | | Value ($) | |
| | | | |
| Government & Agency Obligations 51.8% | |
| U.S. Government Sponsored Agencies 45.6% | |
| Federal Farm Credit Bank: | |
| 0.15%**, 2/6/2014 | | | 75,000,000 | | | | 75,000,000 | |
| 0.19%, 12/13/2013 | | | 15,000,000 | | | | 15,000,000 | |
| 0.211%*, 5/23/2013 | | | 10,000,000 | | | | 9,998,656 | |
| Federal Home Loan Bank: | |
| 0.117%*, 6/3/2013 | | | 35,000,000 | | | | 34,996,150 | |
| 0.12%, 10/3/2013 | | | 50,000,000 | | | | 49,997,423 | |
| 0.125%, 3/27/2014 | | | 15,000,000 | | | | 14,992,270 | |
| 0.15%, 10/15/2013 | | | 38,000,000 | | | | 37,998,836 | |
| 0.16%, 6/5/2013 | | | 25,000,000 | | | | 24,999,760 | |
| 0.16%, 12/19/2013 | | | 15,000,000 | | | | 14,999,389 | |
| 0.17%, 7/5/2013 | | | 30,000,000 | | | | 29,999,090 | |
| 0.17%, 3/25/2014 | | | 15,000,000 | | | | 14,998,374 | |
| 0.171%*, 6/5/2013 | | | 50,000,000 | | | | 49,991,493 | |
| 0.18%**, 7/25/2013 | | | 25,000,000 | | | | 24,999,703 | |
| 0.18%**, 7/26/2013 | | | 15,000,000 | | | | 14,999,647 | |
| 0.18%, 3/7/2014 | | | 22,500,000 | | | | 22,498,775 | |
| 0.21%**, 11/8/2013 | | | 27,000,000 | | | | 26,994,378 | |
| 0.22%**, 11/15/2013 | | | 12,500,000 | | | | 12,497,259 | |
| 0.235%**, 11/4/2013 | | | 49,000,000 | | | | 48,993,658 | |
| 0.28%, 11/14/2013 | | | 10,000,000 | | | | 10,006,609 | |
| 0.31%, 5/16/2013 | | | 20,755,000 | | | | 20,755,569 | |
| 0.31%**, 5/17/2013 | | | 38,000,000 | | | | 38,000,000 | |
| 0.36%, 5/16/2013 | | | 27,500,000 | | | | 27,501,263 | |
| 0.5%, 8/28/2013 | | | 24,000,000 | | | | 24,023,308 | |
| 0.875%, 12/27/2013 | | | 12,000,000 | | | | 12,055,109 | |
| 2.375%, 3/14/2014 | | | 10,000,000 | | | | 10,190,020 | |
| Federal Home Loan Mortgage Corp.: | |
| 0.11%*, 11/19/2013 | | | 17,000,000 | | | | 16,989,507 | |
| 0.119%*, 8/26/2013 | | | 50,000,000 | | | | 49,980,500 | |
| 0.128%*, 7/15/2013 | | | 25,000,000 | | | | 24,993,229 | |
| 0.138%*, 7/9/2013 | | | 38,000,000 | | | | 37,989,803 | |
| 0.139%**, 9/13/2013 | | | 75,000,000 | | | | 74,998,762 | |
| 0.139%*, 8/13/2013 | | | 12,500,000 | | | | 12,494,944 | |
| 0.147%*, 6/12/2013 | | | 25,000,000 | | | | 24,995,625 | |
| 0.149%*, 9/4/2013 | | | 35,000,000 | | | | 34,981,625 | |
| 0.15%*, 5/6/2013 | | | 20,000,000 | | | | 19,999,514 | |
| 0.158%*, 6/25/2013 | | | 35,000,000 | | | | 34,991,444 | |
| 0.165%*, 5/29/2013 | | | 20,000,000 | | | | 19,997,355 | |
| 0.166%*, 5/13/2013 | | | 18,000,000 | | | | 17,998,920 | |
| 1.375%, 2/25/2014 | | | 15,000,000 | | | | 15,151,525 | |
| 3.5%, 5/29/2013 | | | 10,500,000 | | | | 10,526,336 | |
| Federal National Mortgage Association: | |
| 0.09%*, 5/8/2013 | | | 25,000,000 | | | | 24,999,514 | |
| 0.109%*, 7/2/2013 | | | 22,000,000 | | | | 21,995,832 | |
| 0.129%*, 10/1/2013 | | | 38,000,000 | | | | 37,979,005 | |
| 0.139%*, 7/19/2013 | | | 20,000,000 | | | | 19,993,856 | |
| 0.149%*, 9/16/2013 | | | 68,500,000 | | | | 68,460,612 | |
| 0.16%*, 5/1/2013 | | | 10,000,000 | | | | 10,000,000 | |
| 0.169%*, 5/22/2013 | | | 25,000,000 | | | | 24,997,448 | |
| 1.5%, 6/26/2013 | | | 10,000,000 | | | | 10,019,950 | |
| 2.75%, 3/13/2014 | | | 58,000,000 | | | | 59,304,625 | |
| | | | | 1,340,326,670 | |
| U.S. Treasury Obligations 5.2% | |
| U.S. Treasury Notes: | |
| 0.25%, 10/31/2013 | | | 10,000,000 | | | | 10,001,916 | |
| 0.25%, 11/30/2013 | | | 15,000,000 | | | | 15,008,089 | |
| 0.5%, 5/31/2013 | | | 28,500,000 | | | | 28,507,950 | |
| 0.5%, 10/15/2013 | | | 32,500,000 | | | | 32,544,533 | |
| 0.5%, 11/15/2013 | | | 32,500,000 | | | | 32,559,305 | |
| 0.75%, 12/15/2013 | | | 35,000,000 | | | | 35,127,814 | |
| | | | | 153,749,607 | |
| Other Government Related 1.0% | |
| Straight-A Funding LLC, 144A, 0.17%, 6/18/2013 | | | 30,000,000 | | | | 29,993,200 | |
Total Government & Agency Obligations (Cost $1,524,069,477) | | | | 1,524,069,477 | |
| | |
| Repurchase Agreements 48.2% | |
| Barclays Capital, 0.1%, dated 4/25/2013, to be repurchased at $125,002,431 on 5/2/2013 (a) | | | 125,000,000 | | | | 125,000,000 | |
| BNP Paribas, 0.14%, dated 4/30/2013, to be repurchased at $65,000,253 on 5/1/2013 (b) | | | 65,000,000 | | | | 65,000,000 | |
| BNP Paribas, 0.15%, dated 4/30/2013, to be repurchased at $40,000,167 on 5/1/2013 (c) | | | 40,000,000 | | | | 40,000,000 | |
| Citigroup Global Markets, Inc., 0.09%, dated 4/24/2013, to be repurchased at $13,000,228 on 5/1/2013 (d) | | | 13,000,000 | | | | 13,000,000 | |
| Citigroup Global Markets, Inc., 0.14%, dated 4/30/2013, to be repurchased at $42,000,163 on 5/1/2013 (e) | | | 42,000,000 | | | | 42,000,000 | |
| HSBC Securities, Inc., 0.17%, dated 4/30/2013, to be repurchased at $54,000,255 on 5/1/2013 (f) | | | 54,000,000 | | | | 54,000,000 | |
| JPMorgan Securities, Inc., 0.17%, dated 4/30/2013, to be repurchased at $113,000,534 on 5/1/2013 (g) | | | 113,000,000 | | | | 113,000,000 | |
| Merrill Lynch & Co., Inc., 0.09%, dated 4/26/2013, to be repurchased at $85,001,488 on 5/3/2013 (h) | | | 85,000,000 | | | | 85,000,000 | |
| Merrill Lynch & Co., Inc., 0.14%, dated 4/30/2013, to be repurchased at $35,102,349 on 5/1/2013 (i) | | | 35,102,212 | | | | 35,102,212 | |
| Merrill Lynch & Co., Inc., 0.14%, dated 4/5/2013, to be repurchased at $110,014,117 on 5/8/2013 (j) | | | 110,000,000 | | | | 110,000,000 | |
| Morgan Stanley & Co., Inc., 0.17%, dated 4/30/2013, to be repurchased at $424,002,002 on 5/1/2013 (k) | | | 424,000,000 | | | | 424,000,000 | |
| RBS Securities, Inc., 0.14%, dated 4/30/2013, to be repurchased at $135,000,525 on 5/1/2013 (l) | | | 135,000,000 | | | | 135,000,000 | |
| The Goldman Sachs & Co., 0.16%, dated 4/30/2013, to be repurchased at $100,000,444 on 5/1/2013 (m) | | | 100,000,000 | | | | 100,000,000 | |
| The Toronto-Dominion Bank, 0.1%, dated 4/24/2013, to be repurchased at $75,001,458 on 5/1/2013 (n) | | | 75,000,000 | | | | 75,000,000 | |
Total Repurchase Agreements (Cost $1,416,102,212) | | | | 1,416,102,212 | |
| | | % of Net Assets | | | Value ($) | |
| | | | |
Total Investment Portfolio (Cost $2,940,171,689)† | | | 100.0 | | | | 2,940,171,689 | |
| Other Assets and Liabilities, Net | | | 0.0 | | | | 185,473 | |
| Net Assets | | | 100.0 | | | | 2,940,357,162 | |
* Annualized yield at time of purchase; not a coupon rate.
** Floating rate securities' yields vary with a designated market index or market rate, such as the coupon-equivalent of the U.S. Treasury Bill rate. These securities are shown at their current rate as of April 30, 2013.
† The cost for federal income tax purposes was $2,940,171,689.
(a) Collateralized by $126,575,000 Federal Home Loan Bank, with the various coupon rates from 2.13-2.65%, with various maturity dates of 11/5/2024-2/15/2028 with a value of $127,500,282.
(b) Collateralized by $50,645,400 U.S. Treasury Inflation-Indexed Notes, with the various coupon rates from 2.0-2.5%, with various maturity dates of 1/15/2016-7/15/2016 with a value of $66,300,001.
(c) Collateralized by $40,258,000 U.S. Federal Home Loan Mortgage Corp., with the various coupon rates from 0.45-3.01%, with various maturity dates of 1/9/2014-7/9/2027 with a value of $40,800,030.
(d) Collateralized by:
| Principal Amount ($) | | Security | | Rate (%) | | Maturity Date | | Collateral Value ($) | |
| | 2,986,985 | | Federal Home Loan Mortgage Corp. | | | 1.299 | | 11/15/2036 | | | 2,767,845 | |
| | 25,652,820 | | Federal National Mortgage Association — Interest Only | | | 7.05 | | 12/25/2042 | | | 4,912,647 | |
| | 36,197,656 | | Government National Mortgage Association — Interest Only | | | 5.85-6.317 | | 1/20/2038- 11/16/2041 | | | 5,742,486 | |
| Total Collateral Value | | | 13,422,978 | |
(e) Collateralized by:
| Principal Amount ($) | | Security | | Rate (%) | | Maturity Date | | Collateral Value ($) | |
| | 13,766,000 | | U.S. Treasury Inflation-Indexed Note | | | 1.125 | | 1/15/2021 | | | 17,248,540 | |
| | 25,503,800 | | U.S. Treasury Note | | | 0.75 | | 9/15/2013 | | | 25,591,469 | |
| Total Collateral Value | | | 42,840,009 | |
(f) Collateralized by:
| Principal Amount ($) | | Security | | Rate (%) | | Maturity Date | | Collateral Value ($) | |
| | 47,691,333 | | Government National Mortgage Association | | | 3.5-6.0 | | 8/15/2032- 2/20/2043 | | | 52,685,764 | |
| | 2,395,000 | | U.S. Treasury Bill | | | — | | 7/5/2013 | | | 2,394,856 | |
| Total Collateral Value | | | 55,080,620 | |
(g) Collateralized by:
| Principal Amount ($) | | Security | | Rate (%) | | Maturity Date | | Collateral Value ($) | |
| | 1,075,267,081 | | Federal Home Loan Mortgage Corp. — Interest Only | | | 2.5-6.0 | | 9/15/2015- 2/15/2043 | | | 100,729,795 | |
| | 2,288,334 | | Federal National Mortgage Association | | | 3.0 | | 3/25/2033 | | | 2,323,084 | |
| | 106,602,739 | | Federal National Mortgage Association — Interest Only | | | 3.0-6.5 | | 6/25/2020- 8/25/2042 | | | 12,207,334 | |
| Total Collateral Value | | | 115,260,213 | |
(h) Collateralized by:
| Principal Amount ($) | | Security | | Rate (%) | | Maturity Date | | Collateral Value ($) | |
| | 17,990,000 | | Federal Farm Credit Bank | | | 1.5 | | 4/1/2020 | | | 18,185,341 | |
| | 20,650,000 | | Federal Home Loan Mortgage Corp. | | | 1.375 | | 5/1/2020 | | | 20,730,185 | |
| | 46,940,000 | | Federal National Mortgage Association | | | 1.05-6.08 | | 11/15/2017- 10/23/2036 | | | 47,785,043 | |
| Total Collateral Value | | | 86,700,569 | |
(i) Collateralized by $26,210,800 U.S. Treasury Bond, 4.625%, maturing on 2/15/2040 with a value of $35,804,331.
(j) Collateralized by $91,947,100 U.S. Treasury Note, 11.25%, maturing on 2/15/2015 with a value of $112,200,034.
(k) Collateralized by $401,096,407 Federal Home Loan Mortgage Corp., with the various coupon rates from 3.0-5.0%, with various maturity dates of 2/1/2026-4/1/2043 with a value of $432,480,000.
(l) Collateralized by $134,311,400 U.S. Treasury Notes, with the various coupon rates from 3.125-4.0%, with various maturity dates of 8/31/2013-2/15/2014 with a value of $137,705,131.
(m) Collateralized by:
| Principal Amount ($) | | Security | | Rate (%) | | Maturity Date | | Collateral Value ($) | |
| | 660 | | Federal Home Loan Mortgage Corp. | | | 9.5 | | 11/15/2021 | | | 13,281 | |
| | 94,546,134 | | Federal National Mortgage Association | | Zero Coupon-4.0 | | 10/1/2027- 4/1/2043 | | | 101,986,720 | |
| Total Collateral Value | | | 102,000,001 | |
(n) Collateralized by:
| Principal Amount ($) | | Security | | Rate (%) | | Maturity Date | | Collateral Value ($) | |
| | 21,837,000 | | U.S. Treasury Bonds | | | 4.5-6.0 | | 2/15/2026- 5/15/2038 | | | 30,623,017 | |
| | 45,084,400 | | U.S. Treasury Notes | | | 0.125-1.875 | | 12/31/2013- 9/30/2019 | | | 45,877,044 | |
| Total Collateral Value | | | 76,500,061 | |
144A: Security exempt from registration under Rule 144A of the Securities Act of 1933. These securities may be resold in transactions exempt from registration, normally to qualified institutional buyers.
Interest Only: Interest Only (IO) bonds represent the "interest only" portion of payments on a pool of underlying mortgages or mortgage-backed securities. IO securities are subject to prepayment risk of the pool of underlying mortgages.
Fair Value Measurements
Various inputs are used in determining the value of the Fund's investments. These inputs are summarized in three broad levels. Level 1 includes quoted prices in active markets for identical securities. Level 2 includes other significant observable inputs (including quoted prices for similar securities, interest rates, prepayment speeds and credit risk). Level 3 includes significant unobservable inputs (including the Fund's own assumptions in determining the fair value of investments). The inputs or methodology used for valuing securities are not necessarily an indication of the risk associated with investing in those securities. Securities held by the Fund are reflected as Level 2 because the securities are valued at amortized cost (which approximates fair value) and, accordingly, the inputs used to determine value are not quoted prices in an active market.
The following is a summary of the inputs used as of April 30, 2013 in valuing the Fund's investments. For information on the Fund's policy regarding the valuation of investments, please refer to the Security Valuation section of Note 1 in the accompanying Notes to Financial Statements.
| Assets | | Level 1 | | | Level 2 | | | Level 3 | | | Total | |
| | |
| Investments in Securities (o) | | $ | — | | | $ | 1,524,069,477 | | | $ | — | | | $ | 1,524,069,477 | |
| Repurchase Agreements | | | — | | | | 1,416,102,212 | | | | — | | | | 1,416,102,212 | |
| Total | | $ | — | | | $ | 2,940,171,689 | | | $ | — | | | $ | 2,940,171,689 | |
There have been no transfers between fair value measurement levels during the year ended April 30, 2013.
(o) See Investment Portfolio for additional detailed categorizations.
The accompanying notes are an integral part of the financial statements.
Statement of Assets and Liabilities | as of April 30, 2013 | |
| Assets | | Government & Agency Securities Portfolio | |
Investments: Investments in non-affiliated securities, valued at amortized cost | | $ | 1,524,069,477 | |
| Repurchase agreements, valued at amortized cost | | | 1,416,102,212 | |
| Total investments in securities, valued at amortized cost | | | 2,940,171,689 | |
| Receivable for Fund shares sold | | | 200,399 | |
| Interest receivable | | | 1,067,727 | |
| Due from Advisor | | | 27,126 | |
| Other assets | | | 71,710 | |
| Total assets | | | 2,941,538,651 | |
| Liabilities | |
| Payable for Fund shares redeemed | | | 794,880 | |
| Distributions payable | | | 25,829 | |
| Accrued Trustees' fees | | | 28,311 | |
| Other accrued expenses and payables | | | 332,469 | |
| Total liabilities | | | 1,181,489 | |
| Net assets, at value | | $ | 2,940,357,162 | |
| Net Assets Consist of | |
| Undistributed net investment income | | | 201,505 | |
| Accumulated net realized gain (loss) | | | (435,501 | ) |
| Paid-in capital | | | 2,940,591,158 | |
| Net assets, at value | | $ | 2,940,357,162 | |
The accompanying notes are an integral part of the financial statements.
Statement of Assets and Liabilities as of April 30, 2013 (continued) | |
| Net Asset Value | | Government & Agency Securities Portfolio | |
Capital Assets Funds Shares Net Asset Value, offering and redemption price per share ($137,808,041 ÷ 137,818,174 outstanding shares of beneficial interest, no par value, unlimited number of shares authorized) | | $ | 1.00 | |
Davidson Cash Equivalent Shares Net Asset Value, offering and redemption price per share ($20,267,423 ÷ 20,268,915 outstanding shares of beneficial interest, no par value, unlimited number of shares authorized) | | $ | 1.00 | |
Davidson Cash Equivalent Plus Shares Net Asset Value, offering and redemption price per share ($108,250,027 ÷ 108,257,988 outstanding shares of beneficial interest, no par value, unlimited number of shares authorized) | | $ | 1.00 | |
DWS Government & Agency Money Fund Net Asset Value, offering and redemption price per share ($117,365,297 ÷ 117,373,968 outstanding shares of beneficial interest, no par value, unlimited number of shares authorized) | | $ | 1.00 | |
DWS Government Cash Institutional Shares Net Asset Value, offering and redemption price per share ($2,256,081,997 ÷ 2,256,247,886 outstanding shares of beneficial interest, no par value, unlimited number of shares authorized) | | $ | 1.00 | |
Government Cash Managed Shares Net Asset Value, offering and redemption price per share ($222,242,097 ÷ 222,258,439 outstanding shares of beneficial interest, no par value, unlimited number of shares authorized) | | $ | 1.00 | |
Service Shares Net Asset Value, offering and redemption price per share ($78,342,280 ÷ 78,348,040 outstanding shares of beneficial interest, no par value, unlimited number of shares authorized) | | $ | 1.00 | |
The accompanying notes are an integral part of the financial statements.
| for the year ended April 30, 2013 | |
| Investment Income | | Government & Agency Securities Portfolio | |
Income: Interest | | $ | 5,237,165 | |
Expenses: Management fee | | | 1,898,580 | |
| Administration fee | | | 2,969,292 | |
| Services to shareholders | | | 1,499,291 | |
| Distribution and service fees | | | 2,540,744 | |
| Custodian fee | | | 55,371 | |
| Professional fees | | | 135,387 | |
| Reports to shareholders | | | 139,606 | |
| Registration fees | | | 135,888 | |
| Trustees' fees and expenses | | | 135,253 | |
| Other | | | 134,035 | |
| Total expenses before expense reductions | | | 9,643,447 | |
| Expense reductions | | | (5,144,848 | ) |
| Total expenses after expense reductions | | | 4,498,599 | |
| Net investment income | | | 738,566 | |
| Net realized gain (loss) from investments | | | 11,278 | |
| Net increase (decrease) in net assets resulting from operations | | $ | 749,844 | |
The accompanying notes are an integral part of the financial statements.
Statement of Changes in Net Assets | | | Government & Agency Securities Portfolio | |
| Increase (Decrease) in Net Assets | | Years Ended April 30, | |
| | 2013 | | | 2012 | |
Operations: Net investment income | | $ | 738,566 | | | $ | 1,255,673 | |
| Net realized gain (loss) | | | 11,278 | | | | 155,718 | |
| Net increase in net assets resulting from operations | | | 749,844 | | | | 1,411,391 | |
Distributions to shareholders from: Net investment income: Capital Assets Funds Shares | | | (17,994 | ) | | | (24,512 | ) |
| Davidson Cash Equivalent Shares | | | (2,284 | ) | | | (2,348 | ) |
| Davidson Cash Equivalent Plus Shares | | | (9,941 | ) | | | (7,569 | ) |
| DWS Government & Agency Money Fund | | | (12,034 | ) | | | (14,615 | ) |
| DWS Government Cash Institutional Shares | | | (662,372 | ) | | | (1,165,027 | ) |
| Government Cash Managed Shares | | | (24,703 | ) | | | (24,030 | ) |
| Service Shares | | | (9,225 | ) | | | (17,564 | ) |
| Total distributions | | | (738,553 | ) | | | (1,255,665 | ) |
Fund share transactions: Proceeds from shares sold | | | 17,983,371,115 | | | | 33,927,293,511 | |
| Reinvestment of distributions | | | 400,224 | | | | 717,672 | |
| Cost of shares redeemed | | | (18,573,676,534 | ) | | | (35,969,779,735 | ) |
| Net increase (decrease) in net assets from Fund share transactions | | | (589,905,195 | ) | | | (2,041,768,552 | ) |
| Increase (decrease) in net assets | | | (589,893,904 | ) | | | (2,041,612,826 | ) |
| Net assets at beginning of period | | | 3,530,251,066 | | | | 5,571,863,892 | |
| Net assets at end of period (including undistributed net investment income of $201,505 and $201,492, respectively) | | $ | 2,940,357,162 | | | $ | 3,530,251,066 | |
The accompanying notes are an integral part of the financial statements.
Government & Agency Securities Portfolio DWS Government Cash Institutional Shares | |
| | | Years Ended April 30, | |
| | 2013 | | | 2012 | | | 2011 | | | 2010 | | | 2009 | |
| Selected Per Share Data | |
| Net asset value, beginning of period | | $ | 1.00 | | | $ | 1.00 | | | $ | 1.00 | | | $ | 1.00 | | | $ | 1.00 | |
Income (loss) from investment operations: Net investment income | | | .000 | * | | | .000 | * | | | .001 | | | | .001 | | | | .015 | |
| Net realized gain (loss) | | | .000 | * | | | .000 | * | | | (.000 | )* | | | .000 | * | | | .000 | * |
| Total from investment operations | | | .000 | * | | | .000 | * | | | .001 | | | | .001 | | | | .015 | |
Less distributions from: Net investment income | | | (.000 | )* | | | (.000 | )* | | | (.001 | ) | | | (.001 | ) | | | (.015 | ) |
| Net realized gains | | | — | | | | — | | | | — | | | | (.000 | )* | | | — | |
| Total distributions | | | (.000 | )* | | | (.000 | )* | | | (.001 | ) | | | (.001 | ) | | | (.015 | ) |
| Net asset value, end of period | | $ | 1.00 | | | $ | 1.00 | | | $ | 1.00 | | | $ | 1.00 | | | $ | 1.00 | |
Total Return (%)a | | | .03 | | | | .04 | | | | .06 | | | | .14 | | | | 1.49 | |
| Ratios to Average Net Assets and Supplemental Data | |
| Net assets, end of period ($ millions) | | | 2,256 | | | | 2,713 | | | | 4,772 | | | | 6,899 | | | | 14,646 | |
| Ratio of expenses before expense reductions (%) | | | .20 | | | | .19 | | | | .19 | | | | .19 | | | | .21 | |
| Ratio of expenses after expense reductions (%) | | | .15 | | | | .08 | | | | .16 | | | | .18 | | | | .20 | |
| Ratio of net investment income (%) | | | .03 | | | | .04 | | | | .07 | | | | .14 | | | | .94 | b |
a Total return would have been lower had certain expenses not been reduced. b Due to the timing of the subscriptions and redemptions, the amount shown does not correspond to the total return during the period. * Amount is less than $.0005. | |
Government & Agency Securities Portfolio Government Cash Managed Shares | |
| | | Years Ended April 30, | |
| | | 2013 | | | 2012 | | | 2011 | | | 2010 | | | 2009 | |
| Selected Per Share Data | |
| Net asset value, beginning of period | | $ | 1.00 | | | $ | 1.00 | | | $ | 1.00 | | | $ | 1.00 | | | $ | 1.00 | |
Income (loss) from investment operations: Net investment income | | | .000 | * | | | .000 | * | | | .000 | * | | | .000 | * | | | .013 | |
| Net realized gain (loss) | | | .000 | * | | | .000 | * | | | (.000 | )* | | | .000 | * | | | .000 | * |
| Total from investment operations | | | .000 | * | | | .000 | * | | | .000 | * | | | .000 | * | | | .013 | |
Less distributions from: Net investment income | | | (.000 | )* | | | (.000 | )* | | | (.000 | )* | | | (.000 | )* | | | (.013 | ) |
| Net realized gains | | | — | | | | — | | | | — | | | | (.000 | )* | | | — | |
| Total distributions | | | (.000 | )* | | | (.000 | )* | | | (.000 | )* | | | (.000 | )* | | | (.013 | ) |
| Net asset value, end of period | | $ | 1.00 | | | $ | 1.00 | | | $ | 1.00 | | | $ | 1.00 | | | $ | 1.00 | |
Total Return (%)a | | | .01 | | | | .01 | | | | .01 | | | | .02 | | | | 1.27 | |
| Ratios to Average Net Assets and Supplemental Data | |
| Net assets, end of period ($ millions) | | | 222 | | | | 215 | | | | 180 | | | | 280 | | | | 477 | |
| Ratio of expenses before expense reductions (%) | | | .42 | | | | .41 | | | | .41 | | | | .42 | | | | .44 | |
| Ratio of expenses after expense reductions (%) | | | .17 | | | | .11 | | | | .22 | | | | .31 | | | | .43 | |
| Ratio of net investment income (%) | | | .01 | | | | .01 | | | | .01 | | | | .02 | | | | 1.05 | b |
a Total return would have been lower had certain expenses not been reduced. b Due to the timing of the subscriptions and redemptions, the amount shown does not correspond to the total return during the period. * Amount is less than $.0005. | |
Notes to Financial Statements
1. Organization and Significant Accounting Policies
Cash Account Trust (the "Trust") is registered under the Investment Company Act of 1940, as amended (the "1940 Act"), as an open-end investment management company organized as a Massachusetts business trust.
The Trust offers three funds: Money Market Portfolio, Government & Agency Securities Portfolio and Tax-Exempt Portfolio. These financial statements report on Government & Agency Securities Portfolio (the "Fund").
Government & Agency Securities Portfolio offers seven classes of shares: Capital Assets Funds Shares, Davidson Cash Equivalent Shares, Davidson Cash Equivalent Plus Shares, DWS Government & Agency Money Fund, DWS Government Cash Institutional Shares, Government Cash Managed Shares and Service Shares.
The financial highlights for all classes of shares, other than DWS Government Cash Institutional Shares and Government Cash Managed Shares, are provided separately and are available upon request.
The Fund's investment income, realized gains and losses, and certain Fund-level expenses and expense reductions, if any, are borne pro rata on the basis of relative net assets by the holders of all classes of shares of the Fund, except that each class bears certain expenses unique to that class such as distribution and service fees, services to shareholders and certain other class-specific expenses. Differences in class-level expenses may result in payment of different per share dividends by class. All shares of the Trust have equal rights with respect to voting subject to class-specific arrangements.
The Fund's financial statements are prepared in accordance with accounting principles generally accepted in the United States of America which require the use of management estimates. Actual results could differ from those estimates. The policies described below are followed consistently by the Fund in the preparation of its financial statements.
Security Valuation. Various inputs are used in determining the value of the Fund's investments. These inputs are summarized in three broad levels. Level 1 includes quoted prices in active markets for identical securities. Level 2 includes other significant observable inputs (including quoted prices for similar securities, interest rates, prepayment speeds, and credit risk). Level 3 includes significant unobservable inputs (including the Fund's own assumptions in determining the fair value of investments). The inputs or methodology used for valuing securities are not necessarily an indication of the risk associated with investing in those securities.
The Fund values all securities utilizing the amortized cost method permitted in accordance with Rule 2a-7 under the 1940 Act and certain conditions therein. Under this method, which does not take into account unrealized capital gains or losses on securities, an instrument is initially valued at its cost and thereafter assumes a constant accretion/amortization rate to maturity of any discount or premium. Securities held by the Fund are reflected as Level 2 because the securities are valued at amortized cost (which approximates fair value) and, accordingly, the inputs used to determine value are not quoted prices in an active market.
Disclosure about the classification of fair value measurements is included in a table following the Fund's Investment Portfolio.
New Accounting Pronouncement. In January 2013, Accounting Standard Update 2013-01 (ASU 2013-01), Clarifying the Scope of Disclosures about Offsetting Assets and Liabilities, replaced Accounting Standards Update 2011-11 (ASU 2011-11), Disclosures about Offsetting Assets and Liabilities. ASU 2013-01 is effective for fiscal years beginning on or after January 1, 2013, and interim periods within those annual periods. ASU 2011-11 was intended to enhance disclosure requirements on the offsetting of financial assets and liabilities. The ASU 2013-01 limits the scope of the new balance sheet offsetting disclosures to derivatives, repurchase agreements, and securities lending transactions to the extent that they are (1) offset in the financial statements or (2) subject to an enforceable master netting arrangement or similar agreement. Management is currently evaluating the application of ASU 2013-01 and its impact, if any, on the Fund's financial statements.
Repurchase Agreements. The Fund may enter into repurchase agreements with certain banks and broker/dealers whereby the Fund, through its custodian or a sub-custodian bank, receives delivery of the underlying securities, the amount of which at the time of purchase and each subsequent business day is required to be maintained at such a level that the market value is equal to at least the principal amount of the repurchase price plus accrued interest. The custodial bank or another designated subcustodian holds the collateral in a separate account until the agreement matures. If the value of the securities falls below the principal amount of the repurchase agreement plus accrued interest, the financial institution deposits additional collateral by the following business day. If the financial institution either fails to deposit the required additional collateral or fails to repurchase the securities as agreed, the Fund has the right to sell the securities and recover any resulting loss from the financial institution. If the financial institution enters into bankruptcy, the Fund's claims on the collateral may be subject to legal proceedings.
Federal Income Taxes. The Fund's policy is to comply with the requirements of the Internal Revenue Code, as amended, which are applicable to regulated investment companies and to distribute all of its taxable and tax-exempt income to its shareholders.
Under the Regulated Investment Company Modernization Act of 2010, net capital losses may be carried forward indefinitely, and their character is retained as short-term and/or long-term losses. Previously, net capital losses were carried forward for eight years and treated as short-term losses. As a transition rule, the Act requires that post-enactment net capital losses be used before pre-enactment net capital losses.
At April 30, 2013, the Fund had a net tax basis capital loss carryforward of approximately $436,000 of pre-enactment losses, which may be applied against any realized net taxable capital gains of each succeeding year until fully utilized or until April 30, 2019 (the expiration date), whichever occurs first.
The Fund has reviewed the tax positions for the open tax years as of April 30, 2013 and has determined that no provision for income tax is required in the Fund's financial statements. The Fund's federal tax returns for the prior three fiscal years remain open subject to examination by the Internal Revenue Service.
Distribution of Income. Net investment income of the Fund is declared as a daily dividend and is distributed to shareholders monthly. The Fund may take into account capital gains and losses in its daily dividend declarations. The Fund may also make additional distributions for tax purposes if necessary.
Permanent book and tax basis differences relating to shareholder distributions will result in reclassifications to paid in capital. Temporary book and tax basis differences will reverse in a subsequent period. There were no significant book-to-tax differences for the Fund.
At April 30, 2013, the Fund's components of distributable earnings on a tax basis are as follows:
| Undistributed ordinary income* | | $ | 227,334 | |
| Capital loss carryforwards | | $ | (436,000 | ) |
In addition, the tax character of distributions paid to shareholders by the Fund is summarized as follows:
| | | Years Ended April 30, | |
| | | 2013 | | | 2012 | |
| Distributions from ordinary income* | | $ | 738,553 | | | $ | 1,255,665 | |
* For tax purposes, short-term capital gain distributions are considered ordinary income distributions.
Expenses. Expenses of the Trust arising in connection with a specific Fund are allocated to that Fund. Other Trust expenses which cannot be directly attributed to a Fund are apportioned pro rata on the basis of relative net assets among the funds in the Trust based upon the relative net assets or other appropriate measures.
Contingencies. In the normal course of business, the Fund may enter into contracts with service providers that contain general indemnification clauses. The Fund's maximum exposure under these arrangements is unknown as this would involve future claims that may be made against the Fund that have not yet been made. However, based on experience, the Fund expects the risk of loss to be remote.
Other. Investment transactions are accounted for on trade date. Interest income is recorded on the accrual basis. Realized gains and losses from investment transactions are recorded on an identified cost basis and may include proceeds from litigation. All discounts and premiums are accreted/amortized for both tax and financial reporting purposes.
2. Related Parties
Management Agreement. Under an Amended and Restated Investment Management Agreement with Deutsche Investment Management Americas Inc. ("DIMA" or the "Advisor"), an indirect, wholly owned subsidiary of Deutsche Bank AG, the Advisor directs the investments of the Fund in accordance with its investment objectives, policies and restrictions. The Advisor determines the securities, instruments and other contracts relating to investments to be purchased, sold or entered into by the Fund.
The Fund pays a monthly management fee based on the combined average daily net assets of the three Funds in the Trust and allocated to the Fund based on its relative net assets, computed and accrued daily and payable monthly, at the following annual rates:
| First $500 million of the Funds' combined average daily net assets | | | .120 | % |
| Next $500 million of such net assets | | | .100 | % |
| Next $1 billion of such net assets | | | .075 | % |
| Next $1 billion of such net assets | | | .060 | % |
| Over $3 billion of such net assets | | | .050 | % |
The Advisor has agreed to contractually reduce its management fee for the Fund such that the annual effective rate is limited to 0.05% of the Fund's average daily net assets.
For the period from May 1, 2012 through September 30, 2013, the Advisor has contractually agreed to waive its fees and/or reimburse certain operating expenses of the DWS Government Cash Institutional Shares and Government Cash Managed Shares to the extent necessary to maintain the operating expenses (excluding certain expenses such as extraordinary expenses, taxes, brokerage and interest) at 0.23% and 0.46%, respectively.
The Advisor has agreed to voluntarily waive additional expenses. The voluntary waiver may be changed or terminated at any time without notice. Under these arrangements, the Advisor waived certain expenses on DWS Government Cash Institutional Shares and Government Cash Managed Shares.
Accordingly, for the year ended April 30, 2013, the Advisor earned a management fee on the Fund aggregating $1,898,580, of which $1,332,763 was waived, resulting in an annual effective rate of 0.02% of the Fund's average daily net assets.
The Advisor has also agreed to maintain expenses of certain other classes of the Trust. These rates are disclosed in the respective share classes' annual reports that are provided separately and are available upon request.
Administration Fee. Pursuant to an Administrative Services Agreement, DIMA provides most administrative services to the Fund. For all services provided under the Administrative Services Agreement, the Fund pays the Advisor an annual fee ("Administration Fee") of 0.10% of the Fund's average daily net assets, computed and accrued daily and payable monthly. For the year ended April 30, 2013, the Administration Fee was as follows:
| | | Administration Fee | | | Unpaid at April 30, 2013 | |
| Government & Agency Securities Portfolio | | $ | 2,969,292 | | | $ | 237,874 | |
Service Provider Fees. DWS Investments Service Company ("DISC"), an affiliate of the Advisor, is the transfer agent, dividend-paying agent and shareholder service agent for the Fund. Pursuant to a sub-transfer agency agreement between DISC and DST Systems, Inc. ("DST"), DISC has delegated certain transfer agent, dividend-paying agent and shareholder service agent functions to DST. DISC compensates DST out of the shareholder servicing fee it receives from the Fund. For the year ended April 30, 2013, the amounts charged to the Fund by DISC were as follows:
| Government & Agency Securities Portfolio: | | Total Aggregated | | | Waived | | | Unpaid at April 30, 2013 | |
| Capital Assets Funds Shares | | $ | 446,473 | | | $ | 407,085 | | | $ | 21,372 | |
| Davidson Cash Equivalent Shares | | | 57,088 | | | | 52,121 | | | | 618 | |
| Davidson Cash Equivalent Plus Shares | | | 198,754 | | | | 177,388 | | | | 6,098 | |
| DWS Government & Agency Money Fund | | | 108,301 | | | | 82,446 | | | | 9,591 | |
| DWS Government Cash Institutional Shares | | | 194,797 | | | | 194,797 | | | | — | |
| Government Cash Managed Shares | | | 197,828 | | | | 145,451 | | | | 10,765 | |
| Service Shares | | | 230,680 | | | | 212,053 | | | | 3,333 | |
| | | $ | 1,433,921 | | | $ | 1,271,341 | | | $ | 51,777 | |
Distribution Service Agreement. Under the Distribution Service Agreement, in accordance with Rule 12b-1 under the 1940 Act, DWS Investments Distributors, Inc. ("DIDI"), an affiliate of the Advisor, receives a fee ("Distribution Fee"), calculated as a percentage of average daily net assets for the shares listed in the following table.
For the year ended April 30, 2013, the Distribution Fee was as follows:
| Government & Agency Securities Portfolio: | | Distribution Fee | | | Waived | | | Annual Effective Rate | | | Contractual Rate (Up To) | |
| Capital Assets Funds Shares | | $ | 593,656 | | | $ | 593,656 | | | | .00 | % | | | .33 | % |
| Davidson Cash Equivalent Shares | | | 68,505 | | | | 68,505 | | | | .00 | % | | | .30 | % |
| Davidson Cash Equivalent Plus Shares | | | 248,443 | | | | 248,443 | | | | .00 | % | | | .25 | % |
| Service Shares | | | 553,631 | | | | 553,631 | | | | .00 | % | | | .60 | % |
| | | $ | 1,464,235 | | | $ | 1,464,235 | | | | | | | | | |
In addition, DIDI provides information and administrative services for a fee ("Service Fee") for the shares listed in the following table. A portion of these fees may be paid pursuant to a Rule 12b-1 plan.
For the year ended April 30, 2013, the Service Fee was as follows:
| Government & Agency Securities Portfolio: | | Service Fee | | | Waived | | | Annual Effective Rate | | | Contractual Rate (Up To) | |
| Capital Assets Funds Shares | | $ | 449,739 | | | $ | 449,739 | | | | .00 | % | | | .25 | % |
| Davidson Cash Equivalent Shares | | | 57,088 | | | | 57,088 | | | | .00 | % | | | .25 | % |
| Davidson Cash Equivalent Plus Shares | | | 198,754 | | | | 198,754 | | | | .00 | % | | | .20 | % |
| Government Cash Managed Shares | | | 370,928 | | | | 370,928 | | | | .00 | % | | | .15 | % |
| | | $ | 1,076,509 | | | $ | 1,076,509 | | | | | | | | | |
Typesetting and Filing Service Fees. Under an agreement with DIMA, DIMA is compensated for providing typesetting and certain regulatory filing services to the Fund. For the year ended April 30, 2013, the amount charged to the Fund by DIMA included in the Statement of Operations under "reports to shareholders" expenses was as follows:
| | | Total Aggregated | | | Unpaid at April 30, 2013 | |
| Government & Agency Securities Portfolio | | $ | 56,466 | | | $ | 19,054 | |
Trustees' Fees and Expenses. The Fund paid retainer fees to each Trustee not affiliated with the Advisor, plus specified amounts to the Board Chairperson and Vice Chairperson and to each committee Chairperson.
3. Concentration of Ownership
From time to time, the Fund may have a concentration of several shareholder accounts holding a significant percentage of shares outstanding. Investment activities of these shareholders could have a material impact on the Fund.
At April 30, 2013, there was one shareholder account that held approximately 13% of the outstanding shares of the Fund.
4. Line of Credit
The Fund and other affiliated funds (the "Participants") share in a $375 million revolving credit facility provided by a syndication of banks. The Fund may borrow for temporary or emergency purposes, including the meeting of redemption requests that otherwise might require the untimely disposition of securities. The Participants are charged an annual commitment fee which is allocated based on net assets, among each of the Participants. Interest is calculated at a rate per annum equal to the sum of the Federal Funds Rate plus 1.25 percent plus, if LIBOR exceeds the Federal Funds Rate, the amount of such excess. The Fund may borrow up to a maximum of 33 percent of its net assets under the agreement. The Fund had no outstanding loans at April 30, 2013.
5. Share Transactions
The following table summarizes share and dollar activity in the Fund:
Government & Agency Securities Portfolio
| | | Year Ended April 30, 2013 | | | Year Ended April 30, 2012 | |
| | | Shares | | | Dollars | | | Shares | | | Dollars | |
| Shares sold | |
| Capital Assets Funds Shares | | | 106,697,232 | | | $ | 106,697,232 | | | | 447,922,936 | | | $ | 447,922,936 | |
| Davidson Cash Equivalent Shares | | | 31,099,071 | | | | 31,099,071 | | | | 41,768,083 | | | | 41,768,083 | |
| Davidson Cash Equivalent Plus Shares | | | 222,327,364 | | | | 222,327,364 | | | | 213,635,877 | | | | 213,635,877 | |
| DWS Government & Agency Money Fund | | | 53,121,349 | | | | 53,121,349 | | | | 61,520,170 | | | | 61,520,170 | |
| DWS Government Cash Institutional Shares | | | 15,315,065,657 | | | | 15,315,065,657 | | | | 30,092,618,931 | | | | 30,092,618,931 | |
| Government Cash Managed Shares | | | 1,990,326,289 | | | | 1,990,326,289 | | | | 2,673,520,482 | | | | 2,673,520,482 | |
| Service Shares | | | 264,734,153 | | | | 264,734,153 | | | | 396,307,032 | | | | 396,307,032 | |
| | | | | | | $ | 17,983,371,115 | | | | | | | $ | 33,927,293,511 | |
| Shares issued to shareholders in reinvestment of distributions | |
| Capital Assets Funds Shares | | | 17,994 | | | $ | 17,994 | | | | 24,434 | | | $ | 24,434 | |
| Davidson Cash Equivalent Shares | | | 2,284 | | | | 2,284 | | | | 2,343 | | | | 2,343 | |
| Davidson Cash Equivalent Plus Shares | | | 9,940 | | | | 9,940 | | | | 7,560 | | | | 7,560 | |
| DWS Government & Agency Money Fund | | | 11,818 | | | | 11,818 | | | | 13,959 | | | | 13,959 | |
| DWS Government Cash Institutional Shares | | | 341,515 | | | | 341,515 | | | | 644,365 | | | | 644,365 | |
| Government Cash Managed Shares | | | 7,714 | | | | 7,714 | | | | 7,755 | | | | 7,755 | |
| Service Shares | | | 8,959 | | | | 8,959 | | | | 17,256 | | | | 17,256 | |
| | | | | | | $ | 400,224 | | | | | | | $ | 717,672 | |
| Shares redeemed | |
| Capital Assets Funds Shares | | | (205,489,534 | ) | | $ | (205,489,534 | ) | | | (495,723,357 | ) | | $ | (495,723,357 | ) |
| Davidson Cash Equivalent Shares | | | (35,645,815 | ) | | | (35,645,815 | ) | | | (36,015,591 | ) | | | (36,015,591 | ) |
| Davidson Cash Equivalent Plus Shares | | | (207,586,537 | ) | | | (207,586,537 | ) | | | (153,400,457 | ) | | | (153,400,457 | ) |
| DWS Government & Agency Money Fund | | | (75,265,565 | ) | | | (75,265,565 | ) | | | (92,132,646 | ) | | | (92,132,646 | ) |
| DWS Government Cash Institutional Shares | | | (15,771,839,065 | ) | | | (15,771,839,065 | ) | | | (32,152,791,854 | ) | | | (32,152,791,854 | ) |
| Government Cash Managed Shares | | | (1,983,483,875 | ) | | | (1,983,483,875 | ) | | | (2,637,952,274 | ) | | | (2,637,952,274 | ) |
| Service Shares | | | (294,366,143 | ) | | | (294,366,143 | ) | | | (401,763,556 | ) | | | (401,763,556 | ) |
| | | | | | | $ | (18,573,676,534 | ) | | | | | | $ | (35,969,779,735 | ) |
| Net increase (decrease) | |
| Capital Assets Funds Shares | | | (98,774,308 | ) | | $ | (98,774,308 | ) | | | (47,775,987 | ) | | $ | (47,775,987 | ) |
| Davidson Cash Equivalent Shares | | | (4,544,460 | ) | | | (4,544,460 | ) | | | 5,754,835 | | | | 5,754,835 | |
| Davidson Cash Equivalent Plus Shares | | | 14,750,767 | | | | 14,750,767 | | | | 60,242,980 | | | | 60,242,980 | |
| DWS Government & Agency Money Fund | | | (22,132,398 | ) | | | (22,132,398 | ) | | | (30,598,517 | ) | | | (30,598,517 | ) |
| DWS Government Cash Institutional Shares | | | (456,431,893 | ) | | | (456,431,893 | ) | | | (2,059,528,558 | ) | | | (2,059,528,558 | ) |
| Government Cash Managed Shares | | | 6,850,128 | | | | 6,850,128 | | | | 35,575,963 | | | | 35,575,963 | |
| Service Shares | | | (29,623,031 | ) | | | (29,623,031 | ) | | | (5,439,268 | ) | | | (5,439,268 | ) |
| | | | | | | $ | (589,905,195 | ) | | | | | | $ | (2,041,768,552 | ) |
Report of Independent Registered Public Accounting Firm
To the Shareholders and Board of Trustees of Cash Account Trust:
We have audited the accompanying statement of assets and liabilities of Government & Agency Securities Portfolio (the "Fund") (one of the Funds comprising Cash Account Trust), including the investment portfolio, as of April 30, 2013, and the related statement of operations for the year then ended, the statement of changes in net assets for each of the two years in the period then ended, and the financial highlights for each of the five years in the period then ended. These financial statements and financial highlights are the responsibility of the Fund's management. Our responsibility is to express an opinion on these financial statements and financial highlights based on our audits.
We conducted our audits in accordance with the standards of the Public Company Accounting Oversight Board (United States). Those standards require that we plan and perform the audit to obtain reasonable assurance about whether the financial statements and financial highlights are free of material misstatement. We were not engaged to perform an audit of the Fund's internal control over financial reporting. Our audits included consideration of internal control over financial reporting as a basis for designing audit procedures that are appropriate in the circumstances, but not for the purpose of expressing an opinion on the effectiveness of the Fund's internal control over financial reporting. Accordingly, we express no such opinion. An audit also includes examining, on a test basis, evidence supporting the amounts and disclosures in the financial statements and financial highlights, assessing the accounting principles used and significant estimates made by management, and evaluating the overall financial statement presentation. Our procedures included confirmation of securities owned as of April 30, 2013, by correspondence with the custodian and brokers. We believe that our audits provide a reasonable basis for our opinion.
In our opinion, the financial statements and financial highlights referred to above present fairly, in all material respects, the financial position of Government & Agency Securities Portfolio at April 30, 2013, the results of its operations for the year then ended, the changes in its net assets for each of the two years in the period then ended, and the financial highlights for each of the five years in the period then ended, in conformity with U.S. generally accepted accounting principles.
| | | |
Boston, Massachusetts June 19, 2013 | | |
Information About Your Fund's Expenses
As an investor of the Fund, you incur two types of costs: ongoing expenses and transaction costs. Ongoing expenses include management fees, distribution and service (12b-1) fees and other Fund expenses. Examples of transaction costs include account maintenance fees, which are not shown in this section. The following tables are intended to help you understand your ongoing expenses (in dollars) of investing in the Fund and to help you compare these expenses with the ongoing expenses of investing in other mutual funds. In the most recent six-month period, the Fund limited these expenses; had it not done so, expenses would have been higher for the DWS Government Cash Institutional Shares and the Government Cash Managed Shares. The example in the table is based on an investment of $1,000 invested at the beginning of the six-month period and held for the entire period (November 1, 2012 to April 30, 2013).
The tables illustrate your Fund's expenses in two ways:
•Actual Fund Return. This helps you estimate the actual dollar amount of ongoing expenses (but not transaction costs) paid on a $1,000 investment in the Fund using the Fund's actual return during the period. To estimate the expenses you paid over the period, simply divide your account value by $1,000 (for example, an $8,600 account value divided by $1,000 = 8.6), then multiply the result by the number in the "Expenses Paid per $1,000" line under the share class you hold.
• Hypothetical 5% Fund Return. This helps you to compare your Fund's ongoing expenses (but not transaction costs) with those of other mutual funds using the Fund's actual expense ratio and a hypothetical rate of return of 5% per year before expenses. Examples using a 5% hypothetical fund return may be found in the shareholder reports of other mutual funds. The hypothetical account values and expenses may not be used to estimate the actual ending account balance or expenses you paid for the period.
Please note that the expenses shown in these tables are meant to highlight your ongoing expenses only and do not reflect any transaction costs. The "Expenses Paid per $1,000" line of the tables is useful in comparing ongoing expenses only and will not help you determine the relative total expense of owning different funds. If these transaction costs had been included, your costs would have been higher.
Expenses and Value of a $1,000 Investment for the six months ended April 30, 2013 (Unaudited) | |
| Actual Fund Return | | DWS Government Cash Institutional Shares | | | Government Cash Managed Shares | |
| Beginning Account Value 11/1/12 | | $ | 1,000.00 | | | $ | 1,000.00 | |
| Ending Account Value 4/30/13 | | $ | 1,000.15 | | | $ | 1,000.05 | |
Expenses Paid per $1,000* | | $ | .69 | | | $ | .79 | |
| Hypothetical 5% Fund Return | | | | | | | | |
| Beginning Account Value 11/1/12 | | $ | 1,000.00 | | | $ | 1,000.00 | |
| Ending Account Value 4/30/13 | | $ | 1,024.10 | | | $ | 1,024.00 | |
Expenses Paid per $1,000* | | $ | .70 | | | $ | .80 | |
| * Expenses are equal to the Fund's annualized expense ratio for each share class, multiplied by the average account value over the period, multiplied by 181 (the number of days in the most recent six-month period), then divided by 365. | |
| Annualized Expense Ratios | |
| DWS Government Cash Institutional Shares | | | | .14 | % |
| Government Cash Managed Shares | | | | .16 | % |
For more information, please refer to each Fund's prospectus. For an analysis of the fees associated with an investment in the Fund or similar funds, please refer to http://apps.finra.org/fundanalyzer/1/fa.aspx. | |
Tax Information (Unaudited)
A total of 31% of the dividends distributed during the fiscal year was derived from interest on U.S. government securities, which is generally exempt from state income tax.
Please consult a tax advisor if you have questions about federal or state income tax laws, or on how to prepare your tax returns. If you have specific questions about your account, please call (800) 728-3337.
Proxy Voting
The Fund's policies and procedures for voting proxies for portfolio securities and information about how the Fund voted proxies related to its portfolio securities during the 12-month period ended June 30 are available on our Web site — www.dws-investments.com (click on "proxy voting" at the bottom of the page) — or on the SEC's Web site — www.sec.gov. To obtain a written copy of the Fund's policies and procedures without charge, upon request, call us toll free at (800) 728-3337.
Portfolio Holdings
Following the Fund's fiscal first and third quarter-end, a complete portfolio holdings listing is filed with the SEC on Form N-Q. In addition, each month, information about the Fund and its portfolio holdings is filed with the SEC on Form N-MFP. The SEC delays the public availability of the information filed on Form N-MFP for 60 days after the end of the reporting period included in the filing. These forms will be available on the SEC's Web site at www.sec.gov, and they may also be reviewed and copied at the SEC's Public Reference Room in Washington, D.C. Information on the operation of the SEC's Public Reference Room may be obtained by calling (800) SEC-0330. The Fund's portfolio holdings are also posted on www.dws-investments.com from time to time. Please see the Fund's current prospectus for more information.
Money Market Fund Reform
In 2010, the Securities and Exchange Commission adopted amendments to then-existing money market fund regulations, imposing new liquidity, credit quality and maturity requirements on all money market funds. In November 2012, the Financial Stability Oversight Council (FSOC), a board of U.S. regulators established by the Dodd-Frank Act, proposed recommendations for money market fund reform. If the SEC were to adopt one or more of the FSOC proposed recommendations in the future, or if FSOC were to take other steps to establish similar regulations of money market funds in the future, such regulatory action may affect the Fund's operations and/or return potential.
Summary of Management Fee Evaluation by Independent Fee Consultant
September 17, 2012
Pursuant to an Order entered into by Deutsche Investment Management Americas and affiliates (collectively, "DeAM") with the Attorney General of New York, I, Thomas H. Mack, have been appointed the Independent Fee Consultant for the DWS Funds (formerly the DWS Scudder Funds). My duties include preparing an annual written evaluation of the management fees DeAM charges the Funds, considering among other factors the management fees charged by other mutual fund companies for like services, management fees DeAM charges other clients for like services, DeAM's costs of supplying services under the management agreements and related profit margins, possible economies of scale if a Fund grows larger, and the nature and quality of DeAM's services, including fund performance. This report summarizes my evaluation for 2012, including my qualifications, the evaluation process for each of the DWS Funds, consideration of certain complex-level factors, and my conclusions. I served in substantially the same capacity in 2007, 2008, 2009, 2010 and 2011.
Qualifications
For more than 35 years I have served in various professional capacities within the investment management business. I have held investment analysis and advisory positions, including securities analyst, portfolio strategist and director of investment policy with a large investment firm. I have also performed business management functions, including business development, financial management and marketing research and analysis.
Since 1991, I have been an independent consultant within the asset management industry. I have provided services to over 125 client organizations, including investment managers, mutual fund boards, product distributors and related organizations. Over the past ten years I have completed a number of assignments for mutual fund boards, specifically including assisting boards with management contract renewal.
I hold a Master of Business Administration degree, with highest honors, from Harvard University and Master of Science and Bachelor of Science (highest honors) degrees from the University of California at Berkeley. I am an independent director and audit committee financial expert for two closed-end mutual funds and have served in various leadership and financial oversight capacities with non-profit organizations.
Evaluation of Fees for each DWS Fund
My work focused primarily on evaluating, fund-by-fund, the fees charged to each of the 103 mutual fund portfolios in the DWS Fund family. For each Fund, I considered each of the key factors mentioned above, as well as any other relevant information. In doing so I worked closely with the Funds' Independent Directors in their annual contract renewal process, as well as in their approval of contracts for several new funds (documented separately).
In evaluating each Fund's fees, I reviewed comprehensive materials provided by or on behalf of DeAM, including expense information prepared by Lipper Analytical, comparative performance information, profitability data, manager histories, and other materials. I also accessed certain additional information from the Lipper and Morningstar databases and drew on my industry knowledge and experience.
To facilitate evaluating this considerable body of information, I prepared for each Fund a document summarizing the key data elements in each area as well as additional analytics discussed below. This made it possible to consider each key data element in the context of the others.
In the course of contract renewal, DeAM agreed to implement a number of fee and expense adjustments requested by the Independent Directors which will favorably impact future fees and expenses, and my evaluation includes the effects of these changes.
Fees and Expenses Compared with Other Funds
The competitive fee and expense evaluation for each fund focused on two primary comparisons:
The Fund's contractual management fee (the advisory fee plus the administration fee where applicable) compared with those of a group of typically 12-15 funds in the same Lipper investment category (e.g. Large Capitalization Growth) having similar distribution arrangements and being of similar size.
The Fund's total expenses compared with a broader universe of funds from the same Lipper investment category and having similar distribution arrangements.
These two comparisons provide a view of not only the level of the fee compared with funds of similar scale but also the total expense the Fund bears for all the services it receives, in comparison with the investment choices available in the Fund's investment category and distribution channel. The principal figure-of-merit used in these comparisons was the subject Fund's percentile ranking against peers.
DeAM's Fees for Similar Services to Others
DeAM provided management fee schedules for all of its US domiciled fund and non-fund investment management accounts in any of the investment categories where there is a DWS Fund. These similar products included the other DWS Funds, non-fund pooled accounts, institutional accounts and sub-advisory accounts. Using this information, I calculated for each Fund the fee that would be charged to each similar product, at the subject Fund's asset level.
Evaluating information regarding non-fund products is difficult because there are varying levels of services required for different types of accounts, with mutual funds generally requiring considerably more regulatory and administrative types of service as well as having more frequent cash flows than other types of accounts. Also, while mutual fund fees for similar fund products can be expected to be similar, there will be some differences due to different pricing conditions in different distribution channels (e.g. retail funds versus those used in variable insurance products), differences in underlying investment processes and other factors.
Costs and Profit Margins
DeAM provided a detailed profitability analysis for each Fund. After making some adjustments so that the presentation would be more comparable to the available industry figures, I reviewed profit margins from investment management alone, from investment management plus other fund services (excluding distribution) provided to the Funds by DeAM (principally shareholder services), and DeAM profits from all sources, including distribution. A later section comments on overall profitability.
Economies of Scale
Economies of scale — an expected decline in management cost per dollar of fund assets as fund assets grow — are very rarely quantified and documented because of inherent difficulties in collecting and analyzing relevant data. However, in virtually every investment category that I reviewed, larger funds tend to have lower fees and lower total expenses than smaller funds. To see how each DWS Fund compares with this industry observation, I reviewed:
The trend in Fund assets over the last five years and the accompanying trend in total expenses. This shows if the Fund has grown and, if so, whether total expense (management fees as well as other expenses) have declined as a percent of assets.
Whether the Fund has break-points in its management fee schedule, the extent of the fee reduction built into the schedule and the asset levels where the breaks take effect, and in the case of a sub-advised Fund how the Fund's break-points compare with those of the sub-advisory fee schedule.
How the Fund's contractual fee schedule compares with trends in the industry data. To accomplish this, I constructed a chart showing how actual latest-fiscal-year contractual fees of the Fund and of other similar funds relate to average fund assets, with the subject Fund's contractual fee schedule superimposed.
Quality of Service — Performance
The quality-of-service evaluation focused on investment performance, which is the principal result of the investment management service. Each Fund's performance was reviewed over the past 1, 3, 5 and 10 years, as applicable, and compared with that of other funds in the same investment category and with a suitable market index.
In addition, I calculated and reviewed risk-adjusted returns relative to an index of similar mutual funds' returns and a suitable market index. The risk-adjusted returns analysis provides a way of determining the extent to which the Fund's return comparisons are mainly the product of investment value-added (or lack thereof) or alternatively taking considerably more or less risk than is typical in its investment category.
I also received and considered the history of portfolio manager changes for each Fund, as this provided an important context for evaluating the performance results.
Complex-Level Considerations
While this evaluation was conducted mainly at the individual fund level, there are some issues relating to the reasonableness of fees that can alternatively be considered across the whole fund complex:
I reviewed DeAM's profitability analysis for all DWS Funds, with a view toward determining if the allocation procedures used were reasonable and how profit levels compared with public data for other investment managers.
I considered whether DeAM and affiliates receive any significant ancillary or "fallout" benefits that should be considered in interpreting the direct profitability results. These would be situations where serving as the investment manager of the Funds is beneficial to another part of the Deutsche Bank organization.
I considered how aggregated DWS Fund expenses had varied over the years, by asset class and in the context of trends in asset levels.
I considered how aggregated DWS Fund performance measures relative to appropriate peers had varied by asset class and over time.
I reviewed the structure of the DeAM organization, trends in staffing levels, and information on compensation of investment management and other professionals compared with industry data.
Findings
Based on the process and analysis discussed above, which included reviewing a wide range of information from management and external data sources and considering among other factors the fees DeAM charges other clients, the fees charged by other fund managers, DeAM's costs and profits associated with managing the Funds, economies of scale, possible fall-out benefits, and the nature and quality of services provided, in my opinion the management fees charged the DWS Funds are reasonable.
Thomas H. Mack
President, Thomas H. Mack & Co., Inc.
Board Members and Officers
The following table presents certain information regarding the Board Members and Officers of the fund. Each Board Member's year of birth is set forth in parentheses after his or her name. Unless otherwise noted, (i) each Board Member has engaged in the principal occupation(s) noted in the table for at least the most recent five years, although not necessarily in the same capacity; and (ii) the address of each Independent Board Member is c/o Kenneth C. Froewiss, Chairman, DWS Mutual Funds, P.O. Box 78, Short Hills, NJ 07078. Except as otherwise noted below, the term of office for each Board Member is until the election and qualification of a successor, or until such Board Member sooner dies, resigns, is removed or as otherwise provided in the governing documents of the fund. Because the fund does not hold an annual meeting of shareholders, each Board Member will hold office for an indeterminate period. The Board Members may also serve in similar capacities with other funds in the fund complex.
| Independent Board Members |
Name, Year of Birth, Position with the Fund and Length of Time Served1 | | Business Experience and Directorships During the Past Five Years | Number of Funds in DWS Fund Complex Overseen |
Other Directorships Held by Board Member |
Kenneth C. Froewiss (1945) Chairperson since 2013,9 and Board Member since 2001 | | Adjunct Professor of Finance, NYU Stern School of Business (September 2009-present; Clinical Professor from 1997-September 2009); Member, Finance Committee, Association for Asian Studies (2002-present); Director, Mitsui Sumitomo Insurance Group (US) (2004-present); prior thereto, Managing Director, J.P. Morgan (investment banking firm) (until 1996) | 102 | — |
William McClayton (1944) Vice Chairperson since 2013,9 and Board Member since 2004 | | Private equity investor (since October 2009); previously, Managing Director, Diamond Management & Technology Consultants, Inc. (global consulting firm) (2001-2009); Directorship: Board of Managers, YMCA of Metropolitan Chicago; formerly: Senior Partner, Arthur Andersen LLP (accounting) (1966-2001); Trustee, Ravinia Festival | 102 | — |
John W. Ballantine (1946) Board Member since 1999 | | Retired; formerly, Executive Vice President and Chief Risk Management Officer, First Chicago NBD Corporation/The First National Bank of Chicago (1996-1998); Executive Vice President and Head of International Banking (1995-1996); former Directorships: Stockwell Capital Investments PLC (private equity); First Oak Brook Bancshares, Inc. and Oak Brook Bank; Prisma Energy International | 102 | Chairman of the Board, Healthways, Inc.2 (provider of disease and care management services) (2003- present); Portland General Electric2 (utility company) (2003- present) |
Henry P. Becton, Jr. (1943) Board Member since 1990 | | Vice Chair and former President, WGBH Educational Foundation. Directorships: Public Radio International; Public Radio Exchange (PRX); The PBS Foundation; North Bennett Street School (Boston); former Directorships: Association of Public Television Stations; Boston Museum of Science; American Public Television; Concord Academy; New England Aquarium; Mass. Corporation for Educational Telecommunications; Committee for Economic Development; Public Broadcasting Service; Connecticut College | 102 | Lead Director, Becton Dickinson and Company2 (medical technology company); Lead Director, Belo Corporation2 (media company) |
Dawn-Marie Driscoll (1946) Board Member since 1987 | | President, Driscoll Associates (consulting firm); Emeritus Executive Fellow, Center for Business Ethics, Bentley University; formerly, Partner, Palmer & Dodge (1988-1990); Vice President of Corporate Affairs and General Counsel, Filene's (1978-1988). Directorships: Director of ICI Mutual Insurance Company (since 2007); Advisory Board, Center for Business Ethics, Bentley University; Chairman of the Board of Trustees, Southwest Florida Community Foundation (charitable organization); former Directorships: Sun Capital Advisers Trust (mutual funds) (2007-2012), Investment Company Institute (audit, executive, nominating committees) and Independent Directors Council (governance, executive committees) | 102 | — |
Keith R. Fox, CFA (1954) Board Member since 1996 | | Managing General Partner, Exeter Capital Partners (a series of private investment funds) (since 1986). Directorships: Progressive International Corporation (kitchen goods importer and distributor); The Kennel Shop (retailer); former Chairman, National Association of Small Business Investment Companies; former Directorships: BoxTop Media Inc. (advertising); Sun Capital Advisers Trust (mutual funds) (2011-2012) | 102 | — |
Paul K. Freeman (1950) Board Member since 1993, and Chairperson (2009-Jan. 8, 2013) | | Consultant, World Bank/Inter-American Development Bank; Executive and Governing Council of the Independent Directors Council (Chairman of Education Committee); formerly: Project Leader, International Institute for Applied Systems Analysis (1998-2001); Chief Executive Officer, The Eric Group, Inc. (environmental insurance) (1986-1998); Directorships: Denver Zoo Foundation (December 2012-present); former Directorships: Prisma Energy International | 102 | — |
Richard J. Herring (1946) Board Member since 1990 | | Jacob Safra Professor of International Banking and Professor, Finance Department, The Wharton School, University of Pennsylvania (since July 1972); Co-Director, Wharton Financial Institutions Center (since July 2000); Co-Chair, U.S. Shadow Financial Regulatory Committee; Executive Director, Financial Economists Roundtable; formerly: Vice Dean and Director, Wharton Undergraduate Division (July 1995-June 2000); Director, Lauder Institute of International Management Studies (July 2000-June 2006) | 102 | Director, Japan Equity Fund, Inc. (since September 2007), Thai Capital Fund, Inc. (since 2007), Singapore Fund, Inc. (since September 2007), Independent Director of Barclays Bank Delaware (since September 2010) |
Rebecca W. Rimel (1951) Board Member since 1995 | | President and Chief Executive Officer, The Pew Charitable Trusts (charitable organization) (1994 to present); formerly: Executive Vice President, The Glenmede Trust Company (investment trust and wealth management) (1983-2004); Board Member, Investor Education (charitable organization) (2004-2005); Trustee, Executive Committee, Philadelphia Chamber of Commerce (2001-2007); Director, Viasys Health Care2 (January 2007-June 2007); Trustee, Thomas Jefferson Foundation (charitable organization) (1994-2012) | 102 | Director, Becton Dickinson and Company2 (medical technology company) (2012- present); Director, CardioNet, Inc.2 (health care) (2009- present) |
William N. Searcy, Jr. (1946) Board Member since 1993 | | Private investor since October 2003; formerly: Pension & Savings Trust Officer, Sprint Corporation2 (telecommunications) (November 1989-September 2003); Trustee, Sun Capital Advisers Trust (mutual funds) (1998-2012) | 102 | — |
Jean Gleason Stromberg (1943) Board Member since 1997 | | Retired. Formerly, Consultant (1997-2001); Director, Financial Markets U.S. Government Accountability Office (1996-1997); Partner, Fulbright & Jaworski, L.L.P. (law firm) (1978-1996). Directorships: The William and Flora Hewlett Foundation; former Directorships: Service Source, Inc., Mutual Fund Directors Forum (2002-2004), American Bar Retirement Association (funding vehicle for retirement plans) (1987-1990 and 1994-1996) | 102 | — |
Robert H. Wadsworth (1940) Board Member since 1999 | | President, Robert H. Wadsworth & Associates, Inc. (consulting firm) (1983 to present); Director, National Horizon, Inc. (non-profit organization); Director and Treasurer, The Phoenix Boys Choir Association | 105 | — |
Interested Board Member and Officer4 |
Name, Year of Birth, Position with the Fund and Length of Time Served1,6 | | Business Experience and Directorships During the Past Five Years | Number of Funds in DWS Fund Complex Overseen |
Other Directorships Held by Board Member |
Michael J. Woods5 (1967) Board Member since 2013,9 and Executive Vice President since 20139 | | Managing Director,3 Deutsche Asset & Wealth Management (2009-present); Head of the Americas Asset Management Business for Deutsche Bank, Member of the Asset and Wealth Management ("AWM") Extended Executive Committee, AWM Global Client Group Executive Committee and the AWM Active Asset Management Executive Committee; CEO and US Regional Head of DWS Investments; formerly: Sr. VP, Head of the Financial Intermediaries and Investments Group of Evergreen Investments (2007-2009), CEO and Vice Chairman of Board of Directors of XTF Global Asset Management (2006-2007), Managing Director — US Head of Sub-Advisory and Investment Only Business at Citigroup Asset Management (2000-2006). Mr. Woods is currently a board member of The Children's Village, The Big Brothers Big Sisters Organization, and The Mutual Fund Education Alliance. | 38 | — |
Officers4 |
Name, Year of Birth, Position with the Fund and Length of Time Served6 | | Business Experience and Directorships During the Past Five Years |
W. Douglas Beck, CFA7 (1967) President, 2011-present | | Managing Director,3 Deutsche Asset & Wealth Management (2006-present); President of DWS family of funds and Head of Product Management, U.S. for DWS Investments; formerly: Executive Director, Head of Product Management (2002-2006) and President (2005-2006) of the UBS Funds at UBS Global Asset Management; Co-Head of Manager Research/Managed Solutions Group, Merrill Lynch (1998-2002) |
John Millette8 (1962) Vice President and Secretary, 1999-present | | Director,3 Deutsche Asset & Wealth Management |
Paul H. Schubert7 (1963) Chief Financial Officer, 2004-present Treasurer, 2005-present | | Managing Director,3 Deutsche Asset & Wealth Management (since July 2004); formerly: Executive Director, Head of Mutual Fund Services and Treasurer for UBS Family of Funds (1998-2004); Vice President and Director of Mutual Fund Finance at UBS Global Asset Management (1994-1998) |
Caroline Pearson8 (1962) Chief Legal Officer, 2010-present | | Managing Director,3 Deutsche Asset & Wealth Management; formerly: Assistant Secretary for DWS family of funds (1997-2010) |
Melinda Morrow7 (1970) Vice President, 2012-present | | Director,3 Deutsche Asset & Wealth Management |
Hepsen Uzcan8 (1974) Assistant Secretary, since 20139 | | Vice President, Deutsche Asset & Wealth Management |
Paul Antosca8 (1957) Assistant Treasurer, 2007-present | | Director,3 Deutsche Asset & Wealth Management |
Jack Clark8 (1967) Assistant Treasurer, 2007-present | | Director,3 Deutsche Asset & Wealth Management |
Diane Kenneally8 (1966) Assistant Treasurer, 2007-present | | Director,3 Deutsche Asset & Wealth Management |
John Caruso7 (1965) Anti-Money Laundering Compliance Officer, 2010-present | | Managing Director,3 Deutsche Asset & Wealth Management |
Robert Kloby7 (1962) Chief Compliance Officer, 2006-present | | Managing Director,3 Deutsche Asset & Wealth Management |
1 The length of time served represents the year in which the Board Member joined the board of one or more DWS funds currently overseen by the Board.
2 A publicly held company with securities registered pursuant to Section 12 of the Securities Exchange Act of 1934.
3 Executive title, not a board directorship.
4 As a result of their respective positions held with the Advisor, these individuals are considered "interested persons" of the Advisor within the meaning of the 1940 Act. Interested persons receive no compensation from the fund.
5 The mailing address of Mr. Woods is 60 Wall Street, New York, New York 10005. Mr. Woods is an interested Board Member by virtue of his positions with Deutsche Asset & Wealth Management. As an interested person, Mr. Woods receives no compensation from the fund. Mr. Woods is a board member of the following trusts and corporations: Cash Account Trust, DWS Market Trust, DWS Money Funds, DWS State Tax-Free Income Series, DWS Target Fund, DWS Value Series, Inc., DWS Variable Series II, Investors Cash Trust, Tax-Exempt California Money Market Fund, DWS Global High Income Fund, Inc., DWS High Income Opportunities Fund, Inc., DWS High Income Trust, DWS Multi-Market Income Trust, DWS Municipal Income Trust, DWS Strategic Income Trust and DWS Strategic Municipal Income Trust.
6 The length of time served represents the year in which the officer was first elected in such capacity for one or more DWS funds.
7 Address: 60 Wall Street, New York, NY 10005.
8 Address: One Beacon Street, Boston, MA 02108.
9 Effective as of January 9, 2013.
The fund's Statement of Additional Information ("SAI") includes additional information about the Board Members. The SAI is available, without charge, upon request. If you would like to request a copy of the SAI, you may do so by calling the following toll-free number: (800) 728-3337.
Notes
Notes
Notes
Notes
Notes
Notes
Notes

APRIL 30, 2013 Annual Report to Shareholders |
| |
Government & Agency Securities Portfolio DWS Government & Agency Money Fund |
|
Contents
3 Portfolio Management Review 13 Statement of Assets and Liabilities 15 Statement of Operations 16 Statement of Changes in Net Assets 18 Notes to Financial Statements 26 Report of Independent Registered Public Accounting Firm 27 Information About Your Fund's Expenses 30 Summary of Management Fee Evaluation by Independent Fee Consultant 34 Board Members and Officers |
This report must be preceded or accompanied by a prospectus. To obtain a summary prospectus, if available, or prospectus for any of our funds, visit www.dws-investments.com. We advise you to consider the fund's objectives, risks, charges and expenses carefully before investing. The summary prospectus and prospectus contain this and other important information about the fund. Please read the prospectus carefully before you invest.
An investment in this fund is not insured or guaranteed by the Federal Deposit Insurance Corporation (FDIC) or by any other government agency. Although the fund seeks to preserve the value of your investment at $1.00 per share, it is possible to lose money by investing in the fund. The share price of money market funds can fall below the $1.00 share price. You should not rely on or expect the Advisor to enter into support agreements or take other actions to maintain the fund's $1.00 share price. The credit quality of the fund's holdings can change rapidly in certain markets, and the default of a single holding could have an adverse impact on the fund's share price. The fund's share price can also be negatively affected during periods of high redemption pressures and/or illiquid markets. The actions of a few large investors in one class of shares of the fund may have a significant adverse effect on the share prices of all classes of shares of the fund. See the prospectus for specific details regarding the fund's risk profile.
DWS Investments is part of the Deutsche Asset & Wealth Management division of Deutsche Bank AG.
NOT FDIC/NCUA INSURED NO BANK GUARANTEE MAY LOSE VALUE NOT A DEPOSIT NOT INSURED BY ANY FEDERAL GOVERNMENT AGENCY
Portfolio Management Review (Unaudited)
Market Overview
All performance information below is historical and does not guarantee future results. Investment return and principal fluctuate, so your shares may be worth more or less when redeemed. Current performance may differ from performance data shown. Please visit www.dws-investments.com for the fund's most recent month-end performance. The 7-day current yield refers to the income paid by the fund over a 7-day period expressed as an annual percentage rate of the fund's shares outstanding. Yields fluctuate and are not guaranteed.
At the beginning of the fund's most recent fiscal year ended April 30, 2013, we saw another dramatic "flight to quality," as worries concerning Greece's upcoming elections and continuingly worsening conditions for Spanish and Italian banks led global and domestic investors to abandon risky assets. Late in 2012, any negative economic data was overshadowed by investor anticipation of more substantial central bank actions. The European Central Bank (ECB) lowered its interest rate for bank reserves. Then, the head of the ECB, Mario Draghi, stated that the central bank would do "whatever it takes" to preserve the euro. In December 2012, the U.S. Federal Reserve Board (the Fed) altered its guidance regarding rate levels, stating that it would maintain short-term interest rates near zero until U.S. unemployment dropped below 6.5%, and as long as inflation levels did not exceed 2.5%. In the first quarter of 2013, the European situation remained quiescent until the banking crisis in Cyprus reached a boiling point; the crisis was finally resolved after it was agreed that large uninsured depositors in Cyprus' banks would suffer substantial losses. In addition, the U.S. economy was boosted by higher housing prices and some gains in employment levels. In the money market area, we saw a continued supply/demand imbalance as well as a reduction in short-term money market supply due to ongoing quantitative easing by the Fed. In the continued search for yield, money market investors looked to a variety of financial instruments issued in countries around the world.
Positive Contributors to Fund Performance
We were able to maintain a yield that is in line with other similar money market funds during the period ended April 30, 2013.
| Government & Agency Securities Portfolio seeks to provide maximum current income consistent with stability of capital. |
With short-maturity yields trading in a narrow range throughout most of the period, we pursued a "barbell" strategy for the fund: we held a large percentage of portfolio assets in overnight Treasury and agency repurchase agreements for relative yield, flexibility and liquidity purposes. At the same time, we purchased six-month to one-year Treasury and agency securities to take advantage of more attractive rates within that portion of the yield curve.
Fund Performance (as of April 30, 2013)
Performance is historical and does not guarantee future results. Current performance may be lower or higher than the performance data quoted.
An investment in the fund is not insured or guaranteed by the Federal Deposit Insurance Corporation (FDIC) or by any other government agency. Although the fund seeks to preserve the value of your investment at $1.00 per share, it is possible to lose money by investing in the fund.
| | | 7-Day Current Yield | |
| DWS Government & Agency Money Fund | | | .01 | %* |
Yields are historical, will fluctuate and do not guarantee future performance. The 7-day current yield refers to the income paid by the fund over a 7-day period expressed as an annual percentage rate of the fund's shares outstanding. For the most current yield information, visit our Web site at www.dws-investments.com. * The investment advisor has agreed to voluntarily waive fees/reimburse expenses. This waiver may be changed or terminated at any time without notice. | |
Negative Contributors to Fund Performance
The types of securities that we invested in tended to have lower yields than issues carrying more risk. We preferred to be cautious during a time of market uncertainty. In the end this may have cost the fund some yield, but we believe that this represented a prudent approach to preserving principal.
Outlook and Positioning
We anticipate limited growth for the U.S. economy over the remainder of this year, due to steady but unspectacular employment gains and the automatic budget cuts dictated by congressional sequestration. In turn, we think that restrained growth will mean that the Fed will continue its extremely accommodative monetary policy through early 2014. We look for money market rates to continue to be low based on decreases in supply on a number of fronts and strong investor demand.
We continue our insistence on the highest credit quality within the fund. We also plan to maintain our conservative investment strategies and standards under the current market conditions. We continue to apply a careful approach to investing on behalf of the fund and to seek competitive yield for our shareholders.
Portfolio Management Team
A group of investment professionals is responsible for the day-to-day management of the fund. These investment professionals have a broad range of experience managing money market funds.
The views expressed reflect those of the portfolio management team only through the end of the period of the report as stated on the cover. The management team's views are subject to change at any time based on market and other conditions and should not be construed as a recommendation. Past performance is no guarantee of future results. Current and future portfolio holdings are subject to risk.
Terms to Know
Quantitative easing is a government monetary policy often used when interest rates are at or near zero. With this policy government or other securities are purchased from the market, causing the price of the securities purchased to rise and the yield or interest rates on the securities purchased to fall. For the companies whose bonds the central banks are willing to purchase, it means having to pay lower interest rates on new bonds issued to replace existing bonds that have matured. With lower borrowing costs, the central banks hope that consumers will be encouraged to spend more, thus helping the overall economy and improving the balance sheets of the companies providing the goods and services on which consumers are spending their money.
The yield curve is a graphical representation of how yields on bonds of different maturities compare. Normally, yield curves slant up, as bonds with longer maturities typically offer higher yields than short-term bonds.
A repurchase agreement, or "overnight repo," is an agreement between a seller and a buyer, usually of government securities, where the seller agrees to repurchase the securities at a given price and usually at a stated time. Repos are widely used money market instruments that serve as an interest-bearing, short-term "parking place" for large sums of money.
The Securities Industry and Financial Market Association Index of Variable Rate Demand Notes is a weekly high-grade market index consisting of seven-day, tax-exempt, variable-rate demand notes produced by Municipal Market Data Group. Actual issues are selected from Municipal Market Data's database of more than 10,000 active issues. Index returns do not reflect fees or expenses and it is not possible to invest directly into an index.
A "put" bond allows an investor to require the issuer to repurchase the bond at a specified date before its maturity.
Portfolio Summary (Unaudited)
Investment Portfolio as of April 30, 2013
Government & Agency Securities Portfolio
| | | Principal Amount ($) | | | Value ($) | |
| | | | |
| Government & Agency Obligations 51.8% | |
| U.S. Government Sponsored Agencies 45.6% | |
| Federal Farm Credit Bank: | |
| 0.15%**, 2/6/2014 | | | 75,000,000 | | | | 75,000,000 | |
| 0.19%, 12/13/2013 | | | 15,000,000 | | | | 15,000,000 | |
| 0.211%*, 5/23/2013 | | | 10,000,000 | | | | 9,998,656 | |
| Federal Home Loan Bank: | |
| 0.117%*, 6/3/2013 | | | 35,000,000 | | | | 34,996,150 | |
| 0.12%, 10/3/2013 | | | 50,000,000 | | | | 49,997,423 | |
| 0.125%, 3/27/2014 | | | 15,000,000 | | | | 14,992,270 | |
| 0.15%, 10/15/2013 | | | 38,000,000 | | | | 37,998,836 | |
| 0.16%, 6/5/2013 | | | 25,000,000 | | | | 24,999,760 | |
| 0.16%, 12/19/2013 | | | 15,000,000 | | | | 14,999,389 | |
| 0.17%, 7/5/2013 | | | 30,000,000 | | | | 29,999,090 | |
| 0.17%, 3/25/2014 | | | 15,000,000 | | | | 14,998,374 | |
| 0.171%*, 6/5/2013 | | | 50,000,000 | | | | 49,991,493 | |
| 0.18%**, 7/25/2013 | | | 25,000,000 | | | | 24,999,703 | |
| 0.18%**, 7/26/2013 | | | 15,000,000 | | | | 14,999,647 | |
| 0.18%, 3/7/2014 | | | 22,500,000 | | | | 22,498,775 | |
| 0.21%**, 11/8/2013 | | | 27,000,000 | | | | 26,994,378 | |
| 0.22%**, 11/15/2013 | | | 12,500,000 | | | | 12,497,259 | |
| 0.235%**, 11/4/2013 | | | 49,000,000 | | | | 48,993,658 | |
| 0.28%, 11/14/2013 | | | 10,000,000 | | | | 10,006,609 | |
| 0.31%, 5/16/2013 | | | 20,755,000 | | | | 20,755,569 | |
| 0.31%**, 5/17/2013 | | | 38,000,000 | | | | 38,000,000 | |
| 0.36%, 5/16/2013 | | | 27,500,000 | | | | 27,501,263 | |
| 0.5%, 8/28/2013 | | | 24,000,000 | | | | 24,023,308 | |
| 0.875%, 12/27/2013 | | | 12,000,000 | | | | 12,055,109 | |
| 2.375%, 3/14/2014 | | | 10,000,000 | | | | 10,190,020 | |
| Federal Home Loan Mortgage Corp.: | |
| 0.11%*, 11/19/2013 | | | 17,000,000 | | | | 16,989,507 | |
| 0.119%*, 8/26/2013 | | | 50,000,000 | | | | 49,980,500 | |
| 0.128%*, 7/15/2013 | | | 25,000,000 | | | | 24,993,229 | |
| 0.138%*, 7/9/2013 | | | 38,000,000 | | | | 37,989,803 | |
| 0.139%**, 9/13/2013 | | | 75,000,000 | | | | 74,998,762 | |
| 0.139%*, 8/13/2013 | | | 12,500,000 | | | | 12,494,944 | |
| 0.147%*, 6/12/2013 | | | 25,000,000 | | | | 24,995,625 | |
| 0.149%*, 9/4/2013 | | | 35,000,000 | | | | 34,981,625 | |
| 0.15%*, 5/6/2013 | | | 20,000,000 | | | | 19,999,514 | |
| 0.158%*, 6/25/2013 | | | 35,000,000 | | | | 34,991,444 | |
| 0.165%*, 5/29/2013 | | | 20,000,000 | | | | 19,997,355 | |
| 0.166%*, 5/13/2013 | | | 18,000,000 | | | | 17,998,920 | |
| 1.375%, 2/25/2014 | | | 15,000,000 | | | | 15,151,525 | |
| 3.5%, 5/29/2013 | | | 10,500,000 | | | | 10,526,336 | |
| Federal National Mortgage Association: | |
| 0.09%*, 5/8/2013 | | | 25,000,000 | | | | 24,999,514 | |
| 0.109%*, 7/2/2013 | | | 22,000,000 | | | | 21,995,832 | |
| 0.129%*, 10/1/2013 | | | 38,000,000 | | | | 37,979,005 | |
| 0.139%*, 7/19/2013 | | | 20,000,000 | | | | 19,993,856 | |
| 0.149%*, 9/16/2013 | | | 68,500,000 | | | | 68,460,612 | |
| 0.16%*, 5/1/2013 | | | 10,000,000 | | | | 10,000,000 | |
| 0.169%*, 5/22/2013 | | | 25,000,000 | | | | 24,997,448 | |
| 1.5%, 6/26/2013 | | | 10,000,000 | | | | 10,019,950 | |
| 2.75%, 3/13/2014 | | | 58,000,000 | | | | 59,304,625 | |
| | | | | 1,340,326,670 | |
| U.S. Treasury Obligations 5.2% | |
| U.S. Treasury Notes: | |
| 0.25%, 10/31/2013 | | | 10,000,000 | | | | 10,001,916 | |
| 0.25%, 11/30/2013 | | | 15,000,000 | | | | 15,008,089 | |
| 0.5%, 5/31/2013 | | | 28,500,000 | | | | 28,507,950 | |
| 0.5%, 10/15/2013 | | | 32,500,000 | | | | 32,544,533 | |
| 0.5%, 11/15/2013 | | | 32,500,000 | | | | 32,559,305 | |
| 0.75%, 12/15/2013 | | | 35,000,000 | | | | 35,127,814 | |
| | | | | 153,749,607 | |
| Other Government Related 1.0% | |
| Straight-A Funding LLC, 144A, 0.17%, 6/18/2013 | | | 30,000,000 | | | | 29,993,200 | |
Total Government & Agency Obligations (Cost $1,524,069,477) | | | | 1,524,069,477 | |
| | |
| Repurchase Agreements 48.2% | |
| Barclays Capital, 0.1%, dated 4/25/2013, to be repurchased at $125,002,431 on 5/2/2013 (a) | | | 125,000,000 | | | | 125,000,000 | |
| BNP Paribas, 0.14%, dated 4/30/2013, to be repurchased at $65,000,253 on 5/1/2013 (b) | | | 65,000,000 | | | | 65,000,000 | |
| BNP Paribas, 0.15%, dated 4/30/2013, to be repurchased at $40,000,167 on 5/1/2013 (c) | | | 40,000,000 | | | | 40,000,000 | |
| Citigroup Global Markets, Inc., 0.09%, dated 4/24/2013, to be repurchased at $13,000,228 on 5/1/2013 (d) | | | 13,000,000 | | | | 13,000,000 | |
| Citigroup Global Markets, Inc., 0.14%, dated 4/30/2013, to be repurchased at $42,000,163 on 5/1/2013 (e) | | | 42,000,000 | | | | 42,000,000 | |
| HSBC Securities, Inc., 0.17%, dated 4/30/2013, to be repurchased at $54,000,255 on 5/1/2013 (f) | | | 54,000,000 | | | | 54,000,000 | |
| JPMorgan Securities, Inc., 0.17%, dated 4/30/2013, to be repurchased at $113,000,534 on 5/1/2013 (g) | | | 113,000,000 | | | | 113,000,000 | |
| Merrill Lynch & Co., Inc., 0.09%, dated 4/26/2013, to be repurchased at $85,001,488 on 5/3/2013 (h) | | | 85,000,000 | | | | 85,000,000 | |
| Merrill Lynch & Co., Inc., 0.14%, dated 4/30/2013, to be repurchased at $35,102,349 on 5/1/2013 (i) | | | 35,102,212 | | | | 35,102,212 | |
| Merrill Lynch & Co., Inc., 0.14%, dated 4/5/2013, to be repurchased at $110,014,117 on 5/8/2013 (j) | | | 110,000,000 | | | | 110,000,000 | |
| Morgan Stanley & Co., Inc., 0.17%, dated 4/30/2013, to be repurchased at $424,002,002 on 5/1/2013 (k) | | | 424,000,000 | | | | 424,000,000 | |
| RBS Securities, Inc., 0.14%, dated 4/30/2013, to be repurchased at $135,000,525 on 5/1/2013 (l) | | | 135,000,000 | | | | 135,000,000 | |
| The Goldman Sachs & Co., 0.16%, dated 4/30/2013, to be repurchased at $100,000,444 on 5/1/2013 (m) | | | 100,000,000 | | | | 100,000,000 | |
| The Toronto-Dominion Bank, 0.1%, dated 4/24/2013, to be repurchased at $75,001,458 on 5/1/2013 (n) | | | 75,000,000 | | | | 75,000,000 | |
Total Repurchase Agreements (Cost $1,416,102,212) | | | | 1,416,102,212 | |
| | | % of Net Assets | | | Value ($) | |
| | | | |
Total Investment Portfolio (Cost $2,940,171,689)† | | | 100.0 | | | | 2,940,171,689 | |
| Other Assets and Liabilities, Net | | | 0.0 | | | | 185,473 | |
| Net Assets | | | 100.0 | | | | 2,940,357,162 | |
* Annualized yield at time of purchase; not a coupon rate.
** Floating rate securities' yields vary with a designated market index or market rate, such as the coupon-equivalent of the U.S. Treasury Bill rate. These securities are shown at their current rate as of April 30, 2013.
† The cost for federal income tax purposes was $2,940,171,689.
(a) Collateralized by $126,575,000 Federal Home Loan Bank, with the various coupon rates from 2.13-2.65%, with various maturity dates of 11/5/2024-2/15/2028 with a value of $127,500,282.
(b) Collateralized by $50,645,400 U.S. Treasury Inflation-Indexed Notes, with the various coupon rates from 2.0-2.5%, with various maturity dates of 1/15/2016-7/15/2016 with a value of $66,300,001.
(c) Collateralized by $40,258,000 U.S. Federal Home Loan Mortgage Corp., with the various coupon rates from 0.45-3.01%, with various maturity dates of 1/9/2014-7/9/2027 with a value of $40,800,030.
(d) Collateralized by:
| Principal Amount ($) | | Security | | Rate (%) | | Maturity Date | | Collateral Value ($) | |
| | 2,986,985 | | Federal Home Loan Mortgage Corp. | | | 1.299 | | 11/15/2036 | | | 2,767,845 | |
| | 25,652,820 | | Federal National Mortgage Association — Interest Only | | | 7.05 | | 12/25/2042 | | | 4,912,647 | |
| | 36,197,656 | | Government National Mortgage Association — Interest Only | | | 5.85-6.317 | | 1/20/2038- 11/16/2041 | | | 5,742,486 | |
| Total Collateral Value | | | 13,422,978 | |
(e) Collateralized by:
| Principal Amount ($) | | Security | | Rate (%) | | Maturity Date | | Collateral Value ($) | |
| | 13,766,000 | | U.S. Treasury Inflation-Indexed Note | | | 1.125 | | 1/15/2021 | | | 17,248,540 | |
| | 25,503,800 | | U.S. Treasury Note | | | 0.75 | | 9/15/2013 | | | 25,591,469 | |
| Total Collateral Value | | | 42,840,009 | |
(f) Collateralized by:
| Principal Amount ($) | | Security | | Rate (%) | | Maturity Date | | Collateral Value ($) | |
| | 47,691,333 | | Government National Mortgage Association | | | 3.5-6.0 | | 8/15/2032- 2/20/2043 | | | 52,685,764 | |
| | 2,395,000 | | U.S. Treasury Bill | | | — | | 7/5/2013 | | | 2,394,856 | |
| Total Collateral Value | | | 55,080,620 | |
(g) Collateralized by:
| Principal Amount ($) | | Security | | Rate (%) | | Maturity Date | | Collateral Value ($) | |
| | 1,075,267,081 | | Federal Home Loan Mortgage Corp. — Interest Only | | | 2.5-6.0 | | 9/15/2015- 2/15/2043 | | | 100,729,795 | |
| | 2,288,334 | | Federal National Mortgage Association | | | 3.0 | | 3/25/2033 | | | 2,323,084 | |
| | 106,602,739 | | Federal National Mortgage Association — Interest Only | | | 3.0-6.5 | | 6/25/2020- 8/25/2042 | | | 12,207,334 | |
| Total Collateral Value | | | 115,260,213 | |
(h) Collateralized by:
| Principal Amount ($) | | Security | | Rate (%) | | Maturity Date | | Collateral Value ($) | |
| | 17,990,000 | | Federal Farm Credit Bank | | | 1.5 | | 4/1/2020 | | | 18,185,341 | |
| | 20,650,000 | | Federal Home Loan Mortgage Corp. | | | 1.375 | | 5/1/2020 | | | 20,730,185 | |
| | 46,940,000 | | Federal National Mortgage Association | | | 1.05-6.08 | | 11/15/2017- 10/23/2036 | | | 47,785,043 | |
| Total Collateral Value | | | 86,700,569 | |
(i) Collateralized by $26,210,800 U.S. Treasury Bond, 4.625%, maturing on 2/15/2040 with a value of $35,804,331.
(j) Collateralized by $91,947,100 U.S. Treasury Note, 11.25%, maturing on 2/15/2015 with a value of $112,200,034.
(k) Collateralized by $401,096,407 Federal Home Loan Mortgage Corp., with the various coupon rates from 3.0-5.0%, with various maturity dates of 2/1/2026-4/1/2043 with a value of $432,480,000.
(l) Collateralized by $134,311,400 U.S. Treasury Notes, with the various coupon rates from 3.125-4.0%, with various maturity dates of 8/31/2013-2/15/2014 with a value of $137,705,131.
(m) Collateralized by:
| Principal Amount ($) | | Security | | Rate (%) | | Maturity Date | | Collateral Value ($) | |
| | 660 | | Federal Home Loan Mortgage Corp. | | | 9.5 | | 11/15/2021 | | | 13,281 | |
| | 94,546,134 | | Federal National Mortgage Association | | Zero Coupon-4.0 | | 10/1/2027- 4/1/2043 | | | 101,986,720 | |
| Total Collateral Value | | | 102,000,001 | |
(n) Collateralized by:
| Principal Amount ($) | | Security | | Rate (%) | | Maturity Date | | Collateral Value ($) | |
| | 21,837,000 | | U.S. Treasury Bonds | | | 4.5-6.0 | | 2/15/2026- 5/15/2038 | | | 30,623,017 | |
| | 45,084,400 | | U.S. Treasury Notes | | | 0.125-1.875 | | 12/31/2013- 9/30/2019 | | | 45,877,044 | |
| Total Collateral Value | | | 76,500,061 | |
144A: Security exempt from registration under Rule 144A of the Securities Act of 1933. These securities may be resold in transactions exempt from registration, normally to qualified institutional buyers.
Interest Only: Interest Only (IO) bonds represent the "interest only" portion of payments on a pool of underlying mortgages or mortgage-backed securities. IO securities are subject to prepayment risk of the pool of underlying mortgages.
Fair Value Measurements
Various inputs are used in determining the value of the Fund's investments. These inputs are summarized in three broad levels. Level 1 includes quoted prices in active markets for identical securities. Level 2 includes other significant observable inputs (including quoted prices for similar securities, interest rates, prepayment speeds and credit risk). Level 3 includes significant unobservable inputs (including the Fund's own assumptions in determining the fair value of investments). The inputs or methodology used for valuing securities are not necessarily an indication of the risk associated with investing in those securities. Securities held by the Fund are reflected as Level 2 because the securities are valued at amortized cost (which approximates fair value) and, accordingly, the inputs used to determine value are not quoted prices in an active market.
The following is a summary of the inputs used as of April 30, 2013 in valuing the Fund's investments. For information on the Fund's policy regarding the valuation of investments, please refer to the Security Valuation section of Note 1 in the accompanying Notes to Financial Statements.
| Assets | | Level 1 | | | Level 2 | | | Level 3 | | | Total | |
| | |
| Investments in Securities (o) | | $ | — | | | $ | 1,524,069,477 | | | $ | — | | | $ | 1,524,069,477 | |
| Repurchase Agreements | | | — | | | | 1,416,102,212 | | | | — | | | | 1,416,102,212 | |
| Total | | $ | — | | | $ | 2,940,171,689 | | | $ | — | | | $ | 2,940,171,689 | |
There have been no transfers between fair value measurement levels during the year ended April 30, 2013.
(o) See Investment Portfolio for additional detailed categorizations.
The accompanying notes are an integral part of the financial statements.
Statement of Assets and Liabilities | as of April 30, 2013 | |
| Assets | | Government & Agency Securities Portfolio | |
Investments: Investments in non-affiliated securities, valued at amortized cost | | $ | 1,524,069,477 | |
| Repurchase agreements, valued at amortized cost | | | 1,416,102,212 | |
| Total investments in securities, valued at amortized cost | | | 2,940,171,689 | |
| Receivable for Fund shares sold | | | 200,399 | |
| Interest receivable | | | 1,067,727 | |
| Due from Advisor | | | 27,126 | |
| Other assets | | | 71,710 | |
| Total assets | | | 2,941,538,651 | |
| Liabilities | |
| Payable for Fund shares redeemed | | | 794,880 | |
| Distributions payable | | | 25,829 | |
| Accrued Trustees' fees | | | 28,311 | |
| Other accrued expenses and payables | | | 332,469 | |
| Total liabilities | | | 1,181,489 | |
| Net assets, at value | | $ | 2,940,357,162 | |
| Net Assets Consist of | |
| Undistributed net investment income | | | 201,505 | |
| Accumulated net realized gain (loss) | | | (435,501 | ) |
| Paid-in capital | | | 2,940,591,158 | |
| Net assets, at value | | $ | 2,940,357,162 | |
The accompanying notes are an integral part of the financial statements.
Statement of Assets and Liabilities as of April 30, 2013 (continued) | |
| Net Asset Value | | Government & Agency Securities Portfolio | |
Capital Assets Funds Shares Net Asset Value, offering and redemption price per share ($137,808,041 ÷ 137,818,174 outstanding shares of beneficial interest, no par value, unlimited number of shares authorized) | | $ | 1.00 | |
Davidson Cash Equivalent Shares Net Asset Value, offering and redemption price per share ($20,267,423 ÷ 20,268,915 outstanding shares of beneficial interest, no par value, unlimited number of shares authorized) | | $ | 1.00 | |
Davidson Cash Equivalent Plus Shares Net Asset Value, offering and redemption price per share ($108,250,027 ÷ 108,257,988 outstanding shares of beneficial interest, no par value, unlimited number of shares authorized) | | $ | 1.00 | |
DWS Government & Agency Money Fund Net Asset Value, offering and redemption price per share ($117,365,297 ÷ 117,373,968 outstanding shares of beneficial interest, no par value, unlimited number of shares authorized) | | $ | 1.00 | |
DWS Government Cash Institutional Shares Net Asset Value, offering and redemption price per share ($2,256,081,997 ÷ 2,256,247,886 outstanding shares of beneficial interest, no par value, unlimited number of shares authorized) | | $ | 1.00 | |
Government Cash Managed Shares Net Asset Value, offering and redemption price per share ($222,242,097 ÷ 222,258,439 outstanding shares of beneficial interest, no par value, unlimited number of shares authorized) | | $ | 1.00 | |
Service Shares Net Asset Value, offering and redemption price per share ($78,342,280 ÷ 78,348,040 outstanding shares of beneficial interest, no par value, unlimited number of shares authorized) | | $ | 1.00 | |
The accompanying notes are an integral part of the financial statements.
| for the year ended April 30, 2013 | |
| Investment Income | | Government & Agency Securities Portfolio | |
Income: Interest | | $ | 5,237,165 | |
Expenses: Management fee | | | 1,898,580 | |
| Administration fee | | | 2,969,292 | |
| Services to shareholders | | | 1,499,291 | |
| Distribution and service fees | | | 2,540,744 | |
| Custodian fee | | | 55,371 | |
| Professional fees | | | 135,387 | |
| Reports to shareholders | | | 139,606 | |
| Registration fees | | | 135,888 | |
| Trustees' fees and expenses | | | 135,253 | |
| Other | | | 134,035 | |
| Total expenses before expense reductions | | | 9,643,447 | |
| Expense reductions | | | (5,144,848 | ) |
| Total expenses after expense reductions | | | 4,498,599 | |
| Net investment income | | | 738,566 | |
| Net realized gain (loss) from investments | | | 11,278 | |
| Net increase (decrease) in net assets resulting from operations | | $ | 749,844 | |
The accompanying notes are an integral part of the financial statements.
Statement of Changes in Net Assets | | | Government & Agency Securities Portfolio | |
| Increase (Decrease) in Net Assets | | Years Ended April 30, | |
| | 2013 | | | 2012 | |
Operations: Net investment income | | $ | 738,566 | | | $ | 1,255,673 | |
| Net realized gain (loss) | | | 11,278 | | | | 155,718 | |
| Net increase in net assets resulting from operations | | | 749,844 | | | | 1,411,391 | |
Distributions to shareholders from: Net investment income: Capital Assets Funds Shares | | | (17,994 | ) | | | (24,512 | ) |
| Davidson Cash Equivalent Shares | | | (2,284 | ) | | | (2,348 | ) |
| Davidson Cash Equivalent Plus Shares | | | (9,941 | ) | | | (7,569 | ) |
| DWS Government & Agency Money Fund | | | (12,034 | ) | | | (14,615 | ) |
| DWS Government Cash Institutional Shares | | | (662,372 | ) | | | (1,165,027 | ) |
| Government Cash Managed Shares | | | (24,703 | ) | | | (24,030 | ) |
| Service Shares | | | (9,225 | ) | | | (17,564 | ) |
| Total distributions | | | (738,553 | ) | | | (1,255,665 | ) |
Fund share transactions: Proceeds from shares sold | | | 17,983,371,115 | | | | 33,927,293,511 | |
| Reinvestment of distributions | | | 400,224 | | | | 717,672 | |
| Cost of shares redeemed | | | (18,573,676,534 | ) | | | (35,969,779,735 | ) |
| Net increase (decrease) in net assets from Fund share transactions | | | (589,905,195 | ) | | | (2,041,768,552 | ) |
| Increase (decrease) in net assets | | | (589,893,904 | ) | | | (2,041,612,826 | ) |
| Net assets at beginning of period | | | 3,530,251,066 | | | | 5,571,863,892 | |
| Net assets at end of period (including undistributed net investment income of $201,505 and $201,492, respectively) | | $ | 2,940,357,162 | | | $ | 3,530,251,066 | |
The accompanying notes are an integral part of the financial statements.
Government & Agency Securities Portfolio DWS Government & Agency Money Fund | |
| | | Years Ended April 30, | |
| | | 2013 | | | 2012 | | | 2011 | | | 2010 | | | 2009 | |
| Selected Per Share Data | |
| Net asset value, beginning of period | | $ | 1.00 | | | $ | 1.00 | | | $ | 1.00 | | | $ | 1.00 | | | $ | 1.00 | |
Income (loss) from investment operations: Net investment income | | | .000 | * | | | .000 | * | | | .000 | * | | | .001 | | | | .014 | |
| Net realized gain (loss) | | | .000 | * | | | .000 | * | | | (.000 | )* | | | .000 | * | | | .000 | * |
| Total from investment operations | | | .000 | * | | | .000 | * | | | .000 | * | | | .001 | | | | .014 | |
Less distributions from: Net investment income | | | (.000 | )* | | | (.000 | )* | | | (.000 | )* | | | (.001 | ) | | | (.014 | ) |
| Net realized gains | | | — | | | | — | | | | — | | | | (.000 | )* | | | — | |
| Total distributions | | | (.000 | )* | | | (.000 | )* | | | (.000 | )* | | | (.001 | ) | | | (.014 | ) |
| Net asset value, end of period | | $ | 1.00 | | | $ | 1.00 | | | $ | 1.00 | | | $ | 1.00 | | | $ | 1.00 | |
Total Return (%)a | | | .01 | | | | .01 | | | | .02 | | | | .07 | | | | 1.41 | |
| Ratios to Average Net Assets and Supplemental Data | |
| Net assets, end of period ($ millions) | | | 117 | | | | 139 | | | | 170 | | | | 233 | | | | 325 | |
| Ratio of expenses before expense reductions (%) | | | .28 | | | | .26 | | | | .28 | | | | .27 | | | | .26 | |
| Ratio of expenses after expense reductions (%) | | | .17 | | | | .11 | | | | .22 | | | | .26 | | | | .26 | |
| Ratio of net investment income (%) | | | .01 | | | | .01 | | | | .01 | | | | .06 | | | | 1.46 | b |
a Total return would have been lower had certain expenses not been reduced. b Due to the timing of the subscriptions and redemptions, the amount shown does not correspond to the total return during the period. * Amount is less than $.0005. | |
Notes to Financial Statements
1. Organization and Significant Accounting Policies
Cash Account Trust (the "Trust") is registered under the Investment Company Act of 1940, as amended (the "1940 Act"), as an open-end investment management company organized as a Massachusetts business trust.
The Trust offers three funds: Money Market Portfolio, Government & Agency Securities Portfolio and Tax-Exempt Portfolio. These financial statements report on Government & Agency Securities Portfolio (the "Fund").
Government & Agency Securities Portfolio offers seven classes of shares: Capital Assets Funds Shares, Davidson Cash Equivalent Shares, Davidson Cash Equivalent Plus Shares, DWS Government & Agency Money Fund, DWS Government Cash Institutional Shares, Government Cash Managed Shares and Service Shares.
The financial highlights for all classes of shares, other than DWS Government & Agency Money Fund, are provided separately and are available upon request.
The Fund's investment income, realized gains and losses, and certain Fund-level expenses and expense reductions, if any, are borne pro rata on the basis of relative net assets by the holders of all classes of shares of the Fund, except that each class bears certain expenses unique to that class such as distribution and service fees, services to shareholders and certain other class-specific expenses. Differences in class-level expenses may result in payment of different per share dividends by class. All shares of the Trust have equal rights with respect to voting subject to class-specific arrangements.
The Fund's financial statements are prepared in accordance with accounting principles generally accepted in the United States of America which require the use of management estimates. Actual results could differ from those estimates. The policies described below are followed consistently by the Fund in the preparation of its financial statements.
Security Valuation. Various inputs are used in determining the value of the Fund's investments. These inputs are summarized in three broad levels. Level 1 includes quoted prices in active markets for identical securities. Level 2 includes other significant observable inputs (including quoted prices for similar securities, interest rates, prepayment speeds, and credit risk). Level 3 includes significant unobservable inputs (including the Fund's own assumptions in determining the fair value of investments). The inputs or methodology used for valuing securities are not necessarily an indication of the risk associated with investing in those securities.
The Fund values all securities utilizing the amortized cost method permitted in accordance with Rule 2a-7 under the 1940 Act and certain conditions therein. Under this method, which does not take into account unrealized capital gains or losses on securities, an instrument is initially valued at its cost and thereafter assumes a constant accretion/amortization rate to maturity of any discount or premium. Securities held by the Fund are reflected as Level 2 because the securities are valued at amortized cost (which approximates fair value) and, accordingly, the inputs used to determine value are not quoted prices in an active market.
Disclosure about the classification of fair value measurements is included in a table following the Fund's Investment Portfolio.
New Accounting Pronouncement. In January 2013, Accounting Standard Update 2013-01 (ASU 2013-01), Clarifying the Scope of Disclosures about Offsetting Assets and Liabilities, replaced Accounting Standards Update 2011-11 (ASU 2011-11), Disclosures about Offsetting Assets and Liabilities. ASU 2013-01 is effective for fiscal years beginning on or after January 1, 2013, and interim periods within those annual periods. ASU 2011-11 was intended to enhance disclosure requirements on the offsetting of financial assets and liabilities. The ASU 2013-01 limits the scope of the new balance sheet offsetting disclosures to derivatives, repurchase agreements, and securities lending transactions to the extent that they are (1) offset in the financial statements or (2) subject to an enforceable master netting arrangement or similar agreement. Management is currently evaluating the application of ASU 2013-01 and its impact, if any, on the Fund's financial statements.
Repurchase Agreements. The Fund may enter into repurchase agreements with certain banks and broker/dealers whereby the Fund, through its custodian or a sub-custodian bank, receives delivery of the underlying securities, the amount of which at the time of purchase and each subsequent business day is required to be maintained at such a level that the market value is equal to at least the principal amount of the repurchase price plus accrued interest. The custodial bank or another designated subcustodian holds the collateral in a separate account until the agreement matures. If the value of the securities falls below the principal amount of the repurchase agreement plus accrued interest, the financial institution deposits additional collateral by the following business day. If the financial institution either fails to deposit the required additional collateral or fails to repurchase the securities as agreed, the Fund has the right to sell the securities and recover any resulting loss from the financial institution. If the financial institution enters into bankruptcy, the Fund's claims on the collateral may be subject to legal proceedings.
Federal Income Taxes. The Fund's policy is to comply with the requirements of the Internal Revenue Code, as amended, which are applicable to regulated investment companies and to distribute all of its taxable and tax-exempt income to its shareholders.
Under the Regulated Investment Company Modernization Act of 2010, net capital losses may be carried forward indefinitely, and their character is retained as short-term and/or long-term losses. Previously, net capital losses were carried forward for eight years and treated as short-term losses. As a transition rule, the Act requires that post-enactment net capital losses be used before pre-enactment net capital losses.
At April 30, 2013, the Fund had a net tax basis capital loss carryforward of approximately $436,000 of pre-enactment losses, which may be applied against any realized net taxable capital gains of each succeeding year until fully utilized or until April 30, 2019 (the expiration date), whichever occurs first.
The Fund has reviewed the tax positions for the open tax years as of April 30, 2013 and has determined that no provision for income tax is required in the Fund's financial statements. The Fund's federal tax returns for the prior three fiscal years remain open subject to examination by the Internal Revenue Service.
Distribution of Income. Net investment income of the Fund is declared as a daily dividend and is distributed to shareholders monthly. The Fund may take into account capital gains and losses in its daily dividend declarations. The Fund may also make additional distributions for tax purposes if necessary.
Permanent book and tax basis differences relating to shareholder distributions will result in reclassifications to paid in capital. Temporary book and tax basis differences will reverse in a subsequent period. There were no significant book-to-tax differences for the Fund.
At April 30, 2013, the Fund's components of distributable earnings on a tax basis are as follows:
| Undistributed ordinary income* | | $ | 227,334 | |
| Capital loss carryforwards | | $ | (436,000 | ) |
In addition, the tax character of distributions paid to shareholders by the Fund is summarized as follows:
| | | Years Ended April 30, | |
| | | 2013 | | | 2012 | |
| Distributions from ordinary income* | | $ | 738,553 | | | $ | 1,255,665 | |
* For tax purposes, short-term capital gain distributions are considered ordinary income distributions.
Expenses. Expenses of the Trust arising in connection with a specific Fund are allocated to that Fund. Other Trust expenses which cannot be directly attributed to a Fund are apportioned pro rata on the basis of relative net assets among the funds in the Trust based upon the relative net assets or other appropriate measures.
Contingencies. In the normal course of business, the Fund may enter into contracts with service providers that contain general indemnification clauses. The Fund's maximum exposure under these arrangements is unknown as this would involve future claims that may be made against the Fund that have not yet been made. However, based on experience, the Fund expects the risk of loss to be remote.
Other. Investment transactions are accounted for on trade date. Interest income is recorded on the accrual basis. Realized gains and losses from investment transactions are recorded on an identified cost basis and may include proceeds from litigation. All discounts and premiums are accreted/amortized for both tax and financial reporting purposes.
2. Related Parties
Management Agreement. Under an Amended and Restated Investment Management Agreement with Deutsche Investment Management Americas Inc. ("DIMA" or the "Advisor"), an indirect, wholly owned subsidiary of Deutsche Bank AG, the Advisor directs the investments of the Fund in accordance with its investment objectives, policies and restrictions. The Advisor determines the securities, instruments and other contracts relating to investments to be purchased, sold or entered into by the Fund.
The Fund pays a monthly management fee based on the combined average daily net assets of the three Funds in the Trust and allocated to the Fund based on its relative net assets, computed and accrued daily and payable monthly, at the following annual rates:
| First $500 million of the Funds' combined average daily net assets | | | .120 | % |
| Next $500 million of such net assets | | | .100 | % |
| Next $1 billion of such net assets | | | .075 | % |
| Next $1 billion of such net assets | | | .060 | % |
| Over $3 billion of such net assets | | | .050 | % |
The Advisor has agreed to contractually reduce its management fee for the Fund such that the annual effective rate is limited to 0.05% of the Fund's average daily net assets.
For the period from May 1, 2012 through September 30, 2013, the Advisor has contractually agreed to waive its fees and/or reimburse certain operating expenses of the DWS Government & Agency Money Fund to the extent necessary to maintain the operating expenses (excluding certain expenses such as extraordinary expenses, taxes, brokerage and interest) at 0.45%.
The Advisor has agreed to voluntarily waive additional expenses. The voluntary waiver may be changed or terminated at any time without notice. Under these arrangements, the Advisor waived certain expenses on DWS Government & Agency Money Fund shares.
Accordingly, for the year ended April 30, 2013, the Advisor earned a management fee on the Fund aggregating $1,898,580, of which $1,332,763 was waived, resulting in an annual effective rate of 0.02% of the Fund's average daily net assets.
The Advisor has also agreed to maintain expenses of certain other classes of the Trust. These rates are disclosed in the respective share classes' annual reports that are provided separately and are available upon request.
Administration Fee. Pursuant to an Administrative Services Agreement, DIMA provides most administrative services to the Fund. For all services provided under the Administrative Services Agreement, the Fund pays the Advisor an annual fee ("Administration Fee") of 0.10% of the Fund's average daily net assets, computed and accrued daily and payable monthly. For the year ended April 30, 2013, the Administration Fee was as follows:
| | | Administration Fee | | | Unpaid at April 30, 2013 | |
| Government & Agency Securities Portfolio | | $ | 2,969,292 | | | $ | 237,874 | |
Service Provider Fees. DWS Investments Service Company ("DISC"), an affiliate of the Advisor, is the transfer agent, dividend-paying agent and shareholder service agent for the Fund. Pursuant to a sub-transfer agency agreement between DISC and DST Systems, Inc. ("DST"), DISC has delegated certain transfer agent, dividend-paying agent and shareholder service agent functions to DST. DISC compensates DST out of the shareholder servicing fee it receives from the Fund. For the year ended April 30, 2013, the amounts charged to the Fund by DISC were as follows:
| Government & Agency Securities Portfolio: | | Total Aggregated | | | Waived | | | Unpaid at April 30, 2013 | |
| Capital Assets Funds Shares | | $ | 446,473 | | | $ | 407,085 | | | $ | 21,372 | |
| Davidson Cash Equivalent Shares | | | 57,088 | | | | 52,121 | | | | 618 | |
| Davidson Cash Equivalent Plus Shares | | | 198,754 | | | | 177,388 | | | | 6,098 | |
| DWS Government & Agency Money Fund | | | 108,301 | | | | 82,446 | | | | 9,591 | |
| DWS Government Cash Institutional Shares | | | 194,797 | | | | 194,797 | | | | — | |
| Government Cash Managed Shares | | | 197,828 | | | | 145,451 | | | | 10,765 | |
| Service Shares | | | 230,680 | | | | 212,053 | | | | 3,333 | |
| | | $ | 1,433,921 | | | $ | 1,271,341 | | | $ | 51,777 | |
Distribution Service Agreement. Under the Distribution Service Agreement, in accordance with Rule 12b-1 under the 1940 Act, DWS Investments Distributors, Inc. ("DIDI"), an affiliate of the Advisor, receives a fee ("Distribution Fee"), calculated as a percentage of average daily net assets for the shares listed in the following table.
For the year ended April 30, 2013, the Distribution Fee was as follows:
| Government & Agency Securities Portfolio: | | Distribution Fee | | | Waived | | | Annual Effective Rate | | | Contractual Rate (Up To) | |
| Capital Assets Funds Shares | | $ | 593,656 | | | $ | 593,656 | | | | .00 | % | | | .33 | % |
| Davidson Cash Equivalent Shares | | | 68,505 | | | | 68,505 | | | | .00 | % | | | .30 | % |
| Davidson Cash Equivalent Plus Shares | | | 248,443 | | | | 248,443 | | | | .00 | % | | | .25 | % |
| Service Shares | | | 553,631 | | | | 553,631 | | | | .00 | % | | | .60 | % |
| | | $ | 1,464,235 | | | $ | 1,464,235 | | | | | | | | | |
In addition, DIDI provides information and administrative services for a fee ("Service Fee") for the shares listed in the following table. A portion of these fees may be paid pursuant to a Rule 12b-1 plan.
For the year ended April 30, 2013, the Service Fee was as follows:
| Government & Agency Securities Portfolio: | | Service Fee | | | Waived | | | Annual Effective Rate | | | Contractual Rate (Up To) | |
| Capital Assets Funds Shares | | $ | 449,739 | | | $ | 449,739 | | | | .00 | % | | | .25 | % |
| Davidson Cash Equivalent Shares | | | 57,088 | | | | 57,088 | | | | .00 | % | | | .25 | % |
| Davidson Cash Equivalent Plus Shares | | | 198,754 | | | | 198,754 | | | | .00 | % | | | .20 | % |
| Government Cash Managed Shares | | | 370,928 | | | | 370,928 | | | | .00 | % | | | .15 | % |
| | | $ | 1,076,509 | | | $ | 1,076,509 | | | | | | | | | |
Typesetting and Filing Service Fees. Under an agreement with DIMA, DIMA is compensated for providing typesetting and certain regulatory filing services to the Fund. For the year ended April 30, 2013, the amount charged to the Fund by DIMA included in the Statement of Operations under "reports to shareholders" expenses was as follows:
| | | Total Aggregated | | | Unpaid at April 30, 2013 | |
| Government & Agency Securities Portfolio | | $ | 56,466 | | | $ | 19,054 | |
Trustees' Fees and Expenses. The Fund paid retainer fees to each Trustee not affiliated with the Advisor, plus specified amounts to the Board Chairperson and Vice Chairperson and to each committee Chairperson.
3. Concentration of Ownership
From time to time, the Fund may have a concentration of several shareholder accounts holding a significant percentage of shares outstanding. Investment activities of these shareholders could have a material impact on the Fund.
At April 30, 2013, there was one shareholder account that held approximately 13% of the outstanding shares of the Fund.
4. Line of Credit
The Fund and other affiliated funds (the "Participants") share in a $375 million revolving credit facility provided by a syndication of banks. The Fund may borrow for temporary or emergency purposes, including the meeting of redemption requests that otherwise might require the untimely disposition of securities. The Participants are charged an annual commitment fee which is allocated based on net assets, among each of the Participants. Interest is calculated at a rate per annum equal to the sum of the Federal Funds Rate plus 1.25 percent plus, if LIBOR exceeds the Federal Funds Rate, the amount of such excess. The Fund may borrow up to a maximum of 33 percent of its net assets under the agreement. The Fund had no outstanding loans at April 30, 2013.
5. Share Transactions
The following table summarizes share and dollar activity in the Fund:
Government & Agency Securities Portfolio
| | | Year Ended April 30, 2013 | | | Year Ended April 30, 2012 | |
| | | Shares | | | Dollars | | | Shares | | | Dollars | |
| Shares sold | |
| Capital Assets Funds Shares | | | 106,697,232 | | | $ | 106,697,232 | | | | 447,922,936 | | | $ | 447,922,936 | |
| Davidson Cash Equivalent Shares | | | 31,099,071 | | | | 31,099,071 | | | | 41,768,083 | | | | 41,768,083 | |
| Davidson Cash Equivalent Plus Shares | | | 222,327,364 | | | | 222,327,364 | | | | 213,635,877 | | | | 213,635,877 | |
| DWS Government & Agency Money Fund | | | 53,121,349 | | | | 53,121,349 | | | | 61,520,170 | | | | 61,520,170 | |
| DWS Government Cash Institutional Shares | | | 15,315,065,657 | | | | 15,315,065,657 | | | | 30,092,618,931 | | | | 30,092,618,931 | |
| Government Cash Managed Shares | | | 1,990,326,289 | | | | 1,990,326,289 | | | | 2,673,520,482 | | | | 2,673,520,482 | |
| Service Shares | | | 264,734,153 | | | | 264,734,153 | | | | 396,307,032 | | | | 396,307,032 | |
| | | | | | | $ | 17,983,371,115 | | | | | | | $ | 33,927,293,511 | |
| Shares issued to shareholders in reinvestment of distributions | |
| Capital Assets Funds Shares | | | 17,994 | | | $ | 17,994 | | | | 24,434 | | | $ | 24,434 | |
| Davidson Cash Equivalent Shares | | | 2,284 | | | | 2,284 | | | | 2,343 | | | | 2,343 | |
| Davidson Cash Equivalent Plus Shares | | | 9,940 | | | | 9,940 | | | | 7,560 | | | | 7,560 | |
| DWS Government & Agency Money Fund | | | 11,818 | | | | 11,818 | | | | 13,959 | | | | 13,959 | |
| DWS Government Cash Institutional Shares | | | 341,515 | | | | 341,515 | | | | 644,365 | | | | 644,365 | |
| Government Cash Managed Shares | | | 7,714 | | | | 7,714 | | | | 7,755 | | | | 7,755 | |
| Service Shares | | | 8,959 | | | | 8,959 | | | | 17,256 | | | | 17,256 | |
| | | | | | | $ | 400,224 | | | | | | | $ | 717,672 | |
| Shares redeemed | |
| Capital Assets Funds Shares | | | (205,489,534 | ) | | $ | (205,489,534 | ) | | | (495,723,357 | ) | | $ | (495,723,357 | ) |
| Davidson Cash Equivalent Shares | | | (35,645,815 | ) | | | (35,645,815 | ) | | | (36,015,591 | ) | | | (36,015,591 | ) |
| Davidson Cash Equivalent Plus Shares | | | (207,586,537 | ) | | | (207,586,537 | ) | | | (153,400,457 | ) | | | (153,400,457 | ) |
| DWS Government & Agency Money Fund | | | (75,265,565 | ) | | | (75,265,565 | ) | | | (92,132,646 | ) | | | (92,132,646 | ) |
| DWS Government Cash Institutional Shares | | | (15,771,839,065 | ) | | | (15,771,839,065 | ) | | | (32,152,791,854 | ) | | | (32,152,791,854 | ) |
| Government Cash Managed Shares | | | (1,983,483,875 | ) | | | (1,983,483,875 | ) | | | (2,637,952,274 | ) | | | (2,637,952,274 | ) |
| Service Shares | | | (294,366,143 | ) | | | (294,366,143 | ) | | | (401,763,556 | ) | | | (401,763,556 | ) |
| | | | | | | $ | (18,573,676,534 | ) | | | | | | $ | (35,969,779,735 | ) |
| Net increase (decrease) | |
| Capital Assets Funds Shares | | | (98,774,308 | ) | | $ | (98,774,308 | ) | | | (47,775,987 | ) | | $ | (47,775,987 | ) |
| Davidson Cash Equivalent Shares | | | (4,544,460 | ) | | | (4,544,460 | ) | | | 5,754,835 | | | | 5,754,835 | |
| Davidson Cash Equivalent Plus Shares | | | 14,750,767 | | | | 14,750,767 | | | | 60,242,980 | | | | 60,242,980 | |
| DWS Government & Agency Money Fund | | | (22,132,398 | ) | | | (22,132,398 | ) | | | (30,598,517 | ) | | | (30,598,517 | ) |
| DWS Government Cash Institutional Shares | | | (456,431,893 | ) | | | (456,431,893 | ) | | | (2,059,528,558 | ) | | | (2,059,528,558 | ) |
| Government Cash Managed Shares | | | 6,850,128 | | | | 6,850,128 | | | | 35,575,963 | | | | 35,575,963 | |
| Service Shares | | | (29,623,031 | ) | | | (29,623,031 | ) | | | (5,439,268 | ) | | | (5,439,268 | ) |
| | | | | | | $ | (589,905,195 | ) | | | | | | $ | (2,041,768,552 | ) |
Report of Independent Registered Public Accounting Firm
To the Shareholders and Board of Trustees of Cash Account Trust:
We have audited the accompanying statement of assets and liabilities of Government & Agency Securities Portfolio (the "Fund") (one of the Funds comprising Cash Account Trust), including the investment portfolio, as of April 30, 2013, and the related statement of operations for the year then ended, the statement of changes in net assets for each of the two years in the period then ended, and the financial highlights for each of the five years in the period then ended. These financial statements and financial highlights are the responsibility of the Fund's management. Our responsibility is to express an opinion on these financial statements and financial highlights based on our audits.
We conducted our audits in accordance with the standards of the Public Company Accounting Oversight Board (United States). Those standards require that we plan and perform the audit to obtain reasonable assurance about whether the financial statements and financial highlights are free of material misstatement. We were not engaged to perform an audit of the Fund's internal control over financial reporting. Our audits included consideration of internal control over financial reporting as a basis for designing audit procedures that are appropriate in the circumstances, but not for the purpose of expressing an opinion on the effectiveness of the Fund's internal control over financial reporting. Accordingly, we express no such opinion. An audit also includes examining, on a test basis, evidence supporting the amounts and disclosures in the financial statements and financial highlights, assessing the accounting principles used and significant estimates made by management, and evaluating the overall financial statement presentation. Our procedures included confirmation of securities owned as of April 30, 2013, by correspondence with the custodian and brokers. We believe that our audits provide a reasonable basis for our opinion.
In our opinion, the financial statements and financial highlights referred to above present fairly, in all material respects, the financial position of Government & Agency Securities Portfolio at April 30, 2013, the results of its operations for the year then ended, the changes in its net assets for each of the two years in the period then ended, and the financial highlights for each of the five years in the period then ended, in conformity with U.S. generally accepted accounting principles.
| | | |
Boston, Massachusetts June 19, 2013 | | |
Information About Your Fund's Expenses
As an investor of the Fund, you incur two types of costs: ongoing expenses and transaction costs. Ongoing expenses include management fees, distribution and service (12b-1) fees and other Fund expenses. Examples of transaction costs include account maintenance fees, which are not shown in this section. The following tables are intended to help you understand your ongoing expenses (in dollars) of investing in the Fund and to help you compare these expenses with the ongoing expenses of investing in other mutual funds. In the most recent six-month period, the Fund limited these expenses; had it not done so, expenses would have been higher for the DWS Government & Agency Money Fund. The example in the table is based on an investment of $1,000 invested at the beginning of the six-month period and held for the entire period (November 1, 2012 to April 30, 2013).
The tables illustrate your Fund's expenses in two ways:
•Actual Fund Return. This helps you estimate the actual dollar amount of ongoing expenses (but not transaction costs) paid on a $1,000 investment in the Fund using the Fund's actual return during the period. To estimate the expenses you paid over the period, simply divide your account value by $1,000 (for example, an $8,600 account value divided by $1,000 = 8.6), then multiply the result by the number in the "Expenses Paid per $1,000" line under the share class you hold.
• Hypothetical 5% Fund Return. This helps you to compare your Fund's ongoing expenses (but not transaction costs) with those of other mutual funds using the Fund's actual expense ratio and a hypothetical rate of return of 5% per year before expenses. Examples using a 5% hypothetical fund return may be found in the shareholder reports of other mutual funds. The hypothetical account values and expenses may not be used to estimate the actual ending account balance or expenses you paid for the period.
Please note that the expenses shown in these tables are meant to highlight your ongoing expenses only and do not reflect any transaction costs. The "Expenses Paid per $1,000" line of the tables is useful in comparing ongoing expenses only and will not help you determine the relative total expense of owning different funds. If these transaction costs had been included, your costs would have been higher.
Expenses and Value of a $1,000 Investment for the six months ended April 30, 2013 (Unaudited) | |
| Actual Fund Return | | DWS Government & Agency Money Fund | |
| Beginning Account Value 11/1/12 | | $ | 1,000.00 | |
| Ending Account Value 4/30/13 | | $ | 1,000.05 | |
| Expenses Paid per $1,000* | | $ | .79 | |
| Hypothetical 5% Fund Return | | | | |
| Beginning Account Value 11/1/12 | | $ | 1,000.00 | |
| Ending Account Value 4/30/13 | | $ | 1,024.00 | |
| Expenses Paid per $1,000* | | $ | .80 | |
| * Expenses are equal to the Fund's annualized expense ratio for each share class, multiplied by the average account value over the period, multiplied by 181 (the number of days in the most recent six-month period), then divided by 365. | |
| Annualized Expense Ratio | | | | |
| DWS Government & Agency Money Fund | | | .16 | % |
For more information, please refer to the Fund's prospectus. For an analysis of the fees associated with an investment in the Fund or similar funds, please refer to http://apps.finra.org/fundanalyzer/1/fa.aspx. | |
Tax Information (Unaudited)
A total of 31% of the dividends distributed during the fiscal year was derived from interest on U.S. government securities, which is generally exempt from state income tax.
Please consult a tax advisor if you have questions about federal or state income tax laws, or on how to prepare your tax returns. If you have specific questions about your account, please call (800) 728-3337.
Proxy Voting
The Fund's policies and procedures for voting proxies for portfolio securities and information about how the Fund voted proxies related to its portfolio securities during the 12-month period ended June 30 are available on our Web site — www.dws-investments.com (click on "proxy voting" at the bottom of the page) — or on the SEC's Web site — www.sec.gov. To obtain a written copy of the Fund's policies and procedures without charge, upon request, call us toll free at (800) 728-3337.
Portfolio Holdings
Following the Fund's fiscal first and third quarter-end, a complete portfolio holdings listing is filed with the SEC on Form N-Q. In addition, each month, information about the Fund and its portfolio holdings is filed with the SEC on Form N-MFP. The SEC delays the public availability of the information filed on Form N-MFP for 60 days after the end of the reporting period included in the filing. These forms will be available on the SEC's Web site at www.sec.gov, and they may also be reviewed and copied at the SEC's Public Reference Room in Washington, D.C. Information on the operation of the SEC's Public Reference Room may be obtained by calling (800) SEC-0330. The Fund's portfolio holdings are also posted on www.dws-investments.com from time to time. Please see the Fund's current prospectus for more information.
Money Market Fund Reform
In 2010, the Securities and Exchange Commission adopted amendments to then-existing money market fund regulations, imposing new liquidity, credit quality and maturity requirements on all money market funds. In November 2012, the Financial Stability Oversight Council (FSOC), a board of U.S. regulators established by the Dodd-Frank Act, proposed recommendations for money market fund reform. If the SEC were to adopt one or more of the FSOC proposed recommendations in the future, or if FSOC were to take other steps to establish similar regulations of money market funds in the future, such regulatory action may affect the Fund's operations and/or return potential.
Summary of Management Fee Evaluation by Independent Fee Consultant
September 17, 2012
Pursuant to an Order entered into by Deutsche Investment Management Americas and affiliates (collectively, "DeAM") with the Attorney General of New York, I, Thomas H. Mack, have been appointed the Independent Fee Consultant for the DWS Funds (formerly the DWS Scudder Funds). My duties include preparing an annual written evaluation of the management fees DeAM charges the Funds, considering among other factors the management fees charged by other mutual fund companies for like services, management fees DeAM charges other clients for like services, DeAM's costs of supplying services under the management agreements and related profit margins, possible economies of scale if a Fund grows larger, and the nature and quality of DeAM's services, including fund performance. This report summarizes my evaluation for 2012, including my qualifications, the evaluation process for each of the DWS Funds, consideration of certain complex-level factors, and my conclusions. I served in substantially the same capacity in 2007, 2008, 2009, 2010 and 2011.
Qualifications
For more than 35 years I have served in various professional capacities within the investment management business. I have held investment analysis and advisory positions, including securities analyst, portfolio strategist and director of investment policy with a large investment firm. I have also performed business management functions, including business development, financial management and marketing research and analysis.
Since 1991, I have been an independent consultant within the asset management industry. I have provided services to over 125 client organizations, including investment managers, mutual fund boards, product distributors and related organizations. Over the past ten years I have completed a number of assignments for mutual fund boards, specifically including assisting boards with management contract renewal.
I hold a Master of Business Administration degree, with highest honors, from Harvard University and Master of Science and Bachelor of Science (highest honors) degrees from the University of California at Berkeley. I am an independent director and audit committee financial expert for two closed-end mutual funds and have served in various leadership and financial oversight capacities with non-profit organizations.
Evaluation of Fees for each DWS Fund
My work focused primarily on evaluating, fund-by-fund, the fees charged to each of the 103 mutual fund portfolios in the DWS Fund family. For each Fund, I considered each of the key factors mentioned above, as well as any other relevant information. In doing so I worked closely with the Funds' Independent Directors in their annual contract renewal process, as well as in their approval of contracts for several new funds (documented separately).
In evaluating each Fund's fees, I reviewed comprehensive materials provided by or on behalf of DeAM, including expense information prepared by Lipper Analytical, comparative performance information, profitability data, manager histories, and other materials. I also accessed certain additional information from the Lipper and Morningstar databases and drew on my industry knowledge and experience.
To facilitate evaluating this considerable body of information, I prepared for each Fund a document summarizing the key data elements in each area as well as additional analytics discussed below. This made it possible to consider each key data element in the context of the others.
In the course of contract renewal, DeAM agreed to implement a number of fee and expense adjustments requested by the Independent Directors which will favorably impact future fees and expenses, and my evaluation includes the effects of these changes.
Fees and Expenses Compared with Other Funds
The competitive fee and expense evaluation for each fund focused on two primary comparisons:
The Fund's contractual management fee (the advisory fee plus the administration fee where applicable) compared with those of a group of typically 12-15 funds in the same Lipper investment category (e.g. Large Capitalization Growth) having similar distribution arrangements and being of similar size.
The Fund's total expenses compared with a broader universe of funds from the same Lipper investment category and having similar distribution arrangements.
These two comparisons provide a view of not only the level of the fee compared with funds of similar scale but also the total expense the Fund bears for all the services it receives, in comparison with the investment choices available in the Fund's investment category and distribution channel. The principal figure-of-merit used in these comparisons was the subject Fund's percentile ranking against peers.
DeAM's Fees for Similar Services to Others
DeAM provided management fee schedules for all of its US domiciled fund and non-fund investment management accounts in any of the investment categories where there is a DWS Fund. These similar products included the other DWS Funds, non-fund pooled accounts, institutional accounts and sub-advisory accounts. Using this information, I calculated for each Fund the fee that would be charged to each similar product, at the subject Fund's asset level.
Evaluating information regarding non-fund products is difficult because there are varying levels of services required for different types of accounts, with mutual funds generally requiring considerably more regulatory and administrative types of service as well as having more frequent cash flows than other types of accounts. Also, while mutual fund fees for similar fund products can be expected to be similar, there will be some differences due to different pricing conditions in different distribution channels (e.g. retail funds versus those used in variable insurance products), differences in underlying investment processes and other factors.
Costs and Profit Margins
DeAM provided a detailed profitability analysis for each Fund. After making some adjustments so that the presentation would be more comparable to the available industry figures, I reviewed profit margins from investment management alone, from investment management plus other fund services (excluding distribution) provided to the Funds by DeAM (principally shareholder services), and DeAM profits from all sources, including distribution. A later section comments on overall profitability.
Economies of Scale
Economies of scale — an expected decline in management cost per dollar of fund assets as fund assets grow — are very rarely quantified and documented because of inherent difficulties in collecting and analyzing relevant data. However, in virtually every investment category that I reviewed, larger funds tend to have lower fees and lower total expenses than smaller funds. To see how each DWS Fund compares with this industry observation, I reviewed:
The trend in Fund assets over the last five years and the accompanying trend in total expenses. This shows if the Fund has grown and, if so, whether total expense (management fees as well as other expenses) have declined as a percent of assets.
Whether the Fund has break-points in its management fee schedule, the extent of the fee reduction built into the schedule and the asset levels where the breaks take effect, and in the case of a sub-advised Fund how the Fund's break-points compare with those of the sub-advisory fee schedule.
How the Fund's contractual fee schedule compares with trends in the industry data. To accomplish this, I constructed a chart showing how actual latest-fiscal-year contractual fees of the Fund and of other similar funds relate to average fund assets, with the subject Fund's contractual fee schedule superimposed.
Quality of Service — Performance
The quality-of-service evaluation focused on investment performance, which is the principal result of the investment management service. Each Fund's performance was reviewed over the past 1, 3, 5 and 10 years, as applicable, and compared with that of other funds in the same investment category and with a suitable market index.
In addition, I calculated and reviewed risk-adjusted returns relative to an index of similar mutual funds' returns and a suitable market index. The risk-adjusted returns analysis provides a way of determining the extent to which the Fund's return comparisons are mainly the product of investment value-added (or lack thereof) or alternatively taking considerably more or less risk than is typical in its investment category.
I also received and considered the history of portfolio manager changes for each Fund, as this provided an important context for evaluating the performance results.
Complex-Level Considerations
While this evaluation was conducted mainly at the individual fund level, there are some issues relating to the reasonableness of fees that can alternatively be considered across the whole fund complex:
I reviewed DeAM's profitability analysis for all DWS Funds, with a view toward determining if the allocation procedures used were reasonable and how profit levels compared with public data for other investment managers.
I considered whether DeAM and affiliates receive any significant ancillary or "fallout" benefits that should be considered in interpreting the direct profitability results. These would be situations where serving as the investment manager of the Funds is beneficial to another part of the Deutsche Bank organization.
I considered how aggregated DWS Fund expenses had varied over the years, by asset class and in the context of trends in asset levels.
I considered how aggregated DWS Fund performance measures relative to appropriate peers had varied by asset class and over time.
I reviewed the structure of the DeAM organization, trends in staffing levels, and information on compensation of investment management and other professionals compared with industry data.
Findings
Based on the process and analysis discussed above, which included reviewing a wide range of information from management and external data sources and considering among other factors the fees DeAM charges other clients, the fees charged by other fund managers, DeAM's costs and profits associated with managing the Funds, economies of scale, possible fall-out benefits, and the nature and quality of services provided, in my opinion the management fees charged the DWS Funds are reasonable.
Thomas H. Mack
President, Thomas H. Mack & Co., Inc.
Board Members and Officers
The following table presents certain information regarding the Board Members and Officers of the fund. Each Board Member's year of birth is set forth in parentheses after his or her name. Unless otherwise noted, (i) each Board Member has engaged in the principal occupation(s) noted in the table for at least the most recent five years, although not necessarily in the same capacity; and (ii) the address of each Independent Board Member is c/o Kenneth C. Froewiss, Chairman, DWS Mutual Funds, P.O. Box 78, Short Hills, NJ 07078. Except as otherwise noted below, the term of office for each Board Member is until the election and qualification of a successor, or until such Board Member sooner dies, resigns, is removed or as otherwise provided in the governing documents of the fund. Because the fund does not hold an annual meeting of shareholders, each Board Member will hold office for an indeterminate period. The Board Members may also serve in similar capacities with other funds in the fund complex.
| Independent Board Members |
Name, Year of Birth, Position with the Fund and Length of Time Served1 | | Business Experience and Directorships During the Past Five Years | Number of Funds in DWS Fund Complex Overseen |
Other Directorships Held by Board Member |
Kenneth C. Froewiss (1945) Chairperson since 2013,9 and Board Member since 2001 | | Adjunct Professor of Finance, NYU Stern School of Business (September 2009-present; Clinical Professor from 1997-September 2009); Member, Finance Committee, Association for Asian Studies (2002-present); Director, Mitsui Sumitomo Insurance Group (US) (2004-present); prior thereto, Managing Director, J.P. Morgan (investment banking firm) (until 1996) | 102 | — |
William McClayton (1944) Vice Chairperson since 2013,9 and Board Member since 2004 | | Private equity investor (since October 2009); previously, Managing Director, Diamond Management & Technology Consultants, Inc. (global consulting firm) (2001-2009); Directorship: Board of Managers, YMCA of Metropolitan Chicago; formerly: Senior Partner, Arthur Andersen LLP (accounting) (1966-2001); Trustee, Ravinia Festival | 102 | — |
John W. Ballantine (1946) Board Member since 1999 | | Retired; formerly, Executive Vice President and Chief Risk Management Officer, First Chicago NBD Corporation/The First National Bank of Chicago (1996-1998); Executive Vice President and Head of International Banking (1995-1996); former Directorships: Stockwell Capital Investments PLC (private equity); First Oak Brook Bancshares, Inc. and Oak Brook Bank; Prisma Energy International | 102 | Chairman of the Board, Healthways, Inc.2 (provider of disease and care management services) (2003- present); Portland General Electric2 (utility company) (2003- present) |
Henry P. Becton, Jr. (1943) Board Member since 1990 | | Vice Chair and former President, WGBH Educational Foundation. Directorships: Public Radio International; Public Radio Exchange (PRX); The PBS Foundation; North Bennett Street School (Boston); former Directorships: Association of Public Television Stations; Boston Museum of Science; American Public Television; Concord Academy; New England Aquarium; Mass. Corporation for Educational Telecommunications; Committee for Economic Development; Public Broadcasting Service; Connecticut College | 102 | Lead Director, Becton Dickinson and Company2 (medical technology company); Lead Director, Belo Corporation2 (media company) |
Dawn-Marie Driscoll (1946) Board Member since 1987 | | President, Driscoll Associates (consulting firm); Emeritus Executive Fellow, Center for Business Ethics, Bentley University; formerly, Partner, Palmer & Dodge (1988-1990); Vice President of Corporate Affairs and General Counsel, Filene's (1978-1988). Directorships: Director of ICI Mutual Insurance Company (since 2007); Advisory Board, Center for Business Ethics, Bentley University; Chairman of the Board of Trustees, Southwest Florida Community Foundation (charitable organization); former Directorships: Sun Capital Advisers Trust (mutual funds) (2007-2012), Investment Company Institute (audit, executive, nominating committees) and Independent Directors Council (governance, executive committees) | 102 | — |
Keith R. Fox, CFA (1954) Board Member since 1996 | | Managing General Partner, Exeter Capital Partners (a series of private investment funds) (since 1986). Directorships: Progressive International Corporation (kitchen goods importer and distributor); The Kennel Shop (retailer); former Chairman, National Association of Small Business Investment Companies; former Directorships: BoxTop Media Inc. (advertising); Sun Capital Advisers Trust (mutual funds) (2011-2012) | 102 | — |
Paul K. Freeman (1950) Board Member since 1993, and Chairperson (2009-Jan. 8, 2013) | | Consultant, World Bank/Inter-American Development Bank; Executive and Governing Council of the Independent Directors Council (Chairman of Education Committee); formerly: Project Leader, International Institute for Applied Systems Analysis (1998-2001); Chief Executive Officer, The Eric Group, Inc. (environmental insurance) (1986-1998); Directorships: Denver Zoo Foundation (December 2012-present); former Directorships: Prisma Energy International | 102 | — |
Richard J. Herring (1946) Board Member since 1990 | | Jacob Safra Professor of International Banking and Professor, Finance Department, The Wharton School, University of Pennsylvania (since July 1972); Co-Director, Wharton Financial Institutions Center (since July 2000); Co-Chair, U.S. Shadow Financial Regulatory Committee; Executive Director, Financial Economists Roundtable; formerly: Vice Dean and Director, Wharton Undergraduate Division (July 1995-June 2000); Director, Lauder Institute of International Management Studies (July 2000-June 2006) | 102 | Director, Japan Equity Fund, Inc. (since September 2007), Thai Capital Fund, Inc. (since 2007), Singapore Fund, Inc. (since September 2007), Independent Director of Barclays Bank Delaware (since September 2010) |
Rebecca W. Rimel (1951) Board Member since 1995 | | President and Chief Executive Officer, The Pew Charitable Trusts (charitable organization) (1994 to present); formerly: Executive Vice President, The Glenmede Trust Company (investment trust and wealth management) (1983-2004); Board Member, Investor Education (charitable organization) (2004-2005); Trustee, Executive Committee, Philadelphia Chamber of Commerce (2001-2007); Director, Viasys Health Care2 (January 2007-June 2007); Trustee, Thomas Jefferson Foundation (charitable organization) (1994-2012) | 102 | Director, Becton Dickinson and Company2 (medical technology company) (2012- present); Director, CardioNet, Inc.2 (health care) (2009- present) |
William N. Searcy, Jr. (1946) Board Member since 1993 | | Private investor since October 2003; formerly: Pension & Savings Trust Officer, Sprint Corporation2 (telecommunications) (November 1989-September 2003); Trustee, Sun Capital Advisers Trust (mutual funds) (1998-2012) | 102 | — |
Jean Gleason Stromberg (1943) Board Member since 1997 | | Retired. Formerly, Consultant (1997-2001); Director, Financial Markets U.S. Government Accountability Office (1996-1997); Partner, Fulbright & Jaworski, L.L.P. (law firm) (1978-1996). Directorships: The William and Flora Hewlett Foundation; former Directorships: Service Source, Inc., Mutual Fund Directors Forum (2002-2004), American Bar Retirement Association (funding vehicle for retirement plans) (1987-1990 and 1994-1996) | 102 | — |
Robert H. Wadsworth (1940) Board Member since 1999 | | President, Robert H. Wadsworth & Associates, Inc. (consulting firm) (1983 to present); Director, National Horizon, Inc. (non-profit organization); Director and Treasurer, The Phoenix Boys Choir Association | 105 | — |
Interested Board Member and Officer4 |
Name, Year of Birth, Position with the Fund and Length of Time Served1,6 | | Business Experience and Directorships During the Past Five Years | Number of Funds in DWS Fund Complex Overseen |
Other Directorships Held by Board Member |
Michael J. Woods5 (1967) Board Member since 2013,9 and Executive Vice President since 20139 | | Managing Director,3 Deutsche Asset & Wealth Management (2009-present); Head of the Americas Asset Management Business for Deutsche Bank, Member of the Asset and Wealth Management ("AWM") Extended Executive Committee, AWM Global Client Group Executive Committee and the AWM Active Asset Management Executive Committee; CEO and US Regional Head of DWS Investments; formerly: Sr. VP, Head of the Financial Intermediaries and Investments Group of Evergreen Investments (2007-2009), CEO and Vice Chairman of Board of Directors of XTF Global Asset Management (2006-2007), Managing Director — US Head of Sub-Advisory and Investment Only Business at Citigroup Asset Management (2000-2006). Mr. Woods is currently a board member of The Children's Village, The Big Brothers Big Sisters Organization, and The Mutual Fund Education Alliance. | 38 | — |
Officers4 |
Name, Year of Birth, Position with the Fund and Length of Time Served6 | | Business Experience and Directorships During the Past Five Years |
W. Douglas Beck, CFA7 (1967) President, 2011-present | | Managing Director,3 Deutsche Asset & Wealth Management (2006-present); President of DWS family of funds and Head of Product Management, U.S. for DWS Investments; formerly: Executive Director, Head of Product Management (2002-2006) and President (2005-2006) of the UBS Funds at UBS Global Asset Management; Co-Head of Manager Research/Managed Solutions Group, Merrill Lynch (1998-2002) |
John Millette8 (1962) Vice President and Secretary, 1999-present | | Director,3 Deutsche Asset & Wealth Management |
Paul H. Schubert7 (1963) Chief Financial Officer, 2004-present Treasurer, 2005-present | | Managing Director,3 Deutsche Asset & Wealth Management (since July 2004); formerly: Executive Director, Head of Mutual Fund Services and Treasurer for UBS Family of Funds (1998-2004); Vice President and Director of Mutual Fund Finance at UBS Global Asset Management (1994-1998) |
Caroline Pearson8 (1962) Chief Legal Officer, 2010-present | | Managing Director,3 Deutsche Asset & Wealth Management; formerly: Assistant Secretary for DWS family of funds (1997-2010) |
Melinda Morrow7 (1970) Vice President, 2012-present | | Director,3 Deutsche Asset & Wealth Management |
Hepsen Uzcan8 (1974) Assistant Secretary, since 20139 | | Vice President, Deutsche Asset & Wealth Management |
Paul Antosca8 (1957) Assistant Treasurer, 2007-present | | Director,3 Deutsche Asset & Wealth Management |
Jack Clark8 (1967) Assistant Treasurer, 2007-present | | Director,3 Deutsche Asset & Wealth Management |
Diane Kenneally8 (1966) Assistant Treasurer, 2007-present | | Director,3 Deutsche Asset & Wealth Management |
John Caruso7 (1965) Anti-Money Laundering Compliance Officer, 2010-present | | Managing Director,3 Deutsche Asset & Wealth Management |
Robert Kloby7 (1962) Chief Compliance Officer, 2006-present | | Managing Director,3 Deutsche Asset & Wealth Management |
1 The length of time served represents the year in which the Board Member joined the board of one or more DWS funds currently overseen by the Board.
2 A publicly held company with securities registered pursuant to Section 12 of the Securities Exchange Act of 1934.
3 Executive title, not a board directorship.
4 As a result of their respective positions held with the Advisor, these individuals are considered "interested persons" of the Advisor within the meaning of the 1940 Act. Interested persons receive no compensation from the fund.
5 The mailing address of Mr. Woods is 60 Wall Street, New York, New York 10005. Mr. Woods is an interested Board Member by virtue of his positions with Deutsche Asset & Wealth Management. As an interested person, Mr. Woods receives no compensation from the fund. Mr. Woods is a board member of the following trusts and corporations: Cash Account Trust, DWS Market Trust, DWS Money Funds, DWS State Tax-Free Income Series, DWS Target Fund, DWS Value Series, Inc., DWS Variable Series II, Investors Cash Trust, Tax-Exempt California Money Market Fund, DWS Global High Income Fund, Inc., DWS High Income Opportunities Fund, Inc., DWS High Income Trust, DWS Multi-Market Income Trust, DWS Municipal Income Trust, DWS Strategic Income Trust and DWS Strategic Municipal Income Trust.
6 The length of time served represents the year in which the officer was first elected in such capacity for one or more DWS funds.
7 Address: 60 Wall Street, New York, NY 10005.
8 Address: One Beacon Street, Boston, MA 02108.
9 Effective as of January 9, 2013.
The fund's Statement of Additional Information ("SAI") includes additional information about the Board Members. The SAI is available, without charge, upon request. If you would like to request a copy of the SAI, you may do so by calling the following toll-free number: (800) 728-3337.

APRIL 30, 2013 Annual Report to Shareholders |
| |
Tax-Exempt Portfolio DWS Tax-Exempt Cash Institutional Shares Fund #148 Tax-Exempt Cash Managed Shares Fund #248 |
|
Contents
3 Portfolio Management Review 14 Statement of Assets and Liabilities 16 Statement of Operations 17 Statement of Changes in Net Assets 20 Notes to Financial Statements 27 Report of Independent Registered Public Accounting Firm 28 Information About Your Fund's Expenses 31 Summary of Management Fee Evaluation by Independent Fee Consultant 35 Board Members and Officers |
This report must be preceded or accompanied by a prospectus. To obtain a summary prospectus, if available, or prospectus for any of our funds, visit www.dws-investments.com. We advise you to consider the fund's objectives, risks, charges and expenses carefully before investing. The summary prospectus and prospectus contain this and other important information about the fund. Please read the prospectus carefully before you invest.
An investment in this fund is not insured or guaranteed by the Federal Deposit Insurance Corporation (FDIC) or by any other government agency. Although the fund seeks to preserve the value of your investment at $1.00 per share, it is possible to lose money by investing in the fund. The share price of money market funds can fall below the $1.00 share price. You should not rely on or expect the Advisor to enter into support agreements or take other actions to maintain the fund's $1.00 share price. The credit quality of the fund's holdings can change rapidly in certain markets, and the default of a single holding could have an adverse impact on the fund's share price. The fund's share price can also be negatively affected during periods of high redemption pressures and/or illiquid markets. The actions of a few large investors in one class of shares of the fund may have a significant adverse effect on the share prices of all classes of shares of the fund. See the prospectus for specific details regarding the fund's risk profile.
DWS Investments is part of the Deutsche Asset & Wealth Management division of Deutsche Bank AG.
NOT FDIC/NCUA INSURED NO BANK GUARANTEE MAY LOSE VALUE NOT A DEPOSIT NOT INSURED BY ANY FEDERAL GOVERNMENT AGENCY
Portfolio Management Review (Unaudited)
Market Overview
All performance information below is historical and does not guarantee future results. Investment return and principal fluctuate, so your shares may be worth more or less when redeemed. Current performance may differ from performance data shown. Please visit www.dws-investments.com for the fund's most recent month-end performance. The 7-day current yield refers to the income paid by the fund over a 7-day period expressed as an annual percentage rate of the fund's shares outstanding. Yields fluctuate and are not guaranteed.
At the beginning of the fund's most recent fiscal year ended April 30, 2013, we saw another dramatic "flight to quality," as worries concerning Greece's upcoming elections and continuingly worsening conditions for Spanish and Italian banks led global and domestic investors to abandon risky assets. Late in 2012, any negative economic data was overshadowed by investor anticipation of more substantial central bank actions. The European Central Bank (ECB) lowered its interest rate for bank reserves. Then, the head of the ECB, Mario Draghi, stated that the central bank would do "whatever it takes" to preserve the euro. In December 2012, the U.S. Federal Reserve Board (the Fed) altered its guidance regarding rate levels, stating that it would maintain short-term interest rates near zero until U.S. unemployment dropped below 6.5%, and as long as inflation levels did not exceed 2.5%. In the first quarter of 2013, the European situation remained quiescent until the banking crisis in Cyprus reached a boiling point; the crisis was finally resolved after it was agreed that large uninsured depositors in Cyprus' banks would suffer substantial losses. In addition, the U.S. economy was boosted by higher housing prices and some gains in employment levels. In the money market area, we saw a continued supply/demand imbalance as well as a reduction in short-term money market supply due to ongoing quantitative easing by the Fed. In the continued search for yield, money market investors looked to a variety of financial instruments issued in countries around the world.
Positive Contributors to Fund Performance
We were able to maintain a yield that is in line with other similar money market funds during the period ended April 30, 2013.
| Tax-Exempt Portfolio seeks to provide maximum current income that is exempt from federal income taxes to the extent consistent with stability of capital. |
We sought to preserve a balance of liquidity and high quality by maintaining a strong position in variable-rate securities during the period. (The interest rate of variable-rate securities adjusts periodically based on indices such as the Securities Industry and Financial Market Association Index of Variable Rate Demand Notes. Because the interest rates of these instruments adjust as market conditions change, they provide flexibility in an uncertain interest rate environment.) In addition, we took advantage of higher yields along the yield curve by investing in tax-exempt commercial paper, three-month to nine-month municipal "put" bonds, and one-year fixed-rate municipal note issues. We have also maintained broad diversification for the fund by investing in a number of states and municipalities.
Fund Performance (as of April 30, 2013)
Performance is historical and does not guarantee future results. Current performance may be lower or higher than the performance data quoted.
An investment in the fund is not insured or guaranteed by the Federal Deposit Insurance Corporation (FDIC) or by any other government agency. Although the fund seeks to preserve the value of your investment at $1.00 per share, it is possible to lose money by investing in the fund.
| | | 7-Day Current Yield | |
| DWS Tax-Exempt Cash Institutional Shares | | | .01 | %* |
| Equivalent Taxable Yield | | | .02 | %** |
| Tax-Exempt Cash Managed Shares | | | .01 | %* |
| Equivalent Taxable Yield | | | .02 | %** |
Yields are historical, will fluctuate and do not guarantee future performance. The 7-day current yield refers to the income paid by the fund over a 7-day period expressed as an annual percentage rate of the fund's shares outstanding. For the most current yield information, visit our Web site at www.dws-investments.com. * The investment advisor has agreed to voluntarily waive fees/reimburse expenses. This waiver may be changed or terminated at any time without notice. ** The equivalent taxable yield allows you to compare with the performance of taxable money market funds. For the Tax-Exempt Portfolio, the equivalent taxable yield is based upon the marginal income tax rate of 35%. Income may be subject to local taxes and, for some investors, the alternative minimum tax. | |
Negative Contributors to Fund Performance
The types of securities that we invested in tended to have lower yields than issues carrying more risk. We preferred to be cautious during a time of market uncertainty. In the end this may have cost the fund some yield, but we believe that this represented a prudent approach to preserving principal.
Outlook and Positioning
We anticipate limited growth for the U.S. economy over the remainder of this year, due to steady but unspectacular employment gains and the automatic budget cuts dictated by congressional sequestration. In turn, we think that restrained growth will mean that the Fed will continue its extremely accommodative monetary policy through early 2014. We look for money market rates to continue to be low based on decreases in supply on a number of fronts and strong investor demand.
We continue our insistence on the highest credit quality within the fund. We also plan to maintain our conservative investment strategies and standards under the current market conditions. We continue to apply a careful approach to investing on behalf of the fund and to seek competitive yield for our shareholders.
Portfolio Management Team
A group of investment professionals is responsible for the day-to-day management of the fund. These investment professionals have a broad range of experience managing money market funds.
The views expressed reflect those of the portfolio management team only through the end of the period of the report as stated on the cover. The management team's views are subject to change at any time based on market and other conditions and should not be construed as a recommendation. Past performance is no guarantee of future results. Current and future portfolio holdings are subject to risk.
Terms to Know
Quantitative easing is a government monetary policy often used when interest rates are at or near zero. With this policy government or other securities are purchased from the market, causing the price of the securities purchased to rise and the yield or interest rates on the securities purchased to fall. For the companies whose bonds the central banks are willing to purchase, it means having to pay lower interest rates on new bonds issued to replace existing bonds that have matured. With lower borrowing costs, the central banks hope that consumers will be encouraged to spend more, thus helping the overall economy and improving the balance sheets of the companies providing the goods and services on which consumers are spending their money.
The yield curve is a graphical representation of how yields on bonds of different maturities compare. Normally, yield curves slant up, as bonds with longer maturities typically offer higher yields than short-term bonds.
A repurchase agreement, or "overnight repo," is an agreement between a seller and a buyer, usually of government securities, where the seller agrees to repurchase the securities at a given price and usually at a stated time. Repos are widely used money market instruments that serve as an interest-bearing, short-term "parking place" for large sums of money.
The Securities Industry and Financial Market Association Index of Variable Rate Demand Notes is a weekly high-grade market index consisting of seven-day, tax-exempt, variable-rate demand notes produced by Municipal Market Data Group. Actual issues are selected from Municipal Market Data's database of more than 10,000 active issues. Index returns do not reflect fees or expenses and it is not possible to invest directly into an index.
A "put" bond allows an investor to require the issuer to repurchase the bond at a specified date before its maturity.
Portfolio Summary (Unaudited)
Investment Portfolio as of April 30, 2013
Tax-Exempt Portfolio
| | | Principal Amount ($) | | | Value ($) | |
| | | | |
| Municipal Investments 98.7% | |
| Alaska 3.1% | |
| Anchorage, AK: | |
| Tax Anticipation Notes, 2.0%, 9/17/2013 | | | 25,000,000 | | | | 25,174,489 | |
| TECP, 0.19%, 10/3/2013, LOC: Wells Fargo | | | 25,000,000 | | | | 25,000,000 | |
| TECP, 0.23%, 6/5/2013, LOC: Wells Fargo | | | 8,300,000 | | | | 8,300,000 | |
| | | | | 58,474,489 | |
| California 14.5% | |
| California, Golden State Tobacco Securitization Corp., Tobacco Settlement: | | | | | | | | |
| Series B, Prerefunded 6/1/2013 @ 100, 5.5%, 6/1/2043 | | | 24,415,000 | | | | 24,523,306 | |
| Series B, Prerefunded 6/1/2013 @ 100, 5.625%, 6/1/2038 | | | 31,610,000 | | | | 31,753,010 | |
| Series 2003-A-1, Prerefunded 6/1/2013 @ 100, 6.25%, 6/1/2033 | | | 43,745,000 | | | | 43,966,499 | |
| Series 2003-A-1, Prerefunded 6/1/2013 @ 100, 6.75%, 6/1/2039 | | | 38,470,000 | | | | 38,683,616 | |
| California, Nuveen Dividend Advantage Municipal Fund, Series 1-1362, 144A, AMT, 0.4%*, 6/1/2041, LIQ: Morgan Stanley Bank | | | 5,000,000 | | | | 5,000,000 | |
| California, RBC Municipal Products, Inc. Trust: | |
| Series E-21, 144A, 0.26%*, Mandatory Put 9/3/2013 @ 100, 10/1/2013, LIQ: Royal Bank of Canada, LOC: Royal Bank of Canada | | | 25,000,000 | | | | 25,000,000 | |
| Series E-24, 144A, 0.26%*, Mandatory Put 8/1/2013 @ 100, 7/1/2031, LIQ: Royal Bank of Canada, LOC: Royal Bank of Canada | | | 16,865,000 | | | | 16,865,000 | |
| California, State Department of Water Resources, Supply Revenue: | | | | | | | | |
| Series N, 5.0%, 5/1/2013 | | | 10,000,000 | | | | 10,000,000 | |
| Series M, 5.0%, 5/1/2014 | | | 7,500,000 | | | | 7,859,716 | |
| California, State General Obligation: | |
| Prerefunded 4/1/2014 @ 100, 5.0%, 4/1/2031, INS: AMBAC | | | 10,325,000 | | | | 10,778,410 | |
| Prerefunded 4/1/2014 @ 100, 5.25%, 4/1/2034 | | | 6,035,000 | | | | 6,313,855 | |
| California, Statewide Communities Development Authority, Multi-Family Housing Revenue: | | | | | | | | |
| Series 2680, 144A, 0.29%*, 5/15/2018, LOC: JPMorgan Chase Bank NA | | | 14,700,000 | | | | 14,700,000 | |
| Series 2681, 144A, AMT, 0.36%*, 5/15/2018, LOC: JPMorgan Chase Bank NA | | | 12,250,000 | | | | 12,250,000 | |
| California, Wells Fargo Stage Trust: | |
| Series 74C, 144A, 0.19%*, 11/15/2040, GTY: Wells Fargo Bank NA, LIQ: Wells Fargo Bank NA | | | 5,810,000 | | | | 5,810,000 | |
| Series 31C, 144A, AMT, 0.25%*, Mandatory Put 8/15/2013 @ 100, 1/1/2022, GTY: Wells Fargo Bank NA, LIQ: Wells Fargo Bank NA | | | 5,995,000 | | | | 5,995,000 | |
| San Diego County, CA, School District Note Participations, Series A, 2.0%, 6/28/2013 | | | 10,000,000 | | | | 10,029,016 | |
| | | | | 269,527,428 | |
| Colorado 3.8% | |
| Colorado, State Education Loan Program, Series C, 144A, 2.5%, 6/27/2013 | | | 60,000,000 | | | | 60,221,714 | |
| Colorado, Wells Fargo Stage Trust, Series 42C, 144A, AMT, 0.19%*, 11/15/2023, GTY: Wells Fargo Bank NA, LIQ: Wells Fargo Bank NA | | | 9,835,000 | | | | 9,835,000 | |
| | | | | 70,056,714 | |
| District of Columbia 0.8% | |
| District of Columbia, Wells Fargo Stage Trust, Series 57C, 144A, AMT, 0.25%*, Mandatory Put 12/26/2013 @ 100, 10/1/2032, GTY: Wells Fargo Bank NA, LIQ: Wells Fargo Bank NA | | | 13,965,000 | | | | 13,965,000 | |
| Georgia 0.7% | |
| Burke County, GA, Development Authority Revenue, Georgia Power Co. Plant, 144A, 0.21%*, 5/1/2022 | | | 5,555,000 | | | | 5,555,000 | |
| Georgia, Private Colleges & Universities Authority Revenue, Mercer University Project, Series C, 0.24%*, 10/1/2031, LOC: Branch Banking & Trust | | | 8,335,000 | | | | 8,335,000 | |
| | | | | 13,890,000 | |
| Hawaii 0.5% | |
| Hawaii, Wells Fargo State Trust, Series 6C, 144A, 0.19%*, 7/1/2040, GTY: Wells Fargo Bank NA, LIQ: Wells Fargo Bank NA | | | 8,820,000 | | | | 8,820,000 | |
| Idaho 2.5% | |
| Idaho, State General Obligation, 2.0%, 6/28/2013 | | | 47,000,000 | | | | 47,134,110 | |
| Illinois 13.3% | |
| Chicago, IL, Loyola University: | |
| TECP, 0.14%, 5/21/2013 | | | 25,000,000 | | | | 25,000,000 | |
| TECP, 0.15%, 6/3/2013 | | | 25,040,000 | | | | 25,040,000 | |
| Chicago, IL, O'Hare International Airport Revenue, 0.18%, 5/7/2013 | | | 5,000,000 | | | | 5,000,000 | |
| Illinois, BB&T Municipal Trust, Series 5001, 144A, 0.31%*, 6/1/2020, LIQ: Rabobank Nederland, LOC: Rabobank International | | | 23,460,000 | | | | 23,460,000 | |
| Illinois, Educational Facilities Authority Revenue, University of Chicago, Series B-3, 0.24%*, Mandatory Put 3/13/2014 @ 100, 7/1/2036 | | | 18,000,000 | | | | 18,000,000 | |
| Illinois, Educational Facilities Authority Revenues: | |
| TECP, 0.15%, 6/3/2013, LOC: Northern Trust Co. | | | 20,000,000 | | | | 20,000,000 | |
| TECP, 0.16%, 6/3/2013, LOC: Northern Trust Co. | | | 30,000,000 | | | | 30,000,000 | |
| TECP, 0.16%, 7/1/2013, LOC: Northern Trust Co. | | | 16,200,000 | | | | 16,200,000 | |
| TECP, 0.16%, 7/2/2013, LOC: Northern Trust Co. | | | 30,000,000 | | | | 30,000,000 | |
| Illinois, Wells Fargo Stage Trust, Series 27C, 144A, 0.26%*, Mandatory Put 10/24/2013 @ 100, 8/1/2025, GTY: Wells Fargo Bank NA, LIQ: Wells Fargo Bank NA, | | | 38,405,000 | | | | 38,405,000 | |
| Mundelein, IL, Industrial Development Revenue, MacLean Fogg Co. Project, 144A, AMT, 0.38%*, 1/1/2015, LOC: Northern Trust Co. | | | 6,500,000 | | | | 6,500,000 | |
| Woodstock, IL, Multi-Family Housing Revenue, Willow Brooke Apartments, AMT, 0.24%*, 4/1/2042, LOC: Wells Fargo Bank NA | | | 10,000,000 | | | | 10,000,000 | |
| | | | | 247,605,000 | |
| Indiana 3.6% | |
| Indiana, State Finance Authority, Industrial Revenue, Midwest Fertilizer Corp. Project, 0.2%, Mandatory Put 7/1/2013 @ 100, 7/1/2046 | | | 60,000,000 | | | | 60,000,000 | |
| Indiana, Wells Fargo State Trust, Series 100C, 144A, 0.19%*, 8/1/2021, GTY: Wells Fargo Bank NA, LIQ: Wells Fargo Bank NA | | | 7,495,000 | | | | 7,495,000 | |
| | | | | 67,495,000 | |
| Iowa 4.1% | |
| Iowa, State Finance Authority Midwestern Disaster Area Revenue, Fertilizer Co. Project, 0.17%*, Mandatory Put 5/31/2013 @ 100, 12/1/2050 | | | 70,000,000 | | | | 70,000,000 | |
| Iowa, State Finance Authority, Wellness Facilities Revenue, Community Marshalltown Project, 0.26%*, 1/1/2031, LOC: Northern Trust Co. | | | 6,015,000 | | | | 6,015,000 | |
| | | | | 76,015,000 | |
| Kansas 0.8% | |
| Kansas, State Development Finance Authority, Multi-Family Revenue, Oak Ridge Park II Project, Series X, AMT, 0.29%*, 12/1/2036, LOC: U.S. Bank NA | | | 3,650,000 | | | | 3,650,000 | |
| Olathe, KS, General Obligation, Series A, 1.5%, 7/1/2013 | | | 11,280,000 | | | | 11,304,457 | |
| | | | | 14,954,457 | |
| Kentucky 1.9% | |
| Kentucky, State Economic Development Finance Authority, Catholic Health Initiatives: | | | | | | | | |
| Series B, 0.32%**, 2/1/2046 | | | 10,680,000 | | | | 10,680,000 | |
| Series B-2, 0.32%**, 2/1/2046 | | | 12,000,000 | | | | 12,000,000 | |
| Series B-3, 0.32%**, 2/1/2046 | | | 12,415,000 | | | | 12,415,000 | |
| | | | | 35,095,000 | |
| Maryland 1.6% | |
| Maryland, State Health & Higher Educational Facilities Authority Revenue, Pooled Loan Program, Series D, 144A, 0.27%*, 1/1/2029, LOC: Bank of America NA | | | 12,580,000 | | | | 12,580,000 | |
| Montgomery County, MD, TECP, 0.17%, 6/4/2013, LOC: State Street Bank & Trust Co. | | | 17,000,000 | | | | 17,000,000 | |
| | | | | 29,580,000 | |
| Michigan 6.6% | |
| Michigan, RBC Municipal Products, Inc. Trust: | |
| Series L-23, 144A, AMT, 0.26%*, 3/1/2028, INS: AMBAC, LIQ: Royal Bank of Canada, LOC: Royal Bank of Canada | | | 44,995,000 | | | | 44,995,000 | |
| Series L-27, 144A, AMT, 0.26%*, 3/1/2031, LIQ: Royal Bank of Canada, LOC: Royal Bank of Canada | | | 40,000,000 | | | | 40,000,000 | |
| Michigan, State Finance Authority Revenue, Unemployment Obligation Assessment, Series A, 2.0%, 7/1/2013 | | | 11,100,000 | | | | 11,133,708 | |
| Michigan, State Hospital Finance Authority Revenue, Ascension Health Senior Credit Group: | | | | | | | | |
| Series F-7, 0.31%*, 11/15/2047 | | | 11,200,000 | | | | 11,200,000 | |
| Series F-6, 0.31%**, 11/15/2049 | | | 8,660,000 | | | | 8,660,000 | |
| Series F-8, 0.31%**, 11/15/2049 | | | 7,100,000 | | | | 7,100,000 | |
| | | | | 123,088,708 | |
| Minnesota 1.3% | |
| Cohasset, MN, State Power & Light Co. Project, Series A, 0.27%*, 6/1/2020, LOC: JPMorgan Chase Bank NA | | | 24,630,000 | | | | 24,630,000 | |
| Mississippi 0.5% | |
| Mississippi, Redstone Partners Floaters/Residuals Trust, Series C, 144A, AMT, 0.41%*, 12/1/2047, LOC: Wachovia Bank NA | | | 9,220,000 | | | | 9,220,000 | |
| Missouri 5.0% | |
| Missouri, State Health & Educational Facilities: | |
| TECP, 0.12%, 5/21/2013 | | | 28,000,000 | | | | 28,000,000 | |
| TECP, 0.14%, 5/16/2013 | | | 22,000,000 | | | | 22,000,000 | |
| Missouri, University of Curators, TECP, 0.14%, 5/7/2013 | | | 23,000,000 | | | | 23,000,000 | |
| North Kansas City, MO, Hospital Revenue, 0.22%*, 11/1/2033, LOC: Bank of America NA | | | 20,660,000 | | | | 20,660,000 | |
| | | | | 93,660,000 | |
| New York 4.2% | |
| BlackRock New York Municipal Income Quality Trust, Series W-7-40, 144A, AMT, 0.32%*, 10/1/2041, LIQ: Barclays Bank PLC | | | 5,000,000 | | | | 5,000,000 | |
| BlackRock New York Municipal Intermediate Duration Fund, Inc., Series W-7-296, 144A, AMT, 0.32%*, 10/1/2041, LIQ: Barclays Bank PLC | | | 13,500,000 | | | | 13,500,000 | |
| New York, RIB Floater Trust, Series 1WE, 144A, 0.29%*, 9/30/2013, LIQ: Barclays Bank PLC | | | 60,000,000 | | | | 60,000,000 | |
| | | | | 78,500,000 | |
| North Carolina 1.9% | |
| North Carolina, BB&T Municipal Trust: | |
| Series 1008, 144A, 0.31%*, 3/1/2024, LIQ: Branch Banking & Trust, LOC: Branch Banking & Trust | | | 5,515,000 | | | | 5,515,000 | |
| Series 1009, 144A, 0.31%*, 6/1/2024, LIQ: Branch Banking & Trust, LOC: Branch Banking & Trust | | | 15,675,000 | | | | 15,675,000 | |
| North Carolina, Capital Facilities Finance Agency, TECP, 0.15%, 6/5/2013 | | | 13,860,000 | | | | 13,860,000 | |
| | | | | 35,050,000 | |
| Ohio 1.6% | |
| Ohio, Puttable Floating Option Tax-Exempt Receipts, Series 808, 144A, AMT, 0.42%*, 12/1/2041, GTY: Bank of America NA, INS: AMBAC, LIQ: Bank of America NA | | | 30,000,000 | | | | 30,000,000 | |
| Oklahoma 0.5% | |
| Tulsa, OK, Airports Improvement Trust, Special Facilities Revenue, Lufthansa/Bizjet International, Inc., 144A, AMT, 0.26%*, 8/1/2018, LOC: Landesbank Hessen-Thuringen | | | 10,120,000 | | | | 10,120,000 | |
| Other Territories 6.2% | |
| BB&T Municipal Trust, Series 1010, 144A, 0.26%*, 1/15/2019, LIQ: Branch Banking & Trust, LOC: Branch Banking & Trust | | | 5,980,000 | | | | 5,980,000 | |
| BB&T Municipal Trust, Series 5000, 144A, 0.31%*, 10/1/2028, LIQ: Rabobank Nederland, LOC: Rabobank International | | | 6,755,000 | | | | 6,755,000 | |
| BlackRock Muni Holdings Investment Quality Fund, Series W-7-2746, 144A, AMT, 0.43%*, 7/1/2041, LIQ: Bank of America NA | | | 28,100,000 | | | | 28,100,000 | |
| BlackRock Municipal Bond Investment Trust, Series W-7-178, 144A, AMT, 0.32%*, 10/1/2041, LIQ: Barclays Bank PLC | | | 9,300,000 | | | | 9,300,000 | |
| Eagle Tax- Exempt Trust, 144A, AMT, 0.27%*, 4/15/2049, LIQ: Federal Home Loan Bank | | | 14,615,000 | | | | 14,615,000 | |
| Nuveen Premier Income Municipal Fund 2, Inc., Series 1-4895, 144A, AMT, 0.32%*, 5/1/2041, LIQ: Barclays Bank PLC | | | 52,000,000 | | | | 52,000,000 | |
| | | | | 116,750,000 | |
| Pennsylvania 2.7% | |
| Pennsylvania, State Economic Development Financing Authority, IESI PA Corp., 0.26%*, 11/1/2028, GTY: IESI Corp., LOC: Bank of America NA | | | 34,000,000 | | | | 34,000,000 | |
| University of Pittsburgh, PA, The Commonwealth Systems of Higher Education, Pittsburgh Assessment Notes, 2.0%, 7/2/2013 | | | 17,000,000 | | | | 17,051,605 | |
| | | | | 51,051,605 | |
| Puerto Rico 2.6% | |
| Puerto Rico, RIB Floater Trust, Series 8WE, 144A, 0.27%, 9/30/2014, LOC: Barclays Bank PLC | | | 47,500,000 | | | | 47,500,000 | |
| Tennessee 3.5% | |
| Metropolitan Government Nashville & Davidson County, TN: | |
| TECP, 0.2%, 10/3/2013 | | | 10,000,000 | | | | 10,000,000 | |
| TECP, 0.23%, 9/3/2013 | | | 17,000,000 | | | | 17,000,000 | |
| Tennessee, Tennergy Corp., Gas Revenue, Stars Certificates, Series 2006-001, 144A, 0.27%*, 5/1/2016, LOC: BNP Paribas | | | 39,000,000 | | | | 39,000,000 | |
| | | | | 66,000,000 | |
| Texas 9.5% | |
| Harris County, TX, Cultural Education, TECP, 0.23%, 7/9/2013 | | | 40,000,000 | | | | 40,000,000 | |
| Lamar, TX, Consolidated Independent School District, Series R-12266, 144A, 0.25%*, 8/1/2015, SPA: Citibank NA | | | 20,485,000 | | | | 20,485,000 | |
| North Texas, Tollway Authority Revenue, TECP, 0.16%, 6/7/2013, LOC: JPMorgan Chase Bank NA | | | 15,400,000 | | | | 15,400,000 | |
| Texas, JPMorgan Chase Putters/Drivers Trust, Series 4263, 144A, 0.18%*, 8/30/2013, LIQ: JPMorgan Chase Bank NA | | | 30,000,000 | | | | 30,000,000 | |
| Texas, Municipal Power Agency Revenue, TECP, 0.21%, 5/17/2013, LOC: Barclays Bank PLC | | | 15,500,000 | | | | 15,500,000 | |
| Texas, State Transportation Revenue, 2.5%, 8/30/2013 | | | 45,000,000 | | | | 45,339,981 | |
| Texas City, TX, Industrial Development Corp. Revenue, Del Papa Realty Holdings, 0.26%*, 1/1/2051, LOC: Bank of America NA | | | 9,500,000 | | | | 9,500,000 | |
| | | | | 176,224,981 | |
| Washington 0.7% | |
| Washington, Wells Fargo Stage Trust, Series 93C, 144A, 0.29%, Mandatory Put 6/13/2013 @ 100, 8/15/2046, GTY: Wells Fargo Bank NA, LIQ: Wells Fargo Bank NA | | | 13,675,000 | | | | 13,675,000 | |
| West Virginia 0.7% | |
| West Virginia, Economic Development Authority Revenue, Morgantown Energy, AMT, 0.26%*, 4/1/2027, LOC: Union Bank NA | | | 12,210,000 | | | | 12,210,000 | |
| | | % of Net Assets | | | Value ($) | |
| | | | |
Total Investment Portfolio (Cost $1,840,292,492)† | | | 98.7 | | | | 1,840,292,492 | |
| Other Assets and Liabilities, Net | | | 1.3 | | | | 24,009,682 | |
| Net Assets | | | 100.0 | | | | 1,864,302,174 | |
* Variable rate demand notes and variable rate demand preferred shares are securities whose interest rates are reset periodically at market levels. These securities are payable on demand and are shown at their current rates as of April 30, 2013.
** Floating rate securities' yields vary with a designated market index or market rate, such as the coupon-equivalent of the U.S. Treasury Bill rate. These securities are shown at their current rate as of April 30, 2013.
† The cost for federal income tax purposes was $1,840,292,492.
144A: Security exempt from registration under Rule 144A of the Securities Act of 1933. These securities may be resold in transactions exempt from registration, normally to qualified institutional buyers.
AMBAC: Ambac Financial Group, Inc.
AMT: Subject to alternative minimum tax.
GTY: Guaranty Agreement
INS: Insured
LIQ: Liquidity Facility
LOC: Letter of Credit
Prerefunded: Bonds which are prerefunded are collateralized usually by U.S. Treasury securities which are held in escrow and used to pay principal and interest on tax-exempt issues and to retire the bonds in full at the earliest refunding date.
SPA: Standby Bond Purchase Agreement
TECP: Tax Exempt Commercial Paper
Fair Value Measurements
Various inputs are used in determining the value of the Fund's investments. These inputs are summarized in three broad levels. Level 1 includes quoted prices in active markets for identical securities. Level 2 includes other significant observable inputs (including quoted prices for similar securities, interest rates, prepayment speeds and credit risk). Level 3 includes significant unobservable inputs (including the Fund's own assumptions in determining the fair value of investments). The inputs or methodology used for valuing securities are not necessarily an indication of the risk associated with investing in those securities. Securities held by the Fund are reflected as Level 2 because the securities are valued at amortized cost (which approximates fair value) and, accordingly, the inputs used to determine value are not quoted prices in an active market.
The following is a summary of the inputs used as of April 30, 2013 in valuing the Fund's investments. For information on the Fund's policy regarding the valuation of investments, please refer to the Security Valuation section of Note 1 in the accompanying Notes to Financial Statements.
| Assets | | Level 1 | | | Level 2 | | | Level 3 | | | Total | |
| | |
| Municipal Investments (a) | | $ | — | | | $ | 1,840,292,492 | | | $ | — | | | $ | 1,840,292,492 | |
| Total | | $ | — | | | $ | 1,840,292,492 | | | $ | — | | | $ | 1,840,292,492 | |
There have been no transfers between fair value measurement levels during the period ended April 30, 2013.
(a) See Investment Portfolio for additional detailed categorizations.
The accompanying notes are an integral part of the financial statements.
Statement of Assets and Liabilities | as of April 30, 2013 | |
| Assets | | Tax-Exempt Portfolio | |
Investments: Investments in non-affiliated securities, valued at amortized cost | | $ | 1,840,292,492 | |
| Receivable for investments sold | | | 17,580,000 | |
| Receivable for Fund shares sold | | | 298,158 | |
| Interest receivable | | | 7,109,732 | |
| Due from Advisor | | | 3,699 | |
| Other assets | | | 77,001 | |
| Total assets | | | 1,865,361,082 | |
| Liabilities | |
| Cash overdraft | | | 391,974 | |
| Payable for Fund shares redeemed | | | 169,016 | |
| Distributions payable | | | 6,227 | |
| Accrued management fee | | | 110,040 | |
| Accrued Trustees' fees | | | 18,385 | |
| Other accrued expenses and payables | | | 363,266 | |
| Total liabilities | | | 1,058,908 | |
| Net assets, at value | | $ | 1,864,302,174 | |
| Net Assets Consist of | |
| Undistributed net investment income | | | 212,651 | |
| Paid-in capital | | | 1,864,089,523 | |
| Net assets, at value | | $ | 1,864,302,174 | |
The accompanying notes are an integral part of the financial statements.
Statement of Assets and Liabilities as of April 30, 2013 (continued) | |
| Net Asset Value | | Tax-Exempt Portfolio | |
Capital Assets Funds Shares Net Asset Value, offering and redemption price per share ($10,059,102 ÷ 10,056,881 outstanding shares of beneficial interest, no par value, unlimited number of shares authorized) | | $ | 1.00 | |
Davidson Cash Equivalent Shares Net Asset Value, offering and redemption price per share ($70,393,545 ÷ 70,377,984 outstanding shares of beneficial interest, no par value, unlimited number of shares authorized) | | $ | 1.00 | |
DWS Tax-Exempt Cash Institutional Shares Net Asset Value, offering and redemption price per share ($970,451,993 ÷ 970,237,656 outstanding shares of beneficial interest, no par value, unlimited number of shares authorized) | | $ | 1.00 | |
DWS Tax-Exempt Money Fund Net Asset Value, offering and redemption price per share ($241,992,881 ÷ 241,939,471 outstanding shares of beneficial interest, no par value, unlimited number of shares authorized) | | $ | 1.00 | |
DWS Tax-Free Money Fund Class S Net Asset Value, offering and redemption price per share ($99,900,985 ÷ 99,878,925 outstanding shares of beneficial interest, no par value, unlimited number of shares authorized) | | $ | 1.00 | |
Service Shares Net Asset Value, offering and redemption price per share ($44,904,689 ÷ 44,894,771 outstanding shares of beneficial interest, no par value, unlimited number of shares authorized) | | $ | 1.00 | |
Tax-Exempt Cash Managed Shares Net Asset Value, offering and redemption price per share ($115,086,280 ÷ 115,060,862 outstanding shares of beneficial interest, no par value, unlimited number of shares authorized) | | $ | 1.00 | |
Tax-Free Investment Class Net Asset Value, offering and redemption price per share ($311,512,699 ÷ 311,443,897 outstanding shares of beneficial interest, no par value, unlimited number of shares authorized) | | $ | 1.00 | |
The accompanying notes are an integral part of the financial statements.
| for the year ended April 30, 2013 | |
| Investment Income | | Tax-Exempt Portfolio | |
Income: Interest | | $ | 4,226,122 | |
Expenses: Management fee | | | 1,326,518 | |
| Administration fee | | | 2,073,476 | |
| Services to shareholders | | | 1,150,669 | |
| Distribution and service fees | | | 2,113,579 | |
| Custodian fee | | | 27,586 | |
| Professional fees | | | 126,547 | |
| Reports to shareholders | | | 149,965 | |
| Registration fees | | | 153,018 | |
| Trustees' fees and expenses | | | 87,355 | |
| Other | | | 101,842 | |
| Total expenses before expense reductions | | | 7,310,555 | |
| Expense reductions | | | (3,397,143 | ) |
| Total expenses after expense reductions | | | 3,913,412 | |
| Net investment income | | | 312,710 | |
| Net realized gain (loss) from investments | | | 119,059 | |
| Net increase (decrease) in net assets resulting from operations | | $ | 431,769 | |
The accompanying notes are an integral part of the financial statements.
Statement of Changes in Net Assets | | | Tax-Exempt Portfolio | |
| Increase (Decrease) in Net Assets | | Years Ended April 30, | |
| | 2013 | | | 2012 | |
Operations: Net investment income | | $ | 312,710 | | | $ | 659,723 | |
| Net realized gain (loss) | | | 119,059 | | | | 21,137 | |
| Net increase in net assets resulting from operations | | | 431,769 | | | | 680,860 | |
Distributions to shareholders from: Net investment income: Capital Assets Funds Shares | | | (2,578 | ) | | | (2,580 | ) |
| Davidson Cash Equivalent Shares | | | (16,635 | ) | | | (13,672 | ) |
| DWS Tax-Exempt Cash Institutional Shares | | | (347,411 | ) | | | (598,543 | ) |
| DWS Tax-Exempt Money Fund | | | (63,056 | ) | | | (115,000 | ) |
| DWS Tax-Free Money Fund Class S | | | (22,814 | ) | | | (28,531 | ) |
| Service Shares | | | (12,350 | ) | | | (16,307 | ) |
| Tax-Exempt Cash Managed Shares | | | (36,504 | ) | | | (35,814 | ) |
| Tax-Free Investment Class | | | (80,485 | ) | | | (64,866 | ) |
Net realized gain: Capital Assets Funds Shares | | | (686 | ) | | | — | |
| Davidson Cash Equivalent Shares | | | (4,358 | ) | | | — | |
| DWS Tax-Exempt Cash Institutional Shares | | | (58,793 | ) | | | — | |
| DWS Tax-Exempt Money Fund | | | (15,872 | ) | | | — | |
| DWS Tax-Free Money Fund Class S | | | (5,799 | ) | | | — | |
| Service Shares | | | (2,541 | ) | | | — | |
| Tax-Exempt Cash Managed Shares | | | (9,837 | ) | | | — | |
| Tax-Free Investment Class | | | (21,062 | ) | | | — | |
| Total distributions | | | (700,781 | ) | | | (875,313 | ) |
Fund share transactions: Proceeds from shares sold | | | 3,574,503,665 | | | | 5,483,352,307 | |
| Reinvestment of distributions | | | 409,744 | | | | 544,506 | |
| Cost of shares redeemed | | | (3,871,064,788 | ) | | | (5,984,187,987 | ) |
| Net increase (decrease) in net assets from Fund share transactions | | | (296,151,379 | ) | | | (500,291,174 | ) |
| Increase (decrease) in net assets | | | (296,420,391 | ) | | | (500,485,627 | ) |
| Net assets at beginning of period | | | 2,160,722,565 | | | | 2,661,208,192 | |
| Net assets at end of period (including undistributed net investment income of $212,651 and $481,663, respectively) | | $ | 1,864,302,174 | | | $ | 2,160,722,565 | |
The accompanying notes are an integral part of the financial statements.
Tax-Exempt Portfolio DWS Tax-Exempt Cash Institutional Shares | |
| | | Years Ended April 30, | |
| | | 2013 | | | 2012 | | | 2011 | | | 2010 | | | 2009 | |
| Selected Per Share Data | |
| Net asset value, beginning of period | | $ | 1.00 | | | $ | 1.00 | | | $ | 1.00 | | | $ | 1.00 | | | $ | 1.00 | |
Income (loss) from investment operations: Net investment income | | | .000 | * | | | .000 | * | | | .002 | | | | .002 | | | | .016 | |
| Net realized gain (loss) | | | .000 | * | | | .000 | * | | | .000 | * | | | .000 | * | | | .000 | * |
| Total from investment operations | | | .000 | * | | | .000 | * | | | .002 | | | | .002 | | | | .016 | |
Less distributions from: Net investment income | | | (.000 | )* | | | (.000 | )* | | | (.002 | ) | | | (.002 | ) | | | (.016 | ) |
| Net realized gains | | | (.000 | )* | | | — | | | | — | | | | (.000 | )* | | | — | |
| Total distributions | | | (.000 | )* | | | (.000 | )* | | | (.002 | ) | | | (.002 | ) | | | (.016 | ) |
| Net asset value, end of period | | $ | 1.00 | | | $ | 1.00 | | | $ | 1.00 | | | $ | 1.00 | | | $ | 1.00 | |
| Total Return (%) | | | .04 | a | | | .05 | a | | | .16 | | | | .25 | | | | 1.58 | a |
| Ratios to Average Net Assets and Supplemental Data | |
| Net assets, end of period ($ millions) | | | 970 | | | | 1,106 | | | | 1,492 | | | | 1,725 | | | | 1,770 | |
| Ratio of expenses before expense reductions (%) | | | .21 | | | | .21 | | | | .20 | | | | .21 | | | | .23 | |
| Ratio of expenses after expense reductions (%) | | | .18 | | | | .19 | | | | .20 | | | | .21 | | | | .22 | |
| Ratio of net investment income (%) | | | .02 | | | | .04 | | | | .17 | | | | .24 | | | | 1.56 | |
a Total return would have been lower had certain expenses not been reduced. * Amount is less than $.0005. | |
Tax-Exempt Portfolio Tax-Exempt Cash Managed Shares | |
| | | Years Ended April 30, | |
| | | 2013 | | | 2012 | | | 2011 | | | 2010 | | | 2009 | |
| Selected Per Share Data | |
| Net asset value, beginning of period | | $ | 1.00 | | | $ | 1.00 | | | $ | 1.00 | | | $ | 1.00 | | | $ | 1.00 | |
Income (loss) from investment operations: Net investment income | | | .000 | * | | | .000 | * | | | .000 | * | | | .001 | | | | .013 | |
| Net realized gain (loss) | | | .000 | * | | | .000 | * | | | .000 | * | | | .000 | * | | | .000 | * |
| Total from investment operations | | | .000 | * | | | .000 | * | | | .000 | * | | | .001 | | | | .013 | |
Less distributions from: Net investment income | | | (.000 | )* | | | (.000 | )* | | | (.000 | )* | | | (.001 | ) | | | (.013 | ) |
| Net realized gains | | | (.000 | )* | | | — | | | | — | | | | (.000 | )* | | | — | |
| Total distributions | | | (.000 | )* | | | (.000 | )* | | | (.000 | )* | | | (.001 | ) | | | (.013 | ) |
| Net asset value, end of period | | $ | 1.00 | | | $ | 1.00 | | | $ | 1.00 | | | $ | 1.00 | | | $ | 1.00 | |
| Total Return (%) | | | .03 | a | | | .02 | a | | | .01 | a | | | .07 | a | | | 1.36 | |
| Ratios to Average Net Assets and Supplemental Data | |
| Net assets, end of period ($ millions) | | | 115 | | | | 166 | | | | 127 | | | | 209 | | | | 193 | |
| Ratio of expenses before expense reductions (%) | | | .42 | | | | .42 | | | | .39 | | | | .44 | | | | .45 | |
| Ratio of expenses after expense reductions (%) | | | .19 | | | | .22 | | | | .35 | | | | .39 | | | | .45 | |
| Ratio of net investment income (%) | | | .01 | | | | .01 | | | | .01 | | | | .06 | | | | 1.34 | |
a Total return would have been lower had certain expenses not been reduced. * Amount is less than $.0005. | |
Notes to Financial Statements
1. Organization and Significant Accounting Policies
Cash Account Trust (the "Trust") is registered under the Investment Company Act of 1940, as amended (the "1940 Act"), as an open-end investment management company organized as a Massachusetts business trust.
The Trust offers three funds: Money Market Portfolio, Government & Agency Securities Portfolio and Tax-Exempt Portfolio. These financial statements report on Tax-Exempt Portfolio (the "Fund").
Tax-Exempt Portfolio offers eight classes of shares: Capital Assets Funds Shares, Davidson Cash Equivalent Shares, DWS Tax-Exempt Cash Institutional Shares, DWS Tax-Exempt Money Fund, DWS Tax-Free Money Fund Class S, Service Shares, Tax-Exempt Cash Managed Shares and Tax-Free Investment Class.
The financial highlights for all classes of shares, other than DWS Tax-Exempt Cash Institutional Shares and Tax-Exempt Cash Managed Shares, are provided separately and are available upon request.
The Fund's investment income, realized gains and losses, and certain Fund-level expenses and expense reductions, if any, are borne pro rata on the basis of relative net assets by the holders of all classes of shares of the Fund, except that each class bears certain expenses unique to that class such as distribution and service fees, services to shareholders and certain other class-specific expenses. Differences in class-level expenses may result in payment of different per share dividends by class. All shares of the Trust have equal rights with respect to voting subject to class-specific arrangements.
The Fund's financial statements are prepared in accordance with accounting principles generally accepted in the United States of America which require the use of management estimates. Actual results could differ from those estimates. The policies described below are followed consistently by the Fund in the preparation of its financial statements.
Security Valuation. Various inputs are used in determining the value of the Fund's investments. These inputs are summarized in three broad levels. Level 1 includes quoted prices in active markets for identical securities. Level 2 includes other significant observable inputs (including quoted prices for similar securities, interest rates, prepayment speeds, and credit risk). Level 3 includes significant unobservable inputs (including the Fund's own assumptions in determining the fair value of investments). The inputs or methodology used for valuing securities are not necessarily an indication of the risk associated with investing in those securities.
The Fund values all securities utilizing the amortized cost method permitted in accordance with Rule 2a-7 under the 1940 Act and certain conditions therein. Under this method, which does not take into account unrealized capital gains or losses on securities, an instrument is initially valued at its cost and thereafter assumes a constant accretion/amortization rate to maturity of any discount or premium. Securities held by the Fund are reflected as Level 2 because the securities are valued at amortized cost (which approximates fair value) and, accordingly, the inputs used to determine value are not quoted prices in an active market.
Disclosure about the classification of fair value measurements is included in a table following the Fund's Investment Portfolio.
New Accounting Pronouncement. In January 2013, Accounting Standard Update 2013-01 (ASU 2013-01), Clarifying the Scope of Disclosures about Offsetting Assets and Liabilities, replaced Accounting Standards Update 2011-11 (ASU 2011-11), Disclosures about Offsetting Assets and Liabilities. ASU 2013-01 is effective for fiscal years beginning on or after January 1, 2013, and interim periods within those annual periods. ASU 2011-11 was intended to enhance disclosure requirements on the offsetting of financial assets and liabilities. The ASU 2013-01 limits the scope of the new balance sheet offsetting disclosures to derivatives, repurchase agreements, and securities lending transactions to the extent that they are (1) offset in the financial statements or (2) subject to an enforceable master netting arrangement or similar agreement. Management is currently evaluating the application of ASU 2013-01 and its impact, if any, on the Fund's financial statements.
Federal Income Taxes. The Fund's policy is to comply with the requirements of the Internal Revenue Code, as amended, which are applicable to regulated investment companies and to distribute all of its taxable and tax-exempt income to its shareholders.
The Fund has reviewed the tax positions for the open tax years as of April 30, 2013 and has determined that no provision for income tax is required in the Fund's financial statements. The Fund's federal tax returns for the prior three fiscal years remain open subject to examination by the Internal Revenue Service.
Distribution of Income. Net investment income of the Fund is declared as a daily dividend and is distributed to shareholders monthly. The Fund may take into account capital gains and losses in its daily dividend declarations. The Fund may also make additional distributions for tax purposes if necessary.
Permanent book and tax basis differences relating to shareholder distributions will result in reclassifications to paid in capital. Temporary book and tax basis differences will reverse in a subsequent period. There were no significant book-to-tax differences for the Fund.
At April 30, 2013, the Fund's components of distributable earnings on a tax basis are as follows:
| Undistributed tax-exempt income* | | $ | 218,878 | |
In addition, the tax character of distributions paid to shareholders by the Fund is summarized as follows:
| | | Years Ended April 30, | |
| | | 2013 | | | 2012 | |
| Distributions from tax-exempt income | | $ | 581,722 | | | $ | 854,176 | |
| Distributions from ordinary income* | | $ | 119,059 | | | $ | 21,137 | |
* For tax purposes, short-term capital gain distributions are considered ordinary income distributions.
Expenses. Expenses of the Trust arising in connection with a specific Fund are allocated to that Fund. Other Trust expenses which cannot be directly attributed to a Fund are apportioned pro rata on the basis of relative net assets among the funds in the Trust based upon the relative net assets or other appropriate measures.
Contingencies. In the normal course of business, the Fund may enter into contracts with service providers that contain general indemnification clauses. The Fund's maximum exposure under these arrangements is unknown as this would involve future claims that may be made against the Fund that have not yet been made. However, based on experience, the Fund expects the risk of loss to be remote.
Other. Investment transactions are accounted for on trade date. Interest income is recorded on the accrual basis. Realized gains and losses from investment transactions are recorded on an identified cost basis and may include proceeds from litigation. All discounts and premiums are accreted/amortized for both tax and financial reporting purposes.
2. Related Parties
Management Agreement. Under an Amended and Restated Investment Management Agreement with Deutsche Investment Management Americas Inc. ("DIMA" or the "Advisor"), an indirect, wholly owned subsidiary of Deutsche Bank AG, the Advisor directs the investments of the Fund in accordance with its investment objectives, policies and restrictions. The Advisor determines the securities, instruments and other contracts relating to investments to be purchased, sold or entered into by the Fund.
The Fund pays a monthly management fee based on the combined average daily net assets of the three funds in the Trust and allocated to the Fund based on its relative net assets, computed and accrued daily and payable monthly, at the following annual rates:
| First $500 million of the Funds' combined average daily net assets | | | .120 | % |
| Next $500 million of such net assets | | | .100 | % |
| Next $1 billion of such net assets | | | .075 | % |
| Next $1 billion of such net assets | | | .060 | % |
| Over $3 billion of such net assets | | | .050 | % |
For the period from May 1, 2012 through September 30, 2013, the Advisor has contractually agreed to waive its fees and/or reimburse certain operating expenses of the DWS Tax-Exempt Cash Institutional Shares to the extent necessary to maintain the operating expenses (excluding certain expenses such as extraordinary expenses, taxes, brokerage and interest) at 0.20%.
The Advisor has agreed to voluntarily waive additional expenses. The voluntary waiver may be changed or terminated at any time without notice. Under these arrangements, the Advisor waived certain expenses on Tax-Exempt Cash Institutional Shares and Tax-Exempt Cash Managed Shares.
Accordingly, for the year ended April 30, 2013, the Advisor earned a management fee on the Fund aggregating $1,326,518, of which $309,712 was waived, resulting in an annual effective rate of 0.05% of the Fund's average daily net assets.
The Advisor has also agreed to maintain expenses of certain other classes of the Trust. These rates are disclosed in the respective share classes' annual reports that are provided separately and are available upon request.
Administration Fee. Pursuant to an Administrative Services Agreement, DIMA provides most administrative services to the Fund. For all services provided under the Administrative Services Agreement, the Fund pays the Advisor an annual fee ("Administration Fee") of 0.10% of the Fund's average daily net assets, computed and accrued daily and payable monthly. For the year ended April 30, 2013, the Administration Fee was as follows:
| | | Administration Fee | | | Unpaid at April 30, 2013 | |
| Tax-Exempt Portfolio | | $ | 2,073,476 | | | $ | 161,841 | |
Service Provider Fees. DWS Investments Service Company ("DISC"), an affiliate of the Advisor, is the transfer agent, dividend-paying agent and shareholder service agent for the Fund. Pursuant to a sub-transfer agency agreement between DISC and DST Systems, Inc. ("DST"), DISC has delegated certain transfer agent, dividend-paying agent and shareholder service agent functions to DST. DISC compensates DST out of the shareholder servicing fee it receives from the Fund. For the year ended April 30, 2013, the amounts charged to the Fund by DISC were as follows:
| Tax-Exempt Portfolio: | | Total Aggregated | | | Waived | | | Unpaid at April 30, 2013 | |
| Capital Assets Funds Shares | | $ | 30,095 | | | $ | 28,537 | | | $ | — | |
| Davidson Cash Equivalent Shares | | | 101,958 | | | | 96,636 | | | | 286 | |
| DWS Tax-Exempt Cash Institutional Shares | | | 159,779 | | | | 159,779 | | | | — | |
| DWS Tax-Exempt Money Fund | | | 90,009 | | | | 64,368 | | | | 6,013 | |
| DWS Tax-Free Money Fund Class S | | | 62,942 | | | | 51,694 | | | | 3,125 | |
| Service Shares | | | 156,558 | | | | 147,666 | | | | 5,419 | |
| Tax-Exempt Cash Managed Shares | | | 102,865 | | | | 86,626 | | | | 431 | |
| Tax-Free Investment Class | | | 368,933 | | | | 338,546 | | | | — | |
| | | $ | 1,073,139 | | | $ | 973,852 | | | $ | 15,274 | |
Distribution Service Agreement. Under the Distribution Service Agreement, in accordance with Rule 12b-1 under the 1940 Act, DWS Investments Distributors, Inc. ("DIDI"), an affiliate of the Advisor, receives a fee ("Distribution Fee"), calculated as a percentage of average daily net assets for the shares listed in the following table.
For the year ended April 30, 2013, the Distribution Fee was as follows:
| Tax-Exempt Portfolio: | | Distribution Fee | | | Waived | | | Annual Effective Rate | | | Contractual Rate (Up To) | |
| Capital Assets Funds Shares | | $ | 39,725 | | | $ | 39,725 | | | | .00 | % | | | .33 | % |
| Davidson Cash Equivalent Shares | | | 203,917 | | | | 203,917 | | | | .00 | % | | | .30 | % |
| Service Shares | | | 375,740 | | | | 375,740 | | | | .00 | % | | | .60 | % |
| Tax-Free Investment Class | | | 836,286 | | | | 836,286 | | | | .00 | % | | | .25 | % |
| | | $ | 1,455,668 | | | $ | 1,455,668 | | | | | | | | | |
In addition, DIDI provides information and administrative services for a fee ("Service Fee") for the shares listed in the following table. A portion of these fees may be paid pursuant to a Rule 12b-1 plan.
For the year ended April 30, 2013, the Service Fee was as follows:
| Tax-Exempt Portfolio: | | Service Fee | | | Waived | | | Annual Effective Rate | | | Contractual Rate (Up To) | |
| Capital Assets Funds Shares | | $ | 30,095 | | | $ | 30,095 | | | | .00 | % | | | .25 | % |
| Davidson Cash Equivalent Shares | | | 169,930 | | | | 169,930 | | | | .00 | % | | | .25 | % |
| Tax-Exempt Cash Managed Shares | | | 223,726 | | | | 223,726 | | | | .00 | % | | | .15 | % |
| Tax-Free Investment Class | | | 234,160 | | | | 234,160 | | | | .00 | % | | | .07 | % |
| | | $ | 657,911 | | | $ | 657,911 | | | | | | | | | |
Typesetting and Filing Service Fees. Under an agreement with DIMA, DIMA is compensated for providing typesetting and certain regulatory filing services to the Fund. For the year ended April 30, 2013, the amount charged to the Fund by DIMA included in the Statement of Operations under "reports to shareholders" was as follows:
| Fund | | Total Aggregated | | | Unpaid at April 30, 2013 | |
| Tax-Exempt Portfolio | | $ | 85,990 | | | $ | 31,227 | |
Trustees' Fees and Expenses. The Fund paid retainer fees to each Trustee not affiliated with the Advisor, plus specified amounts to the Board Chairperson and Vice Chairperson and to each committee Chairperson.
3. Concentration of Ownership
From time to time, the Fund may have a concentration of several shareholder accounts holding a significant percentage of shares outstanding. Investment activities of these shareholders could have a material impact on the Fund.
At April 30, 2013, three shareholder accounts held approximately 33%, 17% and 12% of the outstanding shares of the Fund.
4. Line of Credit
The Fund and other affiliated funds (the "Participants") share in a $375 million revolving credit facility provided by a syndication of banks. The Fund may borrow for temporary or emergency purposes, including the meeting of redemption requests that otherwise might require the untimely disposition of securities. The Participants are charged an annual commitment fee which is allocated based on net assets, among each of the Participants. Interest is calculated at a rate per annum equal to the sum of the Federal Funds Rate plus 1.25 percent plus, if LIBOR exceeds the Federal Funds Rate, the amount of such excess. The Fund may borrow up to a maximum of 33 percent of its net assets under the agreement. The Fund had no outstanding loans at April 30, 2013.
5. Share Transactions
The following table summarizes share and dollar activity in the Fund:
Tax-Exempt Portfolio
| | | Year Ended April 30, 2013 | | | Year Ended April 30, 2012 | |
| | | Shares | | | Dollars | | | Shares | | | Dollars | |
| Shares sold | |
| Capital Assets Funds Shares | | | 33,780,270 | | | $ | 33,780,270 | | | | 32,054,021 | | | $ | 32,054,021 | |
| Davidson Cash Equivalent Shares | | | 115,063,476 | | | | 115,063,476 | | | | 121,475,389 | | | | 121,475,389 | |
| DWS Tax-Exempt Cash Institutional Shares | | | 2,372,880,502 | | | | 2,372,880,502 | | | | 4,080,690,854 | | | | 4,080,690,854 | |
| DWS Tax-Exempt Money Fund | | | 251,306,829 | | | | 251,306,829 | | | | 325,873,832 | | | | 325,873,832 | |
| DWS Tax-Free Money Fund Class S | | | 28,082,317 | | | | 28,082,317 | | | | 31,868,351 | | | | 31,868,351 | |
| Service Shares | | | 138,095,905 | | | | 138,095,905 | | | | 173,964,295 | | | | 173,964,295 | |
| Tax-Exempt Cash Managed Shares | | | 238,693,476 | | | | 238,693,476 | | | | 387,004,796 | | | | 387,004,796 | |
| Tax-Free Investment Class | | | 396,600,890 | | | | 396,600,890 | | | | 330,420,769 | | | | 330,420,769 | |
| | | | | | | $ | 3,574,503,665 | | | | | | | $ | 5,483,352,307 | |
| Shares issued to shareholders in reinvestment of distributions | |
| Capital Assets Funds Shares | | | 3,264 | | | $ | 3,264 | | | | 2,578 | | | $ | 2,578 | |
| Davidson Cash Equivalent Shares | | | 20,992 | | | | 20,992 | | | | 13,652 | | | | 13,652 | |
| DWS Tax-Exempt Cash Institutional Shares | | | 163,290 | | | | 163,290 | | | | 307,257 | | | | 307,257 | |
| DWS Tax-Exempt Money Fund | | | 76,913 | | | | 76,913 | | | | 112,297 | | | | 112,297 | |
| DWS Tax-Free Money Fund Class S | | | 27,387 | | | | 27,387 | | | | 27,195 | | | | 27,195 | |
| Service Shares | | | 14,768 | | | | 14,768 | | | | 16,265 | | | | 16,265 | |
| Tax-Exempt Cash Managed Shares | | | 2,584 | | | | 2,584 | | | | 1,546 | | | | 1,546 | |
| Tax-Free Investment Class | | | 100,546 | | | | 100,546 | | | | 63,716 | | | | 63,716 | |
| | | | | | | $ | 409,744 | | | | | | | $ | 544,506 | |
| Shares redeemed | |
| Capital Assets Funds Shares | | | (35,324,040 | ) | | $ | (35,324,040 | ) | | | (31,054,695 | ) | | $ | (31,054,695 | ) |
| Davidson Cash Equivalent Shares | | | (106,210,991 | ) | | | (106,210,991 | ) | | | (135,004,695 | ) | | | (135,004,695 | ) |
| DWS Tax-Exempt Cash Institutional Shares | | | (2,508,359,723 | ) | | | (2,508,359,723 | ) | | | (4,467,264,493 | ) | | | (4,467,264,493 | ) |
| DWS Tax-Exempt Money Fund | | | (322,145,746 | ) | | | (322,145,746 | ) | | | (379,194,651 | ) | | | (379,194,651 | ) |
| DWS Tax-Free Money Fund Class S | | | (38,170,621 | ) | | | (38,170,621 | ) | | | (46,678,340 | ) | | | (46,678,340 | ) |
| Service Shares | | | (171,243,303 | ) | | | (171,243,303 | ) | | | (177,914,611 | ) | | | (177,914,611 | ) |
| Tax-Exempt Cash Managed Shares | | | (290,012,104 | ) | | | (290,012,104 | ) | | | (348,035,830 | ) | | | (348,035,830 | ) |
| Tax-Free Investment Class | | | (399,598,260 | ) | | | (399,598,260 | ) | | | (399,040,672 | ) | | | (399,040,672 | ) |
| | | | | | | $ | (3,871,064,788 | ) | | | | | | $ | (5,984,187,987 | ) |
| Net increase (decrease) | |
| Capital Assets Funds Shares | | | (1,540,506 | ) | | $ | (1,540,506 | ) | | | 1,001,904 | | | $ | 1,001,904 | |
| Davidson Cash Equivalent Shares | | | 8,873,477 | | | | 8,873,477 | | | | (13,515,654 | ) | | | (13,515,654 | ) |
| DWS Tax-Exempt Cash Institutional Shares | | | (135,315,931 | ) | | | (135,315,931 | ) | | | (386,266,382 | ) | | | (386,266,382 | ) |
| DWS Tax-Exempt Money Fund | | | (70,762,004 | ) | | | (70,762,004 | ) | | | (53,208,522 | ) | | | (53,208,522 | ) |
| DWS Tax-Free Money Fund Class S | | | (10,060,917 | ) | | | (10,060,917 | ) | | | (14,782,794 | ) | | | (14,782,794 | ) |
| Service Shares | | | (33,132,630 | ) | | | (33,132,630 | ) | | | (3,934,051 | ) | | | (3,934,051 | ) |
| Tax-Exempt Cash Managed Shares | | | (51,316,044 | ) | | | (51,316,044 | ) | | | 38,970,512 | | | | 38,970,512 | |
| Tax-Free Investment Class | | | (2,896,824 | ) | | | (2,896,824 | ) | | | (68,556,187 | ) | | | (68,556,187 | ) |
| | | | | | | $ | (296,151,379 | ) | | | | | | $ | (500,291,174 | ) |
Report of Independent Registered Public Accounting Firm
To the Shareholders and Board of Trustees of Cash Account Trust:
We have audited the accompanying statement of assets and liabilities of Tax-Exempt Portfolio (the "Fund") (one of the Funds comprising Cash Account Trust), including the investment portfolio, as of April 30, 2013, and the related statement of operations for the year then ended, the statement of changes in net assets for each of the two years in the period then ended, and the financial highlights for each of the five years in the period then ended. These financial statements and financial highlights are the responsibility of the Fund's management. Our responsibility is to express an opinion on these financial statements and financial highlights based on our audits.
We conducted our audits in accordance with the standards of the Public Company Accounting Oversight Board (United States). Those standards require that we plan and perform the audit to obtain reasonable assurance about whether the financial statements and financial highlights are free of material misstatement. We were not engaged to perform an audit of the Fund's internal control over financial reporting. Our audits included consideration of internal control over financial reporting as a basis for designing audit procedures that are appropriate in the circumstances, but not for the purpose of expressing an opinion on the effectiveness of the Fund's internal control over financial reporting. Accordingly, we express no such opinion. An audit also includes examining, on a test basis, evidence supporting the amounts and disclosures in the financial statements and financial highlights, assessing the accounting principles used and significant estimates made by management, and evaluating the overall financial statement presentation. Our procedures included confirmation of securities owned as of April 30, 2013, by correspondence with the custodian and brokers. We believe that our audits provide a reasonable basis for our opinion.
In our opinion, the financial statements and financial highlights referred to above present fairly, in all material respects, the financial position of Tax-Exempt Portfolio at April 30, 2013, the results of its operations for the year then ended, the changes in its net assets for each of the two years in the period then ended, and the financial highlights for each of the five years in the period then ended, in conformity with U.S. generally accepted accounting principles.
| | | |
Boston, Massachusetts June 19, 2013 | | |
Information About Your Fund's Expenses
As an investor of the Fund, you incur two types of costs: ongoing expenses and transaction costs. Ongoing expenses include management fees, distribution and service (12b-1) fees and other Fund expenses. Examples of transaction costs include account maintenance fees, which are not shown in this section. The following tables are intended to help you understand your ongoing expenses (in dollars) of investing in the Fund and to help you compare these expenses with the ongoing expenses of investing in other mutual funds. In the most recent six-month period, the Fund limited these expenses; had it not done so, expenses would have been higher for the Tax-Exempt Cash Institutionial Shares and Tax-Exempt Cash Managed Shares. The example in the table is based on an investment of $1,000 invested at the beginning of the six-month period and held for the entire period (November 1, 2012 to April 30, 2013).
The tables illustrate your Fund's expenses in two ways:
•Actual Fund Return. This helps you estimate the actual dollar amount of ongoing expenses (but not transaction costs) paid on a $1,000 investment in the Fund using the Fund's actual return during the period. To estimate the expenses you paid over the period, simply divide your account value by $1,000 (for example, an $8,600 account value divided by $1,000 = 8.6), then multiply the result by the number in the "Expenses Paid per $1,000" line under the share class you hold.
• Hypothetical 5% Fund Return. This helps you to compare your Fund's ongoing expenses (but not transaction costs) with those of other mutual funds using the Fund's actual expense ratio and a hypothetical rate of return of 5% per year before expenses. Examples using a 5% hypothetical fund return may be found in the shareholder reports of other mutual funds. The hypothetical account values and expenses may not be used to estimate the actual ending account balance or expenses you paid for the period.
Please note that the expenses shown in these tables are meant to highlight your ongoing expenses only and do not reflect any transaction costs. The "Expenses Paid per $1,000" line of the tables is useful in comparing ongoing expenses only and will not help you determine the relative total expense of owning different funds. If these transaction costs had been included, your costs would have been higher.
Expenses and Value of a $1,000 Investment for the six months ended April 30, 2013 (Unaudited) | |
| Actual Fund Return | | DWS Tax-Exempt Cash Institutional Shares | | | Tax-Exempt Cash Managed Shares | |
| Beginning Account Value 11/1/12 | | $ | 1,000.00 | | | $ | 1,000.00 | |
| Ending Account Value 4/30/13 | | $ | 1,000.25 | | | $ | 1,000.23 | |
| Expenses Paid per $1,000* | | $ | .84 | | | $ | .89 | |
| Hypothetical 5% Fund Return | | | | | | | | |
| Beginning Account Value 11/1/12 | | $ | 1,000.00 | | | $ | 1,000.00 | |
| Ending Account Value 4/30/13 | | $ | 1,023.95 | | | $ | 1,023.90 | |
| Expenses Paid per $1,000* | | $ | .85 | | | $ | .90 | |
| * Expenses are equal to the Fund's annualized expense ratio for each share class, multiplied by the average account value over the period, multiplied by 181 (the number of days in the most recent six-month period), then divided by 365. | |
| Annualized Expense Ratios | |
| DWS Tax-Exempt Cash Institutional Shares | | | | .17 | % |
| Tax-Exempt Cash Managed Shares | | | | .18 | % |
For more information, please refer to each Fund's prospectus. For an analysis of the fees associated with an investment in the Fund or similar funds, please refer to http://apps.finra.org/fundanalyzer/1/fa.aspx. | |
Tax Information (Unaudited)
Of the dividends paid from net investment income for the taxable year ended April 30, 2013, 100% are designated as exempt interest dividends for federal income tax purposes.
Please consult a tax advisor if you have questions about federal or state income tax laws, or on how to prepare your tax returns. If you have specific questions about your account, please call (800) 728-3337.
Proxy Voting
The Fund's policies and procedures for voting proxies for portfolio securities and information about how the Fund voted proxies related to its portfolio securities during the 12-month period ended June 30 are available on our Web site — www.dws-investments.com (click on "proxy voting" at the bottom of the page) — or on the SEC's Web site — www.sec.gov. To obtain a written copy of the Fund's policies and procedures without charge, upon request, call us toll free at (800) 728-3337.
Portfolio Holdings
Following the Fund's fiscal first and third quarter-end, a complete portfolio holdings listing is filed with the SEC on Form N-Q. In addition, each month, information about the Fund and its portfolio holdings is filed with the SEC on Form N-MFP. The SEC delays the public availability of the information filed on Form N-MFP for 60 days after the end of the reporting period included in the filing. These forms will be available on the SEC's Web site at www.sec.gov, and they may also be reviewed and copied at the SEC's Public Reference Room in Washington, D.C. Information on the operation of the SEC's Public Reference Room may be obtained by calling (800) SEC-0330. The Fund's portfolio holdings are also posted on www.dws-investments.com from time to time. Please see the Fund's current prospectus for more information.
Money Market Fund Reform
In 2010, the Securities and Exchange Commission adopted amendments to then-existing money market fund regulations, imposing new liquidity, credit quality and maturity requirements on all money market funds. In November 2012, the Financial Stability Oversight Council (FSOC), a board of U.S. regulators established by the Dodd-Frank Act, proposed recommendations for money market fund reform. If the SEC were to adopt one or more of the FSOC proposed recommendations in the future, or if FSOC were to take other steps to establish similar regulations of money market funds in the future, such regulatory action may affect the Fund's operations and/or return potential.
Summary of Management Fee Evaluation by Independent Fee Consultant
September 17, 2012
Pursuant to an Order entered into by Deutsche Investment Management Americas and affiliates (collectively, "DeAM") with the Attorney General of New York, I, Thomas H. Mack, have been appointed the Independent Fee Consultant for the DWS Funds (formerly the DWS Scudder Funds). My duties include preparing an annual written evaluation of the management fees DeAM charges the Funds, considering among other factors the management fees charged by other mutual fund companies for like services, management fees DeAM charges other clients for like services, DeAM's costs of supplying services under the management agreements and related profit margins, possible economies of scale if a Fund grows larger, and the nature and quality of DeAM's services, including fund performance. This report summarizes my evaluation for 2012, including my qualifications, the evaluation process for each of the DWS Funds, consideration of certain complex-level factors, and my conclusions. I served in substantially the same capacity in 2007, 2008, 2009, 2010 and 2011.
Qualifications
For more than 35 years I have served in various professional capacities within the investment management business. I have held investment analysis and advisory positions, including securities analyst, portfolio strategist and director of investment policy with a large investment firm. I have also performed business management functions, including business development, financial management and marketing research and analysis.
Since 1991, I have been an independent consultant within the asset management industry. I have provided services to over 125 client organizations, including investment managers, mutual fund boards, product distributors and related organizations. Over the past ten years I have completed a number of assignments for mutual fund boards, specifically including assisting boards with management contract renewal.
I hold a Master of Business Administration degree, with highest honors, from Harvard University and Master of Science and Bachelor of Science (highest honors) degrees from the University of California at Berkeley. I am an independent director and audit committee financial expert for two closed-end mutual funds and have served in various leadership and financial oversight capacities with non-profit organizations.
Evaluation of Fees for each DWS Fund
My work focused primarily on evaluating, fund-by-fund, the fees charged to each of the 103 mutual fund portfolios in the DWS Fund family. For each Fund, I considered each of the key factors mentioned above, as well as any other relevant information. In doing so I worked closely with the Funds' Independent Directors in their annual contract renewal process, as well as in their approval of contracts for several new funds (documented separately).
In evaluating each Fund's fees, I reviewed comprehensive materials provided by or on behalf of DeAM, including expense information prepared by Lipper Analytical, comparative performance information, profitability data, manager histories, and other materials. I also accessed certain additional information from the Lipper and Morningstar databases and drew on my industry knowledge and experience.
To facilitate evaluating this considerable body of information, I prepared for each Fund a document summarizing the key data elements in each area as well as additional analytics discussed below. This made it possible to consider each key data element in the context of the others.
In the course of contract renewal, DeAM agreed to implement a number of fee and expense adjustments requested by the Independent Directors which will favorably impact future fees and expenses, and my evaluation includes the effects of these changes.
Fees and Expenses Compared with Other Funds
The competitive fee and expense evaluation for each fund focused on two primary comparisons:
The Fund's contractual management fee (the advisory fee plus the administration fee where applicable) compared with those of a group of typically 12-15 funds in the same Lipper investment category (e.g. Large Capitalization Growth) having similar distribution arrangements and being of similar size.
The Fund's total expenses compared with a broader universe of funds from the same Lipper investment category and having similar distribution arrangements.
These two comparisons provide a view of not only the level of the fee compared with funds of similar scale but also the total expense the Fund bears for all the services it receives, in comparison with the investment choices available in the Fund's investment category and distribution channel. The principal figure-of-merit used in these comparisons was the subject Fund's percentile ranking against peers.
DeAM's Fees for Similar Services to Others
DeAM provided management fee schedules for all of its US domiciled fund and non-fund investment management accounts in any of the investment categories where there is a DWS Fund. These similar products included the other DWS Funds, non-fund pooled accounts, institutional accounts and sub-advisory accounts. Using this information, I calculated for each Fund the fee that would be charged to each similar product, at the subject Fund's asset level.
Evaluating information regarding non-fund products is difficult because there are varying levels of services required for different types of accounts, with mutual funds generally requiring considerably more regulatory and administrative types of service as well as having more frequent cash flows than other types of accounts. Also, while mutual fund fees for similar fund products can be expected to be similar, there will be some differences due to different pricing conditions in different distribution channels (e.g. retail funds versus those used in variable insurance products), differences in underlying investment processes and other factors.
Costs and Profit Margins
DeAM provided a detailed profitability analysis for each Fund. After making some adjustments so that the presentation would be more comparable to the available industry figures, I reviewed profit margins from investment management alone, from investment management plus other fund services (excluding distribution) provided to the Funds by DeAM (principally shareholder services), and DeAM profits from all sources, including distribution. A later section comments on overall profitability.
Economies of Scale
Economies of scale — an expected decline in management cost per dollar of fund assets as fund assets grow — are very rarely quantified and documented because of inherent difficulties in collecting and analyzing relevant data. However, in virtually every investment category that I reviewed, larger funds tend to have lower fees and lower total expenses than smaller funds. To see how each DWS Fund compares with this industry observation, I reviewed:
The trend in Fund assets over the last five years and the accompanying trend in total expenses. This shows if the Fund has grown and, if so, whether total expense (management fees as well as other expenses) have declined as a percent of assets.
Whether the Fund has break-points in its management fee schedule, the extent of the fee reduction built into the schedule and the asset levels where the breaks take effect, and in the case of a sub-advised Fund how the Fund's break-points compare with those of the sub-advisory fee schedule.
How the Fund's contractual fee schedule compares with trends in the industry data. To accomplish this, I constructed a chart showing how actual latest-fiscal-year contractual fees of the Fund and of other similar funds relate to average fund assets, with the subject Fund's contractual fee schedule superimposed.
Quality of Service — Performance
The quality-of-service evaluation focused on investment performance, which is the principal result of the investment management service. Each Fund's performance was reviewed over the past 1, 3, 5 and 10 years, as applicable, and compared with that of other funds in the same investment category and with a suitable market index.
In addition, I calculated and reviewed risk-adjusted returns relative to an index of similar mutual funds' returns and a suitable market index. The risk-adjusted returns analysis provides a way of determining the extent to which the Fund's return comparisons are mainly the product of investment value-added (or lack thereof) or alternatively taking considerably more or less risk than is typical in its investment category.
I also received and considered the history of portfolio manager changes for each Fund, as this provided an important context for evaluating the performance results.
Complex-Level Considerations
While this evaluation was conducted mainly at the individual fund level, there are some issues relating to the reasonableness of fees that can alternatively be considered across the whole fund complex:
I reviewed DeAM's profitability analysis for all DWS Funds, with a view toward determining if the allocation procedures used were reasonable and how profit levels compared with public data for other investment managers.
I considered whether DeAM and affiliates receive any significant ancillary or "fallout" benefits that should be considered in interpreting the direct profitability results. These would be situations where serving as the investment manager of the Funds is beneficial to another part of the Deutsche Bank organization.
I considered how aggregated DWS Fund expenses had varied over the years, by asset class and in the context of trends in asset levels.
I considered how aggregated DWS Fund performance measures relative to appropriate peers had varied by asset class and over time.
I reviewed the structure of the DeAM organization, trends in staffing levels, and information on compensation of investment management and other professionals compared with industry data.
Findings
Based on the process and analysis discussed above, which included reviewing a wide range of information from management and external data sources and considering among other factors the fees DeAM charges other clients, the fees charged by other fund managers, DeAM's costs and profits associated with managing the Funds, economies of scale, possible fall-out benefits, and the nature and quality of services provided, in my opinion the management fees charged the DWS Funds are reasonable.
Thomas H. Mack
President, Thomas H. Mack & Co., Inc.
Board Members and Officers
The following table presents certain information regarding the Board Members and Officers of the fund. Each Board Member's year of birth is set forth in parentheses after his or her name. Unless otherwise noted, (i) each Board Member has engaged in the principal occupation(s) noted in the table for at least the most recent five years, although not necessarily in the same capacity; and (ii) the address of each Independent Board Member is c/o Kenneth C. Froewiss, Chairman, DWS Mutual Funds, P.O. Box 78, Short Hills, NJ 07078. Except as otherwise noted below, the term of office for each Board Member is until the election and qualification of a successor, or until such Board Member sooner dies, resigns, is removed or as otherwise provided in the governing documents of the fund. Because the fund does not hold an annual meeting of shareholders, each Board Member will hold office for an indeterminate period. The Board Members may also serve in similar capacities with other funds in the fund complex.
| Independent Board Members |
Name, Year of Birth, Position with the Fund and Length of Time Served1 | | Business Experience and Directorships During the Past Five Years | Number of Funds in DWS Fund Complex Overseen |
Other Directorships Held by Board Member |
Kenneth C. Froewiss (1945) Chairperson since 2013,9 and Board Member since 2001 | | Adjunct Professor of Finance, NYU Stern School of Business (September 2009-present; Clinical Professor from 1997-September 2009); Member, Finance Committee, Association for Asian Studies (2002-present); Director, Mitsui Sumitomo Insurance Group (US) (2004-present); prior thereto, Managing Director, J.P. Morgan (investment banking firm) (until 1996) | 102 | — |
William McClayton (1944) Vice Chairperson since 2013,9 and Board Member since 2004 | | Private equity investor (since October 2009); previously, Managing Director, Diamond Management & Technology Consultants, Inc. (global consulting firm) (2001-2009); Directorship: Board of Managers, YMCA of Metropolitan Chicago; formerly: Senior Partner, Arthur Andersen LLP (accounting) (1966-2001); Trustee, Ravinia Festival | 102 | — |
John W. Ballantine (1946) Board Member since 1999 | | Retired; formerly, Executive Vice President and Chief Risk Management Officer, First Chicago NBD Corporation/The First National Bank of Chicago (1996-1998); Executive Vice President and Head of International Banking (1995-1996); former Directorships: Stockwell Capital Investments PLC (private equity); First Oak Brook Bancshares, Inc. and Oak Brook Bank; Prisma Energy International | 102 | Chairman of the Board, Healthways, Inc.2 (provider of disease and care management services) (2003- present); Portland General Electric2 (utility company) (2003- present) |
Henry P. Becton, Jr. (1943) Board Member since 1990 | | Vice Chair and former President, WGBH Educational Foundation. Directorships: Public Radio International; Public Radio Exchange (PRX); The PBS Foundation; North Bennett Street School (Boston); former Directorships: Association of Public Television Stations; Boston Museum of Science; American Public Television; Concord Academy; New England Aquarium; Mass. Corporation for Educational Telecommunications; Committee for Economic Development; Public Broadcasting Service; Connecticut College | 102 | Lead Director, Becton Dickinson and Company2 (medical technology company); Lead Director, Belo Corporation2 (media company) |
Dawn-Marie Driscoll (1946) Board Member since 1987 | | President, Driscoll Associates (consulting firm); Emeritus Executive Fellow, Center for Business Ethics, Bentley University; formerly, Partner, Palmer & Dodge (1988-1990); Vice President of Corporate Affairs and General Counsel, Filene's (1978-1988). Directorships: Director of ICI Mutual Insurance Company (since 2007); Advisory Board, Center for Business Ethics, Bentley University; Chairman of the Board of Trustees, Southwest Florida Community Foundation (charitable organization); former Directorships: Sun Capital Advisers Trust (mutual funds) (2007-2012), Investment Company Institute (audit, executive, nominating committees) and Independent Directors Council (governance, executive committees) | 102 | — |
Keith R. Fox, CFA (1954) Board Member since 1996 | | Managing General Partner, Exeter Capital Partners (a series of private investment funds) (since 1986). Directorships: Progressive International Corporation (kitchen goods importer and distributor); The Kennel Shop (retailer); former Chairman, National Association of Small Business Investment Companies; former Directorships: BoxTop Media Inc. (advertising); Sun Capital Advisers Trust (mutual funds) (2011-2012) | 102 | — |
Paul K. Freeman (1950) Board Member since 1993, and Chairperson (2009-Jan. 8, 2013) | | Consultant, World Bank/Inter-American Development Bank; Executive and Governing Council of the Independent Directors Council (Chairman of Education Committee); formerly: Project Leader, International Institute for Applied Systems Analysis (1998-2001); Chief Executive Officer, The Eric Group, Inc. (environmental insurance) (1986-1998); Directorships: Denver Zoo Foundation (December 2012-present); former Directorships: Prisma Energy International | 102 | — |
Richard J. Herring (1946) Board Member since 1990 | | Jacob Safra Professor of International Banking and Professor, Finance Department, The Wharton School, University of Pennsylvania (since July 1972); Co-Director, Wharton Financial Institutions Center (since July 2000); Co-Chair, U.S. Shadow Financial Regulatory Committee; Executive Director, Financial Economists Roundtable; formerly: Vice Dean and Director, Wharton Undergraduate Division (July 1995-June 2000); Director, Lauder Institute of International Management Studies (July 2000-June 2006) | 102 | Director, Japan Equity Fund, Inc. (since September 2007), Thai Capital Fund, Inc. (since 2007), Singapore Fund, Inc. (since September 2007), Independent Director of Barclays Bank Delaware (since September 2010) |
Rebecca W. Rimel (1951) Board Member since 1995 | | President and Chief Executive Officer, The Pew Charitable Trusts (charitable organization) (1994 to present); formerly: Executive Vice President, The Glenmede Trust Company (investment trust and wealth management) (1983-2004); Board Member, Investor Education (charitable organization) (2004-2005); Trustee, Executive Committee, Philadelphia Chamber of Commerce (2001-2007); Director, Viasys Health Care2 (January 2007-June 2007); Trustee, Thomas Jefferson Foundation (charitable organization) (1994-2012) | 102 | Director, Becton Dickinson and Company2 (medical technology company) (2012- present); Director, CardioNet, Inc.2 (health care) (2009- present) |
William N. Searcy, Jr. (1946) Board Member since 1993 | | Private investor since October 2003; formerly: Pension & Savings Trust Officer, Sprint Corporation2 (telecommunications) (November 1989-September 2003); Trustee, Sun Capital Advisers Trust (mutual funds) (1998-2012) | 102 | — |
Jean Gleason Stromberg (1943) Board Member since 1997 | | Retired. Formerly, Consultant (1997-2001); Director, Financial Markets U.S. Government Accountability Office (1996-1997); Partner, Fulbright & Jaworski, L.L.P. (law firm) (1978-1996). Directorships: The William and Flora Hewlett Foundation; former Directorships: Service Source, Inc., Mutual Fund Directors Forum (2002-2004), American Bar Retirement Association (funding vehicle for retirement plans) (1987-1990 and 1994-1996) | 102 | — |
Robert H. Wadsworth (1940) Board Member since 1999 | | President, Robert H. Wadsworth & Associates, Inc. (consulting firm) (1983 to present); Director, National Horizon, Inc. (non-profit organization); Director and Treasurer, The Phoenix Boys Choir Association | 105 | — |
Interested Board Member and Officer4 |
Name, Year of Birth, Position with the Fund and Length of Time Served1,6 | | Business Experience and Directorships During the Past Five Years | Number of Funds in DWS Fund Complex Overseen |
Other Directorships Held by Board Member |
Michael J. Woods5 (1967) Board Member since 2013,9 and Executive Vice President since 20139 | | Managing Director,3 Deutsche Asset & Wealth Management (2009-present); Head of the Americas Asset Management Business for Deutsche Bank, Member of the Asset and Wealth Management ("AWM") Extended Executive Committee, AWM Global Client Group Executive Committee and the AWM Active Asset Management Executive Committee; CEO and US Regional Head of DWS Investments; formerly: Sr. VP, Head of the Financial Intermediaries and Investments Group of Evergreen Investments (2007-2009), CEO and Vice Chairman of Board of Directors of XTF Global Asset Management (2006-2007), Managing Director — US Head of Sub-Advisory and Investment Only Business at Citigroup Asset Management (2000-2006). Mr. Woods is currently a board member of The Children's Village, The Big Brothers Big Sisters Organization, and The Mutual Fund Education Alliance. | 38 | — |
Officers4 |
Name, Year of Birth, Position with the Fund and Length of Time Served6 | | Business Experience and Directorships During the Past Five Years |
W. Douglas Beck, CFA7 (1967) President, 2011-present | | Managing Director,3 Deutsche Asset & Wealth Management (2006-present); President of DWS family of funds and Head of Product Management, U.S. for DWS Investments; formerly: Executive Director, Head of Product Management (2002-2006) and President (2005-2006) of the UBS Funds at UBS Global Asset Management; Co-Head of Manager Research/Managed Solutions Group, Merrill Lynch (1998-2002) |
John Millette8 (1962) Vice President and Secretary, 1999-present | | Director,3 Deutsche Asset & Wealth Management |
Paul H. Schubert7 (1963) Chief Financial Officer, 2004-present Treasurer, 2005-present | | Managing Director,3 Deutsche Asset & Wealth Management (since July 2004); formerly: Executive Director, Head of Mutual Fund Services and Treasurer for UBS Family of Funds (1998-2004); Vice President and Director of Mutual Fund Finance at UBS Global Asset Management (1994-1998) |
Caroline Pearson8 (1962) Chief Legal Officer, 2010-present | | Managing Director,3 Deutsche Asset & Wealth Management; formerly: Assistant Secretary for DWS family of funds (1997-2010) |
Melinda Morrow7 (1970) Vice President, 2012-present | | Director,3 Deutsche Asset & Wealth Management |
Hepsen Uzcan8 (1974) Assistant Secretary, since 20139 | | Vice President, Deutsche Asset & Wealth Management |
Paul Antosca8 (1957) Assistant Treasurer, 2007-present | | Director,3 Deutsche Asset & Wealth Management |
Jack Clark8 (1967) Assistant Treasurer, 2007-present | | Director,3 Deutsche Asset & Wealth Management |
Diane Kenneally8 (1966) Assistant Treasurer, 2007-present | | Director,3 Deutsche Asset & Wealth Management |
John Caruso7 (1965) Anti-Money Laundering Compliance Officer, 2010-present | | Managing Director,3 Deutsche Asset & Wealth Management |
Robert Kloby7 (1962) Chief Compliance Officer, 2006-present | | Managing Director,3 Deutsche Asset & Wealth Management |
1 The length of time served represents the year in which the Board Member joined the board of one or more DWS funds currently overseen by the Board.
2 A publicly held company with securities registered pursuant to Section 12 of the Securities Exchange Act of 1934.
3 Executive title, not a board directorship.
4 As a result of their respective positions held with the Advisor, these individuals are considered "interested persons" of the Advisor within the meaning of the 1940 Act. Interested persons receive no compensation from the fund.
5 The mailing address of Mr. Woods is 60 Wall Street, New York, New York 10005. Mr. Woods is an interested Board Member by virtue of his positions with Deutsche Asset & Wealth Management. As an interested person, Mr. Woods receives no compensation from the fund. Mr. Woods is a board member of the following trusts and corporations: Cash Account Trust, DWS Market Trust, DWS Money Funds, DWS State Tax-Free Income Series, DWS Target Fund, DWS Value Series, Inc., DWS Variable Series II, Investors Cash Trust, Tax-Exempt California Money Market Fund, DWS Global High Income Fund, Inc., DWS High Income Opportunities Fund, Inc., DWS High Income Trust, DWS Multi-Market Income Trust, DWS Municipal Income Trust, DWS Strategic Income Trust and DWS Strategic Municipal Income Trust.
6 The length of time served represents the year in which the officer was first elected in such capacity for one or more DWS funds.
7 Address: 60 Wall Street, New York, NY 10005.
8 Address: One Beacon Street, Boston, MA 02108.
9 Effective as of January 9, 2013.
The fund's Statement of Additional Information ("SAI") includes additional information about the Board Members. The SAI is available, without charge, upon request. If you would like to request a copy of the SAI, you may do so by calling the following toll-free number: (800) 728-3337.
Notes
Notes
Notes
Notes

APRIL 30, 2013 Annual Report to Shareholders |
| |
Tax-Exempt Portfolio DWS Tax-Exempt Money Fund |
|
Contents
3 Portfolio Management Review 15 Statement of Assets and Liabilities 17 Statement of Operations 18 Statement of Changes in Net Assets 20 Notes to Financial Statements 28 Report of Independent Registered Public Accounting Firm 29 Information About Your Fund's Expenses 32 Summary of Management Fee Evaluation by Independent Fee Consultant 36 Board Members and Officers |
This report must be preceded or accompanied by a prospectus. To obtain a summary prospectus, if available, or prospectus for any of our funds, visit www.dws-investments.com. We advise you to consider the fund's objectives, risks, charges and expenses carefully before investing. The summary prospectus and prospectus contain this and other important information about the fund. Please read the prospectus carefully before you invest.
An investment in this fund is not insured or guaranteed by the Federal Deposit Insurance Corporation (FDIC) or by any other government agency. Although the fund seeks to preserve the value of your investment at $1.00 per share, it is possible to lose money by investing in the fund. The share price of money market funds can fall below the $1.00 share price. You should not rely on or expect the Advisor to enter into support agreements or take other actions to maintain the fund's $1.00 share price. The credit quality of the fund's holdings can change rapidly in certain markets, and the default of a single holding could have an adverse impact on the fund's share price. The fund's share price can also be negatively affected during periods of high redemption pressures and/or illiquid markets. The actions of a few large investors in one class of shares of the fund may have a significant adverse effect on the share prices of all classes of shares of the fund. See the prospectus for specific details regarding the fund's risk profile.
DWS Investments is part of the Deutsche Asset & Wealth Management division of Deutsche Bank AG.
NOT FDIC/NCUA INSURED NO BANK GUARANTEE MAY LOSE VALUE NOT A DEPOSIT NOT INSURED BY ANY FEDERAL GOVERNMENT AGENCY
Portfolio Management Review (Unaudited)
Market Overview
All performance information below is historical and does not guarantee future results. Investment return and principal fluctuate, so your shares may be worth more or less when redeemed. Current performance may differ from performance data shown. Please visit www.dws-investments.com for the fund's most recent month-end performance. The 7-day current yield refers to the income paid by the fund over a 7-day period expressed as an annual percentage rate of the fund's shares outstanding. Yields fluctuate and are not guaranteed.
At the beginning of the fund's most recent fiscal year ended April 30, 2013, we saw another dramatic "flight to quality," as worries concerning Greece's upcoming elections and continuingly worsening conditions for Spanish and Italian banks led global and domestic investors to abandon risky assets. Late in 2012, any negative economic data was overshadowed by investor anticipation of more substantial central bank actions. The European Central Bank (ECB) lowered its interest rate for bank reserves. Then, the head of the ECB, Mario Draghi, stated that the central bank would do "whatever it takes" to preserve the euro. In December 2012, the U.S. Federal Reserve Board (the Fed) altered its guidance regarding rate levels, stating that it would maintain short-term interest rates near zero until U.S. unemployment dropped below 6.5%, and as long as inflation levels did not exceed 2.5%. In the first quarter of 2013, the European situation remained quiescent until the banking crisis in Cyprus reached a boiling point; the crisis was finally resolved after it was agreed that large uninsured depositors in Cyprus' banks would suffer substantial losses. In addition, the U.S. economy was boosted by higher housing prices and some gains in employment levels. In the money market area, we saw a continued supply/demand imbalance as well as a reduction in short-term money market supply due to ongoing quantitative easing by the Fed. In the continued search for yield, money market investors looked to a variety of financial instruments issued in countries around the world.
Positive Contributors to Fund Performance
We were able to maintain a yield that is in line with other similar money market funds during the period ended April 30, 2013.
| Tax-Exempt Portfolio seeks to provide maximum current income that is exempt from federal income taxes to the extent consistent with stability of capital. |
We sought to preserve a balance of liquidity and high quality by maintaining a strong position in variable-rate securities during the period. (The interest rate of variable-rate securities adjusts periodically based on indices such as the Securities Industry and Financial Market Association Index of Variable Rate Demand Notes. Because the interest rates of these instruments adjust as market conditions change, they provide flexibility in an uncertain interest rate environment.) In addition, we took advantage of higher yields along the yield curve by investing in tax-exempt commercial paper, three-month to nine-month municipal "put" bonds, and one-year fixed-rate municipal note issues. We have also maintained broad diversification for the fund by investing in a number of states and municipalities.
Fund Performance (as of April 30, 2013)
Performance is historical and does not guarantee future results. Current performance may be lower or higher than the performance data quoted.
An investment in the fund is not insured or guaranteed by the Federal Deposit Insurance Corporation (FDIC) or by any other government agency. Although the fund seeks to preserve the value of your investment at $1.00 per share, it is possible to lose money by investing in the fund.
| | | 7-Day Current Yield | |
| DWS Tax-Exempt Money Fund | | | .01 | %* |
| Equivalent Taxable Yield | | | .02 | %** |
Yields are historical, will fluctuate and do not guarantee future performance. The 7-day current yield refers to the income paid by the fund over a 7-day period expressed as an annual percentage rate of the fund's shares outstanding. For the most current yield information, visit our Web site at www.dws-investments.com. * The investment advisor has agreed to voluntarily waive fees/reimburse expenses. This waiver may be changed or terminated at any time without notice. ** The equivalent taxable yield allows you to compare with the performance of taxable money market funds. For the Tax-Exempt Portfolio, the equivalent taxable yield is based upon the marginal income tax rate of 35%. Income may be subject to local taxes and, for some investors, the alternative minimum tax. | |
Negative Contributors to Fund Performance
The types of securities that we invested in tended to have lower yields than issues carrying more risk. We preferred to be cautious during a time of market uncertainty. In the end this may have cost the fund some yield, but we believe that this represented a prudent approach to preserving principal.
Outlook and Positioning
We anticipate limited growth for the U.S. economy over the remainder of this year, due to steady but unspectacular employment gains and the automatic budget cuts dictated by congressional sequestration. In turn, we think that restrained growth will mean that the Fed will continue its extremely accommodative monetary policy through early 2014. We look for money market rates to continue to be low based on decreases in supply on a number of fronts and strong investor demand.
We continue our insistence on the highest credit quality within the fund. We also plan to maintain our conservative investment strategies and standards under the current market conditions. We continue to apply a careful approach to investing on behalf of the fund and to seek competitive yield for our shareholders.
Portfolio Management Team
A group of investment professionals is responsible for the day-to-day management of the fund. These investment professionals have a broad range of experience managing money market funds.
The views expressed reflect those of the portfolio management team only through the end of the period of the report as stated on the cover. The management team's views are subject to change at any time based on market and other conditions and should not be construed as a recommendation. Past performance is no guarantee of future results. Current and future portfolio holdings are subject to risk.
Terms to Know
Quantitative easing is a government monetary policy often used when interest rates are at or near zero. With this policy government or other securities are purchased from the market, causing the price of the securities purchased to rise and the yield or interest rates on the securities purchased to fall. For the companies whose bonds the central banks are willing to purchase, it means having to pay lower interest rates on new bonds issued to replace existing bonds that have matured. With lower borrowing costs, the central banks hope that consumers will be encouraged to spend more, thus helping the overall economy and improving the balance sheets of the companies providing the goods and services on which consumers are spending their money.
The yield curve is a graphical representation of how yields on bonds of different maturities compare. Normally, yield curves slant up, as bonds with longer maturities typically offer higher yields than short-term bonds.
A repurchase agreement, or "overnight repo," is an agreement between a seller and a buyer, usually of government securities, where the seller agrees to repurchase the securities at a given price and usually at a stated time. Repos are widely used money market instruments that serve as an interest-bearing, short-term "parking place" for large sums of money.
The Securities Industry and Financial Market Association Index of Variable Rate Demand Notes is a weekly high-grade market index consisting of seven-day, tax-exempt, variable-rate demand notes produced by Municipal Market Data Group. Actual issues are selected from Municipal Market Data's database of more than 10,000 active issues. Index returns do not reflect fees or expenses and it is not possible to invest directly into an index.
A "put" bond allows an investor to require the issuer to repurchase the bond at a specified date before its maturity.
Portfolio Summary (Unaudited)
Investment Portfolio as of April 30, 2013
Tax-Exempt Portfolio
| | | Principal Amount ($) | | | Value ($) | |
| | | | |
| Municipal Investments 98.7% | |
| Alaska 3.1% | |
| Anchorage, AK: | |
| Tax Anticipation Notes, 2.0%, 9/17/2013 | | | 25,000,000 | | | | 25,174,489 | |
| TECP, 0.19%, 10/3/2013, LOC: Wells Fargo | | | 25,000,000 | | | | 25,000,000 | |
| TECP, 0.23%, 6/5/2013, LOC: Wells Fargo | | | 8,300,000 | | | | 8,300,000 | |
| | | | | 58,474,489 | |
| California 14.5% | |
| California, Golden State Tobacco Securitization Corp., Tobacco Settlement: | | | | | | | | |
| Series B, Prerefunded 6/1/2013 @ 100, 5.5%, 6/1/2043 | | | 24,415,000 | | | | 24,523,306 | |
| Series B, Prerefunded 6/1/2013 @ 100, 5.625%, 6/1/2038 | | | 31,610,000 | | | | 31,753,010 | |
| Series 2003-A-1, Prerefunded 6/1/2013 @ 100, 6.25%, 6/1/2033 | | | 43,745,000 | | | | 43,966,499 | |
| Series 2003-A-1, Prerefunded 6/1/2013 @ 100, 6.75%, 6/1/2039 | | | 38,470,000 | | | | 38,683,616 | |
| California, Nuveen Dividend Advantage Municipal Fund, Series 1-1362, 144A, AMT, 0.4%*, 6/1/2041, LIQ: Morgan Stanley Bank | | | 5,000,000 | | | | 5,000,000 | |
| California, RBC Municipal Products, Inc. Trust: | |
| Series E-21, 144A, 0.26%*, Mandatory Put 9/3/2013 @ 100, 10/1/2013, LIQ: Royal Bank of Canada, LOC: Royal Bank of Canada | | | 25,000,000 | | | | 25,000,000 | |
| Series E-24, 144A, 0.26%*, Mandatory Put 8/1/2013 @ 100, 7/1/2031, LIQ: Royal Bank of Canada, LOC: Royal Bank of Canada | | | 16,865,000 | | | | 16,865,000 | |
| California, State Department of Water Resources, Supply Revenue: | | | | | | | | |
| Series N, 5.0%, 5/1/2013 | | | 10,000,000 | | | | 10,000,000 | |
| Series M, 5.0%, 5/1/2014 | | | 7,500,000 | | | | 7,859,716 | |
| California, State General Obligation: | |
| Prerefunded 4/1/2014 @ 100, 5.0%, 4/1/2031, INS: AMBAC | | | 10,325,000 | | | | 10,778,410 | |
| Prerefunded 4/1/2014 @ 100, 5.25%, 4/1/2034 | | | 6,035,000 | | | | 6,313,855 | |
| California, Statewide Communities Development Authority, Multi-Family Housing Revenue: | | | | | | | | |
| Series 2680, 144A, 0.29%*, 5/15/2018, LOC: JPMorgan Chase Bank NA | | | 14,700,000 | | | | 14,700,000 | |
| Series 2681, 144A, AMT, 0.36%*, 5/15/2018, LOC: JPMorgan Chase Bank NA | | | 12,250,000 | | | | 12,250,000 | |
| California, Wells Fargo Stage Trust: | |
| Series 74C, 144A, 0.19%*, 11/15/2040, GTY: Wells Fargo Bank NA, LIQ: Wells Fargo Bank NA | | | 5,810,000 | | | | 5,810,000 | |
| Series 31C, 144A, AMT, 0.25%*, Mandatory Put 8/15/2013 @ 100, 1/1/2022, GTY: Wells Fargo Bank NA, LIQ: Wells Fargo Bank NA | | | 5,995,000 | | | | 5,995,000 | |
| San Diego County, CA, School District Note Participations, Series A, 2.0%, 6/28/2013 | | | 10,000,000 | | | | 10,029,016 | |
| | | | | 269,527,428 | |
| Colorado 3.8% | |
| Colorado, State Education Loan Program, Series C, 144A, 2.5%, 6/27/2013 | | | 60,000,000 | | | | 60,221,714 | |
| Colorado, Wells Fargo Stage Trust, Series 42C, 144A, AMT, 0.19%*, 11/15/2023, GTY: Wells Fargo Bank NA, LIQ: Wells Fargo Bank NA | | | 9,835,000 | | | | 9,835,000 | |
| | | | | 70,056,714 | |
| District of Columbia 0.8% | |
| District of Columbia, Wells Fargo Stage Trust, Series 57C, 144A, AMT, 0.25%*, Mandatory Put 12/26/2013 @ 100, 10/1/2032, GTY: Wells Fargo Bank NA, LIQ: Wells Fargo Bank NA | | | 13,965,000 | | | | 13,965,000 | |
| Georgia 0.7% | |
| Burke County, GA, Development Authority Revenue, Georgia Power Co. Plant, 144A, 0.21%*, 5/1/2022 | | | 5,555,000 | | | | 5,555,000 | |
| Georgia, Private Colleges & Universities Authority Revenue, Mercer University Project, Series C, 0.24%*, 10/1/2031, LOC: Branch Banking & Trust | | | 8,335,000 | | | | 8,335,000 | |
| | | | | 13,890,000 | |
| Hawaii 0.5% | |
| Hawaii, Wells Fargo State Trust, Series 6C, 144A, 0.19%*, 7/1/2040, GTY: Wells Fargo Bank NA, LIQ: Wells Fargo Bank NA | | | 8,820,000 | | | | 8,820,000 | |
| Idaho 2.5% | |
| Idaho, State General Obligation, 2.0%, 6/28/2013 | | | 47,000,000 | | | | 47,134,110 | |
| Illinois 13.3% | |
| Chicago, IL, Loyola University: | |
| TECP, 0.14%, 5/21/2013 | | | 25,000,000 | | | | 25,000,000 | |
| TECP, 0.15%, 6/3/2013 | | | 25,040,000 | | | | 25,040,000 | |
| Chicago, IL, O'Hare International Airport Revenue, 0.18%, 5/7/2013 | | | 5,000,000 | | | | 5,000,000 | |
| Illinois, BB&T Municipal Trust, Series 5001, 144A, 0.31%*, 6/1/2020, LIQ: Rabobank Nederland, LOC: Rabobank International | | | 23,460,000 | | | | 23,460,000 | |
| Illinois, Educational Facilities Authority Revenue, University of Chicago, Series B-3, 0.24%*, Mandatory Put 3/13/2014 @ 100, 7/1/2036 | | | 18,000,000 | | | | 18,000,000 | |
| Illinois, Educational Facilities Authority Revenues: | |
| TECP, 0.15%, 6/3/2013, LOC: Northern Trust Co. | | | 20,000,000 | | | | 20,000,000 | |
| TECP, 0.16%, 6/3/2013, LOC: Northern Trust Co. | | | 30,000,000 | | | | 30,000,000 | |
| TECP, 0.16%, 7/1/2013, LOC: Northern Trust Co. | | | 16,200,000 | | | | 16,200,000 | |
| TECP, 0.16%, 7/2/2013, LOC: Northern Trust Co. | | | 30,000,000 | | | | 30,000,000 | |
| Illinois, Wells Fargo Stage Trust, Series 27C, 144A, 0.26%*, Mandatory Put 10/24/2013 @ 100, 8/1/2025, GTY: Wells Fargo Bank NA, LIQ: Wells Fargo Bank NA, | | | 38,405,000 | | | | 38,405,000 | |
| Mundelein, IL, Industrial Development Revenue, MacLean Fogg Co. Project, 144A, AMT, 0.38%*, 1/1/2015, LOC: Northern Trust Co. | | | 6,500,000 | | | | 6,500,000 | |
| Woodstock, IL, Multi-Family Housing Revenue, Willow Brooke Apartments, AMT, 0.24%*, 4/1/2042, LOC: Wells Fargo Bank NA | | | 10,000,000 | | | | 10,000,000 | |
| | | | | 247,605,000 | |
| Indiana 3.6% | |
| Indiana, State Finance Authority, Industrial Revenue, Midwest Fertilizer Corp. Project, 0.2%, Mandatory Put 7/1/2013 @ 100, 7/1/2046 | | | 60,000,000 | | | | 60,000,000 | |
| Indiana, Wells Fargo State Trust, Series 100C, 144A, 0.19%*, 8/1/2021, GTY: Wells Fargo Bank NA, LIQ: Wells Fargo Bank NA | | | 7,495,000 | | | | 7,495,000 | |
| | | | | 67,495,000 | |
| Iowa 4.1% | |
| Iowa, State Finance Authority Midwestern Disaster Area Revenue, Fertilizer Co. Project, 0.17%*, Mandatory Put 5/31/2013 @ 100, 12/1/2050 | | | 70,000,000 | | | | 70,000,000 | |
| Iowa, State Finance Authority, Wellness Facilities Revenue, Community Marshalltown Project, 0.26%*, 1/1/2031, LOC: Northern Trust Co. | | | 6,015,000 | | | | 6,015,000 | |
| | | | | 76,015,000 | |
| Kansas 0.8% | |
| Kansas, State Development Finance Authority, Multi-Family Revenue, Oak Ridge Park II Project, Series X, AMT, 0.29%*, 12/1/2036, LOC: U.S. Bank NA | | | 3,650,000 | | | | 3,650,000 | |
| Olathe, KS, General Obligation, Series A, 1.5%, 7/1/2013 | | | 11,280,000 | | | | 11,304,457 | |
| | | | | 14,954,457 | |
| Kentucky 1.9% | |
| Kentucky, State Economic Development Finance Authority, Catholic Health Initiatives: | | | | | | | | |
| Series B, 0.32%**, 2/1/2046 | | | 10,680,000 | | | | 10,680,000 | |
| Series B-2, 0.32%**, 2/1/2046 | | | 12,000,000 | | | | 12,000,000 | |
| Series B-3, 0.32%**, 2/1/2046 | | | 12,415,000 | | | | 12,415,000 | |
| | | | | 35,095,000 | |
| Maryland 1.6% | |
| Maryland, State Health & Higher Educational Facilities Authority Revenue, Pooled Loan Program, Series D, 144A, 0.27%*, 1/1/2029, LOC: Bank of America NA | | | 12,580,000 | | | | 12,580,000 | |
| Montgomery County, MD, TECP, 0.17%, 6/4/2013, LOC: State Street Bank & Trust Co. | | | 17,000,000 | | | | 17,000,000 | |
| | | | | 29,580,000 | |
| Michigan 6.6% | |
| Michigan, RBC Municipal Products, Inc. Trust: | |
| Series L-23, 144A, AMT, 0.26%*, 3/1/2028, INS: AMBAC, LIQ: Royal Bank of Canada, LOC: Royal Bank of Canada | | | 44,995,000 | | | | 44,995,000 | |
| Series L-27, 144A, AMT, 0.26%*, 3/1/2031, LIQ: Royal Bank of Canada, LOC: Royal Bank of Canada | | | 40,000,000 | | | | 40,000,000 | |
| Michigan, State Finance Authority Revenue, Unemployment Obligation Assessment, Series A, 2.0%, 7/1/2013 | | | 11,100,000 | | | | 11,133,708 | |
| Michigan, State Hospital Finance Authority Revenue, Ascension Health Senior Credit Group: | | | | | | | | |
| Series F-7, 0.31%*, 11/15/2047 | | | 11,200,000 | | | | 11,200,000 | |
| Series F-6, 0.31%**, 11/15/2049 | | | 8,660,000 | | | | 8,660,000 | |
| Series F-8, 0.31%**, 11/15/2049 | | | 7,100,000 | | | | 7,100,000 | |
| | | | | 123,088,708 | |
| Minnesota 1.3% | |
| Cohasset, MN, State Power & Light Co. Project, Series A, 0.27%*, 6/1/2020, LOC: JPMorgan Chase Bank NA | | | 24,630,000 | | | | 24,630,000 | |
| Mississippi 0.5% | |
| Mississippi, Redstone Partners Floaters/Residuals Trust, Series C, 144A, AMT, 0.41%*, 12/1/2047, LOC: Wachovia Bank NA | | | 9,220,000 | | | | 9,220,000 | |
| Missouri 5.0% | |
| Missouri, State Health & Educational Facilities: | |
| TECP, 0.12%, 5/21/2013 | | | 28,000,000 | | | | 28,000,000 | |
| TECP, 0.14%, 5/16/2013 | | | 22,000,000 | | | | 22,000,000 | |
| Missouri, University of Curators, TECP, 0.14%, 5/7/2013 | | | 23,000,000 | | | | 23,000,000 | |
| North Kansas City, MO, Hospital Revenue, 0.22%*, 11/1/2033, LOC: Bank of America NA | | | 20,660,000 | | | | 20,660,000 | |
| | | | | 93,660,000 | |
| New York 4.2% | |
| BlackRock New York Municipal Income Quality Trust, Series W-7-40, 144A, AMT, 0.32%*, 10/1/2041, LIQ: Barclays Bank PLC | | | 5,000,000 | | | | 5,000,000 | |
| BlackRock New York Municipal Intermediate Duration Fund, Inc., Series W-7-296, 144A, AMT, 0.32%*, 10/1/2041, LIQ: Barclays Bank PLC | | | 13,500,000 | | | | 13,500,000 | |
| New York, RIB Floater Trust, Series 1WE, 144A, 0.29%*, 9/30/2013, LIQ: Barclays Bank PLC | | | 60,000,000 | | | | 60,000,000 | |
| | | | | 78,500,000 | |
| North Carolina 1.9% | |
| North Carolina, BB&T Municipal Trust: | |
| Series 1008, 144A, 0.31%*, 3/1/2024, LIQ: Branch Banking & Trust, LOC: Branch Banking & Trust | | | 5,515,000 | | | | 5,515,000 | |
| Series 1009, 144A, 0.31%*, 6/1/2024, LIQ: Branch Banking & Trust, LOC: Branch Banking & Trust | | | 15,675,000 | | | | 15,675,000 | |
| North Carolina, Capital Facilities Finance Agency, TECP, 0.15%, 6/5/2013 | | | 13,860,000 | | | | 13,860,000 | |
| | | | | 35,050,000 | |
| Ohio 1.6% | |
| Ohio, Puttable Floating Option Tax-Exempt Receipts, Series 808, 144A, AMT, 0.42%*, 12/1/2041, GTY: Bank of America NA, INS: AMBAC, LIQ: Bank of America NA | | | 30,000,000 | | | | 30,000,000 | |
| Oklahoma 0.5% | |
| Tulsa, OK, Airports Improvement Trust, Special Facilities Revenue, Lufthansa/Bizjet International, Inc., 144A, AMT, 0.26%*, 8/1/2018, LOC: Landesbank Hessen-Thuringen | | | 10,120,000 | | | | 10,120,000 | |
| Other Territories 6.2% | |
| BB&T Municipal Trust, Series 1010, 144A, 0.26%*, 1/15/2019, LIQ: Branch Banking & Trust, LOC: Branch Banking & Trust | | | 5,980,000 | | | | 5,980,000 | |
| BB&T Municipal Trust, Series 5000, 144A, 0.31%*, 10/1/2028, LIQ: Rabobank Nederland, LOC: Rabobank International | | | 6,755,000 | | | | 6,755,000 | |
| BlackRock Muni Holdings Investment Quality Fund, Series W-7-2746, 144A, AMT, 0.43%*, 7/1/2041, LIQ: Bank of America NA | | | 28,100,000 | | | | 28,100,000 | |
| BlackRock Municipal Bond Investment Trust, Series W-7-178, 144A, AMT, 0.32%*, 10/1/2041, LIQ: Barclays Bank PLC | | | 9,300,000 | | | | 9,300,000 | |
| Eagle Tax- Exempt Trust, 144A, AMT, 0.27%*, 4/15/2049, LIQ: Federal Home Loan Bank | | | 14,615,000 | | | | 14,615,000 | |
| Nuveen Premier Income Municipal Fund 2, Inc., Series 1-4895, 144A, AMT, 0.32%*, 5/1/2041, LIQ: Barclays Bank PLC | | | 52,000,000 | | | | 52,000,000 | |
| | | | | 116,750,000 | |
| Pennsylvania 2.7% | |
| Pennsylvania, State Economic Development Financing Authority, IESI PA Corp., 0.26%*, 11/1/2028, GTY: IESI Corp., LOC: Bank of America NA | | | 34,000,000 | | | | 34,000,000 | |
| University of Pittsburgh, PA, The Commonwealth Systems of Higher Education, Pittsburgh Assessment Notes, 2.0%, 7/2/2013 | | | 17,000,000 | | | | 17,051,605 | |
| | | | | 51,051,605 | |
| Puerto Rico 2.6% | |
| Puerto Rico, RIB Floater Trust, Series 8WE, 144A, 0.27%, 9/30/2014, LOC: Barclays Bank PLC | | | 47,500,000 | | | | 47,500,000 | |
| Tennessee 3.5% | |
| Metropolitan Government Nashville & Davidson County, TN: | |
| TECP, 0.2%, 10/3/2013 | | | 10,000,000 | | | | 10,000,000 | |
| TECP, 0.23%, 9/3/2013 | | | 17,000,000 | | | | 17,000,000 | |
| Tennessee, Tennergy Corp., Gas Revenue, Stars Certificates, Series 2006-001, 144A, 0.27%*, 5/1/2016, LOC: BNP Paribas | | | 39,000,000 | | | | 39,000,000 | |
| | | | | 66,000,000 | |
| Texas 9.5% | |
| Harris County, TX, Cultural Education, TECP, 0.23%, 7/9/2013 | | | 40,000,000 | | | | 40,000,000 | |
| Lamar, TX, Consolidated Independent School District, Series R-12266, 144A, 0.25%*, 8/1/2015, SPA: Citibank NA | | | 20,485,000 | | | | 20,485,000 | |
| North Texas, Tollway Authority Revenue, TECP, 0.16%, 6/7/2013, LOC: JPMorgan Chase Bank NA | | | 15,400,000 | | | | 15,400,000 | |
| Texas, JPMorgan Chase Putters/Drivers Trust, Series 4263, 144A, 0.18%*, 8/30/2013, LIQ: JPMorgan Chase Bank NA | | | 30,000,000 | | | | 30,000,000 | |
| Texas, Municipal Power Agency Revenue, TECP, 0.21%, 5/17/2013, LOC: Barclays Bank PLC | | | 15,500,000 | | | | 15,500,000 | |
| Texas, State Transportation Revenue, 2.5%, 8/30/2013 | | | 45,000,000 | | | | 45,339,981 | |
| Texas City, TX, Industrial Development Corp. Revenue, Del Papa Realty Holdings, 0.26%*, 1/1/2051, LOC: Bank of America NA | | | 9,500,000 | | | | 9,500,000 | |
| | | | | 176,224,981 | |
| Washington 0.7% | |
| Washington, Wells Fargo Stage Trust, Series 93C, 144A, 0.29%, Mandatory Put 6/13/2013 @ 100, 8/15/2046, GTY: Wells Fargo Bank NA, LIQ: Wells Fargo Bank NA | | | 13,675,000 | | | | 13,675,000 | |
| West Virginia 0.7% | |
| West Virginia, Economic Development Authority Revenue, Morgantown Energy, AMT, 0.26%*, 4/1/2027, LOC: Union Bank NA | | | 12,210,000 | | | | 12,210,000 | |
| | | % of Net Assets | | | Value ($) | |
| | | | |
Total Investment Portfolio (Cost $1,840,292,492)† | | | 98.7 | | | | 1,840,292,492 | |
| Other Assets and Liabilities, Net | | | 1.3 | | | | 24,009,682 | |
| Net Assets | | | 100.0 | | | | 1,864,302,174 | |
* Variable rate demand notes and variable rate demand preferred shares are securities whose interest rates are reset periodically at market levels. These securities are payable on demand and are shown at their current rates as of April 30, 2013.
** Floating rate securities' yields vary with a designated market index or market rate, such as the coupon-equivalent of the U.S. Treasury Bill rate. These securities are shown at their current rate as of April 30, 2013.
† The cost for federal income tax purposes was $1,840,292,492.
144A: Security exempt from registration under Rule 144A of the Securities Act of 1933. These securities may be resold in transactions exempt from registration, normally to qualified institutional buyers.
AMBAC: Ambac Financial Group, Inc.
AMT: Subject to alternative minimum tax.
GTY: Guaranty Agreement
INS: Insured
LIQ: Liquidity Facility
LOC: Letter of Credit
Prerefunded: Bonds which are prerefunded are collateralized usually by U.S. Treasury securities which are held in escrow and used to pay principal and interest on tax-exempt issues and to retire the bonds in full at the earliest refunding date.
SPA: Standby Bond Purchase Agreement
TECP: Tax Exempt Commercial Paper
Fair Value Measurements
Various inputs are used in determining the value of the Fund's investments. These inputs are summarized in three broad levels. Level 1 includes quoted prices in active markets for identical securities. Level 2 includes other significant observable inputs (including quoted prices for similar securities, interest rates, prepayment speeds and credit risk). Level 3 includes significant unobservable inputs (including the Fund's own assumptions in determining the fair value of investments). The inputs or methodology used for valuing securities are not necessarily an indication of the risk associated with investing in those securities. Securities held by the Fund are reflected as Level 2 because the securities are valued at amortized cost (which approximates fair value) and, accordingly, the inputs used to determine value are not quoted prices in an active market.
The following is a summary of the inputs used as of April 30, 2013 in valuing the Fund's investments. For information on the Fund's policy regarding the valuation of investments, please refer to the Security Valuation section of Note 1 in the accompanying Notes to Financial Statements.
| Assets | | Level 1 | | | Level 2 | | | Level 3 | | | Total | |
| | |
| Municipal Investments (a) | | $ | — | | | $ | 1,840,292,492 | | | $ | — | | | $ | 1,840,292,492 | |
| Total | | $ | — | | | $ | 1,840,292,492 | | | $ | — | | | $ | 1,840,292,492 | |
There have been no transfers between fair value measurement levels during the period ended April 30, 2013.
(a) See Investment Portfolio for additional detailed categorizations.
The accompanying notes are an integral part of the financial statements.
Statement of Assets and Liabilities | as of April 30, 2013 | |
| Assets | | Tax-Exempt Portfolio | |
Investments: Investments in non-affiliated securities, valued at amortized cost | | $ | 1,840,292,492 | |
| Receivable for investments sold | | | 17,580,000 | |
| Receivable for Fund shares sold | | | 298,158 | |
| Interest receivable | | | 7,109,732 | |
| Due from Advisor | | | 3,699 | |
| Other assets | | | 77,001 | |
| Total assets | | | 1,865,361,082 | |
| Liabilities | |
| Cash overdraft | | | 391,974 | |
| Payable for Fund shares redeemed | | | 169,016 | |
| Distributions payable | | | 6,227 | |
| Accrued management fee | | | 110,040 | |
| Accrued Trustees' fees | | | 18,385 | |
| Other accrued expenses and payables | | | 363,266 | |
| Total liabilities | | | 1,058,908 | |
| Net assets, at value | | $ | 1,864,302,174 | |
| Net Assets Consist of | |
| Undistributed net investment income | | | 212,651 | |
| Paid-in capital | | | 1,864,089,523 | |
| Net assets, at value | | $ | 1,864,302,174 | |
The accompanying notes are an integral part of the financial statements.
Statement of Assets and Liabilities as of April 30, 2013 (continued) | |
| Net Asset Value | | Tax-Exempt Portfolio | |
Capital Assets Funds Shares Net Asset Value, offering and redemption price per share ($10,059,102 ÷ 10,056,881 outstanding shares of beneficial interest, no par value, unlimited number of shares authorized) | | $ | 1.00 | |
Davidson Cash Equivalent Shares Net Asset Value, offering and redemption price per share ($70,393,545 ÷ 70,377,984 outstanding shares of beneficial interest, no par value, unlimited number of shares authorized) | | $ | 1.00 | |
DWS Tax-Exempt Cash Institutional Shares Net Asset Value, offering and redemption price per share ($970,451,993 ÷ 970,237,656 outstanding shares of beneficial interest, no par value, unlimited number of shares authorized) | | $ | 1.00 | |
DWS Tax-Exempt Money Fund Net Asset Value, offering and redemption price per share ($241,992,881 ÷ 241,939,471 outstanding shares of beneficial interest, no par value, unlimited number of shares authorized) | | $ | 1.00 | |
DWS Tax-Free Money Fund Class S Net Asset Value, offering and redemption price per share ($99,900,985 ÷ 99,878,925 outstanding shares of beneficial interest, no par value, unlimited number of shares authorized) | | $ | 1.00 | |
Service Shares Net Asset Value, offering and redemption price per share ($44,904,689 ÷ 44,894,771 outstanding shares of beneficial interest, no par value, unlimited number of shares authorized) | | $ | 1.00 | |
Tax-Exempt Cash Managed Shares Net Asset Value, offering and redemption price per share ($115,086,280 ÷ 115,060,862 outstanding shares of beneficial interest, no par value, unlimited number of shares authorized) | | $ | 1.00 | |
Tax-Free Investment Class Net Asset Value, offering and redemption price per share ($311,512,699 ÷ 311,443,897 outstanding shares of beneficial interest, no par value, unlimited number of shares authorized) | | $ | 1.00 | |
The accompanying notes are an integral part of the financial statements.
| for the year ended April 30, 2013 | |
| Investment Income | | Tax-Exempt Portfolio | |
Income: Interest | | $ | 4,226,122 | |
Expenses: Management fee | | | 1,326,518 | |
| Administration fee | | | 2,073,476 | |
| Services to shareholders | | | 1,150,669 | |
| Distribution and service fees | | | 2,113,579 | |
| Custodian fee | | | 27,586 | |
| Professional fees | | | 126,547 | |
| Reports to shareholders | | | 149,965 | |
| Registration fees | | | 153,018 | |
| Trustees' fees and expenses | | | 87,355 | |
| Other | | | 101,842 | |
| Total expenses before expense reductions | | | 7,310,555 | |
| Expense reductions | | | (3,397,143 | ) |
| Total expenses after expense reductions | | | 3,913,412 | |
| Net investment income | | | 312,710 | |
| Net realized gain (loss) from investments | | | 119,059 | |
| Net increase (decrease) in net assets resulting from operations | | $ | 431,769 | |
The accompanying notes are an integral part of the financial statements.
Statement of Changes in Net Assets | | | Tax-Exempt Portfolio | |
| Increase (Decrease) in Net Assets | | Years Ended April 30, | |
| | 2013 | | | 2012 | |
Operations: Net investment income | | $ | 312,710 | | | $ | 659,723 | |
| Net realized gain (loss) | | | 119,059 | | | | 21,137 | |
| Net increase in net assets resulting from operations | | | 431,769 | | | | 680,860 | |
Distributions to shareholders from: Net investment income: Capital Assets Funds Shares | | | (2,578 | ) | | | (2,580 | ) |
| Davidson Cash Equivalent Shares | | | (16,635 | ) | | | (13,672 | ) |
| DWS Tax-Exempt Cash Institutional Shares | | | (347,411 | ) | | | (598,543 | ) |
| DWS Tax-Exempt Money Fund | | | (63,056 | ) | | | (115,000 | ) |
| DWS Tax-Free Money Fund Class S | | | (22,814 | ) | | | (28,531 | ) |
| Service Shares | | | (12,350 | ) | | | (16,307 | ) |
| Tax-Exempt Cash Managed Shares | | | (36,504 | ) | | | (35,814 | ) |
| Tax-Free Investment Class | | | (80,485 | ) | | | (64,866 | ) |
Net realized gain: Capital Assets Funds Shares | | | (686 | ) | | | — | |
| Davidson Cash Equivalent Shares | | | (4,358 | ) | | | — | |
| DWS Tax-Exempt Cash Institutional Shares | | | (58,793 | ) | | | — | |
| DWS Tax-Exempt Money Fund | | | (15,872 | ) | | | — | |
| DWS Tax-Free Money Fund Class S | | | (5,799 | ) | | | — | |
| Service Shares | | | (2,541 | ) | | | — | |
| Tax-Exempt Cash Managed Shares | | | (9,837 | ) | | | — | |
| Tax-Free Investment Class | | | (21,062 | ) | | | — | |
| Total distributions | | | (700,781 | ) | | | (875,313 | ) |
Fund share transactions: Proceeds from shares sold | | | 3,574,503,665 | | | | 5,483,352,307 | |
| Reinvestment of distributions | | | 409,744 | | | | 544,506 | |
| Cost of shares redeemed | | | (3,871,064,788 | ) | | | (5,984,187,987 | ) |
| Net increase (decrease) in net assets from Fund share transactions | | | (296,151,379 | ) | | | (500,291,174 | ) |
| Increase (decrease) in net assets | | | (296,420,391 | ) | | | (500,485,627 | ) |
| Net assets at beginning of period | | | 2,160,722,565 | | | | 2,661,208,192 | |
| Net assets at end of period (including undistributed net investment income of $212,651 and $481,663, respectively) | | $ | 1,864,302,174 | | | $ | 2,160,722,565 | |
The accompanying notes are an integral part of the financial statements.
Tax-Exempt Portfolio DWS Tax-Exempt Money Fund | |
| | | Years Ended April 30, | |
| | | 2013 | | | 2012 | | | 2011 | | | 2010 | | | 2009 | |
| Selected Per Share Data | |
| Net asset value, beginning of period | | $ | 1.00 | | | $ | 1.00 | | | $ | 1.00 | | | $ | 1.00 | | | $ | 1.00 | |
Income (loss) from investment operations: Net investment income | | | .000 | * | | | .000 | * | | | .001 | | | | .002 | | | | .016 | |
| Net realized gain (loss) | | | .000 | * | | | .000 | * | | | .000 | * | | | .000 | * | | | .000 | * |
| Total from investment operations | | | .000 | * | | | .000 | * | | | .001 | | | | .002 | | | | .016 | |
Less distributions from: Net investment income | | | (.000 | )* | | | (.000 | )* | | | (.001 | ) | | | (.002 | ) | | | (.016 | ) |
| Net realized gains | | | (.000 | )* | | | — | | | | — | | | | (.000 | )* | | | — | |
| Total distributions | | | (.000 | )* | | | (.000 | )* | | | (.001 | ) | | | (.002 | ) | | | (.016 | ) |
| Net asset value, end of period | | $ | 1.00 | | | $ | 1.00 | | | $ | 1.00 | | | $ | 1.00 | | | $ | 1.00 | |
| Total Return (%) | | | .03 | a | | | .03 | a | | | .14 | | | | .22 | | | | 1.57 | |
| Ratios to Average Net Assets and Supplemental Data | |
| Net assets, end of period ($ millions) | | | 242 | | | | 313 | | | | 366 | | | | 428 | | | | 503 | |
| Ratio of expenses before expense reductions (%) | | | .23 | | | | .22 | | | | .22 | | | | .24 | | | | .24 | |
| Ratio of expenses after expense reductions (%) | | | .19 | | | | .21 | | | | .22 | | | | .24 | | | | .24 | |
| Ratio of net investment income (%) | | | .01 | | | | .02 | | | | .14 | | | | .22 | | | | 1.55 | |
a Total return would have been lower had certain expenses not been reduced. * Amount is less than $.0005. | |
Notes to Financial Statements
1. Organization and Significant Accounting Policies
Cash Account Trust (the "Trust") is registered under the Investment Company Act of 1940, as amended (the "1940 Act"), as an open-end investment management company organized as a Massachusetts business trust.
The Trust offers three funds: Money Market Portfolio, Government & Agency Securities Portfolio and Tax-Exempt Portfolio. These financial statements report on Tax-Exempt Portfolio (the "Fund").
Tax-Exempt Portfolio offers eight classes of shares: Capital Assets Funds Shares, Davidson Cash Equivalent Shares, DWS Tax-Exempt Cash Institutional Shares, DWS Tax-Exempt Money Fund, DWS Tax-Free Money Fund Class S, Service Shares, Tax-Exempt Cash Managed Shares and Tax-Free Investment Class.
The financial highlights for all classes of shares, other than DWS Tax-Exempt Money Fund, are provided separately and are available upon request.
The Fund's investment income, realized gains and losses, and certain Fund-level expenses and expense reductions, if any, are borne pro rata on the basis of relative net assets by the holders of all classes of shares of the Fund, except that each class bears certain expenses unique to that class such as distribution and service fees, services to shareholders and certain other class-specific expenses. Differences in class-level expenses may result in payment of different per share dividends by class. All shares of the Trust have equal rights with respect to voting subject to class-specific arrangements.
The Fund's financial statements are prepared in accordance with accounting principles generally accepted in the United States of America which require the use of management estimates. Actual results could differ from those estimates. The policies described below are followed consistently by the Fund in the preparation of its financial statements.
Security Valuation. Various inputs are used in determining the value of the Fund's investments. These inputs are summarized in three broad levels. Level 1 includes quoted prices in active markets for identical securities. Level 2 includes other significant observable inputs (including quoted prices for similar securities, interest rates, prepayment speeds, and credit risk). Level 3 includes significant unobservable inputs (including the Fund's own assumptions in determining the fair value of investments). The inputs or methodology used for valuing securities are not necessarily an indication of the risk associated with investing in those securities.
The Fund values all securities utilizing the amortized cost method permitted in accordance with Rule 2a-7 under the 1940 Act and certain conditions therein. Under this method, which does not take into account unrealized capital gains or losses on securities, an instrument is initially valued at its cost and thereafter assumes a constant accretion/amortization rate to maturity of any discount or premium. Securities held by the Fund are reflected as Level 2 because the securities are valued at amortized cost (which approximates fair value) and, accordingly, the inputs used to determine value are not quoted prices in an active market.
Disclosure about the classification of fair value measurements is included in a table following the Fund's Investment Portfolio.
New Accounting Pronouncement. In January 2013, Accounting Standard Update 2013-01 (ASU 2013-01), Clarifying the Scope of Disclosures about Offsetting Assets and Liabilities, replaced Accounting Standards Update 2011-11 (ASU 2011-11), Disclosures about Offsetting Assets and Liabilities. ASU 2013-01 is effective for fiscal years beginning on or after January 1, 2013, and interim periods within those annual periods. ASU 2011-11 was intended to enhance disclosure requirements on the offsetting of financial assets and liabilities. The ASU 2013-01 limits the scope of the new balance sheet offsetting disclosures to derivatives, repurchase agreements, and securities lending transactions to the extent that they are (1) offset in the financial statements or (2) subject to an enforceable master netting arrangement or similar agreement. Management is currently evaluating the application of ASU 2013-01 and its impact, if any, on the Fund's financial statements.
Federal Income Taxes. The Fund's policy is to comply with the requirements of the Internal Revenue Code, as amended, which are applicable to regulated investment companies and to distribute all of its taxable and tax-exempt income to its shareholders.
The Fund has reviewed the tax positions for the open tax years as of April 30, 2013 and has determined that no provision for income tax is required in the Fund's financial statements. The Fund's federal tax returns for the prior three fiscal years remain open subject to examination by the Internal Revenue Service.
Distribution of Income. Net investment income of the Fund is declared as a daily dividend and is distributed to shareholders monthly. The Fund may take into account capital gains and losses in its daily dividend declarations. The Fund may also make additional distributions for tax purposes if necessary.
Permanent book and tax basis differences relating to shareholder distributions will result in reclassifications to paid in capital. Temporary book and tax basis differences will reverse in a subsequent period. There were no significant book-to-tax differences for the Fund.
At April 30, 2013, the Fund's components of distributable earnings on a tax basis are as follows:
| Undistributed tax-exempt income* | | $ | 218,878 | |
In addition, the tax character of distributions paid to shareholders by the Fund is summarized as follows:
| | | Years Ended April 30, | |
| | | 2013 | | | 2012 | |
| Distributions from tax-exempt income | | $ | 581,722 | | | $ | 854,176 | |
| Distributions from ordinary income* | | $ | 119,059 | | | $ | 21,137 | |
* For tax purposes, short-term capital gain distributions are considered ordinary income distributions.
Expenses. Expenses of the Trust arising in connection with a specific Fund are allocated to that Fund. Other Trust expenses which cannot be directly attributed to a Fund are apportioned pro rata on the basis of relative net assets among the funds in the Trust based upon the relative net assets or other appropriate measures.
Contingencies. In the normal course of business, the Fund may enter into contracts with service providers that contain general indemnification clauses. The Fund's maximum exposure under these arrangements is unknown as this would involve future claims that may be made against the Fund that have not yet been made. However, based on experience, the Fund expects the risk of loss to be remote.
Other. Investment transactions are accounted for on trade date. Interest income is recorded on the accrual basis. Realized gains and losses from investment transactions are recorded on an identified cost basis and may include proceeds from litigation. All discounts and premiums are accreted/amortized for both tax and financial reporting purposes.
2. Related Parties
Management Agreement. Under an Amended and Restated Investment Management Agreement with Deutsche Investment Management Americas Inc. ("DIMA" or the "Advisor"), an indirect, wholly owned subsidiary of Deutsche Bank AG, the Advisor directs the investments of the Fund in accordance with its investment objectives, policies and restrictions. The Advisor determines the securities, instruments and other contracts relating to investments to be purchased, sold or entered into by the Fund.
The Fund pays a monthly management fee based on the combined average daily net assets of the three funds in the Trust and allocated to the Fund based on its relative net assets, computed and accrued daily and payable monthly, at the following annual rates:
| First $500 million of the Funds' combined average daily net assets | | | .120 | % |
| Next $500 million of such net assets | | | .100 | % |
| Next $1 billion of such net assets | | | .075 | % |
| Next $1 billion of such net assets | | | .060 | % |
| Over $3 billion of such net assets | | | .050 | % |
For the period from May 1, 2012 through September 30, 2013, the Advisor has contractually agreed to waive its fees and/or reimburse certain operating expenses of the DWS Tax-Exempt Money Fund to the extent necessary to maintain the operating expenses (excluding certain expenses such as extraordinary expenses, taxes, brokerage and interest) at 0.40%.
The Advisor has agreed to voluntarily waive additional expenses. The voluntary waiver may be changed or terminated at any time without notice. Under these arrangements, the Advisor waived certain expenses on DWS Tax-Exempt Money Fund shares.
Accordingly, for the year ended April 30, 2013, the Advisor earned a management fee on the Fund aggregating $1,326,518, of which $309,712 was waived, resulting in an annual effective rate of 0.05% of the Fund's average daily net assets.
The Advisor has also agreed to maintain expenses of certain other classes of the Trust. These rates are disclosed in the respective share classes' annual reports that are provided separately and are available upon request.
Administration Fee. Pursuant to an Administrative Services Agreement, DIMA provides most administrative services to the Fund. For all services provided under the Administrative Services Agreement, the Fund pays the Advisor an annual fee ("Administration Fee") of 0.10% of the Fund's average daily net assets, computed and accrued daily and payable monthly. For the year ended April 30, 2013, the Administration Fee was as follows:
| | | Administration Fee | | | Unpaid at April 30, 2013 | |
| Tax-Exempt Portfolio | | $ | 2,073,476 | | | $ | 161,841 | |
Service Provider Fees. DWS Investments Service Company ("DISC"), an affiliate of the Advisor, is the transfer agent, dividend-paying agent and shareholder service agent for the Fund. Pursuant to a sub-transfer agency agreement between DISC and DST Systems, Inc. ("DST"), DISC has delegated certain transfer agent, dividend-paying agent and shareholder service agent functions to DST. DISC compensates DST out of the shareholder servicing fee it receives from the Fund. For the year ended April 30, 2013, the amounts charged to the Fund by DISC were as follows:
| Tax-Exempt Portfolio: | | Total Aggregated | | | Waived | | | Unpaid at April 30, 2013 | |
| Capital Assets Funds Shares | | $ | 30,095 | | | $ | 28,537 | | | $ | — | |
| Davidson Cash Equivalent Shares | | | 101,958 | | | | 96,636 | | | | 286 | |
| DWS Tax-Exempt Cash Institutional Shares | | | 159,779 | | | | 159,779 | | | | — | |
| DWS Tax-Exempt Money Fund | | | 90,009 | | | | 64,368 | | | | 6,013 | |
| DWS Tax-Free Money Fund Class S | | | 62,942 | | | | 51,694 | | | | 3,125 | |
| Service Shares | | | 156,558 | | | | 147,666 | | | | 5,419 | |
| Tax-Exempt Cash Managed Shares | | | 102,865 | | | | 86,626 | | | | 431 | |
| Tax-Free Investment Class | | | 368,933 | | | | 338,546 | | | | — | |
| | | $ | 1,073,139 | | | $ | 973,852 | | | $ | 15,274 | |
Distribution Service Agreement. Under the Distribution Service Agreement, in accordance with Rule 12b-1 under the 1940 Act, DWS Investments Distributors, Inc. ("DIDI"), an affiliate of the Advisor, receives a fee ("Distribution Fee"), calculated as a percentage of average daily net assets for the shares listed in the following table.
For the year ended April 30, 2013, the Distribution Fee was as follows:
| Tax-Exempt Portfolio: | | Distribution Fee | | | Waived | | | Annual Effective Rate | | | Contractual Rate (Up To) | |
| Capital Assets Funds Shares | | $ | 39,725 | | | $ | 39,725 | | | | .00 | % | | | .33 | % |
| Davidson Cash Equivalent Shares | | | 203,917 | | | | 203,917 | | | | .00 | % | | | .30 | % |
| Service Shares | | | 375,740 | | | | 375,740 | | | | .00 | % | | | .60 | % |
| Tax-Free Investment Class | | | 836,286 | | | | 836,286 | | | | .00 | % | | | .25 | % |
| | | $ | 1,455,668 | | | $ | 1,455,668 | | | | | | | | | |
In addition, DIDI provides information and administrative services for a fee ("Service Fee") for the shares listed in the following table. A portion of these fees may be paid pursuant to a Rule 12b-1 plan.
For the year ended April 30, 2013, the Service Fee was as follows:
| Tax-Exempt Portfolio: | | Service Fee | | | Waived | | | Annual Effective Rate | | | Contractual Rate (Up To) | |
| Capital Assets Funds Shares | | $ | 30,095 | | | $ | 30,095 | | | | .00 | % | | | .25 | % |
| Davidson Cash Equivalent Shares | | | 169,930 | | | | 169,930 | | | | .00 | % | | | .25 | % |
| Tax-Exempt Cash Managed Shares | | | 223,726 | | | | 223,726 | | | | .00 | % | | | .15 | % |
| Tax-Free Investment Class | | | 234,160 | | | | 234,160 | | | | .00 | % | | | .07 | % |
| | | $ | 657,911 | | | $ | 657,911 | | | | | | | | | |
Typesetting and Filing Service Fees. Under an agreement with DIMA, DIMA is compensated for providing typesetting and certain regulatory filing services to the Fund. For the year ended April 30, 2013, the amount charged to the Fund by DIMA included in the Statement of Operations under "reports to shareholders" was as follows:
| Fund | | Total Aggregated | | | Unpaid at April 30, 2013 | |
| Tax-Exempt Portfolio | | $ | 85,990 | | | $ | 31,227 | |
Trustees' Fees and Expenses. The Fund paid retainer fees to each Trustee not affiliated with the Advisor, plus specified amounts to the Board Chairperson and Vice Chairperson and to each committee Chairperson.
3. Concentration of Ownership
From time to time, the Fund may have a concentration of several shareholder accounts holding a significant percentage of shares outstanding. Investment activities of these shareholders could have a material impact on the Fund.
At April 30, 2013, three shareholder accounts held approximately 33%, 17% and 12% of the outstanding shares of the Fund.
4. Line of Credit
The Fund and other affiliated funds (the "Participants") share in a $375 million revolving credit facility provided by a syndication of banks. The Fund may borrow for temporary or emergency purposes, including the meeting of redemption requests that otherwise might require the untimely disposition of securities. The Participants are charged an annual commitment fee which is allocated based on net assets, among each of the Participants. Interest is calculated at a rate per annum equal to the sum of the Federal Funds Rate plus 1.25 percent plus, if LIBOR exceeds the Federal Funds Rate, the amount of such excess. The Fund may borrow up to a maximum of 33 percent of its net assets under the agreement. The Fund had no outstanding loans at April 30, 2013.
5. Share Transactions
The following table summarizes share and dollar activity in the Fund:
Tax-Exempt Portfolio
| | | Year Ended April 30, 2013 | | | Year Ended April 30, 2012 | |
| | | Shares | | | Dollars | | | Shares | | | Dollars | |
| Shares sold | |
| Capital Assets Funds Shares | | | 33,780,270 | | | $ | 33,780,270 | | | | 32,054,021 | | | $ | 32,054,021 | |
| Davidson Cash Equivalent Shares | | | 115,063,476 | | | | 115,063,476 | | | | 121,475,389 | | | | 121,475,389 | |
| DWS Tax-Exempt Cash Institutional Shares | | | 2,372,880,502 | | | | 2,372,880,502 | | | | 4,080,690,854 | | | | 4,080,690,854 | |
| DWS Tax-Exempt Money Fund | | | 251,306,829 | | | | 251,306,829 | | | | 325,873,832 | | | | 325,873,832 | |
| DWS Tax-Free Money Fund Class S | | | 28,082,317 | | | | 28,082,317 | | | | 31,868,351 | | | | 31,868,351 | |
| Service Shares | | | 138,095,905 | | | | 138,095,905 | | | | 173,964,295 | | | | 173,964,295 | |
| Tax-Exempt Cash Managed Shares | | | 238,693,476 | | | | 238,693,476 | | | | 387,004,796 | | | | 387,004,796 | |
| Tax-Free Investment Class | | | 396,600,890 | | | | 396,600,890 | | | | 330,420,769 | | | | 330,420,769 | |
| | | | | | | $ | 3,574,503,665 | | | | | | | $ | 5,483,352,307 | |
| Shares issued to shareholders in reinvestment of distributions | |
| Capital Assets Funds Shares | | | 3,264 | | | $ | 3,264 | | | | 2,578 | | | $ | 2,578 | |
| Davidson Cash Equivalent Shares | | | 20,992 | | | | 20,992 | | | | 13,652 | | | | 13,652 | |
| DWS Tax-Exempt Cash Institutional Shares | | | 163,290 | | | | 163,290 | | | | 307,257 | | | | 307,257 | |
| DWS Tax-Exempt Money Fund | | | 76,913 | | | | 76,913 | | | | 112,297 | | | | 112,297 | |
| DWS Tax-Free Money Fund Class S | | | 27,387 | | | | 27,387 | | | | 27,195 | | | | 27,195 | |
| Service Shares | | | 14,768 | | | | 14,768 | | | | 16,265 | | | | 16,265 | |
| Tax-Exempt Cash Managed Shares | | | 2,584 | | | | 2,584 | | | | 1,546 | | | | 1,546 | |
| Tax-Free Investment Class | | | 100,546 | | | | 100,546 | | | | 63,716 | | | | 63,716 | |
| | | | | | | $ | 409,744 | | | | | | | $ | 544,506 | |
| Shares redeemed | |
| Capital Assets Funds Shares | | | (35,324,040 | ) | | $ | (35,324,040 | ) | | | (31,054,695 | ) | | $ | (31,054,695 | ) |
| Davidson Cash Equivalent Shares | | | (106,210,991 | ) | | | (106,210,991 | ) | | | (135,004,695 | ) | | | (135,004,695 | ) |
| DWS Tax-Exempt Cash Institutional Shares | | | (2,508,359,723 | ) | | | (2,508,359,723 | ) | | | (4,467,264,493 | ) | | | (4,467,264,493 | ) |
| DWS Tax-Exempt Money Fund | | | (322,145,746 | ) | | | (322,145,746 | ) | | | (379,194,651 | ) | | | (379,194,651 | ) |
| DWS Tax-Free Money Fund Class S | | | (38,170,621 | ) | | | (38,170,621 | ) | | | (46,678,340 | ) | | | (46,678,340 | ) |
| Service Shares | | | (171,243,303 | ) | | | (171,243,303 | ) | | | (177,914,611 | ) | | | (177,914,611 | ) |
| Tax-Exempt Cash Managed Shares | | | (290,012,104 | ) | | | (290,012,104 | ) | | | (348,035,830 | ) | | | (348,035,830 | ) |
| Tax-Free Investment Class | | | (399,598,260 | ) | | | (399,598,260 | ) | | | (399,040,672 | ) | | | (399,040,672 | ) |
| | | | | | | $ | (3,871,064,788 | ) | | | | | | $ | (5,984,187,987 | ) |
| Net increase (decrease) | |
| Capital Assets Funds Shares | | | (1,540,506 | ) | | $ | (1,540,506 | ) | | | 1,001,904 | | | $ | 1,001,904 | |
| Davidson Cash Equivalent Shares | | | 8,873,477 | | | | 8,873,477 | | | | (13,515,654 | ) | | | (13,515,654 | ) |
| DWS Tax-Exempt Cash Institutional Shares | | | (135,315,931 | ) | | | (135,315,931 | ) | | | (386,266,382 | ) | | | (386,266,382 | ) |
| DWS Tax-Exempt Money Fund | | | (70,762,004 | ) | | | (70,762,004 | ) | | | (53,208,522 | ) | | | (53,208,522 | ) |
| DWS Tax-Free Money Fund Class S | | | (10,060,917 | ) | | | (10,060,917 | ) | | | (14,782,794 | ) | | | (14,782,794 | ) |
| Service Shares | | | (33,132,630 | ) | | | (33,132,630 | ) | | | (3,934,051 | ) | | | (3,934,051 | ) |
| Tax-Exempt Cash Managed Shares | | | (51,316,044 | ) | | | (51,316,044 | ) | | | 38,970,512 | | | | 38,970,512 | |
| Tax-Free Investment Class | | | (2,896,824 | ) | | | (2,896,824 | ) | | | (68,556,187 | ) | | | (68,556,187 | ) |
| | | | | | | $ | (296,151,379 | ) | | | | | | $ | (500,291,174 | ) |
Report of Independent Registered Public Accounting Firm
To the Shareholders and Board of Trustees of Cash Account Trust:
We have audited the accompanying statement of assets and liabilities of Tax-Exempt Portfolio (the "Fund") (one of the Funds comprising Cash Account Trust), including the investment portfolio, as of April 30, 2013, and the related statement of operations for the year then ended, the statement of changes in net assets for each of the two years in the period then ended, and the financial highlights for each of the five years in the period then ended. These financial statements and financial highlights are the responsibility of the Fund's management. Our responsibility is to express an opinion on these financial statements and financial highlights based on our audits.
We conducted our audits in accordance with the standards of the Public Company Accounting Oversight Board (United States). Those standards require that we plan and perform the audit to obtain reasonable assurance about whether the financial statements and financial highlights are free of material misstatement. We were not engaged to perform an audit of the Fund's internal control over financial reporting. Our audits included consideration of internal control over financial reporting as a basis for designing audit procedures that are appropriate in the circumstances, but not for the purpose of expressing an opinion on the effectiveness of the Fund's internal control over financial reporting. Accordingly, we express no such opinion. An audit also includes examining, on a test basis, evidence supporting the amounts and disclosures in the financial statements and financial highlights, assessing the accounting principles used and significant estimates made by management, and evaluating the overall financial statement presentation. Our procedures included confirmation of securities owned as of April 30, 2013, by correspondence with the custodian and brokers. We believe that our audits provide a reasonable basis for our opinion.
In our opinion, the financial statements and financial highlights referred to above present fairly, in all material respects, the financial position of Tax-Exempt Portfolio at April 30, 2013, the results of its operations for the year then ended, the changes in its net assets for each of the two years in the period then ended, and the financial highlights for each of the five years in the period then ended, in conformity with U.S. generally accepted accounting principles.
| | | |
Boston, Massachusetts June 19, 2013 | | |
Information About Your Fund's Expenses
As an investor of the Fund, you incur two types of costs: ongoing expenses and transaction costs. Ongoing expenses include management fees, distribution and service (12b-1) fees and other Fund expenses. Examples of transaction costs include account maintenance fees, which are not shown in this section. The following tables are intended to help you understand your ongoing expenses (in dollars) of investing in the Fund and to help you compare these expenses with the ongoing expenses of investing in other mutual funds. In the most recent six-month period, the Fund limited these expenses; had it not done so, expenses would have been higher for Tax-Exempt Money Fund. The example in the table is based on an investment of $1,000 invested at the beginning of the six-month period and held for the entire period (November 1, 2012 to April 30, 2013).
The tables illustrate your Fund's expenses in two ways:
•Actual Fund Return. This helps you estimate the actual dollar amount of ongoing expenses (but not transaction costs) paid on a $1,000 investment in the Fund using the Fund's actual return during the period. To estimate the expenses you paid over the period, simply divide your account value by $1,000 (for example, an $8,600 account value divided by $1,000 = 8.6), then multiply the result by the number in the "Expenses Paid per $1,000" line under the share class you hold.
• Hypothetical 5% Fund Return. This helps you to compare your Fund's ongoing expenses (but not transaction costs) with those of other mutual funds using the Fund's actual expense ratio and a hypothetical rate of return of 5% per year before expenses. Examples using a 5% hypothetical fund return may be found in the shareholder reports of other mutual funds. The hypothetical account values and expenses may not be used to estimate the actual ending account balance or expenses you paid for the period.
Please note that the expenses shown in these tables are meant to highlight your ongoing expenses only and do not reflect any transaction costs. The "Expenses Paid per $1,000" line of the tables is useful in comparing ongoing expenses only and will not help you determine the relative total expense of owning different funds. If these transaction costs had been included, your costs would have been higher.
Expenses and Value of a $1,000 Investment for the six months ended April 30, 2013 (Unaudited) | |
| Actual Fund Return | | DWS Tax-Exempt Money Fund | |
| Beginning Account Value 11/1/12 | | $ | 1,000.00 | |
| Ending Account Value 4/30/13 | | $ | 1,000.23 | |
| Expenses Paid per $1,000* | | $ | .89 | |
| Hypothetical 5% Fund Return | | | | |
| Beginning Account Value 11/1/12 | | $ | 1,000.00 | |
| Ending Account Value 4/30/13 | | $ | 1,023.90 | |
| Expenses Paid per $1,000* | | $ | .90 | |
| * Expenses are equal to the Fund's annualized expense ratio for each share class, multiplied by the average account value over the period, multiplied by 181 (the number of days in the most recent six-month period), then divided by 365. | |
| Annualized Expense Ratio | | | | |
| DWS Tax-Exempt Money Fund | | | .18 | % |
For more information, please refer to the Fund's prospectus. For an analysis of the fees associated with an investment in the Fund or similar funds, please refer to http://apps.finra.org/fundanalyzer/1/fa.aspx. | |
Tax Information (Unaudited)
Of the dividends paid from net investment income for the taxable year ended April 30, 2013, 100% are designated as exempt interest dividends for federal income tax purposes.
Please consult a tax advisor if you have questions about federal or state income tax laws, or on how to prepare your tax returns. If you have specific questions about your account, please call (800) 728-3337.
Proxy Voting
The Fund's policies and procedures for voting proxies for portfolio securities and information about how the Fund voted proxies related to its portfolio securities during the 12-month period ended June 30 are available on our Web site — www.dws-investments.com (click on "proxy voting" at the bottom of the page) — or on the SEC's Web site — www.sec.gov. To obtain a written copy of the Fund's policies and procedures without charge, upon request, call us toll free at (800) 728-3337.
Portfolio Holdings
Following the Fund's fiscal first and third quarter-end, a complete portfolio holdings listing is filed with the SEC on Form N-Q. In addition, each month, information about the Fund and its portfolio holdings is filed with the SEC on Form N-MFP. The SEC delays the public availability of the information filed on Form N-MFP for 60 days after the end of the reporting period included in the filing. These forms will be available on the SEC's Web site at www.sec.gov, and they may also be reviewed and copied at the SEC's Public Reference Room in Washington, D.C. Information on the operation of the SEC's Public Reference Room may be obtained by calling (800) SEC-0330. The Fund's portfolio holdings are also posted on www.dws-investments.com from time to time. Please see the Fund's current prospectus for more information.
Money Market Fund Reform
In 2010, the Securities and Exchange Commission adopted amendments to then-existing money market fund regulations, imposing new liquidity, credit quality and maturity requirements on all money market funds. In November 2012, the Financial Stability Oversight Council (FSOC), a board of U.S. regulators established by the Dodd-Frank Act, proposed recommendations for money market fund reform. If the SEC were to adopt one or more of the FSOC proposed recommendations in the future, or if FSOC were to take other steps to establish similar regulations of money market funds in the future, such regulatory action may affect the Fund's operations and/or return potential.
Summary of Management Fee Evaluation by Independent Fee Consultant
September 17, 2012
Pursuant to an Order entered into by Deutsche Investment Management Americas and affiliates (collectively, "DeAM") with the Attorney General of New York, I, Thomas H. Mack, have been appointed the Independent Fee Consultant for the DWS Funds (formerly the DWS Scudder Funds). My duties include preparing an annual written evaluation of the management fees DeAM charges the Funds, considering among other factors the management fees charged by other mutual fund companies for like services, management fees DeAM charges other clients for like services, DeAM's costs of supplying services under the management agreements and related profit margins, possible economies of scale if a Fund grows larger, and the nature and quality of DeAM's services, including fund performance. This report summarizes my evaluation for 2012, including my qualifications, the evaluation process for each of the DWS Funds, consideration of certain complex-level factors, and my conclusions. I served in substantially the same capacity in 2007, 2008, 2009, 2010 and 2011.
Qualifications
For more than 35 years I have served in various professional capacities within the investment management business. I have held investment analysis and advisory positions, including securities analyst, portfolio strategist and director of investment policy with a large investment firm. I have also performed business management functions, including business development, financial management and marketing research and analysis.
Since 1991, I have been an independent consultant within the asset management industry. I have provided services to over 125 client organizations, including investment managers, mutual fund boards, product distributors and related organizations. Over the past ten years I have completed a number of assignments for mutual fund boards, specifically including assisting boards with management contract renewal.
I hold a Master of Business Administration degree, with highest honors, from Harvard University and Master of Science and Bachelor of Science (highest honors) degrees from the University of California at Berkeley. I am an independent director and audit committee financial expert for two closed-end mutual funds and have served in various leadership and financial oversight capacities with non-profit organizations.
Evaluation of Fees for each DWS Fund
My work focused primarily on evaluating, fund-by-fund, the fees charged to each of the 103 mutual fund portfolios in the DWS Fund family. For each Fund, I considered each of the key factors mentioned above, as well as any other relevant information. In doing so I worked closely with the Funds' Independent Directors in their annual contract renewal process, as well as in their approval of contracts for several new funds (documented separately).
In evaluating each Fund's fees, I reviewed comprehensive materials provided by or on behalf of DeAM, including expense information prepared by Lipper Analytical, comparative performance information, profitability data, manager histories, and other materials. I also accessed certain additional information from the Lipper and Morningstar databases and drew on my industry knowledge and experience.
To facilitate evaluating this considerable body of information, I prepared for each Fund a document summarizing the key data elements in each area as well as additional analytics discussed below. This made it possible to consider each key data element in the context of the others.
In the course of contract renewal, DeAM agreed to implement a number of fee and expense adjustments requested by the Independent Directors which will favorably impact future fees and expenses, and my evaluation includes the effects of these changes.
Fees and Expenses Compared with Other Funds
The competitive fee and expense evaluation for each fund focused on two primary comparisons:
The Fund's contractual management fee (the advisory fee plus the administration fee where applicable) compared with those of a group of typically 12-15 funds in the same Lipper investment category (e.g. Large Capitalization Growth) having similar distribution arrangements and being of similar size.
The Fund's total expenses compared with a broader universe of funds from the same Lipper investment category and having similar distribution arrangements.
These two comparisons provide a view of not only the level of the fee compared with funds of similar scale but also the total expense the Fund bears for all the services it receives, in comparison with the investment choices available in the Fund's investment category and distribution channel. The principal figure-of-merit used in these comparisons was the subject Fund's percentile ranking against peers.
DeAM's Fees for Similar Services to Others
DeAM provided management fee schedules for all of its US domiciled fund and non-fund investment management accounts in any of the investment categories where there is a DWS Fund. These similar products included the other DWS Funds, non-fund pooled accounts, institutional accounts and sub-advisory accounts. Using this information, I calculated for each Fund the fee that would be charged to each similar product, at the subject Fund's asset level.
Evaluating information regarding non-fund products is difficult because there are varying levels of services required for different types of accounts, with mutual funds generally requiring considerably more regulatory and administrative types of service as well as having more frequent cash flows than other types of accounts. Also, while mutual fund fees for similar fund products can be expected to be similar, there will be some differences due to different pricing conditions in different distribution channels (e.g. retail funds versus those used in variable insurance products), differences in underlying investment processes and other factors.
Costs and Profit Margins
DeAM provided a detailed profitability analysis for each Fund. After making some adjustments so that the presentation would be more comparable to the available industry figures, I reviewed profit margins from investment management alone, from investment management plus other fund services (excluding distribution) provided to the Funds by DeAM (principally shareholder services), and DeAM profits from all sources, including distribution. A later section comments on overall profitability.
Economies of Scale
Economies of scale — an expected decline in management cost per dollar of fund assets as fund assets grow — are very rarely quantified and documented because of inherent difficulties in collecting and analyzing relevant data. However, in virtually every investment category that I reviewed, larger funds tend to have lower fees and lower total expenses than smaller funds. To see how each DWS Fund compares with this industry observation, I reviewed:
The trend in Fund assets over the last five years and the accompanying trend in total expenses. This shows if the Fund has grown and, if so, whether total expense (management fees as well as other expenses) have declined as a percent of assets.
Whether the Fund has break-points in its management fee schedule, the extent of the fee reduction built into the schedule and the asset levels where the breaks take effect, and in the case of a sub-advised Fund how the Fund's break-points compare with those of the sub-advisory fee schedule.
How the Fund's contractual fee schedule compares with trends in the industry data. To accomplish this, I constructed a chart showing how actual latest-fiscal-year contractual fees of the Fund and of other similar funds relate to average fund assets, with the subject Fund's contractual fee schedule superimposed.
Quality of Service — Performance
The quality-of-service evaluation focused on investment performance, which is the principal result of the investment management service. Each Fund's performance was reviewed over the past 1, 3, 5 and 10 years, as applicable, and compared with that of other funds in the same investment category and with a suitable market index.
In addition, I calculated and reviewed risk-adjusted returns relative to an index of similar mutual funds' returns and a suitable market index. The risk-adjusted returns analysis provides a way of determining the extent to which the Fund's return comparisons are mainly the product of investment value-added (or lack thereof) or alternatively taking considerably more or less risk than is typical in its investment category.
I also received and considered the history of portfolio manager changes for each Fund, as this provided an important context for evaluating the performance results.
Complex-Level Considerations
While this evaluation was conducted mainly at the individual fund level, there are some issues relating to the reasonableness of fees that can alternatively be considered across the whole fund complex:
I reviewed DeAM's profitability analysis for all DWS Funds, with a view toward determining if the allocation procedures used were reasonable and how profit levels compared with public data for other investment managers.
I considered whether DeAM and affiliates receive any significant ancillary or "fallout" benefits that should be considered in interpreting the direct profitability results. These would be situations where serving as the investment manager of the Funds is beneficial to another part of the Deutsche Bank organization.
I considered how aggregated DWS Fund expenses had varied over the years, by asset class and in the context of trends in asset levels.
I considered how aggregated DWS Fund performance measures relative to appropriate peers had varied by asset class and over time.
I reviewed the structure of the DeAM organization, trends in staffing levels, and information on compensation of investment management and other professionals compared with industry data.
Findings
Based on the process and analysis discussed above, which included reviewing a wide range of information from management and external data sources and considering among other factors the fees DeAM charges other clients, the fees charged by other fund managers, DeAM's costs and profits associated with managing the Funds, economies of scale, possible fall-out benefits, and the nature and quality of services provided, in my opinion the management fees charged the DWS Funds are reasonable.
Thomas H. Mack
President, Thomas H. Mack & Co., Inc.
Board Members and Officers
The following table presents certain information regarding the Board Members and Officers of the fund. Each Board Member's year of birth is set forth in parentheses after his or her name. Unless otherwise noted, (i) each Board Member has engaged in the principal occupation(s) noted in the table for at least the most recent five years, although not necessarily in the same capacity; and (ii) the address of each Independent Board Member is c/o Kenneth C. Froewiss, Chairman, DWS Mutual Funds, P.O. Box 78, Short Hills, NJ 07078. Except as otherwise noted below, the term of office for each Board Member is until the election and qualification of a successor, or until such Board Member sooner dies, resigns, is removed or as otherwise provided in the governing documents of the fund. Because the fund does not hold an annual meeting of shareholders, each Board Member will hold office for an indeterminate period. The Board Members may also serve in similar capacities with other funds in the fund complex.
| Independent Board Members |
Name, Year of Birth, Position with the Fund and Length of Time Served1 | | Business Experience and Directorships During the Past Five Years | Number of Funds in DWS Fund Complex Overseen |
Other Directorships Held by Board Member |
Kenneth C. Froewiss (1945) Chairperson since 2013,9 and Board Member since 2001 | | Adjunct Professor of Finance, NYU Stern School of Business (September 2009-present; Clinical Professor from 1997-September 2009); Member, Finance Committee, Association for Asian Studies (2002-present); Director, Mitsui Sumitomo Insurance Group (US) (2004-present); prior thereto, Managing Director, J.P. Morgan (investment banking firm) (until 1996) | 102 | — |
William McClayton (1944) Vice Chairperson since 2013,9 and Board Member since 2004 | | Private equity investor (since October 2009); previously, Managing Director, Diamond Management & Technology Consultants, Inc. (global consulting firm) (2001-2009); Directorship: Board of Managers, YMCA of Metropolitan Chicago; formerly: Senior Partner, Arthur Andersen LLP (accounting) (1966-2001); Trustee, Ravinia Festival | 102 | — |
John W. Ballantine (1946) Board Member since 1999 | | Retired; formerly, Executive Vice President and Chief Risk Management Officer, First Chicago NBD Corporation/The First National Bank of Chicago (1996-1998); Executive Vice President and Head of International Banking (1995-1996); former Directorships: Stockwell Capital Investments PLC (private equity); First Oak Brook Bancshares, Inc. and Oak Brook Bank; Prisma Energy International | 102 | Chairman of the Board, Healthways, Inc.2 (provider of disease and care management services) (2003- present); Portland General Electric2 (utility company) (2003- present) |
Henry P. Becton, Jr. (1943) Board Member since 1990 | | Vice Chair and former President, WGBH Educational Foundation. Directorships: Public Radio International; Public Radio Exchange (PRX); The PBS Foundation; North Bennett Street School (Boston); former Directorships: Association of Public Television Stations; Boston Museum of Science; American Public Television; Concord Academy; New England Aquarium; Mass. Corporation for Educational Telecommunications; Committee for Economic Development; Public Broadcasting Service; Connecticut College | 102 | Lead Director, Becton Dickinson and Company2 (medical technology company); Lead Director, Belo Corporation2 (media company) |
Dawn-Marie Driscoll (1946) Board Member since 1987 | | President, Driscoll Associates (consulting firm); Emeritus Executive Fellow, Center for Business Ethics, Bentley University; formerly, Partner, Palmer & Dodge (1988-1990); Vice President of Corporate Affairs and General Counsel, Filene's (1978-1988). Directorships: Director of ICI Mutual Insurance Company (since 2007); Advisory Board, Center for Business Ethics, Bentley University; Chairman of the Board of Trustees, Southwest Florida Community Foundation (charitable organization); former Directorships: Sun Capital Advisers Trust (mutual funds) (2007-2012), Investment Company Institute (audit, executive, nominating committees) and Independent Directors Council (governance, executive committees) | 102 | — |
Keith R. Fox, CFA (1954) Board Member since 1996 | | Managing General Partner, Exeter Capital Partners (a series of private investment funds) (since 1986). Directorships: Progressive International Corporation (kitchen goods importer and distributor); The Kennel Shop (retailer); former Chairman, National Association of Small Business Investment Companies; former Directorships: BoxTop Media Inc. (advertising); Sun Capital Advisers Trust (mutual funds) (2011-2012) | 102 | — |
Paul K. Freeman (1950) Board Member since 1993, and Chairperson (2009-Jan. 8, 2013) | | Consultant, World Bank/Inter-American Development Bank; Executive and Governing Council of the Independent Directors Council (Chairman of Education Committee); formerly: Project Leader, International Institute for Applied Systems Analysis (1998-2001); Chief Executive Officer, The Eric Group, Inc. (environmental insurance) (1986-1998); Directorships: Denver Zoo Foundation (December 2012-present); former Directorships: Prisma Energy International | 102 | — |
Richard J. Herring (1946) Board Member since 1990 | | Jacob Safra Professor of International Banking and Professor, Finance Department, The Wharton School, University of Pennsylvania (since July 1972); Co-Director, Wharton Financial Institutions Center (since July 2000); Co-Chair, U.S. Shadow Financial Regulatory Committee; Executive Director, Financial Economists Roundtable; formerly: Vice Dean and Director, Wharton Undergraduate Division (July 1995-June 2000); Director, Lauder Institute of International Management Studies (July 2000-June 2006) | 102 | Director, Japan Equity Fund, Inc. (since September 2007), Thai Capital Fund, Inc. (since 2007), Singapore Fund, Inc. (since September 2007), Independent Director of Barclays Bank Delaware (since September 2010) |
Rebecca W. Rimel (1951) Board Member since 1995 | | President and Chief Executive Officer, The Pew Charitable Trusts (charitable organization) (1994 to present); formerly: Executive Vice President, The Glenmede Trust Company (investment trust and wealth management) (1983-2004); Board Member, Investor Education (charitable organization) (2004-2005); Trustee, Executive Committee, Philadelphia Chamber of Commerce (2001-2007); Director, Viasys Health Care2 (January 2007-June 2007); Trustee, Thomas Jefferson Foundation (charitable organization) (1994-2012) | 102 | Director, Becton Dickinson and Company2 (medical technology company) (2012- present); Director, CardioNet, Inc.2 (health care) (2009- present) |
William N. Searcy, Jr. (1946) Board Member since 1993 | | Private investor since October 2003; formerly: Pension & Savings Trust Officer, Sprint Corporation2 (telecommunications) (November 1989-September 2003); Trustee, Sun Capital Advisers Trust (mutual funds) (1998-2012) | 102 | — |
Jean Gleason Stromberg (1943) Board Member since 1997 | | Retired. Formerly, Consultant (1997-2001); Director, Financial Markets U.S. Government Accountability Office (1996-1997); Partner, Fulbright & Jaworski, L.L.P. (law firm) (1978-1996). Directorships: The William and Flora Hewlett Foundation; former Directorships: Service Source, Inc., Mutual Fund Directors Forum (2002-2004), American Bar Retirement Association (funding vehicle for retirement plans) (1987-1990 and 1994-1996) | 102 | — |
Robert H. Wadsworth (1940) Board Member since 1999 | | President, Robert H. Wadsworth & Associates, Inc. (consulting firm) (1983 to present); Director, National Horizon, Inc. (non-profit organization); Director and Treasurer, The Phoenix Boys Choir Association | 105 | — |
Interested Board Member and Officer4 |
Name, Year of Birth, Position with the Fund and Length of Time Served1,6 | | Business Experience and Directorships During the Past Five Years | Number of Funds in DWS Fund Complex Overseen |
Other Directorships Held by Board Member |
Michael J. Woods5 (1967) Board Member since 2013,9 and Executive Vice President since 20139 | | Managing Director,3 Deutsche Asset & Wealth Management (2009-present); Head of the Americas Asset Management Business for Deutsche Bank, Member of the Asset and Wealth Management ("AWM") Extended Executive Committee, AWM Global Client Group Executive Committee and the AWM Active Asset Management Executive Committee; CEO and US Regional Head of DWS Investments; formerly: Sr. VP, Head of the Financial Intermediaries and Investments Group of Evergreen Investments (2007-2009), CEO and Vice Chairman of Board of Directors of XTF Global Asset Management (2006-2007), Managing Director — US Head of Sub-Advisory and Investment Only Business at Citigroup Asset Management (2000-2006). Mr. Woods is currently a board member of The Children's Village, The Big Brothers Big Sisters Organization, and The Mutual Fund Education Alliance. | 38 | — |
Officers4 |
Name, Year of Birth, Position with the Fund and Length of Time Served6 | | Business Experience and Directorships During the Past Five Years |
W. Douglas Beck, CFA7 (1967) President, 2011-present | | Managing Director,3 Deutsche Asset & Wealth Management (2006-present); President of DWS family of funds and Head of Product Management, U.S. for DWS Investments; formerly: Executive Director, Head of Product Management (2002-2006) and President (2005-2006) of the UBS Funds at UBS Global Asset Management; Co-Head of Manager Research/Managed Solutions Group, Merrill Lynch (1998-2002) |
John Millette8 (1962) Vice President and Secretary, 1999-present | | Director,3 Deutsche Asset & Wealth Management |
Paul H. Schubert7 (1963) Chief Financial Officer, 2004-present Treasurer, 2005-present | | Managing Director,3 Deutsche Asset & Wealth Management (since July 2004); formerly: Executive Director, Head of Mutual Fund Services and Treasurer for UBS Family of Funds (1998-2004); Vice President and Director of Mutual Fund Finance at UBS Global Asset Management (1994-1998) |
Caroline Pearson8 (1962) Chief Legal Officer, 2010-present | | Managing Director,3 Deutsche Asset & Wealth Management; formerly: Assistant Secretary for DWS family of funds (1997-2010) |
Melinda Morrow7 (1970) Vice President, 2012-present | | Director,3 Deutsche Asset & Wealth Management |
Hepsen Uzcan8 (1974) Assistant Secretary, since 20139 | | Vice President, Deutsche Asset & Wealth Management |
Paul Antosca8 (1957) Assistant Treasurer, 2007-present | | Director,3 Deutsche Asset & Wealth Management |
Jack Clark8 (1967) Assistant Treasurer, 2007-present | | Director,3 Deutsche Asset & Wealth Management |
Diane Kenneally8 (1966) Assistant Treasurer, 2007-present | | Director,3 Deutsche Asset & Wealth Management |
John Caruso7 (1965) Anti-Money Laundering Compliance Officer, 2010-present | | Managing Director,3 Deutsche Asset & Wealth Management |
Robert Kloby7 (1962) Chief Compliance Officer, 2006-present | | Managing Director,3 Deutsche Asset & Wealth Management |
1 The length of time served represents the year in which the Board Member joined the board of one or more DWS funds currently overseen by the Board.
2 A publicly held company with securities registered pursuant to Section 12 of the Securities Exchange Act of 1934.
3 Executive title, not a board directorship.
4 As a result of their respective positions held with the Advisor, these individuals are considered "interested persons" of the Advisor within the meaning of the 1940 Act. Interested persons receive no compensation from the fund.
5 The mailing address of Mr. Woods is 60 Wall Street, New York, New York 10005. Mr. Woods is an interested Board Member by virtue of his positions with Deutsche Asset & Wealth Management. As an interested person, Mr. Woods receives no compensation from the fund. Mr. Woods is a board member of the following trusts and corporations: Cash Account Trust, DWS Market Trust, DWS Money Funds, DWS State Tax-Free Income Series, DWS Target Fund, DWS Value Series, Inc., DWS Variable Series II, Investors Cash Trust, Tax-Exempt California Money Market Fund, DWS Global High Income Fund, Inc., DWS High Income Opportunities Fund, Inc., DWS High Income Trust, DWS Multi-Market Income Trust, DWS Municipal Income Trust, DWS Strategic Income Trust and DWS Strategic Municipal Income Trust.
6 The length of time served represents the year in which the officer was first elected in such capacity for one or more DWS funds.
7 Address: 60 Wall Street, New York, NY 10005.
8 Address: One Beacon Street, Boston, MA 02108.
9 Effective as of January 9, 2013.
The fund's Statement of Additional Information ("SAI") includes additional information about the Board Members. The SAI is available, without charge, upon request. If you would like to request a copy of the SAI, you may do so by calling the following toll-free number: (800) 728-3337.
Notes
Notes
Notes
Notes
Notes

APRIL 30, 2013 Annual Report to Shareholders |
| |
Tax-Exempt Portfolio DWS Tax-Free Money Fund Class S |
|
Contents
3 Portfolio Management Review 15 Statement of Assets and Liabilities 17 Statement of Operations 18 Statement of Changes in Net Assets 20 Notes to Financial Statements 28 Report of Independent Registered Public Accounting Firm 29 Information About Your Fund's Expenses 32 Summary of Management Fee Evaluation by Independent Fee Consultant 36 Board Members and Officers |
This report must be preceded or accompanied by a prospectus. To obtain a summary prospectus, if available, or prospectus for any of our funds, visit www.dws-investments.com. We advise you to consider the fund's objectives, risks, charges and expenses carefully before investing. The summary prospectus and prospectus contain this and other important information about the fund. Please read the prospectus carefully before you invest.
An investment in this fund is not insured or guaranteed by the Federal Deposit Insurance Corporation (FDIC) or by any other government agency. Although the fund seeks to preserve the value of your investment at $1.00 per share, it is possible to lose money by investing in the fund. The share price of money market funds can fall below the $1.00 share price. You should not rely on or expect the Advisor to enter into support agreements or take other actions to maintain the fund's $1.00 share price. The credit quality of the fund's holdings can change rapidly in certain markets, and the default of a single holding could have an adverse impact on the fund's share price. The fund's share price can also be negatively affected during periods of high redemption pressures and/or illiquid markets. The actions of a few large investors in one class of shares of the fund may have a significant adverse effect on the share prices of all classes of shares of the fund. See the prospectus for specific details regarding the fund's risk profile.
DWS Investments is part of the Deutsche Asset & Wealth Management division of Deutsche Bank AG.
NOT FDIC/NCUA INSURED NO BANK GUARANTEE MAY LOSE VALUE NOT A DEPOSIT NOT INSURED BY ANY FEDERAL GOVERNMENT AGENCY
Portfolio Management Review (Unaudited)
Market Overview
All performance information below is historical and does not guarantee future results. Investment return and principal fluctuate, so your shares may be worth more or less when redeemed. Current performance may differ from performance data shown. Please visit www.dws-investments.com for the fund's most recent month-end performance. The 7-day current yield refers to the income paid by the fund over a 7-day period expressed as an annual percentage rate of the fund's shares outstanding. Yields fluctuate and are not guaranteed.
At the beginning of the fund's most recent fiscal year ended April 30, 2013, we saw another dramatic "flight to quality," as worries concerning Greece's upcoming elections and continuingly worsening conditions for Spanish and Italian banks led global and domestic investors to abandon risky assets. Late in 2012, any negative economic data was overshadowed by investor anticipation of more substantial central bank actions. The European Central Bank (ECB) lowered its interest rate for bank reserves. Then, the head of the ECB, Mario Draghi, stated that the central bank would do "whatever it takes" to preserve the euro. In December 2012, the U.S. Federal Reserve Board (the Fed) altered its guidance regarding rate levels, stating that it would maintain short-term interest rates near zero until U.S. unemployment dropped below 6.5%, and as long as inflation levels did not exceed 2.5%. In the first quarter of 2013, the European situation remained quiescent until the banking crisis in Cyprus reached a boiling point; the crisis was finally resolved after it was agreed that large uninsured depositors in Cyprus' banks would suffer substantial losses. In addition, the U.S. economy was boosted by higher housing prices and some gains in employment levels. In the money market area, we saw a continued supply/demand imbalance as well as a reduction in short-term money market supply due to ongoing quantitative easing by the Fed. In the continued search for yield, money market investors looked to a variety of financial instruments issued in countries around the world.
Positive Contributors to Fund Performance
We were able to maintain a yield that is in line with other similar money market funds during the period ended April 30, 2013.
| Tax-Exempt Portfolio seeks to provide maximum current income that is exempt from federal income taxes to the extent consistent with stability of capital. |
We sought to preserve a balance of liquidity and high quality by maintaining a strong position in variable-rate securities during the period. (The interest rate of variable-rate securities adjusts periodically based on indices such as the Securities Industry and Financial Market Association Index of Variable Rate Demand Notes. Because the interest rates of these instruments adjust as market conditions change, they provide flexibility in an uncertain interest rate environment.) In addition, we took advantage of higher yields along the yield curve by investing in tax-exempt commercial paper, three-month to nine-month municipal "put" bonds, and one-year fixed-rate municipal note issues. We have also maintained broad diversification for the fund by investing in a number of states and municipalities.
Fund Performance (as of April 30, 2013)
Performance is historical and does not guarantee future results. Current performance may be lower or higher than the performance data quoted.
An investment in the fund is not insured or guaranteed by the Federal Deposit Insurance Corporation (FDIC) or by any other government agency. Although the fund seeks to preserve the value of your investment at $1.00 per share, it is possible to lose money by investing in the fund.
| | | 7-Day Current Yield | |
| DWS Tax-Free Money Fund Class S | | | .01 | %* |
| Equivalent Taxable Yield | | | .02 | %** |
Yields are historical, will fluctuate and do not guarantee future performance. The 7-day current yield refers to the income paid by the fund over a 7-day period expressed as an annual percentage rate of the fund's shares outstanding. For the most current yield information, visit our Web site at www.dws-investments.com. * The investment advisor has agreed to voluntarily waive fees/reimburse expenses. This waiver may be changed or terminated at any time without notice. ** The equivalent taxable yield allows you to compare with the performance of taxable money market funds. For the Tax-Exempt Portfolio, the equivalent taxable yield is based upon the marginal income tax rate of 35%. Income may be subject to local taxes and, for some investors, the alternative minimum tax. | |
Negative Contributors to Fund Performance
The types of securities that we invested in tended to have lower yields than issues carrying more risk. We preferred to be cautious during a time of market uncertainty. In the end this may have cost the fund some yield, but we believe that this represented a prudent approach to preserving principal.
Outlook and Positioning
We anticipate limited growth for the U.S. economy over the remainder of this year, due to steady but unspectacular employment gains and the automatic budget cuts dictated by congressional sequestration. In turn, we think that restrained growth will mean that the Fed will continue its extremely accommodative monetary policy through early 2014. We look for money market rates to continue to be low based on decreases in supply on a number of fronts and strong investor demand.
We continue our insistence on the highest credit quality within the fund. We also plan to maintain our conservative investment strategies and standards under the current market conditions. We continue to apply a careful approach to investing on behalf of the fund and to seek competitive yield for our shareholders.
Portfolio Management Team
A group of investment professionals is responsible for the day-to-day management of the fund. These investment professionals have a broad range of experience managing money market funds.
The views expressed reflect those of the portfolio management team only through the end of the period of the report as stated on the cover. The management team's views are subject to change at any time based on market and other conditions and should not be construed as a recommendation. Past performance is no guarantee of future results. Current and future portfolio holdings are subject to risk.
Terms to Know
Quantitative easing is a government monetary policy often used when interest rates are at or near zero. With this policy government or other securities are purchased from the market, causing the price of the securities purchased to rise and the yield or interest rates on the securities purchased to fall. For the companies whose bonds the central banks are willing to purchase, it means having to pay lower interest rates on new bonds issued to replace existing bonds that have matured. With lower borrowing costs, the central banks hope that consumers will be encouraged to spend more, thus helping the overall economy and improving the balance sheets of the companies providing the goods and services on which consumers are spending their money.
The yield curve is a graphical representation of how yields on bonds of different maturities compare. Normally, yield curves slant up, as bonds with longer maturities typically offer higher yields than short-term bonds.
A repurchase agreement, or "overnight repo," is an agreement between a seller and a buyer, usually of government securities, where the seller agrees to repurchase the securities at a given price and usually at a stated time. Repos are widely used money market instruments that serve as an interest-bearing, short-term "parking place" for large sums of money.
The Securities Industry and Financial Market Association Index of Variable Rate Demand Notes is a weekly high-grade market index consisting of seven-day, tax-exempt, variable-rate demand notes produced by Municipal Market Data Group. Actual issues are selected from Municipal Market Data's database of more than 10,000 active issues. Index returns do not reflect fees or expenses and it is not possible to invest directly into an index.
A "put" bond allows an investor to require the issuer to repurchase the bond at a specified date before its maturity.
Portfolio Summary (Unaudited)
Investment Portfolio as of April 30, 2013
Tax-Exempt Portfolio
| | | Principal Amount ($) | | | Value ($) | |
| | | | |
| Municipal Investments 98.7% | |
| Alaska 3.1% | |
| Anchorage, AK: | |
| Tax Anticipation Notes, 2.0%, 9/17/2013 | | | 25,000,000 | | | | 25,174,489 | |
| TECP, 0.19%, 10/3/2013, LOC: Wells Fargo | | | 25,000,000 | | | | 25,000,000 | |
| TECP, 0.23%, 6/5/2013, LOC: Wells Fargo | | | 8,300,000 | | | | 8,300,000 | |
| | | | | 58,474,489 | |
| California 14.5% | |
| California, Golden State Tobacco Securitization Corp., Tobacco Settlement: | | | | | | | | |
| Series B, Prerefunded 6/1/2013 @ 100, 5.5%, 6/1/2043 | | | 24,415,000 | | | | 24,523,306 | |
| Series B, Prerefunded 6/1/2013 @ 100, 5.625%, 6/1/2038 | | | 31,610,000 | | | | 31,753,010 | |
| Series 2003-A-1, Prerefunded 6/1/2013 @ 100, 6.25%, 6/1/2033 | | | 43,745,000 | | | | 43,966,499 | |
| Series 2003-A-1, Prerefunded 6/1/2013 @ 100, 6.75%, 6/1/2039 | | | 38,470,000 | | | | 38,683,616 | |
| California, Nuveen Dividend Advantage Municipal Fund, Series 1-1362, 144A, AMT, 0.4%*, 6/1/2041, LIQ: Morgan Stanley Bank | | | 5,000,000 | | | | 5,000,000 | |
| California, RBC Municipal Products, Inc. Trust: | |
| Series E-21, 144A, 0.26%*, Mandatory Put 9/3/2013 @ 100, 10/1/2013, LIQ: Royal Bank of Canada, LOC: Royal Bank of Canada | | | 25,000,000 | | | | 25,000,000 | |
| Series E-24, 144A, 0.26%*, Mandatory Put 8/1/2013 @ 100, 7/1/2031, LIQ: Royal Bank of Canada, LOC: Royal Bank of Canada | | | 16,865,000 | | | | 16,865,000 | |
| California, State Department of Water Resources, Supply Revenue: | | | | | | | | |
| Series N, 5.0%, 5/1/2013 | | | 10,000,000 | | | | 10,000,000 | |
| Series M, 5.0%, 5/1/2014 | | | 7,500,000 | | | | 7,859,716 | |
| California, State General Obligation: | |
| Prerefunded 4/1/2014 @ 100, 5.0%, 4/1/2031, INS: AMBAC | | | 10,325,000 | | | | 10,778,410 | |
| Prerefunded 4/1/2014 @ 100, 5.25%, 4/1/2034 | | | 6,035,000 | | | | 6,313,855 | |
| California, Statewide Communities Development Authority, Multi-Family Housing Revenue: | | | | | | | | |
| Series 2680, 144A, 0.29%*, 5/15/2018, LOC: JPMorgan Chase Bank NA | | | 14,700,000 | | | | 14,700,000 | |
| Series 2681, 144A, AMT, 0.36%*, 5/15/2018, LOC: JPMorgan Chase Bank NA | | | 12,250,000 | | | | 12,250,000 | |
| California, Wells Fargo Stage Trust: | |
| Series 74C, 144A, 0.19%*, 11/15/2040, GTY: Wells Fargo Bank NA, LIQ: Wells Fargo Bank NA | | | 5,810,000 | | | | 5,810,000 | |
| Series 31C, 144A, AMT, 0.25%*, Mandatory Put 8/15/2013 @ 100, 1/1/2022, GTY: Wells Fargo Bank NA, LIQ: Wells Fargo Bank NA | | | 5,995,000 | | | | 5,995,000 | |
| San Diego County, CA, School District Note Participations, Series A, 2.0%, 6/28/2013 | | | 10,000,000 | | | | 10,029,016 | |
| | | | | 269,527,428 | |
| Colorado 3.8% | |
| Colorado, State Education Loan Program, Series C, 144A, 2.5%, 6/27/2013 | | | 60,000,000 | | | | 60,221,714 | |
| Colorado, Wells Fargo Stage Trust, Series 42C, 144A, AMT, 0.19%*, 11/15/2023, GTY: Wells Fargo Bank NA, LIQ: Wells Fargo Bank NA | | | 9,835,000 | | | | 9,835,000 | |
| | | | | 70,056,714 | |
| District of Columbia 0.8% | |
| District of Columbia, Wells Fargo Stage Trust, Series 57C, 144A, AMT, 0.25%*, Mandatory Put 12/26/2013 @ 100, 10/1/2032, GTY: Wells Fargo Bank NA, LIQ: Wells Fargo Bank NA | | | 13,965,000 | | | | 13,965,000 | |
| Georgia 0.7% | |
| Burke County, GA, Development Authority Revenue, Georgia Power Co. Plant, 144A, 0.21%*, 5/1/2022 | | | 5,555,000 | | | | 5,555,000 | |
| Georgia, Private Colleges & Universities Authority Revenue, Mercer University Project, Series C, 0.24%*, 10/1/2031, LOC: Branch Banking & Trust | | | 8,335,000 | | | | 8,335,000 | |
| | | | | 13,890,000 | |
| Hawaii 0.5% | |
| Hawaii, Wells Fargo State Trust, Series 6C, 144A, 0.19%*, 7/1/2040, GTY: Wells Fargo Bank NA, LIQ: Wells Fargo Bank NA | | | 8,820,000 | | | | 8,820,000 | |
| Idaho 2.5% | |
| Idaho, State General Obligation, 2.0%, 6/28/2013 | | | 47,000,000 | | | | 47,134,110 | |
| Illinois 13.3% | |
| Chicago, IL, Loyola University: | |
| TECP, 0.14%, 5/21/2013 | | | 25,000,000 | | | | 25,000,000 | |
| TECP, 0.15%, 6/3/2013 | | | 25,040,000 | | | | 25,040,000 | |
| Chicago, IL, O'Hare International Airport Revenue, 0.18%, 5/7/2013 | | | 5,000,000 | | | | 5,000,000 | |
| Illinois, BB&T Municipal Trust, Series 5001, 144A, 0.31%*, 6/1/2020, LIQ: Rabobank Nederland, LOC: Rabobank International | | | 23,460,000 | | | | 23,460,000 | |
| Illinois, Educational Facilities Authority Revenue, University of Chicago, Series B-3, 0.24%*, Mandatory Put 3/13/2014 @ 100, 7/1/2036 | | | 18,000,000 | | | | 18,000,000 | |
| Illinois, Educational Facilities Authority Revenues: | |
| TECP, 0.15%, 6/3/2013, LOC: Northern Trust Co. | | | 20,000,000 | | | | 20,000,000 | |
| TECP, 0.16%, 6/3/2013, LOC: Northern Trust Co. | | | 30,000,000 | | | | 30,000,000 | |
| TECP, 0.16%, 7/1/2013, LOC: Northern Trust Co. | | | 16,200,000 | | | | 16,200,000 | |
| TECP, 0.16%, 7/2/2013, LOC: Northern Trust Co. | | | 30,000,000 | | | | 30,000,000 | |
| Illinois, Wells Fargo Stage Trust, Series 27C, 144A, 0.26%*, Mandatory Put 10/24/2013 @ 100, 8/1/2025, GTY: Wells Fargo Bank NA, LIQ: Wells Fargo Bank NA, | | | 38,405,000 | | | | 38,405,000 | |
| Mundelein, IL, Industrial Development Revenue, MacLean Fogg Co. Project, 144A, AMT, 0.38%*, 1/1/2015, LOC: Northern Trust Co. | | | 6,500,000 | | | | 6,500,000 | |
| Woodstock, IL, Multi-Family Housing Revenue, Willow Brooke Apartments, AMT, 0.24%*, 4/1/2042, LOC: Wells Fargo Bank NA | | | 10,000,000 | | | | 10,000,000 | |
| | | | | 247,605,000 | |
| Indiana 3.6% | |
| Indiana, State Finance Authority, Industrial Revenue, Midwest Fertilizer Corp. Project, 0.2%, Mandatory Put 7/1/2013 @ 100, 7/1/2046 | | | 60,000,000 | | | | 60,000,000 | |
| Indiana, Wells Fargo State Trust, Series 100C, 144A, 0.19%*, 8/1/2021, GTY: Wells Fargo Bank NA, LIQ: Wells Fargo Bank NA | | | 7,495,000 | | | | 7,495,000 | |
| | | | | 67,495,000 | |
| Iowa 4.1% | |
| Iowa, State Finance Authority Midwestern Disaster Area Revenue, Fertilizer Co. Project, 0.17%*, Mandatory Put 5/31/2013 @ 100, 12/1/2050 | | | 70,000,000 | | | | 70,000,000 | |
| Iowa, State Finance Authority, Wellness Facilities Revenue, Community Marshalltown Project, 0.26%*, 1/1/2031, LOC: Northern Trust Co. | | | 6,015,000 | | | | 6,015,000 | |
| | | | | 76,015,000 | |
| Kansas 0.8% | |
| Kansas, State Development Finance Authority, Multi-Family Revenue, Oak Ridge Park II Project, Series X, AMT, 0.29%*, 12/1/2036, LOC: U.S. Bank NA | | | 3,650,000 | | | | 3,650,000 | |
| Olathe, KS, General Obligation, Series A, 1.5%, 7/1/2013 | | | 11,280,000 | | | | 11,304,457 | |
| | | | | 14,954,457 | |
| Kentucky 1.9% | |
| Kentucky, State Economic Development Finance Authority, Catholic Health Initiatives: | | | | | | | | |
| Series B, 0.32%**, 2/1/2046 | | | 10,680,000 | | | | 10,680,000 | |
| Series B-2, 0.32%**, 2/1/2046 | | | 12,000,000 | | | | 12,000,000 | |
| Series B-3, 0.32%**, 2/1/2046 | | | 12,415,000 | | | | 12,415,000 | |
| | | | | 35,095,000 | |
| Maryland 1.6% | |
| Maryland, State Health & Higher Educational Facilities Authority Revenue, Pooled Loan Program, Series D, 144A, 0.27%*, 1/1/2029, LOC: Bank of America NA | | | 12,580,000 | | | | 12,580,000 | |
| Montgomery County, MD, TECP, 0.17%, 6/4/2013, LOC: State Street Bank & Trust Co. | | | 17,000,000 | | | | 17,000,000 | |
| | | | | 29,580,000 | |
| Michigan 6.6% | |
| Michigan, RBC Municipal Products, Inc. Trust: | |
| Series L-23, 144A, AMT, 0.26%*, 3/1/2028, INS: AMBAC, LIQ: Royal Bank of Canada, LOC: Royal Bank of Canada | | | 44,995,000 | | | | 44,995,000 | |
| Series L-27, 144A, AMT, 0.26%*, 3/1/2031, LIQ: Royal Bank of Canada, LOC: Royal Bank of Canada | | | 40,000,000 | | | | 40,000,000 | |
| Michigan, State Finance Authority Revenue, Unemployment Obligation Assessment, Series A, 2.0%, 7/1/2013 | | | 11,100,000 | | | | 11,133,708 | |
| Michigan, State Hospital Finance Authority Revenue, Ascension Health Senior Credit Group: | | | | | | | | |
| Series F-7, 0.31%*, 11/15/2047 | | | 11,200,000 | | | | 11,200,000 | |
| Series F-6, 0.31%**, 11/15/2049 | | | 8,660,000 | | | | 8,660,000 | |
| Series F-8, 0.31%**, 11/15/2049 | | | 7,100,000 | | | | 7,100,000 | |
| | | | | 123,088,708 | |
| Minnesota 1.3% | |
| Cohasset, MN, State Power & Light Co. Project, Series A, 0.27%*, 6/1/2020, LOC: JPMorgan Chase Bank NA | | | 24,630,000 | | | | 24,630,000 | |
| Mississippi 0.5% | |
| Mississippi, Redstone Partners Floaters/Residuals Trust, Series C, 144A, AMT, 0.41%*, 12/1/2047, LOC: Wachovia Bank NA | | | 9,220,000 | | | | 9,220,000 | |
| Missouri 5.0% | |
| Missouri, State Health & Educational Facilities: | |
| TECP, 0.12%, 5/21/2013 | | | 28,000,000 | | | | 28,000,000 | |
| TECP, 0.14%, 5/16/2013 | | | 22,000,000 | | | | 22,000,000 | |
| Missouri, University of Curators, TECP, 0.14%, 5/7/2013 | | | 23,000,000 | | | | 23,000,000 | |
| North Kansas City, MO, Hospital Revenue, 0.22%*, 11/1/2033, LOC: Bank of America NA | | | 20,660,000 | | | | 20,660,000 | |
| | | | | 93,660,000 | |
| New York 4.2% | |
| BlackRock New York Municipal Income Quality Trust, Series W-7-40, 144A, AMT, 0.32%*, 10/1/2041, LIQ: Barclays Bank PLC | | | 5,000,000 | | | | 5,000,000 | |
| BlackRock New York Municipal Intermediate Duration Fund, Inc., Series W-7-296, 144A, AMT, 0.32%*, 10/1/2041, LIQ: Barclays Bank PLC | | | 13,500,000 | | | | 13,500,000 | |
| New York, RIB Floater Trust, Series 1WE, 144A, 0.29%*, 9/30/2013, LIQ: Barclays Bank PLC | | | 60,000,000 | | | | 60,000,000 | |
| | | | | 78,500,000 | |
| North Carolina 1.9% | |
| North Carolina, BB&T Municipal Trust: | |
| Series 1008, 144A, 0.31%*, 3/1/2024, LIQ: Branch Banking & Trust, LOC: Branch Banking & Trust | | | 5,515,000 | | | | 5,515,000 | |
| Series 1009, 144A, 0.31%*, 6/1/2024, LIQ: Branch Banking & Trust, LOC: Branch Banking & Trust | | | 15,675,000 | | | | 15,675,000 | |
| North Carolina, Capital Facilities Finance Agency, TECP, 0.15%, 6/5/2013 | | | 13,860,000 | | | | 13,860,000 | |
| | | | | 35,050,000 | |
| Ohio 1.6% | |
| Ohio, Puttable Floating Option Tax-Exempt Receipts, Series 808, 144A, AMT, 0.42%*, 12/1/2041, GTY: Bank of America NA, INS: AMBAC, LIQ: Bank of America NA | | | 30,000,000 | | | | 30,000,000 | |
| Oklahoma 0.5% | |
| Tulsa, OK, Airports Improvement Trust, Special Facilities Revenue, Lufthansa/Bizjet International, Inc., 144A, AMT, 0.26%*, 8/1/2018, LOC: Landesbank Hessen-Thuringen | | | 10,120,000 | | | | 10,120,000 | |
| Other Territories 6.2% | |
| BB&T Municipal Trust, Series 1010, 144A, 0.26%*, 1/15/2019, LIQ: Branch Banking & Trust, LOC: Branch Banking & Trust | | | 5,980,000 | | | | 5,980,000 | |
| BB&T Municipal Trust, Series 5000, 144A, 0.31%*, 10/1/2028, LIQ: Rabobank Nederland, LOC: Rabobank International | | | 6,755,000 | | | | 6,755,000 | |
| BlackRock Muni Holdings Investment Quality Fund, Series W-7-2746, 144A, AMT, 0.43%*, 7/1/2041, LIQ: Bank of America NA | | | 28,100,000 | | | | 28,100,000 | |
| BlackRock Municipal Bond Investment Trust, Series W-7-178, 144A, AMT, 0.32%*, 10/1/2041, LIQ: Barclays Bank PLC | | | 9,300,000 | | | | 9,300,000 | |
| Eagle Tax- Exempt Trust, 144A, AMT, 0.27%*, 4/15/2049, LIQ: Federal Home Loan Bank | | | 14,615,000 | | | | 14,615,000 | |
| Nuveen Premier Income Municipal Fund 2, Inc., Series 1-4895, 144A, AMT, 0.32%*, 5/1/2041, LIQ: Barclays Bank PLC | | | 52,000,000 | | | | 52,000,000 | |
| | | | | 116,750,000 | |
| Pennsylvania 2.7% | |
| Pennsylvania, State Economic Development Financing Authority, IESI PA Corp., 0.26%*, 11/1/2028, GTY: IESI Corp., LOC: Bank of America NA | | | 34,000,000 | | | | 34,000,000 | |
| University of Pittsburgh, PA, The Commonwealth Systems of Higher Education, Pittsburgh Assessment Notes, 2.0%, 7/2/2013 | | | 17,000,000 | | | | 17,051,605 | |
| | | | | 51,051,605 | |
| Puerto Rico 2.6% | |
| Puerto Rico, RIB Floater Trust, Series 8WE, 144A, 0.27%, 9/30/2014, LOC: Barclays Bank PLC | | | 47,500,000 | | | | 47,500,000 | |
| Tennessee 3.5% | |
| Metropolitan Government Nashville & Davidson County, TN: | |
| TECP, 0.2%, 10/3/2013 | | | 10,000,000 | | | | 10,000,000 | |
| TECP, 0.23%, 9/3/2013 | | | 17,000,000 | | | | 17,000,000 | |
| Tennessee, Tennergy Corp., Gas Revenue, Stars Certificates, Series 2006-001, 144A, 0.27%*, 5/1/2016, LOC: BNP Paribas | | | 39,000,000 | | | | 39,000,000 | |
| | | | | 66,000,000 | |
| Texas 9.5% | |
| Harris County, TX, Cultural Education, TECP, 0.23%, 7/9/2013 | | | 40,000,000 | | | | 40,000,000 | |
| Lamar, TX, Consolidated Independent School District, Series R-12266, 144A, 0.25%*, 8/1/2015, SPA: Citibank NA | | | 20,485,000 | | | | 20,485,000 | |
| North Texas, Tollway Authority Revenue, TECP, 0.16%, 6/7/2013, LOC: JPMorgan Chase Bank NA | | | 15,400,000 | | | | 15,400,000 | |
| Texas, JPMorgan Chase Putters/Drivers Trust, Series 4263, 144A, 0.18%*, 8/30/2013, LIQ: JPMorgan Chase Bank NA | | | 30,000,000 | | | | 30,000,000 | |
| Texas, Municipal Power Agency Revenue, TECP, 0.21%, 5/17/2013, LOC: Barclays Bank PLC | | | 15,500,000 | | | | 15,500,000 | |
| Texas, State Transportation Revenue, 2.5%, 8/30/2013 | | | 45,000,000 | | | | 45,339,981 | |
| Texas City, TX, Industrial Development Corp. Revenue, Del Papa Realty Holdings, 0.26%*, 1/1/2051, LOC: Bank of America NA | | | 9,500,000 | | | | 9,500,000 | |
| | | | | 176,224,981 | |
| Washington 0.7% | |
| Washington, Wells Fargo Stage Trust, Series 93C, 144A, 0.29%, Mandatory Put 6/13/2013 @ 100, 8/15/2046, GTY: Wells Fargo Bank NA, LIQ: Wells Fargo Bank NA | | | 13,675,000 | | | | 13,675,000 | |
| West Virginia 0.7% | |
| West Virginia, Economic Development Authority Revenue, Morgantown Energy, AMT, 0.26%*, 4/1/2027, LOC: Union Bank NA | | | 12,210,000 | | | | 12,210,000 | |
| | | % of Net Assets | | | Value ($) | |
| | | | |
Total Investment Portfolio (Cost $1,840,292,492)† | | | 98.7 | | | | 1,840,292,492 | |
| Other Assets and Liabilities, Net | | | 1.3 | | | | 24,009,682 | |
| Net Assets | | | 100.0 | | | | 1,864,302,174 | |
* Variable rate demand notes and variable rate demand preferred shares are securities whose interest rates are reset periodically at market levels. These securities are payable on demand and are shown at their current rates as of April 30, 2013.
** Floating rate securities' yields vary with a designated market index or market rate, such as the coupon-equivalent of the U.S. Treasury Bill rate. These securities are shown at their current rate as of April 30, 2013.
† The cost for federal income tax purposes was $1,840,292,492.
144A: Security exempt from registration under Rule 144A of the Securities Act of 1933. These securities may be resold in transactions exempt from registration, normally to qualified institutional buyers.
AMBAC: Ambac Financial Group, Inc.
AMT: Subject to alternative minimum tax.
GTY: Guaranty Agreement
INS: Insured
LIQ: Liquidity Facility
LOC: Letter of Credit
Prerefunded: Bonds which are prerefunded are collateralized usually by U.S. Treasury securities which are held in escrow and used to pay principal and interest on tax-exempt issues and to retire the bonds in full at the earliest refunding date.
SPA: Standby Bond Purchase Agreement
TECP: Tax Exempt Commercial Paper
Fair Value Measurements
Various inputs are used in determining the value of the Fund's investments. These inputs are summarized in three broad levels. Level 1 includes quoted prices in active markets for identical securities. Level 2 includes other significant observable inputs (including quoted prices for similar securities, interest rates, prepayment speeds and credit risk). Level 3 includes significant unobservable inputs (including the Fund's own assumptions in determining the fair value of investments). The inputs or methodology used for valuing securities are not necessarily an indication of the risk associated with investing in those securities. Securities held by the Fund are reflected as Level 2 because the securities are valued at amortized cost (which approximates fair value) and, accordingly, the inputs used to determine value are not quoted prices in an active market.
The following is a summary of the inputs used as of April 30, 2013 in valuing the Fund's investments. For information on the Fund's policy regarding the valuation of investments, please refer to the Security Valuation section of Note 1 in the accompanying Notes to Financial Statements.
| Assets | | Level 1 | | | Level 2 | | | Level 3 | | | Total | |
| | |
| Municipal Investments (a) | | $ | — | | | $ | 1,840,292,492 | | | $ | — | | | $ | 1,840,292,492 | |
| Total | | $ | — | | | $ | 1,840,292,492 | | | $ | — | | | $ | 1,840,292,492 | |
There have been no transfers between fair value measurement levels during the period ended April 30, 2013.
(a) See Investment Portfolio for additional detailed categorizations.
The accompanying notes are an integral part of the financial statements.
Statement of Assets and Liabilities | as of April 30, 2013 | |
| Assets | | Tax-Exempt Portfolio | |
Investments: Investments in non-affiliated securities, valued at amortized cost | | $ | 1,840,292,492 | |
| Receivable for investments sold | | | 17,580,000 | |
| Receivable for Fund shares sold | | | 298,158 | |
| Interest receivable | | | 7,109,732 | |
| Due from Advisor | | | 3,699 | |
| Other assets | | | 77,001 | |
| Total assets | | | 1,865,361,082 | |
| Liabilities | |
| Cash overdraft | | | 391,974 | |
| Payable for Fund shares redeemed | | | 169,016 | |
| Distributions payable | | | 6,227 | |
| Accrued management fee | | | 110,040 | |
| Accrued Trustees' fees | | | 18,385 | |
| Other accrued expenses and payables | | | 363,266 | |
| Total liabilities | | | 1,058,908 | |
| Net assets, at value | | $ | 1,864,302,174 | |
| Net Assets Consist of | |
| Undistributed net investment income | | | 212,651 | |
| Paid-in capital | | | 1,864,089,523 | |
| Net assets, at value | | $ | 1,864,302,174 | |
The accompanying notes are an integral part of the financial statements.
Statement of Assets and Liabilities as of April 30, 2013 (continued) | |
| Net Asset Value | | Tax-Exempt Portfolio | |
Capital Assets Funds Shares Net Asset Value, offering and redemption price per share ($10,059,102 ÷ 10,056,881 outstanding shares of beneficial interest, no par value, unlimited number of shares authorized) | | $ | 1.00 | |
Davidson Cash Equivalent Shares Net Asset Value, offering and redemption price per share ($70,393,545 ÷ 70,377,984 outstanding shares of beneficial interest, no par value, unlimited number of shares authorized) | | $ | 1.00 | |
DWS Tax-Exempt Cash Institutional Shares Net Asset Value, offering and redemption price per share ($970,451,993 ÷ 970,237,656 outstanding shares of beneficial interest, no par value, unlimited number of shares authorized) | | $ | 1.00 | |
DWS Tax-Exempt Money Fund Net Asset Value, offering and redemption price per share ($241,992,881 ÷ 241,939,471 outstanding shares of beneficial interest, no par value, unlimited number of shares authorized) | | $ | 1.00 | |
DWS Tax-Free Money Fund Class S Net Asset Value, offering and redemption price per share ($99,900,985 ÷ 99,878,925 outstanding shares of beneficial interest, no par value, unlimited number of shares authorized) | | $ | 1.00 | |
Service Shares Net Asset Value, offering and redemption price per share ($44,904,689 ÷ 44,894,771 outstanding shares of beneficial interest, no par value, unlimited number of shares authorized) | | $ | 1.00 | |
Tax-Exempt Cash Managed Shares Net Asset Value, offering and redemption price per share ($115,086,280 ÷ 115,060,862 outstanding shares of beneficial interest, no par value, unlimited number of shares authorized) | | $ | 1.00 | |
Tax-Free Investment Class Net Asset Value, offering and redemption price per share ($311,512,699 ÷ 311,443,897 outstanding shares of beneficial interest, no par value, unlimited number of shares authorized) | | $ | 1.00 | |
The accompanying notes are an integral part of the financial statements.
| for the year ended April 30, 2013 | |
| Investment Income | | Tax-Exempt Portfolio | |
Income: Interest | | $ | 4,226,122 | |
Expenses: Management fee | | | 1,326,518 | |
| Administration fee | | | 2,073,476 | |
| Services to shareholders | | | 1,150,669 | |
| Distribution and service fees | | | 2,113,579 | |
| Custodian fee | | | 27,586 | |
| Professional fees | | | 126,547 | |
| Reports to shareholders | | | 149,965 | |
| Registration fees | | | 153,018 | |
| Trustees' fees and expenses | | | 87,355 | |
| Other | | | 101,842 | |
| Total expenses before expense reductions | | | 7,310,555 | |
| Expense reductions | | | (3,397,143 | ) |
| Total expenses after expense reductions | | | 3,913,412 | |
| Net investment income | | | 312,710 | |
| Net realized gain (loss) from investments | | | 119,059 | |
| Net increase (decrease) in net assets resulting from operations | | $ | 431,769 | |
The accompanying notes are an integral part of the financial statements.
Statement of Changes in Net Assets | | | Tax-Exempt Portfolio | |
| Increase (Decrease) in Net Assets | | Years Ended April 30, | |
| | 2013 | | | 2012 | |
Operations: Net investment income | | $ | 312,710 | | | $ | 659,723 | |
| Net realized gain (loss) | | | 119,059 | | | | 21,137 | |
| Net increase in net assets resulting from operations | | | 431,769 | | | | 680,860 | |
Distributions to shareholders from: Net investment income: Capital Assets Funds Shares | | | (2,578 | ) | | | (2,580 | ) |
| Davidson Cash Equivalent Shares | | | (16,635 | ) | | | (13,672 | ) |
| DWS Tax-Exempt Cash Institutional Shares | | | (347,411 | ) | | | (598,543 | ) |
| DWS Tax-Exempt Money Fund | | | (63,056 | ) | | | (115,000 | ) |
| DWS Tax-Free Money Fund Class S | | | (22,814 | ) | | | (28,531 | ) |
| Service Shares | | | (12,350 | ) | | | (16,307 | ) |
| Tax-Exempt Cash Managed Shares | | | (36,504 | ) | | | (35,814 | ) |
| Tax-Free Investment Class | | | (80,485 | ) | | | (64,866 | ) |
Net realized gain: Capital Assets Funds Shares | | | (686 | ) | | | — | |
| Davidson Cash Equivalent Shares | | | (4,358 | ) | | | — | |
| DWS Tax-Exempt Cash Institutional Shares | | | (58,793 | ) | | | — | |
| DWS Tax-Exempt Money Fund | | | (15,872 | ) | | | — | |
| DWS Tax-Free Money Fund Class S | | | (5,799 | ) | | | — | |
| Service Shares | | | (2,541 | ) | | | — | |
| Tax-Exempt Cash Managed Shares | | | (9,837 | ) | | | — | |
| Tax-Free Investment Class | | | (21,062 | ) | | | — | |
| Total distributions | | | (700,781 | ) | | | (875,313 | ) |
Fund share transactions: Proceeds from shares sold | | | 3,574,503,665 | | | | 5,483,352,307 | |
| Reinvestment of distributions | | | 409,744 | | | | 544,506 | |
| Cost of shares redeemed | | | (3,871,064,788 | ) | | | (5,984,187,987 | ) |
| Net increase (decrease) in net assets from Fund share transactions | | | (296,151,379 | ) | | | (500,291,174 | ) |
| Increase (decrease) in net assets | | | (296,420,391 | ) | | | (500,485,627 | ) |
| Net assets at beginning of period | | | 2,160,722,565 | | | | 2,661,208,192 | |
| Net assets at end of period (including undistributed net investment income of $212,651 and $481,663, respectively) | | $ | 1,864,302,174 | | | $ | 2,160,722,565 | |
The accompanying notes are an integral part of the financial statements.
Tax-Exempt Portfolio DWS Tax-Free Money Fund Class S | |
| | | Years Ended April 30, | |
| | 2013 | | | 2012 | | | 2011 | | | 2010 | | | 2009 | |
| Selected Per Share Data | |
| Net asset value, beginning of period | | $ | 1.00 | | | $ | 1.00 | | | $ | 1.00 | | | $ | 1.00 | | | $ | 1.00 | |
Income (loss) from investment operations: Net investment income | | | .000 | * | | | .000 | * | | | .001 | | | | .002 | | | | .015 | |
| Net realized gain (loss) | | | .000 | * | | | .000 | * | | | .000 | * | | | .000 | * | | | .000 | * |
| Total from investment operations | | | .000 | * | | | .000 | * | | | .001 | | | | .002 | | | | .015 | |
Less distributions from: Net investment income | | | (.000 | )* | | | (.000 | )* | | | (.001 | ) | | | (.002 | ) | | | (.015 | ) |
| Net realized gains | | | (.000 | )* | | | — | | | | — | | | | (.000 | )* | | | — | |
| Total distributions | | | (.000 | )* | | | (.000 | )* | | | (.001 | ) | | | (.002 | ) | | | (.015 | ) |
| Net asset value, end of period | | $ | 1.00 | | | $ | 1.00 | | | $ | 1.00 | | | $ | 1.00 | | | $ | 1.00 | |
| Total Return (%) | | | .03 | a | | | .02 | a | | | .12 | | | | .19 | | | | 1.54 | |
| Ratios to Average Net Assets and Supplemental Data | |
| Net assets, end of period ($ millions) | | | 100 | | | | 110 | | | | 125 | | | | 141 | | | | 164 | |
| Ratio of expenses before expense reductions (%) | | | .26 | | | | .25 | | | | .24 | | | | .27 | | | | .26 | |
| Ratio of expenses after expense reductions (%) | | | .20 | | | | .22 | | | | .24 | | | | .27 | | | | .26 | |
| Ratio of net investment income (%) | | | .01 | | | | .01 | | | | .12 | | | | .18 | | | | 1.53 | |
a Total return would have been lower had certain expenses not been reduced. * Amount is less than $.0005. | |
Notes to Financial Statements
1. Organization and Significant Accounting Policies
Cash Account Trust (the "Trust") is registered under the Investment Company Act of 1940, as amended (the "1940 Act"), as an open-end investment management company organized as a Massachusetts business trust.
The Trust offers three funds: Money Market Portfolio, Government & Agency Securities Portfolio and Tax-Exempt Portfolio. These financial statements report on Tax-Exempt Portfolio (the "Fund").
Tax-Exempt Portfolio offers eight classes of shares: Capital Assets Funds Shares, Davidson Cash Equivalent Shares, DWS Tax-Exempt Cash Institutional Shares, DWS Tax-Exempt Money Fund, DWS Tax-Free Money Fund Class S, Service Shares, Tax-Exempt Cash Managed Shares and Tax-Free Investment Class.
The financial highlights for all classes of shares, other than DWS Tax-Free Money Fund Class S, are provided separately and are available upon request.
The Fund's investment income, realized gains and losses, and certain Fund-level expenses and expense reductions, if any, are borne pro rata on the basis of relative net assets by the holders of all classes of shares of the Fund, except that each class bears certain expenses unique to that class such as distribution and service fees, services to shareholders and certain other class-specific expenses. Differences in class-level expenses may result in payment of different per share dividends by class. All shares of the Trust have equal rights with respect to voting subject to class-specific arrangements.
The Fund's financial statements are prepared in accordance with accounting principles generally accepted in the United States of America which require the use of management estimates. Actual results could differ from those estimates. The policies described below are followed consistently by the Fund in the preparation of its financial statements.
Security Valuation. Various inputs are used in determining the value of the Fund's investments. These inputs are summarized in three broad levels. Level 1 includes quoted prices in active markets for identical securities. Level 2 includes other significant observable inputs (including quoted prices for similar securities, interest rates, prepayment speeds, and credit risk). Level 3 includes significant unobservable inputs (including the Fund's own assumptions in determining the fair value of investments). The inputs or methodology used for valuing securities are not necessarily an indication of the risk associated with investing in those securities.
The Fund values all securities utilizing the amortized cost method permitted in accordance with Rule 2a-7 under the 1940 Act and certain conditions therein. Under this method, which does not take into account unrealized capital gains or losses on securities, an instrument is initially valued at its cost and thereafter assumes a constant accretion/amortization rate to maturity of any discount or premium. Securities held by the Fund are reflected as Level 2 because the securities are valued at amortized cost (which approximates fair value) and, accordingly, the inputs used to determine value are not quoted prices in an active market.
Disclosure about the classification of fair value measurements is included in a table following the Fund's Investment Portfolio.
New Accounting Pronouncement. In January 2013, Accounting Standard Update 2013-01 (ASU 2013-01), Clarifying the Scope of Disclosures about Offsetting Assets and Liabilities, replaced Accounting Standards Update 2011-11 (ASU 2011-11), Disclosures about Offsetting Assets and Liabilities. ASU 2013-01 is effective for fiscal years beginning on or after January 1, 2013, and interim periods within those annual periods. ASU 2011-11 was intended to enhance disclosure requirements on the offsetting of financial assets and liabilities. The ASU 2013-01 limits the scope of the new balance sheet offsetting disclosures to derivatives, repurchase agreements, and securities lending transactions to the extent that they are (1) offset in the financial statements or (2) subject to an enforceable master netting arrangement or similar agreement. Management is currently evaluating the application of ASU 2013-01 and its impact, if any, on the Fund's financial statements.
Federal Income Taxes. The Fund's policy is to comply with the requirements of the Internal Revenue Code, as amended, which are applicable to regulated investment companies and to distribute all of its taxable and tax-exempt income to its shareholders.
The Fund has reviewed the tax positions for the open tax years as of April 30, 2013 and has determined that no provision for income tax is required in the Fund's financial statements. The Fund's federal tax returns for the prior three fiscal years remain open subject to examination by the Internal Revenue Service.
Distribution of Income. Net investment income of the Fund is declared as a daily dividend and is distributed to shareholders monthly. The Fund may take into account capital gains and losses in its daily dividend declarations. The Fund may also make additional distributions for tax purposes if necessary.
Permanent book and tax basis differences relating to shareholder distributions will result in reclassifications to paid in capital. Temporary book and tax basis differences will reverse in a subsequent period. There were no significant book-to-tax differences for the Fund.
At April 30, 2013, the Fund's components of distributable earnings on a tax basis are as follows:
| Undistributed tax-exempt income* | | $ | 218,878 | |
In addition, the tax character of distributions paid to shareholders by the Fund is summarized as follows:
| | | Years Ended April 30, | |
| | | 2013 | | | 2012 | |
| Distributions from tax-exempt income | | $ | 581,722 | | | $ | 854,176 | |
| Distributions from ordinary income* | | $ | 119,059 | | | $ | 21,137 | |
* For tax purposes, short-term capital gain distributions are considered ordinary income distributions.
Expenses. Expenses of the Trust arising in connection with a specific Fund are allocated to that Fund. Other Trust expenses which cannot be directly attributed to a Fund are apportioned pro rata on the basis of relative net assets among the funds in the Trust based upon the relative net assets or other appropriate measures.
Contingencies. In the normal course of business, the Fund may enter into contracts with service providers that contain general indemnification clauses. The Fund's maximum exposure under these arrangements is unknown as this would involve future claims that may be made against the Fund that have not yet been made. However, based on experience, the Fund expects the risk of loss to be remote.
Other. Investment transactions are accounted for on trade date. Interest income is recorded on the accrual basis. Realized gains and losses from investment transactions are recorded on an identified cost basis and may include proceeds from litigation. All discounts and premiums are accreted/amortized for both tax and financial reporting purposes.
2. Related Parties
Management Agreement. Under an Amended and Restated Investment Management Agreement with Deutsche Investment Management Americas Inc. ("DIMA" or the "Advisor"), an indirect, wholly owned subsidiary of Deutsche Bank AG, the Advisor directs the investments of the Fund in accordance with its investment objectives, policies and restrictions. The Advisor determines the securities, instruments and other contracts relating to investments to be purchased, sold or entered into by the Fund.
The Fund pays a monthly management fee based on the combined average daily net assets of the three funds in the Trust and allocated to the Fund based on its relative net assets, computed and accrued daily and payable monthly, at the following annual rates:
| First $500 million of the Funds' combined average daily net assets | | | .120 | % |
| Next $500 million of such net assets | | | .100 | % |
| Next $1 billion of such net assets | | | .075 | % |
| Next $1 billion of such net assets | | | .060 | % |
| Over $3 billion of such net assets | | | .050 | % |
For the period from May 1, 2012 through September 30, 2013, the Advisor has contractually agreed to waive its fees and/or reimburse certain operating expenses of the DWS Tax-Free Money Fund Class S to the extent necessary to maintain the operating expenses (excluding certain expenses such as extraordinary expenses, taxes, brokerage and interest) at 0.48%.
The Advisor has agreed to voluntarily waive additional expenses. The voluntary waiver may be changed or terminated at any time without notice. Under these arrangements, the Advisor waived certain expenses on DWS Tax-Free Money Fund Class S shares.
Accordingly, for the year ended April 30, 2013, the Advisor earned a management fee on the Fund aggregating $1,326,518, of which $309,712 was waived, resulting in an annual effective rate of 0.05% of the Fund's average daily net assets.
The Advisor has also agreed to maintain expenses of certain other classes of the Trust. These rates are disclosed in the respective share classes' annual reports that are provided separately and are available upon request.
Administration Fee. Pursuant to an Administrative Services Agreement, DIMA provides most administrative services to the Fund. For all services provided under the Administrative Services Agreement, the Fund pays the Advisor an annual fee ("Administration Fee") of 0.10% of the Fund's average daily net assets, computed and accrued daily and payable monthly. For the year ended April 30, 2013, the Administration Fee was as follows:
| | | Administration Fee | | | Unpaid at April 30, 2013 | |
| Tax-Exempt Portfolio | | $ | 2,073,476 | | | $ | 161,841 | |
Service Provider Fees. DWS Investments Service Company ("DISC"), an affiliate of the Advisor, is the transfer agent, dividend-paying agent and shareholder service agent for the Fund. Pursuant to a sub-transfer agency agreement between DISC and DST Systems, Inc. ("DST"), DISC has delegated certain transfer agent, dividend-paying agent and shareholder service agent functions to DST. DISC compensates DST out of the shareholder servicing fee it receives from the Fund. For the year ended April 30, 2013, the amounts charged to the Fund by DISC were as follows:
| Tax-Exempt Portfolio: | | Total Aggregated | | | Waived | | | Unpaid at April 30, 2013 | |
| Capital Assets Funds Shares | | $ | 30,095 | | | $ | 28,537 | | | $ | — | |
| Davidson Cash Equivalent Shares | | | 101,958 | | | | 96,636 | | | | 286 | |
| DWS Tax-Exempt Cash Institutional Shares | | | 159,779 | | | | 159,779 | | | | — | |
| DWS Tax-Exempt Money Fund | | | 90,009 | | | | 64,368 | | | | 6,013 | |
| DWS Tax-Free Money Fund Class S | | | 62,942 | | | | 51,694 | | | | 3,125 | |
| Service Shares | | | 156,558 | | | | 147,666 | | | | 5,419 | |
| Tax-Exempt Cash Managed Shares | | | 102,865 | | | | 86,626 | | | | 431 | |
| Tax-Free Investment Class | | | 368,933 | | | | 338,546 | | | | — | |
| | | $ | 1,073,139 | | | $ | 973,852 | | | $ | 15,274 | |
Distribution Service Agreement. Under the Distribution Service Agreement, in accordance with Rule 12b-1 under the 1940 Act, DWS Investments Distributors, Inc. ("DIDI"), an affiliate of the Advisor, receives a fee ("Distribution Fee"), calculated as a percentage of average daily net assets for the shares listed in the following table.
For the year ended April 30, 2013, the Distribution Fee was as follows:
| Tax-Exempt Portfolio: | | Distribution Fee | | | Waived | | | Annual Effective Rate | | | Contractual Rate (Up To) | |
| Capital Assets Funds Shares | | $ | 39,725 | | | $ | 39,725 | | | | .00 | % | | | .33 | % |
| Davidson Cash Equivalent Shares | | | 203,917 | | | | 203,917 | | | | .00 | % | | | .30 | % |
| Service Shares | | | 375,740 | | | | 375,740 | | | | .00 | % | | | .60 | % |
| Tax-Free Investment Class | | | 836,286 | | | | 836,286 | | | | .00 | % | | | .25 | % |
| | | $ | 1,455,668 | | | $ | 1,455,668 | | | | | | | | | |
In addition, DIDI provides information and administrative services for a fee ("Service Fee") for the shares listed in the following table. A portion of these fees may be paid pursuant to a Rule 12b-1 plan.
For the year ended April 30, 2013, the Service Fee was as follows:
| Tax-Exempt Portfolio: | | Service Fee | | | Waived | | | Annual Effective Rate | | | Contractual Rate (Up To) | |
| Capital Assets Funds Shares | | $ | 30,095 | | | $ | 30,095 | | | | .00 | % | | | .25 | % |
| Davidson Cash Equivalent Shares | | | 169,930 | | | | 169,930 | | | | .00 | % | | | .25 | % |
| Tax-Exempt Cash Managed Shares | | | 223,726 | | | | 223,726 | | | | .00 | % | | | .15 | % |
| Tax-Free Investment Class | | | 234,160 | | | | 234,160 | | | | .00 | % | | | .07 | % |
| | | $ | 657,911 | | | $ | 657,911 | | | | | | | | | |
Typesetting and Filing Service Fees. Under an agreement with DIMA, DIMA is compensated for providing typesetting and certain regulatory filing services to the Fund. For the year ended April 30, 2013, the amount charged to the Fund by DIMA included in the Statement of Operations under "reports to shareholders" was as follows:
| Fund | | Total Aggregated | | | Unpaid at April 30, 2013 | |
| Tax-Exempt Portfolio | | $ | 85,990 | | | $ | 31,227 | |
Trustees' Fees and Expenses. The Fund paid retainer fees to each Trustee not affiliated with the Advisor, plus specified amounts to the Board Chairperson and Vice Chairperson and to each committee Chairperson.
3. Concentration of Ownership
From time to time, the Fund may have a concentration of several shareholder accounts holding a significant percentage of shares outstanding. Investment activities of these shareholders could have a material impact on the Fund.
At April 30, 2013, three shareholder accounts held approximately 33%, 17% and 12% of the outstanding shares of the Fund.
4. Line of Credit
The Fund and other affiliated funds (the "Participants") share in a $375 million revolving credit facility provided by a syndication of banks. The Fund may borrow for temporary or emergency purposes, including the meeting of redemption requests that otherwise might require the untimely disposition of securities. The Participants are charged an annual commitment fee which is allocated based on net assets, among each of the Participants. Interest is calculated at a rate per annum equal to the sum of the Federal Funds Rate plus 1.25 percent plus, if LIBOR exceeds the Federal Funds Rate, the amount of such excess. The Fund may borrow up to a maximum of 33 percent of its net assets under the agreement. The Fund had no outstanding loans at April 30, 2013.
5. Share Transactions
The following table summarizes share and dollar activity in the Fund:
Tax-Exempt Portfolio
| | | Year Ended April 30, 2013 | | | Year Ended April 30, 2012 | |
| | | Shares | | | Dollars | | | Shares | | | Dollars | |
| Shares sold | |
| Capital Assets Funds Shares | | | 33,780,270 | | | $ | 33,780,270 | | | | 32,054,021 | | | $ | 32,054,021 | |
| Davidson Cash Equivalent Shares | | | 115,063,476 | | | | 115,063,476 | | | | 121,475,389 | | | | 121,475,389 | |
| DWS Tax-Exempt Cash Institutional Shares | | | 2,372,880,502 | | | | 2,372,880,502 | | | | 4,080,690,854 | | | | 4,080,690,854 | |
| DWS Tax-Exempt Money Fund | | | 251,306,829 | | | | 251,306,829 | | | | 325,873,832 | | | | 325,873,832 | |
| DWS Tax-Free Money Fund Class S | | | 28,082,317 | | | | 28,082,317 | | | | 31,868,351 | | | | 31,868,351 | |
| Service Shares | | | 138,095,905 | | | | 138,095,905 | | | | 173,964,295 | | | | 173,964,295 | |
| Tax-Exempt Cash Managed Shares | | | 238,693,476 | | | | 238,693,476 | | | | 387,004,796 | | | | 387,004,796 | |
| Tax-Free Investment Class | | | 396,600,890 | | | | 396,600,890 | | | | 330,420,769 | | | | 330,420,769 | |
| | | | | | | $ | 3,574,503,665 | | | | | | | $ | 5,483,352,307 | |
| Shares issued to shareholders in reinvestment of distributions | |
| Capital Assets Funds Shares | | | 3,264 | | | $ | 3,264 | | | | 2,578 | | | $ | 2,578 | |
| Davidson Cash Equivalent Shares | | | 20,992 | | | | 20,992 | | | | 13,652 | | | | 13,652 | |
| DWS Tax-Exempt Cash Institutional Shares | | | 163,290 | | | | 163,290 | | | | 307,257 | | | | 307,257 | |
| DWS Tax-Exempt Money Fund | | | 76,913 | | | | 76,913 | | | | 112,297 | | | | 112,297 | |
| DWS Tax-Free Money Fund Class S | | | 27,387 | | | | 27,387 | | | | 27,195 | | | | 27,195 | |
| Service Shares | | | 14,768 | | | | 14,768 | | | | 16,265 | | | | 16,265 | |
| Tax-Exempt Cash Managed Shares | | | 2,584 | | | | 2,584 | | | | 1,546 | | | | 1,546 | |
| Tax-Free Investment Class | | | 100,546 | | | | 100,546 | | | | 63,716 | | | | 63,716 | |
| | | | | | | $ | 409,744 | | | | | | | $ | 544,506 | |
| Shares redeemed | |
| Capital Assets Funds Shares | | | (35,324,040 | ) | | $ | (35,324,040 | ) | | | (31,054,695 | ) | | $ | (31,054,695 | ) |
| Davidson Cash Equivalent Shares | | | (106,210,991 | ) | | | (106,210,991 | ) | | | (135,004,695 | ) | | | (135,004,695 | ) |
| DWS Tax-Exempt Cash Institutional Shares | | | (2,508,359,723 | ) | | | (2,508,359,723 | ) | | | (4,467,264,493 | ) | | | (4,467,264,493 | ) |
| DWS Tax-Exempt Money Fund | | | (322,145,746 | ) | | | (322,145,746 | ) | | | (379,194,651 | ) | | | (379,194,651 | ) |
| DWS Tax-Free Money Fund Class S | | | (38,170,621 | ) | | | (38,170,621 | ) | | | (46,678,340 | ) | | | (46,678,340 | ) |
| Service Shares | | | (171,243,303 | ) | | | (171,243,303 | ) | | | (177,914,611 | ) | | | (177,914,611 | ) |
| Tax-Exempt Cash Managed Shares | | | (290,012,104 | ) | | | (290,012,104 | ) | | | (348,035,830 | ) | | | (348,035,830 | ) |
| Tax-Free Investment Class | | | (399,598,260 | ) | | | (399,598,260 | ) | | | (399,040,672 | ) | | | (399,040,672 | ) |
| | | | | | | $ | (3,871,064,788 | ) | | | | | | $ | (5,984,187,987 | ) |
| Net increase (decrease) | |
| Capital Assets Funds Shares | | | (1,540,506 | ) | | $ | (1,540,506 | ) | | | 1,001,904 | | | $ | 1,001,904 | |
| Davidson Cash Equivalent Shares | | | 8,873,477 | | | | 8,873,477 | | | | (13,515,654 | ) | | | (13,515,654 | ) |
| DWS Tax-Exempt Cash Institutional Shares | | | (135,315,931 | ) | | | (135,315,931 | ) | | | (386,266,382 | ) | | | (386,266,382 | ) |
| DWS Tax-Exempt Money Fund | | | (70,762,004 | ) | | | (70,762,004 | ) | | | (53,208,522 | ) | | | (53,208,522 | ) |
| DWS Tax-Free Money Fund Class S | | | (10,060,917 | ) | | | (10,060,917 | ) | | | (14,782,794 | ) | | | (14,782,794 | ) |
| Service Shares | | | (33,132,630 | ) | | | (33,132,630 | ) | | | (3,934,051 | ) | | | (3,934,051 | ) |
| Tax-Exempt Cash Managed Shares | | | (51,316,044 | ) | | | (51,316,044 | ) | | | 38,970,512 | | | | 38,970,512 | |
| Tax-Free Investment Class | | | (2,896,824 | ) | | | (2,896,824 | ) | | | (68,556,187 | ) | | | (68,556,187 | ) |
| | | | | | | $ | (296,151,379 | ) | | | | | | $ | (500,291,174 | ) |
Report of Independent Registered Public Accounting Firm
To the Shareholders and Board of Trustees of Cash Account Trust:
We have audited the accompanying statement of assets and liabilities of Tax-Exempt Portfolio (the "Fund") (one of the Funds comprising Cash Account Trust), including the investment portfolio, as of April 30, 2013, and the related statement of operations for the year then ended, the statement of changes in net assets for each of the two years in the period then ended, and the financial highlights for each of the five years in the period then ended. These financial statements and financial highlights are the responsibility of the Fund's management. Our responsibility is to express an opinion on these financial statements and financial highlights based on our audits.
We conducted our audits in accordance with the standards of the Public Company Accounting Oversight Board (United States). Those standards require that we plan and perform the audit to obtain reasonable assurance about whether the financial statements and financial highlights are free of material misstatement. We were not engaged to perform an audit of the Fund's internal control over financial reporting. Our audits included consideration of internal control over financial reporting as a basis for designing audit procedures that are appropriate in the circumstances, but not for the purpose of expressing an opinion on the effectiveness of the Fund's internal control over financial reporting. Accordingly, we express no such opinion. An audit also includes examining, on a test basis, evidence supporting the amounts and disclosures in the financial statements and financial highlights, assessing the accounting principles used and significant estimates made by management, and evaluating the overall financial statement presentation. Our procedures included confirmation of securities owned as of April 30, 2013, by correspondence with the custodian and brokers. We believe that our audits provide a reasonable basis for our opinion.
In our opinion, the financial statements and financial highlights referred to above present fairly, in all material respects, the financial position of Tax-Exempt Portfolio at April 30, 2013, the results of its operations for the year then ended, the changes in its net assets for each of the two years in the period then ended, and the financial highlights for each of the five years in the period then ended, in conformity with U.S. generally accepted accounting principles.
| | | |
Boston, Massachusetts June 19, 2013 | | |
Information About Your Fund's Expenses
As an investor of the Fund, you incur two types of costs: ongoing expenses and transaction costs. Ongoing expenses include management fees, distribution and service (12b-1) fees and other Fund expenses. Examples of transaction costs include account maintenance fees, which are not shown in this section. The following tables are intended to help you understand your ongoing expenses (in dollars) of investing in the Fund and to help you compare these expenses with the ongoing expenses of investing in other mutual funds. In the most recent six-month period, the Fund limited these expenses; had it not done so, expenses would have been higher for Tax-Free Money Fund Class S. The example in the table is based on an investment of $1,000 invested at the beginning of the six-month period and held for the entire period (November 1, 2012 to April 30, 2013).
The tables illustrate your Fund's expenses in two ways:
•Actual Fund Return. This helps you estimate the actual dollar amount of ongoing expenses (but not transaction costs) paid on a $1,000 investment in the Fund using the Fund's actual return during the period. To estimate the expenses you paid over the period, simply divide your account value by $1,000 (for example, an $8,600 account value divided by $1,000 = 8.6), then multiply the result by the number in the "Expenses Paid per $1,000" line under the share class you hold.
• Hypothetical 5% Fund Return. This helps you to compare your Fund's ongoing expenses (but not transaction costs) with those of other mutual funds using the Fund's actual expense ratio and a hypothetical rate of return of 5% per year before expenses. Examples using a 5% hypothetical fund return may be found in the shareholder reports of other mutual funds. The hypothetical account values and expenses may not be used to estimate the actual ending account balance or expenses you paid for the period.
Please note that the expenses shown in these tables are meant to highlight your ongoing expenses only and do not reflect any transaction costs. The "Expenses Paid per $1,000" line of the tables is useful in comparing ongoing expenses only and will not help you determine the relative total expense of owning different funds. An account maintenance fee of $6.25 per quarter for DWS Tax-Free Money Fund Class S shares may apply for certain accounts whose balances do not meet the applicable minimum initial investment. This fee is not included in these tables. If it was, the estimate of expenses paid for DWS Tax-Free Money Fund Class S shares during the period would be higher, and account value during the period would be lower, by this amount.
Expenses and Value of a $1,000 Investment for the six months ended April 30, 2013 (Unaudited) | |
| Actual Fund Return | | DWS Tax-Free Money Fund Class S | |
| Beginning Account Value 11/1/12 | | $ | 1,000.00 | |
| Ending Account Value 4/30/13 | | $ | 1,000.23 | |
Expenses Paid per $1,000* | | $ | .89 | |
| Hypothetical 5% Fund Return | | | | |
| Beginning Account Value 11/1/12 | | $ | 1,000.00 | |
| Ending Account Value 4/30/13 | | $ | 1,023.90 | |
Expenses Paid per $1,000* | | $ | .90 | |
| * Expenses are equal to the Fund's annualized expense ratio for each share class, multiplied by the average account value over the period, multiplied by 181 (the number of days in the most recent six-month period), then divided by 365. | |
| Annualized Expense Ratio | | | | |
| DWS Tax-Free Money Fund Class S | | | .18 | % |
For more information, please refer to the Fund's prospectus. For an analysis of the fees associated with an investment in the Fund or similar funds, please refer to http://apps.finra.org/fundanalyzer/1/fa.aspx. | |
Tax Information (Unaudited)
Of the dividends paid from net investment income for the taxable year ended April 30, 2013, 100% are designated as exempt interest dividends for federal income tax purposes.
Please consult a tax advisor if you have questions about federal or state income tax laws, or on how to prepare your tax returns. If you have specific questions about your account, please call (800) 728-3337.
Proxy Voting
The Fund's policies and procedures for voting proxies for portfolio securities and information about how the Fund voted proxies related to its portfolio securities during the 12-month period ended June 30 are available on our Web site — www.dws-investments.com (click on "proxy voting" at the bottom of the page) — or on the SEC's Web site — www.sec.gov. To obtain a written copy of the Fund's policies and procedures without charge, upon request, call us toll free at (800) 728-3337.
Portfolio Holdings
Following the Fund's fiscal first and third quarter-end, a complete portfolio holdings listing is filed with the SEC on Form N-Q. In addition, each month, information about the Fund and its portfolio holdings is filed with the SEC on Form N-MFP. The SEC delays the public availability of the information filed on Form N-MFP for 60 days after the end of the reporting period included in the filing. These forms will be available on the SEC's Web site at www.sec.gov, and they may also be reviewed and copied at the SEC's Public Reference Room in Washington, D.C. Information on the operation of the SEC's Public Reference Room may be obtained by calling (800) SEC-0330. The Fund's portfolio holdings are also posted on www.dws-investments.com from time to time. Please see the Fund's current prospectus for more information.
Money Market Fund Reform
In 2010, the Securities and Exchange Commission adopted amendments to then-existing money market fund regulations, imposing new liquidity, credit quality and maturity requirements on all money market funds. In November 2012, the Financial Stability Oversight Council (FSOC), a board of U.S. regulators established by the Dodd-Frank Act, proposed recommendations for money market fund reform. If the SEC were to adopt one or more of the FSOC proposed recommendations in the future, or if FSOC were to take other steps to establish similar regulations of money market funds in the future, such regulatory action may affect the Fund's operations and/or return potential.
Summary of Management Fee Evaluation by Independent Fee Consultant
September 17, 2012
Pursuant to an Order entered into by Deutsche Investment Management Americas and affiliates (collectively, "DeAM") with the Attorney General of New York, I, Thomas H. Mack, have been appointed the Independent Fee Consultant for the DWS Funds (formerly the DWS Scudder Funds). My duties include preparing an annual written evaluation of the management fees DeAM charges the Funds, considering among other factors the management fees charged by other mutual fund companies for like services, management fees DeAM charges other clients for like services, DeAM's costs of supplying services under the management agreements and related profit margins, possible economies of scale if a Fund grows larger, and the nature and quality of DeAM's services, including fund performance. This report summarizes my evaluation for 2012, including my qualifications, the evaluation process for each of the DWS Funds, consideration of certain complex-level factors, and my conclusions. I served in substantially the same capacity in 2007, 2008, 2009, 2010 and 2011.
Qualifications
For more than 35 years I have served in various professional capacities within the investment management business. I have held investment analysis and advisory positions, including securities analyst, portfolio strategist and director of investment policy with a large investment firm. I have also performed business management functions, including business development, financial management and marketing research and analysis.
Since 1991, I have been an independent consultant within the asset management industry. I have provided services to over 125 client organizations, including investment managers, mutual fund boards, product distributors and related organizations. Over the past ten years I have completed a number of assignments for mutual fund boards, specifically including assisting boards with management contract renewal.
I hold a Master of Business Administration degree, with highest honors, from Harvard University and Master of Science and Bachelor of Science (highest honors) degrees from the University of California at Berkeley. I am an independent director and audit committee financial expert for two closed-end mutual funds and have served in various leadership and financial oversight capacities with non-profit organizations.
Evaluation of Fees for each DWS Fund
My work focused primarily on evaluating, fund-by-fund, the fees charged to each of the 103 mutual fund portfolios in the DWS Fund family. For each Fund, I considered each of the key factors mentioned above, as well as any other relevant information. In doing so I worked closely with the Funds' Independent Directors in their annual contract renewal process, as well as in their approval of contracts for several new funds (documented separately).
In evaluating each Fund's fees, I reviewed comprehensive materials provided by or on behalf of DeAM, including expense information prepared by Lipper Analytical, comparative performance information, profitability data, manager histories, and other materials. I also accessed certain additional information from the Lipper and Morningstar databases and drew on my industry knowledge and experience.
To facilitate evaluating this considerable body of information, I prepared for each Fund a document summarizing the key data elements in each area as well as additional analytics discussed below. This made it possible to consider each key data element in the context of the others.
In the course of contract renewal, DeAM agreed to implement a number of fee and expense adjustments requested by the Independent Directors which will favorably impact future fees and expenses, and my evaluation includes the effects of these changes.
Fees and Expenses Compared with Other Funds
The competitive fee and expense evaluation for each fund focused on two primary comparisons:
The Fund's contractual management fee (the advisory fee plus the administration fee where applicable) compared with those of a group of typically 12-15 funds in the same Lipper investment category (e.g. Large Capitalization Growth) having similar distribution arrangements and being of similar size.
The Fund's total expenses compared with a broader universe of funds from the same Lipper investment category and having similar distribution arrangements.
These two comparisons provide a view of not only the level of the fee compared with funds of similar scale but also the total expense the Fund bears for all the services it receives, in comparison with the investment choices available in the Fund's investment category and distribution channel. The principal figure-of-merit used in these comparisons was the subject Fund's percentile ranking against peers.
DeAM's Fees for Similar Services to Others
DeAM provided management fee schedules for all of its US domiciled fund and non-fund investment management accounts in any of the investment categories where there is a DWS Fund. These similar products included the other DWS Funds, non-fund pooled accounts, institutional accounts and sub-advisory accounts. Using this information, I calculated for each Fund the fee that would be charged to each similar product, at the subject Fund's asset level.
Evaluating information regarding non-fund products is difficult because there are varying levels of services required for different types of accounts, with mutual funds generally requiring considerably more regulatory and administrative types of service as well as having more frequent cash flows than other types of accounts. Also, while mutual fund fees for similar fund products can be expected to be similar, there will be some differences due to different pricing conditions in different distribution channels (e.g. retail funds versus those used in variable insurance products), differences in underlying investment processes and other factors.
Costs and Profit Margins
DeAM provided a detailed profitability analysis for each Fund. After making some adjustments so that the presentation would be more comparable to the available industry figures, I reviewed profit margins from investment management alone, from investment management plus other fund services (excluding distribution) provided to the Funds by DeAM (principally shareholder services), and DeAM profits from all sources, including distribution. A later section comments on overall profitability.
Economies of Scale
Economies of scale — an expected decline in management cost per dollar of fund assets as fund assets grow — are very rarely quantified and documented because of inherent difficulties in collecting and analyzing relevant data. However, in virtually every investment category that I reviewed, larger funds tend to have lower fees and lower total expenses than smaller funds. To see how each DWS Fund compares with this industry observation, I reviewed:
The trend in Fund assets over the last five years and the accompanying trend in total expenses. This shows if the Fund has grown and, if so, whether total expense (management fees as well as other expenses) have declined as a percent of assets.
Whether the Fund has break-points in its management fee schedule, the extent of the fee reduction built into the schedule and the asset levels where the breaks take effect, and in the case of a sub-advised Fund how the Fund's break-points compare with those of the sub-advisory fee schedule.
How the Fund's contractual fee schedule compares with trends in the industry data. To accomplish this, I constructed a chart showing how actual latest-fiscal-year contractual fees of the Fund and of other similar funds relate to average fund assets, with the subject Fund's contractual fee schedule superimposed.
Quality of Service — Performance
The quality-of-service evaluation focused on investment performance, which is the principal result of the investment management service. Each Fund's performance was reviewed over the past 1, 3, 5 and 10 years, as applicable, and compared with that of other funds in the same investment category and with a suitable market index.
In addition, I calculated and reviewed risk-adjusted returns relative to an index of similar mutual funds' returns and a suitable market index. The risk-adjusted returns analysis provides a way of determining the extent to which the Fund's return comparisons are mainly the product of investment value-added (or lack thereof) or alternatively taking considerably more or less risk than is typical in its investment category.
I also received and considered the history of portfolio manager changes for each Fund, as this provided an important context for evaluating the performance results.
Complex-Level Considerations
While this evaluation was conducted mainly at the individual fund level, there are some issues relating to the reasonableness of fees that can alternatively be considered across the whole fund complex:
I reviewed DeAM's profitability analysis for all DWS Funds, with a view toward determining if the allocation procedures used were reasonable and how profit levels compared with public data for other investment managers.
I considered whether DeAM and affiliates receive any significant ancillary or "fallout" benefits that should be considered in interpreting the direct profitability results. These would be situations where serving as the investment manager of the Funds is beneficial to another part of the Deutsche Bank organization.
I considered how aggregated DWS Fund expenses had varied over the years, by asset class and in the context of trends in asset levels.
I considered how aggregated DWS Fund performance measures relative to appropriate peers had varied by asset class and over time.
I reviewed the structure of the DeAM organization, trends in staffing levels, and information on compensation of investment management and other professionals compared with industry data.
Findings
Based on the process and analysis discussed above, which included reviewing a wide range of information from management and external data sources and considering among other factors the fees DeAM charges other clients, the fees charged by other fund managers, DeAM's costs and profits associated with managing the Funds, economies of scale, possible fall-out benefits, and the nature and quality of services provided, in my opinion the management fees charged the DWS Funds are reasonable.
Thomas H. Mack
President, Thomas H. Mack & Co., Inc.
Board Members and Officers
The following table presents certain information regarding the Board Members and Officers of the fund. Each Board Member's year of birth is set forth in parentheses after his or her name. Unless otherwise noted, (i) each Board Member has engaged in the principal occupation(s) noted in the table for at least the most recent five years, although not necessarily in the same capacity; and (ii) the address of each Independent Board Member is c/o Kenneth C. Froewiss, Chairman, DWS Mutual Funds, P.O. Box 78, Short Hills, NJ 07078. Except as otherwise noted below, the term of office for each Board Member is until the election and qualification of a successor, or until such Board Member sooner dies, resigns, is removed or as otherwise provided in the governing documents of the fund. Because the fund does not hold an annual meeting of shareholders, each Board Member will hold office for an indeterminate period. The Board Members may also serve in similar capacities with other funds in the fund complex.
| Independent Board Members |
Name, Year of Birth, Position with the Fund and Length of Time Served1 | | Business Experience and Directorships During the Past Five Years | Number of Funds in DWS Fund Complex Overseen |
Other Directorships Held by Board Member |
Kenneth C. Froewiss (1945) Chairperson since 2013,9 and Board Member since 2001 | | Adjunct Professor of Finance, NYU Stern School of Business (September 2009-present; Clinical Professor from 1997-September 2009); Member, Finance Committee, Association for Asian Studies (2002-present); Director, Mitsui Sumitomo Insurance Group (US) (2004-present); prior thereto, Managing Director, J.P. Morgan (investment banking firm) (until 1996) | 102 | — |
William McClayton (1944) Vice Chairperson since 2013,9 and Board Member since 2004 | | Private equity investor (since October 2009); previously, Managing Director, Diamond Management & Technology Consultants, Inc. (global consulting firm) (2001-2009); Directorship: Board of Managers, YMCA of Metropolitan Chicago; formerly: Senior Partner, Arthur Andersen LLP (accounting) (1966-2001); Trustee, Ravinia Festival | 102 | — |
John W. Ballantine (1946) Board Member since 1999 | | Retired; formerly, Executive Vice President and Chief Risk Management Officer, First Chicago NBD Corporation/The First National Bank of Chicago (1996-1998); Executive Vice President and Head of International Banking (1995-1996); former Directorships: Stockwell Capital Investments PLC (private equity); First Oak Brook Bancshares, Inc. and Oak Brook Bank; Prisma Energy International | 102 | Chairman of the Board, Healthways, Inc.2 (provider of disease and care management services) (2003- present); Portland General Electric2 (utility company) (2003- present) |
Henry P. Becton, Jr. (1943) Board Member since 1990 | | Vice Chair and former President, WGBH Educational Foundation. Directorships: Public Radio International; Public Radio Exchange (PRX); The PBS Foundation; North Bennett Street School (Boston); former Directorships: Association of Public Television Stations; Boston Museum of Science; American Public Television; Concord Academy; New England Aquarium; Mass. Corporation for Educational Telecommunications; Committee for Economic Development; Public Broadcasting Service; Connecticut College | 102 | Lead Director, Becton Dickinson and Company2 (medical technology company); Lead Director, Belo Corporation2 (media company) |
Dawn-Marie Driscoll (1946) Board Member since 1987 | | President, Driscoll Associates (consulting firm); Emeritus Executive Fellow, Center for Business Ethics, Bentley University; formerly, Partner, Palmer & Dodge (1988-1990); Vice President of Corporate Affairs and General Counsel, Filene's (1978-1988). Directorships: Director of ICI Mutual Insurance Company (since 2007); Advisory Board, Center for Business Ethics, Bentley University; Chairman of the Board of Trustees, Southwest Florida Community Foundation (charitable organization); former Directorships: Sun Capital Advisers Trust (mutual funds) (2007-2012), Investment Company Institute (audit, executive, nominating committees) and Independent Directors Council (governance, executive committees) | 102 | — |
Keith R. Fox, CFA (1954) Board Member since 1996 | | Managing General Partner, Exeter Capital Partners (a series of private investment funds) (since 1986). Directorships: Progressive International Corporation (kitchen goods importer and distributor); The Kennel Shop (retailer); former Chairman, National Association of Small Business Investment Companies; former Directorships: BoxTop Media Inc. (advertising); Sun Capital Advisers Trust (mutual funds) (2011-2012) | 102 | — |
Paul K. Freeman (1950) Board Member since 1993, and Chairperson (2009-Jan. 8, 2013) | | Consultant, World Bank/Inter-American Development Bank; Executive and Governing Council of the Independent Directors Council (Chairman of Education Committee); formerly: Project Leader, International Institute for Applied Systems Analysis (1998-2001); Chief Executive Officer, The Eric Group, Inc. (environmental insurance) (1986-1998); Directorships: Denver Zoo Foundation (December 2012-present); former Directorships: Prisma Energy International | 102 | — |
Richard J. Herring (1946) Board Member since 1990 | | Jacob Safra Professor of International Banking and Professor, Finance Department, The Wharton School, University of Pennsylvania (since July 1972); Co-Director, Wharton Financial Institutions Center (since July 2000); Co-Chair, U.S. Shadow Financial Regulatory Committee; Executive Director, Financial Economists Roundtable; formerly: Vice Dean and Director, Wharton Undergraduate Division (July 1995-June 2000); Director, Lauder Institute of International Management Studies (July 2000-June 2006) | 102 | Director, Japan Equity Fund, Inc. (since September 2007), Thai Capital Fund, Inc. (since 2007), Singapore Fund, Inc. (since September 2007), Independent Director of Barclays Bank Delaware (since September 2010) |
Rebecca W. Rimel (1951) Board Member since 1995 | | President and Chief Executive Officer, The Pew Charitable Trusts (charitable organization) (1994 to present); formerly: Executive Vice President, The Glenmede Trust Company (investment trust and wealth management) (1983-2004); Board Member, Investor Education (charitable organization) (2004-2005); Trustee, Executive Committee, Philadelphia Chamber of Commerce (2001-2007); Director, Viasys Health Care2 (January 2007-June 2007); Trustee, Thomas Jefferson Foundation (charitable organization) (1994-2012) | 102 | Director, Becton Dickinson and Company2 (medical technology company) (2012- present); Director, CardioNet, Inc.2 (health care) (2009- present) |
William N. Searcy, Jr. (1946) Board Member since 1993 | | Private investor since October 2003; formerly: Pension & Savings Trust Officer, Sprint Corporation2 (telecommunications) (November 1989-September 2003); Trustee, Sun Capital Advisers Trust (mutual funds) (1998-2012) | 102 | — |
Jean Gleason Stromberg (1943) Board Member since 1997 | | Retired. Formerly, Consultant (1997-2001); Director, Financial Markets U.S. Government Accountability Office (1996-1997); Partner, Fulbright & Jaworski, L.L.P. (law firm) (1978-1996). Directorships: The William and Flora Hewlett Foundation; former Directorships: Service Source, Inc., Mutual Fund Directors Forum (2002-2004), American Bar Retirement Association (funding vehicle for retirement plans) (1987-1990 and 1994-1996) | 102 | — |
Robert H. Wadsworth (1940) Board Member since 1999 | | President, Robert H. Wadsworth & Associates, Inc. (consulting firm) (1983 to present); Director, National Horizon, Inc. (non-profit organization); Director and Treasurer, The Phoenix Boys Choir Association | 105 | — |
Interested Board Member and Officer4 |
Name, Year of Birth, Position with the Fund and Length of Time Served1,6 | | Business Experience and Directorships During the Past Five Years | Number of Funds in DWS Fund Complex Overseen |
Other Directorships Held by Board Member |
Michael J. Woods5 (1967) Board Member since 2013,9 and Executive Vice President since 20139 | | Managing Director,3 Deutsche Asset & Wealth Management (2009-present); Head of the Americas Asset Management Business for Deutsche Bank, Member of the Asset and Wealth Management ("AWM") Extended Executive Committee, AWM Global Client Group Executive Committee and the AWM Active Asset Management Executive Committee; CEO and US Regional Head of DWS Investments; formerly: Sr. VP, Head of the Financial Intermediaries and Investments Group of Evergreen Investments (2007-2009), CEO and Vice Chairman of Board of Directors of XTF Global Asset Management (2006-2007), Managing Director — US Head of Sub-Advisory and Investment Only Business at Citigroup Asset Management (2000-2006). Mr. Woods is currently a board member of The Children's Village, The Big Brothers Big Sisters Organization, and The Mutual Fund Education Alliance. | 38 | — |
Officers4 |
Name, Year of Birth, Position with the Fund and Length of Time Served6 | | Business Experience and Directorships During the Past Five Years |
W. Douglas Beck, CFA7 (1967) President, 2011-present | | Managing Director,3 Deutsche Asset & Wealth Management (2006-present); President of DWS family of funds and Head of Product Management, U.S. for DWS Investments; formerly: Executive Director, Head of Product Management (2002-2006) and President (2005-2006) of the UBS Funds at UBS Global Asset Management; Co-Head of Manager Research/Managed Solutions Group, Merrill Lynch (1998-2002) |
John Millette8 (1962) Vice President and Secretary, 1999-present | | Director,3 Deutsche Asset & Wealth Management |
Paul H. Schubert7 (1963) Chief Financial Officer, 2004-present Treasurer, 2005-present | | Managing Director,3 Deutsche Asset & Wealth Management (since July 2004); formerly: Executive Director, Head of Mutual Fund Services and Treasurer for UBS Family of Funds (1998-2004); Vice President and Director of Mutual Fund Finance at UBS Global Asset Management (1994-1998) |
Caroline Pearson8 (1962) Chief Legal Officer, 2010-present | | Managing Director,3 Deutsche Asset & Wealth Management; formerly: Assistant Secretary for DWS family of funds (1997-2010) |
Melinda Morrow7 (1970) Vice President, 2012-present | | Director,3 Deutsche Asset & Wealth Management |
Hepsen Uzcan8 (1974) Assistant Secretary, since 20139 | | Vice President, Deutsche Asset & Wealth Management |
Paul Antosca8 (1957) Assistant Treasurer, 2007-present | | Director,3 Deutsche Asset & Wealth Management |
Jack Clark8 (1967) Assistant Treasurer, 2007-present | | Director,3 Deutsche Asset & Wealth Management |
Diane Kenneally8 (1966) Assistant Treasurer, 2007-present | | Director,3 Deutsche Asset & Wealth Management |
John Caruso7 (1965) Anti-Money Laundering Compliance Officer, 2010-present | | Managing Director,3 Deutsche Asset & Wealth Management |
Robert Kloby7 (1962) Chief Compliance Officer, 2006-present | | Managing Director,3 Deutsche Asset & Wealth Management |
1 The length of time served represents the year in which the Board Member joined the board of one or more DWS funds currently overseen by the Board.
2 A publicly held company with securities registered pursuant to Section 12 of the Securities Exchange Act of 1934.
3 Executive title, not a board directorship.
4 As a result of their respective positions held with the Advisor, these individuals are considered "interested persons" of the Advisor within the meaning of the 1940 Act. Interested persons receive no compensation from the fund.
5 The mailing address of Mr. Woods is 60 Wall Street, New York, New York 10005. Mr. Woods is an interested Board Member by virtue of his positions with Deutsche Asset & Wealth Management. As an interested person, Mr. Woods receives no compensation from the fund. Mr. Woods is a board member of the following trusts and corporations: Cash Account Trust, DWS Market Trust, DWS Money Funds, DWS State Tax-Free Income Series, DWS Target Fund, DWS Value Series, Inc., DWS Variable Series II, Investors Cash Trust, Tax-Exempt California Money Market Fund, DWS Global High Income Fund, Inc., DWS High Income Opportunities Fund, Inc., DWS High Income Trust, DWS Multi-Market Income Trust, DWS Municipal Income Trust, DWS Strategic Income Trust and DWS Strategic Municipal Income Trust.
6 The length of time served represents the year in which the officer was first elected in such capacity for one or more DWS funds.
7 Address: 60 Wall Street, New York, NY 10005.
8 Address: One Beacon Street, Boston, MA 02108.
9 Effective as of January 9, 2013.
The fund's Statement of Additional Information ("SAI") includes additional information about the Board Members. The SAI is available, without charge, upon request. If you would like to request a copy of the SAI, you may do so by calling the following toll-free number: (800) 728-3337.
Notes
Notes
Notes
Notes
Notes
ANNUAL REPORT TO SHAREHOLDERS
Tax-Free Investment Class
Tax-Exempt Portfolio
April 30, 2013
Contents
4 Portfolio Management Review 17 Statement of Assets and Liabilities 19 Statement of Operations 20 Statement of Changes in Net Assets 22 Notes to Financial Statements 31 Report of Independent Registered Public Accounting Firm 32 Information About Your Fund's Expenses 35 Summary of Management Fee Evaluation by Independent Fee Consultant 39 Board Members and Officers |
This report must be preceded or accompanied by a prospectus. To obtain a summary prospectus, if available, or prospectus for any of our funds, visit www.dws-investments.com. We advise you to consider the fund's objectives, risks, charges and expenses carefully before investing. The summary prospectus and prospectus contain this and other important information about the fund. Please read the prospectus carefully before you invest.
An investment in this fund is not insured or guaranteed by the Federal Deposit Insurance Corporation (FDIC) or by any other government agency. Although the fund seeks to preserve the value of your investment at $1.00 per share, it is possible to lose money by investing in the fund. The share price of money market funds can fall below the $1.00 share price. You should not rely on or expect the Advisor to enter into support agreements or take other actions to maintain the fund's $1.00 share price. The credit quality of the fund's holdings can change rapidly in certain markets, and the default of a single holding could have an adverse impact on the fund's share price. The fund's share price can also be negatively affected during periods of high redemption pressures and/or illiquid markets. The actions of a few large investors in one class of shares of the fund may have a significant adverse effect on the share prices of all classes of shares of the fund. See the prospectus for specific details regarding the fund's risk profile.
DWS Investments is part of the Deutsche Asset & Wealth Management division of Deutsche Bank AG.
NOT FDIC/NCUA INSURED NO BANK GUARANTEE MAY LOSE VALUE NOT A DEPOSIT NOT INSURED BY ANY FEDERAL GOVERNMENT AGENCY
Portfolio Management Review (Unaudited)
Market Overview
All performance information below is historical and does not guarantee future results. Investment return and principal fluctuate, so your shares may be worth more or less when redeemed. Current performance may differ from performance data shown. Please visit www.dws-investments.com for the fund's most recent month-end performance. The 7-day current yield refers to the income paid by the fund over a 7-day period expressed as an annual percentage rate of the fund's shares outstanding. Yields fluctuate and are not guaranteed.
At the beginning of the fund's most recent fiscal year ended April 30, 2013, we saw another dramatic "flight to quality," as worries concerning Greece's upcoming elections and continuingly worsening conditions for Spanish and Italian banks led global and domestic investors to abandon risky assets. Late in 2012, any negative economic data was overshadowed by investor anticipation of more substantial central bank actions. The European Central Bank (ECB) lowered its interest rate for bank reserves. Then, the head of the ECB, Mario Draghi, stated that the central bank would do "whatever it takes" to preserve the euro. In December 2012, the U.S. Federal Reserve Board (the Fed) altered its guidance regarding rate levels, stating that it would maintain short-term interest rates near zero until U.S. unemployment dropped below 6.5%, and as long as inflation levels did not exceed 2.5%. In the first quarter of 2013, the European situation remained quiescent until the banking crisis in Cyprus reached a boiling point; the crisis was finally resolved after it was agreed that large uninsured depositors in Cyprus' banks would suffer substantial losses. In addition, the U.S. economy was boosted by higher housing prices and some gains in employment levels. In the money market area, we saw a continued supply/demand imbalance as well as a reduction in short-term money market supply due to ongoing quantitative easing by the Fed. In the continued search for yield, money market investors looked to a variety of financial instruments issued in countries around the world.
Positive Contributors to Fund Performance
We were able to maintain a yield that is in line with other similar money market funds during the period ended April 30, 2013.
| Tax-Exempt Portfolio seeks to provide maximum current income that is exempt from federal income taxes to the extent consistent with stability of capital. |
We sought to preserve a balance of liquidity and high quality by maintaining a strong position in variable-rate securities during the period. (The interest rate of variable-rate securities adjusts periodically based on indices such as the Securities Industry and Financial Market Association Index of Variable Rate Demand Notes. Because the interest rates of these instruments adjust as market conditions change, they provide flexibility in an uncertain interest rate environment.) In addition, we took advantage of higher yields along the yield curve by investing in tax-exempt commercial paper, three-month to nine-month municipal "put" bonds, and one-year fixed-rate municipal note issues. We have also maintained broad diversification for the fund by investing in a number of states and municipalities.
Fund Performance (as of April 30, 2013)
Performance is historical and does not guarantee future results. Current performance may be lower or higher than the performance data quoted.
An investment in the fund is not insured or guaranteed by the Federal Deposit Insurance Corporation (FDIC) or by any other government agency. Although the fund seeks to preserve the value of your investment at $1.00 per share, it is possible to lose money by investing in the fund.
| | | 7-Day Current Yield | |
| Tax-Free Investment Class | | | .01 | %* |
| Equivalent Taxable Yield | | | .02 | %** |
Yields are historical, will fluctuate and do not guarantee future performance. The 7-day current yield refers to the income paid by the fund over a 7-day period expressed as an annual percentage rate of the fund's shares outstanding. For the most current yield information, visit our Web site at www.dws-investments.com. * The investment advisor has agreed to voluntarily waive fees/reimburse expenses. This waiver may be changed or terminated at any time without notice. ** The equivalent taxable yield allows you to compare with the performance of taxable money market funds. For the Tax-Exempt Portfolio, the equivalent taxable yield is based upon the marginal income tax rate of 35%. Income may be subject to local taxes and, for some investors, the alternative minimum tax. | |
Negative Contributors to Fund Performance
The types of securities that we invested in tended to have lower yields than issues carrying more risk. We preferred to be cautious during a time of market uncertainty. In the end this may have cost the fund some yield, but we believe that this represented a prudent approach to preserving principal.
Outlook and Positioning
We anticipate limited growth for the U.S. economy over the remainder of this year, due to steady but unspectacular employment gains and the automatic budget cuts dictated by congressional sequestration. In turn, we think that restrained growth will mean that the Fed will continue its extremely accommodative monetary policy through early 2014. We look for money market rates to continue to be low based on decreases in supply on a number of fronts and strong investor demand.
We continue our insistence on the highest credit quality within the fund. We also plan to maintain our conservative investment strategies and standards under the current market conditions. We continue to apply a careful approach to investing on behalf of the fund and to seek competitive yield for our shareholders.
Portfolio Management Team
A group of investment professionals is responsible for the day-to-day management of the fund. These investment professionals have a broad range of experience managing money market funds.
The views expressed reflect those of the portfolio management team only through the end of the period of the report as stated on the cover. The management team's views are subject to change at any time based on market and other conditions and should not be construed as a recommendation. Past performance is no guarantee of future results. Current and future portfolio holdings are subject to risk.
Terms to Know
Quantitative easing is a government monetary policy often used when interest rates are at or near zero. With this policy government or other securities are purchased from the market, causing the price of the securities purchased to rise and the yield or interest rates on the securities purchased to fall. For the companies whose bonds the central banks are willing to purchase, it means having to pay lower interest rates on new bonds issued to replace existing bonds that have matured. With lower borrowing costs, the central banks hope that consumers will be encouraged to spend more, thus helping the overall economy and improving the balance sheets of the companies providing the goods and services on which consumers are spending their money.
The yield curve is a graphical representation of how yields on bonds of different maturities compare. Normally, yield curves slant up, as bonds with longer maturities typically offer higher yields than short-term bonds.
A repurchase agreement, or "overnight repo," is an agreement between a seller and a buyer, usually of government securities, where the seller agrees to repurchase the securities at a given price and usually at a stated time. Repos are widely used money market instruments that serve as an interest-bearing, short-term "parking place" for large sums of money.
The Securities Industry and Financial Market Association Index of Variable Rate Demand Notes is a weekly high-grade market index consisting of seven-day, tax-exempt, variable-rate demand notes produced by Municipal Market Data Group. Actual issues are selected from Municipal Market Data's database of more than 10,000 active issues. Index returns do not reflect fees or expenses and it is not possible to invest directly into an index.
A "put" bond allows an investor to require the issuer to repurchase the bond at a specified date before its maturity.
Portfolio Summary (Unaudited)
Investment Portfolio as of April 30, 2013
Tax-Exempt Portfolio
| | | Principal Amount ($) | | | Value ($) | |
| | | | |
| Municipal Investments 98.7% | |
| Alaska 3.1% | |
| Anchorage, AK: | |
| Tax Anticipation Notes, 2.0%, 9/17/2013 | | | 25,000,000 | | | | 25,174,489 | |
| TECP, 0.19%, 10/3/2013, LOC: Wells Fargo | | | 25,000,000 | | | | 25,000,000 | |
| TECP, 0.23%, 6/5/2013, LOC: Wells Fargo | | | 8,300,000 | | | | 8,300,000 | |
| | | | | 58,474,489 | |
| California 14.5% | |
| California, Golden State Tobacco Securitization Corp., Tobacco Settlement: | | | | | | | | |
| Series B, Prerefunded 6/1/2013 @ 100, 5.5%, 6/1/2043 | | | 24,415,000 | | | | 24,523,306 | |
| Series B, Prerefunded 6/1/2013 @ 100, 5.625%, 6/1/2038 | | | 31,610,000 | | | | 31,753,010 | |
| Series 2003-A-1, Prerefunded 6/1/2013 @ 100, 6.25%, 6/1/2033 | | | 43,745,000 | | | | 43,966,499 | |
| Series 2003-A-1, Prerefunded 6/1/2013 @ 100, 6.75%, 6/1/2039 | | | 38,470,000 | | | | 38,683,616 | |
| California, Nuveen Dividend Advantage Municipal Fund, Series 1-1362, 144A, AMT, 0.4%*, 6/1/2041, LIQ: Morgan Stanley Bank | | | 5,000,000 | | | | 5,000,000 | |
| California, RBC Municipal Products, Inc. Trust: | |
| Series E-21, 144A, 0.26%*, Mandatory Put 9/3/2013 @ 100, 10/1/2013, LIQ: Royal Bank of Canada, LOC: Royal Bank of Canada | | | 25,000,000 | | | | 25,000,000 | |
| Series E-24, 144A, 0.26%*, Mandatory Put 8/1/2013 @ 100, 7/1/2031, LIQ: Royal Bank of Canada, LOC: Royal Bank of Canada | | | 16,865,000 | | | | 16,865,000 | |
| California, State Department of Water Resources, Supply Revenue: | | | | | | | | |
| Series N, 5.0%, 5/1/2013 | | | 10,000,000 | | | | 10,000,000 | |
| Series M, 5.0%, 5/1/2014 | | | 7,500,000 | | | | 7,859,716 | |
| California, State General Obligation: | |
| Prerefunded 4/1/2014 @ 100, 5.0%, 4/1/2031, INS: AMBAC | | | 10,325,000 | | | | 10,778,410 | |
| Prerefunded 4/1/2014 @ 100, 5.25%, 4/1/2034 | | | 6,035,000 | | | | 6,313,855 | |
| California, Statewide Communities Development Authority, Multi-Family Housing Revenue: | | | | | | | | |
| Series 2680, 144A, 0.29%*, 5/15/2018, LOC: JPMorgan Chase Bank NA | | | 14,700,000 | | | | 14,700,000 | |
| Series 2681, 144A, AMT, 0.36%*, 5/15/2018, LOC: JPMorgan Chase Bank NA | | | 12,250,000 | | | | 12,250,000 | |
| California, Wells Fargo Stage Trust: | |
| Series 74C, 144A, 0.19%*, 11/15/2040, GTY: Wells Fargo Bank NA, LIQ: Wells Fargo Bank NA | | | 5,810,000 | | | | 5,810,000 | |
| Series 31C, 144A, AMT, 0.25%*, Mandatory Put 8/15/2013 @ 100, 1/1/2022, GTY: Wells Fargo Bank NA, LIQ: Wells Fargo Bank NA | | | 5,995,000 | | | | 5,995,000 | |
| San Diego County, CA, School District Note Participations, Series A, 2.0%, 6/28/2013 | | | 10,000,000 | | | | 10,029,016 | |
| | | | | 269,527,428 | |
| Colorado 3.8% | |
| Colorado, State Education Loan Program, Series C, 144A, 2.5%, 6/27/2013 | | | 60,000,000 | | | | 60,221,714 | |
| Colorado, Wells Fargo Stage Trust, Series 42C, 144A, AMT, 0.19%*, 11/15/2023, GTY: Wells Fargo Bank NA, LIQ: Wells Fargo Bank NA | | | 9,835,000 | | | | 9,835,000 | |
| | | | | 70,056,714 | |
| District of Columbia 0.8% | |
| District of Columbia, Wells Fargo Stage Trust, Series 57C, 144A, AMT, 0.25%*, Mandatory Put 12/26/2013 @ 100, 10/1/2032, GTY: Wells Fargo Bank NA, LIQ: Wells Fargo Bank NA | | | 13,965,000 | | | | 13,965,000 | |
| Georgia 0.7% | |
| Burke County, GA, Development Authority Revenue, Georgia Power Co. Plant, 144A, 0.21%*, 5/1/2022 | | | 5,555,000 | | | | 5,555,000 | |
| Georgia, Private Colleges & Universities Authority Revenue, Mercer University Project, Series C, 0.24%*, 10/1/2031, LOC: Branch Banking & Trust | | | 8,335,000 | | | | 8,335,000 | |
| | | | | 13,890,000 | |
| Hawaii 0.5% | |
| Hawaii, Wells Fargo State Trust, Series 6C, 144A, 0.19%*, 7/1/2040, GTY: Wells Fargo Bank NA, LIQ: Wells Fargo Bank NA | | | 8,820,000 | | | | 8,820,000 | |
| Idaho 2.5% | |
| Idaho, State General Obligation, 2.0%, 6/28/2013 | | | 47,000,000 | | | | 47,134,110 | |
| Illinois 13.3% | |
| Chicago, IL, Loyola University: | |
| TECP, 0.14%, 5/21/2013 | | | 25,000,000 | | | | 25,000,000 | |
| TECP, 0.15%, 6/3/2013 | | | 25,040,000 | | | | 25,040,000 | |
| Chicago, IL, O'Hare International Airport Revenue, 0.18%, 5/7/2013 | | | 5,000,000 | | | | 5,000,000 | |
| Illinois, BB&T Municipal Trust, Series 5001, 144A, 0.31%*, 6/1/2020, LIQ: Rabobank Nederland, LOC: Rabobank International | | | 23,460,000 | | | | 23,460,000 | |
| Illinois, Educational Facilities Authority Revenue, University of Chicago, Series B-3, 0.24%*, Mandatory Put 3/13/2014 @ 100, 7/1/2036 | | | 18,000,000 | | | | 18,000,000 | |
| Illinois, Educational Facilities Authority Revenues: | |
| TECP, 0.15%, 6/3/2013, LOC: Northern Trust Co. | | | 20,000,000 | | | | 20,000,000 | |
| TECP, 0.16%, 6/3/2013, LOC: Northern Trust Co. | | | 30,000,000 | | | | 30,000,000 | |
| TECP, 0.16%, 7/1/2013, LOC: Northern Trust Co. | | | 16,200,000 | | | | 16,200,000 | |
| TECP, 0.16%, 7/2/2013, LOC: Northern Trust Co. | | | 30,000,000 | | | | 30,000,000 | |
| Illinois, Wells Fargo Stage Trust, Series 27C, 144A, 0.26%*, Mandatory Put 10/24/2013 @ 100, 8/1/2025, GTY: Wells Fargo Bank NA, LIQ: Wells Fargo Bank NA, | | | 38,405,000 | | | | 38,405,000 | |
| Mundelein, IL, Industrial Development Revenue, MacLean Fogg Co. Project, 144A, AMT, 0.38%*, 1/1/2015, LOC: Northern Trust Co. | | | 6,500,000 | | | | 6,500,000 | |
| Woodstock, IL, Multi-Family Housing Revenue, Willow Brooke Apartments, AMT, 0.24%*, 4/1/2042, LOC: Wells Fargo Bank NA | | | 10,000,000 | | | | 10,000,000 | |
| | | | | 247,605,000 | |
| Indiana 3.6% | |
| Indiana, State Finance Authority, Industrial Revenue, Midwest Fertilizer Corp. Project, 0.2%, Mandatory Put 7/1/2013 @ 100, 7/1/2046 | | | 60,000,000 | | | | 60,000,000 | |
| Indiana, Wells Fargo State Trust, Series 100C, 144A, 0.19%*, 8/1/2021, GTY: Wells Fargo Bank NA, LIQ: Wells Fargo Bank NA | | | 7,495,000 | | | | 7,495,000 | |
| | | | | 67,495,000 | |
| Iowa 4.1% | |
| Iowa, State Finance Authority Midwestern Disaster Area Revenue, Fertilizer Co. Project, 0.17%*, Mandatory Put 5/31/2013 @ 100, 12/1/2050 | | | 70,000,000 | | | | 70,000,000 | |
| Iowa, State Finance Authority, Wellness Facilities Revenue, Community Marshalltown Project, 0.26%*, 1/1/2031, LOC: Northern Trust Co. | | | 6,015,000 | | | | 6,015,000 | |
| | | | | 76,015,000 | |
| Kansas 0.8% | |
| Kansas, State Development Finance Authority, Multi-Family Revenue, Oak Ridge Park II Project, Series X, AMT, 0.29%*, 12/1/2036, LOC: U.S. Bank NA | | | 3,650,000 | | | | 3,650,000 | |
| Olathe, KS, General Obligation, Series A, 1.5%, 7/1/2013 | | | 11,280,000 | | | | 11,304,457 | |
| | | | | 14,954,457 | |
| Kentucky 1.9% | |
| Kentucky, State Economic Development Finance Authority, Catholic Health Initiatives: | | | | | | | | |
| Series B, 0.32%**, 2/1/2046 | | | 10,680,000 | | | | 10,680,000 | |
| Series B-2, 0.32%**, 2/1/2046 | | | 12,000,000 | | | | 12,000,000 | |
| Series B-3, 0.32%**, 2/1/2046 | | | 12,415,000 | | | | 12,415,000 | |
| | | | | 35,095,000 | |
| Maryland 1.6% | |
| Maryland, State Health & Higher Educational Facilities Authority Revenue, Pooled Loan Program, Series D, 144A, 0.27%*, 1/1/2029, LOC: Bank of America NA | | | 12,580,000 | | | | 12,580,000 | |
| Montgomery County, MD, TECP, 0.17%, 6/4/2013, LOC: State Street Bank & Trust Co. | | | 17,000,000 | | | | 17,000,000 | |
| | | | | 29,580,000 | |
| Michigan 6.6% | |
| Michigan, RBC Municipal Products, Inc. Trust: | |
| Series L-23, 144A, AMT, 0.26%*, 3/1/2028, INS: AMBAC, LIQ: Royal Bank of Canada, LOC: Royal Bank of Canada | | | 44,995,000 | | | | 44,995,000 | |
| Series L-27, 144A, AMT, 0.26%*, 3/1/2031, LIQ: Royal Bank of Canada, LOC: Royal Bank of Canada | | | 40,000,000 | | | | 40,000,000 | |
| Michigan, State Finance Authority Revenue, Unemployment Obligation Assessment, Series A, 2.0%, 7/1/2013 | | | 11,100,000 | | | | 11,133,708 | |
| Michigan, State Hospital Finance Authority Revenue, Ascension Health Senior Credit Group: | | | | | | | | |
| Series F-7, 0.31%*, 11/15/2047 | | | 11,200,000 | | | | 11,200,000 | |
| Series F-6, 0.31%**, 11/15/2049 | | | 8,660,000 | | | | 8,660,000 | |
| Series F-8, 0.31%**, 11/15/2049 | | | 7,100,000 | | | | 7,100,000 | |
| | | | | 123,088,708 | |
| Minnesota 1.3% | |
| Cohasset, MN, State Power & Light Co. Project, Series A, 0.27%*, 6/1/2020, LOC: JPMorgan Chase Bank NA | | | 24,630,000 | | | | 24,630,000 | |
| Mississippi 0.5% | |
| Mississippi, Redstone Partners Floaters/Residuals Trust, Series C, 144A, AMT, 0.41%*, 12/1/2047, LOC: Wachovia Bank NA | | | 9,220,000 | | | | 9,220,000 | |
| Missouri 5.0% | |
| Missouri, State Health & Educational Facilities: | |
| TECP, 0.12%, 5/21/2013 | | | 28,000,000 | | | | 28,000,000 | |
| TECP, 0.14%, 5/16/2013 | | | 22,000,000 | | | | 22,000,000 | |
| Missouri, University of Curators, TECP, 0.14%, 5/7/2013 | | | 23,000,000 | | | | 23,000,000 | |
| North Kansas City, MO, Hospital Revenue, 0.22%*, 11/1/2033, LOC: Bank of America NA | | | 20,660,000 | | | | 20,660,000 | |
| | | | | 93,660,000 | |
| New York 4.2% | |
| BlackRock New York Municipal Income Quality Trust, Series W-7-40, 144A, AMT, 0.32%*, 10/1/2041, LIQ: Barclays Bank PLC | | | 5,000,000 | | | | 5,000,000 | |
| BlackRock New York Municipal Intermediate Duration Fund, Inc., Series W-7-296, 144A, AMT, 0.32%*, 10/1/2041, LIQ: Barclays Bank PLC | | | 13,500,000 | | | | 13,500,000 | |
| New York, RIB Floater Trust, Series 1WE, 144A, 0.29%*, 9/30/2013, LIQ: Barclays Bank PLC | | | 60,000,000 | | | | 60,000,000 | |
| | | | | 78,500,000 | |
| North Carolina 1.9% | |
| North Carolina, BB&T Municipal Trust: | |
| Series 1008, 144A, 0.31%*, 3/1/2024, LIQ: Branch Banking & Trust, LOC: Branch Banking & Trust | | | 5,515,000 | | | | 5,515,000 | |
| Series 1009, 144A, 0.31%*, 6/1/2024, LIQ: Branch Banking & Trust, LOC: Branch Banking & Trust | | | 15,675,000 | | | | 15,675,000 | |
| North Carolina, Capital Facilities Finance Agency, TECP, 0.15%, 6/5/2013 | | | 13,860,000 | | | | 13,860,000 | |
| | | | | 35,050,000 | |
| Ohio 1.6% | |
| Ohio, Puttable Floating Option Tax-Exempt Receipts, Series 808, 144A, AMT, 0.42%*, 12/1/2041, GTY: Bank of America NA, INS: AMBAC, LIQ: Bank of America NA | | | 30,000,000 | | | | 30,000,000 | |
| Oklahoma 0.5% | |
| Tulsa, OK, Airports Improvement Trust, Special Facilities Revenue, Lufthansa/Bizjet International, Inc., 144A, AMT, 0.26%*, 8/1/2018, LOC: Landesbank Hessen-Thuringen | | | 10,120,000 | | | | 10,120,000 | |
| Other Territories 6.2% | |
| BB&T Municipal Trust, Series 1010, 144A, 0.26%*, 1/15/2019, LIQ: Branch Banking & Trust, LOC: Branch Banking & Trust | | | 5,980,000 | | | | 5,980,000 | |
| BB&T Municipal Trust, Series 5000, 144A, 0.31%*, 10/1/2028, LIQ: Rabobank Nederland, LOC: Rabobank International | | | 6,755,000 | | | | 6,755,000 | |
| BlackRock Muni Holdings Investment Quality Fund, Series W-7-2746, 144A, AMT, 0.43%*, 7/1/2041, LIQ: Bank of America NA | | | 28,100,000 | | | | 28,100,000 | |
| BlackRock Municipal Bond Investment Trust, Series W-7-178, 144A, AMT, 0.32%*, 10/1/2041, LIQ: Barclays Bank PLC | | | 9,300,000 | | | | 9,300,000 | |
| Eagle Tax- Exempt Trust, 144A, AMT, 0.27%*, 4/15/2049, LIQ: Federal Home Loan Bank | | | 14,615,000 | | | | 14,615,000 | |
| Nuveen Premier Income Municipal Fund 2, Inc., Series 1-4895, 144A, AMT, 0.32%*, 5/1/2041, LIQ: Barclays Bank PLC | | | 52,000,000 | | | | 52,000,000 | |
| | | | | 116,750,000 | |
| Pennsylvania 2.7% | |
| Pennsylvania, State Economic Development Financing Authority, IESI PA Corp., 0.26%*, 11/1/2028, GTY: IESI Corp., LOC: Bank of America NA | | | 34,000,000 | | | | 34,000,000 | |
| University of Pittsburgh, PA, The Commonwealth Systems of Higher Education, Pittsburgh Assessment Notes, 2.0%, 7/2/2013 | | | 17,000,000 | | | | 17,051,605 | |
| | | | | 51,051,605 | |
| Puerto Rico 2.6% | |
| Puerto Rico, RIB Floater Trust, Series 8WE, 144A, 0.27%, 9/30/2014, LOC: Barclays Bank PLC | | | 47,500,000 | | | | 47,500,000 | |
| Tennessee 3.5% | |
| Metropolitan Government Nashville & Davidson County, TN: | |
| TECP, 0.2%, 10/3/2013 | | | 10,000,000 | | | | 10,000,000 | |
| TECP, 0.23%, 9/3/2013 | | | 17,000,000 | | | | 17,000,000 | |
| Tennessee, Tennergy Corp., Gas Revenue, Stars Certificates, Series 2006-001, 144A, 0.27%*, 5/1/2016, LOC: BNP Paribas | | | 39,000,000 | | | | 39,000,000 | |
| | | | | 66,000,000 | |
| Texas 9.5% | |
| Harris County, TX, Cultural Education, TECP, 0.23%, 7/9/2013 | | | 40,000,000 | | | | 40,000,000 | |
| Lamar, TX, Consolidated Independent School District, Series R-12266, 144A, 0.25%*, 8/1/2015, SPA: Citibank NA | | | 20,485,000 | | | | 20,485,000 | |
| North Texas, Tollway Authority Revenue, TECP, 0.16%, 6/7/2013, LOC: JPMorgan Chase Bank NA | | | 15,400,000 | | | | 15,400,000 | |
| Texas, JPMorgan Chase Putters/Drivers Trust, Series 4263, 144A, 0.18%*, 8/30/2013, LIQ: JPMorgan Chase Bank NA | | | 30,000,000 | | | | 30,000,000 | |
| Texas, Municipal Power Agency Revenue, TECP, 0.21%, 5/17/2013, LOC: Barclays Bank PLC | | | 15,500,000 | | | | 15,500,000 | |
| Texas, State Transportation Revenue, 2.5%, 8/30/2013 | | | 45,000,000 | | | | 45,339,981 | |
| Texas City, TX, Industrial Development Corp. Revenue, Del Papa Realty Holdings, 0.26%*, 1/1/2051, LOC: Bank of America NA | | | 9,500,000 | | | | 9,500,000 | |
| | | | | 176,224,981 | |
| Washington 0.7% | |
| Washington, Wells Fargo Stage Trust, Series 93C, 144A, 0.29%, Mandatory Put 6/13/2013 @ 100, 8/15/2046, GTY: Wells Fargo Bank NA, LIQ: Wells Fargo Bank NA | | | 13,675,000 | | | | 13,675,000 | |
| West Virginia 0.7% | |
| West Virginia, Economic Development Authority Revenue, Morgantown Energy, AMT, 0.26%*, 4/1/2027, LOC: Union Bank NA | | | 12,210,000 | | | | 12,210,000 | |
| | | % of Net Assets | | | Value ($) | |
| | | | |
Total Investment Portfolio (Cost $1,840,292,492)† | | | 98.7 | | | | 1,840,292,492 | |
| Other Assets and Liabilities, Net | | | 1.3 | | | | 24,009,682 | |
| Net Assets | | | 100.0 | | | | 1,864,302,174 | |
* Variable rate demand notes and variable rate demand preferred shares are securities whose interest rates are reset periodically at market levels. These securities are payable on demand and are shown at their current rates as of April 30, 2013.
** Floating rate securities' yields vary with a designated market index or market rate, such as the coupon-equivalent of the U.S. Treasury Bill rate. These securities are shown at their current rate as of April 30, 2013.
† The cost for federal income tax purposes was $1,840,292,492.
144A: Security exempt from registration under Rule 144A of the Securities Act of 1933. These securities may be resold in transactions exempt from registration, normally to qualified institutional buyers.
AMBAC: Ambac Financial Group, Inc.
AMT: Subject to alternative minimum tax.
GTY: Guaranty Agreement
INS: Insured
LIQ: Liquidity Facility
LOC: Letter of Credit
Prerefunded: Bonds which are prerefunded are collateralized usually by U.S. Treasury securities which are held in escrow and used to pay principal and interest on tax-exempt issues and to retire the bonds in full at the earliest refunding date.
SPA: Standby Bond Purchase Agreement
TECP: Tax Exempt Commercial Paper
Fair Value Measurements
Various inputs are used in determining the value of the Fund's investments. These inputs are summarized in three broad levels. Level 1 includes quoted prices in active markets for identical securities. Level 2 includes other significant observable inputs (including quoted prices for similar securities, interest rates, prepayment speeds and credit risk). Level 3 includes significant unobservable inputs (including the Fund's own assumptions in determining the fair value of investments). The inputs or methodology used for valuing securities are not necessarily an indication of the risk associated with investing in those securities. Securities held by the Fund are reflected as Level 2 because the securities are valued at amortized cost (which approximates fair value) and, accordingly, the inputs used to determine value are not quoted prices in an active market.
The following is a summary of the inputs used as of April 30, 2013 in valuing the Fund's investments. For information on the Fund's policy regarding the valuation of investments, please refer to the Security Valuation section of Note 1 in the accompanying Notes to Financial Statements.
| Assets | | Level 1 | | | Level 2 | | | Level 3 | | | Total | |
| | |
| Municipal Investments (a) | | $ | — | | | $ | 1,840,292,492 | | | $ | — | | | $ | 1,840,292,492 | |
| Total | | $ | — | | | $ | 1,840,292,492 | | | $ | — | | | $ | 1,840,292,492 | |
There have been no transfers between fair value measurement levels during the period ended April 30, 2013.
(a) See Investment Portfolio for additional detailed categorizations.
The accompanying notes are an integral part of the financial statements.
Statement of Assets and Liabilities | as of April 30, 2013 | |
| Assets | | Tax-Exempt Portfolio | |
Investments: Investments in non-affiliated securities, valued at amortized cost | | $ | 1,840,292,492 | |
| Receivable for investments sold | | | 17,580,000 | |
| Receivable for Fund shares sold | | | 298,158 | |
| Interest receivable | | | 7,109,732 | |
| Due from Advisor | | | 3,699 | |
| Other assets | | | 77,001 | |
| Total assets | | | 1,865,361,082 | |
| Liabilities | |
| Cash overdraft | | | 391,974 | |
| Payable for Fund shares redeemed | | | 169,016 | |
| Distributions payable | | | 6,227 | |
| Accrued management fee | | | 110,040 | |
| Accrued Trustees' fees | | | 18,385 | |
| Other accrued expenses and payables | | | 363,266 | |
| Total liabilities | | | 1,058,908 | |
| Net assets, at value | | $ | 1,864,302,174 | |
| Net Assets Consist of | |
| Undistributed net investment income | | | 212,651 | |
| Paid-in capital | | | 1,864,089,523 | |
| Net assets, at value | | $ | 1,864,302,174 | |
The accompanying notes are an integral part of the financial statements.
Statement of Assets and Liabilities as of April 30, 2013 (continued) | |
| Net Asset Value | | Tax-Exempt Portfolio | |
Capital Assets Funds Shares Net Asset Value, offering and redemption price per share ($10,059,102 ÷ 10,056,881 outstanding shares of beneficial interest, no par value, unlimited number of shares authorized) | | $ | 1.00 | |
Davidson Cash Equivalent Shares Net Asset Value, offering and redemption price per share ($70,393,545 ÷ 70,377,984 outstanding shares of beneficial interest, no par value, unlimited number of shares authorized) | | $ | 1.00 | |
DWS Tax-Exempt Cash Institutional Shares Net Asset Value, offering and redemption price per share ($970,451,993 ÷ 970,237,656 outstanding shares of beneficial interest, no par value, unlimited number of shares authorized) | | $ | 1.00 | |
DWS Tax-Exempt Money Fund Net Asset Value, offering and redemption price per share ($241,992,881 ÷ 241,939,471 outstanding shares of beneficial interest, no par value, unlimited number of shares authorized) | | $ | 1.00 | |
DWS Tax-Free Money Fund Class S Net Asset Value, offering and redemption price per share ($99,900,985 ÷ 99,878,925 outstanding shares of beneficial interest, no par value, unlimited number of shares authorized) | | $ | 1.00 | |
Service Shares Net Asset Value, offering and redemption price per share ($44,904,689 ÷ 44,894,771 outstanding shares of beneficial interest, no par value, unlimited number of shares authorized) | | $ | 1.00 | |
Tax-Exempt Cash Managed Shares Net Asset Value, offering and redemption price per share ($115,086,280 ÷ 115,060,862 outstanding shares of beneficial interest, no par value, unlimited number of shares authorized) | | $ | 1.00 | |
Tax-Free Investment Class Net Asset Value, offering and redemption price per share ($311,512,699 ÷ 311,443,897 outstanding shares of beneficial interest, no par value, unlimited number of shares authorized) | | $ | 1.00 | |
The accompanying notes are an integral part of the financial statements.
| for the year ended April 30, 2013 | |
| Investment Income | | Tax-Exempt Portfolio | |
Income: Interest | | $ | 4,226,122 | |
Expenses: Management fee | | | 1,326,518 | |
| Administration fee | | | 2,073,476 | |
| Services to shareholders | | | 1,150,669 | |
| Distribution and service fees | | | 2,113,579 | |
| Custodian fee | | | 27,586 | |
| Professional fees | | | 126,547 | |
| Reports to shareholders | | | 149,965 | |
| Registration fees | | | 153,018 | |
| Trustees' fees and expenses | | | 87,355 | |
| Other | | | 101,842 | |
| Total expenses before expense reductions | | | 7,310,555 | |
| Expense reductions | | | (3,397,143 | ) |
| Total expenses after expense reductions | | | 3,913,412 | |
| Net investment income | | | 312,710 | |
| Net realized gain (loss) from investments | | | 119,059 | |
| Net increase (decrease) in net assets resulting from operations | | $ | 431,769 | |
The accompanying notes are an integral part of the financial statements.
Statement of Changes in Net Assets | | | Tax-Exempt Portfolio | |
| Increase (Decrease) in Net Assets | | Years Ended April 30, | |
| | 2013 | | | 2012 | |
Operations: Net investment income | | $ | 312,710 | | | $ | 659,723 | |
| Net realized gain (loss) | | | 119,059 | | | | 21,137 | |
| Net increase in net assets resulting from operations | | | 431,769 | | | | 680,860 | |
Distributions to shareholders from: Net investment income: Capital Assets Funds Shares | | | (2,578 | ) | | | (2,580 | ) |
| Davidson Cash Equivalent Shares | | | (16,635 | ) | | | (13,672 | ) |
| DWS Tax-Exempt Cash Institutional Shares | | | (347,411 | ) | | | (598,543 | ) |
| DWS Tax-Exempt Money Fund | | | (63,056 | ) | | | (115,000 | ) |
| DWS Tax-Free Money Fund Class S | | | (22,814 | ) | | | (28,531 | ) |
| Service Shares | | | (12,350 | ) | | | (16,307 | ) |
| Tax-Exempt Cash Managed Shares | | | (36,504 | ) | | | (35,814 | ) |
| Tax-Free Investment Class | | | (80,485 | ) | | | (64,866 | ) |
Net realized gain: Capital Assets Funds Shares | | | (686 | ) | | | — | |
| Davidson Cash Equivalent Shares | | | (4,358 | ) | | | — | |
| DWS Tax-Exempt Cash Institutional Shares | | | (58,793 | ) | | | — | |
| DWS Tax-Exempt Money Fund | | | (15,872 | ) | | | — | |
| DWS Tax-Free Money Fund Class S | | | (5,799 | ) | | | — | |
| Service Shares | | | (2,541 | ) | | | — | |
| Tax-Exempt Cash Managed Shares | | | (9,837 | ) | | | — | |
| Tax-Free Investment Class | | | (21,062 | ) | | | — | |
| Total distributions | | | (700,781 | ) | | | (875,313 | ) |
Fund share transactions: Proceeds from shares sold | | | 3,574,503,665 | | | | 5,483,352,307 | |
| Reinvestment of distributions | | | 409,744 | | | | 544,506 | |
| Cost of shares redeemed | | | (3,871,064,788 | ) | | | (5,984,187,987 | ) |
| Net increase (decrease) in net assets from Fund share transactions | | | (296,151,379 | ) | | | (500,291,174 | ) |
| Increase (decrease) in net assets | | | (296,420,391 | ) | | | (500,485,627 | ) |
| Net assets at beginning of period | | | 2,160,722,565 | | | | 2,661,208,192 | |
| Net assets at end of period (including undistributed net investment income of $212,651 and $481,663, respectively) | | $ | 1,864,302,174 | | | $ | 2,160,722,565 | |
The accompanying notes are an integral part of the financial statements.
Tax-Exempt Portfolio Tax-Free Investment Class | |
| | | Years Ended April 30, | |
| | | 2013 | | | 2012 | | | 2011 | | | 2010 | | | 2009 | |
| Selected Per Share Data | |
| Net asset value, beginning of period | | $ | 1.00 | | | $ | 1.00 | | | $ | 1.00 | | | $ | 1.00 | | | $ | 1.00 | |
Income (loss) from investment operations: Net investment income | | | .000 | * | | | .000 | * | | | .000 | * | | | .000 | * | | | .011 | |
| Net realized gain (loss) | | | .000 | * | | | .000 | * | | | .000 | * | | | .000 | * | | | .000 | * |
| Total from investment operations | | | .000 | * | | | .000 | * | | | .000 | * | | | .000 | * | | | .011 | |
Less distributions from: Net investment income | | | (.000 | )* | | | (.000 | )* | | | (.000 | )* | | | (.000 | )* | | | (.011 | ) |
| Net realized gains | | | (.000 | )* | | | — | | | | — | | | | (.000 | )* | | | — | |
| Total distributions | | | (.000 | )* | | | (.000 | )* | | | (.000 | )* | | | (.000 | )* | | | (.011 | ) |
| Net asset value, end of period | | $ | 1.00 | | | $ | 1.00 | | | $ | 1.00 | | | $ | 1.00 | | | $ | 1.00 | |
| Total Return (%) | | | .03 | a | | | .02 | a | | | .01 | a | | | .04 | a | | | 1.15 | |
| Ratios to Average Net Assets and Supplemental Data | |
| Net assets, end of period ($ millions) | | | 312 | | | | 314 | | | | 383 | | | | 407 | | | | 570 | |
| Ratio of expenses before expense reductions (%) | | | .63 | | | | .62 | | | | .61 | | | | .62 | | | | .63 | |
| Ratio of expenses after expense reductions (%) | | | .19 | | | | .22 | | | | .35 | | | | .45 | | | | .63 | |
| Ratio of net investment income (%) | | | .01 | | | | .01 | | | | .01 | | | | .02 | | | | 1.16 | |
a Total return would have been lower had certain expenses not been reduced. * Amount is less than $.0005. | |
Notes to Financial Statements
1. Organization and Significant Accounting Policies
Cash Account Trust (the "Trust") is registered under the Investment Company Act of 1940, as amended (the "1940 Act"), as an open-end investment management company organized as a Massachusetts business trust.
The Trust offers three funds: Money Market Portfolio, Government & Agency Securities Portfolio and Tax-Exempt Portfolio. These financial statements report on Tax-Exempt Portfolio (the "Fund").
Tax-Exempt Portfolio offers eight classes of shares: Capital Assets Funds Shares, Davidson Cash Equivalent Shares, DWS Tax-Exempt Cash Institutional Shares, DWS Tax-Exempt Money Fund, DWS Tax-Free Money Fund Class S, Service Shares, Tax-Exempt Cash Managed Shares and Tax-Free Investment Class.
The financial highlights for all classes of shares, other than Tax-Free Investment Class, are provided separately and are available upon request.
The Fund's investment income, realized gains and losses, and certain Fund-level expenses and expense reductions, if any, are borne pro rata on the basis of relative net assets by the holders of all classes of shares of the Fund, except that each class bears certain expenses unique to that class such as distribution and service fees, services to shareholders and certain other class-specific expenses. Differences in class-level expenses may result in payment of different per share dividends by class. All shares of the Trust have equal rights with respect to voting subject to class-specific arrangements.
The Fund's financial statements are prepared in accordance with accounting principles generally accepted in the United States of America which require the use of management estimates. Actual results could differ from those estimates. The policies described below are followed consistently by the Fund in the preparation of its financial statements.
Security Valuation. Various inputs are used in determining the value of the Fund's investments. These inputs are summarized in three broad levels. Level 1 includes quoted prices in active markets for identical securities. Level 2 includes other significant observable inputs (including quoted prices for similar securities, interest rates, prepayment speeds, and credit risk). Level 3 includes significant unobservable inputs (including the Fund's own assumptions in determining the fair value of investments). The inputs or methodology used for valuing securities are not necessarily an indication of the risk associated with investing in those securities.
The Fund values all securities utilizing the amortized cost method permitted in accordance with Rule 2a-7 under the 1940 Act and certain conditions therein. Under this method, which does not take into account unrealized capital gains or losses on securities, an instrument is initially valued at its cost and thereafter assumes a constant accretion/amortization rate to maturity of any discount or premium. Securities held by the Fund are reflected as Level 2 because the securities are valued at amortized cost (which approximates fair value) and, accordingly, the inputs used to determine value are not quoted prices in an active market.
Disclosure about the classification of fair value measurements is included in a table following the Fund's Investment Portfolio.
New Accounting Pronouncement. In January 2013, Accounting Standard Update 2013-01 (ASU 2013-01), Clarifying the Scope of Disclosures about Offsetting Assets and Liabilities, replaced Accounting Standards Update 2011-11 (ASU 2011-11), Disclosures about Offsetting Assets and Liabilities. ASU 2013-01 is effective for fiscal years beginning on or after January 1, 2013, and interim periods within those annual periods. ASU 2011-11 was intended to enhance disclosure requirements on the offsetting of financial assets and liabilities. The ASU 2013-01 limits the scope of the new balance sheet offsetting disclosures to derivatives, repurchase agreements, and securities lending transactions to the extent that they are (1) offset in the financial statements or (2) subject to an enforceable master netting arrangement or similar agreement. Management is currently evaluating the application of ASU 2013-01 and its impact, if any, on the Fund's financial statements.
Federal Income Taxes. The Fund's policy is to comply with the requirements of the Internal Revenue Code, as amended, which are applicable to regulated investment companies and to distribute all of its taxable and tax-exempt income to its shareholders.
The Fund has reviewed the tax positions for the open tax years as of April 30, 2013 and has determined that no provision for income tax is required in the Fund's financial statements. The Fund's federal tax returns for the prior three fiscal years remain open subject to examination by the Internal Revenue Service.
Distribution of Income. Net investment income of the Fund is declared as a daily dividend and is distributed to shareholders monthly. The Fund may take into account capital gains and losses in its daily dividend declarations. The Fund may also make additional distributions for tax purposes if necessary.
Permanent book and tax basis differences relating to shareholder distributions will result in reclassifications to paid in capital. Temporary book and tax basis differences will reverse in a subsequent period. There were no significant book-to-tax differences for the Fund.
At April 30, 2013, the Fund's components of distributable earnings on a tax basis are as follows:
| Undistributed tax-exempt income* | | $ | 218,878 | |
In addition, the tax character of distributions paid to shareholders by the Fund is summarized as follows:
| | | Years Ended April 30, | |
| | | 2013 | | | 2012 | |
| Distributions from tax-exempt income | | $ | 581,722 | | | $ | 854,176 | |
| Distributions from ordinary income* | | $ | 119,059 | | | $ | 21,137 | |
* For tax purposes, short-term capital gain distributions are considered ordinary income distributions.
Expenses. Expenses of the Trust arising in connection with a specific Fund are allocated to that Fund. Other Trust expenses which cannot be directly attributed to a Fund are apportioned pro rata on the basis of relative net assets among the funds in the Trust based upon the relative net assets or other appropriate measures.
Contingencies. In the normal course of business, the Fund may enter into contracts with service providers that contain general indemnification clauses. The Fund's maximum exposure under these arrangements is unknown as this would involve future claims that may be made against the Fund that have not yet been made. However, based on experience, the Fund expects the risk of loss to be remote.
Other. Investment transactions are accounted for on trade date. Interest income is recorded on the accrual basis. Realized gains and losses from investment transactions are recorded on an identified cost basis and may include proceeds from litigation. All discounts and premiums are accreted/amortized for both tax and financial reporting purposes.
2. Related Parties
Management Agreement. Under an Amended and Restated Investment Management Agreement with Deutsche Investment Management Americas Inc. ("DIMA" or the "Advisor"), an indirect, wholly owned subsidiary of Deutsche Bank AG, the Advisor directs the investments of the Fund in accordance with its investment objectives, policies and restrictions. The Advisor determines the securities, instruments and other contracts relating to investments to be purchased, sold or entered into by the Fund.
The Fund pays a monthly management fee based on the combined average daily net assets of the three funds in the Trust and allocated to the Fund based on its relative net assets, computed and accrued daily and payable monthly, at the following annual rates:
| First $500 million of the Funds' combined average daily net assets | | | .120 | % |
| Next $500 million of such net assets | | | .100 | % |
| Next $1 billion of such net assets | | | .075 | % |
| Next $1 billion of such net assets | | | .060 | % |
| Over $3 billion of such net assets | | | .050 | % |
For the period from May 1, 2012 through September 30, 2013, the Advisor has contractually agreed to waive its fees and/or reimburse certain operating expenses of the Tax-Free Investment Class to the extent necessary to maintain the operating expenses (excluding certain expenses such as extraordinary expenses, taxes, brokerage and interest) at 0.72%.
The Advisor has agreed to voluntarily waive additional expenses. The voluntary waiver may be changed or terminated at any time without notice. Under these arrangements, the Advisor waived certain expenses on Tax-Free Investment Class shares.
Accordingly, for the year ended April 30, 2013, the Advisor earned a management fee on the Fund aggregating $1,326,518, of which $309,712 was waived, resulting in an annual effective rate of 0.05% of the Fund's average daily net assets.
The Advisor has also agreed to maintain expenses of certain other classes of the Trust. These rates are disclosed in the respective share classes' annual reports that are provided separately and are available upon request.
Administration Fee. Pursuant to an Administrative Services Agreement, DIMA provides most administrative services to the Fund. For all services provided under the Administrative Services Agreement, the Fund pays the Advisor an annual fee ("Administration Fee") of 0.10% of the Fund's average daily net assets, computed and accrued daily and payable monthly. For the year ended April 30, 2013, the Administration Fee was as follows:
| | | Administration Fee | | | Unpaid at April 30, 2013 | |
| Tax-Exempt Portfolio | | $ | 2,073,476 | | | $ | 161,841 | |
Service Provider Fees. DWS Investments Service Company ("DISC"), an affiliate of the Advisor, is the transfer agent, dividend-paying agent and shareholder service agent for the Fund. Pursuant to a sub-transfer agency agreement between DISC and DST Systems, Inc. ("DST"), DISC has delegated certain transfer agent, dividend-paying agent and shareholder service agent functions to DST. DISC compensates DST out of the shareholder servicing fee it receives from the Fund. For the year ended April 30, 2013, the amounts charged to the Fund by DISC were as follows:
| Tax-Exempt Portfolio: | | Total Aggregated | | | Waived | | | Unpaid at April 30, 2013 | |
| Capital Assets Funds Shares | | $ | 30,095 | | | $ | 28,537 | | | $ | — | |
| Davidson Cash Equivalent Shares | | | 101,958 | | | | 96,636 | | | | 286 | |
| DWS Tax-Exempt Cash Institutional Shares | | | 159,779 | | | | 159,779 | | | | — | |
| DWS Tax-Exempt Money Fund | | | 90,009 | | | | 64,368 | | | | 6,013 | |
| DWS Tax-Free Money Fund Class S | | | 62,942 | | | | 51,694 | | | | 3,125 | |
| Service Shares | | | 156,558 | | | | 147,666 | | | | 5,419 | |
| Tax-Exempt Cash Managed Shares | | | 102,865 | | | | 86,626 | | | | 431 | |
| Tax-Free Investment Class | | | 368,933 | | | | 338,546 | | | | — | |
| | | $ | 1,073,139 | | | $ | 973,852 | | | $ | 15,274 | |
Distribution Service Agreement. Under the Distribution Service Agreement, in accordance with Rule 12b-1 under the 1940 Act, DWS Investments Distributors, Inc. ("DIDI"), an affiliate of the Advisor, receives a fee ("Distribution Fee"), calculated as a percentage of average daily net assets for the shares listed in the following table.
For the year ended April 30, 2013, the Distribution Fee was as follows:
| Tax-Exempt Portfolio: | | Distribution Fee | | | Waived | | | Annual Effective Rate | | | Contractual Rate (Up To) | |
| Capital Assets Funds Shares | | $ | 39,725 | | | $ | 39,725 | | | | .00 | % | | | .33 | % |
| Davidson Cash Equivalent Shares | | | 203,917 | | | | 203,917 | | | | .00 | % | | | .30 | % |
| Service Shares | | | 375,740 | | | | 375,740 | | | | .00 | % | | | .60 | % |
| Tax-Free Investment Class | | | 836,286 | | | | 836,286 | | | | .00 | % | | | .25 | % |
| | | $ | 1,455,668 | | | $ | 1,455,668 | | | | | | | | | |
In addition, DIDI provides information and administrative services for a fee ("Service Fee") for the shares listed in the following table. A portion of these fees may be paid pursuant to a Rule 12b-1 plan.
For the year ended April 30, 2013, the Service Fee was as follows:
| Tax-Exempt Portfolio: | | Service Fee | | | Waived | | | Annual Effective Rate | | | Contractual Rate (Up To) | |
| Capital Assets Funds Shares | | $ | 30,095 | | | $ | 30,095 | | | | .00 | % | | | .25 | % |
| Davidson Cash Equivalent Shares | | | 169,930 | | | | 169,930 | | | | .00 | % | | | .25 | % |
| Tax-Exempt Cash Managed Shares | | | 223,726 | | | | 223,726 | | | | .00 | % | | | .15 | % |
| Tax-Free Investment Class | | | 234,160 | | | | 234,160 | | | | .00 | % | | | .07 | % |
| | | $ | 657,911 | | | $ | 657,911 | | | | | | | | | |
Typesetting and Filing Service Fees. Under an agreement with DIMA, DIMA is compensated for providing typesetting and certain regulatory filing services to the Fund. For the year ended April 30, 2013, the amount charged to the Fund by DIMA included in the Statement of Operations under "reports to shareholders" was as follows:
| Fund | | Total Aggregated | | | Unpaid at April 30, 2013 | |
| Tax-Exempt Portfolio | | $ | 85,990 | | | $ | 31,227 | |
Trustees' Fees and Expenses. The Fund paid retainer fees to each Trustee not affiliated with the Advisor, plus specified amounts to the Board Chairperson and Vice Chairperson and to each committee Chairperson.
3. Concentration of Ownership
From time to time, the Fund may have a concentration of several shareholder accounts holding a significant percentage of shares outstanding. Investment activities of these shareholders could have a material impact on the Fund.
At April 30, 2013, three shareholder accounts held approximately 33%, 17% and 12% of the outstanding shares of the Fund.
4. Line of Credit
The Fund and other affiliated funds (the "Participants") share in a $375 million revolving credit facility provided by a syndication of banks. The Fund may borrow for temporary or emergency purposes, including the meeting of redemption requests that otherwise might require the untimely disposition of securities. The Participants are charged an annual commitment fee which is allocated based on net assets, among each of the Participants. Interest is calculated at a rate per annum equal to the sum of the Federal Funds Rate plus 1.25 percent plus, if LIBOR exceeds the Federal Funds Rate, the amount of such excess. The Fund may borrow up to a maximum of 33 percent of its net assets under the agreement. The Fund had no outstanding loans at April 30, 2013.
5. Share Transactions
The following table summarizes share and dollar activity in the Fund:
Tax-Exempt Portfolio
| | | Year Ended April 30, 2013 | | | Year Ended April 30, 2012 | |
| | | Shares | | | Dollars | | | Shares | | | Dollars | |
| Shares sold | |
| Capital Assets Funds Shares | | | 33,780,270 | | | $ | 33,780,270 | | | | 32,054,021 | | | $ | 32,054,021 | |
| Davidson Cash Equivalent Shares | | | 115,063,476 | | | | 115,063,476 | | | | 121,475,389 | | | | 121,475,389 | |
| DWS Tax-Exempt Cash Institutional Shares | | | 2,372,880,502 | | | | 2,372,880,502 | | | | 4,080,690,854 | | | | 4,080,690,854 | |
| DWS Tax-Exempt Money Fund | | | 251,306,829 | | | | 251,306,829 | | | | 325,873,832 | | | | 325,873,832 | |
| DWS Tax-Free Money Fund Class S | | | 28,082,317 | | | | 28,082,317 | | | | 31,868,351 | | | | 31,868,351 | |
| Service Shares | | | 138,095,905 | | | | 138,095,905 | | | | 173,964,295 | | | | 173,964,295 | |
| Tax-Exempt Cash Managed Shares | | | 238,693,476 | | | | 238,693,476 | | | | 387,004,796 | | | | 387,004,796 | |
| Tax-Free Investment Class | | | 396,600,890 | | | | 396,600,890 | | | | 330,420,769 | | | | 330,420,769 | |
| | | | | | | $ | 3,574,503,665 | | | | | | | $ | 5,483,352,307 | |
| Shares issued to shareholders in reinvestment of distributions | |
| Capital Assets Funds Shares | | | 3,264 | | | $ | 3,264 | | | | 2,578 | | | $ | 2,578 | |
| Davidson Cash Equivalent Shares | | | 20,992 | | | | 20,992 | | | | 13,652 | | | | 13,652 | |
| DWS Tax-Exempt Cash Institutional Shares | | | 163,290 | | | | 163,290 | | | | 307,257 | | | | 307,257 | |
| DWS Tax-Exempt Money Fund | | | 76,913 | | | | 76,913 | | | | 112,297 | | | | 112,297 | |
| DWS Tax-Free Money Fund Class S | | | 27,387 | | | | 27,387 | | | | 27,195 | | | | 27,195 | |
| Service Shares | | | 14,768 | | | | 14,768 | | | | 16,265 | | | | 16,265 | |
| Tax-Exempt Cash Managed Shares | | | 2,584 | | | | 2,584 | | | | 1,546 | | | | 1,546 | |
| Tax-Free Investment Class | | | 100,546 | | | | 100,546 | | | | 63,716 | | | | 63,716 | |
| | | | | | | $ | 409,744 | | | | | | | $ | 544,506 | |
| Shares redeemed | |
| Capital Assets Funds Shares | | | (35,324,040 | ) | | $ | (35,324,040 | ) | | | (31,054,695 | ) | | $ | (31,054,695 | ) |
| Davidson Cash Equivalent Shares | | | (106,210,991 | ) | | | (106,210,991 | ) | | | (135,004,695 | ) | | | (135,004,695 | ) |
| DWS Tax-Exempt Cash Institutional Shares | | | (2,508,359,723 | ) | | | (2,508,359,723 | ) | | | (4,467,264,493 | ) | | | (4,467,264,493 | ) |
| DWS Tax-Exempt Money Fund | | | (322,145,746 | ) | | | (322,145,746 | ) | | | (379,194,651 | ) | | | (379,194,651 | ) |
| DWS Tax-Free Money Fund Class S | | | (38,170,621 | ) | | | (38,170,621 | ) | | | (46,678,340 | ) | | | (46,678,340 | ) |
| Service Shares | | | (171,243,303 | ) | | | (171,243,303 | ) | | | (177,914,611 | ) | | | (177,914,611 | ) |
| Tax-Exempt Cash Managed Shares | | | (290,012,104 | ) | | | (290,012,104 | ) | | | (348,035,830 | ) | | | (348,035,830 | ) |
| Tax-Free Investment Class | | | (399,598,260 | ) | | | (399,598,260 | ) | | | (399,040,672 | ) | | | (399,040,672 | ) |
| | | | | | | $ | (3,871,064,788 | ) | | | | | | $ | (5,984,187,987 | ) |
| Net increase (decrease) | |
| Capital Assets Funds Shares | | | (1,540,506 | ) | | $ | (1,540,506 | ) | | | 1,001,904 | | | $ | 1,001,904 | |
| Davidson Cash Equivalent Shares | | | 8,873,477 | | | | 8,873,477 | | | | (13,515,654 | ) | | | (13,515,654 | ) |
| DWS Tax-Exempt Cash Institutional Shares | | | (135,315,931 | ) | | | (135,315,931 | ) | | | (386,266,382 | ) | | | (386,266,382 | ) |
| DWS Tax-Exempt Money Fund | | | (70,762,004 | ) | | | (70,762,004 | ) | | | (53,208,522 | ) | | | (53,208,522 | ) |
| DWS Tax-Free Money Fund Class S | | | (10,060,917 | ) | | | (10,060,917 | ) | | | (14,782,794 | ) | | | (14,782,794 | ) |
| Service Shares | | | (33,132,630 | ) | | | (33,132,630 | ) | | | (3,934,051 | ) | | | (3,934,051 | ) |
| Tax-Exempt Cash Managed Shares | | | (51,316,044 | ) | | | (51,316,044 | ) | | | 38,970,512 | | | | 38,970,512 | |
| Tax-Free Investment Class | | | (2,896,824 | ) | | | (2,896,824 | ) | | | (68,556,187 | ) | | | (68,556,187 | ) |
| | | | | | | $ | (296,151,379 | ) | | | | | | $ | (500,291,174 | ) |
Report of Independent Registered Public Accounting Firm
To the Shareholders and Board of Trustees of Cash Account Trust:
We have audited the accompanying statement of assets and liabilities of Tax-Exempt Portfolio (the "Fund") (one of the Funds comprising Cash Account Trust), including the investment portfolio, as of April 30, 2013, and the related statement of operations for the year then ended, the statement of changes in net assets for each of the two years in the period then ended, and the financial highlights for each of the five years in the period then ended. These financial statements and financial highlights are the responsibility of the Fund's management. Our responsibility is to express an opinion on these financial statements and financial highlights based on our audits.
We conducted our audits in accordance with the standards of the Public Company Accounting Oversight Board (United States). Those standards require that we plan and perform the audit to obtain reasonable assurance about whether the financial statements and financial highlights are free of material misstatement. We were not engaged to perform an audit of the Fund's internal control over financial reporting. Our audits included consideration of internal control over financial reporting as a basis for designing audit procedures that are appropriate in the circumstances, but not for the purpose of expressing an opinion on the effectiveness of the Fund's internal control over financial reporting. Accordingly, we express no such opinion. An audit also includes examining, on a test basis, evidence supporting the amounts and disclosures in the financial statements and financial highlights, assessing the accounting principles used and significant estimates made by management, and evaluating the overall financial statement presentation. Our procedures included confirmation of securities owned as of April 30, 2013, by correspondence with the custodian and brokers. We believe that our audits provide a reasonable basis for our opinion.
In our opinion, the financial statements and financial highlights referred to above present fairly, in all material respects, the financial position of Tax-Exempt Portfolio at April 30, 2013, the results of its operations for the year then ended, the changes in its net assets for each of the two years in the period then ended, and the financial highlights for each of the five years in the period then ended, in conformity with U.S. generally accepted accounting principles.
| | | |
Boston, Massachusetts June 19, 2013 | | |
Information About Your Fund's Expenses
As an investor of the Fund, you incur two types of costs: ongoing expenses and transaction costs. Ongoing expenses include management fees, distribution and service (12b-1) fees and other Fund expenses. Examples of transaction costs include account maintenance fees, which are not shown in this section. The following tables are intended to help you understand your ongoing expenses (in dollars) of investing in the Fund and to help you compare these expenses with the ongoing expenses of investing in other mutual funds. In the most recent six-month period, the Fund limited these expenses; had it not done so, expenses would have been higher for the Tax-Free Investment Class. The example in the table is based on an investment of $1,000 invested at the beginning of the six-month period and held for the entire period (November 1, 2012 to April 30, 2013).
The tables illustrate your Fund's expenses in two ways:
•Actual Fund Return. This helps you estimate the actual dollar amount of ongoing expenses (but not transaction costs) paid on a $1,000 investment in the Fund using the Fund's actual return during the period. To estimate the expenses you paid over the period, simply divide your account value by $1,000 (for example, an $8,600 account value divided by $1,000 = 8.6), then multiply the result by the number in the "Expenses Paid per $1,000" line under the share class you hold.
• Hypothetical 5% Fund Return. This helps you to compare your Fund's ongoing expenses (but not transaction costs) with those of other mutual funds using the Fund's actual expense ratio and a hypothetical rate of return of 5% per year before expenses. Examples using a 5% hypothetical fund return may be found in the shareholder reports of other mutual funds. The hypothetical account values and expenses may not be used to estimate the actual ending account balance or expenses you paid for the period.
Please note that the expenses shown in these tables are meant to highlight your ongoing expenses only and do not reflect any transaction costs. The "Expenses Paid per $1,000" line of the tables is useful in comparing ongoing expenses only and will not help you determine the relative total expense of owning different funds. If these transaction costs had been included, your costs would have been higher.
Expenses and Value of a $1,000 Investment for the six months ended April 30, 2013 (Unaudited) | |
| Actual Fund Return | | Tax-Free Investment Class | |
| Beginning Account Value 11/1/12 | | $ | 1,000.00 | |
| Ending Account Value 4/30/13 | | $ | 1,000.23 | |
Expenses Paid per $1,000* | | $ | .89 | |
| Hypothetical 5% Fund Return | | | | |
| Beginning Account Value 11/1/12 | | $ | 1,000.00 | |
| Ending Account Value 4/30/13 | | $ | 1,023.90 | |
Expenses Paid per $1,000* | | $ | .90 | |
| * Expenses are equal to the Fund's annualized expense ratio for each share class, multiplied by the average account value over the period, multiplied by 181 (the number of days in the most recent six-month period), then divided by 365. | |
| Annualized Expense Ratio | | | | |
| Tax-Free Investment Class | | | .18 | % |
For more information, please refer to the Fund's prospectus. For an analysis of the fees associated with an investment in the Fund or similar funds, please refer to http://apps.finra.org/fundanalyzer/1/fa.aspx. | |
Tax Information (Unaudited)
Of the dividends paid from net investment income for the taxable year ended April 30, 2013, 100% are designated as exempt interest dividends for federal income tax purposes.
Please consult a tax advisor if you have questions about federal or state income tax laws, or on how to prepare your tax returns. If you have specific questions about your account, please call (800) 728-3337.
Proxy Voting
The Fund's policies and procedures for voting proxies for portfolio securities and information about how the Fund voted proxies related to its portfolio securities during the 12-month period ended June 30 are available on our Web site — www.dws-investments.com (click on "proxy voting" at the bottom of the page) — or on the SEC's Web site — www.sec.gov. To obtain a written copy of the Fund's policies and procedures without charge, upon request, call us toll free at (800) 728-3337.
Portfolio Holdings
Following the Fund's fiscal first and third quarter-end, a complete portfolio holdings listing is filed with the SEC on Form N-Q. In addition, each month, information about the Fund and its portfolio holdings is filed with the SEC on Form N-MFP. The SEC delays the public availability of the information filed on Form N-MFP for 60 days after the end of the reporting period included in the filing. These forms will be available on the SEC's Web site at www.sec.gov, and they may also be reviewed and copied at the SEC's Public Reference Room in Washington, D.C. Information on the operation of the SEC's Public Reference Room may be obtained by calling (800) SEC-0330. The Fund's portfolio holdings are also posted on www.dws-investments.com from time to time. Please see the Fund's current prospectus for more information.
Money Market Fund Reform
In 2010, the Securities and Exchange Commission adopted amendments to then-existing money market fund regulations, imposing new liquidity, credit quality and maturity requirements on all money market funds. In November 2012, the Financial Stability Oversight Council (FSOC), a board of U.S. regulators established by the Dodd-Frank Act, proposed recommendations for money market fund reform. If the SEC were to adopt one or more of the FSOC proposed recommendations in the future, or if FSOC were to take other steps to establish similar regulations of money market funds in the future, such regulatory action may affect the Fund's operations and/or return potential.
Summary of Management Fee Evaluation by Independent Fee Consultant
September 17, 2012
Pursuant to an Order entered into by Deutsche Investment Management Americas and affiliates (collectively, "DeAM") with the Attorney General of New York, I, Thomas H. Mack, have been appointed the Independent Fee Consultant for the DWS Funds (formerly the DWS Scudder Funds). My duties include preparing an annual written evaluation of the management fees DeAM charges the Funds, considering among other factors the management fees charged by other mutual fund companies for like services, management fees DeAM charges other clients for like services, DeAM's costs of supplying services under the management agreements and related profit margins, possible economies of scale if a Fund grows larger, and the nature and quality of DeAM's services, including fund performance. This report summarizes my evaluation for 2012, including my qualifications, the evaluation process for each of the DWS Funds, consideration of certain complex-level factors, and my conclusions. I served in substantially the same capacity in 2007, 2008, 2009, 2010 and 2011.
Qualifications
For more than 35 years I have served in various professional capacities within the investment management business. I have held investment analysis and advisory positions, including securities analyst, portfolio strategist and director of investment policy with a large investment firm. I have also performed business management functions, including business development, financial management and marketing research and analysis.
Since 1991, I have been an independent consultant within the asset management industry. I have provided services to over 125 client organizations, including investment managers, mutual fund boards, product distributors and related organizations. Over the past ten years I have completed a number of assignments for mutual fund boards, specifically including assisting boards with management contract renewal.
I hold a Master of Business Administration degree, with highest honors, from Harvard University and Master of Science and Bachelor of Science (highest honors) degrees from the University of California at Berkeley. I am an independent director and audit committee financial expert for two closed-end mutual funds and have served in various leadership and financial oversight capacities with non-profit organizations.
Evaluation of Fees for each DWS Fund
My work focused primarily on evaluating, fund-by-fund, the fees charged to each of the 103 mutual fund portfolios in the DWS Fund family. For each Fund, I considered each of the key factors mentioned above, as well as any other relevant information. In doing so I worked closely with the Funds' Independent Directors in their annual contract renewal process, as well as in their approval of contracts for several new funds (documented separately).
In evaluating each Fund's fees, I reviewed comprehensive materials provided by or on behalf of DeAM, including expense information prepared by Lipper Analytical, comparative performance information, profitability data, manager histories, and other materials. I also accessed certain additional information from the Lipper and Morningstar databases and drew on my industry knowledge and experience.
To facilitate evaluating this considerable body of information, I prepared for each Fund a document summarizing the key data elements in each area as well as additional analytics discussed below. This made it possible to consider each key data element in the context of the others.
In the course of contract renewal, DeAM agreed to implement a number of fee and expense adjustments requested by the Independent Directors which will favorably impact future fees and expenses, and my evaluation includes the effects of these changes.
Fees and Expenses Compared with Other Funds
The competitive fee and expense evaluation for each fund focused on two primary comparisons:
The Fund's contractual management fee (the advisory fee plus the administration fee where applicable) compared with those of a group of typically 12-15 funds in the same Lipper investment category (e.g. Large Capitalization Growth) having similar distribution arrangements and being of similar size.
The Fund's total expenses compared with a broader universe of funds from the same Lipper investment category and having similar distribution arrangements.
These two comparisons provide a view of not only the level of the fee compared with funds of similar scale but also the total expense the Fund bears for all the services it receives, in comparison with the investment choices available in the Fund's investment category and distribution channel. The principal figure-of-merit used in these comparisons was the subject Fund's percentile ranking against peers.
DeAM's Fees for Similar Services to Others
DeAM provided management fee schedules for all of its US domiciled fund and non-fund investment management accounts in any of the investment categories where there is a DWS Fund. These similar products included the other DWS Funds, non-fund pooled accounts, institutional accounts and sub-advisory accounts. Using this information, I calculated for each Fund the fee that would be charged to each similar product, at the subject Fund's asset level.
Evaluating information regarding non-fund products is difficult because there are varying levels of services required for different types of accounts, with mutual funds generally requiring considerably more regulatory and administrative types of service as well as having more frequent cash flows than other types of accounts. Also, while mutual fund fees for similar fund products can be expected to be similar, there will be some differences due to different pricing conditions in different distribution channels (e.g. retail funds versus those used in variable insurance products), differences in underlying investment processes and other factors.
Costs and Profit Margins
DeAM provided a detailed profitability analysis for each Fund. After making some adjustments so that the presentation would be more comparable to the available industry figures, I reviewed profit margins from investment management alone, from investment management plus other fund services (excluding distribution) provided to the Funds by DeAM (principally shareholder services), and DeAM profits from all sources, including distribution. A later section comments on overall profitability.
Economies of Scale
Economies of scale — an expected decline in management cost per dollar of fund assets as fund assets grow — are very rarely quantified and documented because of inherent difficulties in collecting and analyzing relevant data. However, in virtually every investment category that I reviewed, larger funds tend to have lower fees and lower total expenses than smaller funds. To see how each DWS Fund compares with this industry observation, I reviewed:
The trend in Fund assets over the last five years and the accompanying trend in total expenses. This shows if the Fund has grown and, if so, whether total expense (management fees as well as other expenses) have declined as a percent of assets.
Whether the Fund has break-points in its management fee schedule, the extent of the fee reduction built into the schedule and the asset levels where the breaks take effect, and in the case of a sub-advised Fund how the Fund's break-points compare with those of the sub-advisory fee schedule.
How the Fund's contractual fee schedule compares with trends in the industry data. To accomplish this, I constructed a chart showing how actual latest-fiscal-year contractual fees of the Fund and of other similar funds relate to average fund assets, with the subject Fund's contractual fee schedule superimposed.
Quality of Service — Performance
The quality-of-service evaluation focused on investment performance, which is the principal result of the investment management service. Each Fund's performance was reviewed over the past 1, 3, 5 and 10 years, as applicable, and compared with that of other funds in the same investment category and with a suitable market index.
In addition, I calculated and reviewed risk-adjusted returns relative to an index of similar mutual funds' returns and a suitable market index. The risk-adjusted returns analysis provides a way of determining the extent to which the Fund's return comparisons are mainly the product of investment value-added (or lack thereof) or alternatively taking considerably more or less risk than is typical in its investment category.
I also received and considered the history of portfolio manager changes for each Fund, as this provided an important context for evaluating the performance results.
Complex-Level Considerations
While this evaluation was conducted mainly at the individual fund level, there are some issues relating to the reasonableness of fees that can alternatively be considered across the whole fund complex:
I reviewed DeAM's profitability analysis for all DWS Funds, with a view toward determining if the allocation procedures used were reasonable and how profit levels compared with public data for other investment managers.
I considered whether DeAM and affiliates receive any significant ancillary or "fallout" benefits that should be considered in interpreting the direct profitability results. These would be situations where serving as the investment manager of the Funds is beneficial to another part of the Deutsche Bank organization.
I considered how aggregated DWS Fund expenses had varied over the years, by asset class and in the context of trends in asset levels.
I considered how aggregated DWS Fund performance measures relative to appropriate peers had varied by asset class and over time.
I reviewed the structure of the DeAM organization, trends in staffing levels, and information on compensation of investment management and other professionals compared with industry data.
Findings
Based on the process and analysis discussed above, which included reviewing a wide range of information from management and external data sources and considering among other factors the fees DeAM charges other clients, the fees charged by other fund managers, DeAM's costs and profits associated with managing the Funds, economies of scale, possible fall-out benefits, and the nature and quality of services provided, in my opinion the management fees charged the DWS Funds are reasonable.
Thomas H. Mack
President, Thomas H. Mack & Co., Inc.
Board Members and Officers
The following table presents certain information regarding the Board Members and Officers of the fund. Each Board Member's year of birth is set forth in parentheses after his or her name. Unless otherwise noted, (i) each Board Member has engaged in the principal occupation(s) noted in the table for at least the most recent five years, although not necessarily in the same capacity; and (ii) the address of each Independent Board Member is c/o Kenneth C. Froewiss, Chairman, DWS Mutual Funds, P.O. Box 78, Short Hills, NJ 07078. Except as otherwise noted below, the term of office for each Board Member is until the election and qualification of a successor, or until such Board Member sooner dies, resigns, is removed or as otherwise provided in the governing documents of the fund. Because the fund does not hold an annual meeting of shareholders, each Board Member will hold office for an indeterminate period. The Board Members may also serve in similar capacities with other funds in the fund complex.
| Independent Board Members |
Name, Year of Birth, Position with the Fund and Length of Time Served1 | | Business Experience and Directorships During the Past Five Years | Number of Funds in DWS Fund Complex Overseen |
Other Directorships Held by Board Member |
Kenneth C. Froewiss (1945) Chairperson since 2013,9 and Board Member since 2001 | | Adjunct Professor of Finance, NYU Stern School of Business (September 2009-present; Clinical Professor from 1997-September 2009); Member, Finance Committee, Association for Asian Studies (2002-present); Director, Mitsui Sumitomo Insurance Group (US) (2004-present); prior thereto, Managing Director, J.P. Morgan (investment banking firm) (until 1996) | 102 | — |
William McClayton (1944) Vice Chairperson since 2013,9 and Board Member since 2004 | | Private equity investor (since October 2009); previously, Managing Director, Diamond Management & Technology Consultants, Inc. (global consulting firm) (2001-2009); Directorship: Board of Managers, YMCA of Metropolitan Chicago; formerly: Senior Partner, Arthur Andersen LLP (accounting) (1966-2001); Trustee, Ravinia Festival | 102 | — |
John W. Ballantine (1946) Board Member since 1999 | | Retired; formerly, Executive Vice President and Chief Risk Management Officer, First Chicago NBD Corporation/The First National Bank of Chicago (1996-1998); Executive Vice President and Head of International Banking (1995-1996); former Directorships: Stockwell Capital Investments PLC (private equity); First Oak Brook Bancshares, Inc. and Oak Brook Bank; Prisma Energy International | 102 | Chairman of the Board, Healthways, Inc.2 (provider of disease and care management services) (2003- present); Portland General Electric2 (utility company) (2003- present) |
Henry P. Becton, Jr. (1943) Board Member since 1990 | | Vice Chair and former President, WGBH Educational Foundation. Directorships: Public Radio International; Public Radio Exchange (PRX); The PBS Foundation; North Bennett Street School (Boston); former Directorships: Association of Public Television Stations; Boston Museum of Science; American Public Television; Concord Academy; New England Aquarium; Mass. Corporation for Educational Telecommunications; Committee for Economic Development; Public Broadcasting Service; Connecticut College | 102 | Lead Director, Becton Dickinson and Company2 (medical technology company); Lead Director, Belo Corporation2 (media company) |
Dawn-Marie Driscoll (1946) Board Member since 1987 | | President, Driscoll Associates (consulting firm); Emeritus Executive Fellow, Center for Business Ethics, Bentley University; formerly, Partner, Palmer & Dodge (1988-1990); Vice President of Corporate Affairs and General Counsel, Filene's (1978-1988). Directorships: Director of ICI Mutual Insurance Company (since 2007); Advisory Board, Center for Business Ethics, Bentley University; Chairman of the Board of Trustees, Southwest Florida Community Foundation (charitable organization); former Directorships: Sun Capital Advisers Trust (mutual funds) (2007-2012), Investment Company Institute (audit, executive, nominating committees) and Independent Directors Council (governance, executive committees) | 102 | — |
Keith R. Fox, CFA (1954) Board Member since 1996 | | Managing General Partner, Exeter Capital Partners (a series of private investment funds) (since 1986). Directorships: Progressive International Corporation (kitchen goods importer and distributor); The Kennel Shop (retailer); former Chairman, National Association of Small Business Investment Companies; former Directorships: BoxTop Media Inc. (advertising); Sun Capital Advisers Trust (mutual funds) (2011-2012) | 102 | — |
Paul K. Freeman (1950) Board Member since 1993, and Chairperson (2009-Jan. 8, 2013) | | Consultant, World Bank/Inter-American Development Bank; Executive and Governing Council of the Independent Directors Council (Chairman of Education Committee); formerly: Project Leader, International Institute for Applied Systems Analysis (1998-2001); Chief Executive Officer, The Eric Group, Inc. (environmental insurance) (1986-1998); Directorships: Denver Zoo Foundation (December 2012-present); former Directorships: Prisma Energy International | 102 | — |
Richard J. Herring (1946) Board Member since 1990 | | Jacob Safra Professor of International Banking and Professor, Finance Department, The Wharton School, University of Pennsylvania (since July 1972); Co-Director, Wharton Financial Institutions Center (since July 2000); Co-Chair, U.S. Shadow Financial Regulatory Committee; Executive Director, Financial Economists Roundtable; formerly: Vice Dean and Director, Wharton Undergraduate Division (July 1995-June 2000); Director, Lauder Institute of International Management Studies (July 2000-June 2006) | 102 | Director, Japan Equity Fund, Inc. (since September 2007), Thai Capital Fund, Inc. (since 2007), Singapore Fund, Inc. (since September 2007), Independent Director of Barclays Bank Delaware (since September 2010) |
Rebecca W. Rimel (1951) Board Member since 1995 | | President and Chief Executive Officer, The Pew Charitable Trusts (charitable organization) (1994 to present); formerly: Executive Vice President, The Glenmede Trust Company (investment trust and wealth management) (1983-2004); Board Member, Investor Education (charitable organization) (2004-2005); Trustee, Executive Committee, Philadelphia Chamber of Commerce (2001-2007); Director, Viasys Health Care2 (January 2007-June 2007); Trustee, Thomas Jefferson Foundation (charitable organization) (1994-2012) | 102 | Director, Becton Dickinson and Company2 (medical technology company) (2012- present); Director, CardioNet, Inc.2 (health care) (2009- present) |
William N. Searcy, Jr. (1946) Board Member since 1993 | | Private investor since October 2003; formerly: Pension & Savings Trust Officer, Sprint Corporation2 (telecommunications) (November 1989-September 2003); Trustee, Sun Capital Advisers Trust (mutual funds) (1998-2012) | 102 | — |
Jean Gleason Stromberg (1943) Board Member since 1997 | | Retired. Formerly, Consultant (1997-2001); Director, Financial Markets U.S. Government Accountability Office (1996-1997); Partner, Fulbright & Jaworski, L.L.P. (law firm) (1978-1996). Directorships: The William and Flora Hewlett Foundation; former Directorships: Service Source, Inc., Mutual Fund Directors Forum (2002-2004), American Bar Retirement Association (funding vehicle for retirement plans) (1987-1990 and 1994-1996) | 102 | — |
Robert H. Wadsworth (1940) Board Member since 1999 | | President, Robert H. Wadsworth & Associates, Inc. (consulting firm) (1983 to present); Director, National Horizon, Inc. (non-profit organization); Director and Treasurer, The Phoenix Boys Choir Association | 105 | — |
Interested Board Member and Officer4 |
Name, Year of Birth, Position with the Fund and Length of Time Served1,6 | | Business Experience and Directorships During the Past Five Years | Number of Funds in DWS Fund Complex Overseen |
Other Directorships Held by Board Member |
Michael J. Woods5 (1967) Board Member since 2013,9 and Executive Vice President since 20139 | | Managing Director,3 Deutsche Asset & Wealth Management (2009-present); Head of the Americas Asset Management Business for Deutsche Bank, Member of the Asset and Wealth Management ("AWM") Extended Executive Committee, AWM Global Client Group Executive Committee and the AWM Active Asset Management Executive Committee; CEO and US Regional Head of DWS Investments; formerly: Sr. VP, Head of the Financial Intermediaries and Investments Group of Evergreen Investments (2007-2009), CEO and Vice Chairman of Board of Directors of XTF Global Asset Management (2006-2007), Managing Director — US Head of Sub-Advisory and Investment Only Business at Citigroup Asset Management (2000-2006). Mr. Woods is currently a board member of The Children's Village, The Big Brothers Big Sisters Organization, and The Mutual Fund Education Alliance. | 38 | — |
Officers4 |
Name, Year of Birth, Position with the Fund and Length of Time Served6 | | Business Experience and Directorships During the Past Five Years |
W. Douglas Beck, CFA7 (1967) President, 2011-present | | Managing Director,3 Deutsche Asset & Wealth Management (2006-present); President of DWS family of funds and Head of Product Management, U.S. for DWS Investments; formerly: Executive Director, Head of Product Management (2002-2006) and President (2005-2006) of the UBS Funds at UBS Global Asset Management; Co-Head of Manager Research/Managed Solutions Group, Merrill Lynch (1998-2002) |
John Millette8 (1962) Vice President and Secretary, 1999-present | | Director,3 Deutsche Asset & Wealth Management |
Paul H. Schubert7 (1963) Chief Financial Officer, 2004-present Treasurer, 2005-present | | Managing Director,3 Deutsche Asset & Wealth Management (since July 2004); formerly: Executive Director, Head of Mutual Fund Services and Treasurer for UBS Family of Funds (1998-2004); Vice President and Director of Mutual Fund Finance at UBS Global Asset Management (1994-1998) |
Caroline Pearson8 (1962) Chief Legal Officer, 2010-present | | Managing Director,3 Deutsche Asset & Wealth Management; formerly: Assistant Secretary for DWS family of funds (1997-2010) |
Melinda Morrow7 (1970) Vice President, 2012-present | | Director,3 Deutsche Asset & Wealth Management |
Hepsen Uzcan8 (1974) Assistant Secretary, since 20139 | | Vice President, Deutsche Asset & Wealth Management |
Paul Antosca8 (1957) Assistant Treasurer, 2007-present | | Director,3 Deutsche Asset & Wealth Management |
Jack Clark8 (1967) Assistant Treasurer, 2007-present | | Director,3 Deutsche Asset & Wealth Management |
Diane Kenneally8 (1966) Assistant Treasurer, 2007-present | | Director,3 Deutsche Asset & Wealth Management |
John Caruso7 (1965) Anti-Money Laundering Compliance Officer, 2010-present | | Managing Director,3 Deutsche Asset & Wealth Management |
Robert Kloby7 (1962) Chief Compliance Officer, 2006-present | | Managing Director,3 Deutsche Asset & Wealth Management |
1 The length of time served represents the year in which the Board Member joined the board of one or more DWS funds currently overseen by the Board.
2 A publicly held company with securities registered pursuant to Section 12 of the Securities Exchange Act of 1934.
3 Executive title, not a board directorship.
4 As a result of their respective positions held with the Advisor, these individuals are considered "interested persons" of the Advisor within the meaning of the 1940 Act. Interested persons receive no compensation from the fund.
5 The mailing address of Mr. Woods is 60 Wall Street, New York, New York 10005. Mr. Woods is an interested Board Member by virtue of his positions with Deutsche Asset & Wealth Management. As an interested person, Mr. Woods receives no compensation from the fund. Mr. Woods is a board member of the following trusts and corporations: Cash Account Trust, DWS Market Trust, DWS Money Funds, DWS State Tax-Free Income Series, DWS Target Fund, DWS Value Series, Inc., DWS Variable Series II, Investors Cash Trust, Tax-Exempt California Money Market Fund, DWS Global High Income Fund, Inc., DWS High Income Opportunities Fund, Inc., DWS High Income Trust, DWS Multi-Market Income Trust, DWS Municipal Income Trust, DWS Strategic Income Trust and DWS Strategic Municipal Income Trust.
6 The length of time served represents the year in which the officer was first elected in such capacity for one or more DWS funds.
7 Address: 60 Wall Street, New York, NY 10005.
8 Address: One Beacon Street, Boston, MA 02108.
9 Effective as of January 9, 2013.
The fund's Statement of Additional Information ("SAI") includes additional information about the Board Members. The SAI is available, without charge, upon request. If you would like to request a copy of the SAI, you may do so by calling the following toll-free number: (800) 728-3337.
Notes
Notes
Notes
Notes
Notes