| UNITED STATES |
| SECURITIES AND EXCHANGE COMMISSION |
| Washington, D.C. 20549 |
| |
FORM N-CSR |
| |
CERTIFIED SHAREHOLDER REPORT OF REGISTERED |
MANAGEMENT INVESTMENT COMPANIES |
| |
| |
| |
| Investment Company Act File Number: 811-5986 |
|
| |
| T. Rowe Price Index Trust, Inc. |
|
| (Exact name of registrant as specified in charter) |
| |
| 100 East Pratt Street, Baltimore, MD 21202 |
|
| (Address of principal executive offices) |
| |
| David Oestreicher |
| 100 East Pratt Street, Baltimore, MD 21202 |
|
| (Name and address of agent for service) |
| |
| |
| Registrant’s telephone number, including area code: (410) 345-2000 |
| |
| |
| Date of fiscal year end: December 31 |
| |
| |
| Date of reporting period: June 30, 2008 |
Item 1: Report to Shareholders| Equity Index 500 Fund | June 30, 2008 |
The views and opinions in this report were current as of June 30, 2008. They are not guarantees of performance or investment results and should not be taken as investment advice. Investment decisions reflect a variety of factors, and the managers reserve the right to change their views about individual stocks, sectors, and the markets at any time. As a result, the views expressed should not be relied upon as a forecast of the fund’s future investment intent. The report is certified under the Sarbanes-Oxley Act, which requires mutual funds and other public companies to affirm that, to the best of their knowledge, the information in their financial reports is fairly and accurately stated in all material respects.
REPORTS ON THE WEB
Sign up for our E-mail Program, and you can begin to receive updated fund reports and prospectuses online rather than through the mail. Log in to your account at troweprice.com for more information.
Manager’s Letter
Fellow Shareholders
The U.S. stock market sell-off that began last year with revelations of the subprime mortgage problem deepened in the first six months of 2008. As the mountain of mortgage- and credit-related losses in the financial sector piled up, consumers were hit with surging energy and food costs, which led to considerable weakening in the U.S. economy. The bull market that began in 2003 seemed to have run its course, with the broad equity indexes suffering double-digit declines through June.
HIGHLIGHTS
• U.S. equities declined sharply amid continued turbulence in the credit markets and concerns about resurgent inflation.
• The equity market index funds’ results generally tracked their unmanaged benchmarks.
• Pressures on U.S. economic growth have picked up, with the housing slump, credit shortfall, and soaring energy prices squeezing the consumer.
• In replicating the structure and performance of the broad market indexes, we seek to provide shareholders with diversified exposure to U.S. equities.
MARKET ENVIRONMENT
The factors contributing to the increased volatility and downward trajectory in the stock market during the final quarter of 2007 were magnified in the first six months of 2008. The economic environment grew weaker as the housing market remained in free fall, the unemployment rate increased from 5.0% to 5.5%, the economy shed jobs in each of the first six months of the year, and industrial production declined as construction activity waned. Furthermore, consumer spending figures, although positive, were propped up by higher fuel prices (which increased the dollar amount of gasoline sales even when fewer gallons were purchased) and the federal government’s rebate checks.
Another important factor was the extent of the fallout from the mortgage and credit market turmoil, which has consistently exceeded the market’s expectations. Hundreds of billions of dollars in write-downs and losses forced an increasing number of financial companies to raise capital to strengthen their balance sheets, or in some cases stave off insolvency. Limited liquidity in the credit markets put pressure on companies that rely on these markets for financing.
Inflation also reared its head, particularly in the last two months of the period as oil prices rose steadily, establishing record highs on a near-daily basis. The inflation rate, as measured by the consumer price index, rose from 4.1% in 2007 to 5.0% for the 12 months ended June 30, 2008, driven by a 25% increase in energy prices and a 12% rise in transportation costs. The higher inflation rate put the Federal Reserve in a bind—the Fed lowered short-term interest rates aggressively in early 2008 to prevent a recession, but the uncertain inflation outlook forced the Fed to hold rates steady in June.
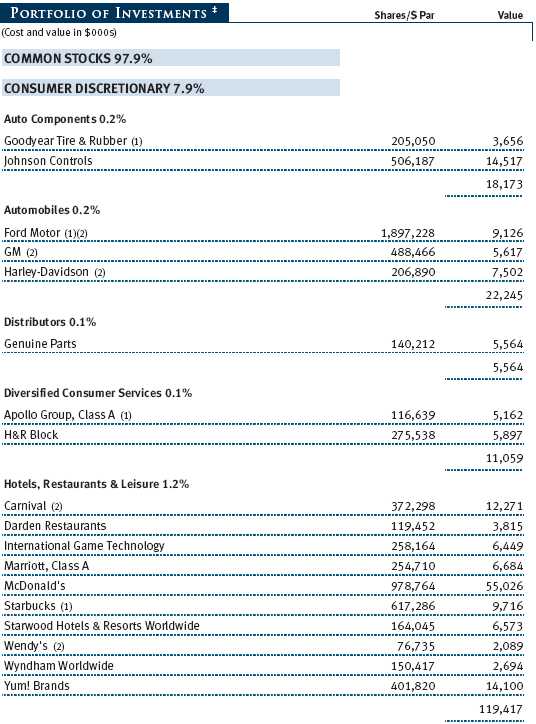
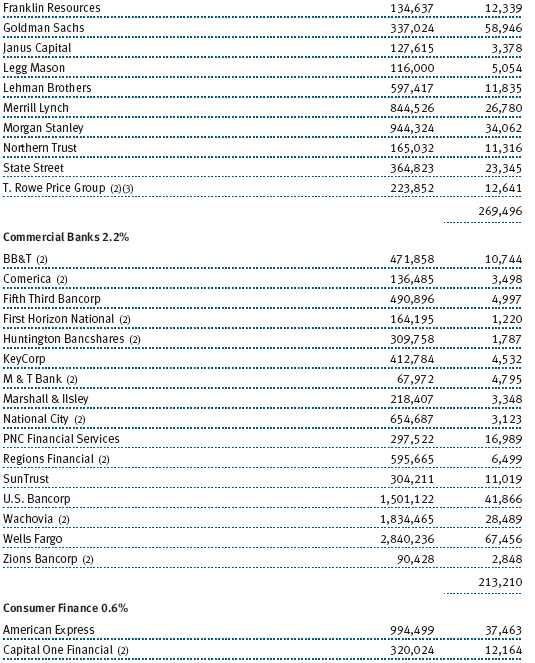
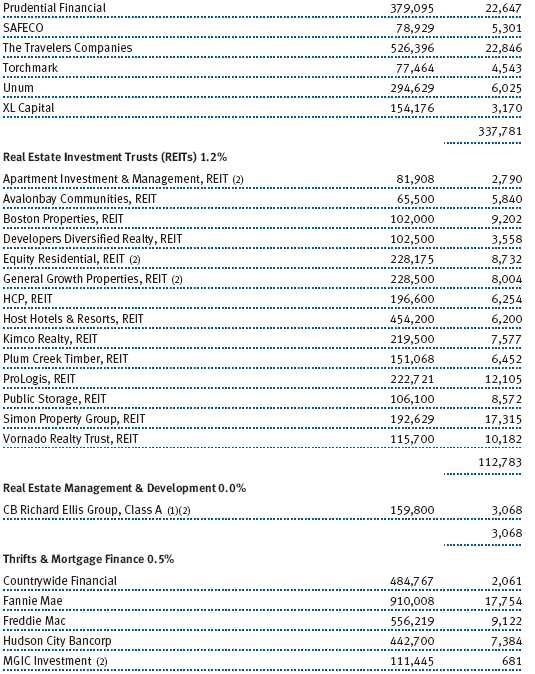
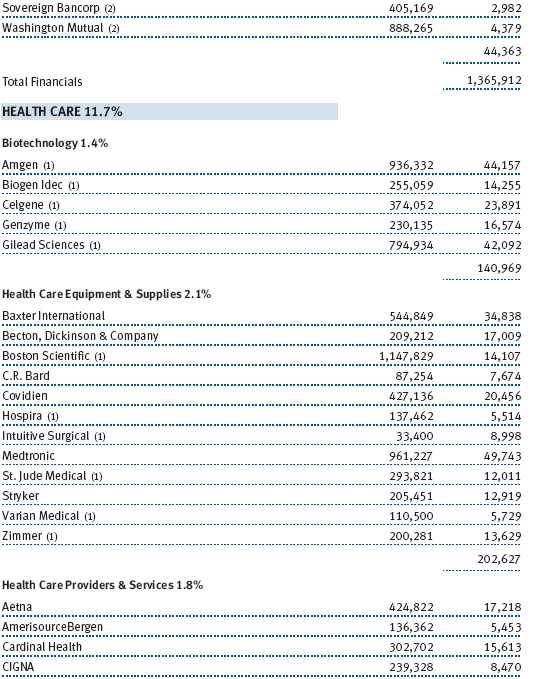
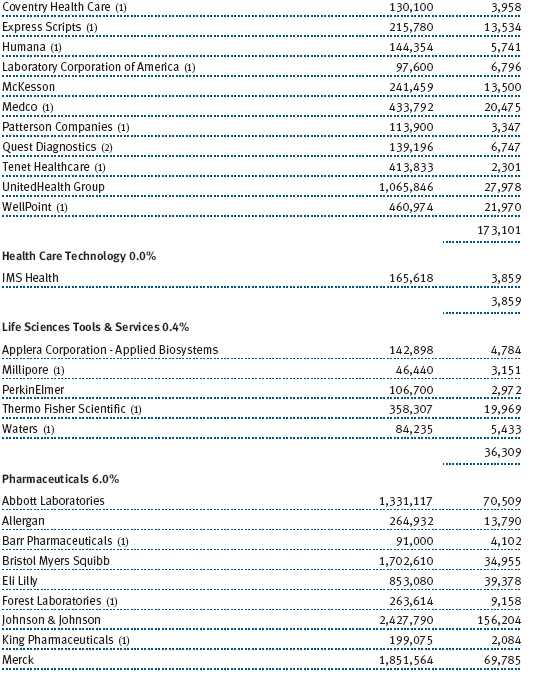
Given these considerable storm clouds, it’s not surprising that stocks began the year with their worst quarter in nearly six years. A ray of sunshine broke through the clouds in April and May as the bailout of near-bankrupt investment bank Bear Stearns—via a Fed-brokered buyout by JPMorgan Chase—led to a return of the optimism that characterized the market prior to the subprime meltdown in mid-2007. However, this positive sentiment was short-lived, as another round of write-downs in the financial sector and surging energy and commodity prices restored the abject pessimism that had taken hold in the first quarter of the year. (Please refer to the fund’s portfolio of investments for a complete listing of holdings and the amount each represents in the portfolio.)
Consequently, the broad stock indexes finished the period with double-digit declines, although smaller companies held up better than larger stocks. The large-cap S&P 500 Index returned -11.91% in the first half of 2008, while the S&P Completion Index, a broad measure of small- and mid-cap stock performance, returned -7.45%. Growth-oriented issues, which outpaced value shares in 2007, continued their outperformance in the first six months of 2008 across all market capitalizations.
SUMMARY OF INVESTMENT STRATEGIES
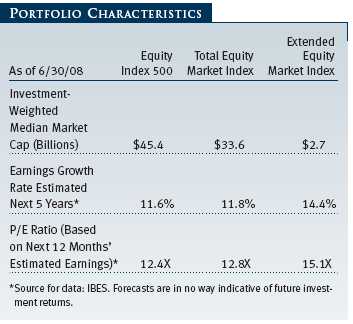
T. Rowe Price’s equity market index funds are designed for investors who want to harness the potential for long-term capital appreciation from broad exposure to large-cap stocks (Equity Index 500 Fund), small- and mid-cap stocks (Extended Equity Market Index Fund), or the entire U.S. stock market (Total Equity Market Index Fund). These funds could serve as core holdings in an investor’s portfolio, as they offer attributes that many investors will find appealing.
• They are well-diversified, which can reduce the potentially negative impact of a given stock on the entire portfolio. The Equity Index 500 Fund invests in all S&P 500 Index stocks, while the Total Equity Market Index Fund and the Extended Equity Market Index Fund invested in approximately 1,655 and 2,017 stocks, respectively, as of June 30, 2008.
• They tend to closely track their benchmarks. The Equity Index 500 Fund uses a full replication strategy so that the weightings of our holdings match those of the S&P 500 Index. The Total Equity Market Index Fund and the Extended Equity Market Index Fund use a sampling strategy to approximate the sector allocations, price/earnings ratio, and other attributes of their benchmarks. We occasionally invest in securities such as futures and exchange-traded funds so that the index funds can accommodate cash flows and remain fully invested.
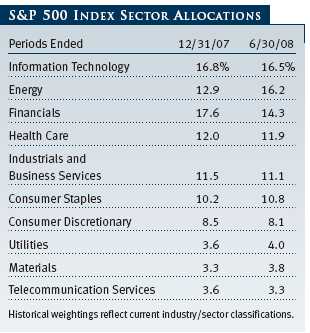
• They offer instant, broad exposure to different sectors of the stock market, and each fund’s sector allocations are consistent with its benchmark’s sector breakdown. As such, changes in the funds’ sector diversification and other overall characteristics reflect changes in the composition of the indexes, rather than strategic shifts that are typical of an actively managed fund.
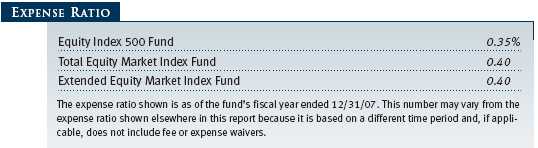
• Their expenses are generally low, which enables investors to retain more of their returns.
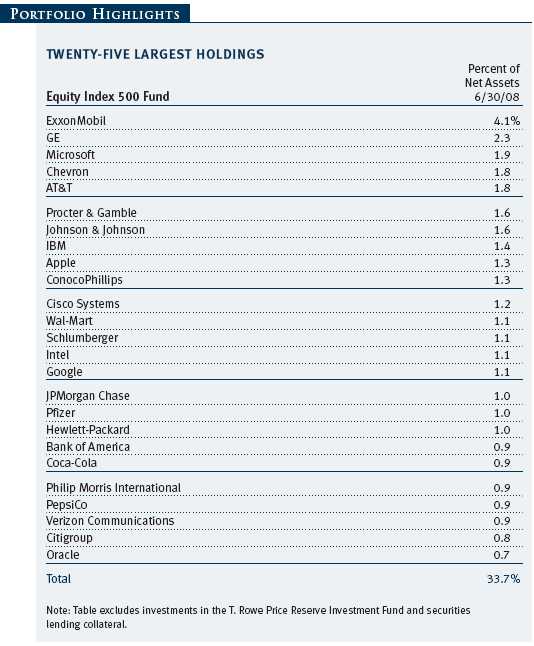
Equity Index 500 Fund
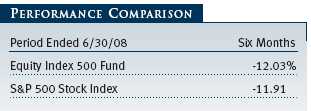
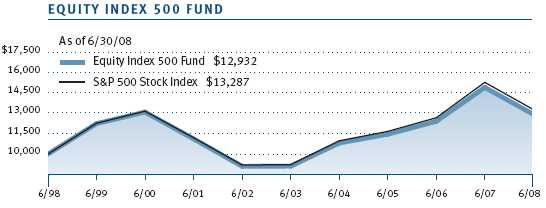
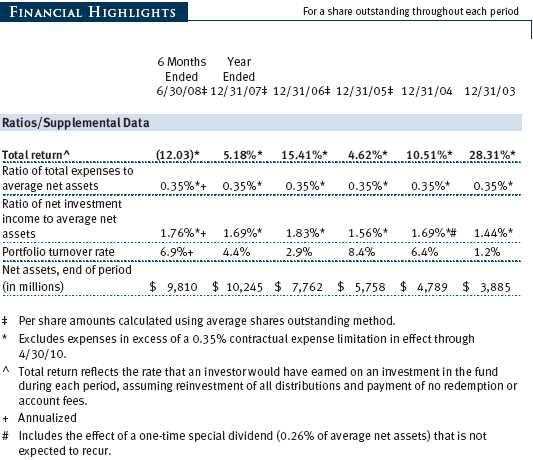
Your fund returned -12.03% for the first six months of 2008. As shown in the accompanying table, the fund’s return closely tracked the performance of its benchmark, the S&P 500 Stock Index. Fund performance tends to lag that of the benchmark due to annual operating and management expenses.
Just two of the 10 major sectors in the S&P 500 advanced for the six-month period. Energy stocks posted the best returns as oil prices increased by 45%, finishing the period at a record high of nearly $140 per barrel. Eight of the fund’s top 10 performance contributors came from this sector, led by energy production and exploration company Devon Energy and energy equipment and services provider Halliburton. A notable exception was the fund’s largest holding, ExxonMobil, which declined during the period as narrower refining profit margins weighed on earnings.
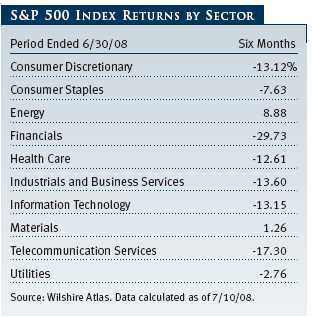
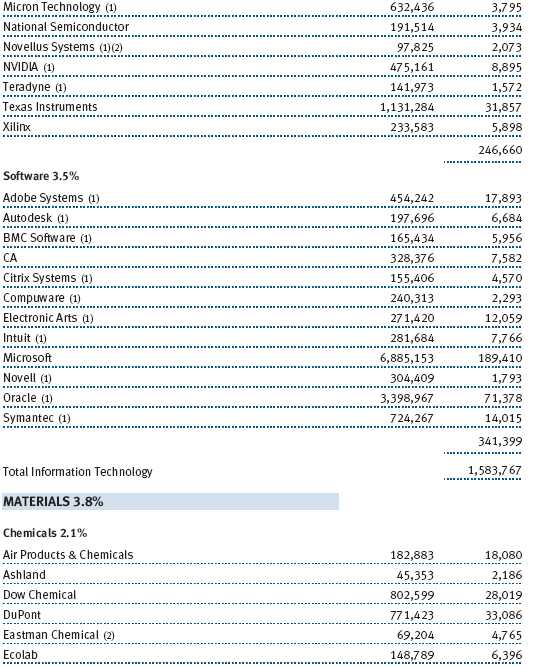
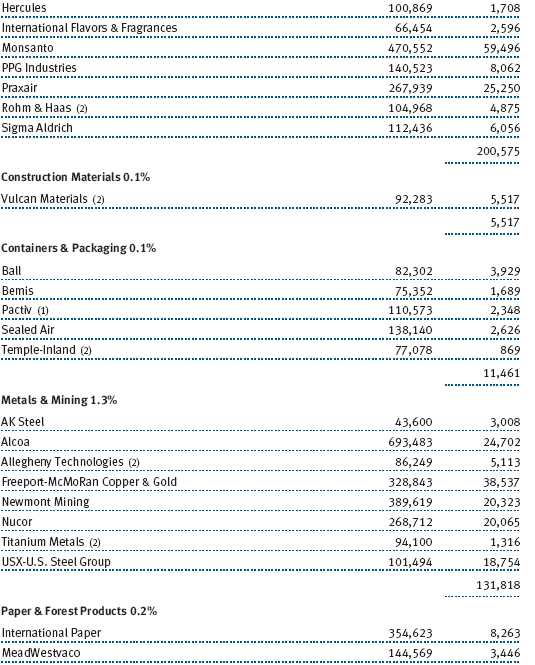
The materials sector, which composed just under 4% of the index at the end of the period, was the only other sector to gain ground. Higher commodity prices were the key behind the positive performance in the materials sector. Metals and mining stocks, led by steelmaker United States Steel and copper producer Freeport-McMoRan Copper & Gold, generated the best results amid strong demand and rising metals prices. Seed and agricultural chemical maker Monsanto also posted a solid gain thanks to the continued boom in agriculture.
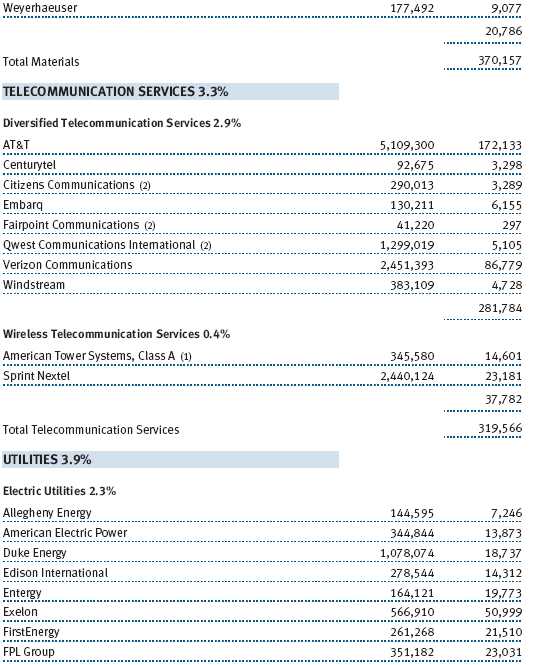
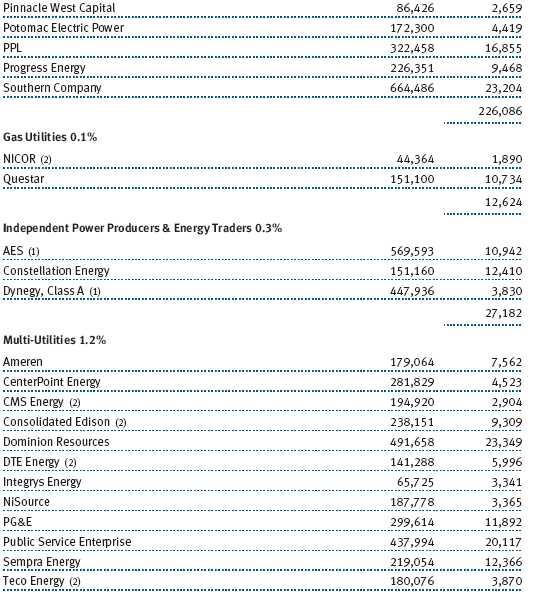
Among the declining sectors, utilities and consumer staples held up the best. Regulated electric and gas utilities were the best performers in the utilities sector, while independent power producers came under pressure as record-high energy prices squeezed their profit margins. Illinois-based electric utility Exelon was the best contributor in the sector as greater energy efficiency provided a lift to earnings. The best performance contributor in the fund came from the consumer staples sector—discount retailer Wal-Mart, which benefited from growing demand for discounted goods in a weak economic environment. Acquisition offers boosted beer maker Anheuser-Busch and confectioner Wrigley.
The remaining sectors of the index all suffered double-digit declines during the six months. Financials were by far the worst performers as the credit crunch and mortgage-related losses sent shares sharply lower. Three of the fund’s four biggest detractors from performance were financial stocks—insurer American International Group, which reported the largest quarterly loss in the company’s history and fired its CEO; Bank of America, which struggled with its acquisition of mortgage lender Countrywide Financial; and Citigroup, which reported $15 billion in losses during the six months.
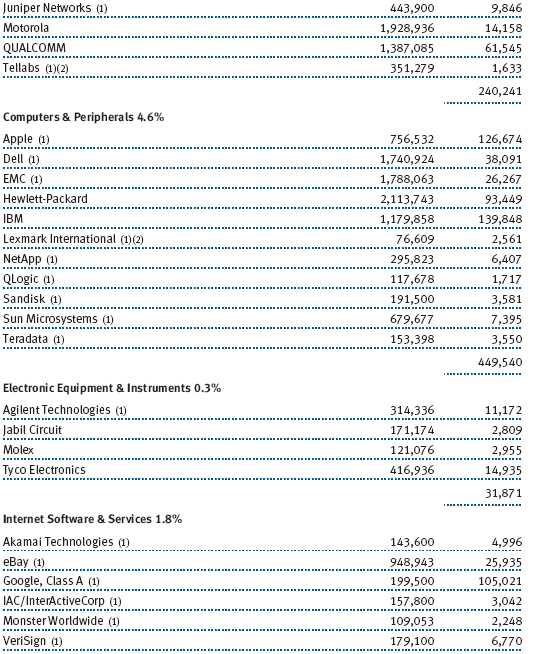
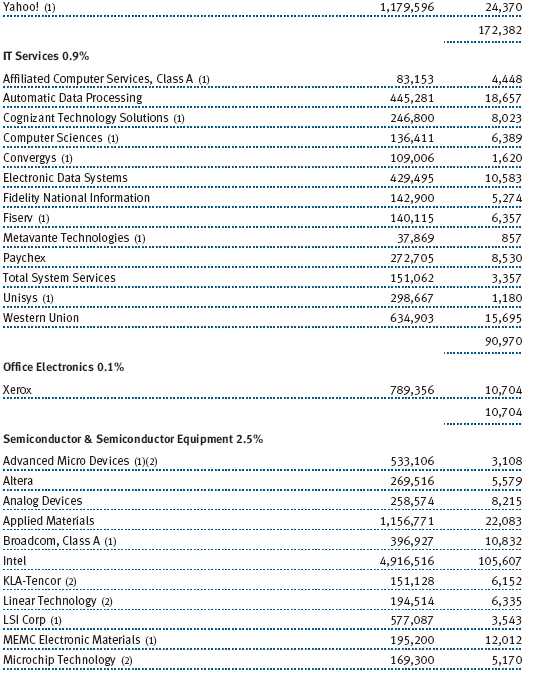
Information technology, the largest sector weighting in the index as of June 30, 2008, was second only to financials in terms of its negative impact on performance. The biggest detractor in this sector was software giant Microsoft, which slumped following its failed takeover attempt of online search company Yahoo!. Consumer electronics maker Apple and online advertising firm Google were also among the weaker performers in the technology sector.
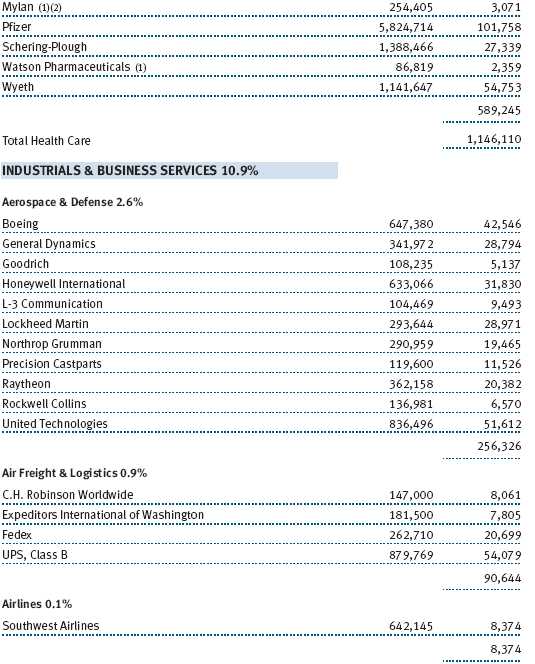
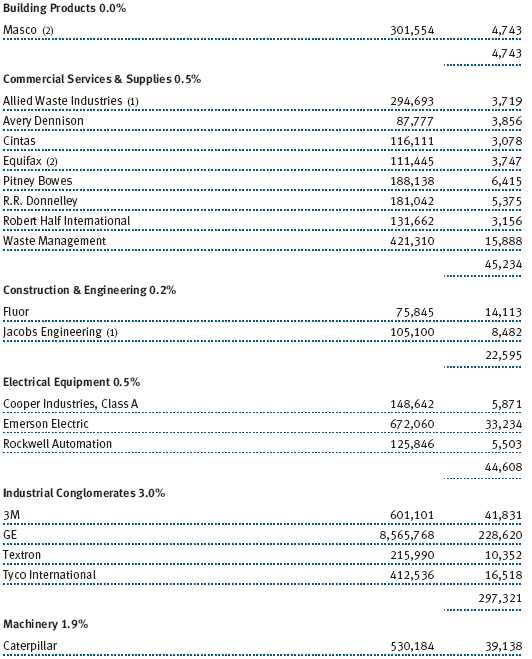
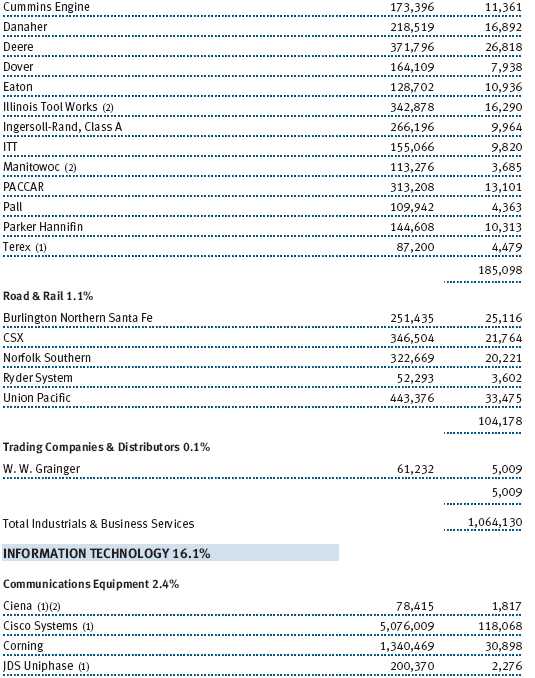
Among other stocks worth noting, industrial conglomerate General Electric was the fund’s worst performer, declining after an earnings shortfall at GE Capital, the company’s finance arm. Pharmaceutical firms Merck and Pfizer were significant decliners in the health care sector. On the positive side, railroad operator CSX delivered a robust return as strong pricing boosted earnings.
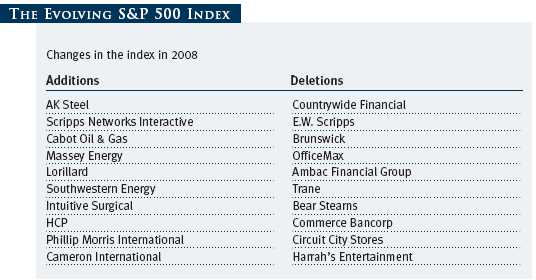
Standard & Poor’s authorized 10 changes to the composition of the S&P 500 Index in the first half of 2008. Please see the table on page 13 for a complete list of index changes.
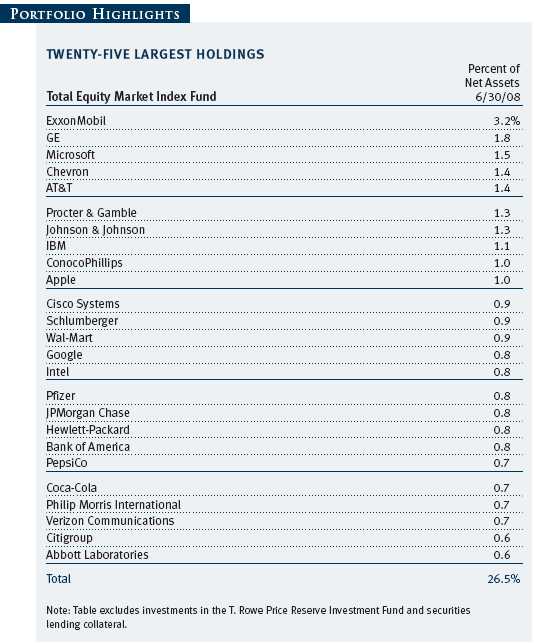
Total Equity Market Index Fund
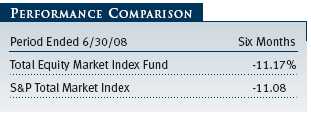
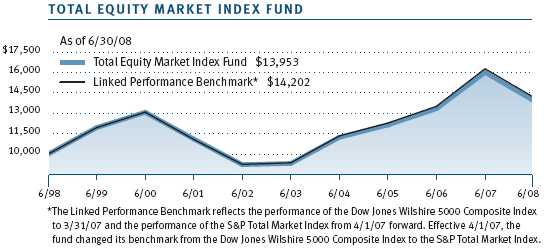
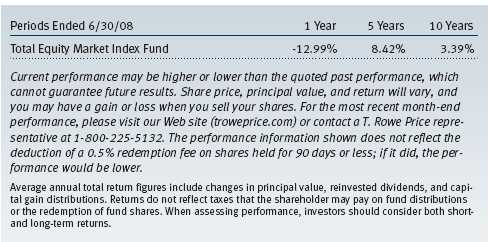
Your fund returned -11.17% for the six months ended June 30, 2008, closely tracking the return of its performance benchmark, the S&P Total Market Index. Fund performance often slightly trails that of the benchmark due to annual operating and management expenses.
In general, what is true about the performance of the S&P 500 Index is also true about the performance of the S&P Total Market Index. The Total Market Index, which represents the entire U.S. stock market, includes all S&P 500 companies. In fact, the S&P 500 represents 75% of the Total Market Index’s overall market value. The largest components of the Total Market Index—as with the S&P 500—have the greatest influence on performance. In addition, the percentage weightings of the major sectors are somewhat similar.
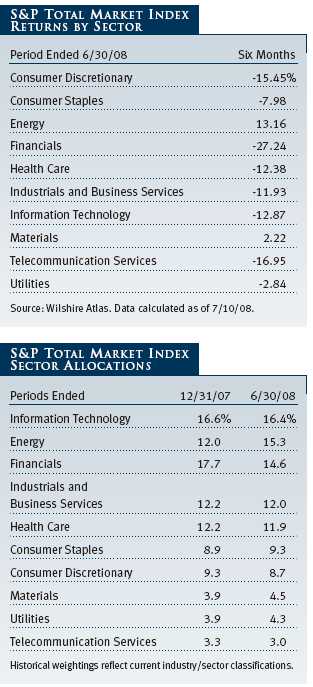
As with the S&P 500, energy and materials were the only sectors of the Total Market Index to advance in the first six months of 2008, benefiting from a sharp rise in oil and commodity prices. Utilities and consumer staples, which tend to be relatively defensive sectors of the market, held up the best among the remaining sectors. Financials suffered the largest losses during the period, followed by telecommunication services and the more economically sensitive consumer discretionary sector.
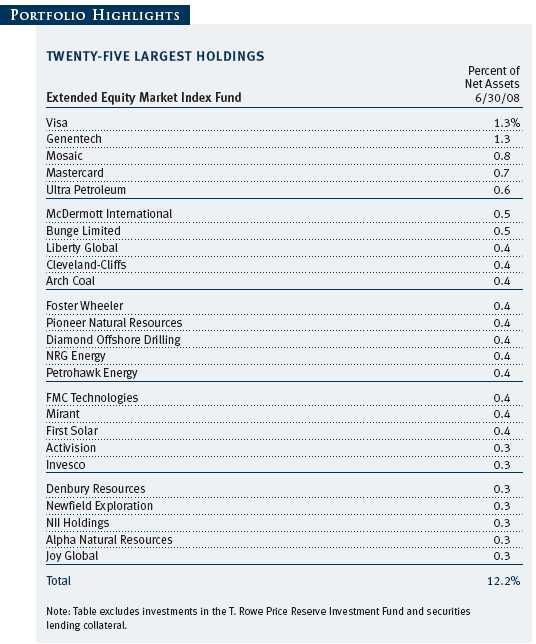
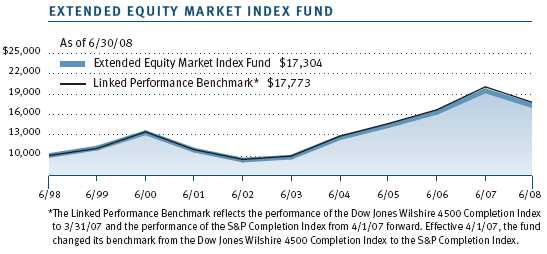
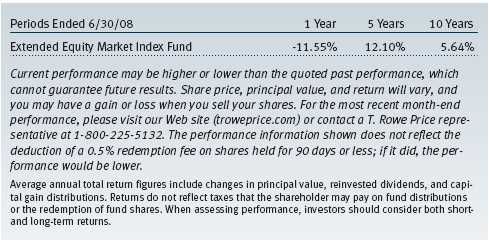
Extended Equity Market Index Fund
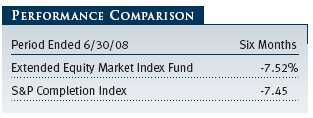
Your fund returned -7.52% in the first half of 2008, closely tracking the return of its benchmark, the S&P Completion Index. Fund performance often slightly trails that of the benchmark due to annual operating and management expenses.
Just two of the 10 sectors in the small- and mid-cap segment of the market posted positive results in the first six months of 2008. The energy sector was far and away the top-performing sector in the S&P Completion Index, generating returns of more than 40% for the six-month period as the price of oil surged. Materials stocks also advanced, benefiting from rising commodity prices.
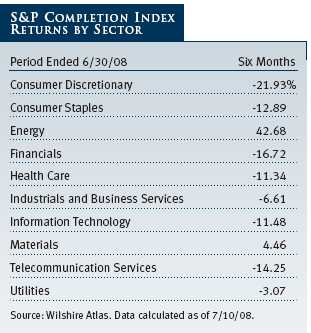
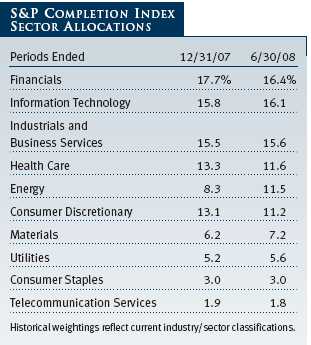
On the downside, consumer discretionary stocks—which are the most sensitive to the economic environment—were the weakest performers in the index, declining by more than 20% as a group. Financials, weighed down by mortgage-related losses, and telecommunication services also declined significantly during the six-month period. Utilities stocks were the best performers among the eight declining sectors, posting a modest negative return.
OUTLOOK
The stock market is likely to remain volatile in the coming months as heightened uncertainty and risk aversion become the dominant themes. The lackluster economic environment will continue to put downward pressure on corporate earnings. Meanwhile, the Fed must walk the razor’s edge between stimulating the economy and restraining inflation without spooking the financial markets—a tall order indeed.
We will continue to focus on our role of replicating the structure and performance of the S&P indexes to provide you with broad exposure to large-cap stocks, small- and mid-cap equities, and the entire U.S. stock market.
Respectfully submitted,

E. Frederick Bair
Chairman of the Investment Advisory Committee, Equity Index 500 Fund and Extended Equity Market Index Fund
Co-chairman of the Investment Advisory Committee, Total Equity Market Index Fund

Ken D. Uematsu
Co-chairman of the Investment Advisory Committee, Total Equity Market Index Fund
July 21, 2008
The committee chairmen have day-to-day responsibility for managing the portfolios and work with committee members in developing and executing the funds’ investment program.
RISKS OF INVESTING
As with all stock mutual funds, the fund’s share price can fall because of weakness in the stock market, a particular industry, or specific holdings. Stock markets can decline for many reasons, including adverse political or economic developments, changes in investor psychology, or heavy institutional selling. The prospects for an industry or company may deteriorate because of a variety of factors, including disappointing earnings or changes in the competitive environment.
GLOSSARY
Dow Jones Wilshire 4500 Completion Index: Tracks the performance of all stocks in the Dow Jones Wilshire 5000 Composite Index, excluding those in the S&P 500 Stock Index.
Dow Jones Wilshire 5000 Composite Index: Tracks the performance of the most active stocks in the broad U.S. market.
Fed funds target rate: An overnight lending rate set by the Federal Reserve and used by banks to meet reserve requirements. Banks also use the fed funds rate as a benchmark for their prime lending rates.
S&P 500 Stock Index: Tracks the stocks of 500 mostly large U.S. companies.
S&P Completion Index: Tracks the performance of the U.S. stocks not included in the S&P 500, which are primarily small- and mid-capitalization stocks. The index includes approximately 4,000 stocks.
S&P Total Market Index: Tracks the performance of a broad spectrum of small-, mid-, and large-capitalization U.S. stocks. Because the largest stocks in the index carry the most weight, large-capitalization stocks make up a substantial majority of the S&P Total Market’s value. The index includes approximately 4,500 stocks.
Performance and Expenses
This chart shows the value of a hypothetical $10,000 investment in the fund over the past 10 fiscal year periods or since inception (for funds lacking 10-year records). The result is compared with benchmarks, which may include a broad-based market index and a peer group average or index. Market indexes do not include expenses, which are deducted from fund returns as well as mutual fund averages and indexes.
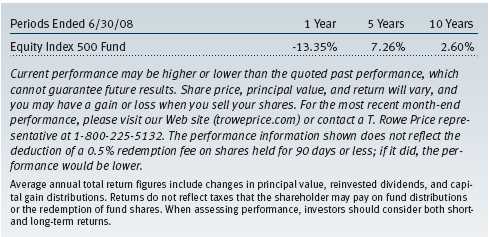
| AVERAGE ANNUAL COMPOUND TOTAL RETURN |
This table shows how the fund would have performed each year if its actual (or cumulative) returns for the periods shown had been earned at a constant rate.
This chart shows the value of a hypothetical $10,000 investment in the fund over the past 10 fiscal year periods or since inception (for funds lacking 10-year records). The result is compared with benchmarks, which may include a broad-based market index and a peer group average or index. Market indexes do not include expenses, which are deducted from fund returns as well as mutual fund averages and indexes.
| AVERAGE ANNUAL COMPOUND TOTAL RETURN |
This table shows how the fund would have performed each year if its actual (or cumulative) returns for the periods shown had been earned at a constant rate.
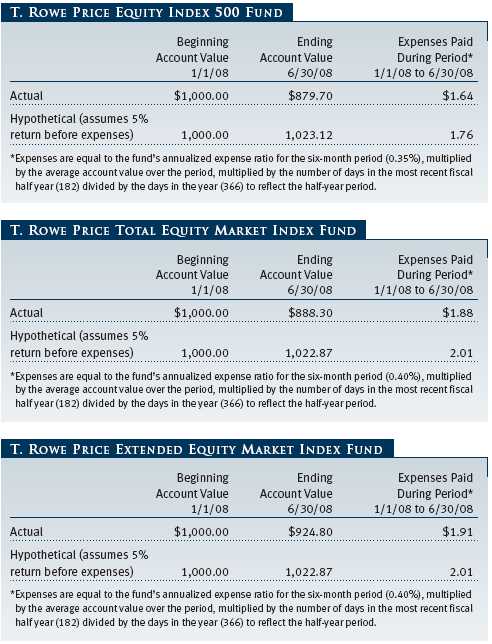
As a mutual fund shareholder, you may incur two types of costs: (1) transaction costs, such as redemption fees or sales loads, and (2) ongoing costs, including management fees, distribution and service (12b-1) fees, and other fund expenses. The following example is intended to help you understand your ongoing costs (in dollars) of investing in the fund and to compare these costs with the ongoing costs of investing in other mutual funds. The example is based on an investment of $1,000 invested at the beginning of the most recent six-month period and held for the entire period.
Actual Expenses
The first line of the following table (“Actual”) provides information about actual account values and actual expenses. You may use the information in this line, together with your account balance, to estimate the expenses that you paid over the period. Simply divide your account value by $1,000 (for example, an $8,600 account value divided by $1,000 = 8.6), then multiply the result by the number in the first line under the heading “Expenses Paid During Period” to estimate the expenses you paid on your account during this period.
Hypothetical Example for Comparison Purposes
The information on the second line of the table (“Hypothetical”) is based on hypothetical account values and expenses derived from the fund’s actual expense ratio and an assumed 5% per year rate of return before expenses (not the fund’s actual return). You may compare the ongoing costs of investing in the fund with other funds by contrasting this 5% hypothetical example and the 5% hypothetical examples that appear in the shareholder reports of the other funds. The hypothetical account values and expenses may not be used to estimate the actual ending account balance or expenses you paid for the period.
Note: T. Rowe Price charges an account maintenance fee that is not included in the accompanying table. The account maintenance fee is charged on a quarterly basis, usually during the last week of a calendar quarter, and applies to accounts with balances below $10,000 on the day of the assessment. The fee is charged to accounts that fall below $10,000 for any reason, including market fluctuations, redemptions, or exchanges. When an account with less than $10,000 is closed either through redemption or exchange, the fee is charged and deducted from the proceeds. The fee applies to IRA accounts but not to retirement plans directly registered with T. Rowe Price Services or accounts maintained by intermediaries through NSCC® Networking. If you are subject to the fee, keep it in mind when you are estimating the ongoing expenses of investing in the fund and when comparing the expenses of this fund with other funds.
You should also be aware that the expenses shown in the table highlight only your ongoing costs and do not reflect any transaction costs, such as redemption fees or sales loads. Therefore, the second line of the table is useful in comparing ongoing costs only and will not help you determine the relative total costs of owning different funds. To the extent a fund charges transaction costs, however, the total cost of owning that fund is higher.
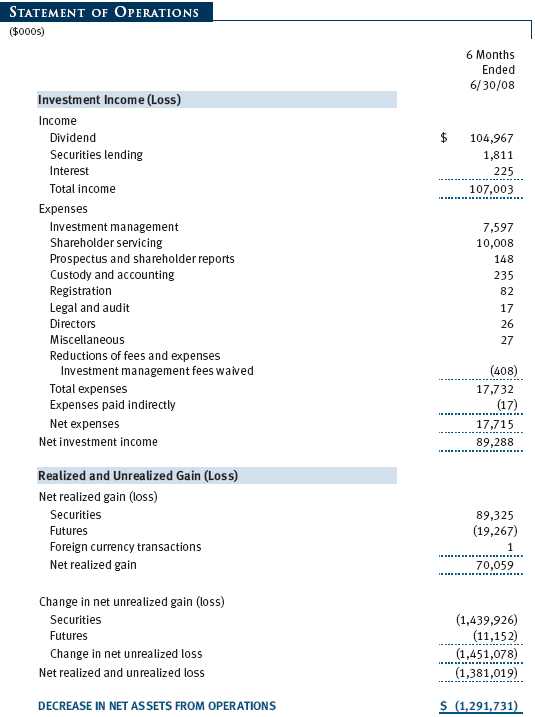
Unaudited
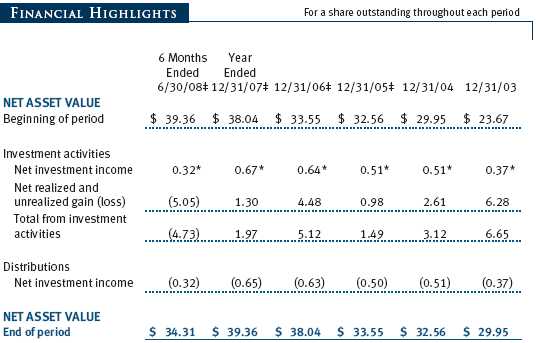
Unaudited
The accompanying notes are an integral part of these financial statements.
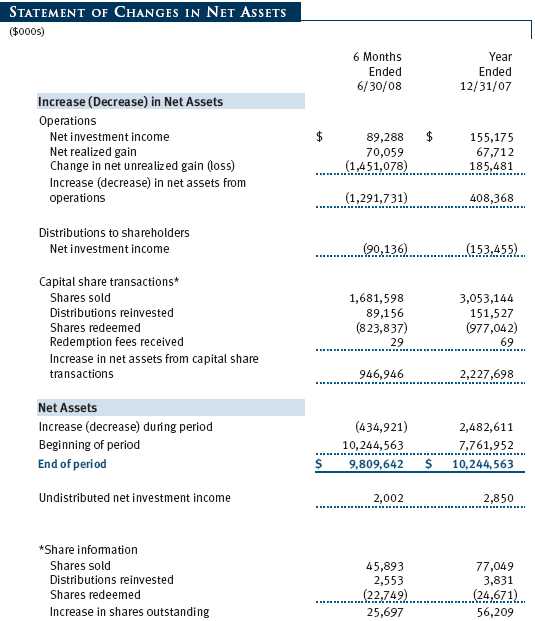
Unaudited


The accompanying notes are an integral part of these financial statements.
Unaudited

The accompanying notes are an integral part of these financial statements.
Unaudited
The accompanying notes are an integral part of these financial statements.
Unaudited
The accompanying notes are an integral part of these financial statements.
Unaudited
| NOTES TO FINANCIAL STATEMENTS |
T. Rowe Price Index Trust, Inc. (the trust), is registered under the Investment Company Act of 1940 (the 1940 Act). The Equity Index 500 Fund (the fund), a diversified, open-end management investment company, is one portfolio established by the trust. The fund commenced operations on March 30, 1990. The fund seeks to match the performance of the Standard & Poor’s 500 Stock Index.
NOTE 1 - SIGNIFICANT ACCOUNTING POLICIES
Basis of Preparation The accompanying financial statements were prepared in accordance with accounting principles generally accepted in the United States of America, which require the use of estimates made by fund management. Fund management believes that estimates and security valuations are appropriate; however, actual results may differ from those estimates, and the security valuations reflected in the financial statements may differ from the value the fund ultimately realizes upon sale of the securities.
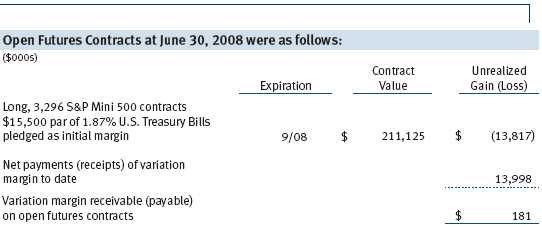
Investment Transactions, Investment Income, and Distributions Income and expenses are recorded on the accrual basis. Premiums and discounts on debt securities are amortized for financial reporting purposes. Dividends received from mutual fund investments are reflected as dividend income; capital gain distributions are reflected as realized gain/loss. Dividend income and capital gain distributions are recorded on the ex-dividend date. Income tax-related interest and penalties, if incurred, would be recorded as income tax expense. Investment transactions are accounted for on the trade date. Realized gains and losses are reported on the identified cost basis. Payments (“variation margin”) made or received to settle the daily fluctuations in the value of futures contracts are recorded as unrealized gains or losses until the contracts are closed. Unsettled variation margin on futures contracts is reflected as other assets or liabilities, and unrealized gains and losses on futures contracts are reflected as the change in net unrealized gain or loss in the accompanying financial statements. Distributions to shareholders are recorded on the ex-dividend date. Income distributions are declared and paid on a quarterly basis. Capital gain distributions, if any, are declared and paid by the fund, typically on an annual basis.
Credits The fund earns credits on temporarily uninvested cash balances at the custodian that reduce the fund’s custody charges. Custody expense in the accompanying financial statements is presented before reduction for credits, which are reflected as expenses paid indirectly.
Redemption Fees A 0.5% fee is assessed on redemptions of fund shares held for 90 days or less to deter short-term trading and to protect the interests of long-term shareholders. Redemption fees are withheld from proceeds that shareholders receive from the sale or exchange of fund shares. The fees are paid to the fund, and are recorded as an increase to paid-in capital. The fees may cause the redemption price per share to differ from the net asset value per share.
In-Kind Redemptions In accordance with guidelines described in the fund’s prospectus, the fund may distribute portfolio securities rather than cash as payment for a redemption of fund shares (in-kind redemption). For financial reporting purposes, the fund recognizes a gain on in-kind redemptions to the extent the value of the distributed securities on the date of redemption exceeds the cost of those securities. Gains and losses realized on in-kind redemptions are not recognized for tax purposes and are reclassified from undistributed realized gain (loss) to paid-in capital. During the six months ended June 30, 2008, the fund realized $129,241,000 of net gain on $226,579,000 of in-kind redemptions.
On January 1, 2008, the fund adopted Statement of Financial Accounting Standards No. 157 (FAS 157), Fair Value Measurements. FAS 157 defines fair value, establishes the framework for measuring fair value, and expands the disclosures of fair value measurements in the financial statements. Adoption of FAS 157 did not have a material impact on the fund’s net assets or results of operations.
In March 2008, the Financial Accounting Standards Board issued Statement of Financial Accounting Standards No. 161, Disclosures about Derivative Instruments and Hedging Activities (“FAS 161”), which is effective for fiscal years and interim periods beginning after November 15, 2008. FAS 161 requires enhanced disclosures about derivative and hedging activities, including how such activities are accounted for and their effect on financial position, performance and cash flows. Management is currently evaluating the impact the adoption of FAS 161 will have on the fund’s financial statements and related disclosures.
NOTE 2 - VALUATION
The fund’s investments are reported at fair value as defined under FAS 157. The fund values its investments and computes its net asset value per share at the close of the New York Stock Exchange (NYSE), normally 4 p.m. ET, each day that the NYSE is open for business.
Valuation Methods Equity securities listed or regularly traded on a securities exchange or in the over-the-counter (OTC) market are valued at the last quoted sale price at the time the valuations are made, except for OTC Bulletin Board securities, which are valued at the mean of the latest bid and asked prices. A security that is listed or traded on more than one exchange is valued at the quotation on the exchange determined to be the primary market for such security. Listed securities not traded on a particular day are valued at the mean of the latest bid and asked prices.
Debt securities with remaining maturities of less than one year at the time of acquisition generally use amortized cost in local currency to approximate fair value. However, if amortized cost is deemed not to reflect fair value or the fund holds a significant amount of such securities with remaining maturities of more than 60 days, the securities are valued at prices furnished by dealers who make markets in such securities or by an independent pricing service.
Investments in mutual funds are valued at the mutual fund’s closing net asset value per share on the day of valuation. Financial futures contracts are valued at closing settlement prices.
Other investments, including restricted securities, and those for which the above valuation procedures are inappropriate or are deemed not to reflect fair value are stated at fair value as determined in good faith by the T. Rowe Price Valuation Committee, established by the fund’s Board of Directors.
Valuation Inputs Various inputs are used to determine the value of the fund’s investments. These inputs are summarized in the three broad levels listed below:
Level 1 – quoted prices in active markets for identical securities
Level 2 – observable inputs other than Level 1 quoted prices (including, but not limited to, quoted prices for similar securities, interest rates, prepayment speeds, credit risk)
Level 3 – unobservable inputs
Observable inputs are those based on market data obtained from sources independent of the fund, and unobservable inputs reflect the fund’s own assumptions based on the best information available. The input levels are not necessarily an indication of the risk or liquidity associated with investments at that level. The following table summarizes the fund’s investments, based on the inputs used to determine their values on June 30, 2008:

NOTE 3 - INVESTMENT TRANSACTIONS
Consistent with its investment objective, the fund engages in the following practices to manage exposure to certain risks or to enhance performance. The investment objective, policies, program, and risk factors of the fund are described more fully in the fund’s prospectus and Statement of Additional Information.
Futures Contracts During the six months ended June 30, 2008, the fund was a party to futures contracts, which provide for the future sale by one party and purchase by another of a specified amount of a specific financial instrument at an agreed upon price, date, time, and place. Risks arise from possible illiquidity of the futures market and from movements in security values.
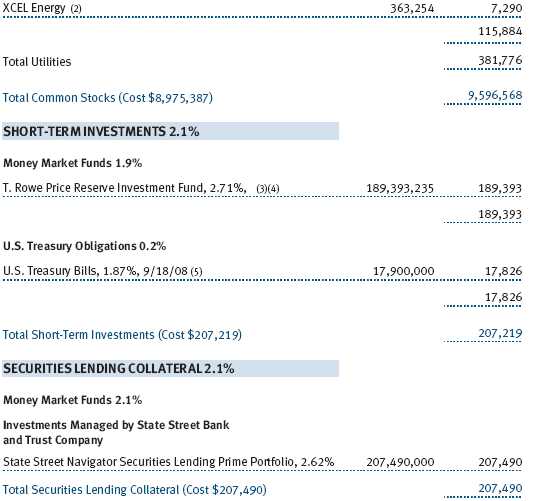
Securities Lending The fund lends its securities to approved brokers to earn additional income. It receives as collateral cash and U.S. government securities valued at 102% to 105% of the value of the securities on loan. Cash collateral is invested by the fund’s lending agent(s) in accordance with investment guidelines approved by fund management. Although risk is mitigated by the collateral, the fund could experience a delay in recovering its securities and a possible loss of income or value if the borrower fails to return the securities or if collateral investments decline in value. Securities lending revenue recognized by the fund consists of earnings on invested collateral and borrowing fees, net of any rebates to the borrower and compensation to the lending agent. On June 30, 2008, the value of loaned securities was $255,151,000; aggregate collateral received included U.S. government securities valued at $61,505,000.
Other Purchases and sales of portfolio securities, other than short-term securities, aggregated $1,266,375,000 and $341,719,000, respectively, for the six months ended June 30, 2008.
NOTE 4 - FEDERAL INCOME TAXES
No provision for federal income taxes is required since the fund intends to continue to qualify as a regulated investment company under Subchapter M of the Internal Revenue Code and distribute to shareholders all of its taxable income and gains. Distributions are determined in accordance with Federal income tax regulations, which differ from generally accepted accounting principles, and, therefore, may differ in amount or character from net investment income and realized gains for financial reporting purposes. Financial reporting records are adjusted for permanent book/tax differences to reflect tax character but are not adjusted for temporary differences. The amount and character of tax-basis distributions and composition of net assets are finalized at fiscal year-end; accordingly, tax-basis balances have not been determined as of June 30, 2008.
The fund intends to retain realized gains to the extent of available capital loss carryforwards. As of December 31, 2007, the fund had $163,806,000 of unused capital loss carryforwards, of which $15,613,000 expire in 2009, $115,599,000 expire in 2010, $3,380,000 expire in 2011, $15,883,000 expire in 2013, and $13,331,000 expire in 2014.
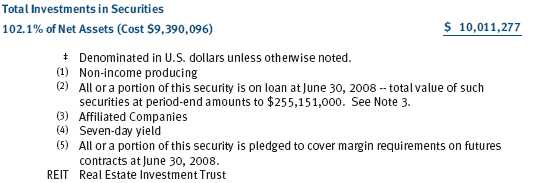
At June 30, 2008, the cost of investments for federal income tax purposes was $9,390,096,000. Net unrealized gain aggregated $607,364,000 at period-end, of which $1,895,195,000 related to appreciated investments and $1,287,831,000 related to depreciated investments.
NOTE 5 - RELATED PARTY TRANSACTIONS
The fund is managed by T. Rowe Price Associates, Inc. (the manager or Price Associates), a wholly owned subsidiary of T. Rowe Price Group, Inc. The investment management agreement between the fund and the manager provides for an annual investment management fee equal to 0.15% of the fund’s average daily net assets. The fee is computed daily and paid monthly.
The fund is also subject to a contractual expense limitation through April 30, 2010. During the limitation period, the manager is required to waive its management fee and reimburse the fund for any expenses, excluding interest, taxes, brokerage commissions, and extraordinary expenses, that would otherwise cause the fund’s ratio of annualized total expenses to average net assets (expense ratio) to exceed its expense limitation of 0.35%. The fund is required to repay the manager for expenses previously reimbursed and management fees waived to the extent the fund’s net assets have grown or expenses have declined sufficiently to allow repayment without causing the fund’s expense ratio to exceed its expense limitation. However, no repayment will be made more than three years after the date of any reimbursement or waiver or later than April 30, 2012. Pursuant to this agreement, management fees in the amount of $408,000 were waived during the six months ended June 30, 2008. Including these amounts, management fees waived in the amount of $1,543,000 remain subject to repayment at June 30, 2008.
In addition, the fund has entered into service agreements with Price Associates and two wholly owned subsidiaries of Price Associates (collectively, Price). Price Associates computes the daily share price and provides certain other administrative services to the fund. T. Rowe Price Services, Inc., provides shareholder and administrative services in its capacity as the fund’s transfer and dividend disbursing agent. T. Rowe Price Retirement Plan Services, Inc., provides subaccounting and recordkeeping services for certain retirement accounts invested in the fund. For the six months ended June 30, 2008, expenses incurred pursuant to these service agreements were $87,000 for Price Associates, $1,288,000 for T. Rowe Price Services, Inc., and $1,058,000 for T. Rowe Price Retirement Plan Services, Inc. The total amount payable at period-end pursuant to these service agreements is reflected as Due to Affiliates in the accompanying financial statements.
Additionally, the fund is one of several mutual funds in which certain college savings plans managed by Price Associates may invest. As approved by the fund’s Board of Directors, shareholder servicing costs associated with each college savings plan are borne by the fund in proportion to the average daily value of its shares owned by the college savings plan. For the six months ended June 30, 2008, the fund was charged $1,040,000 for shareholder servicing costs related to the college savings plans, of which $903,000 was for services provided by Price. The amount payable at period-end pursuant to this agreement is reflected as Due to Affiliates in the accompanying financial statements. At June 30, 2008, approximately 8% of the outstanding shares of the fund were held by college savings plans.
The fund is also one of several mutual funds sponsored by Price Associates (underlying Price funds) in which the T. Rowe Price Retirement Funds (Retirement Funds) may invest. The Retirement Funds do not invest in the underlying Price funds for the purpose of exercising management or control. Pursuant to a special servicing agreement, expenses associated with the operation of the Retirement Funds are borne by each underlying Price fund to the extent of estimated savings to it and in proportion to the average daily value of its shares owned by the Retirement Funds. Expenses allocated under this agreement are reflected as shareholder servicing expense in the accompanying financial statements. For the six months ended June 30, 2008, the fund was allocated $6,201,000 of Retirement Funds’ expenses, of which $4,700,000 related to services provided by Price. The amount payable at period-end pursuant to this agreement is reflected as Due to Affiliates in the accompanying financial statements. At June 30, 2008, approximately 60% of the outstanding shares of the fund were held by the Retirement Funds.
Consistent with its investment objective, the fund may invest in T. Rowe Price Group, Inc. Additionally, the fund may invest in the T. Rowe Price Reserve Investment Fund and the T. Rowe Price Government Reserve Investment Fund (collectively, the T. Rowe Price Reserve Investment Funds), open-end management investment companies managed by Price Associates and considered affiliates of the fund. The T. Rowe Price Reserve Investment Funds are offered as cash management options to mutual funds, trusts, and other accounts managed by Price Associates and/or its affiliates and are not available for direct purchase by members of the public. The T. Rowe Price Reserve Investment Funds pay no investment management fees.
| INFORMATION ON PROXY VOTING POLICIES, PROCEDURES, AND RECORDS |
A description of the policies and procedures used by T. Rowe Price funds and portfolios to determine how to vote proxies relating to portfolio securities is available in each fund’s Statement of Additional Information, which you may request by calling 1-800-225-5132 or by accessing the SEC’s Web site, www.sec.gov. The description of our proxy voting policies and procedures is also available on our Web site, www.troweprice.com. To access it, click on the words “Company Info” at the top of our homepage for individual investors. Then, in the window that appears, click on the “Proxy Voting Policy” navigation button in the top left corner.
Each fund’s most recent annual proxy voting record is available on our Web site and through the SEC’s Web site. To access it through our Web site, follow the directions above, then click on the words “Proxy Voting Record” at the bottom of the Proxy Voting Policy page.
| HOW TO OBTAIN QUARTERLY PORTFOLIO HOLDINGS |
The fund files a complete schedule of portfolio holdings with the Securities and Exchange Commission for the first and third quarters of each fiscal year on Form N-Q. The fund’s Form N-Q is available electronically on the SEC’s Web site (www.sec.gov); hard copies may be reviewed and copied at the SEC’s Public Reference Room, 450 Fifth St. N.W., Washington, DC 20549. For more information on the Public Reference Room, call 1-800-SEC-0330.
| APPROVAL OF INVESTMENT MANAGEMENT AGREEMENT |
On March 4, 2008, the fund’s Board of Directors (Board) unanimously approved the investment advisory contract (Contract) between the fund and its investment manager, T. Rowe Price Associates, Inc. (Manager). The Board considered a variety of factors in connection with its review of the Contract, also taking into account information provided by the Manager during the course of the year, as discussed below:
Services Provided by the Manager
The Board considered the nature, quality, and extent of the services provided to the fund by the Manager. These services included, but were not limited to, management of the fund’s portfolio and a variety of related activities, as well as financial and administrative services, reporting, and communications. The Board also reviewed the background and experience of the Manager’s senior management team and investment personnel involved in the management of the fund. The Board concluded that it was satisfied with the nature, quality, and extent of the services provided by the Manager.
Investment Performance of the Fund
The Board reviewed the fund’s average annual total returns over the 1-, 3-, 5-, and 10-year periods as well as the fund’s year-by-year returns and compared these returns with previously agreed upon comparable performance measures and market data, including those supplied by Lipper and Morningstar, which are independent providers of mutual fund data. On the basis of this evaluation and the Board’s ongoing review of investment results, the Board concluded that the fund’s performance was satisfactory.
Costs, Benefits, Profits, and Economies of Scale
The Board reviewed detailed information regarding the revenues received by the Manager under the Contract and other benefits that the Manager (and its affiliates) may have realized from its relationship with the fund, including research received under “soft dollar” agreements. The Board noted that soft dollars were not used to pay for third-party, non-broker research. The Board also received information on the estimated costs incurred and profits realized by the Manager and its affiliates from advising T. Rowe Price mutual funds, as well as estimates of the gross profits realized from managing the fund in particular. The Board concluded that the Manager’s profits were reasonable in light of the services provided to the fund. The Board also considered whether the fund or other funds benefit under the fee levels set forth in the Contract from any economies of scale realized by the Manager. The Board concluded that, based on the profitability data it reviewed, the Contract provided for a reasonable sharing of benefits from any economies of scale with the fund’s investors.
Fees
The Board reviewed the fund’s management fee rate, operating expenses, and total expense ratio and compared them with fees and expenses of other comparable funds based on information and data supplied by Lipper. The information provided to the Board indicated that the fund’s management fee rate and expense ratio were above the median for certain groups of comparable funds but at or below the median for other groups of comparable funds. The Board also reviewed the fee schedules for comparable privately managed accounts of the Manager and its affiliates. Management informed the Board that the Manager’s responsibilities for privately managed accounts are more limited than its responsibilities for the fund and other T. Rowe Price mutual funds that it or its affiliates advise. On the basis of the information provided, the Board concluded that the fees paid by the fund under the Contract were reasonable.
Approval of the Contract
As noted, the Board approved the continuation of the Contract. No single factor was considered in isolation or to be determinative to the decision. Rather, the Board concluded, in light of a weighting and balancing of all factors considered, that it was in the best interests of the fund to approve the continuation of the Contract, including the fees to be charged for services thereunder.
Item 2. Code of Ethics.
A code of ethics, as defined in Item 2 of Form N-CSR, applicable to its principal executive officer, principal financial officer, principal accounting officer or controller, or persons performing similar functions is filed as an exhibit to the registrant’s annual Form N-CSR. No substantive amendments were approved or waivers were granted to this code of ethics during the registrant’s most recent fiscal half-year.
Item 3. Audit Committee Financial Expert.
Disclosure required in registrant’s annual Form N-CSR.
Item 4. Principal Accountant Fees and Services.
Disclosure required in registrant’s annual Form N-CSR.
Item 5. Audit Committee of Listed Registrants.
Not applicable.
Item 6. Investments.
(a) Not applicable. The complete schedule of investments is included in Item 1 of this Form N-CSR.
(b) Not applicable.
Item 7. Disclosure of Proxy Voting Policies and Procedures for Closed-End Management Investment Companies.
Not applicable.
Item 8. Portfolio Managers of Closed-End Management Investment Companies.
Not applicable.
Item 9. Purchases of Equity Securities by Closed-End Management Investment Company and Affiliated Purchasers.
Not applicable.
Item 10. Submission of Matters to a Vote of Security Holders.
Not applicable.
Item 11. Controls and Procedures.
(a) The registrant’s principal executive officer and principal financial officer have evaluated the registrant’s disclosure controls and procedures within 90 days of this filing and have concluded that the registrant’s disclosure controls and procedures were effective, as of that date, in ensuring that information required to be disclosed by the registrant in this Form N-CSR was recorded, processed, summarized, and reported timely.
(b) The registrant’s principal executive officer and principal financial officer are aware of no change in the registrant’s internal control over financial reporting that occurred during the registrant’s second fiscal quarter covered by this report that has materially affected, or is reasonably likely to materially affect, the registrant’s internal control over financial reporting.
Item 12. Exhibits.
(a)(1) The registrant’s code of ethics pursuant to Item 2 of Form N-CSR is filed with the registrant’s annual Form N-CSR.
(2) Separate certifications by the registrant's principal executive officer and principal financial officer, pursuant to Section 302 of the Sarbanes-Oxley Act of 2002 and required by Rule 30a-2(a) under the Investment Company Act of 1940, are attached.
(3) Written solicitation to repurchase securities issued by closed-end companies: not applicable.
(b) A certification by the registrant's principal executive officer and principal financial officer, pursuant to Section 906 of the Sarbanes-Oxley Act of 2002 and required by Rule 30a-2(b) under the Investment Company Act of 1940, is attached.
| | |
SIGNATURES |
| |
| | Pursuant to the requirements of the Securities Exchange Act of 1934 and the Investment |
| Company Act of 1940, the registrant has duly caused this report to be signed on its behalf by the |
| undersigned, thereunto duly authorized. |
| |
| T. Rowe Price Index Trust, Inc. |
| |
| |
| |
| By | /s/ Edward C. Bernard |
| | Edward C. Bernard |
| | Principal Executive Officer |
| |
| Date | August 20, 2008 |
| |
| |
| |
| | Pursuant to the requirements of the Securities Exchange Act of 1934 and the Investment |
| Company Act of 1940, this report has been signed below by the following persons on behalf of |
| the registrant and in the capacities and on the dates indicated. |
| |
| |
| By | /s/ Edward C. Bernard |
| | Edward C. Bernard |
| | Principal Executive Officer |
| |
| Date | August 20, 2008 |
| |
| |
| |
| By | /s/ Gregory K. Hinkle |
| | Gregory K. Hinkle |
| | Principal Financial Officer |
| |
| Date | August 20, 2008 |