UNITED STATES
SECURITIES AND EXCHANGE COMMISSION
Washington, D.C. 20549
FORM N-CSR
CERTIFIED SHAREHOLDER REPORT OF REGISTERED
MANAGEMENT INVESTMENT COMPANIES
Investment Company Act File Number: 811-05986
| T. Rowe Price Index Trust, Inc. |
|
| (Exact name of registrant as specified in charter) |
| |
| 100 East Pratt Street, Baltimore, MD 21202 |
|
| (Address of principal executive offices) |
| |
| David Oestreicher |
| 100 East Pratt Street, Baltimore, MD 21202 |
|
| (Name and address of agent for service) |
Registrant’s telephone number, including area code: (410) 345-2000
Date of fiscal year end: December 31
Date of reporting period: June 30, 2012
Item 1. Report to Shareholders
| Extended Equity Market Index Fund | June 30, 2012 |
The views and opinions in this report were current as of June 30, 2012. They are not guarantees of performance or investment results and should not be taken as investment advice. Investment decisions reflect a variety of factors, and the managers reserve the right to change their views about individual stocks, sectors, and the markets at any time. As a result, the views expressed should not be relied upon as a forecast of the fund’s future investment intent. The report is certified under the Sarbanes-Oxley Act, which requires mutual funds and other public companies to affirm that, to the best of their knowledge, the information in their financial reports is fairly and accurately stated in all material respects.
REPORTS ON THE WEB
Sign up for our E-mail Program, and you can begin to receive updated fund reports and prospectuses online rather than through the mail. Log in to your account at troweprice.com for more information.
Manager’s Letter
Fellow Shareholders
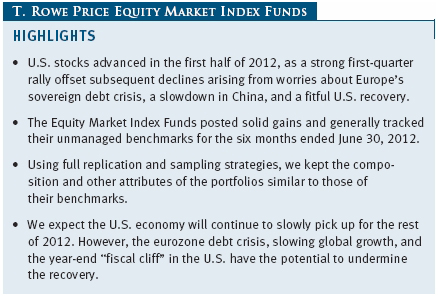
U.S. stocks rallied in the first quarter of 2012 as the U.S. economy strengthened and European leaders took steps to resolve the region’s long-running debt crisis. But concerns about Europe flared up again in the spring as the crisis entered a new phase centered on Spain, while a string of disappointing monthly jobs gains revived worries that the U.S. recovery was stalling. Stocks retreated in April and May but recouped some of their losses in June, helped by a global rally on the final trading day after European leaders agreed on new measures to ease the debt crisis. For the six months ended June 30, 2012, the Equity Index 500, Total Equity Market Index, and Extended Equity Market Index Funds posted solid gains. All three funds broadly tracked the returns of their respective benchmarks over the period.
MARKET ENVIRONMENT
U.S. stocks rallied sharply in the first quarter as the economy showed signs of improvement and European leaders made progress in containing the region’s debt crisis. However, the tenor of economic news turned more negative in the spring. After growing strongly in the first quarter, monthly jobs gains from April to June weakened and the unemployment rate remained stuck at 8.2%, reinforcing other indicators suggesting that the U.S. recovery was losing steam. Investors also grew anxious about a slowdown in China, where data increasingly showed the world’s second-largest economy was cooling after decades of rapid growth. However, Europe remained the focus of investor worries. The region’s intensifying debt crisis produced financial and political upheaval across the eurozone, raising worries about a disorderly Greek default and the survival of the currency bloc itself. The S&P 500 rose to its highest level in almost four years on April 2, 2012, but erased much of its year-to-date gains by June 1 amid rising worries about slowing global growth and the future of the eurozone.
Large-cap stocks outpaced small-cap stocks, and growth stocks fared better than value across all market capitalizations. The large-cap S&P 500 Index gained 9.49%, while the S&P Completion Index—a broad measure of small- and mid-cap stock performance—added 8.80%. Most sectors within the S&P 500 rose over the reporting period. The energy sector was the sole decliner as energy prices, especially for oil and natural gas, tumbled as domestic production soared and global supply rose.
SUMMARY OF INVESTMENT STRATEGIES
T. Rowe Price’s Equity Market Index Funds are designed for investors who want to harness the potential for long-term capital appreciation from broad exposure to large-cap stocks (Equity Index 500 Fund), small- and mid-cap stocks (Extended Equity Market Index Fund), or the entire U.S. stock market (Total Equity Market Index Fund). These funds could serve as core holdings in an investor’s portfolio, as they offer attributes that many investors will find appealing.
- They are well diversified, which can reduce the potentially negative impact of a given stock on the entire portfolio. The Equity Index 500 Fund invests in all S&P 500 Index stocks, while the Total Equity Market Index Fund and the Extended Equity Market Index Fund invested in 1,351 and 1,615 stocks, respectively, as of June 30, 2012. (Diversification cannot assure a profit or protect against loss in a declining market.)
- They tend to closely track their benchmarks. The Equity Index 500 Fund uses a full replication strategy so that the weightings of our holdings match those of the S&P 500 Index. The Total Equity Market Index Fund and the Extended Equity Market Index Fund use a sampling strategy to approximate the sector allocations, price-to-earnings ratio, and other attributes of their benchmarks. We occasionally invest in securities such as futures and exchange-traded funds (ETFs) so that the index funds can accommodate cash flows and remain fully invested.
- They offer instant, broad exposure to different sectors of the stock market, and each fund’s sector allocations are consistent with its benchmark’s sector breakdown. As such, changes in the funds’ sector diversification and other overall characteristics reflect changes in the composition of the indexes, rather than strategic shifts that are typical of an actively managed fund. Since the funds are designed to track their respective indices, they do not have the flexibility to shift assets toward stocks or sectors that are rising or away from those that are declining.
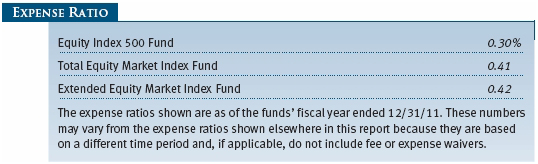
- Their expenses are generally low, which allows investors to retain more of their returns.
Equity Index 500 Fund
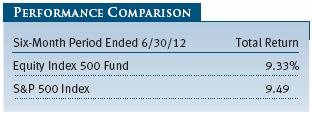
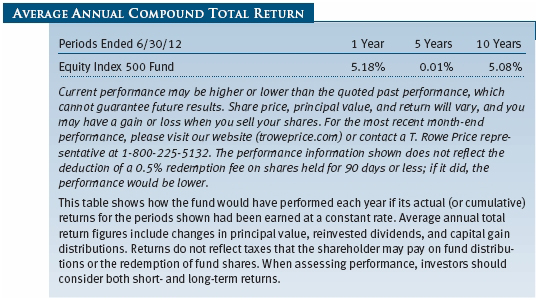
Your fund returned 9.33% in the six-month period ended June 30, 2012, versus 9.49% for the S&P 500 Index. Fund performance tends to slightly lag that of the benchmark due to operating and management expenses.
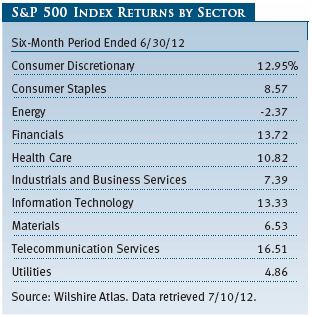
Every sector in the S&P 500 except for energy rose over the reporting period. Telecommunication services, financials, and information technology accounted for the top-performing sectors. Consumer discretionary and health care stocks also outperformed the index with double-digit advances. Consumer staples, industrials and business services, materials, and utilities lagged the benchmark with milder gains. The energy sector declined as domestic production soared and oil and natural gas prices tumbled over the period. Growth stocks outperformed value in the S&P 500.
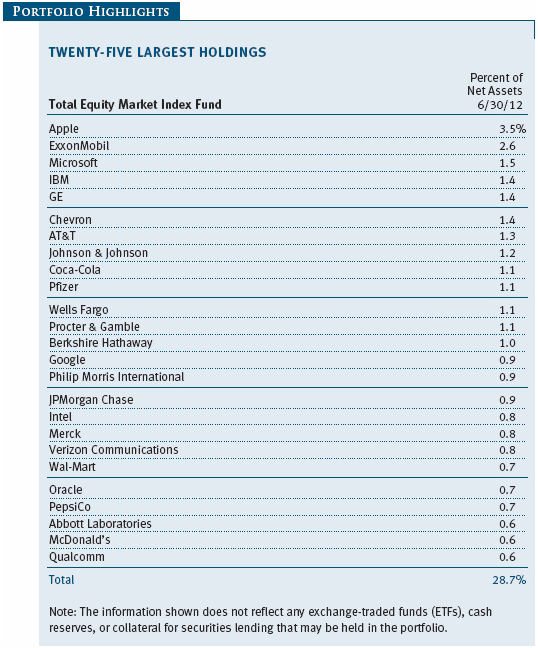
AT&T led gainers in the telecommunications sector, as the largest U.S. phone company continues to benefit from the tremendous commercial success of Apple’s iPhone. Wells Fargo topped advancers in the financials sector. Although U.S. banks remain under pressure due to the sluggish U.S. recovery, weak housing market, low interest rate environment, and unfavorable regulatory changes, they are still in far better shape than their global peers in Europe, many of which are exposed to that region’s debt crisis. In information technology, Apple widely outpaced gainers as sales of the iPhone, iPad, and other devices continued to soar and the company rolled out new versions of its products that met strong consumer demand. Apple’s shares soared 44% in the first half, making it the top contributor in the S&P 500 Index over the reporting period. (Please refer to our portfolio of investments for a complete list of holdings and the amount each represents in the portfolio.)
As noted earlier, the energy sector fell as energy prices slumped due to slowing global growth and soaring supplies of oil and natural gas resulting from a surge in domestic production. Many U.S. companies have found it increasingly easy to find oil and natural gas in areas across the country, and growing use of hydraulic fracturing—a drilling technique known as fracking—helped push natural gas prices to their lowest level in a decade. Oil producer Occidental Petroleum and oilfield services company Halliburton paced decliners in the energy sector. The utilities sector rose but lagged the overall market. Exelon, the largest U.S. power producer, was the biggest decliner. Falling natural gas prices have driven down wholesale electricity prices, which in turn have hurt revenue for power producers.
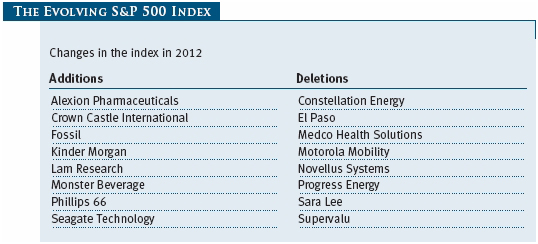
Standard & Poor’s authorized 16 changes to the composition of the S&P 500 Index during the year. Please see the table on page 10 for a complete list of index changes.
Total Equity Market Index Fund
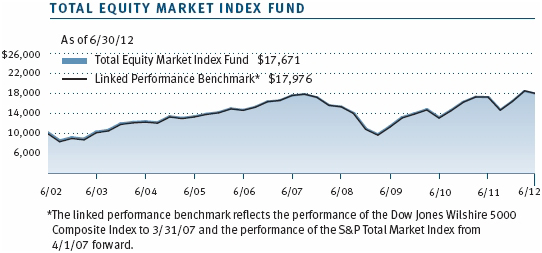
Your fund returned 9.18% for the six-month period ended June 30, 2012, versus 9.37% for its benchmark, the S&P Total Market Index. Fund performance often slightly trails that of the benchmark due to operating and management expenses.
The S&P Total Market Index represents the entire U.S. stock market. It combines the S&P 500 and the S&P Completion Index and offers broad exposure to large-, mid-, small-, and micro-cap companies. Stocks of the S&P 500 represent over 75% of the S&P Total Market Index’s overall market value. As with the S&P 500, the largest holdings of the S&P Total Market Index have the greatest influence on the fund’s performance. In addition, the percentage weightings of the major sectors are broadly similar between the two benchmarks.
As with the S&P 500 Index, telecommunication services and financials were the best-performing sectors of the S&P Total Market Index, followed by consumer discretionary, health care, and information technology, all of which rose 12% or more over the past six months. Consumer staples, industrials and business services, materials, and utilities posted more modest gains that trailed the benchmark. Energy stocks again were the only decliner for the period as oil and natural gas prices slumped.
Extended Equity Market Index Fund
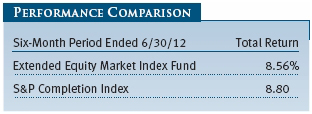
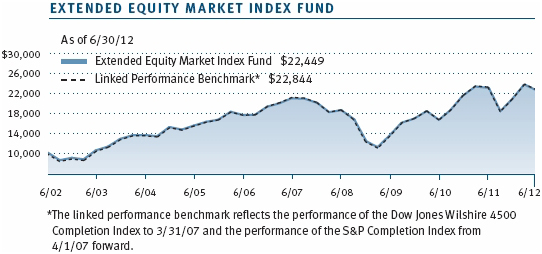
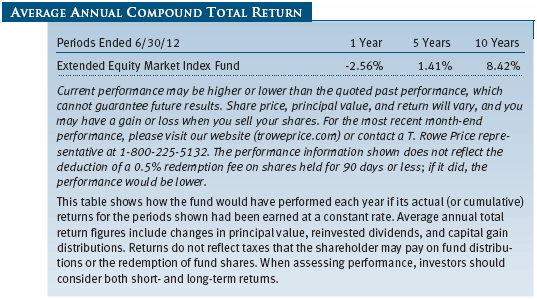
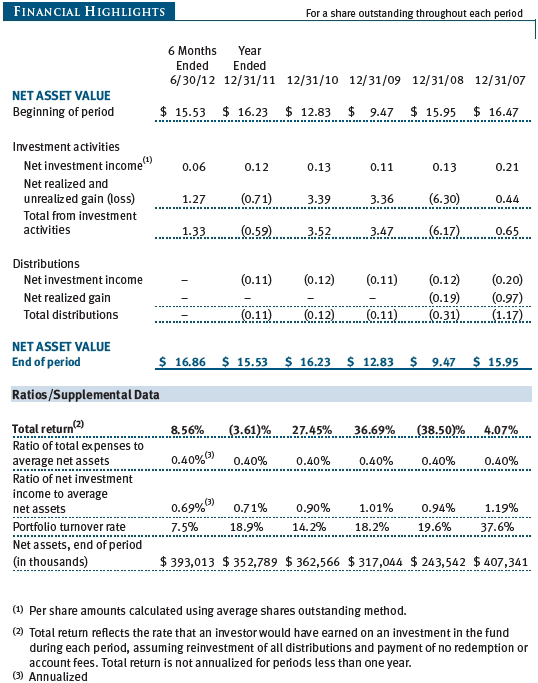
Your fund returned 8.56% for the six-month period ended June 30, 2012, versus 8.80% for the S&P Completion Index. Fund performance tends to slightly lag that of the benchmark due to the fund’s operating and management expenses.
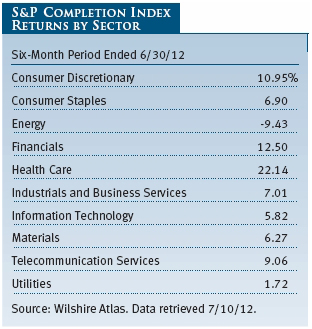
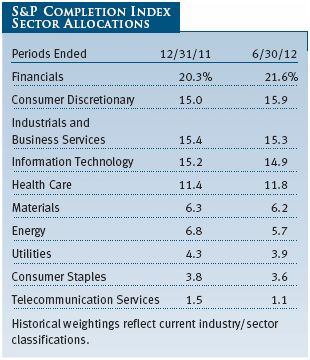
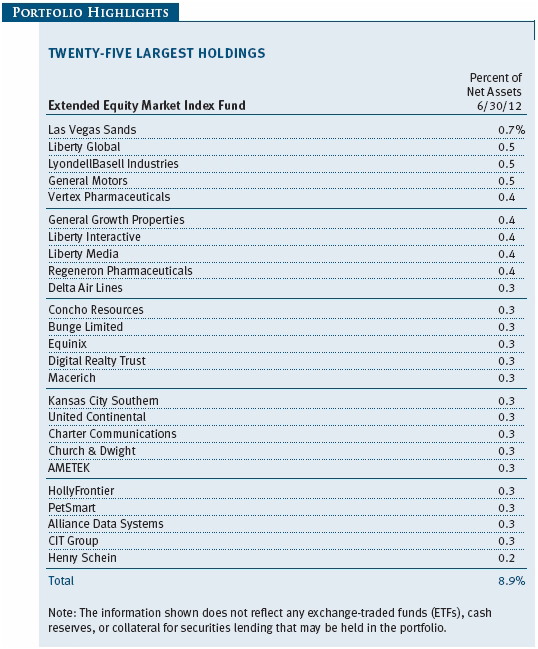
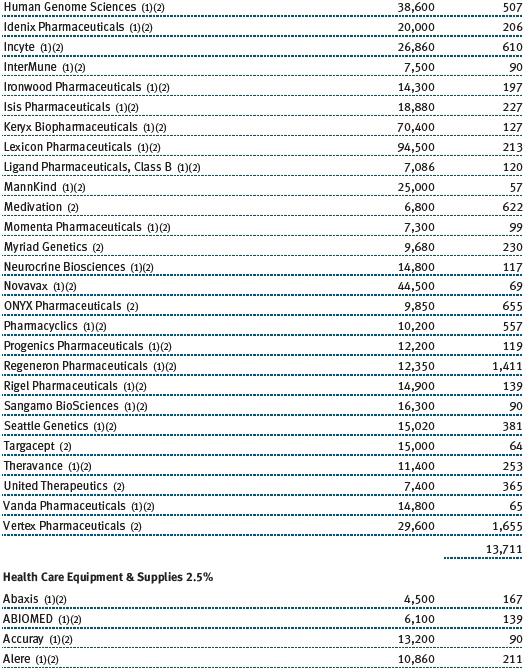
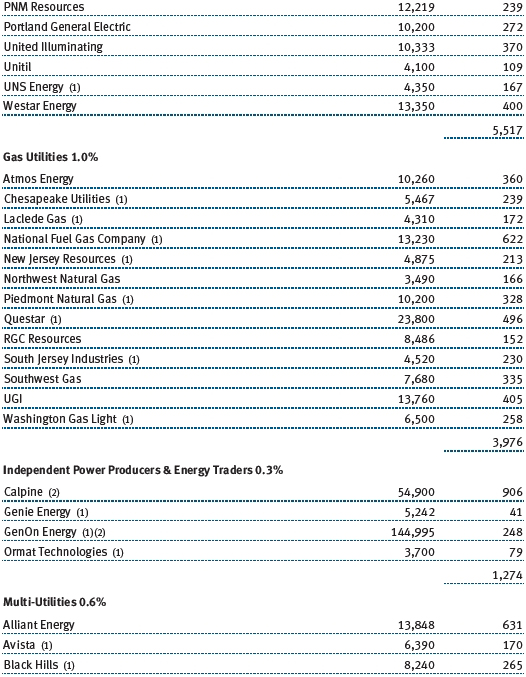
The S&P Completion Index, a subindex of the S&P Total Market Index, includes companies in the S&P Total Market Index and excludes all S&P 500 stocks. The index covers about 4,000 companies and provides exposure to mid-, small-, and micro-cap companies. The health care sector rallied more than 20% and was by far the best performer over the period. A handful of biotechnology companies including Vertex Pharmaceuticals, Regeneron Pharmaceuticals, and Alexion Pharmaceuticals—all of which are developing drugs that received favorable regulatory or clinical news over the period—drove results in the sector. The financials and consumer discretionary sectors posted double-digit returns and were the next-best performers after health care. Industrials and business services, consumer staples, materials, information technology, and utilities underperformed the benchmark with slimmer gains. Once again, the energy sector was the sole decliner, retreating more than 9% over the period.
OUTLOOK
After a brief spell of optimism in the first quarter, risk aversion returned with a vengeance as the threats to global growth have intensified in recent months. Europe’s debt crisis, now entering its third year, is progressing slowly and appears to be getting worse in some countries. China’s economy appears to be decelerating faster than expected, which will have a meaningful impact on many companies that depend on it for growth. Meanwhile, the U.S. continues to grapple with a fitful recovery, high unemployment, and a looming “fiscal cliff” when a series of tax increases and spending cuts are scheduled to occur at year-end. We believe these risks will encourage the Federal Reserve to stick to its highly accommodative policy and raise the possibility of a third round of quantitative easing, or Treasury bond purchases, by the central bank.
As we stated in our last letter in January, recent events have made clear that politics is dictating the direction of financial markets. We continue to believe that risk aversion will remain high and stock market performance volatile until the European debt crisis approaches a resolution. Given that S&P 500 companies generate between 15% and 20% of their profits in Europe, the ongoing financial turmoil and recession in the Continent will likely dampen earnings for these stocks in the near term. Notwithstanding these risks, U.S. corporate earnings growth and balance sheets appear strong and stocks, particularly large-caps, are reasonably valued. We remain focused on our role of replicating the structure and performance of the S&P indexes to provide you with broad exposure to large-cap stocks, small- and mid-cap stocks, and the entire U.S. stock market.
Thank you for investing with T. Rowe Price.

E. Frederick Bair
Cochairman of the Investment Advisory Committee, Equity Index 500 Fund,
Extended Equity Market Index Fund, and Total Equity Market Index Fund

Ken D. Uematsu
Cochairman of the Investment Advisory Committee, Equity Index 500 Fund,
Extended Equity Market Index Fund, and Total Equity Market Index Fund
July 17, 2012
The committee chairmen have day-to-day responsibility for managing the portfolios and work with committee members in developing and executing the funds’ investment program.
RISKS OF INVESTING
As with all stock mutual funds, the fund’s share price can fall because of weakness in the stock market, a particular industry, or specific holdings. Stock markets can decline for many reasons, including adverse political or economic developments, changes in investor psychology, or heavy institutional selling. The prospects for an industry or company may deteriorate because of a variety of factors, including disappointing earnings or changes in the competitive environment.
GLOSSARY
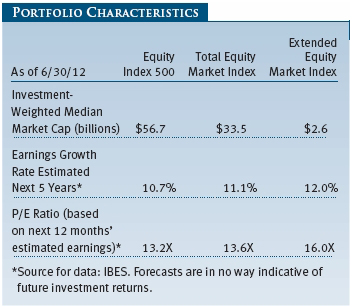
Price-to-earnings (P/E) ratio: A valuation measure calculated by dividing the price of a stock by its reported earnings per share. The ratio is a measure of how much investors are willing to pay for the company’s earnings.
S&P 500 Index: An unmanaged index that tracks the stocks of 500 primarily large-cap U.S. companies.
S&P Completion Index: Tracks the performance of the U.S. stocks not included in the S&P 500, which are primarily small- and mid-capitalization stocks. The index includes approximately 4,000 stocks.
S&P Total Market Index: Tracks the performance of a broad spectrum of small-, mid-, and large-capitalization U.S. stocks. Because the largest stocks in the index carry the most weight, large-capitalization stocks make up a substantial majority of the S&P Total Market’s value. The index includes approximately 4,500 stocks.

Performance and Expenses
This chart shows the value of a hypothetical $10,000 investment in the fund over the past 10 fiscal year periods or since inception (for funds lacking 10-year records). The result is compared with benchmarks, which may include a broad-based market index and a peer group average or index. Market indexes do not include expenses, which are deducted from fund returns as well as mutual fund averages and indexes.
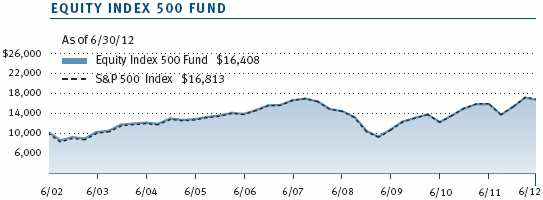
This chart shows the value of a hypothetical $10,000 investment in the fund over the past 10 fiscal year periods or since inception (for funds lacking 10-year records). The result is compared with benchmarks, which may include a broad-based market index and a peer group average or index. Market indexes do not include expenses, which are deducted from fund returns as well as mutual fund averages and indexes.

This chart shows the value of a hypothetical $10,000 investment in the fund over the past 10 fiscal year periods or since inception (for funds lacking 10-year records). The result is compared with benchmarks, which may include a broad-based market index and a peer group average or index. Market indexes do not include expenses, which are deducted from fund returns as well as mutual fund averages and indexes.
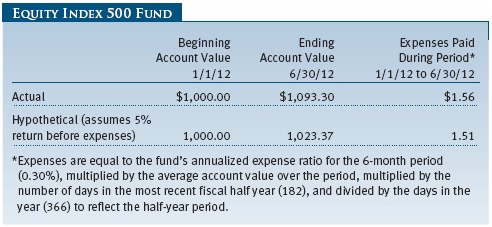
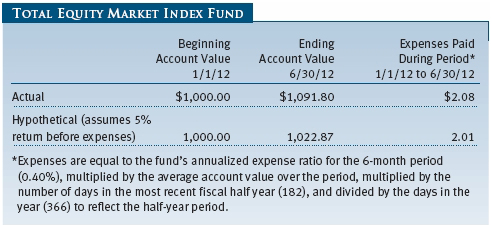
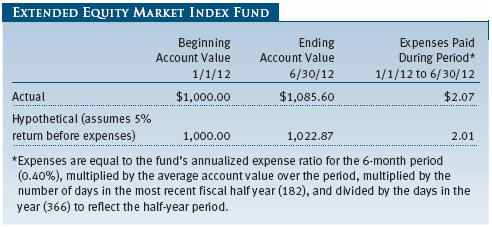
As a mutual fund shareholder, you may incur two types of costs: (1) transaction costs, such as redemption fees or sales loads, and (2) ongoing costs, including management fees, distribution and service (12b-1) fees, and other fund expenses. The following example is intended to help you understand your ongoing costs (in dollars) of investing in the fund and to compare these costs with the ongoing costs of investing in other mutual funds. The example is based on an investment of $1,000 invested at the beginning of the most recent six-month period and held for the entire period.
Actual Expenses
The first line of the following table (Actual) provides information about actual account values and actual expenses. You may use the information on this line, together with your account balance, to estimate the expenses that you paid over the period. Simply divide your account value by $1,000 (for example, an $8,600 account value divided by $1,000 = 8.6), then multiply the result by the number on the first line under the heading “Expenses Paid During Period” to estimate the expenses you paid on your account during this period.
Hypothetical Example for Comparison Purposes
The information on the second line of the table (Hypothetical) is based on hypothetical account values and expenses derived from the fund’s actual expense ratio and an assumed 5% per year rate of return before expenses (not the fund’s actual return). You may compare the ongoing costs of investing in the fund with other funds by contrasting this 5% hypothetical example and the 5% hypothetical examples that appear in the shareholder reports of the other funds. The hypothetical account values and expenses may not be used to estimate the actual ending account balance or expenses you paid for the period.
Note: T. Rowe Price charges an account service fee that is not included in the accompanying table. The account service fee is charged on a quarterly basis, usually during the last week of a calendar quarter, and applies to accounts with balances below $10,000 on the day of the assessment. The fee is charged to accounts that fall below $10,000 for any reason, including market fluctuations, redemptions, or exchanges. When an account with less than $10,000 is closed either through redemption or exchange, the fee is charged and deducted from the proceeds. The fee applies to IRAs but not to retirement plans directly registered with T. Rowe Price Services or accounts maintained by intermediaries through NSCC® Networking. If you are subject to the fee, keep it in mind when you are estimating the ongoing expenses of investing in the fund and when comparing the expenses of this fund with other funds.
You should also be aware that the expenses shown in the table highlight only your ongoing costs and do not reflect any transaction costs, such as redemption fees or sales loads. Therefore, the second line of the table is useful in comparing ongoing costs only and will not help you determine the relative total costs of owning different funds. To the extent a fund charges transaction costs, however, the total cost of owning that fund is higher.
Unaudited
The accompanying notes are an integral part of these financial statements.
Unaudited


The accompanying notes are an integral part of these financial statements.
Unaudited
The accompanying notes are an integral part of these financial statements.
Unaudited
The accompanying notes are an integral part of these financial statements.
Unaudited

The accompanying notes are an integral part of these financial statements.
Unaudited
| Notes to Financial Statements |
T. Rowe Price Index Trust, Inc. (the corporation), is registered under the Investment Company Act of 1940 (the 1940 Act). The Extended Equity Market Index Fund (the fund) is a diversified, open-end management investment company established by the corporation. The fund commenced operations on January 30, 1998. The fund seeks to match the performance of the U.S. stocks not included in the Standard & Poor’s 500 Stock Index®, as represented by the S&P Completion Index.
NOTE 1 - SIGNIFICANT ACCOUNTING POLICIES
Basis of Preparation The accompanying financial statements were prepared in accordance with accounting principles generally accepted in the United States of America (GAAP), which require the use of estimates made by management. Management believes that estimates and valuations are appropriate; however, actual results may differ from those estimates, and the valuations reflected in the accompanying financial statements may differ from the value ultimately realized upon sale or maturity.
Investment Transactions, Investment Income, and Distributions Income and expenses are recorded on the accrual basis. Premiums and discounts on debt securities are amortized for financial reporting purposes. Dividends received from mutual fund investments are reflected as dividend income; capital gain distributions are reflected as realized gain/loss. Dividend income and capital gain distributions are recorded on the ex-dividend date. Income tax-related interest and penalties, if incurred, would be recorded as income tax expense. Investment transactions are accounted for on the trade date. Realized gains and losses are reported on the identified cost basis. Distributions to shareholders are recorded on the ex-dividend date. Income distributions are declared and paid annually. Capital gain distributions, if any, are generally declared and paid by the fund annually.
Credits Credits are earned on the fund’s temporarily uninvested cash balances held at the custodian and such credits reduce the amount paid by the manager for custody of the fund’s assets. In order to pass the benefit of custody credits to the fund, the manager has voluntarily reduced its investment management and administrative expense in the accompanying financial statements.
Redemption Fees A 0.5% fee is assessed on redemptions of fund shares held for 90 days or less to deter short-term trading and to protect the interests of long-term shareholders. Redemption fees are withheld from proceeds that shareholders receive from the sale or exchange of fund shares. The fees are paid to the fund and are recorded as an increase to paid-in capital. The fees may cause the redemption price per share to differ from the net asset value per share.
New Accounting Pronouncements In May 2011, the Financial Accounting Standards Board (FASB) issued amended guidance to align fair value measurement and disclosure requirements in U.S. GAAP with International Financial Reporting Standards. The guidance is effective for fiscal years and interim periods beginning on or after December 15, 2011. Adoption had no effect on net assets or results of operations.
In December 2011, the FASB issued amended guidance to enhance disclosure for offsetting assets and liabilities. The guidance is effective for fiscal years and interim periods beginning on or after January 1, 2013. Adoption will have no effect on the fund’s net assets or results of operations.
NOTE 2 - VALUATION
The fund’s financial instruments are reported at fair value as defined by GAAP. The fund determines the values of its assets and liabilities and computes its net asset value per share at the close of the New York Stock Exchange (NYSE), normally 4 p.m. ET, each day that the NYSE is open for business.
Valuation Methods Equity securities listed or regularly traded on a securities exchange or in the over-the-counter (OTC) market are valued at the last quoted sale price at the time the valuations are made, except for OTC Bulletin Board securities, which are valued at the mean of the latest bid and asked prices. A security that is listed or traded on more than one exchange is valued at the quotation on the exchange determined to be the primary market for such security. Listed securities not traded on a particular day are valued at the mean of the latest bid and asked prices. Debt securities with remaining maturities of less than one year at the time of acquisition generally use amortized cost in local currency to approximate fair value. However, if amortized cost is deemed not to reflect fair value or the fund holds a significant amount of such securities with remaining maturities of more than 60 days, the securities are valued at prices furnished by dealers who make markets in such securities or by an independent pricing service.
Investments in mutual funds are valued at the mutual fund’s closing net asset value per share on the day of valuation. Financial futures contracts are valued at closing settlement prices.
Other investments, including restricted securities and private placements, and those financial instruments for which the above valuation procedures are inappropriate or are deemed not to reflect fair value, are stated at fair value as determined in good faith by the T. Rowe Price Valuation Committee, established by the fund’s Board of Directors (the Board). Subject to oversight by the Board, the Valuation Committee develops pricing-related policies and procedures and approves all fair-value determinations. The Valuation Committee regularly makes good faith judgments, using a wide variety of sources and information, to establish and adjust valuations of certain securities as events occur and circumstances warrant. For instance, in determining the fair value of private-equity instruments, the Valuation Committee considers a variety of factors, including the company’s business prospects, its financial performance, strategic events impacting the company, relevant valuations of similar companies, new rounds of financing, and any negotiated transactions of significant size between other investors in the company. Because any fair-value determination involves a significant amount of judgment, there is a degree of subjectivity inherent in such pricing decisions.
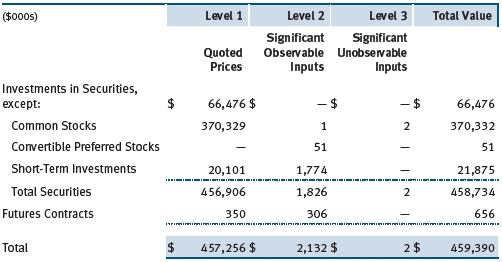
Valuation Inputs Various inputs are used to determine the value of the fund’s financial instruments. These inputs are summarized in the three broad levels listed below:
Level 1 – quoted prices in active markets for identical financial instruments
Level 2 – observable inputs other than Level 1 quoted prices (including, but not limited to, quoted prices for similar financial instruments, interest rates, prepayment speeds, and credit risk)
Level 3 – unobservable inputs
Observable inputs are those based on market data obtained from sources independent of the fund, and unobservable inputs reflect the fund’s own assumptions based on the best information available. The input levels are not necessarily an indication of the risk or liquidity associated with financial instruments at that level. The following table summarizes the fund’s financial instruments, based on the inputs used to determine their values on June 30, 2012:
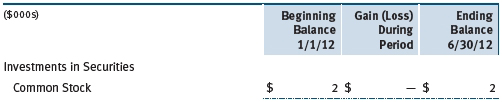
Following is a reconciliation of the fund’s Level 3 holdings for the six months ended June 30, 2012. Gain (loss) reflects both realized and change in unrealized gain (loss) on Level 3 holdings during the period, if any, and is included on the accompanying Statement of Operations. The change in unrealized gain (loss) on Level 3 instruments held at June 30, 2012, totaled $0 for the six months ended June 30, 2012.
NOTE 3 - DERIVATIVE INSTRUMENTS
During the six months ended June 30, 2012, the fund invested in derivative instruments. As defined by GAAP, a derivative is a financial instrument whose value is derived from an underlying security price, foreign exchange rate, interest rate, index of prices or rates, or other variable; it requires little or no initial investment and permits or requires net settlement. The fund invests in derivatives only if the expected risks and rewards are consistent with its investment objectives, policies, and overall risk profile, as described in its prospectus and Statement of Additional Information. The fund may use derivatives for a variety of purposes, such as seeking to hedge against declines in principal value, increase yield, invest in an asset with greater efficiency and at a lower cost than is possible through direct investment, or to adjust credit exposure. The risks associated with the use of derivatives are different from, and potentially much greater than, the risks associated with investing directly in the instruments on which the derivatives are based. Investments in derivatives can magnify returns positively or negatively; however, the fund at all times maintains sufficient cash reserves, liquid assets, or other SEC-permitted asset types to cover the settlement obligations under its open derivative contracts.
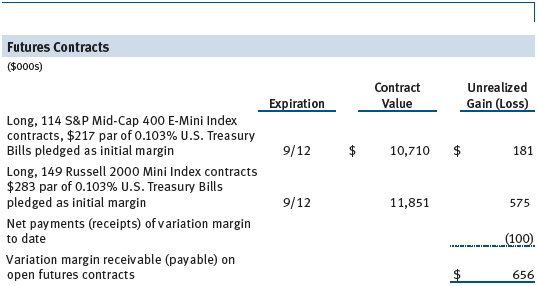
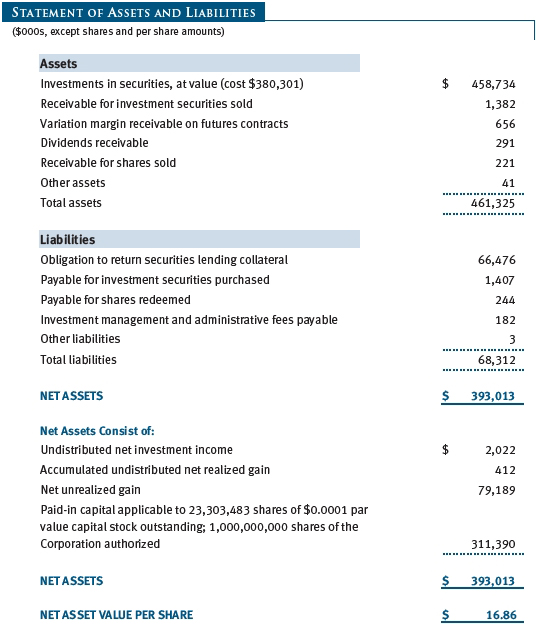
The fund values its derivatives at fair value, as described below and in Note 2, and recognizes changes in fair value currently in its results of operations. Accordingly, the fund does not follow hedge accounting, even for derivatives employed as economic hedges. The fund does not offset the fair value of derivative instruments against the right to reclaim or obligation to return collateral. As of June 30, 2012, the fund held equity futures with cumulative unrealized gain of $756,000; the value reflected on the accompanying Statement of Assets and Liabilities is the related unsettled variation margin.
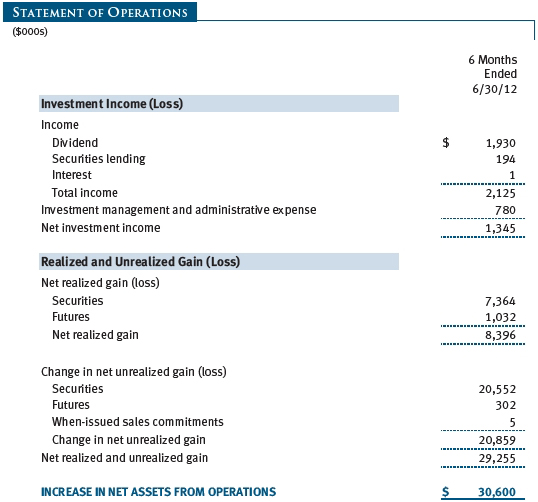
Additionally, during the six months ended June 30, 2012, the fund recognized $1,032,000 of realized gain on Futures and a $302,000 change in unrealized gain on Futures related to its investments in equity derivatives; such amounts are included on the accompanying Statement of Operations.
Counterparty risk related to exchange-traded derivatives, including futures and options contracts, is minimal because the exchange’s clearinghouse provides protection against defaults. Additionally, for exchange-traded derivatives, each broker, in its sole discretion, may change margin requirements applicable to the fund.
Futures Contracts The fund is subject to equity price risk in the normal course of pursuing its investment objectives and uses futures contracts to help manage such risk. The fund may enter into futures contracts as an efficient means of maintaining liquidity while being invested in the market, to facilitate trading, and/or to reduce transaction costs. A futures contract provides for the future sale by one party and purchase by another of a specified amount of a particular underlying financial instrument at an agreed-upon price, date, time, and place. The fund currently invests only in exchange-traded futures, which generally are standardized as to maturity date, underlying financial instrument, and other contract terms. Upon entering into a futures contract, the fund is required to deposit with the broker cash or securities in an amount equal to a certain percentage of the contract value (margin deposit); the margin deposit must then be maintained at the established level over the life of the contract. Subsequent payments are made or received by the fund each day to settle daily fluctuations in the value of the contract (variation margin), which reflect changes in the value of the underlying financial instrument. Variation margin is recorded as unrealized gain or loss until the contract is closed. The value of a futures contract included in net assets is the amount of unsettled variation margin; net variation margin receivable is reflected as an asset, and net variation margin payable is reflected as a liability on the accompanying Statement of Assets and Liabilities. Risks related to the use of futures contracts include possible illiquidity of the futures markets, contract prices that can be highly volatile and imperfectly correlated to movements in hedged security values, and potential losses in excess of the fund’s initial investment. During the six months ended June 30, 2012, the fund’s exposure to futures, based on underlying notional amounts, was generally less than 1% of net assets.
NOTE 4 - OTHER INVESTMENT TRANSACTIONS
Consistent with its investment objective, the fund engages in the following practices to manage exposure to certain risks and/or to enhance performance. The investment objective, policies, program, and risk factors of the fund are described more fully in the fund’s prospectus and Statement of Additional Information.
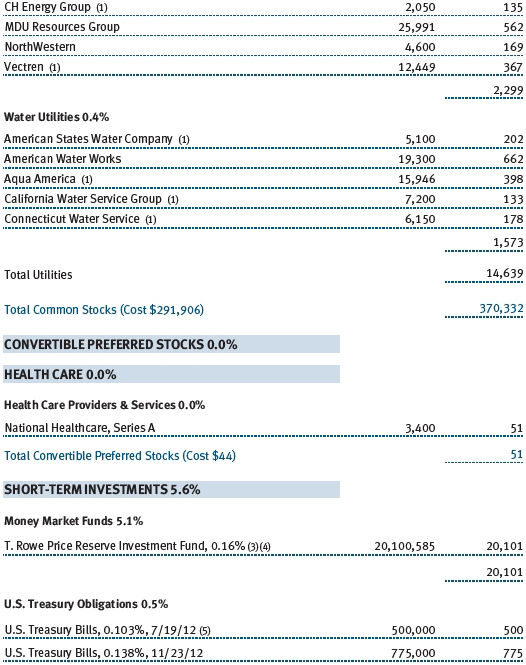
Securities Lending The fund lends its securities to approved brokers to earn additional income. It receives as collateral cash and U.S. government securities valued at 102% to 105% of the value of the securities on loan. Collateral is maintained over the life of the loan in an amount not less than the value of loaned securities as determined at the close of fund business each day; any additional collateral required due to changes in security values is delivered to the fund the next business day. Cash collateral is invested by the fund’s lending agent(s) in accordance with investment guidelines approved by management. Although risk is mitigated by the collateral, the fund could experience a delay in recovering its securities and a possible loss of income or value if the borrower fails to return the securities or if collateral investments decline in value. Securities lending revenue recognized by the fund consists of earnings on invested collateral and borrowing fees, net of any rebates to the borrower and compensation to the lending agent. In accordance with GAAP, investments made with cash collateral are reflected in the accompanying financial statements, but collateral received in the form of securities are not. At June 30, 2012, the value of cash collateral investments was $66,476,000, and the value of loaned securities was $66,553,000, including securities sold but not yet settled, which are not reflected in the accompanying portfolio of investments.
When-Issued Securities The fund may enter into when-issued purchases and/or sales commitments, pursuant to which it agrees to purchase or sell, respectively, the underlying security for a fixed unit price, with payment and delivery at a scheduled future date generally beyond the customary settlement period for such securities. When-issued refers to securities that have not yet been issued but will be issued in the future and may include new securities or securities obtained through a corporate action on a current holding. The fund normally purchases when-issued securities with the intention of taking possession but may enter into a separate agreement to sell the securities before the settlement date. Until settlement, the fund maintains cash reserves and liquid assets sufficient to settle its when-issued commitments. Amounts realized on when-issued transactions are included with realized gain/loss on securities in the accompanying financial statements.
Other Purchases and sales of portfolio securities other than short-term securities aggregated $35,387,000 and $27,505,000, respectively, for the six months ended June 30, 2012.
NOTE 5 - FEDERAL INCOME TAXES
No provision for federal income taxes is required since the fund intends to continue to qualify as a regulated investment company under Subchapter M of the Internal Revenue Code and distribute to shareholders all of its taxable income and gains. Distributions determined in accordance with federal income tax regulations may differ in amount or character from net investment income and realized gains for financial reporting purposes. Financial reporting records are adjusted for permanent book/tax differences to reflect tax character but are not adjusted for temporary differences. The amount and character of tax-basis distributions and composition of net assets are finalized at fiscal year-end; accordingly, tax-basis balances have not been determined as of the date of this report.
The fund intends to retain realized gains to the extent of available capital loss carryforwards. As a result of the Regulated Investment Company Modernization Act of 2010, net capital losses realized on or after January 1, 2011 (effective date) may be carried forward indefinitely to offset future realized capital gains; however, post-effective losses must be used before pre-effective capital loss carryforwards with expiration dates. Accordingly, it is possible that all or a portion of the fund’s pre-effective capital loss carryforwards could expire unused. As of December 31, 2011, the fund had $6,192,000 of available capital loss carryforwards, which all expire in fiscal 2017.
At June 30, 2012, the cost of investments for federal income tax purposes was $381,842,000. Net unrealized gain aggregated $77,648,000 at period-end, of which $113,239,000 related to appreciated investments and $35,591,000 related to depreciated investments.
NOTE 6 - RELATED PARTY TRANSACTIONS
The fund is managed by T. Rowe Price Associates, Inc. (Price Associates), a wholly owned subsidiary of T. Rowe Price Group, Inc. (Price Group). The investment management and administrative agreement between the fund and Price Associates provides for an all-inclusive annual fee equal to 0.40% of the fund’s average daily net assets. The fee is computed daily and paid monthly. The all-inclusive fee covers investment management, shareholder servicing, transfer agency, accounting, and custody services provided to the fund, as well as fund directors’ fees and expenses; interest, taxes, brokerage commissions, and extraordinary expenses are paid directly by the fund.
Additionally, the fund is one of several mutual funds in which certain college savings plans managed by Price Associates may invest. As approved by the fund’s Board of Directors, shareholder servicing costs associated with each college savings plan are allocated to the fund in proportion to the average daily value of its shares owned by the college savings plan. Shareholder servicing costs allocated to the fund are borne by Price Associates, pursuant to the fund’s all-inclusive fee agreement. At June 30, 2012, approximately 1% of the outstanding shares of the fund were held by college savings plans.
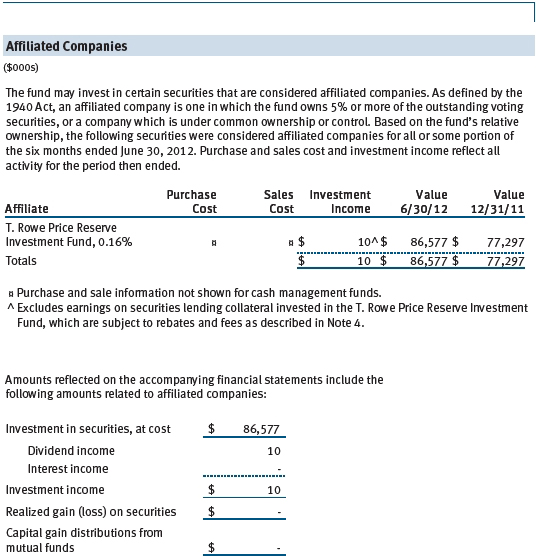
The fund may invest in the T. Rowe Price Reserve Investment Fund and the T. Rowe Price Government Reserve Investment Fund (collectively, the T. Rowe Price Reserve Investment Funds), open-end management investment companies managed by Price Associates and considered affiliates of the fund. The T. Rowe Price Reserve Investment Funds are offered as cash management options to mutual funds, trusts, and other accounts managed by Price Associates and/or its affiliates and are not available for direct purchase by members of the public. The T. Rowe Price Reserve Investment Funds pay no investment management fees.
| Information on Proxy Voting Policies, Procedures, and Records |
A description of the policies and procedures used by T. Rowe Price funds and portfolios to determine how to vote proxies relating to portfolio securities is available in each fund’s Statement of Additional Information, which you may request by calling 1-800-225-5132 or by accessing the SEC’s website, sec.gov. The description of our proxy voting policies and procedures is also available on our website, troweprice.com. To access it, click on the words “Our Company” at the top of our corporate homepage. Then, when the next page appears, click on the words “Proxy Voting Policies” on the left side of the page.
Each fund’s most recent annual proxy voting record is available on our website and through the SEC’s website. To access it through our website, follow the directions above, then click on the words “Proxy Voting Records” on the right side of the Proxy Voting Policies page.
| How to Obtain Quarterly Portfolio Holdings |
The fund files a complete schedule of portfolio holdings with the Securities and Exchange Commission for the first and third quarters of each fiscal year on Form N-Q. The fund’s Form N-Q is available electronically on the SEC’s website (sec.gov); hard copies may be reviewed and copied at the SEC’s Public Reference Room, 100 F St. N.E., Washington, DC 20549. For more information on the Public Reference Room, call 1-800-SEC-0330.
| Approval of Investment Management Agreement |
On March 6, 2012, the fund’s Board of Directors (Board), including a majority of the fund’s independent directors, approved the continuation of the investment management agreement (Advisory Contract) between the fund and its investment advisor, T. Rowe Price Associates, Inc. (Advisor). In connection with its deliberations, the Board requested, and the Advisor provided, such information as the Board (with advice from independent legal counsel) deemed reasonably necessary. The Board considered a variety of factors in connection with its review of the Advisory Contract, also taking into account information provided by the Advisor during the course of the year, as discussed below:
Services Provided by the Advisor
The Board considered the nature, quality, and extent of the services provided to the fund by the Advisor. These services included, but were not limited to, directing the fund’s investments in accordance with its investment program and the overall management of the fund’s portfolio, as well as a variety of related activities such as financial, investment operations, and administrative services; compliance; maintaining the fund’s records and registrations; and shareholder communications. The Board also reviewed the background and experience of the Advisor’s senior management team and investment personnel involved in the management of the fund, as well as the Advisor’s compliance record. The Board concluded that it was satisfied with the nature, quality, and extent of the services provided by the Advisor.
Investment Performance of the Fund
The Board reviewed the fund’s average annual total returns over the three-month and 1-, 3-, 5-, and 10-year periods, as well as the fund’s year-by-year returns, and compared these returns with a wide variety of previously agreed upon comparable performance measures and market data, including those supplied by Lipper and Morningstar, which are independent providers of mutual fund data.
On the basis of this evaluation and the Board’s ongoing review of investment results, and factoring in the relative market conditions during certain of the performance periods, the Board concluded that the fund’s performance was satisfactory.
Costs, Benefits, Profits, and Economies of Scale
The Board reviewed detailed information regarding the revenues received by the Advisor under the Advisory Contract and other benefits that the Advisor (and its affiliates) may have realized from its relationship with the fund, including any research received under “soft dollar” agreements and commission-sharing arrangements with broker-dealers. The Board considered that the Advisor may receive some benefit from soft-dollar arrangements pursuant to which research is received from broker-dealers that execute the applicable fund’s portfolio transactions. The Board received information on the estimated costs incurred and profits realized by the Advisor from managing T. Rowe Price mutual funds. The Board also reviewed estimates of the profits realized from managing the fund in particular, and the Board concluded that the Advisor’s profits were reasonable in light of the services provided to the fund.
The Board also considered whether the fund benefits under the fee levels set forth in the Advisory Contract from any economies of scale realized by the Advisor. The Board noted that, under the Advisory Contract, the fund pays the Advisor a single fee based on the fund’s average daily net assets that includes investment management services and provides for the Advisor to pay all expenses of the fund’s operations except for interest, taxes, portfolio transaction fees, and any nonrecurring extraordinary expenses that may arise. The Board concluded that, based on the profitability data it reviewed and consistent with this single-fee structure, the Advisory Contract provided for a reasonable sharing of any benefits from economies of scale with the fund.
Fees
The Board was provided with information regarding industry trends in management fees and expenses, and the Board reviewed the fund’s single-fee structure in comparison with fees and expenses of other comparable funds based on information and data supplied by Lipper. For these purposes, the Board assumed that the fund’s management fee rate was equal to the single fee less the fund’s operating expenses. The information provided to the Board indicated that the fund’s management fee rate was below the median for comparable funds and that the fund’s total expense ratio was at or below the median for comparable funds.
The Board also reviewed the fee schedules for institutional accounts and private accounts with similar mandates that are advised or subadvised by the Advisor and its affiliates. Management provided the Board with information about the Advisor’s responsibilities and services provided to institutional account clients, including information about how the requirements and economics of the institutional business are fundamentally different from those of the mutual fund business. The Board considered information showing that the mutual fund business is generally more complex from a business and compliance perspective than the institutional business and that the Advisor generally performs significant additional services and assumes greater risk in managing the fund and other T. Rowe Price mutual funds than it does for institutional account clients.
On the basis of the information provided and the factors considered, the Board concluded that the fees paid by the fund under the Advisory Contract are reasonable.
Approval of the Advisory Contract
As noted, the Board approved the continuation of the Advisory Contract. No single factor was considered in isolation or to be determinative to the decision. Rather, the Board concluded, in light of a weighting and balancing of all factors considered, that it was in the best interests of the fund and its shareholders for the Board to approve the continuation of the Advisory Contract (including the fees to be charged for services thereunder). The independent directors were advised throughout the process by independent legal counsel.
Item 2. Code of Ethics.
A code of ethics, as defined in Item 2 of Form N-CSR, applicable to its principal executive officer, principal financial officer, principal accounting officer or controller, or persons performing similar functions is filed as an exhibit to the registrant’s annual Form N-CSR. No substantive amendments were approved or waivers were granted to this code of ethics during the registrant’s most recent fiscal half-year.
Item 3. Audit Committee Financial Expert.
Disclosure required in registrant’s annual Form N-CSR.
Item 4. Principal Accountant Fees and Services.
Disclosure required in registrant’s annual Form N-CSR.
Item 5. Audit Committee of Listed Registrants.
Not applicable.
Item 6. Investments.
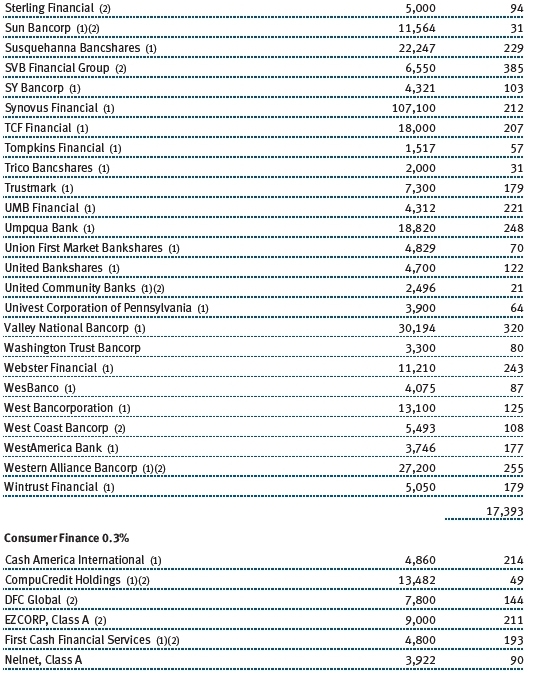
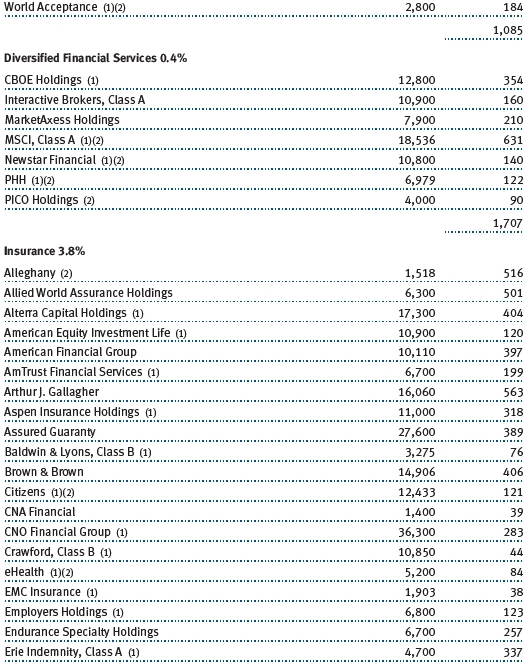
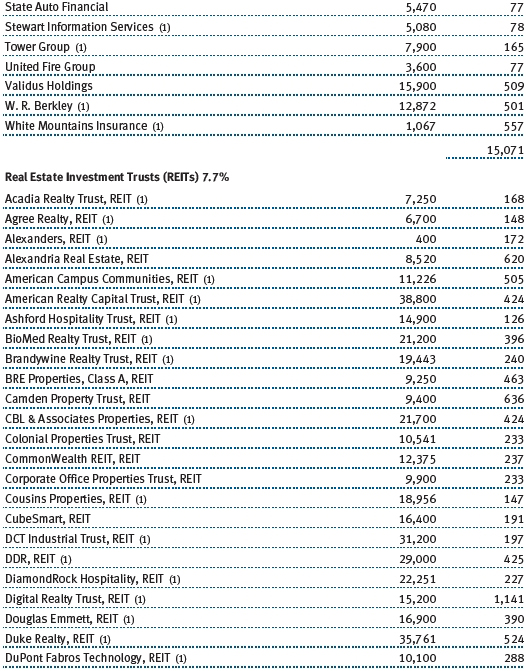
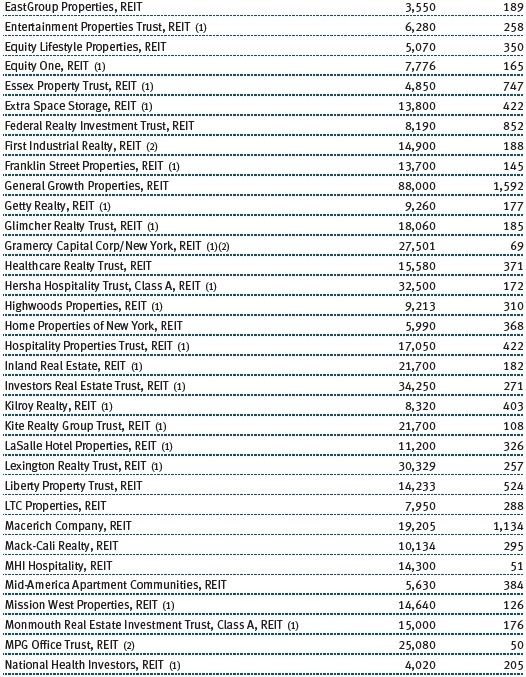
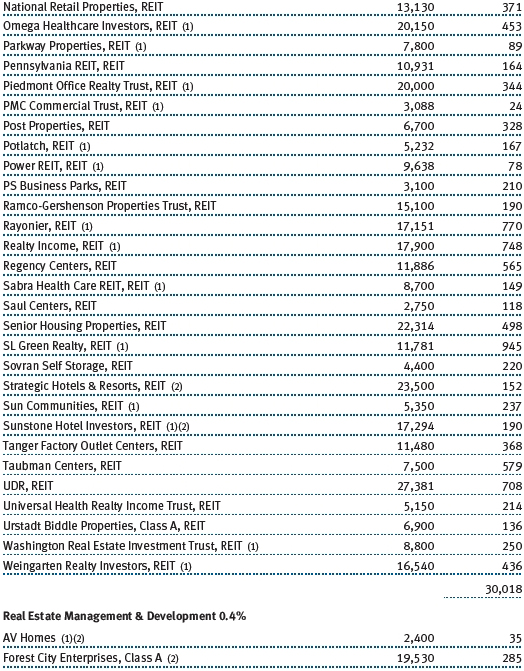
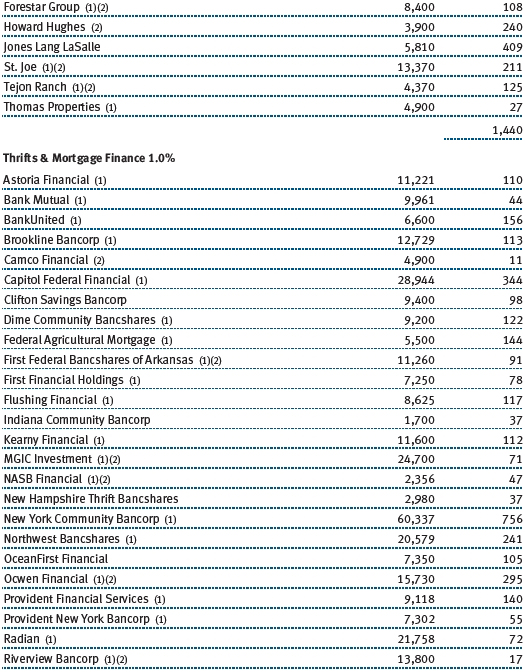
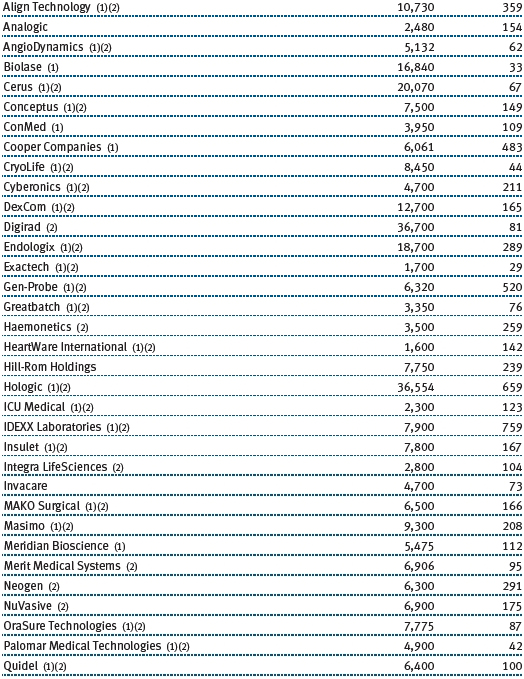
(a) Not applicable. The complete schedule of investments is included in Item 1 of this Form N-CSR.
(b) Not applicable.
Item 7. Disclosure of Proxy Voting Policies and Procedures for Closed-End Management Investment Companies.
Not applicable.
Item 8. Portfolio Managers of Closed-End Management Investment Companies.
Not applicable.
Item 9. Purchases of Equity Securities by Closed-End Management Investment Company and Affiliated Purchasers.
Not applicable.
Item 10. Submission of Matters to a Vote of Security Holders.
Not applicable.
Item 11. Controls and Procedures.
(a) The registrant’s principal executive officer and principal financial officer have evaluated the registrant’s disclosure controls and procedures within 90 days of this filing and have concluded that the registrant’s disclosure controls and procedures were effective, as of that date, in ensuring that information required to be disclosed by the registrant in this Form N-CSR was recorded, processed, summarized, and reported timely.
(b) The registrant’s principal executive officer and principal financial officer are aware of no change in the registrant’s internal control over financial reporting that occurred during the registrant’s second fiscal quarter covered by this report that has materially affected, or is reasonably likely to materially affect, the registrant’s internal control over financial reporting.
Item 12. Exhibits.
(a)(1) The registrant’s code of ethics pursuant to Item 2 of Form N-CSR is filed with the registrant’s annual Form N-CSR.
(2) Separate certifications by the registrant's principal executive officer and principal financial officer, pursuant to Section 302 of the Sarbanes-Oxley Act of 2002 and required by Rule 30a-2(a) under the Investment Company Act of 1940, are attached.
(3) Written solicitation to repurchase securities issued by closed-end companies: not applicable.
(b) A certification by the registrant's principal executive officer and principal financial officer, pursuant to Section 906 of the Sarbanes-Oxley Act of 2002 and required by Rule 30a-2(b) under the Investment Company Act of 1940, is attached.
SIGNATURES
Pursuant to the requirements of the Securities Exchange Act of 1934 and the Investment Company Act of 1940, the registrant has duly caused this report to be signed on its behalf by the undersigned, thereunto duly authorized.
T. Rowe Price Index Trust, Inc.
| By | /s/ Edward C. Bernard |
| | Edward C. Bernard |
| | Principal Executive Officer |
| | |
| Date August 16, 2012 | | |
Pursuant to the requirements of the Securities Exchange Act of 1934 and the Investment Company Act of 1940, this report has been signed below by the following persons on behalf of the registrant and in the capacities and on the dates indicated.
| By | /s/ Edward C. Bernard |
| | Edward C. Bernard |
| | Principal Executive Officer |
| | |
| Date August 16, 2012 | | |
| | |
| | |
| By | /s/ Gregory K. Hinkle |
| | Gregory K. Hinkle |
| | Principal Financial Officer |
| | |
| Date August 16, 2012 | | |