UNITED STATES
SECURITIES AND EXCHANGE COMMISSION
Washington, D.C. 20549
FORM N-CSR
CERTIFIED SHAREHOLDER REPORT OF REGISTERED
MANAGEMENT INVESTMENT COMPANIES
Investment Company Act File Number: 811-05986
| T. Rowe Price Index Trust, Inc. |
|
| (Exact name of registrant as specified in charter) |
| |
| 100 East Pratt Street, Baltimore, MD 21202 |
|
| (Address of principal executive offices) |
| |
| David Oestreicher |
| 100 East Pratt Street, Baltimore, MD 21202 |
|
| (Name and address of agent for service) |
Registrant’s telephone number, including area code: (410) 345-2000
Date of fiscal year end: December 31
Date of reporting period: June 30, 2016
Item 1. Report to Shareholders
| Total Equity Market Index Fund | June 30, 2016 |
The views and opinions in this report were current as of June 30, 2016. They are not guarantees of performance or investment results and should not be taken as investment advice. Investment decisions reflect a variety of factors, and the managers reserve the right to change their views about individual stocks, sectors, and the markets at any time. As a result, the views expressed should not be relied upon as a forecast of the fund’s future investment intent. The report is certified under the Sarbanes-Oxley Act, which requires mutual funds and other public companies to affirm that, to the best of their knowledge, the information in their financial reports is fairly and accurately stated in all material respects.
REPORTS ON THE WEB
Sign up for our Email Program, and you can begin to receive updated fund reports and prospectuses online rather than through the mail. Log in to your account at troweprice.com for more information.
Manager’s Letter
Fellow Shareholders
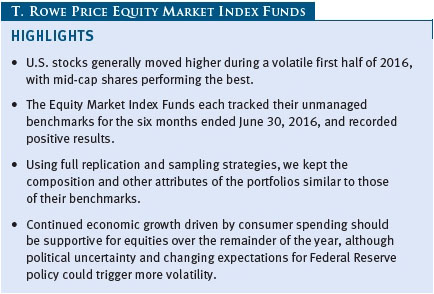
Most major U.S. stock indexes rose in the first half of 2016, a period of significant global market volatility. Equity markets started the year with deep losses as oil prices collapsed to 13-year lows amid concerns about weakening Chinese and global economic growth. In fact, by mid-February, U.S. small-caps had fallen into a bear market, commonly defined as a drop of at least 20% from recent highs. However, equities and other risk assets rallied through late June as central banks in Japan and Europe unveiled new stimulus efforts. Also, the dollar weakened due to diminishing expectations for U.S. interest rate increases in 2016, and commodity prices rebounded sharply. As the period ended, global markets fluctuated wildly in response to the UK’s vote to leave the European Union. For the six months ended June 30, 2016, the Equity Index 500 Fund, Total Equity Market Index Fund, and Extended Equity Market Index Fund each recorded positive results.
MARKET ENVIRONMENT
While the U.S. economy grew at a sluggish 1.1% annual rate in the first quarter, the underlying trend of moderate expansion seems to remain in place. We believe growth is likely to rebound to roughly 2% over the balance of the year. The domestic labor market has been resilient in the face of unfavorable economic developments overseas. Although the pace slowed in the second quarter, jobs growth has been averaging 200,000 per month over the past year, and the national unemployment rate was 4.7% in May, its lowest level in more than eight years. Housing and retail sales data were solid. Existing home sales rose in May to the highest level since February 2007, and retail sales grew 3.1% compared with the same period in 2015.
Headline inflation rose 1.0% in the 12-month period ended June 30. The consumer price index (CPI) stayed below the Fed’s 2% target, held down by a 9% drop in the energy category. Core CPI (which excludes volatile food and energy prices) has risen 2.3% over the most recent 12 months. After starting the year around $37 per barrel, West Texas Intermediate oil prices fell to below $27 in mid-February before climbing to about $50 by the end of June. The price rebound was attributed to speculation about global production cuts and, to a lesser extent, supply disruptions in Nigeria and Canada. Despite the 30% gain in the first half of 2016, oil prices have fallen about 19% since June 2015 amid a global supply glut.
The Federal Reserve raised short-term rates in December, but due to the slowdown in economic activity and elevated global risks, the central bank has kept rates unchanged thus far in 2016. However, in June, the Fed’s policymaking committee did slightly reduce its growth outlook for the remainder of this year and for 2017 and adjusted its policy normalization plan to a more gradual path. We believe that another Fed rate hike is possible this year if the labor market recovery persists and measures of domestic demand strengthen.
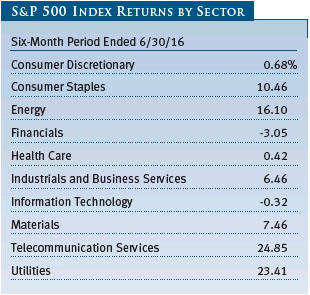
In the U.S., mid-cap shares decisively outperformed their larger and smaller counterparts. Stocks in the telecommunication services and utilities sectors outperformed other sectors, helped by investors seeking attractive income versus low-yielding fixed income alternatives. After losing ground in 2015, energy stocks rallied with crude oil prices, and shares of consumer staples companies also produced solid gains. Financial stocks underperformed as the expected rise in U.S. interest rates, which could help banks make more profitable loans, failed to materialize. Turmoil in Europe’s banking sector also weighed on U.S. financials. Health care and information technology stocks also lagged.
SUMMARY OF INVESTMENT STRATEGIES
T. Rowe Price’s Equity Market Index Funds are designed for investors who want to harness the potential for long-term capital appreciation from broad exposure to large-cap stocks (Equity Index 500 Fund), small- and mid-cap stocks (Extended Equity Market Index Fund), or the entire U.S. stock market (Total Equity Market Index Fund). These funds could serve as core holdings in an investor’s portfolio as they offer attributes that many investors will find appealing.
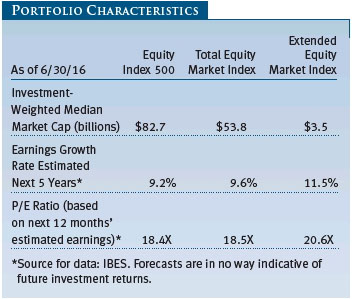
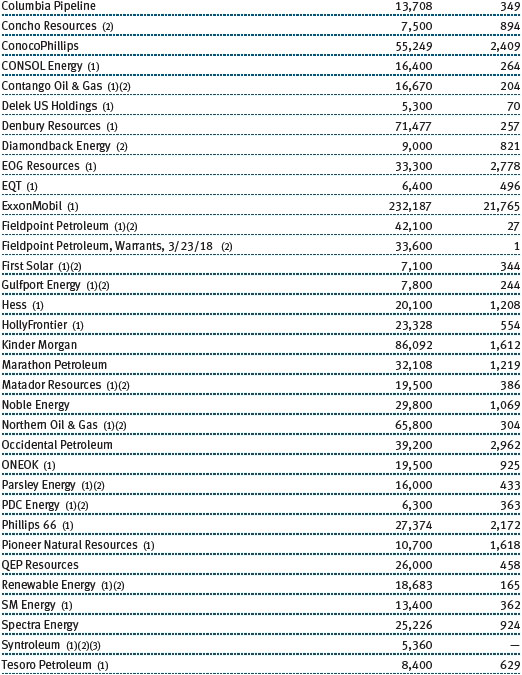
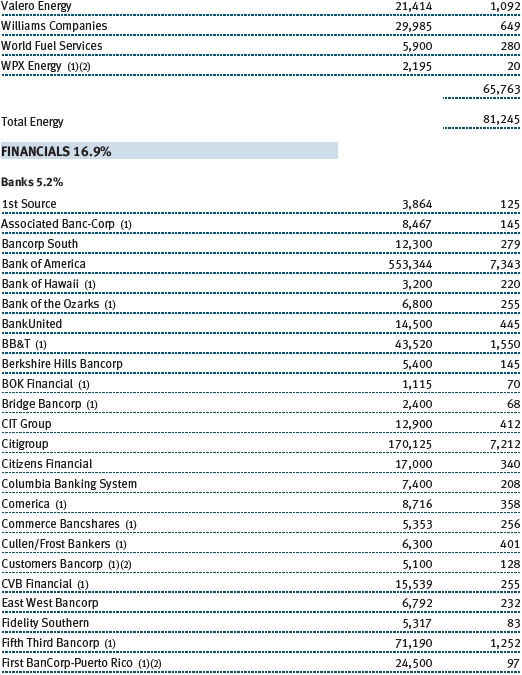
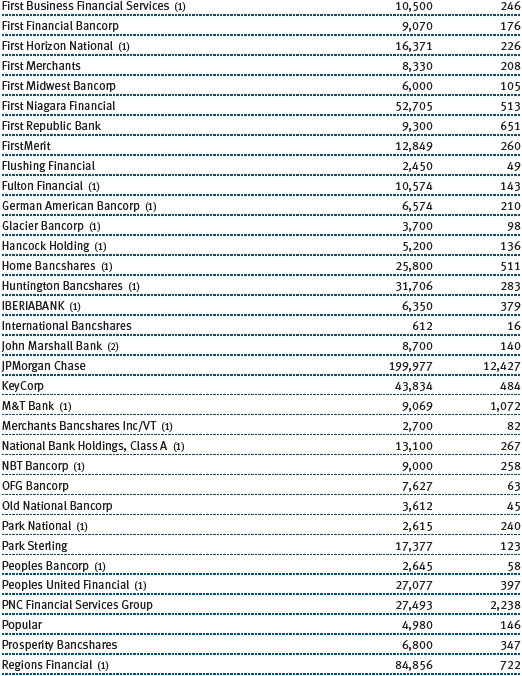
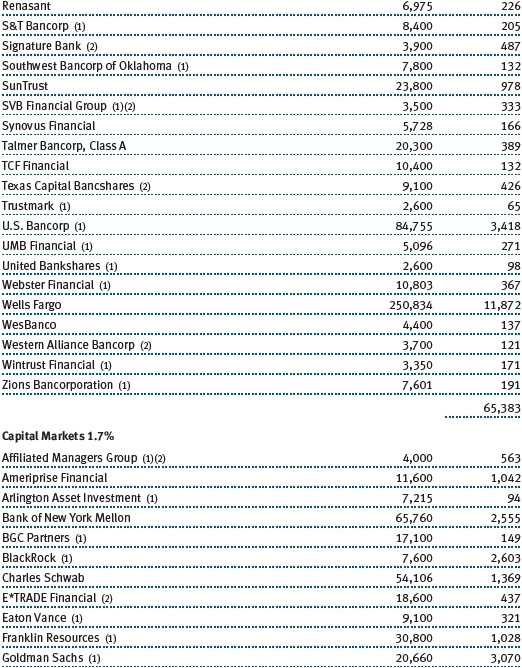
| ● | They are well diversified, which can reduce the potentially negative impact of a given stock on the entire portfolio. The Equity Index 500 Fund invests in all S&P 500 Index stocks, while the Total Equity Market Index Fund and the Extended Equity Market Index Fund owned 1,403 and 1,619 holdings, respectively, as of June 30, 2016. (Diversification cannot assure a profit or protect against loss in a declining market.)
|
| ● | They tend to closely track their benchmarks. The Equity Index 500 Fund uses a full replication strategy so that the weightings of our holdings match those of the S&P 500. The Total Equity Market Index Fund and the Extended Equity Market Index Fund use a sampling strategy to approximate the sector allocations, price-to-earnings ratio, and other attributes of their benchmarks. We occasionally invest in securities such as futures and exchange-traded funds so that the index funds can accommodate cash flows and remain fully invested.
|
| ● | They offer instant, broad exposure to different sectors of the stock market, and each fund’s sector allocations are consistent with its benchmark’s sector breakdown. As such, changes in the funds’ sector diversification and other overall characteristics reflect changes in the composition of the indexes, rather than strategic shifts that are typical of an actively managed fund. Since the funds are designed to track their respective indexes, they do not have the flexibility to shift assets toward stocks or sectors that are rising or away from those that are declining.
|
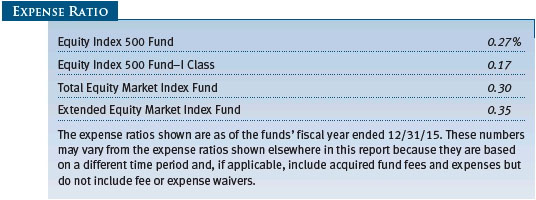
| ● | Their expenses are generally low, which allows investors to retain more of their returns. |
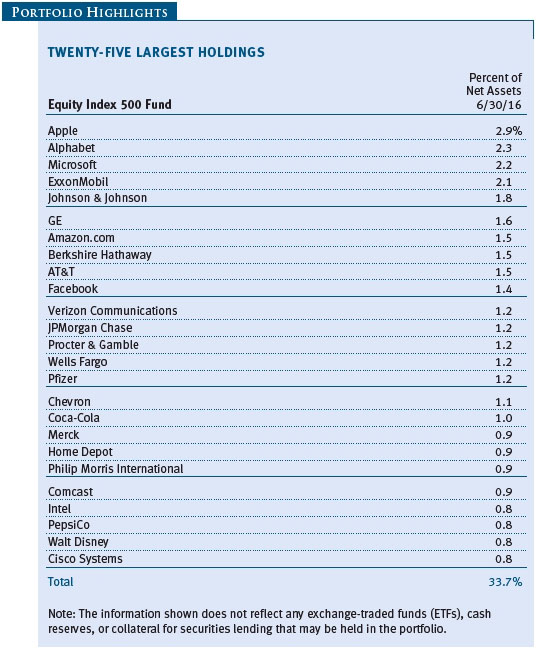
Equity Index 500 Fund
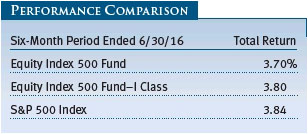
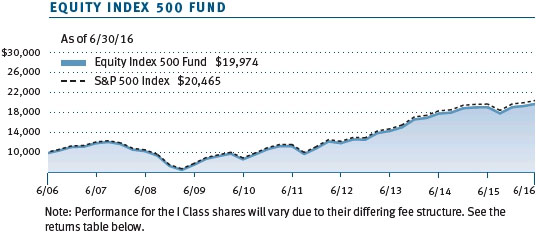
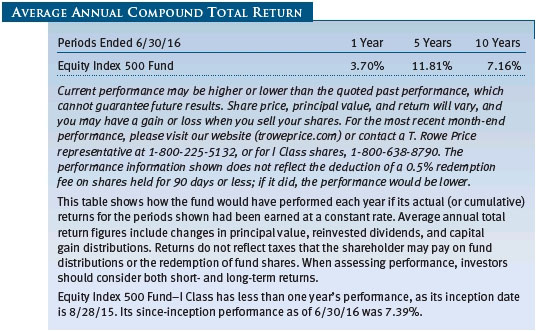
The Equity Index 500 Fund returned 3.70% in the six months ended June 30, 2016, versus 3.84% for the S&P 500 Index. (Performance will vary for the I Class shares, reflecting their different fee structure.) Fund performance tends to slightly lag that of the benchmark due to operating and management expenses. The majority of names in the index recorded positive results for the six-month period. The telecommunication services sector posted strong gains, returning nearly 25%, and utilities and energy—in a reversal from last year—also posted solid returns. Financials and information technology were the only sectors to lose ground during the period.
Telecom services companies AT&T and VerizonCommunications, the top wireless phone operators in the U.S., were two of the fund’s largest contributors during the period. While they reported earnings in line with expectations and have low growth profiles, the companies’ attractive dividends combined with their relative insulation from volatility outside the U.S. led to strong performance. A similar story led to outperformance in the utilities sector, where top contributors included Florida-based NextEra Energy and North Carolina-based Duke Energy. (Please refer to the fund’s portfolio of investments for a complete list of holdings and the amount each represents in the portfolio.)
Energy stocks were also among the best performers in this year’s first half, a dramatic change from 2015 when oil and natural gas prices collapsed amid concerns of excess supply and slowing global growth. Global oil companies ExxonMobil and Chevron ranked among the fund’s top contributors. Both stocks rallied as U.S. oil prices rebounded from February’s lows and crossed the $50 per barrel threshold in June for the first time in nearly a year.
Several of the fund’s biggest detractors were banks, such as Bank of America, Wells Fargo, and Citigroup. The sector faced downward pressure amid concerns ranging from nonperforming loans to energy companies, difficult trading conditions in the first quarter, and low interest rates globally. June’s Brexit referendum dealt another blow to financials as investors worried that the decision would hurt economic growth in the UK and Europe and spur global central banks to further ease monetary policy, which would push interest rates even lower worldwide and severely impact banks’ profitability and stability.
In the IT sector, Apple was among the weakest performers. The company’s shares have slid since mid-2015 as iPhone sales have dropped, increasing investor concerns that its high-growth days are over. Apple was one of the so-called FANG stocks that were notably strong performers amid the generally tepid market results in 2015. In the first half of 2016, the other members of the group have experienced divergent results. Along with Apple, Alphabet (parent company of Google) and Netflix have struggled, while Facebook and Amazon.com remained top contributors.
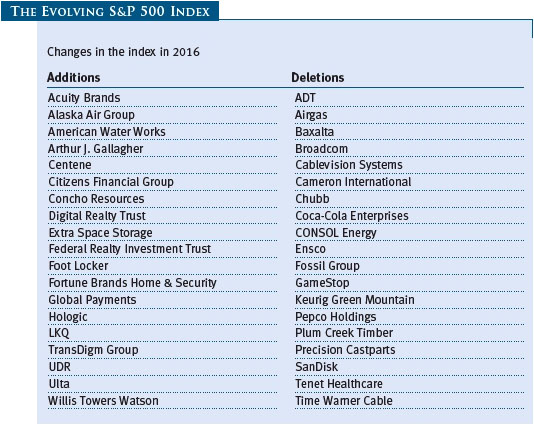
S&P Dow Jones Indices authorized several additions and deletions to the composition of the S&P 500 Index during the period. Please see The Evolving S&P 500 Index table on page 17 for a complete list of index changes.
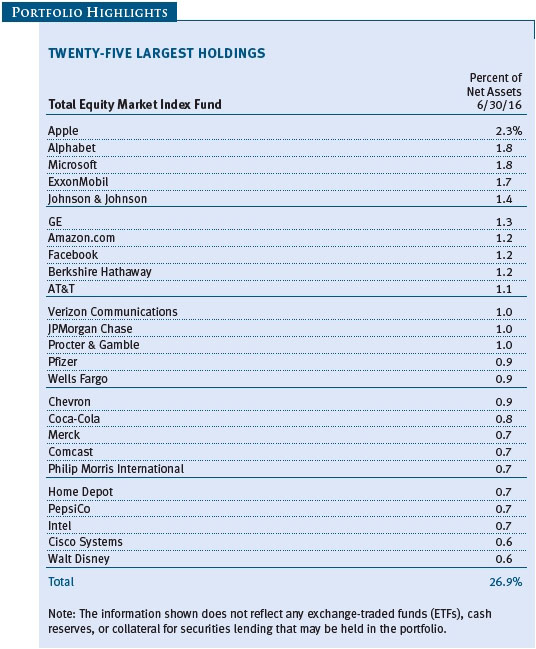
Total Equity Market Index Fund
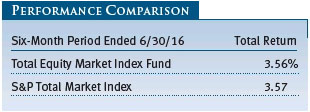
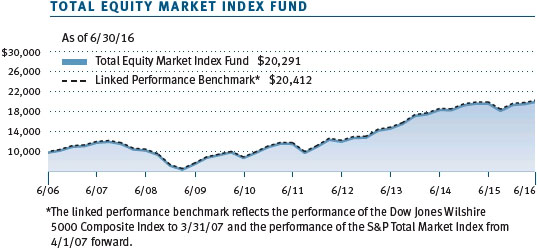
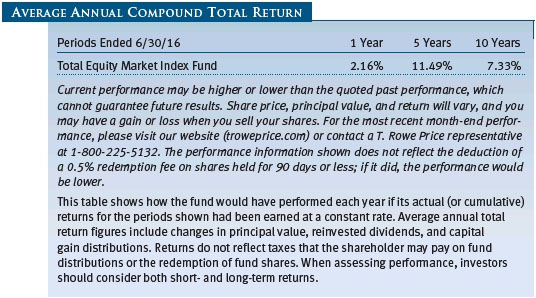
The Total Equity Market Index Fund returned 3.56% for the six months ended June 30, 2016, versus 3.57% for its benchmark, the S&P Total Market Index. Fund performance often slightly trails that of the benchmark due to operating and management expenses. The S&P Total Market Index represents the entire U.S. stock market. It combines the S&P 500 and S&P Completion Indexes, offering broad exposure to large-, mid-, small-, and micro-cap companies. Stocks in the S&P 500 represent about 80% of the S&P Total Market Index’s overall market value.
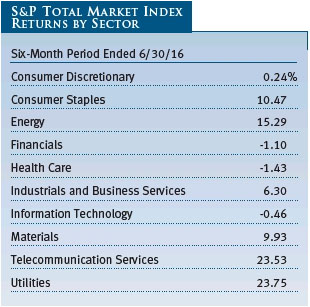
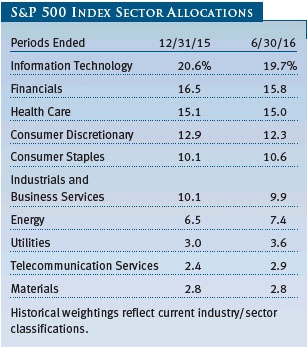
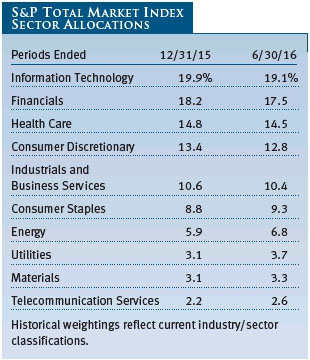
As with the S&P 500, the largest holdings of the S&P Total Market Index have the greatest influence on the fund’s performance. In addition, the sector percentage weightings of the two benchmarks are similar, although the S&P Total Market Index provides modestly greater exposure to financials than the S&P 500 and less exposure to consumer staples. The top performers of the S&P Total Market Index were generally in line with the S&P 500, led by the utilities, telecom services, and energy sectors. After being the strongest performer in the index in 2015, health care recorded the weakest results in the first half of 2016 due to poor results from some smaller biotech companies that are not included in the S&P 500; the financials sector also underperformed.
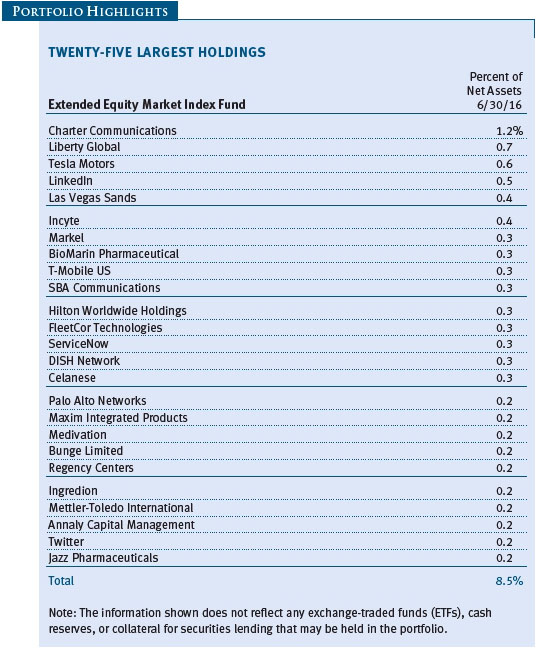
Extended Equity Market Index Fund
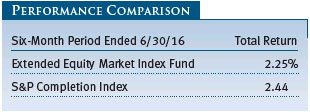
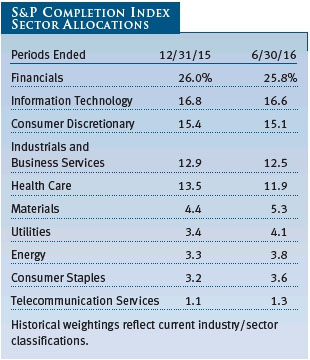
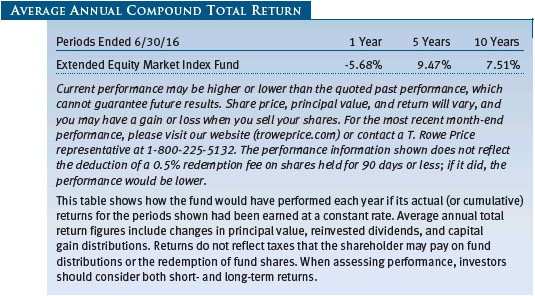
The Extended Equity Market Index Fund returned 2.25% for the six months ended June 30, 2016, versus 2.44% for its benchmark, the S&P Completion Index. Fund performance tends to slightly lag that of the benchmark because of the fund’s operating and management expenses. The S&P Completion Index, a subset of the S&P Total Market Index, excludes all S&P 500 stocks. The index covers more than 3,300 companies and provides exposure to mid-, small-, and micro-cap companies. Financial, information technology, and consumer discretionary companies make up nearly 60% of the benchmark.
Sector results among mid- and small-caps were driven by themes similar to the ones seen in the large-cap universe as investors sought out less risky, higher-yielding stocks and commodity prices rebounded. The utilities sector gained more than 25% for the quarter, while materials, telecom services, and consumer staples also had solid returns and advanced more than 10%. Some of the top-performing companies in the fund included oil and gas producer Continental Resources; Digital Realty Trust, a real estate investment trust that manages data centers; and food processor Ingredion. (Please refer to the fund’s portfolio of investments for a complete list of holdings and the amount each represents in the portfolio.)
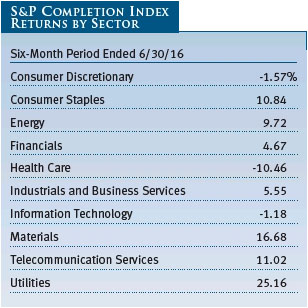
Health care was the weakest sector by a wide margin, and consumer discretionary and information technology also lost ground during the period. Within health care, political rhetoric regarding drug pricing has weighed on biotechnology and pharmaceutical stocks, and there have also been a number of fundamental and clinical disappointments that have hurt the sector over the past six months. Pharmaceutical firms Alkermes, Ionis Pharmaceuticals, and Incyte were among the fund’s weakest performers.
OUTLOOK
Gradual improvement in U.S. economic activity is supported by solid private sector demand, reinforced by an improving job market and increasing wages. Despite industrial weakness, continued growth driven by consumer spending should be supportive for equities over the remainder of the year, although valuations of many companies are trending above historical averages and political uncertainty and changing expectations for Federal Reserve policy could trigger more volatility.
U.S. corporate earnings continue to be hampered by weakness in the energy and materials sectors, with second-quarter 2016 year-over-year growth expected to contract for the fifth straight quarter. However, consensus estimates forecast a rebound in earnings in the third and fourth quarters of this year. While corporate leverage has increased, balance sheets, apart from energy-related sectors, remain broadly healthy and provide the corporate sector flexibility in the use of capital to increase spending, engage in merger and acquisition activity, and return earnings to shareholders.
Thank you for investing with T. Rowe Price.
Respectfully submitted,

Ken D. Uematsu
Chairman of the Investment Advisory Committee, Equity Index 500 Fund, Extended Equity Market Index Fund, and Total Equity Market Index Fund
July 19, 2016
The committee chairman has day-to-day responsibility for managing the portfolios and works with committee members in developing and executing the funds’ investment programs.

| Supplement to Prospectus Dated May 1, 2016 |
The fund’s Board of Directors has approved lowering the fund’s expense limitation from 0.30% to 0.25%, effective September 1, 2016. On page 1, the fee table and expense example are revised as follows, effective September 1, 2016, to reflect the reduction of the expense limitation:
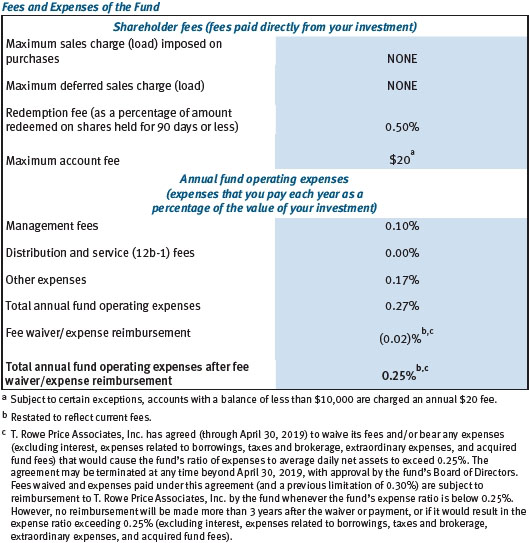
Example This example is intended to help you compare the cost of investing in the fund with the cost of investing in other mutual funds. The example assumes that you invest $10,000 in the fund for the time periods indicated and then redeem all of your shares at the end of those periods. The example also assumes that your investment has a 5% return each year, the fund’s operating expenses remain the same, and the expense limitation currently in place is not renewed. The figures have been adjusted to reflect fee waivers or expense reimbursements only in the periods for which the expense limitation arrangement is expected to continue. Although your actual costs may be higher or lower, based on these assumptions your costs would be:

Additionally, effective September 1, 2016, the second paragraph under the heading, “The Management Fee,” relating to the fund’s previous expense limitation of 0.30% is removed from pages 29 and 30 of the prospectus.

RISKS OF INVESTING
As with all stock mutual funds, the funds’ share prices can fall because of weakness in the stock market, a particular industry, or specific holdings. Stock markets can decline for many reasons, including adverse political or economic developments, changes in investor psychology, or heavy institutional selling. The prospects for an industry or company may deteriorate because of a variety of factors, including disappointing earnings or changes in the competitive environment.
GLOSSARY
Investment-weighted median market capitalization: The investment-weighted midpoint market capitalization (shares outstanding multiplied by current price) representing a typical security in a portfolio. An investment-weighted median represents the breakpoint where 50% of the values are above and 50% of the values are below based on portfolio weight.
Price-to-earnings (P/E) ratio: A valuation measure calculated by dividing the price of a stock by its reported earnings per share. The ratio is a measure of how much investors are willing to pay for the company’s earnings.
Projected earnings growth rate (IBES): A company’s expected earnings per share growth rate for a given time period based on the forecast from the Institutional Brokers’ Estimate System, which is commonly referred to as IBES.
S&P 500 Index: An unmanaged index that tracks the stocks of 500 primarily large-cap U.S. companies.
S&P Completion Index: Tracks the performance of the U.S. stocks not included in the S&P 500, which are primarily small- and mid-capitalization stocks. The index includes approximately 3,300 stocks.
S&P Total Market Index: Tracks the performance of a broad spectrum of small-, mid-, and large-capitalization U.S. stocks. Because the largest stocks in the index carry the most weight, large-capitalization stocks make up a substantial majority of the S&P Total Market Index’s value. The index includes approximately 3,800 stocks.
Performance and Expenses
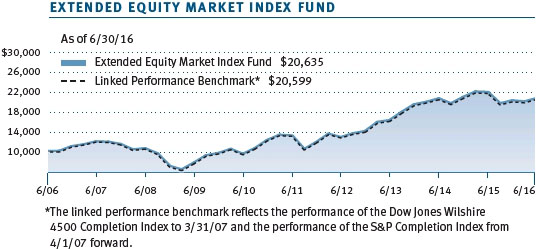
This chart shows the value of a hypothetical $10,000 investment in the fund over the past 10 fiscal year periods or since inception (for funds lacking 10-year records). The result is compared with benchmarks, which may include a broad-based market index and a peer group average or index. Market indexes do not include expenses, which are deducted from fund returns as well as mutual fund averages and indexes.
This chart shows the value of a hypothetical $10,000 investment in the fund over the past 10 fiscal year periods or since inception (for funds lacking 10-year records). The result is compared with benchmarks, which may include a broad-based market index and a peer group average or index. Market indexes do not include expenses, which are deducted from fund returns as well as mutual fund averages and indexes.
This chart shows the value of a hypothetical $10,000 investment in the fund over the past 10 fiscal year periods or since inception (for funds lacking 10-year records). The result is compared with benchmarks, which may include a broad-based market index and a peer group average or index. Market indexes do not include expenses, which are deducted from fund returns as well as mutual fund averages and indexes.
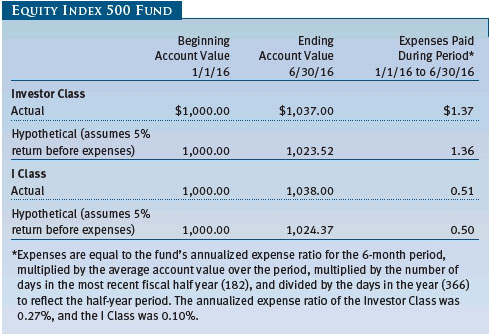
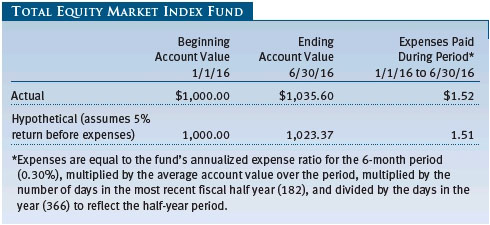
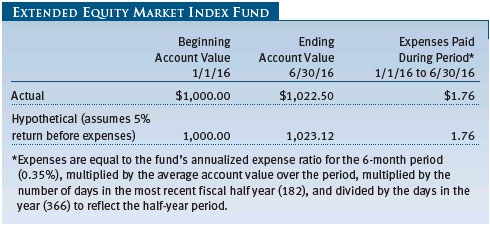
As a mutual fund shareholder, you may incur two types of costs: (1) transaction costs, such as redemption fees or sales loads, and (2) ongoing costs, including management fees, distribution and service (12b-1) fees, and other fund expenses. The following example is intended to help you understand your ongoing costs (in dollars) of investing in the fund and to compare these costs with the ongoing costs of investing in other mutual funds. The example is based on an investment of $1,000 invested at the beginning of the most recent six-month period and held for the entire period.
Please note that the Equity Index 500 Fund has two share classes: The original share class (Investor Class) charges no distribution and service (12b-1) fee, and I Class shares are also available to institutionally oriented clients and impose no 12b-1 or administrative fee payment. Each share class is presented separately in the table.
Actual Expenses
The first line of the following table (Actual) provides information about actual account values and actual expenses. You may use the information on this line, together with your account balance, to estimate the expenses that you paid over the period. Simply divide your account value by $1,000 (for example, an $8,600 account value divided by $1,000 = 8.6), then multiply the result by the number on the first line under the heading “Expenses Paid During Period” to estimate the expenses you paid on your account during this period.
Hypothetical Example for Comparison Purposes
The information on the second line of the table (Hypothetical) is based on hypothetical account values and expenses derived from the fund’s actual expense ratio and an assumed 5% per year rate of return before expenses (not the fund’s actual return). You may compare the ongoing costs of investing in the fund with other funds by contrasting this 5% hypothetical example and the 5% hypothetical examples that appear in the shareholder reports of the other funds. The hypothetical account values and expenses may not be used to estimate the actual ending account balance or expenses you paid for the period.
Note: T. Rowe Price charges an account service fee that is not included in the accompanying table. The account service fee is charged on a quarterly basis, usually during the last week of a calendar quarter, and applies to accounts with balances below $10,000 on the day of the assessment. The fee is charged to accounts that fall below $10,000 for any reason, including market fluctuations, redemptions, or exchanges. When an account with less than $10,000 is closed either through redemption or exchange, the fee is charged and deducted from the proceeds. The fee applies to IRAs but not to retirement plans directly registered with T. Rowe Price Services or accounts maintained by intermediaries through NSCC® Networking. If you are subject to the fee, keep it in mind when you are estimating the ongoing expenses of investing in the fund and when comparing the expenses of this fund with other funds.
You should also be aware that the expenses shown in the table highlight only your ongoing costs and do not reflect any transaction costs, such as redemption fees or sales loads. Therefore, the second line of the table is useful in comparing ongoing costs only and will not help you determine the relative total costs of owning different funds. To the extent a fund charges transaction costs, however, the total cost of owning that fund is higher.
Unaudited
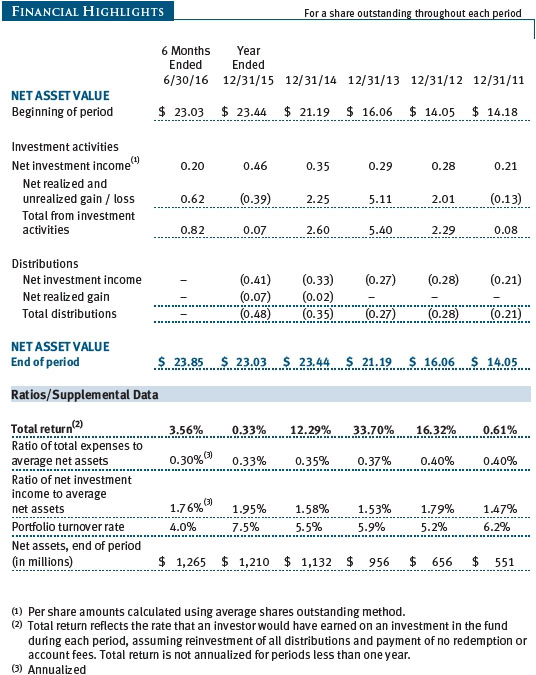
The accompanying notes are an integral part of these financial statements.
Unaudited


The accompanying notes are an integral part of these financial statements.
Unaudited
The accompanying notes are an integral part of these financial statements.
Unaudited
The accompanying notes are an integral part of these financial statements.
Unaudited
The accompanying notes are an integral part of these financial statements.
Unaudited
| Notes to Financial Statements |
T. Rowe Price Index Trust, Inc. (the corporation), is registered under the Investment Company Act of 1940 (the 1940 Act). The Total Equity Market Index Fund (the fund) is a diversified, open-end management investment company established by the corporation. The fund incepted on January 30, 1998. The fund seeks to match the performance of the entire U.S. stock market, as represented by the S&P Total Market Index.
NOTE 1 - SIGNIFICANT ACCOUNTING POLICIES
Basis of Preparation The fund is an investment company and follows accounting and reporting guidance in the Financial Accounting Standards Board (FASB) Accounting Standards Codification Topic 946 (ASC 946). The accompanying financial statements were prepared in accordance with accounting principles generally accepted in the United States of America (GAAP), including, but not limited to, ASC 946. GAAP requires the use of estimates made by management. Management believes that estimates and valuations are appropriate; however, actual results may differ from those estimates, and the valuations reflected in the accompanying financial statements may differ from the value ultimately realized upon sale or maturity.
Investment Transactions, Investment Income, and Distributions Income and expenses are recorded on the accrual basis. Premiums and discounts on debt securities are amortized for financial reporting purposes. Dividends received from mutual fund investments are reflected as dividend income; capital gain distributions, if any, are reflected as realized gain/loss. Earnings on investments recognized as partnerships for federal income tax purposes reflect the tax character of such earnings. Dividend income and capital gain distributions are recorded on the ex-dividend date. Income tax-related interest and penalties, if incurred, would be recorded as income tax expense. Investment transactions are accounted for on the trade date. Realized gains and losses are reported on the identified cost basis. Distributions from REITs are initially recorded as dividend income and, to the extent such represent a return of capital or capital gain for tax purposes, are reclassified when such information becomes available. Income distributions are declared and paid annually. Distributions to shareholders are recorded on the ex-dividend date. Capital gain distributions, if any, are generally declared and paid by the fund annually.
Redemption Fees A 0.50% fee is assessed on redemptions of fund shares held for 90 days or less to deter short-term trading and to protect the interests of long-term shareholders. Redemption fees are withheld from proceeds that shareholders receive from the sale or exchange of fund shares. The fees are paid to the fund and are recorded as an increase to paid-in capital. The fees may cause the redemption price per share to differ from the net asset value per share.
NOTE 2 - VALUATION
The fund’s financial instruments are valued and its net asset value (NAV) per share is computed at the close of the New York Stock Exchange (NYSE), normally 4 p.m. ET, each day the NYSE is open for business.
Fair Value The fund’s financial instruments are reported at fair value, which GAAP defines as the price that would be received to sell an asset or paid to transfer a liability in an orderly transaction between market participants at the measurement date. The T. Rowe Price Valuation Committee (the Valuation Committee) has been established by the fund’s Board of Directors (the Board) to ensure that financial instruments are appropriately priced at fair value in accordance with GAAP and the 1940 Act. Subject to oversight by the Board, the Valuation Committee develops and oversees pricing-related policies and procedures and approves all fair value determinations. Specifically, the Valuation Committee establishes procedures to value securities; determines pricing techniques, sources, and persons eligible to effect fair value pricing actions; oversees the selection, services, and performance of pricing vendors; oversees valuation-related business continuity practices; and provides guidance on internal controls and valuation-related matters. The Valuation Committee reports to the Board and has representation from legal, portfolio management and trading, operations, risk management, and the fund’s treasurer.
Various valuation techniques and inputs are used to determine the fair value of financial instruments. GAAP establishes the following fair value hierarchy that categorizes the inputs used to measure fair value:
Level 1 – quoted prices (unadjusted) in active markets for identical financial instruments that the fund can access at the reporting date
Level 2 – inputs other than Level 1 quoted prices that are observable, either directly or indirectly (including, but not limited to, quoted prices for similar financial instruments in active markets, quoted prices for identical or similar financial instruments in inactive markets, interest rates and yield curves, implied volatilities, and credit spreads)
Level 3 – unobservable inputs
Observable inputs are developed using market data, such as publicly available information about actual events or transactions, and reflect the assumptions that market participants would use to price the financial instrument. Unobservable inputs are those for which market data are not available and are developed using the best information available about the assumptions that market participants would use to price the financial instrument. GAAP requires valuation techniques to maximize the use of relevant observable inputs and minimize the use of unobservable inputs. When multiple inputs are used to derive fair value, the financial instrument is assigned to the level within the fair value hierarchy based on the lowest-level input that is significant to the fair value of the financial instrument. Input levels are not necessarily an indication of the risk or liquidity associated with financial instruments at that level but rather the degree of judgment used in determining those values.
Valuation Techniques Equity securities listed or regularly traded on a securities exchange or in the over-the-counter (OTC) market are valued at the last quoted sale price or, for certain markets, the official closing price at the time the valuations are made. OTC Bulletin Board securities are valued at the mean of the closing bid and asked prices. A security that is listed or traded on more than one exchange is valued at the quotation on the exchange determined to be the primary market for such security. Listed securities not traded on a particular day are valued at the mean of the closing bid and asked prices. Actively traded equity securities listed on a domestic exchange generally are categorized in Level 1 of the fair value hierarchy. OTC Bulletin Board securities, certain preferred securities, and equity securities traded in inactive markets generally are categorized in Level 2 of the fair value hierarchy.
Debt securities generally are traded in the OTC market. Debt securities with remaining maturities of less than one year at the time of acquisition generally use amortized cost in local currency to approximate fair value. However, if amortized cost is deemed not to reflect fair value or the fund holds a significant amount of such securities with remaining maturities of more than 60 days, the securities are valued at prices furnished by dealers who make markets in such securities or by an independent pricing service. Generally, debt securities are categorized in Level 2 of the fair value hierarchy; however, to the extent the valuations include significant unobservable inputs, the securities would be categorized in Level 3.
Investments in mutual funds are valued at the mutual fund’s closing NAV per share on the day of valuation and are categorized in Level 1 of the fair value hierarchy. Financial futures contracts are valued at closing settlement prices and are categorized in Level 1 of the fair value hierarchy. Assets and liabilities other than financial instruments, including short-term receivables and payables, are carried at cost, or estimated realizable value, if less, which approximates fair value.
Thinly traded financial instruments and those for which the above valuation procedures are inappropriate or are deemed not to reflect fair value are stated at fair value as determined in good faith by the Valuation Committee. The objective of any fair value pricing determination is to arrive at a price that could reasonably be expected from a current sale. Financial instruments fair valued by the Valuation Committee are primarily private placements, restricted securities, warrants, rights, and other securities that are not publicly traded.
Subject to oversight by the Board, the Valuation Committee regularly makes good faith judgments to establish and adjust the fair valuations of certain securities as events occur and circumstances warrant. For instance, in determining the fair value of an equity investment with limited market activity, such as a private placement or a thinly traded public company stock, the Valuation Committee considers a variety of factors, which may include, but are not limited to, the issuer’s business prospects, its financial standing and performance, recent investment transactions in the issuer, new rounds of financing, negotiated transactions of significant size between other investors in the company, relevant market valuations of peer companies, strategic events affecting the company, market liquidity for the issuer, and general economic conditions and events. In consultation with the investment and pricing teams, the Valuation Committee will determine an appropriate valuation technique based on available information, which may include both observable and unobservable inputs. The Valuation Committee typically will afford greatest weight to actual prices in arm’s length transactions, to the extent they represent orderly transactions between market participants, transaction information can be reliably obtained, and prices are deemed representative of fair value. However, the Valuation Committee may also consider other valuation methods such as market-based valuation multiples; a discount or premium from market value of a similar, freely traded security of the same issuer; or some combination. Fair value determinations are reviewed on a regular basis and updated as information becomes available, including actual purchase and sale transactions of the issue. Because any fair value determination involves a significant amount of judgment, there is a degree of subjectivity inherent in such pricing decisions, and fair value prices determined by the Valuation Committee could differ from those of other market participants. Depending on the relative significance of unobservable inputs, including the valuation technique(s) used, fair valued securities may be categorized in Level 2 or 3 of the fair value hierarchy.
Valuation Inputs The following table summarizes the fund’s financial instruments, based on the inputs used to determine their fair values on June 30, 2016:
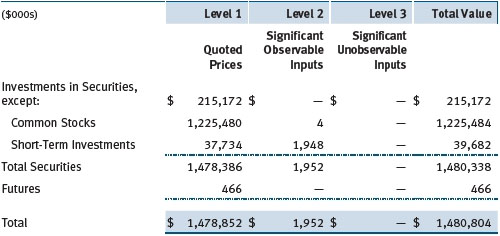
There were no material transfers between Levels 1 and 2 during the six months ended June 30, 2016.
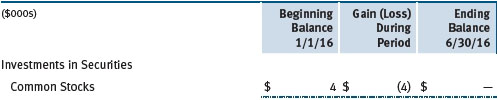
Following is a reconciliation of the fund’s Level 3 holdings for the six months ended June 30, 2016. Gain (loss) reflects both realized and change in unrealized gain/loss on Level 3 holdings during the period, if any, and is included on the accompanying Statement of Operations. The change in unrealized gain/loss on Level 3 instruments held at June 30, 2016, totaled $(4,000) for the six months ended June 30, 2016.
NOTE 3 - DERIVATIVE INSTRUMENTS
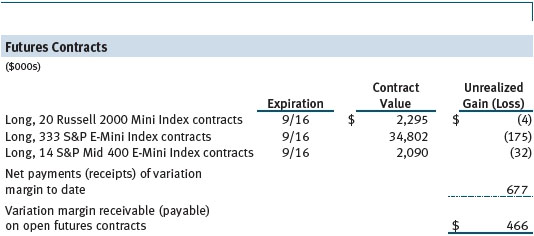
During the six months ended June 30, 2016, the fund invested in derivative instruments. As defined by GAAP, a derivative is a financial instrument whose value is derived from an underlying security price, foreign exchange rate, interest rate, index of prices or rates, or other variable; it requires little or no initial investment and permits or requires net settlement. The fund invests in derivatives only if the expected risks and rewards are consistent with its investment objectives, policies, and overall risk profile, as described in its prospectus and Statement of Additional Information. The fund may use derivatives for a variety of purposes, such as seeking to hedge against declines in principal value, increase yield, invest in an asset with greater efficiency and at a lower cost than is possible through direct investment, or to adjust credit exposure. The risks associated with the use of derivatives are different from, and potentially much greater than, the risks associated with investing directly in the instruments on which the derivatives are based. The fund at all times maintains sufficient cash reserves, liquid assets, or other SEC-permitted asset types to cover its settlement obligations under open derivative contracts.
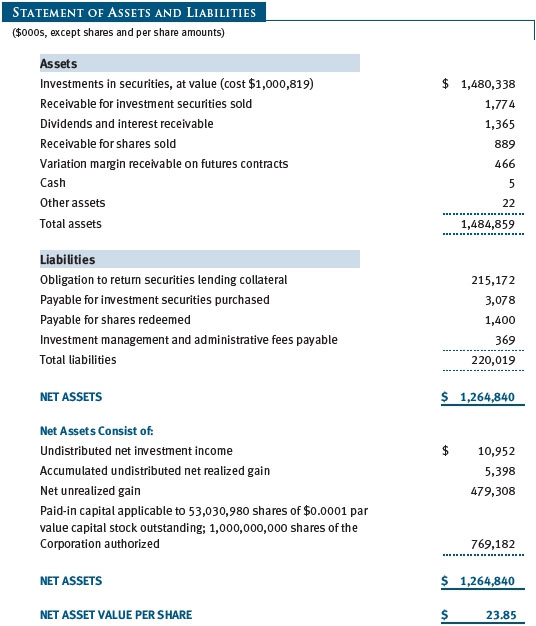
The fund values its derivatives at fair value and recognizes changes in fair value currently in its results of operations. Accordingly, the fund does not follow hedge accounting, even for derivatives employed as economic hedges. Generally, the fund accounts for its derivatives on a gross basis. It does not offset the fair value of derivative liabilities against the fair value of derivative assets on its financial statements, nor does it offset the fair value of derivative instruments against the right to reclaim or obligation to return collateral. As of June 30, 2016, the fund held equity futures with cumulative unrealized loss of $211,000; the value reflected on the accompanying Statement of Assets and Liabilities is the related unsettled variation margin.
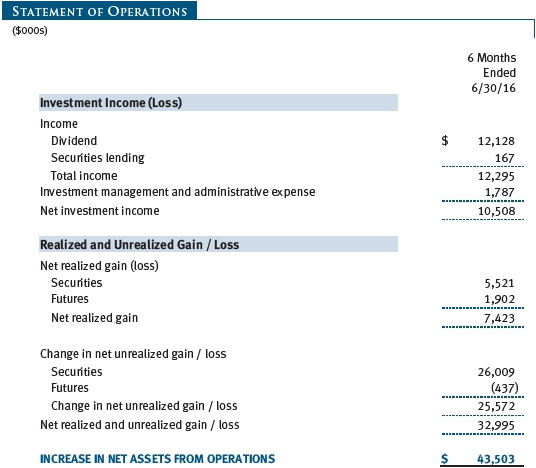
Additionally, during the six months ended June 30, 2016, the fund recognized $1,902,000 of realized gain on Futures and a $(437,000) change in unrealized gain/loss on Futures related to its investments in equity derivatives; such amounts are included on the accompanying Statement of Operations.
Counterparty Risk and Collateral The fund invests in exchange-traded or centrally cleared derivative contracts, such as futures, exchange-traded options, and centrally cleared swaps. Counterparty risk on such derivatives is minimal because the clearinghouse provides protection against counterparty defaults. For futures and centrally cleared swaps, the fund is required to deposit collateral in an amount equal to a certain percentage of the contract value (margin requirement), and the margin requirement must be maintained over the life of the contract. Each clearing broker, in its sole discretion, may adjust the margin requirements applicable to the fund.
Collateral may be in the form of cash or debt securities issued by the U.S. government or related agencies. Cash and currencies posted by the fund are reflected as cash deposits in the accompanying financial statements and generally are restricted from withdrawal by the fund; securities posted by the fund are so noted in the accompanying Portfolio of Investments; both remain in the fund’s assets. As of June 30, 2016, securities valued at $1,683,000 had been posted by the fund for exchange-traded and/or centrally cleared derivatives.
Futures Contracts The fund is subject to equity price risk in the normal course of pursuing its investment objectives and uses futures contracts to help manage such risk. The fund may enter into futures contracts as an efficient means of maintaining liquidity while being invested in the market, to facilitate trading, or to reduce transaction costs. A futures contract provides for the future sale by one party and purchase by another of a specified amount of a specific underlying financial instrument at an agreed-upon price, date, time, and place. The fund currently invests only in exchange-traded futures, which generally are standardized as to maturity date, underlying financial instrument, and other contract terms. Payments are made or received by the fund each day to settle daily fluctuations in the value of the contract (variation margin), which reflect changes in the value of the underlying financial instrument. Variation margin is recorded as unrealized gain or loss until the contract is closed. The value of a futures contract included in net assets is the amount of unsettled variation margin; net variation margin receivable is reflected as an asset, and net variation margin payable is reflected as a liability on the accompanying Statement of Assets and Liabilities. Risks related to the use of futures contracts include possible illiquidity of the futures markets, contract prices that can be highly volatile and imperfectly correlated to movements in hedged security values, and potential losses in excess of the fund’s initial investment. During the six months ended June 30, 2016, the volume of the fund’s activity in futures, based on underlying notional amounts, was generally between 2% and 4% of net assets.
NOTE 4 - OTHER INVESTMENT TRANSACTIONS
Consistent with its investment objective, the fund engages in the following practices to manage exposure to certain risks and/or to enhance performance. The investment objective, policies, program, and risk factors of the fund are described more fully in the fund’s prospectus and Statement of Additional Information.
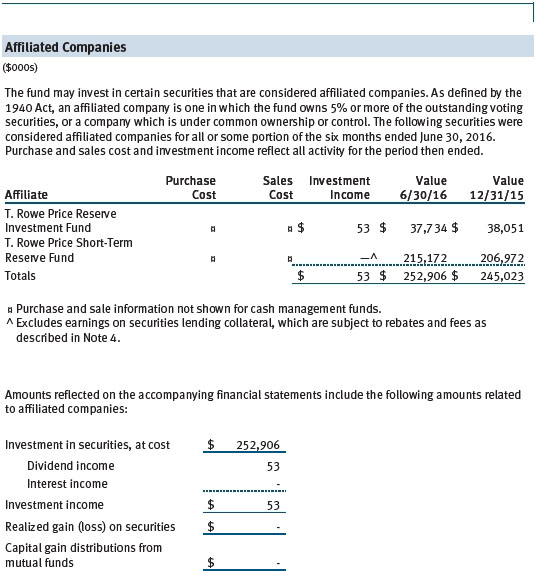
Securities Lending The fund may lend its securities to approved brokers to earn additional income. Its securities lending activities are administered by a lending agent in accordance with a securities lending agreement. Security loans generally do not have stated maturity dates, and the fund may recall a security at any time. The fund receives collateral in the form of cash or U.S. government securities, valued at 102% to 105% of the value of the securities on loan. Collateral is maintained over the life of the loan in an amount not less than the value of loaned securities; any additional collateral required due to changes in security values is delivered to the fund the next business day. Cash collateral is invested by the lending agent(s) in accordance with investment guidelines approved by fund management. Additionally, the lending agent indemnifies the fund against losses resulting from borrower default. Although risk is mitigated by the collateral and indemnification, the fund could experience a delay in recovering its securities and a possible loss of income or value if the borrower fails to return the securities, collateral investments decline in value, and the lending agent fails to perform. Securities lending revenue consists of earnings on invested collateral and borrowing fees, net of any rebates to the borrower, compensation to the lending agent, and other administrative costs. In accordance with GAAP, investments made with cash collateral are reflected in the accompanying financial statements, but collateral received in the form of securities is not. At June 30, 2016, the value of loaned securities was $207,834,000, including securities sold but not yet settled, which are not reflected in the accompanying Portfolio of Investments; the value of cash collateral and related investments was $215,172,000.
Other Purchases and sales of portfolio securities other than short-term securities aggregated $67,744,000 and $47,128,000, respectively, for the six months ended June 30, 2016.
NOTE 5 - FEDERAL INCOME TAXES
No provision for federal income taxes is required since the fund intends to continue to qualify as a regulated investment company under Subchapter M of the Internal Revenue Code and distribute to shareholders all of its taxable income and gains. Distributions determined in accordance with federal income tax regulations may differ in amount or character from net investment income and realized gains for financial reporting purposes. Financial reporting records are adjusted for permanent book/tax differences to reflect tax character but are not adjusted for temporary differences. The amount and character of tax-basis distributions and composition of net assets are finalized at fiscal year-end; accordingly, tax-basis balances have not been determined as of the date of this report.
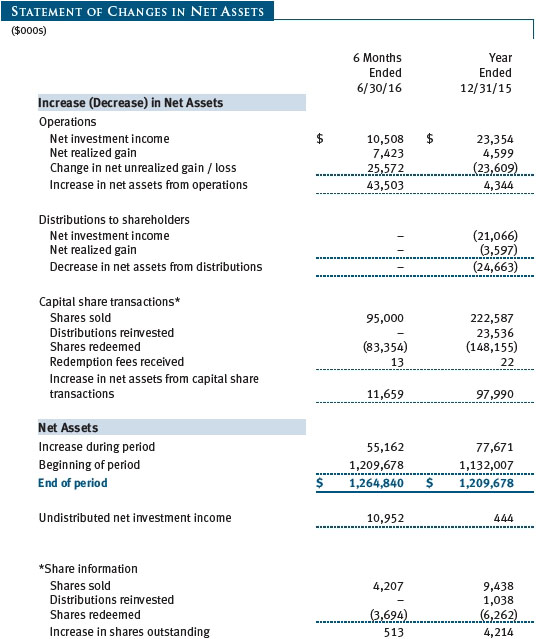
The fund intends to retain realized gains to the extent of available capital loss carryforwards. Net realized capital losses may be carried forward indefinitely to offset future realized capital gains. As of December 31, 2015, the fund had $264,000 of available capital loss carryforwards.
At June 30, 2016, the cost of investments for federal income tax purposes was $1,003,009,000. Net unrealized gain aggregated $477,119,000 at period-end, of which $510,886,000 related to appreciated investments and $33,767,000 related to depreciated investments.
NOTE 6 - RELATED PARTY TRANSACTIONS
The fund is managed by T. Rowe Price Associates, Inc. (Price Associates), a wholly owned subsidiary of T. Rowe Price Group, Inc. (Price Group). The investment management and administrative agreement between the fund and Price Associates provides for an all-inclusive annual fee equal to 0.30% of the fund’s average daily net assets. The fee is computed daily and paid monthly. The all-inclusive fee covers investment management, shareholder servicing, transfer agency, accounting, and custody services provided to the fund, as well as fund directors’ fees and expenses. Interest, taxes, brokerage commissions, and extraordinary expenses are paid directly by the fund.
Additionally, the fund is one of several mutual funds in which certain college savings plans managed by Price Associates may invest. As approved by the fund’s Board of Directors, shareholder servicing costs associated with each college savings plan are allocated to the fund in proportion to the average daily value of its shares owned by the college savings plan. Shareholder servicing costs allocated to the fund are borne by Price Associates, pursuant to the fund’s all-inclusive fee agreement. At June 30, 2016, approximately 18% of the outstanding shares of the fund were held by college savings plans.
The fund may invest in the T. Rowe Price Reserve Investment Fund, the T. Rowe Price Government Reserve Investment Fund, or the T. Rowe Price Short-Term Reserve Fund (collectively, the Price Reserve Investment Funds), open-end management investment companies managed by Price Associates and considered affiliates of the fund. The Price Reserve Investment Funds are offered as short-term investment options to mutual funds, trusts, and other accounts managed by Price Associates or its affiliates and are not available for direct purchase by members of the public. The Price Reserve Investment Funds pay no investment management fees.
The fund may participate in securities purchase and sale transactions with other funds or accounts advised by Price Associates (cross trades), in accordance with procedures adopted by the fund’s Board and Securities and Exchange Commission rules, which require, among other things, that such purchase and sale cross trades be effected at the independent current market price of the security. During the six months ended June 30, 2016, the fund had no purchases or sales cross trades with other funds or accounts advised by Price Associates.
| Information on Proxy Voting Policies, Procedures, and Records |
A description of the policies and procedures used by T. Rowe Price funds and portfolios to determine how to vote proxies relating to portfolio securities is available in each fund’s Statement of Additional Information. You may request this document by calling 1-800-225-5132 or by accessing the SEC’s website, sec.gov.
The description of our proxy voting policies and procedures is also available on our corporate website. To access it, please visit the following Web page
https://www3.troweprice.com/usis/corporate/en/utility/policies.html
and scroll down to the section near the bottom of the page that says, “Proxy Voting Policies.” Click on the Proxy Voting Policies link in the shaded box.
Each fund’s most recent annual proxy voting record is available on our website and through the SEC’s website. To access it through T. Rowe Price, visit the website location shown above, and scroll down to the section near the bottom of the page that says, “Proxy Voting Records.” Click on the Proxy Voting Records link in the shaded box.
| How to Obtain Quarterly Portfolio Holdings |
The fund files a complete schedule of portfolio holdings with the Securities and Exchange Commission for the first and third quarters of each fiscal year on Form N-Q. The fund’s Form N-Q is available electronically on the SEC’s website (sec.gov); hard copies may be reviewed and copied at the SEC’s Public Reference Room, 100 F St. N.E., Washington, DC 20549. For more information on the Public Reference Room, call 1-800-SEC-0330.
| Approval of Investment Management Agreement |
On March 11, 2016, the fund’s Board of Directors (Board), including a majority of the fund’s independent directors, approved the continuation of the investment management agreement (Advisory Contract) between the fund and its investment advisor, T. Rowe Price Associates, Inc. (Advisor). In connection with its deliberations, the Board requested, and the Advisor provided, such information as the Board (with advice from independent legal counsel) deemed reasonably necessary. The Board considered a variety of factors in connection with its review of the Advisory Contract, also taking into account information provided by the Advisor during the course of the year, as discussed below:
Services Provided by the Advisor
The Board considered the nature, quality, and extent of the services provided to the fund by the Advisor. These services included, but were not limited to, directing the fund’s investments in accordance with its investment program and the overall management of the fund’s portfolio, as well as a variety of related activities such as financial, investment operations, and administrative services; compliance; maintaining the fund’s records and registrations; and shareholder communications. The Board also reviewed the background and experience of the Advisor’s senior management team and investment personnel involved in the management of the fund, as well as the Advisor’s compliance record. The Board concluded that it was satisfied with the nature, quality, and extent of the services provided by the Advisor.
Investment Performance of the Fund
The Board reviewed the fund’s three-month, one-year, and year-by-year returns, as well as the fund’s average annualized total returns over the 3-year, 5-year, and 10-year periods, and compared these returns with a wide variety of comparable performance measures and market data, including those supplied by Lipper and Morningstar, which are independent providers of mutual fund data.
On the basis of this evaluation and the Board’s ongoing review of investment results, and factoring in the relative market conditions during certain of the performance periods, the Board concluded that the fund’s performance was satisfactory.
Costs, Benefits, Profits, and Economies of Scale
The Board reviewed detailed information regarding the revenues received by the Advisor under the Advisory Contract and other benefits that the Advisor (and its affiliates) may have realized from its relationship with the fund, including any research received under “soft dollar” agreements and commission-sharing arrangements with broker-dealers. The Board considered that the Advisor may receive some benefit from soft-dollar arrangements pursuant to which research is received from broker-dealers that execute the applicable fund’s portfolio transactions. The Board received information on the estimated costs incurred and profits realized by the Advisor from managing T. Rowe Price mutual funds. The Board also reviewed estimates of the profits realized from managing the fund in particular, and the Board concluded that the Advisor’s profits were reasonable in light of the services provided to the fund.
The Board also considered whether the fund benefits under the fee levels set forth in the Advisory Contract from any economies of scale realized by the Advisor. The Board noted that, under the Advisory Contract, the fund pays the Advisor a single fee, or all-inclusive management fee, which is based on the fund’s average daily net assets. The all-inclusive management fee includes investment management services and provides for the Advisor to pay all of the fund’s ordinary, recurring operating expenses except for interest, taxes, portfolio transaction fees, and any nonrecurring extraordinary expenses that may arise. The Board noted that, effective August 1, 2015, the fund’s all-inclusive management fee rate was lowered from 0.35% to 0.30%. The Board concluded that, based on the profitability data it reviewed and consistent with this all-inclusive management fee structure, the Advisory Contract provided for a reasonable sharing of any benefits from economies of scale with the fund.
Fees
The Board was provided with information regarding industry trends in management fees and expenses, and the Board reviewed the fund’s management fee rate and total expense ratio in comparison with fees and expenses of other comparable funds based on information and data supplied by Lipper. For these purposes, the Board assumed that the fund’s management fee rate was equal to the all-inclusive management fee rate less the fund’s actual operating expenses, and the total expense ratio was equal to the all-inclusive management fee rate. The information provided to the Board indicated that the fund’s management fee rate and total expense ratio were above the median for certain groups of comparable funds and at or below the median for other groups of comparable funds.
The Board also reviewed the fee schedules for institutional accounts (including subadvised mutual funds) and private accounts with similar mandates that are advised or subadvised by the Advisor and its affiliates. Management provided the Board with information about the Advisor’s responsibilities and services provided to subadvisory and other institutional account clients, including information about how the requirements and economics of the institutional business differ from those of the Advisor’s proprietary mutual fund business. The Board considered information showing that the Advisor’s proprietary mutual fund business is generally more complex from a business and compliance perspective than its institutional account business, and considered various other relevant factors, including the broader scope of operations and oversight, more extensive shareholder communication infrastructure, greater asset flows, heightened business risks, and differences in applicable laws and regulations associated with the Advisor’s proprietary mutual fund business. In assessing the reasonableness of the fund’s management fee rate, the Board considered the differences in the nature of the services required for the Advisor to manage its proprietary mutual fund business versus managing a discrete pool of assets as a subadvisor to another institution’s mutual fund or for another institutional account, and the degree to which the Advisor performs significant additional services and assumes greater risk in managing the fund and other T. Rowe Price mutual funds than it does for institutional account clients.
On the basis of the information provided and the factors considered, the Board concluded that the fees paid by the fund under the Advisory Contract are reasonable.
Approval of the Advisory Contract
As noted, the Board approved the continuation of the Advisory Contract. No single factor was considered in isolation or to be determinative to the decision. Rather, the Board concluded, in light of a weighting and balancing of all factors considered, that it was in the best interests of the fund and its shareholders for the Board to approve the continuation of the Advisory Contract (including the fees to be charged for services thereunder). The independent directors were advised throughout the process by independent legal counsel.
Item 2. Code of Ethics.
A code of ethics, as defined in Item 2 of Form N-CSR, applicable to its principal executive officer, principal financial officer, principal accounting officer or controller, or persons performing similar functions is filed as an exhibit to the registrant’s annual Form N-CSR. No substantive amendments were approved or waivers were granted to this code of ethics during the registrant’s most recent fiscal half-year.
Item 3. Audit Committee Financial Expert.
Disclosure required in registrant’s annual Form N-CSR.
Item 4. Principal Accountant Fees and Services.
Disclosure required in registrant’s annual Form N-CSR.
Item 5. Audit Committee of Listed Registrants.
Not applicable.
Item 6. Investments.
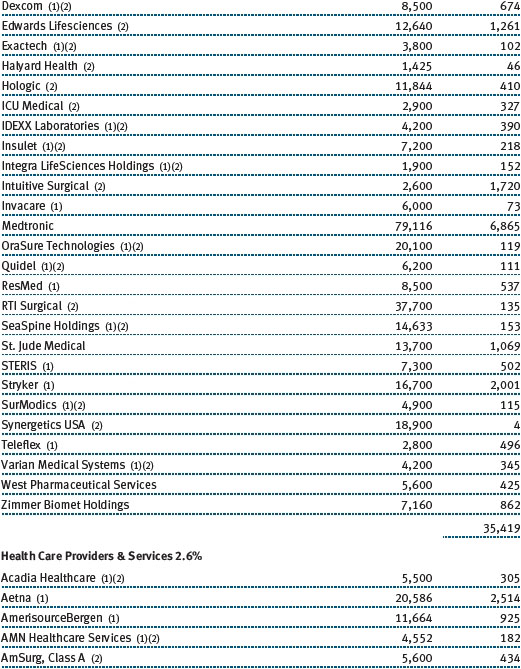
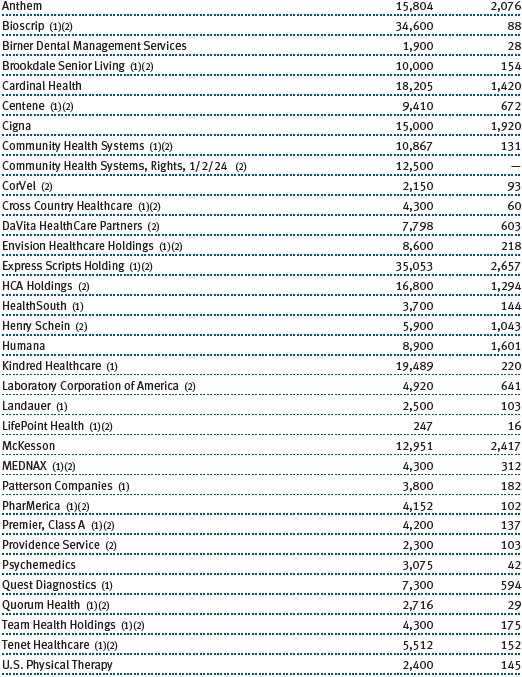
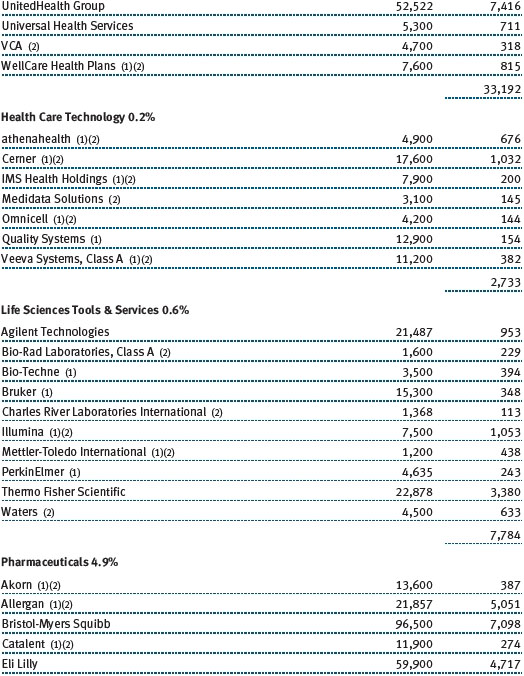
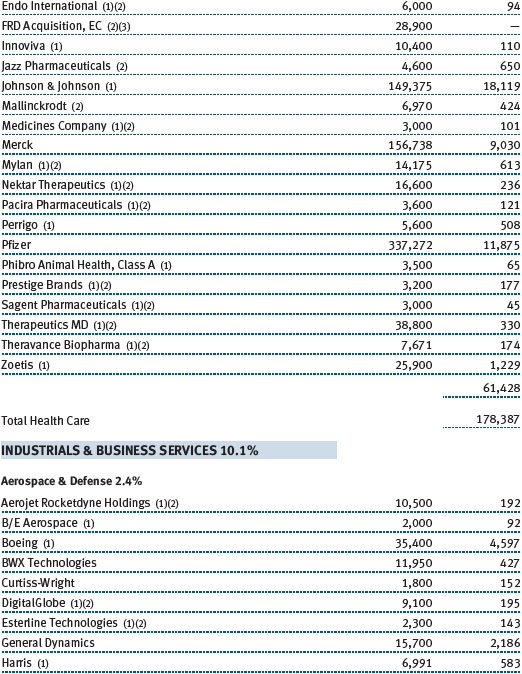
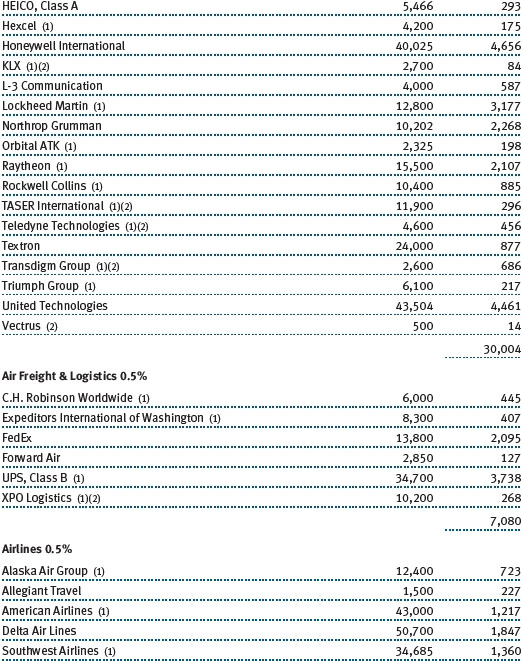
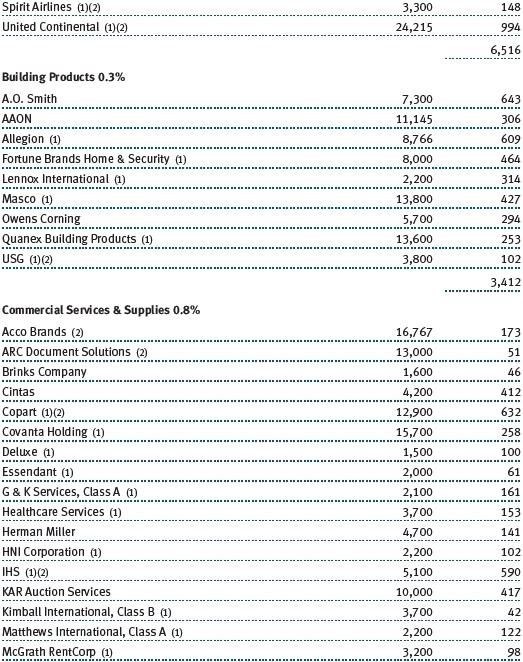
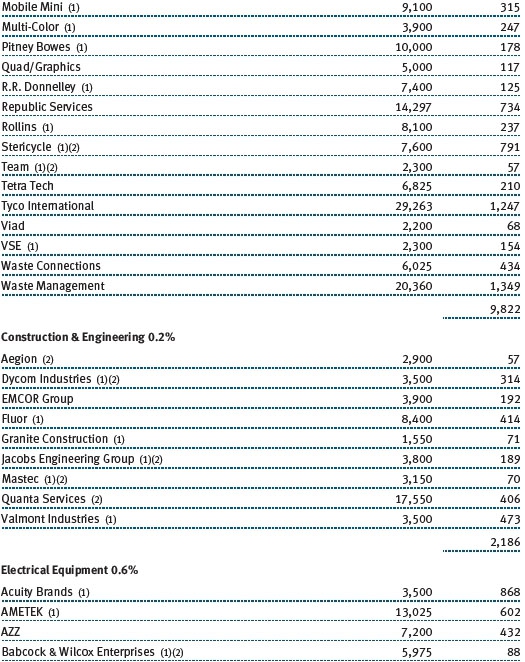
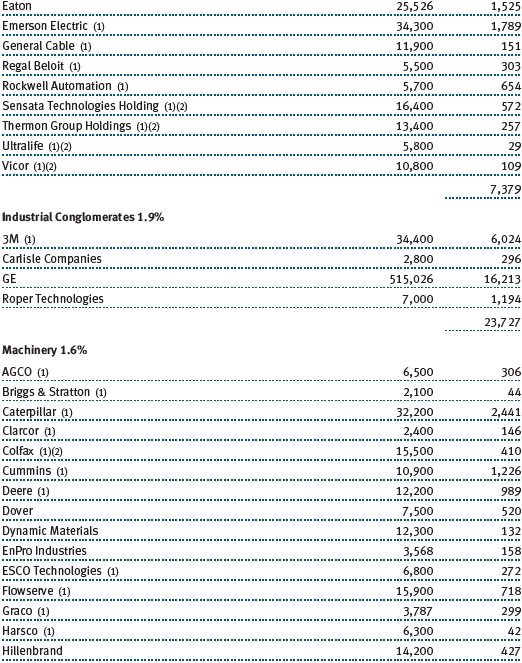
(a) Not applicable. The complete schedule of investments is included in Item 1 of this Form N-CSR.
(b) Not applicable.
Item 7. Disclosure of Proxy Voting Policies and Procedures for Closed-End Management Investment Companies.
Not applicable.
Item 8. Portfolio Managers of Closed-End Management Investment Companies.
Not applicable.
Item 9. Purchases of Equity Securities by Closed-End Management Investment Company and Affiliated Purchasers.
Not applicable.
Item 10. Submission of Matters to a Vote of Security Holders.
Not applicable.
Item 11. Controls and Procedures.
(a) The registrant’s principal executive officer and principal financial officer have evaluated the registrant’s disclosure controls and procedures within 90 days of this filing and have concluded that the registrant’s disclosure controls and procedures were effective, as of that date, in ensuring that information required to be disclosed by the registrant in this Form N-CSR was recorded, processed, summarized, and reported timely.
(b) The registrant’s principal executive officer and principal financial officer are aware of no change in the registrant’s internal control over financial reporting that occurred during the registrant’s second fiscal quarter covered by this report that has materially affected, or is reasonably likely to materially affect, the registrant’s internal control over financial reporting.
Item 12. Exhibits.
(a)(1) The registrant’s code of ethics pursuant to Item 2 of Form N-CSR is filed with the registrant’s annual Form N-CSR.
(2) Separate certifications by the registrant's principal executive officer and principal financial officer, pursuant to Section 302 of the Sarbanes-Oxley Act of 2002 and required by Rule 30a-2(a) under the Investment Company Act of 1940, are attached.
(3) Written solicitation to repurchase securities issued by closed-end companies: not applicable.
(b) A certification by the registrant's principal executive officer and principal financial officer, pursuant to Section 906 of the Sarbanes-Oxley Act of 2002 and required by Rule 30a-2(b) under the Investment Company Act of 1940, is attached.
SIGNATURES
Pursuant to the requirements of the Securities Exchange Act of 1934 and the Investment Company Act of 1940, the registrant has duly caused this report to be signed on its behalf by the undersigned, thereunto duly authorized.
T. Rowe Price Index Trust, Inc.
| | By | /s/ Edward C. Bernard |
| | Edward C. Bernard |
| | Principal Executive Officer |
| |
| Date August 17, 2016 | | |
Pursuant to the requirements of the Securities Exchange Act of 1934 and the Investment Company Act of 1940, this report has been signed below by the following persons on behalf of the registrant and in the capacities and on the dates indicated.
| | By | /s/ Edward C. Bernard |
| | Edward C. Bernard |
| | Principal Executive Officer |
| |
| Date August 17, 2016 | | |
| |
| |
| By | /s/ Catherine D. Mathews |
| | Catherine D. Mathews |
| | Principal Financial Officer |
| |
| Date August 17, 2016 | | |