UNITED STATES
SECURITIES AND EXCHANGE COMMISSION
Washington, D.C. 20549
FORM N-CSR
CERTIFIED SHAREHOLDER REPORT OF REGISTERED
MANAGEMENT INVESTMENT COMPANIES
Investment Company Act File Number: 811-05986
| T. Rowe Price Index Trust, Inc. |
|
| (Exact name of registrant as specified in charter) |
| |
| 100 East Pratt Street, Baltimore, MD 21202 |
|
| (Address of principal executive offices) |
| |
| David Oestreicher |
| 100 East Pratt Street, Baltimore, MD 21202 |
|
| (Name and address of agent for service) |
Registrant’s telephone number, including area code: (410) 345-2000
Date of fiscal year end: December 31
Date of reporting period: June 30, 2018
Item 1. Report to Shareholders
| Mid-Cap Index Fund | June 30, 2018 |
| T. ROWE PRICE MID-CAP INDEX FUND |
|
HIGHLIGHTS
| ■ | The Mid-Cap Index Fund posted gains for the six-month period ended June 30, 2018, performing generally in line with its benchmark the Russell Select Midcap Index. |
| | |
| ■ | The energy, information technology, and health care sectors led, while the materials and industrials and business services were the biggest laggards in the period. |
| | |
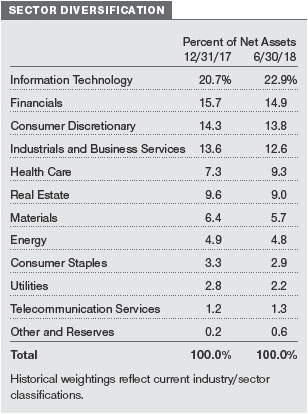
| ■ | In line with the allocations in the index, the information technology and financials sectors together account for almost 40% of the fund’s investments. The telecommunications services sector, the smallest allocation, accounts for about 1%. |
| | |
| ■ | In the near term, we acknowledge that strong earnings growth could continue to buttress stocks, and we believe that equities gains could be fueled by a narrow list of winning stocks. |
Log in to your account at troweprice.com for more information.
*Certain mutual fund accounts that are assessed an annual account service fee can also save money by switching to e-delivery.
CIO Market Commentary
Dear Shareholder
U.S. stocks recorded decent gains in the first half of 2018, but unlike last year, investors had to absorb some bumps along the way. In February, volatility spiked and the S&P 500 Index briefly tumbled over 10% from its highs, putting it in correction territory. The major U.S. benchmarks recovered their losses in the spring, eventually bringing the technology-focused Nasdaq Composite Index and the smaller-cap indexes to new highs. Volatility stayed somewhat elevated, however, and many investors clearly remained anxious as the first half of your fund’s fiscal year ended.
Solid corporate and economic fundamentals initially seemed to promise that 2017’s strong stock market momentum might carry forward into 2018. Continued global synchronized growth led to strong profits for many multinationals. In the U.S., earnings for the S&P 500 rose by nearly 25% in the first quarter versus a year before, according to FactSet—the best performance since the recovery from the financial crisis. Profit growth also picked up in Europe, Japan, and emerging markets, even as growth in many international economies cooled a bit.
Inflation fears presented the first obstacle to the markets in February, however. Stocks tumbled on news that hourly wages had jumped in January, sparking fears that the Federal Reserve would pick up its pace of interest rate increases in order to head off inflation. Wage growth moderated in the following months, but a series of strong economic reports raised growth expectations and sent long-term interest rates to multiyear peaks by May. Investors also worried that the massive U.S. fiscal stimulus from December’s tax cuts and March’s spending bill might overheat the economy, though interest rates fell back in late May and June as Fed officials stressed their intention to move slowly in tightening monetary policy.
Trade tensions soon emerged as a second impediment for the markets. The Trump administration began implementing a more populist trade stance in March, announcing tariffs on steel and aluminum imports, threatening to withdraw from the North American Free Trade Agreement (NAFTA), and later raising the possibility of taxing auto imports. The administration also announced a steady escalation in possible tariffs on Chinese goods, eventually targeting a list of $200 billion in Chinese imports. China and other U.S. trading partners vowed to retaliate proportionately.
Investors initially seemed willing to dismiss the tit-for-tat threats as negotiating tactics, but evidence eventually emerged that even the prospect of tariffs was impacting corporate strategies and profit outlooks. Stocks slumped on June 21, after German automaker Daimler lowered its earnings guidance due to possible tariff increases on SUVs it manufactures in the U.S. and sells in China. A few days later, Harley-Davidson revealed that it was planning to move some of its motorcycle production to Europe to avoid retaliatory tariffs recently announced by the European Union.
Boeing, Caterpillar, and other leading exporters suffered declines as trade tensions worsened, but small-caps, which typically have far less international exposure, fared much better than large-caps in the first half of the year. Growth shares continued to outperform value shares despite the strong performance of energy stocks, which benefited from a rise in oil prices to multiyear highs. Stocks in overseas markets reacted particularly poorly to growing trade fears and fell for the period. A decline in many currencies relative to the dollar also weighed on international bond and stock returns for U.S. investors.
Meanwhile, technology shares continued to dominate, with much of the market’s overall gain to date in 2018 concentrated in a handful of mega-cap companies able to leverage dominant Internet platforms. Data breaches and concerns about the growing power of these firms resulted in calls for government intervention in early 2018. For now, however, the threat of increased regulation seems a longer-term one that appears minor in comparison to the powerful fundamental strength of these companies.
T. Rowe Price’s global team of industry experts is monitoring the possible impact of tariffs and other challenges on a wide range of companies—from the global tech titans to small, domestic firms that get little analyst coverage on Wall Street. While the rest of 2018 may bring further surprises, you can rest assured that your portfolio manager is drawing on a wide range of insights in seeking to provide shareholders with superior returns while minimizing the impact of unforeseen political events or other pitfalls.
Thank you for your continued confidence in T. Rowe Price.
Sincerely,

Robert Sharps
Group Chief Investment Officer
Management’s Discussion of Fund Performance
INVESTMENT OBJECTIVE
The fund seeks to track the performance of a benchmark index that measures the investment return of mid-capitalization U.S. stocks.
FUND COMMENTARY
How did the fund perform in the past six months?
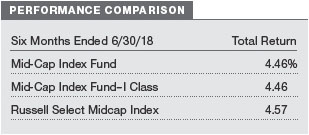
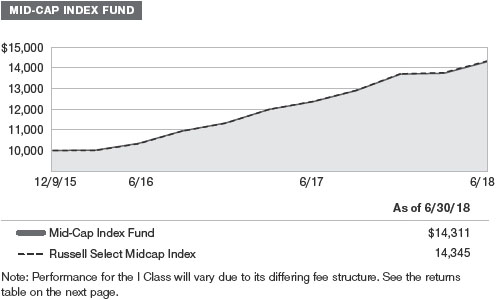
The Mid-Cap Index Fund returned 4.46% in the six-month period ended June 30, 2018, versus 4.57% for the Russell Select Midcap Index. Fund performance tends to slightly lag that of the benchmark because of the fund’s operating and management expenses. (Performance will vary for the I Class shares, reflecting its different fee structure. Past performance cannot guarantee future results.)
What factors influenced the fund’s performance?
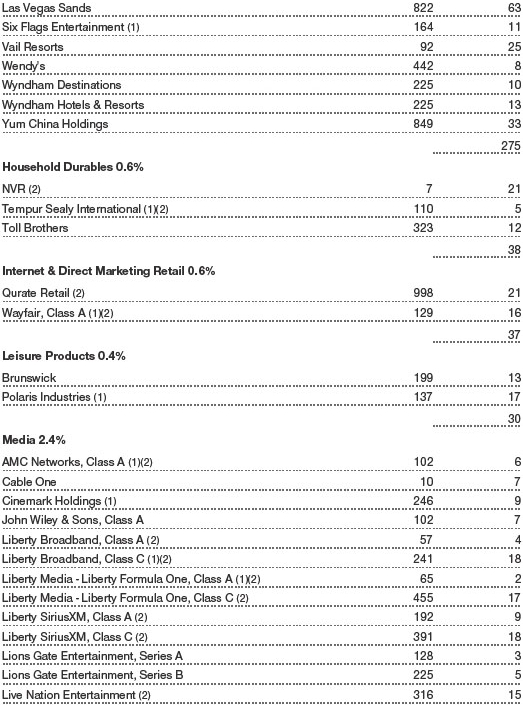
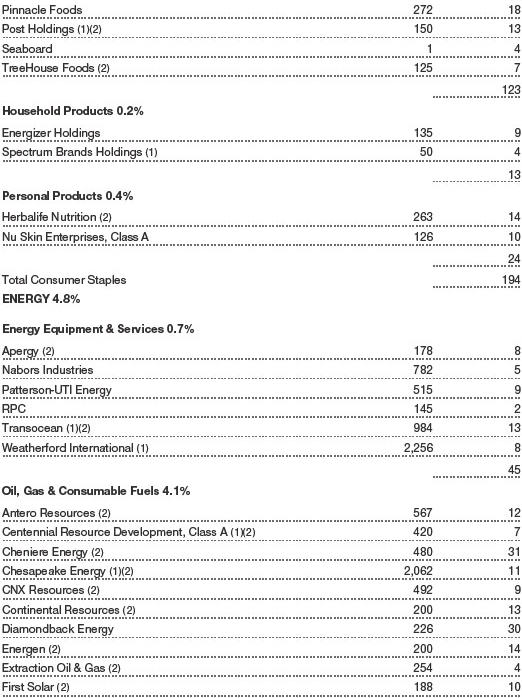
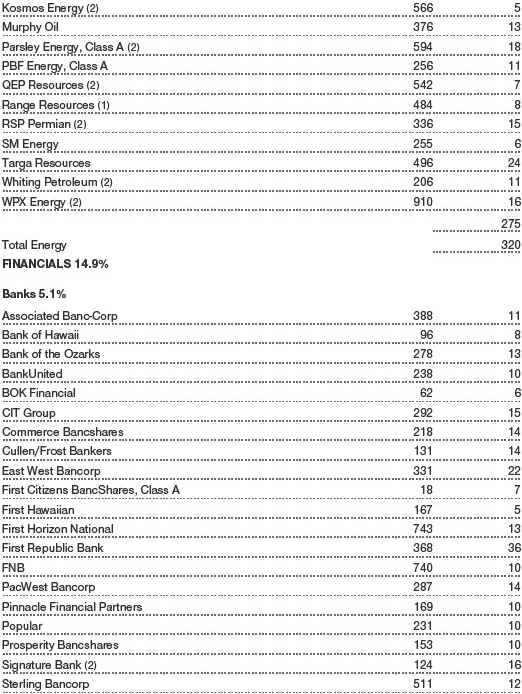
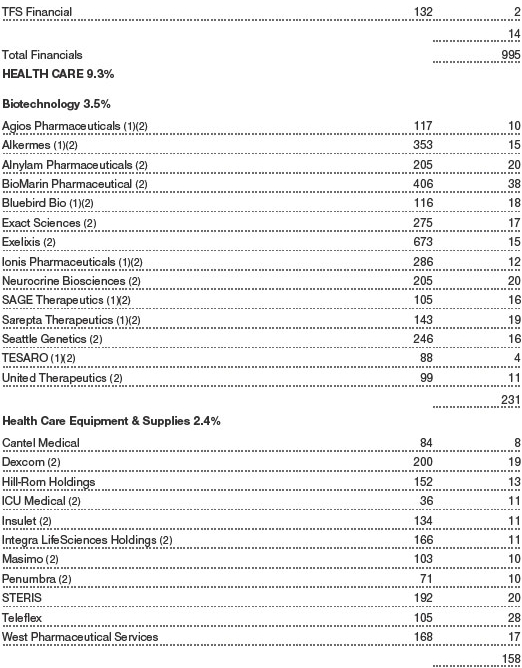
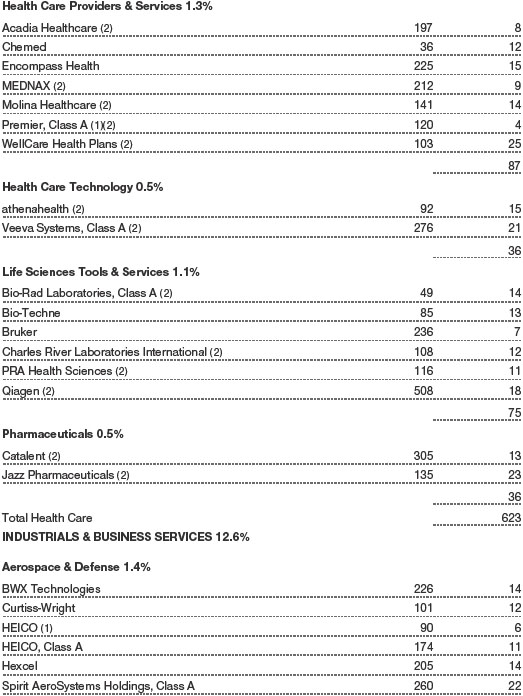
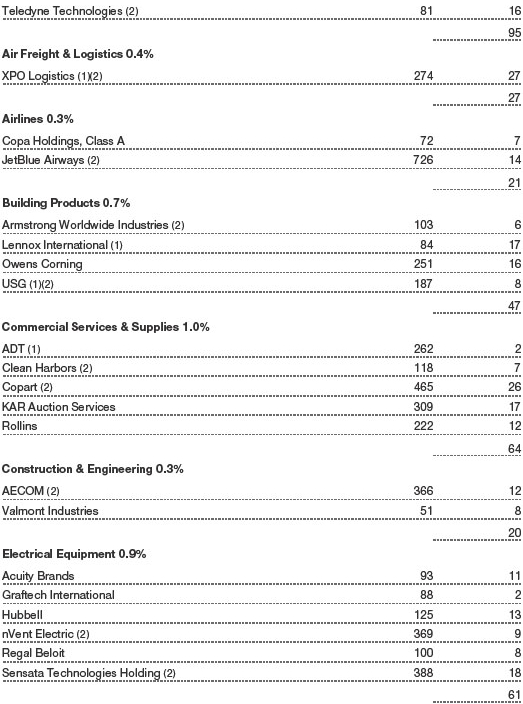
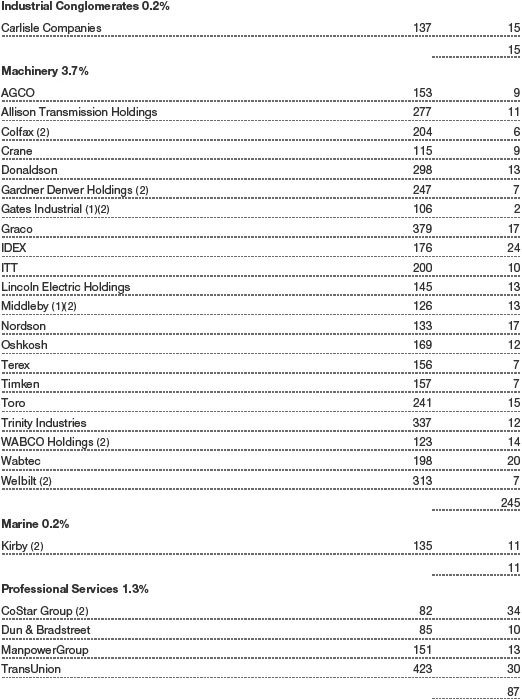
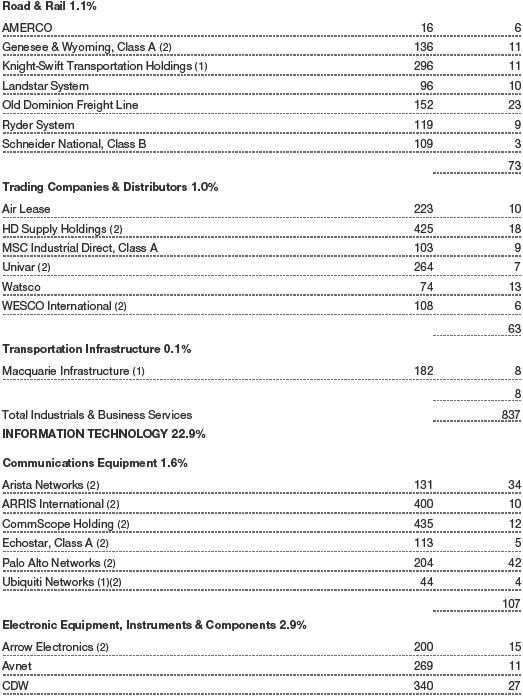
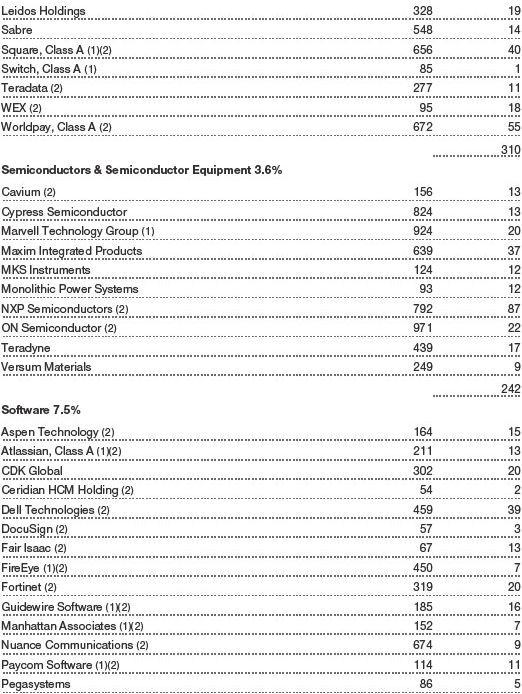
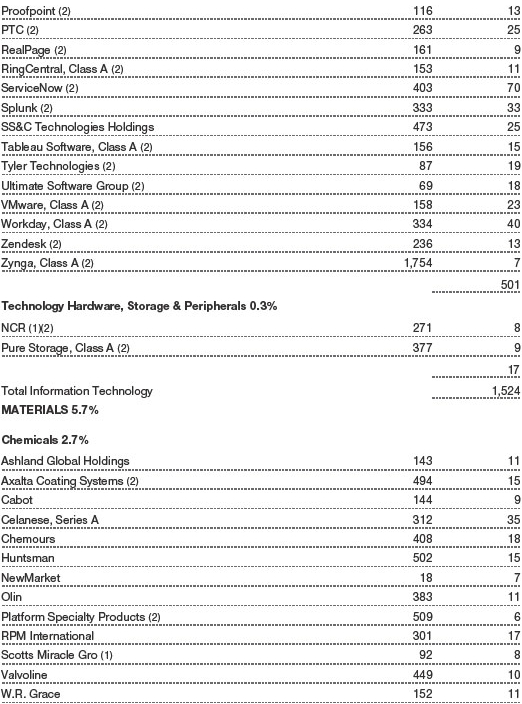
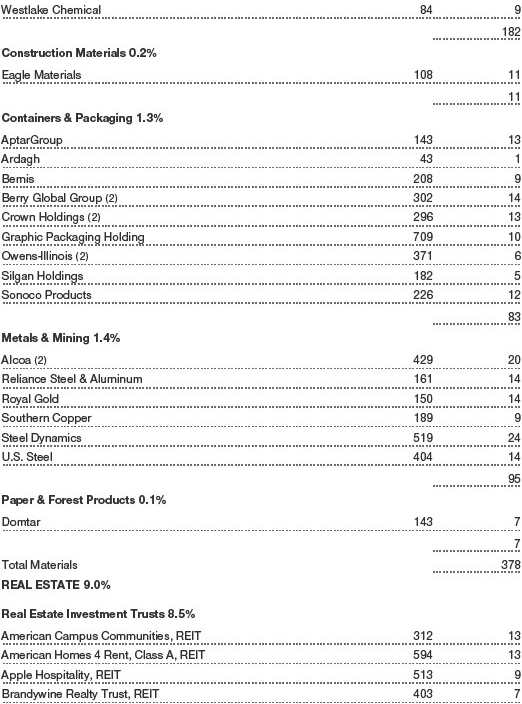
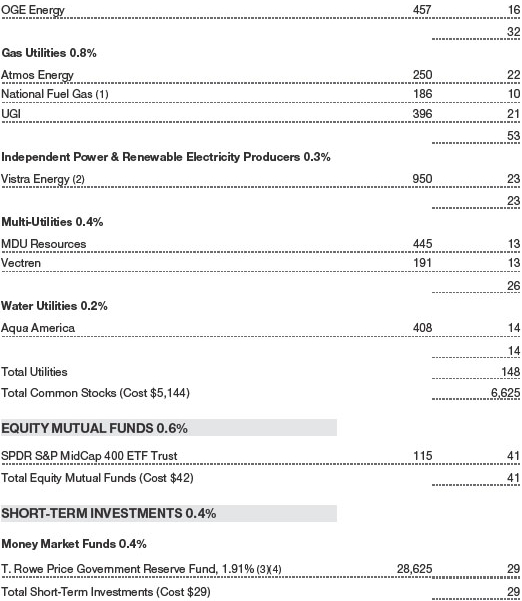
The energy, information technology, and health care sectors led, while the materials and industrials and business services sectors were the biggest laggards in the period. Oil refinery HollyFrontier, energy exploration and production companies Chesapeake Energy and Whiting Petroleum, and natural gas exporter Cheniere Energy performed well. Abiomed, a medical device manufacturer, and biotechnology multinational Bioverativ were the top performers for health care stocks. Shares of social network Twitter led advances in the fund, while electric car maker Tesla Motors, the largest component in the portfolio, also performed well. Worst-performing stocks came from a variety of sectors. Poor performers included Owens Corning, a producer and manufacturer of insulation, roofing, and fiberglass components; Universal Display, a developer of light emitting diodes; Alnylam Pharmaceuticals, a biopharmaceutical company; and NXP Semiconductors, a manufacturer of semiconductors. (Please refer to the fund’s portfolio of investments for a complete list of holdings and the amount each represents in the portfolio.)
How is the fund positioned?
The index, which was created for T. Rowe Price and will be administered by the Russell Investment Group, consists of approximately 500 stocks and includes all stocks in the Russell 1000 Index, except for those also included in the S&P 500 Index. The fund seeks to match the investment returns of mid-capitalization U.S. stocks by seeking to replicate the performance of the Russell Select Midcap Index. The fund employs a full replication strategy, which involves investing substantially all of its assets in all of the stocks in the index and seeking to maintain holdings of each stock in proportion to its weight in the index.
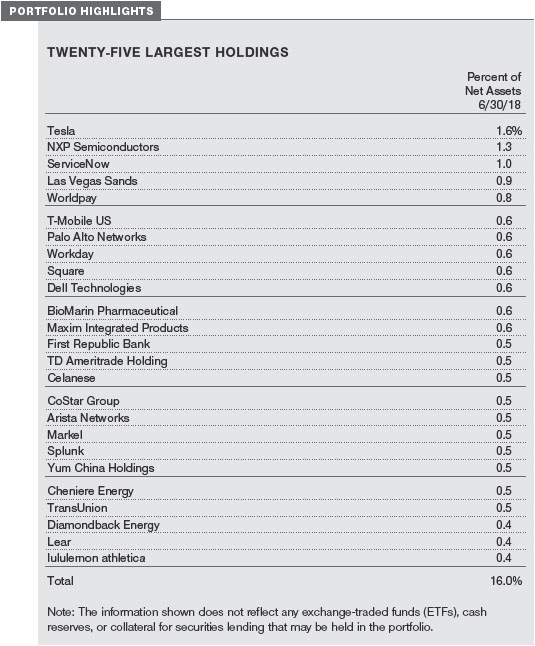
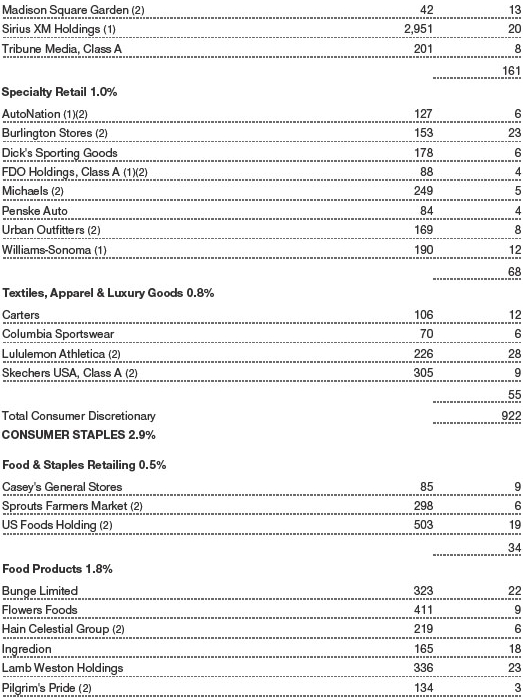
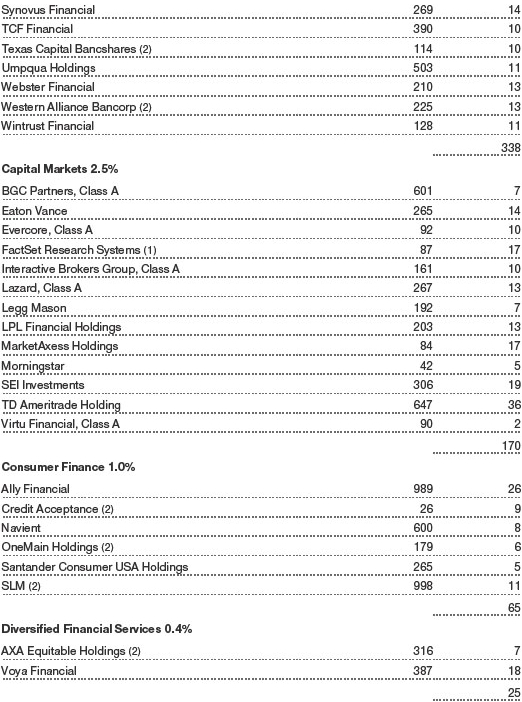
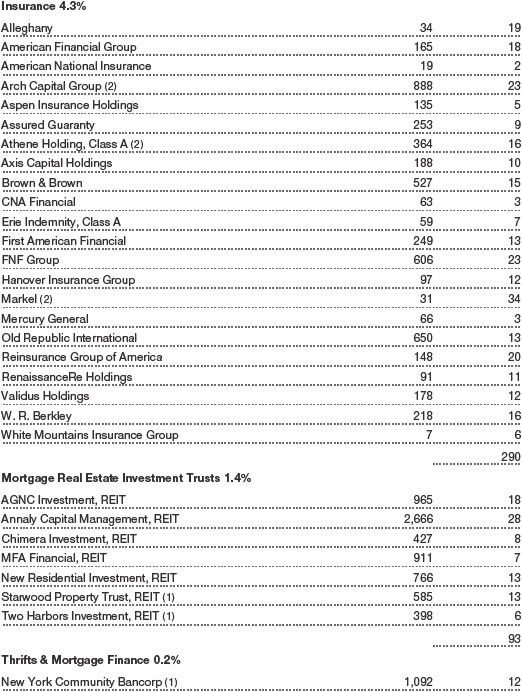
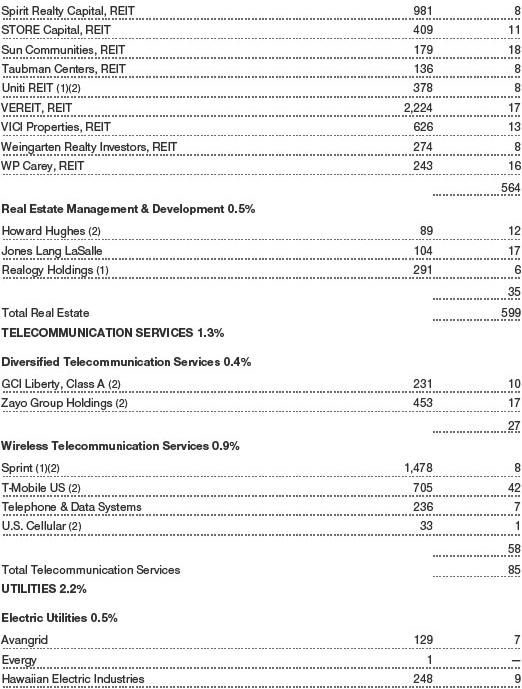
In line with the allocations in the index, the information technology and financials sectors together accounted for almost 40% of the fund’s investments at the end of the period. The telecommunications services sector, the smallest allocation, accounted for about 1% at the end of the period. The top five largest holdings, representing a variety of sectors, are Tesla, NXP Semiconductors, service management software company ServiceNow, gaming resorts operator Las Vegas Sands, and payment processer Worldpay.
What is portfolio management’s outlook?
We believe the U.S. is in the later stages of economic and market cycles. In the near term, we acknowledge that strong earnings growth could continue to buttress stocks, and we believe that equity gains could be fueled by a narrow list of winning stocks. In the intermediate term, we are mindful of potential risks from slowing economic growth, geopolitical shocks, rising oil prices, higher inflation, tight labor markets, and protectionist trade policies. We believe the Federal Reserve is likely to continue with further rate hikes in 2018, but at a measured pace.
The views expressed reflect the opinions of T. Rowe Price as of the date of this report and are subject to change based on changes in market, economic, or other conditions. These views are not intended to be a forecast of future events and are no guarantee of future results.
RISKS OF STOCK INVESTING
As with all stock mutual funds, the funds’ share prices can fall because of weakness in the stock market, a particular industry, or specific holdings. Stock markets can decline for many reasons, including adverse political or economic developments, changes in investor psychology, or heavy institutional selling. The prospects for an industry or company may deteriorate because of a variety of factors, including disappointing earnings or changes in the competitive environment.
BENCHMARK INFORMATION
Note: Frank Russell Company (Russell) is the source and owner of the Russell index data contained or reflected in these materials and all trademarks and copyrights related thereto. Russell® is a registered trademark of Russell. Russell is not responsible for the formatting or configuration of these materials or for any inaccuracy in T. Rowe Price Associates’ presentation thereof.
GROWTH OF $10,000
This chart shows the value of a hypothetical $10,000 investment in the fund over the past 10 fiscal year periods or since inception (for funds lacking 10-year records). The result is compared with benchmarks, which include a broad-based market index and may also include a peer group average or index. Market indexes do not include expenses, which are deducted from fund returns as well as mutual fund averages and indexes.
AVERAGE ANNUAL COMPOUND TOTAL RETURN

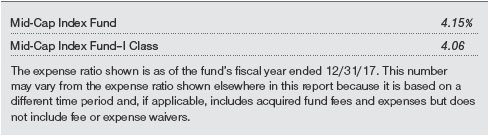
EXPENSE RATIO
FUND EXPENSE EXAMPLE
As a mutual fund shareholder, you may incur two types of costs: (1) transaction costs, such as redemption fees or sales loads, and (2) ongoing costs, including management fees, distribution and service (12b-1) fees, and other fund expenses. The following example is intended to help you understand your ongoing costs (in dollars) of investing in the fund and to compare these costs with the ongoing costs of investing in other mutual funds. The example is based on an investment of $1,000 invested at the beginning of the most recent six-month period and held for the entire period.
Please note that the fund has two share classes: The Investor Class charges no distribution and service (12b-1) fee, and the I Class shares are also available to institutionally oriented clients and impose no 12b-1 or administrative fee payment. Each share class is presented separately in the table.
Actual Expenses
The first line of the following table (Actual) provides information about actual account values and actual expenses. You may use the information on this line, together with your account balance, to estimate the expenses that you paid over the period. Simply divide your account value by $1,000 (for example, an $8,600 account value divided by $1,000 = 8.6), then multiply the result by the number on the first line under the heading “Expenses Paid During Period” to estimate the expenses you paid on your account during this period.
Hypothetical Example for Comparison Purposes
The information on the second line of the table (Hypothetical) is based on hypothetical account values and expenses derived from the fund’s actual expense ratio and an assumed 5% per year rate of return before expenses (not the fund’s actual return). You may compare the ongoing costs of investing in the fund with other funds by contrasting this 5% hypothetical example and the 5% hypothetical examples that appear in the shareholder reports of the other funds. The hypothetical account values and expenses may not be used to estimate the actual ending account balance or expenses you paid for the period.
Note: T. Rowe Price charges an account service fee that is not included in the accompanying table. The account service fee is charged on a quarterly basis, usually during the last week of a calendar quarter, and applies to accounts with balances below $10,000 on the day of the assessment. The fee is charged to accounts that fall below $10,000 for any reason, including market fluctuations, redemptions, or exchanges. When an account with less than $10,000 is closed either through redemption or exchange, the fee is charged and deducted from the proceeds. The fee applies to IRAs but not to retirement plans directly registered with T. Rowe Price Services or accounts maintained by intermediaries through NSCC® Networking. If you are subject to the fee, keep it in mind when you are estimating the ongoing expenses of investing in the fund and when comparing the expenses of this fund with other funds.
You should also be aware that the expenses shown in the table highlight only your ongoing costs and do not reflect any transaction costs, such as redemption fees or sales loads. Therefore, the second line of the table is useful in comparing ongoing costs only and will not help you determine the relative total costs of owning different funds. To the extent a fund charges transaction costs, however, the total cost of owning that fund is higher.

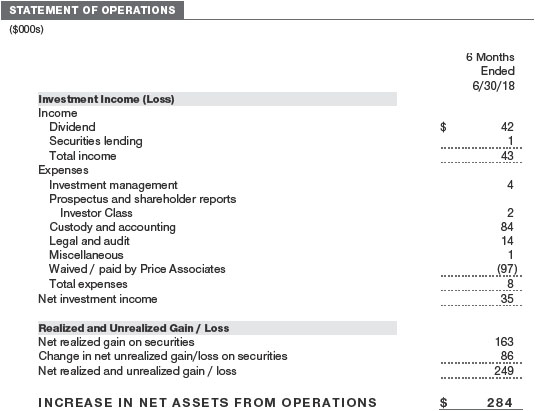
Unaudited
The accompanying notes are an integral part of these financial statements.
Unaudited
The accompanying notes are an integral part of these financial statements.
Unaudited


The accompanying notes are an integral part of these financial statements.
Unaudited
The accompanying notes are an integral part of these financial statements.
Unaudited
The accompanying notes are an integral part of these financial statements.
Unaudited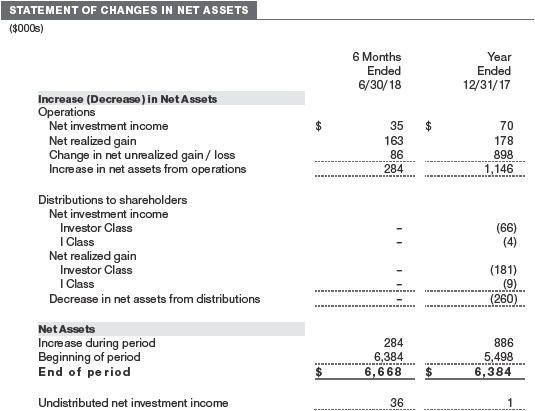
The accompanying notes are an integral part of these financial statements.
Unaudited
| NOTES TO FINANCIAL STATEMENTS |
T. Rowe Price Index Trust, Inc. (the corporation) is registered under the Investment Company Act of 1940 (the 1940 Act). The Mid-Cap Index Fund (the fund) is a diversified, open-end management investment company established by the corporation. The fund is available for investment only by mutual funds, college savings plans, and other institutional client accounts managed by T. Rowe Price Associates, Inc., or its affiliates and is not available for direct purchase by members of the public. The fund seeks to track the performance of a benchmark index that measures the investment return of mid-capitalization U.S. stocks. The fund has two classes of shares: the Mid-Cap Index Fund (Investor Class) and the Mid-Cap Index Fund–I Class (I Class). I Class shares generally are available only to investors meeting a $1,000,000 minimum investment or certain other criteria. Each class has exclusive voting rights on matters related solely to that class; separate voting rights on matters that relate to both classes; and, in all other respects, the same rights and obligations as the other class.
NOTE 1 - SIGNIFICANT ACCOUNTING POLICIES
Basis of Preparation The fund is an investment company and follows accounting and reporting guidance in the Financial Accounting Standards Board (FASB) Accounting Standards Codification Topic 946 (ASC 946). The accompanying financial statements were prepared in accordance with accounting principles generally accepted in the United States of America (GAAP), including, but not limited to, ASC 946. GAAP requires the use of estimates made by management. Management believes that estimates and valuations are appropriate; however, actual results may differ from those estimates, and the valuations reflected in the accompanying financial statements may differ from the value ultimately realized upon sale or maturity.
Investment Transactions, Investment Income, and Distributions Investment transactions are accounted for on the trade date basis. Income and expenses are recorded on the accrual basis. Realized gains and losses are reported on the identified cost basis. Dividends received from mutual fund investments are reflected as dividend income; capital gain distributions are reflected as realized gain/loss. Dividend income and capital gain distributions are recorded on the ex-dividend date. Income tax-related interest and penalties, if incurred, are recorded as income tax expense. Distributions from REITs are initially recorded as dividend income and, to the extent such represent a return of capital or capital gain for tax purposes, are reclassified when such information becomes available. Income distributions, if any, are declared and paid by each class annually. Distributions to shareholders are recorded on the ex-dividend date. A capital gain distribution may also be declared and paid by the fund annually.
Class Accounting Shareholder servicing, prospectus, and shareholder report expenses incurred by each class are charged directly to the class to which they relate. Expenses common to both classes, investment income, and realized and unrealized gains and losses are allocated to the classes based upon the relative daily net assets of each class. To the extent any expenses are waived or reimbursed in accordance with an expense limitation (see Note 5), the waiver or reimbursement is charged to the applicable class or allocated across the classes in the same manner as the related expense.
New Accounting Guidance In March 2017, the FASB issued amended guidance to shorten the amortization period for certain callable debt securities held at a premium. The guidance is effective for fiscal years and interim periods beginning after December 15, 2018. Adoption will have no effect on the fund’s net assets or results of operations.
Indemnification In the normal course of business, the fund may provide indemnification in connection with its officers and directors, service providers, and/or private company investments. The fund’s maximum exposure under these arrangements is unknown; however, the risk of material loss is currently considered to be remote.
NOTE 2 - VALUATION
The fund’s financial instruments are valued and each class’s net asset value (NAV) per share is computed at the close of the New York Stock Exchange (NYSE), normally 4 p.m. ET, each day the NYSE is open for business. However, the NAV per share may be calculated at a time other than the normal close of the NYSE if trading on the NYSE is restricted, if the NYSE closes earlier, or as may be permitted by the SEC.
Fair Value The fund’s financial instruments are reported at fair value, which GAAP defines as the price that would be received to sell an asset or paid to transfer a liability in an orderly transaction between market participants at the measurement date. The T. Rowe Price Valuation Committee (the Valuation Committee) is an internal committee that has been delegated certain responsibilities by the fund’s Board of Directors (the Board) to ensure that financial instruments are appropriately priced at fair value in accordance with GAAP and the 1940 Act. Subject to oversight by the Board, the Valuation Committee develops and oversees pricing-related policies and procedures and approves all fair value determinations. Specifically, the Valuation Committee establishes procedures to value securities; determines pricing techniques, sources, and persons eligible to effect fair value pricing actions; oversees the selection, services, and performance of pricing vendors; oversees valuation-related business continuity practices; and provides guidance on internal controls and valuation-related matters. The Valuation Committee reports to the Board and has representation from legal, portfolio management and trading, operations, risk management, and the fund’s treasurer.
Various valuation techniques and inputs are used to determine the fair value of financial instruments. GAAP establishes the following fair value hierarchy that categorizes the inputs used to measure fair value:
Level 1 – quoted prices (unadjusted) in active markets for identical financial instruments that the fund can access at the reporting date
Level 2 – inputs other than Level 1 quoted prices that are observable, either directly or indirectly (including, but not limited to, quoted prices for similar financial instruments in active markets, quoted prices for identical or similar financial instruments in inactive markets, interest rates and yield curves, implied volatilities, and credit spreads)
Level 3 – unobservable inputs
Observable inputs are developed using market data, such as publicly available information about actual events or transactions, and reflect the assumptions that market participants would use to price the financial instrument. Unobservable inputs are those for which market data are not available and are developed using the best information available about the assumptions that market participants would use to price the financial instrument. GAAP requires valuation techniques to maximize the use of relevant observable inputs and minimize the use of unobservable inputs. When multiple inputs are used to derive fair value, the financial instrument is assigned to the level within the fair value hierarchy based on the lowest-level input that is significant to the fair value of the financial instrument. Input levels are not necessarily an indication of the risk or liquidity associated with financial instruments at that level but rather the degree of judgment used in determining those values.
Valuation Techniques Equity securities listed or regularly traded on a securities exchange or in the over-the-counter (OTC) market are valued at the last quoted sale price or, for certain markets, the official closing price at the time the valuations are made. OTC Bulletin Board securities are valued at the mean of the closing bid and asked prices. A security that is listed or traded on more than one exchange is valued at the quotation on the exchange determined to be the primary market for such security. Listed securities not traded on a particular day are valued at the mean of the closing bid and asked prices. Actively traded equity securities listed on a domestic exchange generally are categorized in Level 1 of the fair value hierarchy. OTC Bulletin Board securities, certain preferred securities, and equity securities traded in inactive markets generally are categorized in Level 2 of the fair value hierarchy.
Investments in mutual funds are valued at the mutual fund’s closing NAV per share on the day of valuation and are categorized in Level 1 of the fair value hierarchy. Assets and liabilities other than financial instruments, including short-term receivables and payables, are carried at cost, or estimated realizable value, if less, which approximates fair value.
Thinly traded financial instruments and those for which the above valuation procedures are inappropriate or are deemed not to reflect fair value are stated at fair value as determined in good faith by the Valuation Committee. The objective of any fair value pricing determination is to arrive at a price that could reasonably be expected from a current sale. Financial instruments fair valued by the Valuation Committee are primarily private placements, restricted securities, warrants, rights, and other securities that are not publicly traded.
Subject to oversight by the Board, the Valuation Committee regularly makes good faith judgments to establish and adjust the fair valuations of certain securities as events occur and circumstances warrant. For instance, in determining the fair value of an equity investment with limited market activity, such as a private placement or a thinly traded public company stock, the Valuation Committee considers a variety of factors, which may include, but are not limited to, the issuer’s business prospects, its financial standing and performance, recent investment transactions in the issuer, new rounds of financing, negotiated transactions of significant size between other investors in the company, relevant market valuations of peer companies, strategic events affecting the company, market liquidity for the issuer, and general economic conditions and events. In consultation with the investment and pricing teams, the Valuation Committee will determine an appropriate valuation technique based on available information, which may include both observable and unobservable inputs. The Valuation Committee typically will afford greatest weight to actual prices in arm’s length transactions, to the extent they represent orderly transactions between market participants, transaction information can be reliably obtained, and prices are deemed representative of fair value. However, the Valuation Committee may also consider other valuation methods such as market-based valuation multiples; a discount or premium from market value of a similar, freely traded security of the same issuer; or some combination. Fair value determinations are reviewed on a regular basis and updated as information becomes available, including actual purchase and sale transactions of the issue. Because any fair value determination involves a significant amount of judgment, there is a degree of subjectivity inherent in such pricing decisions, and fair value prices determined by the Valuation Committee could differ from those of other market participants. Depending on the relative significance of unobservable inputs, including the valuation technique(s) used, fair valued securities may be categorized in Level 2 or 3 of the fair value hierarchy.
Valuation Inputs On June 30, 2018, all of the fund’s financial instruments were classified as Level 1, based on the inputs used to determine their fair values. There were no material transfers between Levels 1 and 2 during the six months ended June 30, 2018.
NOTE 3 - OTHER INVESTMENT TRANSACTIONS
Consistent with its investment objective, the fund engages in the following practices to manage exposure to certain risks and/or to enhance performance. The investment objective, policies, program, and risk factors of the fund are described more fully in the fund’s prospectus and Statement of Additional Information.
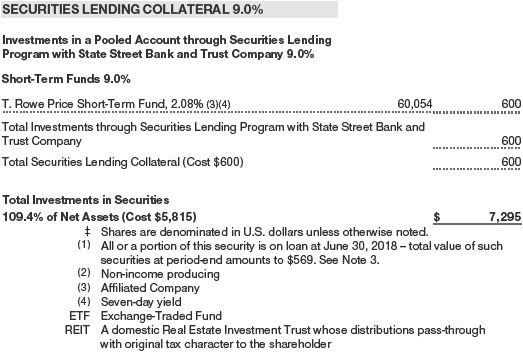
Securities Lending The fund may lend its securities to approved borrowers to earn additional income. Its securities lending activities are administered by a lending agent in accordance with a securities lending agreement. Security loans generally do not have stated maturity dates, and the fund may recall a security at any time. The fund receives collateral in the form of cash or U.S. government securities, valued at 102% to 105% of the value of the securities on loan. Collateral is maintained over the life of the loan in an amount not less than the value of loaned securities; any additional collateral required due to changes in security values is delivered to the fund the next business day. Cash collateral is invested in accordance with investment guidelines approved by fund management. Additionally, the lending agent indemnifies the fund against losses resulting from borrower default. Although risk is mitigated by the collateral and indemnification, the fund could experience a delay in recovering its securities and a possible loss of income or value if the borrower fails to return the securities, collateral investments decline in value, and the lending agent fails to perform. Securities lending revenue consists of earnings on invested collateral and borrowing fees, net of any rebates to the borrower, compensation to the lending agent, and other administrative costs. In accordance with GAAP, investments made with cash collateral are reflected in the accompanying financial statements, but collateral received in the form of securities is not. At June 30, 2018, the value of loaned securities was $569,000; the value of cash collateral and related investments was $600,000.
Other Purchases and sales of portfolio securities other than short-term securities aggregated $1,399,000 and $1,360,000, respectively, for the six months ended June 30, 2018.
NOTE 4 - FEDERAL INCOME TAXES
No provision for federal income taxes is required since the fund intends to continue to qualify as a regulated investment company under Subchapter M of the Internal Revenue Code and distribute to shareholders all of its taxable income and gains. Distributions determined in accordance with federal income tax regulations may differ in amount or character from net investment income and realized gains for financial reporting purposes. Financial reporting records are adjusted for permanent book/tax differences to reflect tax character but are not adjusted for temporary differences. The amount and character of tax-basis distributions and composition of net assets are finalized at fiscal year-end; accordingly, tax-basis balances have not been determined as of the date of this report.
At June 30, 2018, the cost of investments for federal income tax purposes was $5,839,000. Net unrealized gain aggregated $1,456,000 at period-end, of which $1,641,000 related to appreciated investments and $185,000 related to depreciated investments.
NOTE 5 - RELATED PARTY TRANSACTIONS
The fund is managed by T. Rowe Price Associates, Inc. (Price Associates), a wholly owned subsidiary of T. Rowe Price Group, Inc. (Price Group). The investment management agreement between the fund and Price Associates provides for an annual investment management fee equal to 0.12% of the fund’s average daily net assets. The fee is computed daily and paid monthly.
The Investor Class is subject to a contractual expense limitation through April 30, 2020. During the limitation period, Price Associates is required to waive its management fee or pay any expenses (excluding interest, expenses related to borrowings, taxes, brokerage, and other non-recurring expenses permitted by the investment management agreement) that would otherwise cause the class’s ratio of annualized total expenses to average net assets (expense ratio) to exceed its expense limitation of 0.32%. The class is required to repay Price Associates for expenses previously waived/paid to the extent the class’s net assets grow or expenses decline sufficiently to allow repayment without causing the class’s expense ratio (after the repayment is taken into account) to exceed both: (1) the expense limitation in place at the time such amounts were waived; and (2) the class’s current expense limitation. However, no repayment will be made more than three years after the date of a payment or waiver.
The I Class is also subject to an operating expense limitation (I Class limit) pursuant to which Price Associates is contractually required to pay all operating expenses of the I Class, excluding management fees, interest, expenses related to borrowings, taxes, brokerage, and other non-recurring expenses permitted by the investment management agreement, to the extent such operating expenses, on an annualized basis, exceed 0.05% of average net assets. This agreement will continue until April 30, 2020, and may be renewed, revised, or revoked only with approval of the fund’s Board. The I Class is required to repay Price Associates for expenses previously paid to the extent the class’s net assets grow or expenses decline sufficiently to allow repayment without causing the class’s operating expenses (after the repayment is taken into account) to exceed both: (1) the expense limitation in place at the time such amounts were paid; and (2) the class’s current expense limitation. However, no repayment will be made more than three years after the date of a payment or waiver.
Pursuant to this agreement, $97,000 of expenses were waived/paid by Price Associates during the six months ended June 30, 2018. Including these amounts, expenses previously waived/paid by Price Associates in the amount of $561,000 remain subject to repayment by the fund at June 30, 2018.
In addition, the fund has entered into service agreements with Price Associates and two wholly owned subsidiaries of Price Associates, each an affiliate of the fund (collectively, Price). Price Associates provides certain accounting and administrative services to the fund. T. Rowe Price Services, Inc., provides shareholder and administrative services in its capacity as the fund’s transfer and dividend-disbursing agent. For the six months ended June 30, 2018, expenses incurred pursuant to these service agreements were $46,000 for Price Associates and less than $1,000 for T. Rowe Price Services, Inc. All amounts due to and due from Price, exclusive of investment management fees payable, are presented net on the accompanying Statement of Assets and Liabilities.
The fund may invest its cash reserves in certain open-end management investment companies managed by Price Associates and considered affiliates of the fund: the T. Rowe Price Government Reserve Fund or the T. Rowe Price Treasury Reserve Fund, organized as money market funds, or the T. Rowe Price Short-Term Fund, a short-term bond fund (collectively, the Price Reserve Funds). The Price Reserve Funds are offered as short-term investment options to mutual funds, trusts, and other accounts managed by Price Associates or its affiliates and are not available for direct purchase by members of the public. Cash collateral from securities lending is invested in the T. Rowe Price Short-Term Fund. The Price Reserve Funds pay no investment management fees.
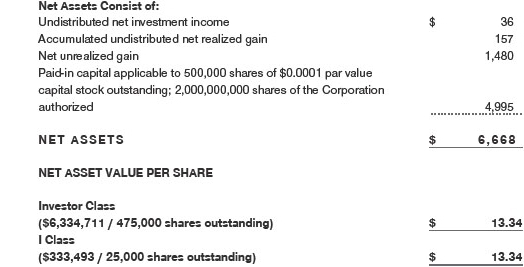
As of June 30, 2018, T. Rowe Price Group, Inc., or its wholly owned subsidiaries owned 475,000 shares of the Investor Class, representing 100% of the Investor Class’s net assets and 25,000 shares of the I Class, representing 100% of the I Class’s net assets.
The fund may participate in securities purchase and sale transactions with other funds or accounts advised by Price Associates (cross trades), in accordance with procedures adopted by the fund’s Board and Securities and Exchange Commission rules, which require, among other things, that such purchase and sale cross trades be effected at the independent current market price of the security. During the six months ended June 30, 2018, the fund had no purchases or sales cross trades with other funds or accounts advised by Price Associates.
INFORMATION ON PROXY VOTING POLICIES, PROCEDURES, AND RECORDS
A description of the policies and procedures used by T. Rowe Price funds and portfolios to determine how to vote proxies relating to portfolio securities is available in each fund’s Statement of Additional Information. You may request this document by calling 1-800-225-5132 or by accessing the SEC’s website, sec.gov.
The description of our proxy voting policies and procedures is also available on our corporate website. To access it, please visit the following Web page:
https://www3.troweprice.com/usis/corporate/en/utility/policies.html
Scroll down to the section near the bottom of the page that says, “Proxy Voting Policies.” Click on the Proxy Voting Policies link in the shaded box.
Each fund’s most recent annual proxy voting record is available on our website and through the SEC’s website. To access it through T. Rowe Price, visit the website location shown above, and scroll down to the section near the bottom of the page that says, “Proxy Voting Records.” Click on the Proxy Voting Records link in the shaded box.
HOW TO OBTAIN QUARTERLY PORTFOLIO HOLDINGS
The fund files a complete schedule of portfolio holdings with the Securities and Exchange Commission for the first and third quarters of each fiscal year on Form N-Q. The fund’s Form N-Q is available electronically on the SEC’s website (sec.gov); hard copies may be reviewed and copied at the SEC’s Public Reference Room, 100 F St. N.E., Washington, DC 20549. For more information on the Public Reference Room, call 1-800-SEC-0330.
APPROVAL OF INVESTMENT MANAGEMENT AGREEMENT
Each year, the fund’s Board of Directors (Board) considers the continuation of the investment management agreement (Advisory Contract) between the fund and its investment advisor, T. Rowe Price Associates, Inc. (Advisor), on behalf of the fund. In that regard, at an in-person meeting held on March 5–6, 2018 (Meeting), the Board, including a majority of the fund’s independent directors, approved the continuation of the fund’s Advisory Contract. At the Meeting, the Board considered the factors and reached the conclusions described below relating to the selection of the Advisor and the approval of the Advisory Contract. The independent directors were assisted in their evaluation of the Advisory Contract by independent legal counsel, from whom they received separate legal advice and with whom they met separately.
In providing information to the Board, the Advisor was guided by a detailed set of requests for information submitted by independent legal counsel on behalf of the independent directors. In considering and approving the Advisory Contract, the Board considered the information it believed was relevant, including, but not limited to, the information discussed below. The Board considered not only the specific information presented in connection with the Meeting but also the knowledge gained over time through interaction with the Advisor about various topics. The Board meets regularly and, at each of its meetings, covers an extensive agenda of topics and materials and considers factors that are relevant to its annual consideration of the renewal of the T. Rowe Price funds’ advisory contracts, including performance and the services and support provided to the funds and their shareholders.
Services Provided by the Advisor
The Board considered the nature, quality, and extent of the services provided to the fund by the Advisor. These services included, but were not limited to, directing the fund’s investments in accordance with its investment program and the overall management of the fund’s portfolio, as well as a variety of related activities such as financial, investment operations, and administrative services; compliance; maintaining the fund’s records and registrations; and shareholder communications. The Board also reviewed the background and experience of the Advisor’s senior management team and investment personnel involved in the management of the fund, as well as the Advisor’s compliance record. The Board concluded that it was satisfied with the nature, quality, and extent of the services provided by the Advisor.
Investment Performance of the Fund
The Board took into account discussions with the Advisor and reports that it receives throughout the year relating to fund performance. In connection with the Meeting, the Board reviewed the fund’s net annualized total returns for the one-year period as of September 30, 2017, and compared this return with the performance of a peer group of funds with similar investment programs and a wide variety of other previously agreed-upon comparable performance measures and market data, including those supplied by Broadridge, which is an independent provider of mutual fund data.
On the basis of this evaluation and the Board’s ongoing review of investment results and factoring in the relative market conditions during certain of the performance periods, the Board concluded that the fund’s performance was satisfactory.
Costs, Benefits, Profits, and Economies of Scale
The Board reviewed detailed information regarding the revenues received by the Advisor under the Advisory Contract and other benefits that the Advisor (and its affiliates) may have realized from its relationship with the fund, including any research received under “soft dollar” agreements and commission-sharing arrangements with broker-dealers. The Board considered that the Advisor may receive some benefit from soft-dollar arrangements pursuant to which research is received from broker-dealers that execute the fund’s portfolio transactions. The Board received information on the estimated costs incurred and profits realized by the Advisor from managing the T. Rowe Price funds. While the Board did not review information regarding profits realized from managing the fund in particular because the fund had either not achieved sufficient portfolio asset size or not recognized sufficient revenues to produce meaningful profit margin percentages, the Board concluded that the Advisor’s profits were reasonable in light of the services provided to the T. Rowe Price funds.
The Board also considered whether the fund benefits under the fee levels set forth in the Advisory Contract from any economies of scale realized by the Advisor. Under the Advisory Contract, the fund pays a fee to the Advisor for investment management services based on the fund’s average daily net assets and the fund pays its own expenses of operations (subject to an expense limitation on total expense ratio with respect to the Investor Class and an expense limitation on operating expenses with respect to the I Class). The fund’s shareholders benefit from potential economies of scale through a decline in operating expenses as the fund grows in size and through the contractual expense limitations in place to reduce the burden of higher operating costs to shareholders until the fund reaches greater scale. The Board concluded that the advisory fee structure continued to be appropriate.
Fees and Expenses
The Board was provided with information regarding industry trends in management fees and expenses. Among other things, the Board reviewed data for peer groups that were compiled by Broadridge, which compared: (i) contractual management fees, total expenses, actual management fees, and nonmanagement expenses of the fund with a group of competitor funds selected by Broadridge (Expense Group) and (ii) total expenses, actual management fees, and nonmanagement expenses of the fund with a broader set of funds within the Lipper investment classification (Expense Universe). The Board considered the fund’s contractual management fee rate, actual management fee rate (which reflects the management fees actually received from the fund by the Advisor after any applicable waivers, reductions, or reimbursements), operating expenses, and total expenses (which reflect the net total expense ratio of the fund after any waivers, reductions, or reimbursements) in comparison with the information for the Broadridge peer groups. Broadridge generally constructed the peer groups by seeking the most comparable funds based on similar investment classifications and objectives, expense structure, asset size, and operating components and attributes and ranked funds into quintiles, with the first quintile representing the funds with the lowest relative expenses and the fifth quintile representing the funds with the highest relative expenses. The information provided to the Board indicated that the fund’s contractual management fee ranked in the first quintile (Expense Group), the fund’s actual management fee rate ranked in the first quintile (Expense Group and Expense Universe), and the fund’s total expenses ranked in the first quintile (Expense Group and Expense Universe).
The Board also reviewed the fee schedules for institutional accounts and private accounts with similar mandates that are advised or subadvised by the Advisor and its affiliates. Management provided the Board with information about the Advisor’s responsibilities and services provided to subadvisory and other institutional account clients, including information about how the requirements and economics of the institutional business are fundamentally different from those of the mutual fund business. The Board considered information showing that the Advisor’s mutual fund business is generally more complex from a business and compliance perspective than its institutional account business and considered various relevant factors, such as the broader scope of operations and oversight, more extensive shareholder communication infrastructure, greater asset flows, heightened business risks, and differences in applicable laws and regulations associated with the Advisor’s proprietary mutual fund business. In assessing the reasonableness of the fund’s management fee rate, the Board considered the differences in the nature of the services required for the Advisor to manage its mutual fund business versus managing a discrete pool of assets as a subadvisor to another institution’s mutual fund or for an institutional account and that the Advisor generally performs significant additional services and assumes greater risk in managing the fund and other T. Rowe Price funds than it does for institutional account clients.
On the basis of the information provided and the factors considered, the Board concluded that the fees paid by the fund under the Advisory Contract are reasonable.
Approval of the Advisory Contract
As noted, the Board approved the continuation of the Advisory Contract. No single factor was considered in isolation or to be determinative to the decision. Rather, the Board concluded, in light of a weighting and balancing of all factors considered, that it was in the best interests of the fund and its shareholders for the Board to approve the continuation of the Advisory Contract (including the fees to be charged for services thereunder).
Item 2. Code of Ethics.
A code of ethics, as defined in Item 2 of Form N-CSR, applicable to its principal executive officer, principal financial officer, principal accounting officer or controller, or persons performing similar functions is filed as an exhibit to the registrant’s annual Form N-CSR. No substantive amendments were approved or waivers were granted to this code of ethics during the registrant’s most recent fiscal half-year.
Item 3. Audit Committee Financial Expert.
Disclosure required in registrant’s annual Form N-CSR.
Item 4. Principal Accountant Fees and Services.
Disclosure required in registrant’s annual Form N-CSR.
Item 5. Audit Committee of Listed Registrants.
Not applicable.
Item 6. Investments.
(a) Not applicable. The complete schedule of investments is included in Item 1 of this Form N-CSR.
(b) Not applicable.
Item 7. Disclosure of Proxy Voting Policies and Procedures for Closed-End Management Investment Companies.
Not applicable.
Item 8. Portfolio Managers of Closed-End Management Investment Companies.
Not applicable.
Item 9. Purchases of Equity Securities by Closed-End Management Investment Company and Affiliated Purchasers.
Not applicable.
Item 10. Submission of Matters to a Vote of Security Holders.
Not applicable.
Item 11. Controls and Procedures.
(a) The registrant’s principal executive officer and principal financial officer have evaluated the registrant’s disclosure controls and procedures within 90 days of this filing and have concluded that the registrant’s disclosure controls and procedures were effective, as of that date, in ensuring that information required to be disclosed by the registrant in this Form N-CSR was recorded, processed, summarized, and reported timely.
(b) During the period, the Price Funds’ accounting agent, The Bank of New York Mellon (BNYM), converted the fund’s books and records from a legacy fund accounting system / operating model to a BNYM fund accounting system / operating model.
Item 12. Exhibits.
(a)(1) The registrant’s code of ethics pursuant to Item 2 of Form N-CSR is filed with the registrant’s annual Form N-CSR.
(2) Separate certifications by the registrant's principal executive officer and principal financial officer, pursuant to Section 302 of the Sarbanes-Oxley Act of 2002 and required by Rule 30a-2(a) under the Investment Company Act of 1940, are attached.
(3) Written solicitation to repurchase securities issued by closed-end companies: not applicable.
(b) A certification by the registrant's principal executive officer and principal financial officer, pursuant to Section 906 of the Sarbanes-Oxley Act of 2002 and required by Rule 30a-2(b) under the Investment Company Act of 1940, is attached.
SIGNATURES
Pursuant to the requirements of the Securities Exchange Act of 1934 and the Investment Company Act of 1940, the registrant has duly caused this report to be signed on its behalf by the undersigned, thereunto duly authorized.
T. Rowe Price Index Trust, Inc.
| By | | /s/ David Oestreicher |
| | | David Oestreicher |
| | | Principal Executive Officer |
| |
| Date | | August 16, 2018 | | | | |
Pursuant to the requirements of the Securities Exchange Act of 1934 and the Investment Company Act of 1940, this report has been signed below by the following persons on behalf of the registrant and in the capacities and on the dates indicated.
| By | | /s/ David Oestreicher |
| | | David Oestreicher |
| | | Principal Executive Officer |
| |
| Date | | August 16, 2018 | | | | |
| |
| |
| By | | /s/ Catherine D. Mathews |
| | | Catherine D. Mathews |
| | | Principal Financial Officer |
| |
| Date | | August 16, 2018 | | | | |