UNITED STATES
SECURITIES AND EXCHANGE COMMISSION
Washington, D.C. 20549
FORM N-CSR
CERTIFIED SHAREHOLDER REPORT OF REGISTERED
MANAGEMENT INVESTMENT COMPANIES
Investment Company Act File Number: 811-05986
| T. Rowe Price Index Trust, Inc. |
| (Exact name of registrant as specified in charter) |
| 100 East Pratt Street, Baltimore, MD 21202 |
| (Address of principal executive offices) |
| David Oestreicher |
| 100 East Pratt Street, Baltimore, MD 21202 |
| (Name and address of agent for service) |
Registrant’s telephone number, including area code: (410) 345-2000
Date of fiscal year end: December 31
Date of reporting period: December 31, 2019
 |
| Extended Equity Market Index Fund | December 31, 2019 |
| PEXMX | Investor Class |
Beginning on January 1, 2021, as permitted by SEC regulations, paper copies of the T. Rowe Price funds’ annual and semiannual shareholder reports will no longer be mailed, unless you specifically request them. Instead, shareholder reports will be made available on the funds’ website (troweprice.com/prospectus), and you will be notified by mail with a website link to access the reports each time a report is posted to the site.
If you already elected to receive reports electronically, you will not be affected by this change and need not take any action. At any time, shareholders who invest directly in T. Rowe Price funds may generally elect to receive reports or other communications electronically by enrolling attroweprice.com/paperlessor, if you are a retirement plan sponsor or invest in the funds through a financial intermediary (such as an investment advisor, broker-dealer, insurance company, or bank), by contacting your representative or your financial intermediary.
You may elect to continue receiving paper copies of future shareholder reports free of charge. To do so, if you invest directly with T. Rowe Price, please call T. Rowe Price as follows: IRA, nonretirement account holders, and institutional investors,1-800-225-5132; small business retirement accounts,1-800-492-7670. If you are a retirement plan sponsor or invest in the T. Rowe Price funds through a financial intermediary, please contact your representative or financial intermediary or follow additional instructions if included with this document. Your election to receive paper copies of reports will apply to all funds held in your account with your financial intermediary or, if you invest directly in the T. Rowe Price funds, with T. Rowe Price. Your election can be changed at any time in the future.
| T. ROWE PRICE EQUITY MARKET INDEX FUNDS |
HIGHLIGHTS
| ■ | Each of the three Equity Market Index Funds produced excellent returns in 2019 and closely tracked its benchmark. |
| ■ | Most sectors in each index fund produced positive returns, led by information technology. Stocks in the energy and utility sectors lagged for the year. |
| ■ | Using full replication and sampling strategies, we kept the composition and other attributes of the index funds similar to those of their benchmarks. |
| ■ | While the current bull market cannot continue indefinitely, the Federal Reserve’s three interest rate cuts in the second half of 2019 are likely to help the economy strengthen somewhat in 2020, and investors will be watching to see if corporate earnings growth improves. There are risks, of course, including geopolitical tensions and U.S. elections in November. |

Log in to your account attroweprice.comfor more information.
*Certain mutual fund accounts that are assessed an annual account service fee can also save money by switching to e-delivery.
CIO Market Commentary
Dear Shareholder
Stocks posted strong gains in 2019 as most major U.S. indexes hit record highs in a broad-based rally that more than offset 2018’s losses. Large- and mid-cap growth stocks were the strongest performers, with the S&P 500 and Nasdaq benchmarks recording their best year since 2013. U.S. shares outpaced their global counterparts, although most non-U.S. indexes also finished with solid double-digit gains.
Technology shares performed best within the S&P 500, helped by strong gains from industry giants Apple and Microsoft, and financial stocks also outperformed the broader market. Fixed income securities produced solid gains during the period as well—with corporate bonds leading the way—as longer-term Treasury yields fell to historic lows in late summer before partially rebounding.
In a sign that public markets have retained discipline, investors expressed skepticism about certain private-equity valuation levels when compared with their prospects for financial profitability. Relatively few initial public offerings (IPOs) saw their prices appreciate during the year, and one high-profile IPO candidate (WeWork) decided to withdraw its offering altogether after its valuation was dramatically reduced in the weeks before its proposed IPO.
Although the year opened with concerns that an escalating U.S.-China trade dispute could lead to a recession, global central banks played a key role in supporting markets. Fed policymakers delivered quarter-percentage-point rate cuts in July, September, and October and took steps to maintain liquidity in short-term lending markets. Other central banks also acted to address flagging growth, including the European Central Bank, which lowered its benchmark deposit rate deeper into negative territory and announced that it was restarting its quantitative easing program.
The pivot to a more accommodative monetary policy was a marked change from 2018, when the Fed raised rates four times, and appeared to be successful in reenergizing the economy. After contracting earlier in 2019, key U.S. manufacturing indicators showed signs of stabilizing by year-end, and the labor market remained strong, with solid payroll gains and an unemployment rate hovering near a 50-year low. With this more encouraging economic backdrop, it was not a surprise that in December Fed officials seemed satisfied that monetary policy was properly positioned to support continued growth and forecast no additional rate moves in 2020.
Besides central bank policy, investors also closely followed developments in the U.S.-China trade dispute. Stocks stumbled in May and August after the U.S. announced new tariffs on some Chinese imports and China retaliated with new tariffs of its own. However, investors generally took an optimistic view of trade negotiations, which limited the trade war’s toll on markets, and in December the two countries announced a “phase one” agreement to reduce some existing tariffs and cancel the imposition of new ones.
With monetary policy worldwide largely committed to ensuring market liquidity and some global economic indicators showing signs of improvement, there are reasons to be optimistic in 2020. However, we caution investors not to expect the outsized gains of the past year. If the post-World War II era is to be a guide, the S&P 500 has on average generated mid-single-digit returns in the fourth year of a presidential cycle.
Further market advances will likely hinge on a resumption in earnings growth, which stalled in 2019, and there is no shortage of global risks in the year ahead. Unresolved trade issues, tensions in the Middle East, and policy debates on taxes, health care, and wealth disparity leading up to the U.S. presidential election all have the potential to cause market volatility.
In addition to these risks, T. Rowe Price analysts will be closely following how disruptive forces such as innovation, technological change, and automation could impact a growing number of global industries. In an uncertain environment, with a wide dispersion of returns possible, we believe that in-depth fundamental research that integrates environmental, social, and governance considerations will be critical to successfully assess opportunities and risks. I am confident our strategic investing approach will continue to serve our shareholders well.
Thank you for your continued confidence in T. Rowe Price.
Sincerely,

Robert Sharps
Group Chief Investment Officer
Management’s Discussion of Fund Performance
EQUITY INDEX 500 FUND
INVESTMENT OBJECTIVE
The fund seeks to track the performance of a benchmark index that measures the investment return of large-capitalization U.S. stocks.
FUND COMMENTARY
How did the fund perform in the past 12 months?
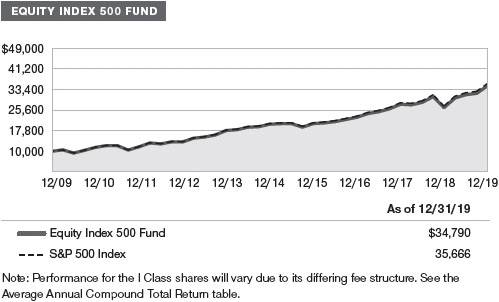
Large-cap U.S. stocks rose significantly during 2019, as the equity market rebounded from deep losses in the fourth quarter of 2018. The Equity Index 500 Fund returned 31.23% versus 31.49% for its benchmark, the S&P 500 Index. Fund performance tends to slightly lag that of the index due to operating and management expenses. (Performance for the I Class shares will vary due to a different fee structure.Past performance cannot guarantee future results.)

What factors influenced the fund’s performance?
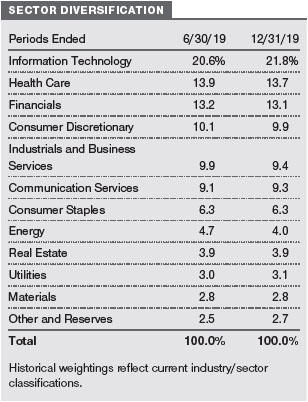
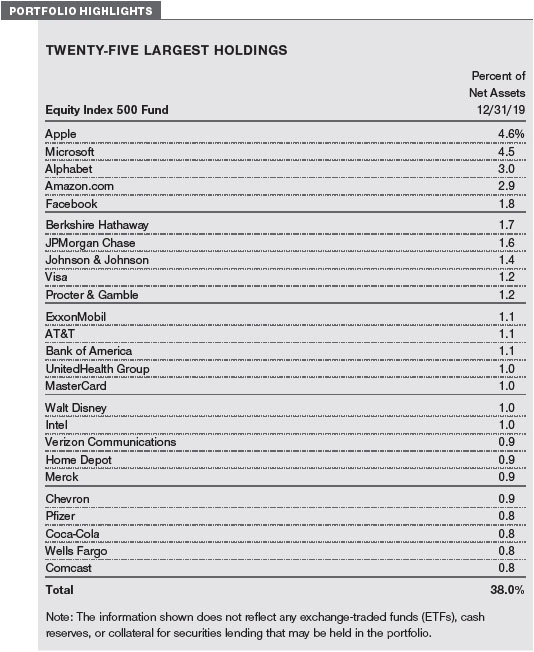
All sectors of the S&P 500 Index produced positive returns in 2019. The information technology (IT) sector, which was the largest sector in the portfolio and index at the end of the year,contributed the most to performance.Applewas the top contributor in the entire portfolio, as strong demand for the iPhone 11 was one of the primary drivers of gains, as iPhone sales account for about half of the company’s total revenue. Software companies also produced very strong returns during the year, withMicrosoftbenefiting from strong corporate earnings. IT services companiesVisaandMasterCardwere also significant contributors. Both companies continue to benefit from the trend toward electronic payments versus cash or checks. Semiconductor-related companies performed well, particularly in the closing months of the year, in anticipation of a cyclical recovery, withNVIDIAandIntelcontributing the most among chipmakers. (Please refer to the portfolio of investments for a complete list of holdings and the amount each represents in the portfolio.)
Financials stocks also significantly contributed to the portfolio’s results. Financials broadly benefited from robust capital markets throughout the year, and falling interest rates provided a tailwind to certain industries. Banks contributed the most to performance, especiallyJPMorgan Chase,Bank of America, andCitigroup, which reported very strong corporate earnings throughout the year.
Communication services stocks also posted very strong gains, led by social media bellwetherFacebook. The company, which boasts that more than 2 billion individuals use Facebook or one of its features every month, benefited from brisk ad revenue growth. Shares ofAlphabet(the parent company of Google) also surged during 2019. Despite its size, the company has proven a remarkable ability to sustain high levels of earnings and revenue growth. Entertainment companyWalt Disneyalso added value, as shares climbed due to favorable financial results and high expectations for its new Disney+ service as well as new “Frozen” and “Star Wars” movies.
Health care stocks produced good returns. While the sector lagged the broad market for the full year, its performance improved in recent months amid reduced worries about new regulations or transformative legislation. Equipment and supply companies contributed the most, led byDanaherandMedtronic. Pharmaceutical stocks also did well, such asJohnson & Johnson, whose fundamentals outweighed concerns about litigation regarding some of its products. Providers and services companies and biotechnology shares contributed to a lesser extent.
Consumer discretionary stocks were also good contributors.Amazon.comwas one of the largest contributors in the entire portfolio. Home improvement retailersHome DepotandLowe’sand off-price retailersTJXandRoss Storesalso produced favorable results. Multiline retailersKohl’sandMacy’sunderperformed, however.
Utilities shares in aggregate made a mild positive contribution to performance. Electric utilities companies led the sector, especiallyNextEra Energy, which is the largest developer of renewable energy sources in North America.The company announced in December that some of its residential Florida customers will see their monthly bills decrease due to lower operating costs. Multi-utilities companies trailed, especiallyCenterPoint Energy, which was hurt late in the year by lower earnings expectations stemming from an unfavorable regulatory decision.
Stocks in the materials sector—the smallest sector in the fund and benchmark—also made a modest contribution to performance. All underlying industries produced gains, however, led by chemical companies. Metals and mining companies and construction materials companies were laggards.

Energy shares contributed the least to the portfolio’s results. Oil prices rose in 2019 but closed below their highest levels amid concerns about slowing global growth and abundant supplies. Equipment and services companies were lackluster. Oil, gas, and consumablefuels companies fared better, led byChevron, which abandoned its attempt to acquireAnadarko Petroleum, received a $1 billion termination fee, and increased its share buyback plans. Anadarko also did well, and we eliminated our position because the company was acquired byOccidental Petroleum, which turned out to be one of our largest detractors for the year.
TOTAL EQUITY MARKET INDEX FUND
INVESTMENT OBJECTIVE
The fund seeks to match the performance of the entire U.S. stock market.
FUND COMMENTARY
How did the fund perform in the past 12 months?
U.S. stocks rose strongly in 2019. The Total Equity Market Index Fund returned 30.67% versus 30.90% for its benchmark, the S&P Total Market Index. Fund performance tends to slightly lag that of the index due to operating and management expenses. (Past performance cannot guarantee future results.)

What factors influenced the fund’s performance?
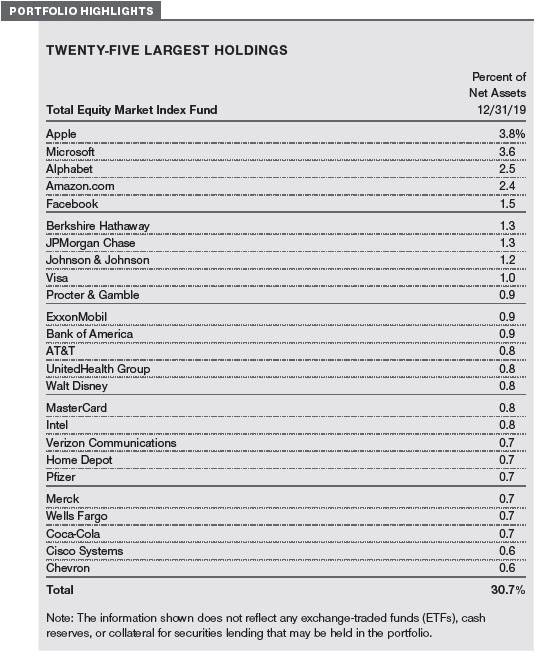
All sectors of the S&P Total Market Index produced positive returns. In the information technology sector,Microsoft, iPhone makerApple, and IT services companiesVisaandMasterCardwere among the most significant contributors—both in the sector and in the entire portfolio. The financials sector was led by banks, especiallyJPMorgan Chase,Bank of America, andCitigroup, but capital markets companies also did well. In health care, equipment and supply companies contributed the most; biotechnology and providers and services companies were less robust. In communication services, a small number of names, such asFacebook,Alphabet(parent company of Google), cable providerComcast,Walt Disney, and telecomgiantAT&T, contributed the bulk of our gains in the sector. (Please refer to the portfolio of investments for a complete list of holdings and the amount each represents in the portfolio.)
Energy stocks contributed the least to our absolute performance; they lagged despite an increase in oil prices for the year.Occidental Petroleumfared poorly, as the company acquiredAnadarko Petroleum—which was one of our best contributors in the sector.Chevron, which abandoned its attempt to acquire Anadarko, also did well. Materials stocks also underperformed. Paper and forest products companies were the largest laggards; construction materials companies trailed, too. Stocks of chemical makers led the sector,especiallyLindeandAir Products & Chemicals. Utilities stocks—which tend to pay above-average dividends—performed well for much of the year as interest rates declined, but their fourth-quarter performance was lackluster, as longer-term interest rates increased from late-summer lows and investors favored higher-risk sectors. Nevertheless,NextEra Energy, which is the largest developer of renewable energy sources in North America, led our holdings in the sector and was among the portfolio’s largest contributors.
EXTENDED EQUITY MARKET INDEX FUND
INVESTMENT OBJECTIVE
The fund seeks to track the performance of a benchmark index that measures the investment return of small- and mid-capitalization U.S. stocks.
FUND COMMENTARY
How did the fund perform in the past 12 months?
Small- and mid-cap U.S. stocks produced excellent returns in 2019. The Extended Equity Market Index Fund returned 27.70% versus 27.95% for its benchmark, the S&P Completion Index. Fund performance tends to slightly lag that of the index due to operating and management expenses. (Past performance cannot guarantee future results.)

What factors influenced the fund’s performance?
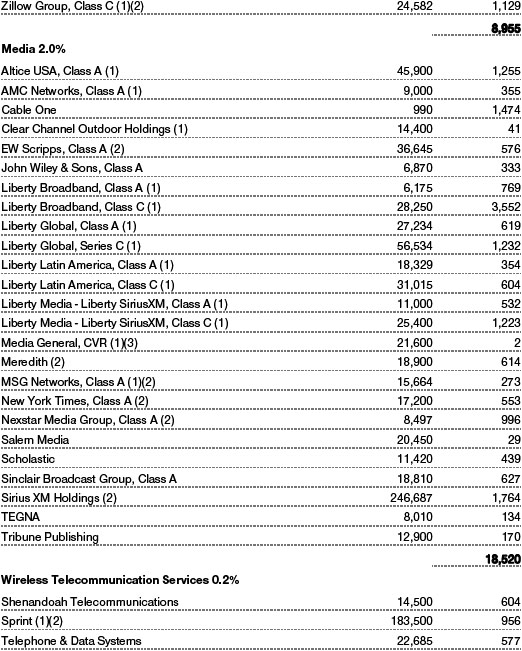
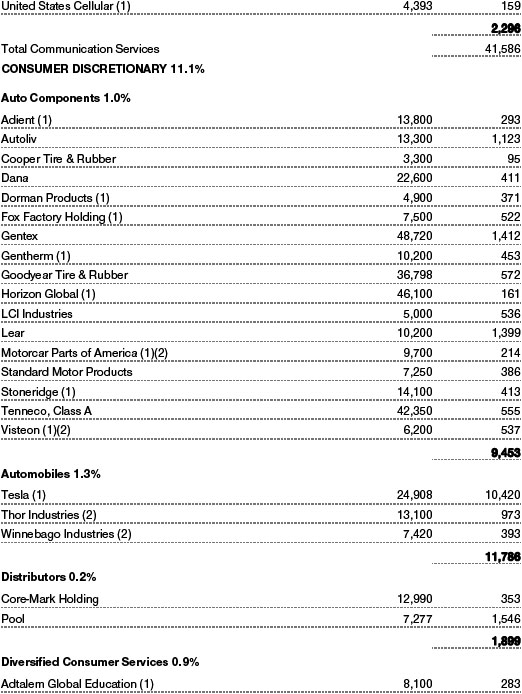
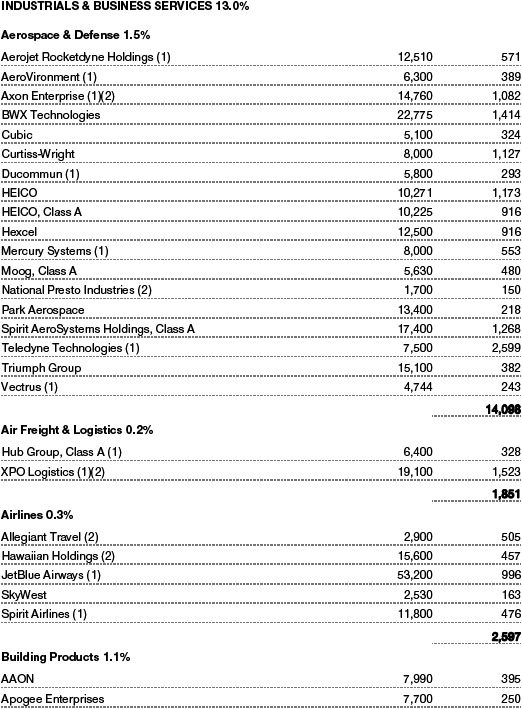
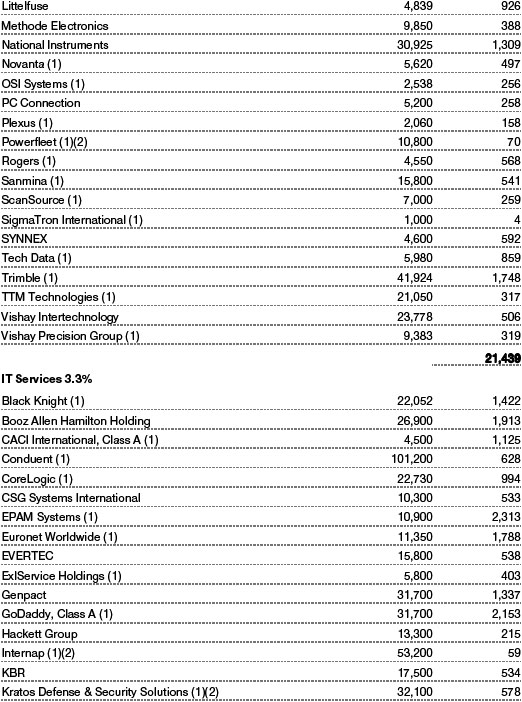
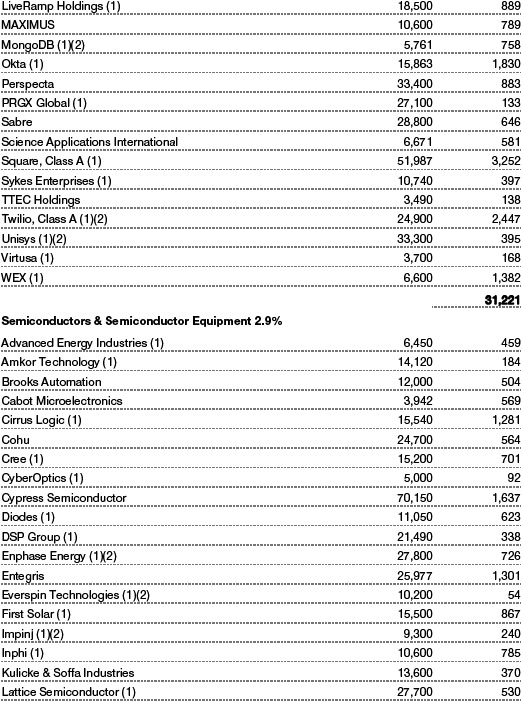
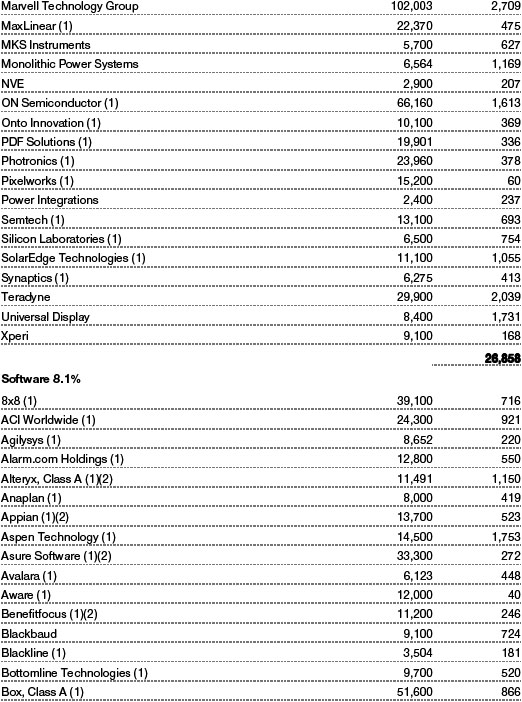
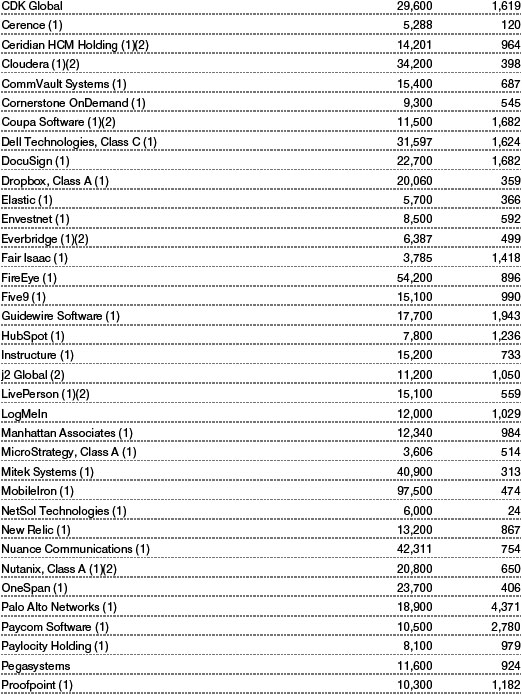
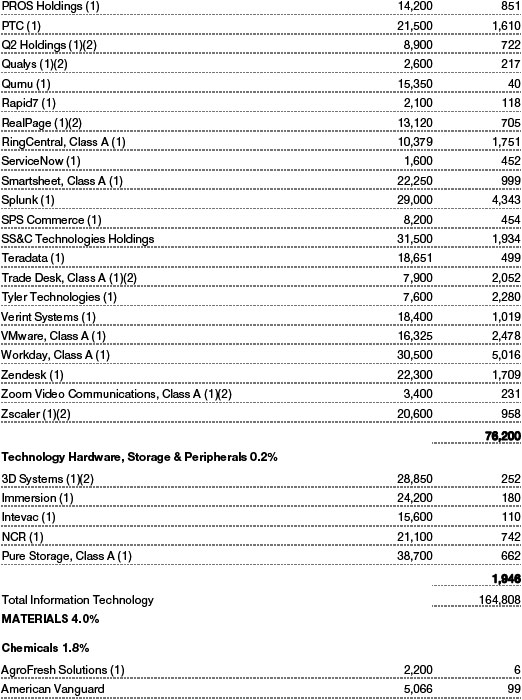
Most sectors of the S&P Completion Index produced positive returns in 2019. The information technology sector contributed the most to our absolute results. Software companiesServiceNowandPaycom Software; IT services companyWorldpay, which was acquired; andTeradyne, which makes automation equipment and systems for testing semiconductors and wireless products, were among the largest contributors in the sector and the entire portfolio. In health care, biotechnology stocks paced the sector’s advance, especiallyArray BioPharma, which was acquired by drug giant Pfizer. In contrast, our pharmaceutical stocks were widely mixed and, in aggregate, produced a small gain. In the industrials and business services sector, most underlying industries produced solid gains,led by machinery. Professional services companiesCoStar Groupand credit bureauTransUnionwere significant contributors, while aerospace and defense stocks were led byTeledyne Technologies, a maker of instruments and highly engineered commercial components used in the aerospace, energy, and environmental end markets. (Please refer to the portfolio of investments for a complete list of holdings and the amount each represents in the portfolio.)
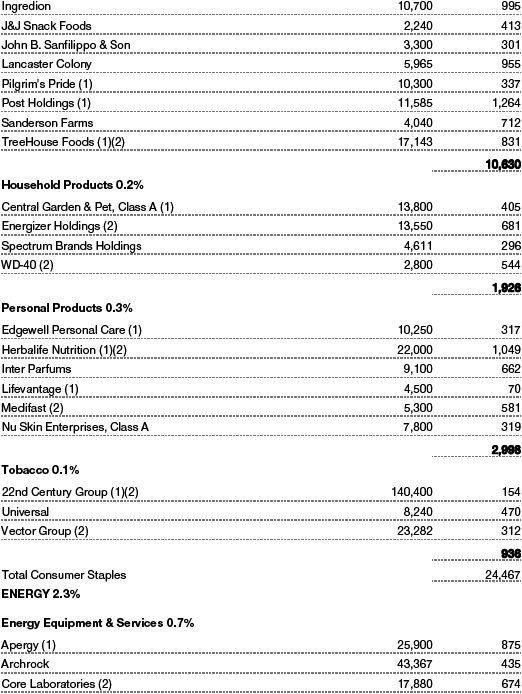
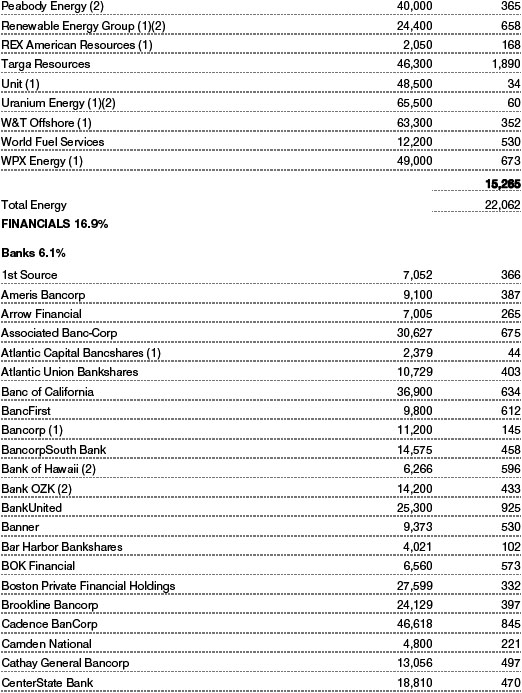
Energy was the only sector that detracted from our absolute performance in 2019, despite higher oil prices. Most of our oil, gas, and consumable fuel stocks declined, butWorld Fuel ServicesandFirst Solarled the few gainers. Equipment and services companies were mostly lower. Consumer staples stocks made a small contribution to full-year performance, led by food products companies and food and staples retailers. Makers of personal products companies underperformed, especiallyHerbalife Nutrition. Utilities stocks were mostly higher, especially electric utilities. Gas utility companies lagged, particularlyUGI. Shares slowly grinded their way lower throughout the year, then fell sharply in November following a disappointing earnings report and weaker guidance for 2020.

How are the Equity Market Index Funds positioned?
The Equity Market Index Funds, which tend to closely track their benchmarks, offer broad exposure to different sectors of the U.S. stock market, and their sector allocations are consistent with those of their benchmarks. As such, changes in each portfolio’s sector diversification and other overall characteristics reflect changes in the composition of the indexes, rather than strategic shifts that are typical of an actively managed fund. Since the portfolios are designed to track their indexes, they do not have the flexibilityto shift assets toward stocks or sectors that are rising or away from those that are declining. The funds’ expenses are generally low, which allows investors to retain more of their returns.
As a reminder, the Equity Market Index Funds are designed for investors who want to harness the potential for long-term capital appreciation from broad exposure to large-cap U.S. stocks, the entire U.S. stock market, or small- and mid-cap U.S. stocks. The portfolios could serve as core holdings in an investor’s portfolio, as they offer attributes that many investors will find appealing.
The Equity Index 500 Fund uses a full replication strategy, which involves investing substantially all of its assets in all of the stocks in the S&P 500. The fund seeks to maintain holdings of each stock in proportion to its weight in the index. The Total Equity Market Index Fund and the Extended Equity Market Index Fund use a sampling strategy, which involves investing substantially all of their assets in a group of stocks representative of the sector allocations, financial characteristics, and other attributes of the S&P Total Market Index and S&P Completion Index, respectively. These two funds do not attempt to fully replicate their indexes by owning each of the stocks in them. All three index funds may occasionally invest in securities such as futures and exchange-traded funds so that they can accommodate cash flows and remain fully invested.
What is portfolio management’s outlook?
The U.S. economic expansion and equity bull market have lasted more than 10 years, making them among the longest in modern history. While we know that the current bull market cannot continue indefinitely, we do not perceive its imminent demise. The Federal Reserve’s three interest rate cuts in the second half of 2019 are likely to help the economy strengthen somewhat in 2020, and investors will be watching to see if corporate earnings growth improves in the new year following generally flat earnings growth throughout 2019. Of course, there is no shortage of global risks as we enter 2020, including unresolved trade issues; geopolitical tensions, especially in the Middle East; and the U.S. presidential and congressional elections in November.
Regardless of economic or market developments or changes in investor sentiment, we will not attempt to determine which stocks or sectors are likely to perform best. Our main task is to use full replication or sampling strategies so that the Equity Market Index Funds are structured like major U.S. equity indexes and closely track their performance.
The views expressed reflect the opinions of T. Rowe Price as of the date of this report and are subject to change based on changes in market, economic, or other conditions. These views are not intended to be a forecast of future events and are no guarantee of future results.
RISKS OF INVESTING IN THE EQUITY MARKET INDEX FUNDS
Common stocks generally fluctuate in value more than bonds and may decline significantly over short time periods. There is a chance that stock prices overall will decline because stock markets tend to move in cycles, with periods of rising and falling prices. The value of a stock in which the funds invest may decline due to general weakness in the U.S. stock market, such as when the U.S. financial markets decline, or because of factors that affect a particular company or industry.
Although stocks issued by larger companies tend to have less overall volatility than stocks issued by smaller companies, larger companies may not be able to attain the high growth rates of successful smaller companies, especially during strong economic periods. In addition, larger companies may be less capable of responding quickly to competitive challenges and industry changes and may suffer sharper price declines as a result of earnings disappointments.
Funds that invest in small and medium-sized companies could be more volatile than funds that are exposed to only large companies. Small and medium-sized companies often have less experienced management, narrower product lines, more limited financial resources, and less publicly available information than larger companies. Smaller companies may have limited trading markets and tend to be more sensitive to changes in overall economic conditions.
Because the funds are passively managed, holdings are generally not reallocated based on changes in market conditions or the outlook for a specific security, industry, or market sector. As a result, the funds’ performance may lag the performance of actively managed funds. Funds that use a sampling strategy (and, thus, do not attempt to fully replicate their benchmark indexes) have a greater potential for their performance to deviate from that of their benchmarks.

GROWTH OF $10,000
This chart shows the value of a hypothetical $10,000 investment in the fund over the past 10 fiscal year periods or since inception (for funds lacking 10-year records). The result is compared with benchmarks, which include a broad-based market index and may also include a peer group average or index. Market indexes do not include expenses, which are deducted from fund returns as well as mutual fund averages and indexes.
AVERAGE ANNUAL COMPOUND TOTAL RETURN

GROWTH OF $10,000
This chart shows the value of a hypothetical $10,000 investment in the fund over the past 10 fiscal year periods or since inception (for funds lacking 10-year records). The result is compared with benchmarks, which include a broad-based market index and may also include a peer group average or index. Market indexes do not include expenses, which are deducted from fund returns as well as mutual fund averages and indexes.

AVERAGE ANNUAL COMPOUND TOTAL RETURN

EXPENSE RATIO

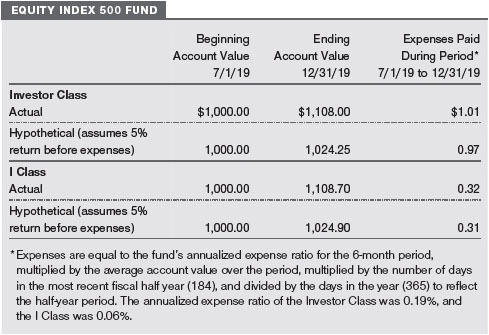
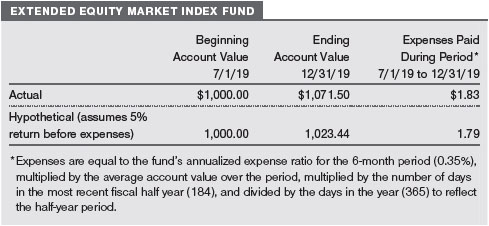
FUND EXPENSE EXAMPLE
As a mutual fund shareholder, you may incur two types of costs: (1) transaction costs, such as redemption fees or sales loads, and (2) ongoing costs, including management fees, distribution and service (12b-1) fees, and other fund expenses. The following example is intended to help you understand your ongoing costs (in dollars) of investing in the fund and to compare these costs with the ongoing costs of investing in other mutual funds. The example is based on an investment of $1,000 invested at the beginning of the most recent six-month period and held for the entire period.
Please note that the Equity Index 500 Fund has two share classes: The original share class (Investor Class) charges no distribution and service (12b-1) fee, and I Class shares are also available to institutionally oriented clients and impose no 12b-1 or administrative fee payment. Each share class is presented separately in the table.
Actual Expenses
The first line of the following table (Actual) provides information about actual account values and actual expenses. You may use the information on this line, together with your account balance, to estimate the expenses that you paid over the period. Simply divide your account value by $1,000 (for example, an $8,600 account value divided by $1,000 = 8.6), then multiply the result by the number on the first line under the heading “Expenses Paid During Period” to estimate the expenses you paid on your account during this period.
Hypothetical Example for Comparison Purposes
The information on the second line of the table (Hypothetical) is based on hypothetical account values and expenses derived from the fund’s actual expense ratio and an assumed 5% per year rate of return before expenses (not the fund’s actual return). You may compare the ongoing costs of investing in the fund with other funds by contrasting this 5% hypothetical example and the 5% hypothetical examples that appear in the shareholder reports of the other funds. The hypothetical account values and expenses may not be used to estimate the actual ending account balance or expenses you paid for the period.
Note:T. Rowe Price charges an account service fee that is not included in the accompanying table. The account service fee is charged on a quarterly basis, usually during the last week of a calendar quarter, and applies to accounts with balances below $10,000 on the day of the assessment. The fee is charged to accounts that fall below $10,000 for any reason, including market fluctuations, redemptions, or exchanges. When an account with less than $10,000 is closed either through redemption or exchange, the fee is charged and deducted from the proceeds. The fee applies to IRAs but not to retirement plans directly registered with T. Rowe Price Services or accounts maintained by intermediaries through NSCC®Networking. If you are subject to the fee, keep it in mind when you are estimating the ongoing expenses of investing in the fund and when comparing the expenses of this fund with other funds.
You should also be aware that the expenses shown in the table highlight only your ongoing costs and do not reflect any transaction costs, such as redemption fees or sales loads. Therefore, the second line of the table is useful in comparing ongoing costs only and will not help you determine the relative total costs of owning different funds. To the extent a fund charges transaction costs, however, the total cost of owning that fund is higher.


The accompanying notes are an integral part of these financial statements.


The accompanying notes are an integral part of these financial statements.

The accompanying notes are an integral part of these financial statements.
The accompanying notes are an integral part of these financial statements.

The accompanying notes are an integral part of these financial statements.
| NOTES TO FINANCIAL STATEMENTS |
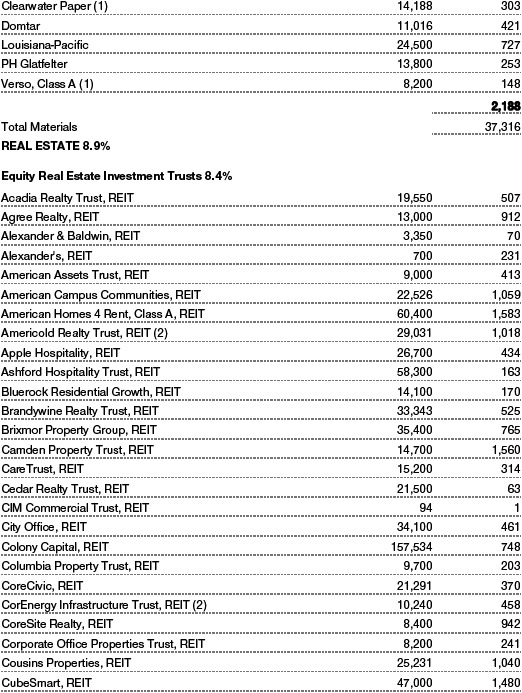
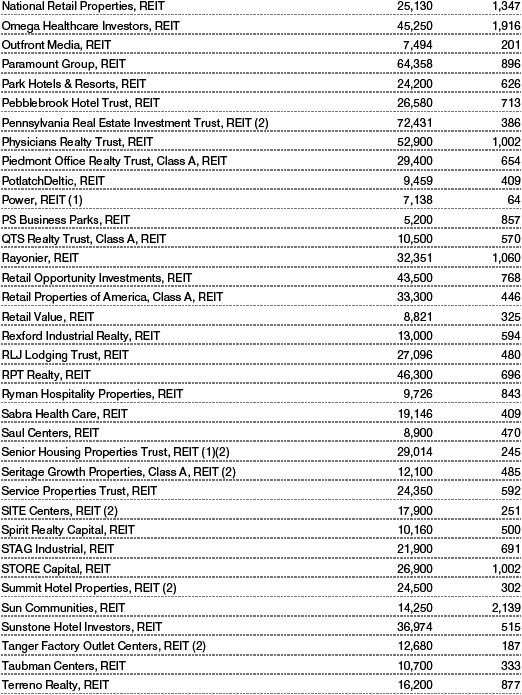
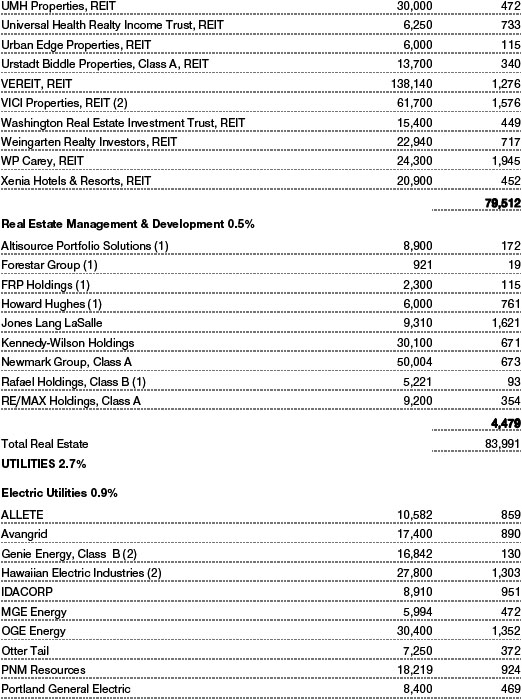
T. Rowe Price Index Trust, Inc. (the corporation) is registered under the Investment Company Act of 1940 (the 1940 Act). The Extended Equity Market Index Fund (the fund) is a diversified, open-end management investment company established by the corporation. The fund seeks to track the performance of a benchmark index that measures the investment return of small- and mid-capitalization U.S. stocks.
NOTE 1 - SIGNIFICANT ACCOUNTING POLICIES
Basis of PreparationThe fund is an investment company and follows accounting and reporting guidance in the Financial Accounting Standards Board (FASB)Accounting Standards CodificationTopic 946 (ASC 946). The accompanying financial statements were prepared in accordance with accounting principles generally accepted in the United States of America (GAAP), including, but not limited to, ASC 946. GAAP requires the use of estimates made by management. Management believes that estimates and valuations are appropriate; however, actual results may differ from those estimates, and the valuations reflected in the accompanying financial statements may differ from the value ultimately realized upon sale or maturity. Certain prior year amounts in the accompanying financial statements and financial highlights have been restated to conform to current year presentation.
Investment Transactions, Investment Income, and Distributions Investment transactions are accounted for on the trade date basis. Income and expenses are recorded on the accrual basis. Realized gains and losses are reported on the identified cost basis. Premiums and discounts on debt securities are amortized for financial reporting purposes. Income tax-related interest and penalties, if incurred, are recorded as income tax expense. Dividends received from mutual fund investments are reflected as dividend income; capital gain distributions are reflected as realized gain/loss. Dividend income and capital gain distributions are recorded on the ex-dividend date. Distributions from REITs are initially recorded as dividend income and, to the extent such represent a return of capital or capital gain for tax purposes, are reclassified when such information becomes available. Non-cash dividends, if any, are recorded at the fair market value of the asset received. Distributions to shareholders are recorded on the ex-dividend date. Income distributions, if any, are declared and paid annually. A capital gain distribution may also be declared and paid by the fund annually.
Redemption FeesPrior to April 1, 2019, a 0.50% fee was assessed on redemptions of fund shares held for 90 days or less to deter short-term trading and to protect the interests of long-term shareholders. Redemption fees were withheld from proceeds that shareholders received from the sale or exchange of fund shares. The fees were paid to the fund and were recorded as an increase to paid-in capital. The fees may have caused the redemption price per share to differ from the net asset value per share.
New Accounting GuidanceEffective January 1, 2019, the fund adopted FASB guidance that shortened the amortization period for certain callable debt securities held at a premium. Adoption had no effect on the fund’s net assets or results of operations.
Indemnification In the normal course of business, the fund may provide indemnification in connection with its officers and directors, service providers, and/or private company investments. The fund’s maximum exposure under these arrangements is unknown; however, the risk of material loss is currently considered to be remote.
NOTE 2 - VALUATION
The fund’s financial instruments are valued and its net asset value (NAV) per share is computed at the close of the New York Stock Exchange (NYSE), normally 4 p.m. ET, each day the NYSE is open for business. However, the NAV per share may be calculated at a time other than the normal close of the NYSE if trading on the NYSE is restricted, if the NYSE closes earlier, or as may be permitted by the SEC.
Fair Value The fund’s financial instruments are reported at fair value, which GAAP defines as the price that would be received to sell an asset or paid to transfer a liability in an orderly transaction between market participants at the measurement date. The T. Rowe Price Valuation Committee (the Valuation Committee) is an internal committee that has been delegated certain responsibilities by the fund’s Board of Directors (the Board) to ensure that financial instruments are appropriately priced at fair value in accordance with GAAP and the 1940 Act. Subject to oversight by the Board, the Valuation Committee develops and oversees pricing-related policies and procedures and approves all fair value determinations. Specifically, the Valuation Committee establishes procedures to value securities; determines pricing techniques, sources, and persons eligible to effect fair value pricing actions; oversees the selection, services, and performance of pricing vendors; oversees valuation-related business continuity practices; and provides guidance on internal controls and valuation-related matters. The Valuation Committee reports to the Board and has representation from legal, portfolio management and trading, operations, risk management, and the fund’s treasurer.
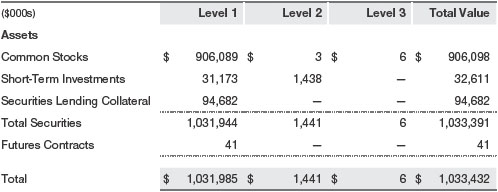
Various valuation techniques and inputs are used to determine the fair value of financial instruments. GAAP establishes the following fair value hierarchy that categorizes the inputs used to measure fair value:
Level 1 – quoted prices (unadjusted) in active markets for identical financial instruments that the fund can access at the reporting date
Level 2 – inputs other than Level 1 quoted prices that are observable, either directly or indirectly (including, but not limited to, quoted prices for similar financial instruments in active markets, quoted prices for identical or similar financial instruments in inactive markets, interest rates and yield curves, implied volatilities, and credit spreads)
Level 3 – unobservable inputs
Observable inputs are developed using market data, such as publicly available information about actual events or transactions, and reflect the assumptions that market participants would use to price the financial instrument. Unobservable inputs are those for which market data are not available and are developed using the best information available about the assumptions that market participants would use to price the financial instrument. GAAP requires valuation techniques to maximize the use of relevant observable inputs and minimize the use of unobservable inputs. When multiple inputs are used to derive fair value, the financial instrument is assigned to the level within the fair value hierarchy based on the lowest-level input that is significant to the fair value of the financial instrument. Input levels are not necessarily an indication of the risk or liquidity associated with financial instruments at that level but rather the degree of judgment used in determining those values.
Valuation TechniquesEquity securities listed or regularly traded on a securities exchange or in the over-the-counter (OTC) market are valued at the last quoted sale price or, for certain markets, the official closing price at the time the valuations are made. OTC Bulletin Board securities are valued at the mean of the closing bid and asked prices. A security that is listed or traded on more than one exchange is valued at the quotation on the exchange determined to be the primary market for such security. Listed securities not traded on a particular day are valued at the mean of the closing bid and asked prices. Actively traded equity securities listed on a domestic exchange generally are categorized in Level 1 of the fair value hierarchy. OTC Bulletin Board securities, certain preferred securities, and equity securities traded in inactive markets generally are categorized in Level 2 of the fair value hierarchy.
Debt securities generally are traded in the OTC market and are valued at prices furnished by independent pricing services or by broker dealers who make markets in such securities. When valuing securities, the independent pricing services consider the yield or price of bonds of comparable quality, coupon, maturity, and type, as well as prices quoted by dealers who make markets in such securities. Generally, debt securities are categorized in Level 2 of the fair value hierarchy; however, to the extent the valuations include significant unobservable inputs, the securities would be categorized in Level 3.
Investments in mutual funds are valued at the mutual fund’s closing NAV per share on the day of valuation and are categorized in Level 1 of the fair value hierarchy. Financial futures contracts are valued at closing settlement prices and are categorized in Level 1 of the fair value hierarchy. Assets and liabilities other than financial instruments, including short-term receivables and payables, are carried at cost, or estimated realizable value, if less, which approximates fair value.
Thinly traded financial instruments and those for which the above valuation procedures are inappropriate or are deemed not to reflect fair value are stated at fair value as determined in good faith by the Valuation Committee. The objective of any fair value pricing determination is to arrive at a price that could reasonably be expected from a current sale. Financial instruments fair valued by the Valuation Committee are primarily private placements, restricted securities, warrants, rights, and other securities that are not publicly traded.
Subject to oversight by the Board, the Valuation Committee regularly makes good faith judgments to establish and adjust the fair valuations of certain securities as events occur and circumstances warrant. For instance, in determining the fair value of an equity investment with limited market activity, such as a private placement or a thinly traded public company stock, the Valuation Committee considers a variety of factors, which may include, but are not limited to, the issuer’s business prospects, its financial standing and performance, recent investment transactions in the issuer, new rounds of financing, negotiated transactions of significant size between other investors in the company, relevant market valuations of peer companies, strategic events affecting the company, market liquidity for the issuer, and general economic conditions and events. In consultation with the investment and pricing teams, the Valuation Committee will determine an appropriate valuation technique based on available information, which may include both observable and unobservable inputs. The Valuation Committee typically will afford greatest weight to actual prices in arm’s length transactions, to the extent they represent orderly transactions between market participants, transaction information can be reliably obtained, and prices are deemed representative of fair value.
However, the Valuation Committee may also consider other valuation methods such as market-based valuation multiples; a discount or premium from market value of a similar, freely traded security of the same issuer; or some combination. Fair value determinations are reviewed on a regular basis and updated as information becomes available, including actual purchase and sale transactions of the issue. Because any fair value determination involves a significant amount of judgment, there is a degree of subjectivity inherent in such pricing decisions, and fair value prices determined by the Valuation Committee could differ from those of other market participants. Depending on the relative significance of unobservable inputs, including the valuation technique(s) used, fair valued securities may be categorized in Level 2 or 3 of the fair value hierarchy.
Valuation InputsThe following table summarizes the fund’s financial instruments, based on the inputs used to determine their fair values on December 31, 2019 (for further detail by category, please refer to the accompanying Portfolio of Investments):
Following is a reconciliation of the fund’s Level 3 holdings for the year ended December 31, 2019. Gain (loss) reflects both realized and change in unrealized gain/loss on Level 3 holdings during the period, if any, and is included on the accompanying Statement of Operations. The change in unrealized gain/loss on Level 3 instruments held at December 31, 2019, totaled $1,000 for the year ended December 31, 2019.

NOTE 3 - DERIVATIVE INSTRUMENTS
During the year ended December 31, 2019, the fund invested in derivative instruments. As defined by GAAP, a derivative is a financial instrument whose value is derived from an underlying security price, foreign exchange rate, interest rate, index of prices or rates, or other variable; it requires little or no initial investment and permits or requires net settlement. The fund invests in derivatives only if the expected risks and rewards are consistent with its investment objectives, policies, and overall risk profile, as described in its prospectus and Statement of Additional Information. The fund may use derivatives for a variety of purposes, such as seeking to hedge against declines in principal value, increase yield, invest in an asset with greater efficiency and at a lower cost than is possible through direct investment, to enhance return, or to adjust credit exposure. The risks associated with the use of derivatives are different from, and potentially much greater than, the risks associated with investing directly in the instruments on which the derivatives are based. The fund at all times maintains sufficient cash reserves, liquid assets, or other SEC-permitted asset types to cover its settlement obligations under open derivative contracts.
The fund values its derivatives at fair value and recognizes changes in fair value currently in its results of operations. Accordingly, the fund does not follow hedge accounting, even for derivatives employed as economic hedges. Generally, the fund accounts for its derivatives on a gross basis. It does not offset the fair value of derivative liabilities against the fair value of derivative assets on its financial statements, nor does it offset the fair value of derivative instruments against the right to reclaim or obligation to return collateral. As of December 31, 2019, the fund held equity futures with cumulative unrealized gain of $439,000; the value reflected on the accompanying Statement of Assets and Liabilities is the related unsettled variation margin.
Additionally, during the year ended December 31, 2019, the fund recognized $3,752,000 of realized gain on Futures and a $2,372,000 change in unrealized gain/loss on Futures related to its investments in equity derivative; such amounts are included on the accompanying Statement of Operations.
Counterparty Risk and CollateralThe fund invests in exchange-traded or centrally cleared derivative contracts, such as futures, exchange-traded options, and centrally cleared swaps. Counterparty risk on such derivatives is minimal because the clearinghouse provides protection against counterparty defaults. For futures and centrally cleared swaps, the fund is required to deposit collateral in an amount specified by the clearinghouse and the clearing firm (margin requirement), and the margin requirement must be maintained over the life of the contract. Each clearinghouse and clearing firm, in its sole discretion, may adjust the margin requirements applicable to the fund.
Collateral may be in the form of cash or debt securities issued by the U.S. government or related agencies. Cash posted by the fund is reflected as cash deposits in the accompanying financial statements and generally is restricted from withdrawal by the fund; securities posted by the fund are so noted in the accompanying Portfolio of Investments; both remain in the fund’s assets. While typically not sold in the same manner as equity or fixed income securities, exchange-traded or centrally cleared derivatives may be closed out only on the exchange or clearinghouse where the contracts were traded. This ability is subject to the liquidity of underlying positions. As of December 31, 2019, securities valued at $1,324,000 had been posted by the fund for exchange-traded and/or centrally cleared derivatives.
Futures ContractsThe fund is subject to equity price risk in the normal course of pursuing its investment objectives and uses futures contracts to help manage such risk. The fund may enter into futures contracts as an efficient means of maintaining liquidity while being invested in the market, to facilitate trading, or to reduce transaction costs. A futures contract provides for the future sale by one party and purchase by another of a specified amount of a specific underlying financial instrument at an agreed upon price, date, time, and place. The fund currently invests only in exchange-traded futures, which generally are standardized as to maturity date, underlying financial instrument, and other contract terms. Payments are made or received by the fund each day to settle daily fluctuations in the value of the contract (variation margin), which reflect changes in the value of the underlying financial instrument. Variation margin is recorded as unrealized gain or loss until the contract is closed. The value of a futures contract included in net assets is the amount of unsettled variation margin; net variation margin receivable is reflected as an asset and net variation margin payable is reflected as a liability on the accompanying Statement of Assets and Liabilities. Risks related to the use of futures contracts include possible illiquidity of the futures markets, contract prices that can be highly volatile and imperfectly correlated to movements in hedged security values, and potential losses in excess of the fund’s initial investment. During the year ended December 31, 2019, the volume of the fund’s activity in futures, based on underlying notional amounts, was generally between 3% and 4% of net assets.
NOTE 4 - OTHER INVESTMENT TRANSACTIONS
Consistent with its investment objective, the fund engages in the following practices to manage exposure to certain risks and/or to enhance performance. The investment objective, policies, program, and risk factors of the fund are described more fully in the fund’s prospectus and Statement of Additional Information.
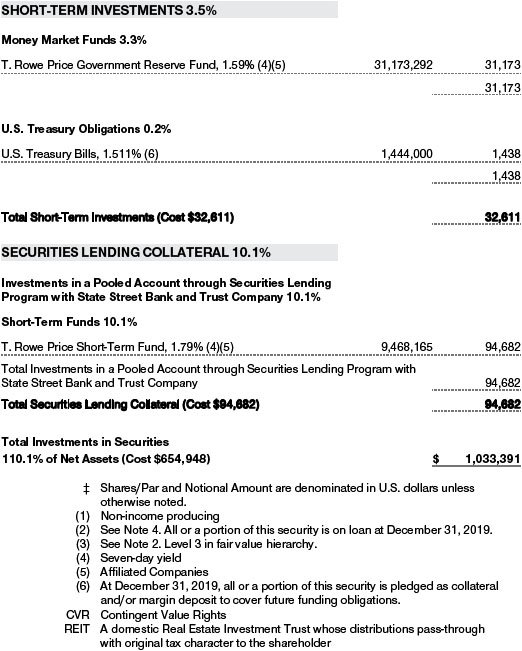
Securities LendingThe fund may lend its securities to approved borrowers to earn additional income. Its securities lending activities are administered by a lending agent in accordance with a securities lending agreement. Security loans generally do not have stated maturity dates, and the fund may recall a security at any time. The fund receives collateral in the form of cash or U.S. government securities. Collateral is maintained over the life of the loan in an amount not less than the value of loaned securities; any additional collateral required due to changes in security values is delivered to the fund the next business day. Cash collateral is invested in accordance with investment guidelines approved by fund management. Additionally, the lending agent indemnifies the fund against losses resulting from borrower default. Although risk is mitigated by the collateral and indemnification, the fund could experience a delay in recovering its securities and a possible loss of income or value if the borrower fails to return the securities, collateral investments decline in value, and the lending agent fails to perform. Securities lending revenue consists of earnings on invested collateral and borrowing fees, net of any rebates to the borrower, compensation to the lending agent, and other administrative costs. In accordance with GAAP, investments made with cash collateral are reflected in the accompanying financial statements, but collateral received in the form of securities is not. At December 31, 2019, the value of loaned securities was $92,971,000; the value of cash collateral and related investments was $94,850,000.
OtherPurchases and sales of portfolio securities other than short-term securities aggregated $148,313,000 and $164,246,000, respectively, for the year ended December 31, 2019.
NOTE 5 - FEDERAL INCOME TAXES
No provision for federal income taxes is required since the fund intends to continue to qualify as a regulated investment company under Subchapter M of the Internal Revenue Code and distribute to shareholders all of its taxable income and gains. Distributions determined in accordance with federal income tax regulations may differ in amount or character from net investment income and realized gains for financial reporting purposes.
The fund files U.S. federal, state, and local tax returns as required. The fund’s tax returns are subject to examination by the relevant tax authorities until expiration of the applicable statute of limitations, which is generally three years after the filing of the tax return but which can be extended to six years in certain circumstances. Tax returns for open years have incorporated no uncertain tax positions that require a provision for income taxes.
Financial reporting records are adjusted for permanent book/tax differences to reflect tax character but are not adjusted for temporary differences. The permanent book/tax adjustments have no impact on results of operations or net assets and relate primarily to a tax practice that treats a portion of the proceeds from each redemption of capital shares as a distribution of taxable net investment income or realized capital gain. For the year ended December 31, 2019, the following reclassification was recorded:
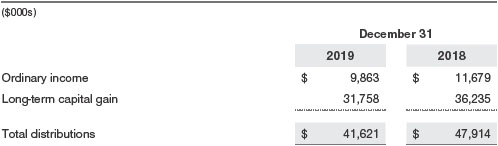
Distributions during the years ended December 31, 2019 and December 31, 2018, were characterized for tax purposes as follows:
At December 31, 2019, the tax-basis cost of investments, including derivatives, and components of net assets were as follows:
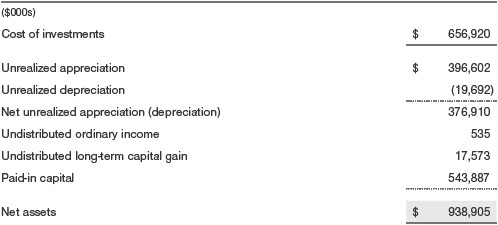
The difference between book-basis and tax-basis net unrealized appreciation (depreciation) is attributable to the deferral of losses from wash sales and/or certain derivative contracts, and the realization of gains/losses on passive foreign investment companies and/or certain open derivative contracts for tax purposes.
NOTE 6 - RELATED PARTY TRANSACTIONS
The fund is managed by T. Rowe Price Associates, Inc. (Price Associates), a wholly owned subsidiary of T. Rowe Price Group, Inc. (Price Group). The investment management and administrative agreement between the fund and Price Associates provides for an all-inclusive annual fee equal to 0.35% of the fund’s average daily net assets. The fee is computed daily and paid monthly. The all-inclusive fee covers investment management services and ordinary, recurring operating expenses but does not cover interest expense; expenses related to borrowing, taxes, and brokerage; or nonrecurring extraordinary expenses.
Additionally, the fund is one of several mutual funds in which certain college savings plans managed by Price Associates may invest. As approved by the fund’s Board of Directors, shareholder servicing costs associated with each college savings plan are allocated to the fund in proportion to the average daily value of its shares owned by the college savings plan. Shareholder servicing costs allocated to the fund are borne by Price Associates, pursuant to the fund’s all-inclusive fee agreement. At December 31, 2019, approximately 2% of the outstanding shares of the fund were held by college savings plans.
The fund may invest its cash reserves in certain open-end management investment companies managed by Price Associates and considered affiliates of the fund: the T. Rowe Price Government Reserve Fund or the T. Rowe Price Treasury Reserve Fund, organized as money market funds, or the T. Rowe Price Short-Term Fund, a short-term bond fund (collectively, the Price Reserve Funds). The Price Reserve Funds are offered as short-term investment options to mutual funds, trusts, and other accounts managed by Price Associates or its affiliates and are not available for direct purchase by members of the public. Cash collateral from securities lending is invested in the T. Rowe Price Short-Term Fund. The Price Reserve Funds pay no investment management fees.
The fund may participate in securities purchase and sale transactions with other funds or accounts advised by Price Associates (cross trades), in accordance with procedures adopted by the fund’s Board and Securities and Exchange Commission rules, which require, among other things, that such purchase and sale cross trades be effected at the independent current market price of the security. During the year ended December 31, 2019, the fund had no purchases or sales cross trades with other funds or accounts advised by Price Associates.
REPORT OF INDEPENDENT REGISTERED PUBLIC ACCOUNTING FIRM
To the Board of Directors of T. Rowe Price Index Trust, Inc. and
Shareholders of T. Rowe Price Extended Equity Market Index Fund
Opinion on the Financial Statements
We have audited the accompanying statement of assets and liabilities, including the portfolio of investments, of T. Rowe Price Extended Equity Market Index Fund (one of the funds constituting T. Rowe Price Index Trust, Inc., referred to hereafter as the “Fund”) as of December 31, 2019, the related statement of operations for the year ended December 31, 2019, the statement of changes in net assets for each of the two years in the period ended December 31, 2019, including the related notes, and the financial highlights for each of the five years in the period ended December 31, 2019 (collectively referred to as the “financial statements”). In our opinion, the financial statements present fairly, in all material respects, the financial position of the Fund as of December 31, 2019, the results of its operations for the year then ended, the changes in its net assets for each of the two years in the period ended December 31, 2019 and the financial highlights for each of the five years in the period ended December 31, 2019 in conformity with accounting principles generally accepted in the United States of America.
Basis for Opinion
These financial statements are the responsibility of the Fund’s management. Our responsibility is to express an opinion on the Fund’s financial statements based on our audits. We are a public accounting firm registered with the Public Company Accounting Oversight Board (United States) (PCAOB) and are required to be independent with respect to the Fund in accordance with the U.S. federal securities laws and the applicable rules and regulations of the Securities and Exchange Commission and the PCAOB.
We conducted our audits of these financial statements in accordance with the standards of the PCAOB. Those standards require that we plan and perform the audit to obtain reasonable assurance about whether the financial statements are free of material misstatement, whether due to error or fraud.
Our audits included performing procedures to assess the risks of material misstatement of the financial statements, whether due to error or fraud, and performing procedures that respond to those risks. Such procedures included examining, on a test basis, evidence regarding the amounts and disclosures in the financial statements. Our audits also included evaluating the accounting principles used and significant estimates made by management, as well as evaluating the overall presentation of the financial statements. Our procedures included confirmation of securities owned as of December 31, 2019 by correspondence with the custodian, transfer agent and brokers; when replies were not received from brokers, we performed other auditing procedures. We believe that our audits provide a reasonable basis for our opinion.
PricewaterhouseCoopers LLP
Baltimore, Maryland
February 14, 2020
We have served as the auditor of one or more investment companies in the T. Rowe Price group of investment companies since 1973.
TAX INFORMATION (UNAUDITED) FOR THE TAX YEAR ENDED 12/31/19
We are providing this information as required by the Internal Revenue Code. The amounts shown may differ from those elsewhere in this report because of differences between tax and financial reporting requirements.
The fund’s distributions to shareholders included:
| ■ | $338,000 from short-term capital gains |
| ■ | $34,619,000 from long-term capital gains, subject to a long-term capital gains tax rate not greater than 20%. |
For taxable non-corporate shareholders, $7,249,000 of the fund’s income represents qualified dividend income subject to long-term capital gains tax rate of not greater than 20%.
For corporate shareholders, $6,910,000 of the fund’s income qualifies for the dividends-received deduction.
For individuals and certain trusts and estates which are entitled to claim a deduction of up to 20% of their combined qualified real estate investment trust (REIT) dividends, $1,738,000 of the fund’s income qualifies as qualified real estate investment trust (REIT) dividends.
INFORMATION ON PROXY VOTING POLICIES, PROCEDURES, AND RECORDS
A description of the policies and procedures used by T. Rowe Price funds and portfolios to determine how to vote proxies relating to portfolio securities is available in each fund’s Statement of Additional Information. You may request this document by calling 1-800-225-5132 or by accessing the SEC’s website, sec.gov.
The description of our proxy voting policies and procedures is also available on our corporate website. To access it, please visit the following Web page:
https://www.troweprice.com/corporate/en/utility/policies.html
Scroll down to the section near the bottom of the page that says, “Proxy Voting Policies.” Click on the Proxy Voting Policies link in the shaded box.
Each fund’s most recent annual proxy voting record is available on our website and through the SEC’s website. To access it through T. Rowe Price, visit the website location shown above, and scroll down to the section near the bottom of the page that says, “Proxy Voting Records.” Click on the Proxy Voting Records link in the shaded box.
HOW TO OBTAIN QUARTERLY PORTFOLIO HOLDINGS
Effective for reporting periods on or after March 1, 2019, a fund, except a money market fund, files a complete schedule of portfolio holdings with the Securities and Exchange Commission (SEC) for the first and third quarters of each fiscal year as an exhibit to its reports on Form N-PORT. Prior to March 1, 2019, a fund, including a money market fund, filed a complete schedule of portfolio holdings with the SEC for the first and third quarters of each fiscal year on Form N-Q. A money market fund files detailed month-end portfolio holdings information on Form N-MFP with the SEC each month and posts a complete schedule of portfolio holdings on its website (troweprice.com) as of each month-end for the previous six months. A fund’s Forms N-PORT, N-MFP, and N-Q are available electronically on the SEC’s website (sec.gov).
ABOUT THE FUND’S DIRECTORS AND OFFICERS
Your fund is overseen by a Board of Directors (Board) that meets regularly to review a wide variety of matters affecting or potentially affecting the fund, including performance, investment programs, compliance matters, advisory fees and expenses, service providers, and business and regulatory affairs. The Board elects the fund’s officers, who are listed in the final table. At least 75% of the Board’s members are independent of the Boards of T. Rowe Price Associates, Inc. (T. Rowe Price), and its affiliates; “inside” or “interested” directors are employees or officers of T. Rowe Price. The business address of each director and officer is 100 East Pratt Street, Baltimore, Maryland 21202. The Statement of Additional Information includes additional information about the fund directors and is available without charge by calling a T. Rowe Price representative at 1-800-638-5660.
| INDEPENDENT DIRECTORS(a) | ||
| Name | ||
| (Year of Birth) | ||
| Year Elected | ||
| [Number of T. Rowe Price | Principal Occupation(s) and Directorships of Public Companies and | |
| Portfolios Overseen] | Other Investment Companies During the Past Five Years | |
| Teresa Bryce Bazemore (1959) 2018 [189] | President, Radian Guaranty (2008 to 2017); Chief Executive Officer, Bazemore Consulting LLC (2018 to present); Director, Chimera Investment Corporation (2017 to present); Director, Federal Home Loan Bank of Pittsburgh (2017 to present) | |
| Ronald J. Daniels (1959) 2018 [189] | President, The Johns Hopkins University(b)and Professor, Political Science Department, The Johns Hopkins University (2009 to present); Director, Lyndhurst Holdings (2015 to present) | |
| Bruce W. Duncan (1951) 2013 [189] | Chief Executive Officer and Director (January 2009 to December 2016), Chairman of the Board (January 2016 to present), and President (January 2009 to September 2016), First Industrial Realty Trust, an owner and operator of industrial properties; Chairman of the Board (2005 to September 2016) and Director (1999 to September 2016), Starwood Hotels & Resorts, a hotel and leisure company; Member, Investment Company Institute Board of Governors (2017 to present); Member, Independent Directors Council Governing Board (2017 to present); Senior Advisor, KKR (November 2018 to present); Director, Boston Properties (May 2016 to present); Director, Marriott International, Inc. (September 2016 to present) | |
| Robert J. Gerrard, Jr. (1952) 2012 [189] | Advisory Board Member, Pipeline Crisis/Winning Strategies, a collaborative working to improve opportunities for young African Americans (1997 to January 2016); Chairman of the Board, all funds (July 2018 to present) | |
| Paul F. McBride (1956) 2013 [189] | Advisory Board Member, Vizzia Technologies (2015 to present); Board Member, Dunbar Armored (2012 to 2018) | |
| Cecilia E. Rouse, Ph.D. (1963) 2012 [189] | Dean, Woodrow Wilson School (2012 to present); Professor and Researcher, Princeton University (1992 to present); Director, MDRC, a nonprofit education and social policy research organization (2011 to present); Member, National Academy of Education (2010 to present); Research Associate of Labor Studies Program at the National Bureau of Economic Research (2011 to 2015); Board Member, National Bureau of Economic Research (2011 to present); Chair of Committee on the Status of Minority Groups in the Economic Profession of the American Economic Association (2012 to 2018); Vice President (2015 to 2016) and Board Member, American Economic Association (2018 to present) | |
| John G. Schreiber (1946) 2001 [189] | Owner/President, Centaur Capital Partners, Inc., a real estate investment company (1991 to present); Cofounder, Partner, and Cochairman of the Investment Committee, Blackstone Real Estate Advisors, L.P. (1992 to 2015); Director, Blackstone Mortgage Trust, a real estate finance company (2012 to 2016); Director and Chairman of the Board, Brixmor Property Group, Inc. (2013 to present); Director, Hilton Worldwide (2007 to present); Director, Hudson Pacific Properties (2014 to 2016); Director, Invitation Homes (2014 to 2017); Director, JMB Realty Corporation (1980 to present) | |
| Mark R. Tercek(c) (1957) 2009 [0] | President and Chief Executive Officer, The Nature Conservancy (2008 to present) | |
| (a)All information about the independent directors was current as of February 19, 2019, unless otherwise indicated, except for the number of portfolios overseen, which is current as of the date of this report. | ||
| (b)William J. Stromberg, president and chief executive officer of T. Rowe Price Group, Inc., the parent company of the Price Funds’ investment advisor, has served on the Board of Trustees of Johns Hopkins University since 2014 and is a member of the Johns Hopkins University Board’s Compensation Committee. | ||
| (c)Effective February 15, 2019, Mr. Tercek resigned from his role as independent director of the Price Funds. | ||
| INSIDE DIRECTORS | ||
| Name | ||
| (Year of Birth) | ||
| Year Elected* | ||
| [Number of T. Rowe Price | Principal Occupation(s) and Directorships of Public Companies and | |
| Portfolios Overseen] | Other Investment Companies During the Past Five Years | |
| David Oestreicher (1967) 2018 [189] | Chief Legal Officer, Vice President, and Secretary, T. Rowe Price Group, Inc.; Director, Vice President, and Secretary, T. Rowe Price Investment Services, Inc., T. Rowe Price Retirement Plan Services, Inc., T. Rowe Price Services, Inc., and T. Rowe Price Trust Company; Vice President and Secretary, T. Rowe Price, T. Rowe Price Hong Kong (Price Hong Kong), and T. Rowe Price International; Vice President, T. Rowe Price Japan (Price Japan) and T. Rowe Price Singapore (Price Singapore); Principal Executive Officer and Executive Vice President, all funds | |
| Robert W. Sharps, CFA, CPA** (1971) 2017 [189] | Director and Vice President, T. Rowe Price; Vice President, T. Rowe Price Group, Inc., and T. Rowe Price Trust Company | |
| *Each inside director serves until retirement, resignation, or election of a successor. | ||
| **Mr. Sharps replaced Edward A. Wiese as director of the domestic fixed income Price Funds effective January 1, 2019. | ||
| OFFICERS | ||
| Name (Year of Birth) | ||
| Position Held With Index Trust | Principal Occupation(s) | |
| E. Frederick Bair, CFA, CPA (1969) Vice President | Vice President, T. Rowe Price, T. Rowe Price Group, Inc., and T. Rowe Price Trust Company | |
| Darrell N. Braman (1963) Vice President and Secretary | Vice President, Price Hong Kong, Price Singapore, T. Rowe Price, T. Rowe Price Group, Inc., T. Rowe Price International, T. Rowe Price Retirement Plan Services, Inc., and T. Rowe Price Services, Inc. | |
| Alan S. Dupski, CPA (1982) Assistant Treasurer | Vice President, T. Rowe Price and T. Rowe Price Group, Inc. | |
| Alexa M. Gagliardi (1988) President | Vice President, T. Rowe Price and T. Rowe Price Trust Company | |
| John R. Gilner (1961) Chief Compliance Officer | Chief Compliance Officer and Vice President, T. Rowe Price; Vice President, T. Rowe Price Group, Inc., and T. Rowe Price Investment Services, Inc. | |
| Gary J. Greb (1961) Vice President | Vice President, T. Rowe Price, T. Rowe Price International, and T. Rowe Price Trust Company | |
| Paul J. Krug, CPA (1964) Vice President | Vice President, T. Rowe Price, T. Rowe Price Group, Inc., and T. Rowe Price Trust Company | |
| Catherine D. Mathews (1963) Principal Financial Officer, Vice President, and Treasurer | Vice President, T. Rowe Price, T. Rowe Price Group, Inc., and T. Rowe Price Trust Company | |
| John W. Ratzesberger (1975) Vice President | Vice President, T. Rowe Price, T. Rowe Price Group,Inc., and T. Rowe Price Trust Company | |
| Shannon H. Rauser (1987) Assistant Secretary | Assistant Vice President, T. Rowe Price | |
| Neil Smith (1972) Vice President | Vice President, Price Hong Kong, Price Japan, Price Singapore, T. Rowe Price Group, Inc., and T. Rowe Price International | |
| Craig A. Thiese (1975) Vice President | Vice President, T. Rowe Price, T. Rowe Price Group, Inc., and T. Rowe Price International | |
| Megan Warren (1968) Vice President | Vice President, T. Rowe Price, T. Rowe Price Group, Inc., T. Rowe Price Retirement Plan Services, Inc., T. Rowe Price Services, Inc., and T. Rowe Price Trust Company; formerly, Executive Director, JPMorgan Chase (to 2017) | |
| Michael T. Wehn (1984) Vice President | Vice President, T. Rowe Price and T. Rowe Price Group, Inc. | |
| Unless otherwise noted, officers have been employees of T. Rowe Price or T. Rowe Price International for at least 5 years. | ||
Item 1. (b) Notice pursuant to Rule 30e-3.
Not applicable.
Item 2. Code of Ethics.
The registrant has adopted a code of ethics, as defined in Item 2 of Form N-CSR, applicable to its principal executive officer, principal financial officer, principal accounting officer or controller, or persons performing similar functions. A copy of this code of ethics is filed as an exhibit to this Form N-CSR. No substantive amendments were approved or waivers were granted to this code of ethics during the period covered by this report.
Item 3. Audit Committee Financial Expert.
The registrant’s Board of Directors/Trustees has determined that Mr. Bruce W. Duncan qualifies as an audit committee financial expert, as defined in Item 3 of Form N-CSR. Mr. Duncan is considered independent for purposes of Item 3 of Form N-CSR.
Item 4. Principal Accountant Fees and Services.
(a) – (d) Aggregate fees billed for the last two fiscal years for professional services rendered to, or on behalf of, the registrant by the registrant’s principal accountant were as follows:
Audit fees include amounts related to the audit of the registrant’s annual financial statements and services normally provided by the accountant in connection with statutory and regulatory filings. Audit-related fees include amounts reasonably related to the performance of the audit of the registrant’s financial statements and specifically include the issuance of a report on internal controls and, if applicable, agreed-upon procedures related to fund acquisitions. Tax fees include amounts related to services for tax compliance, tax planning, and tax advice. The nature of these services specifically includes the review of distribution calculations and the preparation of Federal, state, and excise tax returns. All other fees include the registrant’s pro-rata share of amounts for agreed-upon procedures in conjunction with service contract approvals by the registrant’s Board of Directors/Trustees.
(e)(1) The registrant’s audit committee has adopted a policy whereby audit and non-audit services performed by the registrant’s principal accountant for the registrant, its investment adviser, and any entity controlling, controlled by, or under common control with the investment adviser that provides ongoing services to the registrant require pre-approval in advance at regularly scheduled audit committee meetings. If such a service is required between regularly scheduled audit committee meetings, pre-approval may be authorized by one audit committee member with ratification at the next scheduled audit committee meeting. Waiver of pre-approval for audit or non-audit services requiring fees of a de minimis amount is not permitted.
(2) No services included in (b) – (d) above were approved pursuant to paragraph (c)(7)(i)(C) of Rule 2-01 of Regulation S-X.
(f) Less than 50 percent of the hours expended on the principal accountant’s engagement to audit the registrant’s financial statements for the most recent fiscal year were attributed to work performed by persons other than the principal accountant’s full-time, permanent employees.
(g) The aggregate fees billed for the most recent fiscal year and the preceding fiscal year by the registrant’s principal accountant for non-audit services rendered to the registrant, its investment adviser, and any entity controlling, controlled by, or under common control with the investment adviser that provides ongoing services to the registrant were $3,227,000 and $2,544,000, respectively.
(h) All non-audit services rendered in (g) above were pre-approved by the registrant’s audit committee. Accordingly, these services were considered by the registrant’s audit committee in maintaining the principal accountant’s independence.
Item 5. Audit Committee of Listed Registrants.
Not applicable.
Item 6. Investments.
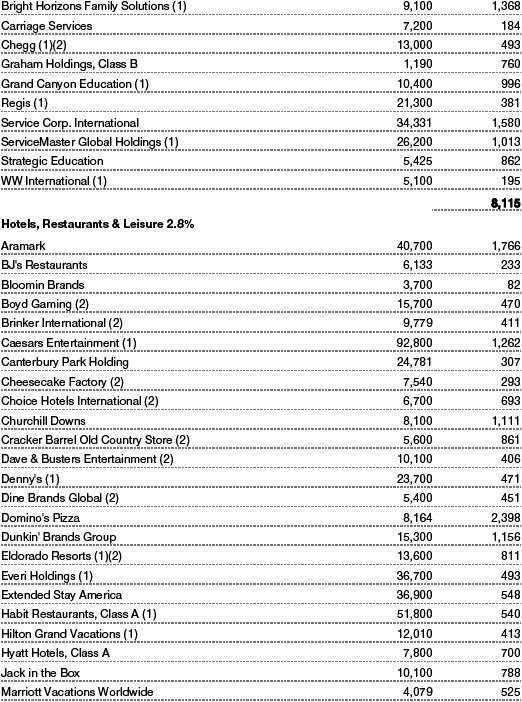
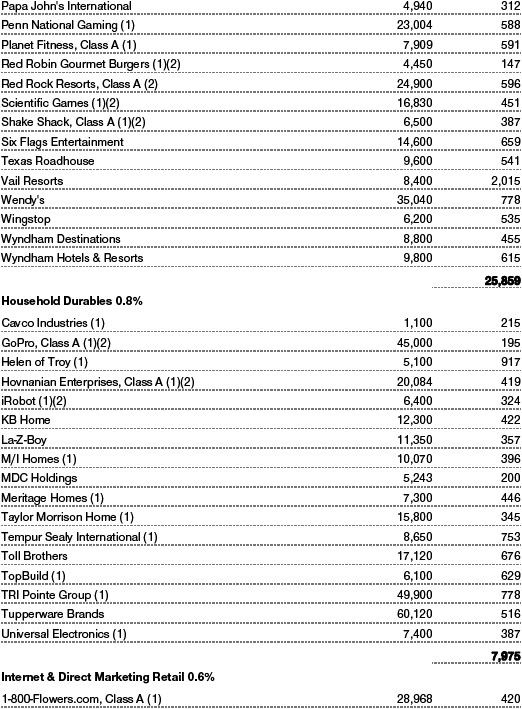
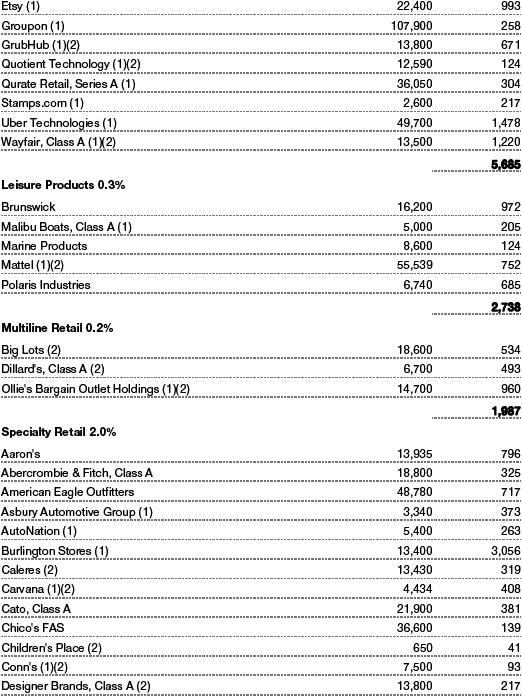
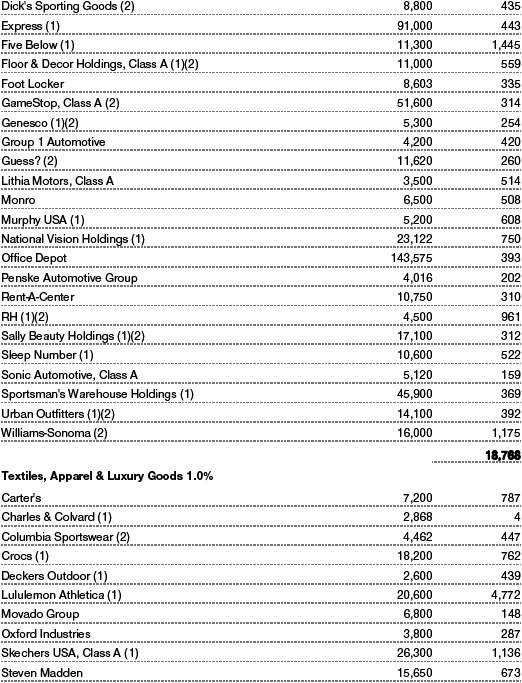
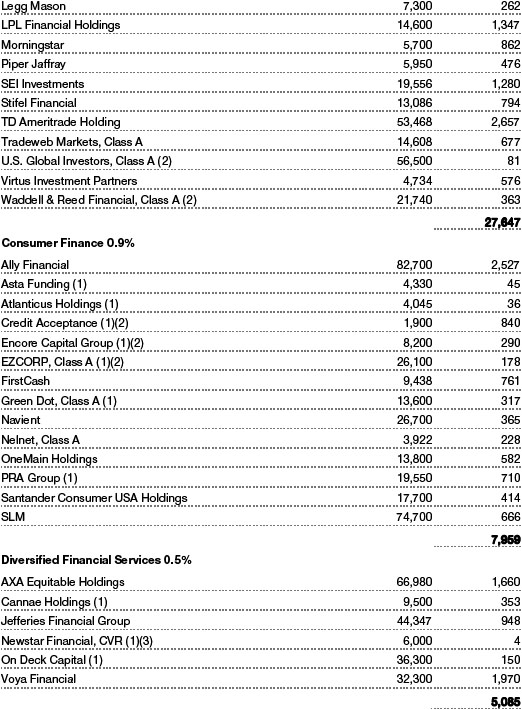
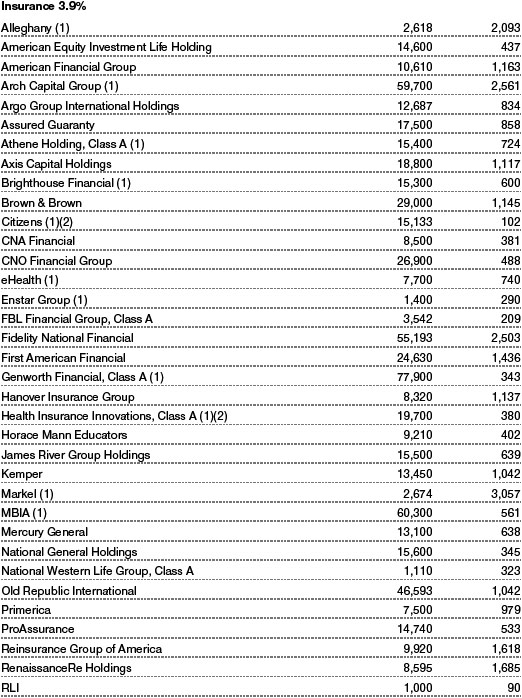
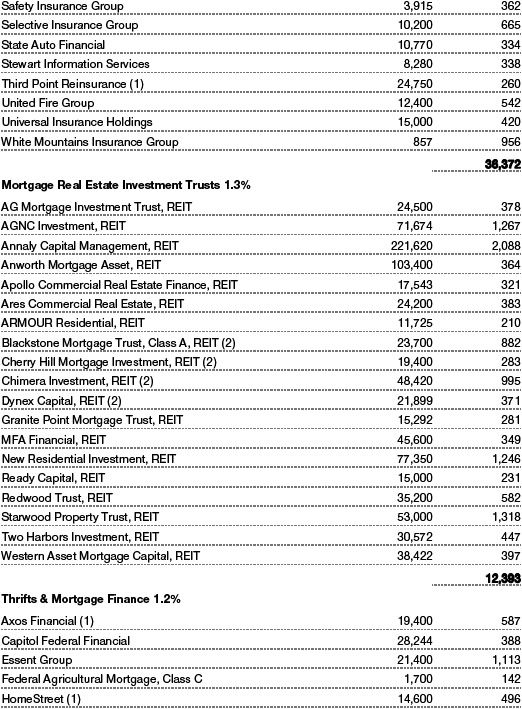
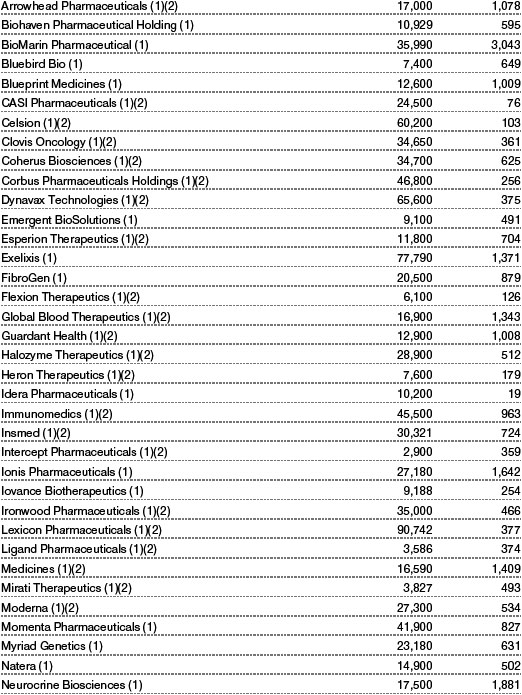
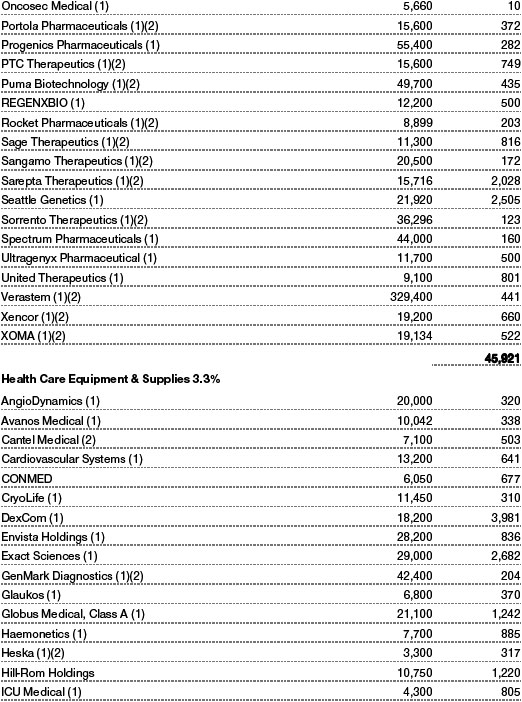
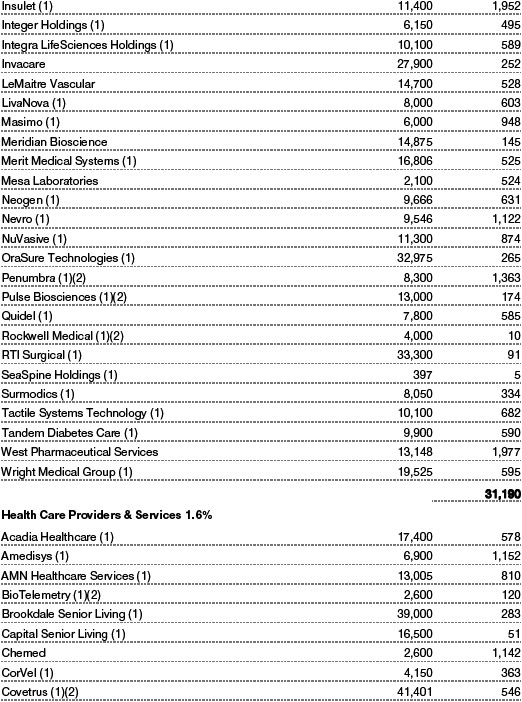
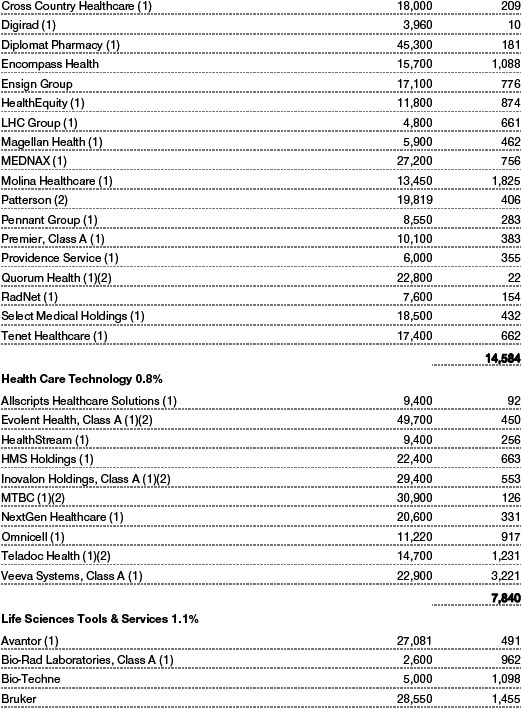
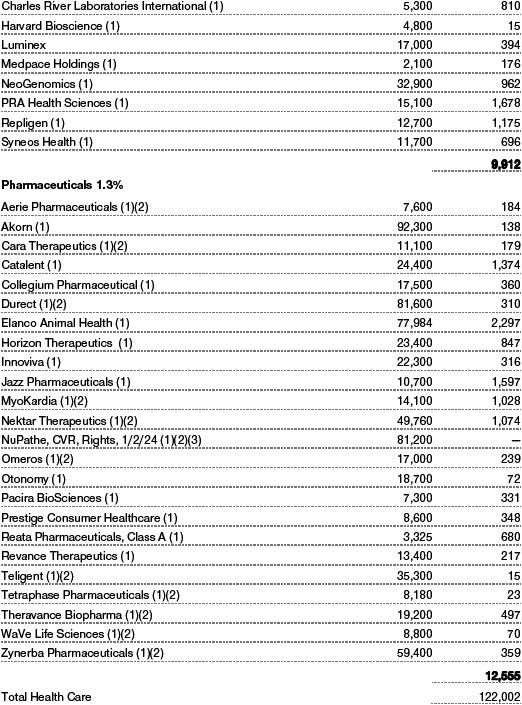
(a) Not applicable. The complete schedule of investments is included in Item 1 of this Form N-CSR.
(b) Not applicable.
Item 7. Disclosure of Proxy Voting Policies and Procedures for Closed-End Management Investment Companies.
Not applicable.
Item 8. Portfolio Managers of Closed-End Management Investment Companies.
Not applicable.
Item 9. Purchases of Equity Securities by Closed-End Management Investment Company and Affiliated Purchasers.
Not applicable.
Item 10. Submission of Matters to a Vote of Security Holders.
Not applicable.
Item 11. Controls and Procedures.
(a) The registrant’s principal executive officer and principal financial officer have evaluated the registrant’s disclosure controls and procedures within 90 days of this filing and have concluded that the registrant’s disclosure controls and procedures were effective, as of that date, in ensuring that information required to be disclosed by the registrant in this Form N-CSR was recorded, processed, summarized, and reported timely.
(b) The registrant’s principal executive officer and principal financial officer are aware of no change in the registrant’s internal control over financial reporting that occurred during the period covered by this report that has materially affected, or is reasonably likely to materially affect, the registrant’s internal control over financial reporting.
Item 12. Disclosure of Securities Lending Activities for Closed-End Management Investment Companies.
Not applicable.
Item 13. Exhibits.
(a)(1) The registrant’s code of ethics pursuant to Item 2 of Form N-CSR is attached.
(2) Separate certifications by the registrant's principal executive officer and principal financial officer, pursuant to Section 302 of the Sarbanes-Oxley Act of 2002 and required by Rule 30a-2(a) under the Investment Company Act of 1940, are attached.
(3) Written solicitation to repurchase securities issued by closed-end companies: not applicable.
(b) A certification by the registrant’s principal executive officer and principal financial officer, pursuant to Section 906 of the Sarbanes-Oxley Act of 2002 and required by Rule 30a-2(b) under the Investment Company Act of 1940, is attached.
SIGNATURES
Pursuant to the requirements of the Securities Exchange Act of 1934 and the Investment Company Act of 1940, the registrant has duly caused this report to be signed on its behalf by the undersigned, thereunto duly authorized.
T. Rowe Price Index Trust, Inc.
| By | /s/ David Oestreicher | |||||
| David Oestreicher | ||||||
| Principal Executive Officer | ||||||
| Date | February 14, 2020 | |||||
Pursuant to the requirements of the Securities Exchange Act of 1934 and the Investment Company Act of 1940, this report has been signed below by the following persons on behalf of the registrant and in the capacities and on the dates indicated.
| By | /s/ David Oestreicher | |||||
| David Oestreicher | ||||||
| Principal Executive Officer | ||||||
| Date | February 14, 2020 | |||||
| By | /s/ Alan S. Dupski | |||||
| Alan S. Dupski | ||||||
| Principal Financial Officer | ||||||
| Date | February 14, 2020 | |||||