UNITED STATES
SECURITIES AND EXCHANGE COMMISSION
Washington, D.C. 20549
FORM N-CSR
CERTIFIED SHAREHOLDER REPORT OF REGISTERED
MANAGEMENT INVESTMENT COMPANIES
Investment Company Act File Number: 811-05986
| T. Rowe Price Index Trust, Inc. |
|
| (Exact name of registrant as specified in charter) |
| |
| 100 East Pratt Street, Baltimore, MD 21202 |
|
| (Address of principal executive offices) |
| |
| David Oestreicher |
| 100 East Pratt Street, Baltimore, MD 21202 |
|
| (Name and address of agent for service) |
Registrant’s telephone number, including area code: (410) 345-2000
Date of fiscal year end: December 31
Date of reporting period: June 30, 2020
Item 1. Reports to Shareholders
(a) Report pursuant to Rule 30e-1.
| Small-Cap Index Fund | June 30, 2020 |
| T. ROWE PRICE SMALL-CAP INDEX FUND |
|
HIGHLIGHTS
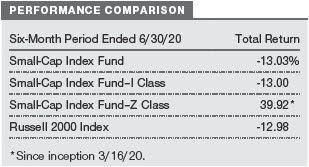
| ■ | Small-cap stocks declined during the first half of 2020. The Small-Cap Index Fund returned -13.03% versus -12.98% for its benchmark, the Russell 2000 Index. |
| |
| ■ | Most sectors of the Russell index produced negative returns. The financials and industrials and business services sectors were the largest detractors. Health care was the only sector to produce positive returns and contribute to performance. |
| |
| ■ | The fund seeks to employ a full replication strategy, which involves investing substantially all of its assets in all of the stocks in the index and seeking to maintain holdings of each stock in proportion to its weight in the index. At the end of our reporting period, health care and financials were the fund’s largest sector allocations. The portfolio had very little exposure to energy and communication services investments. |
| |
| ■ | As we enter the second half of the year, we expect markets to remain volatile. The scale of fiscal and monetary policy stimulus and the potential for medical breakthroughs create the potential for stocks to move higher, but much depends on the course of the coronavirus. Rising tensions between the U.S. and China, social unrest, and the U.S. elections in November could also drive market performance. |

Log in to your account at troweprice.com for more information.
*Certain mutual fund accounts that are assessed an annual account service fee can also save money by switching to e-delivery.
CIO Market Commentary
Dear Shareholder
Financial markets recorded widely mixed results during the first half of 2020 as the spread of the coronavirus disrupted global economies. Although stocks and bonds experienced extraordinary volatility, historic levels of fiscal and monetary stimulus helped mitigate the losses.
Market sentiment was positive as we entered the year, and the S&P 500 Index advanced to a record high on February 19. However, stocks began falling as the coronavirus spread in Italy and other countries outside China. The major indexes continued their slide as cases mounted in the U.S. and New York City became the epicenter of the pandemic. Governments throughout the world issued stay-at-home orders to contain the virus, and some sectors, such as travel, restaurants, and shopping malls, nearly came to a halt.
According to the National Bureau of Economic Research, a recession officially began in February, ending the longest expansion in U.S. history. Over 22 million Americans lost their jobs in March and April, and many measures of economic activity, including retail sales and industrial production, experienced record-setting declines. By March 23, the S&P 500 Index had fallen by about a third from the start of the year.
In response to the rapid economic contraction, global central banks took bold accommodative steps, and many governments around the world passed emergency spending packages. The Federal Reserve cut its short-term lending rate to near zero and began massive purchases of government and corporate bonds to stimulate the economy and supply liquidity in the fixed income market.
The federal government also provided trillions of dollars in fiscal help in the form of direct payments to many Americans, expanded unemployment insurance, and subsidies to sectors such as transportation and health care that had been directly impacted by the pandemic. As lockdowns eased late in the period, there were signs of economic recovery, especially in stronger-than-expected payroll data, but surges in new virus cases in some states remained a concern.
Boosted by the stimulus and indications that the economy was mending faster than many expected, nearly all sectors recouped some of their losses by the end of June, and some segments were back in positive territory. For the six-month period, the tech-heavy Nasdaq Composite Index reached record highs and easily outperformed other benchmarks as the pandemic appeared to accelerate trends in retail, social media, and content streaming that benefited the large technology platforms. Large- and mid-cap growth stocks also produced positive returns and outperformed small-caps and value shares, which lost ground.
The S&P 500 Index finished the period with modest losses overall. Within the benchmark, tech and consumer discretionary stocks rallied, but energy shares were down more than 35% (including dividends) amid tumbling oil prices, and the financials sector struggled in a low-yield environment. Non-U.S. equity markets were generally negative and lagged the U.S. benchmarks.
In the fixed income universe, Treasuries were the top performers as yields dropped to record lows during the period, and other U.S. investment-grade bonds were also generally positive. High yield and emerging markets bonds were particularly hard hit during the market sell-off in March, but the sectors staged a strong recovery as investors sought out higher-yielding securities. Emerging markets debt denominated in U.S. dollars outperformed local currency issues, as weakness in certain currencies weighed on local bond performance in U.S. dollar terms.
As we enter the second half of the year, we expect markets to remain volatile. The scale of the stimulus and the potential for medical breakthroughs create the potential for stocks to move higher, but much depends on the course of the virus. Rising tensions between the U.S. and China, social unrest, and the U.S. elections in November could also drive market performance.
Our investment teams will be carefully monitoring these developments, and I believe that our disciplined fundamental research and strategic investing approach will continue to serve our shareholders well in this uncertain environment.
Thank you for your continued confidence in T. Rowe Price.
Sincerely,

Robert Sharps
Group Chief Investment Officer
Management’s Discussion of Fund Performance
INVESTMENT OBJECTIVE
The fund seeks to track the performance of a benchmark index that measures the investment return of small-capitalization U.S. stocks.
FUND COMMENTARY
How did the fund perform in the past six months?
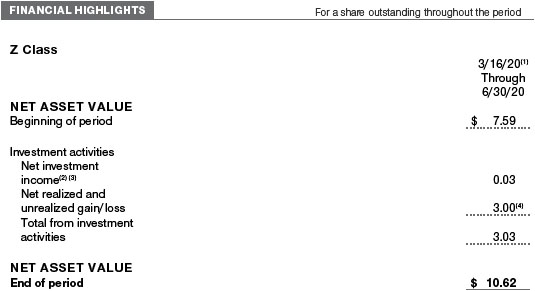
Small-cap stocks declined during the first half of 2020. The Small-Cap Index Fund returned -13.03% versus -12.98% for its benchmark, the Russell 2000 Index. Fund performance tends to slightly lag that of the index due to operating and management expenses. (Performance for the I and Z Class shares will vary due to a different fee structure. Past performance cannot guarantee future results.)
As a reminder, the fund is not available for direct purchase by members of the public. All investments in the fund must be made by T. Rowe Price or one of its affiliated investment advisers on behalf of mutual funds, 529 plans, or other institutional client accounts for which T. Rowe Price or its affiliate has discretionary investment authority.
What factors influenced the fund’s performance?
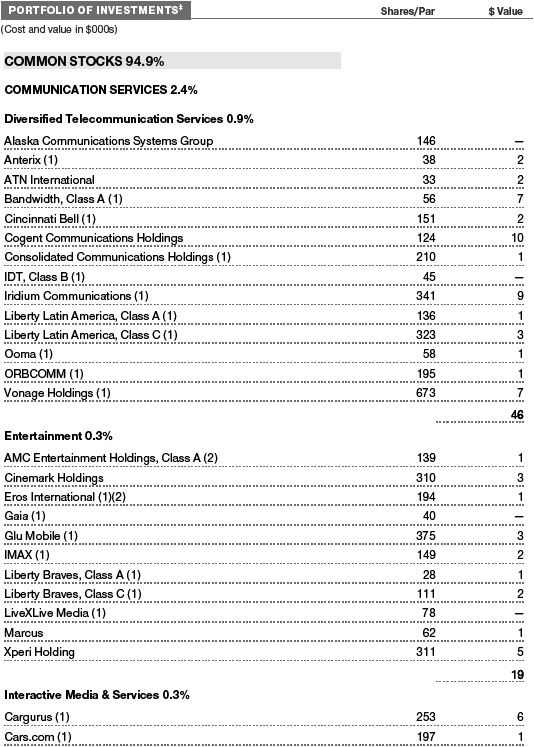
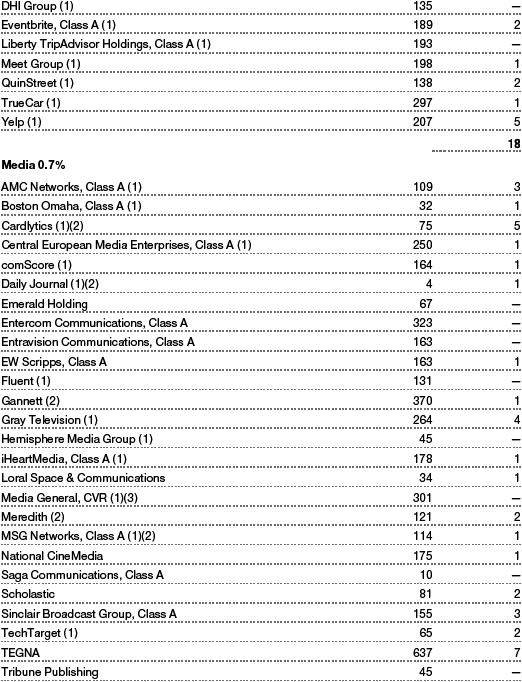
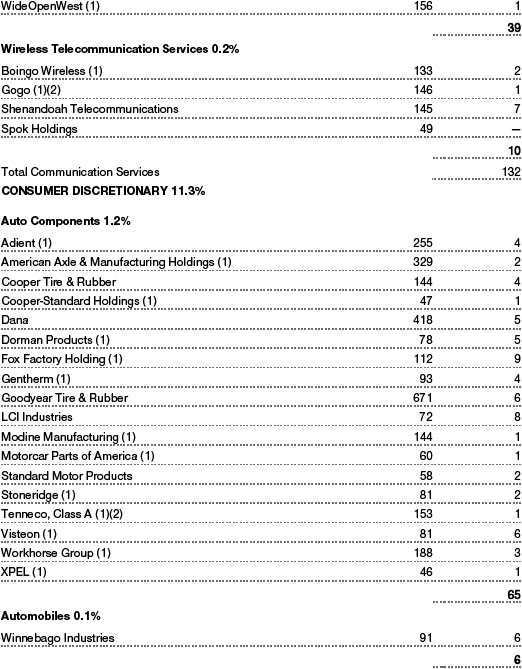
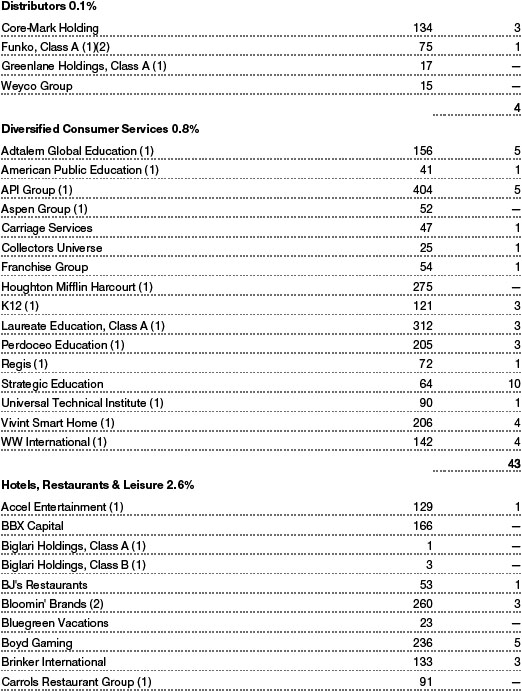
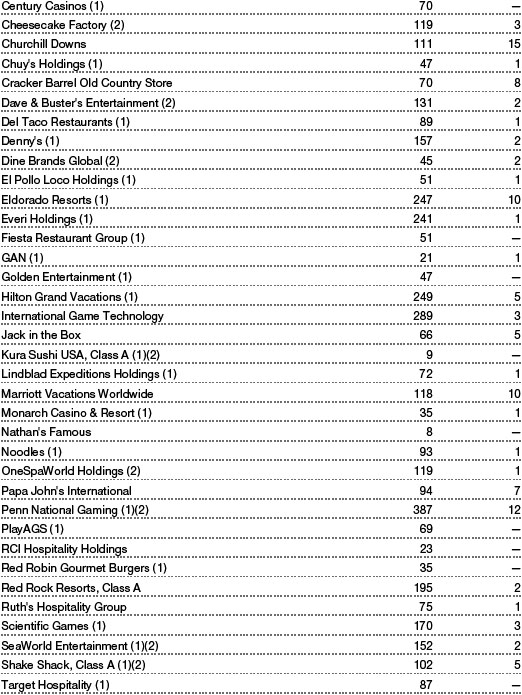
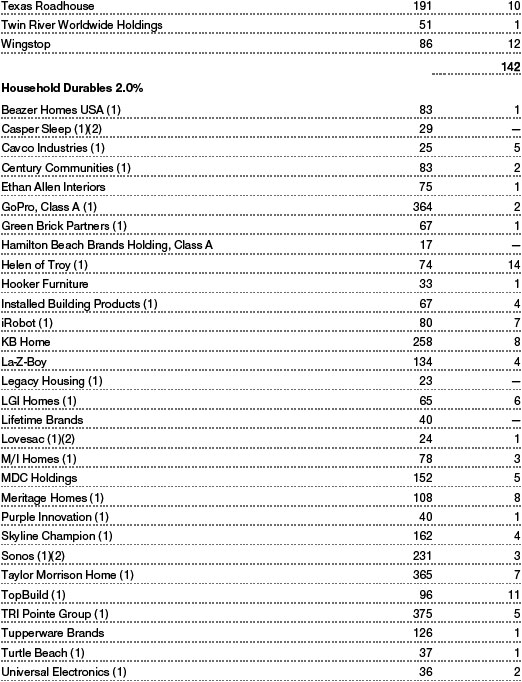
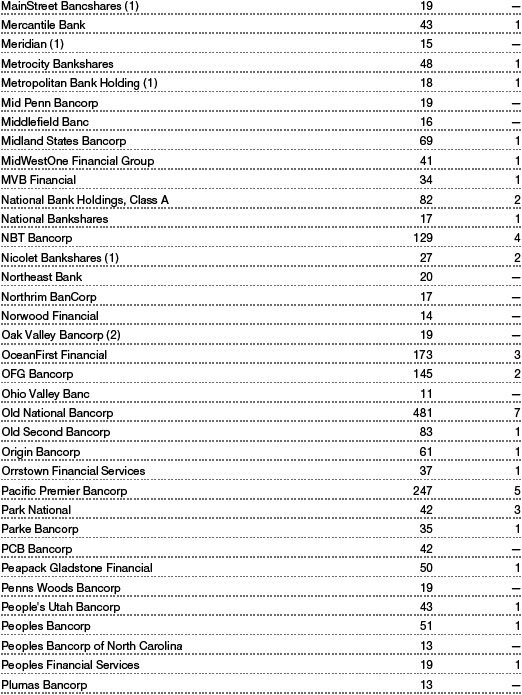
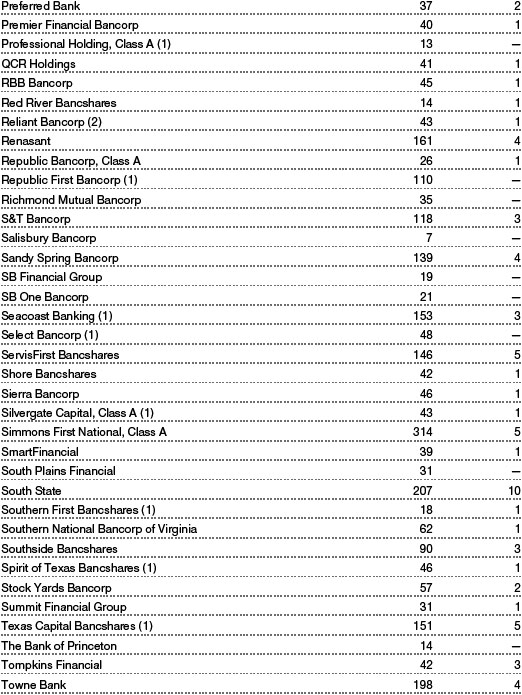
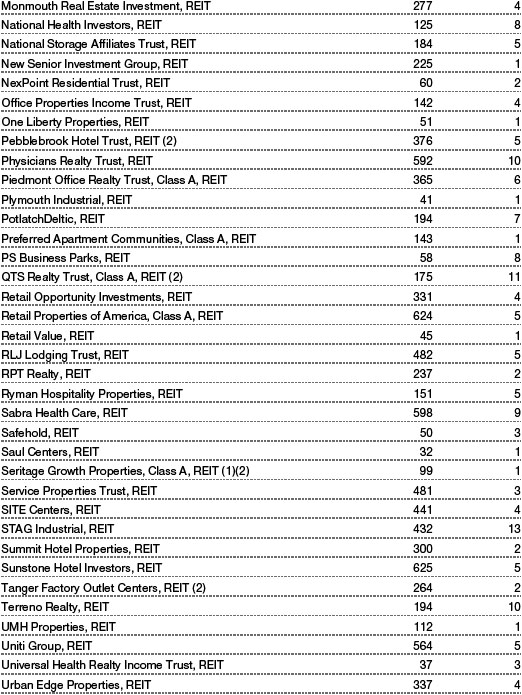
Most sectors of the Russell index produced negative returns during the first half of 2020. Within the portfolio, the financials sector detracted the most, as the banking segment was hit the hardest. The plunge in Treasury yields across the curve made it difficult for banks to create profitable loans. Banks also faced a barrage of refinancing activity, as many homeowners took advantage of some of the lowest mortgage rates in history. Hancock Whitney and South State posted steep losses. The industrials and business services sector declined, led by names in commercial services. Brinks Company, a provider of logistics and security solutions, underperformed. Real estate stocks also declined and weighed on the portfolio’s performance. Ryman Hospitality Properties lagged. (Please refer to the fund’s portfolio of investments for a complete list of holdings and the amount each represents in the portfolio.)
Conversely, health care was the only sector to produce gains during the period and contributed to fund performance. Names in biotechnology performed well, led by Immunomedics, Livongo Health, and Novavax. Elsewhere in the sector, Teladoc Health—the largest public telehealth company—and diagnostic testing solutions firm Quidel were top performers.
To help the fund stay fully invested, the portfolio uses derivatives—specifically, stock index futures based on the Russell 2000 Index—as a cash management tool. In the last six months, the use of these stock index futures had a negative impact on the fund’s performance. As noted, the fund’s performance was in line with that of the Russell 2000 Index in our reporting period.
How is the fund positioned?
The Small-Cap Index Fund seeks to replicate the structure and performance of its benchmark, the Russell 2000 Index. The index, which is constructed by the Russell Investment Group, consists of approximately 2,000 small-cap securities, some of which could be considered micro-caps.
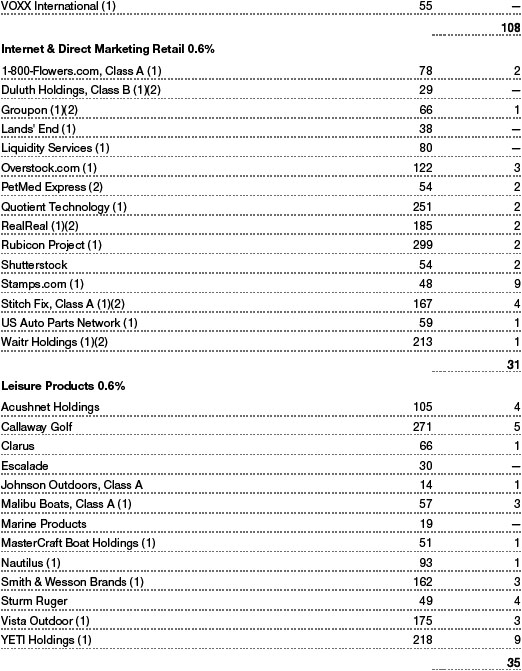
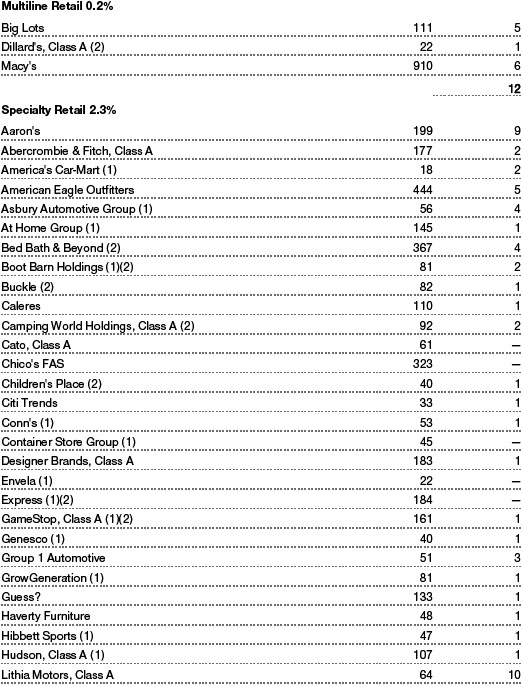
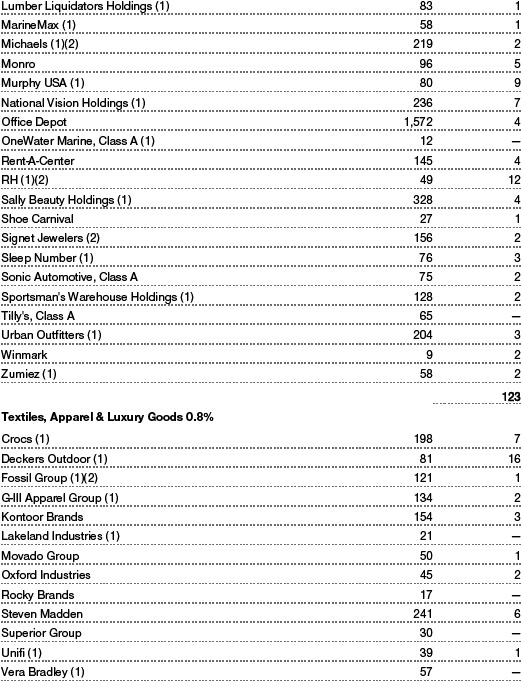
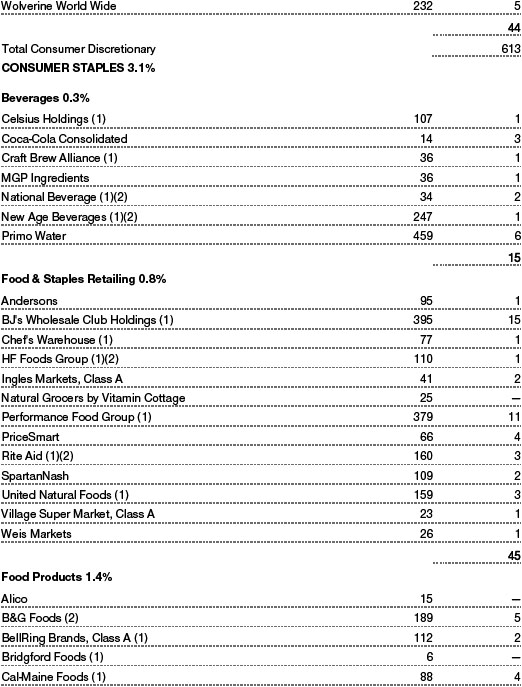
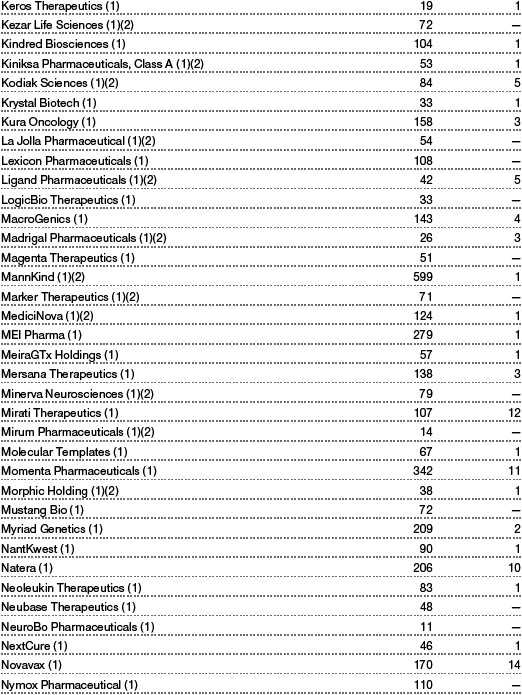
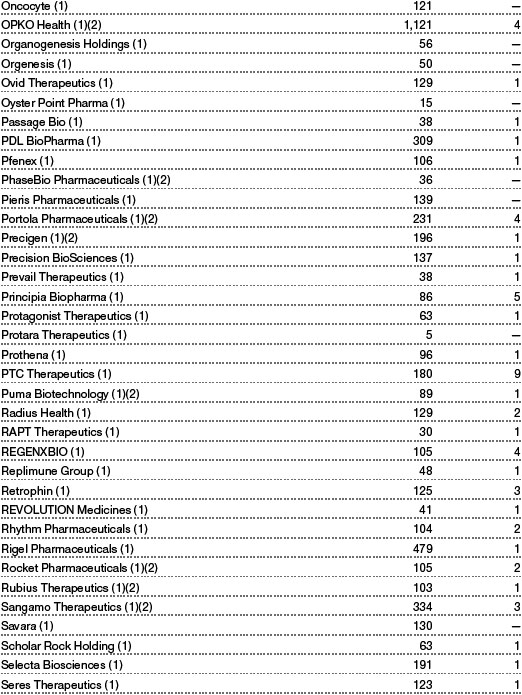
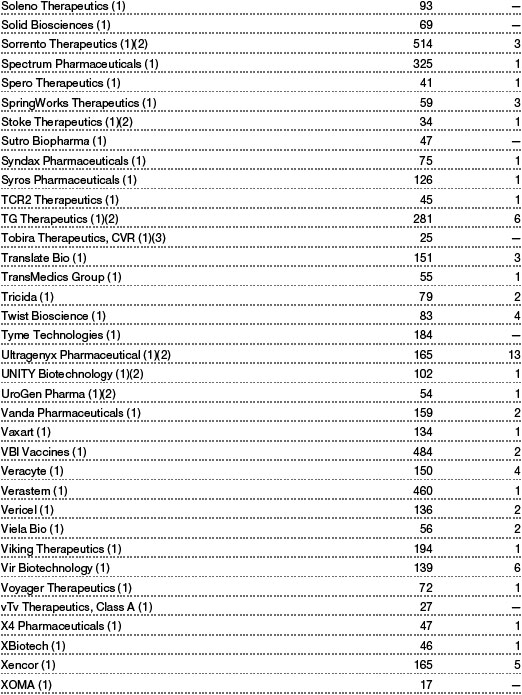
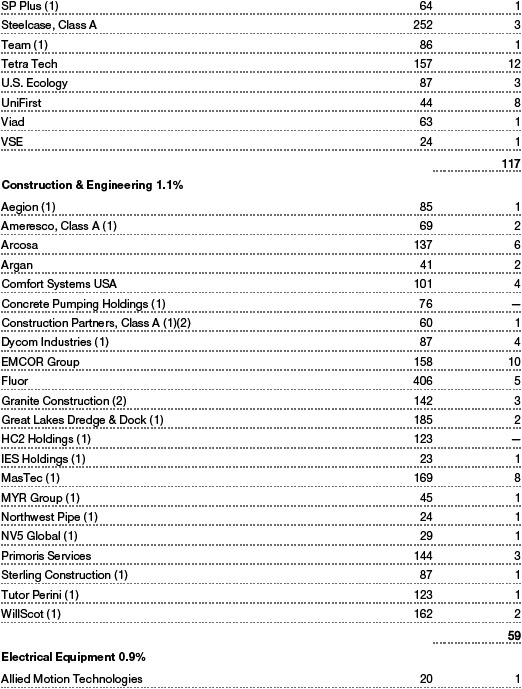
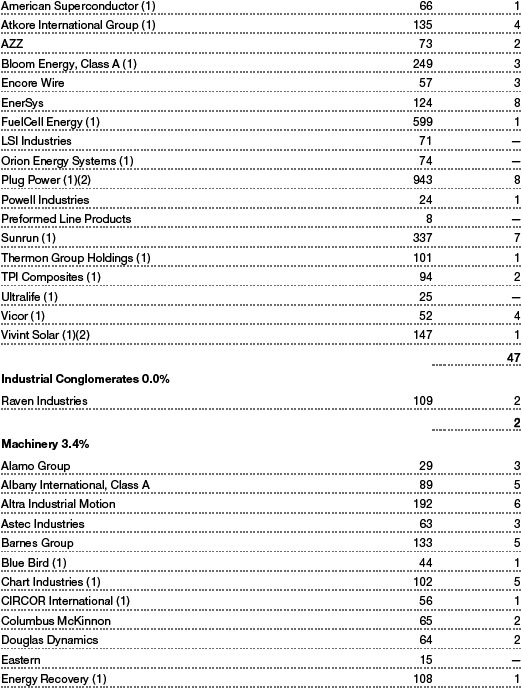
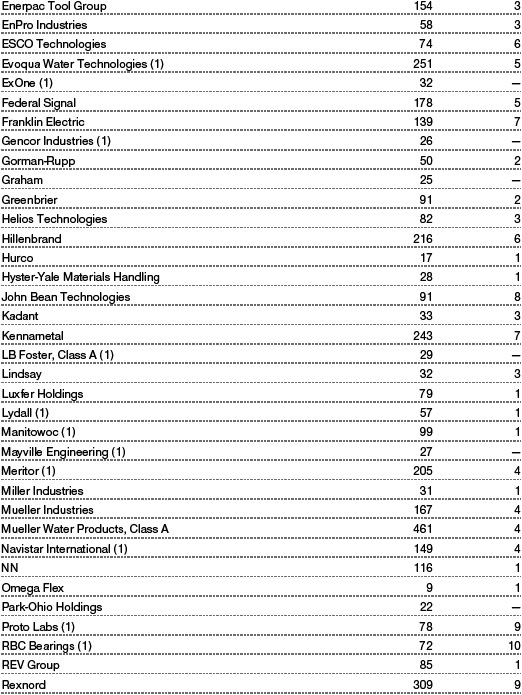
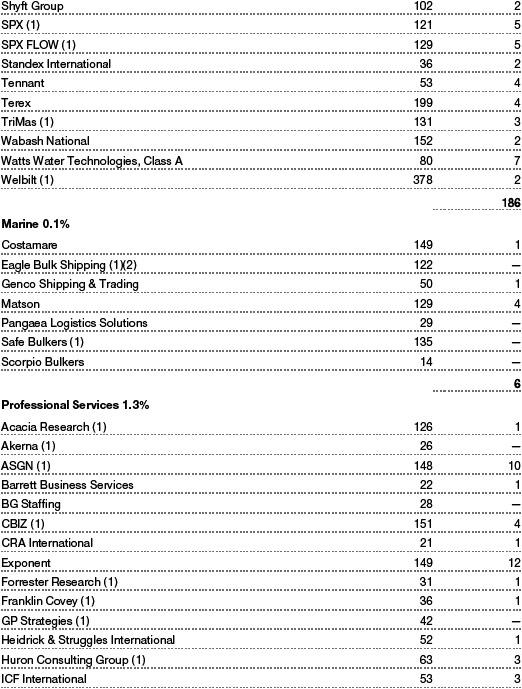
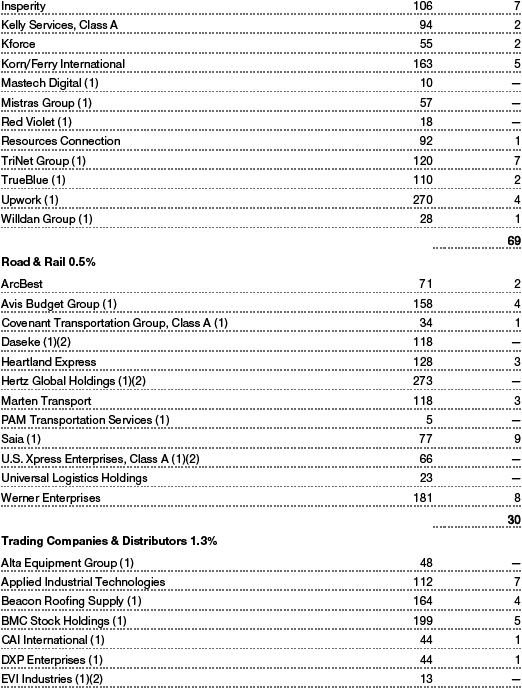
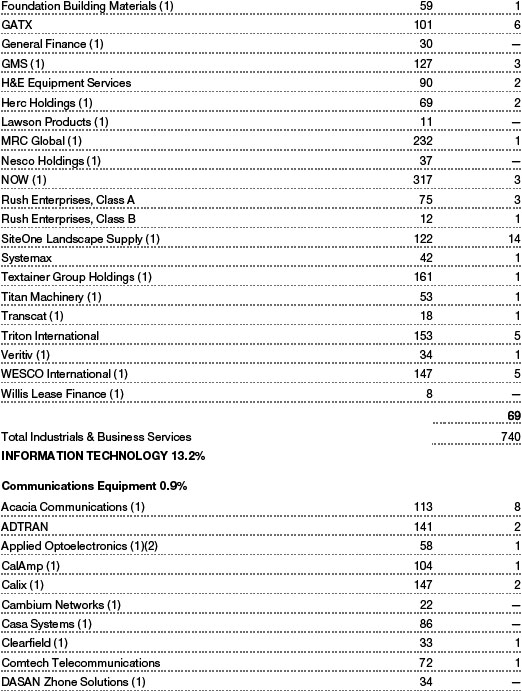
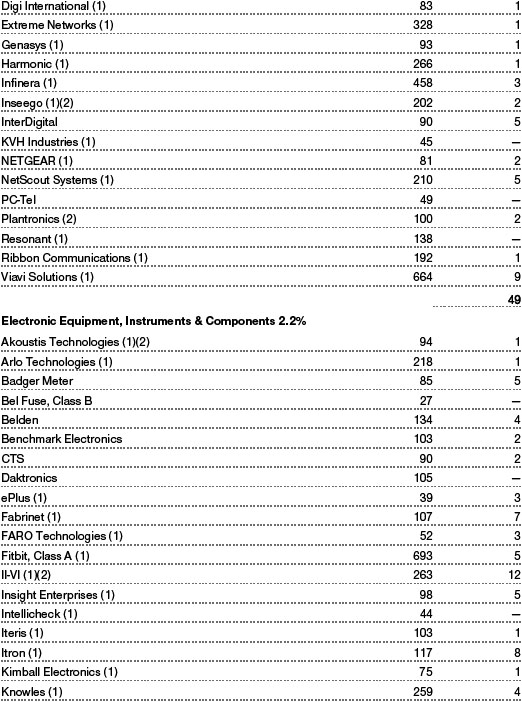
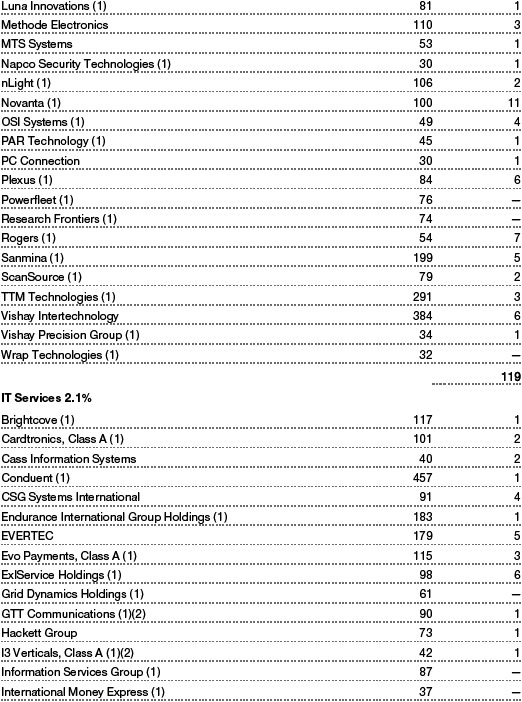
The fund seeks to employ a full replication strategy, which involves investing substantially all of its assets in all of the stocks in the index and seeking to maintain holdings of each stock in proportion to its weight in the index. Since the portfolio is designed to track its index, it does not have the flexibility to shift assets toward stocks or sectors that are rising or away from those that are declining.
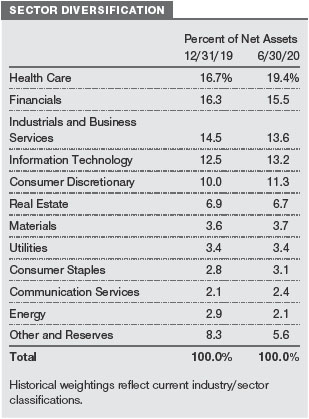
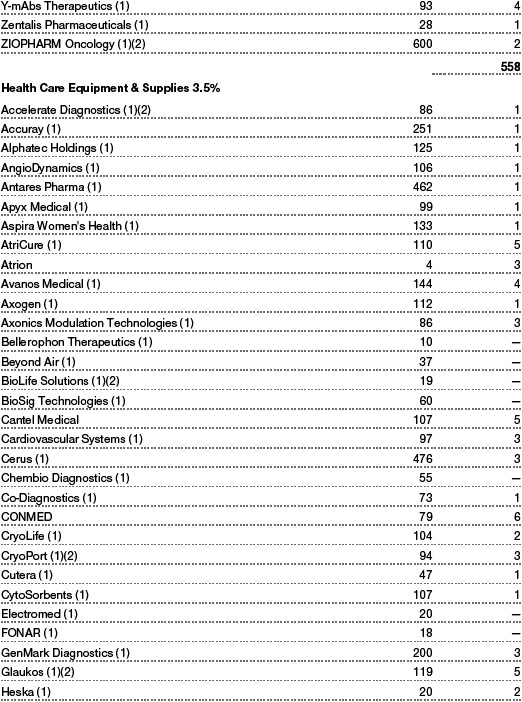
At the end of our reporting period, health care and financials were the fund’s largest sector allocations, as shown in the Sector Diversification table. The industrials and business services and information technology sectors were also significant. The portfolio had very little exposure to energy and communication services investments.
What is portfolio management’s outlook?
As we enter the second half of the year, we expect markets to remain volatile. The scale of the federal government’s and central bank’s stimulus efforts and the potential for medical breakthroughs create the potential for stocks to move higher, but much depends on the course of the virus. As we write this letter, the number of coronavirus cases is increasing in a number of states, causing some governors to pause or reverse some of their reopening efforts, which could hinder economic, market, and corporate earnings recoveries. Rising tensions between the U.S. and China, social unrest, and the U.S. elections in November are among the factors that could also influence market performance.
Regardless of economic or market developments or changes in investor sentiment, we will not attempt to determine which stocks or sectors are likely to perform best. Our main task is to replicate the structure of the Russell 2000 Index to provide broad exposure to small-cap stocks and to attempt to track the index’s performance.
The views expressed reflect the opinions of T. Rowe Price as of the date of this report and are subject to change based on changes in market, economic, or other conditions. These views are not intended to be a forecast of future events and are no guarantee of future results.
RISKS OF INVESTING IN THE SMALL-CAP INDEX FUND
Common stocks generally fluctuate in value more than bonds and may decline significantly over short time periods. There is a chance that stock prices overall will decline because stock markets tend to move in cycles, with periods of rising and falling prices. The value of a stock in which the fund invests may decline due to general weakness in the U.S. stock market, such as when the U.S. financial markets decline, or because of factors that affect a particular company or industry.
Investing primarily in issuers within the same market capitalization category carries the risk that the category may be out of favor due to current market conditions or investor sentiment. Because the fund invests primarily in securities issued by small-cap companies and, to a lesser extent, micro-cap companies, the fund is likely to be more volatile than one that focuses on securities issued by larger companies. Small- and micro-cap companies often have less experienced management, narrower product lines, more limited financial resources, and less publicly available information than larger companies. In addition, smaller companies are typically more sensitive to changes in overall economic conditions and their securities may be difficult to trade. Micro-cap stocks may be even more thinly traded, making it difficult for the fund to buy, sell, and value its shares.
Because the fund is passively managed and seeks to match the performance of its benchmark index, holdings are generally not reallocated based on changes in market conditions or the outlook for a specific security, industry, or market sector. As a result, the fund’s performance may lag the performance of actively managed funds.
The returns of the fund are expected to be slightly below the returns of its benchmark index (referred to as tracking error) because the fund incurs fees and transaction expenses, while the index has no fees or expenses. The risk of tracking error is increased to the extent the fund is unable to fully replicate its benchmark index, which could result from changes in the composition of the index or the timing of purchases and redemptions of fund shares.
BENCHMARK INFORMATION
Note: Frank Russell Company (Russell) is the source and owner of the Russell index data contained or reflected in these materials and all trademarks and copyrights related thereto. Russell® is a registered trademark of Russell. Russell is not responsible for the formatting or configuration of these materials or for any inaccuracy in T. Rowe Price Associates’ presentation thereof.
GROWTH OF $10,000
This chart shows the value of a hypothetical $10,000 investment in the fund over the past 10 fiscal year periods or since inception (for funds lacking 10-year records). The result is compared with benchmarks, which include a broad-based market index and may also include a peer group average or index. Market indexes do not include expenses, which are deducted from fund returns as well as mutual fund averages and indexes.
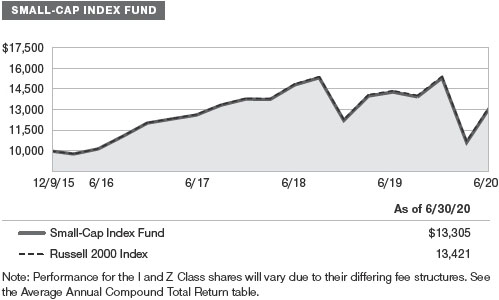
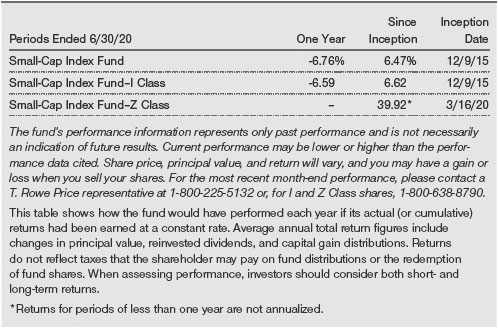
AVERAGE ANNUAL COMPOUND TOTAL RETURN
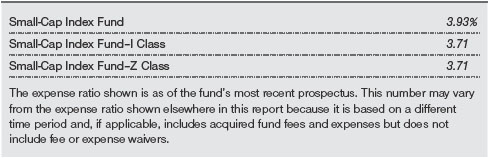
EXPENSE RATIO
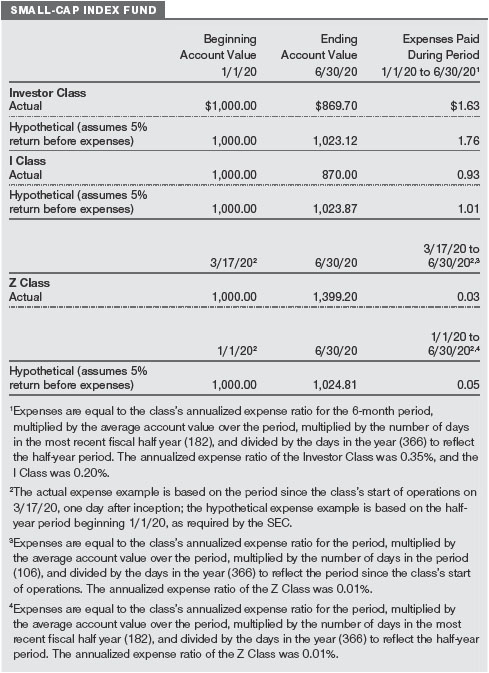
FUND EXPENSE EXAMPLE
As a mutual fund shareholder, you may incur two types of costs: (1) transaction costs, such as redemption fees or sales loads, and (2) ongoing costs, including management fees, distribution and service (12b-1) fees, and other fund expenses. The following example is intended to help you understand your ongoing costs (in dollars) of investing in the fund and to compare these costs with the ongoing costs of investing in other mutual funds. The example is based on an investment of $1,000 invested at the beginning of the most recent six-month period and held for the entire period.
Please note that the fund has three share classes: The Investor Class charges no distribution and service (12b-1) fee, and the I Class shares are also available to institutionally oriented clients and impose no 12b-1 or administrative fee payment, and Z Class shares are offered only to funds advised by T. Rowe Price and other advisory clients of T. Rowe Price or its affiliates that are subject to a contractual fee for investment management services and impose no 12b-1 fee or administrative fee payment. Each share class is presented separately in the table.
Actual Expenses
The first line of the following table (Actual) provides information about actual account values and actual expenses. You may use the information on this line, together with your account balance, to estimate the expenses that you paid over the period. Simply divide your account value by $1,000 (for example, an $8,600 account value divided by $1,000 = 8.6), then multiply the result by the number on the first line under the heading “Expenses Paid During Period” to estimate the expenses you paid on your account during this period.
Hypothetical Example for Comparison Purposes
The information on the second line of the table (Hypothetical) is based on hypothetical account values and expenses derived from the fund’s actual expense ratio and an assumed 5% per year rate of return before expenses (not the fund’s actual return). You may compare the ongoing costs of investing in the fund with other funds by contrasting this 5% hypothetical example and the 5% hypothetical examples that appear in the shareholder reports of the other funds. The hypothetical account values and expenses may not be used to estimate the actual ending account balance or expenses you paid for the period.
Note: T. Rowe Price charges an account service fee that is not included in the accompanying table. The account service fee is charged on a quarterly basis, usually during the last week of a calendar quarter, and applies to accounts with balances below $10,000 on the day of the assessment. The fee is charged to accounts that fall below $10,000 for any reason, including market fluctuations, redemptions, or exchanges. When an account with less than $10,000 is closed either through redemption or exchange, the fee is charged and deducted from the proceeds. The fee applies to IRAs but not to retirement plans directly registered with T. Rowe Price Services or accounts maintained by intermediaries through NSCC® Networking. If you are subject to the fee, keep it in mind when you are estimating the ongoing expenses of investing in the fund and when comparing the expenses of this fund with other funds.
You should also be aware that the expenses shown in the table highlight only your ongoing costs and do not reflect any transaction costs, such as redemption fees or sales loads. Therefore, the second line of the table is useful in comparing ongoing costs only and will not help you determine the relative total costs of owning different funds. To the extent a fund charges transaction costs, however, the total cost of owning that fund is higher.
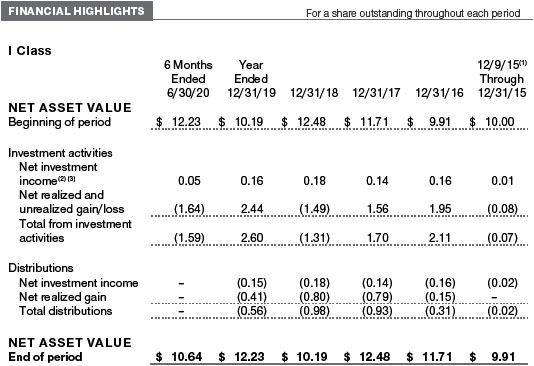
Unaudited
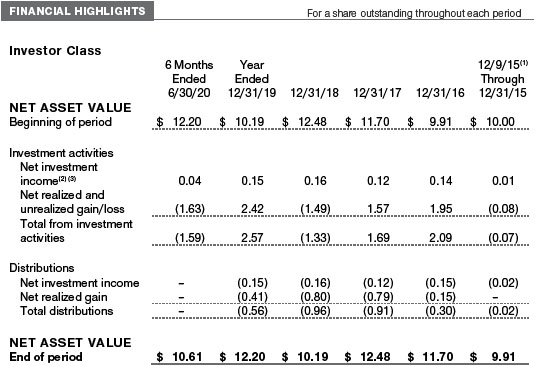
The accompanying notes are an integral part of these financial statements.
Unaudited
The accompanying notes are an integral part of these financial statements.
Unaudited
The accompanying notes are an integral part of these financial statements.
June 30, 2020 (Unaudited)

The accompanying notes are an integral part of these financial statements.
June 30, 2020 (Unaudited)
The accompanying notes are an integral part of these financial statements.
Unaudited
The accompanying notes are an integral part of these financial statements.
Unaudited
The accompanying notes are an integral part of these financial statements.
Unaudited
| NOTES TO FINANCIAL STATEMENTS |
T. Rowe Price Index Trust, Inc. (the corporation) is registered under the Investment Company Act of 1940 (the 1940 Act). The Small-Cap Index Fund (the fund) is a diversified, open-end management investment company established by the corporation. The fund is available for investment only by mutual funds, college savings plans, and other institutional client accounts managed by T. Rowe Price Associates, Inc., or its affiliates and is not available for direct purchase by members of the public. The fund seeks to track the performance of a benchmark index that measures the investment return of small-capitalization U.S. stocks. The fund has three classes of shares: the Small-Cap Index Fund (Investor Class), the Small-Cap Index Fund–I Class (I Class), and the Small-Cap Index Fund–Z Class (Z Class). I Class shares require a $1 million initial investment minimum, although the minimum generally is waived for retirement plans, financial intermediaries, and certain other accounts. The Z Class is only available to funds advised by T. Rowe Price Associates, Inc. and its affiliates and other clients that are subject to a contractual fee for investment management services. Each class has exclusive voting rights on matters related solely to that class; separate voting rights on matters that relate to all classes; and, in all other respects, the same rights and obligations as the other classes.
NOTE 1 - SIGNIFICANT ACCOUNTING POLICIES
Basis of Preparation The fund is an investment company and follows accounting and reporting guidance in the Financial Accounting Standards Board (FASB) Accounting Standards Codification Topic 946 (ASC 946). The accompanying financial statements were prepared in accordance with accounting principles generally accepted in the United States of America (GAAP), including, but not limited to, ASC 946. GAAP requires the use of estimates made by management. Management believes that estimates and valuations are appropriate; however, actual results may differ from those estimates, and the valuations reflected in the accompanying financial statements may differ from the value ultimately realized upon sale or maturity.
Investment Transactions, Investment Income, and Distributions Investment transactions are accounted for on the trade date basis. Income and expenses are recorded on the accrual basis. Realized gains and losses are reported on the identified cost basis. Premiums and discounts on debt securities are amortized for financial reporting purposes. Income tax-related interest and penalties, if incurred, are recorded as income tax expense. Dividends received from mutual fund investments are reflected as dividend income; capital gain distributions are reflected as realized gain/loss. Dividend income and capital gain distributions are recorded on the ex-dividend date. Distributions from REITs are initially recorded as dividend income and, to the extent such represent a return of capital or capital gain for tax purposes, are reclassified when such information becomes available. Non-cash dividends, if any, are recorded at the fair market value of the asset received. Distributions to shareholders are recorded on the ex-dividend date. Income distributions, if any, are declared and paid by each class annually. A capital gain distribution may also be declared and paid by the fund annually.
Class Accounting Shareholder servicing, prospectus, and shareholder report expenses incurred by each class are charged directly to the class to which they relate. Expenses common to both classes, investment income, and realized and unrealized gains and losses are allocated to the classes based upon the relative daily net assets of each class.
New Accounting Guidance In March 2020, the FASB issued Accounting Standards Update (ASU), ASU 2020-04, Reference Rate Reform (Topic 848) – Facilitation of the Effects of Reference Rate Reform on Financial Reporting, which provides optional, temporary relief with respect to the financial reporting of contracts subject to certain types of modifications due to the planned discontinuation of the London Interbank Offered Rate (LIBOR) and other interbank-offered based reference rates as of the end of 2021. The guidance is effective for certain reference rate-related contract modifications that occur during the period March 12, 2020 through December 31, 2022. Management is currently evaluating the impact, if any, of the ASU on the fund’s financial statements.
Indemnification In the normal course of business, the fund may provide indemnification in connection with its officers and directors, service providers, and/or private company investments. The fund’s maximum exposure under these arrangements is unknown; however, the risk of material loss is currently considered to be remote.
NOTE 2 - VALUATION
The fund’s financial instruments are valued and each class’s net asset value (NAV) per share is computed at the close of the New York Stock Exchange (NYSE), normally 4 p.m. ET, each day the NYSE is open for business. However, the NAV per share may be calculated at a time other than the normal close of the NYSE if trading on the NYSE is restricted, if the NYSE closes earlier, or as may be permitted by the SEC.
Fair Value The fund’s financial instruments are reported at fair value, which GAAP defines as the price that would be received to sell an asset or paid to transfer a liability in an orderly transaction between market participants at the measurement date. The T. Rowe Price Valuation Committee (the Valuation Committee) is an internal committee that has been delegated certain responsibilities by the fund’s Board of Directors (the Board) to ensure that financial instruments are appropriately priced at fair value in accordance with GAAP and the 1940 Act. Subject to oversight by the Board, the Valuation Committee develops and oversees pricing-related policies and procedures and approves all fair value determinations. Specifically, the Valuation Committee establishes procedures to value securities; determines pricing techniques, sources, and persons eligible to effect fair value pricing actions; oversees the selection, services, and performance of pricing vendors; oversees valuation-related business continuity practices; and provides guidance on internal controls and valuation-related matters. The Valuation Committee reports to the Board and has representation from legal, portfolio management and trading, operations, risk management, and the fund’s treasurer.
Various valuation techniques and inputs are used to determine the fair value of financial instruments. GAAP establishes the following fair value hierarchy that categorizes the inputs used to measure fair value:
Level 1 – quoted prices (unadjusted) in active markets for identical financial instruments that the fund can access at the reporting date
Level 2 – inputs other than Level 1 quoted prices that are observable, either directly or indirectly (including, but not limited to, quoted prices for similar financial instruments in active markets, quoted prices for identical or similar financial instruments in inactive markets, interest rates and yield curves, implied volatilities, and credit spreads)
Level 3 – unobservable inputs
Observable inputs are developed using market data, such as publicly available information about actual events or transactions, and reflect the assumptions that market participants would use to price the financial instrument. Unobservable inputs are those for which market data are not available and are developed using the best information available about the assumptions that market participants would use to price the financial instrument. GAAP requires valuation techniques to maximize the use of relevant observable inputs and minimize the use of unobservable inputs. When multiple inputs are used to derive fair value, the financial instrument is assigned to the level within the fair value hierarchy based on the lowest-level input that is significant to the fair value of the financial instrument. Input levels are not necessarily an indication of the risk or liquidity associated with financial instruments at that level but rather the degree of judgment used in determining those values.
Valuation Techniques Equity securities listed or regularly traded on a securities exchange or in the over-the-counter (OTC) market are valued at the last quoted sale price or, for certain markets, the official closing price at the time the valuations are made. OTC Bulletin Board securities are valued at the mean of the closing bid and asked prices. A security that is listed or traded on more than one exchange is valued at the quotation on the exchange determined to be the primary market for such security. Listed securities not traded on a particular day are valued at the mean of the closing bid and asked prices. Actively traded equity securities listed on a domestic exchange generally are categorized in Level 1 of the fair value hierarchy. OTC Bulletin Board securities, certain preferred securities, and equity securities traded in inactive markets generally are categorized in Level 2 of the fair value hierarchy.
Debt securities generally are traded in the OTC market and are valued at prices furnished by independent pricing services or by broker dealers who make markets in such securities. When valuing securities, the independent pricing services consider the yield or price of bonds of comparable quality, coupon, maturity, and type, as well as prices quoted by dealers who make markets in such securities. Generally, debt securities are categorized in Level 2 of the fair value hierarchy; however, to the extent the valuations include significant unobservable inputs, the securities would be categorized in Level 3.
Investments in mutual funds are valued at the mutual fund’s closing NAV per share on the day of valuation and are categorized in Level 1 of the fair value hierarchy. Financial futures contracts are valued at closing settlement prices and are categorized in Level 1 of the fair value hierarchy. Assets and liabilities other than financial instruments, including short-term receivables and payables, are carried at cost, or estimated realizable value, if less, which approximates fair value.
Thinly traded financial instruments and those for which the above valuation procedures are inappropriate or are deemed not to reflect fair value are stated at fair value as determined in good faith by the Valuation Committee. The objective of any fair value pricing determination is to arrive at a price that could reasonably be expected from a current sale. Financial instruments fair valued by the Valuation Committee are primarily private placements, restricted securities, warrants, rights, and other securities that are not publicly traded.
Subject to oversight by the Board, the Valuation Committee regularly makes good faith judgments to establish and adjust the fair valuations of certain securities as events occur and circumstances warrant. For instance, in determining the fair value of an equity investment with limited market activity, such as a private placement or a thinly traded public company stock, the Valuation Committee considers a variety of factors, which may include, but are not limited to, the issuer’s business prospects, its financial standing and performance, recent investment transactions in the issuer, new rounds of financing, negotiated transactions of significant size between other investors in the company, relevant market valuations of peer companies, strategic events affecting the company, market liquidity for the issuer, and general economic conditions and events. In consultation with the investment and pricing teams, the Valuation Committee will determine an appropriate valuation technique based on available information, which may include both observable and unobservable inputs. The Valuation Committee typically will afford greatest weight to actual prices in arm’s length transactions, to the extent they represent orderly transactions between market participants, transaction information can be reliably obtained, and prices are deemed representative of fair value. However, the Valuation Committee may also consider other valuation methods such as market-based valuation multiples; a discount or premium from market value of a similar, freely traded security of the same issuer; or some combination. Fair value determinations are reviewed on a regular basis and updated as information becomes available, including actual purchase and sale transactions of the issue. Because any fair value determination involves a significant amount of judgment, there is a degree of subjectivity inherent in such pricing decisions, and fair value prices determined by the Valuation Committee could differ from those of other market participants. Depending on the relative significance of unobservable inputs, including the valuation technique(s) used, fair valued securities may be categorized in Level 2 or 3 of the fair value hierarchy.
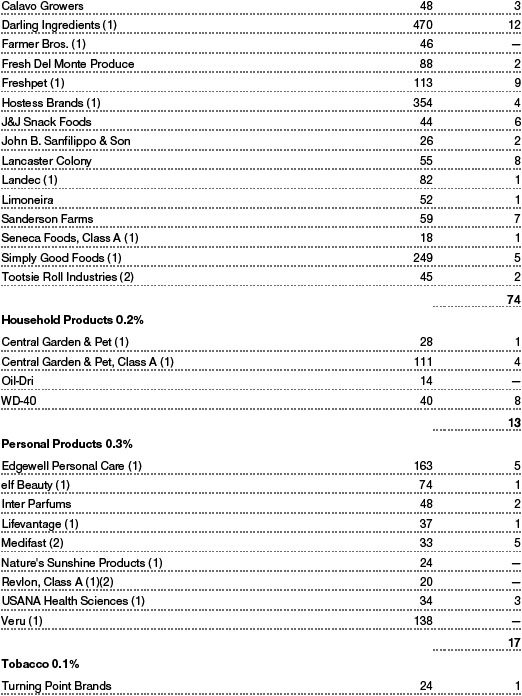
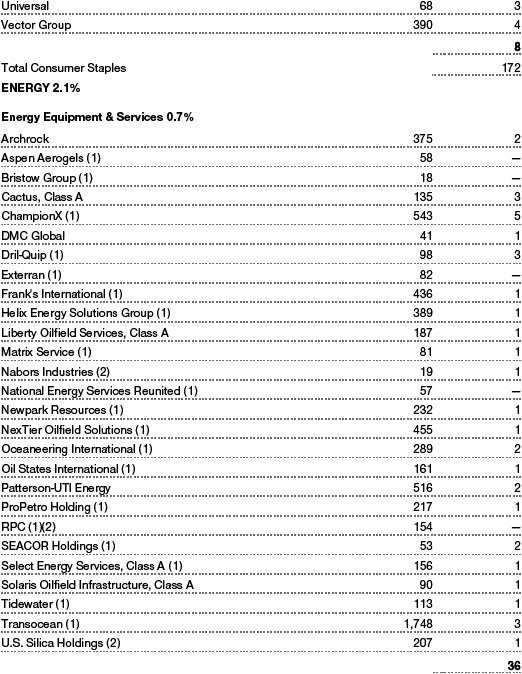
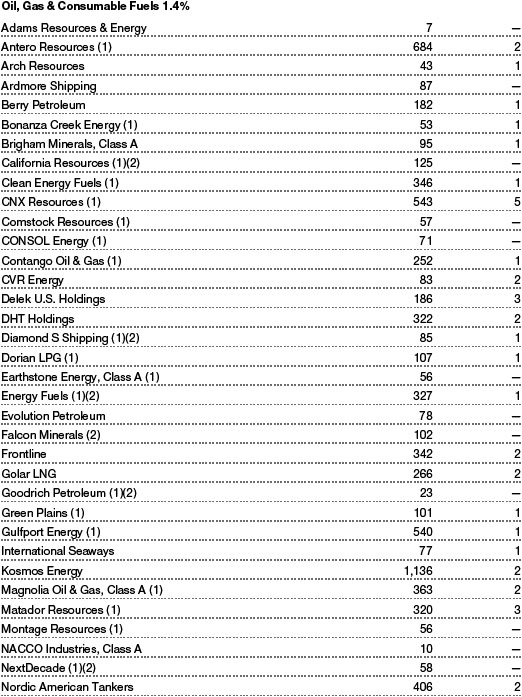
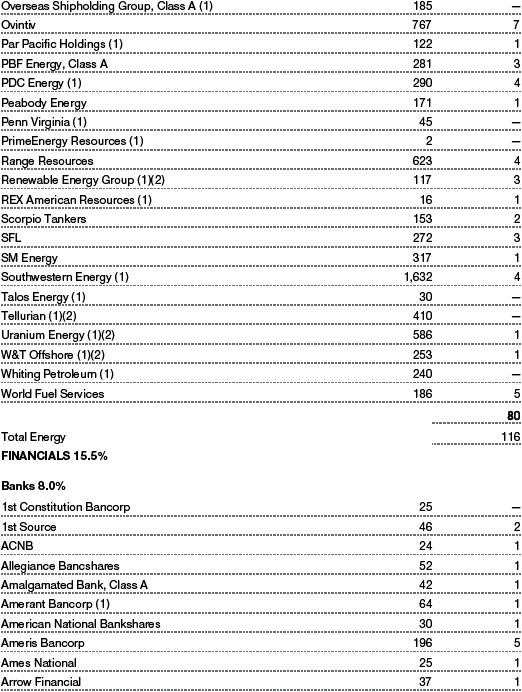
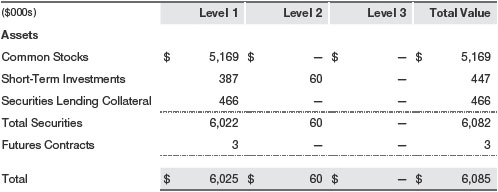
Valuation Inputs The following table summarizes the fund’s financial instruments, based on the inputs used to determine their fair values on June 30, 2020 (for further detail by category, please refer to the accompanying Portfolio of Investments):
NOTE 3 - DERIVATIVE INSTRUMENTS
During the six months ended June 30, 2020, the fund invested in derivative instruments. As defined by GAAP, a derivative is a financial instrument whose value is derived from an underlying security price, foreign exchange rate, interest rate, index of prices or rates, or other variable; it requires little or no initial investment and permits or requires net settlement. The fund invests in derivatives only if the expected risks and rewards are consistent with its investment objectives, policies, and overall risk profile, as described in its prospectus and Statement of Additional Information. The fund may use derivatives for a variety of purposes, such as seeking to hedge against declines in principal value, increase yield, invest in an asset with greater efficiency and at a lower cost than is possible through direct investment, to enhance return, or to adjust credit exposure. The risks associated with the use of derivatives are different from, and potentially much greater than, the risks associated with investing directly in the instruments on which the derivatives are based. The fund at all times maintains sufficient cash reserves, liquid assets, or other SEC-permitted asset types to cover its settlement obligations under open derivative contracts.
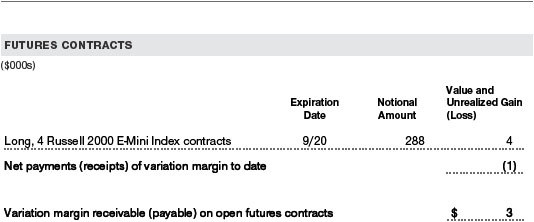
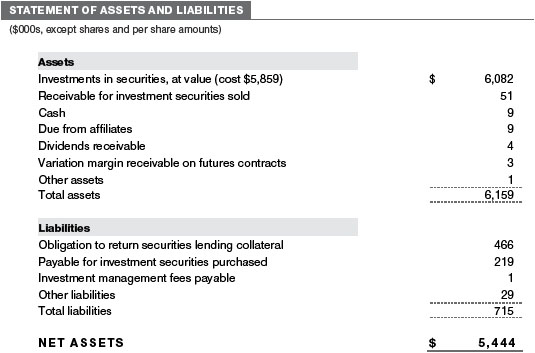
The fund values its derivatives at fair value and recognizes changes in fair value currently in its results of operations. Accordingly, the fund does not follow hedge accounting, even for derivatives employed as economic hedges. Generally, the fund accounts for its derivatives on a gross basis. It does not offset the fair value of derivative liabilities against the fair value of derivative assets on its financial statements, nor does it offset the fair value of derivative instruments against the right to reclaim or obligation to return collateral. As of June 30, 2020, the fund held equity futures with cumulative unrealized gain of $4,000; the value reflected on the accompanying Statement of Assets and Liabilities is the related unsettled variation margin.
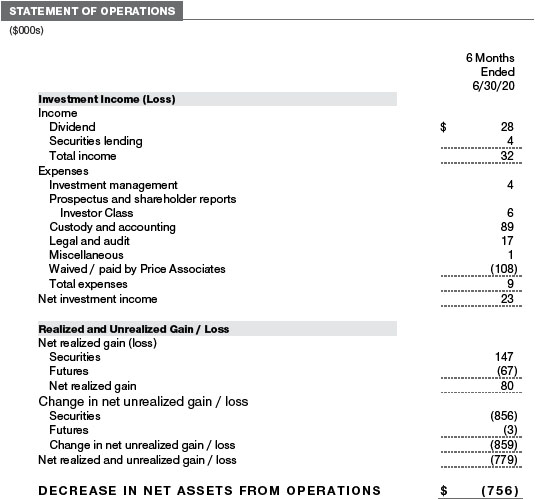
Additionally, during the six months ended June 30, 2020, the fund recognized $(67,000) of realized loss on Futures and a $(3,000) change in unrealized gain/loss on Futures related to its investments in equity derivatives; such amounts are included on the accompanying Statement of Operations.
Counterparty Risk and Collateral The fund invests in exchange-traded or centrally cleared derivative contracts, such as futures, exchange-traded options, and centrally cleared swaps. Counterparty risk on such derivatives is minimal because the clearinghouse provides protection against counterparty defaults. For futures and centrally cleared swaps, the fund is required to deposit collateral in an amount specified by the clearinghouse and the clearing firm (margin requirement), and the margin requirement must be maintained over the life of the contract. Each clearinghouse and clearing firm, in its sole discretion, may adjust the margin requirements applicable to the fund.
Collateral may be in the form of cash or debt securities issued by the U.S. government or related agencies. Cash posted by the fund is reflected as cash deposits in the accompanying financial statements and generally is restricted from withdrawal by the fund; securities posted by the fund are so noted in the accompanying Portfolio of Investments; both remain in the fund’s assets. While typically not sold in the same manner as equity or fixed income securities, exchange-traded or centrally cleared derivatives may be closed out only on the exchange or clearinghouse where the contracts were traded. This ability is subject to the liquidity of underlying positions. As of June 30, 2020, securities valued at $46,000 had been posted by the fund for exchange-traded and/or centrally cleared derivatives.
Futures Contracts The fund is subject to equity price risk in the normal course of pursuing its investment objectives and uses futures contracts to help manage such risk. The fund may enter into futures contracts as an efficient means of maintaining liquidity while being invested in the market, to facilitate trading, or to reduce transaction costs. A futures contract provides for the future sale by one party and purchase by another of a specified amount of a specific underlying financial instrument at an agreed-upon price, date, time, and place. The fund currently invests only in exchange-traded futures, which generally are standardized as to maturity date, underlying financial instrument, and other contract terms. Payments are made or received by the fund each day to settle daily fluctuations in the value of the contract (variation margin), which reflect changes in the value of the underlying financial instrument. Variation margin is recorded as unrealized gain or loss until the contract is closed. The value of a futures contract included in net assets is the amount of unsettled variation margin; net variation margin receivable is reflected as an asset and net variation margin payable is reflected as a liability on the accompanying Statement of Assets and Liabilities. Risks related to the use of futures contracts include possible illiquidity of the futures markets, contract prices that can be highly volatile and imperfectly correlated to movements in hedged security values, and potential losses in excess of the fund’s initial investment. During the six months ended June 30, 2020, the volume of the fund’s activity in futures, based on underlying notional amounts, was generally between 5% and 9% of net assets.
NOTE 4 - OTHER INVESTMENT TRANSACTIONS
Consistent with its investment objective, the fund engages in the following practices to manage exposure to certain risks and/or to enhance performance. The investment objective, policies, program, and risk factors of the fund are described more fully in the fund’s prospectus and Statement of Additional Information.
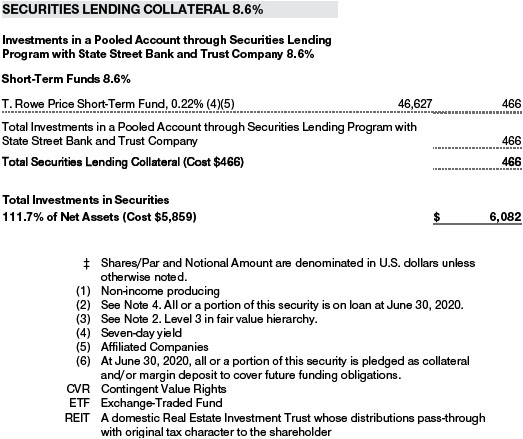
Securities Lending The fund may lend its securities to approved borrowers to earn additional income. Its securities lending activities are administered by a lending agent in accordance with a securities lending agreement. Security loans generally do not have stated maturity dates, and the fund may recall a security at any time. The fund receives collateral in the form of cash or U.S. government securities. Collateral is maintained over the life of the loan in an amount not less than the value of loaned securities; any additional collateral required due to changes in security values is delivered to the fund the next business day. Cash collateral is invested in accordance with investment guidelines approved by fund management. Additionally, the lending agent indemnifies the fund against losses resulting from borrower default. Although risk is mitigated by the collateral and indemnification, the fund could experience a delay in recovering its securities and a possible loss of income or value if the borrower fails to return the securities, collateral investments decline in value, and the lending agent fails to perform. Securities lending revenue consists of earnings on invested collateral and borrowing fees, net of any rebates to the borrower, compensation to the lending agent, and other administrative costs. In accordance with GAAP, investments made with cash collateral are reflected in the accompanying financial statements, but collateral received in the form of securities is not. At June 30, 2020, the value of loaned securities was $456,000, including securities sold but not yet settled, which are not reflected in the accompanying Portfolio of Investments; the value of cash collateral and related investments was $466,000.
Other Purchases and sales of portfolio securities other than short-term securities aggregated $1,039,000 and $761,000, respectively, for the six months ended June 30, 2020.
NOTE 5 - FEDERAL INCOME TAXES
No provision for federal income taxes is required since the fund intends to continue to qualify as a regulated investment company under Subchapter M of the Internal Revenue Code and distribute to shareholders all of its taxable income and gains. Distributions determined in accordance with federal income tax regulations may differ in amount or character from net investment income and realized gains for financial reporting purposes. Financial reporting records are adjusted for permanent book/tax differences to reflect tax character but are not adjusted for temporary differences. The amount and character of tax-basis distributions and composition of net assets are finalized at fiscal year-end; accordingly, tax-basis balances have not been determined as of the date of this report.
At June 30, 2020, the cost of investments for federal income tax purposes was $5,899,000. Net unrealized gain aggregated $187,000 at period-end, of which $1,090,000 related to appreciated investments and $903,000 related to depreciated investments.
NOTE 6 - RELATED PARTY TRANSACTIONS
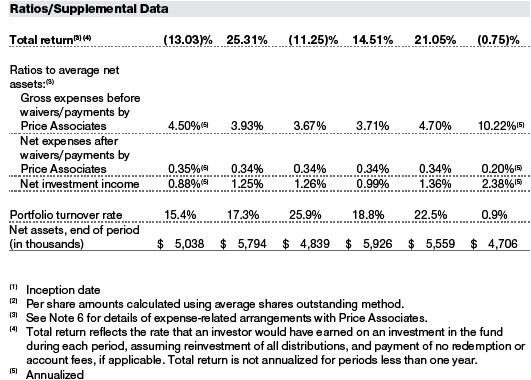
The fund is managed by T. Rowe Price Associates, Inc. (Price Associates), a wholly owned subsidiary of T. Rowe Price Group, Inc. (Price Group). The investment management agreement between the fund and Price Associates provides for an annual investment management fee equal to 0.14% of the fund’s average daily net assets. The fee is computed daily and paid monthly.
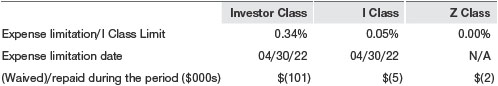
The Investor Class is subject to a contractual expense limitation through the expense limitation date indicated in the table below. During the limitation period, Price Associates is required to waive its management fee or pay any expenses (excluding interest; expenses related to borrowings, taxes, and brokerage; and other non-recurring expenses permitted by the investment management agreement) that would otherwise cause the class’s ratio of annualized total expenses to average net assets (net expense ratio) to exceed its expense limitation. The class is required to repay Price Associates for expenses previously waived/paid to the extent the class’s net assets grow or expenses decline sufficiently to allow repayment without causing the class’s net expense ratio (after the repayment is taken into account) to exceed the lesser of: (1) the expense limitation in place at the time such amounts were waived; or (2) the class’s current expense limitation. However, no repayment will be made more than three years after the date of a payment or waiver.
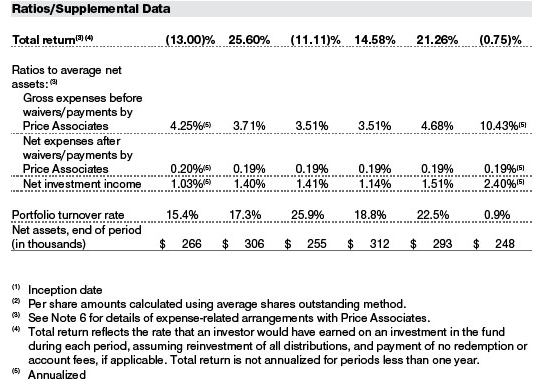
The I Class is also subject to an operating expense limitation (I Class Limit) pursuant to which Price Associates is contractually required to pay all operating expenses of the I Class, excluding management fees; interest; expenses related to borrowings, taxes, and brokerage; and other non-recurring expenses permitted by the investment management agreement, to the extent such operating expenses, on an annualized basis, exceed the I Class Limit. This agreement will continue through the expense limitation date indicated in the table below, and may be renewed, revised, or revoked only with approval of the fund’s Board. The I Class is required to repay Price Associates for expenses previously paid to the extent the class’s net assets grow or expenses decline sufficiently to allow repayment without causing the class’s operating expenses (after the repayment is taken into account) to exceed the lesser of: (1) the I Class Limit in place at the time such amounts were paid; or (2) the current I Class Limit. However, no repayment will be made more than three years after the date of a payment or waiver.
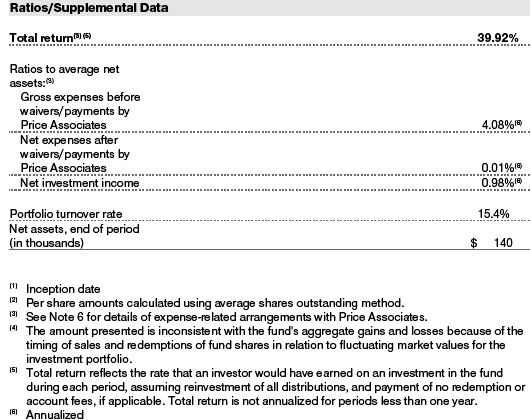
The Z Class is also subject to a contractual expense limitation agreement whereby Price Associates has agreed to waive and/or bear all of the Z Class’ expenses (excluding interest; expenses related to borrowings, taxes, and brokerage; and nonrecurring expenses) in their entirety. This fee waiver and/or expense reimbursement arrangement is expected to remain in place indefinitely, and the agreement may only be amended or terminated with approval by the fund’s Board.
Pursuant to these agreements, expenses were waived/paid by and/or repaid to Price Associates during the six months ended June 30, 2020 as indicated in the table below. Including these amounts, expenses previously waived/paid by Price Associates in the amount of $179,000 remain subject to repayment by the fund at June 30, 2020. Any repayment of expenses previously waived/paid by Price Associates during the period would be included in the net investment income and expense ratios presented on the accompanying Financial Highlights.
In addition, the fund has entered into service agreements with Price Associates and a wholly owned subsidiary of Price Associates, each an affiliate of the fund (collectively, Price). Price Associates provides certain accounting and administrative services to the fund. T. Rowe Price Services, Inc. provides shareholder and administrative services in its capacity as the fund’s transfer and dividend-disbursing agent. For the six months ended June 30, 2020, expenses incurred pursuant to these service agreements were $34,000 for Price Associates and less than $1,000 for T. Rowe Price Services, Inc. All amounts due to and due from Price, exclusive of investment management fees payable, are presented net on the accompanying Statement of Assets and Liabilities.
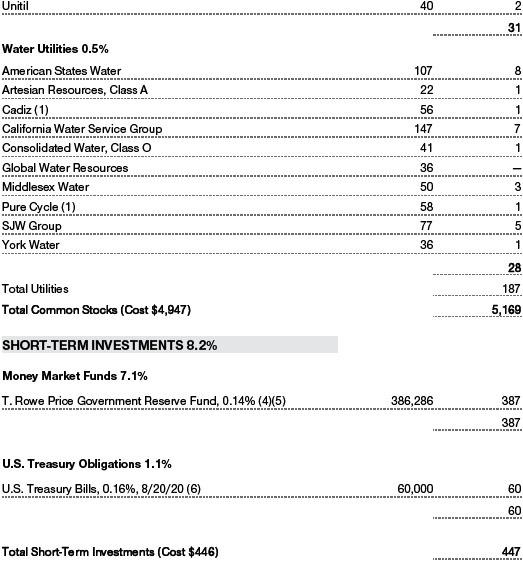
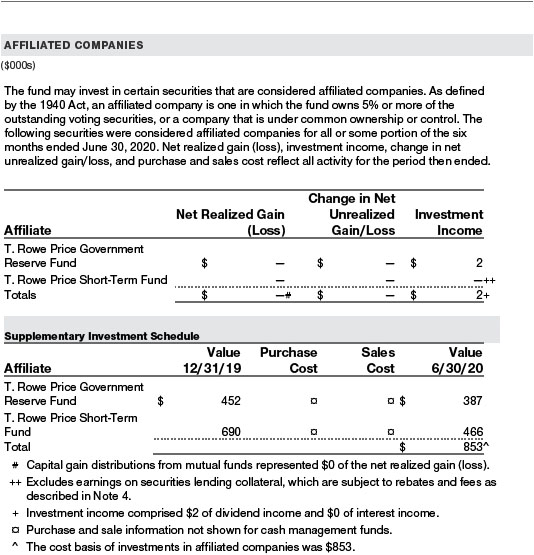
The fund may invest its cash reserves in certain open-end management investment companies managed by Price Associates and considered affiliates of the fund: the T. Rowe Price Government Reserve Fund or the T. Rowe Price Treasury Reserve Fund, organized as money market funds, or the T. Rowe Price Short-Term Fund, a short-term bond fund (collectively, the Price Reserve Funds). The Price Reserve Funds are offered as short-term investment options to mutual funds, trusts, and other accounts managed by Price Associates or its affiliates and are not available for direct purchase by members of the public. Cash collateral from securities lending is invested in the T. Rowe Price Short-Term Fund. The Price Reserve Funds pay no investment management fees.
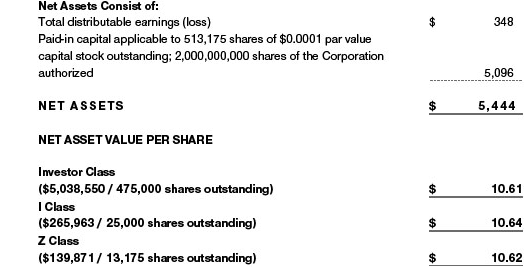
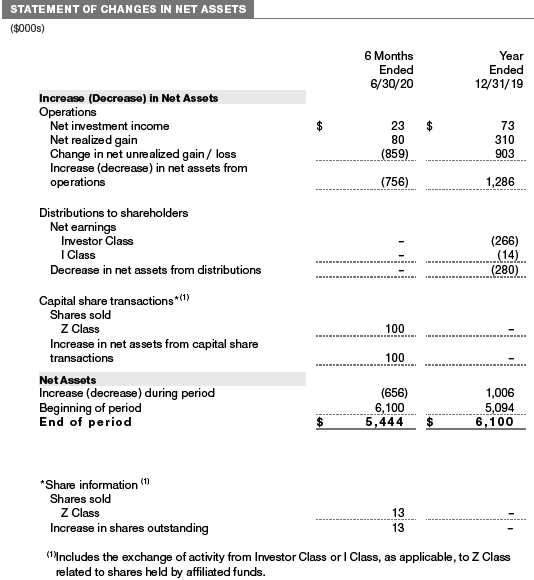
As of June 30, 2020, T. Rowe Price Group, Inc., or its wholly owned subsidiaries owned 475,000 shares of the Investor Class, representing 100% of the Investor Class’s net assets, 25,000 shares of the I Class, representing 100% of the I Class’s net assets, and 13,175 shares of the Z Class, representing 100% of the Z Class’s net assets.
The fund may participate in securities purchase and sale transactions with other funds or accounts advised by Price Associates (cross trades), in accordance with procedures adopted by the fund’s Board and Securities and Exchange Commission rules, which require, among other things, that such purchase and sale cross trades be effected at the independent current market price of the security. During the six months ended June 30, 2020, the fund had no purchases or sales cross trades with other funds or accounts advised by Price Associates.
Effective January 1, 2020, Price Associates has voluntarily agreed to reimburse the fund from its own resources on a monthly basis for the cost of investment research embedded in the cost of the fund’s securities trades. This agreement may be rescinded at any time. For the six months ended June 30, 2020, this reimbursement amounted to less than $1,000.
NOTE 7 - OTHER MATTERS
Unpredictable events such as environmental or natural disasters, war, terrorism, pandemics, outbreaks of infectious diseases, and similar public health threats may significantly affect the economy and the markets and issuers in which a fund invests. Certain events may cause instability across global markets, including reduced liquidity and disruptions in trading markets, while some events may affect certain geographic regions, countries, sectors, and industries more significantly than others, and exacerbate other pre-existing political, social, and economic risks.
These types of events may also cause widespread fear and uncertainty, and result in, among other things: quarantines and travel restrictions, including border closings; disruptions to business operations and supply chains; exchange trading suspensions and closures, and overall reduced liquidity of securities, derivatives, and commodities trading markets; reductions in consumer demand and economic output; and significant challenges in healthcare service preparation and delivery. The funds could be negatively impacted if the value of a portfolio holding were harmed by such political or economic conditions or events. In addition, the operations of the funds, their investment advisers, and the funds’ service providers may be significantly impacted, or even temporarily halted, as a result of extensive employee illnesses or unavailability, government quarantine measures, and restrictions on travel or meetings and other factors related to public emergencies. Recently, a novel strain of coronavirus (COVID-19) has resulted in disruptions to global business activity and caused significant volatility and declines in global financial markets.
Governmental and quasi-governmental authorities and regulators have in the past responded to major economic disruptions with a variety of significant fiscal and monetary policy changes, including but not limited to, direct capital infusions into companies, new monetary programs, and dramatically lower interest rates. An unexpected or quick reversal of these policies, or the ineffectiveness of these policies, could negatively impact overall investor sentiment and further increase volatility in securities markets.
INFORMATION ON PROXY VOTING POLICIES, PROCEDURES, AND RECORDS
A description of the policies and procedures used by T. Rowe Price funds and portfolios to determine how to vote proxies relating to portfolio securities is available in each fund’s Statement of Additional Information. You may request this document by calling 1-800-225-5132 or by accessing the SEC’s website, sec.gov.
The description of our proxy voting policies and procedures is also available on our corporate website. To access it, please visit the following Web page:
https://www.troweprice.com/corporate/en/utility/policies.html
Scroll down to the section near the bottom of the page that says, “Proxy Voting Policies.” Click on the Proxy Voting Policies link in the shaded box.
Each fund’s most recent annual proxy voting record is available on our website and through the SEC’s website. To access it through T. Rowe Price, visit the website location shown above, and scroll down to the section near the bottom of the page that says, “Proxy Voting Records.” Click on the Proxy Voting Records link in the shaded box.
HOW TO OBTAIN QUARTERLY PORTFOLIO HOLDINGS
Effective for reporting periods on or after March 1, 2019, a fund, except a money market fund, files a complete schedule of portfolio holdings with the Securities and Exchange Commission (SEC) for the first and third quarters of each fiscal year as an exhibit to its reports on Form N-PORT. Prior to March 1, 2019, a fund, including a money market fund, filed a complete schedule of portfolio holdings with the SEC for the first and third quarters of each fiscal year on Form N-Q. A money market fund files detailed month-end portfolio holdings information on Form N-MFP with the SEC each month and posts a complete schedule of portfolio holdings on its website (troweprice.com) as of each month-end for the previous six months. A fund’s Forms N-PORT, N-MFP, and N-Q are available electronically on the SEC’s website (sec.gov).
APPROVAL OF INVESTMENT MANAGEMENT AGREEMENT
Each year, the fund’s Board of Directors (Board) considers the continuation of the investment management agreement (Advisory Contract) between the fund and its investment advisor, T. Rowe Price Associates, Inc. (Advisor), on behalf of the fund. In that regard, at a meeting held on March 9–10, 2020 (Meeting), the Board, including all of the fund’s independent directors, approved the continuation of the fund’s Advisory Contract. At the Meeting, the Board considered the factors and reached the conclusions described below relating to the selection of the Advisor and the approval of the Advisory Contract. The independent directors were assisted in their evaluation of the Advisory Contract by independent legal counsel from whom they received separate legal advice and with whom they met separately.
In providing information to the Board, the Advisor was guided by a detailed set of requests for information submitted by independent legal counsel on behalf of the independent directors. In considering and approving the Advisory Contract, the Board considered the information it believed was relevant, including, but not limited to, the information discussed below. The Board considered not only the specific information presented in connection with the Meeting but also the knowledge gained over time through interaction with the Advisor about various topics. The Board meets regularly and, at each of its meetings, covers an extensive agenda of topics and materials and considers factors that are relevant to its annual consideration of the renewal of the T. Rowe Price funds’ advisory contracts, including performance and the services and support provided to the funds and their shareholders.
Services Provided by the Advisor
The Board considered the nature, quality, and extent of the services provided to the fund by the Advisor. These services included, but were not limited to, directing the fund’s investments in accordance with its investment program and the overall management of the fund’s portfolio, as well as a variety of related activities such as financial, investment operations, and administrative services; compliance; maintaining the fund’s records and registrations; and shareholder communications. The Board also reviewed the background and experience of the Advisor’s senior management team and investment personnel involved in the management of the fund, as well as the Advisor’s compliance record. The Board concluded that it was satisfied with the nature, quality, and extent of the services provided by the Advisor.
Investment Performance of the Fund
The Board took into account discussions with the Advisor and reports that it receives throughout the year relating to fund performance. In connection with the Meeting, the Board reviewed the fund’s net annualized total returns for the one-, two-, and three-year periods as of September 30, 2019, and compared these returns with the performance of a peer group of funds with similar investment programs and a wide variety of other previously agreed-upon comparable performance measures and market data, including those supplied by Broadridge, which is an independent provider of mutual fund data.
On the basis of this evaluation and the Board’s ongoing review of investment results, and factoring in the relative market conditions during certain of the performance periods, the Board concluded that the fund’s performance was satisfactory.
Costs, Benefits, Profits, and Economies of Scale
The Board reviewed detailed information regarding the revenues received by the Advisor under the Advisory Contract and other benefits that the Advisor (and its affiliates) may have realized from its relationship with the fund, including any research received under “soft dollar” agreements and commission-sharing arrangements with broker-dealers. The Board considered that the Advisor may have received some benefit from soft-dollar arrangements pursuant to which research is received from broker-dealers that execute the fund’s portfolio transactions. However, the Board also considered that, effective January 2020, the Advisor began bearing the cost of research services for all client accounts that it advises, including the T. Rowe Price funds. The Board received information on the estimated costs incurred and profits realized by the Advisor from managing the T. Rowe Price funds. While the Board did not review information regarding profits realized from managing the fund in particular because the fund had either not achieved sufficient portfolio asset size or not recognized sufficient revenues to produce meaningful profit margin percentages, the Board concluded that the Advisor’s profits were reasonable in light of the services provided to the T. Rowe Price funds.
The Board also considered whether the fund benefits under the fee levels set forth in the Advisory Contract from any economies of scale realized by the Advisor. Under the Advisory Contract, the fund pays a fee to the Advisor for investment management services based on the fund’s average daily net assets and the fund pays its own expenses of operations (subject to an expense limitation on total expense ratio with respect to the Investor Class and an expense limitation on operating expenses with respect to the I Class). The fund’s shareholders benefit from potential economies of scale through a decline in operating expenses as the fund grows in size and through the contractual expense limitations in place to reduce the burden of higher operating costs to shareholders until the fund reaches greater scale. The Board concluded that the advisory fee structure continued to be appropriate.
Fees and Expenses
The Board was provided with information regarding industry trends in management fees and expenses. Among other things, the Board reviewed data for peer groups that were compiled by Broadridge, which compared: (i) contractual management fees, total expenses, actual management fees, and nonmanagement expenses of the fund with a group of competitor funds selected by Broadridge (Expense Group) and (ii) total expenses, actual management fees, and nonmanagement expenses of the fund with a broader set of funds within the Lipper investment classification (Expense Universe). The Board considered the fund’s contractual management fee rate, actual management fee rate (which reflects the management fees actually received from the fund by the Advisor after any applicable waivers, reductions, or reimbursements), operating expenses, and total expenses (which reflects the net total expense ratio of the fund after any waivers, reductions, or reimbursements) in comparison with the information for the Broadridge peer groups. Broadridge generally constructed the peer groups by seeking the most comparable funds based on similar investment classifications and objectives, expense structure, asset size, and operating components and attributes and ranked funds into quintiles, with the first quintile representing the funds with the lowest relative expenses and the fifth quintile representing the funds with the highest relative expenses. The information provided to the Board indicated that the fund’s contractual management fee ranked in the first quintile (Expense Group), the fund’s actual management fee rate ranked in the first quintile (Expense Group and Expense Universe), and the fund’s total expenses ranked in the first quintile (Expense Group and Expense Universe).
The Board also reviewed the fee schedules for other investment portfolios with similar mandates that are advised or subadvised by the Advisor and its affiliates, including separately managed accounts for institutional and individual investors; subadvised funds; and other sponsored investment portfolios, including collective investment trusts and pooled vehicles organized and offered to investors outside the United States. Management provided the Board with information about the Advisor’s responsibilities and services provided to subadvisory and other institutional account clients, including information about how the requirements and economics of the institutional business are fundamentally different from those of the mutual fund business. The Board considered information showing that the Advisor’s mutual fund business is generally more complex from a business and compliance perspective than its institutional account business and considered various relevant factors, such as the broader scope of operations and oversight, more extensive shareholder communication infrastructure, greater asset flows, heightened business risks, and differences in applicable laws and regulations associated with the Advisor’s proprietary mutual fund business. In assessing the reasonableness of the fund’s management fee rate, the Board considered the differences in the nature of the services required for the Advisor to manage its mutual fund business versus managing a discrete pool of assets as a subadvisor to another institution’s mutual fund or for an institutional account and that the Advisor generally performs significant additional services and assumes greater risk in managing the fund and other T. Rowe Price funds than it does for institutional account clients.
On the basis of the information provided and the factors considered, the Board concluded that the fees paid by the fund under the Advisory Contract are reasonable.
Approval of the Advisory Contract
As noted, the Board approved the continuation of the Advisory Contract. No single factor was considered in isolation or to be determinative to the decision. Rather, the Board concluded, in light of a weighting and balancing of all factors considered, that it was in the best interests of the fund and its shareholders for the Board to approve the continuation of the Advisory Contract (including the fees to be charged for services thereunder).
LIQUIDITY RISK MANAGEMENT PROGRAM
In accordance with Rule 22e-4 (Liquidity Rule) under the Investment Company Act of 1940, as amended, the fund has established a liquidity risk management program (Liquidity Program) reasonably designed to assess and manage the fund’s liquidity risk, which generally represents the risk that the fund would not be able to meet redemption requests without significant dilution of remaining investors’ interests in the fund. The fund’s Board of Directors (Board) has appointed the fund’s investment advisor, T. Rowe Price Associates, Inc. (Price Associates), as the administrator of the Liquidity Program. As administrator, Price Associates is responsible for overseeing the day-to-day operations of the Liquidity Program and, among other things, is responsible for assessing, managing, and reviewing with the Board at least annually the liquidity risk of each T. Rowe Price fund. Price Associates has delegated oversight of the Liquidity Program to a Liquidity Risk Committee (LRC), which is a cross-functional committee composed of personnel from multiple departments within Price Associates.
The Liquidity Program’s principal objectives include supporting the T. Rowe Price funds’ compliance with limits on investments in illiquid assets and mitigating the risk that the fund will be unable to timely meet its redemption obligations. The Liquidity Program also includes a number of elements that support the management and assessment of liquidity risk, including an annual assessment of factors that influence the fund’s liquidity and the periodic classification and reclassification of a fund’s investments into categories that reflect the LRC’s assessment of their relative liquidity under current market conditions. Under the Liquidity Program, every investment held by the fund is classified at least monthly into one of four liquidity categories based on estimations of the investment’s ability to be sold during designated time frames in current market conditions without significantly changing the investment’s market value.
As required by the Liquidity Rule, at a meeting held on May 4, 2020, the Board was presented with an annual assessment prepared by the LRC, on behalf of Price Associates, that addressed the operation of the Liquidity Program and assessed its adequacy and effectiveness of implementation, including any material changes to the Liquidity Program and the determination of each fund’s Highly Liquid Investment Minimum (HLIM). The annual assessment included consideration of the following factors, as applicable: the fund’s investment strategy and liquidity of portfolio investments during normal and reasonably foreseeable stressed conditions, including whether the investment strategy is appropriate for an open-end fund, the extent to which the strategy involves a relatively concentrated portfolio or large positions in particular issuers, and the use of borrowings for investment purposes and derivatives; short-term and long-term cash flow projections covering both normal and reasonably foreseeable stressed conditions; and holdings of cash and cash equivalents, as well as available borrowing arrangements.
For the fund and other T. Rowe Price funds, the annual assessment incorporated a report related to a fund’s holdings, shareholder and portfolio concentration, any borrowings during the period, cash flow projections, and other relevant data for the period of June 1, 2019, through March 31, 2020. The report described the methodology for classifying a fund’s investments (including derivative transactions) into one of four liquidity categories, as well as the percentage of a fund’s investments assigned to each category. It also explained the methodology for establishing a fund’s HLIM and noted that the LRC reviews the HLIM assigned to each fund no less frequently than annually.
Certain provisions of the Liquidity Program initially became effective on December 1, 2018, and the full Liquidity Program was formally approved by the Board in April 2019. During the period covered by the annual assessment, the LRC has concluded, and reported to the Board, that the Liquidity Program since its implementation has operated adequately and effectively and is reasonably designed to assess and manage the fund’s liquidity risk.
Item 1. (b) Notice pursuant to Rule 30e-3.
Not applicable.
Item 2. Code of Ethics.
A code of ethics, as defined in Item 2 of Form N-CSR, applicable to its principal executive officer, principal financial officer, principal accounting officer or controller, or persons performing similar functions is filed as an exhibit to the registrant’s annual Form N-CSR. No substantive amendments were approved or waivers were granted to this code of ethics during the registrant’s most recent fiscal half-year.
Item 3. Audit Committee Financial Expert.
Disclosure required in registrant’s annual Form N-CSR.
Item 4. Principal Accountant Fees and Services.
Disclosure required in registrant’s annual Form N-CSR.
Item 5. Audit Committee of Listed Registrants.
Not applicable.
Item 6. Investments.
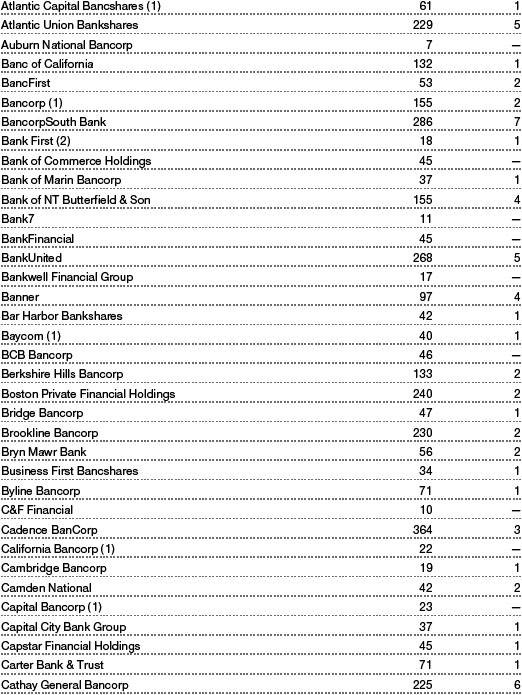
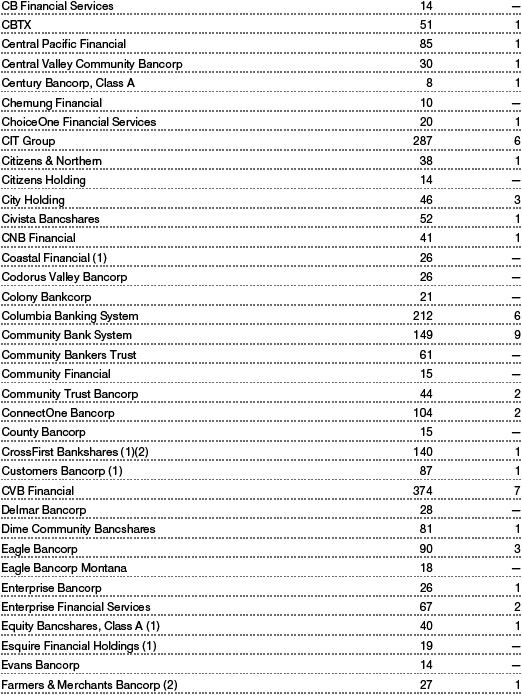
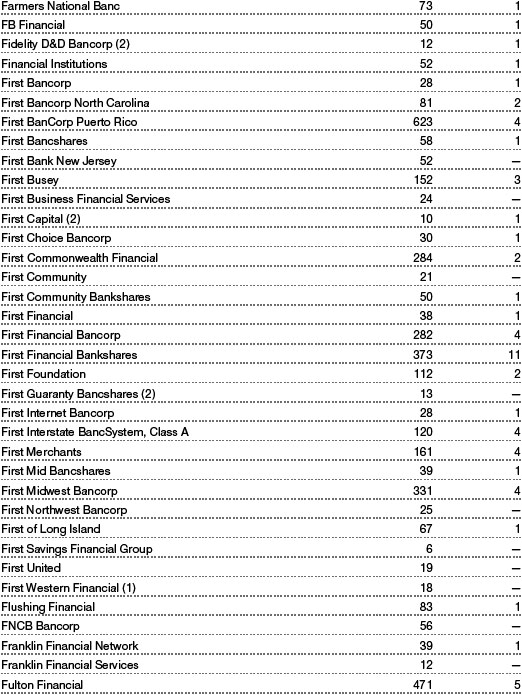
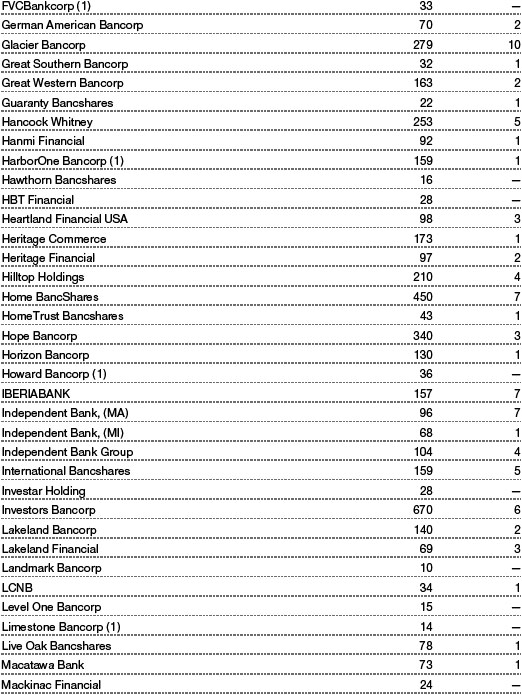
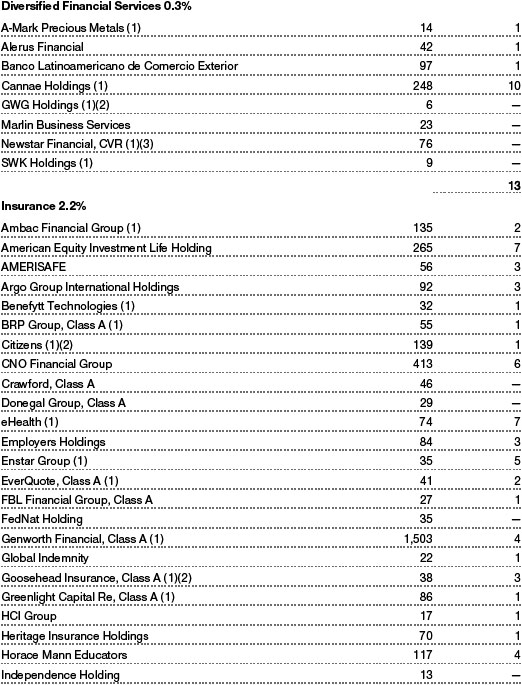
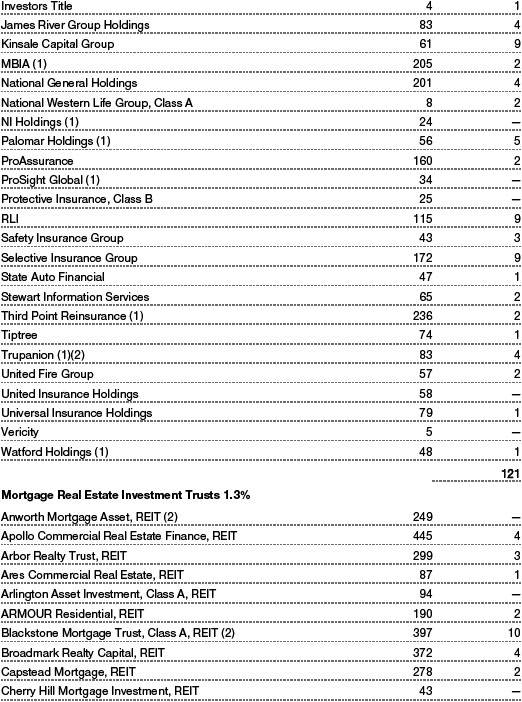
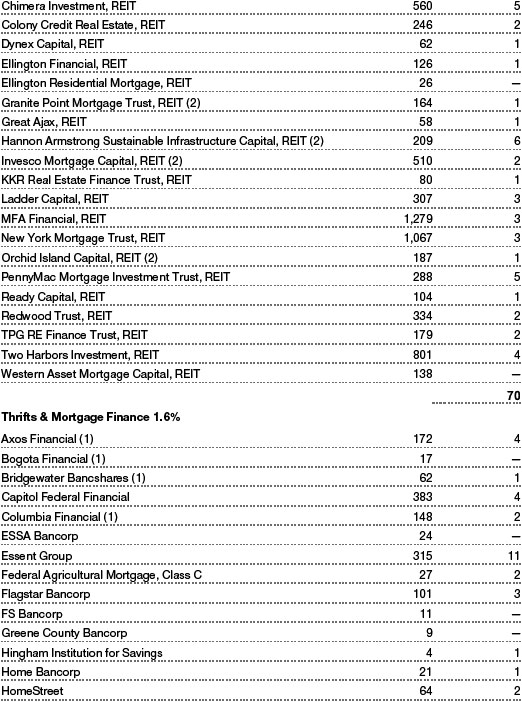
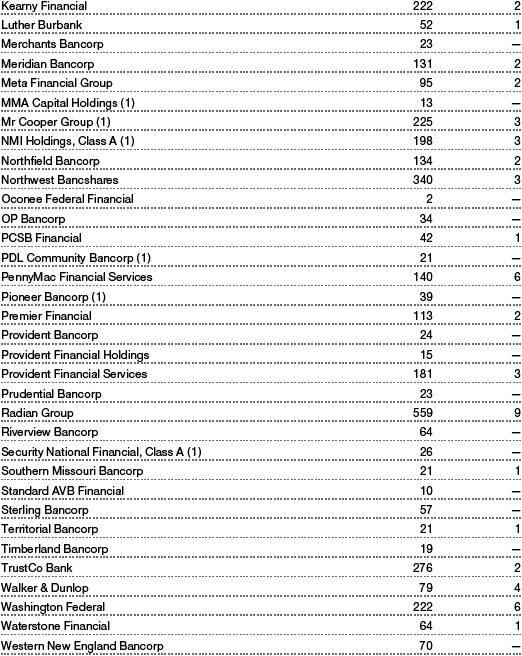
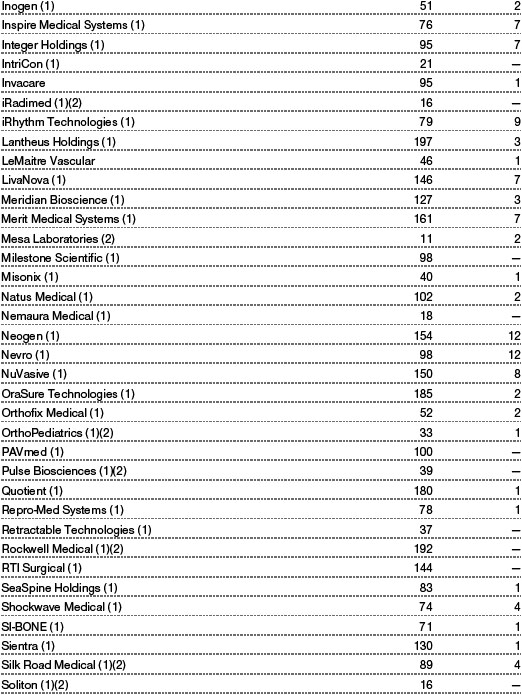
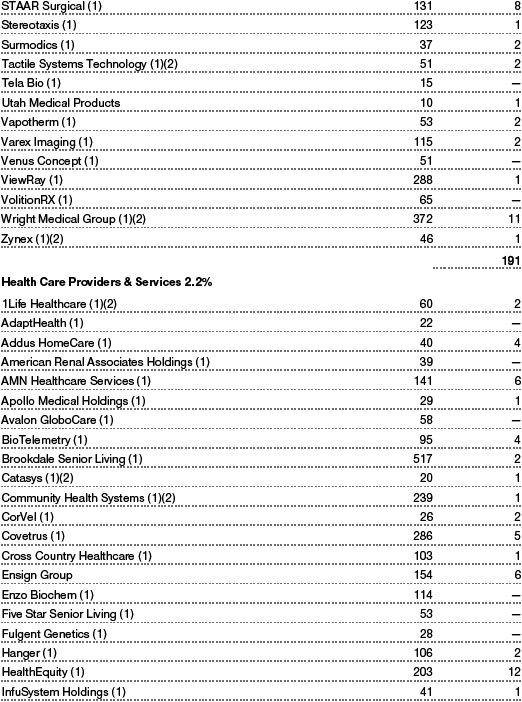
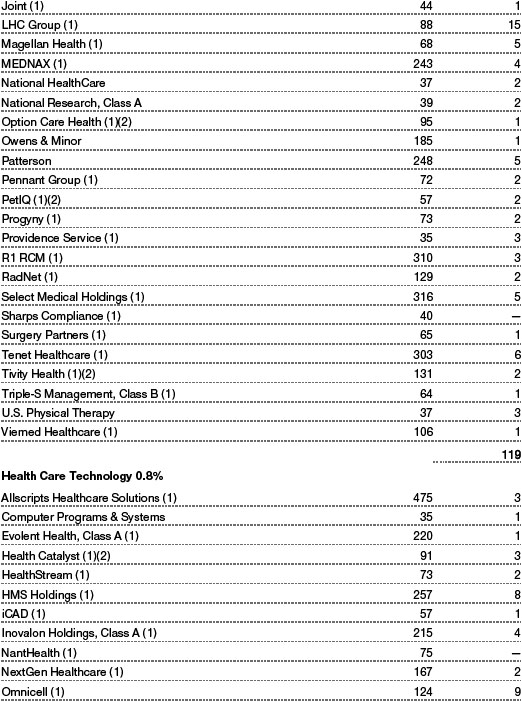
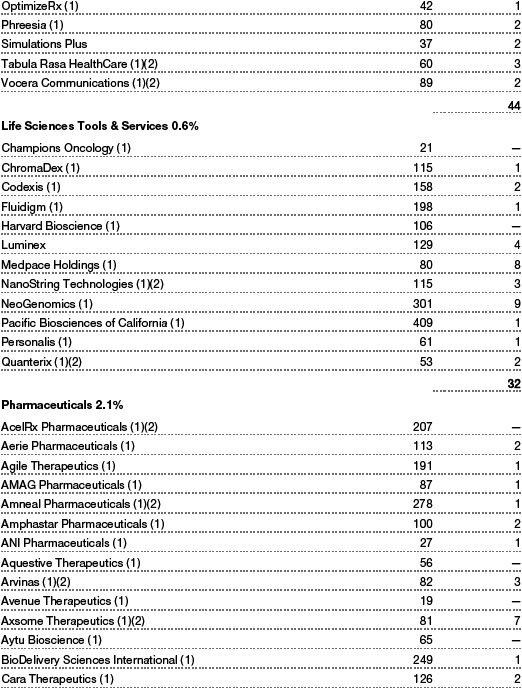
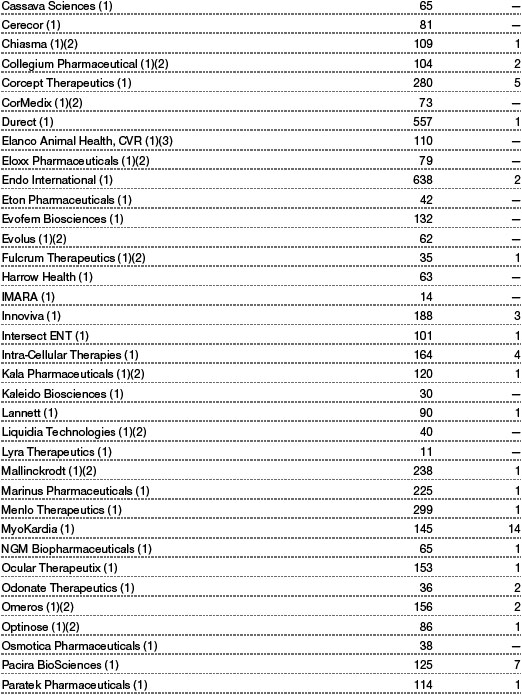
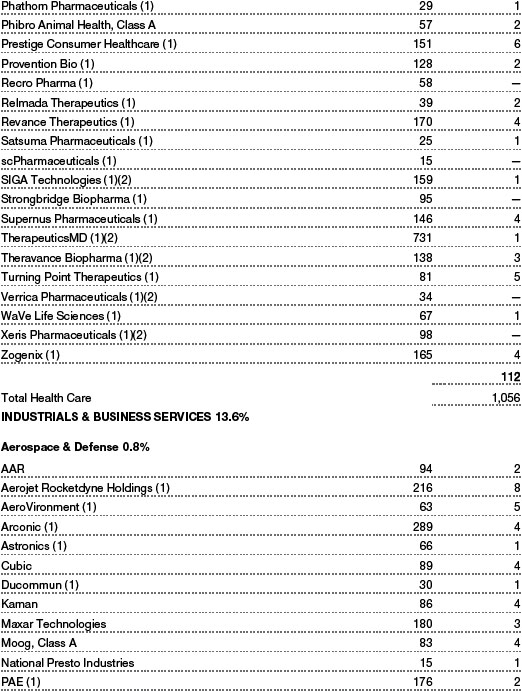
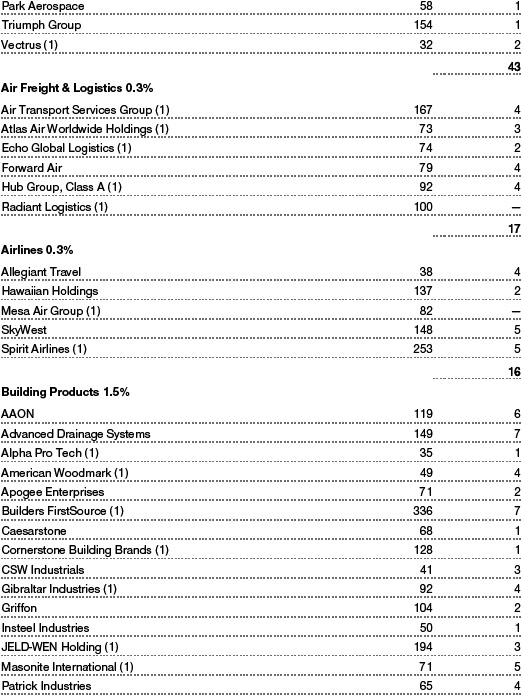
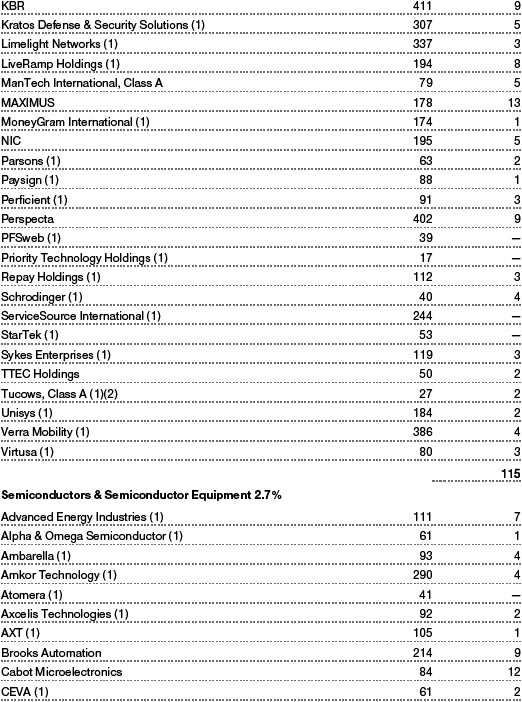
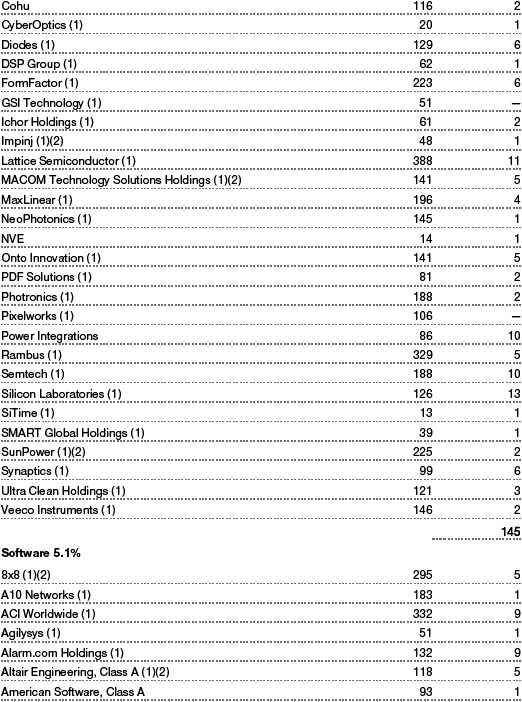
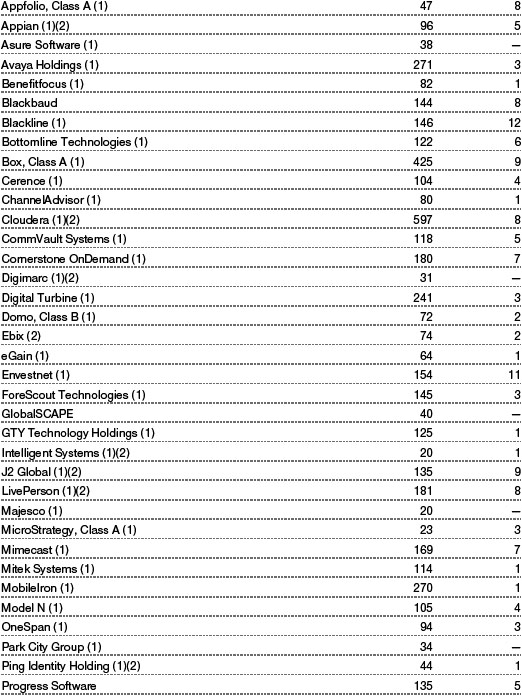
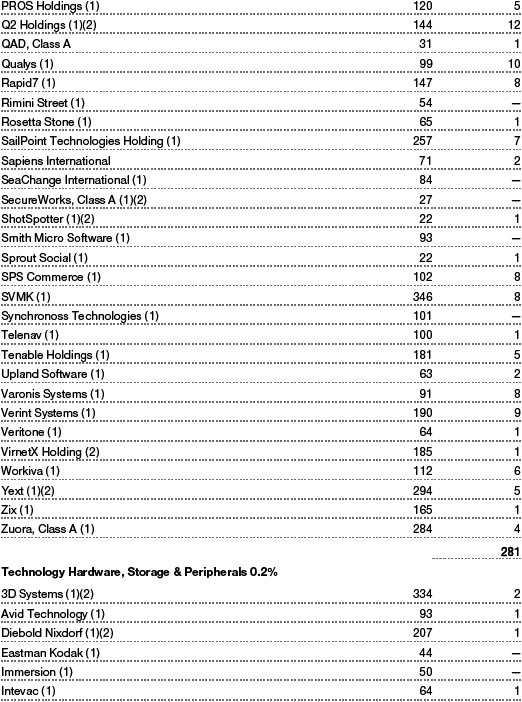
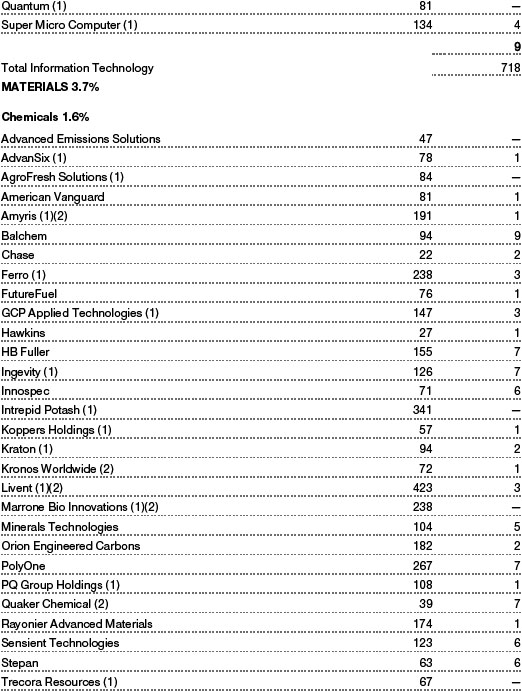
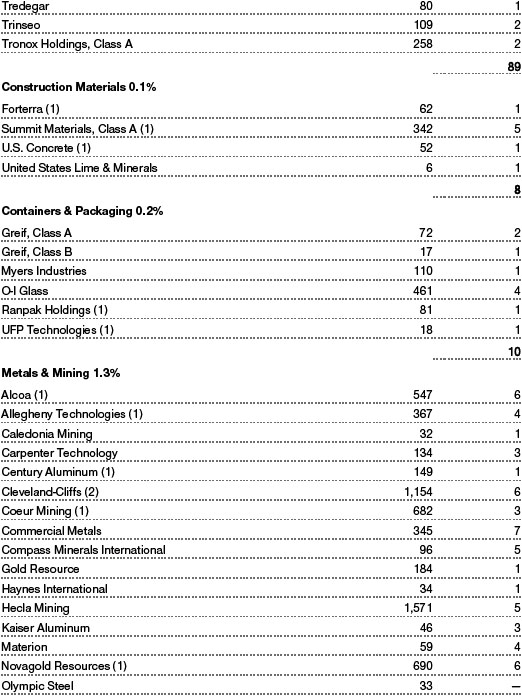
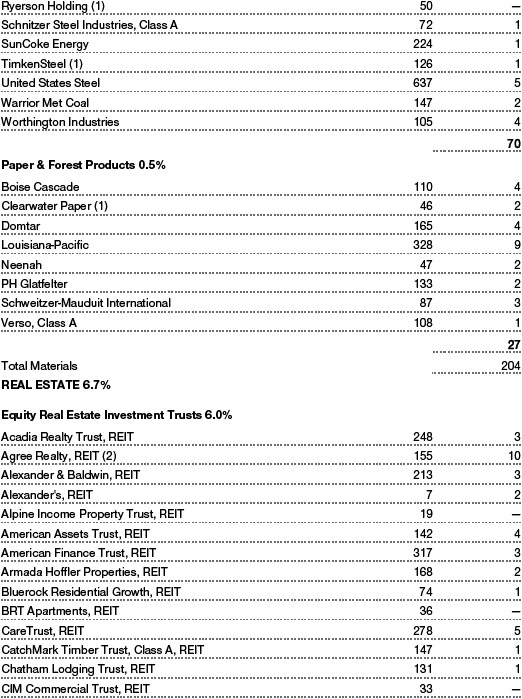
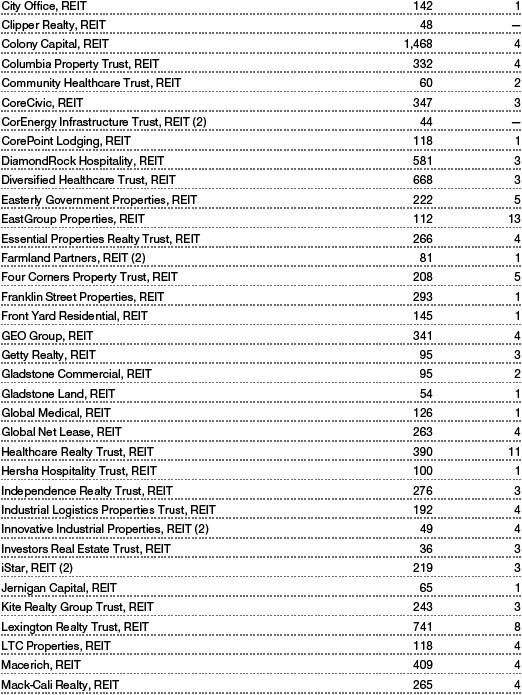
(a) Not applicable. The complete schedule of investments is included in Item 1 of this Form N-CSR.
(b) Not applicable.
Item 7. Disclosure of Proxy Voting Policies and Procedures for Closed-End Management Investment Companies.
Not applicable.
Item 8. Portfolio Managers of Closed-End Management Investment Companies.
Not applicable.
Item 9. Purchases of Equity Securities by Closed-End Management Investment Company and Affiliated Purchasers.
Not applicable.
Item 10. Submission of Matters to a Vote of Security Holders.
There has been no change to the procedures by which shareholders may recommend nominees to the registrant’s board of directors.
Item 11. Controls and Procedures.
(a) The registrant’s principal executive officer and principal financial officer have evaluated the registrant’s disclosure controls and procedures within 90 days of this filing and have concluded that the registrant’s disclosure controls and procedures were effective, as of that date, in ensuring that information required to be disclosed by the registrant in this Form N-CSR was recorded, processed, summarized, and reported timely.
(b) The registrant’s principal executive officer and principal financial officer are aware of no change in the registrant’s internal control over financial reporting that occurred during the period covered by this report that has materially affected, or is reasonably likely to materially affect, the registrant’s internal control over financial reporting.
Item 12. Disclosure of Securities Lending Activities for Closed-End Management Investment Companies.
Not applicable.
Item 13. Exhibits.
(a)(1) The registrant’s code of ethics pursuant to Item 2 of Form N-CSR is filed with the registrant’s annual Form N-CSR.
(2) Separate certifications by the registrant's principal executive officer and principal financial officer, pursuant to Section 302 of the Sarbanes-Oxley Act of 2002 and required by Rule 30a-2(a) under the Investment Company Act of 1940, are attached.
(3) Written solicitation to repurchase securities issued by closed-end companies: not applicable.
(b) A certification by the registrant's principal executive officer and principal financial officer, pursuant to Section 906 of the Sarbanes-Oxley Act of 2002 and required by Rule 30a-2(b) under the Investment Company Act of 1940, is attached.
SIGNATURES
Pursuant to the requirements of the Securities Exchange Act of 1934 and the Investment Company Act of 1940, the registrant has duly caused this report to be signed on its behalf by the undersigned, thereunto duly authorized.
T. Rowe Price Index Trust, Inc.
| By | | /s/ David Oestreicher |
| | | David Oestreicher |
| | | Principal Executive Officer |
| |
| Date | | August 18, 2020 | | | | |
Pursuant to the requirements of the Securities Exchange Act of 1934 and the Investment Company Act of 1940, this report has been signed below by the following persons on behalf of the registrant and in the capacities and on the dates indicated.
| By | | /s/ David Oestreicher |
| | | David Oestreicher |
| | | Principal Executive Officer |
| |
| Date | | August 18, 2020 | | | | |
| |
| |
| By | | /s/ Alan S. Dupski |
| | | Alan S. Dupski |
| | | Principal Financial Officer |
| |
| Date | | August 18, 2020 | | | | |