UNITED STATES
SECURITIES AND EXCHANGE COMMISSION
Washington, D.C. 20549
FORM N-CSR
Certified Shareholder Report of
Registered Management Investment Companies
Investment Company Act File Number: 811-05888
SMALLCAP World Fund, Inc.
(Exact Name of Registrant as Specified in Charter)
333 South Hope Street
Los Angeles, California 90071
(Address of Principal Executive Offices)
Registrant's telephone number, including area code: (213) 486-9200
Date of fiscal year end: September 30
Date of reporting period: March 31, 2013
Patrick F. Quan
SMALLCAP World Fund, Inc.
333 South Hope Street
Los Angeles, California 90071
(Name and Address of Agent for Service)
Copies to:
Mark D. Perlow
K&L Gates LLP
Four Embarcadero Center, Suite 1200
San Francisco, California 94111
(Counsel for the Registrant)
ITEM 1 – Reports to Stockholders
![]()
AMERICAN
FUNDS®
From Capital Group
SMALLCAP World Fund®

Semi-annual report for the six months ended March 31, 2013
SMALLCAP World Fund seeks long-term growth of capital through investments in smaller companies in the United States and around the world.
This fund is one of more than 40 offered by one of the nation’s largest mutual fund families, American Funds, from Capital Group. For more than 80 years, Capital has invested with a long-term focus based on thorough research and attention to risk.
Fund results shown in this report, unless otherwise indicated, are for Class A shares at net asset value. If a sales charge (maximum 5.75%) had been deducted, the results would have been lower. Results are for past periods and are not predictive of results for future periods. Current and future results may be lower or higher than those shown. Share prices and returns will vary, so investors may lose money. Investing for short periods makes losses more likely. Investments are not FDIC-insured, nor are they deposits of or guaranteed by a bank or any other entity, so they may lose value. For current information and month-end results, visit americanfunds.com.
Here are the average annual total returns on a $1,000 investment with all distributions reinvested for periods ended March 31, 2013:
| 1 year | 5 years | 10 years | ||||||||||
| Class A shares | ||||||||||||
| Reflecting 5.75% maximum sales charge | 7.21% | 3.26% | 12.55% | |||||||||
The total annual fund operating expense ratio was 1.14% for Class A shares as of the prospectus dated December 1, 2012.
Investment results assume all distributions are reinvested and reflect applicable fees and expenses. When applicable, investment results reflect fee waivers, without which results would have been lower. Visit americanfunds.com for more information.
Results for other share classes can be found on page 36.
Investing outside the United States may be subject to risks, such as currency fluctuations and political instability. These risks may be heightened in connection with investments in developing countries. Investing in small-capitalization stocks can involve greater risk than is customarily associated with investing in stocks of larger, more established companies. Refer to the fund prospectus and the Risk Factors section of this report for more information on these and other risks associated with investing in the fund.

Fellow investors:
Small-cap markets around the world made gains during the first six months of SMALLCAP World Fund’s fiscal year, though fitfully at times as continued economic and fiscal problems persisted in some areas of the globe.
For the six months ended March 31, 2013, the fund produced a total return of 12.4%, which included reinvestment of dividend payments totaling 54.1 cents a share. Those taking dividends in cash saw a total return of 10.8%.
By way of comparison, the unmanaged MSCI All Country World Small Cap Index returned 13.7% for the period, while the fund’s peer group, the Lipper Global Small-Cap Funds Average, gained 12.7%. Neither benchmark includes sales charges, account fees or taxes.
Market overview
The global economy continued to grow — albeit modestly — over the course of the first six months of the fund’s fiscal year. While declining, continued high
Results at a glance
For periods ended March 31, 2013, with all distributions reinvested
| Average annual total returns | ||||||||||
| Lifetime | ||||||||||
| Total returns | (since | |||||||||
| 6 months | 1 year | 5 years | 10 years | 4/30/90) | ||||||
| SMALLCAP World Fund (Class A shares) | 12.4% | 13.8% | 4.5% | 13.2% | 9.6% | |||||
| MSCI All Country World Small Cap Index* | 13.7 | 13.7 | 6.1 | 13.5 | n/a | |||||
| Lipper Global Small-Cap Funds Average | 12.7 | 13.0 | 4.3 | 12.3 | 9.5 | |||||
| * | The market index is unmanaged and, therefore, has no expenses. It is a free float-adjusted market capitalization weighted index that is designed to measure equity market results of smaller capitalization companies in both developed and emerging markets. Results reflect dividends net of withholding taxes. This index was not in existence as of the date the fund began investment operations; therefore, lifetime results are not available. |
| SMALLCAP World Fund | 1 |
unemployment kept growth muted in the United States, while Europe’s economy remained stagnant in the face of continued economic and fiscal crises. China and other emerging markets saw more vibrant economic growth rates. The Federal Reserve, European Central Bank and Japanese regulators all kept interest rates low during the period.
The movement of equity markets illustrated the continued push-pull between risk and safety. Small-capitalization stocks in the United States and other developed nations fared well, while those in emerging markets saw more meager gains.
Among global small-cap sectors, industrials, financials and consumer discretionary stocks saw the most gains, all traditional hallmarks of economic optimism. Health care, telecommunications services and consumer staples likewise saw strong market returns during the period.
The fund’s holdings
The fund’s portfolio managers remain committed to a broadly diversified portfolio based on strong, bottom-up research into each potential investment. Many portfolio managers believe that emerging markets equities in particular are attractive long-term holdings. The fund had several successful emerging markets holdings during the period, though overall emerging markets lagged other markets to a degree.
Of the major markets, U.S. small-cap market returns contributed positively to the fund, though the fund had a smaller percentage of U.S. companies than its benchmark during the period. Overall, approximately 45% of the fund is invested in U.S. securities and 49% in overseas holdings, with slightly more than 6% kept in cash.
The fund’s holdings in financials, consumer discretionary and industrials helped the
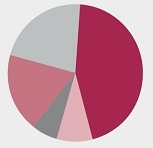
Where are SMALLCAP’s holdings located?

| As of March 31, 2013 | Percent of net assets | |||
| § United States | 44.6 | % | ||
| § Asia & Pacific Basin | 23.2 | |||
| § Europe | 19.6 | |||
| § Other (including Canada & Latin America) | 6.3 | |||
| § Short-term securities & other assets less liabilities | 6.3 | |||
| As of September 30, 2012 | Percent of net assets | |||
| § United States | 44.9 | % | ||
| § Asia & Pacific Basin | 21.7 | |||
| § Europe | 18.6 | |||
| § Other (including Canada & Latin America) | 6.3 | |||
| § Short-term securities & other assets less liabilities | 8.5 |
| 2 | SMALLCAP World Fund |
fund to the greatest extent during the period from a contribution standpoint, while holdings in telecommunications services and energy shares hurt returns.
Looking ahead
We remain optimistic that we will continue to find exciting investments in the global small-cap universe. Certainly, there are challenging issues to contend with, such as the ongoing fiscal crisis in Europe and the high levels of government debt in most developed nations. Slower growth rates in China also bear watching, as does the possible end to quantitative easing in the U.S. Despite these challenges, we believe there will continue to be a vibrant stream of potential investments for the fund. In recent years we have invested in a number of diverse areas including engineering software, online gaming, Indonesian retailing, pet health care and treatments for hepatitis C. We remain very focused on unearthing similarly diverse investments in the future.
We feel the fund remains well-positioned for the road ahead, and it is not our philosophy to make decisions based on short-term market fluctuations; that can only serve to increase volatility for fund investors. Instead, we focus on each individual company, assessing its potential and reviewing it regularly. We believe our research can allow the fund to produce consistent returns over time. We strive to maintain a long-term approach to investing, and encourage you to do the same with regard to your individual holdings.
We thank you for your continued support, and look forward to reporting to you again in six months.
Cordially,

Jonathan Knowles
Vice Chairman of the Board

Gregory W. Wendt
President
May 10, 2013
For current information about the fund, visit americanfunds.com.
| SMALLCAP World Fund | 3 |
| Summary investment portfolio March 31, 2013 | unaudited |
The following summary investment portfolio is designed to streamline the report and help investors better focus on the fund’s principal holdings. See the inside back cover for details on how to obtain a complete schedule of portfolio holdings.
| Industry sector diversification | Percent of net assets |

| Country diversification | Percent of net assets | |||
| United States | 44.6 | % | ||
| United Kingdom | 8.3 | |||
| Euro zone* | 6.9 | |||
| China | 3.7 | |||
| Hong Kong | 3.3 | |||
| India | 3.0 | |||
| Philippines | 2.9 | |||
| Canada | 2.8 | |||
| Japan | 2.2 | |||
| Indonesia | 2.0 | |||
| Australia | 1.6 | |||
| Other countries | 12.4 | |||
| Short-term securities & other assets less liabilities | 6.3 | |||
| * | Countries using the euro as a common currency; those represented in the fund’s portfolio are Austria, Belgium, Finland, France, Germany, Greece, Ireland, Italy, the Netherlands, Slovenia and Spain. |
| Common stocks — 92.97% | Shares | Value (000) | Percent of net assets | |||||||||
| Consumer discretionary — 19.40% | ||||||||||||
| Netflix, Inc.1 | 1,411,123 | $ | 267,281 | 1.23 | % | |||||||
| Lions Gate Entertainment Corp.1,2 | 8,106,121 | 192,682 | .89 | |||||||||
| Mr Price Group Ltd. | 12,586,613 | 159,899 | .73 | |||||||||
| Paddy Power PLC | 1,681,726 | 151,745 | .70 | |||||||||
| Virgin Media Inc. | 2,892,500 | 141,646 | .65 | |||||||||
| DSW Inc., Class A | 2,200,000 | 140,360 | .65 | |||||||||
| lululemon athletica inc.1 | 1,791,000 | 111,669 | .51 | |||||||||
| ASOS PLC1 | 2,174,955 | 110,602 | .51 | |||||||||
| 4 | SMALLCAP World Fund |
| Common stock | Shares | Value (000) | Percent of net assets | |||||||||
| TOD’S SpA | 744,000 | $ | 106,515 | .49 | % | |||||||
| Five Below, Inc.1 | 2,564,833 | 97,182 | .45 | |||||||||
| Chow Sang Sang Holdings International Ltd. | 30,189,000 | 89,059 | .41 | |||||||||
| Domino’s Pizza, Inc. | 1,665,000 | 85,648 | .39 | |||||||||
| Melco Crown Entertainment Ltd. (ADR)1 | 3,500,000 | 81,690 | .38 | |||||||||
| Tesla Motors, Inc.1 | 1,970,593 | 74,666 | .34 | |||||||||
| Dollarama Inc. | 1,155,000 | 74,143 | .34 | |||||||||
| Other securities | 2,334,229 | 10.73 | ||||||||||
| 4,219,016 | 19.40 | |||||||||||
| Health care — 13.09% | ||||||||||||
| Regeneron Pharmaceuticals, Inc.1 | 1,227,820 | 216,587 | 1.00 | |||||||||
| Pharmacyclics, Inc.1 | 2,172,356 | 174,679 | .80 | |||||||||
| Synageva BioPharma Corp.1,2 | 1,905,074 | 104,627 | .48 | |||||||||
| Incyte Corp.1 | 4,445,600 | 104,072 | .48 | |||||||||
| Sysmex Corp. | 1,550,000 | 95,321 | .44 | |||||||||
| Molina Healthcare, Inc.1,2 | 2,982,000 | 92,054 | .42 | |||||||||
| BioMarin Pharmaceutical Inc.1 | 1,457,500 | 90,744 | .42 | |||||||||
| athenahealth, Inc.1 | 864,221 | 83,864 | .39 | |||||||||
| Hikma Pharmaceuticals PLC | 5,189,153 | 81,522 | .38 | |||||||||
| Sirona Dental Systems, Inc.1 | 1,074,750 | 79,241 | .36 | |||||||||
| ArthroCare Corp.1,2 | 2,214,748 | 76,985 | .35 | |||||||||
| Grifols, SA, Class A1 | 2,055,000 | 76,185 | .35 | |||||||||
| Intuitive Surgical, Inc.1 | 155,000 | 76,134 | .35 | |||||||||
| Emeritus Corp.1,2 | 2,729,700 | 75,858 | .35 | |||||||||
| Other securities | 1,419,045 | 6.52 | ||||||||||
| 2,846,918 | 13.09 | |||||||||||
| Industrials — 11.84% | ||||||||||||
| Intertek Group PLC | 2,448,000 | 126,198 | .58 | |||||||||
| MTU Aero Engines Holding AG | 1,118,000 | 105,966 | .49 | |||||||||
| ITT Corp. | 3,455,500 | 98,240 | .45 | |||||||||
| Moog Inc., Class A1 | 1,767,800 | 81,018 | .37 | |||||||||
| Chart Industries, Inc.1 | 999,871 | 80,000 | .37 | |||||||||
| Other securities | 2,083,361 | 9.58 | ||||||||||
| 2,574,783 | 11.84 | |||||||||||
| Information technology — 11.28% | ||||||||||||
| AAC Technologies Holdings Inc. | 47,727,000 | 229,333 | 1.06 | |||||||||
| National Instruments Corp. | 3,286,479 | 107,632 | .50 | |||||||||
| Hittite Microwave Corp.1,2 | 1,651,350 | 100,006 | .46 | |||||||||
| ASM International NV | 2,773,000 | 92,070 | .42 | |||||||||
| OpenTable, Inc.1,2 | 1,385,000 | 87,227 | .40 | |||||||||
| Other securities | 1,836,245 | 8.44 | ||||||||||
| 2,452,513 | 11.28 |
| SMALLCAP World Fund | 5 |
| Common stocks | Shares | Value (000) | Percent of net assets | |||||||||
| Financials — 10.16% | ||||||||||||
| Onex Corp. | 2,487,700 | $ | 118,589 | .55 | % | |||||||
| GT Capital Holdings, Inc. | 5,882,200 | 105,652 | .49 | |||||||||
| SVB Financial Group1 | 1,285,900 | 91,222 | .42 | |||||||||
| Financial Engines, Inc. | 2,335,000 | 84,574 | .39 | |||||||||
| Kotak Mahindra Bank Ltd. | 6,370,098 | 76,535 | .35 | |||||||||
| Security Bank Corp. | 16,590,000 | 73,986 | .34 | |||||||||
| Other securities | 1,658,503 | 7.62 | ||||||||||
| 2,209,061 | 10.16 | |||||||||||
| Energy — 6.08% | ||||||||||||
| Ophir Energy PLC1,2 | 32,010,668 | 225,230 | 1.03 | |||||||||
| InterOil Corp.1 | 2,419,563 | 184,153 | .85 | |||||||||
| Other securities | 913,771 | 4.20 | ||||||||||
| 1,323,154 | 6.08 | |||||||||||
| Consumer staples — 5.92% | ||||||||||||
| Puregold Price Club, Inc.2 | 157,727,900 | 154,790 | .71 | |||||||||
| Super Group Ltd.2 | 44,597,000 | 140,197 | .64 | |||||||||
| Raia Drogasil SA, ordinary nominative | 9,619,912 | 102,529 | .47 | |||||||||
| PT Sumber Alfaria Trijaya Tbk | 145,315,000 | 97,201 | .45 | |||||||||
| Coca-Cola Icecek AS, Class C | 2,861,097 | 82,590 | .38 | |||||||||
| PZ Cussons PLC | 12,468,837 | 76,422 | .35 | |||||||||
| Other securities | 634,613 | 2.92 | ||||||||||
| 1,288,342 | 5.92 | |||||||||||
| Materials — 5.87% | ||||||||||||
| Chr. Hansen Holding A/S | 3,726,000 | 138,225 | .63 | |||||||||
| AptarGroup, Inc. | 2,307,591 | 132,340 | .61 | |||||||||
| James Hardie Industries PLC (CDI) | 9,733,929 | 101,466 | .47 | |||||||||
| Schweitzer-Mauduit International, Inc.2 | 2,482,800 | 96,159 | .44 | |||||||||
| Other securities | 808,982 | 3.72 | ||||||||||
| 1,277,172 | 5.87 | |||||||||||
| Utilities — 2.69% | ||||||||||||
| ENN Energy Holdings Ltd.2 | 55,644,296 | 308,235 | 1.42 | |||||||||
| Manila Water Co., Inc.2 | 104,200,900 | 102,133 | .47 | |||||||||
| Other securities | 173,884 | .80 | ||||||||||
| 584,252 | 2.69 | |||||||||||
| Telecommunication services — 1.71% | ||||||||||||
| Other securities | 372,458 | 1.71 | ||||||||||
| 6 | SMALLCAP World Fund |
| Common stocks | Value (000) | Percent of net assets | ||||||||||
| Miscellaneous — 4.93% | ||||||||||||
| Other common stocks in initial period of acquisition | $ | 1,073,570 | 4.93 | % | ||||||||
| Total common stocks (cost: $14,617,192,000) | 20,221,239 | 92.97 | ||||||||||
| Preferred stocks — 0.07% | ||||||||||||
| Financials — 0.07% | ||||||||||||
| Other securities | 16,311 | .07 | ||||||||||
| Total preferred stocks (cost: $13,738,000) | 16,311 | .07 | ||||||||||
| Warrants — 0.00% | ||||||||||||
| Other — 0.00% | ||||||||||||
| Other securities | 11 | .00 | ||||||||||
| Total warrants (cost: $1,563,000) | 11 | .00 | ||||||||||
| Convertible securities — 0.44% | ||||||||||||
| Other — 0.44% | ||||||||||||
| Other securities | 96,557 | .44 | ||||||||||
| Total convertible securities (cost: $81,875,000) | 96,557 | .44 | ||||||||||
| Bonds & notes — 0.17% | ||||||||||||
| U.S. Treasury bonds & notes — 0.17% | ||||||||||||
| Other securities | 37,107 | .17 | ||||||||||
| Total bonds & notes (cost: $37,099,000) | 37,107 | .17 | ||||||||||
| Short-term securities — 6.45% | Principal amount (000) | |||||||||||
| Freddie Mac 0.10%–0.19% due 4/1–10/22/2013 | $ | 439,450 | 439,300 | 2.02 | ||||||||
| Fannie Mae 0.13%–0.16% due 5/22–12/16/2013 | 195,200 | 195,076 | .90 | |||||||||
| U.S. Treasury Bills 0.106%–0.18% due 4/18–8/15/2013 | 144,050 | 144,027 | .66 | |||||||||
| International Bank for Reconstruction and Development 0.13%–0.15% due 5/24–7/9/2013 | 114,900 | 114,878 | .53 | |||||||||
| Other securities | 509,146 | 2.34 | ||||||||||
| Total short-term securities (cost: $1,402,357,000) | 1,402,427 | 6.45 | ||||||||||
| Total investment securities (cost: $16,153,824,000) | 21,773,652 | 100.10 | ||||||||||
| Other assets less liabilities | (22,718 | ) | (.10 | ) | ||||||||
| Net assets | $ | 21,750,934 | 100.00 | % | ||||||||
As permitted by U.S. Securities and Exchange Commission regulations, “Miscellaneous” securities include holdings in their first year of acquisition that have not previously been publicly disclosed.
“Other securities” includes all issues that are not disclosed separately in the summary investment portfolio.
| SMALLCAP World Fund | 7 |
Forward currency contracts
The fund has entered into forward currency contracts to sell currencies as shown in the following table. The open forward currency contracts shown are generally indicative of the level of activity over the prior 12-month period.
| Unrealized | ||||||||||||||||
| (depreciation) | ||||||||||||||||
| Contract amount | appreciation | |||||||||||||||
| Receive | Deliver | at 3/31/2013 | ||||||||||||||
| Settlement date | Counterparty | (000) | (000) | (000) | ||||||||||||
| Sales: | ||||||||||||||||
| Australian dollars | 4/12/2013 | Barclays Bank PLC | $ | 4,491 | A$ | 4,400 | $ | (86 | ) | |||||||
| British pounds | 4/26/2013 | UBS AG | $ | 139,601 | £ | 91,780 | 176 | |||||||||
| Japanese yen | 4/8/2013 | Bank of New York Mellon | $ | 18,000 | ¥ | 1,685,052 | 101 | |||||||||
| Japanese yen | 4/8/2013 | Bank of New York Mellon | $ | 7,000 | ¥ | 675,430 | (174 | ) | ||||||||
| $ | 17 | |||||||||||||||
Investments in affiliates
A company is considered to be an affiliate of the fund under the Investment Company Act of 1940 if the fund’s holdings in that company represent 5% or more of the outstanding voting shares. The value of the fund’s affiliated-company holdings is either shown in the summary investment portfolio or included in the value of “Other securities” under the respective industry sectors. Further details on such holdings and related transactions during the six months ended March 31, 2013, appear below.
| Dividend | Value of | |||||||||||||||||||||||
| Beginning | Ending | or | affiliates | |||||||||||||||||||||
| shares or | shares or | interest | at | |||||||||||||||||||||
| principal | principal | income | 3/31/2013 | |||||||||||||||||||||
| amount | Additions | Reductions | amount | (000) | (000) | |||||||||||||||||||
| ENN Energy Holdings Ltd. | 55,644,296 | — | — | 55,644,296 | $ | — | $ | 308,235 | ||||||||||||||||
| Ophir Energy PLC1 | 16,717,585 | 15,293,083 | — | 32,010,668 | — | 225,230 | ||||||||||||||||||
| Lions Gate Entertainment Corp.1 | 8,000,000 | 106,121 | — | 8,106,121 | — | 192,682 | ||||||||||||||||||
| Puregold Price Club, Inc. | 87,206,000 | 70,521,900 | — | 157,727,900 | 316 | 154,790 | ||||||||||||||||||
| Super Group Ltd. | 44,597,000 | — | — | 44,597,000 | — | 140,197 | ||||||||||||||||||
| Synageva BioPharma Corp.1 | 1,570,000 | 335,074 | — | 1,905,074 | — | 104,627 | ||||||||||||||||||
| Manila Water Co., Inc. | 81,300,900 | 22,900,000 | — | 104,200,900 | 408 | 102,133 | ||||||||||||||||||
| Hittite Microwave Corp.1 | 1,794,950 | — | 143,600 | 1,651,350 | — | 100,006 | ||||||||||||||||||
| Schweitzer-Mauduit International, Inc. | 2,370,000 | 112,800 | — | 2,482,800 | 1,117 | 96,159 | ||||||||||||||||||
| Molina Healthcare, Inc.1 | 1,850,000 | 1,132,000 | — | 2,982,000 | — | 92,054 | ||||||||||||||||||
| OpenTable, Inc.1 | 1,290,000 | 95,000 | — | 1,385,000 | — | 87,227 | ||||||||||||||||||
| ArthroCare Corp.1 | 1,809,802 | 404,946 | — | 2,214,748 | — | 76,985 | ||||||||||||||||||
| Emeritus Corp.1 | 2,730,000 | — | 300 | 2,729,700 | — | 75,858 | ||||||||||||||||||
| Vistaprint NV1 | 2,050,000 | — | 190,000 | 1,860,000 | — | 71,908 | ||||||||||||||||||
| MD Medical Group Investments PLC (GDR)1 | — | 2,582,900 | — | 2,582,900 | — | 45,382 | ||||||||||||||||||
| MD Medical Group Investments PLC (GDR)1,3 | — | 1,179,100 | — | 1,179,100 | — | 20,717 | ||||||||||||||||||
| Coupons.com Inc., Series B,convertible preferred1,4,5 | 8,191,724 | — | — | 8,191,724 | — | 53,410 | ||||||||||||||||||
| 8 | SMALLCAP World Fund |
| Dividend | Value of | |||||||||||||||||||||||
| Beginning | Ending | or | affiliates | |||||||||||||||||||||
| shares or | shares or | interest | at | |||||||||||||||||||||
| principal | principal | income | 3/31/2013 | |||||||||||||||||||||
| amount | Additions | Reductions | amount | (000) | (000) | |||||||||||||||||||
| Goodpack Ltd. | 30,060,000 | 5,272,000 | — | 35,332,000 | $ | 1,227 | $ | 53,400 | ||||||||||||||||
| Goodpack Ltd., warrants, expire 2012 | 5,272,000 | — | 5,272,000 | — | — | — | ||||||||||||||||||
| Domino’s Pizza Enterprises Ltd. | 3,602,300 | 630,000 | — | 4,232,300 | 1,621 | 50,948 | ||||||||||||||||||
| Northgate PLC | 10,626,805 | — | — | 10,626,805 | 223 | 50,496 | ||||||||||||||||||
| National Financial Partners Corp.1 | 3,174,800 | — | 973,300 | 2,201,500 | — | 49,380 | ||||||||||||||||||
| National Financial Partners Corp. 4.00% convertible notes 2017 | $ | 4,000,000 | — | $ | 4,000,000 | — | 76 | — | ||||||||||||||||
| Demandware, Inc.1,6 | 507,171 | 1,317,949 | — | 1,825,120 | — | 46,267 | ||||||||||||||||||
| Greatview Aseptic Packaging Co. Ltd. | 50,033,000 | 17,900,000 | — | 67,933,000 | — | 45,507 | ||||||||||||||||||
| Bizim Toptan Satis Magazalari AS, non-registered shares | 1,720,474 | 1,193,000 | 290,000 | 2,623,474 | — | 44,351 | ||||||||||||||||||
| Orthofix International NV1 | 1,110,100 | 50,000 | — | 1,160,100 | — | 41,613 | ||||||||||||||||||
| Orexigen Therapeutics, Inc.1,6 | 894,900 | 5,640,100 | — | 6,535,000 | — | 40,844 | ||||||||||||||||||
| Comstock Resources, Inc.1 | 3,078,111 | — | 600,000 | 2,478,111 | — | 40,269 | ||||||||||||||||||
| Cadence Pharmaceuticals, Inc.1 | 6,130,469 | — | 190,500 | 5,939,969 | — | 39,738 | ||||||||||||||||||
| Galapagos NV1 | 1,554,436 | 21,000 | — | 1,575,436 | — | 38,507 | ||||||||||||||||||
| SPS Commerce, Inc.1 | 1,051,300 | — | 150,000 | 901,300 | — | 38,459 | ||||||||||||||||||
| Iridium Communications Inc.1 | 4,206,609 | 1,003,391 | — | 5,210,000 | — | 31,364 | ||||||||||||||||||
| Iridium Communications Inc., Series A, convertible preferred3 | 60,000 | — | — | 60,000 | 190 | 5,582 | ||||||||||||||||||
| Ebix, Inc.6 | 1,465,000 | 745,000 | — | 2,210,000 | 211 | 35,846 | ||||||||||||||||||
| Comfort Systems USA, Inc. | 2,476,000 | — | — | 2,476,000 | 248 | 34,887 | ||||||||||||||||||
| KEYW Holding Corp.1,6 | 1,613,500 | 524,000 | — | 2,137,500 | — | 34,478 | ||||||||||||||||||
| Yip’s Chemical Holdings Ltd. | 27,628,000 | 2,350,000 | — | 29,978,000 | — | 32,131 | ||||||||||||||||||
| AVEO Pharmaceuticals, Inc.1 | 3,387,200 | 759,800 | — | 4,147,000 | — | 30,480 | ||||||||||||||||||
| Immersion Corp.1 | 2,254,000 | — | — | 2,254,000 | — | 26,462 | ||||||||||||||||||
| Cox and Kings (India) Ltd. | 10,592,000 | — | — | 10,592,000 | — | 24,975 | ||||||||||||||||||
| Cox and Kings (India) Ltd. (GDR)4 | 330,000 | — | — | 330,000 | — | 778 | ||||||||||||||||||
| Autoneum Holding AG1 | 373,780 | — | — | 373,780 | — | 24,988 | ||||||||||||||||||
| Responsys, Inc.1 | — | 2,815,000 | — | 2,815,000 | — | 24,913 | ||||||||||||||||||
| African Petroleum Corp. Ltd.1 | 93,646,868 | — | — | 93,646,868 | — | 24,380 | ||||||||||||||||||
| XenoPort, Inc.1 | 2,792,000 | 435,000 | — | 3,227,000 | — | 23,073 | ||||||||||||||||||
| Kingdee International Software Group Co. Ltd.1 | 123,194,000 | 11,674,000 | — | 134,868,000 | — | 22,239 | ||||||||||||||||||
| Manappuram Finance Ltd. | 50,330,986 | 4,600,000 | — | 54,930,986 | 1,517 | 21,831 | ||||||||||||||||||
| Houston Wire & Cable Co. | 1,678,900 | — | — | 1,678,900 | 302 | 21,742 | ||||||||||||||||||
| Mothercare PLC1 | 4,480,000 | — | — | 4,480,000 | — | 21,441 | ||||||||||||||||||
| Greenko Group PLC1 | 9,144,000 | 234,155 | — | 9,378,155 | — | 19,022 | ||||||||||||||||||
| Home Federal Bancorp, Inc. | 1,384,249 | — | — | 1,384,249 | 332 | 17,718 | ||||||||||||||||||
| Frigoglass SAIC1 | 3,052,380 | — | — | 3,052,380 | — | 17,018 | ||||||||||||||||||
| bluebird bio, Inc., Series D, convertible preferred1,4,5 | 22,374,386 | — | — | 22,374,386 | — | 16,009 | ||||||||||||||||||
| Gem Diamonds Ltd.1 | 7,350,000 | — | — | 7,350,000 | — | 15,271 | ||||||||||||||||||
| SMALLCAP World Fund | 9 |
| Dividend | Value of | |||||||||||||||||||||||
| Beginning | Ending | or | affiliates | |||||||||||||||||||||
| shares or | shares or | interest | at | |||||||||||||||||||||
| principal | principal | income | 3/31/2013 | |||||||||||||||||||||
| amount | Additions | Reductions | amount | (000) | (000) | |||||||||||||||||||
| Mahindra Lifespace Developers Ltd. | 2,157,380 | — | — | 2,157,380 | $ | — | $ | 15,042 | ||||||||||||||||
| Mytrah Energy Ltd.1 | 7,918,000 | 2,500,000 | — | 10,418,000 | — | 14,246 | ||||||||||||||||||
| Duluth Metals Ltd.1 | 4,208,800 | 3,037,680 | — | 7,246,480 | — | 13,835 | ||||||||||||||||||
| ValueVision Media, Inc., Class A1 | 3,875,293 | — | — | 3,875,293 | — | 13,409 | ||||||||||||||||||
| Coal of Africa Ltd.1 | 55,734,459 | — | — | 55,734,459 | — | 11,855 | ||||||||||||||||||
| First Southern Bancorp, Inc.1,4,5 | 1,344,915 | — | — | 1,344,915 | — | 7,061 | ||||||||||||||||||
| First Southern Bancorp, Inc., Series C, convertible preferred1,4,5 | 2,299 | — | — | 2,299 | — | 4,658 | ||||||||||||||||||
| NewSat Ltd.1,6 | 2,086,578 | 12,313,985 | — | 14,400,563 | — | 5,923 | ||||||||||||||||||
| NewSat Ltd.1,3 | — | 12,155,000 | — | 12,155,000 | — | 5,000 | ||||||||||||||||||
| Powerland AG, non-registered shares | 1,200,000 | — | — | 1,200,000 | — | 10,592 | ||||||||||||||||||
| Mood Media Corp.1,3 | 6,375,000 | — | — | 6,375,000 | — | 6,462 | ||||||||||||||||||
| Mood Media Corp. (CDI)1,3 | 3,710,000 | — | — | 3,710,000 | — | 3,760 | ||||||||||||||||||
| Falkland Oil and Gas Ltd.1 | 24,225,000 | — | — | 24,225,000 | — | 9,754 | ||||||||||||||||||
| Tilaknager Industries Ltd. | 8,890,000 | — | — | 8,890,000 | — | 9,700 | ||||||||||||||||||
| EACOM Timber Corp.1 | 26,200,000 | — | — | 26,200,000 | — | 9,411 | ||||||||||||||||||
| BNK Petroleum Inc.1 | 5,763,380 | 5,780,000 | — | 11,543,380 | — | 8,861 | ||||||||||||||||||
| Eastern Platinum Ltd.1 | 27,281,450 | 34,350,000 | — | 61,631,450 | — | 8,794 | ||||||||||||||||||
| Mvelaserve Ltd.1 | 9,194,800 | — | — | 9,194,800 | — | 8,387 | ||||||||||||||||||
| Bloomsbury Publishing PLC | 5,405,000 | — | 682,424 | 4,722,576 | 82 | 8,252 | ||||||||||||||||||
| Gran Colombia Gold SA1 | 30,175,000 | — | — | 30,175,000 | — | 8,166 | ||||||||||||||||||
| Gran Colombia Gold SA, warrants, expire 20151 | 1,086,500 | — | — | 1,086,500 | — | 11 | ||||||||||||||||||
| Ultragenyx Pharmaceutical Inc., Series B, convertible preferred4,5 | — | 2,789,614 | — | 2,789,614 | — | 7,725 | ||||||||||||||||||
| Petrodorado Energy Ltd.1 | 38,400,000 | — | — | 38,400,000 | — | 6,802 | ||||||||||||||||||
| Afferro Mining Inc.1 | 6,460,000 | — | — | 6,460,000 | — | 6,134 | ||||||||||||||||||
| Talwalkars Better Value Fitness Ltd. | 1,446,000 | 248,000 | — | 1,694,000 | — | 4,441 | ||||||||||||||||||
| China High Precision Automation Group Ltd.4 | 67,422,000 | — | — | 67,422,000 | 174 | 3,474 | ||||||||||||||||||
| Pacific Coal Resources Ltd.1 | 18,280,000 | — | 15,668,571 | 2,611,429 | — | 3,238 | ||||||||||||||||||
| Pacific Coal Resources Ltd., warrants, expire 20161,4 | 8,500,000 | — | 7,285,714 | 1,214,286 | — | — | ||||||||||||||||||
| BrisConnections Unit Trusts1,4 | 27,290,000 | — | 144,844 | 27,145,156 | — | — | ||||||||||||||||||
| CEC Unet PLC1,4 | 35,100,775 | — | — | 35,100,775 | — | — | ||||||||||||||||||
| Achillion Pharmaceuticals, Inc.1,7 | 3,750,000 | 790,000 | 450,000 | 4,090,000 | — | — | ||||||||||||||||||
| BG Medicine, Inc.7 | 1,418,968 | — | 1,418,968 | — | — | — | ||||||||||||||||||
| CJ CGV Co., Ltd.7 | 1,235,000 | — | 825,000 | 410,000 | 112 | — | ||||||||||||||||||
| Cymer, Inc.1,7 | 1,670,000 | 25,000 | 1,340,000 | 355,000 | — | — | ||||||||||||||||||
| Delticom AG7 | 761,501 | — | 761,501 | — | — | — | ||||||||||||||||||
| Douglas Dynamics, Inc.7 | 1,175,000 | — | 1,175,000 | — | 233 | — | ||||||||||||||||||
| 10 | SMALLCAP World Fund |
| Dividend | Value of | |||||||||||||||||||||||
| Beginning | Ending | or | affiliates | |||||||||||||||||||||
| shares or | shares or | interest | at | |||||||||||||||||||||
| principal | principal | income | 3/31/2013 | |||||||||||||||||||||
| amount | Additions | Reductions | amount | (000) | (000) | |||||||||||||||||||
| Ennis, Inc.7 | 1,472,589 | — | 422,589 | 1,050,000 | $ | 690 | $ | — | ||||||||||||||||
| Exponent, Inc.7 | 936,400 | — | 320,000 | 616,400 | 92 | — | ||||||||||||||||||
| Green Packet Bhd.1,7 | 34,933,616 | — | 17,178,300 | 17,755,316 | — | — | ||||||||||||||||||
| Home Loan Servicing Solutions, Ltd.7 | 1,546,400 | 965,000 | — | 2,511,400 | 1,661 | — | ||||||||||||||||||
| InterOil Corp.1,7 | 2,461,200 | — | 41,637 | 2,419,563 | — | — | ||||||||||||||||||
| NuVasive, Inc.1,7 | 2,492,536 | — | 928,100 | 1,564,436 | — | — | ||||||||||||||||||
| PT Sumber Alfaria Trijaya Tbk7 | 219,452,500 | — | 74,137,500 | 145,315,000 | — | — | ||||||||||||||||||
| Quantum Corp.7 | 13,699,097 | — | 13,699,097 | — | — | — | ||||||||||||||||||
| Standard Parking Corp.7 | 1,048,600 | — | 1,048,600 | — | — | — | ||||||||||||||||||
| U.S. Auto Parts Network, Inc.1,7 | 1,980,000 | — | 604,337 | 1,375,663 | — | — | ||||||||||||||||||
| $ | 10,832 | $ | 3,269,000 | |||||||||||||||||||||
The following footnotes apply to either the individual securities noted or one or more of the securities aggregated and listed as a single line item.
| 1 | Security did not produce income during the last 12 months. |
| 2 | Represents an affiliated company as defined under the Investment Company Act of 1940. |
| 3 | Acquired in a transaction exempt from registration under Rule 144A or section 4(2) of the Securities Act of 1933. May be resold in the U.S. in transactions exempt from registration, normally to qualified institutional buyers. The total value of all such securities, including those in “Other securities,” was $535,070,000, which represented 2.46% of the net assets of the fund. |
| 4 | Valued under fair value procedures adopted by authority of the board of directors. The total value of all such securities, including those in “Miscellaneous” and “Other securities,” was $148,797,000, which represented .68% of the net assets of the fund. |
| 5 | Acquired through a private placement transaction exempt from registration under the Securities Act of 1933. May be subject to legal or contractual restrictions on resale. Further details on these holdings appear below. |
| Percent | ||||||||||||||||
| Acquisition | Cost | Value | of net | |||||||||||||
| date | (000) | (000) | assets | |||||||||||||
| Coupons.com Inc., Series B, convertible preferred | 6/1/2011 | $ | 45,000 | $ | 53,410 | .25 | % | |||||||||
| bluebird bio, Inc., Series D, convertible preferred | 7/20/2012 | 11,149 | 16,009 | .07 | ||||||||||||
| First Southern Bancorp, Inc. | 12/17/2009 | 22,070 | 7,061 | .03 | ||||||||||||
| First Southern Bancorp, Inc., Series C, convertible preferred | 12/17/2009 | — | 4,658 | .02 | ||||||||||||
| Ultragenyx Pharmaceutical Inc., Series B, convertible preferred | 12/17/2012 | 7,726 | 7,725 | .04 | ||||||||||||
| Other restricted securities | 104,375 | 62,651 | .29 | |||||||||||||
| Total restricted securities | $ | 190,320 | $ | 151,514 | .70 | % | ||||||||||
| 6 | This security was an unaffiliated issuer in its initial period of acquisition at 9/30/2012; it was not publicly disclosed. |
| 7 | Unaffiliated issuer at 3/31/2013. |
Key to abbreviations and symbols
ADR = American Depositary Receipts
CDI = CREST Depository Interest
GDR = Global Depositary Receipts
A$ = Australian dollars
£ = British pounds
¥ = Japanese yen
See Notes to Financial Statements
| SMALLCAP World Fund | 11 |
Financial statements
| Statement of assets and liabilities at March 31, 2013 | unaudited |
| (dollars in thousands) |
| Assets: | ||||||||
| Investment securities, at value: | ||||||||
| Unaffiliated issuers (cost: $13,297,847) | $ | 18,504,652 | ||||||
| Affiliated issuers (cost: $2,855,977) | 3,269,000 | $ | 21,773,652 | |||||
| Cash denominated in currencies other than U.S. dollars (cost: $1,821) | 1,820 | |||||||
| Cash | 5,364 | |||||||
| Unrealized appreciation on open forward currency contracts | 277 | |||||||
| Receivables for: | ||||||||
| Sales of investments | 78,397 | |||||||
| Sales of fund’s shares | 25,886 | |||||||
| Dividends and interest | 28,608 | 132,891 | ||||||
| 21,914,004 | ||||||||
| Liabilities: | ||||||||
| Unrealized depreciation on open forward currency contracts | 260 | |||||||
| Payables for: | ||||||||
| Purchases of investments | 98,254 | |||||||
| Repurchases of fund’s shares | 40,255 | |||||||
| Investment advisory services | 11,651 | |||||||
| Services provided by related parties | 9,608 | |||||||
| Directors’ deferred compensation | 2,544 | |||||||
| Other | 498 | 162,810 | ||||||
| Net assets at March 31, 2013 | $ | 21,750,934 | ||||||
| Net assets consist of: | ||||||||
| Capital paid in on shares of capital stock | $ | 16,204,549 | ||||||
| Distributions in excess of net investment income | (350,659 | ) | ||||||
| Undistributed net realized gain | 277,122 | |||||||
| Net unrealized appreciation | 5,619,922 | |||||||
| Net assets at March 31, 2013 | $ | 21,750,934 |
(dollars and shares in thousands, except per-share amounts)
Total authorized capital stock — 1,000,000 shares, $.01 par value (502,958 total shares outstanding)
| Net assets | Shares outstanding | Net asset value per share | |||||||
| Class A | $ 14,789,650 | 339,696 | $ 43.54 | ||||||
| Class B | 196,882 | 4,784 | 41.16 | ||||||
| Class C | 838,648 | 20,608 | 40.70 | ||||||
| Class F-1 | 704,034 | 16,307 | 43.17 | ||||||
| Class F-2 | 510,408 | 11,712 | 43.58 | ||||||
| Class 529-A | 781,767 | 18,069 | 43.26 | ||||||
| Class 529-B | 26,884 | 646 | 41.59 | ||||||
| Class 529-C | 246,101 | 5,949 | 41.37 | ||||||
| Class 529-E | 42,297 | 991 | 42.67 | ||||||
| Class 529-F-1 | 63,121 | 1,456 | 43.34 | ||||||
| Class R-1 | 38,054 | 915 | 41.59 | ||||||
| Class R-2 | 693,215 | 16,670 | 41.58 | ||||||
| Class R-3 | 758,469 | 17,805 | 42.60 | ||||||
| Class R-4 | 615,399 | 14,232 | 43.24 | ||||||
| Class R-5 | 473,510 | 10,775 | 43.95 | ||||||
| Class R-6 | 972,495 | 22,343 | 43.53 | ||||||
See Notes to Financial Statements
| 12 | SMALLCAP World Fund |
| Statement of operations for the six months ended March 31, 2013 | unaudited |
| (dollars in thousands) |
| Investment income: | ||||||||
| Income: | ||||||||
| Dividends (net of non-U.S. taxes of $4,193; also includes $10,756 from affiliates) | $ | 98,177 | ||||||
| Interest (includes $76 from affiliates) | 2,145 | $ | 100,322 | |||||
| Fees and expenses*: | ||||||||
| Investment advisory services | 64,415 | |||||||
| Distribution services | 29,513 | |||||||
| Transfer agent services | 19,753 | |||||||
| Administrative services | 2,230 | |||||||
| Reports to shareholders | 908 | |||||||
| Registration statement and prospectus | 227 | |||||||
| Directors’ compensation | 453 | |||||||
| Auditing and legal | 20 | |||||||
| Custodian | 2,045 | |||||||
| State and local taxes | 118 | |||||||
| Other | 636 | 120,318 | ||||||
| Net investment loss | (19,996 | ) | ||||||
| Net realized gain and unrealized appreciation on investments, forward currency contracts and currency: | ||||||||
| Net realized gain (loss) on: | ||||||||
| Investments (net of non-U.S. taxes of $36; also includes $17,517 net gain from affiliates) | 779,440 | |||||||
| Forward currency contracts | 432 | |||||||
| Currency transactions | (1,602 | ) | 778,270 | |||||
| Net unrealized appreciation on: | ||||||||
| Investments | 1,623,854 | |||||||
| Forward currency contracts | 22 | |||||||
| Currency translations | 98 | 1,623,974 | ||||||
| Net realized gain and unrealized appreciation on investments, forward currency contracts and currency | 2,402,244 | |||||||
| Net increase in net assets resulting from operations | $ | 2,382,248 |
| * | Additional information related to class-specific fees and expenses is included in the Notes to Financial Statements. |
See Notes to Financial Statements
| SMALLCAP World Fund | 13 |
Statements of changes in net assets
(dollars in thousands)
| Six months ended March 31, 2013* | Year ended September 30, 2012 | |||||||
| Operations: | ||||||||
| Net investment (loss) income | $ | (19,996 | ) | $ | 31,013 | |||
| Net realized gain on investments, forward currency contracts and currency transactions | 778,270 | 680,973 | ||||||
| Net unrealized appreciation on investments, forward currency contracts and currency translations | 1,623,974 | 3,429,858 | ||||||
| Net increase in net assets resulting from operations | 2,382,248 | 4,141,844 | ||||||
| Dividends paid to shareholders from net investment income | (257,778 | ) | (53,307 | ) | ||||
| Net capital share transactions | (34,896 | ) | (1,481,164 | ) | ||||
| Total increase in net assets | 2,089,574 | 2,607,373 | ||||||
| Net assets: | ||||||||
| Beginning of period | 19,661,360 | 17,053,987 | ||||||
| End of period (including distributions in excess of net investment income: $(350,659) and $(72,885), respectively) | $ | 21,750,934 | $ | 19,661,360 | ||||
| * | Unaudited. |
See Notes to Financial Statements
| 14 | SMALLCAP World Fund |
| Notes to financial statements | unaudited |
1. Organization
SMALLCAP World Fund, Inc. (the “fund”) is registered under the Investment Company Act of 1940 as an open-end, diversified management investment company. The fund seeks long-term growth of capital through investments in smaller companies in the U.S. and around the world. Shareholders approved a proposal to reorganize the fund from a Maryland corporation to a Delaware statutory trust. The reorganization may be completed in 2013; however, the fund reserves the right to delay the implementation.
The fund has 16 share classes consisting of five retail share classes (Classes A, B and C, as well as two F share classes, F-1 and F-2), five 529 college savings plan share classes (Classes 529-A, 529-B, 529-C, 529-E and 529-F-1) and six retirement plan share classes (Classes R-1, R-2, R-3, R-4, R-5 and R-6). The 529 college savings plan share classes can be used to save for college education. The retirement plan share classes are generally offered only through eligible employer-sponsored retirement plans. The fund’s share classes are further described below:
| Contingent deferred sales | |||||||
| Share class | Initial sales charge | charge upon redemption | Conversion feature | ||||
| Classes A and 529-A | Up to 5.75% | None (except 1% for certain redemptions within one year of purchase without an initial sales charge) | None | ||||
| Classes B and 529-B* | None | Declines from 5% to 0% for redemptions within six years of purchase | Classes B and 529-B convert to Classes A and 529-A, respectively, after eight years | ||||
| Class C | None | 1% for redemptions within one year of purchase | Class C converts to Class F-1 after 10 years | ||||
| Class 529-C | None | 1% for redemptions within one year of purchase | None | ||||
| Class 529-E | None | None | None | ||||
| Classes F-1, F-2 and 529-F-1 | None | None | None | ||||
| Classes R-1, R-2, R-3, R-4, R-5 and R-6 | None | None | None |
| * | Class B and 529-B shares of the fund are not available for purchase. |
Holders of all share classes have equal pro rata rights to assets, dividends and liquidation proceeds. Each share class has identical voting rights, except for the exclusive right to vote on matters affecting only its class. Share classes have different fees and expenses (“class-specific fees and expenses”), primarily due to different arrangements for distribution, administrative and shareholder services. Differences in class-specific fees and expenses will result in differences in net investment income and, therefore, the payment of different per-share dividends by each class.
| SMALLCAP World Fund | 15 |
2. Significant accounting policies
The financial statements have been prepared to comply with accounting principles generally accepted in the United States of America. These principles require management to make estimates and assumptions that affect reported amounts and disclosures. Actual results could differ from those estimates. The fund follows the significant accounting policies described below, as well as the valuation policies described in the next section on valuation.
Security transactions and related investment income — Security transactions are recorded by the fund as of the date the trades are executed with brokers. Realized gains and losses from security transactions are determined based on the specific identified cost of the securities. In the event a security is purchased with a delayed payment date, the fund will segregate liquid assets sufficient to meet its payment obligations. Dividend income is recognized on the ex-dividend date and interest income is recognized on an accrual basis. Market discounts, premiums and original issue discounts on fixed-income securities are amortized daily over the expected life of the security.
Class allocations — Income, fees and expenses (other than class-specific fees and expenses) and realized and unrealized gains and losses are allocated daily among the various share classes based on their relative net assets. Class-specific fees and expenses, such as distribution, administrative and shareholder services, are charged directly to the respective share class.
Dividends and distributions to shareholders — Dividends and distributions to shareholders are recorded on the ex-dividend date.
Currency translation — Assets and liabilities, including investment securities, denominated in currencies other than U.S. dollars are translated into U.S. dollars at the exchange rates supplied by one or more pricing vendors on the valuation date. Purchases and sales of investment securities and income and expenses are translated into U.S. dollars at the exchange rates on the dates of such transactions. On the accompanying financial statements, the effects of changes in exchange rates on investment securities are included with the net realized gain or loss and net unrealized appreciation or depreciation on investments. The realized gain or loss and unrealized appreciation or depreciation resulting from all other transactions denominated in currencies other than U.S. dollars are disclosed separately.
3. Valuation
Capital Research and Management Company (“CRMC”), the fund’s investment adviser, values the fund’s investments at fair value as defined by accounting principles generally accepted in the United States of America. The net asset value of each share class of the fund is generally determined as of approximately 4:00 p.m. New York time each day the New York Stock Exchange is open.
| 16 | SMALLCAP World Fund |
Methods and inputs — The fund’s investment adviser uses the following methods and inputs to establish the fair value of the fund’s assets and liabilities. Use of particular methods and inputs may vary over time based on availability and relevance as market and economic conditions evolve.
Equity securities are generally valued at the official closing price of, or the last reported sale price on, the exchange or market on which such securities are traded, as of the close of business on the day the securities are being valued or, lacking any sales, at the last available bid price. Prices for each security are taken from the principal exchange or market on which the security trades.
Fixed-income securities, including short-term securities purchased with more than 60 days left to maturity, are generally valued at prices obtained from one or more pricing vendors. Vendors value such securities based on one or more of the inputs described in the following table. The table provides examples of inputs that are commonly relevant for valuing particular classes of fixed-income securities in which the fund is authorized to invest. However, these classifications are not exclusive, and any of the inputs may be used to value any other class of fixed-income security.
| Fixed-income class | Examples of standard inputs |
| All | Benchmark yields, transactions, bids, offers, quotations from dealers and trading systems, new issues, spreads and other relationships observed in the markets among comparable securities; and proprietary pricing models such as yield measures calculated using factors such as cash flows, financial or collateral performance and other reference data (collectively referred to as “standard inputs”) |
| Corporate bonds & notes; convertible securities | Standard inputs and underlying equity of the issuer |
| Bonds & notes of governments & government agencies | Standard inputs and interest rate volatilities |
When the fund’s investment adviser deems it appropriate to do so (such as when vendor prices are unavailable or not deemed to be representative), fixed-income securities will be valued in good faith at the mean quoted bid and ask prices that are reasonably and timely available (or bid prices, if ask prices are not available) or at prices for securities of comparable maturity, quality and type.
Securities with both fixed-income and equity characteristics, or equity securities traded principally among fixed-income dealers, are generally valued in the manner described above for either equity or fixed-income securities, depending on which method is deemed most appropriate by the fund’s investment adviser. Short-term securities purchased within 60 days to maturity are valued at amortized cost, which approximates fair value. The value of short-term securities originally purchased with maturities greater than 60 days is determined based on an amortized value to par when they reach 60 days. Forward currency contracts are valued at the mean of representative quoted bid and ask prices, generally based on prices supplied by one or more pricing vendors.
| SMALLCAP World Fund | 17 |
Securities and other assets for which representative market quotations are not readily available or are considered unreliable by the fund’s investment adviser are fair valued as determined in good faith under fair value guidelines adopted by authority of the fund’s board of directors as further described below. The investment adviser follows fair valuation guidelines, consistent with U.S. Securities and Exchange Commission rules and guidance, to consider relevant principles and factors when making fair value determinations. The investment adviser considers relevant indications of value that are reasonably and timely available to it in determining the fair value to be assigned to a particular security, such as the type and cost of the security; contractual or legal restrictions on resale of the security; relevant financial or business developments of the issuer; actively traded similar or related securities; conversion or exchange rights on the security; related corporate actions; significant events occurring after the close of trading in the security; and changes in overall market conditions. In addition, the closing prices of equity securities that trade in markets outside U.S. time zones may be adjusted to reflect significant events that occur after the close of local trading but before the net asset value of each share class of the fund is determined. Fair valuations and valuations of investments that are not actively trading involve judgment and may differ materially from valuations that would have been used had greater market activity occurred.
Processes and structure — The fund’s board of directors has delegated authority to the fund’s investment adviser to make fair value determinations, subject to board oversight. The investment adviser has established a Joint Fair Valuation Committee (the “Fair Valuation Committee”) to administer, implement and oversee the fair valuation process, and to make fair value decisions. The Fair Valuation Committee regularly reviews its own fair value decisions, as well as decisions made under its standing instructions to the investment adviser’s valuation teams. The Fair Valuation Committee reviews changes in fair value measurements from period to period and may, as deemed appropriate, update the fair valuation guidelines to better reflect the results of back testing and address new or evolving issues. The Fair Valuation Committee reports any changes to the fair valuation guidelines to the board of directors with supplemental information to support the changes. The fund’s board and audit committee also regularly review reports that describe fair value determinations and methods.
The fund’s investment adviser has also established a Fixed-Income Pricing Review Group to administer and oversee the fixed-income valuation process, including the use of fixed-income pricing vendors. This group regularly reviews pricing vendor information and market data. Pricing decisions, processes and controls over security valuation are also subject to additional internal reviews, including an annual control self-evaluation program facilitated by the investment adviser’s compliance group.
Classifications — The fund’s investment adviser classifies the fund’s assets and liabilities into three levels based on the inputs used to value the assets or liabilities. Level 1 values are based on quoted prices in active markets for identical securities.
| 18 | SMALLCAP World Fund |
Level 2 values are based on significant observable market inputs, such as quoted prices for similar securities and quoted prices in inactive markets. Certain securities trading outside the U.S. may transfer between Level 1 and Level 2 due to valuation adjustments resulting from significant market movements following the close of local trading. Level 3 values are based on significant unobservable inputs that reflect the investment adviser’s determination of assumptions that market participants might reasonably use in valuing the securities. The valuation levels are not necessarily an indication of the risk or liquidity associated with the underlying investment. For example, U.S. government securities are reflected as Level 2 because the inputs used to determine fair value may not always be quoted prices in an active market. The following tables present the fund’s valuation levels as of March 31, 2013 (dollars in thousands):
| Investment securities | ||||||||||||||||
| Level 1 | Level 2 | Level 3 | Total | |||||||||||||
| Assets: | ||||||||||||||||
| Common stocks: | ||||||||||||||||
| Consumer discretionary | $ | 4,218,208 | $ | 778 | $ | 30 | $ | 4,219,016 | ||||||||
| Health care | 2,846,918 | — | — | 2,846,918 | ||||||||||||
| Industrials | 2,574,783 | — | — | 2,574,783 | ||||||||||||
| Information technology | 2,449,002 | — | 3,511 | 2,452,513 | ||||||||||||
| Financials | 2,176,934 | — | 32,127 | 2,209,061 | ||||||||||||
| Energy | 1,310,233 | 12,920 | 1 | 1,323,154 | ||||||||||||
| Consumer staples | 1,288,342 | — | — | 1,288,342 | ||||||||||||
| Materials | 1,275,670 | — | 1,502 | 1,277,172 | ||||||||||||
| Utilities | 584,252 | — | — | 584,252 | ||||||||||||
| Telecommunication services | 356,967 | — | 15,491 | 372,458 | ||||||||||||
| Miscellaneous | 1,072,935 | — | 635 | 1,073,570 | ||||||||||||
| Preferred stocks | — | 16,311 | — | 16,311 | ||||||||||||
| Warrants | 11 | — | — | 11 | ||||||||||||
| Convertible securities | — | 14,755 | 81,802 | 96,557 | ||||||||||||
| Bonds & notes | — | 37,107 | — | 37,107 | ||||||||||||
| Short-term securities | — | 1,402,427 | — | 1,402,427 | ||||||||||||
| Total | $ | 20,154,255 | $ | 1,484,298 | $ | 135,099 | $ | 21,773,652 | ||||||||
| Other investments* | ||||||||||||||||
| Level 1 | Level 2 | Level 3 | Total | |||||||||||||
| Assets: | ||||||||||||||||
| Unrealized appreciation on open forward currency contracts | $ | — | $ | 277 | $ | — | $ | 277 | ||||||||
| Liabilities: | ||||||||||||||||
| Unrealized depreciation on open forward currency contracts | — | (260 | ) | — | (260 | ) | ||||||||||
| Total | $ | — | $ | 17 | $ | — | $ | 17 | ||||||||
| * | Forward currency contracts are not included in the investment portfolio. |
| SMALLCAP World Fund | 19 |
4. Risk factors
Investing in the fund may involve certain risks including, but not limited to, those described below.
Market conditions — The prices of, and the income generated by, the securities held by the fund may decline due to market conditions and other factors, including those directly involving the issuers of securities held by the fund.
Investing in growth-oriented stocks — Growth-oriented stocks may involve larger price swings and greater potential for loss than other types of investments. These risks may be even greater in the case of smaller capitalization stocks.
Investing in small companies — Investing in smaller companies may pose additional risks. For example, it is often more difficult to value or dispose of small company stocks and more difficult to obtain information about smaller companies than about larger companies. In addition, the prices of these stocks may be more volatile than stocks of larger, more established companies.
Investing outside the U.S. — Securities of issuers domiciled outside the U.S., or with significant operations outside the U.S., may lose value because of adverse political, social, economic or market developments in the countries or regions in which the issuer operates. These securities may also lose value due to changes in foreign currency exchange rates against the U.S. dollar and/or currencies of other countries. Securities markets in certain countries may be more volatile and/or less liquid than those in the U.S. Investments outside the U.S. may also be subject to different settlement and accounting practices and different regulatory, legal and reporting standards, and may be more difficult to value, than those in the U.S. The risks of investing outside the U.S. may be heightened in connection with investments in emerging markets.
Investing in emerging markets — Investing in emerging markets may involve risks in addition to and greater than those generally associated with investing in developed countries. For instance, developing countries may have less developed legal and accounting systems than those in developed countries. The governments of these countries may be less stable and more likely to impose capital controls, nationalize a company or industry, place restrictions on foreign ownership and on withdrawing sale proceeds of securities from the country, and/or impose punitive taxes that could adversely affect the prices of securities. In addition, the economies of these countries may be dependent on relatively few industries that are more susceptible to local and global changes. Securities markets in these countries can also be relatively small and have substantially lower trading volumes. As a result, securities issued in these countries may be more volatile and less liquid, and may be more difficult to value, than securities issued in countries with more developed economies and/or markets. Additionally, there may be increased settlement risks for transactions in local securities.
| 20 | SMALLCAP World Fund |
Management — The investment adviser to the fund actively manages the fund’s investments. Consequently, the fund is subject to the risk that the methods and analyses employed by the investment adviser in this process may not produce the desired results. This could cause the fund to lose value or its investment results to lag relevant benchmarks or other funds with similar objectives.
5. Certain investment techniques
Forward currency contracts — The fund has entered into forward currency contracts, which represent agreements to exchange currencies on specific future dates at predetermined rates. The fund’s investment adviser uses forward currency contracts to manage the fund’s exposure to changes in exchange rates. Upon entering into these contracts, risks may arise from the potential inability of counterparties to meet the terms of their contracts and from possible movements in exchange rates.
On a daily basis, the fund’s investment adviser values forward currency contracts based on the applicable exchange rates and records unrealized appreciation or depreciation for open forward currency contracts in the fund’s statement of assets and liabilities. Realized gains or losses are recorded at the time the forward currency contract is closed or offset by another contract with the same broker for the same settlement date and currency. Closed forward currency contracts that have not reached their settlement date are included in the respective receivables or payables for closed forward currency contracts in the fund’s statement of assets and liabilities. Net realized gains or losses from closed forward currency contracts and net unrealized appreciation or depreciation from open forward currency contracts are recorded in the fund’s statement of operations.
Collateral — To reduce the risk to counterparties of forward currency contracts, the fund has entered into a collateral program with certain counterparties. The program calls for the fund to either receive or pledge collateral based on the net gain or loss on unsettled forward currency contracts by counterparty. The purpose of the collateral is to cover potential losses that could occur in the event that either party cannot meet its contractual obligations.
6. Taxation and distributions
Federal income taxation — The fund complies with the requirements under Subchapter M of the Internal Revenue Code applicable to mutual funds and intends to distribute substantially all of its net taxable income and net capital gains each year. The fund is not subject to income taxes to the extent such distributions are made. Therefore, no federal income tax provision is required.
As of and during the period ended March 31, 2013, the fund did not have a liability for any unrecognized tax benefits. The fund recognizes interest and penalties, if any, related to unrecognized tax benefits as income tax expense in the statement of operations.
| SMALLCAP World Fund | 21 |
During the period, the fund did not incur any interest or penalties.
The fund is not subject to examination by U.S. federal tax authorities for tax years before 2008, by state tax authorities for tax years before 2007 and by tax authorities outside the U.S. for tax years before 2005.
Non-U.S. taxation — Dividend and interest income are recorded net of non-U.S. taxes paid. Gains realized by the fund on the sale of securities in certain countries are subject to non-U.S. taxes. The fund records a liability based on unrealized gains to provide for potential non-U.S. taxes payable upon the sale of these securities.
Distributions — Distributions paid to shareholders are based on net investment income and net realized gains determined on a tax basis, which may differ from net investment income and net realized gains for financial reporting purposes. These differences are due primarily to different treatment for items such as currency gains and losses; short-term capital gains and losses; capital losses related to sales of certain securities within 30 days of purchase; unrealized appreciation of certain investments in securities outside the U.S.; deferred expenses; cost of investments sold; net capital losses; and income on certain investments. The fiscal year in which amounts are distributed may differ from the year in which the net investment income and net realized gains are recorded by the fund for financial reporting purposes.
The components of distributable earnings on a tax basis are reported as of the fund’s most recent year-end. As of September 30, 2012, the components of distributable earnings on a tax basis were as follows (dollars in thousands):
| Undistributed ordinary income | $ | 228,843 | ||
| Capital loss carryforward expiring 2018* | (476,072 | ) |
| * | The capital loss carryforward will be used to offset any capital gains realized by the fund in the current year or in subsequent years through the expiration date. The fund will not make distributions from capital gains while a capital loss carryforward remains. |
Under the Regulated Investment Company Modernization Act of 2010 (the “Act”), net capital losses recognized after September 30, 2011, may be carried forward indefinitely, and their character is retained as short-term and/or long-term losses. Previously, net capital losses were carried forward for eight years and treated as short-term losses. As a transition rule, the Act requires that post-enactment net capital losses be used before pre-enactment net capital losses.
As of March 31, 2013, the tax basis unrealized appreciation (depreciation) and cost of investment securities were as follows (dollars in thousands):
| Gross unrealized appreciation on investment securities | $ | 6,693,446 | ||
| Gross unrealized depreciation on investment securities | (1,376,635 | ) | ||
| Net unrealized appreciation on investment securities | 5,316,811 | |||
| Cost of investment securities | 16,456,841 |
| 22 | SMALLCAP World Fund |
Tax-basis distributions paid to shareholders from ordinary income were as follows (dollars in thousands):
| Six months ended | Year ended | |||||||
| Share class | March 31, 2013 | September 30, 2012 | ||||||
| Class A | $ | 182,045 | $ | 38,933 | ||||
| Class B | 999 | — | ||||||
| Class C | 5,125 | — | ||||||
| Class F-1 | 8,428 | 1,913 | ||||||
| Class F-2 | 7,141 | 1,886 | ||||||
| Class 529-A | 9,344 | 1,827 | ||||||
| Class 529-B | 97 | — | ||||||
| Class 529-C | 1,428 | — | ||||||
| Class 529-E | 423 | 6 | ||||||
| Class 529-F-1 | 842 | 243 | ||||||
| Class R-1 | 253 | — | ||||||
| Class R-2 | 4,501 | — | ||||||
| Class R-3 | 7,719 | — | ||||||
| Class R-4 | 8,016 | 1,787 | ||||||
| Class R-5 | 7,046 | 2,345 | ||||||
| Class R-6 | 14,371 | 4,367 | ||||||
| Total | $ | 257,778 | $ | 53,307 | ||||
7. Fees and transactions with related parties
CRMC, the fund’s investment adviser, is the parent company of American Funds Distributors,® Inc. (“AFD”), the principal underwriter of the fund’s shares, and American Funds Service Company® (“AFS”), the fund’s transfer agent. CRMC, AFD and AFS are considered related parties to the fund.
Investment advisory services — The fund has an investment advisory and service agreement with CRMC that provides for monthly fees accrued daily. These fees are based on a series of decreasing annual rates beginning with 0.800% on the first $1 billion of daily net assets and decreasing to 0.595% on such assets in excess of $27 billion. For the six months ended March 31, 2013, the investment advisory services fee was $64,415,000, which was equivalent to an annualized rate of 0.638% of average daily net assets.
Class-specific fees and expenses — Expenses that are specific to individual share classes are accrued directly to the respective share class. The principal class-specific fees and expenses are described below:
Distribution services — The fund has plans of distribution for all share classes, except Class F-2, R-5 and R-6 shares. Under the plans, the board of directors approves certain categories of expenses that are used to finance activities primarily intended to sell fund shares and service existing accounts. The plans provide for payments, based on an annualized percentage of average daily net assets, ranging
| SMALLCAP World Fund | 23 |
from 0.30% to 1.00% as noted below. In some cases, the board of directors has limited the amounts that may be paid to less than the maximum allowed by the plans. All share classes with a plan may use up to 0.25% of average daily net assets to pay service fees, or to compensate AFD for paying service fees, to firms that have entered into agreements with AFD to provide certain shareholder services. The remaining amounts available to be paid under each plan are paid to dealers to compensate them for their sales activities.
For Class A and 529-A shares, distribution-related expenses include the reimbursement of dealer and wholesaler commissions paid by AFD for certain shares sold without a sales charge. These share classes reimburse AFD for amounts billed within the prior 15 months but only to the extent that the overall annual expense limit of 0.30% is not exceeded. As of March 31, 2013, there were no unreimbursed expenses subject to reimbursement for Class A or 529-A shares.
| Share class | Currently approved limits | Plan limits | ||||||
| Class A | 0.30 | % | 0.30 | % | ||||
| Class 529-A | 0.30 | 0.50 | ||||||
| Classes B and 529-B | 1.00 | 1.00 | ||||||
| Classes C, 529-C and R-1 | 1.00 | 1.00 | ||||||
| Class R-2 | 0.75 | 1.00 | ||||||
| Classes 529-E and R-3 | 0.50 | 0.75 | ||||||
| Classes F-1, 529-F-1 and R-4 | 0.25 | 0.50 | ||||||
Transfer agent services — The fund has a shareholder services agreement with AFS under which the fund compensates AFS for providing transfer agent services to each of the fund’s share classes. These services include recordkeeping, shareholder communications and transaction processing. In addition, the fund reimburses AFS for amounts paid to third parties for performing transfer agent services on behalf of fund shareholders.
Administrative services — The fund has an administrative services agreement with CRMC under which the fund compensates CRMC for providing administrative services to Class A, C, F, 529 and R shares. These services include, but are not limited to, coordinating, monitoring, assisting and overseeing third parties that provide services to fund shareholders. Under the agreement, Class A shares pay an annual fee of 0.01% and Class C, F, 529 and R shares pay an annual fee of 0.05% of their respective average daily net assets.
529 plan services — Each 529 share class is subject to service fees to compensate the Commonwealth of Virginia for the maintenance of the 529 college savings plan. The quarterly fee is based on a series of decreasing annual rates beginning with 0.10% on the first $30 billion of the net assets invested in Class 529 shares of the
| 24 | SMALLCAP World Fund |
| American Funds and decreasing to 0.06% on such assets between $120 billion and $150 billion. The fee for any given calendar quarter is accrued and calculated on the basis of the average net assets of Class 529 shares of the American Funds for the last month of the prior calendar quarter. The fee is included in other expenses on the accompanying financial statements. The Commonwealth of Virginia is not considered a related party. |
| Class-specific expenses under the agreements described above for the six months ended March 31, 2013, were as follows (dollars in thousands): |
| Share class | Distribution services | Transfer agent services | Administrative services | 529 plan services | ||||||||||
| Class A | $16,588 | $15,001 | $691 | Not applicable | ||||||||||
| Class B | 1,003 | 233 | Not applicable | Not applicable | ||||||||||
| Class C | 3,919 | 864 | 197 | Not applicable | ||||||||||
| Class F-1 | 806 | 269 | 162 | Not applicable | ||||||||||
| Class F-2 | Not applicable | 213 | 105 | Not applicable | ||||||||||
| Class 529-A | 758 | 583 | 180 | $354 | ||||||||||
| Class 529-B | 136 | 25 | 7 | 14 | ||||||||||
| Class 529-C | 1,135 | 199 | 57 | 113 | ||||||||||
| Class 529-E | 97 | 23 | 10 | 19 | ||||||||||
| Class 529-F-1 | — | 45 | 14 | 28 | ||||||||||
| Class R-1 | 180 | 26 | 9 | Not applicable | ||||||||||
| Class R-2 | 2,422 | 1,224 | 163 | Not applicable | ||||||||||
| Class R-3 | 1,756 | 660 | 176 | Not applicable | ||||||||||
| Class R-4 | 713 | 283 | 143 | Not applicable | ||||||||||
| Class R-5 | Not applicable | 101 | 106 | Not applicable | ||||||||||
| Class R-6 | Not applicable | 4 | 210 | Not applicable | ||||||||||
| Total class-specific expenses | $29,513 | $19,753 | $2,230 | $528 | ||||||||||
Directors’ deferred compensation — Directors who are unaffiliated with CRMC may elect to defer the cash payment of part or all of their compensation. These deferred amounts, which remain as liabilities of the fund, are treated as if invested in shares of the fund or other American Funds. These amounts represent general, unsecured liabilities of the fund and vary according to the total returns of the selected funds. Directors’ compensation of $453,000, shown on the accompanying financial statements, includes $197,000 in current fees (either paid in cash or deferred) and a net increase of $256,000 in the value of the deferred amounts.
Affiliated officers and directors — Officers and certain directors of the fund are or may be considered to be affiliated with CRMC, AFD and AFS. No affiliated officers or directors received any compensation directly from the fund.
| SMALLCAP World Fund | 25 |
8. Capital share transactions
Capital share transactions in the fund were as follows (dollars and shares in thousands):
| Sales* | Reinvestments of dividends | Repurchases* | Net (decrease) increase | |||||||||||||||||||||||||||||
| Share class | Amount | Shares | Amount | Shares | Amount | Shares | Amount | Shares | ||||||||||||||||||||||||
| Six months ended March 31, 2013 | ||||||||||||||||||||||||||||||||
| Class A | $ | 763,532 | 18,643 | $ | 178,221 | 4,530 | $ | (1,159,215 | ) | (28,693 | ) | $ | (217,462 | ) | (5,520 | ) | ||||||||||||||||
| Class B | 2,798 | 72 | 990 | 27 | (42,899 | ) | (1,121 | ) | (39,111 | ) | (1,022 | ) | ||||||||||||||||||||
| Class C | 53,532 | 1,395 | 5,050 | 137 | (83,864 | ) | (2,219 | ) | (25,282 | ) | (687 | ) | ||||||||||||||||||||
| Class F-1 | 100,381 | 2,466 | 8,312 | 213 | (125,442 | ) | (3,198 | ) | (16,749 | ) | (519 | ) | ||||||||||||||||||||
| Class F-2 | 154,356 | 3,837 | 6,474 | 164 | (41,336 | ) | (1,015 | ) | 119,494 | 2,986 | ||||||||||||||||||||||
| Class 529-A | 55,025 | 1,359 | 9,342 | 239 | (48,014 | ) | (1,193 | ) | 16,353 | 405 | ||||||||||||||||||||||
| Class 529-B | 343 | 9 | 97 | 2 | (6,053 | ) | (157 | ) | (5,613 | ) | (146 | ) | ||||||||||||||||||||
| Class 529-C | 16,456 | 426 | 1,427 | 38 | (18,193 | ) | (474 | ) | (310 | ) | (10) | |||||||||||||||||||||
| Class 529-E | 3,101 | 77 | 423 | 11 | (3,129 | ) | (79 | ) | 395 | 9 | ||||||||||||||||||||||
| Class 529-F-1 | 7,712 | 191 | 842 | 21 | (4,532 | ) | (112 | ) | 4,022 | 100 | ||||||||||||||||||||||
| Class R-1 | 4,065 | 104 | 252 | 7 | (7,111 | ) | (183 | ) | (2,794 | ) | (72 | ) | ||||||||||||||||||||
| Class R-2 | 85,785 | 2,194 | 4,497 | 120 | (114,337 | ) | (2,949 | ) | (24,055 | ) | (635 | ) | ||||||||||||||||||||
| Class R-3 | 109,471 | 2,735 | 7,712 | 200 | (127,744 | ) | (3,224 | ) | (10,561 | ) | (289 | ) | ||||||||||||||||||||
| Class R-4 | 95,486 | 2,361 | 8,015 | 205 | (97,603 | ) | (2,421 | ) | 5,898 | 145 | ||||||||||||||||||||||
| Class R-5 | 85,722 | 2,102 | 7,030 | 177 | (48,245 | ) | (1,177 | ) | 44,507 | 1,102 | ||||||||||||||||||||||
| Class R-6 | 133,347 | 3,240 | 14,371 | 366 | (31,346 | ) | (774 | ) | 116,372 | 2,832 | ||||||||||||||||||||||
| Total net increase (decrease) | $ | 1,671,112 | 41,211 | $ | 253,055 | 6,457 | $ | (1,959,063 | ) | (48,989 | ) | $ | (34,896 | ) | (1,321 | ) | ||||||||||||||||
| Year ended September 30, 2012 | ||||||||||||||||||||||||||||||||
| Class A | $ | 1,129,356 | 31,144 | $ | 38,004 | 1,143 | $ | (2,385,076 | ) | (66,322 | ) | $ | (1,217,716 | ) | (34,035 | ) | ||||||||||||||||
| Class B | 6,271 | 183 | — | — | (112,865 | ) | (3,323 | ) | (106,594 | ) | (3,140 | ) | ||||||||||||||||||||
| Class C | 77,342 | 2,274 | — | — | (188,550 | ) | (5,607 | ) | (111,208 | ) | (3,333 | ) | ||||||||||||||||||||
| Class F-1 | 161,169 | 4,494 | 1,888 | 58 | (227,868 | ) | (6,443 | ) | (64,811 | ) | (1,891 | ) | ||||||||||||||||||||
| Class F-2 | 84,080 | 2,327 | 1,659 | 50 | (75,430 | ) | (2,093 | ) | 10,309 | 284 | ||||||||||||||||||||||
| Class 529-A | 91,331 | 2,547 | 1,827 | 55 | (80,519 | ) | (2,248 | ) | 12,639 | 354 | ||||||||||||||||||||||
| Class 529-B | 936 | 27 | — | — | (14,974 | ) | (438 | ) | (14,038 | ) | (411 | ) | ||||||||||||||||||||
| Class 529-C | 28,268 | 822 | — | — | (36,326 | ) | (1,062 | ) | (8,058 | ) | (240 | ) | ||||||||||||||||||||
| Class 529-E | 4,601 | 131 | 6 | — | † | (5,377 | ) | (152 | ) | (770 | ) | (21 | ) | |||||||||||||||||||
| Class 529-F-1 | 10,007 | 279 | 241 | 7 | (10,405 | ) | (293 | ) | (157 | ) | (7) | |||||||||||||||||||||
| Class R-1 | 8,012 | 232 | — | — | (13,756 | ) | (399 | ) | (5,744 | ) | (167 | ) | ||||||||||||||||||||
| Class R-2 | 155,041 | 4,478 | — | — | (224,117 | ) | (6,504 | ) | (69,076 | ) | (2,026 | ) | ||||||||||||||||||||
| Class R-3 | 194,396 | 5,494 | — | — | (228,474 | ) | (6,466 | ) | (34,078 | ) | (972 | ) | ||||||||||||||||||||
| Class R-4 | 167,985 | 4,674 | 1,787 | 54 | (171,407 | ) | (4,762 | ) | (1,635 | ) | (34 | ) | ||||||||||||||||||||
| Class R-5 | 82,196 | 2,246 | 2,339 | 70 | (91,255 | ) | (2,512 | ) | (6,720 | ) | (196 | ) | ||||||||||||||||||||
| Class R-6 | 188,508 | 5,258 | 4,365 | 131 | (56,380 | ) | (1,542 | ) | 136,493 | 3,847 | ||||||||||||||||||||||
| Total net increase (decrease) | $ | 2,389,499 | 66,610 | $ | 52,116 | 1,568 | $ | (3,922,779 | ) | (110,166 | ) | $ | (1,481,164 | ) | (41,988 | ) | ||||||||||||||||
| * | Includes exchanges between share classes of the fund. |
| † | Amount less than one thousand. |
| 26 | SMALLCAP World Fund |
9. Investment transactions
The fund made purchases and sales of investment securities, excluding short-term securities and U.S. government obligations, if any, of $3,699,104,000 and $3,716,861,000, respectively, during the six months ended March 31, 2013.
| SMALLCAP World Fund | 27 |
Financial highlights
| Income (loss) from investment operations1 | ||||||||||||||||||
| Net asset value, beginning of period | Net investment (loss) income | Net gains (losses) on securities (both realized and unrealized) | Total from investment operations | |||||||||||||||
| Class A: | Six months ended 3/31/20134,5 | $ | 39.27 | $ | (.03 | ) | $ | 4.84 | $ | 4.81 | ||||||||
| Year ended 9/30/2012 | 31.45 | .08 | 7.85 | 7.93 | ||||||||||||||
| Year ended 9/30/2011 | 35.82 | .09 | (3.94 | ) | (3.85 | ) | ||||||||||||
| Year ended 9/30/2010 | 30.26 | .14 | 5.62 | 5.76 | ||||||||||||||
| Year ended 9/30/2009 | 28.46 | .19 | 1.61 | 1.80 | ||||||||||||||
| Year ended 9/30/2008 | 47.43 | .31 | (14.35 | ) | (14.04 | ) | ||||||||||||
| Class B: | Six months ended 3/31/20134,5 | 36.95 | (.17 | ) | 4.57 | 4.40 | ||||||||||||
| Year ended 9/30/2012 | 29.72 | (.20 | ) | 7.43 | 7.23 | |||||||||||||
| Year ended 9/30/2011 | 33.87 | (.20 | ) | (3.71 | ) | (3.91 | ) | |||||||||||
| Year ended 9/30/2010 | 28.66 | (.11 | ) | 5.32 | 5.21 | |||||||||||||
| Year ended 9/30/2009 | 27.16 | .01 | 1.49 | 1.50 | ||||||||||||||
| Year ended 9/30/2008 | 45.49 | .01 | (13.72 | ) | (13.71 | ) | ||||||||||||
| Class C: | Six months ended 3/31/20134,5 | 36.60 | (.18 | ) | 4.53 | 4.35 | ||||||||||||
| Year ended 9/30/2012 | 29.44 | (.19 | ) | 7.35 | 7.16 | |||||||||||||
| Year ended 9/30/2011 | 33.61 | (.19 | ) | (3.69 | ) | (3.88 | ) | |||||||||||
| Year ended 9/30/2010 | 28.44 | (.10 | ) | 5.28 | 5.18 | |||||||||||||
| Year ended 9/30/2009 | 26.93 | .03 | 1.48 | 1.51 | ||||||||||||||
| Year ended 9/30/2008 | 45.18 | .01 | (13.63 | ) | (13.62 | ) | ||||||||||||
| Class F-1: | Six months ended 3/31/20134,5 | 38.94 | (.01 | ) | 4.79 | 4.78 | ||||||||||||
| Year ended 9/30/2012 | 31.18 | .09 | 7.78 | 7.87 | ||||||||||||||
| Year ended 9/30/2011 | 35.53 | .10 | (3.92 | ) | (3.82 | ) | ||||||||||||
| Year ended 9/30/2010 | 30.03 | .15 | 5.57 | 5.72 | ||||||||||||||
| Year ended 9/30/2009 | 28.21 | .21 | 1.61 | 1.82 | ||||||||||||||
| Year ended 9/30/2008 | 47.08 | .31 | (14.23 | ) | (13.92 | ) | ||||||||||||
| Class F-2: | Six months ended 3/31/20134,5 | 39.38 | .03 | 4.85 | 4.88 | |||||||||||||
| Year ended 9/30/2012 | 31.54 | .20 | 7.86 | 8.06 | ||||||||||||||
| Year ended 9/30/2011 | 35.93 | .20 | (3.96 | ) | (3.76 | ) | ||||||||||||
| Year ended 9/30/2010 | 30.39 | .25 | 5.63 | 5.88 | ||||||||||||||
| Year ended 9/30/2009 | 28.47 | .23 | 1.69 | 1.92 | ||||||||||||||
| Period from 8/1/2008 to 9/30/20084 | 33.66 | .08 | (5.27 | ) | (5.19 | ) | ||||||||||||
| 28 | SMALLCAP World Fund |
| Dividends and distributions | ||||||||||||||||||||||||||||||||||
| Dividends (from net investment income) | Distributions (from capital gains) | Total dividends and distributions | Net asset value, end of period | Total return2,3 | Net assets, end of period (in millions) | Ratio of expenses to average net assets before reimbursements/ waivers | Ratio of expenses to average net assets after reimbursements/ waivers3 | Ratio of net (loss) income to average net assets3 | ||||||||||||||||||||||||||
| $ | (.54 | ) | $ | — | $ | (.54 | ) | $ | 43.54 | 12.37 | % | $ | 14,790 | 1.14 | %6 | 1.14 | %6 | (.15 | )%6 | |||||||||||||||
| (.11 | ) | — | (.11 | ) | 39.27 | 25.26 | 13,557 | 1.14 | 1.14 | .23 | ||||||||||||||||||||||||
| (.52 | ) | — | (.52 | ) | 31.45 | (11.01 | ) | 11,926 | 1.09 | 1.09 | .23 | |||||||||||||||||||||||
| (.20 | ) | — | (.20 | ) | 35.82 | 19.11 | 14,432 | 1.13 | 1.13 | .43 | ||||||||||||||||||||||||
| — | — | — | 30.26 | 6.32 | 12,814 | 1.25 | 1.24 | .82 | ||||||||||||||||||||||||||
| (.76 | ) | (4.17 | ) | (4.93 | ) | 28.46 | (32.77 | ) | 13,453 | 1.07 | 1.01 | .80 | ||||||||||||||||||||||
| (.19 | ) | — | (.19 | ) | 41.16 | 11.94 | 197 | 1.90 | 6 | 1.90 | 6 | (.91 | )6 | |||||||||||||||||||||
| — | — | — | 36.95 | 24.33 | 214 | 1.90 | 1.90 | (.58 | ) | |||||||||||||||||||||||||
| (.24 | ) | — | (.24 | ) | 29.72 | (11.68 | ) | 266 | 1.86 | 1.86 | (.55 | ) | ||||||||||||||||||||||
| — | — | — | 33.87 | 18.18 | 397 | 1.89 | 1.89 | (.37 | ) | |||||||||||||||||||||||||
| — | — | — | 28.66 | 5.52 | 428 | 2.02 | 2.00 | .06 | ||||||||||||||||||||||||||
| (.45 | ) | (4.17 | ) | (4.62 | ) | 27.16 | (33.27 | ) | 495 | 1.83 | 1.77 | .03 | ||||||||||||||||||||||
| (.25 | ) | — | (.25 | ) | 40.70 | 11.92 | 839 | 1.94 | 6 | 1.94 | 6 | (.95 | )6 | |||||||||||||||||||||
| — | — | — | 36.60 | 24.32 | 779 | 1.93 | 1.93 | (.56 | ) | |||||||||||||||||||||||||
| (.29 | ) | — | (.29 | ) | 29.44 | (11.70 | ) | 725 | 1.86 | 1.86 | (.53 | ) | ||||||||||||||||||||||
| (.01 | ) | — | (.01 | ) | 33.61 | 18.19 | 865 | 1.88 | 1.88 | (.32 | ) | |||||||||||||||||||||||
| — | — | — | 28.44 | 5.64 | 738 | 1.94 | 1.92 | .13 | ||||||||||||||||||||||||||
| (.46 | ) | (4.17 | ) | (4.63 | ) | 26.93 | (33.31 | ) | 754 | 1.86 | 1.79 | .02 | ||||||||||||||||||||||
| (.55 | ) | — | (.55 | ) | 43.17 | 12.43 | 704 | 1.06 | 6 | 1.06 | 6 | (.06 | )6 | |||||||||||||||||||||
| (.11 | ) | — | (.11 | ) | 38.94 | 25.30 | 655 | 1.12 | 1.12 | .25 | ||||||||||||||||||||||||
| (.53 | ) | — | (.53 | ) | 31.18 | (11.02 | ) | 583 | 1.08 | 1.08 | .25 | |||||||||||||||||||||||
| (.22 | ) | — | (.22 | ) | 35.53 | 19.16 | 654 | 1.10 | 1.10 | .46 | ||||||||||||||||||||||||
| — | — | — | 30.03 | 6.45 | 543 | 1.14 | 1.13 | .94 | ||||||||||||||||||||||||||
| (.78 | ) | (4.17 | ) | (4.95 | ) | 28.21 | (32.77 | ) | 627 | 1.07 | 1.01 | .82 | ||||||||||||||||||||||
| (.68 | ) | — | (.68 | ) | 43.58 | 12.55 | 510 | .83 | 6 | .83 | 6 | .16 | 6 | |||||||||||||||||||||
| (.22 | ) | — | (.22 | ) | 39.38 | 25.69 | 344 | .83 | .83 | .55 | ||||||||||||||||||||||||
| (.63 | ) | — | (.63 | ) | 31.54 | (10.79 | ) | 266 | .82 | .82 | .53 | |||||||||||||||||||||||
| (.34 | ) | — | (.34 | ) | 35.93 | 19.46 | 246 | .81 | .81 | .78 | ||||||||||||||||||||||||
| — | — | — | 30.39 | 6.78 | 158 | .87 | .87 | .91 | ||||||||||||||||||||||||||
| — | — | — | 28.47 | (15.42 | ) | 8 | .14 | .13 | .26 | |||||||||||||||||||||||||
See footnotes on page 33.
| SMALLCAP World Fund | 29 |
Financial highlights (continued)
| Income (loss) from investment operations1 | ||||||||||||||||||
| Net asset value, beginning of period | Net investment (loss) income | Net gains (losses) on securities (both realized and unrealized) | Total from investment operations | |||||||||||||||
| Class 529-A: | Six months ended 3/31/20134,5 | $ | 39.03 | $ | (.04 | ) | $ | 4.80 | $ | 4.76 | ||||||||
| Year ended 9/30/2012 | 31.27 | .07 | 7.80 | 7.87 | ||||||||||||||
| Year ended 9/30/2011 | 35.63 | .08 | (3.92 | ) | (3.84 | ) | ||||||||||||
| Year ended 9/30/2010 | 30.13 | .13 | 5.58 | 5.71 | ||||||||||||||
| Year ended 9/30/2009 | 28.32 | .19 | 1.62 | 1.81 | ||||||||||||||
| Year ended 9/30/2008 | 47.23 | .29 | (14.28 | ) | (13.99 | ) | ||||||||||||
| Class 529-B: | Six months ended 3/31/20134,5 | 37.30 | (.19 | ) | 4.62 | 4.43 | ||||||||||||
| Year ended 9/30/2012 | 30.03 | (.23 | ) | 7.50 | 7.27 | |||||||||||||
| Year ended 9/30/2011 | 34.23 | (.23 | ) | (3.76 | ) | (3.99 | ) | |||||||||||
| Year ended 9/30/2010 | 28.98 | (.13 | ) | 5.38 | 5.25 | |||||||||||||
| Year ended 9/30/2009 | 27.47 | .01 | 1.50 | 1.51 | ||||||||||||||
| Year ended 9/30/2008 | 45.96 | (.02 | ) | (13.89 | ) | (13.91 | ) | |||||||||||
| Class 529-C: | Six months ended 3/31/20134,5 | 37.20 | (.19 | ) | 4.60 | 4.41 | ||||||||||||
| Year ended 9/30/2012 | 29.95 | (.21 | ) | 7.46 | 7.25 | |||||||||||||
| Year ended 9/30/2011 | 34.19 | (.22 | ) | (3.76 | ) | (3.98 | ) | |||||||||||
| Year ended 9/30/2010 | 28.94 | (.12 | ) | 5.37 | 5.25 | |||||||||||||
| Year ended 9/30/2009 | 27.43 | .01 | 1.50 | 1.51 | ||||||||||||||
| Year ended 9/30/2008 | 45.92 | (.01 | ) | (13.89 | ) | (13.90 | ) | |||||||||||
| Class 529-E: | Six months ended 3/31/20134,5 | 38.45 | (.09 | ) | 4.74 | 4.65 | ||||||||||||
| Year ended 9/30/2012 | 30.79 | (.03 | ) | 7.70 | 7.67 | |||||||||||||
| Year ended 9/30/2011 | 35.11 | (.03 | ) | (3.87 | ) | (3.90 | ) | |||||||||||
| Year ended 9/30/2010 | 29.70 | .04 | 5.50 | 5.54 | ||||||||||||||
| Year ended 9/30/2009 | 28.00 | .12 | 1.58 | 1.70 | ||||||||||||||
| Year ended 9/30/2008 | 46.76 | .18 | (14.15 | ) | (13.97 | ) | ||||||||||||
| Class 529-F-1: | Six months ended 3/31/20134,5 | 39.14 | — | 7 | 4.81 | 4.81 | ||||||||||||
| Year ended 9/30/2012 | 31.35 | .14 | 7.83 | 7.97 | ||||||||||||||
| Year ended 9/30/2011 | 35.72 | .15 | (3.94 | ) | (3.79 | ) | ||||||||||||
| Year ended 9/30/2010 | 30.20 | .20 | 5.59 | 5.79 | ||||||||||||||
| Year ended 9/30/2009 | 28.33 | .24 | 1.63 | 1.87 | ||||||||||||||
| Year ended 9/30/2008 | 47.24 | .37 | (14.28 | ) | (13.91 | ) | ||||||||||||
| 30 | SMALLCAP World Fund |
| Dividends and distributions | ||||||||||||||||||||||||||||||||||
| Dividends (from net investment income) | Distributions (from capital gains) | Total dividends and distributions | Net asset value,end of period | Total return2,3 | Net assets, end of period (in millions) | Ratio of expenses to average net assets before reimbursements/ waivers | Ratio of expenses to average net assets after reimbursements/ waivers3 | Ratio of net (loss) income to average net assets3 | ||||||||||||||||||||||||||
| $ | (.53 | ) | $ | — | $ | (.53 | ) | $ | 43.26 | 12.34 | % | $ | 782 | 1.20 | %6 | 1.20 | %6 | (.21 | )%6 | |||||||||||||||
| (.11 | ) | — | (.11 | ) | 39.03 | 25.22 | 689 | 1.19 | 1.19 | .19 | ||||||||||||||||||||||||
| (.52 | ) | — | (.52 | ) | 31.27 | (11.05 | ) | 541 | 1.14 | 1.14 | .20 | |||||||||||||||||||||||
| (.21 | ) | — | (.21 | ) | 35.63 | 19.06 | 548 | 1.16 | 1.16 | .41 | ||||||||||||||||||||||||
| — | — | — | 30.13 | 6.39 | 421 | 1.22 | 1.21 | .84 | ||||||||||||||||||||||||||
| (.75 | ) | (4.17 | ) | (4.92 | ) | 28.32 | (32.79 | ) | 371 | 1.11 | 1.05 | .78 | ||||||||||||||||||||||
| (.14 | ) | — | (.14 | ) | 41.59 | 11.88 | 27 | 2.00 | 6 | 2.00 | 6 | (1.00 | )6 | |||||||||||||||||||||
| — | — | — | 37.30 | 24.21 | 30 | 2.01 | 2.01 | (.68 | ) | |||||||||||||||||||||||||
| (.21 | ) | — | (.21 | ) | 30.03 | (11.78 | ) | 36 | 1.95 | 1.95 | (.63 | ) | ||||||||||||||||||||||
| — | — | — | 34.23 | 18.12 | 52 | 1.97 | 1.97 | (.44 | ) | |||||||||||||||||||||||||
| — | — | — | 28.98 | 5.50 | 51 | 2.05 | 2.03 | .02 | ||||||||||||||||||||||||||
| (.41 | ) | (4.17 | ) | (4.58 | ) | 27.47 | (33.35 | ) | 49 | 1.93 | 1.87 | (.05 | ) | |||||||||||||||||||||
| (.24 | ) | — | (.24 | ) | 41.37 | 11.90 | 246 | 1.99 | 6 | 1.99 | 6 | (1.00 | )6 | |||||||||||||||||||||
| — | — | — | 37.20 | 24.21 | 222 | 2.00 | 2.00 | (.62 | ) | |||||||||||||||||||||||||
| (.26 | ) | — | (.26 | ) | 29.95 | (11.77 | ) | 186 | 1.94 | 1.94 | (.61 | ) | ||||||||||||||||||||||
| — | — | — | 34.19 | 18.10 | 194 | 1.97 | 1.97 | (.40 | ) | |||||||||||||||||||||||||
| — | — | — | 28.94 | 5.54 | 155 | 2.04 | 2.03 | .02 | ||||||||||||||||||||||||||
| (.42 | ) | (4.17 | ) | (4.59 | ) | 27.43 | (33.36 | ) | 140 | 1.93 | 1.86 | (.04 | ) | |||||||||||||||||||||
| (.43 | ) | — | (.43 | ) | 42.67 | 12.20 | 42 | 1.44 | 6 | 1.44 | 6 | (.45 | )6 | |||||||||||||||||||||
| (.01 | ) | — | (.01 | ) | 38.45 | 24.90 | 38 | 1.45 | 1.45 | (.07 | ) | |||||||||||||||||||||||
| (.42 | ) | — | (.42 | ) | 30.79 | (11.32 | ) | 31 | 1.43 | 1.43 | (.08 | ) | ||||||||||||||||||||||
| (.13 | ) | — | (.13 | ) | 35.11 | 18.71 | 31 | 1.46 | 1.46 | .11 | ||||||||||||||||||||||||
| — | — | — | 29.70 | 6.07 | 25 | 1.52 | 1.51 | .54 | ||||||||||||||||||||||||||
| (.62 | ) | (4.17 | ) | (4.79 | ) | 28.00 | (33.01 | ) | 22 | 1.42 | 1.35 | .47 | ||||||||||||||||||||||
| (.61 | ) | — | (.61 | ) | 43.34 | 12.45 | 63 | .98 | 6 | .98 | 6 | — | 6,8 | |||||||||||||||||||||
| (.18 | ) | — | (.18 | ) | 39.14 | 25.51 | 53 | .99 | .99 | .39 | ||||||||||||||||||||||||
| (.58 | ) | — | (.58 | ) | 31.35 | (10.90 | ) | 43 | .94 | .94 | .40 | |||||||||||||||||||||||
| (.27 | ) | — | (.27 | ) | 35.72 | 19.31 | 47 | .95 | .95 | .62 | ||||||||||||||||||||||||
| — | — | — | 30.20 | 6.60 | 35 | 1.02 | 1.01 | 1.04 | ||||||||||||||||||||||||||
| (.83 | ) | (4.17 | ) | (5.00 | ) | 28.33 | (32.66 | ) | 30 | .92 | .85 | .98 | ||||||||||||||||||||||
See footnotes on page 33.
| SMALLCAP World Fund | 31 |
Financial highlights (continued)
| Income (loss) from investment operations1 | ||||||||||||||||||
| Net gains | ||||||||||||||||||
| (losses) on | ||||||||||||||||||
| Net asset | Net | securities | ||||||||||||||||
| value, | investment | (both | Total from | |||||||||||||||
| beginning | (loss) | realized and | investment | |||||||||||||||
| of period | income | unrealized) | operations | |||||||||||||||
| Class R-1: | Six months ended 3/31/20134,5 | $ | 37.40 | $ | (.16 | ) | $ | 4.62 | $ | 4.46 | ||||||||
| Year ended 9/30/2012 | 30.07 | (.17 | ) | 7.50 | 7.33 | |||||||||||||
| Year ended 9/30/2011 | 34.32 | (.19 | ) | (3.77 | ) | (3.96 | ) | |||||||||||
| Year ended 9/30/2010 | 29.05 | (.09 | ) | 5.39 | 5.30 | |||||||||||||
| Year ended 9/30/2009 | 27.51 | .02 | 1.52 | 1.54 | ||||||||||||||
| Year ended 9/30/2008 | 46.04 | .02 | (13.91 | ) | (13.89 | ) | ||||||||||||
| Class R-2: | Six months ended 3/31/20134,5 | 37.39 | (.16 | ) | 4.62 | 4.46 | ||||||||||||
| Year ended 9/30/2012 | 30.07 | (.18 | ) | 7.50 | 7.32 | |||||||||||||
| Year ended 9/30/2011 | 34.30 | (.20 | ) | (3.76 | ) | (3.96 | ) | |||||||||||
| Year ended 9/30/2010 | 29.03 | (.11 | ) | 5.38 | 5.27 | |||||||||||||
| Year ended 9/30/2009 | 27.55 | (.02 | ) | 1.50 | 1.48 | |||||||||||||
| Year ended 9/30/2008 | 46.13 | (.01 | ) | (13.95 | ) | (13.96 | ) | |||||||||||
| Class R-3: | Six months ended 3/31/20134,5 | 38.39 | (.08 | ) | 4.73 | 4.65 | ||||||||||||
| Year ended 9/30/2012 | 30.73 | (.02 | ) | 7.68 | 7.66 | |||||||||||||
| Year ended 9/30/2011 | 35.03 | (.03 | ) | (3.84 | ) | (3.87 | ) | |||||||||||
| Year ended 9/30/2010 | 29.64 | .04 | 5.49 | 5.53 | ||||||||||||||
| Year ended 9/30/2009 | 27.94 | .12 | 1.58 | 1.70 | ||||||||||||||
| Year ended 9/30/2008 | 46.68 | .18 | (14.12 | ) | (13.94 | ) | ||||||||||||
| Class R-4: | Six months ended 3/31/20134,5 | 39.03 | (.02 | ) | 4.80 | 4.78 | ||||||||||||
| Year ended 9/30/2012 | 31.25 | .11 | 7.80 | 7.91 | ||||||||||||||
| Year ended 9/30/2011 | 35.60 | .10 | (3.91 | ) | (3.81 | ) | ||||||||||||
| Year ended 9/30/2010 | 30.12 | .15 | 5.58 | 5.73 | ||||||||||||||
| Year ended 9/30/2009 | 28.29 | .20 | 1.63 | 1.83 | ||||||||||||||
| Year ended 9/30/2008 | 47.20 | .32 | (14.29 | ) | (13.97 | ) | ||||||||||||
| Class R-5: | Six months ended 3/31/20134,5 | 39.71 | .04 | 4.89 | 4.93 | |||||||||||||
| Year ended 9/30/2012 | 31.80 | .22 | 7.93 | 8.15 | ||||||||||||||
| Year ended 9/30/2011 | 36.21 | .22 | (3.99 | ) | (3.77 | ) | ||||||||||||
| Year ended 9/30/2010 | 30.60 | .26 | 5.66 | 5.92 | ||||||||||||||
| Year ended 9/30/2009 | 28.64 | .28 | 1.68 | 1.96 | ||||||||||||||
| Year ended 9/30/2008 | 47.70 | .44 | (14.45 | ) | (14.01 | ) | ||||||||||||
| Class R-6: | Six months ended 3/31/20134,5 | 39.34 | .05 | 4.85 | 4.90 | |||||||||||||
| Year ended 9/30/2012 | 31.52 | .24 | 7.84 | 8.08 | ||||||||||||||
| Year ended 9/30/2011 | 35.89 | .24 | (3.96 | ) | (3.72 | ) | ||||||||||||
| Year ended 9/30/2010 | 30.31 | .27 | 5.62 | 5.89 | ||||||||||||||
| Period from 5/1/2009 to 9/30/20094 | 22.33 | .13 | 7.85 | 7.98 | ||||||||||||||
| Six months ended | Year ended September 30 | |||||||||||||||||||||||
| March 31, 20134,5 | 2012 | 2011 | 2010 | 2009 | 2008 | |||||||||||||||||||
| Portfolio turnover rate for all share classes | 20% | 35% | 39% | 45% | 56% | 50% | ||||||||||||||||||
| 32 | SMALLCAP World Fund |
| Dividends and distributions | ||||||||||||||||||||||||||||||||||
| Dividends (from net investment income) | Distributions (from capital gains) | Total dividends and distributions | Net asset value, end of period | Total return3 | Net assets, end of period (in millions) | Ratio of expenses to average net assets before reimbursements/ waivers | Ratio of expenses to average net assets after reimbursements/ waivers3 | Ratio of net (loss) income to average net assets3 | ||||||||||||||||||||||||||
| $ | (.27 | ) | $ | — | $ | (.27 | ) | $ | 41.59 | 11.99 | % | $ | 38 | 1.85 | %6 | 1.85 | %6 | (.85 | )%6 | |||||||||||||||
| — | — | — | 37.40 | 24.38 | 37 | 1.86 | 1.86 | (.50 | ) | |||||||||||||||||||||||||
| (.29 | ) | — | (.29 | ) | 30.07 | (11.68 | ) | 35 | 1.84 | 1.84 | (.52 | ) | ||||||||||||||||||||||
| (.03 | ) | — | (.03 | ) | 34.32 | 18.25 | 43 | 1.87 | 1.87 | (.30 | ) | |||||||||||||||||||||||
| — | — | — | 29.05 | 5.60 | 36 | 1.94 | 1.93 | .11 | ||||||||||||||||||||||||||
| (.47 | ) | (4.17 | ) | (4.64 | ) | 27.51 | (33.29 | ) | 28 | 1.84 | 1.77 | .05 | ||||||||||||||||||||||
| (.27 | ) | — | (.27 | ) | 41.58 | 12.00 | 693 | 1.84 | 6 | 1.84 | 6 | (.85 | )6 | |||||||||||||||||||||
| — | — | — | 37.39 | 24.34 | 647 | 1.89 | 1.89 | (.52 | ) | |||||||||||||||||||||||||
| (.27 | ) | — | (.27 | ) | 30.07 | (11.72 | ) | 581 | 1.86 | 1.86 | (.54 | ) | ||||||||||||||||||||||
| — | — | — | 34.30 | 18.19 | 712 | 1.93 | 1.93 | (.37 | ) | |||||||||||||||||||||||||
| — | — | — | 29.03 | 5.37 | 603 | 2.15 | 2.14 | (.09 | ) | |||||||||||||||||||||||||
| (.45 | ) | (4.17 | ) | (4.62 | ) | 27.55 | (33.36 | ) | 494 | 1.94 | 1.86 | (.04 | ) | |||||||||||||||||||||
| (.44 | ) | — | (.44 | ) | 42.60 | 12.20 | 758 | 1.41 | 6 | 1.41 | 6 | (.42 | )6 | |||||||||||||||||||||
| — | — | — | 38.39 | 24.92 | 694 | 1.42 | 1.42 | (.05 | ) | |||||||||||||||||||||||||
| (.43 | ) | — | (.43 | ) | 30.73 | (11.28 | ) | 586 | 1.41 | 1.41 | (.08 | ) | ||||||||||||||||||||||
| (.14 | ) | — | (.14 | ) | 35.03 | 18.71 | 667 | 1.44 | 1.44 | .13 | ||||||||||||||||||||||||
| — | — | — | 29.64 | 6.05 | 534 | 1.53 | 1.51 | .53 | ||||||||||||||||||||||||||
| (.63 | ) | (4.17 | ) | (4.80 | ) | 27.94 | (32.99 | ) | 435 | 1.42 | 1.35 | .48 | ||||||||||||||||||||||
| (.57 | ) | — | (.57 | ) | 43.24 | 12.38 | 615 | 1.08 | 6 | 1.08 | 6 | (.08 | )6 | |||||||||||||||||||||
| (.13 | ) | — | (.13 | ) | 39.03 | 25.38 | 550 | 1.08 | 1.08 | .30 | ||||||||||||||||||||||||
| (.54 | ) | — | (.54 | ) | 31.25 | (10.98 | ) | 441 | 1.07 | 1.07 | .26 | |||||||||||||||||||||||
| (.25 | ) | — | (.25 | ) | 35.60 | 19.15 | 486 | 1.09 | 1.09 | .48 | ||||||||||||||||||||||||
| — | — | — | 30.12 | 6.47 | 378 | 1.14 | 1.13 | .88 | ||||||||||||||||||||||||||
| (.77 | ) | (4.17 | ) | (4.94 | ) | 28.29 | (32.78 | ) | 236 | 1.07 | 1.01 | .84 | ||||||||||||||||||||||
| (.69 | ) | — | (.69 | ) | 43.95 | 12.57 | 474 | .77 | 6 | .77 | 6 | .22 | 6 | |||||||||||||||||||||
| (.24 | ) | — | (.24 | ) | 39.71 | 25.77 | 384 | .78 | .78 | .60 | ||||||||||||||||||||||||
| (.64 | ) | — | (.64 | ) | 31.80 | (10.74 | ) | 314 | .77 | .77 | .56 | |||||||||||||||||||||||
| (.31 | ) | — | (.31 | ) | 36.21 | 19.50 | 347 | .78 | .78 | .79 | ||||||||||||||||||||||||
| — | — | — | 30.60 | 6.84 | 260 | .82 | .80 | 1.26 | ||||||||||||||||||||||||||
| (.88 | ) | (4.17 | ) | (5.05 | ) | 28.64 | (32.57 | ) | 440 | .77 | .70 | 1.17 | ||||||||||||||||||||||
| (.71 | ) | — | (.71 | ) | 43.53 | 12.62 | 973 | .73 | 6 | .73 | 6 | .26 | 6 | |||||||||||||||||||||
| (.26 | ) | — | (.26 | ) | 39.34 | 25.79 | 768 | .73 | .73 | .67 | ||||||||||||||||||||||||
| (.65 | ) | — | (.65 | ) | 31.52 | (10.68 | ) | 494 | .72 | .72 | .64 | |||||||||||||||||||||||
| (.31 | ) | — | (.31 | ) | 35.89 | 19.57 | 411 | .73 | .73 | .84 | ||||||||||||||||||||||||
| — | — | — | 30.31 | 35.74 | 317 | .33 | .33 | .51 | ||||||||||||||||||||||||||
| 1 | Based on average shares outstanding. |
| 2 | Total returns exclude any applicable sales charges, including contingent deferred sales charges. |
| 3 | This column reflects the impact, if any, of certain reimbursements/waivers from CRMC. During some of the periods shown, CRMC reduced fees for investment advisory services. In addition, during some of the periods shown, CRMC paid a portion of the fund’s transfer agent fees for certain retirement plan share classes. |
| 4 | Based on operations for the period shown and, accordingly, is not representative of a full year. |
| 5 | Unaudited. |
| 6 | Annualized. |
| 7 | Amount less than $.01. |
| 8 | Amount less than .01%. |
See Notes to Financial Statements
| SMALLCAP World Fund | 33 |
| Expense example | unaudited |
As a shareholder of the fund, you incur two types of costs: (1) transaction costs, such as initial sales charges on purchase payments and contingent deferred sales charges on redemptions (loads), and (2) ongoing costs, including management fees, distribution and service (12b-1) fees, and other expenses. This example is intended to help you understand your ongoing costs (in dollars) of investing in the fund so you can compare these costs with the ongoing costs of investing in other mutual funds. The example is based on an investment of $1,000 invested at the beginning of the period and held for the entire six-month period (October 1, 2012, through March 31, 2013).
Actual expenses:
The first line of each share class in the table on the next page provides information about actual account values and actual expenses. You may use the information in this line, together with the amount you invested, to estimate the expenses that you paid over the period. Simply divide your account value by $1,000 (for example, an $8,600 account value divided by $1,000 = 8.6), then multiply the result by the number in the first line under the heading entitled “Expenses paid during period” to estimate the expenses you paid on your account during this period.
Hypothetical example for comparison purposes:
The second line of each share class in the table on the next page provides information about hypothetical account values and hypothetical expenses based on the actual expense ratio for the share class and an assumed rate of return of 5.00% per year before expenses, which is not the actual return of the share class. The hypothetical account values and expenses may not be used to estimate the actual ending account balance or expenses you paid for the period. You may use this information to compare the ongoing costs of investing in the fund and other funds. To do so, compare this 5.00% hypothetical example with the 5.00% hypothetical examples that appear in the shareholder reports of the other funds.
Notes:
There are some account fees that are charged to certain types of accounts, such as individual retirement accounts and 529 college savings plan accounts (generally, a $10 fee is charged to set up the account and an additional $10 fee is charged to the account annually), that would increase the amount of expenses paid on your account. In addition, retirement plan participants may be subject to certain fees charged by the plan sponsor, and Class F-1, F-2 and 529-F-1 shareholders may be subject to fees charged by financial intermediaries, typically ranging from 0.75% to 1.50% of assets annually depending on services offered. You can estimate the impact of these fees by adding the amount of the fees to the total estimated expenses you paid on your account during the period as calculated above. In addition, your ending account value would be lower by the amount of these fees.
| 34 | SMALLCAP World Fund |
Note that the expenses shown in the table are meant to highlight your ongoing costs only and do not reflect any transactional costs, such as sales charges (loads). Therefore, the second line of each share class in the table is useful in comparing ongoing costs only and will not help you determine the relative total costs of owning different funds. In addition, if these transactional costs were included, your costs would have been higher.
| Beginning | Ending | Expenses | Annualized | |||||||||||||
| account value | account value | paid during | expense | |||||||||||||
| 10/1/2012 | 3/31/2013 | period* | ratio | |||||||||||||
| Class A — actual return | $ | 1,000.00 | $ | 1,123.73 | $ | 6.04 | 1.14 | % | ||||||||
| Class A — assumed 5% return | 1,000.00 | 1,019.25 | 5.74 | 1.14 | ||||||||||||
| Class B — actual return | 1,000.00 | 1,119.36 | 10.04 | 1.90 | ||||||||||||
| Class B — assumed 5% return | 1,000.00 | 1,015.46 | 9.55 | 1.90 | ||||||||||||
| Class C — actual return | 1,000.00 | 1,119.22 | 10.25 | 1.94 | ||||||||||||
| Class C — assumed 5% return | 1,000.00 | 1,015.26 | 9.75 | 1.94 | ||||||||||||
| Class F-1 — actual return | 1,000.00 | 1,124.28 | 5.61 | 1.06 | ||||||||||||
| Class F-1 — assumed 5% return | 1,000.00 | 1,019.65 | 5.34 | 1.06 | ||||||||||||
| Class F-2 — actual return | 1,000.00 | 1,125.50 | 4.40 | .83 | ||||||||||||
| Class F-2 — assumed 5% return | 1,000.00 | 1,020.79 | 4.18 | .83 | ||||||||||||
| Class 529-A — actual return | 1,000.00 | 1,123.38 | 6.35 | 1.20 | ||||||||||||
| Class 529-A — assumed 5% return | 1,000.00 | 1,018.95 | 6.04 | 1.20 | ||||||||||||
| Class 529-B — actual return | 1,000.00 | 1,118.79 | 10.56 | 2.00 | ||||||||||||
| Class 529-B — assumed 5% return | 1,000.00 | 1,014.96 | 10.05 | 2.00 | ||||||||||||
| Class 529-C — actual return | 1,000.00 | 1,118.99 | 10.51 | 1.99 | ||||||||||||
| Class 529-C — assumed 5% return | 1,000.00 | 1,015.01 | 10.00 | 1.99 | ||||||||||||
| Class 529-E — actual return | 1,000.00 | 1,122.00 | 7.62 | 1.44 | ||||||||||||
| Class 529-E — assumed 5% return | 1,000.00 | 1,017.75 | 7.24 | 1.44 | ||||||||||||
| Class 529-F-1 — actual return | 1,000.00 | 1,124.50 | 5.19 | .98 | ||||||||||||
| Class 529-F-1 — assumed 5% return | 1,000.00 | 1,020.04 | 4.94 | .98 | ||||||||||||
| Class R-1 — actual return | 1,000.00 | 1,119.85 | 9.78 | 1.85 | ||||||||||||
| Class R-1 — assumed 5% return | 1,000.00 | 1,015.71 | 9.30 | 1.85 | ||||||||||||
| Class R-2 — actual return | 1,000.00 | 1,120.00 | 9.73 | 1.84 | ||||||||||||
| Class R-2 — assumed 5% return | 1,000.00 | 1,015.76 | 9.25 | 1.84 | ||||||||||||
| Class R-3 — actual return | 1,000.00 | 1,122.03 | 7.46 | 1.41 | ||||||||||||
| Class R-3 — assumed 5% return | 1,000.00 | 1,017.90 | 7.09 | 1.41 | ||||||||||||
| Class R-4 — actual return | 1,000.00 | 1,123.81 | 5.72 | 1.08 | ||||||||||||
| Class R-4 — assumed 5% return | 1,000.00 | 1,019.55 | 5.44 | 1.08 | ||||||||||||
| Class R-5 — actual return | 1,000.00 | 1,125.74 | 4.08 | .77 | ||||||||||||
| Class R-5 — assumed 5% return | 1,000.00 | 1,021.09 | 3.88 | .77 | ||||||||||||
| Class R-6 — actual return | 1,000.00 | 1,126.17 | 3.87 | .73 | ||||||||||||
| Class R-6 — assumed 5% return | 1,000.00 | 1,021.29 | 3.68 | .73 | ||||||||||||
| * | The “expenses paid during period” are equal to the “annualized expense ratio,” multiplied by the average account value over the period, multiplied by the number of days in the period, and divided by 365 (to reflect the one-half year period). |
| SMALLCAP World Fund | 35 |
| Other share class results | unaudited |
Classes B, C, F and 529
Fund results shown are for past periods and are not predictive of results for future periods. Current and future results may be lower or higher than those shown. Share prices and returns will vary, so investors may lose money. For current information and month-end results, visit americanfunds.com.
Average annual total returns for periods ended March 31, 2013:
| 10 years/ | ||||||||||||
| 1 year | 5 years | Life of class1 | ||||||||||
| Class B shares2 | ||||||||||||
| Reflecting applicable contingent deferred sales charge (CDSC), maximum of 5%, payable only if shares are sold within six years of purchase | 7.91 | % | 3.34 | % | 12.53 | % | ||||||
| Not reflecting CDSC | 12.91 | 3.69 | 12.53 | |||||||||
| Class C shares | ||||||||||||
| Reflecting CDSC, maximum of 1%, payable only if shares are sold within one year of purchase | 11.88 | 3.71 | 12.34 | |||||||||
| Not reflecting CDSC | 12.88 | 3.71 | 12.34 | |||||||||
| Class F-1 shares3 | ||||||||||||
| Not reflecting annual asset-based fee charged by sponsoring firm | 13.83 | 4.54 | 13.24 | |||||||||
| Class F-2 shares3 — first sold 8/1/08 | ||||||||||||
| Not reflecting annual asset-based fee charged by sponsoring firm | 14.14 | — | 6.84 | |||||||||
| Class 529-A shares4 | ||||||||||||
| Reflecting 5.75% maximum sales charge | 7.18 | 3.23 | 12.52 | |||||||||
| Not reflecting maximum sales charge | 13.71 | 4.46 | 13.18 | |||||||||
| Class 529-B shares2,4 | ||||||||||||
| Reflecting applicable CDSC, maximum of 5%, payable only if shares are sold within six years of purchase | 7.79 | 3.26 | 12.42 | |||||||||
| Not reflecting CDSC | 12.79 | 3.61 | 12.42 | |||||||||
| Class 529-C shares4 | ||||||||||||
| Reflecting CDSC, maximum of 1%, payable only if shares are sold within one year of purchase | 11.81 | 3.62 | 12.24 | |||||||||
| Not reflecting CDSC | 12.81 | 3.62 | 12.24 | |||||||||
| Class 529-E shares3,4 | 13.41 | 4.16 | 12.84 | |||||||||
| Class 529-F-1 shares3,4 | ||||||||||||
| Not reflecting annual asset-based fee charged by sponsoring firm | 13.97 | 4.67 | 13.34 |
| 1 | Applicable to Class F-2 shares only. All other share classes reflect 10-year results. |
| 2 | These shares are not available for purchase. |
| 3 | These shares are sold without any initial or contingent deferred sales charge. |
| 4 | Results shown do not reflect the $10 account setup fee and an annual $10 account maintenance fee. |
Investment results assume all distributions are reinvested and reflect applicable fees and expenses. When applicable, investment results reflect fee waivers, without which results would have been lower. Visit americanfunds.com for more information.
For information regarding the differences among the various share classes, refer to the fund prospectus.
| 36 | SMALLCAP World Fund |
Offices
| Offices of the fund and of the investment adviser |
| Capital Research and Management Company |
| 333 South Hope Street |
| Los Angeles, CA 90071-1406 |
| 6455 Irvine Center Drive |
| Irvine, CA 92618 |
| Transfer agent for shareholder accounts |
| American Funds Service Company |
| (Write to the address near you.) |
| P.O. Box 6007 |
| Indianapolis, IN 46206-6007 |
| P.O. Box 2280 |
| Norfolk, VA 23501-2280 |
| Custodian of assets |
| State Street Bank and Trust Company |
| One Lincoln Street |
| Boston, MA 02111 |
| Counsel |
| K&L Gates LLP |
| Four Embarcadero Center, Suite 1200 |
| San Francisco, CA 94111-5994 |
| Independent registered public accounting firm |
| Deloitte & Touche LLP |
| 695 Town Center Drive |
| Suite 1200 |
| Costa Mesa, CA 92626-7188 |
| Principal underwriter |
| American Funds Distributors, Inc. |
| 333 South Hope Street |
| Los Angeles, CA 90071-1406 |
Investors should carefully consider investment objectives, risks, charges and expenses. This and other important information is contained in the fund prospectus and summary prospectus, which can be obtained from your financial professional and should be read carefully before investing. You may also call American Funds Service Company (AFS) at (800) 421-4225 or visit the American Funds website at americanfunds.com.
“American Funds Proxy Voting Procedures and Principles” — which describes how we vote proxies relating to portfolio securities — is available on the American Funds website or upon request by calling AFS. The fund files its proxy voting record with the U.S. Securities and Exchange Commission (SEC) for the 12 months ended June 30 by August 31. The proxy voting record is available free of charge on the SEC website at sec.gov and on the American Funds website.
A complete March 31, 2013, portfolio of SMALLCAP World Fund’s investments is available free of charge by calling AFS or visiting the SEC website (where it is part of Form N-CSR).
SMALLCAP World Fund files a complete list of its portfolio holdings with the SEC for the first and third quarters of each fiscal year on Form N-Q. This filing is available free of charge on the SEC website. You may also review or, for a fee, copy this filing at the SEC’s Public Reference Room in Washington, D.C. Additional information regarding the operation of the Public Reference Room may be obtained by calling the SEC’s Office of Investor Education and Advocacy at (800) SEC-0330. Additionally, the list of portfolio holdings is available by calling AFS.
This report is for the information of shareholders of SMALLCAP World Fund, but it also may be used as sales literature when preceded or accompanied by the current prospectus or summary prospectus, which gives details about charges, expenses, investment objectives and operating policies of the fund. If used as sales material after June 30, 2013, this report must be accompanied by an American Funds statistical update for the most recently completed calendar quarter.
The American Funds Advantage
Since 1931, American Funds, part of Capital Group, has helped investors pursue long-term investment success. Our consistent approach — in combination with The Capital SystemSM — has resulted in a superior long-term track record.
Aligned with investor success
We base our decisions on a long-term perspective, which we believe aligns our goals with the interests of our clients. Our portfolio managers average 25 years of investment experience, including 20 years at our company, reflecting a career commitment to our long-term approach.1
The Capital SystemSM
Our investment process, The Capital System, combines individual accountability with teamwork. Each fund is divided into portions that are managed independently by investment professionals with diverse backgrounds, ages and investment approaches. An extensive global research effort is the backbone of our system.
Superior long-term track record
Our equity funds have beaten their Lipper peer indexes in 90% of 10-year periods and 96% of 20-year periods. Our fixed-income funds have beaten their Lipper indexes in 58% of 10-year periods and 63% of 20-year periods.2 Our fund management fees have been among the lowest in the industry.3
| 1 | Portfolio manager experience as of December 31, 2012. |
| 2 | Based on Class A share results for rolling periods through December 31, 2012. Periods covered are the shorter of the fund’s lifetime or since the comparable Lipper index inception date. |
| 3 | Based on management fees for the 20-year period ended December 31, 2012, versus comparable Lipper categories, excluding funds of funds. |
| American Funds span a range of investment objectives | |
| n | Growth funds |
| AMCAP Fund® | |
| EuroPacific Growth Fund® | |
| The Growth Fund of America® | |
| The New Economy Fund® | |
| New Perspective Fund® | |
| New World Fund® | |
| SMALLCAP World Fund® | |
| n | Growth-and-income funds |
| American Mutual Fund® | |
| Capital World Growth and Income Fund® | |
| Fundamental InvestorsSM | |
| International Growth and Income FundSM | |
| The Investment Company of America® | |
| Washington Mutual Investors FundSM | |
| n | Equity-income funds |
| Capital Income Builder® | |
| The Income Fund of America® | |
| n | Balanced funds |
| American Balanced Fund® | |
| American Funds Global Balanced FundSM | |
| n | Bond funds |
| American Funds Mortgage Fund® | |
| American High-Income Trust® | |
| The Bond Fund of America® | |
| Capital World Bond Fund® | |
| Intermediate Bond Fund of America® | |
| Short-Term Bond Fund of America® | |
| U.S. Government Securities Fund® | |
| n | Tax-exempt bond funds |
| American Funds Short-Term Tax-Exempt Bond Fund® | |
| American High-Income Municipal Bond Fund® | |
| Limited Term Tax-Exempt Bond Fund of America® | |
| The Tax-Exempt Bond Fund of America® | |
| State-specific tax-exempt funds | |
| American Funds Tax-Exempt Fund of New York® | |
| The Tax-Exempt Fund of California® | |
| The Tax-Exempt Fund of Maryland® | |
| The Tax-Exempt Fund of Virginia® | |
| n | Money market fund |
| American Funds Money Market Fund® | |
| n | American Funds Portfolio SeriesSM |
| American Funds Global Growth PortfolioSM | |
| American Funds Growth PortfolioSM | |
| American Funds Growth and Income PortfolioSM | |
| American Funds Balanced PortfolioSM | |
| American Funds Income PortfolioSM | |
| American Funds Tax-Advantaged Income PortfolioSM | |
| American Funds Preservation PortfolioSM | |
| American Funds Tax-Exempt Preservation PortfolioSM | |
| n | American Funds Target Date Retirement Series® |
| n | American Funds College Target Date SeriesSM |

ITEM 2 – Code of Ethics
Not applicable for filing of semi-annual reports to shareholders.
ITEM 3 – Audit Committee Financial Expert
Not applicable for filing of semi-annual reports to shareholders.
ITEM 4 – Principal Accountant Fees and Services
Not applicable for filing of semi-annual reports to shareholders.
ITEM 5 – Audit Committee of Listed Registrants
Not applicable to this Registrant, insofar as the Registrant is not a listed issuer as defined in Rule 10A-3 under the Securities Exchange Act of 1934.
ITEM 6 – Schedule of Investments
 | SMALLCAP World Fund® Investment portfolio March 31, 2013 |
unaudited
| Common stocks 92.97% | ||
| Value | ||
| Consumer discretionary 19.40% | Shares | (000) |
| Netflix, Inc.1 | 1,411,123 | $267,281 |
| Lions Gate Entertainment Corp.1,2 | 8,106,121 | 192,682 |
| Mr Price Group Ltd. | 12,586,613 | 159,899 |
| Paddy Power PLC | 1,681,726 | 151,745 |
| Virgin Media Inc. | 2,892,500 | 141,646 |
| DSW Inc., Class A | 2,200,000 | 140,360 |
| lululemon athletica inc.1 | 1,791,000 | 111,669 |
| ASOS PLC1 | 2,174,955 | 110,602 |
| TOD’S SpA | 744,000 | 106,515 |
| Five Below, Inc.1 | 2,564,833 | 97,182 |
| Chow Sang Sang Holdings International Ltd. | 30,189,000 | 89,059 |
| Domino’s Pizza, Inc. | 1,665,000 | 85,648 |
| Melco Crown Entertainment Ltd. (ADR)1 | 3,500,000 | 81,690 |
| Tesla Motors, Inc.1 | 1,970,593 | 74,666 |
| Dollarama Inc. | 1,155,000 | 74,143 |
| PT Ace Hardware Indonesia Tbk | 799,787,500 | 68,312 |
| L’Occitane International SA | 21,662,750 | 65,859 |
| Tiffany & Co. | 947,000 | 65,854 |
| Melco International Development Ltd. | 37,898,000 | 65,616 |
| CTC Media, Inc. | 5,204,000 | 61,355 |
| Domino’s Pizza Enterprises Ltd.2 | 4,232,300 | 50,948 |
| Jubilant FoodWorks Ltd.1 | 2,220,098 | 50,936 |
| Rightmove PLC | 1,833,594 | 49,616 |
| Minth Group Ltd. | 32,284,000 | 47,578 |
| Techtronic Industries Co. Ltd. | 19,300,000 | 46,991 |
| Wendy’s Co. | 8,123,000 | 46,057 |
| Arcos Dorados Holdings Inc., Class A | 3,480,000 | 45,936 |
| PT Global Mediacom Tbk | 190,498,000 | 45,578 |
| William Hill PLC | 7,947,800 | 44,667 |
| Penske Automotive Group, Inc. | 1,312,000 | 43,768 |
| Inchcape PLC | 5,526,591 | 42,194 |
| Gentex Corp. | 1,954,567 | 39,111 |
| Entertainment One Ltd.1 | 13,659,782 | 38,654 |
| Jarden Corp.1 | 862,500 | 36,958 |
| Brunello Cucinelli SpA1 | 1,672,530 | 35,199 |
| Bloomberry Resorts Corp.1 | 100,363,000 | 35,020 |
| Brinker International, Inc. | 890,000 | 33,509 |
| Leggett & Platt, Inc. | 990,000 | 33,442 |
| PT Matahari Department Store Tbk1 | 29,068,000 | 32,905 |
| Café de Coral Holdings Ltd. | 10,672,000 | 32,514 |
| Hyundai Home Shopping Co., Ltd. | 256,200 | 31,893 |
| HUGO BOSS AG | 280,231 | 31,399 |
| Jumbo SA | 4,396,965 | 31,334 |
| Giordano International Ltd. | 30,850,000 | 30,760 |
| YOOX SpA1 | 1,641,469 | 30,759 |
| Parkson Retail Asia Ltd. | 23,182,000 | 30,645 |
| Group 1 Automotive, Inc. | 490,000 | 29,434 |
| John Wiley & Sons, Inc., Class A | 743,883 | 28,982 |
| Boyd Gaming Corp.1 | 3,349,000 | 27,696 |
| PT Mitra Adiperkasa Tbk | 28,873,000 | 27,038 |
| Cox and Kings (India) Ltd.2 | 10,592,000 | 24,975 |
| Cox and Kings (India) Ltd. (GDR)2,3 | 330,000 | 778 |
| Lennar Corp., Class A | 619,000 | 25,676 |
| Navitas Ltd. | 4,625,000 | 25,671 |
| Coway Co., Ltd. | 581,000 | 25,562 |
| Bloomin’ Brands, Inc.1 | 1,400,000 | 25,018 |
| Autoneum Holding AG1,2 | 373,780 | 24,988 |
| Winnebago Industries, Inc.1 | 1,161,516 | 23,974 |
| Daily Mail and General Trust PLC, Class A, nonvoting | 2,210,000 | 23,823 |
| TAKKT AG | 1,456,778 | 23,806 |
| Home Inns & Hotels Management Inc. (ADR)1 | 796,000 | 23,713 |
| CTS Eventim AG | 690,592 | 23,412 |
| Ekornes ASA | 1,445,850 | 23,264 |
| Unibet Group PLC (SDR) | 662,500 | 23,130 |
| Domino’s Pizza Group PLC | 2,465,000 | 22,565 |
| SodaStream International Ltd.1 | 450,000 | 22,338 |
| Zhongsheng Group Holdings Ltd. | 18,356,000 | 22,228 |
| Brunswick Corp. | 639,000 | 21,867 |
| Betfair Group PLC | 2,015,000 | 21,584 |
| Mothercare PLC1,2 | 4,480,000 | 21,441 |
| Zee Entertainment Enterprises Ltd. | 5,385,000 | 20,851 |
| CJ Home Shopping Co., Ltd. | 76,100 | 20,444 |
| Valeo SA, non-registered shares | 365,000 | 19,749 |
| CJ CGV Co., Ltd. | 410,000 | 18,407 |
| START TODAY Co., Ltd. | 1,374,000 | 16,987 |
| Betsson AB, Class B1 | 518,100 | 16,657 |
| Toll Brothers, Inc.1 | 471,800 | 16,154 |
| Ocado Group PLC1 | 6,533,708 | 15,685 |
| HT Media Ltd. | 8,179,036 | 15,275 |
| Headlam Group PLC | 2,809,685 | 14,866 |
| Schibsted ASA | 330,900 | 14,727 |
| China Lodging Group, Ltd. (ADR)1 | 840,000 | 13,826 |
| ValueVision Media, Inc., Class A1,2 | 3,875,293 | 13,409 |
| Chipotle Mexican Grill, Inc.1 | 39,890 | 12,999 |
| Ctrip.com International, Ltd. (ADR)1 | 588,300 | 12,578 |
| Intercontinental Hotels Group PLC | 401,966 | 12,257 |
| D.R. Horton, Inc. | 490,000 | 11,907 |
| Powerland AG, non-registered shares2 | 1,200,000 | 10,592 |
| Big Lots, Inc.1 | 300,000 | 10,581 |
| Mood Media Corp.1,2,4 | 6,375,000 | 6,462 |
| Mood Media Corp. (CDI)1,2,4 | 3,710,000 | 3,760 |
| SHW AG, non-registered shares | 230,000 | 9,685 |
| Sotheby’s Holdings, Inc. | 250,000 | 9,353 |
| CDON Group AB1 | 1,639,521 | 9,309 |
| Michael Kors Holdings Ltd.1 | 150,300 | 8,536 |
| Bloomsbury Publishing PLC2 | 4,722,576 | 8,252 |
| Mando Corp. | 72,600 | 7,635 |
| D.B. Corp Ltd. | 1,840,266 | 7,632 |
| Stella International Holdings Ltd. | 2,494,000 | 7,486 |
| Golden Eagle Retail Group Ltd. | 4,136,000 | 7,459 |
| Parkson Retail Group Ltd. | 11,990,500 | 7,136 |
| Gourmet Master Co., Ltd. | 1,262,000 | 7,111 |
| POLYTEC Holding AG, non-registered shares | 834,369 | 6,866 |
| zooplus AG, non-registered shares1 | 130,000 | 6,811 |
| GVC Holdings PLC | 1,663,694 | 6,698 |
| China Zenix Auto International Ltd. (ADR)1 | 2,152,000 | 6,628 |
| Bijou Brigitte modische Accessoires AG | 52,000 | 4,935 |
| Talwalkars Better Value Fitness Ltd.2 | 1,694,000 | 4,441 |
| U.S. Auto Parts Network, Inc.1 | 1,375,663 | 1,651 |
| Ten Alps PLC1 | 3,439,001 | 72 |
| Five Star Travel Corp.1,3,4 | 96,033 | 30 |
| CEC Unet PLC1,2,3 | 35,100,775 | — |
| Spot Runner, Inc.1,3,5 | 2,980,544 | — |
| Fontainebleau Resorts LLC, Class A, nonvoting units1,3,5 | 1,900,000 | — |
| 4,219,016 | ||
| Health care 13.09% | ||
| Regeneron Pharmaceuticals, Inc.1 | 1,227,820 | 216,587 |
| Pharmacyclics, Inc.1 | 2,172,356 | 174,679 |
| Synageva BioPharma Corp.1,2 | 1,905,074 | 104,627 |
| Incyte Corp.1 | 4,445,600 | 104,072 |
| Sysmex Corp. | 1,550,000 | 95,321 |
| Molina Healthcare, Inc.1,2 | 2,982,000 | 92,054 |
| BioMarin Pharmaceutical Inc.1 | 1,457,500 | 90,744 |
| Grifols, SA, Class A1 | 2,055,000 | 76,185 |
| Grifols, SA, Class B1 | 463,950 | 13,308 |
| athenahealth, Inc.1 | 864,221 | 83,864 |
| Hikma Pharmaceuticals PLC | 5,189,153 | 81,522 |
| Sirona Dental Systems, Inc.1 | 1,074,750 | 79,241 |
| ArthroCare Corp.1,2 | 2,214,748 | 76,985 |
| Intuitive Surgical, Inc.1 | 155,000 | 76,134 |
| Emeritus Corp.1,2 | 2,729,700 | 75,858 |
| MD Medical Group Investments PLC (GDR)1,2 | 2,582,900 | 45,382 |
| MD Medical Group Investments PLC (GDR)1,2,4 | 1,179,100 | 20,717 |
| VCA Antech, Inc.1 | 2,335,000 | 54,849 |
| Ironwood Pharmaceuticals, Inc., Class A1 | 2,750,000 | 50,298 |
| Carl Zeiss Meditec AG, non-registered shares | 1,565,000 | 49,475 |
| Endo Health Solutions Inc.1 | 1,548,100 | 47,620 |
| Hologic, Inc.1 | 1,965,000 | 44,409 |
| Genomma Lab Internacional, SAB de CV, Series B1 | 17,303,000 | 42,307 |
| Illumina, Inc.1 | 781,600 | 42,206 |
| Orthofix International NV1,2 | 1,160,100 | 41,613 |
| Alnylam Pharmaceuticals, Inc.1 | 1,700,000 | 41,429 |
| Orexigen Therapeutics, Inc.1,2 | 6,535,000 | 40,844 |
| Cadence Pharmaceuticals, Inc.1,2 | 5,939,969 | 39,738 |
| Exelixis, Inc.1 | 8,510,000 | 39,316 |
| Galapagos NV1,2 | 1,575,436 | 38,507 |
| GN Store Nord AS | 2,137,699 | 38,035 |
| Teleflex Inc. | 440,700 | 37,244 |
| Cochlear Ltd. | 512,811 | 36,340 |
| Achillion Pharmaceuticals, Inc.1 | 4,090,000 | 35,747 |
| Centene Corp.1 | 783,500 | 34,505 |
| Virbac SA | 145,000 | 33,397 |
| NuVasive, Inc.1 | 1,564,436 | 33,338 |
| Fleury SA, ordinary nominative | 3,265,900 | 30,851 |
| AVEO Pharmaceuticals, Inc.1,2 | 4,147,000 | 30,480 |
| Covance Inc.1 | 400,000 | 29,728 |
| Hill-Rom Holdings, Inc. | 817,068 | 28,777 |
| Thoratec Corp.1 | 723,000 | 27,113 |
| Celesio AG | 1,300,000 | 24,410 |
| XenoPort, Inc.1,2 | 3,227,000 | 23,073 |
| ARIAD Pharmaceuticals, Inc.1 | 1,220,000 | 22,070 |
| Myriad Genetics, Inc.1 | 863,200 | 21,925 |
| Fisher & Paykel Healthcare Corp. Ltd. | 9,500,000 | 20,829 |
| QIAGEN NV1 | 968,751 | 20,189 |
| Luminex Corp.1 | 1,163,674 | 19,224 |
| PT Tempo Scan Pacific Tbk | 48,507,000 | 19,218 |
| JSC Pharmstandard (GDR)1 | 924,610 | 19,093 |
| Wright Medical Group, Inc.1 | 770,485 | 18,345 |
| ChemoCentryx, Inc.1 | 1,326,583 | 18,333 |
| Align Technology, Inc.1 | 500,000 | 16,755 |
| Intercept Pharmaceuticals, Inc.1 | 400,000 | 14,960 |
| Novadaq Technologies Inc.1 | 1,435,000 | 14,221 |
| Nobel Biocare Holding AG | 1,350,000 | 13,502 |
| Abaxis, Inc. | 262,000 | 12,398 |
| Theravance, Inc.1 | 522,000 | 12,330 |
| Tsumura & Co. | 315,000 | 11,626 |
| MEDICA SA | 565,000 | 10,305 |
| Volcano Corp.1 | 415,000 | 9,238 |
| Medivation, Inc.1 | 160,000 | 7,483 |
| St.Shine Optical Co. Ltd. | 314,000 | 6,279 |
| Amplifon SpA | 1,075,000 | 5,622 |
| Krka, dd, Novo mesto | 86,820 | 5,160 |
| Merck Ltd. | 299,383 | 3,477 |
| Savient Pharmaceuticals, Inc.1 | 1,758,122 | 1,407 |
| 2,846,918 | ||
| Industrials 11.84% | ||
| Intertek Group PLC | 2,448,000 | 126,198 |
| MTU Aero Engines Holding AG | 1,118,000 | 105,966 |
| ITT Corp. | 3,455,500 | 98,240 |
| Moog Inc., Class A1 | 1,767,800 | 81,018 |
| Chart Industries, Inc.1 | 999,871 | 80,000 |
| Herman Miller, Inc. | 2,567,000 | 71,029 |
| DKSH Holding AG1 | 732,432 | 65,544 |
| BELIMO Holding AG | 28,050 | 64,673 |
| AirAsia Bhd. | 66,490,000 | 60,768 |
| US Airways Group, Inc.1 | 3,472,000 | 58,920 |
| Globaltrans Investment PLC (GDR) | 2,028,246 | 32,006 |
| Globaltrans Investment PLC (GDR)4 | 1,529,400 | 24,134 |
| MonotaRO Co., Ltd. | 1,142,900 | 55,112 |
| Clean Harbors, Inc.1 | 947,100 | 55,017 |
| Polypore International, Inc.1 | 1,360,000 | 54,645 |
| Goodpack Ltd.2 | 35,332,000 | 53,400 |
| Northgate PLC2 | 10,626,805 | 50,496 |
| MITIE Group PLC | 11,709,000 | 49,954 |
| IDEX Corp. | 875,000 | 46,742 |
| Alliance Global Group, Inc. | 86,660,000 | 44,912 |
| Waste Connections, Inc. | 1,206,000 | 43,392 |
| Cummins India Ltd. | 4,513,800 | 41,442 |
| Beacon Roofing Supply, Inc.1 | 1,070,180 | 41,373 |
| Meggitt PLC | 5,524,722 | 41,214 |
| Landstar System, Inc. | 691,000 | 39,449 |
| MSC Industrial Direct Co., Inc., Class A | 450,000 | 38,601 |
| Comfort Systems USA, Inc.2 | 2,476,000 | 34,887 |
| Watsco, Inc. | 411,700 | 34,657 |
| KEYW Holding Corp.1,2 | 2,137,500 | 34,478 |
| Uponor Oyj | 2,521,600 | 34,258 |
| Exponent, Inc. | 616,400 | 33,249 |
| Masco Corp. | 1,625,000 | 32,906 |
| Proto Labs, Inc.1 | 643,452 | 31,593 |
| SIA Engineering Co. Ltd. | 7,996,000 | 30,551 |
| TransDigm Group Inc. | 190,000 | 29,055 |
| Danieli & C. Officine Meccaniche SpA, nonconvertible shares | 1,740,903 | 28,895 |
| Blount International, Inc.1 | 1,950,500 | 26,098 |
| Steelcase Inc., Class A | 1,690,000 | 24,894 |
| Harsco Corp. | 990,994 | 24,547 |
| SATS Ltd. | 9,770,000 | 23,941 |
| Johnson Electric Holdings Ltd. | 31,420,000 | 23,395 |
| SAI Global Ltd. | 6,399,243 | 22,457 |
| Harmonic Drive Systems Inc. | 1,232,400 | 22,122 |
| Houston Wire & Cable Co.2 | 1,678,900 | 21,742 |
| PT AKR Corporindo Tbk | 40,759,000 | 20,972 |
| Graco Inc. | 340,000 | 19,730 |
| TrueBlue, Inc.1 | 913,000 | 19,301 |
| Luxfer Holdings PLC (ADR) | 1,200,000 | 18,588 |
| Boer Power Holdings Ltd. | 31,753,000 | 18,407 |
| Geberit AG | 74,000 | 18,207 |
| Société BIC SA | 155,500 | 18,055 |
| Cebu Air, Inc. | 10,800,000 | 17,996 |
| Pipavav Defence and Offshore Engineering Co. Ltd.1 | 12,949,326 | 17,500 |
| Mills Estruturas e Serviços de Engenharia SA, ordinary nominative | 1,083,000 | 17,461 |
| AIA Engineering Ltd. | 2,915,050 | 17,050 |
| Frigoglass SAIC1,2 | 3,052,380 | 17,018 |
| Flughafen Zürich AG | 35,400 | 16,464 |
| Concentric AB | 1,520,905 | 16,222 |
| Ennis, Inc. | 1,050,000 | 15,823 |
| KBR, Inc. | 464,200 | 14,892 |
| Carborundum Universal Ltd. | 6,778,611 | 14,773 |
| Singamas Container Holdings Ltd. | 56,310,000 | 14,653 |
| ITE Group PLC | 3,165,000 | 13,123 |
| Thermon Group Holdings, Inc.1 | 590,000 | 13,104 |
| Robert Half International Inc. | 337,000 | 12,648 |
| Andritz AG | 170,000 | 11,404 |
| Hays PLC | 7,755,000 | 11,364 |
| AeroVironment, Inc.1 | 600,000 | 10,878 |
| Mine Safety Appliances Co. | 216,000 | 10,718 |
| United Stationers Inc. | 272,000 | 10,513 |
| USG Corp.1 | 397,000 | 10,497 |
| Regus PLC | 4,315,000 | 10,404 |
| Wienerberger AG | 868,000 | 10,333 |
| NORMA Group AG, non-registered shares | 311,800 | 9,825 |
| Gujarat Pipavav Port Ltd.1 | 10,180,000 | 9,318 |
| Zumtobel AG | 765,918 | 8,835 |
| American Science and Engineering, Inc. | 144,515 | 8,814 |
| Teleperformance SA | 200,000 | 8,522 |
| Mvelaserve Ltd.1,2 | 9,194,800 | 8,387 |
| Pfeiffer Vacuum Technology AG, non-registered shares | 64,000 | 7,059 |
| MISUMI Group Inc. | 241,500 | 6,654 |
| S1 Corp. | 109,000 | 6,211 |
| China Automation Group Ltd. | 27,000,000 | 6,087 |
| Praj Industries Ltd. | 6,825,000 | 4,590 |
| Haldex AB | 761,000 | 4,531 |
| TD Power Systems Ltd. | 961,300 | 4,465 |
| Amara Raja Batteries Ltd. | 828,886 | 4,187 |
| Aker Philadelphia Shipyard ASA1 | 232,201 | 1,069 |
| Securitas AB, Class B | 17,139 | 161 |
| BrisConnections Unit Trusts1,2,3 | 27,145,156 | — |
| 2,574,783 | ||
| Information technology 11.28% | ||
| AAC Technologies Holdings Inc. | 47,727,000 | 229,333 |
| National Instruments Corp. | 3,286,479 | 107,632 |
| Hittite Microwave Corp.1,2 | 1,651,350 | 100,006 |
| ASM International NV | 2,773,000 | 92,070 |
| OpenTable, Inc.1,2 | 1,385,000 | 87,227 |
| Vistaprint NV1,2 | 1,860,000 | 71,908 |
| FactSet Research Systems, Inc. | 768,200 | 71,135 |
| AVEVA Group PLC | 1,997,500 | 68,710 |
| Compuware Corp.1 | 5,235,952 | 65,449 |
| Oxford Instruments PLC | 2,461,000 | 61,883 |
| Itron, Inc.1 | 1,229,900 | 57,067 |
| MercadoLibre, Inc. | 575,000 | 55,522 |
| Angie’s List, Inc.1 | 2,645,650 | 52,278 |
| MICROS Systems, Inc.1 | 1,024,000 | 46,602 |
| Demandware, Inc.1,2 | 1,825,120 | 46,267 |
| Spectris PLC | 1,211,600 | 45,211 |
| Delta Electronics (Thailand) PCL | 33,935,900 | 43,745 |
| Dolby Laboratories, Inc., Class A | 1,268,400 | 42,568 |
| Liquidity Services, Inc.1 | 1,403,036 | 41,825 |
| SINA Corp.1 | 835,000 | 40,573 |
| International Rectifier Corp.1 | 1,846,000 | 39,043 |
| SPS Commerce, Inc.1,2 | 901,300 | 38,459 |
| CoStar Group, Inc.1 | 347,000 | 37,983 |
| OBIC Co., Ltd. | 158,330 | 36,509 |
| Ebix, Inc.2 | 2,210,000 | 35,846 |
| Cymer, Inc.1 | 355,000 | 34,116 |
| Semtech Corp.1 | 960,000 | 33,974 |
| WIN Semiconductors Corp. | 28,575,000 | 31,774 |
| Kingboard Chemical Holdings Ltd. | 10,247,000 | 29,173 |
| Autodesk, Inc.1 | 705,000 | 29,074 |
| Power Integrations, Inc. | 667,100 | 28,959 |
| Global Payments Inc. | 561,116 | 27,865 |
| Finisar Corp.1 | 2,067,000 | 27,264 |
| Immersion Corp.1,2 | 2,254,000 | 26,462 |
| Guidewire Software, Inc.1 | 680,000 | 26,139 |
| Trimble Navigation Ltd.1 | 840,000 | 25,166 |
| Kapsch TrafficCom AG, non-registered shares | 529,594 | 25,129 |
| Responsys, Inc.1,2 | 2,815,000 | 24,913 |
| Demand Media, Inc.1 | 2,696,660 | 23,272 |
| Neopost SA | 375,295 | 22,480 |
| Kingdee International Software Group Co. Ltd.1,2 | 134,868,000 | 22,239 |
| Ellie Mae, Inc.1 | 900,000 | 21,645 |
| Arrow Electronics, Inc.1 | 515,000 | 20,919 |
| Info Edge (India) Ltd. | 3,160,000 | 20,896 |
| Hana Microelectronics PCL | 23,935,000 | 20,433 |
| Bazaarvoice, Inc.1 | 2,765,000 | 20,240 |
| Ultimate Software Group, Inc.1 | 193,600 | 20,165 |
| Persistent Systems Ltd. | 1,999,379 | 20,012 |
| Hamamatsu Photonics KK | 495,000 | 19,926 |
| KLA-Tencor Corp. | 340,650 | 17,966 |
| SciQuest, Inc.1 | 740,000 | 17,790 |
| AOL Inc.1 | 445,000 | 17,128 |
| Youku Inc., Class A (ADR)1 | 890,000 | 14,925 |
| ExlService Holdings, Inc.1 | 451,000 | 14,829 |
| Halma PLC | 1,865,000 | 14,678 |
| Playtech Ltd. | 1,524,421 | 14,638 |
| Genpact Ltd. | 760,000 | 13,824 |
| Splunk Inc.1 | 314,200 | 12,577 |
| Logitech International SA | 1,700,000 | 11,849 |
| Monster Worldwide, Inc.1 | 2,226,000 | 11,286 |
| Avid Technology, Inc.1 | 1,742,153 | 10,923 |
| Active Network, Inc.1 | 2,570,000 | 10,768 |
| Kingboard Laminates Holdings Ltd. | 23,884,236 | 10,523 |
| RealPage, Inc.1 | 468,000 | 9,692 |
| Agilysys, Inc.1 | 745,205 | 7,407 |
| Yaskawa Electric Corp. | 665,000 | 6,590 |
| Tangoe, Inc.1 | 500,000 | 6,195 |
| Dialog Semiconductor PLC1 | 463,458 | 6,148 |
| China High Precision Automation Group Ltd.2,3 | 67,422,000 | 3,474 |
| Green Packet Bhd.1 | 17,755,316 | 2,036 |
| Remark Media, Inc.1 | 81,521 | 144 |
| Remark Media, Inc.1,3,4 | 29,470 | 37 |
| 2,452,513 | ||
| Financials 10.16% | ||
| Onex Corp. | 2,487,700 | 118,589 |
| GT Capital Holdings, Inc. | 5,882,200 | 105,652 |
| SVB Financial Group1 | 1,285,900 | 91,222 |
| Financial Engines, Inc. | 2,335,000 | 84,574 |
| Kotak Mahindra Bank Ltd. | 6,370,098 | 76,535 |
| Security Bank Corp. | 16,590,000 | 73,986 |
| Ocwen Financial Corp.1 | 1,900,000 | 72,048 |
| East West Bancorp, Inc. | 2,497,500 | 64,111 |
| Greenhill & Co., Inc. | 1,167,000 | 62,294 |
| Validus Holdings, Ltd. | 1,665,000 | 62,221 |
| Fibra Uno Administración, SA de CV | 18,471,391 | 60,921 |
| YES BANK Ltd. | 7,585,832 | 59,863 |
| Home Loan Servicing Solutions, Ltd. | 2,511,400 | 58,591 |
| HCC Insurance Holdings, Inc. | 1,257,000 | 52,832 |
| National Financial Partners Corp.1,2 | 2,201,500 | 49,380 |
| First Republic Bank | 1,141,825 | 44,097 |
| Rayonier Inc.1 | 728,400 | 43,464 |
| Assured Guaranty Ltd. | 2,100,000 | 43,281 |
| PT Agung Podomoro Land Tbk | 813,489,000 | 42,694 |
| BOK Financial Corp. | 680,000 | 42,364 |
| East West Banking Corp.1 | 49,110,000 | 40,193 |
| TISCO Financial Group PCL | 20,700,000 | 39,230 |
| Sterling Financial Corp.4 | 1,666,668 | 36,150 |
| Sterling Financial Corp. | 24,500 | 531 |
| Altisource Portfolio Solutions SA1 | 506,123 | 35,302 |
| Tokyo Tatemono Co., Ltd. | 4,840,000 | 33,877 |
| VZ Holding AG | 244,210 | 33,295 |
| Kemper Corp. | 1,000,000 | 32,610 |
| Banco ABC Brasil SA, preferred nominative | 3,777,159 | 30,543 |
| Leucadia National Corp. | 1,104,516 | 30,297 |
| Brait SE | 7,974,880 | 30,136 |
| Starwood Property Trust, Inc. | 980,000 | 27,205 |
| Redwood Trust, Inc. | 1,110,000 | 25,730 |
| Talmer Bancorp, Inc., Class A1,3,5 | 3,068,056 | 25,066 |
| Manappuram Finance Ltd.2 | 54,930,986 | 21,831 |
| DDR Corp. | 1,225,000 | 21,339 |
| Primerica, Inc. | 650,000 | 21,307 |
| Banca Generali SpA | 1,123,069 | 21,304 |
| GRUH Finance Ltd. | 5,450,000 | 21,088 |
| Old Republic International Corp. | 1,635,000 | 20,781 |
| Popular, Inc.1 | 750,720 | 20,727 |
| Capitol Federal Financial, Inc. | 1,697,000 | 20,483 |
| Crédito Real, SAB de CV1 | 10,961,030 | 18,941 |
| CapitalSource Inc. | 1,900,000 | 18,278 |
| IG Group Holdings PLC | 2,210,700 | 17,936 |
| Home Federal Bancorp, Inc.2 | 1,384,249 | 17,718 |
| Tune Ins Holdings Bhd.1 | 36,816,000 | 16,645 |
| Mahindra Lifespace Developers Ltd.2 | 2,157,380 | 15,042 |
| Capitec Bank Holdings Ltd. | 624,500 | 14,524 |
| ICG Group, Inc.1 | 1,137,000 | 14,190 |
| IndusInd Bank Ltd. | 1,900,000 | 14,148 |
| Huaku Construction Corp. | 5,593,380 | 13,842 |
| ING Vysya Bank Ltd. | 1,282,000 | 13,140 |
| Paraná Banco SA, preferred nominative | 1,857,800 | 13,029 |
| Robinsons Land Corp. | 19,826,200 | 12,388 |
| CenterState Banks, Inc. | 1,375,400 | 11,801 |
| First American Financial Corp. | 460,155 | 11,766 |
| Siam Future Development PCL1 | 31,354,088 | 10,814 |
| PT Summarecon Agung Tbk | 42,142,500 | 10,733 |
| Canadian Western Bank | 375,000 | 10,462 |
| Supalai PCL | 14,100,000 | 9,870 |
| Bao Viet Holdings | 4,137,486 | 9,799 |
| Metropolitan Bank & Trust Co. | 2,501,550 | 7,172 |
| First Southern Bancorp, Inc.1,2,3,5 | 1,344,915 | 7,061 |
| Chongqing Rural Commercial Bank Co., Ltd., Class H | 11,500,000 | 6,148 |
| Globe Trade Center SA1 | 2,355,556 | 5,530 |
| ARA Asset Management Ltd. | 2,446,620 | 3,786 |
| Rockville Financial, Inc. | 135,000 | 1,750 |
| Westfield Financial, Inc. | 200,000 | 1,556 |
| OceanFirst Financial Corp. | 100,000 | 1,442 |
| BSB Bancorp, Inc.1 | 100,000 | 1,381 |
| Chicopee Bancorp, Inc. | 25,290 | 425 |
| 2,209,061 | ||
| Energy 6.08% | ||
| Ophir Energy PLC1,2 | 32,010,668 | 225,230 |
| InterOil Corp.1 | 2,419,563 | 184,153 |
| Keyera Corp. | 1,111,200 | 62,430 |
| Gulf Keystone Petroleum Ltd.1,4 | 23,310,000 | 61,801 |
| Ultra Petroleum Corp.1 | 2,990,000 | 60,099 |
| Pacific Rubiales Energy Corp. | 2,834,400 | 59,804 |
| Zhaikmunai LP (GDR)4 | 4,669,500 | 46,695 |
| Zhaikmunai LP (GDR) | 353,650 | 3,536 |
| Peyto Exploration & Development Corp. | 1,830,000 | 48,517 |
| Concho Resources Inc.1 | 473,000 | 46,084 |
| Core Laboratories NV | 306,900 | 42,328 |
| Comstock Resources, Inc.1,2 | 2,478,111 | 40,269 |
| Paramount Resources Ltd.1 | 975,000 | 35,981 |
| Bonanza Creek Energy, Inc.1 | 800,000 | 30,936 |
| Heritage Oil Ltd.1 | 10,628,000 | 28,824 |
| Oasis Petroleum Inc.1 | 724,000 | 27,563 |
| African Petroleum Corp. Ltd.1,2 | 93,646,868 | 24,380 |
| Diamondback Energy, Inc.1 | 900,000 | 24,156 |
| Africa Oil Corp.1,3,5 | 1,865,775 | 12,920 |
| Africa Oil Corp.1 | 1,459,292 | 10,311 |
| Kværner ASA | 10,269,776 | 21,271 |
| Semirara Mining Corp. | 3,082,000 | 20,194 |
| Oceaneering International, Inc. | 295,000 | 19,591 |
| Exillon Energy PLC1 | 7,684,660 | 17,864 |
| Tourmaline Oil Corp.1 | 410,000 | 15,849 |
| Rosetta Resources Inc.1 | 300,800 | 14,312 |
| HollyFrontier Corp. | 255,000 | 13,120 |
| Miclyn Express Offshore Ltd. | 5,600,000 | 12,188 |
| Bill Barrett Corp.1 | 550,000 | 11,148 |
| Tethys Petroleum Ltd. (GBP denominated)1 | 1,147,487 | 911 |
| Tethys Petroleum Ltd.1 | 12,161,000 | 9,215 |
| Carrizo Oil & Gas, Inc.1 | 390,000 | 10,050 |
| Falkland Oil and Gas Ltd.1,2 | 24,225,000 | 9,754 |
| BPZ Resources, Inc.1 | 4,166,600 | 9,458 |
| BNK Petroleum Inc.1,2 | 11,543,380 | 8,861 |
| Goodrich Petroleum Corp.1 | 520,000 | 8,138 |
| SBM Offshore NV1 | 429,700 | 7,110 |
| Petrodorado Energy Ltd.1,2 | 38,400,000 | 6,802 |
| Chu Kong Petroleum and Natural Gas Steel Pipe Holdings Ltd. | 13,678,000 | 6,696 |
| Range Resources Ltd.1 | 100,000,000 | 6,169 |
| Prosafe SE | 600,000 | 5,803 |
| Borders & Southern Petroleum PLC1 | 20,265,000 | 5,465 |
| Gevo, Inc.1 | 1,554,030 | 3,481 |
| Pacific Coal Resources Ltd.1,2 | 2,611,429 | 3,238 |
| LNG Energy Ltd.1,4 | 13,000,000 | 448 |
| 0915988 B.C. Ltd.1,3,5 | 52,000 | 1 |
| 1,323,154 | ||
| Consumer staples 5.92% | ||
| Puregold Price Club, Inc.2 | 157,727,900 | 154,790 |
| Super Group Ltd.2 | 44,597,000 | 140,197 |
| Raia Drogasil SA, ordinary nominative | 9,619,912 | 102,529 |
| PT Sumber Alfaria Trijaya Tbk | 145,315,000 | 97,201 |
| Coca-Cola Icecek AS, Class C | 2,861,097 | 82,590 |
| PZ Cussons PLC | 12,468,837 | 76,422 |
| Emami Ltd. | 5,210,000 | 57,703 |
| Emmi AG | 201,600 | 56,881 |
| Hypermarcas SA, ordinary nominative1 | 6,436,500 | 50,583 |
| O’Key Group SA (GDR) | 4,234,800 | 48,277 |
| Green Mountain Coffee Roasters, Inc.1 | 782,000 | 44,386 |
| Bizim Toptan Satis Magazalari AS, non-registered shares2 | 2,623,474 | 44,351 |
| Davide Campari-Milano SpA | 5,388,500 | 41,922 |
| Marfrig Alimentos SA, ordinary nominative1 | 7,950,000 | 33,185 |
| Kernel Holding SA1 | 1,523,150 | 27,624 |
| CP ALL PCL | 16,139,200 | 25,489 |
| Petra Foods Ltd. | 6,683,000 | 22,410 |
| Wumart Stores, Inc., Class H | 11,980,000 | 21,668 |
| Eurocash SA | 1,265,000 | 20,632 |
| VST Industries Ltd. | 715,400 | 19,954 |
| Origin Enterprises PLC | 3,213,300 | 19,851 |
| WhiteWave Foods Co., Class A1 | 900,000 | 15,363 |
| Marico Ltd. | 3,705,000 | 14,513 |
| PriceSmart, Inc. | 167,700 | 13,052 |
| Tilaknager Industries Ltd.2 | 8,890,000 | 9,700 |
| Church & Dwight Co., Inc. | 150,000 | 9,695 |
| Real Nutriceutical Group Ltd. | 39,400,000 | 9,694 |
| AMOREPACIFIC Corp. | 10,560 | 9,273 |
| Sundrug Co., Ltd. | 194,900 | 8,643 |
| HITEJINRO CO., LTD. | 178,039 | 5,417 |
| McBride PLC1 | 2,409,560 | 4,347 |
| 1,288,342 | ||
| Materials 5.87% | ||
| Chr. Hansen Holding A/S | 3,726,000 | 138,225 |
| AptarGroup, Inc. | 2,307,591 | 132,340 |
| James Hardie Industries PLC (CDI) | 9,733,929 | 101,466 |
| Schweitzer-Mauduit International, Inc.2 | 2,482,800 | 96,159 |
| Yingde Gases Group Co. Ltd. | 64,954,250 | 72,380 |
| FUCHS PETROLUB AG, nonvoting preferred | 388,800 | 32,680 |
| FUCHS PETROLUB AG | 358,647 | 27,581 |
| PolyOne Corp. | 1,992,000 | 48,625 |
| Kenmare Resources PLC1 | 109,972,782 | 48,455 |
| Greatview Aseptic Packaging Co. Ltd.2 | 67,933,000 | 45,507 |
| Sealed Air Corp. | 1,550,000 | 37,370 |
| CPMC Holdings Ltd. | 46,500,000 | 37,019 |
| Ube Industries, Ltd. | 16,703,000 | 32,821 |
| Yip’s Chemical Holdings Ltd.2 | 29,978,000 | 32,131 |
| African Minerals Ltd.1 | 8,638,121 | 30,252 |
| Tiangong International Co. Ltd. | 83,516,000 | 24,315 |
| Frutarom Industries Ltd. | 1,776,332 | 23,974 |
| Siam City Cement PCL | 1,300,000 | 21,485 |
| Symrise AG | 532,000 | 21,076 |
| Valspar Corp. | 333,700 | 20,773 |
| Croda International PLC | 470,000 | 19,588 |
| Boral Ltd. | 3,800,000 | 19,430 |
| Stillwater Mining Co.1 | 1,365,000 | 17,649 |
| Arkema SA | 180,000 | 16,373 |
| Sirius Minerals PLC1 | 52,304,735 | 15,894 |
| Gem Diamonds Ltd.1,2 | 7,350,000 | 15,271 |
| Lonmin PLC1 | 3,225,000 | 14,254 |
| Duluth Metals Ltd.1,2 | 7,246,480 | 13,835 |
| Sika AG, non-registered shares | 5,530 | 13,425 |
| Coal of Africa Ltd.1,2 | 55,734,459 | 11,855 |
| United Phosphorus Ltd. | 4,730,000 | 10,217 |
| Dominion Diamond Corp.1 | 600,000 | 9,798 |
| Mountain Province Diamonds Inc.1 | 2,222,222 | 9,623 |
| EACOM Timber Corp.1,2 | 26,200,000 | 9,411 |
| Eastern Platinum Ltd.1,2 | 61,631,450 | 8,794 |
| J.K. Cement Ltd. | 1,788,638 | 8,737 |
| Gran Colombia Gold SA1,2 | 30,175,000 | 8,166 |
| Cape Lambert Resources Ltd.1 | 32,943,995 | 6,347 |
| Afferro Mining Inc.1,2 | 6,460,000 | 6,134 |
| Yamana Gold Inc. | 315,000 | 4,851 |
| Engro Corp. Ltd.1 | 2,591,160 | 3,397 |
| Mwana Africa PLC1,4 | 45,749,230 | 3,215 |
| China Forestry Holdings Co., Ltd.1,3 | 29,142,000 | 1,502 |
| Gold Road Resources Ltd.1 | 14,050,000 | 1,317 |
| Hummingbird Resources PLC1 | 1,650,000 | 1,279 |
| Rusoro Mining Ltd.1 | 21,437,000 | 1,055 |
| Vatukoula Gold Mines PLC1 | 3,214,081 | 671 |
| Kennady Diamonds Inc.1,4 | 380,952 | 450 |
| 1,277,172 | ||
| Utilities 2.69% | ||
| ENN Energy Holdings Ltd.2 | 55,644,296 | 308,235 |
| Manila Water Co., Inc.2 | 104,200,900 | 102,133 |
| Ratchaburi Electricity Generating Holding PCL | 12,050,000 | 24,483 |
| Ratchaburi Electricity Generating Holding PCL, nonvoting depository receipt | 9,050,200 | 18,388 |
| Glow Energy PCL | 15,790,000 | 41,517 |
| APR Energy PLC | 2,422,208 | 31,097 |
| Greenko Group PLC1,2 | 9,378,155 | 19,022 |
| Energy World Corp. Ltd.1 | 42,673,314 | 16,442 |
| Mytrah Energy Ltd.1,2 | 10,418,000 | 14,246 |
| Torrent Power Ltd. | 3,418,394 | 8,689 |
| 584,252 | ||
| Telecommunication services 1.71% | ||
| PT Sarana Menara Nusantara Tbk1 | 24,732,096 | 61,083 |
| Telephone and Data Systems, Inc. | 2,731,869 | 57,560 |
| Cogent Communications Group, Inc. | 2,115,000 | 55,836 |
| tw telecom inc.1 | 1,657,700 | 41,757 |
| Total Access Communication PCL | 9,964,000 | 33,259 |
| Iridium Communications Inc.1,2 | 5,210,000 | 31,364 |
| NII Holdings, Inc., Class B1 | 5,595,000 | 24,226 |
| Leap Wireless International, Inc.1 | 2,955,100 | 17,406 |
| Visto Corp.1,3,5 | 3,636,364 | 15,491 |
| MetroPCS Communications, Inc.1 | 1,153,300 | 12,571 |
| Hutchison Telecommunications Hong Kong Holdings Ltd. | 22,200,000 | 10,982 |
| NewSat Ltd.1,2 | 14,400,563 | 5,923 |
| NewSat Ltd.1,2,4 | 12,155,000 | 5,000 |
| 372,458 | ||
| Miscellaneous 4.93% | ||
| Other common stocks in initial period of acquisition | 1,073,570 | |
| Total common stocks (cost: $14,617,192,000) | 20,221,239 | |
| Preferred stocks 0.07% | ||
| Financials 0.07% | ||
| Zions Bancorporation, Series C, 9.50% noncumulative depositary shares | 631,000 | 16,311 |
| Total preferred stocks (cost: $13,738,000) | 16,311 | |
| Warrants 0.00% | ||
| Materials 0.00% | ||
| Gran Colombia Gold SA, warrants, expire 20151,2 | 1,086,500 | 11 |
| Duluth Exploration Ltd., warrants, expire 20131,3 | 43,753 | — |
| 11 | ||
| Energy 0.00% | ||
| Pacific Coal Resources Ltd., warrants, expire 20161,2,3 | 1,214,286 | — |
| Total warrants (cost: $1,563,000) | 11 | |
| Convertible securities 0.44% | ||
| Consumer discretionary 0.24% | ||
| Coupons.com Inc., Series B, convertible preferred1,2,3,5 | 8,191,724 | 53,410 |
| Spot Runner, Inc., Series C, convertible preferred1,3,5 | 1,626,016 | — |
| 53,410 | ||
| Health care 0.11% | ||
| bluebird bio, Inc., Series D, convertible preferred1,2,3,5 | 22,374,386 | 16,009 |
| Ultragenyx Pharmaceutical Inc., Series B, convertible preferred2,3,5 | 2,789,614 | 7,725 |
| 23,734 | ||
| Financials 0.06% | ||
| Oriental Financial Group Inc., Series C, 8.75% noncumulative convertible preferred5 | 6,000 | 9,173 |
| First Southern Bancorp, Inc., Series C, convertible preferred1,2,3,5 | 2,299 | 4,658 |
| 13,831 | ||
| Value | ||
| Telecommunication services 0.03% | Shares | (000) |
| Iridium Communications Inc., Series A, convertible preferred2,4 | 60,000 | $ 5,582 |
| Total convertible securities (cost: $81,875,000) | 96,557 | |
| Bonds & notes 0.17% | ||
| Principal amount | ||
| U.S. Treasury bonds & notes 0.17% | (000) | |
| U.S. Treasury 0.25% 2014 | $ 5,000 | 5,004 |
| U.S. Treasury 4.00% 2015 | 30,000 | 32,103 |
| Total bonds & notes (cost: $37,099,000) | 37,107 | |
| Short-term securities 6.45% | ||
| Freddie Mac 0.10%–0.19% due 4/1–10/22/2013 | 439,450 | 439,300 |
| Fannie Mae 0.13%–0.16% due 5/22–12/16/2013 | 195,200 | 195,076 |
| U.S. Treasury Bills 0.106%–0.18% due 4/18–8/15/2013 | 144,050 | 144,027 |
| International Bank for Reconstruction and Development 0.13%–0.15% due 5/24–7/9/2013 | 114,900 | 114,878 |
| Toronto-Dominion Holdings USA Inc. 0.15%–0.17% due 4/8–4/25/20134 | 64,000 | 63,995 |
| Toyota Credit Canada Inc. 0.16%–0.18% due 4/2–5/1/2013 | 60,000 | 59,998 |
| Old Line Funding, LLC 0.18%–0.19% due 4/18–5/6/20134 | 59,900 | 59,897 |
| Reckitt Benckiser Treasury Services PLC 0.15% due 5/8/20134 | 50,000 | 49,988 |
| Mizuho Funding LLC 0.245% due 4/15/20134 | 47,000 | 46,996 |
| Bank of Nova Scotia 0.145% due 4/15/2013 | 40,500 | 40,497 |
| Federal Farm Credit Banks 0.15% due 11/21/2013 | 39,900 | 39,868 |
| Federal Home Loan Bank 0.165%–0.17% due 5/8–5/15/2013 | 34,200 | 34,195 |
| ANZ National (International) Ltd. 0.16% due 4/2/20134 | 29,920 | 29,920 |
| National Australia Funding (Delaware) Inc. 0.165% due 5/13/20134 | 25,000 | 24,997 |
| Victory Receivables Corp. 0.17% due 4/23/20134 | 12,400 | 12,399 |
| Gotham Funding Corp. 0.19% due 5/20/20134 | 5,500 | 5,499 |
| Nestlé Finance International Ltd. 0.12% due 5/2/2013 | 14,000 | 13,999 |
| BHP Billiton Finance (USA) Limited 0.13% due 4/2/20134 | 13,600 | 13,600 |
| Variable Funding Capital Company LLC 0.16% due 4/25/20134 | 10,800 | 10,799 |
| Coca-Cola Co. 0.12% due 5/23/20134 | 2,500 | 2,499 |
| Total short-term securities (cost $1,402,357,000) | 1,402,427 | |
| Total investment securities (cost: $16,153,824,000) | 21,773,652 | |
| Other assets less liabilities | (22,718) | |
| Net assets | $21,750,934 |
As permitted by U.S. Securities and Exchange Commission regulations, “Miscellaneous” securities include holdings in their first year of acquisition that have not previously been publicly disclosed.
1Security did not produce income during the last 12 months.
2Represents an affiliated company as defined under the Investment Company Act of 1940.
3Valued under fair value procedures adopted by authority of the board of directors. The total value of all such securities, including those in “Miscellaneous,” was $148,797,000, which represented .68% of the net assets of the fund.
4Acquired in a transaction exempt from registration under Rule 144A or section 4(2) of the Securities Act of 1933. May be resold in the U.S. in transactions exempt from registration, normally to qualified institutional buyers. The total value of all such securities was $535,070,000, which represented 2.46% of the net assets of the fund.
5Acquired through a private placement transaction exempt from registration under the Securities Act of 1933. May be subject to legal or contractual restrictions on resale. Further details on these holdings appear on the following page.
| Percent | ||||
| Acquisition | Cost | Value | of net | |
| date(s) | (000) | (000) | assets | |
| Coupons.com Inc., Series B, convertible preferred | 6/1/2011 | $ 45,000 | $ 53,410 | .25% |
| Talmer Bancorp, Inc., Class A | 4/28/2010-12/12/2012 | 21,244 | 25,066 | .12 |
| bluebird bio, Inc., Series D, convertible preferred | 7/20/2012 | 11,149 | 16,009 | .07 |
| Visto Corp. | 8/27/2012 | 20,000 | 15,491 | .07 |
| Africa Oil Corp. | 12/3/2012 | 14,557 | 12,920 | .06 |
| First Southern Bancorp, Inc. | 12/17/2009 | 22,070 | 7,061 | .03 |
| First Southern Bancorp, Inc., Series C, convertible preferred | 12/17/2009 | — | 4,658 | .02 |
| Oriental Financial Group Inc., Series C, 8.75% | ||||
| noncumulative convertible preferred | 6/28/2012 | 6,000 | 9,173 | .04 |
| Ultragenyx Pharmaceutical Inc., Series B, convertible preferred | 12/17/2012 | 7,726 | 7,725 | .04 |
| 0915988 B.C. Ltd. | 4/23/2012 | 3 | 1 | .00 |
| Fontainebleau Resorts LLC, Class A, nonvoting units | 10/5/2005-6/1/2007 | 21,500 | — | .00 |
| Spot Runner, Inc. | 10/25/2006-3/20/2008 | 15,071 | — | .00 |
| Spot Runner, Inc., Series C, convertible preferred | 10/25/2006 | 6,000 | — | .00 |
| Total restricted securities | $190,320 | $151,514 | .70% |
Key to abbreviations
ADR = American Depositary Receipts
CDI = CREST Depository Interest
GDR = Global Depositary Receipts
SDR = Swedish Depositary Receipts
GBP = British pounds
Investments are not FDIC-insured, nor are they deposits of or guaranteed by a bank or any other entity, so they may lose value.
Investors should carefully consider investment objectives, risks, charges and expenses. This and other important information is contained in the fund prospectus and summary prospectus, which can be obtained from your financial professional and should be read carefully before investing. You may also call American Funds Service Company (AFS) at (800) 421-4225 or visit the American Funds website at americanfunds.com.
MFGEFPX-035-0513O-S32804
ITEM 7 – Disclosure of Proxy Voting Policies and Procedures for Closed-End Management Investment Companies
Not applicable to this Registrant, insofar as the Registrant is not a closed-end management investment company.
ITEM 8 – Portfolio Managers of Closed-End Management Investment Companies
Not applicable to this Registrant, insofar as the Registrant is not a closed-end management investment company.
ITEM 9 – Purchases of Equity Securities by Closed-End Management Investment Company and Affiliated Purchasers
Not applicable to this Registrant, insofar as the Registrant is not a closed-end management investment company.
ITEM 10 – Submission of Matters to a Vote of Security Holders
There have been no material changes to the procedures by which shareholders may recommend nominees to the Registrant’s board of directors since the Registrant last submitted a proxy statement to its shareholders. The procedures are as follows. The Registrant has a nominating and governance committee comprised solely of persons who are not considered ‘‘interested persons’’ of the Registrant within the meaning of the Investment Company Act of 1940, as amended. The committee periodically reviews such issues as the board’s composition, responsibilities, committees, compensation and other relevant issues, and recommends any appropriate changes to the full board of directors. While the committee normally is able to identify from its own resources an ample number of qualified candidates, it will consider shareholder suggestions of persons to be considered as nominees to fill future vacancies on the board. Such suggestions must be sent in writing to the nominating and governance committee of the Registrant, c/o the Registrant’s Secretary, and must be accompanied by complete biographical and occupational data on the prospective nominee, along with a written consent of the prospective nominee for consideration of his or her name by the nominating and governance committee.
ITEM 11 – Controls and Procedures
| (a) | The Registrant’s Principal Executive Officer and Principal Financial Officer have concluded, based on their evaluation of the Registrant’s disclosure controls and procedures (as such term is defined in Rule 30a-3 under the Investment Company Act of 1940), that such controls and procedures are adequate and reasonably designed to achieve the purposes described in paragraph (c) of such rule. |
| (b) | There were no changes in the Registrant’s internal controls over financial reporting (as defined in Rule 30a-3(d) under the Investment Company Act of 1940) that occurred during the Registrant’s second fiscal quarter of the period covered by this report that has materially affected, or is reasonably likely to materially affect, the Registrant’s internal control over financial reporting. |
ITEM 12 – Exhibits
| (a)(1) | The Code of Ethics that is the subject of the disclosure required by Item 2 is attached as an exhibit hereto. |
| (a)(2) | The certifications required by Rule 30a-2 of the Investment Company Act of 1940 and Sections 302 and 906 of the Sarbanes-Oxley Act of 2002 are attached as exhibits hereto. |
SIGNATURES
Pursuant to the requirements of the Securities Exchange Act of 1934 and the Investment Company Act of 1940, the Registrant has duly caused this report to be signed on its behalf by the undersigned, thereunto duly authorized.
| SMALLCAP WORLD FUND, INC. | |
| By /s/ Paul F. Roye | |
Paul F. Roye, Executive Vice President and Principal Executive Officer | |
| Date: May 31, 2013 |
Pursuant to the requirements of the Securities Exchange Act of 1934 and the Investment Company Act of 1940, this report has been signed below by the following persons on behalf of the Registrant and in the capacities and on the dates indicated.
| By /s/ Paul F. Roye |
Paul F. Roye, Executive Vice President and Principal Executive Officer |
| Date: May 31, 2013 |
| By /s/ Jeffrey P. Regal |
Jeffrey P. Regal, Treasurer and Principal Financial Officer |
| Date: May 31, 2013 |