EXHIBIT 13
Annual Report to Stockholders for the fiscal year ended December 31, 2007

Emclaire Financial Corp. (OTCBB: EMCF), a publicly traded Pennsylvania corporation and bank holding company, provides a wide range of retail and commercial financial products and services to customers in Western Pennsylvania through its wholly owned subsidiary bank, the Farmers National Bank of Emlenton.
The Farmers National Bank of Emlenton is an FDIC-insured national banking association, which conducts business through twelve offices in Venango, Butler, Clarion, Clearfield, Elk, Jefferson and Mercer counties, Pennsylvania. The Bank also provides retail brokerage and other investment services through its Farmers National Financial Services division. To complement consumer and commercial banking activities conducted through its banking offices, the Corporation also invests in U.S. Government, municipal, mortgage-backed and corporate marketable securities primarily through its subsidiary bank.
Farmers National Bank of Emlenton Market Area
| | | At December 31, | |
| Balance Sheet: | | 2007 | | | 2006 | | | 2005 | | | 2004 | | | 2003 | |
| | | | | | | | | | | | | | | | |
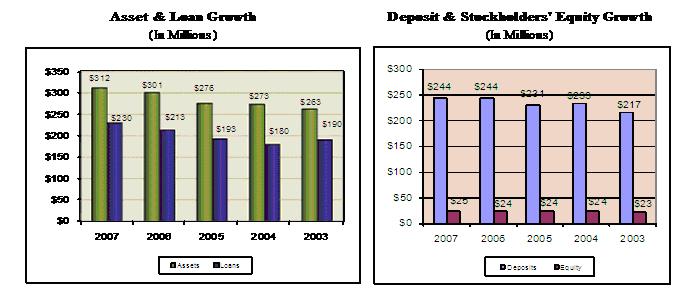
| Total assets | | $ | 311,720 | | | $ | 300,560 | | | $ | 275,517 | | | $ | 273,380 | | | $ | 262,512 | |
| Loans receivable, net | | | 229,819 | | | | 213,344 | | | | 192,526 | | | | 179,575 | | | | 190,482 | |
| Deposits | | | 244,262 | | | | 244,492 | | | | 230,503 | | | | 232,874 | | | | 217,110 | |
| Borrowed funds | | | 40,400 | | | | 30,000 | | | | 19,500 | | | | 15,000 | | | | 20,700 | |
| Stockholders' equity | | | 24,703 | | | | 23,917 | | | | 23,615 | | | | 23,616 | | | | 22,655 | |
| | | | | | | | | | | | | | | | | | | | | |
| Stockholders' equity per common share | | $ | 19.48 | | | $ | 18.86 | | | $ | 18.63 | | | $ | 18.63 | | | $ | 17.87 | |
| Market value per common share | | $ | 25.75 | | | $ | 29.25 | | | $ | 26.60 | | | $ | 26.25 | | | $ | 25.75 | |
| Common shares outstanding | | | 1,267,835 | | | | 1,267,835 | | | | 1,267,835 | | | | 1,267,835 | | | | 1,267,835 | |
| | | | | | | | | | | | | | | | | | | | | |
| Income Statement: | | | | | | | | | | | | | | | |
| | | | | | | | | | | | | | | | | | | | | |
| Net interest income | | $ | 9,969 | | | $ | 9,291 | | | $ | 9,304 | | | $ | 8,734 | | | $ | 9,308 | |
| Noninterest income | | | 2,943 | | | | 2,934 | | | | 3,317 | | | | 2,535 | | | | 1,785 | |
| Net income | | | 2,697 | | | | 1,966 | | | | 2,573 | | | | 2,557 | | | | 2,492 | |
| | | | | | | | | | | | | | | | | | | | | |
| Basic and diluted earnings per common share | | $ | 2.13 | | | $ | 1.55 | | | $ | 2.03 | | | $ | 2.02 | | | $ | 1.91 | |
| Cash dividends per common share | | $ | 1.54 | | | $ | 1.10 | | | $ | 1.02 | | | $ | 0.94 | | | $ | 1.11 | |
| | | | | | | | | | | | | | | | | | | | | |
| Key Ratios: | | | | | | | | | | | | | | | |
| | | | | | | | | | | | | | | | | | | | | |
| Return on average assets | | | 0.90 | % | | | 0.69 | % | | | 0.94 | % | | | 0.96 | % | | | 0.99 | % |
| Return on average equity | | | 11.13 | % | | | 8.28 | % | | | 10.69 | % | | | 11.08 | % | | | 10.96 | % |
| Net interest margin | | | 3.73 | % | | | 3.68 | % | | | 3.82 | % | | | 3.71 | % | | | 4.18 | % |
| Non-performing assets to total assets | | | 0.35 | % | | | 0.65 | % | | | 0.57 | % | | | 0.33 | % | | | 0.52 | % |
| Efficiency ratio | | | 68.66 | % | | | 74.18 | % | | | 69.72 | % | | | 67.11 | % | | | 64.16 | % |
| | | | | | | | | | | | | | | | | | | | | |
| Dear Fellow Shareholder:
During a period of internal transition and growth and external market turmoil for the financial services industry, Emclaire Financial Corp. and its wholly owned subsidiary bank, the Farmers National Bank of Emlenton, delivered record financial performance in 2007. We continue to prove that an independent community bank headquartered in rural Western Pennsylvania can consistently realize sound returns for shareholders, provide safe and competitive banking services for the customers and communities we serve, and offer promising career opportunities for our employees.
In recent years, your board of directors and management team have set forth certain broad objectives and strategies to continue to move the Corporation forward and enhance financial and operational performance. These broad objectives encompass profitably growing our financial institution while managing risk and holding true to the culture and tradition that has brought us to where we are today and expect to be in the future. Herein we will set forth how we successfully executed these strategies of profitability, growth, quality and culture to achieve our record financial results for 2007 while persisting to build a first-class organization | |
Profitability
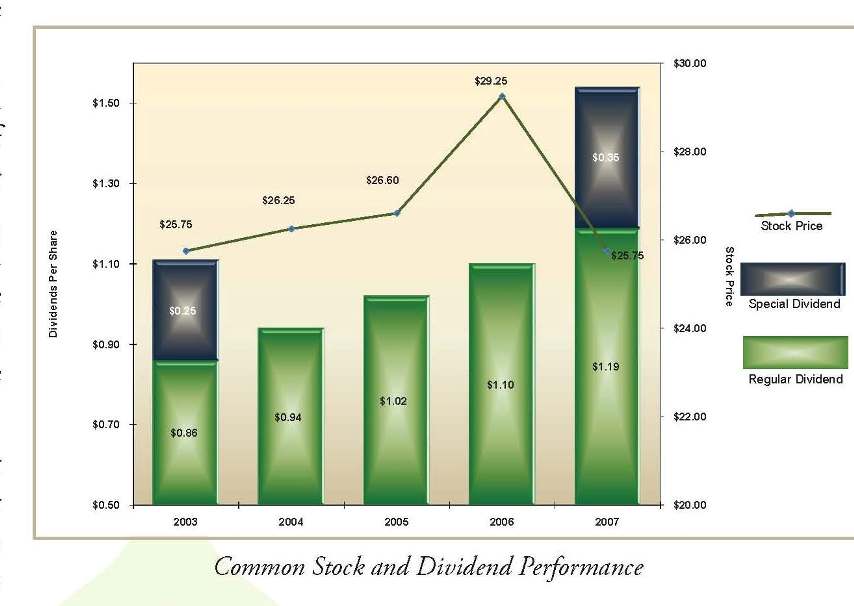
The Corporation’s financial success during 2007 and in recent years is reflected in our record earnings and the positive performance of our common stock.
Earnings. The Corporation realized consolidated net income of $2.7 million or $2.13 per share for 2007, versus $2.0 million or $1.55 per share for 2006. The 2007 results reflected a return on average equity of 11.13%. While results for 2006 included certain one-time charges associated with strategic reorganization initiatives undertaken in that year, the Corporation experienced improved core financial performance through increased net interest and noninterest income and by controlling noninterest expenses between 2007 and 2006.
Net interest income increased $678,000 to $10.0 million for 2007 compared to $9.3 million for 2006. This 7.3% increase can be attributed to continued growth in the Bank’s loan portfolios, particularly commercial loans, and disciplined asset liability management practices. These practices included regimented pricing of loan and deposit products and a tactical focus on maintaining core deposit accounts. This growth and these initiatives provided for an increase in the Corporation’s net interest margin to 3.73% for 2007 versus 3.68% for 2006. This improvement occurred during a period when the market interest rate yield curve was relatively flat to negatively inverted, an extremely difficult rate environment in which to manage a financial institution’s margins.
Excluding security sale gains, which we consider non-recurring income, noninterest revenues increased $202,000 or 8.0% between 2007 and the prior year. As we continue to explore ways to diversify our revenue streams and mitigate our reliance on net interest revenues, we have experienced increases in both customer service fees and financial services division commissions.
Excluding consideration of the one-time 2006 reorganization charges, the Corporation experienced only a modest increase in noninterest expenses of $314,000 or 3.5% between 2007 and the prior year. During 2007, we realized some of the ongoing savings as a result of the 2006 reorganization initiatives while focusing on controlling all expenses. Operating expenses increased primarily as a result of the opening of the new Cranberry office in late 2006 and professional fees associated with required Sarbanes-Oxley compliance initiatives pursued during 2007.
Shareholder Letter
continued
We spent much of 2007 focused on increasing core revenues while controlling operating costs. This focus will continue as we seek new opportunities to efficiently deliver new and traditional banking services.
Stock Performance. One of the Corporation’s cornerstone goals is to be a profitable and growth-oriented entity that is committed to quality and building value for our stockholders. As an example, if you invested $1,000 in the Corporation’s common stock five years ago, at year end 2002, and reinvested cash dividends, the value of your original investment would have increased more than 46% to $1,462 by December 31, 2007. This represents a 9.2% average annual return over that period.
While 2007’s turbulent financial markets saw declines in the values of stock prices of banks and other financial institutions in excess of 30%, the Corporation’s common stock did not see this significant drop in value and ended the year at a modest 12% decline from the closing price at the end of 2006.
Since 2002, we have increased our regular annual cash dividend on our common stock by more than 38% to $1.19 per share for 2007 compared to $0.86 per common share in 2002. Regular cash dividends increased 8% between 2007 and 2006. In connection with our record financial performance in 2007 and our ongoing capital management initiatives, during the fourth quarter we declared and paid a special cash dividend of $0.35 per common share. This is the third special cash dividend that we have paid since 2001; in addition to the 2007 special dividend, we paid a special cash dividend of $0.25 per share in 2002 and again in 2003.
We are proud of our overall stock performance and our favorable dividend policy resulting from our solid core earnings. While we build value, we intend to pursue controlled growth and prudent business practices to continue to provide a safe investment alternative with positive market returns.
Growth
We have and will continue to pursue growth on all fronts, not only internally through organic balance sheet growth in loans and deposits, but through expanding our branch network. The Corporation continues to explore expansion of our core banking business through the acquisition of branches and smaller institutions, expanding our financial services division and investigating other financial services delivery channels and businesses.
Shareholder Letter
continued
Balance Sheet Growth. For the year ended December 31, 2007, we experienced modest asset growth with total assets reaching $311.7 million at year end. The $11.2 million or 3.7% increase in assets was principally driven by loan growth funded by borrowed funds and, to a lesser extent, the employment of cash.
Customer deposits remained relatively flat during 2007 ending the year at $244.3 million as we sought to eliminate higher priced less profitable certificate of deposit accounts and replace these with core demand deposit accounts. The decline in certificate accounts of $10.0 million during the year was offset by increases in noninterest bearing and interest bearing demand deposits of $3.0 million and $6.7 million, respectively. During the year, we sought to expand existing customer balances through cross-selling and negotiated pricing on relationship accounts. We experienced demand deposit customer growth in existing branches and in our new Cranberry office where we cultivated new deposits of $3.1 million. This new office has grown to $6.3 million in deposits since opening in the fourth quarter of 2006.
We remain successful at lending within the markets we serve and during 2007 expanded all loan portfolios. During the year, all classes of loans grew as we continued our shift to more profitable commercial lending. The Corporation’s total loans ended the year at $229.8 million versus $213.3 million at year end 2006.
Our corporate banking group increased commercial real estate loans $10.5 million or 17.1% to $71.6 million at December 31, 2007. Commercial business loans ended the year at $35.6 million up $978,000 from $34.6 million at year end 2006. This growth was the result of focused in-market relationship lending efforts by our commercial lending and branch banking teams. At December 31, 2007, commercial loans comprised 47% of the Bank’s total loan portfolios compared to 29% at December 31, 2001. This successful shift has been a direct result of our strategies to identify and expand key business relationships in all of our markets. While we still consider consumer lending through our branch network as one key to growth, our accomplishments in business lending have proven more profitable.
Our consumer loan portfolios reached record levels as well in 2007, as residential first mortgage, home equity and installment loans ended the year at $65.7 million, $49.4 million and $9.7 million, respectively, up 1.6%, 4.4% and 26.2%, respectively. This excludes $13.0 million of off-balance sheet loans that we have originated and service at December 31, 2007. We experienced nice growth in our installment loan portfolio given a successful automobile loan promotion during the third and fourth quarters of 2007.
New Branch Offices. In November 2006, we opened our eleventh branch office in the Township of Cranberry, Pennsylvania. Since inception, this office has generated new consumer loans of $3.1 million and deposits of $6.3 million. This office has provided us with additional market coverage in our home county, Venango County, and has provided a platform for further commercial business development. During 2007, our corporate banking division originated $2.1 million in commercial loans through this office.
In April 2008, we will open our twelfth office in Grove City, Pennsylvania with high expectations. Strategically expanding to the Grove City area makes sense in a number of regards. This market is contiguous to the Bank’s existing markets, there is an opportunity to penetrate current banking market share, particularly with deposits, as the need for a community bank presence exists and this expansion moves us closer to other growing communities in Western Pennsylvania.

Shareholder Letter
continued
It is important to note that we continue to improve core profitability and operating efficiencies while expanding and investing in de novo branch offices. There are fundamental startup operating costs associated with the opening of each new office. Some of these costs are one-time, but ongoing period costs remain, and we estimate that it takes three to five years for a new office to break even in the markets that we operate. It takes this time to generate loans and deposits to levels that cover basic office working expenses. It is important to note that we are improving overall consolidated profitability while covering these startup costs and investing in advantageous expansion.
Quality
While continually looking towards profitable growth, we remain grounded by maintaining a culture of sound policies, procedures and systems to promote the highest in asset quality, internal controls and integrity.
We remained insulated from the well-chronicled national market conditions that impacted the overall financial services industry during 2007. The Bank has never provided sub-prime mortgage products and for the most part rural and Western Pennsylvania did not experience the sub-prime or real estate crises experienced in other parts of the country.
Asset Quality. Not only did we continue to realize stable growth in all loan portfolios, the credit quality of these portfolios remained strong as measured by any industry standards. The ratio of non-performing assets to total assets was a mere 0.35%, and the allowance for loan losses to non-performing loans provided coverage of 227%, at December 31, 2007. We view the quality of our loan portfolio, including the systems surrounding the loan origination and monitoring processes, as one of the true ideals of the Corporation. Our credit culture and corresponding training are diligently pursued and part of the way we lend.
Compliance. During the year, we complied with the early requirements of Sarbanes-Oxley section 404 for non-accelerated filers. We also significantly enhanced our compliance function by establishing an internal compliance council whereby all internal functional areas are represented to address compliance requirements for corresponding banking disciplines. We made advances in core business processes by improving how we utilize our information technology systems. These initiatives will continue in 2008 and beyond as we seek to better serve our customers and support deposit and lending delivery channels.
Integrity. We have consistently conducted our business with honor and integrity and do not assume unreasonable risks, regardless of the possible rewards. Integrity and attention to quality through sound systems, controls and asset quality management are the Corporation’s foundation for current and future success.
Shareholder Letter
continued
Culture
Much of our effort in 2007 was focused on proactive succession planning, building an experienced management team, marketing initiatives, staff development and community involvement activities.
Succession. In June 2007, the Corporation announced a management transition whereby William C. Marsh was named President and Chief Executive Officer of the Bank. Mr. Marsh will remain as Treasurer and Chief Financial Officer of the Corporation and David L. Cox will serve as Chairman of the Board of the Bank and continue in his role with the Corporation. Mr. Marsh’s promotion from within will facilitate the Corporation’s long term expansion plan by sharing executive responsibilities and permitting the team to focus on growth and strategic initiatives as well as management of the daily operations of the Bank.
Management Team. We have assembled an experienced executive management team capable of responding to daily challenges while focusing on strategic initiatives. Senior Vice President, Chief Lending Officer, Raymond M. Lawton, continues to successfully manage the delicate balance between loan growth and asset quality. He has created a credit culture that has positioned the Bank to navigate safely through a turbulent mortgage market. Senior Vice President, Operations, Kathleen L. Buzzard, transitioned from Retail Banking to Operations mid-year in 2007. Her extensive knowledge of branch banking, deposit products, and technology has proved valuable in not only improving operating efficiencies, but also in team building between the Operations Center and Branch Banking. Paige H. Turk was recently promoted to Senior Vice President, Director of Human Resources and Marketing. Her ability to communicate clearly and consistently to employees and customers has positioned the human resources and marketing functions to perform at a highly integrated level resulting in enhanced customer relationship management.

Marketing. Our definition and story - our brand, will also significantly impact the management of customer relationships. Our brand speaks to our purpose and is communicated in a way that will connect with consumer’s standards so they value their affiliation with the Bank. Our marketing plan is to keep our brand fresh and compelling in a competitive market. That, combined with a customer service standard that is rooted in professional competence, strong product knowledge, and a commitment to engage customers in enduring relationships, has resulted in a consistent, credible and exemplary brand statement. Our look may be fresh and updated, but our roots run deep and will remain firmly planted in integrity and trust.
Staff Development/Training. We continue to invest in employee development and training at all levels of the organization. Service Training and Leadership Development are key initiatives to support the continuation of accountability and excellent performance. We successfully enhanced the performance planning and review process for all employees during 2007 to include higher levels of performance feedback, coaching, communication of standards and ongoing position documentation. Our goal is to sustain a culture where communication and motivation drive accountability and excellence in performance.
Shareholder Letter
continued
Community Involvement. We believe that our responsibility to train individuals and provide meaningful information carries over into our communities as well. We are proud to provide community education programs on Fraud Prevention, Get Smart about Credit, Teaching Children to Save, and Tips for First-Time Home Buyers. We will continue to research and present relevant educational programs to assist our customers, neighbors and communities. Our responsibility to support the communities we serve is also reflected in a host of community involvement activities ranging from food bank collections to raising money for families or individuals in need. We are successful not only because our financial statements reflect stability and continued profitability, but also because we have helped to make the communities we call home responsive, stable and strong.
In late 2007, the Bank lost a valuable advocate and supporter when Bernadette Crooks passed away on New Year’s Eve. Bernadette served on the board of the Corporation and the Bank for almost twenty years before retiring in 2004. She will clearly remain part of the Bank’s rich history. We will miss Bernadette’s dedication, attention to detail and interest in all things Farmers. With respect, we express our deepest condolences to her family and closest friends.
We strive to provide and enhance shareholder value and believe strongly that there is a place for an independent community bank with long-term shareholder growth prospects. We will never waiver from our commitment to providing the very best in community banking. On behalf of your management team, the staff and Board of Directors, we thank you for your ongoing investment and support.
Very truly yours,
 |  |
| David L. Cox | William C. Marsh |
| | |
| Emclaire Financial Corp | Emclaire Financial Corp |
| Chairman of the Board, President and | Treasurer and |
| Chief Executive Officer | Chief Financial Officer |
| | |
| Farmers National Bank of Emlenton | Farmers National Bank of Emlenton |
| Chairman of the Board | President and |
| Chief Executive Officer | |
February 27, 2008

| |
| (Dollar amounts in thousands, except share data) | |
| | | | | | | | | | | | | | | | |
| | | As of December 31, | |
| Financial Condition Data | | 2007 | | | 2006 | | | 2005 | | | 2004 | | | 2003 | |
| | | | | | | | | | | | | | | | |
| Total assets | | $ | 311,720 | | | $ | 300,560 | | | $ | 275,517 | | | $ | 273,380 | | | $ | 262,512 | |
| Securities | | | 51,919 | | | | 51,774 | | | | 56,304 | | | | 63,362 | | | | 49,162 | |
| Loans receivable, net | | | 229,819 | | | | 213,344 | | | | 192,526 | | | | 179,575 | | | | 190,482 | |
| Deposits | | | 244,262 | | | | 244,492 | | | | 230,503 | | | | 232,874 | | | | 217,110 | |
| Borrowed funds | | | 40,400 | | | | 30,000 | | | | 19,500 | | | | 15,000 | | | | 20,700 | |
| Stockholders' equity | | | 24,703 | | | | 23,917 | | | | 23,615 | | | | 23,616 | | | | 22,655 | |
| Stockholders' equity per common share | | $ | 19.48 | | | $ | 18.86 | | | $ | 18.63 | | | $ | 18.63 | | | $ | 17.87 | |
| Tangible stockholders' equity per common share | | $ | 18.36 | | | $ | 17.74 | | | $ | 17.50 | | | $ | 17.48 | | | $ | 16.70 | |
| | | | | | | | | | | | | | | | | | | | | |
| | | For the year ended December 31, | |
| Operations Data | | 2007 | | | 2006 | | | 2005 | | | 2004 | | | 2003 | |
| | | | | | | | | | | | | | | | | | | | | |
| Interest income | | $ | 17,855 | | | $ | 16,259 | | | $ | 14,877 | | | $ | 13,953 | | | $ | 14,209 | |
| Interest expense | | | 7,886 | | | | 6,968 | | | | 5,573 | | | | 5,219 | | | | 4,901 | |
| Net interest income | | | 9,969 | | | | 9,291 | | | | 9,304 | | | | 8,734 | | | | 9,308 | |
| Provision for loan losses | | | 256 | | | | 358 | | | | 205 | | | | 290 | | | | 330 | |
| Net interest income after provision for loan losses | | | 9,713 | | | | 8,933 | | | | 9,099 | | | | 8,444 | | | | 8,978 | |
| Noninterest income | | | 2,943 | | | | 2,934 | | | | 3,317 | | | | 2,535 | | | | 1,785 | |
| Noninterest expense | | | 9,164 | | | | 9,409 | | | | 9,146 | | | | 7,909 | | | | 7,522 | |
| Income before income taxes | | | 3,492 | | | | 2,458 | | | | 3,270 | | | | 3,070 | | | | 3,241 | |
| Provision for income taxes | | | 795 | | | | 492 | | | | 697 | | | | 513 | | | | 749 | |
| | | | | | | | | | | | | | | | | | | | | |
| Net income | | $ | 2,697 | | | $ | 1,966 | | | $ | 2,573 | | | $ | 2,557 | | | $ | 2,492 | |
| | | | | | | | | | | | | | | | | | | | | |
| Average common shares outstanding | | | 1,267,835 | | | | 1,267,835 | | | | 1,267,835 | | | | 1,267,835 | | | | 1,301,714 | |
| Basic and diluted earnings per share | | $ | 2.13 | | | $ | 1.55 | | | $ | 2.03 | | | $ | 2.02 | | | $ | 1.91 | |
| Dividends per share (1) | | $ | 1.54 | | | $ | 1.10 | | | $ | 1.02 | | | $ | 0.94 | | | $ | 1.11 | |
| | | | | | | | | | | | | | | | | | | | | |
| | | As of or for the year ended December 31, | |
| Other Data | | 2007 | | | 2006 | | | 2005 | | | 2004 | | | 2003 | |
| | | | | | | | | | | | | | | | | | | | | |
| Performance Ratios | | | | | | | | | | | | | | | | | | | | |
| Return on average assets | | | 0.90 | % | | | 0.69 | % | | | 0.94 | % | | | 0.96 | % | | | 0.99 | % |
| Return on average equity | | | 11.13 | % | | | 8.28 | % | | | 10.69 | % | | | 11.08 | % | | | 10.96 | % |
| Yield on interest-earning assets (2) | | | 6.55 | % | | | 6.30 | % | | | 6.00 | % | | | 5.81 | % | | | 6.28 | % |
| Cost of interest-bearing liabilities | | | 3.46 | % | | | 3.23 | % | | | 2.70 | % | | | 2.57 | % | | | 2.56 | % |
| Cost of funds | | | 2.89 | % | | | 2.69 | % | | | 2.24 | % | | | 2.15 | % | | | 2.16 | % |
| Interest rate spread (2) | | | 3.09 | % | | | 3.08 | % | | | 3.30 | % | | | 3.24 | % | | | 3.72 | % |
| Net interest margin (2) | | | 3.73 | % | | | 3.68 | % | | | 3.82 | % | | | 3.71 | % | | | 4.18 | % |
| Efficiency ratio (2) (3) | | | 68.66 | % | | | 74.18 | % | | | 69.72 | % | | | 67.11 | % | | | 64.16 | % |
| Noninterest expense to average assets | | | 3.06 | % | | | 3.30 | % | | | 3.33 | % | | | 2.96 | % | | | 2.99 | % |
| Interest-earning assets to average assets | | | 93.13 | % | | | 92.89 | % | | | 92.82 | % | | | 92.86 | % | | | 92.69 | % |
| Loans to deposits | | | 94.09 | % | | | 87.26 | % | | | 83.52 | % | | | 77.11 | % | | | 87.74 | % |
| Dividend payout ratio (1) | | | 72.39 | % | | | 70.93 | % | | | 50.25 | % | | | 46.61 | % | | | 57.98 | % |
| Asset Quality Ratios | | | | | | | | | | | | | | | | | | | | |
| Non-performing loans to total loans | | | 0.41 | % | | | 0.85 | % | | | 0.75 | % | | | 0.46 | % | | | 0.69 | % |
| Non-performing assets to total assets | | | 0.35 | % | | | 0.65 | % | | | 0.57 | % | | | 0.33 | % | | | 0.52 | % |
| Allowance for loan losses to total loans | | | 0.93 | % | | | 0.94 | % | | | 0.96 | % | | | 1.00 | % | | | 0.92 | % |
| Allowance for loan losses to non-performing loans | | | 226.58 | % | | | 110.54 | % | | | 128.72 | % | | | 215.48 | % | | | 133.71 | % |
| Capital Ratios | | | | | | | | | | | | | | | | | | | | |
| Stockholders' equity to assets | | | 7.92 | % | | | 7.96 | % | | | 8.57 | % | | | 8.64 | % | | | 8.63 | % |
| Tangible stockholders' equity to tangible assets | | | 7.50 | % | | | 7.52 | % | | | 8.09 | % | | | 8.15 | % | | | 8.11 | % |
| Average equity to average assets | | | 8.08 | % | | | 8.32 | % | | | 8.75 | % | | | 8.63 | % | | | 9.02 | % |
| | | | | | | | | | | | | | | | | | | | | |
| (1) | Includes special cash dividend or $0.35 per share and $0.25 per share paid in 2007 and 2003, respectively. |
| (2) | Interest income utilized in calculation is on a fully tax equivalent basis. |
| (3) | The efficiency ratio is calculated by dividing noninterest expense (less intangible amortization) by net interest income (on a fully tax equivalent basis) and noninterest income. The efficiency ratio gives a measure of how effectively a financial institution is operating. |
Financial Condition and Results of Operations
The following discussion and analysis represents a review of Emclaire Financial Corp.’s consolidated financial condition and results of operations. This review should be read in conjunction with the consolidated financial statements presented later in this report.
Business Summary
Emclaire Financial Corp. (the Corporation) is a Pennsylvania corporation and bank holding company that provides a full range of retail and commercial financial products and services to customers in Western Pennsylvania through its wholly owned subsidiary bank, the Farmers National Bank of Emlenton (the Bank).
The Bank was organized in 1900 as a national banking association and is a financial intermediary whose principal business consists of attracting deposits from the general public and investing such funds in real estate loans secured by liens on residential and commercial property, consumer loans, commercial business loans, marketable securities and interest-earning deposits. The Bank operates through a network of twelve offices in Venango, Butler, Clarion, Clearfield, Elk, Jefferson and Mercer counties, Pennsylvania. The Corporation and the Bank are headquartered in Emlenton, Pennsylvania. Farmers National Financial Services, formed in 2004, is a division of the Bank that offers retail brokerage and other investment services to customers in the Bank’s market area.
The Bank is subject to examination and comprehensive regulation by the Office of the Comptroller of the Currency (OCC), which is the Bank’s chartering authority, and the Federal Deposit Insurance Corporation (FDIC), which insures customer deposits held by the Bank to the full extent provided by law. The Bank is a member of the Federal Reserve Bank of Cleveland (FRB) and the Federal Home Loan Bank of Pittsburgh (FHLB). The Corporation, as a registered bank holding company, is subject to regulation by the Federal Reserve Board.
Overview
The Corporation reported an increase in income for 2007 as consolidated net income amounted to $2.7 million or $2.13 per share, compared to net income of $2.0 million or $1.55 per share for 2006.
The increase in net income of $731,000 or 37.2% for the year ended December 31, 2007 was primarily due to an increase in net interest income and decreases in the provision for loan losses and noninterest expense, partially offset by an increase in the provision for income taxes. Net interest income increased as a result of growth in the loan portfolio, particularly with respect to commercial loans. Noninterest expense decreased as certain charges associated with strategic reorganization initiatives were experienced in 2006. These 2006 charges included $375,000 in pension expense for employees who took part in an early retirement program as well as $184,000 for severance, other benefits and legal costs associated with the reorganization. Excluding these one-time reorganization charges, noninterest expense increased modestly primarily as a result of the opening of a new banking office in November 2006 and professional fees associated with Sarbanes-Oxley compliance. The provision for income taxes increased due to increased pre-tax income.
During the year ended December 31, 2007, the Corporation experienced asset growth of 3.7% as total assets increased $11.2 million or 3.7% to $311.7 million at year end from $300.6 million at December 31, 2006. This asset growth was driven by total loan portfolio growth of $16.5 million or 7.7% funded by a decrease in cash and equivalents of $6.2 million or 37.3% and an increase in borrowed funds of $10.4 million or 34.7%.
Management’s Discussion and Analysis of
Financial Condition and Results of Operations (continued)
Changes in Financial Condition
Total assets increased $11.2 million or 3.7% to $311.7 million at December 31, 2007 from $300.6 million at December 31, 2006. This increase was primarily due to increases in loans receivable of $16.5 million, partially offset by a decrease in cash and equivalents of $6.2 million.
The increase in the Corporation’s total assets was primarily funded by increases in total liabilities of $10.4 million or 3.7% and total stockholders’ equity of $786,000 or 3.3%. The increase in total liabilities was primarily due to an increase in borrowed funds of $10.4 million or 34.7%.
Cash and cash equivalents. These accounts decreased a combined $6.2 million to $10.5 million at December 31, 2007 from $16.7 million at December 31, 2006. These accounts are typically increased by net operating results, deposits by customers into savings and checking accounts, loan and security repayments and proceeds from borrowed funds. Decreases result from customer deposit withdrawals, new loan originations or other loan fundings, security purchases, repayments of borrowed funds and cash dividends to stockholders. The Corporation maintained a lower balance of cash at year end December 31, 2007 than at the prior year end primarily as a result of loan growth experienced during the year and the purchase of commercial paper late in the year.
Securities. Securities increased $145,000 or 0.3% to $51.9 million at December 31, 2007 from $51.8 million at December 31, 2006. The overall increase in securities for the year resulted from the purchase of commercial paper late in the year, partially offset by management deploying funds from security maturities, calls and repayments into loan growth during the year.
Loans receivable. Net loans receivable increased $16.5 million or 7.7% to $229.8 million at December 31, 2007 from $213.3 million at December 31, 2006, resulting from strong loan production of $82.0 million during 2007. This increase can be primarily attributed to growth in the Corporation’s commercial loan portfolios. Commercial real estate loans increased $10.5 million or 17.1% and commercial business loans increased $1.0 million or 2.8%. This growth in commercial loans can be attributed to the production success of the Bank’s Corporate Banking Group established during 2004 and the related continued market penetration in larger communities served by the Bank.
Also contributing to the growth in the loan portfolio was an increase in home equity loans of $2.1 million or 4.4% due primarily to home equity loan campaigns put forth during the year. In addition, consumer loans increased $2.0 million or 26.2% due to an auto loan campaign during the year. Residential first mortgage loans increased $1.0 million or 1.6% during the year, net of $1.7 million of loans sold, due to strong residential mortgage production of $11.6 million.
Non-performing assets. Non-performing assets include non-accrual loans, loans 90 days past due and still accruing, and real estate acquired through foreclosure (REO). Non-performing assets decreased $858,000 to $1.1 million or 0.35% of total assets at December 31, 2007 from $1.9 million or 0.65% of total assets at December 31, 2006 primarily as the result of the full payoff of one larger credit relationship during the year. Non-performing assets consisted of non-performing loans and REO of $1.0 million and $129,000, respectively, at December 31, 2007 and $1.8 million and $98,000, respectively, at December 31, 2006. At December 31, 2007 non-performing assets consisted primarily of residential mortgage loans.
Management’s Discussion and Analysis of
Financial Condition and Results of Operations (continued)
Federal bank stocks. Federal bank stocks were comprised of FHLB stock and FRB stock of $2.3 million and $333,000, respectively, at December 31, 2007. These stocks are purchased and redeemed at par as directed by the federal banks and levels maintained are based primarily on borrowing and other correspondent relationships between the Corporation and the banks. The increase at December 31, 2007 compared to December 31, 2006 can be attributed to an increase in FHLB borrowings during 2007.
Bank-owned life insurance (BOLI). The Corporation maintains single premium life insurance policies on twenty current and former officers and employees of the Bank. In addition to providing life insurance coverage, whereby the Bank as well as the officers and employees receive life insurance benefits, the appreciation of the cash surrender value of the BOLI will serve to offset and finance existing and future employee benefit costs. Increases in this account during 2007 were associated with the increase in the cash surrender value of the policies, partially offset by certain administrative expenses.
Premises and equipment. Premises and equipment decreased $54,000 to $7.9 million at December 31, 2007 from $8.0 million at December 31, 2006. The overall decrease in premises and equipment during the year was due to the normal depreciation of fixed assets of $663,000, partially offset by capital expenditures of $609,000. Capital expenditures during the year consisted primarily of investments in technology and improvements made at the full service banking facility purchased in December of 2006.
Deposits. Total deposits decreased $230,000 to $244.3 million at December 31, 2007 from $244.5 million at December 31, 2006. While noninterest-bearing deposits increased $3.1 million or 7.0% during the year, interest-bearing deposits decreased by $3.3 million or 1.6%. This change in the deposit composition resulted principally from the Corporation’s focus on maintaining core deposit accounts and establishing strong relationship accounts while allowing certain high rate certificates of deposit to mature. In addition, the Bank opened a new office in November 2006. At December 31, 2007, this office had total deposits of $6.3 million with $3.1 million generated in 2007. Of these deposits, $625,000 is noninterest-bearing and $5.7 million is interest-bearing.
Borrowed funds. Borrowed funds, or advances from the FHLB, increased $10.4 million or 34.7% to $40.4 million at December 31, 2007 from $30.0 million at December 31, 2006. The increase in advances was the result of management matching $5.0 million in long-term borrowed funds with loans originated during the third quarter of 2007. In addition, short-term borrowings of $5.4 million were utilized in funding loan growth and purchasing commercial paper late in the year.
Management’s Discussion and Analysis of
Financial Condition and Results of Operations (continued)
Changes in Results of Operations
The Corporation reported net income of $2.7 million, $2.0 million and $2.6 million in 2007, 2006 and 2005, respectively. The following “Average Balance Sheet and Yield/Rate Analysis” and “Analysis of Changes in Net Interest Income” tables should be utilized in conjunction with the discussion of the net interest income and interest expense components of net income.
Average Balance Sheet and Yield/Rate Analysis. The following table sets forth, for the periods indicated, information concerning the total dollar amounts of interest income from interest-earning assets and the resulting average yields, the total dollar amounts of interest expense on interest-bearing liabilities and the resulting average costs, net interest income, interest rate spread and the net interest margin earned on average interest-earning assets. For purposes of this table, average loan balances include non-accrual loans and exclude the allowance for loan losses and interest income includes accretion of net deferred loan fees. Interest and yields on tax-exempt loans and securities (tax-exempt for federal income tax purposes) are shown on a fully tax equivalent basis. The information is based on average daily balances during the periods presented.
| | | | | | | | | | | | | | | | | | | | | | | |
| (Dollar amounts in thousands) | | Year ended December 31, | |
| | | | | | | | | | | | | | | | | | | | | | | |
| | | 2007 | | | 2006 | | | 2005 | |
| | | Average | | | | Yield / | | | Average | | | | Yield / | | | Average | | | | | Yield / | |
| | | Balance | | Interest | | Rate | | | Balance | | Interest | | Rate | | | Balance | | | Interest | | Rate | |
| | | | | | | | | | | | | | | | | | | | | | | |
| Interest-earning assets: | | | | | | | | | | | | | | | | | | | | | | |
| | | | | | | | | | | | | | | | | | | | | | | |
| Loans, taxable | | $ | 215,771 | | $ | 15,006 | | | 6.95 | % | | $ | 200,499 | | $ | 13,554 | | | 6.76 | % | | $ | 181,109 | | | $ | 12,011 | | | 6.63 | % |
| Loans, tax-exempt | | | 6,286 | | | 407 | | | 6.47 | % | | | 6,781 | | | 438 | | | 6.46 | % | | | 7,052 | | | | 454 | | | 6.44 | % |
| Total loans receivable | | | 222,057 | | | 15,413 | | | 6.94 | % | | | 207,280 | | | 13,992 | | | 6.75 | % | | | 188,161 | | | | 12,465 | | | 6.62 | % |
| | | | | | | | | | | | | | | | | | | | | | | | | | | | | | | | |
| Securities, taxable | | | 36,882 | | | 1,571 | | | 4.26 | % | | | 37,944 | | | 1,481 | | | 3.90 | % | | | 47,075 | | | | 1,714 | | | 3.64 | % |
| Securities, tax-exempt | | | 14,750 | | | 996 | | | 6.75 | % | | | 15,250 | | | 1,013 | | | 6.64 | % | | | 15,468 | | | | 1,012 | | | 6.53 | % |
| Total securities | | | 51,632 | | | 2,567 | | | 4.97 | % | | | 53,194 | | | 2,494 | | | 4.69 | % | | | 62,543 | | | | 2,726 | | | 4.36 | % |
| | | | | | | | | | | | | | | | | | | | | | | | | | | | | | | | |
| Interest-earning deposits with banks | | | 3,209 | | | 166 | | | 5.17 | % | | | 2,608 | | | 129 | | | 4.95 | % | | | 2,978 | | | | 81 | | | 2.72 | % |
| Federal bank stocks | | | 2,315 | | | 144 | | | 6.22 | % | | | 1,945 | | | 94 | | | 4.83 | % | | | 1,633 | | | | 58 | | | 3.55 | % |
| Total interest-earning cash equivalents | | | 5,524 | | | 310 | | | 5.61 | % | | | 4,553 | | | 223 | | | 4.90 | % | | | 4,611 | | | | 139 | | | 3.01 | % |
| | | | | | | | | | | | | | | | | | | | | | | | | | | | | | | | |
| Total interest-earning assets | | | 279,213 | | | 18,290 | | | 6.55 | % | | | 265,027 | | | 16,709 | | | 6.30 | % | | | 255,315 | | | | 15,330 | | | 6.00 | % |
| | | | | | | | | | | | | | | | | | | | | | | | | | | | | | | | |
| Cash and due from banks | | | 5,952 | | | | | | | | | | 6,922 | | | | | | | | | | 7,399 | | | | | | | | |
| Other noninterest-earning assets | | | 14,649 | | | | | | | | | | 13,376 | | | | | | | | | | 12,340 | | | | | | | | |
| | | | | | | | | | | | | | | | | | | | | | | | | | | | | | | | |
| Total Assets | | $ | 299,814 | | | | | | | | | $ | 285,325 | | | | | | | | | $ | 275,054 | | | | | | | | |
| | | | | | | | | | | | | | | | | | | | | | | | | | | | | | | | |
| Interest-bearing liabilities: | | | | | | | | | | | | | | | | | | | | | | | | | | | | | | | |
| Interest-bearing demand deposits | | $ | 73,364 | | | 956 | | | 1.30 | % | | $ | 72,584 | | | 770 | | | 1.06 | % | | $ | 79,063 | | | | 570 | | | 0.72 | % |
| Time deposits | | | 121,889 | | | 5,484 | | | 4.50 | % | | | 120,544 | | | 5,197 | | | 4.31 | % | | | 110,829 | | | | 4,324 | | | 3.90 | % |
| Total interest-bearing deposits | | | 195,253 | | | 6,440 | | | 3.30 | % | | | 193,128 | | | 5,967 | | | 3.09 | % | | | 189,892 | | | | 4,894 | | | 2.58 | % |
| | | | | | | | | | | | | | | | | | | | | | | | | | | | | | | | |
| Borrowed funds, short-term | | | 1,208 | | | 33 | | | 2.73 | % | | | 1,147 | | | 53 | | | 4.62 | % | | | 1,199 | | | | 50 | | | 4.17 | % |
| Borrowed funds, long-term | | | 31,233 | | | 1,413 | | | 4.52 | % | | | 21,521 | | | 948 | | | 4.40 | % | | | 15,000 | | | | 629 | | | 4.19 | % |
| Total borrowed funds | | | 32,441 | | | 1,446 | | | 4.46 | % | | | 22,668 | | | 1,001 | | | 4.42 | % | | | 16,199 | | | | 679 | | | 4.19 | % |
| | | | | | | | | | | | | | | | | | | | | | | | | | | | | | | | |
| Total interest-bearing liabilities | | | 227,694 | | | 7,886 | | | 3.46 | % | | | 215,796 | | | 6,968 | | | 3.23 | % | | | 206,091 | | | | 5,573 | | | 2.70 | % |
| | | | | | | | | | | | | | | | | | | | | | | | | | | | | | | | |
| Noninterest-bearing demand deposits | | | 45,086 | | | - | | | - | | | | 43,556 | | | - | | | - | | | | 42,450 | | | | - | | | - | |
| | | | | | | | | | | | | | | | | | | | | | | | | | | | | | | | |
| Funding and cost of funds | | | 272,780 | | | 7,886 | | | 2.89 | % | | | 259,352 | | | 6,968 | | | 2.69 | % | | | 248,541 | | | | 5,573 | | | 2.24 | % |
| | | | | | | | | | | | | | | | | | | | | | | | | | | | | | | | |
| Other noninterest-bearing liabilities | | | 2,810 | | | | | | | | | | 2,224 | | | | | | | | | | 2,452 | | | | | | | | |
| Total Liabilities | | | 275,590 | | | | | | | | | | 261,576 | | | | | | | | | | 250,993 | | | | | | | | |
| | | | | | | | | | | | | | | | | | | | | | | | | | | | | | | | |
| Stockholders' Equity | | | 24,224 | | | | | | | | | | 23,749 | | | | | | | | | | 24,061 | | | | | | | | |
| | | | | | | | | | | | | | | | | | | | | | | | | | | | | | | | |
| Total Liabilities and Stockholders' Equity | | $ | 299,814 | | | | | | | | | $ | 285,325 | | | | | | | | | $ | 275,054 | | | | | | | | |
| | | | | | | | | | | | | | | | | | | | | | | | | | | | | | | | |
| Net interest income | | | | | $ | 10,404 | | | | | | | | | $ | 9,741 | | | | | | | | | | $ | 9,757 | | | | |
| | | | | | | | | | | | | | | | | | | | | | | | | | | | | | | | |
Interest rate spread (difference between | | | | | | | | | | | | | | | | | | | | | | | | | | | | |
| weighted average rate on interest-earning | | | | | | | | | | | | | | | | | | | | | | | | | | | | |
| assets and interest-bearing liabilities) | | | | | | 3.09 | % | | | | | | | | | 3.08 | % | | | | | | | | | | 3.30 | % |
| | | | | | | | | | | | | | | | | | | | | | | | | | | | | | | | |
Net interest margin (net interest | | | | | | | | | | | | | | | | | | | | | | | | | | | | | | | |
| income as a percentage of average | | | | | | | | | | | | | | | | | | | | | | | | | | | | |
| interest-earning assets) | | | | | | | | | 3.73 | % | | | | | | | | | 3.68 | % | | | | | | | | | | 3.82 | % |
| | | | | | | | | | | | | | | | | | | | | | | | | | | | | | | | |
Management’s Discussion and Analysis of
Financial Condition and Results of Operations (continued)
Analysis of Changes in Net Interest Income. The following table analyzes the changes in interest income and interest expense in terms of: (1) changes in volume of interest-earning assets and interest-bearing liabilities and (2) changes in yields and rates. The table reflects the extent to which changes in the Corporation’s interest income and interest expense are attributable to changes in rate (change in rate multiplied by prior year volume), changes in volume (changes in volume multiplied by prior year rate) and changes attributable to the combined impact of volume/rate (change in rate multiplied by change in volume). The changes attributable to the combined impact of volume/rate are allocated on a consistent basis between the volume and rate variances. Changes in interest income on loans and securities reflect the changes in interest income on a fully tax equivalent basis.
| | | | | | | | | | | | | | | | | | | |
| | | | | | | | | | | | | |
| (Dollar amounts in thousands) | | 2007 versus 2006 | | | 2006 versus 2005 | |
| | | | | | | | | | | | | | | | | | | |
| | | Increase (decrease) due to | | | Increase (decrease) due to | |
| | | Volume | | | Rate | | | Total | | | Volume | | | Rate | | | Total | |
| Interest income: | | | | | | | | | | | | | | | | | | |
| Loans | | $ | 1,018 | | | $ | 403 | | | $ | 1,421 | | | $ | 1,287 | | | $ | 240 | | | $ | 1,527 | |
| Securities | | | (75 | ) | | | 148 | | | | 73 | | | | (428 | ) | | | 196 | | | | (232 | ) |
| Interest-earning deposits with banks | | | 31 | | | | 6 | | | | 37 | | | | (11 | ) | | | 59 | | | | 48 | |
| Federal bank stocks | | | 20 | | | | 30 | | | | 50 | | | | 13 | | | | 23 | | | | 36 | |
| | | | | | | | | | | | | | | | | | | | | | | | | |
| Total interest-earning assets | | | 994 | | | | 587 | | | | 1,581 | | | | 861 | | | | 518 | | | | 1,379 | |
| | | | | | | | | | | | | | | | | | | | | | | | | |
| Interest expense: | | | | | | | | | | | | | | | | | | | | | | | | |
| Deposits | | | 66 | | | | 407 | | | | 473 | | | | 85 | | | | 988 | | | | 1,073 | |
| Borrowed funds | | | 436 | | | | 9 | | | | 445 | | | | 284 | | | | 38 | | | | 322 | |
| | | | | | | | | | | | | | | | | | | | | | | | | |
| Total interest-bearing liabilities | | | 502 | | | | 416 | | | | 918 | | | | 369 | | | | 1,026 | | | | 1,395 | |
| | | | | | | | | | | | | | | | | | | | | | | | | |
| Net interest income | | $ | 492 | | | $ | 171 | | | $ | 663 | | | $ | 492 | | | $ | (508 | ) | | $ | (16 | ) |
| | | | | | | | | | | | | | | | | | | | | | | | | |
2007 Results Compared to 2006 Results
The Corporation reported net income of $2.7 million and $2.0 million for 2007 and 2006, respectively. The $731,000 or 37.2% increase in net income can primarily be attributed to an increase in net interest income of $678,000 and decreases in the provision for loan losses and noninterest expense of $102,000 and $245,000, respectively. Partially offsetting these favorable comparisons, the provision for income taxes increased $303,000.
In addition, 2006 operating results were adversely impacted as the Corporation realized one-time charges associated with strategic reorganization initiatives. Excluding these one-time charges, the Corporation experienced a modest income in noninterest expense for 2007.
Net interest income. The primary source of the Corporation’s revenue is net interest income. Net interest income is the difference between interest income on earning assets such as loans and securities, and interest expense on liabilities, such as deposits and borrowed funds, used to fund the earning assets. Net interest income is impacted by the volume and composition of interest-earning assets and interest-bearing liabilities, and changes in the level of interest rates. Tax equivalent net interest income increased $663,000 to $10.4 million for 2007, compared to $9.7 million for 2006. This increase in net interest income can be attributed to an increase in tax equivalent interest income of $1.6 million partially offset by an increase in interest expense of $918,000.
Interest income. Tax equivalent interest income increased $1.6 million or 9.5% to $18.3 million for 2007, compared to $16.7 million for 2006. This increase can be attributed to an increase in interest earned on loans, securities, interest-earning deposits and federal bank stocks of $1.4 million, $73,000, $37,000 and $50,000, respectively.
Management’s Discussion and Analysis of
Financial Condition and Results of Operations (continued)
Tax equivalent interest earned on loans receivable increased $1.4 million or 10.2% to $15.4 million for 2007, compared to $14.0 million for 2006. During that time, average loans increased $14.8 million or 7.1%, accounting for $1.0 million in additional loan interest income. The increase in average loans outstanding can be attributed to the aforementioned commercial and home equity loan growth experienced during 2007 as well as the positive impact in 2007 of loan growth in 2006. Additionally, the interest rate earned on loans increased as market interest rates for lending were more favorable in 2007 compared to 2006 and the yield on loans increased 19 basis points to 6.94% for 2007, versus 6.75% for 2006 contributing $403,000 in additional interest income. Contributing to the increase in the yield on loans between the periods was the collection of $125,000 of interest and late fees due associated with the payoff of previously non-performing commercial loans during the year that had been on non-accrual status. In connection with the loan payoffs, the Corporation received all principal and interest due under the contractual terms of the loan agreements and interest collected was recorded as loan interest income during the year. In addition, the Corporation recognized $42,000 in prepayment fees resulting from the early payoff of a large commercial mortgage in the fourth quarter of 2007.
Tax equivalent interest earned on securities increased $73,000 or 2.9% to $2.6 million for 2007, compared to $2.5 million for 2006. The average yield on securities increased by 28 basis points as a result of certain lower yielding securities maturing. Partially offsetting the increase in interest income associated with the yield increase was the decrease in the average volume of these assets of $1.6 million or 2.9% primarily as a result of the utilization of these funds for loan growth.
Interest earned on interest-earning deposit accounts increased $37,000 to $166,000 for 2007, compared to $129,000 for 2006, as a result of a higher yield realized on higher average balances maintained. Interest earned on federal bank stocks increased $50,000 to $144,000 for 2007, compared to $94,000 for 2006 as a result of higher volume and higher yield.
Interest expense. Interest expense increased $918,000 or 13.2% to $7.9 million for 2007, compared to $7.0 million for 2006. This increase in interest expense can be attributed to an increase in interest incurred on deposits and borrowed funds of $473,000 and $445,000, respectively.
Deposit interest expense increased $473,000 or 7.9% to $6.4 million for 2007, compared to $6.0 million for 2006. This increase in deposit interest expense was principally rate driven as the cost of interest-bearing deposits increased 21 basis points to 3.30% for 2007 versus 3.09% for 2006 contributing $407,000 in additional expense. The increase in the interest rate on deposits can be attributed to the Corporation offering certain higher priced certificate products in the fourth quarter of 2006. The average volume of deposits increased by $2.1 million or 1.1% contributing an additional $66,000 in interest expense.
Interest expense on borrowed funds increased $445,000 to $1.5 million for 2007, compared to $1.0 million for 2006 due to $15.0 million of FHLB long term borrowings placed in the second and third quarters of 2006 and $5.0 million of FHLB long term borrowings placed in the fourth quarter of 2007. The Corporation utilized these borrowings primarily to fund loan growth.
Provision for loan losses. The Corporation records provisions for loan losses to maintain a level of total allowance for loan losses that management believes, to the best of its knowledge, covers all known and inherent losses that are both probable and reasonably estimable at each reporting date. Management considers historical loss experience, the present and prospective financial condition of borrowers, current conditions (particularly as they relate to markets where the Corporation originates loans), the status of non-performing assets, the estimated underlying value of the collateral and other factors related to the collectibility of the loan portfolio.
The provision for loan losses decreased $102,000 or 28.5% to $256,000 for 2007, compared to $358,000 for 2006. The Corporation’s allowance for loan losses amounted to $2.2 million or 0.93% of the Corporation’s total loan portfolio at December 31, 2007, compared to $2.0 million or 0.94% at December 31, 2006. The allowance for loan losses as a percentage of non-performing loans at December 31, 2007 and 2006 was 226.6% and 110.5%, respectively. The decrease in the provision for loan losses from 2006 to 2007 was primarily due to a lower allowance for loan losses necessary in connection with the aforementioned payoff of previously non-performing large commercial loans during the year.
Management’s Discussion and Analysis of
Financial Condition and Results of Operations (continued)
Noninterest income. Noninterest income includes revenue that is not related to interest rates, but rather to services rendered and activities conducted in the financial services industry, including fees on depository accounts, general transaction and service fees, commissions on financial services, security and loan gains and losses, and earnings on BOLI. Noninterest income increased a modest $9,000, remaining stable at $2.9 million for 2007 and 2006. This increase can be primarily attributed to increases in fees and service charges, commissions on financial services, earnings on BOLI, and other noninterest income of $65,000, $40,000, $24,000 and $98,000, respectively. Partially offsetting the increase in noninterest income were decreases in gains on loan sales and gains on available for sale securities of $25,000 and $193,000, respectively. This decrease in gains on available for sale securities resulted primarily from the 2006 gains realized of $372,000 as management elected to divest a community bank stock investment. During 2007, the Corporation realized $166,000 in gains from the sale of another community bank stock investment as a result of that banks merger with a larger financial institution.
Noninterest expense. Noninterest expense decreased $245,000 or 2.6% to $9.2 million for 2007, compared to $9.4 million for 2006. This decrease in noninterest expense was comprised of decreases in compensation and employee benefits, premises and equipment and intangible amortization expense of $542,000, $48,000 and $7,000, respectively, partially offset by an increase in other expenses of $352,000.
The largest component of noninterest expense, compensation and employee benefits, decreased $542,000 or 9.6%. This decrease was primarily the result of the Corporation realizing non-recurring charges of $559,000 relating to the aforementioned reorganization during 2006. These charges included $375,000 in pension expense for employees who took part in an early retirement program as well as $184,000 for severance, other benefits and legal costs associated with the reorganization. Excluding these one-time charges, the Corporation realized a slight increase in compensation and employee benefits resulting from normal salary and wage adjustments and increases in 401(k) match expense, training expense, director’s fees, incentive expense and stock option expense. Mitigating these increases was the realization of ongoing savings in salaries and wages and employee benefits resulting from the 2006 reorganization.
Premises and equipment expense decreased $48,000 or 2.9% as the Corporation focused on controlling expenses. This decrease was primarily the result of lower equipment and software depreciation. The decrease in equipment depreciation resulted from the write-off of an asset determined to be obsolete during 2006. Partially offsetting these decreases were increased occupancy costs related to a new branch location opened during the fourth quarter of 2006.
Other expense increased $352,000 or 16.5% primarily due to increases in professional fees, travel, entertainment and conferences and telephone expenses of $174,000, $43,000 and $41,000, respectively. Also contributing to this increase was an increase in other noninterest expense of $70,000 primarily consisting of increases in subscriptions, credit bureau expense, and internet banking expense of $41,000, $25,000 and $26,000, respectively. The increase in professional fees resulted primarily from fees associated with required Sarbanes-Oxley compliance initiatives pursued during 2007.
The provision for income taxes increased $303,000 or 61.6% to $795,000 for 2007, compared to $492,000 for 2006, primarily due to the increase in the Corporation’s pre-tax earnings of $1.0 million. In addition, the Corporation’s effective tax rate was 22.8% for 2007, compared with 20.0% for 2006.
Management’s Discussion and Analysis of
Financial Condition and Results of Operations (continued)
2006 Results Compared to 2005 Results
The Corporation reported net income of $2.0 million and $2.6 million for 2006 and 2005, respectively. The $607,000 or 23.6% decrease in net income can be attributed to decreases in net interest income and noninterest income of $13,000 and $383,000, respectively, and increases in the provision for loan losses and noninterest expense of $153,000 and $263,000, respectively. Partially offsetting these unfavorable comparisons, the provision for income taxes decreased $205,000.
Net interest income. The primary source of the Corporation’s revenue is net interest income. Net interest income is the difference between interest income on earning assets such as loans and securities, and interest expense on liabilities, such as deposits and borrowed funds, used to fund the earning assets. Net interest income is impacted by the volume and composition of interest-earning assets and interest-bearing liabilities, and changes in the level of interest rates. Tax equivalent net interest income decreased $16,000 to $9.7 million for 2006. This decrease in net interest income can be attributed to an increase in tax equivalent interest income of $1.4 million and a corresponding increase in interest expense.
Interest income. Tax equivalent interest income increased $1.4 million or 9.0% to $16.7 million for 2006, compared to $15.3 million for 2005. This increase can be attributed to an increase in interest earned on loans, interest-earning deposits and federal bank stocks of $1.5 million, $48,000 and $36,000, respectively, partially offset by a $232,000 decrease in interest earned on securities.
Tax equivalent interest earned on loans receivable increased $1.5 million or 12.2% to $14.0 million for 2006, compared to $12.5 million for 2005. During that time, average loans increased $19.1 million or 10.2%, accounting for $1.3 million in additional loan interest income. Additionally, the interest rate earned on loans increased as market interest rates for lending were more favorable in 2006 compared to 2005 and the yield on loans increased 13 basis points to 6.75% for 2006, versus 6.62% for 2005 contributing $240,000 in additional interest income. The increase in average loans outstanding can be attributed to the aforementioned commercial and home equity loan growth experienced during 2006 as well as the positive impact in 2006 of loan growth in 2005.
Tax equivalent interest earned on securities decreased $232,000 or 8.5% to $2.5 million for 2006, compared to $2.7 million for 2005. The average volume of these assets decreased $9.3 million or 14.9% primarily as a result of the utilization of these funds for loan growth. The average yield on securities increased by 33 basis points, as a result of certain lower yielding securities maturing, partially offsetting the decline in interest income associated with the volume decline.
Interest earned on interest-earning deposit accounts increased $48,000 to $129,000 for 2006, compared to $81,000 for 2005, as a result of a higher yield realized partially offset by lower average balances maintained. Interest earned on federal bank stocks increased $36,000 to $94,000 for 2006, compared to $58,000 for 2005 as a result of a higher volume and higher yield.
Interest expense. Interest expense increased $1.4 million or 25.0% to $7.0 million for 2006, compared to $5.6 million for 2005. This increase in interest expense can be attributed to an increase in interest incurred on deposits and borrowed funds of $1.1 million and $322,000, respectively.
Deposit interest expense increased $1.1 million or 21.9% to $6.0 million for 2006, compared to $4.9 million for 2005. This increase in deposit interest expense was principally rate driven as the cost of interest-bearing deposits increased 51 basis points to 3.09% for 2007 versus 2.58% for 2005 contributing $988,000 in additional expense. The average volume of deposits increased modestly by $3.2 million or 1.7% contributing to an additional $85,000 in interest expense. The increase in the interest rate on deposits can be attributed to the increase in short term market interest rates during 2006 and 2005 as well as to the Corporation offering certain higher priced certificate products during 2006.
Management’s Discussion and Analysis of
Financial Condition and Results of Operations (continued)
Interest expense on borrowed funds increased $322,000 to $1.0 million for 2006, compared to $679,000 for 2005 due to $15.0 million of FHLB long term borrowings placed in the second and third quarters of 2006.
Provision for loan losses. The Corporation records provisions for loan losses to maintain a level of total allowance for loan losses that management believes, to the best of its knowledge, covers all known and inherent losses that are both probable and reasonably estimable at each reporting date. Management considers historical loss experience, the present and prospective financial condition of borrowers, current conditions (particularly as they relate to markets where the Corporation originates loans), the status of non-performing assets, the estimated underlying value of the collateral and other factors related to the collectibility of the loan portfolio.
The provision for loan losses increased $153,000 to $358,000 for 2006, compared to $205,000 for 2005. The Corporation’s allowance for loan losses amounted to $2.0 million or 0.94% of the Corporation’s total loan portfolio at December 31, 2006, compared to $1.9 million or 0.96% at December 31, 2005. The allowance for loan losses as a percentage of non-performing loans at December 31, 2006 and 2005 was 110.5% and 128.7%, respectively. The increase in the provision for loan losses from 2005 to 2006 was primarily due to the aforementioned growth in the loan portfolio.
Noninterest income. Noninterest income includes items that are not related to interest rates, but rather to services rendered and activities conducted in the financial services industry, including fees on depository accounts, general transaction and service fees, commissions on financial services, security and loan gains and losses, and earnings on BOLI. Noninterest income decreased $383,000 or 11.6% to $2.9 million for 2006, compared to $3.3 million for 2005. This decrease can be primarily attributed to a decrease in gains on the sale of securities of $457,000. This decrease resulted primarily from the 2005 gains realized of $628,000 as management elected to divest a community bank stock investment. In 2006, the Corporation realized $372,000 in gains from the sale of this particular investment. Also contributing to the decrease was a 2005 involuntary transaction that resulted from the sale of a community bank which contributed $198,000 to gains on the sale of securities. Partially offsetting the decrease in noninterest income were increases in fee and service income of $64,000 and gains on the sale of loans of $53,000 as management sold $4.0 million of 30-year fixed rate conforming mortgage loans.
Noninterest expense. Noninterest expense increased $263,000 or 2.9% to $9.4 million for 2006, compared to $9.1 million for 2005. This increase in noninterest expense is comprised of increases in compensation and employee benefits and premises and equipment of $525,000 and $26,000, respectively, partially offset by reductions in intangible amortization expense and other expenses of $24,000 and $264,000, respectively.
The largest component of noninterest expense is compensation and employee benefits. This expense increased $525,000 or 10.2%. This increase was primarily the result of the Corporation realizing charges relating to the aforementioned reorganization. These charges included $375,000 in pension expense for employees who took part in an early retirement program as well as $184,000 for severance, other benefits and legal costs associated with the reorganization.
Premises and equipment expense increased $26,000 or 1.6% as a result of increased occupancy costs related to a new drive-thru facility as well as a new branch location. Also contributing to the increase was the write-off of an asset determined to be obsolete.
Other expense decreased $264,000 or 11.0% primarily due to a decrease in telephone expenses of $155,000 as the Corporation received credit from its telephone vendor for billing errors. Also contributing to this decrease was a $203,000 write-off of amounts related to a correspondent bank reconciliation in 2005, which resulted from inefficiencies related to consolidation of their offices as well as variances resulting from the Bank’s technology conversions late in 2004.
Management’s Discussion and Analysis of
Financial Condition and Results of Operations (continued)
The provision for income taxes decreased $205,000 or 29.4% to $492,000 for 2006, compared to $697,000 for 2005, primarily due to the decrease in the Corporation’s pre-tax earnings of $812,000.
Market Risk Management
The primary objective of the Corporation’s asset liability management function is to maximize the Corporation’s net interest income while simultaneously maintaining an acceptable level of interest rate risk given the Corporation’s operating environment, capital and liquidity requirements, balance sheet mix, performance objectives and overall business focus. One of the primary measures of the exposure of the Corporation’s earnings to interest rate risk is the timing difference between the repricing or maturity of interest-earning assets and the repricing or maturity of its interest-bearing liabilities.
The Corporation’s Board of Directors has established a Finance Committee, consisting of four outside directors, the President and Chief Executive Officer and the Chief Financial Officer, to monitor market risk, including primarily interest rate risk. This committee, which meets at least quarterly, generally establishes and monitors the investment, interest rate risk and asset liability management policies established by the Corporation.
In order to minimize the potential for adverse affects of material and prolonged changes in interest rates on the Corporation’s results of operations, the Corporation’s management has implemented and continues to monitor asset liability management policies to better match the maturities and repricing terms of the Corporation’s interest-earning assets and interest-bearing liabilities. Such policies have consisted primarily of (i) originating adjustable-rate mortgage loans; (ii) originating short-term secured commercial loans with the rate on the loan tied to the prime rate or reset features in which the rate changes at determined intervals; (iii) emphasizing investment in shorter-term (15 years or less) investment securities; (iv) selling longer-term (30-year) fixed-rate residential mortgage loans in the secondary market; (v) maintaining a high level of liquid assets (including securities classified as available for sale) that can be readily reinvested in higher yielding investments should interest rates rise; (vi) emphasizing the retention of lower-costing savings accounts and other core deposits; and (vii) lengthening liabilities and locking in lower borrowing rates with longer terms whenever possible.
Interest Rate Sensitivity Gap Analysis
The implementation of asset and liability initiatives and strategies and compliance with related policies, combined with other external factors such as demand for the Corporation’s products and economic and interest rate environments in general, has resulted in the Corporation maintaining a one-year cumulative interest rate sensitivity gap ranging between a positive and negative 20% of total assets. The one-year interest rate sensitivity gap is identified as the difference between the Corporation’s interest-earning assets that are scheduled to mature or reprice within one year and its interest-bearing liabilities that are scheduled to mature or reprice within one year.
Management’s Discussion and Analysis of
Financial Condition and Results of Operations (continued)
The interest rate sensitivity gap is defined as the difference between the amount of interest-earning assets maturing or repricing within a specific time period and the amount of interest-bearing liabilities maturing or repricing within that time period. A gap is considered positive when the amount of interest rate-sensitive assets exceeds the amount of interest rate-sensitive liabilities, and is considered negative when the amount of interest rate-sensitive liabilities exceeds the amount of interest rate-sensitive assets. Generally, during a period of rising interest rates, a negative gap would adversely affect net interest income while a positive gap would result in an increase in net interest income. Conversely, during a period of falling interest rates, a negative gap would result in an increase in net interest income and a positive gap would adversely affect net interest income. The closer to zero, or more neutral, that gap is maintained, generally, the lesser the impact of market interest rate changes on net interest income.
Based on certain assumptions provided by a federal regulatory agency, which management believes most accurately represents the sensitivity of the Corporation’s assets and liabilities to interest rate changes, at December 31, 2007, the Corporation’s interest-earning assets maturing or repricing within one year totaled $72.7 million while the Corporation’s interest-bearing liabilities maturing or repricing within one-year totaled $93.2 million, providing an excess of interest-bearing liabilities over interest-earning assets of $20.5 million or a negative 6.6% of total assets. At December 31, 2007, the percentage of the Corporation’s assets to liabilities maturing or repricing within one year was 78.1%.
The following table presents the amounts of interest-earning assets and interest-bearing liabilities outstanding as of December 31, 2007 which are expected to mature, prepay or reprice in each of the future time periods presented:
| | | | | | | | | | | | | | | | | | | |
| | | | | | | | | | | | | | | | | | | |
| (Dollar amounts in thousands) | | Due in | | | Due within | | | Due within | | | Due within | | | Due in | | | | |
| | | six months | | | six months | | | one to | | | three to | | | over | | | | |
| | | or less | | | to one year | | | three years | | | five years | | | five years | | | Total | |
| | | | | | | | | | | | | | | | | | | |
| Total interest-earning assets | | $ | 47,171 | | | $ | 25,554 | | | $ | 74,212 | | | $ | 43,505 | | | $ | 89,942 | | | $ | 280,384 | |
| | | | | | | | | | | | | | | | | | | | | | | | | |
| Total interest-bearing liabilities | | | 58,930 | | | | 34,224 | | | | 57,827 | | | | 37,169 | | | | 96,516 | | | | 284,666 | |
| | | | | | | | | | | | | | | | | | | | | | | | | |
| Maturity or repricing gap during the period | | $ | (11,759 | ) | | $ | (8,670 | ) | | $ | 16,385 | | | $ | 6,336 | | | $ | (6,574 | ) | | $ | (4,282 | ) |
| | | | | | | | | | | | | | | | | | | | | | | | | |
| Cumulative gap | | $ | (11,759 | ) | | $ | (20,429 | ) | | $ | (4,044 | ) | | $ | 2,292 | | | $ | (4,282 | ) | | | | |
| | | | | | | | | | | | | | | | | | | | | | | | | |
| Ratio of gap during the period to total assets | | | (3.77% | ) | | | (2.78% | ) | | | 5.26 | % | | | 2.03 | % | | | (2.11% | ) | | | | |
| | | | | | | | | | | | | | | | | | | | | | | | | |
| Ratio of cumulative gap to total assets | | | (3.77% | ) | | | (6.55% | ) | | | (1.30% | ) | | | 0.74 | % | | | (1.37% | ) | | | | |
| | | | | | | | | | | | | | | | | | | | | | | | | |
| Total assets | | | | | | | | | | | | | | | | | | | | | | $ | 311,720 | |
| | | | | | | | | | | | | | | | | | | | | | | | | |
Although certain assets and liabilities may have similar maturities or periods of repricing, they may react in different degrees to changes in market interest rates. The interest rates on certain types of assets and liabilities may fluctuate in advance of changes in market interest rates, while interest rates on other types of assets and liabilities may lag behind changes in market interest rates. In the event of a change in interest rates, prepayment and early withdrawal levels would likely deviate significantly from those assumed in calculating the table. The ability of many borrowers to service their debt may decrease in the event of an interest rate increase.
The one-year interest rate sensitivity gap has been the most common industry standard used to measure an institution’s interest rate risk position regarding maturities, repricing and prepayments. In recent years, in addition to utilizing interest rate sensitivity gap analysis, the Corporation has increased its emphasis on the utilization of interest rate sensitivity simulation analysis to evaluate and manage interest rate risk.
Management’s Discussion and Analysis of
Financial Condition and Results of Operations (continued)
Interest Rate Sensitivity Simulation Analysis
The Corporation also utilizes income simulation modeling in measuring its interest rate risk and managing its interest rate sensitivity. The Finance Committee of the Corporation believes that simulation modeling enables the Corporation to more accurately evaluate and manage the possible effects on net interest income due to the exposure to changing market interest rates, the slope of the yield curve and different loan and security prepayment and deposit decay assumptions under various interest rate scenarios.
As with gap analysis and earnings simulation modeling, assumptions about the timing and variability of cash flows are critical in net portfolio equity valuation analysis. Particularly important are the assumptions driving mortgage prepayments and the assumptions about expected attrition of the core deposit portfolios. These assumptions are based on the Corporation’s historical experience and industry standards and are applied consistently across the different rate risk measures.
The Corporation has established the following guidelines for assessing interest rate risk:
Net interest income simulation. Given a 200 basis point parallel and gradual increase or decrease in market interest rates, net interest income may not change by more than 25% for a one-year period.
Portfolio equity simulation. Portfolio equity is the net present value of the Corporation’s existing assets and liabilities. Given a 200 basis point immediate and permanent increase or decrease in market interest rates, portfolio equity may not correspondingly decrease or increase by more than 30% of stockholders’ equity.
These guidelines take into consideration the current interest rate environment, the Corporation’s financial asset and financial liability product mix and characteristics and liquidity sources among other factors. Given the current rate environment, a drop in short-term market interest rates of 200 basis points immediately or over a one-year horizon would seem unlikely. This should be considered in evaluating modeling results outlined in the table below.
The following table presents the simulated impact of a 100 basis point or 200 basis point upward or downward shift of market interest rates on net interest income, for the years ended December 31, 2007 and 2006, respectively. This analysis was done assuming that the interest-earning asset and interest-bearing liability levels at December 31, 2007 remained constant. The impact of the market rate movements on net interest income was developed by simulating the effects of rates changing gradually during a one-year period from the December 31, 2007 levels for net interest income.
| | | | | | | | | | | | | |
| | | Increase | | | Decrease |
| | | | +100 | | | | +200 | | | | -100 | | | | -200 | |
| | | BP | | | BP | | | BP | | | BP | |
| | | | | | | | | | | | | | | | | |
| 2007 Net interest income - increase (decrease) | | | 0.26 | % | | | (0.66 | %) | | | 2.24 | % | | | 5.15 | % |
| | | | | | | | | | | | | | | | | |
| 2006 Net interest income - increase (decrease) | | | 1.12 | % | | | 0.73 | % | | | (0.33 | %) | | | (3.43 | %) |
| | | | | | | | | | | | | | | | | |
Impact of Inflation and Changing Prices
The consolidated financial statements of the Corporation and related notes presented herein have been prepared in accordance with accounting principles generally accepted in the United States of America which require the measurement of financial condition and operating results in terms of historical dollars, without considering changes in the relative purchasing power of money over time due to inflation.
Management’s Discussion and Analysis of
Financial Condition and Results of Operations (continued)
Unlike most industrial companies, substantially all of the assets and liabilities of a financial institution are monetary in nature. As a result, interest rates have a more significant impact on a financial institution’s performance than the effects of general levels of inflation. Interest rates do not necessarily move in the same direction or in the same magnitude as the prices of goods and services since such prices are affected by inflation to a larger degree than interest rates. In the current interest rate environment, liquidity and the maturity structure of the Corporation’s assets and liabilities are critical to the maintenance of acceptable performance levels.
Capital Resources
Total stockholders’ equity increased $786,000 or 3.3% to $24.7 million at December 31, 2007 from $23.9 million at December 31, 2006. Net income of $2.7 million in 2007, represented an increase in earnings of $731,000 or 37.2% compared to last year. Returns on average equity and assets were 11.13% and 0.90%, respectively, for 2007.
The Corporation has maintained a strong capital position with a capital to assets ratio of 7.9% at December 31, 2007, a slight decline compared to the ratio of 8.0% a year earlier. While continuing to sustain this strong capital position, dividends increased to $2.0 million in 2007 from $1.4 million in 2006. Stockholders have taken part in the Corporation’s dividend reinvestment plan introduced during 2003 with 40% of registered shareholder accounts active in the plan at December 31, 2007.
Capital adequacy is intended to enhance the Corporation’s ability to support growth while protecting the interest of shareholders and depositors and to ensure that capital ratios are in compliance with regulatory minimum requirements. Regulatory agencies have developed certain capital ratio requirements that are used to assist them in monitoring the safety and soundness of financial institutions. At December 31, 2007, the Corporation and the Bank were in excess of all regulatory capital requirements.
Liquidity
The Corporation’s primary sources of funds generally have been deposits obtained through the offices of the Bank, borrowings from the FHLB, and amortization and prepayments of outstanding loans and maturing securities. During 2007, the Corporation used its sources of funds primarily to fund loan commitments. As of December 31, 2007, the Corporation had outstanding loan commitments, including undisbursed loans and amounts available under credit lines, totaling $30.7 million, and standby letters of credit totaling $869,000. The Bank is required by the OCC to establish policies to monitor and manage liquidity levels to ensure the Bank’s ability to meet demands for customer withdrawals and the repayment of short-term borrowings, and the Bank is currently in compliance with all liquidity policy limits.
At December 31, 2007, time deposits amounted to $119.5 million or 48.9% of the Corporation’s total consolidated deposits, including approximately $56.2 million, which are scheduled to mature within the next year. Management of the Corporation believes that the Corporation has adequate resources to fund all of its commitments, that all of its commitments will be funded as required by related maturity dates and that, based upon past experience and current pricing policies, it can adjust the rates of time deposits to retain a substantial portion of maturing liabilities. The following table presents the Corporation’s contractual obligations as of December 31, 2007:
| | | | | | | | | | | | | | | | |
| | | | | | | | | | | | | | | | |
| (Dollar amounts in thousands) | | Less than 1 year | | | 1 - 3 years | | | 3 - 5 years | | | Over 5 years | | | Total | |
| | | | | | | | | | | | | | | | |
| Time deposits | | $ | 56,263 | | | $ | 34,234 | | | $ | 18,603 | | | $ | 10,437 | | | $ | 119,537 | |
| Borrowed funds | | | 5,400 | | | | - | | | | 10,000 | | | | 25,000 | | | | 40,400 | |
| Lease obligations | | | 120 | | | | 234 | | | | 105 | | | | - | | | | 459 | |
| Estimated future pension payments | | | 254 | | | | 461 | | | | 422 | | | | 3,371 | | | | 4,508 | |
| Total | | $ | 62,037 | | | $ | 34,929 | | | $ | 29,130 | | | $ | 38,808 | | | $ | 164,904 | |
| | | | | | | | | | | | | | | | | | | | | |
Management’s Discussion and Analysis of
Financial Condition and Results of Operations (continued)
Aside from liquidity available from customer deposits or through sales and maturities of securities, the Corporation has alternative sources of funds such as a line of credit and term borrowing capacity from the FHLB and, to a more limited extent, through the sale of loans. At December 31, 2007, the Corporation’s borrowing capacity with the FHLB, net of funds borrowed, was $110.6 million.
Management is not aware of any conditions, including any regulatory recommendations or requirements, that would adversely impact its liquidity or its ability to meet funding needs in the ordinary course of business.
Critical Accounting Policies
The Corporation’s consolidated financial statements are prepared in accordance with accounting principles generally accepted in the United States of America and follow general practices within the industry in which it operates. Application of these principles requires management to make estimates or judgments that affect the amounts reported in the financial statements and accompanying notes. These estimates are based on information available as of the date of the financial statements; accordingly, as this information changes, the financial statements could reflect different estimates or judgments. Certain policies inherently have a greater reliance on the use of estimates, and as such have a greater possibility of producing results that could be materially different than originally reported. Estimates or judgments are necessary when assets and liabilities are required to be recorded at fair value, when a decline in the value of an asset not carried on the financial statements at fair value warrants an impairment write-down or valuation reserve to be established or when an asset or liability needs to be recorded contingent upon a future event. Carrying assets and liabilities at fair value inherently results in more financial statement volatility. The fair values and the information used to record valuation adjustments for certain assets and liabilities are based either on quoted market prices or are provided by third-party sources, when available. When third-party information is not available, valuation adjustments are estimated in good faith by management primarily though the use of internal cash flow modeling techniques.
The most significant accounting policies followed by the Corporation are presented in Note 1 to the consolidated financial statements. These policies, along with the disclosures presented in the other financial statement notes provide information on how significant assets and liabilities are valued in the financial statements and how those values are determined. Management views critical accounting policies to be those which are highly dependent on subjective or complex judgments, estimates and assumptions and where changes in those estimates and assumptions could have a significant impact on the financial statements. Management has identified the following as a critical accounting policy.
Allowance for loan losses. The Corporation considers that the determination of the allowance for loan losses involves a higher degree of judgment and complexity than its other significant accounting policies. The balance in the allowance for loan losses is determined based on management’s review and evaluation of the loan portfolio in relation to past loss experience, the size and composition of the portfolio, current economic events and conditions and other pertinent factors, including management’s assumptions as to future delinquencies, recoveries and losses. All of these factors may be susceptible to significant change. Among the many factors affecting the allowance for loan losses, some are quantitative while others require qualitative judgment. Although management believes its process for determining the allowance adequately considers all of the potential factors that could potentially result in credit losses, the process includes subjective elements and may be susceptible to significant change. To the extent actual outcomes differ from management’s estimates, additional provisions for loan losses may be required that would adversely impact the Corporation’s financial condition or earnings in future periods.
Management’s Discussion and Analysis of
Financial Condition and Results of Operations (continued)
Recent Accounting and Regulatory Pronouncements
In September 2006, the Financial Accounting Standards Board (FASB) issued Statement of Financial Accounting Standards (SFAS) No. 157, Fair Value Measurements (SFAS 157), which defines fair value, establishes a framework for measuring fair value under generally accepted accounting principles (GAAP), and expands disclosures about fair value measurements. SFAS 157 applies to other accounting pronouncements that require or permit fair value measurements. The new guidance is effective for financial statements issued for fiscal years beginning after November 15, 2007, and for interim periods within those fiscal years. The Corporation is currently evaluating the potential impact, if any, of the adoption of SFAS 157 on its consolidated financial statements.
In December 2007, the FASB issued proposed FASB Staff Position (FSP) 157-b, Effective Date of FASB Statement No. 157 (FSP 157-b), that would permit a one-year deferral in applying the measurement provisions of SFAS 157 to non-financial assets and non-financial liabilities (non-financial items) that are not recognized or disclosed at fair value in an entity’s financial statements on a recurring basis (at least annually). Therefore, if the change in fair value of a non-financial item is not required to be recognized or disclosed in the financial statements on an annual basis or more frequently, the effective date of application of SFAS 157 to that item is deferred until fiscal years beginning after November 15, 2008 and interim periods within those fiscal years. This deferral does not apply, however, to an entity that applies SFAS 157 in interim or annual financial statements before proposed FSP 157-b is finalized. The Corporation is currently evaluating the potential impact, if any, of the adoption of FSP 157-b on its consolidated financial statements.
In September 2006, FASB’s Emerging Issues Task Force (EITF) issued EITF Issue No. 06-4, Accounting for Deferred Compensation and Postretirement Benefit Aspects of Endorsement Split Dollar Life Insurance Arrangements (EITF 06-4). EITF 06-4 requires the recognition of a liability related to the postretirement benefits covered by an endorsement split-dollar life insurance arrangement. The consensus highlights that the employer (who is also the policyholder) has a liability for the benefit it is providing to its employee. As such, if the policyholder has agreed to maintain the insurance policy in force for the employee’s benefit during his or her retirement, then the liability recognized during the employee’s active service period should be based on the future cost of insurance to be incurred during the employee’s retirement. Alternatively, if the policy holder has agreed to provide the employee with a death benefit, then the liability for the future death benefit should be recognized by following the guidance in SFAS 106 or Accounting Principles Board (APB) Opinion No. 12, as appropriate. For transition, an entity can choose to apply the guidance using either of the following approaches: (a) a change in accounting principle through retrospective application to all periods presented or (b) a change in accounting principle through a cumulative-effect adjustment to the balance in retained earnings at the beginning of the year of adoption. The EITF is effective in fiscal years beginning after December 15, 2007, with early adoption permitted. The Corporation does not expect the implementation of EITF 06-4 to have a material impact on its consolidated financial statements.
In September 2006, FASB’s EITF issued EITF Issue No. 06-5, Accounting for Purchases of Life Insurance – Determining the Amount That Could Be Realized in Accordance with FASB Technical Bulletin No. 85-4, Accounting for Purchases of Life Insurance (EITF 06-5). The scope of EITF 06-5 consists of six separate issues relating to accounting for life insurance policies purchased by entities protecting against the loss of key persons. The six issues are clarifications of previously issued guidance on FASB Technical Bulletin No. 85-4. EITF 06-5 is effective for fiscal years beginning after December 15, 2006. The implementation of EITF 06-5 had no effect on the Corporation’s consolidated financial statements.
Management’s Discussion and Analysis of
Financial Condition and Results of Operations (continued)
In February 2007, the FASB issued SFAS No. 159, The Fair Value Option for Financial Assets and Financial Liabilities – Including an amendment of FASB Statement No. 115 (SFAS 159). SFAS 159 permits entities to choose to measure many financial instruments and certain other items at fair value. Unrealized gains and losses on items for which the fair value option has been elected will be recognized in earnings at each subsequent reporting date. SFAS 159 is effective for the Corporation January 1, 2008. The Corporation is evaluating the impact that the adoption of SFAS 159 will have on its consolidated financial statements.
In November 2007, the Securities and Exchange Commission (SEC) issued Staff Accounting Bulletin No. (SAB) 109, Written Loan Commitments Recorded at Fair Value Through Earnings (SAB 109). SAB 109 expresses the views of the staff regarding written loan commitments that are accounted for at fair value through earnings under generally accepted accounting principles. To make the staff’s views consistent with current authoritative accounting guidance, SAB 109 revises and rescinds portions of SAB No. 105, Application of Accounting Principles to Loan Commitments. Specifically, SAB 109 revises the SEC staff’s views on incorporating expected net future cash flows related to loan servicing activities in the fair value measurement of a written loan commitment. SAB 109 retains the staff’s views on incorporating expected net future cash flows related to internally-developed intangible assets in the fair value measurement of a written loan commitment. The staff expects registrants to apply the views in Question 1 of SAB 109 on a prospective basis to derivative loan commitments issued or modified in fiscal quarters beginning after December 15, 2007. The Corporation does not expect SAB 109 to have a material impact on its consolidated financial statements.
In December 2007, the FASB issued SFAS No. 141(R), Business Combinations (SFAS 141R). SFAS 141R establishes principles and requirements for how the acquirer of a business recognizes and measures in its financial statements the identifiable assets acquired, the liabilities assumed, and any noncontrolling interest in the acquiree. SFAS 141R also provides guidance for recognizing and measuring the goodwill acquired in the business combination and determines what information to disclose to enable users of the financial statements to evaluate the nature and financial effects of the business combination. The guidance will become effective for fiscal years beginning after December 15, 2008. This new pronouncement will impact the Corporation’s accounting for business combinations completed beginning January 1, 2009.
In December 2007, the FASB issued SFAS No. 160, Noncontrolling Interest in Consolidated Financial Statements – An Amendment of ARB No. 51 (SFAS 160). SFAS 160 establishes accounting and reporting standards for the noncontrolling interest in a subsidiary and for the deconsolidation of a subsidiary. The guidance will become effective for fiscal years beginning after December 15, 2008. The Corporation believes that this new pronouncement will have an immaterial impact on its consolidated financial statements.
In December 2007, the SEC issued SAB No. 110 (SAB 110) to amend and replace Question 6 of Section D.2 of Topic 14, Share-Based Payment, of the SAB series. Question 6 of Section D.2 Topic 14 expresses the views of the staff regarding the use of the “simplified” method for share option grants prior to December 31, 2007. SAB 110 allows public companies which do not have historically sufficient experience to provide a reasonable estimate to continue use of the “simplified” method for estimating the expected term of “plain vanilla” share option grants after December 31, 2007. SAB 110 is effective January 1, 2008.
Management’s Discussion and Analysis of
Financial Condition and Results of Operations (continued)
Forward Looking Statements
Discussions of certain matters in this Annual Report and other related year end documents may constitute forward-looking statements within the meaning of Section 27A of the Securities Act of 1933, as amended, and Section 21E of the Securities Exchange Act of 1934, as amended (the “Exchange Act”), and as such, may involve risks and uncertainties. These forward-looking statements relate to, among other things, expectations of the business environment in which the Corporation operates, projections of future performance and potential future credit experience. The Corporation’s actual results, performance and achievements may differ materially from the results, performance and achievements expressed or implied in such forward-looking statements due to a wide range of factors. These factors include, but are not limited to, changes in interest rates, general economic conditions, the local economy, accounting principles or guidelines, legislative and regulatory changes, government monetary and fiscal policies, real estate markets, financial services industry competition, attracting and retaining key personnel, regulatory actions and other risks detailed in the Corporation’s reports filed with the SEC from time to time. These factors should be considered in evaluating the forward-looking statements, and undue reliance should not be placed on such statements. The Corporation does not undertake, and specifically disclaims any obligation, to update any forward-looking statements to reflect occurrences or unanticipated events or circumstances after the date of such statements.
(Dollar amounts in thousands, except share data)
| | | December 31, | |
| | | 2007 | | | 2006 | |
| Assets | | | | | | |
| Cash and due from banks | | $ | 10,288 | | | $ | 7,540 | |
| Interest earning deposits with banks | | | 195 | | | | 9,177 | |
| Total cash and cash equivalents | | | 10,483 | | | | 16,717 | |
| Securities available for sale, at fair value | | | 51,919 | | | | 51,774 | |
| Loans receivable, net of allowance for loan losses of $2,157 and $2,035 | | | 229,819 | | | | 213,344 | |
| Federal bank stocks, at cost | | | 2,662 | | | | 2,217 | |
| Bank-owned life insurance | | | 4,987 | | | | 4,794 | |
| Accrued interest receivable | | | 1,365 | | | | 1,374 | |
| Premises and equipment, net | | | 7,904 | | | | 7,958 | |
| Goodwill | | | 1,422 | | | | 1,422 | |
| Prepaid expenses and other assets | | | 1,159 | | | | 960 | |
| Total Assets | | $ | 311,720 | | | $ | 300,560 | |
| | | | | | | | | |
| Liabilities and Stockholders' Equity | | | | | | | | |
| Liabilities | | | | | | | | |
| Deposits: | | | | | | | | |
| Non-interest bearing | | $ | 47,111 | | | $ | 44,045 | |
| Interest bearing | | | 197,151 | | | | 200,447 | |
| Total deposits | | | 244,262 | | | | 244,492 | |
| Borrowed funds: | | | | | | | | |
| Short-term | | | 5,400 | | | | - | |
| Long-term | | | 35,000 | | | | 30,000 | |
| Total borrowed funds | | | 40,400 | | | | 30,000 | |
| Accrued interest payable | | | 771 | | | | 825 | |
| Accrued expenses and other liabilities | | | 1,584 | | | | 1,326 | |
| Total Liabilities | | | 287,017 | | | | 276,643 | |
| Stockholders' Equity | | | | | | | | |
| Preferred stock, $1.00 par value, 3,000,000 shares authorized; none issued | | | - | | | | - | |
| Common stock, $1.25 par value, 12,000,000 shares authorized; | | | | | | | | |
| 1,395,852 shares issued, 1,267,835 shares outstanding | | | 1,745 | | | | 1,745 | |
| Additional paid-in capital | | | 10,902 | | | | 10,871 | |
| Treasury stock, at cost; 128,017 shares | | | (2,653 | ) | | | (2,653 | ) |
| Retained earnings | | | 15,114 | | | | 14,370 | |
| Accumulated other comprehensive loss | | | (405 | ) | | | (416 | ) |
| Total Stockholders' Equity | | | 24,703 | | | | 23,917 | |
| Total Liabilities and Stockholders' Equity | | $ | 311,720 | | | $ | 300,560 | |
See accompanying notes to consolidated financial statements.
Consolidated Statements of Income
(Dollar amounts in thousands, except share data)
| | | | | | | | | | |
| | | Year ended December 31, | |
| | | 2007 | | | 2006 | | | 2005 | |
| Interest and dividend income | | | | | | | | | |
| Loans receivable, including fees | | $ | 15,287 | | | $ | 13,856 | | | $ | 12,325 | |
| Securities: | | | | | | | | | | | | |
| Taxable | | | 1,571 | | | | 1,481 | | | | 1,714 | |
| Exempt from federal income tax | | | 687 | | | | 699 | | | | 699 | |
| Federal bank stocks | | | 144 | | | | 94 | | | | 58 | |
| Deposits with banks | | | 166 | | | | 129 | | | | 81 | |
| Total interest and dividend income | | | 17,855 | | | | 16,259 | | | | 14,877 | |
| Interest expense | | | | | | | | | | | | |
| Deposits | | | 6,440 | | | | 5,967 | | | | 4,894 | |
| Short-term borrowed funds | | | 33 | | | | 53 | | | | 50 | |
| Long-term borrowed funds | | | 1,413 | | | | 948 | | | | 629 | |
| Total interest expense | | | 7,886 | | | | 6,968 | | | | 5,573 | |
| Net interest income | | | 9,969 | | | | 9,291 | | | | 9,304 | |
| Provision for loan losses | | | 256 | | | | 358 | | | | 205 | |
| Net interest income after provision for loan losses | | | 9,713 | | | | 8,933 | | | | 9,099 | |
| Noninterest income | | | | | | | | | | | | |
| Fees and service charges | | | 1,549 | | | | 1,484 | | | | 1,420 | |
| Commissions on financial services | | | 448 | | | | 408 | | | | 437 | |
| Net gain on sales of loans | | | 33 | | | | 58 | | | | 5 | |
| Net gain on available for sale securities | | | 207 | | | | 400 | | | | 857 | |
| Earnings on bank-owned life insurance | | | 219 | | | | 195 | | | | 191 | |
| Other | | | 487 | | | | 389 | | | | 407 | |
| Total noninterest income | | | 2,943 | | | | 2,934 | | | | 3,317 | |
| Noninterest expense | | | | | | | | | | | | |
| Compensation and employee benefits | | | 5,090 | | | | 5,632 | | | | 5,107 | |
| Premises and equipment | | | 1,589 | | | | 1,637 | | | | 1,611 | |
| Intangible amortization expense | | | - | | | | 7 | | | | 31 | |
| Other | | | 2,485 | | | | 2,133 | | | | 2,397 | |
| Total noninterest expense | | | 9,164 | | | | 9,409 | | | | 9,146 | |
| Income before provision for income taxes | | | 3,492 | | | | 2,458 | | | | 3,270 | |
| Provision for income taxes | | | 795 | | | | 492 | | | | 697 | |
| Net income | | $ | 2,697 | | | $ | 1,966 | | | $ | 2,573 | |
| | | | | | | | | | | | | |
| Earnings per share | | | | | | | | | | | | |
| Basic | | $ | 2.13 | | | $ | 1.55 | | | $ | 2.03 | |
| Diluted | | $ | 2.13 | | | $ | 1.55 | | | $ | 2.03 | |
See accompanying notes to consolidated financial statements.
Consolidated Statements of Changes in Stockholders' Equity
(Dollar amounts in thousands, except share data)
| | | | | | | | | | | | | | | Accumulated | | | | |
| | | | | | Additional | | | | | | | | | Other | | | Total | |
| | | Common | | | Paid-in | | | Treasury | | | Retained | | | Comprehensive | | | Stockholders' | |
| | | Stock | | | Capital | | | Stock | | | Earnings | | | Income (Loss) | | | Equity | |
| Balance at January 1, 2005 | | $ | 1,745 | | | $ | 10,871 | | | $ | (2,653 | ) | | $ | 12,398 | | | $ | 1,255 | | | $ | 23,616 | |
| Comprehensive income: | | | | | | | | | | | | | | | | | | | | | | | | |
| Net income | | | | | | | | | | | | | | | 2,573 | | | | | | | | 2,573 | |
| Change in net unrealized gains (losses) on | | | | | | | | | | | | | | | | | | | | | |
| securities available for sale, net of | | | | | | | | | | | | | | | | | | | | | | | | |
| taxes of ($660) | | | | | | | | | | | | | | | | | | | (1,281 | ) | | | (1,281 | ) |
| Comprehensive income | | | | | | | | | | | | | | | | | | | | | | | 1,292 | |
| Dividends declared, $1.02 per share | | | | | | | | | | | | | | | (1,293 | ) | | | | | | | (1,293 | ) |
| Balance at December 31, 2005 | | | 1,745 | | | | 10,871 | | | | (2,653 | ) | | | 13,678 | | | | (26 | ) | | | 23,615 | |
| Cumulative effect of adjustments resulting | | | | | | | | | | | | | | | | | | | | | |
| from the adoption of SAB No. 108 | | | | | | | | | | | | | | | 120 | | | | | | | | 120 | |
| Adjusted balance at December 31, 2005 | | | 1,745 | | | | 10,871 | | | | (2,653 | ) | | | 13,798 | | | | (26 | ) | | | 23,735 | |
| Comprehensive income: | | | | | | | | | | | | | | | | | | | | | | | | |
| Net income | | | | | | | | | | | | | | | 1,966 | | | | | | | | 1,966 | |
| Change in net unrealized losses on | | | | | | | | | | | | | | | | | | | | | | | | |
| securities available for sale, net of | | | | | | | | | | | | | | | | | | | | | | | | |
| taxes of ($14) | | | | | | | | | | | | | | | | | | | (30 | ) | | | (30 | ) |
| Comprehensive income | | | | | | | | | | | | | | | | | | | | | | | 1,936 | |
| Adjustment to initially apply SFAS | | | | | | | | | | | | | | | | | | | | | | | | |
| No. 158, net of taxes of ($185) | | | | | | | | | | | | | | | | | | | (360 | ) | | | (360 | ) |
| Dividends declared, $1.10 per share | | | | | | | | | | | | | | | (1,394 | ) | | | | | | | (1,394 | ) |
| Balance at December 31, 2006 | | | 1,745 | | | | 10,871 | | | | (2,653 | ) | | | 14,370 | | | | (416 | ) | | | 23,917 | |
| Comprehensive income: | | | | | | | | | | | | | | | | | | | | | | | | |
| Net income | | | | | | | | | | | | | | | 2,697 | | | | | | | | 2,697 | |
| Change in net unrealized losses on | | | | | | | | | | | | | | | | | | | | | | | | |
| securities available for sale, net of | | | | | | | | | | | | | | | | | | | | | | | | |
| taxes of ($22) | | | | | | | | | | | | | | | | | | | (43 | ) | | | (43 | ) |
| Change in funded status of defined | | | | | | | | | | | | | | | | | | | | | | | | |
| benefit plan, net of taxes of $27 | | | | | | | | | | | | | | | | | | | 54 | | | | 54 | |
| Comprehensive income | | | | | | | | | | | | | | | | | | | | | | | 2,708 | |
| Stock compensation expense, net of taxes of $16 | | | | 31 | | | | | | | | | | | | | | | | 31 | |
| Dividends declared, $1.54 per share | | | | | | | | | | | | | | | (1,953 | ) | | | | | | | (1,953 | ) |
| Balance at December 31, 2007 | | $ | 1,745 | | | $ | 10,902 | | | $ | (2,653 | ) | | $ | 15,114 | | | $ | (405 | ) | | $ | 24,703 | |
See accompanying notes to consolidated financial statements.
Consolidated Statements of Cash Flows
(Dollar amounts in thousands)
| | | | | | | | | | |
| | | Year ended December 31, | |
| | | 2007 | | | 2006 | | | 2005 | |
| Cash flows from operating activities | | | | | | | | | |
| Net income | | $ | 2,697 | | | $ | 1,966 | | | $ | 2,573 | |
| Adjustments to reconcile net income to net cash provided by operating activities: | |
| Depreciation and amortization of premises and equipment | | | 663 | | | | 849 | | | | 855 | |
| Provision for loan losses | | | 256 | | | | 358 | | | | 205 | |
| Amortization of premiums and accretion of discounts, net | | | 7 | | | | 32 | | | | 94 | |
| Amortization of intangible assets and mortgage servicing rights | | | 17 | | | | 14 | | | | 37 | |
| Realized gain on sales of available for sale securities, net | | | (207 | ) | | | (400 | ) | | | (857 | ) |
| Net gains on sales of loans | | | (33 | ) | | | (58 | ) | | | (5 | ) |
| Originations of loans sold | | | (1,737 | ) | | | (4,008 | ) | | | - | |
| Proceeds from the sale of loans | | | 1,756 | | | | 3,998 | | | | - | |
| Stock compensation expense | | | 31 | | | | - | | | | - | |
| Proceeds from the sale of loans held for sale | | | - | | | | - | | | | 546 | |
| Earnings on bank-owned life insurance, net | | | (193 | ) | | | (171 | ) | | | (175 | ) |
| (Increase) decrease in accrued interest receivable | | | 9 | | | | (103 | ) | | | (68 | ) |
| (Increase) decrease in deferred taxes | | | 156 | | | | 47 | | | | (506 | ) |
| (Increase) decrease in prepaid expenses and other assets | | | (372 | ) | | | (131 | ) | | | 1,078 | |
| Increase (decrease) in accrued interest payable | | | (54 | ) | | | 218 | | | | 30 | |
| Increase (decrease) in accrued expenses and other liabilities | | | 334 | | | | 35 | | | | (176 | ) |
| Net cash provided by operating activities | | | 3,330 | | | | 2,646 | | | | 3,631 | |
| Cash flows from investing activities | | | | | | | | | | | | |
| Loan originations and principal collections, net | | | (16,727 | ) | | | (21,139 | ) | | | (13,286 | ) |
| Available for sale securities: | | | | | | | | | | | | |
| Sales | | | 1,472 | | | | 1,089 | | | | 1,646 | |
| Maturities, repayments and calls | | | 17,006 | | | | 5,848 | | | | 8,809 | |
| Purchases | | | (18,478 | ) | | | (2,076 | ) | | | (4,552 | ) |
| Held to maturity securities: | | | | | | | | | | | | |
| Sales | | | - | | | | 14 | | | | - | |
| Maturities, repayments and calls | | | - | | | | 1 | | | | 1 | |
| Purchase of federal bank stocks | | | (445 | ) | | | (444 | ) | | | (42 | ) |
| Purchases of premises and equipment | | | (609 | ) | | | (2,684 | ) | | | (1,300 | ) |
| Net cash used in investing activities | | | (17,781 | ) | | | (19,391 | ) | | | (8,724 | ) |
| Cash flows from financing activities | | | | | | | | | | | | |
| Net increase (decrease) in deposits | | | (230 | ) | | | 13,989 | | | | (2,371 | ) |
| Proceeds from issuance of long-term debt | | | 5,000 | | | | 15,000 | | | | - | |
| Net change in short-term borrowings | | | 5,400 | | | | (4,500 | ) | | | 4,500 | |
| Dividends paid on common stock | | | (1,953 | ) | | | (1,394 | ) | | | (1,293 | ) |
| Net cash provided by financing activities | | | 8,217 | | | | 23,095 | | | | 836 | |
| Net increase (decrease) in cash and cash equivalents | | | (6,234 | ) | | | 6,350 | | | | (4,257 | ) |
| Cash and cash equivalents at beginning of period | | | 16,717 | | | | 10,367 | | | | 14,624 | |
| Cash and cash equivalents at end of period | | $ | 10,483 | | | $ | 16,717 | | | $ | 10,367 | |
| | | | | | | | | | | | | |
| Supplemental information: | | | | | | | | | | | | |
| Interest paid | | $ | 7,940 | | | $ | 6,750 | | | $ | 5,543 | |
| Income taxes paid | | | 626 | | | | 686 | | | | 442 | |
| | | | | | | | | | | | | |
| Supplemental noncash disclosures: | | | | | | | | | | | | |
| Transfers from loans to foreclosed real estate | | | 253 | | | | 50 | | | | 106 | |
See accompanying notes to consolidated financial statements.
| 1. | Summary of Significant Accounting Policies |
Basis of Presentation and Consolidation. The consolidated financial statements include the accounts of Emclaire Financial Corp. (the Corporation) and its wholly owned subsidiary, the Farmers National Bank of Emlenton (the Bank). All significant intercompany balances and transactions have been eliminated in consolidation.
Nature of Operations. The Corporation provides a variety of financial services to individuals and businesses through its offices in Western Pennsylvania. Its primary deposit products are checking, savings and term certificate accounts and its primary lending products are residential and commercial mortgages, commercial business loans and consumer loans.
Use of Estimates and Classifications. In preparing consolidated financial statements in conformity with accounting principles generally accepted in the United States of America, management is required to make estimates and assumptions that affect the reported amounts of assets and liabilities as of the date of the balance sheet and reported amounts of revenues and expenses during the reporting period. Actual results could differ from those estimates. Material estimates that are particularly susceptible to significant change in the near term relate to the determination of the allowance for loan losses, fair value of financial instruments and the valuation of deferred tax assets. Certain amounts previously reported may have been reclassified to conform to the current year financial statement presentation. Such reclassifications did not affect net income or stockholders’ equity.
Significant Group Concentrations of Credit Risk. Most of the Corporation’s activities are with customers located within the Western Pennsylvania region of the country. Note 2 discusses the type of securities that the Corporation invests in. Note 3 discusses the types of lending the Corporation engages in. The Corporation does not have any significant concentrations to any one industry or customer.
Cash Equivalents. For purposes of the consolidated statements of cash flows, cash and cash equivalents include cash on hand, cash items, interest-earning deposits with other financial institutions and federal funds sold and due from correspondent banks. Interest-earning deposits mature within one year and are carried at cost. Federal funds are generally sold or purchased for one day periods. Net cash flows are reported for loan and deposit transactions.
Restrictions on Cash. Cash on hand or on deposit with the Federal Reserve Bank of approximately $60,000 and $1.1 million were required to meet regulatory reserve and clearing requirements at December 31, 2007 and 2006, respectively. Such balances do not earn interest.
Securities. Securities include investments primarily in bonds and notes and are classified as either available for sale or held to maturity at the time of purchase based on management’s intent. Securities for which the Corporation has the positive intent and ability to hold to maturity are classified as held to maturity and are reported at amortized cost. Securities that are not classified as held to maturity, including equity securities with readily determinable fair values, are classified as available for sale and recorded at fair value, with unrealized gains and losses excluded from earnings and reported in accumulated other comprehensive income.
Notes to Consolidated Financial Statements (continued)
| 1. | Summary of Significant Accounting Policies (continued) |
Securities (continued). Purchase premiums and discounts on securities are recognized in interest income using the interest method over the term of the securities. Declines in the fair value of securities below their cost that are deemed other than temporary result in the security being written down to fair value on an individual basis. Any related write-downs are included in operations. Gains and losses on the sale of securities are recorded on the trade date and are determined using the specific identification method and are included in operations in the period sold.
Loans Held for Sale. Loans originated and intended for sale in the secondary market are carried at the lower of cost or estimated fair value in the aggregate. Net unrealized losses, if any, are recognized through a valuation allowance by charges to income. Loans held for sale are generally sold with servicing rights retained. The carrying value of such loans sold is reduced by the cost allocated to the servicing rights. Gains and losses on sales of mortgage loans are based on the difference between the selling price and the carrying value of the related loan sold.
Loans Receivable. The Corporation grants mortgage, commercial and consumer loans to customers. A substantial portion of the loan portfolio is represented by mortgage loans throughout Western Pennsylvania. The ability of the Corporation’s debtors to honor their contracts is dependent upon real estate and general economic conditions in this area.
Loans that management has the intent and ability to hold for the foreseeable future or until maturity or net pay-off generally are reported at their outstanding unpaid principal balances adjusted for charge-offs, the allowance for loan losses, and any deferred fees or costs on originated loans or premiums or discounts on purchased loans. Interest income is accrued on the unpaid principal balance. Loan origination fees, net of certain direct origination costs, and premiums and discounts are deferred and recognized as an adjustment of the related loan yield using the interest method.
The accrual of interest on loans is typically discontinued at the time the loan is 90 days past due unless the credit is well secured and in the process of collection. Loans are placed on nonaccrual or charged-off at an earlier date if collection of principal or interest is considered doubtful. All interest accrued but not collected for loans that are placed on nonaccrual status or charged-off is reversed against interest income. The interest on these loans is accounted for on the cash-basis or cost-recovery method, until qualifying for return to accrual. Loans are returned to accrual status when all principal and interest amounts contractually due are brought current and future payments are reasonably assured.
Allowance for Loan Losses. The allowance for loan losses is established for probable credit losses through a provision for loan losses charged to earnings. Loan losses are charged against the allowance when management believes the uncollectibility of a loan balance is confirmed. Subsequent recoveries, if any, are typically credited to the allowance.
The allowance for loan losses is evaluated on a regular basis by management and is based upon management’s periodic review of the collectibility of loans in light of historic experience, the nature and volume of the loan portfolio, adverse situations that may affect the borrower’s ability to repay, estimated value of any underlying collateral and prevailing economic conditions. This evaluation is inherently subjective as it requires estimates that are susceptible to significant revision as more information becomes available.
Notes to Consolidated Financial Statements (continued)
| 1. | Summary of Significant Accounting Policies (continued) |
Allowance for Loan Losses (continued). The allowance consists of specific, general and unallocated components. The specific component relates to loans that are classified as either doubtful, substandard or special mention. For such loans that are also classified as impaired, an allowance is established when the discounted cash flows (or collateral value or observable market price) of the impaired loan is lower than the carrying value of that loan. The general component covers non-classified loans and is based on historical loss experience adjusted for qualitative factors. An unallocated component is maintained to cover uncertainties that could affect management’s estimate of probable losses. The unallocated component of the allowance reflects the margin of imprecision inherent in the underlying assumptions used in the methodologies for estimating specific and general losses in the portfolio.
A loan is considered impaired when, based on current information and events, it is probable that the Corporation will be unable to collect the scheduled payments of principal or interest when due according to the contractual terms of the loan agreement. Factors considered by management in determining impairment include payment status, collateral value, and the probability of collecting scheduled principal and interest payments when due. Loans that experience insignificant payment delays and payment shortfalls generally are not classified as impaired. Management determines the significance of payment delays and payment shortfalls on a case-by-case basis, taking into consideration all of the circumstances surrounding the loan and the borrower, including the length of the delay, the reasons for the delay, the borrower’s prior payment record, and the amount of the shortfall in relation to the principal and interest owed. Impairment is measured on a loan by loan basis for commercial loans by either the present value of expected future cash flows discounted at the loans effective interest rate, the loan’s obtainable market price, or the fair value of the collateral if the loan is collateral dependent. Large groups of small balance homogeneous loans are collectively evaluated for impairment. Accordingly, the Corporation does not separately identify individual consumer and residential mortgage loans for impairment disclosures, unless such loans are the subject of a restructuring agreement.
Bank-Owned Life Insurance (BOLI). The Bank purchased life insurance policies on certain key officers and employees. BOLI is recorded at its cash surrender value, or the amount that can be realized.
Premises and Equipment. Land is carried at cost. Premises, furniture and equipment, and leasehold improvements are carried at cost less accumulated depreciation or amortization. Depreciation is calculated on a straight-line basis over the estimated useful lives of the related assets, which are twenty-five to fifty years for buildings and three to ten years for furniture and equipment. Amortization of leasehold improvements is computed using the straight-line method over the shorter of their estimated useful life or the expected term of the leases. Expected terms include lease option periods to the extent that the exercise of such option is reasonably assured. Premises and equipment are reviewed for impairment when events indicate their carrying amount may not be recoverable from future undiscounted cash flows. If impaired, assets are recorded at fair value.
Goodwill and Intangible Assets. Goodwill results from business acquisitions and represents the excess of the purchase price over the fair value of acquired assets and liabilities. Core deposit intangible assets arise from whole bank or branch acquisitions and are measured at fair value and then are amortized on a straight-line basis over their estimated lives, generally less than 10 years. Customer relationship intangible assets arise from the purchase of a customer list from another company or individual and then are amortized on a straight-line basis over two years. Goodwill is not amortized and is assessed at least annually for impairment and any such impairment will be recognized in the period identified.
Notes to Consolidated Financial Statements (continued)
| 1. | Summary of Significant Accounting Policies (continued) |
Servicing Assets. Servicing assets represent the allocated value of retained servicing rights on loans sold. Servicing assets are expensed in proportion to, and over the period of, estimated net servicing revenues. Impairment is evaluated based on the fair value of the assets, using groupings of the underlying loans as to interest rates. Fair value is determined using prices for similar assets with similar characteristics, when available, or based upon discounted cash flows using market-based assumptions. Any impairment of a grouping is reported as a valuation allowance, to the extent that fair value is less than the capitalized amount for a grouping.
Real Estate Acquired Through Foreclosure. Real estate properties acquired through foreclosure are initially recorded at fair value less cost to sell at the date of foreclosure, establishing a new cost basis. After foreclosure, valuations are periodically performed by management and the real estate is carried at the lower of carrying amount or fair value less cost to sell. Revenue and expenses from operations of the properties, gains and losses on sales and additions to the valuation allowance are included in operating results. Real estate acquired through foreclosure is classified in prepaid expenses and other assets and totaled $129,000 and $98,000 at December 31, 2007 and 2006, respectively.
Treasury Stock. Common stock purchased for treasury is recorded at cost. At the date of subsequent reissue, the treasury stock account is reduced by the cost of such stock on the first-in, first-out basis.
Income Taxes. Deferred income tax assets and liabilities are determined using the liability (or balance sheet) method. Under this method, the net deferred tax asset or liability is determined based on the tax effects of the temporary differences between the book and tax basis of the various balance sheet assets and liabilities and gives current recognition to changes in tax rate and laws.
Earnings Per Common Share. Basic earnings per common share (EPS) excludes dilution and is computed by dividing net income by the weighted average number of common shares outstanding during the period. Diluted EPS reflects the potential dilution that could occur if securities or contracts to issue common stock were exercised or converted into common stock or resulted in the issuance of common stock that then shared in the earnings of the Corporation. Options on 84,000 shares of common stock were included in computing diluted earnings per share because their effects were dilutive.
Comprehensive Income. Comprehensive income includes net income from operating results and the net change in accumulated other comprehensive income. Accumulated other comprehensive income is comprised of unrealized holding gains and losses on securities available for sale and the over funded or under funded status of pension and other postretirement benefit plans on the balance sheet. The effects of other comprehensive income are presented as part of the statement of changes in stockholders’ equity.
Operating Segments. Operations are managed and financial performance is evaluated on a corporate-wide basis. Accordingly, all financial services operations are considered by management to be aggregated in one reportable operating segment.
Retirement Plans. The Corporation maintains a noncontributory defined benefit plan covering substantially all employees and officers. The plan calls for benefits to be paid to eligible employees at retirement based primarily on years of service and compensation rates near retirement. The Corporation also maintains a 401(k) plan, which covers substantially all employees and a supplemental executive retirement plan for key executive officers.
Notes to Consolidated Financial Statements (continued)
| 1. | Summary of Significant Accounting Policies (continued) |
Stock Compensation Plans. In December 2004, the Financial Accounting Standards Board (FASB) issued Statement of Financial Accounting Standards (SFAS) No. 123 (revised 2004), Share-Based Payments (SFAS 123(R)). SFAS 123(R) requires that the compensation cost relating to share-based payment transactions be recognized in financial statements. That cost will be measured based on the fair value of the equity or liability instruments issued. SFAS 123(R) covers a wide range of share-based compensation arrangements including stock options, restricted share plans, performance-based awards, share appreciation rights and employee share purchase plans. SFAS 123(R) is a replacement of SFAS 123, Accounting for Stock-Based Compensation, and supersedes Accounting Principles Board (APB) Opinion No. 25, Accounting for Stock Issued to Employees, and its related interpretive guidance. The effect of the statement requires entities to measure the cost of employee services received in exchange for the stock options based on the grant-date fair value of the award, and to recognize the cost over the period the employee is required to provide services for the award. SFAS 123(R) permits entities to use any option-pricing model that meets the fair value objective in the statement. Effective January 1, 2007, the Corporation adopted SFAS 123(R).
Transfers of Financial Assets. Transfers of financial assets are accounted for as sales, when control over the assets has been surrendered. Control over transferred assets is deemed to be surrendered when (1) the assets have been isolated from the Corporation, (2) the transferee obtains the right (free of conditions that constrain it from taking advantage of that right) to pledge or exchange the transferred assets, and (3) the Corporation does not maintain effective control over the transferred assets through an agreement to repurchase them before their maturity.
Advertising. Advertising costs are expensed as incurred.
Off-Balance Sheet Financial Instruments. In the ordinary course of business, the Corporation has entered into off-balance sheet financial instruments, consisting of commitments to extend credit, commitments under line of credit lending arrangements and letters of credit. Such financial instruments are recorded in the financial statements when they are funded or related fees are received.
| | Fair Value of Financial Instruments. Fair values of financial instruments are estimated using relevant market information and other assumptions, as more fully disclosed in a separate note. Fair value estimates involve uncertainties and matters of significant judgment regarding interest rates, credit risk, prepayments, and other factors, especially in the absence of broad markets for particular items. Changes in assumptions or in market conditions could significantly affect the estimates. |
Recently Adopted Accounting Standards. The Corporation, in accordance with Securities and Exchange Commission Staff Accounting Bulletin No. 108, Considering the Effects of Prior Year Misstatements when Quantifying Misstatements in Current Year Financial Statements (SAB 108), adjusted its beginning retained earnings for fiscal 2006 in the accompanying consolidated balance sheet. The provisions of SAB 108 were effective for the Corporation for its December 31, 2006 year end. See Note 12 for additional information on the adoption of SAB 108.
The Corporation adopted Financial Accounting Standard Interpretation (FIN) No. 48, Accounting for Uncertainty in Income Taxes, (FIN 48), effective January 1, 2007. The adoption had no impact on the Corporation’s consolidated financial statements. At January 1, 2007 and December 31, 2007, the Corporation had no FIN 48 unrecognized tax benefits recorded.
Notes to Consolidated Financial Statements (continued)
| 1. | Summary of Significant Accounting Policies (continued) |
Recently Adopted Accounting Standards (continued). The Corporation adopted Statement of Financial Accounting Standards (SFAS) No. 158, Employers’ Accounting for Defined Benefit Pension and Other Postretirement Plans – an amendment of FASB Statements No. 87, 88, 106 and 132(R), (SFAS 158), effective December 31, 2006. The adoption of SFAS 158 resulted in the Corporation recording an additional accrued pension liability of $545,000 and a charge of $360,000, net of taxes, to accumulated other comprehensive income at December 31, 2006. As of December 31, 2007, the Corporation’s liability under SFAS was $465,000 and the charge to accumulated other comprehensive income was $306,000, net of taxes. See Note 13 for additional information on the adoptions of SFAS 158.
The Corporation adopted SFAS 123(R), Share-Based Payment, which requires that compensation cost related to share-based payment transactions be recognized in the financial statements with measurement based upon the fair value of the equity or liability instruments issued. For the year ended December 31, 2007, the Corporation recognized $31,000, net of taxes, in compensation expense for stock options.
Recent Accounting and Regulatory Pronouncements. In September 2006, the Financial Accounting Standards Board (FASB) issued Statement of Financial Accounting Standards (SFAS) No. 157, Fair Value Measurements (SFAS 157), which defines fair value, establishes a framework for measuring fair value under generally accepted accounting principles (GAAP), and expands disclosures about fair value measurements. SFAS 157 applies to other accounting pronouncements that require or permit fair value measurements. The new guidance is effective for financial statements issued for fiscal years beginning after November 15, 2007, and for interim periods within those fiscal years. The Corporation is currently evaluating the potential impact, if any, of the adoption of SFAS 157 on its consolidated financial statements.
In December 2007, the FASB issued proposed FASB Staff Position (FSP) 157-b, Effective Date of FASB Statement No. 157 (FSP 157-b), that would permit a one-year deferral in applying the measurement provisions of SFAS 157 to non-financial assets and non-financial liabilities (non-financial items) that are not recognized or disclosed at fair value in an entity’s financial statements on a recurring basis (at least annually). Therefore, if the change in fair value of a non-financial item is not required to be recognized or disclosed in the financial statements on an annual basis or more frequently, the effective date of application of SFAS 157 to that item is deferred until fiscal years beginning after November 15, 2008 and interim periods within those fiscal years. This deferral does not apply, however, to an entity that applies SFAS 157 in interim or annual financial statements before proposed FSP 157-b is finalized. The Corporation is currently evaluating the potential impact, if any, of the adoption of FSP 157-b on its consolidated financial statements.
Notes to Consolidated Financial Statements (continued)
| 1. | Summary of Significant Accounting Policies (continued) |
Recent Accounting and Regulatory Pronouncements (continued). In September 2006, FASB’s Emerging Issues Task Force (EITF) issued EITF Issue No. 06-4, Accounting for Deferred Compensation and Postretirement Benefit Aspects of Endorsement Split Dollar Life Insurance Arrangements (EITF 06-4). EITF 06-4 requires the recognition of a liability related to the postretirement benefits covered by an endorsement split-dollar life insurance arrangement. The consensus highlights that the employer (who is also the policyholder) has a liability for the benefit it is providing to its employee. As such, if the policyholder has agreed to maintain the insurance policy in force for the employee’s benefit during his or her retirement, then the liability recognized during the employee’s active service period should be based on the future cost of insurance to be incurred during the employee’s retirement. Alternatively, if the policy holder has agreed to provide the employee with a death benefit, then the liability for the future death benefit should be recognized by following the guidance in SFAS 106 or Accounting Principles Board (APB) Opinion No. 12, as appropriate. For transition, an entity can choose to apply the guidance using either of the following approaches: (a) a change in accounting principle through retrospective application to all periods presented or (b) a change in accounting principle through a cumulative-effect adjustment to the balance in retained earnings at the beginning of the year of adoption. The EITF is effective in fiscal years beginning after December 15, 2007, with early adoption permitted. The Corporation does not expect the implementation of EITF 06-4 to have a material impact on its consolidated financial statements.
In September 2006, FASB’s EITF issued EITF Issue No. 06-5, Accounting for Purchases of Life Insurance – Determining the Amount That Could Be Realized in Accordance with FASB Technical Bulletin No. 85-4, Accounting for Purchases of Life Insurance (EITF 06-5). The scope of EITF 06-5 consists of six separate issues relating to accounting for life insurance policies purchased by entities protecting against the loss of key persons. The six issues are clarifications of previously issued guidance on FASB Technical Bulletin No. 85-4. EITF 06-5 is effective for fiscal years beginning after December 15, 2006. The implementation of EITF 06-5 had no effect on the Corporation’s consolidated financial statements.
In February 2007, the FASB issued SFAS No. 159, The Fair Value Option for Financial Assets and Financial Liabilities – Including an amendment of FASB Statement No. 115 (SFAS 159). SFAS 159 permits entities to choose to measure many financial instruments and certain other items at fair value. Unrealized gains and losses on items for which the fair value option has been elected will be recognized in earnings at each subsequent reporting date. SFAS 159 is effective for the Corporation January 1, 2008. The Corporation is evaluating the impact that the adoption of SFAS 159 will have on its consolidated financial statements.
Notes to Consolidated Financial Statements (continued)
| 1. | Summary of Significant Accounting Policies (continued) |
Recent Accounting and Regulatory Pronouncements (continued). In November 2007, the Securities and Exchange Commission (SEC) issued Staff Accounting Bulletin No. (SAB) 109, Written Loan Commitments Recorded at Fair Value Through Earnings (SAB 109). SAB 109 expresses the views of the staff regarding written loan commitments that are accounted for at fair value through earnings under generally accepted accounting principles. To make the staff’s views consistent with current authoritative accounting guidance, SAB 109 revises and rescinds portions of SAB No. 105, Application of Accounting Principles to Loan Commitments. Specifically, SAB 109 revises the SEC staff’s views on incorporating expected net future cash flows related to loan servicing activities in the fair value measurement of a written loan commitment. SAB 109 retains the staff’s views on incorporating expected net future cash flows related to internally-developed intangible assets in the fair value measurement of a written loan commitment. The staff expects registrants to apply the views in Question 1 of SAB 109 on a prospective basis to derivative loan commitments issued or modified in fiscal quarters beginning after December 15, 2007. The Corporation does not expect SAB 109 to have a material impact on its consolidated financial statements.
In December 2007, the FASB issued SFAS No. 141(R), Business Combinations (SFAS 141R). SFAS 141R establishes principles and requirements for how the acquirer of a business recognizes and measures in its financial statements the identifiable assets acquired, the liabilities assumed, and any noncontrolling interest in the acquiree. SFAS 141R also provides guidance for recognizing and measuring the goodwill acquired in the business combination and determines what information to disclose to enable users of the financial statements to evaluate the nature and financial effects of the business combination. The guidance will become effective for fiscal years beginning after December 15, 2008. This new pronouncement will impact the Corporation’s accounting for business combinations completed beginning January 1, 2009.
In December 2007, the FASB issued SFAS No. 160, Noncontrolling Interest in Consolidated Financial Statements – An Amendment of ARB No. 51 (SFAS 160). SFAS 160 establishes accounting and reporting standards for the noncontrolling interest in a subsidiary and for the deconsolidation of a subsidiary. The guidance will become effective for fiscal years beginning after December 15, 2008. The Corporation believes that this new pronouncement will have an immaterial impact on its consolidated financial statements.
In December 2007, the SEC issued SAB No. 110 (SAB 110) to amend and replace Question 6 of Section D.2 of Topic 14, Share-Based Payment, of the SAB series. Question 6 of Section D.2 Topic 14 expresses the views of the staff regarding the use of the “simplified” method for share option grants prior to December 31, 2007. SAB 110 allows public companies which do not have historically sufficient experience to provide a reasonable estimate to continue use of the “simplified” method for estimating the expected term of “plain vanilla” share option grants after December 31, 2007. SAB 110 is effective January 1, 2008.
Notes to Consolidated Financial Statements (continued)
The following table summarizes the Corporation’s securities as of December 31:
| | | | | | | | | | | | | |
| (Dollar amounts in thousands) | | Amortized | | | Unrealized | | | Unrealized | | | Fair | |
| | | Cost | | | gains | | | losses | | | value | |
| | | | | | | | | | | | | |
| Available for sale: | | | | | | | | | | | | |
| December 31, 2007: | | | | | | | | | | | | |
| U.S. Government agencies and related entities | | $ | 29,356 | | | $ | 37 | | | $ | (59 | ) | | $ | 29,334 | |
| Mortgage-backed securities | | | 1,932 | | | | - | | | | (48 | ) | | | 1,884 | |
| Municipal securities | | | 13,685 | | | | 566 | | | | - | | | | 14,251 | |
| Corporate securities | | | 2,939 | | | | - | | | | - | | | | 2,939 | |
| Equity securities | | | 4,156 | | | | - | | | | (645 | ) | | | 3,511 | |
| | | $ | 52,068 | | | $ | 603 | | | $ | (752 | ) | | $ | 51,919 | |
| December 31, 2006: | | | | | | | | | | | | | | | | |
| U.S. Government agencies and related entities | | $ | 31,354 | | | $ | - | | | $ | (606 | ) | | $ | 30,748 | |
| Mortgage-backed securities | | | 2,434 | | | | - | | | | (95 | ) | | | 2,339 | |
| Municipal securities | | | 14,688 | | | | 574 | | | | - | | | | 15,262 | |
| Corporate securities | | | - | | | | - | | | | - | | | | - | |
| Equity securities | | | 3,382 | | | | 176 | | | | (132 | ) | | | 3,425 | |
| | | $ | 51,858 | | | $ | 750 | | | $ | (833 | ) | | $ | 51,774 | |
| | | | | | | | | | | | | | | | | |
| Sales of available for sale securities were as follows: | | | | | | | |
| | | | | | | | | | |
| (Dollar amounts in thousands) | | 2007 | | | 2006 | | | 2005 | |
| | | | | | | | | | |
| Proceeds | | $ | 1,472 | | | $ | 1,089 | | | $ | 1,646 | |
| Gross gains | | | 207 | | | | 400 | | | | 857 | |
| Tax provision related to gains | | | 70 | | | | 136 | | | | 291 | |
| | | | | | | | | | | | | |
| The following table summarizes scheduled maturities of the Corporation’s securities as of December 31, 2007: | |
| | | | | | | |
| (Dollar amounts in thousands) | | Available for sale | |
| | | Amortized | | | Fair | |
| | | cost | | | value | |
| | | | | | | |
| Due in one year or less | | $ | 13,268 | | | $ | 13,254 | |
| Due after one year through five years | | | 16,053 | | | | 16,019 | |
| Due after five through ten years | | | 3,330 | | | | 3,344 | |
| Due after ten years | | | 15,261 | | | | 15,791 | |
| No scheduled maturity | | | 4,156 | | | | 3,511 | |
| | | $ | 52,068 | | | $ | 51,919 | |
| | | | | | | | | |
Expected maturities may differ from contractual maturities because issuers may have the right to call or prepay obligations with or without call or prepayment penalties.
Notes to Consolidated Financial Statements (continued)
Securities with carrying values of $11.5 million and $12.4 million as of December 31, 2007 and 2006, respectively, were pledged to secure public deposits and for other purposes required or permitted by law.
Information pertaining to securities with gross unrealized losses at December 31, 2007 and 2006 aggregated by investment category and length of time that individual securities have been in a continuous loss position, follows:
| | | | | | | | | | | | | | | | | | | |
| | | | | | | | | | | | | | | | | | | |
| (Dollar amounts in thousands) | | Less than 12 Months | | | 12 Months or More | | | Total | |
| | | Fair | | | Unrealized | | | Fair | | | Unrealized | | | Fair | | | Unrealized | |
| Description of Securities | | Value | | | Loss | | | Value | | | Loss | | | Value | | | Loss | |
| | | | | | | | | | | | | | | | | | | |
| December 31, 2007: | | | | | | | | | | | | | | | | | | |
| U.S. Government agencies and related entities | | $ | - | | | $ | - | | | $ | 20,804 | | | $ | (59 | ) | | $ | 20,804 | | | $ | (59 | ) |
| Mortgage-backed securities | | | - | | | | - | | | | 1,884 | | | | (48 | ) | | | 1,884 | | | | (48 | ) |
| Municipal securities | | | - | | | | - | | | | - | | | | - | | | | - | | | | - | |
| Corporate securities | | | - | | | | - | | | | - | | | | - | | | | - | | | | - | |
| Equity securities | | | 888 | | | | (184 | ) | | | 2,557 | | | | (461 | ) | | | 3,445 | | | | (645 | ) |
| | | $ | 888 | | | $ | (184 | ) | | $ | 25,245 | | | $ | (568 | ) | | $ | 26,133 | | | $ | (752 | ) |
| | | | | | | | | | | | | | | | | | | | | | | | | |
| December 31, 2006: | | | | | | | | | | | | | | | | | | | | | | | | |
| U.S. Government agencies and related entities | | $ | 1,224 | | | $ | (23 | ) | | $ | 29,524 | | | $ | (583 | ) | | $ | 30,748 | | | $ | (606 | ) |
| Mortgage-backed securities | | | - | | | | - | | | | 2,339 | | | | (95 | ) | | | 2,339 | | | | (95 | ) |
| Municipal securities | | | - | | | | - | | | | - | | | | - | | | | - | | | | - | |
| Corporate securities | | | - | | | | - | | | | - | | | | - | | | | - | | | | - | |
| Equity securities | | | 1,262 | | | | (57 | ) | | | 960 | | | | (75 | ) | | | 2,222 | | | | (132 | ) |
| | | $ | 2,486 | | | $ | (80 | ) | | $ | 32,823 | | | $ | (753 | ) | | $ | 35,309 | | | $ | (833 | ) |
| | | | | | | | | | | | | | | | | | | | | | | | | |
| | | | | | | |
Management evaluates securities for other than temporary impairment at least on a quarterly basis, and more frequently when economic or market concerns warrant such evaluation. Consideration is given to (1) the length of time and the extent to which the fair value has been less than cost, (2) the financial condition and near-term prospects of the issuer and (3) the intent and ability of the corporation to retain its investment in the issuer for a period of time sufficient to allow for any anticipated recovery in fair value.
As of December 31, 2007, there were 34 securities in an unrealized loss position. These unrealized losses are considered to be temporary impairments. A decline in the value of the debt securities is due only to interest rate fluctuations, rather then erosion of quality. As a result, the payment of contractual cash flows, including principal repayment, is not at risk. As management has the intent and ability to hold these investments until market recovery or maturity, none of the debt securities are deemed to be other than temporary.
Equity securities owned by the Corporation consist of common stock of various financial services providers that have traditionally been high-performing stocks. As a result of recent market volatility in financial stocks from news of sub-prime lending problems, the fair value of most of the stocks held are “under water” as of December 31, 2007, and as such, could be considered to be impaired. The Corporation does not invest in these securities with the intent to sell them for a profit in the near-term. Management believes these securities have potential to appreciate in value over the long-term, while providing for a reasonable dividend yield. In addition, stocks can be cyclical and will experience some down periods. Historically, bank stocks have sustained cyclical losses followed by periods of substantial gains. Based on these circumstances and the ability and intent to hold these securities for a reasonable period of time sufficient for a recovery of fair value, the Corporation does not consider these investments to be other than temporarily impaired at December 31, 2007.
Notes to Consolidated Financial Statements (continued)
The following table summarizes the Corporation’s loans receivable as of December 31:
| | | | | | | |
| (Dollar amounts in thousands) | | 2007 | | | 2006 | |
| | | | | | | |
| Mortgage loans on real estate: | | | | | | |
| Residential first mortgages | | $ | 65,706 | | | $ | 64,662 | |
| Home equity loans and lines of credit | | | 49,426 | | | | 47,330 | |
| Commercial real estate | | | 71,599 | | | | 61,128 | |
| | | | 186,731 | | | | 173,120 | |
| Other loans: | | | | | | | | |
| Commercial business | | | 35,566 | | | | 34,588 | |
| Consumer | | | 9,679 | | | | 7,671 | |
| | | | 45,245 | | | | 42,259 | |
| | | | | | | | | |
| Total loans, gross | | | 231,976 | | | | 215,379 | |
| | | | | | | | | |
| Less allowance for loan losses | | | 2,157 | | | | 2,035 | |
| | | | | | | | | |
| Total loans, net | | $ | 229,819 | | | $ | 213,344 | |
| | | | | | | | | |
Following is an analysis of the changes in the allowance for loan losses for the years ended December 31:
| | | | | | | | | | |
| (Dollar amounts in thousands) | | 2007 | | | 2006 | | | 2005 | |
| | | | | | | | | | |
| Balance at the beginning of the year | | $ | 2,035 | | | $ | 1,869 | | | $ | 1,810 | |
| | | | | | | | | | | | | |
| Provision for loan losses | | | 256 | | | | 358 | | | | 205 | |
| Charge-offs | | | (164 | ) | | | (221 | ) | | | (197 | ) |
| Recoveries | | | 30 | | | | 29 | | | | 51 | |
| | | | | | | | | | | | | |
| Balance at the end of the year | | $ | 2,157 | | | $ | 2,035 | | | $ | 1,869 | |
| | | | | | | | | | | | | |
Non-performing loans, which include primarily non-accrual loans, were $1.0 million and $1.8 million at December 31, 2007 and 2006, respectively. The Corporation is not committed to lend significant additional funds to debtors whose loans are on non-accrual status. At December 31, 2007 there was no recorded investment in loans considered to be impaired. At December 31, 2006, the recorded investment in loans considered to be impaired, requiring an allowance for loan loss, was $461,000, against which approximately $166,000 of the allowance for loan losses was allocated. Additionally, in 2006, there was one impaired loan for $452,000 that did not require an allowance for loan loss. During 2007, 2006 and 2005, impaired loans averaged $255,000, $946,000 and $1.2 million, respectively. The Corporation recognized interest income on impaired loans of approximately $98,000, $14,000 and $95,000, on a cash basis, during 2007, 2006 and 2005, respectively. Nonperforming loans and impaired loans are defined differently. Some loans may be included in both categories whereas other loans may be included in only one category.
The Corporation is required to maintain qualifying collateral with the FHLB to secure all outstanding loans. Loans with book values of $50.0 million and $52.7 million as of December 31, 2007 and 2006, respectively, are pledged as qualifying collateral. The Corporation is in compliance with all FHLB credit policies at December 31, 2007.
Notes to Consolidated Financial Statements (continued)
| 3. | Loans Receivable (continued) |
The Corporation was servicing residential mortgage loans with unpaid principal balances of $7.7 million and $6.3 million at December 31, 2007 and 2006, respectively, for a third party investor. In addition, the Corporation was servicing commercial loans with unpaid principal balances of $5.3 million and $6.0 million at December 2007 and 2006, respectively, for third party investors. Such loans are not reflected in the consolidated balance sheet and servicing operations result in the generation of annual fee income of approximately 0.25% of the unpaid principal balances of such loans.
| | The Bank is a member of the Federal Home Loan Bank of Pittsburgh (FHLB) and the Federal Reserve Bank of Cleveland (FRB). As a member of these federal banking systems, the Bank maintains an investment in the capital stock of the respective regional banks, at cost. These stocks are purchased and redeemed at par as directed by the federal banks and levels maintained are based primarily on borrowing and other correspondent relationships. The Bank’s investment in FHLB and FRB stocks was $2.3 million and $333,000, respectively, at December 31, 2007, and $1.9 million and $333,000, respectively, at December 31, 2006. |
| | Premises and equipment at December 31 are summarized by major classification as follows: |
| | | | | | | |
| | | | | | | |
| (Dollar amounts in thousands) | | 2007 | | | 2006 | |
| | | | | | | |
| Land | | $ | 1,088 | | | $ | 1,088 | |
| Buildings and improvements | | | 5,955 | | | | 5,894 | |
| Leasehold improvements | | | 733 | | | | 696 | |
| Furniture, fixtures and equipment | | | 4,428 | | | | 4,279 | |
| Software | | | 1,878 | | | | 1,735 | |
| Construction in progress | | | 908 | | | | 688 | |
| | | | | | | | | |
| | | | 14,990 | | | | 14,381 | |
| Less accumulated depreciation and amortization | | | 7,086 | | | | 6,423 | |
| | | | | | | | | |
| | | $ | 7,904 | | | $ | 7,958 | |
| | | | | | | | | |
Depreciation and amortization expense for the years ended December 31, 2007, 2006 and 2005 were $663,000, $849,000 and $855,000, respectively.
Notes to Consolidated Financial Statements (continued)
| 5. | Premises and Equipment (continued) |
Rent expense under non-cancelable operating lease agreements for the years ended December 31, 2007, 2006 and 2005 was $115,000, $112,000 and $109,000, respectively. Rent commitments under non-cancelable long-term operating lease agreements for certain branch offices for the years ended December 31, are as follows, before considering renewal options that are generally present:
| | | | |
| | | | |
| (Dollar amounts in thousands) | | Amount | |
| | | | |
| 2008 | | $ | 120 | |
| 2009 | | | 122 | |
| 2010 | | | 112 | |
| 2011 | | | 76 | |
| 2012 | | | 29 | |
| Thereafter | | | - | |
| | | | | |
| | | $ | 459 | |
| | | | | |
| 6. | Goodwill and Intangible Assets |
The following table summarizes the Corporation’s acquired goodwill and intangible assets as of December 31:
| Goodwill and Intangible Assets: | | | | | | | | | | | | |
| | | | | | | | | | | | | |
| | | | | | | | | | | | | |
| (Dollar amounts in thousands) | | 2007 | | | 2006 | |
| | | Gross Carrying Amount | | Accumulated Amortization | | Gross Carrying Amount | | Accumulated Amortization | |
| | | | | | | | | | | | | |
| Goodwill | | $ | 1,422 | | | $ | - | | | $ | 1,422 | | | $ | - | |
| Core deposit intangibles | | | 1,240 | | | | 1,240 | | | | 1,240 | | | | 1,240 | |
| Other customer relationship intangibles | | | 20 | | | | 20 | | | | 20 | | | | 20 | |
| | | | | | | | | | | | | | | | | |
| Total | | $ | 2,682 | | | $ | 1,260 | | | $ | 2,682 | | | $ | 1,260 | |
| | | | | | | | | | | | | | | | | |
Goodwill resulted from two previous branch acquisitions and is no longer amortized. There was no aggregate amortization expense for 2007. Aggregate amortization expense for 2006 and 2005 was $7,000 and $31,000, respectively.
| 7. | Related Party Balances and Transactions |
In the ordinary course of business, the Bank maintains loan and deposit relationships with employees, principal officers and directors. The Bank has granted loans to principal officers and directors and their affiliates amounting to $1.3 million and $1.2 million at December 31, 2007 and 2006, respectively. During 2007, total principal additions and total principal repayments associated with these loans were $350,000 and $282,000, respectively. Deposits from principal officers and directors held by the Bank at December 31, 2007 and 2006 totaled $2.4 million and $2.4 million, respectively.
In addition, directors and their affiliates may provide certain professional and other services to the Corporation and the Bank in the ordinary course of business at market fee rates. During 2007, 2006 and 2005, amounts paid to affiliates for such services totaled $120,000, $117,000 and $55,000, respectively.
Notes to Consolidated Financial Statements (continued)
The following table summarizes the Corporation’s deposits as of December 31:
| | | | | | | | | | | | | | | | | | | |
| | | | | | | | | | | | | | | | | | | |
| (Dollar amounts in thousands) | | 2007 | | | 2006 | |
| | | | | | | | | | | | | | | | | | | |
| | | Weighted | | | | | | | | | Weighted | | | | | | | |
| Type of accounts | | average rate | | | Amount | | | % | | | average rate | | | Amount | | | % | |
| | | | | | | | | | | | | | | | | | | |
| Non-interest bearing deposits | | | - | | | $ | 47,111 | | | | 19.3 | % | | | - | | | $ | 44,045 | | | | 18.0 | % |
| Interest bearing demand deposits | | | 1.28 | % | | | 77,614 | | | | 31.8 | % | | | 0.69 | % | | | 70,951 | | | | 29.0 | % |
| Time deposits | | | 4.48 | % | | | 119,537 | | | | 48.9 | % | | | 4.59 | % | | | 129,496 | | | | 53.0 | % |
| | | | | | | | | | | | | | | | | | | | | | | | | |
| | | | 2.60 | % | | $ | 244,262 | | | | 100.0 | % | | | 2.63 | % | | $ | 244,492 | | | | 100.0 | % |
| | | | | | | | | | | | | | | | | | | | | | | | | |
The Corporation had a total of $32.7 million and $33.0 million in time deposits of $100,000 or more at December 31, 2007 and 2006, respectively.
Scheduled maturities of time deposits for the next five years are as follows:
| | | | | |
| | | | | | | |
| (Dollar amounts in thousands) | | Amount | | | % | |
| | | | | | | |
| 2008 | | $ | 56,263 | | | | 47.1 | % |
| 2009 | | | 19,777 | | | | 16.5 | % |
| 2010 | | | 14,457 | | | | 12.1 | % |
| 2011 | | | 9,425 | | | | 7.9 | % |
| 2012 | | | 9,178 | | | | 7.7 | % |
| Thereafter | | | 10,437 | | | | 8.7 | % |
| | | | | | | | | |
| | | $ | 119,537 | | | | 100.0 | % |
| | | | | | | | | |
The following table summarizes the Corporation’s borrowed funds as of and for the year ended December 31:
| | | | | | | | | | | | | | | | | | | | | | | | | |
| (Dollar amounts in thousands) | | 2007 | | | 2006 | |
| | | | | | | | | | | | Weighted | | | | | | | | | | | | Weighted | |
| | | | | | Average | | | Average | | | average | | | | | | Average | | | Average | | | average | |
| | | Balance | | | Balance | | | Rate | | | rate | | | Balance | | | Balance | | | Rate | | | rate | |
| | | | | | | | | | | | | | | | | | | | | | | | | |
| FHLB advances: | | | | | | | | | | | | | | | | | | | | | | | | |
| Due within 12 months | | $ | 5,400 | | | $ | 1,208 | | | | 4.58 | % | | | 2.73 | % | | $ | - | | | $ | 1,147 | | | | 4.90 | % | | | 4.62 | % |
| Due beyond 12 months but within 5 years | | | 10,000 | | | | 10,000 | | | | 4.18 | % | | | 4.24 | % | | | 5,000 | | | | 5,000 | | | | 4.61 | % | | | 4.68 | % |
| Due beyond 5 years but within 10 years | | | 25,000 | | | | 21,233 | | | | 4.52 | % | | | 4.66 | % | | | 25,000 | | | | 16,521 | | | | 4.45 | % | | | 4.32 | % |
| | | $ | 40,400 | | | $ | 32,441 | | | | | | | | | | | $ | 30,000 | | | $ | 22,668 | | | | | | | | | |
| | | | | | | | | | | | | | | | | | | | | | | | | | | | | | | | | |
| | | | | | | | | | | | | | | | | | | | | | | | | | | | | | | | | |
Notes to Consolidated Financial Statements (continued)
| 9. | Borrowed Funds (continued) |
The Corporation had outstanding advances with the FHLB of $40.4 million and $30.0 million at December 31, 2007 and 2006, respectively. Borrowed funds at December 31, 2007 consist of seven, $5.0 million term advances and $5.4 million in overnight borrowings with the FHLB. The term advances mature between November 2011 and October 2017. If these advances convert to adjustable rate borrowings, the Corporation has the opportunity to repay the advances without penalty at or after the conversion date. All borrowings from the FHLB are secured by a blanket lien of qualified collateral, defined principally as 80 percent of the carrying value of first mortgage loans on owner-occupied residential properties and 95 percent of the market value of U.S. Government and federal agency securities.
The initial three $5.0 million borrowings have fixed rates of 4.61%, 3.74% and 4.04%, respectively, after which the rates may adjust at the option of the FHLB to the then three month LIBOR plus 20, 22 or 25 basis points, respectively, but only if the three month LIBOR exceeds 8.0%.
During 2006, the Corporation entered into agreements with the FHLB to borrow three additional $5.0 million 10 year term advances at initial interest rates of 4.98%, 4.83% and 4.68%, respectively. Two of these borrowings in 2006 are fixed for the first two years of the term after which the rates may adjust at the option of the FHLB to the then three month LIBOR rate plus 24 basis points. The third borrowing in 2006 is also fixed for the first two years of the initial term after which the rates may adjust at the option of the FHLB to the then three month LIBOR plus 24 basis points, but only if the three month LIBOR exceeds 6.0%.
During 2007, the Corporation entered into an agreement with the FHLB to borrow an additional $5.0 million for a 10 year term at an initial interest rate of 4.09%. This borrowing is fixed for the first three years of the term after which the rates may adjust at the option of the FHLB to the then three month LIBOR rate plus 13 basis points.
Scheduled maturities of borrowed funds for the next five years are as follows:
| | | | |
| | | | |
| (Dollar amounts in thousands) | | Amount | |
| | | | |
| 2008 | | $ | 5,400 | |
| 2009 | | | - | |
| 2010 | | | - | |
| 2011 | | | 5,000 | |
| 2012 | | | 5,000 | |
| Thereafter | | | 25,000 | |
| | | | | |
| | | $ | 40,400 | |
| | | | | |
The Bank maintains a credit arrangement with the FHLB as a source of additional liquidity. The total maximum borrowing capacity with the FHLB, excluding loans outstanding, at December 31, 2007 was $96.7 million.
Notes to Consolidated Financial Statements (continued)
| 10. | Insurance of Accounts and Regulatory Matters |
Insurance of Accounts
The Federal Deposit Insurance Corporation (FDIC) insures deposits of account holders up to $100,000 per insured depositor. In addition, federal law provides up to $250,000 in insurance coverage for deposits held in Individual Retirement Accounts (IRAs). To provide this insurance, the Bank must pay an annual premium. In connection with the insurance of deposits, the Bank is required to maintain certain minimum levels of regulatory capital as outlined below.
Restrictions on Dividends, Loans and Advances
The Bank is subject to a regulatory dividend restriction that generally limits the amount of dividends that can be paid by the Bank to the Corporation. Prior regulatory approval is required if the total of all dividends declared in any calendar year exceeds net profits (as defined in the regulations) for the year combined with net retained earnings (as defined) for the two preceding calendar years. In addition, dividends paid by the Bank to the Corporation would be prohibited if the effect thereof would cause the Bank’s capital to be reduced below applicable minimum capital requirements. As of December 31, 2007, $2.1 million of undistributed earnings of the Corporation was available for distribution of dividends without prior regulatory approval.
Loans or advances from the Bank to the Corporation are limited to 10 percent of the Bank’s capital stock and surplus on a secured basis. Funds available for loans or advances by the Bank to the Corporation amounted to approximately $1.1 million. The Corporation has a $1.1 million commercial line of credit available at the Bank for the primary purpose of purchasing qualified equity investments. At December 31, 2007, the Corporation had an outstanding balance on this line of $1.1 million.
Minimum Regulatory Capital Requirements
The Corporation (on a consolidated basis) and the Bank are subject to various regulatory capital requirements administered by the federal banking agencies. Failure to meet minimum capital requirements can initiate certain mandatory and possibly additional discretionary actions by regulators that, if undertaken, could have a direct material effect on the Corporation’s and the Bank’s financial statements. Under capital adequacy guidelines and the regulatory framework for prompt corrective action, the Corporation and the Bank must meet specific capital guidelines that involve quantitative measures of their assets, liabilities and certain off-balance-sheet items as calculated under regulatory accounting practices. The capital amounts and classification are also subject to qualitative judgments by the regulators about components, risk weightings, and other factors. Prompt corrective action provisions are not applicable to bank holding companies.
Quantitative measures established by regulation to ensure capital adequacy require the Corporation and the Bank to maintain minimum amounts and ratios (set forth in the following table) of total and Tier 1 capital (as defined in the regulations) to risk-weighted assets (as defined) and of Tier 1 capital (as defined) to average assets (as defined).
Notes to Consolidated Financial Statements (continued)
| 10. | Insurance of Accounts and Regulatory Matters (continued) |
As of December 31, 2007, the most recent notification from the FDIC categorized the Bank as adequately capitalized under the regulatory framework for prompt corrective action. To be categorized as adequately capitalized, an institution must maintain minimum total risk-based, Tier 1 risk-based and Tier 1 leverage ratios as set forth in the following table. There are no conditions or events since the notification that management believes have changed the Bank’s category.
The following table sets forth certain information concerning regulatory capital of the consolidated Corporation and the Bank as of the dates presented:
| | | | | | | | | | | | | | | | | | | | | | | | | |
| | | | | | | | | | | | | | | | | | | | | | | | | |
| (Dollar amounts in thousands) | | December 31, 2007 | | | December 31, 2006 | |
| | | Consolidated | | | Bank | | | Consolidated | | | Bank | | | | |
| | | Amount | | | Ratio | | | Amount | | | Ratio | | | Amount | | | Ratio | | | Amount | | | Ratio | |
| | | | | | | | | | | | | | | | | | | | | | | | | |
| Total capital to risk weighted assets: | | | | | | | | | | | | | | | | | | | | | | | | |
| Actual | | $ | 25,002 | | | | 10.54 | % | | $ | 23,357 | | | | 9.95 | % | | $ | 24,964 | | | | 11.34 | % | | $ | 23,096 | | | | 10.62 | % |
| For capital adequacy purposes | | | 18,974 | | | | 8.00 | % | | | 18,771 | | | | 8.00 | % | | | 17,617 | | | | 8.00 | % | | | 17,401 | | | | 8.00 | % |
| To be well capitalized | | | N/A | | | | N/A | | | | 23,464 | | | | 10.00 | % | | | N/A | | | | N/A | | | | 21,752 | | | | 10.00 | % |
| Tier 1 capital to risk-weighted assets: | | | | | | | | | | | | | | | | | | | | | | | | | | | | | | | | |
| Actual | | $ | 23,075 | | | | 9.73 | % | | $ | 21,260 | | | | 9.06 | % | | $ | 22,910 | | | | 10.40 | % | | $ | 21,060 | | | | 9.68 | % |
| For capital adequacy purposes | | | 9,487 | | | | 4.00 | % | | | 9,385 | | | | 4.00 | % | | | 8,809 | | | | 4.00 | % | | | 8,701 | | | | 4.00 | % |
| To be well capitalized | | | N/A | | | | N/A | | | | 14,078 | | | | 6.00 | % | | | N/A | | | | N/A | | | | 13,051 | | | | 6.00 | % |
| Tier 1 capital to average assets: | | | | | | | | | | | | | | | | | | | | | | | | | | | | | | | | |
| Actual | | $ | 23,075 | | | | 7.73 | % | | $ | 21,260 | | | | 7.08 | % | | $ | 22,910 | | | | 8.07 | % | | $ | 21,060 | | | | 7.14 | % |
| For capital adequacy purposes | | | 11,936 | | | | 4.00 | % | | | 12,007 | | | | 4.00 | % | | | 11,356 | | | | 4.00 | % | | | 11,793 | | | | 4.00 | % |
| To be well capitalized | | | N/A | | | | N/A | | | | 15,008 | | | | 5.00 | % | | | N/A | | | | N/A | | | | 14,741 | | | | 5.00 | % |
| | | | | | | | | | | | | | | | | | | | | | | | | | | | | | | | | |
At December 31, 2007, the Bank was categorized as adequately capitalized with a total risk-based ratio of 9.95%. The Bank monitors these capital ratios on a monthly basis and based on expected 2008 earnings less dividends, the Bank expects to be categorized as well capitalized by January 31, 2008.
| 11. | Commitments and Legal Contingencies |
In the ordinary course of business, the Corporation has various outstanding commitments and contingent liabilities that are not reflected in the accompanying consolidated financial statements. In addition, the Corporation is involved in certain claims and legal actions arising in the ordinary course of business. The outcome of these claims and actions are not presently determinable; however, in the opinion of the Corporation’s management, after consulting legal counsel, the ultimate disposition of these matters will not have a material adverse effect on the consolidated financial statements.
| | The Corporation and the Bank file a consolidated federal income tax return. The provision for income taxes for the years ended December 31 is comprised of the following: |
| | | | | | | | | | |
| (Dollar amounts in thousands) | | 2007 | | | 2006 | | | 2005 | |
| | | | | | | | | | |
| Current | | $ | 639 | | | $ | 445 | | | $ | 556 | |
| Deferred | | | 156 | | | | 47 | | | | 141 | |
| | | | | | | | | | | | | |
| | | $ | 795 | | | $ | 492 | | | $ | 697 | |
| | | | | | | | | | | | | |
Notes to Consolidated Financial Statements (continued)
| 12. | Income Taxes (continued) |
A reconciliation between the provision for income taxes and the amount computed by multiplying operating results before income taxes by the statutory federal income tax rate of 34% for the years ended December 31 is as follows:
| | | | | | | | | | |
| | | | | | | | | | |
| (Dollar amounts in thousands) | | 2007 | | | 2006 | | | 2005 | |
| | | | | | % Pre-tax | | | | | | % Pre-tax | | | | | | % Pre-tax | |
| | | Amount | | | Income | | | Amount | | | Income | | | Amount | | | Income | |
| | | | | | | | | | | | | | | | | | | |
| Provision at statutory tax rate | | $ | 1,187 | | | | 34.0 | % | | $ | 836 | | | | 34.0 | % | | $ | 1,112 | | | | 34.0 | % |
| Increase (decrease) resulting from: | | | | | | | | | | | | | | | | | | | | | | | | |
| Tax free interest, net of disallowance | | | (288 | ) | | | (8.2 | %) | | | (304 | ) | | | (12.4 | %) | | | (313 | ) | | | (9.6 | %) |
| Earnings on BOLI | | | (65 | ) | | | (1.9 | %) | | | (58 | ) | | | (2.4 | %) | | | (59 | ) | | | (1.8 | %) |
| Other, net | | | (39 | ) | | | (1.1 | %) | | | 18 | | | | 0.7 | % | | | (43 | ) | | | (1.3 | %) |
| | | | | | | | | | | | | | | | | | | | | | | | | |
| Provision | | $ | 795 | | | | 22.8 | % | | $ | 492 | | | | 20.0 | % | | $ | 697 | | | | 21.3 | % |
| | | | | | | | | | | | | | | | | | | | | | | | | |
The tax effects of temporary differences between the financial reporting basis and income tax basis of assets and liabilities that are included in the net deferred tax asset as of December 31 relate to the following:
| (Dollar amounts in thousands) | | 2007 | | | 2006 | |
| | | | | | | |
| Deferred tax assets: | | | | | | |
| | | | | | | |
| Provision for loan losses | | $ | 680 | | | $ | 638 | |
| SFAS 158 pension accrual | | | 158 | | | | 185 | |
| Tax credits | | | - | | | | 148 | |
| Intangible assets | | | 101 | | | | 115 | |
| Accrued pension cost | | | 73 | | | | 77 | |
| Net unrealized loss on securities | | | 51 | | | | 28 | |
| Other | | | 33 | | | | 33 | |
| | | | | | | | | |
| Gross deferred tax assets | | | 1,096 | | | | 1,224 | |
| | | | | | | | | |
| Deferred tax liabilities: | | | | | | | | |
| | | | - | | | | - | |
| Depreciation | | | 354 | | | | 360 | |
| Stock gain | | | 172 | | | | 172 | |
| Prepaid expenses | | | 72 | | | | 58 | |
| Deferred loan fees | | | 55 | | | | 26 | |
| Loan servicing | | | 21 | | | | 19 | |
| Other | | | 46 | | | | 53 | |
| | | | | | | | | |
| Gross deferred tax liabilities | | | 720 | | | | 688 | |
| | | | | | | | | |
| Net deferred tax asset | | $ | 376 | | | $ | 536 | |
| | | | | | | | | |
| | | | | | | | | |
The Corporation determined that it was not required to establish a valuation allowance for deferred tax assets in accordance with SFAS No. 109, Accounting for Income Taxes, since it is more likely than not that the deferred tax asset will be realized through carry-back to taxable income in prior years, future reversals of existing taxable temporary differences, and, to a lesser extent, future taxable income. The Corporation’s net deferred tax asset is recorded in the consolidated financial statements as a component of other assets.
Notes to Consolidated Financial Statements (continued)
| 12. | Income Taxes (continued) |
The adoption of FIN 48 at January 1, 2007 had no impact on the Corporation’s financial statements. At January 1, 2007 and December 31, 2007, the Corporation had no FIN 48 unrecognized tax benefits recorded. The Corporation does not expect the total amount of unrecognized tax benefits to significantly increase within the next twelve months. The Corporation recognizes interest and penalties on unrecognized tax benefits in income taxes expense in its Consolidated Statements of Income.
In September 2006, the SEC released SAB 108. The transition provisions of SAB 108 permit the Corporation to adjust for the cumulative effect on retained earnings of immaterial errors relating to prior years. SAB 108 also requires the adjustment of any prior quarterly financial statements within the fiscal year of adoption for the effects of such errors on the quarters when the information is next presented. Such adjustments do not require previously filed reports with the SEC to be amended. In accordance with SAB 108, the Corporation has adjusted beginning retained earnings for fiscal 2006 in the accompanying consolidated balance sheet as described below. The Corporation considers this adjustment to be immaterial to prior periods.
In connection with adopting SAB 108, the Corporation recorded an adjustment to its opening balance sheet for the year ended December 31, 2006. This adjustment, the cumulative effect of which was $120,000, increased retained earnings, reduced accrued income taxes payable and was recorded to properly reflect current taxes payable. During prior year periods, certain tax reserve amounts accumulated in connection with preparing tax provision estimates. These tax reserves were not considered material to prior period consolidated financial statements; however, in evaluating the current tax position of the Corporation, management determined that these reserves were not necessary and, accordingly, made the aforementioned adjustment.
The Corporation and the Bank are subject to U.S. federal income tax as well as a capital-based franchise tax in the Commonwealth of Pennsylvania. The Corporation and the Bank are no longer subject to examination by taxing authorities for years before 2004.
Notes to Consolidated Financial Statements (continued)
| 13. | Employee Benefit Plans |
Defined Benefit Plan
The Corporation provides pension benefits for eligible employees through a defined benefit pension plan. Substantially all employees participate in the retirement plan on a non-contributing basis, and are fully vested after five years of service. The Corporation uses December 31 as the measurement date for its plans. Information pertaining to changes in obligations and funded status of the defined benefit pension plan is as follows:
| | | | | | | | | | |
| (Dollar amounts in thousands) | | 2007 | | | 2006 | | | 2005 | |
| | | | | | | | | | |
| Change in plan assets: | | | | | | | | | |
| Fair value of plan assets at beginning of year | | $ | 3,525 | | | $ | 3,037 | | | $ | 2,818 | |
| Actual return on plan assets | | | 246 | | | | 296 | | | | 164 | |
| Employer contribution | | | 360 | | | | 280 | | | | 135 | |
| Benefits paid | | | (248 | ) | | | (88 | ) | | | (80 | ) |
| | | | | | | | | | | | | |
| Fair value of plan assets at end of year | | | 3,883 | | | | 3,525 | | | | 3,037 | |
| | | | | | | | | | | | | |
| Change in benefit obligation: | | | | | | | | | | | | |
| Benefit obligation at beginning of year | | | 4,392 | | | | 3,926 | | | | 3,276 | |
| Service cost | | | 238 | | | | 213 | | | | 188 | |
| Interest cost | | | 262 | | | | 237 | | | | 214 | |
| Actuarial (gain)/loss | | | 118 | | | | (40 | ) | | | 154 | |
| Effect of plan amendment | | | - | | | | 144 | | | | - | |
| Effect of change in assumptions | | | (255 | ) | | | - | | | | 174 | |
| Benefits paid | | | (247 | ) | | | (88 | ) | | | (80 | ) |
| | | | | | | | | | | | | |
| Benefit obligation at end of year | | | 4,508 | | | | 4,392 | | | | 3,926 | |
| | | | | | | | | | | | | |
| Funded status (plan assets less benefit obligation) | | | (625 | ) | | | (867 | ) | | | (889 | ) |
| Unrecognized prior service cost | | | (271 | ) | | | (303 | ) | | | (486 | ) |
| Unrecognized net actuarial gain | | | 736 | | | | 847 | | | | 1,283 | |
| Unrecognized transition asset | | | - | | | | - | | | | (48 | ) |
| | | | | | | | | | | | | |
| Accrued pension cost | | $ | (160 | ) | | $ | (323 | ) | | $ | (140 | ) |
| | | | | | | | | | | | | |
| Amounts recognized in accumulated other | | | | | | | | | |
| comprehensive loss, net of tax, consists of: | | | | | | | | | |
| Accumulated net actuarial gain | | $ | 485 | | | $ | 559 | | | $ | - | |
| Accumulated prior service benefit | | | (179 | ) | | | (199 | ) | | | - | |
| | | | | | | | | | | | | |
| Amount recognized, end of year | | $ | 306 | | | $ | 360 | | | $ | - | |
| | | | | | | | | | | | | |
Notes to Consolidated Financial Statements (continued)
| 13. | Employee Benefit Plans (continued) |
Amounts recognized in the year end balance sheet consist of:
| | | | | | | |
| (Dollar amounts in thousands) | | Pension Benefits | |
| | | 2007 | | | 2006 | |
| | | | | | | |
| Prepaid benefit cost | | $ | - | | | $ | - | |
| Accrued benefit cost | | | (160 | ) | | | (323 | ) |
| Intangible assets | | | - | | | | - | |
| Accumulated other comprehensive loss | | | (465 | ) | | | (544 | ) |
| | | | | | | | | |
| Net amount recognized | | $ | (625 | ) | | $ | (867 | ) |
| | | | | | | | | |
The accumulated benefit obligation for all defined benefit pension plans was $4.5 million and $3.8 million at year end 2007 and 2006, respectively.
The components of the periodic pension costs are as follows:
| | | | | | | | | | |
| (Dollar amounts in thousands) | | 2007 | | | 2006 | | | 2005 | |
| | | | | | | | | | |
| Service cost | | $ | 238 | | | $ | 213 | | | $ | 188 | |
| Interest cost | | | 262 | | | | 237 | | | | 214 | |
| Expected return on plan assets | | | (303 | ) | | | (268 | ) | | | (246 | ) |
| Transition asset | | | - | | | | (8 | ) | | | (8 | ) |
| Prior service costs | | | - | | | | 32 | | | | 19 | |
| Effect of Special Termination Benefits | | | - | | | | 274 | | | | - | |
| | | | | | | | | | | | | |
| Net periodic pension cost | | $ | 197 | | | $ | 480 | | | $ | 167 | |
| | | | | | | | | | | | | |
Weighted-average actuarial assumptions include the following:
| | | | | | | | | | |
| | | 2007 | | | 2006 | | | 2005 | |
| | | | | | | | | | |
| Discount rate for benefit obligations and net cost | | | 6.50 | % | | | 6.00 | % | | | 6.30 | % |
| Rate of increase in future compensation levels | | | 4.50 | % | | | 4.50 | % | | | 4.50 | % |
| Expected rate of return on plan assets | | | 8.50 | % | | | 8.50 | % | | | 8.50 | % |
| | | | | | | | | | | | | |
The Corporation’s pension plan asset allocation at year end 2007 and 2006, target allocation for 2008, and expected long-term rate of return by asset category are as follows:
| | | | | | | | | |
| Asset Category | | Target Allocation | | | Percentage of Plan Assets at Year End | | Weighted-Average Expected Long-Term Rate of Return | |
| | | 2008 | | | 2007 | | | 2006 | | | 2007 | |
| | | | | | | | | | | | | |
| Equity Securities | | | 54 | % | | | 54 | % | | 52 | % | | | 6.0 | % |
| Debt Securities | | | 21 | % | | | 21 | % | | 12 | % | | | 2.0 | % |
| Other | | | 30 | % | | | 25 | % | | 36 | % | | | 0.5 | % |
| | | | | | | | | | | | | | | | |
| | | | | | | | 100 | % | | 100 | % | | | 8.5 | % |
| | | | | | | | | | | | | | | | |
| | | | | | | | | | | | | | | | |
Notes to Consolidated Financial Statements (continued)
| 13. | Employee Benefit Plans (continued) |
The intent of the Plan is to provide a range of investment options for building a diversified asset allocation strategy that will provide the highest likelihood of meeting the aggregate actuarial projections. In selecting the options and asset allocation strategy, the Corporation has determined that the benefits of reduced portfolio risk are best received through asset style diversification. The following asset classes or investment categories are utilized to meet the Plan’s objectives: Small company stock, International stock, Mid-cap stock, Large company stock, Diversified bond, Money Market/Stable Value and Cash.
The Corporation expects to contribute approximately $335,000 to its pension plan in 2008.
Estimated future benefit payments, which reflect expected future service, as appropriate, are as follows:
| | | | | | |
| | (Dollar amounts in thousands) | | | | |
| | | | | | |
| | For year ended December 31, | | Pension Benefits | | |
| | | | | | |
| | 2008 | | $ | 254 | | |
| | 2009 | | | 247 | | |
| | 2010 | | | 214 | | |
| | 2011 | | | 195 | | |
| | 2012 | | | 227 | | |
| | 2013-2017 | | | 1,397 | | |
| | Thereafter | | | 1,974 | | |
| | | | | | | |
| | Benefit Obligation | | $ | 4,508 | | |
| | | | | | | |
| | The Corporation adopted SFAS 158 effective December 31, 2006. SFAS 158 requires an employer to recognize the funded status of its defined benefit pension plan as a net asset or liability in its consolidated balance sheet with an offsetting amount in accumulated other comprehensive income, and to recognize changes in that funded status in the year in which changes occur through comprehensive income. The provisions of SFAS 158 are to be applied on a prospective basis; therefore, prior periods presented are not restated. The adoption of SFAS 158 resulted in the Corporation recording an additional accrued pension liability of $545,000 and a charge of $360,000, net of taxes, to accumulated other comprehensive income. As of December 31, 2007, the Corporation’s liability under SFAS 158 was $465,000 and the charge to accumulated other comprehensive income was $306,000, net of taxes. Additionally, SFAS requires an employer to measure the funded status of its defined benefit pension plan as of the date of its year-end financial statements. The Corporation measures the funded status at December 31. |
Defined Contribution Plan
The Corporation maintains a defined contribution 401(k) Plan. Employees are eligible to participate by providing tax-deferred contributions up to 20% of qualified compensation. Employee contributions are vested at all times. The Corporation provides a matching contribution of up to 4% of the participant’s salary. Matching contributions for 2007, 2006 and 2005 were $130,000, $76,000 and $75,000, respectively.
Notes to Consolidated Financial Statements (continued)
| 13. | Employee Benefit Plans (continued) |
Supplemental Executive Retirement Plan
During 2003, the Corporation established a Supplemental Executive Retirement Plan (SERP) to provide certain additional retirement benefits to participating executive officers. The SERP was adopted in order to provide benefits to such executives whose benefits are reduced under the Corporation’s tax-qualified benefit plans pursuant to limitations under the Internal Revenue Code. The SERP is subject to certain vesting provisions and provides that the executives shall receive a supplemental retirement benefit if the executive’s employment is terminated after reaching the normal retirement age of 65. As of December 31, 2007 and 2006, the Corporation’s SERP liability was $215,000 and $161,000, respectively. For the years ended December 31, 2007, 2006 and 2005, the Corporation recognized SERP expense of $54,000, $39,000 and $40,000, respectively.
| 14. | Stock Compensation Plans |
In May 2007, the Corporation adopted the 2007 Stock Incentive Plan and Trust. Under the Plan, the Corporation may grant options to its directors, officers and employees for up to 177,496 shares of common stock. Incentive stock options, non-incentive or compensatory stock options and share awards may be granted under the Plan. The exercise price of each option shall at least equal the market price of a share of common stock on the date of grant and have a contractual term of ten years. Options shall vest and become exercisable at the rate, to the extent and subject to such limitations as may be specified by the Corporation. Effective January 1, 2007, the Corporation adopted SFAS No. 123(R), Share-Based Payment, which requires that compensation cost related to share-based payment transactions be recognized in the financial statements with measurement based upon the fair value of the equity or liability instruments issued. During 2007, 84,000 of options were granted which vest over a three year period. For the year ended December 31, 2007, the Corporation recognized $31,000, net of taxes, in compensation expense for stock options.
The fair value of each option grant is estimated on the date of grant using the Black-Scholes option-pricing model with the following weighted average assumptions:
| | | | | |
| | | | Year ended | |
| | | | December 31, 2007 | |
| | | | | |
| | Dividend yield | | 4.46% | |
| | Expected life | | 10 years | |
| | Expected volatility | | 14.09% | |
| | Risk-free interest rate | | 5.10% | |
| | | | | |
The expected volatility is based on historical stock price fluctuations. The risk-free interest rates for periods within the contractual life of the awards are based on the U.S. Treasury yield curve in effect at the time of the grant. The expected life is based on the maximum term of the options. The dividend yield assumption is based on the Corporation’s history and expectation of dividend payouts.
Notes to Consolidated Financial Statements (continued)
| 14. | Stock Compensation Plans (continued) |
A summary of option activity under the Plan as of December 31, 2007, and changes during the period then ended is presented below:
| | | | | | | | | | | | | |
| | | | | | | | | | | | Weighted-Average | |
| | | | | | Weighted-Average | | | Aggregate | | | Remaining Term | |
| | | Options | | | Exercise Price | | | Intrinsic Value | | | (in years) | |
| | | | | | | | | | | | | |
| Outstanding at the beginning of the year | | | - | | | $ | - | | | | | | | - | |
| Granted | | | 84,000 | | | | 26.00 | | | | | | | 9.5 | |
| Exercised | | | - | | | | - | | | | | | | - | |
| Forfeited | | | - | | | | - | | | | | | | - | |
| Outstanding as of December 31, 2007 | | | 84,000 | | | $ | 26.00 | | | $ | - | | | | 9.5 | |
| | | | | | | | | | | | | | | | | |
| Exercisable as of December 31, 2007 | | | - | | | $ | - | | | $ | - | | | | - | |
| | | | | | | | | | | | | | | | | |
A summary of the status of the Corporation’s nonvested shares as of December 31, 2007, and changes during the period then ended is presented below:
| | | | | | | | | |
| | | | | | | Weighted-Average | | |
| | | | Options | | | Grant-date Fair Value | | |
| | | | | | | | | |
| | Nonvested at the beginning of the year | | | - | | | $ | - | | |
| | Granted | | | 84,000 | | | | 3.39 | | |
| | Vested | | | - | | | | - | | |
| | Forfeited | | | - | | | | - | | |
| | Nonvested as of December 31, 2007 | | | 84,000 | | | $ | 3.39 | | |
| | | | | | | | | | | |
As of December 31, 2007, there was $254,000 of total unrecognized compensation cost related to nonvested share-based compensation arrangements granted under the Plan. That cost is expected to be recognized over a average period of 2.5 years.
| 15. | Financial Instruments |
Fair Value of Financial Instruments
The following table sets forth the carrying amount and fair value of the Corporation’s financial instruments included in the consolidated balance sheet as of December 31:
| | | | | | | | | | | | | |
| (Dollar amounts in thousands) | | 2007 | | | 2006 | |
| | | Carrying amount | | | Fair value | | | Carrying amount | | | Fair value | |
| | | | | | | | | | | | | |
| Financial assets: | | | | | | | | | | | | |
| Cash and cash equivalents | | $ | 10,483 | | | $ | 10,483 | | | $ | 16,717 | | | $ | 16,717 | |
| Securities | | | 51,919 | | | | 51,919 | | | | 51,774 | | | | 51,774 | |
| Loans receivable | | | 229,819 | | | | 229,262 | | | | 213,344 | | | | 210,362 | |
| Federal bank stocks | | | 2,662 | | | | 2,662 | | | | 2,217 | | | | 2,217 | |
| Accrued interest receivable | | | 1,365 | | | | 1,365 | | | | 1,374 | | | | 1,374 | |
| | | | | | | | | | | | | | | | | |
| Financial liabilities: | | | | | | | | | | | | | | | | |
| Deposits | | | 244,262 | | | | 245,829 | | | | 244,492 | | | | 243,328 | |
| Borrowed funds | | | 40,400 | | | | 41,644 | | | | 30,000 | | | | 29,668 | |
| Accrued interest payable | | | 771 | | | | 771 | | | | 825 | | | | 825 | |
| | | | | | | | | | | | | | | | | |
Notes to Consolidated Financial Statements (continued)
| 15. | Financial Instruments (continued) |
The methods and assumptions used to estimate fair value are described as follows:
Carrying amount is the estimated fair value for cash and cash equivalents, short-term borrowings, federal bank stocks, accrued interest receivable and payable, demand deposits, short-term debt, and variable rate loans or deposits that reprice frequently and fully. Security fair values are based on market prices or dealer quotes, and if no such information is available, on the rate and term of the security and information about the issuer. For fixed rate loans or deposits and for variable rate loans or deposits with infrequent repricing or repricing limits, fair value is based on discounted cash flows using current market rates applied to the estimated life and credit risk. Fair values for impaired loans are estimated using discounted cash flow analysis or underlying collateral values. Fair value of loans held for sale is based on market quotes. Fair value of debt is based on current rates for similar financing. The fair value of off-balance sheet items is based on the current fees or cost that would be charged to enter into or terminate such arrangements and is not material.
Off-Balance Sheet Financial Instruments
The Corporation is party to credit related financial instruments with off-balance sheet risk in the normal course of business to meet the financing needs of its customers. These financial instruments include commitments to extend credit and commercial letters of credit. Commitments to extend credit involve, to a varying degree, elements of credit and interest rate risk in excess of amounts recognized in the consolidated statement of financial condition. The Corporation’s exposure to credit loss in the event of non-performance by the other party for commitments to extend credit is represented by the contractual amount of these commitments, less any collateral value obtained. The Corporation uses the same credit policies in making commitments as for on-balance sheet instruments. The Corporation’s distribution of commitments to extend credit approximates the distribution of loans receivable outstanding.
The following table presents the notional amount of the Corporation’s off-balance sheet commitment financial instruments as of December 31:
| | | | | | | | | | | | | |
| (Dollar amounts in thousands) | | 2007 | | | 2006 | |
| | | Fixed Rate | | | Variable Rate | | | Fixed Rate | | | Variable Rate | |
| | | | | | | | | | | | | |
| Commitments to make loans | | $ | 1,054 | | | $ | 3,844 | | | $ | 189 | | | $ | 3,064 | |
| Unused lines of credit | | | 182 | | | | 25,611 | | | | 771 | | | | 18,588 | |
| | | $ | 1,236 | | | $ | 29,455 | | | $ | 960 | | | $ | 21,652 | |
| | | | | | | | | | | | | | | | | |
Commitments to make loans are generally made for periods of 30 days or less. The fixed rate loan commitments have interest rates ranging from 4.00% to 11.25% and maturities ranging from 5 to 30 years at both year end dates. Commitments to extend credit include agreements to lend to a customer as long as there is no violation of any condition established in the contract. These commitments generally have fixed expiration dates or other termination clauses and may require payment of a fee. Commitments to extend credit also include unfunded commitments under commercial and consumer lines of credit, revolving credit lines and overdraft protection agreements. These lines of credit may be collateralized and usually do not contain a specified maturity date and may be drawn upon to the total extent to which the Corporation is committed.
Notes to Consolidated Financial Statements (continued)
| 15. | Financial Instruments (continued) |
Standby letters of credit are conditional commitments issued by the Corporation usually for commercial customers to guarantee the performance of a customer to a third party. The credit risk involved in issuing letters of credit is essentially the same as that involved in extending loan facilities to customers. The Corporation generally holds collateral supporting those commitments if deemed necessary. Standby letters of credit were $869,000 and $463,000 at December 31, 2007 and 2006, respectively. The current amount of the liability as of December 31, 2007 and 2006 for guarantees under standby letters of credit issued is not material.
| 16. | Emclaire Financial Corp. – Condensed Financial Statements, Parent Corporation Only |
Following are condensed financial statements for the parent company as of and for the years ended December 31:
| | | | | | | |
| Condensed Statements of Financial Condition | | | | | December 31, | |
| (Dollar amounts in thousands) | | | | | 2007 | | | 2006 | |
| | | | | | | | | | |
| Assets: | | | | | | | | | |
| Cash and cash equivalents | | | | | $ | 83 | | | $ | 40 | |
| Securities available for sale | | | | | | 3,188 | | | | 3,235 | |
| Equity in net assets of subsidiary bank | | | | | | 22,704 | | | | 21,828 | |
| Other assets | | | | | | - | | | | - | |
| | | | | | | | | | | | |
| Total Assets | | | | | $ | 25,975 | | | $ | 25,103 | |
| | | | | | | | | | | | |
| Liabilities and Stockholders' Equity: | | | | | | | | | | | |
| Accrued expenses and other liabilities | | | | | $ | 1,272 | | | $ | 1,186 | |
| Stockholders' equity | | | | | | 24,703 | | | | 23,917 | |
| | | | | | | | | | | | |
| Total Liabilities and Stockholders' Equity | | | | | $ | 25,975 | | | $ | 25,103 | |
| | | | | | | | | | | | |
| | | | | | | | | | | | |
| Condensed Statements of Operations | | Year ended December 31, | |
| (Dollar amounts in thousands) | | 2007 | | | 2006 | | | 2005 | |
| | | | | | | | | | | | |
| Income: | | | | | | | | | | | |
| Dividends from subsidiary | | $ | 2,159 | | | $ | 1,349 | | | $ | 721 | |
| Investment income | | | 312 | | | | 488 | | | | 917 | |
| | | | | | | | | | | | | |
| Total income | | | 2,471 | | | | 1,837 | | | | 1,638 | |
| | | | | | | | | | | | | |
| Expense: | | | | | | | | | | | | |
| Interest expense | | | 81 | | | | 26 | | | | - | |
| Noninterest expense | | | 201 | | | | 100 | | | | 83 | |
| | | | | | | | | | | | | |
| Total expense | | | 282 | | | | 126 | | | | 83 | |
| | | | | | | | | | | | | |
| Income before income taxes and equity in undistributed | | | | | | | | | | | | |
| operating results of subsidiary | | | 2,189 | | | | 1,711 | | | | 1,555 | |
| | | | | | | | | | | | | |
| Equity in undistributed net income of subsidiary | | | 501 | | | | 405 | | | | 1,241 | |
| | | | | | | | | | | | | |
| Income before income taxes | | | 2,690 | | | | 2,116 | | | | 2,796 | |
| | | | | | | | | | | | | |
| Income tax expense | | | (7 | ) | | | 150 | | | | 223 | |
| | | | | | | | | | | | | |
| Net income | | $ | 2,697 | | | $ | 1,966 | | | $ | 2,573 | |
| | | | | | | | | | | | | |
Notes to Consolidated Financial Statements (continued)
| 16. | Emclaire Financial Corp. – Condensed Financial Statements, Parent Corporation Only (continued) |
| | | | |
| Condensed Statements of Cash Flows | | Year ended December 31, | |
| (Dollar amounts in thousands) | | 2007 | | | 2006 | | | 2005 | |
| | | | | | | | | | |
| Operating activities: | | | | | | | | | |
| Net income | | $ | 2,697 | | | $ | 1,966 | | | $ | 2,573 | |
| Adjustments to reconcile net income to net cash provided | | | | | | | | | | | | |
| by operating activities: | | | | | | | | | | | | |
| Equity in undistributed operating results of subsidiary | | | (501 | ) | | | (405 | ) | | | (1,241 | ) |
| Other, net | | | (109 | ) | | | (300 | ) | | | (803 | ) |
| Net cash provided by operating activities | | | 2,087 | | | | 1,261 | | | | 529 | |
| | | | | | | | | | | | | |
| Investing activities: | | | | | | | | | | | | |
| Purchases of securities | | | (1,039 | ) | | | (1,797 | ) | | | (99 | ) |
| Proceeds from the sale of available for sale securities | | | 698 | | | | 814 | | | | 1,060 | |
| Net cash (used in) provided by investing activities | | | (341 | ) | | | (983 | ) | | | 961 | |
| | | | | | | | | | | | | |
| Financing activities: | | | | | | | | | | | | |
| Net change in borrowings | | | 250 | | | | 850 | | | | - | |
| Dividends paid | | | (1,953 | ) | | | (1,394 | ) | | | (1,293 | ) |
| Net cash used in financing activities | | | (1,703 | ) | | | (544 | ) | | | (1,293 | ) |
| | | | | | | | | | | | | |
| (Decrease) Increase in cash and cash equivalents | | | 43 | | | | (266 | ) | | | 197 | |
| Cash and cash equivalents at beginning of period | | | 40 | | | | 306 | | | | 109 | |
| | | | | | | | | | | | | |
| Cash and cash equivalents at end of period | | $ | 83 | | | $ | 40 | | | $ | 306 | |
| | | | | | | | | | | | | |
| 17. | Other Comprehensive Loss |
Other comprehensive loss components and related taxes were as follows:
| | | | | | | | | | |
| (Dollar amounts in thousands) | | 2007 | | | 2006 | | | 2005 | |
| | | | | | | | | | |
| Unrealized holding gains (losses) on available for sale securities | | $ | 142 | | | $ | 356 | | | $ | (1,084 | ) |
| Reclassification adjustment for gains later recognized in income | | | (207 | ) | | | (400 | ) | | | (857 | ) |
| Amortization of pension prior service cost | | | (31 | ) | | | - | | | | - | |
| Amortization of pension net actuarial loss | | | 112 | | | | - | | | | - | |
| | | | | | | | | | | | | |
| Net unrealized losses | | | 16 | | | | (44 | ) | | | (1,941 | ) |
| | | | | | | | | | | | | |
| Tax effect | | | (5 | ) | | | 14 | | | | 660 | |
| | | | | | | | | | | | | |
| Other comprehensive loss | | $ | 11 | | | $ | (30 | ) | | $ | (1,281 | ) |
| | | | | | | | | | | | | |
Notes to Consolidated Financial Statements (continued)
| 18. | Other Noninterest Income and Expense |
Other noninterest income includes customer bank card processing fee income of $267,000, $232,000 and $209,000 for 2007, 2006 and 2005, respectively.
The following summarizes the Corporation’s other noninterest expenses for the years ended December 31:
| | | | | | | | | | |
| (Dollar amounts in thousands) | | 2007 | | | 2006 | | | 2005 | |
| | | | | | | | | | |
| Professional fees | | $ | 497 | | | $ | 323 | | | $ | 292 | |
| Customer bank card processing | | | 263 | | | | 231 | | | | 241 | |
| Correspondent bank and courier fees | | | 204 | | | | 214 | | | | 150 | |
| Printing and supplies | | | 178 | | | | 195 | | | | 189 | |
| Travel, entertainment and conferences | | | 178 | | | | 162 | | | | 148 | |
| Marketing and advertising | | | 175 | | | | 154 | | | | 109 | |
| Telephone and data communications | | | 157 | | | | 148 | | | | 142 | |
| Postage and freight | | | 156 | | | | 135 | | | | 140 | |
| Pennsylvania shares and use taxes | | | 152 | | | | 116 | | | | 272 | |
| Other | | | 525 | | | | 455 | | | | 714 | |
| Total other noninterest expenses | | $ | 2,485 | | | $ | 2,133 | | | $ | 2,397 | |
| | | | | | | | | | | | | |
| 19. | Quarterly Financial Data (unaudited) |
The following is a summary of selected quarterly data for the years ended December 31:
| | | | | | | | | | | | | |
| (Dollar amounts in thousands, except share data) | | First | | | Second | | | Third | | | Fourth | |
| | | Quarter | | | Quarter | | | Quarter | | | Quarter | |
| | | | | | | | | | | | | |
| 2007: | | | | | | | | | | | | |
| Interest income | | $ | 4,312 | | | $ | 4,416 | | | $ | 4,535 | | | $ | 4,592 | |
| Interest expense | | | 2,003 | | | | 1,918 | | | | 1,939 | | | | 2,026 | |
| Net interest income | | | 2,309 | | | | 2,498 | | | | 2,596 | | | | 2,566 | |
| Provision for loan losses | | | 45 | | | | 30 | | | | 45 | | | | 136 | |
| Net interest income after provision for loan losses | | | 2,264 | | | | 2,468 | | | | 2,551 | | | | 2,430 | |
| Noninterest income | | | 730 | | | | 772 | | | | 696 | | | | 745 | |
| Noninterest expense | | | 2,310 | | | | 2,336 | | | | 2,255 | | | | 2,263 | |
| Income before income taxes | | | 684 | | | | 904 | | | | 992 | | | | 912 | |
| Provision for income taxes | | | 133 | | | | 197 | | | | 238 | | | | 227 | |
| | | | | | | | | | | | | | | | | |
| Net income | | $ | 551 | | | $ | 707 | | | $ | 754 | | | $ | 685 | |
| | | | | | | | | | | | | | | | | |
| Basic earnings per share | | $ | 0.43 | | | $ | 0.56 | | | $ | 0.59 | | | $ | 0.54 | |
| | | | | | | | | | | | | | | | | |
| 2006: | | | | | | | | | | | | | | | | |
| Interest income | | $ | 3,744 | | | $ | 3,931 | | | $ | 4,240 | | | $ | 4,344 | |
| Interest expense | | | 1,482 | | | | 1,614 | | | | 1,855 | | | | 2,017 | |
| Net interest income | | | 2,262 | | | | 2,317 | | | | 2,385 | | | | 2,327 | |
| Provision for loan losses | | | 31 | | | | 47 | | | | 90 | | | | 190 | |
| Net interest income after provision for loan losses | | | 2,231 | | | | 2,270 | | | | 2,295 | | | | 2,137 | |
| Noninterest income | | | 727 | | | | 769 | | | | 793 | | | | 645 | |
| Noninterest expense | | | 2,214 | | | | 2,253 | | | | 2,264 | | | | 2,678 | |
| Income before income taxes | | | 744 | | | | 786 | | | | 824 | | | | 104 | |
| Provision for income taxes | | | 159 | | | | 184 | | | | 132 | | | | 17 | |
| | | | | | | | | | | | | | | | | |
| Net income | | $ | 585 | | | $ | 602 | | | $ | 692 | | | $ | 87 | |
| | | | | | | | | | | | | | | | | |
| Basic earnings per share | | $ | 0.46 | | | $ | 0.47 | | | $ | 0.55 | | | $ | 0.07 | |
| | | | | | | | | | | | | | | | | |

Audit Committee, Board of Directors and Stockholders
Emclaire Financial Corp.
Emlenton, Pennsylvania
We have audited the accompanying consolidated balance sheets of Emclaire Financial Corp. and its subsidiary (the “Corporation”) as of December 31, 2007 and 2006, and the related consolidated statements of income, changes in stockholders’ equity and cash flows for each of the years in the three-year period ended December 31, 2007. The Corporation’s management is responsible for these financial statements. Our responsibility is to express an opinion on these financial statements based on our audits.
We conducted our audits in accordance with the standards of the Public Company Accounting Oversight Board (United States). Those standards require that we plan and perform the audit to obtain reasonable assurance about whether the financial statements are free of material misstatement. The Corporation is not required to have, nor were we engaged to perform, an audit of its internal control over financial reporting. Our audits included consideration of internal control over financial reporting as a basis for designing audit procedures that are appropriate in the circumstances, but not for the purpose of expressing an opinion on the effectiveness of the Corporation’s internal control over financial reporting. Accordingly, we express no such opinion. An audit also includes examining, on a test basis, evidence supporting the amounts and disclosures in the financial statements, assessing the accounting principles used and significant estimates made by management, as well as evaluating the overall financial statement presentation. We believe that our audits provide a reasonable basis for our opinion.
In our opinion, the consolidated financial statements referred to above present fairly, in all material respects, the financial position of Emclaire Financial Corp. and its subsidiary as of December 31, 2007 and 2006, and the results of their operations and their cash flows for each of the years in the three-year period ended December 31, 2007, in conformity with accounting principles generally accepted in the United States of America.
As discussed in Note 1 to the consolidated financial statements, on January 1, 2006, the Corporation has given retroactive effect to the change to the dual method of quantifying misstatements of prior year financial statements. The dual method is required by SEC Staff Accounting Bulletin No. 108, “Considering the Effects of Prior Year Misstatements when Quantifying Misstatements in Current Year Financial Statements.” Also, on December 31, 2006, the Corporation changed its method of accounting for defined benefit pension and other postretirement plans by adopting Statement of Financial Accounting Standards No. 158, “Employers’ Accounting for Defined Benefit Pension and Other Postretirement Plans, an amendment of FASB Statements No. 87, 88, 106, and 132(R).”

Beard Miller Company LLP
Pittsburgh, Pennsylvania
March 19, 2008
Listings and Markets
Emclaire Financial Corp. common stock is traded on the Over the Counter Bulletin Board (OTCBB) under the symbol “EMCF”. The listed market makers for the Corporation’s common stock include:
Ferris, Baker Watts, Inc. 100 Light Street, 8th Floor Baltimore, MD 21202 Telephone: (800) 638-7411 | Boenning and Scattergood 4 Tower Bridge, Suite 300 200 Bar Harbor Drive West Conshonhocken, PA 19428 Telephone: (610) 862-5360 | Parker Hunter, Inc. 600 Grant Street – Suite 3100 Pittsburgh, PA 15219 Telephone: (412) 562-8000 |
The bid and ask price of the Corporation’s common stock were $25.25 and $25.90, respectively, as of February 15, 2008. The Corporation traditionally has paid regular quarterly cash dividends.
The following table sets forth the high and low sale market prices of the Corporation’s common stock as well as cash dividends paid for the quarterly periods presented:
| | | | | | | | | | | | | |
| | | Market Price | | | Cash | |
| | | High | | | Low | | | Close | | | Dividend | |
| | | | | | | | | | | | | |
| 2007: | | | | | | | | | | | | |
| Fourth quarter | | $ | 28.25 | | | $ | 25.20 | | | $ | 25.75 | | | $ | 0.67 | |
| Third quarter | | | 27.75 | | | | 25.00 | | | | 25.60 | | | | 0.29 | |
| Second quarter | | | 27.00 | | | | 23.50 | | | | 25.25 | | | | 0.29 | |
| First quarter | | | 31.00 | | | | 26.75 | | | | 27.25 | | | | 0.29 | |
| | | | | | | | | | | | | | | | | |
| 2006: | | | | | | | | | | | | | | | | |
| Fourth quarter | | $ | 30.00 | | | $ | 25.30 | | | $ | 29.25 | | | $ | 0.29 | |
| Third quarter | | | 29.00 | | | | 25.00 | | | | 25.90 | | | | 0.27 | |
| Second quarter | | | 29.00 | | | | 25.75 | | | | 27.00 | | | | 0.27 | |
| First quarter | | | 27.25 | | | | 25.05 | | | | 26.00 | | | | 0.27 | |
| | | | | | | | | | | | | | | | | |
| | | | | | | | | | | | | | | | | |
Number of Stockholders and Shares Outstanding
As of December 31, 2007, there were approximately 679 stockholders of record and 1,267,835 shares of common stock entitled to vote, receive dividends and considered outstanding for financial reporting purposes. The number of stockholders of record does not include the number of persons or entities who hold their stock in nominee or “street” name.
Dividend Reinvestment and Stock Purchase Plan
Common stockholders may have Corporation dividends reinvested to purchase additional shares. Participants may also make optional cash purchases of common stock through this plan and pay no brokerage commissions or fees. To obtain a plan document and authorization card call 800-757-5755.
Corporate Headquarters
Emclaire Financial Corp.
612 Main Street
Emlenton, PA 16373
Phone: 724-867-2311
Website: www. emclairefinancial.com
Subsidiary Bank
The Farmers National Bank of Emlenton
Website: www.farmersnb.com
Annual Meeting
The annual meeting of the Corporation’s stockholders will be held at 9:00 a.m., on Wednesday, April 23, 2008, at the main office building in Emlenton, Pennsylvania 16373.
Stockholder and Investor Information
Copies of annual reports, quarterly reports and related stockholder literature are available upon written request without charge to stockholders. Requests should be addressed to William C. Marsh, Chief Financial Officer, Emclaire Financial Corp., 612 Main Street, Emlenton, Pennsylvania 16373.
In addition, other public filings of the Corporation, including the Annual Report on Form 10-K, can be obtained from the Securities and Exchange Commission’s web site at http://www.sec.gov.
Independent Registered Public Accounting Firm
Beard Miller Company LLP
P.O. Box 101086
Pittsburgh, PA 15237
Special Counsel
Patton Boggs, L.L.P.
2550 M Street, N.W.
Washington, DC 20037
Registrar and Transfer Agent
Illinois Stock Transfer Company
209 West Jackson Boulevard, Suite 903
Chicago, IL 60606
www.ilstocktransfer.com
800-757-5755
NOTES