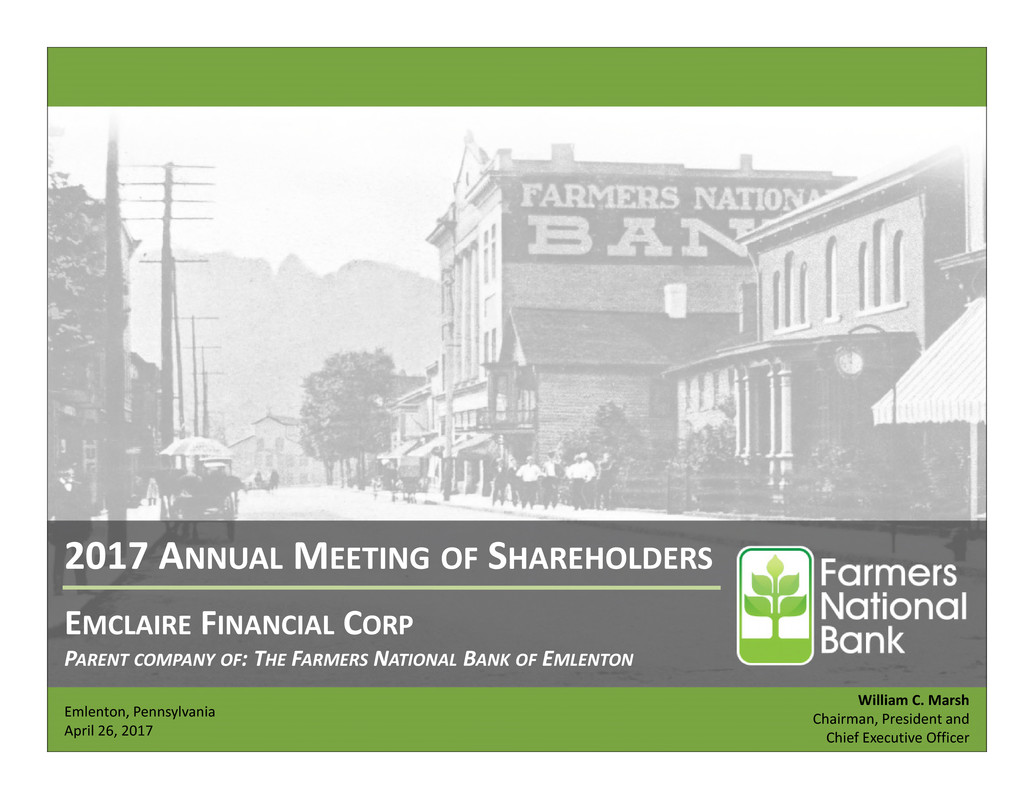
2017 ANNUAL MEETING OF SHAREHOLDERS EMCLAIRE FINANCIAL CORP PARENT COMPANY OF: THE FARMERS NATIONAL BANK OF EMLENTON Emlenton, Pennsylvania April 26, 2017 William C. Marsh Chairman, President and Chief Executive Officer
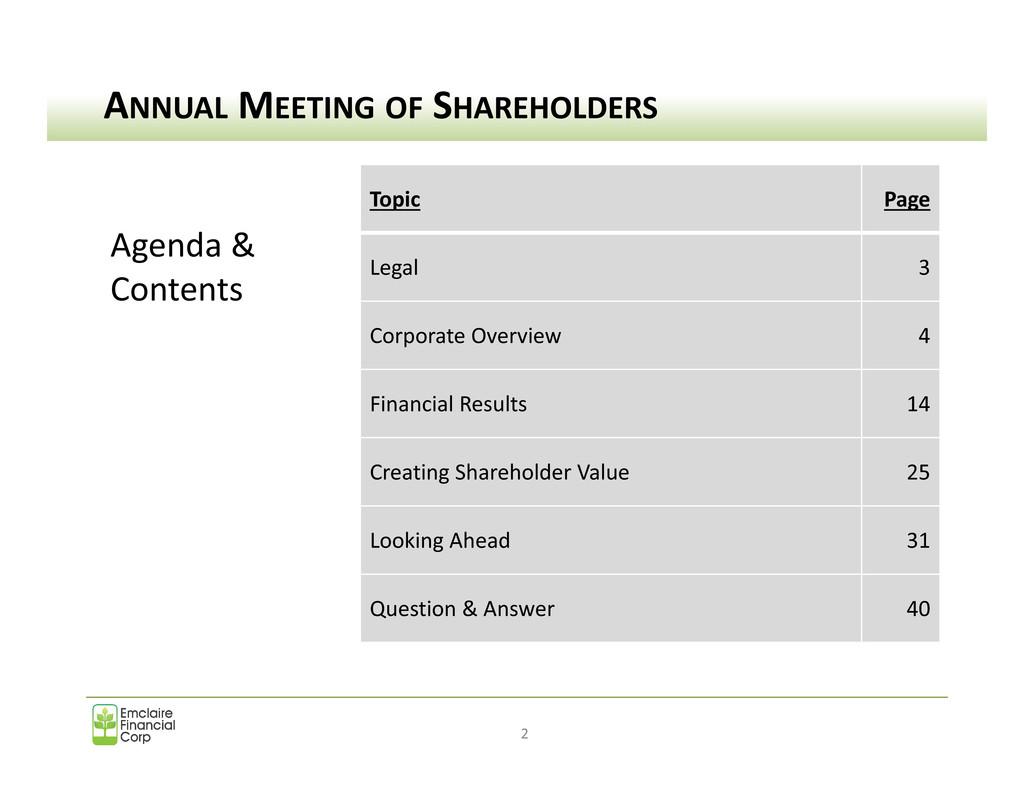
ANNUAL MEETING OF SHAREHOLDERS Agenda & Contents 2 Topic Page Legal 3 Corporate Overview 4 Financial Results 14 Creating Shareholder Value 25 Looking Ahead 31 Question & Answer 40
This presentation contains certain forward-looking statements and information relating to the Company that are based on the beliefs of management as well as assumptions made by and information currently available to management. These forward-looking statements relate to, among other things, expectations of the business environment in which we operate, projections of future performance, potential future credit experience, perceived opportunities in the market and statements regarding our mission and vision. Such statements reflect the current views of the Company with respect to future looking events and are subject to certain risks, uncertainties and assumptions. Should one or more of these risks or uncertainties materialize or should underlying assumptions prove incorrect, actual results may vary materially from those described herein as anticipated, believed, estimated, expected or intended. The Company does not intend to update these forward-looking statements. NOTE: This presentation will be available online at www.emclairefinancial.com. LEGAL 3
CORPORATE OVERVIEW 4 Balance Sheet Growth 2016 Snapshot Economy & Industry Mission & Vision Industry Consolidation
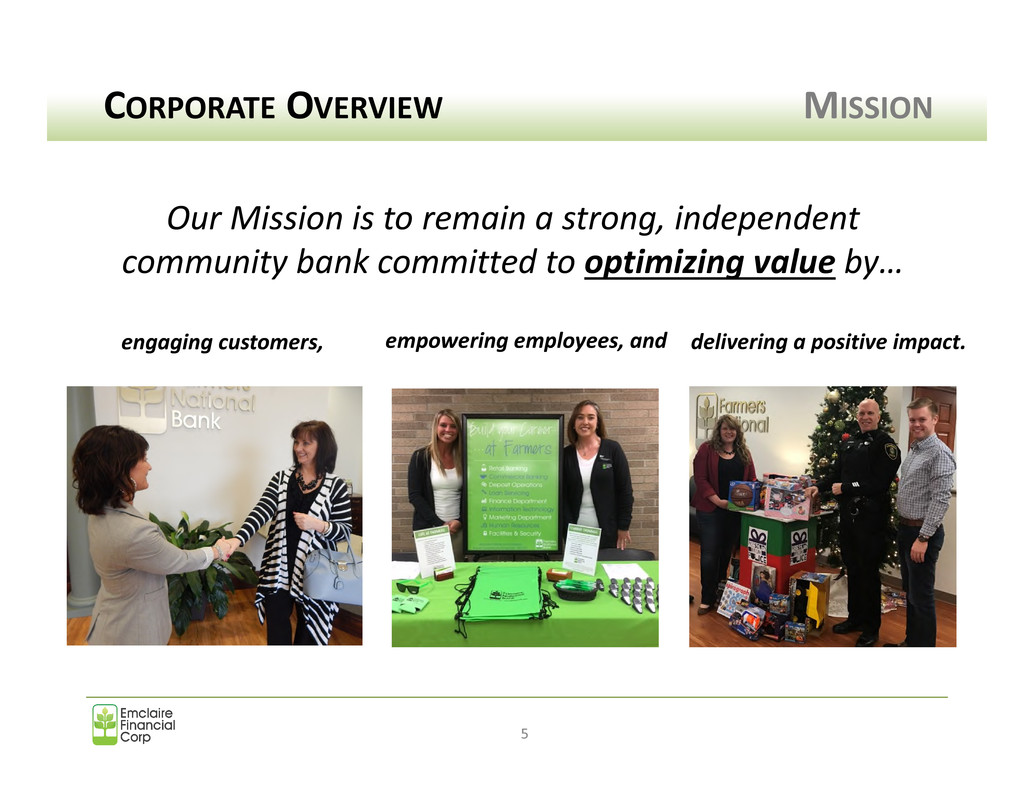
CORPORATE OVERVIEW MISSION 5 Our Mission is to remain a strong, independent community bank committed to optimizing value by… engaging customers, empowering employees, and delivering a positive impact.
CORPORATE OVERVIEW VISION 6 Vision Statement…. • Five year outlook • Reach total assets of $1 billion • Achieve ROAA of 0.70% or better and ROACE of 8.00% or better • Continue sensible expansion of our branch network • Maintain a traditional capital structure • Leverage our capital, franchise, systems, technology, and people to maximize value for shareholders
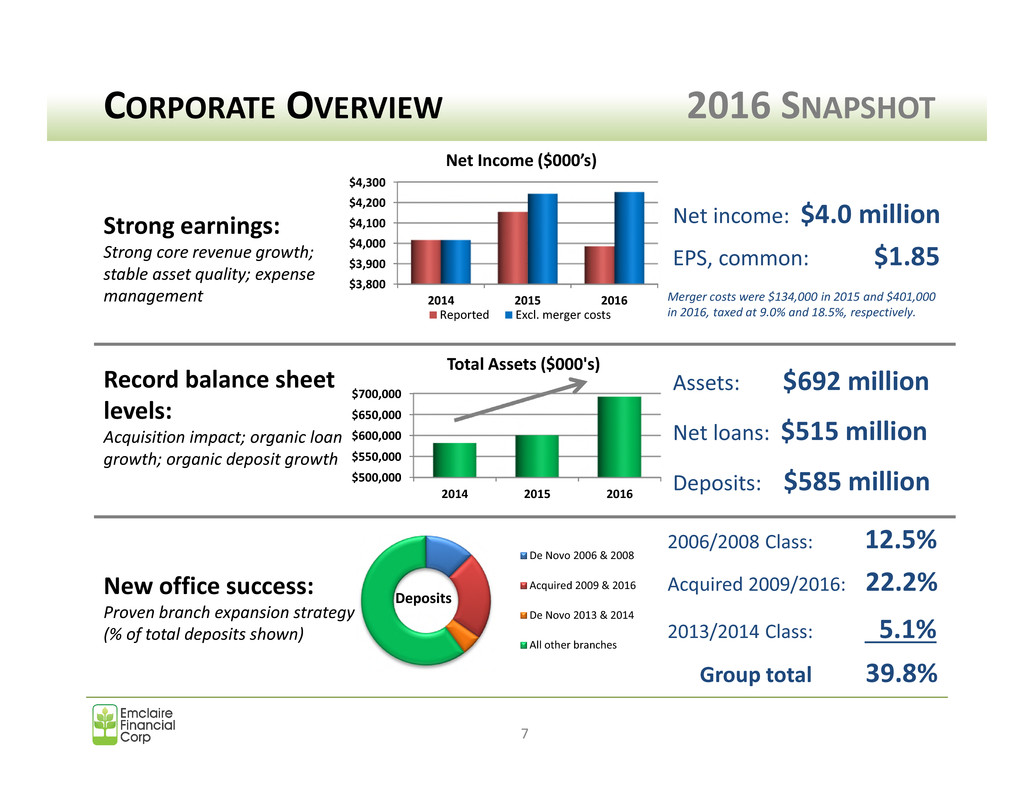
$3,800 $3,900 $4,000 $4,100 $4,200 $4,300 2014 2015 2016 Net Income ($000’s) Reported Excl. merger costs Strong earnings: Strong core revenue growth; stable asset quality; expense management Net income: $4.0 million EPS, common: $1.85 Merger costs were $134,000 in 2015 and $401,000 in 2016, taxed at 9.0% and 18.5%, respectively. Record balance sheet levels: Acquisition impact; organic loan growth; organic deposit growth Assets: $692 million Net loans: $515 million Deposits: $585 million New office success: Proven branch expansion strategy (% of total deposits shown) 2006/2008 Class: 12.5% Acquired 2009/2016: 22.2% 2013/2014 Class: 5.1% Group total 39.8% CORPORATE OVERVIEW 2016 SNAPSHOT 7 $500,000 $550,000 $600,000 $650,000 $700,000 2014 2015 2016 Total Assets ($000's) Deposits De Novo 2006 & 2008 Acquired 2009 & 2016 De Novo 2013 & 2014 All other branches
• Solid earnings • Record asset levels • Record deposit levels • Strong asset quality • Strategic expansion (transformative) – United-American Savings Bank merger completed – Aspinwall branch office opened Expanded platform for growth • Continued need for scale CORPORATE OVERVIEW 2016 SNAPSHOT 8
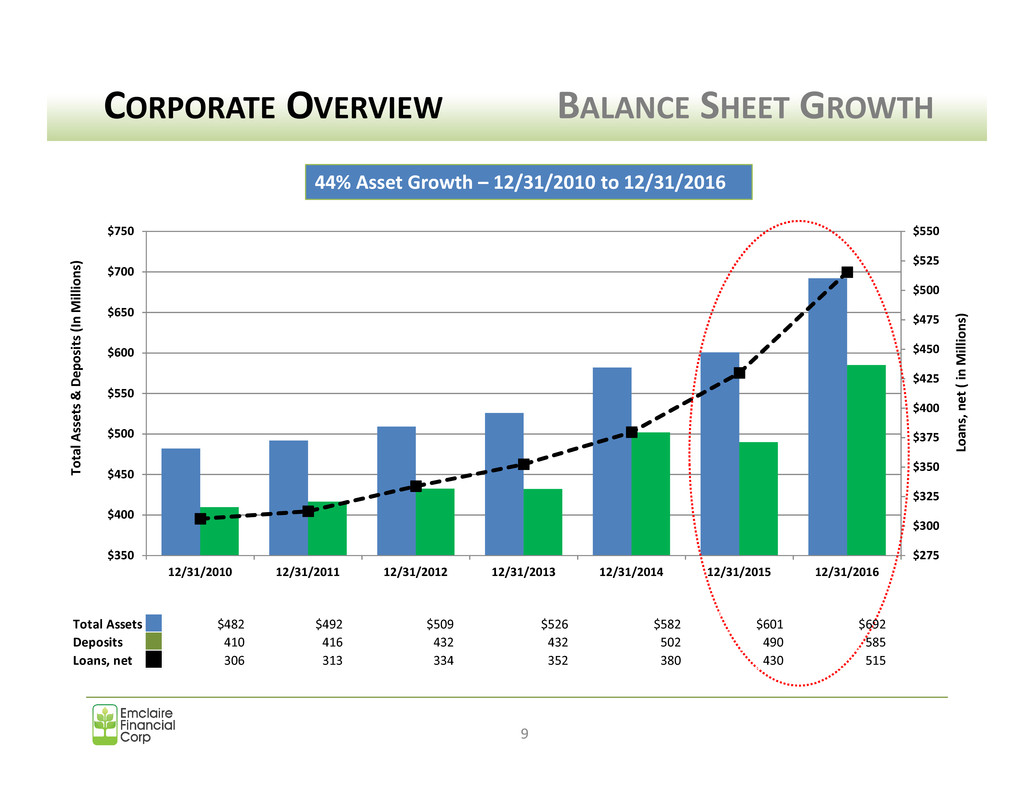
$275 $300 $325 $350 $375 $400 $425 $450 $475 $500 $525 $550 $350 $400 $450 $500 $550 $600 $650 $700 $750 12/31/2010 12/31/2011 12/31/2012 12/31/2013 12/31/2014 12/31/2015 12/31/2016 Lo an s, n et ( in M il li o n s) T o ta lA ss e ts & D e p o si ts (I n M il li o n s) CORPORATE OVERVIEW BALANCE SHEET GROWTH 9 44% Asset Growth – 12/31/2010 to 12/31/2016 Total Assets $482 $492 $509 $526 $582 $601 $692 Deposits 410 416 432 432 502 490 585 Loans, net 306 313 334 352 380 430 515
• Interest rates – short term increase; long term rates have remained steady • Stock market – recent rise … levels sustainable? • Unemployment improving – marginally • Gasoline and energy prices have increased • Bank earnings continue to improve • Bank M&A activity remains strong; bolstering valuations • Dodd-Frank regulatory costs continue to play a role in results (any relief?) CORPORATE OVERVIEW ECONOMY 10
+ Need for community banks to serve rural areas and unique customer needs + Loyal customer base for community banks + Continued prospects for building value in community banking ± Industry consolidation - Continued dramatic increase in new regulations post financial crisis - Yield curve flattening - Competitive loan pricing - Technology demands and risks; retailer breaches - Competitive threat from credit unions and non-bank financial companies and services (Walmart, Target, Paypal, ApplePay, etc.) CORPORATE OVERVIEW INDUSTRY 11
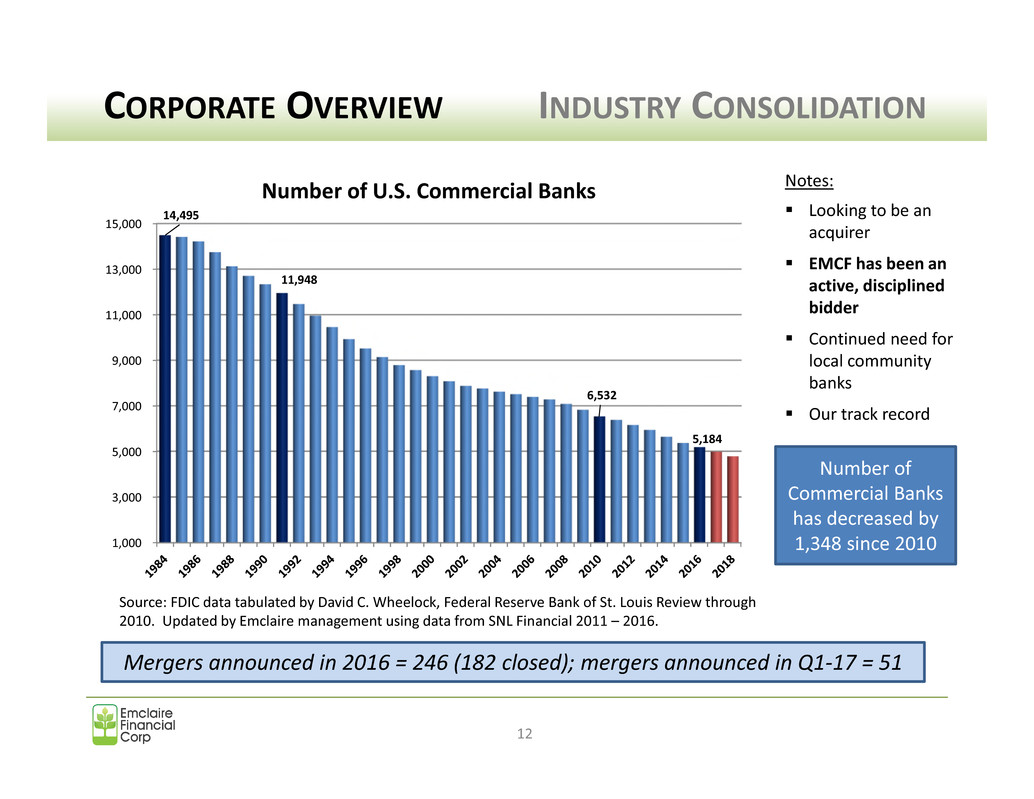
1,000 3,000 5,000 7,000 9,000 11,000 13,000 15,000 14,495 11,948 6,532 5,184 Number of U.S. Commercial Banks CORPORATE OVERVIEW INDUSTRY CONSOLIDATION 12 Mergers announced in 2016 = 246 (182 closed); mergers announced in Q1-17 = 51 Number of Commercial Banks has decreased by 1,348 since 2010 Notes: Looking to be an acquirer EMCF has been an active, disciplined bidder Continued need for local community banks Our track record Source: FDIC data tabulated by David C. Wheelock, Federal Reserve Bank of St. Louis Review through 2010. Updated by Emclaire management using data from SNL Financial 2011 – 2016.
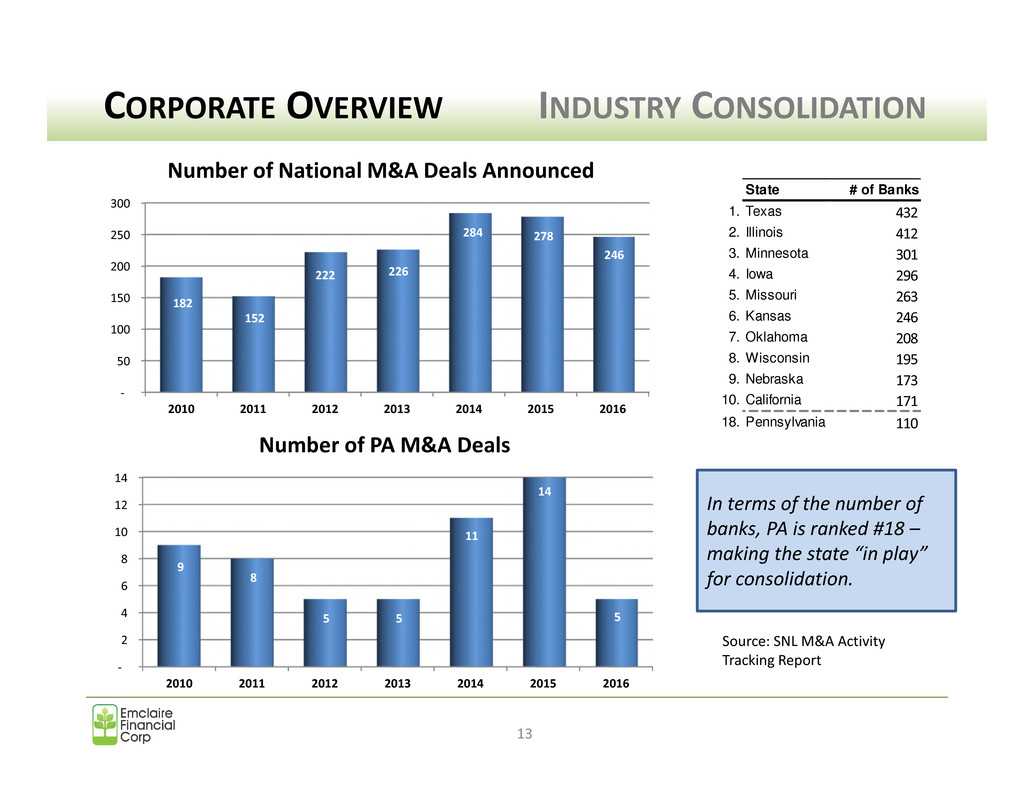
CORPORATE OVERVIEW INDUSTRY CONSOLIDATION 13 In terms of the number of banks, PA is ranked #18 – making the state “in play” for consolidation. Source: SNL M&A Activity Tracking Report - 50 100 150 200 250 300 2010 2011 2012 2013 2014 2015 2016 182 152 222 226 284 278 246 Number of National M&A Deals Announced - 2 4 6 8 10 12 14 2010 2011 2012 2013 2014 2015 2016 9 8 5 5 11 14 5 Number of PA M&A Deals State # of Banks 1. Texas 432 2. Illinois 412 3. Minnesota 301 4. Iowa 296 5. Missouri 263 6. Kansas 246 7. Oklahoma 208 8. Wisconsin 195 9. Nebraska 173 10. California 171 18. Pennsylvania 110
FINANCIAL RESULTS 14 Asset Quality Earnings Capital Consolidated Financial Highlights Q1-2017 Results
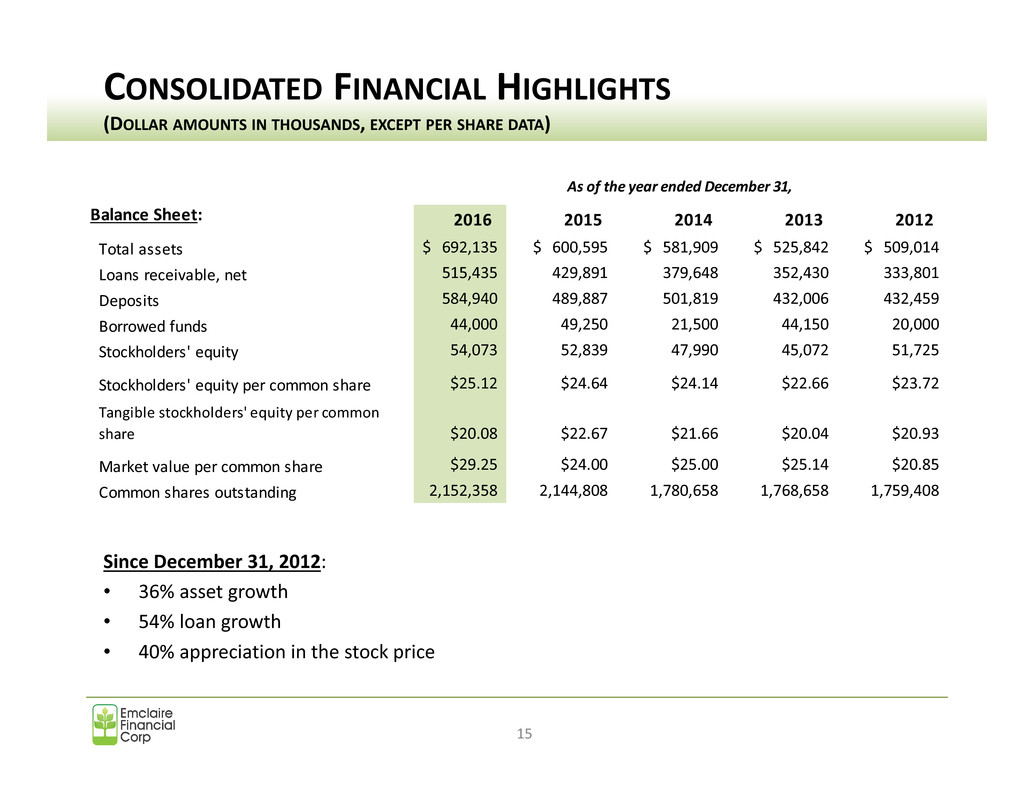
Since December 31, 2012: • 36% asset growth • 54% loan growth • 40% appreciation in the stock price CONSOLIDATED FINANCIAL HIGHLIGHTS (DOLLAR AMOUNTS IN THOUSANDS, EXCEPT PER SHARE DATA) 15 2016 2015 2014 2013 2012 Total assets 692,135$ 600,595$ 581,909$ 525,842$ 509,014$ Loans receivable, net 515,435 429,891 379,648 352,430 333,801 Deposits 584,940 489,887 501,819 432,006 432,459 Borrowed funds 44,000 49,250 21,500 44,150 20,000 Stockholders' equity 54,073 52,839 47,990 45,072 51,725 Stockholders' equity per common share $25.12 $24.64 $24.14 $22.66 $23.72 Tangible stockholders' equity per common share $20.08 $22.67 $21.66 $20.04 $20.93 Market value per common share $29.25 $24.00 $25.00 $25.14 $20.85 Common shares outstanding 2,152,358 2,144,808 1,780,658 1,768,658 1,759,408 As of the year ended December 31, Balance Sheet:
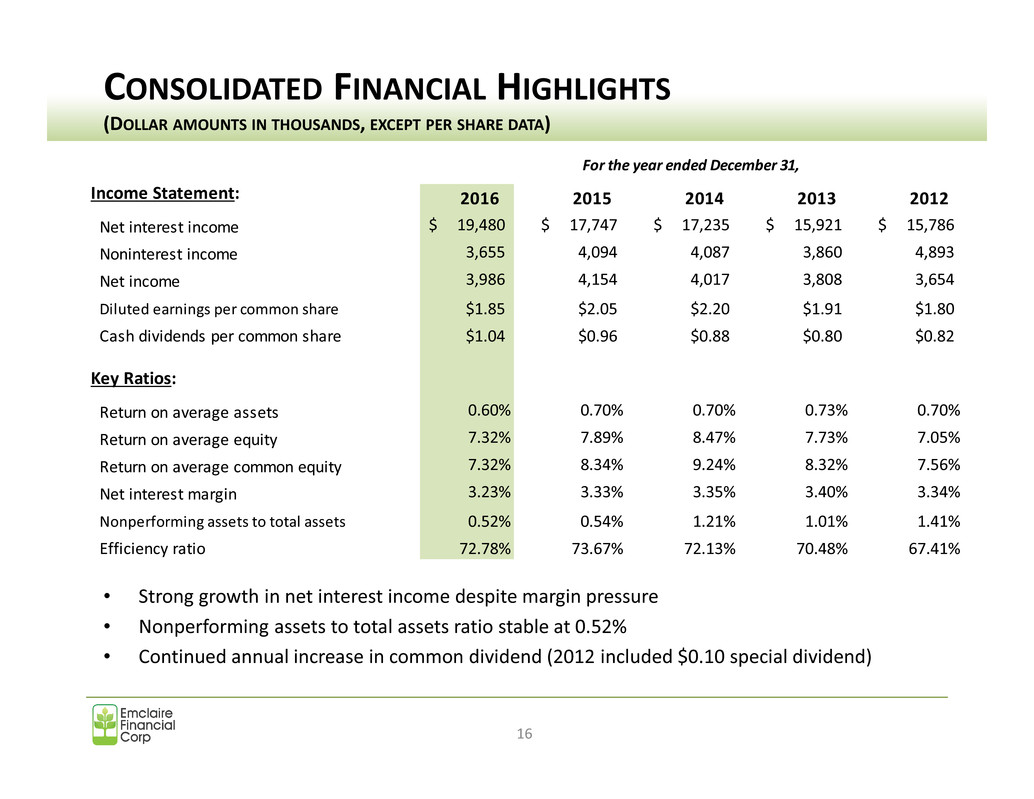
• Strong growth in net interest income despite margin pressure • Nonperforming assets to total assets ratio stable at 0.52% • Continued annual increase in common dividend (2012 included $0.10 special dividend) CONSOLIDATED FINANCIAL HIGHLIGHTS (DOLLAR AMOUNTS IN THOUSANDS, EXCEPT PER SHARE DATA) 16 2016 2015 2014 2013 2012 Net interest income 19,480$ 17,747$ 17,235$ 15,921$ 15,786$ Noninterest income 3,655 4,094 4,087 3,860 4,893 Net income 3,986 4,154 4,017 3,808 3,654 Diluted earnings per common share $1.85 $2.05 $2.20 $1.91 $1.80 Cash dividends per common share $1.04 $0.96 $0.88 $0.80 $0.82 Return on average assets 0.60% 0.70% 0.70% 0.73% 0.70% Return on average equity 7.32% 7.89% 8.47% 7.73% 7.05% Return on average common equity 7.32% 8.34% 9.24% 8.32% 7.56% Net interest margin 3.23% 3.33% 3.35% 3.40% 3.34% Nonperforming assets to total assets 0.52% 0.54% 1.21% 1.01% 1.41% Efficiency ratio 72.78% 73.67% 72.13% 70.48% 67.41% For the year ended December 31, Income Statement: Key Ratios:
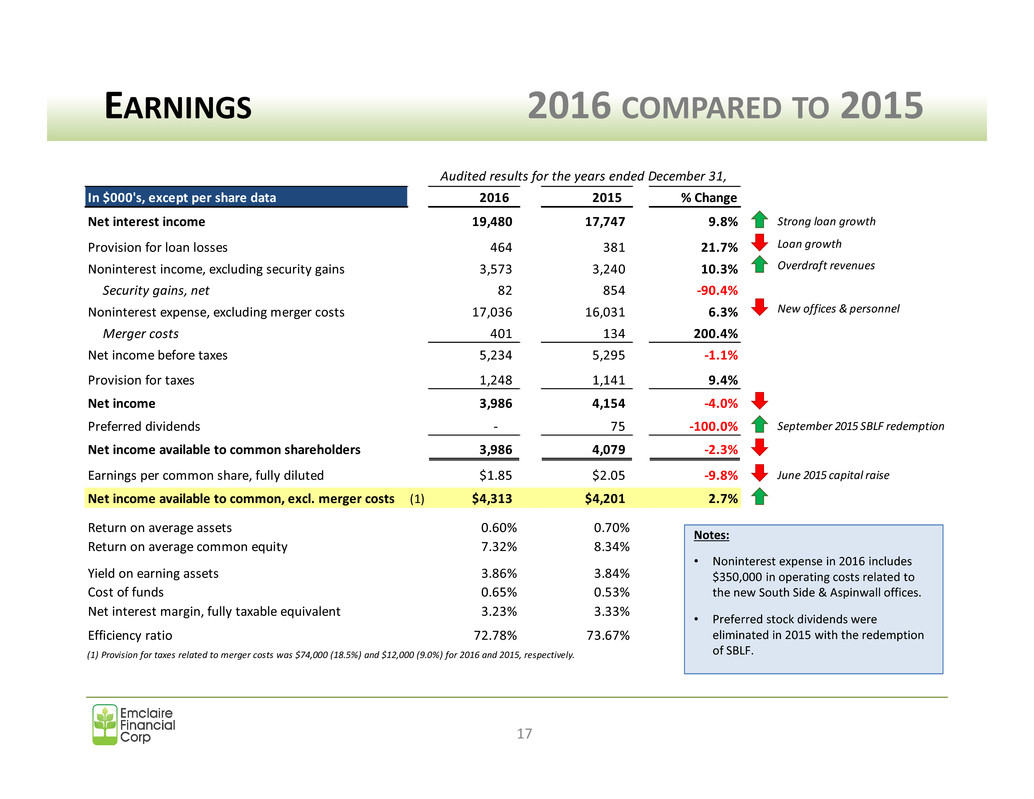
In $000's, except per share data 2016 2015 % Change Net interest income 19,480 17,747 9.8% Strong loan growth Provision for loan losses 464 381 21.7% Loan growth Noninterest income, excluding security gains 3,573 3,240 10.3% Overdraft revenues Security gains, net 82 854 -90.4% Noninterest expense, excluding merger costs 17,036 16,031 6.3% New offices & personnel Merger costs 401 134 200.4% Net income before taxes 5,234 5,295 -1.1% Provision for taxes 1,248 1,141 9.4% Net income 3,986 4,154 -4.0%9.4% Preferred dividends - 75 -100.0% September 2015 SBLF redemption9.4% Net income available to common shareholders 3,986 4,079 -2.3% Earnings per common share, fully diluted $1.85 $2.05 -9.8% June 2015 capital raise Net income available to common, excl. merger costs (1) $4,313 $4,201 2.7% Return on average assets 0.60% 0.70% Return on average common equity 7.32% 8.34% Yield on earning assets 3.86% 3.84% Cost of funds 0.65% 0.53% Net interest margin, fully taxable equivalent 3.23% 3.33% Efficiency ratio 72.78% 73.67% (1) Provision for taxes related to merger costs was $74,000 (18.5%) and $12,000 (9.0%) for 2016 and 2015, respectively. Audited results for the years ended December 31, EARNINGS 2016 COMPARED TO 2015 17 Notes: • Noninterest expense in 2016 includes $350,000 in operating costs related to the new South Side & Aspinwall offices. • Preferred stock dividends were eliminated in 2015 with the redemption of SBLF.
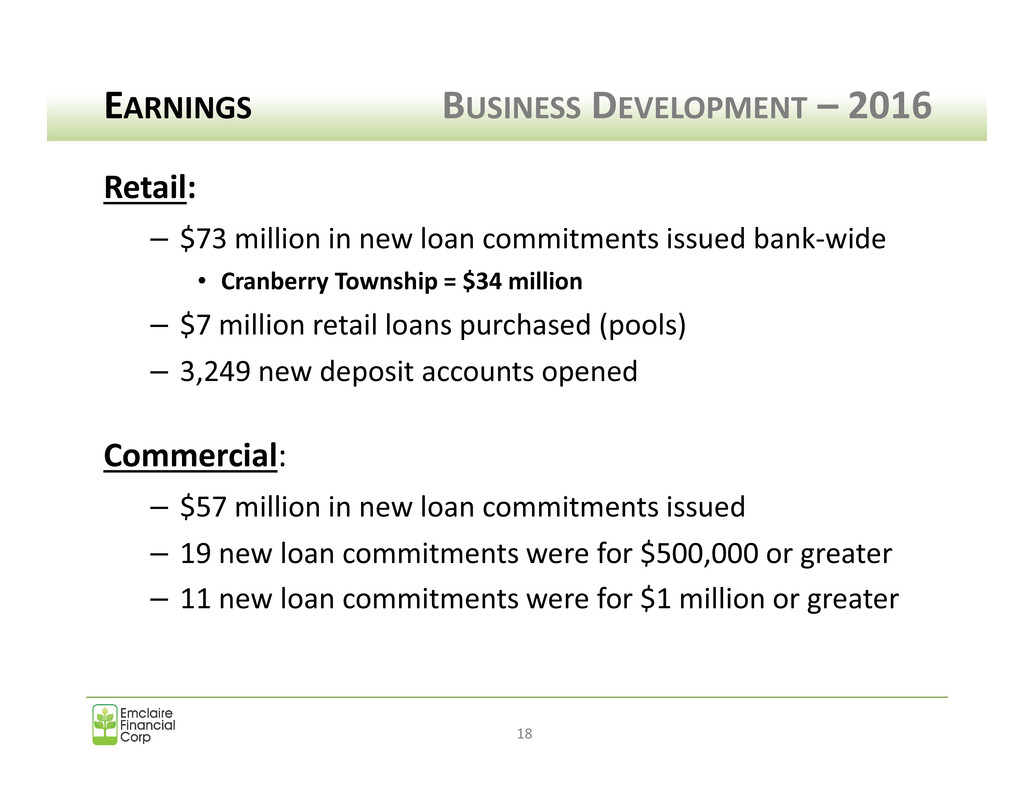
EARNINGS BUSINESS DEVELOPMENT – 2016 18 Retail: – $73 million in new loan commitments issued bank-wide • Cranberry Township = $34 million – $7 million retail loans purchased (pools) – 3,249 new deposit accounts opened Commercial: – $57 million in new loan commitments issued – 19 new loan commitments were for $500,000 or greater – 11 new loan commitments were for $1 million or greater
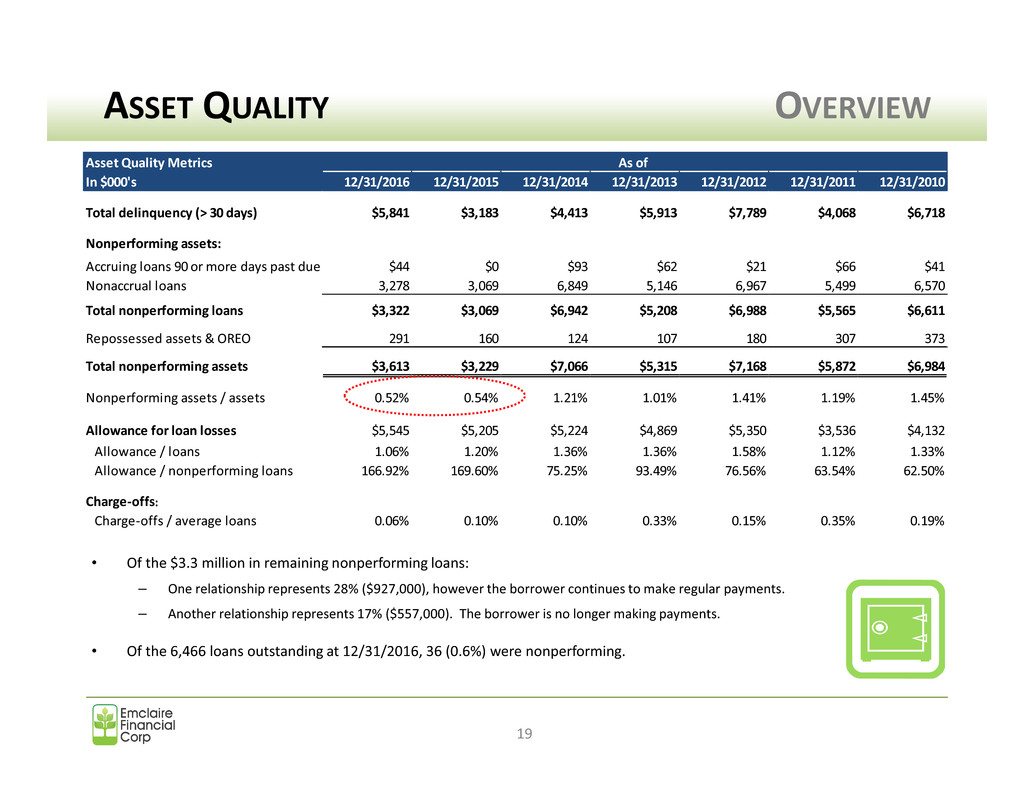
Asset Quality Metrics In $000's 12/31/2016 12/31/2015 12/31/2014 12/31/2013 12/31/2012 12/31/2011 12/31/2010 Total delinquency (> 30 days) $5,841 $3,183 $4,413 $5,913 $7,789 $4,068 $6,718 Nonperforming assets: Accruing loans 90 or more days past due $44 $0 $93 $62 $21 $66 $41 Nonaccrual loans 3,278 3,069 6,849 5,146 6,967 5,499 6,570 Total nonperforming loans $3,322 $3,069 $6,942 $5,208 $6,988 $5,565 $6,611 Repossessed assets & OREO 291 160 124 107 180 307 373 Total nonperforming assets $3,613 $3,229 $7,066 $5,315 $7,168 $5,872 $6,984 Nonperforming assets / assets 0.52% 0.54% 1.21% 1.01% 1.41% 1.19% 1.45% Allowance for loan losses $5,545 $5,205 $5,224 $4,869 $5,350 $3,536 $4,1321. 3 Allowance / loans 1.06% 1.20% 1.36% 1.36% 1.58% 1.12% 1.33% Allowance / nonperforming loans 166.92% 169.60% 75.25% 93.49% 76.56% 63.54% 62.50% Charge-offs: Charge-offs / average loans 0.06% 0.10% 0.10% 0.33% 0.15% 0.35% 0.19% As of ASSET QUALITY OVERVIEW 19 • Of the $3.3 million in remaining nonperforming loans: – One relationship represents 28% ($927,000), however the borrower continues to make regular payments. – Another relationship represents 17% ($557,000). The borrower is no longer making payments. • Of the 6,466 loans outstanding at 12/31/2016, 36 (0.6%) were nonperforming.
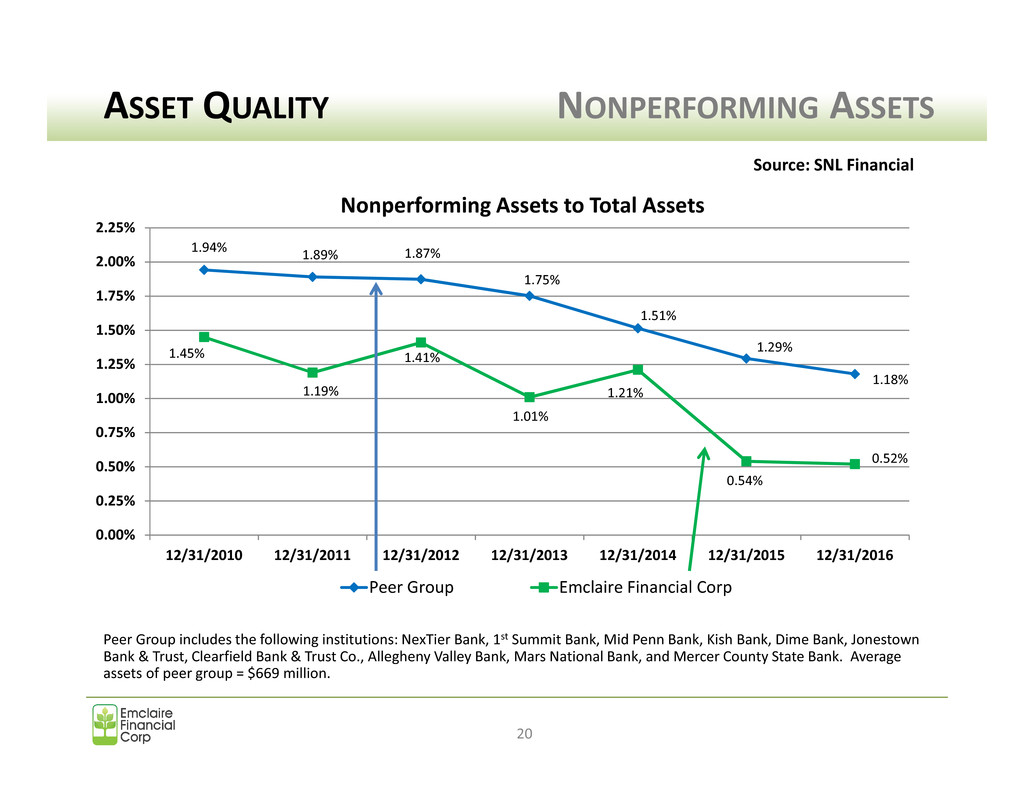
1.94% 1.89% 1.87% 1.75% 1.51% 1.29% 1.18% 1.45% 1.19% 1.41% 1.01% 1.21% 0.54% 0.52% 0.00% 0.25% 0.50% 0.75% 1.00% 1.25% 1.50% 1.75% 2.00% 2.25% 12/31/2010 12/31/2011 12/31/2012 12/31/2013 12/31/2014 12/31/2015 12/31/2016 Nonperforming Assets to Total Assets Peer Group Emclaire Financial Corp ASSET QUALITY NONPERFORMING ASSETS 20 Peer Group includes the following institutions: NexTier Bank, 1st Summit Bank, Mid Penn Bank, Kish Bank, Dime Bank, Jonestown Bank & Trust, Clearfield Bank & Trust Co., Allegheny Valley Bank, Mars National Bank, and Mercer County State Bank. Average assets of peer group = $669 million. Source: SNL Financial
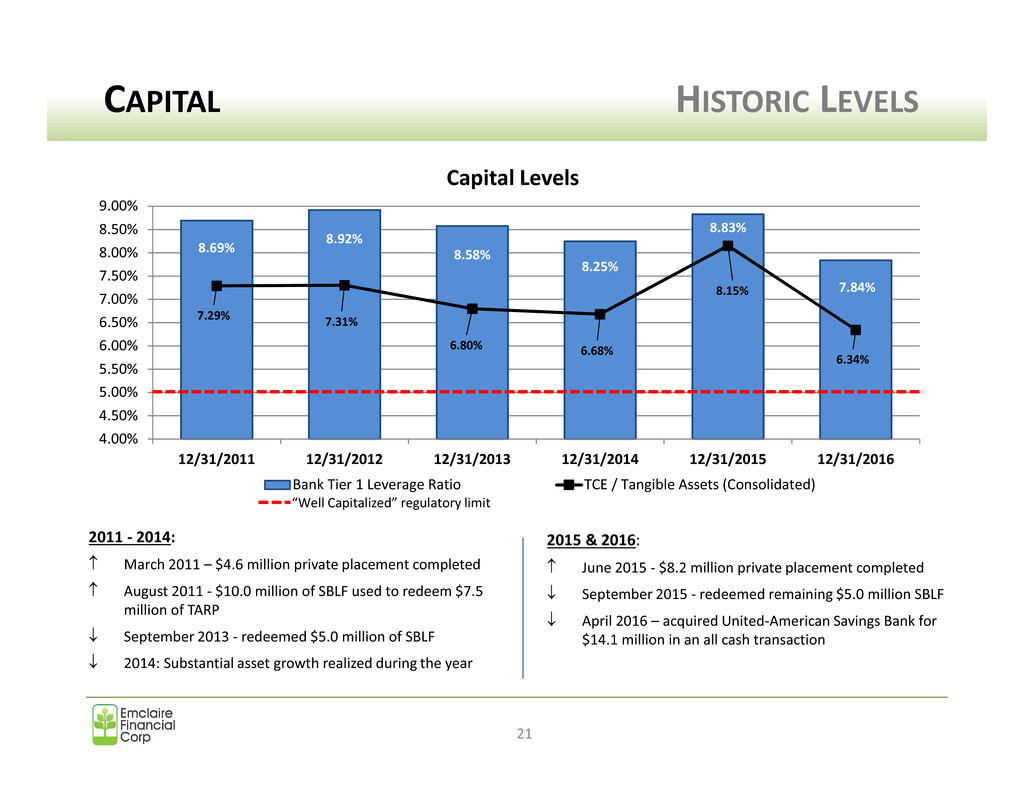
8.69% 8.92% 8.58% 8.25% 8.83% 7.84% 7.29% 7.31% 6.80% 6.68% 8.15% 6.34% 4.00% 4.50% 5.00% 5.50% 6.00% 6.50% 7.00% 7.50% 8.00% 8.50% 9.00% 12/31/2011 12/31/2012 12/31/2013 12/31/2014 12/31/2015 12/31/2016 Capital Levels Bank Tier 1 Leverage Ratio TCE / Tangible Assets (Consolidated) CAPITAL HISTORIC LEVELS 21 2011 - 2014: ↑ March 2011 – $4.6 million private placement completed ↑ August 2011 - $10.0 million of SBLF used to redeem $7.5 million of TARP ↓ September 2013 - redeemed $5.0 million of SBLF ↓ 2014: Substantial asset growth realized during the year “Well Capitalized” regulatory limit 2015 & 2016: ↑ June 2015 - $8.2 million private placement completed ↓ September 2015 - redeemed remaining $5.0 million SBLF ↓ April 2016 – acquired United-American Savings Bank for $14.1 million in an all cash transaction
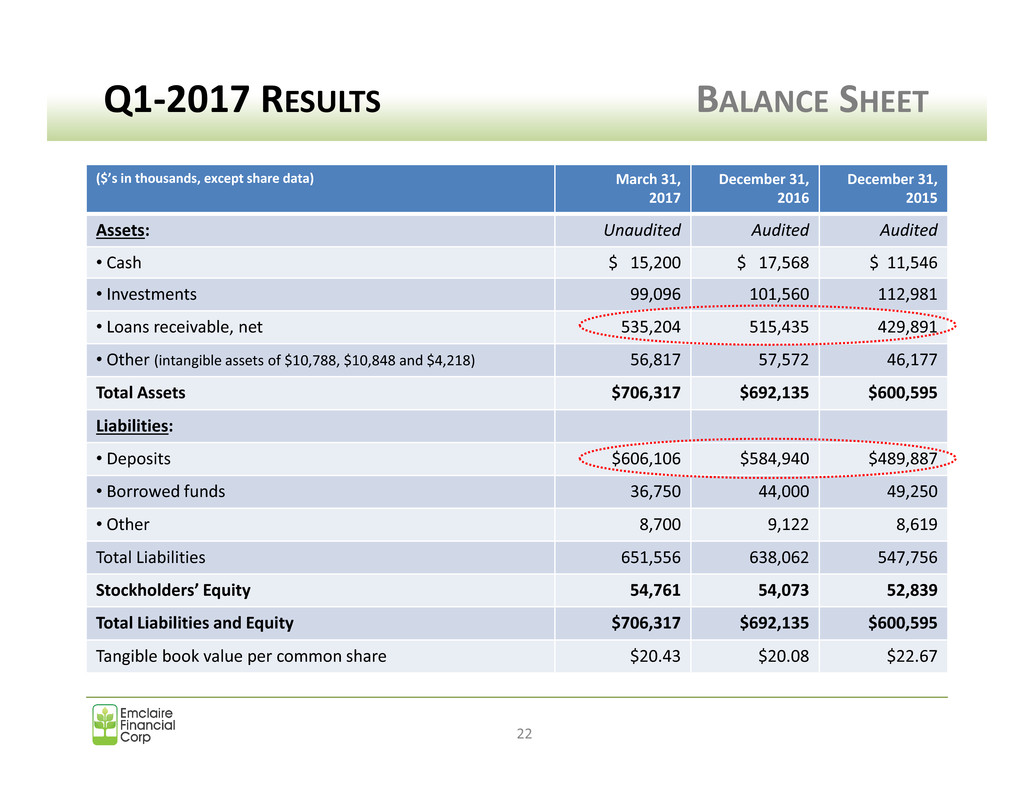
Q1-2017 RESULTS BALANCE SHEET 22 ($’s in thousands, except share data) March 31, 2017 December 31, 2016 December 31, 2015 Assets: Unaudited Audited Audited • Cash $ 15,200 $ 17,568 $ 11,546 • Investments 99,096 101,560 112,981 • Loans receivable, net 535,204 515,435 429,891 • Other (intangible assets of $10,788, $10,848 and $4,218) 56,817 57,572 46,177 Total Assets $706,317 $692,135 $600,595 Liabilities: • Deposits $606,106 $584,940 $489,887 • Borrowed funds 36,750 44,000 49,250 • Other 8,700 9,122 8,619 Total Liabilities 651,556 638,062 547,756 Stockholders’ Equity 54,761 54,073 52,839 Total Liabilities and Equity $706,317 $692,135 $600,595 Tangible book value per common share $20.43 $20.08 $22.67
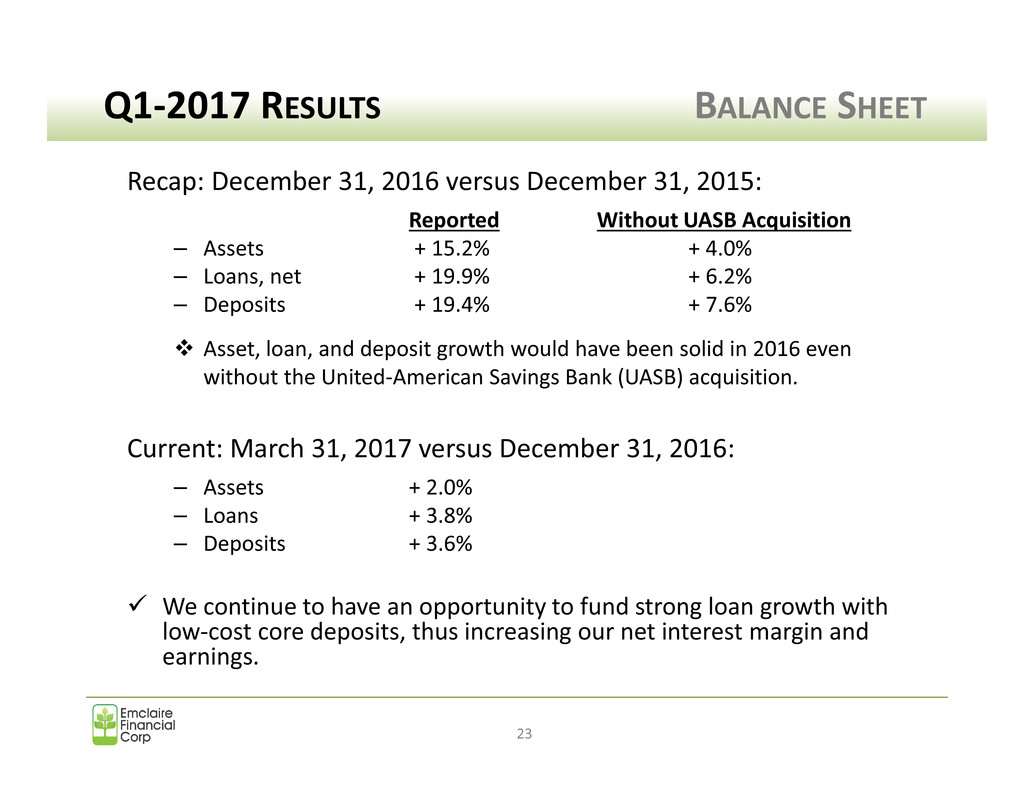
Q1-2017 RESULTS BALANCE SHEET 23 Recap: December 31, 2016 versus December 31, 2015: Reported Without UASB Acquisition – Assets + 15.2% + 4.0% – Loans, net + 19.9% + 6.2% – Deposits + 19.4% + 7.6% Asset, loan, and deposit growth would have been solid in 2016 even without the United-American Savings Bank (UASB) acquisition. Current: March 31, 2017 versus December 31, 2016: – Assets + 2.0% – Loans + 3.8% – Deposits + 3.6% We continue to have an opportunity to fund strong loan growth with low-cost core deposits, thus increasing our net interest margin and earnings.
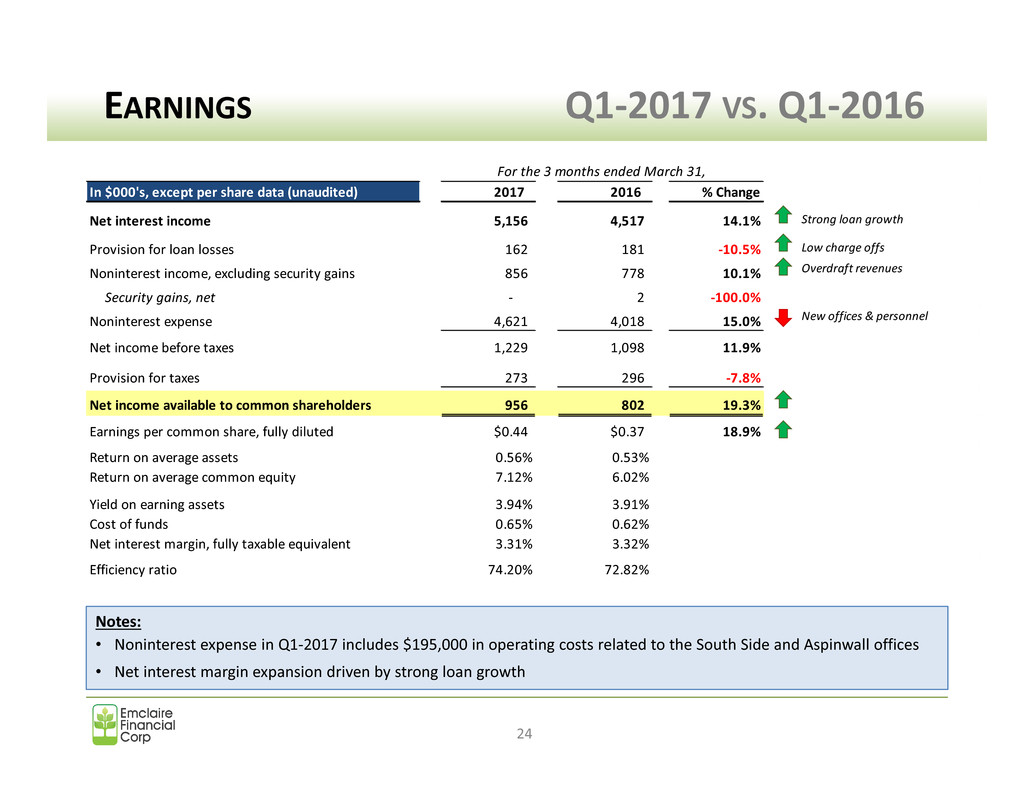
EARNINGS Q1-2017 VS. Q1-2016 24 Notes: • Noninterest expense in Q1-2017 includes $195,000 in operating costs related to the South Side and Aspinwall offices • Net interest margin expansion driven by strong loan growth In $000's, except per share data (unaudited) 2017 2016 % Change Net interest income 5,156 4,517 14.1% Strong loan growth Provision for loan losses 162 181 -10.5% Low charge offs Noninterest income, excluding security gains 856 778 10.1% Overdraft revenues Security gains, net - 2 -100.0% Noninterest expense 4,621 4,018 15.0% New offices & personnel Net income before taxes 1,229 1,098 11.9% Provision for taxes 273 296 -7.8% Net income available to common shareholders 956 802 19.3% Earnings per common share, fully diluted $0.44 $0.37 18.9% Return on average assets 0.56% 0.53% Return on average common equity 7.12% 6.02% Yield on earning assets 3.94% 3.91% Cost of funds 0.65% 0.62% Net interest margin, fully taxable equivalent 3.31% 3.32% Efficiency ratio 74.20% 72.82% For the 3 months ended March 31,
CREATING SHAREHOLDER VALUE 25 Stock Performance – 2016 Stock Performance – Long Term Dividend Recap Value Proposition
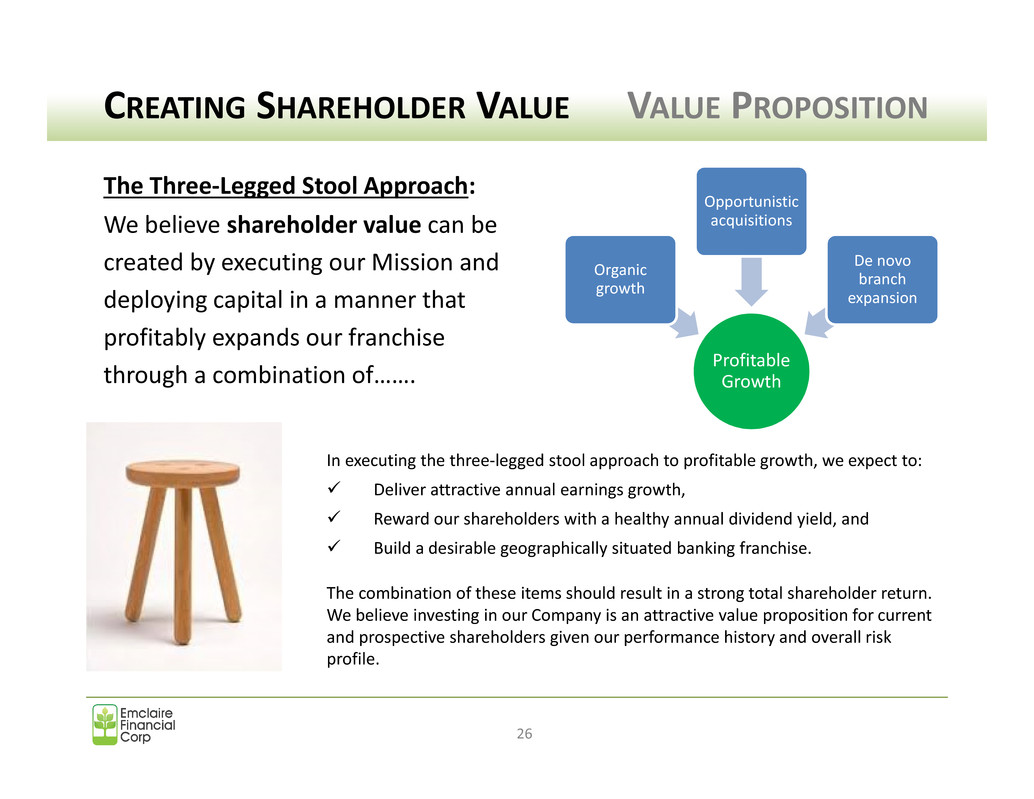
CREATING SHAREHOLDER VALUE VALUE PROPOSITION 26 The Three-Legged Stool Approach: We believe shareholder value can be created by executing our Mission and deploying capital in a manner that profitably expands our franchise through a combination of……. In executing the three-legged stool approach to profitable growth, we expect to: Deliver attractive annual earnings growth, Reward our shareholders with a healthy annual dividend yield, and Build a desirable geographically situated banking franchise. The combination of these items should result in a strong total shareholder return. We believe investing in our Company is an attractive value proposition for current and prospective shareholders given our performance history and overall risk profile. Profitable Growth Organic growth Opportunistic acquisitions De novo branch expansion
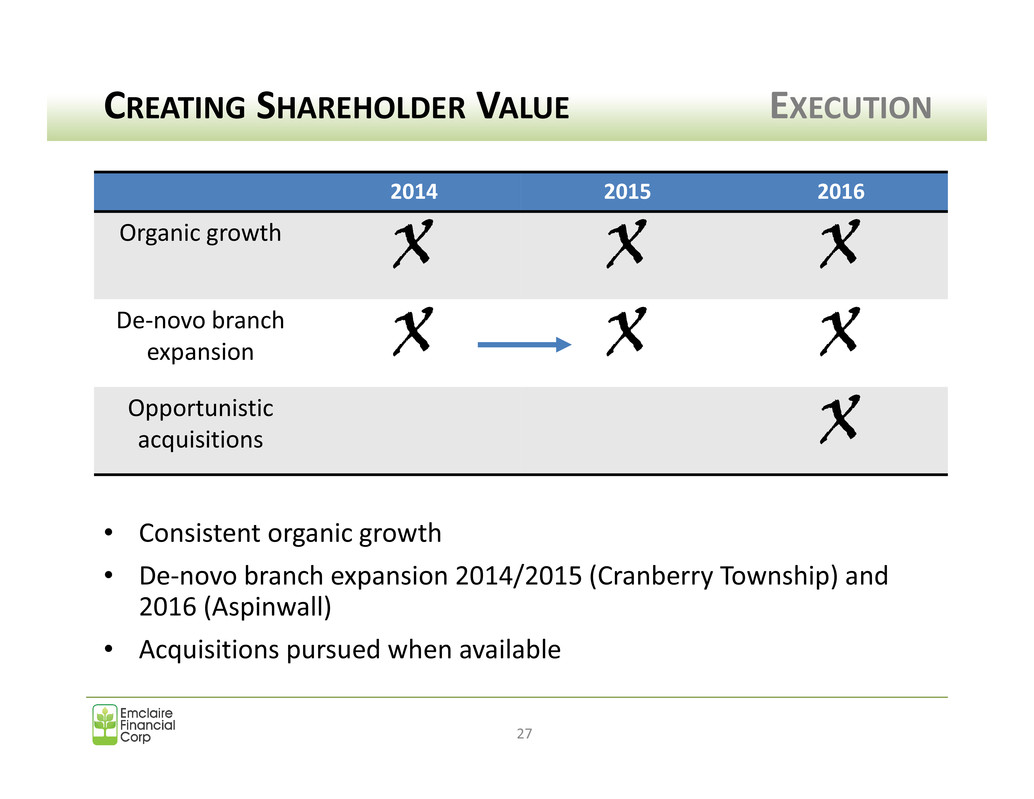
CREATING SHAREHOLDER VALUE EXECUTION 27 • Consistent organic growth • De-novo branch expansion 2014/2015 (Cranberry Township) and 2016 (Aspinwall) • Acquisitions pursued when available 2014 2015 2016 Organic growth X X X De-novo branch expansion X X X Opportunistic acquisitions X
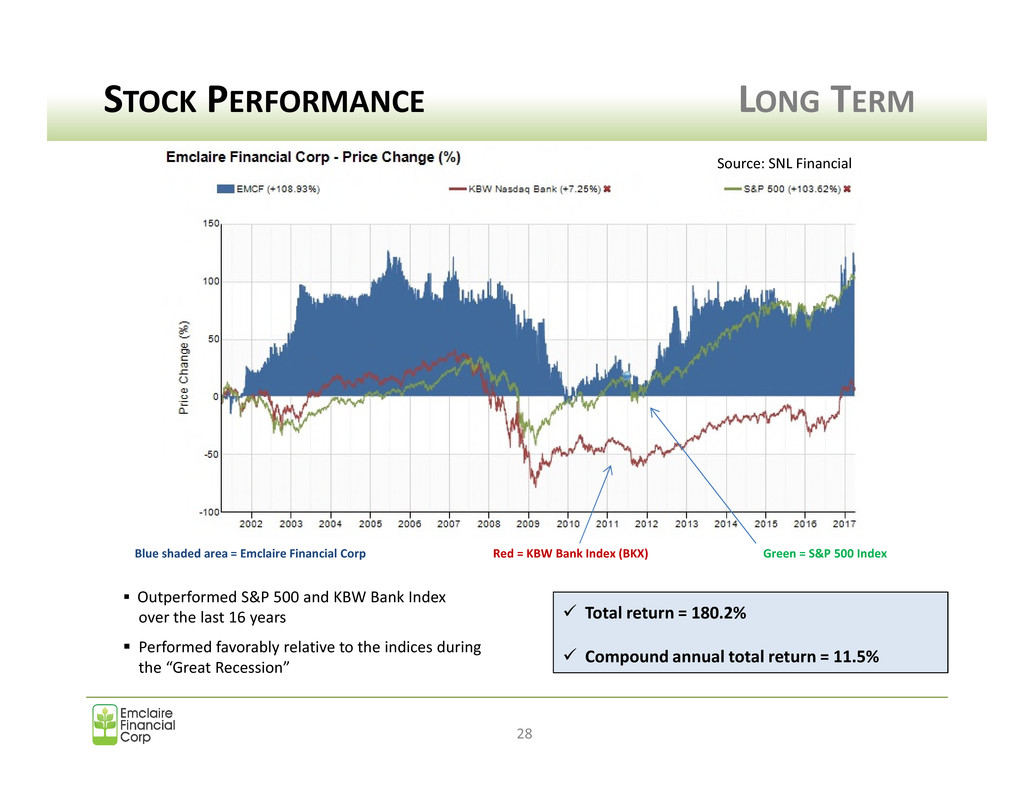
STOCK PERFORMANCE LONG TERM 28 Blue shaded area = Emclaire Financial Corp Red = KBW Bank Index (BKX) Green = S&P 500 Index Outperformed S&P 500 and KBW Bank Index over the last 16 years Performed favorably relative to the indices during the “Great Recession” Total return = 180.2% Compound annual total return = 11.5% Source: SNL Financial
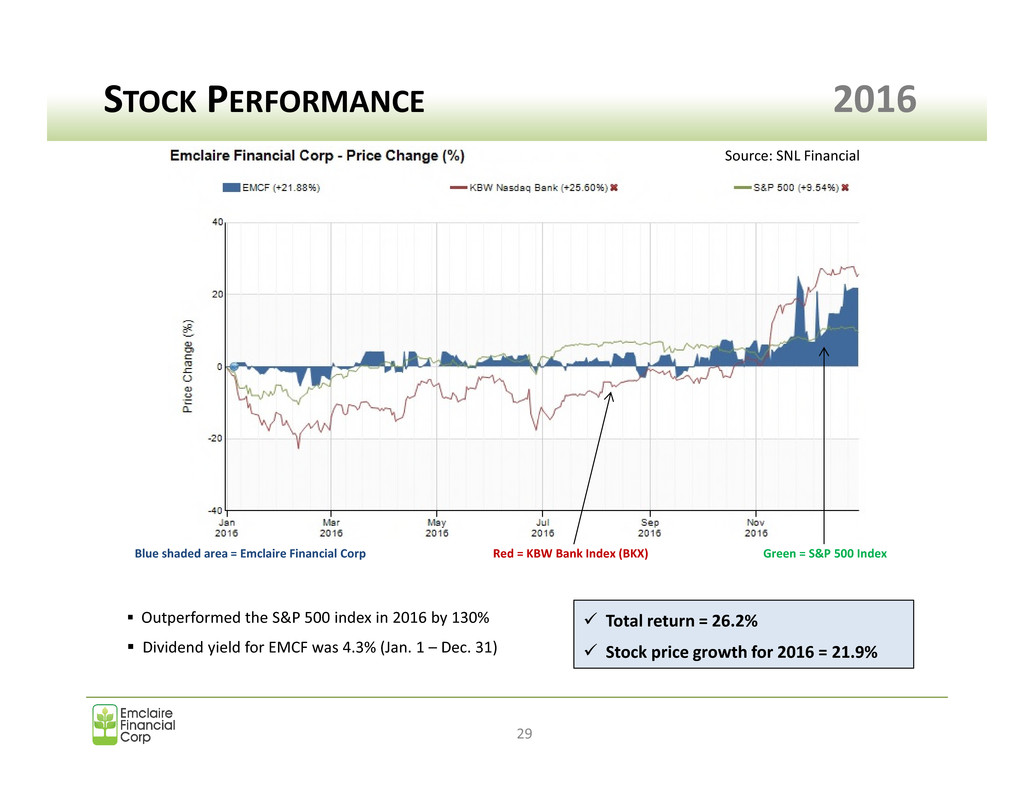
STOCK PERFORMANCE 2016 29 Blue shaded area = Emclaire Financial Corp Red = KBW Bank Index (BKX) Green = S&P 500 Index Source: SNL Financial Outperformed the S&P 500 index in 2016 by 130% Dividend yield for EMCF was 4.3% (Jan. 1 – Dec. 31) Total return = 26.2% Stock price growth for 2016 = 21.9%
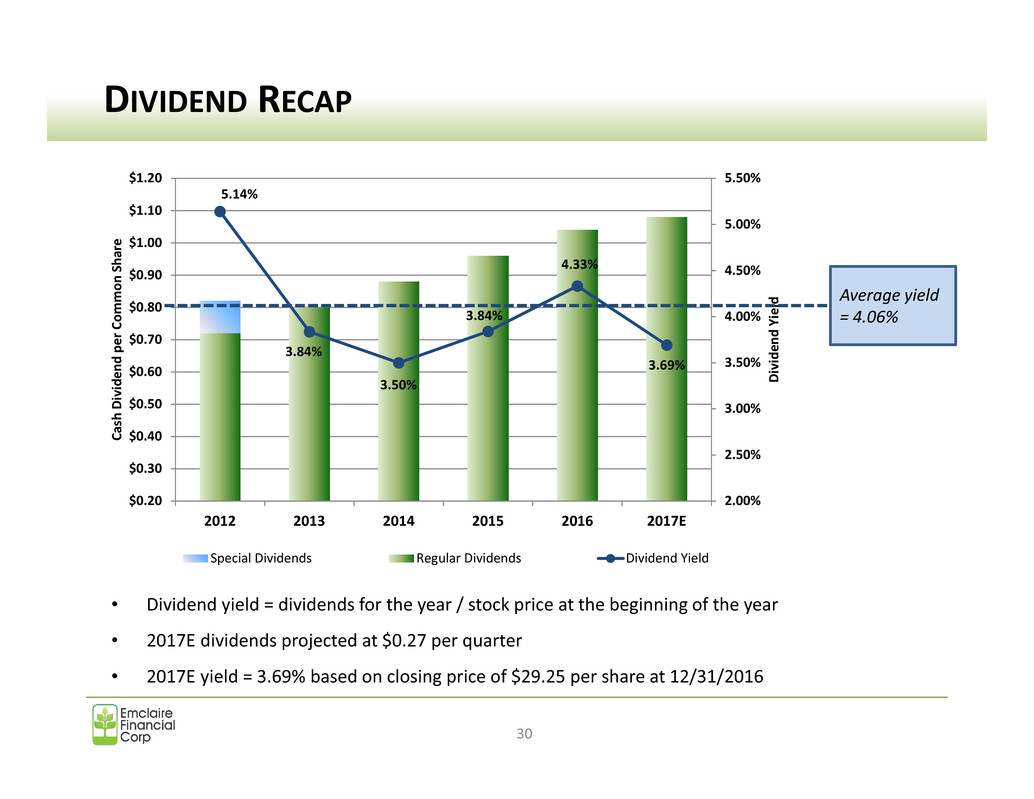
5.14% 3.84% 3.50% 3.84% 4.33% 3.69% 2.00% 2.50% 3.00% 3.50% 4.00% 4.50% 5.00% 5.50% $0.20 $0.30 $0.40 $0.50 $0.60 $0.70 $0.80 $0.90 $1.00 $1.10 $1.20 2012 2013 2014 2015 2016 2017E D iv id e n d Y ie ld C as h D iv id e n d p e r C o m m o n Sh ar e Special Dividends Regular Dividends Dividend Yield DIVIDEND RECAP 30 • Dividend yield = dividends for the year / stock price at the beginning of the year • 2017E dividends projected at $0.27 per quarter • 2017E yield = 3.69% based on closing price of $29.25 per share at 12/31/2016 Average yield = 4.06%
LOOKING AHEAD 31 Strategy Recap Investing in People and Technology Market Assessment Our Franchise
OUR FRANCHISE FRANCHISE MAP 32
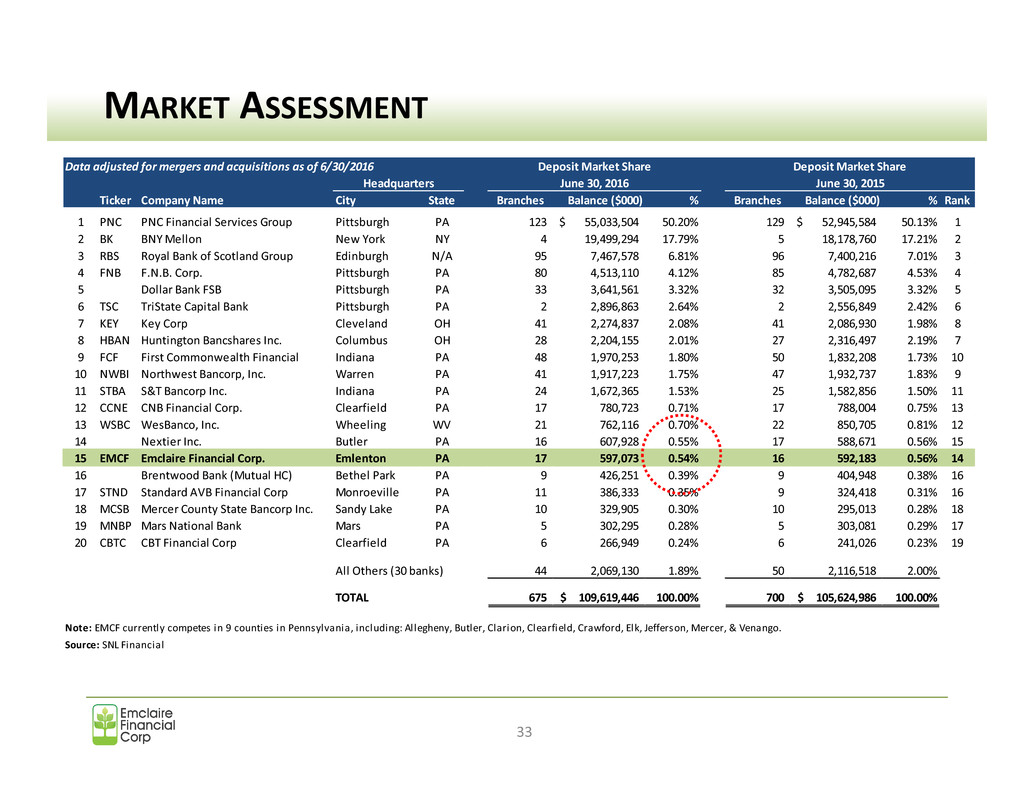
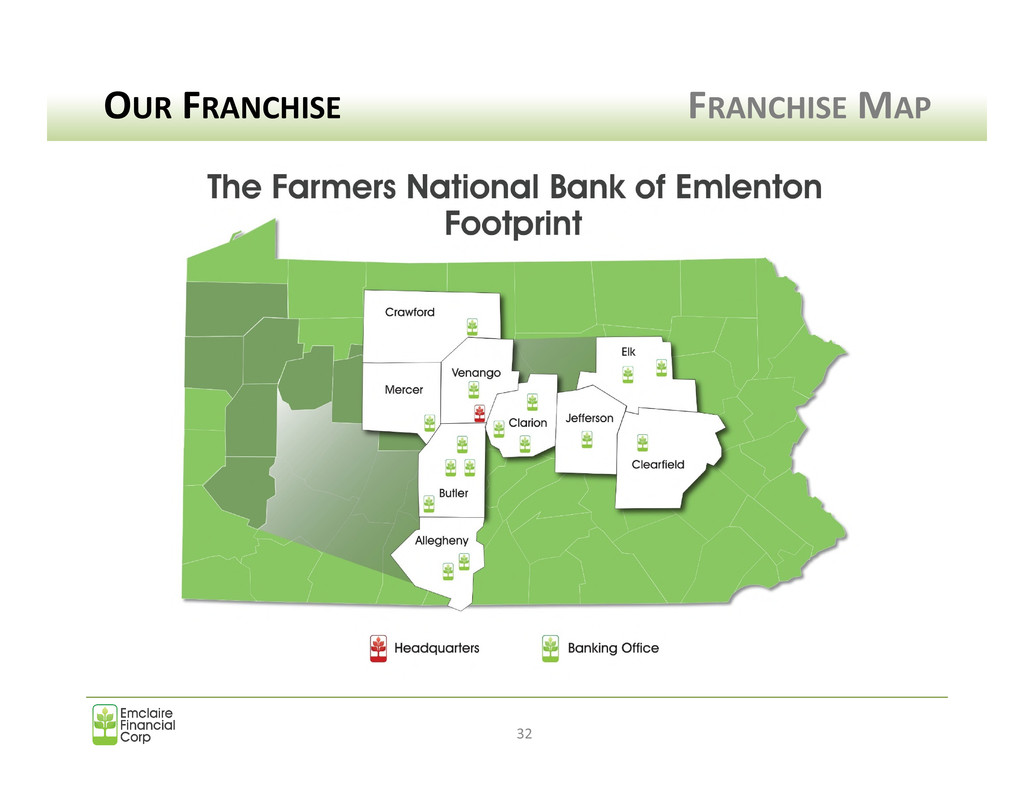
MARKET ASSESSMENT Data adjusted for mergers and acquisitions as of 6/30/2016 Ticker Company Name City State Branches Balance ($000) % Branches Balance ($000) % Rank 1 PNC PNC Financial Services Group Pittsburgh PA 123 55,033,504$ 50.20% 129 52,945,584$ 50.13% 1 2 BK BNY Mellon New York NY 4 19,499,294 17.79% 5 18,178,760 17.21% 2 3 RBS Royal Bank of Scotland Group Edinburgh N/A 95 7,467,578 6.81% 96 7,400,216 7.01% 3 4 FNB F.N.B. Corp. Pittsburgh PA 80 4,513,110 4.12% 85 4,782,687 4.53% 4 5 Dollar Bank FSB Pittsburgh PA 33 3,641,561 3.32% 32 3,505,095 3.32% 5 6 TSC TriState Capital Bank Pittsburgh PA 2 2,896,863 2.64% 2 2,556,849 2.42% 6 7 KEY Key Corp Cleveland OH 41 2,274,837 2.08% 41 2,086,930 1.98% 8 8 HBAN Huntington Bancshares Inc. Columbus OH 28 2,204,155 2.01% 27 2,316,497 2.19% 7 9 FCF First Commonwealth Financial Indiana PA 48 1,970,253 1.80% 50 1,832,208 1.73% 10 10 NWBI Northwest Bancorp, Inc. Warren PA 41 1,917,223 1.75% 47 1,932,737 1.83% 9 11 STBA S&T Bancorp Inc. Indiana PA 24 1,672,365 1.53% 25 1,582,856 1.50% 11 12 CCNE CNB Financial Corp. Clearfield PA 17 780,723 0.71% 17 788,004 0.75% 13 13 WSBC WesBanco, Inc. Wheeling WV 21 762,116 0.70% 22 850,705 0.81% 12 14 Nextier Inc. Butler PA 16 607,928 0.55% 17 588,671 0.56% 15 15 EMCF Emclaire Financial Corp. Emlenton PA 17 597,073 0.54% 16 592,183 0.56% 14 16 Brentwood Bank (Mutual HC) Bethel Park PA 9 426,251 0.39% 9 404,948 0.38% 16 17 STND Standard AVB Financial Corp Monroeville PA 11 386,333 0.35% 9 324,418 0.31% 16 18 MCSB Mercer County State Bancorp Inc. Sandy Lake PA 10 329,905 0.30% 10 295,013 0.28% 18 19 MNBP Mars National Bank Mars PA 5 302,295 0.28% 5 303,081 0.29% 17 20 CBTC CBT Financial Corp Clearfield PA 6 266,949 0.24% 6 241,026 0.23% 19 All Others (30 banks) 44 2,069,130 1.89% 50 2,116,518 2.00% TOTAL 675 109,619,446$ 100.00% 700 105,624,986$ 100.00% Note: EMCF currently competes in 9 counties in Pennsylvania, including: Allegheny, Butler, Clarion, Clearfield, Crawford, Elk, Jefferson, Mercer, & Venango. Source: SNL Financial Headquarters Deposit Market Share June 30, 2015June 30, 2016 Deposit Market Share 33
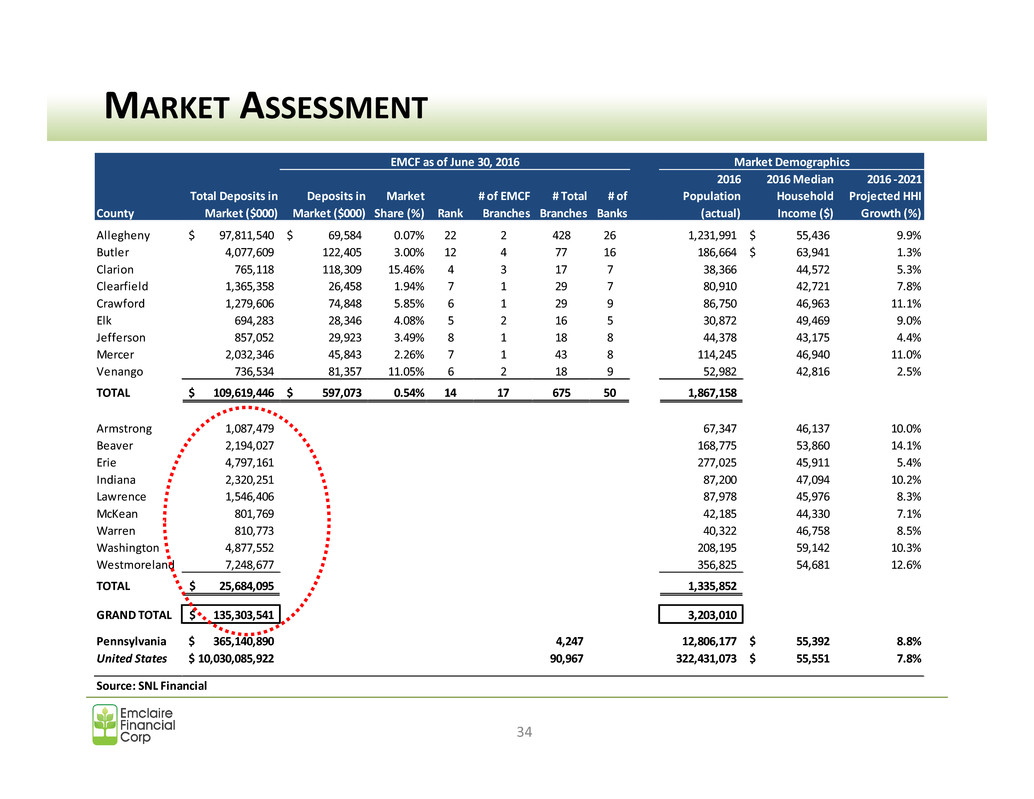
County Allegheny 97,811,540$ 69,584$ 0.07% 22 2 428 26 1,231,991 55,436$ 9.9% Butler 4,077,609 122,405 3.00% 12 4 77 16 186,664 63,941$ 1.3% Clarion 765,118 118,309 15.46% 4 3 17 7 38,366 44,572 5.3% Clearfield 1,365,358 26,458 1.94% 7 1 29 7 80,910 42,721 7.8% Crawford 1,279,606 74,848 5.85% 6 1 29 9 86,750 46,963 11.1% Elk 694,283 28,346 4.08% 5 2 16 5 30,872 49,469 9.0% Jefferson 857,052 29,923 3.49% 8 1 18 8 44,378 43,175 4.4% Mercer 2,032,346 45,843 2.26% 7 1 43 8 114,245 46,940 11.0% Venango 736,534 81,357 11.05% 6 2 18 9 52,982 42,816 2.5% TOTAL 109,619,446$ 597,073$ 0.54% 14 17 675 50 1,867,158 Armstrong 1,087,479 67,347 46,137 10.0% Beaver 2,194,027 168,775 53,860 14.1% Erie 4,797,161 277,025 45,911 5.4% Indiana 2,320,251 87,200 47,094 10.2% Lawrence 1,546,406 87,978 45,976 8.3% McKean 801,769 42,185 44,330 7.1% Warren 810,773 40,322 46,758 8.5% Washington 4,877,552 208,195 59,142 10.3% Westmoreland 7,248,677 356,825 54,681 12.6% TOTAL 25,684,095$ 1,335,852 GRAND TOTAL 135,303,541$ 3,203,010 Pennsylvania 365,140,890$ 4,247 12,806,177 55,392$ 8.8% United States 10,030,085,922$ 90,967 322,431,073 55,551$ 7.8% Source: SNL Financial 2016 Median Household Income ($) 2016 -2021 Projected HHI Growth (%) Total Deposits in Market ($000) EMCF as of June 30, 2016 Market Demographics Deposits in Market ($000) Market Share (%) Rank # of EMCF Branches # of Banks 2016 Population (actual) # Total Branches MARKET ASSESSMENT 34
• Management Trainee Program: – Develop “bench strength” for future growth – Cultivate our “leaders of tomorrow” – Invest in our future • Senior Management Succession Planning: – Identify & develop future executives – Ensure continuity across the management team HUMAN CAPITAL HIGHLIGHTS 35
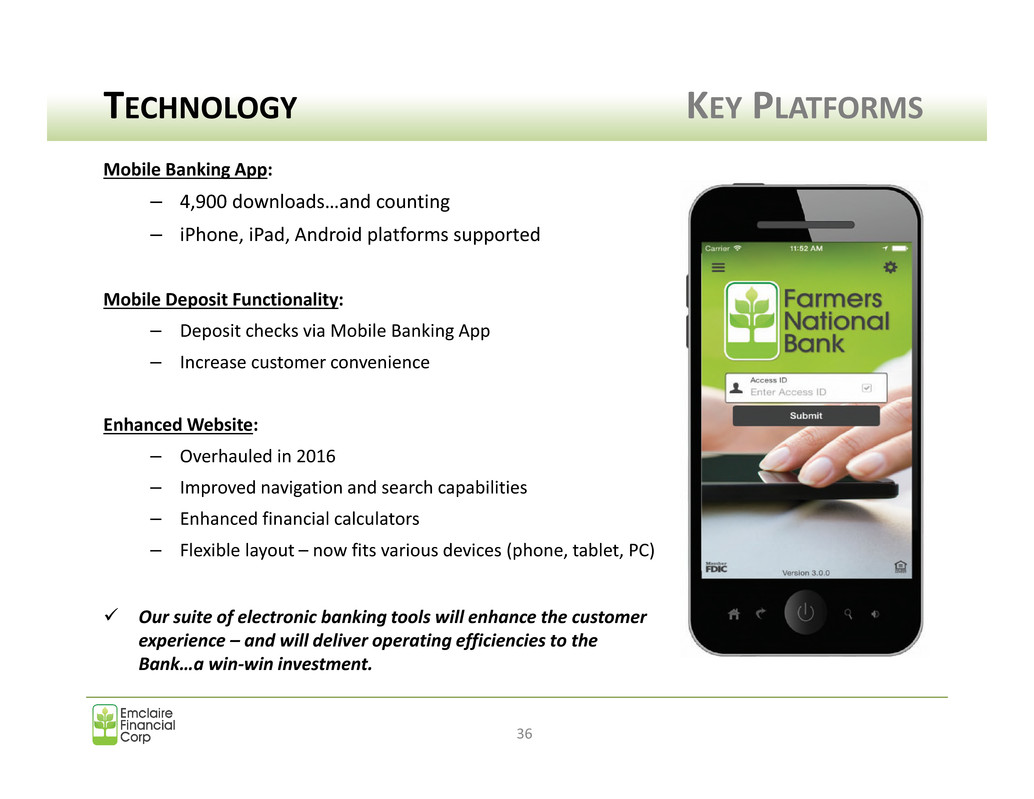
Mobile Banking App: – 4,900 downloads…and counting – iPhone, iPad, Android platforms supported Mobile Deposit Functionality: – Deposit checks via Mobile Banking App – Increase customer convenience Enhanced Website: – Overhauled in 2016 – Improved navigation and search capabilities – Enhanced financial calculators – Flexible layout – now fits various devices (phone, tablet, PC) Our suite of electronic banking tools will enhance the customer experience – and will deliver operating efficiencies to the Bank…a win-win investment. TECHNOLOGY KEY PLATFORMS 36
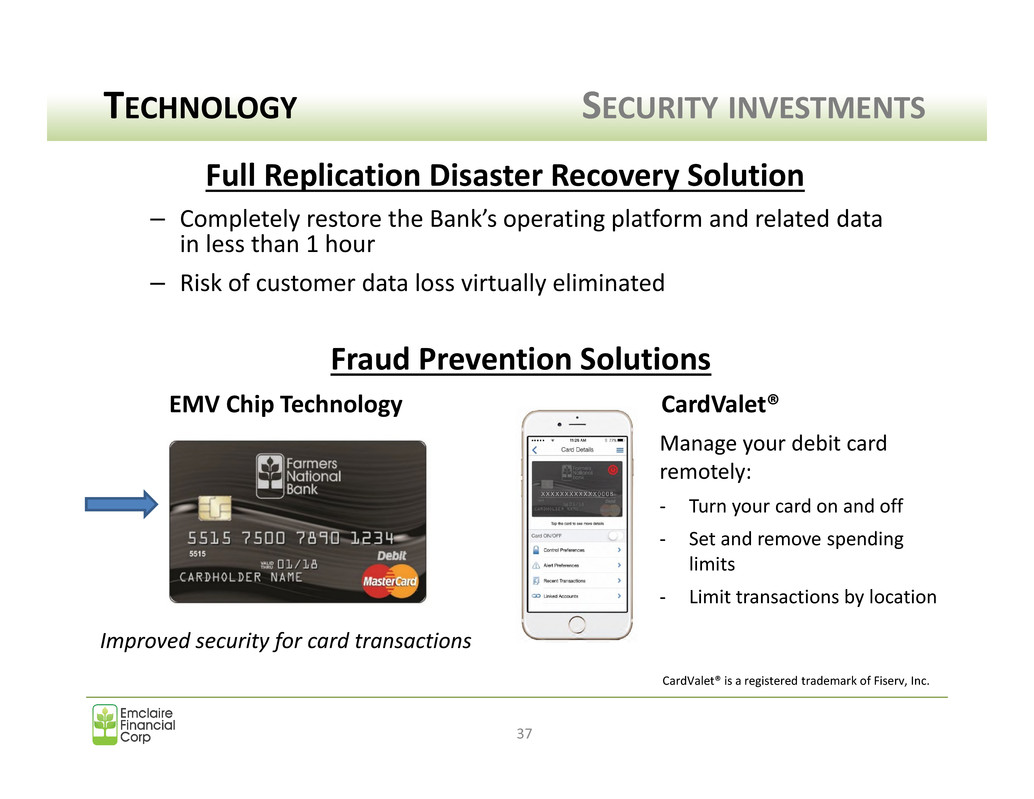
Full Replication Disaster Recovery Solution – Completely restore the Bank’s operating platform and related data in less than 1 hour – Risk of customer data loss virtually eliminated TECHNOLOGY SECURITY INVESTMENTS 37 CardValet® is a registered trademark of Fiserv, Inc. Fraud Prevention Solutions EMV Chip Technology CardValet® Improved security for card transactions Manage your debit card remotely: - Turn your card on and off - Set and remove spending limits - Limit transactions by location
STRATEGY RECAP • Corporate growth & expansion – Expand South Side customer base – Aspinwall branch growth – Next opportunity… • Continued focus on earnings growth • Continued focus on balance sheet growth & mix • Maintain strong asset quality • Improvement in systems, personnel and technology • Focus on key regulatory changes 38 --- Capitalize on our investments ---

WELL POSITIONED Capital Franchise Systems & Technology People 39
Questions and Answers Q&A SESSION 40
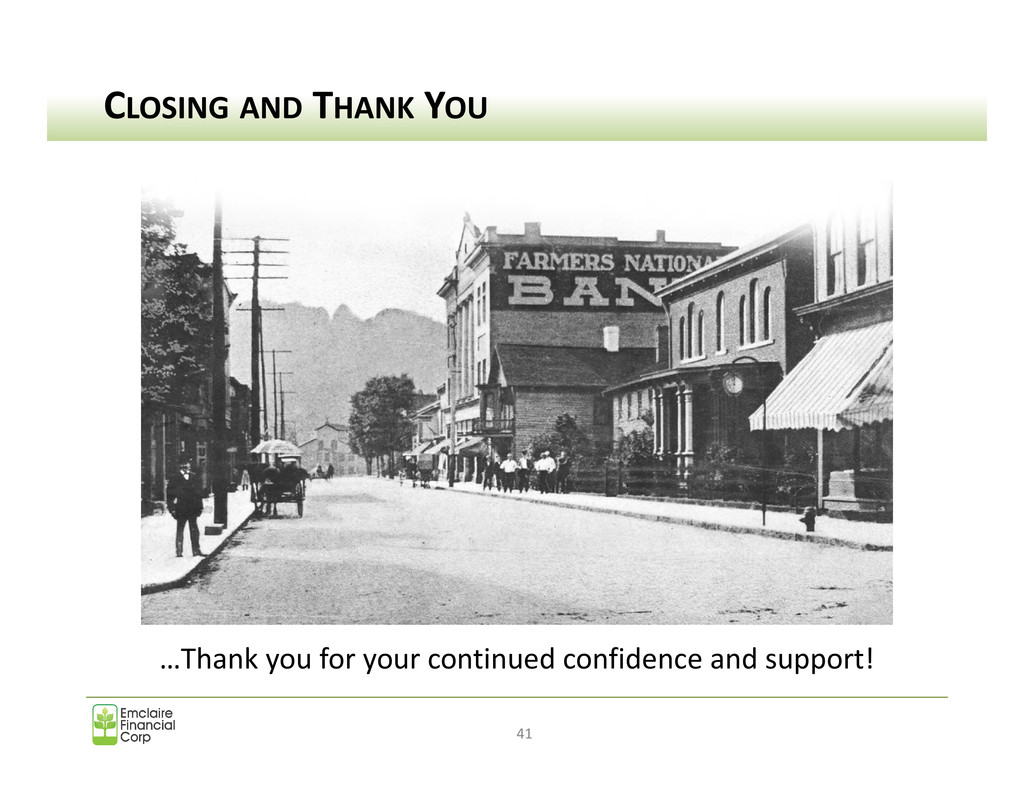
CLOSING AND THANK YOU 41 …Thank you for your continued confidence and support!


